Table of Contents
UNITED STATES
SECURITIES AND EXCHANGE COMMISSION
Washington, D.C. 20549
FORM N-CSR
CERTIFIED SHAREHOLDER REPORT OF REGISTERED
MANAGEMENT INVESTMENT COMPANIES
Investment Company Act file number 811-09102
iShares, Inc.
(Exact name of Registrant as specified in charter)
c/o: State Street Bank and Trust Company
1 Iron Street, Boston, MA 02210
(Address of principal executive offices) (Zip code)
The Corporation Trust Incorporated
351 West Camden Street, Baltimore, MD 21201
(Name and address of agent for service)
Registrant’s telephone number, including area code: 415-670-2000
Date of fiscal year end: August 31, 2014
Date of reporting period: August 31, 2014
Table of Contents
Item 1. Reports to Stockholders.
Table of Contents
AUGUST 31, 2014
2014 ANNUAL REPORT |  |
iShares, Inc.
| Ø | iShares MSCI Austria Capped ETF | EWO | NYSE Arca |
| Ø | iShares MSCI Belgium Capped ETF | EWK | NYSE Arca |
| Ø | iShares MSCI Emerging Markets Eastern Europe ETF | ESR | NYSE Arca |
| Ø | iShares MSCI France ETF | EWQ | NYSE Arca |
| Ø | iShares MSCI Italy Capped ETF | EWI | NYSE Arca |
| Ø | iShares MSCI Netherlands ETF | EWN | NYSE Arca |
| Ø | iShares MSCI Spain Capped ETF | EWP | NYSE Arca |
| Ø | iShares MSCI Sweden ETF | EWD | NYSE Arca |
| Ø | iShares MSCI Switzerland Capped ETF | EWL | NYSE Arca |
| Ø | iShares MSCI United Kingdom ETF | EWU | NYSE Arca |
Table of Contents
| 5 | ||||
| 26 | ||||
| 26 | ||||
| 27 | ||||
| 27 | ||||
| 29 | ||||
| 31 | ||||
| 33 | ||||
| 36 | ||||
| 38 | ||||
| 40 | ||||
| 41 | ||||
| 43 | ||||
| 45 | ||||
| 48 | ||||
| 61 | ||||
| 71 | ||||
| 86 | ||||
| 87 | ||||
| 88 | ||||
| 95 | ||||
| 103 |
Table of Contents
Management’s Discussion of Fund Performance
iSHARES®, INC.
INTERNATIONAL MARKET OVERVIEW
International equities rose during the 12-month period ended August 31, 2014 (the “reporting period”), as modest economic growth and solid corporate profits offset concerns about global growth, the banking system and geopolitical events. Monetary policy continued to be a driving force for international equities, as several countries took steps to stimulate economic growth (as measured by gross domestic product, or “GDP”). The European Central Bank (“ECB”) cut interest rates several times, the Bank of Japan continued its bond purchasing efforts, and the U.S. Federal Reserve Bank (the “Fed”) reduced its unprecedented stimulus program.
Accommodative monetary policy and improving global growth led to a sustained rally in international equities from September to December 2013. However, events in early 2014 dampened the rally, as slow economic growth in the U.S. and China and the conflict in Ukraine raised concerns for international investors. In the final months of the reporting period, stagnant European growth, a Portuguese bank default and military escalation in Ukraine dampened international markets’ performance, particularly in Europe. Despite these challenges, most international markets finished with a solid return for the reporting period.
North American markets delivered strong gains during the reporting period. The U.S. economy strengthened in the latter half of the reporting period, as the combination of accommodative monetary policy, low inflation, steady job growth and rising corporate profits drove economic growth. Canada and Mexico also generated steady economic growth and rising stock prices during the reporting period.
Asian markets advanced during the reporting period, as investors generally embraced the region’s progress toward economic and political reform. Slow global growth presented new challenges for China and India after rapid economic growth in past decades. China, India and Japan, the three largest economies in the region, pursued dramatic changes to improve their competitive edge in the changing global economy.
China, Asia’s largest economy, continued to transition from an economy based on investment and manufacturing toward one based on consumption and services, which led to slowing economic growth. India underwent substantial political and economic change during the reporting period. The Bank of India made significant progress on curbing inflation, while the Indian government pursued growth-oriented political reform. By contrast, Japan attempted to reignite economic growth with monetary stimulus and political reform after twenty years of economic stagnation.
European equities posted solid gains while trailing developed markets in Asia and North America. Europe took steps toward an economic recovery during the reporting period after enduring a financial crisis and an economic recession. Europe’s uneven path to recovery included an improving credit environment and lower interest rates, as well as declining inflation and stagnant demand. France and Germany were mired in sluggish economic growth, while the United Kingdom expanded at a moderate pace during the reporting period. Spain and Italy experienced dramatically improving credit markets and lower interest rates, helping to revive investors’ interest in Spanish and Italian financial markets. European equity markets declined during the final months of the reporting period, as fear of economic stagnation and declining prices spurred the ECB to consider additional monetary support.
At the highest level, economic crosscurrents rippled across markets, while the ebb and flow of geopolitical risks drove market performance during the reporting period. International markets advanced through the uncertainty, as investors welcomed moderate global growth, low inflation and improving credit conditions.
MANAGEMENT’S DISCUSSIONSOF FUND PERFORMANCE | 5 |
Table of Contents
Management’s Discussion of Fund Performance
iSHARES® MSCI AUSTRIA CAPPED ETF
Performance as of August 31, 2014
| Average Annual Total Returns | Cumulative Total Returns | |||||||||||||||||||||||||
| NAV | MARKET | INDEX | NAV | MARKET | INDEX | |||||||||||||||||||||
1 Year | 1.56% | 1.03% | 1.64% | 1.56% | 1.03% | 1.64% | ||||||||||||||||||||
5 Years | 0.16% | 0.02% | 0.19% | 0.80% | 0.11% | 0.97% | ||||||||||||||||||||
10 Years | 3.00% | 2.86% | 2.83% | 34.37% | 32.64% | 32.20% | ||||||||||||||||||||
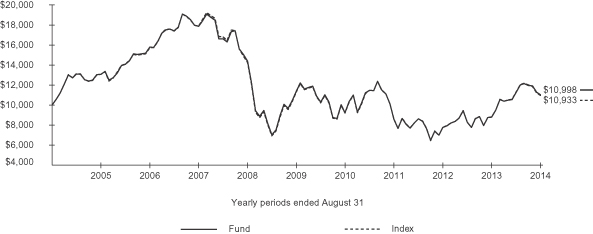
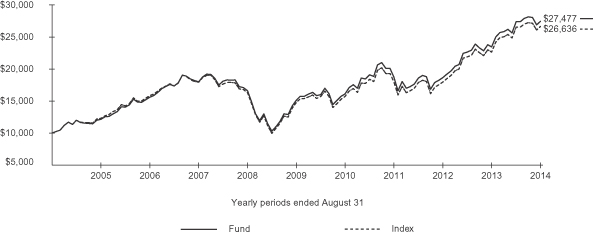
GROWTH OF $10,000 INVESTMENT
(AT NET ASSET VALUE)
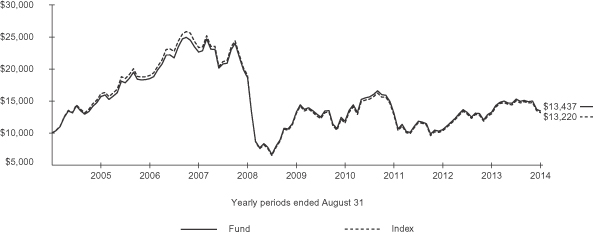
Index performance through January 31, 2008 reflects the performance of the MSCI Austria Index. Index performance beginning on February 1, 2008 through February 11, 2013 reflects the performance of the MSCI Austria Investable Market Index. Index performance beginning on February 12, 2013 reflects the performance of the MSCI Austria Investable Market Index 25/50.
Past performance is no guarantee of future results. Performance results do not reflect the deduction of taxes that a shareholder would pay on fund distributions or on the redemption or sale of fund shares. See “About Fund Performance” on page 26 for more information.
| Shareholder Expenses | ||||||||||||||||||||||||||
| Actual | Hypothetical 5% Return | |||||||||||||||||||||||||
| Beginning Account Value (3/1/14) | Ending Account Value (8/31/14) | Expenses Paid During Period a | Beginning Account Value (3/1/14) | Ending Account Value (8/31/14) | Expenses Paid During Period a | Annualized Expense Ratio | ||||||||||||||||||||
| $ | 1,000.00 | $ | 879.20 | $ | 2.27 | $ | 1,000.00 | $ | 1,022.80 | $ | 2.45 | 0.48% | ||||||||||||||
| a | Expenses are calculated using the Fund’s annualized expense ratio (as disclosed in the table), multiplied by the average account value for the period, multiplied by the number of days in the period (184 days) and divided by the number of days in the year (365 days). See “Shareholder Expenses” on page 26 for more information. |
| 6 | 2014 iSHARES ANNUAL REPORTTO SHAREHOLDERS |
Table of Contents
Management’s Discussion of Fund Performance (Continued)
iSHARES® MSCI AUSTRIA CAPPED ETF
The iShares MSCI Austria Capped ETF (the “Fund”) seeks to track the investment results of a broad-based index composed of Austrian equities, as represented by the MSCI Austria Investable Market Index 25/50 (the “Index”). The Fund invests in a representative sample of securities included in the Index that collectively has an investment profile similar to the Index. Due to the use of representative sampling, the Fund may or may not hold all of the securities that are included in the Index. For the 12-month reporting period ended August 31, 2014, the total return for the Fund was 1.56%, net of fees, while the total return for the Index was 1.64%.
The Index posted a modestly positive return for the reporting period. The Index underperformed on local credit concerns while the broad international developed markets, as measured by the MSCI EAFE Index, advanced on improving credit conditions and generally accommodative monetary policy. During the first half of the reporting period, Austrian stocks benefited from the broad rally in international stocks. However, Austrian stocks declined sharply and trailed international stocks in the second half of the reporting period.
The financials sector, the largest sector representation in the Index, weighed on performance during the reporting period. Austrian banks have struggled to rebuild capital since the financial crisis in 2008. During the reporting period, Austria’s banking issues continued to raise concerns for investors. In particular, loans made to emerging European countries, as well as exposures in Russia and Ukraine, became problematic for several Austrian banks.
The Index declined sharply in the last two months of the reporting period as investors’ scrutiny intensified on the Austrian banking sector after a series of negative headlines. Hungarian legislation that required banks to reimburse borrowers for credit costs weighed on the profits of Austrian banks. The continued weakness in the credit quality of Austrian loans also prompted negative views from a major credit agency. Similarly, the Austrian central bank criticized lending practices, stating that lenders should review their business model.
PORTFOLIO ALLOCATION
As of 8/31/14
| Sector | Percentage of Total Investments* |
Financials | 40.53 | % | ||
Industrials | 22.91 | |||
Materials | 16.22 | |||
Energy | 13.75 | |||
Telecommunication Services | 2.45 | |||
Information Technology | 1.95 | |||
Utilities | 1.62 | |||
Consumer Discretionary | 0.57 | |||
|
| |||
TOTAL | 100.00 | % | ||
|
|
TEN LARGEST FUND HOLDINGS
As of 8/31/14
| Security | Percentage of Total Investments* |
Erste Group Bank AG | 13.88 | % | ||
OMV AG | 10.65 | |||
Voestalpine AG | 8.72 | |||
Andritz AG | 6.86 | |||
Raiffeisen International Bank Holding AG | 4.96 | |||
IMMOFINANZ AG | 4.54 | |||
Vienna Insurance Group AG | 4.48 | |||
Wienerberger AG | 4.34 | |||
Oesterreichische Post AG | 3.96 | |||
CA Immobilien Anlagen AG | 3.92 | |||
|
| |||
TOTAL | 66.31 | % | ||
|
|
| * | Excludes money market funds. |
MANAGEMENT’S DISCUSSIONSOF FUND PERFORMANCE | 7 |
Table of Contents
Management’s Discussion of Fund Performance
iSHARES® MSCI BELGIUM CAPPED ETF
Performance as of August 31, 2014
| Average Annual Total Returns | Cumulative Total Returns | |||||||||||||||||||||||||
| NAV | MARKET | INDEX | NAV | MARKET | INDEX | |||||||||||||||||||||
1 Year | 23.05% | 22.79% | 23.12% | 23.05% | 22.79% | 23.12% | ||||||||||||||||||||
5 Years | 10.84% | 10.80% | 12.67% | 67.29% | 66.98% | 81.58% | ||||||||||||||||||||
10 Years | 5.14% | 5.03% | 5.57% | 65.12% | 63.38% | 71.96% | ||||||||||||||||||||
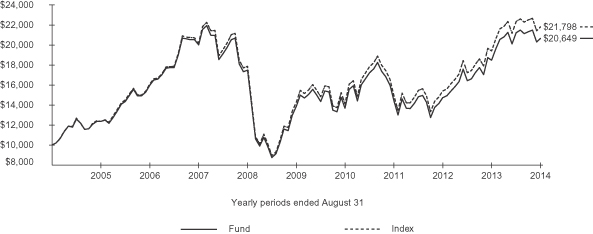
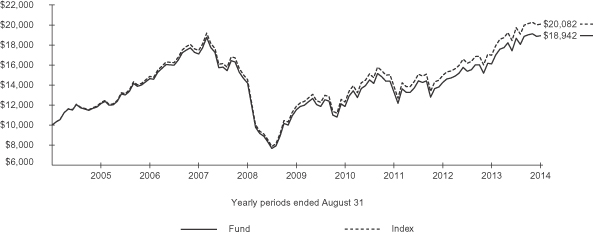
GROWTH OF $10,000 INVESTMENT
(AT NET ASSET VALUE)
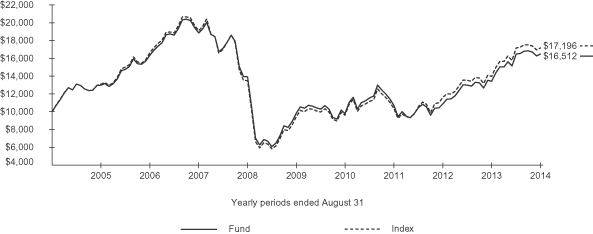
Index performance through November 30, 2007 reflects the performance of the MSCI Belgium Index. Index performance beginning on December 1, 2007 through November 8, 2012 reflects the performance of the MSCI Belgium Investable Market Index. Index performance beginning on November 9, 2012 reflects the performance of the MSCI Belgium Investable Market Index 25/50.
Past performance is no guarantee of future results. Performance results do not reflect the deduction of taxes that a shareholder would pay on fund distributions or on the redemption or sale of fund shares. See “About Fund Performance” on page 26 for more information.
| Shareholder Expenses | ||||||||||||||||||||||||||
| Actual | Hypothetical 5% Return | |||||||||||||||||||||||||
| Beginning Account Value (3/1/14) | Ending Account Value (8/31/14) | Expenses Paid During Period a | Beginning Account Value (3/1/14) | Ending Account Value (8/31/14) | Expenses Paid During Period a | Annualized Expense Ratio | ||||||||||||||||||||
| $ | 1,000.00 | $ | 1,000.30 | $ | 2.42 | $ | 1,000.00 | $ | 1,022.80 | $ | 2.45 | 0.48% | ||||||||||||||
| a | Expenses are calculated using the Fund’s annualized expense ratio (as disclosed in the table), multiplied by the average account value for the period, multiplied by the number of days in the period (184 days) and divided by the number of days in the year (365 days). See “Shareholder Expenses” on page 26 for more information. |
| 8 | 2014 iSHARES ANNUAL REPORTTO SHAREHOLDERS |
Table of Contents
Management’s Discussion of Fund Performance (Continued)
iSHARES® MSCI BELGIUM CAPPED ETF
The iShares MSCI Belgium Capped ETF (the “Fund”) seeks to track the investment results of a broad-based index composed of Belgian equities, as represented by the MSCI Belgium Investable Market Index 25/50 (the “Index”). The Fund invests in a representative sample of securities included in the Index that collectively has an investment profile similar to the Index. Due to the use of representative sampling, the Fund may or may not hold all of the securities that are included in the Index. For the 12-month reporting period ended August 31, 2014, the total return for the Fund was 23.05%, net of fees, while the total return for the Index was 23.12%.
Belgian stocks, as represented by the Index, posted a strong return for the reporting period, outperforming the broad international developed markets, as measured by the MSCI EAFE Index.
The Belgian economy experienced slightly positive growth during the reporting period, as the eurozone’s economy emerged from recession. Low and falling inflation during the reporting period led to concern that the Belgian economy was at risk of a deflationary cycle. Nevertheless, investors found reasons for optimism, as Belgium was well-positioned to benefit from a broader European economic recovery. Belgium’s export-based economy relies heavily on trade with the rest of Europe. Signs of rising demand in Europe boosted industrial production in Belgium, leading investors to Belgian stocks that would benefit from the European recovery. Stock performance was especially strong in the first half of the reporting period, before stagnating in the second half of the reporting period.
Anheuser-Busch InBev NV, the largest constituent in the Index, comprised approximately 20% of the Index as of the end of the reporting period. The stock rallied during the reporting period, contributing to the strong performance of the Index.
PORTFOLIO ALLOCATION
As of 8/31/14
| Sector | Percentage of Total Investments* |
Consumer Staples | 28.91 | % | ||
Financials | 26.29 | |||
Health Care | 12.61 | |||
Materials | 12.35 | |||
Telecommunication Services | 4.38 | |||
Consumer Discretionary | 4.35 | |||
Information Technology | 3.98 | |||
Industrials | 3.48 | |||
Energy | 2.37 | |||
Utilities | 1.28 | |||
|
| |||
TOTAL | 100.00 | % | ||
|
|
TEN LARGEST FUND HOLDINGS
As of 8/31/14
| Security | Percentage of Total Investments* |
Anheuser-Busch InBev NV | 22.33 | % | ||
KBC Groep NV | 7.72 | |||
UCB SA | 6.67 | |||
Solvay SA | 5.15 | |||
Groupe Bruxelles Lambert SA | 4.43 | |||
Delhaize Brothers and Co. “The Lion” (Delhaize Group) SA | 4.26 | |||
Ageas | 4.17 | |||
Belgacom SA | 3.53 | |||
Umicore SA | 3.31 | |||
Colruyt SA | 2.31 | |||
|
| |||
TOTAL | 63.88 | % | ||
|
|
| * | Excludes money market funds. |
MANAGEMENT’S DISCUSSIONSOF FUND PERFORMANCE | 9 |
Table of Contents
Management’s Discussion of Fund Performance
iSHARES® MSCI EMERGING MARKETS EASTERN EUROPE ETF
Performance as of August 31, 2014
| Average Annual Total Returns | Cumulative Total Returns | |||||||||||||||||||||||||
| NAV | MARKET | INDEX | NAV | MARKET | INDEX | |||||||||||||||||||||
1 Year | (3.21)% | (2.90)% | (2.83)% | (3.21)% | (2.90)% | (2.83)% | ||||||||||||||||||||
Since Inception | 0.36% | 0.34% | 0.85% | 1.76% | 1.70% | 4.25% | ||||||||||||||||||||
GROWTH OF $10,000 INVESTMENT
(SINCE INCEPTION AT NET ASSET VALUE)
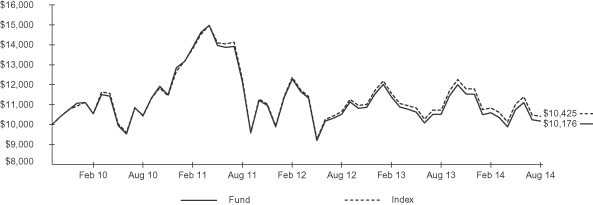
The inception date of the Fund was 9/30/09. The first day of secondary market trading was 10/2/09.
Past performance is no guarantee of future results. Performance results do not reflect the deduction of taxes that a shareholder would pay on fund distributions or on the redemption or sale of fund shares. See “About Fund Performance” on page 26 for more information.
| Shareholder Expenses | ||||||||||||||||||||||||||
| Actual | Hypothetical 5% Return | |||||||||||||||||||||||||
| Beginning Account Value (3/1/14) | Ending Account Value (8/31/14) | Expenses Paid During Period a | Beginning Account Value (3/1/14) | Ending Account Value (8/31/14) | Expenses Paid During Period a | Annualized Expense Ratio | ||||||||||||||||||||
| $ | 1,000.00 | $ | 961.10 | $ | 3.36 | $ | 1,000.00 | $ | 1,021.80 | $ | 3.47 | 0.68% | ||||||||||||||
| a | Expenses are calculated using the Fund’s annualized expense ratio (as disclosed in the table), multiplied by the average account value for the period, multiplied by the number of days in the period (184 days) and divided by the number of days in the year (365 days). See “Shareholder Expenses” on page 26 for more information. |
| 10 | 2014 iSHARES ANNUAL REPORTTO SHAREHOLDERS |
Table of Contents
Management’s Discussion of Fund Performance (Continued)
iSHARES® MSCI EMERGING MARKETS EASTERN EUROPE ETF
The iShares MSCI Emerging Markets Eastern Europe ETF (the “Fund”) seeks to track the investment results of an index composed of Eastern European emerging market equities, as represented by the MSCI Emerging Markets Eastern Europe Index (the “Index”). The Fund invests in a representative sample of securities included in the Index that collectively has an investment profile similar to the Index. Due to the use of representative sampling, the Fund may or may not hold all of the securities that are included in the Index. For the 12-month reporting period ended August 31, 2014, the total return for the Fund was -3.21%, net of fees, while the total return for the Index was -2.83%.
As represented by the Index, emerging markets stocks in Eastern Europe declined by approximately 3% for the reporting period, underperforming the gain of the broad MSCI Emerging Markets Index.
The key factor behind the overall decline for the Index was a negative return for Russian stocks, which comprised approximately 72% of the Index on average for the reporting period. The Russian constituents of the Index declined by 6% for the reporting period as persistent weakness in the Russian economy and an armed conflict in neighboring Ukraine weighed on the country’s equity market.
Among the other three countries in the Index, Poland and the Czech Republic (together comprising approximately one-quarter of the Index) posted positive returns, gaining 7% and 18%, respectively, for the reporting period. The economies in both countries began to recover after an extended period of weakness. The remaining country within the Index, Hungary, produced a large decline, falling by 17% amid a softening economy and its close proximity to the conflict in the Ukraine.
Currency fluctuations relative to the U.S. dollar also contributed to the decline in the Index for the reporting period. A stronger U.S. dollar reduces international equity returns for U.S. investors. Although the U.S. dollar declined by 1% against the Polish zloty, it appreciated by 5% versus the Hungarian forint, 8% against the Czech koruna, and 11% versus the Russian ruble during the reporting period.
PORTFOLIO ALLOCATION
As of 8/31/14
| Sector | Percentage of Total Investments* |
Energy | 42.26 | % | ||
Financials | 26.29 | |||
Materials | 10.05 | |||
Telecommunication Services | 7.64 | |||
Utilities | 5.91 | |||
Consumer Staples | 5.72 | |||
Consumer Discretionary | 1.33 | |||
Health Care | 0.80 | |||
|
| |||
TOTAL | 100.00 | % | ||
|
|
COUNTRY ALLOCATIONS
As of 8/31/14
| Country | Percentage of Total Investments* |
Russia | 69.50 | % | ||
Poland | 24.26 | |||
Czech Republic | 3.32 | |||
Hungary | 2.92 | |||
|
| |||
TOTAL | 100.00 | % | ||
|
|
| * | Excludes money market funds. |
MANAGEMENT’S DISCUSSIONSOF FUND PERFORMANCE | 11 |
Table of Contents
Management’s Discussion of Fund Performance
iSHARES® MSCI FRANCE ETF
Performance as of August 31, 2014
| Average Annual Total Returns | Cumulative Total Returns | |||||||||||||||||||||||||
| NAV | MARKET | INDEX | NAV | MARKET | INDEX | |||||||||||||||||||||
1 Year | 14.07% | 13.45% | 14.11% | 14.07% | 13.45% | 14.11% | ||||||||||||||||||||
5 Years | 5.60% | 5.48% | 5.64% | 31.33% | 30.60% | 31.58% | ||||||||||||||||||||
10 Years | 5.95% | 5.87% | 6.09% | 78.31% | 76.82% | 80.54% | ||||||||||||||||||||
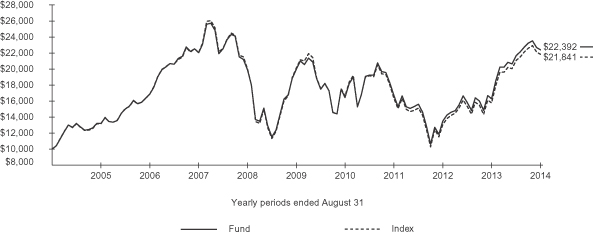
GROWTH OF $10,000 INVESTMENT
(AT NET ASSET VALUE)
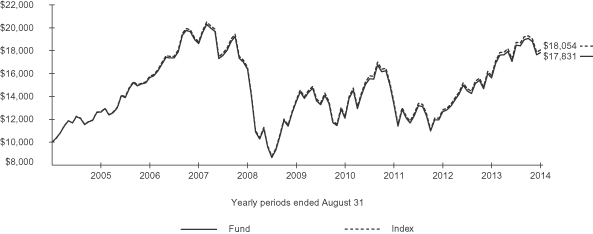
Past performance is no guarantee of future results. Performance results do not reflect the deduction of taxes that a shareholder would pay on fund distributions or on the redemption or sale of fund shares. See “About Fund Performance” on page 26 for more information.
| Shareholder Expenses | ||||||||||||||||||||||||||
| Actual | Hypothetical 5% Return | |||||||||||||||||||||||||
| Beginning Account Value (3/1/14) | Ending Account Value (8/31/14) | Expenses Paid During Period a | Beginning Account Value (3/1/14) | Ending Account Value (8/31/14) | Expenses Paid During Period a | Annualized Expense Ratio | ||||||||||||||||||||
| $ | 1,000.00 | $ | 965.40 | $ | 2.38 | $ | 1,000.00 | $ | 1,022.80 | $ | 2.45 | 0.48% | ||||||||||||||
| a | Expenses are calculated using the Fund’s annualized expense ratio (as disclosed in the table), multiplied by the average account value for the period, multiplied by the number of days in the period (184 days) and divided by the number of days in the year (365 days). See “Shareholder Expenses” on page 26 for more information. |
| 12 | 2014 iSHARES ANNUAL REPORTTO SHAREHOLDERS |
Table of Contents
Management’s Discussion of Fund Performance (Continued)
iSHARES® MSCI FRANCE ETF
The iShares MSCI France ETF (the “Fund”) seeks to track the investment results of an index composed of French equities, as represented by the MSCI France Index (the “Index”). The Fund invests in a representative sample of securities included in the Index that collectively has an investment profile similar to the Index. Due to the use of representative sampling, the Fund may or may not hold all of the securities that are included in the Index. For the 12-month reporting period ended August 31, 2014, the total return for the Fund was 14.07%, net of fees, while the total return for the Index was 14.11%.
French stocks, as represented by the Index, generated solid performance during the reporting period, but underperformed the broad international developed markets, as measured by the MSCI EAFE Index. A sharp correction in the French stock market during the final months of the reporting period limited Index performance, as geopolitical tension, lingering concerns about the banking system and weak economic output discouraged investors.
France, the second largest economy in Europe, experienced stagnant growth for most of the reporting period. Nevertheless, investors found reasons for optimism. Every economic sector in the Index posted a positive return during the reporting period. Financials and industrials stocks, the two largest sectors in the Index, delivered solid gains. Financials stocks rallied on renewed optimism for a sustained European economic recovery, improving credit markets and generally accommodative monetary policy. Industrials stocks advanced despite relatively weak industrial production, as investors anticipated an economic recovery in Europe. The energy sector also generated a solid contribution to the Index return despite declining oil and volatile natural gas prices. The telecommunication services and health care sectors also rallied during the reporting period.
High unemployment, inconsistent consumer spending and relatively lower consumer confidence weighed on consumer-based stocks, which accounted for approximately 24% of the Index during the reporting period. Information technology stocks also lagged the other sectors in the Index.
PORTFOLIO ALLOCATION
As of 8/31/14
| Sector | Percentage of Total Investments* |
Industrials | 17.53 | % | ||
Financials | 17.45 | |||
Consumer Discretionary | 13.45 | |||
Health Care | 11.49 | |||
Energy | 11.40 | |||
Consumer Staples | 10.40 | |||
Materials | 6.05 | |||
Telecommunication Services | 4.95 | |||
Utilities | 4.27 | |||
Information Technology | 3.01 | |||
|
| |||
TOTAL | 100.00 | % | ||
|
|
TEN LARGEST FUND HOLDINGS
As of 8/31/14
| Security | Percentage of Total Investments* |
Total SA | 10.69 | % | ||
Sanofi | 9.85 | |||
BNP Paribas SA | 5.41 | |||
LVMH Moet Hennessy Louis Vuitton SA | 3.67 | |||
AXA SA | 3.41 | |||
Schneider Electric SE | 3.34 | |||
L’Air Liquide SA | 3.33 | |||
L’Oreal SA | 3.15 | |||
Danone SA | 3.06 | |||
Societe Generale | 2.76 | |||
|
| |||
TOTAL | 48.67 | % | ||
|
|
| * | Excludes money market funds. |
MANAGEMENT’S DISCUSSIONSOF FUND PERFORMANCE | 13 |
Table of Contents
Management’s Discussion of Fund Performance
iSHARES® MSCI ITALY CAPPED ETF
Performance as of August 31, 2014
| Average Annual Total Returns | Cumulative Total Returns | |||||||||||||||||||||||||
| NAV | MARKET | INDEX | NAV | MARKET | INDEX | |||||||||||||||||||||
1 Year | 25.20% | 24.88% | 24.30% | 25.20% | 24.88% | 24.30% | ||||||||||||||||||||
5 Years | (0.71)% | (0.78)% | (0.69)% | (3.48)% | (3.85)% | (3.39)% | ||||||||||||||||||||
10 Years | 0.96% | 0.86% | 0.90% | 9.98% | 8.94% | 9.33% | ||||||||||||||||||||
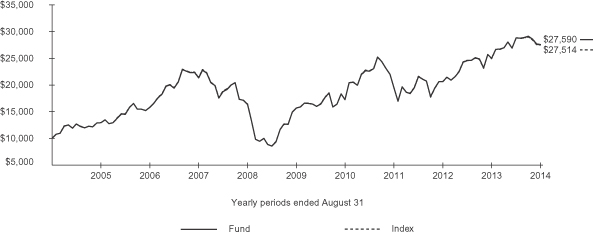
GROWTH OF $10,000 INVESTMENT
(AT NET ASSET VALUE)
Index performance through February 11, 2013 reflects the performance of the MSCI Italy Index. Index performance beginning on February 12, 2013 reflects the performance of the MSCI Italy 25/50 Index.
Past performance is no guarantee of future results. Performance results do not reflect the deduction of taxes that a shareholder would pay on fund distributions or on the redemption or sale of fund shares. See “About Fund Performance” on page 26 for more information.
| Shareholder Expenses | ||||||||||||||||||||||||||
| Actual | Hypothetical 5% Return | |||||||||||||||||||||||||
| Beginning Account Value (3/1/14) | Ending Account Value (8/31/14) | Expenses Paid During Period a | Beginning Account Value (3/1/14) | Ending Account Value (8/31/14) | Expenses Paid During Period a | Annualized Expense Ratio | ||||||||||||||||||||
| $ | 1,000.00 | $ | 976.30 | $ | 2.39 | $ | 1,000.00 | $ | 1,022.80 | $ | 2.45 | 0.48% | ||||||||||||||
| a | Expenses are calculated using the Fund’s annualized expense ratio (as disclosed in the table), multiplied by the average account value for the period, multiplied by the number of days in the period (184 days) and divided by the number of days in the year (365 days). See “Shareholder Expenses” on page 26 for more information. |
| 14 | 2014 iSHARES ANNUAL REPORTTO SHAREHOLDERS |
Table of Contents
Management’s Discussion of Fund Performance (Continued)
iSHARES® MSCI ITALY CAPPED ETF
The iShares MSCI Italy Capped ETF (the “Fund”) seeks to track the investment results of an index composed of Italian equities, as represented by the MSCI Italy 25/50 Index (the “Index”). The Fund invests in a representative sample of securities included in the Index that collectively has an investment profile similar to the Index. Due to the use of representative sampling, the Fund may or may not hold all of the securities that are included in the Index. For the 12-month reporting period ended August 31, 2014, the total return for the Fund was 25.20%, net of fees, while the total return for the Index was 24.30%.
The Index posted strong performance during the reporting period and outperformed the broad international developed markets, as measured by the MSCI EAFE Index.
The Italian stock market rapidly advanced for most of the reporting period on renewed optimism for Europe’s most beleaguered economies. In the last two months of the reporting period, however, the market declined, as investors shifted their focus to geopolitical tensions in Ukraine and stagnant European growth.
The Italian economy remained mired in a multi-year recession during the reporting period. In addition, Italy’s economy fell into deflation, an extended period of declining prices, for the first time in more than 50 years as the reporting period came to a close. The unemployment rate remained above 12% for the entire reporting period. As a result, consumer spending fell during the first half of the reporting period, before stabilizing during the second half of the reporting period. A bright spot for the Italian economy was declining government bond yields, as the European Union’s lending program, reduced government spending and declining inflation drove bond yields lower.
In that environment, the Index posted a strong gain despite economic weakness, as investors anticipated a recovery in the European economy and better growth prospects for the beleaguered Italian economy. Many of the Index’s individual stocks and several economic sectors advanced during the reporting period.
PORTFOLIO ALLOCATION
As of 8/31/14
| Sector | Percentage of Total Investments* |
Financials | 36.11 | % | ||
Energy | 21.98 | |||
Utilities | 17.00 | |||
Industrials | 11.23 | |||
Consumer Discretionary | 9.01 | |||
Telecommunication Services | 4.67 | |||
|
| |||
TOTAL | 100.00 | % | ||
|
|
TEN LARGEST FUND HOLDINGS
As of 8/31/14
| Security | Percentage of Total Investments* |
Eni SpA | 17.18 | % | ||
Enel SpA | 8.55 | |||
Intesa Sanpaolo SpA | 8.49 | |||
UniCredit SpA | 8.34 | |||
Snam SpA | 4.46 | |||
Assicurazioni Generali SpA | 4.46 | |||
Tenaris SA | 4.05 | |||
Atlantia SpA | 3.93 | |||
Luxottica Group SpA | 3.58 | |||
Fiat SpA | 3.43 | |||
|
| |||
TOTAL | 66.47 | % | ||
|
|
| * | Excludes money market funds. |
MANAGEMENT’S DISCUSSIONSOF FUND PERFORMANCE | 15 |
Table of Contents
Management’s Discussion of Fund Performance
iSHARES® MSCI NETHERLANDS ETF
Performance as of August 31, 2014
| Average Annual Total Returns | Cumulative Total Returns | |||||||||||||||||||||||||
| NAV | MARKET | INDEX | NAV | MARKET | INDEX | |||||||||||||||||||||
1 Year | 11.80% | 11.48% | 12.30% | 11.80% | 11.48% | 12.30% | ||||||||||||||||||||
5 Years | 8.27% | 8.17% | 8.80% | 48.76% | 48.13% | 52.47% | ||||||||||||||||||||
10 Years | 7.52% | 7.48% | 8.10% | 106.49% | 105.64% | 117.98% | ||||||||||||||||||||
GROWTH OF $10,000 INVESTMENT
(AT NET ASSET VALUE)
Index performance through January 31, 2008 reflects the performance of the MSCI Netherlands Index. Index performance beginning on February 1, 2008 reflects the performance of the MSCI Netherlands Investable Market Index.
Past performance is no guarantee of future results. Performance results do not reflect the deduction of taxes that a shareholder would pay on fund distributions or on the redemption or sale of fund shares. See “About Fund Performance” on page 26 for more information.
| Shareholder Expenses | ||||||||||||||||||||||||||
| Actual | Hypothetical 5% Return | |||||||||||||||||||||||||
| Beginning Account Value (3/1/14) | Ending Account Value (8/31/14) | Expenses Paid During Period a | Beginning Account Value (3/1/14) | Ending Account Value (8/31/14) | Expenses Paid During Period a | Annualized Expense Ratio | ||||||||||||||||||||
| $ | 1,000.00 | $ | 973.00 | $ | 2.39 | $ | 1,000.00 | $ | 1,022.80 | $ | 2.45 | 0.48% | ||||||||||||||
| a | Expenses are calculated using the Fund’s annualized expense ratio (as disclosed in the table), multiplied by the average account value for the period, multiplied by the number of days in the period (184 days) and divided by the number of days in the year (365 days). See “Shareholder Expenses” on page 26 for more information. |
| 16 | 2014 iSHARES ANNUAL REPORTTO SHAREHOLDERS |
Table of Contents
Management’s Discussion of Fund Performance (Continued)
iSHARES® MSCI NETHERLANDS ETF
The iShares MSCI Netherlands ETF (the “Fund”) seeks to track the investment results of a broad-based index composed of Dutch equities, as represented by the MSCI Netherlands Investable Market Index (the “Index”). The Fund invests in a representative sample of securities included in the Index that collectively has an investment profile similar to the Index. Due to the use of representative sampling, the Fund may or may not hold all of the securities that are included in the Index. For the 12-month reporting period ended August 31, 2014, the total return for the Fund was 11.80%, net of fees, while the total return for the Index was 12.30%.
The Index delivered a solid return for the reporting period. The Dutch stock market rallied sharply in the first few months of the reporting period, but ultimately lagged the MSCI EAFE Index, a broad gauge of international developed market stocks, for the duration of the reporting period.
Consumer-based stocks, which comprised approximately 37% of the Index on average during the reporting period, rallied as consumer spending increased during the second half of the reporting period, aided by rising home prices. As a result, consumer-based stocks posted a solid contribution to the Index’s return. The financials sector was a source of strong performance, as financials stocks rallied on improving credit conditions and lower interest rates in many European countries. The telecommunication services sector also outperformed the overall Index, contributing to the Index’s performance.
The energy sector declined amid volatile oil and natural gas prices, and detracted from the Index’s performance during the reporting period. Other sectors with exposure to the economic cycle, including the industrials and materials sectors, lagged the overall Index, as industrial production declined sharply during the winter of 2013. Information technology stocks also delivered modest results during the reporting period.
PORTFOLIO ALLOCATION
As of 8/31/14
| Sector | Percentage of Total Investments* |
Consumer Staples | 29.35 | % | ||
Financials | 21.37 | |||
Industrials | 15.00 | |||
Information Technology | 11.56 | |||
Consumer Discretionary | 8.07 | |||
Materials | 7.65 | |||
Telecommunication Services | 4.62 | |||
Energy | 2.38 | |||
|
| |||
TOTAL | 100.00 | % | ||
|
|
TEN LARGEST FUND HOLDINGS
As of 8/31/14
| Security | Percentage of Total Investments* |
Unilever NV CVA | 17.63 | % | ||
ING Groep NV CVA | 13.81 | |||
ASML Holding NV | 8.91 | |||
Koninklijke Philips NV | 7.70 | |||
Heineken NV | 4.57 | |||
Akzo Nobel NV | 4.42 | |||
Reed Elsevier NV | 4.15 | |||
Koninklijke Ahold NV | 4.14 | |||
AEGON NV | 3.73 | |||
Koninklijke DSM NV | 3.00 | |||
|
| |||
TOTAL | 72.06 | % | ||
|
|
| * | Excludes money market funds. |
MANAGEMENT’S DISCUSSIONSOF FUND PERFORMANCE | 17 |
Table of Contents
Management’s Discussion of Fund Performance
iSHARES® MSCI SPAIN CAPPED ETF
Performance as of August 31, 2014
| Average Annual Total Returns | Cumulative Total Returns | |||||||||||||||||||||||||
| NAV | MARKET | INDEX | NAV | MARKET | INDEX | |||||||||||||||||||||
1 Year | 37.39% | 36.88% | 38.55% | 37.39% | 36.88% | 38.55% | ||||||||||||||||||||
5 Years | 2.27% | 2.20% | 1.63% | 11.90% | 11.51% | 8.40% | ||||||||||||||||||||
10 Years | 8.40% | 8.29% | 8.13% | 123.92% | 121.84% | 118.41% | ||||||||||||||||||||
GROWTH OF $10,000 INVESTMENT
(AT NET ASSET VALUE)
Index performance through February 11, 2013 reflects the performance of the MSCI Spain Index. Index performance beginning on February 12, 2013 reflects the performance of the MSCI Spain 25/50 Index.
Certain sectors and markets performed exceptionally well based on market conditions during the one-year period. Achieving such exceptional returns involves the risk of volatility and investors should not expect that such exceptional returns will be repeated.
Past performance is no guarantee of future results. Performance results do not reflect the deduction of taxes that a shareholder would pay on fund distributions or on the redemption or sale of fund shares. See “About Fund Performance” on page 26 for more information.
| Shareholder Expenses | ||||||||||||||||||||||||||
| Actual | Hypothetical 5% Return | |||||||||||||||||||||||||
| Beginning Account Value (3/1/14) | Ending Account Value (8/31/14) | Expenses Paid During Period a | Beginning Account Value (3/1/14) | Ending Account Value (8/31/14) | Expenses Paid During Period a | Annualized Expense Ratio | ||||||||||||||||||||
| $ | 1,000.00 | $ | 1,031.70 | $ | 2.46 | $ | 1,000.00 | $ | 1,022.80 | $ | 2.45 | 0.48% | ||||||||||||||
| a | Expenses are calculated using the Fund’s annualized expense ratio (as disclosed in the table), multiplied by the average account value for the period, multiplied by the number of days in the period (184 days) and divided by the number of days in the year (365 days). See “Shareholder Expenses” on page 26 for more information. |
| 18 | 2014 iSHARES ANNUAL REPORTTO SHAREHOLDERS |
Table of Contents
Management’s Discussion of Fund Performance (Continued)
iSHARES® MSCI SPAIN CAPPED ETF
The iShares MSCI Spain Capped ETF (the “Fund”) seeks to track the investment results of an index composed of Spanish equities, as represented by the MSCI Spain 25/50 Index (the “Index”). The Fund invests in a representative sample of securities included in the Index that collectively has an investment profile similar to the Index. Due to the use of representative sampling, the Fund may or may not hold all of the securities that are included in the Index. For the 12-month reporting period ended August 31, 2014, the total return for the Fund was 37.39%, net of fees, while the total return for the Index was 38.55%.
The Index posted strong performance during the reporting period, significantly outperforming the broad international developed markets, as measured by the MSCI EAFE Index.
The Spanish stock market rapidly advanced for most of the reporting period on renewed optimism for Europe’s most beleaguered economies. In the last two months of the reporting period, however, the market declined, as investors shifted their focus to geopolitical tensions in Ukraine and stagnant European growth.
Spain’s economy began to recover during the reporting period, exiting its second recession since the financial crisis in 2008. The unemployment rate remained stubbornly high, exceeding 25% for most of the reporting period. Nevertheless, consumer spending logged consistent growth during the second half of the reporting period, while manufacturing expanded at a steady pace. Spain, similar to many countries throughout the world, experienced strong economic growth in pre-recession years due in part to a housing boom. Sharply declining home prices and high government debt levels have weighed on the economy since 2008. Housing prices declined at a much slower rate during the reporting period, which led to speculation that housing prices could be stabilizing. Similarly, financial reforms also helped drive lending rates on Spanish government debt dramatically lower.
The broad-based equity market rally meant many companies contributed to positive performance during the reporting period. Banco Santander SA, the Index’s largest weighting at approximately 22% as of the end of the reporting period, experienced strong performance on Spain’s improving financial and economic conditions.
PORTFOLIO ALLOCATION
As of 8/31/14
| Sector | Percentage of Total Investments* |
Financials | 48.42 | % | ||
Utilities | 11.68 | |||
Industrials | 11.50 | |||
Telecommunication Services | 10.98 | |||
Consumer Discretionary | 4.70 | |||
Energy | 4.61 | |||
Information Technology | 3.81 | |||
Health Care | 2.32 | |||
Consumer Staples | 1.98 | |||
|
| |||
TOTAL | 100.00 | % | ||
|
|
TEN LARGEST FUND HOLDINGS
As of 8/31/14
| Security | Percentage of Total Investments* |
Banco Santander SA | 22.45 | % | ||
Banco Bilbao Vizcaya Argentaria SA | 12.16 | |||
Telefonica SA | 10.98 | |||
Iberdrola SA | 4.86 | |||
Inditex SA | 4.70 | |||
Repsol SA | 4.61 | |||
Amadeus IT Holding SA Class A | 3.80 | |||
Gas Natural SDG SA | 3.47 | |||
Banco Popular Espanol SA | 3.25 | |||
CaixaBank SA | 3.14 | |||
|
| |||
TOTAL | 73.42 | % | ||
|
|
| * | Excludes money market funds. |
MANAGEMENT’S DISCUSSIONSOF FUND PERFORMANCE | 19 |
Table of Contents
Management’s Discussion of Fund Performance
iSHARES® MSCI SWEDEN ETF
Performance as of August 31, 2014
| Average Annual Total Returns | Cumulative Total Returns | |||||||||||||||||||||||||
| NAV | MARKET | INDEX | NAV | MARKET | INDEX | |||||||||||||||||||||
1 Year | 10.49% | 10.31% | 10.41% | 10.49% | 10.31% | 10.41% | ||||||||||||||||||||
5 Years | 11.92% | 11.84% | 11.87% | 75.59% | 75.02% | 75.20% | ||||||||||||||||||||
10 Years | 10.68% | 10.60% | 10.65% | 175.90% | 173.85% | 175.14% | ||||||||||||||||||||
GROWTH OF $10,000 INVESTMENT
(AT NET ASSET VALUE)
Past performance is no guarantee of future results. Performance results do not reflect the deduction of taxes that a shareholder would pay on fund distributions or on the redemption or sale of fund shares. See “About Fund Performance” on page 26 for more information.
| Shareholder Expenses | ||||||||||||||||||||||||||
| Actual | Hypothetical 5% Return | |||||||||||||||||||||||||
| Beginning Account Value (3/1/14) | Ending Account Value (8/31/14) | Expenses Paid During Period a | Beginning Account Value (3/1/14) | Ending Account Value (8/31/14) | Expenses Paid During Period a | Annualized Expense Ratio | ||||||||||||||||||||
| $ | 1,000.00 | $ | 957.00 | $ | 2.37 | $ | 1,000.00 | $ | 1,022.80 | $ | 2.45 | 0.48% | ||||||||||||||
| a | Expenses are calculated using the Fund’s annualized expense ratio (as disclosed in the table), multiplied by the average account value for the period, multiplied by the number of days in the period (184 days) and divided by the number of days in the year (365 days). See “Shareholder Expenses” on page 26 for more information. |
| 20 | 2014 iSHARES ANNUAL REPORTTO SHAREHOLDERS |
Table of Contents
Management’s Discussion of Fund Performance (Continued)
iSHARES® MSCI SWEDEN ETF
The iShares MSCI Sweden ETF (the “Fund”) seeks to track the investment results of an index composed of Swedish equities, as represented by the MSCI Sweden Index (the “Index”). The Fund invests in a representative sample of securities included in the Index that collectively has an investment profile similar to the Index. Due to the use of representative sampling, the Fund may or may not hold all of the securities that are included in the Index. For the 12-month reporting period ended August 31, 2014, the total return for the Fund was 10.49%, net of fees, while the total return for the Index was 10.41%.
Swedish stocks, as represented by the Index, posted a modest return during the reporting period, underperforming the broad international developed markets, as measured by the MSCI EAFE Index.
Sector performance varied widely during the reporting period, as some economic sectors posted double-digit positive returns, while other sectors delivered negative returns. The financials sector was the largest contributor to Index performance, as financials stocks rallied on improving credit conditions and lower interest rates in many European countries. Financials stocks represented approximately one-third of the Index’s weight on average, and contributed more than half of the Index’s total return. The consumer discretionary sector was another large contributor, as consumer spending increased steadily during the reporting period. The information technology sector also delivered a solid contribution to Index return, as Swedish technology stocks performed in line with the broader Index.
The industrials sector, which represented approximately 26% of the Index on average during the reporting period, posted a modest return, but trailed the broader Index by a wide margin as Swedish industrial production contracted during the reporting period. Several of the Index’s smaller sectors, including health care, energy and consumer staples, detracted from Index performance. The negative impact of these sectors on Index performance was limited, as each sector accounted for approximately 5% or less of the Index on average during the reporting period.
PORTFOLIO ALLOCATION
As of 8/31/14
| Sector | Percentage of Total Investments* |
Financials | 33.47 | % | ||
Industrials | 26.34 | |||
Consumer Discretionary | 12.31 | |||
Information Technology | 11.49 | |||
Telecommunication Services | 6.78 | |||
Consumer Staples | 5.18 | |||
Health Care | 2.34 | |||
Materials | 1.08 | |||
Energy | 1.01 | |||
|
| |||
TOTAL | 100.00 | % | ||
|
|
TEN LARGEST FUND HOLDINGS
As of 8/31/14
| Security | Percentage of Total Investments* |
Hennes & Mauritz AB Class B | 10.03 | % | ||
Nordea Bank AB | 9.84 | |||
Telefonaktiebolaget LM Ericsson Class B | 9.42 | |||
Svenska Handelsbanken AB Class A | 5.82 | |||
Swedbank AB Class A | 5.73 | |||
Skandinaviska Enskilda Banken AB Class A | 4.86 | |||
Atlas Copco AB Class A | 4.85 | |||
Volvo AB Class B | 4.54 | |||
TeliaSonera AB | 4.32 | |||
Investor AB Class B | 4.20 | |||
|
| |||
TOTAL | 63.61 | % | ||
|
|
| * | Excludes money market funds. |
MANAGEMENT’S DISCUSSIONSOF FUND PERFORMANCE | 21 |
Table of Contents
Management’s Discussion of Fund Performance
iSHARES® MSCI SWITZERLAND CAPPED ETF
Performance as of August 31, 2014
| Average Annual Total Returns | Cumulative Total Returns | |||||||||||||||||||||||||
| NAV | MARKET | INDEX | NAV | MARKET | INDEX | |||||||||||||||||||||
1 Year | 17.21% | 17.14% | 17.49% | 17.21% | 17.14% | 17.49% | ||||||||||||||||||||
5 Years | 12.64% | 12.59% | 12.46% | 81.29% | 80.89% | 79.86% | ||||||||||||||||||||
10 Years | 10.64% | 10.63% | 10.29% | 174.77% | 174.66% | 166.36% | ||||||||||||||||||||
GROWTH OF $10,000 INVESTMENT
(AT NET ASSET VALUE)
Index performance through February 11, 2013 reflects the performance of the MSCI Switzerland Index. Index performance beginning on February 12, 2013 reflects the performance of the MSCI Switzerland 25/50 Index.
Past performance is no guarantee of future results. Performance results do not reflect the deduction of taxes that a shareholder would pay on fund distributions or on the redemption or sale of fund shares. See “About Fund Performance” on page 26 for more information.
| Shareholder Expenses | ||||||||||||||||||||||||||
| Actual | Hypothetical 5% Return | |||||||||||||||||||||||||
| Beginning Account Value (3/1/14) | Ending Account Value (8/31/14) | Expenses Paid During Period a | Beginning Account Value (3/1/14) | Ending Account Value (8/31/14) | Expenses Paid During Period a | Annualized Expense Ratio | ||||||||||||||||||||
| $ | 1,000.00 | $ | 1,003.00 | $ | 2.42 | $ | 1,000.00 | $ | 1,022.80 | $ | 2.45 | 0.48% | ||||||||||||||
| a | Expenses are calculated using the Fund’s annualized expense ratio (as disclosed in the table), multiplied by the average account value for the period, multiplied by the number of days in the period (184 days) and divided by the number of days in the year (365 days). See “Shareholder Expenses” on page 26 for more information. |
| 22 | 2014 iSHARES ANNUAL REPORTTO SHAREHOLDERS |
Table of Contents
Management’s Discussion of Fund Performance (Continued)
iSHARES® MSCI SWITZERLAND CAPPED ETF
The iShares MSCI Switzerland Capped ETF (the “Fund”) seeks to track the investment results of an index composed of Swiss equities, as represented by the MSCI Switzerland 25/50 Index (the “Index”). The Fund invests in a representative sample of securities included in the Index that collectively has an investment profile similar to the Index. Due to the use of representative sampling, the Fund may or may not hold all of the securities that are included in the Index. For the 12-month reporting period ended August 31, 2014, the total return for the Fund was 17.21%, net of fees, while the total return for the Index was 17.49%.
Swiss stocks, as represented by the Index, posted solid performance during the reporting period. The Swiss stock market reflected the contours of the broader European equity market, while slightly outpacing the broad international developed markets, as measured by the MSCI EAFE Index.
Switzerland’s economy grew at a modest pace during the reporting period, as the eurozone began to recover from its economic recession. Weak consumer spending was a source of weakness for the Swiss economy. The Swiss franc, which is considered a high-quality currency known for its stability, weakened relative to the U.S. dollar and strengthened relative to the euro in the final months of the reporting period. The stronger U.S. dollar also decreased international equity returns for U.S. investors.
The European food giant Nestle SA and the pharmaceutical company Novartis AG accounted for a combined Index weighting of approximately 28% as of the end of the reporting period. Both stocks performed relatively well, helping propel the broader Swiss stock market to solid gains. Health care company Roche Holding AG, which represented approximately 14% of the Index as of August 31, 2014, posted a modest gain, limiting Index performance.
PORTFOLIO ALLOCATION
As of 8/31/14
| Sector | Percentage of Total Investments* |
Health Care | 31.10 | % | ||
Consumer Staples | 20.71 | |||
Financials | 19.70 | |||
Industrials | 11.12 | |||
Materials | 7.96 | |||
Consumer Discretionary | 6.59 | |||
Telecommunication Services | 1.44 | |||
Energy | 1.38 | |||
|
| |||
TOTAL | 100.00 | % | ||
|
|
TEN LARGEST FUND HOLDINGS
As of 8/31/14
| Security | Percentage of Total Investments* |
Nestle SA Registered | 17.48 | % | ||
Novartis AG Registered | 13.87 | |||
Roche Holding AG Genusschein | 13.77 | |||
UBS AG Registered | 4.52 | |||
ABB Ltd. Registered | 4.34 | |||
Compagnie Financiere Richemont SA Class A Bearer | 4.33 | |||
Zurich Insurance Group AG | 4.00 | |||
Credit Suisse Group AG Registered | 3.79 | |||
Syngenta AG Registered | 3.00 | |||
Swiss Re AG | 2.64 | |||
|
| |||
TOTAL | 71.74 | % | ||
|
|
| * | Excludes money market funds. |
MANAGEMENT’S DISCUSSIONSOF FUND PERFORMANCE | 23 |
Table of Contents
Management’s Discussion of Fund Performance
iSHARES® MSCI UNITED KINGDOM ETF
Performance as of August 31, 2014
| Average Annual Total Returns | Cumulative Total Returns | |||||||||||||||||||||||||
| NAV | MARKET | INDEX | NAV | MARKET | INDEX | |||||||||||||||||||||
1 Year | 17.56% | 16.91% | 18.19% | 17.56% | 16.91% | 18.19% | ||||||||||||||||||||
5 Years | 10.43% | 10.44% | 11.05% | 64.26% | 64.31% | 68.90% | ||||||||||||||||||||
10 Years | 6.60% | 6.44% | 7.22% | 89.42% | 86.60% | 100.82% | ||||||||||||||||||||
GROWTH OF $10,000 INVESTMENT
(AT NET ASSET VALUE)
Past performance is no guarantee of future results. Performance results do not reflect the deduction of taxes that a shareholder would pay on fund distributions or on the redemption or sale of fund shares. See “About Fund Performance” on page 26 for more information.
| Shareholder Expenses | ||||||||||||||||||||||||||
| Actual | Hypothetical 5% Return | |||||||||||||||||||||||||
| Beginning Account Value (3/1/14) | Ending Account Value (8/31/14) | Expenses Paid During Period a | Beginning Account Value (3/1/14) | Ending Account Value (8/31/14) | Expenses Paid During Period a | Annualized Expense Ratio | ||||||||||||||||||||
| $ | 1,000.00 | $ | 1,015.00 | $ | 2.44 | $ | 1,000.00 | $ | 1,022.80 | $ | 2.45 | 0.48% | ||||||||||||||
| a | Expenses are calculated using the Fund’s annualized expense ratio (as disclosed in the table), multiplied by the average account value for the period, multiplied by the number of days in the period (184 days) and divided by the number of days in the year (365 days). See “Shareholder Expenses” on page 26 for more information. |
| 24 | 2014 iSHARES ANNUAL REPORTTO SHAREHOLDERS |
Table of Contents
Management’s Discussion of Fund Performance (Continued)
iSHARES® MSCI UNITED KINGDOM ETF
The iShares MSCI United Kingdom ETF (the “Fund”) seeks to track the investment results of an index composed of U.K. equities, as represented by the MSCI United Kingdom Index (the “Index”). The Fund invests in a representative sample of securities included in the Index that collectively has an investment profile similar to the Index. Due to the use of representative sampling, the Fund may or may not hold all of the securities that are included in the Index. For the 12-month reporting period ended August 31, 2014, the total return for the Fund was 17.56%, net of fees, while the total return for the Index was 18.19%.
United Kingdom stocks, as represented by the Index, posted a solid return for the reporting period, outpacing the broad international developed markets, as measured by the MSCI EAFE Index.
The United Kingdom experienced healthy economic growth during the period. The country’s GDP growth improved throughout the reporting period, expanding by 0.9% during the second quarter of 2014, and nominal GDP surpassed its pre-crisis peak from 2008 on the strength of its services and production sectors. On an annual basis, GDP growth for the second quarter of 2014 was 3.2% versus the second quarter of 2013. In addition, the unemployment rate continued to fall, finishing the reporting period at its lowest rate since late 2008.
Every economic sector in the Index delivered a double-digit positive return, as the United Kingdom experienced a broad-based rally during the reporting period. The energy sector generated the largest contribution to the Index’s return, as England’s global, diversified petroleum companies posted solid returns despite volatile oil and gas prices. The health care sector was the third largest contributor to the Index’s performance during the reporting period, reflecting the strong performance of large pharmaceuticals companies. The materials and consumer discretionary sectors performed in line with the Index, which increased the Index’s total return.
The financials sector, the largest sector in the Index with a 22% weighting on average, lagged several other sectors in the Index while generating the second largest contribution to the Index’s return. Similarly, the telecommunication services and consumer staples sectors posted solid returns while trailing the overall Index during the reporting period.
PORTFOLIO ALLOCATION
As of 8/31/14
| Sector | Percentage of Total Investments* |
Financials | 22.54 | % | ||
Energy | 17.23 | |||
Consumer Staples | 15.97 | |||
Health Care | 9.60 | |||
Materials | 9.38 | |||
Consumer Discretionary | 8.10 | |||
Industrials | 6.79 | |||
Telecommunication Services | 5.06 | |||
Utilities | 4.30 | |||
Information Technology | 1.03 | |||
|
| |||
TOTAL | 100.00 | % | ||
|
|
TEN LARGEST FUND HOLDINGS
As of 8/31/14
| Security | Percentage of Total Investments* |
HSBC Holdings PLC | 7.12 | % | ||
Royal Dutch Shell PLC Class A | 5.49 | |||
BP PLC | 5.09 | |||
GlaxoSmithKline PLC | 4.10 | |||
British American Tobacco PLC | 3.81 | |||
Royal Dutch Shell PLC Class B | 3.56 | |||
AstraZeneca PLC | 3.30 | |||
Vodafone Group PLC | 3.13 | |||
Diageo PLC | 2.56 | |||
Lloyds Banking Group PLC | 2.50 | |||
|
| |||
TOTAL | 40.66 | % | ||
|
|
| * | Excludes money market funds. |
MANAGEMENT’S DISCUSSIONSOF FUND PERFORMANCE | 25 |
Table of Contents
Past performance is no guarantee of future results. Current performance may be lower or higher than the performance data quoted. Performance data current to the most recent month-end is available at www.iShares.com. Performance results assume reinvestment of all dividends and capital gain distributions and do not reflect the deduction of taxes that a shareholder would pay on fund distributions or on the redemption or sale of fund shares. The investment return and principal value of shares will vary with changes in market conditions. Shares may be worth more or less than their original cost when they are redeemed or sold in the market. Performance for certain funds may reflect a waiver of a portion of investment management fees. Without such waiver, performance would have been lower.
Net asset value or “NAV” is the value of one share of a fund as calculated in accordance with the standard formula for valuing mutual fund shares. The price used to calculate market return (“Market Price”) is determined by using the midpoint between the highest bid and the lowest offer on the primary stock exchange on which shares of a fund are listed for trading, as of the time that such fund’s NAV is calculated. Since shares of a fund may not have traded in the secondary market until after the fund’s inception, for the period from inception to the first day of secondary trading, the NAV of the fund is used as a proxy for the Market Price to calculate market returns. Market and NAV returns assume that dividends and capital gain distributions have been reinvested at Market Price and NAV, respectively.
An index is a statistical composite that tracks a specified financial market or sector. Unlike a fund, an index does not actually hold a portfolio of securities and therefore does not incur the expenses incurred by a fund. These expenses negatively impact fund performance. Also, market returns do not include brokerage commissions that may be payable on secondary market transactions. If brokerage commissions were included, market returns would be lower.
As a shareholder of a Fund, you incur two types of costs: (1) transaction costs, including brokerage commissions on purchases and sales of fund shares and (2) ongoing costs, including management fees and other fund expenses. The expense example, which is based on an investment of $1,000 invested on March 1, 2014 and held through August 31, 2014, is intended to help you understand your ongoing costs (in dollars and cents) of investing in a Fund and to compare these costs with the ongoing costs of investing in other funds.
Actual Expenses — The table provides information about actual account values and actual expenses. Annualized expense ratios reflect contractual and voluntary fee waivers, if any. To estimate the expenses that you paid on your account over the period, simply divide your account value by $1,000 (for example, an $8,600 account value divided by $1,000 = 8.6), then multiply the result by the number for your Fund under the heading entitled “Expenses Paid During Period.”
Hypothetical Example for Comparison Purposes — The table also provides information about hypothetical account values and hypothetical expenses based on each Fund’s actual expense ratio and an assumed rate of return of 5% per year before expenses. You may use this information to compare the ongoing costs of investing in your Fund and other funds. To do so, compare this 5% hypothetical example with the 5% hypothetical examples that appear in the shareholder reports of the other funds.
Please note that the expenses shown in the table are meant to highlight your ongoing costs only and do not reflect any transactional costs, such as brokerage commissions paid on purchases and sales of fund shares. Therefore, the hypothetical examples are useful in comparing ongoing costs only and will not help you determine the relative total costs of owning different funds. In addition, if these transactional costs were included, your costs would have been higher.
| 26 | 2014 iSHARES ANNUAL REPORTTO SHAREHOLDERS |
Table of Contents
iSHARES® MSCI AUSTRIA CAPPED ETF
August 31, 2014
| Security | Shares | Value | ||||||
COMMON STOCKS — 98.44% |
| |||||||
AIR FREIGHT & LOGISTICS — 3.90% |
| |||||||
Oesterreichische Post AG | 52,488 | $ | 2,463,359 | |||||
|
| |||||||
| 2,463,359 | ||||||||
BUILDING PRODUCTS — 4.27% |
| |||||||
Wienerberger AG | 179,964 | 2,697,613 | ||||||
|
| |||||||
| 2,697,613 | ||||||||
CHEMICALS — 1.59% |
| |||||||
Lenzing AGa | 16,488 | 1,004,675 | ||||||
|
| |||||||
| 1,004,675 | ||||||||
COMMERCIAL BANKS — 18.55% |
| |||||||
Erste Group Bank AG | 335,484 | 8,630,300 | ||||||
Raiffeisen International Bank Holding AG | 120,132 | 3,085,639 | ||||||
|
| |||||||
| 11,715,939 | ||||||||
CONSTRUCTION MATERIALS — 1.94% |
| |||||||
RHI AG | 40,788 | 1,225,489 | ||||||
|
| |||||||
| 1,225,489 | ||||||||
CONTAINERS & PACKAGING — 2.78% |
| |||||||
Mayr-Melnhof Karton AG | 15,048 | 1,759,332 | ||||||
|
| |||||||
| 1,759,332 | ||||||||
DIVERSIFIED TELECOMMUNICATION SERVICES — 2.41% |
| |||||||
Telekom Austria AG | 162,504 | 1,524,038 | ||||||
|
| |||||||
| 1,524,038 | ||||||||
ELECTRIC UTILITIES — 1.59% |
| |||||||
EVN AG | 74,160 | 1,006,141 | ||||||
|
| |||||||
| 1,006,141 | ||||||||
ELECTRICAL EQUIPMENT — 1.81% | ||||||||
Zumtobel AG | 54,576 | 1,140,855 | ||||||
|
| |||||||
| 1,140,855 | ||||||||
ELECTRONIC EQUIPMENT, INSTRUMENTS & |
| |||||||
Austria Technologie & Systemtechnik AG | 65,988 | 763,152 | ||||||
Kapsch TrafficCom AG | 15,336 | 447,443 | ||||||
|
| |||||||
| 1,210,595 | ||||||||
ENERGY EQUIPMENT & SERVICES — 3.06% |
| |||||||
Schoeller-Bleckmann Oilfield Equipment AG | 18,324 | 1,930,910 | ||||||
|
| |||||||
| 1,930,910 | ||||||||
| Security | Shares | Value | ||||||
HOTELS, RESTAURANTS & LEISURE — 0.56% |
| |||||||
DO & Co. AG | 5,184 | $ | 352,958 | |||||
|
| |||||||
| 352,958 | ||||||||
INSURANCE — 7.47% |
| |||||||
UNIQA Insurance Group AG | 161,100 | 1,937,395 | ||||||
Vienna Insurance Group AG | 57,276 | 2,782,750 | ||||||
|
| |||||||
| 4,720,145 | ||||||||
MACHINERY — 10.00% |
| |||||||
Andritz AG | 79,560 | 4,267,311 | ||||||
Palfinger AG | 28,260 | 903,056 | ||||||
Semperit AG Holding | 20,232 | 1,148,598 | ||||||
|
| |||||||
| 6,318,965 | ||||||||
METALS & MINING — 9.65% |
| |||||||
AMAG Austria Metall AGb | 19,224 | 672,295 | ||||||
Voestalpine AG | 126,108 | 5,423,475 | ||||||
|
| |||||||
| 6,095,770 | ||||||||
OIL, GAS & CONSUMABLE FUELS — 10.48% |
| |||||||
OMV AG | 171,000 | 6,622,093 | ||||||
|
| |||||||
| 6,622,093 | ||||||||
REAL ESTATE MANAGEMENT & DEVELOPMENT — 13.88% |
| |||||||
BUWOG AGc | 64,008 | 1,252,024 | ||||||
CA Immobilien Anlagen AGc | 117,792 | 2,440,598 | ||||||
conwert Immobilien Invest SE | 107,892 | 1,348,391 | ||||||
IMMOEAST AG Escrowc,d | 998,769 | 13 | ||||||
IMMOFINANZ AGc | 898,380 | 2,822,281 | ||||||
IMMOFINANZ AG Escrowc,d | 897,599 | 12 | ||||||
S IMMO AG | 117,252 | 904,272 | ||||||
|
| |||||||
| 8,767,591 | ||||||||
TRANSPORTATION INFRASTRUCTURE — 2.58% |
| |||||||
Flughafen Wien AG | 18,108 | 1,626,936 | ||||||
|
| |||||||
| 1,626,936 | ||||||||
|
| |||||||
TOTAL COMMON STOCKS |
| |||||||
(Cost: $83,626,133) |
| 62,183,404 | ||||||
SHORT-TERM INVESTMENTS — 0.51% |
| |||||||
MONEY MARKET FUNDS — 0.51% |
| |||||||
BlackRock Cash Funds: Institutional, |
| |||||||
0.14%e,f,g | 297,991 | 297,991 | ||||||
BlackRock Cash Funds: Prime, |
| |||||||
0.11%e,f,g | 18,759 | 18,759 | ||||||
SCHEDULESOF INVESTMENTS | 27 |
Table of Contents
Schedule of Investments (Continued)
iSHARES® MSCI AUSTRIA CAPPED ETF
August 31, 2014
| Security | Shares | Value | ||||||
BlackRock Cash Funds: Treasury, |
| |||||||
0.00%e,f | 5,110 | $ | 5,110 | |||||
|
| |||||||
| 321,860 | ||||||||
|
| |||||||
TOTAL SHORT-TERM INVESTMENTS |
| |||||||
(Cost: $321,860) |
| 321,860 | ||||||
|
| |||||||
TOTAL INVESTMENTS |
| |||||||
(Cost: $83,947,993) | 62,505,264 | |||||||
Other Assets, Less Liabilities — 1.05% |
| 664,907 | ||||||
|
| |||||||
NET ASSETS — 100.00% |
| $ | 63,170,171 | |||||
|
| |||||||
| a | All or a portion of this security represents a security on loan. See Note 1. |
| b | This security may be resold to qualified institutional buyers under Rule 144A of the Securities Act of 1933. |
| c | Non-income earning security. |
| d | Security valued using Level 3 inputs in accordance with management’s fair valuation policy. See Note 1. |
| e | Affiliated issuer. See Note 2. |
| f | The rate quoted is the annualized seven-day yield of the fund at period end. |
| g | All or a portion of this security represents an investment of securities lending collateral. See Note 1. |
See notes to financial statements.
| 28 | 2014 iSHARES ANNUAL REPORTTO SHAREHOLDERS |
Table of Contents
Schedule of Investments
iSHARES® MSCI BELGIUM CAPPED ETF
August 31, 2014
| Security | Shares | Value | ||||||
COMMON STOCKS — 99.90% |
| |||||||
AIR FREIGHT & LOGISTICS — 1.33% |
| |||||||
bpost SA | 88,693 | $ | 2,189,913 | |||||
|
| |||||||
| 2,189,913 | ||||||||
BEVERAGES — 22.31% |
| |||||||
Anheuser-Busch InBev NV | 330,088 | 36,761,664 | ||||||
|
| |||||||
| 36,761,664 | ||||||||
BIOTECHNOLOGY — 1.58% |
| |||||||
Ablynx NVa | 164,205 | 1,860,102 | ||||||
ThromboGenics NVa,b | 67,881 | 743,915 | ||||||
|
| |||||||
| 2,604,017 | ||||||||
CAPITAL MARKETS — 1.77% |
| |||||||
GIMV NV | 33,759 | 1,653,964 | ||||||
RHJ International SAa | 248,413 | 1,269,573 | ||||||
|
| |||||||
| 2,923,537 | ||||||||
CHEMICALS — 9.37% |
| |||||||
Solvay SA | 53,724 | 8,474,140 | ||||||
Tessenderlo Chemie NVa | 50,578 | 1,518,634 | ||||||
Umicore SA | 112,167 | 5,439,284 | ||||||
|
| |||||||
| 15,432,058 | ||||||||
COMMERCIAL BANKS — 7.72% |
| |||||||
KBC Groep NVa | 222,519 | 12,713,303 | ||||||
|
| |||||||
| 12,713,303 | ||||||||
COMMUNICATIONS EQUIPMENT — 0.74% |
| |||||||
EVS Broadcast Equipment SAb | 28,314 | 1,225,520 | ||||||
|
| |||||||
| 1,225,520 | ||||||||
CONSTRUCTION & ENGINEERING — 1.38% |
| |||||||
Compagnie d’Entreprises CFE SA | 21,417 | 2,280,817 | ||||||
|
| |||||||
| 2,280,817 | ||||||||
DISTRIBUTORS — 1.03% |
| |||||||
SA D’Ieteren NV | 40,686 | 1,693,227 | ||||||
|
| |||||||
| 1,693,227 | ||||||||
DIVERSIFIED FINANCIAL SERVICES — 7.73% |
| |||||||
Ackermans & van Haaren NV | 28,834 | 3,497,592 | ||||||
Groupe Bruxelles Lambert SA | 73,931 | 7,286,116 | ||||||
KBC Ancora SCAa | 59,290 | 1,948,516 | ||||||
|
| |||||||
| 12,732,224 | ||||||||
DIVERSIFIED TELECOMMUNICATION SERVICES — 3.52% |
| |||||||
Belgacom SA | 162,382 | 5,803,895 | ||||||
|
| |||||||
| 5,803,895 | ||||||||
ELECTRIC UTILITIES — 1.28% |
| |||||||
Elia System Operator SA | 43,197 | 2,112,664 | ||||||
|
| |||||||
| 2,112,664 | ||||||||
| Security | Shares | Value | ||||||
ELECTRONIC EQUIPMENT, INSTRUMENTS & |
| |||||||
Barco NV | 21,103 | $ | 1,499,363 | |||||
|
| |||||||
| 1,499,363 | ||||||||
FOOD & STAPLES RETAILING — 6.57% |
| |||||||
Colruyt SA | 79,618 | 3,806,884 | ||||||
Delhaize Brothers and Co. “The Lion” (Delhaize Group) SA | 100,430 | 7,017,795 | ||||||
|
| |||||||
| 10,824,679 | ||||||||
HEALTH CARE EQUIPMENT & SUPPLIES — 1.15% |
| |||||||
Ion Beam Applications SAa | 124,509 | 1,897,518 | ||||||
|
| |||||||
| 1,897,518 | ||||||||
HEALTH CARE PROVIDERS & SERVICES — 1.51% |
| |||||||
Arseus NV | 45,617 | 2,489,693 | ||||||
|
| |||||||
| 2,489,693 | ||||||||
HEALTH CARE TECHNOLOGY — 1.03% |
| |||||||
Agfa-Gevaert NVa | 591,690 | 1,706,050 | ||||||
|
| |||||||
| 1,706,050 | ||||||||
INSURANCE — 4.17% |
| |||||||
Ageas | 204,127 | 6,868,441 | ||||||
|
| |||||||
| 6,868,441 | ||||||||
IT SERVICES — 0.89% |
| |||||||
Econocom Group SA | 161,777 | 1,461,177 | ||||||
|
| |||||||
| 1,461,177 | ||||||||
MARINE — 0.76% |
| |||||||
Compagnie Maritime Belge SA | 52,151 | 1,251,249 | ||||||
|
| |||||||
| 1,251,249 | ||||||||
MEDIA — 3.32% |
| |||||||
Kinepolis Group | 50,959 | 1,928,114 | ||||||
Telenet Group Holding NVa | 60,379 | 3,536,754 | ||||||
|
| |||||||
| 5,464,868 | ||||||||
METALS & MINING — 2.97% |
| |||||||
Bekaert NV | 61,710 | 2,298,724 | ||||||
Nyrstar NVa,b | 397,969 | 1,544,832 | ||||||
Viohalco SAa,b | 191,664 | 1,047,708 | ||||||
|
| |||||||
| 4,891,264 | ||||||||
OIL, GAS & CONSUMABLE FUELS — 2.37% |
| |||||||
Euronav SAa | 198,440 | 2,424,086 | ||||||
Exmar NV | 94,864 | 1,474,468 | ||||||
|
| |||||||
| 3,898,554 | ||||||||
PHARMACEUTICALS — 7.31% |
| |||||||
Galapagos NVa,b | 65,340 | 1,082,708 | ||||||
UCB SA | 113,014 | 10,971,135 | ||||||
|
| |||||||
| 12,053,843 | ||||||||
SCHEDULESOF INVESTMENTS | 29 |
Table of Contents
Schedule of Investments (Continued)
iSHARES® MSCI BELGIUM CAPPED ETF
August 31, 2014
| Security | Shares | Value | ||||||
REAL ESTATE INVESTMENT TRUSTS (REITS) — 4.88% |
| |||||||
Befimmo SA | 29,403 | $ | 2,381,485 | |||||
Cofinimmo SA | 22,264 | 2,754,312 | ||||||
Intervest Offices & Warehouses NV | 38,841 | 1,196,664 | ||||||
Warehouses De Pauw SCA | 22,627 | 1,706,296 | ||||||
|
| |||||||
| 8,038,757 | ||||||||
SEMICONDUCTORS & SEMICONDUCTOR EQUIPMENT — 1.44% |
| |||||||
Melexis NV | 51,546 | 2,369,584 | ||||||
|
| |||||||
| 2,369,584 | ||||||||
WIRELESS TELECOMMUNICATION SERVICES — 0.86% |
| |||||||
Mobistar SAa | 71,269 | 1,412,358 | ||||||
|
| |||||||
| 1,412,358 | ||||||||
|
| |||||||
TOTAL COMMON STOCKS |
| |||||||
(Cost: $156,766,118) |
| 164,600,237 | ||||||
SHORT-TERM INVESTMENTS — 2.47% |
| |||||||
MONEY MARKET FUNDS — 2.47% |
| |||||||
BlackRock Cash Funds: Institutional, |
| |||||||
0.14%c,d,e | 3,733,359 | 3,733,359 | ||||||
BlackRock Cash Funds: Prime, |
| |||||||
0.11%c,d,e | 235,025 | 235,025 | ||||||
BlackRock Cash Funds: Treasury, |
| |||||||
0.00%c,d | 108,461 | 108,461 | ||||||
|
| |||||||
| 4,076,845 | ||||||||
|
| |||||||
TOTAL SHORT-TERM INVESTMENTS |
| |||||||
(Cost: $4,076,845) |
| 4,076,845 | ||||||
|
| |||||||
TOTAL INVESTMENTS |
| |||||||
(Cost: $160,842,963) | 168,677,082 | |||||||
Other Assets, Less Liabilities — (2.37)% |
| (3,912,026 | ) | |||||
|
| |||||||
NET ASSETS — 100.00% |
| $ | 164,765,056 | |||||
|
| |||||||
| a | Non-income earning security. |
| b | All or a portion of this security represents a security on loan. See Note 1. |
| c | Affiliated issuer. See Note 2. |
| d | The rate quoted is the annualized seven-day yield of the fund at period end. |
| e | All or a portion of this security represents an investment of securities lending collateral. See Note 1. |
See notes to financial statements.
| 30 | 2014 iSHARES ANNUAL REPORTTO SHAREHOLDERS |
Table of Contents
Schedule of Investments
iSHARES® MSCI EMERGING MARKETS EASTERN EUROPE ETF
August 31, 2014
| Security | Shares | Value | ||||||
COMMON STOCKS — 96.21% |
| |||||||
CZECH REPUBLIC — 3.32% |
| |||||||
CEZ AS | 86,424 | $ | 2,512,409 | |||||
Komercni Banka AS | 8,141 | 1,893,319 | ||||||
O2 Czech Republic AS | 42,118 | 591,710 | ||||||
|
| |||||||
| 4,997,438 | ||||||||
HUNGARY — 2.91% |
| |||||||
MOL Hungarian Oil and Gas PLC | 22,392 | 1,103,289 | ||||||
OTP Bank PLC | 119,951 | 2,073,569 | ||||||
Richter Gedeon Nyrt | 74,863 | 1,204,740 | ||||||
|
| |||||||
| 4,381,598 | ||||||||
POLAND — 24.20% |
| |||||||
Alior Bank SAa | 24,358 | 580,582 | ||||||
Bank Handlowy w Warszawie SA | 17,500 | 626,691 | ||||||
Bank Millennium SA | 227,496 | 571,346 | ||||||
Bank Pekao SA | 70,268 | 3,958,049 | ||||||
Bank Zachodni WBK SA | 15,919 | 1,844,649 | ||||||
Cyfrowy Polsat SA | 102,431 | 819,807 | ||||||
ENEA SA | 118,263 | 554,817 | ||||||
Energa SA | 108,504 | 707,557 | ||||||
Eurocash SA | 44,545 | 480,649 | ||||||
Getin Noble Bank SAa | 639,019 | 519,633 | ||||||
Grupa Azoty SA | 26,489 | 619,279 | ||||||
Grupa Lotos SAa | 34,452 | 324,764 | ||||||
Jastrzebska Spolka Weglowa SAa | 28,329 | 296,638 | ||||||
KGHM Polska Miedz SA | 74,963 | 3,090,097 | ||||||
LPP SA | 445 | 1,183,011 | ||||||
mBank SA | 7,905 | 1,145,939 | ||||||
Orange Polska SA | 351,442 | 1,180,505 | ||||||
Polska Grupa Energetyczna SA | 450,148 | 3,070,583 | ||||||
Polski Koncern Naftowy Orlen SA | 171,776 | 2,118,357 | ||||||
Polskie Gornictwo Naftowe i Gazownictwo SA | 947,915 | 1,446,768 | ||||||
Powszechna Kasa Oszczednosci Bank Polski SA | 468,491 | 5,604,573 | ||||||
Powszechny Zaklad Ubezpieczen SA | 30,053 | 4,408,293 | ||||||
Synthos SA | 281,674 | 405,242 | ||||||
Tauron Polska Energia SA | 565,356 | 882,333 | ||||||
|
| |||||||
| 36,440,162 | ||||||||
| Security | Shares | Value | ||||||
RUSSIA — 65.78% |
| |||||||
Alrosa AO | 986,100 | $ | 1,155,669 | |||||
Gazprom OAO | 6,337,232 | 22,581,624 | ||||||
LUKOIL OAO | 273,231 | 15,210,050 | ||||||
Magnit OJSC SP GDR | 139,229 | 8,103,128 | ||||||
MegaFon OAO SP GDR | 49,806 | 1,409,510 | ||||||
MMC Norilsk Nickel OJSC | 29,654 | 5,835,382 | ||||||
Mobile TeleSystems OJSC SP ADR | 276,601 | 5,103,288 | ||||||
Moscow Exchange MICEX-RTS OJSC | 730,690 | 1,226,493 | ||||||
NovaTek OAO SP GDR | 48,744 | 4,903,646 | ||||||
Rosneft Oil Co. OJSC | 623,804 | 3,848,264 | ||||||
Rostelecom OJSC | 428,880 | 1,140,774 | ||||||
RusHydro OJSC | 62,061,000 | 1,150,977 | ||||||
Sberbank of Russia | 5,782,285 | 11,378,514 | ||||||
Severstal OAO | 112,169 | 1,079,602 | ||||||
Sistema JSFC SP GDR | 90,428 | 2,057,237 | ||||||
Surgutneftegas OJSC | 3,825,960 | 2,681,862 | ||||||
Tatneft OAO Class S | 758,249 | 4,702,598 | ||||||
Uralkali OJSC | 707,455 | 2,612,825 | ||||||
VTB Bank OJSC | 2,777,430,999 | 2,861,166 | ||||||
|
| |||||||
| 99,042,609 | ||||||||
|
| |||||||
TOTAL COMMON STOCKS |
| |||||||
(Cost: $167,227,947) |
| 144,861,807 | ||||||
PREFERRED STOCKS — 3.56% |
| |||||||
RUSSIA — 3.56% |
| |||||||
AK Transneft OAO | 834 | 1,834,758 | ||||||
Sberbank of Russia | 533,500 | 795,538 | ||||||
Surgutneftegas OJSC | 3,711,800 | 2,731,732 | ||||||
|
| |||||||
| 5,362,028 | ||||||||
|
| |||||||
TOTAL PREFERRED STOCKS |
| |||||||
(Cost: $5,797,495) |
| 5,362,028 | ||||||
SHORT-TERM INVESTMENTS — 0.06% |
| |||||||
MONEY MARKET FUNDS — 0.06% |
| |||||||
BlackRock Cash Funds: Treasury, |
| |||||||
0.00%b,c | 90,457 | 90,457 | ||||||
|
| |||||||
| 90,457 | ||||||||
|
| |||||||
TOTAL SHORT-TERM INVESTMENTS |
| |||||||
(Cost: $90,457) |
| 90,457 | ||||||
|
| |||||||
SCHEDULESOF INVESTMENTS | 31 |
Table of Contents
Schedule of Investments (Continued)
iSHARES® MSCI EMERGING MARKETS EASTERN EUROPE ETF
August 31, 2014
| Value | ||||||
TOTAL INVESTMENTS | ||||||
(Cost: $173,115,899) | $ | 150,314,292 | ||||
Other Assets, Less Liabilities — 0.17% | 251,695 | |||||
|
| |||||
NET ASSETS — 100.00% | $ | 150,565,987 | ||||
|
| |||||
SP ADR — Sponsored American Depositary Receipts
SP GDR — Sponsored Global Depositary Receipts
| a | Non-income earning security. |
| b | Affiliated issuer. See Note 2. |
| c | The rate quoted is the annualized seven-day yield of the fund at period end. |
See notes to financial statements.
| 32 | 2014 iSHARES ANNUAL REPORTTO SHAREHOLDERS |
Table of Contents
Schedule of Investments
August 31, 2014
| Security | Shares | Value | ||||||
COMMON STOCKS — 99.96% |
| |||||||
AEROSPACE & DEFENSE — 4.93% |
| |||||||
Airbus Group NV | 125,103 | $ | 7,712,795 | |||||
Safran SA | 57,681 | 3,790,134 | ||||||
Thales SA | 19,739 | 1,104,879 | ||||||
Zodiac Aerospace | 39,576 | 1,294,115 | ||||||
|
| |||||||
| 13,901,923 | ||||||||
AIR FREIGHT & LOGISTICS — 0.26% |
| |||||||
Bollore | 1,173 | 741,636 | ||||||
|
| |||||||
| 741,636 | ||||||||
AUTO COMPONENTS — 2.25% |
| |||||||
Compagnie Generale des Etablissements Michelin Class B | 39,686 | 4,398,892 | ||||||
Valeo SA | 16,014 | 1,939,982 | ||||||
|
| |||||||
| 6,338,874 | ||||||||
AUTOMOBILES — 1.55% |
| |||||||
PSA Peugeot Citroen SAa | 83,283 | 1,172,697 | ||||||
Renault SA | 40,902 | 3,209,940 | ||||||
|
| |||||||
| 4,382,637 | ||||||||
BEVERAGES — 2.04% |
| |||||||
Pernod Ricard SA | 45,186 | 5,341,236 | ||||||
Remy Cointreau SAb | 5,151 | 410,419 | ||||||
|
| |||||||
| 5,751,655 | ||||||||
BUILDING PRODUCTS — 1.71% |
| |||||||
Compagnie de Saint-Gobain | 94,554 | 4,811,233 | ||||||
|
| |||||||
| 4,811,233 | ||||||||
CHEMICALS — 3.65% |
| |||||||
Arkema SA | 12,140 | 913,235 | ||||||
L’Air Liquide SA | 73,287 | 9,386,933 | ||||||
|
| |||||||
| 10,300,168 | ||||||||
COMMERCIAL BANKS — 9.79% |
| |||||||
BNP Paribas SA | 225,318 | 15,249,015 | ||||||
Credit Agricole SA | 212,976 | 3,165,804 | ||||||
Natixis | 198,335 | 1,397,671 | ||||||
Societe Generale | 153,255 | 7,783,003 | ||||||
|
| |||||||
| 27,595,493 | ||||||||
COMMERCIAL SERVICES & SUPPLIES — 0.75% |
| |||||||
Edenred SA | 43,334 | 1,288,285 | ||||||
Societe BIC SA | 6,069 | 826,589 | ||||||
|
| |||||||
| 2,114,874 | ||||||||
COMMUNICATIONS EQUIPMENT — 0.74% |
| |||||||
Alcatel-Lucenta,b | 598,689 | 2,075,578 | ||||||
|
| |||||||
| 2,075,578 | ||||||||
| Security | Shares | Value | ||||||
CONSTRUCTION & ENGINEERING — 2.92% |
| |||||||
Bouygues SA | 40,698 | $ | 1,497,523 | |||||
Vinci SA | 102,918 | 6,744,290 | ||||||
|
| |||||||
| 8,241,813 | ||||||||
CONSTRUCTION MATERIALS — 1.29% |
| |||||||
Imerys SA | 7,293 | 584,258 | ||||||
Lafarge SA | 39,780 | 3,054,816 | ||||||
|
| |||||||
| 3,639,074 | ||||||||
DIVERSIFIED FINANCIAL SERVICES — 0.51% |
| |||||||
Eurazeo | 8,058 | 613,808 | ||||||
Wendel | 6,732 | 814,647 | ||||||
|
| |||||||
| 1,428,455 | ||||||||
DIVERSIFIED TELECOMMUNICATION SERVICES — 4.94% |
| |||||||
Iliad SA | 5,559 | 1,224,291 | ||||||
Orange | 394,740 | 5,989,843 | ||||||
Vivendi SA | 257,754 | 6,720,673 | ||||||
|
| |||||||
| 13,934,807 | ||||||||
ELECTRIC UTILITIES — 0.59% |
| |||||||
Electricite de France SA | 51,408 | 1,675,599 | ||||||
|
| |||||||
| 1,675,599 | ||||||||
ELECTRICAL EQUIPMENT — 5.03% |
| |||||||
ALSTOMa | 46,002 | 1,632,095 | ||||||
Legrand SA | 56,508 | 3,131,369 | ||||||
Schneider Electric SE | 110,976 | 9,402,145 | ||||||
|
| |||||||
| 14,165,609 | ||||||||
ENERGY EQUIPMENT & SERVICES — 0.72% |
| |||||||
Technip SA | 21,777 | 2,022,269 | ||||||
|
| |||||||
| 2,022,269 | ||||||||
FOOD & STAPLES RETAILING — 2.15% |
| |||||||
Carrefour SA | 132,957 | 4,620,831 | ||||||
Casino Guichard-Perrachon SA | 11,985 | 1,433,901 | ||||||
|
| |||||||
| 6,054,732 | ||||||||
FOOD PRODUCTS — 3.06% |
| |||||||
Danone SA | 123,165 | 8,621,060 | ||||||
|
| |||||||
| 8,621,060 | ||||||||
HEALTH CARE EQUIPMENT & SUPPLIES — 1.64% |
| |||||||
Essilor International SA | 43,401 | 4,614,586 | ||||||
|
| |||||||
| 4,614,586 | ||||||||
HOTELS, RESTAURANTS & LEISURE — 1.33% |
| |||||||
Accor SA | 36,465 | 1,776,213 | ||||||
Sodexo | 20,043 | 1,979,256 | ||||||
|
| |||||||
| 3,755,469 | ||||||||
SCHEDULESOF INVESTMENTS | 33 |
Table of Contents
Schedule of Investments (Continued)
iSHARES® MSCI FRANCE ETF
August 31, 2014
| Security | Shares | Value | ||||||
INSURANCE — 4.02% |
| |||||||
AXA SA | 386,631 | $ | 9,599,748 | |||||
CNP Assurances SA | 36,557 | 723,016 | ||||||
SCOR SE | 32,738 | 1,004,754 | ||||||
|
| |||||||
| 11,327,518 | ||||||||
IT SERVICES — 1.23% |
| |||||||
Atos SA | 16,881 | 1,291,002 | ||||||
Cap Gemini SA | 30,702 | 2,188,246 | ||||||
|
| |||||||
| 3,479,248 | ||||||||
MACHINERY — 0.37% |
| |||||||
Vallourec SA | 23,154 | 1,036,642 | ||||||
|
| |||||||
| 1,036,642 | ||||||||
MEDIA — 2.69% |
| |||||||
Eutelsat Communications SA | 32,838 | 1,098,008 | ||||||
JCDecaux SA | 14,229 | 503,422 | ||||||
Lagardere SCA | 25,141 | 693,940 | ||||||
Publicis Groupe SA | 38,607 | 2,883,374 | ||||||
SES SA Class A FDR | 64,668 | 2,398,689 | ||||||
|
| |||||||
| 7,577,433 | ||||||||
METALS & MINING — 1.10% |
| |||||||
ArcelorMittal | 212,721 | 3,103,172 | ||||||
|
| |||||||
| 3,103,172 | ||||||||
MULTI-UTILITIES — 3.68% |
| |||||||
GDF Suez | 308,142 | 7,608,309 | ||||||
Suez Environnement SA | 59,793 | 1,104,994 | ||||||
Veolia Environnement | 89,709 | 1,651,352 | ||||||
|
| |||||||
| 10,364,655 | ||||||||
OIL, GAS & CONSUMABLE FUELS — 10.68% |
| |||||||
Total SA | 455,532 | 30,115,349 | ||||||
|
| |||||||
| 30,115,349 | ||||||||
PERSONAL PRODUCTS — 3.15% |
| |||||||
L’Oreal SA | 53,499 | 8,879,081 | ||||||
|
| |||||||
| 8,879,081 | ||||||||
PHARMACEUTICALS — 9.85% |
| |||||||
Sanofi | 252,501 | 27,771,631 | ||||||
|
| |||||||
| 27,771,631 | ||||||||
PROFESSIONAL SERVICES — 0.40% |
| |||||||
Bureau Veritas SA | 46,920 | 1,117,399 | ||||||
|
| |||||||
| 1,117,399 | ||||||||
REAL ESTATE INVESTMENT TRUSTS (REITS) — 3.12% |
| |||||||
Fonciere des Regions | 6,018 | 610,372 | ||||||
Gecina SA | 6,018 | 852,143 | ||||||
Icade | 7,803 | 727,382 | ||||||
| Security | Shares | Value | ||||||
Klepierre | 21,267 | $ | 1,015,468 | |||||
Unibail-Rodamco SE | 20,808 | 5,602,257 | ||||||
|
| |||||||
| 8,807,622 | ||||||||
SEMICONDUCTORS & SEMICONDUCTOR EQUIPMENT — 0.40% |
| |||||||
STMicroelectronics NV | 135,790 | 1,140,070 | ||||||
|
| |||||||
| 1,140,070 | ||||||||
SOFTWARE — 0.63% |
| |||||||
Dassault Systemes SA | 26,928 | 1,787,666 | ||||||
|
| |||||||
| 1,787,666 | ||||||||
TEXTILES, APPAREL & LUXURY GOODS — 5.63% |
| |||||||
Christian Dior SA | 11,630 | 2,073,432 | ||||||
Kering | 16,167 | 3,433,847 | ||||||
LVMH Moet Hennessy Louis Vuitton SA | 59,517 | 10,352,167 | ||||||
|
| |||||||
| 15,859,446 | ||||||||
TRADING COMPANIES & DISTRIBUTORS — 0.41% |
| |||||||
Rexel SA | 57,602 | 1,149,482 | ||||||
|
| |||||||
| 1,149,482 | ||||||||
TRANSPORTATION INFRASTRUCTURE — 0.75% |
| |||||||
Aeroports de Paris | 6,324 | 842,577 | ||||||
Groupe Eurotunnel SA Registered | 99,450 | 1,282,708 | ||||||
|
| |||||||
| 2,125,285 | ||||||||
|
| |||||||
TOTAL COMMON STOCKS |
| |||||||
(Cost: $323,921,120) |
| 281,809,243 | ||||||
SHORT-TERM INVESTMENTS — 0.79% |
| |||||||
MONEY MARKET FUNDS — 0.79% |
| |||||||
BlackRock Cash Funds: Institutional, |
| |||||||
0.14%c,d,e | 2,088,812 | 2,088,812 | ||||||
BlackRock Cash Funds: Prime, |
| |||||||
0.11%c,d,e | 131,497 | 131,497 | ||||||
BlackRock Cash Funds: Treasury, |
| |||||||
0.00%c,d | 1,773 | 1,773 | ||||||
|
| |||||||
| 2,222,082 | ||||||||
|
| |||||||
TOTAL SHORT-TERM INVESTMENTS |
| |||||||
(Cost: $2,222,082) |
| 2,222,082 | ||||||
|
| |||||||
| 34 | 2014 iSHARES ANNUAL REPORTTO SHAREHOLDERS |
Table of Contents
Schedule of Investments (Continued)
iSHARES® MSCI FRANCE ETF
August 31, 2014
| Value | ||||||
TOTAL INVESTMENTS | ||||||
(Cost: $326,143,202) | $ | 284,031,325 | ||||
Other Assets, Less Liabilities — (0.75)% | (2,108,505 | ) | ||||
|
| |||||
NET ASSETS — 100.00% | $ | 281,922,820 | ||||
|
| |||||
FDR — Fiduciary Depositary Receipts
| a | Non-income earning security. |
| b | All or a portion of this security represents a security on loan. See Note 1. |
| c | Affiliated issuer. See Note 2. |
| d | The rate quoted is the annualized seven-day yield of the fund at period end. |
| e | All or a portion of this security represents an investment of securities lending collateral. See Note 1. |
See notes to financial statements.
SCHEDULESOF INVESTMENTS | 35 |
Table of Contents
Schedule of Investments
iSHARES® MSCI ITALY CAPPED ETF
August 31, 2014
| Security | Shares | Value | ||||||
COMMON STOCKS — 99.93% |
| |||||||
AEROSPACE & DEFENSE — 2.03% |
| |||||||
Finmeccanica SpAa | 3,379,320 | $ | 31,692,837 | |||||
|
| |||||||
| 31,692,837 | ||||||||
AUTO COMPONENTS — 2.00% |
| |||||||
Pirelli & C. SpA | 2,028,888 | 31,080,614 | ||||||
|
| |||||||
| 31,080,614 | ||||||||
AUTOMOBILES — 3.42% |
| |||||||
Fiat SpAa,b | 5,439,312 | 53,305,094 | ||||||
|
| |||||||
| 53,305,094 | ||||||||
CAPITAL MARKETS — 2.31% |
| |||||||
Mediobanca SpAa | 4,103,136 | 35,940,935 | ||||||
|
| |||||||
| 35,940,935 | ||||||||
COMMERCIAL BANKS — 25.68% |
| |||||||
Banca Monte dei Paschi di Siena SpAa | 29,561,112 | 44,311,335 | ||||||
Banco Popolare SCa | 2,426,760 | 37,942,798 | ||||||
Intesa Sanpaolo SpA | 44,292,744 | 132,087,227 | ||||||
Intesa Sanpaolo SpA RNC | 4,379,832 | 11,451,695 | ||||||
UniCredit SpA | 16,720,992 | 129,726,632 | ||||||
Unione di Banche Italiane SpA | 5,651,856 | 44,258,303 | ||||||
|
| |||||||
| 399,777,990 | ||||||||
DIVERSIFIED FINANCIAL SERVICES — 2.02% |
| |||||||
Exor SpA | 789,264 | 31,479,656 | ||||||
|
| |||||||
| 31,479,656 | ||||||||
DIVERSIFIED TELECOMMUNICATION SERVICES — 4.67% |
| |||||||
Telecom Italia SpAa | 43,840,440 | 50,557,183 | ||||||
Telecom Italia SpA RNC | 23,996,088 | 22,125,357 | ||||||
|
| |||||||
| 72,682,540 | ||||||||
ELECTRIC UTILITIES — 11.78% |
| |||||||
Enel SpA | 25,093,152 | 133,070,196 | ||||||
Terna SpA | 9,759,528 | 50,392,591 | ||||||
|
| |||||||
| 183,462,787 | ||||||||
ELECTRICAL EQUIPMENT — 2.03% |
| |||||||
Prysmian SpA | 1,549,368 | 31,551,200 | ||||||
|
| |||||||
| 31,551,200 | ||||||||
ENERGY EQUIPMENT & SERVICES — 4.80% |
| |||||||
Saipem SpAa | 491,184 | 11,684,598 | ||||||
Tenaris SA | 2,848,608 | 62,999,223 | ||||||
|
| |||||||
| 74,683,821 | ||||||||
GAS UTILITIES — 4.46% |
| |||||||
Snam SpA | 11,901,816 | 69,386,735 | ||||||
|
| |||||||
| 69,386,735 | ||||||||
| Security | Shares | Value | ||||||
INDEPENDENT POWER PRODUCERS & ENERGY |
| |||||||
Enel Green Power SpA | 4,203,576 | $ | 11,627,598 | |||||
|
| |||||||
| 11,627,598 | ||||||||
INSURANCE — 6.07% |
| |||||||
Assicurazioni Generali SpA | 3,382,560 | 69,327,719 | ||||||
UnipolSai SpA | 8,025,480 | 25,265,083 | ||||||
|
| |||||||
| 94,592,802 | ||||||||
MACHINERY — 3.23% |
| |||||||
CNH Industrial NV | 5,769,144 | 50,230,170 | ||||||
|
| |||||||
| 50,230,170 | ||||||||
OIL, GAS & CONSUMABLE FUELS — 17.17% |
| |||||||
Eni SpA | 10,693,296 | 267,337,330 | ||||||
|
| |||||||
| 267,337,330 | ||||||||
TEXTILES, APPAREL & LUXURY GOODS — 3.58% |
| |||||||
Luxottica Group SpA | 1,041,984 | 55,792,190 | ||||||
|
| |||||||
| 55,792,190 | ||||||||
TRANSPORTATION INFRASTRUCTURE — 3.93% |
| |||||||
Atlantia SpA | 2,402,784 | 61,146,790 | ||||||
|
| |||||||
| 61,146,790 | ||||||||
|
| |||||||
TOTAL COMMON STOCKS |
| |||||||
(Cost: $1,594,016,316) |
| 1,555,771,089 | ||||||
SHORT-TERM INVESTMENTS — 1.27% |
| |||||||
MONEY MARKET FUNDS — 1.27% |
| |||||||
BlackRock Cash Funds: Institutional, |
| |||||||
0.14%c,d,e | 18,612,404 | 18,612,404 | ||||||
BlackRock Cash Funds: Prime, |
| |||||||
0.11%c,d,e | 1,171,702 | 1,171,702 | ||||||
BlackRock Cash Funds: Treasury, |
| |||||||
0.00%c,d | 18,982 | 18,982 | ||||||
|
| |||||||
| 19,803,088 | ||||||||
|
| |||||||
TOTAL SHORT-TERM INVESTMENTS |
| |||||||
(Cost: $19,803,088) |
| 19,803,088 | ||||||
|
| |||||||
| 36 | 2014 iSHARES ANNUAL REPORTTO SHAREHOLDERS |
Table of Contents
Schedule of Investments (Continued)
iSHARES® MSCI ITALY CAPPED ETF
August 31, 2014
| Value | ||||||
TOTAL INVESTMENTS | ||||||
(Cost: $1,613,819,404) | $ | 1,575,574,177 | ||||
Other Assets, Less Liabilities — (1.20)% | (18,713,925 | ) | ||||
|
| |||||
NET ASSETS — 100.00% | $ | 1,556,860,252 | ||||
|
| |||||
| a | Non-income earning security. |
| b | All or a portion of this security represents a security on loan. See Note 1. |
| c | Affiliated issuer. See Note 2. |
| d | The rate quoted is the annualized seven-day yield of the fund at period end. |
| e | All or a portion of this security represents an investment of securities lending collateral. See Note 1. |
See notes to financial statements.
SCHEDULESOF INVESTMENTS | 37 |
Table of Contents
Schedule of Investments
August 31, 2014
| Security | Shares | Value | ||||||
COMMON STOCKS — 99.64% |
| |||||||
AIR FREIGHT & LOGISTICS — 1.43% |
| |||||||
PostNL NVa | 188,136 | $ | 944,415 | |||||
TNT Express NV | 188,270 | 1,410,563 | ||||||
|
| |||||||
| 2,354,978 | ||||||||
BEVERAGES — 6.36% |
| |||||||
Heineken Holding NV | 43,148 | 2,985,519 | ||||||
Heineken NV | 98,490 | 7,511,428 | ||||||
|
| |||||||
| 10,496,947 | ||||||||
CAPITAL MARKETS — 0.15% |
| |||||||
BinckBank NV | 22,378 | 245,449 | ||||||
|
| |||||||
| 245,449 | ||||||||
CHEMICALS — 7.56% |
| |||||||
Akzo Nobel NV | 102,510 | 7,263,059 | ||||||
Koninklijke DSM NV | 73,700 | 4,933,487 | ||||||
Koninklijke Ten Cate NV | 11,524 | 285,601 | ||||||
|
| |||||||
| 12,482,147 | ||||||||
CONSTRUCTION & ENGINEERING — 2.81% |
| |||||||
Arcadis NV | 25,594 | 847,530 | ||||||
Grontmij NVa | 29,882 | 148,744 | ||||||
Koninklijke BAM Groep NVb | 99,160 | 234,974 | ||||||
OCI NVa | 36,046 | 1,207,886 | ||||||
Royal Boskalis Westminster NV CVA | 36,984 | 2,133,488 | ||||||
Royal Imtech NVa,b | 146,864 | 74,284 | ||||||
|
| |||||||
| 4,646,906 | ||||||||
DIVERSIFIED FINANCIAL SERVICES — 13.76% |
| |||||||
ING Groep NV CVAa | 1,647,530 | 22,710,378 | ||||||
SNS REAAL NVa,b,c | 68,952 | 1 | ||||||
|
| |||||||
| 22,710,379 | ||||||||
DIVERSIFIED TELECOMMUNICATION SERVICES — 4.61% |
| |||||||
Koninklijke KPN NVa | 1,368,676 | 4,552,122 | ||||||
Ziggo NV | 64,052 | 3,054,169 | ||||||
|
| |||||||
| 7,606,291 | ||||||||
ELECTRICAL EQUIPMENT — 0.39% |
| |||||||
Kendrion NV | 4,690 | 141,623 | ||||||
TKH Group NV | 14,874 | 503,515 | ||||||
|
| |||||||
| 645,138 | ||||||||
ENERGY EQUIPMENT & SERVICES — 1.44% |
| |||||||
Fugro NV CVA | 31,356 | 1,140,146 | ||||||
SBM Offshore NVa,b | 80,400 | 1,234,298 | ||||||
|
| |||||||
| 2,374,444 | ||||||||
| Security | Shares | Value | ||||||
FOOD & STAPLES RETAILING — 4.22% |
| |||||||
Amsterdam Commodities NV | 6,566 | $ | 154,380 | |||||
Koninklijke Ahold NV | 397,578 | 6,807,968 | ||||||
|
| |||||||
| 6,962,348 | ||||||||
FOOD PRODUCTS — 18.66% |
| |||||||
Corbion NV | 27,872 | 467,723 | ||||||
Koninklijke Wessanen NV | 32,428 | 180,681 | ||||||
Nutreco NV | 30,016 | 1,157,448 | ||||||
Unilever NV CVA | 696,130 | 29,007,480 | ||||||
|
| |||||||
| 30,813,332 | ||||||||
HOUSEHOLD DURABLES — 0.20% |
| |||||||
TomTom NVa,b | 42,746 | 328,709 | ||||||
|
| |||||||
| 328,709 | ||||||||
INDUSTRIAL CONGLOMERATES — 7.67% |
| |||||||
Koninklijke Philips NV | 414,596 | 12,664,197 | ||||||
|
| |||||||
| 12,664,197 | ||||||||
INSURANCE — 4.96% |
| |||||||
AEGON NV | 774,252 | 6,135,387 | ||||||
Delta Lloyd NV | 84,839 | 2,048,936 | ||||||
|
| |||||||
| 8,184,323 | ||||||||
LEISURE EQUIPMENT & PRODUCTS — 0.10% |
| |||||||
Accell Group NV | 8,978 | 162,132 | ||||||
|
| |||||||
| 162,132 | ||||||||
MACHINERY — 0.71% |
| |||||||
Aalberts Industries NV | 42,478 | 1,180,308 | ||||||
|
| |||||||
| 1,180,308 | ||||||||
MEDIA — 7.74% |
| |||||||
Altice SAa | 37,118 | 2,376,144 | ||||||
Reed Elsevier NV | 298,418 | 6,819,873 | ||||||
Wolters Kluwer NV | 129,042 | 3,583,055 | ||||||
|
| |||||||
| 12,779,072 | ||||||||
METALS & MINING — 0.06% |
| |||||||
AMG Advanced Metallurgical Group NVa | 11,122 | 105,523 | ||||||
|
| |||||||
| 105,523 | ||||||||
OIL, GAS & CONSUMABLE FUELS — 0.93% |
| |||||||
Koninklijke Vopak NV | 30,016 | 1,542,737 | ||||||
|
| |||||||
| 1,542,737 | ||||||||
PROFESSIONAL SERVICES — 1.93% |
| |||||||
Brunel International | 8,308 | 205,406 | ||||||
Randstad Holding NV | 53,868 | 2,621,430 | ||||||
USG People NV | 27,336 | 352,905 | ||||||
|
| |||||||
| 3,179,741 | ||||||||
| 38 | 2014 iSHARES ANNUAL REPORTTO SHAREHOLDERS |
Table of Contents
Schedule of Investments (Continued)
iSHARES® MSCI NETHERLANDS ETF
August 31, 2014
| Security | Shares | Value | ||||||
REAL ESTATE INVESTMENT TRUSTS (REITS) — 2.43% |
| |||||||
Corio NV | 30,150 | $ | 1,623,690 | |||||
Eurocommercial Properties NV | 17,420 | 857,937 | ||||||
Nieuwe Steen Investments NV | 54,940 | 313,349 | ||||||
VastNed Retail NV | 8,174 | 398,694 | ||||||
Wereldhave NV | 8,844 | 816,035 | ||||||
|
| |||||||
| 4,009,705 | ||||||||
SEMICONDUCTORS & SEMICONDUCTOR EQUIPMENT — 9.51% |
| |||||||
ASM International NV | 21,574 | 839,731 | ||||||
ASML Holding NV | 152,760 | 14,650,501 | ||||||
BE Semiconductor Industries NV | 11,926 | 210,657 | ||||||
|
| |||||||
| 15,700,889 | ||||||||
SOFTWARE — 2.01% |
| |||||||
Gemalto NVb | 33,768 | 3,314,147 | ||||||
|
| |||||||
| 3,314,147 | ||||||||
|
| |||||||
TOTAL COMMON STOCKS |
| |||||||
(Cost: $174,723,662) |
| 164,489,842 | ||||||
SHORT-TERM INVESTMENTS — 3.36% |
| |||||||
MONEY MARKET FUNDS — 3.36% |
| |||||||
BlackRock Cash Funds: Institutional, |
| |||||||
0.14%d,e,f | 5,198,803 | 5,198,803 | ||||||
BlackRock Cash Funds: Prime, |
| |||||||
0.11%d,e,f | 327,279 | 327,279 | ||||||
BlackRock Cash Funds: Treasury, |
| |||||||
0.00%d,e | 24,972 | 24,972 | ||||||
|
| |||||||
| 5,551,054 | ||||||||
|
| |||||||
TOTAL SHORT-TERM INVESTMENTS |
| |||||||
(Cost: $5,551,054) |
| 5,551,054 | ||||||
|
| |||||||
TOTAL INVESTMENTS |
| |||||||
(Cost: $180,274,716) | 170,040,896 | |||||||
Other Assets, Less Liabilities — (3.00)% |
| (4,949,392 | ) | |||||
|
| |||||||
NET ASSETS — 100.00% |
| $ | 165,091,504 | |||||
|
| |||||||
| a | Non-income earning security. |
| b | All or a portion of this security represents a security on loan. See Note 1. |
| c | Security valued using Level 3 inputs in accordance with management’s fair valuation policy. See Note 1. |
| d | Affiliated issuer. See Note 2. |
| e | The rate quoted is the annualized seven-day yield of the fund at period end. |
| f | All or a portion of this security represents an investment of securities lending collateral. See Note 1. |
See notes to financial statements.
SCHEDULESOF INVESTMENTS | 39 |
Table of Contents
Schedule of Investments
iSHARES® MSCI SPAIN CAPPED ETF
August 31, 2014
| Security | Shares | Value | ||||||
COMMON STOCKS — 99.90% |
| |||||||
AIRLINES — 2.09% |
| |||||||
International Consolidated Airlines Group SAa | 8,603,952 | $ | 51,633,730 | |||||
|
| |||||||
| 51,633,730 | ||||||||
BIOTECHNOLOGY — 2.32% |
| |||||||
Grifols SA | 1,228,556 | 57,334,749 | ||||||
|
| |||||||
| 57,334,749 | ||||||||
COMMERCIAL BANKS — 46.78% |
| |||||||
Banco Bilbao Vizcaya Argentaria SA | 24,765,188 | 300,436,759 | ||||||
Banco de Sabadell SA | 24,423,336 | 77,080,338 | ||||||
Banco Popular Espanol SA | 12,812,847 | 80,183,033 | ||||||
Banco Santander SA | 55,481,524 | 554,679,315 | ||||||
Bankia SAa | 34,568,464 | 67,025,444 | ||||||
CaixaBank SA | 12,855,641 | 77,521,351 | ||||||
|
| |||||||
| 1,156,926,240 | ||||||||
CONSTRUCTION & ENGINEERING — 5.25% |
| |||||||
Actividades de Construcciones y Servicios SA | 1,495,135 | 63,128,868 | ||||||
Ferrovial SA | 3,265,680 | 66,631,080 | ||||||
|
| |||||||
| 129,759,948 | ||||||||
DIVERSIFIED TELECOMMUNICATION SERVICES — 10.97% |
| |||||||
Telefonica SA | 17,062,556 | 271,270,876 | ||||||
|
| |||||||
| 271,270,876 | ||||||||
ELECTRIC UTILITIES — 6.88% |
| |||||||
Iberdrola SA | 16,330,132 | 120,133,653 | ||||||
Red Electrica Corporacion SA | 591,807 | 49,959,971 | ||||||
|
| |||||||
| 170,093,624 | ||||||||
FOOD & STAPLES RETAILING — 1.98% |
| |||||||
Distribuidora Internacional de Alimentacion SA | 5,792,808 | 48,894,887 | ||||||
|
| |||||||
| 48,894,887 | ||||||||
GAS UTILITIES — 4.79% |
| |||||||
Enagas SA | 982,357 | 32,827,788 | ||||||
Gas Natural SDG SA | 2,785,972 | 85,632,054 | ||||||
|
| |||||||
| 118,459,842 | ||||||||
INSURANCE — 1.59% |
| |||||||
Mapfre SA | 10,476,424 | 39,370,112 | ||||||
|
| |||||||
| 39,370,112 | ||||||||
IT SERVICES — 3.80% |
| |||||||
Amadeus IT Holding SA Class A | 2,522,072 | 94,014,691 | ||||||
|
| |||||||
| 94,014,691 | ||||||||
| Security | Shares | Value | ||||||
MACHINERY — 1.38% |
| |||||||
Zardoya Otis SA | 2,265,480 | $ | 32,944,363 | |||||
Zardoya Otis SA New | 89,056 | 1,295,043 | ||||||
|
| |||||||
| 34,239,406 | ||||||||
OIL, GAS & CONSUMABLE FUELS — 4.60% |
| |||||||
Repsol SA | 4,576,432 | 113,870,383 | ||||||
|
| |||||||
| 113,870,383 | ||||||||
SPECIALTY RETAIL — 4.70% |
| |||||||
Inditex SA | 3,999,100 | 116,150,923 | ||||||
|
| |||||||
| 116,150,923 | ||||||||
TRANSPORTATION INFRASTRUCTURE — 2.77% |
| |||||||
Abertis Infraestructuras SA | 3,252,872 | 68,597,789 | ||||||
|
| |||||||
| 68,597,789 | ||||||||
|
| |||||||
TOTAL COMMON STOCKS |
| |||||||
(Cost: $2,374,573,243) |
| 2,470,617,200 | ||||||
SHORT-TERM INVESTMENTS — 0.10% |
| |||||||
MONEY MARKET FUNDS — 0.10% |
| |||||||
BlackRock Cash Funds: Treasury, |
| |||||||
0.00%b,c | 2,538,504 | 2,538,504 | ||||||
|
| |||||||
| 2,538,504 | ||||||||
|
| |||||||
TOTAL SHORT-TERM INVESTMENTS |
| |||||||
(Cost: $2,538,504) |
| 2,538,504 | ||||||
|
| |||||||
TOTAL INVESTMENTS |
| |||||||
(Cost: $2,377,111,747) | 2,473,155,704 | |||||||
Other Assets, Less Liabilities — (0.00)% |
| (118,056 | ) | |||||
|
| |||||||
NET ASSETS — 100.00% |
| $ | 2,473,037,648 | |||||
|
| |||||||
| a | Non-income earning security. |
| b | Affiliated issuer. See Note 2. |
| c | The rate quoted is the annualized seven-day yield of the fund at period end. |
See notes to financial statements.
| 40 | 2014 iSHARES ANNUAL REPORTTO SHAREHOLDERS |
Table of Contents
Schedule of Investments
August 31, 2014
| Security | Shares | Value | ||||||
COMMON STOCKS — 99.92% |
| |||||||
BUILDING PRODUCTS — 4.19% |
| |||||||
Assa Abloy AB Class B | 334,486 | $ | 16,942,013 | |||||
|
| |||||||
| 16,942,013 | ||||||||
COMMERCIAL BANKS — 26.23% |
| |||||||
Nordea Bank AB | 3,041,974 | 39,752,386 | ||||||
Skandinaviska Enskilda Banken AB Class A | 1,499,237 | 19,624,225 | ||||||
Svenska Handelsbanken AB Class A | 500,070 | 23,499,793 | ||||||
Swedbank AB Class A | 906,762 | 23,152,754 | ||||||
|
| |||||||
| 106,029,158 | ||||||||
COMMERCIAL SERVICES & SUPPLIES — 0.85% |
| |||||||
Securitas AB Class B | 314,104 | 3,440,106 | ||||||
|
| |||||||
| 3,440,106 | ||||||||
COMMUNICATIONS EQUIPMENT — 9.41% |
| |||||||
Telefonaktiebolaget LM Ericsson Class B | 3,044,028 | 38,054,444 | ||||||
|
| |||||||
| 38,054,444 | ||||||||
CONSTRUCTION & ENGINEERING — 1.95% |
| |||||||
Skanska AB Class B | 380,780 | 7,898,266 | ||||||
|
| |||||||
| 7,898,266 | ||||||||
DIVERSIFIED FINANCIAL SERVICES — 7.22% |
| |||||||
Industrivarden AB Class C | 146,870 | 2,654,562 | ||||||
Investment AB Kinnevik Class B | 235,578 | 9,583,636 | ||||||
Investor AB Class B | 456,304 | 16,952,876 | ||||||
|
| |||||||
| 29,191,074 | ||||||||
DIVERSIFIED TELECOMMUNICATION SERVICES — 4.31% |
| |||||||
TeliaSonera AB | 2,383,904 | 17,440,072 | ||||||
|
| |||||||
| 17,440,072 | ||||||||
ELECTRONIC EQUIPMENT, INSTRUMENTS & |
| |||||||
Hexagon AB Class B | 255,170 | 8,367,490 | ||||||
|
| |||||||
| 8,367,490 | ||||||||
HEALTH CARE EQUIPMENT & SUPPLIES — 2.34% |
| |||||||
Elekta AB Class Ba | 368,614 | 4,211,599 | ||||||
Getinge AB Class B | 200,344 | 5,250,543 | ||||||
|
| |||||||
| 9,462,142 | ||||||||
HOUSEHOLD DURABLES — 2.28% |
| |||||||
Electrolux AB Class B | 240,634 | 6,120,051 | ||||||
Husqvarna AB Class B | 408,588 | 3,100,492 | ||||||
|
| |||||||
| 9,220,543 | ||||||||
| Security | Shares | Value | ||||||
HOUSEHOLD PRODUCTS — 3.50% |
| |||||||
Svenska Cellulosa AB Class B | 587,286 | $ | 14,152,992 | |||||
|
| |||||||
| 14,152,992 | ||||||||
MACHINERY — 19.32% |
| |||||||
Alfa Laval AB | 315,052 | 7,212,810 | ||||||
Atlas Copco AB Class A | 671,342 | 19,597,360 | ||||||
Atlas Copco AB Class B | 390,892 | 10,446,215 | ||||||
Sandvik AB | 1,066,974 | 13,338,610 | ||||||
SKF AB Class B | 396,106 | 9,159,374 | ||||||
Volvo AB Class B | 1,533,713 | 18,359,455 | ||||||
|
| |||||||
| 78,113,824 | ||||||||
METALS & MINING — 1.08% |
| |||||||
Boliden AB | 273,656 | 4,345,522 | ||||||
|
| |||||||
| 4,345,522 | ||||||||
OIL, GAS & CONSUMABLE FUELS — 1.01% |
| |||||||
Lundin Petroleum ABa,b | 217,882 | 4,069,319 | ||||||
|
| |||||||
| 4,069,319 | ||||||||
SPECIALTY RETAIL — 10.02% |
| |||||||
Hennes & Mauritz AB Class B | 949,738 | 40,503,082 | ||||||
|
| |||||||
| 40,503,082 | ||||||||
TOBACCO — 1.68% |
| |||||||
Swedish Match AB | 202,240 | 6,771,069 | ||||||
|
| |||||||
| 6,771,069 | ||||||||
WIRELESS TELECOMMUNICATION SERVICES — 2.46% |
| |||||||
Millicom International Cellular SA SDR | 66,202 | 5,949,515 | ||||||
Tele2 AB Class B | 319,950 | 3,990,626 | ||||||
|
| |||||||
| 9,940,141 | ||||||||
|
| |||||||
TOTAL COMMON STOCKS |
| |||||||
(Cost: $396,607,637) |
| 403,941,257 | ||||||
SHORT-TERM INVESTMENTS — 1.05% |
| |||||||
MONEY MARKET FUNDS — 1.05% |
| |||||||
BlackRock Cash Funds: Institutional, |
| |||||||
0.14%c,d,e | 3,956,496 | 3,956,496 | ||||||
BlackRock Cash Funds: Prime, | ||||||||
0.11%c,d,e | 249,072 | 249,072 | ||||||
SCHEDULESOF INVESTMENTS | 41 |
Table of Contents
Schedule of Investments (Continued)
iSHARES® MSCI SWEDEN ETF
August 31, 2014
| Security | Shares | Value | ||||||
BlackRock Cash Funds: Treasury, | ||||||||
0.00%c,d | 16,023 | $ | 16,023 | |||||
|
| |||||||
| 4,221,591 | ||||||||
|
| |||||||
TOTAL SHORT-TERM INVESTMENTS |
| |||||||
(Cost: $4,221,591) |
| 4,221,591 | ||||||
|
| |||||||
TOTAL INVESTMENTS |
| |||||||
(Cost: $400,829,228) |
| 408,162,848 | ||||||
Other Assets, Less Liabilities — (0.97)% |
| (3,906,840 | ) | |||||
|
| |||||||
NET ASSETS — 100.00% |
| $ | 404,256,008 | |||||
|
| |||||||
SDR — Swedish Depositary Receipts
| a | All or a portion of this security represents a security on loan. See Note 1. |
| b | Non-income earning security. |
| c | Affiliated issuer. See Note 2. |
| d | The rate quoted is the annualized seven-day yield of the fund at period end. |
| e | All or a portion of this security represents an investment of securities lending collateral. See Note 1. |
See notes to financial statements.
| 42 | 2014 iSHARES ANNUAL REPORTTO SHAREHOLDERS |
Table of Contents
Schedule of Investments
iSHARES® MSCI SWITZERLAND CAPPED ETF
August 31, 2014
| Security | Shares | Value | ||||||
COMMON STOCKS — 99.17% |
| |||||||
BIOTECHNOLOGY — 1.54% |
| |||||||
Actelion Ltd. Registereda | 134,130 | $ | 16,505,379 | |||||
|
| |||||||
| 16,505,379 | ||||||||
BUILDING PRODUCTS — 1.42% |
| |||||||
Geberit AG Registered | 44,880 | 15,264,639 | ||||||
|
| |||||||
| 15,264,639 | ||||||||
CAPITAL MARKETS — 10.00% |
| |||||||
Credit Suisse Group AG Registered | 1,426,725 | 40,316,256 | ||||||
Julius Baer Group Ltd.a | 258,570 | 11,781,543 | ||||||
Partners Group Holding AG | 26,775 | 7,080,750 | ||||||
UBS AG Registereda | 2,673,165 | 48,043,125 | ||||||
|
| |||||||
| 107,221,674 | ||||||||
CHEMICALS — 6.12% |
| |||||||
EMS-Chemie Holding AG Registered | 15,300 | 6,665,611 | ||||||
Givaudan SA Registereda | 9,690 | 16,124,431 | ||||||
Sika AG Bearer | 2,862 | 10,843,632 | ||||||
Syngenta AG Registered | 88,740 | 31,926,440 | ||||||
|
| |||||||
| 65,560,114 | ||||||||
CONSTRUCTION MATERIALS — 1.78% |
| |||||||
Holcim Ltd. Registereda | 239,700 | 19,105,858 | ||||||
|
| |||||||
| 19,105,858 | ||||||||
DIVERSIFIED FINANCIAL SERVICES — 0.49% |
| |||||||
Pargesa Holding SA Bearer | 61,200 | 5,269,007 | ||||||
|
| |||||||
| 5,269,007 | ||||||||
DIVERSIFIED TELECOMMUNICATION SERVICES — 1.43% |
| |||||||
Swisscom AG Registered | 26,265 | 15,285,522 | ||||||
|
| |||||||
| 15,285,522 | ||||||||
ELECTRICAL EQUIPMENT — 4.30% |
| |||||||
ABB Ltd. Registereda | 2,029,035 | 46,148,167 | ||||||
|
| |||||||
| 46,148,167 | ||||||||
ENERGY EQUIPMENT & SERVICES — 1.37% |
| |||||||
Transocean Ltd.b | 381,735 | 14,721,712 | ||||||
|
| |||||||
| 14,721,712 | ||||||||
FOOD PRODUCTS — 20.54% |
| |||||||
Aryzta AGa | 121,125 | 11,089,514 | ||||||
Barry Callebaut AG Registereda | 4,990 | 6,129,551 | ||||||
Lindt & Spruengli AG Participation Certificates | 1,460 | 7,672,632 | ||||||
Lindt & Spruengli AG Registered | 151 | 9,484,386 | ||||||
Nestle SA Registered | 2,388,585 | 185,823,750 | ||||||
|
| |||||||
| 220,199,833 | ||||||||
| Security | Shares | Value | ||||||
HEALTH CARE EQUIPMENT & SUPPLIES — 0.98% |
| |||||||
Sonova Holding AG Registered | 65,790 | $ | 10,545,364 | |||||
|
| |||||||
| 10,545,364 | ||||||||
INSURANCE — 8.40% |
| |||||||
Baloise Holding AG Registered | 67,327 | 8,799,522 | ||||||
Swiss Life Holding AG Registereda | 42,330 | 10,695,160 | ||||||
Swiss Re AGa | 341,190 | 28,033,572 | ||||||
Zurich Insurance Group AGa | 140,760 | 42,573,041 | ||||||
|
| |||||||
| 90,101,295 | ||||||||
LIFE SCIENCES TOOLS & SERVICES — 0.90% |
| |||||||
Lonza Group AG Registereda | 83,895 | 9,627,520 | ||||||
|
| |||||||
| 9,627,520 | ||||||||
MACHINERY — 1.85% |
| |||||||
Schindler Holding AG Participation Certificates | 61,200 | 8,867,435 | ||||||
Schindler Holding AG Registered | 39,270 | 5,724,240 | ||||||
Sulzer AG Registered | 39,780 | 5,290,390 | ||||||
|
| |||||||
| 19,882,065 | ||||||||
MARINE — 0.89% |
| |||||||
Kuehne & Nagel International AG Registered | 70,380 | 9,505,930 | ||||||
|
| |||||||
| 9,505,930 | ||||||||
PHARMACEUTICALS — 27.42% |
| |||||||
Novartis AG Registered | 1,640,415 | 147,500,328 | ||||||
Roche Holding AG Genusschein | 501,075 | 146,462,606 | ||||||
|
| |||||||
| 293,962,934 | ||||||||
PROFESSIONAL SERVICES — 2.56% |
| |||||||
Adecco SA Registereda | 181,560 | 13,777,824 | ||||||
SGS SA Registered | 6,124 | 13,620,776 | ||||||
|
| |||||||
| 27,398,600 | ||||||||
REAL ESTATE MANAGEMENT & DEVELOPMENT — 0.64% |
| |||||||
Swiss Prime Site AG Registereda | 85,680 | 6,857,394 | ||||||
|
| |||||||
| 6,857,394 | ||||||||
TEXTILES, APPAREL & LUXURY GOODS — 6.54% |
| |||||||
Compagnie Financiere Richemont SA Class A Bearer | 481,440 | 46,022,899 | ||||||
Swatch Group AG (The) Bearer | 31,620 | 17,186,697 | ||||||
Swatch Group AG (The) Registered | 67,065 | 6,883,343 | ||||||
|
| |||||||
| 70,092,939 | ||||||||
|
| |||||||
TOTAL COMMON STOCKS |
| |||||||
(Cost: $862,464,710) |
| 1,063,255,946 | ||||||
SCHEDULESOF INVESTMENTS | 43 |
Table of Contents
Schedule of Investments (Continued)
iSHARES® MSCI SWITZERLAND CAPPED ETF
August 31, 2014
| Security | Shares | Value | ||||||
SHORT-TERM INVESTMENTS — 1.31% |
| |||||||
MONEY MARKET FUNDS — 1.31% |
| |||||||
BlackRock Cash Funds: Institutional, |
| |||||||
0.14%c,d,e | 13,254,008 | $ | 13,254,008 | |||||
BlackRock Cash Funds: Prime, | ||||||||
0.11%c,d,e | 834,376 | 834,376 | ||||||
BlackRock Cash Funds: Treasury, |
| |||||||
0.00%c,d | 8,229 | 8,229 | ||||||
|
| |||||||
| 14,096,613 | ||||||||
|
| |||||||
TOTAL SHORT-TERM INVESTMENTS |
| |||||||
(Cost: $14,096,613) |
| 14,096,613 | ||||||
|
| |||||||
TOTAL INVESTMENTS |
| |||||||
(Cost: $876,561,323) | 1,077,352,559 | |||||||
Other Assets, Less Liabilities — (0.48)% |
| (5,195,290 | ) | |||||
|
| |||||||
NET ASSETS — 100.00% |
| $ | 1,072,157,269 | |||||
|
| |||||||
| a | Non-income earning security. |
| b | All or a portion of this security represents a security on loan. See Note 1. |
| c | Affiliated issuer. See Note 2. |
| d | The rate quoted is the annualized seven-day yield of the fund at period end. |
| e | All or a portion of this security represents an investment of securities lending collateral. See Note 1. |
See notes to financial statements.
| 44 | 2014 iSHARES ANNUAL REPORTTO SHAREHOLDERS |
Table of Contents
Schedule of Investments
iSHARES® MSCI UNITED KINGDOM ETF
August 31, 2014
| Security | Shares | Value | ||||||
COMMON STOCKS — 99.10% |
| |||||||
AEROSPACE & DEFENSE — 2.30% |
| |||||||
BAE Systems PLC | 4,579,257 | $ | 33,849,837 | |||||
Cobham PLC | 1,647,832 | 8,130,543 | ||||||
Meggitt PLC | 1,166,394 | 9,135,305 | ||||||
Rolls-Royce Holdings PLCa | 2,723,052 | 46,172,739 | ||||||
|
| |||||||
| 97,288,424 | ||||||||
AIR FREIGHT & LOGISTICS — 0.16% |
| |||||||
Royal Mail PLC | 942,400 | 6,986,561 | ||||||
|
| |||||||
| 6,986,561 | ||||||||
AIRLINES — 0.12% |
| |||||||
easyJet PLC | 230,465 | 5,109,639 | ||||||
|
| |||||||
| 5,109,639 | ||||||||
AUTO COMPONENTS — 0.33% |
| |||||||
GKN PLC | 2,375,311 | 13,842,286 | ||||||
|
| |||||||
| 13,842,286 | ||||||||
BEVERAGES — 4.51% |
| |||||||
Coca-Cola HBC AGa | 290,511 | 6,822,066 | ||||||
Diageo PLC | 3,637,536 | 107,258,555 | ||||||
SABMiller PLC | 1,396,486 | 77,067,433 | ||||||
|
| |||||||
| 191,148,054 | ||||||||
CAPITAL MARKETS — 1.06% |
| |||||||
3i Group PLC | 1,406,381 | 9,183,759 | ||||||
Aberdeen Asset Management PLC | 1,332,289 | 9,611,523 | ||||||
Hargreaves Lansdown PLC | 343,896 | 6,408,021 | ||||||
ICAP PLC | 799,777 | 5,036,643 | ||||||
Investec PLC | 794,235 | 7,234,852 | ||||||
Schroders PLC | 179,916 | 7,278,653 | ||||||
|
| |||||||
| 44,753,451 | ||||||||
CHEMICALS — 0.53% |
| |||||||
Croda International PLC | 196,517 | 7,121,293 | ||||||
Johnson Matthey PLC | 296,575 | 15,554,305 | ||||||
|
| |||||||
| 22,675,598 | ||||||||
COMMERCIAL BANKS — 13.84% |
| |||||||
Barclays PLC | 23,748,546 | 88,523,912 | ||||||
HSBC Holdings PLC | 27,617,424 | 299,043,748 | ||||||
Lloyds Banking Group PLCa | 82,690,943 | 104,740,744 | ||||||
Royal Bank of Scotland Group PLCa | 3,635,468 | 21,904,411 | ||||||
Standard Chartered PLC | 3,573,905 | 71,995,901 | ||||||
|
| |||||||
| 586,208,716 | ||||||||
| Security | Shares | Value | ||||||
COMMERCIAL SERVICES & SUPPLIES — 0.80% |
| |||||||
Aggreko PLC | 370,595 | $ | 10,475,218 | |||||
Babcock International Group PLC | 725,564 | 13,507,821 | ||||||
G4S PLC | 2,245,583 | 9,882,776 | ||||||
|
| |||||||
| 33,865,815 | ||||||||
CONTAINERS & PACKAGING — 0.20% |
| |||||||
Rexam PLC | 1,018,843 | 8,578,655 | ||||||
|
| |||||||
| 8,578,655 | ||||||||
DIVERSIFIED FINANCIAL SERVICES — 0.21% |
| |||||||
London Stock Exchange Group PLC | 256,388 | 8,699,014 | ||||||
|
| |||||||
| 8,699,014 | ||||||||
DIVERSIFIED TELECOMMUNICATION SERVICES — 1.91% |
| |||||||
BT Group PLC | 11,466,332 | 73,695,240 | ||||||
Inmarsat PLC | 616,375 | 7,170,627 | ||||||
|
| |||||||
| 80,865,867 | ||||||||
ELECTRIC UTILITIES — 0.84% |
| |||||||
SSE PLC | 1,411,832 | 35,592,522 | ||||||
|
| |||||||
| 35,592,522 | ||||||||
ENERGY EQUIPMENT & SERVICES — 0.36% |
| |||||||
AMEC PLC | 431,430 | 8,060,590 | ||||||
Petrofac Ltd. | 376,120 | 7,052,195 | ||||||
|
| |||||||
| 15,112,785 | ||||||||
FOOD & STAPLES RETAILING — 1.48% |
| |||||||
J Sainsbury PLC | 1,796,163 | 8,659,578 | ||||||
Tesco PLC | 11,755,477 | 44,892,897 | ||||||
Wm Morrison Supermarkets PLC | 3,041,520 | 8,965,882 | ||||||
|
| |||||||
| 62,518,357 | ||||||||
FOOD PRODUCTS — 2.70% |
| |||||||
Associated British Foods PLC | 515,906 | 24,529,906 | ||||||
Tate & Lyle PLC | 674,989 | 7,583,479 | ||||||
Unilever PLC | 1,858,650 | 82,076,706 | ||||||
|
| |||||||
| 114,190,091 | ||||||||
HEALTH CARE EQUIPMENT & SUPPLIES — 0.53% |
| |||||||
Smith & Nephew PLC | 1,293,607 | 22,407,357 | ||||||
|
| |||||||
| 22,407,357 | ||||||||
HOTELS, RESTAURANTS & LEISURE — 2.21% |
| |||||||
Carnival PLC | 265,942 | 9,919,748 | ||||||
Compass Group PLC | 2,434,012 | 39,594,159 | ||||||
InterContinental Hotels Group PLC | 341,947 | 13,112,536 | ||||||
TUI Travel PLC | 726,291 | 4,493,047 | ||||||
Whitbread PLC | 262,774 | 19,153,667 | ||||||
SCHEDULESOF INVESTMENTS | 45 |
Table of Contents
Schedule of Investments (Continued)
iSHARES® MSCI UNITED KINGDOM ETF
August 31, 2014
| Security | Shares | Value | ||||||
William Hill PLC | 1,262,521 | $ | 7,338,556 | |||||
|
| |||||||
| 93,611,713 | ||||||||
HOUSEHOLD DURABLES — 0.23% |
| |||||||
Persimmon PLCa | 442,348 | 9,726,487 | ||||||
|
| |||||||
| 9,726,487 | ||||||||
HOUSEHOLD PRODUCTS — 1.94% |
| |||||||
Reckitt Benckiser Group PLC | 941,923 | 82,125,621 | ||||||
|
| |||||||
| 82,125,621 | ||||||||
INDUSTRIAL CONGLOMERATES — 0.29% |
| |||||||
Smiths Group PLC | 570,811 | 12,475,334 | ||||||
|
| |||||||
| 12,475,334 | ||||||||
INSURANCE — 5.78% |
| |||||||
Admiral Group PLC | 280,413 | 6,217,036 | ||||||
Aviva PLC | 4,268,721 | 36,935,115 | ||||||
Direct Line Insurance Group PLC | 2,170,908 | 10,776,340 | ||||||
Friends Life Group Ltd. | 2,052,391 | 10,453,888 | ||||||
Legal & General Group PLC | 8,570,306 | 34,401,466 | ||||||
Old Mutual PLC | 7,093,768 | 23,432,344 | ||||||
Prudential PLC | 3,713,498 | 89,424,220 | ||||||
RSA Insurance Group PLC | 1,465,519 | 11,151,942 | ||||||
Standard Life PLC | 3,462,018 | 22,101,241 | ||||||
|
| |||||||
| 244,893,592 | ||||||||
INTERNET & CATALOG RETAIL — 0.09% |
| |||||||
ASOS PLCa,b | 78,258 | 3,681,962 | ||||||
|
| |||||||
| 3,681,962 | ||||||||
MACHINERY — 0.70% |
| |||||||
IMI PLC | 394,593 | 8,886,137 | ||||||
Melrose Industries PLC | 1,553,699 | 7,036,489 | ||||||
Weir Group PLC (The) | 309,188 | 13,581,642 | ||||||
|
| |||||||
| 29,504,268 | ||||||||
MEDIA — 3.08% |
| |||||||
British Sky Broadcasting Group PLC | 1,495,205 | 21,690,403 | ||||||
ITV PLC | 5,547,056 | 19,456,308 | ||||||
Pearson PLC | 1,185,373 | 21,871,222 | ||||||
Reed Elsevier PLC | 1,661,955 | 27,117,883 | ||||||
WPP PLC | 1,922,498 | 40,324,892 | ||||||
|
| |||||||
| 130,460,708 | ||||||||
METALS & MINING — 8.56% |
| |||||||
Anglo American PLC | 2,022,565 | 51,392,280 | ||||||
Antofagasta PLC | 570,720 | 7,445,146 | ||||||
BHP Billiton PLC | 3,058,696 | 96,895,772 | ||||||
Fresnillo PLC | 321,124 | 5,130,407 | ||||||
Glencore PLCa | 15,383,881 | 92,588,717 | ||||||
| Security | Shares | Value | ||||||
Randgold Resources Ltd. | 127,248 | $ | 10,745,976 | |||||
Rio Tinto PLC | 1,842,721 | 98,342,638 | ||||||
|
| |||||||
| 362,540,936 | ||||||||
MULTI-UTILITIES — 2.82% |
| |||||||
Centrica PLC | 7,299,847 | 38,721,541 | ||||||
National Grid PLC | 5,408,455 | 80,748,949 | ||||||
|
| |||||||
| 119,470,490 | ||||||||
MULTILINE RETAIL — 1.02% |
| |||||||
Marks & Spencer Group PLC | 2,365,385 | 16,887,807 | ||||||
Next PLC | 224,497 | 26,452,511 | ||||||
|
| |||||||
| 43,340,318 | ||||||||
OIL, GAS & CONSUMABLE FUELS — 16.71% |
| |||||||
BG Group PLC | 4,938,733 | 98,546,973 | ||||||
BP PLC | 26,703,253 | 213,599,238 | ||||||
Royal Dutch Shell PLC Class A | 5,692,681 | 230,491,287 | ||||||
Royal Dutch Shell PLC Class B | 3,535,966 | 149,480,708 | ||||||
Tullow Oil PLC | 1,318,285 | 15,982,184 | ||||||
|
| |||||||
| 708,100,390 | ||||||||
PHARMACEUTICALS — 8.98% |
| |||||||
AstraZeneca PLC | 1,828,279 | 138,668,381 | ||||||
GlaxoSmithKline PLC | 7,033,271 | 172,228,926 | ||||||
Shire PLC | 853,012 | 69,741,124 | ||||||
|
| |||||||
| 380,638,431 | ||||||||
PROFESSIONAL SERVICES — 1.31% |
| |||||||
Capita PLC | 957,252 | 19,506,296 | ||||||
Experian PLC | 1,438,852 | 25,042,713 | ||||||
Intertek Group PLC | 233,537 | 10,863,575 | ||||||
|
| |||||||
| 55,412,584 | ||||||||
REAL ESTATE INVESTMENT TRUSTS (REITS) — 1.46% |
| |||||||
British Land Co. PLC (The) | 1,392,149 | 16,889,232 | ||||||
Hammerson PLC | 1,031,768 | 10,409,558 | ||||||
Intu Properties PLC | 1,285,742 | 7,302,708 | ||||||
Land Securities Group PLC | 1,144,457 | 20,565,094 | ||||||
SEGRO PLC | 1,076,314 | 6,615,490 | ||||||
|
| |||||||
| 61,782,082 | ||||||||
SEMICONDUCTORS & SEMICONDUCTOR EQUIPMENT — 0.78% |
| |||||||
ARM Holdings PLC | 2,039,253 | 32,884,732 | ||||||
|
| |||||||
| 32,884,732 | ||||||||
SOFTWARE — 0.24% |
| |||||||
Sage Group PLC (The) | 1,588,358 | 10,385,270 | ||||||
|
| |||||||
| 10,385,270 | ||||||||
| 46 | 2014 iSHARES ANNUAL REPORTTO SHAREHOLDERS |
Table of Contents
Schedule of Investments (Continued)
iSHARES® MSCI UNITED KINGDOM ETF
August 31, 2014
| Security | Shares | Value | ||||||
SPECIALTY RETAIL — 0.71% |
| |||||||
Dixons Carphone PLC | 1,419,141 | $ | 8,121,660 | |||||
Kingfisher PLC | 3,439,172 | 17,346,132 | ||||||
Sports Direct International PLCa | 388,770 | 4,684,186 | ||||||
|
| |||||||
| 30,151,978 | ||||||||
TEXTILES, APPAREL & LUXURY GOODS — 0.36% |
| |||||||
Burberry Group PLC | 642,031 | 15,151,444 | ||||||
|
| |||||||
| 15,151,444 | ||||||||
TOBACCO — 5.21% |
| |||||||
British American Tobacco PLC | 2,712,762 | 160,092,865 | ||||||
Imperial Tobacco Group PLC | 1,386,069 | 60,471,242 | ||||||
|
| |||||||
| 220,564,107 | ||||||||
TRADING COMPANIES & DISTRIBUTORS — 1.04% |
| |||||||
Bunzl PLC | 483,894 | 13,227,691 | ||||||
Travis Perkins PLC | 357,348 | 10,344,100 | ||||||
Wolseley PLC | 385,175 | 20,712,804 | ||||||
|
| |||||||
| 44,284,595 | ||||||||
WATER UTILITIES — 0.60% |
| |||||||
Severn Trent PLC | 346,739 | 11,200,212 | ||||||
United Utilities Group PLC | 986,878 | 14,373,649 | ||||||
|
| |||||||
| 25,573,861 | ||||||||
WIRELESS TELECOMMUNICATION SERVICES — 3.10% |
| |||||||
Vodafone Group PLC | 38,292,976 | 131,482,696 | ||||||
|
| |||||||
| 131,482,696 | ||||||||
|
| |||||||
TOTAL COMMON STOCKS |
| |||||||
(Cost: $3,856,074,004) |
| 4,198,086,791 | ||||||
SHORT-TERM INVESTMENTS — 0.04% |
| |||||||
MONEY MARKET FUNDS — 0.04% |
| |||||||
BlackRock Cash Funds: Institutional, |
| |||||||
0.14%c,d,e | 624,587 | 624,587 | ||||||
BlackRock Cash Funds: Prime, | ||||||||
0.11%c,d,e | 39,320 | 39,320 | ||||||
BlackRock Cash Funds: Treasury, |
| |||||||
0.00%c,d | 1,222,980 | 1,222,980 | ||||||
|
| |||||||
| 1,886,887 | ||||||||
|
| |||||||
TOTAL SHORT-TERM INVESTMENTS |
| |||||||
(Cost: $1,886,887) |
| 1,886,887 | ||||||
|
| |||||||
| Value | ||||||
TOTAL INVESTMENTS | ||||||
(Cost: $3,857,960,891) | $ | 4,199,973,678 | ||||
Other Assets, Less Liabilities — 0.86% | 36,385,837 | |||||
|
| |||||
NET ASSETS — 100.00% | $ | 4,236,359,515 | ||||
|
| |||||
| a | Non-income earning security. |
| b | All or a portion of this security represents a security on loan. See Note 1. |
| c | Affiliated issuer. See Note 2. |
| d | The rate quoted is the annualized seven-day yield of the fund at period end. |
| e | All or a portion of this security represents an investment of securities lending collateral. See Note 1. |
Financial futures contracts purchased as of August 31, 2014 were as follows:
| Number of Contracts | Issue (Expiration) | Exchange | Notional Value | Unrealized Appreciation (Depreciation) | ||||||||||
| 331 | FTSE 100 Index (Sept. 2014) | NYSE Liffe London | $ | 37,388,381 | $ | 750,837 | ||||||||
See notes to financial statements.
SCHEDULESOF INVESTMENTS | 47 |
Table of Contents
Statements of Assets and Liabilities
iSHARES®, INC.
August 31, 2014
| iShares MSCI Austria Capped ETF | iShares MSCI Belgium Capped ETF | iShares MSCI Emerging Markets Eastern Europe ETF | ||||||||||
ASSETS | ||||||||||||
Investments, at cost: | ||||||||||||
Unaffiliated | $ | 83,626,133 | $ | 156,766,118 | $ | 173,025,442 | ||||||
Affiliated (Note 2) | 321,860 | 4,076,845 | 90,457 | |||||||||
|
|
|
|
|
| |||||||
Total cost of investments | $ | 83,947,993 | $ | 160,842,963 | $ | 173,115,899 | ||||||
|
|
|
|
|
| |||||||
Investments in securities, at fair value (including securities on loana) (Note 1): | ||||||||||||
Unaffiliated | $ | 62,183,404 | $ | 164,600,237 | $ | 150,223,835 | ||||||
Affiliated (Note 2) | 321,860 | 4,076,845 | 90,457 | |||||||||
|
|
|
|
|
| |||||||
Total fair value of investments | 62,505,264 | 168,677,082 | 150,314,292 | |||||||||
Foreign currency, at valueb | 23,987 | 54,566 | 134,069 | |||||||||
Cash | — | — | 24,522 | |||||||||
Receivables: | ||||||||||||
Investment securities sold | 978,710 | 2,365,554 | 1,872,023 | |||||||||
Dividends and interest | 941,215 | 44,417 | 173,987 | |||||||||
Capital shares sold | — | 2,778 | — | |||||||||
|
|
|
|
|
| |||||||
Total Assets | 64,449,176 | 171,144,397 | 152,518,893 | |||||||||
|
|
|
|
|
| |||||||
LIABILITIES | ||||||||||||
Payables: | ||||||||||||
Investment securities purchased | 936,645 | 2,346,508 | 1,866,935 | |||||||||
Collateral for securities on loan (Note 1) | 316,750 | 3,968,384 | — | |||||||||
Investment advisory fees (Note 2) | 25,610 | 64,449 | 85,971 | |||||||||
|
|
|
|
|
| |||||||
Total Liabilities | 1,279,005 | 6,379,341 | 1,952,906 | |||||||||
|
|
|
|
|
| |||||||
NET ASSETS | $ | 63,170,171 | $ | 164,765,056 | $ | 150,565,987 | ||||||
|
|
|
|
|
| |||||||
Net assets consist of: | ||||||||||||
Paid-in capital | $ | 168,982,688 | $ | 213,190,241 | $ | 178,053,096 | ||||||
Undistributed (distributions in excess of) net investment income | (28 | ) | (626,047 | ) | 2,583,379 | |||||||
Accumulated net realized loss | (84,337,712 | ) | (55,632,245 | ) | (7,263,915 | ) | ||||||
Net unrealized appreciation (depreciation) | (21,474,777 | ) | 7,833,107 | (22,806,573 | ) | |||||||
|
|
|
|
|
| |||||||
NET ASSETS | $ | 63,170,171 | $ | 164,765,056 | $ | 150,565,987 | ||||||
|
|
|
|
|
| |||||||
Shares outstandingc | 3,600,000 | 9,680,000 | 6,600,000 | |||||||||
|
|
|
|
|
| |||||||
Net asset value per share | $ | 17.55 | $ | 17.02 | $ | 22.81 | ||||||
|
|
|
|
|
| |||||||
| a | Securities on loan with values of $304,668, $3,609,891 and $ —, respectively. See Note 1. |
| b | Cost of foreign currency: $24,458, $55,716 and $135,740, respectively. |
| c | $0.001 par value, number of shares authorized: 100 million, 136.2 million and 200 million, respectively. |
See notes to financial statements.
| 48 | 2014 iSHARES ANNUAL REPORTTO SHAREHOLDERS |
Table of Contents
Statements of Assets and Liabilities (Continued)
iSHARES®, INC.
August 31, 2014
| iShares MSCI France ETF | iShares MSCI Italy Capped ETF | iShares MSCI Netherlands ETF | ||||||||||
ASSETS | ||||||||||||
Investments, at cost: | ||||||||||||
Unaffiliated | $ | 323,921,120 | $ | 1,594,016,316 | $ | 174,723,662 | ||||||
Affiliated (Note 2) | 2,222,082 | 19,803,088 | 5,551,054 | |||||||||
|
|
|
|
|
| |||||||
Total cost of investments | $ | 326,143,202 | $ | 1,613,819,404 | $ | 180,274,716 | ||||||
|
|
|
|
|
| |||||||
Investments in securities, at fair value (including securities on loana) (Note 1): | ||||||||||||
Unaffiliated | $ | 281,809,243 | $ | 1,555,771,089 | $ | 164,489,842 | ||||||
Affiliated (Note 2) | 2,222,082 | 19,803,088 | 5,551,054 | |||||||||
|
|
|
|
|
| |||||||
Total fair value of investments | 284,031,325 | 1,575,574,177 | 170,040,896 | |||||||||
Foreign currency, at valueb | 203,710 | 1,859,304 | 195,385 | |||||||||
Receivables: | ||||||||||||
Investment securities sold | 822,723 | 16,115,719 | 146,248 | |||||||||
Due from custodian (Note 4) | — | 1,403,408 | — | |||||||||
Dividends and interest | 10,003 | 83,896 | 448,145 | |||||||||
|
|
|
|
|
| |||||||
Total Assets | 285,067,761 | 1,595,036,504 | 170,830,674 | |||||||||
|
|
|
|
|
| |||||||
LIABILITIES | ||||||||||||
Payables: | ||||||||||||
Investment securities purchased | 802,210 | 17,719,004 | 145,649 | |||||||||
Collateral for securities on loan (Note 1) | 2,220,309 | 19,784,106 | 5,526,082 | |||||||||
Investment advisory fees (Note 2) | 122,422 | 673,142 | 67,439 | |||||||||
|
|
|
|
|
| |||||||
Total Liabilities | 3,144,941 | 38,176,252 | 5,739,170 | |||||||||
|
|
|
|
|
| |||||||
NET ASSETS | $ | 281,922,820 | $ | 1,556,860,252 | $ | 165,091,504 | ||||||
|
|
|
|
|
| |||||||
Net assets consist of: | ||||||||||||
Paid-in capital | $ | 367,662,837 | $ | 1,683,047,930 | $ | 218,184,946 | ||||||
Undistributed net investment income | 275,842 | — | 401,577 | |||||||||
Accumulated net realized loss | (43,898,922 | ) | (87,911,666 | ) | (43,254,874 | ) | ||||||
Net unrealized depreciation | (42,116,937 | ) | (38,276,012 | ) | (10,240,145 | ) | ||||||
|
|
|
|
|
| |||||||
NET ASSETS | $ | 281,922,820 | $ | 1,556,860,252 | $ | 165,091,504 | ||||||
|
|
|
|
|
| |||||||
Shares outstandingc | 10,200,000 | 97,200,000 | 6,700,000 | |||||||||
|
|
|
|
|
| |||||||
Net asset value per share | $ | 27.64 | $ | 16.02 | $ | 24.64 | ||||||
|
|
|
|
|
| |||||||
| a | Securities on loan with values of $2,142,963, $18,823,655 and $5,196,000, respectively. See Note 1. |
| b | Cost of foreign currency: $208,582, $1,890,089 and $196,542, respectively. |
| c | $0.001 par value, number of shares authorized: 340.2 million, 295.4 million and 255 million, respectively. |
See notes to financial statements.
FINANCIAL STATEMENTS | 49 |
Table of Contents
Statements of Assets and Liabilities (Continued)
iSHARES®, INC.
August 31, 2014
| iShares MSCI Spain Capped ETF | iShares MSCI Sweden ETF | iShares MSCI Switzerland Capped ETF | ||||||||||
ASSETS | ||||||||||||
Investments, at cost: | ||||||||||||
Unaffiliated | $ | 2,374,573,243 | $ | 396,607,637 | $ | 862,464,710 | ||||||
Affiliated (Note 2) | 2,538,504 | 4,221,591 | 14,096,613 | |||||||||
|
|
|
|
|
| |||||||
Total cost of investments | $ | 2,377,111,747 | $ | 400,829,228 | $ | 876,561,323 | ||||||
|
|
|
|
|
| |||||||
Investments in securities, at fair value (including securities on loana) (Note 1): | ||||||||||||
Unaffiliated | $ | 2,470,617,200 | $ | 403,941,257 | $ | 1,063,255,946 | ||||||
Affiliated (Note 2) | 2,538,504 | 4,221,591 | 14,096,613 | |||||||||
|
|
|
|
|
| |||||||
Total fair value of investments | 2,473,155,704 | 408,162,848 | 1,077,352,559 | |||||||||
Foreign currency, at valueb | 794,969 | 255,555 | 576,956 | |||||||||
Receivables: | ||||||||||||
Investment securities sold | 9,930,187 | 1,547,781 | 6,778,984 | |||||||||
Due from custodian (Note 4) | 988,404 | — | — | |||||||||
Dividends and interest | 148,159 | 103,810 | 8,207,696 | |||||||||
|
|
|
|
|
| |||||||
Total Assets | 2,485,017,423 | 410,069,994 | 1,092,916,195 | |||||||||
|
|
|
|
|
| |||||||
LIABILITIES | ||||||||||||
Payables: | ||||||||||||
Investment securities purchased | 10,364,960 | 1,444,307 | 6,242,460 | |||||||||
Collateral for securities on loan (Note 1) | — | 4,205,568 | 14,088,384 | |||||||||
Capital shares redeemed | 635,800 | — | — | |||||||||
Investment advisory fees (Note 2) | 979,015 | 164,111 | 428,082 | |||||||||
|
|
|
|
|
| |||||||
Total Liabilities | 11,979,775 | 5,813,986 | 20,758,926 | |||||||||
|
|
|
|
|
| |||||||
NET ASSETS | $ | 2,473,037,648 | $ | 404,256,008 | $ | 1,072,157,269 | ||||||
|
|
|
|
|
| |||||||
Net assets consist of: | ||||||||||||
Paid-in capital | $ | 2,460,806,923 | $ | 442,209,573 | $ | 929,094,970 | ||||||
Undistributed (distributions in excess of) net investment income | 23,027,613 | (1,954,836 | ) | (640,142 | ) | |||||||
Accumulated net realized loss | (106,826,339 | ) | (43,329,250 | ) | (57,011,080 | ) | ||||||
Net unrealized appreciation | 96,029,451 | 7,330,521 | 200,713,521 | |||||||||
|
|
|
|
|
| |||||||
NET ASSETS | $ | 2,473,037,648 | $ | 404,256,008 | $ | 1,072,157,269 | ||||||
|
|
|
|
|
| |||||||
Shares outstandingc | 60,900,000 | 11,850,000 | 31,875,000 | |||||||||
|
|
|
|
|
| |||||||
Net asset value per share | $ | 40.61 | $ | 34.11 | $ | 33.64 | ||||||
|
|
|
|
|
| |||||||
| a | Securities on loan with values of $ —, $3,912,959 and $13,463,173, respectively. See Note 1. |
| b | Cost of foreign currency: $806,785, $258,654 and $583,489, respectively. |
| c | $0.001 par value, number of shares authorized: 127.8 million, 63.6 million and 318.625 million, respectively. |
See notes to financial statements.
| 50 | 2014 iSHARES ANNUAL REPORTTO SHAREHOLDERS |
Table of Contents
Statements of Assets and Liabilities (Continued)
iSHARES®, INC.
August 31, 2014
| iShares MSCI United Kingdom ETF | ||||
ASSETS |
| |||
Investments, at cost: | ||||
Unaffiliated | $ | 3,856,074,004 | ||
Affiliated (Note 2) | 1,886,887 | |||
|
| |||
Total cost of investments | $ | 3,857,960,891 | ||
|
| |||
Investments in securities, at fair value (including securities on loana) (Note 1): | ||||
Unaffiliated | $ | 4,198,086,791 | ||
Affiliated (Note 2) | 1,886,887 | |||
|
| |||
Total fair value of investments | 4,199,973,678 | |||
Foreign currency, at valueb | 19,502,244 | |||
Foreign currency pledged to broker, at valueb | 1,215,472 | |||
Receivables: | ||||
Investment securities sold | 2,496,443 | |||
Dividends and interest | 29,529,868 | |||
Futures variation margin | 750,837 | |||
|
| |||
Total Assets | 4,253,468,542 | |||
|
| |||
LIABILITIES | ||||
Payables: | ||||
Investment securities purchased | 14,752,546 | |||
Collateral for securities on loan (Note 1) | 663,907 | |||
Investment advisory fees (Note 2) | 1,692,574 | |||
|
| |||
Total Liabilities | 17,109,027 | |||
|
| |||
NET ASSETS | $ | 4,236,359,515 | ||
|
| |||
Net assets consist of: | ||||
Paid-in capital | $ | 4,105,517,652 | ||
Undistributed net investment income | 36,730,763 | |||
Accumulated net realized loss | (248,227,427 | ) | ||
Net unrealized appreciation | 342,338,527 | |||
|
| |||
NET ASSETS | $ | 4,236,359,515 | ||
|
| |||
Shares outstandingc | 206,400,000 | |||
|
| |||
Net asset value per share | $ | 20.52 | ||
|
| |||
| a | Securities on loan with a value of $648,053. See Note 1. |
| b | Cost of foreign currency including currency pledged to broker: $20,996,716. |
| c | $0.001 par value, number of shares authorized: 934.2 million. |
See notes to financial statements.
FINANCIAL STATEMENTS | 51 |
Table of Contents
Statements of Operations
iSHARES®, INC.
Year ended August 31, 2014
| iShares MSCI Austria Capped ETF | iShares MSCI Belgium Capped ETF | iShares MSCI Emerging Markets Eastern Europe ETF | ||||||||||
NET INVESTMENT INCOME |
| |||||||||||
Dividends — unaffiliateda | $ | 2,724,024 | $ | 1,895,823 | $ | 4,873,423 | ||||||
Interest — affiliated (Note 2) | 7 | 13 | 23 | |||||||||
Securities lending income — affiliated (Note 2) | 19,440 | 101,569 | 4,883 | |||||||||
|
|
|
|
|
| |||||||
Total investment income | 2,743,471 | 1,997,405 | 4,878,329 | |||||||||
|
|
|
|
|
| |||||||
EXPENSES | ||||||||||||
Investment advisory fees (Note 2) | 423,284 | 402,608 | 961,380 | |||||||||
|
|
|
|
|
| |||||||
Total expenses | 423,284 | 402,608 | 961,380 | |||||||||
|
|
|
|
|
| |||||||
Net investment income | 2,320,187 | 1,594,797 | 3,916,949 | |||||||||
|
|
|
|
|
| |||||||
NET REALIZED AND UNREALIZED GAIN (LOSS) | ||||||||||||
Net realized gain (loss) from: | ||||||||||||
Investments — unaffiliated | (14,957,999 | ) | (4,165,713 | ) | (5,274,910 | ) | ||||||
In-kind redemptions — unaffiliated | 8,838,641 | 7,388,910 | 1,780,417 | |||||||||
Foreign currency transactions | (41,369 | ) | (5,570 | ) | (132,357 | ) | ||||||
|
|
|
|
|
| |||||||
Net realized gain (loss) | (6,160,727 | ) | 3,217,627 | (3,626,850 | ) | |||||||
|
|
|
|
|
| |||||||
Net change in unrealized appreciation/depreciation on: | ||||||||||||
Investments | 7,660,076 | 8,277,494 | (8,338,103 | ) | ||||||||
Translation of assets and liabilities in foreign currencies | (7,639 | ) | (1,040 | ) | 3,760 | |||||||
|
|
|
|
|
| |||||||
Net change in unrealized appreciation/depreciation | 7,652,437 | 8,276,454 | (8,334,343 | ) | ||||||||
|
|
|
|
|
| |||||||
Net realized and unrealized gain (loss) | 1,491,710 | 11,494,081 | (11,961,193 | ) | ||||||||
|
|
|
|
|
| |||||||
NET INCREASE (DECREASE) IN NET ASSETS RESULTING FROM OPERATIONS | $ | 3,811,897 | $ | 13,088,878 | $ | (8,044,244 | ) | |||||
|
|
|
|
|
| |||||||
| a | Net of foreign withholding tax of $262,396, $312,028 and $613,266, respectively. |
See notes to financial statements.
| 52 | 2014 iSHARES ANNUAL REPORTTO SHAREHOLDERS |
Table of Contents
Statements of Operations (Continued)
iSHARES®, INC.
Year ended August 31, 2014
| iShares MSCI France ETF | iShares MSCI Italy Capped ETF | iShares MSCI Netherlands ETF | ||||||||||
NET INVESTMENT INCOME |
| |||||||||||
Dividends — unaffiliateda | $ | 12,599,941 | $ | 34,273,969 | $ | 5,906,829 | ||||||
Interest — affiliated (Note 2) | 36 | 58 | 11 | |||||||||
Securities lending income — affiliated (Note 2) | 14,403 | 1,513,098 | 77,162 | |||||||||
|
|
|
|
|
| |||||||
Total investment income | 12,614,380 | 35,787,125 | 5,984,002 | |||||||||
|
|
|
|
|
| |||||||
EXPENSES | ||||||||||||
Investment advisory fees (Note 2) | 2,136,157 | 5,770,615 | 1,273,241 | |||||||||
|
|
|
|
|
| |||||||
Total expenses | 2,136,157 | 5,770,615 | 1,273,241 | |||||||||
|
|
|
|
|
| |||||||
Net investment income | 10,478,223 | 30,016,510 | 4,710,761 | |||||||||
|
|
|
|
|
| |||||||
NET REALIZED AND UNREALIZED GAIN (LOSS) | ||||||||||||
Net realized gain (loss) from: | ||||||||||||
Investments — unaffiliated | (15,075,523 | ) | (4,569,858 | ) | (2,851,366 | ) | ||||||
In-kind redemptions — unaffiliated | 63,049,330 | 123,103,178 | 31,396,111 | |||||||||
Foreign currency transactions | (23,436 | ) | 135,914 | (48,135 | ) | |||||||
|
|
|
|
|
| |||||||
Net realized gain | 47,950,371 | 118,669,234 | 28,496,610 | |||||||||
|
|
|
|
|
| |||||||
Net change in unrealized appreciation/depreciation on: | ||||||||||||
Investments | 9,095,958 | (43,077,828 | ) | (1,266,295 | ) | |||||||
Translation of assets and liabilities in foreign currencies | (95 | ) | (36,316 | ) | (358 | ) | ||||||
|
|
|
|
|
| |||||||
Net change in unrealized appreciation/depreciation | 9,095,863 | (43,114,144 | ) | (1,266,653 | ) | |||||||
|
|
|
|
|
| |||||||
Net realized and unrealized gain | 57,046,234 | 75,555,090 | 27,229,957 | |||||||||
|
|
|
|
|
| |||||||
NET INCREASE IN NET ASSETS RESULTING FROM OPERATIONS | $ | 67,524,457 | $ | 105,571,600 | $ | 31,940,718 | ||||||
|
|
|
|
|
| |||||||
| a | Net of foreign withholding tax of $2,088,423, $5,168,847 and $673,335, respectively. |
See notes to financial statements.
FINANCIAL STATEMENTS | 53 |
Table of Contents
Statements of Operations (Continued)
iSHARES®, INC.
Year ended August 31, 2014
| iShares MSCI Spain Capped ETF | iShares MSCI Sweden ETF | iShares MSCI Switzerland Capped ETF | ||||||||||
NET INVESTMENT INCOME |
| |||||||||||
Dividends — unaffiliateda | $ | 74,627,703 | $ | 17,065,404 | $ | 30,518,641 | ||||||
Interest — affiliated (Note 2) | 142 | 24 | 44 | |||||||||
Securities lending income — affiliated (Note 2) | 79,954 | 15,159 | 3,070 | |||||||||
|
|
|
|
|
| |||||||
Total investment income | 74,707,799 | 17,080,587 | 30,521,755 | |||||||||
|
|
|
|
|
| |||||||
EXPENSES | ||||||||||||
Investment advisory fees (Note 2) | 7,203,889 | 2,380,666 | 5,066,631 | |||||||||
|
|
|
|
|
| |||||||
Total expenses | 7,203,889 | 2,380,666 | 5,066,631 | |||||||||
|
|
|
|
|
| |||||||
Net investment income | 67,503,910 | 14,699,921 | 25,455,124 | |||||||||
|
|
|
|
|
| |||||||
NET REALIZED AND UNREALIZED GAIN (LOSS) | ||||||||||||
Net realized gain (loss) from: | ||||||||||||
Investments — unaffiliated | (19,709,685 | ) | (2,027,973 | ) | (908,172 | ) | ||||||
In-kind redemptions — unaffiliated | 49,135,263 | 32,984,675 | 34,246,014 | |||||||||
Foreign currency transactions | (154,142 | ) | (178,349 | ) | 14,068 | |||||||
|
|
|
|
|
| |||||||
Net realized gain | 29,271,436 | 30,778,353 | 33,351,910 | |||||||||
|
|
|
|
|
| |||||||
Net change in unrealized appreciation/depreciation on: | ||||||||||||
Investments | 128,785,673 | 1,734,778 | 97,471,648 | |||||||||
Translation of assets and liabilities in foreign currencies | (12,860 | ) | (4,742 | ) | (43,716 | ) | ||||||
|
|
|
|
|
| |||||||
Net change in unrealized appreciation/depreciation | 128,772,813 | 1,730,036 | 97,427,932 | |||||||||
|
|
|
|
|
| |||||||
Net realized and unrealized gain | 158,044,249 | 32,508,389 | 130,779,842 | |||||||||
|
|
|
|
|
| |||||||
NET INCREASE IN NET ASSETS RESULTING FROM OPERATIONS | $ | 225,548,159 | $ | 47,208,310 | $ | 156,234,966 | ||||||
|
|
|
|
|
| |||||||
| a | Net of foreign withholding tax of $4,991,467, $3,000,308 and $4,025,158, respectively. |
See notes to financial statements.
| 54 | 2014 iSHARES ANNUAL REPORTTO SHAREHOLDERS |
Table of Contents
Statements of Operations (Continued)
iSHARES®, INC.
Year ended August 31, 2014
| iShares MSCI United Kingdom ETF | ||||
NET INVESTMENT INCOME |
| |||
Dividends — unaffiliateda | $ | 278,817,674 | b | |
Interest — unaffiliated | 831 | |||
Interest — affiliated (Note 2) | 569 | |||
Securities lending income — affiliated (Note 2) | 5,409 | |||
|
| |||
Total investment income | 278,824,483 | |||
|
| |||
EXPENSES | ||||
Investment advisory fees (Note 2) | 18,609,244 | |||
|
| |||
Total expenses | 18,609,244 | |||
|
| |||
Net investment income | 260,215,239 | |||
|
| |||
NET REALIZED AND UNREALIZED GAIN (LOSS) | ||||
Net realized gain (loss) from: |
| |||
Investments — unaffiliated | (75,826,273 | ) | ||
In-kind redemptions — unaffiliated | 71,678,724 | |||
Futures contracts | 1,396,990 | |||
Foreign currency transactions | 2,560,706 | |||
|
| |||
Net realized loss | (189,853 | ) | ||
|
| |||
Net change in unrealized appreciation/depreciation on: |
| |||
Investments | 293,463,686 | |||
Futures contracts | 643,745 | |||
Translation of assets and liabilities in foreign currencies | (385,492 | ) | ||
|
| |||
Net change in unrealized appreciation/depreciation | 293,721,939 | |||
|
| |||
Net realized and unrealized gain | 293,532,086 | |||
|
| |||
NET INCREASE IN NET ASSETS RESULTING FROM OPERATIONS | $ | 553,747,325 | ||
|
| |||
| a | Net of foreign withholding tax of $1,708,504. |
| b | Includes $125,275,366 related to a one-time special distribution from Vodafone Group PLC. |
See notes to financial statements.
FINANCIAL STATEMENTS | 55 |
Table of Contents
Statements of Changes in Net Assets
iSHARES®, INC.
| iShares MSCI Austria Capped ETF | iShares MSCI Belgium Capped ETF | |||||||||||||||
| Year ended August 31, 2014 | Year ended August 31, 2013 | Year ended August 31, 2014 | Year ended August 31, 2013 | |||||||||||||
INCREASE (DECREASE) IN NET ASSETS | ||||||||||||||||
OPERATIONS: | ||||||||||||||||
Net investment income | $ | 2,320,187 | $ | 1,528,895 | $ | 1,594,797 | $ | 1,598,407 | ||||||||
Net realized gain (loss) | (6,160,727 | ) | (11,669,743 | ) | 3,217,627 | (8,125,719 | ) | |||||||||
Net change in unrealized appreciation/depreciation | 7,652,437 | 26,255,911 | 8,276,454 | 16,321,817 | ||||||||||||
|
|
|
|
|
|
|
| |||||||||
Net increase in net assets resulting from operations | 3,811,897 | 16,115,063 | 13,088,878 | 9,794,505 | ||||||||||||
|
|
|
|
|
|
|
| |||||||||
DISTRIBUTIONS TO SHAREHOLDERS: | ||||||||||||||||
From net investment income | (2,505,599 | ) | (1,541,991 | ) | (2,704,438 | ) | (1,577,907 | ) | ||||||||
|
|
|
|
|
|
|
| |||||||||
Total distributions to shareholders | (2,505,599 | ) | (1,541,991 | ) | (2,704,438 | ) | (1,577,907 | ) | ||||||||
|
|
|
|
|
|
|
| |||||||||
CAPITAL SHARE TRANSACTIONS: | ||||||||||||||||
Proceeds from shares sold | 99,089,245 | 81,897,298 | 110,895,731 | 43,904,093 | ||||||||||||
Cost of shares redeemed | (119,448,599 | ) | (68,004,259 | ) | (27,730,866 | ) | (6,290,893 | ) | ||||||||
|
|
|
|
|
|
|
| |||||||||
Net increase (decrease) in net assets from capital share transactions | (20,359,354 | ) | 13,893,039 | 83,164,865 | 37,613,200 | |||||||||||
|
|
|
|
|
|
|
| |||||||||
INCREASE (DECREASE) IN NET ASSETS | (19,053,056 | ) | 28,466,111 | 93,549,305 | 45,829,798 | |||||||||||
NET ASSETS | ||||||||||||||||
Beginning of year | 82,223,227 | 53,757,116 | 71,215,751 | 25,385,953 | ||||||||||||
|
|
|
|
|
|
|
| |||||||||
End of year | $ | 63,170,171 | $ | 82,223,227 | $ | 164,765,056 | $ | 71,215,751 | ||||||||
|
|
|
|
|
|
|
| |||||||||
Undistributed (distributions in excess of) net investment income included in net assets at end of year | $ | (28 | ) | $ | (273 | ) | $ | (626,047 | ) | $ | 70,140 | |||||
|
|
|
|
|
|
|
| |||||||||
SHARES ISSUED AND REDEEMED | ||||||||||||||||
Shares sold | 5,000,000 | 4,700,000 | 6,520,000 | 3,280,000 | ||||||||||||
Shares redeemed | (6,000,000 | ) | (3,800,000 | ) | (1,800,000 | ) | (440,000 | ) | ||||||||
|
|
|
|
|
|
|
| |||||||||
Net increase (decrease) in shares outstanding | (1,000,000 | ) | 900,000 | 4,720,000 | 2,840,000 | |||||||||||
|
|
|
|
|
|
|
| |||||||||
See notes to financial statements.
| 56 | 2014 iSHARES ANNUAL REPORTTO SHAREHOLDERS |
Table of Contents
Statements of Changes in Net Assets (Continued)
iSHARES®, INC.
| iShares MSCI Emerging Markets Eastern Europe ETF | iShares MSCI France ETF | |||||||||||||||
| Year ended August 31, 2014 | Year ended August 31, 2013 | Year ended August 31, 2014 | Year ended August 31, 2013 | |||||||||||||
INCREASE (DECREASE) IN NET ASSETS | ||||||||||||||||
OPERATIONS: | ||||||||||||||||
Net investment income | $ | 3,916,949 | $ | 1,488,815 | $ | 10,478,223 | $ | 13,818,058 | ||||||||
Net realized gain (loss) | (3,626,850 | ) | (3,516,141 | ) | 47,950,371 | 17,439,638 | ||||||||||
Net change in unrealized appreciation/depreciation | (8,334,343 | ) | (6,591,687 | ) | 9,095,863 | 64,371,651 | ||||||||||
|
|
|
|
|
|
|
| |||||||||
Net increase (decrease) in net assets resulting from operations | (8,044,244 | ) | (8,619,013 | ) | 67,524,457 | 95,629,347 | ||||||||||
|
|
|
|
|
|
|
| |||||||||
DISTRIBUTIONS TO SHAREHOLDERS: | ||||||||||||||||
From net investment income | (1,868,858 | ) | (885,320 | ) | (10,305,702 | ) | (13,699,998 | ) | ||||||||
|
|
|
|
|
|
|
| |||||||||
Total distributions to shareholders | (1,868,858 | ) | (885,320 | ) | (10,305,702 | ) | (13,699,998 | ) | ||||||||
|
|
|
|
|
|
|
| |||||||||
CAPITAL SHARE TRANSACTIONS: | ||||||||||||||||
Proceeds from shares sold | 90,271,091 | 124,132,179 | 84,933,809 | 198,782,962 | ||||||||||||
Cost of shares redeemed | (51,589,448 | ) | (13,432,406 | ) | (387,069,111 | ) | (155,498,446 | ) | ||||||||
|
|
|
|
|
|
|
| |||||||||
Net increase (decrease) in net assets from capital share transactions | 38,681,643 | 110,699,773 | (302,135,302 | ) | 43,284,516 | |||||||||||
|
|
|
|
|
|
|
| |||||||||
INCREASE (DECREASE) IN NET ASSETS | 28,768,541 | 101,195,440 | (244,916,547 | ) | 125,213,865 | |||||||||||
NET ASSETS | ||||||||||||||||
Beginning of year | 121,797,446 | 20,602,006 | 526,839,367 | 401,625,502 | ||||||||||||
|
|
|
|
|
|
|
| |||||||||
End of year | $ | 150,565,987 | $ | 121,797,446 | $ | 281,922,820 | $ | 526,839,367 | ||||||||
|
|
|
|
|
|
|
| |||||||||
Undistributed net investment income included in net assets at end of year | $ | 2,583,379 | $ | 667,494 | $ | 275,842 | $ | 117,337 | ||||||||
|
|
|
|
|
|
|
| |||||||||
SHARES ISSUED AND REDEEMED | ||||||||||||||||
Shares sold | 3,600,000 | 4,800,000 | 3,000,000 | 8,000,000 | ||||||||||||
Shares redeemed | (2,100,000 | ) | (550,000 | ) | (14,000,000 | ) | (6,200,000 | ) | ||||||||
|
|
|
|
|
|
|
| |||||||||
Net increase (decrease) in shares outstanding | 1,500,000 | 4,250,000 | (11,000,000 | ) | 1,800,000 | |||||||||||
|
|
|
|
|
|
|
| |||||||||
See notes to financial statements.
FINANCIAL STATEMENTS | 57 |
Table of Contents
Statements of Changes in Net Assets (Continued)
iSHARES®, INC.
| iShares MSCI Italy Capped ETF | iShares MSCI Netherlands ETF | |||||||||||||||
| Year ended August 31, 2014 | Year ended August 31, 2013 | Year ended August 31, 2014 | Year ended August 31, 2013 | |||||||||||||
INCREASE (DECREASE) IN NET ASSETS | ||||||||||||||||
OPERATIONS: | ||||||||||||||||
Net investment income | $ | 30,016,510 | $ | 13,795,086 | $ | 4,710,761 | $ | 3,074,875 | ||||||||
Net realized gain (loss) | 118,669,234 | (42,529,871 | ) | 28,496,610 | 1,741,733 | |||||||||||
Net change in unrealized appreciation/depreciation | (43,114,144 | ) | 57,298,873 | (1,266,653 | ) | 22,041,313 | ||||||||||
|
|
|
|
|
|
|
| |||||||||
Net increase in net assets resulting from operations | 105,571,600 | 28,564,088 | 31,940,718 | 26,857,921 | ||||||||||||
|
|
|
|
|
|
|
| |||||||||
DISTRIBUTIONS TO SHAREHOLDERS: | ||||||||||||||||
From net investment income | (31,039,889 | ) | (13,839,281 | ) | (5,077,158 | ) | (2,491,248 | ) | ||||||||
Return of capital | — | (452,885 | ) | — | — | |||||||||||
|
|
|
|
|
|
|
| |||||||||
Total distributions to shareholders | (31,039,889 | ) | (14,292,166 | ) | (5,077,158 | ) | (2,491,248 | ) | ||||||||
|
|
|
|
|
|
|
| |||||||||
CAPITAL SHARE TRANSACTIONS: | ||||||||||||||||
Proceeds from shares sold | 1,348,720,763 | 687,838,080 | 53,331,509 | 192,481,969 | ||||||||||||
Cost of shares redeemed | (583,513,961 | ) | (181,200,015 | ) | (168,493,467 | ) | (41,855,281 | ) | ||||||||
|
|
|
|
|
|
|
| |||||||||
Net increase (decrease) in net assets from capital share transactions | 765,206,802 | 506,638,065 | (115,161,958 | ) | 150,626,688 | |||||||||||
|
|
|
|
|
|
|
| |||||||||
INCREASE (DECREASE) IN NET ASSETS | 839,738,513 | 520,909,987 | (88,298,398 | ) | 174,993,361 | |||||||||||
NET ASSETS | ||||||||||||||||
Beginning of year | 717,121,739 | 196,211,752 | 253,389,902 | 78,396,541 | ||||||||||||
|
|
|
|
|
|
|
| |||||||||
End of year | $ | 1,556,860,252 | $ | 717,121,739 | $ | 165,091,504 | $ | 253,389,902 | ||||||||
|
|
|
|
|
|
|
| |||||||||
Undistributed net investment income included in net assets at end of year | $ | — | $ | — | $ | 401,577 | $ | 769,772 | ||||||||
|
|
|
|
|
|
|
| |||||||||
SHARES ISSUED AND REDEEMED | ||||||||||||||||
Shares sold | 79,050,000 | 52,350,000 | 2,200,000 | 8,900,000 | ||||||||||||
Shares redeemed | (36,750,000 | ) | (14,100,000 | ) | (6,750,000 | ) | (1,950,000 | ) | ||||||||
|
|
|
|
|
|
|
| |||||||||
Net increase (decrease) in shares outstanding | 42,300,000 | 38,250,000 | (4,550,000 | ) | 6,950,000 | |||||||||||
|
|
|
|
|
|
|
| |||||||||
See notes to financial statements.
| 58 | 2014 iSHARES ANNUAL REPORTTO SHAREHOLDERS |
Table of Contents
Statements of Changes in Net Assets (Continued)
iSHARES®, INC.
| iShares MSCI Spain Capped ETF | iShares MSCI Sweden ETF | |||||||||||||||
| Year ended August 31, 2014 | Year ended August 31, 2013 | Year ended August 31, 2014 | Year ended August 31, 2013 | |||||||||||||
INCREASE (DECREASE) IN NET ASSETS | ||||||||||||||||
OPERATIONS: | ||||||||||||||||
Net investment income | $ | 67,503,910 | $ | 11,916,599 | $ | 14,699,921 | $ | 12,162,620 | ||||||||
Net realized gain (loss) | 29,271,436 | (33,347,860 | ) | 30,778,353 | 2,931,080 | |||||||||||
Net change in unrealized appreciation/depreciation | 128,772,813 | 54,581,536 | 1,730,036 | 56,694,094 | ||||||||||||
|
|
|
|
|
|
|
| |||||||||
Net increase in net assets resulting from operations | 225,548,159 | 33,150,275 | 47,208,310 | 71,787,794 | ||||||||||||
|
|
|
|
|
|
|
| |||||||||
DISTRIBUTIONS TO SHAREHOLDERS: | ||||||||||||||||
From net investment income | (48,486,263 | ) | (10,629,551 | ) | (17,174,445 | ) | (12,548,817 | ) | ||||||||
|
|
|
|
|
|
|
| |||||||||
Total distributions to shareholders | (48,486,263 | ) | (10,629,551 | ) | (17,174,445 | ) | (12,548,817 | ) | ||||||||
|
|
|
|
|
|
|
| |||||||||
CAPITAL SHARE TRANSACTIONS: | ||||||||||||||||
Proceeds from shares sold | 2,068,530,441 | 465,959,787 | 101,532,730 | 90,137,660 | ||||||||||||
Cost of shares redeemed | (190,332,570 | ) | (265,795,649 | ) | (161,316,482 | ) | (86,203,125 | ) | ||||||||
|
|
|
|
|
|
|
| |||||||||
Net increase (decrease) in net assets from capital share transactions | 1,878,197,871 | 200,164,138 | (59,783,752 | ) | 3,934,535 | |||||||||||
|
|
|
|
|
|
|
| |||||||||
INCREASE (DECREASE) IN NET ASSETS | 2,055,259,767 | 222,684,862 | (29,749,887 | ) | 63,173,512 | |||||||||||
NET ASSETS | ||||||||||||||||
Beginning of year | 417,777,881 | 195,093,019 | 434,005,895 | 370,832,383 | ||||||||||||
|
|
|
|
|
|
|
| |||||||||
End of year | $ | 2,473,037,648 | $ | 417,777,881 | $ | 404,256,008 | $ | 434,005,895 | ||||||||
|
|
|
|
|
|
|
| |||||||||
Undistributed (distributions in excess of) net investment income included in net assets at end of year | $ | 23,027,613 | $ | 4,164,108 | $ | (1,954,836 | ) | $ | (449,084 | ) | ||||||
|
|
|
|
|
|
|
| |||||||||
SHARES ISSUED AND REDEEMED | ||||||||||||||||
Shares sold | 51,825,000 | 15,225,000 | 2,850,000 | 2,850,000 | ||||||||||||
Shares redeemed | (4,650,000 | ) | (8,925,000 | ) | (4,575,000 | ) | (2,850,000 | ) | ||||||||
|
|
|
|
|
|
|
| |||||||||
Net increase (decrease) in shares outstanding | 47,175,000 | 6,300,000 | (1,725,000 | ) | — | |||||||||||
|
|
|
|
|
|
|
| |||||||||
See notes to financial statements.
FINANCIAL STATEMENTS | 59 |
Table of Contents
Statements of Changes in Net Assets (Continued)
iSHARES®, INC.
| iShares MSCI Switzerland Capped ETF | iShares MSCI United Kingdom ETF | |||||||||||||||
| Year ended August 31, 2014 | Year ended August 31, 2013 | Year ended August 31, 2014 | Year ended August 31, 2013 | |||||||||||||
INCREASE (DECREASE) IN NET ASSETS | ||||||||||||||||
OPERATIONS: | ||||||||||||||||
Net investment income | $ | 25,455,124 | $ | 18,633,070 | $ | 260,215,239 | $ | 60,304,419 | ||||||||
Net realized gain (loss) | 33,351,910 | 36,591,404 | (189,853 | ) | (34,126,101 | ) | ||||||||||
Net change in unrealized appreciation/depreciation | 97,427,932 | 102,892,043 | 293,721,939 | 153,873,682 | ||||||||||||
|
|
|
|
|
|
|
| |||||||||
Net increase in net assets resulting from operations | 156,234,966 | 158,116,517 | 553,747,325 | 180,052,000 | ||||||||||||
|
|
|
|
|
|
|
| |||||||||
DISTRIBUTIONS TO SHAREHOLDERS: | ||||||||||||||||
From net investment income | (26,005,188 | ) | (19,030,631 | ) | (244,875,033 | ) | (51,302,175 | ) | ||||||||
|
|
|
|
|
|
|
| |||||||||
Total distributions to shareholders | (26,005,188 | ) | (19,030,631 | ) | (244,875,033 | ) | (51,302,175 | ) | ||||||||
|
|
|
|
|
|
|
| |||||||||
CAPITAL SHARE TRANSACTIONS: | ||||||||||||||||
Proceeds from shares sold | 135,490,352 | 352,868,105 | 1,488,790,094 | 1,203,907,210 | ||||||||||||
Cost of shares redeemed | (96,423,300 | ) | (143,663,266 | ) | (232,099,021 | ) | (18,354,984 | ) | ||||||||
|
|
|
|
|
|
|
| |||||||||
Net increase in net assets from capital share transactions | 39,067,052 | 209,204,839 | 1,256,691,073 | 1,185,552,226 | ||||||||||||
|
|
|
|
|
|
|
| |||||||||
INCREASE IN NET ASSETS | 169,296,830 | 348,290,725 | 1,565,563,365 | 1,314,302,051 | ||||||||||||
NET ASSETS | ||||||||||||||||
Beginning of year | 902,860,439 | 554,569,714 | 2,670,796,150 | 1,356,494,099 | ||||||||||||
|
|
|
|
|
|
|
| |||||||||
End of year | $ | 1,072,157,269 | $ | 902,860,439 | $ | 4,236,359,515 | $ | 2,670,796,150 | ||||||||
|
|
|
|
|
|
|
| |||||||||
Undistributed (distributions in excess of) net investment income included in net assets at end of year | $ | (640,142 | ) | $ | (137,987 | ) | $ | 36,730,763 | $ | 18,644,893 | ||||||
|
|
|
|
|
|
|
| |||||||||
SHARES ISSUED AND REDEEMED | ||||||||||||||||
Shares sold | 4,000,000 | 12,500,000 | 73,600,000 | 64,800,000 | ||||||||||||
Shares redeemed | (2,875,000 | ) | (5,000,000 | ) | (11,200,000 | ) | (1,000,000 | ) | ||||||||
|
|
|
|
|
|
|
| |||||||||
Net increase in shares outstanding | 1,125,000 | 7,500,000 | 62,400,000 | 63,800,000 | ||||||||||||
|
|
|
|
|
|
|
| |||||||||
See notes to financial statements.
| 60 | 2014 iSHARES ANNUAL REPORTTO SHAREHOLDERS |
Table of Contents
iSHARES®, INC.
(For a share outstanding throughout each period)
| iShares MSCI Austria Capped ETF | ||||||||||||||||||||
| Year ended Aug. 31, 2014 | Year ended Aug. 31, 2013 | Year ended Aug. 31, 2012 | Year ended Aug. 31, 2011 | Year ended Aug. 31, 2010 | ||||||||||||||||
Net asset value, beginning of year | $ | 17.87 | $ | 14.53 | $ | 18.76 | $ | 17.27 | $ | 20.21 | ||||||||||
|
|
|
|
|
|
|
|
|
| |||||||||||
Income from investment operations: | ||||||||||||||||||||
Net investment incomea | 0.52 | 0.32 | 0.35 | 0.42 | 0.43 | |||||||||||||||
Net realized and unrealized gain (loss)b | (0.18 | ) | 3.36 | (4.09 | ) | 1.53 | (2.62 | ) | ||||||||||||
|
|
|
|
|
|
|
|
|
| |||||||||||
Total from investment operations | 0.34 | 3.68 | (3.74 | ) | 1.95 | (2.19 | ) | |||||||||||||
|
|
|
|
|
|
|
|
|
| |||||||||||
Less distributions from: | ||||||||||||||||||||
Net investment income | (0.66 | ) | (0.34 | ) | (0.49 | ) | (0.46 | ) | (0.75 | ) | ||||||||||
|
|
|
|
|
|
|
|
|
| |||||||||||
Total distributions | (0.66 | ) | (0.34 | ) | (0.49 | ) | (0.46 | ) | (0.75 | ) | ||||||||||
|
|
|
|
|
|
|
|
|
| |||||||||||
Net asset value, end of year | $ | 17.55 | $ | 17.87 | $ | 14.53 | $ | 18.76 | $ | 17.27 | ||||||||||
|
|
|
|
|
|
|
|
|
| |||||||||||
Total return | 1.56 | % | 25.49 | % | (19.81 | )% | 10.92 | % | (11.07 | )% | ||||||||||
|
|
|
|
|
|
|
|
|
| |||||||||||
Ratios/Supplemental data: | ||||||||||||||||||||
Net assets, end of year (000s) | $ | 63,170 | $ | 82,223 | $ | 53,757 | $ | 136,974 | $ | 110,520 | ||||||||||
Ratio of expenses to average net assets | 0.48 | % | 0.51 | % | 0.52 | % | 0.52 | % | 0.54 | % | ||||||||||
Ratio of net investment income to average net assets | 2.64 | % | 1.82 | % | 2.32 | % | 1.95 | % | 2.20 | % | ||||||||||
Portfolio turnover ratec | 30 | % | 26 | % | 13 | % | 12 | % | 11 | % | ||||||||||
| a | Based on average shares outstanding throughout each period. |
| b | The amounts reported for a share outstanding may not accord with the change in aggregate gains and losses in securities for the fiscal period due to the timing of capital share transactions in relation to the fluctuating market values of the Fund’s underlying securities. |
| c | Portfolio turnover rates exclude portfolio securities received or delivered as a result of processing capital share transactions in Creation Units. |
See notes to financial statements.
FINANCIAL HIGHLIGHTS | 61 |
Table of Contents
Financial Highlights (Continued)
iSHARES®, INC.
(For a share outstanding throughout each period)
| iShares MSCI Belgium Capped ETF | ||||||||||||||||||||
| Year ended Aug. 31, 2014 | Year ended Aug. 31, 2013 | Year ended Aug. 31, 2012 | Year ended Aug. 31, 2011 | Year ended Aug. 31, 2010 | ||||||||||||||||
Net asset value, beginning of year | $ | 14.36 | $ | 11.97 | $ | 12.60 | $ | 11.78 | $ | 12.06 | ||||||||||
|
|
|
|
|
|
|
|
|
| |||||||||||
Income from investment operations: | ||||||||||||||||||||
Net investment incomea | 0.32 | 0.42 | 0.38 | 0.35 | 0.19 | |||||||||||||||
Net realized and unrealized gain (loss)b | 2.95 | 2.36 | (0.33 | ) | 0.80 | (0.27 | ) | |||||||||||||
|
|
|
|
|
|
|
|
|
| |||||||||||
Total from investment operations | 3.27 | 2.78 | 0.05 | 1.15 | (0.08 | ) | ||||||||||||||
|
|
|
|
|
|
|
|
|
| |||||||||||
Less distributions from: | ||||||||||||||||||||
Net investment income | (0.61 | ) | (0.39 | ) | (0.67 | ) | (0.33 | ) | (0.20 | ) | ||||||||||
Return of capital | — | — | (0.01 | ) | — | — | ||||||||||||||
|
|
|
|
|
|
|
|
|
| |||||||||||
Total distributions | (0.61 | ) | (0.39 | ) | (0.68 | ) | (0.33 | ) | (0.20 | ) | ||||||||||
|
|
|
|
|
|
|
|
|
| |||||||||||
Net asset value, end of year | $ | 17.02 | $ | 14.36 | $ | 11.97 | $ | 12.60 | $ | 11.78 | ||||||||||
|
|
|
|
|
|
|
|
|
| |||||||||||
Total return | 23.05 | % | 23.43 | % | 1.11 | % | 9.59 | % | (0.60 | )% | ||||||||||
|
|
|
|
|
|
|
|
|
| |||||||||||
Ratios/Supplemental data: | ||||||||||||||||||||
Net assets, end of year (000s) | $ | 164,765 | $ | 71,216 | $ | 25,386 | $ | 31,256 | $ | 58,896 | ||||||||||
Ratio of expenses to average net assets | 0.48 | % | 0.50 | % | 0.53 | % | 0.52 | % | 0.54 | % | ||||||||||
Ratio of net investment income to average net assets | 1.90 | % | 3.01 | % | 3.35 | % | 2.56 | % | 1.55 | % | ||||||||||
Portfolio turnover ratec | 13 | % | 24 | % | 19 | % | 12 | % | 17 | % | ||||||||||
| a | Based on average shares outstanding throughout each period. |
| b | The amounts reported for a share outstanding may not accord with the change in aggregate gains and losses in securities for the fiscal period due to the timing of capital share transactions in relation to the fluctuating market values of the Fund’s underlying securities. |
| c | Portfolio turnover rates exclude portfolio securities received or delivered as a result of processing capital share transactions in Creation Units. |
See notes to financial statements.
| 62 | 2014 iSHARES ANNUAL REPORTTO SHAREHOLDERS |
Table of Contents
Financial Highlights (Continued)
iSHARES®, INC.
(For a share outstanding throughout each period)
| iShares MSCI Emerging Markets Eastern Europe ETF | ||||||||||||||||||||
| Year ended Aug. 31, 2014 | Year ended Aug. 31, 2013 | Year ended Aug. 31, 2012 | Year ended Aug. 31, 2011 | Period from to Aug. 31, 2010 | ||||||||||||||||
Net asset value, beginning of period | $ | 23.88 | $ | 24.24 | $ | 29.28 | $ | 25.66 | $ | 24.65 | ||||||||||
|
|
|
|
|
|
|
|
|
| |||||||||||
Income from investment operations: | ||||||||||||||||||||
Net investment incomeb | 0.67 | 0.73 | 1.01 | 0.67 | 0.26 | |||||||||||||||
Net realized and unrealized gain (loss)c | (1.41 | ) | (0.77 | ) | (4.92 | ) | 3.45 | 0.89 | ||||||||||||
|
|
|
|
|
|
|
|
|
| |||||||||||
Total from investment operations | (0.74 | ) | (0.04 | ) | (3.91 | ) | 4.12 | 1.15 | ||||||||||||
|
|
|
|
|
|
|
|
|
| |||||||||||
Less distributions from: | ||||||||||||||||||||
Net investment income | (0.33 | ) | (0.32 | ) | (1.13 | ) | (0.50 | ) | (0.13 | ) | ||||||||||
Net realized gain | — | — | — | — | (0.01 | ) | ||||||||||||||
|
|
|
|
|
|
|
|
|
| |||||||||||
Total distributions | (0.33 | ) | (0.32 | ) | (1.13 | ) | (0.50 | ) | (0.14 | ) | ||||||||||
|
|
|
|
|
|
|
|
|
| |||||||||||
Net asset value, end of period | $ | 22.81 | $ | 23.88 | $ | 24.24 | $ | 29.28 | $ | 25.66 | ||||||||||
|
|
|
|
|
|
|
|
|
| |||||||||||
Total return | (3.21 | )% | (0.20 | )% | (13.14 | )% | 15.86 | % | 4.68 | %d | ||||||||||
|
|
|
|
|
|
|
|
|
| |||||||||||
Ratios/Supplemental data: | ||||||||||||||||||||
Net assets, end of period (000s) | $ | 150,566 | $ | 121,797 | $ | 20,602 | $ | 32,212 | $ | 12,832 | ||||||||||
Ratio of expenses to average net assetse | 0.67 | % | 0.67 | % | 0.69 | % | 0.68 | % | 0.69 | % | ||||||||||
Ratio of expenses to average net assets prior to waived fees | n/a | n/a | n/a | 0.68 | % | n/a | ||||||||||||||
Ratio of net investment income to average net assetse | 2.75 | % | 2.96 | % | 3.97 | % | 2.06 | % | 1.05 | % | ||||||||||
Portfolio turnover ratef | 8 | % | 9 | % | 8 | % | 24 | % | 13 | % | ||||||||||
| a | Commencement of operations. |
| b | Based on average shares outstanding throughout each period. |
| c | The amounts reported for a share outstanding may not accord with the change in aggregate gains and losses in securities for the fiscal period due to the timing of capital share transactions in relation to the fluctuating market values of the Fund’s underlying securities. |
| d | Not annualized. |
| e | Annualized for periods of less than one year. |
| f | Portfolio turnover rates exclude portfolio securities received or delivered as a result of processing capital share transactions in Creation Units. |
See notes to financial statements.
FINANCIAL HIGHLIGHTS | 63 |
Table of Contents
Financial Highlights (Continued)
iSHARES®, INC.
(For a share outstanding throughout each period)
| iShares MSCI France ETF | ||||||||||||||||||||
| Year ended Aug. 31, 2014 | Year ended Aug. 31, 2013 | Year ended Aug. 31, 2012 | Year ended Aug. 31, 2011 | Year ended Aug. 31, 2010 | ||||||||||||||||
Net asset value, beginning of year | $ | 24.85 | $ | 20.70 | $ | 22.60 | $ | 21.03 | $ | 24.28 | ||||||||||
|
|
|
|
|
|
|
|
|
| |||||||||||
Income from investment operations: | ||||||||||||||||||||
Net investment incomea | 0.66 | 0.69 | 0.59 | 0.86 | 0.65 | |||||||||||||||
Net realized and unrealized gain (loss)b | 2.86 | 4.14 | (1.80 | ) | 1.38 | (3.30 | ) | |||||||||||||
|
|
|
|
|
|
|
|
|
| |||||||||||
Total from investment operations | 3.52 | 4.83 | (1.21 | ) | 2.24 | (2.65 | ) | |||||||||||||
|
|
|
|
|
|
|
|
|
| |||||||||||
Less distributions from: | ||||||||||||||||||||
Net investment income | (0.73 | ) | (0.68 | ) | (0.69 | ) | (0.67 | ) | (0.60 | ) | ||||||||||
Return of capital | — | — | (0.00 | )c | — | — | ||||||||||||||
|
|
|
|
|
|
|
|
|
| |||||||||||
Total distributions | (0.73 | ) | (0.68 | ) | (0.69 | ) | (0.67 | ) | (0.60 | ) | ||||||||||
|
|
|
|
|
|
|
|
|
| |||||||||||
Net asset value, end of year | $ | 27.64 | $ | 24.85 | $ | 20.70 | $ | 22.60 | $ | 21.03 | ||||||||||
|
|
|
|
|
|
|
|
|
| |||||||||||
Total return | 14.07 | % | 23.56 | % | (5.05 | )% | 10.24 | % | (10.98 | )% | ||||||||||
|
|
|
|
|
|
|
|
|
| |||||||||||
Ratios/Supplemental data: | ||||||||||||||||||||
Net assets, end of year (000s) | $ | 281,923 | $ | 526,839 | $ | 401,626 | $ | 357,137 | $ | 239,706 | ||||||||||
Ratio of expenses to average net assets | 0.48 | % | 0.51 | % | 0.53 | % | 0.52 | % | 0.53 | % | ||||||||||
Ratio of net investment income to average net assets | 2.36 | % | 2.94 | % | 2.91 | % | 3.38 | % | 2.71 | % | ||||||||||
Portfolio turnover rated | 6 | % | 5 | % | 6 | % | 6 | % | 6 | % | ||||||||||
| a | Based on average shares outstanding throughout each period. |
| b | The amounts reported for a share outstanding may not accord with the change in aggregate gains and losses in securities for the fiscal period due to the timing of capital share transactions in relation to the fluctuating market values of the Fund’s underlying securities. |
| c | Rounds to less than $0.01. |
| d | Portfolio turnover rates exclude portfolio securities received or delivered as a result of processing capital share transactions in Creation Units. |
See notes to financial statements.
| 64 | 2014 iSHARES ANNUAL REPORTTO SHAREHOLDERS |
Table of Contents
Financial Highlights (Continued)
iSHARES®, INC.
(For a share outstanding throughout each period)
| iShares MSCI Italy Capped ETF | ||||||||||||||||||||
| Year ended Aug. 31, 2014 | Year ended Aug. 31, 2013 | Year ended Aug. 31, 2012 | Year ended Aug. 31, 2011 | Year ended Aug. 31, 2010 | ||||||||||||||||
Net asset value, beginning of year | $ | 13.06 | $ | 11.78 | $ | 13.58 | $ | 15.00 | $ | 19.05 | ||||||||||
|
|
|
|
|
|
|
|
|
| |||||||||||
Income from investment operations: | ||||||||||||||||||||
Net investment incomea | 0.41 | 0.36 | 0.41 | 0.54 | 0.39 | |||||||||||||||
Net realized and unrealized gain (loss)b | 2.89 | 1.23 | (1.79 | ) | (1.47 | ) | (3.99 | ) | ||||||||||||
|
|
|
|
|
|
|
|
|
| |||||||||||
Total from investment operations | 3.30 | 1.59 | (1.38 | ) | (0.93 | ) | (3.60 | ) | ||||||||||||
|
|
|
|
|
|
|
|
|
| |||||||||||
Less distributions from: | ||||||||||||||||||||
Net investment income | (0.34 | ) | (0.30 | ) | (0.42 | ) | (0.49 | ) | (0.44 | ) | ||||||||||
Return of capital | — | (0.01 | ) | (0.00 | )c | — | (0.01 | ) | ||||||||||||
|
|
|
|
|
|
|
|
|
| |||||||||||
Total distributions | (0.34 | ) | (0.31 | ) | (0.42 | ) | (0.49 | ) | (0.45 | ) | ||||||||||
|
|
|
|
|
|
|
|
|
| |||||||||||
Net asset value, end of year | $ | 16.02 | $ | 13.06 | $ | 11.78 | $ | 13.58 | $ | 15.00 | ||||||||||
|
|
|
|
|
|
|
|
|
| |||||||||||
Total return | 25.20 | % | 13.58 | % | (9.98 | )% | (6.80 | )% | (19.11 | )% | ||||||||||
|
|
|
|
|
|
|
|
|
| |||||||||||
Ratios/Supplemental data: | ||||||||||||||||||||
Net assets, end of year (000s) | $ | 1,556,860 | $ | 717,122 | $ | 196,212 | $ | 144,612 | $ | 76,500 | ||||||||||
Ratio of expenses to average net assets | 0.48 | % | 0.50 | % | 0.53 | % | 0.51 | % | 0.54 | % | ||||||||||
Ratio of net investment income to average net assets | 2.49 | % | 2.78 | % | 3.41 | % | 3.15 | % | 2.17 | % | ||||||||||
Portfolio turnover rated | 24 | % | 45 | % | 14 | % | 16 | % | 12 | % | ||||||||||
| a | Based on average shares outstanding throughout each period. |
| b | The amounts reported for a share outstanding may not accord with the change in aggregate gains and losses in securities for the fiscal period due to the timing of capital share transactions in relation to the fluctuating market values of the Fund’s underlying securities. |
| c | Rounds to less than $0.01. |
| d | Portfolio turnover rates exclude portfolio securities received or delivered as a result of processing capital share transactions in Creation Units. |
See notes to financial statements.
FINANCIAL HIGHLIGHTS | 65 |
Table of Contents
Financial Highlights (Continued)
iSHARES®, INC.
(For a share outstanding throughout each period)
| iShares MSCI Netherlands ETF | ||||||||||||||||||||
| Year ended Aug. 31, 2014 | Year ended Aug. 31, 2013 | Year ended Aug. 31, 2012 | Year ended Aug. 31, 2011 | Year ended Aug. 31, 2010 | ||||||||||||||||
Net asset value, beginning of year | $ | 22.52 | $ | 18.23 | $ | 18.45 | $ | 17.89 | $ | 18.52 | ||||||||||
|
|
|
|
|
|
|
|
|
| |||||||||||
Income from investment operations: | ||||||||||||||||||||
Net investment incomea | 0.45 | 0.44 | 0.39 | 0.48 | 0.45 | |||||||||||||||
Net realized and unrealized gain (loss)b | 2.22 | 4.19 | (0.08 | ) | 0.55 | (0.70 | ) | |||||||||||||
|
|
|
|
|
|
|
|
|
| |||||||||||
Total from investment operations | 2.67 | 4.63 | 0.31 | 1.03 | (0.25 | ) | ||||||||||||||
|
|
|
|
|
|
|
|
|
| |||||||||||
Less distributions from: | ||||||||||||||||||||
Net investment income | (0.55 | ) | (0.34 | ) | (0.53 | ) | (0.47 | ) | (0.38 | ) | ||||||||||
|
|
|
|
|
|
|
|
|
| |||||||||||
Total distributions | (0.55 | ) | (0.34 | ) | (0.53 | ) | (0.47 | ) | (0.38 | ) | ||||||||||
|
|
|
|
|
|
|
|
|
| |||||||||||
Net asset value, end of year | $ | 24.64 | $ | 22.52 | $ | 18.23 | $ | 18.45 | $ | 17.89 | ||||||||||
|
|
|
|
|
|
|
|
|
| |||||||||||
Total return | 11.80 | % | 25.57 | % | 1.96 | % | 5.44 | % | (1.44 | )% | ||||||||||
|
|
|
|
|
|
|
|
|
| |||||||||||
Ratios/Supplemental data: | ||||||||||||||||||||
Net assets, end of year (000s) | $ | 165,092 | $ | 253,390 | $ | 78,397 | $ | 121,740 | $ | 147,611 | ||||||||||
Ratio of expenses to average net assets | 0.48 | % | 0.50 | % | 0.53 | % | 0.52 | % | 0.53 | % | ||||||||||
Ratio of net investment income to average net assets | 1.78 | % | 2.09 | % | 2.21 | % | 2.26 | % | 2.31 | % | ||||||||||
Portfolio turnover ratec | 7 | % | 11 | % | 10 | % | 6 | % | 9 | % | ||||||||||
| a | Based on average shares outstanding throughout each period. |
| b | The amounts reported for a share outstanding may not accord with the change in aggregate gains and losses in securities for the fiscal period due to the timing of capital share transactions in relation to the fluctuating market values of the Fund’s underlying securities. |
| c | Portfolio turnover rates exclude portfolio securities received or delivered as a result of processing capital share transactions in Creation Units. |
See notes to financial statements.
| 66 | 2014 iSHARES ANNUAL REPORTTO SHAREHOLDERS |
Table of Contents
Financial Highlights (Continued)
iSHARES®, INC.
(For a share outstanding throughout each period)
| iShares MSCI Spain Capped ETF | ||||||||||||||||||||
| Year ended Aug. 31, 2014 | Year ended Aug. 31, 2013 | Year ended Aug. 31, 2012 | Year ended Aug. 31, 2011 | Year ended Aug. 31, 2010 | ||||||||||||||||
Net asset value, beginning of year | $ | 30.44 | $ | 26.28 | $ | 35.89 | $ | 37.02 | $ | 47.65 | ||||||||||
|
|
|
|
|
|
|
|
|
| |||||||||||
Income from investment operations: | ||||||||||||||||||||
Net investment incomea | 1.80 | 1.33 | 2.12 | 2.14 | 1.64 | |||||||||||||||
Net realized and unrealized gain (loss)b | 9.53 | 4.07 | (8.93 | ) | (1.36 | ) | (10.01 | ) | ||||||||||||
|
|
|
|
|
|
|
|
|
| |||||||||||
Total from investment operations | 11.33 | 5.40 | (6.81 | ) | 0.78 | (8.37 | ) | |||||||||||||
|
|
|
|
|
|
|
|
|
| |||||||||||
Less distributions from: | ||||||||||||||||||||
Net investment income | (1.16 | ) | (1.24 | ) | (2.80 | ) | (1.91 | ) | (2.26 | ) | ||||||||||
|
|
|
|
|
|
|
|
|
| |||||||||||
Total distributions | (1.16 | ) | (1.24 | ) | (2.80 | ) | (1.91 | ) | (2.26 | ) | ||||||||||
|
|
|
|
|
|
|
|
|
| |||||||||||
Net asset value, end of year | $ | 40.61 | $ | 30.44 | $ | 26.28 | $ | 35.89 | $ | 37.02 | ||||||||||
|
|
|
|
|
|
|
|
|
| |||||||||||
Total return | 37.39 | % | 20.88 | % | (19.36 | )% | 1.78 | % | (17.91 | )% | ||||||||||
|
|
|
|
|
|
|
|
|
| |||||||||||
Ratios/Supplemental data: | ||||||||||||||||||||
Net assets, end of year (000s) | $ | 2,473,038 | $ | 417,778 | $ | 195,093 | $ | 180,360 | $ | 194,362 | ||||||||||
Ratio of expenses to average net assets | 0.48 | % | 0.51 | % | 0.53 | % | 0.52 | % | 0.54 | % | ||||||||||
Ratio of net investment income to average net assets | 4.48 | % | 4.45 | % | 7.60 | % | 5.31 | % | 3.72 | % | ||||||||||
Portfolio turnover ratec | 15 | % | 24 | % | 17 | % | 14 | % | 9 | % | ||||||||||
| a | Based on average shares outstanding throughout each period. |
| b | The amounts reported for a share outstanding may not accord with the change in aggregate gains and losses in securities for the fiscal period due to the timing of capital share transactions in relation to the fluctuating market values of the Fund’s underlying securities. |
| c | Portfolio turnover rates exclude portfolio securities received or delivered as a result of processing capital share transactions in Creation Units. |
See notes to financial statements.
FINANCIAL HIGHLIGHTS | 67 |
Table of Contents
Financial Highlights (Continued)
iSHARES®, INC.
(For a share outstanding throughout each period)
| iShares MSCI Sweden ETF | ||||||||||||||||||||
| Year ended Aug. 31, 2014 | Year ended Aug. 31, 2013 | Year ended Aug. 31, 2012 | Year ended Aug. 31, 2011 | Year ended Aug. 31, 2010 | ||||||||||||||||
Net asset value, beginning of year | $ | 31.97 | $ | 27.32 | $ | 26.82 | $ | 24.46 | $ | 22.86 | ||||||||||
|
|
|
|
|
|
|
|
|
| |||||||||||
Income from investment operations: | ||||||||||||||||||||
Net investment incomea | 1.04 | 0.97 | 0.83 | 1.18 | 0.48 | |||||||||||||||
Net realized and unrealized gainb | 2.33 | 4.70 | 0.58 | 2.22 | 1.73 | |||||||||||||||
|
|
|
|
|
|
|
|
|
| |||||||||||
Total from investment operations | 3.37 | 5.67 | 1.41 | 3.40 | 2.21 | |||||||||||||||
|
|
|
|
|
|
|
|
|
| |||||||||||
Less distributions from: | ||||||||||||||||||||
Net investment income | (1.23 | ) | (1.02 | ) | (0.86 | ) | (1.04 | ) | (0.61 | ) | ||||||||||
Return of capital | — | — | (0.05 | ) | — | — | ||||||||||||||
|
|
|
|
|
|
|
|
|
| |||||||||||
Total distributions | (1.23 | ) | (1.02 | ) | (0.91 | ) | (1.04 | ) | (0.61 | ) | ||||||||||
|
|
|
|
|
|
|
|
|
| |||||||||||
Net asset value, end of year | $ | 34.11 | $ | 31.97 | $ | 27.32 | $ | 26.82 | $ | 24.46 | ||||||||||
|
|
|
|
|
|
|
|
|
| |||||||||||
Total return | 10.49 | % | 21.02 | % | 5.57 | % | 13.40 | % | 9.70 | % | ||||||||||
|
|
|
|
|
|
|
|
|
| |||||||||||
Ratios/Supplemental data: | ||||||||||||||||||||
Net assets, end of year (000s) | $ | 404,256 | $ | 434,006 | $ | 370,832 | $ | 329,887 | $ | 249,491 | ||||||||||
Ratio of expenses to average net assets | 0.48 | % | 0.51 | % | 0.53 | % | 0.51 | % | 0.53 | % | ||||||||||
Ratio of net investment income to average net assets | 2.97 | % | 3.13 | % | 3.17 | % | 3.80 | % | 1.97 | % | ||||||||||
Portfolio turnover ratec | 7 | % | 7 | % | 7 | % | 9 | % | 10 | % | ||||||||||
| a | Based on average shares outstanding throughout each period. |
| b | The amounts reported for a share outstanding may not accord with the change in aggregate gains and losses in securities for the fiscal period due to the timing of capital share transactions in relation to the fluctuating market values of the Fund’s underlying securities. |
| c | Portfolio turnover rates exclude portfolio securities received or delivered as a result of processing capital share transactions in Creation Units. |
See notes to financial statements.
| 68 | 2014 iSHARES ANNUAL REPORTTO SHAREHOLDERS |
Table of Contents
Financial Highlights (Continued)
iSHARES®, INC.
(For a share outstanding throughout each period)
| iShares MSCI Switzerland Capped ETF | ||||||||||||||||||||
| Year ended Aug. 31, 2014 | Year ended Aug. 31, 2013 | Year ended Aug. 31, 2012 | Year ended Aug. 31, 2011 | Year ended Aug. 31, 2010 | ||||||||||||||||
Net asset value, beginning of year | $ | 29.36 | $ | 23.85 | $ | 24.67 | $ | 21.64 | $ | 20.71 | ||||||||||
|
|
|
|
|
|
|
|
|
| |||||||||||
Income from investment operations: | ||||||||||||||||||||
Net investment incomea | 0.80 | 0.67 | 0.63 | 0.59 | 0.39 | |||||||||||||||
Net realized and unrealized gain (loss)b | 4.27 | 5.44 | (0.80 | ) | 2.97 | 0.90 | ||||||||||||||
|
|
|
|
|
|
|
|
|
| |||||||||||
Total from investment operations | 5.07 | 6.11 | (0.17 | ) | 3.56 | 1.29 | ||||||||||||||
|
|
|
|
|
|
|
|
|
| |||||||||||
Less distributions from: | ||||||||||||||||||||
Net investment income | (0.79 | ) | (0.60 | ) | (0.65 | ) | (0.53 | ) | (0.36 | ) | ||||||||||
|
|
|
|
|
|
|
|
|
| |||||||||||
Total distributions | (0.79 | ) | (0.60 | ) | (0.65 | ) | (0.53 | ) | (0.36 | ) | ||||||||||
|
|
|
|
|
|
|
|
|
| |||||||||||
Net asset value, end of year | $ | 33.64 | $ | 29.36 | $ | 23.85 | $ | 24.67 | $ | 21.64 | ||||||||||
|
|
|
|
|
|
|
|
|
| |||||||||||
Total return | 17.21 | % | 25.71 | % | (0.53 | )% | 16.30 | % | 6.35 | % | ||||||||||
|
|
|
|
|
|
|
|
|
| |||||||||||
Ratios/Supplemental data: | ||||||||||||||||||||
Net assets, end of year (000s) | $ | 1,072,157 | $ | 902,860 | $ | 554,570 | $ | 524,159 | $ | 405,755 | ||||||||||
Ratio of expenses to average net assets | 0.48 | % | 0.51 | % | 0.53 | % | 0.52 | % | 0.53 | % | ||||||||||
Ratio of net investment income to average net assets | 2.41 | % | 2.38 | % | 2.73 | % | 2.35 | % | 1.80 | % | ||||||||||
Portfolio turnover ratec | 5 | % | 13 | % | 8 | % | 7 | % | 7 | % | ||||||||||
| a | Based on average shares outstanding throughout each period. |
| b | The amounts reported for a share outstanding may not accord with the change in aggregate gains and losses in securities for the fiscal period due to the timing of capital share transactions in relation to the fluctuating market values of the Fund’s underlying securities. |
| c | Portfolio turnover rates exclude portfolio securities received or delivered as a result of processing capital share transactions in Creation Units. |
See notes to financial statements.
FINANCIAL HIGHLIGHTS | 69 |
Table of Contents
Financial Highlights (Continued)
iSHARES®, INC.
(For a share outstanding throughout each period)
| iShares MSCI United Kingdom ETF | ||||||||||||||||||||
| Year ended Aug. 31, 2014 | Year ended Aug. 31, 2013 | Year ended Aug. 31, 2012 | Year ended Aug. 31, 2011 | Year ended Aug. 31, 2010 | ||||||||||||||||
Net asset value, beginning of year | $ | 18.55 | $ | 16.91 | $ | 16.43 | $ | 15.01 | $ | 15.02 | ||||||||||
|
|
|
|
|
|
|
|
|
| |||||||||||
Income from investment operations: | ||||||||||||||||||||
Net investment incomea | 1.38 | b | 0.66 | 0.64 | 0.54 | 0.46 | ||||||||||||||
Net realized and unrealized gain (loss)c | 1.85 | 1.49 | 0.46 | 1.35 | (0.03 | ) | ||||||||||||||
|
|
|
|
|
|
|
|
|
| |||||||||||
Total from investment operations | 3.23 | 2.15 | 1.10 | 1.89 | 0.43 | |||||||||||||||
|
|
|
|
|
|
|
|
|
| |||||||||||
Less distributions from: | ||||||||||||||||||||
Net investment income | (1.26 | ) | (0.51 | ) | (0.62 | ) | (0.47 | ) | (0.44 | ) | ||||||||||
|
|
|
|
|
|
|
|
|
| |||||||||||
Total distributions | (1.26 | ) | (0.51 | ) | (0.62 | ) | (0.47 | ) | (0.44 | ) | ||||||||||
|
|
|
|
|
|
|
|
|
| |||||||||||
Net asset value, end of year | $ | 20.52 | $ | 18.55 | $ | 16.91 | $ | 16.43 | $ | 15.01 | ||||||||||
|
|
|
|
|
|
|
|
|
| |||||||||||
Total return | 17.56 | % | 12.91 | % | 6.94 | % | 12.50 | % | 2.87 | % | ||||||||||
|
|
|
|
|
|
|
|
|
| |||||||||||
Ratios/Supplemental data: | ||||||||||||||||||||
Net assets, end of year (000s) | $ | 4,236,360 | $ | 2,670,796 | $ | 1,356,494 | $ | 1,199,333 | $ | 930,412 | ||||||||||
Ratio of expenses to average net assets | 0.48 | % | 0.51 | % | 0.53 | % | 0.52 | % | 0.53 | % | ||||||||||
Ratio of net investment income to average net assets | 6.71 | %b | 3.61 | % | 3.88 | % | 3.07 | % | 2.98 | % | ||||||||||
Portfolio turnover rated | 10 | % | 4 | % | 7 | % | 4 | % | 7 | % | ||||||||||
| a | Based on average shares outstanding throughout each period. |
| b | Includes a one-time special distribution from Vodafone Group PLC which represented $0.66 per share and 3.23% of average net assets. |
| c | The amounts reported for a share outstanding may not accord with the change in aggregate gains and losses in securities for the fiscal period due to the timing of capital share transactions in relation to the fluctuating market values of the Fund’s underlying securities. |
| d | Portfolio turnover rates exclude portfolio securities received or delivered as a result of processing capital share transactions in Creation Units. |
See notes to financial statements.
| 70 | 2014 iSHARES ANNUAL REPORTTO SHAREHOLDERS |
Table of Contents
iSHARES®, INC.
iShares, Inc. (the “Company”) is registered under the Investment Company Act of 1940, as amended (the “1940 Act”), as an open-end management investment company. The Company was incorporated under the laws of the State of Maryland on September 1, 1994 pursuant to amended and restated Articles of Incorporation.
These financial statements relate only to the following funds (each, a “Fund,” and collectively, the “Funds”):
| iShares ETF | Diversification Classification | |||
MSCI Austria Capped | Non-diversified | |||
MSCI Belgium Capped | Non-diversified | |||
MSCI Emerging Markets Eastern Europe | Non-diversified | |||
MSCI France | Non-diversified | |||
MSCI Italy Capped | Non-diversified | |||
| iShares ETF | Diversification Classification | |||
MSCI Netherlands | Non-diversified | |||
MSCI Spain Capped | Non-diversified | |||
MSCI Sweden | Non-diversified | |||
MSCI Switzerland Capped | Non-diversified | |||
MSCI United Kingdom | Non-diversified | |||
The investment objective of each Fund is to seek investment results that correspond generally to the price and yield performance, before fees and expenses, of its underlying index. The investment adviser uses a “passive” or index approach to try to achieve each Fund’s investment objective.
Pursuant to the Company’s organizational documents, the Funds’ officers and directors are indemnified against certain liabilities that may arise out of the performance of their duties to the Funds. Additionally, in the normal course of business, the Funds enter into contracts with service providers that contain general indemnification clauses. The Funds’ maximum exposure under these arrangements is unknown as this would involve future claims that may be made against the Funds that have not yet occurred.
FUND REORGANIZATION
The iShares MSCI United Kingdom ETF, a series of iShares Trust (the “Successor Fund”), previously operated as a series of iShares, Inc. (the “Predecessor Fund”), and is continuing the operations of the Predecessor Fund. Before the Successor Fund commenced operations, all of the assets and liabilities of the Predecessor Fund were transferred to the Successor Fund in a reorganization (the “Reorganization”), which was tax-free for U.S. federal income tax purposes. The Reorganization occurred on September 29, 2014. As a result of the Reorganization, the Successor Fund assumed the performance and accounting history of the Predecessor Fund. The Successor Fund has the same investment objective, investment strategy, index methodology, risks, policies and expenses as the Predecessor Fund.
| 1. | SIGNIFICANT ACCOUNTING POLICIES |
The following significant accounting policies are consistently followed by the Funds in the preparation of their financial statements in conformity with accounting principles generally accepted in the United States of America (“U.S. GAAP”). The preparation of financial statements in conformity with U.S. GAAP requires management to make certain estimates and assumptions that affect the reported amounts of assets and liabilities and disclosures of contingent assets and liabilities at the date of the financial statements and the reported amounts of revenue and expenses during the reporting period. Actual results could differ from those estimates. Each Fund is considered an investment company under U.S. GAAP and follows the accounting and reporting guidance applicable to investment companies in the Financial Accounting Standards Board Accounting Standards Codification Topic 946 (ASC 946).
SECURITY VALUATION
Each Fund’s investments are valued at fair value each day that the Fund’s listing exchange is open and, for financial reporting purposes, as of the report date should the reporting period end on a day that the Fund’s listing exchange is not open. U.S. GAAP
NOTESTO FINANCIAL STATEMENTS | 71 |
Table of Contents
Notes to Financial Statements (Continued)
iSHARES®, INC.
defines fair value as the price a fund would receive to sell an asset or pay to transfer a liability in an orderly transaction between market participants at the measurement date. The BlackRock Global Valuation Methodologies Committee (the “Global Valuation Committee”) provides oversight of the valuation of investments for the Funds. The investments of each Fund are valued pursuant to policies and procedures developed by the Global Valuation Committee and approved by the Board of Directors of the Company (the “Board”).
| • | Equity investments traded on a recognized securities exchange are valued at that day’s last reported trade price or the official closing price, as applicable, on the exchange where the stock is primarily traded. Equity investments traded on a recognized exchange for which there were no sales on that day are valued at the last traded price. |
| • | Open-end U.S. mutual funds are valued at that day’s published net asset value (NAV). |
| • | Financial futures contracts are valued at that day’s last reported settlement price on the exchange where the contract is traded. |
In the event that application of these methods of valuation results in a price for an investment which is deemed not to be representative of the fair value of such investment or if a price is not available, the investment will be valued based upon other available factors deemed relevant by the Global Valuation Committee, in accordance with policies approved by the Board. These factors include but are not limited to (i) attributes specific to the investment; (ii) the principal market for the investment; (iii) the customary participants in the principal market for the investment; (iv) data assumptions by market participants for the investment, if reasonably available; (v) quoted prices for similar investments in active markets; and (vi) other factors, such as future cash flows, interest rates, yield curves, volatilities, prepayment speeds, loss severities, credit risks and/or default rates. Valuations based on such factors are reported to the Board on a quarterly basis.
The Global Valuation Committee employs various methods for calibrating valuation approaches for investments where an active market does not exist, including regular due diligence of the Company’s pricing vendors, a regular review of key inputs and assumptions, transactional back-testing or disposition analysis to compare unrealized gains and losses to realized gains and losses, reviews of missing or stale prices, reviews of large movements in market values, and reviews of market related activity.
Fair value pricing could result in a difference between the prices used to calculate a Fund’s net asset value and the prices used by the Fund’s underlying index, which in turn could result in a difference between the Fund’s performance and the performance of the Fund’s underlying index.
Various inputs are used in determining the fair value of financial instruments. Inputs may be based on independent market data (“observable inputs”) or they may be internally developed (“unobservable inputs”). These inputs are categorized into a disclosure hierarchy consisting of three broad levels for financial reporting purposes. The level of a value determined for a financial instrument within the fair value hierarchy is based on the lowest level of any input that is significant to the fair value measurement in its entirety. The categorization of a value determined for a financial instrument within the hierarchy is based upon the pricing transparency of the instrument and is not necessarily an indication of the risk associated with investing in the instrument. The three levels of the fair value hierarchy are as follows:
| • | Level 1 — Unadjusted quoted prices in active markets for identical assets or liabilities; |
| • | Level 2 — Inputs other than quoted prices included within Level 1 that are observable for the asset or liability either directly or indirectly, including quoted prices for similar assets or liabilities in active markets, quoted prices for identical or similar assets or liabilities in markets that are not considered to be active, inputs other than quoted prices that are observable for the asset or liability (such as exchange rates, financing terms, interest rates, yield curves, volatilities, prepayment speeds, loss severities, credit risks and default rates) or other market-corroborated inputs; and |
| 72 | 2014 iSHARES ANNUAL REPORTTO SHAREHOLDERS |
Table of Contents
Notes to Financial Statements (Continued)
iSHARES®, INC.
| • | Level 3 — Unobservable inputs for the asset or liability, including the Global Valuation Committee’s assumptions used in determining the fair value of investments. |
Changes in valuation techniques may result in transfers in or out of an assigned level within the disclosure hierarchy. In accordance with the Company’s policy, transfers between different levels of the fair value hierarchy are deemed to have occurred as of the beginning of the reporting period.
The following table summarizes the value of each of the Funds’ investments according to the fair value hierarchy as of August 31, 2014. The breakdown of each Fund’s investments into major categories is disclosed in its respective schedule of investments.
iShares ETF and | Investments | |||||||||||||||
| Level 1 | Level 2 | Level 3 | Total | |||||||||||||
MSCI Austria Capped | ||||||||||||||||
Assets: | ||||||||||||||||
Common Stocks | $ | 62,183,379 | $ | — | $ | 25 | $ | 62,183,404 | ||||||||
Money Market Funds | 321,860 | — | — | 321,860 | ||||||||||||
|
|
|
|
|
|
|
| |||||||||
| $ | 62,505,239 | $ | — | $ | 25 | $ | 62,505,264 | |||||||||
| �� |
|
|
|
|
|
|
|
| ||||||||
MSCI Belgium Capped | ||||||||||||||||
Assets: | ||||||||||||||||
Common Stocks | $ | 164,600,237 | $ | — | $ | — | $ | 164,600,237 | ||||||||
Money Market Funds | 4,076,845 | — | — | 4,076,845 | ||||||||||||
|
|
|
|
|
|
|
| |||||||||
| $ | 168,677,082 | $ | — | $ | — | $ | 168,677,082 | |||||||||
|
|
|
|
|
|
|
| |||||||||
MSCI Emerging Markets Eastern Europe | ||||||||||||||||
Assets: | ||||||||||||||||
Common Stocks | $ | 144,861,807 | $ | — | $ | — | $ | 144,861,807 | ||||||||
Preferred Stocks | 5,362,028 | — | — | 5,362,028 | ||||||||||||
Money Market Funds | 90,457 | — | — | 90,457 | ||||||||||||
|
|
|
|
|
|
|
| |||||||||
| $ | 150,314,292 | $ | — | $ | — | $ | 150,314,292 | |||||||||
|
|
|
|
|
|
|
| |||||||||
MSCI France | ||||||||||||||||
Assets: | ||||||||||||||||
Common Stocks | $ | 281,809,243 | $ | — | $ | — | $ | 281,809,243 | ||||||||
Money Market Funds | 2,222,082 | — | — | 2,222,082 | ||||||||||||
|
|
|
|
|
|
|
| |||||||||
| $ | 284,031,325 | $ | — | $ | — | $ | 284,031,325 | |||||||||
|
|
|
|
|
|
|
| |||||||||
MSCI Italy Capped | ||||||||||||||||
Assets: | ||||||||||||||||
Common Stocks | $ | 1,555,771,089 | $ | — | $ | — | $ | 1,555,771,089 | ||||||||
Money Market Funds | 19,803,088 | — | — | 19,803,088 | ||||||||||||
|
|
|
|
|
|
|
| |||||||||
| $ | 1,575,574,177 | $ | — | $ | — | $ | 1,575,574,177 | |||||||||
|
|
|
|
|
|
|
| |||||||||
NOTESTO FINANCIAL STATEMENTS | 73 |
Table of Contents
Notes to Financial Statements (Continued)
iSHARES®, INC.
iShares ETF and | Investments | |||||||||||||||
| Level 1 | Level 2 | Level 3 | Total | |||||||||||||
MSCI Netherlands | ||||||||||||||||
Assets: | ||||||||||||||||
Common Stocks | $ | 164,489,841 | $ | — | $ | 1 | $ | 164,489,842 | ||||||||
Money Market Funds | 5,551,054 | — | — | 5,551,054 | ||||||||||||
|
|
|
|
|
|
|
| |||||||||
| $ | 170,040,895 | $ | — | $ | 1 | $ | 170,040,896 | |||||||||
|
|
|
|
|
|
|
| |||||||||
MSCI Spain Capped | ||||||||||||||||
Assets: | ||||||||||||||||
Common Stocks | $ | 2,469,322,157 | $ | 1,295,043 | $ | — | $ | 2,470,617,200 | ||||||||
Money Market Funds | 2,538,504 | — | — | 2,538,504 | ||||||||||||
|
|
|
|
|
|
|
| |||||||||
| $ | 2,471,860,661 | $ | 1,295,043 | $ | — | $ | 2,473,155,704 | |||||||||
|
|
|
|
|
|
|
| |||||||||
MSCI Sweden | ||||||||||||||||
Assets: | ||||||||||||||||
Common Stocks | $ | 403,941,257 | $ | — | $ | — | $ | 403,941,257 | ||||||||
Money Market Funds | 4,221,591 | — | — | 4,221,591 | ||||||||||||
|
|
|
|
|
|
|
| |||||||||
| $ | 408,162,848 | $ | — | $ | — | $ | 408,162,848 | |||||||||
|
|
|
|
|
|
|
| |||||||||
MSCI Switzerland Capped | ||||||||||||||||
Assets: | ||||||||||||||||
Common Stocks | $ | 1,063,255,946 | $ | — | $ | — | $ | 1,063,255,946 | ||||||||
Money Market Funds | 14,096,613 | — | — | 14,096,613 | ||||||||||||
|
|
|
|
|
|
|
| |||||||||
| $ | 1,077,352,559 | $ | — | $ | — | $ | 1,077,352,559 | |||||||||
|
|
|
|
|
|
|
| |||||||||
MSCI United Kingdom | ||||||||||||||||
Assets: | ||||||||||||||||
Common Stocks | $ | 4,198,086,791 | $ | — | $ | — | $ | 4,198,086,791 | ||||||||
Money Market Funds | 1,886,887 | — | — | 1,886,887 | ||||||||||||
Futures Contractsa | 750,837 | — | — | 750,837 | ||||||||||||
|
|
|
|
|
|
|
| |||||||||
| $ | 4,200,724,515 | $ | — | $ | — | $ | 4,200,724,515 | |||||||||
|
|
|
|
|
|
|
| |||||||||
| a | Shown at the unrealized appreciation (depreciation) on the contracts. |
SECURITY TRANSACTIONS AND INCOME RECOGNITION
Security transactions are accounted for on trade date. Dividend income and capital gain distributions, if any, are recognized on the ex-dividend date, net of any foreign taxes withheld at source. Any taxes withheld that are reclaimable from foreign tax authorities as of August 31, 2014 are reflected in dividends receivable. Non-cash dividends received in the form of stock in an elective dividend, if any, are recorded as dividend income at fair value. Distributions received by the Funds may include a return of capital that is estimated by management. Such amounts are recorded as a reduction of the cost of investments or reclassified to capital gains. Interest income is accrued daily. Realized gains and losses on investment transactions are determined using the specific identification method.
| 74 | 2014 iSHARES ANNUAL REPORTTO SHAREHOLDERS |
Table of Contents
Notes to Financial Statements (Continued)
iSHARES®, INC.
FOREIGN CURRENCY TRANSLATION
The accounting records of the Funds are maintained in U.S. dollars. Foreign currencies, as well as investment securities and other assets and liabilities denominated in foreign currencies, are translated into U.S. dollars using exchange rates deemed appropriate by the investment adviser. Purchases and sales of securities, income receipts and expense payments are translated into U.S. dollars on the respective dates of such transactions.
Each Fund does not isolate the effect of fluctuations in foreign exchange rates from the effect of fluctuations in the market prices of securities. Such fluctuations are reflected by the Funds as a component of realized and unrealized gains and losses from investments for financial reporting purposes.
FOREIGN TAXES
The Funds may be subject to foreign taxes (a portion of which may be reclaimable) on income, stock dividends, capital gains on investments, or certain foreign currency transactions. All foreign taxes are recorded in accordance with the applicable foreign tax regulations and rates that exist in the foreign jurisdictions in which the Funds invest. These foreign taxes, if any, are paid by the Funds and are reflected in their statements of operations as follows: foreign taxes withheld at source are presented as a reduction of income, foreign taxes on securities lending income are presented as a reduction of securities lending income, foreign taxes on stock dividends are presented as “other foreign taxes,” and foreign taxes on capital gains from sales of investments and foreign taxes on foreign currency transactions are included in their respective net realized gain (loss) categories. Foreign taxes payable or deferred as of August 31, 2014, if any, are disclosed in the Funds’ statements of assets and liabilities.
DISTRIBUTIONS TO SHAREHOLDERS
Dividends and distributions paid by each Fund are recorded on the ex-dividend dates. Distributions are determined on a tax basis and may differ from net investment income and net realized capital gains for financial reporting purposes. Dividends and distributions are paid in U.S. dollars and cannot be automatically reinvested in additional shares of the Funds.
LOANS OF PORTFOLIO SECURITIES
Each Fund may lend its investment securities to approved borrowers, such as brokers, dealers and other financial institutions. The borrower pledges and maintains with the Fund collateral consisting of cash, an irrevocable letter of credit issued by a bank, or securities issued or guaranteed by the U.S. government. The initial collateral received by each Fund is required to have a value of at least 102% of the current value of the loaned securities for securities traded on U.S. exchanges and a value of at least 105% for all other securities. The collateral is maintained thereafter, at a value equal to at least 100% of the current value of the securities on loan. The market value of the loaned securities is determined at the close of each business day of the Funds and any additional required collateral is delivered to the Funds on the next business day. During the term of the loan, each Fund is entitled to all distributions made on or in respect of the loaned securities. Loans of securities are terminable at any time and the borrower, after notice, is required to return borrowed securities within the standard time period for settlement of securities transactions.
Any cash received as collateral for securities on loan may be reinvested in certain short-term instruments either directly on behalf of a fund or through one or more joint accounts or money market funds, including those managed by BlackRock Fund Advisors (“BFA”), the Funds’ investment adviser, or its affiliates. As of August 31, 2014, any securities on loan were collateralized by cash. The cash collateral received was invested in money market funds managed by BFA and is disclosed in the schedules of investments. The value of any securities on loan as of August 31, 2014 and the value of the related collateral are disclosed in the statements of assets and liabilities. Income earned by the Funds from securities lending is disclosed in the statements of operations.
NOTESTO FINANCIAL STATEMENTS | 75 |
Table of Contents
Notes to Financial Statements (Continued)
iSHARES®, INC.
The risks of securities lending include the risk that the borrower may not provide additional collateral when required or may not return the securities when due. To mitigate these risks, the Funds benefit from a borrower default indemnity provided by BlackRock, Inc. (“BlackRock”). BlackRock’s indemnity allows for full replacement of securities lent. Each Fund could suffer a loss if the value of the investments purchased with cash collateral falls below the value of the cash collateral received.
Securities lending transactions are entered into by the Funds under Master Securities Lending Agreements (“MSLA”) which provide the right, in the event of default (including bankruptcy or insolvency) for the non-defaulting party to liquidate the collateral and calculate a net exposure to the defaulting party or request additional collateral. In the event that a borrower defaults, a Fund, as lender, would offset the market value of the collateral received against the market value of the securities loaned. The value of the collateral is typically greater than that of the market value of the securities loaned, leaving the lender with a net amount payable to the defaulting party. However, bankruptcy or insolvency laws of a particular jurisdiction may impose restrictions on or prohibitions against such a right of offset in the event of an MSLA counterparty’s bankruptcy or insolvency. Under the MSLA, the borrower can resell or re-pledge the loaned securities, and a Fund can reinvest cash collateral, or, upon an event of default, resell or re-pledge the collateral.
The following table is a summary of each Fund’s securities lending agreements which are subject to offset under an MSLA as of August 31, 2014:
| iShares ETF | Market Value of Securities on Loan | Cash Collateral Received a | Net Amount | |||||||||
MSCI Austria Capped | $ | 304,668 | $ | 304,668 | $ | — | ||||||
MSCI Belgium Capped | 3,609,891 | 3,609,891 | — | |||||||||
MSCI France | 2,142,963 | 2,142,963 | — | |||||||||
MSCI Italy Capped | 18,823,655 | 18,823,655 | — | |||||||||
MSCI Netherlands | 5,196,000 | 5,196,000 | — | |||||||||
MSCI Sweden | 3,912,959 | 3,912,959 | — | |||||||||
MSCI Switzerland Capped | 13,463,173 | 13,463,173 | — | |||||||||
MSCI United Kingdom | 648,053 | 648,053 | — | |||||||||
| a | Collateral received in excess of the market value of securities on loan is not presented for financial reporting purposes. The total collateral received is disclosed in each Fund’s statement of assets and liabilities. |
RECENT ACCOUNTING STANDARD
In June 2014, the Financial Accounting Standards Board issued guidance to improve the financial reporting of reverse repurchase agreements and other similar transactions. The guidance will require expanded disclosure for entities that enter into reverse repurchase agreements and similar transactions accounted for as secured borrowings, including securities lending. The guidance is effective for financial statements for fiscal years beginning after December 15, 2014, and interim periods within those fiscal years. Management is evaluating the impact, if any, of this guidance on the Funds’ financial statements and disclosures.
| 2. | INVESTMENT ADVISORY AGREEMENT AND OTHER TRANSACTIONS WITH AFFILIATES |
Pursuant to an Investment Advisory Agreement with the Company, BFA manages the investment of each Fund’s assets. BFA is a California corporation indirectly owned by BlackRock. Under the Investment Advisory Agreement, BFA is responsible for substantially all expenses of the Funds, except interest, taxes, brokerage commissions and other expenses connected with the execution of portfolio transactions, distribution fees, litigation expenses and any extraordinary expenses.
| 76 | 2014 iSHARES ANNUAL REPORTTO SHAREHOLDERS |
Table of Contents
Notes to Financial Statements (Continued)
iSHARES®, INC.
For its investment advisory services to each Fund, except for the iShares MSCI Emerging Markets Eastern Europe ETF, BFA is entitled to an annual investment advisory fee based on each Fund’s allocable portion of the aggregate of the average daily net assets of the Fund and certain other iShares funds, as follows:
| Investment Advisory Fee | Aggregate Average Daily Net Assets | ||||
| 0.59 | % | First $7 billion | |||
| 0.54 | Over $7 billion, up to and including $11 billion | ||||
| 0.49 | Over $11 billion, up to and including $24 billion | ||||
| 0.44 | Over $24 billion, up to and including $48 billion | ||||
| 0.40 | Over $48 billion, up to and including $72 billion | ||||
| 0.36 | Over $72 billiona | ||||
| a | Breakpoint level was added effective July 1, 2014. |
For its investment advisory services to the iShares MSCI Emerging Markets Eastern Europe ETF, BFA is entitled to an annual investment advisory fee based on the Fund’s allocable portion of the aggregate of the average daily net assets of the Fund and certain other iShares funds, as follows:
| Investment Advisory Fee | Aggregate Average Daily Net Assets | ||||
| 0.75 | % | First $14 billion | |||
| 0.68 | Over $14 billion, up to and including $28 billion | ||||
| 0.61 | Over $28 billion, up to and including $42 billion | ||||
| 0.54 | b | Over $42 billion, up to and including $56 billion | |||
| 0.47 | b | Over $56 billion, up to and including $70 billion | |||
| 0.41 | b | Over $70 billion, up to and including $84 billion | |||
| 0.35 | b | Over $84 billion | |||
| b | Investment advisory fee was reduced effective July 1, 2014. Prior to this date, the investment advisory fee for these breakpoint levels were 0.56%, 0.50%, 0.45% and 0.40%, respectively. |
The U.S. Securities and Exchange Commission has issued an exemptive order which permits BlackRock Institutional Trust Company, N.A. (“BTC”), an affiliate of BFA, to serve as securities lending agent for the Funds, subject to applicable conditions. As securities lending agent, BTC bears all operational costs directly related to securities lending. Effective January 1, 2014, each Fund is responsible for fees in connection with the investment of cash collateral received for securities on loan in a money market fund managed by BFA, however, BTC has agreed to reduce the amount of securities lending income it receives in order to effectively limit the collateral investment fees each Fund bears to an annual rate of 0.04% (the “collateral investment fees”). Securities lending income is equal to the total of income earned from the reinvestment of cash collateral, net of fees and other payments to and from borrowers of securities, and less the collateral investment fees. The Funds retain a portion of securities lending income and remit a remaining portion to BTC as compensation for its services as securities lending agent.
Pursuant to a securities lending agreement effective January 1, 2014, (i) each Fund retains 75% of securities lending income and (ii) these amounts can never be less than 65% of the total of securities lending income plus the collateral investment fees.
In addition, commencing the business day following the date that the aggregate securities lending income plus the collateral investment fees generated across all 1940 Act iShares exchange-traded funds (the “iShares ETF Complex”) in a given calendar year exceeds the aggregate securities lending income generated across the iShares ETF Complex in calendar year 2013 and pursuant to a securities lending agreement, (i) each Fund will receive for the remainder of that calendar year 80% of securities lending income and (ii) these amounts can never be less than 65% of the total of securities lending income plus the collateral investment fees.
NOTESTO FINANCIAL STATEMENTS | 77 |
Table of Contents
Notes to Financial Statements (Continued)
iSHARES®, INC.
For the year ended August 31, 2014, each Fund paid to BTC the following amounts in total for securities lending agent services and collateral investment fees:
| iShares ETF | Fees Paid to BTC | |||
MSCI Austria Capped | $ | 7,729 | ||
MSCI Belgium Capped | 38,558 | |||
MSCI Emerging Markets Eastern Europe | 2,001 | |||
MSCI France | 5,665 | |||
MSCI Italy Capped | 584,333 | |||
| iShares ETF | Fees Paid to BTC | |||
MSCI Netherlands | $ | 29,511 | ||
MSCI Spain Capped | 39,695 | |||
MSCI Sweden | 6,300 | |||
MSCI Switzerland Capped | 1,360 | |||
MSCI United Kingdom | 2,805 | |||
Prior to January 1, 2014, each Fund retained 65% of securities lending income and paid no collateral investment fees.
BlackRock Investments, LLC, an affiliate of BFA, is the distributor for each Fund. Pursuant to the distribution agreement, BFA is responsible for any fees or expenses for distribution services provided to the Funds.
Cross trades for the year ended August 31, 2014, if any, were executed by the Funds pursuant to Rule 17a-7 under the 1940 Act. Cross trading is the buying or selling of portfolio securities between funds to which BFA (or an affiliate) serves as investment adviser. At its regularly scheduled quarterly meetings, the Board reviews such transactions as of the most recent calendar quarter for compliance with the requirements and restrictions set forth by Rule 17a-7.
Each Fund may invest its positive cash balances in certain money market funds managed by BFA or an affiliate. The income earned on these temporary cash investments is included in “Interest – affiliated” in the statements of operations.
The PNC Financial Services Group, Inc. is the largest stockholder of BlackRock and is considered to be an affiliate of the Funds for 1940 Act purposes.
Certain directors and officers of the Company are also officers of BTC and/or BFA.
| 3. | INVESTMENT PORTFOLIO TRANSACTIONS |
Purchases and sales of investments (excluding in-kind transactions and short-term investments) for the year ended August 31, 2014 were as follows:
| iShares ETF | Purchases | Sales | ||||||
MSCI Austria Capped | $ | 25,556,935 | $ | 26,387,372 | ||||
MSCI Belgium Capped | 10,972,726 | 11,948,407 | ||||||
MSCI Emerging Markets Eastern Europe | 14,401,424 | 11,161,245 | ||||||
MSCI France | 27,399,017 | 32,515,996 | ||||||
MSCI Italy Capped | 303,731,127 | 288,089,799 | ||||||
MSCI Netherlands | 18,454,287 | 18,294,795 | ||||||
MSCI Spain Capped | 312,638,141 | 228,918,559 | ||||||
MSCI Sweden | 34,554,613 | 37,631,771 | ||||||
MSCI Switzerland Capped | 57,017,193 | 60,702,350 | ||||||
MSCI United Kingdom | 401,122,500 | 385,534,834 | ||||||
| 78 | 2014 iSHARES ANNUAL REPORTTO SHAREHOLDERS |
Table of Contents
Notes to Financial Statements (Continued)
iSHARES®, INC.
In-kind transactions (see Note 4) for the year ended August 31, 2014 were as follows:
| iShares ETF | In-kind Purchases | In-kind Sales | ||||||
MSCI Austria Capped | $ | 97,849,647 | $ | 117,788,012 | ||||
MSCI Belgium Capped | 110,625,501 | 27,662,319 | ||||||
MSCI Emerging Markets Eastern Europe | 89,335,816 | 51,415,550 | ||||||
MSCI France | 84,646,740 | 381,301,594 | ||||||
MSCI Italy Capped | 1,327,555,940 | 581,142,786 | ||||||
MSCI Netherlands | 52,735,238 | 168,183,478 | ||||||
MSCI Spain Capped | 1,996,323,021 | 183,589,344 | ||||||
MSCI Sweden | 101,486,107 | 161,006,548 | ||||||
MSCI Switzerland Capped | 133,149,938 | 94,672,945 | ||||||
MSCI United Kingdom | 1,478,171,084 | 228,721,565 | ||||||
| 4. | CAPITAL SHARE TRANSACTIONS |
Capital shares are issued and redeemed by each Fund only in aggregations of a specified number of shares or multiples thereof (“Creation Units”) at net asset value. Except when aggregated in Creation Units, shares of each Fund are not redeemable. Transactions in capital shares for each Fund are disclosed in detail in the statements of changes in net assets.
The consideration for the purchase of Creation Units of a fund in the Company generally consists of the in-kind deposit of a designated portfolio of securities and a specified amount of cash. Certain funds in the Company may be offered in Creation Units solely or partially for cash in U.S. dollars. Investors purchasing and redeeming Creation Units may pay a purchase transaction fee and a redemption transaction fee directly to State Street Bank and Trust Company, the Company’s administrator, to offset transfer and other transaction costs associated with the issuance and redemption of Creation Units, including Creation Units for cash. Investors transacting in Creation Units for cash may also pay an additional variable charge to compensate the relevant fund for certain transaction costs (i.e., stamp taxes, taxes on currency or other financial transactions, and brokerage costs) and market impact expenses relating to investing in portfolio securities. Such variable charges, if any, are included in “Proceeds from shares sold” in the statements of changes in net assets.
From time to time, settlement of securities related to in-kind contributions or in-kind redemptions may be delayed. In such cases, securities related to in-kind contributions are reflected as “Due from custodian” and securities related to in-kind redemptions are reflected as “Securities related to in-kind transactions” in the statements of assets and liabilities.
| 5. | FINANCIAL FUTURES CONTRACTS |
Each Fund may purchase or sell financial futures contracts in an effort to help such Fund track its underlying index. A futures contract is a standardized, exchange-traded agreement to buy and sell a financial instrument at a set price on a future date. Upon entering into a futures contract, the Fund is required to pledge to the executing broker which holds segregated from its own assets, an amount of cash, U.S. government securities or other high-quality debt and equity securities equal to the minimum initial margin requirements of the exchange on which the contract is traded. Pursuant to the contract, the Fund agrees to receive from or pay to the broker an amount of cash equal to the daily fluctuation in value of the contract. Such receipts or payments are known as margin variation and are recorded by the Fund as unrealized appreciation or depreciation. When the contract is closed, the Fund records a realized gain or loss equal to the difference between the value of the contract at the time it was opened and the value at the time it was closed. Losses may arise if the value of a futures contract decreases due to an unfavorable change in the market rates or values of the underlying instrument during the term of the contract or if the counterparty does not perform
NOTESTO FINANCIAL STATEMENTS | 79 |
Table of Contents
Notes to Financial Statements (Continued)
iSHARES®, INC.
under the contract. The use of futures contracts also involves the risk of an imperfect correlation in the movements in the price of futures contracts and the assets underlying such contracts.
The following table shows the value of futures contracts held by the iShares MSCI United Kingdom ETF as of August 31, 2014 and the related locations in the statement of assets and liabilities, presented by risk exposure category:
| Assets | ||||
Equity contracts: | ||||
Variation margin / Net assets consist of – net unrealized appreciationa | $ | 750,837 | ||
|
| |||
| a | Represents cumulative appreciation of futures contracts as reported in the schedule of investments. |
The following table shows the realized and unrealized gains (losses) on futures contracts held by the iShares MSCI United Kingdom ETF during the year ended August 31, 2014 and the related locations in the statement of operations, presented by risk exposure category:
| Net Realized Gain (Loss) | Net Change in Unrealized | |||||||
Equity contracts: | ||||||||
Futures contracts | $ | 1,396,990 | $ | 643,745 | ||||
|
|
|
| |||||
For the year ended August 31, 2014, the average quarter-end number of contracts and notional value of open futures contracts for the iShares MSCI United Kingdom ETF were 331 and $36,654,427, respectively.
| 6. | MARKET AND CREDIT RISK |
In the normal course of business, each Fund’s investment activities exposes it to various types of risk associated with the financial instruments and markets in which it invests. The significant types of financial risks each Fund is exposed to include market risk and credit risk. Each Fund’s prospectus provides details of these and other types of risk.
BFA uses a “passive” or index approach to try to achieve each Fund’s investment objective following the securities included in its underlying index during upturns as well as downturns. BFA does not take steps to reduce market exposure or to lessen the effects of a declining market. Divergence from the underlying index and the composition of the portfolio is monitored by BFA.
MARKET RISK
Market risk arises mainly from uncertainty about future values of financial instruments influenced by price, currency and interest rate movements. It represents the potential loss each Fund may suffer through holding market positions in the face of market movements. Each Fund is exposed to market risk by virtue of its investment in equity and financial derivative instruments. The fair value of securities held by the Funds may decline due to general market conditions, economic trends or events that are not specifically related to the issuers of the securities including local, regional or global political, social or economic instability or to factors that affect a particular industry or group of industries. The extent of each Fund’s exposure to market risk is the market value of the investments held as shown in the Fund’s schedule of investments.
| 80 | 2014 iSHARES ANNUAL REPORTTO SHAREHOLDERS |
Table of Contents
Notes to Financial Statements (Continued)
iSHARES®, INC.
A diversified portfolio, where this is appropriate and consistent with a fund’s objectives, minimizes the risk that a price change of a particular investment will have a material impact on the NAV of a fund. The investment concentrations within each Fund’s portfolio are disclosed in its schedule of investments.
Each Fund invests a substantial amount of its assets in securities of non-U.S. issuers that trade in non-U.S. markets. This involves certain considerations and risks not typically associated with securities of U.S. issuers. Such risks include, but are not limited to: generally less liquid and less efficient securities markets; generally greater price volatility; exchange rate fluctuations and exchange controls; imposition of restrictions on the expatriation of funds or other assets of the Fund; less publicly available information about issuers; the imposition of withholding or other taxes; higher transaction and custody costs; settlement delays and risk of loss attendant in settlement procedures; difficulties in enforcing contractual obligations; less regulation of securities markets; different accounting, disclosure and reporting requirements; more substantial governmental involvement in the economy; higher inflation rates; greater social, economic and political uncertainties; the risk of nationalization or expropriation of assets; and the risk of war. These risks are heightened for investments in issuers from countries with less developed markets.
Each Fund, except for the iShares MSCI Emerging Markets Eastern Europe ETF, invests all or substantially all of its assets in issuers located in a single country. When a fund concentrates its investments in this manner, it assumes the risk that economic, political and social conditions in that country may have a significant impact on its investment performance.
The United States and the European Union, along with the regulatory bodies of a number of countries including Japan, Australia and Canada (collectively, “Sanctioning Bodies”), have imposed sectorial economic sanctions on certain Russian individuals and Russian corporate entities which include prohibitions on transacting in or dealing in new debt of longer than 30 or 90 days maturity or new equity of such issuers. Securities held by the iShares MSCI Emerging Markets Eastern Europe ETF issued prior to the date of the sanctions being imposed are not currently subject to any restrictions under the sanctions. However, compliance with each of these sanctions may impair the ability of a Fund to buy, sell, hold, receive or deliver the affected securities or other securities of such issuers. The Sanctioning Bodies could also institute broader sanctions on Russia. These sanctions, or even the threat of further sanctions, may result in the decline of the value and liquidity of Russian securities, a weakening of the ruble or other adverse consequences to the Russian economy. Current or future sanctions may result in Russia taking counter measures or retaliatory actions, which may further impair the value and liquidity of Russian securities. These retaliatory measures may include the immediate freeze of Russian assets held by a Fund.
CREDIT RISK
Credit risk is the risk that an issuer or guarantor of debt instruments or the counterparty to a financial transaction, including derivatives contracts, repurchase agreements or loans of portfolio securities, is unable or unwilling to make timely interest and/or principal payments or to otherwise honor its obligations. BFA and its affiliates manage counterparty credit risk by entering into transactions only with counterparties that it believes have the financial resources to honor their obligations and by monitoring the financial stability of those counterparties. Financial assets, which potentially expose the Funds to issuer and counterparty credit risks, consist principally of financial instruments and receivables due from counterparties. The extent of each Fund’s exposure to credit and counterparty risks with respect to those financial assets is approximated by their value recorded in the statement of assets and liabilities.
| 7. | INCOME TAX INFORMATION |
Each Fund is treated as an entity separate from the Company’s other funds for federal income tax purposes. It is the policy of each Fund to qualify as a regulated investment company by complying with the provisions applicable to regulated investment companies, as defined under Subchapter M of the Internal Revenue Code of 1986, as amended, and to annually distribute substantially all of its ordinary income and any net capital gains (taking into account any capital loss carryforwards) sufficient to relieve it from all, or substantially all, federal income and excise taxes. Accordingly, no provision for federal income taxes is required.
NOTESTO FINANCIAL STATEMENTS | 81 |
Table of Contents
Notes to Financial Statements (Continued)
iSHARES®, INC.
U.S. GAAP requires that certain components of net assets be adjusted to reflect permanent differences between financial and tax reporting. These reclassifications have no effect on net assets or net asset values per share. The following permanent differences as of August 31, 2014, attributable to passive foreign investment companies, the expiration of capital loss carryforwards, distributions paid in excess of taxable income, foreign currency transactions and realized gains (losses) from in-kind redemptions, were reclassified to the following accounts:
| iShares ETF | Paid-in Capital | Undistributed Net Investment Income/Distributions in Excess of Net Investment Income | Undistributed Net Realized Gain/Accumulated Net Realized Loss | |||||||||
MSCI Austria Capped | $ | (2,035,562 | ) | $ | 185,657 | $ | 1,849,905 | |||||
MSCI Belgium Capped | 5,537,059 | 413,454 | (5,950,513 | ) | ||||||||
MSCI Emerging Markets Eastern Europe | 725,744 | (132,206 | ) | (593,538 | ) | |||||||
MSCI France | 46,259,081 | (14,016 | ) | (46,245,065 | ) | |||||||
MSCI Italy Capped | 99,141,596 | 1,023,379 | (100,164,975 | ) | ||||||||
MSCI Netherlands | 26,465,118 | (1,798 | ) | (26,463,320 | ) | |||||||
MSCI Spain Capped | 38,950,981 | (154,142 | ) | (38,796,839 | ) | |||||||
MSCI Sweden | 26,919,472 | 968,772 | (27,888,244 | ) | ||||||||
MSCI Switzerland Capped | 33,494,480 | 47,909 | (33,542,389 | ) | ||||||||
MSCI United Kingdom | 55,197,942 | 2,745,664 | (57,943,606 | ) | ||||||||
The tax character of distributions paid during the years ended August 31, 2014 and August 31, 2013 was as follows:
| iShares ETF | 2014 | 2013 | ||||||
MSCI Austria Capped | ||||||||
Ordinary income | $ | 2,505,599 | $ | 1,541,991 | ||||
|
|
|
| |||||
MSCI Belgium Capped | ||||||||
Ordinary income | $ | 2,704,438 | $ | 1,577,907 | ||||
|
|
|
| |||||
MSCI Emerging Markets Eastern Europe | ||||||||
Ordinary income | $ | 1,868,858 | $ | 885,320 | ||||
|
|
|
| |||||
MSCI France | ||||||||
Ordinary income | $ | 10,305,702 | $ | 13,699,998 | ||||
|
|
|
| |||||
MSCI Italy | ||||||||
Ordinary income | $ | 31,039,889 | $ | 13,839,281 | ||||
Return of Capital | — | 452,885 | ||||||
|
|
|
| |||||
| $ | 31,039,889 | 14,292,166 | ||||||
|
|
|
| |||||
MSCI Netherlands | ||||||||
Ordinary income | $ | 5,077,158 | $ | 2,491,248 | ||||
|
|
|
| |||||
MSCI Spain Capped | ||||||||
Ordinary income | $ | 48,486,263 | $ | 10,629,551 | ||||
|
|
|
| |||||
| 82 | 2014 iSHARES ANNUAL REPORTTO SHAREHOLDERS |
Table of Contents
Notes to Financial Statements (Continued)
iSHARES®, INC.
| iShares ETF | 2014 | 2013 | ||||||
MSCI Sweden | ||||||||
Ordinary income | $ | 17,174,445 | $ | 12,548,817 | ||||
|
|
|
| |||||
MSCI Switzerland Capped | ||||||||
Ordinary income | $ | 26,005,188 | $ | 19,030,631 | ||||
|
|
|
| |||||
MSCI United Kingdom | ||||||||
Ordinary income | $ | 244,875,033 | $ | 51,302,175 | ||||
|
|
|
| |||||
As of August 31, 2014, the tax components of accumulated net earnings (losses) were as follows:
| iShares ETF | Undistributed Ordinary Income | Capital Loss Carryforwards | Net Unrealized Gains (Losses) a | Qualified Late-Year Losses b | Total | |||||||||||||||
MSCI Austria Capped | $ | — | $ | (74,605,072 | ) | $ | (26,414,705 | ) | $ | (4,792,740 | ) | $ | (105,812,517 | ) | ||||||
MSCI Belgium Capped | 305,275 | (48,795,778 | ) | 948,084 | (882,766 | ) | (48,425,185 | ) | ||||||||||||
MSCI Emerging Markets Eastern Europe | 2,763,673 | (2,366,476 | ) | (25,572,090 | ) | (2,312,216 | ) | (27,487,109 | ) | |||||||||||
MSCI France | 278,322 | (28,309,469 | ) | (48,528,102 | ) | (9,180,768 | ) | (85,740,017 | ) | |||||||||||
MSCI Italy Capped | — | (64,013,874 | ) | (60,540,652 | ) | (1,633,152 | ) | (126,187,678 | ) | |||||||||||
MSCI Netherlands | 401,577 | (38,790,654 | ) | (12,744,090 | ) | (1,960,275 | ) | (53,093,442 | ) | |||||||||||
MSCI Spain Capped | 23,027,613 | (50,737,031 | ) | 42,265,600 | (2,325,457 | ) | 12,230,725 | |||||||||||||
MSCI Sweden | 2,547,782 | (39,201,715 | ) | (1,245,221 | ) | (54,411 | ) | (37,953,565 | ) | |||||||||||
MSCI Switzerland Capped | — | (43,318,619 | ) | 187,547,430 | (1,166,512 | ) | 143,062,299 | |||||||||||||
MSCI United Kingdom | 37,787,739 | (112,534,842 | ) | 211,999,776 | (6,410,810 | ) | 130,841,863 | |||||||||||||
| a | The difference between book-basis and tax-basis unrealized gains (losses) was attributable primarily to the tax deferral of losses on wash sales, the realization for tax purposes of unrealized gains (losses) on certain futures contracts and the realization for tax purposes of unrealized gains on investments in passive foreign investment companies. |
| b | The Funds have elected to defer certain qualified late-year losses and recognize such losses in the next taxable year. |
NOTESTO FINANCIAL STATEMENTS | 83 |
Table of Contents
Notes to Financial Statements (Continued)
iSHARES®, INC.
As of August 31, 2014, the Funds had capital loss carryforwards available to offset future realized capital gains through the indicated expiration dates as follows:
| iShares ETF | Non- Expiring a | Expiring 2015 | Expiring 2016 | Expiring 2017 | Expiring 2018 | Expiring 2019 | Total | |||||||||||||||||||||
MSCI Austria Capped | $ | 24,634,925 | $ | 9,795,917 | $ | 2,587,916 | $ | 7,102,366 | $ | 16,657,011 | $ | 13,826,937 | $ | 74,605,072 | ||||||||||||||
MSCI Belgium Capped | 11,294,523 | — | 1,698,444 | 5,953,120 | 10,826,174 | 19,023,517 | 48,795,778 | |||||||||||||||||||||
MSCI Emerging Markets Eastern Europe | 2,161,562 | — | — | — | — | 204,914 | 2,366,476 | |||||||||||||||||||||
MSCI France | 14,539,484 | 158,472 | 335,795 | 3,408,374 | 7,008,530 | 2,858,814 | 28,309,469 | |||||||||||||||||||||
MSCI Italy Capped | 33,168,667 | — | 472,268 | 2,743,650 | 18,169,627 | 9,459,662 | 64,013,874 | |||||||||||||||||||||
MSCI Netherlands | 6,930,449 | 260,715 | 1,195,162 | 5,819,153 | 22,256,170 | 2,329,005 | 38,790,654 | |||||||||||||||||||||
MSCI Spain Capped | 21,049,529 | — | — | 5,946,927 | 15,120,672 | 8,619,903 | 50,737,031 | |||||||||||||||||||||
MSCI Sweden | 11,686,467 | — | 100,015 | 13,686,746 | 8,483,510 | 5,244,977 | 39,201,715 | |||||||||||||||||||||
MSCI Switzerland Capped | 10,955,695 | — | — | 2,837,786 | 22,569,380 | 6,955,758 | 43,318,619 | |||||||||||||||||||||
MSCI United Kingdom | 50,058,426 | — | 261,754 | 16,140,312 | 23,559,917 | 22,514,433 | 112,534,842 | |||||||||||||||||||||
| a | Must be utilized prior to losses subject to expiration. |
The Funds may own shares in certain foreign investment entities, referred to, under U.S. tax law, as “passive foreign investment companies.” The Funds may elect to mark-to-market annually the shares of each passive foreign investment company and would be required to distribute to shareholders any such marked-to-market gains.
As of August 31, 2014, gross unrealized appreciation and gross unrealized depreciation based on cost for federal income tax purposes were as follows:
| iShares ETF | Tax Cost | Gross Unrealized Appreciation | Gross Unrealized Depreciation | Net Unrealized Appreciation (Depreciation) | ||||||||||||
MSCI Austria Capped | $ | 88,887,921 | $ | 463,236 | $ | (26,845,893 | ) | $ | (26,382,657 | ) | ||||||
MSCI Belgium Capped | 167,727,986 | 12,300,246 | (11,351,150 | ) | 949,096 | |||||||||||
MSCI Emerging Markets Eastern Europe | 175,881,416 | 2,581,415 | (28,148,539 | ) | (25,567,124 | ) | ||||||||||
MSCI France | 332,554,367 | 5,783,620 | (54,306,662 | ) | (48,523,042 | ) | ||||||||||
MSCI Italy Capped | 1,636,084,044 | 26,543,907 | (87,053,774 | ) | (60,509,867 | ) | ||||||||||
MSCI Netherlands | 182,778,661 | 5,802,524 | (18,540,289 | ) | (12,737,765 | ) | ||||||||||
MSCI Spain Capped | 2,430,875,598 | 120,520,020 | (78,239,914 | ) | 42,280,106 | |||||||||||
MSCI Sweden | 409,404,970 | 36,934,050 | (38,176,172 | ) | (1,242,122 | ) | ||||||||||
MSCI Switzerland Capped | 889,727,414 | 222,015,219 | (34,390,074 | ) | 187,625,145 | |||||||||||
MSCI United Kingdom | 3,987,548,805 | 521,845,607 | (309,420,734 | ) | 212,424,873 | |||||||||||
Management has analyzed tax laws and regulations and their application to the Funds as of August 31, 2014, inclusive of the open tax return years, and does not believe there are any uncertain tax positions that require recognition of a tax liability in the Funds’ financial statements.
| 84 | 2014 iSHARES ANNUAL REPORTTO SHAREHOLDERS |
Table of Contents
Notes to Financial Statements (Continued)
iSHARES®, INC.
| 8. | SUBSEQUENT EVENTS |
Management has evaluated the impact of all subsequent events on the Funds through the date the financial statements were available to be issued and other than the fund reorganization disclosed on page 71 of this report, has determined that there were no subsequent events requiring adjustment or disclosure in the financial statements.
NOTESTO FINANCIAL STATEMENTS | 85 |
Table of Contents
Report of Independent Registered Public Accounting Firm
To the Shareholders and Board of Directors of
iShares, Inc.:
In our opinion, the accompanying statements of assets and liabilities, including the schedules of investments, and the related statements of operations and of changes in net assets and the financial highlights present fairly, in all material respects, the financial position of iShares MSCI Austria Capped ETF, iShares MSCI Belgium Capped ETF, iShares MSCI Emerging Markets Eastern Europe ETF, iShares MSCI France ETF, iShares MSCI Italy Capped ETF, iShares MSCI Netherlands ETF, iShares MSCI Spain Capped ETF, iShares MSCI Sweden ETF, iShares MSCI Switzerland Capped ETF and iShares MSCI United Kingdom ETF (the “Funds”) at August 31, 2014, the results of each of their operations, the changes in each of their net assets and their financial highlights for each of the periods presented, in conformity with accounting principles generally accepted in the United States of America. These financial statements and financial highlights (hereafter referred to as “financial statements”) are the responsibility of the Funds’ management; our responsibility is to express an opinion on these financial statements based on our audits. We conducted our audits of these financial statements in accordance with the standards of the Public Company Accounting Oversight Board (United States). Those standards require that we plan and perform the audit to obtain reasonable assurance about whether the financial statements are free of material misstatement. An audit includes examining, on a test basis, evidence supporting the amounts and disclosures in the financial statements, assessing the accounting principles used and significant estimates made by management, and evaluating the overall financial statement presentation. We believe that our audits, which included confirmation of securities at August 31, 2014 by correspondence with the custodian, transfer agent and brokers, provide a reasonable basis for our opinion.
PricewaterhouseCoopers LLP
San Francisco, California
October 22, 2014
| 86 | 2014 iSHARES ANNUAL REPORTTO SHAREHOLDERS |
Table of Contents
iSHARES®, INC.
For corporate shareholders, 33.90% of the income dividends paid by the iShares MSCI United Kingdom ETF during the fiscal year ended August 31, 2014 qualified for the dividends-received deduction.
For the fiscal year ended August 31, 2014, the Funds earned foreign source income and paid foreign taxes which they intend to pass through to their shareholders pursuant to Section 853 of the Internal Revenue Code (the “Code”) as follows:
| iShares ETF | Foreign Source Income Earned | Foreign Taxes Paid | ||||||
MSCI Austria Capped | $ | 2,986,420 | $ | 262,396 | ||||
MSCI Belgium Capped | 2,207,851 | 312,028 | ||||||
MSCI Emerging Markets Eastern Europe | 5,486,689 | 613,266 | ||||||
MSCI France | 14,688,364 | 2,087,857 | ||||||
MSCI Italy Capped | 39,442,816 | 5,155,493 | ||||||
MSCI Netherlands | 6,580,164 | 673,335 | ||||||
MSCI Spain Capped | 79,618,857 | 4,989,673 | ||||||
MSCI Sweden | 20,065,712 | 3,000,308 | ||||||
MSCI Switzerland Capped | 34,546,477 | 4,025,051 | ||||||
MSCI United Kingdom | 190,603,140 | 1,708,504 | ||||||
Under Section 854(b)(2) of the Code, the Funds hereby designate the following maximum amounts as qualified dividend income for purposes of the maximum rate under Section 1(h)(11) of the Code for the fiscal year ended August 31, 2014:
| iShares ETF | Qualified Dividend Income | |||
MSCI Austria Capped | $ | 1,782,481 | ||
MSCI Belgium Capped | 2,001,842 | |||
MSCI Emerging Markets Eastern Europe | 2,482,124 | |||
MSCI France | 12,393,559 | |||
MSCI Italy Capped | 36,195,382 | |||
| iShares ETF | Qualified Dividend Income | |||
MSCI Netherlands | $ | 5,750,493 | ||
MSCI Spain Capped | 53,475,936 | |||
MSCI Sweden | 19,214,532 | |||
MSCI Switzerland Capped | 30,030,239 | |||
MSCI United Kingdom | 246,583,537 | |||
In February 2015, shareholders will receive Form 1099-DIV which will include their share of qualified dividend income distributed during the calendar year 2014. Shareholders are advised to check with their tax advisers for information on the treatment of these amounts on their income tax returns.
TAX INFORMATION | 87 |
Table of Contents
Board Review and Approval of Investment Advisory
Contract
iSHARES®, INC.
I. iShares MSCI Austria Capped ETF, iShares MSCI Belgium Capped ETF, iShares MSCI France ETF, iShares MSCI Italy Capped ETF, iShares MSCI Netherlands ETF, iShares MSCI Spain Capped ETF, iShares MSCI Sweden ETF, iShares MSCI Switzerland Capped ETF and iShares MSCI United Kingdom ETF
Under Section 15(c) of the Investment Company Act of 1940 (the “1940 Act”), the Company’s Board of Directors (the “Board”), including a majority of Directors who are not “interested persons” of the Company (as that term is defined in the 1940 Act) (the “Independent Directors”), is required annually to consider and approve the Investment Advisory Contract between the Company and BFA (the “Advisory Contract”) on behalf of the Funds. The Independent Directors requested, and BFA provided, such information as the Independent Directors, with advice from independent counsel, deemed reasonably necessary to evaluate the Advisory Contract. A committee of Independent Directors (the “15(c) Committee”), with independent counsel, met with management on March 12, 2014, May 6, 2014, and May 12, 2014, to discuss the types of information the Independent Directors required and the manner in which management would organize and present such information. At a meeting held on May 16, 2014, management presented preliminary information to the Board relating to the continuance of the Advisory Contract, and the Board, including the Independent Directors, reviewed and discussed such information at length. The Independent Directors requested from management certain additional information, which management agreed to provide. At a meeting held on June 12-13, 2014, the Board, including the Independent Directors, reviewed the additional information provided by management in response to these requests. After extensive discussions, the Board, including all of the Independent Directors, approved the continuance of the Advisory Contract for the Funds, based on a review of qualitative and quantitative information provided by BFA, including the additional information management provided at the request of the Independent Directors. The Board noted its satisfaction with the extent and quality of information provided and its frequent interactions with management, as well as the detailed responses and other information provided by BFA. The Board also noted that the Board and BFA agreed to discuss potential enhancements and adjustments to the 15(c) process for the coming year. The Independent Directors were advised by their independent counsel throughout the process, including about the legal standards applicable to their review. In approving the Advisory Contract for the Funds, the Board, including the Independent Directors, considered the following factors, no one of which was controlling, and reached the following conclusions:
Expenses and Performance of the Funds — The Board reviewed statistical information prepared by Lipper Inc. (“Lipper”), an independent provider of investment company data, regarding the expense ratio components, including actual advisory fees, waivers/reimbursements, and gross and net total expenses of each Fund in comparison with the same information for other exchange traded funds (including funds sponsored by an “at cost” service provider) and, in the limited instances where no comparable ETFs existed and the comparison group would not otherwise be reasonable in Lipper’s judgment, pure index institutional mutual funds, objectively selected by Lipper as comprising such Fund’s applicable peer group pursuant to Lipper’s proprietary ETF methodology (the “Lipper Group”). The Board noted that, prior to 2014, Lipper had used a different methodology to determine a Fund’s Lipper group, which included mutual funds, closed-end funds, exchange traded funds, and/or funds with differing investment objective classifications, investment focuses and other characteristics (e.g. actively managed funds and funds sponsored by “at cost” service providers), as applicable. The Board further noted that, after consideration by the 15(c) Committee, the Board determined to use instead Lipper’s proprietary ETF methodology to determine a Fund’s Lipper Group. This determination was based on, among other considerations, the increased number and types of ETFs available for comparative purposes than was the case in prior years. The Board was provided with a detailed description of Lipper’s proprietary ETF methodology used by Lipper to determine the applicable Lipper Groups and to prepare this information. At the Board’s request, Lipper provided, and the Board considered, information on the impact to the iShares funds’ comparative fee rankings that were attributable to the change from a pure index group methodology to Lipper’s proprietary ETF methodology. The Board further noted that due to the limitations in providing comparable funds in the various Lipper Groups, the statistical information provided in Lipper’s report may or may not provide meaningful direct comparisons to the Funds in all instances.
| 88 | 2014 iSHARES ANNUAL REPORTTO SHAREHOLDERS |
Table of Contents
Board Review and Approval of Investment Advisory
Contract (Continued)
iSHARES®, INC.
The Board also noted that the investment advisory fee rates and overall expenses for the Funds were lower than the median of the investment advisory fee rates and overall expenses of the funds in their respective Lipper Group, except for iShares MSCI Netherlands ETF, iShares MSCI Switzerland Capped ETF and iShares MSCI United Kingdom ETF, which were at the median of the investment advisory fee rates and overall expenses of the funds in their respective Lipper Group, and iShares MSCI Austria Capped ETF, which were within range of the median of the investment advisory fee rates and overall expenses of the funds in its Lipper Group.
In addition, the Board reviewed statistical information prepared by Lipper regarding the performance of each Fund for the one-, three-, five-, ten-year, and since inception periods, as applicable, and the “last quarter” period ended December 31, 2013, and a comparison of each Fund’s performance to its performance benchmark index for the same periods. To the extent that any of the comparison funds included in the Lipper Group track the same index as any particular Fund, Lipper also provided, and the Board reviewed, a comparison of such Fund’s performance to that of such relevant comparison funds for the same periods. The Board noted that the Funds generally performed in line with their respective performance benchmark indexes over the relevant periods. In considering this information, the Board noted that the Lipper Group may include funds that are not exchange traded funds or index funds, and that may have different investment objectives and/or benchmarks from the Funds. In addition, the Board noted that each Fund seeks to track its own benchmark index and that, during the prior year, the Board received periodic reports on the Funds’ performance in comparison with their relevant benchmark indexes. Such periodic comparative performance information, including detailed information on certain specific iShares funds requested by the Boards, was also considered.
Based on this review, the other factors considered at the meeting, and their general knowledge of ETF pricing, the Board concluded that the investment advisory fee rate and expense level and the historical performance of each Fund supported the Board’s approval of the continuance of the Advisory Contract for the coming year.
Nature, Extent and Quality of Services Provided by BFA — Based on management’s representations, including information about recent and proposed enhancements to the iShares business, including with respect to shareholder servicing and support, the Board expected that there would be no diminution in the scope of services required of or provided by BFA under the Advisory Contract for the coming year as compared to the scope of services provided by BFA during prior years. In reviewing the scope of these services, the Board considered BFA’s investment philosophy and experience, noting that BFA and its affiliates have committed significant resources over time, including during the past year, to supporting the Funds and their shareholders. The Board acknowledged that resources to support the iShares funds and their shareholders have been added or enhanced in recent years, including in such areas as investor education, product management, customized portfolio consulting support, capital markets support, and proprietary risk and performance analytics tools. The Board also considered BFA’s compliance program and its compliance record with respect to the Funds. In that regard, the Board noted that BFA reports to the Board about portfolio management and compliance matters on a periodic basis in connection with regularly scheduled meetings of the Board, and on other occasions as necessary and appropriate, and has provided information and made appropriate officers available as needed to provide further assistance with these matters. The Board also reviewed the background and experience of the persons responsible for the day-to-day management of the Funds, as well as the resources available to them in managing the Funds. In addition to the above considerations, the Board reviewed and considered detailed presentations regarding BFA’s investment performance, investment and risk management processes and strategies provided at the June 12-13, 2014 meeting and throughout the previous year, and matters related to BFA’s portfolio compliance policies and procedures. The Board noted that each Fund had met its investment objective consistently since its respective inception date.
Based on review of this information, and the performance information discussed above, the Board concluded that the nature, extent and quality of services provided by BFA to the Funds under the Advisory Contract supported the Board’s approval of the continuance of the Advisory Contract for the coming year.
BOARD REVIEWAND APPROVALOF INVESTMENT ADVISORY CONTRACT | 89 |
Table of Contents
Board Review and Approval of Investment Advisory
Contract (Continued)
iSHARES®, INC.
Costs of Services Provided to Funds and Profits Realized by BFA and Affiliates — The Board reviewed information about the profitability to BlackRock of the Funds based on the fees payable to BFA and its affiliates (including fees under the Advisory Contract), and all other sources of revenue and expense to BFA and its affiliates from the Funds’ operations for the last calendar year. The Board reviewed BlackRock’s profitability methodology for the iShares funds, noting that the 15(c) Committee had focused on the methodology and proposed presentation during its meetings. The Board discussed the sources of direct and ancillary revenue with management, including the revenues to BTC from securities lending by the Funds. The Board also discussed BFA’s profit margin as reflected in the Funds’ profitability analyses and reviewed information regarding potential economies of scale (as discussed below). Based on this review, the Board concluded that the profits realized by BFA and its affiliates under the Advisory Contract and from other relationships between the Funds and BFA and/or its affiliates, if any, were within a reasonable range in light of the factors considered.
Economies of Scale — The Board reviewed information regarding potential economies of scale or other efficiencies that may result from increases in the Funds’ assets, noting that the issue of economies of scale had been focused on extensively by the 15(c) Committee during its meetings and addressed by management. The Board and the 15(c) Committee reviewed information provided by BFA regarding scale benefits shared with the iShares funds through relatively low fee rates established at inception, breakpoints, waivers, or other fee reductions, as well as through additional investment in the iShares business and the provision of improved or additional infrastructure and services to the iShares funds and their shareholders. The Board and the 15(c) Committee received information regarding BlackRock’s historical profitability, including BFA’s and its affiliates’ costs in providing services. The cost information distinguished between fixed and variable costs, and explained how the level of fixed and variable costs, as well as the nature of such costs, may impact the existence or size of scale benefits. The Board noted that the Advisory Contract for the Funds already provided for breakpoints in the Funds’ investment advisory fee rates, and that, following negotiations, BFA and the Board had agreed to revise the Advisory Contract for the Funds to provide for additional breakpoints, as the assets of the Funds, on an aggregated basis with the assets of certain other iShares funds, increase. The Board noted that the revisions of the Advisory Contract to provide additional breakpoints had been subject to further negotiation after receipt of management’s proposal, and that at the request of the Board, management had modified its initial proposal regarding adding additional breakpoints to the Funds. The Board noted that it would continue to monitor the sharing of economies of scale to determine the appropriateness of adding new or revised breakpoints in the future. Based on this review, as well as the other factors considered at the meeting, the Board, recognizing its responsibility to consider this issue at least annually, concluded that the structure of the investment advisory fee rates reflects appropriate sharing of potential economies of scale with the Funds’ shareholders and supported the Board’s approval of the continuance of the Advisory Contract for the coming year.
Fees and Services Provided for Other Comparable Funds/Accounts Managed by BFA and its Affiliates — The Board received and considered information regarding the investment advisory/management fee rates for other funds/accounts in the U.S. for which BFA (or its affiliates) provides investment advisory/management services, including open-end and closed-end funds registered under the 1940 Act (including sub-advised funds), collective trust funds, separately managed accounts, and institutional separate accounts (together, the “Other Accounts”), and acknowledged BFA’s assertion that the iShares funds are fundamentally different investment vehicles from the Other Accounts. The Board noted that BFA and its affiliates do not manage Other Accounts with substantially similar investment objectives and strategies as the Funds, except for iShares MSCI Sweden ETF, iShares MSCI Switzerland Capped ETF, and iShares MSCI United Kingdom ETF. The Board further noted that BFA provided the Board with detailed information regarding how the Other Accounts (particularly institutional clients) generally differ from the Funds, including in terms of the different, generally more extensive services provided to the Funds, as well as other significant differences in the approach of BFA and its affiliates to the Funds, on one hand, and Other Accounts, on the other. In that regard, the Board considered that the pricing of services to institutional clients is typically based on a number of factors beyond the nature and extent of the specific services to be provided and often depends on the overall relationship between the client and its affiliates and the adviser and its affiliates. In addition, the Board considered the relative complexity and inherent risks and challenges of managing and providing other services to the Funds, as publicly traded exchange traded funds, as compared to
| 90 | 2014 iSHARES ANNUAL REPORTTO SHAREHOLDERS |
Table of Contents
Board Review and Approval of Investment Advisory
Contract (Continued)
iSHARES®, INC.
the Other Accounts that are institutional clients in light of differing regulatory requirements and client-imposed mandates. The Board also considered the “all-inclusive” nature of the Funds’ advisory fee structure, and the Fund expenses borne by BFA under this arrangement. The Board noted that the investment advisory fee rates under the Advisory Contract for the Funds were generally higher than the investment advisory/management fee rates for the Other Accounts that are institutional clients of BFA (or its affiliates) and concluded that the differences appeared to be consistent with the factors discussed.
Other Benefits to BFA and/or its Affiliates — The Board reviewed the “fallout” benefits or ancillary revenue received by BFA and/or its affiliates in connection with the services provided to the Funds by BFA, such as payment of revenue to BTC, the Funds’ securities lending agent, for loaning portfolio securities (which was included in the profit margins reviewed by the Board pursuant to BFA’s profitability methodology), and payment of advisory fees and/or administration fees to BFA and BTC (or their affiliates) in connection with any investments by the Funds in other funds for which BFA (or its affiliates) provides investment advisory services and/or administration services. The Board noted that BFA generally does not use soft dollars or consider the value of research or other services that may be provided to BFA (including its affiliates) in selecting brokers for portfolio transactions for the Funds. The Board further noted that any portfolio transactions on behalf of the Funds placed through a BFA affiliate or purchased from an underwriting syndicate in which a BFA affiliate participates, are reported to the Board pursuant to Rule 17e-1 or Rule 10f-3, as applicable, under the 1940 Act. The Board concluded that any such ancillary benefits would not be disadvantageous to the Funds’ shareholders and thus would not alter the Board’s conclusion with respect to the appropriateness of approving the continuance of the Advisory Contract for the coming year.
Based on the considerations described above, the Board determined that each Fund’s investment advisory fee rate under the Advisory Contract does not constitute a fee that is so disproportionately large as to bear no reasonable relationship to the services rendered and that could not have been the product of arm’s-length bargaining, and concluded that it is in the best interest of each Fund and its shareholders to approve the continuance of the Advisory Contract for the coming year.
II. iShares MSCI Emerging Markets Eastern Europe ETF
Under Section 15(c) of the Investment Company Act of 1940 (the “1940 Act”), the Company’s Board of Directors (the “Board”), including a majority of Directors who are not “interested persons” of the Company (as that term is defined in the 1940 Act) (the “Independent Directors”), is required annually to consider and approve the Investment Advisory Contract between the Company and BFA (the “Advisory Contract”) on behalf of the Fund. The Independent Directors requested, and BFA provided, such information as the Independent Directors, with advice from independent counsel, deemed reasonably necessary to evaluate the Advisory Contract. A committee of Independent Directors (the “15(c) Committee”), with independent counsel, met with management on March 12, 2014, May 6, 2014, and May 12, 2014, to discuss the types of information the Independent Directors required and the manner in which management would organize and present such information. At a meeting held on May 16, 2014, management presented preliminary information to the Board relating to the continuance of the Advisory Contract, and the Board, including the Independent Directors, reviewed and discussed such information at length. The Independent Directors requested from management certain additional information, which management agreed to provide. At a meeting held on June 12-13, 2014, the Board, including the Independent Directors, reviewed the additional information provided by management in response to these requests. After extensive discussions, the Board, including all of the Independent Directors, approved the continuance of the Advisory Contract for the Fund, based on a review of qualitative and quantitative information provided by BFA, including the additional information management provided at the request of the Independent Directors. The Board noted its satisfaction with the extent and quality of information provided and its frequent interactions with management, as well as the detailed responses and other information provided by BFA. The Board also noted that the Board and BFA agreed to discuss potential enhancements and adjustments to the 15(c) process for the coming year. The Independent Directors were advised by their independent counsel throughout the process, including about the legal standards applicable to their review. In approving the
BOARD REVIEWAND APPROVALOF INVESTMENT ADVISORY CONTRACT | 91 |
Table of Contents
Board Review and Approval of Investment Advisory
Contract (Continued)
iSHARES®, INC.
Advisory Contract for the Fund, the Board, including the Independent Directors, considered the following factors, no one of which was controlling, and reached the following conclusions:
Expenses and Performance of the Fund — The Board reviewed statistical information prepared by Lipper Inc. (“Lipper”), an independent provider of investment company data, regarding the expense ratio components, including actual advisory fees, waivers/reimbursements, and gross and net total expenses of the Fund in comparison with the same information for other exchange traded funds (including funds sponsored by an “at cost” service provider) and, in the limited instances where no comparable ETFs existed and the comparison group would not otherwise be reasonable in Lipper’s judgment, pure index institutional mutual funds, objectively selected by Lipper as comprising the Fund’s applicable peer group pursuant to Lipper’s proprietary ETF methodology (the “Lipper Group”). The Board noted that, prior to 2014, Lipper had used a different methodology to determine the Fund’s Lipper group, which included mutual funds, closed-end funds, exchange traded funds, and/or funds with differing investment objective classifications, investment focuses and other characteristics (e.g. actively managed funds and funds sponsored by “at cost” service providers), as applicable. The Board further noted that, after consideration by the 15(c) Committee, the Board determined to use instead Lipper’s proprietary ETF methodology to determine the Fund’s Lipper Group. This determination was based on, among other considerations, the increased number and types of ETFs available for comparative purposes than was the case in prior years. The Board was provided with a detailed description of Lipper’s proprietary ETF methodology used by Lipper to determine the applicable Lipper Group and to prepare this information. At the Board’s request, Lipper provided, and the Board considered, information on the impact to the iShares funds’ comparative fee rankings that were attributable to the change from a pure index group methodology to Lipper’s proprietary ETF methodology. The Board further noted that due to the limitations in providing comparable funds in the Lipper Group, the statistical information provided in Lipper’s report may or may not provide meaningful direct comparisons to the Fund in all instances.
The Board also noted that the investment advisory fee rate and overall expenses for the Fund were within range of the median of the investment advisory fee rates and overall expenses of the funds in its Lipper Group.
In addition, the Board reviewed statistical information prepared by Lipper regarding the performance of the Fund for the one-, three-, five-, ten-year, and since inception periods, as applicable, and the “last quarter” period ended December 31, 2013, and a comparison of the Fund’s performance to its performance benchmark index for the same periods. To the extent that any of the comparison funds included in the Lipper Group track the same index as the Fund, Lipper also provided, and the Board reviewed, a comparison of the Fund’s performance to that of such relevant comparison funds for the same periods. The Board noted that the Fund generally performed in line with its respective performance benchmark index over the relevant periods. In considering this information, the Board noted that the Lipper Group may include funds that are not exchange traded funds or index funds, and that may have different investment objectives and/or benchmarks from the Fund. In addition, the Board noted that the Fund seeks to track its own benchmark index and that, during the prior year, the Board received periodic reports on the Fund’s performance in comparison with its relevant benchmark index. Such periodic comparative performance information, including detailed information on certain specific iShares funds requested by the Boards, was also considered.
Based on this review, the other factors considered at the meeting, and their general knowledge of ETF pricing, the Board concluded that the investment advisory fee rate and expense level and the historical performance of the Fund supported the Board’s approval of the continuance of the Advisory Contract for the coming year.
Nature, Extent and Quality of Services Provided by BFA — Based on management’s representations, including information about recent and proposed enhancements to the iShares business, including with respect to shareholder servicing and support, the Board expected that there would be no diminution in the scope of services required of or provided by BFA under the Advisory Contract for the coming year as compared to the scope of services provided by BFA during prior years. In reviewing the scope of these services, the Board considered BFA’s investment philosophy and experience, noting that BFA and its affiliates have
| 92 | 2014 iSHARES ANNUAL REPORTTO SHAREHOLDERS |
Table of Contents
Board Review and Approval of Investment Advisory
Contract (Continued)
iSHARES®, INC.
committed significant resources over time, including during the past year, to supporting the Fund and its shareholders. The Board acknowledged that resources to support the iShares funds and their shareholders have been added or enhanced in recent years, including in such areas as investor education, product management, customized portfolio consulting support, capital markets support, and proprietary risk and performance analytics tools. The Board also considered BFA’s compliance program and its compliance record with respect to the Fund. In that regard, the Board noted that BFA reports to the Board about portfolio management and compliance matters on a periodic basis in connection with regularly scheduled meetings of the Board, and on other occasions as necessary and appropriate, and has provided information and made appropriate officers available as needed to provide further assistance with these matters. The Board also reviewed the background and experience of the persons responsible for the day-to-day management of the Fund, as well as the resources available to them in managing the Fund. In addition to the above considerations, the Board reviewed and considered detailed presentations regarding BFA’s investment performance, investment and risk management processes and strategies provided at the June 12-13, 2014 meeting and throughout the previous year, and matters related to BFA’s portfolio compliance policies and procedures. The Board noted that the Fund had met its investment objective consistently since its inception date.
Based on review of this information, and the performance information discussed above, the Board concluded that the nature, extent and quality of services provided by BFA to the Fund under the Advisory Contract supported the Board’s approval of the continuance of the Advisory Contract for the coming year.
Costs of Services Provided to the Fund and Profits Realized by BFA and Affiliates — The Board reviewed information about the profitability to BlackRock of the Fund based on the fees payable to BFA and its affiliates (including fees under the Advisory Contract), and all other sources of revenue and expense to BFA and its affiliates from the Fund’s operations for the last calendar year. The Board reviewed BlackRock’s profitability methodology for the iShares funds, noting that the 15(c) Committee had focused on the methodology and proposed presentation during its meetings. The Board discussed the sources of direct and ancillary revenue with management, including the revenues to BTC from securities lending by the Fund. The Board also discussed BFA’s profit margin as reflected in the Fund’s profitability analysis and reviewed information regarding potential economies of scale (as discussed below). Based on this review, the Board concluded that the profits realized by BFA and its affiliates under the Advisory Contract and from other relationships between the Fund and BFA and/or its affiliates, if any, were within a reasonable range in light of the factors considered.
Economies of Scale — The Board reviewed information regarding potential economies of scale or other efficiencies that may result from increases in the Fund’s assets, noting that the issue of economies of scale had been focused on extensively by the 15(c) Committee during its meetings and addressed by management. The Board and the 15(c) Committee reviewed information provided by BFA regarding scale benefits shared with the iShares funds through relatively low fee rates established at inception, breakpoints, waivers, or other fee reductions, as well as through additional investment in the iShares business and the provision of improved or additional infrastructure and services to the iShares funds and their shareholders. The Board and the 15(c) Committee received information regarding BlackRock’s historical profitability, including BFA’s and its affiliates’ costs in providing services. The cost information distinguished between fixed and variable costs, and explained how the level of fixed and variable costs, as well as the nature of such costs, may impact the existence or size of scale benefits. The Board noted that the Advisory Contract for the Fund already provided for breakpoints in the Fund’s investment advisory fee rate, and that, following receipt of a proposal from the Board and negotiations, BFA and the Board had agreed to revise the Advisory Contract for the Fund to reduce the advisory fee for certain breakpoint tiers, as the assets of the Fund, on an aggregated basis with the assets of certain other iShares funds, increase. The Board noted that it would continue to monitor the sharing of economies of scale to determine the appropriateness of adding new or revised breakpoints in the future. Based on this review, as well as the other factors considered at the meeting, the Board, recognizing its responsibility to consider this issue at least annually, concluded that the structure of the investment advisory fee rate reflects appropriate sharing of potential economies of scale with the Fund’s shareholders and supported the Board’s approval of the continuance of the Advisory Contract for the coming year.
BOARD REVIEWAND APPROVALOF INVESTMENT ADVISORY CONTRACT | 93 |
Table of Contents
Board Review and Approval of Investment Advisory
Contract (Continued)
iSHARES®, INC.
Fees and Services Provided for Other Comparable Funds/Accounts Managed by BFA and its Affiliates — The Board received and considered information regarding the investment advisory/management fee rates for other funds/accounts in the U.S. for which BFA (or its affiliates) provides investment advisory/management services, including open-end and closed-end funds registered under the 1940 Act (including sub-advised funds), collective trust funds, separately managed accounts, and institutional separate accounts (together, the “Other Accounts”), and acknowledged BFA’s assertion that the iShares funds are fundamentally different investment vehicles from the Other Accounts. The Board noted that BFA and its affiliates do manage Other Accounts with a substantially similar investment objective and strategy as the Fund. The Board further noted that BFA provided the Board with detailed information regarding how the Other Accounts (particularly institutional clients) generally differ from the Fund, including in terms of the different, generally more extensive services provided to the Fund, as well as other significant differences in the approach of BFA and its affiliates to the Fund, on one hand, and Other Accounts, on the other. In that regard, the Board considered that the pricing of services to institutional clients is typically based on a number of factors beyond the nature and extent of the specific services to be provided and often depends on the overall relationship between the client and its affiliates and the adviser and its affiliates. In addition, the Board considered the relative complexity and inherent risks and challenges of managing and providing other services to the Fund, as a publicly traded exchange traded fund, as compared to the Other Accounts that are institutional clients in light of differing regulatory requirements and client-imposed mandates. The Board also considered the “all-inclusive” nature of the Fund’s advisory fee structure, and the Fund expenses borne by BFA under this arrangement. The Board noted that the investment advisory fee rate under the Advisory Contract for the Fund was generally higher than the investment advisory/management fee rates for the Other Accounts that are institutional clients of BFA (or its affiliates) and concluded that the differences appeared to be consistent with the factors discussed.
Other Benefits to BFA and/or its Affiliates — The Board reviewed the “fallout” benefits or ancillary revenue received by BFA and/or its affiliates in connection with the services provided to the Fund by BFA, such as payment of revenue to BTC, the Fund’s securities lending agent, for loaning portfolio securities (which was included in the profit margins reviewed by the Board pursuant to BFA’s profitability methodology), and payment of advisory fees and/or administration fees to BFA and BTC (or their affiliates) in connection with any investments by the Fund in other funds for which BFA (or its affiliates) provides investment advisory services and/or administration services. The Board noted that BFA generally does not use soft dollars or consider the value of research or other services that may be provided to BFA (including its affiliates) in selecting brokers for portfolio transactions for the Fund. The Board further noted that any portfolio transactions on behalf of the Fund placed through a BFA affiliate or purchased from an underwriting syndicate in which a BFA affiliate participates, are reported to the Board pursuant to Rule 17e-1 or Rule 10f-3, as applicable, under the 1940 Act. The Board concluded that any such ancillary benefits would not be disadvantageous to the Fund’s shareholders and thus would not alter the Board’s conclusion with respect to the appropriateness of approving the continuance of the Advisory Contract for the coming year.
Based on the considerations described above, the Board determined that the Fund’s investment advisory fee rate under the Advisory Contract does not constitute a fee that is so disproportionately large as to bear no reasonable relationship to the services rendered and that could not have been the product of arm’s-length bargaining, and concluded that it is in the best interest of the Fund and its shareholders to approve the continuance of the Advisory Contract for the coming year.
| 94 | 2014 iSHARES ANNUAL REPORTTO SHAREHOLDERS |
Table of Contents
Supplemental Information (Unaudited)
iSHARES®, INC.
Section 19(a) Notices
The amounts and sources of distributions reported are only estimates and are not being provided for tax reporting purposes. The actual amounts and sources of the amounts for tax reporting purposes will depend upon each Fund’s investment experience during the year and may be subject to changes based on the tax regulations. Shareholders will receive a Form 1099-DIV each calendar year that will inform them how to report distributions for federal income tax purposes.
| Total Cumulative Distributions for the Fiscal Year | % Breakdown of the Total Cumulative Distributions for the Fiscal Year | |||||||||||||||||||||||||||||||
| iShares ETF | Net Investment Income | Net Realized Capital Gains | Return of Capital | Total Per Share | Net Investment Income | Net Realized Capital Gains | Return of Capital | Total Per Share | ||||||||||||||||||||||||
MSCI Austria Capped | $ | 0.592935 | $ | — | $ | 0.062685 | $ | 0.655620 | 90 | % | — | % | 10 | % | 100 | % | ||||||||||||||||
MSCI Belgium Capped | 0.519807 | — | 0.090481 | 0.610288 | 85 | — | 15 | 100 | ||||||||||||||||||||||||
MSCI Italy Capped | 0.341997 | — | — | 0.341997 | 100 | — | — | 100 | ||||||||||||||||||||||||
MSCI Spain Capped | 1.161520 | — | — | 1.161520 | 100 | — | — | 100 | ||||||||||||||||||||||||
MSCI Sweden | 1.213903 | — | 0.017240 | 1.231143 | 99 | — | 1 | 100 | ||||||||||||||||||||||||
MSCI United Kingdom | 1.256140 | — | — | 1.256140 | 100 | — | — | 100 | ||||||||||||||||||||||||
Premium/Discount Information
The tables that follow present information about the differences between the daily market price on secondary markets for shares of a Fund and that Fund’s net asset value. Net asset value, or “NAV,” is the price per share at which each Fund issues and redeems shares. It is calculated in accordance with the standard formula for valuing mutual fund shares. The “Market Price” of each Fund generally is determined using the midpoint between the highest bid and the lowest offer on the primary stock exchange on which the shares of such Fund are listed for trading, as of the time that the Fund’s NAV is calculated. Each Fund’s Market Price may be at, above or below its NAV. The NAV of each Fund will fluctuate with changes in the fair value of its portfolio holdings. The Market Price of each Fund will fluctuate in accordance with changes in its NAV, as well as market supply and demand.
Premiums or discounts are the differences (expressed as a percentage) between the NAV and Market Price of a Fund on a given day, generally at the time NAV is calculated. A premium is the amount that a Fund is trading above the reported NAV, expressed as a percentage of the NAV. A discount is the amount that a Fund is trading below the reported NAV, expressed as a percentage of the NAV.
The following information shows the frequency distributions of premiums and discounts for each of the Funds included in this report. The information shown for each Fund is for five calendar years (or for each full calendar quarter completed after the inception date of such Fund if less than five years) through the date of the most recent quarter-end. The specific periods covered for each Fund are disclosed in the table for such Fund.
SUPPLEMENTAL INFORMATION | 95 |
Table of Contents
Supplemental Information (Unaudited) (Continued)
iSHARES®, INC.
Each line in the table shows the number of trading days in which the Fund traded within the premium/discount range indicated. The number of trading days in each premium/discount range is also shown as a percentage of the total number of trading days in the period covered by each table. All data presented here represents past performance, which cannot be used to predict future results.
iShares MSCI Austria Capped ETF
Period Covered: January 1, 2009 through June 30, 2014
Premium/Discount Range | Number of Days | Percentage of Total Days | ||||||
Greater than 4.5% | 2 | 0.14 | % | |||||
Greater than 4.0% and Less than 4.5% | 1 | 0.07 | ||||||
Greater than 3.5% and Less than 4.0% | 1 | 0.07 | ||||||
Greater than 3.0% and Less than 3.5% | 1 | 0.07 | ||||||
Greater than 2.5% and Less than 3.0% | 4 | 0.29 | ||||||
Greater than 2.0% and Less than 2.5% | 12 | 0.87 | ||||||
Greater than 1.5% and Less than 2.0% | 16 | 1.16 | ||||||
Greater than 1.0% and Less than 1.5% | 58 | 4.20 | ||||||
Greater than 0.5% and Less than 1.0% | 197 | 14.26 | ||||||
Between 0.5% and –0.5% | 814 | 58.91 | ||||||
Less than –0.5% and Greater than –1.0% | 148 | 10.71 | ||||||
Less than –1.0% and Greater than –1.5% | 65 | 4.70 | ||||||
Less than –1.5% and Greater than –2.0% | 33 | 2.39 | ||||||
Less than –2.0% and Greater than –2.5% | 17 | 1.23 | ||||||
Less than –2.5% and Greater than –3.0% | 6 | 0.43 | ||||||
Less than –3.0% and Greater than –3.5% | 3 | 0.22 | ||||||
Less than –3.5% and Greater than –4.0% | 1 | 0.07 | ||||||
Less than –4.0% and Greater than –4.5% | 2 | 0.14 | ||||||
Less than –4.5% | 1 | 0.07 | ||||||
|
|
|
| |||||
| 1,382 | 100.00 | % | ||||||
|
|
|
| |||||
| 96 | 2014 iSHARES ANNUAL REPORTTO SHAREHOLDERS |
Table of Contents
Supplemental Information (Unaudited) (Continued)
iSHARES®, INC.
iShares MSCI Belgium Capped ETF
Period Covered: January 1, 2009 through June 30, 2014
Premium/Discount Range | Number of Days | Percentage of Total Days | ||||||
Greater than 3.5% | 4 | 0.29 | % | |||||
Greater than 3.0% and Less than 3.5% | 1 | 0.07 | ||||||
Greater than 2.5% and Less than 3.0% | 4 | 0.29 | ||||||
Greater than 2.0% and Less than 2.5% | 9 | 0.65 | ||||||
Greater than 1.5% and Less than 2.0% | 22 | 1.59 | ||||||
Greater than 1.0% and Less than 1.5% | 49 | 3.55 | ||||||
Greater than 0.5% and Less than 1.0% | 176 | 12.74 | ||||||
Between 0.5% and –0.5% | 896 | 64.84 | ||||||
Less than –0.5% and Greater than –1.0% | 132 | 9.55 | ||||||
Less than –1.0% and Greater than –1.5% | 60 | 4.34 | ||||||
Less than –1.5% and Greater than –2.0% | 17 | 1.23 | ||||||
Less than –2.0% and Greater than –2.5% | 7 | 0.51 | ||||||
Less than –2.5% and Greater than –3.0% | 2 | 0.14 | ||||||
Less than –3.0% and Greater than –3.5% | 2 | 0.14 | ||||||
Less than –3.5% and Greater than –4.0% | 1 | 0.07 | ||||||
|
|
|
| |||||
| 1,382 | 100.00 | % | ||||||
|
|
|
| |||||
iShares MSCI Emerging Markets Eastern Europe ETF
Period Covered: October 1, 2009 through June 30, 2014
Premium/Discount Range | Number of Days | Percentage of Total Days | ||||||
Greater than 3.5% | 5 | 0.42 | % | |||||
Greater than 3.0% and Less than 3.5% | 2 | 0.17 | ||||||
Greater than 2.5% and Less than 3.0% | 5 | 0.42 | ||||||
Greater than 2.0% and Less than 2.5% | 6 | 0.50 | ||||||
Greater than 1.5% and Less than 2.0% | 23 | 1.93 | ||||||
Greater than 1.0% and Less than 1.5% | 64 | 5.36 | ||||||
Greater than 0.5% and Less than 1.0% | 217 | 18.17 | ||||||
Between 0.5% and –0.5% | 633 | 53.01 | ||||||
Less than –0.5% and Greater than –1.0% | 121 | 10.13 | ||||||
Less than –1.0% and Greater than –1.5% | 64 | 5.36 | ||||||
Less than –1.5% and Greater than –2.0% | 31 | 2.60 | ||||||
Less than –2.0% and Greater than –2.5% | 13 | 1.09 | ||||||
Less than –2.5% and Greater than –3.0% | 3 | 0.25 | ||||||
Less than –3.0% and Greater than –3.5% | 5 | 0.42 | ||||||
Less than –3.5% and Greater than –4.0% | 2 | 0.17 | ||||||
|
|
|
| |||||
| 1,194 | 100.00 | % | ||||||
|
|
|
| |||||
SUPPLEMENTAL INFORMATION | 97 |
Table of Contents
Supplemental Information (Unaudited) (Continued)
iSHARES®, INC.
iShares MSCI France ETF
Period Covered: January 1, 2009 through June 30, 2014
Premium/Discount Range | Number of Days | Percentage of Total Days | ||||||
Greater than 3.5% | 4 | 0.29 | % | |||||
Greater than 3.0% and Less than 3.5% | 1 | 0.07 | ||||||
Greater than 2.5% and Less than 3.0% | 3 | 0.22 | ||||||
Greater than 2.0% and Less than 2.5% | 10 | 0.72 | ||||||
Greater than 1.5% and Less than 2.0% | 22 | 1.59 | ||||||
Greater than 1.0% and Less than 1.5% | 63 | 4.56 | ||||||
Greater than 0.5% and Less than 1.0% | 217 | 15.71 | ||||||
Between 0.5% and –0.5% | 855 | 61.87 | ||||||
Less than –0.5% and Greater than –1.0% | 120 | 8.68 | ||||||
Less than –1.0% and Greater than –1.5% | 49 | 3.55 | ||||||
Less than –1.5% and Greater than –2.0% | 22 | 1.59 | ||||||
Less than –2.0% and Greater than –2.5% | 9 | 0.65 | ||||||
Less than –2.5% and Greater than –3.0% | 5 | 0.36 | ||||||
Less than –3.0% | 2 | 0.14 | ||||||
|
|
|
| |||||
| 1,382 | 100.00 | % | ||||||
|
|
|
| |||||
iShares MSCI Italy Capped ETF
Period Covered: January 1, 2009 through June 30, 2014
Premium/Discount Range | Number of Days | Percentage of Total Days | ||||||
Greater than 4.0% | 2 | 0.14 | % | |||||
Greater than 3.5% and Less than 4.0% | 1 | 0.07 | ||||||
Greater than 3.0% and Less than 3.5% | 4 | 0.29 | ||||||
Greater than 2.5% and Less than 3.0% | 4 | 0.29 | ||||||
Greater than 2.0% and Less than 2.5% | 10 | 0.72 | ||||||
Greater than 1.5% and Less than 2.0% | 28 | 2.03 | ||||||
Greater than 1.0% and Less than 1.5% | 88 | 6.37 | ||||||
Greater than 0.5% and Less than 1.0% | 235 | 17.00 | ||||||
Between 0.5% and –0.5% | 761 | 55.07 | ||||||
Less than –0.5% and Greater than –1.0% | 140 | 10.13 | ||||||
Less than –1.0% and Greater than –1.5% | 64 | 4.63 | ||||||
Less than –1.5% and Greater than –2.0% | 22 | 1.59 | ||||||
Less than –2.0% and Greater than –2.5% | 12 | 0.87 | ||||||
Less than –2.5% and Greater than –3.0% | 7 | 0.51 | ||||||
Less than –3.0% and Greater than –3.5% | 1 | 0.07 | ||||||
Less than –3.5% | 3 | 0.22 | ||||||
|
|
|
| |||||
| 1,382 | 100.00 | % | ||||||
|
|
|
| |||||
| 98 | 2014 iSHARES ANNUAL REPORTTO SHAREHOLDERS |
Table of Contents
Supplemental Information (Unaudited) (Continued)
iSHARES®, INC.
iShares MSCI Netherlands ETF
Period Covered: January 1, 2009 through June 30, 2014
Premium/Discount Range | Number of Days | Percentage of Total Days | ||||||
Greater than 3.5% | 3 | 0.22 | % | |||||
Greater than 3.0% and Less than 3.5% | 1 | 0.07 | ||||||
Greater than 2.5% and Less than 3.0% | 3 | 0.22 | ||||||
Greater than 2.0% and Less than 2.5% | 9 | 0.65 | ||||||
Greater than 1.5% and Less than 2.0% | 19 | 1.37 | ||||||
Greater than 1.0% and Less than 1.5% | 52 | 3.76 | ||||||
Greater than 0.5% and Less than 1.0% | 183 | 13.25 | ||||||
Between 0.5% and –0.5% | 901 | 65.21 | ||||||
Less than –0.5% and Greater than –1.0% | 124 | 8.97 | ||||||
Less than –1.0% and Greater than –1.5% | 56 | 4.05 | ||||||
Less than –1.5% and Greater than –2.0% | 17 | 1.23 | ||||||
Less than –2.0% and Greater than –2.5% | 6 | 0.43 | ||||||
Less than –2.5% and Greater than –3.0% | 6 | 0.43 | ||||||
Less than –3.0% and Greater than –3.5% | 2 | 0.14 | ||||||
|
|
|
| |||||
| 1,382 | 100.00 | % | ||||||
|
|
|
| |||||
iShares MSCI Spain Capped ETF
Period Covered: January 1, 2009 through June 30, 2014
Premium/Discount Range | Number of Days | Percentage of Total Days | ||||||
Greater than 3.5% | 3 | 0.22 | % | |||||
Greater than 3.0% and Less than 3.5% | 4 | 0.29 | ||||||
Greater than 2.5% and Less than 3.0% | 3 | 0.22 | ||||||
Greater than 2.0% and Less than 2.5% | 16 | 1.16 | ||||||
Greater than 1.5% and Less than 2.0% | 27 | 1.95 | ||||||
Greater than 1.0% and Less than 1.5% | 70 | 5.07 | ||||||
Greater than 0.5% and Less than 1.0% | 224 | 16.20 | ||||||
Between 0.5% and –0.5% | 767 | 55.49 | ||||||
Less than –0.5% and Greater than –1.0% | 148 | 10.71 | ||||||
Less than –1.0% and Greater than –1.5% | 69 | 4.99 | ||||||
Less than –1.5% and Greater than –2.0% | 28 | 2.03 | ||||||
Less than –2.0% and Greater than –2.5% | 12 | 0.87 | ||||||
Less than –2.5% and Greater than –3.0% | 8 | 0.58 | ||||||
Less than –3.0% | 3 | 0.22 | ||||||
|
|
|
| |||||
| 1,382 | 100.00 | % | ||||||
|
|
|
| |||||
SUPPLEMENTAL INFORMATION | 99 |
Table of Contents
Supplemental Information (Unaudited) (Continued)
iSHARES®, INC.
iShares MSCI Sweden ETF
Period Covered: January 1, 2009 through June 30, 2014
Premium/Discount Range | Number of Days | Percentage of Total Days | ||||||
Greater than 4.0% | 2 | 0.14 | % | |||||
Greater than 3.5% and Less than 4.0% | 2 | 0.14 | ||||||
Greater than 3.0% and Less than 3.5% | 4 | 0.29 | ||||||
Greater than 2.5% and Less than 3.0% | 7 | 0.51 | ||||||
Greater than 2.0% and Less than 2.5% | 11 | 0.80 | ||||||
Greater than 1.5% and Less than 2.0% | 31 | 2.25 | ||||||
Greater than 1.0% and Less than 1.5% | 78 | 5.64 | ||||||
Greater than 0.5% and Less than 1.0% | 196 | 14.18 | ||||||
Between 0.5% and –0.5% | 772 | 55.86 | ||||||
Less than –0.5% and Greater than –1.0% | 157 | 11.36 | ||||||
Less than –1.0% and Greater than –1.5% | 63 | 4.56 | ||||||
Less than –1.5% and Greater than –2.0% | 28 | 2.03 | ||||||
Less than –2.0% and Greater than –2.5% | 15 | 1.09 | ||||||
Less than –2.5% and Greater than –3.0% | 8 | 0.58 | ||||||
Less than –3.0% and Greater than –3.5% | 5 | 0.36 | ||||||
Less than –3.5% and Greater than –4.0% | 1 | 0.07 | ||||||
Less than –4.0% and Greater than –4.5% | 2 | 0.14 | ||||||
|
|
|
| |||||
| 1,382 | 100.00 | % | ||||||
|
|
|
| |||||
iShares MSCI Switzerland Capped ETF
Period Covered: January 1, 2009 through June 30, 2014
Premium/Discount Range | Number of Days | Percentage of Total Days | ||||||
Greater than 4.0% | 2 | 0.14 | % | |||||
Greater than 3.5% and Less than 4.0% | 1 | 0.07 | ||||||
Greater than 3.0% and Less than 3.5% | 1 | 0.07 | ||||||
Greater than 2.5% and Less than 3.0% | 2 | 0.14 | ||||||
Greater than 2.0% and Less than 2.5% | 3 | 0.22 | ||||||
Greater than 1.5% and Less than 2.0% | 18 | 1.30 | ||||||
Greater than 1.0% and Less than 1.5% | 45 | 3.26 | ||||||
Greater than 0.5% and Less than 1.0% | 190 | 13.75 | ||||||
Between 0.5% and –0.5% | 961 | 69.54 | ||||||
Less than –0.5% and Greater than –1.0% | 89 | 6.44 | ||||||
Less than –1.0% and Greater than –1.5% | 46 | 3.33 | ||||||
Less than –1.5% and Greater than –2.0% | 13 | 0.94 | ||||||
Less than –2.0% and Greater than –2.5% | 8 | 0.58 | ||||||
Less than –2.5% and Greater than –3.0% | 3 | 0.22 | ||||||
|
|
|
| |||||
| 1,382 | 100.00 | % | ||||||
|
|
|
| |||||
| 100 | 2014 iSHARES ANNUAL REPORTTO SHAREHOLDERS |
Table of Contents
Supplemental Information (Unaudited) (Continued)
iSHARES®, INC.
iShares MSCI United Kingdom ETF
Period Covered: January 1, 2009 through June 30, 2014
Premium/Discount Range | Number of Days | Percentage of Total Days | ||||||
Greater than 4.5% | 1 | 0.07 | % | |||||
Greater than 4.0% and Less than 4.5% | 1 | 0.07 | ||||||
Greater than 3.5% and Less than 4.0% | 2 | 0.14 | ||||||
Greater than 3.0% and Less than 3.5% | 1 | 0.07 | ||||||
Greater than 2.5% and Less than 3.0% | 6 | 0.43 | ||||||
Greater than 2.0% and Less than 2.5% | 9 | 0.65 | ||||||
Greater than 1.5% and Less than 2.0% | 35 | 2.53 | ||||||
Greater than 1.0% and Less than 1.5% | 132 | 9.55 | ||||||
Greater than 0.5% and Less than 1.0% | 435 | 31.48 | ||||||
Between 0.5% and –0.5% | 646 | 46.75 | ||||||
Less than –0.5% and Greater than –1.0% | 73 | 5.29 | ||||||
Less than –1.0% and Greater than –1.5% | 24 | 1.74 | ||||||
Less than –1.5% and Greater than –2.0% | 8 | 0.58 | ||||||
Less than –2.0% and Greater than –2.5% | 4 | 0.29 | ||||||
Less than –2.5% and Greater than –3.0% | 3 | 0.22 | ||||||
Less than –3.0% and Greater than –3.5% | 2 | 0.14 | ||||||
|
|
|
| |||||
| 1,382 | 100.00 | % | ||||||
|
|
|
| |||||
Regulation under the Alternative Investment Fund Managers Directive
The Alternative Investment Fund Managers Directive (the “Directive”) imposes detailed and prescriptive obligations on fund managers established in the European Union (the “EU”). These do not currently apply to managers established outside the EU, such as BFA. Rather, non-EU managers are only required to comply with certain disclosure, reporting and transparency obligations of the Directive if such managers market a fund to EU investors.
BFA has registered the iShares MSCI United Kingdom ETF (the “Fund”) for marketing to EU investors in the United Kingdom, the Netherlands, Finland, Sweden and Luxembourg.
Report on Remuneration
BFA is required under the Directive to make quantitative disclosures of remuneration. These disclosures are made in line with BlackRock’s interpretation of currently available regulatory guidance on quantitative remuneration disclosures. As market or regulatory practice develops BlackRock may consider it appropriate to make changes to the way in which quantitative remuneration disclosures are calculated. Where such changes are made, this may result in disclosures in relation to a fund not being comparable to the disclosures made in the prior year, or in relation to other BlackRock fund disclosures in that same year.
Disclosures are provided in relation to both (a) the staff of BFA; and (b) staff who are senior management or who have the ability to materially affect the risk profile of the Fund.
All individuals included in the aggregated figures disclosed are rewarded in line with BlackRock’s remuneration policy for their responsibilities across the relevant BlackRock business area. As all individuals have a number of areas of responsibilities, only the portion of remuneration for those individuals’ services attributable to the Fund is included in the aggregate figures disclosed.
SUPPLEMENTAL INFORMATION | 101 |
Table of Contents
Supplemental Information (Unaudited) (Continued)
iSHARES®, INC.
BlackRock has a clear and well defined pay-for-performance philosophy, and compensation programs which support that philosophy. For senior management, a significant percentage of variable remuneration is deferred over time. All employees are subject to a claw-back policy.
Compensation decisions for employees are made based on full-year financial results and other non-financial goals and objectives. Alongside financial performance, individual compensation is also based on strategic and operating results and other considerations such as management and leadership capabilities. No set formulas are established and no fixed benchmarks are used in determining annual incentive awards. Bonus pools are reviewed by BlackRock’s independent compensation committee, taking into account both actual and projected financial information together with information provided by the Operational Risk and Regulatory Compliance departments in relation to any activities, incidents or events that warrant consideration in making compensation decisions.
Functions such as Finance, Operational Risk, Legal & Compliance, and Human Resources each have their own organizational structures which are independent of the business units. Functional bonus pools are determined with reference to the performance of each individual function and the remuneration of the senior members of control functions is directly overseen by BlackRock’s independent compensation committee. No individual is involved in setting his or her own remuneration.
The figures disclosed are a sum of each individual’s portion of remuneration attributable to the Fund according to an objective apportionment methodology. Accordingly the figures are not representative of any individual’s actual remuneration or their remuneration structure.
The amount of the total remuneration awarded by BFA to its staff which has been attributed to the iShares MSCI United Kingdom ETF in respect of BFA’s financial year ending December 31, 2013 was USD 835,709. This figure is comprised of fixed remuneration of USD 328,597 and variable remuneration of USD 507,112. There were a total of 436 beneficiaries of the remuneration described above.
The amount of the aggregate remuneration awarded by BFA to its senior management and members of its staff whose actions have a material impact on the risk profile of the iShares MSCI United Kingdom ETF which has been attributed to the Fund in respect of BFA’s financial year ending December 31, 2013 was USD 134,263.
| 102 | 2014 iSHARES ANNUAL REPORTTO SHAREHOLDERS |
Table of Contents
Director and Officer Information
iSHARES®, INC.
The Board of Directors has responsibility for the overall management and operations of the Company, including general supervision of the duties performed by BFA and other service providers. Each Director serves until he or she resigns, is removed, dies, retires or becomes incapacitated. The President, Chief Compliance Officer, Treasurer and Secretary shall each hold office until their successors are chosen and qualify, and all other officers shall hold office until he or she resigns or is removed. Directors who are not “interested persons” (as defined in the 1940 Act) of the Company are referred to as independent directors (“Independent Directors”).
The registered investment companies advised by BFA or its affiliates are organized into one complex of closed-end funds, two complexes of open-end funds and one complex of exchange-traded funds (“Exchange-Traded Fund Complex”) (each, a “BlackRock Fund Complex”). Each Fund is included in the BlackRock Fund Complex referred to as the Exchange-Traded Fund Complex. Each Director also serves as a Trustee of iShares Trust, a Director of iShares MSCI Russia Capped ETF, Inc. and a Trustee of iShares U.S. ETF Trust and, as a result, oversees a total of 312 funds (as of August 31, 2014) within the Exchange-Traded Fund Complex. With the exception of Robert S. Kapito and Mark Wiedman, the address of each Director and officer is c/o BlackRock, Inc., 400 Howard Street, San Francisco, CA 94105. The address of Mr. Kapito and Mr. Wiedman is c/o BlackRock, Inc., Park Avenue Plaza, 55 East 52nd Street, New York, NY 10055. The Board has designated Robert H. Silver as its Independent Chairman. Additional information about the Funds’ Directors and officers may be found in the Funds’ combined Statement of Additional Information, which is available without charge, upon request, by calling toll-free 1-800-iShares (1-800-474-2737).
Interested Directors
| Name (Age) | Position(s) | Principal Occupation(s) During the Past 5 Years | Other Directorships Held by Director | |||
Robert S. Kapitoa (57) | Director (since 2009). | President and Director, BlackRock, Inc. (since 2006); Vice Chairman of BlackRock, Inc. and Head of BlackRock, Inc.’s Portfolio Management Group (since its formation in 1998) and BlackRock, Inc.’s predecessor entities (since 1988); Trustee, University of Pennsylvania (since 2009); President of Board of Directors, Hope & Heroes Children’s Cancer Fund (since 2002); President of the Board of Directors, Periwinkle Theatre for Youth (since 1983). | Trustee of iShares Trust (since 2009); Director of iShares MSCI Russia Capped ETF, Inc. (since 2010); Trustee of iShares U.S. ETF Trust (since 2011); Director of BlackRock, Inc. (since 2006). | |||
Mark Wiedmanb (43) | Director (since 2013). | Managing Director, BlackRock, Inc. (since 2007); Global Head of iShares (since 2011); Head of Corporate Strategy, BlackRock, Inc. (2009-2011). | Trustee of iShares Trust. (since 2013); Director of iShares MSCI Russia Capped ETF, Inc. (since 2013); Trustee of iShares U.S. ETF Trust (since 2013); Director of PennyMac Financial Services, Inc. (since 2008). | |||
| a | Robert S. Kapito is deemed to be an “interested person” (as defined in the 1940 Act) of the Company due to his affiliations with BlackRock, Inc. |
| b | Mark Wiedman is deemed to be an “interested person” (as defined in the 1940 Act) of the Company due to his affiliations with BlackRock, Inc. and its affiliates. |
DIRECTORAND OFFICER INFORMATION | 103 |
Table of Contents
Director and Officer Information (Continued)
iSHARES®, INC.
Independent Directors
| Name (Age) | Position(s) | Principal Occupation(s) During the Past 5 Years | Other Directorships Held by Director | |||
Robert H. Silver (59) | Director (since 2007); Independent Chairman (since 2012). | President and Co-Founder of The Bravitas Group, Inc. (since 2006); Director and Vice Chairman of the YMCA of Greater NYC (2001-2011); Broadway Producer (2006-2011); Co-Founder and Vice President of Parentgiving Inc. (since 2008); Director and Member of the Audit and Compensation Committee of EPAM Systems, Inc. (2006-2009); President and Chief Operating Officer of UBS Financial Services Inc. (formerly Paine Webber Inc.) (2003-2005) and various executive positions with UBS and its affiliates (1988-2005); CPA and Audit Manager of KPMG, LLP (formerly Peat Marwick Mitchell) (1977-1983). | Trustee of iShares Trust (since 2007); Director of iShares MSCI Russia Capped ETF, Inc. (since 2010); Trustee of iShares U.S. ETF Trust (since 2011); Independent Chairman of iShares, Trust, iShares MSCI Russia Capped ETF, Inc. and iShares U.S. ETF Trust (since 2012). | |||
Cecilia H. Herbert (65) | Director (since 2005); Nominating and Governance Committee Chair and Equity Plus Committee Chair (since 2012). | Director (1998-2013) and President (2007-2011) of the Board of Directors, Catholic Charities CYO; Trustee (2002-2011) and Chair of the Finance and Investment Committee (2006-2010) of the Thacher School; Member (since 1992) and Chair (1994-2005) of the Investment Committee, Archdiocese of San Francisco; Trustee and Member of the Investment Committee, WNET, the New York public broadcasting/media company (since 2011). | Trustee of iShares Trust (since 2005); Director of iShares MSCI Russia Capped ETF, Inc. (since 2010); Trustee of iShares U.S. ETF Trust (since 2011); Director of Forward Funds (34 portfolios) (since 2009). | |||
Charles A. Hurty (70) | Director (since 2005); Audit Committee Chair (since 2006). | Retired; Partner, KPMG LLP (1968-2001). | Trustee of iShares Trust (since 2005); Director of iShares MSCI Russia Capped ETF, Inc. (since 2010); Trustee of iShares U.S. ETF Trust (since 2011); Director of GMAM Absolute Return Strategy Fund (1 portfolio) (since 2002); Director of SkyBridge Alternative Investments Multi-Adviser Hedge Fund Portfolios LLC (2 portfolios) (since 2002). | |||
John E. Kerrigan (59) | Director (since 2005); Fixed Income Plus Committee Chair (since 2012). | Chief Investment Officer, Santa Clara University (since 2002). | Trustee of iShares Trust (since 2005); Director of iShares MSCI Russia Capped ETF, Inc. (since 2010); Trustee of iShares U.S. ETF Trust (since 2011). | |||
| 104 | 2014 iSHARES ANNUAL REPORTTO SHAREHOLDERS |
Table of Contents
Director and Officer Information (Continued)
iSHARES®, INC.
Independent Directors (Continued)
| Name (Age) | Position(s) | Principal Occupation(s) During the Past 5 Years | Other Directorships Held by Director | |||
John E. Martinez (53) | Director (since 2003); Securities Lending Committee Chair (since 2012). | Director of FirstREX Agreement Corp. (formerly EquityRock, Inc.) (since 2005). | Trustee of iShares Trust (since 2003); Director of iShares MSCI Russia Capped ETF, Inc. (since 2010); Trustee of iShares U.S. ETF Trust (since 2011). | |||
George G.C. Parker (75) | Director (since 2002). | Dean Witter Distinguished Professor of Finance, Emeritus, Stanford University Graduate School of Business (Professor since 1973; Emeritus since 2006). | Trustee of iShares Trust (since 2000); Director of iShares MSCI Russia Capped ETF, Inc. (since 2010); Trustee of iShares U.S. ETF Trust (since 2011); Director of Tejon Ranch Company (since 1999); Director of Threshold Pharmaceuticals (since 2004); Director of Colony Financial, Inc. (since 2009); Director of First Republic Bank (since 2010). | |||
Madhav V. Rajan (50) | Director (since 2011); 15(c) Committee Chair (since 2012). | �� | Robert K. Jaedicke Professor of Accounting and Senior Associate Dean for Academic Affairs and Head of MBA Program, Stanford University Graduate School of Business (since 2001); Professor of Law (by courtesy), Stanford Law School (since 2005); Visiting Professor, University of Chicago (2007-2008). | Trustee of iShares Trust (since 2011); Director of iShares MSCI Russia Capped ETF, Inc. (since 2011); Trustee of iShares U.S. ETF Trust (since 2011); Director, Cavium, Inc. (since 2013). | ||
DIRECTORAND OFFICER INFORMATION | 105 |
Table of Contents
Director and Officer Information (Continued)
iSHARES®, INC.
Officers
| Name (Age) | Position(s) | Principal Occupation(s) During the Past 5 Years | ||
Manish Mehta (43) | President (since 2013). | Managing Director, BlackRock, Inc. (since 2009); Chief Operating Officer for iShares (since 2009); Head of Strategy and Corporate Development, BGI (2005-2009); Chief of Staff to the CEO, BGI (2005-2009). | ||
Jack Gee (54) | Treasurer and Chief Financial Officer (since 2008). | Managing Director, BlackRock, Inc. (since 2009); Senior Director of Fund Administration of Intermediary Investor Business, BGI (2009); Director of Fund Administration of Intermediary Investor Business, BGI (2004-2009). | ||
Edward B. Baer (45) | Vice President and Chief Legal Officer (since 2012). | Managing Director of Legal & Compliance, BlackRock, Inc. (since 2006); Director of Legal & Compliance, BlackRock, Inc. (2004-2006). | ||
Eilleen M. Clavere (62) | Secretary (since 2007). | Director of Global Fund Administration, BlackRock, Inc. (since 2009); Director of Legal Administration of Intermediary Investor Business, BGI (2006-2009); Legal Counsel and Vice President of Atlas Funds, Atlas Advisers, Inc. and Atlas Securities, Inc. (2005-2006); Counsel at Kirkpatrick & Lockhart LLP (2001-2005). | ||
Scott Radell (45) | Executive Vice President (since 2012). | Managing Director, BlackRock, Inc. (since 2009); Head of Portfolio Solutions, BlackRock, Inc. (since 2009); Head of Portfolio Solutions, BGI (2007-2009); Credit Portfolio Manager, BGI (2005-2007); Credit Research Analyst, BGI (2003-2005). | ||
Amy Schioldager (51) | Executive Vice President (since 2007). | Senior Managing Director, BlackRock, Inc. (since 2009); Global Head of Index Equity, BGI (2008-2009); Global Head of U.S. Indexing, BGI (2006-2008); Head of Domestic Equity Portfolio Management, BGI (2001-2006). | ||
Ira P. Shapiro (51) | Vice President (since 2007). | Managing Director, BlackRock, Inc. (since 2009); Head of Strategic Product Initiatives for iShares (since 2012); Chief Legal Officer, Exchange-Traded Fund Complex (2007-2012); Associate General Counsel, BGI (2004-2009). | ||
| 106 | 2014 iSHARES ANNUAL REPORTTO SHAREHOLDERS |
Table of Contents
|
For more information visit www.iShares.com or call 1-800-474-2737
This report is intended for the Funds’ shareholders. It may not be distributed to prospective investors unless it is preceded or accompanied by the current prospectus.
Investing involves risk, including possible loss of principal.
The iShares Funds are distributed by BlackRock Investments, LLC (together with its affiliates, “BlackRock”).
The iShares Funds are not sponsored, endorsed, issued, sold or promoted by MSCI Inc., nor does this company make any representation regarding the advisability of investing in the iShares Funds. BlackRock is not affiliated with the company listed above.
A description of the policies that the Funds use to determine how to vote proxies relating to portfolio securities and information about how the Funds voted proxies relating to portfolio securities during the most recent twelve-month period ending June 30 is available without charge, upon request, by calling toll-free 1-800-474-2737; on the Funds’ website at www.iShares.com; and on the U.S. Securities and Exchange Commission (SEC) website at www.sec.gov.
The Funds file their complete schedules of portfolio holdings with the SEC for the first and third quarters of each fiscal year on Form N-Q. The Funds’ Forms N-Q are available on the SEC’s website or may be reviewed and copied at the SEC’s Public Reference Room in Washington, D.C. Information on the operation of the Public Reference Room may be obtained by calling 1-800-SEC-0330. The Funds also disclose their complete schedules of portfolio holdings on a daily and monthly basis on the Funds’ website.
©2014 BlackRock, Inc. All rights reserved. iSHARES and BLACKROCK are registered trademarks of BlackRock, Inc. or its subsidiaries. All other marks are the property of their respective owners.
iS-AR-82-0814

Table of Contents
AUGUST 31, 2014
2014 ANNUAL REPORT |  |
iShares, Inc.
| Ø | iShares MSCI Australia ETF | EWA | NYSE Arca |
| Ø | iShares MSCI Hong Kong ETF | EWH | NYSE Arca |
| Ø | iShares MSCI Japan Small-Cap ETF | SCJ | NYSE Arca |
| Ø | iShares MSCI Malaysia ETF | EWM | NYSE Arca |
| Ø | iShares MSCI Pacific ex Japan ETF | EPP | NYSE Arca |
| Ø | iShares MSCI Singapore ETF | EWS | NYSE Arca |
| Ø | iShares MSCI South Korea Capped ETF | EWY | NYSE Arca |
| Ø | iShares MSCI Taiwan ETF | EWT | NYSE Arca |
| Ø | iShares MSCI Thailand Capped ETF | THD | NYSE Arca |
Table of Contents
| 5 | ||||
| 24 | ||||
| 24 | ||||
| 25 | ||||
| 25 | ||||
| 27 | ||||
| 29 | ||||
| 40 | ||||
| 42 | ||||
| 45 | ||||
| 47 | ||||
| 50 | ||||
| 53 | ||||
| 57 | ||||
| 68 | ||||
| 77 | ||||
| 91 | ||||
| 92 | ||||
| 93 | ||||
| 103 | ||||
| 114 |
Table of Contents
Management’s Discussion of Fund Performance
iSHARES®, INC.
INTERNATIONAL MARKET OVERVIEW
International equities rose during the 12-month period ended August 31, 2014 (the “reporting period”), as modest economic growth and solid corporate profits offset concerns about global growth, the banking system and geopolitical events. Monetary policy continued to be a driving force for international equities, as several countries took steps to stimulate economic growth (as measured by gross domestic product, or “GDP”). The European Central Bank (“ECB”) cut interest rates several times, the Bank of Japan continued its bond purchasing efforts, and the U.S. Federal Reserve Bank (the “Fed”) reduced its unprecedented stimulus program.
Accommodative monetary policy and improving global growth led to a sustained rally in international equities from September to December 2013. However, events in early 2014 dampened the rally, as slow economic growth in the U.S. and China and the conflict in Ukraine raised concerns for international investors. In the final months of the reporting period, stagnant European growth, a Portuguese bank default and military escalation in Ukraine dampened international markets’ performance, particularly in Europe. Despite these challenges, most international markets finished with a solid return for the reporting period.
North American markets delivered strong gains during the reporting period. The U.S. economy strengthened in the latter half of the reporting period, as the combination of accommodative monetary policy, low inflation, steady job growth and rising corporate profits drove economic growth. Canada and Mexico also generated steady economic growth and rising stock prices during the reporting period.
Asian markets advanced during the reporting period, as investors generally embraced the region’s progress toward economic and political reform. Slow global growth presented new challenges for China and India after rapid economic growth in past decades. China, India and Japan, the three largest economies in the region, pursued dramatic changes to improve their competitive edge in the changing global economy.
China, Asia’s largest economy, continued to transition from an economy based on investment and manufacturing toward one based on consumption and services, which led to slowing economic growth. India underwent substantial political and economic change during the reporting period. The Bank of India made significant progress on curbing inflation, while the Indian government pursued growth-oriented political reform. By contrast, Japan attempted to reignite economic growth with monetary stimulus and political reform after twenty years of economic stagnation.
European equities posted solid gains while trailing developed markets in Asia and North America. Europe took steps toward an economic recovery during the reporting period after enduring a financial crisis and an economic recession. Europe’s uneven path to recovery included an improving credit environment and lower interest rates, as well as declining inflation and stagnant demand. France and Germany were mired in sluggish economic growth, while the United Kingdom expanded at a moderate pace during the reporting period. Spain and Italy experienced dramatically improving credit markets and lower interest rates, helping to revive investors’ interest in Spanish and Italian financial markets. European equity markets declined during the final months of the reporting period, as fear of economic stagnation and declining prices spurred the ECB to consider additional monetary support.
At the highest level, economic crosscurrents rippled across markets, while the ebb and flow of geopolitical risks drove market performance during the reporting period. International markets advanced through the uncertainty, as investors welcomed moderate global growth, low inflation and improving credit conditions.
MANAGEMENT’S DISCUSSIONSOF FUND PERFORMANCE | 5 |
Table of Contents
Management’s Discussion of Fund Performance
iSHARES® MSCI AUSTRALIA ETF
Performance as of August 31, 2014
| Average Annual Total Returns | Cumulative Total Returns | |||||||||||||||||||||||||
| NAV | MARKET | INDEX | NAV | MARKET | INDEX | |||||||||||||||||||||
1 Year | 19.76% | 20.44% | 20.25% | 19.76% | 20.44% | 20.25% | ||||||||||||||||||||
5 Years | 10.96% | 10.97% | 11.43% | 68.20% | 68.31% | 71.82% | ||||||||||||||||||||
10 Years | 12.27% | 12.26% | 12.24% | 218.11% | 218.01% | 217.33% | ||||||||||||||||||||
GROWTH OF $10,000 INVESTMENT
(AT NET ASSET VALUE)
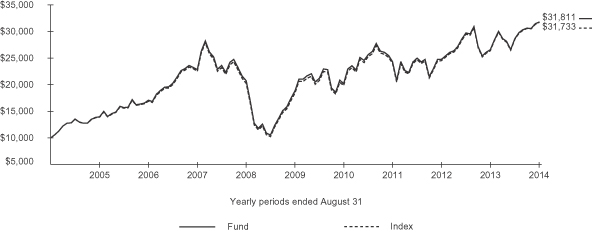
Past performance is no guarantee of future results. Performance results do not reflect the deduction of taxes that a shareholder would pay on fund distributions or on the redemption or sale of fund shares. See “About Fund Performance” on page 24 for more information.
| Shareholder Expenses | ||||||||||||||||||||||||||
| Actual | Hypothetical 5% Return | |||||||||||||||||||||||||
| Beginning Account Value (3/1/14) | Ending Account Value (8/31/14) | Expenses Paid During Period a | Beginning Account Value (3/1/14) | Ending Account Value (8/31/14) | Expenses Paid During Period a | Annualized Expense Ratio | ||||||||||||||||||||
| $ | 1,000.00 | $ | 1,108.60 | $ | 2.55 | $ | 1,000.00 | $ | 1,022.80 | $ | 2.45 | 0.48% | ||||||||||||||
| a | Expenses are calculated using the Fund’s annualized expense ratio (as disclosed in the table), multiplied by the average account value for the period, multiplied by the number of days in the period (184 days) and divided by the number of days in the year (365 days). See “Shareholder Expenses” on page 24 for more information. |
| 6 | 2014 iSHARES ANNUAL REPORTTO SHAREHOLDERS |
Table of Contents
Management’s Discussion of Fund Performance (Continued)
iSHARES® MSCI AUSTRALIA ETF
The iShares MSCI Australia ETF (the “Fund”) seeks to track the investment results of an index composed of Australian equities, as represented by the MSCI Australia Index (the “Index”). The Fund invests in a representative sample of securities included in the Index that collectively has an investment profile similar to the Index. Due to the use of representative sampling, the Fund may or may not hold all of the securities that are included in the Index. For the 12-month reporting period ended August 31, 2014, the total return for the Fund was 19.76%, net of fees, while the total return for the Index was 20.25%.
The Index posted strong returns for the reporting period as investors set aside concerns about a slowdown in China’s infrastructure spending.
Despite a cooling of the economy in China, which is Australia’s largest trading partner, Australia’s economy expanded in the second quarter of 2014, as the country reached its 23rd consecutive year of growth. It was one of the few countries in the world that didn’t contract during the global financial crisis of 2008-2009. GDP in the second quarter of 2014 rose 3.1% versus the same period in 2013.
Although Australia’s economy advanced in the second quarter, it did so at a slower rate than earlier quarters due to a downturn in mining, falling commodity prices and a strengthening Australian dollar. The country’s currency continued to be relatively strong against the U.S. dollar, spurred by a resource investment boom and near-zero interest rates in the United States. Australia’s central bank left short-term interest rates at a record low 2.5% throughout the duration of the reporting period, reflecting concerns that the mining investment boom had cooled towards the end of the reporting period along with China’s infrastructure spending.
The financials sector, which comprised about half of the Index on average, posted the strongest contribution for the reporting period. Banks particularly enjoyed surging profits as the level of bad loans to corporations declined. The second largest sector, materials, produced solid results, helped by a buoyant economy. The industrials sector also generated notable gains during the reporting period. The consumer staples sector lagged on a relative basis. Overall, all sectors produced positive returns during the reporting period.
PORTFOLIO ALLOCATION
As of 8/31/14
| Sector | Percentage of Total Investments* |
Financials | 51.44 | % | ||
Materials | 17.37 | |||
Consumer Staples | 9.01 | |||
Energy | 6.00 | |||
Industrials | 5.70 | |||
Health Care | 4.51 | |||
Telecommunication Services | 2.20 | |||
Consumer Discretionary | 1.72 | |||
Utilities | 1.56 | |||
Information Technology | 0.49 | |||
|
| |||
TOTAL | 100.00 | % | ||
|
|
TEN LARGEST FUND HOLDINGS
As of 8/31/14
| Security | Percentage of Total Investments* |
Commonwealth Bank of Australia | 11.21 | % | ||
BHP Billiton Ltd. | 10.01 | |||
Westpac Banking Corp. | 9.26 | |||
Australia and New Zealand Banking Group Ltd. | 7.80 | |||
National Australia Bank Ltd. | 7.04 | |||
Wesfarmers Ltd. | 4.21 | |||
Woolworths Ltd. | 3.87 | |||
CSL Ltd. | 3.01 | |||
Woodside Petroleum Ltd. | 2.69 | |||
Rio Tinto Ltd. | 2.32 | |||
|
| |||
TOTAL | 61.42 | % | ||
|
|
| * | Excludes money market funds. |
MANAGEMENT’S DISCUSSIONSOF FUND PERFORMANCE | 7 |
Table of Contents
Management’s Discussion of Fund Performance
iSHARES® MSCI HONG KONG ETF
Performance as of August 31, 2014
| Average Annual Total Returns | Cumulative Total Returns | |||||||||||||||||||||||||
| NAV | MARKET | INDEX | NAV | MARKET | INDEX | |||||||||||||||||||||
1 Year | 19.87% | 20.25% | 20.36% | 19.87% | 20.25% | 20.36% | ||||||||||||||||||||
5 Years | 12.12% | 12.07% | 12.70% | 77.22% | 76.82% | 81.82% | ||||||||||||||||||||
10 Years | 10.51% | 10.45% | 11.09% | 171.53% | 170.28% | 186.17% | ||||||||||||||||||||
GROWTH OF $10,000 INVESTMENT
(AT NET ASSET VALUE)
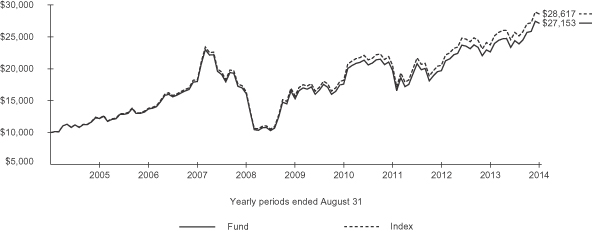
Past performance is no guarantee of future results. Performance results do not reflect the deduction of taxes that a shareholder would pay on fund distributions or on the redemption or sale of fund shares. See “About Fund Performance” on page 24 for more information.
| Shareholder Expenses | ||||||||||||||||||||||||||
| Actual | Hypothetical 5% Return | |||||||||||||||||||||||||
| Beginning Account Value (3/1/14) | Ending Account Value (8/31/14) | Expenses Paid During Period a | Beginning Account Value (3/1/14) | Ending Account Value (8/31/14) | Expenses Paid During Period a | Annualized Expense Ratio | ||||||||||||||||||||
| $ | 1,000.00 | $ | 1,111.60 | $ | 2.55 | $ | 1,000.00 | $ | 1,022.80 | $ | 2.45 | 0.48% | ||||||||||||||
| a | Expenses are calculated using the Fund’s annualized expense ratio (as disclosed in the table), multiplied by the average account value for the period, multiplied by the number of days in the period (184 days) and divided by the number of days in the year (365 days). See “Shareholder Expenses” on page 24 for more information. |
| 8 | 2014 iSHARES ANNUAL REPORTTO SHAREHOLDERS |
Table of Contents
Management’s Discussion of Fund Performance (Continued)
iSHARES® MSCI HONG KONG ETF
The iShares MSCI Hong Kong ETF (the “Fund”) seeks to track the investment results of an index composed of Hong Kong equities, as represented by the MSCI Hong Kong Index (the “Index”). The Fund invests in a representative sample of securities included in the Index that collectively has an investment profile similar to the Index. Due to the use of representative sampling, the Fund may or may not hold all of the securities that are included in the Index. For the 12-month reporting period ended August 31, 2014, the total return for the Fund was 19.87%, net of fees, while the total return for the Index was 20.36%.
Hong Kong stocks, as represented by the Index, posted a strong return during the reporting period, despite a sluggish Hong Kong economy. During the second quarter of 2014, GDP grew just 1.8% compared to the same period in 2013 — and was down 0.1% from the first quarter of 2014. However, since many companies in the Index have significant operations in China, market performance is also closely linked to China’s overall economic environment. China reported growth of 7.5% in the second quarter of 2014 compared to the same period in 2013, which was also indicative of the overall growth rate throughout the reporting period.
Hong Kong is a key financial center in Asia, with significant exposure to real estate investment, development and management companies. Hong Kong property firms continued to benefit from low interest rates and significant investment from China during the reporting period. Bank stocks benefited from liberalization measures regarding banking and trading services between China and Hong Kong. In general, since Hong Kong was transferred from British control to Chinese control in 1997, the Chinese and Hong Kong governments have strengthened business ties and established free trade agreements covering a broad range of goods and services.
In terms of sector performance for the reporting period, the financials, consumer discretionary and industrials sectors were the largest contributors to Index returns. The financials sector was the largest sector weighting in the Index by far, comprising over 60% of the Index on average during the reporting period. The information technology, telecommunication services and utilities sectors were the smallest contributors to Index performance.
PORTFOLIO ALLOCATION
As of 8/31/14
| Sector | Percentage of Total Investments* |
Financials | 61.31 | % | ||
Consumer Discretionary | 15.47 | |||
Utilities | 11.32 | |||
Industrials | 9.89 | |||
Telecommunication Services | 1.37 | |||
Information Technology | 0.64 | |||
|
| |||
TOTAL | 100.00 | % | ||
|
|
TEN LARGEST FUND HOLDINGS
As of 8/31/14
| Security | Percentage of Total Investments* |
AIA Group Ltd. | 16.12 | % | ||
Hutchison Whampoa Ltd. | 7.17 | |||
Cheung Kong (Holdings) Ltd. | 6.70 | |||
Hong Kong Exchanges and Clearing Ltd. | 6.19 | |||
Sun Hung Kai Properties Ltd. | 5.86 | |||
Galaxy Entertainment Group Ltd. | 4.18 | |||
CLP Holdings Ltd. | 3.89 | |||
Sands China Ltd. | 3.83 | |||
Hong Kong and China Gas Co. Ltd. (The) | 3.47 | |||
Link REIT (The) | 3.27 | |||
|
| |||
TOTAL | 60.68 | % | ||
|
|
| * | Excludes money market funds. |
MANAGEMENT’S DISCUSSIONSOF FUND PERFORMANCE | 9 |
Table of Contents
Management’s Discussion of Fund Performance
iSHARES® MSCI JAPAN SMALL-CAP ETF
Performance as of August 31, 2014
| Average Annual Total Returns | Cumulative Total Returns | |||||||||||||||||||||||||
| NAV | MARKET | INDEX | NAV | MARKET | INDEX | |||||||||||||||||||||
1 Year | 16.94% | 17.49% | 17.63% | 16.94% | 17.49% | 17.63% | ||||||||||||||||||||
5 Years | 7.39% | 7.46% | 7.81% | 42.86% | 43.33% | 45.66% | ||||||||||||||||||||
Since Inception | 4.32% | 4.27% | 4.70% | 32.74% | 32.31% | 35.99% | ||||||||||||||||||||
GROWTH OF $10,000 INVESTMENT
(SINCE INCEPTION AT NET ASSET VALUE)
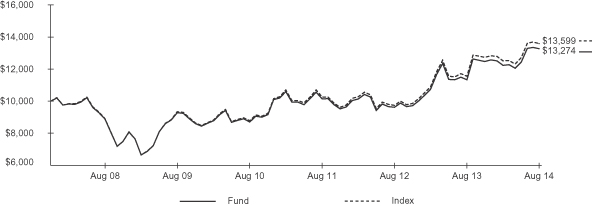
The inception date of the Fund was 12/20/07. The first day of secondary market trading was 12/21/07.
Past performance is no guarantee of future results. Performance results do not reflect the deduction of taxes that a shareholder would pay on fund distributions or on the redemption or sale of fund shares. See “About Fund Performance” on page 24 for more information.
| Shareholder Expenses | ||||||||||||||||||||||||||
| Actual | Hypothetical 5% Return | |||||||||||||||||||||||||
| Beginning Account Value (3/1/14) | Ending Account Value (8/31/14) | Expenses Paid During Period a | Beginning Account Value (3/1/14) | Ending Account Value (8/31/14) | Expenses Paid During Period a | Annualized Expense Ratio | ||||||||||||||||||||
| $ | 1,000.00 | $ | 1,084.10 | $ | 2.52 | $ | 1,000.00 | $ | 1,022.80 | $ | 2.45 | 0.48% | ||||||||||||||
| a | Expenses are calculated using the Fund’s annualized expense ratio (as disclosed in the table), multiplied by the average account value for the period, multiplied by the number of days in the period (184 days) and divided by the number of days in the year (365 days). See “Shareholder Expenses” on page 24 for more information. |
| 10 | 2014 iSHARES ANNUAL REPORTTO SHAREHOLDERS |
Table of Contents
Management’s Discussion of Fund Performance (Continued)
iSHARES® MSCI JAPAN SMALL-CAP ETF
The iShares MSCI Japan Small-Cap ETF (the “Fund”) seeks to track the investment results of an index composed of small-capitalization Japanese equities, as represented by the MSCI Japan Small Cap Index (the “Index”). The Fund invests in a representative sample of securities included in the Index that collectively has an investment profile similar to the Index. Due to the use of representative sampling, the Fund may or may not hold all of the securities that are included in the Index. For the 12-month reporting period ended August 31, 2014, the total return for the Fund was 16.94%, net of fees, while the total return for the Index was 17.63%.
Japanese small-capitalization equities, as represented by the Index, achieved solid results for the reporting period and performed in line with broad international equity indices, despite volatility along the way.
Japanese small-capitalization stocks delivered gains early in the reporting period, helped by government initiatives aimed at revitalizing the country’s stagnant economy. During the remainder of the reporting period, conflicting economic data revealed uneven economic growth levels, and an increase in the consumption tax rate curbed consumer spending. Although these events created an uneven market environment that persisted throughout the reporting period, equities finished the reporting period with solid gains overall.
Within the Index, the industrials sector was the largest contributing sector to positive performance. Industrials stocks as a group achieved gains early in the reporting period as economic conditions strengthened, but lagged in the final months of the reporting period, as the higher consumption tax placed a crimp on consumer demand. The financials and information technology sectors were also meaningful contributors to Index returns for the reporting period. Consumer discretionary and consumer staples stocks collectively contributed to Index returns. Consumer spending spiked to a record high in the first quarter of 2014 in anticipation of the consumption tax increase in April 2014, and then dropped sharply in the second quarter of 2014. The utilities, energy, and telecommunication services sectors made the slightest contributions to Index gains during the reporting period.
PORTFOLIO ALLOCATION
As of 8/31/14
| Sector | Percentage of Total Investments* |
Industrials | 25.15 | % | ||
Financials | 19.76 | |||
Consumer Discretionary | 17.51 | |||
Information Technology | 10.83 | |||
Materials | 10.46 | |||
Consumer Staples | 9.13 | |||
Health Care | 5.68 | |||
Energy | 0.80 | |||
Utilities | 0.53 | |||
Telecommunication Services | 0.15 | |||
|
| |||
TOTAL | 100.00 | % | ||
|
|
TEN LARGEST FUND HOLDINGS
As of 8/31/14
| Security | Percentage of Total Investments* |
Minebea Co. Ltd. | 0.66 | % | ||
Advance Residence Investment Corp. | 0.57 | |||
Alps Electric Co. Ltd. | 0.51 | |||
Ebara Corp. | 0.50 | |||
Mixi Inc. | 0.50 | |||
Misumi Group Inc. | 0.50 | |||
Dowa Holdings Co. Ltd. | 0.48 | |||
ORIX JREIT Inc. | 0.47 | |||
Frontier Real Estate Investment Corp. | 0.47 | |||
Nissan Chemical Industries Ltd. | 0.45 | |||
|
| |||
TOTAL | 5.11 | % | ||
|
|
| * | Excludes money market funds. |
MANAGEMENT’S DISCUSSIONSOF FUND PERFORMANCE | 11 |
Table of Contents
Management’s Discussion of Fund Performance
iSHARES® MSCI MALAYSIA ETF
Performance as of August 31, 2014
| Average Annual Total Returns | Cumulative Total Returns | |||||||||||||||||||||||||
| NAV | MARKET | INDEX | NAV | MARKET | INDEX | |||||||||||||||||||||
1 Year | 14.17% | 14.84% | 14.37% | 14.17% | 14.84% | 14.37% | ||||||||||||||||||||
5 Years | 13.83% | 13.98% | 14.38% | 91.11% | 92.38% | 95.74% | ||||||||||||||||||||
10 Years | 13.01% | 13.15% | 13.57% | 239.79% | 243.94% | 257.05% | ||||||||||||||||||||
GROWTH OF $10,000 INVESTMENT
(AT NET ASSET VALUE)
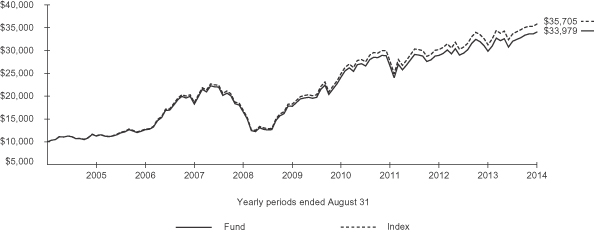
Past performance is no guarantee of future results. Performance results do not reflect the deduction of taxes that a shareholder would pay on fund distributions or on the redemption or sale of fund shares. See “About Fund Performance” on page 24 for more information.
| Shareholder Expenses | ||||||||||||||||||||||||||
| Actual | Hypothetical 5% Return | |||||||||||||||||||||||||
| Beginning Account Value (3/1/14) | Ending Account Value (8/31/14) | Expenses Paid During Period a | Beginning Account Value (3/1/14) | Ending Account Value (8/31/14) | Expenses Paid During Period a | Annualized Expense Ratio | ||||||||||||||||||||
| $ | 1,000.00 | $ | 1,064.10 | $ | 2.50 | $ | 1,000.00 | $ | 1,022.80 | $ | 2.45 | 0.48% | ||||||||||||||
| a | Expenses are calculated using the Fund’s annualized expense ratio (as disclosed in the table), multiplied by the average account value for the period, multiplied by the number of days in the period (184 days) and divided by the number of days in the year (365 days). See “Shareholder Expenses” on page 24 for more information. |
| 12 | 2014 iSHARES ANNUAL REPORTTO SHAREHOLDERS |
Table of Contents
Management’s Discussion of Fund Performance (Continued)
iSHARES® MSCI MALAYSIA ETF
The iShares MSCI Malaysia ETF (the “Fund”) seeks to track the investment results of an index composed of Malaysian equities, as represented by the MSCI Malaysia Index (the “Index”). The Fund invests in a representative sample of securities included in the Index that collectively has an investment profile similar to the Index. Due to the use of representative sampling, the Fund may or may not hold all of the securities that are included in the Index. For the 12-month reporting period ended August 31, 2014, the total return for the Fund was 14.17%, net of fees, while the total return for the Index was 14.37%.
The Malaysian equity market posted a solid, double-digit return during the reporting period, boosted by better than expected economic growth in the second quarter of 2014. Malaysia’s GDP rose 6.4% in the second quarter of 2014 from the same period a year ago, beating consensus estimates. However, a major credit rating agency recently cut Malaysia’s credit outlook to negative because of rising budget deficits. In response, the government announced that it will institute a new goods and services tax and cut fuel subsidies.
Exports of electronics and natural gas to the U.S. and Japan surged during the reporting period. Malaysia is the world’s largest exporter of palm oil. Demand from China is a key driver for palm oil prices, and it has remained strong.
Malaysia’s strong economic performance has allowed its central bank to recently raise short-term interest rates from 3% to 3.25% to combat inflation. The government also announced plans to introduce a consumption tax of 6% and gradually reduce its subsidy program that covers essential goods ranging from gasoline to cooking oil.
The Index’s largest sector allocation was financials, which generated modest returns during the reporting period. Banks generally benefited from regional mergers and the country’s strong economy. The utilities, telecommunication services, and industrials sectors were large contributors to Index performance. Lagging sectors included materials and energy.
PORTFOLIO ALLOCATION As of 8/31/14
| Sector | Percentage of Total Investments* | |||
Financials | 33.76 | % | ||
Industrials | 12.73 | |||
Telecommunication Services | 11.86 | |||
Utilities | 11.67 | |||
Consumer Staples | 9.52 | |||
Consumer Discretionary | 9.42 | |||
Energy | 4.52 | |||
Materials | 4.20 | |||
Health Care | 2.32 | |||
|
| |||
TOTAL | 100.00 | % | ||
|
| |||
TEN LARGEST FUND HOLDINGS As of 8/31/14
| Security | Percentage of Total Investments* | |||
Public Bank Bhd | 9.83 | % | ||
Malayan Banking Bhd | 8.78 | |||
Tenaga Nasional Bhd | 7.17 | |||
CIMB Group Holdings Bhd | 7.17 | |||
Sime Darby Bhd | 5.24 | |||
DiGi.Com Bhd | 4.13 | |||
Genting Bhd | 4.04 | |||
Axiata Group Bhd | 3.63 | |||
Petronas Chemicals Group Bhd | 3.40 | |||
Sapurakencana Petroleum Bhd | 3.11 | |||
|
| |||
TOTAL | 56.50 | % | ||
|
| |||
| * | Excludes money market funds. |
MANAGEMENT’S DISCUSSIONSOF FUND PERFORMANCE | 13 |
Table of Contents
Management’s Discussion of Fund Performance
iSHARES® MSCI PACIFIC EX JAPAN ETF
Performance as of August 31, 2014
| Average Annual Total Returns | Cumulative Total Returns | |||||||||||||||||||||||||
| NAV | MARKET | INDEX | NAV | MARKET | INDEX | |||||||||||||||||||||
1 Year | 19.25% | 19.81% | 19.80% | 19.25% | 19.81% | 19.80% | ||||||||||||||||||||
5 Years | 11.18% | 11.11% | 11.66% | 69.85% | 69.31% | 73.55% | ||||||||||||||||||||
10 Years | 11.77% | 11.73% | 11.92% | 204.21% | 203.21% | 208.30% | ||||||||||||||||||||
GROWTH OF $10,000 INVESTMENT
(AT NET ASSET VALUE)
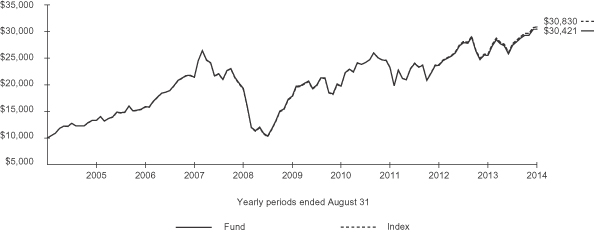
Past performance is no guarantee of future results. Performance results do not reflect the deduction of taxes that a shareholder would pay on fund distributions or on the redemption or sale of fund shares. See “About Fund Performance” on page 24 for more information.
| Shareholder Expenses | ||||||||||||||||||||||||||
| Actual | Hypothetical 5% Return | |||||||||||||||||||||||||
| Beginning Account Value (3/1/14) | Ending Account Value (8/31/14) | Expenses Paid During Period a | Beginning Account Value (3/1/14) | Ending Account Value (8/31/14) | Expenses Paid During Period a | Annualized Expense Ratio | ||||||||||||||||||||
| $ | 1,000.00 | $ | 1,108.40 | $ | 2.60 | $ | 1,000.00 | $ | 1,022.70 | $ | 2.50 | 0.49% | ||||||||||||||
| a | Expenses are calculated using the Fund’s annualized expense ratio (as disclosed in the table), multiplied by the average account value for the period, multiplied by the number of days in the period (184 days) and divided by the number of days in the year (365 days). See “Shareholder Expenses” on page 24 for more information. |
| 14 | 2014 iSHARES ANNUAL REPORTTO SHAREHOLDERS |
Table of Contents
Management’s Discussion of Fund Performance (Continued)
iSHARES® MSCI PACIFIC EX JAPAN ETF
The iShares MSCI Pacific ex Japan ETF (the “Fund”) seeks to track the investment results of an index composed of Pacific region developed market equities, excluding Japan, as represented by the MSCI Pacific ex Japan Index (the “Index”). The Fund invests in a representative sample of securities included in the Index that collectively has an investment profile similar to the Index. Due to the use of representative sampling, the Fund may or may not hold all of the securities that are included in the Index. For the 12-month reporting period ended August 31, 2014, the total return for the Fund was 19.25%, net of fees, while the total return for the Index was 19.80%.
The Index posted a strong double-digit return during the reporting period, led by a large positive exposure to Australian stocks.
Australia’s economy expanded by 3.1% in the second quarter of 2014 versus the same period in 2013, as the country reached its 23rd consecutive year of growth. Banks enjoyed surging profits as the level of bad loans to corporations declined. The materials sector also produced solid results, helped by a buoyant economy.
Although Hong Kong’s economy was sluggish, its stock market performed well because of its links to China, which reported growth in line with expectations of 7.5% in the second quarter of 2014 compared to the same period in 2013. Hong Kong is a key financial center in Asia, with significant exposure to real estate investment, development and management companies. Hong Kong property firms continued to benefit from low interest rates and significant investment from China.
Singapore, the third largest country weighting in the Index, was the weakest performer for the reporting period, as the government restricted lending to cool an overheated real estate market. Singapore’s economy stalled during the second quarter of 2014, as GDP grew just 2.4% compared to the same period in 2013, primarily due to a decline in semiconductor production.
PORTFOLIO ALLOCATION
As of 8/31/14
| Sector | Percentage of Total Investments* | |||
Financials | 53.19 | % | ||
Materials | 11.42 | |||
Industrials | 8.61 | |||
Consumer Staples | 6.31 | |||
Consumer Discretionary | 5.65 | |||
Energy | 3.83 | |||
Utilities | 3.83 | |||
Telecommunication Services | 3.57 | |||
Health Care | 3.04 | |||
Information Technology | 0.55 | |||
|
| |||
TOTAL | 100.00 | % | ||
|
| |||
COUNTRY ALLOCATION
As of 8/31/14
| Country | Percentage of Total Investments* | |||
Australia | 63.83 | % | ||
Hong Kong | 23.49 | |||
Singapore | 11.61 | |||
New Zealand | 1.07 | |||
|
| |||
TOTAL | 100.00 | % | ||
|
| |||
| * | Excludes money market funds. |
MANAGEMENT’S DISCUSSIONSOF FUND PERFORMANCE | 15 |
Table of Contents
Management’s Discussion of Fund Performance
iSHARES® MSCI SINGAPORE ETF
Performance as of August 31, 2014
| Average Annual Total Returns | Cumulative Total Returns | |||||||||||||||||||||||||
| NAV | MARKET | INDEX | NAV | MARKET | INDEX | |||||||||||||||||||||
1 Year | 15.65% | 16.48% | 16.00% | 15.65% | 16.48% | 16.00% | ||||||||||||||||||||
5 Years | 10.48% | 10.47% | 10.84% | 64.62% | 64.52% | 67.29% | ||||||||||||||||||||
10 Years | 12.23% | 12.16% | 12.32% | 216.98% | 215.11% | 219.67% | ||||||||||||||||||||
GROWTH OF $10,000 INVESTMENT
(AT NET ASSET VALUE)
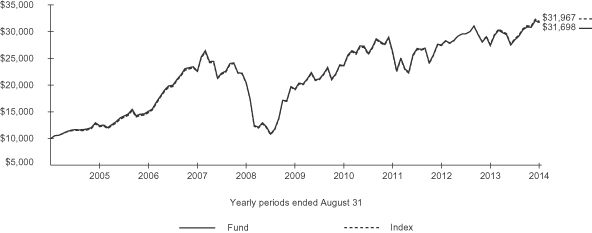
Past performance is no guarantee of future results. Performance results do not reflect the deduction of taxes that a shareholder would pay on fund distributions or on the redemption or sale of fund shares. See “About Fund Performance” on page 24 for more information.
| Shareholder Expenses | ||||||||||||||||||||||||||
| Actual | Hypothetical 5% Return | |||||||||||||||||||||||||
| Beginning Account Value (3/1/14) | Ending Account Value (8/31/14) | Expenses Paid During Period a | Beginning Account Value (3/1/14) | Ending Account Value (8/31/14) | Expenses Paid During Period a | Annualized Expense Ratio | ||||||||||||||||||||
| $ | 1,000.00 | $ | 1,113.80 | $ | 2.56 | $ | 1,000.00 | $ | 1,022.80 | $ | 2.45 | 0.48% | ||||||||||||||
| a | Expenses are calculated using the Fund’s annualized expense ratio (as disclosed in the table), multiplied by the average account value for the period, multiplied by the number of days in the period (184 days) and divided by the number of days in the year (365 days). See “Shareholder Expenses” on page 24 for more information. |
| 16 | 2014 iSHARES ANNUAL REPORTTO SHAREHOLDERS |
Table of Contents
Management’s Discussion of Fund Performance (Continued)
iSHARES® MSCI SINGAPORE ETF
The iShares MSCI Singapore ETF (the “Fund”) seeks to track the investment results of an index composed of Singaporean equities, as represented by the MSCI Singapore Index (the “Index”). The Fund invests in a representative sample of securities included in the Index that collectively has an investment profile similar to the Index. Due to the use of representative sampling, the Fund may or may not hold all of the securities that are included in the Index. For the 12-month reporting period ended August 31, 2014, the total return for the Fund was 15.65%, net of fees, while the total return for the Index was 16.00%.
The Index produced double-digit gains during the reporting period and slightly underperformed the broad international equity market.
During early 2014, the Index declined temporarily after the Fed announced plans to reduce stimulus measures. Such a move would likely cause interest rates to rise, and make investors more cautious about investing in emerging markets. However, as the reporting period progressed, rising expectations that the Fed would be slower to raise rates than originally had been anticipated helped to refuel investors’ appetite for risk, boosting returns for emerging markets equities in the second half of the reporting period. Singapore’s economy stalled during the second quarter of 2014, as GDP grew just 2.4% versus the year ago period, primarily due to a decline in semiconductor production. GDP growth during the quarter was also stagnant compared to the first quarter of 2014.
The Index is heavily weighted towards financials, which comprised more than 53% of the Index on average during the reporting period. As a result, the financials sector contributed the most to Index returns during the reporting period, followed by the industrials and telecommunication services sectors. Consumer discretionary and consumer staples stocks produced the least contribution to Index performance. All sectors produced positive returns.
Within the financials sector, a significant portion of companies are real estate firms. The government has put in place moves to cool the real estate market, which had risen by 60% since the global financial crisis due to low interest rates. Regulators tightened lending rules by increasing processing times for home loans, thus slowing housing sales. The government also sold land to boost housing supply. The moves appeared to be effective, as price declines were reported in the second quarter of 2014 across Singapore’s prime and suburban residential areas.
PORTFOLIO ALLOCATION
As of 8/31/14
| Sector | Percentage of Total Investments* | |||
Financials | 53.55 | % | ||
Industrials | 20.09 | |||
Telecommunication Services | 13.53 | |||
Consumer Discretionary | 8.51 | �� | ||
Consumer Staples | 4.32 | |||
|
| |||
TOTAL | 100.00 | % | ||
|
| |||
TEN LARGEST FUND HOLDINGS
As of 8/31/14
| Security | Percentage of Total Investments* | |||
DBS Group Holdings Ltd. | 12.62 | % | ||
Singapore Telecommunications Ltd. | 12.56 | |||
United Overseas Bank Ltd. | 11.55 | |||
Oversea-Chinese Banking Corp. Ltd. | 10.57 | |||
Keppel Corp. Ltd. | 4.75 | |||
Global Logistic Properties Ltd. | 3.51 | |||
CapitaLand Ltd. | 3.31 | |||
Genting Singapore PLC | 3.01 | |||
Singapore Press Holdings Ltd. | 2.86 | |||
Jardine Cycle & Carriage Ltd. | 2.64 | |||
|
| |||
TOTAL | 67.38 | % | ||
|
| |||
| * | Excludes money market funds. |
MANAGEMENT’S DISCUSSIONSOF FUND PERFORMANCE | 17 |
Table of Contents
Management’s Discussion of Fund Performance
iSHARES® MSCI SOUTH KOREA CAPPED ETF
Performance as of August 31, 2014
| Average Annual Total Returns | Cumulative Total Returns | |||||||||||||||||||||||||
| NAV | MARKET | INDEX | NAV | MARKET | INDEX | |||||||||||||||||||||
1 Year | 16.83% | 17.72% | 17.54% | 16.83% | 17.72% | 17.54% | ||||||||||||||||||||
5 Years | 10.56% | 10.75% | 11.28% | 65.22% | 66.61% | 70.66% | ||||||||||||||||||||
10 Years | 11.64% | 11.62% | 12.32% | 200.62% | 200.09% | 219.50% | ||||||||||||||||||||
GROWTH OF $10,000 INVESTMENT
(AT NET ASSET VALUE)
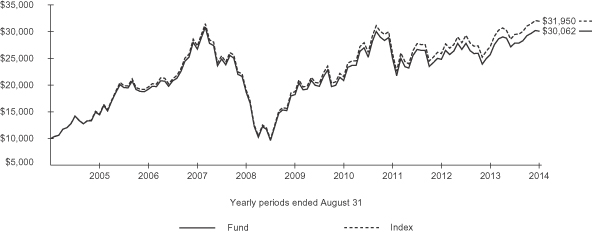
Index performance through February 11, 2013 reflects the performance of the MSCI Korea Index. Index performance beginning on February 12, 2013 reflects the performance of the MSCI Korea 25/50 Index.
Past performance is no guarantee of future results. Performance results do not reflect the deduction of taxes that a shareholder would pay on fund distributions or on the redemption or sale of fund shares. See “About Fund Performance” on page 24 for more information.
| Shareholder Expenses | ||||||||||||||||||||||||||
| Actual | Hypothetical 5% Return | |||||||||||||||||||||||||
| Beginning Account Value (3/1/14) | Ending Account Value (8/31/14) | Expenses Paid During Period a | Beginning Account Value (3/1/14) | Ending Account Value (8/31/14) | Expenses Paid During Period a | Annualized Expense Ratio | ||||||||||||||||||||
| $ | 1,000.00 | $ | 1,079.80 | $ | 3.25 | $ | 1,000.00 | $ | 1,022.10 | $ | 3.16 | 0.62% | ||||||||||||||
| a | Expenses are calculated using the Fund’s annualized expense ratio (as disclosed in the table), multiplied by the average account value for the period, multiplied by the number of days in the period (184 days) and divided by the number of days in the year (365 days). See “Shareholder Expenses” on page 24 for more information. |
| 18 | 2014 iSHARES ANNUAL REPORTTO SHAREHOLDERS |
Table of Contents
Management’s Discussion of Fund Performance (Continued)
iSHARES® MSCI SOUTH KOREA CAPPED ETF
The iShares MSCI South Korea Capped ETF (the “Fund”) seeks to track the investment results of an index composed of South Korean equities, as represented by the MSCI Korea 25/50 Index (the “Index”). The Fund invests in a representative sample of securities included in the Index that collectively has an investment profile similar to the Index. Due to the use of representative sampling, the Fund may or may not hold all of the securities that are included in the Index. For the 12-month reporting period ended August 31, 2014, the total return for the Fund was 16.83%, net of fees, while the total return for the Index was 17.54%.
The Index produced solid gains during the reporting period, performing in line with the broad international equity market.
The South Korean economy grew just 0.5% during the second quarter of 2014 versus the second quarter of 2013. To combat slow growth, the government announced a $40 billion stimulus package which included a relaxation of limits on mortgage loans in an effort to boost a weak real estate market.
A ferry accident in April 2014 which killed more than 300 people took a heavy toll on travel spending, contributing to an overall decline in consumer spending in the second quarter of 2014. Additionally, a sharp rise in the Korean won has hurt exports as did slowing economic growth in China, Korea’s primary export market. South Korean exports to China fell 7% in July 2014 as compared to July 2013, the third straight monthly drop. Meanwhile, South Korea’s household debt rose to almost $1 trillion, doubling over the past decade, generating fears that the economy could spiral downward into negative growth and deflation.
Many South Korean firms have well-established, globally recognized brand names that may potentially benefit from recently signed free-trade agreements with the European Union and the U.S. In addition, the Japanese yen, which had been rapidly declining, stabilized during the reporting period, reducing the advantage to Japanese exporters of electronics and automobiles. However, high levels of Korean consumer debt have had a negative impact on domestic spending.
PORTFOLIO ALLOCATION
As of 8/31/14
| Sector | Percentage of Total Investments* |
Information Technology | 34.23 | % | ||
Consumer Discretionary | 19.02 | |||
Financials | 14.96 | |||
Industrials | 11.78 | |||
Materials | 8.68 | |||
Consumer Staples | 6.03 | |||
Utilities | 1.93 | |||
Energy | 1.58 | |||
Telecommunication Services | 1.15 | |||
Health Care | 0.64 | |||
|
| |||
TOTAL | 100.00 | % | ||
|
|
TEN LARGEST FUND HOLDINGS
As of 8/31/14
| Security | Percentage of Total Investments* |
Samsung Electronics Co. Ltd. | 22.64 | % | ||
Hyundai Motor Co. | 5.51 | |||
SK Hynix Inc. | 3.91 | |||
POSCO | 3.35 | |||
NAVER Corp. | 3.30 | |||
Shinhan Financial Group Co. Ltd. | 3.27 | |||
Hyundai Mobis Co. Ltd. | 3.09 | |||
Kia Motors Corp. | 2.49 | |||
KB Financial Group Inc. | 2.35 | |||
LG Chem Ltd. | 1.93 | |||
|
| |||
TOTAL | 51.84 | % | ||
|
|
| * | Excludes money market funds. |
MANAGEMENT’S DISCUSSIONSOF FUND PERFORMANCE | 19 |
Table of Contents
Management’s Discussion of Fund Performance
iSHARES® MSCI TAIWAN ETF
Performance as of August 31, 2014
| Average Annual Total Returns | Cumulative Total Returns | |||||||||||||||||||||||||
| NAV | MARKET | INDEX | NAV | MARKET | INDEX | |||||||||||||||||||||
1 Year | 23.24% | 24.76% | 23.93% | 23.24% | 24.76% | 23.93% | ||||||||||||||||||||
5 Years | 11.06% | 11.30% | 11.56% | 68.97% | 70.77% | 72.78% | ||||||||||||||||||||
10 Years | 7.21% | 7.38% | 7.88% | 100.68% | 103.78% | 113.54% | ||||||||||||||||||||
GROWTH OF $10,000 INVESTMENT
(AT NET ASSET VALUE)
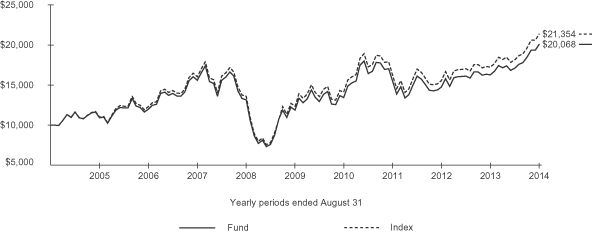
Past performance is no guarantee of future results. Performance results do not reflect the deduction of taxes that a shareholder would pay on fund distributions or on the redemption or sale of fund shares. See “About Fund Performance” on page 24 for more information.
| Shareholder Expenses | ||||||||||||||||||||||||||
| Actual | Hypothetical 5% Return | |||||||||||||||||||||||||
| Beginning Account Value (3/1/14) | Ending Account Value (8/31/14) | Expenses Paid During Period a | Beginning Account Value (3/1/14) | Ending Account Value (8/31/14) | Expenses Paid During Period a | Annualized Expense Ratio | ||||||||||||||||||||
| $ | 1,000.00 | $ | 1,172.50 | $ | 3.40 | $ | 1,000.00 | $ | 1,022.10 | $ | 3.16 | 0.62% | ||||||||||||||
| a | Expenses are calculated using the Fund’s annualized expense ratio (as disclosed in the table), multiplied by the average account value for the period, multiplied by the number of days in the period (184 days) and divided by the number of days in the year (365 days). See “Shareholder Expenses” on page 24 for more information. |
| 20 | 2014 iSHARES ANNUAL REPORTTO SHAREHOLDERS |
Table of Contents
Management’s Discussion of Fund Performance (Continued)
iSHARES® MSCI TAIWAN ETF
The iShares MSCI Taiwan ETF (the “Fund”) seeks to track the investment results of an index composed of Taiwanese equities, as represented by the MSCI Taiwan Index (the “Index”). The Fund invests in a representative sample of securities included in the Index that collectively has an investment profile similar to the Index. Due to the use of representative sampling, the Fund may or may not hold all of the securities that are included in the Index. For the 12-month reporting period ended August 31, 2014, the total return for the Fund was 23.24%, net of fees, while the total return for the Index was 23.93%.
Although performance was relatively modest during the first half of the reporting period, the Taiwanese stock market began to rise starting in early 2014. For the full reporting period, the Index posted a strong, double-digit return and outperformed the broad international equity market.
Taiwan’s economy performed well in recent months. During the second quarter of 2014, GDP rose 3.7% from the same period in 2013. A recovering U.S. economy and strong global demand for mobile devices formed a favorable backdrop for Taiwan’s export-reliant economy.
The current Taiwanese government is attempting to improve its economy by reducing tariffs on hundreds of products, as well as improving relations with China, with which it has had a long-term political conflict. During the reporting period, China and Taiwan worked towards stronger trade agreements, although such ties are considered controversial among a large segment of the Taiwanese population.
The Index is highly concentrated in stocks of information technology companies, primarily semiconductor and hardware manufacturers. Taiwan is the world’s largest supplier of contract computer chip manufacturing services. In addition, it is a major producer of LCD panels, DRAM computer memory, networking equipment and consumer electronics.
In terms of sectors, the top performers within the Index during the reporting period were information technology and financials. Laggards included the health care, telecommunication services, and energy sectors.
PORTFOLIO ALLOCATION
As of 8/31/14
| Sector | Percentage of Total Investments* |
Information Technology | 57.64 | % | ||
Financials | 17.83 | |||
Materials | 10.01 | |||
Telecommunication Services | 4.27 | |||
Consumer Discretionary | 3.96 | |||
Industrials | 2.96 | |||
Consumer Staples | 2.71 | |||
Energy | 0.55 | |||
Health Care | 0.07 | |||
|
| |||
TOTAL | 100.00 | % | ||
|
|
TEN LARGEST FUND HOLDINGS
As of 8/31/14
| Security | Percentage of Total Investments* |
Taiwan Semiconductor Manufacturing Co. Ltd. | 20.17 | % | ||
Hon Hai Precision Industry Co. Ltd. | 8.40 | |||
MediaTek Inc. | 4.63 | |||
Cathay Financial Holding Co. Ltd. | 2.75 | |||
Delta Electronics Inc. | 2.53 | |||
Chunghwa Telecom Co. Ltd. | 2.30 | |||
Nan Ya Plastics Corp. | 2.18 | |||
Fubon Financial Holding Co. Ltd. | 2.16 | |||
Formosa Plastics Corp. | 2.13 | |||
China Steel Corp. | 2.03 | |||
|
| |||
TOTAL | 49.28 | % | ||
|
|
| * | Excludes money market funds. |
MANAGEMENT’S DISCUSSIONSOF FUND PERFORMANCE | 21 |
Table of Contents
Management’s Discussion of Fund Performance
iSHARES® MSCI THAILAND CAPPED ETF
Performance as of August 31, 2014
| Average Annual Total Returns | Cumulative Total Returns | |||||||||||||||||||||||||
| NAV | MARKET | INDEX | NAV | MARKET | INDEX | |||||||||||||||||||||
1 Year | 26.18% | 27.96% | 25.87% | 26.18% | 27.96% | 25.87% | ||||||||||||||||||||
5 Years | 20.77% | 20.72% | 21.17% | 156.89% | 156.34% | 161.19% | ||||||||||||||||||||
Since Inception | 11.26% | 11.28% | 11.63% | 98.72% | 98.96% | 102.86% | ||||||||||||||||||||
GROWTH OF $10,000 INVESTMENT
(SINCE INCEPTION AT NET ASSET VALUE)
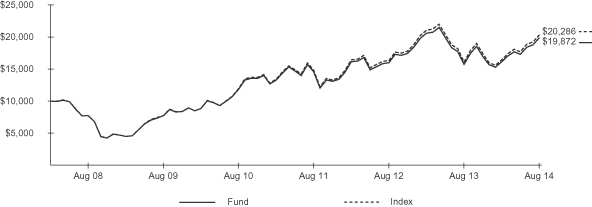
The inception date of the Fund was 3/26/08. The first day of secondary market trading was 3/28/08.
Index performance through February 11, 2013 reflects the performance of the MSCI Thailand Investable Market Index. Index performance beginning on February 12, 2013 reflects the performance of the MSCI Thailand Investable Market Index 25/50.
Past performance is no guarantee of future results. Performance results do not reflect the deduction of taxes that a shareholder would pay on fund distributions or on the redemption or sale of fund shares. See “About Fund Performance” on page 24 for more information.
| Shareholder Expenses | ||||||||||||||||||||||||||
| Actual | Hypothetical 5% Return | |||||||||||||||||||||||||
| Beginning Account Value (3/1/14) | Ending Account Value (8/31/14) | Expenses Paid During Period a | Beginning Account Value (3/1/14) | Ending Account Value (8/31/14) | Expenses Paid During Period a | Annualized Expense Ratio | ||||||||||||||||||||
| $ | 1,000.00 | $ | 1,230.80 | $ | 3.49 | $ | 1,000.00 | $ | 1,022.10 | $ | 3.16 | 0.62% | ||||||||||||||
| a | Expenses are calculated using the Fund’s annualized expense ratio (as disclosed in the table), multiplied by the average account value for the period, multiplied by the number of days in the period (184 days) and divided by the number of days in the year (365 days). See “Shareholder Expenses” on page 24 for more information. |
| 22 | 2014 iSHARES ANNUAL REPORTTO SHAREHOLDERS |
Table of Contents
Management’s Discussion of Fund Performance (Continued)
iSHARES® MSCI THAILAND CAPPED ETF
The iShares MSCI Thailand Capped ETF (the “Fund”) seeks to track the investment results of a broad-based index composed of Thai equities, as represented by the MSCI Thailand Investable Market Index 25/50 (the “Index”). The Fund invests in a representative sample of securities included in the Index that collectively has an investment profile similar to the Index. Due to the use of representative sampling, the Fund may or may not hold all of the securities that are included in the Index. For the 12-month reporting period ended August 31, 2014, the total return for the Fund was 26.18%, net of fees, while the total return for the Index was 25.87%.
Despite several obstacles, the Index posted strong returns during the reporting period and outperformed the broad international equity market.
Early in 2014, the Index declined along with other emerging markets after the Fed announced plans to reduce stimulus measures. Such a move would typically cause interest rates to rise, and make investors more cautious about investing in riskier assets. However, when U.S. interest rates remained low, investor appetite towards risk returned and emerging markets such as Thailand rebounded.
However, the reporting period was marked by political unrest. In May 2014, the Thai military seized power after months of street demonstrations led to the ouster of the former prime minister. As the conflict unfolded, businesses deferred new investments while awaiting clarity on government policy. Tourism was down sharply as well during the second quarter, as many countries advised citizens to avoid travel to Thailand.
Despite these setbacks, GDP expanded 0.4% in the second quarter of 2014 versus the same quarter in 2013. In addition, the new military government recently announced measures to revive the economy, including an approval for $75 billion in spending for infrastructure development for rail lines, airports, and seaports. Meanwhile, Thai consumer confidence rose to its highest level in nearly a year as the end of the reporting period approached
PORTFOLIO ALLOCATION
As of 8/31/14
| Sector | Percentage of Total Investments* |
Financials | 35.10 | % | ||
Energy | 16.41 | |||
Materials | 9.06 | |||
Consumer Staples | 8.33 | |||
Telecommunication Services | 8.23 | |||
Industrials | 8.03 | |||
Consumer Discretionary | 6.27 | |||
Health Care | 3.51 | |||
Information Technology | 2.95 | |||
Utilities | 2.11 | |||
|
| |||
TOTAL | 100.00 | % | ||
|
|
TEN LARGEST FUND HOLDINGS
As of 8/31/14
| Security | Percentage of Total Investments* |
Siam Commercial Bank PCL NVDR | 7.67 | % | ||
PTT PCL NVDR | 6.65 | |||
Kasikornbank PCL Foreign | 6.37 | |||
PTT Exploration & Production PCL NVDR | 5.48 | |||
Advanced Information Service PCL NVDR | 5.25 | |||
CP All PCL NVDR | 5.00 | |||
Kasikornbank PCL NVDR | 3.56 | |||
Siam Cement (The) PCL Foreign | 3.03 | |||
Bangkok Bank PCL NVDR | 2.56 | |||
Airports of Thailand PCL NVDR | 2.46 | |||
|
| |||
TOTAL | 48.03 | % | ||
|
|
| * | Excludes money market funds. |
MANAGEMENT’S DISCUSSIONSOF FUND PERFORMANCE | 23 |
Table of Contents
Past performance is no guarantee of future results. Current performance may be lower or higher than the performance data quoted. Performance data current to the most recent month-end is available at www.iShares.com. Performance results assume reinvestment of all dividends and capital gain distributions and do not reflect the deduction of taxes that a shareholder would pay on fund distributions or on the redemption or sale of fund shares. The investment return and principal value of shares will vary with changes in market conditions. Shares may be worth more or less than their original cost when they are redeemed or sold in the market. Performance for certain funds may reflect a waiver of a portion of investment management fees. Without such waiver, performance would have been lower.
Net asset value or “NAV” is the value of one share of a fund as calculated in accordance with the standard formula for valuing mutual fund shares. The price used to calculate market return (“Market Price”) is determined by using the midpoint between the highest bid and the lowest offer on the primary stock exchange on which shares of a fund are listed for trading, as of the time that such fund’s NAV is calculated. Since shares of a fund may not have traded in the secondary market until after the fund’s inception, for the period from inception to the first day of secondary trading, the NAV of the fund is used as a proxy for the Market Price to calculate market returns. Market and NAV returns assume that dividends and capital gain distributions have been reinvested at Market Price and NAV, respectively.
An index is a statistical composite that tracks a specified financial market or sector. Unlike a fund, an index does not actually hold a portfolio of securities and therefore does not incur the expenses incurred by a fund. These expenses negatively impact fund performance. Also, market returns do not include brokerage commissions that may be payable on secondary market transactions. If brokerage commissions were included, market returns would be lower.
As a shareholder of a Fund, you incur two types of costs: (1) transaction costs, including brokerage commissions on purchases and sales of fund shares and (2) ongoing costs, including management fees and other fund expenses. The expense example, which is based on an investment of $1,000 invested on March 1, 2014 and held through August 31, 2014, is intended to help you understand your ongoing costs (in dollars and cents) of investing in a Fund and to compare these costs with the ongoing costs of investing in other funds.
Actual Expenses — The table provides information about actual account values and actual expenses. Annualized expense ratios reflect contractual and voluntary fee waivers, if any. To estimate the expenses that you paid on your account over the period, simply divide your account value by $1,000 (for example, an $8,600 account value divided by $1,000 = 8.6), then multiply the result by the number for your Fund under the heading entitled “Expenses Paid During Period.”
Hypothetical Example for Comparison Purposes — The table also provides information about hypothetical account values and hypothetical expenses based on each Fund’s actual expense ratio and an assumed rate of return of 5% per year before expenses. You may use this information to compare the ongoing costs of investing in your Fund and other funds. To do so, compare this 5% hypothetical example with the 5% hypothetical examples that appear in the shareholder reports of the other funds.
Please note that the expenses shown in the table are meant to highlight your ongoing costs only and do not reflect any transactional costs, such as brokerage commissions paid on purchases and sales of fund shares. Therefore, the hypothetical examples are useful in comparing ongoing costs only and will not help you determine the relative total costs of owning different funds. In addition, if these transactional costs were included, your costs would have been higher.
| 24 | 2014 iSHARES ANNUAL REPORTTO SHAREHOLDERS |
Table of Contents
August 31, 2014
| Security | Shares | Value | ||||||
COMMON STOCKS — 98.91% |
| |||||||
AIR FREIGHT & LOGISTICS — 0.34% |
| |||||||
Toll Holdings Ltd. | 1,253,782 | $ | 7,000,792 | |||||
|
| |||||||
| 7,000,792 | ||||||||
AIRLINES — 0.13% |
| |||||||
Qantas Airways Ltd.a | 1,980,577 | 2,723,077 | ||||||
|
| |||||||
| 2,723,077 | ||||||||
BEVERAGES — 0.71% |
| |||||||
Coca-Cola Amatil Ltd. | 1,053,949 | 8,871,824 | ||||||
Treasury Wine Estates Ltd. | 1,195,167 | 5,712,159 | ||||||
|
| |||||||
| 14,583,983 | ||||||||
BIOTECHNOLOGY — 2.97% |
| |||||||
CSL Ltd. | 881,362 | 60,893,820 | ||||||
|
| |||||||
| 60,893,820 | ||||||||
CAPITAL MARKETS — 1.42% |
| |||||||
Macquarie Group Ltd. | 531,883 | 29,002,502 | ||||||
|
| |||||||
| 29,002,502 | ||||||||
CHEMICALS — 1.07% |
| |||||||
Incitec Pivot Ltd. | 3,027,210 | 8,777,181 | ||||||
Orica Ltd. | 682,627 | 13,088,447 | ||||||
|
| |||||||
| 21,865,628 | ||||||||
COMMERCIAL BANKS — 35.76% |
| |||||||
Australia and New Zealand Banking Group Ltd. | 5,050,141 | 157,903,108 | ||||||
Bank of Queensland Ltd. | 664,524 | 7,818,836 | ||||||
Bendigo and Adelaide Bank Ltd. | 798,539 | 9,298,573 | ||||||
Commonwealth Bank of Australia | 2,983,778 | 226,941,894 | ||||||
National Australia Bank Ltd. | 4,332,006 | 142,620,683 | ||||||
Westpac Banking Corp. | 5,721,705 | 187,516,876 | ||||||
|
| |||||||
| 732,099,970 | ||||||||
COMMERCIAL SERVICES & SUPPLIES — 1.25% |
| |||||||
Brambles Ltd. | 2,876,343 | 25,557,306 | ||||||
|
| |||||||
| 25,557,306 | ||||||||
CONSTRUCTION & ENGINEERING — 0.19% |
| |||||||
Leighton Holdings Ltd. | 186,888 | 3,922,429 | ||||||
|
| |||||||
| 3,922,429 | ||||||||
CONSTRUCTION MATERIALS — 0.84% |
| |||||||
Boral Ltd. | 1,438,468 | 7,413,147 | ||||||
James Hardie Industries SE | 819,491 | 9,818,477 | ||||||
|
| |||||||
| 17,231,624 | ||||||||
CONTAINERS & PACKAGING — 1.16% |
| |||||||
Amcor Ltd. | 2,220,710 | 23,719,676 | ||||||
|
| |||||||
| 23,719,676 | ||||||||
| Security | Shares | Value | ||||||
DIVERSIFIED FINANCIAL SERVICES — 0.61% |
| |||||||
ASX Ltd. | 356,281 | $ | 12,492,774 | |||||
|
| |||||||
| 12,492,774 | ||||||||
DIVERSIFIED TELECOMMUNICATION SERVICES — 2.18% |
| |||||||
Telstra Corp. Ltd. | 8,014,820 | 41,679,199 | ||||||
TPG Telecom Ltd. | 511,307 | 2,883,698 | ||||||
|
| |||||||
| 44,562,897 | ||||||||
ELECTRIC UTILITIES — 0.20% |
| |||||||
AusNet Services | 3,116,254 | 4,124,203 | ||||||
|
| |||||||
| 4,124,203 | ||||||||
ENERGY EQUIPMENT & SERVICES — 0.29% |
| |||||||
WorleyParsons Ltd. | 380,874 | 5,856,443 | ||||||
|
| |||||||
| 5,856,443 | ||||||||
FOOD & STAPLES RETAILING — 8.20% |
| |||||||
Metcash Ltd. | 1,634,844 | 4,296,684 | ||||||
Wesfarmers Ltd. | 2,104,014 | 85,229,042 | ||||||
Woolworths Ltd. | 2,314,140 | 78,265,227 | ||||||
|
| |||||||
| 167,790,953 | ||||||||
GAS UTILITIES — 0.54% |
| |||||||
APA Group | 1,538,065 | 11,148,776 | ||||||
|
| |||||||
| 11,148,776 | ||||||||
HEALTH CARE EQUIPMENT & SUPPLIES — 0.35% |
| |||||||
Cochlear Ltd. | 105,014 | 7,125,829 | ||||||
|
| |||||||
| 7,125,829 | ||||||||
HEALTH CARE PROVIDERS & SERVICES — 1.14% |
| |||||||
Ramsay Health Care Ltd. | 241,734 | 11,747,830 | ||||||
Sonic Healthcare Ltd. | 700,748 | 11,554,868 | ||||||
|
| |||||||
| 23,302,698 | ||||||||
HOTELS, RESTAURANTS & LEISURE — 1.33% |
| |||||||
Crown Resorts Ltd. | 670,246 | 9,904,718 | ||||||
Flight Centre Travel Group Ltd. | 101,793 | 4,465,207 | ||||||
Tabcorp Holdings Ltd. | 1,404,095 | 4,714,566 | ||||||
Tatts Group Ltd. | 2,639,871 | 8,197,314 | ||||||
|
| |||||||
| 27,281,805 | ||||||||
INSURANCE — 5.60% |
| |||||||
AMP Ltd. | 5,443,243 | 29,935,454 | ||||||
Insurance Australia Group Ltd. | 4,309,373 | 26,077,693 | ||||||
QBE Insurance Group Ltd. | 2,469,661 | 26,609,739 | ||||||
Suncorp Group Ltd. | 2,367,783 | 31,956,487 | ||||||
|
| |||||||
| 114,579,373 | ||||||||
IT SERVICES — 0.49% |
| |||||||
Computershare Ltd. | 870,062 | 10,025,631 | ||||||
|
| |||||||
| 10,025,631 | ||||||||
SCHEDULESOF INVESTMENTS | 25 |
Table of Contents
Schedule of Investments (Continued)
iSHARES® MSCI AUSTRALIA ETF
August 31, 2014
| Security | Shares | Value | ||||||
MEDIA — 0.21% |
| |||||||
REA Group Ltd. | 96,960 | $ | 4,345,705 | |||||
|
| |||||||
| 4,345,705 | ||||||||
METALS & MINING — 14.11% |
| |||||||
Alumina Ltd.a | 4,647,968 | 6,738,227 | ||||||
BHP Billiton Ltd. | 5,910,603 | 202,718,554 | ||||||
Fortescue Metals Group Ltd. | 2,865,223 | 11,174,942 | ||||||
Iluka Resources Ltd. | 770,553 | 6,414,212 | ||||||
Newcrest Mining Ltd.a | 1,410,641 | 14,935,292 | ||||||
Rio Tinto Ltd. | 801,944 | 46,976,132 | ||||||
|
| |||||||
| 288,957,359 | ||||||||
MULTI-UTILITIES — 0.80% |
| |||||||
AGL Energy Ltd. | 1,031,073 | 13,597,508 | ||||||
AGL Energy Ltd. Newa | 205,016 | 2,703,695 | ||||||
|
| |||||||
| 16,301,203 | ||||||||
MULTILINE RETAIL — 0.16% |
| |||||||
Harvey Norman Holdings Ltd. | 977,512 | 3,245,647 | ||||||
|
| |||||||
| 3,245,647 | ||||||||
OIL, GAS & CONSUMABLE FUELS — 5.65% |
| |||||||
Caltex Australia Ltd. | 248,446 | 6,620,263 | ||||||
Origin Energy Ltd. | 2,031,083 | 29,501,896 | ||||||
Santos Ltd. | 1,798,384 | 24,944,476 | ||||||
Woodside Petroleum Ltd. | 1,364,648 | 54,500,353 | ||||||
|
| |||||||
| 115,566,988 | ||||||||
PROFESSIONAL SERVICES — 0.72% |
| |||||||
ALS Ltd. | 725,558 | 5,048,890 | ||||||
Seek Ltd. | 595,103 | 9,723,796 | ||||||
|
| |||||||
| 14,772,686 | ||||||||
REAL ESTATE INVESTMENT TRUSTS (REITS) — 6.83% |
| |||||||
BGP Holdings PLCa,b | 18,888,372 | 249 | ||||||
CFS Retail Property Trust Group | 3,887,967 | 7,818,291 | ||||||
Dexus Property Group | 9,998,770 | 11,268,975 | ||||||
Federation Centres | 2,627,345 | 6,536,564 | ||||||
Goodman Group | 3,179,529 | 16,593,874 | ||||||
GPT Group (The) | 3,101,821 | 11,575,518 | ||||||
Mirvac Group | 6,795,049 | 11,662,173 | ||||||
Scentre Groupa | 9,798,371 | 31,433,938 | ||||||
Stockland Corp. Ltd. | 4,282,431 | 17,022,765 | ||||||
Westfield Corp. | 3,633,172 | 25,893,558 | ||||||
|
| |||||||
| 139,805,905 | ||||||||
REAL ESTATE MANAGEMENT & DEVELOPMENT — 0.66% |
| |||||||
Lend Lease Group | 1,009,614 | 13,503,371 | ||||||
|
| |||||||
| 13,503,371 | ||||||||
| Security | Shares | Value | ||||||
ROAD & RAIL — 1.37% |
| |||||||
Asciano Ltd. | 1,795,041 | $ | 10,543,500 | |||||
Aurizon Holdings Ltd. | 3,933,330 | 17,548,078 | ||||||
|
| |||||||
| 28,091,578 | ||||||||
TRANSPORTATION INFRASTRUCTURE — 1.63% |
| |||||||
Sydney Airport | 1,998,509 | 8,280,578 | ||||||
Transurban Group | 3,315,492 | 24,993,888 | ||||||
|
| |||||||
| 33,274,466 | ||||||||
|
| |||||||
TOTAL COMMON STOCKS |
| |||||||
(Cost: $1,870,287,468) | 2,024,757,097 | |||||||
SHORT-TERM INVESTMENTS — 0.01% |
| |||||||
MONEY MARKET FUNDS — 0.01% |
| |||||||
BlackRock Cash Funds: Treasury, |
| |||||||
0.00%c,d | 343,395 | 343,395 | ||||||
|
| |||||||
| 343,395 | ||||||||
|
| |||||||
TOTAL SHORT-TERM INVESTMENTS |
| |||||||
(Cost: $343,395) | 343,395 | |||||||
|
| |||||||
TOTAL INVESTMENTS |
| |||||||
(Cost: $1,870,630,863) | 2,025,100,492 | |||||||
Other Assets, Less Liabilities — 1.08% |
| 22,012,092 | ||||||
|
| |||||||
NET ASSETS — 100.00% |
| $ | 2,047,112,584 | |||||
|
| |||||||
| a | Non-income earning security. |
| b | Security valued using Level 3 inputs in accordance with management’s fair valuation policy. See Note 1. |
| c | Affiliated issuer. See Note 2. |
| d | The rate quoted is the annualized seven-day yield of the fund at period end. |
Financial futures contracts purchased as of August 31, 2014 were as follows:
| Number of Contracts | Issue (Expiration) | Exchange | Notional Value | Unrealized Appreciation (Depreciation) | ||||||||||
| 151 | ASX SPI 200 Index (Sept. 2014) | Sydney Futures | $ | 19,825,197 | $ | 452,812 | ||||||||
See notes to financial statements.
| 26 | 2014 iSHARES ANNUAL REPORTTO SHAREHOLDERS |
Table of Contents
Schedule of Investments
August 31, 2014
| Security | Shares | Value | ||||||
COMMON STOCKS — 99.42% |
| |||||||
AIRLINES — 0.57% |
| |||||||
Cathay Pacific Airways Ltd. | 9,810,000 | $ | 18,227,260 | |||||
|
| |||||||
| 18,227,260 | ||||||||
COMMERCIAL BANKS — 7.61% |
| |||||||
Bank of East Asia Ltd. (The) | 10,202,410 | 43,441,679 | ||||||
BOC Hong Kong (Holdings) Ltd. | 29,430,000 | 98,920,860 | ||||||
Hang Seng Bank Ltd.a | 6,082,200 | 102,728,332 | ||||||
|
| |||||||
| 245,090,871 | ||||||||
DIVERSIFIED FINANCIAL SERVICES — 6.87% |
| |||||||
First Pacific Co. Ltd. | 19,620,999 | 22,861,186 | ||||||
Hong Kong Exchanges and Clearing Ltd. | 8,632,800 | 198,383,474 | ||||||
|
| |||||||
| 221,244,660 | ||||||||
DIVERSIFIED TELECOMMUNICATION SERVICES — 1.37% |
| |||||||
HKT Trust and HKT Ltd. | 20,302,500 | 24,048,173 | ||||||
PCCW Ltd. | 31,392,169 | 19,969,084 | ||||||
|
| |||||||
| 44,017,257 | ||||||||
ELECTRIC UTILITIES — 7.80% |
| |||||||
Cheung Kong Infrastructure Holdings Ltd. | 3,924,000 | 28,328,200 | ||||||
CLP Holdings Ltd.a | 14,715,200 | 124,554,637 | ||||||
Power Assets Holdings Ltd. | 10,791,000 | 98,300,627 | ||||||
|
| |||||||
| 251,183,464 | ||||||||
GAS UTILITIES — 3.45% |
| |||||||
Hong Kong and China Gas Co. Ltd. (The) | 49,050,788 | 111,264,021 | ||||||
|
| |||||||
| 111,264,021 | ||||||||
HOTELS, RESTAURANTS & LEISURE — 11.98% |
| |||||||
Galaxy Entertainment Group Ltd. | 17,759,000 | 133,820,068 | ||||||
MGM China Holdings Ltd. | 7,063,488 | 23,377,414 | ||||||
Sands China Ltd. | 18,835,200 | 122,730,218 | ||||||
Shangri-La Asia Ltd. | 11,772,000 | 18,227,260 | ||||||
SJM Holdings Ltd.a | 15,696,000 | 39,492,397 | ||||||
Wynn Macau Ltd. | 12,556,800 | 48,119,967 | ||||||
|
| |||||||
| 385,767,324 | ||||||||
HOUSEHOLD DURABLES — 1.02% |
| |||||||
Techtronic Industries Co. Ltd. | 10,791,147 | 32,929,766 | ||||||
|
| |||||||
| 32,929,766 | ||||||||
INDUSTRIAL CONGLOMERATES — 7.82% |
| |||||||
Hutchison Whampoa Ltd. | 17,658,800 | 229,673,883 | ||||||
NWS Holdings Ltd. | 11,772,000 | 22,237,257 | ||||||
|
| |||||||
| 251,911,140 | ||||||||
| Security | Shares | Value | ||||||
INSURANCE — 16.02% |
| |||||||
AIA Group Ltd. | 94,568,400 | $ | 516,150,438 | |||||
|
| |||||||
| 516,150,438 | ||||||||
REAL ESTATE INVESTMENT TRUSTS (REITS) — 3.25% |
| |||||||
Link REIT (The) | 17,658,000 | 104,806,746 | ||||||
|
| |||||||
| 104,806,746 | ||||||||
REAL ESTATE MANAGEMENT & DEVELOPMENT — 27.20% |
| |||||||
Cheung Kong (Holdings) Ltd. | 11,772,000 | 214,625,988 | ||||||
Hang Lung Properties Ltd. | 17,658,000 | 58,327,232 | ||||||
Henderson Land Development Co. Ltd. | 8,335,601 | 55,229,010 | ||||||
Hysan Development Co. Ltd. | 3,924,000 | 19,239,886 | ||||||
Kerry Properties Ltd. | 4,905,000 | 18,227,260 | ||||||
New World Development Co. Ltd. | 41,202,066 | 52,099,669 | ||||||
Sino Land Co. Ltd.a | 23,544,000 | 41,618,911 | ||||||
Sun Hung Kai Properties Ltd. | 12,357,000 | 187,503,880 | ||||||
Swire Pacific Ltd. Class A | 4,905,000 | 66,010,529 | ||||||
Swire Properties Ltd. | 9,025,200 | 30,277,504 | ||||||
Wharf (Holdings) Ltd. (The) | 11,772,150 | 92,048,836 | ||||||
Wheelock and Co. Ltd. | 7,848,357 | 41,114,468 | ||||||
|
| |||||||
| 876,323,173 | ||||||||
ROAD & RAIL — 1.45% |
| |||||||
MTR Corp. Ltd. | 11,772,083 | 46,707,683 | ||||||
|
| |||||||
| 46,707,683 | ||||||||
SEMICONDUCTORS & SEMICONDUCTOR EQUIPMENT — 0.63% |
| |||||||
ASM Pacific Technology Ltd.a | 1,962,000 | 20,417,063 | ||||||
|
| |||||||
| 20,417,063 | ||||||||
TEXTILES, APPAREL & LUXURY GOODS — 2.38% |
| |||||||
Li & Fung Ltd.a | 47,088,000 | 58,448,747 | ||||||
Yue Yuen Industrial (Holdings) Ltd.a | 5,886,000 | 18,265,234 | ||||||
|
| |||||||
| 76,713,981 | ||||||||
|
| |||||||
TOTAL COMMON STOCKS | ||||||||
(Cost: $3,006,192,108) | 3,202,754,847 | |||||||
SHORT-TERM INVESTMENTS — 1.27% |
| |||||||
MONEY MARKET FUNDS — 1.27% |
| |||||||
BlackRock Cash Funds: Institutional, |
| |||||||
0.14%b,c,d | 24,877,555 | 24,877,555 | ||||||
SCHEDULESOF INVESTMENTS | 27 |
Table of Contents
Schedule of Investments (Continued)
iSHARES® MSCI HONG KONG ETF
August 31, 2014
| Security | Shares | Value | ||||||
BlackRock Cash Funds: Prime, | ||||||||
0.11%b,c,d | 1,566,110 | $ | 1,566,110 | |||||
BlackRock Cash Funds: Treasury, |
| |||||||
0.00%b,c | 14,365,446 | 14,365,446 | ||||||
|
| |||||||
| 40,809,111 | ||||||||
|
| |||||||
TOTAL SHORT-TERM INVESTMENTS |
| |||||||
(Cost: $40,809,111) | 40,809,111 | |||||||
|
| |||||||
TOTAL INVESTMENTS |
| |||||||
(Cost: $3,047,001,219) | 3,243,563,958 | |||||||
Other Assets, Less Liabilities — (0.69)% |
| (22,251,740 | ) | |||||
|
| |||||||
NET ASSETS — 100.00% |
| $ | 3,221,312,218 | |||||
|
| |||||||
| a | All or a portion of this security represents a security on loan. See Note 1. |
| b | Affiliated issuer. See Note 2. |
| c | The rate quoted is the annualized seven-day yield of the fund at period end. |
| d | All or a portion of this security represents an investment of securities lending collateral. See Note 1. |
Financial futures contracts purchased as of August 31, 2014 were as follows:
| Number of Contracts | Issue (Expiration) | Exchange | Notional Value | Unrealized Appreciation (Depreciation) | ||||||||||
| 112 | Hang Seng Index (Sept. 2014) | Hong Kong Futures | $ | 17,835,113 | $ | (276,020) | ||||||||
See notes to financial statements.
| 28 | 2014 iSHARES ANNUAL REPORTTO SHAREHOLDERS |
Table of Contents
iSHARES® MSCI JAPAN SMALL-CAP ETF
August 31, 2014
| Security | Shares | Value | ||||||
COMMON STOCKS — 99.73% |
| |||||||
AEROSPACE & DEFENSE — 0.03% |
| |||||||
Jamco Corp. | 3,000 | $ | 52,616 | |||||
|
| |||||||
| 52,616 | ||||||||
AIR FREIGHT & LOGISTICS — 0.28% |
| |||||||
Kintetsu World Express Inc. | 3,000 | 119,411 | ||||||
Konoike Transport Co. Ltd. | 3,000 | 64,398 | ||||||
Mitsui-Soko Co. Ltd. | 30,000 | 125,620 | ||||||
Shibusawa Warehouse Co. Ltd. (The) | 30,000 | 101,940 | ||||||
Yusen Logistics Co. Ltd. | 6,000 | 66,939 | ||||||
|
| |||||||
| 478,308 | ||||||||
AIRLINES — 0.02% |
| |||||||
Skymark Airlines Inc.a,b | 15,000 | 29,167 | ||||||
|
| |||||||
| 29,167 | ||||||||
AUTO COMPONENTS — 3.93% |
| |||||||
Aisan Industry Co. Ltd. | 9,000 | 74,159 | ||||||
Akebono Brake Industry Co. Ltd. | 24,000 | 106,733 | ||||||
Calsonic Kansei Corp. | 60,000 | 346,537 | ||||||
Eagle Industry Co. Ltd. | 6,000 | 124,002 | ||||||
Exedy Corp. | 9,000 | 249,333 | ||||||
FCC Co. Ltd. | 9,000 | 155,075 | ||||||
Futaba Industrial Co. Ltd. | 18,000 | 100,496 | ||||||
G-Tekt Corp. | 6,000 | 62,839 | ||||||
Kayaba Industry Co. Ltd. | 60,000 | 283,005 | ||||||
Keihin Corp. | 12,000 | 169,688 | ||||||
Mitsuba Corp. | 12,000 | 198,450 | ||||||
Musashi Seimitsu Industry Co. Ltd. | 6,000 | 135,785 | ||||||
Nifco Inc. | 15,000 | 507,532 | ||||||
Nippon Seiki Co. Ltd. | 8,000 | 178,505 | ||||||
Nissan Shatai Co. Ltd. | 27,000 | 431,179 | ||||||
Nissin Kogyo Co. Ltd. | 12,000 | 216,932 | ||||||
Pacific Industrial Co. Ltd. | 12,000 | 90,100 | ||||||
Piolax Inc. | 3,000 | 145,546 | ||||||
Press Kogyo Co. Ltd. | 30,000 | 120,422 | ||||||
Riken Corp. | 30,000 | 131,106 | ||||||
Sanden Corp. | 30,000 | 182,509 | ||||||
Showa Corp. | 15,000 | 168,504 | ||||||
Tachi-S Co. Ltd. | 6,000 | 90,793 | ||||||
Taiho Kogyo Co. Ltd. | 6,000 | 66,824 | ||||||
Takata Corp. | 9,000 | 178,813 | ||||||
Tokai Rika Co. Ltd. | 15,000 | 298,166 | ||||||
Tokai Rubber Industries Ltd. | 12,000 | 114,126 | ||||||
Topre Corp. | 12,000 | 183,549 | ||||||
Toyo Tire & Rubber Co. Ltd. | 30,000 | 490,639 | ||||||
| Security | Shares | Value | ||||||
Toyota Boshoku Corp. | 21,000 | $ | 230,043 | |||||
TPR Co. Ltd. | 6,000 | 157,386 | ||||||
TS Tech Co. Ltd. | 15,000 | 402,560 | ||||||
Unipres Corp. | 12,000 | 237,378 | ||||||
Yorozu Corp. | 3,000 | 48,804 | ||||||
|
| |||||||
| 6,677,518 | ||||||||
BEVERAGES — 1.33% |
| |||||||
Coca-Cola East Japan Co. Ltd. | 24,066 | 602,548 | ||||||
Coca-Cola West Co. Ltd. | 21,000 | 327,275 | ||||||
ITO EN Ltd. | 18,000 | 419,137 | ||||||
Sapporo Holdings Ltd. | 90,000 | 385,522 | ||||||
Takara Holdings Inc. | 60,000 | 519,806 | ||||||
|
| |||||||
| 2,254,288 | ||||||||
BIOTECHNOLOGY — 0.58% |
| |||||||
3-D Matrix Ltd.a,b | 6,000 | 213,120 | ||||||
GNI Group Ltd.a,b | 30,000 | 103,095 | ||||||
Japan Tissue Engineering Co. Ltd.b | 6,000 | 98,763 | ||||||
NanoCarrier Co. Ltd.b | 12,000 | 150,744 | ||||||
PeptiDream Inc.a,b | 1,200 | 123,598 | ||||||
ReproCELL Inc.b | 9,000 | 69,134 | ||||||
Takara Bio Inc.a | 15,000 | 219,185 | ||||||
|
| |||||||
| 977,639 | ||||||||
BUILDING PRODUCTS — 1.78% |
| |||||||
Aica Kogyo Co. Ltd. | 15,000 | 358,955 | ||||||
Central Glass Co. Ltd. | 60,000 | 223,516 | ||||||
Maeda Kosen Co. Ltd.a | 6,000 | 75,776 | ||||||
Nichias Corp. | 30,000 | 200,414 | ||||||
Nichiha Corp. | 6,000 | 61,568 | ||||||
Nippon Sheet Glass Co. Ltd.b | 270,000 | 322,280 | ||||||
Nitto Boseki Co. Ltd. | 60,000 | 248,929 | ||||||
Noritz Corp. | 9,000 | 154,989 | ||||||
Okabe Co. Ltd. | 12,000 | 143,813 | ||||||
Sankyo Tateyama Inc. | 9,300 | 179,939 | ||||||
Sanwa Holdings Corp. | 60,000 | 439,525 | ||||||
Sekisui Jushi Corp. | 9,000 | 123,627 | ||||||
Takara Standard Co. Ltd. | 30,000 | 265,678 | ||||||
Takasago Thermal Engineering Co. Ltd. | 18,000 | 227,328 | ||||||
|
| |||||||
| 3,026,337 | ||||||||
CAPITAL MARKETS — 1.61% |
| |||||||
Ichigo Group Holdings Co. Ltd. | 57,000 | 164,056 | ||||||
Ichiyoshi Securities Co. Ltd. | 12,000 | 144,968 | ||||||
IwaiCosmo Holdings Inc. | 6,000 | 58,911 | ||||||
JAFCO Co. Ltd. | 9,000 | 363,431 | ||||||
SCHEDULESOF INVESTMENTS | 29 |
Table of Contents
Schedule of Investments (Continued)
iSHARES® MSCI JAPAN SMALL-CAP ETF
August 31, 2014
| Security | Shares | Value | ||||||
kabu.com Securities Co. Ltd. | 27,000 | $ | 127,612 | |||||
Kyokuto Securities Co. Ltd. | 6,000 | 102,748 | ||||||
Marusan Securities Co. Ltd. | 18,000 | 134,803 | ||||||
Matsui Securities Co. Ltd. | 33,000 | 313,847 | ||||||
Mito Securities Co. Ltd. | 18,000 | 68,961 | ||||||
Monex Group Inc. | 57,000 | 179,420 | ||||||
Okasan Securities Group Inc. | 60,000 | 457,429 | ||||||
Sawada Holdings Co. Ltd. | 6,000 | 42,797 | ||||||
SPARX Group Co. Ltd. | 30,000 | 63,532 | ||||||
Tokai Tokyo Financial Holdings Inc. | 69,000 | 504,789 | ||||||
|
| |||||||
| 2,727,304 | ||||||||
CHEMICALS — 6.61% |
| |||||||
Achilles Corp. | 60,000 | 83,746 | ||||||
Adeka Corp. | 27,000 | 360,745 | ||||||
C. Uyemura & Co. Ltd. | 3,000 | 164,605 | ||||||
Chugoku Marine Paints Ltd. | 30,000 | 224,960 | ||||||
Dainichiseika Color & Chemicals Manufacturing Co. Ltd. | 30,000 | 153,343 | ||||||
Daiso Co. Ltd. | 30,000 | 98,185 | ||||||
Denki Kagaku Kogyo K.K. | 120,000 | 406,603 | ||||||
DIC Corp. | 240,000 | 547,528 | ||||||
Earth Chemical Co. Ltd. | 3,000 | 115,945 | ||||||
Fujimi Inc. | 6,000 | 91,775 | ||||||
Fujimori Kogyo Co. Ltd. | 3,000 | 92,699 | ||||||
Ishihara Sangyo Kaisha Ltd.b | 120,000 | 106,271 | ||||||
JSP Corp. | 6,000 | 105,001 | ||||||
Konishi Co. Ltd. | 6,000 | 118,862 | ||||||
Kureha Corp. | 30,000 | 148,145 | ||||||
Lintec Corp. | 15,000 | 321,413 | ||||||
Nihon Nohyaku Co. Ltd. | 15,000 | 157,530 | ||||||
Nihon Parkerizing Co. Ltd. | 12,000 | 276,190 | ||||||
Nippon Kayaku Co. Ltd. | 60,000 | 738,124 | ||||||
Nippon Shokubai Co. Ltd. | 33,000 | 400,886 | ||||||
Nippon Soda Co. Ltd. | 30,000 | 158,541 | ||||||
Nippon Synthetic Chemical Industry Co. Ltd. (The) | 11,000 | 84,709 | ||||||
Nippon Valqua Industries Ltd. | 30,000 | 90,677 | ||||||
Nissan Chemical Industries Ltd. | 42,000 | 758,454 | ||||||
NOF Corp. | 30,000 | 205,612 | ||||||
Sakai Chemical Industry Co. Ltd. | 30,000 | 92,410 | ||||||
Sakata INX Corp. | 12,000 | 112,740 | ||||||
Sanyo Chemical Industries Ltd. | 6,000 | 39,736 | ||||||
Shin-Etsu Polymer Co. Ltd. | 15,000 | 83,891 | ||||||
Showa Denko K.K. | 450,000 | 649,757 | ||||||
Sumitomo Bakelite Co. Ltd. | 60,000 | 244,309 | ||||||
| Security | Shares | Value | ||||||
Taiyo Holdings Co. Ltd. | 6,000 | $ | 202,435 | |||||
Takasago International Corp. | 30,000 | 162,295 | ||||||
Tenma Corp. | 6,000 | 93,911 | ||||||
Toagosei Co. Ltd. | 60,000 | 250,662 | ||||||
Tokai Carbon Co. Ltd. | 60,000 | 169,226 | ||||||
Tokuyama Corp. | 90,000 | 298,022 | ||||||
Tokyo Ohka Kogyo Co. Ltd. | 12,000 | 324,821 | ||||||
Tosoh Corp. | 150,000 | 620,879 | ||||||
Toyo Ink SC Holdings Co. Ltd. | 60,000 | 281,273 | ||||||
Toyobo Co. Ltd. | 270,000 | 426,241 | ||||||
Ube Industries Ltd. | 330,000 | 559,080 | ||||||
Zeon Corp. | 60,000 | 608,172 | ||||||
|
| |||||||
| 11,230,409 | ||||||||
COMMERCIAL BANKS — 6.06% |
| |||||||
77 Bank Ltd. (The) | 120,000 | 648,024 | ||||||
Aichi Bank Ltd. (The) | 3,000 | 150,744 | ||||||
Ashikaga Holdings Co. Ltd. | 30,000 | 119,267 | ||||||
Awa Bank Ltd. (The) | 60,000 | 350,580 | ||||||
Bank of Iwate Ltd. (The) | 3,000 | 140,347 | ||||||
Bank of Nagoya Ltd. (The) | 60,000 | 237,378 | ||||||
Bank of Saga Ltd. (The) | 60,000 | 138,037 | ||||||
Bank of the Ryukyus Ltd. | 12,000 | 194,407 | ||||||
Chiba Kogyo Bank Ltd. (The) | 12,000 | 88,713 | ||||||
Daishi Bank Ltd. (The) | 90,000 | 323,146 | ||||||
Eighteenth Bank Ltd. (The) | 60,000 | 160,562 | ||||||
Higashi-Nippon Bank Ltd. (The) | 60,000 | 159,985 | ||||||
Higo Bank Ltd. (The) | 60,000 | 318,237 | ||||||
Hokkoku Bank Ltd. (The) | 90,000 | 311,017 | ||||||
Hokuetsu Bank Ltd. (The) | 60,000 | 119,555 | ||||||
Hyakugo Bank Ltd. (The) | 60,000 | 240,266 | ||||||
Hyakujushi Bank Ltd. (The) | 60,000 | 202,147 | ||||||
Jimoto Holdings Inc. | 51,000 | 106,040 | ||||||
Juroku Bank Ltd. (The) | 90,000 | 343,938 | ||||||
Kagoshima Bank Ltd. (The) | 60,000 | 386,966 | ||||||
Kansai Urban Banking Corp. | 90,000 | 109,159 | ||||||
Keiyo Bank Ltd. (The) | 60,000 | 308,418 | ||||||
Kiyo Bank Ltd. (The) | 21,000 | 303,220 | ||||||
Mie Bank Ltd. (The) | 30,000 | 71,040 | ||||||
Minato Bank Ltd. (The) | 60,000 | 114,357 | ||||||
Miyazaki Bank Ltd. (The) | 60,000 | 192,328 | ||||||
Musashino Bank Ltd. (The) | 9,000 | 308,418 | ||||||
Nanto Bank Ltd. (The) | 60,000 | 254,127 | ||||||
Nishi-Nippon City Bank Ltd. (The) | 210,000 | 549,839 | ||||||
North Pacific Bank Ltd. | 108,000 | 438,716 | ||||||
Ogaki Kyoritsu Bank Ltd. (The) | 90,000 | 249,507 | ||||||
| 30 | 2014 iSHARES ANNUAL REPORTTO SHAREHOLDERS |
Table of Contents
Schedule of Investments (Continued)
iSHARES® MSCI JAPAN SMALL-CAP ETF
August 31, 2014
| Security | Shares | Value | ||||||
Oita Bank Ltd. (The) | 60,000 | $ | 225,827 | |||||
San-in Godo Bank Ltd. (The) | 60,000 | 423,353 | ||||||
Senshu Ikeda Holdings Inc. | 66,000 | 349,425 | ||||||
Shiga Bank Ltd. (The) | 60,000 | 347,692 | ||||||
Tochigi Bank Ltd. (The) | 30,000 | 123,309 | ||||||
Toho Bank Ltd. (The) | 60,000 | 213,698 | ||||||
Tokyo Tomin Bank Ltd. (The) | 9,000 | 105,954 | ||||||
TOMONY Holdings Inc. | 45,000 | 190,162 | ||||||
Towa Bank Ltd. (The) | 90,000 | 84,902 | ||||||
Tsukuba Bank Ltd. (The) | 24,000 | 86,865 | ||||||
Yachiyo Bank Ltd. (The) | 3,000 | 95,153 | ||||||
Yamagata Bank Ltd. (The) | 30,000 | 141,791 | ||||||
Yamanashi Chuo Bank Ltd. (The) | 60,000 | 267,989 | ||||||
|
| |||||||
| 10,294,605 | ||||||||
COMMERCIAL SERVICES & SUPPLIES — 1.83% |
| |||||||
AEON Delight Co. Ltd. | 6,000 | 147,451 | ||||||
Daiseki Co. Ltd. | 12,060 | 216,392 | ||||||
Duskin Co. Ltd. | 15,000 | 266,545 | ||||||
Itoki Corp. | 12,000 | 79,010 | ||||||
Kokuyo Co. Ltd. | 27,000 | 215,719 | ||||||
Kyodo Printing Co. Ltd. | 30,000 | 110,892 | ||||||
Matsuda Sangyo Co. Ltd. | 6,060 | 74,434 | ||||||
Mitsubishi Pencil Co. Ltd. | 6,000 | 190,307 | ||||||
Moshi Moshi Hotline Inc. | 12,000 | 118,631 | ||||||
Nissha Printing Co. Ltd. | 9,000 | 116,956 | ||||||
Okamura Corp. | 30,000 | 245,464 | ||||||
Oyo Corp. | 6,000 | 107,831 | ||||||
Pilot Corp. | 6,000 | 329,210 | ||||||
Pronexus Inc. | 6,000 | 44,530 | ||||||
Sanix Inc.a,b | 9,000 | 77,278 | ||||||
Sato Holdings Corp. | 6,000 | 173,268 | ||||||
Sohgo Security Services Co. Ltd. | 18,000 | 448,419 | ||||||
Toppan Forms Co. Ltd. | 15,000 | 151,754 | ||||||
|
| |||||||
| 3,114,091 | ||||||||
COMMUNICATIONS EQUIPMENT — 0.49% |
| |||||||
Denki Kogyo Co. Ltd. | 30,000 | 182,798 | ||||||
Hitachi Kokusai Electric Inc. | 30,000 | 464,937 | ||||||
Icom Inc. | 3,000 | 69,163 | ||||||
Japan Radio Co. Ltd.b | 30,000 | 119,267 | ||||||
|
| |||||||
| 836,165 | ||||||||
COMPUTERS & PERIPHERALS — 0.61% |
| |||||||
Eizo Nanao Corp. | 6,000 | 155,942 | ||||||
Elecom Co. Ltd. | 3,000 | 74,390 | ||||||
Japan Digital Laboratory Co. Ltd. | 6,000 | 110,314 | ||||||
Melco Holdings Inc. | 3,000 | 65,322 | ||||||
| Security | Shares | Value | ||||||
Riso Kagaku Corp. | 3,000 | $ | 97,319 | |||||
Roland DG Corp. | 3,000 | 126,631 | ||||||
Toshiba Tec Corp. | 30,000 | 190,018 | ||||||
Wacom Co. Ltd.a | 48,000 | 216,239 | ||||||
|
| |||||||
| 1,036,175 | ||||||||
CONSTRUCTION & ENGINEERING — 4.71% |
| |||||||
Chudenko Corp. | 9,000 | 144,766 | ||||||
COMSYS Holdings Corp. | 33,000 | 630,871 | ||||||
Fudo Tetra Corp.a | 51,000 | 122,241 | ||||||
Hazama Ando Corp. | 54,000 | 398,691 | ||||||
Hibiya Engineering Ltd. | 6,000 | 93,507 | ||||||
Kandenko Co. Ltd. | 30,000 | 161,717 | ||||||
Kinden Corp. | 30,000 | 322,279 | ||||||
Kumagai Gumi Co. Ltd.b | 60,000 | 213,698 | ||||||
Kyowa Exeo Corp. | 24,000 | 327,824 | ||||||
Maeda Corp. | 30,000 | 274,053 | ||||||
Maeda Road Construction Co. Ltd. | 30,000 | 506,233 | ||||||
MIRAIT Holdings Corp. | 18,000 | �� | 205,323 | |||||
Nippo Corp. | 16,000 | 314,810 | ||||||
Nippon Densetsu Kogyo Co. Ltd. | 12,000 | 201,223 | ||||||
Nippon Koei Co. Ltd. | 30,000 | 136,593 | ||||||
Nippon Road Co. Ltd. (The) | 30,000 | 168,937 | ||||||
Nippon Steel & Sumikin Texeng Co. Ltd. | 8,000 | 48,823 | ||||||
Nishimatsu Construction Co. Ltd. | 90,000 | 480,820 | ||||||
Okumura Corp. | 60,000 | 351,158 | ||||||
OSJB Holdings Corp.a | 60,000 | 87,212 | ||||||
Penta-Ocean Construction Co. Ltd. | 87,000 | 319,911 | ||||||
Raito Kogyo Co. Ltd. | 15,000 | 134,572 | ||||||
SHO-BOND Holdings Co. Ltd. | 6,000 | 249,507 | ||||||
Sumitomo Densetsu Co. Ltd. | 6,000 | 83,804 | ||||||
Sumitomo Mitsui Construction Co. Ltd.b | 228,000 | 278,731 | ||||||
Taihei Dengyo Kaisha Ltd. | 1,000 | 7,595 | ||||||
Taikisha Ltd. | 9,000 | 213,727 | ||||||
Tekken Corp.a | 30,000 | 142,658 | ||||||
Toa Corp. | 60,000 | 111,469 | ||||||
Toda Corp. | 60,000 | 316,504 | ||||||
Tokyu Construction Co. Ltd. | 21,040 | 108,354 | ||||||
Toshiba Plant Systems & Services Corp. | 12,000 | 203,186 | ||||||
Totetsu Kogyo Co. Ltd. | 6,000 | 148,895 | ||||||
Toyo Construction Co. Ltd. | 21,000 | 103,903 | ||||||
Toyo Engineering Corp. | 30,000 | 145,257 | ||||||
Yahagi Construction Co. Ltd. | 9,000 | 67,835 | ||||||
SCHEDULESOF INVESTMENTS | 31 |
Table of Contents
Schedule of Investments (Continued)
iSHARES® MSCI JAPAN SMALL-CAP ETF
August 31, 2014
| Security | Shares | Value | ||||||
Yokogawa Bridge Holdings Corp. | 12,000 | $ | 175,925 | |||||
|
| |||||||
| 8,002,612 | ||||||||
CONSTRUCTION MATERIALS — 0.25% |
| |||||||
Sumitomo Osaka Cement Co. Ltd. | 120,000 | 423,930 | ||||||
|
| |||||||
| 423,930 | ||||||||
CONSUMER FINANCE — 0.91% |
| |||||||
AIFUL Corp.a,b | 93,000 | 411,802 | ||||||
Hitachi Capital Corp. | 15,000 | 395,052 | ||||||
J Trust Co. Ltd. | 24,000 | 264,754 | ||||||
Jaccs Co. Ltd. | 30,000 | 175,001 | ||||||
Orient Corp.b | 111,000 | 256,438 | ||||||
Pocket Card Co. Ltd. | 6,000 | 39,505 | ||||||
|
| |||||||
| 1,542,552 | ||||||||
CONTAINERS & PACKAGING — 0.47% |
| |||||||
FP Corp. | 6,000 | 193,195 | ||||||
Fuji Seal International Inc. | 6,000 | 202,435 | ||||||
Pack Corp. (The) | 6,000 | 116,032 | ||||||
Rengo Co. Ltd. | 60,000 | 282,428 | ||||||
|
| |||||||
| 794,090 | ||||||||
DISTRIBUTORS — 0.37% |
| |||||||
Canon Marketing Japan Inc. | 15,000 | 300,332 | ||||||
Chori Co. Ltd. | 6,000 | 74,332 | ||||||
Doshisha Co. Ltd. | 6,000 | 108,582 | ||||||
Paltac Corp. | 12,000 | 153,516 | ||||||
|
| |||||||
| 636,762 | ||||||||
DIVERSIFIED CONSUMER SERVICES — 0.07% |
| |||||||
JP-Holdings Inc.a | 18,000 | 73,119 | ||||||
Tsukada Global Holdings Inc. | 6,000 | 51,865 | ||||||
|
| |||||||
| 124,984 | ||||||||
DIVERSIFIED FINANCIAL SERVICES — 0.93% |
| |||||||
Century Tokyo Leasing Corp. | 12,080 | 357,568 | ||||||
Financial Products Group Co. Ltd.a | 6,000 | 57,005 | ||||||
Fuyo General Lease Co. Ltd. | 6,000 | 240,554 | ||||||
IBJ Leasing Co. Ltd. | 6,000 | 147,452 | ||||||
Japan Securities Finance Co. Ltd. | 33,000 | 206,161 | ||||||
Ricoh Leasing Co. Ltd. | 6,000 | 173,557 | ||||||
Zenkoku Hosho Co. Ltd. | 15,000 | 402,272 | ||||||
|
| |||||||
| 1,584,569 | ||||||||
ELECTRIC UTILITIES — 0.41% |
| |||||||
Hokkaido Electric Power Co. Inc.b | 57,000 | 492,718 | ||||||
Okinawa Electric Power Co. Inc. (The) | 6,000 | 195,505 | ||||||
|
| |||||||
| 688,223 | ||||||||
| Security | Shares | Value | ||||||
ELECTRICAL EQUIPMENT — 1.77% |
| |||||||
Chiyoda Integre Co. Ltd. | 6,000 | $ | 85,537 | |||||
Cosel Co. Ltd. | 6,000 | 76,527 | ||||||
Daihen Corp. | 30,000 | 121,288 | ||||||
Denyo Co. Ltd. | 3,000 | 43,288 | ||||||
Fujikura Ltd. | 90,000 | 440,968 | ||||||
Furukawa Electric Co. Ltd. | 210,000 | 452,808 | ||||||
Futaba Corp. | 9,000 | 138,788 | ||||||
GS Yuasa Corp. | 120,000 | 723,107 | ||||||
IDEC Corp. | 9,000 | 77,971 | ||||||
Nitto Kogyo Corp. | 9,000 | 186,177 | ||||||
SWCC Showa Holdings Co. Ltd.a,b | 60,000 | 67,575 | ||||||
Takaoka Toko Co. Ltd. | 6,000 | 88,252 | ||||||
Tatsuta Electric Wire and Cable Co. Ltd. | 12,000 | 62,839 | ||||||
Toyo Tanso Co. Ltd. | 3,000 | 66,333 | ||||||
Ushio Inc. | 33,000 | 369,755 | ||||||
|
| |||||||
| 3,001,213 | ||||||||
ELECTRONIC EQUIPMENT, INSTRUMENTS & COMPONENTS — 3.97% |
| |||||||
Ai Holdings Corp. | 12,000 | 243,731 | ||||||
Alps Electric Co. Ltd. | 54,000 | 869,635 | ||||||
Amano Corp. | 18,000 | 194,581 | ||||||
Anritsu Corp. | 42,000 | 358,204 | ||||||
Azbil Corp. | 18,000 | 456,389 | ||||||
Canon Electronics Inc. | 6,000 | 114,357 | ||||||
Daiwabo Holdings Co. Ltd. | 60,000 | 120,710 | ||||||
Enplas Corp. | 3,000 | 169,514 | ||||||
HORIBA Ltd. | 9,000 | 338,307 | ||||||
Hosiden Corp. | 18,000 | 98,243 | ||||||
Iriso Electronics Co. Ltd. | 3,000 | 222,650 | ||||||
Japan Aviation Electronics Industry Ltd. | 12,000 | 276,421 | ||||||
Japan Cash Machine Co. Ltd.a | 6,000 | 121,519 | ||||||
Kaga Electronics Co. Ltd. | 6,000 | 76,296 | ||||||
Koa Corp. | 9,000 | 93,132 | ||||||
Macnica Inc. | 3,000 | 97,608 | ||||||
MARUWA Co. Ltd. | 3,000 | 98,908 | ||||||
Mitsumi Electric Co. Ltd. | 27,000 | 221,437 | ||||||
Nichicon Corp. | 15,000 | 109,592 | ||||||
Nidec Copal Electronics Corp. | 6,000 | 52,847 | ||||||
Nippon Ceramic Co. Ltd. | 6,000 | �� | 93,045 | |||||
Nippon Chemi-Con Corp.b | 60,000 | 177,312 | ||||||
Nippon Signal Co. Ltd. (The) | 18,000 | 185,397 | ||||||
Oki Electric Industry Co. Ltd. | 210,000 | 475,045 | ||||||
| 32 | 2014 iSHARES ANNUAL REPORTTO SHAREHOLDERS |
Table of Contents
Schedule of Investments (Continued)
iSHARES® MSCI JAPAN SMALL-CAP ETF
August 31, 2014
| Security | Shares | Value | ||||||
Ryosan Co. Ltd. | 9,000 | $ | 198,046 | |||||
Ryoyo Electro Corp. | 6,000 | 66,477 | ||||||
SIIX Corp. | 3,000 | 49,410 | ||||||
Taiyo Yuden Co. Ltd. | 30,000 | 303,220 | ||||||
TOKO Inc. | 30,000 | 91,544 | ||||||
Topcon Corp. | 24,000 | 561,159 | ||||||
Toyo Corp. | 9,000 | 102,575 | ||||||
UKC Holdings Corp. | 6,000 | 105,578 | ||||||
|
| |||||||
| 6,742,889 | ||||||||
ENERGY EQUIPMENT & SERVICES — 0.28% |
| |||||||
Japan Drilling Co. Ltd. | 3,000 | 144,390 | ||||||
Modec Inc. | 6,000 | 164,085 | ||||||
Shinko Plantech Co. Ltd. | 12,000 | 93,219 | ||||||
Toyo Kanetsu K.K. | 30,000 | 75,372 | ||||||
|
| |||||||
| 477,066 | ||||||||
FOOD & STAPLES RETAILING — 2.80% |
| |||||||
Ain Pharmaciez Inc. | 3,000 | 145,257 | ||||||
Arcs Co. Ltd. | 9,000 | 190,595 | ||||||
Cawachi Ltd. | 6,000 | 104,712 | ||||||
cocokara fine Inc. | 6,000 | 159,003 | ||||||
Cosmos Pharmaceutical Corp. | 3,000 | 374,549 | ||||||
CREATE HOLDINGS Co. Ltd. | 3,000 | 105,405 | ||||||
Heiwado Co. Ltd. | 9,000 | 146,412 | ||||||
Kasumi Co. Ltd. | 12,000 | 97,261 | ||||||
Kato Sangyo Co. Ltd. | 6,000 | 130,991 | ||||||
Maruetsu Inc. (The) | 30,000 | 129,951 | ||||||
Matsumotokiyoshi Co. Ltd. | 12,000 | 379,458 | ||||||
Ministop Co. Ltd. | 6,000 | 89,522 | ||||||
Mitsubishi Shokuhin Co. Ltd. | 3,000 | 70,896 | ||||||
San-A & Co. Ltd. | 6,000 | 213,698 | ||||||
Sugi Holdings Co. Ltd. | 12,000 | 500,169 | ||||||
Sundrug Co. Ltd. | 9,000 | 400,250 | ||||||
Tsuruha Holdings Inc. | 9,000 | 492,083 | ||||||
UNY Co. Ltd. | 66,000 | 371,661 | ||||||
Valor Co. Ltd. | 12,000 | 192,559 | ||||||
Welcia Holdings Co. Ltd. | 6,000 | 176,445 | ||||||
Yaoko Co. Ltd. | 3,000 | 180,488 | ||||||
Yokohama Reito Co. Ltd. | 12,000 | 95,413 | ||||||
|
| |||||||
| 4,746,778 | ||||||||
FOOD PRODUCTS — 3.02% |
| |||||||
Ariake Japan Co. Ltd. | 6,000 | 140,174 | ||||||
Dydo Drinco Inc. | 3,000 | 127,352 | ||||||
Ezaki Glico Co. Ltd. | 30,000 | 586,803 | ||||||
Fuji Oil Co. Ltd. New | 18,000 | 296,289 | ||||||
Fujiya Co. Ltd. | 30,000 | 57,179 | ||||||
| Security | Shares | Value | ||||||
Hokuto Corp. | 6,000 | $ | 113,549 | |||||
House Foods Group Inc. | 18,000 | 323,319 | ||||||
Itoham Foods Inc. | 60,000 | 289,936 | ||||||
J-Oil Mills Inc. | 30,000 | 99,629 | ||||||
Kagome Co. Ltd. | 24,000 | 405,448 | ||||||
Kameda Seika Co. Ltd. | 3,000 | 93,998 | ||||||
Kewpie Corp. | 30,000 | 514,608 | ||||||
KEY Coffee Inc. | 6,000 | 95,009 | ||||||
Marudai Food Co. Ltd. | 30,000 | 113,202 | ||||||
Maruha Nichiro Corp. | 12,000 | 187,130 | ||||||
MEGMILK SNOW BRAND Co. Ltd. | 12,000 | 157,790 | ||||||
Mitsui Sugar Co. Ltd. | 30,000 | 112,913 | ||||||
Morinaga & Co. Ltd. | 60,000 | 127,641 | ||||||
Morinaga Milk Industry Co. Ltd. | 60,000 | 209,655 | ||||||
Nichirei Corp. | 60,000 | 283,005 | ||||||
Nippon Beet Sugar Manufacturing Co. Ltd. | 30,000 | 56,024 | ||||||
Nippon Flour Mills Co. Ltd. | 30,000 | 151,032 | ||||||
Nippon Suisan Kaisha Ltd.b | 75,000 | 218,030 | ||||||
Nisshin OilliO Group Ltd. (The) | 30,000 | 105,983 | ||||||
Prima Meat Packers Ltd. | 30,000 | 82,591 | ||||||
Sakata Seed Corp. | 9,000 | 119,902 | ||||||
Warabeya Nichiyo Co. Ltd. | 3,000 | 57,352 | ||||||
|
| |||||||
| 5,125,543 | ||||||||
GAS UTILITIES — 0.07% |
| |||||||
Shizuoka Gas Co. Ltd. | 18,000 | 119,382 | ||||||
|
| |||||||
| 119,382 | ||||||||
HEALTH CARE EQUIPMENT & SUPPLIES — 1.62% |
| |||||||
Asahi Intecc Co. Ltd. | 6,000 | 280,695 | ||||||
Eiken Chemical Co. Ltd. | 6,000 | 105,925 | ||||||
Fukuda Denshi Co. Ltd. | 3,000 | 179,044 | ||||||
Hogy Medical Co. Ltd. | 3,000 | 168,359 | ||||||
JEOL Ltd. | 30,000 | 127,930 | ||||||
Mani Inc. | 3,000 | 168,937 | ||||||
Nagaileben Co. Ltd. | 6,000 | 117,014 | ||||||
Nakanishi Inc. | 6,000 | 240,554 | ||||||
Nihon Kohden Corp. | 12,000 | 665,351 | ||||||
Nikkiso Co. Ltd. | 18,000 | 213,813 | ||||||
Nipro Corp.a | 33,000 | 291,611 | ||||||
Paramount Bed Holdings Co. Ltd. | 6,000 | 185,109 | ||||||
|
| |||||||
| 2,744,342 | ||||||||
HEALTH CARE PROVIDERS & SERVICES — 0.75% |
| |||||||
AS ONE Corp. | 3,000 | 98,763 | ||||||
BML Inc. | 3,000 | 99,196 | ||||||
Message Co. Ltd. | 3,000 | 105,838 | ||||||
SCHEDULESOF INVESTMENTS | 33 |
Table of Contents
Schedule of Investments (Continued)
iSHARES® MSCI JAPAN SMALL-CAP ETF
August 31, 2014
| Security | Shares | Value | ||||||
Nichii Gakkan Co. | 15,000 | $ | 126,342 | |||||
Ship Healthcare Holdings Inc. | 9,000 | 287,626 | ||||||
Toho Holdings Co. Ltd. | 15,000 | 290,802 | ||||||
Tokai Corp. (GIFU) | 3,000 | 94,287 | ||||||
Tsukui Corp. | 9,000 | 90,619 | ||||||
Vital KSK Holdings Inc. | 9,000 | 79,444 | ||||||
|
| |||||||
| 1,272,917 | ||||||||
HOTELS, RESTAURANTS & LEISURE — 3.01% |
| |||||||
Accordia Golf Co. Ltd.a | 27,000 | 323,319 | ||||||
Atom Corp. | 15,000 | 88,078 | ||||||
Colowide Co. Ltd. | 18,000 | 236,512 | ||||||
Doutor Nichires Holdings Co. Ltd. | 12,000 | 196,717 | ||||||
Fuji Kyuko Co. Ltd. | 30,000 | 322,857 | ||||||
Fujita Kanko Inc. | 30,000 | 110,025 | ||||||
H.I.S. Co. Ltd. | 12,000 | 358,666 | ||||||
Hiramatsu Inc. | 9,000 | 55,619 | ||||||
Ichibanya Co. Ltd. | 3,000 | 137,893 | ||||||
Kappa Create Co. Ltd.b | 9,000 | 93,912 | ||||||
Kisoji Co. Ltd. | 6,000 | 113,606 | ||||||
KNT-CT Holdings Co. Ltd.b | 30,000 | 51,692 | ||||||
Kura Corp. | 3,000 | 85,479 | ||||||
Kyoritsu Maintenance Co. Ltd. | 3,000 | 133,128 | ||||||
MOS Food Services Inc. | 9,000 | 192,328 | ||||||
Ohsho Food Service Corp. | 3,000 | 115,801 | ||||||
PGM Holdings K.K. | 6,000 | 60,413 | ||||||
Plenus Co. Ltd. | 6,000 | 143,871 | ||||||
Resorttrust Inc. | 21,000 | 461,501 | ||||||
Ringer Hut Co. Ltd.a | 6,000 | 92,987 | ||||||
Round One Corp. | 21,000 | 136,853 | ||||||
Royal Holdings Co. Ltd. | 9,000 | 147,885 | ||||||
Saint Marc Holdings Co. Ltd. | 3,000 | 169,803 | ||||||
Saizeriya Co. Ltd. | 9,000 | 123,107 | ||||||
Starbucks Coffee Japan Ltd. | 12,000 | 146,470 | ||||||
Tokyo Dome Corp. | 60,000 | 278,385 | ||||||
Tokyotokeiba Co. Ltd.a | 30,000 | 94,720 | ||||||
Toridoll Corp. | 6,000 | 66,651 | ||||||
Watami Co. Ltd.a | 6,000 | 76,238 | ||||||
Yomiuri Land Co. Ltd. | 6,000 | 29,225 | ||||||
Yoshinoya Holdings Co. Ltd. | 15,000 | 185,397 | ||||||
Zensho Holdings Co. Ltd.a | 30,000 | 280,117 | ||||||
|
| |||||||
| 5,109,255 | ||||||||
HOUSEHOLD DURABLES — 2.28% |
| |||||||
Alpine Electronics Inc. | 12,000 | 191,519 | ||||||
Chofu Seisakusho Co. Ltd. | 6,000 | 159,003 | ||||||
Clarion Co. Ltd.a,b | 30,000 | 130,818 | ||||||
| Security | Shares | Value | ||||||
Cleanup Corp. | 6,000 | $ | 55,504 | |||||
Corona Corp. | 6,000 | 69,827 | ||||||
Foster Electric Co. Ltd. | 6,000 | 87,443 | ||||||
France Bed Holdings Co. Ltd. | 30,000 | 54,580 | ||||||
Fujitsu General Ltd. | 30,000 | 417,577 | ||||||
Funai Electric Co. Ltd. | 6,000 | 65,322 | ||||||
Haseko Corp. | 87,000 | 721,057 | ||||||
JVC Kenwood Corp.b | 42,000 | 112,798 | ||||||
Misawa Homes Co. Ltd. | 9,000 | 99,976 | ||||||
PanaHome Corp. | 30,000 | 217,163 | ||||||
Pioneer Corp.b | 87,000 | 270,501 | ||||||
Sangetsu Co. Ltd. | 9,000 | 244,655 | ||||||
Starts Corp. Inc. | 6,000 | 98,474 | ||||||
Sumitomo Forestry Co. Ltd. | 42,000 | 469,789 | ||||||
Takamatsu Construction Group Co. Ltd. | 3,000 | 53,655 | ||||||
Tama Home Co. Ltd.a | 6,000 | 39,101 | ||||||
Tamron Co. Ltd. | 6,000 | 126,139 | ||||||
Token Corp. | 2,320 | 105,744 | ||||||
West Holdings Corp. | 6,000 | 82,996 | ||||||
|
| |||||||
| 3,873,641 | ||||||||
HOUSEHOLD PRODUCTS — 0.62% |
| |||||||
Lion Corp. | 60,000 | 348,847 | ||||||
Pigeon Corp. | 12,000 | 710,401 | ||||||
|
| |||||||
| 1,059,248 | ||||||||
INDEPENDENT POWER PRODUCERS & ENERGY TRADERS — 0.05% |
| |||||||
Eneres Co. Ltd.b | 6,000 | 84,382 | ||||||
|
| |||||||
| 84,382 | ||||||||
INDUSTRIAL CONGLOMERATES — 0.32% |
| |||||||
Katakura Industries Co. Ltd. | 6,000 | 78,086 | ||||||
Nisshinbo Holdings Inc. | 36,000 | 335,794 | ||||||
TOKAI Holdings Corp. | 27,000 | 134,370 | ||||||
|
| |||||||
| 548,250 | ||||||||
INTERNET & CATALOG RETAIL — 0.47% |
| |||||||
Askul Corp.a | 6,000 | 144,390 | ||||||
Belluna Co. Ltd. | 15,000 | 69,019 | ||||||
Ikyu Corp. | 6,000 | 84,439 | ||||||
Senshukai Co. Ltd. | 9,000 | 74,765 | ||||||
Start Today Co. Ltd. | 18,000 | 428,840 | ||||||
|
| |||||||
| 801,453 | ||||||||
INTERNET SOFTWARE & SERVICES — 1.03% |
| |||||||
F@N Communications Inc. | 12,000 | 147,625 | ||||||
GMO Internet Inc. | 21,000 | 198,508 | ||||||
| 34 | 2014 iSHARES ANNUAL REPORTTO SHAREHOLDERS |
Table of Contents
Schedule of Investments (Continued)
iSHARES® MSCI JAPAN SMALL-CAP ETF
August 31, 2014
| Security | Shares | Value | ||||||
Gurunavi Inc. | 9,000 | $ | 142,600 | |||||
Infomart Corp. | 6,000 | 106,272 | ||||||
Internet Initiative Japan Inc.a | 9,000 | 188,256 | ||||||
Mixi Inc.a | 15,000 | 843,240 | ||||||
SMS Co. Ltd. | 3,000 | 77,740 | ||||||
UNITED Inc.a | 3,000 | 49,439 | ||||||
|
| |||||||
| 1,753,680 | ||||||||
IT SERVICES — 1.72% |
| |||||||
Digital Garage Inc. | 9,000 | 158,281 | ||||||
Future Architect Inc. | 9,000 | 49,122 | ||||||
GMO Payment Gateway Inc. | 3,037 | 146,463 | ||||||
Ines Corp. | 12,000 | 99,110 | ||||||
Information Services International-Dentsu Ltd. | 3,000 | 34,567 | ||||||
IT Holdings Corp. | 24,048 | 443,991 | ||||||
NEC Networks & System Integration Corp. | 6,000 | 141,965 | ||||||
Net One Systems Co. Ltd. | 27,000 | 168,417 | ||||||
Nihon Unisys Ltd. | 18,000 | 166,338 | ||||||
NS Solutions Corp. | 6,000 | 177,311 | ||||||
OBIC Co. Ltd. | 21,000 | 720,653 | ||||||
SCSK Corp. | 15,256 | 436,305 | ||||||
Trans Cosmos Inc. | 9,000 | 182,885 | ||||||
|
| |||||||
| 2,925,408 | ||||||||
LEISURE EQUIPMENT & PRODUCTS — 0.51% |
| |||||||
Daikoku Denki Co. Ltd. | 3,000 | 59,315 | ||||||
Dunlop Sports Co. Ltd. | 3,000 | 35,549 | ||||||
Fields Corp. | 3,000 | 45,396 | ||||||
Heiwa Corp. | 12,000 | 274,342 | ||||||
Mars Engineering Corp. | 3,000 | 60,702 | ||||||
Mizuno Corp. | 30,000 | 174,424 | ||||||
Tomy Co. Ltd. | 21,000 | 114,415 | ||||||
Universal Entertainment Corp. | 6,000 | 107,022 | ||||||
|
| |||||||
| 871,165 | ||||||||
LIFE SCIENCES TOOLS & SERVICES — 0.16% |
| |||||||
Chiome Bioscience Inc.a,b | 6,000 | 83,573 | ||||||
CMIC Holdings Co. Ltd. | 6,000 | 116,206 | ||||||
EPS Co. Ltd. | 6,000 | 75,949 | ||||||
|
| |||||||
| 275,728 | ||||||||
MACHINERY — 8.13% |
| |||||||
Aichi Corp. | 12,000 | 57,756 | ||||||
Aida Engineering Ltd. | 15,000 | 143,524 | ||||||
Asahi Diamond Industrial Co. Ltd. | 18,000 | 252,972 | ||||||
Bando Chemical Industries Ltd. | 30,000 | 120,710 | ||||||
| Security | Shares | Value | ||||||
CKD Corp. | 18,000 | $ | 170,669 | |||||
Daifuku Co. Ltd. | 27,000 | 320,460 | ||||||
Daiwa Industries Ltd. | 8,000 | 59,912 | ||||||
DMG Mori Seiki Co Ltd. | 39,000 | 491,794 | ||||||
Ebara Corp. | 150,000 | 847,572 | ||||||
Fuji Machine Manufacturing Co. Ltd. | 21,000 | 200,125 | ||||||
Fujitec Co. Ltd. | 24,000 | 281,157 | ||||||
Furukawa Co. Ltd. | 90,000 | 207,922 | ||||||
Glory Ltd. | 18,000 | 544,930 | ||||||
Hitachi Koki Co. Ltd. | 15,000 | 126,342 | ||||||
Hitachi Zosen Corp. | 51,000 | 250,373 | ||||||
Hoshizaki Electric Co. Ltd. | 12,000 | 586,803 | ||||||
Iseki & Co. Ltd. | 60,000 | 161,140 | ||||||
Japan Steel Works Ltd. (The) | 90,000 | 388,988 | ||||||
Juki Corp.b | 30,000 | 91,255 | ||||||
Kitz Corp. | 27,000 | 144,506 | ||||||
Komori Corp. | 15,000 | 174,279 | ||||||
Kyokuto Kaihatsu Kogyo Co. Ltd. | 9,000 | 131,251 | ||||||
Makino Milling Machine Co. Ltd. | 30,000 | 222,939 | ||||||
Max Co. Ltd. | 4,000 | 46,551 | ||||||
Meidensha Corp. | 60,000 | 241,421 | ||||||
Minebea Co. Ltd. | 90,000 | 1,127,978 | ||||||
Mitsui Engineering & Shipbuilding Co. Ltd. | 240,000 | 524,426 | ||||||
Miura Co. Ltd. | 9,000 | 311,017 | ||||||
Nachi-Fujikoshi Corp. | 60,000 | 399,673 | ||||||
Namura Shipbuilding Co. Ltd.a | 12,000 | 111,700 | ||||||
Nippon Sharyo Ltd. | 30,000 | 117,534 | ||||||
Nippon Thompson Co. Ltd. | 30,000 | 155,942 | ||||||
Nitta Corp. | 6,000 | 146,470 | ||||||
Nitto Kohki Co. Ltd. | 3,000 | 60,731 | ||||||
Noritake Co. Ltd. | 30,000 | 77,393 | ||||||
NTN Corp. | 150,000 | 630,986 | ||||||
Obara Group Inc. | 3,000 | 114,357 | ||||||
Oiles Corp. | 6,080 | 154,041 | ||||||
Okuma Corp. | 30,000 | 241,132 | ||||||
OSG Corp. | 24,000 | 410,069 | ||||||
Ryobi Ltd. | 30,000 | 89,522 | ||||||
Shibuya Kogyo Co. Ltd. | 6,000 | 168,128 | ||||||
Shima Seiki Manufacturing Ltd. | 9,000 | 145,286 | ||||||
ShinMaywa Industries Ltd. | 30,000 | 294,845 | ||||||
Sintokogio Ltd. | 15,000 | 100,496 | ||||||
Star Micronics Co. Ltd. | 12,000 | 169,226 | ||||||
Tadano Ltd. | 32,000 | 576,022 | ||||||
Takeuchi Manufacturing Co. Ltd. | 3,000 | 137,315 | ||||||
SCHEDULESOF INVESTMENTS | 35 |
Table of Contents
Schedule of Investments (Continued)
iSHARES® MSCI JAPAN SMALL-CAP ETF
August 31, 2014
| Security | Shares | Value | ||||||
Takuma Co. Ltd. | 30,000 | $ | 191,750 | |||||
Teikoku Sen-I Co. Ltd. | 6,000 | 123,887 | ||||||
Tocalo Co. Ltd. | 6,000 | 118,920 | ||||||
Torishima Pump Manufacturing Co. Ltd.a | 6,000 | 52,269 | ||||||
Toshiba Machine Co. Ltd. | 30,000 | 132,839 | ||||||
Tsubakimoto Chain Co. | 30,000 | 255,860 | ||||||
Tsugami Corp. | 30,000 | 159,118 | ||||||
Union Tool Co. | 3,000 | 77,855 | ||||||
YAMABIKO Corp. | 3,000 | 98,619 | ||||||
Yushin Precision Equipment Co. Ltd. | 3,000 | 69,510 | ||||||
|
| |||||||
| 13,810,267 | ||||||||
MARINE — 0.56% |
| |||||||
Daiichi Chuo Kisen Kaishaa,b | 60,000 | 51,980 | ||||||
Iino Kaiun Kaisha Ltd. | 27,000 | 170,756 | ||||||
Kawasaki Kisen Kaisha Ltd. | 270,000 | 649,757 | ||||||
NS United Kaiwn Kaisha Ltd. | 30,000 | 77,971 | ||||||
|
| |||||||
| 950,464 | ||||||||
MEDIA — 1.84% |
| |||||||
Adways Inc.a,b | 6,000 | 90,273 | ||||||
Asatsu-DK Inc. | 9,000 | 237,898 | ||||||
Avex Group Holdings Inc. | 12,000 | 196,717 | ||||||
COOKPAD Inc.a | 3,000 | 99,629 | ||||||
CyberAgent Inc. | 15,000 | 514,030 | ||||||
Daiichikosho Co. Ltd. | 12,000 | 350,580 | ||||||
Gakken Holdings Co. Ltd. | 30,000 | 80,281 | ||||||
Kadokawa Corp. | 6,000 | 155,999 | ||||||
Next Co. Ltd. | 6,000 | 45,743 | ||||||
Shochiku Co. Ltd. | 30,000 | 279,540 | ||||||
SKY Perfect JSAT Holdings Inc. | 54,000 | 331,116 | ||||||
Toei Co. Ltd. | 30,000 | 165,183 | ||||||
Tohokushinsha Film Corp. | 6,000 | 49,497 | ||||||
Tokyo Broadcasting System Holdings Inc. | 12,000 | 138,384 | ||||||
TV Asahi Holdings Corp. | 6,000 | 103,846 | ||||||
USEN Corp.b | 36,580 | 133,453 | ||||||
ValueCommerce Co. Ltd.a | 6,000 | 47,476 | ||||||
Zenrin Co. Ltd. | 9,000 | 105,261 | ||||||
|
| |||||||
| 3,124,906 | ||||||||
METALS & MINING — 2.51% |
| |||||||
Aichi Steel Corp. | 30,000 | 116,090 | ||||||
Asahi Holdings Inc. | 9,000 | 159,234 | ||||||
Dowa Holdings Co. Ltd. | 90,000 | 808,298 | ||||||
Godo Steel Ltd. | 30,000 | 47,071 | ||||||
Kurimoto Ltd. | 30,000 | 71,040 | ||||||
| Security | Shares | Value | ||||||
Kyoei Steel Ltd. | 6,000 | $ | 111,296 | |||||
Mitsubishi Steel Manufacturing Co. Ltd. | 30,000 | 67,286 | ||||||
Mitsui Mining & Smelting Co. Ltd. | 180,000 | 554,459 | ||||||
Nakayama Steel Works Ltd.b | 60,000 | 47,938 | ||||||
Neturen Co. Ltd. | 9,000 | 65,409 | ||||||
Nippon Denko Co. Ltd. | 30,000 | 79,415 | ||||||
Nippon Light Metal Holdings Co. Ltd. | 156,000 | 249,276 | ||||||
Nippon Yakin Kogyo Co. Ltd.a,b | 45,000 | 130,384 | ||||||
Nisshin Steel Co. Ltd. | 24,000 | 255,513 | ||||||
Nittetsu Mining Co. Ltd. | 30,000 | 131,684 | ||||||
Osaka Steel Co. Ltd. | 3,000 | 58,940 | ||||||
OSAKA Titanium Technologies Co. Ltd. | 6,000 | 146,123 | ||||||
Pacific Metals Co. Ltd.b | 30,000 | 126,775 | ||||||
Sanyo Special Steel Co. Ltd. | 30,000 | 123,598 | ||||||
Toho Zinc Co. Ltd. | 30,000 | 127,641 | ||||||
Tokyo Rope Manufacturing Co. Ltd.b | 30,000 | 51,403 | ||||||
Tokyo Steel Manufacturing Co. Ltd. | 30,000 | 172,113 | ||||||
TOPY Industries Ltd. | 60,000 | 116,090 | ||||||
UACJ Corp. | 73,140 | 310,485 | ||||||
Yodogawa Steel Works Ltd. | 30,000 | 129,374 | ||||||
|
| |||||||
| 4,256,935 | ||||||||
MULTILINE RETAIL — 1.21% |
| |||||||
Daiei Inc. (The)b | 72,000 | 90,793 | ||||||
Fuji Co. Ltd. | 6,000 | 115,685 | ||||||
H2O Retailing Corp. | 24,135 | 396,113 | ||||||
Izumi Co. Ltd. | 12,000 | 375,993 | ||||||
Matsuya Co. Ltd. | 9,000 | 103,441 | ||||||
Parco Co. Ltd. | 6,000 | 50,941 | ||||||
Ryohin Keikaku Co. Ltd. | 6,000 | 674,592 | ||||||
Seria Co. Ltd. | 6,000 | 246,908 | ||||||
|
| |||||||
| 2,054,466 | ||||||||
OIL, GAS & CONSUMABLE FUELS — 0.52% |
| |||||||
Cosmo Oil Co. Ltd. | 180,000 | 337,873 | ||||||
ITOCHU Enex Co. Ltd. | 18,000 | 129,778 | ||||||
Japan Petroleum Exploration Co. Ltd. | 9,000 | 350,869 | ||||||
Nippon Coke & Engineering Co. Ltd. | 57,000 | 62,550 | ||||||
|
| |||||||
| 881,070 | ||||||||
PAPER & FOREST PRODUCTS — 0.59% |
| |||||||
Daio Paper Corp. | 30,000 | 267,411 | ||||||
Hokuetsu Kishu Paper Co. Ltd. | 39,000 | 173,442 | ||||||
Mitsubishi Paper Mills Ltd.b | 90,000 | 77,971 | ||||||
Nippon Paper Industries Co. Ltd.a | 30,000 | 484,574 | ||||||
|
| |||||||
| 1,003,398 | ||||||||
| 36 | 2014 iSHARES ANNUAL REPORTTO SHAREHOLDERS |
Table of Contents
Schedule of Investments (Continued)
iSHARES® MSCI JAPAN SMALL-CAP ETF
August 31, 2014
| Security | Shares | Value | ||||||
PERSONAL PRODUCTS — 1.35% |
| |||||||
Aderans Co. Ltd. | 6,000 | $ | 88,887 | |||||
Artnature Inc. | 3,000 | 90,966 | ||||||
Dr. Ci:Labo Co. Ltd. | 3,000 | 106,416 | ||||||
Euglena Co. Ltd.a,b | 18,000 | 231,140 | ||||||
Fancl Corp. | 12,000 | 149,935 | ||||||
Kobayashi Pharmaceutical Co. Ltd. | 9,000 | 577,850 | ||||||
Kose Corp. | 9,000 | 393,320 | ||||||
Mandom Corp. | 6,000 | 231,602 | ||||||
Milbon Co. Ltd. | 3,500 | 116,066 | ||||||
Noevir Holdings Co. Ltd. | 3,000 | 61,597 | ||||||
Pola Orbis Holdings Inc. | 6,000 | 236,800 | ||||||
|
| |||||||
| 2,284,579 | ||||||||
PHARMACEUTICALS — 2.56% |
| |||||||
Fuso Pharmaceutical Industries Ltd. | 30,000 | 91,543 | ||||||
JCR Pharmaceuticals Co. Ltd. | 3,000 | 72,686 | ||||||
Kaken Pharmaceutical Co. Ltd. | 30,000 | 756,895 | ||||||
Kissei Pharmaceutical Co. Ltd. | 6,000 | 150,224 | ||||||
KYORIN Holdings Inc. | 15,000 | 337,152 | ||||||
Mochida Pharmaceutical Co. Ltd. | 3,000 | 206,478 | ||||||
Nichi-Iko Pharmaceutical Co. Ltd. | 13,250 | 206,495 | ||||||
Nippon Shinyaku Co. Ltd. | 12,000 | 381,768 | ||||||
Rohto Pharmaceutical Co. Ltd. | 27,000 | 382,837 | ||||||
Sawai Pharmaceutical Co. Ltd. | 9,000 | 513,741 | ||||||
Seikagaku Corp. | 12,000 | 219,011 | ||||||
Sosei Group Corp.a,b | 3,000 | 130,529 | ||||||
Torii Pharmaceutical Co. Ltd. | 3,000 | 97,464 | ||||||
Towa Pharmaceutical Co. Ltd. | 3,000 | 122,443 | ||||||
Tsumura & Co. | 18,000 | 460,721 | ||||||
ZERIA Pharmaceutical Co. Ltd. | 9,000 | 220,398 | ||||||
|
| |||||||
| 4,350,385 | ||||||||
PROFESSIONAL SERVICES — 0.90% |
| |||||||
Benefit One Inc. | 9,000 | 85,768 | ||||||
En-Japan Inc. | 3,000 | 64,456 | ||||||
Meitec Corp. | 9,000 | 290,225 | ||||||
Nihon M&A Center Inc. | 9,000 | 284,593 | ||||||
Nomura Co. Ltd. | 12,000 | 111,585 | ||||||
Temp Holdings Co. Ltd. | 15,000 | 518,362 | ||||||
Weathernews Inc. | 3,000 | 92,265 | ||||||
Yumeshin Holdings Co. Ltd.a | 9,000 | 75,978 | ||||||
|
| |||||||
| 1,523,232 | ||||||||
REAL ESTATE INVESTMENT TRUSTS (REITS) — 8.83% |
| |||||||
Activia Properties Inc. | 60 | 529,624 | ||||||
Advance Residence Investment Corp. | 390 | 961,814 | ||||||
| Security | Shares | Value | ||||||
AEON REIT Investment Corp. | 270 | $ | 367,762 | |||||
Comforia Residential REIT Inc. | 120 | 222,708 | ||||||
Daiwa House REIT Investment Corp. | 90 | 409,780 | ||||||
Daiwa Office Investment Corp. | 90 | 476,488 | ||||||
Daiwahouse Residential Investment Corp. | 120 | 554,459 | ||||||
Frontier Real Estate Investment Corp. | 150 | 799,923 | ||||||
Fukuoka REIT Corp. | 210 | 402,272 | ||||||
Global One Real Estate Investment Corp. Ltd. | 60 | 177,023 | ||||||
GLP J-REIT | 600 | 719,064 | ||||||
Hankyu REIT Inc. | 30 | 178,467 | ||||||
Heiwa Real Estate REIT Inc. | 240 | 206,305 | ||||||
Hulic Reit Inc. | 210 | 356,587 | ||||||
Ichigo Real Estate Investment Corp. | 210 | 151,004 | ||||||
Industrial & Infrastructure Fund Investment Corp. | 60 | 531,357 | ||||||
Japan Excellent Inc. | 360 | 485,498 | ||||||
Japan Hotel REIT Investment Corp. | 750 | 454,108 | ||||||
Japan Logistics Fund Inc. | 270 | 622,207 | ||||||
Japan Rental Housing Investments Inc. | 300 | 223,228 | ||||||
Kenedix Realty Investment Corp. | 120 | 665,351 | ||||||
Kenedix Residential Investment Corp. | 60 | 155,711 | ||||||
MID REIT Inc. | 60 | 144,102 | ||||||
Mori Hills REIT Investment Corp. | 360 | 522,231 | ||||||
MORI TRUST Sogo REIT Inc. | 300 | 552,438 | ||||||
Nippon Accommodations Fund Inc. | 150 | 545,796 | ||||||
Nomura Real Estate Master Fund Inc. | 510 | 641,642 | ||||||
Nomura Real Estate Office Fund Inc. | 120 | 556,769 | ||||||
Nomura Real Estate Residential Fund Inc. | 60 | 331,520 | ||||||
ORIX JREIT Inc. | 600 | 804,543 | ||||||
Premier Investment Corp. | 60 | 265,390 | ||||||
Sekisui House SI Residential Investment Corp. | 270 | 283,554 | ||||||
TOKYU REIT Inc. | 300 | 415,844 | ||||||
Top REIT Inc. | 60 | 277,230 | ||||||
|
| |||||||
| 14,991,799 | ||||||||
REAL ESTATE MANAGEMENT & DEVELOPMENT — 1.37% |
| |||||||
Airport Facilities Co. Ltd. | 6,000 | 41,700 | ||||||
Ardepro Co. Ltd.b | 30,000 | 52,558 | ||||||
Daibiru Corp. | 15,000 | 150,310 | ||||||
Daikyo Inc. | 90,000 | 172,402 | ||||||
Goldcrest Co. Ltd. | 6,000 | 123,194 | ||||||
SCHEDULESOF INVESTMENTS | 37 |
Table of Contents
Schedule of Investments (Continued)
iSHARES® MSCI JAPAN SMALL-CAP ETF
August 31, 2014
| Security | Shares | Value | ||||||
Heiwa Real Estate Co. Ltd. | 12,000 | $ | 182,972 | |||||
Kenedix Inc.b | 75,000 | 334,986 | ||||||
Leopalace21 Corp.b | 75,000 | 431,727 | ||||||
Open House Co. Ltd. | 3,000 | 57,410 | ||||||
Raysum Co. Ltd.b | 6,000 | 61,337 | ||||||
Relo Holdings Inc. | 3,000 | 204,168 | ||||||
Sumitomo Real Estate Sales Co. Ltd. | 6,000 | 155,826 | ||||||
Sun Frontier Fudousan Co. Ltd. | 6,000 | 68,903 | ||||||
Takara Leben Co. Ltd. | 27,000 | 91,746 | ||||||
TOC Co. Ltd. | 21,000 | 142,716 | ||||||
Tosei Corp. | 9,000 | 56,832 | ||||||
|
| |||||||
| 2,328,787 | ||||||||
ROAD & RAIL — 1.36% |
| |||||||
Fukuyama Transporting Co. Ltd. | 30,000 | 162,295 | ||||||
Hitachi Transport System Ltd. | 15,000 | 216,874 | ||||||
Nippon Konpo Unyu Soko Co. Ltd. | 18,000 | 318,987 | ||||||
Sankyu Inc. | 90,000 | 451,365 | ||||||
Seino Holdings Co. Ltd. | 45,000 | 422,775 | ||||||
Senko Co. Ltd. | 30,000 | 148,145 | ||||||
Sotetsu Holdings Inc. | 120,000 | 471,290 | ||||||
Trancom Co. Ltd. | 3,000 | 126,053 | ||||||
|
| |||||||
| 2,317,784 | ||||||||
SEMICONDUCTORS & SEMICONDUCTOR EQUIPMENT — 1.51% |
| |||||||
Dainippon Screen Manufacturing Co. Ltd. | 60,000 | 332,098 | ||||||
DISCO Corp. | 9,000 | 576,118 | ||||||
Megachips Corp. | 6,000 | 81,725 | ||||||
Micronics Japan Co. Ltd.a | 3,000 | 185,686 | ||||||
Mimasu Semiconductor Industry Co. Ltd. | 6,000 | 53,944 | ||||||
Mitsui High-Tech Inc. | 9,000 | 62,810 | ||||||
Sanken Electric Co. Ltd. | 30,000 | 249,796 | ||||||
Shindengen Electric Manufacturing Co. Ltd. | 30,000 | 197,526 | ||||||
Shinko Electric Industries Co. Ltd. | 21,000 | 153,631 | ||||||
Sumco Corp. | 36,000 | 310,497 | ||||||
Tokyo Seimitsu Co. Ltd. | 12,000 | 201,569 | ||||||
ULVAC Inc.b | 12,000 | 161,833 | ||||||
|
| |||||||
| 2,567,233 | ||||||||
SOFTWARE — 1.46% |
| |||||||
Broadleaf Co. Ltd. | 9,000 | 152,216 | ||||||
Capcom Co. Ltd. | 15,000 | 275,786 | ||||||
Colopl Inc.a,b | 12,000 | 508,254 | ||||||
DTS Corp. | 6,000 | 130,818 | ||||||
| Security | Shares | Value | ||||||
Dwango Co. Ltd.a | 6,000 | $ | 133,475 | |||||
Fuji Soft Inc. | 6,000 | 144,102 | ||||||
Justsystems Corp.b | 12,000 | 97,723 | ||||||
Koei Tecmo Holdings Co. Ltd. | 9,000 | 137,055 | ||||||
Marvelous Inc. | 9,000 | 114,704 | ||||||
NSD Co. Ltd. | 9,000 | 140,954 | ||||||
Obic Business Consultants Co. Ltd. | 3,000 | 88,511 | ||||||
Square Enix Holdings Co. Ltd. | 24,000 | 552,149 | ||||||
|
| |||||||
| 2,475,747 | ||||||||
SPECIALTY RETAIL — 2.51% |
| |||||||
Adastria Holdings Co. Ltd. | 3,000 | 60,153 | ||||||
Alpen Co. Ltd. | 6,000 | 96,395 | ||||||
Aoki Holdings Inc. | 15,000 | 179,622 | ||||||
Aoyama Trading Co. Ltd. | 15,000 | 371,517 | ||||||
Arc Land Sakamoto Co. Ltd. | 3,000 | 69,538 | ||||||
Asahi Co. Ltd. | 6,000 | 75,083 | ||||||
Autobacs Seven Co. Ltd. | 21,000 | 335,968 | ||||||
BIC Camera Inc.a | 21,000 | 192,444 | ||||||
Chiyoda Co. Ltd. | 6,000 | 126,313 | ||||||
DCM Holdings Co. Ltd. | 27,000 | 183,491 | ||||||
EDION Corp. | 24,000 | 152,014 | ||||||
Geo Holdings Corp. | 12,000 | 105,463 | ||||||
Gulliver International Co. Ltd. | 18,000 | 162,526 | ||||||
Honeys Co. Ltd. | 6,000 | 60,702 | ||||||
Jin Co. Ltd.a | 3,000 | 86,779 | ||||||
Joshin Denki Co. Ltd. | 7,000 | 61,318 | ||||||
K’s Holdings Corp. | 12,000 | 335,563 | ||||||
Keiyo Co. Ltd.a | 12,000 | 56,254 | ||||||
Kohnan Shoji Co. Ltd. | 9,000 | 94,691 | ||||||
Komeri Co. Ltd. | 9,000 | 220,484 | ||||||
Nishimatsuya Chain Co. Ltd. | 15,000 | 118,545 | ||||||
Pal Co. Ltd. | 3,000 | 81,609 | ||||||
Paris Miki Holdings Inc. | 12,000 | 55,792 | ||||||
Shimachu Co. Ltd. | 15,000 | 343,505 | ||||||
T-Gaia Corp. | 9,000 | 79,877 | ||||||
Tsutsumi Jewelry Co. Ltd. | 3,000 | 73,033 | ||||||
United Arrows Ltd. | 6,000 | 220,051 | ||||||
VT Holdings Co. Ltd. | 24,000 | 100,727 | ||||||
Xebio Co. Ltd. | 6,000 | 98,416 | ||||||
Yellow Hat Ltd. | 3,000 | 65,264 | ||||||
|
| |||||||
| 4,263,137 | ||||||||
TEXTILES, APPAREL & LUXURY GOODS — 1.25% |
| |||||||
Daidoh Ltd. | 9,000 | 47,995 | ||||||
Descente Ltd. | 30,000 | 259,325 | ||||||
Fujibo Holdings Inc. | 30,000 | 97,319 | ||||||
| 38 | 2014 iSHARES ANNUAL REPORTTO SHAREHOLDERS |
Table of Contents
Schedule of Investments (Continued)
iSHARES® MSCI JAPAN SMALL-CAP ETF
August 31, 2014
| Security | Shares | Value | ||||||
Gunze Ltd. | 60,000 | $ | 169,803 | |||||
Japan Wool Textile Co. Ltd. (The) | 30,000 | 220,917 | ||||||
Kurabo Industries Ltd. | 60,000 | 106,271 | ||||||
Onward Holdings Co. Ltd. | 30,000 | 200,414 | ||||||
Sanyo Shokai Ltd. | 30,000 | 68,730 | ||||||
Seiko Holdings Corp. | 30,000 | 131,107 | ||||||
Seiren Co. Ltd. | 15,000 | 135,005 | ||||||
TSI Holdings Co. Ltd. | 27,000 | 186,350 | ||||||
Unitika Ltd.b | 180,000 | 79,704 | ||||||
Wacoal Holdings Corp. | 30,000 | 298,311 | ||||||
Yondoshi Holdings Inc. | 6,000 | 121,346 | ||||||
|
| |||||||
| 2,122,597 | ||||||||
TRADING COMPANIES & DISTRIBUTORS — 3.04% |
| |||||||
Hanwa Co. Ltd. | 60,000 | 236,800 | ||||||
Inaba Denki Sangyo Co. Ltd. | 6,000 | 205,612 | ||||||
Inabata & Co. Ltd. | 12,000 | 119,324 | ||||||
Iwatani Corp. | 60,000 | 468,980 | ||||||
Japan Pulp & Paper Co. Ltd. | 30,000 | 94,720 | ||||||
Kamei Corp. | 9,000 | 66,535 | ||||||
Kanamoto Co. Ltd. | 9,000 | 411,513 | ||||||
Kanematsu Corp. | 120,000 | 200,992 | ||||||
Kuroda Electric Co. Ltd. | 9,000 | 138,615 | ||||||
Misumi Group Inc. | 27,000 | 840,786 | ||||||
MonotaRO Co. Ltd. | 9,000 | 251,066 | ||||||
Nagase & Co. Ltd. | 33,000 | 405,651 | ||||||
NEC Capital Solutions Ltd. | 3,000 | 59,720 | ||||||
Nippon Steel & Sumikin Bussan Corp. | 31,440 | 123,175 | ||||||
Nishio Rent All Co. Ltd. | 6,000 | 274,919 | ||||||
Onoken Co. Ltd. | 6,000 | 67,690 | ||||||
Sojitz Corp. | 384,000 | 635,780 | ||||||
Trusco Nakayama Corp. | 6,000 | 154,498 | ||||||
Wakita & Co. Ltd. | 12,000 | 139,308 | ||||||
Yamazen Corp. | 18,000 | 137,229 | ||||||
Yuasa Trading Co. Ltd. | 60,000 | 125,908 | ||||||
|
| |||||||
| 5,158,821 | ||||||||
TRANSPORTATION INFRASTRUCTURE — 0.35% |
| |||||||
Japan Airport Terminal Co. Ltd. | 12,000 | 430,284 | ||||||
Sumitomo Warehouse Co. Ltd. (The) | 30,000 | 162,006 | ||||||
|
| |||||||
| 592,290 | ||||||||
WIRELESS TELECOMMUNICATION SERVICES — 0.15% |
| |||||||
Japan Communications Inc.a,b | 36,000 | 257,130 | ||||||
|
| |||||||
| 257,130 | ||||||||
|
| |||||||
TOTAL COMMON STOCKS |
| |||||||
(Cost: $153,180,710) |
| 169,379,711 | ||||||
| Security | Shares | Value | ||||||
SHORT-TERM INVESTMENTS — 3.78% |
| |||||||
MONEY MARKET FUNDS — 3.78% |
| |||||||
BlackRock Cash Funds: Institutional, |
| |||||||
0.14%c,d,e | 6,026,270 | $ | 6,026,270 | |||||
BlackRock Cash Funds: Prime, |
| |||||||
0.11%c,d,e | 379,370 | 379,370 | ||||||
BlackRock Cash Funds: Treasury, |
| |||||||
0.00%c,d | 15,965 | 15,965 | ||||||
|
| |||||||
| 6,421,605 | ||||||||
|
| |||||||
TOTAL SHORT-TERM INVESTMENTS |
| |||||||
(Cost: $6,421,605) |
| 6,421,605 | ||||||
|
| |||||||
TOTAL INVESTMENTS |
| |||||||
(Cost: $159,602,315) | 175,801,316 | |||||||
Other Assets, Less Liabilities — (3.51)% |
| (5,964,611 | ) | |||||
|
| |||||||
NET ASSETS — 100.00% |
| $ | 169,836,705 | |||||
|
| |||||||
| a | All or a portion of this security represents a security on loan. See Note 1. |
| b | Non-income earning security. |
| c | Affiliated issuer. See Note 2. |
| d | The rate quoted is the annualized seven-day yield of the fund at period end. |
| e | All or a portion of this security represents an investment of securities lending collateral. See Note 1. |
See notes to financial statements.
SCHEDULESOF INVESTMENTS | 39 |
Table of Contents
Schedule of Investments
August 31, 2014
| Security | Shares | Value | ||||||
COMMON STOCKS — 99.62% |
| |||||||
AIRLINES — 0.59% |
| |||||||
AirAsia Bhd | 6,020,700 | $ | 4,603,390 | |||||
|
| |||||||
| 4,603,390 | ||||||||
AUTOMOBILES — 1.34% | ||||||||
UMW Holdings Bhd | 2,678,000 | 10,501,294 | ||||||
|
| |||||||
| 10,501,294 | ||||||||
CHEMICALS — 3.39% | ||||||||
Petronas Chemicals Group Bhd | 13,342,400 | 26,667,868 | ||||||
|
| |||||||
| 26,667,868 | ||||||||
COMMERCIAL BANKS — 32.54% |
| |||||||
Alliance Financial Group Bhd | 5,213,200 | 8,038,119 | ||||||
AMMB Holdings Bhd | 8,431,337 | 17,868,443 | ||||||
CIMB Group Holdings Bhd | 23,979,264 | 56,144,343 | ||||||
Hong Leong Bank Bhd | 2,870,540 | 13,114,142 | ||||||
Hong Leong Financial Group Bhd | 1,013,300 | 5,477,992 | ||||||
Malayan Banking Bhd | 21,481,920 | 68,834,833 | ||||||
Public Bank Bhd | 12,586,980 | 76,991,426 | ||||||
RHB Capital Bhd | 3,242,800 | 9,434,161 | ||||||
|
| |||||||
| 255,903,459 | ||||||||
CONSTRUCTION & ENGINEERING — 4.24% |
| |||||||
Dialog Group Bhd | 17,308,154 | 9,499,717 | ||||||
Gamuda Bhd | 8,302,100 | 12,721,809 | ||||||
IJM Corp. Bhd | 5,392,540 | 11,120,403 | ||||||
|
| |||||||
| 33,341,929 | ||||||||
CONSTRUCTION MATERIALS — 0.80% |
| |||||||
Lafarge Malaysia Bhd | 1,939,560 | 6,276,495 | ||||||
|
| |||||||
| 6,276,495 | ||||||||
DIVERSIFIED TELECOMMUNICATION SERVICES — 1.40% |
| |||||||
Telekom Malaysia Bhd | 5,463,700 | 11,024,471 | ||||||
|
| |||||||
| 11,024,471 | ||||||||
ELECTRIC UTILITIES — 7.14% |
| |||||||
Tenaga Nasional Bhd | 14,303,812 | 56,180,581 | ||||||
|
| |||||||
| 56,180,581 | ||||||||
ENERGY EQUIPMENT & SERVICES — 3.47% |
| |||||||
Bumi Armada Bhda | 3,142,100 | 2,940,734 | ||||||
Sapurakencana Petroleum Bhd | 18,201,200 | 24,368,358 | ||||||
|
| |||||||
| 27,309,092 | ||||||||
FOOD PRODUCTS — 7.58% |
| |||||||
Felda Global Ventures Holdings Bhd | 4,590,600 | 5,563,481 | ||||||
Genting Plantations Bhd | 1,034,600 | 3,302,055 | ||||||
IOI Corp. Bhd | 14,749,630 | 22,367,776 | ||||||
| Security | Shares | Value | ||||||
Kuala Lumpur Kepong Bhd | 2,443,600 | $ | 17,086,594 | |||||
PPB Group Bhd | 2,413,566 | 11,317,419 | ||||||
|
| |||||||
| 59,637,325 | ||||||||
GAS UTILITIES — 2.78% |
| |||||||
Petronas Gas Bhd | 3,022,200 | 21,861,091 | ||||||
|
| |||||||
| 21,861,091 | ||||||||
HEALTH CARE PROVIDERS & SERVICES — 2.31% |
| |||||||
IHH Healthcare Bhd | 11,741,100 | 18,177,845 | ||||||
|
| |||||||
| 18,177,845 | ||||||||
HOTELS, RESTAURANTS & LEISURE — 7.23% |
| |||||||
Berjaya Sports Toto Bhd | 3,050,076 | 3,638,416 | ||||||
Genting Bhd | 10,407,100 | 31,630,716 | ||||||
Genting Malaysia Bhd | 15,097,800 | 21,602,499 | ||||||
|
| |||||||
| 56,871,631 | ||||||||
INDUSTRIAL CONGLOMERATES — 5.59% |
| |||||||
MMC Corp. Bhd | 3,662,400 | 2,869,965 | ||||||
Sime Darby Bhd | 13,683,825 | 41,068,840 | ||||||
|
| |||||||
| 43,938,805 | ||||||||
MARINE — 1.37% |
| |||||||
MISC Bhd | 4,955,320 | 10,816,181 | ||||||
|
| |||||||
| 10,816,181 | ||||||||
MEDIA — 0.82% |
| |||||||
Astro Malaysia Holdings Bhd | 6,182,300 | 6,433,358 | ||||||
|
| |||||||
| 6,433,358 | ||||||||
MULTI-UTILITIES — 1.71% |
| |||||||
YTL Corp. Bhd | 21,883,512 | 11,247,237 | ||||||
YTL Power International Bhda | 4,592,300 | 2,170,852 | ||||||
|
| |||||||
| 13,418,089 | ||||||||
OIL, GAS & CONSUMABLE FUELS — 1.03% |
| |||||||
Petronas Dagangan Bhd | 1,264,700 | 8,064,870 | ||||||
|
| |||||||
| 8,064,870 | ||||||||
REAL ESTATE MANAGEMENT & DEVELOPMENT — 1.09% |
| |||||||
IOI Properties Group Bhda | 5,700,765 | 4,449,201 | ||||||
UEM Sunrise Bhd | 6,808,600 | 4,147,371 | ||||||
|
| |||||||
| 8,596,572 | ||||||||
TOBACCO — 1.90% |
| |||||||
British American Tobacco (Malaysia) Bhd | 654,100 | 14,941,371 | ||||||
|
| |||||||
| 14,941,371 | ||||||||
TRANSPORTATION INFRASTRUCTURE — 0.89% |
| |||||||
Malaysia Airports Holdings Bhd | 2,879,600 | 7,034,556 | ||||||
|
| |||||||
| 7,034,556 | ||||||||
| 40 | 2014 iSHARES ANNUAL REPORTTO SHAREHOLDERS |
Table of Contents
Schedule of Investments (Continued)
iSHARES® MSCI MALAYSIA ETF
August 31, 2014
| Security | Shares | Value | ||||||
WIRELESS TELECOMMUNICATION SERVICES — 10.41% |
| |||||||
Axiata Group Bhd | 12,920,500 | $ | 28,407,064 | |||||
DiGi.Com Bhd | 17,800,700 | 32,359,775 | ||||||
Maxis Bhd | 10,168,100 | 21,129,776 | ||||||
|
| |||||||
| 81,896,615 | ||||||||
|
| |||||||
TOTAL COMMON STOCKS |
| |||||||
(Cost: $329,295,748) | 783,496,888 | |||||||
SHORT-TERM INVESTMENTS — 0.01% |
| |||||||
MONEY MARKET FUNDS — 0.01% |
| |||||||
BlackRock Cash Funds: Treasury, |
| |||||||
0.00%b,c | 49,820 | 49,820 | ||||||
|
| |||||||
| 49,820 | ||||||||
|
| |||||||
TOTAL SHORT-TERM INVESTMENTS |
| |||||||
(Cost: $49,820) | 49,820 | |||||||
|
| |||||||
TOTAL INVESTMENTS |
| |||||||
(Cost: $329,345,568) | 783,546,708 | |||||||
Other Assets, Less Liabilities — 0.37% |
| 2,914,191 | ||||||
|
| |||||||
NET ASSETS — 100.00% | $ | 786,460,899 | ||||||
|
| |||||||
| a | Non-income earning security. |
| b | Affiliated issuer. See Note 2. |
| c | The rate quoted is the annualized seven-day yield of the fund at period end. |
See notes to financial statements.
SCHEDULESOF INVESTMENTS | 41 |
Table of Contents
iSHARES® MSCI PACIFIC EX JAPAN ETF
August 31, 2014
| Security | Shares | Value | ||||||
COMMON STOCKS — 99.05% |
| |||||||
AUSTRALIA — 63.24% | ||||||||
AGL Energy Ltd. | 1,134,068 | $ | 14,955,778 | |||||
AGL Energy Ltd. Newa | 226,814 | 2,991,161 | ||||||
ALS Ltd.a | 799,588 | 5,564,037 | ||||||
Alumina Ltd.b | 5,023,528 | 7,282,682 | ||||||
Amcor Ltd. | 2,436,054 | 26,019,792 | ||||||
AMP Ltd. | 6,022,900 | 33,123,314 | ||||||
APA Group | 1,710,820 | 12,401,003 | ||||||
Asciano Ltd. | 1,967,556 | 11,556,799 | ||||||
ASX Ltd. | 409,964 | 14,375,136 | ||||||
Aurizon Holdings Ltd. | 4,344,398 | 19,382,009 | ||||||
AusNet Services | 3,623,684 | 4,795,761 | ||||||
Australia and New Zealand Banking Group Ltd. | 4,848,378 | 151,594,570 | ||||||
Bank of Queensland Ltd. | 796,424 | 9,370,781 | ||||||
Bendigo and Adelaide Bank Ltd. | 964,342 | 11,229,262 | ||||||
BGP Holdings PLCb,c | 27,004,595 | 356 | ||||||
BHP Billiton Ltd. | 6,398,060 | 219,437,081 | ||||||
Boral Ltd. | 1,571,378 | 8,098,099 | ||||||
Brambles Ltd. | 3,161,514 | 28,091,150 | ||||||
Caltex Australia Ltd. | 269,844 | 7,190,449 | ||||||
CFS Retail Property Trust Group | 4,320,668 | 8,688,407 | ||||||
Coca-Cola Amatil Ltd. | 1,164,352 | 9,801,163 | ||||||
Cochlear Ltd. | 114,356 | 7,759,740 | ||||||
Commonwealth Bank of Australia | 3,235,868 | 246,115,500 | ||||||
Computershare Ltd. | 968,184 | 11,156,280 | ||||||
Crown Resorts Ltd. | 741,506 | 10,957,779 | ||||||
CSL Ltd. | 958,918 | 66,252,210 | ||||||
Dexus Property Group | 11,188,130 | 12,609,427 | ||||||
Federation Centres | 2,913,818 | 7,249,280 | ||||||
Flight Centre Travel Group Ltd. | 110,740 | 4,857,672 | ||||||
Fortescue Metals Group Ltd. | 3,150,440 | 12,287,345 | ||||||
Goodman Group | 3,519,724 | 18,369,342 | ||||||
GPT Group (The) | 3,411,470 | 12,731,080 | ||||||
Harvey Norman Holdings Ltd. | 1,101,976 | 3,658,906 | ||||||
Iluka Resources Ltd. | 837,330 | 6,970,075 | ||||||
Incitec Pivot Ltd. | 3,296,210 | 9,557,127 | ||||||
Insurance Australia Group Ltd. | 4,809,732 | 29,105,560 | ||||||
James Hardie Industries SE | 891,796 | 10,684,777 | ||||||
Leighton Holdings Ltd. | 204,530 | 4,292,701 | ||||||
Lend Lease Group | 1,109,660 | 14,841,465 | ||||||
Macquarie Group Ltd. | 587,148 | 32,015,990 | ||||||
Metcash Ltd. | 1,796,022 | 4,720,291 | ||||||
Mirvac Group | 7,555,406 | 12,967,154 | ||||||
| Security | Shares | Value | ||||||
National Australia Bank Ltd. | 4,794,364 | $ | 157,842,687 | |||||
Newcrest Mining Ltd.b | 1,520,076 | 16,093,945 | ||||||
Orica Ltd. | 747,382 | 14,330,036 | ||||||
Origin Energy Ltd. | 2,223,840 | 32,301,731 | ||||||
Qantas Airways Ltd.b | 2,222,710 | 3,055,983 | ||||||
QBE Insurance Group Ltd. | 2,518,318 | 27,134,002 | ||||||
Ramsay Health Care Ltd. | 265,324 | 12,894,262 | ||||||
REA Group Ltd. | 105,316 | 4,720,217 | ||||||
Rio Tinto Ltd. | 876,428 | 51,339,242 | ||||||
Santos Ltd. | 1,957,838 | 27,156,181 | ||||||
Scentre Groupb | 10,820,428 | 34,712,777 | ||||||
Seek Ltd. | 648,620 | 10,598,247 | ||||||
Sonic Healthcare Ltd. | 773,824 | 12,759,842 | ||||||
Stockland Corp. Ltd. | 4,716,394 | 18,747,778 | ||||||
Suncorp Group Ltd. | 2,634,256 | 35,552,906 | ||||||
Sydney Airport | 2,253,220 | 9,335,941 | ||||||
Tabcorp Holdings Ltd. | 1,559,626 | 5,236,797 | ||||||
Tatts Group Ltd. | 2,895,964 | 8,992,533 | ||||||
Telstra Corp. Ltd. | 8,876,376 | 46,159,520 | ||||||
Toll Holdings Ltd. | 1,402,782 | 7,832,769 | ||||||
TPG Telecom Ltd. | 553,926 | 3,124,064 | ||||||
Transurban Group | 3,592,496 | 27,082,087 | ||||||
Treasury Wine Estates Ltd. | 1,288,200 | 6,156,799 | ||||||
Wesfarmers Ltd. | 2,305,200 | 93,378,650 | ||||||
Westfield Corp. | 4,017,376 | 28,631,774 | ||||||
Westpac Banking Corp. | 6,247,770 | 204,757,552 | ||||||
Woodside Petroleum Ltd. | 1,474,424 | 58,884,510 | ||||||
Woolworths Ltd. | 2,530,070 | 85,568,074 | ||||||
WorleyParsons Ltd. | 414,710 | 6,376,717 | ||||||
|
| |||||||
| 2,195,866,114 | ||||||||
HONG KONG — 23.28% | ||||||||
AIA Group Ltd. | 24,091,614 | 131,491,039 | ||||||
ASM Pacific Technology Ltd.a | 474,600 | 4,938,806 | ||||||
Bank of East Asia Ltd. (The) | 2,621,720 | 11,163,237 | ||||||
BOC Hong Kong (Holdings) Ltd.a | 7,571,000 | 25,447,837 | ||||||
Cathay Pacific Airways Ltd. | 2,260,000 | 4,199,145 | ||||||
Cheung Kong (Holdings) Ltd. | 2,712,000 | 49,444,927 | ||||||
Cheung Kong Infrastructure Holdings Ltd. | 1,130,208 | 8,159,215 | ||||||
CLP Holdings Ltd. | 3,729,000 | 31,563,570 | ||||||
First Pacific Co. Ltd. | 4,972,500 | 5,793,652 | ||||||
Galaxy Entertainment Group Ltd.a | 4,746,000 | 35,762,714 | ||||||
Hang Lung Properties Ltd. | 4,520,736 | 14,932,723 | ||||||
Hang Seng Bank Ltd. | 1,582,000 | 26,719,973 | ||||||
| 42 | 2014 iSHARES ANNUAL REPORTTO SHAREHOLDERS |
Table of Contents
Schedule of Investments (Continued)
iSHARES® MSCI PACIFIC EX JAPAN ETF
August 31, 2014
| Security | Shares | Value | ||||||
Henderson Land Development Co. Ltd. | 1,828,687 | $ | 12,116,292 | |||||
HKT Trust and HKT Ltd.a | 5,198,338 | 6,157,396 | ||||||
Hong Kong and China Gas Co. Ltd. (The) | 12,430,746 | 28,197,198 | ||||||
Hong Kong Exchanges and Clearing Ltd. | 2,192,200 | 50,377,195 | ||||||
Hutchison Whampoa Ltd. | 4,294,000 | 55,848,622 | ||||||
Hysan Development Co. Ltd.a | 1,356,830 | 6,652,715 | ||||||
Kerry Properties Ltd. | 1,356,000 | 5,038,973 | ||||||
Li & Fung Ltd. | 11,753,200 | 14,588,851 | ||||||
Link REIT (The) | 4,520,086 | 26,828,378 | ||||||
MGM China Holdings Ltd. | 1,898,400 | 6,282,970 | ||||||
MTR Corp. Ltd. | 2,938,286 | 11,658,135 | ||||||
New World Development Co. Ltd. | 10,396,921 | 13,146,820 | ||||||
NWS Holdings Ltd. | 2,938,000 | 5,549,869 | ||||||
PCCW Ltd. | 7,458,867 | 4,744,710 | ||||||
Power Assets Holdings Ltd. | 2,748,000 | 25,032,909 | ||||||
Sands China Ltd. | 4,791,200 | 31,219,473 | ||||||
Shangri-La Asia Ltd. | 2,713,000 | 4,200,693 | ||||||
Sino Land Co. Ltd. | 5,876,800 | 10,388,465 | ||||||
SJM Holdings Ltd. | 3,616,000 | 9,098,147 | ||||||
Sun Hung Kai Properties Ltd. | 3,164,000 | 48,010,219 | ||||||
Swire Pacific Ltd. Class A | 1,243,000 | 16,728,050 | ||||||
Swire Properties Ltd. | 2,350,400 | 7,885,060 | ||||||
Techtronic Industries Co. Ltd. | 2,712,207 | 8,276,446 | ||||||
Wharf (Holdings) Ltd. (The) | 3,164,600 | 24,744,651 | ||||||
Wheelock and Co. Ltd. | 1,808,000 | 9,471,404 | ||||||
Wynn Macau Ltd.a | 3,073,600 | 11,778,600 | ||||||
Yue Yuen Industrial (Holdings) Ltd. | 1,469,000 | 4,558,551 | ||||||
|
| |||||||
| 808,197,630 | ||||||||
NEW ZEALAND — 1.06% | ||||||||
Auckland International Airport Ltd. | 1,954,222 | 6,003,679 | ||||||
Contact Energy Ltd. | 770,660 | 3,580,414 | ||||||
Fletcher Building Ltd. | 1,395,324 | 10,745,840 | ||||||
Ryman Healthcare Ltd. | 736,986 | 4,972,465 | ||||||
Spark New Zealand Ltd. | 3,645,832 | 8,957,406 | ||||||
Xero Ltd.a,b | 126,786 | 2,674,542 | ||||||
|
| |||||||
| 36,934,346 | ||||||||
SINGAPORE — 11.47% | ||||||||
Ascendas REIT | 4,068,813 | 7,661,934 | ||||||
CapitaCommercial Trust | 4,068,000 | 5,541,568 | ||||||
| Security | Shares | Value | ||||||
CapitaLand Ltd. | 5,198,000 | $ | 13,828,567 | |||||
CapitaMall Trust Management Ltd. | 4,746,000 | 7,606,074 | ||||||
City Developments Ltd. | 904,000 | 7,265,612 | ||||||
ComfortDelGro Corp. Ltd. | 3,842,000 | 7,727,409 | ||||||
DBS Group Holdings Ltd. | 3,390,000 | 48,678,873 | ||||||
Genting Singapore PLC | 12,204,400 | 11,931,061 | ||||||
Global Logistic Properties Ltd. | 6,102,000 | 13,935,414 | ||||||
Golden Agri-Resources Ltd. | 14,012,987 | 5,726,690 | ||||||
Hutchison Port Holdings Trust | 11,300,000 | 8,136,000 | ||||||
Jardine Cycle & Carriage Ltd. | 226,000 | 8,160,231 | ||||||
Keppel Corp. Ltd. | 2,938,200 | 25,663,192 | ||||||
Keppel Land Ltd. | 1,356,000 | 3,770,440 | ||||||
Noble Group Ltd. | 8,588,708 | 9,359,864 | ||||||
Olam International Ltd.a | 904,549 | 1,920,794 | ||||||
Oversea-Chinese Banking Corp. Ltd. | 5,198,600 | 41,657,118 | ||||||
SembCorp Industries Ltd. | 2,034,240 | 8,345,934 | ||||||
SembCorp Marine Ltd.a | 1,582,200 | 5,020,643 | ||||||
Singapore Airlines Ltd. | 1,130,800 | 9,151,873 | ||||||
Singapore Exchange Ltd. | 1,582,000 | 9,228,703 | ||||||
Singapore Press Holdings Ltd.a | 3,087,517 | 10,267,395 | ||||||
Singapore Technologies Engineering Ltd. | 3,164,000 | 9,279,410 | ||||||
Singapore Telecommunications Ltd. | 16,046,328 | 50,018,203 | ||||||
StarHub Ltd. | 1,130,000 | 3,757,763 | ||||||
United Overseas Bank Ltd.a | 2,539,000 | 46,651,925 | ||||||
UOL Group Ltd. | 904,000 | 4,599,864 | ||||||
Wilmar International Ltd. | 3,842,000 | 9,728,531 | ||||||
Yangzijiang Shipbuilding | 3,842,000 | 3,586,626 | ||||||
|
| |||||||
| 398,207,711 | ||||||||
|
| |||||||
TOTAL COMMON STOCKS |
| |||||||
(Cost: $2,996,489,764) |
| 3,439,205,801 | ||||||
RIGHTS — 0.04% |
| |||||||
SINGAPORE — 0.04% |
| |||||||
Oversea-Chinese Banking Corp. Ltd.b | 649,825 | 1,223,678 | ||||||
|
| |||||||
| 1,223,678 | ||||||||
|
| |||||||
TOTAL RIGHTS |
| |||||||
(Cost: $0) |
| 1,223,678 | ||||||
SCHEDULESOF INVESTMENTS | 43 |
Table of Contents
Schedule of Investments (Continued)
iSHARES® MSCI PACIFIC EX JAPAN ETF
August 31, 2014
| Security | Shares | Value | ||||||
SHORT-TERM INVESTMENTS — 1.08% |
| |||||||
MONEY MARKET FUNDS — 1.08% |
| |||||||
BlackRock Cash Funds: Institutional, |
| |||||||
0.14%d,e,f | 34,859,363 | $ | 34,859,363 | |||||
BlackRock Cash Funds: Prime, SL Agency Shares | ||||||||
0.11%d,e,f | 2,194,493 | 2,194,493 | ||||||
BlackRock Cash Funds: Treasury, |
| |||||||
0.00%d,e | 367,813 | 367,813 | ||||||
|
| |||||||
| 37,421,669 | ||||||||
|
| |||||||
TOTAL SHORT-TERM INVESTMENTS |
| |||||||
(Cost: $37,421,669) |
| 37,421,669 | ||||||
|
| |||||||
TOTAL INVESTMENTS |
| |||||||
(Cost: $3,033,911,433) |
| 3,477,851,148 | ||||||
Other Assets, Less Liabilities — (0.17)% |
| (5,802,828 | ) | |||||
|
| |||||||
NET ASSETS — 100.00% |
| $ | 3,472,048,320 | |||||
|
| |||||||
| a | All or a portion of this security represents a security on loan. See Note 1. |
| b | Non-income earning security. |
| c | Security valued using Level 3 inputs in accordance with management’s fair valuation policy. See Note 1. |
| d | Affiliated issuer. See Note 2. |
| e | The rate quoted is the annualized seven-day yield of the fund at period end. |
| f | All or a portion of this security represents an investment of securities lending collateral. See Note 1. |
See notes to financial statements.
| 44 | 2014 iSHARES ANNUAL REPORTTO SHAREHOLDERS |
Table of Contents
Schedule of Investments
August 31, 2014
| Security | Shares | Value | ||||||
COMMON STOCKS — 97.46% |
| |||||||
AEROSPACE & DEFENSE — 2.10% |
| |||||||
Singapore Technologies Engineering Ltd. | 7,050,000 | $ | 20,676,309 | |||||
|
| |||||||
| 20,676,309 | ||||||||
AIRLINES — 2.32% |
| |||||||
Singapore Airlines Ltd. | 2,820,467 | 22,826,809 | ||||||
|
| |||||||
| 22,826,809 | ||||||||
COMMERCIAL BANKS — 33.96% |
| |||||||
DBS Group Holdings Ltd. | 8,460,500 | 121,488,970 | ||||||
Oversea-Chinese Banking Corp. Ltd. | 12,690,000 | 101,686,766 | ||||||
United Overseas Bank Ltd.a | 6,048,000 | 111,126,760 | ||||||
|
| |||||||
| 334,302,496 | ||||||||
DISTRIBUTORS — 2.59% |
| |||||||
Jardine Cycle & Carriage Ltd. | 705,000 | 25,455,587 | ||||||
|
| |||||||
| 25,455,587 | ||||||||
DIVERSIFIED FINANCIAL SERVICES — 2.51% |
| |||||||
Singapore Exchange Ltd. | 4,230,000 | 24,675,989 | ||||||
|
| |||||||
| 24,675,989 | ||||||||
DIVERSIFIED TELECOMMUNICATION SERVICES — 12.28% |
| |||||||
Singapore Telecommunications Ltd. | 38,775,568 | 120,867,791 | ||||||
|
| |||||||
| 120,867,791 | ||||||||
FOOD & STAPLES RETAILING — 0.46% |
| |||||||
Olam International Ltd. | 2,115,941 | 4,493,164 | ||||||
|
| |||||||
| 4,493,164 | ||||||||
FOOD PRODUCTS — 3.76% |
| |||||||
Golden Agri-Resources Ltd. | 33,840,628 | 13,829,657 | ||||||
Wilmar International Ltd. | 9,165,000 | 23,207,180 | ||||||
|
| |||||||
| 37,036,837 | ||||||||
HOTELS, RESTAURANTS & LEISURE — 2.94% |
| |||||||
Genting Singapore PLC | 29,610,400 | 28,947,224 | ||||||
|
| |||||||
| 28,947,224 | ||||||||
INDUSTRIAL CONGLOMERATES — 6.70% |
| |||||||
Keppel Corp. Ltd. | 5,236,100 | 45,733,795 | ||||||
SembCorp Industries Ltd. | 4,935,000 | 20,246,965 | ||||||
|
| |||||||
| 65,980,760 | ||||||||
MACHINERY — 2.23% |
| |||||||
SembCorp Marine Ltd.a | 4,230,000 | 13,422,653 | ||||||
Yangzijiang Shipbuilding | 9,165,000 | 8,555,812 | ||||||
|
| |||||||
| 21,978,465 | ||||||||
| Security | Shares | Value | ||||||
MEDIA — 2.79% |
| |||||||
Singapore Press Holdings Ltd.a | 8,266,000 | $ | 27,488,201 | |||||
|
| |||||||
| 27,488,201 | ||||||||
REAL ESTATE INVESTMENT TRUSTS (REITS) — 5.09% |
| |||||||
Ascendas REIT | 9,870,335 | 18,586,712 | ||||||
CapitaCommercial Trust | 9,870,000 | 13,445,250 | ||||||
CapitaMall Trust Management Ltd. | 11,280,800 | 18,078,930 | ||||||
|
| |||||||
| 50,110,892 | ||||||||
REAL ESTATE MANAGEMENT & DEVELOPMENT — 10.49% |
| |||||||
CapitaLand Ltd. | 11,985,000 | 31,884,451 | ||||||
City Developments Ltd. | 2,115,000 | 16,998,638 | ||||||
Global Logistic Properties Ltd. | 14,805,000 | 33,810,850 | ||||||
Keppel Land Ltd. | 3,525,000 | 9,801,474 | ||||||
UOL Group Ltd. | 2,115,000 | 10,761,849 | ||||||
|
| |||||||
| 103,257,262 | ||||||||
ROAD & RAIL — 2.02% |
| |||||||
ComfortDelGro Corp. Ltd. | 9,870,000 | 19,851,516 | ||||||
|
| |||||||
| 19,851,516 | ||||||||
TRADING COMPANIES & DISTRIBUTORS — 2.26% |
| |||||||
Noble Group Ltd. | 20,445,999 | 22,281,789 | ||||||
|
| |||||||
| 22,281,789 | ||||||||
TRANSPORTATION INFRASTRUCTURE — 2.01% |
| |||||||
Hutchison Port Holdings Trusta | 27,495,000 | 19,796,400 | ||||||
|
| |||||||
| 19,796,400 | ||||||||
WIRELESS TELECOMMUNICATION SERVICES — 0.95% |
| |||||||
StarHub Ltd. | 2,820,000 | 9,377,779 | ||||||
|
| |||||||
| 9,377,779 | ||||||||
|
| |||||||
TOTAL COMMON STOCKS | ||||||||
(Cost: $898,358,449) | 959,405,270 | |||||||
RIGHTS — 0.30% |
| |||||||
COMMERCIAL BANKS — 0.30% |
| |||||||
Oversea-Chinese Banking Corp. Ltd.b | 1,586,250 | 2,987,049 | ||||||
|
| |||||||
| 2,987,049 | ||||||||
|
| |||||||
TOTAL RIGHTS | ||||||||
(Cost: $0) | 2,987,049 | |||||||
SCHEDULESOF INVESTMENTS | 45 |
Table of Contents
Schedule of Investments (Continued)
iSHARES® MSCI SINGAPORE ETF
August 31, 2014
| Security | Shares | Value | ||||||
SHORT-TERM INVESTMENTS — 4.50% |
| |||||||
MONEY MARKET FUNDS — 4.50% |
| |||||||
BlackRock Cash Funds: Institutional, |
| |||||||
0.14%c,d,e | 41,437,301 | $ | 41,437,301 | |||||
BlackRock Cash Funds: Prime, |
| |||||||
0.11%c,d,e | 2,608,592 | 2,608,592 | ||||||
BlackRock Cash Funds: Treasury, |
| |||||||
0.00%c,d | 243,417 | 243,417 | ||||||
|
| |||||||
| 44,289,310 | ||||||||
|
| |||||||
TOTAL SHORT-TERM INVESTMENTS |
| |||||||
(Cost: $44,289,310) | 44,289,310 | |||||||
|
| |||||||
TOTAL INVESTMENTS |
| |||||||
(Cost: $942,647,759) |
| 1,006,681,629 | ||||||
Other Assets, Less Liabilities — (2.26)% |
| (22,226,687 | ) | |||||
|
| |||||||
NET ASSETS — 100.00% |
| $ | 984,454,942 | |||||
|
| |||||||
| a | All or a portion of this security represents a security on loan. See Note 1. |
| b | Non-income earning security. |
| c | Affiliated issuer. See Note 2. |
| d | The rate quoted is the annualized seven-day yield of the fund at period end. |
| e | All or a portion of this security represents an investment of securities lending collateral. See Note 1. |
Financial futures contracts purchased as of August 31, 2014 were as follows:
| Number of Contracts | Issue (Expiration) | Exchange | Notional Value | Unrealized Appreciation (Depreciation) | ||||||||||
| 195 | MSCI Singapore Index (Sept. 2014) | Singapore | $ | 11,794,223 | $ | (42,726) | ||||||||
See notes to financial statements.
| 46 | 2014 iSHARES ANNUAL REPORTTO SHAREHOLDERS |
Table of Contents
Schedule of Investments
iSHARES® MSCI SOUTH KOREA CAPPED ETF
August 31, 2014
| Security | Shares | Value | ||||||
COMMON STOCKS — 95.62% |
| |||||||
AEROSPACE & DEFENSE — 0.26% |
| |||||||
Korea Aerospace Industries Ltd.a | 356,199 | $ | 12,629,177 | |||||
|
| |||||||
| 12,629,177 | ||||||||
AIR FREIGHT & LOGISTICS — 0.62% |
| |||||||
Hyundai Glovis Co. Ltd. | 102,156 | 30,477,035 | ||||||
|
| |||||||
| 30,477,035 | ||||||||
AIRLINES — 0.18% |
| |||||||
Korean Air Lines Co. Ltd.b | 248,318 | 8,926,664 | ||||||
|
| |||||||
| 8,926,664 | ||||||||
AUTO COMPONENTS — 4.56% |
| |||||||
Halla Visteon Climate Control Corp.a | 299,372 | 15,914,149 | ||||||
Hankook Tire Co. Ltd. | 579,478 | 30,061,189 | ||||||
Hyundai Mobis Co. Ltd. | 519,740 | 150,701,277 | ||||||
Hyundai Wia Corp. | 120,498 | 26,501,360 | ||||||
|
| |||||||
| 223,177,975 | ||||||||
AUTOMOBILES — 7.98% |
| |||||||
Hyundai Motor Co. | 1,169,911 | 268,838,959 | ||||||
Kia Motors Corp. | 2,012,575 | 121,475,014 | ||||||
|
| |||||||
| 390,313,973 | ||||||||
BEVERAGES — 0.12% |
| |||||||
Hite Jinro Co. Ltd.a | 251,255 | 5,724,139 | ||||||
|
| |||||||
| 5,724,139 | ||||||||
BUILDING PRODUCTS — 0.51% |
| |||||||
KCC Corp. | 37,101 | 24,991,354 | ||||||
|
| |||||||
| 24,991,354 | ||||||||
CAPITAL MARKETS — 1.58% |
| |||||||
Daewoo Securities Co. Ltd.b | 1,465,020 | 17,049,397 | ||||||
Korea Investment Holdings Co. Ltd. | 320,115 | 16,069,681 | ||||||
Mirae Asset Securities Co. Ltd. | 194,795 | 9,307,972 | ||||||
Samsung Securities Co. Ltd. | 479,909 | 23,452,331 | ||||||
Woori Investment & Securities Co. Ltd.a | 995,682 | 11,636,502 | ||||||
|
| |||||||
| 77,515,883 | ||||||||
CHEMICALS — 3.71% |
| |||||||
Hanwha Chemical Corp. | 854,506 | 13,821,094 | ||||||
Hanwha Corp. | 372,448 | 11,111,546 | ||||||
Hyosung Corp. | 184,469 | 14,263,395 | ||||||
Kumho Petro Chemical Co. Ltd.a | 114,066 | 9,145,979 | ||||||
LG Chem Ltd. | 354,870 | 94,321,678 | ||||||
| Security | Shares | Value | ||||||
Lotte Chemical Corp. | 122,144 | $ | 19,695,788 | |||||
OCI Co. Ltd.a,b | 132,214 | 18,972,471 | ||||||
|
| |||||||
| 181,331,951 | ||||||||
COMMERCIAL BANKS — 9.64% |
| |||||||
BS Financial Group Inc. | 1,503,845 | 24,917,004 | ||||||
DGB Financial Group Inc. | 1,081,250 | 18,874,821 | ||||||
Hana Financial Group Inc. | 2,176,304 | 91,327,714 | ||||||
Industrial Bank of Korea | 1,694,075 | 29,405,513 | ||||||
KB Financial Group Inc. | 2,797,872 | 114,652,184 | ||||||
Shinhan Financial Group Co. Ltd. | 3,085,623 | 159,766,465 | ||||||
Woori Finance Holdings Co. Ltd.b | 2,410,192 | 32,684,195 | ||||||
|
| |||||||
| 471,627,896 | ||||||||
COMMERCIAL SERVICES & SUPPLIES — 0.23% |
| |||||||
S1 Corp. | 154,928 | 11,306,940 | ||||||
|
| |||||||
| 11,306,940 | ||||||||
CONSTRUCTION & ENGINEERING — 2.48% |
| |||||||
Daelim Industrial Co. Ltd. | 220,106 | 18,972,597 | ||||||
Daewoo Engineering & Construction Co. Ltd.a,b | 894,892 | 7,519,582 | ||||||
Doosan Heavy Industries & Construction Co. Ltd. | 445,526 | 12,676,587 | ||||||
GS Engineering & Construction Corp.a,b | 392,990 | 14,282,441 | ||||||
Hyundai Development Co. Engineering & Construction | 448,115 | 18,208,332 | ||||||
Hyundai Engineering & Construction Co. Ltd. | 560,893 | 35,347,958 | ||||||
Samsung Engineering Co. Ltd.a,b | 226,144 | 14,251,789 | ||||||
|
| |||||||
| 121,259,286 | ||||||||
CONSUMER FINANCE — 0.28% |
| |||||||
Samsung Card Co. Ltd. | 287,381 | 13,817,076 | ||||||
|
| |||||||
| 13,817,076 | ||||||||
DIVERSIFIED TELECOMMUNICATION SERVICES — 0.73% |
| |||||||
KT Corp. | 499,179 | 17,230,894 | ||||||
LG Uplus Corp. | 1,707,013 | 18,434,629 | ||||||
|
| |||||||
| 35,665,523 | ||||||||
ELECTRIC UTILITIES — 1.67% |
| |||||||
Korea Electric Power Corp. | 1,961,851 | 81,651,080 | ||||||
|
| |||||||
| 81,651,080 | ||||||||
SCHEDULESOF INVESTMENTS | 47 |
Table of Contents
Schedule of Investments (Continued)
iSHARES® MSCI SOUTH KOREA CAPPED ETF
August 31, 2014
| Security | Shares | Value | ||||||
ELECTRICAL EQUIPMENT — 0.37% |
| |||||||
LS Corp. | 147,269 | $ | 10,167,000 | |||||
LS Industrial Systems Co. Ltd. | 127,169 | 7,851,255 | ||||||
|
| |||||||
| 18,018,255 | ||||||||
ELECTRONIC EQUIPMENT, INSTRUMENTS & COMPONENTS — 3.35% |
| |||||||
LG Display Co. Ltd.b | 1,788,281 | 61,816,903 | ||||||
LG Innotek Co. Ltd.b | 102,371 | 13,579,466 | ||||||
Samsung Electro-Mechanics Co. Ltd.a | 467,142 | 25,293,255 | ||||||
Samsung SDI Co. Ltd. | 421,687 | 63,006,638 | ||||||
|
| |||||||
| 163,696,262 | ||||||||
FOOD & STAPLES RETAILING — 0.80% |
| |||||||
E-Mart Co. Ltd. | 162,440 | 39,090,054 | ||||||
|
| |||||||
| 39,090,054 | ||||||||
FOOD PRODUCTS — 1.22% |
| |||||||
CJ CheilJedang Corp. | 62,105 | 23,152,710 | ||||||
Lotte Confectionery Co. Ltd. | 5,777 | 12,363,618 | ||||||
ORION Corp.a | 28,111 | 24,203,267 | ||||||
|
| |||||||
| 59,719,595 | ||||||||
GAS UTILITIES — 0.26% |
| |||||||
Korea Gas Corp.b | 226,908 | 12,621,541 | ||||||
|
| |||||||
| 12,621,541 | ||||||||
HOTELS, RESTAURANTS & LEISURE — 1.46% |
| |||||||
Hotel Shilla Co. Ltd.a | 251,295 | 29,492,682 | ||||||
Kangwon Land Inc. | 886,108 | 31,504,703 | ||||||
Paradise Co. Ltd.a | 274,154 | 10,626,019 | ||||||
|
| |||||||
| 71,623,404 | ||||||||
HOUSEHOLD DURABLES — 1.96% |
| |||||||
Coway Co. Ltd. | 417,359 | 35,028,602 | ||||||
LG Electronics Inc.a | 817,890 | 60,981,788 | ||||||
|
| |||||||
| 96,010,390 | ||||||||
HOUSEHOLD PRODUCTS — 0.75% |
| |||||||
LG Household & Health Care Ltd. | 72,634 | 36,748,599 | ||||||
|
| |||||||
| 36,748,599 | ||||||||
INDUSTRIAL CONGLOMERATES — 2.53% |
| |||||||
CJ Corp. | 114,998 | 20,301,437 | ||||||
Doosan Corp. | 64,421 | 7,655,930 | ||||||
LG Corp. | 732,382 | 51,211,484 | ||||||
Samsung Techwin Co. Ltd. | 301,529 | 12,683,280 | ||||||
SK Holdings Co. Ltd. | 201,644 | 31,918,597 | ||||||
|
| |||||||
| 123,770,728 | ||||||||
| Security | Shares | Value | ||||||
INSURANCE — 3.42% |
| |||||||
Dongbu Insurance Co. Ltd. | 337,344 | $ | 20,361,411 | |||||
Hanwha Life Insurance Co. Ltd. | 1,822,070 | 12,507,133 | ||||||
Hyundai Marine & Fire Insurance Co. Ltd. | 515,770 | 15,845,195 | ||||||
Samsung Fire & Marine Insurance Co. Ltd. | 254,868 | 69,752,818 | ||||||
Samsung Life Insurance Co. Ltd. | 465,665 | 48,911,014 | ||||||
|
| |||||||
| 167,377,571 | ||||||||
INTERNET SOFTWARE & SERVICES — 3.30% |
| |||||||
NAVER Corp. | 212,981 | 161,319,008 | ||||||
|
| |||||||
| 161,319,008 | ||||||||
IT SERVICES — 0.67% |
| |||||||
SK C&C Co. Ltd. | 155,532 | 32,595,838 | ||||||
|
| |||||||
| 32,595,838 | ||||||||
MACHINERY — 2.53% |
| |||||||
Daewoo Shipbuilding & Marine Engineering Co. Ltd.a | 795,764 | 19,502,673 | ||||||
Doosan Infracore Co. Ltd.a,b | 1,099,778 | 12,853,069 | ||||||
Hyundai Heavy Industries Co. Ltd. | 323,763 | 45,980,445 | ||||||
Hyundai Mipo Dockyard Co. Ltd.a | 91,614 | 11,655,610 | ||||||
Samsung Heavy Industries Co. Ltd. | 1,254,548 | 33,716,094 | ||||||
|
| |||||||
| 123,707,891 | ||||||||
MARINE — 0.14% |
| |||||||
Hyundai Merchant Marine Co. Ltd.a,b | 581,867 | 7,058,498 | ||||||
|
| |||||||
| 7,058,498 | ||||||||
MEDIA — 0.30% |
| |||||||
Cheil Worldwide Inc.a,b | 647,727 | 14,660,816 | ||||||
|
| |||||||
| 14,660,816 | ||||||||
METALS & MINING — 4.74% |
| |||||||
Hyundai Steel Co. | 541,411 | 40,420,940 | ||||||
Korea Zinc Co. Ltd. | 66,292 | 27,492,269 | ||||||
POSCO | 496,990 | 163,710,893 | ||||||
|
| |||||||
| 231,624,102 | ||||||||
MULTILINE RETAIL — 1.23% |
| |||||||
Hyundai Department Store Co. Ltd. | 120,976 | 18,910,889 | ||||||
Lotte Shopping Co. Ltd. | 86,652 | 28,372,665 | ||||||
| 48 | 2014 iSHARES ANNUAL REPORTTO SHAREHOLDERS |
Table of Contents
Schedule of Investments (Continued)
iSHARES® MSCI SOUTH KOREA CAPPED ETF
August 31, 2014
| Security | Shares | Value | ||||||
Shinsegae Co. Ltd. | 56,191 | $ | 12,912,376 | |||||
|
| |||||||
| 60,195,930 | ||||||||
OIL, GAS & CONSUMABLE FUELS — 1.58% |
| |||||||
GS Holdings Corp. | 408,126 | 17,328,097 | ||||||
S-Oil Corp.a | 359,290 | 16,601,151 | ||||||
SK Innovation Co. Ltd. | 464,737 | 43,130,087 | ||||||
|
| |||||||
| 77,059,335 | ||||||||
PERSONAL PRODUCTS — 1.52% |
| |||||||
AmorePacific Corp. | 24,749 | 51,501,938 | ||||||
AmorePacific Group | 21,944 | 22,897,334 | ||||||
|
| |||||||
| 74,399,272 | ||||||||
PHARMACEUTICALS — 0.64% |
| |||||||
Celltrion Inc.a,b | 491,729 | 20,198,740 | ||||||
Yuhan Corp. | 65,099 | 11,107,182 | ||||||
|
| |||||||
| 31,305,922 | ||||||||
SEMICONDUCTORS & SEMICONDUCTOR |
| |||||||
Samsung Electronics Co. Ltd. | 808,240 | 983,646,294 | ||||||
SK Hynix Inc.b | 4,264,964 | 190,965,398 | ||||||
|
| |||||||
| 1,174,611,692 | ||||||||
SOFTWARE — 0.36% |
| |||||||
NCsoft Corp.a | 121,952 | 17,439,755 | ||||||
|
| |||||||
| 17,439,755 | ||||||||
TOBACCO — 1.61% |
| |||||||
KT&G Corp. | 839,369 | 78,560,203 | ||||||
|
| |||||||
| 78,560,203 | ||||||||
TRADING COMPANIES & DISTRIBUTORS — 1.90% |
| |||||||
Daewoo International Corp.a | 368,411 | 13,534,503 | ||||||
Samsung C&T Corp. | 956,670 | 70,385,702 | ||||||
SK Networks Co. Ltd.b | 932,586 | 9,041,196 | ||||||
|
| |||||||
| 92,961,401 | ||||||||
WIRELESS TELECOMMUNICATION SERVICES — 0.42% |
| |||||||
SK Telecom Co. Ltd. | 77,125 | 20,765,447 | ||||||
|
| |||||||
| 20,765,447 | ||||||||
|
| |||||||
TOTAL COMMON STOCKS |
| |||||||
(Cost: $2,607,754,743) | 4,677,357,461 | |||||||
PREFERRED STOCKS — 4.19% |
| |||||||
AUTOMOBILES — 1.48% |
| |||||||
Hyundai Motor Co. Ltd. | 186,445 | 27,581,982 | ||||||
Hyundai Motor Co. Ltd. Series 2 | 290,430 | 44,970,176 | ||||||
|
| |||||||
| 72,552,158 | ||||||||
| Security | Shares | Value | ||||||
CHEMICALS — 0.22% |
| |||||||
LG Chem Ltd. | 62,319 | $ | 10,847,974 | |||||
|
| |||||||
| 10,847,974 | ||||||||
SEMICONDUCTORS & SEMICONDUCTOR |
| |||||||
Samsung Electronics Co. Ltd. | 120,950 | 121,671,680 | ||||||
|
| |||||||
| 121,671,680 | ||||||||
|
| |||||||
TOTAL PREFERRED STOCKS |
| |||||||
(Cost: $142,816,435) | 205,071,812 | |||||||
SHORT-TERM INVESTMENTS — 3.46% |
| |||||||
MONEY MARKET FUNDS — 3.46% |
| |||||||
BlackRock Cash Funds: Institutional, |
| |||||||
0.14%c,d,e | 159,044,523 | 159,044,523 | ||||||
BlackRock Cash Funds: Prime, | ||||||||
0.11%c,d,e | 10,012,289 | 10,012,289 | ||||||
|
| |||||||
| 169,056,812 | ||||||||
|
| |||||||
TOTAL SHORT-TERM INVESTMENTS |
| |||||||
(Cost: $169,056,812) | 169,056,812 | |||||||
|
| |||||||
TOTAL INVESTMENTS |
| |||||||
(Cost: $2,919,627,990) | 5,051,486,085 | |||||||
Other Assets, Less Liabilities — (3.27)% |
| (159,867,178 | ) | |||||
|
| |||||||
NET ASSETS — 100.00% | $ | 4,891,618,907 | ||||||
|
| |||||||
| a | All or a portion of this security represents a security on loan. See Note 1. |
| b | Non-income earning security. |
| c | Affiliated issuer. See Note 2. |
| d | The rate quoted is the annualized seven-day yield of the fund at period end. |
| e | All or a portion of this security represents an investment of securities lending collateral. See Note 1. |
See notes to financial statements.
SCHEDULESOF INVESTMENTS | 49 |
Table of Contents
Schedule of Investments
August 31, 2014
| Security | Shares | Value | ||||||
COMMON STOCKS — 98.80% |
| |||||||
AIRLINES — 0.34% |
| |||||||
China Airlines Ltd.a | 17,059,761 | $ | 5,707,419 | |||||
EVA Airways Corp.a | 11,033,212 | 5,536,815 | ||||||
|
| |||||||
| 11,244,234 | ||||||||
AUTO COMPONENTS — 0.70% |
| |||||||
Cheng Shin Rubber Industry Co. Ltd. | 10,030,670 | 23,155,057 | ||||||
|
| |||||||
| 23,155,057 | ||||||||
AUTOMOBILES — 0.36% |
| |||||||
China Motor Co. Ltd. | 4,012,000 | 3,838,785 | ||||||
Yulon Motor Co. Ltd.b | 5,015,362 | 8,053,976 | ||||||
|
| |||||||
| 11,892,761 | ||||||||
BUILDING PRODUCTS — 0.16% |
| |||||||
Taiwan Glass Industry Corp.b | 6,018,693 | 5,195,038 | ||||||
|
| |||||||
| 5,195,038 | ||||||||
CAPITAL MARKETS — 0.91% |
| |||||||
Yuanta Financial Holding Co. Ltd. | 55,516,164 | 29,902,820 | ||||||
|
| |||||||
| 29,902,820 | ||||||||
CHEMICALS — 6.29% |
| |||||||
Formosa Chemicals & Fibre Corp. | 20,786,610 | 51,739,642 | ||||||
Formosa Plastics Corp.b | 26,815,518 | 69,527,196 | ||||||
Nan Ya Plastics Corp. | 30,090,938 | 70,972,755 | ||||||
Taiwan Fertilizer Co. Ltd.b | 5,015,000 | 9,513,073 | ||||||
TSRC Corp. | 4,012,556 | 5,618,021 | ||||||
|
| |||||||
| 207,370,687 | ||||||||
COMMERCIAL BANKS — 9.85% |
| |||||||
Chang Hwa Commercial Bank Ltd. | 30,691,531 | 19,098,458 | ||||||
China Development Financial Holding Corp.b | 88,264,508 | 29,824,577 | ||||||
CTBC Financial Holding Co. Ltd. | 86,258,193 | 62,766,287 | ||||||
E.Sun Financial Holding Co. Ltd. | 40,120,463 | 26,375,173 | ||||||
First Financial Holding Co. Ltd. | 48,294,524 | 29,890,724 | ||||||
Hua Nan Financial Holdings Co. Ltd. | 39,257,928 | 24,363,412 | ||||||
Mega Financial Holding Co. Ltd. | 64,192,271 | 55,407,591 | ||||||
SinoPac Financial Holdings Co. Ltd. | 46,613,665 | 21,286,915 | ||||||
| Security | Shares | Value | ||||||
Taishin Financial Holdings Co. Ltd. | 52,925,676 | $ | 26,913,912 | |||||
Taiwan Business Bank Ltd.a | 25,075,770 | 7,852,301 | ||||||
Taiwan Cooperative Financial Holding Co. Ltd. | 37,912,971 | 21,182,202 | ||||||
|
| |||||||
| 324,961,552 | ||||||||
COMPUTERS & PERIPHERALS — 9.55% |
| |||||||
Acer Inc.a,b | 17,051,841 | 14,119,304 | ||||||
Advantech Co. Ltd. | 1,947,771 | 18,278,375 | ||||||
ASUSTeK Computer Inc. | 4,495,857 | 47,078,612 | ||||||
Catcher Technology Co. Ltd.b | 4,012,743 | 40,677,176 | ||||||
Chicony Electronics Co. Ltd. | 3,024,624 | 9,916,634 | ||||||
Clevo Co. | 3,009,991 | 5,689,584 | ||||||
Compal Electronics Inc. | 27,081,554 | 24,100,277 | ||||||
Foxconn Technology Co. Ltd. | 6,018,724 | 15,101,932 | ||||||
HTC Corp.b | 4,012,884 | 18,459,763 | ||||||
Inventec Corp.b | 15,045,868 | 11,829,106 | ||||||
Lite-On Technology Corp. | 13,664,565 | 22,651,986 | ||||||
Pegatron Corp.b | 10,030,037 | 21,274,463 | ||||||
Quanta Computer Inc. | 17,051,240 | 48,146,557 | ||||||
Wistron Corp.b | 15,045,113 | 17,616,934 | ||||||
|
| |||||||
| 314,940,703 | ||||||||
CONSTRUCTION & ENGINEERING — 0.22% |
| |||||||
CTCI Corp. | 4,012,000 | 7,180,944 | ||||||
|
| |||||||
| 7,180,944 | ||||||||
CONSTRUCTION MATERIALS — 1.60% |
| |||||||
Asia Cement Corp.b | 14,064,136 | 19,291,400 | ||||||
Taiwan Cement Corp. | 21,063,504 | 33,472,723 | ||||||
|
| |||||||
| 52,764,123 | ||||||||
DIVERSIFIED FINANCIAL SERVICES — 2.63% |
| |||||||
Chailease Holding Co. Ltd.b | 6,018,940 | 16,270,399 | ||||||
Fubon Financial Holding Co. Ltd. | 43,129,515 | 70,414,357 | ||||||
|
| |||||||
| 86,684,756 | ||||||||
DIVERSIFIED TELECOMMUNICATION SERVICES — 2.50% |
| |||||||
Asia Pacific Telecom Co. Ltd.b | 12,036,000 | 7,771,526 | ||||||
Chunghwa Telecom Co. Ltd. | 24,067,648 | 74,802,513 | ||||||
|
| |||||||
| 82,574,039 | ||||||||
ELECTRICAL EQUIPMENT — 0.70% |
| |||||||
Teco Electric and Machinery Co. Ltd.b | 12,036,092 | 15,140,498 | ||||||
Walsin Lihwa Corp.a | 22,066,069 | 7,899,063 | ||||||
Ya Hsin Industrial Co. Ltd.a,c | 6,845,461 | 2 | ||||||
|
| |||||||
| 23,039,563 | ||||||||
| 50 | 2014 iSHARES ANNUAL REPORTTO SHAREHOLDERS |
Table of Contents
Schedule of Investments (Continued)
iSHARES® MSCI TAIWAN ETF
August 31, 2014
| Security | Shares | Value | ||||||
ELECTRONIC EQUIPMENT, INSTRUMENTS & COMPONENTS — 15.81% |
| |||||||
AU Optronics Corp.b | 56,168,830 | $ | 27,905,426 | |||||
Delta Electronics Inc. | 11,713,180 | 82,292,628 | ||||||
Hon Hai Precision Industry Co. Ltd. | 80,240,194 | 273,816,088 | ||||||
Innolux Corp.b | 50,148,873 | 25,501,844 | ||||||
Largan Precision Co. Ltd. | 645,794 | 53,473,182 | ||||||
Pacific Electric Wire & Cable Co. Ltd.a,c | 197 | — | ||||||
Simplo Technology Co. Ltd. | 1,896,835 | 10,661,189 | ||||||
Synnex Technology International Corp.b | 8,024,538 | 12,241,981 | ||||||
TPK Holding Co. Ltd.b | 1,491,466 | 10,129,225 | ||||||
Unimicron Technology Corp.b | 8,552,794 | 7,224,973 | ||||||
WPG Holdings Co. Ltd. | 9,027,744 | 11,763,959 | ||||||
Zhen Ding Technology Holding Ltd.b | 2,006,072 | 6,630,867 | ||||||
|
| |||||||
| 521,641,362 | ||||||||
FOOD & STAPLES RETAILING — 0.84% |
| |||||||
President Chain Store Corp. | 3,652,215 | 27,675,238 | ||||||
|
| |||||||
| 27,675,238 | ||||||||
FOOD PRODUCTS — 1.84% |
| |||||||
Standard Foods Corp.b | 2,186,859 | 5,618,868 | ||||||
Uni-President Enterprises Co. | 30,090,528 | 55,066,054 | ||||||
|
| |||||||
| 60,684,922 | ||||||||
HOTELS, RESTAURANTS & LEISURE — 0.08% |
| |||||||
Formosa International Hotels Corp. | 237,184 | 2,666,192 | ||||||
|
| |||||||
| 2,666,192 | ||||||||
INDUSTRIAL CONGLOMERATES — 0.66% |
| |||||||
Far Eastern New Century Corp. | 20,461,239 | 21,939,503 | ||||||
|
| |||||||
| 21,939,503 | ||||||||
INSURANCE — 3.71% |
| |||||||
Cathay Financial Holding Co. Ltd. | 52,558,483 | 89,676,741 | ||||||
China Life Insurance Co. Ltd. | 18,054,253 | 16,761,363 | ||||||
Shin Kong Financial Holding Co. Ltd.b | 49,147,898 | 16,031,582 | ||||||
|
| |||||||
| 122,469,686 | ||||||||
LEISURE EQUIPMENT & PRODUCTS — 0.79% |
| |||||||
Giant Manufacturing Co. Ltd. | 1,947,590 | 16,191,636 | ||||||
Merida Industry Co. Ltd. | 1,326,100 | 9,760,359 | ||||||
|
| |||||||
| 25,951,995 | ||||||||
MACHINERY — 0.37% |
| |||||||
Hiwin Technologies Corp.b | 1,248,246 | 12,194,103 | ||||||
|
| |||||||
| 12,194,103 | ||||||||
| Security | Shares | Value | ||||||
MARINE — 0.48% |
| |||||||
Evergreen Marine Corp. Ltd.a | 11,033,766 | $ | 6,736,797 | |||||
U-Ming Marine Transport Corp. | 3,009,800 | 4,954,154 | ||||||
Yang Ming Marine Transport Corp.a | 9,027,635 | 4,062,217 | ||||||
|
| |||||||
| 15,753,168 | ||||||||
METALS & MINING — 2.01% |
| |||||||
China Steel Corp.b | 76,729,977 | 66,229,518 | ||||||
|
| |||||||
| 66,229,518 | ||||||||
MULTILINE RETAIL — 0.19% |
| |||||||
Far Eastern Department Stores Ltd. | 6,138,456 | 6,181,480 | ||||||
|
| |||||||
| 6,181,480 | ||||||||
OIL, GAS & CONSUMABLE FUELS — 0.54% |
| |||||||
Formosa Petrochemical Corp.b | 7,021,950 | 17,736,646 | ||||||
|
| |||||||
| 17,736,646 | ||||||||
PHARMACEUTICALS — 0.06% |
| |||||||
ScinoPharm Taiwan Ltd.b | 1,043,828 | 2,130,226 | ||||||
|
| |||||||
| 2,130,226 | ||||||||
REAL ESTATE MANAGEMENT & DEVELOPMENT — 0.52% |
| |||||||
Farglory Land Development Co. Ltd. | 2,006,270 | 2,785,507 | ||||||
Highwealth Construction Corp. | 4,012,300 | 7,114,364 | ||||||
Ruentex Development Co. Ltd.b | 4,012,487 | 7,208,664 | ||||||
|
| |||||||
| 17,108,535 | ||||||||
SEMICONDUCTORS & SEMICONDUCTOR EQUIPMENT — 31.58% |
| |||||||
Advanced Semiconductor Engineering Inc. | 40,120,448 | 49,998,718 | ||||||
Epistar Corp.b | 5,015,047 | 10,905,741 | ||||||
Hermes Microvision Inc.b | 252,000 | 10,833,542 | ||||||
Inotera Memories Inc.a | 15,045,000 | 24,613,188 | ||||||
Kinsus Interconnect Technology Corp. | 1,793,043 | 7,588,362 | ||||||
MediaTek Inc. | 9,027,175 | 150,853,078 | ||||||
Novatek Microelectronics Corp. Ltd. | 3,557,544 | 18,269,450 | ||||||
Phison Electronics Corp. | 896,698 | 6,494,877 | ||||||
Powertech Technology Inc.b | 4,012,036 | 7,610,526 | ||||||
Radiant Opto-Electronics Corp.b | 2,904,583 | 12,535,461 | ||||||
Realtek Semiconductor Corp.b | 2,893,063 | 10,549,970 | ||||||
Siliconware Precision Industries Co. Ltd. | 19,057,214 | 27,797,947 | ||||||
SCHEDULESOF INVESTMENTS | 51 |
Table of Contents
Schedule of Investments (Continued)
iSHARES® MSCI TAIWAN ETF
August 31, 2014
| Security | Shares | Value | ||||||
Taiwan Semiconductor Manufacturing Co. Ltd.b | 158,474,882 | $ | 657,429,129 | |||||
Transcend Information Inc. | 1,003,905 | 3,375,402 | ||||||
United Microelectronics Corp.b | 78,234,501 | 35,727,102 | ||||||
Vanguard International Semiconductor Corp. | 5,015,000 | 7,340,334 | ||||||
|
| |||||||
| 1,041,922,827 | ||||||||
SPECIALTY RETAIL — 0.68% |
| |||||||
Hotai Motor Co. Ltd. | 1,600,000 | 22,508,824 | ||||||
|
| |||||||
| 22,508,824 | ||||||||
TEXTILES, APPAREL & LUXURY GOODS — 1.12% |
| |||||||
Eclat Textile Co. Ltd. | 1,043,080 | 8,724,177 | ||||||
Formosa Taffeta Co. Ltd.b | 5,015,515 | 5,327,532 | ||||||
Pou Chen Corp. | 13,039,103 | 15,071,712 | ||||||
Ruentex Industries Ltd. | 3,176,262 | 7,704,086 | ||||||
|
| |||||||
| 36,827,507 | ||||||||
WIRELESS TELECOMMUNICATION SERVICES — 1.71% |
| |||||||
Far EasTone Telecommunications Co. Ltd. | 10,030,259 | 21,375,604 | ||||||
Taiwan Mobile Co. Ltd. | 11,033,609 | 35,178,500 | ||||||
|
| |||||||
| 56,554,104 | ||||||||
|
| |||||||
TOTAL COMMON STOCKS |
| |||||||
(Cost: $1,729,095,690) |
| 3,259,082,113 | ||||||
SHORT-TERM INVESTMENTS — 7.02% |
| |||||||
MONEY MARKET FUNDS — 7.02% |
| |||||||
BlackRock Cash Funds: Institutional, |
| |||||||
0.14%d,e,f | 206,882,568 | 206,882,568 | ||||||
BlackRock Cash Funds: Prime, SL Agency Shares | ||||||||
0.11%d,e,f | 13,023,825 | 13,023,825 | ||||||
BlackRock Cash Funds: Treasury, |
| |||||||
0.00%d,e | 11,720,753 | 11,720,753 | ||||||
|
| |||||||
| 231,627,146 | ||||||||
|
| |||||||
TOTAL SHORT-TERM INVESTMENTS |
| |||||||
(Cost: $231,627,146) |
| 231,627,146 | ||||||
|
| |||||||
TOTAL INVESTMENTS |
| |||||||
(Cost: $1,960,722,836) |
| 3,490,709,259 | ||||||
Other Assets, Less Liabilities — (5.82)% |
| (192,045,450 | ) | |||||
|
| |||||||
NET ASSETS — 100.00% |
| $ | 3,298,663,809 | |||||
|
| |||||||
| a | Non-income earning security. |
| b | All or a portion of this security represents a security on loan. See Note 1. |
| c | Security valued using Level 3 inputs in accordance with management’s fair valuation policy. See Note 1. |
| d | Affiliated issuer. See Note 2. |
| e | The rate quoted is the annualized seven-day yield of the fund at period end. |
| f | All or a portion of this security represents an investment of securities lending collateral. See Note 1. |
Financial futures contracts purchased as of August 31, 2014 were as follows:
| Number of Contracts | Issue (Expiration) | Exchange | Notional Value | Unrealized Appreciation (Depreciation) | ||||||||||
| 925 | MSCI Taiwan Index (Sept. 2014) | Singapore | $ | 31,838,500 | $ | 279,225 | ||||||||
See notes to financial statements.
| 52 | 2014 iSHARES ANNUAL REPORTTO SHAREHOLDERS |
Table of Contents
Schedule of Investments
iSHARES® MSCI THAILAND CAPPED ETF
August 31, 2014
| Security | Shares | Value | ||||||
COMMON STOCKS — 99.49% |
| |||||||
AIRLINES — 0.43% |
| |||||||
Nok Airlines PCL NVDR | 700,800 | $ | 351,058 | |||||
Thai Airways International PCL NVDRa | 4,378,166 | 2,083,536 | ||||||
|
| |||||||
| 2,434,594 | ||||||||
AUTO COMPONENTS — 0.54% |
| |||||||
Somboon Advance Technology PCL NVDR | 1,843,225 | 1,027,220 | ||||||
Sri Trang Agro-Industry PCL NVDR | 4,679,571 | 2,065,809 | ||||||
|
| |||||||
| 3,093,029 | ||||||||
BUILDING PRODUCTS — 0.42% |
| |||||||
Diamond Building Products PCL NVDR | 1,746,700 | 341,793 | ||||||
Dynasty Ceramic PCL NVDR | 1,129,000 | 2,058,994 | ||||||
|
| |||||||
| 2,400,787 | ||||||||
CAPITAL MARKETS — 0.06% |
| |||||||
Asia Plus Securities PCL NVDR | 3,195,100 | 372,128 | ||||||
|
| |||||||
| 372,128 | ||||||||
CHEMICALS — 3.68% |
| |||||||
Indorama Ventures PCL NVDR | 7,385,310 | 6,243,061 | ||||||
PTT Global Chemical PCL NVDR | 6,932,607 | 13,457,158 | ||||||
Siam Gas and Petrochemicals PCL NVDR | 2,923,100 | 1,327,018 | ||||||
|
| |||||||
| 21,027,237 | ||||||||
COMMERCIAL BANKS — 26.99% |
| |||||||
Bangkok Bank PCL Foreign | 1,739,200 | 11,162,680 | ||||||
Bangkok Bank PCL NVDR | 2,264,600 | 14,534,847 | ||||||
Kasikornbank PCL Foreign | 5,120,000 | 36,227,927 | ||||||
Kasikornbank PCL NVDR | 2,873,200 | 20,240,138 | ||||||
Kiatnakin Bank PCL NVDR | 2,299,573 | 3,023,859 | ||||||
Krung Thai Bank PCL NVDR | 16,990,300 | 12,500,690 | ||||||
LH Financial Group PCL NVDR | 34,107,561 | 1,815,368 | ||||||
Siam Commercial Bank PCL NVDR | 7,450,400 | 43,620,063 | ||||||
Thanachart Capital PCL NVDR | 3,594,700 | 3,939,089 | ||||||
TISCO Financial Group PCL NVDR | 2,434,810 | 3,354,153 | ||||||
TMB Bank PCL NVDR | 39,917,100 | 3,799,248 | ||||||
|
| |||||||
| 154,218,062 | ||||||||
CONSTRUCTION & ENGINEERING — 1.56% |
| |||||||
CH. Karnchang PCL NVDRb | 3,257,100 | 2,753,340 | ||||||
| Security | Shares | Value | ||||||
Italian-Thai Development PCL NVDRa | 12,079,248 | $ | 2,004,384 | |||||
Sino-Thai Engineering & Construction PCL NVDR | 4,324,828 | 3,452,821 | ||||||
Sriracha Construction PCL NVDR | 317,400 | 350,293 | ||||||
Toyo-Thai Corp. PCL NVDRb | 353,000 | 334,322 | ||||||
|
| |||||||
| 8,895,160 | ||||||||
CONSTRUCTION MATERIALS — 4.44% |
| |||||||
Siam Cement (The) PCL Foreign | 1,252,300 | 17,251,471 | ||||||
Siam Cement (The) PCL NVDRb | 429,300 | 5,913,964 | ||||||
TPI Polene PCL NVDR | 4,285,100 | 2,186,823 | ||||||
|
| |||||||
| 25,352,258 | ||||||||
CONSUMER FINANCE — 0.11% |
| |||||||
Krungthai Card PCL NVDR | 291,100 | 649,370 | ||||||
|
| |||||||
| 649,370 | ||||||||
CONTAINERS & PACKAGING — 0.24% |
| |||||||
Polyplex PCL NVDRa | 3,581,550 | 1,356,818 | ||||||
|
| |||||||
| 1,356,818 | ||||||||
DISTRIBUTORS — 0.31% |
| |||||||
Energy Earth PCL NVDR | 7,525,300 | 1,401,864 | ||||||
Jaymart PCL NVDR | 837,800 | 359,357 | ||||||
|
| |||||||
| 1,761,221 | ||||||||
DIVERSIFIED TELECOMMUNICATION SERVICES — 2.97% |
| |||||||
Jasmine International PCL NVDRb | 18,965,868 | 3,800,299 | ||||||
Samart Telcoms PCL NVDR | 694,400 | 413,074 | ||||||
Thaicom PCL NVDR | 1,411,100 | 1,745,099 | ||||||
True Corp. PCL NVDRa | 30,554,672 | 11,001,213 | ||||||
|
| |||||||
| 16,959,685 | ||||||||
ELECTRICAL EQUIPMENT — 0.10% |
| |||||||
Gunkul Engineering PCL NVDR | 914,266 | 558,177 | ||||||
|
| |||||||
| 558,177 | ||||||||
ELECTRONIC EQUIPMENT, INSTRUMENTS & COMPONENTS — 2.85% |
| |||||||
Cal-Comp Electronics (Thailand) PCL NVDR | 19,416,912 | 1,811,597 | ||||||
Delta Electronics (Thailand) PCL NVDR | 2,838,644 | 5,776,827 | ||||||
Hana Microelectronics PCL NVDR | 3,686,200 | 4,472,143 | ||||||
KCE Electronics PCL NVDR | 483,800 | 586,952 | ||||||
Loxley PCL NVDR | 2,783,805 | 381,749 | ||||||
Samart Corp. PCL NVDR | 3,444,237 | 2,749,782 | ||||||
SCHEDULESOF INVESTMENTS | 53 |
Table of Contents
Schedule of Investments (Continued)
iSHARES® MSCI THAILAND CAPPED ETF
August 31, 2014
| Security | Shares | Value | ||||||
SVI PCL NVDR | 3,767,615 | $ | 521,380 | |||||
|
| |||||||
| 16,300,430 | ||||||||
FOOD & STAPLES RETAILING — 4.97% |
| |||||||
CP All PCL NVDR | 19,100,600 | 28,405,714 | ||||||
|
| |||||||
| 28,405,714 | ||||||||
FOOD PRODUCTS — 3.26% |
| |||||||
Charoen Pokphand Foods PCL NVDR | 13,090,700 | 12,090,659 | ||||||
GFPT PCL NVDR | 4,579,400 | 2,595,089 | ||||||
Khon Kaen Sugar Industry PCL NVDR | 4,162,500 | 1,798,450 | ||||||
Thai Vegetable Oil PCL NVDR | 3,015,853 | 2,124,505 | ||||||
|
| |||||||
| 18,608,703 | ||||||||
HEALTH CARE PROVIDERS & SERVICES — 3.43% |
| |||||||
Bangkok Chain Hospital PCL NVDR | 6,740,425 | 2,099,788 | ||||||
Bangkok Dusit Medical Services PCL NVDR | 12,908,100 | 7,880,649 | ||||||
Bumrungrad Hospital PCL NVDR | 1,891,076 | 7,992,964 | ||||||
Chularat Hospital PCL NVDR | 907,700 | 503,015 | ||||||
Vibhavadi Medical Center PCL NVDR | 2,090,360 | 1,132,224 | ||||||
|
| |||||||
| 19,608,640 | ||||||||
HOTELS, RESTAURANTS & LEISURE — 2.04% |
| |||||||
Central Plaza Hotel PCL NVDR | 3,134,200 | 3,876,046 | ||||||
Erawan Group PCL (The) NVDR | 2,702,800 | 399,412 | ||||||
Minor International PCL NVDR | 6,376,900 | 7,037,749 | ||||||
MK Restaurants Group PCL NVDRb | 195,900 | 374,136 | ||||||
|
| |||||||
| 11,687,343 | ||||||||
HOUSEHOLD PRODUCTS — 0.06% |
| |||||||
DSG International Thailand PCL NVDR | 1,360,980 | 355,798 | ||||||
|
| |||||||
| 355,798 | ||||||||
INDEPENDENT POWER PRODUCERS & ENERGY TRADERS — 1.43% |
| |||||||
CK Power PCL NVDRa | 835,800 | 423,919 | ||||||
Glow Energy PCL NVDR | 2,671,700 | 7,319,153 | ||||||
SPCG PCL NVDR | 515,400 | 427,617 | ||||||
|
| |||||||
| 8,170,689 | ||||||||
INSURANCE — 0.07% |
| |||||||
Thai Reinsurance PCL NVDRa | 3,448,940 | 375,777 | ||||||
|
| |||||||
| 375,777 | ||||||||
| Security | Shares | Value | ||||||
INTERNET & CATALOG RETAIL — 0.08% |
| |||||||
OfficeMate PCL NVDR | 289,800 | $ | 453,663 | |||||
|
| |||||||
| 453,663 | ||||||||
MACHINERY — 0.07% |
| |||||||
BJC Heavy Industries PCL NVDR | 311,400 | 380,232 | ||||||
|
| |||||||
| 380,232 | ||||||||
MARINE — 1.00% |
| |||||||
Precious Shipping PCL NVDRb | 2,608,100 | 2,225,132 | ||||||
Thoresen Thai Agencies PCL NVDRa | 4,779,606 | 3,501,653 | ||||||
|
| |||||||
| 5,726,785 | ||||||||
MEDIA — 2.02% |
| |||||||
BEC World PCL NVDR | 4,875,900 | 7,251,260 | ||||||
Major Cineplex Group PCL NVDR | 3,386,800 | 2,300,988 | ||||||
MCOT PCL NVDR | 1,241,200 | 981,224 | ||||||
RS PCL NVDR | 1,401,700 | 340,112 | ||||||
VGI Global Media PCL NVDRb | 1,683,820 | 701,153 | ||||||
|
| |||||||
| 11,574,737 | ||||||||
METALS & MINING — 0.66% |
| |||||||
G J Steel PCL NVDRa | 526,252,700 | 988,577 | ||||||
STP & I PCL NVDR | 3,441,200 | 2,327,174 | ||||||
Univentures PCL NVDR | 1,312,800 | 439,792 | ||||||
|
| |||||||
| 3,755,543 | ||||||||
OIL, GAS & CONSUMABLE FUELS — 16.33% |
| |||||||
Bangchak Petroleum PCL NVDR | 2,406,600 | 2,580,653 | ||||||
Banpu PCL NVDR | 5,845,400 | 5,902,134 | ||||||
Energy Absolute PCL NVDR | 3,046,000 | 2,355,548 | ||||||
Esso (Thailand) PCL NVDRa | 7,743,700 | 1,430,427 | ||||||
IRPC PCL NVDR | 52,375,000 | 5,444,114 | ||||||
PTT Exploration & Production PCL NVDR | 6,049,884 | 31,158,607 | ||||||
PTT PCL NVDR | 3,765,400 | 37,842,623 | ||||||
Thai Oil PCL NVDR | 4,058,300 | 6,575,361 | ||||||
|
| |||||||
| 93,289,467 | ||||||||
PHARMACEUTICALS — 0.06% |
| |||||||
Mega Lifesciences PCL NVDR | 573,900 | 353,971 | ||||||
|
| |||||||
| 353,971 | ||||||||
REAL ESTATE MANAGEMENT & DEVELOPMENT — 7.70% |
| |||||||
Amata Corp. PCL NVDR | 3,971,100 | 2,076,311 | ||||||
Ananda Development PCL NVDR | 5,327,800 | 567,142 | ||||||
AP (Thailand) PCL NVDR | 7,554,960 | 1,892,288 | ||||||
Asset Corp. PCL NVDR | 12,366,037 | 1,486,712 | ||||||
Bangkok Land PCL NVDR | 52,312,800 | 3,603,261 | ||||||
| 54 | 2014 iSHARES ANNUAL REPORTTO SHAREHOLDERS |
Table of Contents
Schedule of Investments (Continued)
iSHARES® MSCI THAILAND CAPPED ETF
August 31, 2014
| Security | Shares | Value | ||||||
Central Pattana PCL NVDR | 5,824,300 | $ | 8,798,449 | |||||
Country Group Development PCL NVDRa | 5,954,400 | 249,809 | ||||||
Golden Land Property Development PCL NVDRa | 1,634,100 | 526,964 | ||||||
Hemaraj Land and Development PCL NVDR | 27,961,800 | 3,764,425 | ||||||
LPN Development PCL NVDR | 3,440,647 | 2,337,572 | ||||||
MBK PCL NVDR | 729,200 | 369,851 | ||||||
Natural Park PCL NVDRa | 212,525,300 | 399,233 | ||||||
Pruksa Real Estate PCL NVDR | 4,210,980 | 4,548,491 | ||||||
Quality Houses PCL NVDR | 26,032,141 | 3,618,745 | ||||||
Rojana Industrial Park PCL NVDR | 1,599,900 | 405,735 | ||||||
Sansiri PCL NVDR | 22,140,528 | 1,441,838 | ||||||
Siam Future Development PCL NVDR | 6,364,173 | 1,315,076 | ||||||
Supalai PCL NVDR | 4,015,000 | 3,268,316 | ||||||
Thai Factory Development PCL NVDR | 1,732,300 | 349,823 | ||||||
Ticon Industrial Connection PCL NVDR | 4,296,091 | 2,367,289 | ||||||
WHA Corp. PCL NVDR | 529,803 | 605,442 | ||||||
|
| |||||||
| 43,992,772 | ||||||||
ROAD & RAIL — 1.10% |
| |||||||
BTS Group Holdings PCL NVDR | 20,784,300 | 6,279,539 | ||||||
|
| |||||||
| 6,279,539 | ||||||||
SOFTWARE — 0.07% |
| |||||||
Mono Technology PCL NVDR | 3,076,220 | 402,586 | ||||||
|
| |||||||
| 402,586 | ||||||||
SPECIALTY RETAIL — 1.16% |
| |||||||
Home Product Center PCL NVDR | 13,042,409 | 4,287,580 | ||||||
Siam Global House PCL NVDRb | 5,036,104 | 2,333,573 | ||||||
|
| |||||||
| 6,621,153 | ||||||||
TEXTILES, APPAREL & LUXURY GOODS — 0.07% |
| |||||||
MC Group PLC NVDR | 664,400 | 397,309 | ||||||
|
| |||||||
| 397,309 | ||||||||
TRANSPORTATION INFRASTRUCTURE — 3.32% |
| |||||||
Airports of Thailand PCL NVDR | 1,884,800 | 13,985,523 | ||||||
Bangkok Aviation Fuel PCL NVDR | 714,400 | 816,393 | ||||||
Bangkok Expressway PCL NVDR | 2,450,900 | 2,992,646 | ||||||
Bangkok Metro PCL NVDRa | 15,043,241 | 814,803 | ||||||
Namyong Terminal PCL NVDR | 692,300 | 346,800 | ||||||
|
| |||||||
| 18,956,165 | ||||||||
| Security | Shares | Value | ||||||
WATER UTILITIES — 0.67% |
| |||||||
Eastern Water Resources and Management PCL NVDR | 988,700 | $ | 346,695 | |||||
Thai Tap Water Supply PCL NVDR | 8,898,166 | 3,482,375 | ||||||
|
| |||||||
| 3,829,070 | ||||||||
WIRELESS TELECOMMUNICATION SERVICES — 5.22% |
| |||||||
Advanced Information Service PCL NVDR | 4,562,219 | 29,852,967 | ||||||
|
| |||||||
| 29,852,967 | ||||||||
|
| |||||||
TOTAL COMMON STOCKS |
| |||||||
(Cost: $592,868,917) | 568,457,579 | |||||||
WARRANTS — 0.03% |
| |||||||
CHEMICALS — 0.00% |
| |||||||
Indorama Ventures PCL NVDR | ||||||||
(Expires 8/24/17)a | 726,421 | 1 | ||||||
Indorama Ventures PCL NVDR | ||||||||
(Expires 8/24/18)a | 558,785 | — | ||||||
|
| |||||||
| 1 | ||||||||
DISTRIBUTORS — 0.02% |
| |||||||
Energy Earth PCL NVDR | ||||||||
(Expires 9/15/19)a | 3,609,619 | 89,280 | ||||||
|
| |||||||
| 89,280 | ||||||||
ELECTRONIC EQUIPMENT, INSTRUMENTS & COMPONENTS — 0.00% |
| |||||||
Loxley PCL NVDR | ||||||||
(Expires 4/21/16)a | 50,876 | — | ||||||
|
| |||||||
| — | ||||||||
MARINE — 0.00% |
| |||||||
Thoresen Thai Agencies PCL NVDR | ||||||||
(Expires 2/28/17)a | 1 | — | ||||||
|
| |||||||
| — | ||||||||
METALS & MINING — 0.00% |
| |||||||
G J Steel PCL NVDR | ||||||||
(Expires 02/07/20)a | 30 | — | ||||||
|
| |||||||
| — | ||||||||
REAL ESTATE MANAGEMENT & DEVELOPMENT — 0.00% |
| |||||||
Country Group Development PCL NVDR | ||||||||
(Expires 12/31/14)a | 3,042,533 | 1 | ||||||
|
| |||||||
| 1 | ||||||||
SCHEDULESOF INVESTMENTS | 55 |
Table of Contents
Schedule of Investments (Continued)
iSHARES® MSCI THAILAND CAPPED ETF
August 31, 2014
| Security | Shares | Value | ||||||
SOFTWARE — 0.01% |
| |||||||
Mono Technology PCL NVDR | ||||||||
(Expires 12/31/14)a | 1,487,250 | $ | 78,227 | |||||
|
| |||||||
| 78,227 | ||||||||
|
| |||||||
TOTAL WARRANTS |
| |||||||
(Cost: $0) | 167,509 | |||||||
SHORT-TERM INVESTMENTS — 0.96% |
| |||||||
MONEY MARKET FUNDS — 0.96% |
| |||||||
BlackRock Cash Funds: Institutional, |
| |||||||
0.14%c,d,e | 3,695,220 | 3,695,220 | ||||||
BlackRock Cash Funds: Prime, |
| |||||||
0.11%c,d,e | 232,624 | 232,624 | ||||||
BlackRock Cash Funds: Treasury, |
| |||||||
0.00%c,d | 1,586,183 | 1,586,183 | ||||||
|
| |||||||
| 5,514,027 | ||||||||
|
| |||||||
TOTAL SHORT-TERM INVESTMENTS |
| |||||||
(Cost: $5,514,027) | 5,514,027 | |||||||
|
| |||||||
TOTAL INVESTMENTS |
| |||||||
(Cost: $598,382,944) | 574,139,115 | |||||||
Other Assets, Less Liabilities — (0.48)% |
| (2,769,509 | ) | |||||
|
| |||||||
NET ASSETS — 100.00% | $ | 571,369,606 | ||||||
|
| |||||||
NVDR — Non-Voting Depositary Receipts
| a | Non-income earning security. |
| b | All or a portion of this security represents a security on loan. See Note 1. |
| c | Affiliated issuer. See Note 2. |
| d | The rate quoted is the annualized seven-day yield of the fund at period end. |
| e | All or a portion of this security represents an investment of securities lending collateral. See Note 1. |
See notes to financial statements.
| 56 | 2014 iSHARES ANNUAL REPORTTO SHAREHOLDERS |
Table of Contents
Statements of Assets and Liabilities
iSHARES®, INC.
August 31, 2014
| iShares MSCI Australia ETF | iShares MSCI Hong Kong ETF | iShares MSCI Japan Small-Cap ETF | ||||||||||
ASSETS | ||||||||||||
Investments, at cost: | ||||||||||||
Unaffiliated | $ | 1,870,287,468 | $ | 3,006,192,108 | $ | 153,180,710 | ||||||
Affiliated (Note 2) | 343,395 | 40,809,111 | 6,421,605 | |||||||||
|
|
|
|
|
| |||||||
Total cost of investments | $ | 1,870,630,863 | $ | 3,047,001,219 | $ | 159,602,315 | ||||||
|
|
|
|
|
| |||||||
Investments in securities, at fair value (including securities on loana) (Note 1): |
| |||||||||||
Unaffiliated | $ | 2,024,757,097 | $ | 3,202,754,847 | $ | 169,379,711 | ||||||
Affiliated (Note 2) | 343,395 | 40,809,111 | 6,421,605 | |||||||||
|
|
|
|
|
| |||||||
Total fair value of investments | 2,025,100,492 | 3,243,563,958 | 175,801,316 | |||||||||
Foreign currency, at valueb | 7,649,119 | 2,848,579 | 216,107 | |||||||||
Foreign currency pledged to broker, at valueb | 149,148 | 1,633,264 | — | |||||||||
Receivables: | ||||||||||||
Investment securities sold | 9,240,472 | — | — | |||||||||
Due from custodian (Note 4) | — | 1,141,004 | — | |||||||||
Dividends and interest | 15,802,151 | 6,669,048 | 293,469 | |||||||||
Futures variation margin | 452,812 | — | — | |||||||||
|
|
|
|
|
| |||||||
Total Assets | 2,058,394,194 | 3,255,855,853 | 176,310,892 | |||||||||
|
|
|
|
|
| |||||||
LIABILITIES | ||||||||||||
Payables: | ||||||||||||
Investment securities purchased | 10,472,563 | 6,708,674 | — | |||||||||
Collateral for securities on loan (Note 1) | — | 26,443,665 | 6,405,640 | |||||||||
Futures variation margin | — | 276,020 | — | |||||||||
Investment advisory fees (Note 2) | 809,047 | 1,115,276 | 68,547 | |||||||||
|
|
|
|
|
| |||||||
Total Liabilities | 11,281,610 | 34,543,635 | 6,474,187 | |||||||||
|
|
|
|
|
| |||||||
NET ASSETS | $ | 2,047,112,584 | $ | 3,221,312,218 | $ | 169,836,705 | ||||||
|
|
|
|
|
| |||||||
Net assets consist of: | ||||||||||||
Paid-in capital | $ | 2,107,981,108 | $ | 3,435,830,184 | $ | 159,482,654 | ||||||
Undistributed (distributions in excess of) net investment income | 4,863,922 | 6,189,736 | (1,026,401 | ) | ||||||||
Accumulated net realized loss | (220,671,505 | ) | (416,994,632 | ) | (4,811,465 | ) | ||||||
Net unrealized appreciation | 154,939,059 | 196,286,930 | 16,191,917 | |||||||||
|
|
|
|
|
| |||||||
NET ASSETS | $ | 2,047,112,584 | $ | 3,221,312,218 | $ | 169,836,705 | ||||||
|
|
|
|
|
| |||||||
Shares outstandingc | 75,400,000 | 147,150,000 | 3,000,000 | |||||||||
|
|
|
|
|
| |||||||
Net asset value per share | $ | 27.15 | $ | 21.89 | $ | 56.61 | ||||||
|
|
|
|
|
| |||||||
| a | Securities on loan with values of $ —, $24,861,103 and $6,083,697, respectively. See Note 1. |
| b | Cost of foreign currency including currency pledged to broker, if any: $7,810,918, $4,481,749 and $220,226, respectively. |
| c | $0.001 par value, number of shares authorized: 627.8 million, 375 million and 500 million, respectively. |
See notes to financial statements.
FINANCIAL STATEMENTS | 57 |
Table of Contents
Statements of Assets and Liabilities (Continued)
iSHARES®, INC.
August 31, 2014
| iShares MSCI Malaysia ETF | iShares MSCI Pacific ex Japan ETF | iShares MSCI Singapore ETF | ||||||||||
ASSETS | ||||||||||||
Investments, at cost: | ||||||||||||
Unaffiliated | $ | 329,295,748 | $ | 2,996,489,764 | $ | 898,358,449 | ||||||
Affiliated (Note 2) | 49,820 | 37,421,669 | 44,289,310 | |||||||||
|
|
|
|
|
| |||||||
Total cost of investments | $ | 329,345,568 | $ | 3,033,911,433 | $ | 942,647,759 | ||||||
|
|
|
|
|
| |||||||
Investments in securities, at fair value (including securities on loana) (Note 1): |
| |||||||||||
Unaffiliated | $ | 783,496,888 | $ | 3,440,429,479 | $ | 962,392,319 | ||||||
Affiliated (Note 2) | 49,820 | 37,421,669 | 44,289,310 | |||||||||
|
|
|
|
|
| |||||||
Total fair value of investments | 783,546,708 | 3,477,851,148 | 1,006,681,629 | |||||||||
Foreign currency, at valueb | 1,571,715 | 13,156,479 | 16,613,426 | |||||||||
Foreign currency pledged to broker, at valueb | — | — | 231,665 | |||||||||
Receivables: | ||||||||||||
Investment securities sold | — | 6,705,661 | — | |||||||||
Dividends | 1,658,147 | 21,447,451 | 5,417,281 | |||||||||
|
|
|
|
|
| |||||||
Total Assets | 786,776,570 | 3,519,160,739 | 1,028,944,001 | |||||||||
|
|
|
|
|
| |||||||
LIABILITIES | ||||||||||||
Payables: | ||||||||||||
Investment securities purchased | — | 8,639,407 | — | |||||||||
Collateral for securities on loan (Note 1) | — | 37,053,856 | 44,045,893 | |||||||||
Futures variation margin | — | — | 42,726 | |||||||||
Investment advisory fees (Note 2) | 315,671 | 1,419,156 | 400,440 | |||||||||
|
|
|
|
|
| |||||||
Total Liabilities | 315,671 | 47,112,419 | 44,489,059 | |||||||||
|
|
|
|
|
| |||||||
NET ASSETS | $ | 786,460,899 | $ | 3,472,048,320 | $ | 984,454,942 | ||||||
|
|
|
|
|
| |||||||
Net assets consist of: | ||||||||||||
Paid-in capital | $ | 351,176,964 | $ | 3,513,558,498 | $ | 1,137,576,870 | ||||||
Undistributed (distributions in excess of) net investment income | 3,466,057 | 12,734,661 | (2,353,314 | ) | ||||||||
Accumulated net realized loss | (22,393,512 | ) | (498,220,760 | ) | (214,768,671 | ) | ||||||
Net unrealized appreciation | 454,211,390 | 443,975,921 | 64,000,057 | |||||||||
|
|
|
|
|
| |||||||
NET ASSETS | $ | 786,460,899 | $ | 3,472,048,320 | $ | 984,454,942 | ||||||
|
|
|
|
|
| |||||||
Shares outstandingc | 48,750,000 | 67,800,000 | 70,500,000 | |||||||||
|
|
|
|
|
| |||||||
Net asset value per share | $ | 16.13 | $ | 51.21 | $ | 13.96 | ||||||
|
|
|
|
|
| |||||||
| a | Securities on loan with values of $ —, $35,186,830 and $41,676,810, respectively. See Note 1. |
| b | Cost of foreign currency including currency at broker, if any: $1,566,113, $13,153,893 and $16,838,141, respectively. |
| c | $0.001 par value, number of shares authorized: 300 million, 1 billion and 300 million, respectively. |
See notes to financial statements.
| 58 | 2014 iSHARES ANNUAL REPORTTO SHAREHOLDERS |
Table of Contents
Statements of Assets and Liabilities (Continued)
iSHARES®, INC.
August 31, 2014
| iShares MSCI South Korea Capped ETF | iShares MSCI Taiwan ETF | iShares MSCI Thailand Capped ETF | ||||||||||
ASSETS | ||||||||||||
Investments, at cost: | ||||||||||||
Unaffiliated | $ | 2,750,571,178 | $ | 1,729,095,690 | $ | 592,868,917 | ||||||
Affiliated (Note 2) | 169,056,812 | 231,627,146 | 5,514,027 | |||||||||
|
|
|
|
|
| |||||||
Total cost of investments | $ | 2,919,627,990 | $ | 1,960,722,836 | $ | 598,382,944 | ||||||
|
|
|
|
|
| |||||||
Investments in securities, at fair value (including securities on loana) (Note 1): |
| |||||||||||
Unaffiliated | $ | 4,882,429,273 | $ | 3,259,082,113 | $ | 568,625,088 | ||||||
Affiliated (Note 2) | 169,056,812 | 231,627,146 | 5,514,027 | |||||||||
|
|
|
|
|
| |||||||
Total fair value of investments | 5,051,486,085 | 3,490,709,259 | 574,139,115 | |||||||||
Foreign currency, at valueb | 18,440,489 | 1,583,230 | 57,106 | |||||||||
Cash | — | 16,822,038 | — | |||||||||
Cash pledged to broker | — | 1,514,000 | — | |||||||||
Receivables: | ||||||||||||
Investment securities sold | 156,347,739 | — | 1,500,894 | |||||||||
Due from custodian (Note 4) | — | — | 2,531,224 | |||||||||
Dividends and interest | 254,336 | 25,553,957 | 1,908,435 | |||||||||
Capital shares sold | 3,321,553 | 3,290,615 | — | |||||||||
|
|
|
|
|
| |||||||
Total Assets | 5,229,850,202 | 3,539,473,099 | 580,136,774 | |||||||||
|
|
|
|
|
| |||||||
LIABILITIES | ||||||||||||
Payables: | ||||||||||||
Investment securities purchased | 162,547,060 | 16,823,483 | 4,552,886 | |||||||||
Collateral for securities on loan (Note 1) | 169,056,812 | 219,906,393 | 3,927,844 | |||||||||
Futures variation margin | — | 155,462 | — | |||||||||
Due to custodian | 4,183,953 | — | — | |||||||||
Foreign taxes (Note 1) | 3,061 | 2,256,529 | — | |||||||||
Investment advisory fees (Note 2) | 2,440,409 | 1,667,423 | 286,438 | |||||||||
|
|
|
|
|
| |||||||
Total Liabilities | 338,231,295 | 240,809,290 | 8,767,168 | |||||||||
|
|
|
|
|
| |||||||
NET ASSETS | $ | 4,891,618,907 | $ | 3,298,663,809 | $ | 571,369,606 | ||||||
|
|
|
|
|
| |||||||
Net assets consist of: | ||||||||||||
Paid-in capital | $ | 3,729,265,323 | $ | 2,810,816,089 | $ | 618,707,105 | ||||||
Undistributed (distributions in excess of) net investment income | (61,970,456 | ) | 49,428,800 | 1,958,625 | ||||||||
Accumulated net realized loss | (907,525,383 | ) | (1,091,908,580 | ) | (25,052,729 | ) | ||||||
Net unrealized appreciation (depreciation) | 2,131,849,423 | 1,530,327,500 | (24,243,395 | ) | ||||||||
|
|
|
|
|
| |||||||
NET ASSETS | $ | 4,891,618,907 | $ | 3,298,663,809 | $ | 571,369,606 | ||||||
|
|
|
|
|
| |||||||
Shares outstandingc | 73,650,000 | 200,600,000 | 6,850,000 | |||||||||
|
|
|
|
|
| |||||||
Net asset value per share | $ | 66.42 | $ | 16.44 | $ | 83.41 | ||||||
|
|
|
|
|
| |||||||
| a | Securities on loan with values of $161,526,885, $206,680,307 and $3,802,414, respectively. See Note 1. |
| b | Cost of foreign currency: $18,440,489, $1,583,171 and $57,114, respectively. |
| c | $0.001 par value, number of shares authorized: 200 million, 900 million and 200 million, respectively. |
See notes to financial statements.
FINANCIAL STATEMENTS | 59 |
Table of Contents
Statements of Operations
iSHARES®, INC.
Year ended August 31, 2014
| iShares MSCI Australia ETF | iShares MSCI Hong Kong ETF | iShares MSCI Japan Small-Cap ETF | ||||||||||
NET INVESTMENT INCOME | ||||||||||||
Dividends — unaffiliateda | $ | 92,186,961 | $ | 81,049,175 | $ | 2,351,806 | ||||||
Interest — unaffiliated | 5,898 | — | — | |||||||||
Interest — affiliated (Note 2) | 291 | 340 | 17 | |||||||||
Securities lending income — affiliated (Note 2) | 25,186 | 299,900 | 98,240 | |||||||||
|
|
|
|
|
| |||||||
Total investment income | 92,218,336 | 81,349,415 | 2,450,063 | |||||||||
|
|
|
|
|
| |||||||
EXPENSES | ||||||||||||
Investment advisory fees (Note 2) | 9,309,890 | 10,514,616 | 658,384 | |||||||||
|
|
|
|
|
| |||||||
Total expenses | 9,309,890 | 10,514,616 | 658,384 | |||||||||
|
|
|
|
|
| |||||||
Net investment income | 82,908,446 | 70,834,799 | 1,791,679 | |||||||||
|
|
|
|
|
| |||||||
NET REALIZED AND UNREALIZED GAIN (LOSS) | ||||||||||||
Net realized gain (loss) from: | ||||||||||||
Investments — unaffiliated | (26,917,297 | ) | (23,849,229 | ) | (2,130,216 | ) | ||||||
In-kind redemptions — unaffiliated | 60,506,338 | 86,926,510 | 3,947,204 | |||||||||
Futures contracts | 937,496 | 2,720,479 | — | |||||||||
Foreign currency transactions | 946,335 | 2,923 | (21,169 | ) | ||||||||
|
|
|
|
|
| |||||||
Net realized gain | 35,472,872 | 65,800,683 | 1,795,819 | |||||||||
|
|
|
|
|
| |||||||
Net change in unrealized appreciation/depreciation on: | ||||||||||||
Investments | 210,230,385 | 219,009,218 | 15,642,272 | |||||||||
Futures contracts | (253,562 | ) | (169,042 | ) | — | |||||||
Translation of assets and liabilities in foreign currencies | 449,558 | (1,608 | ) | (5,678 | ) | |||||||
|
|
|
|
|
| |||||||
Net change in unrealized appreciation/depreciation | 210,426,381 | 218,838,568 | 15,636,594 | |||||||||
|
|
|
|
|
| |||||||
Net realized and unrealized gain | 245,899,253 | 284,639,251 | 17,432,413 | |||||||||
|
|
|
|
|
| |||||||
NET INCREASE IN NET ASSETS RESULTING FROM OPERATIONS | $ | 328,807,699 | $ | 355,474,050 | $ | 19,224,092 | ||||||
|
|
|
|
|
| |||||||
| a | Net of foreign withholding tax of $1,287,180, $ — and $242,756, respectively. |
See notes to financial statements.
| 60 | 2014 iSHARES ANNUAL REPORTTO SHAREHOLDERS |
Table of Contents
Statements of Operations (Continued)
iSHARES®, INC.
Year ended August 31, 2014
| iShares MSCI Malaysia ETF | iShares MSCI Pacific ex Japan ETF | iShares MSCI Singapore ETF | ||||||||||
NET INVESTMENT INCOME | ||||||||||||
Dividends — unaffiliateda | $ | 31,709,421 | $ | 138,841,819 | $ | 35,847,080 | ||||||
Interest — affiliated (Note 2) | 121 | 624 | 186 | |||||||||
Securities lending income — affiliated (Note 2) | — | 582,676 | 1,428,259 | |||||||||
|
|
|
|
|
| |||||||
Total investment income | 31,709,542 | 139,425,119 | 37,275,525 | |||||||||
|
|
|
|
|
| |||||||
EXPENSES | ||||||||||||
Investment advisory fees (Note 2) | 3,846,410 | 15,652,518 | 5,164,682 | |||||||||
|
|
|
|
|
| |||||||
Total expenses | 3,846,410 | 15,652,518 | 5,164,682 | |||||||||
|
|
|
|
|
| |||||||
Net investment income | 27,863,132 | 123,772,601 | 32,110,843 | |||||||||
|
|
|
|
|
| |||||||
NET REALIZED AND UNREALIZED GAIN (LOSS) | ||||||||||||
Net realized gain (loss) from: | ||||||||||||
Investments — unaffiliated | 41,431,605 | (38,755,034 | ) | (3,636,333 | ) | |||||||
In-kind redemptions — unaffiliated | — | 164,334,399 | 35,593,244 | |||||||||
Futures contracts | — | — | 451,881 | |||||||||
Foreign currency transactions | 5,859 | 794,024 | 121,549 | |||||||||
|
|
|
|
|
| |||||||
Net realized gain | 41,437,464 | 126,373,389 | 32,530,341 | |||||||||
|
|
|
|
|
| |||||||
Net change in unrealized appreciation/depreciation on: | ||||||||||||
Investments | 33,329,346 | 262,157,402 | 84,140,820 | |||||||||
Futures contracts | — | — | 43,054 | |||||||||
Translation of assets and liabilities in foreign currencies | (60,443 | ) | 379,118 | (13,540 | ) | |||||||
|
|
|
|
|
| |||||||
Net change in unrealized appreciation/depreciation | 33,268,903 | 262,536,520 | 84,170,334 | |||||||||
|
|
|
|
|
| |||||||
Net realized and unrealized gain | 74,706,367 | 388,909,909 | 116,700,675 | |||||||||
|
|
|
|
|
| |||||||
NET INCREASE IN NET ASSETS RESULTING FROM OPERATIONS | $ | 102,569,499 | $ | 512,682,510 | $ | 148,811,518 | ||||||
|
|
|
|
|
| |||||||
| a | Net of foreign withholding tax of $680,391, $1,769,553 and $230,769, respectively. |
See notes to financial statements.
FINANCIAL STATEMENTS | 61 |
Table of Contents
Statements of Operations (Continued)
iSHARES®, INC.
Year ended August 31, 2014
| iShares MSCI South Korea Capped ETF | iShares MSCI Taiwan ETF | iShares MSCI Thailand Capped ETF | ||||||||||
NET INVESTMENT INCOME | ||||||||||||
Dividends — unaffiliateda | $ | 39,950,623 | $ | 76,571,665 | $ | 15,639,062 | ||||||
Interest — unaffiliated | 1,360 | 84 | — | |||||||||
Interest — affiliated (Note 2) | 1,289 | 1,526 | 156 | |||||||||
Securities lending income — affiliated (Note 2) | 3,147,503 | 2,713,398 | b | 55,981 | ||||||||
|
|
|
|
|
| |||||||
| 43,100,775 | 79,286,673 | 15,695,199 | ||||||||||
Less: Other foreign taxes (Note 1) | 4,693 | (3,259,410 | ) | (12,233 | ) | |||||||
|
|
|
|
|
| |||||||
Total investment income | 43,105,468 | 76,027,263 | 15,682,966 | |||||||||
|
|
|
|
|
| |||||||
EXPENSES | ||||||||||||
Investment advisory fees (Note 2) | 26,444,377 | 18,110,836 | 3,396,409 | |||||||||
|
|
|
|
|
| |||||||
Total expenses | 26,444,377 | 18,110,836 | 3,396,409 | |||||||||
|
|
|
|
|
| |||||||
Net investment income | 16,661,091 | 57,916,427 | 12,286,557 | |||||||||
|
|
|
|
|
| |||||||
NET REALIZED AND UNREALIZED GAIN (LOSS) | ||||||||||||
Net realized gain (loss) from: | ||||||||||||
Investments — unaffiliated | (38,751,602 | ) | (22,281,259 | ) | (12,835,432 | ) | ||||||
In-kind redemptions — unaffiliated | — | — | 22,212,118 | |||||||||
Futures contracts | — | 1,553,130 | — | |||||||||
Foreign currency transactions | (726,544 | ) | (142,805 | ) | (157,302 | ) | ||||||
|
|
|
|
|
| |||||||
Net realized gain (loss) | (39,478,146 | ) | (20,870,934 | ) | 9,219,384 | |||||||
|
|
|
|
|
| |||||||
Net change in unrealized appreciation/depreciation on: | ||||||||||||
Investments | 623,930,311 | 581,367,407 | 95,809,156 | |||||||||
Futures contracts | — | (208,856 | ) | — | ||||||||
Translation of assets and liabilities in foreign currencies | (7,638 | ) | 51,178 | 44,880 | ||||||||
|
|
|
|
|
| |||||||
Net change in unrealized appreciation/depreciation | 623,922,673 | 581,209,729 | 95,854,036 | |||||||||
|
|
|
|
|
| |||||||
Net realized and unrealized gain | 584,444,527 | 560,338,795 | 105,073,420 | |||||||||
|
|
|
|
|
| |||||||
NET INCREASE IN NET ASSETS RESULTING FROM OPERATIONS | $ | 601,105,618 | $ | 618,255,222 | $ | 117,359,977 | ||||||
|
|
|
|
|
| |||||||
| a | Net of foreign withholding tax of $9,739,208, $17,226,172 and $1,728,103, respectively. |
| b | Net of foreign tax paid of $ —, $632,597 and $ —, respectively. |
See notes to financial statements.
| 62 | 2014 iSHARES ANNUAL REPORTTO SHAREHOLDERS |
Table of Contents
Statements of Changes in Net Assets
iSHARES®, INC.
| iShares MSCI Australia ETF | iShares MSCI Hong Kong ETF | |||||||||||||||
| Year ended August 31, 2014 | Year ended August 31, 2013 | Year ended August 31, 2014 | Year ended August 31, 2013 | |||||||||||||
INCREASE (DECREASE) IN NET ASSETS | ||||||||||||||||
OPERATIONS: | ||||||||||||||||
Net investment income | $ | 82,908,446 | $ | 95,118,733 | $ | 70,834,799 | $ | 71,264,718 | ||||||||
Net realized gain | 35,472,872 | 67,936,094 | 65,800,683 | 176,369,407 | ||||||||||||
Net change in unrealized appreciation/depreciation | 210,426,381 | 13,198,281 | 218,838,568 | 55,861,708 | ||||||||||||
|
|
|
|
|
|
|
| |||||||||
Net increase in net assets resulting from operations | 328,807,699 | 176,253,108 | 355,474,050 | 303,495,833 | ||||||||||||
|
|
|
|
|
|
|
| |||||||||
DISTRIBUTIONS TO SHAREHOLDERS: | ||||||||||||||||
From net investment income | (76,457,082 | ) | (130,032,525 | ) | (69,523,487 | ) | (71,372,977 | ) | ||||||||
|
|
|
|
|
|
|
| |||||||||
Total distributions to shareholders | (76,457,082 | ) | (130,032,525 | ) | (69,523,487 | ) | (71,372,977 | ) | ||||||||
|
|
|
|
|
|
|
| |||||||||
CAPITAL SHARE TRANSACTIONS: | ||||||||||||||||
Proceeds from shares sold | 364,472,393 | 352,326,670 | 1,440,373,193 | 1,549,740,139 | ||||||||||||
Cost of shares redeemed | (486,559,346 | ) | (975,397,089 | ) | (629,867,957 | ) | (1,522,980,733 | ) | ||||||||
|
|
|
|
|
|
|
| |||||||||
Net increase (decrease) in net assets from capital share transactions | (122,086,953 | ) | (623,070,419 | ) | 810,505,236 | 26,759,406 | ||||||||||
|
|
|
|
|
|
|
| |||||||||
INCREASE (DECREASE) IN NET ASSETS | 130,263,664 | (576,849,836 | ) | 1,096,455,799 | 258,882,262 | |||||||||||
NET ASSETS | ||||||||||||||||
Beginning of year | 1,916,848,920 | 2,493,698,756 | 2,124,856,419 | 1,865,974,157 | ||||||||||||
|
|
|
|
|
|
|
| |||||||||
End of year | $ | 2,047,112,584 | $ | 1,916,848,920 | $ | 3,221,312,218 | $ | 2,124,856,419 | ||||||||
|
|
|
|
|
|
|
| |||||||||
Undistributed (distributions in excess of) net investment income included in net assets at end of year | $ | 4,863,922 | $ | (5,060,683 | ) | $ | 6,189,736 | $ | 4,875,501 | |||||||
|
|
|
|
|
|
|
| |||||||||
SHARES ISSUED AND REDEEMED | ||||||||||||||||
Shares sold | 13,800,000 | 14,000,000 | 66,525,000 | 81,300,000 | ||||||||||||
Shares redeemed | (19,600,000 | ) | (39,400,000 | ) | (31,725,000 | ) | (79,125,000 | ) | ||||||||
|
|
|
|
|
|
|
| |||||||||
Net increase (decrease) in shares outstanding | (5,800,000 | ) | (25,400,000 | ) | 34,800,000 | 2,175,000 | ||||||||||
|
|
|
|
|
|
|
| |||||||||
See notes to financial statements.
FINANCIAL STATEMENTS | 63 |
Table of Contents
Statements of Changes in Net Assets (Continued)
iSHARES®, INC.
| iShares MSCI Japan Small-Cap ETF | iShares MSCI Malaysia ETF | |||||||||||||||
| Year ended August 31, 2014 | Year ended August 31, 2013 | Year ended August 31, 2014 | Year ended August 31, 2013 | |||||||||||||
INCREASE (DECREASE) IN NET ASSETS | ||||||||||||||||
OPERATIONS: | ||||||||||||||||
Net investment income | $ | 1,791,679 | $ | 836,485 | $ | 27,863,132 | $ | 26,000,206 | ||||||||
Net realized gain (loss) | 1,795,819 | (227,736 | ) | 41,437,464 | 17,549,880 | |||||||||||
Net change in unrealized appreciation/depreciation | 15,636,594 | 6,085,205 | 33,268,903 | (15,851,478 | ) | |||||||||||
|
|
|
|
|
|
|
| |||||||||
Net increase in net assets resulting from operations | 19,224,092 | 6,693,954 | 102,569,499 | 27,698,608 | ||||||||||||
|
|
|
|
|
|
|
| |||||||||
DISTRIBUTIONS TO SHAREHOLDERS: | ||||||||||||||||
From net investment income | (2,956,269 | ) | (1,107,270 | ) | (26,722,876 | ) | (23,444,016 | ) | ||||||||
|
|
|
|
|
|
|
| |||||||||
Total distributions to shareholders | (2,956,269 | ) | (1,107,270 | ) | (26,722,876 | ) | (23,444,016 | ) | ||||||||
|
|
|
|
|
|
|
| |||||||||
CAPITAL SHARE TRANSACTIONS: | ||||||||||||||||
Proceeds from shares sold | 80,604,743 | 49,278,602 | 52,163,306 | 93,307,043 | ||||||||||||
Cost of shares redeemed | (16,023,548 | ) | (8,694,664 | ) | (150,687,467 | ) | (225,115,455 | ) | ||||||||
|
|
|
|
|
|
|
| |||||||||
Net increase (decrease) in net assets from capital share transactions | 64,581,195 | 40,583,938 | (98,524,161 | ) | (131,808,412 | ) | ||||||||||
|
|
|
|
|
|
|
| |||||||||
INCREASE (DECREASE) IN NET ASSETS | 80,849,018 | 46,170,622 | (22,677,538 | ) | (127,553,820 | ) | ||||||||||
NET ASSETS | ||||||||||||||||
Beginning of year | 88,987,687 | 42,817,065 | 809,138,437 | 936,692,257 | ||||||||||||
|
|
|
|
|
|
|
| |||||||||
End of year | $ | 169,836,705 | $ | 88,987,687 | $ | 786,460,899 | $ | 809,138,437 | ||||||||
|
|
|
|
|
|
|
| |||||||||
Undistributed (distributions in excess of) net investment income included in net assets at end of year | $ | (1,026,401 | ) | $ | (123,338 | ) | $ | 3,466,057 | $ | 2,319,942 | ||||||
|
|
|
|
|
|
|
| |||||||||
SHARES ISSUED AND REDEEMED | ||||||||||||||||
Shares sold | 1,500,000 | 1,000,000 | 3,225,000 | 6,150,000 | ||||||||||||
Shares redeemed | (300,000 | ) | (200,000 | ) | (9,900,000 | ) | (15,225,000 | ) | ||||||||
|
|
|
|
|
|
|
| |||||||||
Net increase (decrease) in shares outstanding | 1,200,000 | 800,000 | (6,675,000 | ) | (9,075,000 | ) | ||||||||||
|
|
|
|
|
|
|
| |||||||||
See notes to financial statements.
| 64 | 2014 iSHARES ANNUAL REPORTTO SHAREHOLDERS |
Table of Contents
Statements of Changes in Net Assets (Continued)
iSHARES®, INC.
| iShares MSCI Pacific ex Japan ETF | iShares MSCI Singapore ETF | |||||||||||||||
| Year ended August 31, 2014 | Year ended August 31, 2013 | Year ended August 31, 2014 | Year ended August 31, 2013 | |||||||||||||
INCREASE (DECREASE) IN NET ASSETS | ||||||||||||||||
OPERATIONS: | ||||||||||||||||
Net investment income | $ | 123,772,601 | $ | 136,122,747 | $ | 32,110,843 | $ | 48,795,283 | ||||||||
Net realized gain | 126,373,389 | 310,413,133 | 32,530,341 | 90,919,970 | ||||||||||||
Net change in unrealized appreciation/depreciation | 262,536,520 | (214,606,307 | ) | 84,170,334 | (131,975,048 | ) | ||||||||||
|
|
|
|
|
|
|
| |||||||||
Net increase in net assets resulting from operations | 512,682,510 | 231,929,573 | 148,811,518 | 7,740,205 | ||||||||||||
|
|
|
|
|
|
|
| |||||||||
DISTRIBUTIONS TO SHAREHOLDERS: | ||||||||||||||||
From net investment income | (118,670,244 | ) | (156,573,693 | ) | (36,850,739 | ) | (63,036,613 | ) | ||||||||
|
|
|
|
|
|
|
| |||||||||
Total distributions to shareholders | (118,670,244 | ) | (156,573,693 | ) | (36,850,739 | ) | (63,036,613 | ) | ||||||||
|
|
|
|
|
|
|
| |||||||||
CAPITAL SHARE TRANSACTIONS: | ||||||||||||||||
Proceeds from shares sold | 752,794,621 | 971,290,034 | 45,906,815 | 206,627,419 | ||||||||||||
Cost of shares redeemed | (682,826,053 | ) | (1,227,160,297 | ) | (308,890,044 | ) | (528,540,126 | ) | ||||||||
|
|
|
|
|
|
|
| |||||||||
Net increase (decrease) in net assets from capital share transactions | 69,968,568 | (255,870,263 | ) | (262,983,229 | ) | (321,912,707 | ) | |||||||||
|
|
|
|
|
|
|
| |||||||||
INCREASE (DECREASE) IN NET ASSETS | 463,980,834 | (180,514,383 | ) | (151,022,450 | ) | (377,209,115 | ) | |||||||||
NET ASSETS | ||||||||||||||||
Beginning of year | 3,008,067,486 | 3,188,581,869 | 1,135,477,392 | 1,512,686,507 | ||||||||||||
|
|
|
|
|
|
|
| |||||||||
End of year | $ | 3,472,048,320 | $ | 3,008,067,486 | $ | 984,454,942 | $ | 1,135,477,392 | ||||||||
|
|
|
|
|
|
|
| |||||||||
Undistributed (distributions in excess of) net investment income included in net assets at end of year | $ | 12,734,661 | $ | 1,949,874 | $ | (2,353,314 | ) | $ | (1,582,316 | ) | ||||||
|
|
|
|
|
|
|
| |||||||||
SHARES ISSUED AND REDEEMED | ||||||||||||||||
Shares sold | 15,300,000 | 20,400,000 | 3,400,000 | 15,200,000 | ||||||||||||
Shares redeemed | (15,000,000 | ) | (26,700,000 | ) | (23,800,000 | ) | (39,800,000 | ) | ||||||||
|
|
|
|
|
|
|
| |||||||||
Net increase (decrease) in shares outstanding | 300,000 | (6,300,000 | ) | (20,400,000 | ) | (24,600,000 | ) | |||||||||
|
|
|
|
|
|
|
| |||||||||
See notes to financial statements.
FINANCIAL STATEMENTS | 65 |
Table of Contents
Statements of Changes in Net Assets (Continued)
iSHARES®, INC.
| iShares MSCI South Korea Capped ETF | iShares MSCI Taiwan ETF | |||||||||||||||
| Year ended August 31, 2014 | Year ended August 31, 2013 | Year ended August 31, 2014 | Year ended August 31, 2013 | |||||||||||||
INCREASE (DECREASE) IN NET ASSETS | ||||||||||||||||
OPERATIONS: | ||||||||||||||||
Net investment income | $ | 16,661,091 | $ | 12,511,437 | $ | 57,916,427 | $ | 47,025,597 | ||||||||
Net realized gain (loss) | (39,478,146 | ) | 693,348 | (20,870,934 | ) | (46,800,296 | ) | |||||||||
Net change in unrealized appreciation/depreciation | 623,922,673 | 69,998,753 | 581,209,729 | 230,468,377 | ||||||||||||
|
|
|
|
|
|
|
| |||||||||
Net increase in net assets resulting from operations | 601,105,618 | 83,203,538 | 618,255,222 | 230,693,678 | ||||||||||||
|
|
|
|
|
|
|
| |||||||||
DISTRIBUTIONS TO SHAREHOLDERS: | ||||||||||||||||
From net investment income | (61,830,398 | ) | (18,847,855 | ) | (51,978,221 | ) | (53,961,288 | ) | ||||||||
|
|
|
|
|
|
|
| |||||||||
Total distributions to shareholders | (61,830,398 | ) | (18,847,855 | ) | (51,978,221 | ) | (53,961,288 | ) | ||||||||
|
|
|
|
|
|
|
| |||||||||
CAPITAL SHARE TRANSACTIONS: | ||||||||||||||||
Proceeds from shares sold | 1,151,119,199 | 699,217,627 | 299,500,305 | 608,307,506 | ||||||||||||
Cost of shares redeemed | (175,291,957 | ) | (56,608,080 | ) | (209,110,415 | ) | (390,170,968 | ) | ||||||||
|
|
|
|
|
|
|
| |||||||||
Net increase in net assets from capital share transactions | 975,827,242 | 642,609,547 | 90,389,890 | 218,136,538 | ||||||||||||
|
|
|
|
|
|
|
| |||||||||
INCREASE IN NET ASSETS | 1,515,102,462 | 706,965,230 | 656,666,891 | 394,868,928 | ||||||||||||
NET ASSETS | ||||||||||||||||
Beginning of year | 3,376,516,445 | 2,669,551,215 | 2,641,996,918 | 2,247,127,990 | ||||||||||||
|
|
|
|
|
|
|
| |||||||||
End of year | $ | 4,891,618,907 | $ | 3,376,516,445 | $ | 3,298,663,809 | $ | 2,641,996,918 | ||||||||
|
|
|
|
|
|
|
| |||||||||
Undistributed (distributions in excess of) net investment income included in net assets at end of year | $ | (61,970,456 | ) | $ | (16,666,480 | ) | $ | 49,428,800 | $ | 43,522,689 | ||||||
|
|
|
|
|
|
|
| |||||||||
SHARES ISSUED AND REDEEMED | ||||||||||||||||
Shares sold | 18,000,000 | 11,900,000 | 21,000,000 | 45,000,000 | ||||||||||||
Shares redeemed | (2,900,000 | ) | (1,050,000 | ) | (14,600,000 | ) | (29,400,000 | ) | ||||||||
|
|
|
|
|
|
|
| |||||||||
Net increase in shares outstanding | 15,100,000 | 10,850,000 | 6,400,000 | 15,600,000 | ||||||||||||
|
|
|
|
|
|
|
| |||||||||
See notes to financial statements.
| 66 | 2014 iSHARES ANNUAL REPORTTO SHAREHOLDERS |
Table of Contents
Statements of Changes in Net Assets (Continued)
iSHARES®, INC.
| iShares MSCI Thailand Capped ETF | ||||||||
| Year ended August 31, 2014 | Year ended August 31, 2013 | |||||||
INCREASE (DECREASE) IN NET ASSETS | ||||||||
OPERATIONS: | ||||||||
Net investment income | $ | 12,286,557 | $ | 18,562,467 | ||||
Net realized gain | 9,219,384 | 93,291,603 | ||||||
Net change in unrealized appreciation/depreciation | 95,854,036 | (137,693,757 | ) | |||||
|
|
|
| |||||
Net increase (decrease) in net assets resulting from operations | 117,359,977 | (25,839,687 | ) | |||||
|
|
|
| |||||
DISTRIBUTIONS TO SHAREHOLDERS: | ||||||||
From net investment income | (12,909,951 | ) | (18,144,635 | ) | ||||
|
|
|
| |||||
Total distributions to shareholders | (12,909,951 | ) | (18,144,635 | ) | ||||
|
|
|
| |||||
CAPITAL SHARE TRANSACTIONS: | ||||||||
Proceeds from shares sold | 341,398,189 | 476,258,075 | ||||||
Cost of shares redeemed | (416,351,403 | ) | (486,368,459 | ) | ||||
|
|
|
| |||||
Net decrease in net assets from capital share transactions | (74,953,214 | ) | (10,110,384 | ) | ||||
|
|
|
| |||||
INCREASE (DECREASE) IN NET ASSETS | 29,496,812 | (54,094,706 | ) | |||||
NET ASSETS | ||||||||
Beginning of year | 541,872,794 | 595,967,500 | ||||||
|
|
|
| |||||
End of year | $ | 571,369,606 | $ | 541,872,794 | ||||
|
|
|
| |||||
Undistributed net investment income included in net assets at end of year | $ | 1,958,625 | $ | 2,739,321 | ||||
|
|
|
| |||||
SHARES ISSUED AND REDEEMED | ||||||||
Shares sold | 4,550,000 | 5,700,000 | ||||||
Shares redeemed | (5,700,000 | ) | (6,150,000 | ) | ||||
|
|
|
| |||||
Net decrease in shares outstanding | (1,150,000 | ) | (450,000 | ) | ||||
|
|
|
| |||||
See notes to financial statements.
FINANCIAL STATEMENTS | 67 |
Table of Contents
iSHARES®, INC.
(For a share outstanding throughout each period)
| iShares MSCI Australia ETF | ||||||||||||||||||||
| Year ended Aug. 31, 2014 | Year ended Aug. 31, 2013 | Year ended Aug. 31, 2012 | Year ended Aug. 31, 2011 | Year ended Aug. 31, 2010 | ||||||||||||||||
Net asset value, beginning of year | $ | 23.61 | $ | 23.39 | $ | 24.18 | $ | 20.92 | $ | 20.33 | ||||||||||
|
|
|
|
|
|
|
|
|
| |||||||||||
Income from investment operations: | ||||||||||||||||||||
Net investment incomea | 1.10 | 1.02 | 1.04 | 0.99 | 0.72 | |||||||||||||||
Net realized and unrealized gain (loss)b | 3.43 | 0.64 | (0.72 | ) | 3.33 | 0.69 | ||||||||||||||
|
|
|
|
|
|
|
|
|
| |||||||||||
Total from investment operations | 4.53 | 1.66 | 0.32 | 4.32 | 1.41 | |||||||||||||||
|
|
|
|
|
|
|
|
|
| |||||||||||
Less distributions from: | ||||||||||||||||||||
Net investment income | (0.99 | ) | (1.44 | ) | (1.11 | ) | (1.06 | ) | (0.82 | ) | ||||||||||
|
|
|
|
|
|
|
|
|
| |||||||||||
Total distributions | (0.99 | ) | (1.44 | ) | (1.11 | ) | (1.06 | ) | (0.82 | ) | ||||||||||
|
|
|
|
|
|
|
|
|
| |||||||||||
Net asset value, end of year | $ | 27.15 | $ | 23.61 | $ | 23.39 | $ | 24.18 | $ | 20.92 | ||||||||||
|
|
|
|
|
|
|
|
|
| |||||||||||
Total return | 19.76 | % | 7.06 | % | 1.84 | % | 20.54 | % | 6.86 | % | ||||||||||
|
|
|
|
|
|
|
|
|
| |||||||||||
Ratios/Supplemental data: | ||||||||||||||||||||
Net assets, end of year (000s) | $ | 2,047,113 | $ | 1,916,849 | $ | 2,493,699 | $ | 3,090,425 | $ | 2,196,817 | ||||||||||
Ratio of expenses to average net assets | 0.48 | % | 0.51 | % | 0.53 | % | 0.52 | % | 0.53 | % | ||||||||||
Ratio of net investment income to average net assets | 4.28 | % | 4.05 | % | 4.61 | % | 3.95 | % | 3.24 | % | ||||||||||
Portfolio turnover ratec | 6 | % | 6 | % | 9 | % | 9 | % | 8 | % | ||||||||||
| a | Based on average shares outstanding throughout each period. |
| b | The amounts reported for a share outstanding may not accord with the change in aggregate gains and losses in securities for the fiscal period due to the timing of capital share transactions in relation to the fluctuating market values of the Fund’s underlying securities. |
| c | Portfolio turnover rates exclude portfolio securities received or delivered as a result of processing capital share transactions in Creation Units. |
See notes to financial statements.
| 68 | 2014 iSHARES ANNUAL REPORTTO SHAREHOLDERS |
Table of Contents
Financial Highlights (Continued)
iSHARES®, INC.
(For a share outstanding throughout each period)
| iShares MSCI Hong Kong ETF | ||||||||||||||||||||
| Year ended Aug. 31, 2014 | Year ended Aug. 31, 2013 | Year ended Aug. 31, 2012 | Year ended Aug. 31, 2011 | Year ended Aug. 31, 2010 | ||||||||||||||||
Net asset value, beginning of year | $ | 18.91 | $ | 16.94 | $ | 17.59 | $ | 16.02 | $ | 14.39 | ||||||||||
|
|
|
|
|
|
|
|
|
| |||||||||||
Income from investment operations: | ||||||||||||||||||||
Net investment incomea | 0.66 | 0.48 | 0.54 | 0.42 | 0.42 | |||||||||||||||
Net realized and unrealized gain (loss)b | 3.04 | 2.05 | (0.65 | ) | 1.56 | 1.69 | ||||||||||||||
|
|
|
|
|
|
|
|
|
| |||||||||||
Total from investment operations | 3.70 | 2.53 | (0.11 | ) | 1.98 | 2.11 | ||||||||||||||
|
|
|
|
|
|
|
|
|
| |||||||||||
Less distributions from: | ||||||||||||||||||||
Net investment income | (0.72 | ) | (0.56 | ) | (0.54 | ) | (0.41 | ) | (0.48 | ) | ||||||||||
|
|
|
|
|
|
|
|
|
| |||||||||||
Total distributions | (0.72 | ) | (0.56 | ) | (0.54 | ) | (0.41 | ) | (0.48 | ) | ||||||||||
|
|
|
|
|
|
|
|
|
| |||||||||||
Net asset value, end of year | $ | 21.89 | $ | 18.91 | $ | 16.94 | $ | 17.59 | $ | 16.02 | ||||||||||
|
|
|
|
|
|
|
|
|
| |||||||||||
Total return | 19.87 | % | 15.04 | % | (0.33 | )% | 12.27 | % | 14.85 | % | ||||||||||
|
|
|
|
|
|
|
|
|
| |||||||||||
Ratios/Supplemental data: | ||||||||||||||||||||
Net assets, end of year (000s) | $ | 3,221,312 | $ | 2,124,856 | $ | 1,865,974 | $ | 1,607,982 | $ | 1,976,317 | ||||||||||
Ratio of expenses to average net assets | 0.48 | % | 0.51 | % | 0.53 | % | 0.52 | % | 0.53 | % | ||||||||||
Ratio of net investment income to average net assets | 3.24 | % | 2.47 | % | 3.26 | % | 2.25 | % | 2.67 | % | ||||||||||
Portfolio turnover ratec | 6 | % | 12 | % | 11 | % | 15 | % | 5 | % | ||||||||||
| a | Based on average shares outstanding throughout each period. |
| b | The amounts reported for a share outstanding may not accord with the change in aggregate gains and losses in securities for the fiscal period due to the timing of capital share transactions in relation to the fluctuating market values of the Fund’s underlying securities. |
| c | Portfolio turnover rates exclude portfolio securities received or delivered as a result of processing capital share transactions in Creation Units. |
See notes to financial statements.
FINANCIAL HIGHLIGHTS | 69 |
Table of Contents
Financial Highlights (Continued)
iSHARES®, INC.
(For a share outstanding throughout each period)
| iShares MSCI Japan Small-Cap ETF | ||||||||||||||||||||
| Year ended Aug. 31, 2014 | Year ended Aug. 31, 2013 | Year ended Aug. 31, 2012 | Year ended Aug. 31, 2011 | Year ended Aug. 31, 2010 | ||||||||||||||||
Net asset value, beginning of year | $ | 49.44 | $ | 42.82 | $ | 46.49 | $ | 40.74 | $ | 44.45 | ||||||||||
|
|
|
|
|
|
|
|
|
| |||||||||||
Income from investment operations: | ||||||||||||||||||||
Net investment incomea | 0.70 | 0.65 | 0.82 | 0.78 | 0.61 | |||||||||||||||
Net realized and unrealized gain (loss)b | 7.61 | 6.97 | (3.25 | ) | 5.87 | (3.39 | ) | |||||||||||||
|
|
|
|
|
|
|
|
|
| |||||||||||
Total from investment operations | 8.31 | 7.62 | (2.43 | ) | 6.65 | (2.78 | ) | |||||||||||||
|
|
|
|
|
|
|
|
|
| |||||||||||
Less distributions from: | ||||||||||||||||||||
Net investment income | (1.14 | ) | (1.00 | ) | (1.24 | ) | (0.90 | ) | (0.93 | ) | ||||||||||
|
|
|
|
|
|
|
|
|
| |||||||||||
Total distributions | (1.14 | ) | (1.00 | ) | (1.24 | ) | (0.90 | ) | (0.93 | ) | ||||||||||
|
|
|
|
|
|
|
|
|
| |||||||||||
Net asset value, end of year | $ | 56.61 | $ | 49.44 | $ | 42.82 | $ | 46.49 | $ | 40.74 | ||||||||||
|
|
|
|
|
|
|
|
|
| |||||||||||
Total return | 16.94 | % | 18.07 | % | (5.18 | )% | 16.38 | % | (6.25 | )% | ||||||||||
|
|
|
|
|
|
|
|
|
| |||||||||||
Ratios/Supplemental data: | ||||||||||||||||||||
Net assets, end of year (000s) | $ | 169,837 | $ | 88,988 | $ | 42,817 | $ | 74,387 | $ | 36,664 | ||||||||||
Ratio of expenses to average net assets | 0.48 | % | 0.50 | % | 0.53 | % | 0.51 | % | 0.53 | % | ||||||||||
Ratio of net investment income to average net assets | 1.31 | % | 1.36 | % | 1.84 | % | 1.72 | % | 1.46 | % | ||||||||||
Portfolio turnover ratec | 14 | % | 17 | % | 7 | % | 10 | % | 7 | % | ||||||||||
| a | Based on average shares outstanding throughout each period. |
| b | The amounts reported for a share outstanding may not accord with the change in aggregate gains and losses in securities for the fiscal period due to the timing of capital share transactions in relation to the fluctuating market values of the Fund’s underlying securities. |
| c | Portfolio turnover rates exclude portfolio securities received or delivered as a result of processing capital share transactions in Creation Units. |
See notes to financial statements.
| 70 | 2014 iSHARES ANNUAL REPORTTO SHAREHOLDERS |
Table of Contents
Financial Highlights (Continued)
iSHARES®, INC.
(For a share outstanding throughout each period)
| iShares MSCI Malaysia ETF | ||||||||||||||||||||
| Year ended Aug. 31, 2014 | Year ended Aug. 31, 2013 | Year ended Aug. 31, 2012 | Year ended Aug. 31, 2011 | Year ended Aug. 31, 2010 | ||||||||||||||||
Net asset value, beginning of year | $ | 14.60 | $ | 14.52 | $ | 13.92 | $ | 12.98 | $ | 9.79 | ||||||||||
|
|
|
|
|
|
|
|
|
| |||||||||||
Income from investment operations: | ||||||||||||||||||||
Net investment incomea | 0.54 | 0.41 | 0.38 | 0.41 | 0.24 | |||||||||||||||
Net realized and unrealized gainb | 1.51 | 0.04 | 0.76 | 0.92 | 3.20 | |||||||||||||||
|
|
|
|
|
|
|
|
|
| |||||||||||
Total from investment operations | 2.05 | 0.45 | 1.14 | 1.33 | 3.44 | |||||||||||||||
|
|
|
|
|
|
|
|
|
| |||||||||||
Less distributions from: | ||||||||||||||||||||
Net investment income | (0.52 | ) | (0.37 | ) | (0.52 | ) | (0.39 | ) | (0.25 | ) | ||||||||||
Return of capital | — | — | (0.02 | ) | — | — | ||||||||||||||
|
|
|
|
|
|
|
|
|
| |||||||||||
Total distributions | (0.52 | ) | (0.37 | ) | (0.54 | ) | (0.39 | ) | (0.25 | ) | ||||||||||
|
|
|
|
|
|
|
|
|
| |||||||||||
Net asset value, end of year | $ | 16.13 | $ | 14.60 | $ | 14.52 | $ | 13.92 | $ | 12.98 | ||||||||||
|
|
|
|
|
|
|
|
|
| |||||||||||
Total return | 14.17 | % | 3.02 | % | 8.61 | % | 10.19 | % | 35.76 | % | ||||||||||
|
|
|
|
|
|
|
|
|
| |||||||||||
Ratios/Supplemental data: | ||||||||||||||||||||
Net assets, end of year (000s) | $ | 786,461 | $ | 809,138 | $ | 936,692 | $ | 978,402 | $ | 794,142 | ||||||||||
Ratio of expenses to average net assets | 0.48 | % | 0.51 | % | 0.53 | % | 0.52 | % | 0.53 | % | ||||||||||
Ratio of net investment income to average net assets | 3.48 | % | 2.71 | % | 2.73 | % | 2.84 | % | 2.17 | % | ||||||||||
Portfolio turnover ratec | 16 | % | 17 | % | 24 | % | 49 | % | 29 | % | ||||||||||
| a | Based on average shares outstanding throughout each period. |
| b | The amounts reported for a share outstanding may not accord with the change in aggregate gains and losses in securities for the fiscal period due to the timing of capital share transactions in relation to the fluctuating market values of the Fund’s underlying securities. |
| c | Portfolio turnover rates include portfolio transactions that are executed as a result of the Fund processing capital share transactions in Creation Units solely for cash in U.S. dollars. Excluding such transactions, the portfolio turnover rates for the years ended August 31, 2014, August 31, 2013, August 31, 2012, August 31, 2011, and August 31, 2010 were 10%, 8%, 14%, 14%, and 10%, respectively. See Note 4. |
See notes to financial statements.
FINANCIAL HIGHLIGHTS | 71 |
Table of Contents
Financial Highlights (Continued)
iSHARES®, INC.
(For a share outstanding throughout each period)
| iShares MSCI Pacific ex Japan ETF | ||||||||||||||||||||
| Year ended Aug. 31, 2014 | Year ended Aug. 31, 2013 | Year ended Aug. 31, 2012 | Year ended Aug. 31, 2011 | Year ended Aug. 31, 2010 | ||||||||||||||||
Net asset value, beginning of year | $ | 44.56 | $ | 43.21 | $ | 44.47 | $ | 39.25 | $ | 36.85 | ||||||||||
|
|
|
|
|
|
|
|
|
| |||||||||||
Income from investment operations: | ||||||||||||||||||||
Net investment incomea | 1.88 | 1.69 | 1.73 | 1.64 | 1.25 | |||||||||||||||
Net realized and unrealized gain (loss)b | 6.51 | 1.71 | (1.14 | ) | 5.31 | 2.52 | ||||||||||||||
|
|
|
|
|
|
|
|
|
| |||||||||||
Total from investment operations | 8.39 | 3.40 | 0.59 | 6.95 | 3.77 | |||||||||||||||
|
|
|
|
|
|
|
|
|
| |||||||||||
Less distributions from: | ||||||||||||||||||||
Net investment income | (1.74 | ) | (2.05 | ) | (1.85 | ) | (1.73 | ) | (1.37 | ) | ||||||||||
|
|
|
|
|
|
|
|
|
| |||||||||||
Total distributions | (1.74 | ) | (2.05 | ) | (1.85 | ) | (1.73 | ) | (1.37 | ) | ||||||||||
|
|
|
|
|
|
|
|
|
| |||||||||||
Net asset value, end of year | $ | 51.21 | $ | 44.56 | $ | 43.21 | $ | 44.47 | $ | 39.25 | ||||||||||
|
|
|
|
|
|
|
|
|
| |||||||||||
Total return | 19.25 | % | 7.87 | % | 1.82 | % | 17.61 | % | 10.27 | % | ||||||||||
|
|
|
|
|
|
|
|
|
| |||||||||||
Ratios/Supplemental data: | ||||||||||||||||||||
Net assets, end of year (000s) | $ | 3,472,048 | $ | 3,008,067 | $ | 3,188,582 | $ | 3,548,867 | $ | 3,438,149 | ||||||||||
Ratio of expenses to average net assets | 0.49 | % | 0.50 | % | 0.50 | % | 0.50 | % | 0.50 | % | ||||||||||
Ratio of net investment income to average net assets | 3.90 | % | 3.59 | % | 4.16 | % | 3.53 | % | 3.09 | % | ||||||||||
Portfolio turnover ratec | 8 | % | 8 | % | 7 | % | 10 | % | 7 | % | ||||||||||
| a | Based on average shares outstanding throughout each period. |
| b | The amounts reported for a share outstanding may not accord with the change in aggregate gains and losses in securities for the fiscal period due to the timing of capital share transactions in relation to the fluctuating market values of the Fund’s underlying securities. |
| c | Portfolio turnover rates exclude portfolio securities received or delivered as a result of processing capital share transactions in Creation Units. |
See notes to financial statements.
| 72 | 2014 iSHARES ANNUAL REPORTTO SHAREHOLDERS |
Table of Contents
Financial Highlights (Continued)
iSHARES®, INC.
(For a share outstanding throughout each period)
| iShares MSCI Singapore ETF | ||||||||||||||||||||
| Year ended Aug. 31, 2014 | Year ended Aug. 31, 2013 | Year ended Aug. 31, 2012 | Year ended Aug. 31, 2011 | Year ended Aug. 31, 2010 | ||||||||||||||||
Net asset value, beginning of year | $ | 12.49 | $ | 13.10 | $ | 13.05 | $ | 12.17 | $ | 10.25 | ||||||||||
|
|
|
|
|
|
|
|
|
| |||||||||||
Income from investment operations: | ||||||||||||||||||||
Net investment incomea | 0.40 | 0.44 | 0.41 | 0.45 | 0.32 | |||||||||||||||
Net realized and unrealized gain (loss)b | 1.52 | (0.47 | ) | 0.11 | 0.92 | 1.97 | ||||||||||||||
|
|
|
|
|
|
|
|
|
| |||||||||||
Total from investment operations | 1.92 | (0.03 | ) | 0.52 | 1.37 | 2.29 | ||||||||||||||
|
|
|
|
|
|
|
|
|
| |||||||||||
Less distributions from: | ||||||||||||||||||||
Net investment income | (0.45 | ) | (0.58 | ) | (0.47 | ) | (0.49 | ) | (0.37 | ) | ||||||||||
|
|
|
|
|
|
|
|
|
| |||||||||||
Total distributions | (0.45 | ) | (0.58 | ) | (0.47 | ) | (0.49 | ) | (0.37 | ) | ||||||||||
|
|
|
|
|
|
|
|
|
| |||||||||||
Net asset value, end of year | $ | 13.96 | $ | 12.49 | $ | 13.10 | $ | 13.05 | $ | 12.17 | ||||||||||
|
|
|
|
|
|
|
|
|
| |||||||||||
Total return | 15.65 | % | (0.38 | )% | 4.67 | % | 11.27 | % | 22.68 | % | ||||||||||
|
|
|
|
|
|
|
|
|
| |||||||||||
Ratios/Supplemental data: | ||||||||||||||||||||
Net assets, end of year (000s) | $ | 984,455 | $ | 1,135,477 | $ | 1,512,687 | $ | 1,713,199 | $ | 1,730,001 | ||||||||||
Ratio of expenses to average net assets | 0.48 | % | 0.51 | % | 0.53 | % | 0.52 | % | 0.53 | % | ||||||||||
Ratio of net investment income to average net assets | 2.99 | % | 3.23 | % | 3.32 | % | 3.34 | % | 2.80 | % | ||||||||||
Portfolio turnover ratec | 4 | % | 10 | % | 3 | % | 10 | % | 9 | % | ||||||||||
| a | Based on average shares outstanding throughout each period. |
| b | The amounts reported for a share outstanding may not accord with the change in aggregate gains and losses in securities for the fiscal period due to the timing of capital share transactions in relation to the fluctuating market values of the Fund’s underlying securities. |
| c | Portfolio turnover rates exclude portfolio securities received or delivered as a result of processing capital share transactions in Creation Units. |
See notes to financial statements.
FINANCIAL HIGHLIGHTS | 73 |
Table of Contents
Financial Highlights (Continued)
iSHARES®, INC.
(For a share outstanding throughout each period)
| iShares MSCI South Korea Capped ETF | ||||||||||||||||||||
| Year ended Aug. 31, 2014 | Year ended Aug. 31, 2013 | Year ended Aug. 31, 2012 | Year ended Aug. 31, 2011 | Year ended Aug. 31, 2010 | ||||||||||||||||
Net asset value, beginning of year | $ | 57.67 | $ | 55.97 | $ | 56.74 | $ | 47.76 | $ | 42.01 | ||||||||||
|
|
|
|
|
|
|
|
|
| |||||||||||
Income from investment operations: | ||||||||||||||||||||
Net investment incomea | 0.25 | 0.23 | 0.23 | 0.29 | 0.32 | |||||||||||||||
Net realized and unrealized gain (loss)b | 9.40 | 1.83 | (0.63 | ) | 9.19 | 5.82 | ||||||||||||||
|
|
|
|
|
|
|
|
|
| |||||||||||
Total from investment operations | 9.65 | 2.06 | (0.40 | ) | 9.48 | 6.14 | ||||||||||||||
|
|
|
|
|
|
|
|
|
| |||||||||||
Less distributions from: | ||||||||||||||||||||
Net investment income | (0.90 | ) | (0.36 | ) | (0.37 | ) | (0.43 | ) | (0.39 | ) | ||||||||||
Return of capital | — | — | — | (0.07 | ) | — | ||||||||||||||
|
|
|
|
|
|
|
|
|
| |||||||||||
Total distributions | (0.90 | ) | (0.36 | ) | (0.37 | ) | (0.50 | ) | (0.39 | ) | ||||||||||
|
|
|
|
|
|
|
|
|
| |||||||||||
Net asset value, end of year | $ | 66.42 | $ | 57.67 | $ | 55.97 | $ | 56.74 | $ | 47.76 | ||||||||||
|
|
|
|
|
|
|
|
|
| |||||||||||
Total return | 16.83 | % | 3.65 | % | (0.62 | )% | 19.76 | % | 14.65 | % | ||||||||||
|
|
|
|
|
|
|
|
|
| |||||||||||
Ratios/Supplemental data: | ||||||||||||||||||||
Net assets, end of year (000s) | $ | 4,891,619 | $ | 3,376,516 | $ | 2,669,551 | $ | 4,071,225 | $ | 3,255,168 | ||||||||||
Ratio of expenses to average net assets | 0.62 | % | 0.61 | % | 0.61 | % | 0.59 | % | 0.61 | % | ||||||||||
Ratio of net investment income to average net assets | 0.39 | % | 0.40 | % | 0.42 | % | 0.49 | % | 0.67 | % | ||||||||||
Portfolio turnover ratec | 13 | % | 13 | % | 12 | % | 18 | % | 14 | % | ||||||||||
| a | Based on average shares outstanding throughout each period. |
| b | The amounts reported for a share outstanding may not accord with the change in aggregate gains and losses in securities for the fiscal period due to the timing of capital share transactions in relation to the fluctuating market values of the Fund’s underlying securities. |
| c | Portfolio turnover rates include portfolio transactions that are executed as a result of the Fund processing capital share transactions in Creation Units solely for cash in U.S. dollars. Excluding such transactions, the portfolio turnover rates for the years ended August 31, 2014, August 31, 2013, August 31, 2012, August 31, 2011, and August 31, 2010 were 10%, 11%, 8%, 6%, and 6%, respectively. See Note 4. |
See notes to financial statements.
| 74 | 2014 iSHARES ANNUAL REPORTTO SHAREHOLDERS |
Table of Contents
Financial Highlights (Continued)
iSHARES®, INC.
(For a share outstanding throughout each period)
| iShares MSCI Taiwan ETF | ||||||||||||||||||||
| Year ended Aug. 31, 2014 | Year ended Aug. 31, 2013 | Year ended Aug. 31, 2012 | Year ended Aug. 31, 2011 | Year ended Aug. 31, 2010 | ||||||||||||||||
Net asset value, beginning of year | $ | 13.60 | $ | 12.58 | $ | 13.78 | $ | 12.19 | $ | 10.94 | ||||||||||
|
|
|
|
|
|
|
|
|
| |||||||||||
Income from investment operations: | ||||||||||||||||||||
Net investment incomea | 0.29 | 0.24 | 0.28 | 0.39 | 0.23 | |||||||||||||||
Net realized and unrealized gain (loss)b | 2.81 | 1.05 | (1.01 | ) | 1.49 | 1.23 | ||||||||||||||
|
|
|
|
|
|
|
|
|
| |||||||||||
Total from investment operations | 3.10 | 1.29 | (0.73 | ) | 1.88 | 1.46 | ||||||||||||||
|
|
|
|
|
|
|
|
|
| |||||||||||
Less distributions from: | ||||||||||||||||||||
Net investment income | (0.26 | ) | (0.27 | ) | (0.47 | ) | (0.29 | ) | (0.21 | ) | ||||||||||
|
|
|
|
|
|
|
|
|
| |||||||||||
Total distributions | (0.26 | ) | (0.27 | ) | (0.47 | ) | (0.29 | ) | (0.21 | ) | ||||||||||
|
|
|
|
|
|
| �� |
|
| |||||||||||
Net asset value, end of year | $ | 16.44 | $ | 13.60 | $ | 12.58 | $ | 13.78 | $ | 12.19 | ||||||||||
|
|
|
|
|
|
|
|
|
| |||||||||||
Total return | 23.24 | % | 10.30 | % | (4.80 | )% | 15.24 | % | 13.30 | % | ||||||||||
|
|
|
|
|
|
|
|
|
| |||||||||||
Ratios/Supplemental data: | ||||||||||||||||||||
Net assets, end of year (000s) | $ | 3,298,664 | $ | 2,641,997 | $ | 2,247,128 | $ | 2,857,512 | $ | 2,721,439 | ||||||||||
Ratio of expenses to average net assets | 0.62 | % | 0.61 | % | 0.61 | % | 0.59 | % | 0.61 | % | ||||||||||
Ratio of net investment income to average net assets | 1.98 | % | 1.80 | % | 2.25 | % | 2.64 | % | 1.90 | % | ||||||||||
Portfolio turnover ratec | 11 | % | 21 | % | 22 | % | 23 | % | 9 | % | ||||||||||
| a | Based on average shares outstanding throughout each period. |
| b | The amounts reported for a share outstanding may not accord with the change in aggregate gains and losses in securities for the fiscal period due to the timing of capital share transactions in relation to the fluctuating market values of the Fund’s underlying securities. |
| c | Portfolio turnover rates include portfolio transactions that are executed as a result of the Fund processing capital share transactions in Creation Units solely for cash in U.S. dollars. Excluding such transactions, the portfolio turnover rates for the years ended August 31, 2014, August 31, 2013, August 31, 2012, August 31, 2011, and August 31, 2010 were 4%, 6%, 7%, 8%, and 4%, respectively. See Note 4. |
See notes to financial statements.
FINANCIAL HIGHLIGHTS | 75 |
Table of Contents
Financial Highlights (Continued)
iSHARES®, INC.
(For a share outstanding throughout each period)
| iShares MSCI Thailand Capped ETF | ||||||||||||||||||||
| Year ended Aug. 31, 2014 | Year ended Aug. 31, 2013 | Year ended Aug. 31, 2012 | Year ended Aug. 31, 2011 | Year ended Aug. 31, 2010 | ||||||||||||||||
Net asset value, beginning of year | $ | 67.73 | $ | 70.53 | $ | 66.27 | $ | 55.06 | $ | 36.87 | ||||||||||
|
|
|
|
|
|
|
|
|
| |||||||||||
Income from investment operations: | ||||||||||||||||||||
Net investment incomea | 1.67 | 1.84 | 1.76 | 1.65 | 1.44 | |||||||||||||||
Net realized and unrealized gain (loss)b | 15.84 | (2.75 | ) | 4.37 | 11.10 | 17.95 | ||||||||||||||
|
|
|
|
|
|
|
|
|
| |||||||||||
Total from investment operations | 17.51 | (0.91 | ) | 6.13 | 12.75 | 19.39 | ||||||||||||||
|
|
|
|
|
|
|
|
|
| |||||||||||
Less distributions from: | ||||||||||||||||||||
Net investment income | (1.83 | ) | (1.89 | ) | (1.87 | ) | (1.54 | ) | (1.20 | ) | ||||||||||
|
|
|
|
|
|
|
|
|
| |||||||||||
Total distributions | (1.83 | ) | (1.89 | ) | (1.87 | ) | (1.54 | ) | (1.20 | ) | ||||||||||
|
|
|
|
|
|
|
|
|
| |||||||||||
Net asset value, end of year | $ | 83.41 | $ | 67.73 | $ | 70.53 | $ | 66.27 | $ | 55.06 | ||||||||||
|
|
|
|
|
|
|
|
|
| |||||||||||
Total return | 26.18 | % | (1.65 | )% | 9.57 | % | 23.33 | % | 53.19 | % | ||||||||||
|
|
|
|
|
|
|
|
|
| |||||||||||
Ratios/Supplemental data: | ||||||||||||||||||||
Net assets, end of year (000s) | $ | 571,370 | $ | 541,873 | $ | 595,968 | $ | 632,840 | $ | 520,304 | ||||||||||
Ratio of expenses to average net assets | 0.62 | % | 0.61 | % | 0.61 | % | 0.59 | % | 0.61 | % | ||||||||||
Ratio of net investment income to average net assets | 2.24 | % | 2.22 | % | 2.66 | % | 2.56 | % | 3.22 | % | ||||||||||
Portfolio turnover ratec | 9 | % | 24 | % | 12 | % | 22 | % | 14 | % | ||||||||||
| a | Based on average shares outstanding throughout each period. |
| b | The amounts reported for a share outstanding may not accord with the change in aggregate gains and losses in securities for the fiscal period due to the timing of capital share transactions in relation to the fluctuating market values of the Fund’s underlying securities. |
| c | Portfolio turnover rates exclude portfolio securities received or delivered as a result of processing capital share transactions in Creation Units. |
See notes to financial statements.
| 76 | 2014 iSHARES ANNUAL REPORTTO SHAREHOLDERS |
Table of Contents
iSHARES®, INC.
iShares, Inc. (the “Company”) is registered under the Investment Company Act of 1940, as amended (the “1940 Act”), as an open-end management investment company. The Company was incorporated under the laws of the State of Maryland on September 1, 1994 pursuant to amended and restated Articles of Incorporation.
These financial statements relate only to the following funds (each, a “Fund,” and collectively, the “Funds”):
| iShares ETF | Diversification Classification | |||
MSCI Australia | Non-diversified | |||
MSCI Hong Kong | Non-diversified | |||
MSCI Japan Small-Cap | Diversified | |||
MSCI Malaysia | Non-diversified | |||
MSCI Pacific ex Japan | Diversified | |||
| iShares ETF | Diversification Classification | |||
MSCI Singapore | Non-diversified | |||
MSCI South Korea Capped | Non-diversified | |||
MSCI Taiwan | Non-diversified | |||
MSCI Thailand Capped | Non-diversified | |||
The investment objective of each Fund is to seek investment results that correspond generally to the price and yield performance, before fees and expenses, of its underlying index. The investment adviser uses a “passive” or index approach to try to achieve each Fund’s investment objective.
Pursuant to the Company’s organizational documents, the Funds’ officers and directors are indemnified against certain liabilities that may arise out of the performance of their duties to the Funds. Additionally, in the normal course of business, the Funds enter into contracts with service providers that contain general indemnification clauses. The Funds’ maximum exposure under these arrangements is unknown as this would involve future claims that may be made against the Funds that have not yet occurred.
| 1. | SIGNIFICANT ACCOUNTING POLICIES |
The following significant accounting policies are consistently followed by the Funds in the preparation of their financial statements in conformity with accounting principles generally accepted in the United States of America (“U.S. GAAP”). The preparation of financial statements in conformity with U.S. GAAP requires management to make certain estimates and assumptions that affect the reported amounts of assets and liabilities and disclosures of contingent assets and liabilities at the date of the financial statements and the reported amounts of revenue and expenses during the reporting period. Actual results could differ from those estimates. Each Fund is considered an investment company under U.S. GAAP and follows the accounting and reporting guidance applicable to investment companies in the Financial Accounting Standards Board Accounting Standards Codification Topic 946 (ASC 946).
SECURITY VALUATION
Each Fund’s investments are valued at fair value each day that the Fund’s listing exchange is open and, for financial reporting purposes, as of the report date should the reporting period end on a day that the Fund’s listing exchange is not open. U.S. GAAP defines fair value as the price a fund would receive to sell an asset or pay to transfer a liability in an orderly transaction between market participants at the measurement date. The BlackRock Global Valuation Methodologies Committee (the “Global Valuation Committee”) provides oversight of the valuation of investments for the Funds. The investments of each Fund are valued pursuant to policies and procedures developed by the Global Valuation Committee and approved by the Board of Directors of the Company (the “Board”).
| • | Equity investments traded on a recognized securities exchange are valued at that day’s last reported trade price or the official closing price, as applicable, on the exchange where the stock is primarily traded. Equity investments traded on a recognized exchange for which there were no sales on that day are valued at the last traded price. |
NOTESTO FINANCIAL STATEMENTS | 77 |
Table of Contents
Notes to Financial Statements (Continued)
iSHARES®, INC.
| • | Open-end U.S. mutual funds are valued at that day’s published net asset value (NAV). |
| • | Financial futures contracts are valued at that day’s last reported settlement price on the exchange where the contract is traded. |
In the event that application of these methods of valuation results in a price for an investment which is deemed not to be representative of the fair value of such investment or if a price is not available, the investment will be valued based upon other available factors deemed relevant by the Global Valuation Committee, in accordance with policies approved by the Board. These factors include but are not limited to (i) attributes specific to the investment; (ii) the principal market for the investment; (iii) the customary participants in the principal market for the investment; (iv) data assumptions by market participants for the investment, if reasonably available; (v) quoted prices for similar investments in active markets; and (vi) other factors, such as future cash flows, interest rates, yield curves, volatilities, prepayment speeds, loss severities, credit risks and/or default rates. Valuations based on such factors are reported to the Board on a quarterly basis.
The Global Valuation Committee employs various methods for calibrating valuation approaches for investments where an active market does not exist, including regular due diligence of the Company’s pricing vendors, a regular review of key inputs and assumptions, transactional back-testing or disposition analysis to compare unrealized gains and losses to realized gains and losses, reviews of missing or stale prices, reviews of large movements in market values, and reviews of market related activity.
Fair value pricing could result in a difference between the prices used to calculate a Fund’s net asset value and the prices used by the Fund’s underlying index, which in turn could result in a difference between the Fund’s performance and the performance of the Fund’s underlying index.
Various inputs are used in determining the fair value of financial instruments. Inputs may be based on independent market data (“observable inputs”) or they may be internally developed (“unobservable inputs”). These inputs are categorized into a disclosure hierarchy consisting of three broad levels for financial reporting purposes. The level of a value determined for a financial instrument within the fair value hierarchy is based on the lowest level of any input that is significant to the fair value measurement in its entirety. The categorization of a value determined for a financial instrument within the hierarchy is based upon the pricing transparency of the instrument and is not necessarily an indication of the risk associated with investing in the instrument. The three levels of the fair value hierarchy are as follows:
| • | Level 1 — Unadjusted quoted prices in active markets for identical assets or liabilities; |
| • | Level 2 — Inputs other than quoted prices included within Level 1 that are observable for the asset or liability either directly or indirectly, including quoted prices for similar assets or liabilities in active markets, quoted prices for identical or similar assets or liabilities in markets that are not considered to be active, inputs other than quoted prices that are observable for the asset or liability (such as exchange rates, financing terms, interest rates, yield curves, volatilities, prepayment speeds, loss severities, credit risks and default rates) or other market-corroborated inputs; and |
| • | Level 3 — Unobservable inputs for the asset or liability, including the Global Valuation Committee’s assumptions used in determining the fair value of investments. |
Changes in valuation techniques may result in transfers in or out of an assigned level within the disclosure hierarchy. In accordance with the Company’s policy, transfers between different levels of the fair value hierarchy are deemed to have occurred as of the beginning of the reporting period.
| 78 | 2014 iSHARES ANNUAL REPORTTO SHAREHOLDERS |
Table of Contents
Notes to Financial Statements (Continued)
iSHARES®, INC.
The following table summarizes the value of each of the Funds’ investments according to the fair value hierarchy as of August 31, 2014. The breakdown of each Fund’s investments into major categories is disclosed in its respective schedule of investments.
iShares ETF and
| Investments | |||||||||||||||
| Level 1 | Level 2 | Level 3 | Total | |||||||||||||
MSCI Australia | ||||||||||||||||
Assets: | ||||||||||||||||
Common Stocks | $ | 2,022,053,153 | $ | 2,703,695 | $ | 249 | $ | 2,024,757,097 | ||||||||
Money Market Funds | 343,395 | — | — | 343,395 | ||||||||||||
Futures Contractsa | 452,812 | — | — | 452,812 | ||||||||||||
|
|
|
|
|
|
|
| |||||||||
| $ | 2,022,849,360 | $ | 2,703,695 | $ | 249 | $ | 2,025,553,304 | |||||||||
|
|
|
|
|
|
|
| |||||||||
MSCI Hong Kong | ||||||||||||||||
Assets: | ||||||||||||||||
Common Stocks | $ | 3,202,754,847 | $ | — | $ | — | $ | 3,202,754,847 | ||||||||
Money Market Funds | 40,809,111 | — | — | 40,809,111 | ||||||||||||
|
|
|
|
|
|
|
| |||||||||
| $ | 3,243,563,958 | $ | — | $ | — | $ | 3,243,563,958 | |||||||||
|
|
|
|
|
|
|
| |||||||||
Liabilities: | ||||||||||||||||
Futures Contractsa | $ | (276,020 | ) | $ | — | $ | — | $ | (276,020 | ) | ||||||
|
|
|
|
|
|
|
| |||||||||
MSCI Japan Small-Cap | ||||||||||||||||
Assets: | ||||||||||||||||
Common Stocks | $ | 169,379,711 | $ | — | $ | — | $ | 169,379,711 | ||||||||
Money Market Funds | 6,421,605 | — | — | 6,421,605 | ||||||||||||
|
|
|
|
|
|
|
| |||||||||
| $ | 175,801,316 | $ | — | $ | — | $ | 175,801,316 | |||||||||
|
|
|
|
|
|
|
| |||||||||
MSCI Malaysia | ||||||||||||||||
Assets: | ||||||||||||||||
Common Stocks | $ | 783,496,888 | $ | — | $ | — | $ | 783,496,888 | ||||||||
Money Market Funds | 49,820 | — | — | 49,820 | ||||||||||||
|
|
|
|
|
|
|
| |||||||||
| $ | 783,546,708 | $ | — | $ | — | $ | 783,546,708 | |||||||||
|
|
|
|
|
|
|
| |||||||||
MSCI Pacific ex Japan | ||||||||||||||||
Assets: | ||||||||||||||||
Common Stocks | $ | 3,436,214,284 | $ | 2,991,161 | $ | 356 | $ | 3,439,205,801 | ||||||||
Rights | — | 1,223,678 | — | 1,223,678 | ||||||||||||
Money Market Funds | 37,421,669 | — | — | 37,421,669 | ||||||||||||
|
|
|
|
|
|
|
| |||||||||
| $ | 3,473,635,953 | $ | 4,214,839 | $ | 356 | $ | 3,477,851,148 | |||||||||
|
|
|
|
|
|
|
| |||||||||
MSCI Singapore | ||||||||||||||||
Assets: | ||||||||||||||||
Common Stocks | $ | 959,405,270 | $ | — | $ | — | $ | 959,405,270 | ||||||||
Rights | — | 2,987,049 | — | 2,987,049 | ||||||||||||
Money Market Funds | 44,289,310 | — | — | 44,289,310 | ||||||||||||
|
|
|
|
|
|
|
| |||||||||
| $ | 1,003,694,580 | $ | 2,987,049 | $ | — | $ | 1,006,681,629 | |||||||||
|
|
|
|
|
|
|
| |||||||||
Liabilities: | ||||||||||||||||
Futures Contractsa | $ | (42,726 | ) | $ | — | $ | — | $ | (42,726 | )�� | ||||||
|
|
|
|
|
|
|
| |||||||||
NOTESTO FINANCIAL STATEMENTS | 79 |
Table of Contents
Notes to Financial Statements (Continued)
iSHARES®, INC.
iShares ETF and
| Investments | |||||||||||||||
| Level 1 | Level 2 | Level 3 | Total | |||||||||||||
MSCI South Korea Capped | ||||||||||||||||
Assets: | ||||||||||||||||
Common Stocks | $ | 4,677,357,461 | $ | — | $ | — | $ | 4,677,357,461 | ||||||||
Preferred Stocks | 205,071,812 | — | — | 205,071,812 | ||||||||||||
Money Market Funds | 169,056,812 | — | — | 169,056,812 | ||||||||||||
|
|
|
|
|
|
|
| |||||||||
| $ | 5,051,486,085 | $ | — | $ | — | $ | 5,051,486,085 | |||||||||
|
|
|
|
|
|
|
| |||||||||
MSCI Taiwan | ||||||||||||||||
Assets: | ||||||||||||||||
Common Stocks | $ | 3,259,082,111 | $ | — | $ | 2 | $ | 3,259,082,113 | ||||||||
Money Market Funds | 231,627,146 | — | — | 231,627,146 | ||||||||||||
Futures Contractsa | 279,225 | — | — | 279,225 | ||||||||||||
|
|
|
|
|
|
|
| |||||||||
| $ | 3,490,988,482 | $ | — | $ | 2 | $ | 3,490,988,484 | |||||||||
|
|
|
|
|
|
|
| |||||||||
MSCI Thailand Capped | ||||||||||||||||
Assets: | ||||||||||||||||
Common Stocks | $ | 567,469,002 | $ | 988,577 | $ | — | $ | 568,457,579 | ||||||||
Warrants | 89,280 | 78,229 | — | 167,509 | ||||||||||||
Money Market Funds | 5,514,027 | — | — | 5,514,027 | ||||||||||||
|
|
|
|
|
|
|
| |||||||||
| $ | 573,072,309 | $ | 1,066,806 | $ | — | $ | 574,139,115 | |||||||||
|
|
|
|
|
|
|
| |||||||||
| a | Shown at the unrealized appreciation (depreciation) on the contracts. |
SECURITY TRANSACTIONS AND INCOME RECOGNITION
Security transactions are accounted for on trade date. Dividend income and capital gain distributions, if any, are recognized on the ex-dividend date, net of any foreign taxes withheld at source. Any taxes withheld that are reclaimable from foreign tax authorities as of August 31, 2014 are reflected in dividends receivable. Non-cash dividends received in the form of stock in an elective dividend, if any, are recorded as dividend income at fair value. Distributions received by the Funds may include a return of capital that is estimated by management. Such amounts are recorded as a reduction of the cost of investments or reclassified to capital gains. Interest income is accrued daily. Realized gains and losses on investment transactions are determined using the specific identification method.
FOREIGN CURRENCY TRANSLATION
The accounting records of the Funds are maintained in U.S. dollars. Foreign currencies, as well as investment securities and other assets and liabilities denominated in foreign currencies, are translated into U.S. dollars using exchange rates deemed appropriate by the investment adviser. Purchases and sales of securities, income receipts and expense payments are translated into U.S. dollars on the respective dates of such transactions.
Each Fund does not isolate the effect of fluctuations in foreign exchange rates from the effect of fluctuations in the market prices of securities. Such fluctuations are reflected by the Funds as a component of realized and unrealized gains and losses from investments for financial reporting purposes.
| 80 | 2014 iSHARES ANNUAL REPORTTO SHAREHOLDERS |
Table of Contents
Notes to Financial Statements (Continued)
iSHARES®, INC.
FOREIGN TAXES
The Funds may be subject to foreign taxes (a portion of which may be reclaimable) on income, stock dividends, capital gains on investments, or certain foreign currency transactions. All foreign taxes are recorded in accordance with the applicable foreign tax regulations and rates that exist in the foreign jurisdictions in which the Funds invest. These foreign taxes, if any, are paid by the Funds and are reflected in their statements of operations as follows: foreign taxes withheld at source are presented as a reduction of income, foreign taxes on securities lending income are presented as a reduction of securities lending income, foreign taxes on stock dividends are presented as “other foreign taxes,” and foreign taxes on capital gains from sales of investments and foreign taxes on foreign currency transactions are included in their respective net realized gain (loss) categories. Foreign taxes payable or deferred as of August 31, 2014, if any, are disclosed in the Funds’ statements of assets and liabilities.
DISTRIBUTIONS TO SHAREHOLDERS
Dividends and distributions paid by each Fund are recorded on the ex-dividend dates. Distributions are determined on a tax basis and may differ from net investment income and net realized capital gains for financial reporting purposes. Dividends and distributions are paid in U.S. dollars and cannot be automatically reinvested in additional shares of the Funds.
LOANS OF PORTFOLIO SECURITIES
Each Fund may lend its investment securities to approved borrowers, such as brokers, dealers and other financial institutions. The borrower pledges and maintains with the Fund collateral consisting of cash, an irrevocable letter of credit issued by a bank, or securities issued or guaranteed by the U.S. government. The initial collateral received by each Fund is required to have a value of at least 102% of the current value of the loaned securities for securities traded on U.S. exchanges and a value of at least 105% for all other securities. The collateral is maintained thereafter, at a value equal to at least 100% of the current value of the securities on loan. The market value of the loaned securities is determined at the close of each business day of the Funds and any additional required collateral is delivered to the Funds on the next business day. During the term of the loan, each Fund is entitled to all distributions made on or in respect of the loaned securities. Loans of securities are terminable at any time and the borrower, after notice, is required to return borrowed securities within the standard time period for settlement of securities transactions.
Any cash received as collateral for securities on loan may be reinvested in certain short-term instruments either directly on behalf of a fund or through one or more joint accounts or money market funds, including those managed by BlackRock Fund Advisors (“BFA”), the Funds’ investment adviser, or its affiliates. As of August 31, 2014, any securities on loan were collateralized by cash. The cash collateral received was invested in money market funds managed by BFA and is disclosed in the schedules of investments. The value of any securities on loan as of August 31, 2014 and the value of the related collateral are disclosed in the statements of assets and liabilities. Income earned by the Funds from securities lending is disclosed in the statements of operations.
The risks of securities lending include the risk that the borrower may not provide additional collateral when required or may not return the securities when due. To mitigate these risks, the Funds benefit from a borrower default indemnity provided by BlackRock, Inc. (“BlackRock”). BlackRock’s indemnity allows for full replacement of securities lent. Each Fund could suffer a loss if the value of the investments purchased with cash collateral falls below the value of the cash collateral received.
Securities lending transactions are entered into by the Funds under Master Securities Lending Agreements (“MSLA”) which provide the right, in the event of default (including bankruptcy or insolvency) for the non-defaulting party to liquidate the collateral and calculate a net exposure to the defaulting party or request additional collateral. In the event that a borrower defaults, a Fund, as lender, would offset the market value of the collateral received against the market value of the securities loaned. The value of the collateral is typically greater than that of the market value of the securities loaned, leaving the lender with a net amount
NOTESTO FINANCIAL STATEMENTS | 81 |
Table of Contents
Notes to Financial Statements (Continued)
iSHARES®, INC.
payable to the defaulting party. However, bankruptcy or insolvency laws of a particular jurisdiction may impose restrictions on or prohibitions against such a right of offset in the event of an MSLA counterparty’s bankruptcy or insolvency. Under the MSLA, the borrower can resell or re-pledge the loaned securities, and a Fund can reinvest cash collateral, or, upon an event of default, resell or re-pledge the collateral.
The following table is a summary of each Fund’s securities lending agreements which are subject to offset under an MSLA as of August 31, 2014:
| iShares ETF | Market Value of Securities on Loan | Cash Collateral Received a | Net Amount | |||||||||
iShares MSCI Hong Kong | $ | 24,861,103 | $ | 24,861,103 | $ | — | ||||||
iShares MSCI Japan Small-Cap | 6,083,697 | 6,083,697 | — | |||||||||
iShares MSCI Pacific ex-Japan | 35,186,830 | 35,186,830 | — | |||||||||
iShares MSCI Singapore | 41,676,810 | 41,676,810 | — | |||||||||
iShares MSCI South Korea Capped | 161,526,885 | 161,526,885 | — | |||||||||
iShares MSCI Taiwan | 206,680,307 | 206,680,307 | — | |||||||||
iShares MSCI Thailand Capped | 3,802,414 | 3,802,414 | — | |||||||||
| a | Collateral received in excess of the market value of securities on loan is not presented for financial reporting purposes. The total collateral received is disclosed in each Fund’s statement of assets and liabilities. |
RECENT ACCOUNTING STANDARD
In June 2014, the Financial Accounting Standards Board issued guidance to improve the financial reporting of reverse repurchase agreements and other similar transactions. The guidance will require expanded disclosure for entities that enter into reverse repurchase agreements and similar transactions accounted for as secured borrowings, including securities lending. The guidance is effective for financial statements for fiscal years beginning after December 15, 2014, and interim periods within those fiscal years. Management is evaluating the impact, if any, of this guidance on the Funds’ financial statements and disclosures.
| 2. | INVESTMENT ADVISORY AGREEMENT AND OTHER TRANSACTIONS WITH AFFILIATES |
Pursuant to an Investment Advisory Agreement with the Company, BFA manages the investment of each Fund’s assets. BFA is a California corporation indirectly owned by BlackRock. Under the Investment Advisory Agreement, BFA is responsible for substantially all expenses of the Funds, except interest, taxes, brokerage commissions and other expenses connected with the execution of portfolio transactions, distribution fees, litigation expenses and any extraordinary expenses.
For its investment advisory services to each of the iShares MSCI Australia, iShares MSCI Hong Kong, iShares MSCI Japan Small-Cap, iShares MSCI Malaysia and iShares MSCI Singapore ETFs, BFA is entitled to an annual investment advisory fee based on each Fund’s allocable portion of the aggregate of the average daily net assets of the Fund and certain other iShares funds, as follows:
| Investment Advisory Fee | Aggregate Average Daily Net Assets | ||||
| 0.59 | % | First $7 billion | |||
| 0.54 | Over $7 billion, up to and including $11 billion | ||||
| 0.49 | Over $11 billion, up to and including $24 billion | ||||
| 0.44 | Over $24 billion, up to and including $48 billion | ||||
| 0.40 | Over $48 billion, up to and including $72 billion | ||||
| 0.36 | Over $72 billiona | ||||
| a | Breakpoint level was added effective July 1, 2014. |
| 82 | 2014 iSHARES ANNUAL REPORTTO SHAREHOLDERS |
Table of Contents
Notes to Financial Statements (Continued)
iSHARES®, INC.
For its investment advisory services to each of the iShares MSCI South Korea Capped, iShares MSCI Taiwan and iShares MSCI Thailand Capped ETFs, BFA is entitled to an annual investment advisory fee based on each Fund’s allocable portion of the aggregate of the average daily net assets of the Fund and certain other iShares funds, as follows:
| Investment Advisory Fee | Aggregate Average Daily Net Assets | ||||
| 0.74 | % | First $2 billion | |||
| 0.69 | Over $2 billion, up to and including $4 billion | ||||
| 0.64 | Over $4 billion, up to and including $8 billion | ||||
| 0.57 | Over $8 billion, up to and including $16 billion | ||||
| 0.51 | Over $16 billion, up to and including $32 billion | ||||
| 0.45 | Over $32 billion | ||||
For its investment advisory services to the iShares MSCI Pacific ex Japan ETF, BFA is entitled to an annual investment advisory fee based on the Fund’s allocable portion of the aggregate of the average daily net assets of the Fund and certain other iShares funds, as follows:
| Investment Advisory Fee | Aggregate Average Daily Net Assets | ||||
| 0.5000 | % | First $46 billion | |||
| 0.4750 | a | Over $46 billion, up to and including $81 billion | |||
| 0.4513 | a | Over $81 billion, up to and including $141 billion | |||
| 0.4287 | a | Over $141 billion | |||
| a | Investment advisory fee level reflects a 5% reduction (rounded to the fourth decimal place) from the investment advisory fee at the prior aggregate average daily net asset level. |
The U.S. Securities and Exchange Commission has issued an exemptive order which permits BlackRock Institutional Trust Company, N.A. (“BTC”), an affiliate of BFA, to serve as securities lending agent for the Funds, subject to applicable conditions. As securities lending agent, BTC bears all operational costs directly related to securities lending. Effective January 1, 2014, each Fund is responsible for fees in connection with the investment of cash collateral received for securities on loan in a money market fund managed by BFA, however, BTC has agreed to reduce the amount of securities lending income it receives in order to effectively limit the collateral investment fees each Fund bears to an annual rate of 0.04% (the “collateral investment fees”). Securities lending income is equal to the total of income earned from the reinvestment of cash collateral, net of fees and other payments to and from borrowers of securities, and less the collateral investment fees. The Funds retain a portion of securities lending income and remit a remaining portion to BTC as compensation for its services as securities lending agent.
Pursuant to a securities lending agreement effective January 1, 2014, (i) each Fund retains 75% of securities lending income and (ii) these amounts can never be less than 65% of the total of securities lending income plus the collateral investment fees.
In addition, commencing the business day following the date that the aggregate securities lending income plus the collateral investment fees generated across all 1940 Act iShares exchange-traded funds (the “iShares ETF Complex”) in a given calendar year exceeds the aggregate securities lending income generated across the iShares ETF Complex in calendar year 2013 and pursuant to a securities lending agreement, (i) each Fund will receive for the remainder of that calendar year 80% of securities lending income and (ii) these amounts can never be less than 65% of the total of securities lending income plus the collateral investment fees.
NOTESTO FINANCIAL STATEMENTS | 83 |
Table of Contents
Notes to Financial Statements (Continued)
iSHARES®, INC.
For the year ended August 31, 2014, each Fund paid to BTC the following amounts in total for securities lending agent services and collateral investment fees:
| iShares ETF | Fees Paid to BTC | |||
MSCI Australia | $ | 11,189 | ||
MSCI Hong Kong | 139,193 | |||
MSCI Japan Small-Cap | 37,512 | |||
MSCI Pacific ex Japan | 250,802 | |||
| iShares ETF | Fees Paid to BTC | |||
MSCI Singapore | $ | 615,310 | ||
MSCI South Korea Capped | 1,270,686 | |||
MSCI Taiwan | 1,369,436 | |||
MSCI Thailand Capped | 19,877 | |||
Prior to January 1, 2014, each Fund retained 65% of securities lending income and paid no collateral investment fees.
For the year ended August 31, 2014, BTC, the Funds’ securities lending agent, has agreed to voluntarily reimburse the iShares MSCI Taiwan ETF in the amount of $183,013, related to the foreign tax on the securities lending income. Such reimbursement is included in “Securities lending income – affiliated” in the Fund’s statement of operations.
BlackRock Investments, LLC, an affiliate of BFA, is the distributor for each Fund. Pursuant to the distribution agreement, BFA is responsible for any fees or expenses for distribution services provided to the Funds.
Cross trades for the year ended August 31, 2014, if any, were executed by the Funds pursuant to Rule 17a-7 under the 1940 Act. Cross trading is the buying or selling of portfolio securities between funds to which BFA (or an affiliate) serves as investment adviser. At its regularly scheduled quarterly meetings, the Board reviews such transactions as of the most recent calendar quarter for compliance with the requirements and restrictions set forth by Rule 17a-7.
Each Fund may invest its positive cash balances in certain money market funds managed by BFA or an affiliate. The income earned on these temporary cash investments is included in “Interest – affiliated” in the statements of operations.
The PNC Financial Services Group, Inc. is the largest stockholder of BlackRock and is considered to be an affiliate of the Funds for 1940 Act purposes.
Certain directors and officers of the Company are also officers of BTC and/or BFA.
| 3. | INVESTMENT PORTFOLIO TRANSACTIONS |
Purchases and sales of investments (excluding in-kind transactions and short-term investments) for the year ended August 31, 2014 were as follows:
| iShares ETF | Purchases | Sales | ||||||
MSCI Australia | $ | 129,515,625 | $ | 121,004,424 | ||||
MSCI Hong Kong | 133,841,580 | 124,646,174 | ||||||
MSCI Japan Small-Cap | 24,457,951 | 19,732,876 | ||||||
MSCI Malaysia | 129,185,868 | 227,748,989 | ||||||
MSCI Pacific ex Japan | 277,283,405 | 266,754,935 | ||||||
MSCI Singapore | 41,173,860 | 70,150,811 | ||||||
MSCI South Korea Capped | 1,496,224,369 | 575,550,451 | ||||||
MSCI Taiwan | 416,478,872 | 334,019,726 | ||||||
MSCI Thailand Capped | 61,641,216 | 50,506,818 | ||||||
| 84 | 2014 iSHARES ANNUAL REPORTTO SHAREHOLDERS |
Table of Contents
Notes to Financial Statements (Continued)
iSHARES®, INC.
In-kind transactions (see Note 4) for the year ended August 31, 2014 were as follows:
| iShares ETF | In-kind Purchases | In-kind Sales | ||||||
MSCI Australia | $ | 361,043,612 | $ | 483,408,721 | ||||
MSCI Hong Kong | 1,395,402,513 | 599,272,889 | ||||||
MSCI Japan Small-Cap | 74,205,070 | 15,762,045 | ||||||
MSCI Pacific ex Japan | 726,860,576 | 668,662,178 | ||||||
MSCI Singapore | 43,855,862 | 296,327,492 | ||||||
MSCI Thailand Capped | 327,617,329 | 413,547,619 | ||||||
| 4. | CAPITAL SHARE TRANSACTIONS |
Capital shares are issued and redeemed by each Fund only in aggregations of a specified number of shares or multiples thereof (“Creation Units”) at net asset value. Except when aggregated in Creation Units, shares of each Fund are not redeemable. Transactions in capital shares for each Fund are disclosed in detail in the statements of changes in net assets.
The consideration for the purchase of Creation Units of a fund in the Company generally consists of the in-kind deposit of a designated portfolio of securities and a specified amount of cash. Certain funds in the Company may be offered in Creation Units solely or partially for cash in U.S. dollars. Investors purchasing and redeeming Creation Units may pay a purchase transaction fee and a redemption transaction fee directly to State Street Bank and Trust Company, the Company’s administrator, to offset transfer and other transaction costs associated with the issuance and redemption of Creation Units, including Creation Units for cash. Investors transacting in Creation Units for cash may also pay an additional variable charge to compensate the relevant fund for certain transaction costs (i.e., stamp taxes, taxes on currency or other financial transactions, and brokerage costs) and market impact expenses relating to investing in portfolio securities. Such variable charges, if any, are included in “Proceeds from shares sold” in the statements of changes in net assets.
From time to time, settlement of securities related to in-kind contributions or in-kind redemptions may be delayed. In such cases, securities related to in-kind contributions are reflected as “Due from custodian” and securities related to in-kind redemptions are reflected as “Securities related to in-kind transactions” in the statements of assets and liabilities.
| 5. | FINANCIAL FUTURES CONTRACTS |
Each Fund may purchase or sell financial futures contracts in an effort to help such Fund track its underlying index. A futures contract is a standardized, exchange-traded agreement to buy and sell a financial instrument at a set price on a future date. Upon entering into a futures contract, the Fund is required to pledge to the executing broker which holds segregated from its own assets, an amount of cash, U.S. government securities or other high-quality debt and equity securities equal to the minimum initial margin requirements of the exchange on which the contract is traded. Pursuant to the contract, the Fund agrees to receive from or pay to the broker an amount of cash equal to the daily fluctuation in value of the contract. Such receipts or payments are known as margin variation and are recorded by the Fund as unrealized appreciation or depreciation. When the contract is closed, the Fund records a realized gain or loss equal to the difference between the value of the contract at the time it was opened and the value at the time it was closed. Losses may arise if the value of a futures contract decreases due to an unfavorable change in the market rates or values of the underlying instrument during the term of the contract or if the counterparty does not perform under the contract. The use of futures contracts also involves the risk of an imperfect correlation in the movements in the price of futures contracts and the assets underlying such contracts.
NOTESTO FINANCIAL STATEMENTS | 85 |
Table of Contents
Notes to Financial Statements (Continued)
iSHARES®, INC.
The following table shows the value of futures contracts held by the Funds as of August 31, 2014 and the related locations in the statements of assets and liabilities, presented by risk exposure category:
| Assets | ||||||||
| iShares MSCI Australia ETF | iShares MSCI Taiwan ETF | |||||||
Equity contracts: | ||||||||
Variation margin/Net assets consist of – net unrealized appreciationa | $ | 452,812 | $ | 279,225 | b | |||
|
|
|
| |||||
| a | Represents cumulative appreciation of futures contracts as reported in the schedules of investments. |
| b | Only current day’s variation margin is reported separately within the statements of assets and liabilities. |
| Liabilities | ||||||||
| iShares MSCI Hong Kong ETF | iShares MSCI Singapore ETF | |||||||
Equity contracts: | ||||||||
Variation margin/Net assets consist of – net unrealized depreciationc | $ | 276,020 | $ | 42,726 | ||||
|
|
|
| |||||
| c | Represents cumulative depreciation of futures contracts as reported in the schedules of investments. |
The following table shows the realized and unrealized gains (losses) on futures contracts held by the Funds during the year ended August 31, 2014 and the related locations in the statements of operations, presented by risk exposure category:
| Net Realized Gain (Loss) | ||||||||||||||||
| iShares MSCI Australia ETF | iShares MSCI Hong Kong ETF | iShares MSCI Singapore ETF | iShares MSCI Taiwan ETF | |||||||||||||
Equity contracts: | ||||||||||||||||
Futures contracts | $ | 937,496 | $ | 2,720,479 | $ | 451,881 | $ | 1,553,130 | ||||||||
|
|
|
|
|
|
|
| |||||||||
| Net Change in Unrealized Appreciation/Depreciation | ||||||||||||||||
| iShares MSCI Australia ETF | iShares MSCI Hong Kong ETF | iShares MSCI Singapore ETF | iShares MSCI Taiwan ETF | |||||||||||||
Equity contracts: | ||||||||||||||||
Futures contracts | $ | (253,562 | ) | $ | (169,042 | ) | $ | 43,054 | $ | (208,856 | ) | |||||
|
|
|
|
|
|
|
| |||||||||
The following table shows the average quarter-end balances of open futures contracts for the year ended August 31, 2014:
| iShares MSCI Australia ETF | iShares MSCI Hong Kong ETF | iShares MSCI Singapore ETF | iShares MSCI Taiwan ETF | |||||||||||||
Average number of contracts purchased | 152 | 81 | 143 | 355 | ||||||||||||
Average value of contracts purchased | $ | 18,568,518 | $ | 12,200,369 | $ | 8,299,242 | $ | 11,250,794 | ||||||||
| 86 | 2014 iSHARES ANNUAL REPORTTO SHAREHOLDERS |
Table of Contents
Notes to Financial Statements (Continued)
iSHARES®, INC.
| 6. | MARKET AND CREDIT RISK |
In the normal course of business, each Fund’s investment activities exposes it to various types of risk associated with the financial instruments and markets in which it invests. The significant types of financial risks each Fund is exposed to include market risk and credit risk. Each Fund’s prospectus provides details of these and other types of risk.
BFA uses a “passive” or index approach to try to achieve each Fund’s investment objective following the securities included in its underlying index during upturns as well as downturns. BFA does not take steps to reduce market exposure or to lessen the effects of a declining market. Divergence from the underlying index and the composition of the portfolio is monitored by BFA.
MARKET RISK
Market risk arises mainly from uncertainty about future values of financial instruments influenced by price, currency and interest rate movements. It represents the potential loss each Fund may suffer through holding market positions in the face of market movements. Each Fund is exposed to market risk by virtue of its investment in equity and financial derivative instruments. The fair value of securities held by the Funds may decline due to general market conditions, economic trends or events that are not specifically related to the issuers of the securities including local, regional or global political, social or economic instability or to factors that affect a particular industry or group of industries. The extent of each Fund’s exposure to market risk is the market value of the investments held as shown in the Fund’s schedule of investments.
A diversified portfolio, where this is appropriate and consistent with a fund’s objectives, minimizes the risk that a price change of a particular investment will have a material impact on the NAV of a fund. The investment concentrations within each Fund’s portfolio are disclosed in its schedule of investments.
Each Fund invests a substantial amount of its assets in securities of non-U.S. issuers that trade in non-U.S. markets. This involves certain considerations and risks not typically associated with securities of U.S. issuers. Such risks include, but are not limited to: generally less liquid and less efficient securities markets; generally greater price volatility; exchange rate fluctuations and exchange controls; imposition of restrictions on the expatriation of funds or other assets of the Fund; less publicly available information about issuers; the imposition of withholding or other taxes; higher transaction and custody costs; settlement delays and risk of loss attendant in settlement procedures; difficulties in enforcing contractual obligations; less regulation of securities markets; different accounting, disclosure and reporting requirements; more substantial governmental involvement in the economy; higher inflation rates; greater social, economic and political uncertainties; the risk of nationalization or expropriation of assets; and the risk of war. These risks are heightened for investments in issuers from countries with less developed markets.
The iShares MSCI Australia ETF, iShares MSCI Hong Kong ETF, iShares MSCI Japan Small-Cap ETF, iShares MSCI Malaysia ETF, iShares MSCI Singapore ETF, iShares MSCI South Korea Capped ETF, iShares MSCI Taiwan ETF and iShares MSCI Thailand Capped ETF each invests all or substantially all of its assets in issuers located in a single country. When a fund concentrates its investments in this manner, it assumes the risk that economic, political and social conditions in that country may have a significant impact on its investment performance.
CREDIT RISK
Credit risk is the risk that an issuer or guarantor of debt instruments or the counterparty to a financial transaction, including derivatives contracts, repurchase agreements or loans of portfolio securities, is unable or unwilling to make timely interest and/or principal payments or to otherwise honor its obligations. BFA and its affiliates manage counterparty credit risk by entering into transactions only with counterparties that it believes have the financial resources to honor their obligations and by monitoring the financial stability of those counterparties. Financial assets, which potentially expose the Funds to issuer and counterparty credit risks, consist principally of financial instruments and receivables due from counterparties. The extent of each Fund’s
NOTESTO FINANCIAL STATEMENTS | 87 |
Table of Contents
Notes to Financial Statements (Continued)
iSHARES®, INC.
exposure to credit and counterparty risks with respect to those financial assets is approximated by their value recorded in the statement of assets and liabilities.
| 7. | INCOME TAX INFORMATION |
Each Fund is treated as an entity separate from the Company’s other funds for federal income tax purposes. It is the policy of each Fund to qualify as a regulated investment company by complying with the provisions applicable to regulated investment companies, as defined under Subchapter M of the Internal Revenue Code of 1986, as amended, and to annually distribute substantially all of its ordinary income and any net capital gains (taking into account any capital loss carryforwards) sufficient to relieve it from all, or substantially all, federal income and excise taxes. Accordingly, no provision for federal income taxes is required.
U.S. GAAP requires that certain components of net assets be adjusted to reflect permanent differences between financial and tax reporting. These reclassifications have no effect on net assets or net asset values per share. The following permanent differences as of August 31, 2014, attributable to passive foreign investment companies, the expiration of capital loss carryforwards, foreign currency transactions and realized gains (losses) from in-kind redemptions, were reclassified to the following accounts:
| iShares ETF | Paid-in Capital | Undistributed Net Investment Income/Distributions in Excess of Net Investment Income | Undistributed Net Realized Gain/Accumulated Net Realized Loss | |||||||||
MSCI Australia | $ | 34,856,876 | $ | 3,473,241 | $ | (38,330,117 | ) | |||||
MSCI Hong Kong | 77,862,871 | 2,923 | (77,865,794 | ) | ||||||||
MSCI Japan Small-Cap | 3,608,713 | 261,527 | (3,870,240 | ) | ||||||||
MSCI Malaysia | — | 5,859 | (5,859 | ) | ||||||||
MSCI Pacific ex Japan | 126,553,513 | 5,682,430 | (132,235,943 | ) | ||||||||
MSCI Singapore | 24,568,783 | 3,968,898 | (28,537,681 | ) | ||||||||
MSCI South Korea Capped | — | (134,669 | ) | 134,669 | ||||||||
MSCI Taiwan | (14,435,986 | ) | (32,095 | ) | 14,468,081 | |||||||
MSCI Thailand Capped | 12,444,630 | (157,302 | ) | (12,287,328 | ) | |||||||
The tax character of distributions paid during the years ended August 31, 2014 and August 31, 2013 was as follows:
| iShares ETF | 2014 | 2013 | ||||||
MSCI Australia | ||||||||
Ordinary income | $ | 76,457,082 | $ | 130,032,525 | ||||
|
|
|
| |||||
MSCI Hong Kong | ||||||||
Ordinary income | $ | 69,523,487 | $ | 71,372,977 | ||||
|
|
|
| |||||
MSCI Japan Small-Cap | ||||||||
Ordinary income | $ | 2,956,269 | $ | 1,107,270 | ||||
|
|
|
| |||||
MSCI Malaysia | ||||||||
Ordinary income | $ | 26,722,876 | $ | 23,444,016 | ||||
|
|
|
| |||||
| 88 | 2014 iSHARES ANNUAL REPORTTO SHAREHOLDERS |
Table of Contents
Notes to Financial Statements (Continued)
iSHARES®, INC.
| iShares ETF | 2014 | 2013 | ||||||
MSCI Pacific ex Japan | ||||||||
Ordinary income | $ | 118,670,244 | $ | 156,573,693 | ||||
|
|
|
| |||||
MSCI Singapore | ||||||||
Ordinary income | $ | 36,850,739 | $ | 63,036,613 | ||||
|
|
|
| |||||
MSCI South Korea Capped | ||||||||
Ordinary income | $ | 61,830,398 | $ | 18,847,855 | ||||
|
|
|
| |||||
MSCI Taiwan | ||||||||
Ordinary income | $ | 51,978,221 | $ | 53,961,288 | ||||
|
|
|
| |||||
MSCI Thailand Capped | ||||||||
Ordinary income | $ | 12,909,951 | $ | 18,144,635 | ||||
|
|
|
| |||||
As of August 31, 2014, the tax components of accumulated net earnings (losses) were as follows:
| iShares ETF | Undistributed Ordinary Income | Undistributed Long-Term Capital Gains | Capital Loss Carryforwards | Net Unrealized Gains (Losses) a | Qualified Late-Year Losses b | Total | ||||||||||||||||||
MSCI Australia | $ | 21,764,950 | $ | — | $ | (148,840,859 | ) | $ | 89,200,925 | $ | (22,993,540 | ) | $ | (60,868,524 | ) | |||||||||
MSCI Hong Kong | 6,189,736 | — | (364,026,301 | ) | 161,312,654 | (17,994,055 | ) | (214,517,966 | ) | |||||||||||||||
MSCI Japan Small-Cap | 1,769,331 | — | (1,737,581 | ) | 12,595,782 | (2,273,481 | ) | 10,354,051 | ||||||||||||||||
MSCI Malaysia | 3,466,057 | 1,987,238 | — | 429,830,640 | — | 435,283,935 | ||||||||||||||||||
MSCI Pacific ex Japan | 31,649,636 | — | (392,888,951 | ) | 350,408,169 | (30,679,032 | ) | (41,510,178 | ) | |||||||||||||||
MSCI Singapore | 2,073,176 | — | (195,833,519 | ) | 46,407,715 | (5,769,300 | ) | (153,121,928 | ) | |||||||||||||||
MSCI South Korea Capped | 43,104,100 | — | (379,453,081 | ) | 1,516,558,034 | (17,855,469 | ) | 1,162,353,584 | ||||||||||||||||
MSCI Taiwan | 60,252,930 | — | (855,861,788 | ) | 1,303,058,111 | (19,601,533 | ) | 487,847,720 | ||||||||||||||||
MSCI Thailand Capped | 1,962,196 | — | (6,238,729 | ) | (37,565,267 | ) | (5,495,699 | ) | (47,337,499 | ) | ||||||||||||||
| a | The difference between book-basis and tax-basis unrealized gains (losses) was attributable primarily to the tax deferral of losses on wash sales and the realization for tax purposes of unrealized gains on investments in passive foreign investment companies. |
| b | The Funds have elected to defer certain qualified late-year losses and recognize such losses in the next taxable year. |
As of August 31, 2014, the Funds had capital loss carryforwards available to offset future realized capital gains through the indicated expiration dates as follows:
| iShares ETF | Non- Expiring a | Expiring 2015 | Expiring 2016 | Expiring 2017 | Expiring 2018 | Expiring 2019 | Total | |||||||||||||||||||||
MSCI Australia | $ | 88,822,192 | $ | 7,066 | $ | 529,868 | $ | 24,006,125 | $ | 23,348,244 | $ | 12,127,364 | $ | 148,840,859 | ||||||||||||||
MSCI Hong Kong | 179,303,227 | 2,899,247 | 3,185,408 | 29,235,556 | 114,836,904 | 34,565,959 | 364,026,301 | |||||||||||||||||||||
MSCI Japan Small-Cap | 860,844 | — | — | 131,718 | 541,322 | 203,697 | 1,737,581 | |||||||||||||||||||||
MSCI Pacific ex Japan | 185,280,633 | — | — | 66,207,828 | 104,799,503 | 36,600,987 | 392,888,951 | |||||||||||||||||||||
MSCI Singapore | 35,336,542 | — | 807,115 | 15,680,510 | 132,420,824 | 11,588,528 | 195,833,519 | |||||||||||||||||||||
MSCI South Korea Capped | 13,366,759 | — | — | 60,990,953 | 226,591,665 | 78,503,704 | 379,453,081 | |||||||||||||||||||||
MSCI Taiwan | 48,030,508 | 64,999,586 | 16,734,578 | 343,375,145 | 363,052,013 | 19,669,958 | 855,861,788 | |||||||||||||||||||||
MSCI Thailand Capped | 2,056,947 | — | — | 555,444 | 2,321,428 | 1,304,910 | 6,238,729 | |||||||||||||||||||||
| a | Must be utilized prior to losses subject to expiration. |
NOTESTO FINANCIAL STATEMENTS | 89 |
Table of Contents
Notes to Financial Statements (Continued)
iSHARES®, INC.
For the year ended August 31, 2014, the iShares MSCI Malaysia ETF utilized $29,674,200 of its capital loss carryforwards.
The Funds may own shares in certain foreign investment entities, referred to, under U.S. tax law, as “passive foreign investment companies.” The Funds may elect to mark-to-market annually the shares of each passive foreign investment company and would be required to distribute to shareholders any such marked-to-market gains.
As of August 31, 2014, gross unrealized appreciation and gross unrealized depreciation based on cost for federal income tax purposes were as follows:
| iShares ETF | Tax Cost | Gross Unrealized | Gross Unrealized Depreciation | Net Unrealized Appreciation (Depreciation) | ||||||||||||
MSCI Australia | $ | 1,936,358,394 | $ | 280,638,608 | $ | (191,896,510 | ) | $ | 88,742,098 | |||||||
MSCI Hong Kong | 3,081,927,689 | 259,998,643 | (98,362,374 | ) | 161,636,269 | |||||||||||
MSCI Japan Small-Cap | 163,198,450 | 21,944,177 | (9,341,311 | ) | 12,602,866 | |||||||||||
MSCI Malaysia | 353,726,318 | 456,443,684 | (26,623,294 | ) | 429,820,390 | |||||||||||
MSCI Pacific ex Japan | 3,127,479,185 | 543,947,244 | (193,575,281 | ) | 350,371,963 | |||||||||||
MSCI Singapore | 960,240,101 | 116,217,167 | (69,775,639 | ) | 46,441,528 | |||||||||||
MSCI South Korea Capped | 3,534,919,379 | 2,144,583,985 | (628,017,279 | ) | 1,516,566,706 | |||||||||||
MSCI Taiwan | 2,187,992,225 | 1,562,391,788 | (259,674,754 | ) | 1,302,717,034 | |||||||||||
MSCI Thailand Capped | 611,704,816 | 37,064,849 | (74,630,550 | ) | (37,565,701 | ) | ||||||||||
Management has analyzed tax laws and regulations and their application to the Funds as of August 31, 2014, inclusive of the open tax return years, and does not believe there are any uncertain tax positions that require recognition of a tax liability in the Funds’ financial statements.
| 8. | SUBSEQUENT EVENTS |
Management has evaluated the impact of all subsequent events on the Funds through the date the financial statements were available to be issued and has determined that there were no subsequent events requiring adjustment or disclosure in the financial statements.
| 90 | 2014 iSHARES ANNUAL REPORTTO SHAREHOLDERS |
Table of Contents
Report of Independent Registered Public Accounting Firm
To the Shareholders and Board of Directors of
iShares, Inc.:
In our opinion, the accompanying statements of assets and liabilities, including the schedules of investments, and the related statements of operations and of changes in net assets and the financial highlights present fairly, in all material respects, the financial position of iShares MSCI Australia ETF, iShares MSCI Hong Kong ETF, iShares MSCI Japan Small-Cap ETF, iShares MSCI Malaysia ETF, iShares MSCI Pacific ex Japan ETF, iShares MSCI Singapore ETF, iShares MSCI South Korea Capped ETF, iShares MSCI Taiwan ETF and iShares MSCI Thailand Capped ETF (the “Funds”) at August 31, 2014, the results of each of their operations, the changes in each of their net assets and their financial highlights for each of the periods presented, in conformity with accounting principles generally accepted in the United States of America. These financial statements and financial highlights (hereafter referred to as “financial statements”) are the responsibility of the Funds’ management; our responsibility is to express an opinion on these financial statements based on our audits. We conducted our audits of these financial statements in accordance with the standards of the Public Company Accounting Oversight Board (United States). Those standards require that we plan and perform the audit to obtain reasonable assurance about whether the financial statements are free of material misstatement. An audit includes examining, on a test basis, evidence supporting the amounts and disclosures in the financial statements, assessing the accounting principles used and significant estimates made by management, and evaluating the overall financial statement presentation. We believe that our audits, which included confirmation of securities at August 31, 2014 by correspondence with the custodian, transfer agent and brokers, provide a reasonable basis for our opinion.
PricewaterhouseCoopers LLP
San Francisco, California
October 22, 2014
REPORTOF INDEPENDENT REGISTERED PUBLIC ACCOUNTING FIRM | 91 |
Table of Contents
iSHARES®, INC.
For the fiscal year ended August 31, 2014, the Funds earned foreign source income and paid foreign taxes which they intend to pass through to their shareholders pursuant to Section 853 of the Internal Revenue Code (the “Code”) as follows:
| iShares ETF | Foreign Source Income Earned | Foreign Taxes Paid | ||||||
MSCI Australia | $ | 93,474,141 | $ | 1,286,424 | ||||
MSCI Hong Kong | 81,049,175 | — | ||||||
MSCI Japan Small-Cap | 2,594,562 | 242,672 | ||||||
MSCI Malaysia | 32,389,812 | — | ||||||
MSCI Pacific ex Japan | 140,611,372 | 1,767,747 | ||||||
MSCI Singapore | 36,077,849 | 230,769 | ||||||
MSCI South Korea Capped | 49,689,831 | 9,734,515 | ||||||
MSCI Taiwan | 93,797,837 | 21,107,950 | ||||||
MSCI Thailand Capped | 17,367,165 | 1,737,998 | ||||||
Under Section 854(b)(2) of the Code, the Funds hereby designate the following maximum amounts as qualified dividend income for purposes of the maximum rate under Section 1(h)(11) of the Code for the fiscal year ended August 31, 2014:
| iShares ETF | Qualified Dividend Income | |||
MSCI Australia | $ | 77,743,506 | ||
MSCI Japan Small-Cap | 2,016,261 | |||
MSCI Pacific ex Japan | 92,155,604 | |||
MSCI South Korea Capped | 48,478,192 | |||
MSCI Thailand Capped | 14,647,949 | |||
In February 2015, shareholders will receive Form 1099-DIV which will include their share of qualified dividend income distributed during the calendar year 2014. Shareholders are advised to check with their tax advisers for information on the treatment of these amounts on their income tax returns.
| 92 | 2014 iSHARES ANNUAL REPORTTO SHAREHOLDERS |
Table of Contents
Board Review and Approval of Investment Advisory
Contract
iSHARES®, INC.
I. iShares MSCI Australia ETF, iShares MSCI Hong Kong ETF, iShares MSCI Japan Small-Cap ETF, iShares MSCI Malaysia ETF and iShares MSCI Singapore ETF
Under Section 15(c) of the Investment Company Act of 1940 (the “1940 Act”), the Company’s Board of Directors (the “Board”), including a majority of Directors who are not “interested persons” of the Company (as that term is defined in the 1940 Act) (the “Independent Directors”), is required annually to consider and approve the Investment Advisory Contract between the Company and BFA (the “Advisory Contract”) on behalf of the Funds. The Independent Directors requested, and BFA provided, such information as the Independent Directors, with advice from independent counsel, deemed reasonably necessary to evaluate the Advisory Contract. A committee of Independent Directors (the “15(c) Committee”), with independent counsel, met with management on March 12, 2014, May 6, 2014, and May 12, 2014, to discuss the types of information the Independent Directors required and the manner in which management would organize and present such information. At a meeting held on May 16, 2014, management presented preliminary information to the Board relating to the continuance of the Advisory Contract, and the Board, including the Independent Directors, reviewed and discussed such information at length. The Independent Directors requested from management certain additional information, which management agreed to provide. At a meeting held on June 12-13, 2014, the Board, including the Independent Directors, reviewed the additional information provided by management in response to these requests. After extensive discussions, the Board, including all of the Independent Directors, approved the continuance of the Advisory Contract for the Funds, based on a review of qualitative and quantitative information provided by BFA, including the additional information management provided at the request of the Independent Directors. The Board noted its satisfaction with the extent and quality of information provided and its frequent interactions with management, as well as the detailed responses and other information provided by BFA. The Board also noted that the Board and BFA agreed to discuss potential enhancements and adjustments to the 15(c) process for the coming year. The Independent Directors were advised by their independent counsel throughout the process, including about the legal standards applicable to their review. In approving the Advisory Contract for the Funds, the Board, including the Independent Directors, considered the following factors, no one of which was controlling, and reached the following conclusions:
Expenses and Performance of the Funds — The Board reviewed statistical information prepared by Lipper Inc. (“Lipper”), an independent provider of investment company data, regarding the expense ratio components, including actual advisory fees, waivers/reimbursements, and gross and net total expenses of each Fund in comparison with the same information for other exchange traded funds (including funds sponsored by an “at cost” service provider) and, in the limited instances where no comparable ETFs existed and the comparison group would not otherwise be reasonable in Lipper’s judgment, pure index institutional mutual funds, objectively selected by Lipper as comprising such Fund’s applicable peer group pursuant to Lipper’s proprietary ETF methodology (the “Lipper Group”). The Board noted that, prior to 2014, Lipper had used a different methodology to determine a Fund’s Lipper group, which included mutual funds, closed-end funds, exchange traded funds, and/or funds with differing investment objective classifications, investment focuses and other characteristics (e.g. actively managed funds and funds sponsored by “at cost” service providers), as applicable. The Board further noted that, after consideration by the 15(c) Committee, the Board determined to use instead Lipper’s proprietary ETF methodology to determine a Fund’s Lipper Group. This determination was based on, among other considerations, the increased number and types of ETFs available for comparative purposes than was the case in prior years. The Board was provided with a detailed description of Lipper’s proprietary ETF methodology used by Lipper to determine the applicable Lipper Groups and to prepare this information. At the Board’s request, Lipper provided, and the Board considered, information on the impact to the iShares funds’ comparative fee rankings that were attributable to the change from a pure index group methodology to Lipper’s proprietary ETF methodology. The Board further noted that due to the limitations in providing comparable funds in the various Lipper Groups, the statistical information provided in Lipper’s report may or may not provide meaningful direct comparisons to the Funds in all instances.
The Board also noted that the investment advisory fee rates and overall expenses for the Funds were lower than the median of the investment advisory fee rates and overall expenses of the funds in their respective Lipper Group.
BOARD REVIEWAND APPROVALOF INVESTMENT ADVISORY CONTRACT | 93 |
Table of Contents
Board Review and Approval of Investment Advisory
Contract (Continued)
iSHARES®, INC.
In addition, the Board reviewed statistical information prepared by Lipper regarding the performance of each Fund for the one-, three-, five-, ten-year, and since inception periods, as applicable, and the “last quarter” period ended December 31, 2013, and a comparison of each Fund’s performance to its performance benchmark index for the same periods. To the extent that any of the comparison funds included in the Lipper Group track the same index as any particular Fund, Lipper also provided, and the Board reviewed, a comparison of such Fund’s performance to that of such relevant comparison funds for the same periods. The Board noted that the Funds generally performed in line with their respective performance benchmark indexes over the relevant periods. In considering this information, the Board noted that the Lipper Group may include funds that are not exchange traded funds or index funds, and that may have different investment objectives and/or benchmarks from the Funds. In addition, the Board noted that each Fund seeks to track its own benchmark index and that, during the prior year, the Board received periodic reports on the Funds’ performance in comparison with their relevant benchmark indexes. Such periodic comparative performance information, including detailed information on certain specific iShares funds requested by the Boards, was also considered.
Based on this review, the other factors considered at the meeting, and their general knowledge of ETF pricing, the Board concluded that the investment advisory fee rate and expense level and the historical performance of each Fund supported the Board’s approval of the continuance of the Advisory Contract for the coming year.
Nature, Extent and Quality of Services Provided by BFA — Based on management’s representations, including information about recent and proposed enhancements to the iShares business, including with respect to shareholder servicing and support, the Board expected that there would be no diminution in the scope of services required of or provided by BFA under the Advisory Contract for the coming year as compared to the scope of services provided by BFA during prior years. In reviewing the scope of these services, the Board considered BFA’s investment philosophy and experience, noting that BFA and its affiliates have committed significant resources over time, including during the past year, to supporting the Funds and their shareholders. The Board acknowledged that resources to support the iShares funds and their shareholders have been added or enhanced in recent years, including in such areas as investor education, product management, customized portfolio consulting support, capital markets support, and proprietary risk and performance analytics tools. The Board also considered BFA’s compliance program and its compliance record with respect to the Funds. In that regard, the Board noted that BFA reports to the Board about portfolio management and compliance matters on a periodic basis in connection with regularly scheduled meetings of the Board, and on other occasions as necessary and appropriate, and has provided information and made appropriate officers available as needed to provide further assistance with these matters. The Board also reviewed the background and experience of the persons responsible for the day-to-day management of the Funds, as well as the resources available to them in managing the Funds. In addition to the above considerations, the Board reviewed and considered detailed presentations regarding BFA’s investment performance, investment and risk management processes and strategies provided at the June 12-13, 2014 meeting and throughout the previous year, and matters related to BFA’s portfolio compliance policies and procedures. The Board noted that each Fund had met its investment objective consistently since its respective inception date.
Based on review of this information, and the performance information discussed above, the Board concluded that the nature, extent and quality of services provided by BFA to the Funds under the Advisory Contract supported the Board’s approval of the continuance of the Advisory Contract for the coming year.
Costs of Services Provided to Funds and Profits Realized by BFA and Affiliates — The Board reviewed information about the profitability to BlackRock of the Funds based on the fees payable to BFA and its affiliates (including fees under the Advisory Contract), and all other sources of revenue and expense to BFA and its affiliates from the Funds’ operations for the last calendar year. The Board reviewed BlackRock’s profitability methodology for the iShares funds, noting that the 15(c) Committee had focused on the methodology and proposed presentation during its meetings. The Board discussed the sources of direct and ancillary revenue with management, including the revenues to BTC from securities lending by the Funds. The Board also discussed BFA’s profit margin as reflected in the Funds’ profitability analyses and reviewed information regarding potential
| 94 | 2014 iSHARES ANNUAL REPORTTO SHAREHOLDERS |
Table of Contents
Board Review and Approval of Investment Advisory
Contract (Continued)
iSHARES®, INC.
economies of scale (as discussed below). Based on this review, the Board concluded that the profits realized by BFA and its affiliates under the Advisory Contract and from other relationships between the Funds and BFA and/or its affiliates, if any, were within a reasonable range in light of the factors considered.
Economies of Scale — The Board reviewed information regarding potential economies of scale or other efficiencies that may result from increases in the Funds’ assets, noting that the issue of economies of scale had been focused on extensively by the 15(c) Committee during its meetings and addressed by management. The Board and the 15(c) Committee reviewed information provided by BFA regarding scale benefits shared with the iShares funds through relatively low fee rates established at inception, breakpoints, waivers, or other fee reductions, as well as through additional investment in the iShares business and the provision of improved or additional infrastructure and services to the iShares funds and their shareholders. The Board and the 15(c) Committee received information regarding BlackRock’s historical profitability, including BFA’s and its affiliates’ costs in providing services. The cost information distinguished between fixed and variable costs, and explained how the level of fixed and variable costs, as well as the nature of such costs, may impact the existence or size of scale benefits. The Board noted that the Advisory Contract for the Funds already provided for breakpoints in the Funds’ investment advisory fee rates, and that, following negotiations, BFA and the Board had agreed to revise the Advisory Contract for the Funds to provide for additional breakpoints, as the assets of the Funds, on an aggregated basis with the assets of certain other iShares funds, increase. The Board noted that the revisions of the Advisory Contract to provide additional breakpoints had been subject to further negotiation after receipt of management’s proposal, and that at the request of the Board, management had modified its initial proposal regarding adding additional breakpoints to the Funds. The Board noted that it would continue to monitor the sharing of economies of scale to determine the appropriateness of adding new or revised breakpoints in the future. Based on this review, as well as the other factors considered at the meeting, the Board, recognizing its responsibility to consider this issue at least annually, concluded that the structure of the investment advisory fee rates reflects appropriate sharing of potential economies of scale with the Funds’ shareholders and supported the Board’s approval of the continuance of the Advisory Contract for the coming year.
Fees and Services Provided for Other Comparable Funds/Accounts Managed by BFA and its Affiliates — The Board received and considered information regarding the investment advisory/management fee rates for other funds/accounts in the U.S. for which BFA (or its affiliates) provides investment advisory/management services, including open-end and closed-end funds registered under the 1940 Act (including sub-advised funds), collective trust funds, separately managed accounts, and institutional separate accounts (together, the “Other Accounts”), and acknowledged BFA’s assertion that the iShares funds are fundamentally different investment vehicles from the Other Accounts. The Board noted that BFA and its affiliates do manage Other Accounts with substantially similar investment objectives and strategies as the Funds, except for iShares MSCI Japan Small-Cap ETF. The Board further noted that BFA provided the Board with detailed information regarding how the Other Accounts (particularly institutional clients) generally differ from the Funds, including in terms of the different, generally more extensive services provided to the Funds, as well as other significant differences in the approach of BFA and its affiliates to the Funds, on one hand, and Other Accounts, on the other. In that regard, the Board considered that the pricing of services to institutional clients is typically based on a number of factors beyond the nature and extent of the specific services to be provided and often depends on the overall relationship between the client and its affiliates and the adviser and its affiliates. In addition, the Board considered the relative complexity and inherent risks and challenges of managing and providing other services to the Funds, as publicly traded exchange traded funds, as compared to the Other Accounts that are institutional clients in light of differing regulatory requirements and client-imposed mandates. The Board also considered the “all-inclusive” nature of the Funds’ advisory fee structure, and the Fund expenses borne by BFA under this arrangement. The Board noted that the investment advisory fee rates under the Advisory Contract for the Funds were generally higher than the investment advisory/management fee rates for the Other Accounts that are institutional clients of BFA (or its affiliates) and concluded that the differences appeared to be consistent with the factors discussed.
BOARD REVIEWAND APPROVALOF INVESTMENT ADVISORY CONTRACT | 95 |
Table of Contents
Board Review and Approval of Investment Advisory
Contract (Continued)
iSHARES®, INC.
Other Benefits to BFA and/or its Affiliates — The Board reviewed the “fallout” benefits or ancillary revenue received by BFA and/or its affiliates in connection with the services provided to the Funds by BFA, such as payment of revenue to BTC, the Funds’ securities lending agent, for loaning portfolio securities (which was included in the profit margins reviewed by the Board pursuant to BFA’s profitability methodology), and payment of advisory fees and/or administration fees to BFA and BTC (or their affiliates) in connection with any investments by the Funds in other funds for which BFA (or its affiliates) provides investment advisory services and/or administration services. The Board noted that BFA generally does not use soft dollars or consider the value of research or other services that may be provided to BFA (including its affiliates) in selecting brokers for portfolio transactions for the Funds. The Board further noted that any portfolio transactions on behalf of the Funds placed through a BFA affiliate or purchased from an underwriting syndicate in which a BFA affiliate participates, are reported to the Board pursuant to Rule 17e-1 or Rule 10f-3, as applicable, under the 1940 Act. The Board concluded that any such ancillary benefits would not be disadvantageous to the Funds’ shareholders and thus would not alter the Board’s conclusion with respect to the appropriateness of approving the continuance of the Advisory Contract for the coming year.
Based on the considerations described above, the Board determined that each Fund’s investment advisory fee rate under the Advisory Contract does not constitute a fee that is so disproportionately large as to bear no reasonable relationship to the services rendered and that could not have been the product of arm’s-length bargaining, and concluded that it is in the best interest of each Fund and its shareholders to approve the continuance of the Advisory Contract for the coming year.
II. iShares MSCI Pacific ex Japan ETF and iShares MSCI Taiwan ETF
Under Section 15(c) of the Investment Company Act of 1940 (the “1940 Act”), the Company’s Board of Directors (the “Board”), including a majority of Directors who are not “interested persons” of the Company (as that term is defined in the 1940 Act) (the “Independent Directors”), is required annually to consider and approve the Investment Advisory Contract between the Company and BFA (the “Advisory Contract”) on behalf of the Funds. The Independent Directors requested, and BFA provided, such information as the Independent Directors, with advice from independent counsel, deemed reasonably necessary to evaluate the Advisory Contract. A committee of Independent Directors (the “15(c) Committee”), with independent counsel, met with management on March 12, 2014, May 6, 2014, and May 12, 2014, to discuss the types of information the Independent Directors required and the manner in which management would organize and present such information. At a meeting held on May 16, 2014, management presented preliminary information to the Board relating to the continuance of the Advisory Contract, and the Board, including the Independent Directors, reviewed and discussed such information at length. The Independent Directors requested from management certain additional information, which management agreed to provide. At a meeting held on June 12-13, 2014, the Board, including the Independent Directors, reviewed the additional information provided by management in response to these requests. After extensive discussions, the Board, including all of the Independent Directors, approved the continuance of the Advisory Contract for the Funds, based on a review of qualitative and quantitative information provided by BFA, including the additional information management provided at the request of the Independent Directors. The Board noted its satisfaction with the extent and quality of information provided and its frequent interactions with management, as well as the detailed responses and other information provided by BFA. The Board also noted that the Board and BFA agreed to discuss potential enhancements and adjustments to the 15(c) process for the coming year. The Independent Directors were advised by their independent counsel throughout the process, including about the legal standards applicable to their review. In approving the Advisory Contract for the Funds, the Board, including the Independent Directors, considered the following factors, no one of which was controlling, and reached the following conclusions:
Expenses and Performance of the Funds — The Board reviewed statistical information prepared by Lipper Inc. (“Lipper”), an independent provider of investment company data, regarding the expense ratio components, including actual advisory fees, waivers/reimbursements, and gross and net total expenses of each Fund in comparison with the same information for other exchange traded funds (including funds sponsored by an “at cost” service provider) and, in the limited instances where no
| 96 | 2014 iSHARES ANNUAL REPORTTO SHAREHOLDERS |
Table of Contents
Board Review and Approval of Investment Advisory
Contract (Continued)
iSHARES®, INC.
comparable ETFs existed and the comparison group would not otherwise be reasonable in Lipper’s judgment, pure index institutional mutual funds, objectively selected by Lipper as comprising such Fund’s applicable peer group pursuant to Lipper’s proprietary ETF methodology (the “Lipper Group”). The Board noted that, prior to 2014, Lipper had used a different methodology to determine a Fund’s Lipper group, which included mutual funds, closed-end funds, exchange traded funds, and/or funds with differing investment objective classifications, investment focuses and other characteristics (e.g. actively managed funds and funds sponsored by “at cost” service providers), as applicable. The Board further noted that, after consideration by the 15(c) Committee, the Board determined to use instead Lipper’s proprietary ETF methodology to determine a Fund’s Lipper Group. This determination was based on, among other considerations, the increased number and types of ETFs available for comparative purposes than was the case in prior years. The Board was provided with a detailed description of Lipper’s proprietary ETF methodology used by Lipper to determine the applicable Lipper Groups and to prepare this information. At the Board’s request, Lipper provided, and the Board considered, information on the impact to the iShares funds’ comparative fee rankings that were attributable to the change from a pure index group methodology to Lipper’s proprietary ETF methodology. The Board further noted that due to the limitations in providing comparable funds in the various Lipper Groups, the statistical information provided in Lipper’s report may or may not provide meaningful direct comparisons to the Funds in all instances.
The Board also noted that the investment advisory fee rates and overall expenses for the Funds were lower than the median of the investment advisory fee rates and overall expenses of the funds in their respective Lipper Group.
In addition, the Board reviewed statistical information prepared by Lipper regarding the performance of each Fund for the one-, three-, five-, ten-year, and since inception periods, as applicable, and the “last quarter” period ended December 31, 2013, and a comparison of each Fund’s performance to its performance benchmark index for the same periods. To the extent that any of the comparison funds included in the Lipper Group track the same index as any particular Fund, Lipper also provided, and the Board reviewed, a comparison of such Fund’s performance to that of such relevant comparison funds for the same periods. The Board noted that the Funds generally performed in line with their respective performance benchmark indexes over the relevant periods. In considering this information, the Board noted that the Lipper Group may include funds that are not exchange traded funds or index funds, and that may have different investment objectives and/or benchmarks from the Funds. In addition, the Board noted that each Fund seeks to track its own benchmark index and that, during the prior year, the Board received periodic reports on the Funds’ performance in comparison with their relevant benchmark indexes. Such periodic comparative performance information, including detailed information on certain specific iShares funds requested by the Boards, was also considered.
Based on this review, the other factors considered at the meeting, and their general knowledge of ETF pricing, the Board concluded that the investment advisory fee rate and expense level and the historical performance of each Fund supported the Board’s approval of the continuance of the Advisory Contract for the coming year.
Nature, Extent and Quality of Services Provided by BFA — Based on management’s representations, including information about recent and proposed enhancements to the iShares business, including with respect to shareholder servicing and support, the Board expected that there would be no diminution in the scope of services required of or provided by BFA under the Advisory Contract for the coming year as compared to the scope of services provided by BFA during prior years. In reviewing the scope of these services, the Board considered BFA’s investment philosophy and experience, noting that BFA and its affiliates have committed significant resources over time, including during the past year, to supporting the Funds and their shareholders. The Board acknowledged that resources to support the iShares funds and their shareholders have been added or enhanced in recent years, including in such areas as investor education, product management, customized portfolio consulting support, capital markets support, and proprietary risk and performance analytics tools. The Board also considered BFA’s compliance program and its compliance record with respect to the Funds. In that regard, the Board noted that BFA reports to the Board about portfolio management and compliance matters on a periodic basis in connection with regularly scheduled meetings of the Board, and on other occasions as necessary and appropriate, and has provided information and made appropriate officers available as needed
BOARD REVIEWAND APPROVALOF INVESTMENT ADVISORY CONTRACT | 97 |
Table of Contents
Board Review and Approval of Investment Advisory
Contract (Continued)
iSHARES®, INC.
to provide further assistance with these matters. The Board also reviewed the background and experience of the persons responsible for the day-to-day management of the Funds, as well as the resources available to them in managing the Funds. In addition to the above considerations, the Board reviewed and considered detailed presentations regarding BFA’s investment performance, investment and risk management processes and strategies provided at the June 12-13, 2014 meeting and throughout the previous year, and matters related to BFA’s portfolio compliance policies and procedures. The Board noted that each Fund had met its investment objective consistently since its respective inception date.
Based on review of this information, and the performance information discussed above, the Board concluded that the nature, extent and quality of services provided by BFA to the Funds under the Advisory Contract supported the Board’s approval of the continuance of the Advisory Contract for the coming year.
Costs of Services Provided to Funds and Profits Realized by BFA and Affiliates — The Board reviewed information about the profitability to BlackRock of the Funds based on the fees payable to BFA and its affiliates (including fees under the Advisory Contract), and all other sources of revenue and expense to BFA and its affiliates from the Funds’ operations for the last calendar year. The Board reviewed BlackRock’s profitability methodology for the iShares funds, noting that the 15(c) Committee had focused on the methodology and proposed presentation during its meetings. The Board discussed the sources of direct and ancillary revenue with management, including the revenues to BTC from securities lending by the Funds. The Board also discussed BFA’s profit margin as reflected in the Funds’ profitability analyses and reviewed information regarding potential economies of scale (as discussed below). Based on this review, the Board concluded that the profits realized by BFA and its affiliates under the Advisory Contract and from other relationships between the Funds and BFA and/or its affiliates, if any, were within a reasonable range in light of the factors considered.
Economies of Scale — The Board reviewed information regarding potential economies of scale or other efficiencies that may result from increases in the Funds’ assets, noting that the issue of economies of scale had been focused on extensively by the 15(c) Committee during its meetings and addressed by management. The Board and the 15(c) Committee reviewed information provided by BFA regarding scale benefits shared with the iShares funds through relatively low fee rates established at inception, breakpoints, waivers, or other fee reductions, as well as through additional investment in the iShares business and the provision of improved or additional infrastructure and services to the iShares funds and their shareholders. The Board and the 15(c) Committee received information regarding BlackRock’s historical profitability, including BFA’s and its affiliates’ costs in providing services. The cost information distinguished between fixed and variable costs, and explained how the level of fixed and variable costs, as well as the nature of such costs, may impact the existence or size of scale benefits. The Board noted that the Advisory Contract for the Funds already provided for breakpoints in the Funds’ investment advisory fee rates as the assets of the Funds, on an aggregated basis with the assets of certain other iShares funds, increase. The Board noted that it would continue to monitor the sharing of economies of scale to determine the appropriateness of adding new or revised breakpoints in the future. Based on this review, as well as the other factors considered at the meeting, the Board, recognizing its responsibility to consider this issue at least annually, concluded that the structure of the investment advisory fee rates reflects appropriate sharing of potential economies of scale with the Funds’ shareholders and supported the Board’s approval of the continuance of the Advisory Contract for the coming year.
Fees and Services Provided for Other Comparable Funds/Accounts Managed by BFA and its Affiliates — The Board received and considered information regarding the investment advisory/management fee rates for other funds/accounts in the U.S. for which BFA (or its affiliates) provides investment advisory/management services, including open-end and closed-end funds registered under the 1940 Act (including sub-advised funds), collective trust funds, separately managed accounts, and institutional separate accounts (together, the “Other Accounts”), and acknowledged BFA’s assertion that the iShares funds are fundamentally different investment vehicles from the Other Accounts. The Board noted that BFA and its affiliates do manage Other Accounts with substantially similar investment objectives and strategies as the Funds. The Board further noted that BFA
| 98 | 2014 iSHARES ANNUAL REPORTTO SHAREHOLDERS |
Table of Contents
Board Review and Approval of Investment Advisory
Contract (Continued)
iSHARES®, INC.
provided the Board with detailed information regarding how the Other Accounts (particularly institutional clients) generally differ from the Funds, including in terms of the different, generally more extensive services provided to the Funds, as well as other significant differences in the approach of BFA and its affiliates to the Funds, on one hand, and Other Accounts, on the other. In that regard, the Board considered that the pricing of services to institutional clients is typically based on a number of factors beyond the nature and extent of the specific services to be provided and often depends on the overall relationship between the client and its affiliates and the adviser and its affiliates. In addition, the Board considered the relative complexity and inherent risks and challenges of managing and providing other services to the Funds, as publicly traded exchange traded funds, as compared to the Other Accounts that are institutional clients in light of differing regulatory requirements and client-imposed mandates. The Board also considered the “all-inclusive” nature of the Funds’ advisory fee structure, and the Fund expenses borne by BFA under this arrangement. The Board noted that the investment advisory fee rates under the Advisory Contract for the Funds were generally higher than the investment advisory/management fee rates for the Other Accounts that are institutional clients of BFA (or its affiliates) and concluded that the differences appeared to be consistent with the factors discussed.
Other Benefits to BFA and/or its Affiliates — The Board reviewed the “fallout” benefits or ancillary revenue received by BFA and/or its affiliates in connection with the services provided to the Funds by BFA, such as payment of revenue to BTC, the Funds’ securities lending agent, for loaning portfolio securities (which was included in the profit margins reviewed by the Board pursuant to BFA’s profitability methodology), and payment of advisory fees and/or administration fees to BFA and BTC (or their affiliates) in connection with any investments by the Funds in other funds for which BFA (or its affiliates) provides investment advisory services and/or administration services. The Board noted that BFA generally does not use soft dollars or consider the value of research or other services that may be provided to BFA (including its affiliates) in selecting brokers for portfolio transactions for the Funds. The Board further noted that any portfolio transactions on behalf of the Funds placed through a BFA affiliate or purchased from an underwriting syndicate in which a BFA affiliate participates, are reported to the Board pursuant to Rule 17e-1 or Rule 10f-3, as applicable, under the 1940 Act. The Board concluded that any such ancillary benefits would not be disadvantageous to the Funds’ shareholders and thus would not alter the Board’s conclusion with respect to the appropriateness of approving the continuance of the Advisory Contract for the coming year.
Based on the considerations described above, the Board determined that each Fund’s investment advisory fee rate under the Advisory Contract does not constitute a fee that is so disproportionately large as to bear no reasonable relationship to the services rendered and that could not have been the product of arm’s-length bargaining, and concluded that it is in the best interest of each Fund and its shareholders to approve the continuance of the Advisory Contract for the coming year.
III. iShares MSCI South Korea Capped ETF and iShares MSCI Thailand Capped ETF
Under Section 15(c) of the Investment Company Act of 1940 (the “1940 Act”), the Company’s Board of Directors (the “Board”), including a majority of Directors who are not “interested persons” of the Company (as that term is defined in the 1940 Act) (the “Independent Directors”), is required annually to consider and approve the Investment Advisory Contract between the Company and BFA (the “Advisory Contract”) on behalf of the Funds. The Independent Directors requested, and BFA provided, such information as the Independent Directors, with advice from independent counsel, deemed reasonably necessary to evaluate the Advisory Contract. A committee of Independent Directors (the “15(c) Committee”), with independent counsel, met with management on March 12, 2014, May 6, 2014, and May 12, 2014, to discuss the types of information the Independent Directors required and the manner in which management would organize and present such information. At a meeting held on May 16, 2014, management presented preliminary information to the Board relating to the continuance of the Advisory Contract, and the Board, including the Independent Directors, reviewed and discussed such information at length. The Independent Directors requested from management certain additional information, which management agreed to provide. At a meeting held on June 12-13, 2014, the Board, including the Independent Directors, reviewed the additional information provided by management in response to these requests. After extensive discussions, the Board, including all of the Independent Directors, approved the
BOARD REVIEWAND APPROVALOF INVESTMENT ADVISORY CONTRACT | 99 |
Table of Contents
Board Review and Approval of Investment Advisory
Contract (Continued)
iSHARES®, INC.
continuance of the Advisory Contract for the Funds, based on a review of qualitative and quantitative information provided by BFA, including the additional information management provided at the request of the Independent Directors. The Board noted its satisfaction with the extent and quality of information provided and its frequent interactions with management, as well as the detailed responses and other information provided by BFA. The Board also noted that the Board and BFA agreed to discuss potential enhancements and adjustments to the 15(c) process for the coming year. The Independent Directors were advised by their independent counsel throughout the process, including about the legal standards applicable to their review. In approving the Advisory Contract for the Funds, the Board, including the Independent Directors, considered the following factors, no one of which was controlling, and reached the following conclusions:
Expenses and Performance of the Funds — The Board reviewed statistical information prepared by Lipper Inc. (“Lipper”), an independent provider of investment company data, regarding the expense ratio components, including actual advisory fees, waivers/reimbursements, and gross and net total expenses of each Fund in comparison with the same information for other exchange traded funds (including funds sponsored by an “at cost” service provider) and, in the limited instances where no comparable ETFs existed and the comparison group would not otherwise be reasonable in Lipper’s judgment, pure index institutional mutual funds, objectively selected by Lipper as comprising such Fund’s applicable peer group pursuant to Lipper’s proprietary ETF methodology (the “Lipper Group”). The Board noted that, prior to 2014, Lipper had used a different methodology to determine a Fund’s Lipper group, which included mutual funds, closed-end funds, exchange traded funds, and/or funds with differing investment objective classifications, investment focuses and other characteristics (e.g. actively managed funds and funds sponsored by “at cost” service providers), as applicable. The Board further noted that, after consideration by the 15(c) Committee, the Board determined to use instead Lipper’s proprietary ETF methodology to determine a Fund’s Lipper Group. This determination was based on, among other considerations, the increased number and types of ETFs available for comparative purposes than was the case in prior years. The Board was provided with a detailed description of Lipper’s proprietary ETF methodology used by Lipper to determine the applicable Lipper Groups and to prepare this information. At the Board’s request, Lipper provided, and the Board considered, information on the impact to the iShares funds’ comparative fee rankings that were attributable to the change from a pure index group methodology to Lipper’s proprietary ETF methodology. The Board further noted that due to the limitations in providing comparable funds in the various Lipper Groups, the statistical information provided in Lipper’s report may or may not provide meaningful direct comparisons to the Funds in all instances.
The Board also noted that the investment advisory fee rate and overall expenses for iShares MSCI South Korea Capped ETF were within range of the median of the investment advisory fee rates and overall expenses of the funds in its Lipper Group, and the investment advisory fee rate and overall expenses for iShares MSCI Thailand Capped ETF were at the median of the investment advisory fee rates and overall expenses of the funds in its Lipper Group.
In addition, the Board reviewed statistical information prepared by Lipper regarding the performance of each Fund for the one-, three-, five-, ten-year, and since inception periods, as applicable, and the “last quarter” period ended December 31, 2013, and a comparison of each Fund’s performance to its performance benchmark index for the same periods. To the extent that any of the comparison funds included in the Lipper Group track the same index as any particular Fund, Lipper also provided, and the Board reviewed, a comparison of such Fund’s performance to that of such relevant comparison funds for the same periods. The Board noted that the Funds generally performed in line with their respective performance benchmark indexes over the relevant periods. In considering this information, the Board noted that the Lipper Group may include funds that are not exchange traded funds or index funds, and that may have different investment objectives and/or benchmarks from the Funds. In addition, the Board noted that each Fund seeks to track its own benchmark index and that, during the prior year, the Board received periodic reports on the Funds’ performance in comparison with their relevant benchmark indexes. Such periodic comparative performance information, including detailed information on certain specific iShares funds requested by the Boards, was also considered.
| 100 | 2014 iSHARES ANNUAL REPORTTO SHAREHOLDERS |
Table of Contents
Board Review and Approval of Investment Advisory
Contract (Continued)
iSHARES®, INC.
Based on this review, the other factors considered at the meeting, and their general knowledge of ETF pricing, the Board concluded that the investment advisory fee rate and expense level and the historical performance of each Fund supported the Board’s approval of the continuance of the Advisory Contract for the coming year.
Nature, Extent and Quality of Services Provided by BFA — Based on management’s representations, including information about recent and proposed enhancements to the iShares business, including with respect to shareholder servicing and support, the Board expected that there would be no diminution in the scope of services required of or provided by BFA under the Advisory Contract for the coming year as compared to the scope of services provided by BFA during prior years. In reviewing the scope of these services, the Board considered BFA’s investment philosophy and experience, noting that BFA and its affiliates have committed significant resources over time, including during the past year, to supporting the Funds and their shareholders. The Board acknowledged that resources to support the iShares funds and their shareholders have been added or enhanced in recent years, including in such areas as investor education, product management, customized portfolio consulting support, capital markets support, and proprietary risk and performance analytics tools. The Board also considered BFA’s compliance program and its compliance record with respect to the Funds. In that regard, the Board noted that BFA reports to the Board about portfolio management and compliance matters on a periodic basis in connection with regularly scheduled meetings of the Board, and on other occasions as necessary and appropriate, and has provided information and made appropriate officers available as needed to provide further assistance with these matters. The Board also reviewed the background and experience of the persons responsible for the day-to-day management of the Funds, as well as the resources available to them in managing the Funds. In addition to the above considerations, the Board reviewed and considered detailed presentations regarding BFA’s investment performance, investment and risk management processes and strategies provided at the June 12-13, 2014 meeting and throughout the previous year, and matters related to BFA’s portfolio compliance policies and procedures. The Board noted that each Fund had met its investment objective consistently since its respective inception date.
Based on review of this information, and the performance information discussed above, the Board concluded that the nature, extent and quality of services provided by BFA to the Funds under the Advisory Contract supported the Board’s approval of the continuance of the Advisory Contract for the coming year.
Costs of Services Provided to Funds and Profits Realized by BFA and Affiliates — The Board reviewed information about the profitability to BlackRock of the Funds based on the fees payable to BFA and its affiliates (including fees under the Advisory Contract), and all other sources of revenue and expense to BFA and its affiliates from the Funds’ operations for the last calendar year. The Board reviewed BlackRock’s profitability methodology for the iShares funds, noting that the 15(c) Committee had focused on the methodology and proposed presentation during its meetings. The Board discussed the sources of direct and ancillary revenue with management, including the revenues to BTC from securities lending by the Funds. The Board also discussed BFA’s profit margin as reflected in the Funds’ profitability analyses and reviewed information regarding potential economies of scale (as discussed below). Based on this review, the Board concluded that the profits realized by BFA and its affiliates under the Advisory Contract and from other relationships between the Funds and BFA and/or its affiliates, if any, were within a reasonable range in light of the factors considered.
Economies of Scale — The Board reviewed information regarding potential economies of scale or other efficiencies that may result from increases in the Funds’ assets, noting that the issue of economies of scale had been focused on extensively by the 15(c) Committee during its meetings and addressed by management. The Board and the 15(c) Committee reviewed information provided by BFA regarding scale benefits shared with the iShares funds through relatively low fee rates established at inception, breakpoints, waivers, or other fee reductions, as well as through additional investment in the iShares business and the provision of improved or additional infrastructure and services to the iShares funds and their shareholders. The Board and the 15(c) Committee received information regarding BlackRock’s historical profitability, including BFA’s and its affiliates’ costs in providing services. The cost information distinguished between fixed and variable costs, and explained how the level of fixed and
BOARD REVIEWAND APPROVALOF INVESTMENT ADVISORY CONTRACT | 101 |
Table of Contents
Board Review and Approval of Investment Advisory
Contract (Continued)
iSHARES®, INC.
variable costs, as well as the nature of such costs, may impact the existence or size of scale benefits. The Board noted that the Advisory Contract for the Funds already provided for breakpoints in the Funds’ investment advisory fee rates as the assets of the Funds, on an aggregated basis with the assets of certain other iShares funds, increase. The Board noted that it would continue to monitor the sharing of economies of scale to determine the appropriateness of adding new or revised breakpoints in the future. Based on this review, as well as the other factors considered at the meeting, the Board, recognizing its responsibility to consider this issue at least annually, concluded that the structure of the investment advisory fee rates reflects appropriate sharing of potential economies of scale with the Funds’ shareholders and supported the Board’s approval of the continuance of the Advisory Contract for the coming year.
Fees and Services Provided for Other Comparable Funds/Accounts Managed by BFA and its Affiliates — The Board received and considered information regarding the investment advisory/management fee rates for other funds/accounts in the U.S. for which BFA (or its affiliates) provides investment advisory/management services, including open-end and closed-end funds registered under the 1940 Act (including sub-advised funds), collective trust funds, separately managed accounts, and institutional separate accounts (together, the “Other Accounts”), and acknowledged BFA’s assertion that the iShares funds are fundamentally different investment vehicles from the Other Accounts. The Board noted that BFA and its affiliates do manage Other Accounts with substantially similar investment objectives and strategies as the Funds. The Board further noted that BFA provided the Board with detailed information regarding how the Other Accounts (particularly institutional clients) generally differ from the Funds, including in terms of the different, generally more extensive services provided to the Funds, as well as other significant differences in the approach of BFA and its affiliates to the Funds, on one hand, and Other Accounts, on the other. In that regard, the Board considered that the pricing of services to institutional clients is typically based on a number of factors beyond the nature and extent of the specific services to be provided and often depends on the overall relationship between the client and its affiliates and the adviser and its affiliates. In addition, the Board considered the relative complexity and inherent risks and challenges of managing and providing other services to the Funds, as publicly traded exchange traded funds, as compared to the Other Accounts that are institutional clients in light of differing regulatory requirements and client-imposed mandates. The Board also considered the “all-inclusive” nature of the Funds’ advisory fee structure, and the Fund expenses borne by BFA under this arrangement. The Board noted that the investment advisory fee rates under the Advisory Contract for the Funds were generally higher than the investment advisory/management fee rates for the Other Accounts that are institutional clients of BFA (or its affiliates) and concluded that the differences appeared to be consistent with the factors discussed.
Other Benefits to BFA and/or its Affiliates — The Board reviewed the “fallout” benefits or ancillary revenue received by BFA and/or its affiliates in connection with the services provided to the Funds by BFA, such as payment of revenue to BTC, the Funds’ securities lending agent, for loaning portfolio securities (which was included in the profit margins reviewed by the Board pursuant to BFA’s profitability methodology), and payment of advisory fees and/or administration fees to BFA and BTC (or their affiliates) in connection with any investments by the Funds in other funds for which BFA (or its affiliates) provides investment advisory services and/or administration services. The Board noted that BFA generally does not use soft dollars or consider the value of research or other services that may be provided to BFA (including its affiliates) in selecting brokers for portfolio transactions for the Funds. The Board further noted that any portfolio transactions on behalf of the Funds placed through a BFA affiliate or purchased from an underwriting syndicate in which a BFA affiliate participates, are reported to the Board pursuant to Rule 17e-1 or Rule 10f-3, as applicable, under the 1940 Act. The Board concluded that any such ancillary benefits would not be disadvantageous to the Funds’ shareholders and thus would not alter the Board’s conclusion with respect to the appropriateness of approving the continuance of the Advisory Contract for the coming year.
Based on the considerations described above, the Board determined that each Fund’s investment advisory fee rate under the Advisory Contract does not constitute a fee that is so disproportionately large as to bear no reasonable relationship to the services rendered and that could not have been the product of arm’s-length bargaining, and concluded that it is in the best interest of each Fund and its shareholders to approve the continuance of the Advisory Contract for the coming year.
| 102 | 2014 iSHARES ANNUAL REPORTTO SHAREHOLDERS |
Table of Contents
Supplemental Information (Unaudited)
iSHARES®, INC.
Section 19(a) Notices
The amounts and sources of distributions reported are only estimates and are not being provided for tax reporting purposes. The actual amounts and sources of the amounts for tax reporting purposes will depend upon each Fund’s investment experience during the year and may be subject to changes based on the tax regulations. Shareholders will receive a Form 1099-DIV each calendar year that will inform them how to report distributions for federal income tax purposes.
| Total Cumulative Distributions for the Fiscal Year | % Breakdown of the Total Cumulative Distributions for the Fiscal Year | |||||||||||||||||||||||||||||||
| iShares ETF | Net Investment Income | Net Realized Capital Gains | Return of Capital | Total Per Share | Net Investment Income | Net Realized Capital Gains | Return of Capital | Total Per Share | ||||||||||||||||||||||||
MSCI Australia | $ | 0.821693 | $ | — | $ | 0.170960 | $ | 0.992653 | 83 | % | — | % | 17 | % | 100 | % | ||||||||||||||||
MSCI Japan Small-Cap | 0.856053 | — | 0.282602 | 1.138655 | 75 | — | 25 | 100 | ||||||||||||||||||||||||
MSCI Malaysia | 0.519638 | — | 0.001943 | 0.521581 | 100 | — | 0 | a | 100 | |||||||||||||||||||||||
MSCI Pacific ex Japan | 1.596731 | — | 0.140090 | 1.736821 | 92 | — | 8 | 100 | ||||||||||||||||||||||||
MSCI Singapore | 0.279324 | — | 0.170261 | 0.449585 | 62 | — | 38 | 100 | ||||||||||||||||||||||||
MSCI South Korea Capped | 0.244213 | — | 0.653832 | 0.898045 | 27 | — | 73 | 100 | ||||||||||||||||||||||||
MSCI Taiwan | 0.237828 | — | 0.024159 | 0.261987 | 91 | — | 9 | 100 | ||||||||||||||||||||||||
| a | Rounds to less than 1%. |
Premium/Discount Information
The tables that follow present information about the differences between the daily market price on secondary markets for shares of a Fund and that Fund’s net asset value. Net asset value, or “NAV,” is the price per share at which each Fund issues and redeems shares. It is calculated in accordance with the standard formula for valuing mutual fund shares. The “Market Price” of each Fund generally is determined using the midpoint between the highest bid and the lowest offer on the primary stock exchange on which the shares of such Fund are listed for trading, as of the time that the Fund’s NAV is calculated. Each Fund’s Market Price may be at, above or below its NAV. The NAV of each Fund will fluctuate with changes in the fair value of its portfolio holdings. The Market Price of each Fund will fluctuate in accordance with changes in its NAV, as well as market supply and demand.
Premiums or discounts are the differences (expressed as a percentage) between the NAV and Market Price of a Fund on a given day, generally at the time NAV is calculated. A premium is the amount that a Fund is trading above the reported NAV, expressed as a percentage of the NAV. A discount is the amount that a Fund is trading below the reported NAV, expressed as a percentage of the NAV.
The following information shows the frequency distributions of premiums and discounts for each of the Funds included in this report. The information shown for each Fund is for five calendar years through the date of the most recent calendar quarter-end. The specific periods covered for each Fund are disclosed in the table for such Fund.
SUPPLEMENTAL INFORMATION | 103 |
Table of Contents
Supplemental Information (Unaudited) (Continued)
iSHARES®, INC.
Each line in the table shows the number of trading days in which the Fund traded within the premium/discount range indicated. The number of trading days in each premium/discount range is also shown as a percentage of the total number of trading days in the period covered by each table. All data presented here represents past performance, which cannot be used to predict future results.
iShares MSCI Australia ETF
Period Covered: January 1, 2009 through June 30, 2014
Premium/Discount Range | Number of Days | Percentage of Total Days | ||||||
Greater than 4.5% | 1 | 0.07 | % | |||||
Greater than 4.0% and Less than 4.5% | 2 | 0.14 | ||||||
Greater than 3.5% and Less than 4.0% | 3 | 0.22 | ||||||
Greater than 3.0% and Less than 3.5% | 8 | 0.58 | ||||||
Greater than 2.5% and Less than 3.0% | 11 | 0.80 | ||||||
Greater than 2.0% and Less than 2.5% | 18 | 1.30 | ||||||
Greater than 1.5% and Less than 2.0% | 56 | 4.05 | ||||||
Greater than 1.0% and Less than 1.5% | 92 | 6.66 | ||||||
Greater than 0.5% and Less than 1.0% | 262 | 18.96 | ||||||
Between 0.5% and –0.5% | 620 | 44.86 | ||||||
Less than –0.5% and Greater than –1.0% | 139 | 10.06 | ||||||
Less than –1.0% and Greater than –1.5% | 79 | 5.72 | ||||||
Less than –1.5% and Greater than –2.0% | 35 | 2.53 | ||||||
Less than –2.0% and Greater than –2.5% | 28 | 2.03 | ||||||
Less than –2.5% and Greater than –3.0% | 12 | 0.87 | ||||||
Less than –3.0% and Greater than –3.5% | 7 | 0.51 | ||||||
Less than –3.5% and Greater than –4.0% | 5 | 0.36 | ||||||
Less than –4.0% and Greater than –4.5% | 2 | 0.14 | ||||||
Less than –4.5% and Greater than –5.0% | 1 | 0.07 | ||||||
Less than –5.0% and Greater than –5.5% | 1 | 0.07 | ||||||
|
|
|
| |||||
| 1,382 | 100.00 | % | ||||||
|
|
|
| |||||
| 104 | 2014 iSHARES ANNUAL REPORTTO SHAREHOLDERS |
Table of Contents
Supplemental Information (Unaudited) (Continued)
iSHARES®, INC.
iShares MSCI Hong Kong ETF
Period Covered: January 1, 2009 through June 30, 2014
Premium/Discount Range | Number of Days | Percentage of Total Days | ||||||
Greater than 4.5% | 2 | 0.14 | % | |||||
Greater than 4.0% and Less than 4.5% | 1 | 0.07 | ||||||
Greater than 3.5% and Less than 4.0% | 1 | 0.07 | ||||||
Greater than 3.0% and Less than 3.5% | 7 | 0.51 | ||||||
Greater than 2.5% and Less than 3.0% | 6 | 0.43 | ||||||
Greater than 2.0% and Less than 2.5% | 21 | 1.52 | ||||||
Greater than 1.5% and Less than 2.0% | 30 | 2.17 | ||||||
Greater than 1.0% and Less than 1.5% | 72 | 5.21 | ||||||
Greater than 0.5% and Less than 1.0% | 219 | 15.85 | ||||||
Between 0.5% and –0.5% | 725 | 52.46 | ||||||
Less than –0.5% and Greater than –1.0% | 154 | 11.14 | ||||||
Less than –1.0% and Greater than –1.5% | 75 | 5.43 | ||||||
Less than –1.5% and Greater than –2.0% | 28 | 2.03 | ||||||
Less than –2.0% and Greater than –2.5% | 17 | 1.23 | ||||||
Less than –2.5% and Greater than –3.0% | 12 | 0.87 | ||||||
Less than –3.0% and Greater than –3.5% | 8 | 0.58 | ||||||
Less than –3.5% | 4 | 0.29 | ||||||
|
|
|
| |||||
| 1,382 | 100.00 | % | ||||||
|
|
|
| |||||
SUPPLEMENTAL INFORMATION | 105 |
Table of Contents
Supplemental Information (Unaudited) (Continued)
iSHARES®, INC.
iShares MSCI Japan Small-Cap ETF
Period Covered: January 1, 2009 through June 30, 2014
Premium/Discount Range | Number of Days | Percentage of Total Days | ||||||
Greater than 5.0% | 4 | 0.29 | % | |||||
Greater than 4.5% and Less than 5.0% | 1 | 0.07 | ||||||
Greater than 4.0% and Less than 4.5% | 2 | 0.14 | ||||||
Greater than 3.5% and Less than 4.0% | 7 | 0.51 | ||||||
Greater than 3.0% and Less than 3.5% | 2 | 0.14 | ||||||
Greater than 2.5% and Less than 3.0% | 8 | 0.58 | ||||||
Greater than 2.0% and Less than 2.5% | 19 | 1.37 | ||||||
Greater than 1.5% and Less than 2.0% | 46 | 3.33 | ||||||
Greater than 1.0% and Less than 1.5% | 118 | 8.54 | ||||||
Greater than 0.5% and Less than 1.0% | 219 | 15.85 | ||||||
Between 0.5% and –0.5% | 614 | 44.43 | ||||||
Less than –0.5% and Greater than –1.0% | 151 | 10.93 | ||||||
Less than –1.0% and Greater than –1.5% | 87 | 6.30 | ||||||
Less than –1.5% and Greater than –2.0% | 48 | 3.47 | ||||||
Less than –2.0% and Greater than –2.5% | 29 | 2.10 | ||||||
Less than –2.5% and Greater than –3.0% | 14 | 1.01 | ||||||
Less than –3.0% and Greater than –3.5% | 7 | 0.51 | ||||||
Less than –3.5% and Greater than –4.0% | 3 | 0.22 | ||||||
Less than –4.0% and Greater than –4.5% | 2 | 0.14 | ||||||
Less than –4.5% | 1 | 0.07 | ||||||
|
|
|
| |||||
| 1,382 | 100.00 | % | ||||||
|
|
|
| |||||
| 106 | 2014 iSHARES ANNUAL REPORTTO SHAREHOLDERS |
Table of Contents
Supplemental Information (Unaudited) (Continued)
iSHARES®, INC.
iShares MSCI Malaysia ETF
Period Covered: January 1, 2009 through June 30, 2014
Premium/Discount Range | Number of Days | Percentage of Total Days | ||||||
Greater than 3.0% | 3 | 0.22 | % | |||||
Greater than 2.5% and Less than 3.0% | 3 | 0.22 | ||||||
Greater than 2.0% and Less than 2.5% | 10 | 0.72 | ||||||
Greater than 1.5% and Less than 2.0% | 24 | 1.74 | ||||||
Greater than 1.0% and Less than 1.5% | 86 | 6.22 | ||||||
Greater than 0.5% and Less than 1.0% | 230 | 16.64 | ||||||
Between 0.5% and –0.5% | 702 | 50.81 | ||||||
Less than –0.5% and Greater than –1.0% | 199 | 14.40 | ||||||
Less than –1.0% and Greater than –1.5% | 69 | 4.99 | ||||||
Less than –1.5% and Greater than –2.0% | 33 | 2.39 | ||||||
Less than –2.0% and Greater than –2.5% | 10 | 0.72 | ||||||
Less than –2.5% and Greater than –3.0% | 7 | 0.51 | ||||||
Less than –3.0% and Greater than –3.5% | 2 | 0.14 | ||||||
Less than –3.5% and Greater than –4.0% | 2 | 0.14 | ||||||
Less than –4.0% and Greater than –4.5% | 2 | 0.14 | ||||||
|
|
|
| |||||
| 1,382 | 100.00 | % | ||||||
|
|
|
| |||||
iShares MSCI Pacific ex Japan ETF
Period Covered: January 1, 2009 through June 30, 2014
Premium/Discount Range | Number of Days | Percentage of Total Days | ||||||
Greater than 4.0% | 3 | 0.22 | % | |||||
Greater than 3.5% and Less than 4.0% | 2 | 0.14 | ||||||
Greater than 3.0% and Less than 3.5% | 6 | 0.43 | ||||||
Greater than 2.5% and Less than 3.0% | 10 | 0.72 | ||||||
Greater than 2.0% and Less than 2.5% | 17 | 1.23 | ||||||
Greater than 1.5% and Less than 2.0% | 41 | 2.97 | ||||||
Greater than 1.0% and Less than 1.5% | 96 | 6.95 | ||||||
Greater than 0.5% and Less than 1.0% | 225 | 16.28 | ||||||
Between 0.5% and –0.5% | 690 | 49.94 | ||||||
Less than –0.5% and Greater than –1.0% | 136 | 9.84 | ||||||
Less than –1.0% and Greater than –1.5% | 75 | 5.43 | ||||||
Less than –1.5% and Greater than –2.0% | 36 | 2.60 | ||||||
Less than –2.0% and Greater than –2.5% | 19 | 1.37 | ||||||
Less than –2.5% and Greater than –3.0% | 13 | 0.94 | ||||||
Less than –3.0% and Greater than –3.5% | 6 | 0.43 | ||||||
Less than –3.5% and Greater than –4.0% | 3 | 0.22 | ||||||
Less than –4.0% and Greater than –4.5% | 1 | 0.07 | ||||||
Less than –4.5% and Greater than –5.0% | 3 | 0.22 | ||||||
|
|
|
| |||||
| 1,382 | 100.00 | % | ||||||
|
|
|
| |||||
SUPPLEMENTAL INFORMATION | 107 |
Table of Contents
Supplemental Information (Unaudited) (Continued)
iSHARES®, INC.
iShares MSCI Singapore ETF
Period Covered: January 1, 2009 through June 30, 2014
Premium/Discount Range | Number of Days | Percentage of Total Days | ||||||
Greater than 4.0% | 1 | 0.07 | % | |||||
Greater than 3.5% and Less than 4.0% | 1 | 0.07 | ||||||
Greater than 3.0% and Less than 3.5% | 3 | 0.22 | ||||||
Greater than 2.5% and Less than 3.0% | 4 | 0.29 | ||||||
Greater than 2.0% and Less than 2.5% | 14 | 1.01 | ||||||
Greater than 1.5% and Less than 2.0% | 20 | 1.45 | ||||||
Greater than 1.0% and Less than 1.5% | 69 | 4.99 | ||||||
Greater than 0.5% and Less than 1.0% | 203 | 14.69 | ||||||
Between 0.5% and –0.5% | 807 | 58.39 | ||||||
Less than –0.5% and Greater than –1.0% | 147 | 10.64 | ||||||
Less than –1.0% and Greater than –1.5% | 60 | 4.34 | ||||||
Less than –1.5% and Greater than –2.0% | 27 | 1.95 | ||||||
Less than –2.0% and Greater than –2.5% | 15 | 1.09 | ||||||
Less than –2.5% and Greater than –3.0% | 4 | 0.29 | ||||||
Less than –3.0% and Greater than –3.5% | 3 | 0.22 | ||||||
Less than –3.5% and Greater than –4.0% | 3 | 0.22 | ||||||
Less than –4.0% | 1 | 0.07 | ||||||
|
|
|
| |||||
| 1,382 | 100.00 | % | ||||||
|
|
|
| |||||
| 108 | 2014 iSHARES ANNUAL REPORTTO SHAREHOLDERS |
Table of Contents
Supplemental Information (Unaudited) (Continued)
iSHARES®, INC.
iShares MSCI South Korea Capped ETF
Period Covered: January 1, 2009 through June 30, 2014
Premium/Discount Range | Number of Days | Percentage of Total Days | ||||||
Greater than 5.0% and Less than 5.5% | 1 | 0.07 | % | |||||
Greater than 4.5% and Less than 5.0% | 2 | 0.14 | ||||||
Greater than 4.0% and Less than 4.5% | 5 | 0.36 | ||||||
Greater than 3.5% and Less than 4.0% | 5 | 0.36 | ||||||
Greater than 3.0% and Less than 3.5% | 5 | 0.36 | ||||||
Greater than 2.5% and Less than 3.0% | 19 | 1.37 | ||||||
Greater than 2.0% and Less than 2.5% | 23 | 1.66 | ||||||
Greater than 1.5% and Less than 2.0% | 56 | 4.05 | ||||||
Greater than 1.0% and Less than 1.5% | 73 | 5.29 | ||||||
Greater than 0.5% and Less than 1.0% | 217 | 15.71 | ||||||
Between 0.5% and –0.5% | 563 | 40.75 | ||||||
Less than –0.5% and Greater than –1.0% | 192 | 13.89 | ||||||
Less than –1.0% and Greater than –1.5% | 84 | 6.09 | ||||||
Less than –1.5% and Greater than –2.0% | 54 | 3.91 | ||||||
Less than –2.0% and Greater than –2.5% | 27 | 1.95 | ||||||
Less than –2.5% and Greater than –3.0% | 21 | 1.52 | ||||||
Less than –3.0% and Greater than –3.5% | 8 | 0.58 | ||||||
Less than –3.5% and Greater than –4.0% | 8 | 0.58 | ||||||
Less than –4.0% and Greater than –4.5% | 7 | 0.51 | ||||||
Less than –4.5% and Greater than –5.0% | 6 | 0.43 | ||||||
Less than –5.0% and Greater than –5.5% | 2 | 0.14 | ||||||
Less than –5.5% and Greater than –6.0% | 2 | 0.14 | ||||||
Less than –6.0% | 2 | 0.14 | ||||||
|
|
|
| |||||
| 1,382 | 100.00 | % | ||||||
|
|
|
| |||||
SUPPLEMENTAL INFORMATION | 109 |
Table of Contents
Supplemental Information (Unaudited) (Continued)
iSHARES®, INC.
iShares MSCI Taiwan ETF
Period Covered: January 1, 2009 through June 30, 2014
Premium/Discount Range | Number of Days | Percentage of Total Days | ||||||
Greater than 5.0% | 2 | 0.14 | % | |||||
Greater than 4.5% and Less than 5.0% | 1 | 0.07 | ||||||
Greater than 4.0% and Less than 4.5% | 2 | 0.14 | ||||||
Greater than 3.5% and Less than 4.0% | 8 | 0.58 | ||||||
Greater than 3.0% and Less than 3.5% | 10 | 0.72 | ||||||
Greater than 2.5% and Less than 3.0% | 7 | 0.51 | ||||||
Greater than 2.0% and Less than 2.5% | 17 | 1.23 | ||||||
Greater than 1.5% and Less than 2.0% | 37 | 2.68 | ||||||
Greater than 1.0% and Less than 1.5% | 85 | 6.15 | ||||||
Greater than 0.5% and Less than 1.0% | 218 | 15.78 | ||||||
Between 0.5% and –0.5% | 632 | 45.74 | ||||||
Less than –0.5% and Greater than –1.0% | 192 | 13.89 | ||||||
Less than –1.0% and Greater than –1.5% | 78 | 5.64 | ||||||
Less than –1.5% and Greater than –2.0% | 43 | 3.11 | ||||||
Less than –2.0% and Greater than –2.5% | 18 | 1.30 | ||||||
Less than –2.5% and Greater than –3.0% | 12 | 0.87 | ||||||
Less than –3.0% and Greater than –3.5% | 12 | 0.87 | ||||||
Less than –3.5% and Greater than –4.0% | 4 | 0.29 | ||||||
Less than –4.0% and Greater than –4.5% | 3 | 0.22 | ||||||
Less than –4.5% and Greater than –5.0% | 1 | 0.07 | ||||||
|
|
|
| |||||
| 1,382 | 100.00 | % | ||||||
|
|
|
| |||||
| 110 | 2014 iSHARES ANNUAL REPORTTO SHAREHOLDERS |
Table of Contents
Supplemental Information (Unaudited) (Continued)
iSHARES®, INC.
iShares MSCI Thailand Capped ETF
Period Covered: January 1, 2009 through June 30, 2014
Premium/Discount Range | Number of Days | Percentage of Total Days | ||||||
Greater than 5.0% | 1 | 0.07 | % | |||||
Greater than 4.5% and Less than 5.0% | 2 | 0.14 | ||||||
Greater than 4.0% and Less than 4.5% | 3 | 0.22 | ||||||
Greater than 3.5% and Less than 4.0% | 3 | 0.22 | ||||||
Greater than 3.0% and Less than 3.5% | 4 | 0.29 | ||||||
Greater than 2.5% and Less than 3.0% | 16 | 1.16 | ||||||
Greater than 2.0% and Less than 2.5% | 23 | 1.66 | ||||||
Greater than 1.5% and Less than 2.0% | 53 | 3.84 | ||||||
Greater than 1.0% and Less than 1.5% | 139 | 10.06 | ||||||
Greater than 0.5% and Less than 1.0% | 250 | 18.09 | ||||||
Between 0.5% and –0.5% | 548 | 39.66 | ||||||
Less than –0.5% and Greater than –1.0% | 165 | 11.94 | ||||||
Less than –1.0% and Greater than –1.5% | 88 | 6.37 | ||||||
Less than –1.5% and Greater than –2.0% | 36 | 2.60 | ||||||
Less than –2.0% and Greater than –2.5% | 29 | 2.10 | ||||||
Less than –2.5% and Greater than –3.0% | 9 | 0.65 | ||||||
Less than –3.0% and Greater than –3.5% | 9 | 0.65 | ||||||
Less than –3.5% and Greater than –4.0% | 1 | 0.07 | ||||||
Less than –4.0% and Greater than –4.5% | 1 | 0.07 | ||||||
Less than –4.5% and Greater than –5.0% | 1 | 0.07 | ||||||
Less than –5.0% | 1 | 0.07 | ||||||
|
|
|
| |||||
| 1,382 | 100.00 | % | ||||||
|
|
|
| |||||
Regulation under the Alternative Investment Fund Managers Directive
The Alternative Investment Fund Managers Directive (the “Directive”) imposes detailed and prescriptive obligations on fund managers established in the European Union (the “EU”). These do not currently apply to managers established outside the EU, such as BFA. Rather, non-EU managers are only required to comply with certain disclosure, reporting and transparency obligations of the Directive if such managers market a fund to EU investors.
BFA has registered the iShares MSCI Hong Kong ETF, iShares MSCI Japan Small-Cap ETF, iShares MSCI Malaysia ETF, iShares MSCI South Korea Capped ETF, iShares MSCI Taiwan ETF, and iShares MSCI Thailand Capped ETF (each a “Fund”, collectively the “Funds”) for marketing to EU investors in the United Kingdom, the Netherlands, Finland, Sweden and Luxembourg.
Report on Remuneration
BFA is required under the Directive to make quantitative disclosures of remuneration. These disclosures are made in line with BlackRock’s interpretation of currently available regulatory guidance on quantitative remuneration disclosures. As market or regulatory practice develops BlackRock may consider it appropriate to make changes to the way in which quantitative remuneration disclosures are calculated. Where such changes are made, this may result in disclosures in relation to a fund not being comparable to the disclosures made in the prior year, or in relation to other BlackRock fund disclosures in that same year.
Disclosures are provided in relation to both (a) the staff of BFA; and (b) staff who are senior management or who have the ability to materially affect the risk profile of the Funds.
SUPPLEMENTAL INFORMATION | 111 |
Table of Contents
Supplemental Information (Unaudited) (Continued)
iSHARES®, INC.
All individuals included in the aggregated figures disclosed are rewarded in line with BlackRock’s remuneration policy for their responsibilities across the relevant BlackRock business area. As all individuals have a number of areas of responsibilities, only the portion of remuneration for those individuals’ services attributable to each Fund is included in the aggregate figures disclosed.
BlackRock has a clear and well defined pay-for-performance philosophy, and compensation programs which support that philosophy. For senior management, a significant percentage of variable remuneration is deferred over time. All employees are subject to a claw-back policy.
Compensation decisions for employees are made based on full-year financial results and other non-financial goals and objectives. Alongside financial performance, individual compensation is also based on strategic and operating results and other considerations such as management and leadership capabilities. No set formulas are established and no fixed benchmarks are used in determining annual incentive awards. Bonus pools are reviewed by BlackRock’s independent compensation committee, taking into account both actual and projected financial information together with information provided by the Operational Risk and Regulatory Compliance departments in relation to any activities, incidents or events that warrant consideration in making compensation decisions.
Functions such as Finance, Operational Risk, Legal & Compliance, and Human Resources each have their own organizational structures which are independent of the business units. Functional bonus pools are determined with reference to the performance of each individual function and the remuneration of the senior members of control functions is directly overseen by BlackRock’s independent compensation committee. No individual is involved in setting his or her own remuneration.
The figures disclosed are a sum of each individual’s portion of remuneration attributable to each Fund according to an objective apportionment methodology. Accordingly the figures are not representative of any individual’s actual remuneration or their remuneration structure.
The amount of the total remuneration awarded by BFA to its staff which has been attributed to the iShares MSCI Hong Kong ETF in respect of BFA’s financial year ending December 31, 2013 was USD 378,785. This figure is comprised of fixed remuneration of USD 148,936 and variable remuneration of USD 229,849. There were a total of 436 beneficiaries of the remuneration described above.
The amount of the aggregate remuneration awarded by BFA to its senior management and members of its staff whose actions have a material impact on the risk profile of the iShares MSCI Hong Kong ETF which has been attributed to the Fund in respect of BFA’s financial year ending December 31, 2013 was USD 60,855.
The amount of the total remuneration awarded by BFA to its staff which has been attributed to the iShares MSCI Japan Small-Cap ETF in respect of BFA’s financial year ending December 31, 2013 was USD 31,248. This figure is comprised of fixed remuneration of USD 12,287 and variable remuneration of USD 18,961. There were a total of 436 beneficiaries of the remuneration described above.
The amount of the aggregate remuneration awarded by BFA to its senior management and members of its staff whose actions have a material impact on the risk profile of the iShares MSCI Japan Small-Cap ETF which has been attributed to the Fund in respect of BFA’s financial year ending December 31, 2013 was USD 5,020.
The amount of the total remuneration awarded by BFA to its staff which has been attributed to the iShares MSCI Malaysia ETF in respect of BFA’s financial year ending December 31, 2013 was USD 154,805. This figure is comprised of fixed remuneration of USD 60,868 and variable remuneration of USD 93,937. There were a total of 436 beneficiaries of the remuneration described above.
The amount of the aggregate remuneration awarded by BFA to its senior management and members of its staff whose actions have a material impact on the risk profile of the iShares MSCI Malaysia ETF which has been attributed to the Fund in respect of BFA’s financial year ending December 31, 2013 was USD 24,871.
| 112 | 2014 iSHARES ANNUAL REPORTTO SHAREHOLDERS |
Table of Contents
Supplemental Information (Unaudited) (Continued)
iSHARES®, INC.
The amount of the total remuneration awarded by BFA to its staff which has been attributed to the iShares MSCI South Korea Capped ETF in respect of BFA’s financial year ending December 31, 2013 was USD 879,760. This figure is comprised of fixed remuneration of USD 345,917 and variable remuneration of USD 533,843. There were a total of 436 beneficiaries of the remuneration described above.
The amount of the aggregate remuneration awarded by BFA to its senior management and members of its staff whose actions have a material impact on the risk profile of the iShares MSCI South Korea Capped ETF which has been attributed to the Fund in respect of BFA’s financial year ending December 31, 2013 was USD 141,340.
The amount of the total remuneration awarded by BFA to its staff which has been attributed to the iShares MSCI Taiwan ETF in respect of BFA’s financial year ending December 31, 2013 was USD 621,848. This figure is comprised of fixed remuneration of USD 244,508 and variable remuneration of USD 377,340. There were a total of 436 beneficiaries of the remuneration described above.
The amount of the aggregate remuneration awarded by BFA to its senior management and members of its staff whose actions have a material impact on the risk profile of the iShares MSCI Taiwan ETF which has been attributed to the Fund in respect of BFA’s financial year ending December 31, 2013 was USD 99,905.
The amount of the total remuneration awarded by BFA to its staff which has been attributed to the iShares MSCI Thailand Capped ETF in respect of BFA’s financial year ending December 31, 2013 was USD 104,958. This figure is comprised of fixed remuneration of USD 41,269 and variable remuneration of USD 63,689. There were a total of 436 beneficiaries of the remuneration described above.
The amount of the aggregate remuneration awarded by BFA to its senior management and members of its staff whose actions have a material impact on the risk profile of the iShares MSCI Thailand Capped ETF which has been attributed to the Fund in respect of BFA’s financial year ending December 31, 2013 was USD 16,862.
SUPPLEMENTAL INFORMATION | 113 |
Table of Contents
Director and Officer Information
iSHARES®, INC.
The Board of Directors has responsibility for the overall management and operations of the Company, including general supervision of the duties performed by BFA and other service providers. Each Director serves until he or she resigns, is removed, dies, retires or becomes incapacitated. The President, Chief Compliance Officer, Treasurer and Secretary shall each hold office until their successors are chosen and qualify, and all other officers shall hold office until he or she resigns or is removed. Directors who are not “interested persons” (as defined in the 1940 Act) of the Company are referred to as independent directors (“Independent Directors”).
The registered investment companies advised by BFA or its affiliates are organized into one complex of closed-end funds, two complexes of open-end funds and one complex of exchange-traded funds (“Exchange-Traded Fund Complex”) (each, a “BlackRock Fund Complex”). Each Fund is included in the BlackRock Fund Complex referred to as the Exchange-Traded Fund Complex. Each Director also serves as a Trustee of iShares Trust, a Director of iShares MSCI Russia Capped ETF, Inc. and a Trustee of iShares U.S. ETF Trust and, as a result, oversees a total of 312 funds (as of August 31, 2014) within the Exchange-Traded Fund Complex. With the exception of Robert S. Kapito and Mark Wiedman, the address of each Director and officer is c/o BlackRock, Inc., 400 Howard Street, San Francisco, CA 94105. The address of Mr. Kapito and Mr. Wiedman is c/o BlackRock, Inc., Park Avenue Plaza, 55 East 52nd Street, New York, NY 10055. The Board has designated Robert H. Silver as its Independent Chairman. Additional information about the Funds’ Directors and officers may be found in the Funds’ combined Statement of Additional Information, which is available without charge, upon request, by calling toll-free 1-800-iShares (1-800-474-2737).
Interested Directors
| Name (Age) | Position(s) | Principal Occupation(s) During the Past 5 Years | Other Directorships Held by Director | |||
Robert S. Kapitoa (57) | Director (since 2009). | President and Director, BlackRock, Inc. (since 2006); Vice Chairman of BlackRock, Inc. and Head of BlackRock, Inc.’s Portfolio Management Group (since its formation in 1998) and BlackRock, Inc.’s predecessor entities (since 1988); Trustee, University of Pennsylvania (since 2009); President of Board of Directors, Hope & Heroes Children’s Cancer Fund (since 2002); President of the Board of Directors, Periwinkle Theatre for Youth (since 1983). | Trustee of iShares Trust (since 2009); Director of iShares MSCI Russia Capped ETF, Inc. (since 2010); Trustee of iShares U.S. ETF Trust (since 2011); Director of BlackRock, Inc. (since 2006). | |||
Mark Wiedmanb (43) | Director (since 2013). | Managing Director, BlackRock, Inc. (since 2007); Global Head of iShares (since 2011); Head of Corporate Strategy, BlackRock, Inc. (2009-2011). | Trustee of iShares Trust. (since 2013); Director of iShares MSCI Russia Capped ETF, Inc. (since 2013); Trustee of iShares U.S. ETF Trust (since 2013); Director of PennyMac Financial Services, Inc. (since 2008). | |||
| a | Robert S. Kapito is deemed to be an “interested person” (as defined in the 1940 Act) of the Company due to his affiliations with BlackRock, Inc. |
| b | Mark Wiedman is deemed to be an “interested person” (as defined in the 1940 Act) of the Company due to his affiliations with BlackRock, Inc. and its affiliates. |
| 114 | 2014 iSHARES ANNUAL REPORTTO SHAREHOLDERS |
Table of Contents
Director and Officer Information (Continued)
iSHARES®, INC.
Independent Directors
| Name (Age) | Position(s) | Principal Occupation(s) During the Past 5 Years | Other Directorships Held by Director | |||
Robert H. Silver (59) | Director (since 2007); Independent Chairman (since 2012). | President and Co-Founder of The Bravitas Group, Inc. (since 2006); Director and Vice Chairman of the YMCA of Greater NYC (2001-2011); Broadway Producer (2006-2011); Co-Founder and Vice President of Parentgiving Inc. (since 2008); Director and Member of the Audit and Compensation Committee of EPAM Systems, Inc. (2006-2009); President and Chief Operating Officer of UBS Financial Services Inc. (formerly Paine Webber Inc.) (2003-2005) and various executive positions with UBS and its affiliates (1988-2005); CPA and Audit Manager of KPMG, LLP (formerly Peat Marwick Mitchell) (1977-1983). | Trustee of iShares Trust (since 2007); Director of iShares MSCI Russia Capped ETF, Inc. (since 2010); Trustee of iShares U.S. ETF Trust (since 2011); Independent Chairman of iShares, Trust, iShares MSCI Russia Capped ETF, Inc. and iShares U.S. ETF Trust (since 2012). | |||
Cecilia H. Herbert (65) | Director (since 2005); Nominating and Governance Committee Chair and Equity Plus Committee Chair (since 2012). | Director (1998-2013) and President (2007-2011) of the Board of Directors, Catholic Charities CYO; Trustee (2002-2011) and Chair of the Finance and Investment Committee (2006-2010) of the Thacher School; Member (since 1992) and Chair (1994-2005) of the Investment Committee, Archdiocese of San Francisco; Trustee and Member of the Investment Committee, WNET, the New York public broadcasting/media company (since 2011). | Trustee of iShares Trust (since 2005); Director of iShares MSCI Russia Capped ETF, Inc. (since 2010); Trustee of iShares U.S. ETF Trust (since 2011); Director of Forward Funds (34 portfolios) (since 2009). | |||
Charles A. Hurty (70) | Director (since 2005); Audit Committee Chair (since 2006). | Retired; Partner, KPMG LLP (1968-2001). | Trustee of iShares Trust (since 2005); Director of iShares MSCI Russia Capped ETF, Inc. (since 2010); Trustee of iShares U.S. ETF Trust (since 2011); Director of GMAM Absolute Return Strategy Fund (1 portfolio) (since 2002); Director of SkyBridge Alternative Investments Multi-Adviser Hedge Fund Portfolios LLC (2 portfolios) (since 2002). | |||
John E. Kerrigan (59) | Director (since 2005); Fixed Income Plus Committee Chair (since 2012). | Chief Investment Officer, Santa Clara University (since 2002). | Trustee of iShares Trust (since 2005); Director of iShares MSCI Russia Capped ETF, Inc. (since 2010); Trustee of iShares U.S. ETF Trust (since 2011). | |||
DIRECTORAND OFFICER INFORMATION | 115 |
Table of Contents
Director and Officer Information (Continued)
iSHARES®, INC.
Independent Directors (Continued)
| Name (Age) | Position(s) | Principal Occupation(s) During the Past 5 Years | Other Directorships Held by Director | |||
John E. Martinez (53) | Director (since 2003); Securities Lending Committee Chair (since 2012). | Director of FirstREX Agreement Corp. (formerly EquityRock, Inc.) (since 2005). | Trustee of iShares Trust (since 2003); Director of iShares MSCI Russia Capped ETF, Inc. (since 2010); Trustee of iShares U.S. ETF Trust (since 2011). | |||
George G.C. Parker (75) | Director (since 2002). | Dean Witter Distinguished Professor of Finance, Emeritus, Stanford University Graduate School of Business (Professor since 1973; Emeritus since 2006). | Trustee of iShares Trust (since 2000); Director of iShares MSCI Russia Capped ETF, Inc. (since 2010); Trustee of iShares U.S. ETF Trust (since 2011); Director of Tejon Ranch Company (since 1999); Director of Threshold Pharmaceuticals (since 2004); Director of Colony Financial, Inc. (since 2009); Director of First Republic Bank (since 2010). | |||
Madhav V. Rajan (50) | Director (since 2011); 15(c) Committee Chair (since 2012). | Robert K. Jaedicke Professor of Accounting and Senior Associate Dean for Academic Affairs and Head of MBA Program, Stanford University Graduate School of Business (since 2001); Professor of Law (by courtesy), Stanford Law School (since 2005); Visiting Professor, University of Chicago (2007-2008). | Trustee of iShares Trust (since 2011); Director of iShares MSCI Russia Capped ETF, Inc. (since 2011); Trustee of iShares U.S. ETF Trust (since 2011); Director, Cavium, Inc. (since 2013). | |||
| 116 | 2014 iSHARES ANNUAL REPORTTO SHAREHOLDERS |
Table of Contents
Director and Officer Information (Continued)
iSHARES®, INC.
Officers
| Name (Age) | Position(s) | Principal Occupation(s) During the Past 5 Years | ||
Manish Mehta (43) | President (since 2013). | Managing Director, BlackRock, Inc. (since 2009); Chief Operating Officer for iShares (since 2009); Head of Strategy and Corporate Development, BGI (2005-2009); Chief of Staff to the CEO, BGI (2005-2009). | ||
Jack Gee (54) | Treasurer and Chief Financial Officer (since 2008). | Managing Director, BlackRock, Inc. (since 2009); Senior Director of Fund Administration of Intermediary Investor Business, BGI (2009); Director of Fund Administration of Intermediary Investor Business, BGI (2004-2009). | ||
Edward B. Baer (45) | Vice President and Chief Legal Officer (since 2012). | Managing Director of Legal & Compliance, BlackRock, Inc. (since 2006); Director of Legal & Compliance, BlackRock, Inc. (2004-2006). | ||
Eilleen M. Clavere (62) | Secretary (since 2007). | Director of Global Fund Administration, BlackRock, Inc. (since 2009); Director of Legal Administration of Intermediary Investor Business, BGI (2006-2009); Legal Counsel and Vice President of Atlas Funds, Atlas Advisers, Inc. and Atlas Securities, Inc. (2005-2006); Counsel at Kirkpatrick & Lockhart LLP (2001-2005). | ||
Scott Radell (45) | Executive Vice President (since 2012). | Managing Director, BlackRock, Inc. (since 2009); Head of Portfolio Solutions, BlackRock, Inc. (since 2009); Head of Portfolio Solutions, BGI (2007-2009); Credit Portfolio Manager, BGI (2005-2007); Credit Research Analyst, BGI (2003-2005). | ||
Amy Schioldager (51) | Executive Vice President (since 2007). | Senior Managing Director, BlackRock, Inc. (since 2009); Global Head of Index Equity, BGI (2008-2009); Global Head of U.S. Indexing, BGI (2006-2008); Head of Domestic Equity Portfolio Management, BGI (2001-2006). | ||
Ira P. Shapiro (51) | Vice President (since 2007). | Managing Director, BlackRock, Inc. (since 2009); Head of Strategic Product Initiatives for iShares (since 2012); Chief Legal Officer, Exchange-Traded Fund Complex (2007-2012); Associate General Counsel, BGI (2004-2009). | ||
DIRECTORAND OFFICER INFORMATION | 117 |
Table of Contents
Notes:
| 118 | 2014 iSHARES ANNUAL REPORTTO SHAREHOLDERS |
Table of Contents
|
For more information visit www.iShares.com or call 1-800-474-2737
This report is intended for the Funds’ shareholders. It may not be distributed to prospective investors unless it is preceded or accompanied by the current prospectus.
Investing involves risk, including possible loss of principal.
The iShares Funds are distributed by BlackRock Investments, LLC (together with its affiliates, “BlackRock”).
The iShares Funds are not sponsored, endorsed, issued, sold or promoted by MSCI Inc., nor does this company make any representation regarding the advisability of investing in the iShares Funds. BlackRock is not affiliated with the company listed above.
A description of the policies that the Funds use to determine how to vote proxies relating to portfolio securities and information about how the Funds voted proxies relating to portfolio securities during the most recent twelve-month period ending June 30 is available without charge, upon request, by calling toll-free 1-800-474-2737; on the Funds’ website at www.iShares.com; and on the U.S. Securities and Exchange Commission (SEC) website at www.sec.gov.
The Funds file their complete schedules of portfolio holdings with the SEC for the first and third quarters of each fiscal year on Form N-Q. The Funds’ Forms N-Q are available on the SEC’s website or may be reviewed and copied at the SEC’s Public Reference Room in Washington, D.C. Information on the operation of the Public Reference Room may be obtained by calling 1-800-SEC-0330. The Funds also disclose their complete schedules of portfolio holdings on a daily and monthly basis on the Funds’ website.
©2014 BlackRock, Inc. All rights reserved. iSHARES and BLACKROCK are registered trademarks of BlackRock, Inc. or its subsidiaries. All other marks are the property of their respective owners.
iS-AR-83-0814

Table of Contents
AUGUST 31, 2014
2014 ANNUAL REPORT
|  |
iShares, Inc.
| Ø | iShares MSCI Brazil Capped ETF | EWZ | NYSE Arca |
| Ø | iShares MSCI Canada ETF | EWC | NYSE Arca |
| Ø | iShares MSCI Chile Capped ETF | ECH | NYSE Arca |
| Ø | iShares MSCI Colombia Capped ETF | ICOL | NYSE Arca |
| Ø | iShares MSCI Israel Capped ETF | EIS | NYSE Arca |
| Ø | iShares MSCI Mexico Capped ETF | EWW | NYSE Arca |
| Ø | iShares MSCI South Africa ETF | EZA | NYSE Arca |
| Ø | iShares MSCI Turkey ETF | TUR | NYSE Arca |
| Ø | iShares MSCI USA ETF | EUSA | NYSE Arca |
Table of Contents
| 5 | ||||
| 24 | ||||
| 24 | ||||
| 25 | ||||
| 25 | ||||
| 28 | ||||
| 31 | ||||
| 33 | ||||
| 34 | ||||
| 36 | ||||
| 39 | ||||
| 41 | ||||
| 44 | ||||
| 53 | ||||
| 64 | ||||
| 73 | ||||
| 88 | ||||
| 89 | ||||
| 90 | ||||
| 104 | ||||
| 112 |
Table of Contents
Management’s Discussion of Fund Performance
iSHARES®, INC.
GLOBAL MARKET OVERVIEW
Global equities advanced for the 12-month period ended August 31, 2014 (the “reporting period”), although sluggish economic recovery in Europe, U.S. Federal Reserve Bank (“Fed”) actions, and slower economic growth in China kept volatility levels elevated.
For U.S. equities, the reporting period began in an environment of volatility, as concern mounted that the Fed would begin to taper its ongoing quantitative easing program, QE3. Market sentiment soon turned positive, though, when the Fed announced that it would delay any tapering of stimulus until the economic recovery appeared more sustainable. When the Fed did, in fact, begin to reduce its bond-buying program at the end of 2013, the effect on markets was positive, as investors had already digested the possibility of tapering and were reassured that the reduction of the stimulus would be gradual. Although gross domestic product (“GDP”) contracted in the first quarter of 2014, it expanded by 4.2% in the second quarter. The housing sector showed signs of improvement, with housing starts and building permits rising in July 2014, and consumer sentiment remained high throughout the second half of the reporting period. Also, in August 2014, the S&P 500® broke 2,000, reaching a new high.
European equities delivered some of the strongest returns among international equity markets for the reporting period, despite slow and uneven economic recovery in the eurozone. For the third quarter of 2013, the eurozone as a whole experienced GDP growth of 0.1%, representing a decline from the previous quarter. In the fourth quarter of 2013 and first quarter of 2014, GDP growth for the eurozone registered only 0.3% and 0.2%, respectively, before stagnating completely in the second quarter of 2014. Underlying the GDP figures for the entire area, Germany’s GDP grew 0.7% in the first quarter of 2014 over the previous quarter, its largest growth rate in three years, but contracted in the second quarter of 2014. France’s economy demonstrated uneven growth before stagnating in the first and second quarters of 2014 amid weak consumer spending and business investment. Elsewhere in Europe, Spain’s economy gained strength, growing 0.6% in the second quarter of 2014, its largest rate in more than six years. Italy’s economy expanded by 0.1% in the fourth quarter of 2013, but contracted again in the first and second quarters of 2014. Unemployment levels remained stubbornly high among many European markets. The United Kingdom experienced healthy economic growth. GDP growth remained steady in the U.K. throughout the reporting period, exceeding its pre-recession peak from 2008 in the second quarter of 2014 largely on the strength of its services and production sectors.
Japanese equities achieved positive returns in an uneven environment, as conflicting data influenced markets to change direction throughout the reporting period. Early in the reporting period, Japanese equities benefited from the Bank of Japan’s measures to improve economic conditions through quantitative easing. The Nikkei Index rallied and the Japanese yen declined, which in turn helped export levels, although not to the extent that had been expected. Economic growth, as measured by GDP, was uneven during the reporting period. GDP growth was positive for the third and fourth quarters of 2013. The fourth quarter of 2013 figures were revised downward in early 2014, however, and disappointing economic data provided cause for concern that Japan’s growth trajectory might slow in the first quarter of 2014. Stock markets were strengthened when economic data indicated Japan’s economy grew at an annualized 6.7% pace in the first quarter of 2014, surpassing the forecast for the quarter. However, concerns surrounding an increase in the country’s consumption tax — its first increase in 17 years — weighed on markets later in the reporting period. Consumer spending, which had improved in anticipation of the consumption tax increase, slumped in the months following the implementation in April 2014, largely causing GDP to contract in the second quarter of 2014.
Emerging market countries as a group delivered double-digit returns and slightly outperformed broad international indices for the reporting period. Early in the reporting period, concern regarding the Fed tapering its quantitative easing program led investors to abandon emerging market holdings. Political uncertainty among some emerging markets compounded investor aversion to emerging markets. As the reporting period progressed, rising expectations that the Fed would be slower to raise rates than originally had been anticipated, as well as reduced political unrest, helped to refuel investors’ appetite for risk, boosting returns for emerging markets equities.
MANAGEMENT’S DISCUSSIONSOF FUND PERFORMANCE | 5 |
Table of Contents
Management’s Discussion of Fund Performance
iSHARES® MSCI BRAZIL CAPPED ETF
Performance as of August 31, 2014
| Average Annual Total Returns | Cumulative Total Returns | |||||||||||||||||||||||||
| NAV | MARKET | INDEX | NAV | MARKET | INDEX | |||||||||||||||||||||
1 Year | 30.33% | 30.91% | 31.32% | 30.33% | 30.91% | 31.32% | ||||||||||||||||||||
5 Years | 1.85% | 1.88% | 2.30% | 9.62% | 9.76% | 12.07% | ||||||||||||||||||||
10 Years | 15.73% | 15.67% | 16.82% | 331.06% | 328.75% | 373.21% | ||||||||||||||||||||
GROWTH OF $10,000 INVESTMENT
(AT NET ASSET VALUE)
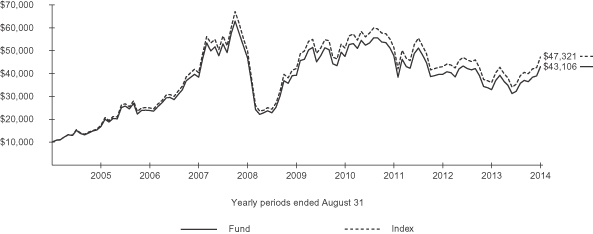
Index performance through February 11, 2013 reflects the performance of the MSCI Brazil Index. Index performance beginning on February 12, 2013 reflects the performance of the MSCI Brazil 25/50 Index.
Past performance is no guarantee of future results. Performance results do not reflect the deduction of taxes that a shareholder would pay on fund distributions or on the redemption or sale of fund shares. See “About Fund Performance” on page 24 for more information.
| Shareholder Expenses | ||||||||||||||||||||||||||
| Actual | Hypothetical 5% Return | |||||||||||||||||||||||||
| Beginning Account Value (3/1/14) | Ending Account Value (8/31/14) | Expenses Paid During Period a | Beginning Account Value (3/1/14) | Ending Account Value (8/31/14) | Expenses Paid During Period a | Annualized Expense Ratio | ||||||||||||||||||||
| $ | 1,000.00 | $ | 1,333.80 | $ | 3.65 | $ | 1,000.00 | $ | 1,022.10 | $ | 3.16 | 0.62% | ||||||||||||||
| a | Expenses are calculated using the Fund’s annualized expense ratio (as disclosed in the table), multiplied by the average account value for the period, multiplied by the number of days in the period (184 days) and divided by the number of days in the year (365 days). See “Shareholder Expenses” on page 24 for more information. |
| 6 | 2014 iSHARES ANNUAL REPORTTO SHAREHOLDERS |
Table of Contents
Management’s Discussion of Fund Performance (Continued)
iSHARES® MSCI BRAZIL CAPPED ETF
The iShares MSCI Brazil Capped ETF (the “Fund”) seeks to track the investment results of an index composed of Brazilian equities, as represented by the MSCI Brazil 25/50 Index (the “Index”). The Fund invests in a representative sample of securities included in the Index that collectively has an investment profile similar to the Index. Due to the use of representative sampling, the Fund may or may not hold all of the securities that are included in the Index. For the 12-month reporting period ended August 31, 2014, the total return for the Fund was 30.33%, net of fees, while the total return for the Index was 31.32%.
Brazilian equities, as represented by the Index, achieved strong results for the reporting period and outpaced broad international equity indices.
Weaker economic activity, combined with concern regarding the Fed tapering of its quantitative easing program, contributed to a decline in Brazilian stocks in late 2013 and early 2014. Such a move would likely cause interest rates to rise, and make investors more cautious about investing in emerging markets, including Brazil.
During the last six months of the reporting period, however, Brazilian stocks benefited from greater investor demand as rising expectations that the Fed would be slower to raise rates than originally had been anticipated helped to refuel investors’ appetite for risk, boosting returns for Brazilian equities. In addition, the Index particularly rallied during the last three months of the reporting period amid optimism about upcoming national elections in Brazil.
Brazil, Latin America’s largest economy, experienced sluggish economic activity during the reporting period. Economic growth, as measured by GDP, contracted in the third quarter of 2013 but expanded by 0.5% for the fourth quarter of 2013. In the first and second quarters of 2014, however, GDP contracted 0.2% and 0.6%, respectively. A key driver of Brazil’s tepid economy was slow growth in China and the European Union, which led to lower levels of foreign direct investment. Reduced demand from neighboring Argentina, which lowered its purchases of Brazilian cars and other durable goods as its own economy slowed, hurt export levels.
PORTFOLIO ALLOCATION
As of 8/31/14
| Sector | Percentage of Total Investments* |
Financials | 31.87 | % | ||
Energy | 15.48 | |||
Consumer Staples | 15.26 | |||
Materials | 11.74 | |||
Utilities | 6.56 | |||
Consumer Discretionary | 6.56 | |||
Industrials | 5.44 | |||
Information Technology | 3.35 | |||
Telecommunication Services | 2.96 | |||
Health Care | 0.78 | |||
|
| |||
TOTAL | 100.00 | % | ||
|
|
TEN LARGEST FUND HOLDINGS
As of 8/31/14
| Security | Percentage of Total Investments* |
Itau Unibanco Holding SA (Preferred) | 9.06 | % | ||
Petroleo Brasileiro SA (Preferred) | 7.87 | |||
Banco Bradesco SA (Preferred) | 6.79 | |||
AMBEV SA | 6.02 | |||
Petroleo Brasileiro SA | 5.00 | |||
Vale SA Class A (Preferred) | 3.70 | |||
BRF SA | 3.66 | |||
Cielo SA | 2.78 | |||
Vale SA | 2.59 | |||
Banco do Brasil SA | 2.58 | |||
|
| |||
TOTAL | 50.05 | % | ||
|
|
| * | Excludes money market funds. |
MANAGEMENT’S DISCUSSIONSOF FUND PERFORMANCE | 7 |
Table of Contents
Management’s Discussion of Fund Performance
iSHARES® MSCI CANADA ETF
Performance as of August 31, 2014
| Average Annual Total Returns | Cumulative Total Returns | |||||||||||||||||||||||||
| NAV | MARKET | INDEX | NAV | MARKET | INDEX | |||||||||||||||||||||
1 Year | 23.00% | 22.55% | 23.19% | 23.00% | 22.55% | 23.19% | ||||||||||||||||||||
5 Years | 8.98% | 8.86% | 9.23% | 53.73% | 52.85% | 55.48% | ||||||||||||||||||||
10 Years | 10.55% | 10.45% | 10.80% | 172.62% | 170.09% | 178.91% | ||||||||||||||||||||
GROWTH OF $10,000 INVESTMENT
(AT NET ASSET VALUE)
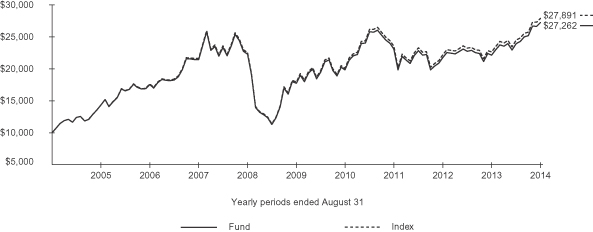
Past performance is no guarantee of future results. Performance results do not reflect the deduction of taxes that a shareholder would pay on fund distributions or on the redemption or sale of fund shares. See “About Fund Performance” on page 24 for more information.
| Shareholder Expenses | ||||||||||||||||||||||||||
| Actual | Hypothetical 5% Return | |||||||||||||||||||||||||
| Beginning Account Value (3/1/14) | Ending Account Value (8/31/14) | Expenses Paid During Period a | Beginning Account Value (3/1/14) | Ending Account Value (8/31/14) | Expenses Paid During Period a | Annualized Expense Ratio | ||||||||||||||||||||
| $ | 1,000.00 | $ | 1,138.10 | $ | 2.59 | $ | 1,000.00 | $ | 1,022.80 | $ | 2.45 | 0.48% | ||||||||||||||
| a | Expenses are calculated using the Fund’s annualized expense ratio (as disclosed in the table), multiplied by the average account value for the period, multiplied by the number of days in the period (184 days) and divided by the number of days in the year (365 days). See “Shareholder Expenses” on page 24 for more information. |
| 8 | 2014 iSHARES ANNUAL REPORTTO SHAREHOLDERS |
Table of Contents
Management’s Discussion of Fund Performance (Continued)
iSHARES® MSCI CANADA ETF
The iShares MSCI Canada ETF (the “Fund”) seeks to track the investment results of an index composed of Canadian equities, as represented by the MSCI Canada Index (the “Index”). The Fund invests in a representative sample of securities included in the Index that collectively has an investment profile similar to the Index. Due to the use of representative sampling, the Fund may or may not hold all of the securities that are included in the Index. For the 12-month reporting period ended August 31, 2014, the total return for the Fund was 23.00%, net of fees, while the total return for the Index was 23.19%.
Canadian stocks, as represented by the Index, posted strong performance during the reporting period. Canadian stocks experienced modest positive returns during the first half of the reporting period, reflecting concerns about consumer credit and sluggish demand for natural resources. Stocks rallied during the second half of the reporting period, as relatively improving global growth lifted Canada’s resources-based economy.
Every economic sector in the Index experienced positive returns. The financials sector, which represented approximately 37% of the Index on average, delivered the largest contribution to Index returns during the reporting period. Canadian financial companies generated solid earnings despite concerns about the housing market and consumer lending. The Index’s 26% weighting on average in the energy sector generated the second largest contribution to Index returns. Improving global growth drove oil prices higher for most of 2014 until the rising U.S. dollar led to lower oil prices in the last two months of the reporting period. Nevertheless, Canadian energy stocks posted strong results on improving demand. Similarly, the industrials sector posted the highest total return of any sector in the Index, as Canadian railroad stocks rallied on increasing demand for shipping oil and lower expenses. Consumer-based stocks also delivered sound results for the reporting period.
The materials sector posted modest returns during the reporting period, as gold and silver miners struggled with weak demand for precious metals. Health care also lagged other sectors in the Index during the reporting period.
PORTFOLIO ALLOCATION
As of 8/31/14
| Sector | Percentage of Total Investments* |
Financials | 37.14 | % | ||
Energy | 27.18 | |||
Materials | 11.43 | |||
Industrials | 7.78 | |||
Consumer Discretionary | 5.34 | |||
Health Care | 3.17 | |||
Consumer Staples | 3.04 | |||
Telecommunication Services | 2.42 | |||
Information Technology | 1.33 | |||
Utilities | 1.17 | |||
|
| |||
TOTAL | 100.00 | % | ||
|
|
TEN LARGEST FUND HOLDINGS
As of 8/31/14
| Security | Percentage of Total Investments* |
Royal Bank of Canada | 7.22 | % | ||
Toronto-Dominion Bank (The) | 6.54 | |||
Bank of Nova Scotia | 5.43 | |||
Suncor Energy Inc. | 4.06 | |||
Canadian National Railway Co. | 3.99 | |||
Bank of Montreal | 3.34 | |||
Canadian Natural Resources Ltd. | 3.21 | |||
Enbridge Inc. | 2.81 | |||
TransCanada Corp. | 2.57 | |||
Canadian Imperial Bank of Commerce | 2.56 | |||
|
| |||
TOTAL | 41.73 | % | ||
|
|
| * | Excludes money market funds. |
MANAGEMENT’S DISCUSSIONSOF FUND PERFORMANCE | 9 |
Table of Contents
Management’s Discussion of Fund Performance
iSHARES® MSCI CHILE CAPPED ETF
Performance as of August 31, 2014
| Average Annual Total Returns | Cumulative Total Returns | |||||||||||||||||||||||||
| NAV | MARKET | INDEX | NAV | MARKET | INDEX | |||||||||||||||||||||
1 Year | (7.40)% | (6.93)% | (7.34)% | (7.40)% | (6.93)% | (7.34)% | ||||||||||||||||||||
5 Years | 0.90% | 0.92% | 1.83% | 4.56% | 4.70% | 9.50% | ||||||||||||||||||||
Since Inception | (0.30)% | (0.35)% | 0.34% | (2.05)% | (2.35)% | 2.34% | ||||||||||||||||||||
GROWTH OF $10,000 INVESTMENT
(SINCE INCEPTION AT NET ASSET VALUE)
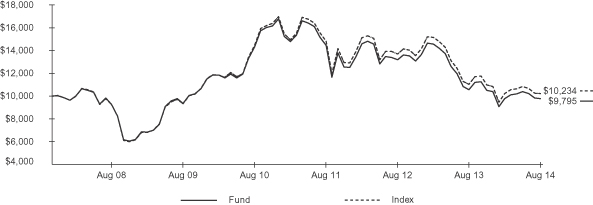
The inception date of the Fund was 11/12/07. The first day of secondary market trading was 11/16/07.
Index performance through February 11, 2013 reflects the performance of the MSCI Chile Investable Market Index. Index performance beginning on February 12, 2013 reflects the performance of the MSCI Chile Investable Market Index 25/50.
Past performance is no guarantee of future results. Performance results do not reflect the deduction of taxes that a shareholder would pay on fund distributions or on the redemption or sale of fund shares. See “About Fund Performance” on page 24 for more information.
| Shareholder Expenses | ||||||||||||||||||||||||||
| Actual | Hypothetical 5% Return | |||||||||||||||||||||||||
| Beginning Account Value (3/1/14) | Ending Account Value (8/31/14) | Expenses Paid During Period a | Beginning Account Value (3/1/14) | Ending Account Value (8/31/14) | Expenses Paid During Period a | Annualized Expense Ratio | ||||||||||||||||||||
| $ | 1,000.00 | $ | 999.90 | $ | 3.13 | $ | 1,000.00 | $ | 1,022.10 | $ | 3.16 | 0.62% | ||||||||||||||
| a | Expenses are calculated using the Fund’s annualized expense ratio (as disclosed in the table), multiplied by the average account value for the period, multiplied by the number of days in the period (184 days) and divided by the number of days in the year (365 days). See “Shareholder Expenses” on page 24 for more information. |
| 10 | 2014 iSHARES ANNUAL REPORTTO SHAREHOLDERS |
Table of Contents
Management’s Discussion of Fund Performance (Continued)
iSHARES® MSCI CHILE CAPPED ETF
The iShares MSCI Chile Capped ETF (the “Fund”) seeks to track the investment results of a broad-based index composed of Chilean equities, as represented by the MSCI Chile Investable Market Index 25/50 (the “Index”). The Fund invests in a representative sample of securities included in the Index that collectively has an investment profile similar to the Index. Due to the use of representative sampling, the Fund may or may not hold all of the securities that are included in the Index. For the 12-month reporting period ended August 31, 2014, the total return for the Fund was -7.40%, net of fees, while the total return for the Index was -7.34%.
As represented by the Index, Chilean equities declined for the reporting period and lagged the performance of broad international equity indexes.
Chile relies on copper exports for much of its economic livelihood. The Chilean economy was hurt during the reporting period as decreased demand in China for copper sent the metal’s price to its lowest level in four years and the recent investment boom in the mining industry appeared to come to an end.
As export levels and foreign direct investment trended downward, economic growth cooled throughout the reporting period. After healthy year-on-year GDP growth of 5.0% in the third quarter of 2013, GDP growth slowed to 2.7% in the fourth quarter of 2013, 2.4% in the first quarter of 2014, and 1.9% in the second quarter of 2014, its slowest quarterly GDP growth level since 2009. Consumer confidence declined to its lowest level in more than two years by the end of the reporting period, and retail sales grew at their slowest pace since 2009. In response, the country’s central bank cut its benchmark interest rate six times between October 2013 and August 2014 to help support economic growth.
PORTFOLIO ALLOCATION
As of 8/31/14
| Sector | Percentage of Total Investments* |
Utilities | 26.38 | % | ||
Financials | 18.24 | |||
Consumer Discretionary | 12.21 | |||
Consumer Staples | 12.09 | |||
Materials | 10.41 | |||
Industrials | 8.07 | |||
Energy | 7.96 | |||
Telecommunication Services | 2.35 | |||
Information Technology | 1.98 | |||
Health Care | 0.31 | |||
|
| |||
TOTAL | 100.00 | % | ||
|
|
TEN LARGEST FUND HOLDINGS
As of 8/31/14
| Security | Percentage of Total Investments* |
S.A.C.I. Falabella SA | 10.36 | % | ||
Enersis SA | 9.30 | |||
Empresas Copec SA | 7.96 | |||
Empresa Nacional de Electricidad SA | 6.89 | |||
LATAM Airlines Group SA | 5.45 | |||
Banco Santander (Chile) SA | 5.26 | |||
Cencosud SA | 4.59 | |||
Banco de Chile | 4.49 | |||
Empresas CMPC SA | 4.46 | |||
Sociedad Quimica y Minera de Chile SA | 4.06 | |||
|
| |||
TOTAL | 62.82 | % | ||
|
|
| * | Excludes money market funds. |
MANAGEMENT’S DISCUSSIONSOF FUND PERFORMANCE | 11 |
Table of Contents
Management’s Discussion of Fund Performance
iSHARES® MSCI COLOMBIA CAPPED ETF
Performance as of August 31, 2014
| Average Annual Total Returns | Cumulative Total Returns | |||||||||||||||||||||||||
| NAV | MARKET | INDEX | NAV | MARKET | INDEX | |||||||||||||||||||||
1 Year | 11.44% | 12.31% | 13.21% | 11.44% | 12.31% | 13.21% | ||||||||||||||||||||
Since Inception | 11.91% | 12.46% | 13.21% | 14.53% | 15.20% | 16.05% | ||||||||||||||||||||
GROWTH OF $10,000 INVESTMENT
(SINCE INCEPTION AT NET ASSET VALUE)
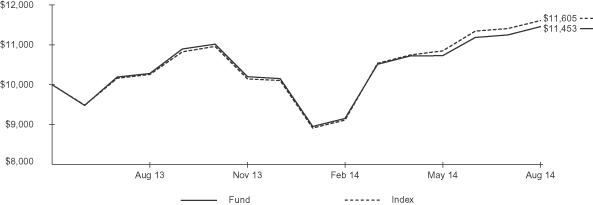
The inception date of the Fund was 6/18/13. The first day of secondary market trading was 6/20/13.
Past performance is no guarantee of future results. Performance results do not reflect the deduction of taxes that a shareholder would pay on fund distributions or on the redemption or sale of fund shares. See “About Fund Performance” on page 24 for more information.
| Shareholder Expenses | ||||||||||||||||||||||||||
| Actual | Hypothetical 5% Return | |||||||||||||||||||||||||
| Beginning Account Value (3/1/14) | Ending Account Value (8/31/14) | Expenses Paid During Period a | Beginning Account Value (3/1/14) | Ending Account Value (8/31/14) | Expenses Paid During Period a | Annualized Expense Ratio | ||||||||||||||||||||
| $ | 1,000.00 | $ | 1,251.30 | $ | 3.46 | $ | 1,000.00 | $ | 1,022.10 | $ | 3.11 | 0.61% | ||||||||||||||
| a | Expenses are calculated using the Fund’s annualized expense ratio (as disclosed in the table), multiplied by the average account value for the period, multiplied by the number of days in the period (184 days) and divided by the number of days in the year (365 days). See “Shareholder Expenses” on page 24 for more information. |
| 12 | 2014 iSHARES ANNUAL REPORTTO SHAREHOLDERS |
Table of Contents
Management’s Discussion of Fund Performance (Continued)
iSHARES® MSCI COLOMBIA CAPPED ETF
The iShares MSCI Colombia Capped ETF (the “Fund”) seeks to track the investment results of a broad-based index composed of Colombian equities, as represented by the MSCI All Colombia Capped Index (the “Index”). The Fund invests in a representative sample of securities included in the Index that collectively has an investment profile similar to the Index. Due to the use of representative sampling, the Fund may or may not hold all of the securities that are included in the Index. For the 12-month reporting period ended August 31, 2014, the total return for the Fund was 11.44%, net of fees, while the total return for the Index was 13.21%.
As represented by the Index, Colombian equities advanced for the reporting period but lagged the performance of broad international equity indexes.
Colombia’s economy relies heavily on exports of commodities, with oil and coal representing nearly 60% of exports. Prior to the beginning of the reporting period, economic growth had slowed as global demand for Colombia’s exports had softened. In response, the government announced a stimulus package aimed primarily at the construction sector.
During the reporting period, the measures appeared to have an impact, as activity within the construction industry accelerated. As economic growth improved and consumer prices increased, Colombia’s central bank raised its benchmark interest rate for five consecutive months, from April 2014 through August 2014, in an effort to slow inflation.
In addition, in July 2014, credit rating agency Moody’s Investors Service upgraded Colombia’s sovereign debt rating one level, from Baa3 to Baa2. This change marked Colombia’s highest rating on record and placed Colombia at the same level as its neighbor Brazil.
PORTFOLIO ALLOCATION
As of 8/31/14
| Sector | Percentage of Total Investments* |
Financials | 35.45 | % | ||
Energy | 24.44 | |||
Utilities | 16.84 | |||
Materials | 10.50 | |||
Consumer Staples | 9.19 | |||
Industrials | 3.58 | |||
|
| |||
TOTAL | 100.00 | % | ||
|
|
TEN LARGEST FUND HOLDINGS
As of 8/31/14
| Security | Percentage of Total Investments* |
Ecopetrol SA | 12.02 | % | ||
Bancolombia SA (Preferred) | 9.28 | |||
Pacific Rubiales Energy Corp. | 8.48 | |||
Grupo de Inversiones Suramericana SA | 6.68 | |||
Cemex Latam Holdings SA | 5.09 | |||
Banco Davivienda SA (Preferred) | 4.83 | |||
Interconexion Electrica SA ESP | 4.77 | |||
Grupo Nutresa SA | 4.62 | |||
Almacenes Exito SA | 4.58 | |||
Corporacion Financiera Colombiana SA | 4.49 | |||
|
| |||
TOTAL | 64.84 | % | ||
|
|
| * | Excludes money market funds. |
MANAGEMENT’S DISCUSSIONSOF FUND PERFORMANCE | 13 |
Table of Contents
Management’s Discussion of Fund Performance
iSHARES® MSCI ISRAEL CAPPED ETF
Performance as of August 31, 2014
| Average Annual Total Returns | Cumulative Total Returns | |||||||||||||||||||||||||
| NAV | MARKET | INDEX | NAV | MARKET | INDEX | |||||||||||||||||||||
1 Year | 20.67% | 22.52% | 21.31% | 20.67% | 22.52% | 21.31% | ||||||||||||||||||||
5 Years | 4.29% | 4.35% | 4.59% | 23.37% | 23.71% | 25.17% | ||||||||||||||||||||
Since Inception | 2.66% | 2.72% | 3.12% | 18.42% | 18.84% | 21.82% | ||||||||||||||||||||
GROWTH OF $10,000 INVESTMENT
(SINCE INCEPTION AT NET ASSET VALUE)
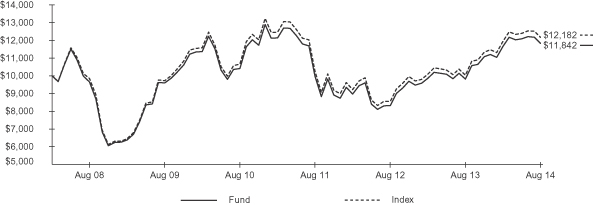
The inception date of the Fund was 3/26/08. The first day of secondary market trading was 3/28/08.
Past performance is no guarantee of future results. Performance results do not reflect the deduction of taxes that a shareholder would pay on fund distributions or on the redemption or sale of fund shares. See “About Fund Performance” on page 24 for more information.
| Shareholder Expenses | ||||||||||||||||||||||||||
| Actual | Hypothetical 5% Return | |||||||||||||||||||||||||
| Beginning Account Value (3/1/14) | Ending Account Value (8/31/14) | Expenses Paid During Period a | Beginning Account Value (3/1/14) | Ending Account Value (8/31/14) | Expenses Paid During Period a | Annualized Expense Ratio | ||||||||||||||||||||
| $ | 1,000.00 | $ | 1,015.00 | $ | 3.15 | $ | 1,000.00 | $ | 1,022.10 | $ | 3.16 | 0.62% | ||||||||||||||
| a | Expenses are calculated using the Fund’s annualized expense ratio (as disclosed in the table), multiplied by the average account value for the period, multiplied by the number of days in the period (184 days) and divided by the number of days in the year (365 days). See “Shareholder Expenses” on page 24 for more information. |
| 14 | 2014 iSHARES ANNUAL REPORTTO SHAREHOLDERS |
Table of Contents
Management’s Discussion of Fund Performance (Continued)
iSHARES® MSCI ISRAEL CAPPED ETF
The iShares MSCI Israel Capped ETF (the “Fund”) seeks to track the investment results of a broad-based index composed of Israeli equities, as represented by the MSCI Israel Capped Investable Market Index (the “Index”). The Fund invests in a representative sample of securities included in the Index that collectively has an investment profile similar to the Index. Due to the use of representative sampling, the Fund may or may not hold all of the securities that are included in the Index. For the 12-month reporting period ended August 31, 2014, the total return for the Fund was 20.67%, net of fees, while the total return for the Index was 21.31%.
The Israeli equity market posted a strong return during the reporting period, despite a recent conflict in Gaza that had an adverse impact on the economy and weighed on returns late in the period.
The 50-day conflict in the summer of 2014 dampened tourism and caused international airlines to cancel service for several days. The number of foreign visitors declined 31% in July and August compared to the same period last year as hotel cancellations surged. Israeli consumer spending during the conflict also fell, and GDP, which had been growing at a 3% rate through the second quarter of 2014 versus the same quarter a year ago, was expected by economists to decline. Meanwhile, government spending on the conflict prompted officials to approve spending cuts to avoid a growing budget deficit. However, Israel’s technology sector remained steady, with a series of successful initial public offerings during the summer. In addition, many Israeli companies were relatively insulated from the harmful economic effects of the conflict because they generate the bulk of their sales and profits overseas.
In late August 2014, the Bank of Israel cut the benchmark interest rate by 25 basis points to 0.25%, citing lower inflation and sluggish global growth as well as worries caused by the conflict. It was the second rate cut in consecutive months and the rate is the lowest on record in Israel to date. One effect of lower interest rates is a weakening currency, which the bank expects will boost exports.
PORTFOLIO ALLOCATION
As of 8/31/14
| Sector | Percentage of Total Investments* |
Financials | 37.85 | % | ||
Health Care | 23.91 | |||
Materials | 10.30 | |||
Telecommunication Services | 7.18 | |||
Information Technology | 5.96 | |||
Energy | 5.51 | |||
Industrials | 5.08 | |||
Consumer Staples | 3.57 | |||
Consumer Discretionary | 0.64 | |||
|
| |||
TOTAL | 100.00 | % | ||
|
|
TEN LARGEST FUND HOLDINGS
As of 8/31/14
| Security | Percentage of Total Investments* |
Teva Pharmaceutical Industries Ltd. | 23.59 | % | ||
Bank Hapoalim BM | 10.47 | |||
Bank Leumi le-Israel BM | 9.04 | |||
Israel Chemicals Ltd. | 5.99 | |||
Bezeq The Israel Telecommunication Corp. Ltd. | 4.88 | |||
NICE Systems Ltd. | 3.84 | |||
Delek Group Ltd. (The) | 3.01 | |||
Mizrahi Tefahot Bank Ltd. | 2.99 | |||
Israel Discount Bank Ltd. Class A | 2.78 | |||
Israel Corp. Ltd. (The) | 2.66 | |||
|
| |||
TOTAL | 69.25 | % | ||
|
|
| * | Excludes money market funds. |
MANAGEMENT’S DISCUSSIONSOF FUND PERFORMANCE | 15 |
Table of Contents
Management’s Discussion of Fund Performance
iSHARES® MSCI MEXICO CAPPED ETF
Performance as of August 31, 2014
| Average Annual Total Returns | Cumulative Total Returns | |||||||||||||||||||||||||
| NAV | MARKET | INDEX | NAV | MARKET | INDEX | |||||||||||||||||||||
1 Year | 17.42% | 18.40% | 17.05% | 17.42% | 18.40% | 17.05% | ||||||||||||||||||||
5 Years | 12.47% | 12.62% | 11.93% | 79.96% | 81.19% | 75.66% | ||||||||||||||||||||
10 Years | 15.68% | 15.68% | 15.30% | 329.06% | 329.01% | 315.31% | ||||||||||||||||||||
GROWTH OF $10,000 INVESTMENT
(AT NET ASSET VALUE)
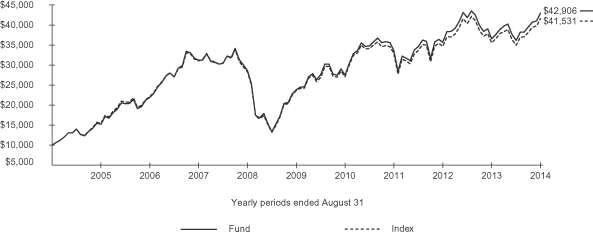
Index performance through November 30, 2007 reflects the performance of the MSCI Mexico Index. Index performance beginning on December 1, 2007 through February 11, 2013 reflects the performance of the MSCI Mexico Investable Market Index. Index performance beginning on February 12, 2013 reflects the performance of the MSCI Mexico Investable Market Index 25/50.
Past performance is no guarantee of future results. Performance results do not reflect the deduction of taxes that a shareholder would pay on fund distributions or on the redemption or sale of fund shares. See “About Fund Performance” on page 24 for more information.
| Shareholder Expenses | ||||||||||||||||||||||||||
| Actual | Hypothetical 5% Return | |||||||||||||||||||||||||
| Beginning Account Value (3/1/14) | Ending Account Value (8/31/14) | Expenses Paid During Period a | Beginning Account Value (3/1/14) | Ending Account Value (8/31/14) | Expenses Paid During Period a | Annualized Expense Ratio | ||||||||||||||||||||
| $ | 1,000.00 | $ | 1,186.40 | $ | 2.65 | $ | 1,000.00 | $ | 1,022.80 | $ | 2.45 | 0.48% | ||||||||||||||
| a | Expenses are calculated using the Fund’s annualized expense ratio (as disclosed in the table), multiplied by the average account value for the period, multiplied by the number of days in the period (184 days) and divided by the number of days in the year (365 days). See “Shareholder Expenses” on page 24 for more information. |
| 16 | 2014 iSHARES ANNUAL REPORTTO SHAREHOLDERS |
Table of Contents
Management’s Discussion of Fund Performance (Continued)
iSHARES® MSCI MEXICO CAPPED ETF
The iShares MSCI Mexico Capped ETF (the “Fund”) seeks to track the investment results of a broad-based index composed of Mexican equities, as represented by the MSCI Mexico Investable Market Index 25/50 (the “Index”). The Fund invests in a representative sample of securities included in the Index that collectively has an investment profile similar to the Index. Due to the use of representative sampling, the Fund may or may not hold all of the securities that are included in the Index. For the 12-month reporting period ended August 31, 2014, the total return for the Fund was 17.42%, net of fees, while the total return for the Index was 17.05%.
As represented by the Index, Mexican equities advanced for the reporting period and performed in line with broad international equity indexes.
Mexico continued to recover, although slowly, from the recession it experienced in 2009. After expanding 1.0% in the third quarter of 2013, GDP growth was a relatively muted 0.17% in the fourth quarter of 2013, followed by 0.44% and 1.0% growth rates in the first and second quarters of 2014, respectively.
Mexico’s export-driven economy has benefited from an increase in export levels in the past several years, due in large part to an increase in automobile production. For the first six months of 2014, automobile output rose 7.4%, supported by new plants owned by three key automobile manufacturers. Export growth strengthened overall during the reporting period, and the services sector, which reflects domestic demand, expanded.
Mexico’s central bank cut its benchmark interest rate three times during the reporting period, the latest time in June 2014 to 3%, a record low, in an effort to further stimulate economic growth. In July 2014, the central bank held rates steady, citing indications of improved economic growth levels.
PORTFOLIO ALLOCATION
As of 8/31/14
| Sector | Percentage of Total Investments* |
Consumer Staples | 22.80 | % | ||
Financials | 20.99 | |||
Telecommunication Services | 16.91 | |||
Materials | 15.80 | |||
Industrials | 12.17 | |||
Consumer Discretionary | 10.32 | |||
Health Care | 1.01 | |||
|
| |||
TOTAL | 100.00 | % | ||
|
|
TEN LARGEST FUND HOLDINGS
As of 8/31/14
| Security | Percentage of Total Investments* |
America Movil SAB de CV Series L | 16.69 | % | ||
Grupo Televisa SAB de CV CPO | 7.37 | |||
Fomento Economico Mexicano SAB de | 7.25 | |||
Grupo Financiero Banorte SAB de CV Series O | 6.70 | |||
Cemex SAB de CV CPO | 6.10 | |||
Wal-Mart de Mexico SAB de CV Series V | 4.66 | |||
Grupo Mexico SAB de CV Series B | 4.59 | |||
Alfa SAB de CV Series A | 3.93 | |||
Fibra Uno Administracion SAB de CV | 3.58 | |||
Grupo Financiero Inbursa SAB de CV Series O | 3.09 | |||
|
| |||
TOTAL | 63.96 | % | ||
|
|
| * | Excludes money market funds. |
MANAGEMENT’S DISCUSSIONSOF FUND PERFORMANCE | 17 |
Table of Contents
Management’s Discussion of Fund Performance
iSHARES® MSCI SOUTH AFRICA ETF
Performance as of August 31, 2014
| Average Annual Total Returns | Cumulative Total Returns | |||||||||||||||||||||||||
| NAV | MARKET | INDEX | NAV | MARKET | INDEX | |||||||||||||||||||||
1 Year | 23.13% | 24.00% | 23.93% | 23.13% | 24.00% | 23.93% | ||||||||||||||||||||
5 Years | 9.47% | 9.31% | 10.16% | 57.19% | 56.06% | 62.23% | ||||||||||||||||||||
10 Years | 12.23% | 12.11% | 13.25% | 217.16% | 213.60% | 246.99% | ||||||||||||||||||||
GROWTH OF $10,000 INVESTMENT
(AT NET ASSET VALUE)
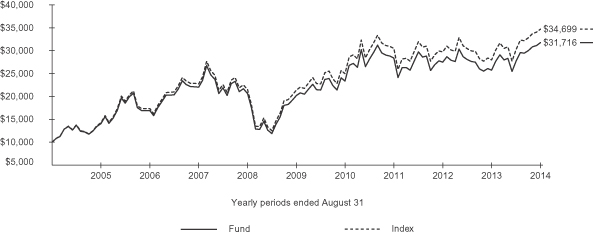
Past performance is no guarantee of future results. Performance results do not reflect the deduction of taxes that a shareholder would pay on fund distributions or on the redemption or sale of fund shares. See “About Fund Performance” on page 24 for more information.
| Shareholder Expenses | ||||||||||||||||||||||||||
| Actual | Hypothetical 5% Return | |||||||||||||||||||||||||
| Beginning Account Value (3/1/14) | Ending Account Value (8/31/14) | Expenses Paid During Period a | Beginning Account Value (3/1/14) | Ending Account Value (8/31/14) | Expenses Paid During Period a | Annualized Expense Ratio | ||||||||||||||||||||
| $ | 1,000.00 | $ | 1,142.40 | $ | 3.35 | $ | 1,000.00 | $ | 1,022.10 | $ | 3.16 | 0.62% | ||||||||||||||
| a | Expenses are calculated using the Fund’s annualized expense ratio (as disclosed in the table), multiplied by the average account value for the period, multiplied by the number of days in the period (184 days) and divided by the number of days in the year (365 days). See “Shareholder Expenses” on page 24 for more information. |
| 18 | 2014 iSHARES ANNUAL REPORTTO SHAREHOLDERS |
Table of Contents
Management’s Discussion of Fund Performance (Continued)
iSHARES® MSCI SOUTH AFRICA ETF
The iShares MSCI South Africa ETF (the “Fund”) seeks to track the investment results of an index composed of South African equities, as represented by the MSCI South Africa Index (the “Index”). The Fund invests in a representative sample of securities included in the Index that collectively has an investment profile similar to the Index. Due to the use of representative sampling, the Fund may or may not hold all of the securities that are included in the Index. For the 12-month reporting period ended August 31, 2014, the total return for the Fund was 23.13%, net of fees, while the total return for the Index was 23.93%.
South African stocks, as represented by the Index, produced strong returns for the reporting period. The Index declined in early 2014 before staging a strong recovery during the second half of the reporting period.
During early 2014, the Index declined temporarily after the Fed announced plans to reduce stimulus measures. Such a move would typically cause interest rates to rise, and make investors more cautious about investing in riskier assets. However, when U.S. interest rates subsequently remained low, investor appetite towards risk returned and emerging markets such as South Africa rebounded. In addition, South African companies benefited from their significant operations in other African markets with stronger economic growth trends.
However, South Africa appears to be facing a period of slower growth after a decade of high growth driven by strong demand for commodities and an expanding middle class. Most recently, the economy has been disrupted by labor unrest, a high crime rate and a burdensome regulatory climate.
During the past decade, rising commodity prices resulted in strong appreciation of the South African rand. More recently, however, South Africa’s rising budget deficit and weakening economic fundamentals have depressed the currency. In July 2014, South Africa’s central bank increased short-term interest rates from 5.5% to 5.75% to combat inflation, which hovered around 6% throughout most of the reporting period. This was the second rate increase during the reporting period, as the central bank also increased the rate by 50 basis points at its January 2014 meeting.
In terms of sector performance, consumer discretionary stocks posted the strongest contribution to Index returns for the reporting period, followed by financials and telecommunication services stocks. The consumer staples, materials and industrials sectors lagged the other sectors.
PORTFOLIO ALLOCATION As of 8/31/14
| Sector | Percentage of Total Investments* |
Financials | 27.50 | % | ||
Consumer Discretionary | 24.68 | |||
Telecommunication Services | 13.28 | |||
Energy | 10.64 | |||
Materials | 9.78 | |||
Health Care | 6.00 | |||
Consumer Staples | 4.88 | |||
Industrials | 3.24 | |||
|
| |||
TOTAL | 100.00 | % | ||
|
|
TEN LARGEST FUND HOLDINGS As of 8/31/14
| Security | Percentage of Total Investments* |
Naspers Ltd. Class N | 15.71 | % | ||
MTN Group Ltd. | 11.89 | |||
Sasol Ltd. | 10.00 | |||
Standard Bank Group Ltd. | 4.91 | |||
FirstRand Ltd. | 3.92 | |||
Sanlam Ltd. | 3.56 | |||
Remgro Ltd. | 3.43 | |||
Steinhoff International Holdings Ltd. | 3.23 | |||
Aspen Pharmacare Holdings Ltd. | 2.86 | |||
Bidvest Group Ltd. | 2.59 | |||
|
| |||
TOTAL | 62.10 | % | ||
|
|
| * | Excludes money market funds. |
MANAGEMENT’S DISCUSSIONSOF FUND PERFORMANCE | 19 |
Table of Contents
Management’s Discussion of Fund Performance
iSHARES® MSCI TURKEY ETF
Performance as of August 31, 2014
| Average Annual Total Returns | Cumulative Total Returns | |||||||||||||||||||||||||
| NAV | MARKET | INDEX | NAV | MARKET | INDEX | |||||||||||||||||||||
1 Year | 15.52% | 16.36% | 16.42% | 15.52% | 16.36% | 16.42% | ||||||||||||||||||||
5 Years | 5.16% | 4.91% | 5.68% | 28.61% | 27.11% | 31.81% | ||||||||||||||||||||
Since Inception | 3.73% | 3.65% | 4.17% | 26.57% | 25.98% | 30.06% | ||||||||||||||||||||
GROWTH OF $10,000 INVESTMENT
(SINCE INCEPTION AT NET ASSET VALUE)
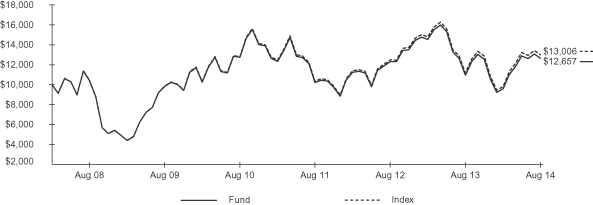
The inception date of the Fund was 3/26/08. The first day of secondary market trading was 3/28/08.
Past performance is no guarantee of future results. Performance results do not reflect the deduction of taxes that a shareholder would pay on fund distributions or on the redemption or sale of fund shares. See “About Fund Performance” on page 24 for more information.
| Shareholder Expenses | ||||||||||||||||||||||||||
| Actual | Hypothetical 5% Return | |||||||||||||||||||||||||
| Beginning Account Value (3/1/14) | Ending Account Value (8/31/14) | Expenses Paid During Period a | Beginning Account Value (3/1/14) | Ending Account Value (8/31/14) | Expenses Paid During Period a | Annualized Expense Ratio | ||||||||||||||||||||
| $ | 1,000.00 | $ | 1,321.30 | $ | 3.63 | $ | 1,000.00 | $ | 1,022.10 | $ | 3.16 | 0.62% | ||||||||||||||
| a | Expenses are calculated using the Fund’s annualized expense ratio (as disclosed in the table), multiplied by the average account value for the period, multiplied by the number of days in the period (184 days) and divided by the number of days in the year (365 days). See “Shareholder Expenses” on page 24 for more information. |
| 20 | 2014 iSHARES ANNUAL REPORTTO SHAREHOLDERS |
Table of Contents
Management’s Discussion of Fund Performance (Continued)
iSHARES® MSCI TURKEY ETF
The iShares MSCI Turkey ETF (the “Fund”) seeks to track the investment results of a broad-based index composed of Turkish equities, as represented by the MSCI Turkey Investable Market Index (the “Index”). The Fund invests in a representative sample of securities included in the Index that collectively has an investment profile similar to the Index. Due to the use of representative sampling, the Fund may or may not hold all of the securities that are included in the Index. For the 12-month reporting period ended August 31, 2014, the total return for the Fund was 15.52%, net of fees, while the total return for the Index was 16.42%.
The Turkish equity market, as represented by the Index, posted a solid return during the reporting period, slightly underperforming the broad international equity market.
Turkey is the largest national economy in Central and Eastern Europe, representing a mix of modern industry along with traditional agriculture. Although the private sector is growing, the state remains a major participant in basic industry, banking, transportation and communications.
Turkey’s economic growth nearly doubled to 4% during 2013, and continued that level of growth into early 2014. This took place despite the country’s dependence on exports to struggling economies in Europe and despite armed conflicts in neighboring Russia/Ukraine and the Middle East. However, economic growth declined during the second quarter of 2014.
The Turkish stock market declined during the first half of the reporting period, before rebounding sharply in the second half of the reporting period. In general, emerging markets saw investment performance lag after the Fed announced plans to reduce stimulus measures, which would potentially cause interest rates to rise, and make investors more cautious about investing in riskier assets. However, as the reporting period progressed, rising expectations that the Fed would be slower to raise rates than originally had been anticipated, as well as reduced political unrest, helped to refuel investors’ appetite for risk, boosting returns for emerging markets equities.
In May 2013, the country’s credit rating was increased by ratings agency Moody’s Investors Service from non-investment grade status to investment grade status for the first time in 20 years. However, political unrest in the region has caused the country’s bond yields to surge higher, a sign that investors require greater return to compensate for increased risk.
PORTFOLIO ALLOCATION As of 8/31/14
| Sector | Percentage of Total Investments* |
Financials | 46.95 | % | ||
Consumer Staples | 13.75 | |||
Industrials | 12.80 | |||
Telecommunication Services | 8.29 | |||
Materials | 7.85 | |||
Consumer Discretionary | 5.53 | |||
Energy | 3.89 | |||
Utilities | 0.49 | |||
Health Care | 0.36 | |||
Information Technology | 0.09 | |||
|
| |||
TOTAL | 100.00 | % | ||
|
|
TEN LARGEST FUND HOLDINGS As of 8/31/14
| Security | Percentage of Total Investments* |
Turkiye Garanti Bankasi AS | 11.25 | % | ||
Akbank TAS | 8.53 | |||
Turkcell Iletisim Hizmetleri AS | 6.40 | |||
BIM Birlesik Magazalar AS | 6.21 | |||
Turkiye Halk Bankasi AS | 5.70 | |||
Haci Omer Sabanci Holding AS | 5.28 | |||
Turkiye Is Bankasi AS Class C | 5.05 | |||
KOC Holding AS | 4.03 | |||
Turkiye Petrol Rafinerileri AS | 3.66 | |||
Anadolu Efes Biracilik ve Malt Sanayii AS | 3.42 | |||
|
| |||
TOTAL | 59.53 | % | ||
|
|
| * | Excludes money market funds. |
MANAGEMENT’S DISCUSSIONSOF FUND PERFORMANCE | 21 |
Table of Contents
Management’s Discussion of Fund Performance
iSHARES® MSCI USA ETF
Performance as of August 31, 2014
| Average Annual Total Returns | Cumulative Total Returns | |||||||||||||||||||||||||
| NAV | MARKET | INDEX | NAV | MARKET | INDEX | |||||||||||||||||||||
1 Year | 24.98% | 25.01% | 25.22% | 24.98% | 25.01% | 25.22% | ||||||||||||||||||||
Since Inception | 15.71% | 15.71% | 15.94% | 87.98% | 87.98% | 89.44% | ||||||||||||||||||||
GROWTH OF $10,000 INVESTMENT
(SINCE INCEPTION AT NET ASSET VALUE)
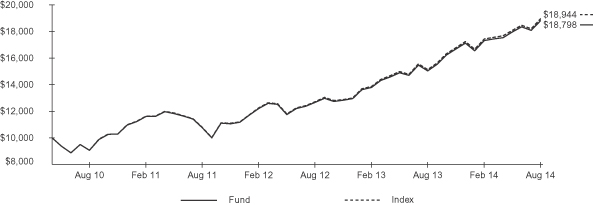
The inception date of the Fund was 5/5/10. The first day of secondary market trading was 5/7/10.
Past performance is no guarantee of future results. Performance results do not reflect the deduction of taxes that a shareholder would pay on fund distributions or on the redemption or sale of fund shares. See “About Fund Performance” on page 24 for more information.
| Shareholder Expenses | ||||||||||||||||||||||||||
| Actual | Hypothetical 5% Return | |||||||||||||||||||||||||
| Beginning Account Value (3/1/14) | Ending Account Value (8/31/14) | Expenses Paid During Period a | Beginning Account Value (3/1/14) | Ending Account Value (8/31/14) | Expenses Paid During Period a | Annualized Expense Ratio | ||||||||||||||||||||
| $ | 1,000.00 | $ | 1,085.30 | $ | 0.79 | $ | 1,000.00 | $ | 1,024.40 | $ | 0.77 | 0.15% | ||||||||||||||
| a | Expenses are calculated using the Fund’s annualized expense ratio (as disclosed in the table), multiplied by the average account value for the period, multiplied by the number of days in the period (184 days) and divided by the number of days in the year (365 days). See “Shareholder Expenses” on page 24 for more information. |
| 22 | 2014 iSHARES ANNUAL REPORTTO SHAREHOLDERS |
Table of Contents
Management’s Discussion of Fund Performance (Continued)
iSHARES® MSCI USA ETF
The iShares MSCI USA ETF (the “Fund”) seeks to track the investment results of an index composed of U.S. equities, as represented by the MSCI USA Index (the “Index”). The Fund invests in a representative sample of securities included in the Index that collectively has an investment profile similar to the Index. Due to the use of representative sampling, the Fund may or may not hold all of the securities that are included in the Index. For the 12-month reporting period ended August 31, 2014, the total return for the Fund was 24.98%, net of fees, while the total return for the Index was 25.22%.
Domestic stocks, as represented by the Index, generated strong performance during the reporting period, and outperformed the broad international developed equity market. This outperformance reflected the overall improvement in the U.S. economy, as the combination of accommodative monetary policy, low inflation, steady job growth, rising corporate profits and healthy consumer sentiment helped drive economic growth in the United States during the majority of the reporting period.
Every sector of the Index posted a positive double-digit return during the reporting period. The information technology sector was the strongest contributor to Index performance, as consumer spending on technology offset slow business spending. Health care was the second largest contributor to performance, as health care stocks gained despite the changing competitive landscape due to the Affordable Care Act. The energy sector also delivered strong results for the reporting period, as energy companies rallied amid rising U.S. production and volatile prices of oil and natural gas. The industrials and materials sectors also added to Index performance during the reporting period, as manufacturing activity continued to expand.
The financials sector posted a solid, positive return while lagging many of the other sectors in the Index on a relative basis. Consumer-based stocks also trailed the overall Index during the reporting period, as retail sales declined sharply during the unusually cold winter. Telecommunication services and utilities underperformed the broader market, although these collectively represented only 6% of the Index on average, which limited their impact on Index performance during the reporting period.
PORTFOLIO ALLOCATION As of 8/31/14
| Sector | Percentage of Total Investments* |
Information Technology | 19.49 | % | ||
Financials | 15.99 | |||
Health Care | 13.62 | |||
Consumer Discretionary | 12.54 | |||
Energy | 10.45 | |||
Industrials | 10.03 | |||
Consumer Staples | 9.15 | |||
Materials | 3.51 | |||
Utilities | 2.77 | |||
Telecommunication Services | 2.45 | |||
|
| |||
TOTAL | 100.00 | % | ||
|
|
TEN LARGEST FUND HOLDINGS As of 8/31/14
| Security | Percentage of Total Investments* |
Apple Inc. | 3.30 | % | ||
Exxon Mobil Corp. | 2.27 | |||
Microsoft Corp. | 1.90 | |||
Johnson & Johnson | 1.56 | |||
General Electric Co. | 1.39 | |||
Wells Fargo & Co. | 1.37 | |||
Chevron Corp. | 1.31 | |||
J.P. Morgan Chase & Co. | 1.20 | |||
Procter & Gamble Co. (The) | 1.20 | |||
Verizon Communications Inc. | 1.10 | |||
|
| |||
TOTAL | 16.60 | % | ||
|
|
| * | Excludes money market funds. |
MANAGEMENT’S DISCUSSIONSOF FUND PERFORMANCE | 23 |
Table of Contents
Past performance is no guarantee of future results. Current performance may be lower or higher than the performance data quoted. Performance data current to the most recent month-end is available at www.iShares.com. Performance results assume reinvestment of all dividends and capital gain distributions and do not reflect the deduction of taxes that a shareholder would pay on fund distributions or on the redemption or sale of fund shares. The investment return and principal value of shares will vary with changes in market conditions. Shares may be worth more or less than their original cost when they are redeemed or sold in the market. Performance for certain funds may reflect a waiver of a portion of investment management fees. Without such waiver, performance would have been lower.
Net asset value or “NAV” is the value of one share of a fund as calculated in accordance with the standard formula for valuing mutual fund shares. The price used to calculate market return (“Market Price”) is determined by using the midpoint between the highest bid and the lowest offer on the primary stock exchange on which shares of a fund are listed for trading, as of the time that such fund’s NAV is calculated. Since shares of a fund may not have traded in the secondary market until after the fund’s inception, for the period from inception to the first day of secondary trading, the NAV of the fund is used as a proxy for the Market Price to calculate market returns. Market and NAV returns assume that dividends and capital gain distributions have been reinvested at Market Price and NAV, respectively.
An index is a statistical composite that tracks a specified financial market or sector. Unlike a fund, an index does not actually hold a portfolio of securities and therefore does not incur the expenses incurred by a fund. These expenses negatively impact fund performance. Also, market returns do not include brokerage commissions that may be payable on secondary market transactions. If brokerage commissions were included, market returns would be lower.
As a shareholder of a Fund, you incur two types of costs: (1) transaction costs, including brokerage commissions on purchases and sales of fund shares and (2) ongoing costs, including management fees and other fund expenses. The expense example, which is based on an investment of $1,000 invested on March 1, 2014 and held through August 31, 2014, is intended to help you understand your ongoing costs (in dollars and cents) of investing in a Fund and to compare these costs with the ongoing costs of investing in other funds.
Actual Expenses — The table provides information about actual account values and actual expenses. Annualized expense ratios reflect contractual and voluntary fee waivers, if any. To estimate the expenses that you paid on your account over the period, simply divide your account value by $1,000 (for example, an $8,600 account value divided by $1,000 = 8.6), then multiply the result by the number for your Fund under the heading entitled “Expenses Paid During Period.”
Hypothetical Example for Comparison Purposes — The table also provides information about hypothetical account values and hypothetical expenses based on each Fund’s actual expense ratio and an assumed rate of return of 5% per year before expenses. You may use this information to compare the ongoing costs of investing in your Fund and other funds. To do so, compare this 5% hypothetical example with the 5% hypothetical examples that appear in the shareholder reports of the other funds.
Please note that the expenses shown in the table are meant to highlight your ongoing costs only and do not reflect any transactional costs, such as brokerage commissions paid on purchases and sales of fund shares. Therefore, the hypothetical examples are useful in comparing ongoing costs only and will not help you determine the relative total costs of owning different funds. In addition, if these transactional costs were included, your costs would have been higher.
| 24 | 2014 iSHARES ANNUAL REPORTTO SHAREHOLDERS |
Table of Contents
iSHARES® MSCI BRAZIL CAPPED ETF
August 31, 2014
| Security | Shares | Value | ||||||
COMMON STOCKS — 59.08% |
| |||||||
AEROSPACE & DEFENSE — 1.38% |
| |||||||
Embraer SA | 7,705,732 | $ | 75,109,837 | |||||
|
| |||||||
| 75,109,837 | ||||||||
BEVERAGES — 6.01% |
| |||||||
AMBEV SA | 44,932,160 | 327,319,706 | ||||||
|
| |||||||
| 327,319,706 | ||||||||
CAPITAL MARKETS — 0.75% |
| |||||||
CETIP SA – | 2,815,683 | 41,086,032 | ||||||
|
| |||||||
| 41,086,032 | ||||||||
COMMERCIAL BANKS — 5.40% |
| |||||||
Banco Bradesco SA | 4,345,920 | 77,729,534 | ||||||
Banco do Brasil SA | 8,982,197 | 140,460,357 | ||||||
Banco Santander (Brasil) SA Units | 11,002,041 | 76,016,873 | ||||||
|
| |||||||
| 294,206,764 | ||||||||
CONTAINERS & PACKAGING — 0.59% |
| |||||||
Klabin SA | 6,373,620 | 32,387,236 | ||||||
|
| |||||||
| 32,387,236 | ||||||||
DIVERSIFIED CONSUMER SERVICES — 3.02% |
| |||||||
Estacio Participacoes SA | 3,637,400 | 48,329,602 | ||||||
Kroton Educacional SA | 3,885,616 | 116,435,634 | ||||||
|
| |||||||
| 164,765,236 | ||||||||
DIVERSIFIED FINANCIAL SERVICES — 2.33% |
| |||||||
BM&F Bovespa SA | 21,047,200 | 126,985,855 | ||||||
|
| |||||||
| 126,985,855 | ||||||||
ELECTRIC UTILITIES — 1.59% |
| |||||||
Centrais Eletricas Brasileiras SA | 4,537,899 | 16,528,738 | ||||||
CPFL Energia SA | 3,466,400 | 34,996,302 | ||||||
EDP Energias do Brasil SA | 3,851,800 | 19,452,231 | ||||||
Transmissora Alianca de Energia Eletrica SA | 1,526,000 | 15,917,785 | ||||||
|
| |||||||
| 86,895,056 | ||||||||
FOOD & STAPLES RETAILING — 0.54% |
| |||||||
Raia Drogasil SA | 3,025,900 | 29,480,736 | ||||||
|
| |||||||
| 29,480,736 | ||||||||
FOOD PRODUCTS — 4.81% |
| |||||||
BRF SA | 7,424,850 | 198,765,844 | ||||||
JBS SA | 9,187,622 | 41,553,813 | ||||||
M Dias Branco SA | 485,600 | 21,919,332 | ||||||
|
| |||||||
| 262,238,989 | ||||||||
| Security | Shares | Value | ||||||
HEALTH CARE PROVIDERS & SERVICES — 0.77% |
| |||||||
Odontoprev SA | 2,250,600 | $ | 9,816,923 | |||||
Qualicorp SAa | 2,590,400 | 32,415,454 | ||||||
|
| |||||||
| 42,232,377 | ||||||||
HOUSEHOLD DURABLES — 0.48% |
| |||||||
Cyrela Brazil Realty SA Empreendimentos e Participacoes | 4,127,500 | 26,175,605 | ||||||
|
| |||||||
| 26,175,605 | ||||||||
INDEPENDENT POWER PRODUCERS & ENERGY TRADERS — 0.69% |
| |||||||
Tractebel Energia SA | 2,235,400 | 37,473,958 | ||||||
|
| |||||||
| 37,473,958 | ||||||||
INSURANCE — 2.94% |
| |||||||
BB Seguridade Participacoes SA | 7,289,500 | 116,433,925 | ||||||
Porto Seguro SA | 1,710,800 | 25,368,972 | ||||||
Sul America SA Units | 2,670,850 | 18,465,755 | ||||||
|
| |||||||
| 160,268,652 | ||||||||
INTERNET & CATALOG RETAIL — 0.49% |
| |||||||
B2W Companhia Global do Varejoa | 1,567,200 | 26,545,498 | ||||||
|
| |||||||
| 26,545,498 | ||||||||
IT SERVICES — 2.78% |
| |||||||
Cielo SA | 8,070,464 | 151,342,615 | ||||||
|
| |||||||
| 151,342,615 | ||||||||
MACHINERY — 0.80% |
| |||||||
WEG SA | 3,486,530 | 43,613,763 | ||||||
|
| |||||||
| 43,613,763 | ||||||||
METALS & MINING — 3.35% |
| |||||||
Companhia Siderurgica Nacional SA | 9,544,054 | 41,886,264 | ||||||
Vale SA | 10,800,900 | 140,565,444 | ||||||
|
| |||||||
| 182,451,708 | ||||||||
MULTILINE RETAIL — 1.30% |
| |||||||
Lojas Americanas SA | 2,690,950 | 15,634,221 | ||||||
Lojas Renner SA | 1,604,600 | 54,946,013 | ||||||
|
| |||||||
| 70,580,234 | ||||||||
OIL, GAS & CONSUMABLE FUELS — 7.60% |
| |||||||
Cosan SA Industria e Comercio | 1,742,490 | 36,211,832 | ||||||
Petroleo Brasileiro SA | 27,483,744 | 271,944,802 | ||||||
Ultrapar Participacoes SA | 4,104,700 | 105,830,101 | ||||||
|
| |||||||
| 413,986,735 | ||||||||
SCHEDULESOF INVESTMENTS | 25 |
Table of Contents
Schedule of Investments (Continued)
iSHARES® MSCI BRAZIL CAPPED ETF
August 31, 2014
| Security | Shares | Value | ||||||
PAPER & FOREST PRODUCTS — 0.84% |
| |||||||
Duratex SA | 2,262,511 | $ | 10,182,336 | |||||
Fibria Celulose SAa | 3,410,126 | 35,479,758 | ||||||
|
| |||||||
| 45,662,094 | ||||||||
PERSONAL PRODUCTS — 1.51% |
| |||||||
Hypermarcas SAa | 4,638,500 | 40,341,092 | ||||||
Natura Cosmeticos SA | 2,274,800 | 41,692,721 | ||||||
|
| |||||||
| 82,033,813 | ||||||||
REAL ESTATE MANAGEMENT & DEVELOPMENT — 1.93% |
| |||||||
BR Malls Participacoes SA | 5,346,500 | 55,602,357 | ||||||
BR Properties SA | 2,758,700 | 18,370,374 | ||||||
Multiplan Empreendimentos Imobiliarios SA | 1,206,800 | 31,125,306 | ||||||
|
| |||||||
| 105,098,037 | ||||||||
ROAD & RAIL — 1.12% |
| |||||||
ALL – America Latina Logistica SA | 6,756,100 | 24,910,203 | ||||||
Localiza Rent A Car SA | 2,028,340 | 36,124,042 | ||||||
|
| |||||||
| 61,034,245 | ||||||||
SOFTWARE — 0.56% |
| |||||||
Totvs SA | 1,685,700 | 30,782,643 | ||||||
|
| |||||||
| 30,782,643 | ||||||||
SPECIALTY RETAIL — 0.38% |
| |||||||
Via Varejo SAa | 1,865,700 | 20,845,344 | ||||||
|
| |||||||
| 20,845,344 | ||||||||
TOBACCO — 0.83% |
| |||||||
Souza Cruz SA | 4,849,100 | 45,423,403 | ||||||
|
| |||||||
| 45,423,403 | ||||||||
TRANSPORTATION INFRASTRUCTURE — 2.12% |
| |||||||
CCR SA | 10,483,000 | 94,918,809 | ||||||
EcoRodovias Infraestrutura e Logistica SA | 3,248,600 | 20,761,538 | ||||||
|
| |||||||
| 115,680,347 | ||||||||
WATER UTILITIES — 1.09% |
| |||||||
Companhia de Saneamento Basico do Estado de Sao Paulo | 4,434,900 | 42,395,706 | ||||||
Companhia de Saneamento de Minas Gerais SA | 958,600 | 17,136,600 | ||||||
|
| |||||||
| 59,532,306 | ||||||||
| Security | Shares | Value | ||||||
WIRELESS TELECOMMUNICATION SERVICES — 1.08% |
| |||||||
TIM Participacoes SA | 10,479,690 | $ | 58,778,624 | |||||
|
| |||||||
| 58,778,624 | ||||||||
|
| |||||||
TOTAL COMMON STOCKS |
| |||||||
(Cost: $1,913,040,349) |
| 3,220,017,448 | ||||||
PREFERRED STOCKS — 40.62% |
| |||||||
CHEMICALS — 0.34% |
| |||||||
Braskem SA Class A | 2,730,836 | 18,611,986 | ||||||
|
| |||||||
| 18,611,986 | ||||||||
COMMERCIAL BANKS — 18.42% |
| |||||||
Banco Bradesco SA | 20,207,436 | 368,828,266 | ||||||
Banco do Estado do Rio Grande do Sul SA Class B | 2,987,010 | 20,624,927 | ||||||
Itau Unibanco Holding SA | 27,278,611 | 492,040,285 | ||||||
Itausa – Investimentos Itau SA | 25,141,529 | 122,474,432 | ||||||
|
| |||||||
| 1,003,967,910 | ||||||||
DIVERSIFIED TELECOMMUNICATION SERVICES — 1.87% |
| |||||||
Oi SA | 39,300,293 | 25,467,777 | ||||||
Telefonica Brasil SA | 3,583,574 | 76,634,719 | ||||||
|
| |||||||
| 102,102,496 | ||||||||
ELECTRIC UTILITIES — 2.27% |
| |||||||
Centrais Eletricas Brasileiras SA Class B | 3,434,551 | 18,956,763 | ||||||
Companhia Energetica de Minas Gerais | 8,945,890 | 76,603,094 | ||||||
Companhia Paranaense de Energia Class B | 1,571,800 | 27,859,752 | ||||||
|
| |||||||
| 123,419,609 | ||||||||
FOOD & STAPLES RETAILING — 1.51% |
| |||||||
Companhia Brasileira de Distribuicao | 1,619,864 | 82,471,858 | ||||||
|
| |||||||
| 82,471,858 | ||||||||
INDEPENDENT POWER PRODUCERS & ENERGY TRADERS — 0.91% |
| |||||||
AES Tiete SA | 1,672,100 | 15,035,486 | ||||||
Companhia Energetica de Sao Paulo Class B | 2,429,270 | 34,405,294 | ||||||
|
| |||||||
| 49,440,780 | ||||||||
METALS & MINING — 6.23% |
| |||||||
Bradespar SA | 3,196,600 | 29,215,200 | ||||||
Gerdau SA | 10,481,046 | 60,706,735 | ||||||
Metalurgica Gerdau SA | 3,845,590 | 27,257,964 | ||||||
| 26 | 2014 iSHARES ANNUAL REPORTTO SHAREHOLDERS |
Table of Contents
Schedule of Investments (Continued)
iSHARES® MSCI BRAZIL CAPPED ETF
August 31, 2014
| Security | Shares | Value | ||||||
Usinas Siderurgicas de Minas Gerais SA Class A | 5,898,300 | $ | 21,299,307 | |||||
Vale SA Class A | 17,306,200 | 200,863,451 | ||||||
|
| |||||||
| 339,342,657 | ||||||||
MULTILINE RETAIL — 0.87% |
| |||||||
Lojas Americanas SA | 6,692,906 | 47,380,231 | ||||||
|
| |||||||
| 47,380,231 | ||||||||
OIL, GAS & CONSUMABLE FUELS — 7.84% |
| |||||||
Petroleo Brasileiro SA | 40,962,178 | 427,461,668 | ||||||
|
| |||||||
| 427,461,668 | ||||||||
PAPER & FOREST PRODUCTS — 0.36% |
| |||||||
Suzano Papel e Celulose SA Class A | 4,881,600 | 19,438,697 | ||||||
|
| |||||||
| 19,438,697 | ||||||||
|
| |||||||
TOTAL PREFERRED STOCKS |
| |||||||
(Cost: $1,238,598,121) |
| 2,213,637,892 | ||||||
SHORT-TERM INVESTMENTS — 0.08% |
| |||||||
MONEY MARKET FUNDS — 0.08% |
| |||||||
BlackRock Cash Funds: Treasury, |
| |||||||
0.00%b,c | 4,267,567 | 4,267,567 | ||||||
|
| |||||||
| 4,267,567 | ||||||||
|
| |||||||
TOTAL SHORT-TERM INVESTMENTS (Cost: $4,267,567) |
| 4,267,567 | ||||||
|
| |||||||
TOTAL INVESTMENTS |
| |||||||
(Cost: $3,155,906,037) |
| 5,437,922,907 | ||||||
Other Assets, Less Liabilities — 0.22% |
| 11,762,428 | ||||||
|
| |||||||
NET ASSETS — 100.00% |
| $ | 5,449,685,335 | |||||
|
| |||||||
| a | Non-income earning security. |
| b | Affiliated issuer. See Note 2. |
| c | The rate quoted is the annualized seven-day yield of the fund at period end. |
See notes to financial statements.
SCHEDULESOF INVESTMENTS | 27 |
Table of Contents
Schedule of Investments
August 31, 2014
| Security | Shares | Value | ||||||
COMMON STOCKS — 99.76% |
| |||||||
AEROSPACE & DEFENSE — 0.54% |
| |||||||
Bombardier Inc. Class B | 3,657,000 | $ | 12,338,898 | |||||
CAE Inc. | 667,000 | 8,264,098 | ||||||
|
| |||||||
| 20,602,996 | ||||||||
AUTO COMPONENTS — 1.66% |
| |||||||
Magna International Inc. Class A | 553,150 | 62,864,560 | ||||||
|
| |||||||
| 62,864,560 | ||||||||
CAPITAL MARKETS — 0.83% |
| |||||||
CI Financial Corp. | 579,600 | 19,064,419 | ||||||
IGM Financial Inc. | 256,450 | 12,265,154 | ||||||
|
| |||||||
| 31,329,573 | ||||||||
CHEMICALS — 3.35% |
| |||||||
Agrium Inc. | 366,850 | 34,772,544 | ||||||
Methanex Corp. | 244,950 | 16,416,561 | ||||||
Potash Corp. of Saskatchewan Inc. | 2,149,350 | 75,670,594 | ||||||
|
| |||||||
| 126,859,699 | ||||||||
COMMERCIAL BANKS — 26.10% |
| |||||||
Bank of Montreal | 1,638,750 | 126,386,564 | ||||||
Bank of Nova Scotia | 3,091,200 | 205,291,586 | ||||||
Canadian Imperial Bank of Commerce | 1,009,700 | 96,720,836 | ||||||
National Bank of Canada | 832,600 | 40,150,547 | ||||||
Royal Bank of Canada | 3,662,750 | 272,726,727 | ||||||
Toronto-Dominion Bank (The) | 4,679,350 | 246,962,699 | ||||||
|
| |||||||
| 988,238,959 | ||||||||
COMPUTERS & PERIPHERALS — 0.34% |
| |||||||
BlackBerry Ltd.a,b | 1,270,750 | 12,944,722 | ||||||
|
| |||||||
| 12,944,722 | ||||||||
CONSTRUCTION & ENGINEERING — 0.52% |
| |||||||
SNC-Lavalin Group Inc. | 386,400 | 19,833,835 | ||||||
|
| |||||||
| 19,833,835 | ||||||||
DIVERSIFIED FINANCIAL SERVICES — 0.35% |
| |||||||
Onex Corp. | 225,400 | 13,155,173 | ||||||
|
| |||||||
| 13,155,173 | ||||||||
DIVERSIFIED TELECOMMUNICATION SERVICES — 1.42% |
| |||||||
BCE Inc. | 652,050 | 29,424,151 | ||||||
Bell Aliant Inc. | 189,750 | 5,396,439 | ||||||
TELUS Corp. NVS | 523,215 | 19,124,660 | ||||||
|
| |||||||
| 53,945,250 | ||||||||
ELECTRIC UTILITIES — 0.44% |
| |||||||
Fortis Inc. | 543,950 | 16,808,669 | ||||||
|
| |||||||
| 16,808,669 | ||||||||
| Security | Shares | Value | ||||||
FOOD & STAPLES RETAILING — 2.51% |
| |||||||
Alimentation Couche-Tard Inc. Class B | 1,060,300 | $ | 31,874,979 | |||||
Empire Co. Ltd. Class A | 140,300 | 9,776,702 | ||||||
George Weston Ltd. | 131,100 | 10,414,277 | ||||||
Loblaw Companies Ltd. | 576,150 | 28,787,582 | ||||||
Metro Inc. Class A | 220,800 | 14,348,183 | ||||||
|
| |||||||
| 95,201,723 | ||||||||
FOOD PRODUCTS — 0.52% |
| |||||||
Saputo Inc. | 322,000 | 19,633,169 | ||||||
|
| |||||||
| 19,633,169 | ||||||||
HEALTH CARE PROVIDERS & SERVICES — 0.65% |
| |||||||
Catamaran Corp.a | 525,550 | 24,820,398 | ||||||
|
| |||||||
| 24,820,398 | ||||||||
HOTELS, RESTAURANTS & LEISURE — 0.73% |
| |||||||
Tim Hortons Inc. | 341,550 | 27,519,216 | ||||||
|
| |||||||
| 27,519,216 | ||||||||
INDEPENDENT POWER PRODUCERS & ENERGY TRADERS — 0.21% |
| |||||||
TransAlta Corp. | 684,250 | 7,910,113 | ||||||
|
| |||||||
| 7,910,113 | ||||||||
INSURANCE — 7.45% |
| |||||||
Fairfax Financial Holdings Ltd. | 52,900 | 24,432,753 | ||||||
Great-West Lifeco Inc. | 761,300 | 22,331,935 | ||||||
Industrial Alliance Insurance and Financial Services Inc. | 253,000 | 10,947,979 | ||||||
Intact Financial Corp. | 334,650 | 22,801,550 | ||||||
Manulife Financial Corp. | 4,709,250 | 95,292,037 | ||||||
Power Corp. of Canada | 943,000 | 27,853,164 | ||||||
Power Financial Corp. | 632,500 | 20,495,391 | ||||||
Sun Life Financial Inc. | 1,551,350 | 57,820,770 | ||||||
|
| |||||||
| 281,975,579 | ||||||||
IT SERVICES — 0.53% |
| |||||||
CGI Group Inc. Class Aa,b | 561,200 | 19,907,791 | ||||||
|
| |||||||
| 19,907,791 | ||||||||
MEDIA — 1.59% |
| |||||||
Shaw Communications Inc. Class B | 987,850 | 24,943,269 | ||||||
Thomson Reuters Corp. | 925,750 | 35,161,005 | ||||||
|
| |||||||
| 60,104,274 | ||||||||
METALS & MINING — 8.06% |
| |||||||
Agnico-Eagle Mines Ltd. | 524,400 | 20,100,993 | ||||||
Barrick Gold Corp. | 2,960,100 | 54,549,342 | ||||||
Eldorado Gold Corp. | 1,815,850 | 15,049,082 | ||||||
| 28 | 2014 iSHARES ANNUAL REPORTTO SHAREHOLDERS |
Table of Contents
Schedule of Investments (Continued)
iSHARES® MSCI CANADA ETF
August 31, 2014
| Security | Shares | Value | ||||||
First Quantum Minerals Ltd. | 1,500,750 | $ | 33,771,198 | |||||
Franco-Nevada Corp. | 396,750 | 22,405,997 | ||||||
Goldcorp Inc. | 2,067,700 | 58,194,866 | ||||||
Kinross Gold Corp.a | 2,898,000 | 11,487,808 | ||||||
New Gold Inc.a,b | 1,274,200 | 8,257,779 | ||||||
Silver Wheaton Corp. | 909,650 | 22,775,842 | ||||||
Teck Resources Ltd. Class B | 1,440,950 | 32,797,470 | ||||||
Turquoise Hill Resources Ltd.a,b | 2,036,650 | 6,871,758 | ||||||
Yamana Gold Inc. | 2,205,700 | 18,829,022 | ||||||
|
| |||||||
| 305,091,157 | ||||||||
MULTI-UTILITIES — 0.51% |
| |||||||
ATCO Ltd. Class I NVS | 193,200 | 8,333,559 | ||||||
Canadian Utilities Ltd. Class A | 308,200 | 11,120,487 | ||||||
|
| |||||||
| 19,454,046 | ||||||||
MULTILINE RETAIL — 0.90% |
| |||||||
Canadian Tire Corp. Ltd. Class A NVS | 194,350 | 20,123,892 | ||||||
Dollarama Inc. | 163,300 | 13,935,636 | ||||||
|
| |||||||
| 34,059,528 | ||||||||
OIL, GAS & CONSUMABLE FUELS — 27.12% |
| |||||||
AltaGas Ltd. | 333,500 | 16,168,486 | ||||||
ARC Resources Ltd. | 800,400 | 23,191,124 | ||||||
Athabasca Oil Corp.a | 813,050 | 5,936,258 | ||||||
Baytex Energy Corp. | 419,750 | 18,813,777 | ||||||
Cameco Corp. | 1,005,100 | 19,698,941 | ||||||
Canadian Natural Resources Ltd. | 2,778,400 | 121,381,310 | ||||||
Canadian Oil Sands Ltd. | 1,231,650 | 26,591,604 | ||||||
Cenovus Energy Inc. | 1,922,800 | 61,472,878 | ||||||
Crescent Point Energy Corp. | 1,045,350 | 43,365,522 | ||||||
Enbridge Inc. | 2,121,750 | 106,072,830 | ||||||
Encana Corp. | 1,882,550 | 43,508,208 | ||||||
Enerplus Corp. | 518,650 | 11,900,621 | ||||||
Husky Energy Inc. | 875,150 | 26,704,277 | ||||||
Imperial Oil Ltd. | 754,400 | 40,239,303 | ||||||
Inter Pipeline Ltd. | 815,350 | 27,269,784 | ||||||
Keyera Corp. | 212,750 | 18,761,618 | ||||||
MEG Energy Corp.a | 395,600 | 14,124,534 | ||||||
Pacific Rubiales Energy Corp. | 796,950 | 16,625,931 | ||||||
Pembina Pipeline Corp. | 821,100 | 37,824,722 | ||||||
Pengrowth Energy Corp. | 1,331,700 | 8,507,657 | ||||||
Penn West Petroleum Ltd. | 1,247,750 | 9,719,740 | ||||||
Peyto Exploration & Development Corp. | 371,450 | 13,193,794 | ||||||
Suncor Energy Inc. | 3,731,750 | 153,535,840 | ||||||
Talisman Energy Inc. | 2,630,050 | 26,500,527 | ||||||
| Security | Shares | Value | ||||||
Tourmaline Oil Corp.a | 432,400 | $ | 21,951,849 | |||||
TransCanada Corp. | 1,799,750 | 96,943,436 | ||||||
Vermilion Energy Inc. | 261,050 | 17,021,495 | ||||||
|
| |||||||
| 1,027,026,066 | ||||||||
PHARMACEUTICALS — 2.51% |
| |||||||
Valeant Pharmaceuticals International Inc.a | 809,600 | 95,069,692 | ||||||
|
| |||||||
| 95,069,692 | ||||||||
REAL ESTATE INVESTMENT TRUSTS (REITS) — 0.44% |
| |||||||
H&R Real Estate | 336,950 | 7,184,746 | ||||||
RioCan Real Estate Investment Trust | 378,350 | 9,448,723 | ||||||
|
| |||||||
| 16,633,469 | ||||||||
REAL ESTATE MANAGEMENT & DEVELOPMENT — 1.89% |
| |||||||
Brookfield Asset Management Inc. Class A | 1,408,750 | 67,466,755 | ||||||
First Capital Realty Inc. | 238,050 | 4,239,803 | ||||||
|
| |||||||
| 71,706,558 | ||||||||
ROAD & RAIL — 6.33% |
| |||||||
Canadian National Railway Co. | 2,091,850 | 150,590,059 | ||||||
Canadian Pacific Railway Ltd. | 443,900 | 89,123,744 | ||||||
|
| |||||||
| 239,713,803 | ||||||||
SOFTWARE — 0.46% |
| |||||||
Open Text Corp. | 309,350 | 17,418,850 | ||||||
|
| |||||||
| 17,418,850 | ||||||||
TEXTILES, APPAREL & LUXURY GOODS — 0.45% |
| |||||||
Gildan Activewear Inc. | 295,550 | 16,985,100 | ||||||
|
| |||||||
| 16,985,100 | ||||||||
TRADING COMPANIES & DISTRIBUTORS — 0.36% |
| |||||||
Finning International Inc. | 437,000 | 13,656,879 | ||||||
|
| |||||||
| 13,656,879 | ||||||||
WIRELESS TELECOMMUNICATION SERVICES — 0.99% |
| |||||||
Rogers Communications Inc. Class B | 920,000 | 37,588,753 | ||||||
|
| |||||||
| 37,588,753 | ||||||||
|
| |||||||
TOTAL COMMON STOCKS |
| |||||||
(Cost: $3,669,195,894) |
| 3,778,059,600 | ||||||
SHORT-TERM INVESTMENTS — 0.85% |
| |||||||
MONEY MARKET FUNDS — 0.85% |
| |||||||
BlackRock Cash Funds: Institutional, |
| |||||||
0.14%c,d,e | 28,348,652 | 28,348,652 | ||||||
SCHEDULESOF INVESTMENTS | 29 |
Table of Contents
Schedule of Investments (Continued)
iSHARES® MSCI CANADA ETF
August 31, 2014
| Security | Shares | Value | ||||||
BlackRock Cash Funds: Prime, | ||||||||
0.11%c,d,e | 1,784,625 | $ | 1,784,625 | |||||
BlackRock Cash Funds: Treasury, | ||||||||
0.00%c,d | 1,917,613 | 1,917,613 | ||||||
|
| |||||||
| 32,050,890 | ||||||||
|
| |||||||
TOTAL SHORT-TERM INVESTMENTS |
| |||||||
(Cost: $32,050,890) |
| 32,050,890 | ||||||
|
| |||||||
TOTAL INVESTMENTS |
| |||||||
(Cost: $3,701,246,784) |
| 3,810,110,490 | ||||||
Other Assets, Less Liabilities — (0.61)% |
| (23,204,260 | ) | |||||
|
| |||||||
NET ASSETS — 100.00% |
| $ | 3,786,906,230 | |||||
|
| |||||||
NVS — Non-Voting Shares
| a | Non-income earning security. |
| b | All or a portion of this security represents a security on loan. See Note 1. |
| c | Affiliated issuer. See Note 2. |
| d | The rate quoted is the annualized seven-day yield of the fund at period end. |
| e | All or a portion of this security represents an investment of securities lending collateral. See Note 1. |
Financial futures contracts purchased as of August 31, 2014 were as follows:
| Number of Contracts | Issue (Expiration) | Exchange | Notional Value | Unrealized Appreciation (Depreciation) | ||||||||||
| 134 | S&P/TSX 60 Index (Sept. 2014) | Montreal | $ | 22,168,832 | $ | 893,090 | ||||||||
See notes to financial statements.
| 30 | 2014 iSHARES ANNUAL REPORTTO SHAREHOLDERS |
Table of Contents
iSHARES® MSCI CHILE CAPPED ETF
August 31, 2014
| Security | Shares | Value | ||||||
COMMON STOCKS — 93.57% |
| |||||||
AIRLINES — 5.43% |
| |||||||
LATAM Airlines Group SAa | 1,548,145 | $ | 19,152,339 | |||||
|
| |||||||
| 19,152,339 | ||||||||
BEVERAGES — 4.30% |
| |||||||
Compania Cervecerias Unidas SA | 881,943 | 9,472,760 | ||||||
Vina Concha y Toro SA | 2,907,432 | 5,670,328 | ||||||
|
| |||||||
| 15,143,088 | ||||||||
COMMERCIAL BANKS — 15.50% |
| |||||||
Banco de Chile | 129,407,440 | 15,791,909 | ||||||
Banco de Credito e Inversiones | 190,597 | 10,387,762 | ||||||
Banco Santander (Chile) SA | 312,394,376 | 18,509,129 | ||||||
CorpBanca SA | 809,060,289 | 9,941,564 | ||||||
|
| |||||||
| 54,630,364 | ||||||||
CONSTRUCTION & ENGINEERING — 0.99% |
| |||||||
Besalco SA | 2,237,657 | 1,531,399 | ||||||
SalfaCorp SA | 2,572,463 | 1,966,799 | ||||||
|
| |||||||
| 3,498,198 | ||||||||
DIVERSIFIED FINANCIAL SERVICES — 0.83% |
| |||||||
Inversiones la Construccion SA | 221,215 | 2,913,836 | ||||||
|
| |||||||
| 2,913,836 | ||||||||
ELECTRIC UTILITIES — 10.36% |
| |||||||
E.CL SA | 2,639,867 | 3,807,854 | ||||||
Enersis SA | 97,126,531 | 32,695,215 | ||||||
|
| |||||||
| 36,503,069 | ||||||||
FOOD & STAPLES RETAILING — 4.58% |
| |||||||
Cencosud SA | 5,383,636 | 16,153,639 | ||||||
|
| |||||||
| 16,153,639 | ||||||||
FOOD PRODUCTS — 1.04% |
| |||||||
Empresas Aquachile SAa | 3,320,738 | 2,154,268 | ||||||
Multiexport Foods SAa | 6,692,098 | 1,528,750 | ||||||
|
| |||||||
| 3,683,018 | ||||||||
HEALTH CARE PROVIDERS & SERVICES — 0.31% |
| |||||||
Cruz Blanca Salud SA | 1,326,692 | 1,081,274 | ||||||
|
| |||||||
| 1,081,274 | ||||||||
HOUSEHOLD DURABLES — 0.25% |
| |||||||
Socovesa SA | 4,038,966 | 870,761 | ||||||
|
| |||||||
| 870,761 | ||||||||
INDEPENDENT POWER PRODUCERS & ENERGY TRADERS — 12.52% |
| |||||||
AES Gener SA | 15,460,203 | 7,903,682 | ||||||
Colbun SA | 45,853,876 | 12,000,783 | ||||||
| Security | Shares | Value | ||||||
Empresa Nacional de Electricidad SA | 15,854,182 | $ | 24,221,995 | |||||
|
| |||||||
| 44,126,460 | ||||||||
IT SERVICES — 1.97% |
| |||||||
Sonda SA | 3,001,776 | 6,956,263 | ||||||
|
| |||||||
| 6,956,263 | ||||||||
MARINE — 0.75% |
| |||||||
Compania SudAmericana de Vapores SAa | 62,692,134 | 2,638,497 | ||||||
|
| |||||||
| 2,638,497 | ||||||||
METALS & MINING — 1.55% |
| |||||||
CAP SA | 460,108 | 5,466,369 | ||||||
|
| |||||||
| 5,466,369 | ||||||||
MULTILINE RETAIL — 11.32% |
| |||||||
Empresas Hites SA | 1,939,973 | 919,371 | ||||||
Ripley Corp. SA | 4,739,100 | 2,558,665 | ||||||
S.A.C.I. Falabella SA | 4,838,522 | 36,437,818 | ||||||
|
| |||||||
| 39,915,854 | ||||||||
OIL, GAS & CONSUMABLE FUELS — 7.94% |
| |||||||
Empresas Copec SA | 2,228,115 | 28,006,660 | ||||||
|
| |||||||
| 28,006,660 | ||||||||
PAPER & FOREST PRODUCTS — 4.78% |
| |||||||
Empresas CMPC SA | 6,293,889 | 15,666,611 | ||||||
Masisa SA | 26,247,583 | 1,197,430 | ||||||
|
| |||||||
| 16,864,041 | ||||||||
REAL ESTATE MANAGEMENT & DEVELOPMENT — 1.87% |
| |||||||
Parque Arauco SA | 3,553,974 | 6,607,363 | ||||||
|
| |||||||
| 6,607,363 | ||||||||
TEXTILES, APPAREL & LUXURY GOODS — 0.61% |
| |||||||
Forus SA | 506,009 | 2,139,030 | ||||||
|
| |||||||
| 2,139,030 | ||||||||
TRANSPORTATION INFRASTRUCTURE — 0.88% |
| |||||||
Sociedad Matriz SAAM SA | 37,585,561 | 3,095,693 | ||||||
|
| |||||||
| 3,095,693 | ||||||||
WATER UTILITIES — 3.45% |
| |||||||
Aguas Andinas SA Series A | 13,732,765 | 8,612,120 | ||||||
Inversiones Aguas Metropolitanas SA | 2,204,197 | 3,532,418 | ||||||
|
| |||||||
| 12,144,538 | ||||||||
WIRELESS TELECOMMUNICATION SERVICES — 2.34% |
| |||||||
Empresa Nacional de Telecomunicaciones SA | 719,394 | 8,252,595 | ||||||
|
| |||||||
| 8,252,595 | ||||||||
|
| |||||||
TOTAL COMMON STOCKS |
| |||||||
(Cost: $284,054,146) |
| 329,842,949 | ||||||
SCHEDULESOF INVESTMENTS | 31 |
Table of Contents
Schedule of Investments (Continued)
iSHARES® MSCI CHILE CAPPED ETF
August 31, 2014
| Security | Shares | Value | ||||||
PREFERRED STOCKS — 6.19% |
| |||||||
BEVERAGES — 2.14% |
| |||||||
Coca-Cola Embonor SA | 1,346,556 | $ | 2,265,511 | |||||
Embotelladora Andina SA Class B | 1,609,332 | 5,275,366 | ||||||
|
| |||||||
| 7,540,877 | ||||||||
CHEMICALS — 4.05% |
| |||||||
Sociedad Quimica y Minera de Chile SA Series B | 521,686 | 14,281,529 | ||||||
|
| |||||||
| 14,281,529 | ||||||||
|
| |||||||
TOTAL PREFERRED STOCKS (Cost: $22,661,488) |
| 21,822,406 | ||||||
SHORT-TERM INVESTMENTS — 0.09% |
| |||||||
MONEY MARKET FUNDS — 0.09% |
| |||||||
BlackRock Cash Funds: Treasury, | ||||||||
0.00%b,c | 316,985 | 316,985 | ||||||
|
| |||||||
| 316,985 | ||||||||
|
| |||||||
TOTAL SHORT-TERM INVESTMENTS (Cost: $316,985) |
| 316,985 | ||||||
|
| |||||||
TOTAL INVESTMENTS IN SECURITIES — 99.85% |
| |||||||
(Cost: $307,032,619) |
| 351,982,340 | ||||||
Other Assets, Less Liabilities — 0.15% |
| 517,113 | ||||||
|
| |||||||
NET ASSETS — 100.00% |
| $ | 352,499,453 | |||||
|
| |||||||
| a | Non-income earning security. |
| b | Affiliated issuer. See Note 2. |
| c | The rate quoted is the annualized seven-day yield of the fund at period end. |
See notes to financial statements.
| 32 | 2014 iSHARES ANNUAL REPORTTO SHAREHOLDERS |
Table of Contents
iSHARES® MSCI COLOMBIA CAPPED ETF
August 31, 2014
| Security | Shares | Value | ||||||
COMMON STOCKS — 78.14% |
| |||||||
COMMERCIAL BANKS — 4.62% |
| |||||||
Banco de Bogota SA | 10,260 | $ | 387,949 | |||||
Bancolombia SA | 46,152 | 709,679 | ||||||
Grupo Aval Acciones y Valores SA | 103,230 | 76,678 | ||||||
|
| |||||||
| 1,174,306 | ||||||||
CONSTRUCTION MATERIALS — 9.45% |
| |||||||
Cementos Argos SA | 42,588 | 250,850 | ||||||
Cemex Latam Holdings SAa | 127,890 | 1,266,601 | ||||||
Grupo Argos SA | 71,118 | 881,538 | ||||||
|
| |||||||
| 2,398,989 | ||||||||
DIVERSIFIED FINANCIAL SERVICES — 14.07% |
| |||||||
Bolsa de Valores de Colombia | 60,729,516 | 791,388 | ||||||
Corporacion Financiera Colombiana SA NVS | 52,398 | 1,117,088 | ||||||
Grupo de Inversiones Suramericana SA | 72,360 | 1,663,362 | ||||||
|
| |||||||
| 3,571,838 | ||||||||
ELECTRIC UTILITIES — 12.46% |
| |||||||
Celsia SA ESP | 289,890 | 982,192 | ||||||
Interconexion Electrica SA ESP | 234,882 | 1,187,602 | ||||||
Isagen SA ESP | 664,848 | 994,612 | ||||||
|
| |||||||
| 3,164,406 | ||||||||
FOOD & STAPLES RETAILING — 4.49% |
| |||||||
Almacenes Exito SA | 66,978 | 1,140,244 | ||||||
|
| |||||||
| 1,140,244 | ||||||||
FOOD PRODUCTS — 4.52% |
| |||||||
Grupo Nutresa SA | 76,914 | 1,149,029 | ||||||
|
| |||||||
| 1,149,029 | ||||||||
GAS UTILITIES — 4.05% |
| |||||||
Empresa de Energia de Bogota SA | 1,132,956 | 1,027,571 | ||||||
|
| |||||||
| 1,027,571 | ||||||||
METALS & MINING — 0.52% |
| |||||||
Mineros SA | 87,826 | 132,761 | ||||||
|
| |||||||
| 132,761 | ||||||||
OIL, GAS & CONSUMABLE FUELS — 23.96% |
| |||||||
Canacol Energy Ltd.a | 156,060 | 981,174 | ||||||
Ecopetrol SA | 1,726,002 | 2,991,455 | ||||||
Pacific Rubiales Energy Corp. | 101,232 | 2,111,897 | ||||||
|
| |||||||
| 6,084,526 | ||||||||
|
| |||||||
TOTAL COMMON STOCKS |
| |||||||
(Cost: $18,094,904) |
| 19,843,670 | ||||||
| Security | Shares | Value | ||||||
PREFERRED STOCKS — 19.90% |
| |||||||
AIRLINES — 3.51% |
| |||||||
Avianca Holdings SA | 437,976 | $ | 890,358 | |||||
|
| |||||||
| 890,358 | ||||||||
COMMERCIAL BANKS — 14.67% |
| |||||||
Banco Davivienda SA | 72,378 | 1,203,502 | ||||||
Bancolombia SA | 145,872 | 2,311,506 | ||||||
Grupo Aval Acciones y Valores SA | 282,528 | 211,331 | ||||||
|
| |||||||
| 3,726,339 | ||||||||
CONSTRUCTION MATERIALS — 0.33% |
| |||||||
Grupo Argos SA | 6,768 | 82,552 | ||||||
|
| |||||||
| 82,552 | ||||||||
DIVERSIFIED FINANCIAL SERVICES — 1.39% |
| |||||||
Grupo de Inversiones Suramericana SA | 15,570 | 353,854 | ||||||
|
| |||||||
| 353,854 | ||||||||
|
| |||||||
TOTAL PREFERRED STOCKS |
| |||||||
(Cost: $4,337,319) |
| 5,053,103 | ||||||
SHORT-TERM INVESTMENTS — 0.21% |
| |||||||
MONEY MARKET FUNDS — 0.21% |
| |||||||
BlackRock Cash Funds: Treasury, | ||||||||
0.00%b,c | 53,269 | 53,269 | ||||||
|
| |||||||
| 53,269 | ||||||||
|
| |||||||
TOTAL SHORT-TERM INVESTMENTS |
| |||||||
(Cost: $53,269) |
| 53,269 | ||||||
|
| |||||||
TOTAL INVESTMENTS |
| |||||||
(Cost: $22,485,492) |
| 24,950,042 | ||||||
Other Assets, Less Liabilities — 1.75% |
| 445,630 | ||||||
|
| |||||||
NET ASSETS — 100.00% |
| $ | 25,395,672 | |||||
|
| |||||||
NVS — Non-Voting Shares
| a | Non-income earning security. |
| b | Affiliated issuer. See Note 2. |
| c | The rate quoted is the annualized seven-day yield of the fund at period end. |
See notes to financial statements.
SCHEDULESOF INVESTMENTS | 33 |
Table of Contents
Schedule of Investments
iSHARES® MSCI ISRAEL CAPPED ETF
August 31, 2014
| Security | Shares | Value | ||||||
COMMON STOCKS — 99.72% |
| |||||||
AEROSPACE & DEFENSE — 2.47% |
| |||||||
Elbit Systems Ltd. | 50,496 | $ | 3,009,892 | |||||
|
| |||||||
| 3,009,892 | ||||||||
BIOTECHNOLOGY — 0.32% | ||||||||
Kamada Ltd.a | 56,016 | 384,910 | ||||||
|
| |||||||
| 384,910 | ||||||||
CHEMICALS — 10.27% | ||||||||
Frutarom | 79,440 | 1,996,909 | ||||||
Israel Chemicals Ltd. | 939,744 | 7,268,505 | ||||||
Israel Corp. Ltd. (The)a | 5,712 | 3,223,845 | ||||||
|
| |||||||
| 12,489,259 | ||||||||
COMMERCIAL BANKS — 25.81% |
| |||||||
Bank Hapoalim BM | 2,239,776 | 12,710,308 | ||||||
Bank Leumi le-Israel BMa | 2,805,264 | 10,966,661 | ||||||
First International Bank of Israel Ltd. | 46,512 | 729,927 | ||||||
Israel Discount Bank Ltd. Class Aa | 2,004,529 | 3,370,467 | ||||||
Mizrahi Tefahot Bank Ltd. | 295,008 | 3,625,183 | ||||||
|
| |||||||
| 31,402,546 | ||||||||
COMMUNICATIONS EQUIPMENT — 0.56% |
| |||||||
Ituran Location and Control Ltd. | 31,440 | 683,884 | ||||||
|
| |||||||
| 683,884 | ||||||||
CONSTRUCTION & ENGINEERING — 1.26% |
| |||||||
Electra (Israel) Ltd. | 3,648 | 547,343 | ||||||
Shikun & Binui Ltd. | 418,896 | 981,736 | ||||||
|
| |||||||
| 1,529,079 | ||||||||
DIVERSIFIED TELECOMMUNICATION SERVICES — 4.86% |
| |||||||
Bezeq The Israel Telecommunication Corp. Ltd. | 3,125,616 | 5,917,683 | ||||||
|
| |||||||
| 5,917,683 | ||||||||
ELECTRICAL EQUIPMENT — 0.73% |
| |||||||
Ormat Industries Ltd. | 119,184 | 882,090 | ||||||
|
| |||||||
| 882,090 | ||||||||
FOOD & STAPLES RETAILING — 0.92% |
| |||||||
Rami Levi Chain Stores Hashikma Marketing 2006 Ltd. | 13,344 | 664,508 | ||||||
Shufersal Ltd. | 161,088 | 459,555 | ||||||
|
| |||||||
| 1,124,063 | ||||||||
FOOD PRODUCTS — 2.64% | ||||||||
Osem Investment Ltd. | 76,080 | 1,680,694 | ||||||
Strauss Group Ltd. | 83,808 | 1,531,532 | ||||||
|
| |||||||
| 3,212,226 | ||||||||
| Security | Shares | Value | ||||||
INDUSTRIAL CONGLOMERATES — 0.36% |
| |||||||
Discount Investment Corp. Ltd. Registereda | 53,280 | $ | 438,675 | |||||
|
| |||||||
| 438,675 | ||||||||
INSURANCE — 3.59% | ||||||||
Clal Insurance Enterprises Holdings Ltd.a | 40,368 | 740,751 | ||||||
Harel Insurance Investments & Financial Services Ltd. | 226,704 | 1,276,973 | ||||||
Menorah Mivtachim Holdings Ltd. | 54,960 | 622,235 | ||||||
Migdal Insurance & Financial Holdings Ltd. | 837,360 | 1,274,907 | ||||||
Phoenix Holdings Ltd. | 131,041 | 452,055 | ||||||
|
| |||||||
| 4,366,921 | ||||||||
IT SERVICES — 0.32% | ||||||||
MATRIX IT Ltd. | 72,048 | 393,716 | ||||||
|
| |||||||
| 393,716 | ||||||||
MACHINERY — 0.25% | ||||||||
Plasson Industries Ltd. | 7,344 | 302,536 | ||||||
|
| |||||||
| 302,536 | ||||||||
OIL, GAS & CONSUMABLE FUELS — 5.49% |
| |||||||
Delek Group Ltd. (The) | 10,032 | 3,654,747 | ||||||
Naphtha Israel Petroleum Corp. Ltd.a | 72,097 | 517,226 | ||||||
Oil Refineries Ltd.a | 2,325,120 | 768,872 | ||||||
Paz Oil Co. Ltd. | 11,280 | 1,740,807 | ||||||
|
| |||||||
| 6,681,652 | ||||||||
PHARMACEUTICALS — 23.52% | ||||||||
Teva Pharmaceutical Industries Ltd. | 548,400 | 28,615,648 | ||||||
|
| |||||||
| 28,615,648 | ||||||||
REAL ESTATE MANAGEMENT & DEVELOPMENT — 8.35% |
| |||||||
Africa Israel Investments Ltd.a | 231,888 | 383,405 | ||||||
Africa Israel Properties Ltd.a | 27,025 | 477,497 | ||||||
Airport City Ltd.a | 70,080 | 687,367 | ||||||
AL-ROV (Israel) Ltd.a | 8,640 | 279,897 | ||||||
Alony Hetz Properties & Investments Ltd. | 169,296 | 1,265,308 | ||||||
Alrov Properties and Lodgings Ltd.a | 9,552 | 226,192 | ||||||
Amot Investments Ltd. | 186,576 | 599,716 | ||||||
Bayside Land Corp. Ltd. | 1,344 | 364,926 | ||||||
Gazit Globe Ltd. | 192,576 | 2,420,961 | ||||||
Jerusalem Economy Ltd. | 42,288 | 356,587 | ||||||
Jerusalem Oil Exploration Ltd.a | 18,480 | 793,409 | ||||||
Melisron Ltd. | 32,641 | 863,307 | ||||||
| 34 | 2014 iSHARES ANNUAL REPORTTO SHAREHOLDERS |
Table of Contents
Schedule of Investments (Continued)
iSHARES® MSCI ISRAEL CAPPED ETF
August 31, 2014
| Security | Shares | Value | ||||||
Nitsba Holdings (1995) Ltd.a | 54,576 | $ | 895,784 | |||||
Norstar Holdings Inc. | 19,584 | 537,292 | ||||||
|
| |||||||
| 10,151,648 | ||||||||
SEMICONDUCTORS & SEMICONDUCTOR EQUIPMENT — 1.23% |
| |||||||
EZchip Semiconductor Ltd.a | 59,664 | 1,499,124 | ||||||
|
| |||||||
| 1,499,124 | ||||||||
SOFTWARE — 3.83% | ||||||||
NICE Systems Ltd. | 120,336 | 4,657,102 | ||||||
|
| |||||||
| 4,657,102 | ||||||||
SPECIALTY RETAIL — 0.64% | ||||||||
Delek Automotive Systems Ltd. | 72,720 | 774,397 | ||||||
|
| |||||||
| 774,397 | ||||||||
WIRELESS TELECOMMUNICATION SERVICES — 2.30% |
| |||||||
Cellcom Israel Ltd. | 122,592 | 1,437,065 | ||||||
Partner Communications Co. Ltd.a | 187,632 | 1,356,078 | ||||||
|
| |||||||
| 2,793,143 | ||||||||
|
| |||||||
TOTAL COMMON STOCKS |
| 121,310,194 | ||||||
SHORT-TERM INVESTMENTS — 0.01% |
| |||||||
MONEY MARKET FUNDS — 0.01% |
| |||||||
BlackRock Cash Funds: Treasury, | ||||||||
0.00%b,c | 11,119 | 11,119 | ||||||
|
| |||||||
| 11,119 | ||||||||
|
| |||||||
TOTAL SHORT-TERM INVESTMENTS |
| 11,119 | ||||||
|
| |||||||
TOTAL INVESTMENTS |
| 121,321,313 | ||||||
Other Assets, Less Liabilities — 0.27% |
| 323,995 | ||||||
|
| |||||||
NET ASSETS — 100.00% | $ | 121,645,308 | ||||||
|
| |||||||
| a | Non-income earning security. |
| b | Affiliated issuer. See Note 2. |
| c | The rate quoted is the annualized seven-day yield of the fund at period end. |
See notes to financial statements.
SCHEDULESOF INVESTMENTS | 35 |
Table of Contents
Schedule of Investments
iSHARES® MSCI MEXICO CAPPED ETF
August 31, 2014
| Security | Shares | Value | ||||||
COMMON STOCKS — 99.81% |
| |||||||
AIRLINES — 0.63% | ||||||||
Controladora Vuela Cia de Aviacion SAB de CVa,b | 9,037,600 | $ | 8,010,844 | |||||
Grupo Aeromexico SAB de CVa,b | 7,755,536 | 12,532,941 | ||||||
|
| |||||||
| 20,543,785 | ||||||||
BEVERAGES — 10.11% | ||||||||
Arca Continental SAB de CV | 5,938,829 | 43,657,240 | ||||||
Coca-Cola FEMSA SAB de CV Series L | 3,898,258 | 42,499,077 | ||||||
Fomento Economico Mexicano SAB de CV BD Units | 24,421,710 | 237,072,972 | ||||||
Organizacion Cultiba SAB de CVb | 4,568,500 | 7,854,375 | ||||||
|
| |||||||
| 331,083,664 | ||||||||
BUILDING PRODUCTS — 0.00% |
| |||||||
Corporacion Geo SAB de CV Series Ba,b,c | 15,588,128 | 12 | ||||||
Urbi Desarrollos Urbanos SAB de CVa,b,c | 29,674,089 | 23 | ||||||
|
| |||||||
| 35 | ||||||||
CAPITAL MARKETS — 0.31% | ||||||||
Grupo Financiero Interacciones SA de CV Series O | 1,220,000 | 10,033,008 | ||||||
|
| |||||||
| 10,033,008 | ||||||||
CHEMICALS — 1.83% | ||||||||
Mexichem SAB de CV | 13,910,574 | 59,991,378 | ||||||
|
| |||||||
| 59,991,378 | ||||||||
COMMERCIAL BANKS — 12.76% |
| |||||||
Banregio Grupo Financiero SAB de CVb | 3,235,900 | 18,268,834 | ||||||
Grupo Financiero Banorte SAB de CV Series O | 31,117,478 | 219,063,428 | ||||||
Grupo Financiero Inbursa SAB de CV Series O | 33,247,292 | 101,022,134 | ||||||
Grupo Financiero Santander Mexico SAB de CV Series Bb | 26,533,650 | 79,466,004 | ||||||
|
| |||||||
| 417,820,400 | ||||||||
CONSTRUCTION & ENGINEERING — 2.22% |
| |||||||
Empresas ICA SAB de CVa,b | 10,254,588 | 19,010,456 | ||||||
Promotora y Operadora Infraestructura SAB de CVa | 3,837,800 | 53,800,523 | ||||||
|
| |||||||
| 72,810,979 | ||||||||
| Security | Shares | Value | ||||||
CONSTRUCTION MATERIALS — 6.09% |
| |||||||
Cemex SAB de CV CPOa | 150,050,600 | $ | 199,333,022 | |||||
|
| |||||||
| 199,333,022 | ||||||||
CONSUMER FINANCE — 1.32% |
| |||||||
Compartamos SAB de CVb | 16,617,206 | 35,482,574 | ||||||
Credito Real SAB de CVb | 2,957,900 | 7,890,448 | ||||||
|
| |||||||
| 43,373,022 | ||||||||
CONTAINERS & PACKAGING — 0.20% |
| |||||||
Bio Pappel SAB de CVa,b | 3,313,281 | 6,398,252 | ||||||
|
| |||||||
| 6,398,252 | ||||||||
DIVERSIFIED FINANCIAL SERVICES — 0.48% |
| |||||||
Bolsa Mexicana de Valores SAB de CV | 7,421,787 | 15,881,733 | ||||||
|
| |||||||
| 15,881,733 | ||||||||
DIVERSIFIED TELECOMMUNICATION SERVICES — 0.22% |
| |||||||
Axtel SAB de CV CPOa,b | 22,902,877 | 7,163,991 | ||||||
|
| |||||||
| 7,163,991 | ||||||||
FOOD & STAPLES RETAILING — 6.13% |
| |||||||
Controladora Comercial Mexicana SAB de CV BC Units | 7,214,655 | 27,787,085 | ||||||
Grupo Comercial Chedraui SAB de CVb | 5,913,700 | 20,546,778 | ||||||
Wal-Mart de Mexico SAB de CV Series V | 55,999,233 | 152,466,268 | ||||||
|
| |||||||
| 200,800,131 | ||||||||
FOOD PRODUCTS — 4.68% | ||||||||
Gruma SAB de CV Series Ba | 2,650,800 | 30,241,278 | ||||||
Grupo Bimbo SAB de CV Series A | 23,825,704 | 75,000,266 | ||||||
Grupo Herdez SAB de CVb | 4,106,044 | 11,499,624 | ||||||
Grupo Lala SAB de CV | 9,608,700 | 24,941,247 | ||||||
Industrias Bachoco SAB de CV Series B | 2,408,400 | 11,517,514 | ||||||
|
| |||||||
| 153,199,929 | ||||||||
HOTELS, RESTAURANTS & LEISURE — 1.06% |
| |||||||
Alsea SAB de CVa,b | 8,022,466 | 27,677,216 | ||||||
Hoteles City Express SAB de CVa,b | 3,536,800 | 6,883,986 | ||||||
|
| |||||||
| 34,561,202 | ||||||||
HOUSEHOLD DURABLES — 0.28% |
| |||||||
Consorcio ARA SAB de CVa,b | 20,286,943 | 9,262,594 | ||||||
|
| |||||||
| 9,262,594 | ||||||||
| 36 | 2014 iSHARES ANNUAL REPORTTO SHAREHOLDERS |
Table of Contents
Schedule of Investments (Continued)
iSHARES® MSCI MEXICO CAPPED ETF
August 31, 2014
| Security | Shares | Value | ||||||
HOUSEHOLD PRODUCTS — 1.84% |
| |||||||
Kimberly-Clark de Mexico SAB de CV Series A | 22,632,554 | $ | 60,391,557 | |||||
|
| |||||||
| 60,391,557 | ||||||||
INDUSTRIAL CONGLOMERATES — 5.51% |
| |||||||
Alfa SAB de CV Series A | 39,882,051 | 128,319,214 | ||||||
Grupo Carso SAB de CV Series A1 | 8,545,733 | 52,220,112 | ||||||
|
| |||||||
| 180,539,326 | ||||||||
INSURANCE — 0.29% | ||||||||
Qualitas Controladora SAB de CV | 3,472,000 | 9,498,179 | ||||||
|
| |||||||
| 9,498,179 | ||||||||
MEDIA — 7.71% | ||||||||
Grupo Televisa SAB de CV CPO | 32,360,697 | 240,784,078 | ||||||
TV Azteca SAB de CV CPOb | 22,113,439 | 11,872,306 | ||||||
|
| |||||||
| 252,656,384 | ||||||||
METALS & MINING — 7.66% | ||||||||
Grupo Mexico SAB de CV Series B | 41,323,886 | 150,119,275 | ||||||
Grupo Simec SAB de CV Series Ba,b | 2,332,454 | 10,442,572 | ||||||
Industrias CH SAB de CV Series Ba,b | 2,893,683 | 15,989,339 | ||||||
Industrias Penoles SAB de CV | 2,065,428 | 52,411,687 | ||||||
Minera Frisco SAB de CV Series A1a | 10,839,303 | 21,793,834 | ||||||
|
| |||||||
| 250,756,707 | ||||||||
MULTILINE RETAIL — 1.25% | ||||||||
El Puerto de Liverpool SAB de CV Series C1 | 2,959,595 | 33,748,279 | ||||||
Grupo Famsa SAB de CV Series Aa,b | 6,372,340 | 7,222,521 | ||||||
|
| |||||||
| 40,970,800 | ||||||||
PHARMACEUTICALS — 1.01% |
| |||||||
Genomma Lab Internacional SAB de CV Series Ba,b | 12,367,193 | 32,990,531 | ||||||
|
| |||||||
| 32,990,531 | ||||||||
REAL ESTATE INVESTMENT TRUSTS (REITS) — 5.33% |
| |||||||
Concentradora Fibra Hotelera Mexicana SAB de CVb | 8,333,500 | 14,537,657 | ||||||
| Security | Shares | Value | ||||||
Fibra Shop Portafolios Inmobiliarios SAPI de CV | 5,986,900 | $ | 8,351,578 | |||||
Fibra Uno Administracion SAB de CV | 32,625,600 | 117,148,248 | ||||||
Macquarie Mexico Real Estate Management SA de CV | 9,666,200 | 19,376,016 | ||||||
TF Administradora Industrial S de RL SAB de CV | 6,614,000 | 15,144,596 | ||||||
|
| |||||||
| 174,558,095 | ||||||||
REAL ESTATE MANAGEMENT & DEVELOPMENT — 0.45% |
| |||||||
Corporacion Inmobiliaria Vesta SAB de CV | 6,856,249 | 14,907,511 | ||||||
|
| |||||||
| 14,907,511 | ||||||||
TRANSPORTATION INFRASTRUCTURE — 3.78% |
| |||||||
Grupo Aeroportuario del Centro Norte SAB de CVb | 4,037,392 | 17,263,630 | ||||||
Grupo Aeroportuario del Pacifico SAB de CV Series B | 4,870,049 | 33,807,835 | ||||||
Grupo Aeroportuario del Sureste SAB de CV Series B | 3,186,065 | 40,840,989 | ||||||
OHL Mexico SAB de CVa,b | 10,899,100 | 32,008,370 | ||||||
|
| |||||||
| 123,920,824 | ||||||||
WIRELESS TELECOMMUNICATION SERVICES — 16.66% |
| |||||||
America Movil SAB de CV Series L | 446,141,118 | 545,584,985 | ||||||
|
| |||||||
| 545,584,985 | ||||||||
|
| |||||||
TOTAL COMMON STOCKS |
| 3,269,032,024 | ||||||
SHORT-TERM INVESTMENTS — 4.25% |
| |||||||
MONEY MARKET FUNDS — 4.25% |
| |||||||
BlackRock Cash Funds: Institutional, |
| |||||||
0.14%d,e,f | 129,695,661 | 129,695,661 | ||||||
BlackRock Cash Funds: Prime, | ||||||||
0.11%d,e,f | 8,164,698 | 8,164,698 | ||||||
BlackRock Cash Funds: Treasury, |
| |||||||
0.00%d,e | 1,249,544 | 1,249,544 | ||||||
|
| |||||||
| 139,109,903 | ||||||||
|
| |||||||
TOTAL SHORT-TERM INVESTMENTS |
| 139,109,903 | ||||||
|
| |||||||
SCHEDULESOF INVESTMENTS | 37 |
Table of Contents
Schedule of Investments (Continued)
iSHARES® MSCI MEXICO CAPPED ETF
August 31, 2014
| Value | ||||||
TOTAL INVESTMENTS | $ | 3,408,141,927 | ||||
Other Assets, Less Liabilities — (4.06)% | (132,989,835 | ) | ||||
|
| |||||
NET ASSETS — 100.00% | $ | 3,275,152,092 | ||||
|
| |||||
CPO — Certificates of Participation (Ordinary)
| a | Non-income earning security. |
| b | All or a portion of this security represents a security on loan. See Note 1. |
| c | Security valued using Level 3 inputs in accordance with management’s fair valuation policy. See Note 1. |
| d | Affiliated issuer. See Note 2. |
| e | The rate quoted is the annualized seven-day yield of the fund at period end. |
| f | All or a portion of this security represents an investment of securities lending collateral. See Note 1. |
See notes to financial statements.
| 38 | 2014 iSHARES ANNUAL REPORTTO SHAREHOLDERS |
Table of Contents
Schedule of Investments
iSHARES® MSCI SOUTH AFRICA ETF
August 31, 2014
| Security | Shares | Value | ||||||
COMMON STOCKS — 99.65% |
| |||||||
CAPITAL MARKETS — 2.11% |
| |||||||
Brait SEa | 611,999 | $ | 4,558,027 | |||||
Coronation Fund Managers Ltd. | 414,274 | 3,895,237 | ||||||
Investec Ltd. | 438,188 | 3,963,526 | ||||||
|
| |||||||
| 12,416,790 | ||||||||
COMMERCIAL BANKS — 7.91% |
| |||||||
Barclays Africa Group Ltd. | 617,852 | 9,677,284 | ||||||
Nedbank Group Ltd. | 374,590 | 8,055,055 | ||||||
Standard Bank Group Ltd. | 2,214,434 | 28,733,465 | ||||||
|
| |||||||
| 46,465,804 | ||||||||
CONSTRUCTION MATERIALS — 0.53% |
| |||||||
PPC Ltd. | 992,719 | 3,090,521 | ||||||
|
| |||||||
| 3,090,521 | ||||||||
CONTAINERS & PACKAGING — 0.74% |
| |||||||
Nampak Ltd. | 1,085,105 | 4,351,480 | ||||||
|
| |||||||
| 4,351,480 | ||||||||
DISTRIBUTORS — 1.03% |
| |||||||
Imperial Holdings Ltd. | 339,419 | 6,070,058 | ||||||
|
| |||||||
| 6,070,058 | ||||||||
DIVERSIFIED FINANCIAL SERVICES — 8.48% |
| |||||||
African Bank Investments Ltd.b,c | 2,626,522 | 2,470 | ||||||
FirstRand Ltd. | 5,649,880 | 22,975,846 | ||||||
Remgro Ltd. | 876,591 | 20,069,758 | ||||||
RMB Holdings Ltd. | 1,286,084 | 6,769,372 | ||||||
|
| |||||||
| 49,817,446 | ||||||||
FOOD & STAPLES RETAILING — 3.40% |
| |||||||
Massmart Holdings Ltd. | 197,795 | 2,432,034 | ||||||
Pick n Pay Stores Ltd. | 437,650 | 2,324,992 | ||||||
Shoprite Holdings Ltd. | 831,691 | 11,530,628 | ||||||
SPAR Group Ltd. (The) | 299,842 | 3,675,499 | ||||||
|
| |||||||
| 19,963,153 | ||||||||
FOOD PRODUCTS — 1.46% |
| |||||||
Tiger Brands Ltd. | 297,181 | 8,578,386 | ||||||
|
| |||||||
| 8,578,386 | ||||||||
HEALTH CARE PROVIDERS & SERVICES — 3.13% |
| |||||||
Life Healthcare Group Holdings Ltd. | 1,709,045 | 7,195,877 | ||||||
Mediclinic International Ltd. | 678,034 | 5,895,837 | ||||||
Netcare Ltd. | 1,748,485 | 5,310,197 | ||||||
|
| |||||||
| 18,401,911 | ||||||||
HOUSEHOLD DURABLES — 3.23% |
| |||||||
Steinhoff International Holdings Ltd. | 3,836,621 | 18,942,491 | ||||||
|
| |||||||
| 18,942,491 | ||||||||
| Security | Shares | Value | ||||||
INDUSTRIAL CONGLOMERATES — 2.58% |
| |||||||
Bidvest Group Ltd. | 573,349 | $ | 15,165,818 | |||||
|
| |||||||
| 15,165,818 | ||||||||
INSURANCE — 6.39% |
| |||||||
Discovery Ltd. | 593,126 | 5,473,731 | ||||||
Liberty Holdings Ltd. | 208,588 | 2,561,015 | ||||||
MMI Holdings Ltd. | 1,859,151 | 4,805,466 | ||||||
Rand Merchant Insurance Holdings Ltd. | 1,218,137 | 3,859,866 | ||||||
Sanlam Ltd. | 3,355,274 | 20,821,792 | ||||||
|
| |||||||
| 37,521,870 | ||||||||
MEDIA — 15.65% |
| |||||||
Naspers Ltd. Class N | 721,474 | 91,954,457 | ||||||
|
| |||||||
| 91,954,457 | ||||||||
METALS & MINING — 7.78% |
| |||||||
African Rainbow Minerals Ltd. | 197,407 | 3,371,663 | ||||||
Anglo American Platinum Ltd.a,b | 98,274 | 4,094,365 | ||||||
AngloGold Ashanti Ltd.a | 734,826 | 12,509,191 | ||||||
Assore Ltd. | 63,592 | 1,881,918 | ||||||
Gold Fields Ltd. | 1,411,726 | 6,691,343 | ||||||
Harmony Gold Mining Co. Ltd.a | 714,669 | 2,165,765 | ||||||
Impala Platinum Holdings Ltd. | 979,127 | 8,861,065 | ||||||
Kumba Iron Ore Ltd. | 117,370 | 3,514,898 | ||||||
Northam Platinum Ltd.a | 651,973 | 2,617,602 | ||||||
|
| |||||||
| 45,707,810 | ||||||||
MULTILINE RETAIL — 1.77% |
| |||||||
Woolworths Holdings Ltd. | 1,388,923 | 10,377,026 | ||||||
|
| |||||||
| 10,377,026 | ||||||||
OIL, GAS & CONSUMABLE FUELS — 10.60% |
| |||||||
Exxaro Resources Ltd.b | 260,999 | 3,702,684 | ||||||
Sasol Ltd. | 1,007,161 | 58,550,455 | ||||||
|
| |||||||
| 62,253,139 | ||||||||
PAPER & FOREST PRODUCTS — 0.69% |
| |||||||
Sappi Ltd.a | 986,532 | 4,081,408 | ||||||
|
| |||||||
| 4,081,408 | ||||||||
PHARMACEUTICALS — 2.85% |
| |||||||
Aspen Pharmacare Holdings Ltd. | 582,012 | 16,726,401 | ||||||
|
| |||||||
| 16,726,401 | ||||||||
REAL ESTATE INVESTMENT TRUSTS (REITS) — 2.51% |
| |||||||
Growthpoint Properties Ltd. | 3,955,017 | 9,371,197 | ||||||
Redefine Properties Ltd. | 5,967,051 | 5,363,692 | ||||||
|
| |||||||
| 14,734,889 | ||||||||
SCHEDULESOF INVESTMENTS | 39 |
Table of Contents
Schedule of Investments (Continued)
iSHARES® MSCI SOUTH AFRICA ETF
August 31, 2014
| Security | Shares | Value | ||||||
SPECIALTY RETAIL — 2.92% |
| |||||||
Foschini Group Ltd. (The) | 364,050 | $ | 3,940,560 | |||||
Mr. Price Group Ltd. | 434,782 | 8,368,268 | ||||||
Truworths International Ltd. | 690,645 | 4,831,411 | ||||||
|
| |||||||
| 17,140,239 | ||||||||
TRADING COMPANIES & DISTRIBUTORS — 0.65% |
| |||||||
Barloworld Ltd. | 400,029 | 3,812,451 | ||||||
|
| |||||||
| 3,812,451 | ||||||||
WIRELESS TELECOMMUNICATION SERVICES — 13.24% |
| |||||||
MTN Group Ltd. | 3,070,110 | 69,580,769 | ||||||
Vodacom Group Ltd. | 677,775 | 8,179,516 | ||||||
|
| |||||||
| 77,760,285 | ||||||||
|
| |||||||
TOTAL COMMON STOCKS |
| |||||||
(Cost: $612,611,093) |
| 585,333,833 | ||||||
SHORT-TERM INVESTMENTS — 0.63% |
| |||||||
MONEY MARKET FUNDS — 0.63% |
| |||||||
BlackRock Cash Funds: Institutional, |
| |||||||
0.14%d,e,f | 3,349,104 | 3,349,104 | ||||||
BlackRock Cash Funds: Prime, | ||||||||
0.11%d,e,f | 210,835 | 210,835 | ||||||
BlackRock Cash Funds: Treasury, | ||||||||
0.00%d,e | 159,767 | 159,767 | ||||||
|
| |||||||
| 3,719,706 | ||||||||
|
| |||||||
TOTAL SHORT-TERM INVESTMENTS |
| |||||||
(Cost: $3,719,706) |
| 3,719,706 | ||||||
|
| |||||||
TOTAL INVESTMENTS |
| |||||||
(Cost: $616,330,799) |
| 589,053,539 | ||||||
Other Assets, Less Liabilities — (0.28)% |
| (1,657,901 | ) | |||||
|
| |||||||
NET ASSETS — 100.00% |
| $ | 587,395,638 | |||||
|
| |||||||
| a | Non-income earning security. |
| b | All or a portion of this security represents a security on loan. See Note 1. |
| c | Security valued using Level 3 inputs in accordance with management’s fair valuation policy. See Note 1. |
| d | Affiliated issuer. See Note 2. |
| e | The rate quoted is the annualized seven-day yield of the fund at period end. |
| f | All or a portion of this security represents an investment of securities lending collateral. See Note 1. |
See notes to financial statements.
| 40 | 2014 iSHARES ANNUAL REPORTTO SHAREHOLDERS |
Table of Contents
iSHARES® MSCI TURKEY ETF
August 31, 2014
| Security | Shares | Value | ||||||
COMMON STOCKS — 99.92% |
| |||||||
AIRLINES — 2.17% |
| |||||||
Turk Hava Yollari AOa | 3,526,470 | $ | 11,194,105 | |||||
|
| |||||||
| 11,194,105 | ||||||||
AUTO COMPONENTS — 0.16% |
| |||||||
Goodyear Lastikleri Turk AS | 22,755 | 840,415 | ||||||
|
| |||||||
| 840,415 | ||||||||
AUTOMOBILES — 2.10% |
| |||||||
Ford Otomotiv Sanayi ASa,b | 448,625 | 5,924,981 | ||||||
Tofas Turk Otomobil Fabrikasi AS | 799,015 | 4,924,535 | ||||||
|
| |||||||
| 10,849,516 | ||||||||
BEVERAGES — 5.66% |
| |||||||
Anadolu Efes Biracilik ve Malt Sanayii ASa | 1,325,340 | 17,626,571 | ||||||
Coca-Cola Icecek AS | 487,845 | 11,529,505 | ||||||
|
| |||||||
| 29,156,076 | ||||||||
BUILDING PRODUCTS — 0.39% |
| |||||||
Trakya Cam Sanayii ASb | 1,652,524 | 2,029,329 | ||||||
|
| |||||||
| 2,029,329 | ||||||||
CHEMICALS — 0.21% |
| |||||||
Gubre Fabrikalari TASb | 533,170 | 1,074,766 | ||||||
|
| |||||||
| 1,074,766 | ||||||||
COMMERCIAL BANKS — 36.88% |
| |||||||
Akbank TAS | 11,503,670 | 43,926,060 | ||||||
Albaraka Turk Katilim Bankasi ASb | 1,735,300 | 1,391,167 | ||||||
Asya Katilim Bankasi ASa,b | 2,949,986 | 1,695,119 | ||||||
Sekerbank TASa,b | 2,519,145 | 2,299,736 | ||||||
Tekstil Bankasi ASa,b | 669,885 | 620,853 | ||||||
Turkiye Garanti Bankasi AS | 14,762,445 | 57,942,913 | ||||||
Turkiye Halk Bankasi AS | 3,994,150 | 29,336,767 | ||||||
Turkiye Is Bankasi AS Class Cb | 10,063,445 | 26,021,930 | ||||||
Turkiye Sinai Kalkinma Bankasi ASb | 3,833,571 | 3,375,326 | ||||||
Turkiye Vakiflar Bankasi TAO Class Db | 4,791,870 | 11,058,418 | ||||||
Yapi ve Kredi Bankasi ASb | 5,554,626 | 12,381,080 | ||||||
|
| |||||||
| 190,049,369 | ||||||||
COMMUNICATIONS EQUIPMENT — 0.09% |
| |||||||
Nortel Networks Netas Telekomunikasyon ASa,b | 164,465 | 480,907 | ||||||
|
| |||||||
| 480,907 | ||||||||
CONSTRUCTION & ENGINEERING — 0.35% |
| |||||||
Tekfen Holding ASa,b | 708,550 | 1,782,908 | ||||||
|
| |||||||
| 1,782,908 | ||||||||
| Security | Shares | Value | ||||||
CONSTRUCTION MATERIALS — 1.52% |
| |||||||
Adana Cimento Sanayii TAS Class Aa,b | 367,225 | $ | 842,357 | |||||
Akcansa Cimento Sanayi ve TASb | 306,545 | 1,910,624 | ||||||
Baticim Bati Anodolu Cimento Sanayii AS | 334,295 | 1,093,687 | ||||||
Cimsa Cimento Sanayi ve TAS | 345,765 | 2,459,507 | ||||||
Konya Cimento Sanayii AS | 6,256 | 765,348 | ||||||
Mardin Cimento Sanayii ve TASa,b | 313,945 | 744,873 | ||||||
|
| |||||||
| 7,816,396 | ||||||||
CONTAINERS & PACKAGING — 0.22% |
| |||||||
Anadolu Cam Sanayii ASb | 707,995 | 574,152 | ||||||
Kartonsan Karton Sanayi ve TASb | 5,365 | 585,490 | ||||||
|
| |||||||
| 1,159,642 | ||||||||
DISTRIBUTORS — 0.28% |
| |||||||
Dogus Otomotiv Servis ve TAS | 351,130 | 1,425,380 | ||||||
|
| |||||||
| 1,425,380 | ||||||||
DIVERSIFIED FINANCIAL SERVICES — 5.28% |
| |||||||
Haci Omer Sabanci Holding AS | 5,868,940 | 27,196,830 | ||||||
|
| |||||||
| 27,196,830 | ||||||||
DIVERSIFIED TELECOMMUNICATION SERVICES — 1.89% |
| |||||||
Turk Telekomunikasyon AS | 3,353,865 | 9,729,231 | ||||||
|
| |||||||
| 9,729,231 | ||||||||
FOOD & STAPLES RETAILING — 6.44% |
| |||||||
BIM Birlesik Magazalar AS | 1,358,270 | 31,974,845 | ||||||
Bizim Toptan Satis Magazalari ASb | 140,230 | 1,208,683 | ||||||
|
| |||||||
| 33,183,528 | ||||||||
FOOD PRODUCTS — 1.65% |
| |||||||
Pinar Sut Mamulleri Sanayii AS | 115,625 | 1,186,818 | ||||||
Ulker Biskuvi Sanayi AS | 983,645 | 7,293,181 | ||||||
|
| |||||||
| 8,479,999 | ||||||||
GAS UTILITIES — 0.00% |
| |||||||
Aygaz AS | 1 | 4 | ||||||
|
| |||||||
| 4 | ||||||||
HEALTH CARE PROVIDERS & SERVICES — 0.16% |
| |||||||
Selcuk Ecza Deposu Ticaret ve Sanayi AS | 797,165 | 842,251 | ||||||
|
| |||||||
| 842,251 | ||||||||
HOTELS, RESTAURANTS & LEISURE — 0.14% |
| |||||||
Net Holding ASa,b | 583,490 | 719,240 | ||||||
| 719,240 | ||||||||
HOUSEHOLD DURABLES — 1.96% |
| |||||||
Arcelik ASb | 1,511,450 | 9,070,311 | ||||||
Vestel Elektronik Sanayi ve TASa,b | 535,020 | 1,033,868 | ||||||
|
| |||||||
| 10,104,179 | ||||||||
SCHEDULESOF INVESTMENTS | 41 |
Table of Contents
Schedule of Investments (Continued)
iSHARES® MSCI TURKEY ETF
August 31, 2014
| Security | Shares | Value | ||||||
INDEPENDENT POWER PRODUCERS & ENERGY TRADERS — 0.49% |
| |||||||
Akenerji Elektrik Uretim ASa,b | 1,395,455 | $ | 743,656 | |||||
Aksa Enerji Uretim ASa | 980,315 | 1,222,015 | ||||||
Zorlu Enerji Elektrik Uretim ASa,b | 955,525 | 580,059 | ||||||
|
| |||||||
| 2,545,730 | ||||||||
INDUSTRIAL CONGLOMERATES — 7.91% |
| |||||||
Akfen Holding ASb | 560,365 | 1,308,761 | ||||||
Alarko Holding AS | 427,350 | 871,355 | ||||||
Dogan Sirketler Grubu Holding ASa,b | 5,483,216 | 1,981,931 | ||||||
Enka Insaat ve Sanayi AS | 2,990,526 | 7,497,276 | ||||||
KOC Holding ASb | 4,052,055 | 20,748,957 | ||||||
Kombassan Holdings ASa,b | 1,041,365 | 1,380,154 | ||||||
Turkiye Sise ve Cam Fabrikalari AS | 3,803,232 | 5,146,290 | ||||||
Yazicilar Holding ASb | 204,610 | 1,848,928 | ||||||
|
| |||||||
| 40,783,652 | ||||||||
INSURANCE — 0.54% |
| |||||||
Aksigorta AS | 587,930 | 762,855 | ||||||
Anadolu Anonim Turk Sigorta Sirketia | 1,276,316 | 857,600 | ||||||
Anadolu Hayat Emeklilik ASb | 486,670 | 1,150,174 | ||||||
|
| |||||||
| 2,770,629 | ||||||||
MACHINERY — 0.28% |
| |||||||
Otokar Otomotiv ve Savunma Sanayi ASb | 53,650 | 1,441,970 | ||||||
|
| |||||||
| 1,441,970 | ||||||||
MEDIA — 0.46% |
| |||||||
Besiktas Futbol Yatirimlar Sanayi ve Ticaret ASa,b | 688,940 | 734,291 | ||||||
Dogan Yayin Holding ASa,b | 3,096,160 | 545,212 | ||||||
Fenerbahce Sportif Hizmetler Sanayi ve Ticaret ASa,b | 39,960 | 656,448 | ||||||
Galatasaray Sportif Sinai ve Ticari Yatirimlar ASa,b | 41,255 | 433,971 | ||||||
|
| |||||||
| 2,369,922 | ||||||||
METALS & MINING — 5.89% |
| |||||||
Borusan Mannesmann Boru Sanayi ve TASb | 271,765 | 831,182 | ||||||
Eregli Demir ve Celik Fabrikalari TAS | 8,946,600 | 17,412,693 | ||||||
Izmir Demir Celik Sanayi ASa,b | 599,400 | 919,398 | ||||||
| Security | Shares | Value | ||||||
Kardemir Karabuk Demir Celik Sanayi ve TAS Class Aa,b | 852,665 | $ | 1,185,382 | |||||
Kardemir Karabuk Demir Celik Sanayi ve TAS Class Ba,b | 352,240 | 483,158 | ||||||
Kardemir Karabuk Demir Celik Sanayi ve TAS Class Da,b | 4,383,945 | 4,611,578 | ||||||
Koza Altin Isletmeleri AS | 292,300 | 3,149,274 | ||||||
Koza Anadolu Metal Madencilik Isletmeleri ASa,b | 1,116,475 | 1,169,273 | ||||||
Park Elektrik Uretim Madencilik Sanayi ve TASb | 332,630 | 584,197 | ||||||
|
| |||||||
| 30,346,135 | ||||||||
MULTILINE RETAIL — 0.11% |
| |||||||
Boyner Buyuk Magazacilik ASa,b | 237,233 | 581,553 | ||||||
|
| |||||||
| 581,553 | ||||||||
OIL, GAS & CONSUMABLE FUELS — 3.88% |
| |||||||
Ipek Dogal Enerji Kaynaklari ve Uretim ASa,b | 664,150 | 686,325 | ||||||
Turcas Petrolculuk ASb | 429,939 | 484,141 | ||||||
Turkiye Petrol Rafinerileri AS | 800,310 | 18,839,986 | ||||||
|
| |||||||
| 20,010,452 | ||||||||
PHARMACEUTICALS — 0.20% |
| |||||||
EIS Eczacibasi Ilac Sanayi ve TASb | 1,049,690 | 1,011,773 | ||||||
|
| |||||||
| 1,011,773 | ||||||||
REAL ESTATE INVESTMENT TRUSTS (REITS) — 4.22% |
| |||||||
Akmerkez Gayrimenkul Yatirim Ortakligi ASb | 132,090 | 997,737 | ||||||
Dogus Gayrimenkul Yatirim Ortakligi ASa,b | 363,525 | 741,217 | ||||||
Emlak Konut Gayrimenkul Yatirim Ortakligi AS | 12,140,070 | 15,302,018 | ||||||
Halk Gayrimenkul Yatrm Ortakligi ASb | 1,108,705 | 621,670 | ||||||
Is Gayrimenkul Yatirim Ortakligi ASb | 1,955,635 | 1,241,558 | ||||||
Sinpas Gayrimenkul Yatirim Ortakligi ASa | 1,527,175 | 601,543 | ||||||
Torunlar Gayrimenkul Yatirim Ortakligi AS | 800,125 | 1,301,438 | ||||||
Vakif Gayrimenkul Yatirim Ortakligi ASb | 678,580 | 965,380 | ||||||
|
| |||||||
| 21,772,561 | ||||||||
| 42 | 2014 iSHARES ANNUAL REPORTTO SHAREHOLDERS |
Table of Contents
Schedule of Investments (Continued)
iSHARES® MSCI TURKEY ETF
August 31, 2014
| Security | Shares | Value | ||||||
TEXTILES, APPAREL & LUXURY GOODS — 0.30% |
| |||||||
Aksa Akrilik Kimya Sanayii AS | 473,785 | $ | 1,561,024 | |||||
|
| |||||||
| 1,561,024 | ||||||||
TRANSPORTATION INFRASTRUCTURE — 1.69% |
| |||||||
TAV Havalimanlari Holding AS | 1,045,065 | 8,692,934 | ||||||
|
| |||||||
| 8,692,934 | ||||||||
WIRELESS TELECOMMUNICATION SERVICES — 6.40% |
| |||||||
Turkcell Iletisim Hizmetleri ASa,b | 5,623,445 | 32,964,888 | ||||||
|
| |||||||
| 32,964,888 | ||||||||
|
| |||||||
TOTAL COMMON STOCKS |
| |||||||
(Cost: $598,408,037) |
| 514,967,294 | ||||||
SHORT-TERM INVESTMENTS — 10.65% |
| |||||||
MONEY MARKET FUNDS — 10.65% |
| |||||||
BlackRock Cash Funds: Institutional, |
| |||||||
0.14%c,d,e | 51,530,834 | 51,530,834 | ||||||
BlackRock Cash Funds: Prime, | ||||||||
0.11%c,d,e | 3,244,007 | 3,244,007 | ||||||
BlackRock Cash Funds: Treasury, | ||||||||
0.00%c,d | 110,246 | 110,246 | ||||||
|
| |||||||
| 54,885,087 | ||||||||
|
| |||||||
TOTAL SHORT-TERM INVESTMENTS |
| |||||||
(Cost: $54,885,087) |
| 54,885,087 | ||||||
|
| |||||||
TOTAL INVESTMENTS |
| |||||||
(Cost: $653,293,124) |
| 569,852,381 | ||||||
Other Assets, Less Liabilities — (10.57)% |
| (54,485,545 | ) | |||||
|
| |||||||
NET ASSETS — 100.00% |
| $ | 515,366,836 | |||||
|
| |||||||
| a | Non-income earning security. |
| b | All or a portion of this security represents a security on loan. See Note 1. |
| c | Affiliated issuer. See Note 2. |
| d | The rate quoted is the annualized seven-day yield of the fund at period end. |
| e | All or a portion of this security represents an investment of securities lending collateral. See Note 1. |
See notes to financial statements.
SCHEDULESOF INVESTMENTS | 43 |
Table of Contents
Schedule of Investments
August 31, 2014
| Security | Shares | Value | ||||||
COMMON STOCKS — 99.72% | ||||||||
AEROSPACE & DEFENSE — 2.53% | ||||||||
B/E Aerospace Inc.a | 274 | $ | 23,219 | |||||
Boeing Co. (The) | 1,743 | 221,012 | ||||||
General Dynamics Corp. | 735 | 90,589 | ||||||
Honeywell International Inc. | 1,866 | 177,699 | ||||||
L-3 Communications Holdings Inc. | 213 | 23,419 | ||||||
Lockheed Martin Corp. | 690 | 120,060 | ||||||
Northrop Grumman Corp. | 514 | 65,391 | ||||||
Precision Castparts Corp. | 368 | 89,814 | ||||||
Raytheon Co. | 790 | 76,109 | ||||||
Rockwell Collins Inc. | 305 | 23,479 | ||||||
Textron Inc. | 727 | 27,626 | ||||||
TransDigm Group Inc. | 124 | 23,311 | ||||||
United Technologies Corp. | 2,198 | 237,340 | ||||||
|
| |||||||
| 1,199,068 | ||||||||
AIR FREIGHT & LOGISTICS — 0.68% | ||||||||
C.H. Robinson Worldwide Inc. | 373 | 25,461 | ||||||
Expeditors International of Washington Inc. | 511 | 21,104 | ||||||
FedEx Corp. | 706 | 104,403 | ||||||
United Parcel Service Inc. Class B | 1,784 | 173,637 | ||||||
|
| |||||||
| 324,605 | ||||||||
AIRLINES — 0.14% | ||||||||
American Airlines Group Inc. | 455 | 17,704 | ||||||
Delta Air Lines Inc. | 538 | 21,294 | ||||||
Southwest Airlines Co. | 442 | 14,148 | ||||||
United Continental Holdings Inc.a | 250 | 11,903 | ||||||
|
| |||||||
| 65,049 | ||||||||
AUTO COMPONENTS — 0.47% | ||||||||
Autoliv Inc. | 244 | 25,300 | ||||||
BorgWarner Inc. | 574 | 35,697 | ||||||
Delphi Automotive PLC | 775 | 53,925 | ||||||
Johnson Controls Inc. | 1,668 | 81,415 | ||||||
TRW Automotive Holdings Corp.a | 295 | 28,406 | ||||||
|
| |||||||
| 224,743 | ||||||||
AUTOMOBILES — 0.78% | ||||||||
Ford Motor Co. | 9,342 | 162,644 | ||||||
General Motors Co. | 3,204 | 111,499 | ||||||
Harley-Davidson Inc. | 555 | 35,276 | ||||||
Tesla Motors Inc.a | 219 | 59,065 | ||||||
|
| |||||||
| 368,484 | ||||||||
| Security | Shares | Value | ||||||
BEVERAGES — 2.01% | ||||||||
Brown-Forman Corp. Class B NVS | 323 | $ | 29,929 | |||||
Coca-Cola Co. (The) | 9,934 | 414,447 | ||||||
Coca-Cola Enterprises Inc. | 607 | 29,002 | ||||||
Constellation Brands Inc. Class Aa | 417 | 36,317 | ||||||
Dr Pepper Snapple Group Inc. | 498 | 31,334 | ||||||
Molson Coors Brewing Co. Class B NVS | 382 | 28,249 | ||||||
Monster Beverage Corp.a | 366 | 32,358 | ||||||
PepsiCo Inc. | 3,818 | 353,127 | ||||||
|
| |||||||
| 954,763 | ||||||||
BIOTECHNOLOGY — 2.82% | ||||||||
Alexion Pharmaceuticals Inc.a | 503 | 85,153 | ||||||
Amgen Inc. | 1,907 | 265,798 | ||||||
Biogen Idec Inc.a | 598 | 205,138 | ||||||
BioMarin Pharmaceutical Inc.a | 359 | 25,568 | ||||||
Celgene Corp.a | 2,015 | 191,465 | ||||||
Gilead Sciences Inc.a | 3,873 | 416,657 | ||||||
Pharmacyclics Inc.a | 163 | 20,276 | ||||||
Regeneron Pharmaceuticals Inc.a | 202 | 70,805 | ||||||
Vertex Pharmaceuticals Inc.a | 606 | 56,703 | ||||||
|
| |||||||
| 1,337,563 | ||||||||
BUILDING PRODUCTS — 0.05% | ||||||||
Masco Corp. | 931 | 21,851 | ||||||
|
| |||||||
| 21,851 | ||||||||
CAPITAL MARKETS — 2.26% | ||||||||
Affiliated Managers Group Inc.a | 134 | 28,294 | ||||||
Ameriprise Financial Inc. | 477 | 59,987 | ||||||
Bank of New York Mellon Corp. (The) | 2,848 | 111,585 | ||||||
BlackRock Inc.b | 338 | 111,719 | ||||||
Charles Schwab Corp. (The) | 2,941 | 83,848 | ||||||
Eaton Vance Corp. NVS | 312 | 12,218 | ||||||
Franklin Resources Inc. | 1,025 | 57,933 | ||||||
Goldman Sachs Group Inc. (The) | 1,078 | 193,081 | ||||||
Invesco Ltd. | 1,085 | 44,311 | ||||||
Legg Mason Inc. | 279 | 13,760 | ||||||
Morgan Stanley | 3,732 | 128,045 | ||||||
Northern Trust Corp. | 563 | 39,044 | ||||||
Raymond James Financial Inc. | 316 | 17,266 | ||||||
SEI Investments Co. | 378 | 14,324 | ||||||
State Street Corp. | 1,091 | 78,585 | ||||||
T. Rowe Price Group Inc. | 659 | 53,376 | ||||||
TD Ameritrade Holding Corp. | 696 | 23,045 | ||||||
|
| |||||||
| 1,070,421 | ||||||||
| 44 | 2014 iSHARES ANNUAL REPORTTO SHAREHOLDERS |
Table of Contents
Schedule of Investments (Continued)
iSHARES® MSCI USA ETF
August 31, 2014
| Security | Shares | Value | ||||||
CHEMICALS — 2.59% | ||||||||
Air Products and Chemicals Inc. | 535 | $ | 71,267 | |||||
Airgas Inc. | 161 | 17,771 | ||||||
Albemarle Corp. | 201 | 12,780 | ||||||
Ashland Inc. | 184 | 19,728 | ||||||
Celanese Corp. Series A | 394 | 24,641 | ||||||
CF Industries Holdings Inc. | 131 | 33,755 | ||||||
Dow Chemical Co. (The) | 3,050 | 163,327 | ||||||
E.I. du Pont de Nemours and Co. | 2,323 | 153,574 | ||||||
Eastman Chemical Co. | 381 | 31,421 | ||||||
Ecolab Inc. | 680 | 78,078 | ||||||
FMC Corp. | 337 | 22,289 | ||||||
International Flavors & Fragrances Inc. | 208 | 21,131 | ||||||
LyondellBasell Industries NV Class A | 1,128 | 128,987 | ||||||
Monsanto Co. | 1,313 | 151,848 | ||||||
Mosaic Co. (The) | 812 | 38,781 | ||||||
PPG Industries Inc. | 346 | 71,228 | ||||||
Praxair Inc. | 733 | 96,426 | ||||||
Sherwin-Williams Co. (The) | 211 | 46,021 | ||||||
Sigma-Aldrich Corp. | 298 | 30,992 | ||||||
Westlake Chemical Corp. | 123 | 11,947 | ||||||
|
| |||||||
| 1,225,992 | ||||||||
COMMERCIAL BANKS — 5.63% | ||||||||
Bank of America Corp. | 26,460 | 425,741 | ||||||
BB&T Corp. | 1,788 | 66,746 | ||||||
CIT Group Inc. | 486 | 23,309 | ||||||
Citigroup Inc. | 7,647 | 394,968 | ||||||
Comerica Inc. | 447 | 22,502 | ||||||
Fifth Third Bancorp | 2,146 | 43,789 | ||||||
First Republic Bank | 315 | 15,403 | ||||||
J.P. Morgan Chase & Co. | 9,538 | 567,034 | ||||||
KeyCorp | 2,213 | 30,119 | ||||||
M&T Bank Corp.c | 298 | 36,842 | ||||||
PNC Financial Services Group Inc. (The)b | 1,343 | 113,819 | ||||||
Regions Financial Corp. | 3,541 | 35,941 | ||||||
SunTrust Banks Inc. | 1,346 | 51,256 | ||||||
U.S. Bancorp | 4,561 | 192,839 | ||||||
Wells Fargo & Co. | 12,597 | 647,990 | ||||||
|
| |||||||
| 2,668,298 | ||||||||
COMMERCIAL SERVICES & SUPPLIES — 0.44% |
| |||||||
ADT Corp. (The) | 471 | 17,361 | ||||||
Cintas Corp. | 269 | 17,792 | ||||||
Iron Mountain Inc. | 415 | 14,932 | ||||||
Republic Services Inc. | 750 | 29,497 | ||||||
| Security | Shares | Value | ||||||
Stericycle Inc.a | 213 | $ | 25,315 | |||||
Tyco International Ltd. | 1,151 | 51,358 | ||||||
Waste Management Inc. | 1,114 | 52,324 | ||||||
|
| |||||||
| 208,579 | ||||||||
COMMUNICATIONS EQUIPMENT — 1.57% |
| |||||||
Cisco Systems Inc. | 12,907 | 322,546 | ||||||
F5 Networks Inc.a | 183 | 22,727 | ||||||
Harris Corp. | 271 | 19,346 | ||||||
Juniper Networks Inc. | 1,073 | 24,883 | ||||||
Motorola Solutions Inc. | 575 | 34,155 | ||||||
QUALCOMM Inc. | 4,238 | 322,512 | ||||||
|
| |||||||
| 746,169 | ||||||||
COMPUTERS & PERIPHERALS — 4.41% |
| |||||||
Apple Inc. | 15,190 | 1,556,975 | ||||||
EMC Corp. | 5,157 | 152,286 | ||||||
Hewlett-Packard Co. | 4,765 | 181,070 | ||||||
NetApp Inc. | 831 | 35,035 | ||||||
SanDisk Corp. | 564 | 55,249 | ||||||
Seagate Technology PLC | 844 | 52,818 | ||||||
Western Digital Corp. | 558 | 57,480 | ||||||
|
| |||||||
| 2,090,913 | ||||||||
CONSTRUCTION & ENGINEERING — 0.19% |
| |||||||
Chicago Bridge & Iron Co. NV | 249 | 15,792 | ||||||
Fluor Corp. | 410 | 30,295 | ||||||
Jacobs Engineering Group Inc.a | 332 | 17,898 | ||||||
KBR Inc. | 355 | 7,817 | ||||||
Quanta Services Inc.a | 538 | 19,551 | ||||||
|
| |||||||
| 91,353 | ||||||||
CONSTRUCTION MATERIALS — 0.08% |
| |||||||
Martin Marietta Materials Inc. | 147 | 19,251 | ||||||
Vulcan Materials Co. | 327 | 20,725 | ||||||
|
| |||||||
| 39,976 | ||||||||
CONSUMER FINANCE — 0.94% |
| |||||||
Ally Financial Inc.a | 779 | 19,164 | ||||||
American Express Co. | 2,395 | 214,472 | ||||||
Capital One Financial Corp. | 1,438 | 118,002 | ||||||
Discover Financial Services | 1,181 | 73,659 | ||||||
Navient Corp. | 1,114 | 19,985 | ||||||
|
| |||||||
| 445,282 | ||||||||
CONTAINERS & PACKAGING — 0.26% |
| |||||||
Avery Dennison Corp. | 241 | 11,599 | ||||||
Ball Corp. | 349 | 22,371 | ||||||
Crown Holdings Inc.a | 367 | 17,715 | ||||||
MeadWestvaco Corp. | 450 | 19,350 | ||||||
SCHEDULESOF INVESTMENTS | 45 |
Table of Contents
Schedule of Investments (Continued)
iSHARES® MSCI USA ETF
August 31, 2014
| Security | Shares | Value | ||||||
Owens-Illinois Inc.a | 434 | $ | 13,363 | |||||
Rock-Tenn Co. Class A | 366 | 17,993 | ||||||
Sealed Air Corp. | 514 | 18,555 | ||||||
|
| |||||||
| 120,946 | ||||||||
DISTRIBUTORS — 0.12% |
| |||||||
Genuine Parts Co. | 388 | 34,043 | ||||||
LKQ Corp.a | 752 | 21,357 | ||||||
|
| |||||||
| 55,400 | ||||||||
DIVERSIFIED CONSUMER SERVICES — 0.05% |
| |||||||
H&R Block Inc. | 697 | 23,370 | ||||||
|
| |||||||
| 23,370 | ||||||||
DIVERSIFIED FINANCIAL SERVICES — 1.37% |
| |||||||
Berkshire Hathaway Inc. Class Ba | 2,826 | 387,868 | ||||||
CME Group Inc. | 805 | 61,623 | ||||||
Intercontinental Exchange Inc. | 291 | 54,999 | ||||||
Leucadia National Corp. | 793 | 19,769 | ||||||
McGraw Hill Financial Inc. | 681 | 55,250 | ||||||
Moody’s Corp. | 483 | 45,194 | ||||||
NASDAQ OMX Group Inc. (The) | 294 | 12,780 | ||||||
Voya Financial Inc. | 352 | 13,760 | ||||||
|
| |||||||
| 651,243 | ||||||||
DIVERSIFIED TELECOMMUNICATION SERVICES — 2.30% |
| |||||||
AT&T Inc. | 13,077 | 457,172 | ||||||
CenturyLink Inc. | 1,454 | 59,599 | ||||||
Frontier Communications Corp. | 2,582 | 17,558 | ||||||
Level 3 Communications Inc.a | 446 | 20,052 | ||||||
Verizon Communications Inc. | 10,438 | 520,021 | ||||||
Windstream Holdings Inc. | 1,526 | 17,244 | ||||||
|
| |||||||
| 1,091,646 | ||||||||
ELECTRIC UTILITIES — 1.43% | ||||||||
American Electric Power Co. Inc. | 1,223 | 65,675 | ||||||
Duke Energy Corp. | 1,773 | 131,184 | ||||||
Edison International | 793 | 46,898 | ||||||
Entergy Corp. | 456 | 35,299 | ||||||
Exelon Corp. | 98 | 3,275 | ||||||
FirstEnergy Corp. | 49 | 1,678 | ||||||
NextEra Energy Inc. | 1,091 | 107,409 | ||||||
Northeast Utilities | 802 | 36,804 | ||||||
OGE Energy Corp. | 521 | 19,548 | ||||||
Pepco Holdings Inc. | 632 | 17,418 | ||||||
Pinnacle West Capital Corp. | 298 | 16,971 | ||||||
PPL Corp. | 1,587 | 54,958 | ||||||
Southern Co. (The) | 2,236 | 99,278 | ||||||
| Security | Shares | Value | ||||||
Xcel Energy Inc. | 1,252 | $ | 40,127 | |||||
|
| |||||||
| 676,522 | ||||||||
ELECTRICAL EQUIPMENT — 0.61% | ||||||||
AMETEK Inc. | 621 | 32,876 | ||||||
Eaton Corp. PLC | 1,201 | 83,842 | ||||||
Emerson Electric Co. | 1,773 | 113,507 | ||||||
Rockwell Automation Inc. | 345 | 40,230 | ||||||
Sensata Technologies Holding NVa,c | 406 | 19,963 | ||||||
|
| |||||||
| 290,418 | ||||||||
ELECTRONIC EQUIPMENT, INSTRUMENTS & COMPONENTS — 0.54% |
| |||||||
Amphenol Corp. Class A | 411 | 42,337 | ||||||
Arrow Electronics Inc.a | 257 | 15,998 | ||||||
Avnet Inc. | 343 | 15,267 | ||||||
Corning Inc. | 3,292 | 68,671 | ||||||
Flextronics International Ltd.a | 1,481 | 16,350 | ||||||
FLIR Systems Inc. | 366 | 12,367 | ||||||
TE Connectivity Ltd. | 1,030 | 64,561 | ||||||
Trimble Navigation Ltd.a | 667 | 22,185 | ||||||
|
| |||||||
| 257,736 | ||||||||
ENERGY EQUIPMENT & SERVICES — 2.00% |
| |||||||
Baker Hughes Inc. | 1,098 | 75,916 | ||||||
Cameron International Corp.a | 514 | 38,206 | ||||||
Core Laboratories NV | 115 | 18,169 | ||||||
Diamond Offshore Drilling Inc.c | 166 | 7,294 | ||||||
Ensco PLC Class A | 586 | 29,581 | ||||||
FMC Technologies Inc.a | 593 | 36,671 | ||||||
Halliburton Co. | 2,133 | 144,212 | ||||||
Helmerich & Payne Inc. | 278 | 29,204 | ||||||
Nabors Industries Ltd. | 674 | 18,340 | ||||||
National Oilwell Varco Inc. | 1,080 | 93,344 | ||||||
Nobel Corp. PLC | 645 | 18,357 | ||||||
Oceaneering International Inc. | 278 | 19,338 | ||||||
Schlumberger Ltd. | 3,269 | 358,413 | ||||||
Superior Energy Services Inc. | 410 | 14,694 | ||||||
Weatherford International Ltd.a | 1,926 | 45,627 | ||||||
|
| |||||||
| 947,366 | ||||||||
FOOD & STAPLES RETAILING — 2.09% |
| |||||||
Costco Wholesale Corp. | 1,109 | 134,278 | ||||||
CVS Caremark Corp. | 2,958 | 235,013 | ||||||
Kroger Co. (The) | 1,235 | 62,960 | ||||||
Safeway Inc. | 585 | 20,346 | ||||||
Sysco Corp. | 1,468 | 55,535 | ||||||
Wal-Mart Stores Inc. | 4,055 | 306,153 | ||||||
| 46 | 2014 iSHARES ANNUAL REPORTTO SHAREHOLDERS |
Table of Contents
Schedule of Investments (Continued)
iSHARES® MSCI USA ETF
August 31, 2014
| Security | Shares | Value | ||||||
Walgreen Co. | 2,295 | $ | 138,893 | |||||
Whole Foods Market Inc. | 941 | 36,831 | ||||||
|
| |||||||
| 990,009 | ||||||||
FOOD PRODUCTS — 1.61% | ||||||||
Archer-Daniels-Midland Co. | 1,658 | 82,668 | ||||||
Bunge Ltd. | 362 | 30,643 | ||||||
Campbell Soup Co. | 516 | 23,127 | ||||||
ConAgra Foods Inc. | 1,058 | 34,068 | ||||||
General Mills Inc. | 1,576 | 84,127 | ||||||
Hershey Co. (The) | 389 | 35,562 | ||||||
Hormel Foods Corp. | 359 | 18,194 | ||||||
J.M. Smucker Co. (The) | 259 | 26,573 | ||||||
Kellogg Co. | 676 | 43,920 | ||||||
Keurig Green Mountain Inc. | 315 | 41,996 | ||||||
Kraft Foods Group Inc. | 1,501 | 88,409 | ||||||
McCormick & Co. Inc. NVS | 294 | 20,489 | ||||||
Mead Johnson Nutrition Co. Class A | 508 | 48,565 | ||||||
Mondelez International Inc. Class A | 4,261 | 154,205 | ||||||
Tyson Foods Inc. Class A | 765 | 29,116 | ||||||
|
| |||||||
| 761,662 | ||||||||
HEALTH CARE EQUIPMENT & SUPPLIES — 2.07% |
| |||||||
Abbott Laboratories | 3,779 | 159,625 | ||||||
Baxter International Inc. | 1,367 | 102,498 | ||||||
Becton, Dickinson and Co. | 486 | 56,945 | ||||||
Boston Scientific Corp.a | 3,335 | 42,288 | ||||||
C.R. Bard Inc. | 201 | 29,836 | ||||||
CareFusion Corp.a | 537 | 24,654 | ||||||
Covidien PLC | 1,129 | 98,031 | ||||||
DENTSPLY International Inc. | 366 | 17,460 | ||||||
Edwards Lifesciences Corp.a | 271 | 26,899 | ||||||
Hologic Inc.a | 553 | 13,753 | ||||||
Intuitive Surgical Inc.a | 101 | 47,471 | ||||||
Medtronic Inc. | 2,509 | 160,200 | ||||||
ResMed Inc.c | 359 | 19,045 | ||||||
St. Jude Medical Inc. | 712 | 46,700 | ||||||
Stryker Corp. | 853 | 71,063 | ||||||
Varian Medical Systems Inc.a,c | 273 | 23,210 | ||||||
Zimmer Holdings Inc. | 432 | 42,902 | ||||||
|
| |||||||
| 982,580 | ||||||||
HEALTH CARE PROVIDERS & SERVICES — 2.24% |
| |||||||
Aetna Inc. | 910 | 74,738 | ||||||
AmerisourceBergen Corp. | 579 | 44,809 | ||||||
Cardinal Health Inc. | 856 | 63,087 | ||||||
Cigna Corp. | 691 | 65,369 | ||||||
| Security | Shares | Value | ||||||
DaVita HealthCare Partners Inc.a | 425 | $ | 31,739 | |||||
Express Scripts Holding Co.a | 1,946 | 143,868 | ||||||
HCA Holdings Inc.a | 779 | 54,390 | ||||||
Henry Schein Inc.a | 208 | 24,895 | ||||||
Humana Inc. | 397 | 51,110 | ||||||
Laboratory Corp. of America Holdingsa | 207 | 22,197 | ||||||
McKesson Corp. | 584 | 113,897 | ||||||
Omnicare Inc. | 256 | 16,325 | ||||||
Patterson Companies Inc. | 226 | 9,101 | ||||||
Quest Diagnostics Inc. | 360 | 22,756 | ||||||
UnitedHealth Group Inc. | 2,474 | 214,446 | ||||||
Universal Health Services Inc. Class B | 228 | 26,092 | ||||||
WellPoint Inc. | 714 | 83,188 | ||||||
|
| |||||||
| 1,062,007 | ||||||||
HEALTH CARE TECHNOLOGY — 0.10% |
| |||||||
Cerner Corp.a | 785 | 45,263 | ||||||
|
| |||||||
| 45,263 | ||||||||
HOTELS, RESTAURANTS & LEISURE — 1.80% |
| |||||||
Carnival Corp. | 991 | 37,539 | ||||||
Chipotle Mexican Grill Inc.a | 78 | 52,935 | ||||||
Darden Restaurants Inc. | 342 | 16,184 | ||||||
Hilton Worldwide Holdings Inc.a | 738 | 18,686 | ||||||
Las Vegas Sands Corp. | 1,020 | 67,840 | ||||||
Marriott International Inc. Class A | 592 | 41,085 | ||||||
McDonald���s Corp. | 2,499 | 234,206 | ||||||
MGM Resorts Internationala | 1,011 | 24,739 | ||||||
Royal Caribbean Cruises Ltd. | 417 | 26,588 | ||||||
Starbucks Corp. | 1,897 | 147,606 | ||||||
Starwood Hotels & Resorts Worldwide Inc. | 477 | 40,326 | ||||||
Wyndham Worldwide Corp. | 328 | 26,548 | ||||||
Wynn Resorts Ltd. | 206 | 39,733 | ||||||
Yum! Brands Inc. | 1,107 | 80,180 | ||||||
|
| |||||||
| 854,195 | ||||||||
HOUSEHOLD DURABLES — 0.36% | ||||||||
D.R. Horton Inc. | 762 | 16,520 | ||||||
Garmin Ltd. | 293 | 15,919 | ||||||
Leggett & Platt Inc. | 368 | 12,913 | ||||||
Lennar Corp. Class A | 448 | 17,553 | ||||||
Mohawk Industries Inc.a | 155 | 22,633 | ||||||
Newell Rubbermaid Inc. | 691 | 23,162 | ||||||
PulteGroup Inc. | 885 | 17,010 | ||||||
Toll Brothers Inc.a | 434 | 15,446 | ||||||
Whirlpool Corp. | 200 | 30,604 | ||||||
|
| |||||||
| 171,760 | ||||||||
SCHEDULESOF INVESTMENTS | 47 |
Table of Contents
Schedule of Investments (Continued)
iSHARES® MSCI USA ETF
August 31, 2014
| Security | Shares | Value | ||||||
HOUSEHOLD PRODUCTS — 1.88% | ||||||||
Church & Dwight Co. Inc. | 343 | $ | 23,406 | |||||
Clorox Co. (The) | 320 | 28,352 | ||||||
Colgate-Palmolive Co. | 2,300 | 148,879 | ||||||
Energizer Holdings Inc. | 169 | 20,537 | ||||||
Kimberly-Clark Corp. | 960 | 103,680 | ||||||
Procter & Gamble Co. (The) | 6,810 | 565,979 | ||||||
|
| |||||||
| 890,833 | ||||||||
INDEPENDENT POWER PRODUCERS & ENERGY TRADERS — 0.16% |
| |||||||
AES Corp. (The) | 1,768 | 26,838 | ||||||
Calpine Corp.a | 916 | 21,773 | ||||||
NRG Energy Inc. | 829 | 25,517 | ||||||
|
| |||||||
| 74,128 | ||||||||
INDUSTRIAL CONGLOMERATES — 2.20% |
| |||||||
3M Co. | 1,574 | 226,656 | ||||||
Danaher Corp. | 1,579 | 120,967 | ||||||
General Electric Co. | 25,245 | 655,865 | ||||||
Roper Industries Inc. | 250 | 37,640 | ||||||
|
| |||||||
| 1,041,128 | ||||||||
INSURANCE — 2.93% | ||||||||
ACE Ltd. | 850 | 90,381 | ||||||
Aflac Inc. | 1,147 | 70,242 | ||||||
Alleghany Corp.a | 40 | 17,245 | ||||||
Allstate Corp. (The) | 1,125 | 69,176 | ||||||
American International Group Inc. | 3,491 | 195,706 | ||||||
Aon PLC | 711 | 61,971 | ||||||
Arch Capital Group Ltd.a | 344 | 19,120 | ||||||
Assurant Inc. | 183 | 12,215 | ||||||
Axis Capital Holdings Ltd. | 288 | 13,887 | ||||||
Chubb Corp. (The) | 618 | 56,825 | ||||||
Cincinnati Financial Corp. | 389 | 18,707 | ||||||
Everest Re Group Ltd. | 124 | 20,316 | ||||||
FNF Groupa | 636 | 18,005 | ||||||
Genworth Financial Inc. Class Aa | 1,244 | 17,653 | ||||||
Hartford Financial Services Group Inc. (The) | 1,137 | 42,126 | ||||||
Lincoln National Corp. | 663 | 36,492 | ||||||
Loews Corp. | 890 | 38,929 | ||||||
Marsh & McLennan Companies Inc. | 1,373 | 72,906 | ||||||
MetLife Inc. | 2,403 | 131,540 | ||||||
PartnerRe Ltd. | 122 | 13,626 | ||||||
Principal Financial Group Inc. | 748 | 40,609 | ||||||
Progressive Corp. (The) | 1,416 | 35,428 | ||||||
Prudential Financial Inc. | 1,154 | 103,514 | ||||||
| Security | Shares | Value | ||||||
RenaissanceRe Holdings Ltd.c | 98 | $ | 10,034 | |||||
Torchmark Corp. | 336 | 18,329 | ||||||
Travelers Companies Inc. (The) | 889 | 84,197 | ||||||
Unum Group | 653 | 23,684 | ||||||
W.R. Berkley Corp. | 271 | 13,103 | ||||||
Willis Group Holdings PLC | 403 | 16,914 | ||||||
XL Group PLC | 712 | 24,336 | ||||||
|
| |||||||
| 1,387,216 | ||||||||
INTERNET & CATALOG RETAIL — 1.38% |
| |||||||
Amazon.com Inc.a | 985 | 333,954 | ||||||
Expedia Inc. | 277 | 23,794 | ||||||
Liberty Interactive Corp. Series Aa | 1,173 | 34,627 | ||||||
Netflix Inc.a | 145 | 69,258 | ||||||
Priceline Group Inc. (The)a | 133 | 165,493 | ||||||
TripAdvisor Inc.a | 294 | 29,133 | ||||||
|
| |||||||
| 656,259 | ||||||||
INTERNET SOFTWARE & SERVICES — 3.45% |
| |||||||
Akamai Technologies Inc.a | 452 | 27,310 | ||||||
eBay Inc.a | 2,870 | 159,285 | ||||||
Equinix Inc.a | 127 | 27,719 | ||||||
Facebook Inc. Class Aa | 5,018 | 375,447 | ||||||
Google Inc. Class Aa | 709 | 412,893 | ||||||
Google Inc. Class Ca | 721 | 412,124 | ||||||
LinkedIn Corp. Class Aa | 266 | 60,049 | ||||||
Rackspace Hosting Inc.a | 289 | 9,999 | ||||||
Twitter Inc.a | 814 | 40,496 | ||||||
VeriSign Inc.a | 315 | 17,979 | ||||||
Yahoo! Inc.a | 2,413 | 92,925 | ||||||
|
| |||||||
| 1,636,226 | ||||||||
IT SERVICES — 3.24% |
| |||||||
Accenture PLC Class A | 1,599 | 129,615 | ||||||
Alliance Data Systems Corp.a | 135 | 35,726 | ||||||
Automatic Data Processing Inc. | 1,212 | 101,178 | ||||||
Cognizant Technology Solutions Corp. Class Aa | 1,525 | 69,738 | ||||||
Computer Sciences Corp. | 360 | 21,524 | ||||||
Fidelity National Information Services Inc. | 727 | 41,257 | ||||||
Fiserv Inc.a | 641 | 41,325 | ||||||
FleetCor Technologies Inc.a | 190 | 27,301 | ||||||
International Business Machines Corp. | 2,419 | 465,174 | ||||||
MasterCard Inc. Class A | 2,544 | 192,861 | ||||||
Paychex Inc. | 815 | 33,945 | ||||||
Teradata Corp.a,c | 401 | 18,314 | ||||||
Total System Services Inc. | 433 | 13,622 | ||||||
| 48 | 2014 iSHARES ANNUAL REPORTTO SHAREHOLDERS |
Table of Contents
Schedule of Investments (Continued)
iSHARES® MSCI USA ETF
August 31, 2014
| Security | Shares | Value | ||||||
Vantiv Inc. Class Aa | 369 | $ | 11,542 | |||||
Visa Inc. Class A | 1,261 | 267,988 | ||||||
Western Union Co. | 1,421 | 24,825 | ||||||
Xerox Corp. | 2,825 | 39,013 | ||||||
|
| |||||||
| 1,534,948 | ||||||||
LEISURE EQUIPMENT & PRODUCTS — 0.14% |
| |||||||
Hasbro Inc. | 295 | 15,533 | ||||||
Mattel Inc. | 866 | 29,868 | ||||||
Polaris Industries Inc. | 159 | 23,116 | ||||||
|
| |||||||
| 68,517 | ||||||||
LIFE SCIENCES TOOLS & SERVICES — 0.59% |
| |||||||
Agilent Technologies Inc. | 828 | 47,329 | ||||||
Illumina Inc.a | 328 | 58,830 | ||||||
Mettler-Toledo International Inc.a | 80 | 21,638 | ||||||
Quintiles Transnational Holdings Inc.a | 142 | 7,969 | ||||||
Thermo Fisher Scientific Inc. | 1,004 | 120,691 | ||||||
Waters Corp.a | 216 | 22,341 | ||||||
|
| |||||||
| 278,798 | ||||||||
MACHINERY — 1.56% | ||||||||
AGCO Corp. | 226 | 11,038 | ||||||
Caterpillar Inc. | 1,492 | 162,732 | ||||||
Cummins Inc. | 450 | 65,299 | ||||||
Deere & Co. | 885 | 74,420 | ||||||
Dover Corp. | 433 | 38,048 | ||||||
Flowserve Corp. | 340 | 25,803 | ||||||
Illinois Tool Works Inc. | 986 | 86,975 | ||||||
Ingersoll-Rand PLC | 696 | 41,899 | ||||||
Joy Global Inc. | 256 | 16,166 | ||||||
PACCAR Inc. | 887 | 55,712 | ||||||
Pall Corp. | 274 | 23,117 | ||||||
Parker Hannifin Corp. | 375 | 43,312 | ||||||
Pentair PLC | 498 | 33,899 | ||||||
SPX Corp. | 96 | 9,989 | ||||||
Stanley Black & Decker Inc. | 379 | 34,679 | ||||||
Xylem Inc. | 479 | 17,848 | ||||||
|
| |||||||
| 740,936 | ||||||||
MEDIA — 3.80% | ||||||||
Cablevision NY Group Class A | 498 | 9,218 | ||||||
CBS Corp. Class B NVS | 1,223 | 72,512 | ||||||
Charter Communications Inc. Class Aa | 196 | 30,746 | ||||||
Comcast Corp. Class A | 5,402 | 295,651 | ||||||
Comcast Corp. Class A Special NVSc | 1,144 | 62,462 | ||||||
DIRECTVa | 1,222 | 105,642 | ||||||
Discovery Communications Inc. Series Aa | 397 | 17,357 | ||||||
| Security | Shares | Value | ||||||
Discovery Communications Inc. Series C NVSa,c | 739 | $ | 31,755 | |||||
DISH Network Corp. Class Aa | 558 | 36,164 | ||||||
Interpublic Group of Companies Inc. (The) | 1,070 | 20,897 | ||||||
Liberty Global PLC Series Aa | 563 | 24,586 | ||||||
Liberty Global PLC Series C NVSa | 1,352 | 56,689 | ||||||
Liberty Media Corp. Class Aa | 233 | 11,471 | ||||||
Liberty Media Corp. Class Ca | 516 | 25,011 | ||||||
News Corp. Class A NVSa | 977 | 17,220 | ||||||
Omnicom Group Inc. | 655 | 47,167 | ||||||
Scripps Networks Interactive Inc. Class A | 205 | 16,341 | ||||||
Sirius XM Holdings Inc.a | 7,664 | 27,820 | ||||||
Time Warner Cable Inc. | 708 | 104,734 | ||||||
Time Warner Inc. | 2,235 | 172,162 | ||||||
Twenty-First Century Fox Inc. Class A | 3,592 | 127,229 | ||||||
Twenty-First Century Fox Inc. Class B | 1,107 | 38,125 | ||||||
Viacom Inc. Class B NVS | 976 | 79,202 | ||||||
Walt Disney Co. (The) | 4,139 | 372,013 | ||||||
|
| |||||||
| 1,802,174 | ||||||||
METALS & MINING — 0.47% | ||||||||
Alcoa Inc. | 2,943 | 48,883 | ||||||
Freeport-McMoRan Inc. | 2,606 | 94,780 | ||||||
Newmont Mining Corp. | 1,276 | 34,567 | ||||||
Nucor Corp. | 804 | 43,674 | ||||||
|
| |||||||
| 221,904 | ||||||||
MULTI-UTILITIES — 1.13% | ||||||||
Alliant Energy Corp. | 278 | 16,260 | ||||||
Ameren Corp. | 618 | 24,714 | ||||||
CenterPoint Energy Inc. | 1,048 | 26,032 | ||||||
CMS Energy Corp. | 691 | 21,103 | ||||||
Consolidated Edison Inc. | 747 | 43,244 | ||||||
Dominion Resources Inc. | 1,466 | 102,942 | ||||||
DTE Energy Co. | 447 | 34,978 | ||||||
Integrys Energy Group Inc. | 202 | 13,714 | ||||||
MDU Resources Group Inc. | 461 | 14,434 | ||||||
NiSource Inc. | 788 | 31,260 | ||||||
PG&E Corp. | 1,165 | 54,149 | ||||||
Public Service Enterprise Group Inc. | 1,264 | 47,261 | ||||||
SCANA Corp. | 332 | 17,244 | ||||||
Sempra Energy | 579 | 61,357 | ||||||
Wisconsin Energy Corp. | 566 | 25,657 | ||||||
|
| |||||||
| 534,349 | ||||||||
SCHEDULESOF INVESTMENTS | 49 |
Table of Contents
Schedule of Investments (Continued)
iSHARES® MSCI USA ETF
August 31, 2014
| Security | Shares | Value | ||||||
MULTILINE RETAIL — 0.66% | ||||||||
Dollar General Corp.a | 812 | $ | 51,960 | |||||
Dollar Tree Inc.a | 536 | 28,743 | ||||||
Family Dollar Stores Inc. | 271 | 21,634 | ||||||
Kohl’s Corp. | 536 | 31,511 | ||||||
Macy’s Inc. | 912 | 56,808 | ||||||
Nordstrom Inc. | 367 | 25,415 | ||||||
Sears Holdings Corp.a,c | 139 | 4,837 | ||||||
Target Corp. | 1,508 | 90,586 | ||||||
|
| |||||||
| 311,494 | ||||||||
OIL, GAS & CONSUMABLE FUELS — 8.42% |
| |||||||
Anadarko Petroleum Corp. | 1,269 | 143,004 | ||||||
Antero Resources Corp.a,c | 132 | 7,636 | ||||||
Apache Corp. | 970 | 98,775 | ||||||
Cabot Oil & Gas Corp. | 1,087 | 36,458 | ||||||
Cheniere Energy Inc.a | 567 | 45,508 | ||||||
Chesapeake Energy Corp. | 1,334 | 36,285 | ||||||
Chevron Corp. | 4,787 | 619,677 | ||||||
Cimarex Energy Co. | 220 | 31,935 | ||||||
Cobalt International Energy Inc.a | 772 | 11,850 | ||||||
Concho Resources Inc.a | 285 | 40,481 | ||||||
ConocoPhillips | 3,091 | 251,051 | ||||||
CONSOL Energy Inc. | 587 | 23,644 | ||||||
Continental Resources Inc.a | 118 | 19,032 | ||||||
Denbury Resources Inc. | 890 | 15,326 | ||||||
Devon Energy Corp. | 976 | 73,610 | ||||||
Energen Corp. | 184 | 14,808 | ||||||
EOG Resources Inc. | 1,373 | 150,865 | ||||||
EQT Corp. | 382 | 37,841 | ||||||
Exxon Mobil Corp. | 10,804 | 1,074,566 | ||||||
Hess Corp. | 711 | 71,882 | ||||||
HollyFrontier Corp. | 486 | 24,315 | ||||||
Kinder Morgan Inc. | 1,686 | 67,878 | ||||||
Kinder Morgan Management LLCa | 257 | 25,114 | ||||||
Marathon Oil Corp. | 1,746 | 72,791 | ||||||
Marathon Petroleum Corp. | 735 | 66,892 | ||||||
Murphy Oil Corp. | 432 | 26,987 | ||||||
Noble Energy Inc. | 907 | 65,431 | ||||||
Occidental Petroleum Corp. | 1,994 | 206,838 | ||||||
ONEOK Inc. | 532 | 37,346 | ||||||
Peabody Energy Corp. | 680 | 10,798 | ||||||
Phillips 66 | 1,424 | 123,917 | ||||||
Pioneer Natural Resources Co. | 366 | 76,366 | ||||||
QEP Resources Inc. | 432 | 15,366 | ||||||
Range Resources Corp. | 406 | 31,908 | ||||||
| Security | Shares | Value | ||||||
Southwestern Energy Co.a | 881 | $ | 36,280 | |||||
Spectra Energy Corp. | 1,687 | 70,281 | ||||||
Tesoro Corp. | 332 | 21,494 | ||||||
Valero Energy Corp. | 1,337 | 72,385 | ||||||
Whiting Petroleum Corp.a | 294 | 27,242 | ||||||
Williams Companies Inc. (The) | 1,773 | 105,387 | ||||||
|
| |||||||
| 3,989,250 | ||||||||
PAPER & FOREST PRODUCTS — 0.11% |
| |||||||
International Paper Co. | 1,042 | 50,485 | ||||||
|
| |||||||
| 50,485 | ||||||||
PERSONAL PRODUCTS — 0.15% | ||||||||
Avon Products Inc. | 1,039 | 14,588 | ||||||
Estee Lauder Companies Inc. (The) Class A | 598 | 45,944 | ||||||
Herbalife Ltd. | 207 | 10,553 | ||||||
|
| |||||||
| 71,085 | ||||||||
PHARMACEUTICALS — 5.76% | ||||||||
AbbVie Inc. | 4,015 | 221,949 | ||||||
Actavis PLCa | 662 | 150,261 | ||||||
Allergan Inc. | 752 | 123,087 | ||||||
Bristol-Myers Squibb Co. | 4,175 | 211,464 | ||||||
Eli Lilly and Co. | 2,524 | 160,425 | ||||||
Endo International PLCa | 360 | 22,936 | ||||||
Hospira Inc.a | 426 | 22,893 | ||||||
Johnson & Johnson | 7,122 | 738,765 | ||||||
Mallinckrodt PLCa | 285 | 23,225 | ||||||
Merck & Co. Inc. | 7,360 | 442,409 | ||||||
Mylan Inc.a | 931 | 45,247 | ||||||
Perrigo Co. PLC | 340 | 50,572 | ||||||
Pfizer Inc. | 16,030 | 471,122 | ||||||
Zoetis Inc. | 1,259 | 44,619 | ||||||
|
| |||||||
| 2,728,974 | ||||||||
PROFESSIONAL SERVICES — 0.36% | ||||||||
Dun & Bradstreet Corp. (The) | 102 | 11,973 | ||||||
Equifax Inc. | 305 | 24,022 | ||||||
IHS Inc. Class Aa | 168 | 23,935 | ||||||
Manpowergroup Inc. | 204 | 15,826 | ||||||
Nielsen NV | 757 | 35,571 | ||||||
Robert Half International Inc. | 342 | 17,172 | ||||||
Towers Watson & Co. Class A | 181 | 19,843 | ||||||
Verisk Analytics Inc. Class Aa | 380 | 24,392 | ||||||
|
| |||||||
| 172,734 | ||||||||
REAL ESTATE INVESTMENT TRUSTS (REITS) — 2.63% |
| |||||||
American Capital Agency Corp. | 848 | 20,055 | ||||||
| 50 | 2014 iSHARES ANNUAL REPORTTO SHAREHOLDERS |
Table of Contents
Schedule of Investments (Continued)
iSHARES® MSCI USA ETF
August 31, 2014
| Security | Shares | Value | ||||||
American Realty Capital Properties Inc. | 2,261 | $ | 29,755 | |||||
American Tower Corp. | 995 | 98,107 | ||||||
Annaly Capital Management Inc. | 2,377 | 28,286 | ||||||
AvalonBay Communities Inc. | 327 | 50,391 | ||||||
Boston Properties Inc. | 388 | 47,111 | ||||||
Camden Property Trust | 225 | 16,839 | ||||||
Crown Castle International Corp. | 842 | 66,947 | ||||||
Digital Realty Trust Inc. | 343 | 22,381 | ||||||
Duke Realty Corp. | 839 | 15,605 | ||||||
Equity Residential | 865 | 57,497 | ||||||
Essex Property Trust Inc. | 163 | 31,532 | ||||||
Federal Realty Investment Trust | 162 | 20,214 | ||||||
General Growth Properties Inc. | 1,335 | 32,801 | ||||||
HCP Inc. | 1,153 | 49,960 | ||||||
Health Care REIT Inc. | 771 | 52,104 | ||||||
Host Hotels & Resorts Inc. | 1,922 | 43,860 | ||||||
Kimco Realty Corp. | 1,062 | 24,946 | ||||||
Liberty Property Trust | 389 | 13,778 | ||||||
Macerich Co. (The) | 354 | 23,113 | ||||||
Plum Creek Timber Co. Inc. | 450 | 18,284 | ||||||
Prologis Inc. | 1,258 | 51,503 | ||||||
Public Storage | 364 | 63,766 | ||||||
Rayonier Inc. | 342 | 11,720 | ||||||
Realty Income Corp. | 566 | 25,312 | ||||||
Regency Centers Corp. | 242 | 13,828 | ||||||
Simon Property Group Inc. | 789 | 134,154 | ||||||
SL Green Realty Corp. | 238 | 26,025 | ||||||
UDR Inc. | 633 | 18,939 | ||||||
Ventas Inc. | 722 | 47,493 | ||||||
Vornado Realty Trust | 427 | 45,206 | ||||||
Weyerhaeuser Co. | 1,317 | 44,712 | ||||||
|
| |||||||
| 1,246,224 | ||||||||
REAL ESTATE MANAGEMENT & DEVELOPMENT — 0.08% |
| |||||||
CBRE Group Inc. Class Aa | 762 | 24,216 | ||||||
Realogy Holdings Corp.a | 361 | 14,718 | ||||||
|
| |||||||
| 38,934 | ||||||||
ROAD & RAIL — 1.02% | ||||||||
CSX Corp. | 2,535 | 78,357 | ||||||
Hertz Global Holdings Inc.a | 1,116 | 32,978 | ||||||
J.B. Hunt Transport Services Inc. | 235 | 17,754 | ||||||
Kansas City Southern Industries Inc. | 271 | 31,263 | ||||||
Norfolk Southern Corp. | 785 | 83,995 | ||||||
Union Pacific Corp. | 2,276 | 239,594 | ||||||
|
| |||||||
| 483,941 | ||||||||
| Security | Shares | Value | ||||||
SEMICONDUCTORS & SEMICONDUCTOR EQUIPMENT — 2.34% |
| |||||||
Altera Corp. | 816 | $ | 28,837 | |||||
Analog Devices Inc. | 806 | 41,203 | ||||||
Applied Materials Inc. | 3,051 | 70,493 | ||||||
Avago Technologies Ltd. | 635 | 52,127 | ||||||
Broadcom Corp. Class A | 1,333 | 52,494 | ||||||
Cree Inc.a | 14 | 638 | ||||||
Intel Corp. | 12,531 | 437,583 | ||||||
KLA-Tencor Corp. | 432 | 33,013 | ||||||
Lam Research Corp. | 410 | 29,483 | ||||||
Linear Technology Corp. | 586 | 26,434 | ||||||
Marvell Technology Group Ltd. | 930 | 12,936 | ||||||
Maxim Integrated Products Inc. | 698 | 21,561 | ||||||
Microchip Technology Inc. | 520 | 25,392 | ||||||
Micron Technology Inc.a | 2,671 | 87,075 | ||||||
NVIDIA Corp. | 1,449 | 28,183 | ||||||
Texas Instruments Inc. | 2,713 | 130,712 | ||||||
Xilinx Inc. | 678 | 28,646 | ||||||
|
| |||||||
| 1,106,810 | ||||||||
SOFTWARE — 3.88% | ||||||||
Activision Blizzard Inc. | 1,269 | 29,872 | ||||||
Adobe Systems Inc.a | 1,196 | 85,992 | ||||||
ANSYS Inc.a | 234 | 19,024 | ||||||
Autodesk Inc.a | 558 | 29,931 | ||||||
CA Inc. | 870 | 24,569 | ||||||
Citrix Systems Inc.a | 412 | 28,947 | ||||||
Electronic Arts Inc.a | 805 | 30,461 | ||||||
FireEye Inc.a | 161 | 5,014 | ||||||
Intuit Inc. | 673 | 55,980 | ||||||
Microsoft Corp. | 19,765 | 897,924 | ||||||
NetSuite Inc.a | 103 | 9,027 | ||||||
Nuance Communications Inc.a,c | 671 | 11,414 | ||||||
Oracle Corp. | 9,013 | 374,310 | ||||||
Red Hat Inc.a | 470 | 28,632 | ||||||
Salesforce.com Inc.a | 1,478 | 87,335 | ||||||
ServiceNow Inc.a,c | 318 | 19,439 | ||||||
Symantec Corp. | 1,739 | 42,223 | ||||||
Synopsys Inc.a | 403 | 16,483 | ||||||
VMware Inc. Class Aa,c | 217 | 21,392 | ||||||
Workday Inc. Class Aa | 238 | 21,675 | ||||||
|
| |||||||
| 1,839,644 | ||||||||
SPECIALTY RETAIL — 2.17% | ||||||||
Advance Auto Parts Inc. | 183 | 24,965 | ||||||
AutoNation Inc.a | 193 | 10,470 | ||||||
SCHEDULESOF INVESTMENTS | 51 |
Table of Contents
Schedule of Investments (Continued)
iSHARES® MSCI USA ETF
August 31, 2014
| Security | Shares | Value | ||||||
AutoZone Inc.a,c | 83 | $ | 44,724 | |||||
Bed Bath & Beyond Inc.a | 538 | 34,572 | ||||||
Best Buy Co. Inc. | 733 | 23,375 | ||||||
CarMax Inc.a,c | 563 | 29,501 | ||||||
Dick’s Sporting Goods Inc. | 252 | 11,358 | ||||||
GameStop Corp. Class A | 307 | 12,955 | ||||||
Gap Inc. (The) | 616 | 28,428 | ||||||
Home Depot Inc. (The) | 3,441 | 321,733 | ||||||
L Brands Inc. | 630 | 40,226 | ||||||
Lowe’s Companies Inc. | 2,546 | 133,690 | ||||||
O’Reilly Automotive Inc.a | 270 | 42,115 | ||||||
PetSmart Inc. | 259 | 18,537 | ||||||
Ross Stores Inc. | 551 | 41,556 | ||||||
Staples Inc. | 1,642 | 19,179 | ||||||
Tiffany & Co. | 316 | 31,897 | ||||||
TJX Companies Inc. (The) | 1,792 | 106,821 | ||||||
Tractor Supply Co. | 344 | 23,031 | ||||||
Ulta Salon, Cosmetics & Fragrance Inc.a | 154 | 14,986 | ||||||
Urban Outfitters Inc.a | 318 | 12,653 | ||||||
|
| |||||||
| 1,026,772 | ||||||||
TEXTILES, APPAREL & LUXURY GOODS — 0.77% |
| |||||||
Coach Inc. | 691 | 25,450 | ||||||
Fossil Group Inc.a | 122 | 12,357 | ||||||
Lululemon Athletica Inc.a | 261 | 10,422 | ||||||
Michael Kors Holdings Ltd.a | 489 | 39,179 | ||||||
Nike Inc. Class B | 1,777 | 139,583 | ||||||
PVH Corp. | 211 | 24,632 | ||||||
Ralph Lauren Corp. | 154 | 26,057 | ||||||
Under Armour Inc. Class Aa | 420 | 28,711 | ||||||
VF Corp. | 889 | 57,003 | ||||||
|
| |||||||
| 363,394 | ||||||||
THRIFTS & MORTGAGE FINANCE — 0.11% |
| |||||||
Hudson City Bancorp Inc. | 1,247 | 12,308 | ||||||
New York Community Bancorp Inc. | 1,139 | 18,167 | ||||||
Ocwen Financial Corp.a,c | 275 | 7,684 | ||||||
People’s United Financial Inc. | 837 | 12,513 | ||||||
|
| |||||||
| 50,672 | ||||||||
TOBACCO — 1.39% | ||||||||
Altria Group Inc. | 4,993 | 215,098 | ||||||
Lorillard Inc. | 917 | 54,745 | ||||||
Philip Morris International Inc. | 3,968 | 339,582 | ||||||
Reynolds American Inc. | 807 | 47,185 | ||||||
|
| |||||||
| 656,610 | ||||||||
| Security | Shares | Value | ||||||
TRADING COMPANIES & DISTRIBUTORS — 0.21% |
| |||||||
Fastenal Co. | 711 | $ | 32,194 | |||||
United Rentals Inc.a,c | 244 | 28,707 | ||||||
W.W. Grainger Inc. | 157 | 38,653 | ||||||
|
| |||||||
| 99,554 | ||||||||
WATER UTILITIES — 0.05% | ||||||||
American Water Works Co. Inc. | 466 | 23,584 | ||||||
|
| |||||||
| 23,584 | ||||||||
WIRELESS TELECOMMUNICATION SERVICES — 0.14% |
| |||||||
SBA Communications Corp. Class Aa | 325 | 35,844 | ||||||
Sprint Corp.a,c | 1,978 | 11,097 | ||||||
T-Mobile US Inc.a | 628 | 18,890 | ||||||
|
| |||||||
| 65,831 | ||||||||
|
| |||||||
TOTAL COMMON STOCKS | 47,258,640 | |||||||
SHORT-TERM INVESTMENTS — 0.81% |
| |||||||
MONEY MARKET FUNDS — 0.81% |
| |||||||
BlackRock Cash Funds: Institutional, SL Agency Shares | ||||||||
0.14%b,d,e | 296,548 | 296,548 | ||||||
BlackRock Cash Funds: Prime, | ||||||||
0.11%b,d,e | 18,668 | 18,668 | ||||||
BlackRock Cash Funds: Treasury, | ||||||||
0.00%b,d | 67,918 | 67,918 | ||||||
|
| |||||||
| 383,134 | ||||||||
|
| |||||||
TOTAL SHORT-TERM INVESTMENTS |
| |||||||
(Cost: $383,134) | 383,134 | |||||||
|
| |||||||
TOTAL INVESTMENTS | 47,641,774 | |||||||
(Cost: $43,836,422) | ||||||||
Other Assets, Less Liabilities — (0.53)% |
| (250,282 | ) | |||||
|
| |||||||
NET ASSETS — 100.00% | $ | 47,391,492 | ||||||
|
| |||||||
NVS | — Non-Voting Shares |
| a | Non-income earning security. |
| b | Affiliated issuer. See Note 2. |
| c | All or a portion of this security represents a security on loan. See Note 1. |
| d | The rate quoted is the annualized seven-day yield of the fund at period end. |
| e | All or a portion of this security represents an investment of securities lending collateral. See Note 1. |
See notes to financial statements.
| 52 | 2014 iSHARES ANNUAL REPORTTO SHAREHOLDERS |
Table of Contents
Statements of Assets and Liabilities
iSHARES®, INC.
August 31, 2014
iShares MSCI Brazil Capped ETF | iShares MSCI Canada ETF | iShares MSCI Chile Capped ETF | ||||||||||
ASSETS | ||||||||||||
Investments, at cost: | ||||||||||||
Unaffiliated | $ | 3,151,638,470 | $ | 3,669,195,894 | $ | 306,715,634 | ||||||
Affiliated (Note 2) | 4,267,567 | 32,050,890 | 316,985 | |||||||||
|
|
|
|
|
| |||||||
Total cost of investments | $ | 3,155,906,037 | $ | 3,701,246,784 | $ | 307,032,619 | ||||||
|
|
|
|
|
| |||||||
Investments in securities, at fair value (including securities on loana) (Note 1): | ||||||||||||
Unaffiliated | $ | 5,433,655,340 | $ | 3,778,059,600 | $ | 351,665,355 | ||||||
Affiliated (Note 2) | 4,267,567 | 32,050,890 | 316,985 | |||||||||
|
|
|
|
|
| |||||||
Total fair value of investments | 5,437,922,907 | 3,810,110,490 | 351,982,340 | |||||||||
Foreign currency, at valueb | 96,722,116 | 14,480,684 | — | |||||||||
Cash | — | 87,285 | — | |||||||||
Receivables: | ||||||||||||
Investment securities sold | 105,791,175 | 4,610,172 | 5,654,193 | |||||||||
Dividends and interest | 8,134,311 | 9,523,456 | 45,700 | |||||||||
Capital shares sold | 1,734,863 | 262,472 | 34,969,746 | |||||||||
Futures variation margin | — | 893,090 | — | |||||||||
|
|
|
|
|
| |||||||
Total Assets | 5,650,305,372 | 3,839,967,649 | 392,651,979 | |||||||||
|
|
|
|
|
| |||||||
LIABILITIES | ||||||||||||
Payables: | ||||||||||||
Investment securities purchased | 198,077,181 | 20,818,513 | 39,978,432 | |||||||||
Due to broker for foreign currency pledged for futures, at valueb | — | 245,792 | — | |||||||||
Collateral for securities on loan (Note 1) | — | 30,133,277 | — | |||||||||
Capital shares redeemed | — | 372,907 | — | |||||||||
Investment advisory fees (Note 2) | 2,542,856 | 1,490,930 | 174,094 | |||||||||
|
|
|
|
|
| |||||||
Total Liabilities | 200,620,037 | 53,061,419 | 40,152,526 | |||||||||
|
|
|
|
|
| |||||||
NET ASSETS | $ | 5,449,685,335 | $ | 3,786,906,230 | $ | 352,499,453 | ||||||
|
|
|
|
|
| |||||||
Net assets consist of: | ||||||||||||
Paid-in capital | $ | 4,977,316,433 | $ | 4,020,446,448 | $ | 458,815,504 | ||||||
Undistributed (distributions in excess of) net investment income | (3,286,174 | ) | 3,649,118 | 21,583 | ||||||||
Accumulated net realized loss | (1,805,495,822 | ) | (346,816,719 | ) | (151,287,180 | ) | ||||||
Net unrealized appreciation | 2,281,150,898 | 109,627,383 | 44,949,546 | |||||||||
|
|
|
|
|
| |||||||
NET ASSETS | $ | 5,449,685,335 | $ | 3,786,906,230 | $ | 352,499,453 | ||||||
|
|
|
|
|
| |||||||
Shares outstandingc | 101,650,000 | 115,000,000 | 8,100,000 | |||||||||
|
|
|
|
|
| |||||||
Net asset value per share | $ | 53.61 | $ | 32.93 | $ | 43.52 | ||||||
|
|
|
|
|
| |||||||
| a | Securities on loan with values of $ —, $28,500,223 and $ —, respectively. See Note 1. |
| b | Cost of foreign currency including currency at broker, if any: $96,620,589, $14,348,128 and $ —, respectively. |
| c | $0.001 par value, number of shares authorized: 500 million, 340.2 million and 200 million, respectively. |
See notes to financial statements.
FINANCIAL STATEMENTS | 53 |
Table of Contents
Statements of Assets and Liabilities (Continued)
iSHARES®, INC.
August 31, 2014
iShares MSCI Colombia | iShares MSCI Israel | iShares MSCI Mexico Capped ETF | ||||||||||
ASSETS | ||||||||||||
Investments, at cost: | ||||||||||||
Unaffiliated | $ | 22,432,223 | $ | 138,192,292 | $ | 3,219,226,307 | ||||||
Affiliated (Note 2) | 53,269 | 11,119 | 139,109,903 | |||||||||
|
|
|
|
|
| |||||||
Total cost of investments | $ | 22,485,492 | $ | 138,203,411 | $ | 3,358,336,210 | ||||||
|
|
|
|
|
| |||||||
Investments in securities, at fair value (including securities on loana) (Note 1): | ||||||||||||
Unaffiliated | $ | 24,896,773 | $ | 121,310,194 | $ | 3,269,032,024 | ||||||
Affiliated (Note 2) | 53,269 | 11,119 | 139,109,903 | |||||||||
|
|
|
|
|
| |||||||
Total fair value of investments | 24,950,042 | 121,321,313 | 3,408,141,927 | |||||||||
Foreign currency, at valueb | 1,323 | 166,691 | 6,151,426 | |||||||||
Cash | — | 15,684 | — | |||||||||
Receivables: | ||||||||||||
Investment securities sold | 919,802 | — | 171,672,731 | |||||||||
Due from custodian (Note 4) | — | 310,777 | — | |||||||||
Dividends and interest | 7,446 | 205,137 | 683,169 | |||||||||
|
|
|
|
|
| |||||||
Total Assets | 25,878,613 | 122,019,602 | 3,586,649,253 | |||||||||
|
|
|
|
|
| |||||||
LIABILITIES | ||||||||||||
Payables: | ||||||||||||
Investment securities purchased | 469,964 | 310,777 | 172,360,109 | |||||||||
Collateral for securities on loan (Note 1) | — | — | 137,860,359 | |||||||||
Investment advisory fees (Note 2) | 12,977 | 63,517 | 1,276,693 | |||||||||
|
|
|
|
|
| |||||||
Total Liabilities | 482,941 | 374,294 | 311,497,161 | |||||||||
|
|
|
|
|
| |||||||
NET ASSETS | $ | 25,395,672 | $ | 121,645,308 | $ | 3,275,152,092 | ||||||
|
|
|
|
|
| |||||||
Net assets consist of: | ||||||||||||
Paid-in capital | $ | 23,088,890 | $ | 173,096,762 | $ | 3,441,594,592 | ||||||
Undistributed (distributions in excess of) net investment income | — | (29,486 | ) | 5,791,200 | ||||||||
Accumulated net realized loss | (157,729 | ) | (34,537,788 | ) | (222,041,441 | ) | ||||||
Net unrealized appreciation (depreciation) | 2,464,511 | (16,884,180 | ) | 49,807,741 | ||||||||
|
|
|
|
|
| |||||||
NET ASSETS | $ | 25,395,672 | $ | 121,645,308 | $ | 3,275,152,092 | ||||||
|
|
|
|
|
| |||||||
Shares outstandingc | 900,000 | 2,400,000 | 45,800,000 | |||||||||
|
|
|
|
|
| |||||||
Net asset value per share | $ | 28.22 | $ | 50.69 | $ | 71.51 | ||||||
|
|
|
|
|
| |||||||
| a | Securities on loan with values of $ —, $ — and $124,185,860, respectively. See Note 1. |
| b | Cost of foreign currency: $1,344, $166,162 and $6,152,722, respectively. |
| c | $0.001 par value, number of shares authorized: 25 million, 500 million and 255 million, respectively. |
See notes to financial statements.
| 54 | 2014 iSHARES ANNUAL REPORTTO SHAREHOLDERS |
Table of Contents
Statements of Assets and Liabilities (Continued)
iSHARES®, INC.
August 31, 2014
iShares MSCI South Africa ETF | iShares MSCI | iShares MSCI USA ETF | ||||||||||
ASSETS | ||||||||||||
Investments, at cost: | ||||||||||||
Unaffiliated | $ | 612,611,093 | $ | 598,408,037 | $ | 43,245,366 | ||||||
Affiliated (Note 2) | 3,719,706 | 54,885,087 | 591,056 | |||||||||
|
|
|
|
|
| |||||||
Total cost of investments | $ | 616,330,799 | $ | 653,293,124 | $ | 43,836,422 | ||||||
|
|
|
|
|
| |||||||
Investments in securities, at fair value (including securities on loana) (Note 1): | ||||||||||||
Unaffiliated | $ | 585,333,833 | $ | 514,967,294 | $ | 47,033,102 | ||||||
Affiliated (Note 2) | 3,719,706 | 54,885,087 | 608,672 | |||||||||
|
|
|
|
|
| |||||||
Total fair value of investments | 589,053,539 | 569,852,381 | 47,641,774 | |||||||||
Foreign currency, at valueb | 485,864 | 489,806 | — | |||||||||
Receivables: | ||||||||||||
Investment securities sold | 5,667,530 | — | 156,788 | |||||||||
Dividends and interest | 1,125,850 | 92,652 | 103,428 | |||||||||
|
|
|
|
|
| |||||||
Total Assets | 596,332,783 | 570,434,839 | 47,901,990 | |||||||||
|
|
|
|
|
| |||||||
LIABILITIES | ||||||||||||
Payables: | ||||||||||||
Investment securities purchased | 5,071,719 | — | 188,969 | |||||||||
Collateral for securities on loan (Note 1) | 3,559,939 | 54,774,841 | 315,216 | |||||||||
Capital shares redeemed | — | 22,923 | — | |||||||||
Investment advisory fees (Note 2) | 305,487 | 270,239 | 6,313 | |||||||||
|
|
|
|
|
| |||||||
Total Liabilities | 8,937,145 | 55,068,003 | 510,498 | |||||||||
|
|
|
|
|
| |||||||
NET ASSETS | $ | 587,395,638 | $ | 515,366,836 | $ | 47,391,492 | ||||||
|
|
|
|
|
| |||||||
Net assets consist of: | ||||||||||||
Paid-in capital | $ | 695,618,803 | $ | 655,415,592 | $ | 43,711,522 | ||||||
Undistributed net investment income | 836,307 | — | 133,983 | |||||||||
Accumulated net realized loss | (81,787,271 | ) | (56,602,285 | ) | (259,365 | ) | ||||||
Net unrealized appreciation (depreciation) | (27,272,201 | ) | (83,446,471 | ) | 3,805,352 | |||||||
|
|
|
|
|
| |||||||
NET ASSETS | $ | 587,395,638 | $ | 515,366,836 | $ | 47,391,492 | ||||||
|
|
|
|
|
| |||||||
Shares outstandingc | 8,300,000 | 9,250,000 | 1,100,000 | |||||||||
|
|
|
|
|
| |||||||
Net asset value per share | $ | 70.77 | $ | 55.72 | $ | 43.08 | ||||||
|
|
|
|
|
| |||||||
| a | Securities on loan with values of $3,377,559, $51,535,094 and $309,911, respectively. See Note 1. |
| b | Cost of foreign currency: $486,568, $495,528 and $ —, respectively. |
| c | $0.001 par value, number of shares authorized: 400 million, 200 million and 500 million, respectively. |
See notes to financial statements.
FINANCIAL STATEMENTS | 55 |
Table of Contents
Statements of Operations
iSHARES®, INC.
Year ended August 31, 2014
iShares MSCI Brazil Capped ETF | iShares MSCI Canada ETF | iShares MSCI Chile | ||||||||||
NET INVESTMENT INCOME | ||||||||||||
Dividends — unaffiliateda | $ | 187,425,894 | $ | 81,585,704 | $ | 7,181,222 | ||||||
Interest — unaffiliated | — | 2,394 | — | |||||||||
Interest — affiliated (Note 2) | 537 | 383 | 52 | |||||||||
Securities lending income — affiliated (Note 2) | — | 1,065,225 | — | |||||||||
|
|
|
|
|
| |||||||
Total investment income | 187,426,431 | 82,653,706 | 7,181,274 | |||||||||
|
|
|
|
|
| |||||||
EXPENSES | ||||||||||||
Investment advisory fees (Note 2) | 29,033,197 | 16,221,385 | 2,104,233 | |||||||||
|
|
|
|
|
| |||||||
Total expenses | 29,033,197 | 16,221,385 | 2,104,233 | |||||||||
|
|
|
|
|
| |||||||
Net investment income | 158,393,234 | 66,432,321 | 5,077,041 | |||||||||
|
|
|
|
|
| |||||||
NET REALIZED AND UNREALIZED GAIN (LOSS) | ||||||||||||
Net realized gain (loss) from: | ||||||||||||
Investments — unaffiliated | (23,777,530 | ) | (50,773,679 | ) | (40,704,676 | ) | ||||||
In-kind redemptions — unaffiliated | — | 53,425,766 | — | |||||||||
Futures contracts | — | 2,438,399 | — | |||||||||
Foreign currency transactions | (679,380 | ) | 1,174,181 | (297,290 | ) | |||||||
|
|
|
|
|
| |||||||
Net realized gain (loss) | (24,456,910 | ) | 6,264,667 | (41,001,966 | ) | |||||||
|
|
|
|
|
| |||||||
Net change in unrealized appreciation/depreciation on: | ||||||||||||
Investments | 1,183,727,046 | 621,327,362 | (2,261,755 | ) | ||||||||
Futures contracts | — | 473,482 | — | |||||||||
Translation of assets and liabilities in foreign currencies | 1,879,635 | 117,579 | 2,418 | |||||||||
|
|
|
|
|
| |||||||
Net change in unrealized appreciation/depreciation | 1,185,606,681 | 621,918,423 | (2,259,337 | ) | ||||||||
|
|
|
|
|
| |||||||
Net realized and unrealized gain (loss) | 1,161,149,771 | 628,183,090 | (43,261,303 | ) | ||||||||
|
|
|
|
|
| |||||||
NET INCREASE (DECREASE) IN NET ASSETS RESULTING FROM OPERATIONS | $ | 1,319,543,005 | $ | 694,615,411 | $ | (38,184,262 | ) | |||||
|
|
|
|
|
| |||||||
| a | Net of foreign withholding tax of $15,133,581, $13,239,940 and $1,932,229, respectively. |
See notes to financial statements.
| 56 | 2014 iSHARES ANNUAL REPORTTO SHAREHOLDERS |
Table of Contents
Statements of Operations (Continued)
iSHARES®, INC.
Year ended August 31, 2014
iShares MSCI Colombia | iShares MSCI Israel | iShares MSCI Mexico | ||||||||||
NET INVESTMENT INCOME | ||||||||||||
Dividends — unaffiliateda | $ | 667,453 | $ | 2,495,865 | $ | 54,885,193 | ||||||
Interest — affiliated (Note 2) | 5 | 11 | 228 | |||||||||
Securities lending income — affiliated (Note 2) | — | 19,882 | 1,152,843 | |||||||||
|
|
|
|
|
| |||||||
Total investment income | 667,458 | 2,515,758 | 56,038,264 | |||||||||
|
|
|
|
|
| |||||||
EXPENSES | ||||||||||||
Investment advisory fees (Note 2) | 129,378 | 660,053 | 12,859,191 | |||||||||
Commitment fees (Note 8) | 10 | — | — | |||||||||
Interest expense (Note 8) | 263 | — | — | |||||||||
|
|
|
|
|
| |||||||
Total expenses | 129,651 | 660,053 | 12,859,191 | |||||||||
|
|
|
|
|
| |||||||
Net investment income | 537,807 | 1,855,705 | 43,179,073 | |||||||||
|
|
|
|
|
| |||||||
NET REALIZED AND UNREALIZED GAIN (LOSS) | ||||||||||||
Net realized gain (loss) from: | ||||||||||||
Investments — unaffiliated | (96,247 | ) | (3,484,675 | ) | (100,816,124 | ) | ||||||
Investments — affiliated (Note 2) | — | — | (19,863,537 | ) | ||||||||
In-kind redemptions — unaffiliated | — | 13,880,363 | 71,202,595 | |||||||||
In-kind redemptions — affiliated (Note 2) | — | — | (64,003 | ) | ||||||||
Foreign currency transactions | (30,039 | ) | 27,237 | (264,810 | ) | |||||||
|
|
|
|
|
| |||||||
Net realized gain (loss) | (126,286 | ) | 10,422,925 | (49,805,879 | ) | |||||||
|
|
|
|
|
| |||||||
Net change in unrealized appreciation/depreciation on: | ||||||||||||
Investments | 2,089,609 | 4,245,934 | 416,437,490 | |||||||||
Translation of assets and liabilities in foreign currencies | 1,550 | (759 | ) | 211,625 | ||||||||
|
|
|
|
|
| |||||||
Net change in unrealized appreciation/depreciation | 2,091,159 | 4,245,175 | 416,649,115 | |||||||||
|
|
|
|
|
| |||||||
Net realized and unrealized gain | 1,964,873 | 14,668,100 | 366,843,236 | |||||||||
|
|
|
|
|
| |||||||
NET INCREASE IN NET ASSETS RESULTING FROM OPERATIONS | $ | 2,502,680 | $ | 16,523,805 | $ | 410,022,309 | ||||||
|
|
|
|
|
| |||||||
| a | Net of foreign withholding tax of $10,006, $595,662 and $612,833, respectively. |
See notes to financial statements.
FINANCIAL STATEMENTS | 57 |
Table of Contents
Statements of Operations (Continued)
iSHARES®, INC.
Year ended August 31, 2014
iShares MSCI South Africa ETF | iShares MSCI | iShares MSCI USA ETF | ||||||||||
NET INVESTMENT INCOME | ||||||||||||
Dividends — unaffiliateda | $ | 16,365,495 | $ | 10,717,821 | $ | 2,568,279 | ||||||
Dividends — affiliated (Note 2) | — | — | 14,017 | |||||||||
Interest — affiliated (Note 2) | 55 | 16 | 28 | |||||||||
Securities lending income — affiliated (Note 2) | 149,288 | 924,795 | 5,776 | |||||||||
|
|
|
|
|
| |||||||
Total investment income | 16,514,838 | 11,642,632 | 2,588,100 | |||||||||
|
|
|
|
|
| |||||||
EXPENSES | ||||||||||||
Investment advisory fees (Note 2) | 3,384,634 | 3,190,075 | 196,623 | |||||||||
|
|
|
|
|
| |||||||
Total expenses | 3,384,634 | 3,190,075 | 196,623 | |||||||||
|
|
|
|
|
| |||||||
Net investment income | 13,130,204 | 8,452,557 | 2,391,477 | |||||||||
|
|
|
|
|
| |||||||
NET REALIZED AND UNREALIZED GAIN (LOSS) | ||||||||||||
Net realized gain (loss) from: | ||||||||||||
Investments — unaffiliated | (12,973,359 | ) | (20,693,968 | ) | (201,309 | ) | ||||||
Investments — affiliated (Note 2) | — | — | (133 | ) | ||||||||
In-kind redemptions — unaffiliated | 51,033,118 | 25,122,524 | 56,817,914 | |||||||||
In-kind redemptions — affiliated (Note 2) | — | — | 308,322 | |||||||||
Foreign currency transactions | 1,640 | (26,751 | ) | — | ||||||||
|
|
|
|
|
| |||||||
Net realized gain | 38,061,399 | 4,401,805 | 56,924,794 | |||||||||
|
|
|
|
|
| |||||||
Net change in unrealized appreciation/depreciation on: | ||||||||||||
Investments | 57,083,194 | 93,536,186 | (29,707,391 | ) | ||||||||
Short positions (Note 1) | — | — | (7 | ) | ||||||||
Translation of assets and liabilities in foreign currencies | 18,819 | 19,725 | — | |||||||||
|
|
|
|
|
| |||||||
Net change in unrealized appreciation/depreciation | 57,102,013 | 93,555,911 | (29,707,398 | ) | ||||||||
|
|
|
|
|
| |||||||
Net realized and unrealized gain | 95,163,412 | 97,957,716 | 27,217,396 | |||||||||
|
|
|
|
|
| |||||||
NET INCREASE IN NET ASSETS RESULTING FROM OPERATIONS | $ | 108,293,616 | $ | 106,410,273 | $ | 29,608,873 | ||||||
|
|
|
|
|
| |||||||
| a | Net of foreign withholding tax of $2,652,977, $1,656,844 and $326, respectively. |
See notes to financial statements.
| 58 | 2014 iSHARES ANNUAL REPORTTO SHAREHOLDERS |
Table of Contents
Statements of Changes in Net Assets
iSHARES®, INC.
| iShares MSCI Brazil Capped ETF | iShares MSCI Canada ETF | |||||||||||||||
| Year ended August 31, 2014 | Year ended August 31, 2013 | Year ended August 31, 2014 | Year ended August 31, 2013 | |||||||||||||
INCREASE (DECREASE) IN NET ASSETS | ||||||||||||||||
OPERATIONS: | ||||||||||||||||
Net investment income | $ | 158,393,234 | $ | 234,016,311 | $ | 66,432,321 | $ | 90,664,360 | ||||||||
Net realized gain (loss) | (24,456,910 | ) | (504,905,186 | ) | 6,264,667 | (217,797 | ) | |||||||||
Net change in unrealized appreciation/depreciation | 1,185,606,681 | (731,631,556 | ) | 621,918,423 | (21,929,084 | ) | ||||||||||
|
|
|
|
|
|
|
| |||||||||
Net increase (decrease) in net assets resulting from operations | 1,319,543,005 | (1,002,520,431 | ) | 694,615,411 | 68,517,479 | |||||||||||
|
|
|
|
|
|
|
| |||||||||
DISTRIBUTIONS TO SHAREHOLDERS: | ||||||||||||||||
From net investment income | (151,885,117 | ) | (201,420,612 | ) | (71,105,660 | ) | (101,089,405 | ) | ||||||||
|
|
|
|
|
|
|
| |||||||||
Total distributions to shareholders | (151,885,117 | ) | (201,420,612 | ) | (71,105,660 | ) | (101,089,405 | ) | ||||||||
|
|
|
|
|
|
|
| |||||||||
CAPITAL SHARE TRANSACTIONS: | ||||||||||||||||
Proceeds from shares sold | 2,103,462,834 | 2,841,464,893 | 537,013,459 | 644,392,669 | ||||||||||||
Cost of shares redeemed | (2,805,065,721 | ) | (4,024,510,606 | ) | (801,840,234 | ) | (1,438,141,791 | ) | ||||||||
|
|
|
|
|
|
|
| |||||||||
Net decrease in net assets from capital share transactions | (701,602,887 | ) | (1,183,045,713 | ) | (264,826,775 | ) | (793,749,122 | ) | ||||||||
|
|
|
|
|
|
|
| |||||||||
INCREASE (DECREASE) IN NET ASSETS | 466,055,001 | (2,386,986,756 | ) | 358,682,976 | (826,321,048 | ) | ||||||||||
NET ASSETS | ||||||||||||||||
Beginning of year | 4,983,630,334 | 7,370,617,090 | 3,428,223,254 | 4,254,544,302 | ||||||||||||
|
|
|
|
|
|
|
| |||||||||
End of year | $ | 5,449,685,335 | $ | 4,983,630,334 | $ | 3,786,906,230 | $ | 3,428,223,254 | ||||||||
|
|
|
|
|
|
|
| |||||||||
Undistributed (distributions in excess of) net investment income included in net assets at end of year | $ | (3,286,174 | ) | $ | (11,312,557 | ) | $ | 3,649,118 | $ | 5,407,684 | ||||||
|
|
|
|
|
|
|
| |||||||||
SHARES ISSUED AND REDEEMED | ||||||||||||||||
Shares sold | 45,450,000 | 56,450,000 | 17,400,000 | 22,700,000 | ||||||||||||
Shares redeemed | (61,000,000 | ) | (79,350,000 | ) | (27,800,000 | ) | (51,900,000 | ) | ||||||||
|
|
|
|
|
|
|
| |||||||||
Net decrease in shares outstanding | (15,550,000 | ) | (22,900,000 | ) | (10,400,000 | ) | (29,200,000 | ) | ||||||||
|
|
|
|
|
|
|
| |||||||||
See notes to financial statements.
FINANCIAL STATEMENTS | 59 |
Table of Contents
Statements of Changes in Net Assets (Continued)
iSHARES®, INC.
| iShares MSCI Chile Capped ETF | iShares MSCI Colombia Capped ETF | |||||||||||||||
| Year ended August 31, 2014 | Year ended August 31, 2013 | Year ended August 31, 2014 | Period from June 18, 2013a to August 31, 2013 | |||||||||||||
INCREASE (DECREASE) IN NET ASSETS | ||||||||||||||||
OPERATIONS: | ||||||||||||||||
Net investment income | $ | 5,077,041 | $ | 5,971,692 | $ | 537,807 | $ | 18,943 | ||||||||
Net realized loss | (41,001,966 | ) | (18,305,706 | ) | (126,286 | ) | (39,871 | ) | ||||||||
Net change in unrealized appreciation/depreciation | (2,259,337 | ) | (89,351,302 | ) | 2,091,159 | 373,352 | ||||||||||
|
|
|
|
|
|
|
| |||||||||
Net increase (decrease) in net assets resulting from operations | (38,184,262 | ) | (101,685,316 | ) | 2,502,680 | 352,424 | ||||||||||
|
|
|
|
|
|
|
| |||||||||
DISTRIBUTIONS TO SHAREHOLDERS: | ||||||||||||||||
From net investment income | (4,758,168 | ) | (5,669,647 | ) | (523,757 | ) | — | |||||||||
From net realized gain | — | — | (24,565 | ) | — | |||||||||||
Return of capital | — | (235,875 | ) | (10,400 | ) | — | ||||||||||
|
|
|
|
|
|
|
| |||||||||
Total distributions to shareholders | (4,758,168 | ) | (5,905,522 | ) | (558,722 | ) | — | |||||||||
|
|
|
|
|
|
|
| |||||||||
CAPITAL SHARE TRANSACTIONS: | ||||||||||||||||
Proceeds from shares sold | 306,288,062 | 96,241,277 | 5,263,753 | 17,835,537 | ||||||||||||
Cost of shares redeemed | (275,735,795 | ) | (172,557,468 | ) | — | — | ||||||||||
|
|
|
|
|
|
|
| |||||||||
Net increase (decrease) in net assets from capital share transactions | 30,552,267 | (76,316,191 | ) | 5,263,753 | 17,835,537 | |||||||||||
|
|
|
|
|
|
|
| |||||||||
INCREASE (DECREASE) IN NET ASSETS | (12,390,163 | ) | (183,907,029 | ) | 7,207,711 | 18,187,961 | ||||||||||
NET ASSETS | ||||||||||||||||
Beginning of period | 364,889,616 | 548,796,645 | 18,187,961 | — | ||||||||||||
|
|
|
|
|
|
|
| |||||||||
End of period | $ | 352,499,453 | $ | 364,889,616 | $ | 25,395,672 | $ | 18,187,961 | ||||||||
|
|
|
|
|
|
|
| |||||||||
Undistributed net investment income included in net assets at end of period | $ | 21,583 | $ | — | $ | — | $ | 15,989 | ||||||||
|
|
|
|
|
|
|
| |||||||||
SHARES ISSUED AND REDEEMED | ||||||||||||||||
Shares sold | 6,450,000 | 1,600,000 | 200,000 | 700,000 | ||||||||||||
Shares redeemed | (6,000,000 | ) | (3,050,000 | ) | — | — | ||||||||||
|
|
|
|
|
|
|
| |||||||||
Net increase (decrease) in shares outstanding | 450,000 | (1,450,000 | ) | 200,000 | 700,000 | |||||||||||
|
|
|
|
|
|
|
| |||||||||
| a | Commencement of operations. |
See notes to financial statements.
| 60 | 2014 iSHARES ANNUAL REPORTTO SHAREHOLDERS |
Table of Contents
Statements of Changes in Net Assets (Continued)
iSHARES®, INC.
| iShares MSCI Israel Capped ETF | iShares MSCI Mexico Capped ETF | |||||||||||||||
| Year ended August 31, 2014 | Year ended August 31, 2013 | Year ended August 31, 2014 | Year ended August 31, 2013 | |||||||||||||
INCREASE (DECREASE) IN NET ASSETS | ||||||||||||||||
OPERATIONS: | ||||||||||||||||
Net investment income | $ | 1,855,705 | $ | 1,746,415 | $ | 43,179,073 | $ | 23,387,350 | ||||||||
Net realized gain (loss) | 10,422,925 | (2,451,315 | ) | (49,805,879 | ) | 58,110,855 | ||||||||||
Net change in unrealized appreciation/depreciation | 4,245,175 | 13,324,637 | 416,649,115 | (251,180,438 | ) | |||||||||||
|
|
|
|
|
|
|
| |||||||||
Net increase (decrease) in net assets resulting from operations | 16,523,805 | 12,619,737 | 410,022,309 | (169,682,233 | ) | |||||||||||
|
|
|
|
|
|
|
| |||||||||
DISTRIBUTIONS TO SHAREHOLDERS: | ||||||||||||||||
From net investment income | (2,015,418 | ) | (1,885,659 | ) | (41,504,491 | ) | (20,571,276 | ) | ||||||||
|
|
|
|
|
|
|
| |||||||||
Total distributions to shareholders | (2,015,418 | ) | (1,885,659 | ) | (41,504,491 | ) | (20,571,276 | ) | ||||||||
|
|
|
|
|
|
|
| |||||||||
CAPITAL SHARE TRANSACTIONS: | ||||||||||||||||
Proceeds from shares sold | 124,975,600 | 4,057,008 | 2,034,431,562 | 2,551,091,943 | ||||||||||||
Cost of shares redeemed | (88,548,464 | ) | (12,993,789 | ) | (1,344,849,484 | ) | (1,326,485,790 | ) | ||||||||
|
|
|
|
|
|
|
| |||||||||
Net increase (decrease) in net assets from capital share transactions | 36,427,136 | (8,936,781 | ) | 689,582,078 | 1,224,606,153 | |||||||||||
|
|
|
|
|
|
|
| |||||||||
INCREASE IN NET ASSETS | 50,935,523 | 1,797,297 | 1,058,099,896 | 1,034,352,644 | ||||||||||||
NET ASSETS | ||||||||||||||||
Beginning of year | 70,709,785 | 68,912,488 | 2,217,052,196 | 1,182,699,552 | ||||||||||||
|
|
|
|
|
|
|
| |||||||||
End of year | $ | 121,645,308 | $ | 70,709,785 | $ | 3,275,152,092 | $ | 2,217,052,196 | ||||||||
|
|
|
|
|
|
|
| |||||||||
Undistributed (distributions in excess of) net investment income included in net assets at end of year | $ | (29,486 | ) | $ | (114,132 | ) | $ | 5,791,200 | $ | 4,231,855 | ||||||
|
|
|
|
|
|
|
| |||||||||
SHARES ISSUED AND REDEEMED | ||||||||||||||||
Shares sold | 2,500,000 | 100,000 | 31,000,000 | 36,200,000 | ||||||||||||
Shares redeemed | (1,750,000 | ) | (300,000 | ) | (21,000,000 | ) | (19,800,000 | ) | ||||||||
|
|
|
|
|
|
|
| |||||||||
Net increase (decrease) in shares outstanding | 750,000 | (200,000 | ) | 10,000,000 | 16,400,000 | |||||||||||
|
|
|
|
|
|
|
| |||||||||
See notes to financial statements.
FINANCIAL STATEMENTS | 61 |
Table of Contents
Statements of Changes in Net Assets (Continued)
iSHARES®, INC.
| iShares MSCI South Africa ETF | iShares MSCI Turkey ETF | |||||||||||||||
| Year ended August 31, 2014 | Year ended August 31, 2013 | Year ended August 31, 2014 | Year ended August 31, 2013 | |||||||||||||
INCREASE (DECREASE) IN NET ASSETS | ||||||||||||||||
OPERATIONS: | ||||||||||||||||
Net investment income | $ | 13,130,204 | $ | 10,563,037 | $ | 8,452,557 | $ | 12,304,114 | ||||||||
Net realized gain | 38,061,399 | 9,898,524 | 4,401,805 | 23,341,248 | ||||||||||||
Net change in unrealized appreciation/depreciation | 57,102,013 | (55,224,683 | ) | 93,555,911 | (125,847,399 | ) | ||||||||||
|
|
|
|
|
|
|
| |||||||||
Net increase (decrease) in net assets resulting from operations | 108,293,616 | (34,763,122 | ) | 106,410,273 | (90,202,037 | ) | ||||||||||
|
|
|
|
|
|
|
| |||||||||
DISTRIBUTIONS TO SHAREHOLDERS: | ||||||||||||||||
From net investment income | (12,294,677 | ) | (13,575,195 | ) | (8,703,391 | ) | (12,901,893 | ) | ||||||||
|
|
|
|
|
|
|
| |||||||||
Total distributions to shareholders | (12,294,677 | ) | (13,575,195 | ) | (8,703,391 | ) | (12,901,893 | ) | ||||||||
|
|
|
|
|
|
|
| |||||||||
CAPITAL SHARE TRANSACTIONS: | ||||||||||||||||
Proceeds from shares sold | 281,249,453 | 295,390,025 | 364,224,026 | 506,879,433 | ||||||||||||
Cost of shares redeemed | (337,422,079 | ) | (171,404,561 | ) | (382,640,118 | ) | (528,983,742 | ) | ||||||||
|
|
|
|
|
|
|
| |||||||||
Net increase (decrease) in net assets from capital share transactions | (56,172,626 | ) | 123,985,464 | (18,416,092 | ) | (22,104,309 | ) | |||||||||
|
|
|
|
|
|
|
| |||||||||
INCREASE (DECREASE) IN NET ASSETS | 39,826,313 | 75,647,147 | 79,290,790 | (125,208,239 | ) | |||||||||||
NET ASSETS | ||||||||||||||||
Beginning of year | 547,569,325 | 471,922,178 | 436,076,046 | 561,284,285 | ||||||||||||
|
|
|
|
|
|
|
| |||||||||
End of year | $ | 587,395,638 | $ | 547,569,325 | $ | 515,366,836 | $ | 436,076,046 | ||||||||
|
|
|
|
|
|
|
| |||||||||
Undistributed (distributions in excess of) net investment income included in net assets at end of year | $ | 836,307 | $ | (999,286 | ) | $ | — | $ | (53 | ) | ||||||
|
|
|
|
|
|
|
| |||||||||
SHARES ISSUED AND REDEEMED | ||||||||||||||||
Shares sold | 4,300,000 | 4,800,000 | 7,500,000 | 7,950,000 | ||||||||||||
Shares redeemed | (5,300,000 | ) | (2,800,000 | ) | (7,150,000 | ) | (9,050,000 | ) | ||||||||
|
|
|
|
|
|
|
| |||||||||
Net increase (decrease) in shares outstanding | (1,000,000 | ) | 2,000,000 | 350,000 | (1,100,000 | ) | ||||||||||
|
|
|
|
|
|
|
| |||||||||
See notes to financial statements.
| 62 | 2014 iSHARES ANNUAL REPORTTO SHAREHOLDERS |
Table of Contents
Statements of Changes in Net Assets (Continued)
iSHARES®, INC.
| iShares MSCI USA ETF | ||||||||
| Year ended August 31, 2014 | Year ended August 31, 2013 | |||||||
INCREASE (DECREASE) IN NET ASSETS | ||||||||
OPERATIONS: | ||||||||
Net investment income | $ | 2,391,477 | $ | 3,339,631 | ||||
Net realized gain | 56,924,794 | 4,666,050 | ||||||
Net change in unrealized appreciation/depreciation | (29,707,398 | ) | 18,945,599 | |||||
|
|
|
| |||||
Net increase in net assets resulting from operations | 29,608,873 | 26,951,280 | ||||||
|
|
|
| |||||
DISTRIBUTIONS TO SHAREHOLDERS: | ||||||||
From net investment income | (2,876,350 | ) | (3,310,642 | ) | ||||
|
|
|
| |||||
Total distributions to shareholders | (2,876,350 | ) | (3,310,642 | ) | ||||
|
|
|
| |||||
CAPITAL SHARE TRANSACTIONS: | ||||||||
Proceeds from shares sold | 48,587,993 | 36,217,071 | ||||||
Cost of shares redeemed | (207,759,194 | ) | (25,497,372 | ) | ||||
|
|
|
| |||||
Net increase (decrease) in net assets from capital share transactions | (159,171,201 | ) | 10,719,699 | |||||
|
|
|
| |||||
INCREASE (DECREASE) IN NET ASSETS | (132,438,678 | ) | 34,360,337 | |||||
NET ASSETS | ||||||||
Beginning of year | 179,830,170 | 145,469,833 | ||||||
|
|
|
| |||||
End of year | $ | 47,391,492 | $ | 179,830,170 | ||||
|
|
|
| |||||
Undistributed net investment income included in net assets at end of year | $ | 133,983 | $ | 618,856 | ||||
|
|
|
| |||||
SHARES ISSUED AND REDEEMED | ||||||||
Shares sold | 1,250,000 | 1,100,000 | ||||||
Shares redeemed | (5,250,000 | ) | (800,000 | ) | ||||
|
|
|
| |||||
Net increase (decrease) in shares outstanding | (4,000,000 | ) | 300,000 | |||||
|
|
|
| |||||
See notes to financial statements.
FINANCIAL STATEMENTS | 63 |
Table of Contents
iSHARES®, INC.
(For a share outstanding throughout each period)
| iShares MSCI Brazil Capped ETF | ||||||||||||||||||||
| Year ended Aug. 31, 2014 | Year ended Aug. 31, 2013 | Year ended Aug. 31, 2012 | Year ended Aug. 31, 2011 | Year ended Aug. 31, 2010 | ||||||||||||||||
Net asset value, beginning of year | $ | 42.52 | $ | 52.61 | $ | 65.00 | $ | 68.07 | $ | 58.26 | ||||||||||
|
|
|
|
|
|
|
|
|
| |||||||||||
Income from investment operations: | ||||||||||||||||||||
Net investment incomea | 1.56 | 1.59 | 1.73 | 2.24 | 1.56 | |||||||||||||||
Net realized and unrealized gain (loss)b | 11.08 | (10.32 | ) | (12.64 | ) | (1.69 | ) | 10.83 | ||||||||||||
|
|
|
|
|
|
|
|
|
| |||||||||||
Total from investment operations | 12.64 | (8.73 | ) | (10.91 | ) | 0.55 | 12.39 | |||||||||||||
|
|
|
|
|
|
|
|
|
| |||||||||||
Less distributions from: | ||||||||||||||||||||
Net investment income | (1.55 | ) | (1.36 | ) | (0.56 | ) | (3.62 | ) | (2.58 | ) | ||||||||||
Return of capital | — | — | (0.92 | ) | — | — | ||||||||||||||
|
|
|
|
|
|
|
|
|
| |||||||||||
Total distributions | (1.55 | ) | (1.36 | ) | (1.48 | ) | (3.62 | ) | (2.58 | ) | ||||||||||
|
|
|
|
|
|
|
|
|
| |||||||||||
Net asset value, end of year | $ | 53.61 | $ | 42.52 | $ | 52.61 | $ | 65.00 | $ | 68.07 | ||||||||||
|
|
|
|
|
|
|
|
|
| |||||||||||
Total return | 30.33 | % | (16.85 | )% | (16.79 | )% | 0.36 | % | 21.12 | % | ||||||||||
|
|
|
|
|
|
|
|
|
| |||||||||||
Ratios/Supplemental data: | ||||||||||||||||||||
Net assets, end of year (000s) | $ | 5,449,685 | $ | 4,983,630 | $ | 7,370,617 | $ | 11,332,121 | $ | 9,240,453 | ||||||||||
Ratio of expenses to average net assets | 0.62 | % | 0.61 | % | 0.61 | % | 0.59 | % | 0.61 | % | ||||||||||
Ratio of net investment income to average net assets | 3.37 | % | 3.02 | % | 2.92 | % | 3.08 | % | 2.24 | % | ||||||||||
Portfolio turnover ratec | 54 | % | 56 | % | 7 | % | 11 | % | 13 | % | ||||||||||
| a | Based on average shares outstanding throughout each period. |
| b | The amounts reported for a share outstanding may not accord with the change in aggregate gains and losses in securities for the fiscal period due to the timing of capital share transactions in relation to the fluctuating market values of the Fund’s underlying securities. |
| c | Portfolio turnover rates include portfolio transactions that are executed as a result of the Fund processing capital share transactions in Creation Units solely for cash in U.S. dollars. Excluding such transactions, the portfolio turnover rates for the years ended August 31, 2014, August 31, 2013, August 31, 2012, August 31, 2011 and August 31, 2010 were 11%, 20%, 6%, 11% and 13%, respectively. See Note 4. |
See notes to financial statements.
| 64 | 2014 iSHARES ANNUAL REPORTTO SHAREHOLDERS |
Table of Contents
Financial Highlights (Continued)
iSHARES®, INC.
(For a share outstanding throughout each period)
| iShares MSCI Canada ETF | ||||||||||||||||||||
| Year ended Aug. 31, 2014 | Year ended Aug. 31, 2013 | Year ended Aug. 31, 2012 | Year ended Aug. 31, 2011 | Year ended Aug. 31, 2010 | ||||||||||||||||
Net asset value, beginning of year | $ | 27.34 | $ | 27.52 | $ | 29.89 | $ | 26.10 | $ | 23.70 | ||||||||||
|
|
|
|
|
|
|
|
|
| |||||||||||
Income from investment operations: | ||||||||||||||||||||
Net investment incomea | 0.59 | 0.60 | 0.53 | 0.53 | 0.43 | |||||||||||||||
Net realized and unrealized gain (loss)b | 5.62 | (0.10 | ) | (2.33 | ) | 3.78 | 2.39 | |||||||||||||
|
|
|
|
|
|
|
|
|
| |||||||||||
Total from investment operations | 6.21 | 0.50 | (1.80 | ) | 4.31 | 2.82 | ||||||||||||||
|
|
|
|
|
|
|
|
|
| |||||||||||
Less distributions from: | ||||||||||||||||||||
Net investment income | (0.62 | ) | (0.68 | ) | (0.57 | ) | (0.52 | ) | (0.42 | ) | ||||||||||
|
|
|
|
|
|
|
|
|
| |||||||||||
Total distributions | (0.62 | ) | (0.68 | ) | (0.57 | ) | (0.52 | ) | (0.42 | ) | ||||||||||
|
|
|
|
|
|
|
|
|
| |||||||||||
Net asset value, end of year | $ | 32.93 | $ | 27.34 | $ | 27.52 | $ | 29.89 | $ | 26.10 | ||||||||||
|
|
|
|
|
|
|
|
|
| |||||||||||
Total return | 23.00 | % | 1.84 | % | (5.87 | )% | 16.50 | % | 11.91 | % | ||||||||||
|
|
|
|
|
|
|
|
|
| |||||||||||
Ratios/Supplemental data: | ||||||||||||||||||||
Net assets, end of year (000s) | $ | 3,786,906 | $ | 3,428,223 | $ | 4,254,544 | $ | 5,092,547 | $ | 3,447,242 | ||||||||||
Ratio of expenses to average net assets | 0.48 | % | 0.51 | % | 0.53 | % | 0.52 | % | 0.53 | % | ||||||||||
Ratio of net investment income to average net assets | 1.97 | % | 2.12 | % | 1.94 | % | 1.70 | % | 1.63 | % | ||||||||||
Portfolio turnover ratec | 6 | % | 7 | % | 5 | % | 8 | % | 6 | % | ||||||||||
| a | Based on average shares outstanding throughout each period. |
| b | The amounts reported for a share outstanding may not accord with the change in aggregate gains and losses in securities for the fiscal period due to the timing of capital share transactions in relation to the fluctuating market values of the Fund’s underlying securities. |
| c | Portfolio turnover rates exclude portfolio securities received or delivered as a result of processing capital share transactions in Creation Units. |
See notes to financial statements.
FINANCIAL HIGHLIGHTS | 65 |
Table of Contents
Financial Highlights (Continued)
iSHARES®, INC.
(For a share outstanding throughout each period)
| iShares MSCI Chile Capped ETF | ||||||||||||||||||||
| Year ended Aug. 31, 2014 | Year ended Aug. 31, 2013 | Year ended Aug. 31, 2012 | Year ended Aug. 31, 2011 | Year ended Aug. 31, 2010 | ||||||||||||||||
Net asset value, beginning of year | $ | 47.70 | $ | 60.31 | $ | 67.11 | $ | 67.37 | $ | 44.61 | ||||||||||
|
|
|
|
|
|
|
|
|
| |||||||||||
Income from investment operations: | ||||||||||||||||||||
Net investment incomea | 0.69 | 0.68 | 0.97 | 0.95 | 0.59 | |||||||||||||||
Net realized and unrealized gain (loss)b | (4.18 | ) | (12.58 | ) | (6.80 | ) | (0.23 | ) | 22.86 | |||||||||||
|
|
|
|
|
|
|
|
|
| |||||||||||
Total from investment operations | (3.49 | ) | (11.90 | ) | (5.83 | ) | 0.72 | 23.45 | ||||||||||||
|
|
|
|
|
|
|
|
|
| |||||||||||
Less distributions from: | ||||||||||||||||||||
Net investment income | (0.69 | ) | (0.68 | ) | (0.92 | ) | (0.98 | ) | (0.66 | ) | ||||||||||
Return of capital | — | (0.03 | ) | (0.05 | ) | (0.00 | )c | (0.03 | ) | |||||||||||
|
|
|
|
|
|
|
|
|
| |||||||||||
Total distributions | (0.69 | ) | (0.71 | ) | (0.97 | ) | (0.98 | ) | (0.69 | ) | ||||||||||
|
|
|
|
|
|
|
|
|
| |||||||||||
Net asset value, end of year | $ | 43.52 | $ | 47.70 | $ | 60.31 | $ | 67.11 | $ | 67.37 | ||||||||||
|
|
|
|
|
|
|
|
|
| |||||||||||
Total return | (7.40 | )% | (19.87 | )% | (8.68 | )% | 0.93 | % | 52.88 | % | ||||||||||
|
|
|
|
|
|
|
|
|
| |||||||||||
Ratios/Supplemental data: | ||||||||||||||||||||
Net assets, end of year (000s) | $ | 352,499 | $ | 364,890 | $ | 548,797 | $ | 708,018 | $ | 670,350 | ||||||||||
Ratio of expenses to average net assets | 0.62 | % | 0.61 | % | 0.61 | % | 0.59 | % | 0.61 | % | ||||||||||
Ratio of net investment income to average net assets | 1.49 | % | 1.12 | % | 1.55 | % | 1.30 | % | 1.05 | % | ||||||||||
Portfolio turnover rated | 91 | % | 34 | % | 48 | % | 38 | % | 42 | % | ||||||||||
| a | Based on average shares outstanding throughout each period. |
| b | The amounts reported for a share outstanding may not accord with the change in aggregate gains and losses in securities for the fiscal period due to the timing of capital share transactions in relation to the fluctuating market values of the Fund’s underlying securities. |
| c | Rounds to less than $0.01. |
| d | Portfolio turnover rates include portfolio transactions that are executed as a result of the Fund processing capital share transactions in Creation Units solely for cash in U.S. dollars. Excluding such transactions, the portfolio turnover rates for the years ended August 31, 2014, August 31, 2013, August 31, 2012, August 31, 2011, and August 31, 2010 were 11%, 16%, 20%, 12%, and 9%, respectively. See Note 4. |
See notes to financial statements.
| 66 | 2014 iSHARES ANNUAL REPORTTO SHAREHOLDERS |
Table of Contents
Financial Highlights (Continued)
iSHARES®, INC.
(For a share outstanding throughout each period)
iShares MSCI Colombia Capped ETF |
| Year ended Aug. 31, 2014 | Period from Jun. 18, 2013a to Aug. 31, 2013 | |||||||
Net asset value, beginning of period | $ | 25.98 | $ | 25.28 | ||||
|
|
|
| |||||
Income from investment operations: | ||||||||
Net investment incomeb | 0.67 | 0.03 | ||||||
Net realized and unrealized gainc | 2.24 | 0.67 | ||||||
|
|
|
| |||||
Total from investment operations | 2.91 | 0.70 | ||||||
|
|
|
| |||||
Less distributions from: | ||||||||
Net investment income | (0.63 | ) | — | |||||
Net realized gain | (0.03 | ) | — | |||||
Return of capital | (0.01 | ) | — | |||||
|
|
|
| |||||
Total distributions | (0.67 | ) | — | |||||
|
|
|
| |||||
Net asset value, end of period | $ | 28.22 | $ | 25.98 | ||||
|
|
|
| |||||
Total return | 11.44 | % | 2.77 | %d | ||||
|
|
|
| |||||
Ratios/Supplemental data: | ||||||||
Net assets, end of period (000s) | $ | 25,396 | $ | 18,188 | ||||
Ratio of expenses to average net assetse | 0.61 | % | 0.61 | % | ||||
Ratio of net investment income to average net assetse | 2.54 | % | 0.61 | % | ||||
Portfolio turnover ratef | 34 | % | 2 | % | ||||
| a | Commencement of operations. |
| b | Based on average shares outstanding throughout each period. |
| c | The amounts reported for a share outstanding may not accord with the change in aggregate gains and losses in securities for the fiscal period due to the timing of capital share transactions in relation to the fluctuating market values of the Fund’s underlying securities. |
| d | Not annualized. |
| e | Annualized for periods of less than one year. |
| f | Portfolio turnover rates include portfolio transactions that are executed as a result of the Fund processing capital share transactions in Creation Units solely for cash in U.S. dollars. Excluding such transactions, the portfolio turnover rates for the year ended August 31, 2014 and for the period ended August 31, 2013 were 33% and 2%, respectively. See Note 4. |
See notes to financial statements.
FINANCIAL HIGHLIGHTS | 67 |
Table of Contents
Financial Highlights (Continued)
iSHARES®, INC.
(For a share outstanding throughout each period)
| iShares MSCI Israel Capped ETF | ||||||||||||||||||||
| Year ended Aug. 31, 2014 | Year ended Aug. 31, 2013 | Year ended Aug. 31, 2012 | Year ended Aug. 31, 2011 | Year ended Aug. 31, 2010 | ||||||||||||||||
Net asset value, beginning of year | $ | 42.85 | $ | 37.25 | $ | 45.89 | $ | 49.41 | $ | 46.87 | ||||||||||
|
|
|
|
|
|
|
|
|
| |||||||||||
Income from investment operations: | ||||||||||||||||||||
Net investment incomea | 0.87 | 0.95 | 1.12 | 1.39 | 1.40 | |||||||||||||||
Net realized and unrealized gain (loss)b | 7.95 | 5.68 | (8.66 | ) | (3.18 | ) | 2.63 | |||||||||||||
|
|
|
|
|
|
|
|
|
| |||||||||||
Total from investment operations | 8.82 | 6.63 | (7.54 | ) | (1.79 | ) | 4.03 | |||||||||||||
|
|
|
|
|
|
|
|
|
| |||||||||||
Less distributions from: | ||||||||||||||||||||
Net investment income | (0.98 | ) | (1.03 | ) | (1.07 | ) | (1.73 | ) | (1.49 | ) | ||||||||||
Return of capital | — | — | (0.03 | ) | — | — | ||||||||||||||
|
|
|
|
|
|
|
|
|
| |||||||||||
Total distributions | (0.98 | ) | (1.03 | ) | (1.10 | ) | (1.73 | ) | (1.49 | ) | ||||||||||
|
|
|
|
|
|
|
|
|
| |||||||||||
Net asset value, end of year | $ | 50.69 | $ | 42.85 | $ | 37.25 | $ | 45.89 | $ | 49.41 | ||||||||||
|
|
|
|
|
|
|
|
|
| |||||||||||
Total return | 20.67 | % | 17.82 | % | (16.52 | )% | (4.26 | )% | 8.57 | % | ||||||||||
|
|
|
|
|
|
|
|
|
| |||||||||||
Ratios/Supplemental data: | ||||||||||||||||||||
Net assets, end of year (000s) | $ | 121,645 | $ | 70,710 | $ | 68,912 | $ | 78,018 | $ | 128,473 | ||||||||||
Ratio of expenses to average net assets | 0.62 | % | 0.61 | % | 0.61 | % | 0.59 | % | 0.61 | % | ||||||||||
Ratio of net investment income to average net assets | 1.74 | % | 2.20 | % | 2.75 | % | 2.49 | % | 2.64 | % | ||||||||||
Portfolio turnover ratec | 15 | % | 14 | % | 20 | % | 17 | % | 21 | % | ||||||||||
| a | Based on average shares outstanding throughout each period. |
| b | The amounts reported for a share outstanding may not accord with the change in aggregate gains and losses in securities for the fiscal period due to the timing of capital share transactions in relation to the fluctuating market values of the Fund’s underlying securities. |
| c | Portfolio turnover rates exclude portfolio securities received or delivered as a result of processing capital share transactions in Creation Units. |
See notes to financial statements.
| 68 | 2014 iSHARES ANNUAL REPORTTO SHAREHOLDERS |
Table of Contents
Financial Highlights (Continued)
iSHARES®, INC.
(For a share outstanding throughout each period)
| iShares MSCI Mexico Capped ETF | ||||||||||||||||||||
| Year ended Aug. 31, 2014 | Year ended Aug. 31, 2013 | Year ended Aug. 31, 2012 | Year ended Aug. 31, 2011 | Year ended Aug. 31, 2010 | ||||||||||||||||
Net asset value, beginning of year | $ | 61.93 | $ | 60.96 | $ | 58.39 | $ | 48.17 | $ | 42.59 | ||||||||||
|
|
|
|
|
|
|
|
|
| |||||||||||
Income from investment operations: | ||||||||||||||||||||
Net investment incomea | 1.06 | 0.75 | 0.73 | 0.80 | 0.72 | |||||||||||||||
Net realized and unrealized gainb | 9.61 | 0.85 | 2.76 | 10.15 | 5.61 | |||||||||||||||
|
|
|
|
|
|
|
|
|
| |||||||||||
Total from investment operations | 10.67 | 1.60 | 3.49 | 10.95 | 6.33 | |||||||||||||||
|
|
|
|
|
|
|
|
|
| |||||||||||
Less distributions from: | ||||||||||||||||||||
Net investment income | (1.09 | ) | (0.63 | ) | (0.92 | ) | (0.73 | ) | (0.75 | ) | ||||||||||
|
|
|
|
|
|
|
|
|
| |||||||||||
Total distributions | (1.09 | ) | (0.63 | ) | (0.92 | ) | (0.73 | ) | (0.75 | ) | ||||||||||
|
|
|
|
|
|
|
|
|
| |||||||||||
Net asset value, end of year | $ | 71.51 | $ | 61.93 | $ | 60.96 | $ | 58.39 | $ | 48.17 | ||||||||||
|
|
|
|
|
|
|
|
|
| |||||||||||
Total return | 17.42 | % | 2.53 | % | 6.13 | % | 22.67 | % | 14.83 | % | ||||||||||
|
|
|
|
|
|
|
|
|
| |||||||||||
Ratios/Supplemental data: | ||||||||||||||||||||
Net assets, end of year (000s) | $ | 3,275,152 | $ | 2,217,052 | $ | 1,182,700 | $ | 1,243,731 | $ | 1,450,039 | ||||||||||
Ratio of expenses to average net assets | 0.48 | % | 0.50 | % | 0.53 | % | 0.52 | % | 0.53 | % | ||||||||||
Ratio of net investment income to average net assets | 1.61 | % | 1.09 | % | 1.26 | % | 1.35 | % | 1.46 | % | ||||||||||
Portfolio turnover ratec | 19 | % | 32 | % | 10 | % | 5 | % | 11 | % | ||||||||||
| a | Based on average shares outstanding throughout each period. |
| b | The amounts reported for a share outstanding may not accord with the change in aggregate gains and losses in securities for the fiscal period due to the timing of capital share transactions in relation to the fluctuating market values of the Fund’s underlying securities. |
| c | Portfolio turnover rates exclude portfolio securities received or delivered as a result of processing capital share transactions in Creation Units. |
See notes to financial statements.
FINANCIAL HIGHLIGHTS | 69 |
Table of Contents
Financial Highlights (Continued)
iSHARES®, INC.
(For a share outstanding throughout each period)
| iShares MSCI South Africa ETF | ||||||||||||||||||||
| Year ended Aug. 31, 2014 | Year ended Aug. 31, 2013 | Year ended Aug. 31, 2012 | Year ended Aug. 31, 2011 | Year ended Aug. 31, 2010 | ||||||||||||||||
Net asset value, beginning of year | $ | 58.88 | $ | 64.65 | $ | 69.06 | $ | 58.74 | $ | 51.99 | ||||||||||
|
|
|
|
|
|
|
|
|
| |||||||||||
Income from investment operations: | ||||||||||||||||||||
Net investment incomea | 1.57 | 1.32 | 2.10 | 1.65 | 1.18 | |||||||||||||||
Net realized and unrealized gain (loss)b | 11.86 | (5.31 | ) | (4.41 | ) | 11.08 | 6.92 | |||||||||||||
|
|
|
|
|
|
|
|
|
| |||||||||||
Total from investment operations | 13.43 | (3.99 | ) | (2.31 | ) | 12.73 | 8.10 | |||||||||||||
|
|
|
|
|
|
|
|
|
| |||||||||||
Less distributions from: | ||||||||||||||||||||
Net investment income | (1.54 | ) | (1.78 | ) | (2.10 | ) | (2.41 | ) | (1.35 | ) | ||||||||||
|
|
|
|
|
|
|
|
|
| |||||||||||
Total distributions | (1.54 | ) | (1.78 | ) | (2.10 | ) | (2.41 | ) | (1.35 | ) | ||||||||||
|
|
|
|
|
|
|
|
|
| |||||||||||
Net asset value, end of year | $ | 70.77 | $ | 58.88 | $ | 64.65 | $ | 69.06 | $ | 58.74 | ||||||||||
|
|
|
|
|
|
|
|
|
| |||||||||||
Total return | 23.13 | % | (6.35 | )% | (3.17 | )% | 21.58 | % | 15.80 | % | ||||||||||
|
|
|
|
|
|
|
|
|
| |||||||||||
Ratios/Supplemental data: | ||||||||||||||||||||
Net assets, end of year (000s) | $ | 587,396 | $ | 547,569 | $ | 471,922 | $ | 504,102 | $ | 505,191 | ||||||||||
Ratio of expenses to average net assets | 0.62 | % | 0.61 | % | 0.61 | % | 0.59 | % | 0.61 | % | ||||||||||
Ratio of net investment income to average net assets | 2.40 | % | 2.08 | % | 3.26 | % | 2.38 | % | 2.09 | % | ||||||||||
Portfolio turnover ratec | 6 | % | 5 | % | 4 | % | 4 | % | 5 | % | ||||||||||
| a | Based on average shares outstanding throughout each period. |
| b | The amounts reported for a share outstanding may not accord with the change in aggregate gains and losses in securities for the fiscal period due to the timing of capital share transactions in relation to the fluctuating market values of the Fund’s underlying securities. |
| c | Portfolio turnover rates exclude portfolio securities received or delivered as a result of processing capital share transactions in Creation Units. |
See notes to financial statements.
| 70 | 2014 iSHARES ANNUAL REPORTTO SHAREHOLDERS |
Table of Contents
Financial Highlights (Continued)
iSHARES®, INC.
(For a share outstanding throughout each period)
| iShares MSCI Turkey ETF | ||||||||||||||||||||
| Year ended Aug. 31, 2014 | Year ended Aug. 31, 2013 | Year ended Aug. 31, 2012 | Year ended Aug. 31, 2011 | Year ended Aug. 31, 2010 | ||||||||||||||||
Net asset value, beginning of year | $ | 49.00 | $ | 56.13 | $ | 47.73 | $ | 60.81 | $ | 48.01 | ||||||||||
|
|
|
|
|
|
|
|
|
| |||||||||||
Income from investment operations: | ||||||||||||||||||||
Net investment incomea | 0.85 | 1.07 | 0.86 | 0.84 | 1.00 | |||||||||||||||
Net realized and unrealized gain (loss)b | 6.75 | (7.08 | ) | 8.70 | (12.59 | ) | 13.02 | |||||||||||||
|
|
|
|
|
|
|
|
|
| |||||||||||
Total from investment operations | 7.60 | (6.01 | ) | 9.56 | (11.75 | ) | 14.02 | |||||||||||||
|
|
|
|
|
|
|
|
|
| |||||||||||
Less distributions from: | ||||||||||||||||||||
Net investment income | (0.88 | ) | (1.12 | ) | (1.16 | ) | (1.33 | ) | (1.22 | ) | ||||||||||
|
|
|
|
|
|
|
|
|
| |||||||||||
Total distributions | (0.88 | ) | (1.12 | ) | (1.16 | ) | (1.33 | ) | (1.22 | ) | ||||||||||
|
|
|
|
|
|
|
|
|
| |||||||||||
Net asset value, end of year | $ | 55.72 | $ | 49.00 | $ | 56.13 | $ | 47.73 | $ | 60.81 | ||||||||||
|
|
|
|
|
|
|
|
|
| |||||||||||
Total return | 15.52 | % | (11.05 | )% | 20.37 | % | (19.74 | )% | 29.55 | % | ||||||||||
|
|
|
|
|
|
|
|
|
| |||||||||||
Ratios/Supplemental data: | ||||||||||||||||||||
Net assets, end of year (000s) | $ | 515,367 | $ | 436,076 | $ | 561,284 | $ | 448,677 | $ | 601,988 | ||||||||||
Ratio of expenses to average net assets | 0.62 | % | 0.61 | % | 0.61 | % | 0.59 | % | 0.61 | % | ||||||||||
Ratio of net investment income to average net assets | 1.64 | % | 1.67 | % | 1.75 | % | 1.30 | % | 1.81 | % | ||||||||||
Portfolio turnover ratec | 8 | % | 9 | % | 9 | % | 12 | % | 13 | % | ||||||||||
| a | Based on average shares outstanding throughout each period. |
| b | The amounts reported for a share outstanding may not accord with the change in aggregate gains and losses in securities for the fiscal period due to the timing of capital share transactions in relation to the fluctuating market values of the Fund’s underlying securities. |
| c | Portfolio turnover rates exclude portfolio securities received or delivered as a result of processing capital share transactions in Creation Units. |
See notes to financial statements.
FINANCIAL HIGHLIGHTS | 71 |
Table of Contents
Financial Highlights (Continued)
iSHARES®, INC.
(For a share outstanding throughout each period)
| iShares MSCI USA ETF | ||||||||||||||||||||
| Year ended Aug. 31, 2014 | Year ended Aug. 31, 2013 | Year ended Aug. 31, 2012 | Year ended Aug. 31, 2011 | Period from to Aug. 31, 2010 | ||||||||||||||||
Net asset value, beginning of period | $ | 35.26 | $ | 30.31 | $ | 26.17 | $ | 22.44 | $ | 24.83 | ||||||||||
|
|
|
|
|
|
|
|
|
| |||||||||||
Income from investment operations: | ||||||||||||||||||||
Net investment incomeb | 0.71 | 0.69 | 0.59 | 0.51 | 0.17 | |||||||||||||||
Net realized and unrealized gain (loss)c | 8.01 | 4.96 | 3.94 | 3.73 | (2.49 | ) | ||||||||||||||
|
|
|
|
|
|
|
|
|
| |||||||||||
Total from investment operations | 8.72 | 5.65 | 4.53 | 4.24 | (2.32 | ) | ||||||||||||||
|
|
|
|
|
|
|
|
|
| |||||||||||
Less distributions from: | ||||||||||||||||||||
Net investment income | (0.90 | ) | (0.70 | ) | (0.39 | ) | (0.51 | ) | (0.07 | ) | ||||||||||
|
|
|
|
|
|
|
|
|
| |||||||||||
Total distributions | (0.90 | ) | (0.70 | ) | (0.39 | ) | (0.51 | ) | (0.07 | ) | ||||||||||
|
|
|
|
|
|
|
|
|
| |||||||||||
Net asset value, end of period | $ | 43.08 | $ | 35.26 | $ | 30.31 | $ | 26.17 | $ | 22.44 | ||||||||||
|
|
|
|
|
|
|
|
|
| |||||||||||
Total return | 24.98 | % | 18.85 | % | 17.44 | % | 18.89 | % | (9.37 | )%d | ||||||||||
|
|
|
|
|
|
|
|
|
| |||||||||||
Ratios/Supplemental data: | ||||||||||||||||||||
Net assets, end of period (000s) | $ | 47,391 | $ | 179,830 | $ | 145,470 | $ | 5,233 | $ | 2,244 | ||||||||||
Ratio of expenses to average net assetse | 0.15 | % | 0.15 | % | 0.15 | % | 0.15 | % | 0.15 | % | ||||||||||
Ratio of net investment income to average net assetse | 1.82 | % | 2.10 | % | 2.04 | % | 1.90 | % | 2.21 | % | ||||||||||
Portfolio turnover ratef | 6 | % | 5 | % | 6 | % | 8 | % | 1 | % | ||||||||||
| a | Commencement of operations. |
| b | Based on average shares outstanding throughout each period. |
| c | The amounts reported for a share outstanding may not accord with the change in aggregate gains and losses in securities for the fiscal period due to the timing of capital share transactions in relation to the fluctuating market values of the Fund’s underlying securities. |
| d | Not annualized. |
| e | Annualized for periods of less than one year. |
| f | Portfolio turnover rates exclude portfolio securities received or delivered as a result of processing capital share transactions in Creation Units. |
See notes to financial statements.
| 72 | 2014 iSHARES ANNUAL REPORTTO SHAREHOLDERS |
Table of Contents
iSHARES®, INC.
iShares, Inc. (the “Company”) is registered under the Investment Company Act of 1940, as amended (the “1940 Act”), as an open-end management investment company. The Company was incorporated under the laws of the State of Maryland on September 1, 1994 pursuant to amended and restated Articles of Incorporation.
These financial statements relate only to the following funds (each, a “Fund,” and collectively, the “Funds”):
| iShares ETF | Diversification Classification | |||
MSCI Brazil Capped | Non-diversified | |||
MSCI Canada | Diversified | |||
MSCI Chile Capped | Non-diversified | |||
MSCI Colombia Capped | Non-diversified | |||
MSCI Israel Capped | Non-diversified | |||
| iShares ETF | Diversification Classification | |||
MSCI Mexico Capped | Non-diversified | |||
MSCI South Africa | Non-diversified | |||
MSCI Turkey | Non-diversified | |||
MSCI USA | Diversified | |||
The investment objective of each Fund is to seek investment results that correspond generally to the price and yield performance, before fees and expenses, of its underlying index. The investment adviser uses a “passive” or index approach to try to achieve each Fund’s investment objective.
Pursuant to the Company’s organizational documents, the Funds’ officers and directors are indemnified against certain liabilities that may arise out of the performance of their duties to the Funds. Additionally, in the normal course of business, the Funds enter into contracts with service providers that contain general indemnification clauses. The Funds’ maximum exposure under these arrangements is unknown as this would involve future claims that may be made against the Funds that have not yet occurred.
| 1. | SIGNIFICANT ACCOUNTING POLICIES |
The following significant accounting policies are consistently followed by the Funds in the preparation of their financial statements in conformity with accounting principles generally accepted in the United States of America (“U.S. GAAP”). The preparation of financial statements in conformity with U.S. GAAP requires management to make certain estimates and assumptions that affect the reported amounts of assets and liabilities and disclosures of contingent assets and liabilities at the date of the financial statements and the reported amounts of revenue and expenses during the reporting period. Actual results could differ from those estimates. Each Fund is considered an investment company under U.S. GAAP and follows the accounting and reporting guidance applicable to investment companies in the Financial Accounting Standards Board Accounting Standards Codification Topic 946 (ASC 946).
SECURITY VALUATION
Each Fund’s investments are valued at fair value each day that the Fund’s listing exchange is open and, for financial reporting purposes, as of the report date should the reporting period end on a day that the Fund’s listing exchange is not open. U.S. GAAP defines fair value as the price a fund would receive to sell an asset or pay to transfer a liability in an orderly transaction between market participants at the measurement date. The BlackRock Global Valuation Methodologies Committee (the “Global Valuation Committee”) provides oversight of the valuation of investments for the Funds. The investments of each Fund are valued pursuant to policies and procedures developed by the Global Valuation Committee and approved by the Board of Directors of the Company (the “Board”).
| • | Equity investments traded on a recognized securities exchange are valued at that day’s last reported trade price or the official closing price, as applicable, on the exchange where the stock is primarily traded. Equity investments traded on a recognized exchange for which there were no sales on that day are valued at the last traded price. |
NOTESTO FINANCIAL STATEMENTS | 73 |
Table of Contents
Notes to Financial Statements (Continued)
iSHARES®, INC.
| • | Open-end U.S. mutual funds are valued at that day’s published net asset value (NAV). |
| • | Financial futures contracts are valued at that day’s last reported settlement price on the exchange where the contract is traded. |
In the event that application of these methods of valuation results in a price for an investment which is deemed not to be representative of the fair value of such investment or if a price is not available, the investment will be valued based upon other available factors deemed relevant by the Global Valuation Committee, in accordance with policies approved by the Board. These factors include but are not limited to (i) attributes specific to the investment; (ii) the principal market for the investment; (iii) the customary participants in the principal market for the investment; (iv) data assumptions by market participants for the investment, if reasonably available; (v) quoted prices for similar investments in active markets; and (vi) other factors, such as future cash flows, interest rates, yield curves, volatilities, prepayment speeds, loss severities, credit risks and/or default rates. Valuations based on such factors are reported to the Board on a quarterly basis.
The Global Valuation Committee employs various methods for calibrating valuation approaches for investments where an active market does not exist, including regular due diligence of the Company’s pricing vendors, a regular review of key inputs and assumptions, transactional back-testing or disposition analysis to compare unrealized gains and losses to realized gains and losses, reviews of missing or stale prices, reviews of large movements in market values, and reviews of market related activity.
Fair value pricing could result in a difference between the prices used to calculate a Fund’s net asset value and the prices used by the Fund’s underlying index, which in turn could result in a difference between the Fund’s performance and the performance of the Fund’s underlying index.
Various inputs are used in determining the fair value of financial instruments. Inputs may be based on independent market data (“observable inputs”) or they may be internally developed (“unobservable inputs”). These inputs are categorized into a disclosure hierarchy consisting of three broad levels for financial reporting purposes. The level of a value determined for a financial instrument within the fair value hierarchy is based on the lowest level of any input that is significant to the fair value measurement in its entirety. The categorization of a value determined for a financial instrument within the hierarchy is based upon the pricing transparency of the instrument and is not necessarily an indication of the risk associated with investing in the instrument. The three levels of the fair value hierarchy are as follows:
| • | Level 1 — Unadjusted quoted prices in active markets for identical assets or liabilities; |
| • | Level 2 — Inputs other than quoted prices included within Level 1 that are observable for the asset or liability either directly or indirectly, including quoted prices for similar assets or liabilities in active markets, quoted prices for identical or similar assets or liabilities in markets that are not considered to be active, inputs other than quoted prices that are observable for the asset or liability (such as exchange rates, financing terms, interest rates, yield curves, volatilities, prepayment speeds, loss severities, credit risks and default rates) or other market-corroborated inputs; and |
| • | Level 3 — Unobservable inputs for the asset or liability, including the Global Valuation Committee’s assumptions used in determining the fair value of investments. |
Changes in valuation techniques may result in transfers in or out of an assigned level within the disclosure hierarchy. In accordance with the Company’s policy, transfers between different levels of the fair value hierarchy are deemed to have occurred as of the beginning of the reporting period.
| 74 | 2014 iSHARES ANNUAL REPORTTO SHAREHOLDERS |
Table of Contents
Notes to Financial Statements (Continued)
iSHARES®, INC.
The following table summarizes the value of each of the Funds’ investments according to the fair value hierarchy as of August 31, 2014. The breakdown of each Fund’s investments into major categories is disclosed in its respective schedule of investments.
iShares ETF and
| Investments | |||||||||||||||
| Level 1 | Level 2 | Level 3 | Total | |||||||||||||
MSCI Brazil Capped | ||||||||||||||||
Assets: | ||||||||||||||||
Common Stocks | $ | 3,220,017,448 | $ | — | $ | — | $ | 3,220,017,448 | ||||||||
Preferred Stocks | 2,213,637,892 | — | — | 2,213,637,892 | ||||||||||||
Money Market Funds | 4,267,567 | — | — | 4,267,567 | ||||||||||||
|
|
|
|
|
|
|
| |||||||||
| $ | 5,437,922,907 | $ | — | $ | — | $ | 5,437,922,907 | |||||||||
|
|
|
|
|
|
|
| |||||||||
MSCI Canada | ||||||||||||||||
Assets: | ||||||||||||||||
Common Stocks | $ | 3,778,059,600 | $ | — | $ | — | $ | 3,778,059,600 | ||||||||
Money Market Funds | 32,050,890 | — | — | 32,050,890 | ||||||||||||
Futures Contractsa | 893,090 | — | — | 893,090 | ||||||||||||
|
|
|
|
|
|
|
| |||||||||
| $ | 3,811,003,580 | $ | — | $ | — | $ | 3,811,003,580 | |||||||||
|
|
|
|
|
|
|
| |||||||||
MSCI Chile Capped | ||||||||||||||||
Assets: | ||||||||||||||||
Common Stocks | $ | 329,842,949 | $ | — | $ | — | $ | 329,842,949 | ||||||||
Preferred Stocks | 21,822,406 | — | — | 21,822,406 | ||||||||||||
Money Market Funds | 316,985 | — | — | 316,985 | ||||||||||||
|
|
|
|
|
|
|
| |||||||||
| $ | 351,982,340 | $ | — | $ | — | $ | 351,982,340 | |||||||||
|
|
|
|
|
|
|
| |||||||||
MSCI Colombia Capped | ||||||||||||||||
Assets: | ||||||||||||||||
Common Stocks | $ | 19,843,670 | $ | — | $ | — | $ | 19,843,670 | ||||||||
Preferred Stocks | 5,053,103 | — | — | 5,053,103 | ||||||||||||
Money Market Funds | 53,269 | — | — | 53,269 | ||||||||||||
|
|
|
|
|
|
|
| |||||||||
| $ | 24,950,042 | $ | — | $ | — | $ | 24,950,042 | |||||||||
|
|
|
|
|
|
|
| |||||||||
MSCI Israel Capped | ||||||||||||||||
Assets: | ||||||||||||||||
Common Stocks | $ | 121,310,194 | $ | — | $ | — | $ | 121,310,194 | ||||||||
Money Market Funds | 11,119 | — | — | 11,119 | ||||||||||||
|
|
|
|
|
|
|
| |||||||||
| $ | 121,321,313 | $ | — | $ | — | $ | 121,321,313 | |||||||||
|
|
|
|
|
|
|
| |||||||||
MSCI Mexico Capped | ||||||||||||||||
Assets: | ||||||||||||||||
Common Stocks | $ | 3,269,031,989 | $ | — | $ | 35 | $ | 3,269,032,024 | ||||||||
Money Market Funds | 139,109,903 | — | — | 139,109,903 | ||||||||||||
|
|
|
|
|
|
|
| |||||||||
| $ | 3,408,141,892 | $ | — | $ | 35 | $ | 3,408,141,927 | |||||||||
|
|
|
|
|
|
|
| |||||||||
NOTESTO FINANCIAL STATEMENTS | 75 |
Table of Contents
Notes to Financial Statements (Continued)
iSHARES®, INC.
iShares ETF and
| Investments | |||||||||||||||
| Level 1 | Level 2 | Level 3 | Total | |||||||||||||
MSCI South Africa | ||||||||||||||||
Assets: | ||||||||||||||||
Common Stocks | $ | 585,331,363 | $ | — | $ | 2,470 | $ | 585,333,833 | ||||||||
Money Market Funds | 3,719,706 | — | — | 3,719,706 | ||||||||||||
|
|
|
|
|
|
|
| |||||||||
| $ | 589,051,069 | $ | — | $ | 2,470 | $ | 589,053,539 | |||||||||
|
|
|
|
|
|
|
| |||||||||
MSCI Turkey | ||||||||||||||||
Assets: | ||||||||||||||||
Common Stocks | $ | 513,272,175 | $ | 1,695,119 | $ | — | $ | 514,967,294 | ||||||||
Money Market Funds | 54,885,087 | — | — | 54,885,087 | ||||||||||||
|
|
|
|
|
|
|
| |||||||||
| $ | 568,157,262 | $ | 1,695,119 | $ | — | $ | 569,852,381 | |||||||||
|
|
|
|
|
|
|
| |||||||||
MSCI USA | ||||||||||||||||
Assets: | ||||||||||||||||
Common Stocks | $ | 47,258,640 | $ | — | $ | — | $ | 47,258,640 | ||||||||
Money Market Funds | 383,134 | — | — | 383,134 | ||||||||||||
|
|
|
|
|
|
|
| |||||||||
| $ | 47,641,774 | $ | — | $ | — | $ | 47,641,774 | |||||||||
|
|
|
|
|
|
|
| |||||||||
| a | Shown at the unrealized appreciation (depreciation) on the contracts. |
SECURITY TRANSACTIONS AND INCOME RECOGNITION
Security transactions are accounted for on trade date. Dividend income and capital gain distributions, if any, are recognized on the ex-dividend date, net of any foreign taxes withheld at source. Any taxes withheld that are reclaimable from foreign tax authorities as of August 31, 2014 are reflected in dividends receivable. Non-cash dividends received in the form of stock in an elective dividend, if any, are recorded as dividend income at fair value. Distributions received by the Funds may include a return of capital that is estimated by management. Such amounts are recorded as a reduction of the cost of investments or reclassified to capital gains. Interest income is accrued daily. Realized gains and losses on investment transactions are determined using the specific identification method.
SHORT POSITIONS
From time to time, in order to track the performance of their respective benchmark index, the Funds may sell non-index securities that will be received through corporate actions occurring on the opening of market trading on the following business day. Such short positions are valued consistent with how securities are valued as described under “Security Valuation.” The obligation to deliver the securities is recorded as a liability in the Funds’ statements of assets and liabilities and is equal to the current fair value of the securities to be delivered. Any market fluctuations between the value of the obligation to sell these securities and the current fair value are reflected as unrealized appreciation (depreciation) in the Funds’ statements of operations. Upon receipt of the securities related to the corporate actions, the Funds record a realized gain (loss). Dividends on securities sold short, if any, are reflected as an expense in the statement of operations. Details of the short position resulting from the non-index securities sold by the Funds, if any, are included in their respective schedule of investments.
| 76 | 2014 iSHARES ANNUAL REPORTTO SHAREHOLDERS |
Table of Contents
Notes to Financial Statements (Continued)
iSHARES®, INC.
FOREIGN CURRENCY TRANSLATION
The accounting records of the Funds are maintained in U.S. dollars. Foreign currencies, as well as investment securities and other assets and liabilities denominated in foreign currencies, are translated into U.S. dollars using exchange rates deemed appropriate by the investment adviser. Purchases and sales of securities, income receipts and expense payments are translated into U.S. dollars on the respective dates of such transactions.
Each Fund does not isolate the effect of fluctuations in foreign exchange rates from the effect of fluctuations in the market prices of securities. Such fluctuations are reflected by the Funds as a component of realized and unrealized gains and losses from investments for financial reporting purposes.
FOREIGN TAXES
The Funds may be subject to foreign taxes (a portion of which may be reclaimable) on income, stock dividends, capital gains on investments, or certain foreign currency transactions. All foreign taxes are recorded in accordance with the applicable foreign tax regulations and rates that exist in the foreign jurisdictions in which the Funds invest. These foreign taxes, if any, are paid by the Funds and are reflected in their statements of operations as follows: foreign taxes withheld at source are presented as a reduction of income, foreign taxes on securities lending income are presented as a reduction of securities lending income, foreign taxes on stock dividends are presented as “other foreign taxes,” and foreign taxes on capital gains from sales of investments and foreign taxes on foreign currency transactions are included in their respective net realized gain (loss) categories. Foreign taxes payable or deferred as of August 31, 2014, if any, are disclosed in the Funds’ statements of assets and liabilities.
DISTRIBUTIONS TO SHAREHOLDERS
Dividends and distributions paid by each Fund are recorded on the ex-dividend dates. Distributions are determined on a tax basis and may differ from net investment income and net realized capital gains for financial reporting purposes. Dividends and distributions are paid in U.S. dollars and cannot be automatically reinvested in additional shares of the Funds.
LOANS OF PORTFOLIO SECURITIES
Each Fund may lend its investment securities to approved borrowers, such as brokers, dealers and other financial institutions. The borrower pledges and maintains with the Fund collateral consisting of cash, an irrevocable letter of credit issued by a bank, or securities issued or guaranteed by the U.S. government. The initial collateral received by each Fund is required to have a value of at least 102% of the current value of the loaned securities for securities traded on U.S. exchanges and a value of at least 105% for all other securities. The collateral is maintained thereafter, at a value equal to at least 100% of the current value of the securities on loan. The market value of the loaned securities is determined at the close of each business day of the Funds and any additional required collateral is delivered to the Funds on the next business day. During the term of the loan, each Fund is entitled to all distributions made on or in respect of the loaned securities. Loans of securities are terminable at any time and the borrower, after notice, is required to return borrowed securities within the standard time period for settlement of securities transactions.
Any cash received as collateral for securities on loan may be reinvested in certain short-term instruments either directly on behalf of a fund or through one or more joint accounts or money market funds, including those managed by BlackRock Fund Advisors (“BFA”), the Funds’ investment adviser, or its affiliates. As of August 31, 2014, any securities on loan were collateralized by cash. The cash collateral received was invested in money market funds managed by BFA and is disclosed in the schedules of investments. The value of any securities on loan as of August 31, 2014 and the value of the related collateral are disclosed in the statements of assets and liabilities. Income earned by the Funds from securities lending is disclosed in the statements of operations.
NOTESTO FINANCIAL STATEMENTS | 77 |
Table of Contents
Notes to Financial Statements (Continued)
iSHARES®, INC.
The risks of securities lending include the risk that the borrower may not provide additional collateral when required or may not return the securities when due. To mitigate these risks, the Funds benefit from a borrower default indemnity provided by BlackRock, Inc. (“BlackRock”). BlackRock’s indemnity allows for full replacement of securities lent. Each Fund could suffer a loss if the value of the investments purchased with cash collateral falls below the value of the cash collateral received.
Securities lending transactions are entered into by the Funds under Master Securities Lending Agreements (“MSLA”) which provide the right, in the event of default (including bankruptcy or insolvency) for the non-defaulting party to liquidate the collateral and calculate a net exposure to the defaulting party or request additional collateral. In the event that a borrower defaults, a Fund, as lender, would offset the market value of the collateral received against the market value of the securities loaned. The value of the collateral is typically greater than that of the market value of the securities loaned, leaving the lender with a net amount payable to the defaulting party. However, bankruptcy or insolvency laws of a particular jurisdiction may impose restrictions on or prohibitions against such a right of offset in the event of an MSLA counterparty’s bankruptcy or insolvency. Under the MSLA, the borrower can resell or re-pledge the loaned securities, and a Fund can reinvest cash collateral, or, upon an event of default, resell or re-pledge the collateral.
The following table is a summary of each Fund’s securities lending agreements which are subject to offset under an MSLA as of August 31, 2014:
| iShares ETF | Market Value of Securities on Loan | Cash Collateral Received a | Net Amount | |||||||||
MSCI Canada | $ | 28,500,223 | $ | 28,500,223 | $ | — | ||||||
MSCI Mexico Capped | 124,185,860 | 124,185,860 | — | |||||||||
MSCI South Africa | 3,377,559 | 3,377,559 | — | |||||||||
MSCI Turkey | 51,535,094 | 51,535,094 | — | |||||||||
MSCI USA | 309,911 | 309,911 | — | |||||||||
| a | Collateral received in excess of the market value of securities on loan is not presented for financial reporting purposes. The total collateral received is disclosed in each Fund’s statement of assets and liabilities. |
RECENT ACCOUNTING STANDARD
In June 2014, the Financial Accounting Standards Board issued guidance to improve the financial reporting of reverse repurchase agreements and other similar transactions. The guidance will require expanded disclosure for entities that enter into reverse repurchase agreements and similar transactions accounted for as secured borrowings, including securities lending. The guidance is effective for financial statements for fiscal years beginning after December 15, 2014, and interim periods within those fiscal years. Management is evaluating the impact, if any, of this guidance on the Funds’ financial statements and disclosures.
| 2. | INVESTMENT ADVISORY AGREEMENT AND OTHER TRANSACTIONS WITH AFFILIATES |
Pursuant to an Investment Advisory Agreement with the Company, BFA manages the investment of each Fund’s assets. BFA is a California corporation indirectly owned by BlackRock. Under the Investment Advisory Agreement, BFA is responsible for substantially all expenses of the Funds, except interest, taxes, brokerage commissions and other expenses connected with the execution of portfolio transactions, distribution fees, litigation expenses and any extraordinary expenses.
| 78 | 2014 iSHARES ANNUAL REPORTTO SHAREHOLDERS |
Table of Contents
Notes to Financial Statements (Continued)
iSHARES®, INC.
For its investment advisory services to each of the iShares MSCI Canada and iShares MSCI Mexico Capped ETFs, BFA is entitled to an annual investment advisory fee based on each Fund’s allocable portion of the aggregate of the average daily net assets of the Fund and certain other iShares funds, as follows:
| Investment Advisory Fee | Aggregate Average Daily Net Assets | ||||
| 0.59 | % | First $7 billion | |||
| 0.54 | Over $7 billion, up to and including $11 billion | ||||
| 0.49 | Over $11 billion, up to and including $24 billion | ||||
| 0.44 | Over $24 billion, up to and including $48 billion | ||||
| 0.40 | Over $48 billion, up to and including $72 billion | ||||
| 0.36 | Over $72 billiona | ||||
| a | Breakpoint level was added effective July 1, 2014. |
For its investment advisory services to each of the iShares MSCI Brazil Capped, iShares MSCI Chile Capped, iShares MSCI Israel Capped, iShares MSCI South Africa and iShares MSCI Turkey ETFs, BFA is entitled to an annual investment advisory fee based on each Fund’s allocable portion of the aggregate of the average daily net assets of the Fund and certain other iShares funds, as follows:
| Investment Advisory Fee | Aggregate Average Daily Net Assets | ||||
| 0.74 | % | First $2 billion | |||
| 0.69 | Over $2 billion, up to and including $4 billion | ||||
| 0.64 | Over $4 billion, up to and including $8 billion | ||||
| 0.57 | Over $8 billion, up to and including $16 billion | ||||
| 0.51 | Over $16 billion, up to and including $32 billion | ||||
| 0.45 | Over $32 billion | ||||
For its investment advisory services to each Fund, BFA is entitled to an annual investment advisory fee based on the average daily net assets of each Fund as follows:
| iShares ETF | Investment Advisory Fee | |||
MSCI Colombia Capped | 0.61 | % | ||
MSCI USA | 0.15 | |||
The U.S. Securities and Exchange Commission has issued an exemptive order which permits BlackRock Institutional Trust Company, N.A. (“BTC”), an affiliate of BFA, to serve as securities lending agent for the Funds subject to applicable conditions. As securities lending agent, BTC bears all operational costs directly related to securities lending. Effective January 1, 2014, each Fund is responsible for fees in connection with the investment of cash collateral received for securities on loan in a money market fund managed by BFA, however, BTC has agreed to reduce the amount of securities lending income it receives in order to effectively limit the collateral investment fees each Fund bears to an annual rate of 0.04% (the “collateral investment fees”). Securities lending income is equal to the total of income earned from the reinvestment of cash collateral, net of fees and other payments to and from borrowers of securities, and less the collateral investment fees. The Funds retain a portion of securities lending income and remit a remaining portion to BTC as compensation for its services as securities lending agent.
NOTESTO FINANCIAL STATEMENTS | 79 |
Table of Contents
Notes to Financial Statements (Continued)
iSHARES®, INC.
Pursuant to a securities lending agreement effective January 1, 2014, (i) the iShares MSCI USA ETF (the “Group 1 Fund”) retains 70% of securities lending income and (ii) the amount retained can never be less than 65% of the total of securities lending income plus the collateral investment fees.
Pursuant to a securities lending agreement effective January 1, 2014, (i) the iShares MSCI Brazil Capped, iShares MSCI Canada, iShares MSCI Chile Capped, iShares MSCI Colombia Capped, iShares MSCI Israel Capped, iShares MSCI Mexico Capped, iShares MSCI South Africa and iShares MSCI Turkey ETFs (the “Group 2 Funds”) retain 75% of securities lending income and (ii) these amounts can never be less than 65% of the total of securities lending income plus the collateral investment fees.
In addition, commencing the business day following the date that the aggregate securities lending income plus the collateral investment fees generated across all 1940 Act iShares exchange-traded funds (the “iShares ETF Complex”) in a given calendar year exceeds the aggregate securities lending income generated across the iShares ETF Complex in calendar year 2013 and pursuant to a securities lending agreement, each Group 1 Fund will (i) receive for the remainder of that calendar year 75% of securities lending income and (ii) the amount retained can never be less than 65% of the total of securities lending income plus the collateral investment fees. Each Group 2 Fund will (i) receive for the remainder of that calendar year 80% of securities lending income and (ii) these amounts can never be less than 65% of the total of securities lending income plus the collateral investment fees.
For the year ended August 31, 2014, each Fund paid to BTC the following amounts in total for securities lending agent services and collateral investment fees:
| iShares ETF | Fees Paid to BTC | |||
MSCI Canada | $ | 393,308 | ||
MSCI Israel Capped | 9,376 | |||
MSCI Mexico Capped | 514,945 | |||
MSCI South Africa | 59,464 | |||
MSCI Turkey | 354,188 | |||
MSCI USA | 2,997 | |||
Prior to January 1, 2014, each Fund retained 65% of securities lending income and paid no collateral investment fees.
BlackRock Investments, LLC, an affiliate of BFA, is the distributor for each Fund. Pursuant to the distribution agreement, BFA is responsible for any fees or expenses for distribution services provided to the Funds.
Cross trades for the year ended August 31, 2014, if any, were executed by the Funds pursuant to Rule 17a-7 under the 1940 Act. Cross trading is the buying or selling of portfolio securities between funds to which BFA (or an affiliate) serves as investment adviser. At its regularly scheduled quarterly meetings, the Board reviews such transactions as of the most recent calendar quarter for compliance with the requirements and restrictions set forth by Rule 17a-7.
Each Fund may invest its positive cash balances in certain money market funds managed by BFA or an affiliate. The income earned on these temporary cash investments is included in “Interest – affiliated” in the statements of operations.
The PNC Financial Services Group, Inc. is the largest stockholder of BlackRock and is considered to be an affiliate of the Funds for 1940 Act purposes.
| 80 | 2014 iSHARES ANNUAL REPORTTO SHAREHOLDERS |
Table of Contents
Notes to Financial Statements (Continued)
iSHARES®, INC.
Investments in issuers considered to be affiliates of the Funds (excluding money market funds) during the year ended August 31, 2014, for purposes of Section 2(a)(3) of the 1940 Act, were as follows:
| iShares ETF and Name of Affiliated Issuer | Shares Held at Beginning of Year | Shares Purchased | Shares Sold | Shares Held at End of Year | Value at of Year | Dividend Income | Net Realized Gain (Loss) | |||||||||||||||||||||
MSCI Mexico Capped | ||||||||||||||||||||||||||||
Desarrolladora Homex SAB de CV | 28,207,210 | 5,221,000 | (33,428,210 | ) | — | $ | — | $ | — | $ | (19,927,540 | ) | ||||||||||||||||
|
|
|
|
|
| |||||||||||||||||||||||
MSCI USA | ||||||||||||||||||||||||||||
BlackRock Inc. | 1,575 | 404 | (1,641 | ) | 338 | $ | 111,719 | $ | 6,372 | $ | 175,180 | |||||||||||||||||
PNC Financial Services Group Inc. (The) | 6,204 | 1,654 | (6,515 | ) | 1,343 | 113,819 | 7,645 | 133,009 | ||||||||||||||||||||
|
|
|
|
|
| |||||||||||||||||||||||
| $ | 225,538 | $ | 14,017 | $ | 308,189 | |||||||||||||||||||||||
|
|
|
|
|
| |||||||||||||||||||||||
Certain directors and officers of the Company are also officers of BTC and/or BFA.
| 3. | INVESTMENT PORTFOLIO TRANSACTIONS |
Purchases and sales of investments (excluding in-kind transactions and short-term investments) for the year ended August 31, 2014 were as follows:
| iShares ETF | Purchases | Sales | ||||||
MSCI Brazil Capped | $ | 2,567,009,818 | $ | 3,239,191,320 | ||||
MSCI Canada | 189,981,357 | 191,623,352 | ||||||
MSCI Chile Capped | 341,894,894 | 311,839,157 | ||||||
MSCI Colombia Capped | 11,546,678 | 7,096,336 | ||||||
MSCI Israel Capped | 15,419,833 | 15,837,959 | ||||||
MSCI Mexico Capped | 504,694,694 | 495,798,020 | ||||||
MSCI South Africa | 36,200,812 | 31,255,319 | ||||||
MSCI Turkey | 43,509,653 | 44,991,678 | ||||||
MSCI USA | 7,636,532 | 8,518,661 | ||||||
In-kind transactions (see Note 4) for the year ended August 31, 2014 were as follows:
| iShares ETF | In-kind Purchases | In-kind Sales | ||||||
MSCI Canada | $ | 531,561,946 | $ | 792,146,793 | ||||
MSCI Colombia Capped | 327,187 | — | ||||||
MSCI Israel Capped | 124,371,328 | 87,646,524 | ||||||
MSCI Mexico Capped | 2,014,187,958 | 1,339,450,361 | ||||||
MSCI South Africa | 274,522,214 | 336,633,310 | ||||||
MSCI Turkey | 363,711,226 | 380,877,821 | ||||||
MSCI USA | 48,383,549 | 206,769,988 | ||||||
NOTESTO FINANCIAL STATEMENTS | 81 |
Table of Contents
Notes to Financial Statements (Continued)
iSHARES®, INC.
| 4. | CAPITAL SHARE TRANSACTIONS |
Capital shares are issued and redeemed by each Fund only in aggregations of a specified number of shares or multiples thereof (“Creation Units”) at net asset value. Except when aggregated in Creation Units, shares of each Fund are not redeemable. Transactions in capital shares for each Fund are disclosed in detail in the statements of changes in net assets.
The consideration for the purchase of Creation Units of a fund in the Company generally consists of the in-kind deposit of a designated portfolio of securities and a specified amount of cash. Certain funds in the Company may be offered in Creation Units solely or partially for cash in U.S. dollars. Investors purchasing and redeeming Creation Units may pay a purchase transaction fee and a redemption transaction fee directly to State Street Bank and Trust Company, the Company’s administrator, to offset transfer and other transaction costs associated with the issuance and redemption of Creation Units, including Creation Units for cash. Investors transacting in Creation Units for cash may also pay an additional variable charge to compensate the relevant fund for certain transaction costs (i.e., stamp taxes, taxes on currency or other financial transactions, and brokerage costs) and market impact expenses relating to investing in portfolio securities. Such variable charges, if any, are included in “Proceeds from shares sold” in the statements of changes in net assets.
From time to time, settlement of securities related to in-kind contributions or in-kind redemptions may be delayed. In such cases, securities related to in-kind contributions are reflected as “Due from custodian” and securities related to in-kind redemptions are reflected as “Securities related to in-kind transactions” in the statements of assets and liabilities.
| 5. | FINANCIAL FUTURES CONTRACTS |
Each Fund may purchase or sell financial futures contracts in an effort to help such Fund track its underlying index. A futures contract is a standardized, exchange-traded agreement to buy and sell a financial instrument at a set price on a future date. Upon entering into a futures contract, the Fund is required to pledge to the executing broker which holds segregated from its own assets, an amount of cash, U.S. government securities or other high-quality debt and equity securities equal to the minimum initial margin requirements of the exchange on which the contract is traded. Pursuant to the contract, the Fund agrees to receive from or pay to the broker an amount of cash equal to the daily fluctuation in value of the contract. Such receipts or payments are known as margin variation and are recorded by the Fund as unrealized appreciation or depreciation. When the contract is closed, the Fund records a realized gain or loss equal to the difference between the value of the contract at the time it was opened and the value at the time it was closed. Losses may arise if the value of a futures contract decreases due to an unfavorable change in the market rates or values of the underlying instrument during the term of the contract or if the counterparty does not perform under the contract. The use of futures contracts also involves the risk of an imperfect correlation in the movements in the price of futures contracts and the assets underlying such contracts.
The following table shows the value of futures contracts held by the iShares MSCI Canada ETF as of August 31, 2014 and the related locations in the statements of assets and liabilities, presented by risk exposure category:
| Assets | ||||
Equity contracts: | ||||
Variation margin / Net assets consist of – net unrealized appreciationa | $ | 893,090 | ||
|
| |||
| a | Represents cumulative appreciation of futures contracts as reported in the schedule of investments. |
| 82 | 2014 iSHARES ANNUAL REPORTTO SHAREHOLDERS |
Table of Contents
Notes to Financial Statements (Continued)
iSHARES®, INC.
The following table shows the realized and unrealized gains (losses) on futures contracts held by the iShares MSCI Canada ETF during the year ended August 31, 2014 and the related locations in the statements of operations, presented by risk exposure category:
| Net Realized Gain (Loss) | Net Change in Unrealized Appreciation/Depreciation | |||||||
Equity contracts: | ||||||||
Futures contracts | $ | 2,438,399 | $ | 473,482 | ||||
|
|
|
| |||||
For the year ended August 31, 2014, the average quarter-end number of contracts and notional value of open futures contracts for the iShares MSCI Canada ETF were 82 and $12,427,393, respectively.
| 6. | MARKET AND CREDIT RISK |
In the normal course of business, each Fund’s investment activities exposes it to various types of risk associated with the financial instruments and markets in which it invests. The significant types of financial risks each Fund is exposed to include market risk and credit risk. Each Fund’s prospectus provides details of these and other types of risk.
BFA uses a “passive” or index approach to try to achieve each Fund’s investment objective following the securities included in its underlying index during upturns as well as downturns. BFA does not take steps to reduce market exposure or to lessen the effects of a declining market. Divergence from the underlying index and the composition of the portfolio is monitored by BFA.
MARKET RISK
Market risk arises mainly from uncertainty about future values of financial instruments influenced by price, currency and interest rate movements. It represents the potential loss each Fund may suffer through holding market positions in the face of market movements. Each Fund is exposed to market risk by virtue of its investment in equity and financial derivative instruments. The fair value of securities held by the Funds may decline due to general market conditions, economic trends or events that are not specifically related to the issuers of the securities including local, regional or global political, social or economic instability or to factors that affect a particular industry or group of industries. The extent of each Fund’s exposure to market risk is the market value of the investments held as shown in the Fund’s schedule of investments.
A diversified portfolio, where this is appropriate and consistent with a fund’s objectives, minimizes the risk that a price change of a particular investment will have a material impact on the NAV of a fund. The investment concentrations within each Fund’s portfolio are disclosed in its schedule of investments.
Each Fund, except for the iShares MSCI USA ETF, invests a substantial amount of its assets in securities of non-U.S. issuers that trade in non-U.S. markets. This involves certain considerations and risks not typically associated with securities of U.S. issuers. Such risks include, but are not limited to: generally less liquid and less efficient securities markets; generally greater price volatility; exchange rate fluctuations and exchange controls; imposition of restrictions on the expatriation of funds or other assets of the Fund; less publicly available information about issuers; the imposition of withholding or other taxes; higher transaction and custody costs; settlement delays and risk of loss attendant in settlement procedures; difficulties in enforcing contractual obligations; less regulation of securities markets; different accounting, disclosure and reporting requirements; more substantial governmental involvement in the economy; higher inflation rates; greater social, economic and political uncertainties; the risk of nationalization or expropriation of assets; and the risk of war. These risks are heightened for investments in issuers from countries with less developed markets.
NOTESTO FINANCIAL STATEMENTS | 83 |
Table of Contents
Notes to Financial Statements (Continued)
iSHARES®, INC.
Each Fund, except for the iShares MSCI USA ETF, invests all or substantially all of its assets in issuers located in a single country other than the U.S. When a fund concentrates its investments in this manner, it assumes the risk that economic, political and social conditions in that country may have a significant impact on its investment performance.
CREDIT RISK
Credit risk is the risk that an issuer or guarantor of debt instruments or the counterparty to a financial transaction, including derivatives contracts, repurchase agreements or loans of portfolio securities, is unable or unwilling to make timely interest and/or principal payments or to otherwise honor its obligations. BFA and its affiliates manage counterparty credit risk by entering into transactions only with counterparties that it believes have the financial resources to honor their obligations and by monitoring the financial stability of those counterparties. Financial assets, which potentially expose the Funds to issuer and counterparty credit risks, consist principally of financial instruments and receivables due from counterparties. The extent of each Fund’s exposure to credit and counterparty risks with respect to those financial assets is approximated by their value recorded in the statement of assets and liabilities.
| 7. | INCOME TAX INFORMATION |
Each Fund is treated as an entity separate from the Company’s other funds for federal income tax purposes. It is the policy of each Fund to qualify as a regulated investment company by complying with the provisions applicable to regulated investment companies, as defined under Subchapter M of the Internal Revenue Code of 1986, as amended, and to annually distribute substantially all of its ordinary income and any net capital gains (taking into account any capital loss carryforwards) sufficient to relieve it from all, or substantially all, federal income and excise taxes. Accordingly, no provision for federal income taxes is required.
U.S. GAAP requires that certain components of net assets be adjusted to reflect permanent differences between financial and tax reporting. These reclassifications have no effect on net assets or net asset values per share. The following permanent differences as of August 31, 2014, attributable to passive foreign investment companies, the expiration of capital loss carryforwards, distributions paid in excess of taxable income, foreign currency transactions and realized gains (losses) from in-kind redemptions, were reclassified to the following accounts:
| iShares ETF | Paid-in Capital | Undistributed Net Investment Income/Distributions in Excess of Net Investment Income | Undistributed Net Realized Gain/Accumulated Net Realized Loss | |||||||||
MSCI Brazil Capped | $ | — | $ | 1,518,266 | $ | (1,518,266 | ) | |||||
MSCI Canada | 25,269,848 | 2,914,773 | (28,184,621 | ) | ||||||||
MSCI Chile Capped | — | (297,290 | ) | 297,290 | ||||||||
MSCI Colombia Capped | — | (30,039 | ) | 30,039 | ||||||||
MSCI Israel Capped | 11,457,880 | 244,359 | (11,702,239 | ) | ||||||||
MSCI Mexico Capped | (6,252,333 | ) | (115,237 | ) | 6,367,570 | |||||||
MSCI South Africa | 42,288,384 | 1,000,066 | (43,288,450 | ) | ||||||||
MSCI Turkey | 18,732,905 | 250,887 | (18,983,792 | ) | ||||||||
MSCI USA | 56,688,371 | — | (56,688,371 | ) | ||||||||
| 84 | 2014 iSHARES ANNUAL REPORTTO SHAREHOLDERS |
Table of Contents
Notes to Financial Statements (Continued)
iSHARES®, INC.
The tax character of distributions paid during the years ended August 31, 2014 and August 31, 2013 was as follows:
| iShares ETF | 2014 | 2013 | ||||||
MSCI Brazil Capped | ||||||||
Ordinary income | $ | 151,885,117 | $ | 201,420,612 | ||||
|
|
|
| |||||
MSCI Canada | ||||||||
Ordinary income | $ | 71,105,660 | $ | 101,089,405 | ||||
|
|
|
| |||||
MSCI Chile Capped | ||||||||
Ordinary income | $ | 4,758,168 | $ | 5,669,647 | ||||
Return of Capital | — | 235,875 | ||||||
|
|
|
| |||||
| $ | 4,758,168 | $ | 5,905,522 | |||||
|
|
|
| |||||
MSCI Colombia Capped | ||||||||
Ordinary income | $ | 548,322 | $ | — | ||||
Return of Capital | 10,400 | — | ||||||
|
|
|
| |||||
| $ | 558,722 | $ | — | |||||
|
|
|
| |||||
MSCI Israel Capped | ||||||||
Ordinary income | $ | 2,015,418 | $ | 1,885,659 | ||||
|
|
|
| |||||
MSCI Mexico Capped | ||||||||
Ordinary income | $ | 41,504,491 | $ | 20,571,276 | ||||
|
|
|
| |||||
MSCI South Africa | ||||||||
Ordinary income | $ | 12,294,677 | $ | 13,575,195 | ||||
|
|
|
| |||||
MSCI Turkey | ||||||||
Ordinary income | $ | 8,703,391 | $ | 12,901,893 | ||||
|
|
|
| |||||
MSCI USA | ||||||||
Ordinary income | $ | 2,876,350 | $ | 3,310,642 | ||||
|
|
|
| |||||
As of August 31, 2014, the tax components of accumulated net earnings (losses) were as follows:
| iShares ETF | Undistributed Ordinary Income | Capital Loss | Net Unrealized | Qualified Late-Year Losses b | Total | |||||||||||||||
MSCI Brazil Capped | $ | 4,341,889 | $ | (1,187,638,541 | ) | $ | 1,703,875,279 | $ | (48,209,725 | ) | $ | 472,368,902 | ||||||||
MSCI Canada | 7,492,187 | (264,812,268 | ) | 55,221,153 | (31,441,290 | ) | (233,540,218 | ) | ||||||||||||
MSCI Chile Capped | 21,583 | (80,566,157 | ) | (1,409,601 | ) | (24,361,876 | ) | (106,316,051 | ) | |||||||||||
MSCI Colombia Capped | — | — | 2,347,121 | (40,339 | ) | 2,306,782 | ||||||||||||||
MSCI Israel Capped | 46,719 | (32,196,728 | ) | (18,162,579 | ) | (1,138,866 | ) | (51,451,454 | ) | |||||||||||
MSCI Mexico Capped | 9,283,283 | (77,936,111 | ) | (35,652,424 | ) | (62,137,248 | ) | (166,442,500 | ) | |||||||||||
MSCI South Africa | 837,167 | (66,190,816 | ) | (37,193,872 | ) | (5,675,644 | ) | (108,223,165 | ) | |||||||||||
MSCI Turkey | — | (32,397,921 | ) | (99,684,609 | ) | (7,966,226 | ) | (140,048,756 | ) | |||||||||||
MSCI USA | 133,983 | (56,840 | ) | 3,671,622 | (68,795 | ) | 3,679,970 | |||||||||||||
| a | The difference between book-basis and tax-basis unrealized gains (losses) was attributable primarily to the tax deferral of losses on wash sales and the realization for tax purposes of unrealized gains on investments in passive foreign investment companies. |
| b | The Funds have elected to defer certain qualified late-year losses and recognize such losses in the next taxable year. |
NOTESTO FINANCIAL STATEMENTS | 85 |
Table of Contents
Notes to Financial Statements (Continued)
iSHARES®, INC.
As of August 31, 2014, the Funds had capital loss carryforwards available to offset future realized capital gains through the indicated expiration dates as follows:
| iShares ETF | Non- Expiring a | Expiring 2015 | Expiring 2016 | Expiring 2017 | Expiring 2018 | Expiring 2019 | Total | |||||||||||||||||||||
MSCI Brazil Capped | $ | 989,412,231 | $ | — | $ | — | $ | — | $ | 198,226,310 | $ | — | $ | 1,187,638,541 | ||||||||||||||
MSCI Canada | 142,622,027 | 5,363,291 | 5,107,471 | 27,886,883 | 68,928,677 | 14,903,919 | 264,812,268 | |||||||||||||||||||||
MSCI Chile Capped | 65,990,195 | — | — | 1,886,881 | 11,712,090 | 976,991 | 80,566,157 | |||||||||||||||||||||
MSCI Israel Capped | 13,480,809 | — | — | 784,479 | 10,801,191 | 7,130,249 | 32,196,728 | |||||||||||||||||||||
MSCI Mexico Capped | 42,455,837 | — | 853,150 | 8,973,988 | 2,789,471 | 22,863,665 | 77,936,111 | |||||||||||||||||||||
MSCI South Africa | 27,277,976 | 1,607,845 | 972,024 | 15,339,464 | 14,856,365 | 6,137,142 | 66,190,816 | |||||||||||||||||||||
MSCI Turkey | 21,835,364 | — | — | 720,636 | 5,982,737 | 3,859,184 | 32,397,921 | |||||||||||||||||||||
MSCI USA | 56,840 | — | — | — | — | — | 56,840 | |||||||||||||||||||||
| a | Must be utilized prior to losses subject to expiration. |
For the year ended August 31, 2014, the Funds utilized their capital loss carryforwards as follows:
| iShares ETF | Utilized | |||
MSCI Colombia Capped | $ | 36,917 | ||
MSCI USA | 118,640 | |||
The Funds may own shares in certain foreign investment entities, referred to, under U.S. tax law, as “passive foreign investment companies.” The Funds may elect to mark-to-market annually the shares of each passive foreign investment company and would be required to distribute to shareholders any such marked-to-market gains.
As of August 31, 2014, gross unrealized appreciation and gross unrealized depreciation based on cost for federal income tax purposes were as follows:
| iShares ETF | Tax Cost | Gross Unrealized Appreciation | Gross Unrealized Depreciation | Net Unrealized Appreciation (Depreciation) | ||||||||||||
MSCI Brazil Capped | $ | 3,733,181,656 | $ | 2,307,316,849 | $ | (602,575,598 | ) | $ | 1,704,741,251 | |||||||
MSCI Canada | 3,755,644,171 | 614,936,207 | (560,469,888 | ) | 54,466,319 | |||||||||||
MSCI Chile Capped | 353,391,766 | 53,164,604 | (54,574,030 | ) | (1,409,426 | ) | ||||||||||
MSCI Colombia Capped | 22,602,882 | 2,999,710 | (652,550 | ) | 2,347,160 | |||||||||||
MSCI Israel Capped | 139,481,810 | 1,123,618 | (19,284,115 | ) | (18,160,497 | ) | ||||||||||
MSCI Mexico Capped | 3,443,796,375 | 187,278,849 | (222,933,297 | ) | (35,654,448 | ) | ||||||||||
MSCI South Africa | 626,252,470 | 72,791,371 | (109,990,302 | ) | (37,198,931 | ) | ||||||||||
MSCI Turkey | 669,531,262 | 11,172,988 | (110,851,869 | ) | (99,678,881 | ) | ||||||||||
MSCI USA | 43,970,152 | 4,065,093 | (393,471 | ) | 3,671,622 | |||||||||||
| 86 | 2014 iSHARES ANNUAL REPORTTO SHAREHOLDERS |
Table of Contents
Notes to Financial Statements (Continued)
iSHARES®, INC.
Management has analyzed tax laws and regulations and their application to the Funds as of August 31, 2014, inclusive of the open tax return years, and does not believe there are any uncertain tax positions that require recognition of a tax liability in the Funds’ financial statements.
| 8. | LINE OF CREDIT |
The iShares MSCI Colombia Capped ETF, along with certain other iShares funds, are parties to a $150 million credit agreement with State Street Bank and Trust Company, which expires October 28, 2015. The line of credit may be used for temporary or emergency purposes, including redemptions, settlement of trades and rebalancing of portfolio holdings. The credit agreement has the following terms: a commitment fee of 0.08% per annum on the unused portion of the credit agreement and interest at a rate equal to the higher of (a) the one-month LIBOR plus 1.00% per annum or (b) the U.S. Federal Funds rate plus 1.00% per annum on amounts borrowed. The commitment fee is allocated to each fund participating in the credit agreement based on each fund’s pro-rata share of the aggregate average daily value of assets invested in local securities of certain foreign markets.
For the year ended August 31, 2014, the iShares MSCI Colombia Capped ETF’s maximum amount borrowed, the average borrowings and the weighted average interest rate under the credit agreement were $900,000, $22,192 and 1.17% respectively.
| 9. | SUBSEQUENT EVENTS |
Management has evaluated the impact of all subsequent events on the Funds through the date the financial statements were available to be issued and has determined that there were no subsequent events requiring adjustment or disclosure in the financial statements.
NOTESTO FINANCIAL STATEMENTS | 87 |
Table of Contents
Report of Independent Registered Public Accounting Firm
To the Shareholders and Board of Directors of
iShares, Inc.:
In our opinion, the accompanying statements of assets and liabilities, including the schedules of investments, and the related statements of operations and of changes in net assets and the financial highlights present fairly, in all material respects, the financial position of iShares MSCI Brazil Capped ETF, iShares MSCI Canada ETF, iShares MSCI Chile Capped ETF, iShares MSCI Colombia Capped ETF, iShares MSCI Israel Capped ETF, iShares MSCI Mexico Capped ETF, iShares MSCI South Africa ETF, iShares MSCI Turkey ETF and iShares MSCI USA ETF (the “Funds”) at August 31, 2014, the results of each of their operations, the changes in each of their net assets and their financial highlights for each of the periods presented, in conformity with accounting principles generally accepted in the United States of America. These financial statements and financial highlights (hereafter referred to as “financial statements”) are the responsibility of the Funds’ management; our responsibility is to express an opinion on these financial statements based on our audits. We conducted our audits of these financial statements in accordance with the standards of the Public Company Accounting Oversight Board (United States). Those standards require that we plan and perform the audit to obtain reasonable assurance about whether the financial statements are free of material misstatement. An audit includes examining, on a test basis, evidence supporting the amounts and disclosures in the financial statements, assessing the accounting principles used and significant estimates made by management, and evaluating the overall financial statement presentation. We believe that our audits, which included confirmation of securities at August 31, 2014 by correspondence with the custodian, transfer agent and brokers, provide a reasonable basis for our opinion.
PricewaterhouseCoopers LLP
San Francisco, California
October 22, 2014
| 88 | 2014 iSHARES ANNUAL REPORTTO SHAREHOLDERS |
Table of Contents
iSHARES®, INC.
For corporate shareholders, 100.00% of the income dividends paid by the iShares MSCI USA ETF during the fiscal year ended August 31, 2014 qualified for the dividends-received deduction.
For the fiscal year ended August 31, 2014, certain Funds earned foreign source income and paid foreign taxes which they intend to pass through to their shareholders pursuant to Section 853 of the Internal Revenue Code (the “Code”) as follows:
| iShares ETF | Foreign Source Income Earned | Foreign Taxes Paid | ||||||
MSCI Brazil Capped | $ | 202,559,475 | $ | 15,126,259 | ||||
MSCI Canada | 94,825,644 | 13,237,727 | ||||||
MSCI Chile Capped | 9,113,451 | 1,927,200 | ||||||
MSCI Colombia Capped | 677,459 | 10,006 | ||||||
MSCI Israel Capped | 3,091,527 | 592,434 | ||||||
MSCI Mexico Capped | 55,498,026 | 612,833 | ||||||
MSCI South Africa | 19,018,472 | 2,652,794 | ||||||
MSCI Turkey | 12,374,665 | 1,652,304 | ||||||
Under Section 871(k)(2)(C) of the Code, the iShares MSCI Colombia Capped ETF hereby designates $24,565 as short-term capital gain dividends for the fiscal year ended August 31, 2014.
Under Section 854(b)(2) of the Code, the Funds hereby designate the following maximum amounts as qualified dividend income for purposes of the maximum rate under Section 1(h)(11) of the Code for the fiscal year ended August 31, 2014:
| iShares ETF | Qualified Dividend Income | |||
MSCI Brazil Capped | $ | 9,778,920 | ||
MSCI Canada | 84,343,387 | |||
MSCI Colombia Capped | 558,328 | |||
MSCI Israel Capped | 2,607,852 | |||
| iShares ETF | Qualified Dividend Income | |||
MSCI Mexico Capped | $ | 42,117,324 | ||
MSCI South Africa | 14,947,471 | |||
MSCI Turkey | 10,355,695 | |||
MSCI USA | 2,516,643 | |||
In February 2015, shareholders will receive Form 1099-DIV which will include their share of qualified dividend income distributed during the calendar year 2014. Shareholders are advised to check with their tax advisers for information on the treatment of these amounts on their income tax returns.
TAX INFORMATION | 89 |
Table of Contents
Board Review and Approval of Investment Advisory
Contract
iSHARES®, INC.
I. iShares MSCI Brazil Capped ETF, iShares MSCI Chile Capped ETF, iShares MSCI Israel Capped ETF, iShares MSCI South Africa ETF and iShares MSCI Turkey ETF
Under Section 15(c) of the Investment Company Act of 1940 (the “1940 Act”), the Company’s Board of Directors (the “Board”), including a majority of Directors who are not “interested persons” of the Company (as that term is defined in the 1940 Act) (the “Independent Directors”), is required annually to consider and approve the Investment Advisory Contract between the Company and BFA (the “Advisory Contract”) on behalf of the Funds. The Independent Directors requested, and BFA provided, such information as the Independent Directors, with advice from independent counsel, deemed reasonably necessary to evaluate the Advisory Contract. A committee of Independent Directors (the “15(c) Committee”), with independent counsel, met with management on March 12, 2014, May 6, 2014, and May 12, 2014, to discuss the types of information the Independent Directors required and the manner in which management would organize and present such information. At a meeting held on May 16, 2014, management presented preliminary information to the Board relating to the continuance of the Advisory Contract, and the Board, including the Independent Directors, reviewed and discussed such information at length. The Independent Directors requested from management certain additional information, which management agreed to provide. At a meeting held on June 12-13, 2014, the Board, including the Independent Directors, reviewed the additional information provided by management in response to these requests. After extensive discussions, the Board, including all of the Independent Directors, approved the continuance of the Advisory Contract for the Funds, based on a review of qualitative and quantitative information provided by BFA, including the additional information management provided at the request of the Independent Directors. The Board noted its satisfaction with the extent and quality of information provided and its frequent interactions with management, as well as the detailed responses and other information provided by BFA. The Board also noted that the Board and BFA agreed to discuss potential enhancements and adjustments to the 15(c) process for the coming year. The Independent Directors were advised by their independent counsel throughout the process, including about the legal standards applicable to their review. In approving the Advisory Contract for the Funds, the Board, including the Independent Directors, considered the following factors, no one of which was controlling, and reached the following conclusions:
Expenses and Performance of the Funds — The Board reviewed statistical information prepared by Lipper Inc. (“Lipper”), an independent provider of investment company data, regarding the expense ratio components, including actual advisory fees, waivers/reimbursements, and gross and net total expenses of each Fund in comparison with the same information for other exchange traded funds (including funds sponsored by an “at cost” service provider) and, in the limited instances where no comparable ETFs existed and the comparison group would not otherwise be reasonable in Lipper’s judgment, pure index institutional mutual funds, objectively selected by Lipper as comprising such Fund’s applicable peer group pursuant to Lipper’s proprietary ETF methodology (the “Lipper Group”). The Board noted that, prior to 2014, Lipper had used a different methodology to determine a Fund’s Lipper group, which included mutual funds, closed-end funds, exchange traded funds, and/or funds with differing investment objective classifications, investment focuses and other characteristics (e.g. actively managed funds and funds sponsored by “at cost” service providers), as applicable. The Board further noted that, after consideration by the 15(c) Committee, the Board determined to use instead Lipper’s proprietary ETF methodology to determine a Fund’s Lipper Group. This determination was based on, among other considerations, the increased number and types of ETFs available for comparative purposes than was the case in prior years. The Board was provided with a detailed description of Lipper’s proprietary ETF methodology used by Lipper to determine the applicable Lipper Groups and to prepare this information. At the Board’s request, Lipper provided, and the Board considered, information on the impact to the iShares funds’ comparative fee rankings that were attributable to the change from a pure index group methodology to Lipper’s proprietary ETF methodology. The Board further noted that due to the limitations in providing comparable funds in the various Lipper Groups, the statistical information provided in Lipper’s report may or may not provide meaningful direct comparisons to the Funds in all instances.
The Board also noted that the investment advisory fee rates and overall expenses for iShares MSCI Israel Capped ETF, iShares MSCI South Africa ETF and iShares MSCI Turkey ETF were lower than the median of the investment advisory fee rates and
| 90 | 2014 iSHARES ANNUAL REPORTTO SHAREHOLDERS |
Table of Contents
Board Review and Approval of Investment Advisory
Contract (Continued)
iSHARES®, INC.
overall expenses of the funds in their respective Lipper Group, and the investment advisory fee rates and overall expenses for iShares MSCI Brazil Capped ETF and iShares MSCI Chile Capped ETF were at the median of the investment advisory fee rates and overall expenses of the funds in their respective Lipper Group.
In addition, the Board reviewed statistical information prepared by Lipper regarding the performance of each Fund for the one-, three-, five-, ten-year, and since inception periods, as applicable, and the “last quarter” period ended December 31, 2013, and a comparison of each Fund’s performance to its performance benchmark index for the same periods. To the extent that any of the comparison funds included in the Lipper Group track the same index as any particular Fund, Lipper also provided, and the Board reviewed, a comparison of such Fund’s performance to that of such relevant comparison funds for the same periods. The Board noted that the Funds generally performed in line with their respective performance benchmark indexes over the relevant periods. In considering this information, the Board noted that the Lipper Group may include funds that are not exchange traded funds or index funds, and that may have different investment objectives and/or benchmarks from the Funds. In addition, the Board noted that each Fund seeks to track its own benchmark index and that, during the prior year, the Board received periodic reports on the Funds’ performance in comparison with their relevant benchmark indexes. Such periodic comparative performance information, including detailed information on certain specific iShares funds requested by the Boards, was also considered.
Based on this review, the other factors considered at the meeting, and their general knowledge of ETF pricing, the Board concluded that the investment advisory fee rate and expense level and the historical performance of each Fund supported the Board’s approval of the continuance of the Advisory Contract for the coming year.
Nature, Extent and Quality of Services Provided by BFA — Based on management’s representations, including information about recent and proposed enhancements to the iShares business, including with respect to shareholder servicing and support, the Board expected that there would be no diminution in the scope of services required of or provided by BFA under the Advisory Contract for the coming year as compared to the scope of services provided by BFA during prior years. In reviewing the scope of these services, the Board considered BFA’s investment philosophy and experience, noting that BFA and its affiliates have committed significant resources over time, including during the past year, to supporting the Funds and their shareholders. The Board acknowledged that resources to support the iShares funds and their shareholders have been added or enhanced in recent years, including in such areas as investor education, product management, customized portfolio consulting support, capital markets support, and proprietary risk and performance analytics tools. The Board also considered BFA’s compliance program and its compliance record with respect to the Funds. In that regard, the Board noted that BFA reports to the Board about portfolio management and compliance matters on a periodic basis in connection with regularly scheduled meetings of the Board, and on other occasions as necessary and appropriate, and has provided information and made appropriate officers available as needed to provide further assistance with these matters. The Board also reviewed the background and experience of the persons responsible for the day-to-day management of the Funds, as well as the resources available to them in managing the Funds. In addition to the above considerations, the Board reviewed and considered detailed presentations regarding BFA’s investment performance, investment and risk management processes and strategies provided at the June 12-13, 2014 meeting and throughout the previous year, and matters related to BFA’s portfolio compliance policies and procedures. The Board noted that each Fund had met its investment objective consistently since its respective inception date.
Based on review of this information, and the performance information discussed above, the Board concluded that the nature, extent and quality of services provided by BFA to the Funds under the Advisory Contract supported the Board’s approval of the continuance of the Advisory Contract for the coming year.
Costs of Services Provided to Funds and Profits Realized by BFA and Affiliates — The Board reviewed information about the profitability to BlackRock of the Funds based on the fees payable to BFA and its affiliates (including fees under the Advisory Contract), and all other sources of revenue and expense to BFA and its affiliates from the Funds’ operations for the last calendar
BOARD REVIEWAND APPROVALOF INVESTMENT ADVISORY CONTRACT | 91 |
Table of Contents
Board Review and Approval of Investment Advisory
Contract (Continued)
iSHARES®, INC.
year. The Board reviewed BlackRock’s profitability methodology for the iShares funds, noting that the 15(c) Committee had focused on the methodology and proposed presentation during its meetings. The Board discussed the sources of direct and ancillary revenue with management, including the revenues to BTC from securities lending by the Funds. The Board also discussed BFA’s profit margin as reflected in the Funds’ profitability analyses and reviewed information regarding potential economies of scale (as discussed below). Based on this review, the Board concluded that the profits realized by BFA and its affiliates under the Advisory Contract and from other relationships between the Funds and BFA and/or its affiliates, if any, were within a reasonable range in light of the factors considered.
Economies of Scale — The Board reviewed information regarding potential economies of scale or other efficiencies that may result from increases in the Funds’ assets, noting that the issue of economies of scale had been focused on extensively by the 15(c) Committee during its meetings and addressed by management. The Board and the 15(c) Committee reviewed information provided by BFA regarding scale benefits shared with the iShares funds through relatively low fee rates established at inception, breakpoints, waivers, or other fee reductions, as well as through additional investment in the iShares business and the provision of improved or additional infrastructure and services to the iShares funds and their shareholders. The Board and the 15(c) Committee received information regarding BlackRock’s historical profitability, including BFA’s and its affiliates’ costs in providing services. The cost information distinguished between fixed and variable costs, and explained how the level of fixed and variable costs, as well as the nature of such costs, may impact the existence or size of scale benefits. The Board noted that the Advisory Contract for the Funds already provided for breakpoints in the Funds’ investment advisory fee rates as the assets of the Funds, on an aggregated basis with the assets of certain other iShares funds, increase. The Board noted that it would continue to monitor the sharing of economies of scale to determine the appropriateness of adding new or revised breakpoints in the future. Based on this review, as well as the other factors considered at the meeting, the Board, recognizing its responsibility to consider this issue at least annually, concluded that the structure of the investment advisory fee rates reflects appropriate sharing of potential economies of scale with the Funds’ shareholders and supported the Board’s approval of the continuance of the Advisory Contract for the coming year.
Fees and Services Provided for Other Comparable Funds/Accounts Managed by BFA and its Affiliates — The Board received and considered information regarding the investment advisory/management fee rates for other funds/accounts in the U.S. for which BFA (or its affiliates) provides investment advisory/management services, including open-end and closed-end funds registered under the 1940 Act (including sub-advised funds), collective trust funds, separately managed accounts, and institutional separate accounts (together, the “Other Accounts”), and acknowledged BFA’s assertion that the iShares funds are fundamentally different investment vehicles from the Other Accounts. The Board noted that BFA and its affiliates do manage Other Accounts with substantially similar investment objectives and strategies as the Funds, except for iShares MSCI Israel Capped ETF. The Board further noted that BFA provided the Board with detailed information regarding how the Other Accounts (particularly institutional clients) generally differ from the Funds, including in terms of the different, generally more extensive services provided to the Funds, as well as other significant differences in the approach of BFA and its affiliates to the Funds, on one hand, and Other Accounts, on the other. In that regard, the Board considered that the pricing of services to institutional clients is typically based on a number of factors beyond the nature and extent of the specific services to be provided and often depends on the overall relationship between the client and its affiliates and the adviser and its affiliates. In addition, the Board considered the relative complexity and inherent risks and challenges of managing and providing other services to the Funds, as publicly traded exchange traded funds, as compared to the Other Accounts that are institutional clients in light of differing regulatory requirements and client-imposed mandates. The Board also considered the “all-inclusive” nature of the Funds’ advisory fee structure, and the Fund expenses borne by BFA under this arrangement. The Board noted that the investment advisory fee rates under the Advisory Contract for the Funds were generally higher than the investment advisory/management fee rates for the Other Accounts that are institutional clients of BFA (or its affiliates) and concluded that the differences appeared to be consistent with the factors discussed.
| 92 | 2014 iSHARES ANNUAL REPORTTO SHAREHOLDERS |
Table of Contents
Board Review and Approval of Investment Advisory
Contract (Continued)
iSHARES®, INC.
Other Benefits to BFA and/or its Affiliates — The Board reviewed the “fallout” benefits or ancillary revenue received by BFA and/or its affiliates in connection with the services provided to the Funds by BFA, such as payment of revenue to BTC, the Funds’ securities lending agent, for loaning portfolio securities (which was included in the profit margins reviewed by the Board pursuant to BFA’s profitability methodology), and payment of advisory fees and/or administration fees to BFA and BTC (or their affiliates) in connection with any investments by the Funds in other funds for which BFA (or its affiliates) provides investment advisory services and/or administration services. The Board noted that BFA generally does not use soft dollars or consider the value of research or other services that may be provided to BFA (including its affiliates) in selecting brokers for portfolio transactions for the Funds. The Board further noted that any portfolio transactions on behalf of the Funds placed through a BFA affiliate or purchased from an underwriting syndicate in which a BFA affiliate participates, are reported to the Board pursuant to Rule 17e-1 or Rule 10f-3, as applicable, under the 1940 Act. The Board concluded that any such ancillary benefits would not be disadvantageous to the Funds’ shareholders and thus would not alter the Board’s conclusion with respect to the appropriateness of approving the continuance of the Advisory Contract for the coming year.
Based on the considerations described above, the Board determined that each Fund’s investment advisory fee rate under the Advisory Contract does not constitute a fee that is so disproportionately large as to bear no reasonable relationship to the services rendered and that could not have been the product of arm’s-length bargaining, and concluded that it is in the best interest of each Fund and its shareholders to approve the continuance of the Advisory Contract for the coming year.
II. iShares MSCI Canada ETF and iShares MSCI Mexico Capped ETF
Under Section 15(c) of the Investment Company Act of 1940 (the “1940 Act”), the Company’s Board of Directors (the “Board”), including a majority of Directors who are not “interested persons” of the Company (as that term is defined in the 1940 Act) (the “Independent Directors”), is required annually to consider and approve the Investment Advisory Contract between the Company and BFA (the “Advisory Contract”) on behalf of the Funds. The Independent Directors requested, and BFA provided, such information as the Independent Directors, with advice from independent counsel, deemed reasonably necessary to evaluate the Advisory Contract. A committee of Independent Directors (the “15(c) Committee”), with independent counsel, met with management on March 12, 2014, May 6, 2014, and May 12, 2014, to discuss the types of information the Independent Directors required and the manner in which management would organize and present such information. At a meeting held on May 16, 2014, management presented preliminary information to the Board relating to the continuance of the Advisory Contract, and the Board, including the Independent Directors, reviewed and discussed such information at length. The Independent Directors requested from management certain additional information, which management agreed to provide. At a meeting held on June 12-13, 2014, the Board, including the Independent Directors, reviewed the additional information provided by management in response to these requests. After extensive discussions, the Board, including all of the Independent Directors, approved the continuance of the Advisory Contract for the Funds, based on a review of qualitative and quantitative information provided by BFA, including the additional information management provided at the request of the Independent Directors. The Board noted its satisfaction with the extent and quality of information provided and its frequent interactions with management, as well as the detailed responses and other information provided by BFA. The Board also noted that the Board and BFA agreed to discuss potential enhancements and adjustments to the 15(c) process for the coming year. The Independent Directors were advised by their independent counsel throughout the process, including about the legal standards applicable to their review. In approving the Advisory Contract for the Funds, the Board, including the Independent Directors, considered the following factors, no one of which was controlling, and reached the following conclusions:
Expenses and Performance of the Funds — The Board reviewed statistical information prepared by Lipper Inc. (“Lipper”), an independent provider of investment company data, regarding the expense ratio components, including actual advisory fees, waivers/reimbursements, and gross and net total expenses of each Fund in comparison with the same information for other exchange traded funds (including funds sponsored by an “at cost” service provider) and, in the limited instances where no
BOARD REVIEWAND APPROVALOF INVESTMENT ADVISORY CONTRACT | 93 |
Table of Contents
Board Review and Approval of Investment Advisory
Contract (Continued)
iSHARES®, INC.
comparable ETFs existed and the comparison group would not otherwise be reasonable in Lipper’s judgment, pure index institutional mutual funds, objectively selected by Lipper as comprising such Fund’s applicable peer group pursuant to Lipper’s proprietary ETF methodology (the “Lipper Group”). The Board noted that, prior to 2014, Lipper had used a different methodology to determine a Fund’s Lipper group, which included mutual funds, closed-end funds, exchange traded funds, and/or funds with differing investment objective classifications, investment focuses and other characteristics (e.g. actively managed funds and funds sponsored by “at cost” service providers), as applicable. The Board further noted that, after consideration by the 15(c) Committee, the Board determined to use instead Lipper’s proprietary ETF methodology to determine a Fund’s Lipper Group. This determination was based on, among other considerations, the increased number and types of ETFs available for comparative purposes than was the case in prior years. The Board was provided with a detailed description of Lipper’s proprietary ETF methodology used by Lipper to determine the applicable Lipper Groups and to prepare this information. At the Board’s request, Lipper provided, and the Board considered, information on the impact to the iShares funds’ comparative fee rankings that were attributable to the change from a pure index group methodology to Lipper’s proprietary ETF methodology. The Board further noted that due to the limitations in providing comparable funds in the various Lipper Groups, the statistical information provided in Lipper’s report may or may not provide meaningful direct comparisons to the Funds in all instances.
The Board also noted that the investment advisory fee rates and overall expenses for the Funds were lower than the median of the investment advisory fee rates and overall expenses of the funds in their respective Lipper Group.
In addition, the Board reviewed statistical information prepared by Lipper regarding the performance of each Fund for the one-, three-, five-, ten-year, and since inception periods, as applicable, and the “last quarter” period ended December 31, 2013, and a comparison of each Fund’s performance to its performance benchmark index for the same periods. To the extent that any of the comparison funds included in the Lipper Group track the same index as any particular Fund, Lipper also provided, and the Board reviewed, a comparison of such Fund’s performance to that of such relevant comparison funds for the same periods. The Board noted that the Funds generally performed in line with their respective performance benchmark indexes over the relevant periods. In considering this information, the Board noted that the Lipper Group may include funds that are not exchange traded funds or index funds, and that may have different investment objectives and/or benchmarks from the Funds. In addition, the Board noted that each Fund seeks to track its own benchmark index and that, during the prior year, the Board received periodic reports on the Funds’ performance in comparison with their relevant benchmark indexes. Such periodic comparative performance information, including detailed information on certain specific iShares funds requested by the Boards, was also considered.
Based on this review, the other factors considered at the meeting, and their general knowledge of ETF pricing, the Board concluded that the investment advisory fee rate and expense level and the historical performance of each Fund supported the Board’s approval of the continuance of the Advisory Contract for the coming year.
Nature, Extent and Quality of Services Provided by BFA — Based on management’s representations, including information about recent and proposed enhancements to the iShares business, including with respect to shareholder servicing and support, the Board expected that there would be no diminution in the scope of services required of or provided by BFA under the Advisory Contract for the coming year as compared to the scope of services provided by BFA during prior years. In reviewing the scope of these services, the Board considered BFA’s investment philosophy and experience, noting that BFA and its affiliates have committed significant resources over time, including during the past year, to supporting the Funds and their shareholders. The Board acknowledged that resources to support the iShares funds and their shareholders have been added or enhanced in recent years, including in such areas as investor education, product management, customized portfolio consulting support, capital markets support, and proprietary risk and performance analytics tools. The Board also considered BFA’s compliance program and its compliance record with respect to the Funds. In that regard, the Board noted that BFA reports to the Board about portfolio management and compliance matters on a periodic basis in connection with regularly scheduled meetings of the Board, and on other occasions as necessary and appropriate, and has provided information and made appropriate officers available as needed
| 94 | 2014 iSHARES ANNUAL REPORTTO SHAREHOLDERS |
Table of Contents
Board Review and Approval of Investment Advisory
Contract (Continued)
iSHARES®, INC.
to provide further assistance with these matters. The Board also reviewed the background and experience of the persons responsible for the day-to-day management of the Funds, as well as the resources available to them in managing the Funds. In addition to the above considerations, the Board reviewed and considered detailed presentations regarding BFA’s investment performance, investment and risk management processes and strategies provided at the June 12-13, 2014 meeting and throughout the previous year, and matters related to BFA’s portfolio compliance policies and procedures. The Board noted that each Fund had met its investment objective consistently since its respective inception date.
Based on review of this information, and the performance information discussed above, the Board concluded that the nature, extent and quality of services provided by BFA to the Funds under the Advisory Contract supported the Board’s approval of the continuance of the Advisory Contract for the coming year.
Costs of Services Provided to Funds and Profits Realized by BFA and Affiliates — The Board reviewed information about the profitability to BlackRock of the Funds based on the fees payable to BFA and its affiliates (including fees under the Advisory Contract), and all other sources of revenue and expense to BFA and its affiliates from the Funds’ operations for the last calendar year. The Board reviewed BlackRock’s profitability methodology for the iShares funds, noting that the 15(c) Committee had focused on the methodology and proposed presentation during its meetings. The Board discussed the sources of direct and ancillary revenue with management, including the revenues to BTC from securities lending by the Funds. The Board also discussed BFA’s profit margin as reflected in the Funds’ profitability analyses and reviewed information regarding potential economies of scale (as discussed below). Based on this review, the Board concluded that the profits realized by BFA and its affiliates under the Advisory Contract and from other relationships between the Funds and BFA and/or its affiliates, if any, were within a reasonable range in light of the factors considered.
Economies of Scale — The Board reviewed information regarding potential economies of scale or other efficiencies that may result from increases in the Funds’ assets, noting that the issue of economies of scale had been focused on extensively by the 15(c) Committee during its meetings and addressed by management. The Board and the 15(c) Committee reviewed information provided by BFA regarding scale benefits shared with the iShares funds through relatively low fee rates established at inception, breakpoints, waivers, or other fee reductions, as well as through additional investment in the iShares business and the provision of improved or additional infrastructure and services to the iShares funds and their shareholders. The Board and the 15(c) Committee received information regarding BlackRock’s historical profitability, including BFA’s and its affiliates’ costs in providing services. The cost information distinguished between fixed and variable costs, and explained how the level of fixed and variable costs, as well as the nature of such costs, may impact the existence or size of scale benefits. The Board noted that the Advisory Contract for the Funds already provided for breakpoints in the Funds’ investment advisory fee rates, and that, following negotiations, BFA and the Board had agreed to revise the Advisory Contract for the Funds to provide for additional breakpoints, as the assets of the Funds, on an aggregated basis with the assets of certain other iShares funds, increase. The Board noted that the revisions of the Advisory Contract to provide additional breakpoints had been subject to further negotiation after receipt of management’s proposal, and that at the request of the Board, management had modified its initial proposal regarding adding additional breakpoints to the Funds. The Board noted that it would continue to monitor the sharing of economies of scale to determine the appropriateness of adding new or revised breakpoints in the future. Based on this review, as well as the other factors considered at the meeting, the Board, recognizing its responsibility to consider this issue at least annually, concluded that the structure of the investment advisory fee rates reflects appropriate sharing of potential economies of scale with the Funds’ shareholders and supported the Board’s approval of the continuance of the Advisory Contract for the coming year.
Fees and Services Provided for Other Comparable Funds/Accounts Managed by BFA and its Affiliates — The Board received and considered information regarding the investment advisory/management fee rates for other funds/accounts in the U.S. for which BFA (or its affiliates) provides investment advisory/management services, including open-end and closed-end funds registered under the 1940 Act (including sub-advised funds), collective trust funds, separately managed accounts, and
BOARD REVIEWAND APPROVALOF INVESTMENT ADVISORY CONTRACT | 95 |
Table of Contents
Board Review and Approval of Investment Advisory
Contract (Continued)
iSHARES®, INC.
institutional separate accounts (together, the “Other Accounts”), and acknowledged BFA’s assertion that the iShares funds are fundamentally different investment vehicles from the Other Accounts. The Board noted that BFA and its affiliates do manage Other Accounts with substantially similar investment objectives and strategies as the Funds. The Board further noted that BFA provided the Board with detailed information regarding how the Other Accounts (particularly institutional clients) generally differ from the Funds, including in terms of the different, generally more extensive services provided to the Funds, as well as other significant differences in the approach of BFA and its affiliates to the Funds, on one hand, and Other Accounts, on the other. In that regard, the Board considered that the pricing of services to institutional clients is typically based on a number of factors beyond the nature and extent of the specific services to be provided and often depends on the overall relationship between the client and its affiliates and the adviser and its affiliates. In addition, the Board considered the relative complexity and inherent risks and challenges of managing and providing other services to the Funds, as publicly traded exchange traded funds, as compared to the Other Accounts that are institutional clients in light of differing regulatory requirements and client-imposed mandates. The Board also considered the “all-inclusive” nature of the Funds’ advisory fee structure, and the Fund expenses borne by BFA under this arrangement. The Board noted that the investment advisory fee rates under the Advisory Contract for the Funds were generally higher than the investment advisory/management fee rates for the Other Accounts that are institutional clients of BFA (or its affiliates) and concluded that the differences appeared to be consistent with the factors discussed.
Other Benefits to BFA and/or its Affiliates — The Board reviewed the “fallout” benefits or ancillary revenue received by BFA and/or its affiliates in connection with the services provided to the Funds by BFA, such as payment of revenue to BTC, the Funds’ securities lending agent, for loaning portfolio securities (which was included in the profit margins reviewed by the Board pursuant to BFA’s profitability methodology), and payment of advisory fees and/or administration fees to BFA and BTC (or their affiliates) in connection with any investments by the Funds in other funds for which BFA (or its affiliates) provides investment advisory services and/or administration services. The Board noted that BFA generally does not use soft dollars or consider the value of research or other services that may be provided to BFA (including its affiliates) in selecting brokers for portfolio transactions for the Funds. The Board further noted that any portfolio transactions on behalf of the Funds placed through a BFA affiliate or purchased from an underwriting syndicate in which a BFA affiliate participates, are reported to the Board pursuant to Rule 17e-1 or Rule 10f-3, as applicable, under the 1940 Act. The Board concluded that any such ancillary benefits would not be disadvantageous to the Funds’ shareholders and thus would not alter the Board’s conclusion with respect to the appropriateness of approving the continuance of the Advisory Contract for the coming year.
Based on the considerations described above, the Board determined that each Fund’s investment advisory fee rate under the Advisory Contract does not constitute a fee that is so disproportionately large as to bear no reasonable relationship to the services rendered and that could not have been the product of arm’s-length bargaining, and concluded that it is in the best interest of each Fund and its shareholders to approve the continuance of the Advisory Contract for the coming year.
III. iShares MSCI Colombia Capped ETF
Under Section 15(c) of the Investment Company Act of 1940 (the “1940 Act”), the Company’s Board of Directors (the “Board”), including a majority of Directors who are not “interested persons” of the Company (as that term is defined in the 1940 Act) (the “Independent Directors”), is required annually to consider and approve the Investment Advisory Contract between the Company and BFA (the “Advisory Contract”) on behalf of the Fund. The Independent Directors requested, and BFA provided, such information as the Independent Directors, with advice from independent counsel, deemed reasonably necessary to evaluate the Advisory Contract. A committee of Independent Directors (the “15(c) Committee”), with independent counsel, met with management on March 12, 2014, May 6, 2014, and May 12, 2014, to discuss the types of information the Independent Directors required and the manner in which management would organize and present such information. At a meeting held on May 16, 2014, management presented preliminary information to the Board relating to the continuance of the Advisory Contract, and the Board, including the Independent Directors, reviewed and discussed such information at length. The Independent Directors
| 96 | 2014 iSHARES ANNUAL REPORTTO SHAREHOLDERS |
Table of Contents
Board Review and Approval of Investment Advisory
Contract (Continued)
iSHARES®, INC.
requested from management certain additional information, which management agreed to provide. At a meeting held on June 12-13, 2014, the Board, including the Independent Directors, reviewed the additional information provided by management in response to these requests. After extensive discussions, the Board, including all of the Independent Directors, approved the continuance of the Advisory Contract for the Fund, based on a review of qualitative and quantitative information provided by BFA, including the additional information management provided at the request of the Independent Directors. The Board noted its satisfaction with the extent and quality of information provided and its frequent interactions with management, as well as the detailed responses and other information provided by BFA. The Board also noted that the Board and BFA agreed to discuss potential enhancements and adjustments to the 15(c) process for the coming year. The Independent Directors were advised by their independent counsel throughout the process, including about the legal standards applicable to their review. In approving the Advisory Contract for the Fund, the Board, including the Independent Directors, considered the following factors, no one of which was controlling, and reached the following conclusions:
Expenses and Performance of the Fund — The Board reviewed statistical information prepared by Lipper Inc. (“Lipper”), an independent provider of investment company data, regarding the expense ratio components, including actual advisory fees, waivers/reimbursements, and gross and net total expenses of the Fund in comparison with the same information for other exchange traded funds (including funds sponsored by an “at cost” service provider) and, in the limited instances where no comparable ETFs existed and the comparison group would not otherwise be reasonable in Lipper’s judgment, pure index institutional mutual funds, objectively selected by Lipper as comprising the Fund’s applicable peer group pursuant to Lipper’s proprietary ETF methodology (the “Lipper Group”). The Board noted that, prior to 2014, Lipper had used a different methodology to determine the Fund’s Lipper group, which included mutual funds, closed-end funds, exchange traded funds, and/or funds with differing investment objective classifications, investment focuses and other characteristics (e.g. actively managed funds and funds sponsored by “at cost” service providers), as applicable. The Board further noted that, after consideration by the 15(c) Committee, the Board determined to use instead Lipper’s proprietary ETF methodology to determine the Fund’s Lipper Group. This determination was based on, among other considerations, the increased number and types of ETFs available for comparative purposes than was the case in prior years. The Board was provided with a detailed description of Lipper’s proprietary ETF methodology used by Lipper to determine the applicable Lipper Group and to prepare this information. At the Board’s request, Lipper provided, and the Board considered, information on the impact to the iShares funds’ comparative fee rankings that were attributable to the change from a pure index group methodology to Lipper’s proprietary ETF methodology. The Board further noted that due to the limitations in providing comparable funds in the Lipper Group, the statistical information provided in Lipper’s report may or may not provide meaningful direct comparisons to the Fund in all instances.
The Board also noted that the investment advisory fee rate and overall expenses for the Fund were within range of the median of the investment advisory fee rates and overall expenses of the funds in its Lipper Group.
In addition, the Board reviewed statistical information prepared by Lipper regarding the performance of the Fund for the one-, three-, five-, ten-year, and since inception periods, as applicable, and the “last quarter” period ended December 31, 2013, and a comparison of the Fund’s performance to its performance benchmark index for the same periods. To the extent that any of the comparison funds included in the Lipper Group track the same index as the Fund, Lipper also provided, and the Board reviewed, a comparison of the Fund’s performance to that of such relevant comparison funds for the same periods. The Board noted that the Fund generally performed in line with its respective performance benchmark index over the relevant periods. In considering this information, the Board noted that the Lipper Group may include funds that are not exchange traded funds or index funds, and that may have different investment objectives and/or benchmarks from the Fund. In addition, the Board noted that the Fund seeks to track its own benchmark index and that, during the prior year, the Board received periodic reports on the Fund’s performance in comparison with its relevant benchmark index. Such periodic comparative performance information, including detailed information on certain specific iShares funds requested by the Boards, was also considered.
BOARD REVIEWAND APPROVALOF INVESTMENT ADVISORY CONTRACT | 97 |
Table of Contents
Board Review and Approval of Investment Advisory
Contract (Continued)
iSHARES®, INC.
Based on this review, the other factors considered at the meeting, and their general knowledge of ETF pricing, the Board concluded that the investment advisory fee rate and expense level and the historical performance of the Fund supported the Board’s approval of the continuance of the Advisory Contract for the coming year.
Nature, Extent and Quality of Services Provided by BFA — Based on management’s representations, including information about recent and proposed enhancements to the iShares business, including with respect to shareholder servicing and support, the Board expected that there would be no diminution in the scope of services required of or provided by BFA under the Advisory Contract for the coming year as compared to the scope of services provided by BFA during prior years. In reviewing the scope of these services, the Board considered BFA’s investment philosophy and experience, noting that BFA and its affiliates have committed significant resources over time, including during the past year, to supporting the Fund and its shareholders. The Board acknowledged that resources to support the iShares funds and their shareholders have been added or enhanced in recent years, including in such areas as investor education, product management, customized portfolio consulting support, capital markets support, and proprietary risk and performance analytics tools. The Board also considered BFA’s compliance program and its compliance record with respect to the Fund. In that regard, the Board noted that BFA reports to the Board about portfolio management and compliance matters on a periodic basis in connection with regularly scheduled meetings of the Board, and on other occasions as necessary and appropriate, and has provided information and made appropriate officers available as needed to provide further assistance with these matters. The Board also reviewed the background and experience of the persons responsible for the day-to-day management of the Fund, as well as the resources available to them in managing the Fund. In addition to the above considerations, the Board reviewed and considered detailed presentations regarding BFA’s investment performance, investment and risk management processes and strategies provided at the June 12-13, 2014 meeting and throughout the previous year, and matters related to BFA’s portfolio compliance policies and procedures. The Board noted that the Fund had met its investment objective consistently since its inception date.
Based on review of this information, and the performance information discussed above, the Board concluded that the nature, extent and quality of services provided by BFA to the Fund under the Advisory Contract supported the Board’s approval of the continuance of the Advisory Contract for the coming year.
Costs of Services Provided to the Fund and Profits Realized by BFA and Affiliates — The Board reviewed information about the profitability to BlackRock of the Fund based on the fees payable to BFA and its affiliates (including fees under the Advisory Contract), and all other sources of revenue and expense to BFA and its affiliates from the Fund’s operations for the last calendar year. The Board reviewed BlackRock’s profitability methodology for the iShares funds, noting that the 15(c) Committee had focused on the methodology and proposed presentation during its meetings. The Board discussed the sources of direct and ancillary revenue with management, including the revenues to BTC from securities lending by the Fund. The Board also discussed BFA’s profit margin as reflected in the Fund’s profitability analysis and reviewed information regarding potential economies of scale (as discussed below). Based on this review, the Board concluded that the profits realized by BFA and its affiliates under the Advisory Contract and from other relationships between the Fund and BFA and/or its affiliates, if any, were within a reasonable range in light of the factors considered.
Economies of Scale — The Board reviewed information regarding potential economies of scale or other efficiencies that may result from increases in the Fund’s assets, noting that the issue of economies of scale had been focused on extensively by the 15(c) Committee during its meetings and addressed by management. The Board and the 15(c) Committee reviewed information provided by BFA regarding scale benefits shared with the iShares funds through relatively low fee rates established at inception, breakpoints, waivers, or other fee reductions, as well as through additional investment in the iShares business and the provision of improved or additional infrastructure and services to the iShares funds and their shareholders. The Board and the 15(c) Committee received information regarding BlackRock’s historical profitability, including BFA’s and its affiliates’ costs in providing services. The cost information distinguished between fixed and variable costs, and explained how the level of fixed and
| 98 | 2014 iSHARES ANNUAL REPORTTO SHAREHOLDERS |
Table of Contents
Board Review and Approval of Investment Advisory
Contract (Continued)
iSHARES®, INC.
variable costs, as well as the nature of such costs, may impact the existence or size of scale benefits. The Board noted that the Advisory Contract for the Fund did not provide for any breakpoints in the Fund’s investment advisory fee rate as the assets of the Fund increase. However, the Board noted that should material economies of scale exist in the future, a breakpoint structure for the Fund may be appropriate, and that it would continue to monitor the sharing of economies of scale to determine the appropriateness of adding breakpoints in the future. Based on this review, as well as the other factors considered at the meeting, the Board, recognizing its responsibility to consider this issue at least annually, concluded that the investment advisory fee rate incorporates potential economies of scale and supported the Board’s approval of the continuance of the Advisory Contract for the coming year.
Fees and Services Provided for Other Comparable Funds/Accounts Managed by BFA and its Affiliates — The Board received and considered information regarding the investment advisory/management fee rates for other funds/accounts in the U.S. for which BFA (or its affiliates) provides investment advisory/management services, including open-end and closed-end funds registered under the 1940 Act (including sub-advised funds), collective trust funds, separately managed accounts, and institutional separate accounts (together, the “Other Accounts”), and acknowledged BFA’s assertion that the iShares funds are fundamentally different investment vehicles from the Other Accounts. The Board noted that BFA and its affiliates do manage Other Accounts with a substantially similar investment objective and strategy as the Fund. The Board further noted that BFA provided the Board with detailed information regarding how the Other Accounts (particularly institutional clients) generally differ from the Fund, including in terms of the different, generally more extensive services provided to the Fund, as well as other significant differences in the approach of BFA and its affiliates to the Fund, on one hand, and Other Accounts, on the other. In that regard, the Board considered that the pricing of services to institutional clients is typically based on a number of factors beyond the nature and extent of the specific services to be provided and often depends on the overall relationship between the client and its affiliates and the adviser and its affiliates. In addition, the Board considered the relative complexity and inherent risks and challenges of managing and providing other services to the Fund, as a publicly traded exchange traded fund, as compared to the Other Accounts that are institutional clients in light of differing regulatory requirements and client-imposed mandates. The Board also considered the “all-inclusive” nature of the Fund’s advisory fee structure, and the Fund expenses borne by BFA under this arrangement. The Board noted that the investment advisory fee rate under the Advisory Contract for the Fund was generally higher than the investment advisory/management fee rates for the Other Accounts that are institutional clients of BFA (or its affiliates) and concluded that the differences appeared to be consistent with the factors discussed.
Other Benefits to BFA and/or its Affiliates — The Board reviewed the “fallout” benefits or ancillary revenue received by BFA and/or its affiliates in connection with the services provided to the Fund by BFA, such as payment of revenue to BTC, the Fund’s securities lending agent, for loaning portfolio securities (which was included in the profit margins reviewed by the Board pursuant to BFA’s profitability methodology), and payment of advisory fees and/or administration fees to BFA and BTC (or their affiliates) in connection with any investments by the Fund in other funds for which BFA (or its affiliates) provides investment advisory services and/or administration services. The Board noted that BFA generally does not use soft dollars or consider the value of research or other services that may be provided to BFA (including its affiliates) in selecting brokers for portfolio transactions for the Fund. The Board further noted that any portfolio transactions on behalf of the Fund placed through a BFA affiliate or purchased from an underwriting syndicate in which a BFA affiliate participates, are reported to the Board pursuant to Rule 17e-1 or Rule 10f-3, as applicable, under the 1940 Act. The Board concluded that any such ancillary benefits would not be disadvantageous to the Fund’s shareholders and thus would not alter the Board’s conclusion with respect to the appropriateness of approving the continuance of the Advisory Contract for the coming year.
Based on the considerations described above, the Board determined that the Fund’s investment advisory fee rate under the Advisory Contract does not constitute a fee that is so disproportionately large as to bear no reasonable relationship to the services rendered and that could not have been the product of arm’s-length bargaining, and concluded that it is in the best interest of the Fund and its shareholders to approve the continuance of the Advisory Contract for the coming year.
BOARD REVIEWAND APPROVALOF INVESTMENT ADVISORY CONTRACT | 99 |
Table of Contents
Board Review and Approval of Investment Advisory
Contract (Continued)
iSHARES®, INC.
IV. iShares MSCI USA ETF
Under Section 15(c) of the Investment Company Act of 1940 (the “1940 Act”), the Company’s Board of Directors (the “Board”), including a majority of Directors who are not “interested persons” of the Company (as that term is defined in the 1940 Act) (the “Independent Directors”), is required annually to consider and approve the Investment Advisory Contract between the Company and BFA (the “Advisory Contract”) on behalf of the Fund. The Independent Directors requested, and BFA provided, such information as the Independent Directors, with advice from independent counsel, deemed reasonably necessary to evaluate the Advisory Contract. A committee of Independent Directors (the “15(c) Committee”), with independent counsel, met with management on March 12, 2014, May 6, 2014, and May 12, 2014, to discuss the types of information the Independent Directors required and the manner in which management would organize and present such information. At a meeting held on May 16, 2014, management presented preliminary information to the Board relating to the continuance of the Advisory Contract, and the Board, including the Independent Directors, reviewed and discussed such information at length. The Independent Directors requested from management certain additional information, which management agreed to provide. At a meeting held on June 12-13, 2014, the Board, including the Independent Directors, reviewed the additional information provided by management in response to these requests. After extensive discussions, the Board, including all of the Independent Directors, approved the continuance of the Advisory Contract for the Fund, based on a review of qualitative and quantitative information provided by BFA, including the additional information management provided at the request of the Independent Directors. The Board noted its satisfaction with the extent and quality of information provided and its frequent interactions with management, as well as the detailed responses and other information provided by BFA. The Board also noted that the Board and BFA agreed to discuss potential enhancements and adjustments to the 15(c) process for the coming year. The Independent Directors were advised by their independent counsel throughout the process, including about the legal standards applicable to their review. In approving the Advisory Contract for the Fund, the Board, including the Independent Directors, considered the following factors, no one of which was controlling, and reached the following conclusions:
Expenses and Performance of the Fund — The Board reviewed statistical information prepared by Lipper Inc. (“Lipper”), an independent provider of investment company data, regarding the expense ratio components, including actual advisory fees, waivers/reimbursements, and gross and net total expenses of the Fund in comparison with the same information for other exchange traded funds (including funds sponsored by an “at cost” service provider) and, in the limited instances where no comparable ETFs existed and the comparison group would not otherwise be reasonable in Lipper’s judgment, pure index institutional mutual funds, objectively selected by Lipper as comprising the Fund’s applicable peer group pursuant to Lipper’s proprietary ETF methodology (the “Lipper Group”). The Board noted that, prior to 2014, Lipper had used a different methodology to determine the Fund’s Lipper group, which included mutual funds, closed-end funds, exchange traded funds, and/or funds with differing investment objective classifications, investment focuses and other characteristics (e.g. actively managed funds and funds sponsored by “at cost” service providers), as applicable. The Board further noted that, after consideration by the 15(c) Committee, the Board determined to use instead Lipper’s proprietary ETF methodology to determine the Fund’s Lipper Group. This determination was based on, among other considerations, the increased number and types of ETFs available for comparative purposes than was the case in prior years. The Board was provided with a detailed description of Lipper’s proprietary ETF methodology used by Lipper to determine the applicable Lipper Group and to prepare this information. At the Board’s request, Lipper provided, and the Board considered, information on the impact to the iShares funds’ comparative fee rankings that were attributable to the change from a pure index group methodology to Lipper’s proprietary ETF methodology. The Board further noted that due to the limitations in providing comparable funds in the Lipper Group, the statistical information provided in Lipper’s report may or may not provide meaningful direct comparisons to the Fund in all instances.
The Board also noted that the investment advisory fee rate and overall expenses for the Fund were lower than the median of the investment advisory fee rates and overall expenses of the funds in its Lipper Group.
| 100 | 2014 iSHARES ANNUAL REPORTTO SHAREHOLDERS |
Table of Contents
Board Review and Approval of Investment Advisory
Contract (Continued)
iSHARES®, INC.
In addition, the Board reviewed statistical information prepared by Lipper regarding the performance of the Fund for the one-, three-, five-, ten-year, and since inception periods, as applicable, and the “last quarter” period ended December 31, 2013, and a comparison of the Fund’s performance to its performance benchmark index for the same periods. To the extent that any of the comparison funds included in the Lipper Group track the same index as the Fund, Lipper also provided, and the Board reviewed, a comparison of the Fund’s performance to that of such relevant comparison funds for the same periods. The Board noted that the Fund generally performed in line with its respective performance benchmark index over the relevant periods. In considering this information, the Board noted that the Lipper Group may include funds that are not exchange traded funds or index funds, and that may have different investment objectives and/or benchmarks from the Fund. In addition, the Board noted that the Fund seeks to track its own benchmark index and that, during the prior year, the Board received periodic reports on the Fund’s performance in comparison with its relevant benchmark index. Such periodic comparative performance information, including detailed information on certain specific iShares funds requested by the Boards, was also considered.
Based on this review, the other factors considered at the meeting, and their general knowledge of ETF pricing, the Board concluded that the investment advisory fee rate and expense level and the historical performance of the Fund supported the Board’s approval of the continuance of the Advisory Contract for the coming year.
Nature, Extent and Quality of Services Provided by BFA — Based on management’s representations, including information about recent and proposed enhancements to the iShares business, including with respect to shareholder servicing and support, the Board expected that there would be no diminution in the scope of services required of or provided by BFA under the Advisory Contract for the coming year as compared to the scope of services provided by BFA during prior years. In reviewing the scope of these services, the Board considered BFA’s investment philosophy and experience, noting that BFA and its affiliates have committed significant resources over time, including during the past year, to supporting the Fund and its shareholders. The Board acknowledged that resources to support the iShares funds and their shareholders have been added or enhanced in recent years, including in such areas as investor education, product management, customized portfolio consulting support, capital markets support, and proprietary risk and performance analytics tools. The Board also considered BFA’s compliance program and its compliance record with respect to the Fund. In that regard, the Board noted that BFA reports to the Board about portfolio management and compliance matters on a periodic basis in connection with regularly scheduled meetings of the Board, and on other occasions as necessary and appropriate, and has provided information and made appropriate officers available as needed to provide further assistance with these matters. The Board also reviewed the background and experience of the persons responsible for the day-to-day management of the Fund, as well as the resources available to them in managing the Fund. In addition to the above considerations, the Board reviewed and considered detailed presentations regarding BFA’s investment performance, investment and risk management processes and strategies provided at the June 12-13, 2014 meeting and throughout the previous year, and matters related to BFA’s portfolio compliance policies and procedures. The Board noted that the Fund had met its investment objective consistently since its inception date.
Based on review of this information, and the performance information discussed above, the Board concluded that the nature, extent and quality of services provided by BFA to the Fund under the Advisory Contract supported the Board’s approval of the continuance of the Advisory Contract for the coming year.
Costs of Services Provided to the Fund and Profits Realized by BFA and Affiliates — The Board reviewed information about the profitability to BlackRock of the Fund based on the fees payable to BFA and its affiliates (including fees under the Advisory Contract), and all other sources of revenue and expense to BFA and its affiliates from the Fund’s operations for the last calendar year. The Board reviewed BlackRock’s profitability methodology for the iShares funds, noting that the 15(c) Committee had focused on the methodology and proposed presentation during its meetings. The Board discussed the sources of direct and ancillary revenue with management, including the revenues to BTC from securities lending by the Fund. The Board also discussed BFA’s profit margin as reflected in the Fund’s profitability analysis and reviewed information regarding potential
BOARD REVIEWAND APPROVALOF INVESTMENT ADVISORY CONTRACT | 101 |
Table of Contents
Board Review and Approval of Investment Advisory
Contract (Continued)
iSHARES®, INC.
economies of scale (as discussed below). Based on this review, the Board concluded that the profits realized by BFA and its affiliates under the Advisory Contract and from other relationships between the Fund and BFA and/or its affiliates, if any, were within a reasonable range in light of the factors considered.
Economies of Scale — The Board reviewed information regarding potential economies of scale or other efficiencies that may result from increases in the Fund’s assets, noting that the issue of economies of scale had been focused on extensively by the 15(c) Committee during its meetings and addressed by management. The Board and the 15(c) Committee reviewed information provided by BFA regarding scale benefits shared with the iShares funds through relatively low fee rates established at inception, breakpoints, waivers, or other fee reductions, as well as through additional investment in the iShares business and the provision of improved or additional infrastructure and services to the iShares funds and their shareholders. The Board and the 15(c) Committee received information regarding BlackRock’s historical profitability, including BFA’s and its affiliates’ costs in providing services. The cost information distinguished between fixed and variable costs, and explained how the level of fixed and variable costs, as well as the nature of such costs, may impact the existence or size of scale benefits. The Board noted that the Advisory Contract for the Fund did not provide for any breakpoints in the Fund’s investment advisory fee rate as the assets of the Fund increase. However, the Board further noted management’s assertion that future economies of scale for the Fund had been taken into consideration by fixing the investment advisory fee rate at the low end of the market place, effectively giving Fund shareholders, from inception, the benefits of a lower fee. The Board noted that it would continue to monitor the sharing of economies of scale to determine the appropriateness of adding breakpoints in the future. Based on this review, as well as the other factors considered at the meeting, the Board, recognizing its responsibility to consider this issue at least annually, concluded that the investment advisory fee rate incorporates potential economies of scale and supported the Board’s approval of the continuance of the Advisory Contract for the coming year.
Fees and Services Provided for Other Comparable Funds/Accounts Managed by BFA and its Affiliates — The Board received and considered information regarding the investment advisory/management fee rates for other funds/accounts in the U.S. for which BFA (or its affiliates) provides investment advisory/management services, including open-end and closed-end funds registered under the 1940 Act (including sub-advised funds), collective trust funds, separately managed accounts, and institutional separate accounts (together, the “Other Accounts”), and acknowledged BFA’s assertion that the iShares funds are fundamentally different investment vehicles from the Other Accounts. The Board noted that BFA and its affiliates do manage Other Accounts with a substantially similar investment objective and strategy as the Fund. The Board further noted that BFA provided the Board with detailed information regarding how the Other Accounts (particularly institutional clients) generally differ from the Fund, including in terms of the different, generally more extensive services provided to the Fund, as well as other significant differences in the approach of BFA and its affiliates to the Fund, on one hand, and Other Accounts, on the other. In that regard, the Board considered that the pricing of services to institutional clients is typically based on a number of factors beyond the nature and extent of the specific services to be provided and often depends on the overall relationship between the client and its affiliates and the adviser and its affiliates. In addition, the Board considered the relative complexity and inherent risks and challenges of managing and providing other services to the Fund, as a publicly traded exchange traded fund, as compared to the Other Accounts that are institutional clients in light of differing regulatory requirements and client-imposed mandates. The Board also considered the “all-inclusive” nature of the Fund’s advisory fee structure, and the Fund expenses borne by BFA under this arrangement. The Board noted that the investment advisory fee rate under the Advisory Contract for the Fund was generally higher than the investment advisory/management fee rates for the Other Accounts that are institutional clients of BFA (or its affiliates) and concluded that the differences appeared to be consistent with the factors discussed.
Other Benefits to BFA and/or its Affiliates — The Board reviewed the “fallout” benefits or ancillary revenue received by BFA and/or its affiliates in connection with the services provided to the Fund by BFA, such as payment of revenue to BTC, the Fund’s securities lending agent, for loaning portfolio securities (which was included in the profit margins reviewed by the Board pursuant to BFA’s profitability methodology), and payment of advisory fees and/or administration fees to BFA and BTC (or their affiliates) in
| 102 | 2014 iSHARES ANNUAL REPORTTO SHAREHOLDERS |
Table of Contents
Board Review and Approval of Investment Advisory
Contract (Continued)
iSHARES®, INC.
connection with any investments by the Fund in other funds for which BFA (or its affiliates) provides investment advisory services and/or administration services. The Board noted that BFA generally does not use soft dollars or consider the value of research or other services that may be provided to BFA (including its affiliates) in selecting brokers for portfolio transactions for the Fund. The Board further noted that any portfolio transactions on behalf of the Fund placed through a BFA affiliate or purchased from an underwriting syndicate in which a BFA affiliate participates, are reported to the Board pursuant to Rule 17e-1 or Rule 10f-3, as applicable, under the 1940 Act. The Board concluded that any such ancillary benefits would not be disadvantageous to the Fund’s shareholders and thus would not alter the Board’s conclusion with respect to the appropriateness of approving the continuance of the Advisory Contract for the coming year.
Based on the considerations described above, the Board determined that the Fund’s investment advisory fee rate under the Advisory Contract does not constitute a fee that is so disproportionately large as to bear no reasonable relationship to the services rendered and that could not have been the product of arm’s-length bargaining, and concluded that it is in the best interest of the Fund and its shareholders to approve the continuance of the Advisory Contract for the coming year.
BOARD REVIEWAND APPROVALOF INVESTMENT ADVISORY CONTRACT | 103 |
Table of Contents
Supplemental Information (Unaudited)
iSHARES®, INC.
Section 19(a) Notices
The amounts and sources of distributions reported are only estimates and are not being provided for tax reporting purposes. The actual amounts and sources of the amounts for tax reporting purposes will depend upon each Fund’s investment experience during the year and may be subject to changes based on the tax regulations. Shareholders will receive a Form 1099-DIV each calendar year that will inform them how to report distributions for federal income tax purposes.
| Total Cumulative Distributions for the Fiscal Year | % Breakdown of the Total Cumulative Distributions for the Fiscal Year | |||||||||||||||||||||||||||||||
| iShares ETF | Net Investment Income | Net Realized Capital Gains | Return of Capital | Total Per Share | Net Investment Income | Net Realized Capital Gains | Return of Capital | Total Per Share | ||||||||||||||||||||||||
MSCI Brazil Capped | $ | 1.393764 | $ | — | $ | 0.156416 | $ | 1.550180 | 90 | % | — | % | 10 | % | 100 | % | ||||||||||||||||
MSCI Canada | 0.552739 | — | 0.069719 | 0.622458 | 89 | — | 11 | 100 | ||||||||||||||||||||||||
MSCI Colombia Capped | 0.674415 | — | — | 0.674415 | 100 | — | — | 100 | ||||||||||||||||||||||||
MSCI Israel Capped | 0.876068 | — | 0.108215 | 0.984283 | 89 | — | 11 | 100 | ||||||||||||||||||||||||
MSCI Mexico Capped | 1.093145 | — | — | 1.093145 | 100 | — | — | 100 | ||||||||||||||||||||||||
MSCI South Africa | 1.543938 | — | — | 1.543938 | 100 | — | — | 100 | ||||||||||||||||||||||||
MSCI USA | 0.895585 | — | 0.007571 | 0.903156 | 99 | — | 1 | 100 | ||||||||||||||||||||||||
Premium/Discount Information
The tables that follow present information about the differences between the daily market price on secondary markets for shares of a Fund and that Fund’s net asset value. Net asset value, or “NAV,” is the price per share at which each Fund issues and redeems shares. It is calculated in accordance with the standard formula for valuing mutual fund shares. The “Market Price” of each Fund generally is determined using the midpoint between the highest bid and the lowest offer on the primary stock exchange on which the shares of such Fund are listed for trading, as of the time that the Fund’s NAV is calculated. Each Fund’s Market Price may be at, above or below its NAV. The NAV of each Fund will fluctuate with changes in the fair value of its portfolio holdings. The Market Price of each Fund will fluctuate in accordance with changes in its NAV, as well as market supply and demand.
Premiums or discounts are the differences (expressed as a percentage) between the NAV and Market Price of a Fund on a given day, generally at the time NAV is calculated. A premium is the amount that a Fund is trading above the reported NAV, expressed as a percentage of the NAV. A discount is the amount that a Fund is trading below the reported NAV, expressed as a percentage of the NAV.
The following information shows the frequency distributions of premiums and discounts for each of the Funds included in this report. The information shown for each Fund is for five calendar years (or for each full calender quarter completed after the inception date of such Fund if less than five years) through the date of the most recent calendar quarter-end. The specific periods covered for each Fund are disclosed in the table for such Fund.
| 104 | 2014 iSHARES ANNUAL REPORTTO SHAREHOLDERS |
Table of Contents
Supplemental Information (Unaudited) (Continued)
iSHARES®, INC.
Each line in the table shows the number of trading days in which the Fund traded within the premium/discount range indicated. The number of trading days in each premium/discount range is also shown as a percentage of the total number of trading days in the period covered by each table. All data presented here represents past performance, which cannot be used to predict future results.
iShares MSCI Brazil Capped ETF
Period Covered: January 1, 2009 through June 30, 2014
Premium/Discount Range | Number of Days | Percentage of Total Days | ||||||
Greater than 3.0% and Less than 3.5% | 4 | 0.29 | % | |||||
Greater than 2.5% and Less than 3.0% | 10 | 0.72 | ||||||
Greater than 2.0% and Less than 2.5% | 31 | 2.25 | ||||||
Greater than 1.5% and Less than 2.0% | 64 | 4.63 | ||||||
Greater than 1.0% and Less than 1.5% | 98 | 7.09 | ||||||
Greater than 0.5% and Less than 1.0% | 154 | 11.14 | ||||||
Between 0.5% and –0.5% | 887 | 64.19 | ||||||
Less than –0.5% and Greater than –1.0% | 103 | 7.46 | ||||||
Less than –1.0% and Greater than –1.5% | 23 | 1.66 | ||||||
Less than –1.5% and Greater than –2.0% | 5 | 0.36 | ||||||
Less than –2.0% and Greater than –2.5% | 2 | 0.14 | ||||||
Less than –2.5% | 1 | 0.07 | ||||||
|
|
|
| |||||
| 1,382 | 100.00 | % | ||||||
|
|
|
| |||||
iShares MSCI Canada ETF
Period Covered: January 1, 2009 through June 30, 2014
Premium/Discount Range | Number of Days | Percentage of Total Days | ||||||
Greater than 2.5% | 2 | 0.14 | % | |||||
Greater than 2.0% and Less than 2.5% | 2 | 0.14 | ||||||
Greater than 1.5% and Less than 2.0% | 2 | 0.14 | ||||||
Greater than 1.0% and Less than 1.5% | 14 | 1.01 | ||||||
Greater than 0.5% and Less than 1.0% | 77 | 5.58 | ||||||
Between 0.5% and –0.5% | 1,193 | 86.33 | ||||||
Less than –0.5% and Greater than –1.0% | 82 | 5.94 | ||||||
Less than –1.0% and Greater than –1.5% | 8 | 0.58 | ||||||
Less than –1.5% and Greater than –2.0% | 1 | 0.07 | ||||||
Less than –2.0% and Greater than –2.5% | 1 | 0.07 | ||||||
|
|
|
| |||||
| 1,382 | 100.00 | % | ||||||
|
|
|
| |||||
SUPPLEMENTAL INFORMATION | 105 |
Table of Contents
Supplemental Information (Unaudited) (Continued)
iSHARES®, INC.
iShares MSCI Chile Capped ETF
Period Covered: January 1, 2009 through June 30, 2014
Premium/Discount Range | Number of Days | Percentage of Total Days | ||||||
Greater than 3.0% | 4 | 0.29 | % | |||||
Greater than 2.5% and Less than 3.0% | 2 | 0.14 | ||||||
Greater than 2.0% and Less than 2.5% | 3 | 0.22 | ||||||
Greater than 1.5% and Less than 2.0% | 6 | 0.43 | ||||||
Greater than 1.0% and Less than 1.5% | 32 | 2.32 | ||||||
Greater than 0.5% and Less than 1.0% | 191 | 13.82 | ||||||
Between 0.5% and –0.5% | 873 | 63.17 | ||||||
Less than –0.5% and Greater than –1.0% | 223 | 16.14 | ||||||
Less than –1.0% and Greater than –1.5% | 28 | 2.03 | ||||||
Less than –1.5% and Greater than –2.0% | 13 | 0.94 | ||||||
Less than –2.0% and Greater than –2.5% | 5 | 0.36 | ||||||
Less than –2.5% | 2 | 0.14 | ||||||
|
|
|
| |||||
| 1,382 | 100.00 | % | ||||||
|
|
|
| |||||
iShares MSCI Colombia Capped ETF
Period Covered: July 1, 2013 through June 30, 2014
Premium/Discount Range | Number of Days | Percentage of Total Days | ||||||
Greater than 2.0% and Less than 2.5% | 2 | 0.79 | % | |||||
Greater than 1.5% and Less than 2.0% | 8 | 3.17 | ||||||
Greater than 1.0% and Less than 1.5% | 34 | 13.49 | ||||||
Greater than 0.5% and Less than 1.0% | 79 | 31.35 | ||||||
Between 0.5% and –0.5% | 125 | 49.61 | ||||||
Less than –0.5% and Greater than –1.0% | 4 | 1.59 | ||||||
|
|
|
| |||||
| 252 | 100.00 | % | ||||||
|
|
|
| |||||
| 106 | 2014 iSHARES ANNUAL REPORTTO SHAREHOLDERS |
Table of Contents
Supplemental Information (Unaudited) (Continued)
iSHARES®, INC.
iShares MSCI Israel Capped ETF
Period Covered: January 1, 2009 through June 30, 2014
Premium/Discount Range | Number of Days | Percentage of Total Days | ||||||
Greater than 3.5% | 2 | 0.14 | % | |||||
Greater than 3.0% and Less than 3.5% | 1 | 0.07 | ||||||
Greater than 2.5% and Less than 3.0% | 5 | 0.36 | ||||||
Greater than 2.0% and Less than 2.5% | 10 | 0.72 | ||||||
Greater than 1.5% and Less than 2.0% | 24 | 1.74 | ||||||
Greater than 1.0% and Less than 1.5% | 69 | 4.99 | ||||||
Greater than 0.5% and Less than 1.0% | 210 | 15.20 | ||||||
Between 0.5% and –0.5% | 732 | 52.97 | ||||||
Less than –0.5% and Greater than –1.0% | 185 | 13.39 | ||||||
Less than –1.0% and Greater than –1.5% | 75 | 5.43 | ||||||
Less than –1.5% and Greater than –2.0% | 40 | 2.90 | ||||||
Less than –2.0% and Greater than –2.5% | 11 | 0.80 | ||||||
Less than –2.5% and Greater than –3.0% | 10 | 0.72 | ||||||
Less than –3.0% and Greater than –3.5% | 4 | 0.29 | ||||||
Less than –3.5% and Greater than –4.0% | 2 | 0.14 | ||||||
Less than –4.0% | 2 | 0.14 | ||||||
|
|
|
| |||||
| 1,382 | 100.00 | % | ||||||
|
|
|
| |||||
iShares MSCI Mexico Capped ETF
Period Covered: January 1, 2009 through June 30, 2014
Premium/Discount Range | Number of Days | Percentage of Total Days | ||||||
Greater than 2.5% | 2 | 0.14 | % | |||||
Greater than 2.0% and Less than 2.5% | 3 | 0.22 | ||||||
Greater than 1.5% and Less than 2.0% | 5 | 0.36 | ||||||
Greater than 1.0% and Less than 1.5% | 27 | 1.95 | ||||||
Greater than 0.5% and Less than 1.0% | 103 | 7.46 | ||||||
Between 0.5% and –0.5% | 1,043 | 75.48 | ||||||
Less than –0.5% and Greater than –1.0% | 148 | 10.71 | ||||||
Less than –1.0% and Greater than –1.5% | 40 | 2.90 | ||||||
Less than –1.5% and Greater than –2.0% | 6 | 0.43 | ||||||
Less than –2.0% and Greater than –2.5% | 2 | 0.14 | ||||||
Less than –2.5% and Greater than –3.0% | 2 | 0.14 | ||||||
Less than –3.0% and Greater than –3.5% | 1 | 0.07 | ||||||
|
|
|
| |||||
| 1,382 | 100.00 | % | ||||||
|
|
|
| |||||
SUPPLEMENTAL INFORMATION | 107 |
Table of Contents
Supplemental Information (Unaudited) (Continued)
iSHARES®, INC.
iShares MSCI South Africa ETF
Period Covered: January 1, 2009 through June 30, 2014
Premium/Discount Range | Number of Days | Percentage of Total Days | ||||||
Greater than 4.5% | 3 | 0.22 | % | |||||
Greater than 4.0% and Less than 4.5% | 2 | 0.14 | ||||||
Greater than 3.5% and Less than 4.0% | 4 | 0.29 | ||||||
Greater than 3.0% and Less than 3.5% | 8 | 0.58 | ||||||
Greater than 2.5% and Less than 3.0% | 7 | 0.51 | ||||||
Greater than 2.0% and Less than 2.5% | 24 | 1.74 | ||||||
Greater than 1.5% and Less than 2.0% | 45 | 3.26 | ||||||
Greater than 1.0% and Less than 1.5% | 117 | 8.46 | ||||||
Greater than 0.5% and Less than 1.0% | 257 | 18.60 | ||||||
Between 0.5% and –0.5% | 588 | 42.54 | ||||||
Less than –0.5% and Greater than –1.0% | 164 | 11.86 | ||||||
Less than –1.0% and Greater than –1.5% | 66 | 4.78 | ||||||
Less than –1.5% and Greater than –2.0% | 49 | 3.55 | ||||||
Less than –2.0% and Greater than –2.5% | 29 | 2.10 | ||||||
Less than –2.5% and Greater than –3.0% | 3 | 0.22 | ||||||
Less than –3.0% and Greater than –3.5% | 10 | 0.72 | ||||||
Less than –3.5% and Greater than –4.0% | 4 | 0.29 | ||||||
Less than –4.0% | 2 | 0.14 | ||||||
|
|
|
| |||||
| 1,382 | 100.00 | % | ||||||
|
|
|
| |||||
| 108 | 2014 iSHARES ANNUAL REPORTTO SHAREHOLDERS |
Table of Contents
Supplemental Information (Unaudited) (Continued)
iSHARES®, INC.
iShares MSCI Turkey ETF
Period Covered: January 1, 2009 through June 30, 2014
Premium/Discount Range | Number of Days | Percentage of Total Days | ||||||
Greater than 4.5% | 1 | 0.07 | % | |||||
Greater than 4.0% and Less than 4.5% | 1 | 0.07 | ||||||
Greater than 3.5% and Less than 4.0% | 1 | 0.07 | ||||||
Greater than 3.0% and Less than 3.5% | 11 | 0.80 | ||||||
Greater than 2.5% and Less than 3.0% | 16 | 1.16 | ||||||
Greater than 2.0% and Less than 2.5% | 20 | 1.45 | ||||||
Greater than 1.5% and Less than 2.0% | 43 | 3.11 | ||||||
Greater than 1.0% and Less than 1.5% | 115 | 8.32 | ||||||
Greater than 0.5% and Less than 1.0% | 249 | 18.02 | ||||||
Between 0.5% and –0.5% | 602 | 43.57 | ||||||
Less than –0.5% and Greater than –1.0% | 151 | 10.93 | ||||||
Less than –1.0% and Greater than –1.5% | 86 | 6.22 | ||||||
Less than –1.5% and Greater than –2.0% | 37 | 2.68 | ||||||
Less than –2.0% and Greater than –2.5% | 23 | 1.66 | ||||||
Less than –2.5% and Greater than –3.0% | 13 | 0.94 | ||||||
Less than –3.0% and Greater than –3.5% | 5 | 0.36 | ||||||
Less than –3.5% and Greater than –4.0% | 2 | 0.14 | ||||||
Less than –4.0% and Greater than –4.5% | 4 | 0.29 | ||||||
Less than –4.5% and Greater than –5.0% | 1 | 0.07 | ||||||
Less than –5.0% | 1 | 0.07 | ||||||
|
|
|
| |||||
| 1,382 | 100.00 | % | ||||||
|
|
|
| |||||
iShares MSCI USA ETF
Period Covered: July 1, 2010 through June 30, 2014
Premium/Discount Range | Number of Days | Percentage of Total Days | ||||||
Greater than 1.5% | 1 | 0.10 | % | |||||
Greater than 1.0% and Less than 1.5% | 3 | 0.30 | ||||||
Greater than 0.5% and Less than 1.0% | 7 | 0.70 | ||||||
Between 0.5% and –0.5% | 983 | 97.71 | ||||||
Less than –0.5% and Greater than –1.0% | 12 | 1.19 | ||||||
|
|
|
| |||||
| 1,006 | 100.00 | % | ||||||
|
|
|
| |||||
Regulation under the Alternative Investment Fund Managers Directive
The Alternative Investment Fund Managers Directive (the “Directive”) imposes detailed and prescriptive obligations on fund managers established in the European Union (the “EU”). These do not currently apply to managers established outside the EU, such as BFA. Rather, non-EU managers are only required to comply with certain disclosure, reporting and transparency obligations of the Directive if such managers market a fund to EU investors.
SUPPLEMENTAL INFORMATION | 109 |
Table of Contents
Supplemental Information (Unaudited) (Continued)
iSHARES®, INC.
BFA has registered the iShares MSCI Brazil Capped ETF, iShares MSCI Canada ETF, iShares MSCI Mexico Capped ETF, and iShares MSCI USA ETF (each a “Fund”, collectively the “Funds”) for marketing to EU investors in the United Kingdom, the Netherlands, Finland, Sweden and Luxembourg.
Report on Remuneration
BFA is required under the Directive to make quantitative disclosures of remuneration. These disclosures are made in line with BlackRock’s interpretation of currently available regulatory guidance on quantitative remuneration disclosures. As market or regulatory practice develops BlackRock may consider it appropriate to make changes to the way in which quantitative remuneration disclosures are calculated. Where such changes are made, this may result in disclosures in relation to a fund not being comparable to the disclosures made in the prior year, or in relation to other BlackRock fund disclosures in that same year.
Disclosures are provided in relation to both (a) the staff of BFA; and (b) staff who are senior management or who have the ability to materially affect the risk profile of the Funds.
All individuals included in the aggregated figures disclosed are rewarded in line with BlackRock’s remuneration policy for their responsibilities across the relevant BlackRock business area. As all individuals have a number of areas of responsibilities, only the portion of remuneration for those individuals’ services attributable to each Fund is included in the aggregate figures disclosed.
BlackRock has a clear and well defined pay-for-performance philosophy, and compensation programs which support that philosophy. For senior management, a significant percentage of variable remuneration is deferred over time. All employees are subject to a claw-back policy.
Compensation decisions for employees are made based on full-year financial results and other non-financial goals and objectives. Alongside financial performance, individual compensation is also based on strategic and operating results and other considerations such as management and leadership capabilities. No set formulas are established and no fixed benchmarks are used in determining annual incentive awards. Bonus pools are reviewed by BlackRock’s independent compensation committee, taking into account both actual and projected financial information together with information provided by the Operational Risk and Regulatory Compliance departments in relation to any activities, incidents or events that warrant consideration in making compensation decisions.
Functions such as Finance, Operational Risk, Legal & Compliance, and Human Resources each have their own organizational structures which are independent of the business units. Functional bonus pools are determined with reference to the performance of each individual function and the remuneration of the senior members of control functions is directly overseen by BlackRock’s independent compensation committee. No individual is involved in setting his or her own remuneration.
The figures disclosed are a sum of each individual’s portion of remuneration attributable to each Fund according to an objective apportionment methodology. Accordingly the figures are not representative of any individual’s actual remuneration or their remuneration structure.
The amount of the total remuneration awarded by BFA to its staff which has been attributed to the iShares MSCI Brazil Capped ETF in respect of BFA’s financial year ending December 31, 2013 was USD 925,434. This figure is comprised of fixed remuneration of USD 363,876 and variable remuneration of USD 561,558. There were a total of 436 beneficiaries of the remuneration described above.
The amount of the aggregate remuneration awarded by BFA to its senior management and members of its staff whose actions have a material impact on the risk profile of the iShares MSCI Brazil Capped ETF which has been attributed to the Fund in respect of BFA’s financial year ending December 31, 2013 was USD 148,678.
| 110 | 2014 iSHARES ANNUAL REPORTTO SHAREHOLDERS |
Table of Contents
Supplemental Information (Unaudited) (Continued)
iSHARES®, INC.
The amount of the total remuneration awarded by BFA to its staff which has been attributed to the iShares MSCI Canada ETF in respect of BFA’s financial year ending December 31, 2013 was USD 689,165. This figure is comprised of fixed remuneration of USD 270,977 and variable remuneration of USD 418,188. There were a total of 436 beneficiaries of the remuneration described above.
The amount of the aggregate remuneration awarded by BFA to its senior management and members of its staff whose actions have a material impact on the risk profile of the iShares MSCI Canada ETF which has been attributed to the Fund in respect of BFA’s financial year ending December 31, 2013 was USD 110,720.
The amount of the total remuneration awarded by BFA to its staff which has been attributed to the iShares MSCI Mexico Capped ETF in respect of BFA’s financial year ending December 31, 2013 was USD 565,663. This figure is comprised of fixed remuneration of USD 222,416 and variable remuneration of USD 343,247. There were a total of 436 beneficiaries of the remuneration described above.
The amount of the aggregate remuneration awarded by BFA to its senior management and members of its staff whose actions have a material impact on the risk profile of the iShares MSCI Mexico Capped ETF which has been attributed to the Fund in respect of BFA’s financial year ending December 31, 2013 was USD 90,878.
The amount of the total remuneration awarded by BFA to its staff which has been attributed to the iShares MSCI USA ETF in respect of BFA’s financial year ending December 31, 2013 was USD 14,049. This figure is comprised of fixed remuneration of USD 5,524 and variable remuneration of USD 8,525. There were a total of 436 beneficiaries of the remuneration described above.
The amount of the aggregate remuneration awarded by BFA to its senior management and members of its staff whose actions have a material impact on the risk profile of the iShares MSCI USA ETF which has been attributed to the Fund in respect of BFA’s financial year ending December 31, 2013 was USD 2,257.
SUPPLEMENTAL INFORMATION | 111 |
Table of Contents
Director and Officer Information
iSHARES®, INC.
The Board of Directors has responsibility for the overall management and operations of the Company, including general supervision of the duties performed by BFA and other service providers. Each Director serves until he or she resigns, is removed, dies, retires or becomes incapacitated. The President, Chief Compliance Officer, Treasurer and Secretary shall each hold office until their successors are chosen and qualify, and all other officers shall hold office until he or she resigns or is removed. Directors who are not “interested persons” (as defined in the 1940 Act) of the Company are referred to as independent directors (“Independent Directors”).
The registered investment companies advised by BFA or its affiliates are organized into one complex of closed-end funds, two complexes of open-end funds and one complex of exchange-traded funds (“Exchange-Traded Fund Complex”) (each, a “BlackRock Fund Complex”). Each Fund is included in the BlackRock Fund Complex referred to as the Exchange-Traded Fund Complex. Each Director also serves as a Trustee of iShares Trust, a Director of iShares MSCI Russia Capped ETF, Inc. and a Trustee of iShares U.S. ETF Trust and, as a result, oversees a total of 312 funds (as of August 31, 2014) within the Exchange-Traded Fund Complex. With the exception of Robert S. Kapito and Mark Wiedman, the address of each Director and officer is c/o BlackRock, Inc., 400 Howard Street, San Francisco, CA 94105. The address of Mr. Kapito and Mr. Wiedman is c/o BlackRock, Inc., Park Avenue Plaza, 55 East 52nd Street, New York, NY 10055. The Board has designated Robert H. Silver as its Independent Chairman. Additional information about the Funds’ Directors and officers may be found in the Funds’ combined Statement of Additional Information, which is available without charge, upon request, by calling toll-free 1-800-iShares (1-800-474-2737).
Interested Directors
| Name (Age) | Position(s) | Principal Occupation(s) During the Past 5 Years | Other Directorships Held by Director | |||
Robert S. Kapitoa (57) | Director (since 2009). | President and Director, BlackRock, Inc. (since 2006); Vice Chairman of BlackRock, Inc. and Head of BlackRock, Inc.’s Portfolio Management Group (since its formation in 1998) and BlackRock, Inc.’s predecessor entities (since 1988); Trustee, University of Pennsylvania (since 2009); President of Board of Directors, Hope & Heroes Children’s Cancer Fund (since 2002); President of the Board of Directors, Periwinkle Theatre for Youth (since 1983). | Trustee of iShares Trust (since 2009); Director of iShares MSCI Russia Capped ETF, Inc. (since 2010); Trustee of iShares U.S. ETF Trust (since 2011); Director of BlackRock, Inc. (since 2006). | |||
Mark Wiedmanb (43) | Director (since 2013). | Managing Director, BlackRock, Inc. (since 2007); Global Head of iShares (since 2011); Head of Corporate Strategy, BlackRock, Inc. (2009-2011). | Trustee of iShares Trust. (since 2013); Director of iShares MSCI Russia Capped ETF, Inc. (since 2013); Trustee of iShares U.S. ETF Trust (since 2013); Director of PennyMac Financial Services, Inc. (since 2008). | |||
| a | Robert S. Kapito is deemed to be an “interested person” (as defined in the 1940 Act) of the Company due to his affiliations with BlackRock, Inc. |
| b | Mark Wiedman is deemed to be an “interested person” (as defined in the 1940 Act) of the Company due to his affiliations with BlackRock, Inc. and its affiliates. |
| 112 | 2014 iSHARES ANNUAL REPORTTO SHAREHOLDERS |
Table of Contents
Director and Officer Information (Continued)
iSHARES®, INC.
Independent Directors
| Name (Age) | Position(s) | Principal Occupation(s) During the Past 5 Years | Other Directorships Held by Director | |||
Robert H. Silver (59) | Director (since 2007); Independent Chairman (since 2012). | President and Co-Founder of The Bravitas Group, Inc. (since 2006); Director and Vice Chairman of the YMCA of Greater NYC (2001-2011); Broadway Producer (2006-2011); Co-Founder and Vice President of Parentgiving Inc. (since 2008); Director and Member of the Audit and Compensation Committee of EPAM Systems, Inc. (2006-2009); President and Chief Operating Officer of UBS Financial Services Inc. (formerly Paine Webber Inc.) (2003-2005) and various executive positions with UBS and its affiliates (1988-2005); CPA and Audit Manager of KPMG, LLP (formerly Peat Marwick Mitchell) (1977-1983). | Trustee of iShares Trust (since 2007); Director of iShares MSCI Russia Capped ETF, Inc. (since 2010); Trustee of iShares U.S. ETF Trust (since 2011); Independent Chairman of iShares, Trust, iShares MSCI Russia Capped ETF, Inc. and iShares U.S. ETF Trust (since 2012). | |||
Cecilia H. Herbert (65) | Director (since 2005); Nominating and Governance Committee Chair and Equity Plus Committee Chair (since 2012). | Director (1998-2013) and President (2007-2011) of the Board of Directors, Catholic Charities CYO; Trustee (2002-2011) and Chair of the Finance and Investment Committee (2006-2010) of the Thacher School; Member (since 1992) and Chair (1994-2005) of the Investment Committee, Archdiocese of San Francisco; Trustee and Member of the Investment Committee, WNET, the New York public broadcasting/media company (since 2011). | Trustee of iShares Trust (since 2005); Director of iShares MSCI Russia Capped ETF, Inc. (since 2010); Trustee of iShares U.S. ETF Trust (since 2011); Director of Forward Funds (34 portfolios) (since 2009). | |||
Charles A. Hurty (70) | Director (since 2005); Audit Committee Chair (since 2006). | Retired; Partner, KPMG LLP (1968-2001). | Trustee of iShares Trust (since 2005); Director of iShares MSCI Russia Capped ETF, Inc. (since 2010); Trustee of iShares U.S. ETF Trust (since 2011); Director of GMAM Absolute Return Strategy Fund (1 portfolio) (since 2002); Director of SkyBridge Alternative Investments Multi-Adviser Hedge Fund Portfolios LLC (2 portfolios) (since 2002). | |||
John E. Kerrigan (59) | Director (since 2005); Fixed Income Plus Committee Chair (since 2012). | Chief Investment Officer, Santa Clara University (since 2002). | Trustee of iShares Trust (since 2005); Director of iShares MSCI Russia Capped ETF, Inc. (since 2010); Trustee of iShares U.S. ETF Trust (since 2011). | |||
DIRECTORAND OFFICER INFORMATION | 113 |
Table of Contents
Director and Officer Information (Continued)
iSHARES®, INC.
Independent Directors (Continued)
| Name (Age) | Position(s) | Principal Occupation(s) During the Past 5 Years | Other Directorships Held by Director | |||
John E. Martinez (53) | Director (since 2003); Securities Lending Committee Chair (since 2012). | Director of FirstREX Agreement Corp. (formerly EquityRock, Inc.) (since 2005). | Trustee of iShares Trust (since 2003); Director of iShares MSCI Russia Capped ETF, Inc. (since 2010); Trustee of iShares U.S. ETF Trust (since 2011). | |||
George G.C. Parker (75) | Director (since 2002). | Dean Witter Distinguished Professor of Finance, Emeritus, Stanford University Graduate School of Business (Professor since 1973; Emeritus since 2006). | Trustee of iShares Trust (since 2000); Director of iShares MSCI Russia Capped ETF, Inc. (since 2010); Trustee of iShares U.S. ETF Trust (since 2011); Director of Tejon Ranch Company (since 1999); Director of Threshold Pharmaceuticals (since 2004); Director of Colony Financial, Inc. (since 2009); Director of First Republic Bank (since 2010). | |||
Madhav V. Rajan (50) | Director (since 2011); 15(c) Committee Chair (since 2012). | Robert K. Jaedicke Professor of Accounting and Senior Associate Dean for Academic Affairs and Head of MBA Program, Stanford University Graduate School of Business (since 2001); Professor of Law (by courtesy), Stanford Law School (since 2005); Visiting Professor, University of Chicago (2007-2008). | Trustee of iShares Trust (since 2011); Director of iShares MSCI Russia Capped ETF, Inc. (since 2011); Trustee of iShares U.S. ETF Trust (since 2011); Director, Cavium, Inc. (since 2013). | |||
| 114 | 2014 iSHARES ANNUAL REPORTTO SHAREHOLDERS |
Table of Contents
Director and Officer Information (Continued)
iSHARES®, INC.
Officers
| Name (Age) | Position(s) | Principal Occupation(s) During the Past 5 Years | ||
Manish Mehta (43) | President (since 2013). | Managing Director, BlackRock, Inc. (since 2009); Chief Operating Officer for iShares (since 2009); Head of Strategy and Corporate Development, BGI (2005-2009); Chief of Staff to the CEO, BGI (2005-2009). | ||
Jack Gee (54) | Treasurer and Chief Financial Officer (since 2008). | Managing Director, BlackRock, Inc. (since 2009); Senior Director of Fund Administration of Intermediary Investor Business, BGI (2009); Director of Fund Administration of Intermediary Investor Business, BGI (2004-2009). | ||
Edward B. Baer (45) | Vice President and Chief Legal Officer (since 2012). | Managing Director of Legal & Compliance, BlackRock, Inc. (since 2006); Director of Legal & Compliance, BlackRock, Inc. (2004-2006). | ||
Eilleen M. Clavere (62) | Secretary (since 2007). | Director of Global Fund Administration, BlackRock, Inc. (since 2009); Director of Legal Administration of Intermediary Investor Business, BGI (2006-2009); Legal Counsel and Vice President of Atlas Funds, Atlas Advisers, Inc. and Atlas Securities, Inc. (2005-2006); Counsel at Kirkpatrick & Lockhart LLP (2001-2005). | ||
Scott Radell (45) | Executive Vice President (since 2012). | Managing Director, BlackRock, Inc. (since 2009); Head of Portfolio Solutions, BlackRock, Inc. (since 2009); Head of Portfolio Solutions, BGI (2007-2009); Credit Portfolio Manager, BGI (2005-2007); Credit Research Analyst, BGI (2003-2005). | ||
Amy Schioldager (51) | Executive Vice President (since 2007). | Senior Managing Director, BlackRock, Inc. (since 2009); Global Head of Index Equity, BGI (2008-2009); Global Head of U.S. Indexing, BGI (2006-2008); Head of Domestic Equity Portfolio Management, BGI (2001-2006). | ||
Ira P. Shapiro (51) | Vice President (since 2007). | Managing Director, BlackRock, Inc. (since 2009); Head of Strategic Product Initiatives for iShares (since 2012); Chief Legal Officer, Exchange-Traded Fund Complex (2007-2012); Associate General Counsel, BGI (2004-2009). | ||
DIRECTORAND OFFICER INFORMATION | 115 |
Table of Contents
Notes:
| 116 | 2014 iSHARES ANNUAL REPORTTO SHAREHOLDERS |
Table of Contents
Notes:
NOTES | 117 |
Table of Contents
Notes:
| 118 | 2014 iSHARES ANNUAL REPORTTO SHAREHOLDERS |
Table of Contents
|
For more information visit www.iShares.com or call 1-800-474-2737
This report is intended for the Funds’ shareholders. It may not be distributed to prospective investors unless it is preceded or accompanied by the current prospectus.
Investing involves risk, including possible loss of principal.
The iShares Funds are distributed by BlackRock Investments, LLC (together with its affiliates, “BlackRock”).
The iShares Funds are not sponsored, endorsed, issued, sold or promoted by MSCI Inc., nor does this company make any representation regarding the advisability of investing in the iShares Funds. BlackRock is not affiliated with the company listed above.
A description of the policies that the Funds use to determine how to vote proxies relating to portfolio securities and information about how the Funds voted proxies relating to portfolio securities during the most recent twelve-month period ending June 30 is available without charge, upon request, by calling toll-free 1-800-474-2737; on the Funds’ website at www.iShares.com; and on the U.S. Securities and Exchange Commission (SEC) website at www.sec.gov.
The Funds file their complete schedules of portfolio holdings with the SEC for the first and third quarters of each fiscal year on Form N-Q. The Funds’ Forms N-Q are available on the SEC’s website or may be reviewed and copied at the SEC’s Public Reference Room in Washington, D.C. Information on the operation of the Public Reference Room may be obtained by calling 1-800-SEC-0330. The Funds also disclose their complete schedules of portfolio holdings on a daily and monthly basis on the Funds’ website.
©2014 BlackRock, Inc. All rights reserved. iSHARES and BLACKROCK are registered trademarks of BlackRock, Inc. or its subsidiaries. All other marks are the property of their respective owners.

iS-AR-84-0814
Table of Contents
AUGUST 31, 2014
2014 ANNUAL REPORT |  |
iShares, Inc.
| Ø | iShares MSCI BRIC ETF | BKF | NYSE Arca |
| Ø | iShares MSCI Emerging Markets Asia ETF | EEMA | NASDAQ |
| Ø | iShares MSCI Emerging Markets Consumer Discretionary ETF | EMDI | NASDAQ |
| Ø | iShares MSCI Emerging Markets Energy Capped ETF | EMEY | NASDAQ |
| Ø | iShares MSCI Emerging Markets Growth ETF | EGRW | NASDAQ |
| Ø | iShares MSCI Emerging Markets Minimum Volatility ETF | EEMV | NYSE Arca |
| Ø | iShares MSCI Emerging Markets Small-Cap ETF | EEMS | NYSE Arca |
| Ø | iShares MSCI Emerging Markets Value ETF | EVAL | NASDAQ |
Table of Contents
| 5 | ||||
| 22 | ||||
| 22 | ||||
| 23 | ||||
| 23 | ||||
| 29 | ||||
| 37 | ||||
| 39 | ||||
| 41 | ||||
| 48 | ||||
| 53 | ||||
| 63 | ||||
| 70 | ||||
| 80 | ||||
| 88 | ||||
| 103 | ||||
| 104 | ||||
| 105 | ||||
| 112 | ||||
| 119 |
Table of Contents
Management’s Discussion of Fund Performance
iSHARES®, INC.
EMERGING MARKETS OVERVIEW
Stocks of companies in emerging markets gained approximately 20% for the 12-month period ended August 31, 2014 (the “reporting period”). Emerging markets stocks experienced substantial volatility in the first six months of the reporting period, rising sharply during the first two months and then falling back over the ensuing three months. However, emerging markets stocks rallied steadily during the remainder of the reporting period.
Uncertainty regarding the pace of growth in many emerging economies helped contribute to the volatility in emerging markets stocks during the first half of the reporting period. Most notably, economic growth slowed in several bellwether emerging economies, including China, Brazil, and India. In contrast, many developed countries saw their economies strengthen as their central banks maintained or expanded accommodative monetary policies. Weaker economic activity contributed to the decline in emerging markets stocks in late 2013 and early 2014.
During the last six months of the reporting period, however, stocks in emerging markets benefited from greater investor demand. This was driven partly by improving economic growth in many emerging markets as central banks in developing countries began to implement economic stimulus efforts. Furthermore, better economic conditions in developed countries led to stronger demand for exports, and many emerging economies are major exporters to developed nations. These developments helped fuel a recovery in emerging markets stocks over the last half of the reporting period.
From a regional perspective, emerging equity markets in Latin America generated the best returns, gaining 24% for the reporting period. Brazil, the largest equity market in Latin America, led the region’s advance, gaining more than 30%. Much of those gains occurred in the last three months of the reporting period amid optimism about upcoming national elections. Peru, one of the worst-performing markets in 2013, rebounded strongly in the first eight months of 2014. Chile was the only market in the region to decline for the reporting period as economic growth slowed markedly.
Emerging markets in Asia also performed well, returning 22% for the reporting period. Although nearly every market in the region posted double-digit gains, India was the best performer, rising by more than 50% for the reporting period. A meaningful increase in economic activity and stronger corporate earnings growth propelled the Indian stock market to record highs by the end of the reporting period. Other top-performing markets in the region included the Philippines and Thailand. The laggards among emerging markets in Asia included South Korea and Malaysia.
In contrast to other regions, emerging markets stocks in Eastern Europe declined for the reporting period, falling by approximately 3%. Hungary was the weakest-performing market in the region, declining by more than 17% amid continued economic weakness and armed conflict between Russia and Ukraine, which shares a border with Hungary. Russia’s stock market, the largest in the region, also declined in response to these events. On the positive side, equity markets in Greece and the Czech Republic posted double-digit gains as the economies in both countries began to recover after an extended period of weakness.
MANAGEMENT’S DISCUSSIONSOF FUND PERFORMANCE | 5 |
Table of Contents
Management’s Discussion of Fund Performance
iSHARES® MSCI BRIC ETF
Performance as of August 31, 2014
| Average Annual Total Returns | Cumulative Total Returns | |||||||||||||||||||||||||
| NAV | MARKET | INDEX | NAV | MARKET | INDEX | |||||||||||||||||||||
1 Year | 21.73% | 22.74% | 22.80% | 21.73% | 22.74% | 22.80% | ||||||||||||||||||||
5 Years | 3.97% | 4.10% | 4.90% | 21.51% | 22.24% | 26.99% | ||||||||||||||||||||
Since Inception | (2.75)% | (2.74)% | (2.30)% | (17.25)% | (17.23)% | (14.66)% | ||||||||||||||||||||
GROWTH OF $10,000 INVESTMENT
(SINCE INCEPTION AT NET ASSET VALUE)
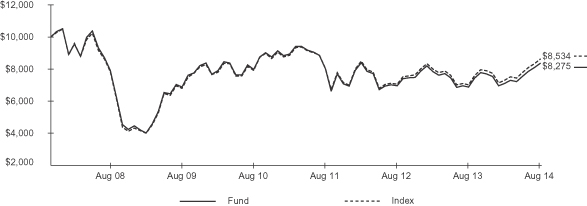
The inception date of the Fund was 11/12/07. The first day of secondary market trading was 11/16/07.
Past performance is no guarantee of future results. Performance results do not reflect the deduction of taxes that a shareholder would pay on fund distributions or on the redemption or sale of fund shares. See “About Fund Performance” on page 22 for more information.
| Shareholder Expenses | ||||||||||||||||||||||||||
| Actual | Hypothetical 5% Return | |||||||||||||||||||||||||
| Beginning Account Value (3/1/14) | Ending Account Value (8/31/14) | Expenses Paid During Period a | Beginning Account Value (3/1/14) | Ending Account Value (8/31/14) | Expenses Paid During Period a | Annualized Expense Ratio | ||||||||||||||||||||
| $ | 1,000.00 | $ | 1,177.00 | $ | 3.73 | $ | 1,000.00 | $ | 1,021.80 | $ | 3.47 | 0.68% | ||||||||||||||
| a | Expenses are calculated using the Fund’s annualized expense ratio (as disclosed in the table), multiplied by the average account value for the period, multiplied by the number of days in the period (184 days) and divided by the number of days in the year (365 days). See “Shareholder Expenses” on page 22 for more information. |
| 6 | 2014 iSHARES ANNUAL REPORTTO SHAREHOLDERS |
Table of Contents
Management’s Discussion of Fund Performance (Continued)
iSHARES® MSCI BRIC ETF
The iShares MSCI BRIC ETF (the “Fund”) seeks to track the investment of an index composed of Chinese equities that are available to international investors, and Brazilian, Russian, and Indian equities, as represented by the MSCI BRIC Index (the “Index”). The Fund invests in a representative sample of securities included in the Index that collectively has an investment profile similar to the Index. Due to the use of representative sampling, the Fund may or may not hold all of the securities that are included in the Index. For the 12-month reporting period ended August 31, 2014, the total return for the Fund was 21.73%, net of fees, while the total return for the Index was 22.80%.
As represented by the Index, stocks in Brazil, Russia, India, and China advanced by approximately 23% for the reporting period, outpacing the gain of the broad emerging markets. Three of the four countries in the Index posted positive returns for the reporting period, led by India, which gained more than 50%. The Indian stock market finished the reporting period at an all-time high helped by strong economic growth and improved corporate earnings.
Brazil returned more than 30% for the reporting period, while China, the largest country weighting in the Index, gained 17%. Much of the advance in both markets occurred over the last few months of the reporting period as the Chinese equity market benefited from signs of improvement in the domestic economy and Brazilian stocks rallied amid optimism about upcoming national elections.
The only country in the Index to decline was Russia, which fell by 6% for the reporting period. Persistent weakness in the Russian economy and an armed conflict in neighboring Ukraine weighed on the country’s stock market.
Currency fluctuations relative to the U.S. dollar had a modestly positive impact on Index performance for the reporting period. A weaker U.S. dollar increases international equity returns for U.S. investors. The U.S. dollar was largely unchanged against the Chinese yuan, but it declined by 6% versus the Brazilian real and 8% against the Indian rupee for the reporting period. In contrast, the U.S. dollar appreciated by 11% versus the Russian ruble.
PORTFOLIO ALLOCATION As of 8/31/14
| Sector | Percentage of Total Investments* | |||
Financials | 29.93 | % | ||
Energy | 19.41 | |||
Information Technology | 10.41 | |||
Consumer Staples | 8.90 | |||
Telecommunication Services | 7.58 | |||
Materials | 7.13 | |||
Consumer Discretionary | 5.14 | |||
Industrials | 5.10 | |||
Utilities | 3.86 | |||
Health Care | 2.54 | |||
|
| |||
TOTAL | 100.00 | % | ||
|
| |||
COUNTRY ALLOCATION As of 8/31/14
| Country | Percentage of Total Investments* | |||
China | 45.32 | % | ||
Brazil | 28.05 | |||
India | 15.85 | |||
Russia | 10.78 | |||
|
| |||
TOTAL | 100.00 | % | ||
|
| |||
| * | Excludes money market funds. |
MANAGEMENT’S DISCUSSIONSOF FUND PERFORMANCE | 7 |
Table of Contents
Management’s Discussion of Fund Performance
iSHARES® MSCI EMERGING MARKETS ASIA ETF
Performance as of August 31, 2014
| Average Annual Total Returns | Cumulative Total Returns | |||||||||||||||||||||||||
| NAV | MARKET | INDEX | NAV | MARKET | INDEX | |||||||||||||||||||||
1 Year | 21.54% | 23.10% | 21.79% | 21.54% | 23.10% | 21.79% | ||||||||||||||||||||
Since Inception | 7.02% | 7.11% | 7.40% | 18.99% | 19.25% | 20.07% | ||||||||||||||||||||
GROWTH OF $10,000 INVESTMENT
(SINCE INCEPTION AT NET ASSET VALUE)
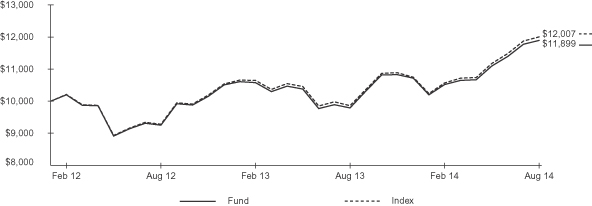
The inception date of the Fund was 2/8/12. The first day of secondary market trading was 2/9/12.
Past performance is no guarantee of future results. Performance results do not reflect the deduction of taxes that a shareholder would pay on fund distributions or on the redemption or sale of fund shares. See “About Fund Performance” on page 22 for more information.
| Shareholder Expenses | ||||||||||||||||||||||||||
| Actual | Hypothetical 5% Return | |||||||||||||||||||||||||
| Beginning Account Value (3/1/14) | Ending Account Value (8/31/14) | Expenses Paid During Period a | Beginning Account Value (3/1/14) | Ending Account Value (8/31/14) | Expenses Paid During Period a | Annualized Expense Ratio | ||||||||||||||||||||
| $ | 1,000.00 | $ | 1,131.10 | $ | 2.63 | $ | 1,000.00 | $ | 1,022.70 | $ | 2.50 | 0.49% | ||||||||||||||
| a | Expenses are calculated using the Fund’s annualized expense ratio (as disclosed in the table), multiplied by the average account value for the period, multiplied by the number of days in the period (184 days) and divided by the number of days in the year (365 days). See “Shareholder Expenses” on page 22 for more information. |
| 8 | 2014 iSHARES ANNUAL REPORTTO SHAREHOLDERS |
Table of Contents
Management’s Discussion of Fund Performance (Continued)
iSHARES® MSCI EMERGING MARKETS ASIA ETF
The iShares MSCI Emerging Markets Asia ETF (the “Fund”) seeks to track the investment results of an index composed of Asian emerging market equities, as represented by the MSCI Emerging Markets Asia Index (the “Index”). The Fund invests in a representative sample of securities included in the Index that collectively has an investment profile similar to the Index. Due to the use of representative sampling, the Fund may or may not hold all of the securities that are included in the Index. For the 12-month reporting period ended August 31, 2014, the total return for the Fund was 21.54%, net of fees, while the total return for the Index was 21.79%.
As represented by the Index, emerging markets in Asia gained nearly 22% for the reporting period, outperforming the gain of the broad emerging markets. All of the countries represented in the Index generated positive returns for the reporting period, led by India (the fourth-largest country weighting in the Index during the reporting period), which gained more than 50%. The Indian stock market finished the reporting period at an all-time high helped by strong economic growth and improved corporate earnings.
Other top-performing markets within the Index included Taiwan (the third-largest country weighting in the Index), the Philippines, and Thailand, each of which gained more than 22% for the reporting period. China and South Korea, the two largest country weightings in the Index, were among the weakest-performing markets, though each gained approximately 17% for the reporting period.
Currency fluctuations relative to the U.S. dollar had a positive impact on Index performance for the reporting period. A weaker U.S. dollar increases international equity returns for U.S. investors. The U.S. dollar was largely unchanged against the Chinese yuan and Taiwan dollar, but it declined by approximately 8% versus both the Indian rupee and the South Korean won for the reporting period, as well as 4% against the Malaysian ringgit.
PORTFOLIO ALLOCATION
As of 8/31/14
| Sector | Percentage of Total Investments* |
Information Technology | 25.93 | % | ||
Financials | 25.26 | |||
Consumer Discretionary | 9.26 | |||
Industrials | 7.45 | |||
Energy | 7.36 | |||
Telecommunication Services | 6.88 | |||
Materials | 6.50 | |||
Consumer Staples | 6.16 | |||
Utilities | 3.16 | |||
Health Care | 2.04 | |||
|
| |||
TOTAL | 100.00 | % | ||
|
|
COUNTRY ALLOCATION
As of 8/31/14
| Country | Percentage of Total Investments* |
China | 30.51 | % | ||
South Korea | 24.21 | |||
Taiwan | 19.06 | |||
India | 10.65 | |||
Malaysia | 6.09 | |||
Indonesia | 4.06 | |||
Thailand | 3.63 | |||
Philippines | 1.79 | |||
|
| |||
TOTAL | 100.00 | % | ||
|
|
| * | Excludes money market funds. |
MANAGEMENT’S DISCUSSIONSOF FUND PERFORMANCE | 9 |
Table of Contents
Management’s Discussion of Fund Performance
iSHARES® MSCI EMERGING MARKETS CONSUMER DISCRETIONARY ETF
Performance as of August 31, 2014
| Average Annual Total Returns | Cumulative Total Returns | |||||||||||||||||||||||||
| NAV | MARKET | INDEX | NAV | MARKET | INDEX | |||||||||||||||||||||
1 Year | 23.16% | 24.80% | 24.04% | 23.16% | 24.80% | 24.04% | ||||||||||||||||||||
Since Inception | 7.95% | 8.30% | 8.78% | 21.66% | 22.66% | 24.05% | ||||||||||||||||||||
GROWTH OF $10,000 INVESTMENT
(SINCE INCEPTION AT NET ASSET VALUE)
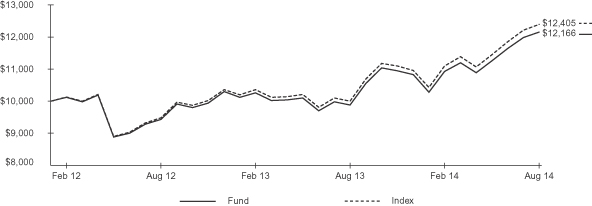
The inception date of the Fund was 2/8/12. The first day of secondary market trading was 2/9/12.
Past performance is no guarantee of future results. Performance results do not reflect the deduction of taxes that a shareholder would pay on fund distributions or on the redemption or sale of fund shares. See “About Fund Performance” on page 22 for more information.
| Shareholder Expenses | ||||||||||||||||||||||||||
| Actual | Hypothetical 5% Return | |||||||||||||||||||||||||
| Beginning Account Value (3/1/14) | Ending Account Value (8/31/14) | Expenses Paid During Period a | Beginning Account Value (3/1/14) | Ending Account Value (8/31/14) | Expenses Paid During Period a | Annualized Expense Ratio | ||||||||||||||||||||
| $ | 1,000.00 | $ | 1,113.00 | $ | 3.62 | $ | 1,000.00 | $ | 1,021.80 | $ | 3.47 | 0.68% | ||||||||||||||
| a | Expenses are calculated using the Fund’s annualized expense ratio (as disclosed in the table), multiplied by the average account value for the period, multiplied by the number of days in the period (184 days) and divided by the number of days in the year (365 days). See “Shareholder Expenses” on page 22 for more information. |
| 10 | 2014 iSHARES ANNUAL REPORTTO SHAREHOLDERS |
Table of Contents
Management’s Discussion of Fund Performance (Continued)
iSHARES® MSCI EMERGING MARKETS CONSUMER DISCRETIONARY ETF
The iShares MSCI Emerging Markets Consumer Discretionary ETF (the “Fund”) seeks to track the investment results of an index composed of emerging market equities in the consumer discretionary sector, as represented by the MSCI Emerging Markets Consumer Discretionary Index (the “Index”). The Fund invests in a representative sample of securities included in the Index that collectively has an investment profile similar to the Index. Due to the use of representative sampling, the Fund may or may not hold all of the securities that are included in the Index. For the 12-month reporting period ended August 31, 2014, the total return for the Fund was 23.16%, net of fees, while the total return for the Index was 24.04%.
As represented by the Index, consumer discretionary stocks in emerging market countries gained approximately 24% for the reporting period, outperforming the gain of the broad emerging markets. Emerging economies are driven primarily by exports to developed countries, but many emerging markets are also seeing a domestic consumption increase due to greater consumer spending from a rapidly growing middle class. This trend aided consumer discretionary stocks in emerging markets during the reporting period.
All but one of the 15 countries represented in the Index generated positive returns for the reporting period, led by India, Brazil, and Mexico, which produced gains of 72%, 48%, and 44%, respectively. South Africa, the second-largest country weighting in the Index during the period, also gained more than 40% for the reporting period.
The only country to decline within the Index was Chile, which fell sharply during the reporting period. Weaker economic growth, including a meaningful drop in consumer spending, contributed to the large decline in Chilean consumer discretionary stocks.
Currency fluctuations relative to the U.S. dollar had a positive impact on Index performance for the reporting period. A weaker U.S. dollar increases international equity returns for U.S. investors. Although the U.S. dollar appreciated by 4% against the South African rand for the reporting period, it declined by 6% versus the Brazilian real and 8% against both the Indian rupee and the South Korean won.
PORTFOLIO ALLOCATION
As of 8/31/14
| Sector | Percentage of Total Investments* |
Automobiles & Components | 40.00 | % | ||
Media | 20.52 | |||
Retailing | 17.69 | |||
Consumer Durables & Apparel | 11.02 | |||
Consumer Services | 10.77 | |||
|
| |||
TOTAL | 100.00 | % | ||
|
|
TEN LARGEST COUNTRY ALLOCATIONS
As of 8/31/14
| Country | Percentage of Total Investments* |
South Korea | 30.80 | % | ||
South Africa | 20.08 | |||
China | 11.15 | |||
Brazil | 7.11 | |||
Mexico | 5.42 | |||
Indonesia | 4.99 | |||
Taiwan | 4.90 | |||
India | 4.90 | |||
Malaysia | 3.86 | |||
Chile | 1.86 | |||
|
| |||
TOTAL | 95.07 | % | ||
|
|
| * | Excludes money market funds. |
MANAGEMENT’S DISCUSSIONSOF FUND PERFORMANCE | 11 |
Table of Contents
Management’s Discussion of Fund Performance
iSHARES® MSCI EMERGING MARKETS ENERGY CAPPED ETF
Performance as of August 31, 2014
| Average Annual Total Returns | Cumulative Total Returns | |||||||||||||||||||||||||
| NAV | MARKET | INDEX | NAV | MARKET | INDEX | |||||||||||||||||||||
1 Year | 11.65% | 12.42% | 12.19% | 11.65% | 12.42% | 12.19% | ||||||||||||||||||||
Since Inception | (7.14)% | (7.24)% | (6.59)% | (17.29)% | (17.52)% | (16.02)% | ||||||||||||||||||||
GROWTH OF $10,000 INVESTMENT
(SINCE INCEPTION AT NET ASSET VALUE)
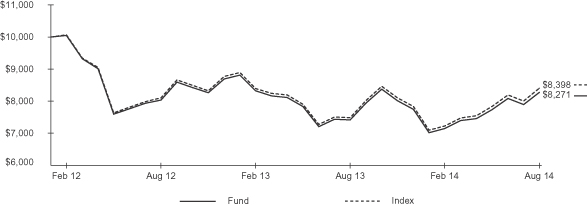
The inception date of the Fund was 2/8/12. The first day of secondary market trading was 2/9/12.
Past performance is no guarantee of future results. Performance results do not reflect the deduction of taxes that a shareholder would pay on fund distributions or on the redemption or sale of fund shares. See “About Fund Performance” on page 22 for more information.
| Shareholder Expenses | ||||||||||||||||||||||||||
| Actual | Hypothetical 5% Return | |||||||||||||||||||||||||
| Beginning Account Value (3/1/14) | Ending Account Value (8/31/14) | Expenses Paid During Period a | Beginning Account Value (3/1/14) | Ending Account Value (8/31/14) | Expenses Paid During Period a | Annualized Expense Ratio | ||||||||||||||||||||
| $ | 1,000.00 | $ | 1,157.80 | $ | 3.70 | $ | 1,000.00 | $ | 1,021.80 | $ | 3.47 | 0.68% | ||||||||||||||
| a | Expenses are calculated using the Fund’s annualized expense ratio (as disclosed in the table), multiplied by the average account value for the period, multiplied by the number of days in the period (184 days) and divided by the number of days in the year (365 days). See “Shareholder Expenses” on page 22 for more information. |
| 12 | 2014 iSHARES ANNUAL REPORTTO SHAREHOLDERS |
Table of Contents
Management’s Discussion of Fund Performance (Continued)
iSHARES® MSCI EMERGING MARKETS ENERGY CAPPED ETF
The iShares MSCI Emerging Markets Energy Capped ETF (the “Fund”) seeks to track the investment results of an index composed of emerging market equities in the energy sector, as represented by the MSCI Emerging Markets Energy 25/50 Index (the “Index”). The Fund invests in a representative sample of securities included in the Index that collectively has an investment profile similar to the Index. Due to the use of representative sampling, the Fund may or may not hold all of the securities that are included in the Index. For the 12-month reporting period ended August 31, 2014, the total return for the Fund was 11.65%, net of fees, while the total return for the Index was 12.19%.
As represented by the Index, energy stocks in emerging market countries advanced by approximately 12% for the reporting period, trailing the gain of the broad emerging markets. One factor behind the underperformance of energy stocks in emerging markets was an abundance of supply, which had a negative impact on global energy prices. Energy production increased around the globe during the reporting period, driven by a shale oil and gas boom in the United States (in particular, domestic natural gas production increased in each of the last eight months of the reporting period), increased offshore drilling in Asia and South America, and growth in alternative energy sources such as wind and solar.
Another contributing factor was reduced demand for energy exports from emerging markets. Two of the primary export centers for energy from emerging markets are the U.S. and Europe. However, increased domestic energy production curtailed demand for foreign energy in the United States, while subdued economic growth dampened energy demand in Europe. Furthermore, major energy consumers among emerging economies, including Russia and Brazil, experienced weaker economic growth during the reporting period.
Currency fluctuations relative to the U.S. dollar also weighed on Index performance. A stronger U.S. dollar lowers international equity returns for U.S. investors. The U.S. dollar appreciated by 11% against the Russian ruble, 4% against the South African rand, and 1% against the Chinese yuan for the reporting period. Together, these three countries comprised more than half of the Index as of the end of the reporting period.
PORTFOLIO ALLOCATION As of 8/31/14
| Sector | Percentage of Total Investments* |
Integrated Oil & Gas | 53.50 | % | ||
Oil & Gas Exploration & Production | 16.06 | |||
Oil & Gas Refining & Marketing | 15.57 | |||
Coal & Consumable Fuels | 8.27 | |||
Oil & Gas Storage & Transportation | 3.35 | |||
Oil & Gas Equipment & Services | 1.75 | |||
Oil & Gas Drilling | 1.50 | |||
|
| |||
TOTAL | 100.00 | % | ||
|
|
TEN LARGEST COUNTRY ALLOCATIONS As of 8/31/14
| Country | Percentage of Total Investments* |
Russia | 23.49 | % | ||
China | 22.77 | |||
Brazil | 16.90 | |||
India | 9.00 | |||
South Africa | 6.67 | |||
Thailand | 5.57 | |||
South Korea | 2.98 | |||
Poland | 2.39 | |||
Malaysia | 2.37 | |||
Colombia | 2.18 | |||
|
| |||
TOTAL | 94.32 | % | ||
|
|
| * | Excludes money market funds. |
MANAGEMENT’S DISCUSSIONSOF FUND PERFORMANCE | 13 |
Table of Contents
Management’s Discussion of Fund Performance
iSHARES® MSCI EMERGING MARKETS GROWTH ETF
Performance as of August 31, 2014
| Average Annual Total Returns | Cumulative Total Returns | |||||||||||||||||||||||||
| NAV | MARKET | INDEX | NAV | MARKET | INDEX | |||||||||||||||||||||
1 Year | 19.36% | 17.28% | 20.16% | 19.36% | 17.28% | 20.16% | ||||||||||||||||||||
Since Inception | 5.35% | 5.20% | 6.11% | 14.29% | 13.87% | 16.39% | ||||||||||||||||||||
GROWTH OF $10,000 INVESTMENT
(SINCE INCEPTION AT NET ASSET VALUE)
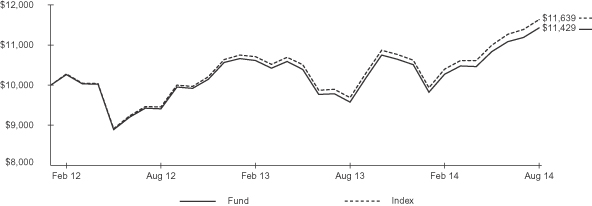
The inception date of the Fund was 2/8/12. The first day of secondary market trading was 2/9/12.
Past performance is no guarantee of future results. Performance results do not reflect the deduction of taxes that a shareholder would pay on fund distributions or on the redemption or sale of fund shares. See “About Fund Performance” on page 22 for more information.
| Shareholder Expenses | ||||||||||||||||||||||||||
| Actual | Hypothetical 5% Return | |||||||||||||||||||||||||
| Beginning Account Value (3/1/14) | Ending Account Value (8/31/14) | Expenses Paid During Period a | Beginning Account Value (3/1/14) | Ending Account Value (8/31/14) | Expenses Paid During Period a | Annualized Expense Ratio | ||||||||||||||||||||
| $ | 1,000.00 | $ | 1,112.70 | $ | 2.61 | $ | 1,000.00 | $ | 1,022.70 | $ | 2.50 | 0.49% | ||||||||||||||
| a | Expenses are calculated using the Fund’s annualized expense ratio (as disclosed in the table), multiplied by the average account value for the period, multiplied by the number of days in the period (184 days) and divided by the number of days in the year (365 days). See “Shareholder Expenses” on page 22 for more information. |
| 14 | 2014 iSHARES ANNUAL REPORTTO SHAREHOLDERS |
Table of Contents
Management’s Discussion of Fund Performance (Continued)
iSHARES® MSCI EMERGING MARKETS GROWTH ETF
The iShares MSCI Emerging Markets Growth ETF (the “Fund”) seeks to track the investment results of an index composed of emerging market equities that exhibit growth characteristics, as represented by the MSCI Emerging Markets Growth Index (the “Index”). The Fund invests in a representative sample of securities included in the Index that collectively has an investment profile similar to the Index. Due to the use of representative sampling, the Fund may or may not hold all of the securities that are included in the Index. For the 12-month reporting period ended August 31, 2014, the total return for the Fund was 19.36%, net of fees, while the total return for the Index was 20.16%.
As represented by the Index, growth stocks in emerging market countries advanced by just over 20% for the reporting period, narrowly outperforming the return of the broad emerging markets. Of the 25 countries represented in the Index, 19 generated positive returns for the reporting period, including the three largest countries: China, South Korea, and Taiwan, which together comprised approximately 47% of the Index on average during the reporting period. The major markets with the strongest performance within the Index included India, Brazil, and South Africa, where growth stocks produced returns of 49%, 35%, and 30%, respectively, for the reporting period.
Among the declining countries in the Index, Hungary was the weakest performer, falling substantially for the reporting period. Persistent weakness in the Hungarian economy weighed on growth stocks in the country. Russia and Chile were also notable decliners within the Index.
Currency fluctuations relative to the U.S. dollar had a modestly positive impact on Index performance for the reporting period. A weaker U.S. dollar increases international equity returns for U.S. investors. The U.S. dollar was largely unchanged against the Chinese yuan and Taiwan dollar, but it declined by 6% versus the Brazilian real and 8.5% against the South Korean won for the reporting period.
PORTFOLIO ALLOCATION As of 8/31/14
| Sector | Percentage of Total Investments* | |||
Information Technology | 23.96 | % | ||
Financials | 21.98 | |||
Consumer Staples | 13.74 | |||
Consumer Discretionary | 10.96 | |||
Industrials | 7.23 | |||
Materials | 5.80 | |||
Energy | 4.95 | |||
Telecommunication Services | 4.69 | |||
Health Care | 3.47 | |||
Utilities | 3.22 | |||
|
| |||
TOTAL | 100.00 | % | ||
|
| |||
TEN LARGEST COUNTRY ALLOCATIONS As of 8/31/14
| Country | Percentage of Total Investments* | |||
China | 19.15 | % | ||
South Korea | 15.45 | |||
Brazil | 11.99 | |||
Taiwan | 11.55 | |||
South Africa | 7.73 | |||
India | 6.54 | |||
Mexico | 5.24 | |||
Russia | 4.65 | |||
Malaysia | 3.66 | |||
Indonesia | 2.56 | |||
|
| |||
TOTAL | 88.52 | % | ||
|
| |||
| * | Excludes money market funds. |
MANAGEMENT’S DISCUSSIONSOF FUND PERFORMANCE | 15 |
Table of Contents
Management’s Discussion of Fund Performance
iSHARES® MSCI EMERGING MARKETS MINIMUM VOLATILITY ETF
Performance as of August 31, 2014
| Average Annual Total Returns | Cumulative Total Returns | |||||||||||||||||||||||||
| NAV | MARKET | INDEX | NAV | MARKET | INDEX | |||||||||||||||||||||
1 Year | 15.44% | 16.73% | 15.63% | 15.44% | 16.73% | 15.63% | ||||||||||||||||||||
Since Inception | 11.27% | 11.34% | 11.54% | 35.89% | 36.14% | 36.79% | ||||||||||||||||||||
GROWTH OF $10,000 INVESTMENT
(SINCE INCEPTION AT NET ASSET VALUE)
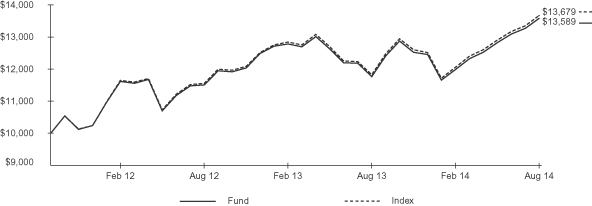
The inception date of the Fund was 10/18/11. The first day of secondary market trading was 10/20/11.
Past performance is no guarantee of future results. Performance results do not reflect the deduction of taxes that a shareholder would pay on fund distributions or on the redemption or sale of fund shares. See “About Fund Performance” on page 22 for more information.
| Shareholder Expenses | ||||||||||||||||||||||||||
| Actual | Hypothetical 5% Return | |||||||||||||||||||||||||
| Beginning Account Value (3/1/14) | Ending Account Value | Expenses Paid During Period a | Beginning Account Value (3/1/14) | Ending Account Value (8/31/14) | Expenses Paid During Period a | Annualized Expense Ratio | ||||||||||||||||||||
| $ | 1,000.00 | $ | 1,133.30 | $ | 1.34 | $ | 1,000.00 | $ | 1,023.90 | $ | 1.28 | 0.25% | ||||||||||||||
| a | Expenses are calculated using the Fund’s annualized expense ratio (as disclosed in the table), multiplied by the average account value for the period, multiplied by the number of days in the period (184 days) and divided by the number of days in the year (365 days). See “Shareholder Expenses” on page 22 for more information. |
| 16 | 2014 iSHARES ANNUAL REPORTTO SHAREHOLDERS |
Table of Contents
Management’s Discussion of Fund Performance (Continued)
iSHARES® MSCI EMERGING MARKETS MINIMUM VOLATILITY ETF
The iShares MSCI Emerging Markets Minimum Volatility ETF (the “Fund”) seeks to track the investment results of an index composed of emerging market equities that, in the aggregate, have lower volatility characteristics relative to the broader emerging equity markets, as represented by the MSCI Emerging Markets Minimum Volatility (USD) Index (the “Index”). The Fund invests in a representative sample of securities included in the Index that collectively has an investment profile similar to the Index. Due to the use of representative sampling, the Fund may or may not hold all of the securities that are included in the Index. For the 12-month reporting period ended August 31, 2014, the total return for the Fund was 15.44%, net of fees, while the total return for the Index was 15.63%.
As represented by the Index, lower-volatility stocks in emerging market countries advanced by more than 15% for the reporting period but trailed the gain of the broad emerging markets. Of the 22 countries represented in the Index, 17 generated positive returns for the reporting period, including the three largest countries: China, Taiwan, and South Korea, which together comprised more than 45% of the Index on average during the reporting period. The major markets with the strongest performance within the Index included India, Korea, and Thailand, where lower-volatility stocks produced returns of 50%, 39%, and 31%, respectively, for the reporting period.
The five countries within the Index which declined during the reporting period had relatively small weights in the Index: Poland, the United Arab Emirates, Qatar, Morocco, and Russia. Collectively, these five countries comprised less than 3% of the Index on average during the reporting period.
Currency fluctuations relative to the U.S. dollar had a modestly positive impact on Index performance for the reporting period. A weaker U.S. dollar increases international equity returns for U.S. investors. The U.S. dollar was largely unchanged against the Chinese yuan and Taiwan dollar, but it declined by 4% versus the Malaysian ringgit and 8% against the South Korean won for the reporting period.
PORTFOLIO ALLOCATION As of 8/31/14
| Sector | Percentage of Total Investments* |
Financials | 26.42 | % | ||
Consumer Staples | 13.37 | |||
Telecommunication Services | 13.16 | |||
Information Technology | 12.36 | |||
Utilities | 8.22 | |||
Health Care | 7.25 | |||
Industrials | 6.53 | |||
Energy | 5.38 | |||
Consumer Discretionary | 3.90 | |||
Materials | 3.41 | |||
|
| |||
TOTAL | 100.00 | % | ||
|
|
TEN LARGEST COUNTRY ALLOCATIONS As of 8/31/14
| Country | Percentage of Total Investments* |
China | 20.60 | % | ||
Taiwan | 16.29 | |||
South Korea | 12.00 | |||
Malaysia | 8.58 | |||
South Africa | 7.03 | |||
Brazil | 5.90 | |||
Philippines | 4.54 | |||
Indonesia | 4.33 | |||
Chile | 4.24 | |||
Colombia | 3.04 | |||
|
| |||
TOTAL | 86.55 | % | ||
|
|
| * | Excludes money market funds. |
MANAGEMENT’S DISCUSSIONSOF FUND PERFORMANCE | 17 |
Table of Contents
Management’s Discussion of Fund Performance
iSHARES® MSCI EMERGING MARKETS SMALL-CAP ETF
Performance as of August 31, 2014
| Average Annual Total Returns | Cumulative Total Returns | |||||||||||||||||||||||||
| NAV | MARKET | INDEX | NAV | MARKET | INDEX | |||||||||||||||||||||
1 Year | 19.92% | 21.48% | 21.14% | 19.92% | 21.48% | 21.14% | ||||||||||||||||||||
Since Inception | 3.51% | 3.63% | 4.35% | 11.08% | 11.46% | 13.83% | ||||||||||||||||||||
GROWTH OF $10,000 INVESTMENT
(SINCE INCEPTION AT NET ASSET VALUE)
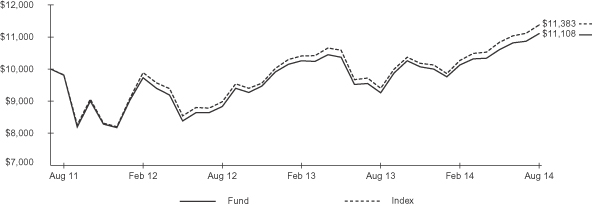
The inception date of the Fund was 8/16/11. The first day of secondary market trading was 8/18/11.
Past performance is no guarantee of future results. Performance results do not reflect the deduction of taxes that a shareholder would pay on fund distributions or on the redemption or sale of fund shares. See “About Fund Performance” on page 22 for more information.
| Shareholder Expenses | ||||||||||||||||||||||||||
| Actual | Hypothetical 5% Return | |||||||||||||||||||||||||
| Beginning Account Value (3/1/14) | Ending Account Value (8/31/14) | Expenses Paid During Period a | Beginning Account Value (3/1/14) | Ending Account Value (8/31/14) | Expenses Paid During Period a | Annualized Expense Ratio | ||||||||||||||||||||
| $ | 1,000.00 | $ | 1,096.00 | $ | 3.59 | $ | 1,000.00 | $ | 1,021.80 | $ | 3.47 | 0.68% | ||||||||||||||
| a | Expenses are calculated using the Fund’s annualized expense ratio (as disclosed in the table), multiplied by the average account value for the period, multiplied by the number of days in the period (184 days) and divided by the number of days in the year (365 days). See “Shareholder Expenses” on page 22 for more information. |
| 18 | 2014 iSHARES ANNUAL REPORTTO SHAREHOLDERS |
Table of Contents
Management’s Discussion of Fund Performance (Continued)
iSHARES® MSCI EMERGING MARKETS SMALL-CAP ETF
The iShares MSCI Emerging Markets Small-Cap ETF (the “Fund”) seeks to track the investment results of an index composed of small-capitalization emerging market equities, as represented by the MSCI Emerging Markets Small Cap Index (the “Index”). The Fund invests in a representative sample of securities included in the Index that collectively has an investment profile similar to the Index. Due to the use of representative sampling, the Fund may or may not hold all of the securities that are included in the Index. For the 12-month reporting period ended August 31, 2014, the total return for the Fund was 19.92%, net of fees, while the total return for the Index was 21.14%.
As represented by the Index, small-capitalization stocks in emerging market countries advanced by approximately 21% for the reporting period, slightly outperforming the gain for the broad emerging markets. Of the 25 countries represented in the Index, 20 generated positive returns for the reporting period, including the three largest countries: Taiwan, South Korea, and China, which together comprised over 55% of the Index on average during the reporting period. The major markets with the strongest performance within the Index included India and Thailand, where small-capitalization stocks produced returns of 104% and 39%, respectively, for the reporting period.
Among the countries which declined in the Index, Russia was the weakest performer, declining by 17% for the reporting period. Persistent weakness in the Russian economy and an armed conflict in neighboring Ukraine weighed on small-capitalization stocks in the country. Chile and the Czech Republic also detracted from Index performance.
Currency fluctuations relative to the U.S. dollar had a modestly positive impact on Index performance for the reporting period. A weaker U.S. dollar increases international equity returns for U.S. investors. The U.S. dollar was largely unchanged against the Chinese yuan and Taiwan dollar, but it declined by 8% versus both the Indian rupee and the South Korean won for the reporting period.
PORTFOLIO ALLOCATION As of 8/31/14
| Sector | Percentage of Total Investments* | |||
Financials | 19.45 | % | ||
Information Technology | 17.44 | |||
Consumer Discretionary | 17.28 | |||
Industrials | 14.51 | |||
Materials | 11.91 | |||
Consumer Staples | 6.92 | |||
Health Care | 4.71 | |||
Utilities | 3.32 | |||
Energy | 2.65 | |||
Telecommunication Services | 1.81 | |||
|
| |||
TOTAL | 100.00 | % | ||
|
| |||
TEN LARGEST COUNTRY ALLOCATIONS As of 8/31/14
| Country | Percentage of Total Investments* | |||
Taiwan | 19.91 | % | ||
China | 19.08 | |||
South Korea | 16.88 | |||
South Africa | 7.28 | |||
India | 6.57 | |||
Brazil | 5.82 | |||
Malaysia | 4.76 | |||
Thailand | 4.26 | |||
Indonesia | 3.57 | |||
Mexico | 2.66 | |||
|
| |||
TOTAL | 90.79 | % | ||
|
| |||
| * | Excludes money market funds. |
MANAGEMENT’S DISCUSSIONSOF FUND PERFORMANCE | 19 |
Table of Contents
Management’s Discussion of Fund Performance
iSHARES® MSCI EMERGING MARKETS VALUE ETF
Performance as of August 31, 2014
| Average Annual Total Returns | Cumulative Total Returns | |||||||||||||||||||||||||
| NAV | MARKET | INDEX | NAV | MARKET | INDEX | |||||||||||||||||||||
1 Year | 19.20% | 20.62% | 19.77% | 19.20% | 20.62% | 19.77% | ||||||||||||||||||||
Since Inception | 0.96% | 2.07% | 1.41% | 2.49% | 5.38% | 3.64% | ||||||||||||||||||||
GROWTH OF $10,000 INVESTMENT
(SINCE INCEPTION AT NET ASSET VALUE)
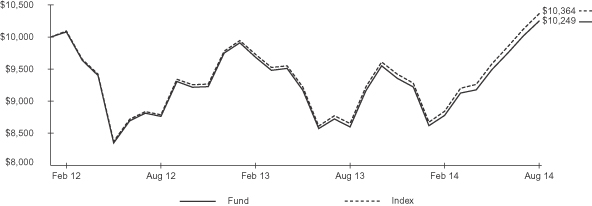
The inception date of the Fund was 2/8/12. The first day of secondary market trading was 2/9/12.
Past performance is no guarantee of future results. Performance results do not reflect the deduction of taxes that a shareholder would pay on fund distributions or on the redemption or sale of fund shares. See “About Fund Performance” on page 22 for more information.
| Shareholder Expenses | ||||||||||||||||||||||||||
| Actual | Hypothetical 5% Return | |||||||||||||||||||||||||
| Beginning Account Value (3/1/14) | Ending Account Value (8/31/14) | Expenses Paid During Period a | Beginning Account Value (3/1/14) | Ending Account Value (8/31/14) | Expenses Paid During Period a | Annualized Expense Ratio | ||||||||||||||||||||
| $ | 1,000.00 | $ | 1,168.20 | $ | 2.68 | $ | 1,000.00 | $ | 1,022.70 | $ | 2.50 | 0.49% | ||||||||||||||
| a | Expenses are calculated using the Fund’s annualized expense ratio (as disclosed in the table), multiplied by the average account value for the period, multiplied by the number of days in the period (184 days) and divided by the number of days in the year (365 days). See “Shareholder Expenses” on page 22 for more information. |
| 20 | 2014 iSHARES ANNUAL REPORTTO SHAREHOLDERS |
Table of Contents
Management’s Discussion of Fund Performance (Continued)
iSHARES® MSCI EMERGING MARKETS VALUE ETF
The iShares MSCI Emerging Markets Value ETF (the “Fund”) seeks to track the investment results of an index composed of emerging market equities that exhibit value characteristics, as represented by the MSCI Emerging Markets Value Index (the “Index”). The Fund invests in a representative sample of securities included in the Index that collectively has an investment profile similar to the Index. Due to the use of representative sampling, the Fund may or may not hold all of the securities that are included in the Index. For the 12-month reporting period ended August 31, 2014, the total return for the Fund was 19.20%, net of fees, while the total return for the Index was 19.77%.
As represented by the Index, value stocks in emerging market countries advanced by nearly 20% for the reporting period, narrowly trailing the return of the broad emerging markets. Of the 24 countries represented in the Index, 20 generated positive returns for the reporting period, including the three largest countries: China, South Korea, and Taiwan, which together comprised more than 45% of the Index on average during the reporting period. The markets which provided the strongest performance within the Index included India and Brazil, where value stocks produced returns of 56% and 30%, respectively, for the reporting period.
Among the countries to decline in the Index, Qatar and the United Arab Emirates — newly added to the Index during the reporting period — detracted the most. Lower energy prices and political instability in the Middle East contributed to the decline in value stocks in these two countries. Russia and Hungary were the other two countries in the Index to post negative returns for the reporting period.
Currency fluctuations relative to the U.S. dollar had a modestly positive impact on Index performance for the reporting period. A weaker U.S. dollar increases international equity returns for U.S. investors. The U.S. dollar was largely unchanged against the Chinese yuan and Taiwan dollar, but it declined by 6% versus the Brazilian real and 8.5% against the South Korean won for the reporting period.
PORTFOLIO ALLOCATION As of 8/31/14
| Sector | Percentage of Total Investments* |
Financials | 32.84 | % | ||
Energy | 16.13 | |||
Materials | 11.13 | |||
Telecommunication Services | 10.19 | |||
Information Technology | 9.16 | |||
Consumer Discretionary | 7.55 | |||
Industrials | 5.84 | |||
Utilities | 3.80 | |||
Consumer Staples | 3.05 | |||
Health Care | 0.31 | |||
|
| |||
TOTAL | 100.00 | % | ||
|
|
TEN LARGEST COUNTRY ALLOCATIONS As of 8/31/14
| Country | Percentage of Total Investments* |
China | 19.08 | % | ||
South Korea | 14.99 | |||
Taiwan | 12.11 | |||
Brazil | 11.69 | |||
South Africa | 7.26 | |||
India | 6.79 | |||
Mexico | 5.34 | |||
Russia | 4.48 | |||
Malaysia | 3.88 | |||
Indonesia | 2.54 | |||
|
| |||
TOTAL | 88.16 | % | ||
|
|
| * | Excludes money market funds. |
MANAGEMENT’S DISCUSSIONSOF FUND PERFORMANCE | 21 |
Table of Contents
Past performance is no guarantee of future results. Current performance may be lower or higher than the performance data quoted. Performance data current to the most recent month-end is available at www.iShares.com. Performance results assume reinvestment of all dividends and capital gain distributions and do not reflect the deduction of taxes that a shareholder would pay on fund distributions or on the redemption or sale of fund shares. The investment return and principal value of shares will vary with changes in market conditions. Shares may be worth more or less than their original cost when they are redeemed or sold in the market. Performance for certain funds may reflect a waiver of a portion of investment management fees. Without such waiver, performance would have been lower.
Net asset value or “NAV” is the value of one share of a fund as calculated in accordance with the standard formula for valuing mutual fund shares. The price used to calculate market return (“Market Price”) is determined by using the midpoint between the highest bid and the lowest offer on the primary stock exchange on which shares of a fund are listed for trading, as of the time that such fund’s NAV is calculated. Since shares of a fund may not have traded in the secondary market until after the fund’s inception, for the period from inception to the first day of secondary trading, the NAV of the fund is used as a proxy for the Market Price to calculate market returns. Market and NAV returns assume that dividends and capital gain distributions have been reinvested at Market Price and NAV, respectively.
An index is a statistical composite that tracks a specified financial market or sector. Unlike a fund, an index does not actually hold a portfolio of securities and therefore does not incur the expenses incurred by a fund. These expenses negatively impact fund performance. Also, market returns do not include brokerage commissions that may be payable on secondary market transactions. If brokerage commissions were included, market returns would be lower.
As a shareholder of the Fund, you incur two types of costs: (1) transaction costs, including brokerage commissions on purchases and sales of fund shares and (2) ongoing costs, including management fees and other fund expenses. The expense example, which is based on an investment of $1,000 invested on March 1, 2014 and held through August 31, 2014, is intended to help you understand your ongoing costs (in dollars and cents) of investing in the Fund and to compare these costs with the ongoing costs of investing in other funds.
Actual Expenses — The table provides information about actual account values and actual expenses. To estimate the expenses that you paid on your account over the period, simply divide your account value by $1,000 (for example, an $8,600 account value divided by $1,000 = 8.6), then multiply the result by the number for your Fund under the heading entitled “Expenses Paid During Period.”
Hypothetical Example for Comparison Purposes — The table also provides information about hypothetical account values and hypothetical expenses based on the Fund’s actual expense ratio and an assumed rate of return of 5% per year before expenses. You may use this information to compare the ongoing costs of investing in your Fund and other funds. To do so, compare this 5% hypothetical example with the 5% hypothetical examples that appear in the shareholder reports of the other funds.
Please note that the expenses shown in the table are meant to highlight your ongoing costs only and do not reflect any transactional costs, such as brokerage commissions paid on purchases and sales of fund shares. Therefore, the hypothetical examples are useful in comparing ongoing costs only and will not help you determine the relative total costs of owning different funds. In addition, if these transactional costs were included, your costs would have been higher.
| 22 | 2014 iSHARES ANNUAL REPORTTO SHAREHOLDERS |
Table of Contents
Consolidated Schedule of Investments
August 31, 2014
| Security | Shares | Value | ||||||
COMMON STOCKS — 87.45% |
| |||||||
BRAZIL — 16.26% |
| |||||||
ALL – America Latina Logistica SA | 100,000 | $ | 368,707 | |||||
AMBEV SA | 1,080,365 | 7,870,193 | ||||||
B2W Companhia Global do Varejoa | 40,000 | 677,527 | ||||||
Banco Bradesco SA | 160,090 | 2,863,312 | ||||||
Banco do Brasil SA | 200,089 | 3,128,920 | ||||||
Banco Santander (Brasil) SA Units | 223,337 | 1,543,112 | ||||||
BB Seguridade Participacoes SA | 162,600 | 2,597,182 | ||||||
BM&F Bovespa SA | 440,069 | 2,655,106 | ||||||
BR Malls Participacoes SA | 100,000 | 1,039,977 | ||||||
BR Properties SA | 40,000 | 266,363 | ||||||
BRF SA | 160,000 | 4,283,256 | ||||||
CCR SA | 200,000 | 1,810,909 | ||||||
Centrais Eletricas Brasileiras SA | 80,400 | 292,847 | ||||||
CETIP SA – Mercados Organizados | 40,547 | 591,656 | ||||||
Cielo SA | 160,168 | 3,003,575 | ||||||
Companhia de Saneamento Basico do Estado de Sao Paulo | 80,000 | 764,765 | ||||||
Companhia de Saneamento de Minas Gerais SA | 20,000 | 357,534 | ||||||
Companhia Siderurgica Nacional SA | 160,000 | 702,197 | ||||||
Cosan SA Industria e Comercio | 40,000 | 831,266 | ||||||
CPFL Energia SA | 60,000 | 605,752 | ||||||
Cyrela Brazil Realty SA Empreendimentos e Participacoes | 60,000 | 380,505 | ||||||
Duratex SA | 66,448 | 299,046 | ||||||
EcoRodovias Infraestrutura e Logistica SA | 40,000 | 255,637 | ||||||
EDP Energias do Brasil SA | 60,000 | 303,010 | ||||||
Embraer SA | 160,000 | 1,559,563 | ||||||
Estacio Participacoes SA | 80,000 | 1,062,948 | ||||||
Fibria Celulose SAa | 60,041 | 624,681 | ||||||
Hypermarcas SAa | 80,000 | 695,761 | ||||||
JBS SA | 180,052 | 814,340 | ||||||
Klabin SA | 120,000 | 609,774 | ||||||
| Security | Shares | Value | ||||||
Kroton Educacional SA | 70,366 | $ | 2,108,574 | |||||
Localiza Rent A Car SA | 40,060 | 713,455 | ||||||
Lojas Americanas SA | 25,300 | 146,991 | ||||||
Lojas Renner SA | 20,000 | 684,856 | ||||||
Multiplan Empreendimentos Imobiliarios SA | 20,000 | 515,832 | ||||||
Natura Cosmeticos SA | 40,000 | 733,123 | ||||||
Odontoprev SA | 60,000 | 261,715 | ||||||
Petroleo Brasileiro SA | 680,000 | 6,728,431 | ||||||
Porto Seguro SA | 20,000 | 296,574 | ||||||
Qualicorp SAa | 40,000 | 500,547 | ||||||
Raia Drogasil SA | 60,050 | 585,055 | ||||||
Souza Cruz SA | 100,000 | 936,739 | ||||||
Sul America SA Units | 40,072 | 277,050 | ||||||
TIM Participacoes SA | 200,069 | 1,122,150 | ||||||
Totvs SA | 20,000 | 365,221 | ||||||
Tractebel Energia SA | 40,000 | 670,555 | ||||||
Transmissora Alianca de Energia Eletrica SA | 20,600 | 214,880 | ||||||
Ultrapar Participacoes SA | 80,000 | 2,062,613 | ||||||
Vale SA | 300,000 | 3,904,270 | ||||||
Via Varejo SAa | 21,300 | 237,983 | ||||||
WEG SA | 72,720 | 909,670 | ||||||
|
| |||||||
| 66,835,705 | ||||||||
CHINA — 45.21% |
| |||||||
AAC Technologies Holdings Inc.b | 200,000 | 1,304,491 | ||||||
Agile Property Holdings Ltd. | 400,000 | 313,800 | ||||||
Agricultural Bank of China Ltd. Class H | 4,800,000 | 2,217,247 | ||||||
Air China Ltd. Class H | 408,000 | 252,692 | ||||||
Alibaba Pictures Group Ltd.a | 1,890,000 | 392,625 | ||||||
Aluminum Corp. of China Ltd. Class Ha,b | 800,000 | 339,606 | ||||||
Anhui Conch Cement Co. Ltd. Class Hb | 300,000 | 1,083,850 | ||||||
Anta Sports Products Ltd. | 200,040 | 384,069 | ||||||
Bank of China Ltd. Class H | 18,000,000 | 8,361,129 | ||||||
Bank of Communications Co. Ltd. Class H | 2,004,200 | 1,463,684 | ||||||
BBMG Corp. Class H | 300,000 | 223,738 | ||||||
Beijing Capital International Airport Co. Ltd. Class H | 400,000 | 312,768 | ||||||
Beijing Enterprises Holdings Ltd. | 100,000 | 861,919 | ||||||
CONSOLIDATED SCHEDULESOF INVESTMENTS | 23 |
Table of Contents
Consolidated Schedule of Investments (Continued)
iSHARES® MSCI BRIC ETF
August 31, 2014
| Security | Shares | Value | ||||||
Beijing Enterprises Water Group Ltd. | 1,200,000 | $ | 817,533 | |||||
Belle International Holdings Ltd. | 1,000,000 | 1,278,685 | ||||||
Biostime International Holdings Ltd. | 56,500 | 211,051 | ||||||
Brilliance China Automotive Holdings Ltd. | 800,000 | 1,482,294 | ||||||
BYD Co. Ltd. Class Hb | 100,000 | 710,309 | ||||||
China Agri-Industries Holdings Ltd. | 415,800 | 170,072 | ||||||
China BlueChemical Ltd. Class H | 400,000 | 197,157 | ||||||
China Cinda Asset Management Co. Ltd.a,b | 1,000,000 | 512,248 | ||||||
China CITIC Bank Corp. Ltd. Class H | 1,800,000 | 1,135,720 | ||||||
China Coal Energy Co. Class Hb | 800,000 | 487,216 | ||||||
China Communications Construction Co. Ltd. Class H | 1,000,000 | 729,018 | ||||||
China Communications Services Corp. Ltd. Class H | 400,800 | 193,415 | ||||||
China Construction Bank Corp. Class H | 16,200,370 | 12,040,300 | ||||||
China COSCO Holdings Co. Ltd. Class Ha,b | 600,000 | 258,576 | ||||||
China Everbright Bank Co. Ltd. | 426,000 | 198,979 | ||||||
China Everbright International Ltd.b | 600,000 | 822,178 | ||||||
China Everbright Ltd. | 400,000 | 758,695 | ||||||
China Gas Holdings Ltd. | 400,000 | 712,244 | ||||||
China Huishan Dairy Holdings Co. Ltd.a,b | 1,278,000 | 296,820 | ||||||
China International Marine Containers (Group) Co. Ltd. Class H | 120,000 | 258,266 | ||||||
China Life Insurance Co. Ltd. Class H | 1,600,000 | 4,593,459 | ||||||
China Longyuan Power Group Corp. Ltd. Class H | 600,000 | 648,762 | ||||||
China Mengniu Dairy Co. Ltd. | 200,000 | 927,724 | ||||||
China Merchants Bank Co. Ltd. Class H | 1,078,456 | 2,062,246 | ||||||
China Merchants Holdings (International) Co. Ltd. | 400,000 | 1,326,426 | ||||||
China Minsheng Banking Corp. Ltd. Class H | 1,439,000 | 1,351,705 | ||||||
| Security | Shares | Value | ||||||
China Mobile Ltd. | 1,400,000 | $ | 17,413,857 | |||||
China National Building Material Co. Ltd. Class H | 800,000 | 734,954 | ||||||
China Oilfield Services Ltd. Class H | 410,000 | 1,214,106 | ||||||
China Overseas Land & Investment Ltd. | 800,800 | 2,252,529 | ||||||
China Pacific Insurance (Group) Co. Ltd. Class H | 600,000 | 2,252,860 | ||||||
China Petroleum & Chemical Corp. Class H | 5,806,600 | 5,888,902 | ||||||
China Railway Construction Corp. Ltd. Class H | 400,000 | 382,960 | ||||||
China Railway Group Ltd. Class H | 800,000 | 413,927 | ||||||
China Resources Cement Holdings Ltd.b | 400,000 | 275,091 | ||||||
China Resources Enterprise Ltd. | 400,000 | 1,076,108 | ||||||
China Resources Gas Group Ltd. | 211,000 | 613,930 | ||||||
China Resources Land Ltd. | 400,000 | 915,595 | ||||||
China Resources Power Holdings Co. Ltd.b | 400,200 | 1,210,904 | ||||||
China Shenhua Energy Co. Ltd. Class H | 800,000 | 2,307,052 | ||||||
China Shipping Container Lines Co. Ltd. Class Ha | 800,000 | 228,125 | ||||||
China State Construction International Holdings Ltd. | 400,000 | 645,149 | ||||||
China Taiping Insurance Holdings Co. Ltd.a,b | 200,000 | 486,700 | ||||||
China Telecom Corp. Ltd. Class H | 3,200,000 | 1,977,768 | ||||||
China Unicom (Hong Kong) Ltd. | 1,077,900 | 1,922,102 | ||||||
China Vanke Co. Ltd.a | 314,301 | 588,847 | ||||||
Chongqing Changan Automobile Co. Ltd. | 200,000 | 412,895 | ||||||
Chongqing Rural Commercial Bank Co. Ltd. Class H | 600,000 | 298,059 | ||||||
CITIC 21CN Co. Ltd.a | 826,000 | 650,129 | ||||||
CITIC Pacific Ltd.b | 403,000 | 784,145 | ||||||
CITIC Securities Co. Ltd. Class H | 200,000 | 474,830 | ||||||
CNOOC Ltd. | 4,000,000 | 8,041,135 | ||||||
COSCO Pacific Ltd. | 400,000 | 560,505 | ||||||
| 24 | 2014 iSHARES ANNUAL REPORTTO SHAREHOLDERS |
Table of Contents
Consolidated Schedule of Investments (Continued)
iSHARES® MSCI BRIC ETF
August 31, 2014
| Security | Shares | Value | ||||||
Country Garden Holdings Co. Ltd. | 1,000,356 | $ | 444,020 | |||||
CSPC Pharmaceutical Group Ltd. | 400,000 | 334,445 | ||||||
CSR Corp Ltd. Class H | 403,000 | 363,473 | ||||||
Datang International Power Generation Co. Ltd. Class H | 800,000 | 443,862 | ||||||
Dongfeng Motor Group Co. Ltd. Class H | 800,000 | 1,482,294 | ||||||
ENN Energy Holdings Ltd. | 124,000 | 875,983 | ||||||
Evergrande Real Estate Group Ltd.b | 1,400,000 | 585,279 | ||||||
Far East Horizon Ltd. | 400,000 | 322,574 | ||||||
Fosun International Ltd.b | 400,000 | 491,345 | ||||||
Franshion Properties (China) Ltd.b | 800,000 | 216,770 | ||||||
GCL-Poly Energy Holdings Ltd.a,b | 2,400,000 | 863,983 | ||||||
Geely Automobile Holdings Ltd. | 1,000,000 | 383,218 | ||||||
Golden Eagle Retail Group Ltd.b | 200,000 | 245,931 | ||||||
GOME Electrical Appliances Holdings Ltd. | 2,400,400 | 427,418 | ||||||
Great Wall Motor Co. Ltd. Class H | 255,500 | 1,084,618 | ||||||
Guangdong Investment Ltd. | 400,000 | 483,604 | ||||||
Guangzhou Automobile Group Co. Ltd. Class H | 326,454 | 339,506 | ||||||
Guangzhou R&F Properties Co. Ltd. Class H | 240,000 | 289,233 | ||||||
Haier Electronics Group Co. Ltd.b | 230,000 | 664,761 | ||||||
Haitian International Holdings Ltd. | 200,000 | 521,280 | ||||||
Haitong Securities Co. Ltd. Class H | 320,000 | 511,164 | ||||||
Hanergy Solar Group Ltd.a,b | 2,544,000 | 416,880 | ||||||
Hengan International Group Co. Ltd. | 200,000 | 2,132,862 | ||||||
Huaneng Power International Inc. Class H | 800,000 | 962,046 | ||||||
Industrial and Commercial Bank of China Ltd. Class H | 16,603,050 | 11,011,358 | ||||||
Inner Mongolia Yitai Coal Co. Ltd. Class B | 240,970 | 406,998 | ||||||
Intime Retail Group Co. Ltd.b | 200,000 | 181,932 | ||||||
| Security | Shares | Value | ||||||
Jiangsu Expressway Co. Ltd. Class H | 400,000 | $ | 455,733 | |||||
Jiangxi Copper Co. Ltd. Class H | 400,000 | 707,083 | ||||||
Kingboard Chemical Holdings Co. Ltd. | 100,100 | 207,946 | ||||||
Kingsoft Corp. Ltd. | 200,000 | 572,892 | ||||||
Kunlun Energy Co. Ltd. | 800,000 | 1,321,265 | ||||||
Lee & Man Paper Manufacturing Ltd. | 400,000 | 235,350 | ||||||
Lenovo Group Ltd.b | 1,600,000 | 2,444,340 | ||||||
Longfor Properties Co. Ltd. | 300,000 | 383,218 | ||||||
New China Life Insurance Co. Ltd. Class H | 180,000 | 642,181 | ||||||
New World China Land Ltd. | 400,000 | 245,157 | ||||||
Nine Dragons Paper (Holdings) Ltd.b | 400,000 | 312,252 | ||||||
People’s Insurance Co. Group of China Ltd. Class H | 1,200,000 | 501,668 | ||||||
PetroChina Co. Ltd. Class H | 4,800,000 | 6,812,771 | ||||||
PICC Property and Casualty Co. Ltd. Class H | 801,200 | 1,329,449 | ||||||
Ping An Insurance (Group) Co. of China Ltd. Class H | 475,500 | 3,871,415 | ||||||
Poly Property Group Co. Ltd. | 408,984 | 177,839 | ||||||
Shandong Weigao Group Medical Polymer Co. Ltd. Class H | 608,000 | 615,833 | ||||||
Shanghai Electric Group Co. Ltd. Class H | 400,000 | 175,480 | ||||||
Shanghai Fosun Pharmaceutical (Group) Co. Ltd. | 106,500 | 346,290 | ||||||
Shanghai Industrial Holdings Ltd. | 200,000 | 667,084 | ||||||
Shanghai Pharmaceuticals Holding Co. Ltd. Class H | 160,000 | 328,252 | ||||||
Shenzhou International Group Holdings Ltd. | 200,000 | 623,214 | ||||||
Shimao Property Holdings Ltd. | 300,000 | 660,374 | ||||||
Shui On Land Ltd. | 900,333 | 235,825 | ||||||
Sihuan Pharmaceutical Holdings Group Ltd. | 1,008,000 | 675,022 | ||||||
Sino Biopharmaceutical Ltd. | 800,000 | 737,018 | ||||||
Sino-Ocean Land Holdings Ltd. | 700,000 | 395,605 | ||||||
Sinopec Engineering Group Co. Ltd. | 200,000 | 228,125 | ||||||
CONSOLIDATED SCHEDULESOF INVESTMENTS | 25 |
Table of Contents
Consolidated Schedule of Investments (Continued)
iSHARES® MSCI BRIC ETF
August 31, 2014
| Security | Shares | Value | ||||||
Sinopec Shanghai Petrochemical Co. Ltd. Class H | 671,000 | $ | 224,240 | |||||
Sinopharm Group Co. Ltd. Class H | 240,000 | 837,661 | ||||||
SOHO China Ltd. | 500,000 | 409,024 | ||||||
Sun Art Retail Group Ltd.b | 500,000 | 596,763 | ||||||
Tencent Holdings Ltd. | 1,174,100 | 19,163,971 | ||||||
Tingyi (Cayman Islands) Holding Corp. | 400,000 | 1,122,559 | ||||||
Tsingtao Brewery Co. Ltd. Class H | 40,000 | 303,736 | ||||||
Uni-President China Holdings Ltd.b | 242,400 | 218,938 | ||||||
Want Want China Holdings Ltd.b | 1,400,000 | 1,735,966 | ||||||
Weichai Power Co. Ltd. Class H | 111,775 | 452,860 | ||||||
Yanzhou Coal Mining Co. Ltd. Class H | 400,000 | 338,574 | ||||||
Yingde Gases Group Co. Ltd.b | 283,500 | 303,248 | ||||||
Yuexiu Property Co. Ltd.b | 1,224,000 | 262,168 | ||||||
Zhejiang Expressway Co. Ltd. Class H | 400,000 | 397,928 | ||||||
Zhongsheng Group Holdings Ltd. | 100,000 | 110,837 | ||||||
Zhuzhou CSR Times Electric Co. Ltd. Class H | 100,000 | 346,445 | ||||||
Zijin Mining Group Co. Ltd. Class H | 1,601,000 | 417,285 | ||||||
Zoomlion Heavy Industry Science and Technology Co. Ltd. Class H | 280,000 | 174,500 | ||||||
ZTE Corp. Class Hb | 160,040 | 360,548 | ||||||
|
| |||||||
| 185,888,649 | ||||||||
INDIA — 15.81% |
| |||||||
ACC Ltd. | 5,200 | 127,905 | ||||||
Adani Enterprises Ltd. | 29,782 | 235,046 | ||||||
Adani Ports & Special Economic Zone Ltd. | 114,096 | 531,840 | ||||||
Aditya Birla Nuvo Ltd. | 7,800 | 186,876 | ||||||
Ambuja Cements Ltd. | 151,800 | 516,090 | ||||||
Apollo Hospitals Enterprise Ltd. | 18,000 | 348,016 | ||||||
Asian Paints Ltd. | 69,000 | 709,786 | ||||||
Aurobindo Pharma Ltd. | 31,746 | 427,718 | ||||||
Bajaj Auto Ltd. | 19,000 | 707,240 | ||||||
| Security | Shares | Value | ||||||
Bharat Heavy Electricals Ltd. | 131,400 | $ | 521,659 | |||||
Bharat Petroleum Corp. Ltd. | 39,800 | 455,391 | ||||||
Bharti Airtel Ltd. | 138,600 | 844,665 | ||||||
Cairn India Ltd. | 106,600 | 573,142 | ||||||
Cipla Ltd. | 78,800 | 667,748 | ||||||
Coal India Ltd. | 116,000 | 680,745 | ||||||
Dabur India Ltd. | 61,808 | 236,924 | ||||||
Divi’s Laboratories Ltd. | 9,800 | 252,712 | ||||||
DLF Ltd. | 98,800 | 288,682 | ||||||
Dr. Reddy’s Laboratories Ltd. | 26,504 | 1,287,593 | ||||||
GAIL (India) Ltd. | 77,400 | 565,576 | ||||||
GlaxoSmithKline Consumer Healthcare Ltd. | 2,400 | 210,914 | ||||||
Godrej Consumer Products Ltd. | 28,600 | 464,703 | ||||||
HCL Technologies Ltd. | 56,400 | 1,515,727 | ||||||
HDFC Bank Ltd. | 84,122 | 1,169,432 | ||||||
Hero Motocorp Ltd. | 18,400 | 789,854 | ||||||
Hindalco Industries Ltd. | 250,201 | 701,371 | ||||||
Hindustan Unilever Ltd. | 170,871 | 2,090,692 | ||||||
Housing Development Finance Corp. Ltd. | 335,200 | 5,935,603 | ||||||
ICICI Bank Ltd. | 50,200 | 1,287,926 | ||||||
Idea Cellular Ltd. | 234,400 | 625,401 | ||||||
Infosys Ltd. | 104,600 | 6,203,601 | ||||||
ITC Ltd. | 505,000 | 2,956,930 | ||||||
Jaiprakash Associates Ltd. | 235,200 | 180,237 | ||||||
Jindal Steel & Power Ltd. | 80,800 | 310,257 | ||||||
JSW Steel Ltd. | 19,000 | 389,394 | ||||||
Larsen & Toubro Ltd. | 72,405 | 1,821,461 | ||||||
LIC Housing Finance Ltd. | 66,200 | 330,182 | ||||||
Mahindra & Mahindra Financial Services Ltd. | 59,489 | 273,818 | ||||||
Mahindra & Mahindra Ltd. | 74,600 | 1,730,012 | ||||||
Nestle India Ltd. | 5,094 | 506,088 | ||||||
NTPC Ltd. | 366,970 | 830,944 | ||||||
Oil & Natural Gas Corp. Ltd. | 175,800 | 1,260,267 | ||||||
Oil India Ltd. | 27,200 | 275,855 | ||||||
Piramal Enterprises Ltd. | 17,600 | 199,885 | ||||||
Power Finance Corp. Ltd. | 59,583 | 245,579 | ||||||
Power Grid Corp. of India Ltd. | 176,400 | 375,591 | ||||||
Ranbaxy Laboratories Ltd.a | 29,000 | 306,201 | ||||||
Reliance Capital Ltd. | 21,815 | 190,108 | ||||||
Reliance Communications Ltd. | 177,600 | 339,512 | ||||||
Reliance Industries Ltd. | 294,000 | 4,838,790 | ||||||
Reliance Infrastructure Ltd. | 25,400 | 292,719 | ||||||
| 26 | 2014 iSHARES ANNUAL REPORTTO SHAREHOLDERS |
Table of Contents
Consolidated Schedule of Investments (Continued)
iSHARES® MSCI BRIC ETF
August 31, 2014
| Security | Shares | Value | ||||||
Reliance Power Ltd.a | 135,401 | $ | 166,350 | |||||
Rural Electrification Corp. Ltd. | 65,209 | 288,379 | ||||||
Sesa Sterlite Ltd. | 269,319 | 1,230,088 | ||||||
Shriram Transport Finance Co. Ltd. | 33,049 | 492,440 | ||||||
Siemens Ltd. | 16,403 | 214,715 | ||||||
State Bank of India | 32,693 | 1,325,769 | ||||||
Sun Pharmaceuticals Industries Ltd. | 163,815 | 2,308,879 | ||||||
Tata Consultancy Services Ltd. | 106,800 | 4,439,469 | ||||||
Tata Motors Ltd. | 171,600 | 1,484,815 | ||||||
Tata Power Co. Ltd. | 277,507 | 396,047 | ||||||
Tata Steel Ltd. | 67,401 | 569,987 | ||||||
Tech Mahindra Ltd. | 13,200 | 514,034 | ||||||
Ultratech Cement Ltd. | 9,001 | 378,263 | ||||||
United Breweries Ltd. | 14,800 | 172,500 | ||||||
United Spirits Ltd. | 16,100 | 636,266 | ||||||
Wipro Ltd. | 142,000 | 1,322,767 | ||||||
Yes Bank Ltd. | 27,000 | 254,538 | ||||||
|
| |||||||
| 65,009,714 | ||||||||
RUSSIA — 10.17% |
| |||||||
Alrosa AO | 384,000 | 450,032 | ||||||
Gazprom OAO | 2,706,008 | 9,642,389 | ||||||
LUKOIL OAO | 116,600 | 6,490,815 | ||||||
Magnit OJSC SP GDRc | 59,804 | 3,480,593 | ||||||
MegaFon OAO SP GDRc | 22,800 | 645,240 | ||||||
MMC Norilsk Nickel OJSC | 12,604 | 2,480,244 | ||||||
Mobile TeleSystems OJSC SP ADR | 123,000 | 2,269,350 | ||||||
Moscow Exchange MICEX-RTS OJSC | 244,000 | 409,564 | ||||||
NovaTek OAO SP GDRc | 21,000 | 2,112,600 | ||||||
Rosneft Oil Co. OJSC | 266,042 | �� | 1,641,220 | |||||
Rostelecom OJSC | 186,640 | 496,442 | ||||||
RusHydro OJSC | 26,200,200 | 485,906 | ||||||
Sberbank of Russia | 2,315,330 | 4,556,160 | ||||||
Severstal OAO | 46,000 | 442,740 | ||||||
Sistema JSFC SP GDRc | 39,600 | 900,900 | ||||||
Surgutneftegas OJSC | 1,580,020 | 1,107,538 | ||||||
Tatneft OAO Class S | 324,003 | 2,009,440 | ||||||
Uralkali OJSC | 308,000 | 1,137,528 | ||||||
VTB Bank OJSC | 1,045,176,001 | 1,076,686 | ||||||
|
| |||||||
| 41,835,387 | ||||||||
|
| |||||||
TOTAL COMMON STOCKS |
| |||||||
(Cost: $338,317,110) |
| 359,569,455 | ||||||
| Security | Shares | Value | ||||||
PREFERRED STOCKS — 12.31% |
| |||||||
BRAZIL — 11.73% |
| |||||||
AES Tiete SA | 20,000 | $ | 179,839 | |||||
Banco Bradesco SA | 460,008 | 8,396,115 | ||||||
Banco do Estado do Rio Grande do Sul SA Class B | 40,000 | 276,195 | ||||||
Bradespar SA | 60,000 | 548,368 | ||||||
Braskem SA Class A | 40,000 | 272,620 | ||||||
Centrais Eletricas Brasileiras SA Class B | 40,082 | 221,230 | ||||||
Companhia Brasileira de Distribuicao | 20,056 | 1,021,108 | ||||||
Companhia Energetica de Minas Gerais | 164,232 | 1,406,308 | ||||||
Companhia Energetica de Sao Paulo Class B | 40,000 | 566,512 | ||||||
Companhia Paranaense de Energia Class B | 20,000 | 354,495 | ||||||
Gerdau SA | 200,000 | 1,158,410 | ||||||
Itau Unibanco Holding SA | 637,627 | 11,501,252 | ||||||
Itausa-Investimentos Itau SA | 740,385 | 3,606,711 | ||||||
Lojas Americanas SA | 125,388 | 887,640 | ||||||
Metalurgica Gerdau SA | 60,000 | 425,286 | ||||||
Oi SA | 620,099 | 401,843 | ||||||
Petroleo Brasileiro SA | 960,014 | 10,018,246 | ||||||
Suzano Papel e Celulose SA Class A | 80,000 | 318,563 | ||||||
Telefonica Brasil SA | 60,064 | 1,284,468 | ||||||
Usinas Siderurgicas de Minas Gerais SA Class A | 80,000 | 288,887 | ||||||
Vale SA Class A | 440,000 | 5,106,836 | ||||||
|
| |||||||
| 48,240,932 | ||||||||
RUSSIA — 0.58% |
| |||||||
AK Transneft OAO | 400 | 879,980 | ||||||
Sberbank of Russia | 207,930 | 310,059 | ||||||
Surgutneftegas OJSC | 1,620,000 | 1,192,253 | ||||||
|
| |||||||
| 2,382,292 | ||||||||
|
| |||||||
TOTAL PREFERRED STOCKS |
| |||||||
(Cost: $45,031,238) |
| 50,623,224 | ||||||
CONSOLIDATED SCHEDULESOF INVESTMENTS | 27 |
Table of Contents
Consolidated Schedule of Investments (Continued)
iSHARES® MSCI BRIC ETF
August 31, 2014
| Security | Shares | Value | ||||||
SHORT-TERM INVESTMENTS — 2.74% |
| |||||||
MONEY MARKET FUNDS — 2.74% |
| |||||||
BlackRock Cash Funds: Institutional, |
| |||||||
0.14%d,e,f | 10,298,252 | $ | 10,298,252 | |||||
BlackRock Cash Funds: Prime, |
| |||||||
0.11%d,e,f | 648,303 | 648,303 | ||||||
BlackRock Cash Funds: Treasury, |
| |||||||
0.00%d,e | 299,256 | 299,256 | ||||||
|
| |||||||
| 11,245,811 | ||||||||
|
| |||||||
TOTAL SHORT-TERM INVESTMENTS |
| |||||||
(Cost: $11,245,811) |
| 11,245,811 | ||||||
|
| |||||||
TOTAL INVESTMENTS |
| |||||||
(Cost: $394,594,159) | 421,438,490 | |||||||
Other Assets, Less Liabilities — (2.50)% |
| (10,273,991 | ) | |||||
|
| |||||||
NET ASSETS — 100.00% |
| $ | 411,164,499 | |||||
|
| |||||||
SP ADR — Sponsored American Depositary Receipts
SP GDR — Sponsored Global Depositary Receipts
| a | Non-income earning security. |
| b | All or a portion of this security represents a security on loan. See Note 1. |
| c | This security may be resold to qualified foreign investors and foreign institutional buyers under Regulation S of the Securities Act of 1933. |
| d | Affiliated issuer. See Note 2. |
| e | The rate quoted is the annualized seven-day yield of the fund at period end. |
| f | All or a portion of this security represents an investment of securities lending collateral. See Note 1. |
See notes to consolidated financial statements.
| 28 | 2014 iSHARES ANNUAL REPORTTO SHAREHOLDERS |
Table of Contents
Consolidated Schedule of Investments
iSHARES® MSCI EMERGING MARKETS ASIA ETF
August 31, 2014
| Security | Shares | Value | ||||||
COMMON STOCKS — 98.50% |
| |||||||
CHINA — 30.41% |
| |||||||
AAC Technologies Holdings Inc. | 22,500 | $ | 146,755 | |||||
Agile Property Holdings Ltd. | 40,000 | 31,380 | ||||||
Agricultural Bank of China Ltd. Class H | 654,000 | 302,100 | ||||||
Air China Ltd. Class H | 52,000 | 32,206 | ||||||
Alibaba Pictures Group Ltd.a | 210,000 | 43,625 | ||||||
Aluminum Corp. of China Ltd. Class Ha,b | 118,000 | 50,092 | ||||||
Anhui Conch Cement Co. Ltd. Class Hb | 38,000 | 137,288 | ||||||
Anta Sports Products Ltd. | 32,000 | 61,439 | ||||||
AviChina Industry & Technology Co. Ltd. Class H | 64,000 | 38,152 | ||||||
Bank of China Ltd. Class H | 2,418,000 | 1,123,178 | ||||||
Bank of Communications Co. Ltd. Class H | 269,000 | 196,453 | ||||||
BBMG Corp. Class H | 38,000 | 28,340 | ||||||
Beijing Capital International Airport Co. Ltd. Class H | 48,000 | 37,532 | ||||||
Beijing Enterprises Holdings Ltd. | 15,500 | 133,597 | ||||||
Beijing Enterprises Water Group Ltd. | 130,000 | 88,566 | ||||||
Belle International Holdings Ltd. | 140,000 | 179,016 | ||||||
Biostime International Holdings Ltd. | 5,000 | 18,677 | ||||||
Brilliance China Automotive Holdings Ltd. | 92,000 | 170,464 | ||||||
BYD Co. Ltd. Class Hb | 19,000 | 134,959 | ||||||
China Agri-Industries Holdings Ltd. | 69,800 | 28,550 | ||||||
China BlueChemical Ltd. Class H | 46,000 | 22,673 | ||||||
China Cinda Asset Management Co. Ltd.a | 153,000 | 78,374 | ||||||
China CITIC Bank Corp. Ltd. Class H | 248,000 | 156,477 | ||||||
China Coal Energy Co. Class Hb | 125,000 | 76,128 | ||||||
China Communications Construction Co. Ltd. Class H | 129,000 | 94,043 | ||||||
China Communications Services Corp. Ltd. Class H | 66,000 | 31,850 | ||||||
China Construction Bank Corp. Class H | 2,182,000 | 1,621,687 | ||||||
China COSCO Holdings Co. Ltd. Class Ha | 85,500 | 36,847 | ||||||
China Everbright Bank Co. Ltd. | 91,000 | 42,505 | ||||||
China Everbright International Ltd.b | 75,000 | 102,772 | ||||||
| Security | Shares | Value | ||||||
China Everbright Ltd.b | 26,000 | $ | 49,315 | |||||
China Gas Holdings Ltd. | 60,000 | 106,837 | ||||||
China Huishan Dairy Holdings Co. Ltd.a,b | 182,000 | 42,270 | ||||||
China International Marine Containers (Group) Co. Ltd. Class H | 15,800 | 34,005 | ||||||
China Life Insurance Co. Ltd. Class H | 224,000 | 643,084 | ||||||
China Longyuan Power Group Corp. Ltd. Class H | 87,000 | 94,070 | ||||||
China Mengniu Dairy Co. Ltd. | 41,000 | 190,183 | ||||||
China Merchants Bank Co. Ltd. Class H | 138,831 | 265,476 | ||||||
China Merchants Holdings (International) Co. Ltd.b | 36,000 | 119,378 | ||||||
China Minsheng Banking Corp. Ltd. Class H | 188,800 | 177,347 | ||||||
China Mobile Ltd. | 183,500 | 2,282,459 | ||||||
China National Building Material Co. Ltd. Class H | 86,000 | 79,007 | ||||||
China Oilfield Services Ltd. Class H | 54,000 | 159,907 | ||||||
China Overseas Land & Investment Ltd.b | 122,000 | 343,168 | ||||||
China Pacific Insurance (Group) Co. Ltd. Class H | 79,600 | 298,879 | ||||||
China Petroleum & Chemical Corp. Class H | 766,600 | 777,466 | ||||||
China Railway Construction Corp. Ltd. Class H | 61,000 | 58,401 | ||||||
China Railway Group Ltd. Class H | 120,000 | 62,089 | ||||||
China Resources Cement Holdings Ltd.b | 60,000 | 41,264 | ||||||
China Resources Enterprise Ltd. | 36,000 | 96,850 | ||||||
China Resources Gas Group Ltd. | 26,000 | 75,650 | ||||||
China Resources Land Ltd. | 62,000 | 141,917 | ||||||
China Resources Power Holdings Co. Ltd. | 58,000 | 175,493 | ||||||
China Shenhua Energy Co. Ltd. Class H | 102,000 | 294,149 | ||||||
China Shipping Container Lines Co. Ltd. Class Ha | 117,000 | 33,363 | ||||||
China State Construction International Holdings Ltd. | 50,000 | 80,644 | ||||||
China Taiping Insurance Holdings Co. Ltd.a | 25,800 | 62,784 | ||||||
CONSOLIDATED SCHEDULESOF INVESTMENTS | 29 |
Table of Contents
Consolidated Schedule of Investments (Continued)
iSHARES® MSCI EMERGING MARKETS ASIA ETF
August 31, 2014
| Security | Shares | Value | ||||||
China Telecom Corp. Ltd. Class H | 416,000 | $ | 257,110 | |||||
China Unicom (Hong Kong) Ltd. | 142,000 | 253,213 | ||||||
China Vanke Co. Ltd.a | 41,600 | 77,938 | ||||||
Chongqing Changan Automobile Co. Ltd. | 24,900 | 51,405 | ||||||
Chongqing Rural Commercial Bank Co. Ltd. Class H | 68,000 | 33,780 | ||||||
CITIC 21CN Co. Ltd.a | 74,000 | 58,244 | ||||||
CITIC Pacific Ltd.b | 66,000 | 128,421 | ||||||
CITIC Securities Co. Ltd. Class H | 31,500 | 74,786 | ||||||
CNOOC Ltd. | 536,000 | 1,077,512 | ||||||
COSCO Pacific Ltd. | 52,000 | 72,866 | ||||||
Country Garden Holdings Co. Ltd.b | 139,964 | 62,125 | ||||||
CSPC Pharmaceutical Group Ltd. | 50,000 | 41,806 | ||||||
CSR Corp Ltd. Class H | 63,000 | 56,821 | ||||||
Datang International Power Generation Co. Ltd. Class H | 86,000 | 47,715 | ||||||
Dongfeng Motor Group Co. Ltd. Class H | 82,000 | 151,935 | ||||||
ENN Energy Holdings Ltd. | 22,000 | 155,416 | ||||||
Evergrande Real Estate Group Ltd.b | 177,000 | 73,996 | ||||||
Far East Horizon Ltd. | 45,000 | 36,290 | ||||||
Fosun International Ltd. | 53,000 | 65,103 | ||||||
Franshion Properties (China) Ltd. | 100,000 | 27,096 | ||||||
GCL-Poly Energy Holdings Ltd.a | 294,000 | 105,838 | ||||||
Geely Automobile Holdings Ltd. | 160,000 | 61,315 | ||||||
Golden Eagle Retail Group Ltd.b | 14,000 | 17,215 | ||||||
GOME Electrical Appliances Holdings Ltd. | 288,000 | 51,282 | ||||||
Great Wall Motor Co. Ltd. Class H | 31,000 | 131,597 | ||||||
Guangdong Investment Ltd. | 80,000 | 96,721 | ||||||
Guangzhou Automobile Group Co. Ltd. Class H | 68,000 | 70,719 | ||||||
Guangzhou R&F Properties Co. Ltd. Class H | 33,600 | 40,493 | ||||||
Haier Electronics Group Co. Ltd. | 31,000 | 89,598 | ||||||
Haitian International Holdings Ltd. | 19,000 | 49,522 | ||||||
Haitong Securities Co. Ltd. Class H | 40,800 | 65,173 | ||||||
Hanergy Solar Group Ltd.a,b | 352,000 | 57,681 | ||||||
Hengan International Group Co. Ltd. | 22,000 | 234,615 | ||||||
Huaneng Power International Inc. Class H | 96,000 | 115,446 | ||||||
Industrial and Commercial Bank of China Ltd. Class H | 2,236,000 | 1,482,944 | ||||||
Inner Mongolia Yitai Coal Co. Ltd. Class B | 30,900 | 52,190 | ||||||
| Security | Shares | Value | ||||||
Intime Retail Group Co. Ltd.b | 40,000 | $ | 36,386 | |||||
Jiangsu Expressway Co. Ltd. Class H | 36,000 | 41,016 | ||||||
Jiangxi Copper Co. Ltd. Class H | 40,000 | 70,708 | ||||||
Kingboard Chemical Holdings Co. Ltd. | 18,200 | 37,808 | ||||||
Kingsoft Corp. Ltd.b | 20,000 | 57,289 | ||||||
Kunlun Energy Co. Ltd. | 96,000 | 158,552 | ||||||
Lee & Man Paper Manufacturing Ltd. | 43,000 | 25,300 | ||||||
Lenovo Group Ltd. | 186,000 | 284,154 | ||||||
Longfor Properties Co. Ltd. | 42,000 | 53,651 | ||||||
New China Life Insurance Co. Ltd. Class H | 26,600 | 94,900 | ||||||
New World China Land Ltd. | 78,000 | 47,806 | ||||||
Nine Dragons Paper (Holdings) Ltd.b | 46,000 | 35,909 | ||||||
People’s Insurance Co. Group of China Ltd. Class H | 192,000 | 80,267 | ||||||
PetroChina Co. Ltd. Class H | 634,000 | 899,854 | ||||||
PICC Property and Casualty Co. Ltd. Class H | 98,000 | 162,614 | ||||||
Ping An Insurance (Group) Co. of China Ltd. Class H | 61,000 | 496,648 | ||||||
Poly Property Group Co. Ltd.b | 66,000 | 28,699 | ||||||
Shandong Weigao Group Medical Polymer Co. Ltd. Class H | 56,000 | 56,721 | ||||||
Shanghai Electric Group Co. Ltd. Class H | 82,000 | 35,974 | ||||||
Shanghai Fosun Pharmaceutical (Group) Co. Ltd. | 13,000 | 42,270 | ||||||
Shanghai Industrial Holdings Ltd. | 15,000 | 50,031 | ||||||
Shanghai Pharmaceuticals Holding Co. Ltd. Class H | 21,800 | 44,724 | ||||||
Shenzhou International Group Holdings Ltd. | 16,000 | 49,857 | ||||||
Shimao Property Holdings Ltd.b | 42,000 | 92,452 | ||||||
Shui On Land Ltd. | 121,500 | 31,825 | ||||||
Sihuan Pharmaceutical Holdings Group Ltd. | 124,000 | 83,038 | ||||||
Sino Biopharmaceutical Ltd. | 88,000 | 81,072 | ||||||
Sino-Ocean Land Holdings Ltd.b | 100,000 | 56,515 | ||||||
Sinopec Engineering Group Co. Ltd. | 30,500 | 34,789 | ||||||
Sinopec Shanghai Petrochemical Co. Ltd. Class H | 111,000 | 37,095 | ||||||
Sinopharm Group Co. Ltd. Class H | 30,000 | 104,708 | ||||||
SOHO China Ltd. | 59,000 | 48,265 | ||||||
Sun Art Retail Group Ltd.b | 73,500 | 87,724 | ||||||
| 30 | 2014 iSHARES ANNUAL REPORTTO SHAREHOLDERS |
Table of Contents
Consolidated Schedule of Investments (Continued)
iSHARES® MSCI EMERGING MARKETS ASIA ETF
August 31, 2014
| Security | Shares | Value | ||||||
Tencent Holdings Ltd. | 154,600 | $ | 2,523,422 | |||||
Tingyi (Cayman Islands) Holding Corp. | 60,000 | 168,384 | ||||||
Tsingtao Brewery Co. Ltd. Class H | 10,000 | 75,934 | ||||||
Uni-President China Holdings Ltd.b | 38,600 | 34,864 | ||||||
Want Want China Holdings Ltd. | 179,000 | 221,956 | ||||||
Weichai Power Co. Ltd. Class Hb | 14,800 | 59,963 | ||||||
Yanzhou Coal Mining Co. Ltd. Class Hb | 60,000 | 50,786 | ||||||
Yingde Gases Group Co. Ltd. | 30,000 | 32,090 | ||||||
Yuexiu Property Co. Ltd. | 158,000 | 33,842 | ||||||
Zhejiang Expressway Co. Ltd. Class H | 46,000 | 45,762 | ||||||
Zhongsheng Group Holdings Ltd. | 21,500 | 23,830 | ||||||
Zhuzhou CSR Times Electric Co. Ltd. Class H | 16,500 | 57,163 | ||||||
Zijin Mining Group Co. Ltd. Class H | 182,000 | 47,437 | ||||||
Zoomlion Heavy Industry Science and Technology Co. Ltd. Class Hb | 38,000 | 23,682 | ||||||
ZTE Corp. Class H | 18,000 | 40,551 | ||||||
|
| |||||||
| 24,545,394 | ||||||||
INDIA — 10.61% | ||||||||
ACC Ltd. | 507 | 12,471 | ||||||
Adani Enterprises Ltd. | 3,848 | 30,369 | ||||||
Adani Ports & Special Economic Zone Ltd. | 15,060 | 70,200 | ||||||
Aditya Birla Nuvo Ltd. | 1,040 | 24,917 | ||||||
Ambuja Cements Ltd. | 19,711 | 67,014 | ||||||
Apollo Hospitals Enterprise Ltd. | 2,172 | 41,994 | ||||||
Asian Paints Ltd. | 8,819 | 90,719 | ||||||
Aurobindo Pharma Ltd. | 3,978 | 53,596 | ||||||
Bajaj Auto Ltd. | 2,561 | 95,328 | ||||||
Bharat Heavy Electricals Ltd. | 17,488 | 69,427 | ||||||
Bharat Petroleum Corp. Ltd. | 5,366 | 61,398 | ||||||
Bharti Airtel Ltd. | 18,635 | 113,567 | ||||||
Cairn India Ltd. | 14,166 | 76,164 | ||||||
Cipla Ltd. | 10,085 | 85,460 | ||||||
Coal India Ltd. | 14,872 | 87,276 | ||||||
Dabur India Ltd. | 14,335 | 54,949 | ||||||
Divi’s Laboratories Ltd. | 1,117 | 28,804 | ||||||
DLF Ltd. | 12,948 | 37,833 | ||||||
Dr. Reddy’s Laboratories Ltd. | 3,565 | 173,192 | ||||||
GAIL (India) Ltd. | 9,167 | 66,985 | ||||||
GlaxoSmithKline Consumer Healthcare Ltd. | 316 | 27,770 | ||||||
| Security | Shares | Value | ||||||
Godrej Consumer Products Ltd. | 3,620 | $ | 58,819 | |||||
HCL Technologies Ltd. | 7,390 | 198,603 | ||||||
HDFC Bank Ltd. | 11,856 | 164,818 | ||||||
Hero Motocorp Ltd. | 1,260 | 54,088 | ||||||
Hindalco Industries Ltd. | 32,076 | 89,916 | ||||||
Hindustan Unilever Ltd. | 22,988 | 281,270 | ||||||
Housing Development Finance Corp. Ltd. | 44,846 | 794,117 | ||||||
ICICI Bank Ltd. | 6,716 | 172,305 | ||||||
Idea Cellular Ltd. | 31,125 | 83,044 | ||||||
Infosys Ltd. | 13,881 | 823,252 | ||||||
ITC Ltd. | 67,466 | 395,034 | ||||||
Jaiprakash Associates Ltd. | 33,607 | 25,754 | ||||||
Jindal Steel & Power Ltd. | 11,155 | 42,833 | ||||||
JSW Steel Ltd. | 2,609 | 53,470 | ||||||
Larsen & Toubro Ltd. | 9,480 | 238,484 | ||||||
LIC Housing Finance Ltd. | 8,917 | 44,475 | ||||||
Mahindra & Mahindra Financial Services Ltd. | 7,962 | 36,648 | ||||||
Mahindra & Mahindra Ltd. | 10,247 | 237,633 | ||||||
Nestle India Ltd. | 692 | 68,750 | ||||||
NTPC Ltd. | 50,194 | 113,656 | ||||||
Oil & Natural Gas Corp. Ltd. | 23,355 | 167,426 | ||||||
Oil India Ltd. | 3,836 | 38,904 | ||||||
Piramal Enterprises Ltd. | 1,914 | 21,738 | ||||||
Power Finance Corp. Ltd. | 7,644 | 31,506 | ||||||
Power Grid Corp. of India Ltd. | 24,135 | 51,388 | ||||||
Ranbaxy Laboratories Ltd.a | 3,738 | 39,468 | ||||||
Reliance Capital Ltd. | 2,646 | 23,059 | ||||||
Reliance Communications Ltd. | 25,961 | 49,629 | ||||||
Reliance Industries Ltd. | 38,998 | 641,847 | ||||||
Reliance Infrastructure Ltd. | 3,265 | 37,627 | ||||||
Reliance Power Ltd.a | 15,274 | 18,765 | ||||||
Rural Electrification Corp. Ltd. | 9,320 | 41,217 | ||||||
Sesa Sterlite Ltd. | 35,538 | 162,316 | ||||||
Shriram Transport Finance Co. Ltd. | 4,482 | 66,783 | ||||||
Siemens Ltd. | 2,028 | 26,546 | ||||||
State Bank of India | 4,566 | 185,161 | ||||||
Sun Pharmaceuticals Industries Ltd. | 21,947 | 309,330 | ||||||
Tata Consultancy Services Ltd. | 14,203 | 590,391 | ||||||
Tata Motors Ltd. | 22,823 | 197,482 | ||||||
Tata Power Co. Ltd. | 35,410 | 50,536 | ||||||
Tata Steel Ltd. | 8,795 | 74,376 | ||||||
Tech Mahindra Ltd. | 1,715 | 66,786 | ||||||
Ultratech Cement Ltd. | 1,096 | 46,059 | ||||||
CONSOLIDATED SCHEDULESOF INVESTMENTS | 31 |
Table of Contents
Consolidated Schedule of Investments (Continued)
iSHARES® MSCI EMERGING MARKETS ASIA ETF
August 31, 2014
| Security | Shares | Value | ||||||
United Breweries Ltd. | 2,054 | $ | 23,940 | |||||
United Spirits Ltd. | 1,349 | 53,312 | ||||||
Wipro Ltd. | 18,672 | 173,935 | ||||||
Yes Bank Ltd. | 3,042 | 28,678 | ||||||
|
| |||||||
| 8,564,607 | ||||||||
INDONESIA — 4.05% | ||||||||
PT Adaro Energy Tbk | 447,500 | 50,307 | ||||||
PT Astra Agro Lestari Tbk | 12,600 | 27,467 | ||||||
PT Astra International Tbk | 607,100 | 393,142 | ||||||
PT Bank Central Asia Tbk | 370,100 | 354,359 | ||||||
PT Bank Danamon Indonesia Tbk | 108,400 | 34,751 | ||||||
PT Bank Mandiri (Persero) Tbk | 280,800 | 249,053 | ||||||
PT Bank Negara Indonesia (Persero) Tbk | 236,900 | 108,349 | ||||||
PT Bank Rakyat Indonesia (Persero) Tbk | 333,500 | 315,040 | ||||||
PT Bukit Asam (Persero) Tbk | 21,600 | 24,651 | ||||||
PT Bumi Serpong Damai Tbk | 199,600 | 27,387 | ||||||
PT Charoen Pokphand Indonesia Tbk | 211,100 | 69,389 | ||||||
PT Global Mediacom Tbk | 184,600 | 30,537 | ||||||
PT Gudang Garam Tbk | 14,500 | 66,937 | ||||||
PT Indo Tambangraya Megah Tbk | 12,500 | 30,108 | ||||||
PT Indocement Tunggal Prakarsa Tbk | 46,400 | 96,192 | ||||||
PT Indofood CBP Sukses Makmur Tbk | 39,700 | 35,636 | ||||||
PT Indofood Sukses Makmur Tbk | 124,500 | 73,173 | ||||||
PT Jasa Marga (Persero) Tbk | 55,300 | 29,311 | ||||||
PT Kalbe Farma Tbk | 666,500 | 94,583 | ||||||
PT Lippo Karawaci Tbk | 598,700 | 54,765 | ||||||
PT Matahari Department Store Tbk | 59,400 | 82,645 | ||||||
PT Media Nusantara Citra Tbk | 137,800 | 33,044 | ||||||
PT Perusahaan Gas Negara (Persero) Tbk | 330,000 | 163,625 | ||||||
PT Semen Gresik (Persero) Tbk | 91,000 | 126,221 | ||||||
PT Surya Citra Media Tbk | 136,300 | 47,890 | ||||||
PT Telekomunikasi Indonesia (Persero) Tbk | 1,505,000 | 342,879 | ||||||
PT Tower Bersama Infrastructure Tbk | 60,600 | 40,797 | ||||||
PT Unilever Indonesia Tbk | 47,100 | 124,922 | ||||||
PT United Tractors Tbk | 49,400 | 93,542 | ||||||
PT XL Axiata Tbk | 97,400 | 49,543 | ||||||
|
| |||||||
| 3,270,245 | ||||||||
MALAYSIA — 6.07% | ||||||||
AirAsia Bhd | 34,000 | 25,996 | ||||||
Alliance Financial Group Bhd | 31,200 | 48,107 | ||||||
AMMB Holdings Bhd | 61,500 | 130,336 | ||||||
| Security | Shares | Value | ||||||
Astro Malaysia Holdings Bhd | 47,700 | $ | 49,637 | |||||
Axiata Group Bhd | 80,600 | 177,207 | ||||||
Berjaya Sports Toto Bhd | 17,237 | 20,562 | ||||||
British American Tobacco (Malaysia) Bhd | 3,700 | 84,518 | ||||||
Bumi Armada Bhda | 29,000 | 27,141 | ||||||
CIMB Group Holdings Bhd | 151,700 | 355,186 | ||||||
Dialog Group Bhd | 106,378 | 58,386 | ||||||
DiGi.Com Bhd | 92,600 | 168,337 | ||||||
Felda Global Ventures Holdings Bhd | 38,800 | 47,023 | ||||||
Gamuda Bhd | 50,000 | 76,618 | ||||||
Genting Bhd | 62,500 | 189,959 | ||||||
Genting Malaysia Bhd | 90,200 | 129,062 | ||||||
Genting Plantations Bhd | 5,300 | 16,916 | ||||||
Hong Leong Bank Bhd | 18,400 | 84,061 | ||||||
Hong Leong Financial Group Bhd | 7,000 | 37,843 | ||||||
IHH Healthcare Bhd | 77,100 | 119,368 | ||||||
IJM Corp. Bhd | 33,000 | 68,052 | ||||||
IOI Corp. Bhd | 89,300 | 135,423 | ||||||
IOI Properties Group Bhda | 41,999 | 32,778 | ||||||
Kuala Lumpur Kepong Bhd | 13,700 | 95,796 | ||||||
Lafarge Malaysia Bhd | 10,900 | 35,273 | ||||||
Malayan Banking Bhd | 136,900 | 438,671 | ||||||
Malaysia Airports Holdings Bhd | 21,200 | 51,789 | ||||||
Maxis Bhd | 57,400 | 119,280 | ||||||
MISC Bhd | 33,000 | 72,030 | ||||||
MMC Corp. Bhd | 20,200 | 15,829 | ||||||
Petronas Chemicals Group Bhd | 83,700 | 167,294 | ||||||
Petronas Dagangan Bhd | 7,800 | 49,740 | ||||||
Petronas Gas Bhd | 21,300 | 154,074 | ||||||
PPB Group Bhd | 13,600 | 63,772 | ||||||
Public Bank Bhd | 82,610 | 505,305 | ||||||
RHB Capital Bhd | 14,600 | 42,475 | ||||||
Sapurakencana Petroleum Bhd | 110,700 | 148,209 | ||||||
Sime Darby Bhd | 91,200 | 273,716 | ||||||
Telekom Malaysia Bhd | 31,300 | 63,156 | ||||||
Tenaga Nasional Bhd | 84,700 | 332,673 | ||||||
UEM Sunrise Bhd | 47,400 | 28,873 | ||||||
UMW Holdings Bhd | 17,400 | 68,231 | ||||||
YTL Corp. Bhd | 129,653 | 66,636 | ||||||
YTL Power International Bhda | 53,915 | 25,486 | ||||||
|
| |||||||
| 4,900,824 | ||||||||
PHILIPPINES — 1.78% | ||||||||
Aboitiz Equity Ventures Inc. | 61,110 | 76,738 | ||||||
Aboitiz Power Corp. | 45,000 | 38,704 | ||||||
| 32 | 2014 iSHARES ANNUAL REPORTTO SHAREHOLDERS |
Table of Contents
Consolidated Schedule of Investments (Continued)
iSHARES® MSCI EMERGING MARKETS ASIA ETF
August 31, 2014
| Security | Shares | Value | ||||||
Alliance Global Group Inc. | 65,500 | $ | 36,956 | |||||
Ayala Corp. | 6,110 | 98,166 | ||||||
Ayala Land Inc. | 201,400 | 152,436 | ||||||
Bank of the Philippine Islands | 23,520 | 51,248 | ||||||
BDO Unibank Inc. | 47,840 | 99,301 | ||||||
DMCI Holdings Inc. | 25,000 | 45,871 | ||||||
Energy Development Corp. | 270,600 | 45,121 | ||||||
Globe Telecom Inc. | 1,050 | 43,349 | ||||||
International Container Terminal Services Inc. | 15,640 | 40,499 | ||||||
JG Summit Holdings Inc. | 76,556 | 90,340 | ||||||
Jollibee Foods Corp. | 12,710 | 52,472 | ||||||
Megaworld Corp. | 330,000 | 33,076 | ||||||
Metro Pacific Investments Corp. | 340,000 | 40,160 | ||||||
Metropolitan Bank & Trust Co. | 7,364 | 14,517 | ||||||
Philippine Long Distance Telephone Co. | 2,870 | 227,099 | ||||||
SM Investments Corp. | 4,523 | 80,086 | ||||||
SM Prime Holdings Inc. | 192,950 | 71,604 | ||||||
Universal Robina Corp. | 26,610 | 99,177 | ||||||
|
| |||||||
| 1,436,920 | ||||||||
SOUTH KOREA — 22.96% | ||||||||
AmorePacific Corp. | 98 | 203,935 | ||||||
AmorePacific Group | 88 | 91,823 | ||||||
BS Financial Group Inc. | 5,803 | 96,149 | ||||||
Celltrion Inc.a,b | 1,889 | 77,594 | ||||||
Cheil Worldwide Inc.a | 2,431 | 55,024 | ||||||
CJ CheilJedang Corp. | 241 | 89,845 | ||||||
CJ Corp. | 448 | 79,089 | ||||||
Coway Co. Ltd. | 1,629 | 136,721 | ||||||
Daelim Industrial Co. Ltd. | 840 | 72,406 | ||||||
Daewoo Engineering & Construction Co. Ltd.a | 3,276 | 27,528 | ||||||
Daewoo International Corp. | 1,460 | 53,637 | ||||||
Daewoo Securities Co. Ltd.a | 6,253 | 72,770 | ||||||
Daewoo Shipbuilding & Marine Engineering Co. Ltd. | 3,258 | 79,847 | ||||||
DGB Financial Group Inc. | 1,920 | 33,516 | ||||||
Dongbu Insurance Co. Ltd. | 1,330 | 80,276 | ||||||
Doosan Corp. | 301 | 35,772 | ||||||
Doosan Heavy Industries & Construction Co. Ltd. | 1,904 | 54,175 | ||||||
Doosan Infracore Co. Ltd.a | 4,415 | 51,598 | ||||||
E-Mart Co. Ltd. | 649 | 156,177 | ||||||
GS Engineering & Construction Corp.a | 1,480 | 53,788 | ||||||
| Security | Shares | Value | ||||||
GS Holdings Corp. | 1,605 | $ | 68,145 | |||||
Halla Visteon Climate Control Corp. | 1,168 | 62,089 | ||||||
Hana Financial Group Inc. | 8,750 | 367,190 | ||||||
Hankook Tire Co. Ltd. | 2,243 | 116,359 | ||||||
Hanwha Chemical Corp. | 3,454 | 55,866 | ||||||
Hanwha Corp. | 1,505 | 44,900 | ||||||
Hanwha Life Insurance Co. Ltd. | 7,971 | 54,715 | ||||||
Hite Jinro Co. Ltd. | 1,002 | 22,828 | ||||||
Hotel Shilla Co. Ltd. | 1,014 | 119,006 | ||||||
Hyosung Corp. | 736 | 56,909 | ||||||
Hyundai Department Store Co. Ltd. | 476 | 74,408 | ||||||
Hyundai Development Co. Engineering & Construction | 1,700 | 69,076 | ||||||
Hyundai Engineering & Construction Co. Ltd. | 2,307 | 145,389 | ||||||
Hyundai Glovis Co. Ltd. | 410 | 122,319 | ||||||
Hyundai Heavy Industries Co. Ltd. | 1,285 | 182,494 | ||||||
Hyundai Marine & Fire Insurance Co. Ltd. | 840 | 25,806 | ||||||
Hyundai Merchant Marine Co. Ltd.a | 2,034 | 24,674 | ||||||
Hyundai Mipo Dockyard Co. Ltd.b | 348 | 44,274 | ||||||
Hyundai Mobis Co. Ltd. | 2,065 | 598,757 | ||||||
Hyundai Motor Co. | 4,648 | 1,068,084 | ||||||
Hyundai Steel Co. | 2,173 | 162,233 | ||||||
Hyundai Wia Corp. | 466 | 102,488 | ||||||
Industrial Bank of Korea | 7,415 | 128,709 | ||||||
Kangwon Land Inc. | 3,716 | 132,119 | ||||||
KB Financial Group Inc. | 9,038 | 370,362 | ||||||
KCC Corp. | 143 | 96,325 | ||||||
Kia Motors Corp. | 8,017 | 483,890 | ||||||
Korea Aerospace Industries Ltd. | 1,477 | 52,368 | ||||||
Korea Electric Power Corp. | 7,750 | 322,550 | ||||||
Korea Gas Corp.a | 913 | 50,785 | ||||||
Korea Investment Holdings Co. Ltd. | 1,313 | 65,912 | ||||||
Korea Zinc Co. Ltd. | 266 | 110,314 | ||||||
Korean Air Lines Co. Ltd.a | 843 | 30,305 | ||||||
KT Corp. | 2,065 | 71,281 | ||||||
KT&G Corp. | 3,315 | 310,265 | ||||||
Kumho Petro Chemical Co. Ltd. | 393 | 31,511 | ||||||
LG Chem Ltd. | 1,430 | 380,083 | ||||||
LG Corp. | 2,966 | 207,396 | ||||||
LG Display Co. Ltd.a | 7,124 | 246,261 | ||||||
LG Electronics Inc. | 3,237 | 241,350 | ||||||
LG Household & Health Care Ltd. | 289 | 146,217 | ||||||
LG Innotek Co. Ltd.a | 363 | 48,152 | ||||||
CONSOLIDATED SCHEDULESOF INVESTMENTS | 33 |
Table of Contents
Consolidated Schedule of Investments (Continued)
iSHARES® MSCI EMERGING MARKETS ASIA ETF
August 31, 2014
| Security | Shares | Value | ||||||
LG Uplus Corp. | 6,893 | $ | 74,440 | |||||
Lotte Chemical Corp. | 471 | 75,949 | ||||||
Lotte Confectionery Co. Ltd. | 23 | 49,223 | ||||||
Lotte Shopping Co. Ltd. | 352 | 115,256 | ||||||
LS Corp. | 600 | 41,422 | ||||||
LS Industrial Systems Co. Ltd. | 467 | 28,832 | ||||||
Mirae Asset Securities Co. Ltd. | 720 | 34,404 | ||||||
NAVER Corp. | 846 | 640,789 | ||||||
NCsoft Corp. | 460 | 65,782 | ||||||
OCI Co. Ltd.a | 520 | 74,619 | ||||||
ORION Corp. | 108 | 92,987 | ||||||
Paradise Co. Ltd. | 1,313 | 50,891 | ||||||
POSCO | 1,974 | 650,245 | ||||||
S-Oil Corp. | 1,445 | 66,767 | ||||||
S1 Corp. | 558 | 40,724 | ||||||
Samsung C&T Corp. | 3,772 | 277,520 | ||||||
Samsung Card Co. Ltd. | 1,216 | 58,464 | ||||||
Samsung Electro-Mechanics Co. Ltd. | 1,805 | 97,731 | ||||||
Samsung Electronics Co. Ltd. | 3,334 | 4,057,553 | ||||||
Samsung Engineering Co. Ltd.a | 860 | 54,198 | ||||||
Samsung Fire & Marine Insurance Co. Ltd. | 1,014 | 277,514 | ||||||
Samsung Heavy Industries Co. Ltd. | 4,888 | 131,365 | ||||||
Samsung Life Insurance Co. Ltd. | 1,866 | 195,995 | ||||||
Samsung SDI Co. Ltd. | 1,660 | 248,030 | ||||||
Samsung Securities Co. Ltd. | 1,846 | 90,211 | ||||||
Samsung Techwin Co. Ltd. | 1,018 | 42,820 | ||||||
Shinhan Financial Group Co. Ltd. | 11,855 | 613,825 | ||||||
Shinsegae Co. Ltd. | 230 | 52,853 | ||||||
SK C&C Co. Ltd. | 623 | 130,566 | ||||||
SK Holdings Co. Ltd. | 818 | 129,483 | ||||||
SK Hynix Inc.a | 17,137 | 767,316 | ||||||
SK Innovation Co. Ltd. | 1,838 | 170,576 | ||||||
SK Networks Co. Ltd.a | 3,278 | 31,779 | ||||||
SK Telecom Co. Ltd. | 302 | 81,312 | ||||||
Woori Finance Holdings Co. Ltd.a | 9,764 | 132,408 | ||||||
Woori Investment & Securities Co. Ltd. | 4,156 | 48,571 | ||||||
Yuhan Corp. | 107 | 18,256 | ||||||
|
| |||||||
| 18,526,510 | ||||||||
TAIWAN — 19.00% | ||||||||
Acer Inc.a | 80,000 | 66,242 | ||||||
Advanced Semiconductor Engineering Inc. | 185,434 | 231,091 | ||||||
Advantech Co. Ltd. | 9,000 | 84,458 | ||||||
| Security | Shares | Value | ||||||
Asia Cement Corp. | 63,229 | $ | 86,730 | |||||
Asia Pacific Telecom Co. Ltd. | 63,000 | 40,678 | ||||||
ASUSTeK Computer Inc. | 21,000 | 219,903 | ||||||
AU Optronics Corp. | 266,000 | 132,152 | ||||||
Catcher Technology Co. Ltd. | 19,000 | 192,603 | ||||||
Cathay Financial Holding Co. Ltd. | 245,944 | 419,636 | ||||||
Chailease Holding Co. Ltd. | 27,170 | 73,446 | ||||||
Chang Hwa Commercial Bank Ltd. | 154,655 | 96,237 | ||||||
Cheng Shin Rubber Industry Co. Ltd. | 48,776 | 112,596 | ||||||
Chicony Electronics Co. Ltd. | 15,599 | 51,143 | ||||||
China Airlines Ltd.a | 73,000 | 24,422 | ||||||
China Development Financial Holding Corp. | 414,200 | 139,958 | ||||||
China Life Insurance Co. Ltd. | 85,388 | 79,273 | ||||||
China Motor Co. Ltd. | 14,000 | 13,396 | ||||||
China Steel Corp. | 347,866 | 300,261 | ||||||
Chunghwa Telecom Co. Ltd. | 113,000 | 351,205 | ||||||
Clevo Co. | 12,322 | 23,291 | ||||||
Compal Electronics Inc. | 128,000 | 113,909 | ||||||
CTBC Financial Holding Co. Ltd. | 400,218 | 291,221 | ||||||
CTCI Corp. | 20,000 | 35,797 | ||||||
Delta Electronics Inc. | 54,000 | 379,385 | ||||||
E.Sun Financial Holding Co. Ltd. | 194,295 | 127,729 | ||||||
Eclat Textile Co. Ltd. | 5,200 | 43,492 | ||||||
Epistar Corp. | 27,000 | 58,714 | ||||||
EVA Airways Corp.a | 64,000 | 32,117 | ||||||
Evergreen Marine Corp. Ltd.a | 48,000 | 29,307 | ||||||
Far Eastern Department Stores Ltd. | 34,546 | 34,788 | ||||||
Far Eastern New Century Corp. | 98,589 | 105,712 | ||||||
Far EasTone Telecommunications Co. Ltd. | 48,000 | 102,293 | ||||||
Farglory Land Development Co. Ltd. | 8,530 | 11,843 | ||||||
First Financial Holding Co. Ltd. | 228,885 | 141,663 | ||||||
Formosa Chemicals & Fibre Corp. | 96,950 | 241,317 | ||||||
Formosa International Hotels Corp. | 1,210 | 13,602 | ||||||
Formosa Petrochemical Corp. | 34,000 | 85,880 | ||||||
Formosa Plastics Corp. | 123,400 | 319,951 | ||||||
Formosa Taffeta Co. Ltd. | 25,000 | 26,555 | ||||||
Foxconn Technology Co. Ltd. | 26,370 | 66,167 | ||||||
Fubon Financial Holding Co. Ltd. | 198,396 | 323,906 | ||||||
Giant Manufacturing Co. Ltd. | 9,000 | 74,823 | ||||||
Hermes Microvision Inc. | 1,000 | 42,990 | ||||||
Highwealth Construction Corp. | 16,800 | 29,789 | ||||||
Hiwin Technologies Corp. | 5,348 | 52,245 | ||||||
Hon Hai Precision Industry Co. Ltd. | 374,528 | 1,278,060 | ||||||
| 34 | 2014 iSHARES ANNUAL REPORTTO SHAREHOLDERS |
Table of Contents
Consolidated Schedule of Investments (Continued)
iSHARES® MSCI EMERGING MARKETS ASIA ETF
August 31, 2014
| Security | Shares | Value | ||||||
Hotai Motor Co. Ltd. | 7,000 | $ | 98,476 | |||||
HTC Corp. | 20,000 | 92,003 | ||||||
Hua Nan Financial Holdings Co. Ltd. | 188,093 | 116,730 | ||||||
Innolux Corp. | 238,620 | 121,344 | ||||||
Inotera Memories Inc.a | 68,000 | 111,246 | ||||||
Inventec Corp. | 71,980 | 56,591 | ||||||
Kinsus Interconnect Technology Corp. | 8,000 | 33,857 | ||||||
Largan Precision Co. Ltd. | 3,000 | 248,407 | ||||||
Lite-On Technology Corp. | 65,615 | 108,771 | ||||||
MediaTek Inc. | 42,176 | 704,803 | ||||||
Mega Financial Holding Co. Ltd. | 303,542 | 262,002 | ||||||
Merida Industry Co. Ltd. | 7,350 | 54,097 | ||||||
Nan Ya Plastics Corp. | 142,090 | 335,135 | ||||||
Novatek Microelectronics Corp. Ltd. | 17,000 | 87,302 | ||||||
Pegatron Corp. | 51,000 | 108,175 | ||||||
Phison Electronics Corp. | 4,000 | 28,972 | ||||||
Pou Chen Corp. | 64,000 | 73,977 | ||||||
Powertech Technology Inc. | 23,000 | 43,629 | ||||||
President Chain Store Corp. | 18,000 | 136,398 | ||||||
Quanta Computer Inc. | 80,000 | 225,891 | ||||||
Radiant Opto-Electronics Corp. | 13,363 | 57,671 | ||||||
Realtek Semiconductor Corp. | 14,140 | 51,564 | ||||||
Ruentex Development Co. Ltd. | 18,633 | 33,475 | ||||||
Ruentex Industries Ltd. | 14,855 | 36,031 | ||||||
ScinoPharm Taiwan Ltd. | 9,526 | 19,441 | ||||||
Shin Kong Financial Holding Co. Ltd. | 221,282 | 72,180 | ||||||
Siliconware Precision Industries Co. Ltd. | 90,000 | 131,279 | ||||||
Simplo Technology Co. Ltd. | 9,200 | 51,709 | ||||||
SinoPac Financial Holdings Co. Ltd. | 226,748 | 103,548 | ||||||
Standard Foods Corp. | 9,103 | 23,389 | ||||||
Synnex Technology International Corp. | 40,000 | 61,023 | ||||||
Taishin Financial Holdings Co. Ltd. | 257,067 | 130,724 | ||||||
Taiwan Business Bank Ltd.a | 145,864 | 45,676 | ||||||
Taiwan Cement Corp. | 102,000 | 162,092 | ||||||
Taiwan Cooperative Financial Holding Co. Ltd. | 188,832 | 105,502 | ||||||
Taiwan Fertilizer Co. Ltd. | 24,000 | 45,526 | ||||||
Taiwan Glass Industry Corp. | 28,450 | 24,557 | ||||||
Taiwan Mobile Co. Ltd. | 50,000 | 159,415 | ||||||
Taiwan Semiconductor Manufacturing Co. Ltd. | 742,000 | 3,078,169 | ||||||
Teco Electric and Machinery Co. Ltd. | 56,000 | 70,444 | ||||||
TPK Holding Co. Ltd. | 8,591 | 58,345 | ||||||
| Security | Shares | Value | ||||||
Transcend Information Inc. | 6,000 | $ | 20,174 | |||||
TSRC Corp. | 16,380 | 22,934 | ||||||
U-Ming Marine Transport Corp. | 15,000 | 24,690 | ||||||
Uni-President Enterprises Co. | 139,241 | 254,813 | ||||||
Unimicron Technology Corp. | 37,000 | 31,256 | ||||||
United Microelectronics Corp. | 370,000 | 168,967 | ||||||
Vanguard International Semiconductor Corp. | 23,000 | 33,665 | ||||||
Walsin Lihwa Corp.a | 85,000 | 30,428 | ||||||
Wistron Corp. | 70,105 | 82,089 | ||||||
WPG Holdings Co. Ltd. | 44,000 | 57,336 | ||||||
Yang Ming Marine Transport Corp.a | 34,000 | 15,299 | ||||||
Yuanta Financial Holding Co. Ltd. | 260,350 | 140,233 | ||||||
Yulon Motor Co. Ltd. | 28,000 | 44,964 | ||||||
Zhen Ding Technology Holding Ltd. | 10,455 | 34,558 | ||||||
|
| |||||||
| 15,332,948 | ||||||||
THAILAND — 3.62% | ||||||||
Advanced Information Service PCL NVDR | 31,600 | 206,775 | ||||||
Airports of Thailand PCL NVDR | 12,600 | 93,494 | ||||||
Bangkok Bank PCL Foreign | 14,400 | 92,423 | ||||||
Bangkok Bank PCL NVDR | 19,100 | 122,589 | ||||||
Bangkok Dusit Medical Services PCL NVDR | 97,800 | 59,709 | ||||||
Banpu PCL NVDR | 30,000 | 30,291 | ||||||
BEC World PCL NVDR | 28,400 | 42,236 | ||||||
BTS Group Holdings PCL NVDR | 183,000 | 55,290 | ||||||
Bumrungrad Hospital PCL NVDR | 11,000 | 46,493 | ||||||
Central Pattana PCL NVDR | 39,700 | 59,973 | ||||||
Charoen Pokphand Foods PCL NVDR | 79,300 | 73,242 | ||||||
CP All PCL NVDR | 134,000 | 199,280 | ||||||
Glow Energy PCL NVDR | 16,400 | 44,928 | ||||||
Home Product Center PCL NVDR | 89,332 | 29,367 | ||||||
Indorama Ventures PCL NVDR | 34,000 | 28,741 | ||||||
IRPC PCL NVDR | 260,500 | 27,078 | ||||||
Kasikornbank PCL Foreign | 35,400 | 250,482 | ||||||
Kasikornbank PCL NVDR | 19,500 | 137,367 | ||||||
Krung Thai Bank PCL NVDR | 107,250 | 78,910 | ||||||
Minor International PCL NVDR | 43,600 | 48,118 | ||||||
PTT Exploration & Production PCL NVDR | 41,810 | 215,333 | ||||||
PTT Global Chemical PCL NVDR | 48,900 | 94,922 | ||||||
PTT PCL NVDR | 25,900 | 260,297 | ||||||
Siam Cement (The) PCL Foreign | 9,000 | 123,983 | ||||||
CONSOLIDATED SCHEDULESOF INVESTMENTS | 35 |
Table of Contents
Consolidated Schedule of Investments (Continued)
iSHARES® MSCI EMERGING MARKETS ASIA ETF
August 31, 2014
| Security | Shares | Value | ||||||
Siam Cement (The) PCL NVDR | 3,500 | $ | 48,215 | |||||
Siam Commercial Bank PCL NVDR | 47,900 | 280,442 | ||||||
Thai Oil PCL NVDR | 26,800 | 43,422 | ||||||
TMB Bank PCL NVDR | 388,000 | 36,929 | ||||||
True Corp. PCL NVDRa | 243,390 | 87,633 | ||||||
|
| |||||||
| 2,917,962 | ||||||||
|
| |||||||
TOTAL COMMON STOCKS |
| |||||||
(Cost: $73,329,018) |
| 79,495,410 | ||||||
PREFERRED STOCKS — 1.18% |
| |||||||
SOUTH KOREA — 1.18% |
| |||||||
Hyundai Motor Co. Ltd. | 742 | 109,769 | ||||||
Hyundai Motor Co. Ltd. Series 2 | 1,154 | 178,686 | ||||||
LG Chem Ltd. | 211 | 36,729 | ||||||
Samsung Electronics Co. Ltd. | 621 | 624,705 | ||||||
|
| |||||||
| 949,889 | ||||||||
|
| |||||||
TOTAL PREFERRED STOCKS |
| |||||||
(Cost: $784,727) |
| 949,889 | ||||||
WARRANTS — 0.00% |
| |||||||
THAILAND — 0.00% |
| |||||||
Indorama Ventures PCL NVDR (Expires 8/24/17)a | 3,400 | — | ||||||
Indorama Ventures PCL NVDR (Expires 8/24/18)a | 2,615 | — | ||||||
|
| |||||||
| — | ||||||||
|
| |||||||
TOTAL WARRANTS |
| |||||||
(Cost: $0) |
| — | ||||||
SHORT-TERM INVESTMENTS — 2.33% |
| |||||||
MONEY MARKET FUNDS — 2.33% |
| |||||||
BlackRock Cash Funds: Institutional, | ||||||||
0.14%c,d,e | 1,690,830 | 1,690,830 | ||||||
BlackRock Cash Funds: Prime, | ||||||||
0.11%c,d,e | 106,442 | 106,442 | ||||||
BlackRock Cash Funds: Treasury, | ||||||||
0.00%c,d | 85,519 | 85,519 | ||||||
|
| |||||||
| 1,882,791 | ||||||||
|
| |||||||
TOTAL SHORT-TERM INVESTMENTS |
| |||||||
(Cost: $1,882,791) |
| 1,882,791 | ||||||
|
| |||||||
| Value | ||||||
TOTAL INVESTMENTS |
| |||||
(Cost: $75,996,536) | $ | 82,328,090 | ||||
Other Assets, Less Liabilities — (2.01)% | (1,621,854 | ) | ||||
|
| |||||
NET ASSETS — 100.00% | $ | 80,706,236 | ||||
|
| |||||
NVDR — Non-Voting Depositary Receipts
| a | Non-income earning security. |
| b | All or a portion of this security represents a security on loan. See Note 1. |
| c | Affiliated issuer. See Note 2. |
| d | The rate quoted is the annualized seven-day yield of the fund at period end. |
| e | All or a portion of this security represents an investment of securities lending collateral. See Note 1. |
See notes to consolidated financial statements.
| 36 | 2014 iSHARES ANNUAL REPORTTO SHAREHOLDERS |
Table of Contents
Consolidated Schedule of Investments
iSHARES® MSCI EMERGING MARKETS CONSUMER DISCRETIONARY ETF
August 31, 2014
| Security | Shares | Value | ||||||
COMMON STOCKS — 96.45% |
| |||||||
BRAZIL — 6.22% |
| |||||||
B2W Companhia Global do Varejoa | 1,800 | $ | 30,489 | |||||
Cyrela Brazil Realty SA Empreendimentos e Participacoes | 4,000 | 25,367 | ||||||
Estacio Participacoes SA | 4,600 | 61,120 | ||||||
Kroton Educacional SA | 5,322 | 159,478 | ||||||
Lojas Americanas SA | 2,550 | 14,815 | ||||||
Lojas Renner SA | 2,002 | 68,554 | ||||||
Via Varejo SAa | 2,000 | 22,346 | ||||||
|
| |||||||
| 382,169 | ||||||||
CHILE — 1.85% | ||||||||
S.A.C.I. Falabella SA | 15,126 | 113,910 | ||||||
|
| |||||||
| 113,910 | ||||||||
CHINA — 11.12% | ||||||||
Alibaba Pictures Group Ltd.a | 80,000 | 16,619 | ||||||
Anta Sports Products Ltd. | 16,002 | 30,723 | ||||||
Belle International Holdings Ltd. | 72,001 | 92,067 | ||||||
Brilliance China Automotive Holdings Ltd. | 48,000 | 88,938 | ||||||
BYD Co. Ltd. Class Hb | 10,000 | 71,031 | ||||||
Chongqing Changan Automobile Co. Ltd. | 13,200 | 27,251 | ||||||
Dongfeng Motor Group Co. Ltd. Class H | 44,001 | 81,528 | ||||||
Geely Automobile Holdings Ltd.b | 80,001 | 30,658 | ||||||
Golden Eagle Retail Group Ltd. | 8,000 | 9,837 | ||||||
GOME Electrical Appliances Holdings Ltd. | 166,000 | 29,558 | ||||||
Great Wall Motor Co. Ltd. Class H | 16,002 | 67,930 | ||||||
Guangzhou Automobile Group Co. Ltd. Class H | 36,001 | 37,440 | ||||||
Haier Electronics Group Co. Ltd. | 16,001 | 46,247 | ||||||
Intime Retail Group Co. Ltd.b | 19,001 | 17,284 | ||||||
Shenzhou International Group Holdings Ltd.b | 8,000 | 24,929 | ||||||
Zhongsheng Group Holdings Ltd. | 10,000 | 11,084 | ||||||
|
| |||||||
| 683,124 | ||||||||
GREECE — 1.63% | ||||||||
Folli Follie Groupa | 480 | 19,916 | ||||||
Jumbo SAa | 1,658 | 24,460 | ||||||
OPAP SA | 3,500 | 55,737 | ||||||
|
| |||||||
| 100,113 | ||||||||
INDIA — 4.88% | ||||||||
Bajaj Auto Ltd. | 1,304 | 48,539 | ||||||
| Security | Shares | Value | ||||||
Hero Motocorp Ltd. | 620 | $ | 26,615 | |||||
Mahindra & Mahindra Ltd. | 5,272 | 122,260 | ||||||
Tata Motors Ltd. | 11,862 | 102,639 | ||||||
|
| |||||||
| 300,053 | ||||||||
INDONESIA — 4.98% | ||||||||
PT Astra International Tbk | 313,600 | 203,079 | ||||||
PT Global Mediacom Tbk | 101,000 | 16,708 | ||||||
PT Matahari Department Store Tbk | 31,000 | 43,131 | ||||||
PT Media Nusantara Citra Tbk | 75,200 | 18,033 | ||||||
PT Surya Citra Media Tbk | 71,000 | 24,946 | ||||||
|
| |||||||
| 305,897 | ||||||||
MALAYSIA — 3.85% | ||||||||
Astro Malaysia Holdings Bhd | 24,200 | 25,182 | ||||||
Berjaya Sports Toto Bhd | 10,265 | 12,245 | ||||||
Genting Bhd | 31,800 | 96,651 | ||||||
Genting Malaysia Bhd | 47,001 | 67,251 | ||||||
UMW Holdings Bhd | 9,001 | 35,296 | ||||||
|
| |||||||
| 236,625 | ||||||||
MEXICO — 5.40% | ||||||||
El Puerto de Liverpool SAB de CV Series C1 | 3,001 | 34,221 | ||||||
Grupo Televisa SAB de CV CPO | 40,002 | 297,640 | ||||||
|
| |||||||
| 331,861 | ||||||||
PHILIPPINES — 0.46% | ||||||||
Jollibee Foods Corp. | 6,841 | 28,243 | ||||||
|
| |||||||
| 28,243 | ||||||||
POLAND — 0.93% | ||||||||
Cyfrowy Polsat SA | 2,860 | 22,890 | ||||||
LPP SA | 13 | 34,560 | ||||||
|
| |||||||
| 57,450 | ||||||||
SOUTH AFRICA — 20.02% | ||||||||
Foschini Group Ltd. (The) | 3,085 | 33,392 | ||||||
Imperial Holdings Ltd. | 2,890 | 51,684 | ||||||
Mr. Price Group Ltd. | 3,753 | 72,234 | ||||||
Naspers Ltd. Class N | 6,142 | 782,820 | ||||||
Steinhoff International Holdings Ltd. | 32,370 | 159,820 | ||||||
Truworths International Ltd. | 6,040 | 42,253 | ||||||
Woolworths Holdings Ltd. | 11,802 | 88,176 | ||||||
|
| |||||||
| 1,230,379 | ||||||||
SOUTH KOREA — 28.33% | ||||||||
Cheil Worldwide Inc.a | 1,272 | 28,791 | ||||||
Coway Co. Ltd. | 829 | 69,577 | ||||||
Halla Visteon Climate Control Corp. | 580 | 30,832 | ||||||
Hankook Tire Co. Ltd. | 1,140 | 59,139 | ||||||
CONSOLIDATED SCHEDULESOF INVESTMENTS | 37 |
Table of Contents
Consolidated Schedule of Investments (Continued)
iSHARES® MSCI EMERGING MARKETS CONSUMER DISCRETIONARY ETF
August 31, 2014
| Security | Shares | Value | ||||||
Hotel Shilla Co. Ltd. | 526 | $ | 61,733 | |||||
Hyundai Department Store Co. Ltd. | 236 | 36,891 | ||||||
Hyundai Mobis Co. Ltd. | 1,060 | 307,352 | ||||||
Hyundai Motor Co. | 2,394 | 550,128 | ||||||
Hyundai Wia Corp. | 236 | 51,904 | ||||||
Kangwon Land Inc. | 1,842 | 65,491 | ||||||
Kia Motors Corp. | 4,092 | 246,985 | ||||||
LG Electronics Inc. | 1,658 | 123,620 | ||||||
Lotte Shopping Co. Ltd. | 174 | 56,973 | ||||||
Paradise Co. Ltd. | 674 | 26,124 | ||||||
Shinsegae Co. Ltd. | 112 | 25,737 | ||||||
|
| |||||||
| 1,741,277 | ||||||||
TAIWAN — 4.89% | ||||||||
Cheng Shin Rubber Industry Co. Ltd. | 24,754 | 57,143 | ||||||
China Motor Co. Ltd. | 10,002 | 9,570 | ||||||
Eclat Textile Co. Ltd. | 2,080 | 17,397 | ||||||
Far Eastern Department Stores Ltd. | 16,900 | 17,018 | ||||||
Formosa International Hotels Corp. | 1 | 11 | ||||||
Formosa Taffeta Co. Ltd. | 12,002 | 12,749 | ||||||
Giant Manufacturing Co. Ltd. | 4,001 | 33,263 | ||||||
Hotai Motor Co. Ltd. | 4,001 | 56,286 | ||||||
Merida Industry Co. Ltd. | 2,200 | 16,192 | ||||||
Pou Chen Corp. | 32,000 | 36,988 | ||||||
Ruentex Industries Ltd. | 8,760 | 21,248 | ||||||
Yulon Motor Co. Ltd. | 14,001 | 22,484 | ||||||
|
| |||||||
| 300,349 | ||||||||
THAILAND — 1.09% | ||||||||
BEC World PCL NVDR | 15,801 | 23,499 | ||||||
Home Product Center PCL NVDR | 54,666 | 17,971 | ||||||
Minor International PCL NVDR | 23,400 | 25,825 | ||||||
|
| |||||||
| 67,295 | ||||||||
TURKEY — 0.80% | ||||||||
Arcelik AS | 3,758 | 22,552 | ||||||
Ford Otomotiv Sanayi ASa | 1,002 | 13,233 | ||||||
Tofas Turk Otomobil Fabrikasi AS | 2,128 | 13,116 | ||||||
|
| |||||||
| 48,901 | ||||||||
|
| |||||||
TOTAL COMMON STOCKS |
| |||||||
(Cost: $5,052,698) |
| 5,927,646 | ||||||
PREFERRED STOCKS — 3.25% |
| |||||||
BRAZIL — 0.88% |
| |||||||
Lojas Americanas SA | 7,601 | 53,810 | ||||||
|
| |||||||
| 53,810 | ||||||||
| Security | Shares | Value | ||||||
SOUTH KOREA — 2.37% | ||||||||
Hyundai Motor Co. Ltd. | 374 | $ | 55,328 | |||||
Hyundai Motor Co. Ltd. Series 2 | 584 | 90,427 | ||||||
|
| |||||||
| 145,755 | ||||||||
|
| |||||||
TOTAL PREFERRED STOCKS |
| |||||||
(Cost: $126,280) |
| 199,565 | ||||||
SHORT-TERM INVESTMENTS — 2.44% |
| |||||||
MONEY MARKET FUNDS — 2.44% |
| |||||||
BlackRock Cash Funds: Institutional, |
| |||||||
0.14%c,d,e | 132,756 | 132,756 | ||||||
BlackRock Cash Funds: Prime, |
| |||||||
0.11%c,d,e | 8,357 | 8,357 | ||||||
BlackRock Cash Funds: Treasury, |
| |||||||
0.00%c,d | 8,971 | 8,971 | ||||||
|
| |||||||
| 150,084 | ||||||||
|
| |||||||
TOTAL SHORT-TERM INVESTMENTS |
| |||||||
(Cost: $150,084) |
| 150,084 | ||||||
|
| |||||||
TOTAL INVESTMENTS |
| |||||||
(Cost: $5,329,062) |
| 6,277,295 | ||||||
Other Assets, Less Liabilities — (2.14)% |
| (131,343 | ) | |||||
|
| |||||||
NET ASSETS — 100.00% |
| $ | 6,145,952 | |||||
|
| |||||||
CPO — Certificates of Participation (Ordinary)
NVDR — Non-Voting Depositary Receipts
| a | Non-income earning security. |
| b | All or a portion of this security represents a security on loan. See Note 1. |
| c | Affiliated issuer. See Note 2. |
| d | The rate quoted is the annualized seven-day yield of the fund at period end. |
| e | All or a portion of this security represents an investment of securities lending collateral. See Note 1. |
See notes to consolidated financial statements.
| 38 | 2014 iSHARES ANNUAL REPORTTO SHAREHOLDERS |
Table of Contents
Consolidated Schedule of Investments
iSHARES® MSCI EMERGING MARKETS ENERGY CAPPED ETF
August 31, 2014
| Security | Shares | Value | ||||||
COMMON STOCKS — 89.02% |
| |||||||
BRAZIL — 8.44% |
| |||||||
Cosan SA Industria e Comercio | 800 | $ | 16,625 | |||||
Petroleo Brasileiro SA | 10,502 | 103,915 | ||||||
Ultrapar Participacoes SA | 1,801 | 46,435 | ||||||
|
| |||||||
| 166,975 | ||||||||
CHILE — 1.52% |
| |||||||
Empresas Copec SA | 2,399 | 30,155 | ||||||
|
| |||||||
| 30,155 | ||||||||
CHINA — 22.74% |
| |||||||
China Coal Energy Co. Class Ha | 26,000 | 15,835 | ||||||
China Oilfield Services Ltd. Class H | 10,001 | 29,615 | ||||||
China Petroleum & Chemical Corp. Class H | 86,402 | 87,627 | ||||||
China Shenhua Energy Co. Ltd. Class H | 16,500 | 47,583 | ||||||
CNOOC Ltd. | 66,001 | 132,681 | ||||||
Inner Mongolia Yitai Coal Co. Ltd. Class B | 8,000 | 13,512 | ||||||
Kunlun Energy Co. Ltd. | 2,000 | 3,303 | ||||||
PetroChina Co. Ltd. Class H | 76,000 | 107,869 | ||||||
Yanzhou Coal Mining Co. Ltd. Class H | 14,002 | 11,852 | ||||||
|
| |||||||
| 449,877 | ||||||||
COLOMBIA — 2.17% |
| |||||||
Ecopetrol SA | 24,804 | 42,990 | ||||||
|
| |||||||
| 42,990 | ||||||||
HUNGARY — 0.71% |
| |||||||
MOL Hungarian Oil and Gas PLC | 285 | 14,042 | ||||||
|
| |||||||
| 14,042 | ||||||||
INDIA — 8.99% |
| |||||||
Bharat Petroleum Corp. Ltd. | 1,296 | 14,829 | ||||||
Cairn India Ltd. | 2,926 | 15,732 | ||||||
Coal India Ltd. | 3,119 | 18,304 | ||||||
Oil & Natural Gas Corp. Ltd. | 4,161 | 29,829 | ||||||
Oil India Ltd. | 1,043 | 10,578 | ||||||
Reliance Industries Ltd. | 5,378 | 88,513 | ||||||
|
| |||||||
| 177,785 | ||||||||
INDONESIA — 1.61% |
| |||||||
PT Adaro Energy Tbk | 116,202 | 13,063 | ||||||
PT Bukit Asam (Persero) Tbk | 8,500 | 9,701 | ||||||
PT Indo Tambangraya Megah Tbk | 3,800 | 9,153 | ||||||
|
| |||||||
| 31,917 | ||||||||
MALAYSIA — 2.36% |
| |||||||
Bumi Armada Bhdb | 8,701 | 8,144 | ||||||
| Security | Shares | Value | ||||||
Petronas Dagangan Bhd | 1,901 | $ | 12,122 | |||||
Sapurakencana Petroleum Bhd | 19,801 | 26,510 | ||||||
|
| |||||||
| 46,776 | ||||||||
POLAND — 2.39% |
| |||||||
Grupa Lotos SAb | 817 | 7,701 | ||||||
Polski Koncern Naftowy Orlen SA | 1,812 | 22,346 | ||||||
Polskie Gornictwo Naftowe i Gazownictwo SA | 11,287 | 17,227 | ||||||
|
| |||||||
| 47,274 | ||||||||
RUSSIA — 21.06% |
| |||||||
Gazprom OAO | 45,720 | 162,915 | ||||||
LUKOIL OAO | 1,836 | 102,205 | ||||||
NovaTek OAO SP GDRc | 446 | 44,868 | ||||||
Rosneft Oil Co. OJSC | 5,942 | 36,656 | ||||||
Surgutneftegas OJSC | 37,802 | 26,498 | ||||||
Tatneft OAO Class S | 7,021 | 43,544 | ||||||
|
| |||||||
| 416,686 | ||||||||
SOUTH AFRICA — 6.67% |
| |||||||
Exxaro Resources Ltd. | 1,022 | 14,498 | ||||||
Sasol Ltd. | 2,019 | 117,373 | ||||||
|
| |||||||
| 131,871 | ||||||||
SOUTH KOREA — 2.98% |
| |||||||
GS Holdings Corp. | 354 | 15,030 | ||||||
S-Oil Corp. | 309 | 14,277 | ||||||
SK Innovation Co. Ltd. | 319 | 29,605 | ||||||
|
| |||||||
| 58,912 | ||||||||
TAIWAN — 0.89% |
| |||||||
Formosa Petrochemical Corp. | 7,000 | 17,681 | ||||||
|
| |||||||
| 17,681 | ||||||||
THAILAND — 5.56% |
| |||||||
Banpu PCL NVDR | 9,700 | 9,794 | ||||||
IRPC PCL NVDR | 94,100 | 9,781 | ||||||
PTT Exploration & Production PCL NVDR | 7,133 | 36,737 | ||||||
PTT PCL NVDR | 4,302 | 43,236 | ||||||
Thai Oil PCL NVDR | 6,501 | 10,533 | ||||||
|
| |||||||
| 110,081 | ||||||||
TURKEY — 0.93% |
| |||||||
Turkiye Petrol Rafinerileri AS | 784 | 18,456 | ||||||
|
| |||||||
| 18,456 | ||||||||
|
| |||||||
TOTAL COMMON STOCKS |
| |||||||
(Cost: $2,078,492) |
| 1,761,478 | ||||||
CONSOLIDATED SCHEDULESOF INVESTMENTS | 39 |
Table of Contents
Consolidated Schedule of Investments (Continued)
iSHARES® MSCI EMERGING MARKETS ENERGY CAPPED ETF
August 31, 2014
| Security | Shares | Value | ||||||
PREFERRED STOCKS — 10.83% |
| |||||||
BRAZIL — 8.44% |
| |||||||
Petroleo Brasileiro SA | 16,000 | $ | 166,968 | |||||
|
| |||||||
| 166,968 | ||||||||
RUSSIA — 2.39% |
| |||||||
AK Transneft OAO | 9 | 19,800 | ||||||
Surgutneftegas OJSC | 37,402 | 27,526 | ||||||
|
| |||||||
| 47,326 | ||||||||
|
| |||||||
TOTAL PREFERRED STOCKS |
| |||||||
(Cost: $263,525) |
| 214,294 | ||||||
SHORT-TERM INVESTMENTS — 0.90% |
| |||||||
MONEY MARKET FUNDS — 0.90% |
| |||||||
BlackRock Cash Funds: Institutional, |
| |||||||
0.14%d,e,f | 15,078 | 15,078 | ||||||
BlackRock Cash Funds: Prime, |
| |||||||
0.11%d,e,f | 949 | 949 | ||||||
BlackRock Cash Funds: Treasury, |
| |||||||
0.00%d,e | 1,758 | 1,758 | ||||||
|
| |||||||
| 17,785 | ||||||||
|
| |||||||
TOTAL SHORT-TERM INVESTMENTS |
| |||||||
(Cost: $17,785) |
| 17,785 | ||||||
|
| |||||||
TOTAL INVESTMENTS |
| |||||||
(Cost: $2,359,802) | 1,993,557 | |||||||
Other Assets, Less Liabilities — (0.75)% |
| (14,777 | ) | |||||
|
| |||||||
NET ASSETS — 100.00% |
| $ | 1,978,780 | |||||
|
| |||||||
SP GDR — Sponsored Global Depositary Receipts
NVDR — Non-Voting Depositary Receipts
| a | All or a portion of this security represents a security on loan. See Note 1. |
| b | Non-income earning security. |
| c | This security may be resold to qualified foreign investors and foreign institutional buyers under Regulation S of the Securities Act of 1933. |
| d | Affiliated issuer. See Note 2. |
| e | The rate quoted is the annualized seven-day yield of the fund at period end. |
| f | All or a portion of this security represents an investment of securities lending collateral. See Note 1. |
See notes to consolidated financial statements.
| 40 | 2014 iSHARES ANNUAL REPORTTO SHAREHOLDERS |
Table of Contents
Consolidated Schedule of Investments
iSHARES® MSCI EMERGING MARKETS GROWTH ETF
August 31, 2014
| Security | Shares | Value | ||||||
COMMON STOCKS — 95.16% |
| |||||||
BRAZIL — 8.30% |
| |||||||
ALL – America Latina Logistica SA | 1,400 | $ | 5,162 | |||||
AMBEV SA | 13,500 | 98,344 | ||||||
Banco Bradesco SA | 880 | 15,739 | ||||||
BB Seguridade Participacoes SA | 2,000 | 31,946 | ||||||
BR Malls Participacoes SA | 1,200 | 12,480 | ||||||
BR Properties SA | 600 | 3,995 | ||||||
BRF SA | 1,800 | 48,187 | ||||||
CCR SA | 2,600 | 23,542 | ||||||
CETIP SA – Mercados Organizados | 600 | 8,755 | ||||||
Cielo SA | 2,160 | 40,506 | ||||||
Companhia Siderurgica Nacional SA | 600 | 2,633 | ||||||
Cosan SA Industria e Comercio | 400 | 8,313 | ||||||
EcoRodovias Infraestrutura e Logistica SA | 400 | 2,556 | ||||||
Embraer SA | 2,000 | 19,495 | ||||||
Estacio Participacoes SA | 1,000 | 13,287 | ||||||
Fibria Celulose SAa | 400 | 4,162 | ||||||
Hypermarcas SAa | 1,000 | 8,697 | ||||||
JBS SA | 1,800 | 8,141 | ||||||
Klabin SA | 1,400 | 7,114 | ||||||
Kroton Educacional SA | 971 | 29,097 | ||||||
Localiza Rent A Car SA | 410 | 7,302 | ||||||
Lojas Americanas SA | 500 | 2,905 | ||||||
Lojas Renner SA | 400 | 13,697 | ||||||
Multiplan Empreendimentos Imobiliarios SA | 200 | 5,158 | ||||||
Natura Cosmeticos SA | 400 | 7,331 | ||||||
Odontoprev SA | 800 | 3,490 | ||||||
Qualicorp SAa | 400 | 5,005 | ||||||
Raia Drogasil SA | 600 | 5,846 | ||||||
Souza Cruz SA | 600 | 5,620 | ||||||
Totvs SA | 400 | 7,304 | ||||||
Ultrapar Participacoes SA | 1,000 | 25,783 | ||||||
WEG SA | 780 | 9,757 | ||||||
|
| |||||||
| 491,349 | ||||||||
CHILE — 1.12% |
| |||||||
Cencosud SA | 3,256 | 9,769 | ||||||
Empresas Copec SA | 1,190 | 14,958 | ||||||
Enersis SA | 19,774 | 6,656 | ||||||
LATAM Airlines Group SAa | 932 | 11,530 | ||||||
S.A.C.I. Falabella SA | 2,658 | 20,017 | ||||||
Vina Concha y Toro SA | 1,795 | 3,501 | ||||||
|
| |||||||
| 66,431 | ||||||||
| Security | Shares | Value | ||||||
CHINA — 19.08% |
| |||||||
AAC Technologies Holdings Inc. | 2,000 | $ | 13,045 | |||||
Anhui Conch Cement Co. Ltd. Class Hb | 4,000 | 14,451 | ||||||
AviChina Industry & Technology Co. Ltd. Class H | 8,000 | 4,769 | ||||||
Beijing Capital International Airport Co. Ltd. Class H | 8,000 | 6,255 | ||||||
Beijing Enterprises Holdings Ltd. | 1,000 | 8,619 | ||||||
Beijing Enterprises Water Group Ltd. | 12,000 | 8,175 | ||||||
Belle International Holdings Ltd. | 8,000 | 10,229 | ||||||
Biostime International Holdings Ltd.b | 1,000 | 3,735 | ||||||
Brilliance China Automotive Holdings Ltd. | 8,000 | 14,823 | ||||||
BYD Co. Ltd. Class H | 2,000 | 14,206 | ||||||
China Cinda Asset Management Co. Ltd.a | 10,000 | 5,122 | ||||||
China Everbright International Ltd. | 8,000 | 10,962 | ||||||
China Gas Holdings Ltd. | 4,000 | 7,122 | ||||||
China Huishan Dairy Holdings Co. Ltd.a,b | 12,000 | 2,787 | ||||||
China Life Insurance Co. Ltd. Class H | 22,000 | 63,160 | ||||||
China Longyuan Power Group Corp. Ltd. Class H | �� | 8,000 | 8,650 | |||||
China Mengniu Dairy Co. Ltd. | 4,000 | 18,554 | ||||||
China Minsheng Banking Corp. Ltd. Class H | 6,300 | 5,918 | ||||||
China Oilfield Services Ltd. Class H | 4,000 | 11,845 | ||||||
China Overseas Land & Investment Ltd.b | 12,000 | 33,754 | ||||||
China Pacific Insurance (Group) Co. Ltd. Class H | 7,200 | 27,034 | ||||||
China Resources Enterprise Ltd. | 4,000 | 10,761 | ||||||
China Resources Gas Group Ltd. | 4,000 | 11,638 | ||||||
China Resources Land Ltd. | 4,000 | 9,156 | ||||||
China Resources Power Holdings Co. Ltd. | 4,000 | 12,103 | ||||||
China Shipping Container Lines Co. Ltd. Class Ha,b | 14,000 | 3,992 | ||||||
China State Construction International Holdings Ltd. | 4,000 | 6,452 | ||||||
China Taiping Insurance Holdings Co. Ltd.a | 2,400 | 5,840 | ||||||
China Unicom (Hong Kong) Ltd. | 12,000 | 21,398 | ||||||
Chongqing Changan Automobile Co. Ltd. | 2,200 | 4,542 | ||||||
CONSOLIDATED SCHEDULESOF INVESTMENTS | 41 |
Table of Contents
Consolidated Schedule of Investments (Continued)
iSHARES® MSCI EMERGING MARKETS GROWTH ETF
August 31, 2014
| Security | Shares | Value | ||||||
CITIC 21CN Co. Ltd.a | 8,000 | $ | 6,297 | |||||
CNOOC Ltd. | 52,000 | 104,535 | ||||||
Country Garden Holdings Co. Ltd.b | 2,000 | 888 | ||||||
CSPC Pharmaceutical Group Ltd. | 4,000 | 3,344 | ||||||
CSR Corp Ltd. Class H | 6,000 | 5,412 | ||||||
Dongfeng Motor Group Co. Ltd. Class H | 8,000 | 14,823 | ||||||
ENN Energy Holdings Ltd. | 4,000 | 28,258 | ||||||
Evergrande Real Estate Group Ltd.b | 8,000 | 3,344 | ||||||
GCL-Poly Energy Holdings Ltd.a | 24,000 | 8,640 | ||||||
Geely Automobile Holdings Ltd. | 20,000 | 7,664 | ||||||
Golden Eagle Retail Group Ltd. | 2,000 | 2,459 | ||||||
Great Wall Motor Co. Ltd. Class H | 3,000 | 12,735 | ||||||
Guangzhou Automobile Group Co. Ltd. Class H | 4,000 | 4,160 | ||||||
Haier Electronics Group Co. Ltd. | 2,000 | 5,781 | ||||||
Haitian International Holdings Ltd. | 4,000 | 10,426 | ||||||
Haitong Securities Co. Ltd. Class H | 2,400 | 3,834 | ||||||
Hanergy Solar Group Ltd.a,b | 32,000 | 5,244 | ||||||
Hengan International Group Co. Ltd. | 2,000 | 21,329 | ||||||
Huaneng Power International Inc. Class H | 8,000 | 9,620 | ||||||
Intime Retail Group Co. Ltd.b | 3,000 | 2,729 | ||||||
Kingsoft Corp. Ltd.b | 2,000 | 5,729 | ||||||
Kunlun Energy Co. Ltd. | 8,000 | 13,213 | ||||||
Lee & Man Paper Manufacturing Ltd. | 4,000 | 2,354 | ||||||
Lenovo Group Ltd. | 20,000 | 30,554 | ||||||
Longfor Properties Co. Ltd. | 4,000 | 5,110 | ||||||
New China Life Insurance Co. Ltd. Class H | 2,200 | 7,849 | ||||||
People’s Insurance Co. Group of China Ltd. Class H | 14,000 | 5,853 | ||||||
PICC Property and Casualty Co. Ltd. Class H | 8,000 | 13,275 | ||||||
Ping An Insurance (Group) Co. of China Ltd. Class H | 5,000 | 40,709 | ||||||
Shandong Weigao Group Medical Polymer Co. Ltd. Class H | 8,000 | 8,103 | ||||||
Shanghai Fosun Pharmaceutical (Group) Co. Ltd. | 2,000 | 6,503 | ||||||
Shanghai Pharmaceuticals Holding Co. Ltd. Class H | 1,600 | 3,283 | ||||||
Shenzhou International Group Holdings Ltd. | 2,000 | 6,232 | ||||||
Shimao Property Holdings Ltd. | 4,000 | 8,805 | ||||||
| Security | Shares | Value | ||||||
Sihuan Pharmaceutical Holdings Group Ltd. | 12,000 | $ | 8,036 | |||||
Sino Biopharmaceutical Ltd. | 8,000 | 7,370 | ||||||
Sinopec Engineering Group Co. Ltd. | 2,000 | 2,281 | ||||||
Sinopharm Group Co. Ltd. Class H | 3,200 | 11,169 | ||||||
Sun Art Retail Group Ltd.b | 7,000 | 8,355 | ||||||
Tencent Holdings Ltd. | 14,200 | 231,776 | ||||||
Tingyi (Cayman Islands) Holding Corp. | 4,000 | 11,226 | ||||||
Uni-President China Holdings Ltd. | 4,800 | 4,335 | ||||||
Want Want China Holdings Ltd. | 18,000 | 22,320 | ||||||
Weichai Power Co. Ltd. Class H | 2,000 | 8,103 | ||||||
Yingde Gases Group Co. Ltd. | 3,000 | 3,209 | ||||||
Zhongsheng Group Holdings Ltd. | 2,000 | 2,217 | ||||||
Zhuzhou CSR Times Electric Co. Ltd. Class H | 2,000 | 6,929 | ||||||
ZTE Corp. Class H | 1,600 | 3,605 | ||||||
|
| |||||||
| 1,129,122 | ||||||||
COLOMBIA — 0.56% |
| |||||||
Almacenes Exito SA | 404 | 6,878 | ||||||
Cementos Argos SA | 1,006 | 5,926 | ||||||
Cemex Latam Holdings SAa | 424 | 4,199 | ||||||
Corporacion Financiera Colombiana SA NVS | 176 | 3,752 | ||||||
Ecopetrol SA | 3,926 | 6,804 | ||||||
Isagen SA ESP | 3,778 | 5,652 | ||||||
|
| |||||||
| 33,211 | ||||||||
CZECH REPUBLIC — 0.22% |
| |||||||
Komercni Banka AS | 56 | 13,024 | ||||||
|
| |||||||
| 13,024 | ||||||||
GREECE — 0.88% |
| |||||||
Alpha Bank AEa | 4,027 | 3,533 | ||||||
Eurobank Ergasias SAa | 22,352 | 9,510 | ||||||
Folli Follie Groupa | 160 | 6,638 | ||||||
Hellenic Telecommunications Organization SAa | 344 | 4,930 | ||||||
Jumbo SAa | 288 | 4,249 | ||||||
National Bank of Greece SAa | 4,334 | 14,900 | ||||||
Piraeus Bank SAa | 2,200 | 4,347 | ||||||
Titan Cement Co. SA | 140 | 3,743 | ||||||
|
| |||||||
| 51,850 | ||||||||
HUNGARY — 0.18% |
| |||||||
OTP Bank PLC | 322 | 5,567 | ||||||
Richter Gedeon Nyrt | 306 | 4,924 | ||||||
|
| |||||||
| 10,491 | ||||||||
| 42 | 2014 iSHARES ANNUAL REPORTTO SHAREHOLDERS |
Table of Contents
Consolidated Schedule of Investments (Continued)
iSHARES® MSCI EMERGING MARKETS GROWTH ETF
August 31, 2014
| Security | Shares | Value | ||||||
INDIA — 6.51% |
| |||||||
Adani Enterprises Ltd. | 471 | $ | 3,717 | |||||
Adani Ports & Special Economic Zone Ltd. | 1,216 | 5,668 | ||||||
Apollo Hospitals Enterprise Ltd. | 113 | 2,185 | ||||||
Asian Paints Ltd. | 800 | 8,229 | ||||||
Aurobindo Pharma Ltd. | 496 | 6,683 | ||||||
Bharti Airtel Ltd. | 1,708 | 10,409 | ||||||
Cipla Ltd. | 972 | 8,237 | ||||||
Dabur India Ltd. | 1,222 | 4,684 | ||||||
Divi’s Laboratories Ltd. | 190 | 4,900 | ||||||
Dr. Reddy’s Laboratories Ltd. | 290 | 14,088 | ||||||
GlaxoSmithKline Consumer Healthcare Ltd. | 32 | 2,812 | ||||||
Godrej Consumer Products Ltd. | 338 | 5,492 | ||||||
HCL Technologies Ltd. | 624 | 16,770 | ||||||
HDFC Bank Ltd. | 1,147 | 15,945 | ||||||
Hindustan Unilever Ltd. | 1,866 | 22,831 | ||||||
Housing Development Finance Corp. Ltd. | 2,752 | 48,731 | ||||||
Idea Cellular Ltd. | 2,042 | 5,448 | ||||||
ITC Ltd. | 6,298 | 36,877 | ||||||
Jaiprakash Associates Ltd. | 3,153 | 2,416 | ||||||
Larsen & Toubro Ltd. | 934 | 23,496 | ||||||
Mahindra & Mahindra Financial Services Ltd. | 650 | 2,992 | ||||||
Nestle India Ltd. | 36 | 3,577 | ||||||
Ranbaxy Laboratories Ltd.a | 198 | 2,091 | ||||||
Siemens Ltd. | 251 | 3,286 | ||||||
Sun Pharmaceuticals Industries Ltd. | 1,850 | 26,075 | ||||||
Tata Consultancy Services Ltd. | 1,350 | 56,117 | ||||||
Tata Motors Ltd. | 2,074 | 17,946 | ||||||
Tech Mahindra Ltd. | 194 | 7,555 | ||||||
Ultratech Cement Ltd. | 96 | 4,034 | ||||||
United Breweries Ltd. | 263 | 3,065 | ||||||
United Spirits Ltd. | 232 | 9,169 | ||||||
|
| |||||||
| 385,525 | ||||||||
INDONESIA — 2.55% |
| |||||||
PT Astra International Tbk | 19,000 | 12,304 | ||||||
PT Bank Central Asia Tbk | 36,000 | 34,469 | ||||||
PT Bank Rakyat Indonesia (Persero) Tbk | 15,000 | 14,170 | ||||||
PT Bumi Serpong Damai Tbk | 24,000 | 3,293 | ||||||
PT Charoen Pokphand Indonesia Tbk | 21,000 | 6,903 | ||||||
PT Global Mediacom Tbk | 18,000 | 2,978 | ||||||
| Security | Shares | Value | ||||||
PT Gudang Garam Tbk | 1,400 | $ | 6,463 | |||||
PT Indocement Tunggal Prakarsa Tbk | 4,000 | 8,292 | ||||||
PT Indofood CBP Sukses Makmur Tbk | 4,000 | 3,590 | ||||||
PT Jasa Marga (Persero) Tbk | 6,000 | 3,180 | ||||||
PT Kalbe Farma Tbk | 70,000 | 9,934 | ||||||
PT Lippo Karawaci Tbk | 61,000 | 5,580 | ||||||
PT Matahari Department Store Tbk | 4,000 | 5,565 | ||||||
PT Media Nusantara Citra Tbk | 16,000 | 3,837 | ||||||
PT Semen Gresik (Persero) Tbk | 8,000 | 11,096 | ||||||
PT Surya Citra Media Tbk | 14,000 | 4,919 | ||||||
PT Tower Bersama Infrastructure Tbk | 6,000 | 4,039 | ||||||
PT Unilever Indonesia Tbk | 4,000 | 10,609 | ||||||
|
| |||||||
| 151,221 | ||||||||
MALAYSIA — 3.65% |
| |||||||
Astro Malaysia Holdings Bhd | 5,000 | 5,203 | ||||||
Axiata Group Bhd | 2,200 | 4,837 | ||||||
British American Tobacco (Malaysia) Bhd | 200 | 4,568 | ||||||
Bumi Armada Bhda | 3,600 | 3,369 | ||||||
Dialog Group Bhd | 10,886 | 5,975 | ||||||
DiGi.Com Bhd | 9,200 | 16,725 | ||||||
Felda Global Ventures Holdings Bhd | 3,400 | 4,120 | ||||||
Gamuda Bhd | 4,500 | 6,896 | ||||||
Genting Bhd | 3,200 | 9,726 | ||||||
Genting Plantations Bhd | 800 | 2,553 | ||||||
IHH Healthcare Bhd | 6,000 | 9,289 | ||||||
IJM Corp. Bhd | 2,600 | 5,362 | ||||||
IOI Corp. Bhd | 7,800 | 11,829 | ||||||
Kuala Lumpur Kepong Bhd | 1,600 | 11,188 | ||||||
Malaysia Airports Holdings Bhd | 1,600 | 3,909 | ||||||
MMC Corp. Bhd | 2,200 | 1,724 | ||||||
Petronas Dagangan Bhd | 600 | 3,826 | ||||||
Petronas Gas Bhd | 1,800 | 13,020 | ||||||
Public Bank Bhd | 7,260 | 44,407 | ||||||
Sapurakencana Petroleum Bhd | 10,400 | 13,924 | ||||||
Tenaga Nasional Bhd | 7,800 | 30,636 | ||||||
UEM Sunrise Bhd | 4,800 | 2,924 | ||||||
|
| |||||||
| 216,010 | ||||||||
MEXICO — 5.22% |
| |||||||
Alfa SAB de CV Series A | 7,400 | 23,809 | ||||||
America Movil SAB de CV Series L | 45,800 | 56,009 | ||||||
Cemex SAB de CV CPOa | 10,000 | 13,284 | ||||||
Compartamos SAB de CV | 3,000 | 6,406 | ||||||
CONSOLIDATED SCHEDULESOF INVESTMENTS | 43 |
Table of Contents
Consolidated Schedule of Investments (Continued)
iSHARES® MSCI EMERGING MARKETS GROWTH ETF
August 31, 2014
| Security | Shares | Value | ||||||
El Puerto de Liverpool SAB de CV Series C1 | 600 | $ | 6,842 | |||||
Genomma Lab Internacional SAB de CV Series Ba,b | 2,200 | 5,869 | ||||||
Gruma SAB de CV Series Ba | 600 | 6,845 | ||||||
Grupo Bimbo SAB de CV Series A | 4,800 | 15,110 | ||||||
Grupo Carso SAB de CV Series A1 | 1,000 | 6,111 | ||||||
Grupo Financiero Banorte SAB de CV Series O | 4,600 | 32,383 | ||||||
Grupo Financiero Inbursa SAB de CV Series O | 4,200 | 12,762 | ||||||
Grupo Televisa SAB de CV CPO | 7,200 | 53,573 | ||||||
Mexichem SAB de CV | 3,200 | 13,800 | ||||||
Minera Frisco SAB de CV Series A1a | 1,800 | 3,619 | ||||||
Promotora y Operadora Infraestructura SAB de CVa | 800 | 11,215 | ||||||
Wal-Mart de Mexico SAB de CV Series V | 15,200 | 41,384 | ||||||
|
| |||||||
| 309,021 | ||||||||
PERU — 0.45% |
| |||||||
Credicorp Ltd. | 74 | 11,475 | ||||||
Southern Copper Corp. | 458 | 15,027 | ||||||
|
| |||||||
| 26,502 | ||||||||
PHILIPPINES — 0.98% |
| |||||||
Alliance Global Group Inc. | 5,000 | 2,821 | ||||||
Ayala Corp. | 220 | 3,535 | ||||||
Ayala Land Inc. | 16,000 | 12,110 | ||||||
Bank of the Philippine Islands | 1,722 | 3,752 | ||||||
DMCI Holdings Inc. | 4,000 | 7,339 | ||||||
International Container Terminal Services Inc. | 2,400 | 6,215 | ||||||
Jollibee Foods Corp. | 1,240 | 5,119 | ||||||
SM Investments Corp. | 348 | 6,162 | ||||||
SM Prime Holdings Inc. | 7,200 | 2,672 | ||||||
Universal Robina Corp. | 2,200 | 8,200 | ||||||
|
| |||||||
| 57,925 | ||||||||
POLAND — 1.45% |
| |||||||
Alior Bank SAa | 118 | 2,813 | ||||||
Bank Millennium SA | 1,094 | 2,747 | ||||||
Bank Pekao SA | 350 | 19,715 | ||||||
Bank Zachodni WBK SA | 78 | 9,038 | ||||||
Cyfrowy Polsat SA | 644 | 5,154 | ||||||
Energa SA | 888 | 5,791 | ||||||
Eurocash SA | 200 | 2,158 | ||||||
Grupa Azoty SA | 124 | 2,899 | ||||||
| Security | Shares | Value | ||||||
mBank SA | 40 | $ | 5,798 | |||||
Powszechna Kasa Oszczednosci Bank Polski SA | 2,472 | 29,573 | ||||||
|
| |||||||
| 85,686 | ||||||||
QATAR — 0.52% |
| |||||||
Barwa Real Estate Co. | 29 | 311 | ||||||
Masraf Al Rayan QSC | 1,180 | 16,852 | ||||||
Qatar Electricity & Water Co. QSC | 9 | 423 | ||||||
Qatar National Bank SAQ | 131 | 7,267 | ||||||
Vodafone Qatar QSC | 1,164 | 6,183 | ||||||
|
| |||||||
| 31,036 | ||||||||
RUSSIA — 4.40% |
| |||||||
Alrosa AO | 5,000 | 5,860 | ||||||
Magnit OJSC SP GDRc | 748 | 43,534 | ||||||
MegaFon OAO SP GDRc | 264 | 7,471 | ||||||
Mobile TeleSystems OJSC SP ADR | 1,474 | 27,195 | ||||||
Moscow Exchange MICEX-RTS OJSC | 2,500 | 4,196 | ||||||
NovaTek OAO SP GDRc | 260 | 26,156 | ||||||
Rosneft Oil Co. OJSC | 780 | 4,812 | ||||||
Rostelecom OJSC | 3,420 | 9,097 | ||||||
RusHydro OJSC | 242,000 | 4,488 | ||||||
Sberbank of Russia | 31,040 | 61,081 | ||||||
Severstal OAO | 380 | 3,658 | ||||||
Sistema JSFC SP GDRc | 476 | 10,829 | ||||||
Surgutneftegas OJSC | 10,000 | 7,010 | ||||||
Tatneft OAO Class S | 4,100 | 25,428 | ||||||
Uralkali OJSC | 1,140 | 4,210 | ||||||
VTB Bank OJSC | 14,740,000 | 15,184 | ||||||
|
| |||||||
| 260,209 | ||||||||
SOUTH AFRICA — 7.70% |
| |||||||
Anglo American Platinum Ltd.a,b | 150 | 6,249 | ||||||
AngloGold Ashanti Ltd.a | 1,232 | 20,973 | ||||||
Aspen Pharmacare Holdings Ltd. | 810 | 23,279 | ||||||
Assore Ltd. | 80 | 2,367 | ||||||
Bidvest Group Ltd. | 840 | 22,219 | ||||||
Coronation Fund Managers Ltd. | 904 | 8,500 | ||||||
Discovery Ltd. | 1,046 | 9,653 | ||||||
Life Healthcare Group Holdings Ltd. | 2,630 | 11,074 | ||||||
Massmart Holdings Ltd. | 318 | 3,910 | ||||||
Mr. Price Group Ltd. | 692 | 13,319 | ||||||
MTN Group Ltd. | 2,316 | 52,490 | ||||||
Nampak Ltd. | 1,646 | 6,601 | ||||||
Naspers Ltd. Class N | 1,110 | 141,474 | ||||||
Netcare Ltd. | 2,136 | 6,487 | ||||||
| 44 | 2014 iSHARES ANNUAL REPORTTO SHAREHOLDERS |
Table of Contents
Consolidated Schedule of Investments (Continued)
iSHARES® MSCI EMERGING MARKETS GROWTH ETF
August 31, 2014
| Security | Shares | Value | ||||||
Northam Platinum Ltd.a | 829 | $ | 3,328 | |||||
Pick n Pay Stores Ltd. | 754 | 4,006 | ||||||
Rand Merchant Insurance Holdings Ltd. | 1,164 | 3,688 | ||||||
Remgro Ltd. | 1,278 | 29,260 | ||||||
Sanlam Ltd. | 5,518 | 34,243 | ||||||
Sappi Ltd.a | 985 | 4,075 | ||||||
Shoprite Holdings Ltd. | 1,234 | 17,108 | ||||||
SPAR Group Ltd. (The) | 516 | 6,325 | ||||||
Truworths International Ltd. | 1,282 | 8,968 | ||||||
Woolworths Holdings Ltd. | 2,182 | 16,302 | ||||||
|
| |||||||
| 455,898 | ||||||||
SOUTH KOREA — 15.40% |
| |||||||
AmorePacific Corp. | 12 | 24,972 | ||||||
AmorePacific Group | 8 | 8,348 | ||||||
Celltrion Inc.a | 179 | 7,353 | ||||||
Cheil Worldwide Inc.a | 180 | 4,074 | ||||||
CJ CheilJedang Corp. | 24 | 8,947 | ||||||
CJ Corp. | 44 | 7,768 | ||||||
Coway Co. Ltd. | 132 | 11,079 | ||||||
Daewoo Engineering & Construction Co. Ltd.a | 420 | 3,529 | ||||||
Daewoo International Corp. | 100 | 3,674 | ||||||
Daewoo Securities Co. Ltd.a | 420 | 4,888 | ||||||
Daewoo Shipbuilding & Marine Engineering Co. Ltd. | 100 | 2,451 | ||||||
Doosan Corp. | 34 | 4,041 | ||||||
Doosan Infracore Co. Ltd.a | 224 | 2,618 | ||||||
E-Mart Co. Ltd. | 60 | 14,439 | ||||||
Halla Visteon Climate Control Corp. | 80 | 4,253 | ||||||
Hankook Tire Co. Ltd. | 206 | 10,686 | ||||||
Hotel Shilla Co. Ltd. | 104 | 12,206 | ||||||
Hyundai Glovis Co. Ltd. | 36 | 10,740 | ||||||
Hyundai Mipo Dockyard Co. Ltd. | 18 | 2,290 | ||||||
Hyundai Wia Corp. | 44 | 9,677 | ||||||
Korea Aerospace Industries Ltd. | 100 | 3,545 | ||||||
Korea Electric Power Corp. | 710 | 29,550 | ||||||
Korea Gas Corp.a | 81 | 4,506 | ||||||
Korean Air Lines Co. Ltd.a | 80 | 2,876 | ||||||
Kumho Petro Chemical Co. Ltd. | 48 | 3,849 | ||||||
LG Display Co. Ltd.a | 700 | 24,197 | ||||||
LG Electronics Inc. | 302 | 22,517 | ||||||
LG Household & Health Care Ltd. | 26 | 13,154 | ||||||
LG Innotek Co. Ltd.a | 30 | 3,979 | ||||||
LG Uplus Corp. | 720 | 7,775 | ||||||
| Security | Shares | Value | ||||||
Lotte Chemical Corp. | 46 | $ | 7,417 | |||||
Lotte Confectionery Co. Ltd. | 2 | 4,280 | ||||||
LS Industrial Systems Co. Ltd. | 46 | 2,840 | ||||||
NAVER Corp. | 80 | 60,595 | ||||||
NCsoft Corp. | 44 | 6,292 | ||||||
OCI Co. Ltd.a | 50 | 7,175 | ||||||
ORION Corp. | 10 | 8,610 | ||||||
Paradise Co. Ltd. | 154 | 5,969 | ||||||
S1 Corp. | 17 | 1,241 | ||||||
Samsung C&T Corp. | 357 | 26,266 | ||||||
Samsung Electro-Mechanics Co. Ltd. | 134 | 7,255 | ||||||
Samsung Electronics Co. Ltd. | 306 | 372,409 | ||||||
Samsung Engineering Co. Ltd.a | 82 | 5,168 | ||||||
Samsung Life Insurance Co. Ltd. | 164 | 17,226 | ||||||
Samsung SDI Co. Ltd. | 73 | 10,907 | ||||||
Samsung Securities Co. Ltd. | 160 | 7,819 | ||||||
Samsung Techwin Co. Ltd. | 102 | 4,290 | ||||||
SK C&C Co. Ltd. | 52 | 10,898 | ||||||
SK Hynix Inc.a | 1,574 | 70,476 | ||||||
|
| |||||||
| 911,114 | ||||||||
TAIWAN — 11.51% |
| |||||||
Acer Inc.a | 4,000 | 3,312 | ||||||
Cathay Financial Holding Co. Ltd. | 29,920 | 51,050 | ||||||
Chailease Holding Co. Ltd. | 2,420 | 6,542 | ||||||
Cheng Shin Rubber Industry Co. Ltd. | 4,900 | 11,311 | ||||||
China Airlines Ltd.a | 20,000 | 6,691 | ||||||
China Steel Corp. | 28,560 | 24,652 | ||||||
Delta Electronics Inc. | 6,000 | 42,154 | ||||||
Epistar Corp. | 2,000 | 4,349 | ||||||
EVA Airways Corp.a | 6,000 | 3,011 | ||||||
Formosa Chemicals & Fibre Corp. | 6,000 | 14,935 | ||||||
Formosa Petrochemical Corp. | 4,000 | 10,104 | ||||||
Formosa Plastics Corp. | 12,000 | 31,114 | ||||||
Giant Manufacturing Co. Ltd. | 2,000 | 16,627 | ||||||
Hiwin Technologies Corp. | 52 | 508 | ||||||
HTC Corp. | 2,000 | 9,200 | ||||||
MediaTek Inc. | 4,000 | 66,844 | ||||||
Nan Ya Plastics Corp. | 14,000 | 33,021 | ||||||
President Chain Store Corp. | 2,000 | 15,155 | ||||||
Standard Foods Corp. | 2,507 | 6,441 | ||||||
Taiwan Semiconductor Manufacturing Co. Ltd. | 70,000 | 290,393 | ||||||
Uni-President Enterprises Co. | 13,483 | 24,674 | ||||||
Vanguard International Semiconductor Corp. | 2,000 | 2,927 | ||||||
CONSOLIDATED SCHEDULESOF INVESTMENTS | 45 |
Table of Contents
Consolidated Schedule of Investments (Continued)
iSHARES® MSCI EMERGING MARKETS GROWTH ETF
August 31, 2014
| Security | Shares | Value | ||||||
Yang Ming Marine Transport Corp.a | 6,000 | $ | 2,700 | |||||
Yulon Motor Co. Ltd. | 2,000 | 3,212 | ||||||
|
| |||||||
| 680,927 | ||||||||
THAILAND — 2.34% |
| |||||||
Advanced Information Service PCL NVDR | 2,800 | 18,322 | ||||||
Airports of Thailand PCL NVDR | 1,400 | 10,388 | ||||||
Bangkok Dusit Medical Services PCL NVDR | 10,000 | 6,105 | ||||||
BEC World PCL NVDR | 3,200 | 4,759 | ||||||
Central Pattana PCL NVDR | 4,400 | 6,647 | ||||||
Charoen Pokphand Foods PCL NVDR | 5,600 | 5,172 | ||||||
CP All PCL NVDR | 12,800 | 19,036 | ||||||
Glow Energy PCL NVDR | 1,400 | 3,835 | ||||||
Home Product Center PCL NVDR | 12,266 | 4,032 | ||||||
Indorama Ventures PCL NVDR | 4,200 | 3,551 | ||||||
IRPC PCL NVDR | 30,000 | 3,118 | ||||||
Kasikornbank PCL Foreign | 1,600 | 11,321 | ||||||
Minor International PCL NVDR | 4,800 | 5,298 | ||||||
Siam Cement (The) PCL Foreign | 1,200 | 16,531 | ||||||
Siam Commercial Bank PCL NVDR | 2,400 | 14,051 | ||||||
TMB Bank PCL NVDR | 34,800 | 3,312 | ||||||
True Corp. PCL NVDRa | 7,776 | 2,800 | ||||||
|
| |||||||
| 138,278 | ||||||||
TURKEY — 1.60% |
| |||||||
Akbank TAS | 3,174 | 12,120 | ||||||
Anadolu Efes Biracilik ve Malt Sanayii ASa | 602 | 8,006 | ||||||
Arcelik AS | 666 | 3,997 | ||||||
BIM Birlesik Magazalar AS | 620 | 14,595 | ||||||
Coca-Cola Icecek AS | 196 | 4,632 | ||||||
Eregli Demir ve Celik Fabrikalari TAS | 3,828 | 7,451 | ||||||
Haci Omer Sabanci Holding AS | 1,049 | 4,861 | ||||||
TAV Havalimanlari Holding AS | 512 | 4,259 | ||||||
Turk Hava Yollari AOa | 586 | 1,860 | ||||||
Turkcell Iletisim Hizmetleri ASa | 694 | 4,068 | ||||||
Turkiye Garanti Bankasi AS | 6,594 | 25,882 | ||||||
Ulker Biskuvi Sanayi AS | 386 | 2,862 | ||||||
|
| |||||||
| 94,593 | ||||||||
UNITED ARAB EMIRATES — 0.54% |
| |||||||
Abu Dhabi Commercial Bank PJSC | 339 | 739 | ||||||
Aldar Properties PJSC | 9,687 | 10,523 | ||||||
Arabtec Holding Co.a | 3,690 | 4,732 | ||||||
DP World Ltd. | 189 | 3,549 | ||||||
| Security | Shares | Value | ||||||
Dubai Financial Market PJSC | 6,389 | $ | 5,914 | |||||
Emaar Properties PJSC | 2,397 | 6,689 | ||||||
|
| |||||||
| 32,146 | ||||||||
|
| |||||||
TOTAL COMMON STOCKS |
| |||||||
(Cost: $4,935,577) |
| 5,631,569 | ||||||
PREFERRED STOCKS — 4.49% |
| |||||||
BRAZIL — 3.65% | ||||||||
Banco Bradesco SA | 2,270 | 41,432 | ||||||
Companhia Brasileira de Distribuicao | 400 | 20,365 | ||||||
Itau Unibanco Holding SA | 7,942 | 143,254 | ||||||
Lojas Americanas SA | 1,500 | 10,619 | ||||||
|
| |||||||
| 215,670 | ||||||||
CHILE — 0.16% |
| |||||||
Embotelladora Andina SA Class B | 632 | 2,072 | ||||||
Sociedad Quimica y Minera de Chile SA Series B | 262 | 7,172 | ||||||
|
| |||||||
| 9,244 | ||||||||
COLOMBIA — 0.45% |
| |||||||
Bancolombia SA | 1,202 | 19,047 | ||||||
Grupo Aval Acciones y Valores SA | 10,148 | 7,591 | ||||||
|
| |||||||
| 26,638 | ||||||||
RUSSIA — 0.23% |
| |||||||
AK Transneft OAO | 4 | 8,800 | ||||||
Sberbank of Russia | 3,400 | 5,070 | ||||||
|
| |||||||
| 13,870 | ||||||||
|
| |||||||
TOTAL PREFERRED STOCKS |
| |||||||
(Cost: $248,922) |
| 265,422 | ||||||
WARRANTS — 0.00% | ||||||||
THAILAND — 0.00% | ||||||||
Indorama Ventures PCL NVDR | 420 | — | ||||||
Indorama Ventures PCL NVDR | 323 | — | ||||||
|
| |||||||
| — | ||||||||
|
| |||||||
TOTAL WARRANTS |
| |||||||
(Cost: $0) |
| — | ||||||
| 46 | 2014 iSHARES ANNUAL REPORTTO SHAREHOLDERS |
Table of Contents
Consolidated Schedule of Investments (Continued)
iSHARES® MSCI EMERGING MARKETS GROWTH ETF
August 31, 2014
| Security | Shares | Value | ||||||
SHORT-TERM INVESTMENTS — 1.71% |
| |||||||
MONEY MARKET FUNDS — 1.71% |
| |||||||
BlackRock Cash Funds: Institutional, |
| |||||||
0.14%d,e,f | 92,272 | $ | 92,272 | |||||
BlackRock Cash Funds: Prime, | ||||||||
0.11%d,e,f | 5,809 | 5,809 | ||||||
BlackRock Cash Funds: Treasury, | ||||||||
0.00%d,e | 3,235 | 3,235 | ||||||
|
| |||||||
| 101,316 | ||||||||
|
| |||||||
TOTAL SHORT-TERM INVESTMENTS |
| |||||||
(Cost: $101,316) |
| 101,316 | ||||||
|
| |||||||
TOTAL INVESTMENTS |
| |||||||
(Cost: $5,285,815) |
| 5,998,307 | ||||||
Other Assets, Less Liabilities — (1.36)% |
| (80,594 | ) | |||||
|
| |||||||
NET ASSETS — 100.00% |
| $ | 5,917,713 | |||||
|
| |||||||
CPO — Certificates of Participation (Ordinary)
NVDR — Non-Voting Depositary Receipts
NVS — Non-Voting Shares
SP ADR — Sponsored American Depositary Receipts
SP GDR — Sponsored Global Depositary Receipts
| a | Non-income earning security. |
| b | All or a portion of this security represents a security on loan. See Note 1. |
| c | This security may be resold to qualified foreign investors and foreign institutional buyers under Regulation S of the Securities Act of 1933. |
| d | Affiliated issuer. See Note 2. |
| e | The rate quoted is the annualized seven-day yield of the fund at period end. |
| f | All or a portion of this security represents an investment of securities lending collateral. See Note 1. |
See notes to consolidated financial statements.
CONSOLIDATED SCHEDULESOF INVESTMENTS | 47 |
Table of Contents
Consolidated Schedule of Investments
iSHARES® MSCI EMERGING MARKETS MINIMUM VOLATILITY ETF
August 31, 2014
| Security | Shares | Value | ||||||
COMMON STOCKS — 96.24% |
| |||||||
BRAZIL — 5.44% |
| |||||||
AMBEV SA | 1,698,300 | $ | 12,371,697 | |||||
CCR SA | 1,032,300 | 9,347,008 | ||||||
Cielo SA | 1,069,240 | 20,051,087 | ||||||
EcoRodovias Infraestrutura e Logistica SA | 1,631,700 | 10,428,062 | ||||||
Estacio Participacoes SA | 133,200 | 1,769,809 | ||||||
Kroton Educacional SA | 99,900 | 2,993,584 | ||||||
Natura Cosmeticos SA | 268,200 | 4,915,592 | ||||||
Souza Cruz SA | 899,100 | 8,422,219 | ||||||
Totvs SA | 569,700 | 10,403,317 | ||||||
Tractebel Energia SA | 1,065,600 | 17,863,581 | ||||||
Transmissora Alianca de Energia Eletrica SA | 569,500 | 5,940,484 | ||||||
Ultrapar Participacoes SA | 333,400 | 8,595,940 | ||||||
|
| |||||||
| 113,102,380 | ||||||||
CHILE — 4.22% |
| |||||||
AES Gener SA | 5,367,294 | 2,743,909 | ||||||
Aguas Andinas SA Series A | 20,852,127 | 13,076,829 | ||||||
Banco de Chile | 197,750,718 | 24,132,008 | ||||||
Banco de Credito e Inversiones | 130,536 | 7,114,367 | ||||||
Colbun SA | 45,019,602 | 11,782,438 | ||||||
Compania Cervecerias Unidas SA | 163,503 | 1,756,150 | ||||||
CorpBanca SA | 559,842,264 | 6,879,225 | ||||||
Empresa Nacional de Electricidad SA | 7,725,933 | 11,803,668 | ||||||
Empresa Nacional de Telecomunicaciones SA | 154,569 | 1,773,153 | ||||||
S.A.C.I. Falabella SA | 242,091 | 1,823,133 | ||||||
Vina Concha y Toro SA | 2,479,851 | 4,836,422 | ||||||
|
| |||||||
| 87,721,302 | ||||||||
CHINA — 20.49% |
| |||||||
AAC Technologies Holdings Inc.a | 1,014,000 | 6,613,769 | ||||||
Agricultural Bank of China Ltd. Class H | 13,986,000 | 6,460,505 | ||||||
Bank of China Ltd. Class H | 38,295,000 | 17,788,302 | ||||||
Bank of Communications Co. Ltd. Class H | 2,345,000 | 1,712,573 | ||||||
Beijing Enterprises Holdings Ltd. | 1,831,500 | 15,786,043 | ||||||
China BlueChemical Ltd. Class H | 2,022,000 | 996,631 | ||||||
| Security | Shares | Value | ||||||
China CITIC Bank Corp. Ltd. Class H | 3,663,000 | $ | 2,311,190 | |||||
China Communications Services Corp. Ltd. Class H | 11,538,000 | 5,567,908 | ||||||
China Construction Bank Corp. Class H | 19,314,000 | 14,354,385 | ||||||
China Gas Holdings Ltd.a | 6,780,000 | 12,072,541 | ||||||
China Life Insurance Co. Ltd. Class H | 1,340,000 | 3,847,022 | ||||||
China Mengniu Dairy Co. Ltd. | 2,345,000 | 10,877,564 | ||||||
China Minsheng Banking Corp. Ltd. Class H | 999,100 | 938,491 | ||||||
China Mobile Ltd. | 2,679,000 | 33,322,658 | ||||||
China Pacific Insurance (Group) Co. Ltd. Class H | 666,000 | 2,500,674 | ||||||
China Petroleum & Chemical Corp. Class H | 12,450,000 | 12,626,465 | ||||||
China Resources Enterprise Ltd.a | 670,000 | 1,802,481 | ||||||
China Resources Gas Group Ltd. | 7,326,000 | 21,315,884 | ||||||
China Resources Power Holdings Co. Ltd. | 3,350,000 | 10,136,255 | ||||||
China Telecom Corp. Ltd. Class H | 6,704,000 | 4,143,424 | ||||||
China Vanke Co. Ltd.a,b | 1,005,576 | 1,883,959 | ||||||
CSPC Pharmaceutical Group Ltd. | 3,330,000 | 2,784,256 | ||||||
ENN Energy Holdings Ltd. | 332,000 | 2,345,374 | ||||||
Guangdong Investment Ltd. | 10,656,000 | 12,883,198 | ||||||
Haier Electronics Group Co. Ltd. | 1,052,000 | 3,040,561 | ||||||
Hanergy Solar Group Ltd.a,b | 28,638,000 | 4,692,846 | ||||||
Hengan International Group Co. Ltd. | 1,676,000 | 17,873,383 | ||||||
Huaneng Power International Inc. Class H | 666,000 | 800,903 | ||||||
Industrial and Commercial Bank of China Ltd. Class H | 17,316,000 | 11,484,196 | ||||||
Inner Mongolia Yitai Coal Co. Ltd. Class B | 3,896,127 | 6,580,559 | ||||||
Jiangsu Expressway Co. Ltd. Class H | 10,724,000 | 12,218,205 | ||||||
Kunlun Energy Co. Ltd.a | 3,404,000 | 5,621,982 | ||||||
Lenovo Group Ltd. | 12,216,000 | 18,662,534 | ||||||
| 48 | 2014 iSHARES ANNUAL REPORTTO SHAREHOLDERS |
Table of Contents
Consolidated Schedule of Investments (Continued)
iSHARES® MSCI EMERGING MARKETS MINIMUM VOLATILITY ETF
August 31, 2014
| Security | Shares | Value | ||||||
PetroChina Co. Ltd. Class H | 3,336,000 | $ | 4,734,876 | |||||
Shandong Weigao Group Medical Polymer Co. Ltd. Class H | 1,340,000 | 1,357,264 | ||||||
Shanghai Pharmaceuticals Holding Co. Ltd. Class H | 6,393,600 | 13,116,938 | ||||||
Shenzhou International Group Holdings Ltd. | 2,997,000 | 9,338,858 | ||||||
Sihuan Pharmaceutical Holdings Group Ltd. | 9,657,000 | 6,466,950 | ||||||
Sino Biopharmaceutical Ltd. | 10,704,000 | 9,861,301 | ||||||
Sinopec Engineering Group Co. Ltd. | 1,665,000 | 1,899,137 | ||||||
Sinopharm Group Co. Ltd. Class H | 399,600 | 1,394,706 | ||||||
SOHO China Ltd. | 15,151,500 | 12,394,665 | ||||||
Sun Art Retail Group Ltd.a | 17,149,500 | 20,468,362 | ||||||
Tencent Holdings Ltd. | 999,000 | 16,305,943 | ||||||
Tingyi (Cayman Islands) Holding Corp. | 5,548,000 | 15,569,892 | ||||||
Tsingtao Brewery Co. Ltd. Class H | 1,020,000 | 7,745,269 | ||||||
Uni-President China Holdings Ltd.a | 3,330,000 | 3,007,684 | ||||||
Want Want China Holdings Ltd. | 1,665,000 | 2,064,560 | ||||||
Zhejiang Expressway Co. Ltd. Class H | 12,734,000 | 12,668,031 | ||||||
ZTE Corp. Class Ha | 799,200 | 1,800,485 | ||||||
|
| |||||||
| 426,241,642 | ||||||||
COLOMBIA — 1.11% |
| |||||||
Almacenes Exito SA | 180,486 | 3,072,623 | ||||||
Corporacion Financiera Colombiana SA NVS | 195,138 | 4,160,204 | ||||||
Ecopetrol SA | 6,221,772 | 10,783,389 | ||||||
Grupo Argos SA | 412,254 | 5,110,063 | ||||||
|
| |||||||
| 23,126,279 | ||||||||
CZECH REPUBLIC — 0.51% |
| |||||||
O2 Czech Republic AS | 757,908 | 10,647,756 | ||||||
|
| |||||||
| 10,647,756 | ||||||||
EGYPT — 0.72% |
| |||||||
Commercial International Bank (Egypt) SAE | 2,037,866 | 13,170,508 | ||||||
Telecom Egypt Co. | 849,842 | 1,712,746 | ||||||
|
| |||||||
| 14,883,254 | ||||||||
| Security | Shares | Value | ||||||
INDIA — 2.41% |
| |||||||
Cipla Ltd. | 1,559,772 | $ | 13,217,448 | |||||
Dabur India Ltd. | 2,872,791 | 11,012,050 | ||||||
Divi’s Laboratories Ltd. | 181,152 | 4,671,351 | ||||||
Dr. Reddy’s Laboratories Ltd. | 119,214 | 5,791,545 | ||||||
Hindustan Unilever Ltd. | 101,898 | 1,246,773 | ||||||
Sun Pharmaceuticals Industries Ltd. | 920,412 | 12,972,682 | ||||||
Tata Consultancy Services Ltd. | 27,639 | 1,148,900 | ||||||
|
| |||||||
| 50,060,749 | ||||||||
INDONESIA — 4.31% |
| |||||||
PT Astra Agro Lestari Tbk | 1,712,300 | 3,732,733 | ||||||
PT Bank Central Asia Tbk | 26,540,100 | 25,411,337 | ||||||
PT Bank Danamon Indonesia Tbk | 14,418,900 | 4,622,430 | ||||||
PT Bank Mandiri (Persero) Tbk | 7,758,900 | 6,881,692 | ||||||
PT Bank Negara Indonesia (Persero) Tbk | 7,559,100 | 3,457,250 | ||||||
PT Indocement Tunggal Prakarsa Tbk | 569,100 | 1,179,797 | ||||||
PT Indofood Sukses Makmur Tbk | 4,861,800 | 2,857,437 | ||||||
PT Jasa Marga (Persero) Tbk | 19,613,700 | 10,395,806 | ||||||
PT Kalbe Farma Tbk | 17,882,100 | 2,537,661 | ||||||
PT Perusahaan Gas Negara (Persero) Tbk | 4,229,100 | 2,096,925 | ||||||
PT Telekomunikasi Indonesia (Persero) Tbk | 57,076,200 | 13,003,469 | ||||||
PT Unilever Indonesia Tbk | 5,094,900 | 13,513,082 | ||||||
|
| |||||||
| 89,689,619 | ||||||||
MALAYSIA — 8.53% |
| |||||||
Astro Malaysia Holdings Bhd | 971,500 | 1,010,952 | ||||||
Axiata Group Bhd | 2,763,900 | 6,076,722 | ||||||
Berjaya Sports Toto Bhd | 3,463,297 | 4,131,344 | ||||||
Hong Leong Bank Bhd | 3,796,200 | 17,343,046 | ||||||
IHH Healthcare Bhd | 15,817,500 | 24,489,023 | ||||||
Malayan Banking Bhd | 9,324,000 | 29,877,030 | ||||||
Maxis Bhd | 9,856,800 | 20,482,881 | ||||||
Petronas Chemicals Group Bhd | 3,363,300 | 6,722,332 | ||||||
Petronas Dagangan Bhd | 1,964,700 | 12,528,702 | ||||||
Petronas Gas Bhd | 1,665,000 | 12,043,782 | ||||||
Public Bank Bhd | 5,128,280 | 31,368,413 | ||||||
Sime Darby Bhd | 2,412,600 | 7,240,861 | ||||||
Tenaga Nasional Bhd | 1,065,600 | 4,185,320 | ||||||
|
| |||||||
| 177,500,408 | ||||||||
CONSOLIDATED SCHEDULESOF INVESTMENTS | 49 |
Table of Contents
Consolidated Schedule of Investments (Continued)
iSHARES® MSCI EMERGING MARKETS MINIMUM VOLATILITY ETF
August 31, 2014
| Security | Shares | Value | ||||||
MEXICO — 1.73% |
| |||||||
Arca Continental SAB de CV | 268,000 | $ | 1,970,109 | |||||
Coca-Cola FEMSA SAB de CV Series L | 266,400 | 2,904,311 | ||||||
El Puerto de Liverpool SAB de CV Series C1 | 1,565,100 | 17,846,844 | ||||||
Fibra Uno Administracion SAB de CV | 632,700 | 2,271,826 | ||||||
Grupo Aeroportuario del Pacifico SAB de CV Series B | 699,300 | 4,854,534 | ||||||
Grupo Aeroportuario del Sureste SAB de CV Series B | 233,100 | 2,988,023 | ||||||
Wal-Mart de Mexico SAB de CV Series V | 1,132,200 | 3,082,584 | ||||||
|
| |||||||
| 35,918,231 | ||||||||
PERU — 1.25% |
| |||||||
Compania de Minas Buenaventura SA SP ADR | 180,819 | 2,632,724 | ||||||
Credicorp Ltd. | 150,183 | 23,288,878 | ||||||
|
| |||||||
| 25,921,602 | ||||||||
PHILIPPINES — 4.51% |
| |||||||
Aboitiz Power Corp. | 3,962,700 | 3,408,286 | ||||||
Bank of the Philippine Islands | 6,360,304 | 13,858,460 | ||||||
BDO Unibank Inc. | 1,072,260 | 2,225,677 | ||||||
International Container Terminal Services Inc. | 2,920,410 | 7,562,254 | ||||||
Jollibee Foods Corp. | 1,641,700 | 6,777,661 | ||||||
Metropolitan Bank & Trust Co. | 2,685,390 | 5,293,791 | ||||||
Philippine Long Distance Telephone Co. | 692,639 | 54,807,444 | ||||||
|
| |||||||
| 93,933,573 | ||||||||
POLAND — 0.22% |
| |||||||
Bank Zachodni WBK SA | 40,293 | 4,669,040 | ||||||
|
| |||||||
| 4,669,040 | ||||||||
QATAR — 1.48% |
| |||||||
Commercial Bank of Qatar QSC (The) | 139,527 | 2,609,521 | ||||||
Ooredoo QSC | 92,907 | 2,916,421 | ||||||
Qatar Electricity & Water Co. QSC | 263,070 | 12,354,435 | ||||||
Qatar Islamic Bank SAQ | 295,704 | 9,664,060 | ||||||
Qatar National Bank SAQ | 58,941 | 3,269,824 | ||||||
|
| |||||||
| 30,814,261 | ||||||||
| Security | Shares | Value | ||||||
RUSSIA — 0.83% |
| |||||||
LUKOIL OAO | 205,128 | $ | 11,418,936 | |||||
Rosneft Oil Co. OJSC | 965,700 | 5,957,429 | ||||||
|
| |||||||
| 17,376,365 | ||||||||
SOUTH AFRICA — 6.99% |
| |||||||
Aspen Pharmacare Holdings Ltd. | 313,353 | 9,005,429 | ||||||
Bidvest Group Ltd. | 186,147 | 4,923,827 | ||||||
Discovery Ltd. | 495,171 | 4,569,742 | ||||||
Foschini Group Ltd. (The) | 175,491 | 1,899,555 | ||||||
Growthpoint Properties Ltd. | 961,631 | 2,278,532 | ||||||
Liberty Holdings Ltd. | 344,988 | 4,235,716 | ||||||
Life Healthcare Group Holdings Ltd. | 4,128,867 | 17,384,458 | ||||||
Mediclinic International Ltd. | 133,533 | 1,161,135 | ||||||
Mr. Price Group Ltd. | 151,848 | 2,922,625 | ||||||
MTN Group Ltd. | 57,609 | 1,305,647 | ||||||
Nedbank Group Ltd. | 386,613 | 8,313,594 | ||||||
Pick n Pay Stores Ltd.a | 870,462 | 4,624,283 | ||||||
PPC Ltd. | 1,791,540 | 5,577,401 | ||||||
Redefine Properties Ltd. | 7,291,019 | 6,553,787 | ||||||
Remgro Ltd. | 624,708 | 14,302,837 | ||||||
Sasol Ltd. | 101,232 | 5,885,037 | ||||||
Shoprite Holdings Ltd. | 618,714 | 8,577,898 | ||||||
SPAR Group Ltd. (The) | 399,267 | 4,894,262 | ||||||
Standard Bank Group Ltd. | 1,678,986 | 21,785,741 | ||||||
Tiger Brands Ltd. | 120,546 | 3,479,664 | ||||||
Truworths International Ltd. | 568,431 | 3,976,462 | ||||||
Vodacom Group Ltd. | 645,687 | 7,792,272 | ||||||
|
| |||||||
| 145,449,904 | ||||||||
SOUTH KOREA — 11.44% |
| |||||||
AmorePacific Corp. | 12,321 | 25,639,637 | ||||||
AmorePacific Group | 5,328 | 5,559,469 | ||||||
CJ CheilJedang Corp. | 11,988 | 4,469,120 | ||||||
Dongbu Insurance Co. Ltd. | 236,763 | 14,290,543 | ||||||
E-Mart Co. Ltd. | 13,611 | 3,275,392 | ||||||
Hyundai Marine & Fire Insurance Co. Ltd. | 458,541 | 14,087,038 | ||||||
Hyundai Wia Corp. | 11,514 | 2,532,296 | ||||||
Kangwon Land Inc. | 360,639 | 12,822,167 | ||||||
Korea Electric Power Corp. | 101,565 | 4,227,075 | ||||||
KT Corp. | 376,623 | 13,000,449 | ||||||
KT&G Corp. | 342,324 | 32,039,595 | ||||||
LG Household & Health Care Ltd. | 2,997 | 1,516,309 | ||||||
| 50 | 2014 iSHARES ANNUAL REPORTTO SHAREHOLDERS |
Table of Contents
Consolidated Schedule of Investments (Continued)
iSHARES® MSCI EMERGING MARKETS MINIMUM VOLATILITY ETF
August 31, 2014
| Security | Shares | Value | ||||||
Lotte Shopping Co. Ltd. | 8,658 | $ | 2,834,909 | |||||
NAVER Corp. | 2,942 | 2,228,370 | ||||||
ORION Corp. | 7,992 | 6,881,026 | ||||||
S1 Corp. | 150,516 | 10,984,944 | ||||||
Samsung Electro-Mechanics Co. Ltd. | 14,985 | 811,358 | ||||||
Samsung Electronics Co. Ltd. | 6,724 | 8,183,260 | ||||||
Samsung Fire & Marine Insurance Co. Ltd. | 46,287 | 12,667,925 | ||||||
Samsung Life Insurance Co. Ltd. | 103,563 | 10,877,715 | ||||||
Samsung SDI Co. Ltd. | 67,599 | 10,100,349 | ||||||
SK C&C Co. Ltd. | 40,293 | 8,444,462 | ||||||
SK Telecom Co. Ltd. | 67,599 | 18,200,628 | ||||||
Yuhan Corp. | 72,576 | 12,382,906 | ||||||
|
| |||||||
| 238,056,942 | ||||||||
TAIWAN — 16.20% |
| |||||||
Advanced Semiconductor Engineering Inc. | 1,341,000 | 1,671,175 | ||||||
Advantech Co. Ltd. | 2,680,000 | 25,149,797 | ||||||
Asia Cement Corp. | 9,482,125 | 13,006,377 | ||||||
ASUSTeK Computer Inc. | 842,000 | 8,817,049 | ||||||
Chicony Electronics Co. Ltd. | 2,676,960 | 8,776,771 | ||||||
China Airlines Ltd.b | 17,316,828 | 5,793,422 | ||||||
China Steel Corp. | 16,775,517 | 14,479,796 | ||||||
Chunghwa Telecom Co. Ltd. | 8,991,000 | 27,944,126 | ||||||
Compal Electronics Inc. | 1,332,000 | 1,185,367 | ||||||
Delta Electronics Inc. | 670,000 | 4,707,181 | ||||||
EVA Airways Corp.b | 2,664,000 | 1,336,880 | ||||||
Far EasTone Telecommunications Co. Ltd. | 9,417,000 | 20,068,681 | ||||||
First Financial Holding Co. Ltd. | 12,321,119 | 7,625,858 | ||||||
Formosa Chemicals & Fibre Corp. | 333,300 | 829,612 | ||||||
Formosa Petrochemical Corp. | 2,997,000 | 7,570,081 | ||||||
Formosa Plastics Corp. | 2,823,840 | 7,321,644 | ||||||
Formosa Taffeta Co. Ltd. | 4,692,000 | 4,983,891 | ||||||
Foxconn Technology Co. Ltd. | 3,146,850 | 7,895,945 | ||||||
Hua Nan Financial Holdings Co. Ltd. | 22,289,474 | 13,832,814 | ||||||
Kinsus Interconnect Technology Corp. | 1,998,000 | 8,455,764 | ||||||
Lite-On Technology Corp. | 11,322,511 | 18,769,523 | ||||||
MediaTek Inc. | 333,000 | 5,564,761 | ||||||
President Chain Store Corp. | 1,340,000 | 10,154,062 | ||||||
| Security | Shares | Value | ||||||
ScinoPharm Taiwan Ltd. | 2,197,814 | $ | 4,485,260 | |||||
Standard Foods Corp. | 737,400 | 1,894,659 | ||||||
Synnex Technology International Corp. | 4,662,000 | 7,112,199 | ||||||
Taiwan Cement Corp. | 4,662,000 | 7,408,541 | ||||||
Taiwan Cooperative Financial Holding Co. Ltd. | 38,808,769 | 21,682,690 | ||||||
Taiwan Mobile Co. Ltd. | 7,372,000 | 23,504,177 | ||||||
Taiwan Semiconductor Manufacturing Co. Ltd. | 7,326,000 | 30,391,730 | ||||||
Transcend Information Inc. | 1,665,000 | 5,598,183 | ||||||
U-Ming Marine Transport Corp. | 4,357,000 | 7,171,657 | ||||||
United Microelectronics Corp. | 3,996,000 | 1,824,841 | ||||||
|
| |||||||
| 337,014,514 | ||||||||
THAILAND — 2.30% |
| |||||||
Advanced Information Service PCL NVDR | 934,100 | 6,112,301 | ||||||
Bangkok Bank PCL NVDR | 1,528,000 | 9,807,138 | ||||||
Bangkok Dusit Medical Services PCL NVDR | 11,306,500 | 6,902,841 | ||||||
CP All PCL NVDR | 5,825,500 | 8,663,471 | ||||||
Kasikornbank PCL NVDR | 752,300 | 5,299,546 | ||||||
PTT Exploration & Production PCL NVDR | 764,800 | 3,938,936 | ||||||
PTT PCL NVDR | 709,000 | 7,125,517 | ||||||
|
| |||||||
| 47,849,750 | ||||||||
UNITED ARAB EMIRATES — 1.55% |
| |||||||
DP World Ltd. | 503,496 | 9,455,655 | ||||||
First Gulf Bank PJSC | 934,731 | 4,644,326 | ||||||
National Bank of Abu Dhabi PJSC | 4,775,112 | 18,200,560 | ||||||
|
| |||||||
| 32,300,541 | ||||||||
|
| |||||||
TOTAL COMMON STOCKS |
| |||||||
(Cost: $1,844,307,910) |
| 2,002,278,112 | ||||||
PREFERRED STOCKS — 3.23% |
| |||||||
BRAZIL — 0.44% |
| |||||||
AES Tiete SA | 775,100 | 6,969,682 | ||||||
Companhia Energetica de Minas Gerais | 99,985 | 856,165 | ||||||
Companhia Paranaense de Energia Class B | 68,800 | 1,219,463 | ||||||
|
| |||||||
| 9,045,310 | ||||||||
CONSOLIDATED SCHEDULESOF INVESTMENTS | 51 |
Table of Contents
Consolidated Schedule of Investments (Continued)
iSHARES® MSCI EMERGING MARKETS MINIMUM VOLATILITY ETF
August 31, 2014
| Security | Shares | Value | ||||||
COLOMBIA — 1.91% |
| |||||||
Banco Davivienda SA | 810,855 | $ | 13,482,903 | |||||
Grupo Argos SA | 444,555 | 5,422,391 | ||||||
Grupo de Inversiones Suramericana SA | 920,079 | 20,910,341 | ||||||
|
| |||||||
| 39,815,635 | ||||||||
RUSSIA — 0.38% |
| |||||||
AK Transneft OAO | 2,026 | 4,457,099 | ||||||
Surgutneftegas OJSC | 4,662,000 | 3,431,040 | ||||||
|
| |||||||
| 7,888,139 | ||||||||
SOUTH KOREA — 0.50% |
| |||||||
Samsung Electronics Co. Ltd. | 10,323 | 10,384,595 | ||||||
|
| |||||||
| 10,384,595 | ||||||||
|
| |||||||
TOTAL PREFERRED STOCKS |
| |||||||
(Cost: $59,018,294) |
| 67,133,679 | ||||||
SHORT-TERM INVESTMENTS — 2.14% |
| |||||||
MONEY MARKET FUNDS — 2.14% |
| |||||||
BlackRock Cash Funds: Institutional, |
| |||||||
0.14%c,d,e | 41,908,947 | 41,908,947 | ||||||
BlackRock Cash Funds: Prime, |
| |||||||
0.11%c,d,e | 2,638,283 | 2,638,283 | ||||||
|
| |||||||
| 44,547,230 | ||||||||
|
| |||||||
TOTAL SHORT-TERM INVESTMENTS |
| |||||||
(Cost: $44,547,230) |
| 44,547,230 | ||||||
|
| |||||||
TOTAL INVESTMENTS |
| |||||||
(Cost: $1,947,873,434) | 2,113,959,021 | |||||||
Other Assets, Less Liabilities — (1.61)% |
| (33,595,711 | ) | |||||
|
| |||||||
NET ASSETS — 100.00% |
| $ | 2,080,363,310 | |||||
|
| |||||||
NVDR — Non-Voting Depositary Receipts
NVS — Non-Voting Shares
SP ADR — Sponsored American Depositary Receipts
| a | All or a portion of this security represents a security on loan. See Note 1. |
| b | Non-income earning security. |
| c | Affiliated issuer. See Note 2. |
| d | The rate quoted is the annualized seven-day yield of the fund at period end. |
| e | All or a portion of this security represents an investment of securities lending collateral. See Note 1. |
See notes to consolidated financial statements.
| 52 | 2014 iSHARES ANNUAL REPORTTO SHAREHOLDERS |
Table of Contents
Consolidated Schedule of Investments
iSHARES® MSCI EMERGING MARKETS SMALL-CAP ETF
August 31, 2014
| Security | Shares | Value | ||||||
COMMON STOCKS — 98.78% |
| |||||||
BRAZIL — 5.08% |
| |||||||
Aliansce Shopping Centers SA | 12,500 | $ | 116,534 | |||||
Alupar Investimento SA Units | 4,800 | 39,643 | ||||||
Arezzo Industria e Comercio SA | 5,700 | 81,849 | ||||||
Autometal SA | 4,200 | 36,246 | ||||||
Banco ABC Brasil SAa | 163 | 1,049 | ||||||
Banco Pan SAa | 14,689 | 22,977 | ||||||
Brasil Brokers Participacoes SA | 14,000 | 22,650 | ||||||
Brasil Insurance Participacoes e Administracao SA | 6,400 | 22,853 | ||||||
Brazil Pharma SAa | 8,400 | 15,692 | ||||||
Companhia Hering SA | 9,600 | 120,088 | ||||||
Direcional Engenharia SA | 9,200 | 46,667 | ||||||
Equatorial Energia SA | 13,542 | 159,172 | ||||||
Eternit SA | 12,600 | 47,302 | ||||||
Even Construtora e Incorporadora SA | 22,200 | 67,169 | ||||||
EZ TEC Empreendimentos e Participacoes SA | 7,000 | 77,241 | ||||||
Fleury SA | 5,600 | 40,019 | ||||||
Gafisa SA | 37,800 | 56,931 | ||||||
Helbor Empreendimentos SA | 14,040 | 37,460 | ||||||
Iguatemi Empresa de Shopping Centers SA | 5,900 | 72,512 | ||||||
International Meal Co. Holdings SA | 6,200 | 54,282 | ||||||
Iochpe-Maxion SA | 7,000 | 55,967 | ||||||
Julio Simoes Logistica SA | 7,000 | 37,228 | ||||||
LPS Brasil – Consultoria de | 5,400 | 26,547 | ||||||
Marfrig Global Foods SAa | 24,900 | 84,575 | ||||||
Mills Estruturas e Servicos de Engenharia SA | 6,600 | 67,547 | ||||||
MRV Engenharia e Participacoes SA | 22,400 | 91,300 | ||||||
Multiplus SA | 5,300 | 77,692 | ||||||
PDG Realty SA Empreendimentos e Participacoesa | 88,200 | 58,733 | ||||||
Prumo Logistica SAa | 76,165 | 36,082 | ||||||
Restoque Comercio e Confeccoes de Roupas SAa | 11,200 | 45,550 | ||||||
Santos Brasil Participacoes SA Units | 4,400 | 33,685 | ||||||
Sao Martinho SA | 5,900 | 119,685 | ||||||
SLC Agricola SA | 4,200 | 32,492 | ||||||
Smiles SA | 4,300 | 76,101 | ||||||
| Security | Shares | Value | ||||||
Tecnisa SA | 16,500 | $ | 46,973 | |||||
Tegma Gestao Logistica SA | 2,700 | 23,771 | ||||||
TPI – Triunfo Participacoes e Investimentos SA | 12,800 | 35,296 | ||||||
Valid Solucoes e Servicos de Seguranca em Meios de Pagamento e Identificacao SA | 5,200 | 88,311 | ||||||
Vanguarda Agro SAa | 39,310 | 43,218 | ||||||
|
| |||||||
| 2,219,089 | ||||||||
CHILE — 1.15% |
| |||||||
Besalco SA | 32,595 | 22,307 | ||||||
Compania SudAmericana de Vapores SAa | 612,458 | 25,776 | ||||||
E.CL SA | 34,912 | 50,359 | ||||||
Inversiones Aguas Metropolitanas SA | 37,310 | 59,793 | ||||||
Parque Arauco SA | 53,937 | 100,277 | ||||||
SalfaCorp SA | 30,432 | 23,267 | ||||||
Sociedad Matriz SAAM SA | 786,147 | 64,750 | ||||||
Sonda SA | 66,935 | 155,114 | ||||||
|
| |||||||
| 501,643 | ||||||||
CHINA — 19.01% |
| |||||||
361 Degrees International Ltd. | 129,000 | 37,950 | ||||||
Ajisen (China) Holdings Ltd.b | 42,000 | 34,683 | ||||||
Anhui Expressway Co. Ltd. Class H | 112,000 | 67,199 | ||||||
Anton Oilfield Services Groupb | 106,000 | 45,545 | ||||||
Anxin-China Holdings Ltd. | 224,000 | 26,301 | ||||||
Asia Cement China Holdings Corp. | 119,000 | 81,993 | ||||||
Asian Citrus Holdings Ltd. | 84,000 | 17,884 | ||||||
Beijing Capital Land Ltd. Class H | 126,000 | 45,522 | ||||||
Beijing Tong Ren Tang Chinese Medicine Co. Ltd.b | 28,000 | 36,923 | ||||||
Boshiwa International Holding Ltd.a,c | 32,000 | 3,423 | ||||||
Bosideng International Holdings Ltd.b | 336,000 | 53,325 | ||||||
BYD Electronic International Co. Ltd. | 88,000 | 81,753 | ||||||
C C Land Holdings Ltd. | 159,000 | 33,441 | ||||||
Carnival Group International Holdings Ltd.a,b | 682,000 | 96,798 | ||||||
China Datang Corp. Renewable Power Co. Ltd. Class H | 210,000 | 32,245 | ||||||
China Dongxiang Group Co. | 320,000 | 68,954 | ||||||
China High Speed Transmission Equipment Group Co. Ltd.a | 96,000 | 83,364 | ||||||
CONSOLIDATED SCHEDULESOF INVESTMENTS | 53 |
Table of Contents
Consolidated Schedule of Investments (Continued)
iSHARES® MSCI EMERGING MARKETS SMALL-CAP ETF
August 31, 2014
| Security | Shares | Value | ||||||
China Huiyuan Juice Group Ltd.a | 63,000 | $ | 27,232 | |||||
China Lilang Ltd. | 106,000 | 71,532 | ||||||
China LotSynergy Holdings Ltd.b | 640,000 | 56,154 | ||||||
China Lumena New Materials Corp.b,c | 210,000 | 30,483 | ||||||
China Medical System Holdings Ltd. | 108,000 | 156,074 | ||||||
China Merchants Land Ltd. | 112,000 | 17,775 | ||||||
China Metal Recycling Holdings Ltd.a,b,c | 12,000 | — | ||||||
China Modern Dairy Holdings Ltd.a,b | 187,000 | 91,689 | ||||||
China Oil and Gas Group Ltd. | 420,000 | 73,702 | ||||||
China Overseas Grand Oceans Group Ltd.b | 77,000 | 48,484 | ||||||
China Power International Development Ltd. | 239,000 | 108,859 | ||||||
China Power New Energy Development Co. Ltd.a | 560,000 | 39,741 | ||||||
China Precious Metal Resources Holdings Co. Ltd.a,b | 408,000 | 50,012 | ||||||
China Rare Earth Holdings Ltd.a | 448,000 | 63,586 | ||||||
China Resources and Transportation Group Ltd.a,b | 1,500,000 | 63,870 | ||||||
China Rongsheng Heavy Industries Group Holdings Ltd.a,b | 320,000 | 56,154 | ||||||
China Shanshui Cement Group Ltd.b | 126,000 | 46,335 | ||||||
China Shineway Pharmaceutical Group Ltd.b | 36,000 | 62,430 | ||||||
China Singyes Solar Technologies Holdings Ltd.b | 54,000 | 89,603 | ||||||
China South City Holdings Ltd. | 280,000 | 139,817 | ||||||
China Suntien Green Energy Corp. Ltd. Class H | 154,000 | 46,497 | ||||||
China Travel International Investment Hong Kong Ltd. | 446,000 | 140,991 | ||||||
China Vanadium Titano-Magnetite Mining Co. Ltd.b | 195,000 | 21,890 | ||||||
China Water Affairs Group Ltd. | 150,000 | 53,999 | ||||||
China Yongda Automobiles Services Holdings Ltd.b | 51,000 | 44,616 | ||||||
China Yurun Food Group Ltd.a,b | 112,000 | 54,626 | ||||||
China ZhengTong Auto Services Holdings Ltd. | 112,000 | 59,829 | ||||||
Chinasoft International Ltd.a,b | 168,000 | 61,129 | ||||||
Chongqing Machinery & Electric Co. Ltd. Class H | 280,000 | 41,909 | ||||||
| Security | Shares | Value | ||||||
CIMC Enric Holdings Ltd. | 56,000 | $ | 61,996 | |||||
CITIC Dameng Holdings Ltd.a | 392,000 | 31,359 | ||||||
CITIC Resources Holdings Ltd.a,b | 336,000 | 54,193 | ||||||
Comba Telecom Systems Holdings Ltd.a,b | 173,000 | 75,226 | ||||||
Coolpad Group Ltd. | 224,000 | 48,556 | ||||||
Cosco International Holdings Ltd. | 196,000 | 95,596 | ||||||
Dah Chong Hong Holdings Ltd. | 105,000 | 65,166 | ||||||
Dazhong Transportation Group Co. Ltd. Class B | 75,200 | 48,955 | ||||||
Digital China Holdings Ltd. | 82,000 | 79,459 | ||||||
Dongyue Group Ltd. | 166,000 | 69,397 | ||||||
EverChina International Holdings Co. Ltd.a | 510,000 | 25,006 | ||||||
Fantasia Holdings Group Co. Ltd.b | 238,500 | 28,619 | ||||||
FDG Electric Vehicles Ltd.a,b | 640,000 | 45,418 | ||||||
First Tractor Co. Ltd. Class H | 92,000 | 63,152 | ||||||
Fufeng Group Ltd. | 88,400 | 35,017 | ||||||
Goldin Properties Holdings Ltd.a,b | 126,000 | 67,307 | ||||||
Greatview Aseptic Packaging Co. Ltd. | 118,000 | 91,353 | ||||||
Hangzhou Steam Turbine Co. Ltd. Class B | 39,080 | 46,441 | ||||||
Harbin Electric Co. Ltd. Class H | 108,000 | 64,241 | ||||||
HC International Inc.a,b | 50,000 | 96,127 | ||||||
Hengdeli Holdings Ltd. | 169,600 | 30,637 | ||||||
Hi Sun Technology (China) Ltd.a,b | 144,000 | 34,374 | ||||||
Hisense Kelon Electrical Holdings Co. Ltd. Class Ha | 45,000 | 56,438 | ||||||
Hopewell Highway Infrastructure Ltd. | 64,000 | 32,041 | ||||||
Hopson Development Holdings Ltd.a | 48,000 | 48,371 | ||||||
Hua Han Bio-Pharmaceutical Holdings Ltd. Class H | 232,000 | 73,640 | ||||||
Huabao International Holdings Ltd. | 185,000 | 134,391 | ||||||
Hunan Nonferrous Metal Corp. Ltd. Class Ha | 212,000 | 75,498 | ||||||
Jiangsu Future Land Co. Ltd. Class B | 74,700 | 37,873 | ||||||
Ju Teng International Holdings Ltd. | 98,000 | 56,776 | ||||||
Kaisa Group Holdings Ltd.b | 154,000 | 56,631 | ||||||
Kingdee International Software Group Co. Ltd.a | 198,000 | 63,870 | ||||||
KWG Property Holdings Ltd.b | 124,500 | 90,441 | ||||||
Labixiaoxin Snacks Group Ltd.a,b | 158,000 | 27,726 | ||||||
| 54 | 2014 iSHARES ANNUAL REPORTTO SHAREHOLDERS |
Table of Contents
Consolidated Schedule of Investments (Continued)
iSHARES® MSCI EMERGING MARKETS SMALL-CAP ETF
August 31, 2014
| Security | Shares | Value | ||||||
Lao Feng Xiang Co. Ltd. Class B | 21,900 | $ | 60,970 | |||||
Li Ning Co. Ltd.a,b | 77,000 | 42,920 | ||||||
Lijun International Pharmaceutical (Holding) Co. Ltd. | 192,000 | 97,856 | ||||||
Lonking Holdings Ltd.b | 168,000 | 29,481 | ||||||
Luthai Textile Co. Ltd. Class B | 55,800 | 76,895 | ||||||
MIE Holdings Corp. | 112,000 | 18,787 | ||||||
Mingfa Group International Co. Ltd.a | 282,000 | 76,048 | ||||||
Minth Group Ltd.b | 72,000 | 153,287 | ||||||
MMG Ltd. | 128,000 | 46,575 | ||||||
NetDragon Websoft Inc. | 21,000 | 40,590 | ||||||
New World Department Store China Ltd. | 51,000 | 21,847 | ||||||
North Mining Shares Co. Ltd.a,b | 1,280,000 | 57,805 | ||||||
NVC Lighting Holdings Ltd. | 108,000 | 24,665 | ||||||
Peak Sport Products Co. Ltd. | 186,000 | 56,159 | ||||||
Phoenix Satellite Television Holdings Ltd. | 156,000 | 52,938 | ||||||
Ports Design Ltd.b | 42,000 | 17,450 | ||||||
Renhe Commercial Holdings Co. Ltd.a | 812,000 | 37,194 | ||||||
REXLot Holdings Ltd.b | 700,000 | 80,386 | ||||||
Semiconductor Manufacturing International Corp.a,b | 1,893,000 | 178,305 | ||||||
Shenguan Holdings Group Ltd. | 144,000 | 52,396 | ||||||
Shenzhen Expressway Co. Ltd. Class H | 144,000 | 91,043 | ||||||
Shenzhen International Holdings Ltd. | 79,500 | 106,477 | ||||||
Shenzhen Investment Ltd. | 204,000 | 65,016 | ||||||
Shougang Concord International Enterprises Co. Ltd.a | 1,460,000 | 67,818 | ||||||
Shougang Fushan Resources Group Ltd.b | 128,000 | 35,179 | ||||||
Shunfeng Photovoltaic International Ltd.a,b | 96,000 | 121,391 | ||||||
Sino Oil And Gas Holdings Ltd.a | 1,330,000 | 41,186 | ||||||
Sinopec Kantons Holdings Ltd.b | 84,000 | 70,342 | ||||||
Sinotrans Ltd. Class H | 196,000 | 132,013 | ||||||
Sinotrans Shipping Ltd.a,b | 231,000 | 72,428 | ||||||
Skyworth Digital Holdings Ltd. | 140,000 | 75,147 | ||||||
Sparkle Roll Group Ltd.a,b | 432,000 | 23,132 | ||||||
Springland International Holdings | 119,000 | 46,831 | ||||||
Sunac China Holdings Ltd. | 126,000 | 97,709 | ||||||
Sunny Optical Technology Group Co Ltd.b | 56,000 | 76,303 | ||||||
| Security | Shares | Value | ||||||
Superb Summit International Group Ltd.a,b | 450,000 | $ | 92,901 | |||||
TCL Communication Technology Holdings Ltd. | 56,000 | 69,439 | ||||||
Tech Pro Technology Development Ltd.a,b | 188,000 | 106,006 | ||||||
Texhong Textile Group Ltd.b | 21,000 | 15,255 | ||||||
Tianjin Development Holdings Ltd. | 84,000 | 70,450 | ||||||
Tianjin Port Development Holdings Ltd. | 306,000 | 50,933 | ||||||
Tianneng Power International Ltd. | 84,000 | 30,781 | ||||||
Tibet 5100 Water Resources Holdings Ltd.b | 126,000 | 41,457 | ||||||
Tong Ren Tang Technologies Co. Ltd. Class H | 56,000 | 78,615 | ||||||
Towngas China Co. Ltd. | 96,000 | 102,315 | ||||||
Travelsky Technology Ltd. Class H | 112,000 | 110,119 | ||||||
V1 Group Ltd.a,b | 392,000 | 37,935 | ||||||
Vinda International Holdings Ltd. | 32,000 | 49,217 | ||||||
West China Cement Ltd. | 496,000 | 53,119 | ||||||
Wison Engineering Services Co. Ltd.a,c | 112,000 | 22,891 | ||||||
Xingda International Holdings Ltd. | 72,000 | 26,849 | ||||||
Xinjiang Xinxin Mining Industry Co. Ltd. Class Ha | 266,000 | 61,779 | ||||||
XTEP International Holdings Ltd. | 104,000 | 48,711 | ||||||
Yanchang Petroleum International Ltd.a,b | 570,000 | 30,154 | ||||||
Yip’s Chemical Holdings Ltd. | 42,000 | 30,294 | ||||||
Yuexiu Real Estate Investment Trust | 168,000 | 86,708 | ||||||
Yuexiu Transport Infrastructure Ltd. | 102,000 | 62,120 | ||||||
|
| |||||||
| 8,300,229 | ||||||||
COLOMBIA — 0.15% |
| |||||||
Bolsa de Valores de Colombia | 5,125,689 | 66,795 | ||||||
|
| |||||||
| 66,795 | ||||||||
CZECH REPUBLIC — 0.11% |
| |||||||
Pegas Nonwovens SA | 918 | 27,449 | ||||||
Philip Morris CR AS | 42 | 20,754 | ||||||
|
| |||||||
| 48,203 | ||||||||
EGYPT — 0.62% |
| |||||||
Orascom Telecom Media And Technology Holding SAE SP GDRa,b | 379,722 | 269,603 | ||||||
|
| |||||||
| 269,603 | ||||||||
CONSOLIDATED SCHEDULESOF INVESTMENTS | 55 |
Table of Contents
Consolidated Schedule of Investments (Continued)
iSHARES® MSCI EMERGING MARKETS SMALL-CAP ETF
August 31, 2014
| Security | Shares | Value | ||||||
GREECE — 0.78% |
| |||||||
Ellaktor SAa | 12,590 | $ | 57,711 | |||||
Frigoglass SAa | 3,621 | 15,262 | ||||||
Hellenic Exchanges – Athens Stock Exchange SA Holding | 6,730 | 62,940 | ||||||
Intralot SAa | 9,520 | 22,195 | ||||||
Marfin Investment Group Holdings SAa | 54,404 | 28,593 | ||||||
Metka SA | 2,902 | 43,691 | ||||||
Motor Oil (Hellas) Corinth Refineries SA | 3,556 | 38,362 | ||||||
Mytilineos Holdings SAa | 8,895 | 72,408 | ||||||
|
| |||||||
| 341,162 | ||||||||
INDIA — 6.54% |
| |||||||
Amtek Auto Ltd. | 19,296 | 74,729 | ||||||
Andhra Bank | 42,882 | 50,776 | ||||||
Ashok Leyland Ltd.a | 199,824 | 120,033 | ||||||
Bajaj Finance Ltd. | 2,119 | 86,304 | ||||||
Bharat Forge Ltd. | 12,795 | 166,938 | ||||||
Biocon Ltd. | 9,207 | 70,410 | ||||||
CESC Ltd. | 11,994 | 137,472 | ||||||
Cox & Kings Ltd. | 22,366 | 109,655 | ||||||
EID Parry India Ltd.a | 19,334 | 66,592 | ||||||
Gujarat Fluorochemicals Ltd. | 7,756 | 66,433 | ||||||
Gujarat Gas Co. Ltd. | 6,386 | 46,969 | ||||||
Gujarat Mineral Development Corp. Ltd. | 20,594 | 49,364 | ||||||
Gujarat State Petronet Ltd. | 47,500 | 66,929 | ||||||
GVK Power & Infrastructure Ltd.a | 218,148 | 49,073 | ||||||
Havells India Ltd. | 17,000 | 79,621 | ||||||
Hexaware Technologies Ltd. | 26,508 | 69,852 | ||||||
Housing Development & Infrastructure Ltd.a | 30,968 | 46,136 | ||||||
IIFL Holdings Ltd. | 31,083 | 71,381 | ||||||
Indiabulls Housing Finance Ltd. | 14,574 | 90,667 | ||||||
Indian Hotels Co. Ltd.a | 52,728 | 83,897 | ||||||
Indraprastha Gas Ltd. | 14,042 | 87,358 | ||||||
Jammu & Kashmir Bank Ltd. (The) | 3,864 | 94,779 | ||||||
Jindal Saw Ltd. | 31,094 | 39,713 | ||||||
Just Dial Ltd.a | 2,296 | 62,334 | ||||||
Manappuram Finance Ltd. | 58,164 | 24,874 | ||||||
MAX India Ltd. | 22,092 | 118,506 | ||||||
MindTree Ltd. | 8,524 | 158,266 | ||||||
PTC India Ltd. | 50,208 | 72,151 | ||||||
Redington India Ltd. | 35,392 | 61,242 | ||||||
| Security | Shares | Value | ||||||
SE Investments Ltd. | 13,709 | $ | 75,198 | |||||
Syndicate Bank | 29,834 | 58,680 | ||||||
Tata Global Beverages Ltd. | 30,940 | 76,738 | ||||||
Thermax Ltd. | 8,521 | 120,611 | ||||||
Torrent Pharmaceuticals Ltd. | 8,540 | 117,200 | ||||||
Voltas Ltd. | 21,622 | 87,176 | ||||||
|
| |||||||
| 2,858,057 | ||||||||
INDONESIA — 3.56% |
| |||||||
PT ACE Hardware Indonesia Tbk | 714,000 | 57,071 | ||||||
PT Agung Podomoro Land Tbk | 844,500 | 27,290 | ||||||
PT Alam Sutera Realty Tbk | 916,500 | 39,959 | ||||||
PT Arwana Citramulia Tbk | 778,300 | 67,534 | ||||||
PT Bank Bukopin Tbk | 1,082,200 | 68,461 | ||||||
PT Bank Pembangunan Daerah Jawa Barat dan Banten Tbk | 308,000 | 22,907 | ||||||
PT Bank Tabungan Negara (Persero) Tbk | 724,423 | 69,052 | ||||||
PT Bumi Resources Tbka | 1,113,000 | 18,554 | ||||||
PT Ciputra Development Tbk | 916,300 | 95,175 | ||||||
PT Gajah Tunggal Tbk | 161,000 | 24,362 | ||||||
PT Garuda Indonesia (Persero) Tbka | 644,409 | 23,854 | ||||||
PT Hanson International Tbka | 1,015,000 | 57,702 | ||||||
PT Japfa Comfeed Indonesia Tbk | 429,000 | 47,310 | ||||||
PT Kawasan Industri Jababeka Tbk | 1,971,275 | 47,691 | ||||||
PT Medco Energi Internasional Tbk | 164,900 | 51,454 | ||||||
PT Mitra Adiperkasa Tbk | 77,000 | 39,660 | ||||||
PT MNC Investama Tbk | 1,967,000 | 63,395 | ||||||
PT MNC Sky Vision Tbk | 112,985 | 15,744 | ||||||
PT Multipolar Tbk | 766,152 | 51,743 | ||||||
PT Pakuwon Jati Tbk | 2,088,000 | 77,647 | ||||||
PT Perusahaan Perkebunan London Sumatra Indonesia Tbk | 224,000 | 35,809 | ||||||
PT Ramayana Lestari Sentosa Tbk | 369,000 | 31,387 | ||||||
PT Sampoerna Agro Tbk | 154,000 | 27,779 | ||||||
PT Sentul City Tbka | 2,065,000 | 21,007 | ||||||
PT Sigmagold Inti Perkasa Tbka | 892,500 | 33,724 | ||||||
PT Sugih Energy Tbka | 1,511,300 | 54,005 | ||||||
PT Summarecon Agung Tbk | 1,060,800 | 121,519 | ||||||
PT Surya Semesta Internusa Tbk | 432,450 | 29,945 | ||||||
PT Timah (Persero) Tbk | 721,096 | 88,153 | ||||||
PT Trada Maritime Tbka | 483,000 | 76,182 | ||||||
PT Wijaya Karya (Persero) Tbk | 272,000 | 66,736 | ||||||
|
| |||||||
| 1,552,811 | ||||||||
| 56 | 2014 iSHARES ANNUAL REPORTTO SHAREHOLDERS |
Table of Contents
Consolidated Schedule of Investments (Continued)
iSHARES® MSCI EMERGING MARKETS SMALL-CAP ETF
August 31, 2014
| Security | Shares | Value | ||||||
MALAYSIA — 4.74% |
| |||||||
Bursa Malaysia Bhd | 32,300 | $ | 82,595 | |||||
Carlsberg Brewery Malaysia Bhd | 22,500 | 89,229 | ||||||
DRB-Hicom Bhd | 125,000 | 87,643 | ||||||
Eastern & Oriental Bhd | 100,000 | 90,102 | ||||||
Hibiscus Petroleum Bhda | 56,000 | 27,360 | ||||||
IGB Corp. Bhd | 129,900 | 118,278 | ||||||
IJM Land Bhd | 78,200 | 81,872 | ||||||
KNM Group Bhda | 201,600 | 61,081 | ||||||
KPJ Healthcare Bhd | 100,150 | 121,693 | ||||||
Magnum Bhd | 84,800 | 82,594 | ||||||
Mah Sing Group Bhd | 82,620 | 64,219 | ||||||
Malaysian Airline System Bhda | 625,600 | 49,619 | ||||||
Malaysian Pacific Industries Bhd | 70,000 | 126,586 | ||||||
Malaysian Resources Corp. Bhd | 154,000 | 83,058 | ||||||
Media Prima Bhd | 95,200 | 68,863 | ||||||
OSK Holdings Bhd | 108,387 | 78,058 | ||||||
POS Malaysia Bhd | 71,800 | 110,479 | ||||||
QL Resources Bhd | 98,700 | 103,961 | ||||||
Sarawak Oil Palms Bhd | 29,400 | 56,897 | ||||||
Scomi Group Bhda | 451,800 | 58,052 | ||||||
Sunway Real Estate Investment Trust Bhd | 191,700 | 88,795 | ||||||
TIME dotCom Bhda | 58,400 | 90,416 | ||||||
Top Glove Corp. Bhd | 57,700 | 87,685 | ||||||
Wah Seong Corp. Bhd | 109,946 | 66,275 | ||||||
WCT Holdings Bhd | 139,890 | 94,532 | ||||||
|
| |||||||
| 2,069,942 | ||||||||
MEXICO — 2.65% |
| |||||||
Alsea SAB de CVa,b | 42,659 | 147,172 | ||||||
Axtel SAB de CV CPOa,b | 105,000 | 32,844 | ||||||
Banregio Grupo Financiero SAB de CV | 16,800 | 94,847 | ||||||
Bolsa Mexicana de Valores SAB de CV | 37,300 | 79,817 | ||||||
Concentradora Fibra Hotelera Mexicana SAB de CV | 43,300 | 75,536 | ||||||
Consorcio ARA SAB de CVa | 107,800 | 49,219 | ||||||
Corporacion Geo SAB de CV Series Ba,c | 38,700 | — | ||||||
Corporacion Inmobiliaria Vesta SAB de CV | 40,200 | 87,407 | ||||||
Empresas ICA SAB de CVa,b | 47,700 | 88,428 | ||||||
Grupo Aeromexico SAB de CVa,b | 46,500 | 75,144 | ||||||
| Security | Shares | Value | ||||||
Grupo Aeroportuario del Centro Norte SAB de CVb | 20,700 | $ | 88,512 | |||||
Grupo Herdez SAB de CV | 17,900 | 50,132 | ||||||
Industrias CH SAB de CV Series Ba | 9,600 | 53,046 | ||||||
Macquarie Mexico Real Estate Management SA de CV | 47,600 | 95,415 | ||||||
TF Administradora Industrial S de RL SAB de CV | 37,700 | 86,325 | ||||||
TV Azteca SAB de CV CPO | 96,600 | 51,863 | ||||||
Urbi Desarrollos Urbanos SAB de CVa,b,c | 124,600 | — | ||||||
|
| |||||||
| 1,155,707 | ||||||||
PHILIPPINES — 1.18% |
| |||||||
Belle Corp. | 615,933 | 67,103 | ||||||
Cebu Air Inc. | 24,080 | 34,463 | ||||||
Cosco Capital Inc. | 178,500 | 33,776 | ||||||
EEI Corp. | 239,772 | 61,263 | ||||||
Filinvest Land Inc. | 1,572,000 | 55,885 | ||||||
First Gen Corp. | 139,400 | 77,054 | ||||||
First Philippine Holdings Corp. | 24,370 | 44,156 | ||||||
Manila Water Co. Inc. | 93,500 | 64,335 | ||||||
Melco Crown Philippines Resorts Corp.a | 124,100 | 32,847 | ||||||
Philippine National Banka | 21,303 | 42,655 | ||||||
|
| |||||||
| 513,537 | ||||||||
POLAND — 1.19% |
| |||||||
Asseco Poland SA | 6,510 | 86,125 | ||||||
Budimex SA | 1,428 | 54,488 | ||||||
Globe Trade Centre SAa | 21,742 | 40,120 | ||||||
Lubelski Wegiel Bogdanka SA | 3,126 | 113,900 | ||||||
Netia SA | 37,106 | 63,829 | ||||||
Rovese SAa | 39,452 | 15,053 | ||||||
TVN SAa | 21,567 | 94,569 | ||||||
Warsaw Stock Exchange SA | 4,521 | 53,251 | ||||||
|
| |||||||
| 521,335 | ||||||||
QATAR — 0.92% |
| |||||||
Al Khalij Commercial Bank | 7,264 | 43,290 | ||||||
Qatar Insurance Co. SAQ | 5,542 | 152,202 | ||||||
Qatar National Cement Co. | 1,222 | 47,991 | ||||||
Qatari Investors Group QSC | 2,839 | 46,002 | ||||||
Salam International Investment Co. | 9,826 | 53,189 | ||||||
United Development Co. PSC | 7,497 | 60,018 | ||||||
|
| |||||||
| 402,692 | ||||||||
CONSOLIDATED SCHEDULESOF INVESTMENTS | 57 |
Table of Contents
Consolidated Schedule of Investments (Continued)
iSHARES® MSCI EMERGING MARKETS SMALL-CAP ETF
August 31, 2014
| Security | Shares | Value | ||||||
RUSSIA — 0.63% |
| |||||||
Aeroflot – Russian Airlines OJSC | 44,056 | $ | 55,824 | |||||
LSR Group OJSC SP GDRd | 25,743 | 92,675 | ||||||
M Video OJSC | 5,280 | 27,089 | ||||||
Pharmstandard GDRa,d | 3,822 | 44,756 | ||||||
TMK OAO SP GDRd | 5,508 | 53,896 | ||||||
|
| |||||||
| 274,240 | ||||||||
SOUTH AFRICA — 7.26% |
| |||||||
Acucap Properties Ltd. | 14,130 | 62,430 | ||||||
Adcock Ingram Holdings Ltd.a | 14,580 | 70,738 | ||||||
Aeci Ltd. | 9,453 | 109,325 | ||||||
African Oxygen Ltd. | 7,920 | 13,404 | ||||||
ArcelorMittal South Africa Ltd.a | 18,217 | 67,418 | ||||||
Astral Foods Ltd. | 7,104 | 95,518 | ||||||
Aveng Ltd.a | 22,848 | 49,067 | ||||||
AVI Ltd. | 24,248 | 139,008 | ||||||
Capital Property Funda | 110,667 | 124,346 | ||||||
City Lodge Hotels Ltd. | 4,600 | 53,632 | ||||||
Clicks Group Ltd. | 17,268 | 112,274 | ||||||
Clover Industries Ltd. | 23,106 | 39,888 | ||||||
DataTec Ltd. | 20,474 | 103,473 | ||||||
Emira Property Fund | 32,457 | 46,082 | ||||||
Famous Brands Ltd. | 5,043 | 46,872 | ||||||
Fountainhead Property Trust | 25,261 | 18,574 | ||||||
Grindrod Ltd. | 29,634 | 68,990 | ||||||
Group Five Ltd. | 15,912 | 60,968 | ||||||
Hyprop Investments Ltd. | 16,254 | 131,968 | ||||||
Illovo Sugar Ltd. | 15,810 | 43,110 | ||||||
JSE Ltd. | 10,063 | 95,876 | ||||||
Lewis Group Ltd. | 4,653 | 26,250 | ||||||
Mondi Ltd. | 10,066 | 171,594 | ||||||
Murray & Roberts Holdings Ltd.a | 36,657 | 90,958 | ||||||
Omnia Holdings Ltd. | 5,020 | 106,792 | ||||||
Pick n Pay Holdings Ltd. | 27,573 | 62,818 | ||||||
Pinnacle Holdings Ltd. | 23,019 | 29,219 | ||||||
Resilient Property Income Fund Ltd. | 23,866 | 157,754 | ||||||
Reunert Ltd. | 11,152 | 69,206 | ||||||
Royal Bafokeng Platinum Ltd.a | 7,820 | 53,676 | ||||||
SA Corporate Real Estate Fund Nominees Pty Ltd. | 141,096 | 56,251 | ||||||
Sibanye Gold Ltd. | 65,433 | 154,240 | ||||||
Sun International Ltd. | 9,989 | 109,889 | ||||||
Super Group Ltd.a | 24,300 | 71,401 | ||||||
Telkom SA SOC Ltd.a | 20,791 | 111,722 | ||||||
Tongaat Hulett Ltd. | 8,751 | 140,389 | ||||||
| Security | Shares | Value | ||||||
Trencor Ltd. | 11,136 | $ | 76,436 | |||||
Vukile Property Fund Ltd. | 48,907 | 76,841 | ||||||
Wilson Bayly Holmes-Ovcon Ltd. | 3,846 | 50,041 | ||||||
|
| |||||||
| 3,168,438 | ||||||||
SOUTH KOREA — 16.81% |
| |||||||
Able C&C Co. Ltd. | 1,078 | 30,194 | ||||||
Ahnlab Inc. | 644 | 23,881 | ||||||
Asiana Airlines Inc.a | 15,120 | 71,950 | ||||||
Binggrae Co. Ltd. | 561 | 50,293 | ||||||
Chabiotech Co. Ltd.a | 5,024 | 63,423 | ||||||
Chadiostech Co. Ltd.a | 21,113 | 60,073 | ||||||
Chong Kun Dang Pharmaceutical Corp. | 954 | 66,049 | ||||||
CJ CGV Co. Ltd. | 1,800 | 91,602 | ||||||
CJ E&M Corp.a | 1,880 | 87,793 | ||||||
CJ O Shopping Co. Ltd. | 266 | 94,416 | ||||||
Com2uS Corp.a | 688 | 85,292 | ||||||
Cosmax Inc.a | 910 | 95,133 | ||||||
CrucialTec Co. Ltd.a | 3,201 | 26,834 | ||||||
D.I Corp.a | 2,944 | 25,173 | ||||||
Daesang Corp. | 2,337 | 127,458 | ||||||
Daishin Securities Co. Ltd. | 5,760 | 68,737 | ||||||
Daum Communications Corp. | 1,050 | 170,970 | ||||||
Dong-A Socio Holdings Co. Ltd. | 490 | 58,474 | ||||||
Dong-A ST Co. Ltd. | 463 | 45,891 | ||||||
Dongsuh Companies Inc. | 4,116 | 81,796 | ||||||
Dongyang Mechatronics Corp. | 6,510 | 58,169 | ||||||
Doosan Engine Co. Ltd.a | 8,680 | 66,687 | ||||||
Duksan Hi-Metal Co. Ltd.a | 3,373 | 53,226 | ||||||
Fila Korea Ltd. | 1,294 | 128,896 | ||||||
Foosung Co. Ltd.a | 15,181 | 47,087 | ||||||
GemVax & Kael Co. Ltd.a | 2,588 | 62,534 | ||||||
Grand Korea Leisure Co. Ltd. | 3,050 | 135,963 | ||||||
Green Cross Corp. | 574 | 67,366 | ||||||
GS Home Shopping Inc. | 340 | 94,896 | ||||||
Hana Tour Service Inc. | 1,136 | 79,658 | ||||||
Handsome Co. Ltd. | 1,590 | 48,612 | ||||||
Hanjin Heavy Industries & Construction Co. Ltd.a | 6,972 | 42,701 | ||||||
Hanjin Shipping Co. Ltd.a | 11,450 | 70,126 | ||||||
Hankook Tire Worldwide Co. Ltd. | 3,030 | 65,295 | ||||||
Hanmi Pharm Co. Ltd.a | 590 | 54,057 | ||||||
Hansol Paper Co. | 5,180 | 59,517 | ||||||
Hanssem Co. Ltd. | 1,088 | 127,154 | ||||||
| 58 | 2014 iSHARES ANNUAL REPORTTO SHAREHOLDERS |
Table of Contents
Consolidated Schedule of Investments (Continued)
iSHARES® MSCI EMERGING MARKETS SMALL-CAP ETF
August 31, 2014
| Security | Shares | Value | ||||||
Hanwha Investment & Securities Co. Ltd.a | 11,370 | $ | 50,966 | |||||
Huchems Fine Chemical Corp. | 3,360 | 78,039 | ||||||
Hwa Shin Co. Ltd. | 3,060 | 34,102 | ||||||
Hyundai Corp. | 2,240 | 83,065 | ||||||
Hyundai Greenfood Co. Ltd. | 4,200 | 82,637 | ||||||
Hyundai Home Shopping Network Corp. | 490 | 78,771 | ||||||
Hyundai Securities Co. Ltd.a | 9,719 | 74,957 | ||||||
Ilyang Pharmaceutical Co. Ltd. | 2,304 | 53,513 | ||||||
Interflex Co. Ltd.a | 2,441 | 33,704 | ||||||
INTOPS Co. Ltd. | 1,830 | 30,682 | ||||||
Jusung Engineering Co. Ltd.a | 7,483 | 29,004 | ||||||
KEPCO Plant Service & Engineering Co. Ltd. | 1,872 | 144,376 | ||||||
KIWOOM Securities Co. Ltd. | 1,047 | 54,005 | ||||||
Kolao Holdings | 2,522 | 47,383 | ||||||
Kolon Industries Inc. | 1,668 | 98,868 | ||||||
Komipharm International Co. Ltd.a | 6,443 | 59,540 | ||||||
Korea Petrochemical Industrial Co. Ltd. | 812 | 57,740 | ||||||
Korean Reinsurance Co. | 8,434 | 98,152 | ||||||
KT Skylife Co. Ltd. | 2,489 | 55,355 | ||||||
Kumho Tire Co. Inc.a | 6,740 | 68,799 | ||||||
LF Corp. | 2,490 | 74,900 | ||||||
LG Hausys Ltd. | 778 | 158,830 | ||||||
LG International Corp. | 3,072 | 84,530 | ||||||
LG Life Sciences Ltd.a | 1,260 | 41,940 | ||||||
LIG Insurance Co. Ltd. | 3,570 | 106,507 | ||||||
Lock & Lock Co. Ltd. | 1,775 | 21,095 | ||||||
Lotte Chilsung Beverage Co. Ltd. | 56 | 113,883 | ||||||
Lotte Food Co. Ltd. | 70 | 53,642 | ||||||
Lumens Co. Ltd.a | 5,378 | 43,811 | ||||||
Mando Corp. | 952 | 128,630 | ||||||
Medipost Co. Ltd.a | 880 | 49,296 | ||||||
Medy-Tox Inc. | 500 | 99,610 | ||||||
MegaStudy Co. Ltd. | 713 | 46,059 | ||||||
Meritz Finance Group Inc. | 9,600 | 73,850 | ||||||
Meritz Fire & Marine Insurance Co. Ltd. | 5,790 | 78,232 | ||||||
Namhae Chemical Corp. | 8,250 | 75,995 | ||||||
Namyang Dairy Products Co. Ltd. | 57 | 46,547 | ||||||
Nexen Tire Corp. | 3,094 | 43,788 | ||||||
NHN Entertainment Corp.a | 848 | 60,551 | ||||||
NongShim Co. Ltd. | 246 | 61,139 | ||||||
| Security | Shares | Value | ||||||
OCI Materials Co. Ltd. | 1,260 | $ | 56,417 | |||||
Partron Co. Ltd. | 3,864 | 36,127 | ||||||
Poongsan Corp. | 2,380 | 73,939 | ||||||
POSCO Chemtech Co. Ltd. | 448 | 70,119 | ||||||
POSCO ICT Co. Ltd. | 6,389 | 45,998 | ||||||
S&T Dynamics Co. Ltd. | 6,110 | 58,994 | ||||||
S.M. Entertainment Co.a | 1,783 | 73,152 | ||||||
Samsung Fine Chemicals Co. Ltd. | 1,413 | 55,742 | ||||||
Samyang Holdings Corp. | 384 | 31,661 | ||||||
SeAH Besteel Corp. | 1,343 | 47,418 | ||||||
Seegene Inc.a | 1,098 | 62,266 | ||||||
Seoul Semiconductor Co. Ltd. | 2,976 | 85,704 | ||||||
SFA Engineering Corp. | 912 | 39,576 | ||||||
SK Broadband Co. Ltd.a | 12,796 | 45,810 | ||||||
SK Chemicals Co. Ltd. | 1,626 | 108,566 | ||||||
SK Securities Co. Ltd.a | 101,600 | 103,709 | ||||||
SKC Co. Ltd. | 1,961 | 66,240 | ||||||
Soulbrain Co. Ltd. | 843 | 24,319 | ||||||
Sung Kwang Bend Co. Ltd. | 2,007 | 34,738 | ||||||
Sungwoo Hitech Co. Ltd. | 3,247 | 54,600 | ||||||
Suprema Inc.a | 2,358 | 57,906 | ||||||
Taekwang Industrial Co. Ltd. | 55 | 70,625 | ||||||
Taewoong Co. Ltd.a | 2,279 | 50,347 | ||||||
Taihan Electric Wire Co. Ltd.a | 9,521 | 20,236 | ||||||
TK Corp.a | 3,199 | 47,956 | ||||||
TONGYANG Life Insurance Co. | 2,760 | 31,031 | ||||||
TONGYANG Securities Inc.a | 10,440 | 31,044 | ||||||
ViroMed Co. Ltd.a | 1,599 | 95,093 | ||||||
Wonik IPS Co. Ltd.a | 8,271 | 106,044 | ||||||
Woongjin Thinkbig Co. Ltd.a | 5,880 | 39,724 | ||||||
YESCO Co. Ltd. | 1,030 | 40,328 | ||||||
Youngone Corp. | 1,960 | 109,410 | ||||||
|
| |||||||
| 7,338,708 | ||||||||
TAIWAN — 19.83% |
| |||||||
Ability Enterprise Co. Ltd. | 54,000 | 34,777 | ||||||
ALI Corp. | 39,000 | 37,186 | ||||||
Altek Corp.a | 51,133 | 44,135 | ||||||
Ambassador Hotel Ltd. (The) | 27,000 | 25,428 | ||||||
AmTRAN Technology Co. Ltd. | 78,312 | 50,565 | ||||||
Asia Optical Co. Inc.a | 30,000 | 46,169 | ||||||
Asia Polymer Corp. | 78,400 | 56,393 | ||||||
BES Engineering Corp. | 248,000 | 66,044 | ||||||
Career Technology (MFG.) Co. Ltd. | 50,000 | 77,031 | ||||||
Cathay Real Estate Development Co. Ltd. | 84,000 | 47,353 | ||||||
CONSOLIDATED SCHEDULESOF INVESTMENTS | 59 |
Table of Contents
Consolidated Schedule of Investments (Continued)
iSHARES® MSCI EMERGING MARKETS SMALL-CAP ETF
August 31, 2014
| Security | Shares | Value | ||||||
Cheng Loong Corp. | 132,000 | $ | 54,760 | |||||
Cheng Uei Precision Industry Co. Ltd. | 32,000 | 61,879 | ||||||
China Bills Finance Corp. | 153,000 | 57,585 | ||||||
China Man-Made Fibers Corp.a | 93,000 | 29,465 | ||||||
China Petrochemical Development Corp.a | 144,000 | 51,307 | ||||||
China Steel Chemical Corp. | 18,000 | 113,213 | ||||||
China Synthetic Rubber Corp. | 51,000 | 52,637 | ||||||
Chipbond Technology Corp. | 39,000 | 68,239 | ||||||
Chong Hong Construction Co. | 12,040 | 32,788 | ||||||
Chroma ATE Inc. | 33,000 | 97,155 | ||||||
Chung Hung Steel Corp.a | 247,000 | 68,587 | ||||||
Compeq Manufacturing Co. Ltd. | 114,000 | 69,604 | ||||||
Coretronic Corp. | 60,000 | 99,664 | ||||||
CSBC Corp. Taiwan | 69,420 | 40,992 | ||||||
Cyberlink Corp. | 21,125 | 66,010 | ||||||
CyberTAN Technology Inc. | 42,000 | 39,554 | ||||||
D-Link Corp. | 126,000 | 90,631 | ||||||
Dynapack International Technology Corp. | 16,000 | 47,319 | ||||||
Elan Microelectronics Corp. | 36,000 | 61,786 | ||||||
Eternal Materials Co. Ltd. | 69,440 | 75,038 | ||||||
Everlight Electronics Co. Ltd. | 43,000 | 95,522 | ||||||
Faraday Technology Corp. | 42,000 | 50,163 | ||||||
Feng Hsin Iron & Steel Co. Ltd. | 32,000 | 46,035 | ||||||
Feng Tay Enterprise Co. Ltd. | 32,240 | 92,328 | ||||||
Firich Enterprises Co. Ltd. | 16,719 | 96,766 | ||||||
FLEXium Interconnect Inc. | 16,610 | 47,067 | ||||||
Formosan Rubber Group Inc. | 84,000 | 94,144 | ||||||
G Tech Optoelectronics Corp.a | 35,000 | 36,416 | ||||||
Gallop No. 1 REIT | 170,000 | 110,848 | ||||||
Gemtek Technology Corp. | 36,000 | 33,964 | ||||||
Genesis Photonics Inc.a | 62,899 | 41,455 | ||||||
Genius Electronic Optical Co. Ltd.a | 6,357 | 17,418 | ||||||
Gigabyte Technology Co. Ltd. | 63,000 | 84,097 | ||||||
Gigastorage Corp.a | 56,400 | 53,776 | ||||||
Gintech Energy Corp.a | 56,000 | 53,489 | ||||||
Global Unichip Corp. | 20,000 | 55,871 | ||||||
Gloria Material Technology Corp. | 86,818 | 72,613 | ||||||
Goldsun Development & Construction Co. Ltd.a | 210,000 | 74,472 | ||||||
Grand Pacific Petrochemical Corp. | 98,000 | 49,671 | ||||||
Great Wall Enterprise Co. Ltd. | 73,128 | 74,375 | ||||||
Greatek Electronics Inc. | 81,000 | 111,106 | ||||||
| Security | Shares | Value | ||||||
Green Energy Technology Inc.a | 36,125 | $ | 28,825 | |||||
HannStar Display Corp. | 187,320 | 65,802 | ||||||
HannsTouch Solution Inc.a | 145,000 | 40,458 | ||||||
Hey Song Corp. | 22,500 | 25,029 | ||||||
Ho Tung Chemical Corp. | 151,951 | 57,190 | ||||||
Holy Stone Enterprise Co. Ltd. | 64,500 | 96,889 | ||||||
Huaku Development Co. Ltd. | 22,080 | 53,186 | ||||||
Huang Hsiang Construction Co. | 12,000 | 16,480 | ||||||
Hung Sheng Construction Ltd. | 68,000 | 47,888 | ||||||
Infortrend Technology Inc. | 84,000 | 48,336 | ||||||
ITEQ Corp. | 51,600 | 46,955 | ||||||
Jih Sun Financial Holdings Co. Ltd. | 95,197 | 26,657 | ||||||
Kenda Rubber Industrial Co. Ltd. | 52,198 | 111,065 | ||||||
Kerry TJ Logistics Co. Ltd. | 42,000 | 56,978 | ||||||
King Yuan Electronics Co. Ltd. | 112,000 | 102,481 | ||||||
King’s Town Bank | 73,000 | 82,304 | ||||||
Kingdom Construction Co. | 39,000 | 36,860 | ||||||
Kinpo Electronics Inc.a | 168,000 | 81,216 | ||||||
Lealea Enterprise Co. Ltd. | 165,590 | 52,186 | ||||||
Lien Hwa Industrial Corp. | 70,000 | 49,062 | ||||||
Macronix International Co. Ltd.a | 240,000 | 62,227 | ||||||
Makalot Industrial Co. Ltd. | 15,231 | 75,160 | ||||||
Masterlink Securities Corp. | 210,496 | 72,887 | ||||||
Medigen Biotechnology Corp.a | 10,397 | 48,349 | ||||||
Mercuries & Associates Ltd. | 29,548 | 19,820 | ||||||
Micro-Star International Co. Ltd. | 93,000 | 127,721 | ||||||
Microbio Co. Ltd.a | 65,727 | 64,978 | ||||||
MIN AIK Technology Co. Ltd. | 14,000 | 76,814 | ||||||
Mitac Holdings Corp. | 69,000 | 59,673 | ||||||
Motech Industries Inc. | 28,000 | 37,938 | ||||||
Nan Kang Rubber Tire Co. Ltd. | 32,000 | 36,774 | ||||||
Neo Solar Power Corp. | 83,854 | 81,075 | ||||||
Newmax Technology Co. Ltd. | 15,939 | 22,076 | ||||||
Pan-International Industrial Corp. | 48,722 | 35,290 | ||||||
PChome Online Inc. | 8,774 | 88,061 | ||||||
Pixart Imaging Inc. | 21,635 | 50,811 | ||||||
President Securities Corp. | 127,510 | 72,307 | ||||||
Primax Electronics Ltd. | 45,000 | 66,091 | ||||||
Prince Housing & Development Corp. | 135,917 | 58,658 | ||||||
Qisda Corp.a | 153,000 | 77,804 | ||||||
Radium Life Tech Co. Ltd. | 71,968 | 46,108 | ||||||
Ritek Corp.a | 266,000 | 36,487 | ||||||
Sanyang Industry Co. Ltd. | 76,820 | 71,833 | ||||||
Senao International Co. Ltd. | 9,000 | 16,259 | ||||||
| 60 | 2014 iSHARES ANNUAL REPORTTO SHAREHOLDERS |
Table of Contents
Consolidated Schedule of Investments (Continued)
iSHARES® MSCI EMERGING MARKETS SMALL-CAP ETF
August 31, 2014
| Security | Shares | Value | ||||||
Shihlin Electric & Engineering Corp. | 56,000 | $ | 77,001 | |||||
Shining Building Business Co. Ltd.a | 98,280 | 71,350 | ||||||
Shinkong Synthetic Fibers Corp. | 126,135 | 46,419 | ||||||
Shinkong Textile Co. Ltd. | 27,000 | 37,306 | ||||||
Silitech Technology Corp. | 32,425 | 28,910 | ||||||
Sino-American Silicon Products Inc.a | 42,000 | 68,149 | ||||||
Sinyi Realty Co. | 40,879 | 54,021 | ||||||
Soft-World International Corp. | 21,140 | 69,947 | ||||||
Solar Applied Materials Technology Corp. | 56,799 | 52,732 | ||||||
Solartech Energy Corp.a | 83,744 | 63,318 | ||||||
Ta Chen Stainless Pipe Co. Ltd. | 203,600 | 149,172 | ||||||
Ta Chong Bank Ltd.a | 104,552 | 33,929 | ||||||
Taichung Commercial Bank Co. Ltd. | 95,694 | 33,456 | ||||||
Taiflex Scientific Co. Ltd. | 31,000 | 55,901 | ||||||
Taiwan Hon Chuan Enterprise Co. Ltd. | 27,000 | 53,656 | ||||||
Taiwan Life Insurance Co. Ltd.a | 48,599 | 34,469 | ||||||
Taiwan Paiho Ltd. | 56,050 | 71,819 | ||||||
Taiwan Secom Co. Ltd. | 30,450 | 86,489 | ||||||
Taiwan Surface Mounting Technology Co. Ltd. | 41,746 | 66,270 | ||||||
Taiwan TEA Corp. | 91,000 | 58,149 | ||||||
Taiwan-Sogo Shinkong Security Corp. | 64,640 | 89,746 | ||||||
Ton Yi Industrial Corp. | 84,000 | 64,355 | ||||||
Tong Hsing Electronic Industries Ltd. | 16,000 | 77,081 | ||||||
Tong Yang Industry Co. Ltd. | 47,133 | 59,921 | ||||||
Tripod Technology Corp. | 32,000 | 64,984 | ||||||
Tsann Kuen Enterprise Co. Ltd. | 15,000 | 18,769 | ||||||
TTY Biopharm Co. Ltd. | 25,450 | 58,324 | ||||||
TXC Corp. | 47,000 | 68,793 | ||||||
Union Bank of Taiwana | 119,546 | 42,994 | ||||||
Unity Opto Technology Co. Ltd.a | 51,679 | 60,167 | ||||||
UPC Technology Corp. | 115,661 | 45,660 | ||||||
USI Corp. | 64,950 | 35,093 | ||||||
Visual Photonics Epitaxy Co. Ltd. | 69,900 | 72,612 | ||||||
Wah Lee Industrial Corp. | 42,000 | 80,514 | ||||||
Waterland Financial Holdings Co. Ltd. | 172,826 | 52,789 | ||||||
Weikeng Industrial Co. Ltd. | 126,000 | 98,640 | ||||||
Win Semiconductors Corp. | 36,000 | 36,734 | ||||||
Winbond Electronics Corp.a | 252,000 | 85,572 | ||||||
Wintek Corp.a | 155,000 | 52,634 | ||||||
| Security | Shares | Value | ||||||
WT Microelectronics Co. Ltd. | 58,063 | $ | 91,493 | |||||
Yageo Corp. | 170,100 | 142,269 | ||||||
YFY Inc. | 202,000 | 92,247 | ||||||
Yieh Phui Enterprise Co. Ltd. | 205,034 | 66,880 | ||||||
YungShin Global Holding Corp. | 35,000 | 66,978 | ||||||
Yungtay Engineering Co. Ltd. | 40,000 | 99,162 | ||||||
Zinwell Corp. | 39,000 | 36,403 | ||||||
|
| |||||||
| 8,659,215 | ||||||||
THAILAND — 4.24% |
| |||||||
Amata Corp. PCL NVDR | 93,600 | 48,939 | ||||||
Bangkok Expressway PCL NVDR | 30,700 | 37,486 | ||||||
Bangkok Land PCL NVDR | 1,458,400 | 100,453 | ||||||
Central Plaza Hotel PCL NVDR | 75,500 | 93,370 | ||||||
Delta Electronics (Thailand) PCL NVDR | 56,000 | 113,964 | ||||||
Energy Absolute PCL NVDR | 155,200 | 120,020 | ||||||
Esso (Thailand) PCL NVDRa | 212,300 | 39,216 | ||||||
G J Steel PCL NVDRa | 10,545,900 | 19,811 | ||||||
Hana Microelectronics PCL NVDR | 81,200 | 98,513 | ||||||
Hemaraj Land and Development PCL NVDR | 596,400 | 80,292 | ||||||
Jasmine International PCL NVDR | 460,800 | 92,333 | ||||||
Khon Kaen Sugar Industry PCL NVDR | 135,500 | 58,544 | ||||||
Kiatnakin Bank PCL NVDRb | 50,432 | 66,316 | ||||||
Pruksa Real Estate PCL NVDR | 91,700 | 99,050 | ||||||
Siam Global House PCL NVDR | 110,900 | 51,388 | ||||||
Sino-Thai Engineering & Construction PCL NVDR | 86,128 | 68,762 | ||||||
Sri Trang Agro-Industry PCL NVDRb | 146,500 | 64,673 | ||||||
Supalai PCL NVDR | 110,300 | 89,787 | ||||||
Thai Airways International PCL NVDRa,b | 66,300 | 31,552 | ||||||
Thai Tap Water Supply PCL NVDR | 224,000 | 87,664 | ||||||
Thai Vegetable Oil PCL NVDR | 101,200 | 71,290 | ||||||
Thaicom PCL NVDR | 66,800 | 82,611 | ||||||
Thanachart Capital PCL NVDR | 77,000 | 84,377 | ||||||
TISCO Financial Group PCL NVDR | 50,740 | 69,899 | ||||||
VGI Global Media PCL NVDRb | 196,100 | 81,657 | ||||||
|
| |||||||
| 1,851,967 | ||||||||
TURKEY — 1.71% |
| |||||||
Akcansa Cimento Sanayi ve TAS | 6,512 | 40,588 | ||||||
Aksa Akrilik Kimya Sanayii AS | 6,000 | 19,769 | ||||||
Asya Katilim Bankasi ASa | 86,928 | 49,950 | ||||||
Bizim Toptan Satis Magazalari ASb | 6,742 | 58,111 | ||||||
CONSOLIDATED SCHEDULESOF INVESTMENTS | 61 |
Table of Contents
Consolidated Schedule of Investments (Continued)
iSHARES® MSCI EMERGING MARKETS SMALL-CAP ETF
August 31, 2014
| Security | Shares | Value | ||||||
Cimsa Cimento Sanayi ve TAS | 7,535 | $ | 53,598 | |||||
Dogan Sirketler Grubu Holding ASa | 70,000 | 25,302 | ||||||
Kardemir Karabuk Demir Celik Sanayi ve TAS Class Da | 103,152 | 108,508 | ||||||
Kombassan Holdings ASa | 15,008 | 19,891 | ||||||
Koza Anadolu Metal Madencilik Isletmeleri ASa | 25,802 | 27,022 | ||||||
Net Holding ASa,b | 45,555 | 56,153 | ||||||
Nortel Networks Netas Telekomunikasyon ASa | 7,112 | 20,796 | ||||||
Sekerbank TASa | 33,750 | 30,810 | ||||||
Tekfen Holding ASa | 16,352 | 41,146 | ||||||
Trakya Cam Sanayii AS | 38,096 | 46,783 | ||||||
Turkiye Sinai Kalkinma Bankasi AS | 101,187 | 89,092 | ||||||
Yazicilar Holding AS | 6,356 | 57,435 | ||||||
|
| |||||||
| 744,954 | ||||||||
UNITED ARAB EMIRATES — 0.62% |
| |||||||
Air Arabia PJSC | 193,264 | 72,611 | ||||||
Ajman Bank PJSCa | 55,344 | 39,929 | ||||||
Al Waha Capital PJSC | 86,683 | 70,091 | ||||||
Dana Gas PJSCa | 283,248 | 53,981 | ||||||
Eshraq Properties Co. PJSCa | 97,728 | 36,185 | ||||||
|
| |||||||
| 272,797 | ||||||||
|
| |||||||
TOTAL COMMON STOCKS |
| |||||||
(Cost: $40,711,154) |
| 43,131,124 | ||||||
PREFERRED STOCKS — 0.82% |
| |||||||
BRAZIL — 0.71% |
| |||||||
Banco ABC Brasil SA | 6,438 | 43,159 | ||||||
Banco Daycoval SA | 6,000 | 24,294 | ||||||
Banco Industrial e Comercial SA | 6,300 | 21,398 | ||||||
Banco Pan SA | 17,711 | 27,783 | ||||||
Companhia de Ferro Ligas da Bahia – Ferbasa | 7,500 | 34,356 | ||||||
GOL Linhas Aereas Inteligentes SA | 8,100 | 50,210 | ||||||
Marcopolo SA | 28,800 | 55,990 | ||||||
Randon SA Implementos e Participacoes | 10,125 | 32,852 | ||||||
Saraiva Livreiros Editores SA | 2,800 | 21,361 | ||||||
|
| |||||||
| 311,403 | ||||||||
COLOMBIA — 0.11% |
| |||||||
Avianca Holdings SA | 23,977 | 48,743 | ||||||
|
| |||||||
| 48,743 | ||||||||
|
| |||||||
TOTAL PREFERRED STOCKS |
| |||||||
(Cost: $441,168) |
| 360,146 | ||||||
| Security | Shares | Value | ||||||
RIGHTS — 0.01% |
| |||||||
BRAZIL — 0.00% |
| |||||||
Banco Pan SAa | 1,738 | $ | 8 | |||||
|
| |||||||
| 8 | ||||||||
INDONESIA — 0.00% |
| |||||||
PT Bumi Resources Tbka | 1,725,150 | 148 | ||||||
|
| |||||||
| 148 | ||||||||
SOUTH KOREA — 0.01% |
| |||||||
Meritz Financial Group Inc.a | 2,236 | 4,168 | ||||||
|
| |||||||
| 4,168 | ||||||||
|
| |||||||
TOTAL RIGHTS |
| |||||||
(Cost: $0) |
| 4,324 | ||||||
SHORT-TERM INVESTMENTS — 6.29% |
| |||||||
MONEY MARKET FUNDS — 6.29% |
| |||||||
BlackRock Cash Funds: Institutional, |
| |||||||
0.14%e,f,g | 2,582,348 | 2,582,348 | ||||||
BlackRock Cash Funds: Prime, |
| |||||||
0.11%e,f,g | 162,566 | 162,566 | ||||||
|
| |||||||
| 2,744,914 | ||||||||
|
| |||||||
TOTAL SHORT-TERM INVESTMENTS |
| |||||||
(Cost: $2,744,914) |
| 2,744,914 | ||||||
|
| |||||||
TOTAL INVESTMENTS |
| |||||||
(Cost: $43,897,236) | 46,240,508 | |||||||
Other Assets, Less Liabilities — (5.90)% |
| (2,574,623 | ) | |||||
|
| |||||||
NET ASSETS — 100.00% |
| $ | 43,665,885 | |||||
|
| |||||||
CPO — Certificates of Participation (Ordinary)
GDR — Global Depositary Receipts
NVDR — Non-Voting Depositary Receipts
SP GDR — Sponsored Global Depositary Receipts
| a | Non-income earning security. |
| b | All or a portion of this security represents a security on loan. See Note 1. |
| c | Security valued using Level 3 inputs in accordance with management’s fair valuation policy. See Note 1. |
| d | This security may be resold to qualified foreign investors and foreign institutional buyers under Regulation S of the Securities Act of 1933. |
| e | Affiliated issuer. See Note 2. |
| f | The rate quoted is the annualized seven-day yield of the fund at period end. |
| g | All or a portion of this security represents an investment of securities lending collateral. See Note 1. |
See notes to consolidated financial statements.
| 62 | 2014 iSHARES ANNUAL REPORTTO SHAREHOLDERS |
Table of Contents
Consolidated Schedule of Investments
iSHARES® MSCI EMERGING MARKETS VALUE ETF
August 31, 2014
| Security | Shares | Value | ||||||
COMMON STOCKS — 91.14% |
| |||||||
BRAZIL — 5.07% |
| |||||||
B2W Companhia Global do Varejoa | 1,000 | $ | 16,938 | |||||
Banco Bradesco SA | 3,000 | 53,657 | ||||||
Banco do Brasil SA | 10,000 | 156,376 | ||||||
Banco Santander (Brasil) SA Units | 11,000 | 76,003 | ||||||
BM&F Bovespa SA | 21,000 | 126,701 | ||||||
Centrais Eletricas Brasileiras SA | 3,000 | 10,927 | ||||||
Companhia de Saneamento Basico do Estado de Sao Paulo | 4,000 | 38,238 | ||||||
Companhia de Saneamento de Minas Gerais SA | 1,000 | 17,877 | ||||||
Companhia Siderurgica Nacional SA | 6,000 | 26,332 | ||||||
CPFL Energia SA | 2,000 | 20,192 | ||||||
Cyrela Brazil Realty SA Empreendimentos e Participacoes | 4,000 | 25,367 | ||||||
Duratex SA | 4,000 | 18,002 | ||||||
EDP Energias do Brasil SA | 3,000 | 15,151 | ||||||
Fibria Celulose SAa | 1,000 | 10,404 | ||||||
Petroleo Brasileiro SA | 35,000 | 346,316 | ||||||
Porto Seguro SA | 1,000 | 14,829 | ||||||
Souza Cruz SA | 2,000 | 18,735 | ||||||
Sul America SA Units | 2,000 | 13,828 | ||||||
TIM Participacoes SA | 10,000 | 56,088 | ||||||
Tractebel Energia SA | 2,000 | 33,528 | ||||||
Vale SA | 14,000 | 182,199 | ||||||
|
| |||||||
| 1,277,688 | ||||||||
CHILE — 1.47% |
| |||||||
AES Gener SA | 25,036 | 12,799 | ||||||
Aguas Andinas SA Series A | 33,240 | 20,846 | ||||||
Banco de Chile | 237,634 | 28,999 | ||||||
Banco de Credito e Inversiones | 370 | 20,166 | ||||||
Banco Santander (Chile) SA | 808,230 | 47,887 | ||||||
CAP SA | 720 | 8,554 | ||||||
Colbun SA | 90,590 | 23,709 | ||||||
Compania Cervecerias Unidas SA | 1,700 | 18,259 | ||||||
CorpBanca SA | 1,841,860 | 22,632 | ||||||
Empresa Nacional de Electricidad SA | 40,590 | 62,013 | ||||||
Empresa Nacional de Telecomunicaciones SA | 1,450 | 16,634 | ||||||
Empresas CMPC SA | 14,423 | 35,902 | ||||||
Enersis SA | 152,530 | 51,345 | ||||||
|
| |||||||
| 369,745 | ||||||||
CHINA — 19.01% |
| |||||||
Agile Property Holdings Ltd. | 20,000 | 15,690 | ||||||
| Security | Shares | Value | ||||||
Agricultural Bank of China Ltd. Class H | 262,000 | $ | 121,025 | |||||
Air China Ltd. Class H | 20,000 | 12,387 | ||||||
Aluminum Corp. of China Ltd. Class Ha,b | 40,000 | 16,980 | ||||||
Anta Sports Products Ltd. | 10,000 | 19,200 | ||||||
Bank of China Ltd. Class H | 940,000 | 436,637 | ||||||
Bank of Communications Co. Ltd. Class H | 110,000 | 80,334 | ||||||
BBMG Corp. Class H | 15,000 | 11,187 | ||||||
Belle International Holdings Ltd. | 20,000 | 25,574 | ||||||
China Agri-Industries Holdings Ltd.b | 30,800 | 12,598 | ||||||
China BlueChemical Ltd. Class H | 20,000 | 9,858 | ||||||
China CITIC Bank Corp. Ltd. Class H | 100,000 | 63,095 | ||||||
China Coal Energy Co. Class Hb | 50,000 | 30,451 | ||||||
China Communications Construction Co. Ltd. Class H | 50,000 | 36,451 | ||||||
China Communications Services Corp. Ltd. Class H | 40,000 | 19,303 | ||||||
China Construction Bank Corp. Class H | 850,000 | 631,730 | ||||||
China COSCO Holdings Co. Ltd. Class Ha,b | 25,000 | 10,774 | ||||||
China Everbright Bank Co. Ltd. | 30,000 | 14,013 | ||||||
China Everbright Ltd.b | 20,000 | 37,935 | ||||||
China International Marine Containers (Group) Co. Ltd. Class H | 4,000 | 8,609 | ||||||
China Merchants Bank Co. Ltd. Class H | 55,000 | 105,172 | ||||||
China Minsheng Banking Corp. Ltd. Class H | 47,400 | 44,525 | ||||||
China Mobile Ltd. | 70,000 | 870,693 | ||||||
China National Building Material Co. Ltd. Class H | 40,000 | 36,748 | ||||||
China Petroleum & Chemical Corp. Class H | 300,000 | 304,252 | ||||||
China Railway Construction Corp. Ltd. Class H | 25,000 | 23,935 | ||||||
China Railway Group Ltd. Class H | 50,000 | 25,870 | ||||||
China Resources Cement Holdings Ltd.b | 20,000 | 13,755 | ||||||
China Shenhua Energy Co. Ltd. Class H | 40,000 | 115,353 | ||||||
China Telecom Corp. Ltd. Class H | 160,000 | 98,888 | ||||||
CONSOLIDATED SCHEDULESOF INVESTMENTS | 63 |
Table of Contents
Consolidated Schedule of Investments (Continued)
iSHARES® MSCI EMERGING MARKETS VALUE ETF
August 31, 2014
| Security | Shares | Value | ||||||
Chongqing Rural Commercial Bank Co. Ltd. Class H | 30,000 | $ | 14,903 | |||||
CITIC Pacific Ltd.b | 20,000 | 38,915 | ||||||
CITIC Securities Co. Ltd. Class H | 10,000 | 23,741 | ||||||
COSCO Pacific Ltd. | 20,000 | 28,025 | ||||||
Country Garden Holdings Co. Ltd.b | 40,000 | 17,754 | ||||||
Datang International Power Generation Co. Ltd. Class H | 40,000 | 22,193 | ||||||
Evergrande Real Estate Group Ltd.b | 50,000 | 20,903 | ||||||
Far East Horizon Ltd. | 20,000 | 16,129 | ||||||
Fosun International Ltd. | 15,000 | 18,425 | ||||||
Franshion Properties (China) Ltd. | 40,000 | 10,838 | ||||||
GOME Electrical Appliances Holdings Ltd. | 80,000 | 14,245 | ||||||
Guangdong Investment Ltd. | 20,000 | 24,180 | ||||||
Guangzhou R&F Properties Co. Ltd. Class H | 12,000 | 14,462 | ||||||
Haitong Securities Co. Ltd. Class H | 12,000 | 19,169 | ||||||
Industrial and Commercial Bank of China Ltd. Class H | 870,000 | 576,995 | ||||||
Inner Mongolia Yitai Coal Co. Ltd. Class B | 100 | 169 | ||||||
Jiangsu Expressway Co. Ltd. Class H | 20,000 | 22,787 | ||||||
Jiangxi Copper Co. Ltd. Class H | 20,000 | 35,354 | ||||||
Kingboard Chemical Holdings Co. Ltd. | 10,000 | 20,774 | ||||||
New World China Land Ltd. | 40,000 | 24,516 | ||||||
Nine Dragons Paper (Holdings) Ltd.b | 20,000 | 15,613 | ||||||
PetroChina Co. Ltd. Class H | 240,000 | 340,639 | ||||||
Poly Property Group Co. Ltd.b | 30,000 | 13,045 | ||||||
Shanghai Electric Group Co. Ltd. Class H | 40,000 | 17,548 | ||||||
Shanghai Pharmaceuticals Holding Co. Ltd. Class H | 6,000 | 12,309 | ||||||
Shimao Property Holdings Ltd. | 5,000 | 11,006 | ||||||
Shui On Land Ltd. | 45,833 | 12,005 | ||||||
Sino-Ocean Land Holdings Ltd.b | 35,000 | 19,780 | ||||||
Sinopec Shanghai Petrochemical Co. Ltd. Class H | 40,000 | 13,367 | ||||||
SOHO China Ltd. | 25,000 | 20,451 | ||||||
Yanzhou Coal Mining Co. Ltd. Class H | 20,000 | 16,929 | ||||||
Yuexiu Property Co. Ltd.b | 80,000 | 17,135 | ||||||
Zhejiang Expressway Co. Ltd. Class H | 20,000 | 19,896 | ||||||
Zijin Mining Group Co. Ltd. Class H | 80,000 | 20,851 | ||||||
| Security | Shares | Value | ||||||
Zoomlion Heavy Industry Science and Technology Co. Ltd. Class H | 18,000 | $ | 11,218 | |||||
ZTE Corp. Class H | 4,000 | 9,011 | ||||||
|
| |||||||
| 4,788,302 | ||||||||
COLOMBIA — 0.78% |
| |||||||
Almacenes Exito SA | 1,040 | 17,705 | ||||||
Ecopetrol SA | 38,430 | 66,606 | ||||||
Grupo Argos SA | 2,190 | 27,146 | ||||||
Grupo de Inversiones Suramericana SA | 2,790 | 64,134 | ||||||
Interconexion Electrica SA ESP | 4,180 | 21,135 | ||||||
|
| |||||||
| 196,726 | ||||||||
CZECH REPUBLIC — 0.22% |
| |||||||
CEZ AS | 1,890 | 54,944 | ||||||
|
| |||||||
| 54,944 | ||||||||
EGYPT — 0.15% |
| |||||||
Global Telecom Holding SAE GDRa | 10,183 | 36,537 | ||||||
|
| |||||||
| 36,537 | ||||||||
GREECE — 0.53% |
| |||||||
Alpha Bank AEa | 30,456 | 26,718 | ||||||
Hellenic Telecommunications Organization SAa | 1,002 | 14,360 | ||||||
OPAP SA | 2,635 | 41,962 | ||||||
Piraeus Bank SAa | 16,075 | 31,761 | ||||||
Public Power Corp. SAa | 1,310 | 19,067 | ||||||
|
| |||||||
| 133,868 | ||||||||
HUNGARY — 0.18% |
| |||||||
MOL Hungarian Oil and Gas PLC | 510 | 25,129 | ||||||
OTP Bank PLC | 1,210 | 20,917 | ||||||
|
| |||||||
| 46,046 | ||||||||
INDIA — 6.77% |
| |||||||
ACC Ltd. | 280 | 6,887 | ||||||
Aditya Birla Nuvo Ltd. | 520 | 12,458 | ||||||
Ambuja Cements Ltd. | 8,530 | 29,000 | ||||||
Bajaj Auto Ltd. | 980 | 36,479 | ||||||
Bharat Heavy Electricals Ltd. | 7,000 | 27,790 | ||||||
Bharat Petroleum Corp. Ltd. | 1,960 | 22,426 | ||||||
Cairn India Ltd. | 5,460 | 29,356 | ||||||
Cipla Ltd. | 2,020 | 17,117 | ||||||
Coal India Ltd. | 5,750 | 33,744 | ||||||
DLF Ltd. | 5,570 | 16,275 | ||||||
GAIL (India) Ltd. | 3,870 | 28,279 | ||||||
Hero Motocorp Ltd. | 500 | 21,463 | ||||||
Hindalco Industries Ltd. | 12,510 | 35,068 | ||||||
| 64 | 2014 iSHARES ANNUAL REPORTTO SHAREHOLDERS |
Table of Contents
Consolidated Schedule of Investments (Continued)
iSHARES® MSCI EMERGING MARKETS VALUE ETF
August 31, 2014
| Security | Shares | Value | ||||||
Housing Development Finance Corp. Ltd. | 5,910 | $ | 104,652 | |||||
ICICI Bank Ltd. | 2,470 | 63,370 | ||||||
Infosys Ltd. | 5,360 | 317,890 | ||||||
Jindal Steel & Power Ltd. | 2,920 | 11,212 | ||||||
JSW Steel Ltd. | 1,020 | 20,904 | ||||||
LIC Housing Finance Ltd. | 2,881 | 14,369 | ||||||
Mahindra & Mahindra Ltd. | 3,950 | 91,602 | ||||||
NTPC Ltd. | 19,510 | 44,177 | ||||||
Oil & Natural Gas Corp. Ltd. | 8,940 | 64,089 | ||||||
Oil India Ltd. | 1,550 | 15,720 | ||||||
Piramal Enterprises Ltd. | 850 | 9,654 | ||||||
Power Finance Corp. Ltd. | 2,900 | 11,953 | ||||||
Power Grid Corp. of India Ltd. | 9,960 | 21,207 | ||||||
Reliance Capital Ltd. | 1,210 | 10,545 | ||||||
Reliance Communications Ltd. | 8,720 | 16,670 | ||||||
Reliance Industries Ltd. | 15,190 | 250,004 | ||||||
Reliance Infrastructure Ltd. | 1,190 | 13,714 | ||||||
Reliance Power Ltd.a | 5,490 | 6,745 | ||||||
Rural Electrification Corp. Ltd. | 3,710 | 16,407 | ||||||
Sesa Sterlite Ltd. | 13,954 | 63,734 | ||||||
Shriram Transport Finance Co. Ltd. | 1,730 | 25,778 | ||||||
State Bank of India | 1,740 | 70,561 | ||||||
Tata Power Co. Ltd. | 13,051 | 18,626 | ||||||
Tata Steel Ltd. | 3,430 | 29,006 | ||||||
Wipro Ltd. | 7,310 | 68,095 | ||||||
Yes Bank Ltd. | 720 | 6,788 | ||||||
|
| |||||||
| 1,703,814 | ||||||||
INDONESIA — 2.53% |
| |||||||
PT Adaro Energy Tbk | 168,000 | 18,886 | ||||||
PT Astra Agro Lestari Tbk | 5,000 | 10,900 | ||||||
PT Astra International Tbk | 154,000 | 99,726 | ||||||
PT Bank Danamon Indonesia Tbk | 39,000 | 12,503 | ||||||
PT Bank Mandiri (Persero) Tbk | 110,000 | 97,564 | ||||||
PT Bank Negara Indonesia (Persero) Tbk | 87,000 | 39,791 | ||||||
PT Bank Rakyat Indonesia (Persero) Tbk | 65,000 | 61,402 | ||||||
PT Bukit Asam (Persero) Tbk | 10,000 | 11,413 | ||||||
PT Indo Tambangraya Megah Tbk | 5,000 | 12,043 | ||||||
PT Indofood Sukses Makmur Tbk | 51,000 | 29,974 | ||||||
PT Perusahaan Gas Negara (Persero) Tbk | 126,000 | 62,475 | ||||||
PT Telekomunikasi Indonesia (Persero) Tbk | 585,000 | 133,278 | ||||||
| Security | Shares | Value | ||||||
PT United Tractors Tbk | 20,000 | $ | 37,871 | |||||
PT XL Axiata Tbk | 20,000 | 10,173 | ||||||
|
| |||||||
| 637,999 | ||||||||
MALAYSIA — 3.86% |
| |||||||
AirAsia Bhd | 15,000 | 11,469 | ||||||
Alliance Financial Group Bhd | 14,000 | 21,586 | ||||||
AMMB Holdings Bhd | 18,000 | 38,147 | ||||||
Axiata Group Bhd | 16,000 | 35,178 | ||||||
Berjaya Sports Toto Bhd | 4,221 | 5,035 | ||||||
British American Tobacco (Malaysia) Bhd | 1,000 | 22,843 | ||||||
CIMB Group Holdings Bhd | 57,700 | 135,097 | ||||||
Genting Bhd | 12,000 | 36,472 | ||||||
Genting Malaysia Bhd | 34,000 | 48,649 | ||||||
Hong Leong Bank Bhd | 7,000 | 31,980 | ||||||
Hong Leong Financial Group Bhd | 1,000 | 5,406 | ||||||
IOI Properties Group Bhda | 15,600 | 12,175 | ||||||
Lafarge Malaysia Bhd | 6,000 | 19,416 | ||||||
Malayan Banking Bhd | 51,000 | 163,420 | ||||||
Maxis Bhd | 21,000 | 43,639 | ||||||
MISC Bhd | 13,000 | 28,376 | ||||||
MMC Corp. Bhd | 5,000 | 3,918 | ||||||
Petronas Chemicals Group Bhd | 32,000 | 63,959 | ||||||
PPB Group Bhd | 6,000 | 28,135 | ||||||
RHB Capital Bhd | 7,000 | 20,365 | ||||||
Sime Darby Bhd | 35,000 | 105,044 | ||||||
Telekom Malaysia Bhd | 12,000 | 24,213 | ||||||
UEM Sunrise Bhd | 9,000 | 5,482 | ||||||
UMW Holdings Bhd | 7,000 | 27,449 | ||||||
YTL Corp. Bhd | 52,000 | 26,726 | ||||||
YTL Power International Bhda | 18,440 | 8,717 | ||||||
|
| |||||||
| 972,896 | ||||||||
MEXICO — 5.32% |
| |||||||
America Movil SAB de CV Series L | 199,000 | 243,357 | ||||||
Arca Continental SAB de CV | 5,000 | 36,756 | ||||||
Cemex SAB de CV CPOa | 90,001 | 119,561 | ||||||
Coca-Cola FEMSA SAB de CV Series L | 5,000 | 54,510 | ||||||
Controladora Comercial Mexicana SAB de CV BC Units | 5,000 | 19,257 | ||||||
Fibra Uno Administracion SAB de CV | 27,000 | 96,948 | ||||||
Fomento Economico Mexicano SAB de CV BD Units | 23,000 | 223,272 | ||||||
Grupo Aeroportuario del Pacifico SAB de CV Series B | 4,000 | 27,768 | ||||||
CONSOLIDATED SCHEDULESOF INVESTMENTS | 65 |
Table of Contents
Consolidated Schedule of Investments (Continued)
iSHARES® MSCI EMERGING MARKETS VALUE ETF
August 31, 2014
| Security | Shares | Value | ||||||
Grupo Aeroportuario del Sureste SAB de CV Series B | 2,000 | $ | 25,637 | |||||
Grupo Carso SAB de CV Series A1 | 4,000 | 24,443 | ||||||
Grupo Comercial Chedraui SAB de CVb | 4,000 | 13,898 | ||||||
Grupo Financiero Banorte SAB de CV Series O | 10,000 | 70,399 | ||||||
Grupo Financiero Inbursa SAB de CV Series O | 10,000 | 30,385 | ||||||
Grupo Financiero Santander Mexico SAB de CV Series Bb | 21,000 | 62,893 | ||||||
Grupo Lala SAB de CV | 4,000 | 10,383 | ||||||
Grupo Mexico SAB de CV Series B | 45,000 | 163,474 | ||||||
Industrias Penoles SAB de CV | 1,650 | 41,870 | ||||||
Kimberly-Clark de Mexico SAB de CV Series A | 18,000 | 48,030 | ||||||
OHL Mexico SAB de CVa | 9,000 | 26,431 | ||||||
|
| |||||||
| 1,339,272 | ||||||||
PERU — 0.40% |
| |||||||
Compania de Minas Buenaventura SA SP ADR | 1,544 | 22,480 | ||||||
Credicorp Ltd. | 510 | 79,086 | ||||||
|
| |||||||
| 101,566 | ||||||||
PHILIPPINES — 1.27% |
| |||||||
Aboitiz Equity Ventures Inc. | 22,120 | 27,777 | ||||||
Aboitiz Power Corp. | 17,000 | 14,622 | ||||||
Ayala Corp. | 1,600 | 25,706 | ||||||
BDO Unibank Inc. | 11,000 | 22,833 | ||||||
Energy Development Corp. | 109,000 | 18,175 | ||||||
Globe Telecom Inc. | 450 | 18,578 | ||||||
JG Summit Holdings Inc. | 27,940 | 32,970 | ||||||
Megaworld Corp. | 120,000 | 12,027 | ||||||
Metro Pacific Investments Corp. | 123,600 | 14,600 | ||||||
Metropolitan Bank & Trust Co. | 3,340 | 6,584 | ||||||
Philippine Long Distance Telephone Co. | 1,200 | 94,954 | ||||||
SM Investments Corp. | 713 | 12,625 | ||||||
SM Prime Holdings Inc. | 49,000 | 18,184 | ||||||
|
| |||||||
| 319,635 | ||||||||
POLAND — 1.60% |
| |||||||
Bank Handlowy w Warszawie SA | 400 | 14,324 | ||||||
ENEA SA | 2,592 | 12,160 | ||||||
Getin Noble Bank SAa | 12,400 | 10,083 | ||||||
Grupa Lotos SAa | 952 | 8,974 | ||||||
Jastrzebska Spolka Weglowa SAa | 690 | 7,225 | ||||||
| Security | Shares | Value | ||||||
KGHM Polska Miedz SA | 1,650 | $ | 68,016 | |||||
Orange Polska SA | 5,240 | 17,601 | ||||||
Polska Grupa Energetyczna SA | 8,490 | 57,913 | ||||||
Polski Koncern Naftowy Orlen SA | 3,790 | 46,739 | ||||||
Polskie Gornictwo Naftowe i Gazownictwo SA | 21,880 | 33,395 | ||||||
Powszechny Zaklad Ubezpieczen SA | 670 | 98,278 | ||||||
Synthos SA | 6,610 | 9,510 | ||||||
Tauron Polska Energia SA | 12,050 | 18,806 | ||||||
|
| |||||||
| 403,024 | ||||||||
QATAR — 0.53% |
| |||||||
Barwa Real Estate Co. | 740 | 7,946 | ||||||
Commercial Bank of Qatar QSC (The) | 440 | 8,229 | ||||||
Doha Bank QSC | 410 | 6,869 | ||||||
Industries Qatar QSC | 920 | 48,890 | ||||||
Ooredoo QSC | 940 | 29,507 | ||||||
Qatar Electricity & Water Co. QSC | 190 | 8,923 | ||||||
Qatar Islamic Bank SAQ | 720 | 23,531 | ||||||
|
| |||||||
| 133,895 | ||||||||
RUSSIA — 4.23% |
| |||||||
Gazprom OAO | 138,440 | 493,307 | ||||||
LUKOIL OAO | 5,970 | 332,334 | ||||||
MMC Norilsk Nickel OJSC | 640 | 125,941 | ||||||
Rosneft Oil Co. OJSC | 8,900 | 54,904 | ||||||
Surgutneftegas OJSC | 30,000 | 21,029 | ||||||
Uralkali OJSC | 10,200 | 37,671 | ||||||
|
| |||||||
| 1,065,186 | ||||||||
SOUTH AFRICA — 7.23% |
| |||||||
African Bank Investments Ltd.b,c | 17,203 | 16 | ||||||
African Rainbow Minerals Ltd. | 1,100 | 18,788 | ||||||
Barclays Africa Group Ltd. | 4,030 | 63,121 | ||||||
Barloworld Ltd. | 2,740 | 26,113 | ||||||
Exxaro Resources Ltd. | 1,680 | 23,834 | ||||||
FirstRand Ltd. | 36,100 | 146,805 | ||||||
Foschini Group Ltd. (The) | 2,310 | 25,004 | ||||||
Gold Fields Ltd. | 9,490 | 44,981 | ||||||
Growthpoint Properties Ltd. | 24,690 | 58,502 | ||||||
Harmony Gold Mining Co. Ltd.a | 4,740 | 14,364 | ||||||
Impala Platinum Holdings Ltd. | 6,030 | 54,571 | ||||||
Imperial Holdings Ltd. | 2,190 | 39,165 | ||||||
Investec Ltd. | 2,790 | 25,236 | ||||||
Kumba Iron Ore Ltd. | 750 | 22,460 | ||||||
Liberty Holdings Ltd. | 1,380 | 16,944 | ||||||
Mediclinic International Ltd. | 4,240 | 36,869 | ||||||
MMI Holdings Ltd. | 12,150 | 31,405 | ||||||
| 66 | 2014 iSHARES ANNUAL REPORTTO SHAREHOLDERS |
Table of Contents
Consolidated Schedule of Investments (Continued)
iSHARES® MSCI EMERGING MARKETS VALUE ETF
August 31, 2014
| Security | Shares | Value | ||||||
MTN Group Ltd. | 9,940 | $ | 225,280 | |||||
Nedbank Group Ltd. | 2,450 | 52,684 | ||||||
PPC Ltd. | 6,250 | 19,457 | ||||||
Redefine Properties Ltd. | 38,940 | 35,003 | ||||||
RMB Holdings Ltd. | 8,000 | 42,108 | ||||||
Sappi Ltd.a | 2,260 | 9,350 | ||||||
Sasol Ltd. | 6,540 | 380,197 | ||||||
Standard Bank Group Ltd. | 14,140 | 183,474 | ||||||
Steinhoff International Holdings Ltd. | 24,320 | 120,075 | ||||||
Tiger Brands Ltd. | 1,870 | 53,979 | ||||||
Vodacom Group Ltd. | 4,300 | 51,893 | ||||||
|
| |||||||
| 1,821,678 | ||||||||
SOUTH KOREA — 13.49% |
| |||||||
BS Financial Group Inc. | 2,185 | 36,203 | ||||||
CJ Corp. | 80 | 14,123 | ||||||
Coway Co. Ltd. | 200 | 16,786 | ||||||
Daelim Industrial Co. Ltd. | 326 | 28,100 | ||||||
Daewoo Shipbuilding & Marine Engineering Co. Ltd. | 800 | 19,606 | ||||||
DGB Financial Group Inc. | 1,030 | 17,980 | ||||||
Dongbu Insurance Co. Ltd. | 510 | 30,783 | ||||||
Doosan Heavy Industries & Construction Co. Ltd. | 706 | 20,088 | ||||||
GS Engineering & Construction Corp.a | 394 | 14,319 | ||||||
GS Holdings Corp. | 700 | 29,720 | ||||||
Hana Financial Group Inc. | 3,343 | 140,288 | ||||||
Hanwha Chemical Corp. | 900 | 14,557 | ||||||
Hanwha Corp. | 600 | 17,900 | ||||||
Hanwha Life Insurance Co. Ltd. | 3,100 | 21,279 | ||||||
Hite Jinro Co. Ltd. | 300 | 6,835 | ||||||
Hyosung Corp. | 110 | 8,505 | ||||||
Hyundai Department Store Co. Ltd. | 180 | 28,137 | ||||||
Hyundai Development Co. Engineering & Construction | 380 | 15,441 | ||||||
Hyundai Engineering & Construction Co. Ltd. | 920 | 57,979 | ||||||
Hyundai Heavy Industries Co. Ltd. | 490 | 69,589 | ||||||
Hyundai Marine & Fire Insurance Co. Ltd. | 560 | 17,204 | ||||||
Hyundai Merchant Marine Co. Ltd.a | 527 | 6,393 | ||||||
Hyundai Mipo Dockyard Co. Ltd. | 60 | 7,633 | ||||||
Hyundai Mobis Co. Ltd. | 810 | 234,864 | ||||||
Hyundai Motor Co. | 1,800 | 413,630 | ||||||
Hyundai Steel Co. | 830 | 61,967 | ||||||
Industrial Bank of Korea | 2,524 | 43,811 | ||||||
| Security | Shares | Value | ||||||
Kangwon Land Inc. | 1,500 | $ | 53,331 | |||||
KB Financial Group Inc. | 3,750 | 153,669 | ||||||
KCC Corp. | 60 | 40,416 | ||||||
Kia Motors Corp. | 3,100 | 187,110 | ||||||
Korea Investment Holdings Co. Ltd. | 500 | 25,100 | ||||||
Korea Zinc Co. Ltd. | 103 | 42,716 | ||||||
KT Corp. | 820 | 28,305 | ||||||
KT&G Corp. | 1,260 | 117,929 | ||||||
LG Chem Ltd. | 550 | 146,186 | ||||||
LG Corp. | 1,150 | 80,413 | ||||||
Lotte Confectionery Co. Ltd. | 10 | 21,401 | ||||||
Lotte Shopping Co. Ltd. | 130 | 42,566 | ||||||
LS Corp. | 230 | 15,878 | ||||||
LS Industrial Systems Co. Ltd. | 150 | 9,261 | ||||||
Mirae Asset Securities Co. Ltd. | 300 | 14,335 | ||||||
OCI Co. Ltd.a | 70 | 10,045 | ||||||
POSCO | 760 | 250,348 | ||||||
S-Oil Corp. | 630 | 29,109 | ||||||
Samsung Card Co. Ltd. | 400 | 19,232 | ||||||
Samsung Electro-Mechanics Co. Ltd. | 240 | 12,995 | ||||||
Samsung Fire & Marine Insurance Co. Ltd. | 390 | 106,736 | ||||||
Samsung Heavy Industries Co. Ltd. | 1,850 | 49,719 | ||||||
Samsung SDI Co. Ltd. | 300 | 44,825 | ||||||
Shinhan Financial Group Co. Ltd. | 4,950 | 256,300 | ||||||
Shinsegae Co. Ltd. | 80 | 18,383 | ||||||
SK Holdings Co. Ltd. | 310 | 49,070 | ||||||
SK Innovation Co. Ltd. | 720 | 66,820 | ||||||
SK Networks Co. Ltd.a | 600 | 5,817 | ||||||
SK Telecom Co. Ltd. | 110 | 29,617 | ||||||
Woori Finance Holdings Co. Ltd.a | 3,942 | 53,457 | ||||||
Woori Investment & Securities Co. Ltd. | 1,700 | 19,868 | ||||||
Yuhan Corp. | 16 | 2,730 | ||||||
|
| |||||||
| 3,397,407 | ||||||||
TAIWAN — 12.07% |
| |||||||
Acer Inc.a | 24,000 | 19,873 | ||||||
Advanced Semiconductor Engineering Inc. | 70,000 | 87,235 | ||||||
Asia Cement Corp. | 20,706 | 28,402 | ||||||
Asia Pacific Telecom Co. Ltd. | 20,000 | 12,914 | ||||||
ASUSTeK Computer Inc. | 10,000 | 104,716 | ||||||
AU Optronics Corp. | 110,000 | 54,649 | ||||||
Catcher Technology Co. Ltd. | 10,000 | 101,370 | ||||||
Chang Hwa Commercial Bank Ltd. | 31,671 | 19,708 | ||||||
CONSOLIDATED SCHEDULESOF INVESTMENTS | 67 |
Table of Contents
Consolidated Schedule of Investments (Continued)
iSHARES® MSCI EMERGING MARKETS VALUE ETF
August 31, 2014
| Security | Shares | Value | ||||||
Chicony Electronics Co. Ltd. | 10,095 | $ | 33,098 | |||||
China Development Financial Holding Corp. | 160,000 | 54,064 | ||||||
China Life Insurance Co. Ltd. | 33,000 | 30,637 | ||||||
China Motor Co. Ltd. | 10,000 | 9,568 | ||||||
China Steel Corp. | 51,856 | 44,760 | ||||||
Chunghwa Telecom Co. Ltd. | 50,000 | 155,401 | ||||||
Clevo Co. | 10,000 | 18,902 | ||||||
Compal Electronics Inc. | 50,000 | 44,496 | ||||||
CTBC Financial Holding Co. Ltd. | 150,529 | 109,533 | ||||||
CTCI Corp. | 10,000 | 17,899 | ||||||
E.Sun Financial Holding Co. Ltd. | 76,241 | 50,121 | ||||||
Far Eastern Department Stores Ltd. | 10,200 | 10,271 | ||||||
Far Eastern New Century Corp. | 31,208 | 33,463 | ||||||
Far EasTone Telecommunications Co. Ltd. | 20,000 | 42,622 | ||||||
First Financial Holding Co. Ltd. | 89,355 | 55,304 | ||||||
Formosa Chemicals & Fibre Corp. | 20,720 | 51,574 | ||||||
Formosa Taffeta Co. Ltd. | 10,000 | 10,622 | ||||||
Foxconn Technology Co. Ltd. | 10,500 | 26,346 | ||||||
Fubon Financial Holding Co. Ltd. | 70,000 | 114,284 | ||||||
Hon Hai Precision Industry Co. Ltd. | 145,776 | 497,454 | ||||||
Hua Nan Financial Holdings Co. Ltd. | 74,263 | 46,088 | ||||||
Innolux Corp. | 87,774 | 44,635 | ||||||
Inotera Memories Inc.a | 30,000 | 49,079 | ||||||
Inventec Corp. | 30,000 | 23,586 | ||||||
Lite-On Technology Corp. | 20,189 | 33,468 | ||||||
Mega Financial Holding Co. Ltd. | 116,130 | 100,238 | ||||||
Novatek Microelectronics Corp. Ltd. | 10,000 | 51,354 | ||||||
Pegatron Corp. | 20,000 | 42,422 | ||||||
Pou Chen Corp. | 20,000 | 23,118 | ||||||
Powertech Technology Inc. | 10,000 | 18,969 | ||||||
Quanta Computer Inc. | 30,000 | 84,709 | ||||||
Realtek Semiconductor Corp. | 10,060 | 36,685 | ||||||
Ruentex Development Co. Ltd. | 10,586 | 19,018 | ||||||
Ruentex Industries Ltd. | 10,000 | 24,255 | ||||||
Shin Kong Financial Holding Co. Ltd. | 90,259 | 29,442 | ||||||
Siliconware Precision Industries Co. Ltd. | 40,000 | 58,346 | ||||||
SinoPac Financial Holdings Co. Ltd. | 44,264 | 20,214 | ||||||
Synnex Technology International Corp. | 20,000 | 30,511 | ||||||
Taishin Financial Holdings Co. Ltd. | 99,023 | 50,355 | ||||||
Taiwan Cement Corp. | 40,000 | 63,565 | ||||||
Taiwan Cooperative Financial Holding Co. Ltd. | 73,660 | 41,154 | ||||||
| Security | Shares | Value | ||||||
Taiwan Glass Industry Corp. | 10,000 | $ | 8,631 | |||||
Taiwan Mobile Co. Ltd. | 20,000 | 63,766 | ||||||
Teco Electric and Machinery Co. Ltd. | 20,000 | 25,158 | ||||||
U-Ming Marine Transport Corp. | 10,000 | 16,460 | ||||||
Unimicron Technology Corp. | 10,000 | 8,448 | ||||||
United Microelectronics Corp. | 140,000 | 63,933 | ||||||
Walsin Lihwa Corp.a | 50,000 | 17,899 | ||||||
Wistron Corp. | 31,518 | 36,906 | ||||||
WPG Holdings Co. Ltd. | 10,000 | 13,031 | ||||||
Yuanta Financial Holding Co. Ltd. | 102,500 | 55,210 | ||||||
|
| |||||||
| 3,039,939 | ||||||||
THAILAND — 2.21% |
| |||||||
Bangkok Bank PCL Foreign | 6,000 | 38,510 | ||||||
Bangkok Bank PCL NVDR | 7,000 | 44,928 | ||||||
Banpu PCL NVDR | 12,300 | 12,419 | ||||||
BTS Group Holdings PCL NVDR | 65,000 | 19,638 | ||||||
Kasikornbank PCL Foreign | 6,000 | 42,455 | ||||||
Kasikornbank PCL NVDR | 7,000 | 49,311 | ||||||
Krung Thai Bank PCL NVDR | 46,000 | 33,845 | ||||||
PTT Exploration & Production PCL NVDR | 17,000 | 87,555 | ||||||
PTT Global Chemical PCL NVDR | 18,000 | 34,940 | ||||||
PTT PCL NVDR | 10,000 | 100,501 | ||||||
Siam Commercial Bank PCL NVDR | 9,000 | 52,693 | ||||||
Thai Oil PCL NVDR | 10,000 | 16,202 | ||||||
True Corp. PCL NVDRa | 62,492 | 22,500 | ||||||
|
| |||||||
| 555,497 | ||||||||
TURKEY — 1.66% |
| |||||||
Akbank TAS | 7,860 | 30,013 | ||||||
Emlak Konut Gayrimenkul Yatirim Ortakligi AS | 22,280 | 28,083 | ||||||
Enka Insaat ve Sanayi AS | 5,433 | 13,621 | ||||||
Ford Otomotiv Sanayi ASa | 700 | 9,245 | ||||||
Haci Omer Sabanci Holding AS | 7,360 | 34,106 | ||||||
KOC Holding AS | 7,630 | 39,070 | ||||||
Koza Altin Isletmeleri AS | 530 | 5,710 | ||||||
Tofas Turk Otomobil Fabrikasi AS | 1,420 | 8,752 | ||||||
Turk Hava Yollari AOa | 3,162 | 10,037 | ||||||
Turk Telekomunikasyon AS | 5,620 | 16,303 | ||||||
Turkcell Iletisim Hizmetleri ASa | 6,600 | 38,690 | ||||||
Turkiye Halk Bankasi AS | 6,950 | 51,047 | ||||||
Turkiye Is Bankasi AS Class C | 18,100 | 46,803 | ||||||
Turkiye Petrol Rafinerileri AS | 1,520 | 35,782 | ||||||
Turkiye Sise ve Cam Fabrikalari AS | 5,268 | 7,128 | ||||||
| 68 | 2014 iSHARES ANNUAL REPORTTO SHAREHOLDERS |
Table of Contents
Consolidated Schedule of Investments (Continued)
iSHARES® MSCI EMERGING MARKETS VALUE ETF
August 31, 2014
| Security | Shares | Value | ||||||
Turkiye Vakiflar Bankasi TAO Class D | 9,520 | $ | 21,970 | |||||
Yapi ve Kredi Bankasi AS | 9,970 | 22,223 | ||||||
|
| |||||||
| 418,583 | ||||||||
UNITED ARAB EMIRATES — 0.56% |
| |||||||
Abu Dhabi Commercial Bank PJSC | 8,530 | 18,602 | ||||||
DP World Ltd. | 970 | 18,216 | ||||||
Dubai Islamic Bank PJSC | 5,940 | 12,630 | ||||||
Emaar Properties PJSC | 13,640 | 38,064 | ||||||
First Gulf Bank PJSC | 5,090 | 25,290 | ||||||
National Bank of Abu Dhabi PJSC | 7,340 | 27,977 | ||||||
|
| |||||||
| 140,779 | ||||||||
|
| |||||||
TOTAL COMMON STOCKS |
| |||||||
(Cost: $21,699,455) | 22,955,026 | |||||||
PREFERRED STOCKS — 8.52% |
| |||||||
BRAZIL — 6.58% | ||||||||
AES Tiete SA | 1,000 | 8,992 | ||||||
Banco Bradesco SA | 16,000 | 292,034 | ||||||
Banco do Estado do Rio Grande do Sul SA Class B | 2,000 | 13,810 | ||||||
Bradespar SA | 3,000 | 27,418 | ||||||
Braskem SA Class A | 2,000 | 13,631 | ||||||
Centrais Eletricas Brasileiras SA Class B | 3,000 | 16,558 | ||||||
Companhia Energetica de Minas Gerais | 8,395 | 71,886 | ||||||
Companhia Energetica de Sao Paulo Class B | 2,000 | 28,326 | ||||||
Companhia Paranaense de Energia Class B | 1,000 | 17,725 | ||||||
Gerdau SA | 10,000 | 57,920 | ||||||
Itausa – Investimentos Itau SA | 38,096 | 185,581 | ||||||
Metalurgica Gerdau SA | 3,000 | 21,264 | ||||||
Oi SA | 40,000 | 25,921 | ||||||
Petroleo Brasileiro SA | 49,000 | 511,341 | ||||||
Suzano Papel e Celulose SA Class A | 4,000 | 15,928 | ||||||
Telefonica Brasil SA | 3,000 | 64,155 | ||||||
Usinas Siderurgicas de Minas Gerais SA Class A | 5,000 | 18,055 | ||||||
Vale SA Class A | 23,000 | 266,948 | ||||||
|
| |||||||
| 1,657,493 | ||||||||
COLOMBIA — 0.25% |
| |||||||
Banco Davivienda SA | 1,150 | 19,122 | ||||||
Grupo Argos SA | 1,390 | 16,954 | ||||||
| Security | Shares | Value | ||||||
Grupo de Inversiones Suramericana SA | 1,150 | $ | 26,136 | |||||
|
| |||||||
| 62,212 | ||||||||
RUSSIA — 0.24% |
| |||||||
Surgutneftegas OJSC | 82,000 | 60,349 | ||||||
|
| |||||||
| 60,349 | ||||||||
SOUTH KOREA — 1.45% |
| |||||||
Hyundai Motor Co. Ltd. | 290 | 42,901 | ||||||
Hyundai Motor Co. Ltd. Series 2 | 440 | 68,130 | ||||||
LG Chem Ltd. | 80 | 13,926 | ||||||
Samsung Electronics Co. Ltd. | 240 | 241,432 | ||||||
|
| |||||||
| 366,389 | ||||||||
|
| |||||||
TOTAL PREFERRED STOCKS |
| |||||||
(Cost: $2,032,207) |
| 2,146,443 | ||||||
SHORT-TERM INVESTMENTS — 1.20% |
| |||||||
MONEY MARKET FUNDS — 1.20% |
| |||||||
BlackRock Cash Funds: Institutional, |
| |||||||
0.14%d,e,f | 282,936 | 282,936 | ||||||
BlackRock Cash Funds: Prime, |
| |||||||
0.11%d,e,f | 17,812 | 17,812 | ||||||
|
| |||||||
| 300,748 | ||||||||
|
| |||||||
TOTAL SHORT-TERM INVESTMENTS |
| |||||||
(Cost: $300,748) |
| 300,748 | ||||||
|
| |||||||
TOTAL INVESTMENTS |
| |||||||
(Cost: $24,032,410) |
| 25,402,217 | ||||||
Other Assets, Less Liabilities — (0.86)% |
| (216,316 | ) | |||||
|
| |||||||
NET ASSETS — 100.00% |
| $ | 25,185,901 | |||||
|
| |||||||
CPO — Certificates of Participation (Ordinary)
GDR — Global Depositary Receipts
NVDR — Non-Voting Depositary Receipts
SP ADR — Sponsored American Depositary Receipts
| a | Non-income earning security. |
| b | All or a portion of this security represents a security on loan. See Note 1. |
| c | Security valued using Level 3 inputs in accordance with management’s fair valuation policy. See Note 1. |
| d | Affiliated issuer. See Note 2. |
| e | The rate quoted is the annualized seven-day yield of the fund at period end. |
| f | All or a portion of this security represents an investment of securities lending collateral. See Note 1. |
See notes to consolidated financial statements.
CONSOLIDATED SCHEDULESOF INVESTMENTS | 69 |
Table of Contents
Consolidated Statements of Assets and Liabilities
iSHARES®, INC.
August 31, 2014
| iShares MSCI BRIC ETF | iShares MSCI Emerging Markets | iShares MSCI Emerging Markets | ||||||||||
ASSETS | ||||||||||||
Investments, at cost: | ||||||||||||
Unaffiliated | $ | 383,348,348 | $ | 74,113,745 | $ | 5,178,978 | ||||||
Affiliated (Note 2) | 11,245,811 | 1,882,791 | 150,084 | |||||||||
|
|
|
|
|
| |||||||
Total cost of investments | $ | 394,594,159 | $ | 75,996,536 | $ | 5,329,062 | ||||||
|
|
|
|
|
| |||||||
Investments in securities, at fair value (including securities on loana) (Note 1): | ||||||||||||
Unaffiliated | $ | 410,192,679 | $ | 80,445,299 | $ | 6,127,211 | ||||||
Affiliated (Note 2) | 11,245,811 | 1,882,791 | 150,084 | |||||||||
|
|
|
|
|
| |||||||
Total fair value of investments | 421,438,490 | 82,328,090 | 6,277,295 | |||||||||
Foreign currency, at valueb | 579,517 | 134,004 | 8,285 | |||||||||
Cash | 17,368 | — | — | |||||||||
Receivables: | ||||||||||||
Investment securities sold | — | 276,862 | 59,355 | |||||||||
Dividends and interest | 293,660 | 147,641 | 3,802 | |||||||||
|
|
|
|
|
| |||||||
Total Assets | 422,329,035 | 82,886,597 | 6,348,737 | |||||||||
|
|
|
|
|
| |||||||
LIABILITIES | ||||||||||||
Payables: | ||||||||||||
Investment securities purchased | — | 339,892 | 55,101 | |||||||||
Collateral for securities on loan (Note 1) | 10,946,555 | 1,797,272 | 141,113 | |||||||||
Due to custodian | — | — | 3,130 | |||||||||
Foreign taxes (Note 1) | — | 10,587 | 41 | |||||||||
Investment advisory fees (Note 2) | 217,981 | 32,610 | 3,400 | |||||||||
|
|
|
|
|
| |||||||
Total Liabilities | 11,164,536 | 2,180,361 | 202,785 | |||||||||
|
|
|
|
|
| |||||||
NET ASSETS | $ | 411,164,499 | $ | 80,706,236 | $ | 6,145,952 | ||||||
|
|
|
|
|
| |||||||
Net assets consist of: | ||||||||||||
Paid-in capital | $ | 571,666,633 | $ | 84,370,118 | $ | 6,088,418 | ||||||
Undistributed net investment income | 2,756,022 | 433,762 | 11,762 | |||||||||
Accumulated net realized loss | (190,106,412 | ) | (10,429,625 | ) | (902,431 | ) | ||||||
Net unrealized appreciation | 26,848,256 | 6,331,981 | 948,203 | |||||||||
|
|
|
|
|
| |||||||
NET ASSETS | $ | 411,164,499 | $ | 80,706,236 | $ | 6,145,952 | ||||||
|
|
|
|
|
| |||||||
Shares outstandingc | 10,000,000 | 1,300,000 | 100,000 | |||||||||
|
|
|
|
|
| |||||||
Net asset value per share | $ | 41.12 | $ | 62.08 | $ | 61.46 | ||||||
|
|
|
|
|
| |||||||
| a | Securities on loan with values of $10,299,207, $1,693,860 and $129,957, respectively. See Note 1. |
| b | Cost of foreign currency: $575,514, $133,986 and $8,319, respectively. |
| c | $0.001 par value, number of shares authorized: 500 million, 500 million and 500 million, respectively. |
See notes to consolidated financial statements.
| 70 | 2014 iSHARES ANNUAL REPORTTO SHAREHOLDERS |
Table of Contents
Consolidated Statements of Assets and Liabilities (Continued)
iSHARES®, INC.
August 31, 2014
iShares MSCI Emerging Markets | iShares MSCI Emerging Markets | iShares MSCI Emerging Markets Minimum Volatility ETF | ||||||||||
ASSETS | ||||||||||||
Investments, at cost: | ||||||||||||
Unaffiliated | $ | 2,342,017 | $ | 5,184,499 | $ | 1,903,326,204 | ||||||
Affiliated (Note 2) | 17,785 | 101,316 | 44,547,230 | |||||||||
|
|
|
|
|
| |||||||
Total cost of investments | $ | 2,359,802 | $ | 5,285,815 | $ | 1,947,873,434 | ||||||
|
|
|
|
|
| |||||||
Investments in securities, at fair value (including securities on loana) (Note 1): | ||||||||||||
Unaffiliated | $ | 1,975,772 | $ | 5,896,991 | $ | 2,069,411,791 | ||||||
Affiliated (Note 2) | 17,785 | 101,316 | 44,547,230 | |||||||||
|
|
|
|
|
| |||||||
Total fair value of investments | 1,993,557 | 5,998,307 | 2,113,959,021 | |||||||||
Foreign currency, at valueb | 1,865 | 14,419 | 10,107,131 | |||||||||
Cash | — | 342 | — | |||||||||
Receivables: | ||||||||||||
Investment securities sold | 46,847 | — | 35,387,142 | |||||||||
Due from custodian (Note 4) | — | — | 4,686,450 | |||||||||
Dividends and interest | 549 | 5,263 | 6,008,424 | |||||||||
Capital shares sold | — | — | 4,511,297 | |||||||||
|
|
|
|
|
| |||||||
Total Assets | 2,042,818 | 6,018,331 | 2,174,659,465 | |||||||||
|
|
|
|
|
| |||||||
LIABILITIES | ||||||||||||
Payables: | ||||||||||||
Investment securities purchased | 46,932 | — | 45,071,147 | |||||||||
Collateral for securities on loan (Note 1) | 16,027 | 98,081 | 44,547,230 | |||||||||
Line of credit (Note 7) | — | — | 2,000,258 | |||||||||
Due to custodian | — | — | 2,102,561 | |||||||||
Foreign taxes (Note 1) | — | 104 | 146,345 | |||||||||
Investment advisory fees (Note 2) | 1,079 | 2,433 | 428,614 | |||||||||
|
|
|
|
|
| |||||||
Total Liabilities | 64,038 | 100,618 | 94,296,155 | |||||||||
|
|
|
|
|
| |||||||
NET ASSETS | $ | 1,978,780 | $ | 5,917,713 | $ | 2,080,363,310 | ||||||
|
|
|
|
|
| |||||||
Net assets consist of: | ||||||||||||
Paid-in capital | $ | 3,421,694 | $ | 5,931,623 | $ | 2,038,702,260 | ||||||
Undistributed net investment income | 20,121 | 27,387 | 14,508,908 | |||||||||
Accumulated net realized loss | (1,096,750 | ) | (753,717 | ) | (138,943,596 | ) | ||||||
Net unrealized appreciation (depreciation) | (366,285 | ) | 712,420 | 166,095,738 | ||||||||
|
|
|
|
|
| |||||||
NET ASSETS | $ | 1,978,780 | $ | 5,917,713 | $ | 2,080,363,310 | ||||||
|
|
|
|
|
| |||||||
Shares outstandingc | 50,000 | 100,000 | 33,300,000 | |||||||||
|
|
|
|
|
| |||||||
Net asset value per share | $ | 39.58 | $ | 59.18 | $ | 62.47 | ||||||
|
|
|
|
|
| |||||||
| a | Securities on loan with values of $15,043, $91,878 and $41,364,601, respectively. See Note 1. |
| b | Cost of foreign currency: $1,861, $14,507 and $10,105,547, respectively. |
| c | $0.001 par value, number of shares authorized: 500 million, 500 million and 500 million, respectively. |
See notes to consolidated financial statements.
CONSOLIDATED FINANCIAL STATEMENTS | 71 |
Table of Contents
Consolidated Statements of Assets and Liabilities (Continued)
iSHARES®, INC.
August 31, 2014
| iShares MSCI Emerging Markets Small-Cap ETF | iShares MSCI Emerging Markets | |||||||
ASSETS | ||||||||
Investments, at cost: | ||||||||
Unaffiliated | $ | 41,152,322 | $ | 23,731,662 | ||||
Affiliated (Note 2) | 2,744,914 | 300,748 | ||||||
|
|
|
| |||||
Total cost of investments | $ | 43,897,236 | $ | 24,032,410 | ||||
|
|
|
| |||||
Investments in securities, at fair value (including securities on loana) (Note 1): | ||||||||
Unaffiliated | $ | 43,495,594 | $ | 25,101,469 | ||||
Affiliated (Note 2) | 2,744,914 | 300,748 | ||||||
|
|
|
| |||||
Total fair value of investments | 46,240,508 | 25,402,217 | ||||||
Foreign currency, at valueb | 67,553 | 28,762 | ||||||
Cash | 102,908 | 31,686 | ||||||
Receivables: | ||||||||
Investment securities sold | 492,613 | 119,607 | ||||||
Dividends and interest | 114,724 | 54,739 | ||||||
|
|
|
| |||||
Total Assets | 47,018,306 | 25,637,011 | ||||||
|
|
|
| |||||
LIABILITIES | ||||||||
Payables: | ||||||||
Investment securities purchased | 575,992 | 136,865 | ||||||
Collateral for securities on loan (Note 1) | 2,744,914 | 300,748 | ||||||
Foreign taxes (Note 1) | 7,638 | 3,207 | ||||||
Investment advisory fees (Note 2) | 23,877 | 10,290 | ||||||
|
|
|
| |||||
Total Liabilities | 3,352,421 | 451,110 | ||||||
|
|
|
| |||||
NET ASSETS | $ | 43,665,885 | $ | 25,185,901 | ||||
|
|
|
| |||||
Net assets consist of: | ||||||||
Paid-in capital | $ | 49,236,652 | $ | 24,845,732 | ||||
Undistributed net investment income | 262,193 | 199,118 | ||||||
Accumulated net realized loss | (8,176,392 | ) | (1,228,542 | ) | ||||
Net unrealized appreciation | 2,343,432 | 1,369,593 | ||||||
|
|
|
| |||||
NET ASSETS | $ | 43,665,885 | $ | 25,185,901 | ||||
|
|
|
| |||||
Shares outstandingc | 850,000 | 500,000 | ||||||
|
|
|
| |||||
Net asset value per share | $ | 51.37 | $ | 50.37 | ||||
|
|
|
| |||||
| a | Securities on loan with values of $2,467,641 and $281,971, respectively. See Note 1. |
| b | Cost of foreign currency: $67,406 and $28,980, respectively. |
| c | $0.001 par value, number of shares authorized: 500 million and 500 million, respectively. |
See notes to consolidated financial statements.
| 72 | 2014 iSHARES ANNUAL REPORTTO SHAREHOLDERS |
Table of Contents
Consolidated Statements of Operations
iSHARES®, INC.
Year ended August 31, 2014
| iShares MSCI BRIC ETF | iShares MSCI Emerging Markets | iShares MSCI Emerging Markets | ||||||||||
NET INVESTMENT INCOME | ||||||||||||
Dividends — unaffiliateda | $ | 13,215,356 | $ | 1,186,110 | $ | 74,029 | ||||||
Interest — affiliated (Note 2) | 62 | 7 | — | |||||||||
Securities lending income — affiliated (Note 2) | 209,092 | 14,757 | 1,912 | |||||||||
Payment from affiliate (Note 2) | — | 56,083 | — | |||||||||
|
|
|
|
|
| |||||||
| 13,424,510 | 1,256,957 | 75,941 | ||||||||||
Less: Other foreign taxes (Note 1) | — | (13,348 | ) | (79 | ) | |||||||
|
|
|
|
|
| |||||||
Total investment income | 13,424,510 | 1,243,609 | 75,862 | |||||||||
|
|
|
|
|
| |||||||
EXPENSES | ||||||||||||
Investment advisory fees (Note 2) | 2,950,620 | 296,354 | 34,904 | |||||||||
Mauritius income taxes (Note 1) | 29,259 | — | — | |||||||||
Commitment fees (Note 7) | 2,067 | 124 | 6 | |||||||||
Interest expense (Note 7) | 747 | 71 | — | |||||||||
|
|
|
|
|
| |||||||
Total expenses | 2,982,693 | 296,549 | 34,910 | |||||||||
Less investment advisory fees waived (Note 2) | — | (82,805 | ) | — | ||||||||
|
|
|
|
|
| |||||||
Net expenses | 2,982,693 | 213,744 | 34,910 | |||||||||
|
|
|
|
|
| |||||||
Net investment income | 10,441,817 | 1,029,865 | 40,952 | |||||||||
|
|
|
|
|
| |||||||
NET REALIZED AND UNREALIZED GAIN (LOSS) | ||||||||||||
Net realized gain (loss) from: | ||||||||||||
Investments — unaffiliated | (18,681,878 | ) | (609,610 | ) | (85,134 | ) | ||||||
In-kind redemptions — unaffiliated | 3,406,947 | 508,260 | — | |||||||||
Foreign currency transactions | (179,175 | ) | (34,303 | ) | (2,922 | ) | ||||||
|
|
|
|
|
| |||||||
Net realized loss | (15,454,106 | ) | (135,653 | ) | (88,056 | ) | ||||||
|
|
|
|
|
| |||||||
Net change in unrealized appreciation/depreciation on: | ||||||||||||
Investments | 84,718,499 | 7,841,847 | 897,849 | |||||||||
Translation of assets and liabilities in foreign currencies | 71,119 | 1,132 | 86 | |||||||||
|
|
|
|
|
| |||||||
Net change in unrealized appreciation/depreciation | 84,789,618 | 7,842,979 | 897,935 | |||||||||
|
|
|
|
|
| |||||||
Net realized and unrealized gain | 69,335,512 | 7,707,326 | 809,879 | |||||||||
|
|
|
|
|
| |||||||
NET INCREASE IN NET ASSETS RESULTING FROM OPERATIONS | $ | 79,777,329 | $ | 8,737,191 | $ | 850,831 | ||||||
|
|
|
|
|
| |||||||
| a | Net of foreign withholding tax of $1,127,225, $159,300 and $11,752, respectively. |
See notes to consolidated financial statements.
CONSOLIDATED FINANCIAL STATEMENTS | 73 |
Table of Contents
Consolidated Statements of Operations (Continued)
iSHARES®, INC.
Year ended August 31, 2014
iShares MSCI Emerging Markets | iShares MSCI Emerging Markets | iShares MSCI Emerging Markets Minimum Volatility ETF | ||||||||||
NET INVESTMENT INCOME | ||||||||||||
Dividends — unaffiliateda | $ | 64,633 | $ | 106,777 | $ | 62,833,263 | ||||||
Interest — affiliated (Note 2) | — | 2 | 322 | |||||||||
Securities lending income — affiliated (Note 2) | 403 | 1,776 | 473,774 | |||||||||
|
|
|
|
|
| |||||||
| 65,036 | 108,555 | 63,307,359 | ||||||||||
Less: Other foreign taxes (Note 1) | — | (475 | ) | (150,578 | ) | |||||||
|
|
|
|
|
| |||||||
Total investment income | 65,036 | 108,080 | 63,156,781 | |||||||||
|
|
|
|
|
| |||||||
EXPENSES | ||||||||||||
Investment advisory fees (Note 2) | 12,636 | 37,510 | 15,031,499 | |||||||||
Mauritius income taxes (Note 1) | — | — | 25,329 | |||||||||
Commitment fees (Note 7) | 4 | 10 | 1,304 | |||||||||
Interest expense (Note 7) | — | — | 2,799 | |||||||||
|
|
|
|
|
| |||||||
Total expenses | 12,640 | 37,520 | 15,060,931 | |||||||||
Less investment advisory fees waived (Note 2) | — | (10,481 | ) | (9,452,759 | ) | |||||||
|
|
|
|
|
| |||||||
Net expenses | 12,640 | 27,039 | 5,608,172 | |||||||||
|
|
|
|
|
| |||||||
Net investment income | 52,396 | 81,041 | 57,548,609 | |||||||||
|
|
|
|
|
| |||||||
NET REALIZED AND UNREALIZED GAIN (LOSS) | ||||||||||||
Net realized gain (loss) from: | ||||||||||||
Investments — unaffiliated | (92,989 | ) | (106,192 | ) | (108,755,712 | ) | ||||||
In-kind redemptions — unaffiliated | — | — | 30,119,837 | |||||||||
Foreign currency transactions | (867 | ) | (786 | ) | (1,401,815 | ) | ||||||
|
|
|
|
|
| |||||||
Net realized loss | (93,856 | ) | (106,978 | ) | (80,037,690 | ) | ||||||
|
|
|
|
|
| |||||||
Net change in unrealized appreciation/depreciation on: | ||||||||||||
Investments | 249,873 | 992,241 | 311,471,749 | |||||||||
Translation of assets and liabilities in foreign currencies | 63 | 278 | 134,328 | |||||||||
|
|
|
|
|
| |||||||
Net change in unrealized appreciation/depreciation | 249,936 | 992,519 | 311,606,077 | |||||||||
|
|
|
|
|
| |||||||
Net realized and unrealized gain | 156,080 | 885,541 | 231,568,387 | |||||||||
|
|
|
|
|
| |||||||
NET INCREASE IN NET ASSETS RESULTING FROM OPERATIONS | $ | 208,476 | $ | 966,582 | $ | 289,116,996 | ||||||
|
|
|
|
|
| |||||||
| a | Net of foreign withholding tax of $7,464, $12,434 and $7,625,142, respectively. |
See notes to consolidated financial statements.
| 74 | 2014 iSHARES ANNUAL REPORTTO SHAREHOLDERS |
Table of Contents
Consolidated Statements of Operations (Continued)
iSHARES®, INC.
Year ended August 31, 2014
| iShares MSCI Emerging Markets Small-Cap ETF | iShares MSCI Emerging Markets | |||||||
NET INVESTMENT INCOME | ||||||||
Dividends — unaffiliateda | $ | 847,809 | $ | 624,368 | ||||
Interest — unaffiliated | 1 | — | ||||||
Interest — affiliated (Note 2) | 7 | 3 | ||||||
Securities lending income — affiliated (Note 2) | 42,427 | 2,220 | ||||||
Payment from affiliate (Note 2) | 73,193 | — | ||||||
|
|
|
| |||||
| 963,437 | 626,591 | |||||||
Less: Other foreign taxes (Note 1) | (9,439 | ) | (3,659 | ) | ||||
|
|
|
| |||||
Total investment income | 953,998 | 622,932 | ||||||
|
|
|
| |||||
EXPENSES | ||||||||
Investment advisory fees (Note 2) | 247,131 | 123,624 | ||||||
Commitment fees (Note 7) | 52 | 29 | ||||||
Interest expense (Note 7) | 71 | 44 | ||||||
|
|
|
| |||||
Total expenses | 247,254 | 123,697 | ||||||
Less investment advisory fees waived (Note 2) | — | (34,542 | ) | |||||
|
|
|
| |||||
Net expenses | 247,254 | 89,155 | ||||||
|
|
|
| |||||
Net investment income | 706,744 | 533,777 | ||||||
|
|
|
| |||||
NET REALIZED AND UNREALIZED GAIN (LOSS) | ||||||||
Net realized gain (loss) from: | ||||||||
Investments — unaffiliated | 343,767 | (252,624 | ) | |||||
Foreign currency transactions | (5,245 | ) | (6,018 | ) | ||||
|
|
|
| |||||
Net realized gain (loss) | 338,522 | (258,642 | ) | |||||
|
|
|
| |||||
Net change in unrealized appreciation/depreciation on: | ||||||||
Investments | 5,680,030 | 2,859,994 | ||||||
Translation of assets and liabilities in foreign currencies | 1,401 | 903 | ||||||
|
|
|
| |||||
Net change in unrealized appreciation/depreciation | 5,681,431 | 2,860,897 | ||||||
|
|
|
| |||||
Net realized and unrealized gain | 6,019,953 | 2,602,255 | ||||||
|
|
|
| |||||
NET INCREASE IN NET ASSETS RESULTING FROM OPERATIONS | $ | 6,726,697 | $ | 3,136,032 | ||||
|
|
|
| |||||
| a | Net of foreign withholding tax of $100,196 and $77,694, respectively. |
See notes to consolidated financial statements.
CONSOLIDATED FINANCIAL STATEMENTS | 75 |
Table of Contents
Consolidated Statements of Changes in Net Assets
iSHARES®, INC.
| iShares MSCI BRIC ETF | iShares MSCI Emerging Markets Asia ETF | |||||||||||||||
| Year ended August 31, 2014 | Year ended August 31, 2013 | Year ended August 31, 2014 | Year ended August 31, 2013 | |||||||||||||
INCREASE (DECREASE) IN NET ASSETS | ||||||||||||||||
OPERATIONS: | ||||||||||||||||
Net investment income | $ | 10,441,817 | $ | 14,531,717 | $ | 1,029,865 | $ | 1,481,906 | ||||||||
Net realized loss | (15,454,106 | ) | (28,282,720 | ) | (135,653 | ) | (13,002,316 | ) | ||||||||
Net change in unrealized appreciation/depreciation | 84,789,618 | 18,953,553 | 7,842,979 | 187,713 | ||||||||||||
|
|
|
|
|
|
|
| |||||||||
Net increase (decrease) in net assets resulting from operations | 79,777,329 | 5,202,550 | 8,737,191 | (11,332,697 | ) | |||||||||||
|
|
|
|
|
|
|
| |||||||||
DISTRIBUTIONS TO SHAREHOLDERS: | ||||||||||||||||
From net investment income | (7,905,401 | ) | (13,252,516 | ) | (898,216 | ) | (1,144,738 | ) | ||||||||
|
|
|
|
|
|
|
| |||||||||
Total distributions to shareholders | (7,905,401 | ) | (13,252,516 | ) | (898,216 | ) | (1,144,738 | ) | ||||||||
|
|
|
|
|
|
|
| |||||||||
CAPITAL SHARE TRANSACTIONS: | ||||||||||||||||
Proceeds from shares sold | 38,350,012 | 21,679,666 | 59,268,915 | 208,872,206 | ||||||||||||
Cost of shares redeemed | (173,918,382 | ) | (223,917,437 | ) | (17,742,448 | ) | (185,124,642 | ) | ||||||||
|
|
|
|
|
|
|
| |||||||||
Net increase (decrease) in net assets from capital share transactions | (135,568,370 | ) | (202,237,771 | ) | 41,526,467 | 23,747,564 | ||||||||||
|
|
|
|
|
|
|
| |||||||||
INCREASE (DECREASE) IN NET ASSETS | (63,696,442 | ) | (210,287,737 | ) | 49,365,442 | 11,270,129 | ||||||||||
NET ASSETS | ||||||||||||||||
Beginning of year | 474,860,941 | 685,148,678 | 31,340,794 | 20,070,665 | ||||||||||||
|
|
|
|
|
|
|
| |||||||||
End of year | $ | 411,164,499 | $ | 474,860,941 | $ | 80,706,236 | $ | 31,340,794 | ||||||||
|
|
|
|
|
|
|
| |||||||||
Undistributed net investment income included in net assets at end of year | $ | 2,756,022 | $ | 275,301 | $ | 433,762 | $ | 336,245 | ||||||||
|
|
|
|
|
|
|
| |||||||||
SHARES ISSUED AND REDEEMED | ||||||||||||||||
Shares sold | 950,000 | 550,000 | 1,000,000 | 3,650,000 | ||||||||||||
Shares redeemed | (4,750,000 | ) | (5,950,000 | ) | (300,000 | ) | (3,450,000 | ) | ||||||||
|
|
|
|
|
|
|
| |||||||||
Net increase (decrease) in shares outstanding | (3,800,000 | ) | (5,400,000 | ) | 700,000 | 200,000 | ||||||||||
|
|
|
|
|
|
|
| |||||||||
See notes to consolidated financial statements.
| 76 | 2014 iSHARES ANNUAL REPORTTO SHAREHOLDERS |
Table of Contents
Consolidated Statements of Changes in Net Assets (Continued)
iSHARES®, INC.
| iShares MSCI Emerging Markets Consumer Discretionary ETF | iShares MSCI Emerging Markets Energy Capped ETF | |||||||||||||||
| Year ended August 31, 2014 | Year ended August 31, 2013 | Year ended August 31, 2014 | Year ended August 31, 2013 | |||||||||||||
INCREASE (DECREASE) IN NET ASSETS | ||||||||||||||||
OPERATIONS: | ||||||||||||||||
Net investment income | $ | 40,952 | $ | 19,267 | $ | 52,396 | $ | 51,980 | ||||||||
Net realized loss | (88,056 | ) | (42,811 | ) | (93,856 | ) | (89,021 | ) | ||||||||
Net change in unrealized appreciation/depreciation | 897,935 | 138,120 | 249,936 | (118,848 | ) | |||||||||||
|
|
|
|
|
|
|
| |||||||||
Net increase (decrease) in net assets resulting from operations | 850,831 | 114,576 | 208,476 | (155,889 | ) | |||||||||||
|
|
|
|
|
|
|
| |||||||||
DISTRIBUTIONS TO SHAREHOLDERS: | ||||||||||||||||
From net investment income | (29,115 | ) | (30,681 | ) | (34,812 | ) | (46,822 | ) | ||||||||
|
|
|
|
|
|
|
| |||||||||
Total distributions to shareholders | (29,115 | ) | (30,681 | ) | (34,812 | ) | (46,822 | ) | ||||||||
|
|
|
|
|
|
|
| |||||||||
CAPITAL SHARE TRANSACTIONS: | ||||||||||||||||
Proceeds from shares sold | 2,816,123 | — | — | — | ||||||||||||
|
|
|
|
|
|
|
| |||||||||
Net increase in net assets from capital share transactions | 2,816,123 | — | — | — | ||||||||||||
|
|
|
|
|
|
|
| |||||||||
INCREASE (DECREASE) IN NET ASSETS | 3,637,839 | 83,895 | 173,664 | (202,711 | ) | |||||||||||
NET ASSETS | ||||||||||||||||
Beginning of year | 2,508,113 | 2,424,218 | 1,805,116 | 2,007,827 | ||||||||||||
|
|
|
|
|
|
|
| |||||||||
End of year | $ | 6,145,952 | $ | 2,508,113 | $ | 1,978,780 | $ | 1,805,116 | ||||||||
|
|
|
|
|
|
|
| |||||||||
Undistributed net investment income included in net assets at end of year | $ | 11,762 | $ | 2,847 | $ | 20,121 | $ | 3,193 | ||||||||
|
|
|
|
|
|
|
| |||||||||
SHARES ISSUED | ||||||||||||||||
Shares sold | 50,000 | — | — | — | ||||||||||||
|
|
|
|
|
|
|
| |||||||||
Net increase in shares outstanding | 50,000 | — | — | — | ||||||||||||
|
|
|
|
|
|
|
| |||||||||
See notes to consolidated financial statements.
CONSOLIDATED FINANCIAL STATEMENTS | 77 |
Table of Contents
Consolidated Statements of Changes in Net Assets (Continued)
iSHARES®, INC.
| iShares MSCI Emerging Markets Growth ETF | iShares MSCI Emerging Markets Minimum Volatility ETF | |||||||||||||||
| Year ended August 31, 2014 | Year ended August 31, 2013 | Year ended August 31, 2014 | Year ended August 31, 2013 | |||||||||||||
INCREASE (DECREASE) IN NET ASSETS | ||||||||||||||||
OPERATIONS: | ||||||||||||||||
Net investment income | $ | 81,041 | $ | 56,453 | $ | 57,548,609 | $ | 44,316,678 | ||||||||
Net realized loss | (106,978 | ) | (488,613 | ) | (80,037,690 | ) | (21,497,246 | ) | ||||||||
Net change in unrealized appreciation/depreciation | 992,519 | 188,328 | 311,606,077 | (153,606,739 | ) | |||||||||||
|
|
|
|
|
|
|
| |||||||||
Net increase (decrease) in net assets resulting from operations | 966,582 | (243,832 | ) | 289,116,996 | (130,787,307 | ) | ||||||||||
|
|
|
|
|
|
|
| |||||||||
DISTRIBUTIONS TO SHAREHOLDERS: | ||||||||||||||||
From net investment income | (75,147 | ) | (78,638 | ) | (58,169,702 | ) | (29,485,424 | ) | ||||||||
|
|
|
|
|
|
|
| |||||||||
Total distributions to shareholders | (75,147 | ) | (78,638 | ) | (58,169,702 | ) | (29,485,424 | ) | ||||||||
|
|
|
|
|
|
|
| |||||||||
CAPITAL SHARE TRANSACTIONS: | ||||||||||||||||
Proceeds from shares sold | — | 2,836,973 | 323,291,843 | 2,246,859,727 | ||||||||||||
Cost of shares redeemed | — | (7,609,183 | ) | (929,603,299 | ) | (18,086,598 | ) | |||||||||
|
|
|
|
|
|
|
| |||||||||
Net increase (decrease) in net assets from capital share transactions | — | (4,772,210 | ) | (606,311,456 | ) | 2,228,773,129 | ||||||||||
|
|
|
|
|
|
|
| |||||||||
INCREASE (DECREASE) IN NET ASSETS | 891,435 | (5,094,680 | ) | (375,364,162 | ) | 2,068,500,398 | ||||||||||
NET ASSETS | ||||||||||||||||
Beginning of year | 5,026,278 | 10,120,958 | 2,455,727,472 | 387,227,074 | ||||||||||||
|
|
|
|
|
|
|
| |||||||||
End of year | $ | 5,917,713 | $ | 5,026,278 | $ | 2,080,363,310 | $ | 2,455,727,472 | ||||||||
|
|
|
|
|
|
|
| |||||||||
Undistributed net investment income included in net assets at end of year | $ | 27,387 | $ | 20,197 | $ | 14,508,908 | $ | 15,887,809 | ||||||||
|
|
|
|
|
|
|
| |||||||||
SHARES ISSUED AND REDEEMED | ||||||||||||||||
Shares sold | — | 50,000 | 5,300,000 | 37,500,000 | ||||||||||||
Shares redeemed | — | (150,000 | ) | (16,200,000 | ) | (300,000 | ) | |||||||||
|
|
|
|
|
|
|
| |||||||||
Net increase (decrease) in shares outstanding | — | (100,000 | ) | (10,900,000 | ) | 37,200,000 | ||||||||||
|
|
|
|
|
|
|
| |||||||||
See notes to consolidated financial statements.
| 78 | 2014 iSHARES ANNUAL REPORTTO SHAREHOLDERS |
Table of Contents
Consolidated Statements of Changes in Net Assets (Continued)
iSHARES®, INC.
| iShares MSCI Emerging Markets Small-Cap ETF | iShares MSCI Emerging Markets Value ETF | |||||||||||||||
| Year ended August 31, 2014 | Year ended August 31, 2013 | Year ended August 31, 2014 | Year ended August 31, 2013 | |||||||||||||
INCREASE (DECREASE) IN NET ASSETS | ||||||||||||||||
OPERATIONS: | ||||||||||||||||
Net investment income | $ | 706,744 | $ | 452,278 | $ | 533,777 | $ | 287,929 | ||||||||
Net realized gain (loss) | 338,522 | 192,570 | (258,642 | ) | (808,943 | ) | ||||||||||
Net change in unrealized appreciation/depreciation | 5,681,431 | (2,594,104 | ) | 2,860,897 | (187,045 | ) | ||||||||||
|
|
|
|
|
|
|
| |||||||||
Net increase (decrease) in net assets resulting from operations | 6,726,697 | (1,949,256 | ) | 3,136,032 | (708,059 | ) | ||||||||||
|
|
|
|
|
|
|
| |||||||||
DISTRIBUTIONS TO SHAREHOLDERS: | ||||||||||||||||
From net investment income | (736,376 | ) | (514,561 | ) | (388,580 | ) | (279,968 | ) | ||||||||
|
|
|
|
|
|
|
| |||||||||
Total distributions to shareholders | (736,376 | ) | (514,561 | ) | (388,580 | ) | (279,968 | ) | ||||||||
|
|
|
|
|
|
|
| |||||||||
CAPITAL SHARE TRANSACTIONS: | ||||||||||||||||
Proceeds from shares sold | 7,031,811 | 24,419,011 | 11,651,839 | 7,122,017 | ||||||||||||
Cost of shares redeemed | — | — | — | (4,408,081 | ) | |||||||||||
|
|
|
|
|
|
|
| |||||||||
Net increase in net assets from capital share transactions | 7,031,811 | 24,419,011 | 11,651,839 | 2,713,936 | ||||||||||||
|
|
|
|
|
|
|
| |||||||||
INCREASE IN NET ASSETS | 13,022,132 | 21,955,194 | 14,399,291 | 1,725,909 | ||||||||||||
NET ASSETS | ||||||||||||||||
Beginning of year | 30,643,753 | 8,688,559 | 10,786,610 | 9,060,701 | ||||||||||||
|
|
|
|
|
|
|
| |||||||||
End of year | $ | 43,665,885 | $ | 30,643,753 | $ | 25,185,901 | $ | 10,786,610 | ||||||||
|
|
|
|
|
|
|
| |||||||||
Undistributed net investment income included in net assets at end of year | $ | 262,193 | $ | 171,259 | $ | 199,118 | $ | 48,204 | ||||||||
|
|
|
|
|
|
|
| |||||||||
SHARES ISSUED AND REDEEMED | ||||||||||||||||
Shares sold | 150,000 | 500,000 | 250,000 | 150,000 | ||||||||||||
Shares redeemed | — | — | — | (100,000 | ) | |||||||||||
|
|
|
|
|
|
|
| |||||||||
Net increase in shares outstanding | 150,000 | 500,000 | 250,000 | 50,000 | ||||||||||||
|
|
|
|
|
|
|
| |||||||||
See notes to consolidated financial statements.
CONSOLIDATED FINANCIAL STATEMENTS | 79 |
Table of Contents
iSHARES®, INC.
(For a share outstanding throughout each period)
iShares MSCI BRIC ETF | ||||||||||
| Year ended Aug. 31, 2014 (Consolidated) | Year ended Aug. 31, 2013 (Consolidated) | Year ended Aug. 31, 2012 (Consolidated) | Year ended Aug. 31, 2011 (Consolidated) | Year ended Aug. 31, 2010 | ||||||||||||||||
Net asset value, beginning of year | $ | 34.41 | $ | 35.68 | $ | 42.25 | $ | 42.94 | $ | 37.57 | ||||||||||
|
|
|
|
|
|
|
|
|
| |||||||||||
Income from investment operations: | ||||||||||||||||||||
Net investment incomea | 0.89 | 0.84 | 0.98 | 0.89 | 0.66 | |||||||||||||||
Net realized and unrealized gain (loss)b | 6.53 | (1.25 | ) | (6.62 | ) | (0.58 | ) | 5.35 | ||||||||||||
|
|
|
|
|
|
|
|
|
| |||||||||||
Total from investment operations | 7.42 | (0.41 | ) | (5.64 | ) | 0.31 | 6.01 | |||||||||||||
|
|
|
|
|
|
|
|
|
| |||||||||||
Less distributions from: | ||||||||||||||||||||
Net investment income | (0.71 | ) | (0.86 | ) | (0.93 | ) | (1.00 | ) | (0.64 | ) | ||||||||||
|
|
|
|
|
|
|
|
|
| |||||||||||
Total distributions | (0.71 | ) | (0.86 | ) | (0.93 | ) | (1.00 | ) | (0.64 | ) | ||||||||||
|
|
|
|
|
|
|
|
|
| |||||||||||
Net asset value, end of year | $ | 41.12 | $ | 34.41 | $ | 35.68 | $ | 42.25 | $ | 42.94 | ||||||||||
|
|
|
|
|
|
|
|
|
| |||||||||||
Total return | 21.73 | % | (1.17 | )% | (13.33 | )% | 0.49 | % | 15.95 | % | ||||||||||
|
|
|
|
|
|
|
|
|
| |||||||||||
Ratios/Supplemental data: | ||||||||||||||||||||
Net assets, end of year (000s) | $ | 411,164 | $ | 474,861 | $ | 685,149 | $ | 866,194 | $ | 946,814 | ||||||||||
Ratio of expenses to average net assets | 0.68 | % | 0.67 | % | 0.69 | % | 0.67 | % | 0.69 | % | ||||||||||
Ratio of expenses to average net assets prior to waived fees | n/a | n/a | n/a | 0.67 | % | n/a | ||||||||||||||
Ratio of net investment income to average net assets | 2.38 | % | 2.18 | % | 2.55 | % | 1.86 | % | 1.52 | % | ||||||||||
Portfolio turnover ratec | 10 | % | 10 | % | 32 | % | 13 | % | 9 | % | ||||||||||
| a | Based on average shares outstanding throughout each period. |
| b | The amounts reported for a share outstanding may not accord with the change in aggregate gains and losses in securities for the fiscal period due to the timing of capital share transactions in relation to the fluctuating market values of the Fund’s underlying securities. |
| c | Portfolio turnover rates exclude portfolio securities received or delivered in Creation Units but include portfolio transactions that are executed as a result of the Fund processing capital share transactions in Creation Units partially for cash in U.S. dollars. Excluding such cash transactions, the portfolio turnover rates for the years ended August 31, 2014, August 31, 2013, August 31, 2012, August 31, 2011 and August 31, 2010 were 6%, 9%, 20%, 10% and 8%, respectively. See Note 4. |
See notes to consolidated financial statements.
| 80 | 2014 iSHARES ANNUAL REPORTTO SHAREHOLDERS |
Table of Contents
Consolidated Financial Highlights (Continued)
iSHARES®, INC.
(For a share outstanding throughout each period)
iShares MSCI Emerging Markets Asia ETF | ||||||
| Year ended Aug. 31, 2014 | Year ended Aug. 31, 2013 | Period from to Aug. 31, 2012 | ||||||||||
Net asset value, beginning of period | $ | 52.23 | $ | 50.18 | $ | 54.71 | ||||||
|
|
|
|
|
| |||||||
Income from investment operations: | ||||||||||||
Net investment incomeb | 1.36 | 1.15 | 0.87 | |||||||||
Net realized and unrealized gain (loss)c | 9.75 | 1.82 | (4.99 | ) | ||||||||
|
|
|
|
|
| |||||||
Total from investment operations | 11.11 | 2.97 | (4.12 | ) | ||||||||
|
|
|
|
|
| |||||||
Less distributions from: | ||||||||||||
Net investment income | (1.26 | ) | (0.92 | ) | (0.41 | ) | ||||||
|
|
|
|
|
| |||||||
Total distributions | (1.26 | ) | (0.92 | ) | (0.41 | ) | ||||||
|
|
|
|
|
| |||||||
Net asset value, end of period | $ | 62.08 | $ | 52.23 | $ | 50.18 | ||||||
|
|
|
|
|
| |||||||
Total return | 21.54 | %e | 5.88 | % | (7.52 | )%d | ||||||
|
|
|
|
|
| |||||||
Ratios/Supplemental data: | ||||||||||||
Net assets, end of period (000s) | $ | 80,706 | $ | 31,341 | $ | 20,071 | ||||||
Ratio of expenses to average net assetsf | 0.49 | % | 0.49 | % | 0.49 | % | ||||||
Ratio of expenses to average net assets prior to waived feesf | 0.68 | % | 0.68 | % | 0.68 | % | ||||||
Ratio of net investment income to average net assetsf | 2.36 | % | 2.09 | % | 3.05 | % | ||||||
Portfolio turnover rateg | 33 | % | 174 | % | 3 | % | ||||||
| a | Commencement of operations. |
| b | Based on average shares outstanding throughout each period. |
| c | The amounts reported for a share outstanding may not accord with the change in aggregate gains and losses in securities for the fiscal period due to the timing of capital share transactions in relation to the fluctuating market values of the Fund’s underlying securities. |
| d | Not annualized. |
| e | Includes payment from an affiliate. See Note 2. Not including these proceeds, the Fund’s total return would have been 21.46%. |
| f | Annualized for periods of less than one year. |
| g | Portfolio turnover rates exclude portfolio securities received or delivered in Creation Units but include portfolio transactions that are executed as a result of the Fund processing capital share transactions in Creation Units partially for cash in U.S. dollars. Excluding such cash transactions, the portfolio turnover rates for the years ended August 31, 2014, August 31, 2013 and the period ended August 31, 2012 were 33%. 21% and 3%, respectively. See Note 4. |
See notes to consolidated financial statements.
CONSOLIDATED FINANCIAL HIGHLIGHTS | 81 |
Table of Contents
Consolidated Financial Highlights (Continued)
iSHARES®, INC.
(For a share outstanding throughout each period)
iShares MSCI Emerging Markets Consumer Discretionary ETF
| Year ended Aug. 31, 2014 | Year ended Aug. 31, 2013 | Period from to Aug. 31, 2012 | ||||||||||
Net asset value, beginning of period | $ | 50.16 | $ | 48.48 | $ | 51.54 | ||||||
|
|
|
|
|
| |||||||
Income from investment operations: | ||||||||||||
Net investment incomeb | 0.44 | 0.39 | 0.26 | |||||||||
Net realized and unrealized gain (loss)c | 11.15 | 1.90 | (3.19 | ) | ||||||||
|
|
|
|
|
| |||||||
Total from investment operations | 11.59 | 2.29 | (2.93 | ) | ||||||||
|
|
|
|
|
| |||||||
Less distributions from: | ||||||||||||
Net investment income | (0.29 | ) | (0.61 | ) | (0.13 | ) | ||||||
|
|
|
|
|
| |||||||
Total distributions | (0.29 | ) | (0.61 | ) | (0.13 | ) | ||||||
|
|
|
|
|
| |||||||
Net asset value, end of period | $ | 61.46 | $ | 50.16 | $ | 48.48 | ||||||
|
|
|
|
|
| |||||||
Total return | 23.16 | % | 4.73 | % | (5.68 | )%d | ||||||
|
|
|
|
|
| |||||||
Ratios/Supplemental data: | ||||||||||||
Net assets, end of period (000s) | $ | 6,146 | $ | 2,508 | $ | 2,424 | ||||||
Ratio of expenses to average net assetse | 0.67 | % | 0.67 | % | 0.68 | % | ||||||
Ratio of net investment income to average net assetse | 0.79 | % | 0.76 | % | 0.94 | % | ||||||
Portfolio turnover ratef | 10 | % | 10 | % | 54 | % | ||||||
| a | Commencement of operations. |
| b | Based on average shares outstanding throughout each period. |
| c | The amounts reported for a share outstanding may not accord with the change in aggregate gains and losses in securities for the fiscal period due to the timing of capital share transactions in relation to the fluctuating market values of the Fund’s underlying securities. |
| d | Not annualized. |
| e | Annualized for periods of less than one year. |
| f | Portfolio turnover rates exclude portfolio securities received or delivered in Creation Units but include portfolio transactions that are executed as a result of the Fund processing capital share transactions in Creation Units partially for cash in U.S. dollars. Excluding such cash transactions, the portfolio turnover rates for the years ended August 31, 2014, August 31, 2013 and the period ended August 31, 2012 were 10%, 10%, and 5%, respectively. See Note 4. |
See notes to consolidated financial statements.
| 82 | 2014 iSHARES ANNUAL REPORTTO SHAREHOLDERS |
Table of Contents
Consolidated Financial Highlights (Continued)
iSHARES®, INC.
(For a share outstanding throughout each period)
iShares MSCI Emerging Markets Energy Capped ETF
| Year ended Aug. 31, 2014 | Year ended Aug. 31, 2013 | Period from to Aug. 31, 2012 | ||||||||||
Net asset value, beginning of period | $ | 36.10 | $ | 40.16 | $ | 51.12 | ||||||
|
|
|
|
|
| |||||||
Income from investment operations: | ||||||||||||
Net investment incomeb | 1.05 | 1.04 | 1.05 | |||||||||
Net realized and unrealized gain (loss)c | 3.13 | (4.16 | ) | (11.14 | ) | |||||||
|
|
|
|
|
| |||||||
Total from investment operations | 4.18 | (3.12 | ) | (10.09 | ) | |||||||
|
|
|
|
|
| |||||||
Less distributions from: | ||||||||||||
Net investment income | (0.70 | ) | (0.94 | ) | (0.84 | ) | ||||||
Return of capital | — | — | (0.03 | ) | ||||||||
|
|
|
|
|
| |||||||
Total distributions | (0.70 | ) | (0.94 | ) | (0.87 | ) | ||||||
|
|
|
|
|
| |||||||
Net asset value, end of period | $ | 39.58 | $ | 36.10 | $ | 40.16 | ||||||
|
|
|
|
|
| |||||||
Total return | 11.65 | % | (7.73 | )% | (19.71 | )%d | ||||||
|
|
|
|
|
| |||||||
Ratios/Supplemental data: | ||||||||||||
Net assets, end of period (000s) | $ | 1,979 | $ | 1,805 | $ | 2,008 | ||||||
Ratio of expenses to average net assetse | 0.67 | % | 0.67 | % | 0.68 | % | ||||||
Ratio of net investment income to average net assetse | 2.79 | % | 2.56 | % | 4.23 | % | ||||||
Portfolio turnover ratef | 15 | % | 7 | % | 29 | % | ||||||
| a | Commencement of operations. |
| b | Based on average shares outstanding throughout each period. |
| c | The amounts reported for a share outstanding may not accord with the change in aggregate gains and losses in securities for the fiscal period due to the timing of capital share transactions in relation to the fluctuating market values of the Fund’s underlying securities. |
| d | Not annualized. |
| e | Annualized for periods of less than one year. |
| f | Portfolio turnover rates exclude portfolio securities received or delivered in Creation Units but include portfolio transactions that are executed as a result of the Fund processing capital share transactions in Creation Units partially for cash in U.S. dollars. Excluding such cash transactions, the portfolio turnover rates for the years ended August 31, 2014, August 31, 2013 and the period ended August 31, 2012 were 15%, 7% and 3%, respectively. See Note 4. |
See notes to consolidated financial statements.
CONSOLIDATED FINANCIAL HIGHLIGHTS | 83 |
Table of Contents
Consolidated Financial Highlights (Continued)
iSHARES®, INC.
(For a share outstanding throughout each period)
iShares MSCI Emerging Markets Growth ETF
| Year ended Aug. 31, 2014 | Year ended Aug. 31, 2013 | Period from to Aug. 31, 2012 | ||||||||||
Net asset value, beginning of period | $ | 50.26 | $ | 50.60 | $ | 54.24 | ||||||
|
|
|
|
|
| |||||||
Income from investment operations: | ||||||||||||
Net investment incomeb | 0.81 | 0.85 | 0.66 | |||||||||
Net realized and unrealized gain (loss)c | 8.86 | 0.13 | (3.87 | ) | ||||||||
|
|
|
|
|
| |||||||
Total from investment operations | 9.67 | 0.98 | (3.21 | ) | ||||||||
|
|
|
|
|
| |||||||
Less distributions from: | ||||||||||||
Net investment income | (0.75 | ) | (1.32 | ) | (0.43 | ) | ||||||
|
|
|
|
|
| |||||||
Total distributions | (0.75 | ) | (1.32 | ) | (0.43 | ) | ||||||
|
|
|
|
|
| |||||||
Net asset value, end of period | $ | 59.18 | $ | 50.26 | $ | 50.60 | ||||||
|
|
|
|
|
| |||||||
Total return | 19.36 | % | 1.76 | % | (5.90 | )%d | ||||||
|
|
|
|
|
| |||||||
Ratios/Supplemental data: | ||||||||||||
Net assets, end of period (000s) | $ | 5,918 | $ | 5,026 | $ | 10,121 | ||||||
Ratio of expenses to average net assetse | 0.49 | % | 0.49 | % | 0.49 | % | ||||||
Ratio of expenses to average net assets prior to waived feese | 0.68 | % | 0.68 | % | 0.68 | % | ||||||
Ratio of net investment income to average net assetse | 1.47 | % | 1.59 | % | 2.27 | % | ||||||
Portfolio turnover ratef | 26 | % | 64 | % | 12 | % | ||||||
| a | Commencement of operations. |
| b | Based on average shares outstanding throughout each period. |
| c | The amounts reported for a share outstanding may not accord with the change in aggregate gains and losses in securities for the fiscal period due to the timing of capital share transactions in relation to the fluctuating market values of the Fund’s underlying securities. |
| d | Not annualized. |
| e | Annualized for periods of less than one year. |
| f | Portfolio turnover rates exclude portfolio securities received or delivered in Creation Units but include portfolio transactions that are executed as a result of the Fund processing capital share transactions in Creation Units partially for cash in U.S. dollars. Excluding such cash transactions, the portfolio turnover rates for the years ended August 31, 2014, August 31, 2013 and the period ended August 31, 2012 were 26%, 28% and 12%, respectively. See Note 4. |
See notes to consolidated financial statements.
| 84 | 2014 iSHARES ANNUAL REPORTTO SHAREHOLDERS |
Table of Contents
Consolidated Financial Highlights (Continued)
iSHARES®, INC.
(For a share outstanding throughout each period)
iShares MSCI Emerging Markets Minimum Volatility ETF
| Year ended Aug. 31, 2014 | Year ended Aug. 31, 2013 | Period from to Aug. 31, 2012 | ||||||||||
Net asset value, beginning of period | $ | 55.56 | $ | 55.32 | $ | 49.30 | ||||||
|
|
|
|
|
| |||||||
Income from investment operations: | ||||||||||||
Net investment incomeb | 1.51 | 1.85 | 1.93 | |||||||||
Net realized and unrealized gain (loss)c | 6.94 | (0.60 | ) | 5.41 | ||||||||
|
|
|
|
|
| |||||||
Total from investment operations | 8.45 | 1.25 | 7.34 | |||||||||
|
|
|
|
|
| |||||||
Less distributions from: | ||||||||||||
Net investment income | (1.54 | ) | (1.01 | ) | (1.32 | ) | ||||||
|
|
|
|
|
| |||||||
Total distributions | (1.54 | ) | (1.01 | ) | (1.32 | ) | ||||||
|
|
|
|
|
| |||||||
Net asset value, end of period | $ | 62.47 | $ | 55.56 | $ | 55.32 | ||||||
|
|
|
|
|
| |||||||
Total return | 15.44 | % | 2.22 | % | 15.16 | %d | ||||||
|
|
|
|
|
| |||||||
Ratios/Supplemental data: | ||||||||||||
Net assets, end of period (000s) | $ | 2,080,363 | $ | 2,455,727 | $ | 387,227 | ||||||
Ratio of expenses to average net assetse | 0.25 | % | 0.25 | % | 0.25 | % | ||||||
Ratio of expenses to average net assets prior to waived feese | 0.67 | % | 0.67 | % | 0.69 | % | ||||||
Ratio of net investment income to average net assetse | 2.58 | % | 3.13 | % | 4.08 | % | ||||||
Portfolio turnover ratef | 34 | % | 23 | % | 31 | % | ||||||
| a | Commencement of operations. |
| b | Based on average shares outstanding throughout each period. |
| c | The amounts reported for a share outstanding may not accord with the change in aggregate gains and losses in securities for the fiscal period due to the timing of capital share transactions in relation to the fluctuating market values of the Fund’s underlying securities. |
| d | Not annualized. |
| e | Annualized for periods of less than one year. |
| f | Portfolio turnover rates exclude portfolio securities received or delivered in Creation Units but include portfolio transactions that are executed as a result of the Fund processing capital share transactions in Creation Units partially for cash in U.S. dollars. Excluding such cash transactions, the portfolio turnover rates for the years ended August 31, 2014, August 31, 2013 and the period ended August 31, 2012 were 26%, 23% and 16%, respectively. See Note 4. |
See notes to consolidated financial statements.
CONSOLIDATED FINANCIAL HIGHLIGHTS | 85 |
Table of Contents
Consolidated Financial Highlights (Continued)
iSHARES®, INC.
(For a share outstanding throughout each period)
iShares MSCI Emerging Markets Small-Cap ETF
| Year ended Aug. 31, 2014 | Year ended Aug. 31, 2013 | Year ended Aug. 31, 2012 | Period from to Aug. 31, 2011 | |||||||||||||
Net asset value, beginning of period | $ | 43.78 | $ | 43.44 | $ | 49.60 | $ | 50.54 | ||||||||
|
|
|
|
|
|
|
| |||||||||
Income from investment operations: | ||||||||||||||||
Net investment incomeb | 0.93 | 1.07 | 0.50 | 0.07 | ||||||||||||
Net realized and unrealized gain (loss)c | 7.67 | 1.13 | (5.52 | ) | (1.01 | ) | ||||||||||
|
|
|
|
|
|
|
| |||||||||
Total from investment operations | 8.60 | 2.20 | (5.02 | ) | (0.94 | ) | ||||||||||
|
|
|
|
|
|
|
| |||||||||
Less distributions from: | ||||||||||||||||
Net investment income | (1.01 | ) | (1.86 | ) | (1.14 | ) | — | |||||||||
|
|
|
|
|
|
|
| |||||||||
Total distributions | (1.01 | ) | (1.86 | ) | (1.14 | ) | — | |||||||||
|
|
|
|
|
|
|
| |||||||||
Net asset value, end of period | $ | 51.37 | $ | 43.78 | $ | 43.44 | $ | 49.60 | ||||||||
|
|
|
|
|
|
|
| |||||||||
Total return | 19.92 | %e | 4.85 | % | (9.98 | )% | (1.86 | )%d | ||||||||
|
|
|
|
|
|
|
| |||||||||
Ratios/Supplemental data: | ||||||||||||||||
Net assets, end of period (000s) | $ | 43,666 | $ | 30,644 | $ | 8,689 | $ | 69,443 | ||||||||
Ratio of expenses to average net assetsf | 0.67 | % | 0.67 | % | 0.69 | % | 0.69 | % | ||||||||
Ratio of net investment income to average net assetsf | 1.93 | % | 2.26 | % | 1.13 | % | 3.33 | % | ||||||||
Portfolio turnover rateg | 20 | % | 21 | % | 32 | % | 2 | % | ||||||||
| a | Commencement of operations. |
| b | Based on average shares outstanding throughout each period. |
| c | The amounts reported for a share outstanding may not accord with the change in aggregate gains and losses in securities for the fiscal period due to the timing of capital share transactions in relation to the fluctuating market values of the Fund’s underlying securities. |
| d | Not annualized. |
| e | Includes payment from an affiliate. See Note 2. Not including these proceeds, the Fund’s total return would have been 19.73%. |
| f | Annualized for periods of less than one year. |
| g | Portfolio turnover rates exclude portfolio securities received or delivered in Creation Units but include portfolio transactions that are executed as a result of the Fund processing capital share transactions in Creation Units partially for cash in U.S. dollars. Excluding such cash transactions, the portfolio turnover rates for the years ended August 31, 2014, August 31, 2013, August 31, 2012 and the period ended August 31, 2011 were 20%, 21%, 17% and 2%, respectively. See Note 4. |
See notes to consolidated financial statements.
| 86 | 2014 iSHARES ANNUAL REPORTTO SHAREHOLDERS |
Table of Contents
Consolidated Financial Highlights (Continued)
iSHARES®, INC.
(For a share outstanding throughout each period)
iShares MSCI Emerging Markets Value ETF
| Year ended Aug. 31, 2014 | Year ended Aug. 31, 2013 | Period from to Aug. 31, 2012 | ||||||||||
Net asset value, beginning of period | $ | 43.15 | $ | 45.30 | $ | 52.58 | ||||||
|
|
|
|
|
| |||||||
Income from investment operations: | ||||||||||||
Net investment incomeb | 1.36 | 1.34 | 1.00 | |||||||||
Net realized and unrealized gain (loss)c | 6.83 | (2.11 | ) | (7.54 | ) | |||||||
|
|
|
|
|
| |||||||
Total from investment operations | 8.19 | (0.77 | ) | (6.54 | ) | |||||||
|
|
|
|
|
| |||||||
Less distributions from: | ||||||||||||
Net investment income | (0.97 | ) | (1.38 | ) | (0.74 | ) | ||||||
|
|
|
|
|
| |||||||
Total distributions | (0.97 | ) | (1.38 | ) | (0.74 | ) | ||||||
|
|
|
|
|
| |||||||
Net asset value, end of period | $ | 50.37 | $ | 43.15 | $ | 45.30 | ||||||
|
|
|
|
|
| |||||||
Total return | 19.20 | % | (1.83 | )% | (12.41 | )%d | ||||||
|
|
|
|
|
| |||||||
Ratios/Supplemental data: | ||||||||||||
Net assets, end of period (000s) | $ | 25,186 | $ | 10,787 | $ | 9,061 | ||||||
Ratio of expenses to average net assetse | 0.49 | % | 0.49 | % | 0.49 | % | ||||||
Ratio of expenses to average net assets prior to waived feese | 0.68 | % | 0.68 | % | 0.68 | % | ||||||
Ratio of net investment income to average net assetse | 2.94 | % | 2.84 | % | 3.73 | % | ||||||
Portfolio turnover ratef | 25 | % | 47 | % | 12 | % | ||||||
| a | Commencement of operations. |
| b | Based on average shares outstanding throughout each period. |
| c | The amounts reported for a share outstanding may not accord with the change in aggregate gains and losses in securities for the fiscal period due to the timing of capital share transactions in relation to the fluctuating market values of the Fund’s underlying securities. |
| d | Not annualized. |
| e | Annualized for periods of less than one year. |
| f | Portfolio turnover rates exclude portfolio securities received or delivered in Creation Units but include portfolio transactions that are executed as a result of the Fund processing capital share transactions in Creation Units partially for cash in U.S. dollars. Excluding such cash transactions, the portfolio turnover rates for the years ended August 31, 2014, August 31, 2013 and the period ended August 31, 2012, were 25%, 26% and 12%, respectively. See Note 4. |
See notes to consolidated financial statements.
CONSOLIDATED FINANCIAL HIGHLIGHTS | 87 |
Table of Contents
Notes to Consolidated Financial Statements
iSHARES®, INC.
iShares, Inc. (the “Company”) is registered under the Investment Company Act of 1940, as amended (the “1940 Act”), as an open-end management investment company. The Company was incorporated under the laws of the State of Maryland on September 1, 1994 pursuant to amended and restated Articles of Incorporation.
These consolidated financial statements relate only to the following funds (each, a “Fund,” and collectively, the “Funds”):
| iShares ETF | Diversification Classification | |||
MSCI BRIC | Diversified | |||
MSCI Emerging Markets Asia | Diversified | |||
MSCI Emerging Markets Consumer Discretionary | Non-diversified | |||
MSCI Emerging Markets Energy Capped | Non-diversified | |||
| iShares ETF | Diversification Classification | |||
MSCI Emerging Markets Growth | Non-diversified | |||
MSCI Emerging Markets Minimum Volatility | Non-diversified | |||
MSCI Emerging Markets Small-Cap | Non-diversified | |||
MSCI Emerging Markets Value | Non-diversified | |||
The investment objective of each Fund is to seek investment results that correspond generally to the price and yield performance, before fees and expenses, of its underlying index. The investment adviser uses a “passive” or index approach to try to achieve each Fund’s investment objective.
Each Fund carries out its investment strategies associated with investment in Indian securities by investing in a wholly-owned subsidiary in the Republic of Mauritius (each, a “Subsidiary”), which in turn invests in Indian securities included in the underlying index. The investment adviser of each Fund also serves as the investment adviser to each Subsidiary. Through this investment structure, each Fund expects to obtain certain benefits under a current tax treaty between Mauritius and India. The accompanying consolidated financial statements for each Fund include the accounts of its Subsidiary. Intercompany accounts and transactions, if any, have been eliminated.
Pursuant to the Company’s organizational documents, the Funds’ officers and directors are indemnified against certain liabilities that may arise out of the performance of their duties to the Funds. Additionally, in the normal course of business, the Funds enter into contracts with service providers that contain general indemnification clauses. The Funds’ maximum exposure under these arrangements is unknown as this would involve future claims that may be made against the Funds that have not yet occurred.
| 1. | SIGNIFICANT ACCOUNTING POLICIES |
The following significant accounting policies are consistently followed by the Funds in the preparation of their financial statements in conformity with accounting principles generally accepted in the United States of America (“U.S. GAAP”). The preparation of financial statements in conformity with U.S. GAAP requires management to make certain estimates and assumptions that affect the reported amounts of assets and liabilities and disclosures of contingent assets and liabilities at the date of the financial statements and the reported amounts of revenue and expenses during the reporting period. Actual results could differ from those estimates. Each Fund is considered an investment company under U.S. GAAP and follows the accounting and reporting guidance applicable to investment companies in the Financial Accounting Standards Board Accounting Standards Codification Topic 946 (ASC 946).
SECURITY VALUATION
Each Fund’s investments are valued at fair value each day that the Fund’s listing exchange is open and, for financial reporting purposes, as of the report date should the reporting period end on a day that the Fund’s listing exchange is not open. U.S. GAAP defines fair value as the price a fund would receive to sell an asset or pay to transfer a liability in an orderly transaction between market participants at the measurement date. The BlackRock Global Valuation Methodologies Committee (the “Global Valuation
| 88 | 2014 iSHARES ANNUAL REPORTTO SHAREHOLDERS |
Table of Contents
Notes to Consolidated Financial Statements (Continued)
iSHARES®, INC.
Committee”) provides oversight of the valuation of investments for the Funds. The investments of each Fund are valued pursuant to policies and procedures developed by the Global Valuation Committee and approved by the Board of Directors of the Company (the “Board”).
| • | Equity investments traded on a recognized securities exchange are valued at that day’s last reported trade price or the official closing price, as applicable, on the exchange where the stock is primarily traded. Equity investments traded on a recognized exchange for which there were no sales on that day are valued at the last traded price. |
| • | Open-end U.S. mutual funds are valued at that day’s published net asset value (NAV). |
In the event that application of these methods of valuation results in a price for an investment which is deemed not to be representative of the fair value of such investment or if a price is not available, the investment will be valued based upon other available factors deemed relevant by the Global Valuation Committee, in accordance with policies approved by the Board. These factors include but are not limited to (i) attributes specific to the investment; (ii) the principal market for the investment; (iii) the customary participants in the principal market for the investment; (iv) data assumptions by market participants for the investment, if reasonably available; (v) quoted prices for similar investments in active markets; and (vi) other factors, such as future cash flows, interest rates, yield curves, volatilities, prepayment speeds, loss severities, credit risks and/or default rates. Valuations based on such factors are reported to the Board on a quarterly basis.
The Global Valuation Committee employs various methods for calibrating valuation approaches for investments where an active market does not exist, including regular due diligence of the Company’s pricing vendors, a regular review of key inputs and assumptions, transactional back-testing or disposition analysis to compare unrealized gains and losses to realized gains and losses, reviews of missing or stale prices, reviews of large movements in market values, and reviews of market related activity.
Fair value pricing could result in a difference between the prices used to calculate a Fund’s net asset value and the prices used by the Fund’s underlying index, which in turn could result in a difference between the Fund’s performance and the performance of the Fund’s underlying index.
Various inputs are used in determining the fair value of financial instruments. Inputs may be based on independent market data (“observable inputs”) or they may be internally developed (“unobservable inputs”). These inputs are categorized into a disclosure hierarchy consisting of three broad levels for financial reporting purposes. The level of a value determined for a financial instrument within the fair value hierarchy is based on the lowest level of any input that is significant to the fair value measurement in its entirety. The categorization of a value determined for a financial instrument within the hierarchy is based upon the pricing transparency of the instrument and is not necessarily an indication of the risk associated with investing in the instrument. The three levels of the fair value hierarchy are as follows:
| • | Level 1 — Unadjusted quoted prices in active markets for identical assets or liabilities; |
| • | Level 2 — Inputs other than quoted prices included within Level 1 that are observable for the asset or liability either directly or indirectly, including quoted prices for similar assets or liabilities in active markets, quoted prices for identical or similar assets or liabilities in markets that are not considered to be active, inputs other than quoted prices that are observable for the asset or liability (such as exchange rates, financing terms, interest rates, yield curves, volatilities, prepayment speeds, loss severities, credit risks and default rates) or other market-corroborated inputs; and |
| • | Level 3 — Unobservable inputs for the asset or liability, including the Global Valuation Committee’s assumptions used in determining the fair value of investments. |
NOTESTO CONSOLIDATED FINANCIAL STATEMENTS | 89 |
Table of Contents
Notes to Consolidated Financial Statements (Continued)
iSHARES®, INC.
Changes in valuation techniques may result in transfers in or out of an assigned level within the disclosure hierarchy. In accordance with the Company’s policy, transfers between different levels of the fair value hierarchy are deemed to have occurred as of the beginning of the reporting period.
The following table summarizes the value of each of the Funds’ investments according to the fair value hierarchy as of August 31, 2014. The breakdown of each Fund’s investments into major categories is disclosed in its respective consolidated schedule of investments.
iShares ETF and | Investments | |||||||||||||||
| Level 1 | Level 2 | Level 3 | Total | |||||||||||||
MSCI BRIC | ||||||||||||||||
Assets: | ||||||||||||||||
Common Stocks | $ | 359,176,830 | $ | 392,625 | $ | — | $ | 359,569,455 | ||||||||
Preferred Stocks | 50,623,224 | — | — | 50,623,224 | ||||||||||||
Money Market Funds | 11,245,811 | — | — | 11,245,811 | ||||||||||||
|
|
|
|
|
|
|
| |||||||||
| $ | 421,045,865 | $ | 392,625 | $ | — | $ | 421,438,490 | |||||||||
|
|
|
|
|
|
|
| |||||||||
MSCI Emerging Markets Asia | ||||||||||||||||
Assets: | ||||||||||||||||
Common Stocks | $ | 79,451,785 | $ | 43,625 | $ | — | $ | 79,495,410 | ||||||||
Preferred Stocks | 949,889 | — | — | 949,889 | ||||||||||||
Warrants | — | 0 | a | — | 0 | a | ||||||||||
Money Market Funds | 1,882,791 | — | — | 1,882,791 | ||||||||||||
|
|
|
|
|
|
|
| |||||||||
| $ | 82,284,465 | $ | 43,625 | $ | — | $ | 82,328,090 | |||||||||
|
|
|
|
|
|
|
| |||||||||
MSCI Emerging Markets Consumer Discretionary | ||||||||||||||||
Assets: | ||||||||||||||||
Common Stocks | $ | 5,911,027 | $ | 16,619 | $ | — | $ | 5,927,646 | ||||||||
Preferred Stocks | 199,565 | — | — | 199,565 | ||||||||||||
Money Market Funds | 150,084 | — | — | 150,084 | ||||||||||||
|
|
|
|
|
|
|
| |||||||||
| $ | 6,260,676 | $ | 16,619 | $ | — | $ | 6,277,295 | |||||||||
|
|
|
|
|
|
|
| |||||||||
MSCI Emerging Markets Energy Capped | ||||||||||||||||
Assets: | ||||||||||||||||
Common Stocks | $ | 1,761,478 | $ | — | $ | — | $ | 1,761,478 | ||||||||
Preferred Stocks | 214,294 | — | — | 214,294 | ||||||||||||
Money Market Funds | 17,785 | — | — | 17,785 | ||||||||||||
|
|
|
|
|
|
|
| |||||||||
| $ | 1,993,557 | $ | — | $ | — | $ | 1,993,557 | |||||||||
|
|
|
|
|
|
|
| |||||||||
MSCI Emerging Markets Growth | ||||||||||||||||
Assets: | ||||||||||||||||
Common Stocks | $ | 5,631,569 | $ | — | $ | — | $ | 5,631,569 | ||||||||
Preferred Stocks | 265,422 | — | — | 265,422 | ||||||||||||
Warrants | — | 0 | a | — | 0 | a | ||||||||||
Money Market Funds | 101,316 | — | — | 101,316 | ||||||||||||
|
|
|
|
|
|
|
| |||||||||
| $ | 5,998,307 | $ | 0 | a | $ | — | $ | 5,998,307 | ||||||||
|
|
|
|
|
|
|
| |||||||||
| 90 | 2014 iSHARES ANNUAL REPORTTO SHAREHOLDERS |
Table of Contents
Notes to Consolidated Financial Statements (Continued)
iSHARES®, INC.
iShares ETF and | Investments | |||||||||||||||
| Level 1 | Level 2 | Level 3 | Total | |||||||||||||
MSCI Emerging Markets Minimum Volatility | ||||||||||||||||
Assets: | ||||||||||||||||
Common Stocks | $ | 2,002,278,112 | $ | — | $ | — | $ | 2,002,278,112 | ||||||||
Preferred Stocks | 67,133,679 | — | — | 67,133,679 | ||||||||||||
Money Market Funds | 44,547,230 | — | — | 44,547,230 | ||||||||||||
|
|
|
|
|
|
|
| |||||||||
| $ | 2,113,959,021 | $ | — | $ | — | $ | 2,113,959,021 | |||||||||
|
|
|
|
|
|
|
| |||||||||
MSCI Emerging Markets Small-Cap | ||||||||||||||||
Assets: | ||||||||||||||||
Common Stocks | $ | 42,468,929 | $ | 605,398 | $ | 56,797 | $ | 43,131,124 | ||||||||
Preferred Stocks | 360,146 | — | — | 360,146 | ||||||||||||
Rights | 148 | 4,176 | — | 4,324 | ||||||||||||
Money Market Funds | 2,744,914 | — | — | 2,744,914 | ||||||||||||
|
|
|
|
|
|
|
| |||||||||
| $ | 45,574,137 | $ | 609,574 | $ | 56,797 | $ | 46,240,508 | |||||||||
|
|
|
|
|
|
|
| |||||||||
MSCI Emerging Markets Value | ||||||||||||||||
Assets: | ||||||||||||||||
Common Stocks | $ | 22,955,010 | $ | — | $ | 16 | $ | 22,955,026 | ||||||||
Preferred Stocks | 2,146,443 | — | — | 2,146,443 | ||||||||||||
Money Market Funds | 300,748 | — | — | 300,748 | ||||||||||||
|
|
|
|
|
|
|
| |||||||||
| $ | 25,402,201 | $ | — | $ | 16 | $ | 25,402,217 | |||||||||
|
|
|
|
|
|
|
| |||||||||
| a | Rounds to less than $1. |
The iShares MSCI Emerging Markets Small-Cap ETF had transfers from Level 1 to Level 2 in the amount of $392,890 resulting from a temporary suspension of trading.
SECURITY TRANSACTIONS AND INCOME RECOGNITION
Security transactions are accounted for on trade date. Dividend income and capital gain distributions, if any, are recognized on the ex-dividend date, net of any foreign taxes withheld at source. Any taxes withheld that are reclaimable from foreign tax authorities as of August 31, 2014 are reflected in dividends receivable. Non-cash dividends received in the form of stock in an elective dividend, if any, are recorded as dividend income at fair value. Distributions received by the Funds may include a return of capital that is estimated by management. Such amounts are recorded as a reduction of the cost of investments or reclassified to capital gains. Interest income is accrued daily. Realized gains and losses on investment transactions are determined using the specific identification method.
FOREIGN CURRENCY TRANSLATION
The accounting records of the Funds are maintained in U.S. dollars. Foreign currencies, as well as investment securities and other assets and liabilities denominated in foreign currencies, are translated into U.S. dollars using exchange rates deemed appropriate by the investment adviser. Purchases and sales of securities, income receipts and expense payments are translated into U.S. dollars on the respective dates of such transactions.
NOTESTO CONSOLIDATED FINANCIAL STATEMENTS | 91 |
Table of Contents
Notes to Consolidated Financial Statements (Continued)
iSHARES®, INC.
Each Fund does not isolate the effect of fluctuations in foreign exchange rates from the effect of fluctuations in the market prices of securities. Such fluctuations are reflected by the Funds as a component of realized and unrealized gains and losses from investments for financial reporting purposes.
FOREIGN TAXES
The Funds may be subject to foreign taxes (a portion of which may be reclaimable) on income, stock dividends, capital gains on investments, or certain foreign currency transactions. All foreign taxes are recorded in accordance with the applicable foreign tax regulations and rates that exist in the foreign jurisdictions in which the Funds invest. These foreign taxes, if any, are paid by the Funds and are reflected in their consolidated statements of operations as follows: foreign taxes withheld at source are presented as a reduction of income, foreign taxes on securities lending income are presented as a reduction of securities lending income, foreign taxes on stock dividends are presented as “other foreign taxes,” and foreign taxes on capital gains from sales of investments and foreign taxes on foreign currency transactions are included in their respective net realized gain (loss) categories. Foreign taxes payable or deferred as of August 31, 2014, if any, are disclosed in the Funds’ consolidated statements of assets and liabilities.
Each Fund conducts its investment activities in India through its Subsidiary and expects to obtain benefits under the Double Tax Avoidance Agreement (“DTAA”). In order to be eligible to claim benefits under the DTAA, each Subsidiary must satisfy certain conditions, including the establishment and maintenance of valid tax residence in Mauritius. Each Subsidiary is subject to tax in Mauritius on its net income at the rate of 15%. However, a system of tax credits effectively reduces the Mauritius income tax rate to a maximum of 3%. These income taxes, if any, are paid by the Funds and are disclosed in the consolidated statements of operations. Further, each Subsidiary is not subject to tax in Mauritius on any gains from the sale of securities. Any dividends paid by a Subsidiary to its Fund will also be exempt from tax in Mauritius. The foregoing is based upon current interpretation and practice and is subject to future changes in the tax laws of India or Mauritius and in the DTAA.
As a result of legislative changes enacted by the 2012 India Finance Act (“the Act”) and its general anti-avoidance rules (“GAAR”), which are effective April 1, 2013 but have been proposed to be deferred until April 1, 2016, the Subsidiaries’ ability to leverage the treaty between Mauritius and India may be adversely impacted, and therefore the Funds may be subject to taxes on capital gains and/or dividends realized on Indian securities. The Act also includes provisions that impose Indian tax on the transfer of shares of an Indian company. However, until more definitive guidance on the legislative changes is available, the impact to the Funds, if any, cannot be determined at this time.
DISTRIBUTIONS TO SHAREHOLDERS
Dividends and distributions paid by each Fund are recorded on the ex-dividend dates. Distributions are determined on a tax basis and may differ from net investment income and net realized capital gains for financial reporting purposes. Dividends and distributions are paid in U.S. dollars and cannot be automatically reinvested in additional shares of the Funds.
LOANS OF PORTFOLIO SECURITIES
Each Fund may lend its investment securities to approved borrowers, such as brokers, dealers and other financial institutions. The borrower pledges and maintains with the Fund collateral consisting of cash, an irrevocable letter of credit issued by a bank, or securities issued or guaranteed by the U.S. government. The initial collateral received by each Fund is required to have a value of at least 102% of the current value of the loaned securities for securities traded on U.S. exchanges and a value of at least 105% for all other securities. The collateral is maintained thereafter, at a value equal to at least 100% of the current value of the securities on loan. The market value of the loaned securities is determined at the close of each business day of the Funds and any additional required collateral is delivered to the Funds on the next business day. During the term of the loan, each Fund is
| 92 | 2014 iSHARES ANNUAL REPORTTO SHAREHOLDERS |
Table of Contents
Notes to Consolidated Financial Statements (Continued)
iSHARES®, INC.
entitled to all distributions made on or in respect of the loaned securities. Loans of securities are terminable at any time and the borrower, after notice, is required to return borrowed securities within the standard time period for settlement of securities transactions.
Any cash received as collateral for securities on loan may be reinvested in certain short-term instruments either directly on behalf of a fund or through one or more joint accounts or money market funds, including those managed by BlackRock Fund Advisors (“BFA”), the Funds’ investment adviser, or its affiliates. As of August 31, 2014, any securities on loan were collateralized by cash. The cash collateral received was invested in money market funds managed by BFA and is disclosed in the consolidated schedules of investments. The value of any securities on loan as of August 31, 2014 and the value of the related collateral are disclosed in the consolidated statements of assets and liabilities. Income earned by the Funds from securities lending is disclosed in the consolidated statements of operations.
The risks of securities lending include the risk that the borrower may not provide additional collateral when required or may not return the securities when due. To mitigate these risks, the Funds benefit from a borrower default indemnity provided by BlackRock, Inc. (“BlackRock”). BlackRock’s indemnity allows for full replacement of securities lent. Each Fund could suffer a loss if the value of the investments purchased with cash collateral falls below the value of the cash collateral received.
Securities lending transactions are entered into by the Funds under Master Securities Lending Agreements (“MSLA”) which provide the right, in the event of default (including bankruptcy or insolvency) for the non-defaulting party to liquidate the collateral and calculate a net exposure to the defaulting party or request additional collateral. In the event that a borrower defaults, a Fund, as lender, would offset the market value of the collateral received against the market value of the securities loaned. The value of the collateral is typically greater than that of the market value of the securities loaned, leaving the lender with a net amount payable to the defaulting party. However, bankruptcy or insolvency laws of a particular jurisdiction may impose restrictions on or prohibitions against such a right of offset in the event of an MSLA counterparty’s bankruptcy or insolvency. Under the MSLA, the borrower can resell or re-pledge the loaned securities, and a Fund can reinvest cash collateral, or, upon an event of default, resell or re-pledge the collateral.
The following table is a summary of each Fund’s securities lending agreements which are subject to offset under an MSLA as of August 31, 2014:
| iShares ETF | Market Value of Securities on Loan | Cash Collateral Received a | Net Amount | |||||||||
MSCI BRIC | $ | 10,299,207 | $ | 10,299,207 | $ | — | ||||||
MSCI Emerging Markets Asia | 1,693,860 | 1,693,860 | — | |||||||||
MSCI Emerging Markets Consumer Discretionary | 129,957 | 129,957 | — | |||||||||
MSCI Emerging Markets Energy Capped | 15,043 | 15,043 | — | |||||||||
MSCI Emerging Markets Growth | 91,878 | 91,878 | — | |||||||||
MSCI Emerging Markets Minimum Volatility | 41,364,601 | 41,364,601 | — | |||||||||
MSCI Emerging Markets Small-Cap | 2,467,641 | 2,467,641 | — | |||||||||
MSCI Emerging Markets Value | 281,971 | 281,971 | — | |||||||||
| a | Collateral received in excess of the market value of securities on loan is not presented for financial reporting purposes. The total collateral received is disclosed in each Fund’s consolidated statement of assets and liabilities. |
RECENT ACCOUNTING STANDARD
In June 2014, the Financial Accounting Standards Board issued guidance to improve the financial reporting of reverse repurchase agreements and other similar transactions. The guidance will require expanded disclosure for entities that enter into reverse
NOTESTO CONSOLIDATED FINANCIAL STATEMENTS | 93 |
Table of Contents
Notes to Consolidated Financial Statements (Continued)
iSHARES®, INC.
repurchase agreements and similar transactions accounted for as secured borrowings, including securities lending. The guidance is effective for financial statements for fiscal years beginning after December 15, 2014, and interim periods within those fiscal years. Management is evaluating the impact, if any, of this guidance on the Funds’ financial statements and disclosures.
| 2. | INVESTMENT ADVISORY AGREEMENT AND OTHER TRANSACTIONS WITH AFFILIATES |
Pursuant to an Investment Advisory Agreement with the Company, BFA manages the investment of each Fund’s assets. BFA is a California corporation indirectly owned by BlackRock. Under the Investment Advisory Agreement, BFA is responsible for substantially all expenses of the Funds, except interest, taxes, brokerage commissions and other expenses connected with the execution of portfolio transactions, distribution fees, litigation expenses and any extraordinary expenses.
Each Subsidiary has entered into a separate contract with BFA under which BFA provides investment advisory services to the Subsidiary but does not receive separate compensation from the Subsidiary for providing it with such services. Each Subsidiary has also entered into separate arrangements that provide for the provision of other services to the Subsidiary (including administrative, custody, transfer agency and other services), and BFA pays the costs and expenses related to the provision of those services.
For its investment advisory services to each of the iShares MSCI BRIC, iShares MSCI Emerging Markets Consumer Discretionary, iShares MSCI Emerging Markets Energy Capped, iShares MSCI Emerging Markets Minimum Volatility and iShares MSCI Emerging Markets Small-Cap ETFs, BFA is entitled to an annual investment advisory fee based on each Fund’s allocable portion of the aggregate of the average daily net assets of the Fund and certain other iShares funds, as follows:
| Investment Advisory Fee | Aggregate Average Daily Net Assets | ||||
| 0.75 | % | First $14 billion | |||
| 0.68 | Over $14 billion, up to and including $28 billion | ||||
| 0.61 | Over $28 billion, up to and including $42 billion | ||||
| 0.54 | a | Over $42 billion, up to and including $56 billion | |||
| 0.47 | a | Over $56 billion, up to and including $70 billion | |||
| 0.41 | a | Over $70 billion, up to and including $84 billion | |||
| 0.35 | a | Over $84 billion | |||
| a | Investment advisory fee was reduced effective July 1, 2014. Prior to this date, the investment advisory fee for these breakpoint levels were 0.56%, 0.50%, 0.45% and 0.40%, respectively. |
BFA has contractually agreed to waive a portion of its investment advisory fees for the iShares MSCI Emerging Markets Minimum Volatility ETF through December 31, 2015 in order to limit total annual operating expenses to 0.25% of average daily net assets.
For its investment advisory services to each Fund, BFA is entitled to an annual investment advisory fee based on the average daily net assets of each Fund as follows:
| iShares ETF | Investment Advisory Fee | |||
MSCI Emerging Markets Asia | 0.68 | % | ||
MSCI Emerging Markets Growth | 0.68 | |||
MSCI Emerging Markets Value | 0.68 | |||
| 94 | 2014 iSHARES ANNUAL REPORTTO SHAREHOLDERS |
Table of Contents
Notes to Consolidated Financial Statements (Continued)
iSHARES®, INC.
BFA has contractually agreed to waive a portion of its investment advisory fees for the iShares MSCI Emerging Markets Asia, iShares MSCI Emerging Markets Growth and iShares MSCI Emerging Markets Value ETFs through December 31, 2015 in order to limit total annual operating expenses to 0.49% of average daily net assets.
The U.S. Securities and Exchange Commission has issued an exemptive order which permits BlackRock Institutional Trust Company, N.A. (“BTC”), an affiliate of BFA, to serve as securities lending agent for the Funds, subject to applicable conditions. As securities lending agent, BTC bears all operational costs directly related to securities lending. Effective January 1, 2014, each Fund is responsible for fees in connection with the investment of cash collateral received for securities on loan in a money market fund managed by BFA, however, BTC has agreed to reduce the amount of securities lending income it receives in order to effectively limit the collateral investment fees each Fund bears to an annual rate of 0.04% (the “collateral investment fees”). Securities lending income is equal to the total of income earned from the reinvestment of cash collateral, net of fees and other payments to and from borrowers of securities, and less the collateral investment fees. The Funds retain a portion of securities lending income and remit a remaining portion to BTC as compensation for its services as securities lending agent.
Pursuant to a securities lending agreement effective January 1, 2014, (i) each Fund retains 75% of securities lending income and (ii) these amounts can never be less than 65% of the total of securities lending income plus the collateral investment fees.
In addition, commencing the business day following the date that the aggregate securities lending income plus the collateral investment fees generated across all 1940 Act iShares exchange-traded funds (the “iShares ETF Complex”) in a given calendar year exceeds the aggregate securities lending income generated across the iShares ETF Complex in calendar year 2013 and pursuant to a securities lending agreement, (i) each Fund will receive for the remainder of that calendar year 80% of securities lending income and (ii) these amounts can never be less than 65% of the total of securities lending income plus the collateral investment fees.
For the year ended August 31, 2014, each Fund paid to BTC the following amounts in total for securities lending agent services and collateral investment fees:
| iShares ETF | Fees Paid to BTC | |||
MSCI BRIC | $ | 85,817 | ||
MSCI Emerging Markets Asia | 5,634 | |||
MSCI Emerging Markets Consumer Discretionary | 750 | |||
MSCI Emerging Markets Energy Capped | 159 | |||
| iShares ETF | Fees Paid to BTC | |||
MSCI Emerging Markets Growth | $ | 712 | ||
MSCI Emerging Markets Minimum Volatility | 180,207 | |||
MSCI Emerging Markets Small-Cap | 16,538 | |||
MSCI Emerging Markets Value | 901 | |||
Prior to January 1, 2014, each Fund retained 65% of securities lending income and paid no collateral investment fees.
The iShares MSCI Emerging Markets Asia ETF and iShares MSCI Emerging Markets Small-Cap ETF received payments from BTC to compensate for forgone securities lending revenue. The payments are reported in the consolidated statements of operations under “Payment from affiliate”.
BlackRock Investments, LLC, an affiliate of BFA, is the distributor for each Fund. Pursuant to the distribution agreement, BFA is responsible for any fees or expenses for distribution services provided to the Funds.
NOTESTO CONSOLIDATED FINANCIAL STATEMENTS | 95 |
Table of Contents
Notes to Consolidated Financial Statements (Continued)
iSHARES®, INC.
Cross trades for the year ended August 31, 2014, if any, were executed by the Funds pursuant to Rule 17a-7 under the 1940 Act. Cross trading is the buying or selling of portfolio securities between funds to which BFA (or an affiliate) serves as investment adviser. At its regularly scheduled quarterly meetings, the Board reviews such transactions as of the most recent calendar quarter for compliance with the requirements and restrictions set forth by Rule 17a-7.
Each Fund may invest its positive cash balances in certain money market funds managed by BFA or an affiliate. The income earned on these temporary cash investments is included in “Interest – affiliated” in the consolidated statements of operations.
The PNC Financial Services Group, Inc. is the largest stockholder of BlackRock and is considered to be an affiliate of the Funds for 1940 Act purposes.
Certain directors and officers of the Company are also officers of BTC and/or BFA.
| 3. | INVESTMENT PORTFOLIO TRANSACTIONS |
Purchases and sales of investments (excluding in-kind transactions and short-term investments) for the year ended August 31, 2014 were as follows:
| iShares ETF | Purchases | Sales | ||||||
MSCI BRIC | $ | 44,449,722 | $ | 98,111,932 | ||||
MSCI Emerging Markets Asia | 61,811,236 | 14,207,207 | ||||||
MSCI Emerging Markets Consumer Discretionary | 2,100,244 | 522,907 | ||||||
MSCI Emerging Markets Energy Capped | 310,499 | 280,559 | ||||||
MSCI Emerging Markets Growth | 1,408,358 | 1,403,944 | ||||||
MSCI Emerging Markets Minimum Volatility | 750,037,910 | 1,087,073,266 | ||||||
MSCI Emerging Markets Small-Cap | 14,325,388 | 7,382,078 | ||||||
MSCI Emerging Markets Value | 10,818,183 | 4,582,232 | ||||||
In-kind transactions (see Note 4) for the year ended August 31, 2014 were as follows:
| iShares ETF | In-kind Purchases | In-kind Sales | ||||||
MSCI BRIC | $ | 20,731,287 | $ | 97,915,716 | ||||
MSCI Emerging Markets Asia | — | 6,079,281 | ||||||
MSCI Emerging Markets Consumer Discretionary | 1,235,754 | — | ||||||
MSCI Emerging Markets Minimum Volatility | 134,846,964 | 408,731,720 | ||||||
MSCI Emerging Markets Value | 5,537,729 | — | ||||||
| 4. | CAPITAL SHARE TRANSACTIONS |
Capital shares are issued and redeemed by each Fund only in aggregations of a specified number of shares or multiples thereof (“Creation Units”) at net asset value. Except when aggregated in Creation Units, shares of each Fund are not redeemable. Transactions in capital shares for each Fund are disclosed in detail in the consolidated statements of changes in net assets.
The consideration for the purchase of Creation Units of a fund in the Company generally consists of the in-kind deposit of a designated portfolio of securities and a specified amount of cash. Certain funds in the Company may be offered in Creation Units solely or partially for cash in U.S. dollars. Investors purchasing and redeeming Creation Units may pay a purchase transaction fee
| 96 | 2014 iSHARES ANNUAL REPORTTO SHAREHOLDERS |
Table of Contents
Notes to Consolidated Financial Statements (Continued)
iSHARES®, INC.
and a redemption transaction fee directly to State Street Bank and Trust Company, the Company’s administrator, to offset transfer and other transaction costs associated with the issuance and redemption of Creation Units, including Creation Units for cash. Investors transacting in Creation Units for cash may also pay an additional variable charge to compensate the relevant fund for certain transaction costs (i.e., stamp taxes, taxes on currency or other financial transactions, and brokerage costs) and market impact expenses relating to investing in portfolio securities. Such variable charges, if any, are included in “Proceeds from shares sold” in the consolidated statements of changes in net assets.
From time to time, settlement of securities related to in-kind contributions or in-kind redemptions may be delayed. In such cases, securities related to in-kind contributions are reflected as “Due from custodian” and securities related to in-kind redemptions are reflected as “Securities related to in-kind transactions” in the consolidated statements of assets and liabilities.
| 5. | MARKET AND CREDIT RISK |
In the normal course of business, each Fund’s investment activities exposes it to various types of risk associated with the financial instruments and markets in which it invests. The significant types of financial risks each Fund is exposed to include market risk and credit risk. Each Fund’s prospectus provides details of these and other types of risk.
BFA uses a “passive” or index approach to try to achieve each Fund’s investment objective following the securities included in its underlying index during upturns as well as downturns. BFA does not take steps to reduce market exposure or to lessen the effects of a declining market. Divergence from the underlying index and the composition of the portfolio is monitored by BFA.
MARKET RISK
Market risk arises mainly from uncertainty about future values of financial instruments influenced by price, currency and interest rate movements. It represents the potential loss each Fund may suffer through holding market positions in the face of market movements. Each Fund is exposed to market risk by virtue of its investment in equity instruments. The fair value of securities held by the Funds may decline due to general market conditions, economic trends or events that are not specifically related to the issuers of the securities including local, regional or global political, social or economic instability or to factors that affect a particular industry or group of industries. The extent of each Fund’s exposure to market risk is the market value of the investments held as shown in the Fund’s consolidated schedule of investments.
A diversified portfolio, where this is appropriate and consistent with a fund’s objectives, minimizes the risk that a price change of a particular investment will have a material impact on the NAV of a fund. The investment concentrations within each Fund’s portfolio are disclosed in its consolidated schedule of investments.
Each Fund invests a substantial amount of its assets in securities of non-U.S. issuers that trade in non-U.S. markets. This involves certain considerations and risks not typically associated with securities of U.S. issuers. Such risks include, but are not limited to: generally less liquid and less efficient securities markets; generally greater price volatility; exchange rate fluctuations and exchange controls; imposition of restrictions on the expatriation of funds or other assets of the Fund; less publicly available information about issuers; the imposition of withholding or other taxes; higher transaction and custody costs; settlement delays and risk of loss attendant in settlement procedures; difficulties in enforcing contractual obligations; less regulation of securities markets; different accounting, disclosure and reporting requirements; more substantial governmental involvement in the economy; higher inflation rates; greater social, economic and political uncertainties; the risk of nationalization or expropriation of assets; and the risk of war. These risks are heightened for investments in issuers from countries with less developed markets.
The iShares MSCI Emerging Markets Consumer Discretionary ETF and iShares MSCI Emerging Markets Energy Capped ETF each invests its assets in securities within a single or limited number of market sectors. When a fund concentrates its investments
NOTESTO CONSOLIDATED FINANCIAL STATEMENTS | 97 |
Table of Contents
Notes to Consolidated Financial Statements (Continued)
iSHARES®, INC.
in this manner, it assumes the risk that economic, political and social conditions affecting those market sectors may have a significant impact on its investment performance.
The United States and the European Union, along with the regulatory bodies of a number of countries including Japan, Australia and Canada (collectively, “Sanctioning Bodies”), have imposed sectorial economic sanctions on certain Russian individuals and Russian corporate entities which include prohibitions on transacting in or dealing in new debt of longer than 30 or 90 days maturity or new equity of such issuers. Securities held by the Fund issued prior to the date of the sanctions being imposed are not currently subject to any restrictions under the sanctions. However, compliance with each of these sanctions may impair the ability of a Fund to buy, sell, hold, receive or deliver the affected securities or other securities of such issuers. The Sanctioning Bodies could also institute broader sanctions on Russia. These sanctions, or even the threat of further sanctions, may result in the decline of the value and liquidity of Russian securities, a weakening of the ruble or other adverse consequences to the Russian economy. Current or future sanctions may result in Russia taking counter measures or retaliatory actions, which may further impair the value and liquidity of Russian securities. These retaliatory measures may include the immediate freeze of Russian assets held by a Fund.
CREDIT RISK
Credit risk is the risk that an issuer or guarantor of debt instruments or the counterparty to a financial transaction, including derivatives contracts, repurchase agreements or loans of portfolio securities, is unable or unwilling to make timely interest and/or principal payments or to otherwise honor its obligations. BFA and its affiliates manage counterparty credit risk by entering into transactions only with counterparties that it believes have the financial resources to honor their obligations and by monitoring the financial stability of those counterparties. Financial assets, which potentially expose the Funds to issuer and counterparty credit risks, consist principally of financial instruments and receivables due from counterparties. The extent of each Fund’s exposure to credit and counterparty risks with respect to those financial assets is approximated by their value recorded in the consolidated statement of assets and liabilities.
| 6. | INCOME TAX INFORMATION |
Each Fund is treated as an entity separate from the Company’s other funds for federal income tax purposes. It is the policy of each Fund to qualify as a regulated investment company by complying with the provisions applicable to regulated investment companies, as defined under Subchapter M of the Internal Revenue Code of 1986, as amended, and to annually distribute substantially all of its ordinary income and any net capital gains (taking into account any capital loss carryforwards) sufficient to relieve it from all, or substantially all, federal income and excise taxes. Accordingly, no provision for federal income taxes is required.
U.S. GAAP requires that certain components of net assets be adjusted to reflect permanent differences between financial and tax reporting. These reclassifications have no effect on net assets or net asset values per share. The following permanent differences as of August 31, 2014, attributable to passive foreign investment companies, foreign currency transactions and realized gains (losses) from in-kind redemptions, were reclassified to the following accounts:
| 98 | 2014 iSHARES ANNUAL REPORTTO SHAREHOLDERS |
Table of Contents
Notes to Consolidated Financial Statements (Continued)
iSHARES®, INC.
| iShares ETF | Paid-in Capital | Undistributed Net Investment Income/Distributions in Excess of Net Investment Income | Undistributed Net Realized Gain/Accumulated Net Realized Loss | |||||||||
MSCI BRIC | $ | 2,209,208 | $ | (55,695 | ) | $ | (2,153,513 | ) | ||||
MSCI Emerging Markets Asia | 471,951 | (34,132 | ) | (437,819 | ) | |||||||
MSCI Emerging Markets Consumer Discretionary | — | (2,922 | ) | 2,922 | ||||||||
MSCI Emerging Markets Energy Capped | — | (656 | ) | 656 | ||||||||
MSCI Emerging Markets Growth | — | 1,296 | (1,296 | ) | ||||||||
MSCI Emerging Markets Minimum Volatility | 28,692,108 | (757,808 | ) | (27,934,300 | ) | |||||||
MSCI Emerging Markets Small-Cap | — | 120,566 | (120,566 | ) | ||||||||
MSCI Emerging Markets Value | — | 5,717 | (5,717 | ) | ||||||||
The tax character of distributions paid during the years ended August 31, 2014 and August 31, 2013 was as follows:
| iShares ETF | 2014 | 2013 | ||||||
MSCI BRIC | ||||||||
Ordinary income | $ | 7,905,401 | $ | 13,252,516 | ||||
|
|
|
| |||||
MSCI Emerging Markets Asia | ||||||||
Ordinary income | $ | 898,216 | $ | 1,144,738 | ||||
|
|
|
| |||||
MSCI Emerging Markets Consumer Discretionary | ||||||||
Ordinary income | $ | 29,115 | $ | 30,681 | ||||
|
|
|
| |||||
MSCI Emerging Markets Energy Capped | ||||||||
Ordinary income | $ | 34,812 | $ | 46,822 | ||||
|
|
|
| |||||
MSCI Emerging Markets Growth | ||||||||
Ordinary income | $ | 75,147 | $ | 78,638 | ||||
|
|
|
| |||||
MSCI Emerging Markets Minimum Volatility | ||||||||
Ordinary income | $ | 58,169,702 | $ | 29,485,424 | ||||
|
|
|
| |||||
MSCI Emerging Markets Small-Cap | ||||||||
Ordinary income | $ | 736,376 | $ | 514,561 | ||||
|
|
|
| |||||
MSCI Emerging Markets Value | ||||||||
Ordinary income | $ | 388,580 | $ | 279,968 | ||||
|
|
|
| |||||
NOTESTO CONSOLIDATED FINANCIAL STATEMENTS | 99 |
Table of Contents
Notes to Consolidated Financial Statements (Continued)
iSHARES®, INC.
As of August 31, 2014, the tax components of accumulated net earnings (losses) were as follows:
| iShares ETF | Undistributed Income | Capital Loss Carryforwards | Net Unrealized | Qualified Late-Year Losses b | Total | |||||||||||||||
MSCI BRIC | $ | 3,292,439 | $ | (161,689,487 | ) | $ | 14,859,237 | $ | (16,964,323 | ) | $ | (160,502,134 | ) | |||||||
MSCI Emerging Markets Asia | 572,819 | (9,289,694 | ) | 5,102,865 | (49,872 | ) | (3,663,882 | ) | ||||||||||||
MSCI Emerging Markets Consumer Discretionary | 12,712 | (811,736 | ) | 941,670 | (85,112 | ) | 57,534 | |||||||||||||
MSCI Emerging Markets Energy Capped | 23,066 | (996,570 | ) | (384,982 | ) | (84,428 | ) | (1,442,914 | ) | |||||||||||
MSCI Emerging Markets Growth | 36,659 | (627,663 | ) | 687,774 | (110,680 | ) | (13,910 | ) | ||||||||||||
MSCI Emerging Markets Minimum Volatility | 16,274,223 | (15,978,688 | ) | 137,994,013 | (96,628,498 | ) | 41,661,050 | |||||||||||||
MSCI Emerging Markets Small-Cap | 639,121 | (8,080,278 | ) | 1,870,390 | — | (5,570,767 | ) | |||||||||||||
MSCI Emerging Markets Value | 240,271 | (511,452 | ) | 793,655 | (182,305 | ) | 340,169 | |||||||||||||
| a | The difference between book-basis and tax-basis unrealized gains (losses) was attributable primarily to the tax deferral of losses on wash sales and the realization for tax purposes of unrealized gains on investments in passive foreign investment companies. |
| b | The Funds have elected to defer certain qualified late-year losses and recognize such losses in the next taxable year. |
As of August 31, 2014, the Funds had capital loss carryforwards available to offset future realized capital gains through the indicated expiration dates as follows:
| iShares ETF | Non- Expiring a | Expiring 2017 | Expiring 2018 | Expiring 2019 | Total | |||||||||||||||
MSCI BRIC | $ | 141,120,103 | $ | 1,540,740 | $ | 11,268,086 | $ | 7,760,558 | $ | 161,689,487 | ||||||||||
MSCI Emerging Markets Asia | 9,289,694 | — | — | — | 9,289,694 | |||||||||||||||
MSCI Emerging Markets Consumer Discretionary | 811,736 | — | — | — | 811,736 | |||||||||||||||
MSCI Emerging Markets Energy Capped | 996,570 | — | — | — | 996,570 | |||||||||||||||
MSCI Emerging Markets Growth | 627,663 | — | — | — | 627,663 | |||||||||||||||
MSCI Emerging Markets Minimum Volatility | 15,978,688 | — | — | — | 15,978,688 | |||||||||||||||
MSCI Emerging Markets Small-Cap | 8,080,278 | — | — | — | 8,080,278 | |||||||||||||||
MSCI Emerging Markets Value | 511,452 | — | — | — | 511,452 | |||||||||||||||
| a | Must be utilized prior to losses subject to expiration. |
For the year ended August 31, 2014, the iShares MSCI Emerging Markets Small-Cap ETF utilized $208,303 of its capital loss carryforwards.
The Funds may own shares in certain foreign investment entities, referred to, under U.S. tax law, as “passive foreign investment companies.” The Funds may elect to mark-to-market annually the shares of each passive foreign investment company and would be required to distribute to shareholders any such marked-to-market gains.
| 100 | 2014 iSHARES ANNUAL REPORTTO SHAREHOLDERS |
Table of Contents
Notes to Consolidated Financial Statements (Continued)
iSHARES®, INC.
As of August 31, 2014, gross unrealized appreciation and gross unrealized depreciation based on cost for federal income tax purposes were as follows:
| iShares ETF | Tax Cost | Gross Unrealized Appreciation | Gross Unrealized Depreciation | Net Unrealized Appreciation (Depreciation) | ||||||||||||
MSCI BRIC | $ | 406,583,178 | $ | 77,419,534 | $ | (62,564,222 | ) | $ | 14,855,312 | |||||||
MSCI Emerging Markets Asia | 77,225,652 | 8,228,088 | (3,125,650 | ) | 5,102,438 | |||||||||||
MSCI Emerging Markets Consumer Discretionary | 5,335,598 | 1,138,380 | (196,683 | ) | 941,697 | |||||||||||
MSCI Emerging Markets Energy Capped | 2,378,501 | 80,424 | (465,368 | ) | (384,944 | ) | ||||||||||
MSCI Emerging Markets Growth | 5,310,461 | 998,908 | (311,062 | ) | 687,846 | |||||||||||
MSCI Emerging Markets Minimum Volatility | 1,975,975,968 | 244,953,186 | (106,970,133 | ) | 137,983,053 | |||||||||||
MSCI Emerging Markets Small-Cap | 44,370,310 | 6,229,690 | (4,359,492 | ) | 1,870,198 | |||||||||||
MSCI Emerging Markets Value | 24,608,348 | 2,425,827 | (1,631,958 | ) | 793,869 | |||||||||||
Management has analyzed tax laws and regulations and their application to the Funds as of August 31, 2014, inclusive of the open tax return years, and does not believe there are any uncertain tax positions that require recognition of a tax liability in the Funds’ consolidated financial statements.
| 7. | LINE OF CREDIT |
The Funds, along with certain other iShares funds, are parties to a $150 million credit agreement with State Street Bank and Trust Company, which expires October 28, 2015. The line of credit may be used for temporary or emergency purposes, including redemptions, settlement of trades and rebalancing of portfolio holdings. The credit agreement has the following terms: a commitment fee of 0.08% per annum on the unused portion of the credit agreement and interest at a rate equal to the higher of (a) the one-month LIBOR plus 1.00% per annum or (b) the U.S. Federal Funds rate plus 1.00% per annum on amounts borrowed. The commitment fee is allocated to each fund participating in the credit agreement based on each fund’s pro-rata share of the aggregate average daily value of assets invested in local securities of certain foreign markets.
For the year ended August 31, 2014, the maximum amounts borrowed, the average borrowings and the weighted average interest rates under the credit agreement were as follows:
| iShares ETF | Maximum Amount Borrowed | Average Borrowings | Weighted Average Interest Rates | |||||||||
MSCI BRIC | $ | 1,600,000 | $ | 63,521 | 1.16 | % | ||||||
MSCI Emerging Markets Asia | 120,000 | 6,041 | 1.16 | |||||||||
MSCI Emerging Markets Minimum Volatility | 11,365,000 | 239,877 | 1.15 | |||||||||
MSCI Emerging Markets Small-Cap | 200,000 | 5,959 | 1.17 | |||||||||
MSCI Emerging Markets Value | 125,000 | 3,778 | 1.16 | |||||||||
The iShares MSCI Emerging Markets Consumer Discretionary ETF, the iShares MSCI Emerging Markets Energy Capped ETF, and the iShares MSCI Emerging Markets Growth ETF did not borrow under the credit agreement during the year ended August 31, 2014.
NOTESTO CONSOLIDATED FINANCIAL STATEMENTS | 101 |
Table of Contents
Notes to Consolidated Financial Statements (Continued)
iSHARES®, INC.
| 8. | SUBSEQUENT EVENTS |
Management has evaluated the impact of all subsequent events on the Funds through the date the consolidated financial statements were available to be issued and has determined that there were no subsequent events requiring adjustment or disclosure in the consolidated financial statements.
| 102 | 2014 iSHARES ANNUAL REPORTTO SHAREHOLDERS |
Table of Contents
Report of Independent Registered Public Accounting Firm
To the Shareholders and Board of Directors of
iShares, Inc.:
In our opinion, the accompanying consolidated statements of assets and liabilities, including the consolidated schedules of investments, and the related consolidated statements of operations and of changes in net assets and the consolidated financial highlights present fairly, in all material respects, the financial position of iShares MSCI BRIC ETF, iShares MSCI Emerging Markets Asia ETF, iShares MSCI Emerging Markets Consumer Discretionary ETF, iShares MSCI Emerging Markets Energy Capped ETF, iShares MSCI Emerging Markets Growth ETF, iShares MSCI Emerging Markets Minimum Volatility ETF, iShares MSCI Emerging Markets Small-Cap ETF and iShares MSCI Emerging Markets Value ETF and their subsidiaries (the “Funds”) at August 31, 2014, the results of each of their operations, the changes in each of their net assets and their financial highlights for each of the periods presented, in conformity with accounting principles generally accepted in the United States of America. These consolidated financial statements and consolidated financial highlights (hereafter referred to as “financial statements”) are the responsibility of the Funds’ management; our responsibility is to express an opinion on these financial statements based on our audits. We conducted our audits of these financial statements in accordance with the standards of the Public Company Accounting Oversight Board (United States). Those standards require that we plan and perform the audit to obtain reasonable assurance about whether the financial statements are free of material misstatement. An audit includes examining, on a test basis, evidence supporting the amounts and disclosures in the financial statements, assessing the accounting principles used and significant estimates made by management, and evaluating the overall financial statement presentation. We believe that our audits, which included confirmation of securities at August 31, 2014 by correspondence with the custodian, transfer agent and brokers, provide a reasonable basis for our opinion.
PricewaterhouseCoopers LLP
San Francisco, California
October 22, 2014
REPORTOF INDEPENDENT REGISTERED PUBLIC ACCOUNTING FIRM | 103 |
Table of Contents
iSHARES®, INC.
For the fiscal year ended August 31, 2014, the Funds earned foreign source income and paid foreign taxes which they intend to pass through to their shareholders pursuant to Section 853 of the Internal Revenue Code (the “Code”) as follow:
| iShares ETF | Foreign Source Income Earned | Foreign Taxes Paid | ||||||
MSCI BRIC | $ | 14,342,581 | $ | 1,153,698 | ||||
MSCI Emerging Markets Asia | 1,345,410 | 168,537 | ||||||
MSCI Emerging Markets Consumer Discretionary | 85,781 | 10,436 | ||||||
MSCI Emerging Markets Energy Capped | 72,097 | 7,443 | ||||||
MSCI Emerging Markets Growth | 119,155 | 12,606 | ||||||
MSCI Emerging Markets Minimum Volatility | 70,461,415 | 7,649,359 | ||||||
MSCI Emerging Markets Small-Cap | 948,005 | 107,130 | ||||||
MSCI Emerging Markets Value | 701,544 | 81,281 | ||||||
Under Section 854(b)(2) of the Code, the Funds hereby designate the following maximum amounts as qualified dividend income for purposes of the maximum rate under Section 1(h)(11) of the Code for the fiscal year ended August 31, 2014:
| iShares ETF | Qualified Dividend Income | |||
MSCI BRIC | $ | 8,384,985 | ||
MSCI Emerging Markets Asia | 744,246 | |||
MSCI Emerging Markets Consumer Discretionary | 39,551 | |||
MSCI Emerging Markets Energy | 42,255 | |||
| iShares ETF | Qualified Dividend Income | |||
MSCI Emerging Markets Growth | $ | 62,726 | ||
MSCI Emerging Markets Minimum Volatility | 35,573,909 | |||
MSCI Emerging Markets Small-Cap | 356,410 | |||
MSCI Emerging Markets Value | 439,985 | |||
In February 2015, shareholders will receive Form 1099-DIV which will include their share of qualified dividend income distributed during the calendar year 2014. Shareholders are advised to check with their tax advisers for information on the treatment of these amounts on their income tax returns.
| 104 | 2014 iSHARES ANNUAL REPORTTO SHAREHOLDERS |
Table of Contents
Board Review and Approval of Investment Advisory
Contract
iSHARES®, INC.
I. iShares MSCI BRIC ETF, iShares MSCI Emerging Markets Consumer Discretionary ETF, iShares MSCI Emerging Markets Energy Capped ETF, iShares Emerging Markets Minimum Volatility ETF and iShares MSCI Emerging Markets Small-Cap ETF
Under Section 15(c) of the Investment Company Act of 1940 (the “1940 Act”), the Company’s Board of Directors (the “Board”), including a majority of Directors who are not “interested persons” of the Company (as that term is defined in the 1940 Act) (the “Independent Directors”), is required annually to consider and approve the Investment Advisory Contract between the Company and BFA (the “Advisory Contract”) on behalf of the Funds. The Independent Directors requested, and BFA provided, such information as the Independent Directors, with advice from independent counsel, deemed reasonably necessary to evaluate the Advisory Contract. A committee of Independent Directors (the “15(c) Committee”), with independent counsel, met with management on March 12, 2014, May 6, 2014, and May 12, 2014, to discuss the types of information the Independent Directors required and the manner in which management would organize and present such information. At a meeting held on May 16, 2014, management presented preliminary information to the Board relating to the continuance of the Advisory Contract, and the Board, including the Independent Directors, reviewed and discussed such information at length. The Independent Directors requested from management certain additional information, which management agreed to provide. At a meeting held on June 12-13, 2014, the Board, including the Independent Directors, reviewed the additional information provided by management in response to these requests. After extensive discussions, the Board, including all of the Independent Directors, approved the continuance of the Advisory Contract for the Funds, based on a review of qualitative and quantitative information provided by BFA, including the additional information management provided at the request of the Independent Directors. The Board noted its satisfaction with the extent and quality of information provided and its frequent interactions with management, as well as the detailed responses and other information provided by BFA. The Board also noted that the Board and BFA agreed to discuss potential enhancements and adjustments to the 15(c) process for the coming year. The Independent Directors were advised by their independent counsel throughout the process, including about the legal standards applicable to their review. In approving the Advisory Contract for the Funds, the Board, including the Independent Directors, considered the following factors, no one of which was controlling, and reached the following conclusions:
Expenses and Performance of the Funds — The Board reviewed statistical information prepared by Lipper Inc. (“Lipper”), an independent provider of investment company data, regarding the expense ratio components, including actual advisory fees, waivers/reimbursements, and gross and net total expenses of each Fund in comparison with the same information for other exchange traded funds (including funds sponsored by an “at cost” service provider) and, in the limited instances where no comparable ETFs existed and the comparison group would not otherwise be reasonable in Lipper’s judgment, pure index institutional mutual funds, objectively selected by Lipper as comprising such Fund’s applicable peer group pursuant to Lipper’s proprietary ETF methodology (the “Lipper Group”). The Board noted that, prior to 2014, Lipper had used a different methodology to determine a Fund’s Lipper group, which included mutual funds, closed-end funds, exchange traded funds, and/or funds with differing investment objective classifications, investment focuses and other characteristics (e.g. actively managed funds and funds sponsored by “at cost” service providers), as applicable. The Board further noted that, after consideration by the 15(c) Committee, the Board determined to use instead Lipper’s proprietary ETF methodology to determine a Fund’s Lipper Group. This determination was based on, among other considerations, the increased number and types of ETFs available for comparative purposes than was the case in prior years. The Board was provided with a detailed description of Lipper’s proprietary ETF methodology used by Lipper to determine the applicable Lipper Groups and to prepare this information. At the Board’s request, Lipper provided, and the Board considered, information on the impact to the iShares funds’ comparative fee rankings that were attributable to the change from a pure index group methodology to Lipper’s proprietary ETF methodology. The Board further noted that due to the limitations in providing comparable funds in the various Lipper Groups, the statistical information provided in Lipper’s report may or may not provide meaningful direct comparisons to the Funds in all instances.
BOARD REVIEWAND APPROVALOF INVESTMENT ADVISORY CONTRACT | 105 |
Table of Contents
Board Review and Approval of Investment Advisory
Contract (Continued)
iSHARES®, INC.
The Board also noted that the investment advisory fee rates and overall expenses for the Funds were lower than the median of the investment advisory fee rates and overall expenses of the funds in their respective Lipper Group, except for iShares MSCI Emerging Markets Energy Capped ETF, which were within range of the median of the investment advisory fee rates and overall expenses of the funds in its Lipper Group.
In addition, the Board reviewed statistical information prepared by Lipper regarding the performance of each Fund for the one-, three-, five-, ten-year, and since inception periods, as applicable, and the “last quarter” period ended December 31, 2013, and a comparison of each Fund’s performance to its performance benchmark index for the same periods. To the extent that any of the comparison funds included in the Lipper Group track the same index as any particular Fund, Lipper also provided, and the Board reviewed, a comparison of such Fund’s performance to that of such relevant comparison funds for the same periods. The Board noted that the Funds generally performed in line with their respective performance benchmark indexes over the relevant periods. In considering this information, the Board noted that the Lipper Group may include funds that are not exchange traded funds or index funds, and that may have different investment objectives and/or benchmarks from the Funds. In addition, the Board noted that each Fund seeks to track its own benchmark index and that, during the prior year, the Board received periodic reports on the Funds’ performance in comparison with their relevant benchmark indexes. Such periodic comparative performance information, including detailed information on certain specific iShares funds requested by the Boards, was also considered.
Based on this review, the other factors considered at the meeting, and their general knowledge of ETF pricing, the Board concluded that the investment advisory fee rate and expense level and the historical performance of each Fund supported the Board’s approval of the continuance of the Advisory Contract for the coming year.
Nature, Extent and Quality of Services Provided by BFA — Based on management’s representations, including information about recent and proposed enhancements to the iShares business, including with respect to shareholder servicing and support, the Board expected that there would be no diminution in the scope of services required of or provided by BFA under the Advisory Contract for the coming year as compared to the scope of services provided by BFA during prior years. In reviewing the scope of these services, the Board considered BFA’s investment philosophy and experience, noting that BFA and its affiliates have committed significant resources over time, including during the past year, to supporting the Funds and their shareholders. The Board acknowledged that resources to support the iShares funds and their shareholders have been added or enhanced in recent years, including in such areas as investor education, product management, customized portfolio consulting support, capital markets support, and proprietary risk and performance analytics tools. The Board also considered BFA’s compliance program and its compliance record with respect to the Funds. In that regard, the Board noted that BFA reports to the Board about portfolio management and compliance matters on a periodic basis in connection with regularly scheduled meetings of the Board, and on other occasions as necessary and appropriate, and has provided information and made appropriate officers available as needed to provide further assistance with these matters. The Board also reviewed the background and experience of the persons responsible for the day-to-day management of the Funds, as well as the resources available to them in managing the Funds. In addition to the above considerations, the Board reviewed and considered detailed presentations regarding BFA’s investment performance, investment and risk management processes and strategies provided at the June 12-13, 2014 meeting and throughout the previous year, and matters related to BFA’s portfolio compliance policies and procedures. The Board noted that each Fund had met its investment objective consistently since its respective inception date.
Based on review of this information, and the performance information discussed above, the Board concluded that the nature, extent and quality of services provided by BFA to the Funds under the Advisory Contract supported the Board’s approval of the continuance of the Advisory Contract for the coming year.
Costs of Services Provided to Funds and Profits Realized by BFA and Affiliates — The Board reviewed information about the profitability to BlackRock of the Funds based on the fees payable to BFA and its affiliates (including fees under the Advisory
| 106 | 2014 iSHARES ANNUAL REPORTTO SHAREHOLDERS |
Table of Contents
Board Review and Approval of Investment Advisory
Contract (Continued)
iSHARES®, INC.
Contract), and all other sources of revenue and expense to BFA and its affiliates from the Funds’ operations for the last calendar year. The Board reviewed BlackRock’s profitability methodology for the iShares funds, noting that the 15(c) Committee had focused on the methodology and proposed presentation during its meetings. The Board discussed the sources of direct and ancillary revenue with management, including the revenues to BTC from securities lending by the Funds. The Board also discussed BFA’s profit margin as reflected in the Funds’ profitability analyses and reviewed information regarding potential economies of scale (as discussed below). Based on this review, the Board concluded that the profits realized by BFA and its affiliates under the Advisory Contract and from other relationships between the Funds and BFA and/or its affiliates, if any, were within a reasonable range in light of the factors considered.
Economies of Scale — The Board reviewed information regarding potential economies of scale or other efficiencies that may result from increases in the Funds’ assets, noting that the issue of economies of scale had been focused on extensively by the 15(c) Committee during its meetings and addressed by management. The Board and the 15(c) Committee reviewed information provided by BFA regarding scale benefits shared with the iShares funds through relatively low fee rates established at inception, breakpoints, waivers, or other fee reductions, as well as through additional investment in the iShares business and the provision of improved or additional infrastructure and services to the iShares funds and their shareholders. The Board and the 15(c) Committee received information regarding BlackRock’s historical profitability, including BFA’s and its affiliates’ costs in providing services. The cost information distinguished between fixed and variable costs, and explained how the level of fixed and variable costs, as well as the nature of such costs, may impact the existence or size of scale benefits. The Board noted that the Advisory Contract for the Funds already provided for breakpoints in the Funds’ investment advisory fee rates, and that, following receipt of a proposal from the Board and negotiations, BFA and the Board had agreed to revise the Advisory Contract for the Funds to reduce the advisory fee for certain breakpoint tiers, as the assets of the Funds, on an aggregated basis with the assets of certain other iShares funds, increase. The Board noted that it would continue to monitor the sharing of economies of scale to determine the appropriateness of adding new or revised breakpoints in the future. Based on this review, as well as the other factors considered at the meeting, the Board, recognizing its responsibility to consider this issue at least annually, concluded that the structure of the investment advisory fee rates reflects appropriate sharing of potential economies of scale with the Funds’ shareholders and supported the Board’s approval of the continuance of the Advisory Contract for the coming year.
Fees and Services Provided for Other Comparable Funds/Accounts Managed by BFA and its Affiliates — The Board received and considered information regarding the investment advisory/management fee rates for other funds/accounts in the U.S. for which BFA (or its affiliates) provides investment advisory/management services, including open-end and closed-end funds registered under the 1940 Act (including sub-advised funds), collective trust funds, separately managed accounts, and institutional separate accounts (together, the “Other Accounts”), and acknowledged BFA’s assertion that the iShares funds are fundamentally different investment vehicles from the Other Accounts. The Board noted that BFA and its affiliates do manage Other Accounts with substantially similar investment objectives and strategies as the Funds, except for iShares MSCI Emerging Markets Consumer Discretionary ETF and iShares MSCI Emerging Markets Energy Capped ETF. The Board further noted that BFA provided the Board with detailed information regarding how the Other Accounts (particularly institutional clients) generally differ from the Funds, including in terms of the different, generally more extensive services provided to the Funds, as well as other significant differences in the approach of BFA and its affiliates to the Funds, on one hand, and Other Accounts, on the other. In that regard, the Board considered that the pricing of services to institutional clients is typically based on a number of factors beyond the nature and extent of the specific services to be provided and often depends on the overall relationship between the client and its affiliates and the adviser and its affiliates. In addition, the Board considered the relative complexity and inherent risks and challenges of managing and providing other services to the Funds, as publicly traded exchange traded funds, as compared to the Other Accounts that are institutional clients in light of differing regulatory requirements and client-imposed mandates. The Board also considered the “all-inclusive” nature of the Funds’ advisory fee structure, and the Fund expenses borne by BFA under this arrangement. The Board noted that the investment advisory fee rates under the Advisory Contract for the Funds were
BOARD REVIEWAND APPROVALOF INVESTMENT ADVISORY CONTRACT | 107 |
Table of Contents
Board Review and Approval of Investment Advisory
Contract (Continued)
iSHARES®, INC.
generally higher than the investment advisory/management fee rates for the Other Accounts that are institutional clients of BFA (or its affiliates) and concluded that the differences appeared to be consistent with the factors discussed.
Other Benefits to BFA and/or its Affiliates — The Board reviewed the “fallout” benefits or ancillary revenue received by BFA and/or its affiliates in connection with the services provided to the Funds by BFA, such as payment of revenue to BTC, the Funds’ securities lending agent, for loaning portfolio securities (which was included in the profit margins reviewed by the Board pursuant to BFA’s profitability methodology), and payment of advisory fees and/or administration fees to BFA and BTC (or their affiliates) in connection with any investments by the Funds in other funds for which BFA (or its affiliates) provides investment advisory services and/or administration services. The Board noted that BFA generally does not use soft dollars or consider the value of research or other services that may be provided to BFA (including its affiliates) in selecting brokers for portfolio transactions for the Funds. The Board further noted that any portfolio transactions on behalf of the Funds placed through a BFA affiliate or purchased from an underwriting syndicate in which a BFA affiliate participates, are reported to the Board pursuant to Rule 17e-1 or Rule 10f-3, as applicable, under the 1940 Act. The Board concluded that any such ancillary benefits would not be disadvantageous to the Funds’ shareholders and thus would not alter the Board’s conclusion with respect to the appropriateness of approving the continuance of the Advisory Contract for the coming year.
Based on the considerations described above, the Board determined that each Fund’s investment advisory fee rate under the Advisory Contract does not constitute a fee that is so disproportionately large as to bear no reasonable relationship to the services rendered and that could not have been the product of arm’s-length bargaining, and concluded that it is in the best interest of each Fund and its shareholders to approve the continuance of the Advisory Contract for the coming year.
II. iShares MSCI Emerging Markets Asia ETF, iShares MSCI Emerging Markets Growth ETF and iShares MSCI Emerging Markets Value ETF
Under Section 15(c) of the Investment Company Act of 1940 (the “1940 Act”), the Company’s Board of Directors (the “Board”), including a majority of Directors who are not “interested persons” of the Company (as that term is defined in the 1940 Act) (the “Independent Directors”), is required annually to consider and approve the Investment Advisory Contract between the Company and BFA (the “Advisory Contract”) on behalf of the Funds. The Independent Directors requested, and BFA provided, such information as the Independent Directors, with advice from independent counsel, deemed reasonably necessary to evaluate the Advisory Contract. A committee of Independent Directors (the “15(c) Committee”), with independent counsel, met with management on March 12, 2014, May 6, 2014, and May 12, 2014, to discuss the types of information the Independent Directors required and the manner in which management would organize and present such information. At a meeting held on May 16, 2014, management presented preliminary information to the Board relating to the continuance of the Advisory Contract, and the Board, including the Independent Directors, reviewed and discussed such information at length. The Independent Directors requested from management certain additional information, which management agreed to provide. At a meeting held on June 12-13, 2014, the Board, including the Independent Directors, reviewed the additional information provided by management in response to these requests. After extensive discussions, the Board, including all of the Independent Directors, approved the continuance of the Advisory Contract for the Funds, based on a review of qualitative and quantitative information provided by BFA, including the additional information management provided at the request of the Independent Directors. The Board noted its satisfaction with the extent and quality of information provided and its frequent interactions with management, as well as the detailed responses and other information provided by BFA. The Board also noted that the Board and BFA agreed to discuss potential enhancements and adjustments to the 15(c) process for the coming year. The Independent Directors were advised by their independent counsel throughout the process, including about the legal standards applicable to their review. In approving the
| 108 | 2014 iSHARES ANNUAL REPORTTO SHAREHOLDERS |
Table of Contents
Board Review and Approval of Investment Advisory
Contract (Continued)
iSHARES®, INC.
Advisory Contract for the Funds, the Board, including the Independent Directors, considered the following factors, no one of which was controlling, and reached the following conclusions:
Expenses and Performance of the Funds — The Board reviewed statistical information prepared by Lipper Inc. (“Lipper”), an independent provider of investment company data, regarding the expense ratio components, including actual advisory fees, waivers/reimbursements, and gross and net total expenses of each Fund in comparison with the same information for other exchange traded funds (including funds sponsored by an “at cost” service provider) and, in the limited instances where no comparable ETFs existed and the comparison group would not otherwise be reasonable in Lipper’s judgment, pure index institutional mutual funds, objectively selected by Lipper as comprising such Fund’s applicable peer group pursuant to Lipper’s proprietary ETF methodology (the “Lipper Group”). The Board noted that, prior to 2014, Lipper had used a different methodology to determine a Fund’s Lipper group, which included mutual funds, closed-end funds, exchange traded funds, and/or funds with differing investment objective classifications, investment focuses and other characteristics (e.g. actively managed funds and funds sponsored by “at cost” service providers), as applicable. The Board further noted that, after consideration by the 15(c) Committee, the Board determined to use instead Lipper’s proprietary ETF methodology to determine a Fund’s Lipper Group. This determination was based on, among other considerations, the increased number and types of ETFs available for comparative purposes than was the case in prior years. The Board was provided with a detailed description of Lipper’s proprietary ETF methodology used by Lipper to determine the applicable Lipper Groups and to prepare this information. At the Board’s request, Lipper provided, and the Board considered, information on the impact to the iShares funds’ comparative fee rankings that were attributable to the change from a pure index group methodology to Lipper’s proprietary ETF methodology. The Board further noted that due to the limitations in providing comparable funds in the various Lipper Groups, the statistical information provided in Lipper’s report may or may not provide meaningful direct comparisons to the Funds in all instances.
The Board also noted that the investment advisory fee rates and overall expenses for the Funds were within range of the median of the investment advisory fee rates and overall expenses of the funds in their respective Lipper Group.
In addition, the Board reviewed statistical information prepared by Lipper regarding the performance of each Fund for the one-, three-, five-, ten-year, and since inception periods, as applicable, and the “last quarter” period ended December 31, 2013, and a comparison of each Fund’s performance to its performance benchmark index for the same periods. To the extent that any of the comparison funds included in the Lipper Group track the same index as any particular Fund, Lipper also provided, and the Board reviewed, a comparison of such Fund’s performance to that of such relevant comparison funds for the same periods. The Board noted that the Funds generally performed in line with their respective performance benchmark indexes over the relevant periods. In considering this information, the Board noted that the Lipper Group may include funds that are not exchange traded funds or index funds, and that may have different investment objectives and/or benchmarks from the Funds. In addition, the Board noted that each Fund seeks to track its own benchmark index and that, during the prior year, the Board received periodic reports on the Funds’ performance in comparison with their relevant benchmark indexes. Such periodic comparative performance information, including detailed information on certain specific iShares funds requested by the Boards, was also considered.
Based on this review, the other factors considered at the meeting, and their general knowledge of ETF pricing, the Board concluded that the investment advisory fee rate and expense level and the historical performance of each Fund supported the Board’s approval of the continuance of the Advisory Contract for the coming year.
Nature, Extent and Quality of Services Provided by BFA — Based on management’s representations, including information about recent and proposed enhancements to the iShares business, including with respect to shareholder servicing and support, the Board expected that there would be no diminution in the scope of services required of or provided by BFA under the Advisory Contract for the coming year as compared to the scope of services provided by BFA during prior years. In reviewing the scope of these services, the Board considered BFA’s investment philosophy and experience, noting that BFA and its affiliates have
BOARD REVIEWAND APPROVALOF INVESTMENT ADVISORY CONTRACT | 109 |
Table of Contents
Board Review and Approval of Investment Advisory
Contract (Continued)
iSHARES®, INC.
committed significant resources over time, including during the past year, to supporting the Funds and their shareholders. The Board acknowledged that resources to support the iShares funds and their shareholders have been added or enhanced in recent years, including in such areas as investor education, product management, customized portfolio consulting support, capital markets support, and proprietary risk and performance analytics tools. The Board also considered BFA’s compliance program and its compliance record with respect to the Funds. In that regard, the Board noted that BFA reports to the Board about portfolio management and compliance matters on a periodic basis in connection with regularly scheduled meetings of the Board, and on other occasions as necessary and appropriate, and has provided information and made appropriate officers available as needed to provide further assistance with these matters. The Board also reviewed the background and experience of the persons responsible for the day-to-day management of the Funds, as well as the resources available to them in managing the Funds. In addition to the above considerations, the Board reviewed and considered detailed presentations regarding BFA’s investment performance, investment and risk management processes and strategies provided at the June 12-13, 2014 meeting and throughout the previous year, and matters related to BFA’s portfolio compliance policies and procedures. The Board noted that each Fund had met its investment objective consistently since its respective inception date.
Based on review of this information, and the performance information discussed above, the Board concluded that the nature, extent and quality of services provided by BFA to the Funds under the Advisory Contract supported the Board’s approval of the continuance of the Advisory Contract for the coming year.
Costs of Services Provided to Funds and Profits Realized by BFA and Affiliates — The Board reviewed information about the profitability to BlackRock of the Funds based on the fees payable to BFA and its affiliates (including fees under the Advisory Contract), and all other sources of revenue and expense to BFA and its affiliates from the Funds’ operations for the last calendar year. The Board reviewed BlackRock’s profitability methodology for the iShares funds, noting that the 15(c) Committee had focused on the methodology and proposed presentation during its meetings. The Board discussed the sources of direct and ancillary revenue with management, including the revenues to BTC from securities lending by the Funds. The Board also discussed BFA’s profit margin as reflected in the Funds’ profitability analyses and reviewed information regarding potential economies of scale (as discussed below). Based on this review, the Board concluded that the profits realized by BFA and its affiliates under the Advisory Contract and from other relationships between the Funds and BFA and/or its affiliates, if any, were within a reasonable range in light of the factors considered.
Economies of Scale — The Board reviewed information regarding potential economies of scale or other efficiencies that may result from increases in the Funds’ assets, noting that the issue of economies of scale had been focused on extensively by the 15(c) Committee during its meetings and addressed by management. The Board and the 15(c) Committee reviewed information provided by BFA regarding scale benefits shared with the iShares funds through relatively low fee rates established at inception, breakpoints, waivers, or other fee reductions, as well as through additional investment in the iShares business and the provision of improved or additional infrastructure and services to the iShares funds and their shareholders. The Board and the 15(c) Committee received information regarding BlackRock’s historical profitability, including BFA’s and its affiliates’ costs in providing services. The cost information distinguished between fixed and variable costs, and explained how the level of fixed and variable costs, as well as the nature of such costs, may impact the existence or size of scale benefits. The Board noted that the Advisory Contract for the Funds did not provide for any breakpoints in the Funds’ investment advisory fee rates as the assets of the Funds increase. However, the Board noted that should material economies of scale exist in the future, a breakpoint structure for the Funds may be appropriate, and that it would continue to monitor the sharing of economies of scale to determine the appropriateness of adding breakpoints in the future. Based on this review, as well as the other factors considered at the meeting, the Board, recognizing its responsibility to consider this issue at least annually, concluded that the investment advisory fee rates incorporate potential economies of scale and supported the Board’s approval of the continuance of the Advisory Contract for the coming year.
| 110 | 2014 iSHARES ANNUAL REPORTTO SHAREHOLDERS |
Table of Contents
Board Review and Approval of Investment Advisory
Contract (Continued)
iSHARES®, INC.
Fees and Services Provided for Other Comparable Funds/Accounts Managed by BFA and its Affiliates — The Board received and considered information regarding the investment advisory/management fee rates for other funds/accounts in the U.S. for which BFA (or its affiliates) provides investment advisory/management services, including open-end and closed-end funds registered under the 1940 Act (including sub-advised funds), collective trust funds, separately managed accounts, and institutional separate accounts (together, the “Other Accounts”), and acknowledged BFA’s assertion that the iShares funds are fundamentally different investment vehicles from the Other Accounts. The Board noted that BFA and its affiliates do manage Other Accounts with substantially similar investment objectives and strategies as the Funds. The Board further noted that BFA provided the Board with detailed information regarding how the Other Accounts (particularly institutional clients) generally differ from the Funds, including in terms of the different, generally more extensive services provided to the Funds, as well as other significant differences in the approach of BFA and its affiliates to the Funds, on one hand, and Other Accounts, on the other. In that regard, the Board considered that the pricing of services to institutional clients is typically based on a number of factors beyond the nature and extent of the specific services to be provided and often depends on the overall relationship between the client and its affiliates and the adviser and its affiliates. In addition, the Board considered the relative complexity and inherent risks and challenges of managing and providing other services to the Funds, as publicly traded exchange traded funds, as compared to the Other Accounts that are institutional clients in light of differing regulatory requirements and client-imposed mandates. The Board also considered the “all-inclusive” nature of the Funds’ advisory fee structure, and the Fund expenses borne by BFA under this arrangement. The Board noted that the investment advisory fee rates under the Advisory Contract for the Funds were generally higher than the investment advisory/management fee rates for the Other Accounts that are institutional clients of BFA (or its affiliates) and concluded that the differences appeared to be consistent with the factors discussed.
Other Benefits to BFA and/or its Affiliates — The Board reviewed the “fallout” benefits or ancillary revenue received by BFA and/or its affiliates in connection with the services provided to the Funds by BFA, such as payment of revenue to BTC, the Funds’ securities lending agent, for loaning portfolio securities (which was included in the profit margins reviewed by the Board pursuant to BFA’s profitability methodology), and payment of advisory fees and/or administration fees to BFA and BTC (or their affiliates) in connection with any investments by the Funds in other funds for which BFA (or its affiliates) provides investment advisory services and/or administration services. The Board noted that BFA generally does not use soft dollars or consider the value of research or other services that may be provided to BFA (including its affiliates) in selecting brokers for portfolio transactions for the Funds. The Board further noted that any portfolio transactions on behalf of the Funds placed through a BFA affiliate or purchased from an underwriting syndicate in which a BFA affiliate participates, are reported to the Board pursuant to Rule 17e-1 or Rule 10f-3, as applicable, under the 1940 Act. The Board concluded that any such ancillary benefits would not be disadvantageous to the Funds’ shareholders and thus would not alter the Board’s conclusion with respect to the appropriateness of approving the continuance of the Advisory Contract for the coming year.
Based on the considerations described above, the Board determined that each Fund’s investment advisory fee rate under the Advisory Contract does not constitute a fee that is so disproportionately large as to bear no reasonable relationship to the services rendered and that could not have been the product of arm’s-length bargaining, and concluded that it is in the best interest of each Fund and its shareholders to approve the continuance of the Advisory Contract for the coming year.
BOARD REVIEWAND APPROVALOF INVESTMENT ADVISORY CONTRACT | 111 |
Table of Contents
Supplemental Information (Unaudited)
iSHARES®, INC.
Section 19(a) Notices
The amounts and sources of distributions reported are only estimates and are not being provided for tax reporting purposes. The actual amounts and sources of the amounts for tax reporting purposes will depend upon each Fund’s investment experience during the year and may be subject to changes based on the tax regulations. Shareholders will receive a Form 1099-DIV each calendar year that will inform them how to report distributions for federal income tax purposes.
| Total Cumulative Distributions for the Fiscal Year | % Breakdown of the Total Cumulative Distributions for the Fiscal Year | |||||||||||||||||||||||||||||||
| iShares ETF | Net Investment Income | Net Realized Capital Gains | Return of Capital | Total Per Share | Net Investment Income | Net Realized Capital Gains | Return of Capital | Total Per Share | ||||||||||||||||||||||||
MSCI BRIC | $ | 0.706005 | $ | — | $ | — | $ | 0.706005 | 100 | % | — | % | — | % | 100 | % | ||||||||||||||||
MSCI Emerging Markets Asia | 1.262684 | — | — | 1.262684 | 100 | — | — | 100 | ||||||||||||||||||||||||
MSCI Emerging Markets Consumer Discretionary | 0.291145 | — | — | 0.291145 | 100 | — | — | 100 | ||||||||||||||||||||||||
MSCI Emerging Markets Energy Capped | 0.696232 | — | — | 0.696232 | 100 | — | — | 100 | ||||||||||||||||||||||||
MSCI Emerging Markets Growth | 0.726213 | — | 0.025252 | 0.751465 | 97 | — | 3 | 100 | ||||||||||||||||||||||||
MSCI Emerging Markets Minimum Volatility | 1.543810 | — | — | 1.543810 | 100 | — | — | 100 | ||||||||||||||||||||||||
MSCI Emerging Markets Small-Cap | 0.958645 | — | 0.053946 | 1.012591 | 95 | — | 5 | 100 | ||||||||||||||||||||||||
MSCI Emerging Markets Value | 0.965075 | — | — | 0.965075 | 100 | — | — | 100 | ||||||||||||||||||||||||
Premium/Discount Information
The tables that follow present information about the differences between the daily market price on secondary markets for shares of a Fund and that Fund’s net asset value. Net asset value, or “NAV,” is the price per share at which each Fund issues and redeems shares. It is calculated in accordance with the standard formula for valuing mutual fund shares. The “Market Price” of each Fund generally is determined using the midpoint between the highest bid and the lowest offer on the primary stock exchange on which the shares of such Fund are listed for trading, as of the time that the Fund’s NAV is calculated. Each Fund’s Market Price may be at, above or below its NAV. The NAV of each Fund will fluctuate with changes in the fair value of its portfolio holdings. The Market Price of each Fund will fluctuate in accordance with changes in its NAV, as well as market supply and demand.
Premiums or discounts are the differences (expressed as a percentage) between the NAV and Market Price of a Fund on a given day, generally at the time NAV is calculated. A premium is the amount that a Fund is trading above the reported NAV, expressed as a percentage of the NAV. A discount is the amount that a Fund is trading below the reported NAV, expressed as a percentage of the NAV.
The following information shows the frequency distributions of premiums and discounts for each of the Funds included in this report. The information shown for each Fund is for five calendar years (or for each full calendar quarter completed after the inception date of such Fund if less than five years) through the date of the most recent calendar quarter-end. The specific periods covered for each Fund are disclosed in the table for such Fund.
| 112 | 2014 iSHARES ANNUAL REPORTTO SHAREHOLDERS |
Table of Contents
Supplemental Information (Unaudited) (Continued)
iSHARES®, INC.
Each line in the table shows the number of trading days in which the Fund traded within the premium/discount range indicated. The number of trading days in each premium/discount range is also shown as a percentage of the total number of trading days in the period covered by each table. All data presented here represents past performance, which cannot be used to predict future results.
iShares MSCI BRIC ETF
Period Covered: January 1, 2009 through June 30, 2014
Premium/Discount Range | Number of Days | Percentage of Total Days | ||||||
Greater than 3.5% | 1 | 0.07 | % | |||||
Greater than 3.0% and Less than 3.5% | 2 | 0.14 | ||||||
Greater than 2.5% and Less than 3.0% | 6 | 0.43 | ||||||
Greater than 2.0% and Less than 2.5% | 14 | 1.01 | ||||||
Greater than 1.5% and Less than 2.0% | 42 | 3.04 | ||||||
Greater than 1.0% and Less than 1.5% | 152 | 11.00 | ||||||
Greater than 0.5% and Less than 1.0% | 195 | 14.11 | ||||||
Between 0.5% and –0.5% | 653 | 47.26 | ||||||
Less than –0.5% and Greater than –1.0% | 198 | 14.34 | ||||||
Less than –1.0% and Greater than –1.5% | 71 | 5.14 | ||||||
Less than –1.5% and Greater than –2.0% | 30 | 2.17 | ||||||
Less than –2.0% and Greater than –2.5% | 10 | 0.72 | ||||||
Less than –2.5% and Greater than –3.0% | 5 | 0.36 | ||||||
Less than –3.0% and Greater than –3.5% | 1 | 0.07 | ||||||
Less than –3.5% | 2 | 0.14 | ||||||
|
|
|
| |||||
| 1,382 | 100.00 | % | ||||||
|
|
|
| |||||
iShares MSCI Emerging Markets Asia ETF
Period Covered: April 1, 2012 through June 30, 2014
Premium/Discount Range | Number of Days | Percentage of Total Days | ||||||
Greater than 3.0% | 1 | 0.18 | % | |||||
Greater than 2.5% and Less than 3.0% | 2 | 0.35 | ||||||
Greater than 2.0% and Less than 2.5% | 3 | 0.53 | ||||||
Greater than 1.5% and Less than 2.0% | 17 | 3.01 | ||||||
Greater than 1.0% and Less than 1.5% | 53 | 9.41 | ||||||
Greater than 0.5% and Less than 1.0% | 112 | 19.86 | ||||||
Between 0.5% and –0.5% | 262 | 46.46 | ||||||
Less than –0.5% and Greater than –1.0% | 70 | 12.41 | ||||||
Less than –1.0% and Greater than –1.5% | 28 | 4.96 | ||||||
Less than –1.5% and Greater than –2.0% | 12 | 2.13 | ||||||
Less than –2.0% and Greater than –2.5% | 2 | 0.35 | ||||||
Less than –2.5% and Greater than –3.0% | 2 | 0.35 | ||||||
|
|
|
| |||||
| 564 | 100.00 | % | ||||||
|
|
|
| |||||
SUPPLEMENTAL INFORMATION | 113 |
Table of Contents
Supplemental Information (Unaudited) (Continued)
iSHARES®, INC.
iShares MSCI Emerging Markets Consumer Discretionary ETF
Period Covered: April 1, 2012 through June 30, 2014
Premium/Discount Range | Number of Days | Percentage of Total Days | ||||||
Greater than 2.5% | 5 | 0.89 | % | |||||
Greater than 2.0% and Less than 2.5% | 6 | 1.06 | ||||||
Greater than 1.5% and Less than 2.0% | 9 | 1.60 | ||||||
Greater than 1.0% and Less than 1.5% | 51 | 9.04 | ||||||
Greater than 0.5% and Less than 1.0% | 126 | 22.34 | ||||||
Between 0.5% and –0.5% | 291 | 51.60 | ||||||
Less than –0.5% and Greater than –1.0% | 52 | 9.22 | ||||||
Less than –1.0% and Greater than –1.5% | 17 | 3.01 | ||||||
Less than –1.5% and Greater than –2.0% | 2 | 0.35 | ||||||
Less than –2.0% and Greater than –2.5% | 5 | 0.89 | ||||||
|
|
|
| |||||
| 564 | 100.00 | % | ||||||
|
|
|
| |||||
iShares MSCI Emerging Markets Energy Capped ETF
Period Covered: April 1, 2012 through June 30, 2014
Premium/Discount Range | Number of Days | Percentage of Total Days | ||||||
Greater than 3.0% and Less than 3.5% | 1 | 0.18 | % | |||||
Greater than 2.5% and Less than 3.0% | 1 | 0.18 | ||||||
Greater than 2.0% and Less than 2.5% | 2 | 0.35 | ||||||
Greater than 1.5% and Less than 2.0% | 12 | 2.13 | ||||||
Greater than 1.0% and Less than 1.5% | 43 | 7.61 | ||||||
Greater than 0.5% and Less than 1.0% | 102 | 18.09 | ||||||
Between 0.5% and –0.5% | 306 | 54.25 | ||||||
Less than –0.5% and Greater than –1.0% | 60 | 10.64 | ||||||
Less than –1.0% and Greater than –1.5% | 27 | 4.79 | ||||||
Less than –1.5% and Greater than –2.0% | 8 | 1.42 | ||||||
Less than –2.0% and Greater than –2.5% | 1 | 0.18 | ||||||
Less than –2.5% and Greater than –3.0% | 1 | 0.18 | ||||||
|
|
|
| |||||
| 564 | 100.00 | % | ||||||
|
|
|
| |||||
| 114 | 2014 iSHARES ANNUAL REPORTTO SHAREHOLDERS |
Table of Contents
Supplemental Information (Unaudited) (Continued)
iSHARES®, INC.
iShares MSCI Emerging Markets Growth ETF
Period Covered: April 1, 2012 through June 30, 2014
Premium/Discount Range | Number of Days | Percentage of Total Days | ||||||
Greater than 3.5% | 3 | 0.53 | % | |||||
Greater than 3.0% and Less than 3.5% | 4 | 0.71 | ||||||
Greater than 2.5% and Less than 3.0% | 23 | 4.08 | ||||||
Greater than 2.0% and Less than 2.5% | 41 | 7.27 | ||||||
Greater than 1.5% and Less than 2.0% | 45 | 7.98 | ||||||
Greater than 1.0% and Less than 1.5% | 82 | 14.54 | ||||||
Greater than 0.5% and Less than 1.0% | 93 | 16.49 | ||||||
Between 0.5% and –0.5% | 210 | 37.23 | ||||||
Less than –0.5% and Greater than –1.0% | 46 | 8.16 | ||||||
Less than –1.0% and Greater than –1.5% | 13 | 2.30 | ||||||
Less than –1.5% and Greater than –2.0% | 3 | 0.53 | ||||||
Less than –2.0% and Greater than –2.5% | 1 | 0.18 | ||||||
|
|
|
| |||||
| 564 | 100.00 | % | ||||||
|
|
|
| |||||
iShares MSCI Emerging Markets Minimum Volatility ETF
Period Covered: January 1, 2012 through June 30, 2014
Premium/Discount Range | Number of Days | Percentage of Total Days | ||||||
Greater than 3.0% | 1 | 0.16 | % | |||||
Greater than 2.5% and Less than 3.0% | 1 | 0.16 | ||||||
Greater than 2.0% and Less than 2.5% | 1 | 0.16 | ||||||
Greater than 1.5% and Less than 2.0% | 14 | 2.24 | ||||||
Greater than 1.0% and Less than 1.5% | 34 | 5.43 | ||||||
Greater than 0.5% and Less than 1.0% | 127 | 20.29 | ||||||
Between 0.5% and –0.5% | 354 | 56.55 | ||||||
Less than –0.5% and Greater than –1.0% | �� | 65 | 10.38 | |||||
Less than –1.0% and Greater than –1.5% | 21 | 3.35 | ||||||
Less than –1.5% and Greater than –2.0% | 6 | 0.96 | ||||||
Less than –2.0% and Greater than –2.5% | 1 | 0.16 | ||||||
Less than –2.5% and Greater than –3.0% | 1 | 0.16 | ||||||
|
|
|
| |||||
| 626 | 100.00 | % | ||||||
|
|
|
| |||||
SUPPLEMENTAL INFORMATION | 115 |
Table of Contents
Supplemental Information (Unaudited) (Continued)
iSHARES®, INC.
iShares MSCI Emerging Markets Small-Cap ETF
Period Covered: October 1, 2011 through June 30, 2014
Premium/Discount Range | Number of Days | Percentage of Total Days | ||||||
Greater than 5.5% | 1 | 0.15 | % | |||||
Greater than 5.0% and Less than 5.5% | 1 | 0.15 | ||||||
Greater than 4.5% and Less than 5.0% | 2 | 0.29 | ||||||
Greater than 4.0% and Less than 4.5% | 3 | 0.44 | ||||||
Greater than 3.5% and Less than 4.0% | 2 | 0.29 | ||||||
Greater than 3.0% and Less than 3.5% | 4 | 0.58 | ||||||
Greater than 2.5% and Less than 3.0% | 5 | 0.73 | ||||||
Greater than 2.0% and Less than 2.5% | 17 | 2.47 | ||||||
Greater than 1.5% and Less than 2.0% | 40 | 5.81 | ||||||
Greater than 1.0% and Less than 1.5% | 65 | 9.43 | ||||||
Greater than 0.5% and Less than 1.0% | 117 | 16.97 | ||||||
Between 0.5% and –0.5% | 278 | 40.34 | ||||||
Less than –0.5% and Greater than –1.0% | 95 | 13.78 | ||||||
Less than –1.0% and Greater than –1.5% | 33 | 4.79 | ||||||
Less than –1.5% and Greater than –2.0% | 16 | 2.32 | ||||||
Less than –2.0% and Greater than –2.5% | 8 | 1.16 | ||||||
Less than –2.5% and Greater than –3.0% | 1 | 0.15 | ||||||
Less than –3.0% | 1 | 0.15 | ||||||
|
|
|
| |||||
| 689 | 100.00 | % | ||||||
|
|
|
| |||||
iShares MSCI Emerging Markets Value ETF
Period Covered: April 1, 2012 through June 30, 2014
Premium/Discount Range | Number of Days | Percentage of Total Days | ||||||
Greater than 5.0% and Less than 5.5% | 6 | 1.06 | % | |||||
Greater than 4.5% and Less than 5.0% | 9 | 1.60 | ||||||
Greater than 4.0% and Less than 4.5% | 6 | 1.06 | ||||||
Greater than 3.5% and Less than 4.0% | 13 | 2.30 | ||||||
Greater than 3.0% and Less than 3.5% | 16 | 2.84 | ||||||
Greater than 2.5% and Less than 3.0% | 22 | 3.90 | ||||||
Greater than 2.0% and Less than 2.5% | 34 | 6.03 | ||||||
Greater than 1.5% and Less than 2.0% | 74 | 13.12 | ||||||
Greater than 1.0% and Less than 1.5% | 109 | 19.33 | ||||||
Greater than 0.5% and Less than 1.0% | 124 | 21.99 | ||||||
Between 0.5% and –0.5% | 130 | 23.05 | ||||||
Less than –0.5% and Greater than –1.0% | 17 | 3.01 | ||||||
Less than –1.0% and Greater than –1.5% | 4 | 0.71 | ||||||
|
|
|
| |||||
| 564 | 100.00 | % | ||||||
|
|
|
| |||||
| 116 | 2014 iSHARES ANNUAL REPORTTO SHAREHOLDERS |
Table of Contents
Supplemental Information (Unaudited) (Continued)
iSHARES®, INC.
Regulation under the Alternative Investment Fund Managers Directive
The Alternative Investment Fund Managers Directive (the “Directive”) imposes detailed and prescriptive obligations on fund managers established in the European Union (the “EU”). These do not currently apply to managers established outside the EU, such as BFA. Rather, non-EU managers are only required to comply with certain disclosure, reporting and transparency obligations of the Directive if such managers market a fund to EU investors.
BFA has registered the iShares MSCI BRIC ETF and iShares MSCI Emerging Markets Minimum Volatility ETF (each a “Fund”, collectively the “Funds”) for marketing to EU investors in the United Kingdom, the Netherlands, Finland, Sweden and Luxembourg.
Report on Remuneration
BFA is required under the Directive to make quantitative disclosures of remuneration. These disclosures are made in line with BlackRock’s interpretation of currently available regulatory guidance on quantitative remuneration disclosures. As market or regulatory practice develops BlackRock may consider it appropriate to make changes to the way in which quantitative remuneration disclosures are calculated. Where such changes are made, this may result in disclosures in relation to a fund not being comparable to the disclosures made in the prior year, or in relation to other BlackRock fund disclosures in that same year.
Disclosures are provided in relation to both (a) the staff of BFA; and (b) staff who are senior management or who have the ability to materially affect the risk profile of the Funds.
All individuals included in the aggregated figures disclosed are rewarded in line with BlackRock’s remuneration policy for their responsibilities across the relevant BlackRock business area. As all individuals have a number of areas of responsibilities, only the portion of remuneration for those individuals’ services attributable to each Fund is included in the aggregate figures disclosed.
BlackRock has a clear and well defined pay-for-performance philosophy, and compensation programs which support that philosophy. For senior management, a significant percentage of variable remuneration is deferred over time. All employees are subject to a claw-back policy.
Compensation decisions for employees are made based on full-year financial results and other non-financial goals and objectives. Alongside financial performance, individual compensation is also based on strategic and operating results and other considerations such as management and leadership capabilities. No set formulas are established and no fixed benchmarks are used in determining annual incentive awards.
Bonus pools are reviewed by BlackRock’s independent compensation committee, taking into account both actual and projected financial information together with information provided by the Operational Risk and Regulatory Compliance departments in relation to any activities, incidents or events that warrant consideration in making compensation decisions.
Functions such as Finance, Operational Risk, Legal & Compliance, and Human Resources each have their own organizational structures which are independent of the business units. Functional bonus pools are determined with reference to the performance of each individual function and the remuneration of the senior members of control functions is directly overseen by BlackRock’s independent compensation committee. No individual is involved in setting his or her own remuneration.
The figures disclosed are a sum of each individual’s portion of remuneration attributable to each Fund according to an objective apportionment methodology. Accordingly the figures are not representative of any individual’s actual remuneration or their remuneration structure.
SUPPLEMENTAL INFORMATION | 117 |
Table of Contents
Supplemental Information (Unaudited) (Continued)
iSHARES®, INC.
The amount of the total remuneration awarded by BFA to its staff which has been attributed to the iShares MSCI BRIC ETF in respect of BFA’s financial year ending December 31, 2013 was USD 77,184. This figure is comprised of fixed remuneration of USD 30,349 and variable remuneration of USD 46,835. There were a total of 436 beneficiaries of the remuneration described above.
The amount of the aggregate remuneration awarded by BFA to its senior management and members of its staff whose actions have a material impact on the risk profile of the iShares MSCI BRIC ETF which has been attributed to the Fund in respect of BFA’s financial year ending December 31, 2013 was USD 12,400.
The amount of the total remuneration awarded by BFA to its staff which has been attributed to the iShares MSCI Emerging Markets Minimum Volatility ETF in respect of BFA’s financial year ending December 31, 2013 was USD 376,814. This figure is comprised of fixed remuneration of USD 148,162 and variable remuneration of USD 228,652. There were a total of 436 beneficiaries of the remuneration described above.
The amount of the aggregate remuneration awarded by BFA to its senior management and members of its staff whose actions have a material impact on the risk profile of the iShares MSCI Emerging Markets Minimum Volatility ETF which has been attributed to the Fund in respect of BFA’s financial year ending December 31, 2013 was USD 60,538.
| 118 | 2014 iSHARES ANNUAL REPORTTO SHAREHOLDERS |
Table of Contents
Director and Officer Information
iSHARES®, INC.
The Board of Directors has responsibility for the overall management and operations of the Company, including general supervision of the duties performed by BFA and other service providers. Each Director serves until he or she resigns, is removed, dies, retires or becomes incapacitated. The President, Chief Compliance Officer, Treasurer and Secretary shall each hold office until their successors are chosen and qualify, and all other officers shall hold office until he or she resigns or is removed. Directors who are not “interested persons” (as defined in the 1940 Act) of the Company are referred to as independent directors (“Independent Directors”).
The registered investment companies advised by BFA or its affiliates are organized into one complex of closed-end funds, two complexes of open-end funds and one complex of exchange-traded funds (“Exchange-Traded Fund Complex”) (each, a “BlackRock Fund Complex”). Each Fund is included in the BlackRock Fund Complex referred to as the Exchange-Traded Fund Complex. Each Director also serves as a Trustee of iShares Trust, a Director of iShares MSCI Russia Capped ETF, Inc. and a Trustee of iShares U.S. ETF Trust and, as a result, oversees a total of 312 funds (as of August 31, 2014) within the Exchange-Traded Fund Complex. With the exception of Robert S. Kapito and Mark Wiedman, the address of each Director and officer is c/o BlackRock, Inc., 400 Howard Street, San Francisco, CA 94105. The address of Mr. Kapito and Mr. Wiedman is c/o BlackRock, Inc., Park Avenue Plaza, 55 East 52nd Street, New York, NY 10055. The Board has designated Robert H. Silver as its Independent Chairman. Additional information about the Funds’ Directors and officers may be found in the Funds’ combined Statement of Additional Information, which is available without charge, upon request, by calling toll-free 1-800-iShares (1-800-474-2737).
Interested Directors
| Name (Age) | Position(s) | Principal Occupation(s) During the Past 5 Years | Other Directorships Held by Director | |||
Robert S. Kapitoa (57) | Director (since 2009). | President and Director, BlackRock, Inc. (since 2006); Vice Chairman of BlackRock, Inc. and Head of BlackRock, Inc.’s Portfolio Management Group (since its formation in 1998) and BlackRock, Inc.’s predecessor entities (since 1988); Trustee, University of Pennsylvania (since 2009); President of Board of Directors, Hope & Heroes Children’s Cancer Fund (since 2002); President of the Board of Directors, Periwinkle Theatre for Youth (since 1983). | Trustee of iShares Trust (since 2009); Director of iShares MSCI Russia Capped ETF, Inc. (since 2010); Trustee of iShares U.S. ETF Trust (since 2011); Director of BlackRock, Inc. (since 2006). | |||
Mark Wiedmanb (43) | Director (since 2013). | Managing Director, BlackRock, Inc. (since 2007); Global Head of iShares (since 2011); Head of Corporate Strategy, BlackRock, Inc. (2009-2011). | Trustee of iShares Trust. (since 2013); Director of iShares MSCI Russia Capped ETF, Inc. (since 2013);Trustee of iShares U.S. ETF Trust (since 2013); Director of PennyMac Financial Services, Inc. (since 2008). | |||
| a | Robert S. Kapito is deemed to be an “interested person” (as defined in the 1940 Act) of the Company due to his affiliations with BlackRock, Inc. |
| b | Mark Wiedman is deemed to be an “interested person” (as defined in the 1940 Act) of the Company due to his affiliations with BlackRock, Inc. and its affiliates. |
DIRECTORAND OFFICER INFORMATION | 119 |
Table of Contents
Director and Officer Information (Continued)
iSHARES®, INC.
Independent Directors
| Name (Age) | Position(s) | Principal Occupation(s) During the Past 5 Years | Other Directorships Held by Director | |||
Robert H. Silver (59) | Director (since 2007); Independent Chairman (since 2012). | President and Co-Founder of The Bravitas Group, Inc. (since 2006); Director and Vice Chairman of the YMCA of Greater NYC (2001-2011); Broadway Producer (2006-2011); Co-Founder and Vice President of Parentgiving Inc. (since 2008); Director and Member of the Audit and Compensation Committee of EPAM Systems, Inc. (2006-2009); President and Chief Operating Officer of UBS Financial Services Inc. (formerly Paine Webber Inc.) (2003-2005) and various executive positions with UBS and its affiliates (1988-2005); CPA and Audit Manager of KPMG, LLP (formerly Peat Marwick Mitchell) (1977-1983). | Trustee of iShares Trust (since 2007); Director of iShares MSCI Russia Capped ETF, Inc. (since 2010); Trustee of iShares U.S. ETF Trust (since 2011); Independent Chairman of iShares, Trust, iShares MSCI Russia Capped ETF, Inc. and iShares U.S. ETF Trust (since 2012). | |||
Cecilia H. Herbert (65) | Director (since 2005); Nominating and Governance Committee Chair and Equity Plus Committee Chair (since 2012). | Director (1998-2013) and President (2007-2011) of the Board of Directors, Catholic Charities CYO; Trustee (2002-2011) and Chair of the Finance and Investment Committee (2006-2010) of the Thacher School; Member (since 1992) and Chair (1994-2005) of the Investment Committee, Archdiocese of San Francisco; Trustee and Member of the Investment Committee, WNET, the New York public broadcasting/media company (since 2011). | Trustee of iShares Trust (since 2005); Director of iShares MSCI Russia Capped ETF, Inc. (since 2010); Trustee of iShares U.S. ETF Trust (since 2011); Director of Forward Funds (34 portfolios) (since 2009). | |||
Charles A. Hurty (70) | Director (since 2005); Audit Committee Chair (since 2006). | Retired; Partner, KPMG LLP (1968-2001). | Trustee of iShares Trust (since 2005); Director of iShares MSCI Russia Capped ETF, Inc. (since 2010); Trustee of iShares U.S. ETF Trust (since 2011); Director of GMAM Absolute Return Strategy Fund (1 portfolio) (since 2002); Director of SkyBridge Alternative Investments Multi-Adviser Hedge Fund Portfolios LLC (2 portfolios) (since 2002). | |||
John E. Kerrigan (59) | Director (since 2005); Fixed Income Plus Committee Chair (since 2012). | Chief Investment Officer, Santa Clara University (since 2002). | Trustee of iShares Trust (since 2005); Director of iShares MSCI Russia Capped ETF, Inc. (since 2010); Trustee of iShares U.S. ETF Trust (since 2011). | |||
| 120 | 2014 iSHARES ANNUAL REPORTTO SHAREHOLDERS |
Table of Contents
Director and Officer Information (Continued)
iSHARES®, INC.
Independent Directors (Continued)
| Name (Age) | Position(s) | Principal Occupation(s) During the Past 5 Years | Other Directorships Held by Director | |||
John E. Martinez (53) | Director (since 2003); Securities Lending Committee Chair (since 2012). | Director of FirstREX Agreement Corp. (formerly EquityRock, Inc.) (since 2005). | Trustee of iShares Trust (since 2003); Director of iShares MSCI Russia Capped ETF, Inc. (since 2010); Trustee of iShares U.S. ETF Trust (since 2011). | |||
George G.C. Parker (75) | Director (since 2002). | Dean Witter Distinguished Professor of Finance, Emeritus, Stanford University Graduate School of Business (Professor since 1973; Emeritus since 2006). | Trustee of iShares Trust (since 2000); Director of iShares MSCI Russia Capped ETF, Inc. (since 2010); Trustee of iShares U.S. ETF Trust (since 2011); Director of Tejon Ranch Company (since 1999); Director of Threshold Pharmaceuticals (since 2004); Director of Colony Financial, Inc. (since 2009); Director of First Republic Bank (since 2010). | |||
Madhav V. Rajan (50) | Director (since 2011); 15(c) Committee Chair (since 2012). | Robert K. Jaedicke Professor of Accounting and Senior Associate Dean for Academic Affairs and Head of MBA Program, Stanford University Graduate School of Business (since 2001); Professor of Law (by courtesy), Stanford Law School (since 2005); Visiting Professor, University of Chicago (2007-2008). | Trustee of iShares Trust (since 2011); Director of iShares MSCI Russia Capped ETF, Inc. (since 2011); Trustee of iShares U.S. ETF Trust (since 2011); Director, Cavium, Inc. (since 2013). | |||
DIRECTORAND OFFICER INFORMATION | 121 |
Table of Contents
Director and Officer Information (Continued)
iSHARES®, INC.
Officers
| Name (Age) | Position(s) | Principal Occupation(s) During the Past 5 Years | ||
Manish Mehta (43) | President (since 2013). | Managing Director, BlackRock, Inc. (since 2009); Chief Operating Officer for iShares (since 2009); Head of Strategy and Corporate Development, BGI (2005-2009); Chief of Staff to the CEO, BGI (2005-2009). | ||
Jack Gee (54) | Treasurer and Chief Financial Officer (since 2008). | Managing Director, BlackRock, Inc. (since 2009); Senior Director of Fund Administration of Intermediary Investor Business, BGI (2009); Director of Fund Administration of Intermediary Investor Business, BGI (2004-2009). | ||
Edward B. Baer (45) | Vice President and Chief Legal Officer (since 2012). | Managing Director of Legal & Compliance, BlackRock, Inc. (since 2006); Director of Legal & Compliance, BlackRock, Inc. (2004-2006). | ||
Eilleen M. Clavere (62) | Secretary (since 2007). | Director of Global Fund Administration, BlackRock, Inc. (since 2009); Director of Legal Administration of Intermediary Investor Business, BGI (2006-2009); Legal Counsel and Vice President of Atlas Funds, Atlas Advisers, Inc. and Atlas Securities, Inc. (2005-2006); Counsel at Kirkpatrick & Lockhart LLP (2001-2005). | ||
Scott Radell (45) | Executive Vice President (since 2012). | Managing Director, BlackRock, Inc. (since 2009); Head of Portfolio Solutions, BlackRock, Inc. (since 2009); Head of Portfolio Solutions, BGI (2007-2009); Credit Portfolio Manager, BGI (2005-2007); Credit Research Analyst, BGI (2003-2005). | ||
Amy Schioldager (51) | Executive Vice President (since 2007). | Senior Managing Director, BlackRock, Inc. (since 2009); Global Head of Index Equity, BGI (2008-2009); Global Head of U.S. Indexing, BGI (2006-2008); Head of Domestic Equity Portfolio Management, BGI (2001-2006). | ||
Ira P. Shapiro (51) | Vice President (since 2007). | Managing Director, BlackRock, Inc. (since 2009); Head of Strategic Product Initiatives for iShares (since 2012); Chief Legal Officer, Exchange-Traded Fund Complex (2007-2012); Associate General Counsel, BGI (2004-2009). | ||
| 122 | 2014 iSHARES ANNUAL REPORTTO SHAREHOLDERS |
Table of Contents
|
For more information visit www.iShares.com or call 1-800-474-2737
This report is intended for the Funds’ shareholders. It may not be distributed to prospective investors unless it is preceded or accompanied by the current prospectus.
Investing involves risk, including possible loss of principal.
The iShares Funds are distributed by BlackRock Investments, LLC (together with its affiliates, “BlackRock”).
The iShares Funds are not sponsored, endorsed, issued, sold or promoted by MSCI Inc., nor does this company make any representation regarding the advisability of investing in the iShares Funds. BlackRock is not affiliated with the company listed above.
A description of the policies that the Funds use to determine how to vote proxies relating to portfolio securities and information about how the Funds voted proxies relating to portfolio securities during the most recent twelve-month period ending June 30 is available without charge, upon request, by calling toll-free 1-800-474-2737; on the Funds’ website at www.iShares.com; and on the U.S. Securities and Exchange Commission (SEC) website at www.sec.gov.
The Funds file their complete schedules of portfolio holdings with the SEC for the first and third quarters of each fiscal year on Form N-Q. The Funds’ Forms N-Q are available on the SEC’s website or may be reviewed and copied at the SEC’s Public Reference Room in Washington, D.C. Information on the operation of the Public Reference Room may be obtained by calling 1-800-SEC-0330. The Funds also disclose their complete schedules of portfolio holdings on a daily and monthly basis on the Funds’ website.
©2014 BlackRock, Inc. All rights reserved. iSHARES and BLACKROCK are registered trademarks of BlackRock, Inc. or its subsidiaries. All other marks are the property of their respective owners.
iS-AR-810-0814

Table of Contents
AUGUST 31, 2014
2014 ANNUAL REPORT |  |
iShares, Inc.
| Ø | iShares MSCI Emerging Markets ETF | EEM | NYSE Arca |
Table of Contents
| 5 | ||||
| 8 | ||||
| 8 | ||||
| 9 | ||||
| 24 | ||||
| 27 | ||||
| 28 | ||||
| 40 | ||||
| 41 | ||||
| 42 | ||||
| 46 | ||||
| 49 |
Table of Contents
Management’s Discussion of Fund Performance
iSHARES® MSCI EMERGING MARKETS ETF
EMERGING MARKETS OVERVIEW
Stocks of companies in emerging markets gained approximately 20% for the 12-month period ended August 31, 2014 (the “reporting period”). Emerging markets stocks experienced substantial volatility in the first six months of the reporting period, rising sharply during the first two months and then falling back over the ensuing three months. However, emerging markets stocks rallied steadily during the remainder of the reporting period.
Uncertainty regarding the pace of growth in many emerging economies helped contribute to the volatility in emerging markets stocks during the first half of the reporting period. Most notably, economic growth slowed in several bellwether emerging economies, including China, Brazil, and India. In contrast, many developed countries saw their economies strengthen as their central banks maintained or expanded accommodative monetary policies. Weaker economic activity contributed to the decline in emerging markets stocks in late 2013 and early 2014.
During the last six months of the reporting period, however, stocks in emerging markets benefited from greater investor demand. This was driven partly by improving economic growth in many emerging markets as central banks in developing countries began to implement economic stimulus efforts. Furthermore, better economic conditions in developed countries led to stronger demand for exports, and many emerging economies are major exporters to developed nations. These developments helped fuel a recovery in emerging markets stocks over the last half of the reporting period.
From a regional perspective, emerging equity markets in Latin America generated the best returns, gaining 24% for the reporting period. Brazil, the largest equity market in Latin America, led the region’s advance, gaining more than 30%. Much of those gains occurred in the last three months of the reporting period amid optimism about upcoming national elections. Peru, one of the worst-performing markets in 2013, rebounded strongly in the first eight months of 2014. Chile was the only market in the region to decline for the reporting period as economic growth slowed markedly.
Emerging markets in Asia also performed well, returning 22% for the reporting period. Although nearly every market in the region posted double-digit gains, India was the best performer, rising by more than 50% for the reporting period. A meaningful increase in economic activity and stronger corporate earnings growth propelled the Indian stock market to record highs by the end of the reporting period. Other top-performing markets in the region included the Philippines and Thailand. The laggards among emerging markets in Asia included South Korea and Malaysia.
In contrast to other regions, emerging markets stocks in Eastern Europe declined for the reporting period, falling by approximately 3%. Hungary was the weakest-performing market in the region, declining by more than 17% amid continued economic weakness and armed conflict between Russia and Ukraine, which shares a border with Hungary. Russia’s stock market, the largest in the region, also declined in response to these events. On the positive side, equity markets in Greece and the Czech Republic posted double-digit gains as the economies in both countries began to recover after an extended period of weakness.
MANAGEMENT’S DISCUSSIONOF FUND PERFORMANCE | 5 |
Table of Contents
Management’s Discussion of Fund Performance
iSHARES® MSCI EMERGING MARKETS ETF
Performance as of August 31, 2014
| Average Annual Total Returns | Cumulative Total Returns | |||||||||||||||||||||||||
| NAV | MARKET | INDEX | NAV | MARKET | INDEX | |||||||||||||||||||||
1 Year | 19.34% | 20.48% | 19.98% | 19.34% | 20.48% | 19.98% | ||||||||||||||||||||
5 Years | 6.84% | 6.90% | 7.90% | 39.21% | 39.61% | 46.26% | ||||||||||||||||||||
10 Years | 11.55% | 11.57% | 12.16% | 198.39% | 198.90% | 215.01% | ||||||||||||||||||||
GROWTH OF $10,000 INVESTMENT
(AT NET ASSET VALUE)
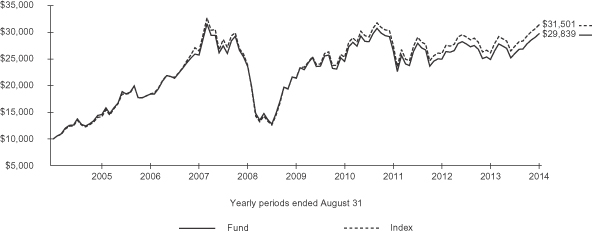
Past performance is no guarantee of future results. Performance results do not reflect the deduction of taxes that a shareholder would pay on fund distributions or on the redemption or sale of fund shares. See “About Fund Performance” on page 8 for more information.
| Shareholder Expenses | ||||||||||||||||||||||||||
| Actual | Hypothetical 5% Return | |||||||||||||||||||||||||
| Beginning Account Value (3/1/14) | Ending Account Value (8/31/14) | Expenses Paid During Period a | Beginning Account Value (3/1/14) | Ending Account Value (8/31/14) | Expenses Paid During Period a | Annualized Expense Ratio | ||||||||||||||||||||
| $ | 1,000.00 | $ | 1,143.30 | $ | 3.67 | $ | 1,000.00 | $ | 1,021.80 | $ | 3.47 | 0.68% | ||||||||||||||
| a | Expenses are calculated using the Fund’s annualized expense ratio (as disclosed in the table), multiplied by the average account value for the period, multiplied by the number of days in the period (184 days) and divided by the number of days in the year (365 days). See “Shareholder Expenses” on page 8 for more information. |
| 6 | 2014 iSHARES ANNUAL REPORTTO SHAREHOLDERS |
Table of Contents
Management’s Discussion of Fund Performance (Continued)
iSHARES® MSCI EMERGING MARKETS ETF
The iShares MSCI Emerging Markets ETF (the “Fund”) seeks to track the investment results of an index composed of large- and mid-capitalization emerging market equities, as represented by the MSCI Emerging Markets Index (the “Index”). The Fund invests in a representative sample of securities included in the Index that collectively has an investment profile similar to the Index. Due to the use of representative sampling, the Fund may or may not hold all of the securities that are included in the Index. For the 12-month reporting period ended August 31, 2014, the total return for the Fund was 19.34%, net of fees, while the total return for the Index was 19.98%.
As represented by the Index, emerging markets stocks returned approximately 20% for the reporting period. Of the 25 countries represented in the Index, 19 generated positive returns for the reporting period, including the three largest countries: China, South Korea, and Taiwan, which together comprised more than 45% of the Index on average during the reporting period. The markets that provided the strongest results within the Index included India and Brazil, which produced returns of 52% and 33%, respectively, for the reporting period.
Among the countries which declined within the Index, Hungary was the weakest performer, falling by 17% during the reporting period. Russia and Chile were also notable decliners within the Index.
From a sector perspective, information technology stocks (the Index’s second-largest sector weighting as of August 31, 2014) and health care stocks both returned more than 30% for the reporting period. The utilities sector also generated strong returns, gaining more than 25%. Declining demand and lower prices for commodities weighed on the energy and materials sectors, which produced the lowest returns in the Index.
Currency fluctuations relative to the U.S. dollar had a modestly positive impact on Index performance for the reporting period. In local currency terms, the Index returned 17.84% for the reporting period. The U.S. dollar was largely unchanged against the Chinese yuan and Taiwan dollar, but it declined by 6% versus the Brazilian real and 8.5% against the South Korean won for the reporting period. A weaker U.S. dollar increases international equity returns for U.S. investors.
PORTFOLIO ALLOCATION
As of 8/31/14
| Sector | Percentage of Total Investments* |
Financials | 27.53 | % | ||
Information Technology | 16.63 | |||
Energy | 10.58 | |||
Consumer Discretionary | 9.26 | |||
Materials | 8.48 | |||
Consumer Staples | 8.20 | |||
Telecommunication Services | 7.53 | |||
Industrials | 6.40 | |||
Utilities | 3.51 | |||
Health Care | 1.88 | |||
|
| |||
TOTAL | 100.00 | % | ||
|
|
TEN LARGEST COUNTRY ALLOCATIONS
As of 8/31/14
| Country | Percentage of Total Investments* |
China | 19.06 | % | ||
South Korea | 15.13 | |||
Taiwan | 11.89 | |||
Brazil | 11.80 | |||
South Africa | 7.51 | |||
India | 6.66 | |||
Mexico | 5.25 | |||
Russia | 4.55 | |||
Malaysia | 3.79 | |||
Indonesia | 2.54 | |||
|
| |||
TOTAL | 88.18 | % | ||
|
|
| * | Excludes money market funds. |
MANAGEMENT’S DISCUSSIONOF FUND PERFORMANCE | 7 |
Table of Contents
Past performance is no guarantee of future results. Current performance may be lower or higher than the performance data quoted. Performance data current to the most recent month-end is available at www.iShares.com. Performance results assume reinvestment of all dividends and capital gain distributions and do not reflect the deduction of taxes that a shareholder would pay on fund distributions or on the redemption or sale of fund shares. The investment return and principal value of shares will vary with changes in market conditions. Shares may be worth more or less than their original cost when they are redeemed or sold in the market. Performance for certain funds may reflect a waiver of a portion of investment management fees. Without such waiver, performance would have been lower.
Net asset value or “NAV” is the value of one share of a fund as calculated in accordance with the standard formula for valuing mutual fund shares. The price used to calculate market return (“Market Price”) is determined by using the midpoint between the highest bid and the lowest offer on the primary stock exchange on which shares of a fund are listed for trading, as of the time that such fund’s NAV is calculated. Since shares of a fund may not have traded in the secondary market until after the fund’s inception, for the period from inception to the first day of secondary trading, the NAV of the fund is used as a proxy for the Market Price to calculate market returns. Market and NAV returns assume that dividends and capital gain distributions have been reinvested at Market Price and NAV, respectively.
An index is a statistical composite that tracks a specified financial market or sector. Unlike a fund, an index does not actually hold a portfolio of securities and therefore does not incur the expenses incurred by a fund. These expenses negatively impact fund performance. Also, market returns do not include brokerage commissions that may be payable on secondary market transactions. If brokerage commissions were included, market returns would be lower.
As a shareholder of the Fund, you incur two types of costs: (1) transaction costs, including brokerage commissions on purchases and sales of fund shares and (2) ongoing costs, including management fees and other fund expenses. The expense example, which is based on an investment of $1,000 invested on March 1, 2014 and held through August 31, 2014, is intended to help you understand your ongoing costs (in dollars and cents) of investing in the Fund and to compare these costs with the ongoing costs of investing in other funds.
Actual Expenses — The table provides information about actual account values and actual expenses. Annualized expense ratios reflect contractual and voluntary fee waivers, if any. To estimate the expenses that you paid on your account over the period, simply divide your account value by $1,000 (for example, an $8,600 account value divided by $1,000 = 8.6), then multiply the result by the number for your Fund under the heading entitled “Expenses Paid During Period.”
Hypothetical Example for Comparison Purposes — The table also provides information about hypothetical account values and hypothetical expenses based on the Fund’s actual expense ratio and an assumed rate of return of 5% per year before expenses. You may use this information to compare the ongoing costs of investing in your Fund and other funds. To do so, compare this 5% hypothetical example with the 5% hypothetical examples that appear in the shareholder reports of the other funds.
Please note that the expenses shown in the table are meant to highlight your ongoing costs only and do not reflect any transactional costs, such as brokerage commissions paid on purchases and sales of fund shares. Therefore, the hypothetical examples are useful in comparing ongoing costs only and will not help you determine the relative total costs of owning different funds. In addition, if these transactional costs were included, your costs would have been higher.
| 8 | 2014 iSHARES ANNUAL REPORTTO SHAREHOLDERS |
Table of Contents
Consolidated Schedule of Investments
iSHARES® MSCI EMERGING MARKETS ETF
August 31, 2014
| Security | Shares | Value | ||||||
COMMON STOCKS — 93.18% |
| |||||||
BRAZIL — 6.70% |
| |||||||
ALL – America Latina Logistica SA | 4,714,900 | $ | 17,384,159 | |||||
AMBEV SA | 49,028,715 | 357,162,099 | ||||||
B2W Companhia Global do Varejoa | 955,000 | 16,175,951 | ||||||
Banco Bradesco SA | 6,779,440 | 121,254,581 | ||||||
Banco do Brasil SA | 8,868,574 | 138,683,562 | ||||||
Banco Santander (Brasil) SA Units | 10,117,880 | 69,907,901 | ||||||
BB Seguridade Participacoes SA | 7,227,400 | 115,442,013 | ||||||
BM&F Bovespa SA | 19,560,000 | 118,013,005 | ||||||
BR Malls Participacoes SA | 4,493,700 | 46,733,436 | ||||||
BR Properties SA | 1,982,700 | 13,202,936 | ||||||
BRF SA | 6,923,985 | 185,357,512 | ||||||
CCR SA | 9,503,100 | 86,046,259 | ||||||
Centrais Eletricas Brasileiras SA | 2,823,837 | 10,285,478 | ||||||
CETIP SA – Mercados Organizados | 2,193,734 | 32,010,643 | ||||||
Cielo SA | 7,308,724 | 137,057,969 | ||||||
Companhia de Saneamento Basico do Estado de Sao Paulo | 3,622,524 | 34,629,746 | ||||||
Companhia de Saneamento de Minas Gerais SA | 448,700 | 8,021,273 | ||||||
Companhia Siderurgica Nacional SA | 7,562,428 | 33,189,445 | ||||||
Cosan SA Industria e Comercio | 1,328,700 | 27,612,590 | ||||||
CPFL Energia SA | 2,403,136 | 24,261,734 | ||||||
Cyrela Brazil Realty SA Empreendimentos e Participacoes | 2,945,900 | 18,682,184 | ||||||
Duratex SA | 3,573,655 | 16,083,085 | ||||||
EcoRodovias Infraestrutura e Logistica SA | 2,022,200 | 12,923,716 | ||||||
EDP Energias do Brasil SA | 2,852,900 | 14,407,620 | ||||||
Embraer SA | 6,369,200 | 62,082,301 | ||||||
Estacio Participacoes SA | 2,883,600 | 38,313,972 | ||||||
Fibria Celulose SAa | 2,763,461 | 28,751,703 | ||||||
Hypermarcas SAa | 3,463,500 | 30,122,102 | ||||||
| Security | Shares | Value | ||||||
JBS SA | 7,169,465 | $ | 32,426,085 | |||||
Klabin SA | 4,843,100 | 24,609,974 | ||||||
Kroton Educacional SA | 3,524,395 | 105,611,354 | ||||||
Localiza Rent A Car SA | 1,369,089 | 24,383,007 | ||||||
Lojas Americanas SA | 1,320,375 | 7,671,281 | ||||||
Lojas Renner SA | 1,320,700 | 45,224,479 | ||||||
M Dias Branco SA | 240,300 | 10,846,819 | ||||||
Multiplan Empreendimentos Imobiliarios SA | 790,900 | 20,398,578 | ||||||
Natura Cosmeticos SA | 1,857,800 | 34,049,911 | ||||||
Odontoprev SA | 3,348,500 | 14,605,868 | ||||||
Petroleo Brasileiro SA | 30,936,074 | 306,104,748 | ||||||
Porto Seguro SA | 1,218,800 | 18,073,243 | ||||||
Qualicorp SAa | 2,032,600 | 25,435,320 | ||||||
Raia Drogasil SA | 1,986,500 | 19,354,070 | ||||||
Souza Cruz SA | 4,060,200 | 38,033,471 | ||||||
Sul America SA Units | 1,561,065 | 10,792,910 | ||||||
TIM Participacoes SA | 9,084,276 | 50,952,007 | ||||||
Totvs SA | 1,275,400 | 23,290,136 | ||||||
Tractebel Energia SA | 1,699,000 | 28,481,817 | ||||||
Transmissora Alianca de Energia Eletrica SA | 582,500 | 6,076,088 | ||||||
Ultrapar Participacoes SA | 3,533,000 | 91,090,152 | ||||||
Vale SA | 13,614,748 | 177,185,521 | ||||||
Via Varejo SAa | 682,700 | 7,627,762 | ||||||
WEG SA | 2,902,010 | 36,301,875 | ||||||
|
| |||||||
| 2,972,425,451 | ||||||||
CHILE — 1.29% |
| |||||||
AES Gener SA | 26,459,574 | 13,526,864 | ||||||
Aguas Andinas SA Series A | 25,681,778 | 16,105,610 | ||||||
Banco de Chile | 250,839,136 | 30,610,518 | ||||||
Banco de Credito e Inversiones | 354,265 | 19,307,862 | ||||||
Banco Santander (Chile) SA | 724,533,055 | 42,928,032 | ||||||
CAP SA | 792,020 | 9,409,691 | ||||||
Cencosud SA | 12,334,771 | 37,010,570 | ||||||
Colbun SA | 72,389,581 | 18,945,653 | ||||||
Compania Cervecerias Unidas SA | 1,352,797 | 14,530,101 | ||||||
CorpBanca SA | 1,559,548,234 | 19,163,404 | ||||||
Empresa Nacional de Electricidad SA | 35,764,185 | 54,640,466 | ||||||
Empresa Nacional de Telecomunicaciones SA | 1,264,698 | 14,508,101 | ||||||
CONSOLIDATED SCHEDULEOF INVESTMENTS | 9 |
Table of Contents
Consolidated Schedule of Investments (Continued)
iSHARES® MSCI EMERGING MARKETS ETF
August 31, 2014
| Security | Shares | Value | ||||||
Empresas CMPC SA | 13,146,940 | $ | 32,725,077 | |||||
Empresas Copec SA | 4,682,573 | 58,858,375 | ||||||
Enersis SA | 215,440,405 | 72,522,617 | ||||||
LATAM Airlines Group SAa | 3,280,936 | 40,588,962 | ||||||
S.A.C.I. Falabella SA | 9,480,444 | 71,395,085 | ||||||
Vina Concha y Toro SA | 3,330,034 | 6,494,524 | ||||||
|
| |||||||
| 573,271,512 | ||||||||
CHINA — 18.98% |
| |||||||
AAC Technologies Holdings Inc.b | 7,291,500 | 47,558,476 | ||||||
Agile Property Holdings Ltd. | 15,620,000 | 12,253,905 | ||||||
Agricultural Bank of China Ltd. Class H | 225,030,000 | 103,947,330 | ||||||
Air China Ltd. Class H | 19,382,000 | 12,004,103 | ||||||
Alibaba Pictures Group Ltd.a,b | 45,210,000 | 9,391,831 | ||||||
Aluminum Corp. of China Ltd. Class Ha,b | 39,130,000 | 16,610,995 | ||||||
Anhui Conch Cement Co. Ltd. Class Hb | 13,129,500 | 47,434,695 | ||||||
Anta Sports Products Ltd.b | 10,001,402 | 19,202,320 | ||||||
AviChina Industry & Technology Co. Ltd. Class H | 20,580,000 | 12,268,098 | ||||||
Bank of China Ltd. Class H | 813,508,000 | 377,880,273 | ||||||
Bank of Communications Co. Ltd. Class H | 90,576,600 | 66,148,856 | ||||||
BBMG Corp. Class H | 11,282,500 | 8,414,398 | ||||||
Beijing Capital International Airport Co. Ltd. Class H | 24,294,000 | 18,995,973 | ||||||
Beijing Enterprises Holdings Ltd. | 5,901,500 | 50,866,138 | ||||||
Beijing Enterprises Water Group Ltd. | 37,318,000 | 25,423,900 | ||||||
Belle International Holdings Ltd.b | 47,484,000 | 60,717,075 | ||||||
Biostime International Holdings Ltd.b | 1,592,500 | 5,948,643 | ||||||
Brilliance China Automotive Holdings Ltd. | 30,336,000 | 56,208,584 | ||||||
BYD Co. Ltd. Class Hb | �� | 6,389,000 | 45,381,631 | |||||
China Agri-Industries Holdings Ltd.b | 29,346,600 | 12,003,474 | ||||||
| Security | Shares | Value | ||||||
China BlueChemical Ltd. Class H | 13,522,000 | $ | 6,664,908 | |||||
China Cinda Asset Management Co. Ltd.a,b | 42,437,000 | 21,738,275 | ||||||
China CITIC Bank Corp. Ltd. Class H | 85,298,800 | 53,819,750 | ||||||
China Coal Energy Co. Class Hb | 41,247,000 | 25,120,267 | ||||||
China Communications Construction Co. Ltd. Class H | 47,362,000 | 34,527,758 | ||||||
China Communications Services Corp. Ltd. Class H | 19,650,000 | 9,482,526 | ||||||
China Construction Bank Corp. Class H | 750,622,760 | 557,871,409 | ||||||
China COSCO Holdings Co. Ltd. Class Ha,b | 27,692,000 | 11,934,128 | ||||||
China Everbright Bank Co. Ltd. | 12,208,000 | 5,702,207 | ||||||
China Everbright International Ltd.b | 25,701,000 | 35,217,979 | ||||||
China Everbright Ltd.b | 12,670,000 | 24,031,664 | ||||||
China Gas Holdings Ltd. | 23,734,000 | 42,261,014 | ||||||
China Huishan Dairy Holdings Co. Ltd.a,b | 38,329,000 | 8,902,047 | ||||||
China International Marine Containers (Group) Co. Ltd. Class H | 2,694,400 | 5,798,932 | ||||||
China Life Insurance Co. Ltd. Class H | 77,443,000 | 222,332,052 | ||||||
China Longyuan Power Group Corp. Ltd. Class H | 27,857,000 | 30,120,922 | ||||||
China Mengniu Dairy Co. Ltd. | 14,932,000 | 69,263,872 | ||||||
China Merchants Bank Co. Ltd. Class H | 47,271,467 | 90,393,494 | ||||||
China Merchants Holdings (International) Co. Ltd.b | 12,506,000 | 41,470,707 | ||||||
China Minsheng Banking Corp. Ltd. Class Hb | 64,289,040 | 60,389,052 | ||||||
China Mobile Ltd. | 62,642,000 | 779,170,571 | ||||||
China National Building Material Co. Ltd. Class H | 28,060,000 | 25,778,495 | ||||||
China Oilfield Services Ltd. Class H | 18,034,000 | 53,402,876 | ||||||
| 10 | 2014 iSHARES ANNUAL REPORTTO SHAREHOLDERS |
Table of Contents
Consolidated Schedule of Investments (Continued)
iSHARES® MSCI EMERGING MARKETS ETF
August 31, 2014
| Security | Shares | Value | ||||||
China Overseas Land & Investment Ltd.b | 42,430,960 | $ | 119,351,874 | |||||
China Pacific Insurance (Group) Co. Ltd. Class H | 27,908,600 | 104,790,263 | ||||||
China Petroleum & Chemical Corp. Class H | 266,136,800 | 269,909,001 | ||||||
China Railway Construction Corp. Ltd. Class H | 20,229,500 | 19,367,740 | ||||||
China Railway Group Ltd. Class H | 39,168,000 | 20,265,889 | ||||||
China Resources Cement Holdings Ltd.b | 23,330,000 | 16,044,709 | ||||||
China Resources Enterprise Ltd.b | 13,494,000 | 36,302,510 | ||||||
China Resources Gas Group Ltd. | 9,426,000 | 27,426,089 | ||||||
China Resources Land Ltd.b | 21,468,000 | 49,139,993 | ||||||
China Resources Power Holdings Co. Ltd. | 21,072,999 | 63,761,582 | ||||||
China Shenhua Energy Co. Ltd. Class H | 34,397,000 | 99,194,590 | ||||||
China Shipping Container Lines Co. Ltd. Class Ha,b | 42,190,000 | 12,030,722 | ||||||
China State Construction International Holdings Ltd. | 17,930,000 | 28,918,795 | ||||||
China Taiping Insurance Holdings Co. Ltd.a | 8,015,600 | 19,505,973 | ||||||
China Telecom Corp. Ltd. Class H | 141,792,000 | 87,634,908 | ||||||
China Unicom (Hong Kong) Ltd. | 49,152,000 | 87,647,418 | ||||||
China Vanke Co. Ltd.a,b | 11,502,431 | 21,549,944 | ||||||
Chongqing Changan Automobile Co. Ltd. | 6,936,556 | 14,320,355 | ||||||
Chongqing Rural Commercial Bank Co. Ltd. Class H | 25,853,000 | 12,842,855 | ||||||
CITIC 21CN Co. Ltd.a | 21,796,000 | 17,155,229 | ||||||
CITIC Pacific Ltd.b | 22,154,000 | 43,106,562 | ||||||
CITIC Securities Co. Ltd. Class Hb | 11,380,500 | 27,018,987 | ||||||
CNOOC Ltd. | 184,540,000 | 370,977,749 | ||||||
COSCO Pacific Ltd. | 16,088,000 | 22,543,522 | ||||||
| Security | Shares | Value | ||||||
Country Garden Holdings Co. Ltd.b | 47,600,381 | $ | 21,128,018 | |||||
CSPC Pharmaceutical Group Ltd. | 15,984,000 | 13,364,428 | ||||||
CSR Corp Ltd. Class H | 19,715,000 | 17,781,314 | ||||||
Datang International Power Generation Co. Ltd. Class H | 29,162,000 | 16,179,893 | ||||||
Dongfeng Motor Group Co. Ltd. Class H | 30,784,000 | 57,038,669 | ||||||
ENN Energy Holdings Ltd.b | 8,280,000 | 58,493,061 | ||||||
Evergrande Real Estate Group Ltd.b | 68,761,388 | 28,746,140 | ||||||
Far East Horizon Ltd. | 13,728,000 | 11,070,753 | ||||||
Fosun International Ltd.b | 16,277,500 | 19,994,684 | ||||||
Franshion Properties (China) Ltd.b | 27,548,000 | 7,464,475 | ||||||
GCL-Poly Energy Holdings Ltd.a,b | 103,280,000 | 37,180,080 | ||||||
Geely Automobile Holdings Ltd.b | 48,535,000 | 18,599,505 | ||||||
Golden Eagle Retail Group Ltd.b | 6,710,000 | 8,250,976 | ||||||
GOME Electrical Appliances Holdings Ltd.b | 105,372,200 | 18,762,687 | ||||||
Great Wall Motor Co. Ltd. Class H | 10,815,500 | 45,912,653 | ||||||
Guangdong Investment Ltd. | 30,666,110 | 37,075,599 | ||||||
Guangzhou Automobile Group Co. Ltd. Class H | 24,018,742 | 24,979,008 | ||||||
Guangzhou R&F Properties Co. Ltd. Class H | 10,320,400 | 12,437,506 | ||||||
Haier Electronics Group Co. Ltd.b | 10,104,000 | 29,203,254 | ||||||
Haitian International Holdings Ltd.b | 3,314,000 | 8,637,613 | ||||||
Haitong Securities Co. Ltd. Class H | 11,796,800 | 18,844,072 | ||||||
Hanergy Solar Group Ltd.a,b | 120,572,000 | 19,757,868 | ||||||
Hengan International Group Co. Ltd. | 7,793,500 | 83,112,298 | ||||||
Huaneng Power International Inc. Class H | 35,304,000 | 42,455,085 | ||||||
Industrial and Commercial Bank of China Ltd. Class H | 766,193,085 | 508,149,192 | ||||||
CONSOLIDATED SCHEDULEOF INVESTMENTS | 11 |
Table of Contents
Consolidated Schedule of Investments (Continued)
iSHARES® MSCI EMERGING MARKETS ETF
August 31, 2014
| Security | Shares | Value | ||||||
Inner Mongolia Yitai Coal Co. Ltd. Class B | 10,359,754 | $ | 17,497,624 | |||||
Intime Retail Group Co. Ltd.b | 10,775,500 | 9,802,039 | ||||||
Jiangsu Expressway Co. Ltd. Class H | 10,996,000 | 12,528,103 | ||||||
Jiangxi Copper Co. Ltd. Class H | 15,705,000 | 27,761,850 | ||||||
Kingboard Chemical Holdings Co. Ltd. | 6,464,100 | 13,428,387 | ||||||
Kingsoft Corp. Ltd.b | 6,220,000 | 17,816,945 | ||||||
Kunlun Energy Co. Ltd.b | 33,880,000 | 55,955,562 | ||||||
Lee & Man Paper Manufacturing Ltd.b | 15,114,000 | 8,892,710 | ||||||
Lenovo Group Ltd.b | 66,620,000 | 101,776,198 | ||||||
Longfor Properties Co. Ltd. | 16,467,500 | 21,035,496 | ||||||
New China Life Insurance Co. Ltd. Class H | 7,548,100 | 26,929,152 | ||||||
New World China Land Ltd. | 15,310,000 | 9,383,367 | ||||||
Nine Dragons Paper (Holdings) Ltd.b | 17,162,000 | 13,397,173 | ||||||
People’s Insurance Co. Group of China Ltd. Class H | 52,687,000 | 22,026,139 | ||||||
PetroChina Co. Ltd. Class H | 219,010,000 | 310,846,887 | ||||||
PICC Property and Casualty Co. Ltd. Class H | 34,231,200 | 56,800,608 | ||||||
Ping An Insurance (Group) Co. of China Ltd. Class H | 20,484,000 | 166,776,179 | ||||||
Poly Property Group Co. Ltd.b | 22,657,458 | 9,852,149 | ||||||
Shandong Weigao Group Medical Polymer Co. Ltd. Class H | 17,724,000 | 17,952,349 | ||||||
Shanghai Electric Group Co. Ltd. Class H | 22,670,000 | 9,945,356 | ||||||
Shanghai Fosun Pharmaceutical (Group) Co. Ltd. | 3,046,500 | 9,905,847 | ||||||
Shanghai Industrial Holdings Ltd. | 7,003,000 | 23,357,941 | ||||||
Shanghai Pharmaceuticals Holding Co. Ltd. Class H | 7,018,900 | 14,399,787 | ||||||
| Security | Shares | Value | ||||||
Shenzhou International Group Holdings Ltd.b | 4,625,000 | $ | 14,411,818 | |||||
Shimao Property Holdings Ltd. | 15,558,500 | 34,248,113 | ||||||
Shui On Land Ltd. | 59,305,600 | 15,533,940 | ||||||
Sihuan Pharmaceutical Holdings Group Ltd. | 49,172,000 | 32,928,741 | ||||||
Sino Biopharmaceutical Ltd. | 31,732,000 | 29,233,819 | ||||||
Sino-Ocean Land Holdings Ltd.b | 42,704,000 | 24,134,181 | ||||||
Sinopec Engineering Group Co. Ltd. | 8,396,500 | 9,577,242 | ||||||
Sinopec Shanghai Petrochemical Co. Ltd. Class H | 45,481,000 | 15,199,163 | ||||||
Sinopharm Group Co. Ltd. Class H | 10,033,600 | 35,019,823 | ||||||
SOHO China Ltd.b | 28,523,000 | 23,333,203 | ||||||
Sun Art Retail Group Ltd.b | 23,811,500 | 28,419,627 | ||||||
Tencent Holdings Ltd. | 53,261,900 | 869,354,832 | ||||||
Tingyi (Cayman Islands) Holding Corp.b | 21,244,000 | 59,619,104 | ||||||
Tsingtao Brewery Co. Ltd. Class H | 3,954,000 | 30,024,309 | ||||||
Uni-President China Holdings Ltd.b | 10,492,800 | 9,477,184 | ||||||
Want Want China Holdings Ltd.b | 64,250,000 | 79,668,458 | ||||||
Weichai Power Co. Ltd. Class H | 4,587,200 | 18,585,199 | ||||||
Yanzhou Coal Mining Co. Ltd. Class Hb | 19,678,800 | 16,656,830 | ||||||
Yingde Gases Group Co. Ltd.b | 10,379,000 | 11,101,967 | ||||||
Yuexiu Property Co. Ltd.b | 55,510,000 | 11,889,654 | ||||||
Zhejiang Expressway Co. Ltd. Class H | 23,190,000 | 23,069,863 | ||||||
Zhongsheng Group Holdings Ltd.b | 6,555,500 | 7,265,891 | ||||||
Zhuzhou CSR Times Electric Co. Ltd. Class H | 5,463,500 | 18,928,018 | ||||||
Zijin Mining Group Co. Ltd. Class H | 68,096,000 | 17,748,549 | ||||||
Zoomlion Heavy Industry Science and Technology Co. Ltd. Class Hb | 11,758,240 | 7,327,897 | ||||||
| 12 | 2014 iSHARES ANNUAL REPORTTO SHAREHOLDERS |
Table of Contents
Consolidated Schedule of Investments (Continued)
iSHARES® MSCI EMERGING MARKETS ETF
August 31, 2014
| Security | Shares | Value | ||||||
ZTE Corp. Class Hb | 6,806,000 | $ | 15,332,963 | |||||
|
| |||||||
| 8,415,639,929 | ||||||||
COLOMBIA — 0.71% |
| |||||||
Almacenes Exito SA | 2,076,043 | 35,342,889 | ||||||
Bancolombia SA SP ADR | 125,588 | 7,947,209 | ||||||
Cementos Argos SA | 4,262,073 | 25,104,342 | ||||||
Cemex Latam Holdings SAa | 1,296,716 | 12,842,453 | ||||||
Corporacion Financiera Colombiana SA NVS | 917,095 | 19,551,818 | ||||||
Ecopetrol SA | 53,064,979 | 91,970,630 | ||||||
Grupo Argos SA | 2,811,888 | 34,854,542 | ||||||
Grupo Inversiones Suramericana SA | 2,480,410 | 57,017,947 | ||||||
Interconexion Electrica SA ESP | 3,454,516 | 17,466,604 | ||||||
Isagen SA ESP | 8,464,719 | 12,663,214 | ||||||
|
| |||||||
| 314,761,648 | ||||||||
CZECH REPUBLIC — 0.24% |
| |||||||
CEZ AS | 1,808,547 | 52,575,788 | ||||||
Komercni Banka AS | 183,908 | 42,770,723 | ||||||
O2 Czech Republic AS | 655,264 | 9,205,723 | ||||||
|
| |||||||
| 104,552,234 | ||||||||
EGYPT — 0.15% |
| |||||||
Global Telecom Holding SAE GDRa | 19,076,478 | 68,446,403 | ||||||
|
| |||||||
| 68,446,403 | ||||||||
GREECE — 0.68% |
| |||||||
Alpha Bank AEa | 39,479,599 | 34,633,690 | ||||||
Eurobank Ergasias SAa | 82,540,477 | 35,117,315 | ||||||
Folli Follie Groupa | 337,602 | 14,007,718 | ||||||
Hellenic Telecommunications Organization SAa | 2,498,563 | 35,807,253 | ||||||
Jumbo SAa | 1,072,839 | 15,827,211 | ||||||
National Bank of Greece SAa | 16,274,025 | 55,948,352 | ||||||
OPAP SA | 2,254,483 | 35,902,532 | ||||||
Piraeus Bank SAa | 21,849,424 | 43,170,101 | ||||||
Public Power Corp. SAa | 1,204,930 | 17,537,832 | ||||||
Titan Cement Co. SA | 448,750 | 11,999,200 | ||||||
|
| |||||||
| 299,951,204 | ||||||||
HUNGARY — 0.19% |
| |||||||
MOL Hungarian Oil and Gas PLC | 496,924 | 24,484,222 | ||||||
OTP Bank PLC | 2,355,090 | 40,711,977 | ||||||
| Security | Shares | Value | ||||||
Richter Gedeon Nyrt | 1,151,156 | $ | 18,525,086 | |||||
|
| |||||||
| 83,721,285 | ||||||||
INDIA — 6.63% |
| |||||||
ACC Ltd. | 465,589 | 11,452,124 | ||||||
Adani Enterprises Ltd. | 1,386,677 | 10,943,962 | ||||||
Adani Ports & Special Economic Zone Ltd. | 4,352,384 | 20,287,934 | ||||||
Aditya Birla Nuvo Ltd. | 321,522 | 7,703,175 | ||||||
Ambuja Cements Ltd. | 7,057,346 | 23,993,581 | ||||||
Apollo Hospitals Enterprise Ltd. | 754,123 | 14,580,374 | ||||||
Asian Paints Ltd. | 3,061,522 | 31,493,112 | ||||||
Aurobindo Pharma Ltd. | 1,233,805 | 16,623,225 | ||||||
Bajaj Auto Ltd. | 844,755 | 31,444,432 | ||||||
Bharat Heavy Electricals Ltd. | 6,028,483 | 23,933,117 | ||||||
Bharat Petroleum Corp. Ltd. | 1,880,787 | 21,519,947 | ||||||
Bharti Airtel Ltd. | 6,295,572 | 38,366,884 | ||||||
Cairn India Ltd. | 4,747,488 | 25,525,181 | ||||||
Cipla Ltd. | 3,698,509 | 31,341,024 | ||||||
Coal India Ltd. | 5,304,742 | 31,130,828 | ||||||
Dabur India Ltd. | 3,774,842 | 14,469,813 | ||||||
Divi’s Laboratories Ltd. | 447,291 | 11,534,255 | ||||||
DLF Ltd. | 4,421,162 | 12,918,128 | ||||||
Dr. Reddy’s Laboratories Ltd. | 1,145,446 | 55,647,005 | ||||||
GAIL (India) Ltd. | 3,640,647 | 26,602,882 | ||||||
GlaxoSmithKline Consumer Healthcare Ltd. | 62,077 | 5,455,369 | ||||||
Godrej Consumer Products Ltd. | 1,202,367 | 19,536,482 | ||||||
HCL Technologies Ltd. | 2,533,859 | 68,096,417 | ||||||
HDFC Bank Ltd. | 4,486,807 | 62,373,864 | ||||||
Hero Motocorp Ltd. | 568,346 | 24,397,292 | ||||||
Hindalco Industries Ltd. | 11,344,858 | 31,802,247 | ||||||
Hindustan Unilever Ltd. | 7,298,082 | 89,295,665 | ||||||
Housing Development Finance Corp. Ltd. | 15,642,460 | 276,991,155 | ||||||
ICICI Bank Ltd. | 2,360,455 | 60,559,597 | ||||||
Idea Cellular Ltd. | 8,846,117 | 23,602,280 | ||||||
Infosys Ltd. | 4,778,679 | 283,413,151 | ||||||
ITC Ltd. | 23,183,272 | 135,745,164 | ||||||
Jaiprakash Associates Ltd. | 10,333,808 | 7,918,953 | ||||||
Jindal Steel & Power Ltd. | 3,734,898 | 14,341,319 | ||||||
CONSOLIDATED SCHEDULEOF INVESTMENTS | 13 |
Table of Contents
Consolidated Schedule of Investments (Continued)
iSHARES® MSCI EMERGING MARKETS ETF
August 31, 2014
| Security | Shares | Value | ||||||
JSW Steel Ltd. | 914,154 | $ | 18,735,035 | |||||
Larsen & Toubro Ltd. | 3,396,372 | 85,441,032 | ||||||
LIC Housing Finance Ltd. | 3,395,004 | 16,933,058 | ||||||
Mahindra & Mahindra Financial Services Ltd. | 2,513,945 | 11,571,273 | ||||||
Mahindra & Mahindra Ltd. | 3,364,106 | 78,015,326 | ||||||
Nestle India Ltd. | 159,654 | 15,861,604 | ||||||
NTPC Ltd. | 14,790,304 | 33,490,240 | ||||||
Oil & Natural Gas Corp. Ltd. | 8,097,881 | 58,051,718 | ||||||
Oil India Ltd. | 807,592 | 8,190,378 | ||||||
Piramal Enterprises Ltd. | 448,420 | 5,092,759 | ||||||
Power Finance Corp. Ltd. | 2,594,309 | 10,692,760 | ||||||
Power Grid Corp. of India Ltd. | 11,140,550 | 23,720,485 | ||||||
Ranbaxy Laboratories Ltd.a | 1,380,729 | 14,578,660 | ||||||
Reliance Capital Ltd. | 1,030,587 | 8,981,121 | ||||||
Reliance Communications Ltd. | 6,655,923 | 12,723,913 | ||||||
Reliance Industries Ltd. | 13,404,957 | 220,625,091 | ||||||
Reliance Infrastructure Ltd. | 938,789 | 10,818,971 | ||||||
Reliance Power Ltd.a | 5,295,592 | 6,506,038 | ||||||
Rural Electrification Corp. Ltd. | 3,073,246 | 13,591,061 | ||||||
Sesa Sterlite Ltd. | 11,585,268 | 52,914,585 | ||||||
Shriram Transport Finance Co. Ltd. | 1,424,466 | 21,224,966 | ||||||
Siemens Ltd. | 633,964 | 8,298,576 | ||||||
State Bank of India | 1,505,813 | 61,063,844 | ||||||
Sun Pharmaceuticals Industries Ltd. | 7,177,656 | 101,164,968 | ||||||
Tata Consultancy Services Ltd. | 4,923,026 | 204,640,650 | ||||||
Tata Motors Ltd. | 8,152,201 | 70,539,109 | ||||||
Tata Power Co. Ltd. | 10,922,633 | 15,588,332 | ||||||
Tata Steel Ltd. | 3,107,218 | 26,276,679 | ||||||
Tech Mahindra Ltd. | 766,192 | 29,837,042 | ||||||
Ultratech Cement Ltd. | 546,226 | 22,954,905 | ||||||
United Breweries Ltd. | 693,851 | 8,087,115 | ||||||
United Spirits Ltd. | 587,276 | 23,208,919 | ||||||
Wipro Ltd. | 6,402,766 | 59,643,432 | ||||||
Yes Bank Ltd. | 1,718,905 | 16,204,674 | ||||||
|
| |||||||
| 2,940,308,257 | ||||||||
INDONESIA — 2.53% |
| |||||||
PT Adaro Energy Tbk | 134,488,400 | 15,118,807 | ||||||
PT Astra Agro Lestari Tbk | 4,458,000 | 9,718,230 | ||||||
| Security | Shares | Value | ||||||
PT Astra International Tbk | 214,256,500 | $ | 138,746,996 | |||||
PT Bank Central Asia Tbk | 133,646,200 | 127,962,166 | ||||||
PT Bank Danamon Indonesia Tbk | 40,519,316 | 12,989,736 | ||||||
PT Bank Mandiri (Persero) Tbk | 101,807,000 | 90,296,869 | ||||||
PT Bank Negara Indonesia (Persero) Tbk | 80,400,776 | 36,772,315 | ||||||
PT Bank Rakyat Indonesia (Persero) Tbk | 120,928,922 | 114,235,058 | ||||||
PT Bukit Asam (Persero) Tbk | 6,722,100 | 7,671,728 | ||||||
PT Bumi Serpong Damai Tbk | 68,856,100 | 9,447,663 | ||||||
PT Charoen Pokphand Indonesia Tbk | 84,286,045 | 27,705,052 | ||||||
PT Global Mediacom Tbk | 59,561,400 | 9,852,645 | ||||||
PT Gudang Garam Tbk | 5,689,100 | 26,262,996 | ||||||
PT Indo Tambangraya Megah Tbk | 3,878,100 | 9,340,925 | ||||||
PT Indocement Tunggal Prakarsa Tbk | 13,793,000 | 28,594,165 | ||||||
PT Indofood CBP Sukses Makmur Tbk | 7,604,900 | 6,826,369 | ||||||
PT Indofood Sukses Makmur Tbk | 51,135,000 | 30,053,697 | ||||||
PT Jasa Marga (Persero) Tbk | 18,690,600 | 9,906,537 | ||||||
PT Kalbe Farma Tbk | 231,877,715 | 32,905,921 | ||||||
PT Lippo Karawaci Tbk | 200,082,400 | 18,302,045 | ||||||
PT Matahari Department Store Tbk | 17,880,100 | 24,876,993 | ||||||
PT Media Nusantara Citra Tbk | 38,071,700 | 9,129,397 | ||||||
PT Perusahaan Gas Negara (Persero) Tbk | 123,897,500 | 61,432,400 | ||||||
PT Semen Gresik (Persero) Tbk | 29,563,400 | 41,005,870 | ||||||
PT Surya Citra Media Tbk | 25,752,900 | 9,048,465 | ||||||
PT Telekomunikasi Indonesia (Persero) Tbk | 503,505,400 | 114,711,852 | ||||||
PT Tower Bersama Infrastructure Tbk | 10,931,600 | 7,359,380 | ||||||
PT Unilever Indonesia Tbk | 15,111,700 | 40,080,401 | ||||||
PT United Tractors Tbk | 21,105,953 | 39,965,536 | ||||||
| 14 | 2014 iSHARES ANNUAL REPORTTO SHAREHOLDERS |
Table of Contents
Consolidated Schedule of Investments (Continued)
iSHARES® MSCI EMERGING MARKETS ETF
August 31, 2014
| Security | Shares | Value | ||||||
PT XL Axiata Tbk | 22,137,300 | $ | 11,260,264 | |||||
|
| |||||||
| 1,121,580,478 | ||||||||
MALAYSIA — 3.78% |
| |||||||
AirAsia Bhd | 12,885,700 | 9,852,328 | ||||||
Alliance Financial Group Bhd | 9,434,000 | 14,546,079 | ||||||
AMMB Holdings Bhd | 23,181,175 | 49,127,617 | ||||||
Astro Malaysia Holdings Bhd | 8,595,700 | 8,944,764 | ||||||
Axiata Group Bhd | 26,452,100 | 58,157,695 | ||||||
Berjaya Sports Toto Bhdb | 11,799,763 | 14,075,859 | ||||||
British American Tobacco (Malaysia) Bhd | 1,541,500 | 35,211,929 | ||||||
Bumi Armada Bhdb | 10,012,400 | 9,370,742 | ||||||
CIMB Group Holdings Bhd | 49,302,800 | 115,436,124 | ||||||
Dialog Group Bhd | 23,234,312 | 12,752,335 | ||||||
DiGi.Com Bhd | 32,174,900 | 58,490,538 | ||||||
Felda Global Ventures Holdings Bhd | 11,885,500 | 14,404,381 | ||||||
Gamuda Bhd | 17,829,000 | 27,320,454 | ||||||
Genting Bhd | 22,774,900 | 69,220,667 | ||||||
Genting Malaysia Bhd | 36,649,300 | 52,439,195 | ||||||
Genting Plantations Bhd | 4,210,400 | 13,438,015 | ||||||
Hong Leong Bank Bhd | 4,435,500 | 20,263,706 | ||||||
Hong Leong Financial Group Bhd | 908,000 | 4,908,731 | ||||||
IHH Healthcare Bhd | 22,664,900 | 35,090,327 | ||||||
IJM Corp. Bhd | 15,042,920 | 31,021,250 | ||||||
IOI Corp. Bhd | 34,059,220 | 51,650,721 | ||||||
IOI Properties Group Bhda | 20,015,959 | 15,621,592 | ||||||
Kuala Lumpur Kepong Bhd | 5,937,900 | 41,520,088 | ||||||
Lafarge Malaysia Bhd | 3,931,700 | 12,723,141 | ||||||
Malayan Banking Bhd | 44,929,900 | 143,969,540 | ||||||
Malaysia Airports Holdings Bhd | 5,597,300 | 13,673,607 | ||||||
Maxis Bhd | 19,147,300 | 39,788,964 | ||||||
MISC Bhd | 10,797,900 | 23,569,020 | ||||||
MMC Corp. Bhdb | 13,292,600 | 10,416,473 | ||||||
Petronas Chemicals Group Bhd | 25,686,000 | 51,339,404 | ||||||
Petronas Dagangan Bhdb | 1,766,500 | 11,264,800 | ||||||
Petronas Gas Bhd | 6,292,400 | 45,516,091 | ||||||
PPB Group Bhd | 5,416,700 | 25,399,374 | ||||||
Public Bank Bhdb | 26,940,130 | 164,786,074 | ||||||
RHB Capital Bhd | 4,425,200 | 12,874,075 | ||||||
| Security | Shares | Value | ||||||
Sapurakencana Petroleum Bhd | 36,545,900 | $ | 48,928,838 | |||||
Sime Darby Bhd | 29,437,073 | 88,348,576 | ||||||
Telekom Malaysia Bhd | 11,481,000 | 23,165,977 | ||||||
Tenaga Nasional Bhd | 30,783,350 | 120,906,686 | ||||||
UEM Sunrise Bhd | 11,738,900 | 7,150,599 | ||||||
UMW Holdings Bhd | 7,460,600 | 29,255,398 | ||||||
YTL Corp. Bhd | 46,249,162 | 23,770,191 | ||||||
YTL Power International Bhda | 32,782,043 | 15,496,588 | ||||||
|
| |||||||
| 1,675,208,553 | ||||||||
MEXICO — 5.22% |
| |||||||
Alfa SAB de CV Series A | 31,297,900 | 100,699,985 | ||||||
America Movil SAB de CV Series L | 356,030,900 | 435,389,399 | ||||||
Arca Continental SAB de CV | 4,497,836 | 33,064,280 | ||||||
Cemex SAB de CV CPOa | 124,508,560 | 165,401,987 | ||||||
Coca-Cola FEMSA SAB de CV Series L | 4,332,193 | 47,229,866 | ||||||
Compartamos SAB de CVb | 11,590,900 | 24,749,947 | ||||||
Controladora Comercial Mexicana SAB de CV BC Units | 3,933,200 | 15,148,633 | ||||||
El Puerto de Liverpool SAB de CV Series C1b | 2,197,700 | 25,060,385 | ||||||
Fibra Uno Administracion SAB de CV | 22,017,600 | 79,058,263 | ||||||
Fomento Economico Mexicano SAB de CV BD Units | 20,804,800 | 201,961,934 | ||||||
Genomma Lab Internacional SAB de CV Series Ba,b | 7,563,400 | 20,176,008 | ||||||
Gruma SAB de CV Series Ba | 1,678,200 | 19,145,508 | ||||||
Grupo Aeroportuario del Pacifico SAB de CV Series B | 2,423,000 | 16,820,444 | ||||||
Grupo Aeroportuario del Sureste SAB de CV Series B | 2,218,600 | 28,439,413 | ||||||
Grupo Bimbo SAB de CV Series A | 15,275,500 | 48,085,318 | ||||||
Grupo Carso SAB de CV Series A1 | 4,739,741 | 28,962,969 | ||||||
CONSOLIDATED SCHEDULEOF INVESTMENTS | 15 |
Table of Contents
Consolidated Schedule of Investments (Continued)
iSHARES® MSCI EMERGING MARKETS ETF
August 31, 2014
| Security | Shares | Value | ||||||
Grupo Comercial Chedraui SAB de CVb | 1,327,400 | $ | 4,611,968 | |||||
Grupo Financiero Banorte SAB de CV Series O | 26,062,256 | 183,475,253 | ||||||
Grupo Financiero Inbursa SAB de CV Series O | 23,482,800 | 71,352,655 | ||||||
Grupo Financiero Santander Mexico SAB de CV Series B | 19,440,500 | 58,222,629 | ||||||
Grupo Lala SAB de CV | 3,804,500 | 9,875,319 | ||||||
Grupo Mexico SAB de CV Series B | 40,429,988 | 146,871,969 | ||||||
Grupo Televisa SAB de CV CPO | 27,438,800 | 204,162,047 | ||||||
Industrias Penoles SAB de CV | 1,541,868 | 39,125,984 | ||||||
Kimberly-Clark de Mexico SAB de CV Series A | 18,163,500 | 48,466,561 | ||||||
Mexichem SAB de CV | 10,542,192 | 45,464,740 | ||||||
Minera Frisco SAB de CV Series A1a,b | 4,681,241 | 9,412,246 | ||||||
OHL Mexico SAB de CVa,b | 5,980,400 | 17,563,180 | ||||||
Promotora y Operadora Infraestructura SAB de CVa | 2,478,000 | 34,738,052 | ||||||
Wal-Mart de Mexico SAB de CV Series V | 56,324,500 | 153,351,857 | ||||||
|
| |||||||
| 2,316,088,799 | ||||||||
PERU — 0.45% |
| |||||||
Compania de Minas Buenaventura SA SP ADR | 2,053,058 | 29,892,524 | ||||||
Credicorp Ltd. | 729,183 | 113,074,408 | ||||||
Southern Copper Corp. | 1,709,336 | 56,083,314 | ||||||
|
| |||||||
| 199,050,246 | ||||||||
PHILIPPINES — 1.12% |
| |||||||
Aboitiz Equity Ventures Inc. | 20,928,790 | 26,280,992 | ||||||
Aboitiz Power Corp. | 8,364,964 | 7,194,636 | ||||||
Alliance Global Group Inc. | 21,184,080 | 11,952,486 | ||||||
Ayala Corp. | 2,502,906 | 40,212,974 | ||||||
Ayala Land Inc. | 66,961,200 | 50,681,642 | ||||||
Bank of the Philippine Islands | 12,142,132 | 26,456,480 | ||||||
BDO Unibank Inc. | 13,785,106 | 28,613,580 | ||||||
DMCI Holdings Inc. | 4,013,000 | 7,363,303 | ||||||
| Security | Shares | Value | ||||||
Energy Development Corp. | 59,867,700 | $ | 9,982,527 | |||||
Globe Telecom Inc. | 540,945 | 22,332,592 | ||||||
International Container Terminal Services Inc. | 8,264,580 | 21,400,713 | ||||||
JG Summit Holdings Inc. | 18,746,324 | 22,121,522 | ||||||
Jollibee Foods Corp. | 6,276,029 | 25,910,211 | ||||||
Megaworld Corp. | 60,508,000 | 6,064,678 | ||||||
Metro Pacific Investments Corp. | 58,778,300 | 6,942,850 | ||||||
Metropolitan Bank & Trust Co. | 3,053,008 | 6,018,487 | ||||||
Philippine Long Distance Telephone Co. | 965,058 | 76,363,534 | ||||||
SM Investments Corp. | 2,000,795 | 35,426,921 | ||||||
SM Prime Holdings Inc. | 78,632,125 | 29,180,454 | ||||||
Universal Robina Corp. | 9,115,310 | 33,973,346 | ||||||
|
| |||||||
| 494,473,928 | ||||||||
POLAND — 1.57% |
| |||||||
Alior Bank SAa,b | 436,994 | 10,415,911 | ||||||
Bank Handlowy w Warszawie SA | 371,157 | 13,291,468 | ||||||
Bank Millennium SA | 4,776,000 | 11,994,708 | ||||||
Bank Pekao SA | 1,425,533 | 80,297,275 | ||||||
Bank Zachodni WBK SA | 310,975 | 36,034,916 | ||||||
Cyfrowy Polsat SA | 2,262,251 | 18,105,932 | ||||||
ENEA SA | 1,460,631 | 6,852,382 | ||||||
Energa SA | 1,108,446 | 7,228,204 | ||||||
Eurocash SAb | 770,972 | 8,318,931 | ||||||
Getin Noble Bank SAa | 5,956,056 | 4,843,306 | ||||||
Grupa Azoty SA | 246,446 | 5,761,596 | ||||||
Grupa Lotos SAa | 718,226 | 6,770,398 | ||||||
Jastrzebska Spolka Weglowa SAa,b | 446,172 | 4,671,944 | ||||||
KGHM Polska Miedz SA | 1,448,575 | 59,712,632 | ||||||
LPP SA | 6,307 | 16,766,854 | ||||||
mBank SAb | 165,991 | 24,062,686 | ||||||
Orange Polska SA | 7,395,100 | 24,840,375 | ||||||
Polska Grupa Energetyczna SA | 7,947,457 | 54,211,781 | ||||||
Polski Koncern Naftowy Orlen SA | 3,385,793 | 41,753,896 | ||||||
Polskie Gornictwo Naftowe i Gazownictwo SA | 19,249,068 | 29,379,158 | ||||||
Powszechna Kasa Oszczednosci Bank Polski SA | 9,409,058 | 112,560,861 | ||||||
| 16 | 2014 iSHARES ANNUAL REPORTTO SHAREHOLDERS |
Table of Contents
Consolidated Schedule of Investments (Continued)
iSHARES® MSCI EMERGING MARKETS ETF
August 31, 2014
| Security | Shares | Value | ||||||
Powszechny Zaklad Ubezpieczen SA | 609,262 | $ | 89,368,971 | |||||
Synthos SA | 6,472,617 | 9,312,099 | ||||||
Tauron Polska Energia SA | 11,965,526 | 18,674,207 | ||||||
|
| |||||||
| 695,230,491 | ||||||||
QATAR — 0.55% |
| |||||||
Barwa Real Estate Co. | 1,705,955 | 18,318,917 | ||||||
Commercial Bank of Qatar QSC (The) | 619,932 | 11,594,356 | ||||||
Doha Bank QSC | 435,272 | 7,291,989 | ||||||
Industries Qatar QSC | 704,667 | 37,447,288 | ||||||
Masraf Al Rayan QSC | 3,684,569 | 52,619,353 | ||||||
Ooredoo QSC | 635,756 | 19,956,858 | ||||||
Qatar Electricity & Water Co. QSC | 281,988 | 13,242,873 | ||||||
Qatar Islamic Bank SAQ | 435,362 | 14,228,298 | ||||||
Qatar National Bank SAQ | 835,514 | 46,351,156 | ||||||
Vodafone Qatar QSC | 3,875,307 | 20,583,444 | ||||||
|
| |||||||
| 241,634,532 | ||||||||
RUSSIA — 4.29% |
| |||||||
Alrosa AO | 12,951,100 | 15,178,155 | ||||||
Gazprom OAO | 122,292,017 | 435,766,333 | ||||||
LUKOIL OAO | 5,332,613 | 296,852,516 | ||||||
Magnit OJSC SP GDRc | 2,740,340 | 159,487,788 | ||||||
MegaFon OAO SP GDRc | 922,853 | 26,116,740 | ||||||
MMC Norilsk Nickel OJSC | 570,086 | 112,182,836 | ||||||
Mobile TeleSystems OJSC SP ADR | 5,404,707 | 99,716,844 | ||||||
Moscow Exchange MICEX-RTS OJSC | 10,185,950 | 17,097,528 | ||||||
NovaTek OAO SP GDRc | 959,331 | 96,508,698 | ||||||
Rosneft Oil Co. OJSC | 12,050,787 | 74,341,628 | ||||||
Rostelecom OJSC | 10,356,280 | 27,546,572 | ||||||
RusHydro OJSC | 1,242,867,100 | 23,050,093 | ||||||
Sberbank of Russia | 108,558,521 | 213,623,958 | ||||||
Severstal OAO | 2,184,703 | 21,027,290 | ||||||
Sistema JSFC SP GDRc | 1,475,529 | 33,568,285 | ||||||
Surgutneftegas OJSC | 73,914,910 | 51,811,728 | ||||||
Tatneft OAO Class S | 15,298,100 | 94,877,565 | ||||||
Uralkali OJSC | 13,667,315 | 50,477,141 | ||||||
VTB Bank OJSC | 51,186,902,000 | 52,730,096 | ||||||
|
| |||||||
| 1,901,961,794 | ||||||||
SOUTH AFRICA — 7.48% |
| |||||||
African Bank Investments Ltd.b,d | 14,665,413 | 13,789 | ||||||
| Security | Shares | Value | ||||||
African Rainbow Minerals Ltd. | 832,511 | $ | 14,219,082 | |||||
Anglo American Platinum Ltd.a,b | 689,401 | 28,722,341 | ||||||
AngloGold Ashanti Ltd.a | 4,159,205 | 70,803,549 | ||||||
Aspen Pharmacare Holdings Ltd. | 3,387,069 | 97,340,734 | ||||||
Assore Ltd. | 234,252 | 6,932,365 | ||||||
Barclays Africa Group Ltd. | 3,184,584 | 49,879,459 | ||||||
Barloworld Ltd. | 2,297,077 | 21,892,146 | ||||||
Bidvest Group Ltd. | 3,432,730 | 90,800,121 | ||||||
Brait SEa | 2,574,828 | 19,176,724 | ||||||
Coronation Fund Managers Ltd. | 1,781,180 | 16,747,654 | ||||||
Discovery Ltd. | 2,786,998 | 25,720,128 | ||||||
Exxaro Resources Ltd.b | 1,589,755 | 22,553,194 | ||||||
FirstRand Ltd. | 33,506,256 | 136,256,800 | ||||||
Foschini Group Ltd. (The) | 2,297,100 | 24,864,335 | ||||||
Gold Fields Ltd. | 7,958,240 | 37,720,714 | ||||||
Growthpoint Properties Ltd. | 19,817,853 | 46,957,321 | ||||||
Harmony Gold Mining Co. Ltd.a | 4,288,064 | 12,994,744 | ||||||
Impala Platinum Holdings Ltd. | 5,582,685 | 50,523,105 | ||||||
Imperial Holdings Ltd. | 1,973,250 | 35,288,955 | ||||||
Investec Ltd. | 3,280,234 | 29,670,582 | ||||||
Kumba Iron Ore Ltd. | 645,762 | 19,338,736 | ||||||
Liberty Holdings Ltd. | 1,338,246 | 16,430,803 | ||||||
Life Healthcare Group Holdings Ltd. | 9,358,258 | 39,402,636 | ||||||
Massmart Holdings Ltd. | 723,765 | 8,899,219 | ||||||
Mediclinic International Ltd. | 3,213,835 | 27,945,866 | ||||||
MMI Holdings Ltd. | 9,412,757 | 24,329,756 | ||||||
Mr. Price Group Ltd. | 2,361,138 | 45,444,924 | ||||||
MTN Group Ltd. | 17,512,687 | 396,906,376 | ||||||
Nampak Ltd. | 4,545,841 | 18,229,697 | ||||||
Naspers Ltd. Class N | 4,115,243 | 524,502,528 | ||||||
Nedbank Group Ltd. | 2,416,220 | 51,957,568 | ||||||
Netcare Ltd. | 12,413,515 | 37,700,184 | ||||||
Northam Platinum Ltd.a | 2,522,549 | 10,127,766 | ||||||
Pick n Pay Stores Ltd.b | 3,787,908 | 20,123,061 | ||||||
PPC Ltd. | 6,437,418 | 20,040,893 | ||||||
Rand Merchant Insurance Holdings Ltd. | 5,137,235 | 16,278,167 | ||||||
Redefine Properties Ltd. | 27,071,094 | 24,333,796 | ||||||
CONSOLIDATED SCHEDULEOF INVESTMENTS | 17 |
Table of Contents
Consolidated Schedule of Investments (Continued)
iSHARES® MSCI EMERGING MARKETS ETF
August 31, 2014
| Security | Shares | Value | ||||||
Remgro Ltd. | 4,803,300 | $ | 109,972,690 | |||||
RMB Holdings Ltd. | 6,101,453 | 32,115,326 | ||||||
Sanlam Ltd. | 19,770,202 | 122,687,753 | ||||||
Sappi Ltd.a,b | 4,327,252 | 17,902,391 | ||||||
Sasol Ltd. | 5,767,409 | 335,283,453 | ||||||
Shoprite Holdings Ltd. | 4,717,923 | 65,409,646 | ||||||
SPAR Group Ltd. (The) | 1,943,283 | 23,820,994 | ||||||
Standard Bank Group Ltd. | 13,114,664 | 170,169,776 | ||||||
Steinhoff International Holdings Ltd. | 21,537,419 | 106,336,374 | ||||||
Tiger Brands Ltd. | 1,827,498 | 52,752,307 | ||||||
Truworths International Ltd. | 4,858,485 | 33,987,559 | ||||||
Vodacom Group Ltd.b | 3,576,080 | 43,156,804 | ||||||
Woolworths Holdings Ltd. | 8,156,412 | 60,938,799 | ||||||
|
| |||||||
| 3,315,603,690 | ||||||||
SOUTH KOREA — 14.34% |
| |||||||
AmorePacific Corp. | 36,252 | 75,439,341 | ||||||
AmorePacific Group | 27,207 | 28,388,980 | ||||||
BS Financial Group Inc. | 2,043,075 | 33,851,432 | ||||||
Celltrion Inc.a,b | 697,770 | 28,662,282 | ||||||
Cheil Worldwide Inc.a | 1,000,978 | 22,656,388 | ||||||
CJ CheilJedang Corp. | 87,124 | 32,479,779 | ||||||
CJ Corp. | 160,336 | 28,305,285 | ||||||
Coway Co. Ltd. | 613,094 | 51,456,481 | ||||||
Daelim Industrial Co. Ltd. | 300,009 | 25,860,039 | ||||||
Daewoo Engineering & Construction Co. Ltd.a | 841,431 | 7,070,361 | ||||||
Daewoo International Corp. | 425,263 | 15,623,104 | ||||||
Daewoo Securities Co. Ltd.a | 1,633,573 | 19,010,959 | ||||||
Daewoo Shipbuilding & Marine Engineering Co. Ltd.b | 1,047,105 | 25,662,566 | ||||||
DGB Financial Group Inc. | 1,409,590 | 24,606,483 | ||||||
Dongbu Insurance Co. Ltd. | 452,777 | 27,328,717 | ||||||
Doosan Corp. | 112,558 | 13,376,635 | ||||||
Doosan Heavy Industries & Construction Co. Ltd.b | 502,832 | 14,307,119 | ||||||
Doosan Infracore Co. Ltd.a | 1,265,982 | 14,795,490 | ||||||
E-Mart Co. Ltd. | 222,899 | 53,639,091 | ||||||
GS Engineering & Construction Corp.a,b | 481,090 | 17,484,261 | ||||||
GS Holdings Corp. | 517,439 | 21,969,278 | ||||||
Halla Visteon Climate Control Corp.b | 342,506 | 18,207,085 | ||||||
| Security | Shares | Value | ||||||
Hana Financial Group Inc. | 2,914,276 | $ | 122,296,409 | |||||
Hankook Tire Co. Ltd. | 768,155 | 39,849,059 | ||||||
Hanwha Chemical Corp.b | 907,788 | 14,682,897 | ||||||
Hanwha Corp. | 425,142 | 12,683,609 | ||||||
Hanwha Life Insurance Co. Ltd. | 2,335,251 | 16,029,732 | ||||||
Hite Jinro Co. Ltd.b | 136,289 | 3,104,962 | ||||||
Hotel Shilla Co. Ltd. | 334,337 | 39,238,723 | ||||||
Hyosung Corp. | 241,315 | 18,658,806 | ||||||
Hyundai Department Store Co. Ltd. | 147,258 | 23,019,274 | ||||||
Hyundai Development Co. Engineering & Constructionb | 544,360 | 22,119,071 | ||||||
Hyundai Engineering & Construction Co. Ltd. | 762,943 | 48,081,323 | ||||||
Hyundai Glovis Co. Ltd. | 139,558 | 41,635,480 | ||||||
Hyundai Heavy Industries Co. Ltd. | 435,433 | 61,839,688 | ||||||
Hyundai Marine & Fire Insurance Co. Ltd. | 617,900 | 18,982,775 | ||||||
Hyundai Merchant Marine Co. Ltd.a,b | 654,272 | 7,936,827 | ||||||
Hyundai Mipo Dockyard Co. Ltd.b | 129,944 | 16,532,152 | ||||||
Hyundai Mobis Co. Ltd. | 714,589 | 207,198,743 | ||||||
Hyundai Motor Co. | 1,598,958 | 367,431,544 | ||||||
Hyundai Steel Co. | 684,887 | 51,132,645 | ||||||
Hyundai Wia Corp. | 161,201 | 35,453,250 | ||||||
Industrial Bank of Korea | 2,428,153 | 42,147,535 | ||||||
Kangwon Land Inc. | 1,109,856 | 39,459,844 | ||||||
KB Financial Group Inc. | 3,636,075 | 149,000,361 | ||||||
KCC Corp. | 45,905 | 30,921,756 | ||||||
Kia Motors Corp. | 2,750,706 | 166,027,129 | ||||||
Korea Aerospace Industries Ltd.b | 482,681 | 17,113,647 | ||||||
Korea Electric Power Corp. | 2,723,726 | 113,359,867 | ||||||
Korea Gas Corp.a | 296,540 | 16,494,754 | ||||||
Korea Investment Holdings Co. Ltd. | 335,545 | 16,844,263 | ||||||
Korea Zinc Co. Ltd. | 90,291 | 37,445,008 | ||||||
Korean Air Lines Co. Ltd.a | 290,146 | 10,430,319 | ||||||
KT Corp. | 557,161 | 19,232,344 | ||||||
KT Corp. SP ADR | 515,745 | 8,819,239 | ||||||
KT&G Corp. | 1,146,353 | 107,292,174 | ||||||
| 18 | 2014 iSHARES ANNUAL REPORTTO SHAREHOLDERS |
Table of Contents
Consolidated Schedule of Investments (Continued)
iSHARES® MSCI EMERGING MARKETS ETF
August 31, 2014
| Security | Shares | Value | ||||||
Kumho Petro Chemical Co. Ltd.b | 144,924 | $ | 11,620,219 | |||||
LG Chem Ltd. | 478,377 | 127,148,875 | ||||||
LG Corp. | 1,031,991 | 72,161,509 | ||||||
LG Display Co. Ltd.a | 2,445,697 | 84,542,315 | ||||||
LG Electronics Inc.b | 1,112,676 | 82,961,000 | ||||||
LG Household & Health Care Ltd. | 99,802 | 50,494,034 | ||||||
LG Innotek Co. Ltd.a,b | 122,847 | 16,295,598 | ||||||
LG Uplus Corp. | 2,179,870 | 23,541,177 | ||||||
Lotte Chemical Corp.b | 171,630 | 27,675,433 | ||||||
Lotte Confectionery Co. Ltd. | 5,126 | 10,970,383 | ||||||
Lotte Shopping Co. Ltd. | 106,353 | 34,823,409 | ||||||
LS Corp. | 162,913 | 11,247,014 | ||||||
LS Industrial Systems Co. Ltd. | 181,391 | 11,198,853 | ||||||
Mirae Asset Securities Co. Ltd. | 208,814 | 9,977,847 | ||||||
NAVER Corp. | 294,410 | 222,996,085 | ||||||
NCsoft Corp. | 163,523 | 23,384,620 | ||||||
OCI Co. Ltd.a,b | 176,908 | 25,385,980 | ||||||
ORION Corp.b | 37,030 | 31,882,430 | ||||||
Paradise Co. Ltd.b | 389,758 | 15,106,750 | ||||||
POSCO | 675,740 | 222,592,002 | ||||||
S-Oil Corp.b | 459,114 | 21,213,562 | ||||||
S1 Corp. | 232,891 | 16,996,828 | ||||||
Samsung C&T Corp. | 1,344,946 | 98,952,583 | ||||||
Samsung Card Co. Ltd. | 369,215 | 17,751,596 | ||||||
Samsung Electro-Mechanics Co. Ltd. | 608,782 | 32,962,308 | ||||||
Samsung Electronics Co. Ltd. | 1,142,508 | 1,390,457,983 | ||||||
Samsung Engineering Co. Ltd.a,b | 300,728 | 18,952,137 | ||||||
Samsung Fire & Marine Insurance Co. Ltd. | 353,369 | 96,710,782 | ||||||
Samsung Heavy Industries Co. Ltd. | 1,658,623 | 44,575,646 | ||||||
Samsung Life Insurance Co. Ltd. | 638,615 | 67,076,776 | ||||||
Samsung SDI Co. Ltd.b | 597,118 | 89,218,775 | ||||||
Samsung Securities Co. Ltd.b | 611,155 | 29,866,098 | ||||||
Samsung Techwin Co. Ltd. | 384,418 | 16,169,858 | ||||||
| Security | Shares | Value | ||||||
Shinhan Financial Group Co. Ltd. | 4,281,288 | $ | 221,675,250 | |||||
Shinsegae Co. Ltd. | 79,007 | 18,155,364 | ||||||
SK C&C Co. Ltd. | 232,441 | 48,714,150 | ||||||
SK Holdings Co. Ltd. | 264,331 | 41,841,437 | ||||||
SK Hynix Inc.a | 5,883,926 | 263,455,043 | ||||||
SK Innovation Co. Ltd. | 608,180 | 56,442,367 | ||||||
SK Networks Co. Ltd.a | 1,046,836 | 10,148,822 | ||||||
SK Telecom Co. Ltd. | 83,194 | 22,399,489 | ||||||
SK Telecom Co. Ltd. SP ADR | 209,048 | 6,254,716 | ||||||
Woori Finance Holdings Co. Ltd.a | 3,066,954 | 41,590,431 | ||||||
Woori Investment & Securities Co. Ltd.b | 1,180,928 | 13,801,466 | ||||||
Yuhan Corp. | 93,193 | 15,900,576 | ||||||
|
| |||||||
| 6,359,965,941 | ||||||||
TAIWAN — 11.83% |
| |||||||
Acer Inc.a,b | 27,067,053 | 22,412,123 | ||||||
Advanced Semiconductor Engineering Inc.b | 63,147,701 | 78,695,634 | ||||||
Advantech Co. Ltd. | 2,841,800 | 26,668,169 | ||||||
Asia Cement Corp.b | 24,320,077 | 33,359,200 | ||||||
Asia Pacific Telecom Co. Ltd.b | 14,414,000 | 9,306,977 | ||||||
ASUSTeK Computer Inc.b | 7,062,968 | 73,960,254 | ||||||
AU Optronics Corp.b | 88,289,000 | 43,863,156 | ||||||
Catcher Technology Co. Ltd.b | 6,839,210 | 69,329,072 | ||||||
Cathay Financial Holding Co. Ltd. | 85,806,644 | 146,405,676 | ||||||
Chailease Holding Co. Ltd.b | 9,478,820 | 25,623,146 | ||||||
Chang Hwa Commercial Bank Ltd. | 46,139,996 | 28,711,595 | ||||||
Cheng Shin Rubber Industry Co. Ltd.b | 17,112,128 | 39,502,077 | ||||||
Chicony Electronics Co. Ltd. | 6,884,088 | 22,570,403 | ||||||
China Airlines Ltd.a | 22,475,347 | 7,519,228 | ||||||
China Development Financial Holding Corp. | 153,754,848 | 51,953,763 | ||||||
China Life Insurance Co. Ltd. | 25,322,803 | 23,509,402 | ||||||
China Motor Co. Ltd.b | 4,907,000 | 4,695,144 | ||||||
China Steel Corp.b | 125,158,313 | 108,030,460 | ||||||
CONSOLIDATED SCHEDULEOF INVESTMENTS | 19 |
Table of Contents
Consolidated Schedule of Investments (Continued)
iSHARES® MSCI EMERGING MARKETS ETF
August 31, 2014
| Security | Shares | Value | ||||||
Chunghwa Telecom Co. Ltd. | 40,272,410 | $ | 125,167,089 | |||||
Clevo Co. | 7,110,553 | 13,440,600 | ||||||
Compal Electronics Inc. | 44,509,908 | 39,610,028 | ||||||
CTBC Financial Holding Co. Ltd. | 137,841,755 | 100,301,372 | ||||||
CTCI Corp. | 3,085,000 | 5,521,738 | ||||||
Delta Electronics Inc. | 19,433,000 | 136,529,332 | ||||||
E.Sun Financial Holding Co. Ltd. | 60,105,232 | 39,513,150 | ||||||
Eclat Textile Co. Ltd.b | 1,699,360 | 14,213,212 | ||||||
Epistar Corp.b | 8,332,345 | 18,119,551 | ||||||
EVA Airways Corp.a | 13,635,800 | 6,842,876 | ||||||
Evergreen Marine Corp. Ltd.a | 18,588,325 | 11,349,323 | ||||||
Far Eastern Department Stores Ltd.b | 12,458,191 | 12,545,509 | ||||||
Far Eastern New Century Corp. | 31,965,763 | 34,275,195 | ||||||
Far EasTone Telecommunications Co. Ltd. | 15,829,000 | 33,733,370 | ||||||
Farglory Land Development Co. Ltd. | 9,574,727 | 13,293,561 | ||||||
First Financial Holding Co. Ltd. | 73,675,706 | 45,599,791 | ||||||
Formosa Chemicals & Fibre Corp. | 32,836,090 | 81,731,824 | ||||||
Formosa International Hotels Corp. | 265,015 | 2,979,041 | ||||||
Formosa Petrochemical Corp.b | 9,433,000 | 23,826,684 | ||||||
Formosa Plastics Corp. | 44,922,280 | 116,474,355 | ||||||
Formosa Taffeta Co. Ltd. | 9,638,000 | 10,237,584 | ||||||
Foxconn Technology Co. Ltd. | 8,836,659 | 22,172,577 | ||||||
Fubon Financial Holding Co. Ltd. | 69,644,969 | 113,704,170 | ||||||
Giant Manufacturing Co. Ltd. | 3,670,203 | 30,512,887 | ||||||
Hermes Microvision Inc.b | 383,000 | 16,465,265 | ||||||
Highwealth Construction Corp. | 5,057,900 | 8,968,358 | ||||||
Hiwin Technologies Corp.b | 2,099,449 | 20,509,497 | ||||||
Hon Hai Precision Industry Co. Ltd.b | 129,861,812 | 443,147,650 | ||||||
Hotai Motor Co. Ltd.b | 2,594,000 | 36,492,431 | ||||||
| Security | Shares | Value | ||||||
HTC Corp.b | 7,108,708 | $ | 32,700,937 | |||||
Hua Nan Financial Holdings Co. Ltd. | 51,427,636 | 31,915,915 | ||||||
Innolux Corp.b | 79,171,004 | 40,260,259 | ||||||
Inotera Memories Inc.a | 23,446,000 | 38,356,983 | ||||||
Inventec Corp. | 25,379,281 | 19,953,266 | ||||||
Kinsus Interconnect Technology Corp. | 2,534,000 | 10,724,177 | ||||||
Largan Precision Co. Ltd. | 1,024,000 | 84,789,482 | ||||||
Lite-On Technology Corp. | 21,388,157 | 35,455,519 | ||||||
MediaTek Inc.b | 14,642,338 | 244,688,039 | ||||||
Mega Financial Holding Co. Ltd. | 96,734,162 | 83,496,140 | ||||||
Merida Industry Co. Ltd. | 2,131,500 | 15,688,262 | ||||||
Nan Ya Plastics Corp. | 50,648,160 | 119,459,202 | ||||||
Novatek Microelectronics Corp. Ltd. | 5,600,000 | 28,758,301 | ||||||
Pegatron Corp.b | 15,736,414 | 33,378,118 | ||||||
Phison Electronics Corp. | 1,213,535 | 8,789,760 | ||||||
Pou Chen Corp.b | 23,502,220 | 27,165,879 | ||||||
Powertech Technology Inc.b | 5,903,300 | 11,198,110 | ||||||
President Chain Store Corp. | 6,288,000 | 47,648,316 | ||||||
Quanta Computer Inc. | 26,725,000 | 75,461,769 | ||||||
Radiant Opto-Electronics Corp.b | 4,722,240 | 20,380,019 | ||||||
Realtek Semiconductor Corp.b | 4,448,637 | 16,222,594 | ||||||
Ruentex Development Co. Ltd.b | 7,718,337 | 13,866,436 | ||||||
Ruentex Industries Ltd. | 6,217,598 | 15,080,907 | ||||||
ScinoPharm Taiwan Ltd.b | 3,131,545 | 6,390,801 | ||||||
Shin Kong Financial Holding Co. Ltd. | 62,095,479 | 20,254,961 | ||||||
Siliconware Precision Industries Co. Ltd.b | 32,476,190 | 47,371,636 | ||||||
Simplo Technology Co. Ltd. | 3,261,202 | 18,329,634 | ||||||
SinoPac Financial Holdings Co. Ltd. | 72,647,278 | 33,175,602 | ||||||
Standard Foods Corp.b | 3,449,066 | 8,861,955 | ||||||
Synnex Technology International Corp.b | 13,735,985 | 20,955,184 | ||||||
Taishin Financial Holdings Co. Ltd. | 74,402,025 | 37,835,124 | ||||||
Taiwan Business Bank Ltd.a | 27,507,723 | 8,613,850 | ||||||
| 20 | 2014 iSHARES ANNUAL REPORTTO SHAREHOLDERS |
Table of Contents
Consolidated Schedule of Investments (Continued)
iSHARES® MSCI EMERGING MARKETS ETF
August 31, 2014
| Security | Shares | Value | ||||||
Taiwan Cement Corp. | 37,268,296 | $ | 59,224,304 | |||||
Taiwan Cooperative Financial Holding Co. Ltd. | 50,577,808 | 28,258,122 | ||||||
Taiwan Fertilizer Co. Ltd. | 6,863,000 | 13,018,588 | ||||||
Taiwan Glass Industry Corp. | 5,548,176 | 4,788,911 | ||||||
Taiwan Mobile Co. Ltd. | 17,630,600 | 56,211,712 | ||||||
Taiwan Semiconductor Manufacturing Co. Ltd.b | 255,640,000 | 1,060,516,218 | ||||||
Teco Electric and Machinery Co. Ltd. | 25,285,000 | 31,806,628 | ||||||
TPK Holding Co. Ltd.b | 2,548,827 | 17,310,245 | ||||||
Transcend Information Inc. | 872,000 | 2,931,901 | ||||||
TSRC Corp. | 9,685,992 | 13,561,458 | ||||||
U-Ming Marine Transport Corp. | 4,221,000 | 6,947,799 | ||||||
Uni-President Enterprises Co. | 49,142,576 | 89,931,547 | ||||||
Unimicron Technology Corp.b | 11,417,000 | 9,644,511 | ||||||
United Microelectronics Corp.b | 125,911,000 | 57,499,378 | ||||||
Vanguard International Semiconductor Corp. | 7,943,000 | 11,625,976 | ||||||
Walsin Lihwa Corp.a | 23,964,000 | 8,578,471 | ||||||
Wistron Corp.b | 21,373,560 | 25,027,169 | ||||||
WPG Holdings Co. Ltd. | 12,366,532 | 16,114,699 | ||||||
Yang Ming Marine Transport Corp.a | 27,899,075 | 12,553,907 | ||||||
Yuanta Financial Holding Co. Ltd. | 85,158,343 | 45,869,066 | ||||||
Yulon Motor Co. Ltd.b | 10,513,000 | 16,882,421 | ||||||
Zhen Ding Technology Holding Ltd.b | 2,490,075 | 8,230,689 | ||||||
|
| |||||||
| 5,247,154,356 | ||||||||
THAILAND — 2.26% |
| |||||||
Advanced Information Service PCL NVDR | 10,898,600 | 71,315,197 | ||||||
Airports of Thailand PCL NVDR | 4,683,200 | 34,750,107 | ||||||
Bangkok Bank PCL Foreign | 5,999,000 | 38,503,287 | ||||||
Bangkok Bank PCL NVDR | 5,591,700 | 35,889,120 | ||||||
Bangkok Dusit Medical Services PCL NVDR | 33,448,600 | 20,421,030 | ||||||
Banpu PCL NVDR | 12,185,100 | 12,303,365 | ||||||
BEC World PCL NVDR | 10,493,000 | 15,604,806 | ||||||
| Security | Shares | Value | ||||||
BTS Group Holdings PCL NVDR | 49,254,600 | $ | 14,881,243 | |||||
Bumrungrad Hospital PCL NVDR | 1,790,900 | 7,569,552 | ||||||
Central Pattana PCL NVDR | 14,047,500 | 21,220,785 | ||||||
Charoen Pokphand Foods PCL NVDR | 29,338,900 | 27,097,607 | ||||||
CP All PCL NVDR | 47,111,600 | 70,062,649 | ||||||
Glow Energy PCL NVDR | 5,805,800 | 15,905,056 | ||||||
Home Product Center PCL NVDRb | 22,819,371 | 7,501,672 | ||||||
Indorama Ventures PCL NVDR | 15,598,980 | 13,186,364 | ||||||
IRPC PCL NVDRb | 102,211,700 | 10,624,385 | ||||||
Kasikornbank PCL Foreign | 12,113,500 | 85,712,304 | ||||||
Kasikornbank PCL NVDR | 6,887,900 | 48,521,525 | ||||||
Krung Thai Bank PCL NVDR | 39,131,500 | 28,791,179 | ||||||
Minor International PCL NVDR | 13,023,900 | 14,373,590 | ||||||
PTT Exploration & Production PCL NVDR | 14,249,839 | 73,390,686 | ||||||
PTT Global Chemical PCL NVDR | 16,225,530 | 31,496,019 | ||||||
PTT PCL NVDR | 8,712,300 | 87,559,433 | ||||||
Siam Cement (The) PCL Foreign | 3,194,200 | 44,002,755 | ||||||
Siam Cement (The) PCL NVDR | 1,168,400 | 16,095,679 | ||||||
Siam Commercial Bank PCL NVDR | 17,211,200 | 100,766,888 | ||||||
Thai Oil PCL NVDRb | 8,881,900 | 14,390,680 | ||||||
TMB Bank PCL NVDR | 120,598,500 | 11,478,380 | ||||||
True Corp. PCL NVDRa | 84,177,521 | 30,308,124 | ||||||
|
| |||||||
| 1,003,723,467 | ||||||||
TURKEY — 1.65% |
| |||||||
Akbank TAS | 19,426,349 | 74,178,325 | ||||||
Anadolu Efes Biracilik ve Malt Sanayii ASa | 1,805,540 | 24,013,067 | ||||||
Arcelik ASb | 1,904,832 | 11,431,022 | ||||||
BIM Birlesik Magazalar AS | 2,163,651 | 50,934,206 | ||||||
Coca-Cola Icecek AS | 573,270 | 13,548,400 | ||||||
Emlak Konut Gayrimenkul Yatirim Ortakligi AS | 22,321,286 | 28,134,988 | ||||||
Enka Insaat ve Sanayi AS | 3,937,520 | 9,871,397 | ||||||
CONSOLIDATED SCHEDULEOF INVESTMENTS | 21 |
Table of Contents
Consolidated Schedule of Investments (Continued)
iSHARES® MSCI EMERGING MARKETS ETF
August 31, 2014
| Security | Shares | Value | ||||||
Eregli Demir ve Celik Fabrikalari TASb | 16,848,984 | $ | 32,793,036 | |||||
Ford Otomotiv Sanayi ASa,b | 790,984 | 10,446,509 | ||||||
Haci Omer Sabanci Holding ASb | 9,310,475 | 43,144,999 | ||||||
KOC Holding ASb | 6,449,156 | 33,023,552 | ||||||
Koza Altin Isletmeleri ASb | 549,303 | 5,918,253 | ||||||
Migros Ticaret ASa | 1 | 5 | ||||||
TAV Havalimanlari Holding AS | 1,845,772 | 15,353,278 | ||||||
Tofas Turk Otomobil Fabrikasi AS | 1,124,006 | 6,927,538 | ||||||
Turk Hava Yollari AOa | 6,233,759 | 19,787,877 | ||||||
Turk Telekomunikasyon AS | 4,396,000 | 12,752,362 | ||||||
Turkcell Iletisim Hizmetleri ASa | 8,415,551 | 49,332,339 | ||||||
Turkiye Garanti Bankasi AS | 24,717,705 | 97,017,522 | ||||||
Turkiye Halk Bankasi AS | 6,789,127 | 49,865,689 | ||||||
Turkiye Is Bankasi AS Class C | 17,016,453 | 44,000,930 | ||||||
Turkiye Petrol Rafinerileri AS | 1,438,872 | 33,872,285 | ||||||
Turkiye Sise ve Cam Fabrikalari AS | 5,572,107 | 7,539,819 | ||||||
Turkiye Vakiflar Bankasi TAO Class D | 9,502,047 | 21,928,309 | ||||||
Ulker Biskuvi Sanayi AS | 1,157,705 | 8,583,739 | ||||||
Yapi ve Kredi Bankasi ASb | 11,304,720 | 25,197,852 | ||||||
|
| |||||||
| 729,597,298 | ||||||||
UNITED ARAB EMIRATES — 0.54% |
| |||||||
Abu Dhabi Commercial Bank PJSC | 9,584,051 | 20,900,409 | ||||||
Aldar Properties PJSC | 33,110,250 | 35,967,356 | ||||||
Arabtec Holding Co.a | 14,915,775 | 19,126,693 | ||||||
DP World Ltd. | 1,470,898 | 27,623,465 | ||||||
Dubai Financial Market PJSC | 17,274,086 | 15,989,952 | ||||||
Dubai Islamic Bank PJSC | 8,456,984 | 17,982,071 | ||||||
Emaar Properties PJSC | 18,914,676 | 52,783,226 | ||||||
First Gulf Bank PJSC | 5,454,806 | 27,102,874 | ||||||
National Bank of Abu Dhabi PJSC | 5,340,984 | 20,357,408 | ||||||
|
| |||||||
| 237,833,454 | ||||||||
|
| |||||||
TOTAL COMMON STOCKS |
| |||||||
(Cost: $37,699,853,887) |
| 41,312,184,950 | ||||||
| Security | Shares | Value | ||||||
PREFERRED STOCKS — 6.39% |
| |||||||
BRAZIL — 5.05% |
| |||||||
AES Tiete SA | 1,148,600 | $ | 10,328,186 | |||||
Banco Bradesco SA | 21,867,758 | 399,132,639 | ||||||
Banco do Estado do Rio Grande do Sul SA Class B | 1,990,800 | 13,746,223 | ||||||
Bradespar SA | 2,382,500 | 21,774,765 | ||||||
Braskem SA Class A | 1,684,900 | 11,483,419 | ||||||
Centrais Eletricas Brasileiras SA Class B | 2,514,737 | 13,879,914 | ||||||
Companhia Brasileira de Distribuicao | 1,344,286 | 68,441,403 | ||||||
Companhia Energetica de Minas Gerais | 7,614,602 | 65,203,358 | ||||||
Companhia Energetica de Sao Paulo Class B | 1,879,900 | 26,624,670 | ||||||
Companhia Paranaense de Energia Class B | 1,095,375 | 19,415,241 | ||||||
Gerdau SA | 8,990,185 | 52,071,595 | ||||||
Itau Unibanco Holding SA | 28,966,852 | 522,492,077 | ||||||
Itausa – Investimentos Itau SA | 34,180,465 | 166,506,701 | ||||||
Lojas Americanas SA | 5,188,170 | 36,727,945 | ||||||
Metalurgica Gerdau SA | 2,975,600 | 21,091,379 | ||||||
Oi SA | 24,933,268 | 16,157,511 | ||||||
Petroleo Brasileiro SA | 43,278,927 | 451,638,151 | ||||||
Suzano Papel e Celulose SA Class A | 3,141,100 | 12,507,967 | ||||||
Telefonica Brasil SA | 3,152,967 | 67,426,190 | ||||||
Usinas Siderurgicas de Minas Gerais SA Class Aa | 4,045,800 | 14,609,758 | ||||||
Vale SA Class A | 19,618,851 | 227,705,106 | ||||||
|
| |||||||
| 2,238,964,198 | ||||||||
CHILE — 0.08% |
| |||||||
Embotelladora Andina SA Class B | 2,311,266 | 7,576,294 | ||||||
Sociedad Quimica y Minera de Chile SA Series B | 1,012,934 | 27,729,796 | ||||||
|
| |||||||
| 35,306,090 | ||||||||
COLOMBIA — 0.30% |
| |||||||
Banco Davivienda SA | 1,013,555 | 16,853,399 | ||||||
Bancolombia SA | 4,591,374 | 72,755,490 | ||||||
Grupo Argos SA | 1,130,982 | 13,794,980 | ||||||
| 22 | 2014 iSHARES ANNUAL REPORTTO SHAREHOLDERS |
Table of Contents
Consolidated Schedule of Investments (Continued)
iSHARES® MSCI EMERGING MARKETS ETF
August 31, 2014
| Security | Shares | Value | ||||||
Grupo Aval Acciones y Valores SA | 17,400,983 | $ | 13,015,930 | |||||
Grupo de Inversiones Suramericana SA | 809,505 | 18,397,361 | ||||||
|
| |||||||
| 134,817,160 | ||||||||
RUSSIA — 0.24% |
| |||||||
AK Transneft OAO | 16,535 | 36,376,176 | ||||||
Sberbank of Russia | 10,334,738 | 15,410,822 | ||||||
Surgutneftegas OJSC | 75,498,900 | 55,564,080 | ||||||
|
| |||||||
| 107,351,078 | ||||||||
SOUTH KOREA — 0.72% |
| |||||||
Hyundai Motor Co. Ltd. | 210,091 | 31,080,083 | ||||||
Hyundai Motor Co. Ltd. Series 2 | 370,515 | 57,370,536 | ||||||
LG Chem Ltd. | 79,510 | 13,840,441 | ||||||
Samsung Electronics Co. Ltd. | 215,447 | 216,732,521 | ||||||
|
| |||||||
| 319,023,581 | ||||||||
|
| |||||||
TOTAL PREFERRED STOCKS |
| |||||||
(Cost: $2,534,046,945) |
| 2,835,462,107 | ||||||
WARRANTS — 0.00% |
| |||||||
THAILAND — 0.00% |
| |||||||
Indorama Ventures PCL NVDR (Expires 8/24/17)a | 1,536,398 | — | ||||||
Indorama Ventures PCL NVDR (Expires 8/24/18)a | 1,181,844 | — | ||||||
|
| |||||||
| — | ||||||||
|
| |||||||
TOTAL WARRANTS |
| |||||||
(Cost: $0) |
| — | ||||||
SHORT-TERM INVESTMENTS — 3.23% |
| |||||||
MONEY MARKET FUNDS — 3.23% |
| |||||||
BlackRock Cash Funds: Institutional, |
| |||||||
0.14%e,f,g | 1,288,620,844 | 1,288,620,844 | ||||||
BlackRock Cash Funds: Prime, |
| |||||||
0.11%e,f,g | 81,122,217 | 81,122,217 | ||||||
BlackRock Cash Funds: Treasury, |
| |||||||
0.00%e,f | 60,786,501 | 60,786,501 | ||||||
|
| |||||||
| 1,430,529,562 | ||||||||
|
| |||||||
TOTAL SHORT-TERM INVESTMENTS |
| |||||||
(Cost: $1,430,529,562) |
| 1,430,529,562 | ||||||
|
| |||||||
| Value | ||||||
TOTAL INVESTMENTS | ||||||
(Cost: $41,664,430,394) | $ | 45,578,176,619 | ||||
Other Assets, Less Liabilities — (2.80)% | (1,241,775,976 | ) | ||||
|
| |||||
NET ASSETS — 100.00% | $ | 44,336,400,643 | ||||
|
| |||||
CPO — Certificates of Participation (Ordinary)
GDR — Global Depositary Receipts
NVDR — Non-Voting Depositary Receipts
NVS — Non-Voting Shares
SP ADR — Sponsored American Depositary Receipts
SP GDR — Sponsored Global Depositary Receipts
| a | Non-income earning security. |
| b | All or a portion of this security represents a security on loan. See Note 1. |
| c | This security may be resold to qualified foreign investors and foreign institutional buyers under Regulation S of the Securities Act of 1933. |
| d | Security valued using Level 3 inputs in accordance with management’s fair valuation policy. See Note 1. |
| e | Affiliated issuer. See Note 2. |
| f | The rate quoted is the annualized seven-day yield of the fund at period end. |
| g | All or a portion of this security represents an investment of securities lending collateral. See Note 1. |
Financial futures contracts purchased as of August 31, 2014 were as follows:
| Number of Contracts | Issue (Expiration) | Exchange | Notional Value | Unrealized Appreciation (Depreciation) | ||||||||||
| 2,800 | MSCI Emerging Markets E-Mini (Sept. 2014) | NYSE Liffe | $ | 152,012,000 | $ | 6,299,526 | ||||||||
See notes to consolidated financial statements.
CONSOLIDATED SCHEDULEOF INVESTMENTS | 23 |
Table of Contents
Consolidated Statement of Assets and Liabilities
iSHARES® MSCI EMERGING MARKETS ETF
August 31, 2014
ASSETS | ||||
Investments, at cost: | ||||
Unaffiliated | $ | 40,233,900,832 | ||
Affiliated (Note 2) | 1,430,529,562 | |||
|
| |||
Total cost of investments | $ | 41,664,430,394 | ||
|
| |||
Investments in securities, at fair value (including securities on loana) (Note 1): | ||||
Unaffiliated | $ | 44,147,647,057 | ||
Affiliated (Note 2) | 1,430,529,562 | |||
|
| |||
Total fair value of investments | 45,578,176,619 | |||
Foreign currency, at valueb | 66,224,001 | |||
Cash | 34,357,462 | |||
Cash pledged to broker | 5,983,010 | |||
Receivables: | ||||
Investment securities sold | 109,173,594 | |||
Due from custodian (Note 4) | 95,942 | |||
Dividends and interest | 71,968,868 | |||
Capital shares sold | 58,109,170 | |||
|
| |||
Total Assets | 45,924,088,666 | |||
|
| |||
LIABILITIES | ||||
Payables: | ||||
Investment securities purchased | 190,003,812 | |||
Collateral for securities on loan (Note 1) | 1,369,743,061 | |||
Futures variation margin | 243,135 | |||
Foreign taxes (Note 1) | 3,472,462 | |||
Investment advisory fees (Note 2) | 24,225,553 | |||
|
| |||
Total Liabilities | 1,587,688,023 | |||
|
| |||
NET ASSETS | $ | 44,336,400,643 | ||
|
| |||
Net assets consist of: | ||||
Paid-in capital | $ | 48,142,717,237 | ||
Undistributed net investment income | 173,862,959 | |||
Accumulated net realized loss | (7,900,251,692 | ) | ||
Net unrealized appreciation | 3,920,072,139 | |||
|
| |||
NET ASSETS | $ | 44,336,400,643 | ||
|
| |||
Shares outstandingc | 982,800,000 | |||
|
| |||
Net asset value per share | $ | 45.11 | ||
|
| |||
| a | Securities on loan with a value of $1,288,540,140. See Note 1. |
| b | Cost of foreign currency: $66,214,437. |
| c | $0.001 par value, number of shares authorized: 2 billion. |
See notes to consolidated financial statements.
| 24 | 2014 iSHARES ANNUAL REPORTTO SHAREHOLDERS |
Table of Contents
Consolidated Statement of Operations
iSHARES® MSCI EMERGING MARKETS ETF
Year ended August 31, 2014
NET INVESTMENT INCOME | ||||
Dividends — unaffiliateda | $ | 1,002,192,423 | ||
Interest — affiliated (Note 2) | 10,782 | |||
Securities lending income — affiliated (Note 2)b | 20,304,239 | |||
|
| |||
| 1,022,507,444 | ||||
Less: Other foreign taxes (Note 1) | (4,977,501 | ) | ||
|
| |||
Total investment income | 1,017,529,943 | |||
|
| |||
EXPENSES | ||||
Investment advisory fees (Note 2) | 258,410,222 | |||
Mauritius income taxes (Note 1) | 1,047,435 | |||
Commitment fees (Note 8) | 68,560 | |||
Interest expense (Note 8) | 5,367 | |||
|
| |||
Total expenses | 259,531,584 | |||
Less investment advisory fees waived (Note 2) | (784,811 | ) | ||
|
| |||
Net expenses | 258,746,773 | |||
|
| |||
Net investment income | 758,783,170 | |||
|
| |||
NET REALIZED AND UNREALIZED GAIN (LOSS) | ||||
Net realized gain (loss) from: | ||||
Investments — unaffiliated | (1,503,688,768 | ) | ||
In-kind redemptions — unaffiliated | 523,811,253 | |||
Futures contracts | 28,111,882 | |||
Foreign currency transactions | (18,733,713 | ) | ||
|
| |||
Net realized loss | (970,499,346 | ) | ||
|
| |||
Net change in unrealized appreciation/depreciation on: | ||||
Investments | 6,253,004,868 | |||
Futures contracts | 10,980,560 | |||
Translation of assets and liabilities in foreign currencies | 3,281,195 | |||
|
| |||
Net change in unrealized appreciation/depreciation | 6,267,266,623 | |||
|
| |||
Net realized and unrealized gain | 5,296,767,277 | |||
|
| |||
NET INCREASE IN NET ASSETS RESULTING FROM OPERATIONS | $ | 6,055,550,447 | ||
|
| |||
| a | Net of foreign withholding tax of $118,489,281. |
| b | Net of securities lending income tax paid $1,145,038. |
See notes to consolidated financial statements.
FINANCIAL STATEMENTS | 25 |
Table of Contents
Consolidated Statements of Changes in Net Assets
iSHARES® MSCI EMERGING MARKETS ETF
Year ended August 31, 2014 | Year ended August 31, 2013 | |||||||
INCREASE (DECREASE) IN NET ASSETS | ||||||||
OPERATIONS: | ||||||||
Net investment income | $ | 758,783,170 | $ | 751,988,177 | ||||
Net realized loss | (970,499,346 | ) | (879,811,483 | ) | ||||
Net change in unrealized appreciation/depreciation | 6,267,266,623 | (306,437,138 | ) | |||||
|
|
|
| |||||
Net increase (decrease) in net assets resulting from operations | 6,055,550,447 | (434,260,444 | ) | |||||
|
|
|
| |||||
DISTRIBUTIONS TO SHAREHOLDERS: | ||||||||
From net investment income | (673,353,625 | ) | (729,020,568 | ) | ||||
|
|
|
| |||||
Total distributions to shareholders | (673,353,625 | ) | (729,020,568 | ) | ||||
|
|
|
| |||||
CAPITAL SHARE TRANSACTIONS: | ||||||||
Proceeds from shares sold | 16,425,662,994 | 15,077,037,675 | ||||||
Cost of shares redeemed | (12,275,651,505 | ) | (13,366,192,611 | ) | ||||
|
|
|
| |||||
Net increase in net assets from capital share transactions | 4,150,011,489 | 1,710,845,064 | ||||||
|
|
|
| |||||
INCREASE IN NET ASSETS | 9,532,208,311 | 547,564,052 | ||||||
NET ASSETS | ||||||||
Beginning of year | 34,804,192,332 | 34,256,628,280 | ||||||
|
|
|
| |||||
End of year | $ | 44,336,400,643 | $ | 34,804,192,332 | ||||
|
|
|
| |||||
Undistributed net investment income included in net assets at end of year | $ | 173,862,959 | $ | 99,170,750 | ||||
|
|
|
| |||||
SHARES ISSUED AND REDEEMED | ||||||||
Shares sold | 388,800,000 | 355,500,000 | ||||||
Shares redeemed | (311,400,000 | ) | (323,550,000 | ) | ||||
|
|
|
| |||||
Net increase in shares outstanding | 77,400,000 | 31,950,000 | ||||||
|
|
|
| |||||
See notes to consolidated financial statements.
| 26 | 2014 iSHARES ANNUAL REPORTTO SHAREHOLDERS |
Table of Contents
iSHARES® MSCI EMERGING MARKETS ETF
(For a share outstanding throughout each period)
| Year ended Aug. 31, 2014 (Consolidated) | Year ended Aug. 31, 2013 (Consolidated) | Year ended Aug. 31, 2012 (Consolidated) | Year ended Aug. 31, 2011 (Consolidated) | Year ended Aug. 31, 2010 | ||||||||||||||||
Net asset value, beginning of year | $ | 38.44 | $ | 39.22 | $ | 42.71 | $ | 40.19 | $ | 35.48 | ||||||||||
|
|
|
|
|
| �� |
|
|
|
| ||||||||||
Income from investment operations: | ||||||||||||||||||||
Net investment incomea | 0.83 | 0.75 | 0.86 | 0.81 | 0.58 | |||||||||||||||
Net realized and unrealized gain (loss)b | 6.55 | (0.76 | ) | (3.53 | ) | 2.56 | 4.73 | |||||||||||||
|
|
|
|
|
|
|
|
|
| |||||||||||
Total from investment operations | 7.38 | (0.01 | ) | (2.67 | ) | 3.37 | 5.31 | |||||||||||||
|
|
|
|
|
|
|
|
|
| |||||||||||
Less distributions from: | ||||||||||||||||||||
Net investment income | (0.71 | ) | (0.77 | ) | (0.82 | ) | (0.85 | ) | (0.60 | ) | ||||||||||
|
|
|
|
|
|
|
|
|
| |||||||||||
Total distributions | (0.71 | ) | (0.77 | ) | (0.82 | ) | (0.85 | ) | (0.60 | ) | ||||||||||
|
|
|
|
|
|
|
|
|
| |||||||||||
Net asset value, end of year | $ | 45.11 | $ | 38.44 | $ | 39.22 | $ | 42.71 | $ | 40.19 | ||||||||||
|
|
|
|
|
|
|
|
|
| |||||||||||
Total return | 19.34 | % | (0.08 | )% | (6.18 | )% | 8.23 | % | 14.97 | % | ||||||||||
|
|
|
|
|
|
|
|
|
| |||||||||||
Ratios/Supplemental data: | ||||||||||||||||||||
Net assets, end of year (000s) | $ | 44,336,401 | $ | 34,804,192 | $ | 34,256,628 | $ | 33,496,549 | $ | 39,766,955 | ||||||||||
Ratio of expenses to average net assets | 0.67 | % | 0.67 | % | 0.68 | % | 0.67 | % | 0.68 | % | ||||||||||
Ratio of expenses to average net assets prior to waived fees | 0.68 | % | 0.67 | % | 0.69 | % | 0.67 | % | 0.68 | % | ||||||||||
Ratio of net investment income to average net assets | 1.98 | % | 1.78 | % | 2.13 | % | 1.76 | % | 1.45 | % | ||||||||||
Portfolio turnover ratec | 22 | % | 24 | % | 15 | % | 17 | % | 14 | % | ||||||||||
| a | Based on average shares outstanding throughout each period. |
| b | The amounts reported for a share outstanding may not accord with the change in aggregate gains and losses in securities for the fiscal period due to the timing of capital share transactions in relation to the fluctuating market values of the Fund’s underlying securities. |
| c | Portfolio turnover rates exclude portfolio securities received or delivered in Creation Units but include portfolio transactions that are executed as a result of the Fund processing capital share transactions in Creation Units partially for cash in U.S. dollars. Excluding such cash transactions, the portfolio turnover rates for the years ended August 31, 2014, August 31, 2013, August 31, 2012 and August 31, 2011 were 7%, 9%, 10% and 15%, respectively. See Note 4. |
See notes to consolidated financial statements.
FINANCIAL HIGHLIGHTS | 27 |
Table of Contents
Notes to Consolidated Financial Statements
iSHARES® MSCI EMERGING MARKETS ETF
iShares, Inc. (the “Company”) is registered under the Investment Company Act of 1940, as amended (the “1940 Act”), as an open-end management investment company. The Company was incorporated under the laws of the State of Maryland on September 1, 1994 pursuant to amended and restated Articles of Incorporation.
These consolidated financial statements relate only to the following fund (the “Fund”):
| iShares ETF | Diversification Classification | |
MSCI Emerging Markets | Diversified |
The investment objective of the Fund is to seek investment results that correspond generally to the price and yield performance, before fees and expenses, of its underlying index. The investment adviser uses a “passive” or index approach to try to achieve the Fund’s investment objective.
The Fund carries out its investment strategies associated with investment in Indian securities by investing in a wholly-owned subsidiary in the Republic of Mauritius (the “Subsidiary”), which in turn invests in Indian securities included in the underlying index. The investment adviser of the Fund also serves as the investment adviser to the Subsidiary. Through this investment structure, the Fund expects to obtain certain benefits under a current tax treaty between Mauritius and India. The accompanying consolidated financial statements for the Fund include the accounts of the Subsidiary. Intercompany accounts and transactions, if any, have been eliminated.
Pursuant to the Company’s organizational documents, the Fund’s officers and directors are indemnified against certain liabilities that may arise out of the performance of their duties to the Fund. Additionally, in the normal course of business, the Fund enters into contracts with service providers that contain general indemnification clauses. The Fund’s maximum exposure under these arrangements is unknown as this would involve future claims that may be made against the Fund that have not yet occurred.
| 1. | SIGNIFICANT ACCOUNTING POLICIES |
The following significant accounting policies are consistently followed by the Fund in the preparation of its financial statements in conformity with accounting principles generally accepted in the United States of America (“U.S. GAAP”). The preparation of financial statements in conformity with U.S. GAAP requires management to make certain estimates and assumptions that affect the reported amounts of assets and liabilities and disclosures of contingent assets and liabilities at the date of the financial statements and the reported amounts of revenue and expenses during the reporting period. Actual results could differ from those estimates. The Fund is considered an investment company under U.S. GAAP and follows the accounting and reporting guidance applicable to investment companies in the Financial Accounting Standards Board Accounting Standards Codification Topic 946 (ASC 946).
SECURITY VALUATION
The Fund’s investments are valued at fair value each day that the Fund’s listing exchange is open and, for financial reporting purposes, as of the report date should the reporting period end on a day that the Fund’s listing exchange is not open. U.S. GAAP defines fair value as the price a fund would receive to sell an asset or pay to transfer a liability in an orderly transaction between market participants at the measurement date. The BlackRock Global Valuation Methodologies Committee (the “Global Valuation Committee”) provides oversight of the valuation of investments for the Fund. The investments of the Fund are valued pursuant to
| 28 | 2014 iSHARES ANNUAL REPORTTO SHAREHOLDERS |
Table of Contents
Notes to Consolidated Financial Statements (Continued)
iSHARES® MSCI EMERGING MARKETS ETF
policies and procedures developed by the Global Valuation Committee and approved by the Board of Directors of the Company (the “Board”).
| • | Equity investments traded on a recognized securities exchange are valued at that day’s last reported trade price or the official closing price, as applicable, on the exchange where the stock is primarily traded. Equity investments traded on a recognized exchange for which there were no sales on that day are valued at the last traded price. |
| • | Open-end U.S. mutual funds are valued at that day’s published net asset value (NAV). |
| • | Financial futures contracts are valued at that day’s last reported settlement price on the exchange where the contract is traded. |
In the event that application of these methods of valuation results in a price for an investment which is deemed not to be representative of the fair value of such investment or if a price is not available, the investment will be valued based upon other available factors deemed relevant by the Global Valuation Committee, in accordance with policies approved by the Board. These factors include but are not limited to (i) attributes specific to the investment; (ii) the principal market for the investment; (iii) the customary participants in the principal market for the investment; (iv) data assumptions by market participants for the investment, if reasonably available; (v) quoted prices for similar investments in active markets; and (vi) other factors, such as future cash flows, interest rates, yield curves, volatilities, prepayment speeds, loss severities, credit risks and/or default rates. Valuations based on such factors are reported to the Board on a quarterly basis.
The Global Valuation Committee employs various methods for calibrating valuation approaches for investments where an active market does not exist, including regular due diligence of the Company’s pricing vendors, a regular review of key inputs and assumptions, transactional back-testing or disposition analysis to compare unrealized gains and losses to realized gains and losses, reviews of missing or stale prices, reviews of large movements in market values, and reviews of market related activity.
Fair value pricing could result in a difference between the prices used to calculate the Fund’s net asset value and the prices used by the Fund’s underlying index, which in turn could result in a difference between the Fund’s performance and the performance of the Fund’s underlying index.
Various inputs are used in determining the fair value of financial instruments. Inputs may be based on independent market data (“observable inputs”) or they may be internally developed (“unobservable inputs”). These inputs are categorized into a disclosure hierarchy consisting of three broad levels for financial reporting purposes. The level of a value determined for a financial instrument within the fair value hierarchy is based on the lowest level of any input that is significant to the fair value measurement in its entirety. The categorization of a value determined for a financial instrument within the hierarchy is based upon the pricing transparency of the instrument and is not necessarily an indication of the risk associated with investing in the instrument. The three levels of the fair value hierarchy are as follows:
| • | Level 1 — Unadjusted quoted prices in active markets for identical assets or liabilities; |
| • | Level 2 — Inputs other than quoted prices included within Level 1 that are observable for the asset or liability either directly or indirectly, including quoted prices for similar assets or liabilities in active markets, quoted prices for identical or similar assets or liabilities in markets that are not considered to be active, inputs other than quoted prices that are observable for the asset or liability (such as exchange rates, financing terms, interest rates, yield curves, volatilities, prepayment speeds, loss severities, credit risks and default rates) or other market-corroborated inputs; and |
| • | Level 3 — Unobservable inputs for the asset or liability, including the Global Valuation Committee’s assumptions used in determining the fair value of investments. |
NOTESTO CONSOLIDATED FINANCIAL STATEMENTS | 29 |
Table of Contents
Notes to Consolidated Financial Statements (Continued)
iSHARES® MSCI EMERGING MARKETS ETF
Changes in valuation techniques may result in transfers in or out of an assigned level within the disclosure hierarchy. In accordance with the Company’s policy, transfers between different levels of the fair value hierarchy are deemed to have occurred as of the beginning of the reporting period.
The following table summarizes the value of each of the Fund’s investments according to the fair value hierarchy as of August 31, 2014. The breakdown of the Fund’s investments into major categories is disclosed in its consolidated schedule of investments.
| Investments | ||||||||||||||||
| Investment Type | Level 1 | Level 2 | Level 3 | Total | ||||||||||||
Assets: | ||||||||||||||||
Common Stocks | $ | 41,302,779,330 | $ | 9,391,831 | $ | 13,789 | $ | 41,312,184,950 | ||||||||
Preferred Stocks | 2,835,462,107 | — | — | 2,835,462,107 | ||||||||||||
Warrants | — | 0 | a | — | 0 | a | ||||||||||
Money Market Funds | 1,430,529,562 | — | — | 1,430,529,562 | ||||||||||||
Futures Contractsb | 6,299,526 | — | — | 6,299,526 | ||||||||||||
|
|
|
|
|
|
|
| |||||||||
| $ | 45,575,070,525 | $ | 9,391,831 | $ | 13,789 | $ | 45,584,476,145 | |||||||||
|
|
|
|
|
|
|
| |||||||||
| a | Rounds to less than $1. |
| b | Shown at the unrealized appreciation (depreciation) on the contracts. |
SECURITY TRANSACTIONS AND INCOME RECOGNITION
Security transactions are accounted for on trade date. Dividend income and capital gain distributions, if any, are recognized on the ex-dividend date, net of any foreign taxes withheld at source. Any taxes withheld that are reclaimable from foreign tax authorities as of August 31, 2014 are reflected in dividends receivable. Non-cash dividends received in the form of stock in an elective dividend, if any, are recorded as dividend income at fair value. Distributions received by the Fund may include a return of capital that is estimated by management. Such amounts are recorded as a reduction of the cost of investments or reclassified to capital gains. Interest income is accrued daily. Realized gains and losses on investment transactions are determined using the specific identification method.
FOREIGN CURRENCY TRANSLATION
The accounting records of the Fund are maintained in U.S. dollars. Foreign currencies, as well as investment securities and other assets and liabilities denominated in foreign currencies, are translated into U.S. dollars using exchange rates deemed appropriate by the investment adviser. Purchases and sales of securities, income receipts and expense payments are translated into U.S. dollars on the respective dates of such transactions.
The Fund does not isolate the effect of fluctuations in foreign exchange rates from the effect of fluctuations in the market prices of securities. Such fluctuations are reflected by the Fund as a component of realized and unrealized gains and losses from investments for financial reporting purposes.
FOREIGN TAXES
The Fund may be subject to foreign taxes (a portion of which may be reclaimable) on income, stock dividends, capital gains on investments, or certain foreign currency transactions. All foreign taxes are recorded in accordance with the applicable foreign tax regulations and rates that exist in the foreign jurisdictions in which the Fund invests. These foreign taxes, if any, are paid by the
| 30 | 2014 iSHARES ANNUAL REPORTTO SHAREHOLDERS |
Table of Contents
Notes to Consolidated Financial Statements (Continued)
iSHARES® MSCI EMERGING MARKETS ETF
Fund and are reflected in its consolidated statement of operations as follows: foreign taxes withheld at source are presented as a reduction of income, foreign taxes on securities lending income are presented as a reduction of securities lending income, foreign taxes on stock dividends are presented as “other foreign taxes,” and foreign taxes on capital gains from sales of investments and foreign taxes on foreign currency transactions are included in their respective net realized gain (loss) categories. Foreign taxes payable or deferred as of August 31, 2014, if any, are disclosed in the Fund’s consolidated statement of assets and liabilities.
The Fund conducts its investment activities in India through the Subsidiary and expects to obtain benefits under the Double Tax Avoidance Agreement (“DTAA”). In order to be eligible to claim benefits under the DTAA, the Subsidiary must satisfy certain conditions, including the establishment and maintenance of valid tax residence in Mauritius. The Subsidiary is subject to tax in Mauritius on its net income at the rate of 15%. However, a system of tax credits effectively reduces the Mauritius income tax rate to a maximum of 3%. These income taxes, if any, are paid by the Fund and are disclosed in the consolidated statement of operations. Further, the Subsidiary is not subject to tax in Mauritius on any gains from the sale of securities. Any dividends paid by the Subsidiary to the Fund will also be exempt from tax in Mauritius. The foregoing is based upon current interpretation and practice and is subject to future changes in the tax laws of India or Mauritius and in the DTAA.
As a result of legislative changes enacted by the 2012 India Finance Act (“the Act”) and its general anti-avoidance rules (“GAAR”), which are effective April 1, 2013 but have been proposed to be deferred until April 1, 2016, the Subsidiary’s ability to leverage the treaty between Mauritius and India may be adversely impacted, and therefore the Fund may be subject to taxes on capital gains and/or dividends realized on Indian securities. The Act also includes provisions that impose Indian tax on the transfer of shares of an Indian company. However, until more definitive guidance on the legislative changes is available, the impact to the Fund, if any, cannot be determined at this time.
DISTRIBUTIONS TO SHAREHOLDERS
Dividends and distributions paid by the Fund are recorded on the ex-dividend dates. Distributions are determined on a tax basis and may differ from net investment income and net realized capital gains for financial reporting purposes. Dividends and distributions are paid in U.S. dollars and cannot be automatically reinvested in additional shares of the Fund.
LOANS OF PORTFOLIO SECURITIES
The Fund may lend its investment securities to approved borrowers, such as brokers, dealers and other financial institutions. The borrower pledges and maintains with the Fund collateral consisting of cash, an irrevocable letter of credit issued by a bank, or securities issued or guaranteed by the U.S. government. The initial collateral received by the Fund is required to have a value of at least 102% of the current value of the loaned securities for securities traded on U.S. exchanges and a value of at least 105% for all other securities. The collateral is maintained thereafter, at a value equal to at least 100% of the current value of the securities on loan. The market value of the loaned securities is determined at the close of each business day of the Fund and any additional required collateral is delivered to the Fund on the next business day. During the term of the loan, the Fund is entitled to all distributions made on or in respect of the loaned securities. Loans of securities are terminable at any time and the borrower, after notice, is required to return borrowed securities within the standard time period for settlement of securities transactions.
Any cash received as collateral for securities on loan may be reinvested in certain short-term instruments either directly on behalf of a fund or through one or more joint accounts or money market funds, including those managed by BlackRock Fund Advisors (“BFA”), the Fund’s investment adviser, or its affiliates. As of August 31, 2014, any securities on loan were collateralized by cash. The cash collateral received was invested in money market funds managed by BFA and is disclosed in the consolidated schedule of investments. The value of any securities on loan as of August 31, 2014 and the value of the related collateral are disclosed in the consolidated statement of assets and liabilities. Income earned by the Fund from securities lending is disclosed in the consolidated statement of operations.
NOTESTO CONSOLIDATED FINANCIAL STATEMENTS | 31 |
Table of Contents
Notes to Consolidated Financial Statements (Continued)
iSHARES® MSCI EMERGING MARKETS ETF
The risks of securities lending include the risk that the borrower may not provide additional collateral when required or may not return the securities when due. To mitigate these risks, the Fund benefits from a borrower default indemnity provided by BlackRock, Inc. (“BlackRock”). BlackRock’s indemnity allows for full replacement of securities lent. The Fund could suffer a loss if the value of the investments purchased with cash collateral falls below the value of the cash collateral received.
Securities lending transactions are entered into by the Fund under Master Securities Lending Agreements (“MSLA”) which provide the right, in the event of default (including bankruptcy or insolvency) for the non-defaulting party to liquidate the collateral and calculate a net exposure to the defaulting party or request additional collateral. In the event that a borrower defaults, the Fund, as lender, would offset the market value of the collateral received against the market value of the securities loaned. The value of the collateral is typically greater than that of the market value of the securities loaned, leaving the lender with a net amount payable to the defaulting party. However, bankruptcy or insolvency laws of a particular jurisdiction may impose restrictions on or prohibitions against such a right of offset in the event of an MSLA counterparty’s bankruptcy or insolvency. Under the MSLA, the borrower can resell or re-pledge the loaned securities, and the Fund can reinvest cash collateral, or, upon an event of default, resell or re-pledge the collateral.
The following table is a summary of the Fund’s securities lending agreements which are subject to offset under an MSLA as of August 31, 2014:
Market Value of Securities on Loan | Cash Collateral Received a | Net Amount | ||||||
| $1,288,540,140 | $ | 1,288,540,140 | $ | — | ||||
| a | Collateral received in excess of the market value of securities on loan is not presented for financial reporting purposes. The total collateral received is disclosed in the Fund’s statement of assets and liabilities. |
RECENT ACCOUNTING STANDARD
In June 2014, the Financial Accounting Standards Board issued guidance to improve the financial reporting of reverse repurchase agreements and other similar transactions. The guidance will require expanded disclosure for entities that enter into reverse repurchase agreements and similar transactions accounted for as secured borrowings, including securities lending. The guidance is effective for financial statements for fiscal years beginning after December 15, 2014, and interim periods within those fiscal years. Management is evaluating the impact, if any, of this guidance on the Fund’s financial statements and disclosures.
| 2. | INVESTMENT ADVISORY AGREEMENT AND OTHER TRANSACTIONS WITH AFFILIATES |
Pursuant to an Investment Advisory Agreement with the Company, BFA manages the investment of the Fund’s assets. BFA is a California corporation indirectly owned by BlackRock. Under the Investment Advisory Agreement, BFA is responsible for substantially all expenses of the Fund, except interest, taxes, brokerage commissions and other expenses connected with the execution of portfolio transactions, distribution fees, litigation expenses and any extraordinary expenses.
The Subsidiary has entered into a separate contract with BFA under which BFA provides investment advisory services to the Subsidiary but does not receive separate compensation from the Subsidiary for providing it with such services. The Subsidiary has also entered into separate arrangements that provide for the provision of other services to the Subsidiary (including administrative, custody, transfer agency and other services), and BFA pays the costs and expenses related to the provision of those services.
| 32 | 2014 iSHARES ANNUAL REPORTTO SHAREHOLDERS |
Table of Contents
Notes to Consolidated Financial Statements (Continued)
iSHARES® MSCI EMERGING MARKETS ETF
For its investment advisory services to the Fund, BFA is entitled to an annual investment advisory fee based on the Fund’s allocable portion of the aggregate of the average daily net assets of the Fund and certain other iShares funds, as follows:
| Investment Advisory Fee | Aggregate Average Daily Net Assets | ||||
| 0.75 | % | First $14 billion | |||
| 0.68 | Over $14 billion, up to and including $28 billion | ||||
| 0.61 | Over $28 billion, up to and including $42 billion | ||||
| 0.54 | a | Over $42 billion, up to and including $56 billion | |||
| 0.47 | a | Over $56 billion, up to and including $70 billion | |||
| 0.41 | a | Over $70 billion, up to and including $84 billion | |||
| 0.35 | a | Over $84 billion | |||
| a | Investment advisory fee was reduced effective July 1, 2014. Prior to this date, the investment advisory fee for these breakpoint levels were 0.56%, 0.50%, 0.45% and 0.40%, respectively. |
For the year ended August 31, 2014, BFA has voluntarily waived a portion of its investment advisory fees for the Fund in the amount of $784,811.
BFA has contractually agreed to waive a portion of its investment advisory fees for the Fund through December 31, 2015 in an amount equal to the Fund’s pro rata share of the fees and expenses attributable to the Fund’s investment in other iShares funds. The Fund did not hold any iShares Funds during the year ended August 31, 2014.
The U.S. Securities and Exchange Commission has issued an exemptive order which permits BlackRock Institutional Trust Company, N.A. (“BTC”), an affiliate of BFA, to serve as securities lending agent for the Fund, subject to applicable conditions. As securities lending agent, BTC bears all operational costs directly related to securities lending. Effective January 1, 2014, the Fund is responsible for fees in connection with the investment of cash collateral received for securities on loan in a money market fund managed by BFA, however, BTC has agreed to reduce the amount of securities lending income it receives in order to effectively limit the collateral investment fees the Fund bears to an annual rate of 0.04% (the “collateral investment fees”). Securities lending income is equal to the total of income earned from the reinvestment of cash collateral, net of fees and other payments to and from borrowers of securities, and less the collateral investment fees. The Fund retains a portion of securities lending income and remits a remaining portion to BTC as compensation for its services as securities lending agent.
Pursuant to a securities lending agreement effective January 1, 2014, (i) the Fund retains 75% of securities lending income and (ii) these amounts can never be less than 65% of the total of securities lending income plus the collateral investment fees.
In addition, commencing the business day following the date that the aggregate securities lending income plus the collateral investment fees generated across all 1940 Act iShares exchange-traded funds (the “iShares ETF Complex”) in a given calendar year exceeds the aggregate securities lending income generated across the iShares ETF Complex in calendar year 2013 and pursuant to a securities lending agreement, (i) the Fund will receive for the remainder of that calendar year 80% of securities lending income and (ii) these amounts can never be less than 65% of the total of securities lending income plus the collateral investment fees.
For the year ended August 31, 2014, the Fund paid to BTC securities lending agent services and collateral investment fees in the amount of $8,714,344.
Prior to January 1, 2014, the Fund retained 65% of securities lending income and paid no collateral investment fees.
BlackRock Investments, LLC, an affiliate of BFA, is the distributor for the Fund. Pursuant to the distribution agreement, BFA is responsible for any fees or expenses for distribution services provided to the Fund.
NOTESTO CONSOLIDATED FINANCIAL STATEMENTS | 33 |
Table of Contents
Notes to Consolidated Financial Statements (Continued)
iSHARES® MSCI EMERGING MARKETS ETF
Cross trades for the year ended August 31, 2014, if any, were executed by the Fund pursuant to Rule 17a-7 under the 1940 Act. Cross trading is the buying or selling of portfolio securities between funds to which BFA (or an affiliate) serves as investment adviser. At its regularly scheduled quarterly meetings, the Board reviews such transactions as of the most recent calendar quarter for compliance with the requirements and restrictions set forth by Rule 17a-7.
The Fund may invest its positive cash balances in certain money market funds managed by BFA or an affiliate. The income earned on these temporary cash investments is included in “Interest – affiliated” in the consolidated statement of operations.
The PNC Financial Services Group, Inc. is the largest stockholder of BlackRock and is considered to be an affiliate of the Fund for 1940 Act purposes.
The Fund, in order to improve its portfolio liquidity and its ability to track its underlying index, may invest in shares of other iShares funds that invest in securities in the Fund’s underlying index.
Certain directors and officers of the Company are also officers of BTC and/or BFA.
| 3. | INVESTMENT PORTFOLIO TRANSACTIONS |
Purchases and sales of investments (excluding in-kind transactions and short-term investments) for the year ended August 31, 2014, were $ 11,064,753,979 and $ 8,451,267,337, respectively.
In-kind purchases and sales (see Note 4) for the year ended August 31, 2014, were $7,515,819,648 and $5,791,343,761, respectively.
| 4. | CAPITAL SHARE TRANSACTIONS |
Capital shares are issued and redeemed by the Fund only in aggregations of a specified number of shares or multiples thereof (“Creation Units”) at net asset value. Except when aggregated in Creation Units, shares of the Fund are not redeemable. Transactions in capital shares for the Fund are disclosed in detail in the consolidated statements of changes in net assets.
The consideration for the purchase of Creation Units of a fund in the Company generally consists of the in-kind deposit of a designated portfolio of securities and a specified amount of cash. Certain funds in the Company may be offered in Creation Units solely or partially for cash in U.S. dollars. Investors purchasing and redeeming Creation Units may pay a purchase transaction fee and a redemption transaction fee directly to State Street Bank and Trust Company, the Company’s administrator, to offset transfer and other transaction costs associated with the issuance and redemption of Creation Units, including Creation Units for cash. Investors transacting in Creation Units for cash may also pay an additional variable charge to compensate the relevant fund for certain transaction costs (i.e., stamp taxes, taxes on currency or other financial transactions, and brokerage costs) and market impact expenses relating to investing in portfolio securities. Such variable charges, if any, are included in “Proceeds from shares sold” in the consolidated statement of changes in net assets.
From time to time, settlement of securities related to in-kind contributions or in-kind redemptions may be delayed. In such cases, securities related to in-kind contributions are reflected as “Due from custodian” and securities related to in-kind redemptions are reflected as “Securities related to in-kind transactions” in the consolidated statement of assets and liabilities.
| 5. | FINANCIAL FUTURES CONTRACTS |
The Fund may purchase or sell financial futures contracts in an effort to help the Fund track its underlying index. A futures contract is a standardized, exchange-traded agreement to buy and sell a financial instrument at a set price on a future date. Upon
| 34 | 2014 iSHARES ANNUAL REPORTTO SHAREHOLDERS |
Table of Contents
Notes to Consolidated Financial Statements (Continued)
iSHARES® MSCI EMERGING MARKETS ETF
entering into a futures contract, the Fund is required to pledge to the executing broker which holds segregated from its own assets, an amount of cash, U.S. government securities or other high-quality debt and equity securities equal to the minimum initial margin requirements of the exchange on which the contract is traded. Pursuant to the contract, the Fund agrees to receive from or pay to the broker an amount of cash equal to the daily fluctuation in value of the contract. Such receipts or payments are known as margin variation and are recorded by the Fund as unrealized appreciation or depreciation. When the contract is closed, the Fund records a realized gain or loss equal to the difference between the value of the contract at the time it was opened and the value at the time it was closed. Losses may arise if the value of a futures contract decreases due to an unfavorable change in the market rates or values of the underlying instrument during the term of the contract or if the counterparty does not perform under the contract. The use of futures contracts also involves the risk of an imperfect correlation in the movements in the price of futures contracts and the assets underlying such contracts.
The following table shows the value of futures contracts held by the Fund as of August 31, 2014 and the related locations in the consolidated statement of assets and liabilities, presented by risk exposure category:
| Assets | ||||
Equity contracts: | ||||
Variation margin / Net assets consist of – net unrealized appreciationa | $ | 6,299,526 | ||
|
| |||
| a | Represents cumulative appreciation of futures contracts as reported in the consolidated schedule of investments. Only current day’s variation margin is reported separately within the consolidated statement of assets and liabilities. |
The following table shows the realized and unrealized gains (losses) on futures contracts held by the Fund during the year ended August 31, 2014 and the related locations in the consolidated statement of operations, presented by risk exposure category:
| Net Realized Gain (Loss) | Net Change in Unrealized Appreciation/Depreciation | |||||||
Equity contracts: | ||||||||
Futures contracts | $ | 28,111,882 | $ | 10,980,560 | ||||
|
|
|
| |||||
The following table shows the average quarter-end balances of open futures contracts for the year ended August 31, 2014:
Average number of contracts purchased | 2,974 | |||
Average number of contracts sold | (196 | ) | ||
Average value of contracts purchased | $ | 147,191,295 | ||
Average value of contracts sold | $ | (9,936,220 | ) |
| 6. | MARKET AND CREDIT RISK |
In the normal course of business, the Fund’s investment activities exposes it to various types of risk associated with the financial instruments and markets in which it invests. The significant types of financial risks the Fund is exposed to include market risk and credit risk. The Fund’s prospectus provides details of these and other types of risk.
BFA uses a “passive” or index approach to try to achieve the Fund’s investment objective following the securities included in its underlying index during upturns as well as downturns. BFA does not take steps to reduce market exposure or to lessen the effects of a declining market. Divergence from the underlying index and the composition of the portfolio is monitored by BFA.
NOTESTO CONSOLIDATED FINANCIAL STATEMENTS | 35 |
Table of Contents
Notes to Consolidated Financial Statements (Continued)
iSHARES® MSCI EMERGING MARKETS ETF
MARKET RISK
Market risk arises mainly from uncertainty about future values of financial instruments influenced by price, currency and interest rate movements. It represents the potential loss the Fund may suffer through holding market positions in the face of market movements. The Fund is exposed to market risk by virtue of its investment in equity and financial derivative instruments. The fair value of securities held by the Fund may decline due to general market conditions, economic trends or events that are not specifically related to the issuers of the securities including local, regional or global political, social or economic instability or to factors that affect a particular industry or group of industries. The extent of the Fund’s exposure to market risk is the market value of the investments held as shown in the Fund’s consolidated schedule of investments.
A diversified portfolio, where this is appropriate and consistent with a fund’s objectives, minimizes the risk that a price change of a particular investment will have a material impact on the NAV of a fund. The investment concentrations within the Fund’s portfolio are disclosed in its consolidated schedule of investments.
The Fund invests a substantial amount of its assets in securities of non-U.S. issuers that trade in non-U.S. markets. This involves certain considerations and risks not typically associated with securities of U.S. issuers. Such risks include, but are not limited to: generally less liquid and less efficient securities markets; generally greater price volatility; exchange rate fluctuations and exchange controls; imposition of restrictions on the expatriation of funds or other assets of the Fund; less publicly available information about issuers; the imposition of withholding or other taxes; higher transaction and custody costs; settlement delays and risk of loss attendant in settlement procedures; difficulties in enforcing contractual obligations; less regulation of securities markets; different accounting, disclosure and reporting requirements; more substantial governmental involvement in the economy; higher inflation rates; greater social, economic and political uncertainties; the risk of nationalization or expropriation of assets; and the risk of war. These risks are heightened for investments in issuers from countries with less developed markets.
The United States and the European Union, along with the regulatory bodies of a number of countries including Japan, Australia and Canada (collectively, “Sanctioning Bodies”), have imposed sectorial economic sanctions on certain Russian individuals and Russian corporate entities which include prohibitions on transacting in or dealing in new debt of longer than 30 or 90 days maturity or new equity of such issuers. Securities held by the Fund issued prior to the date of the sanctions being imposed are not currently subject to any restrictions under the sanctions. However, compliance with each of these sanctions may impair the ability of a Fund to buy, sell, hold, receive or deliver the affected securities or other securities of such issuers. The Sanctioning Bodies could also institute broader sanctions on Russia. These sanctions, or even the threat of further sanctions, may result in the decline of the value and liquidity of Russian securities, a weakening of the ruble or other adverse consequences to the Russian economy. Current or future sanctions may result in Russia taking counter measures or retaliatory actions, which may further impair the value and liquidity of Russian securities. These retaliatory measures may include the immediate freeze of Russian assets held by a Fund.
CREDIT RISK
Credit risk is the risk that an issuer or guarantor of debt instruments or the counterparty to a financial transaction, including derivatives contracts, repurchase agreements or loans of portfolio securities, is unable or unwilling to make timely interest and/or principal payments or to otherwise honor its obligations. BFA and its affiliates manage counterparty credit risk by entering into transactions only with counterparties that it believes have the financial resources to honor their obligations and by monitoring the financial stability of those counterparties. Financial assets, which potentially expose the Fund to issuer and counterparty credit risks, consist principally of financial instruments and receivables due from counterparties. The extent of the Fund’s exposure to credit and counterparty risks with respect to those financial assets is approximated by their value recorded in the consolidated statement of assets and liabilities.
| 36 | 2014 iSHARES ANNUAL REPORTTO SHAREHOLDERS |
Table of Contents
Notes to Consolidated Financial Statements (Continued)
iSHARES® MSCI EMERGING MARKETS ETF
| 7. | INCOME TAX INFORMATION |
The Fund is treated as an entity separate from the Company’s other funds for federal income tax purposes. It is the policy of the Fund to qualify as a regulated investment company by complying with the provisions applicable to regulated investment companies, as defined under Subchapter M of the Internal Revenue Code of 1986, as amended, and to annually distribute substantially all of its ordinary income and any net capital gains (taking into account any capital loss carryforwards) sufficient to relieve it from all, or substantially all, federal income and excise taxes. Accordingly, no provision for federal income taxes is required.
U.S. GAAP requires that certain components of net assets be adjusted to reflect permanent differences between financial and tax reporting. These reclassifications have no effect on net assets or net asset values per share. The following permanent differences as of August 31, 2014, attributable to passive foreign investment companies, the expiration of capital loss carryforwards, foreign currency transactions and realized gains (losses) from in-kind redemptions, were reclassified to the following accounts:
Paid-in Capital | Undistributed Net Investment Income/Distributions Investment Income | Undistributed Net Realized Gain/Accumulated Net Realized Loss | ||||||
| $456,390,241 | $ | (10,737,336 | ) | $ | (445,652,905 | ) | ||
The tax character of distributions paid during the years ended August 31, 2014 and August 31, 2013 was as follows:
| 2014 | 2013 | |||||||
Ordinary income | $ | 673,353,625 | $ | 729,020,568 | ||||
As of August 31, 2014, the tax components of accumulated net earnings (losses) were as follows:
| Undistributed Ordinary Income | Capital Loss Carryforwards | Net Unrealized | Qualified Late-Year Losses b | Total | ||||||||||||
| $264,497,248 | $ | (5,790,591,468 | ) | $ | 2,696,435,746 | $ | (976,658,120 | ) | $ | (3,806,316,594 | ) | |||||
| a | The difference between book-basis and tax-basis unrealized gains (losses) was attributable primarily to the tax deferral of losses on wash sales, the realization for tax purposes of unrealized gains (losses) on certain futures contracts and the realization for tax purpose of unrealized gains on investments in passive foreign investment companies. |
| b | The Fund has elected to defer certain qualified late-year losses and recognize such losses in the next taxable year. |
As of August 31, 2014, the Fund had capital loss carryforwards available to offset future realized capital gains through the indicated expiration dates as follows:
Non- Expiring a | Expiring 2015 | Expiring 2016 | Expiring 2017 | Expiring 2018 | Expiring 2019 | Total | ||||||||||||||||||||
| $3,444,042,588 | $ | 29,973,301 | $ | 13,844,901 | $ | 228,196,854 | $ | 1,201,366,175 | $ | 873,167,649 | $ | 5,790,591,468 | ||||||||||||||
| a | Must be utilized prior to losses subject to expiration. |
NOTESTO CONSOLIDATED FINANCIAL STATEMENTS | 37 |
Table of Contents
Notes to Consolidated Financial Statements (Continued)
iSHARES® MSCI EMERGING MARKETS ETF
The Fund may own shares in certain foreign investment entities, referred to, under U.S. tax law, as “passive foreign investment companies.” The Fund may elect to mark-to-market annually the shares of each passive foreign investment company and would be required to distribute to shareholders any such marked-to-market gains.
As of August 31, 2014, the cost of investments for federal income tax purposes was $42,881,767,261. Net unrealized appreciation was $2,696,409,358, of which $7,609,310,065 represented gross unrealized appreciation on securities and $4,912,900,707 represented gross unrealized depreciation on securities.
Management has analyzed tax laws and regulations and their application to the Fund as of August 31, 2014, inclusive of the open tax return years, and does not believe there are any uncertain tax positions that require recognition of a tax liability in the Fund’s consolidated financial statements.
| 8. | LINE OF CREDIT |
The Fund, along with certain other iShares funds, is a party to a $150 million credit agreement with State Street Bank and Trust Company, which expires October 28, 2015. The line of credit may be used for temporary or emergency purposes, including redemptions, settlement of trades and rebalancing of portfolio holdings. The credit agreement has the following terms: a commitment fee of 0.08% per annum on the unused portion of the credit agreement and interest at a rate equal to the higher of (a) the one-month LIBOR plus 1.00% per annum or (b) the U.S. Federal Funds rate plus 1.00% per annum on amounts borrowed. The commitment fee is allocated to each fund participating in the credit agreement based on each fund’s pro-rata share of the aggregate average daily value of assets invested in local securities of certain foreign markets.
For the year ended August 31, 2014, the Fund’s maximum amount borrowed, the average borrowings and the average interest rate under the credit agreement were $24,000,000, $460,274 and 1.15%, respectively.
| 9. | LEGAL PROCEEDINGS |
On January 18, 2013, a lawsuit was filed in the United States District Court for the Middle District of Tennessee by Laborers’ Local 265 Pension Fund and Plumbers and Pipefitters Local No. 572 Pension Fund (the “Plaintiffs”) against BFA, BTC, and the current members of the iShares Trust Board of Trustees and the Board of Directors of iShares, Inc. (collectively, “Defendants”) for alleged violations of, among other things, Sections 36(a) and 36(b) of the 1940 Act. The complaint purports to be brought derivatively on behalf of iShares Trust and iShares, Inc., as well as the following eight funds: iShares Russell Mid-Cap ETF; iShares MSCI EAFE ETF; iShares MSCI Emerging Markets ETF; iShares Russell 2000 Growth ETF; iShares Russell 2000 Value ETF; iShares Core S&P Mid-Cap ETF; iShares Core S&P Small-Cap ETF; and iShares U.S. Real Estate ETF. The complaint alleges, among other things, that BFA and BTC breached their fiduciary duties under the 1940 Act by charging allegedly excessive fees in connection with the provision of securities lending services to the above eight funds, that the individual defendants breached their fiduciary duties under the 1940 Act by approving those fee arrangements, and that the securities lending contracts are unenforceable under Section 47(b) of the 1940 Act. Plaintiffs seek injunctive relief, rescission of the securities lending contracts, and monetary damages of an unspecified amount. Defendants believe the claims are without merit and intend to vigorously defend themselves against the allegations in the lawsuit. On March 11, 2013, the Defendants filed a motion to dismiss the lawsuit. On August 28, 2013, the court dismissed the claims without prejudice. The deadline for the Plaintiffs’ request to amend the complaint was September 17, 2013. The Plaintiffs submitted a motion to extend the time to file and the court granted the 30-day extension until October 17, 2013. The Plaintiffs did not amend their complaint prior to this deadline. The Court dismissed the complaint with prejudice on October 24, 2013. The Plaintiffs filed a notice of appeal on November 8, 2013. On February 13, 2014, the Plaintiffs filed an appeal brief with the United States Court of Appeals for the Sixth Circuit (“the Sixth Circuit”). The Defendants filed a response on March 17, 2014. The Plaintiffs filed their response on
| 38 | 2014 iSHARES ANNUAL REPORTTO SHAREHOLDERS |
Table of Contents
Notes to Consolidated Financial Statements (Continued)
iSHARES® MSCI EMERGING MARKETS ETF
April 3, 2014. Oral argument of the Plaintiff’s appeal was heard by the Sixth Circuit on July 30, 2014. On September 30, 2014, the Sixth Circuit affirmed the dismissal of the lawsuit.
| 10. | SUBSEQUENT EVENTS |
Management has evaluated the impact of all subsequent events on the Fund through the date the consolidated financial statements were available to be issued and has determined that there were no subsequent events requiring adjustment or disclosure in the consolidated financial statements.
NOTESTO CONSOLIDATED FINANCIAL STATEMENTS | 39 |
Table of Contents
Report of Independent Registered Public Accounting Firm
To the Shareholders and Board of Directors of
iShares, Inc.:
In our opinion, the accompanying consolidated statement of assets and liabilities, including the consolidated schedule of investments, and the related consolidated statements of operations and of changes in net assets and the consolidated financial highlights present fairly, in all material respects, the financial position of iShares MSCI Emerging Markets ETF and its subsidiary (the “Fund”) at August 31, 2014, the results of its operations, the changes in its net assets and its financial highlights for each of the periods presented, in conformity with accounting principles generally accepted in the United States of America. These consolidated financial statements and consolidated financial highlights (hereafter referred to as “financial statements”) are the responsibility of the Fund’s management; our responsibility is to express an opinion on these financial statements based on our audits. We conducted our audits of these financial statements in accordance with the standards of the Public Company Accounting Oversight Board (United States). Those standards require that we plan and perform the audit to obtain reasonable assurance about whether the financial statements are free of material misstatement. An audit includes examining, on a test basis, evidence supporting the amounts and disclosures in the financial statements, assessing the accounting principles used and significant estimates made by management, and evaluating the overall financial statement presentation. We believe that our audits, which included confirmation of securities at August 31, 2014 by correspondence with the custodian, transfer agent and brokers, provide a reasonable basis for our opinion.
PricewaterhouseCoopers LLP
San Francisco, California
October 22, 2014
| 40 | 2014 iSHARES ANNUAL REPORTTO SHAREHOLDERS |
Table of Contents
iSHARES® MSCI EMERGING MARKETS ETF
For the fiscal year ended August 31, 2014, the Fund earned foreign source income of $1,119,908,950 and paid foreign taxes of $124,221,501 which it intends to pass through to its shareholders pursuant to Section 853 of the Internal Revenue Code (the “Code”).
Under Section 854(b)(2) of the Code, the Fund hereby designates the maximum amount of $653,311,329 as qualified dividend income for purposes of the maximum rate under Section 1(h)(11) of the Code for the fiscal year ended August 31, 2014.
In February 2015, shareholders will receive Form 1099-DIV which will include their share of qualified dividend income distributed during the calendar year 2014. Shareholders are advised to check with their tax advisers for information on the treatment of these amounts on their income tax returns.
TAX INFORMATION | 41 |
Table of Contents
Board Review and Approval of Investment Advisory
Contract
iSHARES® MSCI EMERGING MARKETS ETF
Under Section 15(c) of the Investment Company Act of 1940 (the “1940 Act”), the Company’s Board of Directors (the “Board”), including a majority of Directors who are not “interested persons” of the Company (as that term is defined in the 1940 Act) (the “Independent Directors”), is required annually to consider and approve the Investment Advisory Contract between the Company and BFA (the “Advisory Contract”) on behalf of the Fund. The Independent Directors requested, and BFA provided, such information as the Independent Directors, with advice from independent counsel, deemed reasonably necessary to evaluate the Advisory Contract. A committee of Independent Directors (the “15(c) Committee”), with independent counsel, met with management on March 12, 2014, May 6, 2014, and May 12, 2014, to discuss the types of information the Independent Directors required and the manner in which management would organize and present such information. At a meeting held on May 16, 2014, management presented preliminary information to the Board relating to the continuance of the Advisory Contract, and the Board, including the Independent Directors, reviewed and discussed such information at length. The Independent Directors requested from management certain additional information, which management agreed to provide. At a meeting held on June 12-13, 2014, the Board, including the Independent Directors, reviewed the additional information provided by management in response to these requests. After extensive discussions, the Board, including all of the Independent Directors, approved the continuance of the Advisory Contract for the Fund, based on a review of qualitative and quantitative information provided by BFA, including the additional information management provided at the request of the Independent Directors. The Board noted its satisfaction with the extent and quality of information provided and its frequent interactions with management, as well as the detailed responses and other information provided by BFA. The Board also noted that the Board and BFA agreed to discuss potential enhancements and adjustments to the 15(c) process for the coming year. The Independent Directors were advised by their independent counsel throughout the process, including about the legal standards applicable to their review. In approving the Advisory Contract for the Fund, the Board, including the Independent Directors, considered the following factors, no one of which was controlling, and reached the following conclusions:
Expenses and Performance of the Fund — The Board reviewed statistical information prepared by Lipper Inc. (“Lipper”), an independent provider of investment company data, regarding the expense ratio components, including actual advisory fees, waivers/reimbursements, and gross and net total expenses of the Fund in comparison with the same information for other exchange traded funds (including funds sponsored by an “at cost” service provider) and, in the limited instances where no comparable ETFs existed and the comparison group would not otherwise be reasonable in Lipper’s judgment, pure index institutional mutual funds, objectively selected by Lipper as comprising the Fund’s applicable peer group pursuant to Lipper’s proprietary ETF methodology (the “Lipper Group”). The Board noted that, prior to 2014, Lipper had used a different methodology to determine the Fund’s Lipper group, which included mutual funds, closed-end funds, exchange traded funds, and/or funds with differing investment objective classifications, investment focuses and other characteristics (e.g. actively managed funds and funds sponsored by “at cost” service providers), as applicable. The Board further noted that, after consideration by the 15(c) Committee, the Board determined to use instead Lipper’s proprietary ETF methodology to determine the Fund’s Lipper Group. This determination was based on, among other considerations, the increased number and types of ETFs available for comparative purposes than was the case in prior years. The Board was provided with a detailed description of Lipper’s proprietary ETF methodology used by Lipper to determine the applicable Lipper Group and to prepare this information. At the Board’s request, Lipper provided, and the Board considered, information on the impact to the iShares funds’ comparative fee rankings that were attributable to the change from a pure index group methodology to Lipper’s proprietary ETF methodology. The Board further noted that due to the limitations in providing comparable funds in the Lipper Group, the statistical information provided in Lipper’s report may or may not provide meaningful direct comparisons to the Fund in all instances.
The Board also noted that the investment advisory fee rate and overall expenses for the Fund were within range of the median of the investment advisory fee rates and overall expenses of the funds in its Lipper Group.
In addition, the Board reviewed statistical information prepared by Lipper regarding the performance of the Fund for the one-, three-, five-, ten-year, and since inception periods, as applicable, and the “last quarter” period ended December 31, 2013, and a
| 42 | 2014 iSHARES ANNUAL REPORTTO SHAREHOLDERS |
Table of Contents
Board Review and Approval of Investment Advisory
Contract (Unaudited) (Continued)
iSHARES® MSCI EMERGING MARKETS ETF
comparison of the Fund’s performance to its performance benchmark index for the same periods. To the extent that any of the comparison funds included in the Lipper Group track the same index as the Fund, Lipper also provided, and the Board reviewed, a comparison of the Fund’s performance to that of such relevant comparison funds for the same periods. The Board noted that the Fund generally performed in line with its respective performance benchmark index over the relevant periods. In considering this information, the Board noted that the Lipper Group may include funds that are not exchange traded funds or index funds, and that may have different investment objectives and/or benchmarks from the Fund. In addition, the Board noted that the Fund seeks to track its own benchmark index and that, during the prior year, the Board received periodic reports on the Fund’s performance in comparison with its relevant benchmark index. Such periodic comparative performance information, including detailed information on certain specific iShares funds requested by the Boards, was also considered.
Based on this review, the other factors considered at the meeting, and their general knowledge of ETF pricing, the Board concluded that the investment advisory fee rate and expense level and the historical performance of the Fund supported the Board’s approval of the continuance of the Advisory Contract for the coming year.
Nature, Extent and Quality of Services Provided by BFA — Based on management’s representations, including information about recent and proposed enhancements to the iShares business, including with respect to shareholder servicing and support, the Board expected that there would be no diminution in the scope of services required of or provided by BFA under the Advisory Contract for the coming year as compared to the scope of services provided by BFA during prior years. In reviewing the scope of these services, the Board considered BFA’s investment philosophy and experience, noting that BFA and its affiliates have committed significant resources over time, including during the past year, to supporting the Fund and its shareholders. The Board acknowledged that resources to support the iShares funds and their shareholders have been added or enhanced in recent years, including in such areas as investor education, product management, customized portfolio consulting support, capital markets support, and proprietary risk and performance analytics tools. The Board also considered BFA’s compliance program and its compliance record with respect to the Fund. In that regard, the Board noted that BFA reports to the Board about portfolio management and compliance matters on a periodic basis in connection with regularly scheduled meetings of the Board, and on other occasions as necessary and appropriate, and has provided information and made appropriate officers available as needed to provide further assistance with these matters. The Board also reviewed the background and experience of the persons responsible for the day-to-day management of the Fund, as well as the resources available to them in managing the Fund. In addition to the above considerations, the Board reviewed and considered detailed presentations regarding BFA’s investment performance, investment and risk management processes and strategies provided at the June 12-13, 2014 meeting and throughout the previous year, and matters related to BFA’s portfolio compliance policies and procedures. The Board noted that the Fund had met its investment objective consistently since its inception date.
Based on review of this information, and the performance information discussed above, the Board concluded that the nature, extent and quality of services provided by BFA to the Fund under the Advisory Contract supported the Board’s approval of the continuance of the Advisory Contract for the coming year.
Costs of Services Provided to the Fund and Profits Realized by BFA and Affiliates — The Board reviewed information about the profitability to BlackRock of the Fund based on the fees payable to BFA and its affiliates (including fees under the Advisory Contract), and all other sources of revenue and expense to BFA and its affiliates from the Fund’s operations for the last calendar year. The Board reviewed BlackRock’s profitability methodology for the iShares funds, noting that the 15(c) Committee had focused on the methodology and proposed presentation during its meetings. The Board discussed the sources of direct and ancillary revenue with management, including the revenues to BTC from securities lending by the Fund. The Board also discussed BFA’s profit margin as reflected in the Fund’s profitability analysis and reviewed information regarding potential economies of scale (as discussed below). Based on this review, the Board concluded that the profits realized by BFA and its
BOARD REVIEWAND APPROVALOF INVESTMENT ADVISORY CONTRACT | 43 |
Table of Contents
Board Review and Approval of Investment Advisory
Contract (Unaudited) (Continued)
iSHARES® MSCI EMERGING MARKETS ETF
affiliates under the Advisory Contract and from other relationships between the Fund and BFA and/or its affiliates, if any, were within a reasonable range in light of the factors considered.
Economies of Scale — The Board reviewed information regarding potential economies of scale or other efficiencies that may result from increases in the Fund’s assets, noting that the issue of economies of scale had been focused on extensively by the 15(c) Committee during its meetings and addressed by management. The Board and the 15(c) Committee reviewed information provided by BFA regarding scale benefits shared with the iShares funds through relatively low fee rates established at inception, breakpoints, waivers, or other fee reductions, as well as through additional investment in the iShares business and the provision of improved or additional infrastructure and services to the iShares funds and their shareholders. The Board and the 15(c) Committee received information regarding BlackRock’s historical profitability, including BFA’s and its affiliates’ costs in providing services. The cost information distinguished between fixed and variable costs, and explained how the level of fixed and variable costs, as well as the nature of such costs, may impact the existence or size of scale benefits. The Board noted that the Advisory Contract for the Fund already provided for breakpoints in the Fund’s investment advisory fee rate, and that, following receipt of a proposal from the Board and negotiations, BFA and the Board had agreed to revise the Advisory Contract for the Fund to reduce the advisory fee for certain breakpoint tiers, as the assets of the Fund, on an aggregated basis with the assets of certain other iShares funds, increase. The Board noted that it would continue to monitor the sharing of economies of scale to determine the appropriateness of adding new or revised breakpoints in the future. Based on this review, as well as the other factors considered at the meeting, the Board, recognizing its responsibility to consider this issue at least annually, concluded that the structure of the investment advisory fee rate reflects appropriate sharing of potential economies of scale with the Fund’s shareholders and supported the Board’s approval of the continuance of the Advisory Contract for the coming year.
Fees and Services Provided for Other Comparable Funds/Accounts Managed by BFA and its Affiliates — The Board received and considered information regarding the investment advisory/management fee rates for other funds/accounts in the U.S. for which BFA (or its affiliates) provides investment advisory/management services, including open-end and closed-end funds registered under the 1940 Act (including sub-advised funds), collective trust funds, separately managed accounts, and institutional separate accounts (together, the “Other Accounts”), and acknowledged BFA’s assertion that the iShares funds are fundamentally different investment vehicles from the Other Accounts. The Board noted that BFA and its affiliates do manage Other Accounts with a substantially similar investment objective and strategy as the Fund. The Board further noted that BFA provided the Board with detailed information regarding how the Other Accounts (particularly institutional clients) generally differ from the Fund, including in terms of the different, generally more extensive services provided to the Fund, as well as other significant differences in the approach of BFA and its affiliates to the Fund, on one hand, and Other Accounts, on the other. In that regard, the Board considered that the pricing of services to institutional clients is typically based on a number of factors beyond the nature and extent of the specific services to be provided and often depends on the overall relationship between the client and its affiliates and the adviser and its affiliates. In addition, the Board considered the relative complexity and inherent risks and challenges of managing and providing other services to the Fund, as a publicly traded exchange traded fund, as compared to the Other Accounts that are institutional clients in light of differing regulatory requirements and client-imposed mandates. The Board also considered the “all-inclusive” nature of the Fund’s advisory fee structure, and the Fund expenses borne by BFA under this arrangement. The Board noted that the investment advisory fee rate under the Advisory Contract for the Fund was generally higher than the investment advisory/management fee rates for the Other Accounts that are institutional clients of BFA (or its affiliates) and concluded that the differences appeared to be consistent with the factors discussed.
Other Benefits to BFA and/or its Affiliates — The Board reviewed the “fallout” benefits or ancillary revenue received by BFA and/or its affiliates in connection with the services provided to the Fund by BFA, such as payment of revenue to BTC, the Fund’s securities lending agent, for loaning portfolio securities (which was included in the profit margins reviewed by the Board pursuant to BFA’s profitability methodology), and payment of advisory fees and/or administration fees to BFA and BTC (or their affiliates) in connection with any investments by the Fund in other funds for which BFA (or its affiliates) provides investment advisory services
| 44 | 2014 iSHARES ANNUAL REPORTTO SHAREHOLDERS |
Table of Contents
Board Review and Approval of Investment Advisory
Contract (Unaudited) (Continued)
iSHARES® MSCI EMERGING MARKETS ETF
and/or administration services. The Board noted that BFA generally does not use soft dollars or consider the value of research or other services that may be provided to BFA (including its affiliates) in selecting brokers for portfolio transactions for the Fund. The Board further noted that any portfolio transactions on behalf of the Fund placed through a BFA affiliate or purchased from an underwriting syndicate in which a BFA affiliate participates, are reported to the Board pursuant to Rule 17e-1 or Rule 10f-3, as applicable, under the 1940 Act. The Board concluded that any such ancillary benefits would not be disadvantageous to the Fund’s shareholders and thus would not alter the Board’s conclusion with respect to the appropriateness of approving the continuance of the Advisory Contract for the coming year.
Based on the considerations described above, the Board determined that the Fund’s investment advisory fee rate under the Advisory Contract does not constitute a fee that is so disproportionately large as to bear no reasonable relationship to the services rendered and that could not have been the product of arm’s-length bargaining, and concluded that it is in the best interest of the Fund and its shareholders to approve the continuance of the Advisory Contract for the coming year.
BOARD REVIEWAND APPROVALOF INVESTMENT ADVISORY CONTRACT | 45 |
Table of Contents
Supplemental Information (Unaudited)
iSHARES® MSCI EMERGING MARKETS ETF
Section 19(a) Notices
The amounts and sources of distributions reported are only estimates and are not being provided for tax reporting purposes. The actual amounts and sources of the amounts for tax reporting purposes will depend upon the Fund’s investment experience during the year and may be subject to changes based on the tax regulations. Shareholders will receive a Form 1099-DIV each calendar year that will inform them how to report distributions for federal income tax purposes.
| Total Cumulative Distributions for the Fiscal Year | % Breakdown of the Total Cumulative Distributions for the Fiscal Year | |||||||||||||||||||||||||||||
Net Investment Income | Net Realized Capital Gains | Return of Capital | Total Per Share | Net Investment Income | Net Realized Capital Gains | Return of Capital | Total Per Share | |||||||||||||||||||||||
| $ | 0.644808 | $ | — | $ | 0.061600 | $ | 0.706408 | 91 | % | — | % | 9 | % | 100 | % | |||||||||||||||
Premium/Discount Information
The tables that follow present information about the differences between the daily market price on secondary markets for shares of a Fund and that Fund’s net asset value. Net asset value, or “NAV,” is the price per share at which each Fund issues and redeems shares. It is calculated in accordance with the standard formula for valuing mutual fund shares. The “Market Price” of each Fund generally is determined using the midpoint between the highest bid and the lowest offer on the primary stock exchange on which the shares of such Fund are listed for trading, as of the time that the Fund’s NAV is calculated. Each Fund’s Market Price may be at, above or below its NAV. The NAV of each Fund will fluctuate with changes in the fair value of its portfolio holdings. The Market Price of each Fund will fluctuate in accordance with changes in its NAV, as well as market supply and demand.
Premiums or discounts are the differences (expressed as a percentage) between the NAV and Market Price of a Fund on a given day, generally at the time NAV is calculated. A premium is the amount that a Fund is trading above the reported NAV, expressed as a percentage of the NAV. A discount is the amount that a Fund is trading below the reported NAV, expressed as a percentage of the NAV.
The following information shows the frequency distributions of premiums and discounts for each of the Funds included in this report. The information shown for each Fund is for five calendar years (or for each full calendar quarter completed after the inception date of such Fund if less than five years) through the date of the most recent calendar quarter-end. The specific periods covered for each Fund are disclosed in the table for such Fund.
| 46 | 2014 iSHARES ANNUAL REPORTTO SHAREHOLDERS |
Table of Contents
Supplemental Information (Unaudited) (Continued)
iSHARES® MSCI EMERGING MARKETS ETF
Each line in the table shows the number of trading days in which the Fund traded within the premium/discount range indicated. The number of trading days in each premium/discount range is also shown as a percentage of the total number of trading days in the period covered by each table. All data presented here represents past performance, which cannot be used to predict future results.
Period Covered: January 1, 2009 through June 30, 2014
Premium/Discount Range | Number of Days | Percentage of Total Days | ||||||
Greater than 4.0% and Less than 4.5% | 1 | 0.07 | % | |||||
Greater than 3.5% and Less than 4.0% | 1 | 0.07 | ||||||
Greater than 3.0% and Less than 3.5% | 1 | 0.07 | ||||||
Greater than 2.5% and Less than 3.0% | 4 | 0.29 | ||||||
Greater than 2.0% and Less than 2.5% | 10 | 0.72 | ||||||
Greater than 1.5% and Less than 2.0% | 22 | 1.59 | ||||||
Greater than 1.0% and Less than 1.5% | 54 | 3.91 | ||||||
Greater than 0.5% and Less than 1.0% | 258 | 18.68 | ||||||
Between 0.5% and –0.5% | 737 | 53.34 | ||||||
Less than –0.5% and Greater than –1.0% | 181 | 13.10 | ||||||
Less than –1.0% and Greater than –1.5% | 69 | 4.99 | ||||||
Less than –1.5% and Greater than –2.0% | 23 | 1.66 | ||||||
Less than –2.0% and Greater than –2.5% | 11 | 0.80 | ||||||
Less than –2.5% and Greater than –3.0% | 6 | 0.43 | ||||||
Less than –3.0% and Greater than –3.5% | 2 | 0.14 | ||||||
Less than –3.5% and Greater than –4.0% | 1 | 0.07 | ||||||
Less than –4.0% and Greater than –4.5% | 1 | 0.07 | ||||||
|
|
|
| |||||
| 1,382 | 100.00 | % | ||||||
|
|
|
| |||||
Regulation under the Alternative Investment Fund Managers Directive
The Alternative Investment Fund Managers Directive (the “Directive”) imposes detailed and prescriptive obligations on fund managers established in the European Union (the “EU”). These do not currently apply to managers established outside the EU, such as BFA. Rather, non-EU managers are only required to comply with certain disclosure, reporting and transparency obligations of the Directive if such managers market a fund to EU investors.
BFA has registered the iShares MSCI Emerging Markets ETF (the “Fund”) for marketing to EU investors in the United Kingdom, the Netherlands, Finland, Sweden and Luxembourg.
Report on Remuneration
BFA is required under the Directive to make quantitative disclosures of remuneration. These disclosures are made in line with BlackRock’s interpretation of currently available regulatory guidance on quantitative remuneration disclosures. As market or regulatory practice develops BlackRock may consider it appropriate to make changes to the way in which quantitative remuneration disclosures are calculated. Where such changes are made, this may result in disclosures in relation to a fund not being comparable to the disclosures made in the prior year, or in relation to other BlackRock fund disclosures in that same year.
SUPPLEMENTAL INFORMATION | 47 |
Table of Contents
Supplemental Information (Unaudited) (Continued)
iSHARES® MSCI EMERGING MARKETS ETF
Disclosures are provided in relation to both (a) the staff of BFA; and (b) staff who are senior management or who have the ability to materially affect the risk profile of the Fund.
All individuals included in the aggregated figures disclosed are rewarded in line with BlackRock’s remuneration policy for their responsibilities across the relevant BlackRock business area. As all individuals have a number of areas of responsibilities, only the portion of remuneration for those individuals’ services attributable to the Fund is included in the aggregate figures disclosed.
BlackRock has a clear and well defined pay-for-performance philosophy, and compensation programs which support that philosophy. For senior management, a significant percentage of variable remuneration is deferred over time. All employees are subject to a claw-back policy.
Compensation decisions for employees are made based on full-year financial results and other non-financial goals and objectives. Alongside financial performance, individual compensation is also based on strategic and operating results and other considerations such as management and leadership capabilities. No set formulas are established and no fixed benchmarks are used in determining annual incentive awards.
Bonus pools are reviewed by BlackRock’s independent compensation committee, taking into account both actual and projected financial information together with information provided by the Operational Risk and Regulatory Compliance departments in relation to any activities, incidents or events that warrant consideration in making compensation decisions.
Functions such as Finance, Operational Risk, Legal & Compliance, and Human Resources each have their own organizational structures which are independent of the business units. Functional bonus pools are determined with reference to the performance of each individual function and the remuneration of the senior members of control functions is directly overseen by BlackRock’s independent compensation committee. No individual is involved in setting his or her own remuneration.
The figures disclosed are a sum of each individual’s portion of remuneration attributable to the Fund according to an objective apportionment methodology. Accordingly the figures are not representative of any individual’s actual remuneration or their remuneration structure.
The amount of the total remuneration awarded by BFA to its staff which has been attributed to the iShares MSCI Emerging Markets ETF in respect of BFA’s financial year ending December 31, 2013 is USD 7,774,980. This figure is comprised of fixed remuneration of USD 3,057,085 and variable remuneration of USD 4,717,895. There were a total of 436 beneficiaries of the remuneration described above.
The amount of the aggregate remuneration awarded by BFA to its senior management and members of its staff whose actions have a material impact on the risk profile of the iShares MSCI Emerging Markets ETF which has been attributed to the Fund in respect of BFA’s financial year ending December 31, 2013 was USD 1,249,110.
| 48 | 2014 iSHARES ANNUAL REPORTTO SHAREHOLDERS |
Table of Contents
Director and Officer Information
iSHARES®, INC.
The Board of Directors has responsibility for the overall management and operations of the Company, including general supervision of the duties performed by BFA and other service providers. Each Director serves until he or she resigns, is removed, dies, retires or becomes incapacitated. The President, Chief Compliance Officer, Treasurer and Secretary shall each hold office until their successors are chosen and qualify, and all other officers shall hold office until he or she resigns or is removed. Directors who are not “interested persons” (as defined in the 1940 Act) of the Company are referred to as independent directors (“Independent Directors”).
The registered investment companies advised by BFA or its affiliates are organized into one complex of closed-end funds, two complexes of open-end funds and one complex of exchange-traded funds (“Exchange-Traded Fund Complex”) (each, a “BlackRock Fund Complex”). Each Fund is included in the BlackRock Fund Complex referred to as the Exchange-Traded Fund Complex. Each Director also serves as a Trustee of iShares Trust, a Director of iShares MSCI Russia Capped ETF, Inc. and a Trustee of iShares U.S. ETF Trust and, as a result, oversees a total of 312 funds (as of August 31, 2014) within the Exchange-Traded Fund Complex. With the exception of Robert S. Kapito and Mark Wiedman, the address of each Director and officer is c/o BlackRock, Inc., 400 Howard Street, San Francisco, CA 94105. The address of Mr. Kapito and Mr. Wiedman is c/o BlackRock, Inc., Park Avenue Plaza, 55 East 52nd Street, New York, NY 10055. The Board has designated Robert H. Silver as its Independent Chairman. Additional information about the Funds’ Directors and officers may be found in the Funds’ combined Statement of Additional Information, which is available without charge, upon request, by calling toll-free 1-800-iShares (1-800-474-2737).
Interested Directors
| Name (Age) | Position(s) | Principal Occupation(s) During the Past 5 Years | Other Directorships Held by Director | |||
Robert S. Kapitoa (57) | Director (since 2009). | President and Director, BlackRock, Inc. (since 2006); Vice Chairman of BlackRock, Inc. and Head of BlackRock, Inc.’s Portfolio Management Group (since its formation in 1998) and BlackRock, Inc.’s predecessor entities (since 1988); Trustee, University of Pennsylvania (since 2009); President of Board of Directors, Hope & Heroes Children’s Cancer Fund (since 2002); President of the Board of Directors, Periwinkle Theatre for Youth (since 1983). | Trustee of iShares Trust (since 2009); Director of iShares MSCI Russia Capped ETF, Inc. (since 2010); Trustee of iShares U.S. ETF Trust (since 2011); Director of BlackRock, Inc. (since 2006). | |||
Mark Wiedmanb (43) | Director (since 2013). | Managing Director, BlackRock, Inc. (since 2007); Global Head of iShares (since 2011); Head of Corporate Strategy, BlackRock, Inc. (2009-2011). | Trustee of iShares Trust. (since 2013); Director of iShares MSCI Russia Capped ETF, Inc. (since 2013);Trustee of iShares U.S. ETF Trust (since 2013); Director of PennyMac Financial Services, Inc. (since 2008). | |||
| a | Robert S. Kapito is deemed to be an “interested person” (as defined in the 1940 Act) of the Company due to his affiliations with BlackRock, Inc. |
| b | Mark Wiedman is deemed to be an “interested person” (as defined in the 1940 Act) of the Company due to his affiliations with BlackRock, Inc. and its affiliates. |
DIRECTORAND OFFICER INFORMATION | 49 |
Table of Contents
Director and Officer Information (Continued)
iSHARES®, INC.
Independent Directors
| Name (Age) | Position(s) | Principal Occupation(s) During the Past 5 Years | Other Directorships Held by Director | |||
Robert H. Silver (59) | Director (since 2007); Independent Chairman (since 2012). | President and Co-Founder of The Bravitas Group, Inc. (since 2006); Director and Vice Chairman of the YMCA of Greater NYC (2001-2011); Broadway Producer (2006-2011); Co-Founder and Vice President of Parentgiving Inc. (since 2008); Director and Member of the Audit and Compensation Committee of EPAM Systems, Inc. (2006-2009); President and Chief Operating Officer of UBS Financial Services Inc. (formerly Paine Webber Inc.) (2003-2005) and various executive positions with UBS and its affiliates (1988-2005); CPA and Audit Manager of KPMG, LLP (formerly Peat Marwick Mitchell) (1977-1983). | Trustee of iShares Trust (since 2007); Director of iShares MSCI Russia Capped ETF, Inc. (since 2010); Trustee of iShares U.S. ETF Trust (since 2011); Independent Chairman of iShares, Trust, iShares MSCI Russia Capped ETF, Inc. and iShares U.S. ETF Trust (since 2012). | |||
Cecilia H. Herbert (65) | Director (since 2005); Nominating and Governance Committee Chair and Equity Plus Committee Chair (since 2012). | Director (1998-2013) and President (2007-2011) of the Board of Directors, Catholic Charities CYO; Trustee (2002-2011) and Chair of the Finance and Investment Committee (2006-2010) of the Thacher School; Member (since 1992) and Chair (1994-2005) of the Investment Committee, Archdiocese of San Francisco; Trustee and Member of the Investment Committee, WNET, the New York public broadcasting/media company (since 2011). | Trustee of iShares Trust (since 2005); Director of iShares MSCI Russia Capped ETF, Inc. (since 2010); Trustee of iShares U.S. ETF Trust (since 2011); Director of Forward Funds (34 portfolios) (since 2009). | |||
Charles A. Hurty (70) | Director (since 2005); Audit Committee Chair (since 2006). | Retired; Partner, KPMG LLP (1968-2001). | Trustee of iShares Trust (since 2005); Director of iShares MSCI Russia Capped ETF, Inc. (since 2010); Trustee of iShares U.S. ETF Trust (since 2011); Director of GMAM Absolute Return Strategy Fund (1 portfolio) (since 2002); Director of SkyBridge Alternative Investments Multi-Adviser Hedge Fund Portfolios LLC (2 portfolios) (since 2002). | |||
John E. Kerrigan (59) | Director (since 2005); Fixed Income Plus Committee Chair (since 2012). | Chief Investment Officer, Santa Clara University (since 2002). | Trustee of iShares Trust (since 2005); Director of iShares MSCI Russia Capped ETF, Inc. (since 2010); Trustee of iShares U.S. ETF Trust (since 2011). | |||
| 50 | 2014 iSHARES ANNUAL REPORTTO SHAREHOLDERS |
Table of Contents
Director and Officer Information (Continued)
iSHARES®, INC.
Independent Directors (Continued)
| Name (Age) | Position(s) | Principal Occupation(s) During the Past 5 Years | Other Directorships Held by Director | |||
John E. Martinez (53) | Director (since 2003); Securities Lending Committee Chair (since 2012). | Director of FirstREX Agreement Corp. (formerly EquityRock, Inc.) (since 2005). | Trustee of iShares Trust (since 2003); Director of iShares MSCI Russia Capped ETF, Inc. (since 2010); Trustee of iShares U.S. ETF Trust (since 2011). | |||
George G.C. Parker (75) | Director (since 2002). | Dean Witter Distinguished Professor of Finance, Emeritus, Stanford University Graduate School of Business (Professor since 1973; Emeritus since 2006). | Trustee of iShares Trust (since 2000); Director of iShares MSCI Russia Capped ETF, Inc. (since 2010); Trustee of iShares U.S. ETF Trust (since 2011); Director of Tejon Ranch Company (since 1999); Director of Threshold Pharmaceuticals (since 2004); Director of Colony Financial, Inc. (since 2009); Director of First Republic Bank (since 2010). | |||
Madhav V. Rajan (50) | Director (since 2011); 15(c) Committee Chair (since 2012). | Robert K. Jaedicke Professor of Accounting and Senior Associate Dean for Academic Affairs and Head of MBA Program, Stanford University Graduate School of Business (since 2001); Professor of Law (by courtesy), Stanford Law School (since 2005); Visiting Professor, University of Chicago (2007-2008). | Trustee of iShares Trust (since 2011); Director of iShares MSCI Russia Capped ETF, Inc. (since 2011); Trustee of iShares U.S. ETF Trust (since 2011); Director, Cavium, Inc. (since 2013). | |||
DIRECTORAND OFFICER INFORMATION | 51 |
Table of Contents
Director and Officer Information (Continued)
iSHARES®, INC.
Officers
| Name (Age) | Position(s) | Principal Occupation(s) During the Past 5 Years | ||
Manish Mehta (43) | President (since 2013). | Managing Director, BlackRock, Inc. (since 2009); Chief Operating Officer for iShares (since 2009); Head of Strategy and Corporate Development, BGI (2005-2009); Chief of Staff to the CEO, BGI (2005-2009). | ||
Jack Gee (54) | Treasurer and Chief Financial Officer (since 2008). | Managing Director, BlackRock, Inc. (since 2009); Senior Director of Fund Administration of Intermediary Investor Business, BGI (2009); Director of Fund Administration of Intermediary Investor Business, BGI (2004-2009). | ||
Edward B. Baer (45) | Vice President and Chief Legal Officer (since 2012). | Managing Director of Legal & Compliance, BlackRock, Inc. (since 2006); Director of Legal & Compliance, BlackRock, Inc. (2004-2006). | ||
Eilleen M. Clavere (62) | Secretary (since 2007). | Director of Global Fund Administration, BlackRock, Inc. (since 2009); Director of Legal Administration of Intermediary Investor Business, BGI (2006-2009); Legal Counsel and Vice President of Atlas Funds, Atlas Advisers, Inc. and Atlas Securities, Inc. (2005-2006); Counsel at Kirkpatrick & Lockhart LLP (2001-2005). | ||
Scott Radell (45) | Executive Vice President (since 2012). | Managing Director, BlackRock, Inc. (since 2009); Head of Portfolio Solutions, BlackRock, Inc. (since 2009); Head of Portfolio Solutions, BGI (2007-2009); Credit Portfolio Manager, BGI (2005-2007); Credit Research Analyst, BGI (2003-2005). | ||
Amy Schioldager (51) | Executive Vice President (since 2007). | Senior Managing Director, BlackRock, Inc. (since 2009); Global Head of Index Equity, BGI (2008-2009); Global Head of U.S. Indexing, BGI (2006-2008); Head of Domestic Equity Portfolio Management, BGI (2001-2006). | ||
Ira P. Shapiro (51) | Vice President (since 2007). | Managing Director, BlackRock, Inc. (since 2009); Head of Strategic Product Initiatives for iShares (since 2012); Chief Legal Officer, Exchange-Traded Fund Complex (2007-2012); Associate General Counsel, BGI (2004-2009). | ||
| 52 | 2014 iSHARES ANNUAL REPORTTO SHAREHOLDERS |
Table of Contents
Notes:
NOTES | 53 |
Table of Contents
Notes:
| 54 | 2014 iSHARES ANNUAL REPORTTO SHAREHOLDERS |
Table of Contents
|
For more information visit www.iShares.com or call 1-800-474-2737
This report is intended for the Fund’s shareholders. It may not be distributed to prospective investors unless it is preceded or accompanied by the current prospectus.
Investing involves risk, including possible loss of principal.
The iShares Funds are distributed by BlackRock Investments, LLC (together with its affiliates, “BlackRock”).
The iShares Funds are not sponsored, endorsed, issued, sold or promoted by MSCI Inc., nor does this company make any representation regarding the advisability of investing in the iShares Funds. BlackRock is not affiliated with the company listed above.
A description of the policies that the Fund uses to determine how to vote proxies relating to portfolio securities and information about how the Fund voted proxies relating to portfolio securities during the most recent twelve-month period ending June 30 is available without charge, upon request, by calling toll-free 1-800-474-2737; on the Fund’s website at www.iShares.com; and on the U.S. Securities and Exchange Commission (SEC) website at www.sec.gov.
The Fund files its complete schedule of portfolio holdings with the SEC for the first and third quarters of each fiscal year on Form N-Q. The Fund’s Form N-Q is available on the SEC’s website or may be reviewed and copied at the SEC’s Public Reference Room in Washington, D.C. Information on the operation of the Public Reference Room may be obtained by calling 1-800-SEC-0330. The Fund also discloses its complete schedule of portfolio holdings on a daily and monthly basis on the Fund’s website.
©2014 BlackRock, Inc. All rights reserved. iSHARES and BLACKROCK are registered trademarks of BlackRock, Inc. or its subsidiaries. All other marks are the property of their respective owners.

iS-AR-85-0814
Table of Contents
AUGUST 31, 2014
2014 ANNUAL REPORT
|  |
iShares, Inc.
| Ø | iShares MSCI All Country World Minimum Volatility ETF | ACWV | NYSE Arca |
| Ø | iShares MSCI Emerging Markets EMEA ETF | EEME | NASDAQ |
| Ø | iShares MSCI Frontier 100 ETF | FM | NYSE Arca |
| Ø | iShares MSCI World ETF | URTH | NYSE Arca |
Table of Contents
| 5 | ||||
| 14 | ||||
| 14 | ||||
| 15 | ||||
| 15 | ||||
| 21 | ||||
| 24 | ||||
| 27 | ||||
| 42 | ||||
| 48 | ||||
| 52 | ||||
| 64 | ||||
| 65 | ||||
| 66 | ||||
| 80 | ||||
| 84 |
Table of Contents
Management’s Discussion of Fund Performance
iSHARES®, INC.
GLOBAL MARKET OVERVIEW
Global equities advanced for the 12-month period ended August 31, 2014 (the “reporting period”), although sluggish economic recovery in Europe, U.S. Federal Reserve Bank (“Fed”) actions, and slower economic growth in China kept volatility levels elevated.
For U.S. equities, the reporting period began in an environment of volatility, as concern mounted that the Fed would begin to taper its ongoing quantitative easing program, QE3. Market sentiment soon turned positive, though, when the Fed announced that it would delay any tapering of stimulus until the economic recovery appeared more sustainable. When the Fed did, in fact, begin to reduce its bond-buying program at the end of 2013, the effect on markets was positive, as investors had already digested the possibility of tapering and were reassured that the reduction of the stimulus would be gradual. Although gross domestic product (“GDP”) contracted in the first quarter of 2014, it expanded by 4.2% in the second quarter. The housing sector showed signs of improvement, with housing starts and building permits rising in July 2014, and consumer sentiment remained high throughout the second half of the reporting period. Also, in August 2014, the S&P 500® broke 2,000, reaching a new high.
European equities delivered some of the strongest returns among international equity markets for the reporting period, despite slow and uneven economic recovery in the eurozone. For the third quarter of 2013, the eurozone as a whole experienced GDP growth of 0.1%, representing a decline from the previous quarter. In the fourth quarter of 2013 and first quarter of 2014, GDP growth for the eurozone registered only 0.3% and 0.2%, respectively, before stagnating completely in the second quarter of 2014. Underlying the GDP figures for the entire area, Germany’s GDP grew 0.7% in the first quarter of 2014 over the previous quarter, its largest growth rate in three years, but contracted in the second quarter of 2014. France’s economy demonstrated uneven growth before stagnating in the first and second quarters of 2014 amid weak consumer spending and business investment. Elsewhere in Europe, Spain’s economy gained strength, growing 0.6% in the second quarter of 2014, its largest rate in more than six years. Italy’s economy expanded by 0.1% in the fourth quarter of 2013, but contracted again in the first and second quarters of 2014. Unemployment levels remained stubbornly high among many European markets. The United Kingdom experienced healthy economic growth. GDP growth remained steady in the U.K. throughout the reporting period, exceeding its pre-recession peak from 2008 in the second quarter of 2014 largely on the strength of its services and production sectors.
Japanese equities achieved positive returns in an uneven environment, as conflicting data influenced markets to change direction throughout the reporting period. Early in the reporting period, Japanese equities benefited from the Bank of Japan’s measures to improve economic conditions through quantitative easing. The Nikkei Index rallied and the Japanese yen declined, which in turn helped export levels, although not to the extent that had been expected. Economic growth, as measured by GDP, was uneven during the reporting period. GDP growth was positive for the third and fourth quarters of 2013. The fourth quarter of 2013 figures were revised downward in early 2014, however, and disappointing economic data provided cause for concern that Japan’s growth trajectory might slow in the first quarter of 2014. Stock markets were strengthened when economic data indicated Japan’s economy grew at an annualized 6.7% pace in the first quarter of 2014, surpassing the forecast for the quarter. However, concerns surrounding an increase in the country’s consumption tax — its first increase in 17 years — weighed on markets later in the reporting period. Consumer spending, which had improved in anticipation of the consumption tax increase, slumped in the months following the implementation in April 2014, largely causing GDP to contract in the second quarter of 2014.
Emerging market countries as a group delivered double-digit returns and slightly outperformed broad international indices for the reporting period. Early in the reporting period, concern regarding the Fed tapering its quantitative easing program led investors to abandon emerging market holdings. Political uncertainty among some emerging markets compounded investor aversion to emerging markets. As the reporting period progressed, rising expectations that the Fed would be slower to raise rates than originally had been anticipated, as well as reduced political unrest, helped to refuel investors’ appetite for risk, boosting returns for emerging markets equities.
MANAGEMENT’S DISCUSSIONSOF FUND PERFORMANCE | 5 |
Table of Contents
Management’s Discussion of Fund Performance
iSHARES® MSCI ALL COUNTRY WORLD MINIMUM VOLATILITY ETF
Performance as of August 31, 2014
| Average Annual Total Returns | Cumulative Total Returns | |||||||||||||||||||||||||
| NAV | MARKET | INDEX | NAV | MARKET | INDEX | |||||||||||||||||||||
1 Year | 16.70% | 16.83% | 16.53% | 16.70% | 16.83% | 16.53% | ||||||||||||||||||||
Since Inception | 13.87% | 13.80% | 13.58% | 45.20% | 44.92% | 44.09% | ||||||||||||||||||||
GROWTH OF $10,000 INVESTMENT
(SINCE INCEPTION AT NET ASSET VALUE)
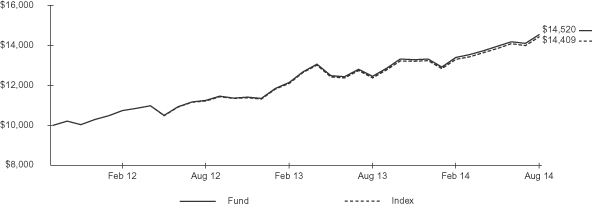
The inception date of the Fund was 10/18/11. The first day of secondary market trading was 10/20/11.
Past performance is no guarantee of future results. Performance results do not reflect the deduction of taxes that a shareholder would pay on fund distributions or on the redemption or sale of fund shares. See “About Fund Performance” on page 14 for more information.
| Shareholder Expenses | ||||||||||||||||||||||||||
| Actual | Hypothetical 5% Return | |||||||||||||||||||||||||
| Beginning Account Value (3/1/14) | Ending Account Value (8/31/14) | Expenses Paid During Period a | Beginning Account Value (3/1/14) | Ending Account Value (8/31/14) | Expenses Paid During Period a | Annualized Expense Ratio | ||||||||||||||||||||
| $ | 1,000.00 | $ | 1,084.30 | $ | 1.05 | $ | 1,000.00 | $ | 1,024.20 | $ | 1.02 | 0.20% | ||||||||||||||
| a | Expenses are calculated using the Fund’s annualized expense ratio (as disclosed in the table), multiplied by the average account value for the period, multiplied by the number of days in the period (184 days) and divided by the number of days in the year (365 days). See “Shareholder Expenses” on page 14 for more information. |
| 6 | 2014 iSHARES ANNUAL REPORTTO SHAREHOLDERS |
Table of Contents
Management’s Discussion of Fund Performance (Continued)
iSHARES® MSCI ALL COUNTRY WORLD MINIMUM VOLATILITY ETF
The iShares MSCI All Country World Minimum Volatility ETF (the “Fund”) seeks to track the investment results of an index composed of developed and emerging market equities that, in the aggregate, have lower volatility characteristics relative to the broader developed and emerging equity markets, as represented by the MSCI ACWI Minimum Volatility (USD) Index (the “Index”). The Fund invests in a representative sample of securities included in the Index that collectively has an investment profile similar to the Index. Due to the use of representative sampling, the Fund may or may not hold all of the securities that are included in the Index. For the 12-month reporting period ended August 31, 2014, the total return for the Fund was 16.70%, net of fees, while the total return for the Index was 16.53%.
Lower volatility stocks worldwide, as represented by the Index, achieved double-digit gains for the reporting period.
The United States, the largest country weighting at an average of 51% of the Index, produced positive absolute returns and was the largest contributor by far to Index performance. The continued low-interest-rate environment, improving economic growth (as measured by GDP growth), and improving consumer sentiment all contributed to stock market strength.
Canada was also a notable contributor to Index returns. Representing 9% of the Index on average during the reporting period, the Canadian market generated strong absolute gains amid resurgence among energy and gold mining stocks.
Japan, which accounted for an average of 13% of the Index, achieved solid results and contributed meaningfully to Index results, despite volatility during the reporting period. Japan’s Nikkei Index delivered outsized gains early in the reporting period, helped by government initiatives aimed at revitalizing the country’s stagnant economy. During the remainder of the reporting period, however, Japanese stocks experienced considerable volatility amid conflicting economic data and the negative effects of an increased consumption tax.
Switzerland comprised an average of 6% of the Index during the reporting period. Despite uneven GDP growth throughout the reporting period, Switzerland benefited from a widening trade surplus and increasing foreign investment. The Swiss equity market achieved healthy gains and contributed meaningfully to Index returns.
PORTFOLIO ALLOCATION
As of 8/31/14
| Sector | Percentage of Total Investments* | |||
Financials | 16.77 | % | ||
Health Care | 15.76 | |||
Consumer Staples | 14.04 | |||
Consumer Discretionary | 11.50 | |||
Industrials | 9.17 | |||
Telecommunication Services | 8.81 | |||
Utilities | 8.24 | |||
Information Technology | 7.54 | |||
Energy | 5.20 | |||
Materials | 2.97 | |||
|
| |||
TOTAL | 100.00 | % | ||
|
| |||
TEN LARGEST COUNTRY ALLOCATIONS
As of 8/31/14
| Country | Percentage of Total Investments* | |||
United States | 50.02 | % | ||
Japan | 12.31 | |||
Canada | 9.13 | |||
Switzerland | 5.91 | |||
China | 4.93 | |||
Taiwan | 3.83 | |||
Hong Kong | 3.19 | |||
United Kingdom | 2.80 | |||
Singapore | 1.46 | |||
Malaysia | 1.32 | |||
|
| |||
TOTAL | 94.90 | % | ||
|
| |||
| * | Excludes money market funds. |
MANAGEMENT’S DISCUSSIONSOF FUND PERFORMANCE | 7 |
Table of Contents
Management’s Discussion of Fund Performance
iSHARES® MSCI EMERGING MARKETS EMEA ETF
Performance as of August 31, 2014
| Average Annual Total Returns | Cumulative Total Returns | |||||||||||||||||||||||||
| NAV | MARKET | INDEX | NAV | MARKET | INDEX | |||||||||||||||||||||
1 Year | 9.61% | 9.67% | 9.98% | 9.61% | 9.67% | 9.98% | ||||||||||||||||||||
Since Inception | 3.11% | 3.59% | 3.55% | 8.35% | 9.67% | 9.55% | ||||||||||||||||||||
GROWTH OF $10,000 INVESTMENT
(SINCE INCEPTION AT NET ASSET VALUE)
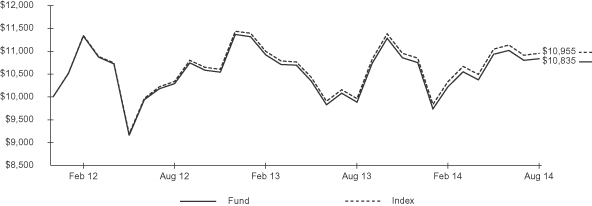
The inception date of the Fund was 1/18/12. The first day of secondary market trading was 1/19/12.
Past performance is no guarantee of future results. Performance results do not reflect the deduction of taxes that a shareholder would pay on fund distributions or on the redemption or sale of fund shares. See “About Fund Performance” on page 14 for more information.
| Shareholder Expenses | ||||||||||||||||||||||||||
| Actual | Hypothetical 5% Return | |||||||||||||||||||||||||
| Beginning Account Value (3/1/14) | Ending Account Value (8/31/14) | Expenses Paid During Period a | Beginning Account Value (3/1/14) | Ending Account Value (8/31/14) | Expenses Paid During Period a | Annualized Expense Ratio | ||||||||||||||||||||
| $ | 1,000.00 | $ | 1,060.10 | $ | 2.54 | $ | 1,000.00 | $ | 1,022.70 | $ | 2.50 | 0.49% | ||||||||||||||
| a | Expenses are calculated using the Fund’s annualized expense ratio (as disclosed in the table), multiplied by the average account value for the period, multiplied by the number of days in the period (184 days) and divided by the number of days in the year (365 days). See “Shareholder Expenses” on page 14 for more information. |
| 8 | 2014 iSHARES ANNUAL REPORTTO SHAREHOLDERS |
Table of Contents
Management’s Discussion of Fund Performance (Continued)
iSHARES® MSCI EMERGING MARKETS EMEA ETF
The iShares MSCI Emerging Markets EMEA ETF (the “Fund”) seeks to track the investment results of an index composed of European, Middle Eastern and African emerging market equities, as represented by the MSCI Emerging Markets EMEA Index (the “Index”). The Fund invests in a representative sample of securities included in the Index that collectively has an investment profile similar to the Index. Due to the use of representative sampling, the Fund may or may not hold all of the securities that are included in the Index. For the 12-month reporting period ended August 31, 2014, the total return for the Fund was 9.61%, net of fees, while the total return for the Index was 9.98%.
As represented by the Index, equities of emerging market countries in Europe, the Middle East, and Africa advanced modestly for the reporting period, although the group underperformed the broad emerging markets.
The key drivers of underperformance in these emerging markets were expectations of Fed policy and geopolitical conflict. In the past several years, emerging markets have benefited from investors seeking higher yielding alternatives in a low-interest rate environment. During the reporting period, expectations of the Fed tapering its quantitative easing program drove many investors away from emerging market holdings, particularly in early 2014. In addition, political unrest among some emerging markets compounded investor aversion to certain emerging markets.
South African equities, which comprised an average of 42% of the Index during the reporting period, generated strong returns despite uneven economic activity. Following healthy GDP growth of 3.8% in the fourth quarter of 2013, GDP contracted in the first quarter of 2014 and then gained only 0.6% in the second quarter of 2014. A five-month strike in the country’s platinum mines helped curb economic growth.
During the reporting period, Russian equities accounted for an average of 31% of the Index. Russian equities as a group declined during the reporting period, which contributed to the Index’s relative underperformance. Western countries imposed sanctions on Russia beginning in the spring of 2014, including restricting access to western financial markets, due to Russia’s role in the Ukraine crisis. Russia, in turn, imposed bans on food imports from a number of western countries. As a result, economic conditions slowed to near-recession levels in Russia, with the country’s GDP shrinking 0.3% during the second quarter of 2014.
PORTFOLIO ALLOCATION
As of 8/31/14
| Sector | Percentage of Total Investments* | |||
Financials | 33.37 | % | ||
Energy | 20.52 | |||
Consumer Discretionary | 12.21 | |||
Telecommunication Services | 10.73 | |||
Materials | 8.49 | |||
Consumer Staples | 5.61 | |||
Industrials | 3.64 | |||
Health Care | 2.84 | |||
Utilities | 2.59 | |||
|
| |||
TOTAL | 100.00 | % | ||
|
| |||
TEN LARGEST COUNTRY ALLOCATIONS
As of 8/31/14
| Country | Percentage of Total Investments* | |||
South Africa | 42.42 | % | ||
Russia | 25.69 | |||
Turkey | 9.26 | |||
Poland | 8.97 | |||
Greece | 3.91 | |||
Qatar | 3.22 | |||
United Arab Emirates | 3.04 | |||
Czech Republic | 1.23 | |||
Egypt | 1.18 | |||
Hungary | 1.08 | |||
|
| |||
TOTAL | 100.00 | % | ||
|
| |||
| * | Excludes money market funds. |
MANAGEMENT’S DISCUSSIONSOF FUND PERFORMANCE | 9 |
Table of Contents
Management’s Discussion of Fund Performance
iSHARES® MSCI FRONTIER 100 ETF
Performance as of August 31, 2014
| Average Annual Total Returns | Cumulative Total Returns | |||||||||||||||||||||||||
| NAV | MARKET | INDEX | NAV | MARKET | INDEX | |||||||||||||||||||||
1 Year | 28.56% | 27.73% | 29.55% | 28.56% | 27.73% | 29.55% | ||||||||||||||||||||
Since Inception | 24.91% | 25.52% | 25.57% | 54.97% | 56.47% | 56.49% | ||||||||||||||||||||
GROWTH OF $10,000 INVESTMENT
(SINCE INCEPTION AT NET ASSET VALUE)
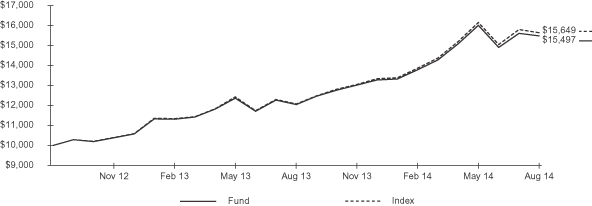
The inception date of the Fund was 9/12/12. The first day of secondary market trading was 9/13/12.
Past performance is no guarantee of future results. Performance results do not reflect the deduction of taxes that a shareholder would pay on fund distributions or on the redemption or sale of fund shares. See “About Fund Performance” on page 14 for more information.
| Shareholder Expenses | ||||||||||||||||||||||||||
| Actual | Hypothetical 5% Return | |||||||||||||||||||||||||
| Beginning Account Value (3/1/14) | Ending Account Value (8/31/14) | Expenses Paid During Period a | Beginning Account Value (3/1/14) | Ending Account Value (8/31/14) | Expenses Paid During Period a | Annualized Expense Ratio | ||||||||||||||||||||
| $ | 1,000.00 | $ | 1,123.40 | $ | 4.23 | $ | 1,000.00 | $ | 1,021.20 | $ | 4.02 | 0.79% | ||||||||||||||
| a | Expenses are calculated using the Fund’s annualized expense ratio (as disclosed in the table), multiplied by the average account value for the period, multiplied by the number of days in the period (184 days) and divided by the number of days in the year (365 days). See “Shareholder Expenses” on page 14 for more information. |
| 10 | 2014 iSHARES ANNUAL REPORTTO SHAREHOLDERS |
Table of Contents
Management’s Discussion of Fund Performance (Continued)
iSHARES® MSCI FRONTIER 100 ETF
The iShares MSCI Frontier 100 ETF (the “Fund”) seeks to track the investment results of an index composed of frontier market equities, as represented by the MSCI Frontier Markets 100 Index (the “Index”). The Fund invests in a representative sample of securities included in the Index that collectively has an investment profile similar to the Index. Due to the use of representative sampling, the Fund may or may not hold all of the securities that are included in the Index. For the 12-month reporting period ended August 31, 2014, the total return for the Fund was 28.56%, net of fees, while the total return for the Index was 29.55%.
Frontier markets, as represented by the Index, experienced strong gains during the reporting period and outpaced the performance of broader international markets.
Kuwait’s equity market contributed positively to Index results. Holding the sixth largest proven oil reserves in the world, Kuwait is the tenth largest producer of oil and the eighth largest exporter of oil. During the reporting period, export levels declined, largely due to lower oil prices as a result of increased supply in non-OPEC countries. Kuwait’s economic growth, as measured by annual GDP, expanded only 0.82% for 2013.
Nigeria’s equity market also contributed to Index performance. In April of 2014, Nigeria’s National Bureau of Statistics revised its GDP methodology, basing GDP on production patterns in 2010 and increasing the number of industries it measures, with greater emphasis given to industries such as telecommunications and financial services. As a result, Nigeria surpassed South Africa as the largest economy on the African continent.
Argentina’s equity market outpaced most global markets during the reporting period, as investors flocked to high-yielding companies, particularly those backed by the government. Late in the reporting period, however, Argentina defaulted on certain of its sovereign debt as negotiations with U.S. hedge funds failed to reach resolution.
Qatar’s equities contributed meaningfully to Index gains. The Qatar economy, as measured by annualized GDP, grew 6.2% in the first quarter of 2014, the most recent quarter for which data is available. The country’s successful bid in 2010 to host the 2022 FIFA World Cup continued to drive sizable infrastructure projects, estimated at $200 billion and including new roads, a new rail and metro system, and new airport.
In May 2014, the global index provider MSCI upgraded both Qatar and its neighbor, United Arab Emirates, from frontier market status to emerging market status. The upgrade created the potential for higher capital flows and greater access to funds from around the world. Indeed, in anticipation of the shift, investment dollars flowed into the two markets, lifting stock prices.
PORTFOLIO ALLOCATION
As of 8/31/14
| Sector | Percentage of Total Investments* |
Financials | 53.68 | % | ||
Telecommunication Services | 14.07 | |||
Energy | 12.60 | |||
Consumer Staples | 6.87 | |||
Industrials | 6.82 | |||
Materials | 4.10 | |||
Utilities | 1.01 | |||
Health Care | 0.85 | |||
|
| |||
TOTAL | 100.00 | % | ||
|
|
TEN LARGEST COUNTRY ALLOCATIONS
As of 8/31/14
| Country | Percentage of Total Investments* |
Kuwait | 23.16 | % | ||
Nigeria | 14.29 | |||
Argentina | 8.00 | |||
Qatar | 7.98 | |||
United Arab Emirates | 7.56 | |||
Pakistan | 7.18 | |||
Kenya | 5.47 | |||
Oman | 5.26 | |||
Kazakhstan | 4.75 | |||
Morocco | 3.84 | |||
|
| |||
TOTAL | 87.49 | % | ||
|
|
| * | Excludes money market funds. |
MANAGEMENT’S DISCUSSIONSOF FUND PERFORMANCE | 11 |
Table of Contents
Management’s Discussion of Fund Performance
iSHARES® MSCI WORLD ETF
Performance as of August 31, 2014
| Average Annual Total Returns | Cumulative Total Returns | |||||||||||||||||||||||||
| NAV | MARKET | INDEX | NAV | MARKET | INDEX | |||||||||||||||||||||
1 Year | 21.07% | 18.51% | 21.10% | 21.07% | 18.51% | 21.10% | ||||||||||||||||||||
Since Inception | 17.69% | 17.75% | 17.59% | 53.74% | 53.95% | 53.39% | ||||||||||||||||||||
GROWTH OF $10,000 INVESTMENT
(SINCE INCEPTION AT NET ASSET VALUE)
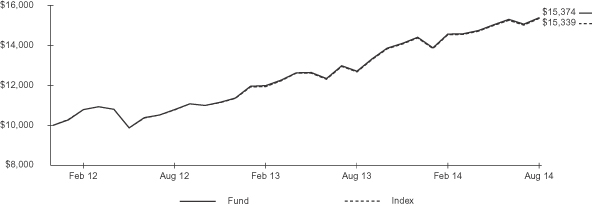
The inception date of the Fund was 1/10/12. The first day of secondary market trading was 1/12/12.
Past performance is no guarantee of future results. Performance results do not reflect the deduction of taxes that a shareholder would pay on fund distributions or on the redemption or sale of fund shares. See “About Fund Performance” on page 14 for more information.
| Shareholder Expenses | ||||||||||||||||||||||||||
| Actual | Hypothetical 5% Return | |||||||||||||||||||||||||
| Beginning Account Value (3/1/14) | Ending Account Value (8/31/14) | Expenses Paid During Period a | Beginning Account Value (3/1/14) | Ending Account Value (8/31/14) | Expenses Paid During Period a | Annualized Expense Ratio | ||||||||||||||||||||
| $ | 1,000.00 | $ | 1,055.80 | $ | 1.24 | $ | 1,000.00 | $ | 1,024.00 | $ | 1.22 | 0.24% | ||||||||||||||
| a | Expenses are calculated using the Fund’s annualized expense ratio (as disclosed in the table), multiplied by the average account value for the period, multiplied by the number of days in the period (184 days) and divided by the number of days in the year (365 days). See “Shareholder Expenses” on page 14 for more information. |
| 12 | 2014 iSHARES ANNUAL REPORTTO SHAREHOLDERS |
Table of Contents
Management’s Discussion of Fund Performance (Continued)
iSHARES® MSCI WORLD ETF
The iShares MSCI World ETF (the “Fund”) seeks to track the investment results of an index composed of developed market equities, as represented by the MSCI World Index (the “Index”). The Fund invests in a representative sample of securities included in the Index that collectively has an investment profile similar to the Index. Due to the use of representative sampling, the Fund may or may not hold all of the securities that are included in the Index. For the 12-month reporting period ended August 31, 2014, the total return for the Fund was 21.07%, net of fees, while the total return for the Index was 21.10%.
Global stocks, as represented by the Index, achieved strong gains for the reporting period. Equity markets faced challenges throughout the reporting period, however, keeping volatility levels high.
The United States, the largest country weighting at an average of 55% of the Index, produced strong positive absolute returns and was the largest contributor by far to Index performance. The continued low-interest-rate environment, improving economic growth (as measured by GDP growth), and improving consumer sentiment all contributed to stock market strength, resulting in strong returns for United States equities.
United Kingdom equities, which represented an average of 9% of the Index, delivered sound gains and contributed notably to Index results. The country’s GDP growth continued its positive trajectory throughout the reporting period, exceeding its pre-recession peak from 2008 in the second quarter of 2014, as the services and production sectors improved.
Japanese equities, which accounted for an average 8% of the Index, achieved modestly positive results and contributed to Index performance despite volatility during the reporting period. Japan’s Nikkei Index delivered outsized gains early in the reporting period, helped by government initiatives aimed at revitalizing the country’s stagnant economy. During the remainder of the reporting period, however, Japanese stocks experienced considerable volatility amid conflicting economic data and the negative effects of an increased consumption tax.
Canada was a notable contributor to Index returns. Representing 4% of the Index on average during the reporting period, the Canadian market generated strong absolute gains amid resurgence among energy and gold mining stocks.
France and Germany each represented 4% of the Index on average during the reporting period. Both markets achieved solid returns and contributed to positive Index results, despite uneven levels of economic recovery in both countries.
PORTFOLIO ALLOCATION
As of 8/31/14
| Sector | Percentage of Total Investments* | |||
Financials | 20.80 | % | ||
Information Technology | 12.88 | |||
Health Care | 12.06 | |||
Consumer Discretionary | 11.83 | |||
Industrials | 10.78 | |||
Energy | 9.73 | |||
Consumer Staples | 9.47 | |||
Materials | 5.67 | |||
Telecommunication Services | 3.46 | |||
Utilities | 3.31 | |||
| 0.01 | ||||
|
| |||
TOTAL | 100.00 | % | ||
|
| |||
TEN LARGEST COUNTRY ALLOCATIONS
As of 8/31/14
| Country | Percentage of Total Investments* | |||
United States | 55.80 | % | ||
United Kingdom | 8.57 | |||
Japan | 8.08 | |||
Canada | 4.38 | |||
France | 3.91 | |||
Switzerland | 3.73 | |||
Germany | 3.47 | |||
Australia | 3.30 | |||
Spain | 1.45 | |||
Hong Kong | 1.22 | |||
|
| |||
TOTAL | 93.91 | % | ||
|
| |||
| * | Excludes money market funds. |
MANAGEMENT’S DISCUSSIONSOF FUND PERFORMANCE | 13 |
Table of Contents
Past performance is no guarantee of future results. Current performance may be lower or higher than the performance data quoted. Performance data current to the most recent month-end is available at www.iShares.com. Performance results assume reinvestment of all dividends and capital gain distributions and do not reflect the deduction of taxes that a shareholder would pay on fund distributions or on the redemption or sale of fund shares. The investment return and principal value of shares will vary with changes in market conditions. Shares may be worth more or less than their original cost when they are redeemed or sold in the market. Performance for certain funds may reflect a waiver of a portion of investment management fees. Without such waiver, performance would have been lower.
Net asset value or “NAV” is the value of one share of a fund as calculated in accordance with the standard formula for valuing mutual fund shares. The price used to calculate market return (“Market Price”) is determined by using the midpoint between the highest bid and the lowest offer on the primary stock exchange on which shares of a fund are listed for trading, as of the time that such fund’s NAV is calculated. Since shares of a fund may not have traded in the secondary market until after the fund’s inception, for the period from inception to the first day of secondary trading, the NAV of the fund is used as a proxy for the Market Price to calculate market returns. Market and NAV returns assume that dividends and capital gain distributions have been reinvested at Market Price and NAV, respectively.
An index is a statistical composite that tracks a specified financial market or sector. Unlike a fund, an index does not actually hold a portfolio of securities and therefore does not incur the expenses incurred by a fund. These expenses negatively impact fund performance. Also, market returns do not include brokerage commissions that may be payable on secondary market transactions. If brokerage commissions were included, market returns would be lower.
As a shareholder of a Fund, you incur two types of costs: (1) transaction costs, including brokerage commissions on purchases and sales of fund shares and (2) ongoing costs, including management fees and other fund expenses. The expense example, which is based on an investment of $1,000 invested on March 1, 2014 and held through August 31, 2014, is intended to help you understand your ongoing costs (in dollars and cents) of investing in a Fund and to compare these costs with the ongoing costs of investing in other funds.
Actual Expenses — The table provides information about actual account values and actual expenses. Annualized expense ratios reflect contractual and voluntary fee waivers, if any. To estimate the expenses that you paid on your account over the period, simply divide your account value by $1,000 (for example, an $8,600 account value divided by $1,000 = 8.6), then multiply the result by the number for your Fund under the heading entitled “Expenses Paid During Period.”
Hypothetical Example for Comparison Purposes — The table also provides information about hypothetical account values and hypothetical expenses based on each Fund’s actual expense ratio and an assumed rate of return of 5% per year before expenses. You may use this information to compare the ongoing costs of investing in your Fund and other funds. To do so, compare this 5% hypothetical example with the 5% hypothetical examples that appear in the shareholder reports of the other funds.
Please note that the expenses shown in the table are meant to highlight your ongoing costs only and do not reflect any transactional costs, such as brokerage commissions paid on purchases and sales of fund shares. Therefore, the hypothetical examples are useful in comparing ongoing costs only and will not help you determine the relative total costs of owning different funds. In addition, if these transactional costs were included, your costs would have been higher.
| 14 | 2014 iSHARES ANNUAL REPORTTO SHAREHOLDERS |
Table of Contents
iSHARES® MSCI ALL COUNTRY WORLD MINIMUM VOLATILITY ETF
August 31, 2014
| Security | Shares | Value | ||||||
COMMON STOCKS — 99.28% |
| |||||||
CANADA — 9.09% |
| |||||||
Agnico-Eagle Mines Ltd. | 111,078 | $ | 4,257,777 | |||||
Bank of Montreal | 64,452 | 4,970,781 | ||||||
Bank of Nova Scotia | 98,281 | 6,527,000 | ||||||
Barrick Gold Corp. | 36,637 | 675,154 | ||||||
BCE Inc. | 172,331 | 7,776,541 | ||||||
Bell Aliant Inc.a | 50,545 | 1,437,486 | ||||||
Canadian Imperial Bank of Commerce | 46,034 | 4,409,673 | ||||||
Dollarama Inc. | 44,531 | 3,800,170 | ||||||
Enbridge Inc. | 270,811 | 13,538,678 | ||||||
Fairfax Financial Holdings Ltd. | 5,627 | 2,598,924 | ||||||
First Capital Realty Inc. | 63,137 | 1,124,505 | ||||||
Franco-Nevada Corp. | 36,825 | 2,079,649 | ||||||
Goldcorp Inc. | 179,660 | 5,056,483 | ||||||
H&R Real Estate Investment Trust | 34,946 | 745,150 | ||||||
Intact Financial Corp. | 88,509 | 6,030,606 | ||||||
National Bank of Canada | 214,241 | 10,331,364 | ||||||
Pembina Pipeline Corp. | 118,767 | 5,471,110 | ||||||
RioCan Real Estate Investment Trust | 66,896 | 1,670,627 | ||||||
Shaw Communications Inc. Class B | 260,099 | 6,567,515 | ||||||
TELUS Corp. NVS | 121,856 | 4,454,105 | ||||||
Thomson Reuters Corp. | 58,626 | 2,226,680 | ||||||
Tim Hortons Inc. | 80,991 | 6,525,571 | ||||||
TransCanada Corp. | 265,549 | 14,303,783 | ||||||
|
| |||||||
| 116,579,332 | ||||||||
CHILE — 0.20% |
| |||||||
Banco de Chile | 16,360,744 | 1,996,542 | ||||||
Empresa Nacional de Electricidad SA | 411,768 | 629,098 | ||||||
|
| |||||||
| 2,625,640 | ||||||||
CHINA — 4.91% |
| |||||||
Bank of China Ltd. Class H | 7,144,000 | 3,318,439 | ||||||
Beijing Capital International Airport Co. Ltd. Class H | 728,000 | 569,238 | ||||||
Beijing Enterprises Holdings Ltd. | 376,000 | 3,240,815 | ||||||
China Communications Services Corp. Ltd. Class H | 1,128,000 | 544,341 | ||||||
China Construction Bank Corp. Class H | 8,446,000 | 6,277,164 | ||||||
| Security | �� Shares | Value | ||||||
China Gas Holdings Ltd. | 752,000 | $ | 1,339,019 | |||||
China Mengniu Dairy Co. Ltd. | 376,000 | 1,744,121 | ||||||
China Mobile Ltd. | 1,222,000 | 15,199,809 | ||||||
China Resources Gas Group Ltd.a | 752,000 | 2,188,035 | ||||||
China Resources Power Holdings Co. Ltd. | 376,000 | 1,137,681 | ||||||
China Unicom (Hong Kong) Ltd. | 1,128,000 | 2,011,440 | ||||||
Guangdong Investment Ltd. | 1,128,000 | 1,363,762 | ||||||
Haier Electronics Group Co. Ltd.a | 376,000 | 1,086,740 | ||||||
Hanergy Solar Group Ltd.a | 4,112,000 | 673,824 | ||||||
Hengan International Group Co. Ltd. | 282,000 | 3,007,335 | ||||||
Industrial and Commercial Bank of China Ltd. Class H | 1,692,000 | 1,122,156 | ||||||
Jiangsu Expressway Co. Ltd. Class H | 752,000 | 856,778 | ||||||
Kunlun Energy Co. Ltd.a | 1,128,000 | 1,862,983 | ||||||
Lenovo Group Ltd.a | 1,504,000 | 2,297,680 | ||||||
Shanghai Pharmaceuticals Holding Co. Ltd. Class H | 468,700 | 961,572 | ||||||
Shenzhou International Group Holdings Ltd.a | 376,000 | 1,171,642 | ||||||
Sihuan Pharmaceutical Holdings Group Ltd.a | 2,243,000 | 1,502,057 | ||||||
Sino Biopharmaceutical Ltd. | 2,256,000 | 2,078,391 | ||||||
Sinopharm Group Co. Ltd. Class H | 220,800 | 770,648 | ||||||
SOHO China Ltd.a | 934,000 | 764,058 | ||||||
Sun Art Retail Group Ltd.a | 1,592,000 | 1,900,092 | ||||||
Tingyi (Cayman Islands) Holding Corp. | 752,000 | 2,110,411 | ||||||
Yuexiu Property Co. Ltd.a | 3,760,000 | 805,352 | ||||||
Zhejiang Expressway Co. Ltd. Class H | 1,104,000 | 1,098,281 | ||||||
|
| |||||||
| 63,003,864 | ||||||||
COLOMBIA — 0.10% |
| |||||||
Corporacion Financiera Colombiana SA NVS | 32,502 | 692,920 | ||||||
Ecopetrol SA | 328,886 | 570,015 | ||||||
|
| |||||||
| 1,262,935 | ||||||||
CZECH REPUBLIC — 0.06% |
| |||||||
O2 Czech Republic AS | 52,674 | 740,011 | ||||||
|
| |||||||
| 740,011 | ||||||||
SCHEDULESOF INVESTMENTS | 15 |
Table of Contents
Schedule of Investments (Continued)
iSHARES® MSCI ALL COUNTRY WORLD MINIMUM VOLATILITY ETF
August 31, 2014
| Security | Shares | Value | ||||||
EGYPT — 0.08% |
| |||||||
Commercial International Bank (Egypt) SAE | 151,888 | $ | 981,636 | |||||
|
| |||||||
| 981,636 | ||||||||
FRANCE — 0.21% | ||||||||
Iliad SA | 12,205 | 2,687,979 | ||||||
|
| |||||||
| 2,687,979 | ||||||||
GERMANY — 0.43% |
| |||||||
Fresenius Medical Care AG & Co. KGaA | 23,481 | 1,659,969 | ||||||
Kabel Deutschland Holding AG | 13,332 | 1,886,042 | ||||||
MAN SE | 16,339 | 1,942,337 | ||||||
|
| |||||||
| 5,488,348 | ||||||||
HONG KONG — 3.17% |
| |||||||
Cheung Kong Infrastructure Holdings Ltd. | 376,000 | 2,714,425 | ||||||
CLP Holdings Ltd. | 1,128,000 | 9,547,789 | ||||||
Hang Seng Bank Ltd. | 506,300 | 8,551,405 | ||||||
Hong Kong and China Gas Co. Ltd. (The)a | 204,600 | 464,103 | ||||||
Link REIT (The) | 1,504,000 | 8,926,795 | ||||||
MTR Corp. Ltd. | 1,034,000 | 4,102,566 | ||||||
Power Assets Holdings Ltd. | 564,000 | 5,137,759 | ||||||
Swire Pacific Ltd. Class Aa | 94,000 | 1,265,033 | ||||||
|
| |||||||
| 40,709,875 | ||||||||
INDONESIA — 0.69% |
| |||||||
PT Bank Central Asia Tbk | 4,418,000 | 4,230,100 | ||||||
PT Jasa Marga (Persero) Tbk | 1,466,400 | 777,233 | ||||||
PT Kalbe Farma Tbk | 8,738,100 | 1,240,030 | ||||||
PT Telekomunikasi Indonesia (Persero) Tbk | 4,396,700 | 1,001,685 | ||||||
PT Tower Bersama Infrastructure Tbk | 1,032,500 | 695,100 | ||||||
PT XL Axiata Tbk | 1,859,500 | 945,845 | ||||||
|
| |||||||
| 8,889,993 | ||||||||
IRELAND — 0.20% |
| |||||||
Kerry Group PLC Class A | 20,098 | 1,515,584 | ||||||
Ryanair Holdings PLC SP ADRb | 18,464 | 1,013,674 | ||||||
|
| |||||||
| 2,529,258 | ||||||||
ISRAEL — 0.56% |
| |||||||
Bank Leumi le-Israel BMa,b | 167,823 | 656,073 | ||||||
NICE Systems Ltd. | 39,456 | 1,526,979 | ||||||
| Security | Shares | Value | ||||||
Teva Pharmaceutical Industries Ltd. | 96,026 | $ | 5,010,661 | |||||
|
| |||||||
| 7,193,713 | ||||||||
JAPAN — 12.25% |
| |||||||
ABC-MART Inc. | 18,800 | 964,567 | ||||||
Ajinomoto Co. Inc. | 54,000 | 879,251 | ||||||
ANA Holdings Inc.a | 740,000 | 1,801,473 | ||||||
Aozora Bank Ltd. | 564,000 | 1,927,323 | ||||||
Astellas Pharma Inc. | 186,800 | 2,693,617 | ||||||
Bank of Yokohama Ltd. (The) | 188,000 | 1,038,221 | ||||||
Benesse Holdings Inc. | 37,600 | 1,333,744 | ||||||
Calbee Inc. | 56,400 | 1,949,040 | ||||||
Chugai Pharmaceutical Co. Ltd. | 75,200 | 2,385,176 | ||||||
Chugoku Bank Ltd. (The) | 111,600 | 1,690,893 | ||||||
East Japan Railway Co. | 18,800 | 1,462,775 | ||||||
Eisai Co. Ltd. | 150,400 | 6,291,218 | ||||||
FamilyMart Co. Ltd. | 37,600 | 1,578,053 | ||||||
Hikari Tsushin Inc. | 18,800 | 1,169,062 | ||||||
Hisamitsu Pharmaceutical Co. Inc. | 37,600 | 1,494,807 | ||||||
ITOCHU Techno-Solutions Corp. | 18,800 | 836,983 | ||||||
Japan Airlines Co. Ltd. | 40,100 | 2,258,122 | ||||||
Japan Prime Realty Investment Corp. | 564 | 2,076,623 | ||||||
Japan Real Estate Investment Corp. | 376 | 2,070,289 | ||||||
Japan Retail Fund Investment Corp. | 1,492 | 3,133,796 | ||||||
Kamigumi Co. Ltd. | 188,000 | 1,751,783 | ||||||
Keio Corp. | 188,000 | 1,453,184 | ||||||
Kintetsu Corp. | 188,000 | 660,538 | ||||||
Kyowa Hakko Kirin Co. Ltd. | 188,000 | 2,551,668 | ||||||
Lawson Inc. | 37,600 | 2,703,682 | ||||||
M3 Inc. | 55,200 | 966,538 | ||||||
McDonald’s Holdings Co. (Japan) Ltd.a | 37,600 | 928,373 | ||||||
Miraca Holdings Inc. | 37,600 | 1,751,783 | ||||||
Mitsubishi Tanabe Pharma Corp. | 168,000 | 2,574,539 | ||||||
Nagoya Railroad Co. Ltd. | 376,000 | 1,556,336 | ||||||
Nippon Building Fund Inc. | 188 | 1,047,812 | ||||||
Nippon Prologis REIT Inc. | 928 | 2,256,464 | ||||||
Nippon Telegraph and Telephone Corp. | 37,600 | 2,526,332 | ||||||
Nissin Foods Holdings Co. Ltd. | 37,600 | 2,157,155 | ||||||
| 16 | 2014 iSHARES ANNUAL REPORTTO SHAREHOLDERS |
Table of Contents
Schedule of Investments (Continued)
iSHARES® MSCI ALL COUNTRY WORLD MINIMUM VOLATILITY ETF
August 31, 2014
| Security | Shares | Value | ||||||
Nitori Holdings Co. Ltd. | 37,600 | $ | 2,258,497 | |||||
Nomura Research Institute Ltd. | 56,400 | 1,783,453 | ||||||
NTT DOCOMO Inc. | 694,200 | 12,018,277 | ||||||
Odakyu Electric Railway Co. Ltd. | 188,000 | 1,856,745 | ||||||
Oracle Corp. Japan | 25,500 | 1,040,766 | ||||||
Oriental Land Co. Ltd. | 37,600 | 7,327,449 | ||||||
Osaka Gas Co. Ltd. | 564,000 | 2,323,646 | ||||||
Otsuka Corp. | 15,900 | 674,968 | ||||||
Otsuka Holdings Co. Ltd. | 244,400 | 8,897,539 | ||||||
PARK24 Co. Ltd. | 74,000 | 1,289,310 | ||||||
Rakuten Inc. | 55,200 | 715,206 | ||||||
Sankyo Co. Ltd. | 18,800 | 721,163 | ||||||
Santen Pharmaceutical Co. Ltd. | 56,400 | 3,257,448 | ||||||
Secom Co. Ltd. | 94,000 | 5,753,920 | ||||||
Shimamura Co. Ltd. | 18,800 | 1,697,492 | ||||||
Suntory Beverage & Food Ltd. | 75,200 | 2,761,592 | ||||||
Suzuken Co. Ltd. | 56,400 | 1,881,176 | ||||||
Takeda Pharmaceutical Co. Ltd. | 244,400 | 11,174,857 | ||||||
Tobu Railway Co. Ltd. | 752,000 | 3,945,132 | ||||||
Toho Co. Ltd. | 74,000 | 1,715,994 | ||||||
Tokyo Gas Co. Ltd. | 188,000 | 1,069,348 | ||||||
TonenGeneral Sekiyu K.K. | 188,000 | 1,717,399 | ||||||
Unicharm Corp. | 18,800 | 1,236,202 | ||||||
United Urban Investment Corp. | 1,680 | 2,713,616 | ||||||
USS Co. Ltd. | 149,200 | 2,463,089 | ||||||
West Japan Railway Co. | 112,800 | 5,342,758 | ||||||
Yamato Holdings Co. Ltd. | 243,200 | 5,032,087 | ||||||
Yamazaki Baking Co. Ltd. | 48,000 | 632,546 | ||||||
|
| |||||||
| 157,222,895 | ||||||||
LUXEMBOURG — 0.21% |
| |||||||
Altice SAa,b | 42,300 | 2,707,874 | ||||||
|
| |||||||
| 2,707,874 | ||||||||
MALAYSIA — 1.31% |
| |||||||
Axiata Group Bhd | 600,300 | 1,319,822 | ||||||
Hong Leong Bank Bhd | 131,600 | 601,218 | ||||||
IHH Healthcare Bhd | 1,633,900 | 2,529,642 | ||||||
Malayan Banking Bhd | 864,800 | 2,771,091 | ||||||
Maxis Bhd | 1,314,500 | 2,731,591 | ||||||
Petronas Dagangan Bhd | 92,800 | 591,777 | ||||||
Public Bank Bhd | 803,460 | 4,914,565 | ||||||
Telekom Malaysia Bhd | 656,600 | 1,324,866 | ||||||
|
| |||||||
| 16,784,572 | ||||||||
| Security | Shares | Value | ||||||
NEW ZEALAND — 0.13% |
| |||||||
Auckland International Airport Ltd. | 558,738 | $ | 1,716,531 | |||||
|
| |||||||
| 1,716,531 | ||||||||
PERU — 0.17% |
| |||||||
Compania de Minas Buenaventura SA SP ADR | 106,551 | 1,551,383 | ||||||
Credicorp Ltd. | 3,935 | 610,200 | ||||||
|
| |||||||
| 2,161,583 | ||||||||
PHILIPPINES — 0.44% |
| |||||||
Bank of the Philippine Islands | 520,489 | 1,134,093 | ||||||
BDO Unibank Inc. | 674,590 | 1,400,239 | ||||||
International Container Terminal Services Inc. | 341,940 | 885,436 | ||||||
Philippine Long Distance Telephone Co. | 28,200 | 2,231,422 | ||||||
|
| |||||||
| 5,651,190 | ||||||||
QATAR — 0.27% |
| |||||||
Ooredoo QSC | 15,323 | 481,000 | ||||||
Qatar National Bank SAQ | 54,227 | 3,008,309 | ||||||
|
| |||||||
| 3,489,309 | ||||||||
RUSSIA — 0.11% |
| |||||||
Alrosa AO | 1,233,100 | 1,445,142 | ||||||
|
| |||||||
| 1,445,142 | ||||||||
SINGAPORE — 1.45% |
| |||||||
ComfortDelGro Corp. Ltd. | 1,304,000 | 2,622,733 | ||||||
Oversea-Chinese Banking Corp. Ltd. | 376,000 | 3,012,941 | ||||||
Singapore Airlines Ltd.a | 376,000 | 3,043,071 | ||||||
Singapore Press Holdings Ltd.a | 1,030,000 | 3,425,217 | ||||||
Singapore Technologies Engineering Ltd. | 376,000 | 1,102,737 | ||||||
Singapore Telecommunications Ltd.a | 1,316,000 | 4,102,119 | ||||||
StarHub Ltd.a | 376,000 | 1,250,371 | ||||||
|
| |||||||
| 18,559,189 | ||||||||
SOUTH KOREA — 0.40% |
| |||||||
Dongbu Insurance Co. Ltd. | 28,556 | 1,723,583 | ||||||
Samsung Fire & Marine Insurance Co. Ltd. | 6,534 | 1,788,239 | ||||||
Samsung Life Insurance Co. Ltd. | 7,144 | 750,369 | ||||||
Yuhan Corp. | 4,900 | 836,037 | ||||||
|
| |||||||
| 5,098,228 | ||||||||
SCHEDULESOF INVESTMENTS | 17 |
Table of Contents
Schedule of Investments (Continued)
iSHARES® MSCI ALL COUNTRY WORLD MINIMUM VOLATILITY ETF
August 31, 2014
| Security | Shares | Value | ||||||
SWITZERLAND — 5.88% |
| |||||||
Barry Callebaut AG Registered | 1,492 | $ | 1,832,724 | |||||
Givaudan SA Registeredb | 5,627 | 9,363,485 | ||||||
Kuehne & Nagel International AG Registered | 5,627 | 760,015 | ||||||
Lindt & Spruengli AG Registered | 68 | 4,271,114 | ||||||
Nestle SA Registered | 191,688 | 14,912,671 | ||||||
Novartis AG Registered | 194,319 | 17,472,479 | ||||||
Partners Group Holding AG | 6,942 | 1,835,838 | ||||||
Roche Holding AG Genusschein | 18,783 | 5,490,210 | ||||||
Schindler Holding AG Registered | 14,272 | 2,080,376 | ||||||
SGS SA Registered | 2,444 | 5,435,855 | ||||||
Swiss Prime Site AG Registeredb | 38,516 | 3,082,626 | ||||||
Swisscom AG Registered | 15,400 | 8,962,385 | ||||||
|
| |||||||
| 75,499,778 | ||||||||
TAIWAN — 3.82% |
| |||||||
Advanced Semiconductor Engineering Inc. | 740,000 | 922,199 | ||||||
Advantech Co. Ltd. | 188,000 | 1,764,240 | ||||||
Chang Hwa Commercial Bank Ltd. | 3,248,096 | 2,021,197 | ||||||
Chicony Electronics Co. Ltd. | 188,930 | 619,432 | ||||||
China Development Financial Holding Corp. | 2,620,000 | 885,298 | ||||||
Chunghwa Telecom Co. Ltd. | 2,632,000 | 8,180,285 | ||||||
Far EasTone Telecommunications Co. Ltd. | 928,000 | 1,977,672 | ||||||
First Financial Holding Co. Ltd. | 5,014,232 | 3,103,437 | ||||||
Foxconn Technology Co. Ltd. | 382,200 | 959,000 | ||||||
Hua Nan Financial Holdings Co. Ltd. | 4,053,050 | 2,515,317 | ||||||
Kinsus Interconnect Technology Corp. | 188,000 | 795,637 | ||||||
Lite-On Technology Corp. | 1,311,261 | 2,173,700 | ||||||
MediaTek Inc. | 188,760 | 3,154,367 | ||||||
SinoPac Financial Holdings Co. Ltd. | 4,862,519 | 2,220,551 | ||||||
Taiwan Business Bank Ltd.b | 2,724,800 | 853,252 | ||||||
Taiwan Cooperative Financial Holding Co. Ltd. | 3,935,062 | 2,198,543 | ||||||
Taiwan Mobile Co. Ltd. | 1,128,000 | 3,596,407 | ||||||
Taiwan Semiconductor Manufacturing Co. Ltd. | 2,444,000 | 10,138,874 | ||||||
Yulon Motor Co. Ltd. | 552,000 | 886,436 | ||||||
|
| |||||||
| 48,965,844 | ||||||||
| Security | Shares | Value | ||||||
THAILAND — 0.39% |
| |||||||
Advanced Information Service PCL NVDR | 316,900 | $ | 2,073,641 | |||||
Airports of Thailand PCL NVDR | 99,200 | 736,080 | ||||||
Bumrungrad Hospital PCL NVDR | 240,800 | 1,017,784 | ||||||
PTT Exploration & Production PCL NVDR | 240,800 | 1,240,188 | ||||||
|
| |||||||
| 5,067,693 | ||||||||
UNITED ARAB EMIRATES — 0.17% |
| |||||||
DP World Ltd. | 34,199 | 642,257 | ||||||
National Bank of Abu Dhabi PJSC | 412,192 | 1,571,089 | ||||||
|
| |||||||
| 2,213,346 | ||||||||
UNITED KINGDOM — 2.79% |
| |||||||
Babcock International Group PLC | 205,220 | 3,820,580 | ||||||
British Sky Broadcasting Group PLC | 342,605 | 4,970,048 | ||||||
Capita PLC | 37,953 | 773,383 | ||||||
Compass Group PLC | 371,270 | 6,039,462 | ||||||
GlaxoSmithKline PLC | 216,684 | 5,306,102 | ||||||
Intertek Group PLC | 56,747 | 2,639,733 | ||||||
Randgold Resources Ltd. | 34,945 | 2,951,073 | ||||||
Reckitt Benckiser Group PLC | 49,229 | 4,292,243 | ||||||
Royal Dutch Shell PLC Class B | 31,374 | 1,326,316 | ||||||
Smith & Nephew PLC | 57,686 | 999,214 | ||||||
SSE PLC | 105,987 | 2,671,950 | ||||||
|
| |||||||
| 35,790,104 | ||||||||
UNITED STATES — 49.79% |
| |||||||
3M Co. | 5,627 | 810,288 | ||||||
Abbott Laboratories | 226,269 | 9,557,603 | ||||||
Actavis PLCb | 2,996 | 680,032 | ||||||
Airgas Inc. | 5,999 | 662,170 | ||||||
Alleghany Corp.b | 9,400 | 4,052,622 | ||||||
Altria Group Inc. | 133,238 | 5,739,893 | ||||||
American Tower Corp. | 34,758 | 3,427,139 | ||||||
American Water Works Co. Inc. | 22,541 | 1,140,800 | ||||||
AmerisourceBergen Corp. | 134,930 | 10,442,233 | ||||||
Amgen Inc. | 23,293 | 3,246,578 | ||||||
Antero Resources Corp.a,b | 9,761 | 564,674 | ||||||
Arch Capital Group Ltd.b | 89,072 | 4,950,622 | ||||||
AT&T Inc. | 146,019 | 5,104,824 | ||||||
Automatic Data Processing Inc. | 230,592 | 19,249,820 | ||||||
AutoZone Inc.a,b | 18,031 | 9,715,824 | ||||||
| 18 | 2014 iSHARES ANNUAL REPORTTO SHAREHOLDERS |
Table of Contents
Schedule of Investments (Continued)
iSHARES® MSCI ALL COUNTRY WORLD MINIMUM VOLATILITY ETF
August 31, 2014
| Security | Shares | Value | ||||||
Becton, Dickinson and Co. | 67,835 | $ | 7,948,227 | |||||
Bed Bath & Beyond Inc.a,b | 13,520 | 868,795 | ||||||
Berkshire Hathaway Inc. Class Bb | 35,133 | 4,822,004 | ||||||
Bristol-Myers Squibb Co. | 127,601 | 6,462,991 | ||||||
C.H. Robinson Worldwide Inc. | 13,896 | 948,541 | ||||||
C.R. Bard Inc. | 40,396 | 5,996,382 | ||||||
Chevron Corp. | 5,627 | 728,415 | ||||||
Chubb Corp. (The) | 87,381 | 8,034,683 | ||||||
Church & Dwight Co. Inc. | 91,704 | 6,257,881 | ||||||
Clorox Co. (The) | 72,722 | 6,443,169 | ||||||
Coca-Cola Co. (The) | 110,686 | 4,617,820 | ||||||
Colgate-Palmolive Co. | 188,306 | 12,189,047 | ||||||
Consolidated Edison Inc. | 195,071 | 11,292,660 | ||||||
Costco Wholesale Corp. | 9,761 | 1,181,862 | ||||||
Crown Castle International Corp. | 44,531 | 3,540,660 | ||||||
DaVita HealthCare Partners Inc.b | 23,857 | 1,781,641 | ||||||
Dollar General Corp.b | 117,263 | 7,503,659 | ||||||
Dollar Tree Inc.b | 56,747 | 3,043,058 | ||||||
Dominion Resources Inc. | 128,728 | 9,039,280 | ||||||
Duke Energy Corp. | 133,614 | 9,886,100 | ||||||
Ecolab Inc. | 70,654 | 8,112,492 | ||||||
Eli Lilly and Co. | 153,160 | 9,734,850 | ||||||
Everest Re Group Ltd. | 31,375 | 5,140,480 | ||||||
Exxon Mobil Corp. | 121,962 | 12,130,341 | ||||||
Family Dollar Stores Inc. | 68,963 | 5,505,316 | ||||||
Federal Realty Investment Trust | 42,463 | 5,298,533 | ||||||
General Mills Inc. | 325,502 | 17,375,297 | ||||||
Genuine Parts Co. | 16,340 | 1,433,672 | ||||||
Health Care REIT Inc. | 65,768 | 4,444,601 | ||||||
Henry Schein Inc.b | 26,676 | 3,192,850 | ||||||
Hershey Co. (The) | 57,686 | 5,273,654 | ||||||
Hormel Foods Corp. | 96,590 | 4,895,181 | ||||||
Intel Corp. | 54,491 | 1,902,826 | ||||||
International Business Machines Corp. | 34,570 | 6,647,811 | ||||||
Intuit Inc. | 72,534 | 6,033,378 | ||||||
J.B. Hunt Transport Services Inc. | 27,428 | 2,072,185 | ||||||
J.M. Smucker Co. (The) | 29,683 | 3,045,476 | ||||||
Johnson & Johnson | 181,539 | 18,831,041 | ||||||
Kellogg Co. | 145,079 | 9,425,783 | ||||||
Kimberly-Clark Corp. | 110,686 | 11,954,088 | ||||||
Kinder Morgan Inc. | 115,760 | 4,660,498 | ||||||
Kinder Morgan Management LLCa,b | 69,203 | 6,762,517 | ||||||
| Security | Shares | Value | ||||||
Laboratory Corp. of America Holdingsb | 50,545 | $ | 5,419,940 | |||||
Marsh & McLennan Companies Inc. | 187,178 | 9,939,152 | ||||||
McCormick & Co. Inc. NVS | 78,548 | 5,474,010 | ||||||
McDonald’s Corp. | 178,224 | 16,703,153 | ||||||
McKesson Corp. | 13,896 | 2,710,137 | ||||||
Merck & Co. Inc. | 196,762 | 11,827,364 | ||||||
Microsoft Corp. | 97,342 | 4,422,247 | ||||||
Motorola Solutions Inc. | 59,378 | 3,527,053 | ||||||
Newmont Mining Corp. | 25,924 | 702,281 | ||||||
NextEra Energy Inc. | 13,896 | 1,368,061 | ||||||
O’Reilly Automotive Inc.b | 40,020 | 6,242,320 | ||||||
OGE Energy Corp. | 17,279 | 648,308 | ||||||
PartnerRe Ltd. | 30,999 | 3,462,278 | ||||||
Patterson Companies Inc. | 23,105 | 930,438 | ||||||
Paychex Inc. | 218,375 | 9,095,319 | ||||||
People’s United Financial Inc. | 211,047 | 3,155,153 | ||||||
PepsiCo Inc. | 122,338 | 11,315,042 | ||||||
Perrigo Co. PLC | 12,769 | 1,899,261 | ||||||
PetSmart Inc. | 49,793 | 3,563,685 | ||||||
Pfizer Inc. | 157,295 | 4,622,900 | ||||||
PG&E Corp. | 229,464 | 10,665,487 | ||||||
Procter & Gamble Co. (The) | 137,749 | 11,448,319 | ||||||
Public Storage | 4,687 | 821,069 | ||||||
QUALCOMM Inc. | 114,633 | 8,723,571 | ||||||
Range Resources Corp. | 12,204 | 959,112 | ||||||
RenaissanceRe Holdings Ltd.a | 27,428 | 2,808,353 | ||||||
Republic Services Inc. | 92,831 | 3,651,043 | ||||||
Reynolds American Inc. | 19,722 | 1,153,145 | ||||||
Ross Stores Inc. | 68,775 | 5,187,011 | ||||||
SBA Communications Corp. Class Ab | 25,736 | 2,838,423 | ||||||
SCANA Corp. | 15,302 | 794,786 | ||||||
Sherwin-Williams Co. (The) | 4,875 | 1,063,286 | ||||||
Southern Co. (The) | 383,011 | 17,005,688 | ||||||
Southwest Airlines Co. | 120,084 | 3,843,889 | ||||||
Starbucks Corp. | 57,123 | 4,444,741 | ||||||
Stericycle Inc.b | 57,348 | 6,815,810 | ||||||
Synopsys Inc.b | 103,732 | 4,242,639 | ||||||
Sysco Corp. | 24,233 | 916,734 | ||||||
Target Corp. | 120,647 | 7,247,265 | ||||||
TJX Companies Inc. (The) | 200,333 | 11,941,850 | ||||||
Travelers Companies Inc. (The) | 58,062 | 5,499,052 | ||||||
SCHEDULESOF INVESTMENTS | 19 |
Table of Contents
Schedule of Investments (Continued)
iSHARES® MSCI ALL COUNTRY WORLD MINIMUM VOLATILITY ETF
August 31, 2014
| Security | Shares | Value | ||||||
Union Pacific Corp. | 46,597 | $ | 4,905,266 | |||||
United Parcel Service Inc. Class B | 61,445 | 5,980,442 | ||||||
UnitedHealth Group Inc. | 37,389 | 3,240,879 | ||||||
Verisk Analytics Inc. Class Ab | 90,576 | 5,814,074 | ||||||
Verizon Communications Inc. | 285,659 | 14,231,531 | ||||||
Visa Inc. Class A | 14,648 | 3,112,993 | ||||||
W.R. Berkley Corp. | 73,474 | 3,552,468 | ||||||
Wal-Mart Stores Inc. | 147,522 | 11,137,911 | ||||||
Waste Management Inc. | 176,653 | 8,297,391 | ||||||
Wisconsin Energy Corp. | 149,777 | 6,789,391 | ||||||
Xcel Energy Inc. | 186,613 | 5,980,947 | ||||||
Yum! Brands Inc. | 11,265 | 815,924 | ||||||
|
| |||||||
| 638,763,459 | ||||||||
|
| |||||||
TOTAL COMMON STOCKS |
| |||||||
(Cost: $1,098,989,276) |
| 1,273,829,321 | ||||||
PREFERRED STOCKS — 0.25% |
| |||||||
COLOMBIA — 0.25% |
| |||||||
Banco Davivienda SA | 59,378 | 987,338 | ||||||
Grupo Aval Acciones y Valores SA | 1,000,583 | 748,436 | ||||||
Grupo de Inversiones Suramericana SA | 64,452 | 1,464,780 | ||||||
|
| |||||||
| 3,200,554 | ||||||||
|
| |||||||
TOTAL PREFERRED STOCKS |
| |||||||
(Cost: $2,763,520) |
| 3,200,554 | ||||||
RIGHTS — 0.01% |
| |||||||
SINGAPORE — 0.01% |
| |||||||
Oversea-Chinese Banking Corp. Ltd.b | 47,000 | 88,505 | ||||||
|
| |||||||
| 88,505 | ||||||||
|
| |||||||
TOTAL RIGHTS |
| |||||||
(Cost: $0) |
| 88,505 | ||||||
SHORT-TERM INVESTMENTS — 2.85% |
| |||||||
MONEY MARKET FUNDS — 2.85% |
| |||||||
BlackRock Cash Funds: Institutional, |
| |||||||
0.14%c,d,e | 34,387,455 | 34,387,455 | ||||||
| Security | Shares | Value | ||||||
BlackRock Cash Funds: Prime, |
| |||||||
0.11%c,d,e | 2,164,784 | $ | 2,164,784 | |||||
|
| |||||||
| 36,552,239 | ||||||||
|
| |||||||
TOTAL SHORT-TERM INVESTMENTS |
| |||||||
(Cost: $36,552,239) |
| 36,552,239 | ||||||
|
| |||||||
TOTAL INVESTMENTS |
| |||||||
(Cost: $1,138,305,035) | 1,313,670,619 | |||||||
Other Assets, Less Liabilities — (2.39)% |
| (30,658,155 | ) | |||||
|
| |||||||
NET ASSETS — 100.00% |
| $ | 1,283,012,464 | |||||
|
| |||||||
NVDR — Non-Voting Depositary Receipts
NVS — Non-Voting Shares
SP ADR — Sponsored American Depositary Receipts
| a | All or a portion of this security represents a security on loan. See Note 1. |
| b | Non-income earning security. |
| c | Affiliated issuer. See Note 2. |
| d | The rate quoted is the annualized seven-day yield of the fund at period end. |
| e | All or a portion of this security represents an investment of securities lending collateral. See Note 1. |
See notes to financial statements.
| 20 | 2014 iSHARES ANNUAL REPORTTO SHAREHOLDERS |
Table of Contents
Schedule of Investments
iSHARES® MSCI EMERGING MARKETS EMEA ETF
August 31, 2014
| Security | Shares | Value | ||||||
COMMON STOCKS — 98.52% |
| |||||||
CZECH REPUBLIC — 1.23% |
| |||||||
CEZ AS | 2,202 | $ | 64,014 | |||||
Komercni Banka AS | 208 | 48,374 | ||||||
O2 Czech Republic AS | 1,076 | 15,116 | ||||||
|
| |||||||
| 127,504 | ||||||||
EGYPT — 1.17% | ||||||||
Commercial International Bank (Egypt) SAE SP GDR | 13,600 | 86,360 | ||||||
Global Telecom Holding SAE GDRa | 9,770 | 35,055 | ||||||
|
| |||||||
| 121,415 | ||||||||
GREECE — 3.91% | ||||||||
Alpha Bank AEa | 52,730 | 46,258 | ||||||
Eurobank Ergasias SAa | 110,624 | 47,066 | ||||||
Folli Follie Groupa | 460 | 19,086 | ||||||
Hellenic Telecommunications Organization SAa | 3,408 | 48,840 | ||||||
Jumbo SAa | 1,420 | 20,949 | ||||||
National Bank of Greece SAa | 21,966 | 75,517 | ||||||
OPAP SA | 3,046 | 48,507 | ||||||
Piraeus Bank SAa | 29,262 | 57,816 | ||||||
Public Power Corp. SAa | 1,620 | 23,579 | ||||||
Titan Cement Co. SA | 640 | 17,113 | ||||||
|
| |||||||
| 404,731 | ||||||||
HUNGARY — 1.08% | ||||||||
MOL Hungarian Oil and Gas PLC | 570 | 28,085 | ||||||
OTP Bank PLC | 3,066 | 53,001 | ||||||
Richter Gedeon Nyrt | 1,916 | 30,834 | ||||||
|
| |||||||
| 111,920 | ||||||||
POLAND — 8.95% | ||||||||
Alior Bank SAa | 640 | 15,255 | ||||||
Bank Handlowy w Warszawie SA | 454 | 16,258 | ||||||
Bank Millennium SA | 5,792 | 14,546 | ||||||
Bank Pekao SA | 1,796 | 101,165 | ||||||
Bank Zachodni WBK SA | 392 | 45,424 | ||||||
Cyfrowy Polsat SA | 2,422 | 19,384 | ||||||
ENEA SA | 3,070 | 14,403 | ||||||
Energa SA | 2,754 | 17,959 | ||||||
Eurocash SA | 1,156 | 12,473 | ||||||
Getin Noble Bank SAa | 16,582 | 13,484 | ||||||
Grupa Azoty SA | 690 | 16,131 | ||||||
Grupa Lotos SAa | 886 | 8,352 | ||||||
Jastrzebska Spolka Weglowa SAa | 736 | 7,707 | ||||||
| Security | Shares | Value | ||||||
KGHM Polska Miedz SA | 1,910 | $ | 78,733 | |||||
LPP SA | 11 | 29,243 | ||||||
mBank SA | 202 | 29,283 | ||||||
Orange Polska SA | 8,950 | 30,063 | ||||||
Polska Grupa Energetyczna SA | 11,476 | 78,281 | ||||||
Polski Koncern Naftowy Orlen SA | 4,376 | 53,965 | ||||||
Polskie Gornictwo Naftowe i Gazownictwo SA | 24,144 | 36,850 | ||||||
Powszechna Kasa Oszczednosci Bank Polski SA | 11,936 | 142,791 | ||||||
Powszechny Zaklad Ubezpieczen SA | 766 | 112,360 | ||||||
Synthos SA | 7,360 | 10,589 | ||||||
Tauron Polska Energia SA | 14,622 | 22,820 | ||||||
|
| |||||||
| 927,519 | ||||||||
QATAR — 3.21% | ||||||||
Barwa Real Estate Co. | 1,328 | 14,260 | ||||||
Commercial Bank of Qatar QSC (The) | 538 | 10,062 | ||||||
Doha Bank QSC | 468 | 7,840 | ||||||
Industries Qatar QSC | 1,074 | 57,074 | ||||||
Masraf Al Rayan QSC | 5,014 | 71,605 | ||||||
Ooredoo QSC | 1,114 | 34,969 | ||||||
Qatar Electricity & Water Co. QSC | 382 | 17,940 | ||||||
Qatar Islamic Bank SAQ | 768 | 25,100 | ||||||
Qatar National Bank SAQ | 1,242 | 68,902 | ||||||
Vodafone Qatar QSC | 4,702 | 24,974 | ||||||
|
| |||||||
| 332,726 | ||||||||
RUSSIA — 24.35% | ||||||||
Alrosa AO | 25,200 | 29,533 | ||||||
Gazprom OAO | 161,460 | 575,335 | ||||||
LUKOIL OAO | 6,962 | 387,556 | ||||||
Magnit OJSC SP GDRb | 3,548 | 206,494 | ||||||
MegaFon OAO SP GDRb | 1,270 | 35,941 | ||||||
MMC Norilsk Nickel OJSC | 756 | 148,767 | ||||||
Mobile TeleSystems OJSC SP ADR | 7,046 | 129,999 | ||||||
Moscow Exchange MICEX-RTS OJSC | 18,080 | 30,348 | ||||||
NovaTek OAO SP GDRb | 1,242 | 124,945 | ||||||
Rosneft Oil Co. OJSC | 15,900 | 98,088 | ||||||
Rostelecom OJSC | 10,920 | 29,046 | ||||||
RusHydro OJSC | 1,546,000 | 28,672 | ||||||
Sberbank of Russia | 147,220 | 289,703 | ||||||
Severstal OAO | 2,860 | 27,527 | ||||||
Sistema JSFC SP GDRb | 2,304 | 52,416 | ||||||
Surgutneftegas OJSC | 98,000 | 68,694 | ||||||
Tatneft OAO Class S | 19,320 | 119,821 | ||||||
SCHEDULESOF INVESTMENTS | 21 |
Table of Contents
Schedule of Investments (Continued)
iSHARES® MSCI EMERGING MARKETS EMEA ETF
August 31, 2014
| Security | Shares | Value | ||||||
Uralkali OJSC | 18,020 | $ | 66,553 | |||||
VTB Bank OJSC | 70,920,000 | 73,058 | ||||||
|
| |||||||
| 2,522,496 | ||||||||
SOUTH AFRICA — 42.34% | ||||||||
African Bank Investments Ltd.c,d | 19,726 | 19 | ||||||
African Rainbow Minerals Ltd. | 1,506 | 25,722 | ||||||
Anglo American Platinum Ltd.a | 736 | 30,664 | ||||||
AngloGold Ashanti Ltd.a | 5,502 | 93,662 | ||||||
Aspen Pharmacare Holdings Ltd. | 4,358 | 125,244 | ||||||
Assore Ltd. | 486 | 14,382 | ||||||
Barclays Africa Group Ltd. | 4,626 | 72,456 | ||||||
Barloworld Ltd. | 3,054 | 29,106 | ||||||
Bidvest Group Ltd. | 4,292 | 113,529 | ||||||
Brait SEa | 4,582 | 34,126 | ||||||
Coronation Fund Managers Ltd. | 3,102 | 29,167 | ||||||
Discovery Ltd. | 4,440 | 40,975 | ||||||
Exxaro Resources Ltd. | 1,952 | 27,692 | ||||||
FirstRand Ltd. | 42,296 | 172,001 | ||||||
Foschini Group Ltd. (The) | 2,726 | 29,507 | ||||||
Gold Fields Ltd. | 10,568 | 50,091 | ||||||
Growthpoint Properties Ltd. | 29,608 | 70,155 | ||||||
Harmony Gold Mining Co. Ltd.a | 5,322 | 16,128 | ||||||
Impala Platinum Holdings Ltd. | 7,362 | 66,626 | ||||||
Imperial Holdings Ltd. | 2,542 | 45,460 | ||||||
Investec Ltd. | 3,280 | 29,668 | ||||||
Kumba Iron Ore Ltd. | 896 | 26,833 | ||||||
Liberty Holdings Ltd. | 1,550 | 19,031 | ||||||
Life Healthcare Group Holdings Ltd. | 12,794 | 53,869 | ||||||
Massmart Holdings Ltd. | 1,510 | 18,567 | ||||||
Mediclinic International Ltd. | 5,076 | 44,138 | ||||||
MMI Holdings Ltd. | 13,918 | 35,975 | ||||||
Mr. Price Group Ltd. | 3,256 | 62,668 | ||||||
MTN Group Ltd. | 22,984 | 520,908 | ||||||
Nampak Ltd. | 8,256 | 33,108 | ||||||
Naspers Ltd. Class N | 5,402 | 688,504 | ||||||
Nedbank Group Ltd. | 2,804 | 60,296 | ||||||
Netcare Ltd. | 13,090 | 39,755 | ||||||
Northam Platinum Ltd.a | 4,885 | 19,613 | ||||||
Pick n Pay Stores Ltd. | 3,340 | 17,744 | ||||||
PPC Ltd. | 7,458 | 23,218 | ||||||
Rand Merchant Insurance Holdings Ltd. | 9,296 | 29,456 | ||||||
Redefine Properties Ltd. | 45,858 | 41,221 | ||||||
Remgro Ltd. | 6,562 | 150,239 | ||||||
RMB Holdings Ltd. | 9,628 | 50,677 | ||||||
| Security | Shares | Value | ||||||
Sanlam Ltd. | 24,872 | $ | 154,348 | |||||
Sappi Ltd.a | 7,386 | 30,557 | ||||||
Sasol Ltd. | 7,540 | 438,331 | ||||||
Shoprite Holdings Ltd. | 6,226 | 86,318 | ||||||
SPAR Group Ltd. (The) | 2,244 | 27,507 | ||||||
Standard Bank Group Ltd. | 16,578 | 215,108 | ||||||
Steinhoff International Holdings Ltd. | 28,722 | 141,809 | ||||||
Tiger Brands Ltd. | 2,226 | 64,255 | ||||||
Truworths International Ltd. | 5,170 | 36,167 | ||||||
Vodacom Group Ltd. | 5,074 | 61,234 | ||||||
Woolworths Holdings Ltd. | 10,464 | 78,179 | ||||||
|
| |||||||
| 4,386,013 | ||||||||
TURKEY — 9.24% | ||||||||
Akbank TAS | 24,552 | 93,750 | ||||||
Anadolu Efes Biracilik ve Malt Sanayii ASa | 2,828 | 37,611 | ||||||
Arcelik AS | 3,288 | 19,731 | ||||||
BIM Birlesik Magazalar AS | 2,900 | 68,268 | ||||||
Coca-Cola Icecek AS | 1,062 | 25,099 | ||||||
Emlak Konut Gayrimenkul Yatirim Ortakligi AS | 25,916 | 32,666 | ||||||
Enka Insaat ve Sanayi AS | 6,508 | 16,316 | ||||||
Eregli Demir ve Celik Fabrikalari TAS | 19,096 | 37,166 | ||||||
Ford Otomotiv Sanayi ASa | 976 | 12,890 | ||||||
Haci Omer Sabanci Holding AS | 12,524 | 58,037 | ||||||
KOC Holding AS | 8,648 | 44,283 | ||||||
Koza Altin Isletmeleri AS | 672 | 7,240 | ||||||
TAV Havalimanlari Holding AS | 2,210 | 18,383 | ||||||
Tofas Turk Otomobil Fabrikasi AS | 1,738 | 10,712 | ||||||
Turk Hava Yollari AOa | 7,676 | 24,366 | ||||||
Turk Telekomunikasyon AS | 7,098 | 20,591 | ||||||
Turkcell Iletisim Hizmetleri ASa | 12,004 | 70,368 | ||||||
Turkiye Garanti Bankasi AS | 31,508 | 123,670 | ||||||
Turkiye Halk Bankasi AS | 8,526 | 62,623 | ||||||
Turkiye Is Bankasi AS Class C | 21,474 | 55,527 | ||||||
Turkiye Petrol Rafinerileri AS | 1,708 | 40,208 | ||||||
Turkiye Sise ve Cam Fabrikalari AS | 8,195 | 11,089 | ||||||
Turkiye Vakiflar Bankasi TAO Class D | 10,428 | 24,065 | ||||||
Ulker Biskuvi Sanayi AS | 2,102 | 15,585 | ||||||
Yapi ve Kredi Bankasi ASc | 12,090 | 26,948 | ||||||
�� |
| |||||||
| 957,192 | ||||||||
UNITED ARAB EMIRATES — 3.04% |
| |||||||
Abu Dhabi Commercial Bank PJSC | 15,562 | 33,937 | ||||||
Aldar Properties PJSC | 43,730 | 47,503 | ||||||
| 22 | 2014 iSHARES ANNUAL REPORTTO SHAREHOLDERS |
Table of Contents
Schedule of Investments (Continued)
iSHARES® MSCI EMERGING MARKETS EMEA ETF
August 31, 2014
| Security | Shares | Value | ||||||
Arabtec Holding Co.a | 15,280 | $ | 19,594 | |||||
DP World Ltd. | 2,264 | 42,518 | ||||||
Dubai Financial Market PJSC | 27,810 | 25,743 | ||||||
Dubai Islamic Bank PJSC | 7,148 | 15,199 | ||||||
Emaar Properties PJSC | 24,414 | 68,129 | ||||||
First Gulf Bank PJSC | 5,940 | 29,514 | ||||||
National Bank of Abu Dhabi PJSC | 8,562 | 32,634 | ||||||
|
| |||||||
| 314,771 | ||||||||
|
| |||||||
TOTAL COMMON STOCKS | ||||||||
(Cost: $10,390,054) |
| 10,206,287 | ||||||
PREFERRED STOCKS — 1.29% |
| |||||||
RUSSIA — 1.29% | ||||||||
AK Transneft OAO | 20 | 43,999 | ||||||
Sberbank of Russia | 13,600 | 20,280 | ||||||
Surgutneftegas OJSC | 95,000 | 69,916 | ||||||
|
| |||||||
| 134,195 | ||||||||
|
| |||||||
TOTAL PREFERRED STOCKS |
| |||||||
(Cost: $142,335) |
| 134,195 | ||||||
SHORT-TERM INVESTMENTS — 0.29% |
| |||||||
MONEY MARKET FUNDS — 0.29% |
| |||||||
BlackRock Cash Funds: Institutional, |
| |||||||
0.14%e,f,g | 28,184 | 28,184 | ||||||
BlackRock Cash Funds: Prime, |
| |||||||
0.11%e,f,g | 1,774 | 1,774 | ||||||
|
| |||||||
| 29,958 | ||||||||
|
| |||||||
TOTAL SHORT-TERM INVESTMENTS |
| |||||||
(Cost: $29,958) |
| 29,958 | ||||||
|
| |||||||
TOTAL INVESTMENTS | ||||||||
(Cost: $10,562,347) |
| 10,370,440 | ||||||
Other Assets, Less Liabilities — (0.10)% |
| (10,864 | ) | |||||
|
| |||||||
NET ASSETS — 100.00% |
| $ | 10,359,576 | |||||
|
| |||||||
GDR — Global Depositary Receipts
SP ADR — Sponsored American Depositary Receipts
SP GDR — Sponsored Global Depositary Receipts
| a | Non-income earning security. |
| b | This security may be resold to qualified foreign investors and foreign institutional buyers under Regulation S of the Securities Act of 1933. |
| c | All or a portion of this security represents a security on loan. See Note 1. |
| d | Security valued using Level 3 inputs in accordance with management’s fair valuation policy. See Note 1. |
| e | Affiliated issuer. See Note 2. |
| f | The rate quoted is the annualized seven-day yield of the fund at period end. |
| g | All or a portion of this security represents an investment of securities lending collateral. See Note 1. |
See notes to financial statements.
SCHEDULESOF INVESTMENTS | 23 |
Table of Contents
iSHARES® MSCI FRONTIER 100 ETF
August 31, 2014
| Security | Shares | Value | ||||||
COMMON STOCKS — 99.67% |
| |||||||
ARGENTINA — 7.97% |
| |||||||
Banco Macro SA SP ADR | 300,330 | $ | 10,490,527 | |||||
BBVA Banco Frances SA SP ADR | 354,474 | 3,753,880 | ||||||
Cresud SA SP ADR | 160,317 | 1,789,138 | ||||||
Groupo Financiero Galicia SP ADR | 684,837 | 8,683,733 | ||||||
Pampa Energia SA SP ADRa | 206,847 | 1,840,938 | ||||||
Petrobras Argentina SA Class B SP ADR | 560,052 | 3,612,336 | ||||||
Telecom Argentina SA SP ADR | 687,798 | 12,951,236 | ||||||
YPF SA SP ADR | 623,502 | 20,600,506 | ||||||
|
| |||||||
| 63,722,294 | ||||||||
BAHRAIN — 0.27% |
| |||||||
Al-Salam Bank | 3,888,115 | 2,145,167 | ||||||
|
| |||||||
| 2,145,167 | ||||||||
BANGLADESH — 2.17% |
| |||||||
GrameenPhone Ltd. | 1,099,800 | 4,561,428 | ||||||
Islami Bank Bangladesh Ltd. | 4,600,801 | 1,372,753 | ||||||
Lafarge Surma Cement Ltd. | 2,030,000 | 2,789,873 | ||||||
Square Pharmaceuticals Ltd. | 2,195,378 | 6,797,108 | ||||||
Titas Gas Transmission & Distribution Co. Ltd. | 1,692,400 | 1,783,775 | ||||||
|
| |||||||
| 17,304,937 | ||||||||
ESTONIA — 0.18% |
| |||||||
Tallink Group AS | 1,565,581 | 1,464,150 | ||||||
|
| |||||||
| 1,464,150 | ||||||||
JORDAN — 0.75% |
| |||||||
Arab Bank PLC | 469,152 | 5,099,838 | ||||||
Jordan Phosphate Mines Co.a | 44,415 | 415,715 | ||||||
Jordan Telecommunications Co. PSC | 107,074 | 468,595 | ||||||
|
| |||||||
| 5,984,148 | ||||||||
KAZAKHSTAN — 4.74% |
| |||||||
Halyk Savings Bank of Kazakhstan JSC SP GDRb | 569,358 | 6,661,489 | ||||||
KazMunaiGaz Exploration Production JSC SP GDRb | 1,333,719 | 24,006,942 | ||||||
KCell JSC SP GDRb | 474,606 | 7,218,757 | ||||||
|
| |||||||
| 37,887,188 | ||||||||
| Security | Shares | Value | ||||||
KENYA — 5.45% |
| |||||||
Co-operative Bank of Kenya Ltd. (The) | 10,695,884 | $ | 2,317,038 | |||||
East African Breweries Ltd. | 2,805,942 | 8,792,375 | ||||||
Equity Bank Ltd. | 15,322,300 | 8,103,139 | ||||||
Kenya Commercial Bank Ltd. | 18,252,160 | 11,872,163 | ||||||
Safaricom Ltd. | 85,320,300 | 12,498,845 | ||||||
|
| |||||||
| 43,583,560 | ||||||||
KUWAIT — 23.08% |
| |||||||
Agility Public Warehousing Co. KSC | 4,420,023 | 13,358,706 | ||||||
Al-Qurain Petrochemicals Co. | 1,206,396 | 1,081,114 | ||||||
ALAFCO Aviation Lease and Finance Co. KSCC | 977,130 | 944,336 | ||||||
Burgan Bank SAK | 3,727,048 | 6,941,963 | ||||||
Commercial Real Estate Co. KPSC | 5,066,271 | 1,762,646 | ||||||
Gulf Bank KSCa | 8,445,322 | 10,091,054 | ||||||
Jazeera Airways | 658,188 | 1,075,584 | ||||||
Kuwait Finance House | 13,025,439 | 37,078,213 | ||||||
Kuwait International Bank KSCP | 1,592,595 | 1,846,974 | ||||||
Kuwait Portland Cement Co. | 79,429 | 379,629 | ||||||
Kuwait Projects Co. Holding KSCP | 3,655,710 | 9,250,083 | ||||||
Mabanee Co. KPSC | 2,462,283 | 9,345,513 | ||||||
Mobile Telecommunications Co. KSC | 15,613,457 | 35,665,953 | ||||||
National Bank of Kuwait SAK | 14,577,538 | 50,717,844 | ||||||
National Industries Group Holding KPSCa | 3,195,765 | 2,560,655 | ||||||
National Real Estate Co. KSCa | 1,687,770 | 925,293 | ||||||
Warba Bank KSCPa | 1,535,490 | 1,483,956 | ||||||
|
| |||||||
| 184,509,516 | ||||||||
MAURITIUS — 1.17% |
| |||||||
MCB Group Ltd. | 936,202 | 6,324,666 | ||||||
State Bank of Mauritius Ltd. | 88,101,571 | 3,022,254 | ||||||
|
| |||||||
| 9,346,920 | ||||||||
MOROCCO — 3.83% |
| |||||||
Attijariwafa Bank | 218,691 | 8,427,164 | ||||||
Banque Centrale Populaire | 147,848 | 3,393,517 | ||||||
Douja Promotion Groupe Addoha SA | 1,321,452 | 7,975,162 | ||||||
Maroc Telecom SA | 872,510 | 10,787,468 | ||||||
|
| |||||||
| 30,583,311 | ||||||||
| 24 | 2014 iSHARES ANNUAL REPORTTO SHAREHOLDERS |
Table of Contents
Schedule of Investments (Continued)
iSHARES® MSCI FRONTIER 100 ETF
August 31, 2014
| Security | Shares | Value | ||||||
NIGERIA — 14.24% |
| |||||||
Access Bank PLC | 70,192,620 | $ | 4,282,676 | |||||
Afriland Properties PLCa | 7,291 | 98 | ||||||
Dangote Cement PLC | 4,181,778 | 5,798,718 | ||||||
Diamond Bank PLC | 36,284,094 | 1,364,064 | ||||||
Ecobank Transnational Inc.a | 27,913,869 | 2,907,336 | ||||||
FBN Holdings PLC | 108,238,820 | 10,032,737 | ||||||
Guaranty Trust Bank PLC | 98,219,754 | 18,099,166 | ||||||
Guinness Nigeria PLC | 2,828,368 | 3,224,751 | ||||||
Lafarge Africa PLC | 6,531,543 | 4,710,069 | ||||||
Nestle Nigeria PLC | 1,769,009 | 11,774,387 | ||||||
Nigerian Breweries PLC | 21,854,295 | 23,839,580 | ||||||
Oando PLC | 12,505,149 | 2,115,533 | ||||||
SEPLAT Petroleum Development Co. PLCa | 606,582 | 2,542,067 | ||||||
Transnational Corp. of Nigeria PLC | 90,993,222 | 3,420,798 | ||||||
Union Bank of Nigeria PLCa | 7,625,421 | 380,660 | ||||||
United Bank for Africa PLC | 101,169,333 | 4,738,610 | ||||||
Zenith Bank PLC | 96,307,794 | 14,601,083 | ||||||
|
| |||||||
| 113,832,333 | ||||||||
OMAN — 5.25% |
| |||||||
Ahli Bank SAOG | 1,603,625 | 958,010 | ||||||
Bank Sohar SAOG | 2,657,709 | 1,753,398 | ||||||
BankMuscat SAOG | 6,998,535 | 13,306,306 | ||||||
HSBC Bank Oman SAOG | 6,107,205 | 2,649,099 | ||||||
National Bank of Oman SAOG | 2,449,170 | 2,480,977 | ||||||
Oman Cables Industry | 317,250 | 2,138,347 | ||||||
Oman Cement Co. SAOG | 1,016,469 | 1,995,976 | ||||||
Oman Telecommunications Co. SAOG | 1,966,412 | 8,938,236 | ||||||
Omani Qatari Telecommunications Co. SAOG | 2,243,592 | 3,822,848 | ||||||
Raysut Cement Co. | 410,191 | 2,258,714 | ||||||
Renaissance Services SAOG | 887,031 | 1,640,431 | ||||||
|
| |||||||
| 41,942,342 | ||||||||
PAKISTAN — 7.16% |
| |||||||
Bank Al Habib Ltd. | 2,538,000 | 1,121,355 | ||||||
Engro Corp. Ltd.a | 2,098,961 | 3,397,906 | ||||||
Fauji Fertilizer Co. Ltd. | 5,160,650 | 5,819,855 | ||||||
Hub Power Co. Ltd. (The) | 3,841,030 | 2,369,861 | ||||||
Lucky Cement Ltd. | 761,298 | 2,590,656 | ||||||
MCB Bank Ltd. | 3,233,166 | 8,881,445 | ||||||
National Bank of Pakistan | 4,268,126 | 2,407,080 | ||||||
| Security | Shares | Value | ||||||
Oil & Gas Development Co. Ltd. | 5,160,600 | $ | 13,221,472 | |||||
Pakistan Oilfields Ltd. | 846,000 | 4,664,006 | ||||||
Pakistan Petroleum Ltd. | 1,254,150 | 2,741,891 | ||||||
Pakistan State Oil Co. Ltd. | 846,000 | 3,080,487 | ||||||
United Bank Ltd. | 3,933,967 | 6,940,931 | ||||||
|
| |||||||
| 57,236,945 | ||||||||
QATAR — 7.95% |
| |||||||
Al Khalij Commercial Bank | 270,720 | 1,613,376 | ||||||
Barwa Real Estate Co. | 292,293 | 3,138,706 | ||||||
Commercial Bank of Qatar QSC (The) | 115,902 | 2,167,672 | ||||||
Doha Bank QSC | 101,097 | 1,693,650 | ||||||
Industries Qatar QSC | 109,134 | 5,799,580 | ||||||
Masraf Al Rayan QSC | 1,104,876 | 15,778,741 | ||||||
Ooredoo QSC | 240,687 | 7,555,345 | ||||||
Qatar Electricity & Water Co. QSC | 82,485 | 3,873,705 | ||||||
Qatar Gas Transport Co. Ltd. | 399,735 | 2,579,856 | ||||||
Qatar Islamic Bank SAQ | 149,319 | 4,879,974 | ||||||
Qatar National Bank SAQ | 126,054 | 6,992,999 | ||||||
Qatar Navigation QSC | 85,869 | 2,098,852 | ||||||
Vodafone Qatar QSC | 1,016,469 | 5,398,910 | ||||||
|
| |||||||
| 63,571,366 | ||||||||
ROMANIA — 2.75% |
| |||||||
Banca Transilvaniaa | 10,070,380 | 5,399,668 | ||||||
BRD-Groupe Societe Generale SAa | 1,249,119 | 3,363,811 | ||||||
OMV Petrom SA | 39,804,300 | 5,842,439 | ||||||
Societatea Nationala de Gaze Naturale ROMGAZ SA | 470,799 | 5,119,297 | ||||||
Transgaz SA Medias | 33,840 | 2,270,124 | ||||||
|
| |||||||
| 21,995,339 | ||||||||
SLOVENIA — 0.28% |
| |||||||
Telekom Slovenije DD | 12,690 | 2,206,416 | ||||||
|
| |||||||
| 2,206,416 | ||||||||
SRI LANKA — 1.94% |
| |||||||
Commercial Bank of Ceylon PLC | 4,092,032 | 4,650,393 | ||||||
John Keells Holdings PLC | 5,687,095 | 10,873,736 | ||||||
|
| |||||||
| 15,524,129 | ||||||||
UNITED ARAB EMIRATES — 7.53% |
| |||||||
Abu Dhabi Commercial Bank PJSC | 3,364,542 | 7,337,221 | ||||||
Arabtec Holding Co.a | 3,303,630 | 4,236,288 | ||||||
SCHEDULESOF INVESTMENTS | 25 |
Table of Contents
Schedule of Investments (Continued)
iSHARES® MSCI FRONTIER 100 ETF
August 31, 2014
| Security | Shares or Principal | Value | ||||||
Dana Gas PJSCa | 10,075,437 | $ | 1,920,150 | |||||
DP World Ltd. | 499,140 | 9,373,849 | ||||||
Dubai Financial Market PJSC | 6,012,522 | 5,565,558 | ||||||
Dubai Islamic Bank PJSC | 1,545,219 | 3,285,597 | ||||||
Emaar Properties PJSC | 5,380,983 | 15,016,152 | ||||||
First Gulf Bank PJSC | 1,289,727 | 6,408,167 | ||||||
National Bank of Abu Dhabi PJSC | 1,851,048 | 7,055,355 | ||||||
|
| |||||||
| 60,198,337 | ||||||||
VIETNAM — 2.96% |
| |||||||
Bank for Foreign Trade of Vietnam JSC | 1,742,760 | 2,302,302 | ||||||
Bao Viet Holdings | 448,380 | 937,166 | ||||||
Masan Group Corp.a | 1,762,390 | 7,067,853 | ||||||
PetroVietnam Drilling and Well Services JSC | 575,980 | 2,676,765 | ||||||
PetroVietnam Fertilizer & Chemicals JSC | 1,125,180 | 1,773,108 | ||||||
Saigon Thuong Tin Commercial JSB | 2,812,956 | 2,574,727 | ||||||
Vingroup JSC | 2,302,155 | 6,354,143 | ||||||
|
| |||||||
| 23,686,064 | ||||||||
|
| |||||||
TOTAL COMMON STOCKS (Cost: $715,158,602) |
| 796,724,462 | ||||||
CONVERTIBLE BONDS — 0.00% |
| |||||||
OMAN — 0.00% | ||||||||
BankMuscat SAOG | ||||||||
4.50%, 03/20/17c | $ | 540,521 | — | |||||
|
| |||||||
| — | ||||||||
|
| |||||||
TOTAL CONVERTIBLE BONDS |
| — | ||||||
|
| |||||||
TOTAL INVESTMENTS |
| 796,724,462 | ||||||
Other Assets, Less Liabilities — 0.33% |
| 2,624,301 | ||||||
|
| |||||||
NET ASSETS — 100.00% | $ | 799,348,763 | ||||||
|
| |||||||
SP ADR — Sponsored American Depositary Receipts
SP GDR — Sponsored Global Depositary Receipts
| a | Non-income earning security. |
| b | This security may be resold to qualified foreign investors and foreign institutional buyers under Regulation S of the Securities Act of 1933. |
| c | Security valued using Level 3 inputs in accordance with management’s fair valuation policy. See Note 1. |
See notes to financial statements.
| 26 | 2014 iSHARES ANNUAL REPORTTO SHAREHOLDERS |
Table of Contents
Schedule of Investments
August 31, 2014
| Security | Shares | Value | ||||||
COMMON STOCKS — 99.40% |
| |||||||
AUSTRALIA — 3.29% |
| |||||||
AGL Energy Ltd. | 3,220 | $ | 42,464 | |||||
AGL Energy Ltd. New | 644 | 8,493 | ||||||
Amcor Ltd. | 7,268 | 77,630 | ||||||
AMP Ltd. | 15,640 | 86,013 | ||||||
APA Group | 5,635 | 40,846 | ||||||
Asciano Ltd. | 6,854 | 40,258 | ||||||
ASX Ltd. | 1,383 | 48,494 | ||||||
Aurizon Holdings Ltd. | 11,638 | 51,922 | ||||||
Australia and New Zealand Banking Group Ltd. | 13,179 | 412,069 | ||||||
Bendigo and Adelaide Bank Ltd. | 2,806 | 32,674 | ||||||
BHP Billiton Ltd. | 16,054 | 550,611 | ||||||
Brambles Ltd. | 8,579 | 76,227 | ||||||
CFS Retail Property Trust Group | 18,906 | 38,018 | ||||||
Cochlear Ltd. | 345 | 23,410 | ||||||
Commonwealth Bank of Australia | 7,728 | 587,781 | ||||||
Computershare Ltd. | 3,289 | 37,899 | ||||||
Crown Resorts Ltd. | 3,404 | 50,303 | ||||||
CSL Ltd. | 2,461 | 170,032 | ||||||
Dexus Property Group | 43,263 | 48,759 | ||||||
Fortescue Metals Group Ltd. | 12,387 | 48,312 | ||||||
Goodman Group | 11,730 | 61,219 | ||||||
GPT Group (The) | 13,754 | 51,328 | ||||||
Iluka Resources Ltd. | 3,037 | 25,281 | ||||||
Incitec Pivot Ltd. | 10,166 | 29,476 | ||||||
Insurance Australia Group Ltd. | 12,351 | 74,741 | ||||||
James Hardie Industries SE | 3,542 | 42,437 | ||||||
Lend Lease Group | 4,853 | 64,908 | ||||||
Macquarie Group Ltd. | 1,643 | 89,589 | ||||||
Mirvac Group | 31,188 | 53,527 | ||||||
National Australia Bank Ltd. | 11,316 | 372,552 | ||||||
Newcrest Mining Ltd.a | 6,049 | 64,044 | ||||||
Orica Ltd. | 2,185 | 41,894 | ||||||
Origin Energy Ltd. | 5,911 | 85,858 | ||||||
QBE Insurance Group Ltd. | 7,337 | 79,054 | ||||||
Ramsay Health Care Ltd. | 943 | 45,828 | ||||||
Rio Tinto Ltd. | 2,392 | 140,118 | ||||||
Santos Ltd. | 5,198 | 72,099 | ||||||
Scentre Groupa | 34,605 | 111,016 | ||||||
Sonic Healthcare Ltd. | 2,438 | 40,201 | ||||||
Stockland Corp. Ltd. | 14,766 | 58,695 | ||||||
Suncorp Group Ltd. | 6,440 | 86,917 | ||||||
| Security | Shares | Value | ||||||
Sydney Airport | 4,675 | $ | 19,370 | |||||
Tatts Group Ltd. | 11,362 | 35,281 | ||||||
Telstra Corp. Ltd. | 20,585 | 107,047 | ||||||
Toll Holdings Ltd. | 4,531 | 25,300 | ||||||
Transurban Group | 9,448 | 71,224 | ||||||
Wesfarmers Ltd. | 5,177 | 209,709 | ||||||
Westfield Corp. | 12,167 | 86,714 | ||||||
Westpac Banking Corp. | 14,881 | 487,694 | ||||||
Woodside Petroleum Ltd. | 3,289 | 131,354 | ||||||
Woolworths Ltd. | 6,371 | 215,470 | ||||||
|
| |||||||
| 5,552,160 | ||||||||
AUSTRIA — 0.10% |
| |||||||
Andritz AG | 667 | 35,775 | ||||||
Erste Group Bank AG | 1,886 | 48,517 | ||||||
IMMOFINANZ AGa | 11,126 | 34,953 | ||||||
OMV AG | 897 | 34,737 | ||||||
Telekom Austria AG | 2,323 | 21,786 | ||||||
|
| |||||||
| 175,768 | ||||||||
BELGIUM — 0.49% | ||||||||
Ageas | 1,610 | 54,173 | ||||||
Anheuser-Busch InBev NV | 3,956 | 440,577 | ||||||
Belgacom SA | 759 | 27,128 | ||||||
Colruyt SA | 483 | 23,094 | ||||||
Groupe Bruxelles Lambert SA | 391 | 38,534 | ||||||
KBC Groep NVa | 1,579 | 90,214 | ||||||
Solvay SA | 322 | 50,791 | ||||||
UCB SA | 598 | 58,053 | ||||||
Umicore SA | 851 | 41,267 | ||||||
|
| |||||||
| 823,831 | ||||||||
CANADA — 4.37% | ||||||||
Agnico-Eagle Mines Ltd. | 1,472 | 56,424 | ||||||
Agrium Inc. | 805 | 76,303 | ||||||
Alimentation Couche-Tard Inc. Class B | 2,685 | 80,717 | ||||||
ARC Resources Ltd. | 1,633 | 47,315 | ||||||
Bank of Montreal | 2,944 | 227,052 | ||||||
Bank of Nova Scotia | 5,957 | 395,614 | ||||||
Barrick Gold Corp. | 6,670 | 122,916 | ||||||
Baytex Energy Corp. | 759 | 34,019 | ||||||
BCE Inc. | 989 | 44,629 | ||||||
BlackBerry Ltd.a,b | 2,392 | 24,367 | ||||||
Bombardier Inc. Class B | 8,947 | 30,188 | ||||||
Brookfield Asset Management Inc. Class A | 3,220 | 154,210 | ||||||
SCHEDULESOF INVESTMENTS | 27 |
Table of Contents
Schedule of Investments (Continued)
iSHARES® MSCI WORLD ETF
August 31, 2014
| Security | Shares | Value | ||||||
Cameco Corp. | 2,208 | $ | 43,275 | |||||
Canadian Imperial Bank of Commerce | 2,093 | 200,492 | ||||||
Canadian National Railway Co. | 4,324 | 311,280 | ||||||
Canadian Natural Resources Ltd. | 5,520 | 241,155 | ||||||
Canadian Oil Sands Ltd. | 2,622 | 56,610 | ||||||
Canadian Pacific Railway Ltd. | 1,058 | 212,419 | ||||||
Canadian Tire Corp. Ltd. Class A NVS | 437 | 45,249 | ||||||
Canadian Utilities Ltd. Class A | 736 | 26,556 | ||||||
Catamaran Corp.a | 1,127 | 53,225 | ||||||
Cenovus Energy Inc. | 3,864 | 123,534 | ||||||
CGI Group Inc. Class Aa,b | 1,380 | 48,954 | ||||||
CI Financial Corp. | 1,242 | 40,852 | ||||||
Crescent Point Energy Corp. | 1,817 | 75,377 | ||||||
Eldorado Gold Corp. | 3,276 | 27,150 | ||||||
Enbridge Inc. | 3,749 | 187,424 | ||||||
Encana Corp. | 3,933 | 90,897 | ||||||
Finning International Inc. | 1,219 | 38,096 | ||||||
First Quantum Minerals Ltd. | 3,757 | 84,543 | ||||||
Fortis Inc.b | 1,219 | 37,669 | ||||||
Franco-Nevada Corp. | 1,311 | 74,037 | ||||||
George Weston Ltd. | 391 | 31,060 | ||||||
Gildan Activewear Inc. | 667 | 38,332 | ||||||
Goldcorp Inc. | 4,945 | 139,176 | ||||||
Great-West Lifeco Inc. | 1,081 | 31,710 | ||||||
Husky Energy Inc. | 1,794 | 54,742 | ||||||
IGM Financial Inc. | 667 | 31,900 | ||||||
Imperial Oil Ltd. | 1,518 | 80,969 | ||||||
Intact Financial Corp. | 851 | 57,983 | ||||||
Inter Pipeline Ltd. | 1,396 | 46,690 | ||||||
Loblaw Companies Ltd. | 1,403 | 70,102 | ||||||
Magna International Inc. Class A | 1,173 | 133,310 | ||||||
Manulife Financial Corp. | 8,855 | 179,182 | ||||||
MEG Energy Corp.a | 828 | 29,563 | ||||||
Metro Inc. Class A | 736 | 47,827 | ||||||
National Bank of Canada | 1,656 | 79,857 | ||||||
Onex Corp. | 644 | 37,586 | ||||||
Open Text Corp. | 736 | 41,443 | ||||||
Pacific Rubiales Energy Corp. | 1,725 | 35,987 | ||||||
Pembina Pipeline Corp. | 1,748 | 80,523 | ||||||
Pengrowth Energy Corp. | 4,301 | 27,477 | ||||||
Potash Corp. of Saskatchewan Inc. | 4,301 | 151,422 | ||||||
Power Corp. of Canada | 1,564 | 46,196 | ||||||
Power Financial Corp. | 828 | 26,830 | ||||||
RioCan Real Estate Investment Trust | 1,541 | 38,484 | ||||||
| Security | Shares | Value | ||||||
Rogers Communications Inc. Class B | 1,840 | $ | 75,178 | |||||
Royal Bank of Canada | 6,831 | 508,633 | ||||||
Saputo Inc. | 828 | 50,485 | ||||||
Shaw Communications Inc. Class B | 1,961 | 49,515 | ||||||
Silver Wheaton Corp. | 2,990 | 74,864 | ||||||
SNC-Lavalin Group Inc. | 943 | 48,404 | ||||||
Sun Life Financial Inc. | 2,875 | 107,155 | ||||||
Suncor Energy Inc. | 7,705 | 317,008 | ||||||
Talisman Energy Inc. | 5,267 | 53,071 | ||||||
Teck Resources Ltd. Class B | 3,220 | 73,290 | ||||||
TELUS Corp. NVS | 64 | 2,339 | ||||||
Thomson Reuters Corp. | 1,748 | 66,391 | ||||||
Tim Hortons Inc. | 1,012 | 81,538 | ||||||
Toronto-Dominion Bank (The) | 8,878 | 468,555 | ||||||
Tourmaline Oil Corp.a | 1,081 | 54,880 | ||||||
TransAlta Corp. | 1,725 | 19,942 | ||||||
TransCanada Corp. | 3,404 | 183,356 | ||||||
Valeant Pharmaceuticals International Inc.a,b | 1,717 | 201,624 | ||||||
Vermilion Energy Inc. | 690 | 44,991 | ||||||
Yamana Gold Inc. | 4,117 | 35,145 | ||||||
|
| |||||||
| 7,367,263 | ||||||||
DENMARK — 0.56% | ||||||||
Carlsberg A/S Class B | 690 | 63,072 | ||||||
Coloplast A/S Class B | 851 | 70,808 | ||||||
Danske Bank A/S | 3,979 | 112,140 | ||||||
DSV A/S | 1,932 | 59,403 | ||||||
Novo Nordisk A/S Class B | 10,235 | 468,690 | ||||||
Novozymes A/S Class B | 1,587 | 73,852 | ||||||
Vestas Wind Systems A/Sa | 1,518 | 64,038 | ||||||
William Demant Holding A/Sa,b | 437 | 33,842 | ||||||
|
| |||||||
| 945,845 | ||||||||
FINLAND — 0.34% | ||||||||
Elisa OYJ | 897 | 24,481 | ||||||
Fortum OYJ | 2,024 | 50,921 | ||||||
Kone OYJ Class B | 1,794 | 76,090 | ||||||
Metso OYJ | 828 | 32,545 | ||||||
Nokia OYJ | 19,067 | 160,611 | ||||||
Sampo OYJ Class A | 1,932 | 95,253 | ||||||
Stora Enso OYJ Class R | 3,726 | 32,515 | ||||||
UPM-Kymmene OYJ | 3,059 | 46,055 | ||||||
Wartsila OYJ Abp | 1,012 | 51,001 | ||||||
|
| |||||||
| 569,472 | ||||||||
| 28 | 2014 iSHARES ANNUAL REPORTTO SHAREHOLDERS |
Table of Contents
Schedule of Investments (Continued)
iSHARES® MSCI WORLD ETF
August 31, 2014
| Security | Shares | Value | ||||||
FRANCE — 3.89% |
| |||||||
Accor SA | 920 | $ | 44,813 | |||||
Airbus Group NV | 3,100 | 191,120 | ||||||
Alcatel-Lucenta,b | 17,411 | 60,362 | ||||||
ALSTOMa | 1,173 | 41,617 | ||||||
ArcelorMittal | 5,681 | 82,874 | ||||||
Atos SA | 391 | 29,902 | ||||||
AXA SA | 8,533 | 211,868 | ||||||
BNP Paribas SA | 5,198 | 351,789 | ||||||
Bollore | 46 | 29,084 | ||||||
Bouygues SA | 1,058 | 38,930 | ||||||
Bureau Veritas SA | 1,472 | 35,056 | ||||||
Cap Gemini SA | 851 | 60,654 | ||||||
Carrefour SA | 3,151 | 109,511 | ||||||
Casino Guichard-Perrachon SA | 368 | 44,028 | ||||||
Christian Dior SA | 253 | 45,106 | ||||||
Compagnie de Saint-Gobain | 2,070 | 105,329 | ||||||
Compagnie Generale des Etablissements Michelin Class B | 805 | 89,228 | ||||||
Credit Agricole SA | 6,233 | 92,651 | ||||||
Danone SA | 2,898 | 202,848 | ||||||
Dassault Systemes SA | 736 | 48,861 | ||||||
Edenred SA | 1,265 | 37,607 | ||||||
Electricite de France SA | 1,127 | 36,734 | ||||||
Essilor International SA | 1,035 | 110,046 | ||||||
Eutelsat Communications SA | 874 | 29,224 | ||||||
GDF Suez | 6,923 | 170,935 | ||||||
Groupe Eurotunnel SA Registered | 4,370 | 56,364 | ||||||
Iliad SA | 184 | 40,523 | ||||||
Kering | 414 | 87,933 | ||||||
Klepierre | 897 | 42,830 | ||||||
L’Air Liquide SA | 1,693 | 216,847 | ||||||
L’Oreal SA | 1,196 | 198,497 | ||||||
Lafarge SA | 1,081 | 83,013 | ||||||
Lagardere SCA | 897 | 24,759 | ||||||
Legrand SA | 1,449 | 80,296 | ||||||
LVMH Moet Hennessy Louis Vuitton SA | 1,334 | 232,031 | ||||||
Orange | 9,614 | 145,884 | ||||||
Pernod Ricard SA | 1,104 | 130,499 | ||||||
PSA Peugeot Citroen SAa | 2,737 | 38,539 | ||||||
Publicis Groupe SA | 966 | 72,146 | ||||||
Renault SA | 1,003 | 78,714 | ||||||
Safran SA | 1,311 | 86,144 | ||||||
Sanofi | 5,796 | 637,480 | ||||||
| Security | Shares | Value | ||||||
Schneider Electric SE | 2,756 | $ | 233,495 | |||||
SCOR SE | 1,012 | 31,059 | ||||||
SES SA Class A FDR | 1,932 | 71,662 | ||||||
Societe BIC SA | 230 | 31,326 | ||||||
Societe Generale | 3,779 | 191,915 | ||||||
Sodexo | 575 | 56,782 | ||||||
STMicroelectronics NV | 3,611 | 30,317 | ||||||
Suez Environnement SA | 1,633 | 30,178 | ||||||
Technip SA | 644 | 59,804 | ||||||
Thales SA | 713 | 39,910 | ||||||
Total SA | 10,603 | 700,967 | ||||||
Unibail-Rodamco SE | 552 | 148,618 | ||||||
Vallourec SA | 667 | 29,863 | �� | |||||
Veolia Environnement | 2,415 | 44,455 | ||||||
Vinci SA | 2,369 | 155,242 | ||||||
Vivendi SA | 6,279 | 163,719 | ||||||
|
| |||||||
| 6,571,988 | ||||||||
GERMANY — 3.25% |
| |||||||
Adidas AG | 1,127 | 84,675 | ||||||
Allianz SE Registered | 2,185 | 373,575 | ||||||
BASF SE | 4,646 | 479,112 | ||||||
Bayer AG Registered | 4,117 | 553,408 | ||||||
Bayerische Motoren Werke AG | 1,610 | 187,893 | ||||||
Beiersdorf AG | 621 | 54,797 | ||||||
Brenntag AG | 1,242 | 65,888 | ||||||
Commerzbank AGa | 5,773 | 87,600 | ||||||
Continental AG | 616 | 131,852 | ||||||
Daimler AG Registered | 4,715 | 386,548 | ||||||
Deutsche Bank AG Registered | 6,833 | 234,371 | ||||||
Deutsche Boerse AG | 1,127 | 80,326 | ||||||
Deutsche Post AG Registered | 5,267 | 172,645 | ||||||
Deutsche Telekom AG Registered | 15,456 | 231,681 | ||||||
E.ON SE | 9,177 | 167,176 | ||||||
Fresenius Medical Care AG & Co. KGaA | 1,150 | 81,298 | ||||||
Fresenius SE & Co. KGaA | 2,070 | 101,239 | ||||||
GEA Group AG | 1,403 | 63,628 | ||||||
Hannover Rueck SE Registered | 460 | 38,300 | ||||||
HeidelbergCement AG | 828 | 62,625 | ||||||
Henkel AG & Co. KGaA | 736 | 70,179 | ||||||
Infineon Technologies AG | 6,210 | 72,351 | ||||||
Kabel Deutschland Holding AG | 253 | 35,791 | ||||||
Lanxess AG | 552 | 34,257 | ||||||
Linde AG | 1,012 | 200,818 | ||||||
SCHEDULESOF INVESTMENTS | 29 |
Table of Contents
Schedule of Investments (Continued)
iSHARES® MSCI WORLD ETF
August 31, 2014
| Security | Shares | Value | ||||||
MAN SE | 299 | $ | 35,544 | |||||
Merck KGaA | 690 | 60,194 | ||||||
Muenchener Rueckversicherungs-Gesellschaft AG Registered | 897 | 180,301 | ||||||
Osram Licht AGa | 828 | 34,704 | ||||||
QIAGEN NVa | 1,679 | 40,759 | ||||||
RWE AG | 2,714 | 106,460 | ||||||
SAP SE | 4,669 | 364,081 | ||||||
Siemens AG Registered | 4,048 | 508,355 | ||||||
ThyssenKrupp AGa | 2,817 | 78,386 | ||||||
Volkswagen AG | 92 | 20,662 | ||||||
|
| |||||||
| 5,481,479 | ||||||||
HONG KONG — 1.22% | ||||||||
AIA Group Ltd.b | 73,600 | 401,706 | ||||||
Bank of East Asia Ltd. (The) | 23,000 | 97,934 | ||||||
BOC Hong Kong (Holdings) Ltd. | 34,500 | 115,962 | ||||||
CLP Holdings Ltd. | 23,000 | 194,680 | ||||||
Galaxy Entertainment Group Ltd.b | 10,000 | 75,353 | ||||||
Hang Seng Bank Ltd. | 11,500 | 194,235 | ||||||
Hong Kong and China Gas Co. Ltd. (The)b | 76,464 | 173,447 | ||||||
Hong Kong Exchanges and Clearing Ltd. | 5,100 | 117,199 | ||||||
Li & Fung Ltd.b | 46,000 | 57,098 | ||||||
Link REIT (The) | 23,000 | 136,514 | ||||||
Michael Kors Holdings Ltd.a | 1,058 | 84,767 | ||||||
MTR Corp. Ltd. | 34,500 | 136,885 | ||||||
New World Development Co. Ltd. | 59,333 | 75,026 | ||||||
Sands China Ltd. | 18,400 | 119,894 | ||||||
Wynn Macau Ltd.b | 18,400 | 70,512 | ||||||
|
| |||||||
| 2,051,212 | ||||||||
IRELAND — 0.18% | ||||||||
Bank of Irelanda | 127,765 | 50,993 | ||||||
CRH PLC | 3,910 | 90,541 | ||||||
Kerry Group PLC Class A | 1,012 | 76,315 | ||||||
Pentair PLC | 1,173 | 79,846 | ||||||
|
| |||||||
| 297,695 | ||||||||
ISRAEL — 0.18% | ||||||||
Bank Hapoalim BM | 11,500 | 65,260 | ||||||
Teva Pharmaceutical Industries Ltd. | 4,692 | 244,830 | ||||||
|
| |||||||
| 310,090 | ||||||||
ITALY — 0.98% | ||||||||
Assicurazioni Generali SpA | 6,256 | 128,221 | ||||||
Atlantia SpA | 2,921 | 74,334 | ||||||
| Security | Shares | Value | ||||||
Banca Monte dei Paschi di Siena SpAa | 39,995 | $ | 59,951 | |||||
CNH Industrial NVa | 6,072 | 52,867 | ||||||
Enel Green Power SpA | 11,132 | 30,792 | ||||||
Enel SpA | 34,040 | 180,516 | ||||||
Eni SpA | 12,305 | 307,631 | ||||||
Fiat SpAa,b | 5,083 | 49,813 | ||||||
Intesa Sanpaolo SpA | 66,493 | 198,292 | ||||||
Intesa Sanpaolo SpA RNC | 10,005 | 26,159 | ||||||
Luxottica Group SpA | 1,012 | 54,187 | ||||||
Saipem SpAa | 1,817 | 43,224 | ||||||
Snam SpA | 10,741 | 62,619 | ||||||
Telecom Italia SpAa,b | 64,101 | 73,922 | ||||||
Telecom Italia SpA RNC | 26,473 | 24,409 | ||||||
Tenaris SA | 2,576 | 56,970 | ||||||
Terna SpA | 8,418 | 43,466 | ||||||
UniCredit SpA | 24,748 | 192,003 | ||||||
|
| |||||||
| 1,659,376 | ||||||||
JAPAN — 8.05% | ||||||||
AEON Co. Ltd. | 6,900 | 74,656 | ||||||
Asahi Group Holdings Ltd. | 4,600 | 145,282 | ||||||
Astellas Pharma Inc. | 16,100 | 232,159 | ||||||
Bridgestone Corp. | 4,600 | 158,034 | ||||||
Canon Inc. | 6,900 | 225,760 | ||||||
Chubu Electric Power Co. Inc.a | 4,600 | 53,202 | ||||||
Chugai Pharmaceutical Co. Ltd. | 4,600 | 145,902 | ||||||
Chugoku Electric Power Co. Inc. (The) | 4,600 | 60,752 | ||||||
Dai-ichi Life Insurance Co. Ltd. (The) | 6,900 | 98,998 | ||||||
Daiichi Sankyo Co. Ltd. | 6,900 | 122,079 | ||||||
Daikin Industries Ltd. | 2,300 | 158,743 | ||||||
Daiwa Securities Group Inc. | 3,000 | 24,434 | ||||||
Denso Corp. | 4,600 | 199,834 | ||||||
East Japan Railway Co. | 2,300 | 178,957 | ||||||
FANUC Corp. | 700 | 117,245 | ||||||
Fast Retailing Co. Ltd. | 200 | 62,665 | ||||||
Fuji Heavy Industries Ltd. | 4,600 | 130,869 | ||||||
FUJIFILM Holdings Corp. | 4,600 | 138,839 | ||||||
Fujitsu Ltd. | 9,000 | 61,831 | ||||||
GungHo Online Entertainment Inc.b | 4,600 | 24,620 | ||||||
Hakuhodo DY Holdings Inc. | 9,200 | 95,290 | ||||||
Hitachi Ltd. | 23,000 | 174,130 | ||||||
Honda Motor Co. Ltd. | 11,500 | 388,887 | ||||||
Hoya Corp. | 4,600 | 148,891 | ||||||
| 30 | 2014 iSHARES ANNUAL REPORTTO SHAREHOLDERS |
Table of Contents
Schedule of Investments (Continued)
iSHARES® MSCI WORLD ETF
August 31, 2014
| Security | Shares | Value | ||||||
INPEX Corp. | 6,900 | $ | 98,965 | |||||
ITOCHU Corp. | 11,500 | 146,400 | ||||||
Japan Display Inc.a | 6,900 | 35,003 | ||||||
Japan Retail Fund Investment Corp. | 46 | 96,618 | ||||||
Japan Tobacco Inc. | 6,900 | 236,719 | ||||||
JFE Holdings Inc. | 4,600 | 93,165 | ||||||
JTEKT Corp. | 4,600 | 73,239 | ||||||
JX Holdings Inc. | 23,000 | 118,404 | ||||||
Kansai Electric Power Co. Inc. (The)a | 6,900 | 63,212 | ||||||
Kao Corp. | 4,600 | 198,595 | ||||||
KDDI Corp. | 4,600 | 265,634 | ||||||
Kirin Holdings Co. Ltd. | 6,900 | 92,622 | ||||||
Kobe Steel Ltd. | 23,000 | 37,416 | ||||||
Komatsu Ltd. | 6,900 | 156,418 | ||||||
Konica Minolta Holdings Inc. | 6,900 | 75,918 | ||||||
Kuraray Co. Ltd. | 6,900 | 85,947 | ||||||
Kyocera Corp. | 2,300 | 107,699 | ||||||
Kyushu Electric Power Co. Inc.a | 2,300 | 23,380 | ||||||
Marui Group Co. Ltd. | 4,600 | 38,700 | ||||||
Mazda Motor Corp. | 4,600 | 108,662 | ||||||
Mitsubishi Chemical Holdings Corp. | 16,100 | 80,419 | ||||||
Mitsubishi Corp. | 11,500 | 238,170 | ||||||
Mitsubishi Electric Corp. | 8,000 | 100,265 | ||||||
Mitsubishi Estate Co. Ltd. | 5,000 | 115,585 | ||||||
Mitsubishi Heavy Industries Ltd. | 23,000 | 141,762 | ||||||
Mitsubishi Motors Corp. | 4,600 | 52,383 | ||||||
Mitsubishi UFJ Financial Group Inc. | 78,800 | 453,753 | ||||||
Mitsubishi UFJ Lease & Finance Co. Ltd. | 16,100 | 86,013 | ||||||
Mitsui & Co. Ltd. | 13,900 | 226,928 | ||||||
Mitsui Fudosan Co. Ltd. | 4,000 | 127,641 | ||||||
Mizuho Financial Group Inc. | 158,800 | 302,513 | ||||||
MS&AD Insurance Group Holdings Inc. | 4,200 | 94,867 | ||||||
Murata Manufacturing Co. Ltd. | 800 | 76,500 | ||||||
Nagoya Railroad Co. Ltd. | 23,000 | 95,201 | ||||||
NEC Corp. | 15,000 | 53,424 | ||||||
Nikon Corp. | 4,600 | 66,885 | ||||||
Nintendo Co. Ltd. | 500 | 55,494 | ||||||
Nippon Steel & Sumitomo Metal Corp. | 46,470 | 131,691 | ||||||
Nippon Telegraph and Telephone Corp. | 2,300 | 154,536 | ||||||
Nissan Motor Co. Ltd. | 18,400 | 176,942 | ||||||
NKSJ Holdings Inc. | 4,200 | 101,599 | ||||||
Nomura Holdings Inc. | 25,300 | 162,538 | ||||||
| Security | Shares | Value | ||||||
NTT DOCOMO Inc. | 13,800 | $ | 238,911 | |||||
Olympus Corp.a | 2,300 | 82,250 | ||||||
Omron Corp. | 2,300 | 99,740 | ||||||
ORIX Corp. | 9,200 | 139,038 | ||||||
Otsuka Holdings Co. Ltd. | 4,600 | 167,466 | ||||||
Panasonic Corp. | 13,800 | 168,839 | ||||||
Rakuten Inc. | 6,900 | 89,401 | ||||||
Resona Holdings Inc. | 25,300 | 137,404 | ||||||
Ricoh Co. Ltd. | 6,300 | 68,255 | ||||||
Sekisui House Ltd. | 4,100 | 51,622 | ||||||
Seven & I Holdings Co. Ltd. | 4,600 | 184,757 | ||||||
Seven Bank Ltd. | 18,400 | 74,744 | ||||||
Shin-Etsu Chemical Co. Ltd. | 2,300 | 142,935 | ||||||
Shionogi & Co. Ltd. | 4,600 | 108,485 | ||||||
Shiseido Co. Ltd. | 4,600 | 85,017 | ||||||
SoftBank Corp. | 4,600 | 332,364 | ||||||
Sony Corp. | 6,900 | 132,175 | ||||||
Sumitomo Corp. | 9,200 | 118,935 | ||||||
Sumitomo Electric Industries Ltd. | 9,200 | 134,876 | ||||||
Sumitomo Mitsui Financial Group Inc. | 8,600 | 347,734 | ||||||
Sumitomo Mitsui Trust Holdings Inc. | 23,000 | 94,515 | ||||||
Sumitomo Realty & Development Co. Ltd. | 2,000 | 77,567 | ||||||
Suzuki Motor Corp. | 2,300 | 74,855 | ||||||
T&D Holdings Inc. | 6,900 | 85,714 | ||||||
Takeda Pharmaceutical Co. Ltd. | 4,600 | 210,329 | ||||||
Tohoku Electric Power Co. Inc. | 4,600 | 50,877 | ||||||
Tokio Marine Holdings Inc. | 4,600 | 140,433 | ||||||
Tokyo Electric Power Co. Inc.a | 10,700 | 38,727 | ||||||
Tokyu Fudosan Holdings Corp. | 6,900 | 53,003 | ||||||
Toshiba Corp. | 23,000 | 101,533 | ||||||
Toyota Motor Corp. | 16,100 | 918,716 | ||||||
USS Co. Ltd. | 6,900 | 113,910 | ||||||
Yahoo! Japan Corp. | 16,200 | 65,340 | ||||||
Yamada Denki Co. Ltd. | 9,200 | 29,579 | ||||||
Yamato Holdings Co. Ltd. | 4,600 | 95,179 | ||||||
Yokogawa Electric Corp. | 4,600 | 53,268 | ||||||
|
| |||||||
| 13,578,377 | ||||||||
LUXEMBOURG — 0.02% | ||||||||
Altice SAa,b | 598 | 38,282 | ||||||
|
| |||||||
| 38,282 | ||||||||
NETHERLANDS — 0.99% | ||||||||
AEGON NV | 9,568 | 75,819 | ||||||
Akzo Nobel NV | 1,242 | 87,998 | ||||||
SCHEDULESOF INVESTMENTS | 31 |
Table of Contents
Schedule of Investments (Continued)
iSHARES® MSCI WORLD ETF
August 31, 2014
| Security | Shares | Value | ||||||
ASML Holding NV | 1,748 | $ | 167,643 | |||||
Corio NV | 603 | 32,474 | ||||||
Gemalto NVb | 500 | 49,072 | ||||||
Heineken Holding NV | 552 | 38,194 | ||||||
Heineken NV | 1,127 | 85,952 | ||||||
ING Groep NV CVAa | 20,217 | 278,681 | ||||||
Koninklijke Ahold NV | 4,796 | 82,125 | ||||||
Koninklijke DSM NV | 1,036 | 69,350 | ||||||
Koninklijke KPN NVa | 16,364 | 54,426 | ||||||
Koninklijke Philips NV | 5,466 | 166,964 | ||||||
Randstad Holding NV | 797 | 38,785 | ||||||
Reed Elsevier NV | 3,404 | 77,793 | ||||||
Unilever NV CVA | 7,820 | 325,856 | ||||||
Wolters Kluwer NV | 1,518 | 42,150 | ||||||
|
| |||||||
| 1,673,282 | ||||||||
NEW ZEALAND — 0.05% | ||||||||
Fletcher Building Ltd. | 5,612 | 43,220 | ||||||
Spark New Zealand Ltd. | 14,053 | 34,527 | ||||||
|
| |||||||
| 77,747 | ||||||||
NORWAY — 0.34% | ||||||||
DNB ASA | 5,221 | 97,706 | ||||||
Norsk Hydro ASA | 7,153 | 42,150 | ||||||
Orkla ASA | 5,198 | 47,123 | ||||||
Seadrill Ltd.b | 2,208 | 81,569 | ||||||
Statoil ASA | 6,141 | 172,980 | ||||||
Telenor ASA | 3,519 | 80,951 | ||||||
Yara International ASA | 1,035 | 52,108 | ||||||
|
| |||||||
| 574,587 | ||||||||
PORTUGAL — 0.08% | ||||||||
Energias de Portugal SA | 15,640 | 75,894 | ||||||
Galp Energia SGPS SA Class B | 3,059 | 54,396 | ||||||
|
| |||||||
| 130,290 | ||||||||
SINGAPORE — 0.54% | ||||||||
Ascendas REIT | 46,000 | 86,622 | ||||||
CapitaLand Ltd. | 46,000 | 122,377 | ||||||
CapitaMall Trust Management Ltd. | 69,000 | 110,581 | ||||||
Genting Singapore PLC | 92,000 | 89,940 | ||||||
Global Logistic Properties Ltd. | 46,000 | 105,052 | ||||||
Golden Agri-Resources Ltd. | 115,000 | 46,997 | ||||||
Hutchison Port Holdings Trustb | 92,000 | 66,240 | ||||||
Noble Group Ltd. | 69,000 | 75,195 | ||||||
Singapore Telecommunications Ltd.b | 69,000 | 215,081 | ||||||
|
| |||||||
| 918,085 | ||||||||
| Security | Shares | Value | ||||||
SPAIN — 1.44% | ||||||||
Abertis Infraestructuras SA | 2,875 | $ | 60,629 | |||||
Actividades de Construcciones y Servicios SA | 1,205 | 50,879 | ||||||
Amadeus IT Holding SA Class A | 2,047 | 76,306 | ||||||
Banco Bilbao Vizcaya Argentaria SA | 30,053 | 364,585 | ||||||
Banco de Sabadell SA | 20,543 | 64,834 | ||||||
Banco Popular Espanol SA | 10,680 | 66,836 | ||||||
Banco Santander SA | 58,997 | 589,825 | ||||||
Bankia SAa | 25,875 | 50,169 | ||||||
CaixaBank SA | 10,603 | 63,938 | ||||||
Distribuidora Internacional de Alimentacion SA | 4,393 | 37,080 | ||||||
Enagas SA | 236 | 7,886 | ||||||
Ferrovial SA | 2,737 | 55,844 | ||||||
Gas Natural SDG SA | 1,909 | 58,677 | ||||||
Grifols SA | 966 | 45,082 | ||||||
Iberdrola SA | 22,379 | 164,632 | ||||||
Inditex SA | 5,290 | 153,644 | ||||||
International Consolidated Airlines Group SAa | 12,420 | 74,534 | ||||||
Red Electrica Corporacion SA | 112 | 9,455 | ||||||
Repsol SA | 4,255 | 105,873 | ||||||
Telefonica SA | 19,228 | 305,698 | ||||||
Zardoya Otis SA | 1,358 | 19,748 | ||||||
Zardoya Otis SA New | 37 | 538 | ||||||
|
| |||||||
| 2,426,692 | ||||||||
SWEDEN — 1.20% | ||||||||
Alfa Laval AB | 2,139 | 48,970 | ||||||
Assa Abloy AB Class B | 2,116 | 107,177 | ||||||
Atlas Copco AB Class A | 3,013 | 87,954 | ||||||
Atlas Copco AB Class B | 2,576 | 68,841 | ||||||
Boliden AB | 2,534 | 40,239 | ||||||
Electrolux AB Class B | 1,311 | 33,343 | ||||||
Elekta AB Class B | 2,254 | 25,753 | ||||||
Hennes & Mauritz AB Class B | 4,600 | 196,174 | ||||||
Hexagon AB Class B | 1,334 | 43,744 | ||||||
Investment AB Kinnevik Class B | 1,472 | 59,883 | ||||||
Investor AB Class B | 2,829 | 105,105 | ||||||
Lundin Petroleum ABa,b | 1,196 | 22,337 | ||||||
Millicom International Cellular SA SDRb | 322 | 28,938 | ||||||
Nordea Bank AB | 14,099 | 184,245 | ||||||
Sandvik AB | 6,008 | 75,108 | ||||||
| 32 | 2014 iSHARES ANNUAL REPORTTO SHAREHOLDERS |
Table of Contents
Schedule of Investments (Continued)
iSHARES® MSCI WORLD ETF
August 31, 2014
| Security | Shares | Value | ||||||
Skandinaviska Enskilda Banken AB Class A | 7,268 | $ | 95,134 | |||||
Skanska AB Class B | 2,576 | 53,432 | ||||||
SKF AB Class B | 2,300 | 53,184 | ||||||
Svenska Cellulosa AB Class B | 2,806 | 67,622 | ||||||
Svenska Handelsbanken AB Class A | 2,277 | 107,003 | ||||||
Swedbank AB Class A | 4,577 | 116,867 | ||||||
Swedish Match AB | 1,219 | 40,813 | ||||||
Tele2 AB Class B | 1,564 | 19,507 | ||||||
Telefonaktiebolaget LM Ericsson Class B | 15,111 | 188,908 | ||||||
TeliaSonera AB | 9,085 | 66,464 | ||||||
Volvo AB Class B | 8,061 | 96,495 | ||||||
|
| |||||||
| 2,033,240 | ||||||||
SWITZERLAND — 3.72% | ||||||||
ABB Ltd. Registereda | 11,477 | 261,032 | ||||||
Actelion Ltd. Registereda | 667 | 82,078 | ||||||
Adecco SA Registereda | 828 | 62,833 | ||||||
Aryzta AGa | 805 | 73,701 | ||||||
Baloise Holding AG Registered | 437 | 57,115 | ||||||
Compagnie Financiere Richemont SA Class A Bearer | 2,691 | 257,244 | ||||||
Credit Suisse Group AG Registered | 7,820 | 220,977 | ||||||
Geberit AG Registered | 276 | 93,873 | ||||||
Givaudan SA Registereda | 69 | 114,818 | ||||||
Holcim Ltd. Registereda | 1,265 | 100,830 | ||||||
Julius Baer Group Ltd.a | 1,357 | 61,831 | ||||||
Kuehne & Nagel International AG Registered | 345 | 46,598 | ||||||
Nestle SA Registered | 15,732 | 1,223,896 | ||||||
Novartis AG Registered | 11,040 | 992,678 | ||||||
Partners Group Holding AG | 184 | 48,659 | ||||||
Roche Holding AG Genusschein | 3,404 | 994,978 | ||||||
Schindler Holding AG Participation Certificates | 276 | 39,990 | ||||||
Schindler Holding AG Registered | 207 | 30,174 | ||||||
SGS SA Registered | 46 | 102,312 | ||||||
Sonova Holding AG Registered | 299 | 47,926 | ||||||
Sulzer AG Registered | 207 | 27,529 | ||||||
Swatch Group AG (The) Bearer | 230 | 125,014 | ||||||
Swiss Life Holding AG Registereda | 207 | 52,301 | ||||||
Swiss Prime Site AG Registereda | 552 | 44,179 | ||||||
Swiss Re AGa | 1,748 | 143,623 | ||||||
| Security | Shares | Value | ||||||
Swisscom AG Registered | 115 | $ | 66,927 | |||||
Syngenta AG Registered | 506 | 182,046 | ||||||
Transocean Ltd.b | 2,047 | 78,943 | ||||||
UBS AG Registereda | 18,791 | 337,719 | ||||||
Weatherford International Ltd.a | 3,956 | 93,718 | ||||||
Zurich Insurance Group AGa | 690 | 208,691 | ||||||
|
| |||||||
| 6,274,233 | ||||||||
UNITED KINGDOM — 8.54% | ||||||||
3i Group PLC | 6,877 | 44,907 | ||||||
Aberdeen Asset Management PLC | 6,141 | 44,303 | ||||||
Admiral Group PLC | 1,081 | 23,967 | ||||||
Aggreko PLC | 1,487 | 42,031 | ||||||
AMEC PLC | 1,817 | 33,948 | ||||||
Anglo American PLC | 6,900 | 175,325 | ||||||
Antofagasta PLC | 2,277 | 29,704 | ||||||
ARM Holdings PLC | 7,314 | 117,945 | ||||||
Associated British Foods PLC | 2,139 | 101,704 | ||||||
AstraZeneca PLC | 6,371 | 483,217 | ||||||
Aviva PLC | 15,732 | 136,121 | ||||||
Babcock International Group PLC | 3,456 | 64,340 | ||||||
BAE Systems PLC | 17,135 | 126,662 | ||||||
Barclays PLC | 80,178 | 298,868 | ||||||
BG Group PLC | 16,813 | 335,485 | ||||||
BHP Billiton PLC | 10,534 | 333,704 | ||||||
BP PLC | 90,574 | 724,501 | ||||||
British American Tobacco PLC | 9,361 | 552,437 | ||||||
British Land Co. PLC (The) | 6,187 | 75,059 | ||||||
British Sky Broadcasting Group PLC | 5,037 | 73,070 | ||||||
BT Group PLC | 37,375 | 240,213 | ||||||
Bunzl PLC | 2,507 | 68,531 | ||||||
Burberry Group PLC | 2,277 | 53,736 | ||||||
Capita PLC | 3,519 | 71,708 | ||||||
Carnival PLC | 1,058 | 39,464 | ||||||
Centrica PLC | 25,300 | 134,202 | ||||||
Cobham PLC | 8,073 | 39,833 | ||||||
Compass Group PLC | 9,026 | 146,826 | ||||||
Croda International PLC | 897 | 32,505 | ||||||
Diageo PLC | 12,374 | 364,867 | ||||||
Experian PLC | 5,428 | 94,472 | ||||||
Friends Life Group Ltd. | 5,612 | 28,585 | ||||||
G4S PLC | 7,935 | 34,922 | ||||||
GKN PLC | 6,555 | 38,200 | ||||||
GlaxoSmithKline PLC | 23,460 | 574,482 | ||||||
Glencore PLCa | 51,313 | 308,830 | ||||||
SCHEDULESOF INVESTMENTS | 33 |
Table of Contents
Schedule of Investments (Continued)
iSHARES® MSCI WORLD ETF
August 31, 2014
| Security | Shares | Value | ||||||
Hammerson PLC | 6,325 | $ | 63,813 | |||||
HSBC Holdings PLC | 92,437 | 1,000,916 | ||||||
ICAP PLC | 3,680 | 23,175 | ||||||
IMI PLC | 1,932 | 43,508 | ||||||
Imperial Tobacco Group PLC | 4,899 | 213,733 | ||||||
Inmarsat PLC | 2,599 | 30,236 | ||||||
InterContinental Hotels Group PLC | 1,613 | 61,853 | ||||||
Intertek Group PLC | 989 | 46,006 | ||||||
Intu Properties PLC | 7,080 | 40,213 | ||||||
Investec PLC | 3,703 | 33,731 | ||||||
ITV PLC | 21,045 | 73,815 | ||||||
J Sainsbury PLC | 7,751 | 37,369 | ||||||
Johnson Matthey PLC | 1,265 | 66,345 | ||||||
Kingfisher PLC | 11,868 | 59,859 | ||||||
Land Securities Group PLC | 5,198 | 93,404 | ||||||
Legal & General Group PLC | 28,819 | 115,680 | ||||||
Lloyds Banking Group PLCa | 290,122 | 367,484 | ||||||
London Stock Exchange Group PLC | 1,196 | 40,579 | ||||||
Marks & Spencer Group PLC | 7,843 | 55,996 | ||||||
Meggitt PLC | 5,980 | 46,836 | ||||||
National Grid PLC | 16,836 | 251,364 | ||||||
Next PLC | 851 | 100,273 | ||||||
Nobel Corp. PLC | 1,265 | 36,002 | ||||||
Old Mutual PLC | 22,747 | 75,139 | ||||||
Pearson PLC | 3,956 | 72,992 | ||||||
Petrofac Ltd. | 1,403 | 26,306 | ||||||
Prudential PLC | 12,121 | 291,884 | ||||||
Randgold Resources Ltd. | 460 | 38,847 | ||||||
Reckitt Benckiser Group PLC | 3,013 | 262,701 | ||||||
Reed Elsevier PLC | 6,256 | 102,078 | ||||||
Rexam PLC | 4,043 | 34,042 | ||||||
Rio Tinto PLC | 6,647 | 354,738 | ||||||
Rolls-Royce Holdings PLCa | 9,798 | 166,137 | ||||||
Royal Bank of Scotland Group PLCa | 12,351 | 74,417 | ||||||
Royal Dutch Shell PLC Class A | 17,894 | 724,511 | ||||||
Royal Dutch Shell PLC Class B | 13,248 | 560,051 | ||||||
RSA Insurance Group PLC | 5,767 | 43,884 | ||||||
SABMiller PLC | 4,738 | 261,475 | ||||||
Sage Group PLC (The) | 7,270 | 47,534 | ||||||
SEGRO PLC | 7,475 | 45,945 | ||||||
Severn Trent PLC | 1,288 | 41,604 | ||||||
Shire PLC | 3,128 | 255,741 | ||||||
Smith & Nephew PLC | 4,807 | 83,265 | ||||||
Smiths Group PLC | 2,484 | 54,289 | ||||||
SSE PLC | 4,733 | 119,320 | ||||||
| Security | Shares | Value | ||||||
Standard Chartered PLC | 11,454 | $ | 230,740 | |||||
Standard Life PLC | 11,408 | 72,828 | ||||||
Tate & Lyle PLC | 3,151 | 35,401 | ||||||
Tesco PLC | 39,744 | 151,778 | ||||||
Tullow Oil PLC | 4,554 | 55,210 | ||||||
Unilever PLC | 6,302 | 278,292 | ||||||
United Utilities Group PLC | 3,542 | 51,588 | ||||||
Vodafone Group PLC | 129,217 | 443,679 | ||||||
Weir Group PLC (The) | 1,311 | 57,588 | ||||||
Whitbread PLC | 1,196 | 87,177 | ||||||
Wolseley PLC | 1,506 | 80,985 | ||||||
WPP PLC | 6,279 | 131,704 | ||||||
|
| |||||||
| 14,404,734 | ||||||||
UNITED STATES — 55.58% | ||||||||
3M Co. | 3,036 | 437,184 | ||||||
Abbott Laboratories | 7,337 | 309,915 | ||||||
AbbVie Inc. | 7,751 | 428,475 | ||||||
Accenture PLC Class A | 3,197 | 259,149 | ||||||
ACE Ltd. | 1,541 | 163,855 | ||||||
Actavis PLCa | 1,426 | 323,673 | ||||||
Activision Blizzard Inc. | 2,645 | 62,263 | ||||||
Adobe Systems Inc.a | 2,507 | 180,253 | ||||||
ADT Corp. (The) | 920 | 33,911 | ||||||
Advance Auto Parts Inc. | 391 | 53,340 | ||||||
AES Corp. (The) | 3,381 | 51,324 | ||||||
Aetna Inc. | 1,955 | 160,564 | ||||||
Affiliated Managers Group Inc.a | 414 | 87,416 | ||||||
Aflac Inc. | 2,208 | 135,218 | ||||||
AGCO Corp. | 644 | 31,453 | ||||||
Agilent Technologies Inc. | 1,725 | 98,601 | ||||||
Air Products and Chemicals Inc. | 1,058 | 140,936 | ||||||
Airgas Inc. | 414 | 45,697 | ||||||
Akamai Technologies Inc.a | 989 | 59,755 | ||||||
Albemarle Corp. | 552 | 35,096 | ||||||
Alcoa Inc. | 6,302 | 104,676 | ||||||
Alexion Pharmaceuticals Inc.a | 1,012 | 171,321 | ||||||
Alleghany Corp.a | 92 | 39,664 | ||||||
Allergan Inc. | 1,541 | 252,231 | ||||||
Alliance Data Systems Corp.a | 299 | 79,127 | ||||||
Alliant Energy Corp. | 759 | 44,394 | ||||||
Allstate Corp. (The) | 2,093 | 128,699 | ||||||
Altera Corp. | 1,748 | 61,774 | ||||||
Altria Group Inc. | 9,637 | 415,162 | ||||||
Amazon.com Inc.a | 1,955 | 662,823 | ||||||
| 34 | 2014 iSHARES ANNUAL REPORTTO SHAREHOLDERS |
Table of Contents
Schedule of Investments (Continued)
iSHARES® MSCI WORLD ETF
August 31, 2014
| Security | Shares | Value | ||||||
Ameren Corp. | 1,426 | $ | 57,026 | |||||
American Capital Agency Corp. | 1,748 | 41,340 | ||||||
American Electric Power Co. Inc. | 2,438 | 130,921 | ||||||
American Express Co. | 4,830 | 432,526 | ||||||
American International Group Inc. | 6,831 | 382,946 | ||||||
American Tower Corp. | 2,070 | 204,102 | ||||||
American Water Works Co. Inc. | 1,081 | 54,709 | ||||||
Ameriprise Financial Inc. | 1,104 | 138,839 | ||||||
AmerisourceBergen Corp. | 1,311 | 101,458 | ||||||
AMETEK Inc. | 1,541 | 81,581 | ||||||
Amgen Inc. | 3,726 | 519,330 | ||||||
Amphenol Corp. Class A | 782 | 80,554 | ||||||
Anadarko Petroleum Corp. | 2,484 | 279,922 | ||||||
Analog Devices Inc. | 1,590 | 81,281 | ||||||
Annaly Capital Management Inc. | 5,083 | 60,488 | ||||||
ANSYS Inc.a | 575 | 46,748 | ||||||
Aon PLC | 1,472 | 128,300 | ||||||
Apache Corp. | 1,817 | 185,025 | ||||||
Apple Inc. | 30,130 | 3,088,325 | ||||||
Applied Materials Inc. | 6,624 | 153,048 | ||||||
Arch Capital Group Ltd.a | 644 | 35,794 | ||||||
Archer-Daniels-Midland Co. | 3,381 | 168,577 | ||||||
Arrow Electronics Inc.a | 621 | 38,657 | ||||||
Assurant Inc. | 460 | 30,705 | ||||||
AT&T Inc. | 25,277 | 883,684 | ||||||
Autodesk Inc.a | 1,242 | 66,621 | ||||||
Autoliv Inc. | 506 | 52,467 | ||||||
Automatic Data Processing Inc. | 2,346 | 195,844 | ||||||
AutoZone Inc.a | 161 | 86,753 | ||||||
Avago Technologies Ltd. | 1,403 | 115,172 | ||||||
AvalonBay Communities Inc. | 667 | 102,785 | ||||||
Avery Dennison Corp. | 736 | 35,424 | ||||||
Avnet Inc. | 805 | 35,831 | ||||||
Axis Capital Holdings Ltd. | 552 | 26,617 | ||||||
Baker Hughes Inc. | 2,139 | 147,890 | ||||||
Ball Corp. | 966 | 61,921 | ||||||
Bank of America Corp. | 53,199 | 855,972 | ||||||
Bank of New York Mellon Corp. (The) | 5,819 | 227,988 | ||||||
Baxter International Inc. | 2,530 | 189,699 | ||||||
BB&T Corp. | 3,151 | 117,627 | ||||||
Becton, Dickinson and Co. | 851 | 99,712 | ||||||
Bed Bath & Beyond Inc.a,b | 1,150 | 73,899 | ||||||
Berkshire Hathaway Inc. Class Ba | 5,221 | 716,582 | ||||||
Best Buy Co. Inc. | 1,725 | 55,010 | ||||||
Biogen Idec Inc.a | 1,219 | 418,166 | ||||||
| Security | Shares | Value | ||||||
BlackRock Inc.c | 690 | $ | 228,066 | |||||
Boeing Co. (The) | 3,565 | 452,042 | ||||||
BorgWarner Inc. | 966 | 60,076 | ||||||
Boston Properties Inc. | 874 | 106,121 | ||||||
Boston Scientific Corp.a | 7,498 | 95,075 | ||||||
Bristol-Myers Squibb Co. | 8,165 | 413,557 | ||||||
Broadcom Corp. Class A | 2,645 | 104,160 | ||||||
Brown-Forman Corp. Class B NVS | 759 | 70,329 | ||||||
Bunge Ltd. | 805 | 68,143 | ||||||
C.H. Robinson Worldwide Inc. | 874 | 59,659 | ||||||
C.R. Bard Inc. | 414 | 61,454 | ||||||
CA Inc. | 1,771 | 50,013 | ||||||
Cabot Oil & Gas Corp. | 2,346 | 78,685 | ||||||
Calpine Corp.a | 2,162 | 51,391 | ||||||
Cameron International Corp.a | 1,242 | 92,318 | ||||||
Campbell Soup Co. | 1,035 | 46,389 | ||||||
Capital One Financial Corp. | 2,829 | 232,148 | ||||||
Cardinal Health Inc. | 1,656 | 122,047 | ||||||
CareFusion Corp.a | 1,265 | 58,076 | ||||||
CarMax Inc.a | 1,173 | 61,465 | ||||||
Carnival Corp. | 1,817 | 68,828 | ||||||
Caterpillar Inc. | 3,243 | 353,714 | ||||||
CBRE Group Inc. Class Aa | 2,047 | 65,054 | ||||||
CBS Corp. Class B NVS | 2,990 | 177,277 | ||||||
Celanese Corp. Series A | 897 | 56,098 | ||||||
Celgene Corp.a | 4,278 | 406,496 | ||||||
CenterPoint Energy Inc. | 2,162 | 53,704 | ||||||
CenturyLink Inc. | 3,013 | 123,503 | ||||||
Cerner Corp.a | 1,564 | 90,180 | ||||||
CF Industries Holdings Inc. | 322 | 82,970 | ||||||
Charles Schwab Corp. (The) | 6,256 | 178,359 | ||||||
Charter Communications Inc. Class Aa | 437 | 68,552 | ||||||
Cheniere Energy Inc.a | 1,288 | 103,375 | ||||||
Chesapeake Energy Corp. | 3,082 | 83,830 | ||||||
Chevron Corp. | 9,246 | 1,196,895 | ||||||
Chipotle Mexican Grill Inc.a | 184 | 124,872 | ||||||
Chubb Corp. (The) | 1,150 | 105,743 | ||||||
Church & Dwight Co. Inc. | 713 | 48,655 | ||||||
Cigna Corp. | 1,449 | 137,075 | ||||||
Cimarex Energy Co. | 506 | 73,451 | ||||||
Cincinnati Financial Corp. | 644 | 30,970 | ||||||
Cintas Corp. | 805 | 53,243 | ||||||
Cisco Systems Inc. | 25,047 | 625,925 | ||||||
CIT Group Inc. | 943 | 45,226 | ||||||
SCHEDULESOF INVESTMENTS | 35 |
Table of Contents
Schedule of Investments (Continued)
iSHARES® MSCI WORLD ETF
August 31, 2014
| Security | Shares | Value | ||||||
Citigroup Inc. | 15,134 | $ | 781,671 | |||||
Citrix Systems Inc.a | 989 | 69,487 | ||||||
Clorox Co. (The) | 529 | 46,869 | ||||||
CME Group Inc. | 1,587 | 121,485 | ||||||
CMS Energy Corp. | 1,587 | 48,467 | ||||||
Coach Inc. | 1,380 | 50,825 | ||||||
Cobalt International Energy Inc.a | 1,702 | 26,126 | ||||||
Coca-Cola Co. (The) | 18,952 | 790,677 | ||||||
Coca-Cola Enterprises Inc. | 1,679 | 80,223 | ||||||
Cognizant Technology Solutions Corp. Class Aa | 3,082 | 140,940 | ||||||
Colgate-Palmolive Co. | 4,324 | 279,893 | ||||||
Comcast Corp. Class A | 10,879 | 595,408 | ||||||
Comcast Corp. Class A Special NVS | 2,047 | 111,766 | ||||||
Comerica Inc. | 943 | 47,471 | ||||||
Computer Sciences Corp. | 828 | 49,506 | ||||||
ConAgra Foods Inc. | 2,254 | 72,579 | ||||||
Concho Resources Inc.a | 621 | 88,207 | ||||||
ConocoPhillips | 5,430 | 441,025 | ||||||
CONSOL Energy Inc. | 1,380 | 55,586 | ||||||
Consolidated Edison Inc. | 1,334 | 77,225 | ||||||
Constellation Brands Inc. Class Aa | 874 | 76,117 | ||||||
Continental Resources Inc.a | 362 | 58,387 | ||||||
Core Laboratories NV | 253 | 39,971 | ||||||
Corning Inc. | 6,900 | 143,934 | ||||||
Costco Wholesale Corp. | 2,162 | 261,775 | ||||||
Covidien PLC | 2,254 | 195,715 | ||||||
Cree Inc.a | 598 | 27,245 | ||||||
Crown Castle International Corp. | 1,702 | 135,326 | ||||||
Crown Holdings Inc.a | 966 | 46,629 | ||||||
CSX Corp. | 5,244 | 162,092 | ||||||
Cummins Inc. | 943 | 136,839 | ||||||
CVS Caremark Corp. | 5,842 | 464,147 | ||||||
D.R. Horton Inc. | 1,564 | 33,908 | ||||||
Danaher Corp. | 3,013 | 230,826 | ||||||
Darden Restaurants Inc. | 805 | 38,093 | ||||||
DaVita HealthCare Partners Inc.a | 920 | 68,706 | ||||||
Deere & Co. | 1,771 | 148,923 | ||||||
Delphi Automotive PLC | 1,311 | 91,219 | ||||||
Denbury Resources Inc. | 2,162 | 37,230 | ||||||
DENTSPLY International Inc. | 851 | 40,597 | ||||||
Devon Energy Corp. | 1,840 | 138,773 | ||||||
Dick’s Sporting Goods Inc. | 575 | 25,915 | ||||||
Digital Realty Trust Inc. | 805 | 52,526 | ||||||
DIRECTVa | 2,599 | 224,684 | ||||||
| Security | Shares | Value | ||||||
Discover Financial Services | 2,576 | $ | 160,665 | |||||
Discovery Communications Inc. Series Aa | 782 | 34,189 | ||||||
Discovery Communications Inc. Series C NVSa,b | 1,748 | 75,112 | ||||||
DISH Network Corp. Class Aa | 1,288 | 83,475 | ||||||
Dollar General Corp.a | 1,587 | 101,552 | ||||||
Dollar Tree Inc.a | 1,196 | 64,136 | ||||||
Dominion Resources Inc. | 2,737 | 192,192 | ||||||
Dover Corp. | 1,035 | 90,945 | ||||||
Dow Chemical Co. (The) | 5,888 | 315,302 | ||||||
Dr Pepper Snapple Group Inc. | 1,196 | 75,252 | ||||||
DTE Energy Co. | 897 | 70,190 | ||||||
Duke Energy Corp. | 3,197 | 236,546 | ||||||
Duke Realty Corp. | 2,852 | 53,047 | ||||||
Dun & Bradstreet Corp. (The) | 322 | 37,796 | ||||||
E.I. du Pont de Nemours and Co. | 4,485 | 296,503 | ||||||
Eastman Chemical Co. | 874 | 72,079 | ||||||
Eaton Corp. PLC | 2,415 | 168,591 | ||||||
Eaton Vance Corp. NVS | 920 | 36,027 | ||||||
eBay Inc.a | 6,072 | 336,996 | ||||||
Ecolab Inc. | 1,518 | 174,297 | ||||||
Edison International | 1,817 | 107,457 | ||||||
Edwards Lifesciences Corp.a | 621 | 61,640 | ||||||
Electronic Arts Inc.a | 1,840 | 69,626 | ||||||
Eli Lilly and Co. | 4,738 | 301,147 | ||||||
EMC Corp. | 9,729 | 287,297 | ||||||
Emerson Electric Co. | 3,542 | 226,759 | ||||||
Energen Corp. | 483 | 38,872 | ||||||
Energizer Holdings Inc. | 322 | 39,129 | ||||||
Ensco PLC Class A | 1,196 | 60,374 | ||||||
Entergy Corp. | 1,035 | 80,119 | ||||||
EOG Resources Inc. | 2,760 | 303,269 | ||||||
EQT Corp. | 851 | 84,300 | ||||||
Equifax Inc. | 782 | 61,590 | ||||||
Equinix Inc.a | 276 | 60,240 | ||||||
Equity Residential | 1,748 | 116,190 | ||||||
Essex Property Trust Inc. | 305 | 59,002 | ||||||
Estee Lauder Companies Inc. (The) Class A | 1,150 | 88,355 | ||||||
Everest Re Group Ltd. | 253 | 41,452 | ||||||
Exelon Corp. | 4,669 | 156,038 | ||||||
Expedia Inc. | 621 | 53,344 | ||||||
Expeditors International of Washington Inc. | 1,196 | 49,395 | ||||||
| 36 | 2014 iSHARES ANNUAL REPORTTO SHAREHOLDERS |
Table of Contents
Schedule of Investments (Continued)
iSHARES® MSCI WORLD ETF
August 31, 2014
| Security | Shares | Value | ||||||
Express Scripts Holding Co.a | 3,933 | $ | 290,767 | |||||
Exxon Mobil Corp. | 21,252 | 2,113,724 | ||||||
F5 Networks Inc.a | 437 | 54,271 | ||||||
Facebook Inc. Class Aa | 9,522 | 712,436 | ||||||
Family Dollar Stores Inc. | 529 | 42,230 | ||||||
Fastenal Co. | 1,587 | 71,859 | ||||||
Federal Realty Investment Trust | 575 | 71,749 | ||||||
FedEx Corp. | 1,472 | 217,679 | ||||||
Fidelity National Information Services Inc. | 1,311 | 74,399 | ||||||
Fifth Third Bancorp | 4,094 | 83,538 | ||||||
First Republic Bank | 920 | 44,988 | ||||||
FirstEnergy Corp. | 2,277 | 77,964 | ||||||
Fiserv Inc.a | 1,472 | 94,900 | ||||||
Flextronics International Ltd.a,b | 3,979 | 43,928 | ||||||
FLIR Systems Inc. | 1,012 | 34,195 | ||||||
Flowserve Corp. | 1,035 | 78,546 | ||||||
Fluor Corp. | 989 | 73,077 | ||||||
FMC Corp. | 851 | 56,285 | ||||||
FMC Technologies Inc.a | 1,219 | 75,383 | ||||||
FNF Groupa | 1,242 | 35,161 | ||||||
Ford Motor Co. | 17,296 | 301,123 | ||||||
Fossil Group Inc.a | 322 | 32,615 | ||||||
Franklin Resources Inc. | 2,254 | 127,396 | ||||||
Freeport-McMoRan Inc. | 5,384 | 195,816 | ||||||
Frontier Communications Corp. | 6,049 | 41,133 | ||||||
Gap Inc. (The) | 1,403 | 64,748 | ||||||
Garmin Ltd. | 621 | 33,739 | ||||||
General Dynamics Corp. | 1,518 | 187,094 | ||||||
General Electric Co. | 48,806 | 1,267,980 | ||||||
General Growth Properties Inc. | 2,691 | 66,118 | ||||||
General Mills Inc. | 3,013 | 160,834 | ||||||
General Motors Co. | 5,571 | 193,871 | ||||||
Genuine Parts Co. | 759 | 66,595 | ||||||
Gilead Sciences Inc.a | 7,820 | 841,276 | ||||||
Goldman Sachs Group Inc. (The) | 2,047 | 366,638 | ||||||
Google Inc. Class Aa | 1,403 | 817,051 | ||||||
Google Inc. Class Ca | 1,449 | 828,248 | ||||||
H&R Block Inc. | 1,817 | 60,924 | ||||||
Halliburton Co. | 4,485 | 303,231 | ||||||
Harley-Davidson Inc. | 943 | 59,937 | ||||||
Harris Corp. | 690 | 49,259 | ||||||
Hartford Financial Services Group Inc. (The) | 2,139 | 79,250 | ||||||
Hasbro Inc. | 575 | 30,277 | ||||||
| Security | Shares | Value | ||||||
HCA Holdings Inc.a | 1,610 | $ | 112,410 | |||||
HCP Inc. | 2,599 | 112,615 | ||||||
Health Care REIT Inc. | 1,564 | 105,695 | ||||||
Helmerich & Payne Inc. | 759 | �� | 79,733 | |||||
Henry Schein Inc.a | 529 | 63,316 | ||||||
Hershey Co. (The) | 851 | 77,798 | ||||||
Hertz Global Holdings Inc.a | 2,677 | 79,105 | ||||||
Hess Corp. | 1,541 | 155,795 | ||||||
Hewlett-Packard Co. | 9,614 | 365,332 | ||||||
HollyFrontier Corp. | 1,012 | 50,630 | ||||||
Hologic Inc.a | 1,587 | 39,469 | ||||||
Home Depot Inc. (The) | 6,854 | 640,849 | ||||||
Honeywell International Inc. | 3,611 | 343,876 | ||||||
Hormel Foods Corp. | 966 | 48,957 | ||||||
Hospira Inc.a | 920 | 49,441 | ||||||
Host Hotels & Resorts Inc. | 4,945 | 112,845 | ||||||
Humana Inc. | 828 | 106,597 | ||||||
IHS Inc. Class Aa | 414 | 58,983 | ||||||
Illinois Tool Works Inc. | 2,047 | 180,566 | ||||||
Illumina Inc.a | 759 | 136,134 | ||||||
Ingersoll-Rand PLC | 1,679 | 101,076 | ||||||
Integrys Energy Group Inc. | 552 | 37,475 | ||||||
Intel Corp. | 24,196 | 844,924 | ||||||
Intercontinental Exchange Inc. | 627 | 118,503 | ||||||
International Business Machines Corp. | 4,899 | 942,078 | ||||||
International Flavors & Fragrances Inc. | 529 | 53,741 | ||||||
International Paper Co. | 2,024 | 98,063 | ||||||
Interpublic Group of Companies Inc. (The) | 2,553 | 49,860 | ||||||
Intuit Inc. | 1,449 | 120,528 | ||||||
Intuitive Surgical Inc.a | 207 | 97,292 | ||||||
Invesco Ltd. | 2,415 | 98,629 | ||||||
Iron Mountain Inc. | 874 | 31,447 | ||||||
J.B. Hunt Transport Services Inc. | 598 | 45,179 | ||||||
J.M. Smucker Co. (The) | 621 | 63,715 | ||||||
J.P. Morgan Chase & Co. | 18,538 | 1,102,084 | ||||||
Jacobs Engineering Group Inc.a | 920 | 49,597 | ||||||
Johnson & Johnson | 13,685 | 1,419,545 | ||||||
Johnson Controls Inc. | 3,266 | 159,413 | ||||||
Joy Global Inc. | 644 | 40,669 | ||||||
Juniper Networks Inc. | 2,760 | 64,004 | ||||||
Kansas City Southern Industries Inc. | 621 | 71,639 | ||||||
Kellogg Co. | 1,219 | 79,198 | ||||||
SCHEDULESOF INVESTMENTS | 37 |
Table of Contents
Schedule of Investments (Continued)
iSHARES® MSCI WORLD ETF
August 31, 2014
| Security | Shares | Value | ||||||
Keurig Green Mountain Inc. | 713 | $ | 95,057 | |||||
KeyCorp | 4,439 | 60,415 | ||||||
Kimberly-Clark Corp. | 1,725 | 186,300 | ||||||
Kimco Realty Corp. | 2,047 | 48,084 | ||||||
Kinder Morgan Inc. | 3,243 | 130,563 | ||||||
Kinder Morgan Management LLCa,b | 734 | 71,726 | ||||||
KLA-Tencor Corp. | 966 | 73,822 | ||||||
Kohl’s Corp. | 1,104 | 64,904 | ||||||
Kraft Foods Group Inc. | 2,737 | 161,209 | ||||||
Kroger Co. (The) | 2,806 | 143,050 | ||||||
L Brands Inc. | 1,219 | 77,833 | ||||||
L-3 Communications Holdings Inc. | 575 | 63,221 | ||||||
Laboratory Corp. of America Holdingsa | 506 | 54,258 | ||||||
Lam Research Corp. | 920 | 66,157 | ||||||
Las Vegas Sands Corp. | 2,093 | 139,205 | ||||||
Legg Mason Inc. | 874 | 43,106 | ||||||
Leggett & Platt Inc. | 874 | 30,669 | ||||||
Leucadia National Corp. | 1,794 | 44,724 | ||||||
Level 3 Communications Inc.a | 920 | 41,363 | ||||||
Liberty Global PLC Series Aa | 1,426 | 62,273 | ||||||
Liberty Global PLC Series C NVSa | 2,737 | 114,762 | ||||||
Liberty Interactive Corp. Series Aa | 2,760 | 81,475 | ||||||
Liberty Media Corp. Class Aa | 598 | 29,440 | ||||||
Liberty Media Corp. Class Ca | 1,144 | 55,450 | ||||||
Liberty Property Trust | 1,173 | 41,548 | ||||||
Lincoln National Corp. | 1,541 | 84,817 | ||||||
Linear Technology Corp. | 1,334 | 60,177 | ||||||
LinkedIn Corp. Class Aa | 529 | 119,422 | ||||||
Lockheed Martin Corp. | 1,380 | 240,120 | ||||||
Loews Corp. | 1,380 | 60,361 | ||||||
Lorillard Inc. | 2,001 | 119,460 | ||||||
Lowe’s Companies Inc. | 5,451 | 286,232 | ||||||
Lululemon Athletica Inc.a | 597 | 23,838 | ||||||
LyondellBasell Industries NV Class A | 2,323 | 265,635 | ||||||
M&T Bank Corp. | 552 | 68,244 | ||||||
Macerich Co. (The) | 989 | 64,572 | ||||||
Macy’s Inc. | 2,001 | 124,642 | ||||||
Manpowergroup Inc. | 621 | 48,177 | ||||||
Marathon Oil Corp. | 3,105 | 129,447 | ||||||
Marathon Petroleum Corp. | 1,610 | 146,526 | ||||||
Marriott International Inc. Class A | 1,495 | 103,753 | ||||||
Marsh & McLennan Companies Inc. | 2,300 | 122,130 | ||||||
Martin Marietta Materials Inc. | 322 | 42,169 | ||||||
| Security | Shares | Value | ||||||
Marvell Technology Group Ltd. | 2,760 | $ | 38,392 | |||||
Masco Corp. | 2,116 | 49,663 | ||||||
MasterCard Inc. Class A | 5,359 | 406,266 | ||||||
Mattel Inc. | 1,610 | 55,529 | ||||||
Maxim Integrated Products Inc. | 1,725 | 53,285 | ||||||
McCormick & Co. Inc. NVS | 782 | 54,498 | ||||||
McDonald’s Corp. | 4,600 | 431,112 | ||||||
McGraw Hill Financial Inc. | 1,357 | 110,093 | ||||||
McKesson Corp. | 1,173 | 228,770 | ||||||
MDU Resources Group Inc. | 1,449 | 45,368 | ||||||
Mead Johnson Nutrition Co. Class A | 1,035 | 98,946 | ||||||
MeadWestvaco Corp. | 1,334 | 57,362 | ||||||
Medtronic Inc. | 4,853 | 309,864 | ||||||
Merck & Co. Inc. | 14,444 | 868,229 | ||||||
MetLife Inc. | 4,531 | 248,027 | ||||||
MGM Resorts Internationala | 2,415 | 59,095 | ||||||
Microchip Technology Inc. | 1,196 | 58,401 | ||||||
Micron Technology Inc.a | 5,589 | 182,201 | ||||||
Microsoft Corp. | 39,261 | 1,783,627 | ||||||
Mohawk Industries Inc.a | 345 | 50,377 | ||||||
Molson Coors Brewing Co. Class B NVS | 874 | 64,632 | ||||||
Mondelez International Inc. Class A | 8,257 | 298,821 | ||||||
Monsanto Co. | 2,645 | 305,894 | ||||||
Monster Beverage Corp.a | 828 | 73,203 | ||||||
Moody’s Corp. | 1,081 | 101,149 | ||||||
Morgan Stanley | 7,383 | 253,311 | ||||||
Mosaic Co. (The) | 1,541 | 73,598 | ||||||
Motorola Solutions Inc. | 1,196 | 71,042 | ||||||
Murphy Oil Corp. | 897 | 56,036 | ||||||
Mylan Inc.a | 2,001 | 97,249 | ||||||
Nabors Industries Ltd. | 1,610 | 43,808 | ||||||
NASDAQ OMX Group Inc. (The) | 805 | 34,993 | ||||||
National Oilwell Varco Inc. | 1,909 | 164,995 | ||||||
Navient Corp. | 2,576 | 46,213 | ||||||
NetApp Inc. | 1,840 | 77,574 | ||||||
Netflix Inc.a | 322 | 153,800 | ||||||
New York Community Bancorp Inc. | 1,886 | 30,082 | ||||||
Newell Rubbermaid Inc. | 1,495 | 50,112 | ||||||
News Corp. Class A NVSa | 1,958 | 34,510 | ||||||
NextEra Energy Inc. | 2,226 | 219,150 | ||||||
Nielsen NV | 1,265 | 59,442 | ||||||
Nike Inc. Class B | 3,680 | 289,064 | ||||||
NiSource Inc. | 1,679 | 66,606 | ||||||
Noble Energy Inc. | 1,794 | 129,419 | ||||||
| 38 | 2014 iSHARES ANNUAL REPORTTO SHAREHOLDERS |
Table of Contents
Schedule of Investments (Continued)
iSHARES® MSCI WORLD ETF
August 31, 2014
| Security | Shares | Value | ||||||
Nordstrom Inc. | 805 | $ | 55,746 | |||||
Norfolk Southern Corp. | 1,610 | 172,270 | ||||||
Northeast Utilities | 1,587 | 72,827 | ||||||
Northern Trust Corp. | 1,150 | 79,753 | ||||||
Northrop Grumman Corp. | 1,058 | 134,599 | ||||||
NRG Energy Inc. | 1,955 | 60,175 | ||||||
Nucor Corp. | 1,610 | 87,455 | ||||||
NVIDIA Corp. | 3,358 | 65,313 | ||||||
O’Reilly Automotive Inc.a | 598 | 93,276 | ||||||
Occidental Petroleum Corp. | 3,933 | 407,970 | ||||||
Omnicare Inc. | 713 | 45,468 | ||||||
Omnicom Group Inc. | 1,311 | 94,405 | ||||||
ONEOK Inc. | 1,129 | 79,256 | ||||||
Oracle Corp. | 17,871 | 742,183 | ||||||
Owens-Illinois Inc.a | 1,035 | 31,868 | ||||||
PACCAR Inc. | 1,817 | 114,126 | ||||||
Pall Corp. | 736 | 62,096 | ||||||
Parker Hannifin Corp. | 828 | 95,634 | ||||||
PartnerRe Ltd. | 276 | 30,826 | ||||||
Patterson Companies Inc. | 644 | 25,934 | ||||||
Paychex Inc. | 1,748 | 72,804 | ||||||
People’s United Financial Inc. | 1,978 | 29,571 | ||||||
Pepco Holdings Inc. | 1,564 | 43,104 | ||||||
PepsiCo Inc. | 7,222 | 667,963 | ||||||
Perrigo Co. PLC | 736 | 109,473 | ||||||
PetSmart Inc. | 598 | 42,799 | ||||||
Pfizer Inc. | 31,073 | 913,235 | ||||||
PG&E Corp. | 2,507 | 116,525 | ||||||
Pharmacyclics Inc.a | 299 | 37,193 | ||||||
Philip Morris International Inc. | 7,544 | 645,616 | ||||||
Phillips 66 | 2,990 | 260,190 | ||||||
Pinnacle West Capital Corp. | 713 | 40,605 | ||||||
Pioneer Natural Resources Co. | 759 | 158,365 | ||||||
Plum Creek Timber Co. Inc.b | 1,127 | 45,790 | ||||||
PNC Financial Services Group Inc. (The)c | 2,507 | 212,468 | ||||||
PPG Industries Inc. | 805 | 165,717 | ||||||
PPL Corp. | 3,266 | 113,102 | ||||||
Praxair Inc. | 1,311 | 172,462 | ||||||
Precision Castparts Corp. | 759 | 185,242 | ||||||
Priceline Group Inc. (The)a | 276 | 343,430 | ||||||
Principal Financial Group Inc. | 1,541 | 83,661 | ||||||
Procter & Gamble Co. (The) | 12,903 | 1,072,368 | ||||||
Progressive Corp. (The) | 2,507 | 62,725 | ||||||
Prologis Inc. | 2,806 | 114,878 | ||||||
| Security | Shares | Value | ||||||
Prudential Financial Inc. | 2,300 | $ | 206,310 | |||||
Public Service Enterprise Group Inc. | 3,174 | 118,676 | ||||||
Public Storage | 759 | 132,962 | ||||||
PulteGroup Inc. | 2,070 | 39,785 | ||||||
PVH Corp. | 460 | 53,700 | ||||||
QEP Resources Inc. | 1,012 | 35,997 | ||||||
QUALCOMM Inc. | 8,234 | 626,607 | ||||||
Quanta Services Inc.a | 1,449 | 52,657 | ||||||
Quest Diagnostics Inc. | 828 | 52,338 | ||||||
Ralph Lauren Corp. | 299 | 50,591 | ||||||
Range Resources Corp. | 828 | 65,073 | ||||||
Raytheon Co. | 1,633 | 157,323 | ||||||
Realty Income Corp. | 1,104 | 49,371 | ||||||
Red Hat Inc.a | 1,035 | 63,052 | ||||||
Regency Centers Corp. | 759 | 43,369 | ||||||
Regeneron Pharmaceuticals Inc.a | 437 | 153,177 | ||||||
Regions Financial Corp. | 7,038 | 71,436 | ||||||
RenaissanceRe Holdings Ltd. | 299 | 30,615 | ||||||
Republic Services Inc. | 1,564 | 61,512 | ||||||
Reynolds American Inc. | 1,702 | 99,516 | ||||||
Robert Half International Inc. | 966 | 48,503 | ||||||
Rock-Tenn Co. Class A | 920 | 45,227 | ||||||
Rockwell Automation Inc. | 782 | 91,189 | ||||||
Rockwell Collins Inc. | 828 | 63,739 | ||||||
Roper Industries Inc. | 621 | 93,498 | ||||||
Ross Stores Inc. | 1,150 | 86,733 | ||||||
Royal Caribbean Cruises Ltd. | 851 | 54,260 | ||||||
Safeway Inc. | 1,334 | 46,397 | ||||||
Salesforce.com Inc.a,b | 3,243 | 191,629 | ||||||
SanDisk Corp. | 1,242 | 121,666 | ||||||
SBA Communications Corp. Class Aa | 851 | 93,857 | ||||||
SCANA Corp. | 759 | 39,422 | ||||||
Schlumberger Ltd. | 6,463 | 708,603 | ||||||
Scripps Networks Interactive Inc. Class A | 506 | 40,333 | ||||||
Seagate Technology PLC | 1,817 | 113,708 | ||||||
SEI Investments Co. | 1,242 | 47,066 | ||||||
Sempra Energy | 1,173 | 124,303 | ||||||
Sherwin-Williams Co. (The) | 483 | 105,347 | ||||||
Sigma-Aldrich Corp. | 713 | 74,152 | ||||||
Simon Property Group Inc. | 1,544 | 262,526 | ||||||
Sirius XM Holdings Inc.a | 20,884 | 75,809 | ||||||
SL Green Realty Corp. | 453 | 49,536 | ||||||
Southern Co. (The) | 3,956 | 175,646 | ||||||
SCHEDULESOF INVESTMENTS | 39 |
Table of Contents
Schedule of Investments (Continued)
iSHARES® MSCI WORLD ETF
August 31, 2014
| Security | Shares | Value | ||||||
Southwestern Energy Co.a | 1,794 | $ | 73,877 | |||||
Spectra Energy Corp. | 3,082 | 128,396 | ||||||
Sprint Corp.a,b | 5,687 | 31,904 | ||||||
SPX Corp. | 276 | 28,718 | ||||||
St. Jude Medical Inc. | 1,587 | 104,091 | ||||||
Stanley Black & Decker Inc. | 874 | 79,971 | ||||||
Staples Inc. | 2,921 | 34,117 | ||||||
Starbucks Corp. | 3,818 | 297,079 | ||||||
Starwood Hotels & Resorts Worldwide Inc. | 1,104 | 93,332 | ||||||
State Street Corp. | 2,323 | 167,326 | ||||||
Stericycle Inc.a | 506 | 60,138 | ||||||
Stryker Corp. | 1,472 | 122,632 | ||||||
SunTrust Banks Inc. | 2,691 | 102,473 | ||||||
Superior Energy Services Inc. | 943 | 33,797 | ||||||
Symantec Corp. | 3,611 | 87,675 | ||||||
Synopsys Inc.a | 1,035 | 42,332 | ||||||
Sysco Corp. | 2,668 | 100,930 | ||||||
T. Rowe Price Group Inc. | 1,334 | 108,047 | ||||||
Target Corp. | 2,852 | 171,320 | ||||||
TD Ameritrade Holding Corp. | 1,403 | 46,453 | ||||||
TE Connectivity Ltd. | 2,024 | 126,864 | ||||||
Teradata Corp.a | 989 | 45,168 | ||||||
Tesla Motors Inc.a,b | 460 | 124,062 | ||||||
Texas Instruments Inc. | 5,348 | 257,667 | ||||||
Textron Inc. | 1,679 | 63,802 | ||||||
Thermo Fisher Scientific Inc. | 1,886 | 226,716 | ||||||
Tiffany & Co. | 644 | 65,005 | ||||||
Time Warner Cable Inc. | 1,403 | 207,546 | ||||||
Time Warner Inc. | 4,462 | 343,708 | ||||||
TJX Companies Inc. (The) | 3,565 | 212,510 | ||||||
Toll Brothers Inc.a | 805 | 28,650 | ||||||
Torchmark Corp. | 724 | 39,494 | ||||||
Total System Services Inc. | 1,219 | 38,350 | ||||||
Tractor Supply Co. | 782 | 52,355 | ||||||
TransDigm Group Inc. | 345 | 64,857 | ||||||
Travelers Companies Inc. (The) | 1,656 | 156,840 | ||||||
Trimble Navigation Ltd.a | 1,380 | 45,899 | ||||||
TRW Automotive Holdings Corp.a | 598 | 57,581 | ||||||
Twenty-First Century Fox Inc. Class A | 7,889 | 279,428 | ||||||
Twenty-First Century Fox Inc. Class B | 1,771 | 60,993 | ||||||
Twitter Inc.a | 1,621 | 80,645 | ||||||
Tyco International Ltd. | 2,576 | 114,941 | ||||||
Tyson Foods Inc. Class A | 1,771 | 67,404 | ||||||
U.S. Bancorp | 8,625 | 364,665 | ||||||
| Security | Shares | Value | ||||||
UDR Inc. | 1,817 | $ | 54,365 | |||||
Ulta Salon, Cosmetics & Fragrance Inc.a | 368 | 35,810 | ||||||
Union Pacific Corp. | 4,577 | 481,821 | ||||||
United Parcel Service Inc. Class B | 3,381 | 329,073 | ||||||
United Technologies Corp. | 4,255 | 459,455 | ||||||
UnitedHealth Group Inc. | 4,876 | 422,652 | ||||||
Unum Group | 1,265 | 45,882 | ||||||
Urban Outfitters Inc.a | 667 | 26,540 | ||||||
Valero Energy Corp. | 2,806 | 151,917 | ||||||
Varian Medical Systems Inc.a | 598 | 50,842 | ||||||
Ventas Inc. | 1,617 | 106,366 | ||||||
VeriSign Inc.a,b | 920 | 52,509 | ||||||
Verisk Analytics Inc. Class Aa | 851 | 54,626 | ||||||
Verizon Communications Inc. | 20,217 | 1,007,211 | ||||||
Vertex Pharmaceuticals Inc.a | 1,196 | 111,910 | ||||||
VF Corp. | 1,932 | 123,880 | ||||||
Viacom Inc. Class B NVS | 2,070 | 167,981 | ||||||
Visa Inc. Class A | 2,553 | 542,564 | ||||||
VMware Inc. Class Aa,b | 437 | 43,079 | ||||||
Vornado Realty Trust | 966 | 102,270 | ||||||
Vulcan Materials Co. | 713 | 45,190 | ||||||
W.R. Berkley Corp. | 506 | 24,465 | ||||||
W.W. Grainger Inc. | 345 | 84,939 | ||||||
Wal-Mart Stores Inc. | 7,567 | 571,308 | ||||||
Walgreen Co. | 4,508 | 272,824 | ||||||
Walt Disney Co. (The) | 8,257 | 742,139 | ||||||
Waste Management Inc. | 2,093 | 98,308 | ||||||
Waters Corp.a | 437 | 45,199 | ||||||
WellPoint Inc. | 1,495 | 174,182 | ||||||
Wells Fargo & Co. | 24,357 | 1,252,924 | ||||||
Western Digital Corp. | 1,127 | 116,092 | ||||||
Western Union Co. | 3,105 | 54,244 | ||||||
Weyerhaeuser Co. | 3,220 | 109,319 | ||||||
Whirlpool Corp. | 437 | 66,870 | ||||||
Whiting Petroleum Corp.a | 667 | 61,804 | ||||||
Williams Companies Inc. (The) | 3,450 | 205,068 | ||||||
Willis Group Holdings PLC | 782 | 32,821 | ||||||
Windstream Holdings Inc. | 2,783 | 31,448 | ||||||
Wisconsin Energy Corp. | 1,242 | 56,300 | ||||||
Wyndham Worldwide Corp. | 897 | 72,603 | ||||||
Wynn Resorts Ltd. | 478 | 92,197 | ||||||
Xcel Energy Inc. | 2,346 | 75,189 | ||||||
Xerox Corp. | 6,509 | 89,889 | ||||||
Xilinx Inc. | 1,495 | 63,164 | ||||||
| 40 | 2014 iSHARES ANNUAL REPORTTO SHAREHOLDERS |
Table of Contents
Schedule of Investments (Continued)
iSHARES® MSCI WORLD ETF
August 31, 2014
| Security | Shares | Value | ||||||
XL Group PLC | 1,449 | $ | 49,527 | |||||
Xylem Inc. | 1,196 | 44,563 | ||||||
Yahoo! Inc.a | 5,566 | 214,347 | ||||||
Yum! Brands Inc. | 2,300 | 166,589 | ||||||
Zimmer Holdings Inc. | 897 | 89,081 | ||||||
Zoetis Inc. | 2,760 | 97,814 | ||||||
|
| |||||||
| 93,780,305 | ||||||||
|
| |||||||
TOTAL COMMON STOCKS |
| |||||||
(Cost: $154,461,333) |
| 167,716,033 | ||||||
PREFERRED STOCKS — 0.21% |
| |||||||
GERMANY — 0.21% | ||||||||
Henkel AG & Co. KGaA | 897 | 94,286 | ||||||
Porsche Automobil Holding SE | 736 | 67,135 | ||||||
Volkswagen AG | 828 | 186,336 | ||||||
|
| |||||||
| 347,757 | ||||||||
|
| |||||||
TOTAL PREFERRED STOCKS |
| |||||||
(Cost: $372,367) |
| 347,757 | ||||||
SHORT-TERM INVESTMENTS — 1.20% |
| |||||||
MONEY MARKET FUNDS — 1.20% |
| |||||||
BlackRock Cash Funds: Institutional, |
| |||||||
0.14%c,d,e | 1,762,887 | 1,762,887 | ||||||
BlackRock Cash Funds: Prime, |
| |||||||
0.11%c,d,e | 110,979 | 110,979 | ||||||
BlackRock Cash Funds: Treasury, |
| |||||||
0.00%c,d | 151,852 | 151,852 | ||||||
|
| |||||||
| 2,025,718 | ||||||||
|
| |||||||
TOTAL SHORT-TERM INVESTMENTS |
| |||||||
(Cost: $2,025,718) |
| 2,025,718 | ||||||
|
| |||||||
TOTAL INVESTMENTS |
| |||||||
(Cost: $156,859,418) |
| 170,089,508 | ||||||
Other Assets, Less Liabilities — (0.81)% |
| (1,361,095 | ) | |||||
|
| |||||||
NET ASSETS — 100.00% |
| $ | 168,728,413 | |||||
|
| |||||||
FDR — Fiduciary Depositary Receipts
NVS — Non-Voting Shares
SDR — Swedish Depositary Receipts
| a | Non-income earning security. |
| b | All or a portion of this security represents a security on loan. See Note 1. |
| c | Affiliated issuer. See Note 2. |
| d | The rate quoted is the annualized seven-day yield of the fund at period end. |
| e | All or a portion of this security represents an investment of securities lending collateral. See Note 1. |
See notes to financial statements.
SCHEDULESOF INVESTMENTS | 41 |
Table of Contents
Statements of Assets and Liabilities
iSHARES®, INC.
August 31, 2014
| iShares MSCI All Country World Minimum Volatility ETF | iShares MSCI Emerging Markets EMEA ETF | iShares MSCI 100 ETF | ||||||||||
ASSETS | ||||||||||||
Investments, at cost: | ||||||||||||
Unaffiliated | $ | 1,101,752,796 | $ | 10,532,389 | $ | 715,158,602 | ||||||
Affiliated (Note 2) | 36,552,239 | 29,958 | — | |||||||||
|
|
|
|
|
| |||||||
Total cost of investments | $ | 1,138,305,035 | $ | 10,562,347 | $ | 715,158,602 | ||||||
|
|
|
|
|
| |||||||
Investments in securities, at fair value (including securities on loana) (Note 1): |
| |||||||||||
Unaffiliated | $ | 1,277,118,380 | $ | 10,340,482 | $ | 796,724,462 | ||||||
Affiliated (Note 2) | 36,552,239 | 29,958 | — | |||||||||
|
|
|
|
|
| |||||||
Total fair value of investments | 1,313,670,619 | 10,370,440 | 796,724,462 | |||||||||
Foreign currency, at valueb | 2,234,626 | 8,143 | 591,199 | |||||||||
Cash | 583,801 | 34,927 | 2,119,357 | |||||||||
Receivables: | ||||||||||||
Investment securities sold | 1,486,115 | 114,162 | 37,514,414 | |||||||||
Dividends and interest | 3,747,070 | 11,437 | 333,827 | |||||||||
|
|
|
|
|
| |||||||
Total Assets | 1,321,722,231 | 10,539,109 | 837,283,259 | |||||||||
|
|
|
|
|
| |||||||
LIABILITIES | ||||||||||||
Payables: | ||||||||||||
Investment securities purchased | 1,875,719 | 145,255 | 35,712,007 | |||||||||
Collateral for securities on loan (Note 1) | 36,552,239 | 29,958 | — | |||||||||
Deferred foreign capital gains taxes (Note 1) | 67,281 | — | 1,696,304 | |||||||||
Investment advisory fees (Note 2) | 214,528 | 4,320 | 526,185 | |||||||||
|
|
|
|
|
| |||||||
Total Liabilities | 38,709,767 | 179,533 | 37,934,496 | |||||||||
|
|
|
|
|
| |||||||
NET ASSETS | $ | 1,283,012,464 | $ | 10,359,576 | $ | 799,348,763 | ||||||
|
|
|
|
|
| |||||||
Net assets consist of: | ||||||||||||
Paid-in capital | $ | 1,122,340,345 | $ | 10,937,826 | $ | 706,235,701 | ||||||
Undistributed (distributions in excess of) net investment income | 5,984,087 | 84,072 | (169,855 | ) | ||||||||
Undistributed net realized gain (accumulated net realized loss) | (20,653,807 | ) | (470,285 | ) | 12,849,871 | |||||||
Net unrealized appreciation (depreciation) | 175,341,839 | (192,037 | ) | 80,433,046 | ||||||||
|
|
|
|
|
| |||||||
NET ASSETS | $ | 1,283,012,464 | $ | 10,359,576 | $ | 799,348,763 | ||||||
|
|
|
|
|
| |||||||
Shares outstandingc | 18,800,000 | 200,000 | 21,150,000 | |||||||||
|
|
|
|
|
| |||||||
Net asset value per share | $ | 68.25 | $ | 51.80 | $ | 37.79 | ||||||
|
|
|
|
|
| |||||||
| a | Securities on loan with values of $35,033,138, $26,966 and $ —, respectively. See Note 1. |
| b | Cost of foreign currency: $2,245,780, $8,214 and $591,655, respectively. |
| c | $0.001 par value, number of shares authorized: 500 million, 500 million and 500 million, respectively. |
See notes to financial statements.
| 42 | 2014 iSHARES ANNUAL REPORTTO SHAREHOLDERS |
Table of Contents
Statements of Assets and Liabilities (Continued)
iSHARES®, INC.
August 31, 2014
World ETF | ||||
ASSETS | ||||
Investments, at cost: | ||||
Unaffiliated | $ | 154,444,531 | ||
Affiliated (Note 2) | 2,414,887 | |||
|
| |||
Total cost of investments | $ | 156,859,418 | ||
|
| |||
Investments in securities, at fair value (including securities on loana) (Note 1): | ||||
Unaffiliated | $ | 167,623,256 | ||
Affiliated (Note 2) | 2,466,252 | |||
|
| |||
Total fair value of investments | 170,089,508 | |||
Foreign currency, at valueb | 130,436 | �� | ||
Cash | 210 | |||
Receivables: | ||||
Investment securities sold | 96,667 | |||
Dividends and interest | 406,492 | |||
|
| |||
Total Assets | 170,723,313 | |||
|
| |||
LIABILITIES | ||||
Payables: | ||||
Investment securities purchased | 87,251 | |||
Collateral for securities on loan (Note 1) | 1,873,866 | |||
Investment advisory fees (Note 2) | 33,783 | |||
|
| |||
Total Liabilities | 1,994,900 | |||
|
| |||
NET ASSETS | $ | 168,728,413 | ||
|
| |||
Net assets consist of: | ||||
Paid-in capital | $ | 155,432,877 | ||
Undistributed net investment income | 568,421 | |||
Accumulated net realized loss | (500,347 | ) | ||
Net unrealized appreciation | 13,227,462 | |||
|
| |||
NET ASSETS | $ | 168,728,413 | ||
|
| |||
Shares outstandingc | 2,300,000 | |||
|
| |||
Net asset value per share | $ | 73.36 | ||
|
| |||
| a | Securities on loan with a value of $1,794,237. See Note 1. |
| b | Cost of foreign currency: $131,035. |
| c | $0.001 par value, number of shares authorized: 500 million. |
See notes to financial statements.
FINANCIAL STATEMENTS | 43 |
Table of Contents
Statements of Operations
iSHARES®, INC.
Year ended August 31, 2014
| iShares MSCI All Country World Minimum Volatility ETF | iShares MSCI Emerging Markets EMEA ETF | iShares MSCI 100 ETF | ||||||||||
NET INVESTMENT INCOME | ||||||||||||
Dividends — unaffiliateda | $ | 32,306,956 | $ | 280,535 | $ | 21,405,222 | ||||||
Interest — unaffiliated | — | — | 3,085 | |||||||||
Interest — affiliated (Note 2) | 205 | 1 | 777 | |||||||||
Securities lending income — affiliated (Note 2) | 141,778 | 2,301 | — | |||||||||
|
|
|
|
|
| |||||||
| 32,448,939 | 282,837 | 21,409,084 | ||||||||||
Less: Other foreign taxes (Note 1) | (67,343 | ) | — | — | ||||||||
|
|
|
|
|
| |||||||
Total investment income | 32,381,596 | 282,837 | 21,409,084 | |||||||||
|
|
|
|
|
| |||||||
EXPENSES | ||||||||||||
Investment advisory fees (Note 2) | 3,757,055 | 66,881 | 4,380,187 | |||||||||
Commitment fees (Note 7) | — | — | 691 | |||||||||
Interest expense (Note 7) | — | — | 5,370 | |||||||||
|
|
|
|
|
| |||||||
Total expenses | 3,757,055 | 66,881 | 4,386,248 | |||||||||
Less investment advisory fees waived (Note 2) | (1,500,283 | ) | (18,687 | ) | — | |||||||
|
|
|
|
|
| |||||||
Net expenses | 2,256,772 | 48,194 | 4,386,248 | |||||||||
|
|
|
|
|
| |||||||
Net investment income | 30,124,824 | 234,643 | 17,022,836 | |||||||||
|
|
|
|
|
| |||||||
NET REALIZED AND UNREALIZED GAIN (LOSS) | ||||||||||||
Net realized gain (loss) from: | ||||||||||||
Investments — unaffiliatedb | (14,629,896 | ) | (324,407 | ) | 16,809,925 | |||||||
Investments — affiliated (Note 2) | (31,409 | ) | — | — | ||||||||
In-kind redemptions — unaffiliated | 30,364,712 | — | 4,349,669 | |||||||||
In-kind redemptions — affiliated (Note 2) | 2,798 | — | — | |||||||||
Foreign currency transactions | 14,994 | (4,431 | ) | (1,110,990 | ) | |||||||
|
|
|
|
|
| |||||||
Net realized gain (loss) | 15,721,199 | (328,838 | ) | 20,048,604 | ||||||||
|
|
|
|
|
| |||||||
Net change in unrealized appreciation/depreciation on: | ||||||||||||
Investmentsc | 127,055,410 | 562,832 | 81,913,054 | |||||||||
Translation of assets and liabilities in foreign currencies | (12,543 | ) | 80 | (295 | ) | |||||||
|
|
|
|
|
| |||||||
Net change in unrealized appreciation/depreciation | 127,042,867 | 562,912 | 81,912,759 | |||||||||
|
|
|
|
|
| |||||||
Net realized and unrealized gain | 142,764,066 | 234,074 | 101,961,363 | |||||||||
|
|
|
|
|
| |||||||
NET INCREASE IN NET ASSETS RESULTING FROM OPERATIONS | $ | 172,888,890 | $ | 468,717 | $ | 118,984,199 | ||||||
|
|
|
|
|
| |||||||
| a | Net of foreign withholding tax of $1,685,749, $39,973 and $1,863,335, respectively. |
| b | Net of foreign capital gains taxes of $ —, $ — and $578,568, respectively. |
| c | Net of deferred foreign capital gains taxes of $ —, $ — and $1,128,254, respectively. |
See notes to financial statements.
| 44 | 2014 iSHARES ANNUAL REPORTTO SHAREHOLDERS |
Table of Contents
Statements of Operations (Continued)
iSHARES®, INC.
Year ended August 31, 2014
World ETF | ||||
NET INVESTMENT INCOME | ||||
Dividends — unaffiliateda | $ | 3,491,968 | ||
Dividends — affiliated (Note 2) | 8,473 | |||
Interest — affiliated (Note 2) | 12 | |||
Securities lending income — affiliated (Note 2) | 13,685 | |||
|
| |||
Total investment income | 3,514,138 | |||
|
| |||
EXPENSES | ||||
Investment advisory fees (Note 2) | 299,743 | |||
|
| |||
Total expenses | 299,743 | |||
|
| |||
Net investment income | 3,214,395 | |||
|
| |||
NET REALIZED AND UNREALIZED GAIN (LOSS) | ||||
Net realized gain (loss) from: | ||||
Investments — unaffiliated | (452,123 | ) | ||
Investments — affiliated (Note 2) | 13 | |||
In-kind redemptions — unaffiliated | 3,477,356 | |||
In-kind redemptions — affiliated (Note 2) | 9,195 | |||
Foreign currency transactions | 3,719 | |||
|
| |||
Net realized gain | 3,038,160 | |||
|
| |||
Net change in unrealized appreciation/depreciation on: | ||||
Investments | 13,583,672 | |||
Translation of assets and liabilities in foreign currencies | (2,428 | ) | ||
|
| |||
Net change in unrealized appreciation/depreciation | 13,581,244 | |||
|
| |||
Net realized and unrealized gain | 16,619,404 | |||
|
| |||
NET INCREASE IN NET ASSETS RESULTING FROM OPERATIONS | $ | 19,833,799 | ||
|
| |||
| a | Net of foreign withholding tax of $151,434. |
See notes to financial statements.
FINANCIAL STATEMENTS | 45 |
Table of Contents
Statements of Changes in Net Assets
iSHARES®, INC.
| iShares MSCI All Country World Minimum Volatility ETF | iShares MSCI Emerging Markets EMEA ETF | |||||||||||||||
| Year ended August 31, 2014 | Year ended August 31, 2013 | Year ended August 31, 2014 | Year ended August 31, 2013 | |||||||||||||
INCREASE (DECREASE) IN NET ASSETS | ||||||||||||||||
OPERATIONS: | ||||||||||||||||
Net investment income | $ | 30,124,824 | $ | 23,353,046 | $ | 234,643 | $ | 162,306 | ||||||||
Net realized gain (loss) | 15,721,199 | 15,102,144 | (328,838 | ) | 437,250 | |||||||||||
Net change in unrealized appreciation/depreciation | 127,042,867 | 28,767,070 | 562,912 | (407,972 | ) | |||||||||||
|
|
|
|
|
|
|
| |||||||||
Net increase in net assets resulting from operations | 172,888,890 | 67,222,260 | 468,717 | 191,584 | ||||||||||||
|
|
|
|
|
|
|
| |||||||||
DISTRIBUTIONS TO SHAREHOLDERS: | ||||||||||||||||
From net investment income | (29,115,840 | ) | (21,734,941 | ) | (158,907 | ) | (177,671 | ) | ||||||||
|
|
|
|
|
|
|
| |||||||||
Total distributions to shareholders | (29,115,840 | ) | (21,734,941 | ) | (158,907 | ) | (177,671 | ) | ||||||||
|
|
|
|
|
|
|
| |||||||||
CAPITAL SHARE TRANSACTIONS: | ||||||||||||||||
Proceeds from shares sold | 261,249,242 | 492,714,983 | 5,251,709 | — | ||||||||||||
Cost of shares redeemed | (129,769,428 | ) | (109,218,290 | ) | — | (5,559,099 | ) | |||||||||
|
|
|
|
|
|
|
| |||||||||
Net increase (decrease) in net assets from capital share transactions | 131,479,814 | 383,496,693 | 5,251,709 | (5,559,099 | ) | |||||||||||
|
|
|
|
|
|
|
| |||||||||
INCREASE (DECREASE) IN NET ASSETS | 275,252,864 | 428,984,012 | 5,561,519 | (5,545,186 | ) | |||||||||||
NET ASSETS | ||||||||||||||||
Beginning of year | 1,007,759,600 | 578,775,588 | 4,798,057 | 10,343,243 | ||||||||||||
|
|
|
|
|
|
|
| |||||||||
End of year | $ | 1,283,012,464 | $ | 1,007,759,600 | $ | 10,359,576 | $ | 4,798,057 | ||||||||
|
|
|
|
|
|
|
| |||||||||
Undistributed net investment income included in net assets at end of year | $ | 5,984,087 | $ | 4,621,411 | $ | 84,072 | $ | 12,385 | ||||||||
|
|
|
|
|
|
|
| |||||||||
SHARES ISSUED AND REDEEMED | ||||||||||||||||
Shares sold | 4,000,000 | 8,200,000 | 100,000 | — | ||||||||||||
Shares redeemed | (2,000,000 | ) | (1,800,000 | ) | — | (100,000 | ) | |||||||||
|
|
|
|
|
|
|
| |||||||||
Net increase (decrease) in shares outstanding | 2,000,000 | 6,400,000 | 100,000 | (100,000 | ) | |||||||||||
|
|
|
|
|
|
|
| |||||||||
See notes to financial statements.
| 46 | 2014 iSHARES ANNUAL REPORTTO SHAREHOLDERS |
Table of Contents
Statements of Changes in Net Assets (Continued)
iSHARES®, INC.
| iShares MSCI Frontier 100 ETF | iShares MSCI World ETF | |||||||||||||||
| Year ended August 31, 2014 | Period from to August 31, 2013 | Year ended August 31, 2014 | Year ended August 31, 2013 | |||||||||||||
INCREASE (DECREASE) IN NET ASSETS | ||||||||||||||||
OPERATIONS: | ||||||||||||||||
Net investment income | $ | 17,022,836 | $ | 2,027,213 | $ | 3,214,395 | $ | 313,385 | ||||||||
Net realized gain (loss) | 20,048,604 | (2,074,597 | ) | 3,038,160 | 1,592,421 | |||||||||||
Net change in unrealized appreciation/depreciation | 81,912,759 | (1,479,713 | ) | 13,581,244 | (936,157 | ) | ||||||||||
|
|
|
|
|
|
|
| |||||||||
Net increase (decrease) in net assets resulting from operations | 118,984,199 | (1,527,097 | ) | 19,833,799 | 969,649 | |||||||||||
|
|
|
|
|
|
|
| |||||||||
DISTRIBUTIONS TO SHAREHOLDERS: | ||||||||||||||||
From net investment income | (15,334,501 | ) | (2,007,790 | ) | (2,735,328 | ) | (292,821 | ) | ||||||||
Return of capital | — | (180,295 | ) | — | — | |||||||||||
|
|
|
|
|
|
|
| |||||||||
Total distributions to shareholders | (15,334,501 | ) | (2,188,085 | ) | (2,735,328 | ) | (292,821 | ) | ||||||||
|
|
|
|
|
|
|
| |||||||||
CAPITAL SHARE TRANSACTIONS: | ||||||||||||||||
Proceeds from shares sold | 581,098,884 | 294,121,892 | 148,427,324 | 24,918,447 | ||||||||||||
Cost of shares redeemed | (165,483,378 | ) | (10,323,151 | ) | (21,501,639 | ) | (11,580,026 | ) | ||||||||
|
|
|
|
|
|
|
| |||||||||
Net increase in net assets from capital share transactions | 415,615,506 | 283,798,741 | 126,925,685 | 13,338,421 | ||||||||||||
|
|
|
|
|
|
|
| |||||||||
INCREASE IN NET ASSETS | 519,265,204 | 280,083,559 | 144,024,156 | 14,015,249 | ||||||||||||
NET ASSETS | ||||||||||||||||
Beginning of year | 280,083,559 | — | 24,704,257 | 10,689,008 | ||||||||||||
|
|
|
|
|
|
|
| |||||||||
End of year | $ | 799,348,763 | $ | 280,083,559 | $ | 168,728,413 | $ | 24,704,257 | ||||||||
|
|
|
|
| �� |
|
| |||||||||
Undistributed (distributions in excess of) net investment income included in net assets at end of year | $ | (169,855 | ) | $ | (241,782 | ) | $ | 568,421 | $ | 85,201 | ||||||
|
|
|
|
|
|
|
| |||||||||
SHARES ISSUED AND REDEEMED | ||||||||||||||||
Shares sold | 16,150,000 | 9,650,000 | 2,200,000 | 400,000 | ||||||||||||
Shares redeemed | (4,300,000 | ) | (350,000 | ) | (300,000 | ) | (200,000 | ) | ||||||||
|
|
|
|
|
|
|
| |||||||||
Net increase in shares outstanding | 11,850,000 | 9,300,000 | 1,900,000 | 200,000 | ||||||||||||
|
|
|
|
|
|
|
| |||||||||
| a | Commencement of operations. |
See notes to financial statements.
FINANCIAL STATEMENTS | 47 |
Table of Contents
iSHARES®, INC.
(For a share outstanding throughout each period)
iShares MSCI All Country World Minimum Volatility ETF |
| Year ended Aug. 31, 2014 | Year ended Aug. 31, 2013 | Period from to Aug. 31, 2012 | ||||||||||
Net asset value, beginning of period | $ | 59.99 | $ | 55.65 | $ | 50.02 | ||||||
|
|
|
|
|
| |||||||
Income from investment operations: | ||||||||||||
Net investment incomeb | 1.72 | 1.68 | 1.49 | |||||||||
Net realized and unrealized gainc | 8.18 | 4.20 | 4.67 | |||||||||
|
|
|
|
|
| |||||||
Total from investment operations | 9.90 | 5.88 | 6.16 | |||||||||
|
|
|
|
|
| |||||||
Less distributions from: | ||||||||||||
Net investment income | (1.64 | ) | (1.54 | ) | (0.53 | ) | ||||||
|
|
|
|
|
| |||||||
Total distributions | (1.64 | ) | (1.54 | ) | (0.53 | ) | ||||||
|
|
|
|
|
| |||||||
Net asset value, end of period | $ | 68.25 | $ | 59.99 | $ | 55.65 | ||||||
|
|
|
|
|
| |||||||
Total return | 16.70 | % | 10.69 | % | 12.41 | %d | ||||||
|
|
|
|
|
| |||||||
Ratios/Supplemental data: | ||||||||||||
Net assets, end of period (000s) | $ | 1,283,012 | $ | 1,007,760 | $ | 578,776 | ||||||
Ratio of expenses to average net assetse | 0.20 | % | 0.20 | % | 0.23 | % | ||||||
Ratio of expenses to average net assets prior to waived feese | 0.33 | % | 0.34 | % | 0.34 | % | ||||||
Ratio of net investment income to average net assetse | 2.67 | % | 2.83 | % | 3.17 | % | ||||||
Portfolio turnover ratef | 24 | % | 13 | % | 22 | % | ||||||
| a | Commencement of operations. |
| b | Based on average shares outstanding throughout each period. |
| c | The amounts reported for a share outstanding may not accord with the change in aggregate gains and losses in securities for the fiscal period due to the timing of capital share transactions in relation to the fluctuating market values of the Fund’s underlying securities. |
| d | Not annualized. |
| e | Annualized for periods of less than one year. |
| f | Portfolio turnover rates exclude portfolio securities received or delivered in Creation Units but include portfolio transactions that are executed as a result of the Fund processing capital share transactions in Creation Units partially for cash in U.S. dollars. Excluding such cash transactions, the portfolio turnover rates for the years ended August 31, 2014, August 31, 2013, and the period ended August 31, 2012 were 23%, 13%, and 22%, respectively. See Note 4. |
See notes to financial statements.
| 48 | 2014 iSHARES ANNUAL REPORTTO SHAREHOLDERS |
Table of Contents
Financial Highlights (Continued)
iSHARES®, INC.
(For a share outstanding throughout each period)
iShares MSCI Emerging Markets EMEA ETF |
| Year ended Aug. 31, 2014 | Year ended Aug. 31, 2013 | Period from to Aug. 31, 2012 | ||||||||||
Net asset value, beginning of period | $ | 47.98 | $ | 51.72 | $ | 51.16 | ||||||
|
|
|
|
|
| |||||||
Income from investment operations: | ||||||||||||
Net investment incomeb | 1.23 | 1.26 | 1.43 | |||||||||
Net realized and unrealized gain (loss)c | 3.38 | (3.22 | ) | 0.02 | ||||||||
|
|
|
|
|
| |||||||
Total from investment operations | 4.61 | (1.96 | ) | 1.45 | ||||||||
|
|
|
|
|
| |||||||
Less distributions from: | ||||||||||||
Net investment income | (0.79 | ) | (1.78 | ) | (0.89 | ) | ||||||
|
|
|
|
|
| |||||||
Total distributions | (0.79 | ) | (1.78 | ) | (0.89 | ) | ||||||
|
|
|
|
|
| |||||||
Net asset value, end of period | $ | 51.80 | $ | 47.98 | $ | 51.72 | ||||||
|
|
|
|
|
| |||||||
Total return | 9.61 | % | (3.95 | )% | 2.91 | %d | ||||||
|
|
|
|
|
| |||||||
Ratios/Supplemental data: | ||||||||||||
Net assets, end of period (000s) | $ | 10,360 | $ | 4,798 | $ | 10,343 | ||||||
Ratio of expenses to average net assetse | 0.49 | % | 0.49 | % | 0.49 | % | ||||||
Ratio of expenses to average net assets prior to waived feese | 0.68 | % | 0.68 | % | 0.68 | % | ||||||
Ratio of net investment income to average net assetse | 2.39 | % | 2.39 | % | 4.46 | % | ||||||
Portfolio turnover ratef | 18 | % | 8 | % | 5 | % | ||||||
| a | Commencement of operations. |
| b | Based on average shares outstanding throughout each period. |
| c | The amounts reported for a share outstanding may not accord with the change in aggregate gains and losses in securities for the fiscal period due to the timing of capital share transactions in relation to the fluctuating market values of the Fund’s underlying securities. |
| d | Not annualized. |
| e | Annualized for periods of less than one year. |
| f | Portfolio turnover rates exclude portfolio securities received or delivered as a result of processing capital share transactions in Creation Units. |
See notes to financial statements.
FINANCIAL HIGHLIGHTS | 49 |
Table of Contents
Financial Highlights (Continued)
iSHARES®, INC.
(For a share outstanding throughout each period)
iShares MSCI Frontier 100 ETF |
| Year ended Aug. 31, 2014 | Period from to Aug. 31, 2013 | |||||||
Net asset value, beginning of period | $ | 30.12 | $ | 25.25 | ||||
|
|
|
| |||||
Income from investment operations: | ||||||||
Net investment incomeb | 1.09 | 0.67 | ||||||
Net realized and unrealized gainc | 7.47 | 4.51 | ||||||
|
|
|
| |||||
Total from investment operations | 8.56 | 5.18 | ||||||
|
|
|
| |||||
Less distributions from: | ||||||||
Net investment income | (0.89 | ) | (0.28 | ) | ||||
Return of capital | — | (0.03 | ) | |||||
|
|
|
| |||||
Total distributions | (0.89 | ) | (0.31 | ) | ||||
|
|
|
| |||||
Net asset value, end of period | $ | 37.79 | $ | 30.12 | ||||
|
|
|
| |||||
Total return | 28.56 | % | 20.54 | %d | ||||
|
|
|
| |||||
Ratios/Supplemental data: | ||||||||
Net assets, end of period (000s) | $ | 799,349 | $ | 280,084 | ||||
Ratio of expenses to average net assetse | 0.79 | % | 0.79 | % | ||||
Ratio of net investment income to average net assetse | 3.07 | % | 2.32 | % | ||||
Portfolio turnover ratef | 61 | % | 18 | % | ||||
| a | Commencement of operations. |
| b | Based on average shares outstanding throughout each period. |
| c | The amounts reported for a share outstanding may not accord with the change in aggregate gains and losses in securities for the fiscal period due to the timing of capital share transactions in relation to the fluctuating market values of the Fund’s underlying securities. |
| d | Not annualized. |
| e | Annualized for periods of less than one year. |
| f | Portfolio turnover rates exclude portfolio securities received or delivered in Creation Units but include portfolio transactions that are executed as a result of the Fund processing capital share transactions in Creation Units partially for cash in U.S. dollars. Excluding such cash transactions, the portfolio turnover rates for the year ended August 31, 2014 and period ended August 31, 2013 were 42% and 10%, respectively. See Note 4. |
See notes to financial statements.
| 50 | 2014 iSHARES ANNUAL REPORTTO SHAREHOLDERS |
Table of Contents
Financial Highlights (Continued)
iSHARES®, INC.
(For a share outstanding throughout each period)
| iShares MSCI World ETF | ||||||||||||
| Year ended Aug. 31, 2014 | Year ended Aug. 31, 2013 | Period from to Aug. 31, 2012 | ||||||||||
Net asset value, beginning of period | $ | 61.76 | $ | 53.45 | $ | 50.32 | ||||||
|
|
|
|
|
| |||||||
Income from investment operations: | ||||||||||||
Net investment incomeb | 1.81 | 1.40 | 0.98 | |||||||||
Net realized and unrealized gainc | 11.16 | 8.03 | 2.89 | |||||||||
|
|
|
|
|
| |||||||
Total from investment operations | 12.97 | 9.43 | 3.87 | |||||||||
|
|
|
|
|
| |||||||
Less distributions from: | ||||||||||||
Net investment income | (1.37 | ) | (1.12 | ) | (0.74 | ) | ||||||
|
|
|
|
|
| |||||||
Total distributions | (1.37 | ) | (1.12 | ) | (0.74 | ) | ||||||
|
|
|
|
|
| |||||||
Net asset value, end of period | $ | 73.36 | $ | 61.76 | $ | 53.45 | ||||||
|
|
|
|
|
| |||||||
Total return | 21.07 | % | 17.84 | % | 7.76 | %d | ||||||
|
|
|
|
|
| |||||||
Ratios/Supplemental data: | ||||||||||||
Net assets, end of period (000s) | $ | 168,728 | $ | 24,704 | $ | 10,689 | ||||||
Ratio of expenses to average net assetse | 0.24 | % | 0.24 | % | 0.24 | % | ||||||
Ratio of net investment income to average net assetse | 2.57 | % | 2.34 | % | 2.91 | % | ||||||
Portfolio turnover ratef | 5 | % | 5 | % | 3 | % | ||||||
| a | Commencement of operations. |
| b | Based on average shares outstanding throughout each period. |
| c | The amounts reported for a share outstanding may not accord with the change in aggregate gains and losses in securities for the fiscal period due to the timing of capital share transactions in relation to the fluctuating market values of the Fund’s underlying securities. |
| d | Not annualized. |
| e | Annualized for periods of less than one year. |
| f | Portfolio turnover rates exclude portfolio securities received or delivered as a result of processing capital share transactions in Creation Units. |
See notes to financial statements.
FINANCIAL HIGHLIGHTS | 51 |
Table of Contents
iSHARES®, INC.
iShares, Inc. (the “Company”) is registered under the Investment Company Act of 1940, as amended (the “1940 Act”), as an open-end management investment company. The Company was incorporated under the laws of the State of Maryland on September 1, 1994 pursuant to amended and restated Articles of Incorporation.
These financial statements relate only to the following funds (each, a “Fund,” and collectively, the “Funds”):
| iShares ETF | Diversification Classification | |
MSCI All Country World Minimum Volatility | Non-diversified | |
MSCI Emerging Markets EMEA | Non-diversified | |
MSCI Frontier 100 | Non-diversified | |
MSCI World | Diversified |
The investment objective of each Fund is to seek investment results that correspond generally to the price and yield performance, before fees and expenses, of its underlying index. The investment adviser uses a “passive” or index approach to try to achieve each Fund’s investment objective.
Pursuant to the Company’s organizational documents, the Funds’ officers and directors are indemnified against certain liabilities that may arise out of the performance of their duties to the Funds. Additionally, in the normal course of business, the Funds enter into contracts with service providers that contain general indemnification clauses. The Funds’ maximum exposure under these arrangements is unknown as this would involve future claims that may be made against the Funds that have not yet occurred.
| 1. | SIGNIFICANT ACCOUNTING POLICIES |
The following significant accounting policies are consistently followed by the Funds in the preparation of their financial statements in conformity with accounting principles generally accepted in the United States of America (“U.S. GAAP”). The preparation of financial statements in conformity with U.S. GAAP requires management to make certain estimates and assumptions that affect the reported amounts of assets and liabilities and disclosures of contingent assets and liabilities at the date of the financial statements and the reported amounts of revenue and expenses during the reporting period. Actual results could differ from those estimates. Each Fund is considered an investment company under U.S. GAAP and follows the accounting and reporting guidance applicable to investment companies in the Financial Accounting Standards Board Accounting Standards Codification Topic 946 (ASC 946).
SECURITY VALUATION
Each Fund’s investments are valued at fair value each day that the Fund’s listing exchange is open and, for financial reporting purposes, as of the report date should the reporting period end on a day that the Fund’s listing exchange is not open. U.S. GAAP defines fair value as the price a fund would receive to sell an asset or pay to transfer a liability in an orderly transaction between market participants at the measurement date. The BlackRock Global Valuation Methodologies Committee (the “Global Valuation Committee”) provides oversight of the valuation of investments for the Funds. The investments of each Fund are valued pursuant to policies and procedures developed by the Global Valuation Committee and approved by the Board of Directors of the Company (the “Board”).
| • | Equity investments traded on a recognized securities exchange are valued at that day’s last reported trade price or the official closing price, as applicable, on the exchange where the stock is primarily traded. Equity investments traded on a recognized exchange for which there were no sales on that day are valued at the last traded price. |
| • | Open-end U.S. mutual funds are valued at that day’s published net asset value (NAV). |
| 52 | 2014 iSHARES ANNUAL REPORTTO SHAREHOLDERS |
Table of Contents
Notes to Financial Statements (Continued)
iSHARES®, INC.
In the event that application of these methods of valuation results in a price for an investment which is deemed not to be representative of the fair value of such investment or if a price is not available, the investment will be valued based upon other available factors deemed relevant by the Global Valuation Committee, in accordance with policies approved by the Board. These factors include but are not limited to (i) attributes specific to the investment; (ii) the principal market for the investment; (iii) the customary participants in the principal market for the investment; (iv) data assumptions by market participants for the investment, if reasonably available; (v) quoted prices for similar investments in active markets; and (vi) other factors, such as future cash flows, interest rates, yield curves, volatilities, prepayment speeds, loss severities, credit risks and/or default rates. Valuations based on such factors are reported to the Board on a quarterly basis.
The Global Valuation Committee employs various methods for calibrating valuation approaches for investments where an active market does not exist, including regular due diligence of the Company’s pricing vendors, a regular review of key inputs and assumptions, transactional back-testing or disposition analysis to compare unrealized gains and losses to realized gains and losses, reviews of missing or stale prices, reviews of large movements in market values, and reviews of market related activity.
Fair value pricing could result in a difference between the prices used to calculate a Fund’s net asset value and the prices used by the Fund’s underlying index, which in turn could result in a difference between the Fund’s performance and the performance of the Fund’s underlying index.
Various inputs are used in determining the fair value of financial instruments. Inputs may be based on independent market data (“observable inputs”) or they may be internally developed (“unobservable inputs”). These inputs are categorized into a disclosure hierarchy consisting of three broad levels for financial reporting purposes. The level of a value determined for a financial instrument within the fair value hierarchy is based on the lowest level of any input that is significant to the fair value measurement in its entirety. The categorization of a value determined for a financial instrument within the hierarchy is based upon the pricing transparency of the instrument and is not necessarily an indication of the risk associated with investing in the instrument. The three levels of the fair value hierarchy are as follows:
| • | Level 1 — Unadjusted quoted prices in active markets for identical assets or liabilities; |
| • | Level 2 — Inputs other than quoted prices included within Level 1 that are observable for the asset or liability either directly or indirectly, including quoted prices for similar assets or liabilities in active markets, quoted prices for identical or similar assets or liabilities in markets that are not considered to be active, inputs other than quoted prices that are observable for the asset or liability (such as exchange rates, financing terms, interest rates, yield curves, volatilities, prepayment speeds, loss severities, credit risks and default rates) or other market-corroborated inputs; and |
| • | Level 3 — Unobservable inputs for the asset or liability, including the Global Valuation Committee’s assumptions used in determining the fair value of investments. |
Changes in valuation techniques may result in transfers in or out of an assigned level within the disclosure hierarchy. In accordance with the Company’s policy, transfers between different levels of the fair value hierarchy are deemed to have occurred as of the beginning of the reporting period.
NOTESTO FINANCIAL STATEMENTS | 53 |
Table of Contents
Notes to Financial Statements (Continued)
iSHARES®, INC.
The following table summarizes the value of each of the Funds’ investments according to the fair value hierarchy as of August 31, 2014. The breakdown of each Fund’s investments into major categories is disclosed in its respective schedule of investments.
iShares ETF and | Investments | |||||||||||||||
| Level 1 | Level 2 | Level 3 | Total | |||||||||||||
MSCI All Country World Minimum Volatility | ||||||||||||||||
Assets: | ||||||||||||||||
Common Stocks | $ | 1,273,829,321 | $ | — | $ | — | $ | 1,273,829,321 | ||||||||
Preferred Stocks | 3,200,554 | — | — | 3,200,554 | ||||||||||||
Rights | — | 88,505 | — | 88,505 | ||||||||||||
Money Market Funds | 36,552,239 | — | — | 36,552,239 | ||||||||||||
|
|
|
|
|
|
|
| |||||||||
| $ | 1,313,582,114 | $ | 88,505 | $ | — | $ | 1,313,670,619 | |||||||||
|
|
|
|
|
|
|
| |||||||||
MSCI Emerging Markets EMEA | ||||||||||||||||
Assets: | ||||||||||||||||
Common Stocks | $ | 10,206,268 | $ | — | $ | 19 | $ | 10,206,287 | ||||||||
Preferred Stocks | 134,195 | — | — | 134,195 | ||||||||||||
Money Market Funds | 29,958 | — | — | 29,958 | ||||||||||||
|
|
|
|
|
|
|
| |||||||||
| $ | 10,370,421 | $ | — | $ | 19 | $ | 10,370,440 | |||||||||
|
|
|
|
|
|
|
| |||||||||
MSCI Frontier 100 | ||||||||||||||||
Assets: | ||||||||||||||||
Common Stocks | $ | 796,724,364 | $ | 98 | $ | — | $ | 796,724,462 | ||||||||
Convertible Bonds | — | — | 0 | a | 0 | a | ||||||||||
|
|
|
|
|
|
|
| |||||||||
| $ | 796,724,364 | $ | 98 | $ | 0 | a | $ | 796,724,462 | ||||||||
|
|
|
|
|
|
|
| |||||||||
MSCI World | ||||||||||||||||
Assets: | ||||||||||||||||
Common Stocks | $ | 167,707,002 | $ | 9,031 | $ | — | $ | 167,716,033 | ||||||||
Preferred Stocks | 347,757 | — | — | 347,757 | ||||||||||||
Money Market Funds | 2,025,718 | — | — | 2,025,718 | ||||||||||||
|
|
|
|
|
|
|
| |||||||||
| $ | 170,080,477 | $ | 9,031 | $ | — | $ | 170,089,508 | |||||||||
|
|
|
|
|
|
|
| |||||||||
| a | Rounds to less than $1. |
SECURITY TRANSACTIONS AND INCOME RECOGNITION
Security transactions are accounted for on trade date. Dividend income and capital gain distributions, if any, are recognized on the ex-dividend date, net of any foreign taxes withheld at source. Any taxes withheld that are reclaimable from foreign tax authorities as of August 31, 2014 are reflected in dividends receivable. Non-cash dividends received in the form of stock in an elective dividend, if any, are recorded as dividend income at fair value. Distributions received by the Funds may include a return of capital that is estimated by management. Such amounts are recorded as a reduction of the cost of investments or reclassified to capital gains. Interest income is accrued daily. Realized gains and losses on investment transactions are determined using the specific identification method.
| 54 | 2014 iSHARES ANNUAL REPORTTO SHAREHOLDERS |
Table of Contents
Notes to Financial Statements (Continued)
iSHARES®, INC.
FOREIGN CURRENCY TRANSLATION
The accounting records of the Funds are maintained in U.S. dollars. Foreign currencies, as well as investment securities and other assets and liabilities denominated in foreign currencies, are translated into U.S. dollars using exchange rates deemed appropriate by the investment adviser. Purchases and sales of securities, income receipts and expense payments are translated into U.S. dollars on the respective dates of such transactions.
Each Fund does not isolate the effect of fluctuations in foreign exchange rates from the effect of fluctuations in the market prices of securities. Such fluctuations are reflected by the Funds as a component of realized and unrealized gains and losses from investments for financial reporting purposes.
FOREIGN TAXES
The Funds may be subject to foreign taxes (a portion of which may be reclaimable) on income, stock dividends, capital gains on investments, or certain foreign currency transactions. All foreign taxes are recorded in accordance with the applicable foreign tax regulations and rates that exist in the foreign jurisdictions in which the Funds invest. These foreign taxes, if any, are paid by the Funds and are reflected in their statements of operations as follows: foreign taxes withheld at source are presented as a reduction of income, foreign taxes on securities lending income are presented as a reduction of securities lending income, foreign taxes on stock dividends are presented as “other foreign taxes,” and foreign taxes on capital gains from sales of investments and foreign taxes on foreign currency transactions are included in their respective net realized gain (loss) categories. Foreign taxes payable or deferred as of August 31, 2014, if any, are disclosed in the Funds’ statements of assets and liabilities.
DISTRIBUTIONS TO SHAREHOLDERS
Dividends and distributions paid by each Fund are recorded on the ex-dividend dates. Distributions are determined on a tax basis and may differ from net investment income and net realized capital gains for financial reporting purposes. Dividends and distributions are paid in U.S. dollars and cannot be automatically reinvested in additional shares of the Funds.
LOANS OF PORTFOLIO SECURITIES
Each Fund may lend its investment securities to approved borrowers, such as brokers, dealers and other financial institutions. The borrower pledges and maintains with the Fund collateral consisting of cash, an irrevocable letter of credit issued by a bank, or securities issued or guaranteed by the U.S. government. The initial collateral received by each Fund is required to have a value of at least 102% of the current value of the loaned securities for securities traded on U.S. exchanges and a value of at least 105% for all other securities. The collateral is maintained thereafter, at a value equal to at least 100% of the current value of the securities on loan. The market value of the loaned securities is determined at the close of each business day of the Funds and any additional required collateral is delivered to the Funds on the next business day. During the term of the loan, each Fund is entitled to all distributions made on or in respect of the loaned securities. Loans of securities are terminable at any time and the borrower, after notice, is required to return borrowed securities within the standard time period for settlement of securities transactions.
Any cash received as collateral for securities on loan may be reinvested in certain short-term instruments either directly on behalf of a fund or through one or more joint accounts or money market funds, including those managed by BlackRock Fund Advisors (“BFA”), the Funds’ investment adviser, or its affiliates. As of August 31, 2014, any securities on loan were collateralized by cash. The cash collateral received was invested in money market funds managed by BFA and is disclosed in the schedules of investments. The value of any securities on loan as of August 31, 2014 and the value of the related collateral are disclosed in the statements of assets and liabilities. Income earned by the Funds from securities lending is disclosed in the statements of operations.
NOTESTO FINANCIAL STATEMENTS | 55 |
Table of Contents
Notes to Financial Statements (Continued)
iSHARES®, INC.
The risks of securities lending include the risk that the borrower may not provide additional collateral when required or may not return the securities when due. To mitigate these risks, the Funds benefit from a borrower default indemnity provided by BlackRock, Inc. (“BlackRock”). BlackRock’s indemnity allows for full replacement of securities lent. Each Fund could suffer a loss if the value of the investments purchased with cash collateral falls below the value of the cash collateral received.
Securities lending transactions are entered into by the Funds under Master Securities Lending Agreements (“MSLA”) which provide the right, in the event of default (including bankruptcy or insolvency) for the non-defaulting party to liquidate the collateral and calculate a net exposure to the defaulting party or request additional collateral. In the event that a borrower defaults, a Fund, as lender, would offset the market value of the collateral received against the market value of the securities loaned. The value of the collateral is typically greater than that of the market value of the securities loaned, leaving the lender with a net amount payable to the defaulting party. However, bankruptcy or insolvency laws of a particular jurisdiction may impose restrictions on or prohibitions against such a right of offset in the event of an MSLA counterparty’s bankruptcy or insolvency. Under the MSLA, the borrower can resell or re-pledge the loaned securities, and a Fund can reinvest cash collateral, or, upon an event of default, resell or re-pledge the collateral.
The following table is a summary of each Fund’s securities lending agreements which are subject to offset under an MSLA as of August 31, 2014:
| iShares ETF | Market Value of Securities on Loan | Cash Collateral Received a | Net Amount | |||||||||
MSCI All Country World Minimum Volatility | $ | 35,033,138 | $ | 35,033,138 | $ | — | ||||||
MSCI Emerging Markets EMEA | 26,966 | 26,966 | — | |||||||||
MSCI World | 1,794,237 | 1,794,237 | — | |||||||||
| a | Collateral received in excess of the market value of securities on loan is not presented for financial reporting purposes. The total collateral received is disclosed in each Fund’s statement of assets and liabilities. |
RECENT ACCOUNTING STANDARD
In June 2014, the Financial Accounting Standards Board issued guidance to improve the financial reporting of reverse repurchase agreements and other similar transactions. The guidance will require expanded disclosure for entities that enter into reverse repurchase agreements and similar transactions accounted for as secured borrowings, including securities lending. The guidance is effective for financial statements for fiscal years beginning after December 15, 2014, and interim periods within those fiscal years. Management is evaluating the impact, if any, of this guidance on the Funds’ financial statements and disclosures.
| 2. | INVESTMENT ADVISORY AGREEMENT AND OTHER TRANSACTIONS WITH AFFILIATES |
Pursuant to an Investment Advisory Agreement with the Company, BFA manages the investment of each Fund’s assets. BFA is a California corporation indirectly owned by BlackRock. Under the Investment Advisory Agreement, BFA is responsible for substantially all expenses of the Funds, except interest, taxes, brokerage commissions and other expenses connected with the execution of portfolio transactions, distribution fees, litigation expenses and any extraordinary expenses.
| 56 | 2014 iSHARES ANNUAL REPORTTO SHAREHOLDERS |
Table of Contents
Notes to Financial Statements (Continued)
iSHARES®, INC.
For its investment advisory services to the iShares MSCI All Country World Minimum Volatility ETF, BFA is entitled to an annual investment advisory fee based on the Fund’s allocable portion of the aggregate of the average daily net assets of the Fund and certain other iShares funds, as follows:
| Investment Advisory Fee | Aggregate Average Daily Net Assets | ||||
| 0.350 | % | First $30 billion | |||
| 0.320 | Over $30 billion, up to and including $60 billion | ||||
| 0.280 | Over $60 billion, up to and including $90 billion | ||||
| 0.252 | Over $90 billiona | ||||
| a | Breakpoint level added effective July 1, 2014. |
BFA has voluntarily waived a portion of its investment advisory fees for the iShares MSCI All Country World Minimum Volatility ETF in the amount of $1,493,893.
BFA has contractually agreed to waive a portion of its investment advisory fees for the iShares MSCI All Country World Minimum Volatility ETF through December 31, 2015 in an amount equal to the investment advisory fees payable on the amount of the Fund’s investment in other iShares funds. In association with this agreement, for the year ended August 31, 2014, BFA waived its investment advisory fees for the iShares MSCI All Country World Minimum Volatility ETF in the amount of $6,390.
Effective September 12, 2014, BFA has contractually agreed to waive an additional portion of its investment advisory fees for the iShares MSCI All Country World Minimum Volatility ETF through December 31, 2015 in order to limit total annual operating expenses to 0.20% of average daily net assets.
For its investment advisory services to each Fund, BFA is entitled to an annual investment advisory fee based on the average daily net assets of each Fund as follows:
| iShares ETF | Investment Advisory Fee | |||
MSCI Emerging Markets EMEA | 0.68 | % | ||
MSCI Frontier 100 | 0.79 | |||
MSCI World | 0.24 | |||
BFA has contractually agreed to waive a portion of its investment advisory fees for the iShares MSCI Emerging Markets EMEA ETF through December 31, 2015 in order to limit total annual operating expenses to 0.49% of average daily net assets.
The U.S. Securities and Exchange Commission has issued an exemptive order which permits BlackRock Institutional Trust Company, N.A. (“BTC”), an affiliate of BFA, to serve as securities lending agent for the Funds, subject to applicable conditions. As securities lending agent, BTC bears all operational costs directly related to securities lending. Effective January 1, 2014, each Fund is responsible for fees in connection with the investment of cash collateral received for securities on loan in a money market fund managed by BFA, however, BTC has agreed to reduce the amount of securities lending income it receives in order to effectively limit the collateral investment fees each Fund bears to an annual rate of 0.04% (the “collateral investment fees”). Securities lending income is equal to the total of income earned from the reinvestment of cash collateral, net of fees and other payments to and from borrowers of securities, and less the collateral investment fees. The Funds retain a portion of securities lending income and remit a remaining portion to BTC as compensation for its services as securities lending agent.
NOTESTO FINANCIAL STATEMENTS | 57 |
Table of Contents
Notes to Financial Statements (Continued)
iSHARES®, INC.
Pursuant to a securities lending agreement effective January 1, 2014, (i) the iShares MSCI World ETF (the “Group 1 Fund”) retains 70% of securities lending income and (ii) the amount retained can never be less than 65% of the total of securities lending income plus the collateral investment fees.
Pursuant to a securities lending agreement effective January 1, 2014, (i) the iShares MSCI All Country World Minimum Volatility ETF, iShares MSCI Emerging Markets EMEA ETF and iShares MSCI Frontier 100 ETF (the “Group 2 Funds”) retain 75% of securities lending income and (ii) these amounts can never be less than 65% of the total of securities lending income plus the collateral investment fees.
In addition, commencing the business day following the date that the aggregate securities lending income plus the collateral investment fees generated across all 1940 Act iShares exchange-traded funds (the “iShares ETF Complex”) in a given calendar year exceeds the aggregate securities lending income generated across the iShares ETF Complex in calendar year 2013 and pursuant to a securities lending agreement, the Group 1 Fund will (i) receive for the remainder of that calendar year 75% of securities lending income and (ii) the amount retained can never be less than 65% of the total of securities lending income plus the collateral investment fees. Each Group 2 Fund will (i) receive for the remainder of that calendar year 80% of securities lending income and (ii) these amounts can never be less than 65% of the total of securities lending income plus the collateral investment fees.
For the year ended August 31, 2014, each Fund paid to BTC the following amounts in total for securities lending agent services and collateral investment fees:
| iShares ETF | Fees Paid to BTC | |||
MSCI All Country World Minimum Volatility | $ | 69,852 | ||
MSCI Emerging Markets EMEA | 828 | |||
MSCI World | 6,227 | |||
Prior to January 1, 2014, each Fund retained 65% of securities lending income and paid no collateral investment fees.
BlackRock Investments, LLC, an affiliate of BFA, is the distributor for each Fund. Pursuant to the distribution agreement, BFA is responsible for any fees or expenses for distribution services provided to the Funds.
Cross trades for the year ended August 31, 2014, if any, were executed by the Funds pursuant to Rule 17a-7 under the 1940 Act. Cross trading is the buying or selling of portfolio securities between funds to which BFA (or an affiliate) serves as investment adviser. At its regularly scheduled quarterly meetings, the Board reviews such transactions as of the most recent calendar quarter for compliance with the requirements and restrictions set forth by Rule 17a-7.
Each Fund may invest its positive cash balances in certain money market funds managed by BFA or an affiliate. The income earned on these temporary cash investments is included in “Interest – affiliated” in the statements of operations.
The PNC Financial Services Group, Inc. is the largest stockholder of BlackRock and is considered to be an affiliate of the Funds for 1940 Act purposes.
Certain Funds, in order to improve their portfolio liquidity and their ability to track their respective underlying index, may invest in shares of other iShares funds that invest in securities in each Fund’s respective underlying index.
| 58 | 2014 iSHARES ANNUAL REPORTTO SHAREHOLDERS |
Table of Contents
Notes to Financial Statements (Continued)
iSHARES®, INC.
Investments in issuers considered to be affiliates of the Funds (excluding money market funds) during the year ended August 31, 2014, for purposes of Section 2(a)(3) of the 1940 Act, were as follows:
| iShares ETF and Name of Affiliated Issuer | Shares Held at Beginning of year | Shares Purchased | Shares Sold | Shares Held at End of year | Value at End of year | Dividend Income | Net Realized Gain (Loss) | |||||||||||||||||||||
MSCI All Country World Minimum Volatility | ||||||||||||||||||||||||||||
iShares India 50 ETF | 135,154 | 5,900 | (141,054 | ) | — | $ | — | $ | — | $ | (28,611 | ) | ||||||||||||||||
|
|
|
|
|
| |||||||||||||||||||||||
MSCI World | ||||||||||||||||||||||||||||
BlackRock Inc. | 124 | 681 | (115 | ) | 690 | $ | 228,066 | $ | 4,693 | $ | 3,996 | |||||||||||||||||
PNC Financial Services Group Inc. (The) | 436 | 2,398 | (327 | ) | 2,507 | 212,468 | 3,780 | 5,212 | ||||||||||||||||||||
|
|
|
|
|
| |||||||||||||||||||||||
| $ | 440,534 | $ | 8,473 | $ | 9,208 | |||||||||||||||||||||||
|
|
|
|
|
| |||||||||||||||||||||||
Certain directors and officers of the Company are also officers of BTC and/or BFA.
| 3. | INVESTMENT PORTFOLIO TRANSACTIONS |
Purchases and sales of investments (excluding in-kind transactions and short-term investments) for the year ended August 31, 2014 were as follows:
| iShares ETF | Purchases | Sales | ||||||
MSCI All Country World Minimum Volatility | $ | 349,492,598 | $ | 264,969,951 | ||||
MSCI Emerging Markets EMEA | 1,822,609 | 1,712,896 | ||||||
MSCI Frontier 100 | 745,303,855 | 333,120,995 | ||||||
MSCI World | 7,333,338 | 6,002,597 | ||||||
In-kind transactions (see Note 4) for the year ended August 31, 2014 were as follows:
| iShares ETF | In-kind Purchases | In-kind Sales | ||||||
MSCI All Country World Minimum Volatility | $ | 169,594,921 | $ | 124,142,735 | ||||
MSCI Emerging Markets EMEA | 5,229,082 | — | ||||||
MSCI Frontier 100 | 14,632,474 | 14,254,486 | ||||||
MSCI World | 146,778,646 | 21,248,638 | ||||||
| 4. | CAPITAL SHARE TRANSACTIONS |
Capital shares are issued and redeemed by each Fund only in aggregations of a specified number of shares or multiples thereof (“Creation Units”) at net asset value. Except when aggregated in Creation Units, shares of each Fund are not redeemable. Transactions in capital shares for each Fund are disclosed in detail in the statements of changes in net assets.
The consideration for the purchase of Creation Units of a fund in the Company generally consists of the in-kind deposit of a designated portfolio of securities and a specified amount of cash. Certain funds in the Company may be offered in Creation Units
NOTESTO FINANCIAL STATEMENTS | 59 |
Table of Contents
Notes to Financial Statements (Continued)
iSHARES®, INC.
solely or partially for cash in U.S. dollars. Investors purchasing and redeeming Creation Units may pay a purchase transaction fee and a redemption transaction fee directly to State Street Bank and Trust Company, the Company’s administrator, to offset transfer and other transaction costs associated with the issuance and redemption of Creation Units, including Creation Units for cash. Investors transacting in Creation Units for cash may also pay an additional variable charge to compensate the relevant fund for certain transaction costs (i.e., stamp taxes, taxes on currency or other financial transactions, and brokerage costs) and market impact expenses relating to investing in portfolio securities. Such variable charges, if any, are included in “Proceeds from shares sold” in the statements of changes in net assets.
| 5. | MARKET AND CREDIT RISK |
In the normal course of business, each Fund’s investment activities exposes it to various types of risk associated with the financial instruments and markets in which it invests. The significant types of financial risks each Fund is exposed to include market risk and credit risk. Each Fund’s prospectus provides details of these and other types of risk.
BFA uses a “passive” or index approach to try to achieve each Fund’s investment objective following the securities included in its underlying index during upturns as well as downturns. BFA does not take steps to reduce market exposure or to lessen the effects of a declining market. Divergence from the underlying index and the composition of the portfolio is monitored by BFA.
MARKET RISK
Market risk arises mainly from uncertainty about future values of financial instruments influenced by price, currency and interest rate movements. It represents the potential loss each Fund may suffer through holding market positions in the face of market movements. Each Fund is exposed to market risk by virtue of its investment in equity and financial derivative instruments. The fair value of securities held by the Funds may decline due to general market conditions, economic trends or events that are not specifically related to the issuers of the securities including local, regional or global political, social or economic instability or to factors that affect a particular industry or group of industries. The extent of each Fund’s exposure to market risk is the market value of the investments held as shown in the Fund’s schedule of investments.
A diversified portfolio, where this is appropriate and consistent with a fund’s objectives, minimizes the risk that a price change of a particular investment will have a material impact on the NAV of a fund. The investment concentrations within each Fund’s portfolio are disclosed in its schedule of investments.
Each Fund invests a substantial amount of its assets in securities of non-U.S. issuers that trade in non-U.S. markets. This involves certain considerations and risks not typically associated with securities of U.S. issuers. Such risks include, but are not limited to: generally less liquid and less efficient securities markets; generally greater price volatility; exchange rate fluctuations and exchange controls; imposition of restrictions on the expatriation of funds or other assets of the Fund; less publicly available information about issuers; the imposition of withholding or other taxes; higher transaction and custody costs; settlement delays and risk of loss attendant in settlement procedures; difficulties in enforcing contractual obligations; less regulation of securities markets; different accounting, disclosure and reporting requirements; more substantial governmental involvement in the economy; higher inflation rates; greater social, economic and political uncertainties; the risk of nationalization or expropriation of assets; and the risk of war. These risks are heightened for investments in issuers from countries with less developed markets.
The United States and the European Union, along with the regulatory bodies of a number of countries including Japan, Australia and Canada (collectively, “Sanctioning Bodies”), have imposed sectorial economic sanctions on certain Russian individuals and Russian corporate entities which include prohibitions on transacting in or dealing in new debt of longer than 30 or 90 days maturity or new equity of such issuers. Securities held by the iShares MSCI All Country World Minimum Volatility ETF and iShares MSCI Emerging Markets EMEA ETF issued prior to the date of the sanctions being imposed are not currently subject to any restrictions under the sanctions. However, compliance with each of these sanctions may impair the ability of a Fund to buy,
| 60 | 2014 iSHARES ANNUAL REPORTTO SHAREHOLDERS |
Table of Contents
Notes to Financial Statements (Continued)
iSHARES®, INC.
sell, hold, receive or deliver the affected securities or other securities of such issuers. The Sanctioning Bodies could also institute broader sanctions on Russia. These sanctions, or even the threat of further sanctions, may result in the decline of the value and liquidity of Russian securities, a weakening of the ruble or other adverse consequences to the Russian economy. Current or future sanctions may result in Russia taking counter measures or retaliatory actions, which may further impair the value and liquidity of Russian securities. These retaliatory measures may include the immediate freeze of Russian assets held by a Fund.
CREDIT RISK
Credit risk is the risk that an issuer or guarantor of debt instruments or the counterparty to a financial transaction, including derivatives contracts, repurchase agreements or loans of portfolio securities, is unable or unwilling to make timely interest and/or principal payments or to otherwise honor its obligations. BFA and its affiliates manage counterparty credit risk by entering into transactions only with counterparties that it believes have the financial resources to honor their obligations and by monitoring the financial stability of those counterparties. Financial assets, which potentially expose the Funds to issuer and counterparty credit risks, consist principally of financial instruments and receivables due from counterparties. The extent of each Fund’s exposure to credit and counterparty risks with respect to those financial assets is approximated by their value recorded in the statement of assets and liabilities.
| 6. | INCOME TAX INFORMATION |
Each Fund is treated as an entity separate from the Company’s other funds for federal income tax purposes. It is the policy of each Fund to qualify as a regulated investment company by complying with the provisions applicable to regulated investment companies, as defined under Subchapter M of the Internal Revenue Code of 1986, as amended, and to annually distribute substantially all of its ordinary income and any net capital gains (taking into account any capital loss carryforwards) sufficient to relieve it from all, or substantially all, federal income and excise taxes. Accordingly, no provision for federal income taxes is required.
U.S. GAAP requires that certain components of net assets be adjusted to reflect permanent differences between financial and tax reporting. These reclassifications have no effect on net assets or net asset values per share. The following permanent differences as of August 31, 2014, attributable to the use of equalization, passive foreign investment companies, foreign currency transactions and realized gains (losses) from in-kind redemptions, were reclassified to the following accounts:
| iShares ETF | Paid-in Capital | Undistributed Net Investment Income/Distributions in Excess of Net Investment Income | Undistributed Net Realized Gain/Accumulated Net Realized Loss | |||||||||
MSCI All Country World Minimum Volatility | $ | 29,914,303 | $ | 353,692 | $ | (30,267,995 | ) | |||||
MSCI Emerging Markets EMEA | — | (4,049 | ) | 4,049 | ||||||||
MSCI Frontier 100 | 7,001,749 | (1,616,408 | ) | (5,385,341 | ) | |||||||
MSCI World | 3,474,085 | 4,153 | (3,478,238 | ) | ||||||||
The tax character of distributions paid during the years ended August 31, 2014 and August 31, 2013 was as follows:
| iShares ETF | 2014 | 2013 | ||||||
MSCI All Country World Minimum Volatility | ||||||||
Ordinary income | $ | 29,115,840 | $ | 21,734,941 | ||||
|
|
|
| |||||
NOTESTO FINANCIAL STATEMENTS | 61 |
Table of Contents
Notes to Financial Statements (Continued)
iSHARES®, INC.
| iShares ETF | 2014 | 2013 | ||||||
MSCI Emerging Markets EMEA | ||||||||
Ordinary income | $ | 158,907 | $ | 177,671 | ||||
|
|
|
| |||||
MSCI Frontier 100 | ||||||||
Ordinary income | $ | 15,334,501 | $ | 2,007,790 | ||||
Return of capital | — | 180,295 | ||||||
|
|
|
| |||||
| $ | 15,334,501 | $ | 2,188,085 | |||||
|
|
|
| |||||
MSCI World | ||||||||
Ordinary income | $ | 2,735,328 | $ | 292,821 | ||||
|
|
|
| |||||
As of August 31, 2014, the tax components of accumulated net earnings (losses) were as follows:
| iShares ETF | Undistributed Ordinary Income | Undistributed Long-Term | Capital Loss Carryforwards | Net Unrealized Gains (Losses) a | Qualified Late-Year Losses b | Total | ||||||||||||||||||
MSCI All Country World Minimum Volatility | $ | 6,482,255 | $ | — | $ | (5,163,254 | ) | $ | 169,820,245 | $ | (10,467,127 | ) | $ | 160,672,119 | ||||||||||
MSCI Emerging Markets EMEA | 89,048 | — | (138,849 | ) | (212,440 | ) | (316,009 | ) | (578,250 | ) | ||||||||||||||
MSCI Frontier 100 | 21,438,582 | 3,227,083 | — | 68,447,397 | — | 93,113,062 | ||||||||||||||||||
MSCI World | 644,116 | — | (82,372 | ) | 13,059,431 | (325,639 | ) | 13,295,536 | ||||||||||||||||
| a | The difference between book-basis and tax-basis unrealized gains (losses) was attributable primarily to the tax deferral of losses on wash sales and the realization for tax purpose of unrealized gains on investments in passive foreign investment companies. |
| b | The Funds have elected to defer certain qualified late-year losses and recognize such losses in the next taxable year. |
As of August 31, 2014, the Funds had non-expiring capital loss carryforwards available to offset future realized capital gains as follows:
| iShares ETF | Non- Expiring | |||
MSCI All Country World Minimum Volatility | $ | 5,163,254 | ||
MSCI Emerging Markets EMEA | 138,849 | |||
MSCI World | 82,372 | |||
The Funds may own shares in certain foreign investment entities, referred to, under U.S. tax law, as “passive foreign investment companies.” The Funds may elect to mark-to-market annually the shares of each passive foreign investment company and would be required to distribute to shareholders any such marked-to-market gains.
| 62 | 2014 iSHARES ANNUAL REPORTTO SHAREHOLDERS |
Table of Contents
Notes to Financial Statements (Continued)
iSHARES®, INC.
As of August 31, 2014, gross unrealized appreciation and gross unrealized depreciation based on cost for federal income tax purposes were as follows:
| iShares ETF | Tax Cost | Gross Unrealized Appreciation | Gross Unrealized Depreciation | Net Unrealized Appreciation (Depreciation) | ||||||||||||
MSCI All Country World Minimum Volatility | $ | 1,143,826,629 | $ | 184,277,614 | $ | (14,433,624 | ) | $ | 169,843,990 | |||||||
MSCI Emerging Markets EMEA | 10,582,759 | 1,006,669 | (1,218,988 | ) | (212,319 | ) | ||||||||||
MSCI Frontier 100 | 727,144,251 | 93,619,041 | (24,038,830 | ) | 69,580,211 | |||||||||||
MSCI World | 157,027,449 | 15,698,798 | (2,636,739 | ) | 13,062,059 | |||||||||||
Management has analyzed tax laws and regulations and their application to the Funds as of August 31, 2014, inclusive of the open tax return years, and does not believe there are any uncertain tax positions that require recognition of a tax liability in the Funds’ financial statements.
| 7. | LINE OF CREDIT |
The iShares MSCI Frontier 100 ETF, along with certain other iShares funds, is a party to a $150 million credit agreement with State Street Bank and Trust Company, which expires October 28, 2015. The line of credit may be used for temporary or emergency purposes, including redemptions, settlement of trades and rebalancing of portfolio holdings. The credit agreement has the following terms: a commitment fee of 0.08% per annum on the unused portion of the credit agreement and interest at a rate equal to the higher of (a) the one-month LIBOR plus 1.00% per annum or (b) the U.S. Federal Funds rate plus 1.00% per annum on amounts borrowed. The commitment fee is allocated to each fund participating in the credit agreement based on each fund’s pro-rata share of the aggregate average daily value of assets invested in local securities of certain foreign markets.
For the year ended August 31, 2014, the Fund’s maximum amount borrowed, the average borrowings and the weighted average interest rate under the credit agreement were $23,000,000, $460,274 and 1.15%, respectively.
| 8. | SUBSEQUENT EVENTS |
Management has evaluated the impact of all subsequent events on the Funds through the date the financial statements were available to be issued and has determined that there were no subsequent events requiring adjustment or disclosure in the financial statements.
NOTESTO FINANCIAL STATEMENTS | 63 |
Table of Contents
Report of Independent Registered Public Accounting Firm
To the Shareholders and Board of Directors of
iShares, Inc.:
In our opinion, the accompanying statements of assets and liabilities, including the schedules of investments, and the related statements of operations and of changes in net assets and the financial highlights present fairly, in all material respects, the financial position of iShares MSCI All Country World Minimum Volatility ETF, iShares MSCI Emerging Markets EMEA ETF, iShares MSCI Frontier 100 ETF and iShares MSCI World ETF (the “Funds”) at August 31, 2014, the results of each of their operations, the changes in each of their net assets and their financial highlights for each of the periods presented, in conformity with accounting principles generally accepted in the United States of America. These financial statements and financial highlights (hereafter referred to as “financial statements”) are the responsibility of the Funds’ management; our responsibility is to express an opinion on these financial statements based on our audits. We conducted our audits of these financial statements in accordance with the standards of the Public Company Accounting Oversight Board (United States). Those standards require that we plan and perform the audit to obtain reasonable assurance about whether the financial statements are free of material misstatement. An audit includes examining, on a test basis, evidence supporting the amounts and disclosures in the financial statements, assessing the accounting principles used and significant estimates made by management, and evaluating the overall financial statement presentation. We believe that our audits, which included confirmation of securities at August 31, 2014 by correspondence with the custodian, transfer agent and brokers, provide a reasonable basis for our opinion.
PricewaterhouseCoopers LLP
San Francisco, California
October 22, 2014
| 64 | 2014 iSHARES ANNUAL REPORTTO SHAREHOLDERS |
Table of Contents
iSHARES®, INC.
For the fiscal year ended August 31, 2014, the Funds earned foreign source income and paid foreign taxes which they intend to pass through to their shareholders pursuant to Section 853 of the Internal Revenue Code (the “Code”) as follows:
| iShares ETF | Foreign Source Income Earned | Foreign Taxes Paid | ||||||
MSCI Emerging Markets EMEA | $ | 320,508 | $ | 39,965 | ||||
MSCI Frontier 100 | 23,268,557 | 2,441,639 | ||||||
For corporate shareholders, the following percentages of the income dividends paid by the Funds during the fiscal year ended August 31, 2014 qualified for the dividends-received deduction:
| iShares ETF | Dividends- Received Deduction | |||
MSCI All Country World Minimum Volatility | 47.54 | % | ||
MSCI World | 46.34 | |||
Under Section 854(b)(2) of the Code, the Funds hereby designate the following maximum amounts as qualified dividend income for purposes of the maximum rate under Section 1(h)(11) of the Code for the fiscal year ended August 31, 2014:
| iShares ETF | Qualified Dividend Income | |||
MSCI All Country World Minimum Volatility | $ | 27,881,285 | ||
MSCI Emerging Markets EMEA | 198,872 | |||
MSCI Frontier 100 | 3,947,879 | |||
MSCI World | 2,735,328 | |||
In February 2015, shareholders will receive Form 1099-DIV which will include their share of qualified dividend income distributed during the calendar year 2014. Shareholders are advised to check with their tax advisers for information on the treatment of these amounts on their income tax returns.
TAX INFORMATION | 65 |
Table of Contents
Board Review and Approval of Investment Advisory
Contract
iSHARES®, INC.
I. iShares MSCI All Country World Minimum Volatility ETF
Under Section 15(c) of the Investment Company Act of 1940 (the “1940 Act”), the Company’s Board of Directors (the “Board”), including a majority of Directors who are not “interested persons” of the Company (as that term is defined in the 1940 Act) (the “Independent Directors”), is required annually to consider and approve the Investment Advisory Contract between the Company and BFA (the “Advisory Contract”) on behalf of the Fund. The Independent Directors requested, and BFA provided, such information as the Independent Directors, with advice from independent counsel, deemed reasonably necessary to evaluate the Advisory Contract. A committee of Independent Directors (the “15(c) Committee”), with independent counsel, met with management on March 12, 2014, May 6, 2014, and May 12, 2014, to discuss the types of information the Independent Directors required and the manner in which management would organize and present such information. At a meeting held on May 16, 2014, management presented preliminary information to the Board relating to the continuance of the Advisory Contract, and the Board, including the Independent Directors, reviewed and discussed such information at length. The Independent Directors requested from management certain additional information, which management agreed to provide. At a meeting held on June 12-13, 2014, the Board, including the Independent Directors, reviewed the additional information provided by management in response to these requests. After extensive discussions, the Board, including all of the Independent Directors, approved the continuance of the Advisory Contract for the Fund, based on a review of qualitative and quantitative information provided by BFA, including the additional information management provided at the request of the Independent Directors. The Board noted its satisfaction with the extent and quality of information provided and its frequent interactions with management, as well as the detailed responses and other information provided by BFA. The Board also noted that the Board and BFA agreed to discuss potential enhancements and adjustments to the 15(c) process for the coming year. The Independent Directors were advised by their independent counsel throughout the process, including about the legal standards applicable to their review. In approving the Advisory Contract for the Fund, the Board, including the Independent Directors, considered the following factors, no one of which was controlling, and reached the following conclusions:
Expenses and Performance of the Fund — The Board reviewed statistical information prepared by Lipper Inc. (“Lipper”), an independent provider of investment company data, regarding the expense ratio components, including actual advisory fees, waivers/reimbursements, and gross and net total expenses of the Fund in comparison with the same information for other exchange traded funds (including funds sponsored by an “at cost” service provider) and, in the limited instances where no comparable ETFs existed and the comparison group would not otherwise be reasonable in Lipper’s judgment, pure index institutional mutual funds, objectively selected by Lipper as comprising the Fund’s applicable peer group pursuant to Lipper’s proprietary ETF methodology (the “Lipper Group”). The Board noted that, prior to 2014, Lipper had used a different methodology to determine the Fund’s Lipper group, which included mutual funds, closed-end funds, exchange traded funds, and/or funds with differing investment objective classifications, investment focuses and other characteristics (e.g. actively managed funds and funds sponsored by “at cost” service providers), as applicable. The Board further noted that, after consideration by the 15(c) Committee, the Board determined to use instead Lipper’s proprietary ETF methodology to determine the Fund’s Lipper Group. This determination was based on, among other considerations, the increased number and types of ETFs available for comparative purposes than was the case in prior years. The Board was provided with a detailed description of Lipper’s proprietary ETF methodology used by Lipper to determine the applicable Lipper Group and to prepare this information. At the Board’s request, Lipper provided, and the Board considered, information on the impact to the iShares funds’ comparative fee rankings that were attributable to the change from a pure index group methodology to Lipper’s proprietary ETF methodology. The Board further noted that due to the limitations in providing comparable funds in the Lipper Group, the statistical information provided in Lipper’s report may or may not provide meaningful direct comparisons to the Fund in all instances.
The Board also noted that the investment advisory fee rate and overall expenses for the Fund were within range of the median of the investment advisory fee rates and overall expenses of the funds in its Lipper Group.
| 66 | 2014 iSHARES ANNUAL REPORTTO SHAREHOLDERS |
Table of Contents
Board Review and Approval of Investment Advisory
Contract (Continued)
iSHARES®, INC.
In addition, the Board reviewed statistical information prepared by Lipper regarding the performance of the Fund for the one-, three-, five-, ten-year, and since inception periods, as applicable, and the “last quarter” period ended December 31, 2013, and a comparison of the Fund’s performance to its performance benchmark index for the same periods. To the extent that any of the comparison funds included in the Lipper Group track the same index as the Fund, Lipper also provided, and the Board reviewed, a comparison of the Fund’s performance to that of such relevant comparison funds for the same periods. The Board noted that the Fund generally performed in line with its respective performance benchmark index over the relevant periods. In considering this information, the Board noted that the Lipper Group may include funds that are not exchange traded funds or index funds, and that may have different investment objectives and/or benchmarks from the Fund. In addition, the Board noted that the Fund seeks to track its own benchmark index and that, during the prior year, the Board received periodic reports on the Fund’s performance in comparison with its relevant benchmark index. Such periodic comparative performance information, including detailed information on certain specific iShares funds requested by the Boards, was also considered.
Based on this review, the other factors considered at the meeting, and their general knowledge of ETF pricing, the Board concluded that the investment advisory fee rate and expense level and the historical performance of the Fund supported the Board’s approval of the continuance of the Advisory Contract for the coming year.
Nature, Extent and Quality of Services Provided by BFA — Based on management’s representations, including information about recent and proposed enhancements to the iShares business, including with respect to shareholder servicing and support, the Board expected that there would be no diminution in the scope of services required of or provided by BFA under the Advisory Contract for the coming year as compared to the scope of services provided by BFA during prior years. In reviewing the scope of these services, the Board considered BFA’s investment philosophy and experience, noting that BFA and its affiliates have committed significant resources over time, including during the past year, to supporting the Fund and its shareholders. The Board acknowledged that resources to support the iShares funds and their shareholders have been added or enhanced in recent years, including in such areas as investor education, product management, customized portfolio consulting support, capital markets support, and proprietary risk and performance analytics tools. The Board also considered BFA’s compliance program and its compliance record with respect to the Fund. In that regard, the Board noted that BFA reports to the Board about portfolio management and compliance matters on a periodic basis in connection with regularly scheduled meetings of the Board, and on other occasions as necessary and appropriate, and has provided information and made appropriate officers available as needed to provide further assistance with these matters. The Board also reviewed the background and experience of the persons responsible for the day-to-day management of the Fund, as well as the resources available to them in managing the Fund. In addition to the above considerations, the Board reviewed and considered detailed presentations regarding BFA’s investment performance, investment and risk management processes and strategies provided at the June 12-13, 2014 meeting and throughout the previous year, and matters related to BFA’s portfolio compliance policies and procedures. The Board noted that the Fund had met its investment objective consistently since its inception date.
Based on review of this information, and the performance information discussed above, the Board concluded that the nature, extent and quality of services provided by BFA to the Fund under the Advisory Contract supported the Board’s approval of the continuance of the Advisory Contract for the coming year.
Costs of Services Provided to the Fund and Profits Realized by BFA and Affiliates — The Board reviewed information about the profitability to BlackRock of the Fund based on the fees payable to BFA and its affiliates (including fees under the Advisory Contract), and all other sources of revenue and expense to BFA and its affiliates from the Fund’s operations for the last calendar year. The Board reviewed BlackRock’s profitability methodology for the iShares funds, noting that the 15(c) Committee had focused on the methodology and proposed presentation during its meetings. The Board discussed the sources of direct and ancillary revenue with management, including the revenues to BTC from securities lending by the Fund. The Board also discussed BFA’s profit margin as reflected in the Fund’s profitability analysis and reviewed information regarding potential
BOARD REVIEWAND APPROVALOF INVESTMENT ADVISORY CONTRACT | 67 |
Table of Contents
Board Review and Approval of Investment Advisory
Contract (Continued)
iSHARES®, INC.
economies of scale (as discussed below). Based on this review, the Board concluded that the profits realized by BFA and its affiliates under the Advisory Contract and from other relationships between the Fund and BFA and/or its affiliates, if any, were within a reasonable range in light of the factors considered.
Economies of Scale — The Board reviewed information regarding potential economies of scale or other efficiencies that may result from increases in the Fund’s assets, noting that the issue of economies of scale had been focused on extensively by the 15(c) Committee during its meetings and addressed by management. The Board and the 15(c) Committee reviewed information provided by BFA regarding scale benefits shared with the iShares funds through relatively low fee rates established at inception, breakpoints, waivers, or other fee reductions, as well as through additional investment in the iShares business and the provision of improved or additional infrastructure and services to the iShares funds and their shareholders. The Board and the 15(c) Committee received information regarding BlackRock’s historical profitability, including BFA’s and its affiliates’ costs in providing services. The cost information distinguished between fixed and variable costs, and explained how the level of fixed and variable costs, as well as the nature of such costs, may impact the existence or size of scale benefits. The Board noted that the Advisory Contract for the Fund already provided for breakpoints in the Fund’s investment advisory fee rate, and that, following negotiations, BFA and the Board had agreed to revise the Advisory Contract for the Fund to provide for additional breakpoints, as the assets of the Fund, on an aggregated basis with the assets of certain other iShares funds, increase. The Board noted that the revisions of the Advisory Contract to provide additional breakpoints had been subject to further negotiation after receipt of management’s proposal, and that at the request of the Board, management had modified its initial proposal regarding adding additional breakpoints to the Fund. The Board noted that it would continue to monitor the sharing of economies of scale to determine the appropriateness of adding new or revised breakpoints in the future. Based on this review, as well as the other factors considered at the meeting, the Board, recognizing its responsibility to consider this issue at least annually, concluded that the structure of the investment advisory fee rate reflects appropriate sharing of potential economies of scale with the Fund’s shareholders and supported the Board’s approval of the continuance of the Advisory Contract for the coming year.
Fees and Services Provided for Other Comparable Funds/Accounts Managed by BFA and its Affiliates — The Board received and considered information regarding the investment advisory/management fee rates for other funds/accounts in the U.S. for which BFA (or its affiliates) provides investment advisory/management services, including open-end and closed-end funds registered under the 1940 Act (including sub-advised funds), collective trust funds, separately managed accounts, and institutional separate accounts (together, the “Other Accounts”), and acknowledged BFA’s assertion that the iShares funds are fundamentally different investment vehicles from the Other Accounts. The Board noted that BFA and its affiliates do manage Other Accounts with a substantially similar investment objective and strategy as the Fund. The Board further noted that BFA provided the Board with detailed information regarding how the Other Accounts (particularly institutional clients) generally differ from the Fund, including in terms of the different, generally more extensive services provided to the Fund, as well as other significant differences in the approach of BFA and its affiliates to the Fund, on one hand, and Other Accounts, on the other. In that regard, the Board considered that the pricing of services to institutional clients is typically based on a number of factors beyond the nature and extent of the specific services to be provided and often depends on the overall relationship between the client and its affiliates and the adviser and its affiliates. In addition, the Board considered the relative complexity and inherent risks and challenges of managing and providing other services to the Fund, as a publicly traded exchange traded fund, as compared to the Other Accounts that are institutional clients in light of differing regulatory requirements and client-imposed mandates. The Board also considered the “all-inclusive” nature of the Fund’s advisory fee structure, and the Fund expenses borne by BFA under this arrangement. The Board noted that the investment advisory fee rate under the Advisory Contract for the Fund was generally higher than the investment advisory/management fee rates for the Other Accounts that are institutional clients of BFA (or its affiliates) and concluded that the differences appeared to be consistent with the factors discussed.
Other Benefits to BFA and/or its Affiliates — The Board reviewed the “fallout” benefits or ancillary revenue received by BFA and/or its affiliates in connection with the services provided to the Fund by BFA, such as payment of revenue to BTC, the Fund’s
| 68 | 2014 iSHARES ANNUAL REPORTTO SHAREHOLDERS |
Table of Contents
Board Review and Approval of Investment Advisory
Contract (Continued)
iSHARES®, INC.
securities lending agent, for loaning portfolio securities (which was included in the profit margins reviewed by the Board pursuant to BFA’s profitability methodology), and payment of advisory fees and/or administration fees to BFA and BTC (or their affiliates) in connection with any investments by the Fund in other funds for which BFA (or its affiliates) provides investment advisory services and/or administration services. The Board noted that BFA generally does not use soft dollars or consider the value of research or other services that may be provided to BFA (including its affiliates) in selecting brokers for portfolio transactions for the Fund. The Board further noted that any portfolio transactions on behalf of the Fund placed through a BFA affiliate or purchased from an underwriting syndicate in which a BFA affiliate participates, are reported to the Board pursuant to Rule 17e-1 or Rule 10f-3, as applicable, under the 1940 Act. The Board concluded that any such ancillary benefits would not be disadvantageous to the Fund’s shareholders and thus would not alter the Board’s conclusion with respect to the appropriateness of approving the continuance of the Advisory Contract for the coming year.
Based on the considerations described above, the Board determined that the Fund’s investment advisory fee rate under the Advisory Contract does not constitute a fee that is so disproportionately large as to bear no reasonable relationship to the services rendered and that could not have been the product of arm’s-length bargaining, and concluded that it is in the best interest of the Fund and its shareholders to approve the continuance of the Advisory Contract for the coming year.
II. iShares MSCI Emerging Markets EMEA ETF
Under Section 15(c) of the Investment Company Act of 1940 (the “1940 Act”), the Company’s Board of Directors (the “Board”), including a majority of Directors who are not “interested persons” of the Company (as that term is defined in the 1940 Act) (the “Independent Directors”), is required annually to consider and approve the Investment Advisory Contract between the Company and BFA (the “Advisory Contract”) on behalf of the Fund. The Independent Directors requested, and BFA provided, such information as the Independent Directors, with advice from independent counsel, deemed reasonably necessary to evaluate the Advisory Contract. A committee of Independent Directors (the “15(c) Committee”), with independent counsel, met with management on March 12, 2014, May 6, 2014, and May 12, 2014, to discuss the types of information the Independent Directors required and the manner in which management would organize and present such information. At a meeting held on May 16, 2014, management presented preliminary information to the Board relating to the continuance of the Advisory Contract, and the Board, including the Independent Directors, reviewed and discussed such information at length. The Independent Directors requested from management certain additional information, which management agreed to provide. At a meeting held on June 12-13, 2014, the Board, including the Independent Directors, reviewed the additional information provided by management in response to these requests. After extensive discussions, the Board, including all of the Independent Directors, approved the continuance of the Advisory Contract for the Fund, based on a review of qualitative and quantitative information provided by BFA, including the additional information management provided at the request of the Independent Directors. The Board noted its satisfaction with the extent and quality of information provided and its frequent interactions with management, as well as the detailed responses and other information provided by BFA. The Board also noted that the Board and BFA agreed to discuss potential enhancements and adjustments to the 15(c) process for the coming year. The Independent Directors were advised by their independent counsel throughout the process, including about the legal standards applicable to their review. In approving the Advisory Contract for the Fund, the Board, including the Independent Directors, considered the following factors, no one of which was controlling, and reached the following conclusions:
Expenses and Performance of the Fund — The Board reviewed statistical information prepared by Lipper Inc. (“Lipper”), an independent provider of investment company data, regarding the expense ratio components, including actual advisory fees, waivers/reimbursements, and gross and net total expenses of the Fund in comparison with the same information for other exchange traded funds (including funds sponsored by an “at cost” service provider) and, in the limited instances where no comparable ETFs existed and the comparison group would not otherwise be reasonable in Lipper’s judgment, pure index institutional mutual funds, objectively selected by Lipper as comprising the Fund’s applicable peer group pursuant to Lipper’s
BOARD REVIEWAND APPROVALOF INVESTMENT ADVISORY CONTRACT | 69 |
Table of Contents
Board Review and Approval of Investment Advisory
Contract (Continued)
iSHARES®, INC.
proprietary ETF methodology (the “Lipper Group”). The Board noted that, prior to 2014, Lipper had used a different methodology to determine the Fund’s Lipper group, which included mutual funds, closed-end funds, exchange traded funds, and/or funds with differing investment objective classifications, investment focuses and other characteristics (e.g. actively managed funds and funds sponsored by “at cost” service providers), as applicable. The Board further noted that, after consideration by the 15(c) Committee, the Board determined to use instead Lipper’s proprietary ETF methodology to determine the Fund’s Lipper Group. This determination was based on, among other considerations, the increased number and types of ETFs available for comparative purposes than was the case in prior years. The Board was provided with a detailed description of Lipper’s proprietary ETF methodology used by Lipper to determine the applicable Lipper Group and to prepare this information. At the Board’s request, Lipper provided, and the Board considered, information on the impact to the iShares funds’ comparative fee rankings that were attributable to the change from a pure index group methodology to Lipper’s proprietary ETF methodology. The Board further noted that due to the limitations in providing comparable funds in the Lipper Group, the statistical information provided in Lipper’s report may or may not provide meaningful direct comparisons to the Fund in all instances.
The Board also noted that the investment advisory fee rate and overall expenses for the Fund were within range of the median of the investment advisory fee rates and overall expenses of the funds in its Lipper Group.
In addition, the Board reviewed statistical information prepared by Lipper regarding the performance of the Fund for the one-, three-, five-, ten-year, and since inception periods, as applicable, and the “last quarter” period ended December 31, 2013, and a comparison of the Fund’s performance to its performance benchmark index for the same periods. To the extent that any of the comparison funds included in the Lipper Group track the same index as the Fund, Lipper also provided, and the Board reviewed, a comparison of the Fund’s performance to that of such relevant comparison funds for the same periods. The Board noted that the Fund generally performed in line with its respective performance benchmark index over the relevant periods. In considering this information, the Board noted that the Lipper Group may include funds that are not exchange traded funds or index funds, and that may have different investment objectives and/or benchmarks from the Fund. In addition, the Board noted that the Fund seeks to track its own benchmark index and that, during the prior year, the Board received periodic reports on the Fund’s performance in comparison with its relevant benchmark index. Such periodic comparative performance information, including detailed information on certain specific iShares funds requested by the Boards, was also considered.
Based on this review, the other factors considered at the meeting, and their general knowledge of ETF pricing, the Board concluded that the investment advisory fee rate and expense level and the historical performance of the Fund supported the Board’s approval of the continuance of the Advisory Contract for the coming year.
Nature, Extent and Quality of Services Provided by BFA — Based on management’s representations, including information about recent and proposed enhancements to the iShares business, including with respect to shareholder servicing and support, the Board expected that there would be no diminution in the scope of services required of or provided by BFA under the Advisory Contract for the coming year as compared to the scope of services provided by BFA during prior years. In reviewing the scope of these services, the Board considered BFA’s investment philosophy and experience, noting that BFA and its affiliates have committed significant resources over time, including during the past year, to supporting the Fund and its shareholders. The Board acknowledged that resources to support the iShares funds and their shareholders have been added or enhanced in recent years, including in such areas as investor education, product management, customized portfolio consulting support, capital markets support, and proprietary risk and performance analytics tools. The Board also considered BFA’s compliance program and its compliance record with respect to the Fund. In that regard, the Board noted that BFA reports to the Board about portfolio management and compliance matters on a periodic basis in connection with regularly scheduled meetings of the Board, and on other occasions as necessary and appropriate, and has provided information and made appropriate officers available as needed to provide further assistance with these matters. The Board also reviewed the background and experience of the persons responsible for the day-to-day management of the Fund, as well as the resources available to them in managing the Fund. In
| 70 | 2014 iSHARES ANNUAL REPORTTO SHAREHOLDERS |
Table of Contents
Board Review and Approval of Investment Advisory
Contract (Continued)
iSHARES®, INC.
addition to the above considerations, the Board reviewed and considered detailed presentations regarding BFA’s investment performance, investment and risk management processes and strategies provided at the June 12-13, 2014 meeting and throughout the previous year, and matters related to BFA’s portfolio compliance policies and procedures. The Board noted that the Fund had met its investment objective consistently since its inception date.
Based on review of this information, and the performance information discussed above, the Board concluded that the nature, extent and quality of services provided by BFA to the Fund under the Advisory Contract supported the Board’s approval of the continuance of the Advisory Contract for the coming year.
Costs of Services Provided to the Fund and Profits Realized by BFA and Affiliates — The Board reviewed information about the profitability to BlackRock of the Fund based on the fees payable to BFA and its affiliates (including fees under the Advisory Contract), and all other sources of revenue and expense to BFA and its affiliates from the Fund’s operations for the last calendar year. The Board reviewed BlackRock’s profitability methodology for the iShares funds, noting that the 15(c) Committee had focused on the methodology and proposed presentation during its meetings. The Board discussed the sources of direct and ancillary revenue with management, including the revenues to BTC from securities lending by the Fund. The Board also discussed BFA’s profit margin as reflected in the Fund’s profitability analysis and reviewed information regarding potential economies of scale (as discussed below). Based on this review, the Board concluded that the profits realized by BFA and its affiliates under the Advisory Contract and from other relationships between the Fund and BFA and/or its affiliates, if any, were within a reasonable range in light of the factors considered.
Economies of Scale — The Board reviewed information regarding potential economies of scale or other efficiencies that may result from increases in the Fund’s assets, noting that the issue of economies of scale had been focused on extensively by the 15(c) Committee during its meetings and addressed by management. The Board and the 15(c) Committee reviewed information provided by BFA regarding scale benefits shared with the iShares funds through relatively low fee rates established at inception, breakpoints, waivers, or other fee reductions, as well as through additional investment in the iShares business and the provision of improved or additional infrastructure and services to the iShares funds and their shareholders. The Board and the 15(c) Committee received information regarding BlackRock’s historical profitability, including BFA’s and its affiliates’ costs in providing services. The cost information distinguished between fixed and variable costs, and explained how the level of fixed and variable costs, as well as the nature of such costs, may impact the existence or size of scale benefits. The Board noted that the Advisory Contract for the Fund did not provide for any breakpoints in the Fund’s investment advisory fee rate as the assets of the Fund increase. However, the Board noted that should material economies of scale exist in the future, a breakpoint structure for the Fund may be appropriate, and that it would continue to monitor the sharing of economies of scale to determine the appropriateness of adding breakpoints in the future. Based on this review, as well as the other factors considered at the meeting, the Board, recognizing its responsibility to consider this issue at least annually, concluded that the investment advisory fee rate incorporates potential economies of scale and supported the Board’s approval of the continuance of the Advisory Contract for the coming year.
Fees and Services Provided for Other Comparable Funds/Accounts Managed by BFA and its Affiliates — The Board received and considered information regarding the investment advisory/management fee rates for other funds/accounts in the U.S. for which BFA (or its affiliates) provides investment advisory/management services, including open-end and closed-end funds registered under the 1940 Act (including sub-advised funds), collective trust funds, separately managed accounts, and institutional separate accounts (together, the “Other Accounts”), and acknowledged BFA’s assertion that the iShares funds are fundamentally different investment vehicles from the Other Accounts. The Board noted that BFA and its affiliates do manage Other Accounts with a substantially similar investment objective and strategy as the Fund. The Board further noted that BFA provided the Board with detailed information regarding how the Other Accounts (particularly institutional clients) generally differ from the Fund, including in terms of the different, generally more extensive services provided to the Fund, as well as other
BOARD REVIEWAND APPROVALOF INVESTMENT ADVISORY CONTRACT | 71 |
Table of Contents
Board Review and Approval of Investment Advisory
Contract (Continued)
iSHARES®, INC.
significant differences in the approach of BFA and its affiliates to the Fund, on one hand, and Other Accounts, on the other. In that regard, the Board considered that the pricing of services to institutional clients is typically based on a number of factors beyond the nature and extent of the specific services to be provided and often depends on the overall relationship between the client and its affiliates and the adviser and its affiliates. In addition, the Board considered the relative complexity and inherent risks and challenges of managing and providing other services to the Fund, as a publicly traded exchange traded fund, as compared to the Other Accounts that are institutional clients in light of differing regulatory requirements and client-imposed mandates. The Board also considered the “all-inclusive” nature of the Fund’s advisory fee structure, and the Fund expenses borne by BFA under this arrangement. The Board noted that the investment advisory fee rate under the Advisory Contract for the Fund was generally higher than the investment advisory/management fee rates for the Other Accounts that are institutional clients of BFA (or its affiliates) and concluded that the differences appeared to be consistent with the factors discussed.
Other Benefits to BFA and/or its Affiliates — The Board reviewed the “fallout” benefits or ancillary revenue received by BFA and/or its affiliates in connection with the services provided to the Fund by BFA, such as payment of revenue to BTC, the Fund’s securities lending agent, for loaning portfolio securities (which was included in the profit margins reviewed by the Board pursuant to BFA’s profitability methodology), and payment of advisory fees and/or administration fees to BFA and BTC (or their affiliates) in connection with any investments by the Fund in other funds for which BFA (or its affiliates) provides investment advisory services and/or administration services. The Board noted that BFA generally does not use soft dollars or consider the value of research or other services that may be provided to BFA (including its affiliates) in selecting brokers for portfolio transactions for the Fund. The Board further noted that any portfolio transactions on behalf of the Fund placed through a BFA affiliate or purchased from an underwriting syndicate in which a BFA affiliate participates, are reported to the Board pursuant to Rule 17e-1 or Rule 10f-3, as applicable, under the 1940 Act. The Board concluded that any such ancillary benefits would not be disadvantageous to the Fund’s shareholders and thus would not alter the Board’s conclusion with respect to the appropriateness of approving the continuance of the Advisory Contract for the coming year.
Based on the considerations described above, the Board determined that the Fund’s investment advisory fee rate under the Advisory Contract does not constitute a fee that is so disproportionately large as to bear no reasonable relationship to the services rendered and that could not have been the product of arm’s-length bargaining, and concluded that it is in the best interest of the Fund and its shareholders to approve the continuance of the Advisory Contract for the coming year.
III. iShares MSCI Frontier 100 ETF
Under Section 15(c) of the Investment Company Act of 1940 (the “1940 Act”), the Company’s Board of Directors (the “Board”), including a majority of Directors who are not “interested persons” of the Company (as that term is defined in the 1940 Act) (the “Independent Directors”), is required annually to consider and approve the Investment Advisory Contract between the Company and BFA (the “Advisory Contract”) on behalf of the Fund. The Independent Directors requested, and BFA provided, such information as the Independent Directors, with advice from independent counsel, deemed reasonably necessary to evaluate the Advisory Contract. A committee of Independent Directors (the “15(c) Committee”), with independent counsel, met with management on March 12, 2014, May 6, 2014, and May 12, 2014, to discuss the types of information the Independent Directors required and the manner in which management would organize and present such information. At a meeting held on May 16, 2014, management presented preliminary information to the Board relating to the continuance of the Advisory Contract, and the Board, including the Independent Directors, reviewed and discussed such information at length. The Independent Directors requested from management certain additional information, which management agreed to provide. At a meeting held on June 12-13, 2014, the Board, including the Independent Directors, reviewed the additional information provided by management in response to these requests. After extensive discussions, the Board, including all of the Independent Directors, approved the continuance of the Advisory Contract for the Fund, based on a review of qualitative and quantitative information provided by BFA, including the additional information management provided at the request of the Independent Directors. The Board noted its
| 72 | 2014 iSHARES ANNUAL REPORTTO SHAREHOLDERS |
Table of Contents
Board Review and Approval of Investment Advisory
Contract (Continued)
iSHARES®, INC.
satisfaction with the extent and quality of information provided and its frequent interactions with management, as well as the detailed responses and other information provided by BFA. The Board also noted that the Board and BFA agreed to discuss potential enhancements and adjustments to the 15(c) process for the coming year. The Independent Directors were advised by their independent counsel throughout the process, including about the legal standards applicable to their review. In approving the Advisory Contract for the Fund, the Board, including the Independent Directors, considered the following factors, no one of which was controlling, and reached the following conclusions:
Expenses and Performance of the Fund — The Board reviewed statistical information prepared by Lipper Inc. (“Lipper”), an independent provider of investment company data, regarding the expense ratio components, including actual advisory fees, waivers/reimbursements, and gross and net total expenses of the Fund in comparison with the same information for other exchange traded funds (including funds sponsored by an “at cost” service provider) and, in the limited instances where no comparable ETFs existed and the comparison group would not otherwise be reasonable in Lipper’s judgment, pure index institutional mutual funds, objectively selected by Lipper as comprising the Fund’s applicable peer group pursuant to Lipper’s proprietary ETF methodology (the “Lipper Group”). The Board noted that, prior to 2014, Lipper had used a different methodology to determine the Fund’s Lipper group, which included mutual funds, closed-end funds, exchange traded funds, and/or funds with differing investment objective classifications, investment focuses and other characteristics (e.g. actively managed funds and funds sponsored by “at cost” service providers), as applicable. The Board further noted that, after consideration by the 15(c) Committee, the Board determined to use instead Lipper’s proprietary ETF methodology to determine the Fund’s Lipper Group. This determination was based on, among other considerations, the increased number and types of ETFs available for comparative purposes than was the case in prior years. The Board was provided with a detailed description of Lipper’s proprietary ETF methodology used by Lipper to determine the applicable Lipper Group and to prepare this information. At the Board’s request, Lipper provided, and the Board considered, information on the impact to the iShares funds’ comparative fee rankings that were attributable to the change from a pure index group methodology to Lipper’s proprietary ETF methodology. The Board further noted that due to the limitations in providing comparable funds in the Lipper Group, the statistical information provided in Lipper’s report may or may not provide meaningful direct comparisons to the Fund in all instances.
The Board also noted that the investment advisory fee rate and overall expenses for the Fund were within range of the median of the investment advisory fee rates and overall expenses of the funds in its Lipper Group. The Board further noted that the Fund invests in smaller, “frontier markets” exposures, as compared to the competitor funds as determined by Lipper, which invest primarily in “emerging markets” exposures.
In addition, the Board reviewed statistical information prepared by Lipper regarding the performance of the Fund for the one-, three-, five-, ten-year, and since inception periods, as applicable, and the “last quarter” period ended December 31, 2013, and a comparison of the Fund’s performance to its performance benchmark index for the same periods. To the extent that any of the comparison funds included in the Lipper Group track the same index as the Fund, Lipper also provided, and the Board reviewed, a comparison of the Fund’s performance to that of such relevant comparison funds for the same periods. The Board noted that the Fund generally performed in line with its respective performance benchmark index over the relevant periods. In considering this information, the Board noted that the Lipper Group may include funds that are not exchange traded funds or index funds, and that may have different investment objectives and/or benchmarks from the Fund. In addition, the Board noted that the Fund seeks to track its own benchmark index and that, during the prior year, the Board received periodic reports on the Fund’s performance in comparison with its relevant benchmark index. Such periodic comparative performance information, including detailed information on certain specific iShares funds requested by the Boards, was also considered.
Based on this review, the other factors considered at the meeting, and their general knowledge of ETF pricing, the Board concluded that the investment advisory fee rate and expense level and the historical performance of the Fund supported the Board’s approval of the continuance of the Advisory Contract for the coming year.
BOARD REVIEWAND APPROVALOF INVESTMENT ADVISORY CONTRACT | 73 |
Table of Contents
Board Review and Approval of Investment Advisory
Contract (Continued)
iSHARES®, INC.
Nature, Extent and Quality of Services Provided by BFA — Based on management’s representations, including information about recent and proposed enhancements to the iShares business, including with respect to shareholder servicing and support, the Board expected that there would be no diminution in the scope of services required of or provided by BFA under the Advisory Contract for the coming year as compared to the scope of services provided by BFA during prior years. In reviewing the scope of these services, the Board considered BFA’s investment philosophy and experience, noting that BFA and its affiliates have committed significant resources over time, including during the past year, to supporting the Fund and its shareholders. The Board acknowledged that resources to support the iShares funds and their shareholders have been added or enhanced in recent years, including in such areas as investor education, product management, customized portfolio consulting support, capital markets support, and proprietary risk and performance analytics tools. The Board also considered BFA’s compliance program and its compliance record with respect to the Fund. In that regard, the Board noted that BFA reports to the Board about portfolio management and compliance matters on a periodic basis in connection with regularly scheduled meetings of the Board, and on other occasions as necessary and appropriate, and has provided information and made appropriate officers available as needed to provide further assistance with these matters. The Board also reviewed the background and experience of the persons responsible for the day-to-day management of the Fund, as well as the resources available to them in managing the Fund. In addition to the above considerations, the Board reviewed and considered detailed presentations regarding BFA’s investment performance, investment and risk management processes and strategies provided at the June 12-13, 2014 meeting and throughout the previous year, and matters related to BFA’s portfolio compliance policies and procedures. The Board noted that the Fund had met its investment objective consistently since its inception date.
Based on review of this information, and the performance information discussed above, the Board concluded that the nature, extent and quality of services provided by BFA to the Fund under the Advisory Contract supported the Board’s approval of the continuance of the Advisory Contract for the coming year.
Costs of Services Provided to the Fund and Profits Realized by BFA and Affiliates — The Board reviewed information about the profitability to BlackRock of the Fund based on the fees payable to BFA and its affiliates (including fees under the Advisory Contract), and all other sources of revenue and expense to BFA and its affiliates from the Fund’s operations for the last calendar year. The Board reviewed BlackRock’s profitability methodology for the iShares funds, noting that the 15(c) Committee had focused on the methodology and proposed presentation during its meetings. The Board discussed the sources of direct and ancillary revenue with management, including the revenues to BTC from securities lending by the Fund. The Board also discussed BFA’s profit margin as reflected in the Fund’s profitability analysis and reviewed information regarding potential economies of scale (as discussed below). Based on this review, the Board concluded that the profits realized by BFA and its affiliates under the Advisory Contract and from other relationships between the Fund and BFA and/or its affiliates, if any, were within a reasonable range in light of the factors considered.
Economies of Scale — The Board reviewed information regarding potential economies of scale or other efficiencies that may result from increases in the Fund’s assets, noting that the issue of economies of scale had been focused on extensively by the 15(c) Committee during its meetings and addressed by management. The Board and the 15(c) Committee reviewed information provided by BFA regarding scale benefits shared with the iShares funds through relatively low fee rates established at inception, breakpoints, waivers, or other fee reductions, as well as through additional investment in the iShares business and the provision of improved or additional infrastructure and services to the iShares funds and their shareholders. The Board and the 15(c) Committee received information regarding BlackRock’s historical profitability, including BFA’s and its affiliates’ costs in providing services. The cost information distinguished between fixed and variable costs, and explained how the level of fixed and variable costs, as well as the nature of such costs, may impact the existence or size of scale benefits. The Board noted that the Advisory Contract for the Fund did not provide for any breakpoints in the Fund’s investment advisory fee rate as the assets of the Fund increase. However, the Board noted that should material economies of scale exist in the future, a breakpoint structure for the Fund may be appropriate, and that it would continue to monitor the sharing of economies of scale to determine the
| 74 | 2014 iSHARES ANNUAL REPORTTO SHAREHOLDERS |
Table of Contents
Board Review and Approval of Investment Advisory
Contract (Continued)
iSHARES®, INC.
appropriateness of adding breakpoints in the future. Based on this review, as well as the other factors considered at the meeting, the Board, recognizing its responsibility to consider this issue at least annually, concluded that the investment advisory fee rate incorporates potential economies of scale and supported the Board’s approval of the continuance of the Advisory Contract for the coming year.
Fees and Services Provided for Other Comparable Funds/Accounts Managed by BFA and its Affiliates — The Board received and considered information regarding the investment advisory/management fee rates for other funds/accounts in the U.S. for which BFA (or its affiliates) provides investment advisory/management services, including open-end and closed-end funds registered under the 1940 Act (including sub-advised funds), collective trust funds, separately managed accounts, and institutional separate accounts (together, the “Other Accounts”), and acknowledged BFA’s assertion that the iShares funds are fundamentally different investment vehicles from the Other Accounts. The Board noted that BFA and its affiliates do manage Other Accounts with a substantially similar investment objective and strategy as the Fund. The Board further noted that BFA provided the Board with detailed information regarding how the Other Accounts (particularly institutional clients) generally differ from the Fund, including in terms of the different, generally more extensive services provided to the Fund, as well as other significant differences in the approach of BFA and its affiliates to the Fund, on one hand, and Other Accounts, on the other. In that regard, the Board considered that the pricing of services to institutional clients is typically based on a number of factors beyond the nature and extent of the specific services to be provided and often depends on the overall relationship between the client and its affiliates and the adviser and its affiliates. In addition, the Board considered the relative complexity and inherent risks and challenges of managing and providing other services to the Fund, as a publicly traded exchange traded fund, as compared to the Other Accounts that are institutional clients in light of differing regulatory requirements and client-imposed mandates. The Board also considered the “all-inclusive” nature of the Fund’s advisory fee structure, and the Fund expenses borne by BFA under this arrangement. The Board noted that the investment advisory fee rate under the Advisory Contract for the Fund was generally higher than the investment advisory/management fee rates for the Other Accounts that are institutional clients of BFA (or its affiliates) and concluded that the differences appeared to be consistent with the factors discussed.
Other Benefits to BFA and/or its Affiliates — The Board reviewed the “fallout” benefits or ancillary revenue received by BFA and/or its affiliates in connection with the services provided to the Fund by BFA, such as payment of revenue to BTC, the Fund’s securities lending agent, for loaning portfolio securities (which was included in the profit margins reviewed by the Board pursuant to BFA’s profitability methodology), and payment of advisory fees and/or administration fees to BFA and BTC (or their affiliates) in connection with any investments by the Fund in other funds for which BFA (or its affiliates) provides investment advisory services and/or administration services. The Board noted that BFA generally does not use soft dollars or consider the value of research or other services that may be provided to BFA (including its affiliates) in selecting brokers for portfolio transactions for the Fund. The Board further noted that any portfolio transactions on behalf of the Fund placed through a BFA affiliate or purchased from an underwriting syndicate in which a BFA affiliate participates, are reported to the Board pursuant to Rule 17e-1 or Rule 10f-3, as applicable, under the 1940 Act. The Board concluded that any such ancillary benefits would not be disadvantageous to the Fund’s shareholders and thus would not alter the Board’s conclusion with respect to the appropriateness of approving the continuance of the Advisory Contract for the coming year.
Based on the considerations described above, the Board determined that the Fund’s investment advisory fee rate under the Advisory Contract does not constitute a fee that is so disproportionately large as to bear no reasonable relationship to the services rendered and that could not have been the product of arm’s-length bargaining, and concluded that it is in the best interest of the Fund and its shareholders to approve the continuance of the Advisory Contract for the coming year.
BOARD REVIEWAND APPROVALOF INVESTMENT ADVISORY CONTRACT | 75 |
Table of Contents
Board Review and Approval of Investment Advisory
Contract (Continued)
iSHARES®, INC.
IV. iShares MSCI World ETF
Under Section 15(c) of the Investment Company Act of 1940 (the “1940 Act”), the Company’s Board of Directors (the “Board”), including a majority of Directors who are not “interested persons” of the Company (as that term is defined in the 1940 Act) (the “Independent Directors”), is required annually to consider and approve the Investment Advisory Contract between the Company and BFA (the “Advisory Contract”) on behalf of the Fund. The Independent Directors requested, and BFA provided, such information as the Independent Directors, with advice from independent counsel, deemed reasonably necessary to evaluate the Advisory Contract. A committee of Independent Directors (the “15(c) Committee”), with independent counsel, met with management on March 12, 2014, May 6, 2014, and May 12, 2014, to discuss the types of information the Independent Directors required and the manner in which management would organize and present such information. At a meeting held on May 16, 2014, management presented preliminary information to the Board relating to the continuance of the Advisory Contract, and the Board, including the Independent Directors, reviewed and discussed such information at length. The Independent Directors requested from management certain additional information, which management agreed to provide. At a meeting held on June 12-13, 2014, the Board, including the Independent Directors, reviewed the additional information provided by management in response to these requests. After extensive discussions, the Board, including all of the Independent Directors, approved the continuance of the Advisory Contract for the Fund, based on a review of qualitative and quantitative information provided by BFA, including the additional information management provided at the request of the Independent Directors. The Board noted its satisfaction with the extent and quality of information provided and its frequent interactions with management, as well as the detailed responses and other information provided by BFA. The Board also noted that the Board and BFA agreed to discuss potential enhancements and adjustments to the 15(c) process for the coming year. The Independent Directors were advised by their independent counsel throughout the process, including about the legal standards applicable to their review. In approving the Advisory Contract for the Fund, the Board, including the Independent Directors, considered the following factors, no one of which was controlling, and reached the following conclusions:
Expenses and Performance of the Fund — The Board reviewed statistical information prepared by Lipper Inc. (“Lipper”), an independent provider of investment company data, regarding the expense ratio components, including actual advisory fees, waivers/reimbursements, and gross and net total expenses of the Fund in comparison with the same information for other exchange traded funds (including funds sponsored by an “at cost” service provider) and, in the limited instances where no comparable ETFs existed and the comparison group would not otherwise be reasonable in Lipper’s judgment, pure index institutional mutual funds, objectively selected by Lipper as comprising the Fund’s applicable peer group pursuant to Lipper’s proprietary ETF methodology (the “Lipper Group”). The Board noted that, prior to 2014, Lipper had used a different methodology to determine the Fund’s Lipper group, which included mutual funds, closed-end funds, exchange traded funds, and/or funds with differing investment objective classifications, investment focuses and other characteristics (e.g. actively managed funds and funds sponsored by “at cost” service providers), as applicable. The Board further noted that, after consideration by the 15(c) Committee, the Board determined to use instead Lipper’s proprietary ETF methodology to determine the Fund’s Lipper Group. This determination was based on, among other considerations, the increased number and types of ETFs available for comparative purposes than was the case in prior years. The Board was provided with a detailed description of Lipper’s proprietary ETF methodology used by Lipper to determine the applicable Lipper Group and to prepare this information. At the Board’s request, Lipper provided, and the Board considered, information on the impact to the iShares funds’ comparative fee rankings that were attributable to the change from a pure index group methodology to Lipper’s proprietary ETF methodology. The Board further noted that due to the limitations in providing comparable funds in the Lipper Group, the statistical information provided in Lipper’s report may or may not provide meaningful direct comparisons to the Fund in all instances.
The Board also noted that the investment advisory fee rate and overall expenses for the Fund were lower than the median of the investment advisory fee rates and overall expenses of the funds in its Lipper Group.
| 76 | 2014 iSHARES ANNUAL REPORTTO SHAREHOLDERS |
Table of Contents
Board Review and Approval of Investment Advisory
Contract (Continued)
iSHARES®, INC.
In addition, the Board reviewed statistical information prepared by Lipper regarding the performance of the Fund for the one-, three-, five-, ten-year, and since inception periods, as applicable, and the “last quarter” period ended December 31, 2013, and a comparison of the Fund’s performance to its performance benchmark index for the same periods. To the extent that any of the comparison funds included in the Lipper Group track the same index as the Fund, Lipper also provided, and the Board reviewed, a comparison of the Fund’s performance to that of such relevant comparison funds for the same periods. The Board noted that the Fund generally performed in line with its respective performance benchmark index over the relevant periods. In considering this information, the Board noted that the Lipper Group may include funds that are not exchange traded funds or index funds, and that may have different investment objectives and/or benchmarks from the Fund. In addition, the Board noted that the Fund seeks to track its own benchmark index and that, during the prior year, the Board received periodic reports on the Fund’s performance in comparison with its relevant benchmark index. Such periodic comparative performance information, including detailed information on certain specific iShares funds requested by the Boards, was also considered.
Based on this review, the other factors considered at the meeting, and their general knowledge of ETF pricing, the Board concluded that the investment advisory fee rate and expense level and the historical performance of the Fund supported the Board’s approval of the continuance of the Advisory Contract for the coming year.
Nature, Extent and Quality of Services Provided by BFA — Based on management’s representations, including information about recent and proposed enhancements to the iShares business, including with respect to shareholder servicing and support, the Board expected that there would be no diminution in the scope of services required of or provided by BFA under the Advisory Contract for the coming year as compared to the scope of services provided by BFA during prior years. In reviewing the scope of these services, the Board considered BFA’s investment philosophy and experience, noting that BFA and its affiliates have committed significant resources over time, including during the past year, to supporting the Fund and its shareholders. The Board acknowledged that resources to support the iShares funds and their shareholders have been added or enhanced in recent years, including in such areas as investor education, product management, customized portfolio consulting support, capital markets support, and proprietary risk and performance analytics tools. The Board also considered BFA’s compliance program and its compliance record with respect to the Fund. In that regard, the Board noted that BFA reports to the Board about portfolio management and compliance matters on a periodic basis in connection with regularly scheduled meetings of the Board, and on other occasions as necessary and appropriate, and has provided information and made appropriate officers available as needed to provide further assistance with these matters. The Board also reviewed the background and experience of the persons responsible for the day-to-day management of the Fund, as well as the resources available to them in managing the Fund. In addition to the above considerations, the Board reviewed and considered detailed presentations regarding BFA’s investment performance, investment and risk management processes and strategies provided at the June 12-13, 2014 meeting and throughout the previous year, and matters related to BFA’s portfolio compliance policies and procedures. The Board noted that the Fund had met its investment objective consistently since its inception date.
Based on review of this information, and the performance information discussed above, the Board concluded that the nature, extent and quality of services provided by BFA to the Fund under the Advisory Contract supported the Board’s approval of the continuance of the Advisory Contract for the coming year.
Costs of Services Provided to the Fund and Profits Realized by BFA and Affiliates — The Board reviewed information about the profitability to BlackRock of the Fund based on the fees payable to BFA and its affiliates (including fees under the Advisory Contract), and all other sources of revenue and expense to BFA and its affiliates from the Fund’s operations for the last calendar year. The Board reviewed BlackRock’s profitability methodology for the iShares funds, noting that the 15(c) Committee had focused on the methodology and proposed presentation during its meetings. The Board discussed the sources of direct and ancillary revenue with management, including the revenues to BTC from securities lending by the Fund. The Board also discussed BFA’s profit margin as reflected in the Fund’s profitability analysis and reviewed information regarding potential
BOARD REVIEWAND APPROVALOF INVESTMENT ADVISORY CONTRACT | 77 |
Table of Contents
Board Review and Approval of Investment Advisory
Contract (Continued)
iSHARES®, INC.
economies of scale (as discussed below). Based on this review, the Board concluded that the profits realized by BFA and its affiliates under the Advisory Contract and from other relationships between the Fund and BFA and/or its affiliates, if any, were within a reasonable range in light of the factors considered.
Economies of Scale — The Board reviewed information regarding potential economies of scale or other efficiencies that may result from increases in the Fund’s assets, noting that the issue of economies of scale had been focused on extensively by the 15(c) Committee during its meetings and addressed by management. The Board and the 15(c) Committee reviewed information provided by BFA regarding scale benefits shared with the iShares funds through relatively low fee rates established at inception, breakpoints, waivers, or other fee reductions, as well as through additional investment in the iShares business and the provision of improved or additional infrastructure and services to the iShares funds and their shareholders. The Board and the 15(c) Committee received information regarding BlackRock’s historical profitability, including BFA’s and its affiliates’ costs in providing services. The cost information distinguished between fixed and variable costs, and explained how the level of fixed and variable costs, as well as the nature of such costs, may impact the existence or size of scale benefits. The Board noted that the Advisory Contract for the Fund did not provide for any breakpoints in the Fund’s investment advisory fee rate as the assets of the Fund increase. However, the Board noted that should material economies of scale exist in the future, a breakpoint structure for the Fund may be appropriate, and that it would continue to monitor the sharing of economies of scale to determine the appropriateness of adding breakpoints in the future. Based on this review, as well as the other factors considered at the meeting, the Board, recognizing its responsibility to consider this issue at least annually, concluded that the investment advisory fee rate incorporates potential economies of scale and supported the Board’s approval of the continuance of the Advisory Contract for the coming year.
Fees and Services Provided for Other Comparable Funds/Accounts Managed by BFA and its Affiliates — The Board received and considered information regarding the investment advisory/management fee rates for other funds/accounts in the U.S. for which BFA (or its affiliates) provides investment advisory/management services, including open-end and closed-end funds registered under the 1940 Act (including sub-advised funds), collective trust funds, separately managed accounts, and institutional separate accounts (together, the “Other Accounts”), and acknowledged BFA’s assertion that the iShares funds are fundamentally different investment vehicles from the Other Accounts. The Board noted that BFA and its affiliates do manage Other Accounts with a substantially similar investment objective and strategy as the Fund. The Board further noted that BFA provided the Board with detailed information regarding how the Other Accounts (particularly institutional clients) generally differ from the Fund, including in terms of the different, generally more extensive services provided to the Fund, as well as other significant differences in the approach of BFA and its affiliates to the Fund, on one hand, and Other Accounts, on the other. In that regard, the Board considered that the pricing of services to institutional clients is typically based on a number of factors beyond the nature and extent of the specific services to be provided and often depends on the overall relationship between the client and its affiliates and the adviser and its affiliates. In addition, the Board considered the relative complexity and inherent risks and challenges of managing and providing other services to the Fund, as a publicly traded exchange traded fund, as compared to the Other Accounts that are institutional clients in light of differing regulatory requirements and client-imposed mandates. The Board also considered the “all-inclusive” nature of the Fund’s advisory fee structure, and the Fund expenses borne by BFA under this arrangement. The Board noted that the investment advisory fee rate under the Advisory Contract for the Fund was generally higher than the investment advisory/management fee rates for the Other Accounts that are institutional clients of BFA (or its affiliates) and concluded that the differences appeared to be consistent with the factors discussed.
Other Benefits to BFA and/or its Affiliates — The Board reviewed the “fallout” benefits or ancillary revenue received by BFA and/or its affiliates in connection with the services provided to the Fund by BFA, such as payment of revenue to BTC, the Fund’s securities lending agent, for loaning portfolio securities (which was included in the profit margins reviewed by the Board pursuant to BFA’s profitability methodology), and payment of advisory fees and/or administration fees to BFA and BTC (or their affiliates) in connection with any investments by the Fund in other funds for which BFA (or its affiliates) provides investment advisory services
| 78 | 2014 iSHARES ANNUAL REPORTTO SHAREHOLDERS |
Table of Contents
Board Review and Approval of Investment Advisory
Contract (Continued)
iSHARES®, INC.
and/or administration services. The Board noted that BFA generally does not use soft dollars or consider the value of research or other services that may be provided to BFA (including its affiliates) in selecting brokers for portfolio transactions for the Fund. The Board further noted that any portfolio transactions on behalf of the Fund placed through a BFA affiliate or purchased from an underwriting syndicate in which a BFA affiliate participates, are reported to the Board pursuant to Rule 17e-1 or Rule 10f-3, as applicable, under the 1940 Act. The Board concluded that any such ancillary benefits would not be disadvantageous to the Fund’s shareholders and thus would not alter the Board’s conclusion with respect to the appropriateness of approving the continuance of the Advisory Contract for the coming year.
Based on the considerations described above, the Board determined that the Fund’s investment advisory fee rate under the Advisory Contract does not constitute a fee that is so disproportionately large as to bear no reasonable relationship to the services rendered and that could not have been the product of arm’s-length bargaining, and concluded that it is in the best interest of the Fund and its shareholders to approve the continuance of the Advisory Contract for the coming year.
BOARD REVIEWAND APPROVALOF INVESTMENT ADVISORY CONTRACT | 79 |
Table of Contents
Supplemental Information (Unaudited)
iSHARES®, INC.
Section 19(a) Notices
The amounts and sources of distributions reported are only estimates and are not being provided for tax reporting purposes. The actual amounts and sources of the amounts for tax reporting purposes will depend upon each Fund’s investment experience during the year and may be subject to changes based on the tax regulations. Shareholders will receive a Form 1099-DIV each calendar year that will inform them how to report distributions for federal income tax purposes.
| Total Cumulative Distributions for the Fiscal Year | % Breakdown of the Total Cumulative Distributions for the Fiscal Year | |||||||||||||||||||||||||||||||
| iShares ETF | Net Investment Income | Net Realized Capital Gains | Return of Capital | Total Per Share | Net Investment Income | Net Realized Capital Gains | Return of Capital | Total Per Share | ||||||||||||||||||||||||
MSCI All Country World Minimum Volatility | $ | 1.617449 | $ | — | $ | 0.025316 | $ | 1.642765 | 98 | % | — | % | 2 | % | 100 | % | ||||||||||||||||
MSCI Frontier 100 | 0.892750 | — | — | 0.892750 | 100 | — | — | 100 | ||||||||||||||||||||||||
MSCI World | 1.360023 | — | 0.005392 | 1.365415 | 100 | — | 0 | a | 100 | |||||||||||||||||||||||
| a | Rounds to less than 1%. |
Premium/Discount Information
The tables that follow present information about the differences between the daily market price on secondary markets for shares of a Fund and that Fund’s net asset value. Net asset value, or “NAV,” is the price per share at which each Fund issues and redeems shares. It is calculated in accordance with the standard formula for valuing mutual fund shares. The “Market Price” of each Fund generally is determined using the midpoint between the highest bid and the lowest offer on the primary stock exchange on which the shares of such Fund are listed for trading, as of the time that the Fund’s NAV is calculated. Each Fund’s Market Price may be at, above or below its NAV. The NAV of each Fund will fluctuate with changes in the fair value of its portfolio holdings. The Market Price of each Fund will fluctuate in accordance with changes in its NAV, as well as market supply and demand.
Premiums or discounts are the differences (expressed as a percentage) between the NAV and Market Price of a Fund on a given day, generally at the time NAV is calculated. A premium is the amount that a Fund is trading above the reported NAV, expressed as a percentage of the NAV. A discount is the amount that a Fund is trading below the reported NAV, expressed as a percentage of the NAV.
The following information shows the frequency distributions of premiums and discounts for each of the Funds included in this report. The information shown for each Fund is for five calendar years (or for each full calendar quarter completed after the inception date of such Fund if less than five years) through the date of the most recent calendar quarter-end. The specific periods covered for each Fund are disclosed in the table for such Fund.
| 80 | 2014 iSHARES ANNUAL REPORTTO SHAREHOLDERS |
Table of Contents
Supplemental Information (Unaudited) (Continued)
iSHARES®, INC.
Each line in the table shows the number of trading days in which the Fund traded within the premium/discount range indicated. The number of trading days in each premium/discount range is also shown as a percentage of the total number of trading days in the period covered by each table. All data presented here represents past performance, which cannot be used to predict future results.
iShares MSCI All Country World Minimum Volatility ETF
Period Covered: January 1, 2012 through June 30, 2014
Premium/Discount Range | Number of Days | Percentage of Total Days | ||||||
Greater than 3.0% | 2 | 0.32 | % | |||||
Greater than 2.5% and Less than 3.0% | 1 | 0.16 | ||||||
Greater than 2.0% and Less than 2.5% | 6 | 0.96 | ||||||
Greater than 1.5% and Less than 2.0% | 3 | 0.48 | ||||||
Greater than 1.0% and Less than 1.5% | 16 | 2.56 | ||||||
Greater than 0.5% and Less than 1.0% | 84 | 13.42 | ||||||
Between 0.5% and –0.5% | 502 | 80.18 | ||||||
Less than –0.5% and Greater than –1.0% | 10 | 1.60 | ||||||
Less than –1.0% and Greater than –1.5% | 2 | 0.32 | ||||||
|
|
|
| |||||
| 626 | 100.00 | % | ||||||
|
|
|
| |||||
iShares MSCI Emerging Markets EMEA ETF
Period Covered: April 1, 2012 through June 30, 2014
Premium/Discount Range | Number of Days | Percentage of Total Days | ||||||
Greater than 4.0% | 1 | 0.18 | % | |||||
Greater than 3.5% and Less than 4.0% | 4 | 0.71 | ||||||
Greater than 3.0% and Less than 3.5% | 9 | 1.60 | ||||||
Greater than 2.5% and Less than 3.0% | 12 | 2.13 | ||||||
Greater than 2.0% and Less than 2.5% | 12 | 2.13 | ||||||
Greater than 1.5% and Less than 2.0% | 18 | 3.19 | ||||||
Greater than 1.0% and Less than 1.5% | 40 | 7.09 | ||||||
Greater than 0.5% and Less than 1.0% | 121 | 21.45 | ||||||
Between 0.5% and –0.5% | 273 | 48.41 | ||||||
Less than –0.5% and Greater than –1.0% | 48 | 8.51 | ||||||
Less than –1.0% and Greater than –1.5% | 15 | 2.66 | ||||||
Less than –1.5% and Greater than –2.0% | 7 | 1.24 | ||||||
Less than –2.0% and Greater than –2.5% | 2 | 0.35 | ||||||
Less than –2.5% and Greater than –3.0% | 2 | 0.35 | ||||||
|
|
|
| |||||
| 564 | 100.00 | % | ||||||
|
|
|
| |||||
SUPPLEMENTAL INFORMATION | 81 |
Table of Contents
Supplemental Information (Unaudited) (Continued)
iSHARES®, INC.
iShares MSCI Frontier 100 ETF
Period Covered: October 1, 2012 through June 30, 2014
Premium/Discount Range | Number of Days | Percentage of Total Days | ||||||
Greater than 3.0% and Less than 3.5% | 18 | 4.11 | % | |||||
Greater than 2.5% and Less than 3.0% | 38 | 8.68 | ||||||
Greater than 2.0% and Less than 2.5% | 73 | 16.67 | ||||||
Greater than 1.5% and Less than 2.0% | 139 | 31.73 | ||||||
Greater than 1.0% and Less than 1.5% | 80 | 18.26 | ||||||
Greater than 0.5% and Less than 1.0% | 22 | 5.02 | ||||||
Between 0.5% and –0.5% | 18 | 4.11 | ||||||
Less than –0.5% and Greater than –1.0% | 26 | 5.94 | ||||||
Less than –1.0% and Greater than –1.5% | 17 | 3.88 | ||||||
Less than –1.5% and Greater than –2.0% | 4 | 0.91 | ||||||
Less than –2.0% and Greater than –2.5% | 1 | 0.23 | ||||||
Less than –2.5% and Greater than –3.0% | 2 | 0.46 | ||||||
|
|
|
| |||||
| 438 | 100.00 | % | ||||||
|
|
|
| |||||
iShares MSCI World ETF
Period Covered: April 1, 2012 through June 30, 2014
Premium/Discount Range | Number of Days | Percentage of Total Days | ||||||
Greater than 2.5% and Less than 3.0% | 3 | 0.53 | % | |||||
Greater than 2.0% and Less than 2.5% | 37 | 6.56 | ||||||
Greater than 1.5% and Less than 2.0% | 48 | 8.51 | ||||||
Greater than 1.0% and Less than 1.5% | 76 | 13.48 | ||||||
Greater than 0.5% and Less than 1.0% | 185 | 32.80 | ||||||
Between 0.5% and –0.5% | 215 | 38.12 | ||||||
|
|
|
| |||||
| 564 | 100.00 | % | ||||||
|
|
|
| |||||
Regulation under the Alternative Investment Fund Managers Directive
The Alternative Investment Fund Managers Directive (the “Directive”) imposes detailed and prescriptive obligations on fund managers established in the European Union (the “EU”). These do not currently apply to managers established outside the EU, such as BFA. Rather, non-EU managers are only required to comply with certain disclosure, reporting and transparency obligations of the Directive if such managers market a fund to EU investors.
BFA has registered the iShares MSCI Frontier 100 ETF (the “Fund”) for marketing to EU investors in the United Kingdom, the Netherlands, Finland, Sweden and Luxembourg.
Report on Remuneration
BFA is required under the Directive to make quantitative disclosures of remuneration. These disclosures are made in line with BlackRock’s interpretation of currently available regulatory guidance on quantitative remuneration disclosures. As market or
| 82 | 2014 iSHARES ANNUAL REPORTTO SHAREHOLDERS |
Table of Contents
Supplemental Information (Unaudited) (Continued)
iSHARES®, INC.
regulatory practice develops BlackRock may consider it appropriate to make changes to the way in which quantitative remuneration disclosures are calculated. Where such changes are made, this may result in disclosures in relation to a fund not being comparable to the disclosures made in the prior year, or in relation to other BlackRock fund disclosures in that same year.
Disclosures are provided in relation to both (a) the staff of BFA; and (b) staff who are senior management or who have the ability to materially affect the risk profile of the Fund.
All individuals included in the aggregated figures disclosed are rewarded in line with BlackRock’s remuneration policy for their responsibilities across the relevant BlackRock business area. As all individuals have a number of areas of responsibilities, only the portion of remuneration for those individuals’ services attributable to the Fund is included in the aggregate figures disclosed.
BlackRock has a clear and well defined pay-for-performance philosophy, and compensation programs which support that philosophy. For senior management, a significant percentage of variable remuneration is deferred over time. All employees are subject to a claw-back policy.
Compensation decisions for employees are made based on full-year financial results and other non-financial goals and objectives. Alongside financial performance, individual compensation is also based on strategic and operating results and other considerations such as management and leadership capabilities. No set formulas are established and no fixed benchmarks are used in determining annual incentive awards. Bonus pools are reviewed by BlackRock’s independent compensation committee, taking into account both actual and projected financial information together with information provided by the Operational Risk and Regulatory Compliance departments in relation to any activities, incidents or events that warrant consideration in making compensation decisions.
Functions such as Finance, Operational Risk, Legal & Compliance, and Human Resources each have their own organizational structures which are independent of the business units. Functional bonus pools are determined with reference to the performance of each individual function and the remuneration of the senior members of control functions is directly overseen by BlackRock’s independent compensation committee. No individual is involved in setting his or her own remuneration.
The figures disclosed are a sum of each individual’s portion of remuneration attributable to the Fund according to an objective apportionment methodology. Accordingly the figures are not representative of any individual’s actual remuneration or their remuneration structure.
The amount of the total remuneration awarded by BFA to its staff which has been attributed to the iShares MSCI Frontier 100 ETF in respect of BFA’s financial year ending December 31, 2013 is USD 126,716. This figure is comprised of fixed remuneration of USD 49,824 and variable remuneration of USD 76,892. There were a total of 436 beneficiaries of the remuneration described above.
The amount of the aggregate remuneration awarded by BFA to its senior management and members of its staff whose actions have a material impact on the risk profile of the iShares MSCI Frontier 100 ETF which has been attributed to the Fund in respect of BFA’s financial year ending December 31, 2013 was USD 20,358.
SUPPLEMENTAL INFORMATION | 83 |
Table of Contents
Director and Officer Information
iSHARES®, INC.
The Board of Directors has responsibility for the overall management and operations of the Company, including general supervision of the duties performed by BFA and other service providers. Each Director serves until he or she resigns, is removed, dies, retires or becomes incapacitated. The President, Chief Compliance Officer, Treasurer and Secretary shall each hold office until their successors are chosen and qualify, and all other officers shall hold office until he or she resigns or is removed. Directors who are not “interested persons” (as defined in the 1940 Act) of the Company are referred to as independent directors (“Independent Directors”).
The registered investment companies advised by BFA or its affiliates are organized into one complex of closed-end funds, two complexes of open-end funds and one complex of exchange-traded funds (“Exchange-Traded Fund Complex”) (each, a “BlackRock Fund Complex”). Each Fund is included in the BlackRock Fund Complex referred to as the Exchange-Traded Fund Complex. Each Director also serves as a Trustee of iShares Trust, a Director of iShares MSCI Russia Capped ETF, Inc. and a Trustee of iShares U.S. ETF Trust and, as a result, oversees a total of 312 funds (as of August 31, 2014) within the Exchange-Traded Fund Complex. With the exception of Robert S. Kapito and Mark Wiedman, the address of each Director and officer is c/o BlackRock, Inc., 400 Howard Street, San Francisco, CA 94105. The address of Mr. Kapito and Mr. Wiedman is c/o BlackRock, Inc., Park Avenue Plaza, 55 East 52nd Street, New York, NY 10055. The Board has designated Robert H. Silver as its Independent Chairman. Additional information about the Funds’ Directors and officers may be found in the Funds’ combined Statement of Additional Information, which is available without charge, upon request, by calling toll-free 1-800-iShares (1-800-474-2737).
Interested Directors
| Name (Age) | Position(s) | Principal Occupation(s) During the Past 5 Years | Other Directorships Held by Director | |||
Robert S. Kapitoa (57) | Director (since 2009). | President and Director, BlackRock, Inc. (since 2006); Vice Chairman of BlackRock, Inc. and Head of BlackRock, Inc.’s Portfolio Management Group (since its formation in 1998) and BlackRock, Inc.’s predecessor entities (since 1988); Trustee, University of Pennsylvania (since 2009); President of Board of Directors, Hope & Heroes Children’s Cancer Fund (since 2002); President of the Board of Directors, Periwinkle Theatre for Youth (since 1983). | Trustee of iShares Trust (since 2009); Director of iShares MSCI Russia Capped ETF, Inc. (since 2010); Trustee of iShares U.S. ETF Trust (since 2011); Director of BlackRock, Inc. (since 2006). | |||
Mark Wiedmanb (43) | Director (since 2013). | Managing Director, BlackRock, Inc. (since 2007); Global Head of iShares (since 2011); Head of Corporate Strategy, BlackRock, Inc. (2009-2011). | Trustee of iShares Trust. (since 2013); Director of iShares MSCI Russia Capped ETF, Inc. (since 2013); Trustee of iShares U.S. ETF Trust (since 2013); Director of PennyMac Financial Services, Inc. (since 2008). | |||
| a | Robert S. Kapito is deemed to be an “interested person” (as defined in the 1940 Act) of the Company due to his affiliations with BlackRock, Inc. |
| b | Mark Wiedman is deemed to be an “interested person” (as defined in the 1940 Act) of the Company due to his affiliations with BlackRock, Inc. and its affiliates. |
| 84 | 2014 iSHARES ANNUAL REPORTTO SHAREHOLDERS |
Table of Contents
Director and Officer Information (Continued)
iSHARES®, INC.
Independent Directors
| Name (Age) | Position(s) | Principal Occupation(s) During the Past 5 Years | Other Directorships Held by Director | |||
Robert H. Silver (59) | Director (since 2007); Independent Chairman (since 2012). | President and Co-Founder of The Bravitas Group, Inc. (since 2006); Director and Vice Chairman of the YMCA of Greater NYC (2001-2011); Broadway Producer (2006-2011); Co-Founder and Vice President of Parentgiving Inc. (since 2008); Director and Member of the Audit and Compensation Committee of EPAM Systems, Inc. (2006-2009); President and Chief Operating Officer of UBS Financial Services Inc. (formerly Paine Webber Inc.) (2003-2005) and various executive positions with UBS and its affiliates (1988-2005); CPA and Audit Manager of KPMG, LLP (formerly Peat Marwick Mitchell) (1977-1983). | Trustee of iShares Trust (since 2007); Director of iShares MSCI Russia Capped ETF, Inc. (since 2010); Trustee of iShares U.S. ETF Trust (since 2011); Independent Chairman of iShares, Trust, iShares MSCI Russia Capped ETF, Inc. and iShares U.S. ETF Trust (since 2012). | |||
Cecilia H. Herbert (65) | Director (since 2005); Nominating and Governance Committee Chair and Equity Plus Committee Chair (since 2012). | Director (1998-2013) and President (2007-2011) of the Board of Directors, Catholic Charities CYO; Trustee (2002-2011) and Chair of the Finance and Investment Committee (2006-2010) of the Thacher School; Member (since 1992) and Chair (1994-2005) of the Investment Committee, Archdiocese of San Francisco; Trustee and Member of the Investment Committee, WNET, the New York public broadcasting/media company (since 2011). | Trustee of iShares Trust (since 2005); Director of iShares MSCI Russia Capped ETF, Inc. (since 2010); Trustee of iShares U.S. ETF Trust (since 2011); Director of Forward Funds (34 portfolios) (since 2009). | |||
Charles A. Hurty (70) | Director (since 2005); Audit Committee Chair (since 2006). | Retired; Partner, KPMG LLP (1968-2001). | Trustee of iShares Trust (since 2005); Director of iShares MSCI Russia Capped ETF, Inc. (since 2010); Trustee of iShares U.S. ETF Trust (since 2011); Director of GMAM Absolute Return Strategy Fund (1 portfolio) (since 2002); Director of SkyBridge Alternative Investments Multi-Adviser Hedge Fund Portfolios LLC (2 portfolios) (since 2002). | |||
John E. Kerrigan (59) | Director (since 2005); Fixed Income Plus Committee Chair (since 2012). | Chief Investment Officer, Santa Clara University (since 2002). | Trustee of iShares Trust (since 2005); Director of iShares MSCI Russia Capped ETF, Inc. (since 2010); Trustee of iShares U.S. ETF Trust (since 2011). | |||
DIRECTORAND OFFICER INFORMATION | 85 |
Table of Contents
Director and Officer Information (Continued)
iSHARES®, INC.
Independent Directors (Continued)
| Name (Age) | Position(s) | Principal Occupation(s) During the Past 5 Years | Other Directorships Held by Director | |||
John E. Martinez (53) | Director (since 2003); Securities Lending Committee Chair (since 2012). | Director of FirstREX Agreement Corp. (formerly EquityRock, Inc.) (since 2005). | Trustee of iShares Trust (since 2003); Director of iShares MSCI Russia Capped ETF, Inc. (since 2010); Trustee of iShares U.S. ETF Trust (since 2011). | |||
George G.C. Parker (75) | Director (since 2002). | Dean Witter Distinguished Professor of Finance, Emeritus, Stanford University Graduate School of Business (Professor since 1973; Emeritus since 2006). | Trustee of iShares Trust (since 2000); Director of iShares MSCI Russia Capped ETF, Inc. (since 2010); Trustee of iShares U.S. ETF Trust (since 2011); Director of Tejon Ranch Company (since 1999); Director of Threshold Pharmaceuticals (since 2004); Director of Colony Financial, Inc. (since 2009); Director of First Republic Bank (since 2010). | |||
Madhav V. Rajan (50) | Director (since 2011); 15(c) Committee Chair (since 2012). | Robert K. Jaedicke Professor of Accounting and Senior Associate Dean for Academic Affairs and Head of MBA Program, Stanford University Graduate School of Business (since 2001); Professor of Law (by courtesy), Stanford Law School (since 2005); Visiting Professor, University of Chicago (2007-2008). | Trustee of iShares Trust (since 2011); Director of iShares MSCI Russia Capped ETF, Inc. (since 2011); Trustee of iShares U.S. ETF Trust (since 2011); Director, Cavium, Inc. (since 2013). | |||
| 86 | 2014 iSHARES ANNUAL REPORTTO SHAREHOLDERS |
Table of Contents
Director and Officer Information (Continued)
iSHARES®, INC.
Officers
| Name (Age) | Position(s) | Principal Occupation(s) During the Past 5 Years | ||
Manish Mehta (43) | President (since 2013). | Managing Director, BlackRock, Inc. (since 2009); Chief Operating Officer for iShares (since 2009); Head of Strategy and Corporate Development, BGI (2005-2009); Chief of Staff to the CEO, BGI (2005-2009). | ||
Jack Gee (54) | Treasurer and Chief Financial Officer (since 2008). | Managing Director, BlackRock, Inc. (since 2009); Senior Director of Fund Administration of Intermediary Investor Business, BGI (2009); Director of Fund Administration of Intermediary Investor Business, BGI (2004-2009). | ||
Edward B. Baer (45) | Vice President and Chief Legal Officer (since 2012). | Managing Director of Legal & Compliance, BlackRock, Inc. (since 2006); Director of Legal & Compliance, BlackRock, Inc. (2004-2006). | ||
Eilleen M. Clavere (62) | Secretary (since 2007). | Director of Global Fund Administration, BlackRock, Inc. (since 2009); Director of Legal Administration of Intermediary Investor Business, BGI (2006-2009); Legal Counsel and Vice President of Atlas Funds, Atlas Advisers, Inc. and Atlas Securities, Inc. (2005-2006); Counsel at Kirkpatrick & Lockhart LLP (2001-2005). | ||
Scott Radell (45) | Executive Vice President (since 2012). | Managing Director, BlackRock, Inc. (since 2009); Head of Portfolio Solutions, BlackRock, Inc. (since 2009); Head of Portfolio Solutions, BGI (2007-2009); Credit Portfolio Manager, BGI (2005-2007); Credit Research Analyst, BGI (2003-2005). | ||
Amy Schioldager (51) | Executive Vice President (since 2007). | Senior Managing Director, BlackRock, Inc. (since 2009); Global Head of Index Equity, BGI (2008-2009); Global Head of U.S. Indexing, BGI (2006-2008); Head of Domestic Equity Portfolio Management, BGI (2001-2006). | ||
Ira P. Shapiro (51) | Vice President (since 2007). | Managing Director, BlackRock, Inc. (since 2009); Head of Strategic Product Initiatives for iShares (since 2012); Chief Legal Officer, Exchange-Traded Fund Complex (2007-2012); Associate General Counsel, BGI (2004-2009). | ||
DIRECTORAND OFFICER INFORMATION | 87 |
Table of Contents
Notes:
| 88 | 2014 iSHARES ANNUAL REPORTTO SHAREHOLDERS |
Table of Contents
Notes:
NOTES | 89 |
Table of Contents
Notes:
| 90 | 2014 iSHARES ANNUAL REPORTTO SHAREHOLDERS |
Table of Contents
|
For more information visit www.iShares.com or call 1-800-474-2737
This report is intended for the Funds’ shareholders. It may not be distributed to prospective investors unless it is preceded or accompanied by the current prospectus.
Investing involves risk, including possible loss of principal.
The iShares Funds are distributed by BlackRock Investments, LLC (together with its affiliates, “BlackRock”).
The iShares Funds are not sponsored, endorsed, issued, sold or promoted by MSCI Inc., nor does this company make any representation regarding the advisability of investing in the iShares Funds. BlackRock is not affiliated with the company listed above.
A description of the policies that the Funds use to determine how to vote proxies relating to portfolio securities and information about how the Funds voted proxies relating to portfolio securities during the most recent twelve-month period ending June 30 is available without charge, upon request, by calling toll-free 1-800-474-2737; on the Funds’ website at www.iShares.com; and on the U.S. Securities and Exchange Commission (SEC) website at www.sec.gov.
The Funds file their complete schedules of portfolio holdings with the SEC for the first and third quarters of each fiscal year on Form N-Q. The Funds’ Forms N-Q are available on the SEC’s website or may be reviewed and copied at the SEC’s Public Reference Room in Washington, D.C. Information on the operation of the Public Reference Room may be obtained by calling 1-800-SEC-0330. The Funds also disclose their complete schedules of portfolio holdings on a daily and monthly basis on the Funds’ website.
©2014 BlackRock, Inc. All rights reserved. iSHARES and BLACKROCK are registered trademarks of BlackRock, Inc. or its subsidiaries. All other marks are the property of their respective owners.
iS-AR-811-0814

Table of Contents
AUGUST 31, 2014
2014 ANNUAL REPORT |  |
iShares, Inc.
| Ø | iShares MSCI Global Agriculture Producers ETF | VEGI | NYSE Arca |
| Ø | iShares MSCI Global Energy Producers ETF | FILL | NYSE Arca |
| Ø | iShares MSCI Global Gold Miners ETF | RING | NYSE Arca |
| Ø | iShares MSCI Global Metals & Mining Producers ETF | PICK | NYSE Arca |
| Ø | iShares MSCI Global Silver Miners ETF | SLVP | NYSE Arca |
Table of Contents
| 5 | ||||
| 16 | ||||
| 16 | ||||
| 17 | ||||
| 17 | ||||
| 20 | ||||
| 24 | ||||
| 25 | ||||
| 30 | ||||
| 31 | ||||
| 38 | ||||
| 43 | ||||
| 55 | ||||
| 56 | ||||
| 57 | ||||
| 61 | ||||
| 65 |
Table of Contents
Management’s Discussion of Fund Performance
iSHARES®, INC.
GLOBAL MARKET OVERVIEW
Global equities advanced for the 12-month period ended August 31, 2014 (the “reporting period”), although sluggish economic recovery in Europe, U.S. Federal Reserve Bank (“Fed”) actions, and slower economic growth in China kept volatility levels elevated.
For U.S. equities, the reporting period began in an environment of volatility, as concern mounted that the Fed would begin to taper its ongoing quantitative easing program, QE3. Market sentiment soon turned positive, though, when the Fed announced that it would delay any tapering of stimulus until the economic recovery appeared more sustainable. When the Fed did, in fact, begin to reduce its bond-buying program at the end of 2013, the effect on markets was positive, as investors had already digested the possibility of tapering and were reassured that the reduction of the stimulus would be gradual. Although gross domestic product (“GDP”) contracted in the first quarter of 2014, it expanded by 4.2% in the second quarter. The housing sector showed signs of improvement, with housing starts and building permits rising in July 2014, and consumer sentiment remained high throughout the second half of the reporting period. Also, in August 2014, the S&P 500® broke 2,000, reaching a new high.
European equities delivered some of the strongest returns among international equity markets for the reporting period, despite slow and uneven economic recovery in the eurozone. For the third quarter of 2013, the eurozone as a whole experienced GDP growth of 0.1%, representing a decline from the previous quarter. In the fourth quarter of 2013 and first quarter of 2014, GDP growth for the eurozone registered only 0.3% and 0.2%, respectively, before stagnating completely in the second quarter of 2014. Underlying the GDP figures for the entire area, Germany’s GDP grew 0.7% in the first quarter of 2014 over the previous quarter, its largest growth rate in three years, but contracted in the second quarter of 2014. France’s economy demonstrated uneven growth before stagnating in the first and second quarters of 2014 amid weak consumer spending and business investment. Elsewhere in Europe, Spain’s economy gained strength, growing 0.6% in the second quarter of 2014, its largest rate in more than six years. Italy’s economy expanded by 0.1% in the fourth quarter of 2013, but contracted again in the first and second quarters of 2014. Unemployment levels remained stubbornly high among many European markets. The United Kingdom experienced healthy economic growth. GDP growth remained steady in the U.K. throughout the reporting period, exceeding its pre-recession peak from 2008 in the second quarter of 2014 largely on the strength of its services and production sectors.
Japanese equities achieved positive returns in an uneven environment, as conflicting data influenced markets to change direction throughout the reporting period. Early in the reporting period, Japanese equities benefited from the Bank of Japan’s measures to improve economic conditions through quantitative easing. The Nikkei Index rallied and the Japanese yen declined, which in turn helped export levels, although not to the extent that had been expected. Economic growth, as measured by GDP, was uneven during the reporting period. GDP growth was positive for the third and fourth quarters of 2013. The fourth quarter of 2013 figures were revised downward in early 2014, however, and disappointing economic data provided cause for concern that Japan’s growth trajectory might slow in the first quarter of 2014. Stock markets were strengthened when economic data indicated Japan’s economy grew at an annualized 6.7% pace in the first quarter of 2014, surpassing the forecast for the quarter. However, concerns surrounding an increase in the country’s consumption tax — its first increase in 17 years — weighed on markets later in the reporting period. Consumer spending, which had improved in anticipation of the consumption tax increase, slumped in the months following the implementation in April 2014, largely causing GDP to contract in the second quarter of 2014.
Emerging market countries as a group delivered double-digit returns and slightly outperformed broad international indices for the reporting period. Early in the reporting period, concern regarding the Fed tapering its quantitative easing program led investors to abandon emerging market holdings. Political uncertainty among some emerging markets compounded investor aversion to emerging markets. As the reporting period progressed, rising expectations that the Fed would be slower to raise rates than originally had been anticipated, as well as reduced political unrest, helped to refuel investors’ appetite for risk, boosting returns for emerging markets equities.
MANAGEMENT’S DISCUSSIONSOF FUND PERFORMANCE | 5 |
Table of Contents
Management’s Discussion of Fund Performance
iSHARES® MSCI GLOBAL AGRICULTURE PRODUCERS ETF
Performance as of August 31, 2014
| Average Annual Total Returns | Cumulative Total Returns | |||||||||||||||||||||||||
| NAV | MARKET | INDEX | NAV | MARKET | INDEX | |||||||||||||||||||||
1 Year | 13.05% | 13.38% | 13.29% | 13.05% | 13.38% | 13.29% | ||||||||||||||||||||
Since Inception | 5.30% | 5.50% | 5.53% | 14.26% | 14.82% | 14.92% | ||||||||||||||||||||
GROWTH OF $10,000 INVESTMENT
(SINCE INCEPTION AT NET ASSET VALUE)
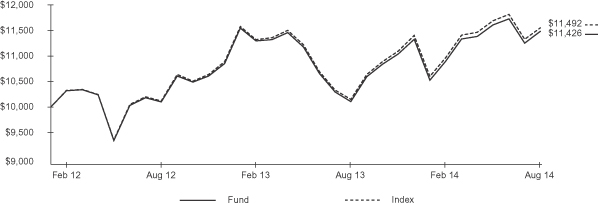
The inception date of the Fund was 1/31/12. The first day of secondary market trading was 2/2/12.
Past performance is no guarantee of future results. Performance results do not reflect the deduction of taxes that a shareholder would pay on fund distributions or on the redemption or sale of fund shares. See “About Fund Performance” on page 16 for more information.
| Shareholder Expenses | ||||||||||||||||||||||||||
| Actual | Hypothetical 5% Return | |||||||||||||||||||||||||
| Beginning Account Value (3/1/14) | Ending Account Value (8/31/14) | Expenses Paid During Period a | Beginning Account Value (3/1/14) | Ending Account Value (8/31/14) | Expenses Paid During Period a | Annualized Expense Ratio | ||||||||||||||||||||
| $ | 1,000.00 | $ | 1,052.30 | $ | 1.97 | $ | 1,000.00 | $ | 1,023.30 | $ | 1.94 | 0.38% | ||||||||||||||
| a | Expenses are calculated using the Fund’s annualized expense ratio (as disclosed in the table), multiplied by the average account value for the period, multiplied by the number of days in the period (184 days) and divided by the number of days in the year (365 days). See “Shareholder Expenses” on page 16 for more information. |
| 6 | 2014 iSHARES ANNUAL REPORTTO SHAREHOLDERS |
Table of Contents
Management’s Discussion of Fund Performance (Continued)
iSHARES® MSCI GLOBAL AGRICULTURE PRODUCERS ETF
The iShares MSCI Global Agriculture Producers ETF (the “Fund”) seeks to track the investment results of an index composed of global equities of companies primarily engaged in the business of agriculture, as represented by the MSCI ACWI Select Agriculture Producers Investable Market Index (the “Index”). The Fund invests in a representative sample of securities included in the Index that collectively has an investment profile similar to the Index. Due to the use of representative sampling, the Fund may or may not hold all of the securities that are included in the Index. For the 12-month reporting period ended August 31, 2014, the total return for the Fund was 13.05%, net of fees, while the total return for the Index was 13.29%.
As represented by the Index, global agriculture producers stocks gained approximately 13% for the reporting period, trailing the return of the broad global equity market. Mixed global economic conditions kept demand for agricultural products in check. U.S. economic growth improved during the reporting period, but economic activity in Europe remained subdued throughout the reporting period and growth in emerging economies softened during the first half of the reporting period before signs of recovery emerged later. At the same time, a wet spring and favorable summer weather in 2014 led to expectations of a record-breaking growing season globally. Global wheat production was forecast to reach an all-time high in 2014, while U.S. farmers were expected to harvest record levels of corn and soybeans.
Consequently, the prices of most agricultural commodities declined sharply for the reporting period. For example, the price of wheat declined by more than 14% for the reporting period, cotton prices fell by 19%, soybean prices dropped by 23%, and corn prices tumbled by 27%.
Currency fluctuations relative to the U.S. dollar had a modestly negative impact on Index performance for the reporting period. The U.S. comprised nearly half of the Index as of August 31, 2014; the top country weightings in the remainder of the Index included Canada, Switzerland, Japan, and Norway. The U.S. dollar appreciated by 3% against the Canadian dollar, 6% versus the Japanese yen, and 1% against the Norwegian krone, though the dollar fell by 1% versus the Swiss franc. A stronger U.S. dollar reduces international equity returns for U.S. investors.
PORTFOLIO ALLOCATION
As of 8/31/14
| Sector/Investment Type | Percentage of Total Investments* |
Materials | 51.19 | % | ||
Food, Beverage & Tobacco | 31.51 | |||
Capital Goods | 16.50 | |||
Investment Companies | 0.80 | |||
|
| |||
TOTAL | 100.00 | % | ||
|
|
TEN LARGEST COUNTRY ALLOCATIONS
As of 8/31/14
| Country | Percentage of Total Investments* |
United States | 48.52 | % | ||
Canada | 11.06 | |||
Switzerland | 8.39 | |||
Japan | 5.77 | |||
Norway | 4.02 | |||
Malaysia | 2.92 | |||
Singapore | 2.39 | |||
Italy | 2.08 | |||
Germany | 1.88 | |||
China | 1.36 | |||
|
| |||
TOTAL | 88.39 | % | ||
|
|
| * | Excludes money market funds. |
MANAGEMENT’S DISCUSSIONSOF FUND PERFORMANCE | 7 |
Table of Contents
Management’s Discussion of Fund Performance
iSHARES® MSCI GLOBAL ENERGY PRODUCERS ETF
Performance as of August 31, 2014
| Average Annual Total Returns | Cumulative Total Returns | |||||||||||||||||||||||||
| NAV | MARKET | INDEX | NAV | MARKET | INDEX | |||||||||||||||||||||
1 Year | 19.44% | 19.36% | 19.63% | 19.44% | 19.36% | 19.63% | ||||||||||||||||||||
Since Inception | 7.59% | 7.51% | 7.58% | 20.79% | 20.58% | 20.78% | ||||||||||||||||||||
GROWTH OF $10,000 INVESTMENT
(SINCE INCEPTION AT NET ASSET VALUE)
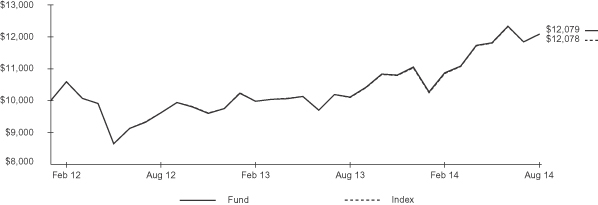
The inception date of the Fund was 1/31/12. The first day of secondary market trading was 2/2/12.
Past performance is no guarantee of future results. Performance results do not reflect the deduction of taxes that a shareholder would pay on fund distributions or on the redemption or sale of fund shares. See “About Fund Performance” on page 16 for more information.
| Shareholder Expenses | ||||||||||||||||||||||||||
| Actual | Hypothetical 5% Return | |||||||||||||||||||||||||
| Beginning Account Value (3/1/14) | Ending Account Value (8/31/14) | Expenses Paid During Period a | Beginning Account Value (3/1/14) | Ending Account Value (8/31/14) | Expenses Paid During Period a | Annualized Expense Ratio | ||||||||||||||||||||
| $ | 1,000.00 | $ | 1,111.10 | $ | 2.08 | $ | 1,000.00 | $ | 1,023.20 | $ | 1.99 | 0.39% | ||||||||||||||
| a | Expenses are calculated using the Fund’s annualized expense ratio (as disclosed in the table), multiplied by the average account value for the period, multiplied by the number of days in the period (184 days) and divided by the number of days in the year (365 days). See “Shareholder Expenses” on page 16 for more information. |
| 8 | 2014 iSHARES ANNUAL REPORTTO SHAREHOLDERS |
Table of Contents
Management’s Discussion of Fund Performance (Continued)
iSHARES® MSCI GLOBAL ENERGY PRODUCERS ETF
The iShares MSCI Global Energy Producers ETF (the “Fund”) seeks to track the investment results of an index composed of global equities of companies primarily engaged in the business of energy exploration and production, as represented by the MSCI ACWI Select Energy Producers Investable Market Index (the “Index”). The Fund invests in a representative sample of securities included in the Index that collectively has an investment profile similar to the Index. Due to the use of representative sampling, the Fund may or may not hold all of the securities that are included in the Index. For the 12-month reporting period ended August 31, 2014, the total return for the Fund was 19.44%, net of fees, while the total return for the Index was 19.63%.
As represented by the Index, global energy production stocks advanced by just under 20% for the reporting period, narrowly trailing the gain of the broad global equity market. U.S. energy stocks, which comprised approximately half of the Index at the end of the reporting period, were among the best performers, returning nearly 25% for the reporting period. Strong production levels, particularly from a boom in shale oil and gas extraction, and improving economic growth domestically helped drive the rally in U.S. energy stocks.
In other regions of the world, energy production stocks posted double-digit gains but lagged the U.S. energy sector. Economic growth in Europe remained subdued throughout the reporting period, dampening demand for energy on the Continent. In addition, other notable energy consumers — including Russia, Japan, and Brazil, all three of which are among the top 10 countries in the world in terms of energy consumption — experienced markedly weaker economic growth during the reporting period.
Currency fluctuations relative to the U.S. dollar had a modestly negative impact on Index performance for the reporting period. A stronger U.S. dollar reduces international equity returns for U.S. investors. The U.S. dollar appreciated by 11% against the Russian ruble, 6% versus the Japanese yen, 3% against the Canadian dollar, and 1% versus the euro and the Chinese yuan. These countries comprised approximately one-third of the Index as of the end of the reporting period.
PORTFOLIO ALLOCATION
As of 8/31/14
| Sector | Percentage of Total Investments* |
Integrated Oil & Gas | 60.41 | % | ||
Oil & Gas Exploration & Production | 32.81 | |||
Oil & Gas Refining & Marketing | 5.08 | |||
Coal & Consumable Fuels | 1.70 | |||
|
| |||
TOTAL | 100.00 | % | ||
|
|
TEN LARGEST COUNTRY ALLOCATIONS
As of 8/31/14
| Country | Percentage of Total Investments* |
United States | 50.01 | % | ||
United Kingdom | 16.73 | |||
Canada | 10.81 | |||
France | 4.81 | |||
China | 2.96 | |||
Brazil | 2.52 | |||
Italy | 2.17 | |||
Russia | 2.10 | |||
Australia | 1.58 | |||
Norway | 1.17 | |||
|
| |||
TOTAL | 94.86 | % | ||
|
|
| * | Excludes money market funds. |
MANAGEMENT’S DISCUSSIONSOF FUND PERFORMANCE | 9 |
Table of Contents
Management’s Discussion of Fund Performance
iSHARES® MSCI GLOBAL GOLD MINERS ETF
Performance as of August 31, 2014
| Average Annual Total Returns | Cumulative Total Returns | |||||||||||||||||||||||||
| NAV | MARKET | INDEX | NAV | MARKET | INDEX | |||||||||||||||||||||
1 Year | (2.01)% | (2.61)% | (1.90)% | (2.01)% | (2.61)% | (1.90)% | ||||||||||||||||||||
Since Inception | (25.75)% | (25.85)% | (25.67)% | (53.65)% | (53.82)% | (53.52)% | ||||||||||||||||||||
GROWTH OF $10,000 INVESTMENT
(SINCE INCEPTION AT NET ASSET VALUE)
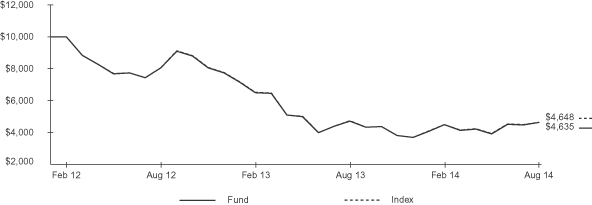
The inception date of the Fund was 1/31/12. The first day of secondary market trading was 2/2/12.
Past performance is no guarantee of future results. Performance results do not reflect the deduction of taxes that a shareholder would pay on fund distributions or on the redemption or sale of fund shares. See “About Fund Performance” on page 16 for more information.
| Shareholder Expenses | ||||||||||||||||||||||||||
| Actual | Hypothetical 5% Return | |||||||||||||||||||||||||
| Beginning Account Value (3/1/14) | Ending Account Value (8/31/14) | Expenses Paid During Period a | Beginning Account Value (3/1/14) | Ending Account Value (8/31/14) | Expenses Paid During Period a | Annualized Expense Ratio | ||||||||||||||||||||
| $ | 1,000.00 | $ | 1,030.50 | $ | 2.00 | $ | 1,000.00 | $ | 1,023.20 | $ | 1.99 | 0.39% | ||||||||||||||
| a | Expenses are calculated using the Fund’s annualized expense ratio (as disclosed in the table), multiplied by the average account value for the period, multiplied by the number of days in the period (184 days) and divided by the number of days in the year (365 days). See “Shareholder Expenses” on page 16 for more information. |
| 10 | 2014 iSHARES ANNUAL REPORTTO SHAREHOLDERS |
Table of Contents
Management’s Discussion of Fund Performance (Continued)
iSHARES® MSCI GLOBAL GOLD MINERS ETF
The iShares MSCI Global Gold Miners ETF (the “Fund”) seeks to track the investment results of an index composed of global equities of companies primarily engaged in the business of gold mining, as represented by the MSCI ACWI Select Gold Miners Investable Market Index (the “Index”). The Fund invests in a representative sample of securities included in the Index that collectively has an investment profile similar to the Index. Due to the use of representative sampling, the Fund may or may not hold all of the securities that are included in the Index. For the 12-month reporting period ended August 31, 2014, the total return for the Fund was -2.01%, net of fees, while the total return for the Index was -1.90%.
As represented by the Index, global gold mining stocks declined by approximately 2% for the reporting period, trailing the strong gain of the broad global equity market. Mixed global economic conditions kept demand for commodities in check, and gold was no exception. U.S. economic growth improved during the reporting period, but economic activity in Europe remained subdued throughout the reporting period and growth in emerging economies softened during the first half of the reporting period before signs of recovery emerged later. In addition, demand for gold typically increases when inflation or inflation expectations rise, but global inflation remained low by historical standards.
For the reporting period, the price of gold fell by 8% overall, ending the period at $1,286 per ounce — approximately 33% below the all-time high of $1,909 per ounce reached in August 2011. The price of gold traded between $1,200 and $1,400 per ounce throughout the reporting period.
Currency fluctuations relative to the U.S. dollar also had a negative impact on Index performance for the reporting period. A stronger dollar lowers international equity returns for U.S. investors. The U.S. dollar strengthened against many foreign currencies during the reporting period, including 3% against the Canadian dollar, 4% versus the South African rand, and 6% against the Turkish lira. These three countries comprised approximately two-thirds of the Index as of August 31, 2014. In addition, gold is generally priced in U.S. dollars, so a stronger dollar makes gold more expensive for foreign buyers.
COUNTRY ALLOCATION
As of 8/31/14
| Country | Percentage of Total Investments* |
Canada | 60.26 | % | ||
United States | 11.03 | |||
South Africa | 10.84 | |||
United Kingdom | 7.19 | |||
Australia | 5.73 | |||
Peru | 2.56 | |||
Hong Kong | 0.86 | |||
Turkey | 0.79 | |||
China | 0.74 | |||
|
| |||
TOTAL | 100.00 | % | ||
|
|
TEN LARGEST FUND HOLDINGS
As of 8/31/14
| Security | Percentage of Total Investments* |
Goldcorp Inc. (Canada) | 15.93 | % | ||
Barrick Gold Corp. (Canada) | 14.88 | |||
Newmont Mining Corp. | 8.78 | |||
Agnico-Eagle Mines Ltd. (Canada) | 4.59 | |||
Newcrest Mining Ltd. (Australia) | 4.58 | |||
Randgold Resources Ltd. (United Kingdom) | 4.53 | |||
Eldorado Gold Corp. (Canada) | 4.52 | |||
Yamana Gold Inc. (Canada) | 4.45 | |||
AngloGold Ashanti Ltd. (South Africa) | 4.44 | |||
Kinross Gold Corp. (Canada) | 3.85 | |||
|
| |||
TOTAL | 70.55 | % | ||
|
|
| * | Excludes money market funds. |
MANAGEMENT’S DISCUSSIONSOF FUND PERFORMANCE | 11 |
Table of Contents
Management’s Discussion of Fund Performance
iSHARES® MSCI GLOBAL METALS & MINING PRODUCERS ETF
Performance as of August 31, 2014
| Average Annual Total Returns | Cumulative Total Returns | |||||||||||||||||||||||||
| NAV | MARKET | INDEX | NAV | MARKET | INDEX | |||||||||||||||||||||
1 Year | 15.32% | 17.19% | 15.67% | 15.32% | 17.19% | 15.67% | ||||||||||||||||||||
Since Inception | (5.38)% | (5.21)% | (5.43)% | (13.31)% | (12.90)% | (13.43)% | ||||||||||||||||||||
GROWTH OF $10,000 INVESTMENT
(SINCE INCEPTION AT NET ASSET VALUE)
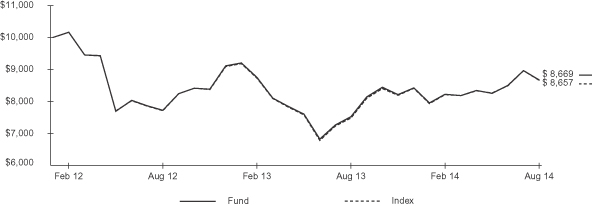
The inception date of the Fund was 1/31/12. The first day of secondary market trading was 2/2/12.
Past performance is no guarantee of future results. Performance results do not reflect the deduction of taxes that a shareholder would pay on fund distributions or on the redemption or sale of fund shares. See “About Fund Performance” on page 16 for more information.
| Shareholder Expenses | ||||||||||||||||||||||||||
| Actual | Hypothetical 5% Return | |||||||||||||||||||||||||
| Beginning Account Value (3/1/14) | Ending Account Value (8/31/14) | Expenses Paid During Period a | Beginning Account Value (3/1/14) | Ending Account Value (8/31/14) | Expenses Paid During Period a | Annualized Expense Ratio | ||||||||||||||||||||
| $ | 1,000.00 | $ | 1,054.00 | $ | 2.02 | $ | 1,000.00 | $ | 1,023.20 | $ | 1.99 | 0.39% | ||||||||||||||
| a | Expenses are calculated using the Fund’s annualized expense ratio (as disclosed in the table), multiplied by the average account value for the period, multiplied by the number of days in the period (184 days) and divided by the number of days in the year (365 days). See “Shareholder Expenses” on page 16 for more information. |
| 12 | 2014 iSHARES ANNUAL REPORTTO SHAREHOLDERS |
Table of Contents
Management’s Discussion of Fund Performance (Continued)
iSHARES® MSCI GLOBAL METALS & MINING PRODUCERS ETF
The iShares MSCI Global Metals & Mining Producers ETF (the “Fund”) seeks to track the investment results of an index composed of global equities of companies primarily engaged in mining, extraction or production of diversified metals, excluding gold and silver, as represented by the MSCI ACWI Select Metals & Mining Producers ex Gold & Silver Investable Market Index (the “Index”). The Fund invests in a representative sample of securities included in the Index that collectively has an investment profile similar to the Index. Due to the use of representative sampling, the Fund may or may not hold all of the securities that are included in the Index. For the 12-month reporting period ended August 31, 2014, the total return for the Fund was 15.32%, net of fees, while the total return for the Index was 15.67%.
As represented by the Index, global metals and mining stocks advanced by nearly 16% for the reporting period, trailing the gain of the broad global equity market. Demand for industrial metals was mixed as global economic conditions varied by region. U.S. economic growth improved during the reporting period, but economic activity in Europe remained subdued throughout the reporting period and growth in emerging economies softened during the first half of the reporting period before signs of recovery emerged later.
Overall, the prices of industrial metals declined for the reporting period as the International Monetary Fund Commodity Metals Price Index fell by 7%. However, this masked significant variation in the performance of individual metals. For example, iron ore prices plunged by more than 30% amid rising production levels and slowing demand from emerging markets. In contrast, nickel surged by 30% after Indonesia (which supplies one-fifth of global nickel exports) banned nickel ore exports in early 2014.
Currency fluctuations relative to the U.S. dollar had a mixed but slightly positive impact on Index performance for the reporting period. A weaker dollar increases international equity returns for U.S. investors. The U.S. dollar declined by 7% against the British pound, 6% against the Brazilian real, 5% versus the Australian dollar, and 1% against the Japanese yen. These countries comprised approximately half of the Index as of August 31, 2014.
PORTFOLIO ALLOCATION
As of 8/31/14
| Sector | Percentage of Total Investments* |
Diversified Metals & Mining | 62.11 | % | ||
Steel | 31.50 | |||
Aluminum | 4.25 | |||
Precious Metals & Minerals | 2.14 | |||
|
| |||
TOTAL | 100.00 | % | ||
|
|
TEN LARGEST COUNTRY ALLOCATIONS
As of 8/31/14
| Country | Percentage of Total Investments* |
United Kingdom | 27.21 | % | ||
Australia | 18.14 | |||
United States | 14.00 | |||
Japan | 7.47 | |||
Brazil | 5.91 | |||
Canada | 4.80 | |||
South Korea | 3.85 | |||
France | 1.87 | |||
Mexico | 1.84 | |||
Germany | 1.76 | |||
|
| |||
TOTAL | 86.85 | % | ||
|
|
| * | Excludes money market funds. |
MANAGEMENT’S DISCUSSIONSOF FUND PERFORMANCE | 13 |
Table of Contents
Management’s Discussion of Fund Performance
iSHARES® MSCI GLOBAL SILVER MINERS ETF
Performance as of August 31, 2014
| Average Annual Total Returns | Cumulative Total Returns | |||||||||||||||||||||||||
| NAV | MARKET | INDEX | NAV | MARKET | INDEX | |||||||||||||||||||||
1 Year | (7.48)% | (7.49)% | (7.24)% | (7.48)% | (7.49)% | (7.24)% | ||||||||||||||||||||
Since Inception | (21.80)% | (21.54)% | (21.69)% | (47.02)% | (46.56)% | (46.84)% | ||||||||||||||||||||
GROWTH OF $10,000 INVESTMENT
(SINCE INCEPTION AT NET ASSET VALUE)
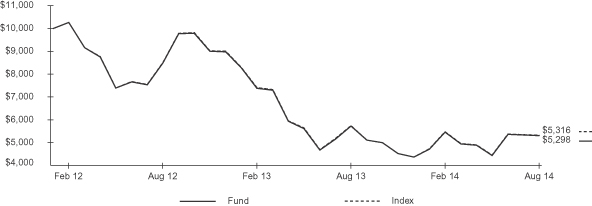
The inception date of the Fund was 1/31/12. The first day of secondary market trading was 2/2/12.
Past performance is no guarantee of future results. Performance results do not reflect the deduction of taxes that a shareholder would pay on fund distributions or on the redemption or sale of fund shares. See “About Fund Performance” on page 16 for more information.
| Shareholder Expenses | ||||||||||||||||||||||||||
| Actual | Hypothetical 5% Return | |||||||||||||||||||||||||
| Beginning Account Value (3/1/14) | Ending Account Value (8/31/14) | Expenses Paid During Period a | Beginning Account Value (3/1/14) | Ending Account Value (8/31/14) | Expenses Paid During Period a | Annualized Expense Ratio | ||||||||||||||||||||
| $ | 1,000.00 | $ | 969.70 | $ | 1.94 | $ | 1,000.00 | $ | 1,023.20 | $ | 1.99 | 0.39% | ||||||||||||||
| a | Expenses are calculated using the Fund’s annualized expense ratio (as disclosed in the table), multiplied by the average account value for the period, multiplied by the number of days in the period (184 days) and divided by the number of days in the year (365 days). See “Shareholder Expenses” on page 16 for more information. |
| 14 | 2014 iSHARES ANNUAL REPORTTO SHAREHOLDERS |
Table of Contents
Management’s Discussion of Fund Performance (Continued)
iSHARES® MSCI GLOBAL SILVER MINERS ETF
The iShares MSCI Global Silver Miners ETF (the “Fund”) seeks to track the investment results of an index composed of global equities of companies primarily engaged in the business of silver mining, as represented by the MSCI ACWI Select Silver Miners Investable Market Index (the “Index”). The Fund invests in a representative sample of securities included in the Index that collectively has an investment profile similar to the Index. Due to the use of representative sampling, the Fund may or may not hold all of the securities that are included in the Index. For the 12-month reporting period ended August 31, 2014, the total return for the Fund was -7.48%, net of fees, while the total return for the Index was -7.24%.
As represented by the Index, global silver mining stocks declined by approximately 7% for the reporting period, trailing the strong gain of the broad global equity market. Mixed global economic conditions kept demand for commodities in check, and silver was no exception. U.S. economic growth improved during the reporting period, but economic activity in Europe remained subdued throughout the reporting period and growth in emerging economies softened during the first half of the reporting period before signs of recovery emerged later.
The price of silver ended the reporting period at $19.47 per ounce, down approximately 18% from the beginning of the period and more than 35% from August 2012. The price of silver traded between $18 and $25 per ounce throughout the reporting period.
Currency fluctuations relative to the U.S. dollar also had a negative impact on Index performance for the reporting period. A stronger dollar lowers international equity returns for U.S. investors. The U.S. dollar strengthened against many foreign currencies during the reporting period, including 1% versus the Peruvian sol and 3% against the Canadian dollar. These two countries comprised over 60% of the Index as of August 31, 2014. In addition, silver is generally priced in U.S. dollars, so a stronger dollar makes silver more expensive for foreign buyers.
COUNTRY ALLOCATION
As of 8/31/14
| Country | Percentage of Total Investments* |
Canada | 58.42 | % | ||
United Kingdom | 12.51 | |||
United States | 12.49 | |||
Mexico | 8.53 | |||
Peru | 5.22 | |||
Hong Kong | 2.65 | |||
Australia | 0.18 | |||
|
| |||
TOTAL | 100.00 | % | ||
|
|
TEN LARGEST FUND HOLDINGS
As of 8/31/14
| Security | Percentage of Total Investments* |
Silver Wheaton Corp. (Canada) | 22.31 | % | ||
Industrias Penoles SAB de CV (Mexico) | 8.53 | |||
Fresnillo PLC (United Kingdom) | 8.28 | |||
Compania de Minas Buenaventura SA SP ADR (Peru) | 5.21 | |||
First Majestic Silver Corp. (Canada) | 4.56 | |||
Pan American Silver Corp. (Canada) | 4.56 | |||
Tahoe Resources Inc. (Canada) | 4.45 | |||
Hecla Mining Co. | 4.25 | |||
Coeur Mining Inc. | 3.30 | |||
Silver Standard Resources Inc. (Canada) | 3.14 | |||
|
| |||
TOTAL | 68.59 | % | ||
|
|
| * | Excludes money market funds. |
MANAGEMENT’S DISCUSSIONSOF FUND PERFORMANCE | 15 |
Table of Contents
Past performance is no guarantee of future results. Current performance may be lower or higher than the performance data quoted. Performance data current to the most recent month-end is available at www.iShares.com. Performance results assume reinvestment of all dividends and capital gain distributions and do not reflect the deduction of taxes that a shareholder would pay on fund distributions or on the redemption or sale of fund shares. The investment return and principal value of shares will vary with changes in market conditions. Shares may be worth more or less than their original cost when they are redeemed or sold in the market. Performance for certain funds may reflect a waiver of a portion of investment management fees. Without such waiver, performance would have been lower.
Net asset value or “NAV” is the value of one share of a fund as calculated in accordance with the standard formula for valuing mutual fund shares. The price used to calculate market return (“Market Price”) is determined by using the midpoint between the highest bid and the lowest offer on the primary stock exchange on which shares of a fund are listed for trading, as of the time that such fund’s NAV is calculated. Since shares of a fund may not have traded in the secondary market until after the fund’s inception, for the period from inception to the first day of secondary trading, the NAV of the fund is used as a proxy for the Market Price to calculate market returns. Market and NAV returns assume that dividends and capital gain distributions have been reinvested at Market Price and NAV, respectively.
An index is a statistical composite that tracks a specified financial market or sector. Unlike a fund, an index does not actually hold a portfolio of securities and therefore does not incur the expenses incurred by a fund. These expenses negatively impact fund performance. Also, market returns do not include brokerage commissions that may be payable on secondary market transactions. If brokerage commissions were included, market returns would be lower.
As a shareholder of a Fund, you incur two types of costs: (1) transaction costs, including brokerage commissions on purchases and sales of fund shares and (2) ongoing costs, including management fees and other fund expenses. The expense example, which is based on an investment of $1,000 invested on March 1, 2014 and held through August 31, 2014, is intended to help you understand your ongoing costs (in dollars and cents) of investing in a Fund and to compare these costs with the ongoing costs of investing in other funds.
Actual Expenses — The table provides information about actual account values and actual expenses. Annualized expense ratios reflect contractual and voluntary fee waivers, if any. To estimate the expenses that you paid on your account over the period, simply divide your account value by $1,000 (for example, an $8,600 account value divided by $1,000 = 8.6), then multiply the result by the number for your Fund under the heading entitled “Expenses Paid During Period.”
Hypothetical Example for Comparison Purposes — The table also provides information about hypothetical account values and hypothetical expenses based on each Fund’s actual expense ratio and an assumed rate of return of 5% per year before expenses. You may use this information to compare the ongoing costs of investing in your Fund and other funds. To do so, compare this 5% hypothetical example with the 5% hypothetical examples that appear in the shareholder reports of the other funds.
Please note that the expenses shown in the table are meant to highlight your ongoing costs only and do not reflect any transactional costs, such as brokerage commissions paid on purchases and sales of fund shares. Therefore, the hypothetical examples are useful in comparing ongoing costs only and will not help you determine the relative total costs of owning different funds. In addition, if these transactional costs were included, your costs would have been higher.
| 16 | 2014 iSHARES ANNUAL REPORTTO SHAREHOLDERS |
Table of Contents
iSHARES® MSCI GLOBAL AGRICULTURE PRODUCERS ETF
August 31, 2014
| Security | Shares | Value | ||||||
COMMON STOCKS — 98.20% |
| |||||||
AUSTRALIA — 0.82% |
| |||||||
Australian Agricultural Co. Ltd.a | 45,594 | $ | 53,092 | |||||
GrainCorp Ltd. Class A | 21,352 | 180,933 | ||||||
Nufarm Ltd. | 21,148 | 85,250 | ||||||
Tassal Group Ltd. | 16,524 | 61,665 | ||||||
|
| |||||||
| 380,940 | ||||||||
BRAZIL — 0.58% | ||||||||
BrasilAgro — Companhia Brasileira Propriedades Agricolas | 3,400 | 14,724 | ||||||
Sao Martinho SA | 7,900 | 160,256 | ||||||
SLC Agricola SA | 6,800 | 52,606 | ||||||
Tereos Internacional SA | 34,000 | 42,547 | ||||||
|
| |||||||
| 270,133 | ||||||||
CANADA — 11.02% | ||||||||
AG Growth International Inc. | 1,666 | 72,169 | ||||||
Agrium Inc. | 16,660 | 1,579,148 | ||||||
Potash Corp. of Saskatchewan Inc. | 98,362 | 3,462,959 | ||||||
|
| |||||||
| 5,114,276 | ||||||||
CHILE — 0.11% | ||||||||
Empresas Aquachile SAa | 49,213 | 31,926 | ||||||
Multiexport Foods SAa | 79,492 | 18,159 | ||||||
|
| |||||||
| 50,085 | ||||||||
CHINA — 1.35% | ||||||||
Century Sunshine Group Holdings Ltd. | 170,000 | 22,813 | ||||||
China Agri-Industries Holdings Ltd.b | 239,200 | 97,839 | ||||||
China BlueChemical Ltd. Class H | 204,000 | 100,550 | ||||||
China Huishan Dairy Holdings Co. Ltd.a,b | 680,000 | 157,932 | ||||||
China Modern Dairy Holdings Ltd.a,b | 215,000 | 105,417 | ||||||
First Tractor Co. Ltd. Class H | 68,000 | 46,678 | ||||||
Hubei Sanonda Co. Ltd. Class B | 100 | 122 | ||||||
Sinofert Holdings Ltd.a | 272,000 | 42,466 | ||||||
YuanShengTai Dairy Farm Ltd.a,b | 306,000 | 53,697 | ||||||
|
| |||||||
| 627,514 | ||||||||
DENMARK — 0.33% | ||||||||
Auriga Industries A/S Class Ba | 1,734 | 96,267 | ||||||
United International Enterprises Ltd. | 272 | 54,824 | ||||||
|
| |||||||
| 151,091 | ||||||||
FINLAND — 0.04% | ||||||||
HKScan OYJ Class A | 3,502 | 16,422 | ||||||
|
| |||||||
| 16,422 | ||||||||
| Security | Shares | Value | ||||||
FRANCE — 0.26% | ||||||||
Naturex | 667 | $ | 51,836 | |||||
Vilmorin & Cie SA | 612 | 69,617 | ||||||
|
| |||||||
| 121,453 | ||||||||
GERMANY — 1.88% | ||||||||
K+S AG Registered | 19,992 | 623,050 | ||||||
KWS Saat AG | 238 | 84,737 | ||||||
Suedzucker AGb | 9,418 | 162,511 | ||||||
|
| |||||||
| 870,298 | ||||||||
INDONESIA — 1.31% | ||||||||
PT Astra Agro Lestari Tbk | 47,600 | 103,766 | ||||||
PT BW Plantation Tbk | 226,700 | 19,961 | ||||||
PT Charoen Pokphand Indonesia Tbk | 867,000 | 284,985 | ||||||
PT Japfa Comfeed Indonesia Tbk | 588,200 | 64,867 | ||||||
PT Malindo Feedmill Tbk | 104,300 | 30,048 | ||||||
PT Perusahaan Perkebunan London Sumatra Indonesia Tbk | 360,400 | 57,615 | ||||||
PT Salim Ivomas Pratama Tbk | 476,000 | 33,775 | ||||||
PT Sampoerna Agro Tbk | 77,100 | 13,907 | ||||||
|
| |||||||
| 608,924 | ||||||||
ISRAEL — 1.24% | ||||||||
Israel Chemicals Ltd. | 51,272 | 396,566 | ||||||
Israel Corp. Ltd. (The)a | 317 | 178,915 | ||||||
|
| |||||||
| 575,481 | ||||||||
ITALY — 2.07% | ||||||||
CNH Industrial NV | 109,176 | 950,562 | ||||||
Societa per la Bonifica dei Terreni Ferraresi e Imprese Agricole SpAb | 306 | 11,669 | ||||||
|
| |||||||
| 962,231 | ||||||||
JAPAN — 5.75% |
| |||||||
Hokuto Corp. | 4,500 | 85,161 | ||||||
Iseki & Co. Ltd. | 34,000 | 91,313 | ||||||
Kubota Corp. | 136,000 | 1,945,382 | ||||||
Maruha Nichiro Corp. | 6,800 | 106,040 | ||||||
Mitsui Sugar Co. Ltd. | 11,000 | 41,402 | ||||||
NH Foods Ltd. | 14,000 | 296,751 | ||||||
Nihon Nohyaku Co. Ltd. | 3,400 | 35,707 | ||||||
Nippon Beet Sugar Manufacturing Co. Ltd. | 11,000 | 20,542 | ||||||
Sakata Seed Corp. | 3,400 | 45,296 | ||||||
|
| |||||||
| 2,667,594 | ||||||||
MALAYSIA — 2.91% |
| |||||||
Felda Global Ventures Holdings Bhd | 139,400 | 168,943 | ||||||
Genting Plantations Bhd | 23,900 | 76,280 | ||||||
SCHEDULESOF INVESTMENTS | 17 |
Table of Contents
Schedule of Investments (Continued)
iSHARES® MSCI GLOBAL AGRICULTURE PRODUCERS ETF
August 31, 2014
| Security | Shares | Value | ||||||
IOI Corp. Bhd | 329,800 | $ | 500,141 | |||||
Kim Loong Resources Bhd | 17,000 | 14,508 | ||||||
Kuala Lumpur Kepong Bhd | 54,400 | 380,386 | ||||||
QL Resources Bhd | 62,650 | 65,989 | ||||||
Rimbunan Sawit Bhd | 75,900 | 17,217 | ||||||
Sarawak Oil Palms Bhd | 17,000 | 32,900 | ||||||
TDM Bhd | 70,200 | 21,158 | ||||||
TH Plantations Bhd | 37,400 | 21,239 | ||||||
TSH Resources Bhd | 47,600 | 51,345 | ||||||
|
| |||||||
| 1,350,106 | ||||||||
MEXICO — 0.52% |
| |||||||
Grupo Lala SAB de CV | 74,800 | 194,158 | ||||||
Industrias Bachoco SAB de CV Series B | 10,200 | 48,779 | ||||||
|
| |||||||
| 242,937 | ||||||||
NETHERLANDS — 0.66% |
| |||||||
Nutreco NV | 7,990 | 308,103 | ||||||
|
| |||||||
| 308,103 | ||||||||
NORWAY — 4.01% |
| |||||||
Austevoll Seafood ASA | 10,676 | 68,094 | ||||||
Bakkafrost P/F | 4,420 | 95,881 | ||||||
Cermaq ASA | 4,998 | 65,942 | ||||||
Leroey Seafood Group ASA | 2,516 | 93,273 | ||||||
Marine Harvest ASA | 35,564 | 482,750 | ||||||
Yara International ASA | 20,944 | 1,054,456 | ||||||
|
| |||||||
| 1,860,396 | ||||||||
POLAND — 0.40% |
| |||||||
Grupa Azoty SA | 5,780 | 135,129 | ||||||
Kernel Holding SAa | 6,052 | 48,740 | ||||||
|
| |||||||
| 183,869 | ||||||||
RUSSIA — 1.28% |
| |||||||
Acron JSC | 988 | 30,475 | ||||||
Uralkali OJSC | 152,320 | 562,559 | ||||||
|
| |||||||
| 593,034 | ||||||||
SINGAPORE — 2.38% |
| |||||||
Bumitama Agri Ltd.b | 45,000 | 40,386 | ||||||
First Resources Ltd.b | 68,000 | 110,069 | ||||||
GMG Global Ltd.b | 442,000 | 28,334 | ||||||
Golden Agri-Resources Ltd. | 816,000 | 333,475 | ||||||
Indofood Agri Resources Ltd. | 68,000 | 47,133 | ||||||
Wilmar International Ltd. | 215,000 | 544,413 | ||||||
|
| |||||||
| 1,103,810 | ||||||||
SOUTH AFRICA — 0.72% |
| |||||||
Astral Foods Ltd. | 4,760 | 64,001 | ||||||
| Security | Shares | Value | ||||||
Illovo Sugar Ltd. | 24,344 | $ | 66,380 | |||||
Tongaat Hulett Ltd. | 12,580 | 201,817 | ||||||
|
| |||||||
| 332,198 | ||||||||
SOUTH KOREA — 0.42% |
| |||||||
Dongwon Industries Co. Ltd. | 136 | 52,310 | ||||||
Farmscoa | 1,428 | 20,914 | ||||||
Harim Co. Ltd.a,b | 4,397 | 22,506 | ||||||
Namhae Chemical Corp. | 3,196 | 29,440 | ||||||
Nong Woo Bio Co. Ltd. | 1,122 | 27,775 | ||||||
Silla Co. Ltd. | 802 | 22,661 | ||||||
TS Corp. | 564 | 19,719 | ||||||
|
| |||||||
| 195,325 | ||||||||
SPAIN — 0.00% |
| |||||||
Pescanova SAa,c | 414 | — | ||||||
|
| |||||||
| — | ||||||||
SWEDEN — 0.20% |
| |||||||
Cloetta ABa,b | 27,540 | 90,862 | ||||||
|
| |||||||
| 90,862 | ||||||||
SWITZERLAND — 8.36% |
| |||||||
Syngenta AG Registered | 10,778 | 3,877,656 | ||||||
|
| |||||||
| 3,877,656 | ||||||||
TAIWAN — 0.41% |
| |||||||
Sinon Corp. | 68,000 | 39,471 | ||||||
Taiwan Fertilizer Co. Ltd. | 79,000 | 149,857 | ||||||
|
| |||||||
| 189,328 | ||||||||
THAILAND — 0.78% |
| |||||||
Charoen Pokphand Foods PCL NVDR | 313,900 | 289,920 | ||||||
GFPT PCL NVDR | 65,700 | 37,231 | ||||||
Khon Kaen Sugar Industry PCL NVDR | 86,100 | 37,201 | ||||||
|
| |||||||
| 364,352 | ||||||||
TURKEY — 0.04% |
| |||||||
Gubre Fabrikalari TAS | 10,438 | 21,041 | ||||||
|
| |||||||
| 21,041 | ||||||||
UNITED STATES — 48.35% |
| |||||||
AGCO Corp. | 10,302 | 503,150 | ||||||
Alico Inc. | 476 | 18,583 | ||||||
Archer-Daniels-Midland Co. | 76,025 | 3,790,606 | ||||||
Bunge Ltd. | 16,966 | 1,436,172 | ||||||
Cal-Maine Foods Inc. | 1,768 | 139,866 | ||||||
CF Industries Holdings Inc. | 6,256 | 1,611,984 | ||||||
Darling Ingredients Inc.a | 19,176 | 369,713 | ||||||
Deere & Co. | 40,392 | 3,396,563 | ||||||
Fresh Del Monte Produce Inc. | 5,304 | 169,410 | ||||||
Ingredion Inc. | 8,602 | 686,096 | ||||||
| 18 | 2014 iSHARES ANNUAL REPORTTO SHAREHOLDERS |
Table of Contents
Schedule of Investments (Continued)
iSHARES® MSCI GLOBAL AGRICULTURE PRODUCERS ETF
August 31, 2014
| Security | Shares | Value | ||||||
Intrepid Potash Inc.a | 6,902 | $ | 105,808 | |||||
Lindsay Corp. | 1,598 | 124,292 | ||||||
Monsanto Co. | 60,690 | 7,018,798 | ||||||
Mosaic Co. (The) | 37,366 | 1,784,600 | ||||||
Pilgrim’s Pride Corp.a | 7,650 | 228,506 | ||||||
Sanderson Farms Inc. | 2,482 | 231,620 | ||||||
Scotts Miracle-Gro Co. (The) Class A | 5,508 | 317,977 | ||||||
Titan International Inc. | 6,392 | 92,684 | ||||||
Toro Co. (The) | 6,596 | 405,852 | ||||||
|
| |||||||
| 22,432,280 | ||||||||
|
| |||||||
TOTAL COMMON STOCKS | ||||||||
(Cost: $45,353,726) | 45,561,739 | |||||||
INVESTMENT COMPANIES — 0.80% |
| |||||||
INDIA — 0.80% |
| |||||||
iShares India 50 ETFd | 12,183 | 368,780 | ||||||
|
| |||||||
| 368,780 | ||||||||
|
| |||||||
TOTAL INVESTMENT COMPANIES |
| |||||||
(Cost: $297,489) | 368,780 | |||||||
PREFERRED STOCKS — 0.66% |
| |||||||
CHILE — 0.66% |
| |||||||
Sociedad Quimica y Minera de Chile SA Series B | 11,118 | 304,363 | ||||||
|
| |||||||
| 304,363 | ||||||||
|
| |||||||
TOTAL PREFERRED STOCKS | ||||||||
(Cost: $308,941) | 304,363 | |||||||
SHORT-TERM INVESTMENTS — 1.59% |
| |||||||
MONEY MARKET FUNDS — 1.59% |
| |||||||
BlackRock Cash Funds: Institutional, |
| |||||||
0.14%d,e,f | 655,162 | 655,162 | ||||||
BlackRock Cash Funds: Prime, |
| |||||||
0.11%d,e,f | 41,244 | 41,244 | ||||||
BlackRock Cash Funds: Treasury, |
| |||||||
0.00%d,e | 41,173 | 41,173 | ||||||
|
| |||||||
| 737,579 | ||||||||
|
| |||||||
TOTAL SHORT-TERM INVESTMENTS |
| |||||||
(Cost: $737,579) | 737,579 | |||||||
|
| |||||||
| Value | ||||||
TOTAL INVESTMENTS | ||||||
(Cost: $46,697,735) | $ | 46,972,461 | ||||
Other Assets, Less Liabilities — (1.25)% | (577,750 | ) | ||||
|
| |||||
NET ASSETS — 100.00% | $ | 46,394,711 | ||||
|
| |||||
NVDR — Non-Voting Depositary Receipts
| a | Non-income earning security. |
| b | All or a portion of this security represents a security on loan. See Note 1. |
| c | Security valued using Level 3 inputs in accordance with management’s fair valuation policy. See Note 1. |
| d | Affiliated issuer. See Note 2. |
| e | The rate quoted is the annualized seven-day yield of the fund at period end. |
| f | All or a portion of this security represents an investment of securities lending collateral. See Note 1. |
See notes to financial statements.
SCHEDULESOF INVESTMENTS | 19 |
Table of Contents
Schedule of Investments
iSHARES® MSCI GLOBAL ENERGY PRODUCERS ETF
August 31, 2014
| Security | Shares | Value | ||||||
COMMON STOCKS — 97.79% |
| |||||||
AUSTRALIA — 1.57% |
| |||||||
AWE Ltd.a,b | 1,407 | $ | 2,290 | |||||
Beach Energy Ltd. | 3,316 | 5,040 | ||||||
Buru Energy Ltd.a,b | 444 | 384 | ||||||
Drillsearch Energy Ltd.a,b | 1,218 | 1,658 | ||||||
Karoon Gas Australia Ltd.a,b | 396 | 1,404 | ||||||
Roc Oil Co. Ltd.a | 2,025 | 1,297 | ||||||
Santos Ltd. | 2,745 | 38,074 | ||||||
Senex Energy Ltd.a,b | 1,927 | 1,054 | ||||||
Sundance Energy Australia Ltd.a | 3,105 | 3,950 | ||||||
Whitehaven Coal Ltd.a,b | 2,040 | 3,768 | ||||||
Woodside Petroleum Ltd. | 1,845 | 73,684 | ||||||
|
| |||||||
| 132,603 | ||||||||
AUSTRIA — 0.20% |
| |||||||
OMV AG | 444 | 17,194 | ||||||
|
| |||||||
| 17,194 | ||||||||
BRAZIL — 1.05% |
| |||||||
Petroleo Brasileiro SA | 8,700 | 86,085 | ||||||
QGEP Participacoes SA | 600 | 2,574 | ||||||
|
| |||||||
| 88,659 | ||||||||
CANADA — 10.75% |
| |||||||
Advantage Oil & Gas Ltd.a | 408 | 2,528 | ||||||
ARC Resources Ltd. | 879 | 25,469 | ||||||
Athabasca Oil Corp.a | 900 | 6,571 | ||||||
Bankers Petroleum Ltd.a | 633 | 3,851 | ||||||
Baytex Energy Corp. | 372 | 16,674 | ||||||
Bellatrix Exploration Ltd.a | 684 | 5,309 | ||||||
Birchcliff Energy Ltd.a | 237 | 2,775 | ||||||
BlackPearl Resources Inc.a | 753 | 1,548 | ||||||
Bonavista Energy Corp. | 468 | 6,394 | ||||||
Bonterra Energy Corp. | 84 | 5,098 | ||||||
Cameco Corp. | 1,077 | 21,108 | ||||||
Canacol Energy Ltd.a | 240 | 1,509 | ||||||
Canadian Natural Resources Ltd. | 3,114 | 136,043 | ||||||
Canadian Oil Sands Ltd. | 1,323 | 28,564 | ||||||
Cenovus Energy Inc. | 2,175 | 69,536 | ||||||
Crescent Point Energy Corp. | 1,083 | 44,927 | ||||||
Crew Energy Inc.a | 531 | 5,458 | ||||||
DeeThree Exploration Ltd.a | 252 | 2,602 | ||||||
Denison Mines Corp.a | 807 | 1,094 | ||||||
Encana Corp. | 2,022 | 46,731 | ||||||
Enerplus Corp. | 630 | 14,456 | ||||||
Husky Energy Inc. | 990 | 30,209 | ||||||
| Security | Shares | Value | ||||||
Imperial Oil Ltd. | 828 | $ | 44,165 | |||||
Ithaca Energy Inc.a | 807 | 1,838 | ||||||
Kelt Exploration Ltd.a | 252 | 3,173 | ||||||
Legacy Oil & Gas Inc. Class Aa | 339 | 2,447 | ||||||
Lightstream Resources Ltd. | 468 | 2,709 | ||||||
Long Run Exploration Ltd. | 342 | 1,662 | ||||||
MEG Energy Corp.a | 462 | 16,495 | ||||||
NuVista Energy Ltd.a | 234 | 2,513 | ||||||
Pacific Rubiales Energy Corp. | 915 | 19,089 | ||||||
Painted Pony Petroleum Ltd.a | 291 | 3,903 | ||||||
Paramount Resources Ltd. Class Aa | 204 | 11,340 | ||||||
Parex Resources Inc.a | 300 | 3,880 | ||||||
Pengrowth Energy Corp. | 1,687 | 10,778 | ||||||
Penn West Petroleum Ltd. | 1,350 | 10,516 | ||||||
Peyto Exploration & Development Corp. | 375 | 13,320 | ||||||
Raging River Exploration Inc.a | 363 | 3,681 | ||||||
RMP Energy Inc.a | 393 | 3,170 | ||||||
Suncor Energy Inc. | 4,209 | 173,171 | ||||||
Surge Energy Inc. | 816 | 6,530 | ||||||
Talisman Energy Inc. | 2,898 | 29,200 | ||||||
TORC Oil & Gas Ltd. | 234 | 3,149 | ||||||
Tourmaline Oil Corp.a | 453 | 22,998 | ||||||
TransGlobe Energy Corp. | 174 | 1,182 | ||||||
Trilogy Energy Corp. | 267 | 7,109 | ||||||
Twin Butte Energy Ltd. | 900 | 1,576 | ||||||
Vermilion Energy Inc. | 285 | 18,583 | ||||||
Whitecap Resources Inc. | 477 | 8,095 | ||||||
|
| |||||||
| 904,726 | ||||||||
CHINA — 2.94% |
| |||||||
China Coal Energy Co. Class Hb | 9,000 | 5,481 | ||||||
China Shenhua Energy Co. Ltd. Class H | 9,000 | 25,954 | ||||||
CNOOC Ltd. | 51,000 | 102,524 | ||||||
Hidili Industry International Development Ltd.a,b | 18,000 | 2,114 | ||||||
Inner Mongolia Yitai Coal Co. Ltd. Class B | 100 | 169 | ||||||
Kunlun Energy Co. Ltd. | 12,000 | 19,819 | ||||||
MIE Holdings Corp.b | 6,000 | 1,006 | ||||||
PetroChina Co. Ltd. Class H | 60,000 | 85,160 | ||||||
Yanzhou Coal Mining Co. Ltd. Class H | 6,000 | 5,079 | ||||||
|
| |||||||
| 247,306 | ||||||||
COLOMBIA — 0.32% | ||||||||
Ecopetrol SA | 15,714 | 27,235 | ||||||
|
| |||||||
| 27,235 | ||||||||
| 20 | 2014 iSHARES ANNUAL REPORTTO SHAREHOLDERS |
Table of Contents
Schedule of Investments (Continued)
iSHARES® MSCI GLOBAL ENERGY PRODUCERS ETF
August 31, 2014
| Security | Shares | Value | ||||||
FINLAND — 0.09% |
| |||||||
Neste Oil OYJb | 366 | $ | 7,183 | |||||
|
| |||||||
| 7,183 | ||||||||
FRANCE — 4.78% |
| |||||||
Etablissements Maurel et Proma | 222 | 3,474 | ||||||
MPI | 534 | 3,011 | ||||||
Total SA | 5,988 | 395,868 | ||||||
|
| |||||||
| 402,353 | ||||||||
GREECE — 0.02% |
| |||||||
Motor Oil (Hellas) Corinth Refineries SA | 176 | 1,899 | ||||||
|
| |||||||
| 1,899 | ||||||||
HUNGARY — 0.09% |
| |||||||
MOL Hungarian Oil and Gas PLC | 150 | 7,391 | ||||||
|
| |||||||
| 7,391 | ||||||||
INDIA — 0.91% |
| |||||||
Reliance Industries Ltd. SP GDRc | 2,301 | 76,577 | ||||||
|
| |||||||
| 76,577 | ||||||||
INDONESIA — 0.19% |
| |||||||
PT Adaro Energy Tbk | 31,800 | 3,575 | ||||||
PT Bukit Asam (Persero) Tbk | 3,000 | 3,423 | ||||||
PT Energi Mega Persada Tbka | 366,000 | 2,816 | ||||||
PT Indo Tambangraya Megah Tbk | 1,500 | 3,613 | ||||||
PT Medco Energi Internasional Tbk | 5,400 | 1,685 | ||||||
PT Sugih Energy Tbka | 34,500 | 1,233 | ||||||
|
| |||||||
| 16,345 | ||||||||
ISRAEL — 0.03% |
| |||||||
Naphtha Israel Petroleum Corp. Ltd.a | 184 | 1,316 | ||||||
Oil Refineries Ltd.a | 4,366 | 1,444 | ||||||
|
| |||||||
| 2,760 | ||||||||
ITALY — 2.16% |
| |||||||
Eni SpA | 7,092 | 177,303 | ||||||
ERG SpA | 258 | 3,623 | ||||||
Saras SpAa,b | 873 | 1,045 | ||||||
|
| |||||||
| 181,971 | ||||||||
JAPAN — 1.04% |
| |||||||
Cosmo Oil Co. Ltd. | 3,000 | 5,631 | ||||||
Idemitsu Kosan Co. Ltd. | 300 | 6,590 | ||||||
INPEX Corp. | 2,400 | 34,423 | ||||||
Japan Petroleum Exploration Co. Ltd. | 100 | 3,898 | ||||||
JX Holdings Inc. | 6,000 | 30,888 | ||||||
Showa Shell Sekiyu K.K. | 600 | 6,446 | ||||||
|
| |||||||
| 87,876 | ||||||||
| Security | Shares | Value | ||||||
MALAYSIA — 0.03% |
| |||||||
Petron Malaysia Refining & Marketing Bhd | 2,700 | $ | 2,458 | |||||
|
| |||||||
| 2,458 | ||||||||
NEW ZEALAND — 0.01% |
| |||||||
New Zealand Oil & Gas Ltd. | 1,452 | 942 | ||||||
|
| |||||||
| 942 | ||||||||
NORWAY — 1.16% |
| |||||||
Det norske oljeselskap ASAa,b | 182 | 1,878 | ||||||
DNO ASAa | 1,728 | 5,226 | ||||||
Statoil ASA | 3,219 | 90,673 | ||||||
|
| |||||||
| 97,777 | ||||||||
POLAND — 0.18% |
| |||||||
Grupa Lotos SAa | 126 | 1,188 | ||||||
Lubelski Wegiel Bogdanka SA | 96 | 3,498 | ||||||
Polski Koncern Naftowy Orlen SA | 837 | 10,322 | ||||||
|
| |||||||
| 15,008 | ||||||||
PORTUGAL — 0.21% |
| |||||||
Galp Energia SGPS SA Class B | 975 | 17,338 | ||||||
|
| |||||||
| 17,338 | ||||||||
RUSSIA — 1.92% |
| |||||||
LUKOIL OAO | 1,407 | 78,324 | ||||||
NovaTek OAO SP GDRd | 267 | 26,860 | ||||||
Rosneft Oil Co. OJSC | 3,100 | 19,124 | ||||||
Surgutneftegas OJSC | 19,200 | 13,459 | ||||||
Tatneft OAO Class S | 3,900 | 24,187 | ||||||
|
| |||||||
| 161,954 | ||||||||
SOUTH AFRICA — 0.09% |
| |||||||
Exxaro Resources Ltd. | 531 | 7,533 | ||||||
|
| |||||||
| 7,533 | ||||||||
SOUTH KOREA — 0.28% |
| |||||||
S-Oil Corp. | 153 | 7,070 | ||||||
SK Innovation Co. Ltd. | 174 | 16,148 | ||||||
|
| |||||||
| 23,218 | ||||||||
SPAIN — 0.74% |
| |||||||
Repsol SA | 2,517 | 62,628 | ||||||
|
| |||||||
| 62,628 | ||||||||
SWEDEN — 0.13% |
| |||||||
Lundin Petroleum ABa,b | 591 | 11,038 | ||||||
|
| |||||||
| 11,038 | ||||||||
THAILAND — 0.45% |
| |||||||
Bangchak Petroleum PCL NVDR | 1,500 | 1,608 | ||||||
Banpu PCL NVDR | 4,500 | 4,544 | ||||||
SCHEDULESOF INVESTMENTS | 21 |
Table of Contents
Schedule of Investments (Continued)
iSHARES® MSCI GLOBAL ENERGY PRODUCERS ETF
August 31, 2014
| Security | Shares | Value | ||||||
Esso (Thailand) PCL NVDRa | 9,600 | $ | 1,773 | |||||
IRPC PCL NVDR | 44,700 | 4,646 | ||||||
PTT Exploration & Production PCL NVDR | 3,631 | 18,701 | ||||||
Thai Oil PCL NVDR | 3,900 | 6,319 | ||||||
|
| |||||||
| 37,591 | ||||||||
TURKEY — 0.10% |
| |||||||
Turkiye Petrol Rafinerileri AS | 342 | 8,051 | ||||||
|
| |||||||
| 8,051 | ||||||||
UNITED KINGDOM — 16.63% |
| |||||||
Afren PLCa | 2,832 | 4,586 | ||||||
Amerisur Resources PLCa | 1,911 | 2,047 | ||||||
Anglo Pacific Group PLC | 318 | 857 | ||||||
BG Group PLC | 9,549 | 190,540 | ||||||
BP PLC | 51,729 | 413,780 | ||||||
Cairn Energy PLCa | 1,515 | 4,519 | ||||||
EnQuest PLCa | 2,649 | 5,301 | ||||||
Faroe Petroleum PLCa | 492 | 903 | ||||||
Hargreaves Services PLC | 81 | 1,065 | ||||||
Ophir Energy PLCa | 1,446 | 5,634 | ||||||
Premier Oil PLC | 1,479 | 8,548 | ||||||
Royal Dutch Shell PLC Class A | 10,206 | 413,231 | ||||||
Royal Dutch Shell PLC Class B | 7,354 | 310,885 | ||||||
Salamander Energy PLCa | 727 | 1,274 | ||||||
SOCO International PLCa | 651 | 4,573 | ||||||
Tullow Oil PLC | 2,586 | 31,351 | ||||||
Xcite Energy Ltd.a,b | 693 | 748 | ||||||
|
| |||||||
| 1,399,842 | ||||||||
UNITED STATES — 49.72% |
| |||||||
Abraxas Petroleum Corp.a | 588 | 3,475 | ||||||
Alpha Natural Resources Inc.a | 807 | 3,188 | ||||||
Anadarko Petroleum Corp. | 1,389 | 156,526 | ||||||
Antero Resources Corp.a | 147 | 8,504 | ||||||
Apache Corp. | 1,095 | 111,504 | ||||||
Approach Resources Inc.a | 138 | 2,467 | ||||||
Arch Coal Inc. | 813 | 2,480 | ||||||
Athlon Energy Inc.a | 129 | 6,004 | ||||||
Bill Barrett Corp.a | 141 | 3,211 | ||||||
Bonanza Creek Energy Inc.a | 69 | 4,237 | ||||||
Cabot Oil & Gas Corp. | 1,194 | 40,047 | ||||||
Callon Petroleum Co.a | 297 | 3,187 | ||||||
Carrizo Oil & Gas Inc.a | 96 | 6,021 | ||||||
Chesapeake Energy Corp. | 1,506 | 40,963 | ||||||
Chevron Corp. | 5,298 | 685,826 | ||||||
Cimarex Energy Co. | 258 | 37,451 | ||||||
Clayton Williams Energy Inc.a | 18 | 2,132 | ||||||
| Security | Shares | Value | ||||||
Cloud Peak Energy Inc.a | 99 | $ | 1,555 | |||||
Cobalt International Energy Inc.a | 810 | 12,434 | ||||||
Comstock Resources Inc. | 126 | 3,072 | ||||||
Concho Resources Inc.a | 297 | 42,186 | ||||||
ConocoPhillips | 3,447 | 279,965 | ||||||
CONSOL Energy Inc. | 684 | 27,552 | ||||||
Contango Oil & Gas Co.a | 66 | 2,615 | ||||||
Continental Resources Inc.a | 123 | 19,839 | ||||||
CVR Energy Inc. | 48 | 2,382 | ||||||
Delek US Holdings Inc. | 96 | 3,358 | ||||||
Denbury Resources Inc. | 1,092 | 18,804 | ||||||
Devon Energy Corp. | 1,098 | 82,811 | ||||||
Diamondback Energy Inc.a | 91 | 7,858 | ||||||
Energen Corp. | 201 | 16,176 | ||||||
Energy XXI (Bermuda) Ltd. | 250 | 4,125 | ||||||
EOG Resources Inc. | 1,548 | 170,094 | ||||||
EQT Corp. | 423 | 41,902 | ||||||
EXCO Resources Inc. | 442 | 2,135 | ||||||
Exxon Mobil Corp. | 12,030 | 1,196,504 | ||||||
Forest Oil Corp.a | 234 | 381 | ||||||
Goodrich Petroleum Corp.a | 129 | 2,851 | ||||||
Gulfport Energy Corp.a | 258 | 15,093 | ||||||
Halcon Resources Corp.a | 780 | 4,290 | ||||||
Hess Corp. | 828 | 83,711 | ||||||
HollyFrontier Corp. | 522 | 26,116 | ||||||
Kodiak Oil & Gas Corp.a | 846 | 13,764 | ||||||
Kosmos Energy Ltd.a | 291 | 2,916 | ||||||
Laredo Petroleum Inc.a | 192 | 4,539 | ||||||
Linn Co. LLC | 298 | 9,372 | ||||||
Magnum Hunter Resources Corp.a | 483 | 3,338 | ||||||
Marathon Oil Corp. | 1,956 | 81,546 | ||||||
Marathon Petroleum Corp. | 810 | 73,718 | ||||||
Matador Resources Co.a | 171 | 4,679 | ||||||
Murphy Oil Corp. | 513 | 32,047 | ||||||
Newfield Exploration Co.a | 366 | 16,404 | ||||||
Noble Energy Inc. | 996 | 71,851 | ||||||
Northern Oil and Gas Inc.a | 255 | 4,297 | ||||||
Oasis Petroleum Inc.a | 333 | 16,380 | ||||||
Occidental Petroleum Corp. | 2,205 | 228,725 | ||||||
PBF Energy Inc. | 246 | 6,989 | ||||||
PDC Energy Inc.a | 102 | 6,129 | ||||||
Peabody Energy Corp. | 822 | 13,053 | ||||||
Penn Virginia Corp.a | 123 | 1,847 | ||||||
Pioneer Natural Resources Co. | 396 | 82,625 | ||||||
QEP Resources Inc. | 486 | 17,287 | ||||||
Range Resources Corp. | 447 | 35,130 | ||||||
| 22 | 2014 iSHARES ANNUAL REPORTTO SHAREHOLDERS |
Table of Contents
Schedule of Investments (Continued)
iSHARES® MSCI GLOBAL ENERGY PRODUCERS ETF
August 31, 2014
| Security | Shares | Value | ||||||
Resolute Energy Corp.a | 159 | $ | 1,277 | |||||
Rex Energy Corp.a | 99 | 1,513 | ||||||
Rosetta Resources Inc.a | 186 | 9,300 | ||||||
RSP Permian Inc.a | 108 | 3,089 | ||||||
Sanchez Energy Corp.a | 141 | 4,680 | ||||||
SandRidge Energy Inc.a | 984 | 5,156 | ||||||
SM Energy Co. | 207 | 18,431 | ||||||
Solazyme Inc.a | 114 | 1,069 | ||||||
Southwestern Energy Co.a | 963 | 39,656 | ||||||
Stone Energy Corp.a | 162 | 5,701 | ||||||
Swift Energy Co.a | 243 | 2,758 | ||||||
Tesoro Corp. | 384 | 24,860 | ||||||
Triangle Petroleum Corp.a | 303 | 3,633 | ||||||
Ultra Petroleum Corp.a | 429 | 11,381 | ||||||
VAALCO Energy Inc.a | 414 | 3,788 | ||||||
Valero Energy Corp. | 1,479 | 80,073 | ||||||
W&T Offshore Inc. | 180 | 2,686 | ||||||
Western Refining Inc. | 186 | 8,655 | ||||||
Whiting Petroleum Corp.a | 345 | 31,968 | ||||||
WPX Energy Inc.a | 534 | 14,215 | ||||||
|
| |||||||
| 4,185,557 | ||||||||
|
| |||||||
TOTAL COMMON STOCKS |
| |||||||
(Cost: $7,562,999) | 8,233,013 | |||||||
PREFERRED STOCKS — 1.62% |
| |||||||
BRAZIL — 1.45% |
| |||||||
Petroleo Brasileiro SA | 11,700 | 122,096 | ||||||
|
| |||||||
| 122,096 | ||||||||
RUSSIA — 0.17% | ||||||||
Surgutneftegas OJSC | 19,200 | 14,130 | ||||||
|
| |||||||
| 14,130 | ||||||||
|
| |||||||
TOTAL PREFERRED STOCKS |
| |||||||
(Cost: $157,013) | 136,226 | |||||||
WARRANTS — 0.00% |
| |||||||
UNITED STATES — 0.00% |
| |||||||
Magnum Hunter Resources Corp. (Expires 04/15/16)a | 50 | — | ||||||
|
| |||||||
| — | ||||||||
|
| |||||||
TOTAL WARRANTS | ||||||||
(Cost: $0) | — | |||||||
| Security | Shares | Value | ||||||
SHORT-TERM INVESTMENTS — 0.43% |
| |||||||
MONEY MARKET FUNDS — 0.43% |
| |||||||
BlackRock Cash Funds: Institutional, |
| |||||||
0.14%e,f,g | 26,300 | $ | 26,300 | |||||
BlackRock Cash Funds: Prime, |
| |||||||
0.11%e,f,g | 1,656 | 1,656 | ||||||
BlackRock Cash Funds: Treasury, |
| |||||||
0.00%e,f | 7,908 | 7,908 | ||||||
|
| |||||||
| 35,864 | ||||||||
|
| |||||||
TOTAL SHORT-TERM INVESTMENTS |
| |||||||
(Cost: $35,864) | 35,864 | |||||||
|
| |||||||
TOTAL INVESTMENTS |
| |||||||
(Cost: $7,755,876) | 8,405,103 | |||||||
Other Assets, Less Liabilities — 0.16% |
| 13,487 | ||||||
|
| |||||||
NET ASSETS — 100.00% | $ | 8,418,590 | ||||||
|
| |||||||
NVDR — Non-Voting Depositary Receipts
SP GDR — Sponsored Global Depositary Receipts
| a | Non-income earning security. |
| b | All or a portion of this security represents a security on loan. See Note 1. |
| c | This security may be resold to qualified institutional buyers under Rule 144A of the Securities Act of 1933. |
| d | This security may be resold to qualified foreign investors and foreign institutional buyers under Regulation S of the Securities Act of 1933. |
| e | Affiliated issuer. See Note 2. |
| f | The rate quoted is the annualized seven-day yield of the fund at period end. |
| g | All or a portion of this security represents an investment of securities lending collateral. See Note 1. |
See notes to financial statements.
SCHEDULESOF INVESTMENTS | 23 |
Table of Contents
Schedule of Investments
iSHARES® MSCI GLOBAL GOLD MINERS ETF
August 31, 2014
| Security | Shares | Value | ||||||
COMMON STOCKS — 99.86% |
| |||||||
AUSTRALIA — 5.72% |
| |||||||
Medusa Mining Ltd.a | 331,128 | $ | 374,742 | |||||
Newcrest Mining Ltd.a | 306,432 | 3,244,377 | ||||||
Resolute Mining Ltd.a | 831,726 | 443,410 | ||||||
|
| |||||||
| 4,062,529 | ||||||||
CANADA — 60.17% |
| |||||||
Agnico-Eagle Mines Ltd. | 84,798 | 3,250,427 | ||||||
Alacer Gold Corp. | 260,316 | 592,745 | ||||||
Argonaut Gold Inc.a | 164,178 | 673,512 | ||||||
AuRico Gold Inc. | 198,576 | 906,155 | ||||||
Barrick Gold Corp. | 572,166 | 10,543,995 | ||||||
Centerra Gold Inc. | 146,034 | 883,137 | ||||||
China Gold International Resources Corp. Ltd.a | 189,126 | 536,998 | ||||||
Eldorado Gold Corp. | 386,442 | 3,202,686 | ||||||
Goldcorp Inc. | 401,310 | 11,294,763 | ||||||
Kinross Gold Corp.a | 687,708 | 2,726,107 | ||||||
New Gold Inc.a | 316,260 | 2,049,604 | ||||||
Osisko Gold Royalties Ltd.a | 44,100 | 611,444 | ||||||
Primero Mining Corp.a | 129,150 | 881,042 | ||||||
SEMAFO Inc.a | 213,066 | 950,670 | ||||||
Timmins Gold Corp.a | 258,174 | 449,826 | ||||||
Yamana Gold Inc. | 369,684 | 3,155,818 | ||||||
|
| |||||||
| 42,708,929 | ||||||||
CHINA — 0.74% |
| |||||||
China Precious Metal Resources Holdings Co. Ltd.a,b | 4,285,000 | 525,248 | ||||||
|
| |||||||
| 525,248 | ||||||||
HONG KONG — 0.86% |
| |||||||
G-Resources Group Ltd.a | 22,680,000 | 611,616 | ||||||
|
| |||||||
| 611,616 | ||||||||
PERU — 2.55% |
| |||||||
Compania de Minas Buenaventura SA SP ADR | 124,488 | 1,812,545 | ||||||
|
| |||||||
| 1,812,545 | ||||||||
SOUTH AFRICA — 10.83% |
| |||||||
AngloGold Ashanti Ltd.a | 184,968 | 3,148,773 | ||||||
Gold Fields Ltd. | 486,864 | 2,307,653 | ||||||
Harmony Gold Mining Co. Ltd.a | 306,684 | 929,389 | ||||||
Sibanye Gold Ltd. | 550,998 | 1,298,825 | ||||||
|
| |||||||
| 7,684,640 | ||||||||
TURKEY — 0.79% |
| |||||||
Koza Altin Isletmeleri AS | 52,164 | 562,021 | ||||||
|
| |||||||
| 562,021 | ||||||||
| Security | Shares | Value | ||||||
UNITED KINGDOM — 7.18% |
| |||||||
African Barrick Gold PLC | 24,696 | $ | 95,808 | |||||
Centamin PLCa | 856,548 | 910,407 | ||||||
Highland Gold Mining Ltd. | 341,334 | 396,809 | ||||||
Pan African Resources PLC | 1,913,562 | 476,692 | ||||||
Randgold Resources Ltd. | 38,052 | 3,213,457 | ||||||
|
| |||||||
| 5,093,173 | ||||||||
UNITED STATES — 11.02% |
| |||||||
Allied Nevada Gold Corp.a | 144,270 | 551,111 | ||||||
Gold Resource Corp. | 68,418 | 424,192 | ||||||
McEwen Mining Inc.a | 223,146 | 618,115 | ||||||
Newmont Mining Corp. | 229,824 | 6,225,932 | ||||||
|
| |||||||
| 7,819,350 | ||||||||
|
| |||||||
TOTAL COMMON STOCKS |
| |||||||
(Cost: $74,761,636) |
| 70,880,051 | ||||||
SHORT-TERM INVESTMENTS — 0.22% |
| |||||||
MONEY MARKET FUNDS — 0.22% |
| |||||||
BlackRock Cash Funds: Institutional, |
| |||||||
0.14%c,d,e | 141,116 | 141,116 | ||||||
BlackRock Cash Funds: Prime, |
| |||||||
0.11%c,d,e | 8,884 | 8,884 | ||||||
BlackRock Cash Funds: Treasury, |
| |||||||
0.00%c,d | 5,814 | 5,814 | ||||||
|
| |||||||
| 155,814 | ||||||||
|
| |||||||
TOTAL SHORT-TERM INVESTMENTS |
| |||||||
(Cost: $155,814) |
| 155,814 | ||||||
|
| |||||||
TOTAL INVESTMENTS |
| |||||||
(Cost: $74,917,450) | 71,035,865 | |||||||
Other Assets, Less Liabilities — (0.08)% |
| (59,394 | ) | |||||
|
| |||||||
NET ASSETS — 100.00% |
| $ | 70,976,471 | |||||
|
| |||||||
SP ADR — Sponsored American Depositary Receipts
| a | Non-income earning security. |
| b | All or a portion of this security represents a security on loan. See Note 1. |
| c | Affiliated issuer. See Note 2. |
| d | The rate quoted is the annualized seven-day yield of the fund at period end. |
| e | All or a portion of this security represents an investment of securities lending collateral. See Note 1. |
See notes to financial statements.
| 24 | 2014 iSHARES ANNUAL REPORTTO SHAREHOLDERS |
Table of Contents
Schedule of Investments
iSHARES® MSCI GLOBAL METALS & MINING PRODUCERS ETF
August 31, 2014
| Security | Shares | Value | ||||||
COMMON STOCKS — 95.92% |
| |||||||
AUSTRALIA — 18.07% |
| |||||||
Alumina Ltd.a | 515,427 | $ | 747,222 | |||||
Aquarius Platinum Ltd.a | 280,827 | 120,822 | ||||||
Arrium Ltd. | 287,925 | 211,397 | ||||||
Atlas Iron Ltd.b | 180,362 | 96,155 | ||||||
BC Iron Ltd. | 23,114 | 60,316 | ||||||
BHP Billiton Ltd. | 648,284 | 22,234,482 | ||||||
BlueScope Steel Ltd.a | 114,783 | 591,534 | ||||||
Cudeco Ltd.a,b | 30,212 | 48,037 | ||||||
Fortescue Metals Group Ltd. | 319,958 | 1,247,900 | ||||||
Iluka Resources Ltd. | 85,176 | 709,019 | ||||||
Independence Group NL | 47,867 | 209,076 | ||||||
Lynas Corp. Ltd.a,b | 434,071 | 64,958 | ||||||
Metals X Ltd.a | 183,820 | 38,684 | ||||||
Mount Gibson Iron Ltd. | 135,045 | 87,152 | ||||||
OZ Minerals Ltd. | 62,244 | 249,750 | ||||||
PanAust Ltd. | 104,104 | 222,974 | ||||||
Rio Tinto Ltd. | 87,906 | 5,149,342 | ||||||
Sandfire Resources NLa | 18,928 | 112,239 | ||||||
Sims Metal Management Ltd.a | 34,581 | 389,417 | ||||||
Sirius Resources NLa | 53,508 | 189,674 | ||||||
Sundance Resources Ltd.a,b | 552,916 | 43,957 | ||||||
Syrah Resources Ltd.a,b | 22,206 | 104,885 | ||||||
Tiger Resources Ltd.a | 193,285 | 54,234 | ||||||
Western Areas NL | 40,951 | 188,060 | ||||||
Western Desert Resources Ltd.a | 84,631 | 15,040 | ||||||
|
| |||||||
| 33,186,326 | ||||||||
AUSTRIA — 0.55% |
| |||||||
AMAG Austria Metall AGc | 910 | 31,824 | ||||||
Voestalpine AG | 22,750 | 978,400 | ||||||
|
| |||||||
| 1,010,224 | ||||||||
BELGIUM — 0.25% |
| |||||||
Bekaert NV | 7,826 | 291,522 | ||||||
Nyrstar NVa,b | 29,484 | 114,450 | ||||||
Viohalco SAa | 9,880 | 54,008 | ||||||
|
| |||||||
| 459,980 | ||||||||
BRAZIL — 2.22% |
| |||||||
Companhia Siderurgica Nacional SA | 145,600 | 638,999 | ||||||
Paranapanema SAa | 36,600 | 36,803 | ||||||
Vale SA | 261,900 | 3,408,428 | ||||||
|
| |||||||
| 4,084,230 | ||||||||
| Security | Shares | Value | ||||||
CANADA — 4.78% |
| |||||||
Canam Group Inc. | 8,008 | $ | 84,159 | |||||
Capstone Mining Corp.a | 71,709 | 179,148 | ||||||
Dominion Diamond Corp.a | 14,742 | 200,184 | ||||||
Dundee Precious Metals Inc.a | 21,112 | 108,796 | ||||||
First Quantum Minerals Ltd. | 119,938 | 2,698,950 | ||||||
HudBay Minerals Inc. | 48,230 | 489,080 | ||||||
Imperial Metals Corp.a | 8,920 | 74,008 | ||||||
Ivanhoe Mines Ltd.a | 97,189 | 129,914 | ||||||
Labrador Iron Ore Royalty Corp. | 12,558 | 347,190 | ||||||
Lundin Mining Corp.a | 107,684 | 577,756 | ||||||
Major Drilling Group International Inc. | 16,320 | 122,767 | ||||||
Nevsun Resources Ltd. | 39,907 | 165,551 | ||||||
Sherritt International Corp. | 62,790 | 247,166 | ||||||
Taseko Mines Ltd.a | 42,406 | 93,041 | ||||||
Teck Resources Ltd. Class B | 115,388 | 2,626,347 | ||||||
Thompson Creek Metals Co. Inc.a | 30,576 | 88,226 | ||||||
Turquoise Hill Resources Ltd.a,b | 161,280 | 544,167 | ||||||
|
| |||||||
| 8,776,450 | ||||||||
CHILE — 0.11% |
| |||||||
CAP SA | 16,866 | 200,379 | ||||||
|
| |||||||
| 200,379 | ||||||||
CHINA — 1.27% |
| |||||||
Aluminum Corp. of China Ltd. Class Ha,b | 608,000 | 258,101 | ||||||
China Metal Recycling Holdings Ltd.a,d | 132,000 | — | ||||||
China Rare Earth Holdings Ltd.a | 364,000 | 51,663 | ||||||
China Vanadium Titano-Magnetite Mining | 182,000 | 20,430 | ||||||
Chinalco Mining Corp.a | 728,000 | 93,934 | ||||||
Chongqing Iron & Steel Co. Ltd. Class Ha | 244,000 | 54,466 | ||||||
CITIC Dameng Holdings Ltd.a | 182,000 | 14,560 | ||||||
Fosun International Ltd. | 364,000 | 447,124 | ||||||
Honbridge Holdings Ltd.a | 364,000 | 72,799 | ||||||
Hunan Nonferrous Metal Corp. Ltd. Class Ha | 364,000 | 129,628 | ||||||
Inner Mongolia Eerduosi Resourses Co. Ltd. Class B | 32,774 | 25,646 | ||||||
Jiangxi Copper Co. Ltd. Class H | 304,000 | 537,383 | ||||||
MMG Ltd. | 728,000 | 264,893 | ||||||
North Mining Shares Co. Ltd.a,b | 1,750,000 | 79,031 | ||||||
SCHEDULESOF INVESTMENTS | 25 |
Table of Contents
Schedule of Investments (Continued)
iSHARES® MSCI GLOBAL METALS & MINING PRODUCERS ETF
August 31, 2014
| Security | Shares | Value | ||||||
Shougang Concord International Enterprises | 1,092,000 | $ | 50,724 | |||||
Shougang Fushan Resources Group Ltd.b | 364,000 | 100,039 | ||||||
Tiangong International Co. Ltd.b | 364,000 | 82,662 | ||||||
Xinjiang Xinxin Mining Industry Co. Ltd. Class Ha | 182,000 | 42,270 | ||||||
|
| |||||||
| 2,325,353 | ||||||||
FINLAND — 0.17% |
| |||||||
Outokumpu OYJa,b | 40,223 | 311,533 | ||||||
|
| |||||||
| 311,533 | ||||||||
FRANCE — 1.86% |
| |||||||
Aperama | 10,374 | 334,989 | ||||||
ArcelorMittal | 203,294 | 2,965,651 | ||||||
Erameta | 1,092 | 120,278 | ||||||
|
| |||||||
| 3,420,918 | ||||||||
GERMANY — 1.75% |
| |||||||
Aurubis AG | 6,916 | 340,614 | ||||||
Salzgitter AG | 8,372 | 313,404 | ||||||
ThyssenKrupp AGa | 92,092 | 2,562,539 | ||||||
|
| |||||||
| 3,216,557 | ||||||||
GREECE — 0.07% |
| |||||||
Mytilineos Holdings SAa | 16,804 | 136,790 | ||||||
|
| |||||||
| 136,790 | ||||||||
HONG KONG — 0.03% |
| |||||||
CST Mining Group Ltd.a | 4,368,000 | 25,925 | ||||||
IRC Ltd.a | 364,000 | 30,059 | ||||||
|
| |||||||
| 55,984 | ||||||||
INDIA — 1.20% |
| |||||||
Sesa Sterlite Ltd. SP ADR | 72,905 | 1,340,723 | ||||||
Tata Steel Ltd. SP GDRe | 101,010 | 862,625 | ||||||
|
| |||||||
| 2,203,348 | ||||||||
INDONESIA — 0.12% |
| |||||||
PT Aneka Tambang (Persero) Tbk | 819,000 | 83,668 | ||||||
PT Borneo Lumbung Energi & Metal Tbka | 471,630 | 3,911 | ||||||
PT Krakatau Steel (Persero) Tbka | 1,078,400 | 46,556 | ||||||
PT Timah (Persero) Tbk | 734,067 | 89,739 | ||||||
|
| |||||||
| 223,874 | ||||||||
JAPAN — 7.43% |
| |||||||
Asahi Holdings Inc. | 12,200 | 215,850 | ||||||
Dowa Holdings Co. Ltd. | 43,000 | 386,187 | ||||||
Hitachi Metals Ltd. | 31,000 | 528,777 | ||||||
JFE Holdings Inc. | 109,200 | 2,211,646 | ||||||
| Security | Shares | Value | ||||||
Kobe Steel Ltd. | 728,000 | $ | 1,184,310 | |||||
Maruichi Steel Tube Ltd. | 12,200 | 324,597 | ||||||
Mitsubishi Materials Corp. | 281,000 | 949,425 | ||||||
Mitsui Mining & Smelting Co. Ltd. | 122,000 | 375,800 | ||||||
Neturen Co. Ltd. | 12,200 | 88,665 | ||||||
Nippon Light Metal Holdings Co. Ltd. | 145,600 | 232,657 | ||||||
Nippon Steel & Sumitomo Metal Corp. | 1,456,400 | 4,127,296 | ||||||
Nippon Yakin Kogyo Co. Ltd.a,b | 36,400 | 105,467 | ||||||
Nisshin Steel Co. Ltd. | 18,200 | 193,764 | ||||||
OSAKA Titanium Technologies Co. Ltd. | 12,200 | 297,117 | ||||||
Sumitomo Metal Mining Co. Ltd. | 91,000 | 1,382,717 | ||||||
Toho Titanium Co. Ltd.a,b | 12,200 | 90,075 | ||||||
Tokyo Steel Manufacturing Co. Ltd. | 18,200 | 104,415 | ||||||
TOPY Industries Ltd. | 52,000 | 100,611 | ||||||
UACJ Corp. | 83,386 | 353,980 | ||||||
Yamato Kogyo Co. Ltd. | 12,200 | 403,985 | ||||||
|
| |||||||
| 13,657,341 | ||||||||
MALAYSIA — 0.06% |
| |||||||
Press Metal Bhd | 48,600 | 102,381 | ||||||
|
| |||||||
| 102,381 | ||||||||
MEXICO — 1.83% |
| |||||||
Grupo Mexico SAB de CV Series B | 782,600 | 2,842,989 | ||||||
Grupo Simec SAB de CV Series Ba | 18,200 | 81,483 | ||||||
Industrias CH SAB de CV Series Ba | 33,600 | 185,660 | ||||||
Minera Frisco SAB de CV Series A1a | 127,400 | 256,154 | ||||||
|
| |||||||
| 3,366,286 | ||||||||
NETHERLANDS — 0.03% |
| |||||||
AMG Advanced Metallurgical Group NVa | 6,006 | 56,984 | ||||||
|
| |||||||
| 56,984 | ||||||||
NORWAY — 0.88% |
| |||||||
Norsk Hydro ASA | 275,184 | 1,621,560 | ||||||
|
| |||||||
| 1,621,560 | ||||||||
PERU — 0.61% |
| |||||||
Southern Copper Corp. | 34,034 | 1,116,656 | ||||||
|
| |||||||
| 1,116,656 | ||||||||
PHILIPPINES — 0.10% |
| |||||||
Atlas Consolidated Mining & Development Corp. | 182,000 | 70,295 | ||||||
Nickel Asia Corp. | 127,400 | 115,420 | ||||||
|
| |||||||
| 185,715 | ||||||||
| 26 | 2014 iSHARES ANNUAL REPORTTO SHAREHOLDERS |
Table of Contents
Schedule of Investments (Continued)
iSHARES® MSCI GLOBAL METALS & MINING PRODUCERS ETF
August 31, 2014
| Security | Shares | Value | ||||||
POLAND — 0.70% |
| |||||||
Jastrzebska Spolka Weglowa SAa | 11,285 | $ | 118,167 | |||||
KGHM Polska Miedz SA | 28,392 | 1,170,365 | ||||||
|
| |||||||
| 1,288,532 | ||||||||
RUSSIA — 1.73% |
| |||||||
Alrosa AO | 382,200 | 447,923 | ||||||
Mechel OAO SP ADRa | 38,220 | 65,356 | ||||||
MMC Norilsk Nickel OJSC | 11,284 | 2,220,491 | ||||||
Severstal OAO | 45,500 | 437,928 | ||||||
|
| |||||||
| 3,171,698 | ||||||||
SINGAPORE — 0.05% |
| |||||||
Midas Holdings Ltd.b | 304,000 | 95,004 | ||||||
|
| |||||||
| 95,004 | ||||||||
SOUTH AFRICA — 1.62% |
| |||||||
African Rainbow Minerals Ltd. | 22,750 | 388,564 | ||||||
Anglo American Platinum Ltd.a | 10,556 | 439,792 | ||||||
ArcelorMittal South Africa Ltd.a | 40,404 | 149,529 | ||||||
Assore Ltd. | 7,280 | 215,442 | ||||||
Impala Platinum Holdings Ltd. | 108,836 | 984,962 | ||||||
Kumba Iron Ore Ltd. | 13,650 | 408,779 | ||||||
Merafe Resources Ltd.a | 325,053 | 40,649 | ||||||
Northam Platinum Ltd.a | 67,886 | 272,555 | ||||||
Royal Bafokeng Platinum Ltd.a | 10,036 | 68,886 | ||||||
|
| |||||||
| 2,969,158 | ||||||||
SOUTH KOREA — 3.84% |
| |||||||
Dongkuk Steel Mill Co. Ltd. | 12,082 | 87,462 | ||||||
Hyundai BNG Steel Co. Ltd.a | 2,003 | 45,534 | ||||||
Hyundai Hysco Co. Ltd. | 1,974 | 161,004 | ||||||
Hyundai Steel Co. | 14,622 | 1,091,657 | ||||||
Jenax Inc.a,b | 2,731 | 25,453 | ||||||
KISCO Corp. | 1,290 | 39,376 | ||||||
KISWIRE Ltd. | 1,290 | 66,412 | ||||||
Korea Zinc Co. Ltd. | 1,638 | 679,303 | ||||||
Poongsan Corp. | 3,640 | 113,082 | ||||||
Poongsan Holdings Corp. | 1,290 | 60,177 | ||||||
POSCO | 13,286 | 4,376,472 | �� | |||||
POSCO Chemtech Co. Ltd. | 546 | 85,458 | ||||||
Posco M-Tech Co. Ltd.b | 5,096 | 19,299 | ||||||
SeAH Besteel Corp. | 3,110 | 109,806 | ||||||
SeAH Holdings Corp. | 182 | 29,617 | ||||||
SeAH Steel Corp. | 668 | 61,599 | ||||||
|
| |||||||
| 7,051,711 | ||||||||
SPAIN — 0.28% |
| |||||||
Acerinox SA | 23,720 | 363,993 | ||||||
Tubacex SA | 19,474 | 99,526 | ||||||
| Security | Shares | Value | ||||||
Tubos Reunidos SA | 14,015 | $ | 47,167 | |||||
|
| |||||||
| 510,686 | ||||||||
SWEDEN — 0.87% |
| |||||||
Boliden AB | 55,146 | 875,691 | ||||||
SSAB AB Class Aa | 51,521 | 476,953 | ||||||
SSAB AB Class Ba,b | 30,394 | 250,999 | ||||||
|
| |||||||
| 1,603,643 | ||||||||
SWITZERLAND — 0.09% |
| |||||||
Schmolz + Bickenbach AG Registereda | 115,934 | 167,094 | ||||||
|
| |||||||
| 167,094 | ||||||||
TAIWAN — 1.73% |
| |||||||
China Metal Products Co. Ltd. | 127,011 | 136,612 | ||||||
China Steel Corp. | 2,413,612 | 2,083,310 | ||||||
Chun Yuan Steel Industrial Co. Ltd. | 182,040 | 73,996 | ||||||
Chung Hung Steel Corp.a | 182,000 | 50,538 | ||||||
Feng Hsin Iron & Steel Co. Ltd. | 122,000 | 175,507 | ||||||
Gloria Material Technology Corp. | 128,201 | 107,226 | ||||||
Ta Chen Stainless Pipe Co. Ltd. | 182,300 | 133,566 | ||||||
Ton Yi Industrial Corp. | 182,000 | 139,436 | ||||||
Tung Ho Steel Enterprise Corp. | 182,000 | 152,831 | ||||||
YC INOX Co. Ltd. | 122,000 | 121,427 | ||||||
|
| |||||||
| 3,174,449 | ||||||||
THAILAND — 0.09% |
| |||||||
G J Steel PCL NVDRa | 18,824,300 | 35,362 | ||||||
G Steel PCL NVDRa | 9,564,400 | 44,917 | ||||||
STP & I PCL NVDR | 127,400 | 86,157 | ||||||
|
| |||||||
| 166,436 | ||||||||
TURKEY — 0.49% |
| |||||||
Borusan Mannesmann Boru Sanayi ve TAS | 8,613 | 26,342 | ||||||
Eregli Demir ve Celik Fabrikalari TAS | 294,479 | 573,142 | ||||||
Izmir Demir Celik Sanayi ASa | 19,368 | 29,708 | ||||||
Kardemir Karabuk Demir Celik Sanayi ve TAS Class Aa | 29,327 | 40,771 | ||||||
Kardemir Karabuk Demir Celik Sanayi ve TAS Class Ba | 14,578 | 19,996 | ||||||
Kardemir Karabuk Demir Celik Sanayi ve TAS Class Da | 145,465 | 153,018 | ||||||
Koza Anadolu Metal Madencilik Isletmeleri ASa | 35,410 | 37,085 | ||||||
Park Elektrik Uretim Madencilik Sanayi ve TAS | 10,570 | 18,564 | ||||||
|
| |||||||
| 898,626 | ||||||||
SCHEDULESOF INVESTMENTS | 27 |
Table of Contents
Schedule of Investments (Continued)
iSHARES® MSCI GLOBAL METALS & MINING PRODUCERS ETF
August 31, 2014
| Security | Shares | Value | ||||||
UNITED KINGDOM — 27.10% |
| |||||||
African Minerals Ltd.a,b | 65,885 | $ | 33,646 | |||||
Anglo American PLC | 281,918 | 7,163,384 | ||||||
Antofagasta PLC | 78,624 | 1,025,664 | ||||||
BHP Billiton PLC | 425,880 | 13,491,361 | ||||||
Evraz PLC | 80,083 | 150,021 | ||||||
Ferrexpo PLC | 37,128 | 81,453 | ||||||
Gem Diamonds Ltd.a | 19,838 | 70,587 | ||||||
Glencore PLC | 2,145,416 | 12,912,302 | ||||||
Kazakhmys PLCa,b | 56,239 | 277,301 | ||||||
Lonmin PLCa | 88,270 | 336,874 | ||||||
Petra Diamonds Ltd.a | 72,800 | 215,932 | ||||||
Rio Tinto PLC | 256,802 | 13,705,051 | ||||||
Vedanta Resources PLC | 18,753 | 314,866 | ||||||
|
| |||||||
| 49,778,442 | ||||||||
UNITED STATES — 13.94% |
| |||||||
A.M. Castle & Co.a,b | 4,490 | 44,002 | ||||||
AK Steel Holding Corp.a | 28,210 | 308,053 | ||||||
Alcoa Inc. | 227,737 | 3,782,711 | ||||||
Allegheny Technologies Inc. | 22,386 | 944,018 | ||||||
Carpenter Technology Corp. | 10,556 | 577,730 | ||||||
Century Aluminum Co.a | 11,284 | 281,874 | ||||||
Cliffs Natural Resources Inc.b | 29,848 | 449,809 | ||||||
Commercial Metals Co. | 23,114 | 399,410 | ||||||
Compass Minerals International Inc. | 6,552 | 583,587 | ||||||
Freeport-McMoRan Inc. | 209,482 | 7,618,860 | ||||||
Globe Specialty Metals Inc. | 12,376 | 254,203 | ||||||
Haynes International Inc. | 2,488 | 123,355 | ||||||
Horsehead Holding Corp.a | 10,556 | 213,126 | ||||||
Kaiser Aluminum Corp. | 3,276 | 263,882 | ||||||
Materion Corp. | 3,944 | 128,693 | ||||||
Molycorp Inc.a,b | 40,223 | 71,999 | ||||||
Nucor Corp. | 64,428 | 3,499,729 | ||||||
Olympic Steel Inc. | 2,366 | 56,879 | ||||||
Reliance Steel & Aluminum Co. | 15,652 | 1,094,388 | ||||||
RTI International Metals Inc.a | 4,914 | 142,555 | ||||||
Schnitzer Steel Industries Inc. Class A | 5,460 | 151,187 | ||||||
Steel Dynamics Inc. | 45,500 | 1,057,420 | ||||||
Stillwater Mining Co.a,b | 23,478 | 435,752 | ||||||
SunCoke Energy Inc.a | 13,650 | 327,736 | ||||||
TimkenSteel Corp. | 5,642 | 269,575 | ||||||
United States Steel Corp. | 30,030 | 1,160,659 | ||||||
| Security | Shares | Value | ||||||
Universal Stainless & Alloy Products Inc.a | 1,820 | $ | 58,295 | |||||
US Silica Holdings Inc. | 10,920 | 784,165 | ||||||
Walter Energy Inc.b | 13,651 | 76,309 | ||||||
Worthington Industries Inc. | 10,920 | 441,605 | ||||||
|
| |||||||
| 25,601,566 | ||||||||
|
| |||||||
TOTAL COMMON STOCKS |
| |||||||
(Cost: $165,197,025) |
| 176,195,914 | ||||||
PREFERRED STOCKS — 3.66% |
| |||||||
BRAZIL — 3.66% |
| |||||||
Bradespar SA | 48,600 | 444,178 | ||||||
Companhia de Ferro Ligas da | 12,200 | 55,887 | ||||||
Gerdau SA | 182,000 | 1,054,153 | ||||||
Metalurgica Gerdau SA | 54,600 | 387,011 | ||||||
Usinas Siderurgicas de Minas Gerais SA Class A | 72,800 | 262,887 | ||||||
Vale SA Class A | 389,200 | 4,517,228 | ||||||
|
| |||||||
| 6,721,344 | ||||||||
|
| |||||||
TOTAL PREFERRED STOCKS |
| |||||||
(Cost: $8,470,544) |
| 6,721,344 | ||||||
SHORT-TERM INVESTMENTS — 1.73% |
| |||||||
MONEY MARKET FUNDS — 1.73% |
| |||||||
BlackRock Cash Funds: Institutional, |
| |||||||
0.14%f,g,h | 2,780,886 | 2,780,886 | ||||||
BlackRock Cash Funds: Prime, | ||||||||
0.11%f,g,h | 175,064 | 175,064 | ||||||
BlackRock Cash Funds: Treasury, | ||||||||
0.00%f,g | 228,620 | 228,620 | ||||||
|
| |||||||
| 3,184,570 | ||||||||
|
| |||||||
TOTAL SHORT-TERM INVESTMENTS |
| |||||||
(Cost: $3,184,570) |
| 3,184,570 | ||||||
|
| |||||||
| 28 | 2014 iSHARES ANNUAL REPORTTO SHAREHOLDERS |
Table of Contents
Schedule of Investments (Continued)
iSHARES® MSCI GLOBAL METALS & MINING PRODUCERS ETF
August 31, 2014
| Value | ||||||
TOTAL INVESTMENTS | ||||||
(Cost: $176,852,139) | $ | 186,101,828 | ||||
Other Assets, Less Liabilities — (1.31)% | (2,402,606 | ) | ||||
|
| |||||
NET ASSETS — 100.00% | $ | 183,699,222 | ||||
|
| |||||
NVDR — Non-Voting Depositary Receipts
SP ADR — Sponsored American Depositary Receipts
SP GDR — Sponsored Global Depositary Receipts
| a | Non-income earning security. |
| b | All or a portion of this security represents a security on loan. See Note 1. |
| c | This security may be resold to qualified institutional buyers under Rule 144A of the Securities Act of 1933. |
| d | Security valued using Level 3 inputs in accordance with management’s fair valuation policy. See Note 1. |
| e | This security may be resold to qualified foreign investors and foreign institutional buyers under Regulation S of the Securities Act of 1933. |
| f | Affiliated issuer. See Note 2. |
| g | The rate quoted is the annualized seven-day yield of the fund at period end. |
| h | All or a portion of this security represents an investment of securities lending collateral. See Note 1. |
See notes to financial statements.
SCHEDULESOF INVESTMENTS | 29 |
Table of Contents
Schedule of Investments
iSHARES® MSCI GLOBAL SILVER MINERS ETF
August 31, 2014
| Security | Shares | Value | ||||||
COMMON STOCKS — 99.99% |
| |||||||
AUSTRALIA — 0.18% |
| |||||||
Alcyone Resources Ltd.a | 26,593,384 | $ | 24,872 | |||||
|
| |||||||
| 24,872 | ||||||||
CANADA — 58.42% |
| |||||||
Alexco Resource Corp.a,b | 132,396 | 131,816 | ||||||
Endeavour Silver Corp.a | 63,063 | 352,304 | ||||||
Excellon Resources Inc.a | 119,262 | 153,922 | ||||||
First Majestic Silver Corp.a | 62,040 | 637,129 | ||||||
Fortuna Silver Mines Inc.a | 76,461 | 394,024 | ||||||
Great Panther Silver Ltd.a | 148,665 | 182,277 | ||||||
Klondex Mines Ltd.a | 101,068 | 191,002 | ||||||
MAG Silver Corp.a | 39,116 | 320,933 | ||||||
Mandalay Resources Corp.b | 176,946 | 185,959 | ||||||
Minco Silver Corp.a | 136,323 | 143,267 | ||||||
Pan American Silver Corp. | 44,275 | 636,727 | ||||||
Scorpio Mining Corp.a | 444,752 | 139,402 | ||||||
Silver Standard Resources Inc.a | 46,574 | 438,369 | ||||||
Silver Wheaton Corp. | 124,498 | 3,117,184 | ||||||
Silvercorp Metals Inc. | 131,384 | 242,238 | ||||||
Tahoe Resources Inc.a | 24,222 | 621,655 | ||||||
US Silver & Gold Inc.a | 261,294 | 137,301 | ||||||
Wildcat Silver Corp.a | 283,360 | 138,447 | ||||||
|
| |||||||
| 8,163,956 | ||||||||
HONG KONG — 2.65% |
| |||||||
G-Resources Group Ltd.a,b | 13,761,000 | 371,096 | ||||||
|
| |||||||
| 371,096 | ||||||||
MEXICO — 8.53% |
| |||||||
Industrias Penoles SAB de CV | 46,970 | 1,191,897 | ||||||
|
| |||||||
| 1,191,897 | ||||||||
PERU — 5.22% |
| |||||||
Compania de Minas Buenaventura SA SP ADR | 50,061 | 728,888 | ||||||
|
| |||||||
| 728,888 | ||||||||
UNITED KINGDOM — 12.50% |
| |||||||
Arian Silver Corp.a,b | 206,030 | 121,896 | ||||||
Fresnillo PLC | 72,457 | 1,157,602 | ||||||
Hochschild Mining PLCa | 120,483 | 322,948 | ||||||
Patagonia Gold PLCa,b | 1,128,061 | 145,191 | ||||||
|
| |||||||
| 1,747,637 | ||||||||
UNITED STATES — 12.49% |
| |||||||
Coeur Mining Inc.a | 58,245 | 461,301 | ||||||
Golden Minerals Co.a | 127,292 | 141,294 | ||||||
| Security | Shares | Value | ||||||
Hecla Mining Co. | 181,786 | $ | 594,440 | |||||
McEwen Mining Inc.a | 135,377 | 374,994 | ||||||
Paramount Gold and Silver Corp.a | 166,606 | 173,270 | ||||||
|
| |||||||
| 1,745,299 | ||||||||
|
| |||||||
TOTAL COMMON STOCKS |
| |||||||
(Cost: $13,943,339) |
| 13,973,645 | ||||||
SHORT-TERM INVESTMENTS — 2.05% |
| |||||||
MONEY MARKET FUNDS — 2.05% |
| |||||||
BlackRock Cash Funds: Institutional, |
| |||||||
0.14%c,d,e | 264,783 | 264,783 | ||||||
BlackRock Cash Funds: Prime, |
| |||||||
0.11%c,d,e | 16,669 | 16,669 | ||||||
BlackRock Cash Funds: Treasury, |
| |||||||
0.00%c,d | 5,319 | 5,319 | ||||||
|
| |||||||
| 286,771 | ||||||||
|
| |||||||
TOTAL SHORT-TERM INVESTMENTS |
| |||||||
(Cost: $286,771) |
| 286,771 | ||||||
|
| |||||||
TOTAL INVESTMENTS |
| |||||||
(Cost: $14,230,110) | 14,260,416 | |||||||
Other Assets, Less Liabilities — (2.04)% |
| (285,091 | ) | |||||
|
| |||||||
NET ASSETS — 100.00% |
| $ | 13,975,325 | |||||
|
| |||||||
SP ADR — Sponsored American Depositary Receipts
| a | Non-income earning security. |
| b | All or a portion of this security represents a security on loan. See Note 1. |
| c | Affiliated issuer. See Note 2. |
| d | The rate quoted is the annualized seven-day yield of the fund at period end. |
| e | All or a portion of this security represents an investment of securities lending collateral. See Note 1. |
See notes to financial statements.
| 30 | 2014 iSHARES ANNUAL REPORTTO SHAREHOLDERS |
Table of Contents
Statements of Assets and Liabilities
iSHARES®, INC.
August 31, 2014
| iShares MSCI Global Agriculture Producers ETF | iShares MSCI Global Energy Producers ETF | iShares MSCI Global Gold Miners ETF | ||||||||||
ASSETS | ||||||||||||
Investments, at cost: | ||||||||||||
Unaffiliated | $ | 45,662,667 | $ | 7,720,012 | $ | 74,761,636 | ||||||
Affiliated (Note 2) | 1,035,068 | 35,864 | 155,814 | |||||||||
|
|
|
|
|
| |||||||
Total cost of investments | $ | 46,697,735 | $ | 7,755,876 | $ | 74,917,450 | ||||||
|
|
|
|
|
| |||||||
Investments in securities, at fair value (including securities on loana) (Note 1): | ||||||||||||
Unaffiliated | $ | 45,866,102 | $ | 8,369,239 | $ | 70,880,051 | ||||||
Affiliated (Note 2) | 1,106,359 | 35,864 | 155,814 | |||||||||
|
|
|
|
|
| |||||||
Total fair value of investments | 46,972,461 | 8,405,103 | 71,035,865 | |||||||||
Foreign currency, at valueb | 69,147 | 8,538 | 56,410 | |||||||||
Cash | — | — | 17,366 | |||||||||
Receivables: | ||||||||||||
Investment securities sold | 43,809 | — | 2,306,683 | |||||||||
Dividends and interest | 89,106 | 35,633 | 35,305 | |||||||||
|
|
|
|
|
| |||||||
Total Assets | 47,174,523 | 8,449,274 | 73,451,629 | |||||||||
|
|
|
|
|
| |||||||
LIABILITIES | ||||||||||||
Payables: | ||||||||||||
Investment securities purchased | 68,408 | — | 2,301,938 | |||||||||
Collateral for securities on loan (Note 1) | 696,406 | 27,956 | 150,000 | |||||||||
Investment advisory fees (Note 2) | 14,998 | 2,728 | 23,220 | |||||||||
|
|
|
|
|
| |||||||
Total Liabilities | 779,812 | 30,684 | 2,475,158 | |||||||||
|
|
|
|
|
| |||||||
NET ASSETS | $ | 46,394,711 | $ | 8,418,590 | $ | 70,976,471 | ||||||
|
|
|
|
|
| |||||||
Net assets consist of: | ||||||||||||
Paid-in capital | $ | 46,930,804 | $ | 7,880,424 | $ | 88,667,032 | ||||||
Undistributed net investment income | 146,167 | 36,482 | 57,467 | |||||||||
Accumulated net realized loss | (956,467 | ) | (147,472 | ) | (13,866,805 | ) | ||||||
Net unrealized appreciation (depreciation) | 274,207 | 649,156 | (3,881,223 | ) | ||||||||
|
|
|
|
|
| |||||||
NET ASSETS | $ | 46,394,711 | $ | 8,418,590 | $ | 70,976,471 | ||||||
|
|
|
|
|
| |||||||
Shares outstandingc | 1,700,000 | 300,000 | 6,300,000 | |||||||||
|
|
|
|
|
| |||||||
Net asset value per share | $ | 27.29 | $ | 28.06 | $ | 11.27 | ||||||
|
|
|
|
|
| |||||||
| a | Securities on loan with values of $636,605, $26,150 and $122,578, respectively. See Note 1. |
| b | Cost of foreign currency: $69,110, $8,607 and $56,277, respectively. |
| c | $0.001 par value, number of shares authorized: 500 million, 500 million and 500 million, respectively. |
See notes to financial statements.
FINANCIAL STATEMENTS | 31 |
Table of Contents
Statements of Assets and Liabilities (Continued)
iSHARES®, INC.
August 31, 2014
| iShares MSCI Global Metals & Mining Producers ETF | iShares MSCI Global Silver Miners ETF | |||||||
ASSETS | ||||||||
Investments, at cost: | ||||||||
Unaffiliated | $ | 173,667,569 | $ | 13,943,339 | ||||
Affiliated (Note 2) | 3,184,570 | 286,771 | ||||||
|
|
|
| |||||
Total cost of investments | $ | 176,852,139 | $ | 14,230,110 | ||||
|
|
|
| |||||
Investments in securities, at fair value (including securities on loana) (Note 1): | ||||||||
Unaffiliated | $ | 182,917,258 | $ | 13,973,645 | ||||
Affiliated (Note 2) | 3,184,570 | 286,771 | ||||||
|
|
|
| |||||
Total fair value of investments | 186,101,828 | 14,260,416 | ||||||
Foreign currency, at valueb | 206,663 | 3,130 | ||||||
Receivables: | ||||||||
Investment securities sold | — | 707,715 | ||||||
Dividends and interest | 557,678 | 15,203 | ||||||
Capital shares sold | — | 4,488 | ||||||
|
|
|
| |||||
Total Assets | 186,866,169 | 14,990,952 | ||||||
|
|
|
| |||||
LIABILITIES | ||||||||
Payables: | ||||||||
Investment securities purchased | 145,910 | 730,297 | ||||||
Collateral for securities on loan (Note 1) | 2,955,950 | 281,452 | ||||||
Foreign taxes (Note 1) | 3,322 | — | ||||||
Investment advisory fees (Note 2) | 61,765 | 3,878 | ||||||
|
|
|
| |||||
Total Liabilities | 3,166,947 | 1,015,627 | ||||||
|
|
|
| |||||
NET ASSETS | $ | 183,699,222 | $ | 13,975,325 | ||||
|
|
|
| |||||
Net assets consist of: | ||||||||
Paid-in capital | $ | 182,099,485 | $ | 15,614,686 | ||||
Undistributed (distributions in excess of) net investment income | 517,663 | (42,879 | ) | |||||
Accumulated net realized loss | (8,164,167 | ) | (1,626,748 | ) | ||||
Net unrealized appreciation | 9,246,241 | 30,266 | ||||||
|
|
|
| |||||
NET ASSETS | $ | 183,699,222 | $ | 13,975,325 | ||||
|
|
|
| |||||
Shares outstandingc | 9,100,000 | 1,100,000 | ||||||
|
|
|
| |||||
Net asset value per share | $ | 20.19 | $ | 12.70 | ||||
|
|
|
| |||||
| a | Securities on loan with values of $2,791,957 and $263,060, respectively. See Note 1. |
| b | Cost of foreign currency: $208,150 and $3,168, respectively. |
| c | $0.001 par value, number of shares authorized: 500 million and 500 million, respectively. |
See notes to financial statements.
| 32 | 2014 iSHARES ANNUAL REPORTTO SHAREHOLDERS |
Table of Contents
Statements of Operations
iSHARES®, INC.
Year ended August 31, 2014
| iShares MSCI Global Agriculture Producers ETF | iShares MSCI Global Energy Producers ETF | iShares MSCI Global Gold Miners ETF | ||||||||||
NET INVESTMENT INCOME | ||||||||||||
Dividends — unaffiliateda | $ | 1,048,924 | $ | 164,359 | $ | 608,060 | ||||||
Dividends — affiliated (Note 2) | 2,411 | — | — | |||||||||
Interest — affiliated (Note 2) | 8 | 1 | 5 | |||||||||
Securities lending income — affiliated (Note 2) | 11,571 | 334 | 13,951 | |||||||||
|
|
|
|
|
| |||||||
Total investment income | 1,062,914 | 164,694 | 622,016 | |||||||||
|
|
|
|
|
| |||||||
EXPENSES | ||||||||||||
Investment advisory fees (Note 2) | 162,274 | 21,673 | 202,118 | |||||||||
|
|
|
|
|
| |||||||
Total expenses | 162,274 | 21,673 | 202,118 | |||||||||
Less investment advisory fees waived (Note 2) | (2,676 | ) | — | — | ||||||||
|
|
|
|
|
| |||||||
Net expenses | 159,598 | 21,673 | 202,118 | |||||||||
|
|
|
|
|
| |||||||
Net investment income | 903,316 | 143,021 | 419,898 | |||||||||
|
|
|
|
|
| |||||||
NET REALIZED AND UNREALIZED GAIN (LOSS) | ||||||||||||
Net realized gain (loss) from: | ||||||||||||
Investments — unaffiliated | (838,051 | ) | (96,957 | ) | (9,991,753 | ) | ||||||
Investments — affiliated (Note 2) | (3,608 | ) | — | — | ||||||||
In-kind redemptions — unaffiliated | 790,947 | — | 429,548 | |||||||||
In-kind redemptions — affiliated (Note 2) | 583 | — | — | |||||||||
Foreign currency transactions | (4,825 | ) | 380 | (462 | ) | |||||||
|
|
|
|
|
| |||||||
Net realized loss | (54,954 | ) | (96,577 | ) | (9,562,667 | ) | ||||||
|
|
|
|
|
| |||||||
Net change in unrealized appreciation/depreciation on: | ||||||||||||
Investments | 3,654,542 | 849,427 | 11,791,515 | |||||||||
Translation of assets and liabilities in foreign currencies | (9 | ) | 138 | 1,043 | ||||||||
|
|
|
|
|
| |||||||
Net change in unrealized appreciation/depreciation | 3,654,533 | 849,565 | 11,792,558 | |||||||||
|
|
|
|
|
| |||||||
Net realized and unrealized gain | 3,599,579 | 752,988 | 2,229,891 | |||||||||
|
|
|
|
|
| |||||||
NET INCREASE IN NET ASSETS RESULTING FROM OPERATIONS | $ | 4,502,895 | $ | 896,009 | $ | 2,649,789 | ||||||
|
|
|
|
|
| |||||||
| a | Net of foreign withholding tax of $98,080, $11,062 and $79,463, respectively. |
See notes to financial statements.
FINANCIAL STATEMENTS | 33 |
Table of Contents
Statements of Operations (Continued)
iSHARES®, INC.
Year ended August 31, 2014
| iShares MSCI Global Metals & Mining Producers ETF | iShares MSCI Global Silver Miners ETF | |||||||
NET INVESTMENT INCOME | ||||||||
Dividends — unaffiliateda | $ | 4,947,817 | $ | 85,822 | ||||
Interest — affiliated (Note 2) | 27 | 1 | ||||||
Securities lending income — affiliated (Note 2) | 77,319 | 4,370 | ||||||
|
|
|
| |||||
| 5,025,163 | 90,193 | |||||||
Less: Other foreign taxes (Note 1) | (3,322 | ) | — | |||||
|
|
|
| |||||
Total investment income | 5,021,841 | 90,193 | ||||||
|
|
|
| |||||
EXPENSES | ||||||||
Investment advisory fees (Note 2) | 670,187 | 34,325 | ||||||
|
|
|
| |||||
Total expenses | 670,187 | 34,325 | ||||||
|
|
|
| |||||
Net investment income | 4,351,654 | 55,868 | ||||||
|
|
|
| |||||
NET REALIZED AND UNREALIZED GAIN (LOSS) | ||||||||
Net realized gain (loss) from: | ||||||||
Investments — unaffiliated | (5,441,579 | ) | (1,309,491 | ) | ||||
In-kind redemptions — unaffiliated | 10,731,513 | — | ||||||
Foreign currency transactions | (2,052 | ) | 487 | |||||
|
|
|
| |||||
Net realized gain (loss) | 5,287,882 | (1,309,004 | ) | |||||
|
|
|
| |||||
Net change in unrealized appreciation/depreciation on: | ||||||||
Investments | 24,023,100 | 1,092,782 | ||||||
Translation of assets and liabilities in foreign currencies | 2,806 | (219 | ) | |||||
|
|
|
| |||||
Net change in unrealized appreciation/depreciation | 24,025,906 | 1,092,563 | ||||||
|
|
|
| |||||
Net realized and unrealized gain (loss) | 29,313,788 | (216,441 | ) | |||||
|
|
|
| |||||
NET INCREASE (DECREASE) IN NET ASSETS RESULTING FROM OPERATIONS | $ | 33,665,442 | $ | (160,573 | ) | |||
|
|
|
| |||||
| a | Net of foreign withholding tax of $266,040 and $8,507, respectively. |
See notes to financial statements.
| 34 | 2014 iSHARES ANNUAL REPORTTO SHAREHOLDERS |
Table of Contents
Statements of Changes in Net Assets
iSHARES®, INC.
| iShares MSCI Global Agriculture Producers ETF | iShares MSCI Global Energy Producers ETF | |||||||||||||||
| Year ended August 31, 2014 | Year ended August 31, 2013 | Year ended August 31, 2014 | Year ended August 31, 2013 | |||||||||||||
INCREASE (DECREASE) IN NET ASSETS | ||||||||||||||||
OPERATIONS: | ||||||||||||||||
Net investment income | $ | 903,316 | $ | 391,116 | $ | 143,021 | $ | 125,538 | ||||||||
Net realized loss | (54,954 | ) | (138,365 | ) | (96,577 | ) | (25,626 | ) | ||||||||
Net change in unrealized appreciation/depreciation | 3,654,533 | (3,296,695 | ) | 849,565 | 135,914 | |||||||||||
|
|
|
|
|
|
|
| |||||||||
Net increase (decrease) in net assets resulting from operations | 4,502,895 | (3,043,944 | ) | 896,009 | 235,826 | |||||||||||
|
|
|
|
|
|
|
| |||||||||
DISTRIBUTIONS TO SHAREHOLDERS: | ||||||||||||||||
From net investment income | (869,161 | ) | (289,367 | ) | (128,943 | ) | (125,608 | ) | ||||||||
|
|
|
|
|
|
|
| |||||||||
Total distributions to shareholders | (869,161 | ) | (289,367 | ) | (128,943 | ) | (125,608 | ) | ||||||||
|
|
|
|
|
|
|
| |||||||||
CAPITAL SHARE TRANSACTIONS: | ||||||||||||||||
Proceeds from shares sold | 12,206,285 | 29,084,665 | 2,840,186 | — | ||||||||||||
Cost of shares redeemed | (5,161,272 | ) | — | — | — | |||||||||||
|
|
|
|
|
|
|
| |||||||||
Net increase in net assets from capital share transactions | 7,045,013 | 29,084,665 | 2,840,186 | — | ||||||||||||
|
|
|
|
|
|
|
| |||||||||
INCREASE IN NET ASSETS | 10,678,747 | 25,751,354 | 3,607,252 | 110,218 | ||||||||||||
NET ASSETS | ||||||||||||||||
Beginning of year | 35,715,964 | 9,964,610 | 4,811,338 | 4,701,120 | ||||||||||||
|
|
|
|
|
|
|
| |||||||||
End of year | $ | 46,394,711 | $ | 35,715,964 | $ | 8,418,590 | $ | 4,811,338 | ||||||||
|
|
|
|
|
|
|
| |||||||||
Undistributed net investment income included in net assets at end of year | $ | 146,167 | $ | 116,739 | $ | 36,482 | $ | 21,722 | ||||||||
|
|
|
|
|
|
|
| |||||||||
SHARES ISSUED AND REDEEMED | ||||||||||||||||
Shares sold | 450,000 | 1,050,000 | 100,000 | — | ||||||||||||
Shares redeemed | (200,000 | ) | — | — | — | |||||||||||
|
|
|
|
|
|
|
| |||||||||
Net increase in shares outstanding | 250,000 | 1,050,000 | 100,000 | — | ||||||||||||
|
|
|
|
|
|
|
| |||||||||
See notes to financial statements.
FINANCIAL STATEMENTS | 35 |
Table of Contents
Statements of Changes in Net Assets (Continued)
iSHARES®, INC.
| iShares MSCI Global Gold Miners ETF | iShares MSCI Global Metals & Mining Producers ETF | |||||||||||||||
| Year ended August 31, 2014 | Year ended August 31, 2013 | Year ended August 31, 2014 | Year ended August 31, 2013 | |||||||||||||
INCREASE (DECREASE) IN NET ASSETS | ||||||||||||||||
OPERATIONS: | ||||||||||||||||
Net investment income | $ | 419,898 | $ | 443,449 | $ | 4,351,654 | $ | 5,685,352 | ||||||||
Net realized gain (loss) | (9,562,667 | ) | (3,263,008 | ) | 5,287,882 | 2,266,989 | ||||||||||
Net change in unrealized appreciation/depreciation | 11,792,558 | (11,579,719 | ) | 24,025,906 | (14,102,532 | ) | ||||||||||
|
|
|
|
|
|
|
| |||||||||
Net increase (decrease) in net assets resulting from operations | 2,649,789 | (14,399,278 | ) | 33,665,442 | (6,150,191 | ) | ||||||||||
|
|
|
|
|
|
|
| |||||||||
DISTRIBUTIONS TO SHAREHOLDERS: | ||||||||||||||||
From net investment income | (410,920 | ) | (426,169 | ) | (4,935,233 | ) | (4,641,648 | ) | ||||||||
|
|
|
|
|
|
|
| |||||||||
Total distributions to shareholders | (410,920 | ) | (426,169 | ) | (4,935,233 | ) | (4,641,648 | ) | ||||||||
|
|
|
|
|
|
|
| |||||||||
CAPITAL SHARE TRANSACTIONS: | ||||||||||||||||
Proceeds from shares sold | 33,392,792 | 33,445,251 | 51,854,849 | 172,833,069 | ||||||||||||
Cost of shares redeemed | (2,940,209 | ) | (12,419,198 | ) | (119,693,896 | ) | (62,756,852 | ) | ||||||||
|
|
|
|
|
|
|
| |||||||||
Net increase (decrease) in net assets from capital share transactions | 30,452,583 | 21,026,053 | (67,839,047 | ) | 110,076,217 | |||||||||||
|
|
|
|
|
|
|
| |||||||||
INCREASE (DECREASE) IN NET ASSETS | 32,691,452 | 6,200,606 | (39,108,838 | ) | 99,284,378 | |||||||||||
NET ASSETS | ||||||||||||||||
Beginning of year | 38,285,019 | 32,084,413 | 222,808,060 | 123,523,682 | ||||||||||||
|
|
|
|
|
|
|
| |||||||||
End of year | $ | 70,976,471 | $ | 38,285,019 | $ | 183,699,222 | $ | 222,808,060 | ||||||||
|
|
|
|
|
|
|
| |||||||||
Undistributed net investment income included in net assets at end of year | $ | 57,467 | $ | 48,755 | $ | 517,663 | $ | 1,097,994 | ||||||||
|
|
|
|
|
|
|
| |||||||||
SHARES ISSUED AND REDEEMED | ||||||||||||||||
Shares sold | 3,300,000 | 2,450,000 | 2,650,000 | 8,950,000 | ||||||||||||
Shares redeemed | (300,000 | ) | (750,000 | ) | (5,850,000 | ) | (3,150,000 | ) | ||||||||
|
|
|
|
|
|
|
| |||||||||
Net increase (decrease) in shares outstanding | 3,000,000 | 1,700,000 | (3,200,000 | ) | 5,800,000 | |||||||||||
|
|
|
|
|
|
|
| |||||||||
See notes to financial statements.
| 36 | 2014 iSHARES ANNUAL REPORTTO SHAREHOLDERS |
Table of Contents
Statements of Changes in Net Assets (Continued)
iSHARES®, INC.
| iShares MSCI Global Silver Miners ETF | ||||||||
| Year ended August 31, 2014 | Year ended August 31, 2013 | |||||||
INCREASE (DECREASE) IN NET ASSETS | ||||||||
OPERATIONS: | ||||||||
Net investment income | $ | 55,868 | $ | 32,646 | ||||
Net realized loss | (1,309,004 | ) | (219,152 | ) | ||||
Net change in unrealized appreciation/depreciation | 1,092,563 | (720,832 | ) | |||||
|
|
|
| |||||
Net decrease in net assets resulting from operations | (160,573 | ) | (907,338 | ) | ||||
|
|
|
| |||||
DISTRIBUTIONS TO SHAREHOLDERS: | ||||||||
From net investment income | (104,622 | ) | (44,671 | ) | ||||
|
|
|
| |||||
Total distributions to shareholders | (104,622 | ) | (44,671 | ) | ||||
|
|
|
| |||||
CAPITAL SHARE TRANSACTIONS: | ||||||||
Proceeds from shares sold | 7,281,618 | 5,816,496 | ||||||
|
|
|
| |||||
Net increase in net assets from capital share transactions | 7,281,618 | 5,816,496 | ||||||
|
|
|
| |||||
INCREASE IN NET ASSETS | 7,016,423 | 4,864,487 | ||||||
NET ASSETS | ||||||||
Beginning of year | 6,958,902 | 2,094,415 | ||||||
|
|
|
| |||||
End of year | $ | 13,975,325 | $ | 6,958,902 | ||||
|
|
|
| |||||
Distributions in excess of net investment income included in net assets at end of year | $ | (42,879 | ) | $ | (6,916 | ) | ||
|
|
|
| |||||
SHARES ISSUED | ||||||||
Shares sold | 600,000 | 400,000 | ||||||
|
|
|
| |||||
Net increase in shares outstanding | 600,000 | 400,000 | ||||||
|
|
|
| |||||
See notes to financial statements.
FINANCIAL STATEMENTS | 37 |
Table of Contents
iSHARES®, INC.
(For a share outstanding throughout each period)
iShares MSCI Global Agriculture Producers ETF |
| Year ended Aug. 31, 2014 | Year ended Aug. 31, 2013 | Period from to Aug. 31, 2012 | ||||||||||
Net asset value, beginning of period | $ | 24.63 | $ | 24.91 | $ | 24.88 | ||||||
|
|
|
|
|
| |||||||
Income from investment operations: | ||||||||||||
Net investment incomeb | 0.58 | 0.50 | 0.28 | |||||||||
Net realized and unrealized gain (loss)c | 2.63 | (0.46 | ) | (0.05 | ) | |||||||
|
|
|
|
|
| |||||||
Total from investment operations | 3.21 | 0.04 | 0.23 | |||||||||
|
|
|
|
|
| |||||||
Less distributions from: | ||||||||||||
Net investment income | (0.55 | ) | (0.32 | ) | (0.20 | ) | ||||||
|
|
|
|
|
| |||||||
Total distributions | (0.55 | ) | (0.32 | ) | (0.20 | ) | ||||||
|
|
|
|
|
| |||||||
Net asset value, end of period | $ | 27.29 | $ | 24.63 | $ | 24.91 | ||||||
|
|
|
|
|
| |||||||
Total return | 13.05 | % | 0.10 | % | 0.97 | %d | ||||||
|
|
|
|
|
| |||||||
Ratios/Supplemental data: | ||||||||||||
Net assets, end of period (000s) | $ | 46,395 | $ | 35,716 | $ | 9,965 | ||||||
Ratio of expenses to average net assetse | 0.38 | % | 0.38 | % | 0.38 | % | ||||||
Ratio of expenses to average net assets prior to waived feese | 0.39 | % | 0.39 | % | 0.39 | % | ||||||
Ratio of net investment income to average net assetse | 2.17 | % | 1.87 | % | 1.93 | % | ||||||
Portfolio turnover ratef | 14 | % | 6 | % | 6 | % | ||||||
| a | Commencement of operations. |
| b | Based on average shares outstanding throughout each period. |
| c | The amounts reported for a share outstanding may not accord with the change in aggregate gains and losses in securities for the fiscal period due to the timing of capital share transactions in relation to the fluctuating market values of the Fund’s underlying securities. |
| d | Not annualized. |
| e | Annualized for periods of less than one year. |
| f | Portfolio turnover rates exclude portfolio securities received or delivered in Creation Units but include portfolio transactions that are executed as a result of the Fund processing capital share transactions in Creation Units partially for cash in U.S. dollars. Excluding such cash transactions, the portfolio turnover rates for the years ended August 31, 2014, August 31, 2013 and the period ended August 31, 2012 were 13%, 6% and 6%, respectively. See Note 4. |
See notes to financial statements.
| 38 | 2014 iSHARES ANNUAL REPORTTO SHAREHOLDERS |
Table of Contents
Financial Highlights (Continued)
iSHARES®, INC.
(For a share outstanding throughout each period)
iShares MSCI Global Energy Producers ETF |
| Year ended Aug. 31, 2014 | Year ended Aug. 31, 2013 | Period from to | ||||||||||
Net asset value, beginning of period | $ | 24.06 | $ | 23.51 | $ | 24.79 | ||||||
|
|
|
|
|
| |||||||
Income from investment operations: | ||||||||||||
Net investment incomeb | 0.68 | 0.63 | 0.43 | |||||||||
Net realized and unrealized gain (loss)c | 3.96 | 0.55 | (1.39 | ) | ||||||||
|
|
|
|
|
| |||||||
Total from investment operations | 4.64 | 1.18 | (0.96 | ) | ||||||||
|
|
|
|
|
| |||||||
Less distributions from: | ||||||||||||
Net investment income | (0.64 | ) | (0.63 | ) | (0.32 | ) | ||||||
|
|
|
|
|
| |||||||
Total distributions | (0.64 | ) | (0.63 | ) | (0.32 | ) | ||||||
|
|
|
|
|
| |||||||
Net asset value, end of period | $ | 28.06 | $ | 24.06 | $ | 23.51 | ||||||
|
|
|
|
|
| |||||||
Total return | 19.44 | % | 5.10 | % | (3.77 | )%d | ||||||
|
|
|
|
|
| |||||||
Ratios/Supplemental data: | ||||||||||||
Net assets, end of period (000s) | $ | 8,419 | $ | 4,811 | $ | 4,701 | ||||||
Ratio of expenses to average net assetse | 0.39 | % | 0.39 | % | 0.39 | % | ||||||
Ratio of net investment income to average net assetse | 2.57 | % | 2.61 | % | 3.16 | % | ||||||
Portfolio turnover ratef | 8 | % | 6 | % | 5 | % | ||||||
| a | Commencement of operations. |
| b | Based on average shares outstanding throughout each period. |
| c | The amounts reported for a share outstanding may not accord with the change in aggregate gains and losses in securities for the fiscal period due to the timing of capital share transactions in relation to the fluctuating market values of the Fund’s underlying securities. |
| d | Not annualized. |
| e | Annualized for periods of less than one year. |
| f | Portfolio turnover rates exclude portfolio securities received or delivered in Creation Units but include portfolio transactions that are executed as a result of the Fund processing capital share transactions in Creation Units partially for cash in U.S. dollars. Excluding such cash transactions, the portfolio turnover rates for the years ended August 31, 2014, August 31, 2013 and the period ended August 31, 2012 were 8%, 6% and 5%, respectively. See Note 4. |
See notes to financial statements.
FINANCIAL HIGHLIGHTS | 39 |
Table of Contents
Financial Highlights (Continued)
iSHARES®, INC.
(For a share outstanding throughout each period)
iShares MSCI Global Gold Miners ETF |
| Year ended Aug. 31, 2014 | Year ended Aug. 31, 2013 | Period from to | ||||||||||
Net asset value, beginning of period | $ | 11.60 | $ | 20.05 | $ | 25.00 | ||||||
|
|
|
|
|
| |||||||
Income from investment operations: | ||||||||||||
Net investment incomeb | 0.08 | 0.21 | 0.15 | |||||||||
Net realized and unrealized lossc | (0.33 | ) | (8.47 | ) | (5.02 | ) | ||||||
|
|
|
|
|
| |||||||
Total from investment operations | (0.25 | ) | (8.26 | ) | (4.87 | ) | ||||||
|
|
|
|
|
| |||||||
Less distributions from: | ||||||||||||
Net investment income | (0.08 | ) | (0.19 | ) | (0.08 | ) | ||||||
|
|
|
|
|
| |||||||
Total distributions | (0.08 | ) | (0.19 | ) | (0.08 | ) | ||||||
|
|
|
|
|
| |||||||
Net asset value, end of period | $ | 11.27 | $ | 11.60 | $ | 20.05 | ||||||
|
|
|
|
|
| |||||||
Total return | (2.01 | )% | (41.28 | )% | (19.45 | )%d | ||||||
|
|
|
|
|
| |||||||
Ratios/Supplemental data: | ||||||||||||
Net assets, end of period (000s) | $ | 70,976 | $ | 38,285 | $ | 32,084 | ||||||
Ratio of expenses to average net assetse | 0.39 | % | 0.39 | % | 0.39 | % | ||||||
Ratio of net investment income to average net assetse | 0.81 | % | 1.37 | % | 1.25 | % | ||||||
Portfolio turnover ratef | 22 | % | 19 | % | 11 | % | ||||||
| a | Commencement of operations. |
| b | Based on average shares outstanding throughout each period. |
| c | The amounts reported for a share outstanding may not accord with the change in aggregate gains and losses in securities for the fiscal period due to the timing of capital share transactions in relation to the fluctuating market values of the Fund’s underlying securities. |
| d | Not annualized. |
| e | Annualized for periods of less than one year. |
| f | Portfolio turnover rates exclude portfolio securities received or delivered as a result of processing capital share transactions in Creation Units. |
See notes to financial statements.
| 40 | 2014 iSHARES ANNUAL REPORTTO SHAREHOLDERS |
Table of Contents
Financial Highlights (Continued)
iSHARES®, INC.
(For a share outstanding throughout each period)
iShares MSCI Global Metals & Mining Producers ETF |
| �� | Year ended Aug. 31, 2014 | Year ended Aug. 31, 2013 | Period from to | |||||||||
Net asset value, beginning of period | $ | 18.11 | $ | 19.00 | $ | 24.76 | ||||||
|
|
|
|
|
| |||||||
Income from investment operations: | ||||||||||||
Net investment incomeb | 0.50 | 0.50 | 0.37 | |||||||||
Net realized and unrealized gain (loss)c | 2.23 | (1.00 | ) | (6.00 | ) | |||||||
|
|
|
|
|
| |||||||
Total from investment operations | 2.73 | (0.50 | ) | (5.63 | ) | |||||||
|
|
|
|
|
| |||||||
Less distributions from: | ||||||||||||
Net investment income | (0.65 | ) | (0.39 | ) | (0.13 | ) | ||||||
|
|
|
|
|
| |||||||
Total distributions | (0.65 | ) | (0.39 | ) | (0.13 | ) | ||||||
|
|
|
|
|
| |||||||
Net asset value, end of period | $ | 20.19 | $ | 18.11 | $ | 19.00 | ||||||
|
|
|
|
|
| |||||||
Total return | 15.32 | % | (2.68 | )% | (22.76 | )%d | ||||||
|
|
|
|
|
| |||||||
Ratios/Supplemental data: | ||||||||||||
Net assets, end of period (000s) | $ | 183,699 | $ | 222,808 | $ | 123,524 | ||||||
Ratio of expenses to average net assetse | 0.39 | % | 0.39 | % | 0.39 | % | ||||||
Ratio of expenses to average net assets prior to waived feese | 0.39 | % | 0.39 | % | 0.39 | % | ||||||
Ratio of net investment income to average net assetse | 2.53 | % | 2.51 | % | 2.98 | % | ||||||
Portfolio turnover ratef | 18 | % | 11 | % | 1 | % | ||||||
| a | Commencement of operations. |
| b | Based on average shares outstanding throughout each period. |
| c | The amounts reported for a share outstanding may not accord with the change in aggregate gains and losses in securities for the fiscal period due to the timing of capital share transactions in relation to the fluctuating market values of the Fund’s underlying securities. |
| d | Not annualized. |
| e | Annualized for periods of less than one year. |
| f | Portfolio turnover rates exclude portfolio securities received or delivered in Creation Units but include portfolio transactions that are executed as a result of the Fund processing capital share transactions in Creation Units partially for cash in U.S. dollars. Excluding such cash transactions, the portfolio turnover rates for the years ended August 31, 2014, August 31, 2013 and the period ended August 31, 2012 were 15%, 7% and 1%, respectively. See Note 4. |
See notes to financial statements.
FINANCIAL HIGHLIGHTS | 41 |
Table of Contents
Financial Highlights (Continued)
iSHARES®, INC.
(For a share outstanding throughout each period)
iShares MSCI Global Silver Miners ETF |
| Year ended Aug. 31, 2014 | Year ended Aug. 31, 2013 | Period from to Aug. 31, 2012 | ||||||||||
Net asset value, beginning of period | $ | 13.92 | $ | 20.94 | $ | 24.87 | ||||||
|
|
|
|
|
| |||||||
Income from investment operations: | ||||||||||||
Net investment incomeb | 0.08 | 0.16 | 0.11 | |||||||||
Net realized and unrealized gain (loss)c | (1.15 | ) | (6.90 | ) | (3.90 | ) | ||||||
|
|
|
|
|
| |||||||
Total from investment operations | (1.07 | ) | (6.74 | ) | (3.79 | ) | ||||||
|
|
|
|
|
| |||||||
Less distributions from: | ||||||||||||
Net investment income | (0.15 | ) | (0.28 | ) | (0.14 | ) | ||||||
|
|
|
|
|
| |||||||
Total distributions | (0.15 | ) | (0.28 | ) | (0.14 | ) | ||||||
|
|
|
|
|
| |||||||
Net asset value, end of period | $ | 12.70 | $ | 13.92 | $ | 20.94 | ||||||
|
|
|
|
|
| |||||||
Total return | (7.48 | )% | (32.49 | )% | (15.18 | )%d | ||||||
|
|
|
|
|
| |||||||
Ratios/Supplemental data: | ||||||||||||
Net assets, end of period (000s) | $ | 13,975 | $ | 6,959 | $ | 2,094 | ||||||
Ratio of expenses to average net assetse | 0.39 | % | 0.39 | % | 0.39 | % | ||||||
Ratio of net investment income to average net assetse | 0.63 | % | 1.03 | % | 0.86 | % | ||||||
Portfolio turnover ratef | 22 | % | 13 | % | 9 | % | ||||||
| a | Commencement of operations. |
| b | Based on average shares outstanding throughout each period. |
| c | The amounts reported for a share outstanding may not accord with the change in aggregate gains and losses in securities for the fiscal period due to the timing of capital share transactions in relation to the fluctuating market values of the Fund’s underlying securities. |
| d | Not annualized. |
| e | Annualized for periods of less than one year. |
| f | Portfolio turnover rates exclude portfolio securities received or delivered as a result of processing capital share transactions in Creation Units. |
See notes to financial statements.
| 42 | 2014 iSHARES ANNUAL REPORTTO SHAREHOLDERS |
Table of Contents
iSHARES®, INC.
iShares, Inc. (the “Company”) is registered under the Investment Company Act of 1940, as amended (the “1940 Act”), as an open-end management investment company. The Company was incorporated under the laws of the State of Maryland on September 1, 1994 pursuant to amended and restated Articles of Incorporation.
These financial statements relate only to the following funds (each, a “Fund,” and collectively, the “Funds”):
| iShares ETF | Diversification Classification | |
MSCI Global Agriculture Producers | Non-diversified | |
MSCI Global Energy Producers | Non-diversified | |
MSCI Global Gold Miners | Non-diversified | |
MSCI Global Metals & Mining Producers | Non-diversified | |
MSCI Global Silver Miners | Non-diversified |
The investment objective of each Fund is to seek investment results that correspond generally to the price and yield performance, before fees and expenses, of its underlying index. The investment adviser uses a “passive” or index approach to try to achieve each Fund’s investment objective.
Pursuant to the Company’s organizational documents, the Funds’ officers and directors are indemnified against certain liabilities that may arise out of the performance of their duties to the Funds. Additionally, in the normal course of business, the Funds enter into contracts with service providers that contain general indemnification clauses. The Funds’ maximum exposure under these arrangements is unknown as this would involve future claims that may be made against the Funds that have not yet occurred.
| 1. | SIGNIFICANT ACCOUNTING POLICIES |
The following significant accounting policies are consistently followed by the Funds in the preparation of their financial statements in conformity with accounting principles generally accepted in the United States of America (“U.S. GAAP”). The preparation of financial statements in conformity with U.S. GAAP requires management to make certain estimates and assumptions that affect the reported amounts of assets and liabilities and disclosures of contingent assets and liabilities at the date of the financial statements and the reported amounts of revenue and expenses during the reporting period. Actual results could differ from those estimates. Each Fund is considered an investment company under U.S. GAAP and follows the accounting and reporting guidance applicable to investment companies in the Financial Accounting Standards Board Accounting Standards Codification Topic 946 (ASC 946).
SECURITY VALUATION
Each Fund’s investments are valued at fair value each day that the Fund’s listing exchange is open and, for financial reporting purposes, as of the report date should the reporting period end on a day that the Fund’s listing exchange is not open. U.S. GAAP defines fair value as the price a fund would receive to sell an asset or pay to transfer a liability in an orderly transaction between market participants at the measurement date. The BlackRock Global Valuation Methodologies Committee (the “Global Valuation Committee”) provides oversight of the valuation of investments for the Funds. The investments of each Fund are valued pursuant to policies and procedures developed by the Global Valuation Committee and approved by the Board of Directors of the Company (the “Board”).
| • | Equity investments traded on a recognized securities exchange are valued at that day’s last reported trade price or the official closing price, as applicable, on the exchange where the stock is primarily traded. Equity investments traded on a recognized exchange for which there were no sales on that day are valued at the last traded price. |
NOTESTO FINANCIAL STATEMENTS | 43 |
Table of Contents
Notes to Financial Statements (Continued)
iSHARES®, INC.
| • | Exchange-traded funds and closed-end funds traded on a recognized securities exchange are valued at that day’s last reported trade price or the official closing price, as applicable, on the exchange where the fund is primarily traded. Funds traded on a recognized exchange for which there were no sales on that day are valued at the last traded price. |
| • | Open-end U.S. mutual funds are valued at that day’s published net asset value (NAV). |
In the event that application of these methods of valuation results in a price for an investment which is deemed not to be representative of the fair value of such investment or if a price is not available, the investment will be valued based upon other available factors deemed relevant by the Global Valuation Committee, in accordance with policies approved by the Board. These factors include but are not limited to (i) attributes specific to the investment; (ii) the principal market for the investment; (iii) the customary participants in the principal market for the investment; (iv) data assumptions by market participants for the investment, if reasonably available; (v) quoted prices for similar investments in active markets; and (vi) other factors, such as future cash flows, interest rates, yield curves, volatilities, prepayment speeds, loss severities, credit risks and/or default rates. Valuations based on such factors are reported to the Board on a quarterly basis.
The Global Valuation Committee employs various methods for calibrating valuation approaches for investments where an active market does not exist, including regular due diligence of the Company’s pricing vendors, a regular review of key inputs and assumptions, transactional back-testing or disposition analysis to compare unrealized gains and losses to realized gains and losses, reviews of missing or stale prices, reviews of large movements in market values, and reviews of market related activity.
Fair value pricing could result in a difference between the prices used to calculate a Fund’s net asset value and the prices used by the Fund’s underlying index, which in turn could result in a difference between the Fund’s performance and the performance of the Fund’s underlying index.
Various inputs are used in determining the fair value of financial instruments. Inputs may be based on independent market data (“observable inputs”) or they may be internally developed (“unobservable inputs”). These inputs are categorized into a disclosure hierarchy consisting of three broad levels for financial reporting purposes. The level of a value determined for a financial instrument within the fair value hierarchy is based on the lowest level of any input that is significant to the fair value measurement in its entirety. The categorization of a value determined for a financial instrument within the hierarchy is based upon the pricing transparency of the instrument and is not necessarily an indication of the risk associated with investing in the instrument. The three levels of the fair value hierarchy are as follows:
| • | Level 1 — Unadjusted quoted prices in active markets for identical assets or liabilities; |
| • | Level 2 — Inputs other than quoted prices included within Level 1 that are observable for the asset or liability either directly or indirectly, including quoted prices for similar assets or liabilities in active markets, quoted prices for identical or similar assets or liabilities in markets that are not considered to be active, inputs other than quoted prices that are observable for the asset or liability (such as exchange rates, financing terms, interest rates, yield curves, volatilities, prepayment speeds, loss severities, credit risks and default rates) or other market-corroborated inputs; and |
| • | Level 3 — Unobservable inputs for the asset or liability, including the Global Valuation Committee’s assumptions used in determining the fair value of investments. |
Changes in valuation techniques may result in transfers in or out of an assigned level within the disclosure hierarchy. In accordance with the Company’s policy, transfers between different levels of the fair value hierarchy are deemed to have occurred as of the beginning of the reporting period.
| 44 | 2014 iSHARES ANNUAL REPORTTO SHAREHOLDERS |
Table of Contents
Notes to Financial Statements (Continued)
iSHARES®, INC.
The following table summarizes the value of each of the Funds’ investments according to the fair value hierarchy as of August 31, 2014. The breakdown of each Fund’s investments into major categories is disclosed in its respective schedule of investments.
iShares ETF and | Investments | |||||||||||||||
| Level 1 | Level 2 | Level 3 | Total | |||||||||||||
MSCI Global Agriculture Producers | ||||||||||||||||
Assets: | ||||||||||||||||
Common Stocks | $ | 45,561,739 | $ | — | $ | 0 | a | $ | 45,561,739 | |||||||
Investment Companies | 368,780 | — | — | 368,780 | ||||||||||||
Preferred Stocks | 304,363 | — | — | 304,363 | ||||||||||||
Money Market Funds | 737,579 | — | — | 737,579 | ||||||||||||
|
|
|
|
|
|
|
| |||||||||
| $ | 46,972,461 | $ | — | $ | 0 | a | $ | 46,972,461 | ||||||||
|
|
|
|
|
|
|
| |||||||||
MSCI Global Energy Producers | ||||||||||||||||
Assets: | ||||||||||||||||
Common Stocks | $ | 8,233,013 | $ | — | $ | — | $ | 8,233,013 | ||||||||
Preferred Stocks | 136,226 | — | — | 136,226 | ||||||||||||
Warrants | — | 0 | a | — | 0 | a | ||||||||||
Money Market Funds | 35,864 | — | — | 35,864 | ||||||||||||
|
|
|
|
|
|
|
| |||||||||
| $ | 8,405,103 | $ | 0 | a | $ | — | $ | 8,405,103 | ||||||||
|
|
|
|
|
|
|
| |||||||||
MSCI Global Gold Miners | ||||||||||||||||
Assets: | ||||||||||||||||
Common Stocks | $ | 70,880,051 | $ | — | $ | — | $ | 70,880,051 | ||||||||
Money Market Funds | 155,814 | — | — | 155,814 | ||||||||||||
|
|
|
|
|
|
|
| |||||||||
| $ | 71,035,865 | $ | — | $ | — | $ | 71,035,865 | |||||||||
|
|
|
|
|
|
|
| |||||||||
MSCI Global Metals & Mining Producers | ||||||||||||||||
Assets: | ||||||||||||||||
Common Stocks | $ | 176,031,844 | $ | 164,070 | $ | 0 | a | $ | 176,195,914 | |||||||
Preferred Stocks | 6,721,344 | — | — | 6,721,344 | ||||||||||||
Money Market Funds | 3,184,570 | — | — | 3,184,570 | ||||||||||||
|
|
|
|
|
|
|
| |||||||||
| $ | 185,937,758 | $ | 164,070 | $ | 0 | a | $ | 186,101,828 | ||||||||
|
|
|
|
|
|
|
| |||||||||
MSCI Global Silver Miners | ||||||||||||||||
Assets: | ||||||||||||||||
Common Stocks | $ | 13,948,773 | $ | 24,872 | $ | — | $ | 13,973,645 | ||||||||
Money Market Funds | 286,771 | — | — | 286,771 | ||||||||||||
|
|
|
|
|
|
|
| |||||||||
| $ | 14,235,544 | $ | 24,872 | $ | — | $ | 14,260,416 | |||||||||
|
|
|
|
|
|
|
| |||||||||
| a | Rounds to less than $1. |
SECURITY TRANSACTIONS AND INCOME RECOGNITION
Security transactions are accounted for on trade date. Dividend income and capital gain distributions, if any, are recognized on the ex-dividend date, net of any foreign taxes withheld at source. Any taxes withheld that are reclaimable from foreign tax authorities as of August 31, 2014 are reflected in dividends receivable. Non-cash dividends received in the form of stock in an
NOTESTO FINANCIAL STATEMENTS | 45 |
Table of Contents
Notes to Financial Statements (Continued)
iSHARES®, INC.
elective dividend, if any, are recorded as dividend income at fair value. Distributions received by the Funds may include a return of capital that is estimated by management. Such amounts are recorded as a reduction of the cost of investments or reclassified to capital gains. Interest income is accrued daily. Realized gains and losses on investment transactions are determined using the specific identification method.
FOREIGN CURRENCY TRANSLATION
The accounting records of the Funds are maintained in U.S. dollars. Foreign currencies, as well as investment securities and other assets and liabilities denominated in foreign currencies, are translated into U.S. dollars using exchange rates deemed appropriate by the investment adviser. Purchases and sales of securities, income receipts and expense payments are translated into U.S. dollars on the respective dates of such transactions.
Each Fund does not isolate the effect of fluctuations in foreign exchange rates from the effect of fluctuations in the market prices of securities. Such fluctuations are reflected by the Funds as a component of realized and unrealized gains and losses from investments for financial reporting purposes.
FOREIGN TAXES
The Funds may be subject to foreign taxes (a portion of which may be reclaimable) on income, stock dividends, capital gains on investments, or certain foreign currency transactions. All foreign taxes are recorded in accordance with the applicable foreign tax regulations and rates that exist in the foreign jurisdictions in which the Funds invest. These foreign taxes, if any, are paid by the Funds and are reflected in their statements of operations as follows: foreign taxes withheld at source are presented as a reduction of income, foreign taxes on securities lending income are presented as a reduction of securities lending income, foreign taxes on stock dividends are presented as “other foreign taxes,” and foreign taxes on capital gains from sales of investments and foreign taxes on foreign currency transactions are included in their respective net realized gain (loss) categories. Foreign taxes payable or deferred as of August 31, 2014, if any, are disclosed in the Funds’ statements of assets and liabilities.
DISTRIBUTIONS TO SHAREHOLDERS
Dividends and distributions paid by each Fund are recorded on the ex-dividend dates. Distributions are determined on a tax basis and may differ from net investment income and net realized capital gains for financial reporting purposes. Dividends and distributions are paid in U.S. dollars and cannot be automatically reinvested in additional shares of the Funds.
LOANS OF PORTFOLIO SECURITIES
Each Fund may lend its investment securities to approved borrowers, such as brokers, dealers and other financial institutions. The borrower pledges and maintains with the Fund collateral consisting of cash, an irrevocable letter of credit issued by a bank, or securities issued or guaranteed by the U.S. government. The initial collateral received by each Fund is required to have a value of at least 102% of the current value of the loaned securities for securities traded on U.S. exchanges and a value of at least 105% for all other securities. The collateral is maintained thereafter, at a value equal to at least 100% of the current value of the securities on loan. The market value of the loaned securities is determined at the close of each business day of the Funds and any additional required collateral is delivered to the Funds on the next business day. During the term of the loan, each Fund is entitled to all distributions made on or in respect of the loaned securities. Loans of securities are terminable at any time and the borrower, after notice, is required to return borrowed securities within the standard time period for settlement of securities transactions.
| 46 | 2014 iSHARES ANNUAL REPORTTO SHAREHOLDERS |
Table of Contents
Notes to Financial Statements (Continued)
iSHARES®, INC.
Any cash received as collateral for securities on loan may be reinvested in certain short-term instruments either directly on behalf of a fund or through one or more joint accounts or money market funds, including those managed by BlackRock Fund Advisors (“BFA”), the Funds’ investment adviser, or its affiliates. As of August 31, 2014, any securities on loan were collateralized by cash. The cash collateral received was invested in money market funds managed by BFA and is disclosed in the schedules of investments. The value of any securities on loan as of August 31, 2014 and the value of the related collateral are disclosed in the statements of assets and liabilities. Income earned by the Funds from securities lending is disclosed in the statements of operations.
The risks of securities lending include the risk that the borrower may not provide additional collateral when required or may not return the securities when due. To mitigate these risks, the Funds benefit from a borrower default indemnity provided by BlackRock, Inc. (“BlackRock”). BlackRock’s indemnity allows for full replacement of securities lent. Each Fund could suffer a loss if the value of the investments purchased with cash collateral falls below the value of the cash collateral received.
Securities lending transactions are entered into by the Funds under Master Securities Lending Agreements (“MSLA”) which provide the right, in the event of default (including bankruptcy or insolvency) for the non-defaulting party to liquidate the collateral and calculate a net exposure to the defaulting party or request additional collateral. In the event that a borrower defaults, a Fund, as lender, would offset the market value of the collateral received against the market value of the securities loaned. The value of the collateral is typically greater than that of the market value of the securities loaned, leaving the lender with a net amount payable to the defaulting party. However, bankruptcy or insolvency laws of a particular jurisdiction may impose restrictions on or prohibitions against such a right of offset in the event of an MSLA counterparty’s bankruptcy or insolvency. Under the MSLA, the borrower can resell or re-pledge the loaned securities, and a Fund can reinvest cash collateral, or, upon an event of default, resell or re-pledge the collateral.
The following table is a summary of each Fund’s securities lending agreements which are subject to offset under an MSLA as of August 31, 2014:
| iShares ETF | Market Value of Securities on Loan | Cash Collateral Received a | Net Amount | |||||||||
MSCI Global Agriculture Producers | $ | 636,605 | $ | 636,605 | $ | — | ||||||
MSCI Global Energy Producers | 26,150 | 26,150 | — | |||||||||
MSCI Global Gold Miners | 122,578 | 122,578 | — | |||||||||
MSCI Global Metals & Mining Producers | 2,791,957 | 2,791,957 | — | |||||||||
MSCI Global Silver Miners | 263,060 | 263,060 | — | |||||||||
| a | Collateral received in excess of the market value of securities on loan is not presented for financial reporting purposes. The total collateral received is disclosed in each Fund’s statement of assets and liabilities. |
RECENT ACCOUNTING STANDARD
In June 2014, the Financial Accounting Standards Board issued guidance to improve the financial reporting of reverse repurchase agreements and other similar transactions. The guidance will require expanded disclosure for entities that enter into reverse repurchase agreements and similar transactions accounted for as secured borrowings, including securities lending. The guidance is effective for financial statements for fiscal years beginning after December 15, 2014, and interim periods within those fiscal years. Management is evaluating the impact, if any, of this guidance on the Funds’ financial statements and disclosures.
NOTESTO FINANCIAL STATEMENTS | 47 |
Table of Contents
Notes to Financial Statements (Continued)
iSHARES®, INC.
| 2. | INVESTMENT ADVISORY AGREEMENT AND OTHER TRANSACTIONS WITH AFFILIATES |
Pursuant to an Investment Advisory Agreement with the Company, BFA manages the investment of each Fund’s assets. BFA is a California corporation indirectly owned by BlackRock. Under the Investment Advisory Agreement, BFA is responsible for substantially all expenses of the Funds, except interest, taxes, brokerage commissions and other expenses connected with the execution of portfolio transactions, distribution fees, litigation expenses and any extraordinary expenses.
For its investment advisory services to each Fund, BFA is entitled to an annual investment advisory fee of 0.39% based on the average daily net assets of each Fund.
BFA has contractually agreed to waive a portion of its investment advisory fees for the iShares MSCI Global Agriculture Producers and iShares MSCI Global Metals & Mining Producers ETFs through December 31, 2015 in an amount equal to each Fund’s pro rata share of the fees and expenses attributable to each Fund’s investments in other iShares funds. The iShares MSCI Global Metals & Mining Producers ETF did not hold any iShares funds during the year ended August 31, 2014.
The U.S. Securities and Exchange Commission has issued an exemptive order which permits BlackRock Institutional Trust Company, N.A. (“BTC”), an affiliate of BFA, to serve as securities lending agent for the Funds, subject to applicable conditions. As securities lending agent, BTC bears all operational costs directly related to securities lending. Effective January 1, 2014, each Fund is responsible for fees in connection with the investment of cash collateral received for securities on loan in a money market fund managed by BFA, however, BTC has agreed to reduce the amount of securities lending income it receives in order to effectively limit the collateral investment fees each Fund bears to an annual rate of 0.04% (the “collateral investment fees”). Securities lending income is equal to the total of income earned from the reinvestment of cash collateral, net of fees and other payments to and from borrowers of securities, and less the collateral investment fees. The Funds retain a portion of securities lending income and remit a remaining portion to BTC as compensation for its services as securities lending agent.
Pursuant to a securities lending agreement effective January 1, 2014, (i) each Fund retains 75% of securities lending income and (ii) these amounts can never be less than 65% of the total of securities lending income plus the collateral investment fees.
In addition, commencing the business day following the date that the aggregate securities lending income plus the collateral investment fees generated across all 1940 Act iShares exchange-traded funds (the “iShares ETF Complex”) in a given calendar year exceeds the aggregate securities lending income generated across the iShares ETF Complex in calendar year 2013 and pursuant to a securities lending agreement, (i) each Fund will receive for the remainder of that calendar year 80% of securities lending income and (ii) these amounts can never be less than 65% of the total of securities lending income plus the collateral investment fees.
For the year ended August 31, 2014, each Fund paid to BTC the following amounts in total for securities lending agent services and collateral investment fees:
| iShares ETF | Fees Paid to BTC | |||
MSCI Global Agriculture Producers | $ | 4,875 | ||
MSCI Global Energy Producers | 136 | |||
MSCI Global Gold Miners | 6,337 | |||
MSCI Global Metals & Mining Producers | 31,657 | |||
MSCI Global Silver Miners | 1,808 | |||
| 48 | 2014 iSHARES ANNUAL REPORTTO SHAREHOLDERS |
Table of Contents
Notes to Financial Statements (Continued)
iSHARES®, INC.
Prior to January 1, 2014, each Fund retained 65% of securities lending income and paid no collateral investment fees.
BlackRock Investments, LLC, an affiliate of BFA, is the distributor for each Fund. Pursuant to the distribution agreement, BFA is responsible for any fees or expenses for distribution services provided to the Funds.
Cross trades for the year ended August 31, 2014, if any, were executed by the Funds pursuant to Rule 17a-7 under the 1940 Act. Cross trading is the buying or selling of portfolio securities between funds to which BFA (or an affiliate) serves as investment adviser. At its regularly scheduled quarterly meetings, the Board reviews such transactions as of the most recent calendar quarter for compliance with the requirements and restrictions set forth by Rule 17a-7.
Each Fund may invest its positive cash balances in certain money market funds managed by BFA or an affiliate. The income earned on these temporary cash investments is included in “Interest — affiliated” in the statements of operations.
The PNC Financial Services Group, Inc. is the largest stockholder of BlackRock and is considered to be an affiliate of the Funds for 1940 Act purposes.
The iShares MSCI Global Agriculture Producers and iShares MSCI Global Metals & Mining Producers ETFs, in order to improve their portfolio liquidity and their ability to track their underlying index, may invest in shares of other iShares funds that invest in securities in each Fund’s respective underlying index.
Investments in issuers considered to be affiliates of the Funds (excluding money market funds) during the year ended August 31, 2014, for purposes of Section 2(a)(3) of the 1940 Act, were as follows:
| iShares ETF and Name of Affiliated Issuer | Shares Held at Beginning of Year | Shares Purchased | Shares Sold | Shares Held at End of Year | Value at End of Year | Dividend Income | Net Realized Gain (Loss) | |||||||||||||||||||||
MSCI Global Agriculture Producers | ||||||||||||||||||||||||||||
iShares India 50 ETF | 12,191 | 3,470 | (3,478 | ) | 12,183 | $ | 368,780 | $ | 2,411 | $ | (3,025 | ) | ||||||||||||||||
|
|
|
|
|
| |||||||||||||||||||||||
Certain directors and officers of the Company are also officers of BTC and/or BFA.
| 3. | INVESTMENT PORTFOLIO TRANSACTIONS |
Purchases and sales of investments (excluding in-kind transactions and short-term investments) for the year ended August 31, 2014 were as follows:
| iShares ETF | Purchases | Sales | ||||||
MSCI Global Agriculture Producers | $ | 6,070,031 | $ | 5,585,647 | ||||
MSCI Global Energy Producers | 536,391 | 447,313 | ||||||
MSCI Global Gold Miners | 11,404,421 | 11,377,559 | ||||||
MSCI Global Metals & Mining Producers | 31,368,933 | 42,940,117 | ||||||
MSCI Global Silver Miners | 2,019,467 | 2,035,788 | ||||||
NOTESTO FINANCIAL STATEMENTS | 49 |
Table of Contents
Notes to Financial Statements (Continued)
iSHARES®, INC.
In-kind transactions (see Note 4) for the year ended August 31, 2014 were as follows:
| iShares ETF | In-kind Purchases | In-kind Sales | ||||||
MSCI Global Agriculture Producers | $ | 11,349,614 | $ | 4,799,069 | ||||
MSCI Global Energy Producers | 2,748,838 | — | ||||||
MSCI Global Gold Miners | 33,338,722 | 2,940,097 | ||||||
MSCI Global Metals & Mining Producers | 43,362,895 | 99,794,832 | ||||||
MSCI Global Silver Miners | 7,265,272 | — | ||||||
| 4. | CAPITAL SHARE TRANSACTIONS |
Capital shares are issued and redeemed by each Fund only in aggregations of a specified number of shares or multiples thereof (“Creation Units”) at net asset value. Except when aggregated in Creation Units, shares of each Fund are not redeemable. Transactions in capital shares for each Fund are disclosed in detail in the statements of changes in net assets.
The consideration for the purchase of Creation Units of a fund in the Company generally consists of the in-kind deposit of a designated portfolio of securities and a specified amount of cash. Certain funds in the Company may be offered in Creation Units solely or partially for cash in U.S. dollars. Investors purchasing and redeeming Creation Units may pay a purchase transaction fee and a redemption transaction fee directly to State Street Bank and Trust Company, the Company’s administrator, to offset transfer and other transaction costs associated with the issuance and redemption of Creation Units, including Creation Units for cash. Investors transacting in Creation Units for cash may also pay an additional variable charge to compensate the relevant fund for certain transaction costs (i.e., stamp taxes, taxes on currency or other financial transactions, and brokerage costs) and market impact expenses relating to investing in portfolio securities. Such variable charges, if any, are included in “Proceeds from shares sold” in the statements of changes in net assets.
| 5. | MARKET AND CREDIT RISK |
In the normal course of business, each Fund’s investment activities exposes it to various types of risk associated with the financial instruments and markets in which it invests. The significant types of financial risks each Fund is exposed to include market risk and credit risk. Each Fund’s prospectus provides details of these and other types of risk.
BFA uses a “passive” or index approach to try to achieve each Fund’s investment objective following the securities included in its underlying index during upturns as well as downturns. BFA does not take steps to reduce market exposure or to lessen the effects of a declining market. Divergence from the underlying index and the composition of the portfolio is monitored by BFA.
MARKET RISK
Market risk arises mainly from uncertainty about future values of financial instruments influenced by price, currency and interest rate movements. It represents the potential loss each Fund may suffer through holding market positions in the face of market movements. Each Fund is exposed to market risk by virtue of its direct or indirect investment in equity instruments. The fair value of securities held by the Funds may decline due to general market conditions, economic trends or events that are not specifically related to the issuers of the securities including local, regional or global political, social or economic instability or to factors that affect a particular industry or group of industries. The extent of each Fund’s exposure to market risk is the market value of the investments held as shown in the Fund’s schedule of investments.
| 50 | 2014 iSHARES ANNUAL REPORTTO SHAREHOLDERS |
Table of Contents
Notes to Financial Statements (Continued)
iSHARES®, INC.
A diversified portfolio, where this is appropriate and consistent with a fund’s objectives, minimizes the risk that a price change of a particular investment will have a material impact on the NAV of a fund. The investment concentrations within each Fund’s portfolio are disclosed in its schedule of investments.
Each Fund invests a substantial amount of its assets in securities of non-U.S. issuers that trade in non-U.S. markets. This involves certain considerations and risks not typically associated with securities of U.S. issuers. Such risks include, but are not limited to: generally less liquid and less efficient securities markets; generally greater price volatility; exchange rate fluctuations and exchange controls; imposition of restrictions on the expatriation of funds or other assets of the Fund; less publicly available information about issuers; the imposition of withholding or other taxes; higher transaction and custody costs; settlement delays and risk of loss attendant in settlement procedures; difficulties in enforcing contractual obligations; less regulation of securities markets; different accounting, disclosure and reporting requirements; more substantial governmental involvement in the economy; higher inflation rates; greater social, economic and political uncertainties; the risk of nationalization or expropriation of assets; and the risk of war. These risks are heightened for investments in issuers from countries with less developed markets.
Each Fund invests all or substantially all of its assets in securities within a single or limited number of market sectors. When a fund concentrates its investments in this manner, it assumes the risk that economic, political and social conditions affecting those market sectors may have a significant impact on its investment performance.
The United States and the European Union, along with the regulatory bodies of a number of countries including Japan, Australia and Canada (collectively, “Sanctioning Bodies”), have imposed sectorial economic sanctions on certain Russian individuals and Russian corporate entities which include prohibitions on transacting in or dealing in new debt of longer than 30 or 90 days maturity or new equity of such issuers. Securities held by the iShares MSCI Global Agriculture Producers ETF, iShares MSCI Global Energy Producers ETF and iShares MSCI Global Metals & Mining Producers ETF issued prior to the date of the sanctions being imposed are not currently subject to any restrictions under the sanctions. However, compliance with each of these sanctions may impair the ability of a Fund to buy, sell, hold, receive or deliver the affected securities or other securities of such issuers. The Sanctioning Bodies could also institute broader sanctions on Russia. These sanctions, or even the threat of further sanctions, may result in the decline of the value and liquidity of Russian securities, a weakening of the ruble or other adverse consequences to the Russian economy. Current or future sanctions may result in Russia taking counter measures or retaliatory actions, which may further impair the value and liquidity of Russian securities. These retaliatory measures may include the immediate freeze of Russian assets held by a Fund.
CREDIT RISK
Credit risk is the risk that an issuer or guarantor of debt instruments or the counterparty to a financial transaction, including derivatives contracts, repurchase agreements or loans of portfolio securities, is unable or unwilling to make timely interest and/or principal payments or to otherwise honor its obligations. BFA and its affiliates manage counterparty credit risk by entering into transactions only with counterparties that it believes have the financial resources to honor their obligations and by monitoring the financial stability of those counterparties. Financial assets, which potentially expose the Funds to issuer and counterparty credit risks, consist principally of financial instruments and receivables due from counterparties. The extent of each Fund’s exposure to credit and counterparty risks with respect to those financial assets is approximated by their value recorded in the statement of assets and liabilities.
| 6. | INCOME TAX INFORMATION |
Each Fund is treated as an entity separate from the Company’s other funds for federal income tax purposes. It is the policy of each Fund to qualify as a regulated investment company by complying with the provisions applicable to regulated investment companies, as defined under Subchapter M of the Internal Revenue Code of 1986, as amended, and to annually distribute
NOTESTO FINANCIAL STATEMENTS | 51 |
Table of Contents
Notes to Financial Statements (Continued)
iSHARES®, INC.
substantially all of its ordinary income and any net capital gains (taking into account any capital loss carryforwards) sufficient to relieve it from all, or substantially all, federal income and excise taxes. Accordingly, no provision for federal income taxes is required.
U.S. GAAP requires that certain components of net assets be adjusted to reflect permanent differences between financial and tax reporting. These reclassifications have no effect on net assets or net asset values per share. The following permanent differences as of August 31, 2014, attributable to passive foreign investment companies, foreign currency transactions and realized gains (losses) from in-kind redemptions, were reclassified to the following accounts:
| iShares ETF | Paid-in Capital | Undistributed Net Investment Income/Distributions in Excess of Net Investment Income | Undistributed Net Realized Gain/Accumulated Net Realized Loss | |||||||||
MSCI Global Agriculture Producers | $ | 742,845 | $ | (4,727 | ) | $ | (738,118 | ) | ||||
MSCI Global Energy Producers | — | 682 | (682 | ) | ||||||||
MSCI Global Gold Miners | 171,367 | (266 | ) | (171,101 | ) | |||||||
MSCI Global Metals & Mining Producers | 10,226,274 | 3,248 | (10,229,522 | ) | ||||||||
MSCI Global Silver Miners | — | 12,791 | (12,791 | ) | ||||||||
The tax character of distributions paid during the years ended August 31, 2014 and August 31, 2013 was as follows:
| iShares ETF | 2014 | 2013 | ||||||
MSCI Global Agriculture Producers | ||||||||
Ordinary income | $ | 869,161 | $ | 289,367 | ||||
|
|
|
| |||||
MSCI Global Energy Producers | ||||||||
Ordinary income | $ | 128,943 | $ | 125,608 | ||||
|
|
|
| |||||
MSCI Global Gold Miners | ||||||||
Ordinary income | $ | 410,920 | $ | 426,169 | ||||
|
|
|
| |||||
MSCI Global Metals & Mining Producers | ||||||||
Ordinary income | $ | 4,935,233 | $ | 4,641,648 | ||||
|
|
|
| |||||
MSCI Global Silver Miners | ||||||||
Ordinary income | $ | 104,622 | $ | 44,671 | ||||
|
|
|
| |||||
| 52 | 2014 iSHARES ANNUAL REPORTTO SHAREHOLDERS |
Table of Contents
Notes to Financial Statements (Continued)
iSHARES®, INC.
As of August 31, 2014, the tax components of accumulated net earnings (losses) were as follows:
| iShares ETF | Undistributed Ordinary Income | Capital Loss Carryforwards | Net Unrealized Gains (Losses) a | Qualified Late-Year Losses b | Total | |||||||||||||||
MSCI Global Agriculture Producers | $ | 146,167 | $ | (17,007 | ) | $ | (130,474 | ) | $ | (534,779 | ) | $ | (536,093 | ) | ||||||
MSCI Global Energy Producers | 39,534 | (38,653 | ) | 626,512 | (89,227 | ) | 538,166 | |||||||||||||
MSCI Global Gold Miners | 57,761 | (1,723,545 | ) | (13,271,955 | ) | (2,752,822 | ) | (17,690,561 | ) | |||||||||||
MSCI Global Metals & Mining Producers | 708,967 | (1,369,119 | ) | 5,587,704 | (3,327,815 | ) | 1,599,737 | |||||||||||||
MSCI Global Silver Miners | 230,835 | (112,746 | ) | (1,256,912 | ) | (500,538 | ) | (1,639,361 | ) | |||||||||||
| a | The difference between book-basis and tax-basis unrealized gains (losses) was attributable primarily to the tax deferral of losses on wash sales and the realization for tax purposes of unrealized gains on investments in passive foreign investment companies. |
| b | The Funds have elected to defer certain qualified late-year losses and recognize such losses in the next taxable year. |
As of August 31, 2014, the Funds had non-expiring capital loss carryforwards available to offset future realized capital gains as follows:
| iShares ETF | Non- Expiring | |||
MSCI Global Agriculture Producers | $ | 17,007 | ||
MSCI Global Energy Producers | 38,653 | |||
MSCI Global Gold Miners | 1,723,545 | |||
MSCI Global Metals & Mining Producers | 1,369,119 | |||
MSCI Global Silver Miners | 112,746 | |||
For the year ended August 31, 2014, the iShares MSCI Global Agriculture Producers ETF utilized $1,531 of its capital loss carryforwards.
The Funds may own shares in certain foreign investment entities, referred to, under U.S. tax law, as “passive foreign investment companies.” The Funds may elect to mark-to-market annually the shares of each passive foreign investment company and would be required to distribute to shareholders any such marked-to-market gains.
As of August 31, 2014, gross unrealized appreciation and gross unrealized depreciation based on cost for federal income tax purposes were as follows:
| iShares ETF | Tax Cost | Gross Unrealized Appreciation | Gross Unrealized Depreciation | Net Unrealized Appreciation (Depreciation) | ||||||||||||
MSCI Global Agriculture Producers | $ | 47,102,416 | $ | 3,617,890 | $ | (3,747,845 | ) | $ | (129,955 | ) | ||||||
MSCI Global Energy Producers | 7,778,520 | 859,365 | (232,782 | ) | 626,583 | |||||||||||
MSCI Global Gold Miners | 84,307,955 | 3,497,855 | (16,769,945 | ) | (13,272,090 | ) | ||||||||||
MSCI Global Metals & Mining Producers | 180,510,676 | 18,373,716 | (12,782,564 | ) | 5,591,152 | |||||||||||
MSCI Global Silver Miners | 15,517,271 | 841,572 | (2,098,427 | ) | (1,256,855 | ) | ||||||||||
Management has analyzed tax laws and regulations and their application to the Funds as of August 31, 2014, inclusive of the open tax return years, and does not believe there are any uncertain tax positions that require recognition of a tax liability in the Funds’ financial statements.
NOTESTO FINANCIAL STATEMENTS | 53 |
Table of Contents
Notes to Financial Statements (Continued)
iSHARES®, INC.
| 7. | SUBSEQUENT EVENTS |
Management has evaluated the impact of all subsequent events on the Funds through the date the financial statements were available to be issued and has determined that there were no subsequent events requiring adjustment or disclosure in the financial statements.
| 54 | 2014 iSHARES ANNUAL REPORTTO SHAREHOLDERS |
Table of Contents
Report of Independent Registered Public Accounting Firm
To the Shareholders and Board of Directors of
iShares, Inc.:
In our opinion, the accompanying statements of assets and liabilities, including the schedules of investments, and the related statements of operations and of changes in net assets and the financial highlights present fairly, in all material respects, the financial position of iShares MSCI Global Agriculture Producers ETF, iShares MSCI Global Energy Producers ETF, iShares MSCI Global Gold Miners ETF, iShares MSCI Global Metals & Mining Producers ETF and iShares MSCI Global Silver Miners ETF (the “Funds”) at August 31, 2014, the results of each of their operations, the changes in each of their net assets and their financial highlights for each of the periods presented, in conformity with accounting principles generally accepted in the United States of America. These financial statements and financial highlights (hereafter referred to as “financial statements”) are the responsibility of the Funds’ management; our responsibility is to express an opinion on these financial statements based on our audits. We conducted our audits of these financial statements in accordance with the standards of the Public Company Accounting Oversight Board (United States). Those standards require that we plan and perform the audit to obtain reasonable assurance about whether the financial statements are free of material misstatement. An audit includes examining, on a test basis, evidence supporting the amounts and disclosures in the financial statements, assessing the accounting principles used and significant estimates made by management, and evaluating the overall financial statement presentation. We believe that our audits, which included confirmation of securities at August 31, 2014 by correspondence with the custodian, transfer agent and brokers, provide a reasonable basis for our opinion.
PricewaterhouseCoopers LLP
San Francisco, California
October 22, 2014
REPORTOF INDEPENDENT REGISTERED PUBLIC ACCOUNTING FIRM | 55 |
Table of Contents
iSHARES®, INC.
For the fiscal year ended August 31, 2014, the Funds earned foreign source income and paid foreign taxes which they intend to pass through to their shareholders pursuant to Section 853 of the Internal Revenue Code (the “Code”) as follows:
| iShares ETF | Foreign Source Income Earned | Foreign Taxes Paid | ||||||
MSCI Global Gold Miners | $ | 584,109 | $ | 79,457 | ||||
MSCI Global Metals & Mining Producers | 4,680,426 | 269,354 | ||||||
MSCI Global Silver Miners | 93,071 | 8,507 | ||||||
For corporate shareholders, the following percentages of the income dividends paid by the Funds during the fiscal year ended August 31, 2014 qualified for the dividends-received deduction:
| iShares ETF | Dividends- Received Deduction | |||
MSCI Global Agriculture Producers | 38.19 | % | ||
MSCI Global Energy Producers | 43.53 | |||
MSCI Global Gold Miners | 21.77 | |||
MSCI Global Metals & Mining Producers | 11.01 | |||
MSCI Global Silver Miners | 0.41 | |||
Under Section 854(b)(2) of the Code, the Funds hereby designate the following maximum amounts as qualified dividend income for purposes of the maximum rate under Section 1(h)(11) of the Code for the fiscal year ended August 31, 2014:
| iShares ETF | Qualified Dividend Income | |||
MSCI Global Agriculture Producers | $ | 869,161 | ||
MSCI Global Energy Producers | 128,943 | |||
MSCI Global Gold Miners | 490,377 | |||
MSCI Global Metals & Mining Producers | 4,046,386 | |||
MSCI Global Silver Miners | 94,319 | |||
In February 2015, shareholders will receive Form 1099-DIV which will include their share of qualified dividend income distributed during the calendar year 2014. Shareholders are advised to check with their tax advisers for information on the treatment of these amounts on their income tax returns.
| 56 | 2014 iSHARES ANNUAL REPORTTO SHAREHOLDERS |
Table of Contents
Board Review and Approval of Investment Advisory
Contract
iSHARES®, INC.
Under Section 15(c) of the Investment Company Act of 1940 (the “1940 Act”), the Company’s Board of Directors (the “Board”), including a majority of Directors who are not “interested persons” of the Company (as that term is defined in the 1940 Act) (the “Independent Directors”), is required annually to consider and approve the Investment Advisory Contract between the Company and BFA (the “Advisory Contract”) on behalf of the Funds. The Independent Directors requested, and BFA provided, such information as the Independent Directors, with advice from independent counsel, deemed reasonably necessary to evaluate the Advisory Contract. A committee of Independent Directors (the “15(c) Committee”), with independent counsel, met with management on March 12, 2014, May 6, 2014, and May 12, 2014, to discuss the types of information the Independent Directors required and the manner in which management would organize and present such information. At a meeting held on May 16, 2014, management presented preliminary information to the Board relating to the continuance of the Advisory Contract, and the Board, including the Independent Directors, reviewed and discussed such information at length. The Independent Directors requested from management certain additional information, which management agreed to provide. At a meeting held on June 12-13, 2014, the Board, including the Independent Directors, reviewed the additional information provided by management in response to these requests. After extensive discussions, the Board, including all of the Independent Directors, approved the continuance of the Advisory Contract for the Funds, based on a review of qualitative and quantitative information provided by BFA, including the additional information management provided at the request of the Independent Directors. The Board noted its satisfaction with the extent and quality of information provided and its frequent interactions with management, as well as the detailed responses and other information provided by BFA. The Board also noted that the Board and BFA agreed to discuss potential enhancements and adjustments to the 15(c) process for the coming year. The Independent Directors were advised by their independent counsel throughout the process, including about the legal standards applicable to their review. In approving the Advisory Contract for the Funds, the Board, including the Independent Directors, considered the following factors, no one of which was controlling, and reached the following conclusions:
Expenses and Performance of the Funds — The Board reviewed statistical information prepared by Lipper Inc. (“Lipper”), an independent provider of investment company data, regarding the expense ratio components, including actual advisory fees, waivers/reimbursements, and gross and net total expenses of each Fund in comparison with the same information for other exchange traded funds (including funds sponsored by an “at cost” service provider) and, in the limited instances where no comparable ETFs existed and the comparison group would not otherwise be reasonable in Lipper’s judgment, pure index institutional mutual funds, objectively selected by Lipper as comprising such Fund’s applicable peer group pursuant to Lipper’s proprietary ETF methodology (the “Lipper Group”). The Board noted that, prior to 2014, Lipper had used a different methodology to determine a Fund’s Lipper group, which included mutual funds, closed-end funds, exchange traded funds, and/or funds with differing investment objective classifications, investment focuses and other characteristics (e.g. actively managed funds and funds sponsored by “at cost” service providers), as applicable. The Board further noted that, after consideration by the 15(c) Committee, the Board determined to use instead Lipper’s proprietary ETF methodology to determine a Fund’s Lipper Group. This determination was based on, among other considerations, the increased number and types of ETFs available for comparative purposes than was the case in prior years. The Board was provided with a detailed description of Lipper’s proprietary ETF methodology used by Lipper to determine the applicable Lipper Groups and to prepare this information. At the Board’s request, Lipper provided, and the Board considered, information on the impact to the iShares funds’ comparative fee rankings that were attributable to the change from a pure index group methodology to Lipper’s proprietary ETF methodology. The Board further noted that due to the limitations in providing comparable funds in the various Lipper Groups, the statistical information provided in Lipper’s report may or may not provide meaningful direct comparisons to the Funds in all instances.
The Board also noted that the investment advisory fee rates and overall expenses for the Funds were lower than the median of the investment advisory fee rates and overall expenses of the funds in their respective Lipper Group.
In addition, the Board reviewed statistical information prepared by Lipper regarding the performance of each Fund for the one-, three-, five-, ten-year, and since inception periods, as applicable, and the “last quarter” period ended December 31, 2013, and a
BOARD REVIEWAND APPROVALOF INVESTMENT ADVISORY CONTRACT | 57 |
Table of Contents
Board Review and Approval of Investment Advisory
Contract (Continued)
iSHARES®, INC.
comparison of each Fund’s performance to its performance benchmark index for the same periods. To the extent that any of the comparison funds included in the Lipper Group track the same index as any particular Fund, Lipper also provided, and the Board reviewed, a comparison of such Fund’s performance to that of such relevant comparison funds for the same periods. The Board noted that the Funds generally performed in line with their respective performance benchmark indexes over the relevant periods. In considering this information, the Board noted that the Lipper Group may include funds that are not exchange traded funds or index funds, and that may have different investment objectives and/or benchmarks from the Funds. In addition, the Board noted that each Fund seeks to track its own benchmark index and that, during the prior year, the Board received periodic reports on the Funds’ performance in comparison with their relevant benchmark indexes. Such periodic comparative performance information, including detailed information on certain specific iShares funds requested by the Boards, was also considered.
Based on this review, the other factors considered at the meeting, and their general knowledge of ETF pricing, the Board concluded that the investment advisory fee rate and expense level and the historical performance of each Fund supported the Board’s approval of the continuance of the Advisory Contract for the coming year.
Nature, Extent and Quality of Services Provided by BFA — Based on management’s representations, including information about recent and proposed enhancements to the iShares business, including with respect to shareholder servicing and support, the Board expected that there would be no diminution in the scope of services required of or provided by BFA under the Advisory Contract for the coming year as compared to the scope of services provided by BFA during prior years. In reviewing the scope of these services, the Board considered BFA’s investment philosophy and experience, noting that BFA and its affiliates have committed significant resources over time, including during the past year, to supporting the Funds and their shareholders. The Board acknowledged that resources to support the iShares funds and their shareholders have been added or enhanced in recent years, including in such areas as investor education, product management, customized portfolio consulting support, capital markets support, and proprietary risk and performance analytics tools. The Board also considered BFA’s compliance program and its compliance record with respect to the Funds. In that regard, the Board noted that BFA reports to the Board about portfolio management and compliance matters on a periodic basis in connection with regularly scheduled meetings of the Board, and on other occasions as necessary and appropriate, and has provided information and made appropriate officers available as needed to provide further assistance with these matters. The Board also reviewed the background and experience of the persons responsible for the day-to-day management of the Funds, as well as the resources available to them in managing the Funds. In addition to the above considerations, the Board reviewed and considered detailed presentations regarding BFA’s investment performance, investment and risk management processes and strategies provided at the June 12-13, 2014 meeting and throughout the previous year, and matters related to BFA’s portfolio compliance policies and procedures. The Board noted that each Fund had met its investment objective consistently since its respective inception date.
Based on review of this information, and the performance information discussed above, the Board concluded that the nature, extent and quality of services provided by BFA to the Funds under the Advisory Contract supported the Board’s approval of the continuance of the Advisory Contract for the coming year.
Costs of Services Provided to Funds and Profits Realized by BFA and Affiliates — The Board reviewed information about the profitability to BlackRock of the Funds based on the fees payable to BFA and its affiliates (including fees under the Advisory Contract), and all other sources of revenue and expense to BFA and its affiliates from the Funds’ operations for the last calendar year. The Board reviewed BlackRock’s profitability methodology for the iShares funds, noting that the 15(c) Committee had focused on the methodology and proposed presentation during its meetings. The Board discussed the sources of direct and ancillary revenue with management, including the revenues to BTC from securities lending by the Funds. The Board also discussed BFA’s profit margin as reflected in the Funds’ profitability analyses and reviewed information regarding potential economies of scale (as discussed below). Based on this review, the Board concluded that the profits realized by BFA and its
| 58 | 2014 iSHARES ANNUAL REPORTTO SHAREHOLDERS |
Table of Contents
Board Review and Approval of Investment Advisory
Contract (Continued)
iSHARES®, INC.
affiliates under the Advisory Contract and from other relationships between the Funds and BFA and/or its affiliates, if any, were within a reasonable range in light of the factors considered.
Economies of Scale — The Board reviewed information regarding potential economies of scale or other efficiencies that may result from increases in the Funds’ assets, noting that the issue of economies of scale had been focused on extensively by the 15(c) Committee during its meetings and addressed by management. The Board and the 15(c) Committee reviewed information provided by BFA regarding scale benefits shared with the iShares funds through relatively low fee rates established at inception, breakpoints, waivers, or other fee reductions, as well as through additional investment in the iShares business and the provision of improved or additional infrastructure and services to the iShares funds and their shareholders. The Board and the 15(c) Committee received information regarding BlackRock’s historical profitability, including BFA’s and its affiliates’ costs in providing services. The cost information distinguished between fixed and variable costs, and explained how the level of fixed and variable costs, as well as the nature of such costs, may impact the existence or size of scale benefits. The Board noted that the Advisory Contract for the Funds did not provide for any breakpoints in the Funds’ investment advisory fee rates as the assets of the Funds increase. However, the Board noted that should material economies of scale exist in the future, a breakpoint structure for the Funds may be appropriate, and that it would continue to monitor the sharing of economies of scale to determine the appropriateness of adding breakpoints in the future. Based on this review, as well as the other factors considered at the meeting, the Board, recognizing its responsibility to consider this issue at least annually, concluded that the investment advisory fee rates incorporate potential economies of scale and supported the Board’s approval of the continuance of the Advisory Contract for the coming year.
Fees and Services Provided for Other Comparable Funds/Accounts Managed by BFA and its Affiliates — The Board received and considered information regarding the investment advisory/management fee rates for other funds/accounts in the U.S. for which BFA (or its affiliates) provides investment advisory/management services, including open-end and closed-end funds registered under the 1940 Act (including sub-advised funds), collective trust funds, separately managed accounts, and institutional separate accounts (together, the “Other Accounts”), and acknowledged BFA’s assertion that the iShares funds are fundamentally different investment vehicles from the Other Accounts. The Board noted that BFA and its affiliates do not manage Other Accounts with substantially similar investment objectives and strategies as the Funds. The Board further noted that BFA provided the Board with detailed information regarding how the Other Accounts (particularly institutional clients) generally differ from the Funds, including in terms of the different, generally more extensive services provided to the Funds, as well as other significant differences in the approach of BFA and its affiliates to the Funds, on one hand, and Other Accounts, on the other. In that regard, the Board considered that the pricing of services to institutional clients is typically based on a number of factors beyond the nature and extent of the specific services to be provided and often depends on the overall relationship between the client and its affiliates and the adviser and its affiliates. In addition, the Board considered the relative complexity and inherent risks and challenges of managing and providing other services to the Funds, as publicly traded exchange traded funds, as compared to the Other Accounts that are institutional clients in light of differing regulatory requirements and client-imposed mandates. The Board also considered the “all-inclusive” nature of the Funds’ advisory fee structure, and the Fund expenses borne by BFA under this arrangement. The Board noted that the investment advisory fee rates under the Advisory Contract for the Funds were generally higher than the investment advisory/management fee rates for the Other Accounts that are institutional clients of BFA (or its affiliates) and concluded that the differences appeared to be consistent with the factors discussed.
Other Benefits to BFA and/or its Affiliates — The Board reviewed the “fallout” benefits or ancillary revenue received by BFA and/or its affiliates in connection with the services provided to the Funds by BFA, such as payment of revenue to BTC, the Funds’ securities lending agent, for loaning portfolio securities (which was included in the profit margins reviewed by the Board pursuant to BFA’s profitability methodology), and payment of advisory fees and/or administration fees to BFA and BTC (or their affiliates) in connection with any investments by the Funds in other funds for which BFA (or its affiliates) provides investment advisory services and/or administration services. The Board noted that BFA generally does not use soft dollars or consider the value of
BOARD REVIEWAND APPROVALOF INVESTMENT ADVISORY CONTRACT | 59 |
Table of Contents
Board Review and Approval of Investment Advisory
Contract (Continued)
iSHARES®, INC.
research or other services that may be provided to BFA (including its affiliates) in selecting brokers for portfolio transactions for the Funds. The Board further noted that any portfolio transactions on behalf of the Funds placed through a BFA affiliate or purchased from an underwriting syndicate in which a BFA affiliate participates, are reported to the Board pursuant to Rule 17e-1 or Rule 10f-3, as applicable, under the 1940 Act. The Board concluded that any such ancillary benefits would not be disadvantageous to the Funds’ shareholders and thus would not alter the Board’s conclusion with respect to the appropriateness of approving the continuance of the Advisory Contract for the coming year.
Based on the considerations described above, the Board determined that each Fund’s investment advisory fee rate under the Advisory Contract does not constitute a fee that is so disproportionately large as to bear no reasonable relationship to the services rendered and that could not have been the product of arm’s-length bargaining, and concluded that it is in the best interest of each Fund and its shareholders to approve the continuance of the Advisory Contract for the coming year.
| 60 | 2014 iSHARES ANNUAL REPORTTO SHAREHOLDERS |
Table of Contents
Supplemental Information (Unaudited)
iSHARES®, INC.
Section 19(a) Notices
The amounts and sources of distributions reported are only estimates and are not being provided for tax reporting purposes. The actual amounts and sources of the amounts for tax reporting purposes will depend upon each Fund’s investment experience during the year and may be subject to changes based on the tax regulations. Shareholders will receive a Form 1099-DIV each calendar year that will inform them how to report distributions for federal income tax purposes.
| Total Cumulative Distributions for the Fiscal Year | % Breakdown of the Total Cumulative Distributions for the Fiscal Year | |||||||||||||||||||||||||||||||
| iShares ETF | Net Investment Income | Net Realized Capital Gains | Return of Capital | Total Per Share | Net Investment Income | Net Realized Capital Gains | Return of Capital | Total Per Share | ||||||||||||||||||||||||
MSCI Global Agriculture Producers | $ | 0.536425 | $ | — | $ | 0.016805 | $ | 0.553230 | 97 | % | — | % | 3 | % | 100 | % | ||||||||||||||||
MSCI Global Energy Producers | 0.644714 | — | — | 0.644714 | 100 | — | — | 100 | ||||||||||||||||||||||||
MSCI Global Gold Miners | 0.082362 | — | — | 0.082362 | 100 | — | — | 100 | ||||||||||||||||||||||||
MSCI Global Metals & Mining Producers | 0.635364 | — | 0.016834 | 0.652198 | 97 | — | 3 | 100 | ||||||||||||||||||||||||
MSCI Global Silver Miners | 0.122015 | — | 0.024362 | 0.146377 | 83 | — | 17 | 100 | ||||||||||||||||||||||||
Premium/Discount Information
The tables that follow present information about the differences between the daily market price on secondary markets for shares of a Fund and that Fund’s net asset value. Net asset value, or “NAV,” is the price per share at which each Fund issues and redeems shares. It is calculated in accordance with the standard formula for valuing mutual fund shares. The “Market Price” of each Fund generally is determined using the midpoint between the highest bid and the lowest offer on the primary stock exchange on which the shares of such Fund are listed for trading, as of the time that the Fund’s NAV is calculated. Each Fund’s Market Price may be at, above or below its NAV. The NAV of each Fund will fluctuate with changes in the fair value of its portfolio holdings. The Market Price of each Fund will fluctuate in accordance with changes in its NAV, as well as market supply and demand.
Premiums or discounts are the differences (expressed as a percentage) between the NAV and Market Price of a Fund on a given day, generally at the time NAV is calculated. A premium is the amount that a Fund is trading above the reported NAV, expressed as a percentage of the NAV. A discount is the amount that a Fund is trading below the reported NAV, expressed as a percentage of the NAV.
SUPPLEMENTAL INFORMATION | 61 |
Table of Contents
Supplemental Information (Unaudited) (Continued)
iSHARES®, INC.
The following information shows the frequency distributions of premiums and discounts for each of the Funds included in this report. The information shown for each Fund is for five calendar years (or for each full calendar quarter completed after the inception date of such Fund if less than five years) through the date of the most recent calendar quarter-end. The specific periods covered for each Fund are disclosed in the table for such Fund.
Each line in the table shows the number of trading days in which the Fund traded within the premium/discount range indicated. The number of trading days in each premium/discount range is also shown as a percentage of the total number of trading days in the period covered by each table. All data presented here represents past performance, which cannot be used to predict future results.
iShares MSCI Global Agriculture Producers ETF
Period Covered: April 1, 2012 through June 30, 2014
Premium/Discount Range | Number of Days | Percentage of Total Days | ||||||
Greater than 1.5% and Less than 2.0% | 2 | 0.35 | % | |||||
Greater than 1.0% and Less than 1.5% | 12 | 2.13 | ||||||
Greater than 0.5% and Less than 1.0% | 248 | 43.97 | ||||||
Between 0.5% and –0.5% | 290 | 51.42 | ||||||
Less than –0.5% and Greater than –1.0% | 11 | 1.95 | ||||||
Less than –1.0% and Greater than –1.5% | 1 | 0.18 | ||||||
|
|
|
| |||||
| 564 | 100.00 | % | ||||||
|
|
|
| |||||
iShares MSCI Global Energy Producers ETF
Period Covered: April 1, 2012 through June 30, 2014
Premium/Discount Range | Number of Days | Percentage of Total Days | ||||||
Greater than 0.5% and Less than 1.0% | 14 | 2.48 | % | |||||
Between 0.5% and –0.5% | 482 | 85.46 | ||||||
Less than –0.5% and Greater than –1.0% | 58 | 10.28 | ||||||
Less than –1.0% and Greater than –1.5% | 9 | 1.60 | ||||||
Less than –1.5% and Greater than –2.0% | 1 | 0.18 | ||||||
|
|
|
| |||||
| 564 | 100.00 | % | ||||||
|
|
|
| |||||
| 62 | 2014 iSHARES ANNUAL REPORTTO SHAREHOLDERS |
Table of Contents
Supplemental Information (Unaudited) (Continued)
iSHARES®, INC.
iShares MSCI Global Gold Miners ETF
Period Covered: April 1, 2012 through June 30, 2014
Premium/Discount Range | Number of Days | Percentage of Total Days | ||||||
Greater than 2.5% | 3 | 0.53 | % | |||||
Greater than 2.0% and Less than 2.5% | 2 | 0.35 | ||||||
Greater than 1.5% and Less than 2.0% | 2 | 0.35 | ||||||
Greater than 1.0% and Less than 1.5% | 15 | 2.66 | ||||||
Greater than 0.5% and Less than 1.0% | 129 | 22.87 | ||||||
Between 0.5% and –0.5% | 397 | 70.40 | ||||||
Less than –0.5% and Greater than –1.0% | 11 | 1.95 | ||||||
Less than –1.0% and Greater than –1.5% | 3 | 0.53 | ||||||
Less than –1.5% and Greater than –2.0% | 1 | 0.18 | ||||||
Less than –2.0% | 1 | 0.18 | ||||||
|
|
|
| |||||
| 564 | 100.00 | % | ||||||
|
|
|
| |||||
iShares MSCI Global Metals & Mining Producers ETF
Period Covered: April 1, 2012 through June 30, 2014
Premium/Discount Range | Number of Days | Percentage of Total Days | ||||||
Greater than 4.5% | 5 | 0.89 | % | |||||
Greater than 4.0% and Less than 4.5% | 1 | 0.18 | ||||||
Greater than 3.5% and Less than 4.0% | 1 | 0.18 | ||||||
Greater than 3.0% and Less than 3.5% | 1 | 0.18 | ||||||
Greater than 2.5% and Less than 3.0% | 6 | 1.06 | ||||||
Greater than 2.0% and Less than 2.5% | 6 | 1.06 | ||||||
Greater than 1.5% and Less than 2.0% | 22 | 3.90 | ||||||
Greater than 1.0% and Less than 1.5% | 89 | 15.78 | ||||||
Greater than 0.5% and Less than 1.0% | 143 | 25.35 | ||||||
Between 0.5% and –0.5% | 241 | 42.73 | ||||||
Less than –0.5% and Greater than –1.0% | 36 | 6.38 | ||||||
Less than –1.0% and Greater than –1.5% | 12 | 2.13 | ||||||
Less than –1.5% and Greater than –2.0% | 1 | 0.18 | ||||||
|
|
|
| |||||
| 564 | 100.00 | % | ||||||
|
|
|
| |||||
SUPPLEMENTAL INFORMATION | 63 |
Table of Contents
Supplemental Information (Unaudited) (Continued)
iSHARES®, INC.
iShares MSCI Global Silver Miners ETF
Period Covered: April 1, 2012 through June 30, 2014
Premium/Discount Range | Number of Days | Percentage of Total Days | ||||||
Greater than 3.0% and Less than 3.5% | 1 | 0.18 | % | |||||
Greater than 2.5% and Less than 3.0% | 2 | 0.35 | ||||||
Greater than 2.0% and Less than 2.5% | 1 | 0.18 | ||||||
Greater than 1.5% and Less than 2.0% | 12 | 2.13 | ||||||
Greater than 1.0% and Less than 1.5% | 40 | 7.09 | ||||||
Greater than 0.5% and Less than 1.0% | 113 | 20.04 | ||||||
Between 0.5% and –0.5% | 254 | 45.03 | ||||||
Less than –0.5% and Greater than –1.0% | 67 | 11.88 | ||||||
Less than –1.0% and Greater than –1.5% | 36 | 6.38 | ||||||
Less than –1.5% and Greater than –2.0% | 27 | 4.79 | ||||||
Less than –2.0% and Greater than –2.5% | 8 | 1.42 | ||||||
Less than –2.5% and Greater than –3.0% | 3 | 0.53 | ||||||
|
|
|
| |||||
| 564 | 100.00 | % | ||||||
|
|
|
| |||||
| 64 | 2014 iSHARES ANNUAL REPORTTO SHAREHOLDERS |
Table of Contents
Director and Officer Information
iSHARES®, INC.
The Board of Directors has responsibility for the overall management and operations of the Company, including general supervision of the duties performed by BFA and other service providers. Each Director serves until he or she resigns, is removed, dies, retires or becomes incapacitated. The President, Chief Compliance Officer, Treasurer and Secretary shall each hold office until their successors are chosen and qualify, and all other officers shall hold office until he or she resigns or is removed. Directors who are not “interested persons” (as defined in the 1940 Act) of the Company are referred to as independent directors (“Independent Directors”).
The registered investment companies advised by BFA or its affiliates are organized into one complex of closed-end funds, two complexes of open-end funds and one complex of exchange-traded funds (“Exchange-Traded Fund Complex”) (each, a “BlackRock Fund Complex”). Each Fund is included in the BlackRock Fund Complex referred to as the Exchange-Traded Fund Complex. Each Director also serves as a Trustee of iShares Trust, a Director of iShares MSCI Russia Capped ETF, Inc. and a Trustee of iShares U.S. ETF Trust and, as a result, oversees a total of 312 funds (as of August 31, 2014) within the Exchange-Traded Fund Complex. With the exception of Robert S. Kapito and Mark Wiedman, the address of each Director and officer is c/o BlackRock, Inc., 400 Howard Street, San Francisco, CA 94105. The address of Mr. Kapito and Mr. Wiedman is c/o BlackRock, Inc., Park Avenue Plaza, 55 East 52nd Street, New York, NY 10055. The Board has designated Robert H. Silver as its Independent Chairman. Additional information about the Funds’ Directors and officers may be found in the Funds’ combined Statement of Additional Information, which is available without charge, upon request, by calling toll-free 1-800-iShares (1-800-474-2737).
Interested Directors
| Name (Age) | Position(s) | Principal Occupation(s) During the Past 5 Years | Other Directorships Held by Director | |||
Robert S. Kapitoa (57) | Director (since 2009). | President and Director, BlackRock, Inc. (since 2006); Vice Chairman of BlackRock, Inc. and Head of BlackRock, Inc.’s Portfolio Management Group (since its formation in 1998) and BlackRock, Inc.’s predecessor entities (since 1988); Trustee, University of Pennsylvania (since 2009); President of Board of Directors, Hope & Heroes Children’s Cancer Fund (since 2002); President of the Board of Directors, Periwinkle Theatre for Youth (since 1983). | Trustee of iShares Trust (since 2009); Director of iShares MSCI Russia Capped ETF, Inc. (since 2010); Trustee of iShares U.S. ETF Trust (since 2011); Director of BlackRock, Inc. (since 2006). | |||
Mark Wiedmanb (43) | Director (since 2013). | Managing Director, BlackRock, Inc. (since 2007); Global Head of iShares (since 2011); Head of Corporate Strategy, BlackRock, Inc. (2009-2011). | Trustee of iShares Trust. (since 2013); Director of iShares MSCI Russia Capped ETF, Inc. (since 2013); Trustee of iShares U.S. ETF Trust (since 2013); Director of PennyMac Financial Services, Inc. (since 2008). | |||
| a | Robert S. Kapito is deemed to be an “interested person” (as defined in the 1940 Act) of the Company due to his affiliations with BlackRock, Inc. |
| b | Mark Wiedman is deemed to be an “interested person” (as defined in the 1940 Act) of the Company due to his affiliations with BlackRock, Inc. and its affiliates. |
DIRECTORAND OFFICER INFORMATION | 65 |
Table of Contents
Director and Officer Information (Continued)
iSHARES®, INC.
Independent Directors
| Name (Age) | Position(s) | Principal Occupation(s) During the Past 5 Years | Other Directorships Held by Director | |||
Robert H. Silver (59) | Director (since 2007); Independent Chairman (since 2012). | President and Co-Founder of The Bravitas Group, Inc. (since 2006); Director and Vice Chairman of the YMCA of Greater NYC (2001-2011); Broadway Producer (2006-2011); Co-Founder and Vice President of Parentgiving Inc. (since 2008); Director and Member of the Audit and Compensation Committee of EPAM Systems, Inc. (2006-2009); President and Chief Operating Officer of UBS Financial Services Inc. (formerly Paine Webber Inc.) (2003-2005) and various executive positions with UBS and its affiliates (1988-2005); CPA and Audit Manager of KPMG, LLP (formerly Peat Marwick Mitchell) (1977-1983). | Trustee of iShares Trust (since 2007); Director of iShares MSCI Russia Capped ETF, Inc. (since 2010); Trustee of iShares U.S. ETF Trust (since 2011); Independent Chairman of iShares, Trust, iShares MSCI Russia Capped ETF, Inc. and iShares U.S. ETF Trust (since 2012). | |||
Cecilia H. Herbert (65) | Director (since 2005); Nominating and Governance Committee Chair and Equity Plus Committee Chair (since 2012). | Director (1998-2013) and President (2007-2011) of the Board of Directors, Catholic Charities CYO; Trustee (2002-2011) and Chair of the Finance and Investment Committee (2006-2010) of the Thacher School; Member (since 1992) and Chair (1994-2005) of the Investment Committee, Archdiocese of San Francisco; Trustee and Member of the Investment Committee, WNET, the New York public broadcasting/media company (since 2011). | Trustee of iShares Trust (since 2005); Director of iShares MSCI Russia Capped ETF, Inc. (since 2010); Trustee of iShares U.S. ETF Trust (since 2011); Director of Forward Funds (34 portfolios) (since 2009). | |||
Charles A. Hurty (70) | Director (since 2005); Audit Committee Chair (since 2006). | Retired; Partner, KPMG LLP (1968-2001). | Trustee of iShares Trust (since 2005); Director of iShares MSCI Russia Capped ETF, Inc. (since 2010); Trustee of iShares U.S. ETF Trust (since 2011); Director of GMAM Absolute Return Strategy Fund (1 portfolio) (since 2002); Director of SkyBridge Alternative Investments Multi-Adviser Hedge Fund Portfolios LLC (2 portfolios) (since 2002). | |||
John E. Kerrigan (59) | Director (since 2005); Fixed Income Plus Committee Chair (since 2012). | Chief Investment Officer, Santa Clara University (since 2002). | Trustee of iShares Trust (since 2005); Director of iShares MSCI Russia Capped ETF, Inc. (since 2010); Trustee of iShares U.S. ETF Trust (since 2011). | |||
| 66 | 2014 iSHARES ANNUAL REPORTTO SHAREHOLDERS |
Table of Contents
Director and Officer Information (Continued)
iSHARES®, INC.
Independent Directors (Continued)
| Name (Age) | Position(s) | Principal Occupation(s) During the Past 5 Years | Other Directorships Held by Director | |||
John E. Martinez (53) | Director (since 2003); Securities Lending Committee Chair (since 2012). | Director of FirstREX Agreement Corp. (formerly EquityRock, Inc.) (since 2005). | Trustee of iShares Trust (since 2003); Director of iShares MSCI Russia Capped ETF, Inc. (since 2010); Trustee of iShares U.S. ETF Trust (since 2011). | |||
George G.C. Parker (75) | Director (since 2002). | Dean Witter Distinguished Professor of Finance, Emeritus, Stanford University Graduate School of Business (Professor since 1973; Emeritus since 2006). | Trustee of iShares Trust (since 2000); Director of iShares MSCI Russia Capped ETF, Inc. (since 2010); Trustee of iShares U.S. ETF Trust (since 2011); Director of Tejon Ranch Company (since 1999); Director of Threshold Pharmaceuticals (since 2004); Director of Colony Financial, Inc. (since 2009); Director of First Republic Bank (since 2010). | |||
Madhav V. Rajan (50) | Director (since 2011); 15(c) Committee Chair (since 2012). | Robert K. Jaedicke Professor of Accounting and Senior Associate Dean for Academic Affairs and Head of MBA Program, Stanford University Graduate School of Business (since 2001); Professor of Law (by courtesy), Stanford Law School (since 2005); Visiting Professor, University of Chicago (2007-2008). | Trustee of iShares Trust (since 2011); Director of iShares MSCI Russia Capped ETF, Inc. (since 2011); Trustee of iShares U.S. ETF Trust (since 2011); Director, Cavium, Inc. (since 2013). | |||
DIRECTORAND OFFICER INFORMATION | 67 |
Table of Contents
Director and Officer Information (Continued)
iSHARES®, INC.
Officers
| Name (Age) | Position(s) | Principal Occupation(s) During the Past 5 Years | ||
Manish Mehta (43) | President (since 2013). | Managing Director, BlackRock, Inc. (since 2009); Chief Operating Officer for iShares (since 2009); Head of Strategy and Corporate Development, BGI (2005-2009); Chief of Staff to the CEO, BGI (2005-2009). | ||
Jack Gee (54) | Treasurer and Chief Financial Officer (since 2008). | Managing Director, BlackRock, Inc. (since 2009); Senior Director of Fund Administration of Intermediary Investor Business, BGI (2009); Director of Fund Administration of Intermediary Investor Business, BGI (2004-2009). | ||
Edward B. Baer (45) | Vice President and Chief Legal Officer (since 2012). | Managing Director of Legal & Compliance, BlackRock, Inc. (since 2006); Director of Legal & Compliance, BlackRock, Inc. (2004-2006). | ||
Eilleen M. Clavere (62) | Secretary (since 2007). | Director of Global Fund Administration, BlackRock, Inc. (since 2009); Director of Legal Administration of Intermediary Investor Business, BGI (2006-2009); Legal Counsel and Vice President of Atlas Funds, Atlas Advisers, Inc. and Atlas Securities, Inc. (2005-2006); Counsel at Kirkpatrick & Lockhart LLP (2001-2005). | ||
Scott Radell (45) | Executive Vice President (since 2012). | Managing Director, BlackRock, Inc. (since 2009); Head of Portfolio Solutions, BlackRock, Inc. (since 2009); Head of Portfolio Solutions, BGI (2007-2009); Credit Portfolio Manager, BGI (2005-2007); Credit Research Analyst, BGI (2003-2005). | ||
Amy Schioldager (51) | Executive Vice President (since 2007). | Senior Managing Director, BlackRock, Inc. (since 2009); Global Head of Index Equity, BGI (2008-2009); Global Head of U.S. Indexing, BGI (2006-2008); Head of Domestic Equity Portfolio Management, BGI (2001-2006). | ||
Ira P. Shapiro (51) | Vice President (since 2007). | Managing Director, BlackRock, Inc. (since 2009); Head of Strategic Product Initiatives for iShares (since 2012); Chief Legal Officer, Exchange-Traded Fund Complex (2007-2012); Associate General Counsel, BGI (2004-2009). | ||
| 68 | 2014 iSHARES ANNUAL REPORTTO SHAREHOLDERS |
Table of Contents
Notes:
NOTES | 69 |
Table of Contents
Notes:
| 70 | 2014 iSHARES ANNUAL REPORTTO SHAREHOLDERS |
Table of Contents
|
For more information visit www.iShares.com or call 1-800-474-2737
This report is intended for the Funds’ shareholders. It may not be distributed to prospective investors unless it is preceded or accompanied by the current prospectus.
Investing involves risk, including possible loss of principal.
The iShares Funds are distributed by BlackRock Investments, LLC (together with its affiliates, “BlackRock”).
The iShares Funds are not sponsored, endorsed, issued, sold or promoted by MSCI Inc., nor does this company make any representation regarding the advisability of investing in the iShares Funds. BlackRock is not affiliated with the company listed above.
A description of the policies that the Funds use to determine how to vote proxies relating to portfolio securities and information about how the Funds voted proxies relating to portfolio securities during the most recent twelve-month period ending June 30 is available without charge, upon request, by calling toll-free 1-800-474-2737; on the Funds’ website at www.iShares.com; and on the U.S. Securities and Exchange Commission (SEC) website at www.sec.gov.
The Funds file their complete schedules of portfolio holdings with the SEC for the first and third quarters of each fiscal year on Form N-Q. The Funds’ Forms N-Q are available on the SEC’s website or may be reviewed and copied at the SEC’s Public Reference Room in Washington, D.C. Information on the operation of the Public Reference Room may be obtained by calling 1-800-SEC-0330. The Funds also disclose their complete schedules of portfolio holdings on a daily and monthly basis on the Funds’ website.
©2014 BlackRock, Inc. All rights reserved. iSHARES and BLACKROCK are registered trademarks of BlackRock, Inc. or its subsidiaries. All other marks are the property of their respective owners.
iS-AR-812-0814

Table of Contents
AUGUST 31, 2014
2014 ANNUAL REPORT
|  |
iShares, Inc.
| Ø | iShares Core MSCI Emerging Markets ETF | IEMG | NYSE Arca |
Table of Contents
| 5 | ||||
| 8 | ||||
| 8 | ||||
| 9 | ||||
| 38 | ||||
| 41 | ||||
| 42 | ||||
| 53 | ||||
| 54 | ||||
| 55 | ||||
| 59 | ||||
| 62 |
Table of Contents
Management’s Discussion of Fund Performance
iSHARES®, INC.
EMERGING MARKETS OVERVIEW
Stocks of companies in emerging markets gained approximately 20% for the 12-month period ended August 31, 2014 (the “reporting period”). Emerging markets stocks experienced substantial volatility in the first six months of the reporting period, rising sharply during the first two months and then falling back over the ensuing three months. However, emerging markets stocks rallied steadily during the remainder of the reporting period.
Uncertainty regarding the pace of growth in many emerging economies helped contribute to the volatility in emerging markets stocks during the first half of the reporting period. Most notably, economic growth slowed in several bellwether emerging economies, including China, Brazil, and India. In contrast, many developed countries saw their economies strengthen as their central banks maintained or expanded accommodative monetary policies. Weaker economic activity contributed to the decline in emerging markets stocks in late 2013 and early 2014.
During the last six months of the reporting period, however, stocks in emerging markets benefited from greater investor demand. This was driven partly by improving economic growth in many emerging markets as central banks in developing countries began to implement economic stimulus efforts. Furthermore, better economic conditions in developed countries led to stronger demand for exports, and many emerging economies are major exporters to developed nations. These developments helped fuel a recovery in emerging markets stocks over the last half of the reporting period.
From a regional perspective, emerging equity markets in Latin America generated the best returns, gaining 24% for the reporting period. Brazil, the largest equity market in Latin America, led the region’s advance, gaining more than 30%. Much of those gains occurred in the last three months of the reporting period amid optimism about upcoming national elections. Peru, one of the worst-performing markets in 2013, rebounded strongly in the first eight months of 2014. Chile was the only market in the region to decline for the reporting period as economic growth slowed markedly.
Emerging markets in Asia also performed well, returning 22% for the reporting period. Although nearly every market in the region posted double-digit gains, India was the best performer, rising by more than 50% for the reporting period. A meaningful increase in economic activity and stronger corporate earnings growth propelled the Indian stock market to record highs by the end of the reporting period. Other top-performing markets in the region included the Philippines and Thailand. The laggards among emerging markets in Asia included South Korea and Malaysia.
In contrast to other regions, emerging markets stocks in Eastern Europe declined for the reporting period, falling by approximately 3%. Hungary was the weakest-performing market in the region, declining by more than 17% amid continued economic weakness and armed conflict between Russia and Ukraine, which shares a border with Hungary. Russia’s stock market, the largest in the region, also declined in response to these events. On the positive side, equity markets in Greece and the Czech Republic posted double-digit gains as the economies in both countries began to recover after an extended period of weakness.
MANAGEMENT’S DISCUSSIONOF FUND PERFORMANCE | 5 |
Table of Contents
Management’s Discussion of Fund Performance
iSHARES® CORE MSCI EMERGING MARKETS ETF
Performance as of August 31, 2014
| Average Annual Total Returns | Cumulative Total Returns | |||||||||||||||||||||||||
| NAV | MARKET | INDEX | NAV | MARKET | INDEX | |||||||||||||||||||||
1 Year | 20.05% | 20.98% | 20.12% | 20.05% | 20.98% | 20.12% | ||||||||||||||||||||
Since Inception | 6.83% | 6.87% | 6.83% | 13.15% | 13.24% | 13.13% | ||||||||||||||||||||
GROWTH OF $10,000 INVESTMENT
(SINCE INCEPTION AT NET ASSET VALUE)

The inception date of the Fund was 10/18/12. The first day of secondary market trading was 10/22/12.
Past performance is no guarantee of future results. Performance results do not reflect the deduction of taxes that a shareholder would pay on fund distributions or on the redemption or sale of fund shares. See “About Fund Performance” on page 8 for more information.
| Shareholder Expenses | ||||||||||||||||||||||||||
| Actual | Hypothetical 5% Return | |||||||||||||||||||||||||
| Beginning Account Value (3/1/14) | Ending Account Value (8/31/14) | Expenses Paid During Period a | Beginning Account Value (3/1/14) | Ending Account Value (8/31/14) | Expenses Paid During Period a | Annualized Expense Ratio | ||||||||||||||||||||
| $ | 1,000.00 | $ | 1,140.30 | $ | 0.97 | $ | 1,000.00 | $ | 1,024.30 | $ | 0.92 | 0.18% | ||||||||||||||
| a | Expenses are calculated using the Fund’s annualized expense ratio (as disclosed in the table), multiplied by the average account value for the period, multiplied by the number of days in the period (184 days) and divided by the number of days in the year (365 days). See “Shareholder Expenses” on page 8 for more information. |
| 6 | 2014 iSHARES ANNUAL REPORTTO SHAREHOLDERS |
Table of Contents
Management’s Discussion of Fund Performance (Continued)
iSHARES® CORE MSCI EMERGING MARKETS ETF
The iShares Core MSCI Emerging Markets ETF (the “Fund”) seeks to track the investment results of an index composed of large-, mid- and small-capitalization emerging market equities, as represented by the MSCI Emerging Markets Investable Market Index (the “Index”). The Fund invests in a representative sample of securities included in the Index that collectively has an investment profile similar to the Index. Due to the use of representative sampling, the Fund may or may not hold all of the securities that are included in the Index. For the 12-month reporting period ended August 31, 2014, the total return for the Fund was 20.05%, net of fees, while the total return for the Index was 20.12%.
As represented by the Index, emerging markets stocks advanced by 20% for the reporting period. Of the 25 countries represented in the Index, 19 generated positive returns for the reporting period, including the three largest country constituents: China, South Korea, and Taiwan, which together comprised more than 45% of the Index as of the end of the reporting period. The markets that provided the strongest results within the Index included India and Brazil, which produced returns of 57% and 31%, respectively, for the reporting period.
Among the countries which declined within the Index, Hungary was the weakest performer, falling by 14% for the reporting period. Persistent weakness in the Hungarian economy weighed on the country’s stock market. Russia and Chile were also notable decliners within the Index.
Currency fluctuations relative to the U.S. dollar had a modestly positive impact on Index performance for the reporting period. In local currency terms, the Index returned 17.99% for the reporting period. The U.S. dollar was largely unchanged against the Chinese yuan and Taiwan dollar, but it declined by 6% versus the Brazilian real and 8.5% against the South Korean won for the reporting period. A weaker U.S. dollar increases international equity returns for U.S. investors.
PORTFOLIO ALLOCATION
As of 8/31/14
| Sector | Percentage of Total Investments* |
Financials | 26.57 | % | ||
Information Technology | 16.65 | |||
Consumer Discretionary | 10.30 | |||
Energy | 9.53 | |||
Materials | 8.86 | |||
Consumer Staples | 8.10 | |||
Industrials | 7.49 | |||
Telecommunication Services | 6.65 | |||
Utilities | 3.47 | |||
Health Care | 2.38 | |||
|
| |||
TOTAL | 100.00 | % | ||
|
|
TEN LARGEST COUNTRY ALLOCATIONS
As of 8/31/14
| Country | Percentage of Total Investments* |
China | 19.04 | % | ||
South Korea | 15.35 | |||
Taiwan | 12.91 | |||
Brazil | 11.03 | |||
South Africa | 7.47 | |||
India | 6.62 | |||
Mexico | 4.91 | |||
Russia | 4.06 | |||
Malaysia | 3.92 | |||
Indonesia | 2.66 | |||
|
| |||
TOTAL | 87.97 | % | ||
|
|
| * | Excludes money market funds. |
MANAGEMENT’S DISCUSSIONOF FUND PERFORMANCE | 7 |
Table of Contents
Past performance is no guarantee of future results. Current performance may be lower or higher than the performance data quoted. Performance data current to the most recent month-end is available at www.iShares.com. Performance results assume reinvestment of all dividends and capital gain distributions and do not reflect the deduction of taxes that a shareholder would pay on fund distributions or on the redemption or sale of fund shares. The investment return and principal value of shares will vary with changes in market conditions. Shares may be worth more or less than their original cost when they are redeemed or sold in the market. Performance for certain funds may reflect a waiver of a portion of investment management fees. Without such waiver, performance would have been lower.
Net asset value or “NAV” is the value of one share of a fund as calculated in accordance with the standard formula for valuing mutual fund shares. The price used to calculate market return (“Market Price”) is determined by using the midpoint between the highest bid and the lowest offer on the primary stock exchange on which shares of a fund are listed for trading, as of the time that such fund’s NAV is calculated. Since shares of a fund may not have traded in the secondary market until after the fund’s inception, for the period from inception to the first day of secondary trading, the NAV of the fund is used as a proxy for the Market Price to calculate market returns. Market and NAV returns assume that dividends and capital gain distributions have been reinvested at Market Price and NAV, respectively.
An index is a statistical composite that tracks a specified financial market or sector. Unlike a fund, an index does not actually hold a portfolio of securities and therefore does not incur the expenses incurred by a fund. These expenses negatively impact fund performance. Also, market returns do not include brokerage commissions that may be payable on secondary market transactions. If brokerage commissions were included, market returns would be lower.
As a shareholder of a Fund, you incur two types of costs: (1) transaction costs, including brokerage commissions on purchases and sales of fund shares and (2) ongoing costs, including management fees and other fund expenses. The expense example, which is based on an investment of $1,000 invested on March 1, 2014 and held through August 31, 2014, is intended to help you understand your ongoing costs (in dollars and cents) of investing in a Fund and to compare these costs with the ongoing costs of investing in other funds.
Actual Expenses — The table provides information about actual account values and actual expenses. Annualized expense ratios reflect contractual and voluntary fee waivers, if any. To estimate the expenses that you paid on your account over the period, simply divide your account value by $1,000 (for example, an $8,600 account value divided by $1,000 = 8.6), then multiply the result by the number for your Fund under the heading entitled “Expenses Paid During Period.”
Hypothetical Example for Comparison Purposes — The table also provides information about hypothetical account values and hypothetical expenses based on each Fund’s actual expense ratio and an assumed rate of return of 5% per year before expenses. You may use this information to compare the ongoing costs of investing in your Fund and other funds. To do so, compare this 5% hypothetical example with the 5% hypothetical examples that appear in the shareholder reports of the other funds.
Please note that the expenses shown in the table are meant to highlight your ongoing costs only and do not reflect any transactional costs, such as brokerage commissions paid on purchases and sales of fund shares. Therefore, the hypothetical examples are useful in comparing ongoing costs only and will not help you determine the relative total costs of owning different funds. In addition, if these transactional costs were included, your costs would have been higher.
| 8 | 2014 iSHARES ANNUAL REPORTTO SHAREHOLDERS |
Table of Contents
Consolidated Schedule of Investments
iSHARES® CORE MSCI EMERGING MARKETS ETF
August 31, 2014
| Security | Shares | Value | ||||||
COMMON STOCKS — 93.77% |
| |||||||
BRAZIL — 6.53% |
| |||||||
Abril Educacao SA Units | 52,600 | $ | 921,038 | |||||
Aliansce Shopping Centers SA | 117,100 | 1,091,688 | ||||||
ALL – America Latina Logistica SA | 539,600 | 1,989,542 | ||||||
Alupar Investimento SA Units | 100,400 | 829,207 | ||||||
AMBEV SA | 5,419,100 | 39,476,807 | ||||||
Arezzo Industria e Comercio SA | 59,300 | 851,516 | ||||||
Autometal SA | 54,400 | 469,471 | ||||||
B2W Companhia Global do Varejoa | 132,951 | 2,251,947 | ||||||
Banco ABC Brasil SAa | 2,729 | 17,563 | ||||||
Banco Bradesco SA | 744,060 | 13,307,985 | ||||||
Banco do Brasil SA | 990,400 | 15,487,518 | ||||||
Banco Pan SAa | 168,863 | 264,137 | ||||||
Banco Santander (Brasil) SA Units | 1,064,400 | 7,354,304 | ||||||
BB Seguridade Participacoes SA | 809,000 | 12,922,017 | ||||||
BM&F Bovespa SA | 2,076,600 | 12,528,927 | ||||||
BR Malls Participacoes SA | 503,100 | 5,232,123 | ||||||
BR Properties SA | 195,200 | 1,299,850 | ||||||
Brasil Brokers Participacoes SA | 391,200 | 632,899 | ||||||
BRF SA | 753,200 | 20,163,429 | ||||||
CCR SA | 995,200 | 9,011,084 | ||||||
Centrais Eletricas Brasileiras SA | 363,700 | 1,324,732 | ||||||
CETIP SA – Mercados Organizados | 232,662 | 3,394,970 | ||||||
Cielo SA | 813,760 | 15,260,159 | ||||||
Companhia de Saneamento Basico do Estado de Sao Paulo | 386,400 | 3,693,815 | ||||||
Companhia de Saneamento de Minas Gerais SA | 73,500 | 1,313,937 | ||||||
Companhia Hering SA | 177,900 | 2,225,390 | ||||||
Companhia Siderurgica Nacional SA | 852,600 | 3,741,830 | ||||||
Cosan SA Industria e Comercio | 157,800 | 3,279,346 | ||||||
CPFL Energia SA | 274,100 | 2,767,276 | ||||||
| Security | Shares | Value | ||||||
Cyrela Brazil Realty SA Empreendimentos e Participacoes | 298,800 | $ | 1,894,917 | |||||
Duratex SA | 352,429 | 1,586,092 | ||||||
EcoRodovias Infraestrutura e Logistica SA | 252,000 | 1,610,512 | ||||||
EDP Energias do Brasil SA | 295,900 | 1,494,344 | ||||||
Embraer SA | 763,000 | 7,437,166 | ||||||
Equatorial Energia SA | 184,376 | 2,167,142 | ||||||
Estacio Participacoes SA | 350,100 | 4,651,728 | ||||||
Eternit SA | 183,300 | 688,128 | ||||||
Even Construtora e Incorporadora SA | 339,200 | 1,026,294 | ||||||
EZ TEC Empreendimentos e Participacoes SA | 67,600 | 745,925 | ||||||
Fibria Celulose SAa | 285,800 | 2,973,531 | ||||||
Fleury SA | 96,300 | 688,180 | ||||||
GAEC Educacao SA | 44,200 | 591,822 | ||||||
Gafisa SA | 561,300 | 845,380 | ||||||
Helbor Empreendimentos SA | 243,970 | 650,936 | ||||||
Hypermarcas SAa | 378,500 | 3,291,819 | ||||||
Iguatemi Empresa de Shopping Centers SA | 92,700 | 1,139,304 | ||||||
International Meal Co. Holdings SA | 76,300 | 668,015 | ||||||
Iochpe-Maxion SA | 108,700 | 869,095 | ||||||
JBS SA | 852,900 | 3,857,500 | ||||||
Julio Simoes Logistica SA | 109,000 | 579,697 | ||||||
Klabin SA | 490,300 | 2,491,435 | ||||||
Kroton Educacional SA | 397,314 | 11,905,836 | ||||||
Light SA | 89,100 | 979,580 | ||||||
Linx SA | 32,500 | 745,559 | ||||||
Localiza Rent A Car SA | 169,635 | 3,021,141 | ||||||
Lojas Americanas SA | 197,425 | 1,147,025 | ||||||
Lojas Renner SA | 157,800 | 5,403,515 | ||||||
LPS Brasil – Consultoria de Imoveis SA | 112,900 | 555,027 | ||||||
M Dias Branco SA | 52,600 | 2,374,293 | ||||||
Magazine Luiza SA | 107,900 | 434,001 | ||||||
Magnesita Refratarios SA | 288,800 | 496,919 | ||||||
Marfrig Global Foods SAa | 355,600 | 1,207,821 | ||||||
Mills Estruturas e Servicos de Engenharia SA | 113,500 | 1,161,605 | ||||||
Minerva SAa | 128,000 | 762,548 | ||||||
CONSOLIDATED SCHEDULEOF INVESTMENTS | 9 |
Table of Contents
Consolidated Schedule of Investments (Continued)
iSHARES® CORE MSCI EMERGING MARKETS ETF
August 31, 2014
| Security | Shares | Value | ||||||
MRV Engenharia e Participacoes SA | 392,100 | $ | 1,598,155 | |||||
Multiplan Empreendimentos Imobiliarios SA | 105,200 | 2,713,277 | ||||||
Multiplus SA | 59,000 | 864,875 | ||||||
Natura Cosmeticos SA | 210,400 | 3,856,228 | ||||||
Odontoprev SA | 302,100 | 1,317,734 | ||||||
PDG Realty SA Empreendimentos e Participacoesa | 1,470,300 | 979,083 | ||||||
Petroleo Brasileiro SA | 3,422,600 | 33,865,775 | ||||||
Porto Seguro SA | 132,800 | 1,969,254 | ||||||
Prumo Logistica SAa | 735,845 | 348,594 | ||||||
Qualicorp SAa | 242,800 | 3,038,323 | ||||||
Raia Drogasil SA | 251,000 | 2,445,443 | ||||||
Restoque Comercio e Confeccoes de Roupas SAa | 133,500 | 542,938 | ||||||
Santos Brasil Participacoes SA Units | 64,600 | 494,558 | ||||||
Sao Martinho SA | 63,100 | 1,280,020 | ||||||
SLC Agricola SA | 76,300 | 590,267 | ||||||
Smiles SA | 46,600 | 824,723 | ||||||
Sonae Sierra Brasil SA | 56,600 | 480,615 | ||||||
Souza Cruz SA | 435,200 | 4,076,687 | ||||||
Sul America SA Units | 213,089 | 1,473,257 | ||||||
Technos SA | 93,400 | 517,184 | ||||||
Tecnisa SA | 211,300 | 601,542 | ||||||
Tegma Gestao Logistica SA | 51,000 | 449,018 | ||||||
TIM Participacoes SA | 966,700 | 5,422,040 | ||||||
Totvs SA | 157,800 | 2,881,593 | ||||||
TPI – Triunfo Participacoes e Investimentos SA | 127,700 | 352,130 | ||||||
Tractebel Energia SA | 178,700 | 2,995,704 | ||||||
Transmissora Alianca de Energia Eletrica SA | 102,500 | 1,069,183 | ||||||
Ultrapar Participacoes SA | 405,400 | 10,452,292 | ||||||
Vale SA | 1,532,500 | 19,944,314 | ||||||
Valid Solucoes e Servicos de Seguranca em Meios de Pagamento e Identificacao SA | 69,300 | 1,176,912 | ||||||
Vanguarda Agro SAa | 574,429 | 631,537 | ||||||
Via Varejo SAa | 142,100 | 1,587,674 | ||||||
WEG SA | 321,430 | 4,020,838 | ||||||
|
| |||||||
| 370,110,106 | ||||||||
| Security | Shares | Value | ||||||
CHILE — 1.28% |
| |||||||
AES Gener SA | 2,970,101 | $ | 1,518,398 | |||||
Aguas Andinas SA Series A | 2,963,437 | 1,858,437 | ||||||
Banco de Chile | 26,483,702 | 3,231,871 | ||||||
Banco de Credito e Inversiones | 40,115 | 2,186,315 | ||||||
Banco Santander (Chile) SA | 79,179,965 | 4,691,353 | ||||||
Besalco SA | 542,317 | 371,149 | ||||||
CAP SA | 97,772 | 1,161,592 | ||||||
Cencosud SA | 1,531,843 | 4,596,306 | ||||||
Colbun SA | 9,424,479 | 2,466,555 | ||||||
Compania Cervecerias Unidas SA | 175,570 | 1,885,760 | ||||||
Compania SudAmericana de Vapores SAa | 9,872,666 | 415,507 | ||||||
CorpBanca SA | 162,281,045 | 1,994,076 | ||||||
Cruz Blanca Salud SA | 400,463 | 326,383 | ||||||
E.CL SA | 657,034 | 947,733 | ||||||
Empresa Nacional de Electricidad SA | 3,802,925 | 5,810,103 | ||||||
Empresa Nacional de Telecomunicaciones SA | 149,401 | 1,713,867 | ||||||
Empresas CMPC SA | 1,456,860 | 3,626,384 | ||||||
Empresas Copec SA | 519,114 | 6,525,089 | ||||||
Enersis SA | 22,567,481 | 7,596,777 | ||||||
Inversiones Aguas Metropolitanas SA | 484,298 | 776,130 | ||||||
Inversiones la Construccion SA | 49,006 | 645,505 | ||||||
LATAM Airlines Group SAa | 378,096 | 4,677,484 | ||||||
Masisa SA | 2,505,068 | 114,283 | ||||||
Parque Arauco SA | 726,737 | 1,351,111 | ||||||
S.A.C.I. Falabella SA | 1,118,417 | 8,422,546 | ||||||
SalfaCorp SA | 661,320 | 505,618 | ||||||
Sociedad Matriz SAAM SA | 9,218,037 | 759,233 | ||||||
Sonda SA | 626,596 | 1,452,063 | ||||||
Vina Concha y Toro SA | 594,746 | 1,159,926 | ||||||
|
| |||||||
| 72,787,554 | ||||||||
CHINA — 18.93% |
| |||||||
361 Degrees International Ltd. | 1,847,000 | 543,365 | ||||||
AAC Technologies Holdings Inc.b | 856,000 | 5,583,221 | ||||||
Agile Property Holdings Ltd. | 2,104,000 | 1,650,590 | ||||||
Agricultural Bank of China Ltd. Class H | 24,321,000 | 11,234,515 | ||||||
| 10 | 2014 iSHARES ANNUAL REPORTTO SHAREHOLDERS |
Table of Contents
Consolidated Schedule of Investments (Continued)
iSHARES® CORE MSCI EMERGING MARKETS ETF
August 31, 2014
| Security | Shares | Value | ||||||
Air China Ltd. Class H | 2,118,000 | $ | 1,311,768 | |||||
Ajisen (China) Holdings Ltd. | 842,000 | 695,316 | ||||||
Alcatel-Lucenta | 2,660,000 | 432,456 | ||||||
Alibaba Pictures Group Ltd.a | 5,860,000 | 1,217,344 | ||||||
Aluminum Corp. of China Ltd. Class Ha,b | 4,696,000 | 1,993,489 | ||||||
Anhui Conch Cement Co. Ltd. Class Hb | 1,578,000 | 5,701,051 | ||||||
Anhui Expressway Co. Ltd. Class H | 948,000 | 568,789 | ||||||
Anta Sports Products Ltd. | 1,185,000 | 2,275,156 | ||||||
Anton Oilfield Services Groupb | 1,536,000 | 659,972 | ||||||
APT Satellite Holdings Ltd. | 373,000 | 548,660 | ||||||
Asia Cement China Holdings Corp. | 864,000 | 595,312 | ||||||
Asian Citrus Holdings Ltd.b | 2,252,000 | 479,449 | ||||||
AviChina Industry & Technology Co. Ltd. Class H | 2,608,000 | 1,554,674 | ||||||
Bank of China Ltd. Class H | 90,499,000 | 42,037,432 | ||||||
Bank of Communications Co. Ltd. Class H | 9,867,000 | 7,205,953 | ||||||
BBMG Corp. Class H | 1,405,000 | 1,047,838 | ||||||
Beijing Capital International Airport Co. Ltd. Class H | 1,844,000 | 1,441,861 | ||||||
Beijing Capital Land Ltd. Class H | 1,692,000 | 611,291 | ||||||
Beijing Enterprises Holdings Ltd. | 595,000 | 5,128,417 | ||||||
Beijing Enterprises Water Group Ltd.b | 5,108,000 | 3,479,964 | ||||||
Beijing Tong Ren Tang Chinese Medicine Co. Ltd. | 352,000 | 464,177 | ||||||
Belle International Holdings Ltd. | 5,355,000 | 6,847,358 | ||||||
Biostime International Holdings Ltd.b | 232,500 | 868,483 | ||||||
Bosideng International Holdings Ltd.b | 3,622,000 | 574,835 | ||||||
Brilliance China Automotive Holdings Ltd. | 3,502,000 | 6,488,742 | ||||||
BYD Co. Ltd. Class Hb | 743,000 | 5,277,595 | ||||||
BYD Electronic International Co. Ltd. | 981,500 | 911,828 | ||||||
C C Land Holdings Ltd. | 3,031,000 | 637,475 | ||||||
| Security | Shares | Value | ||||||
Carnival Group International Holdings Ltd.a | 9,367,000 | $ | 1,329,484 | |||||
Chaowei Power Holdings Ltd.b | 987,000 | 518,324 | ||||||
China Agri-Industries Holdings Ltd.b | 2,638,200 | 1,079,088 | ||||||
China Aoyuan Property Group Ltd. | 3,583,000 | 601,008 | ||||||
China BlueChemical Ltd. Class H | 2,242,000 | 1,105,068 | ||||||
China Cinda Asset Management Co. Ltd.a | 6,110,000 | 3,129,836 | ||||||
China CITIC Bank Corp. Ltd. Class H | 9,458,000 | 5,967,577 | ||||||
China Coal Energy Co. Class Hb | 4,710,000 | 2,868,486 | ||||||
China Communications Construction Co. Ltd. Class H | 5,064,000 | 3,691,748 | ||||||
China Communications Services Corp. Ltd. Class H | 2,946,000 | 1,421,655 | ||||||
China Construction Bank Corp. Class H | 82,488,000 | 61,306,024 | ||||||
China COSCO Holdings Co. Ltd. Class Ha,b | 3,095,000 | 1,333,819 | ||||||
China Datang Corp. Renewable Power Co. Ltd. Class H | 3,576,000 | 549,078 | ||||||
China Dongxiang Group Co. | 4,245,000 | 914,711 | ||||||
China Everbright Bank Co. Ltd. | 3,154,000 | 1,473,195 | ||||||
China Everbright International Ltd.b | 2,918,000 | 3,998,524 | ||||||
China Everbright Ltd. | 1,052,000 | 1,995,368 | ||||||
China Gas Holdings Ltd. | 2,356,000 | 4,195,119 | ||||||
China High Speed Transmission Equipment Group Co. Ltd.a,b | 1,306,000 | 1,134,092 | ||||||
China Huishan Dairy Holdings Co. Ltd.a,b | 7,006,000 | 1,627,169 | ||||||
China Huiyuan Juice Group Ltd.a | 794,500 | 343,422 | ||||||
China International Marine Containers (Group) Co. Ltd. Class H | 607,000 | 1,306,395 | ||||||
China Life Insurance Co. Ltd. Class H | 8,562,000 | 24,580,750 | ||||||
CONSOLIDATED SCHEDULEOF INVESTMENTS | 11 |
Table of Contents
Consolidated Schedule of Investments (Continued)
iSHARES® CORE MSCI EMERGING MARKETS ETF
August 31, 2014
| Security | Shares | Value | ||||||
China Lilang Ltd. | 758,000 | $ | 511,518 | |||||
China Longyuan Power Group Corp. Ltd. Class H | 3,495,000 | 3,779,037 | ||||||
China LotSynergy Holdings Ltd.b | 8,440,000 | 740,528 | ||||||
China Lumena New Materials Corp.b,c | 2,584,000 | 375,090 | ||||||
China Medical System Holdings Ltd.b | 1,343,000 | 1,940,814 | ||||||
China Mengniu Dairy Co. Ltd. | 1,582,000 | 7,338,297 | ||||||
China Merchants Bank Co. Ltd. Class H | 5,250,964 | 10,041,004 | ||||||
China Merchants Holdings (International) Co. Ltd. | 1,306,000 | 4,330,781 | ||||||
China Metal Recycling Holdings Ltd.a,b,c | 62,400 | — | ||||||
China Minsheng Banking Corp. Ltd. Class H | 7,200,100 | 6,763,318 | ||||||
China Mobile Ltd. | 7,007,500 | 87,162,571 | ||||||
China Modern Dairy Holdings Ltd.a,b | 2,443,000 | 1,197,835 | ||||||
China National Building Material Co. Ltd. Class H | 3,250,000 | 2,985,749 | ||||||
China National Materials Co. Ltd. Class H | 2,392,000 | 570,983 | ||||||
China New Town Development Co. Ltd.a | 5,680,000 | 315,142 | ||||||
China Oil and Gas Group Ltd.b | 10,520,000 | 1,846,055 | ||||||
China Oilfield Services Ltd. Class H | 2,178,000 | 6,449,565 | ||||||
China Overseas Land & Investment Ltd.b | 5,260,000 | 14,795,585 | ||||||
China Pacific Insurance (Group) Co. Ltd. Class H | 3,044,200 | 11,430,259 | ||||||
China Petroleum & Chemical Corp. Class H | 29,278,200 | 29,693,187 | ||||||
China Power International Development Ltd. | 3,158,000 | 1,438,390 | ||||||
China Power New Energy Development Co. Ltd.a | 6,300,000 | 447,088 | ||||||
China Precious Metal Resources Holdings Co. Ltd.a,b | 6,474,000 | 793,572 | ||||||
China Railway Construction Corp. Ltd. Class Hb | 2,306,500 | 2,208,245 | ||||||
| Security | Shares | Value | ||||||
China Railway Group Ltd. Class H | 4,681,000 | $ | 2,421,993 | |||||
China Rare Earth Holdings Ltd.a | 4,656,000 | 660,839 | ||||||
China Resources and Transportation Group Ltd.a,b | 20,700,000 | 881,402 | ||||||
China Resources Cement Holdings Ltd.b | 2,364,000 | 1,625,790 | ||||||
China Resources Enterprise Ltd. | 1,398,000 | 3,760,998 | ||||||
China Resources Gas Group Ltd. | 1,056,000 | 3,072,560 | ||||||
China Resources Land Ltd. | 2,384,000 | 5,456,947 | ||||||
China Resources Power Holdings Co. Ltd. | 2,222,000 | 6,723,212 | ||||||
China Rongsheng Heavy Industries Group Holdings Ltd.a,b | 4,031,500 | 707,450 | ||||||
China SCE Property Holdings Ltd.b | 3,139,200 | 595,424 | ||||||
China Shanshui Cement Group Ltd.b | 2,434,000 | 895,067 | ||||||
China Shenhua Energy Co. Ltd. Class H | 3,881,500 | 11,193,529 | ||||||
China Shineway Pharmaceutical Group Ltd. | 526,000 | 912,168 | ||||||
China Shipping Container Lines Co. Ltd. Class Ha,b | 4,574,000 | 1,304,303 | ||||||
China Singyes Solar Technologies Holdings Ltd. | 586,000 | 972,363 | ||||||
China South City Holdings Ltd.b | 2,324,000 | 1,160,478 | ||||||
China State Construction International Holdings Ltd. | 2,066,000 | 3,332,194 | ||||||
China Suntien Green Energy Corp. Ltd. Class Hb | 2,318,000 | 699,873 | ||||||
China Taiping Insurance Holdings Co. Ltd.a | 1,017,200 | 2,475,358 | ||||||
China Telecom Corp. Ltd. Class H | 15,896,000 | 9,824,563 | ||||||
China Traditional Chinese Medicine Co. Ltd.a | 1,138,000 | 496,305 | ||||||
China Travel International Investment Hong Kong Ltd.b | 3,960,000 | 1,251,847 | ||||||
| 12 | 2014 iSHARES ANNUAL REPORTTO SHAREHOLDERS |
Table of Contents
Consolidated Schedule of Investments (Continued)
iSHARES® CORE MSCI EMERGING MARKETS ETF
August 31, 2014
| Security | Shares | Value | ||||||
China Unicom (Hong Kong) Ltd. | 5,500,000 | $ | 9,807,552 | |||||
China Vanke Co. Ltd.a | 1,458,487 | 2,732,493 | ||||||
China Water Affairs Group Ltd.b | 1,720,000 | 619,188 | ||||||
China Yongda Automobiles Services Holdings Ltd.b | 237,000 | 207,333 | ||||||
China Yurun Food Group Ltd.a,b | 1,992,000 | 971,563 | ||||||
China ZhengTong Auto Services Holdings Ltd. | 1,275,500 | 681,351 | ||||||
Chinasoft International Ltd.a,b | 2,010,000 | 731,366 | ||||||
Chongqing Changan Automobile Co. Ltd. | 1,003,300 | 2,071,289 | ||||||
Chongqing Rural Commercial Bank Co. Ltd. Class H | 3,062,000 | 1,521,093 | ||||||
CIMC Enric Holdings Ltd. | 1,052,000 | 1,164,643 | ||||||
CITIC 21CN Co. Ltd.a | 2,866,000 | 2,255,776 | ||||||
CITIC Pacific Ltd. | 2,620,000 | 5,097,914 | ||||||
CITIC Resources Holdings Ltd.a | 3,350,000 | 540,312 | ||||||
CITIC Securities Co. Ltd. Class H | 1,232,000 | 2,924,950 | ||||||
CNOOC Ltd. | 20,441,000 | 41,092,209 | ||||||
Comba Telecom Systems Holdings Ltd.a,b | 1,953,500 | 849,441 | ||||||
Coolpad Group Ltd. | 4,024,000 | 872,282 | ||||||
Cosco International Holdings Ltd.b | 1,840,000 | 897,428 | ||||||
COSCO Pacific Ltd. | 2,114,000 | 2,962,270 | ||||||
Country Garden Holdings Co. Ltd.b | 5,404,000 | 2,398,632 | ||||||
CPMC Holdings Ltd. | 783,000 | 618,305 | ||||||
CSPC Pharmaceutical Group Ltd.b | 2,832,000 | 2,367,872 | ||||||
CSR Corp Ltd. Class H | 2,386,000 | 2,151,976 | ||||||
Dah Chong Hong Holdings Ltd.b | 1,219,000 | 756,552 | ||||||
Daphne International Holdings Ltd.b | 1,338,000 | 690,567 | ||||||
Datang International Power Generation Co. Ltd. Class H | 3,062,000 | 1,698,883 | ||||||
Dazhong Transportation Group Co. Ltd. Class B | 738,800 | 480,959 | ||||||
Digital China Holdings Ltd. | 1,149,000 | 1,113,397 | ||||||
| Security | Shares | Value | ||||||
Dongfeng Motor Group Co. Ltd. Class H | 3,130,000 | $ | 5,799,475 | |||||
Dongyue Group Ltd.b | 1,736,000 | 725,746 | ||||||
ENN Energy Holdings Ltd.b | 1,052,000 | 7,431,727 | ||||||
EverChina International Holdings Co. Ltd.a,b | 10,650,000 | 522,183 | ||||||
Evergrande Real Estate Group Ltd.b | 6,759,000 | 2,825,643 | ||||||
Fantasia Holdings Group Co. Ltd.b | 3,579,000 | 429,472 | ||||||
Far East Horizon Ltd. | 1,699,000 | 1,370,135 | ||||||
FDG Electric Vehicles Ltd.a,b | 9,840,000 | 698,309 | ||||||
First Tractor Co. Ltd. Class H | 724,000 | 496,981 | ||||||
Fosun International Ltd. | 2,031,000 | 2,494,806 | ||||||
Franshion Properties (China) Ltd. | 4,580,000 | 1,241,008 | ||||||
Fufeng Group Ltd. | 1,517,400 | 601,075 | ||||||
GCL-Poly Energy Holdings Ltd.a,b | 11,667,000 | 4,200,039 | ||||||
Geely Automobile Holdings Ltd.b | 6,235,000 | 2,389,367 | ||||||
Glorious Property Holdings Ltd.a | 3,431,000 | 486,971 | ||||||
Golden Eagle Retail Group Ltd. | 680,000 | 836,164 | ||||||
GOME Electrical Appliances Holdings Ltd. | 12,172,000 | 2,167,359 | ||||||
Goodbaby International Holdings Ltd.b | 1,179,000 | 585,685 | ||||||
Great Wall Motor Co. Ltd. Class H | 1,315,000 | 5,582,279 | ||||||
Greatview Aseptic Packaging Co. Ltd.b | 1,482,000 | 1,147,333 | ||||||
Guangdong Investment Ltd. | 3,156,000 | 3,815,632 | ||||||
Guangdong Land Holdings Ltd. | 1,884,000 | 408,395 | ||||||
Guangzhou Automobile Group Co. Ltd. Class H | 3,156,000 | 3,282,176 | ||||||
Guangzhou R&F Properties Co. Ltd. Class H | 1,190,800 | 1,435,078 | ||||||
Haier Electronics Group Co. Ltd. | 1,247,000 | 3,604,162 | ||||||
Haitian International Holdings Ltd. | 771,000 | 2,009,535 | ||||||
Haitong Securities Co. Ltd. Class H | 1,547,200 | 2,471,479 | ||||||
CONSOLIDATED SCHEDULEOF INVESTMENTS | 13 |
Table of Contents
Consolidated Schedule of Investments (Continued)
iSHARES® CORE MSCI EMERGING MARKETS ETF
August 31, 2014
| Security | Shares | Value | ||||||
Hanergy Solar Group Ltd.a,b | 13,182,000 | $ | 2,160,105 | |||||
Hangzhou Steam Turbine Co. Ltd. Class B | 556,700 | 661,562 | ||||||
Harbin Electric Co. Ltd. Class H | 1,130,000 | 672,155 | ||||||
HC International Inc.a,b | 414,000 | 795,933 | ||||||
Hengan International Group Co. Ltd.b | 834,000 | 8,894,034 | ||||||
Hengdeli Holdings Ltd.b | 3,966,800 | 716,569 | ||||||
Hi Sun Technology (China) Ltd.a,b | 2,472,000 | 590,079 | ||||||
Hidili Industry International Development Ltd.a,b | 3,800,000 | 446,185 | ||||||
Hisense Kelon Electrical Holdings Co. Ltd. Class Ha | 529,000 | 663,456 | ||||||
Honbridge Holdings Ltd.a | 2,506,000 | 501,190 | ||||||
Honghua Group Ltd.b | 2,391,000 | 635,531 | ||||||
Hopson Development Holdings Ltd.a,b | 1,052,000 | 1,060,124 | ||||||
Hua Han Bio-Pharmaceutical Holdings Ltd. Class H | 3,184,160 | 1,010,694 | ||||||
Huabao International Holdings Ltd.b | 2,485,000 | 1,805,197 | ||||||
Huaneng Power International Inc. Class H | 4,208,000 | 5,060,361 | ||||||
Hunan Nonferrous Metal Corp. Ltd. Class Ha | 2,462,000 | 876,773 | ||||||
Industrial and Commercial Bank of China Ltd. Class H | 84,355,000 | 55,945,330 | ||||||
Inner Mongolia Yitai Coal Co. Ltd. Class B | 1,270,500 | 2,145,874 | ||||||
Intime Retail Group Co. Ltd.b | 1,488,500 | 1,354,029 | ||||||
Jiangsu Expressway Co. Ltd. Class H | 1,422,000 | 1,620,131 | ||||||
Jiangsu Future Land Co. Ltd. Class B | 1,203,100 | 609,972 | ||||||
Jiangxi Copper Co. Ltd. Class H | 1,503,000 | 2,656,865 | ||||||
Ju Teng International Holdings Ltd. | 1,178,000 | 682,467 | ||||||
Kaisa Group Holdings Ltd.b | 2,014,000 | 740,618 | ||||||
Kingboard Chemical Holdings Co. Ltd. | 785,200 | 1,631,158 | ||||||
Kingboard Laminates Holdings Ltd.b | 1,420,000 | 630,285 | ||||||
| Security | Shares | Value | ||||||
Kingdee International Software Group Co. Ltd.a | 2,446,000 | $ | 789,017 | |||||
Kingsoft Corp. Ltd.b | 780,000 | 2,234,279 | ||||||
Kunlun Energy Co. Ltd. | 4,208,000 | 6,949,853 | ||||||
KWG Property Holdings Ltd. | 1,468,500 | 1,066,774 | ||||||
Landing International Development Ltd.a | 7,205,000 | 441,588 | ||||||
Lao Feng Xiang Co. Ltd. Class B | 256,006 | 712,721 | ||||||
Lee & Man Paper Manufacturing Ltd. | 1,722,000 | 1,013,183 | ||||||
Lenovo Group Ltd. | 7,760,000 | 11,855,048 | ||||||
Li Ning Co. Ltd.a,b | 1,302,500 | 726,025 | ||||||
Lianhua Supermarket Holdings Co. Ltd. Class Ha | 626,000 | 363,477 | ||||||
Lijun International Pharmaceutical (Holding) Co. Ltd. | 2,678,000 | 1,364,890 | ||||||
Longfor Properties Co. Ltd. | 1,607,000 | 2,052,773 | ||||||
Lonking Holdings Ltd. | 3,815,000 | 669,458 | ||||||
Luthai Textile Co. Ltd. Class B | 472,969 | 651,769 | ||||||
Microport Scientific Corp.a,b | 742,000 | 428,916 | ||||||
MIE Holdings Corp.b | 2,698,000 | 452,559 | ||||||
Mingfa Group International Co. Ltd.a | 3,066,000 | 826,815 | ||||||
Minth Group Ltd.b | 1,052,000 | 2,239,699 | ||||||
MMG Ltd. | 2,140,000 | 778,669 | ||||||
NetDragon Websoft Inc. | 259,000 | 500,612 | ||||||
New China Life Insurance Co. Ltd. Class H | 970,800 | 3,463,497 | ||||||
New World China Land Ltd. | 3,006,000 | 1,842,351 | ||||||
New World Department Store China Ltd.b | 876,000 | 375,260 | ||||||
Nexteer Automotive Group Ltd.b | 992,000 | 852,464 | ||||||
Nine Dragons Paper (Holdings) Ltd.b | 1,936,000 | 1,511,300 | ||||||
North Mining Shares Co. Ltd.a,b | 12,530,000 | 565,860 | ||||||
NVC Lighting Holdings Ltd. | 1,831,000 | 418,169 | ||||||
Parkson Retail Group Ltd.b | 1,696,000 | 560,216 | ||||||
PAX Global Technology Ltd.a | 715,000 | 650,407 | ||||||
People’s Insurance Co. Group of China Ltd. Class H | 7,720,000 | 3,227,396 | ||||||
PetroChina Co. Ltd. Class H | 24,202,000 | 34,350,561 | ||||||
| 14 | 2014 iSHARES ANNUAL REPORTTO SHAREHOLDERS |
Table of Contents
Consolidated Schedule of Investments (Continued)
iSHARES® CORE MSCI EMERGING MARKETS ETF
August 31, 2014
| Security | Shares | Value | ||||||
Phoenix Satellite Television Holdings Ltd.b | 1,786,000 | $ | 606,076 | |||||
PICC Property and Casualty Co. Ltd. Class H | 4,208,000 | 6,982,430 | ||||||
Ping An Insurance (Group) Co. of China Ltd. Class H | 2,367,000 | 19,271,588 | ||||||
Poly Property Group Co. Ltd. | 2,587,000 | 1,124,906 | ||||||
Ports Design Ltd.b | 1,420,500 | 590,183 | ||||||
Real Nutriceutical Group Ltd.b | 2,240,000 | 664,761 | ||||||
Renhe Commercial Holdings Co. Ltd.a,b | 15,500,000 | 709,986 | ||||||
REXLot Holdings Ltd.b | 13,150,000 | 1,510,100 | ||||||
Road King Infrastructure Ltd. | 582,000 | 523,414 | ||||||
Sany Heavy Equipment International Holdings Co. Ltd.a | 1,948,000 | 424,781 | ||||||
Semiconductor Manufacturing International Corp.a,b | 28,430,000 | 2,677,871 | ||||||
Shandong Weigao Group Medical Polymer Co. Ltd. Class H | 2,340,000 | 2,370,148 | ||||||
Shanghai Electric Group Co. Ltd. Class H | 3,452,000 | 1,514,396 | ||||||
Shanghai Fosun Pharmaceutical (Group) Co. Ltd. | 487,000 | 1,583,505 | ||||||
Shanghai Industrial Holdings Ltd. | 573,000 | 1,911,195 | ||||||
Shanghai Industrial Urban Development Group Ltd.a | 2,672,000 | 510,256 | ||||||
Shanghai Jin Jiang International Hotels Group Co. Ltd. Class H | 1,894,000 | 632,950 | ||||||
Shanghai Mechanical and Electrical Industry Co. Ltd. Class B | 354,400 | 748,847 | ||||||
Shanghai Pharmaceuticals Holding Co. Ltd. Class H | 825,900 | 1,694,394 | ||||||
Shenzhen Expressway Co. Ltd. Class H | 1,360,000 | 859,854 | ||||||
Shenzhen International Holdings Ltd. | 1,130,750 | 1,514,446 | ||||||
Shenzhen Investment Ltd.b | 2,880,000 | 917,866 | ||||||
Shenzhou International Group Holdings Ltd.b | 659,000 | 2,053,489 | ||||||
| Security | Shares | Value | ||||||
Shimao Property Holdings Ltd.b | 1,627,500 | $ | 3,582,531 | |||||
Shougang Concord International Enterprises Co. Ltd.a,b | 15,698,000 | 729,183 | ||||||
Shui On Land Ltd. | 4,493,666 | 1,177,028 | ||||||
Shunfeng Photovoltaic International Ltd.a | 1,136,000 | 1,436,463 | ||||||
Sihuan Pharmaceutical Holdings Group Ltd. | 4,980,000 | 3,334,929 | ||||||
Sino Biopharmaceutical Ltd. | 4,208,000 | 3,876,715 | ||||||
Sino Oil And Gas Holdings Ltd.a,b | 17,305,000 | 535,886 | ||||||
Sino-Ocean Land Holdings Ltd. | 3,889,500 | 2,198,152 | ||||||
Sinofert Holdings Ltd.a,b | 3,798,000 | 592,967 | ||||||
Sinopec Engineering Group Co. Ltd. | 1,393,000 | 1,588,888 | ||||||
Sinopec Kantons Holdings Ltd.b | 1,274,000 | 1,066,852 | ||||||
Sinopec Shanghai Petrochemical Co. Ltd. Class H | 4,195,000 | 1,401,915 | ||||||
Sinopharm Group Co. Ltd. Class H | 1,162,000 | 4,055,676 | ||||||
Sinotrans Ltd. Class H | 2,251,000 | 1,516,128 | ||||||
Sinotrans Shipping Ltd.a,b | 2,284,000 | 716,131 | ||||||
Skyworth Digital Holdings Ltd.b | 2,226,000 | 1,194,836 | ||||||
SOHO China Ltd. | 2,039,000 | 1,668,001 | ||||||
Sun Art Retail Group Ltd.b | 2,770,000 | 3,306,065 | ||||||
Sunac China Holdings Ltd.b | 1,853,000 | 1,436,944 | ||||||
Sunny Optical Technology Group Co Ltd.b | 828,000 | 1,128,195 | ||||||
Superb Summit International Group Ltd.a | 5,125,000 | 1,058,044 | ||||||
TCC International Holdings Ltd. | 1,386,000 | 615,193 | ||||||
TCL Communication Technology Holdings Ltd. | 718,000 | 890,303 | ||||||
TCL Multimedia Technology Holdings Ltd.a,b | 940,000 | 360,225 | ||||||
Tech Pro Technology Development Ltd.a,b | 2,014,000 | 1,135,614 | ||||||
Tencent Holdings Ltd. | 5,913,900 | 96,528,241 | ||||||
CONSOLIDATED SCHEDULEOF INVESTMENTS | 15 |
Table of Contents
Consolidated Schedule of Investments (Continued)
iSHARES® CORE MSCI EMERGING MARKETS ETF
August 31, 2014
| Security | Shares | Value | ||||||
Tiangong International Co. Ltd.b | 2,182,000 | $ | 495,516 | |||||
Tianjin Development Holdings Ltd.b | 630,000 | 528,377 | ||||||
Tianjin Port Development Holdings Ltd.b | 3,424,000 | 569,919 | ||||||
Tianneng Power International Ltd.b | 1,264,000 | 463,186 | ||||||
Tibet 5100 Water Resources Holdings Ltd.b | 1,950,000 | 641,600 | ||||||
Tingyi (Cayman Islands) Holding Corp. | 2,230,000 | 6,258,266 | ||||||
Tong Ren Tang Technologies Co. Ltd. Class H | 1,052,000 | 1,476,844 | ||||||
Tongda Group Holdings Ltd. | 3,700,000 | 506,055 | ||||||
Towngas China Co. Ltd. | 1,165,000 | 1,241,640 | ||||||
Travelsky Technology Ltd. Class H | 1,174,000 | 1,154,285 | ||||||
Tsingtao Brewery Co. Ltd. Class H | 410,000 | 3,113,295 | ||||||
Uni-President China Holdings Ltd. | 1,588,200 | 1,434,475 | ||||||
V1 Group Ltd.a | 4,770,000 | 461,604 | ||||||
Vinda International Holdings Ltd. | 398,000 | 612,138 | ||||||
Wanda Commercial Properties Group Co. Ltd.a | 1,321,000 | 378,395 | ||||||
Want Want China Holdings Ltd. | 6,858,000 | 8,503,755 | ||||||
Wasion Group Holdings Ltd. | 828,000 | 691,233 | ||||||
Weichai Power Co. Ltd. Class H | 571,000 | 2,313,426 | ||||||
Weiqiao Textile Co. Ltd. Class H | 833,500 | 422,657 | ||||||
Welling Holding Ltd. | 1,572,000 | 405,670 | ||||||
West China Cement Ltd. | 5,472,000 | 586,022 | ||||||
Wisdom Holdings Groupb | 979,000 | 545,703 | ||||||
Xingda International Holdings Ltd. | 1,347,000 | 502,291 | ||||||
Xinhua Winshare Publishing and Media Co. Ltd. Class H | 1,000,000 | 868,370 | ||||||
XTEP International Holdings Ltd.b | 1,170,000 | 548,002 | ||||||
Yanchang Petroleum International Ltd.a,b | 9,050,000 | 478,765 | ||||||
| Security | Shares | Value | ||||||
Yanzhou Coal Mining Co. Ltd. Class Hb | 2,200,000 | $ | 1,862,158 | |||||
Yashili International Holdings Ltd.b | 1,161,000 | 387,991 | ||||||
Yingde Gases Group Co. Ltd.b | 1,367,000 | 1,462,221 | ||||||
Yuanda China Holdings Ltd. | 5,074,000 | 327,349 | ||||||
YuanShengTai Dairy Farm Ltd.a,b | 3,688,000 | 647,172 | ||||||
Yuexiu Property Co. Ltd. | 6,502,000 | 1,392,659 | ||||||
Yuexiu Real Estate Investment Trustb | 1,482,000 | 764,888 | ||||||
Yuexiu Transport Infrastructure Ltd. | 1,216,000 | 740,569 | ||||||
Yuzhou Properties Co. Ltd.b | 2,269,400 | 509,507 | ||||||
Zhejiang Expressway Co. Ltd. Class H | 2,104,000 | 2,093,100 | ||||||
Zhongsheng Group Holdings Ltd.b | 801,500 | 888,355 | ||||||
Zhuzhou CSR Times Electric Co. Ltd. Class H | 628,000 | 2,175,674 | ||||||
Zijin Mining Group Co. Ltd. Class H | 7,310,000 | 1,905,279 | ||||||
Zoomlion Heavy Industry Science and Technology Co. Ltd. Class H | 1,649,400 | 1,027,929 | ||||||
ZTE Corp. Class H | 719,200 | 1,620,257 | ||||||
|
| |||||||
| 1,073,490,829 | ||||||||
COLOMBIA — 0.61% |
| |||||||
Almacenes Exito SA | 228,201 | 3,884,930 | ||||||
Bolsa de Valores de Colombia | 70,105,382 | 913,568 | ||||||
Cementos Argos SA | 474,048 | 2,792,224 | ||||||
Cemex Latam Holdings SAa | 204,420 | 2,024,541 | ||||||
Corporacion Financiera Colombiana SA NVS | 88,561 | 1,888,058 | ||||||
Ecopetrol SA | 5,611,123 | 9,725,030 | ||||||
Grupo Argos SA | 309,102 | 3,831,450 | ||||||
Grupo de Inversiones Suramericana SA | 266,912 | 6,135,588 | ||||||
Interconexion Electrica SA ESP | 429,396 | 2,171,097 | ||||||
Isagen SA ESP | 962,192 | 1,439,439 | ||||||
|
| |||||||
| 34,805,925 | ||||||||
CZECH REPUBLIC — 0.20% |
| |||||||
CEZ AS | 188,795 | 5,488,409 | ||||||
Komercni Banka AS | 18,705 | 4,350,145 | ||||||
| 16 | 2014 iSHARES ANNUAL REPORTTO SHAREHOLDERS |
Table of Contents
Consolidated Schedule of Investments (Continued)
iSHARES® CORE MSCI EMERGING MARKETS ETF
August 31, 2014
| Security | Shares | Value | ||||||
O2 Czech Republic AS | 34,709 | $ | 487,622 | |||||
Pegas Nonwovens SA | 18,891 | 564,866 | ||||||
Philip Morris CR AS | 750 | 370,598 | ||||||
|
| |||||||
| 11,261,640 | ||||||||
EGYPT — 0.32% |
| |||||||
Citadel Capital SAEa | 1,364,817 | 870,423 | ||||||
Commercial International Bank (Egypt) SAE | 1,012,705 | 6,545,003 | ||||||
EFG-Hermes Holding Co. SAEa | 443,422 | 1,123,741 | ||||||
Egyptian Kuwaiti Holding Co. SAEa | 713,388 | 691,986 | ||||||
ezzsteela | 345,127 | 827,334 | ||||||
Global Telecom Holding SAEa | 2,547,167 | 1,927,283 | ||||||
Global Telecom Holding SAE GDRa | 199,452 | 715,634 | ||||||
Orascom Telecom Media And Technology Holding SAE SP GDRa | 50,000 | 35,500 | ||||||
Palm Hills Developments SAEa | 1,806,060 | 1,101,310 | ||||||
Pioneers Holding For Financial Investments SAEa | 348,529 | 754,085 | ||||||
Six of October Development & Investment Co.a | 114,554 | 726,892 | ||||||
South Valley Cement Co. | 408,965 | 483,319 | ||||||
Talaat Moustafa Group Holding Co. SAE | 1,332,071 | 1,944,996 | ||||||
Telecom Egypt Co. | 348,002 | 701,353 | ||||||
|
| |||||||
| 18,448,859 | ||||||||
GREECE — 0.70% |
| |||||||
Alpha Bank AEa | 4,418,880 | 3,876,486 | ||||||
Athens Water Supply & Sewage Co. SA | 37,905 | 471,325 | ||||||
Ellaktor SAa | 155,720 | 713,798 | ||||||
Eurobank Ergasias SAa | 9,365,305 | 3,984,522 | ||||||
Folli Follie Groupa | 39,173 | 1,625,359 | ||||||
Frigoglass SAa | 63,414 | 267,292 | ||||||
Hellenic Exchanges – Athens Stock Exchange SA Holding | 83,990 | 785,485 | ||||||
Hellenic Telecommunications Organization SAa | 284,104 | 4,071,534 | ||||||
Intralot SAa | 180,110 | 419,916 | ||||||
Jumbo SAa | 119,722 | 1,766,216 | ||||||
| Security | Shares | Value | ||||||
Marfin Investment Group Holdings SAa | 851,158 | $ | 447,337 | |||||
Metka SA | 39,203 | 590,225 | ||||||
Motor Oil (Hellas) Corinth Refineries SA | 67,432 | 727,448 | ||||||
Mytilineos Holdings SAa | 98,052 | 798,172 | ||||||
National Bank of Greece SAa | 1,831,220 | 6,295,538 | ||||||
OPAP SA | 258,514 | 4,116,823 | ||||||
Piraeus Bank SAa | 2,473,175 | 4,886,500 | ||||||
Piraeus Port Authority SA | 13,844 | 307,265 | ||||||
Public Power Corp. SAa | 130,680 | 1,902,056 | ||||||
Titan Cement Co. SA | 53,700 | 1,435,893 | ||||||
|
| |||||||
| 39,489,190 | ||||||||
HUNGARY — 0.18% |
| |||||||
Magyar Telekom Telecommunications PLCa | 553,937 | 853,495 | ||||||
MOL Hungarian Oil and Gas PLC | 45,782 | 2,255,751 | ||||||
OTP Bank PLC | 261,850 | 4,526,549 | ||||||
Richter Gedeon Nyrt | 163,311 | 2,628,098 | ||||||
|
| |||||||
| 10,263,893 | ||||||||
INDIA — 6.58% |
| |||||||
ACC Ltd. | 28,578 | 702,935 | ||||||
Adani Enterprises Ltd. | 162,129 | 1,279,558 | ||||||
Adani Ports & Special Economic Zone Ltd. | 597,120 | 2,783,378 | ||||||
Aditya Birla Nuvo Ltd. | 50,453 | 1,208,777 | ||||||
Amara Raja Batteries Ltd. | 67,724 | 616,246 | ||||||
Ambuja Cements Ltd. | 848,486 | 2,884,685 | ||||||
Apollo Hospitals Enterprise Ltd. | 92,444 | 1,787,332 | ||||||
Apollo Tyres Ltd. | 195,819 | 533,436 | ||||||
Arvind Ltd. | 183,648 | 867,697 | ||||||
Ashok Leyland Ltd.a | 1,524,335 | 915,656 | ||||||
Asian Paints Ltd. | 337,712 | 3,473,959 | ||||||
Aurobindo Pharma Ltd. | 159,062 | 2,143,064 | ||||||
Bajaj Auto Ltd. | 93,725 | 3,488,739 | ||||||
Bajaj Finance Ltd. | 20,300 | 826,787 | ||||||
Balrampur Chini Mills Ltd. | 485,675 | 575,879 | ||||||
Bayer CropScience Ltd. | 13,806 | 544,345 | ||||||
Berger Paints India Ltd. | 120,790 | 686,461 | ||||||
Bharat Forge Ltd. | 116,608 | 1,521,400 | ||||||
Bharat Heavy Electricals Ltd. | 695,353 | 2,760,556 | ||||||
Bharat Petroleum Corp. Ltd. | 210,401 | 2,407,406 | ||||||
Bharti Airtel Ltd. | 695,255 | 4,237,068 | ||||||
CONSOLIDATED SCHEDULEOF INVESTMENTS | 17 |
Table of Contents
Consolidated Schedule of Investments (Continued)
iSHARES® CORE MSCI EMERGING MARKETS ETF
August 31, 2014
| Security | Shares | Value | ||||||
Biocon Ltd. | 78,661 | $ | 601,560 | |||||
Britannia Industries Ltd. | 36,558 | 748,812 | ||||||
Cairn India Ltd. | 495,405 | 2,663,577 | ||||||
Century Textiles & Industries Ltd. | 53,570 | 523,914 | ||||||
CESC Ltd. | 78,961 | 905,033 | ||||||
Cipla Ltd. | 401,540 | 3,402,635 | ||||||
Coal India Ltd. | 586,283 | 3,440,596 | ||||||
Dabur India Ltd. | 605,347 | 2,320,430 | ||||||
DCB Bank Ltd.a | 724,051 | 1,020,210 | ||||||
Dewan Housing Finance Corp. Ltd. | 109,315 | 642,505 | ||||||
Divi’s Laboratories Ltd. | 49,070 | 1,265,364 | ||||||
DLF Ltd. | 512,967 | 1,498,831 | ||||||
Dr. Reddy’s Laboratories Ltd. | 135,668 | 6,590,898 | ||||||
GAIL (India) Ltd. | 373,442 | 2,728,810 | ||||||
Gateway Distriparks Ltd. | 195,419 | 849,564 | ||||||
GlaxoSmithKline Consumer Healthcare Ltd. | 11,963 | 1,051,317 | ||||||
GMR Infrastructure Ltd. | 1,803,336 | 753,371 | ||||||
Godrej Consumer Products Ltd. | 139,557 | 2,267,571 | ||||||
Godrej Industries Ltd. | 111,823 | 594,497 | ||||||
Gruh Finance Ltd. | 220,242 | 754,768 | ||||||
Gujarat Pipavav Port Ltd.a | 333,365 | 788,363 | ||||||
Havells India Ltd. | 320,752 | 1,502,270 | ||||||
HCL Technologies Ltd. | 284,664 | 7,650,228 | ||||||
HDFC Bank Ltd. | 446,333 | 6,204,749 | ||||||
Hero Motocorp Ltd. | 55,637 | 2,388,320 | ||||||
Hexaware Technologies Ltd. | 218,682 | 576,257 | ||||||
Hindalco Industries Ltd. | 1,316,792 | 3,691,271 | ||||||
Hindustan Unilever Ltd. | 868,216 | 10,623,055 | ||||||
Housing Development & Infrastructure Ltd.a | 370,431 | 551,862 | ||||||
Housing Development Finance Corp. Ltd. | 1,712,747 | 30,328,719 | ||||||
ICICI Bank Ltd. | 254,732 | 6,535,379 | ||||||
Idea Cellular Ltd. | 1,257,922 | 3,356,255 | ||||||
IFCI Ltd. | 849,256 | 470,254 | ||||||
Indiabulls Housing Finance Ltd. | 214,530 | 1,334,625 | ||||||
Indiabulls Real Estate Ltd. | 303,813 | 344,468 | ||||||
Indian Hotels Co. Ltd.a | 469,894 | 747,664 | ||||||
Infosys Ltd. | 528,850 | 31,364,953 | ||||||
IRB Infrastructure Developers Ltd. | 160,257 | 664,084 | ||||||
| Security | Shares | Value | ||||||
ITC Ltd. | 2,548,532 | $ | 14,922,436 | |||||
Jain Irrigation Systems Ltd. | 441,638 | 648,119 | ||||||
Jaiprakash Associates Ltd. | 1,374,028 | 1,052,938 | ||||||
Jammu & Kashmir Bank Ltd. (The) | 31,090 | 762,596 | ||||||
Jindal Steel & Power Ltd. | 440,920 | 1,693,051 | ||||||
JSW Steel Ltd. | 103,386 | 2,118,834 | ||||||
Just Dial Ltd.a | 27,610 | 749,583 | ||||||
Kailash Auto Finance Ltd.a | 485,675 | 264,128 | ||||||
Karur Vysya Bank Ltd. (The) | 87,409 | 677,103 | ||||||
Kaveri Seed Co. Ltd. | 31,471 | 469,161 | ||||||
KPIT Technologies Ltd. | 134,234 | 327,732 | ||||||
Larsen & Toubro Ltd. | 367,765 | 9,251,702 | ||||||
LIC Housing Finance Ltd. | 350,023 | 1,745,789 | ||||||
Mahindra & Mahindra Financial Services Ltd. | 336,865 | 1,550,534 | ||||||
Mahindra & Mahindra Ltd. | 390,384 | 9,053,203 | ||||||
MAX India Ltd. | 180,419 | 967,805 | ||||||
MindTree Ltd. | 63,060 | 1,170,840 | ||||||
Mphasis Ltd. | 93,778 | 688,653 | ||||||
MRF Ltd. | 1,563 | 618,991 | ||||||
Nestle India Ltd. | 26,432 | 2,626,016 | ||||||
NIIT Technologies Ltd. | 74,296 | 440,291 | ||||||
NTPC Ltd. | 1,892,870 | 4,286,097 | ||||||
Oil & Natural Gas Corp. Ltd. | 881,754 | 6,321,078 | ||||||
Oil India Ltd. | 134,127 | 1,360,279 | ||||||
Page Industries Ltd. | 6,692 | 785,455 | ||||||
Piramal Enterprises Ltd. | 84,455 | 959,165 | ||||||
Power Finance Corp. Ltd. | 324,833 | 1,338,839 | ||||||
Power Grid Corp. of India Ltd. | 916,214 | 1,950,805 | ||||||
Prestige Estates Projects Ltd. | 161,760 | 594,204 | ||||||
PTC India Ltd. | 400,652 | 575,756 | ||||||
Rallis India Ltd. | 113,020 | 434,255 | ||||||
Ramco Cements Ltd. (The) | 91,424 | 503,374 | ||||||
Ranbaxy Laboratories Ltd.a | 152,215 | 1,607,188 | ||||||
Raymond Ltd. | 84,667 | 634,375 | ||||||
Redington India Ltd. | 312,592 | 540,906 | ||||||
Reliance Capital Ltd. | 123,906 | 1,079,787 | ||||||
Reliance Communications Ltd. | 1,000,229 | 1,912,106 | ||||||
Reliance Industries Ltd. | 1,483,465 | 24,415,565 | ||||||
Reliance Infrastructure Ltd. | 129,160 | 1,488,490 | ||||||
Reliance Power Ltd.a | 717,852 | 881,936 | ||||||
Rural Electrification Corp. Ltd. | 366,497 | 1,620,789 | ||||||
Sesa Sterlite Ltd. | 1,371,773 | 6,265,440 | ||||||
Shree Renuka Sugars Ltd. | 1,102,864 | 352,597 | ||||||
| 18 | 2014 iSHARES ANNUAL REPORTTO SHAREHOLDERS |
Table of Contents
Consolidated Schedule of Investments (Continued)
iSHARES® CORE MSCI EMERGING MARKETS ETF
August 31, 2014
| Security | Shares | Value | ||||||
Shriram Transport Finance Co. Ltd. | 176,353 | $ | 2,627,712 | |||||
Siemens Ltd. | 92,075 | 1,205,260 | ||||||
SKS Microfinance Ltd.a | 126,124 | 616,278 | ||||||
Sobha Developers Ltd. | 67,088 | 502,718 | ||||||
State Bank of India | 174,378 | 7,071,390 | ||||||
Sun Pharma Advanced Research Co. Ltd.a | 122,222 | 395,086 | ||||||
Sun Pharmaceuticals Industries Ltd. | 839,259 | 11,828,877 | ||||||
Sundaram Finance Ltd. | 47,268 | 727,949 | ||||||
Supreme Industries Ltd. | 59,597 | 579,519 | ||||||
Suzlon Energy Ltd.a | 1,469,197 | 521,773 | ||||||
Tata Consultancy Services Ltd. | 540,846 | 22,481,920 | ||||||
Tata Global Beverages Ltd. | 368,205 | 913,231 | ||||||
Tata Motors Ltd. | 865,862 | 7,492,103 | ||||||
Tata Power Co. Ltd. | 1,351,174 | 1,928,340 | ||||||
Tata Steel Ltd. | 359,570 | 3,040,760 | ||||||
Tech Mahindra Ltd. | 66,010 | 2,570,561 | ||||||
Thermax Ltd. | 53,969 | 763,909 | ||||||
Torrent Pharmaceuticals Ltd. | 56,718 | 778,377 | ||||||
TTK Prestige Ltd. | 5,047 | 389,296 | ||||||
TV18 Broadcast Ltd.a | 819,744 | 392,445 | ||||||
Ultratech Cement Ltd. | 42,797 | 1,798,525 | ||||||
Unitech Ltd.a | 1,709,387 | 611,300 | ||||||
United Breweries Ltd. | 79,549 | 927,176 | ||||||
United Spirits Ltd. | 70,009 | 2,766,728 | ||||||
Vijaya Bank | 692,494 | 515,262 | ||||||
Wipro Ltd. | 710,942 | 6,622,610 | ||||||
Yes Bank Ltd. | 129,273 | 1,218,698 | ||||||
|
| |||||||
| 372,988,197 | ||||||||
INDONESIA — 2.65% |
| |||||||
PT ACE Hardware Indonesia Tbk | 10,194,400 | 814,855 | ||||||
PT Adaro Energy Tbk | 17,167,700 | 1,929,944 | ||||||
PT Alam Sutera Realty Tbk | 15,971,800 | 696,355 | ||||||
PT Aneka Tambang (Persero) Tbk | 5,062,500 | 517,178 | ||||||
PT Arwana Citramulia Tbk | 7,412,800 | 643,214 | ||||||
PT Astra Agro Lestari Tbk | 479,600 | 1,045,505 | ||||||
PT Astra International Tbk | 23,246,100 | 15,053,576 | ||||||
PT Bank Bukopin Tbk | 7,849,600 | 496,577 | ||||||
PT Bank Central Asia Tbk | 14,327,000 | 13,717,666 | ||||||
PT Bank Danamon | 4,171,900 | 1,337,433 | ||||||
| Security | Shares | Value | ||||||
PT Bank Mandiri (Persero) Tbk | 10,872,700 | $ | 9,643,451 | |||||
PT Bank Negara Indonesia (Persero) Tbk | 8,946,800 | 4,091,932 | ||||||
PT Bank Pembangunan Daerah Jawa Barat dan Banten Tbk | 5,754,700 | 428,005 | ||||||
PT Bank Rakyat Indonesia (Persero) Tbk | 12,951,100 | 12,234,209 | ||||||
PT Bank Tabungan Negara (Persero) Tbk | 6,450,176 | 614,828 | ||||||
PT Benakat Integra Tbka | 40,964,600 | 462,263 | ||||||
PT Bukit Asam (Persero) Tbk | 1,008,500 | 1,150,970 | ||||||
PT Bumi Serpong Damai Tbk | 9,363,800 | 1,284,796 | ||||||
PT Charoen Pokphand Indonesia Tbk | 8,761,300 | 2,879,863 | ||||||
PT Ciputra Development Tbk | 13,314,100 | 1,382,914 | ||||||
PT Ciputra Property Tbk | 6,260,700 | 404,089 | ||||||
PT Energi Mega Persada Tbka | 66,627,500 | 512,629 | ||||||
PT Gajah Tunggal Tbk | 2,530,100 | 382,841 | ||||||
PT Global Mediacom Tbk | 7,688,800 | 1,271,881 | ||||||
PT Gudang Garam Tbk | 570,500 | 2,633,640 | ||||||
PT Hanson International Tbka | 9,504,500 | 540,328 | ||||||
PT Indo Tambangraya Megah Tbk | 492,300 | 1,185,771 | ||||||
PT Indocement Tunggal Prakarsa Tbk | 1,729,200 | 3,584,792 | ||||||
PT Indofood CBP Sukses Makmur Tbk | 1,419,300 | 1,274,003 | ||||||
PT Indofood Sukses Makmur Tbk | 5,108,100 | 3,002,196 | ||||||
PT Japfa Comfeed Indonesia Tbk | 6,772,600 | 746,882 | ||||||
PT Jasa Marga (Persero) Tbk | 2,602,100 | 1,379,185 | ||||||
PT Kalbe Farma Tbk | 25,535,600 | 3,623,774 | ||||||
PT Kawasan Industri Jababeka Tbk | 27,696,423 | 670,065 | ||||||
PT Krakatau Steel (Persero) Tbka | 3,841,400 | 165,839 | ||||||
PT Lippo Cikarang Tbka | 656,700 | 478,595 | ||||||
PT Lippo Karawaci Tbk | 21,042,500 | 1,924,811 | ||||||
PT Matahari Department Store Tbk | 2,423,000 | 3,371,175 | ||||||
PT Medco Energi Internasional Tbk | 2,100,500 | 655,424 | ||||||
CONSOLIDATED SCHEDULEOF INVESTMENTS | 19 |
Table of Contents
Consolidated Schedule of Investments (Continued)
iSHARES® CORE MSCI EMERGING MARKETS ETF
August 31, 2014
| Security | Shares | Value | ||||||
PT Media Nusantara Citra Tbk | 6,174,200 | $ | 1,480,541 | |||||
PT Mitra Adiperkasa Tbk | 1,102,300 | 567,759 | ||||||
PT MNC Investama Tbk | 37,956,500 | 1,223,304 | ||||||
PT MNC Sky Vision Tbk | 1,676,400 | 233,600 | ||||||
PT Modernland Realty Tbk | 15,965,300 | 730,193 | ||||||
PT Multipolar Tbk | 9,384,053 | 633,760 | ||||||
PT Pakuwon Jati Tbk | 28,290,900 | 1,052,066 | ||||||
PT Panin Financial Tbka | 23,170,500 | 520,952 | ||||||
PT Pembangunan Perumahan (Persero) Tbk | 3,100,700 | 653,407 | ||||||
PT Perusahaan Gas Negara (Persero) Tbk | 12,728,300 | 6,311,104 | ||||||
PT Perusahaan Perkebunan London Sumatra Indonesia Tbk | 3,930,800 | 628,390 | ||||||
PT Ramayana Lestari Sentosa Tbk | 5,348,500 | 454,948 | ||||||
PT Salim Ivomas Pratama Tbk | 5,669,700 | 402,295 | ||||||
PT Semen Gresik (Persero) Tbk | 3,451,500 | 4,787,398 | ||||||
PT Sigmagold Inti Perkasa Tbka | 13,929,900 | 526,353 | ||||||
PT Sugih Energy Tbka | 24,668,400 | 881,504 | ||||||
PT Summarecon Agung Tbk | 12,629,200 | 1,446,730 | ||||||
PT Surya Citra Media Tbk | 5,474,300 | 1,923,434 | ||||||
PT Telekomunikasi Indonesia (Persero) Tbk | 58,369,800 | 13,298,185 | ||||||
PT Timah (Persero) Tbk | 4,328,452 | 529,146 | ||||||
PT Tower Bersama Infrastructure Tbk | 2,393,500 | 1,611,354 | ||||||
PT Trada Maritime Tbka | 5,988,800 | 944,590 | ||||||
PT Unilever Indonesia Tbk | 1,758,300 | 4,663,497 | ||||||
PT United Tractors Tbk | 1,994,900 | 3,777,477 | ||||||
PT Wijaya Karya (Persero) Tbk | 3,141,600 | 770,797 | ||||||
PT XL Axiata Tbk | 3,691,400 | 1,877,652 | ||||||
|
| |||||||
| 150,163,890 | ||||||||
MALAYSIA — 3.89% |
| |||||||
AEON Credit Service (M) Bhd | 115,200 | 607,432 | ||||||
AirAsia Bhd | 1,618,100 | 1,237,189 | ||||||
Alliance Financial Group Bhd | 1,401,600 | 2,161,097 | ||||||
AMMB Holdings Bhd | 2,340,100 | 4,959,349 | ||||||
Astro Malaysia Holdings Bhd | 2,146,800 | 2,233,980 | ||||||
Axiata Group Bhd | 2,836,700 | 6,236,780 | ||||||
| Security | Shares | Value | ||||||
Berjaya Corp. Bhd | 4,299,000 | $ | 695,587 | |||||
Berjaya Sports Toto Bhd | 777,945 | 928,006 | ||||||
British American Tobacco (Malaysia) Bhd | 159,900 | 3,652,538 | ||||||
Bumi Armada Bhda | 1,353,100 | 1,266,385 | ||||||
Bursa Malaysia Bhd | 461,900 | 1,181,128 | ||||||
Cahya Mata Sarawak Bhd | 542,500 | 721,153 | ||||||
CapitaMalls Malaysia Trust Bhd | 1,726,300 | 772,234 | ||||||
Carlsberg Brewery Malaysia Bhd | 222,600 | 882,773 | ||||||
CIMB Group Holdings Bhd | 5,799,200 | 13,578,076 | ||||||
Dialog Group Bhd | 4,559,096 | 2,502,296 | ||||||
DiGi.Com Bhd | 3,657,500 | 6,648,945 | ||||||
DRB-Hicom Bhdb | 1,131,400 | 793,272 | ||||||
Eastern & Oriental Bhd | 937,000 | 844,251 | ||||||
Felda Global Ventures Holdings Bhd | 1,634,800 | 1,981,261 | ||||||
Gamuda Bhd | 1,995,100 | 3,057,212 | ||||||
Genting Bhd | 2,364,600 | 7,186,824 | ||||||
Genting Malaysia Bhd | 3,475,700 | 4,973,162 | ||||||
Genting Plantations Bhd | 328,500 | 1,048,449 | ||||||
Hartalega Holdings Bhd | 460,900 | 1,008,950 | ||||||
Hong Leong Bank Bhd | 671,800 | 3,069,137 | ||||||
Hong Leong Financial Group Bhd | 311,600 | 1,684,538 | ||||||
IGB Corp. Bhd | 1,025,100 | 933,387 | ||||||
IHH Healthcare Bhd | 3,033,300 | 4,696,226 | ||||||
IJM Corp. Bhd | 1,310,400 | 2,702,284 | ||||||
IJM Land Bhd | 805,300 | 843,112 | ||||||
IOI Corp. Bhd | 3,442,900 | 5,221,149 | ||||||
IOI Properties Group Bhda | 1,830,149 | 1,428,352 | ||||||
KPJ Healthcare Bhdb | 803,850 | 976,759 | ||||||
Kuala Lumpur Kepong Bhd | 587,300 | 4,106,628 | ||||||
Lafarge Malaysia Bhd | 550,200 | 1,780,470 | ||||||
Magnum Bhd | 859,100 | 836,750 | ||||||
Mah Sing Group Bhdb | 1,126,860 | 875,891 | ||||||
Malayan Banking Bhd | 5,144,800 | 16,485,558 | ||||||
Malaysia Airports Holdings Bhd | 871,400 | 2,128,737 | ||||||
Malaysia Building Society Bhdb | 1,281,100 | 1,012,037 | ||||||
Malaysian Airline System Bhda | 6,107,500 | 484,415 | ||||||
Malaysian Resources Corp. Bhd | 1,964,800 | 1,059,695 | ||||||
| 20 | 2014 iSHARES ANNUAL REPORTTO SHAREHOLDERS |
Table of Contents
Consolidated Schedule of Investments (Continued)
iSHARES® CORE MSCI EMERGING MARKETS ETF
August 31, 2014
| Security | Shares | Value | ||||||
Maxis Bhd | 2,125,100 | $ | 4,416,055 | |||||
Media Chinese International Ltd. | 1,225,700 | 353,866 | ||||||
Media Prima Bhd | 1,413,200 | 1,022,239 | ||||||
MISC Bhd | 1,346,100 | 2,938,188 | ||||||
MMC Corp. Bhd | 1,258,200 | 985,963 | ||||||
OSK Holdings Bhd | 996,000 | 717,297 | ||||||
Parkson Holdings Bhda | 647,189 | 615,979 | ||||||
Pavilion Real Estate Investment Trust Bhd | 1,189,400 | 524,513 | ||||||
Petronas Chemicals Group Bhd | 3,202,800 | 6,401,536 | ||||||
Petronas Dagangan Bhd | 310,000 | 1,976,840 | ||||||
Petronas Gas Bhd | 824,300 | 5,962,576 | ||||||
POS Malaysia Bhd | 556,100 | 855,674 | ||||||
PPB Group Bhd | 586,800 | 2,751,556 | ||||||
Public Bank Bhd | 3,159,360 | 19,325,019 | ||||||
QL Resources Bhd | 841,450 | 886,299 | ||||||
RHB Capital Bhd | 695,300 | 2,022,811 | ||||||
Sapurakencana Petroleum Bhd | 4,298,800 | 5,755,373 | ||||||
Sarawak Oil Palms Bhd | 252,000 | 487,690 | ||||||
Sime Darby Bhdb | 3,412,000 | 10,240,330 | ||||||
Sunway Bhd | 868,900 | 826,999 | ||||||
Sunway Real Estate Investment Trust Bhd | 2,072,600 | 960,024 | ||||||
Supermax Corp. Bhdb | 947,700 | 661,466 | ||||||
Ta Ann Holdings Bhd | 482,100 | 593,448 | ||||||
TA Enterprise Bhd | 2,068,500 | 607,031 | ||||||
TAN Chong Motor Holdings Bhd | 109,751 | 156,688 | ||||||
Telekom Malaysia Bhd | 1,306,100 | 2,635,405 | ||||||
Tenaga Nasional Bhd | 3,262,500 | 12,814,007 | ||||||
TIME dotCom Bhda | 549,000 | 849,975 | ||||||
Top Glove Corp. Bhdb | 662,000 | 1,006,022 | ||||||
TSH Resources Bhd | 770,600 | 831,231 | ||||||
UEM Sunrise Bhd | 2,030,000 | 1,236,548 | ||||||
UMW Holdings Bhd | 671,200 | 2,631,990 | ||||||
UOA Development Bhd | 779,500 | 521,810 | ||||||
WCT Holdings Bhd | 1,460,480 | 986,936 | ||||||
YTL Corp. Bhd | 5,256,600 | 2,701,679 | ||||||
YTL Power International Bhda | 2,026,335 | 957,880 | ||||||
|
| |||||||
| 220,702,397 | ||||||||
MEXICO — 4.89% |
| |||||||
Alfa SAB de CV Series A | 3,268,500 | 10,516,293 | ||||||
Alsea SAB de CVa,b | 586,500 | 2,023,404 | ||||||
| Security | Shares | Value | ||||||
America Movil SAB de CV Series L | 39,040,500 | $ | 47,742,541 | |||||
Arca Continental SAB de CV | 464,000 | 3,410,935 | ||||||
Axtel SAB de CV CPOa,b | 1,423,800 | 445,363 | ||||||
Banregio Grupo Financiero SAB de CV | 241,500 | 1,363,430 | ||||||
Bolsa Mexicana de Valores SAB de CV | 536,200 | 1,147,404 | ||||||
Cemex SAB de CV CPOa | 13,806,091 | 18,340,545 | ||||||
Coca-Cola FEMSA SAB de CV Series L | 481,200 | 5,246,075 | ||||||
Compartamos SAB de CV | 1,265,300 | 2,701,784 | ||||||
Concentradora Fibra Hotelera Mexicana SAB de CV | 595,300 | 1,038,491 | ||||||
Consorcio ARA SAB de CVa | 1,113,200 | 508,264 | ||||||
Controladora Comercial Mexicana SAB de CV BC Units | 477,000 | 1,837,155 | ||||||
Controladora Vuela Cia de Aviacion SAB de CVa,b | 568,500 | 503,913 | ||||||
Corporacion Inmobiliaria Vesta SAB de CV | 483,400 | 1,051,054 | ||||||
El Puerto de Liverpool SAB de CV Series C1 | 205,800 | 2,346,738 | ||||||
Empresas ICA SAB de CVa,b | 710,600 | 1,317,345 | ||||||
Fibra Uno Administracion SAB de CV | 2,632,100 | 9,451,042 | ||||||
Fomento Economico Mexicano SAB de CV BD Units | 2,211,400 | 21,467,095 | ||||||
Genomma Lab Internacional SAB de CV Series Ba,b | 938,100 | 2,502,461 | ||||||
Gruma SAB de CV Series Ba | 210,400 | 2,400,319 | ||||||
Grupo Aeromexico SAB de CVa,b | 662,100 | 1,069,953 | ||||||
Grupo Aeroportuario del Centro Norte SAB de CVb | 294,700 | 1,260,118 | ||||||
Grupo Aeroportuario del Pacifico SAB de CV Series B | 372,400 | 2,585,197 | ||||||
Grupo Aeroportuario del Sureste SAB de CV Series B | 237,400 | 3,043,143 | ||||||
Grupo Bimbo SAB de CV Series A | 1,905,700 | 5,998,900 | ||||||
CONSOLIDATED SCHEDULEOF INVESTMENTS | 21 |
Table of Contents
Consolidated Schedule of Investments (Continued)
iSHARES® CORE MSCI EMERGING MARKETS ETF
August 31, 2014
| Security | Shares | Value | ||||||
Grupo Carso SAB de CV Series A1 | 673,200 | $ | 4,113,700 | |||||
Grupo Comercial Chedraui SAB de CV | 404,100 | 1,404,020 | ||||||
Grupo Famsa SAB de CV Series Aa,b | 457,400 | 518,425 | ||||||
Grupo Financiero Banorte SAB de CV Series O | 2,874,300 | 20,234,738 | ||||||
Grupo Financiero Inbursa SAB de CV Series O | 2,730,700 | 8,297,251 | ||||||
Grupo Financiero Santander Mexico SAB de CV Series B | 2,115,300 | 6,335,142 | ||||||
Grupo Herdez SAB de CVb | 309,600 | 867,084 | ||||||
Grupo Lala SAB de CV | 687,000 | 1,783,242 | ||||||
Grupo Mexico SAB de CV Series B | 4,387,400 | 15,938,320 | ||||||
Grupo Simec SAB de CV Series Ba | 154,500 | 691,708 | ||||||
Grupo Televisa SAB de CV CPO | 2,962,600 | 22,043,620 | ||||||
Industrias CH SAB de CV Series Ba,b | 193,100 | 1,066,994 | ||||||
Industrias Penoles SAB de CV | 164,360 | 4,170,750 | ||||||
Kimberly-Clark de Mexico SAB de CV Series A | 1,733,800 | 4,626,384 | ||||||
Macquarie Mexico Real Estate Management SA de CV | 688,700 | 1,380,508 | ||||||
Mexichem SAB de CV | 1,105,000 | 4,765,474 | ||||||
Minera Frisco SAB de CV Series A1a | 773,700 | 1,555,625 | ||||||
OHL Mexico SAB de CVa | 816,900 | 2,399,064 | ||||||
Promotora y Operadora Infraestructura SAB de CVa | 312,600 | 4,382,209 | ||||||
Qualitas Controladora SAB de CV | 271,800 | 743,550 | ||||||
TF Administradora Industrial S de RL SAB de CV | 530,300 | 1,214,270 | ||||||
TV Azteca SAB de CV CPO | 1,321,000 | 709,221 | ||||||
Urbi Desarrollos Urbanos SAB de CVa,b,c | 558,900 | — | ||||||
Wal-Mart de Mexico SAB de CV Series V | 6,028,100 | 16,412,402 | ||||||
|
| |||||||
| 276,972,663 | ||||||||
| Security | Shares | Value | ||||||
PERU — 0.40% |
| |||||||
Compania de Minas Buenaventura SA SP ADR | 235,720 | $ | 3,432,083 | |||||
Credicorp Ltd. | 81,043 | 12,567,338 | ||||||
Southern Copper Corp. | 203,428 | 6,674,473 | ||||||
|
| |||||||
| 22,673,894 | ||||||||
PHILIPPINES — 1.13% |
| |||||||
Aboitiz Equity Ventures Inc. | 2,210,540 | 2,775,850 | ||||||
Aboitiz Power Corp. | 1,550,400 | 1,333,486 | ||||||
Alliance Global Group Inc. | 2,526,500 | 1,425,502 | ||||||
Atlas Consolidated Mining & Development Corp. | 1,297,000 | 500,951 | ||||||
Ayala Corp. | 238,870 | 3,837,808 | ||||||
Ayala Land Inc. | 8,144,300 | 6,164,264 | ||||||
Bank of the Philippine Islands | 906,495 | 1,975,161 | ||||||
BDO Unibank Inc. | 1,849,140 | 3,838,238 | ||||||
Belle Corp. | 6,152,600 | 670,295 | ||||||
Cebu Air Inc. | 330,290 | 472,709 | ||||||
Cosco Capital Inc. | 2,738,200 | 518,123 | ||||||
DMCI Holdings Inc. | 1,001,000 | 1,836,697 | ||||||
East West Banking Corp.a | 629,600 | 420,215 | ||||||
Energy Development Corp. | 11,052,000 | 1,842,845 | ||||||
Filinvest Land Inc. | 13,084,000 | 465,142 | ||||||
First Gen Corp. | 1,510,500 | 834,932 | ||||||
First Philippine Holdings Corp. | 290,210 | 525,839 | ||||||
Globe Telecom Inc. | 37,810 | 1,560,963 | ||||||
International Container Terminal Services Inc. | 584,130 | 1,512,575 | ||||||
JG Summit Holdings Inc. | 2,880,013 | 3,398,548 | ||||||
Jollibee Foods Corp. | 491,470 | 2,029,005 | ||||||
Lopez Holdings Corp. | 3,303,200 | 424,264 | ||||||
Manila Water Co. Inc. | 1,301,200 | 895,321 | ||||||
Megaworld Corp. | 14,545,000 | 1,457,836 | ||||||
Melco Crown Philippines Resorts Corp.a | 1,965,700 | 520,279 | ||||||
Metro Pacific Investments Corp. | 13,296,000 | 1,570,514 | ||||||
Metropolitan Bank & Trust Co. | 322,280 | 635,320 | ||||||
Nickel Asia Corp. | 885,875 | 802,570 | ||||||
Philippine Long Distance Telephone Co. | 101,390 | 8,022,833 | ||||||
Philippine National Banka | 296,276 | 593,232 | ||||||
Rizal Commercial Banking Corp. | 532,980 | 651,556 | ||||||
SM Investments Corp. | 180,955 | 3,204,066 | ||||||
| 22 | 2014 iSHARES ANNUAL REPORTTO SHAREHOLDERS |
Table of Contents
Consolidated Schedule of Investments (Continued)
iSHARES® CORE MSCI EMERGING MARKETS ETF
August 31, 2014
| Security | Shares | Value | ||||||
SM Prime Holdings Inc. | 7,468,096 | $ | 2,771,417 | |||||
Universal Robina Corp. | 1,006,800 | 3,752,408 | ||||||
Vista Land & Lifescapes Inc. | 5,223,200 | 727,175 | ||||||
|
| |||||||
| 63,967,939 | ||||||||
POLAND — 1.52% |
| |||||||
Alior Bank SAa | 57,553 | 1,371,797 | ||||||
Asseco Poland SA | 88,787 | 1,174,626 | ||||||
Bank Handlowy w Warszawie SA | 40,224 | 1,440,458 | ||||||
Bank Millennium SA | 535,726 | 1,345,452 | ||||||
Bank Pekao SA | 149,676 | 8,430,934 | ||||||
Bank Zachodni WBK SA | 35,075 | 4,064,393 | ||||||
Budimex SA | 16,554 | 631,644 | ||||||
Ciech SA | 53,040 | 599,185 | ||||||
Cyfrowy Polsat SA | 229,220 | 1,834,563 | ||||||
ENEA SA | 249,096 | 1,168,605 | ||||||
Energa SA | 240,530 | 1,568,502 | ||||||
Eurocash SA | 101,764 | 1,098,053 | ||||||
Getin Holding SAa | 435,822 | 363,940 | ||||||
Getin Noble Bank SAa | 1,553,041 | 1,262,892 | ||||||
Globe Trade Centre SAa | 335,358 | 618,829 | ||||||
Grupa Azoty SA | 60,493 | 1,414,250 | ||||||
Grupa Lotos SAa | 80,499 | 758,828 | ||||||
Jastrzebska Spolka Weglowa SAa | 70,526 | 738,490 | ||||||
Kernel Holding SAa | 66,036 | 531,824 | ||||||
KGHM Polska Miedz SA | 159,826 | 6,588,289 | ||||||
LPP SA | 618 | 1,642,923 | ||||||
Lubelski Wegiel Bogdanka SA | 42,415 | 1,545,451 | ||||||
mBank SA | 17,452 | 2,529,908 | ||||||
Netia SA | 446,880 | 768,712 | ||||||
Orange Polska SA | 763,025 | 2,563,025 | ||||||
Polska Grupa Energetyczna SA | 962,526 | 6,565,654 | ||||||
Polski Koncern Naftowy Orlen SA | 364,765 | 4,498,314 | ||||||
Polskie Gornictwo Naftowe i Gazownictwo SA | 2,036,499 | 3,108,235 | ||||||
Powszechna Kasa Oszczednosci Bank Polski SA | 996,848 | 11,925,324 | ||||||
Powszechny Zaklad Ubezpieczen SA | 63,513 | 9,316,339 | ||||||
Rovese SAa | 663,091 | 253,013 | ||||||
Synthos SA | 652,268 | 938,412 | ||||||
| Security | Shares | Value | ||||||
Tauron Polska Energia SA | 1,198,148 | $ | 1,869,911 | |||||
TVN SAa | 227,091 | 995,767 | ||||||
Warsaw Stock Exchange SAb | 54,664 | 643,860 | ||||||
|
| |||||||
| 86,170,402 | ||||||||
QATAR — 0.58% | ||||||||
Al Khalij Commercial Bank | 117,064 | 697,652 | ||||||
Barwa Real Estate Co. | 112,457 | 1,207,588 | ||||||
Commercial Bank of Qatar QSC (The) | 40,026 | 748,591 | ||||||
Doha Bank QSC | 35,117 | 588,305 | ||||||
Industries Qatar QSC | 81,782 | 4,346,044 | ||||||
Masraf Al Rayan QSC | 430,437 | 6,147,074 | ||||||
Meera Consumer Goods Co. | 9,521 | 489,490 | ||||||
National Leasing | 54,783 | 425,030 | ||||||
Ooredoo QSC | 90,335 | 2,835,683 | ||||||
Qatar Electricity & Water Co. QSC | 29,894 | 1,403,898 | ||||||
Qatar Industrial Manufacturing Co.a | 39,710 | 511,479 | ||||||
Qatar Insurance Co. SAQ | 51,812 | 1,422,938 | ||||||
Qatar Islamic Bank SAQ | 71,969 | 2,352,057 | ||||||
Qatar National Bank SAQ | 94,582 | 5,247,052 | ||||||
Qatar National Cement Co. | 13,255 | 520,561 | ||||||
Qatari Investors Group QSC | 39,418 | 638,708 | ||||||
Salam International Investment Co. | 111,437 | 603,214 | ||||||
United Development Co. PSC | 95,739 | 766,448 | ||||||
Vodafone Qatar QSC | 399,732 | 2,123,151 | ||||||
|
| |||||||
| 33,074,963 | ||||||||
RUSSIA — 3.82% |
| |||||||
Aeroflot – Russian Airlines OJSC | 703,656 | 891,622 | ||||||
Alrosa AO | 2,193,500 | 2,570,691 | ||||||
Gazprom OAO | 13,631,830 | 48,574,655 | ||||||
Inter RAO JSCa | 3,042,100,000 | 741,503 | ||||||
LSR Group OJSC SP GDRd | 277,882 | 1,000,375 | ||||||
LUKOIL OAO | 587,132 | 32,684,092 | ||||||
M Video OJSC | 128,040 | 656,912 | ||||||
Magnit OJSC SP GDRd | 301,275 | 17,534,205 | ||||||
Mechel OAO SP ADRa | 69,398 | 118,671 | ||||||
MegaFon OAO SP GDRd | 111,689 | 3,160,799 | ||||||
MMC Norilsk Nickel OJSC | 64,404 | 12,673,567 | ||||||
Mobile TeleSystems OJSC SP ADR | 605,338 | 11,168,486 | ||||||
CONSOLIDATED SCHEDULEOF INVESTMENTS | 23 |
Table of Contents
Consolidated Schedule of Investments (Continued)
iSHARES® CORE MSCI EMERGING MARKETS ETF
August 31, 2014
| Security | Shares | Value | ||||||
Moscow Exchange MICEX-RTS OJSC | 1,714,400 | $ | 2,877,690 | |||||
NovaTek OAO SP GDRd | 104,982 | 10,561,189 | ||||||
Rosneft Oil Co. OJSC | 1,347,140 | 8,310,543 | ||||||
Rostelecom OJSC | 986,670 | 2,624,434 | ||||||
RusHydro OJSC | 141,886,000 | 2,631,404 | ||||||
Sberbank of Russia | 11,610,310 | 22,847,035 | ||||||
Severstal OAO | 257,900 | 2,482,231 | ||||||
Sistema JSFC SP GDRd | 199,973 | 4,549,386 | ||||||
Surgutneftegas OJSC | 8,328,900 | 5,838,263 | ||||||
Tatneft OAO Class S | 1,631,600 | 10,119,050 | ||||||
TMK OAO SP GDRd | 60,000 | 587,100 | ||||||
Uralkali OJSC | 1,552,880 | 5,735,212 | ||||||
VTB Bank OJSC | 5,653,430,000 | 5,823,871 | ||||||
|
| |||||||
| 216,762,986 | ||||||||
SOUTH AFRICA — 7.41% |
| |||||||
Acucap Properties Ltd. | 168,597 | 744,906 | ||||||
Adcock Ingram Holdings Ltd.a,b | 168,371 | 816,889 | ||||||
Adcorp Holdings Ltd. | 241,762 | 754,696 | ||||||
Advtech Ltd. | 675,365 | 508,648 | ||||||
Aeci Ltd. | 140,062 | 1,619,838 | ||||||
African Oxygen Ltd. | 217,375 | 367,899 | ||||||
African Rainbow Minerals Ltd. | 123,092 | 2,102,381 | ||||||
Anglo American Platinum Ltd.a | 61,892 | 2,578,591 | ||||||
AngloGold Ashanti Ltd.a | 468,274 | 7,971,586 | ||||||
ArcelorMittal South Africa Ltd.a | 222,203 | 822,340 | ||||||
Aspen Pharmacare Holdings Ltd. | 367,043 | 10,548,423 | ||||||
Assore Ltd. | 41,784 | 1,236,540 | ||||||
Astral Foods Ltd. | 69,418 | 933,371 | ||||||
Attacq Ltd.a | 498,993 | 867,516 | ||||||
Aveng Ltd.a | 502,014 | 1,078,098 | ||||||
AVI Ltd. | 324,711 | 1,861,484 | ||||||
Barclays Africa Group Ltd. | 376,551 | 5,897,838 | ||||||
Barloworld Ltd. | 255,128 | 2,431,481 | ||||||
Bidvest Group Ltd. | 352,062 | 9,312,492 | ||||||
Blue Label Telecoms Ltd. | 723,057 | 605,074 | ||||||
Brait SEa | 402,703 | 2,999,239 | ||||||
Capital Property Funda | 1,618,719 | 1,818,802 | ||||||
Cashbuild Ltd.b | 49,015 | 609,219 | ||||||
City Lodge Hotels Ltd. | 57,257 | 667,569 | ||||||
Clicks Group Ltd. | 290,529 | 1,888,982 | ||||||
| Security | Shares | Value | ||||||
Clover Industries Ltd. | 430,672 | $ | 743,473 | |||||
Coronation Fund Managers Ltd. | 265,844 | 2,499,614 | ||||||
DataTec Ltd. | 226,490 | 1,144,653 | ||||||
Discovery Ltd. | 373,500 | 3,446,887 | ||||||
Emira Property Fund | 590,673 | 838,630 | ||||||
EOH Holdings Ltd. | 121,718 | 1,075,793 | ||||||
Exxaro Resources Ltd. | 152,816 | 2,167,937 | ||||||
Famous Brands Ltd. | 74,864 | 695,818 | ||||||
FirstRand Ltd. | 3,529,319 | 14,352,356 | ||||||
Foschini Group Ltd. (The) | 229,169 | 2,480,578 | ||||||
Fountainhead Property Trust | 624,771 | 459,382 | ||||||
Gold Fields Ltd. | 905,702 | 4,292,875 | ||||||
Grindrod Ltd. | 543,736 | 1,265,858 | ||||||
Group Five Ltd. | 212,046 | 812,463 | ||||||
Growthpoint Properties Ltd. | 2,299,646 | 5,448,886 | ||||||
Harmony Gold Mining Co. Ltd.a | 505,820 | 1,532,860 | ||||||
Hosken Consolidated Investments Ltd. | 63,928 | 1,010,187 | ||||||
Hudaco Industries Ltd. | 111,233 | 977,893 | ||||||
Hyprop Investments Ltd. | 253,755 | 2,060,265 | ||||||
Illovo Sugar Ltd. | 296,155 | 807,538 | ||||||
Impala Platinum Holdings Ltd. | 616,702 | 5,581,132 | ||||||
Imperial Holdings Ltd. | 208,946 | 3,736,722 | ||||||
Investec Ltd. | 265,844 | 2,404,629 | ||||||
JSE Ltd. | 120,334 | 1,146,496 | ||||||
Kumba Iron Ore Ltd. | 72,788 | 2,179,794 | ||||||
Lewis Group Ltd. | 124,747 | 703,765 | ||||||
Liberty Holdings Ltd. | 122,012 | 1,498,047 | ||||||
Life Healthcare Group Holdings Ltd. | 1,078,435 | 4,540,715 | ||||||
Massmart Holdings Ltd. | 128,267 | 1,577,136 | ||||||
Mediclinic International Ltd. | 425,397 | 3,699,035 | ||||||
Metair Investments Ltd. | 202,030 | 664,860 | ||||||
MMI Holdings Ltd. | 1,145,675 | 2,961,300 | ||||||
Mondi Ltd. | 131,888 | 2,248,274 | ||||||
Mpact Ltd. | 259,571 | 860,323 | ||||||
Mr. Price Group Ltd. | 273,276 | 5,259,755 | ||||||
MTN Group Ltd. | 1,927,187 | 43,677,638 | ||||||
Murray & Roberts Holdings Ltd.a | 548,131 | 1,360,097 | ||||||
Nampak Ltd. | 682,020 | 2,735,031 | ||||||
Naspers Ltd. Class N | 455,894 | 58,105,331 | ||||||
Nedbank Group Ltd. | 231,507 | 4,978,247 | ||||||
| 24 | 2014 iSHARES ANNUAL REPORTTO SHAREHOLDERS |
Table of Contents
Consolidated Schedule of Investments (Continued)
iSHARES® CORE MSCI EMERGING MARKETS ETF
August 31, 2014
| Security | Shares | Value | ||||||
Netcare Ltd. | 1,115,856 | $ | 3,388,885 | |||||
Northam Platinum Ltd.a | 423,071 | 1,698,585 | ||||||
Omnia Holdings Ltd. | 75,235 | 1,600,496 | ||||||
Pick n Pay Holdings Ltd. | 363,828 | 828,888 | ||||||
Pick n Pay Stores Ltd. | 283,814 | 1,507,747 | ||||||
PPC Ltd. | 610,381 | 1,900,231 | ||||||
Rand Merchant Insurance Holdings Ltd. | 781,963 | 2,477,777 | ||||||
Redefine Properties Ltd. | 3,346,653 | 3,008,256 | ||||||
Remgro Ltd. | 537,928 | 12,315,989 | ||||||
Resilient Property Income Fund Ltd. | 263,121 | 1,739,230 | ||||||
Reunert Ltd. | 208,987 | 1,296,909 | ||||||
RMB Holdings Ltd. | 796,179 | 4,190,731 | ||||||
Royal Bafokeng Platinum Ltd.a | 98,281 | 674,588 | ||||||
SA Corporate Real Estate Fund Nominees Pty Ltd. | 1,893,336 | 754,814 | ||||||
Sanlam Ltd. | 2,108,246 | 13,083,122 | ||||||
Sappi Ltd.a | 634,888 | 2,626,612 | ||||||
Sasol Ltd. | 627,753 | 36,493,891 | ||||||
Shoprite Holdings Ltd. | 517,557 | 7,175,450 | ||||||
Sibanye Gold Ltd. | 917,446 | 2,162,624 | ||||||
SPAR Group Ltd. (The) | 183,633 | 2,250,995 | ||||||
Standard Bank Group Ltd. | 1,375,883 | 17,852,817 | ||||||
Steinhoff International Holdings Ltd. | 2,408,215 | 11,890,044 | ||||||
Sun International Ltd. | 118,726 | 1,306,104 | ||||||
Super Group Ltd.a | 354,180 | 1,040,687 | ||||||
Telkom SA SOC Ltd.a | 312,903 | 1,681,404 | ||||||
Tiger Brands Ltd. | 185,567 | 5,356,552 | ||||||
Tongaat Hulett Ltd. | 126,361 | 2,027,165 | ||||||
Trencor Ltd. | 208,258 | 1,429,456 | ||||||
Truworths International Ltd. | 437,693 | 3,061,884 | ||||||
Vodacom Group Ltd. | 416,783 | 5,029,815 | ||||||
Vukile Property Fund Ltd. | 634,345 | 996,663 | ||||||
Wilson Bayly Holmes-Ovcon Ltd. | 71,056 | 924,528 | ||||||
Woolworths Holdings Ltd. | 866,321 | 6,472,523 | ||||||
Zeder Investments Ltd. | 1,392,818 | 759,571 | ||||||
|
| |||||||
| 420,081,208 | ||||||||
SOUTH KOREA — 14.63% | ||||||||
Ahnlab Inc. | 12,052 | 446,921 | ||||||
AmorePacific Corp. | 3,758 | 7,820,287 | ||||||
AmorePacific Group | 3,329 | 3,473,625 | ||||||
| Security | Shares | Value | ||||||
Asia Cement Co. Ltd. | 4,106 | $ | 469,743 | |||||
Asiana Airlines Inc.a | 125,625 | 597,801 | ||||||
ATLASBX Co. Ltd. | 12,564 | 574,949 | ||||||
Binggrae Co. Ltd. | 7,677 | 688,238 | ||||||
Bioland Ltd. | 21,312 | 437,191 | ||||||
BS Financial Group Inc. | 221,028 | 3,662,183 | ||||||
Bukwang Pharmaceutical Co. Ltd. | 37,654 | 640,595 | ||||||
Capro Corp.a | 82,391 | 314,060 | ||||||
Celltrion Inc.a,b | 72,453 | 2,976,150 | ||||||
Chabiotech Co. Ltd.a | 49,904 | 629,983 | ||||||
Chadiostech Co. Ltd.a | 188,599 | 536,622 | ||||||
Cheil Worldwide Inc.a | 92,750 | 2,099,327 | ||||||
Chong Kun Dang Pharmaceutical Corp. | 10,163 | 703,627 | ||||||
CJ CGV Co. Ltd. | 17,040 | 867,167 | ||||||
CJ CheilJedang Corp. | 9,068 | 3,380,545 | ||||||
CJ Corp. | 17,253 | 3,045,798 | ||||||
CJ E&M Corp.a | 23,690 | 1,106,289 | ||||||
CJ Freshway Corp.a,b | 13,627 | 471,055 | ||||||
CJ Hellovision Co. Ltd. | 44,278 | 633,198 | ||||||
CJ O Shopping Co. Ltd. | 3,648 | 1,294,852 | ||||||
Com2uS Corp.a | 8,628 | 1,069,618 | ||||||
Cosmax Inc.a,b | 8,735 | 913,171 | ||||||
Coway Co. Ltd. | 62,181 | 5,218,801 | ||||||
Daeduck Electronics Co. | 63,663 | 529,923 | ||||||
Daeduck GDS Co. Ltd. | 32,771 | 433,090 | ||||||
Daekyo Co. Ltd. | 50,143 | 338,754 | ||||||
Daelim Industrial Co. Ltd. | 32,065 | 2,763,924 | ||||||
Daesang Corp. | 26,028 | 1,419,546 | ||||||
Daewoo Engineering & Construction Co. Ltd.a | 129,120 | 1,084,967 | ||||||
Daewoo International Corp. | 54,086 | 1,986,985 | ||||||
Daewoo Securities Co. Ltd.a | 205,129 | 2,387,220 | ||||||
Daewoo Shipbuilding & Marine Engineering Co. Ltd.b | 123,597 | 3,029,129 | ||||||
Daewoong Pharmaceutical Co. Ltd. | 7,620 | 495,249 | ||||||
Daishin Securities Co. Ltd. | 59,513 | 710,200 | ||||||
Daou Technology Inc. | 50,218 | 614,136 | ||||||
Daum Communications Corp.b | 13,731 | 2,235,799 | ||||||
DGB Financial Group Inc. | 106,040 | 1,851,085 | ||||||
Dong-A Socio Holdings Co. Ltd. | 3,733 | 445,479 | ||||||
CONSOLIDATED SCHEDULEOF INVESTMENTS | 25 |
Table of Contents
Consolidated Schedule of Investments (Continued)
iSHARES® CORE MSCI EMERGING MARKETS ETF
August 31, 2014
| Security | Shares | Value | ||||||
Dong-A ST Co. Ltd. | 5,628 | $ | 557,832 | |||||
Dongbu Insurance Co. Ltd. | 49,750 | 3,002,811 | ||||||
Dongkuk Steel Mill Co. Ltd. | 77,272 | 559,373 | ||||||
Dongsuh Companies Inc. | 36,011 | 715,639 | ||||||
Dongwon Industries Co. Ltd. | 1,609 | 618,877 | ||||||
Dongyang Mechatronics Corp. | 51,991 | 464,558 | ||||||
Doosan Corp. | 8,566 | 1,018,002 | ||||||
Doosan Engine Co. Ltd.a | 51,600 | 396,434 | ||||||
Doosan Heavy Industries & Construction Co. Ltd. | 67,966 | 1,933,842 | ||||||
Doosan Infracore Co. Ltd.a | 161,745 | 1,890,308 | ||||||
Duksan Hi-Metal Co. Ltd.a | 24,984 | 394,244 | ||||||
DuzonBIzon Co. Ltd. | 49,211 | 405,258 | ||||||
E-Mart Co. Ltd. | 23,985 | 5,771,823 | ||||||
E1 Corp. | 5,365 | 367,738 | ||||||
EO Technics Co. Ltd. | 11,392 | 917,921 | ||||||
Fila Korea Ltd. | 11,444 | 1,139,942 | ||||||
Foosung Co. Ltd.a | 175,316 | 543,783 | ||||||
GemVax & Kael Co. Ltd.a,b | 30,485 | 736,607 | ||||||
Global & Yuasa Battery Co. Ltd. | 9,066 | 419,346 | ||||||
Golfzon Co. Ltd. | 23,292 | 550,169 | ||||||
Grand Korea Leisure Co. Ltd. | 37,600 | 1,676,138 | ||||||
Green Cross Corp. | 6,465 | 758,750 | ||||||
Green Cross Holdings Corp. | 34,326 | 561,972 | ||||||
GS Engineering & Construction Corp.a | 57,136 | 2,076,495 | ||||||
GS Global Corp.b | 67,396 | 642,088 | ||||||
GS Holdings Corp. | 56,319 | 2,391,176 | ||||||
GS Home Shopping Inc. | 3,939 | 1,099,400 | ||||||
Gwangju Shinsegae Co. Ltd. | 1,368 | 380,468 | ||||||
Halla Corp.a | 74,830 | 529,149 | ||||||
Halla Visteon Climate Control Corp.b | 43,741 | 2,325,203 | ||||||
Hana Financial Group Inc. | 332,950 | 13,972,112 | ||||||
Hana Tour Service Inc. | 12,679 | 889,074 | ||||||
Hancom Inc. | 23,883 | 592,394 | ||||||
Handsome Co. Ltd. | 18,729 | 572,611 | ||||||
Hanil Cement Co. Ltd. | 4,170 | 581,937 | ||||||
Hanil E-Hwa Co. Ltd.a | 21,614 | 498,809 | ||||||
Hanil E-Hwa Co. Ltd. New | 28,692 | 557,456 | ||||||
Hanjin Heavy Industries & Construction Co. Ltd.a | 80,791 | 494,810 | ||||||
Hanjin Kal Corp.a | 26,812 | 687,521 | ||||||
Hanjin Shipping Co. Ltd.a,b | 110,630 | 677,560 | ||||||
| Security | Shares | Value | ||||||
Hanjin Transportation Co. Ltd. | 13,237 | $ | 490,864 | |||||
Hankook Shell Oil Co. Ltd. | 1,101 | 606,991 | ||||||
Hankook Tire Co. Ltd. | 83,351 | 4,323,944 | ||||||
Hankook Tire Worldwide Co. Ltd. | 26,465 | 570,305 | ||||||
Hanmi Pharm Co. Ltd.a | 8,298 | 760,278 | ||||||
Hansae Co. Ltd. | 24,799 | 756,969 | ||||||
Hansol Chemical Co. Ltd. | 21,337 | 672,338 | ||||||
Hansol Paper Co. | 51,727 | 594,329 | ||||||
Hanssem Co. Ltd. | 11,620 | 1,358,026 | ||||||
Hanwha Chemical Corp. | 121,151 | 1,959,541 | ||||||
Hanwha Corp. | 53,899 | 1,608,013 | ||||||
Hanwha General Insurance Co. Ltd.a | 89,120 | 535,274 | ||||||
Hanwha Investment & Securities Co. Ltd.a | 143,303 | 642,351 | ||||||
Hanwha Life Insurance Co. Ltd. | 216,910 | 1,488,923 | ||||||
Hite Jinro Co. Ltd. | 33,946 | 773,364 | ||||||
HMC Investment Securities Co. Ltd.a | 50,317 | 637,678 | ||||||
Hotel Shilla Co. Ltd. | 39,274 | 4,609,306 | ||||||
Huchems Fine Chemical Corp. | 33,363 | 774,889 | ||||||
Hwa Shin Co. Ltd. | 34,868 | 388,588 | ||||||
Hy-Lok Corp. | 17,884 | 606,746 | ||||||
Hyosung Corp. | 26,290 | 2,032,779 | ||||||
Hyundai Corp.b | 16,438 | 609,565 | ||||||
Hyundai Department Store Co. Ltd. | 17,487 | 2,733,556 | ||||||
Hyundai Development Co. Engineering & Construction | 65,118 | 2,645,951 | ||||||
Hyundai Engineering & Construction Co. Ltd. | 83,366 | 5,253,797 | ||||||
Hyundai Glovis Co. Ltd. | 15,411 | 4,597,690 | ||||||
Hyundai Greenfood Co. Ltd. | 49,954 | 982,871 | ||||||
Hyundai Heavy Industries Co. Ltd. | 48,199 | 6,845,166 | ||||||
Hyundai Home Shopping Network Corp. | 7,038 | 1,131,411 | ||||||
Hyundai Hysco Co. Ltd.b | 11,819 | 963,984 | ||||||
Hyundai Marine & Fire Insurance Co. Ltd. | 58,740 | 1,804,577 | ||||||
Hyundai Merchant Marine Co. Ltd.a,b | 83,430 | 1,012,071 | ||||||
| 26 | 2014 iSHARES ANNUAL REPORTTO SHAREHOLDERS |
Table of Contents
Consolidated Schedule of Investments (Continued)
iSHARES® CORE MSCI EMERGING MARKETS ETF
August 31, 2014
| Security | Shares | Value | ||||||
Hyundai Mipo Dockyard Co. Ltd. | 13,369 | $ | 1,700,874 | |||||
Hyundai Mobis Co. Ltd. | 77,967 | 22,606,931 | ||||||
Hyundai Motor Co. | 176,672 | 40,598,231 | ||||||
Hyundai Securities Co. Ltd.a | 158,497 | 1,222,394 | ||||||
Hyundai Steel Co. | 80,121 | 5,981,715 | ||||||
Hyundai Wia Corp. | 17,759 | 3,905,772 | ||||||
Iljin Display Co. Ltd. | 40,130 | 318,206 | ||||||
Ilyang Pharmaceutical Co. Ltd. | 27,299 | 634,047 | ||||||
iMarketKorea Inc. | 23,279 | �� | 751,898 | |||||
Industrial Bank of Korea | 289,599 | 5,026,818 | ||||||
Interpark Corp. | 46,876 | 531,657 | ||||||
ISU Chemical Co. Ltd. | 43,300 | 535,939 | ||||||
JB Financial Group Co. Ltd.b | 93,362 | 683,215 | ||||||
JoyCity Corp.a | 17,491 | 295,844 | ||||||
Jusung Engineering Co. Ltd.a | 130,594 | 506,173 | ||||||
Kangwon Land Inc. | 135,304 | 4,810,601 | ||||||
KB Capital Co. Ltd. | 20,978 | 466,546 | ||||||
KB Financial Group Inc. | 362,760 | 14,865,307 | ||||||
KCC Corp. | 5,559 | 3,744,560 | ||||||
KEPCO Plant Service & Engineering Co. Ltd. | 22,485 | 1,734,136 | ||||||
Kia Motors Corp. | 301,344 | 18,188,523 | ||||||
KISWIRE Ltd.b | 10,934 | 562,902 | ||||||
KIWOOM Securities Co. Ltd. | 15,596 | 804,449 | ||||||
Koh Young Technology Inc. | 24,353 | 665,297 | ||||||
Kolao Holdingsb | 33,395 | 627,422 | ||||||
Kolon Industries Inc. | 19,913 | 1,180,306 | ||||||
Komipharm International Co. Ltd.a,b | 56,770 | 524,617 | ||||||
Korea Aerospace Industries Ltd. | 53,709 | 1,904,274 | ||||||
Korea District Heating Corp. | 5,384 | 345,676 | ||||||
Korea Electric Power Corp. | 295,331 | 12,291,502 | ||||||
Korea Gas Corp.a | 32,018 | 1,780,971 | ||||||
Korea Investment Holdings Co. Ltd. | 44,950 | 2,256,477 | ||||||
Korea Kolmar Co. Ltd. | 16,640 | 884,556 | ||||||
Korea Zinc Co. Ltd. | 9,906 | 4,108,164 | ||||||
Korean Air Lines Co. Ltd.a | 34,453 | 1,238,534 | ||||||
Korean Reinsurance Co. | 113,813 | 1,324,516 | ||||||
KT Corp. | 72,376 | 2,498,309 | ||||||
KT Skylife Co. Ltd. | 29,925 | 665,525 | ||||||
KT&G Corp. | 126,313 | 11,822,184 | ||||||
| Security | Shares | Value | ||||||
Kukdo Chemical Co. Ltd.b | 10,559 | $ | 521,728 | |||||
Kumho Petro Chemical Co. Ltd. | 15,666 | 1,256,123 | ||||||
Kumho Tire Co. Inc.a | 84,287 | 860,368 | ||||||
Kwang Dong Pharmaceutical Co. Ltd.b | 59,691 | 594,585 | ||||||
Kwangju Banka | 47,853 | 535,659 | ||||||
Kyongnam Banka | 52,071 | 698,423 | ||||||
LF Corp. | 24,599 | 739,947 | ||||||
LG Chem Ltd. | 53,147 | 14,126,058 | ||||||
LG Corp. | 108,856 | 7,611,707 | ||||||
LG Display Co. Ltd.a | 268,080 | 9,266,930 | ||||||
LG Electronics Inc. | 121,652 | 9,070,360 | ||||||
LG Hausys Ltd. | 7,756 | 1,583,404 | ||||||
LG Household & Health Care Ltd. | 10,826 | 5,477,329 | ||||||
LG Innotek Co. Ltd.a | 15,187 | 2,014,549 | ||||||
LG International Corp. | 36,658 | 1,008,687 | ||||||
LG Life Sciences Ltd.a,b | 22,541 | 750,292 | ||||||
LG Uplus Corp. | 250,566 | 2,705,950 | ||||||
LIG Insurance Co. Ltd. | 48,101 | 1,435,037 | ||||||
Lock & Lock Co. Ltd.b | 32,611 | 387,556 | ||||||
Lotte Chemical Corp. | 17,929 | 2,891,061 | ||||||
Lotte Chilsung Beverage Co. Ltd. | 843 | 1,714,351 | ||||||
Lotte Confectionery Co. Ltd. | 822 | 1,759,199 | ||||||
Lotte Food Co. Ltd. | 918 | 703,473 | ||||||
Lotte Shopping Co. Ltd. | 12,424 | 4,068,019 | ||||||
LS Corp. | 20,836 | 1,438,454 | ||||||
LS Industrial Systems Co. Ltd. | 17,947 | 1,108,025 | ||||||
Lumens Co. Ltd.a,b | 61,195 | 498,516 | ||||||
Maeil Dairy Industry Co. Ltd.b | 12,662 | 445,814 | ||||||
Mando Corp. | 13,774 | 1,861,076 | ||||||
Medipost Co. Ltd.a | 11,614 | 650,599 | ||||||
Medy-Tox Inc. | 5,350 | 1,065,832 | ||||||
MegaStudy Co. Ltd. | 8,457 | 546,312 | ||||||
Meritz Fire & Marine Insurance Co. Ltd. | 73,776 | 996,825 | ||||||
Meritz Securities Co. Ltd. | 257,721 | 868,009 | ||||||
Mirae Asset Securities Co. Ltd. | 28,364 | 1,355,329 | ||||||
Modetour Network Inc. | 24,753 | 633,503 | ||||||
Muhak Co. Ltd.a | 19,992 | 657,560 | ||||||
Namhae Chemical Corp. | 49,345 | 454,541 | ||||||
Namyang Dairy Products Co. Ltd. | 786 | 641,854 | ||||||
CONSOLIDATED SCHEDULEOF INVESTMENTS | 27 |
Table of Contents
Consolidated Schedule of Investments (Continued)
iSHARES® CORE MSCI EMERGING MARKETS ETF
August 31, 2014
| Security | Shares | Value | ||||||
Naturalendo Tech Co. Ltd.a,b | 15,489 | $ | 733,243 | |||||
NAVER Corp. | 32,270 | 24,442,389 | ||||||
NCsoft Corp. | 17,680 | 2,528,330 | ||||||
Neowiz Games Corp.a | 35,061 | 698,488 | ||||||
Nexen Corp. | 3,883 | 337,386 | ||||||
Nexen Tire Corp. | 41,320 | 584,784 | ||||||
NH Investment & Securities Co. Ltd. | 65,235 | 519,847 | ||||||
NHN Entertainment Corp.a | 15,255 | 1,089,267 | ||||||
NICE Holdings Co. Ltd. | 37,136 | 525,570 | ||||||
Nong Shim Holdings Co. Ltd. | 5,486 | 630,326 | ||||||
NongShim Co. Ltd. | 3,691 | 917,335 | ||||||
OCI Co. Ltd.a,b | 19,239 | 2,760,762 | ||||||
OCI Materials Co. Ltd. | 11,763 | 526,693 | ||||||
ORION Corp. | 4,128 | 3,554,163 | ||||||
Osstem Implant Co. Ltd.a | 17,928 | 661,282 | ||||||
Ottogi Corp. | 1,985 | 1,211,810 | ||||||
Paradise Co. Ltd. | 55,116 | 2,136,258 | ||||||
Partron Co. Ltd. | 60,615 | 566,724 | ||||||
Poongsan Corp. | 27,236 | 846,130 | ||||||
POSCO | 74,666 | 24,595,339 | ||||||
POSCO Chemtech Co. Ltd. | 3,533 | 552,973 | ||||||
POSCO ICT Co. Ltd.b | 70,126 | 504,877 | ||||||
Pyeong Hwa Automotive Co. Ltd.b | 19,375 | 422,296 | ||||||
S&T Dynamics Co. Ltd. | 56,539 | 545,901 | ||||||
S-Oil Corp. | 51,385 | 2,374,266 | ||||||
S.M. Entertainment Co.a | 21,781 | 893,624 | ||||||
S1 Corp. | 21,883 | 1,597,063 | ||||||
Samchully Co. Ltd. | 3,865 | 627,045 | ||||||
SamkwangGlass Co. Ltd. | 8,441 | 587,736 | ||||||
Samsung C&T Corp. | 143,941 | 10,590,264 | ||||||
Samsung Card Co. Ltd. | 39,312 | 1,890,093 | ||||||
Samsung Electro-Mechanics Co. Ltd. | 67,710 | 3,666,136 | ||||||
Samsung Electronics Co. Ltd. | 126,919 | 154,463,283 | ||||||
Samsung Engineering Co. Ltd.a,b | 33,082 | 2,084,856 | ||||||
Samsung Fine Chemicals Co. Ltd. | 24,279 | 957,799 | ||||||
Samsung Fire & Marine Insurance Co. Ltd. | 38,379 | 10,503,647 | ||||||
Samsung Heavy Industries Co. Ltd. | 186,140 | 5,002,530 | ||||||
Samsung Life Insurance Co. Ltd. | 68,728 | 7,218,829 | ||||||
| Security | Shares | Value | ||||||
Samsung SDI Co. Ltd. | 63,114 | $ | 9,430,219 | |||||
Samsung Securities Co. Ltd. | 70,428 | 3,441,696 | ||||||
Samsung Techwin Co. Ltd. | 42,835 | 1,801,778 | ||||||
SBS Media Holdings Co. Ltd. | 92,153 | 355,361 | ||||||
SeAH Besteel Corp. | 17,575 | 620,529 | ||||||
SeAH Steel Corp. | 4,316 | 397,994 | ||||||
Sebang Co. Ltd. | 21,893 | 458,826 | ||||||
Seegene Inc.a,b | 12,881 | 730,467 | ||||||
Seobu T&Da | 20,678 | 473,129 | ||||||
Seoul Semiconductor Co. Ltd. | 38,434 | 1,106,833 | ||||||
SFA Engineering Corp. | 13,980 | 606,657 | ||||||
Shinhan Financial Group Co. Ltd. | 455,463 | 23,582,827 | ||||||
Shinsegae Co. Ltd. | 7,889 | 1,812,848 | ||||||
Shinsegae Food Co. Ltd. | 6,913 | 770,422 | ||||||
Shinsegae International Co. Ltd. | 4,742 | 551,858 | ||||||
Simm Tech Co. Ltd.a,b | 63,342 | 454,786 | ||||||
Sindoh Co. Ltd. | 6,921 | 464,153 | ||||||
SK Broadband Co. Ltd.a | 203,452 | 728,370 | ||||||
SK C&C Co. Ltd. | 23,499 | 4,924,836 | ||||||
SK Chemicals Co. Ltd. | 18,060 | 1,205,841 | ||||||
SK Gas Co. Ltd. | 6,904 | 769,419 | ||||||
SK Holdings Co. Ltd. | 29,542 | 4,676,257 | ||||||
SK Hynix Inc.a | 655,642 | 29,356,622 | ||||||
SK Innovation Co. Ltd. | 69,210 | 6,423,059 | ||||||
SK Networks Co. Ltd.a | 145,251 | 1,408,173 | ||||||
SK Securities Co. Ltd.a | 917,809 | 936,863 | ||||||
SK Telecom Co. Ltd. | 11,069 | 2,980,262 | ||||||
SKC Co. Ltd. | 25,502 | 861,427 | ||||||
SL Corp. | 18,936 | 373,510 | ||||||
Soulbrain Co. Ltd. | 19,776 | 570,490 | ||||||
Ssangyong Motor Co.a | 58,082 | 432,486 | ||||||
Sung Kwang Bend Co. Ltd. | 31,793 | 550,291 | ||||||
Sungwoo Hitech Co. Ltd. | 42,509 | 714,807 | ||||||
Suprema Inc.a | 23,870 | 586,186 | ||||||
Taekwang Industrial Co. Ltd. | 486 | 624,066 | ||||||
Taewoong Co. Ltd.a | 19,182 | 423,765 | ||||||
Taeyoung Engineering & Construction Co. Ltd.a | 88,401 | 499,569 | ||||||
Taihan Electric Wire Co. Ltd.a | 168,710 | 358,568 | ||||||
Tera Resource Co. Ltd.a,c | 196,444 | — | ||||||
TK Corp.a | 35,158 | 527,049 | ||||||
TONGYANG Life Insurance Co. | 46,589 | 523,807 | ||||||
| 28 | 2014 iSHARES ANNUAL REPORTTO SHAREHOLDERS |
Table of Contents
Consolidated Schedule of Investments (Continued)
iSHARES® CORE MSCI EMERGING MARKETS ETF
August 31, 2014
| Security | Shares | Value | ||||||
TONGYANG Securities Inc.a | 209,455 | $ | 622,819 | |||||
ViroMed Co. Ltd.a | 15,739 | 936,004 | ||||||
WeMade Entertainment Co. Ltd.a | 12,231 | 508,444 | ||||||
Wonik IPS Co. Ltd.a | 60,266 | 772,679 | ||||||
Woori Finance Holdings Co. Ltd.a | 352,143 | 4,775,350 | ||||||
Woori Investment & Securities Co. Ltd. | 141,730 | 1,656,394 | ||||||
YG Entertainment Inc. | 12,931 | 621,076 | ||||||
Youlchon Chemical Co. Ltd. | 34,408 | 463,207 | ||||||
Youngone Corp. | 25,769 | 1,438,459 | ||||||
Youngone Holdings Co. Ltd. | 7,142 | 574,065 | ||||||
Yuhan Corp. | 7,596 | 1,296,028 | ||||||
Yungjin Pharmaceutical Co. Ltd.a,b | 384,590 | 608,775 | ||||||
|
| |||||||
| 829,275,909 | ||||||||
TAIWAN — 12.84% | ||||||||
A-DATA Technology Co. Ltd. | 250,820 | 581,517 | ||||||
Ability Enterprise Co. Ltd. | 844,000 | 543,551 | ||||||
AcBel Polytech Inc. | 494,000 | 785,858 | ||||||
Accton Technology Corp. | 1,111,000 | 676,476 | ||||||
Acer Inc.a | 2,927,000 | 2,423,621 | ||||||
Advanced Semiconductor Engineering Inc. | 7,125,000 | 8,879,284 | ||||||
Advantech Co. Ltd. | 526,000 | 4,936,117 | ||||||
Airtac International Group | 136,800 | 1,407,337 | ||||||
ALI Corp. | 602,000 | 573,995 | ||||||
Alpha Networks Inc. | 748,000 | 516,760 | ||||||
Altek Corp.a | 682,000 | 588,669 | ||||||
Ambassador Hotel Ltd. (The) | 594,000 | 559,412 | ||||||
AmTRAN Technology Co. Ltd. | 941,000 | 607,594 | ||||||
Ardentec Corp. | 887,912 | 822,842 | ||||||
Asia Cement Corp. | 2,149,050 | 2,947,794 | ||||||
Asia Optical Co. Inc.a | 436,000 | 670,982 | ||||||
Asia Pacific Telecom Co. Ltd. | 2,288,000 | 1,477,339 | ||||||
Asia Polymer Corp. | 862,000 | 620,030 | ||||||
ASUSTeK Computer Inc. | 807,000 | 8,450,544 | ||||||
AU Optronics Corp. | 9,912,000 | 4,924,414 | ||||||
Bank of Kaohsiung Co. Ltd. | 2,037,168 | 637,243 | ||||||
BES Engineering Corp. | 2,333,000 | 621,290 | ||||||
Bizlink Holding Inc. | 102,643 | 503,076 | ||||||
Brogent Technologies Inc. | 34,401 | 448,851 | ||||||
Capital Securities Corp. | 1,782,000 | 623,004 | ||||||
Career Technology (MFG.) Co. Ltd. | 450,000 | 693,280 | ||||||
| Security | Shares | Value | ||||||
Catcher Technology Co. Ltd. | 741,000 | $ | 7,511,517 | |||||
Cathay Financial Holding Co. Ltd. | 9,362,078 | 15,973,837 | ||||||
Cathay Real Estate Development Co. Ltd. | 842,000 | 474,656 | ||||||
Chailease Holding Co. Ltd. | 1,157,640 | 3,129,332 | ||||||
Chang Hwa Commercial Bank Ltd. | 4,997,440 | 3,109,763 | ||||||
Cheng Loong Corp. | 1,146,000 | 475,415 | ||||||
Cheng Shin Rubber Industry Co. Ltd. | 1,786,650 | 4,124,349 | ||||||
Cheng Uei Precision Industry Co. Ltd. | 598,000 | 1,156,367 | ||||||
Chia Hsin Cement Corp. | 975,000 | 500,703 | ||||||
Chicony Electronics Co. Ltd. | 548,410 | 1,798,035 | ||||||
Chin-Poon Industrial Co. Ltd. | 526,000 | 932,671 | ||||||
China Airlines Ltd.a | 2,044,000 | 683,829 | ||||||
China Bills Finance Corp. | 1,342,000 | 505,094 | ||||||
China Development Financial Holding Corp. | 14,872,000 | 5,025,249 | ||||||
China Life Insurance Co. Ltd. | 3,280,044 | 3,045,156 | ||||||
China Man-Made Fibers Corp.a | 1,786,000 | 565,846 | ||||||
China Metal Products Co. Ltd. | 536,146 | 576,675 | ||||||
China Motor Co. Ltd. | 398,000 | 380,817 | ||||||
China Petrochemical Development Corp.a | 2,973,900 | 1,059,602 | ||||||
China Steel Chemical Corp. | 159,000 | 1,000,050 | ||||||
China Steel Corp. | 12,667,529 | 10,933,984 | ||||||
China Synthetic Rubber Corp. | 560,000 | 577,976 | ||||||
Chipbond Technology Corp. | 705,000 | 1,233,552 | ||||||
Chong Hong Construction Co. | 189,000 | 514,699 | ||||||
Chroma ATE Inc. | 526,000 | 1,548,586 | ||||||
Chung Hung Steel Corp.a | 2,334,000 | 648,106 | ||||||
Chunghwa Telecom Co. Ltd. | 4,208,000 | 13,078,510 | ||||||
Clevo Co. | 478,175 | 903,862 | ||||||
CMC Magnetics Corp.a | 3,657,000 | 587,263 | ||||||
Compal Electronics Inc. | 4,856,000 | 4,321,427 | ||||||
Compeq Manufacturing Co. Ltd. | 1,236,000 | 754,654 | ||||||
Continental Holdings Corp. | 1,629,600 | 648,776 | ||||||
Coretronic Corp. | 615,750 | 1,022,799 | ||||||
Coxon Precise Industrial Co. Ltd. | 311,000 | 561,851 | ||||||
CSBC Corp. Taiwan | 956,000 | 564,507 | ||||||
CONSOLIDATED SCHEDULEOF INVESTMENTS | 29 |
Table of Contents
Consolidated Schedule of Investments (Continued)
iSHARES® CORE MSCI EMERGING MARKETS ETF
August 31, 2014
| Security | Shares | Value | ||||||
CTBC Financial Holding Co. Ltd. | 15,073,935 | $ | 10,968,638 | |||||
CTCI Corp. | 741,000 | 1,326,291 | ||||||
Cyberlink Corp. | 213,540 | 667,257 | ||||||
CyberTAN Technology Inc. | 522,000 | 491,604 | ||||||
D-Link Corp. | 912,000 | 655,994 | ||||||
Delta Electronics Inc. | 2,097,000 | 14,732,775 | ||||||
Depo Auto Parts Industrial Co. Ltd. | 126,000 | 514,277 | ||||||
Dynapack International Technology Corp. | 211,000 | 624,024 | ||||||
E Ink Holdings Inc.a | 1,052,000 | 640,551 | ||||||
E.Sun Financial Holding Co. Ltd. | 7,162,526 | 4,708,641 | ||||||
Eclat Textile Co. Ltd. | 203,062 | 1,698,382 | ||||||
Elan Microelectronics Corp. | 526,000 | 902,755 | ||||||
Elite Material Co. Ltd. | 614,000 | 705,605 | ||||||
Elite Semiconductor Memory Technology Inc. | 337,000 | 580,636 | ||||||
Epistar Corp. | 1,052,000 | 2,287,683 | ||||||
Eternal Materials Co. Ltd. | 871,030 | 941,244 | ||||||
EVA Airways Corp.a | 1,549,000 | 777,337 | ||||||
Evergreen Marine Corp. Ltd.a | 1,560,000 | 952,477 | ||||||
Everlight Chemical Industrial Corp. | 679,192 | 755,529 | ||||||
Everlight Electronics Co. Ltd. | 526,000 | 1,168,478 | ||||||
Far Eastern Department Stores Ltd. | 959,167 | 965,890 | ||||||
Far Eastern International Bank Ltd. | 2,028,587 | 732,967 | ||||||
Far Eastern New Century Corp. | 3,143,291 | 3,370,384 | ||||||
Far EasTone Telecommunications Co. Ltd. | 2,104,000 | 4,483,859 | ||||||
Faraday Technology Corp. | 513,000 | 612,706 | ||||||
Farglory Land Development Co. Ltd. | 531,782 | 738,327 | ||||||
Federal Corp. | 940,354 | 611,896 | ||||||
Feng Hsin Iron & Steel Co. Ltd. | 559,000 | 804,169 | ||||||
Feng Tay Enterprise Co. Ltd. | 547,305 | 1,567,364 | ||||||
Firich Enterprises Co. Ltd. | 194,523 | 1,125,859 | ||||||
First Financial Holding Co. Ltd. | 7,821,272 | 4,840,787 | ||||||
FLEXium Interconnect Inc. | 265,471 | 752,259 | ||||||
| Security | Shares | Value | ||||||
Forhouse Corp.a | 1,345,000 | $ | 578,219 | |||||
Formosa Chemicals & Fibre Corp. | 3,537,210 | 8,804,417 | ||||||
Formosa Epitaxy Inc.a | 685,000 | 413,651 | ||||||
Formosa Petrochemical Corp. | 1,578,000 | 3,985,848 | ||||||
Formosa Plastics Corp. | 4,538,800 | 11,768,187 | ||||||
Formosa Taffeta Co. Ltd. | 783,000 | 831,711 | ||||||
Formosan Rubber Group Inc. | 659,000 | 738,579 | ||||||
Foxconn Technology Co. Ltd. | 1,102,720 | 2,766,899 | ||||||
Fubon Financial Holding Co. Ltd. | 7,551,000 | 12,327,957 | ||||||
G Tech Optoelectronics Corp.a | 385,000 | 400,579 | ||||||
Gemtek Technology Corp. | 622,000 | 586,822 | ||||||
Getac Technology Corp. | 853,000 | 463,734 | ||||||
Giant Manufacturing Co. Ltd. | 526,000 | 4,372,995 | ||||||
Gigabyte Technology Co. Ltd. | 681,000 | 909,048 | ||||||
Gigasolar Materials Corp. | 33,800 | 590,274 | ||||||
Gigastorage Corp.a | 566,000 | 539,670 | ||||||
Gintech Energy Corp.a | 551,000 | 526,289 | ||||||
Global Mixed Mode Technology Inc. | 195,000 | 581,924 | ||||||
Gloria Material Technology Corp. | 869,200 | 726,987 | ||||||
Goldsun Development & Construction Co. Ltd.a | 1,424,000 | 504,990 | ||||||
Gourmet Master Co. Ltd. | 75,000 | 607,216 | ||||||
Grand Pacific Petrochemical Corp. | 1,264,000 | 640,658 | ||||||
Grape King Bio Ltd. | 135,000 | 598,434 | ||||||
Great Wall Enterprise Co. Ltd. | 747,500 | 760,242 | ||||||
Greatek Electronics Inc. | 428,000 | 587,076 | ||||||
HannStar Display Corp. | 3,050,640 | 1,071,635 | ||||||
HannsTouch Solution Inc.a | 1,832,000 | 511,162 | ||||||
Hermes Microvision Inc. | 46,000 | 1,977,551 | ||||||
Hey Song Corp. | 432,000 | 480,554 | ||||||
Highwealth Construction Corp. | 790,100 | 1,400,957 | ||||||
Hiwin Technologies Corp. | 236,770 | 2,313,004 | ||||||
Ho Tung Chemical Corp. | 1,758,550 | 661,872 | ||||||
Holy Stone Enterprise Co. Ltd. | 498,900 | 749,422 | ||||||
Hon Hai Precision Industry Co. Ltd. | 14,264,568 | 48,677,203 | ||||||
Hotai Motor Co. Ltd. | 282,000 | 3,967,180 | ||||||
HTC Corp. | 780,000 | 3,588,097 | ||||||
Hua Nan Financial Holdings Co. Ltd. | 6,467,116 | 4,013,483 | ||||||
| 30 | 2014 iSHARES ANNUAL REPORTTO SHAREHOLDERS |
Table of Contents
Consolidated Schedule of Investments (Continued)
iSHARES® CORE MSCI EMERGING MARKETS ETF
August 31, 2014
| Security | Shares | Value | ||||||
Huaku Development Co. Ltd. | 299,000 | $ | 720,229 | |||||
Hung Sheng Construction Ltd. | 773,000 | 544,375 | ||||||
Ichia Technologies Inc. | 413,000 | 624,533 | ||||||
IEI Integration Corp. | 284,210 | 557,191 | ||||||
Innolux Corp. | 8,964,241 | 4,558,521 | ||||||
Inotera Memories Inc.a | 2,643,000 | 4,323,872 | ||||||
Inventec Corp. | 2,697,000 | 2,120,389 | ||||||
ITEQ Corp. | 618,000 | 562,373 | ||||||
Kee Tai Properties Co. Ltd. | 910,000 | 586,056 | ||||||
Kenda Rubber Industrial Co. Ltd. | 548,744 | 1,167,599 | ||||||
Kerry TJ Logistics Co. Ltd. | 438,000 | 594,199 | ||||||
King Slide Works Co. Ltd. | 74,000 | 992,757 | ||||||
King Yuan Electronics Co. Ltd. | 1,350,000 | 1,235,259 | ||||||
King’s Town Bank Co. Ltd. | 1,009,000 | 1,137,596 | ||||||
Kingdom Construction Co. | 489,000 | 462,162 | ||||||
Kinpo Electronics Inc.a | 1,441,000 | 696,624 | ||||||
Kinsus Interconnect Technology Corp. | 526,000 | 2,226,092 | ||||||
Kuoyang Construction Co. Ltd. | 1,425,023 | 681,749 | ||||||
Largan Precision Co. Ltd. | 118,000 | 9,770,663 | ||||||
Lealea Enterprise Co. Ltd. | 1,511,173 | 476,247 | ||||||
Lien Hwa Industrial Corp. | 611,000 | 428,245 | ||||||
Lite-On Technology Corp. | 2,302,547 | 3,816,972 | ||||||
Long Bon International Co. Ltd. | 633,000 | 427,781 | ||||||
Macronix International Co. Ltd.a | 3,984,000 | 1,032,970 | ||||||
Makalot Industrial Co. Ltd. | 183,727 | 906,634 | ||||||
Masterlink Securities Corp. | 1,230,592 | 426,110 | ||||||
MediaTek Inc. | 1,626,572 | 27,181,637 | ||||||
Medigen Biotechnology Corp.a | 115,088 | 535,195 | ||||||
Mega Financial Holding Co. Ltd. | 11,090,958 | 9,573,166 | ||||||
Merida Industry Co. Ltd. | 243,850 | 1,794,784 | ||||||
Merry Electronics Co. Ltd. | 196,070 | 1,128,253 | ||||||
Micro-Star International Co. Ltd. | 873,000 | 1,198,931 | ||||||
Microbio Co. Ltd.a | 703,141 | 695,131 | ||||||
MIN AIK Technology Co. Ltd. | 166,000 | 910,791 | ||||||
Mitac Holdings Corp. | 624,000 | 539,650 | ||||||
Motech Industries Inc. | 526,000 | 712,701 | ||||||
Nan Kang Rubber Tire Co. Ltd. | 509,000 | 584,940 | ||||||
| Security | Shares | Value | ||||||
Nan Ya Plastics Corp. | 5,383,440 | $ | 12,697,430 | |||||
Nan Ya Printed Circuit Board Corp.a | 284,000 | 527,325 | ||||||
National Petroleum Co. Ltd. | 508,000 | 579,542 | ||||||
Neo Solar Power Corp. | 765,251 | 739,892 | ||||||
Novatek Microelectronics Corp. Ltd. | 661,000 | 3,394,507 | ||||||
OptoTech Corp. | 1,562,000 | 794,313 | ||||||
Oriental Union Chemical Corp. | 653,000 | 613,884 | ||||||
Pan-International Industrial Corp. | 765,366 | 554,363 | ||||||
Parade Technologies Ltd. | 66,000 | 787,173 | ||||||
PChome Online Inc. | 92,502 | 928,409 | ||||||
Pegatron Corp. | 1,885,000 | 3,998,227 | ||||||
PharmaEngine Inc.a | 64,000 | 527,793 | ||||||
Phison Electronics Corp. | 153,000 | 1,108,195 | ||||||
Phytohealth Corp.a | 607,000 | 745,284 | ||||||
Pixart Imaging Inc. | 264,000 | 620,023 | ||||||
Pou Chen Corp. | 2,354,000 | 2,720,955 | ||||||
Powertech Technology Inc. | 782,000 | 1,483,394 | ||||||
President Chain Store Corp. | 645,000 | 4,887,590 | ||||||
President Securities Corp. | 748,000 | 424,168 | ||||||
Prince Housing & Development Corp. | 1,410,995 | 608,951 | ||||||
Qisda Corp.a | 1,983,000 | 1,008,401 | ||||||
Quanta Computer Inc. | 3,156,000 | 8,911,407 | ||||||
Radiant Opto-Electronics Corp. | 526,940 | 2,274,143 | ||||||
Radium Life Tech Co. Ltd. | 841,036 | 538,828 | ||||||
Realtek Semiconductor Corp. | 526,110 | 1,918,536 | ||||||
Rich Development Co. Ltd. | 1,486,770 | 651,601 | ||||||
Richtek Technology Corp. | 177,000 | 988,910 | ||||||
Ritek Corp.a | 3,632,000 | 498,192 | ||||||
Ruentex Development Co. Ltd. | 752,964 | 1,352,743 | ||||||
Ruentex Industries Ltd. | 592,906 | 1,438,105 | ||||||
Sampo Corp. | 1,751,000 | 761,546 | ||||||
Sanyang Industry Co. Ltd. | 623,000 | 582,555 | ||||||
ScinoPharm Taiwan Ltd. | 304,366 | 621,145 | ||||||
Sercomm Corp. | 320,000 | 762,249 | ||||||
Shih Wei Navigation Co. Ltd. | 708,675 | 502,632 | ||||||
Shihlin Electric & Engineering Corp. | 417,000 | 573,383 | ||||||
Shihlin Paper Corp.a | 160,000 | 241,950 | ||||||
Shin Kong Financial Holding Co. Ltd. | 8,219,943 | 2,681,268 | ||||||
CONSOLIDATED SCHEDULEOF INVESTMENTS | 31 |
Table of Contents
Consolidated Schedule of Investments (Continued)
iSHARES® CORE MSCI EMERGING MARKETS ETF
August 31, 2014
| Security | Shares | Value | ||||||
Shin Zu Shing Co. Ltd. | 230,000 | $ | 623,275 | |||||
Shining Building Business Co. Ltd.a | 624,910 | 453,674 | ||||||
Shinkong Synthetic Fibers Corp. | 1,842,000 | 677,874 | ||||||
Shinkong Textile Co. Ltd. | 218,000 | 301,213 | ||||||
Sigurd Microelectronics Corp. | 593,000 | 664,609 | ||||||
Silicon Integrated Systems Corp.a | 1,936,000 | 633,448 | ||||||
Siliconware Precision Industries Co. Ltd. | 3,385,000 | 4,937,555 | ||||||
Silitech Technology Corp. | 533,350 | 475,528 | ||||||
Simplo Technology Co. Ltd. | 526,000 | 2,956,391 | ||||||
Sino-American Silicon Products Inc.a | 605,000 | 981,666 | ||||||
Sinon Corp. | 1,844,000 | 1,070,353 | ||||||
SinoPac Financial Holdings Co. Ltd. | 7,523,541 | 3,435,752 | ||||||
Sinyi Realty Co. | 295,687 | 390,747 | ||||||
Soft-World International Corp. | 145,000 | 479,768 | ||||||
Solar Applied Materials Technology Corp. | 663,000 | 615,522 | ||||||
Sonix Technology Co. Ltd. | 503,000 | 890,206 | ||||||
St.Shine Optical Co. Ltd. | 60,000 | 1,240,528 | ||||||
Standard Foods Corp. | 573,953 | 1,474,702 | ||||||
Synnex Technology International Corp. | 1,578,000 | 2,407,347 | ||||||
Ta Chen Stainless Pipe Co. Ltd. | 1,273,200 | 932,841 | ||||||
Ta Chong Bank Ltd.a | 1,871,489 | 607,332 | ||||||
Taichung Commercial Bank Co. Ltd. | 1,604,975 | 561,114 | ||||||
Taiflex Scientific Co. Ltd. | 526,000 | 948,509 | ||||||
Taigen Biopharmaceuticals Holdings Ltd.a | 298,000 | 400,783 | ||||||
Tainan Spinning Co. Ltd. | 1,157,995 | 716,713 | ||||||
Taishin Financial Holdings Co. Ltd. | 8,931,316 | 4,541,778 | ||||||
Taiwan Acceptance Corp. | 158,000 | 425,520 | ||||||
Taiwan Business Bank Ltd.a | 4,207,404 | 1,317,519 | ||||||
Taiwan Cement Corp. | 3,720,000 | 5,911,577 | ||||||
Taiwan Cogeneration Corp. | 733,000 | 549,312 | ||||||
Taiwan Cooperative Financial Holding Co. Ltd. | 6,241,872 | 3,487,371 | ||||||
Taiwan Fertilizer Co. Ltd. | 1,052,000 | 1,995,564 | ||||||
| Security | Shares | Value | ||||||
Taiwan Glass Industry Corp. | 1,055,000 | $ | 910,624 | |||||
Taiwan Hon Chuan Enterprise Co. Ltd. | 526,000 | 1,045,295 | ||||||
Taiwan Land Development Corp.a | 2,372,538 | 932,648 | ||||||
Taiwan Life Insurance Co. Ltd.a | 691,674 | 490,574 | ||||||
Taiwan Liposome Co. Ltd.a | 57,000 | 440,508 | ||||||
Taiwan Mobile Co. Ltd. | 2,104,000 | 6,708,192 | ||||||
Taiwan PCB Techvest Co. Ltd. | 428,042 | 698,832 | ||||||
Taiwan Prosperity Chemical Corp.a | 541,000 | 492,304 | ||||||
Taiwan Sakura Corp. | 1,221,000 | 890,510 | ||||||
Taiwan Secom Co. Ltd. | 291,185 | 827,072 | ||||||
Taiwan Semiconductor Manufacturing Co. Ltd. | 28,404,000 | 117,833,291 | ||||||
Taiwan Surface Mounting Technology Co. Ltd. | 366,392 | 581,633 | ||||||
Taiwan TEA Corp. | 948,000 | 605,771 | ||||||
Taiwan-Sogo Shinkong Security Corp. | 551,770 | 766,078 | ||||||
Tatung Co. Ltd.a | 2,228,000 | 721,535 | ||||||
Teco Electric and Machinery Co. Ltd. | 2,238,000 | 2,815,236 | ||||||
Test Research Inc. | 343,400 | 605,449 | ||||||
Test-Rite International Co. Ltd. | 746,000 | 490,420 | ||||||
Ton Yi Industrial Corp. | 927,000 | 710,202 | ||||||
Tong Hsing Electronic Industries Ltd. | 174,000 | 838,260 | ||||||
Tong Yang Industry Co. Ltd. | 526,400 | 669,216 | ||||||
Topco Scientific Co. Ltd. | 536,351 | 1,046,127 | ||||||
TPK Holding Co. Ltd. | 290,000 | 1,969,522 | ||||||
Transcend Information Inc. | 189,000 | 635,469 | ||||||
Tripod Technology Corp. | 526,000 | 1,068,172 | ||||||
Tsann Kuen Enterprise Co. Ltd. | 367,000 | 459,203 | ||||||
TSRC Corp. | 701,900 | 982,737 | ||||||
TTY Biopharm Co. Ltd. | 315,124 | 722,169 | ||||||
Tung Ho Steel Enterprise Corp. | 767,000 | 644,074 | ||||||
TWi Pharmaceuticals Inc.a | 52,000 | 440,140 | ||||||
TXC Corp. | 470,000 | 687,928 | ||||||
U-Ming Marine Transport Corp. | 526,000 | 865,800 | ||||||
| 32 | 2014 iSHARES ANNUAL REPORTTO SHAREHOLDERS |
Table of Contents
Consolidated Schedule of Investments (Continued)
iSHARES® CORE MSCI EMERGING MARKETS ETF
August 31, 2014
| Security | Shares | Value | ||||||
Uni-President Enterprises Co. | 5,237,971 | $ | 9,585,554 | |||||
Unimicron Technology Corp. | 1,465,000 | 1,237,559 | ||||||
Union Bank of Taiwana | 1,530,511 | 550,442 | ||||||
Unitech Printed Circuit Board Corp.a | 1,781,000 | 768,636 | ||||||
United Microelectronics Corp. | 13,526,000 | 6,176,876 | ||||||
Unity Opto Technology Co. Ltd.a | 442,000 | 514,598 | ||||||
UPC Technology Corp. | 1,241,146 | 489,972 | ||||||
USI Corp. | 1,117,000 | 603,521 | ||||||
Vanguard International Semiconductor Corp. | 951,000 | 1,391,956 | ||||||
Visual Photonics Epitaxy Co. Ltd. | 578,000 | 600,422 | ||||||
Wah Lee Industrial Corp. | 526,000 | 1,008,340 | ||||||
Walsin Lihwa Corp.a | 3,757,000 | 1,344,906 | ||||||
Wan Hai Lines Ltd. | 685,000 | 450,319 | ||||||
Waterland Financial Holdings Co. Ltd. | 1,505,293 | 459,789 | ||||||
Wei Chuan Foods Corp. | 526,000 | 774,293 | ||||||
Win Semiconductors Corp. | 656,000 | 669,377 | ||||||
Winbond Electronics Corp.a | 3,248,000 | 1,102,932 | ||||||
Wintek Corp.a | 2,475,000 | 840,443 | ||||||
Wistron Corp. | 2,590,299 | 3,033,086 | ||||||
Wistron NeWeb Corp. | 296,591 | 773,962 | ||||||
Wowprime Corp. | 69,260 | 842,275 | ||||||
WPG Holdings Co. Ltd. | 1,496,000 | 1,949,422 | ||||||
WT Microelectronics Co. Ltd. | 526,050 | 828,924 | ||||||
Yageo Corp. | 2,415,500 | 2,020,291 | ||||||
Yang Ming Marine Transport Corp.a | 1,487,000 | 669,114 | ||||||
Yem Chio Co. Ltd. | 1,341,467 | 792,121 | ||||||
YFY Inc. | 1,128,000 | 515,120 | ||||||
Yieh Phui Enterprise Co. Ltd. | 1,547,340 | 504,728 | ||||||
Youngtek Electronics Corp. | 302,853 | 706,206 | ||||||
Yuanta Financial Holding Co. Ltd. | 9,304,425 | 5,011,667 | ||||||
Yulon Motor Co. Ltd. | 1,052,000 | 1,689,366 | ||||||
YungShin Global Holding Corp. | 526,000 | 1,006,581 | ||||||
Yungtay Engineering Co. Ltd. | 526,000 | 1,303,980 | ||||||
Zhen Ding Technology Holding Ltd. | 345,950 | 1,143,502 | ||||||
Zinwell Corp. | 571,000 | 532,975 | ||||||
|
| |||||||
| 727,757,292 | ||||||||
| Security | Shares | Value | ||||||
THAILAND — 2.50% |
| |||||||
Advanced Information Service PCL NVDR | 1,222,200 | $ | 7,997,489 | |||||
Airports of Thailand PCL NVDR | 516,500 | 3,832,514 | ||||||
Amata Corp. PCL NVDR | 1,194,800 | 624,708 | ||||||
AP (Thailand) PCL NVDR | 3,038,300 | 761,002 | ||||||
Bangchak Petroleum PCL NVDR | 556,300 | 596,533 | ||||||
Bangkok Bank PCL Foreign | 606,800 | 3,894,615 | ||||||
Bangkok Bank PCL NVDR | 646,400 | 4,148,779 | ||||||
Bangkok Chain Hospital PCL NVDR | 2,603,850 | 811,155 | ||||||
Bangkok Dusit Medical Services PCL NVDR | 4,065,000 | 2,481,763 | ||||||
Bangkok Expressway PCL NVDR | 663,300 | 809,915 | ||||||
Bangkok Land PCL NVDR | 14,253,200 | 981,748 | ||||||
Banpu PCL NVDR | 1,255,500 | 1,267,685 | ||||||
BEC World PCL NVDR | 1,242,300 | 1,847,503 | ||||||
BTS Group Holdings PCL NVDR | 6,724,000 | 2,031,515 | ||||||
Bumrungrad Hospital PCL NVDR | 481,100 | 2,033,453 | ||||||
Central Pattana PCL NVDR | 1,663,100 | 2,512,354 | ||||||
Central Plaza Hotel PCL NVDR | 766,400 | 947,802 | ||||||
Charoen Pokphand Foods PCL NVDR | 3,206,400 | 2,961,453 | ||||||
CP All PCL NVDR | 5,135,500 | 7,637,328 | ||||||
Delta Electronics (Thailand) PCL NVDR | 629,100 | 1,280,260 | ||||||
Dynasty Ceramic PCL NVDR | 303,500 | 553,503 | ||||||
Energy Absolute PCL NVDR | 1,712,800 | 1,324,551 | ||||||
Esso (Thailand) PCL NVDRa | 2,538,000 | 468,823 | ||||||
Glow Energy PCL NVDR | 656,600 | 1,798,763 | ||||||
Hana Microelectronics PCL NVDR | 784,900 | 952,250 | ||||||
Hemaraj Land and Development PCL NVDR | 7,020,800 | 945,192 | ||||||
Home Product Center PCL NVDRb | 4,123,984 | 1,355,724 | ||||||
Indorama Ventures PCL NVDR | 1,551,000 | 1,311,115 | ||||||
IRPC PCL NVDR | 12,671,100 | 1,317,096 | ||||||
CONSOLIDATED SCHEDULEOF INVESTMENTS | 33 |
Table of Contents
Consolidated Schedule of Investments (Continued)
iSHARES® CORE MSCI EMERGING MARKETS ETF
August 31, 2014
| Security | Shares | Value | ||||||
Jasmine International PCL NVDRb | 4,792,100 | $ | 960,220 | |||||
Kasikornbank PCL Foreign | 1,350,600 | 9,556,531 | ||||||
Kasikornbank PCL NVDR | 744,200 | 5,242,486 | ||||||
Khon Kaen Sugar Industry PCL NVDR | 1,304,100 | 563,450 | ||||||
Kiatnakin Bank PCL NVDRb | 620,400 | 815,805 | ||||||
Krung Thai Bank PCL NVDR | 4,394,500 | 3,233,273 | ||||||
LPN Development PCL NVDRb | 1,016,300 | 690,473 | ||||||
Major Cineplex Group PCL NVDR | 1,045,300 | 710,176 | ||||||
Minor International PCL NVDR | 1,995,400 | 2,202,187 | ||||||
Polyplex PCL NVDRa | 1,041,400 | 394,519 | ||||||
Pruksa Real Estate PCL NVDRb | 951,200 | 1,027,439 | ||||||
PTT Exploration & Production PCL NVDR | 1,589,301 | 8,185,348 | ||||||
PTT Global Chemical PCL NVDR | 1,913,500 | 3,714,371 | ||||||
PTT PCL NVDR | 983,600 | 9,885,272 | ||||||
Quality Houses PCL NVDR | 5,966,600 | 829,421 | ||||||
Siam Cement (The) PCL Foreign | 364,800 | 5,025,423 | ||||||
Siam Cement (The) PCL NVDR | 108,800 | 1,498,810 | ||||||
Siam Commercial Bank PCL NVDR | 1,834,300 | 10,739,327 | ||||||
Siam Global House PCL NVDR | 1,588,258 | 735,949 | ||||||
Sino-Thai Engineering & Construction PCL NVDR | 1,051,428 | 839,431 | ||||||
Sri Trang Agro-Industry PCL NVDRb | 1,067,500 | 471,251 | ||||||
Supalai PCL NVDR | 980,800 | 798,397 | ||||||
Thai Airways International PCL NVDRa,b | 1,048,900 | 499,163 | ||||||
Thai Oil PCL NVDR | 946,800 | 1,534,029 | ||||||
Thai Tap Water Supply PCL NVDR | 2,142,400 | 838,447 | ||||||
Thai Vegetable Oil PCL NVDR | 856,000 | 603,006 | ||||||
Thaicom PCL NVDR | 672,900 | 832,171 | ||||||
Thanachart Capital PCL NVDR | 914,100 | 1,001,675 | ||||||
| Security | Shares | Value | ||||||
Thoresen Thai Agencies PCL NVDRa | 953,702 | $ | 698,705 | |||||
Ticon Industrial Connection PCL NVDRb | 1,060,760 | 584,514 | ||||||
TISCO Financial Group PCL NVDRb | 639,750 | 881,309 | ||||||
TMB Bank PCL NVDR | 16,965,200 | 1,614,722 | ||||||
TPI Polene PCL NVDR | 1,098,800 | 560,753 | ||||||
True Corp. PCL NVDRa | 9,526,618 | 3,430,060 | ||||||
VGI Global Media PCL NVDRb | 2,102,700 | 875,576 | ||||||
|
| |||||||
| 141,560,280 | ||||||||
TURKEY — 1.63% |
| |||||||
Akbank TAS | 2,135,127 | 8,152,852 | ||||||
Akfen Holding ASb | 199,222 | 465,293 | ||||||
Akmerkez Gayrimenkul Yatirim Ortakligi AS | 39,681 | 299,729 | ||||||
Aksa Akrilik Kimya Sanayii AS | 115,628 | 380,970 | ||||||
Albaraka Turk Katilim Bankasi AS | 621,938 | 498,599 | ||||||
Anadolu Efes Biracilik ve Malt Sanayii ASa | 245,333 | 3,262,845 | ||||||
Arcelik AS | 281,259 | 1,687,854 | ||||||
Asya Katilim Bankasi ASa | 682,196 | 392,003 | ||||||
BIM Birlesik Magazalar AS | 249,352 | 5,869,961 | ||||||
Bizim Toptan Satis Magazalari ASb | 59,724 | 514,779 | ||||||
Cimsa Cimento Sanayi ve TAS | 84,989 | 604,547 | ||||||
Coca-Cola Icecek AS | 91,525 | 2,163,060 | ||||||
Dogan Sirketler Grubu Holding ASa | 1,354,031 | 489,420 | ||||||
Dogan Yayin Holding ASa,b | 2,417,985 | 425,790 | ||||||
Dogus Otomotiv Servis ve TAS | 81,744 | 331,832 | ||||||
Emlak Konut Gayrimenkul Yatirim Ortakligi AS | 2,255,417 | 2,842,853 | ||||||
Enka Insaat ve Sanayi AS | 580,935 | 1,456,409 | ||||||
Eregli Demir ve Celik Fabrikalari TASb | 1,690,438 | 3,290,085 | ||||||
Ford Otomotiv Sanayi ASa | 89,118 | 1,176,980 | ||||||
Haci Omer Sabanci Holding AS | 1,096,374 | 5,080,627 | ||||||
Is Gayrimenkul Yatirim Ortakligi AS | 890,891 | 565,593 | ||||||
| 34 | 2014 iSHARES ANNUAL REPORTTO SHAREHOLDERS |
Table of Contents
Consolidated Schedule of Investments (Continued)
iSHARES® CORE MSCI EMERGING MARKETS ETF
August 31, 2014
| Security | Shares | Value | ||||||
Kardemir Karabuk Demir Celik Sanayi ve TAS Class Da | 1,159,413 | $ | 1,219,615 | |||||
KOC Holding ASb | 758,262 | 3,882,757 | ||||||
Koza Altin Isletmeleri AS | 62,341 | 671,669 | ||||||
Sekerbank TASa,b | 567,131 | 517,736 | ||||||
TAV Havalimanlari Holding AS | 198,479 | 1,650,964 | ||||||
Tofas Turk Otomobil Fabrikasi AS | 156,612 | 965,240 | ||||||
Trakya Cam Sanayii AS | 486,520 | 597,455 | ||||||
Turk Hava Yollari AOa | 660,491 | 2,096,602 | ||||||
Turk Telekomunikasyon AS | 642,178 | 1,862,895 | ||||||
Turkcell Iletisim Hizmetleri ASa | 1,030,397 | 6,040,234 | ||||||
Turkiye Garanti Bankasi AS | 2,709,268 | 10,633,935 | ||||||
Turkiye Halk Bankasi AS | 743,505 | 5,460,995 | ||||||
Turkiye Is Bankasi AS Class C | 1,906,529 | 4,929,879 | ||||||
Turkiye Petrol Rafinerileri AS | 148,662 | 3,499,631 | ||||||
Turkiye Sinai Kalkinma Bankasi ASb | 985,366 | 867,581 | ||||||
Turkiye Sise ve Cam Fabrikalari AS | 850,311 | 1,150,586 | ||||||
Turkiye Vakiflar Bankasi TAO Class D | 949,083 | 2,190,242 | ||||||
Ulker Biskuvi Sanayi AS | 189,922 | 1,408,166 | ||||||
Yapi ve Kredi Bankasi ASb | 1,092,807 | 2,435,831 | ||||||
Yazicilar Holding AS | 47,192 | 426,444 | ||||||
|
| |||||||
| 92,460,538 | ||||||||
UNITED ARAB EMIRATES — 0.55% |
| |||||||
Abu Dhabi Commercial Bank PJSC | 1,324,305 | 2,887,977 | ||||||
Agthia Group PJSC | 243,062 | 370,577 | ||||||
Air Arabia PJSC | 2,574,137 | 967,128 | ||||||
Ajman Bank PJSCa | 664,437 | 479,372 | ||||||
Al Waha Capital PJSC | 1,132,325 | 915,589 | ||||||
Aldar Properties PJSC | 3,638,123 | 3,952,059 | ||||||
Arabtec Holding Co.a | 1,309,511 | 1,679,203 | ||||||
Dana Gas PJSCa | 3,863,854 | 736,363 | ||||||
DP World Ltd. | 187,420 | 3,519,748 | ||||||
Dubai Financial Market PJSC | 2,313,721 | 2,141,722 | ||||||
Dubai Islamic Bank PJSC | 620,954 | 1,320,333 | ||||||
Emaar Properties PJSC | 2,067,491 | 5,769,533 | ||||||
Eshraq Properties Co. PJSCa | 1,102,023 | 408,040 | ||||||
First Gulf Bank PJSC | 488,676 | 2,428,047 | ||||||
| Security | Shares | Value | ||||||
Gulf General Investment Co.a | 1,004,954 | $ | 331,058 | |||||
National Bank of Abu Dhabi PJSC | 711,214 | 2,710,825 | ||||||
RAK Properties PJSC | 1,311,842 | 375,011 | ||||||
|
| |||||||
| 30,992,585 | ||||||||
|
| |||||||
TOTAL COMMON STOCKS |
| |||||||
(Cost: $4,920,185,188) | 5,316,263,139 | |||||||
PREFERRED STOCKS — 5.66% |
| |||||||
BRAZIL — 4.44% |
| |||||||
AES Tiete SA | 118,500 | 1,065,549 | ||||||
Banco ABC Brasil SA | 107,384 | 719,877 | ||||||
Banco Bradesco SA | 2,402,570 | 43,851,963 | ||||||
Banco Daycoval SA | 102,200 | 413,815 | ||||||
Banco do Estado do Rio Grande do Sul SA Class B | 214,900 | 1,483,857 | ||||||
Banco Industrial e Comercial SA | 110,200 | 374,302 | ||||||
Banco Pan SA | 216,800 | 340,090 | ||||||
Banco Pine SA | 125,333 | 457,630 | ||||||
Bradespar SA | 258,000 | 2,357,981 | ||||||
Braskem SA Class A | 177,000 | 1,206,342 | ||||||
Centrais Eletricas Brasileiras SA Class B | 224,000 | 1,236,352 | ||||||
Companhia Brasileira de Distribuicao | 157,800 | 8,034,044 | ||||||
Companhia de Ferro Ligas da Bahia – Ferbasa | 79,500 | 364,182 | ||||||
Companhia Energetica de Minas Gerais | 872,020 | 7,467,052 | ||||||
Companhia Energetica de Sao Paulo Class B | 219,400 | 3,107,321 | ||||||
Companhia Energetica do Ceara Class A | 23,300 | 380,081 | ||||||
Companhia Paranaense de Energia Class B | 121,000 | 2,144,694 | ||||||
Eletropaulo Metropolitana Eletricidade de Sao Paulo SA | 124,800 | 574,485 | ||||||
Eucatex SA Industria e Comercio | 85,900 | 172,756 | ||||||
Gerdau SA | 983,500 | 5,696,480 | ||||||
GOL Linhas Aereas Inteligentes SA | 114,400 | 709,136 | ||||||
Itau Unibanco Holding SA | 3,172,948 | 57,232,322 | ||||||
CONSOLIDATED SCHEDULEOF INVESTMENTS | 35 |
Table of Contents
Consolidated Schedule of Investments (Continued)
iSHARES® CORE MSCI EMERGING MARKETS ETF
August 31, 2014
| Security | Shares | Value | ||||||
Itausa – Investimentos Itau SA | 3,658,798 | $ | 17,823,467 | |||||
Lojas Americanas SA | 563,975 | 3,992,476 | ||||||
Marcopolo SA | 577,700 | 1,123,101 | ||||||
Metalurgica Gerdau SA | 321,700 | 2,280,245 | ||||||
Petroleo Brasileiro SA | 4,840,900 | 50,517,314 | ||||||
Randon SA Implementos e Participacoes | 266,750 | 865,502 | ||||||
Saraiva Livreiros Editores SA | 54,600 | 416,537 | ||||||
Suzano Papel e Celulose SA Class A | 376,500 | 1,499,236 | ||||||
Telefonica Brasil SA | 330,700 | 7,072,018 | ||||||
Usinas Siderurgicas de Minas Gerais SA Class A | 448,100 | 1,618,131 | ||||||
Vale SA Class A | 2,140,500 | 24,843,595 | ||||||
|
| |||||||
| 251,441,933 | ||||||||
CHILE — 0.07% |
| |||||||
Embotelladora Andina SA Class B | 351,990 | 1,153,818 | ||||||
Sociedad Quimica y Minera de Chile SA Series B | 112,725 | 3,085,928 | ||||||
|
| |||||||
| 4,239,746 | ||||||||
COLOMBIA — 0.28% |
| |||||||
Avianca Holdings SA | 431,269 | 876,723 | ||||||
Banco Davivienda SA | 126,607 | 2,105,222 | ||||||
Bancolombia SA | 488,265 | 7,737,109 | ||||||
Grupo Argos SA | 142,858 | 1,742,489 | ||||||
Grupo Aval Acciones y Valores SA | 1,406,422 | 1,052,003 | ||||||
Grupo de Inversiones Suramericana SA | 105,403 | 2,395,460 | ||||||
|
| |||||||
| 15,909,006 | ||||||||
RUSSIA — 0.21% |
| |||||||
AK Transneft OAO | 2,054 | 4,518,698 | ||||||
Sberbank of Russia | 1,072,800 | 1,599,724 | ||||||
Surgutneftegas OJSC | 8,049,600 | 5,924,174 | ||||||
|
| |||||||
| 12,042,596 | ||||||||
SOUTH AFRICA — 0.02% |
| |||||||
Allied Electronics Corp. Ltd. | 375,459 | 902,339 | ||||||
|
| |||||||
| 902,339 | ||||||||
SOUTH KOREA — 0.64% |
| |||||||
Hyundai Motor Co. Ltd. | 27,405 | 4,054,194 | ||||||
Hyundai Motor Co. Ltd. Series 2 | 43,267 | 6,699,461 | ||||||
| Security | Shares | Value | ||||||
LG Chem Ltd. | 8,786 | $ | 1,529,394 | |||||
Samsung Electronics Co. Ltd. | 23,799 | 23,941,003 | ||||||
|
| |||||||
| 36,224,052 | ||||||||
|
| |||||||
TOTAL PREFERRED STOCKS |
| |||||||
(Cost: $283,100,969) | 320,759,672 | |||||||
RIGHTS — 0.00% |
| |||||||
BRAZIL — 0.00% |
| |||||||
Banco Pan SAa | 19,991 | 89 | ||||||
|
| |||||||
| 89 | ||||||||
SOUTH KOREA — 0.00% |
| |||||||
JB Financial Group Co. Ltd.a | 20,266 | 22,586 | ||||||
|
| |||||||
| 22,586 | ||||||||
TOTAL RIGHTS | ||||||||
(Cost: $0) | 22,675 | |||||||
WARRANTS — 0.00% |
| |||||||
THAILAND — 0.00% |
| |||||||
Indorama Ventures PCL NVDR (Expires 8/24/17)a | 144,050 | — | ||||||
Indorama Ventures PCL NVDR (Expires 8/24/18)a | 110,807 | — | ||||||
Thoresen Thai Agencies PCL NVDR (Expires 2/28/17)a | 1 | — | ||||||
|
| |||||||
| — | ||||||||
|
| |||||||
TOTAL WARRANTS | ||||||||
(Cost: $0) | — | |||||||
SHORT-TERM INVESTMENTS — 4.60% |
| |||||||
MONEY MARKET FUNDS — 4.60% |
| |||||||
BlackRock Cash Funds: Institutional, |
| |||||||
0.14%e,f,g | 114,015,877 | 114,015,877 | ||||||
BlackRock Cash Funds: Prime, |
| |||||||
0.11%e,f,g | 7,177,612 | 7,177,612 | ||||||
BlackRock Cash Funds: Treasury, |
| |||||||
0.00%e,f | 139,668,164 | 139,668,164 | ||||||
|
| |||||||
| 260,861,653 | ||||||||
|
| |||||||
TOTAL SHORT-TERM INVESTMENTS |
| |||||||
(Cost: $260,861,653) | 260,861,653 | |||||||
|
| |||||||
| 36 | 2014 iSHARES ANNUAL REPORTTO SHAREHOLDERS |
Table of Contents
Consolidated Schedule of Investments (Continued)
iSHARES® CORE MSCI EMERGING MARKETS ETF
August 31, 2014
| Value | ||||||
TOTAL INVESTMENTS | ||||||
(Cost: $5,464,147,810) | $ | 5,897,907,139 | ||||
Other Assets, Less Liabilities — (4.03)% | (228,740,213 | ) | ||||
|
| |||||
NET ASSETS — 100.00% | $ | 5,669,166,926 | ||||
|
| |||||
CPO — Certificates of Participation (Ordinary)
GDR — Global Depositary Receipts
NVDR — Non-Voting Depositary Receipts
NVS — Non-Voting Shares
SP ADR — Sponsored American Depositary Receipts
SP GDR — Sponsored Global Depositary Receipts
| a | Non-income earning security. |
| b | All or a portion of this security represents a security on loan. See Note 1. |
| c | Security valued using Level 3 inputs in accordance with management’s fair valuation policy. See Note 1. |
| d | This security may be resold to qualified foreign investors and foreign institutional buyers under Regulation S of the Securities Act of 1933. |
| e | Affiliated issuer. See Note 2. |
| f | The rate quoted is the annualized seven-day yield of the fund at period end. |
| g | All or a portion of this security represents an investment of securities lending collateral. See Note 1. |
Financial futures contracts purchased as of August 31, 2014 were as follows:
Number of Contracts | Issue (Expiration) | Exchange | Notional Value | Unrealized Appreciation (Depreciation) | ||||||||||
| 484 | MSCI Emerging Markets E-Mini (Sept. 2014) | NYSE Liffe | $ | 26,276,360 | $ | 370,530 | ||||||||
See notes to consolidated financial statements.
CONSOLIDATED SCHEDULEOF INVESTMENTS | 37 |
Table of Contents
Consolidated Statement of Assets and Liabilities
iSHARES® CORE MSCI EMERGING MARKETS ETF
August 31, 2014
ASSETS | ||||
Investments, at cost: | ||||
Unaffiliated | $ | 5,203,286,157 | ||
Affiliated (Note 2) | 260,861,653 | |||
|
| |||
Total cost of investments | $ | 5,464,147,810 | ||
|
| |||
Investments in securities, at fair value (including securities on loana) (Note 1): | ||||
Unaffiliated | $ | 5,637,045,486 | ||
Affiliated (Note 2) | 260,861,653 | |||
|
| |||
Total fair value of investments | 5,897,907,139 | |||
Foreign currency, at valueb | 181,211,425 | |||
Cash | 9,348,492 | |||
Cash pledged to broker | 779,946 | |||
Receivables: | ||||
Investment securities sold | 9,286,863 | |||
Dividends and interest | 8,890,194 | |||
Futures variation margin | 370,530 | |||
|
| |||
Total Assets | 6,107,794,589 | |||
|
| |||
LIABILITIES | ||||
Payables: | ||||
Investment securities purchased | 316,151,008 | |||
Collateral for securities on loan (Note 1) | 121,193,489 | |||
Foreign taxes (Note 1) | 482,762 | |||
Investment advisory fees (Note 2) | 800,404 | |||
|
| |||
Total Liabilities | 438,627,663 | |||
|
| |||
NET ASSETS | $ | 5,669,166,926 | ||
|
| |||
Net assets consist of: | ||||
Paid-in capital | $ | 5,259,501,818 | ||
Undistributed net investment income | 35,140,187 | |||
Accumulated net realized loss | (59,406,948 | ) | ||
Net unrealized appreciation | 433,931,869 | |||
|
| |||
NET ASSETS | $ | 5,669,166,926 | ||
|
| |||
Shares outstandingc | 105,200,000 | |||
|
| |||
Net asset value per share | $ | 53.89 | ||
|
| |||
| a | Securities on loan with a value of $112,869,006. See Note 1. |
| b | Cost of foreign currency: $181,215,803. |
| c | $0.001 par value, number of shares authorized: 250 million. |
See notes to consolidated financial statements.
| 38 | 2014 iSHARES ANNUAL REPORTTO SHAREHOLDERS |
Table of Contents
Consolidated Statement of Operations
iSHARES® CORE MSCI EMERGING MARKETS ETF
Year ended August 31, 2014
NET INVESTMENT INCOME | ||||
Dividends — unaffiliateda | $ | 100,925,143 | ||
Interest — affiliated (Note 2) | 1,242 | |||
Securities lending income — affiliated (Note 2) | 1,821,173 | |||
|
| |||
| 102,747,558 | ||||
Less: Other foreign taxes (Note 1) | (613,675 | ) | ||
|
| |||
Total investment income | 102,133,883 | |||
|
| |||
EXPENSES | ||||
Investment advisory fees (Note 2) | 6,606,028 | |||
Mauritius income taxes (Note 1) | 77,381 | |||
Commitment fees (Note 8) | 5,084 | |||
Interest expense (Note 8) | 3,174 | |||
|
| |||
Total expenses | 6,691,667 | |||
Less investment advisory fees waived (Note 2) | (501,946 | ) | ||
|
| |||
Net expenses | 6,189,721 | |||
|
| |||
Net investment income | 95,944,162 | |||
|
| |||
NET REALIZED AND UNREALIZED GAIN (LOSS) | ||||
Net realized gain (loss) from: |
| |||
Investments — unaffiliated | (52,467,963 | ) | ||
Futures contracts | 2,597,960 | |||
Foreign currency transactions | (911,089 | ) | ||
|
| |||
Net realized loss | (50,781,092 | ) | ||
|
| |||
Net change in unrealized appreciation/depreciation on: |
| |||
Investments | 584,310,060 | |||
Futures contracts | 600,924 | |||
Translation of assets and liabilities in foreign currencies | (125,633 | ) | ||
|
| |||
Net change in unrealized appreciation/depreciation | 584,785,351 | |||
|
| |||
Net realized and unrealized gain | 534,004,259 | |||
|
| |||
NET INCREASE IN NET ASSETS RESULTING FROM OPERATIONS | $ | 629,948,421 | ||
|
| |||
| a | Net of foreign withholding tax of $12,345,922. |
See notes to consolidated financial statements.
CONSOLIDATED FINANCIAL STATEMENTS | 39 |
Table of Contents
Consolidated Statements of Changes in Net Assets
iSHARES® CORE MSCI EMERGING MARKETS ETF
Year ended August 31, 2014 | Period from October 18, 2012a to August 31, 2013 | |||||||
INCREASE (DECREASE) IN NET ASSETS | ||||||||
OPERATIONS: | ||||||||
Net investment income | $ | 95,944,162 | $ | 24,214,512 | ||||
Net realized loss | (50,781,092 | ) | (9,822,479 | ) | ||||
Net change in unrealized appreciation/depreciation | 584,785,351 | (150,853,482 | ) | |||||
|
|
|
| |||||
Net increase (decrease) in net assets resulting from operations | 629,948,421 | (136,461,449 | ) | |||||
|
|
|
| |||||
DISTRIBUTIONS TO SHAREHOLDERS: | ||||||||
From net investment income | (69,107,942 | ) | (14,713,922 | ) | ||||
|
|
|
| |||||
Total distributions to shareholders | (69,107,942 | ) | (14,713,922 | ) | ||||
|
|
|
| |||||
CAPITAL SHARE TRANSACTIONS: | ||||||||
Proceeds from shares sold | 3,243,361,038 | 2,016,140,780 | ||||||
|
|
|
| |||||
Net increase in net assets from capital share transactions | 3,243,361,038 | 2,016,140,780 | ||||||
|
|
|
| |||||
INCREASE IN NET ASSETS | 3,804,201,517 | 1,864,965,409 | ||||||
NET ASSETS | ||||||||
Beginning of period | 1,864,965,409 | — | ||||||
|
|
|
| |||||
End of period | $ | 5,669,166,926 | $ | 1,864,965,409 | ||||
|
|
|
| |||||
Undistributed net investment income included in net assets at end of period | $ | 35,140,187 | $ | 9,146,582 | ||||
|
|
|
| |||||
SHARES ISSUED | ||||||||
Shares sold | 64,400,000 | 40,800,000 | ||||||
|
|
|
| |||||
Net increase in shares outstanding | 64,400,000 | 40,800,000 | ||||||
|
|
|
| |||||
| a | Commencement of operations. |
See notes to consolidated financial statements.
| 40 | 2014 iSHARES ANNUAL REPORTTO SHAREHOLDERS |
Table of Contents
Consolidated Financial Highlights
iSHARES® CORE MSCI EMERGING MARKETS ETF
(For a share outstanding throughout each period)
Year ended Aug. 31, 2014 | Period from Oct. 18, 2012a to Aug. 31, 2013 | |||||||
Net asset value, beginning of period | $ | 45.71 | $ | 49.06 | ||||
|
|
|
| |||||
Income from investment operations: | ||||||||
Net investment incomeb | 1.31 | 1.33 | ||||||
Net realized and unrealized gain (loss)c | 7.78 | (4.14 | ) | |||||
|
|
|
| |||||
Total from investment operations | 9.09 | (2.81 | ) | |||||
|
|
|
| |||||
Less distributions from: | ||||||||
Net investment income | (0.91 | ) | (0.54 | ) | ||||
|
|
|
| |||||
Total distributions | (0.91 | ) | (0.54 | ) | ||||
|
|
|
| |||||
Net asset value, end of period | $ | 53.89 | $ | 45.71 | ||||
|
|
|
| |||||
Total return | 20.05 | % | (5.75 | )%d | ||||
|
|
|
| |||||
Ratios/Supplemental data: | ||||||||
Net assets, end of period (000s) | $ | 5,669,167 | $ | 1,864,965 | ||||
Ratio of expenses to average net assetse | 0.17 | % | 0.05 | % | ||||
Ratio of expenses to average net assets prior to waived feese | 0.18 | % | 0.18 | % | ||||
Ratio of net investment income to average net assetse | 2.61 | % | 3.17 | % | ||||
Portfolio turnover ratef | 8 | % | 15 | % | ||||
| a | Commencement of operations. |
| b | Based on average shares outstanding throughout each period. |
| c | The amounts reported for a share outstanding may not accord with the change in aggregate gains and losses in securities for the fiscal period due to the timing of capital share transactions in relation to the fluctuating market values of the Fund’s underlying securities. |
| d | Not annualized. |
| e | Annualized for periods of less than one year. |
| f | Portfolio turnover rates exclude portfolio securities received or delivered in Creation Units but includes portfolio transactions that are executed as a result of the Fund processing capital share transactions in Creation Units partially for cash in U.S. dollars. Excluding such cash transactions, the portfolio turnover rates for the year ended August 31, 2014 and the period ended August 31, 2013 were 8% and 15%, respectively. See Note 4. |
See notes to consolidated financial statements.
CONSOLIDATED FINANCIAL HIGHLIGHTS | 41 |
Table of Contents
Notes to Consolidated Financial Statements
iSHARES® CORE MSCI EMERGING MARKETS ETF
iShares, Inc. (the “Company”) is registered under the Investment Company Act of 1940, as amended (the “1940 Act”), as an open-end management investment company. The Company was incorporated under the laws of the State of Maryland on September 1, 1994 pursuant to amended and restated Articles of Incorporation.
These consolidated financial statements relate only to the following fund (the “Fund”):
| iShares ETF | Diversification Classification | |
Core MSCI Emerging Markets | Diversified |
The investment objective of the Fund is to seek investment results that correspond generally to the price and yield performance, before fees and expenses, of its underlying index. The investment adviser uses a “passive” or index approach to try to achieve the Fund’s investment objective.
The Fund carries out its investment strategies associated with investment in Indian securities by investing in a wholly-owned subsidiary in the Republic of Mauritius (the “Subsidiary”), which in turn invests in Indian securities included in the underlying index. The investment adviser of the Fund also serves as the investment adviser to the Subsidiary. Through this investment structure, the Fund expects to obtain certain benefits under a current tax treaty between Mauritius and India. The accompanying consolidated financial statements for the Fund include the accounts of the Subsidiary. Intercompany accounts and transactions, if any, have been eliminated.
Pursuant to the Company’s organizational documents, the Fund’s officers and directors are indemnified against certain liabilities that may arise out of the performance of their duties to the Fund. Additionally, in the normal course of business, the Fund enters into contracts with service providers that contain general indemnification clauses. The Fund’s maximum exposure under these arrangements is unknown as this would involve future claims that may be made against the Fund that have not yet occurred.
| 1. | SIGNIFICANT ACCOUNTING POLICIES |
The following significant accounting policies are consistently followed by the Fund in the preparation of its financial statements in conformity with accounting principles generally accepted in the United States of America (“U.S. GAAP”). The preparation of financial statements in conformity with U.S. GAAP requires management to make certain estimates and assumptions that affect the reported amounts of assets and liabilities and disclosures of contingent assets and liabilities at the date of the financial statements and the reported amounts of revenue and expenses during the reporting period. Actual results could differ from those estimates. The Fund is considered an investment company under U.S. GAAP and follows the accounting and reporting guidance applicable to investment companies in the Financial Accounting Standards Board Accounting Standards Codification Topic 946 (ASC 946).
SECURITY VALUATION
The Fund’s investments are valued at fair value each day that the Fund’s listing exchange is open and, for financial reporting purposes, as of the report date should the reporting period end on a day that the Fund’s listing exchange is not open. U.S. GAAP defines fair value as the price a fund would receive to sell an asset or pay to transfer a liability in an orderly transaction between market participants at the measurement date. The BlackRock Global Valuation Methodologies Committee (the “Global Valuation Committee”) provides oversight of the valuation of investments for the Fund. The investments of the Fund are valued pursuant to
| 42 | 2014 iSHARES ANNUAL REPORTTO SHAREHOLDERS |
Table of Contents
Notes to Consolidated Financial Statements (Continued)
iSHARES® CORE MSCI EMERGING MARKETS ETF
policies and procedures developed by the Global Valuation Committee and approved by the Board of Directors of the Company (the “Board”).
| • | Equity investments traded on a recognized securities exchange are valued at that day’s last reported trade price or the official closing price, as applicable, on the exchange where the stock is primarily traded. Equity investments traded on a recognized exchange for which there were no sales on that day are valued at the last traded price. |
| • | Open-end U.S. mutual funds are valued at that day’s published net asset value (NAV). |
| • | Financial futures contracts are valued at that day’s last reported settlement price on the exchange where the contract is traded. |
In the event that application of these methods of valuation results in a price for an investment which is deemed not to be representative of the fair value of such investment or if a price is not available, the investment will be valued based upon other available factors deemed relevant by the Global Valuation Committee, in accordance with policies approved by the Board. These factors include but are not limited to (i) attributes specific to the investment; (ii) the principal market for the investment; (iii) the customary participants in the principal market for the investment; (iv) data assumptions by market participants for the investment, if reasonably available; (v) quoted prices for similar investments in active markets; and (vi) other factors, such as future cash flows, interest rates, yield curves, volatilities, prepayment speeds, loss severities, credit risks and/or default rates. Valuations based on such factors are reported to the Board on a quarterly basis.
The Global Valuation Committee employs various methods for calibrating valuation approaches for investments where an active market does not exist, including regular due diligence of the Company’s pricing vendors, a regular review of key inputs and assumptions, transactional back-testing or disposition analysis to compare unrealized gains and losses to realized gains and losses, reviews of missing or stale prices, reviews of large movements in market values, and reviews of market related activity.
Fair value pricing could result in a difference between the prices used to calculate the Fund’s net asset value and the prices used by the Fund’s underlying index, which in turn could result in a difference between the Fund’s performance and the performance of the Fund’s underlying index.
Various inputs are used in determining the fair value of financial instruments. Inputs may be based on independent market data (“observable inputs”) or they may be internally developed (“unobservable inputs”). These inputs are categorized into a disclosure hierarchy consisting of three broad levels for financial reporting purposes. The level of a value determined for a financial instrument within the fair value hierarchy is based on the lowest level of any input that is significant to the fair value measurement in its entirety. The categorization of a value determined for a financial instrument within the hierarchy is based upon the pricing transparency of the instrument and is not necessarily an indication of the risk associated with investing in the instrument. The three levels of the fair value hierarchy are as follows:
| • | Level 1 — Unadjusted quoted prices in active markets for identical assets or liabilities; |
| • | Level 2 — Inputs other than quoted prices included within Level 1 that are observable for the asset or liability either directly or indirectly, including quoted prices for similar assets or liabilities in active markets, quoted prices for identical or similar assets or liabilities in markets that are not considered to be active, inputs other than quoted prices that are observable for the asset or liability (such as exchange rates, financing terms, interest rates, yield curves, volatilities, prepayment speeds, loss severities, credit risks and default rates) or other market-corroborated inputs; and |
| • | Level 3 — Unobservable inputs for the asset or liability, including the Global Valuation Committee’s assumptions used in determining the fair value of investments. |
NOTES TO CONSOLIDATED FINANCIAL STATEMENTS | 43 |
Table of Contents
Notes to Consolidated Financial Statements (Continued)
iSHARES® CORE MSCI EMERGING MARKETS ETF
Changes in valuation techniques may result in transfers in or out of an assigned level within the disclosure hierarchy. In accordance with the Company’s policy, transfers between different levels of the fair value hierarchy are deemed to have occurred as of the beginning of the reporting period.
The following table summarizes the value of each of the Fund’s investments according to the fair value hierarchy as of August 31, 2014. The breakdown of the Fund’s investments into major categories is disclosed in its consolidated schedule of investments.
| Investments | ||||||||||||||||
| Investment Type | Level 1 | Level 2 | Level 3 | Total | ||||||||||||
Assets: | ||||||||||||||||
Common Stocks | $ | 5,307,279,075 | $ | 8,608,974 | $ | 375,090 | $ | 5,316,263,139 | ||||||||
Preferred Stocks | 320,759,672 | — | — | 320,759,672 | ||||||||||||
Rights | — | 22,675 | — | 22,675 | ||||||||||||
Warrants | 0 | a | 0 | a | — | 0 | a | |||||||||
Money Market Funds | 260,861,653 | — | — | 260,861,653 | ||||||||||||
Futures Contractsb | 370,530 | — | — | 370,530 | ||||||||||||
|
|
|
|
|
|
|
| |||||||||
| $ | 5,889,270,930 | $ | 8,631,649 | $ | 375,090 | $ | 5,898,277,669 | |||||||||
|
|
|
|
|
|
|
| |||||||||
| a | Rounds to less than $1. |
| b | Shown at the unrealized appreciation (depreciation) on the contracts. |
SECURITY TRANSACTIONS AND INCOME RECOGNITION
Security transactions are accounted for on trade date. Dividend income and capital gain distributions, if any, are recognized on the ex-dividend date, net of any foreign taxes withheld at source. Any taxes withheld that are reclaimable from foreign tax authorities as of August 31, 2014 are reflected in dividends receivable. Non-cash dividends received in the form of stock in an elective dividend, if any, are recorded as dividend income at fair value. Distributions received by the Fund may include a return of capital that is estimated by management. Such amounts are recorded as a reduction of the cost of investments or reclassified to capital gains. Interest income is accrued daily. Realized gains and losses on investment transactions are determined using the specific identification method.
FOREIGN CURRENCY TRANSLATION
The accounting records of the Fund are maintained in U.S. dollars. Foreign currencies, as well as investment securities and other assets and liabilities denominated in foreign currencies, are translated into U.S. dollars using exchange rates deemed appropriate by the investment adviser. Purchases and sales of securities, income receipts and expense payments are translated into U.S. dollars on the respective dates of such transactions.
The Fund does not isolate the effect of fluctuations in foreign exchange rates from the effect of fluctuations in the market prices of securities. Such fluctuations are reflected by the Fund as a component of realized and unrealized gains and losses from investments for financial reporting purposes.
FOREIGN TAXES
The Fund may be subject to foreign taxes (a portion of which may be reclaimable) on income, stock dividends, capital gains on investments, or certain foreign currency transactions. All foreign taxes are recorded in accordance with the applicable foreign tax regulations and rates that exist in the foreign jurisdictions in which the Fund invests. These foreign taxes, if any, are paid by the Fund and are reflected in its consolidated statement of operations as follows: foreign taxes withheld at source are presented as a
| 44 | 2014 iSHARES ANNUAL REPORTTO SHAREHOLDERS |
Table of Contents
Notes to Consolidated Financial Statements (Continued)
iSHARES® CORE MSCI EMERGING MARKETS ETF
reduction of income, foreign taxes on securities lending income are presented as a reduction of securities lending income, foreign taxes on stock dividends are presented as “other foreign taxes,” and foreign taxes on capital gains from sales of investments and foreign taxes on foreign currency transactions are included in their respective net realized gain (loss) categories. Foreign taxes payable or deferred as of August 31, 2014, if any, are disclosed in the Fund’s consolidated statement of assets and liabilities.
The Fund conducts its investment activities in India through the Subsidiary and expects to obtain benefits under the Double Tax Avoidance Agreement (“DTAA”). In order to be eligible to claim benefits under the DTAA, the Subsidiary must satisfy certain conditions, including the establishment and maintenance of valid tax residence in Mauritius. The Subsidiary is subject to tax in Mauritius on its net income at the rate of 15%. However, a system of tax credits effectively reduces the Mauritius income tax rate to a maximum of 3%. These income taxes, if any, are paid by the Fund and are disclosed in the consolidated statement of operations. Further, the Subsidiary is not subject to tax in Mauritius on any gains from the sale of securities. Any dividends paid by the Subsidiary to the Fund will also be exempt from tax in Mauritius. The foregoing is based upon current interpretation and practice and is subject to future changes in the tax laws of India or Mauritius and in the DTAA.
As a result of legislative changes enacted by the 2012 India Finance Act (“the Act”) and its general anti-avoidance rules (“GAAR”), which are effective April 1, 2013 but have been proposed to be deferred until April 1, 2016, the Subsidiary’s ability to leverage the treaty between Mauritius and India may be adversely impacted, and therefore the Fund may be subject to taxes on capital gains and/or dividends realized on Indian securities. The Act also includes provisions that impose Indian tax on the transfer of shares of an Indian company. However, until more definitive guidance on the legislative changes is available, the impact to the Fund, if any, cannot be determined at this time.
DISTRIBUTIONS TO SHAREHOLDERS
Dividends and distributions paid by the Fund are recorded on the ex-dividend dates. Distributions are determined on a tax basis and may differ from net investment income and net realized capital gains for financial reporting purposes. Dividends and distributions are paid in U.S. dollars and cannot be automatically reinvested in additional shares of the Fund.
LOANS OF PORTFOLIO SECURITIES
The Fund may lend its investment securities to approved borrowers, such as brokers, dealers and other financial institutions. The borrower pledges and maintains with the Fund collateral consisting of cash, an irrevocable letter of credit issued by a bank, or securities issued or guaranteed by the U.S. government. The initial collateral received by the Fund is required to have a value of at least 102% of the current value of the loaned securities for securities traded on U.S. exchanges and a value of at least 105% for all other securities. The collateral is maintained thereafter, at a value equal to at least 100% of the current value of the securities on loan. The market value of the loaned securities is determined at the close of each business day of the Fund and any additional required collateral is delivered to the Fund on the next business day. During the term of the loan, the Fund is entitled to all distributions made on or in respect of the loaned securities. Loans of securities are terminable at any time and the borrower, after notice, is required to return borrowed securities within the standard time period for settlement of securities transactions.
Any cash received as collateral for securities on loan may be reinvested in certain short-term instruments either directly on behalf of a fund or through one or more joint accounts or money market funds, including those managed by BlackRock Fund Advisors (“BFA”), the Fund’s investment adviser, or its affiliates. As of August 31, 2014, any securities on loan were collateralized by cash. The cash collateral received was invested in money market funds managed by BFA and is disclosed in the consolidated schedule of investments. The value of any securities on loan as of August 31, 2014 and the value of the related collateral are disclosed in the consolidated statement of assets and liabilities. Income earned by the Fund from securities lending is disclosed in the consolidated statement of operations.
NOTES TO CONSOLIDATED FINANCIAL STATEMENTS | 45 |
Table of Contents
Notes to Consolidated Financial Statements (Continued)
iSHARES® CORE MSCI EMERGING MARKETS ETF
The risks of securities lending include the risk that the borrower may not provide additional collateral when required or may not return the securities when due. To mitigate these risks, the Fund benefits from a borrower default indemnity provided by BlackRock, Inc. (“BlackRock”). BlackRock’s indemnity allows for full replacement of securities lent. The Fund could suffer a loss if the value of the investments purchased with cash collateral falls below the value of the cash collateral received.
Securities lending transactions are entered into by the Fund under Master Securities Lending Agreements (“MSLA”) which provide the right, in the event of default (including bankruptcy or insolvency) for the non-defaulting party to liquidate the collateral and calculate a net exposure to the defaulting party or request additional collateral. In the event that a borrower defaults, the Fund, as lender, would offset the market value of the collateral received against the market value of the securities loaned. The value of the collateral is typically greater than that of the market value of the securities loaned, leaving the lender with a net amount payable to the defaulting party. However, bankruptcy or insolvency laws of a particular jurisdiction may impose restrictions on or prohibitions against such a right of offset in the event of an MSLA counterparty’s bankruptcy or insolvency. Under the MSLA, the borrower can resell or re-pledge the loaned securities, and the Fund can reinvest cash collateral, or, upon an event of default, resell or re-pledge the collateral.
The following table is a summary of the Fund’s securities lending agreements which are subject to offset under an MSLA as of August 31, 2014:
| Market Value of Securities on Loan | Cash Collateral Received a | Net Amount | ||||||||
| $ | 112,869,006 | $ | 112,869,006 | $ | — | |||||
| a | Collateral received in excess of the market value of securities on loan is not presented for financial reporting purposes. The total collateral received is disclosed in the Fund’s statement of assets and liabilities. |
RECENT ACCOUNTING STANDARD
In June 2014, the Financial Accounting Standards Board issued guidance to improve the financial reporting of reverse repurchase agreements and other similar transactions. The guidance will require expanded disclosure for entities that enter into reverse repurchase agreements and similar transactions accounted for as secured borrowings, including securities lending. The guidance is effective for financial statements for fiscal years beginning after December 15, 2014, and interim periods within those fiscal years. Management is evaluating the impact, if any, of this guidance on the Fund’s financial statements and disclosures.
| 2. | INVESTMENT ADVISORY AGREEMENT AND OTHER TRANSACTIONS WITH AFFILIATES |
Pursuant to an Investment Advisory Agreement with the Company, BFA manages the investment of the Fund’s assets. BFA is a California corporation indirectly owned by BlackRock. Under the Investment Advisory Agreement, BFA is responsible for substantially all expenses of the Fund, except interest, taxes, brokerage commissions and other expenses connected with the execution of portfolio transactions, distribution fees, litigation expenses and any extraordinary expenses.
The Subsidiary has entered into a separate contract with BFA under which BFA provides investment advisory services to the Subsidiary but does not receive separate compensation from the Subsidiary for providing it with such services. The Subsidiary has also entered into separate arrangements that provide for the provision of other services to the Subsidiary (including administrative, custody, transfer agency and other services), and BFA pays the costs and expenses related to the provision of those services.
For its investment advisory services to the Fund, BFA is entitled to an annual investment advisory fee of 0.18% based on the average daily net assets of the Fund.
| 46 | 2014 iSHARES ANNUAL REPORTTO SHAREHOLDERS |
Table of Contents
Notes to Consolidated Financial Statements (Continued)
iSHARES® CORE MSCI EMERGING MARKETS ETF
For the year ended August 31, 2014, BFA has voluntarily waived a portion of its investment advisory fees for the Fund in the amount of $501,946.
BFA has contractually agreed to waive a portion of its investment advisory fees for the Fund through December 31, 2014 in an amount equal to the Fund’s pro rata share of the fees and expenses attributable to the Fund’s investments in other iShares funds. The Fund did not hold any iShares funds during the year ended August 31, 2014.
The U.S. Securities and Exchange Commission has issued an exemptive order which permits BlackRock Institutional Trust Company, N.A. (“BTC”), an affiliate of BFA, to serve as securities lending agent for the Fund, subject to applicable conditions. As securities lending agent, BTC bears all operational costs directly related to securities lending. Effective January 1, 2014, the Fund is responsible for fees in connection with the investment of cash collateral received for securities on loan in a money market fund managed by BFA, however, BTC has agreed to reduce the amount of securities lending income it receives in order to effectively limit the collateral investment fees the Fund bears to an annual rate of 0.04% (the “collateral investment fees”). Securities lending income is equal to the total of income earned from the reinvestment of cash collateral, net of fees and other payments to and from borrowers of securities, and less the collateral investment fees. The Fund retains a portion of securities lending income and remits a remaining portion to BTC as compensation for its services as securities lending agent.
Pursuant to a securities lending agreement effective January 1, 2014, (i) the Fund retains 75% of securities lending income and (ii) these amounts can never be less than 65% of the total of securities lending income plus the collateral investment fees.
In addition, commencing the business day following the date that the aggregate securities lending income plus the collateral investment fees generated across all 1940 Act iShares exchange-traded funds (the “iShares ETF Complex”) in a given calendar year exceeds the aggregate securities lending income generated across the iShares ETF Complex in calendar year 2013) and pursuant to a securities lending agreement, (i) the Fund will receive for the remainder of that calendar year 80% of securities lending income and (ii) these amounts can never be less than 65% of the total of securities lending income plus the collateral investment fees.
For the year ended August 31, 2014, the Fund paid to BTC securities lending agent services and collateral investment fees in the amount of $698,115. Prior to January 1, 2014, the Fund retained 65% of securities lending income and paid no collateral investment fees.
BlackRock Investments, LLC, an affiliate of BFA, is the distributor for the Fund. Pursuant to the distribution agreement, BFA is responsible for any fees or expenses for distribution services provided to the Fund.
Cross trades for the year ended August 31, 2014, if any, were executed by the Fund pursuant to Rule 17a-7 under the 1940 Act. Cross trading is the buying or selling of portfolio securities between funds to which BFA (or an affiliate) serves as investment adviser. At its regularly scheduled quarterly meetings, the Board reviews such transactions as of the most recent calendar quarter for compliance with the requirements and restrictions set forth by Rule 17a-7.
The Fund may invest its positive cash balances in certain money market funds managed by BFA or an affiliate. The income earned on these temporary cash investments is included in “Interest – affiliated” in the consolidated statement of operations.
The PNC Financial Services Group, Inc. is the largest stockholder of BlackRock and is considered to be an affiliate of the Fund for 1940 Act purposes.
The Fund in order to improve its portfolio liquidity and its ability to track its underlying index, may invest in shares of other iShares funds that invest in securities in the Fund’s underlying index.
NOTES TO CONSOLIDATED FINANCIAL STATEMENTS | 47 |
Table of Contents
Notes to Consolidated Financial Statements (Continued)
iSHARES® CORE MSCI EMERGING MARKETS ETF
Certain directors and officers of the Company are also officers of BTC and/or BFA.
| 3. | INVESTMENT PORTFOLIO TRANSACTIONS |
Purchases and sales of investments (excluding in-kind transactions and short-term investments) for the year ended August 31, 2014, were $3,039,067,756 and $302,820,587, respectively.
In-kind purchases and sales (see Note 4) for the year ended August 31, 2014, were $514,966,670 and $ —, respectively.
| 4. | CAPITAL SHARE TRANSACTIONS |
Capital shares are issued and redeemed by the Fund only in aggregations of a specified number of shares or multiples thereof (“Creation Units”) at net asset value. Except when aggregated in Creation Units, shares of the Fund are not redeemable. Transactions in capital shares for the Fund are disclosed in detail in the consolidated statements of changes in net assets.
The consideration for the purchase of Creation Units of a fund in the Company generally consists of the in-kind deposit of a designated portfolio of securities and a specified amount of cash. Certain funds in the Company may be offered in Creation Units solely or partially for cash in U.S. dollars. Investors purchasing and redeeming Creation Units may pay a purchase transaction fee and a redemption transaction fee directly to State Street Bank and Trust Company, the Company’s administrator, to offset transfer and other transaction costs associated with the issuance and redemption of Creation Units, including Creation Units for cash. Investors transacting in Creation Units for cash may also pay an additional variable charge to compensate the relevant fund for certain transaction costs (i.e., stamp taxes, taxes on currency or other financial transactions, and brokerage costs) and market impact expenses relating to investing in portfolio securities. Such variable charges, if any, are included in “Proceeds from shares sold” in the consolidated statements of changes in net assets.
| 5. | FINANCIAL FUTURES CONTRACTS |
The Fund may purchase or sell financial futures contracts in an effort to help the Fund track its underlying index. A futures contract is a standardized, exchange-traded agreement to buy and sell a financial instrument at a set price on a future date. Upon entering into a futures contract, the Fund is required to pledge to the executing broker which holds segregated from its own assets, an amount of cash, U.S. government securities or other high-quality debt and equity securities equal to the minimum initial margin requirements of the exchange on which the contract is traded. Pursuant to the contract, the Fund agrees to receive from or pay to the broker an amount of cash equal to the daily fluctuation in value of the contract. Such receipts or payments are known as margin variation and are recorded by the Fund as unrealized appreciation or depreciation. When the contract is closed, the Fund records a realized gain or loss equal to the difference between the value of the contract at the time it was opened and the value at the time it was closed. Losses may arise if the value of a futures contract decreases due to an unfavorable change in the market rates or values of the underlying instrument during the term of the contract or if the counterparty does not perform under the contract. The use of futures contracts also involves the risk of an imperfect correlation in the movements in the price of futures contracts and the assets underlying such contracts.
The following table shows the value of futures contracts held by the Fund as of August 31, 2014 and the related locations in the consolidated statement of assets and liabilities, presented by risk exposure category:
| Assets | ||||
Equity contracts: | ||||
Variation margin / Net assets consist of – net unrealized appreciationa | $ | 370,530 | ||
|
| |||
| a | Represents cumulative appreciation of futures contracts as reported in the consolidated schedule of investments. |
| 48 | 2014 iSHARES ANNUAL REPORTTO SHAREHOLDERS |
Table of Contents
Notes to Consolidated Financial Statements (Continued)
iSHARES® CORE MSCI EMERGING MARKETS ETF
The following table shows the realized and unrealized gains (losses) on futures contracts held by the Fund during the year ended August 31, 2014 and the related locations in the consolidated statement of operations, presented by risk exposure category:
| Net Realized Gain (Loss) | Net Change in Unrealized Appreciation/Depreciation | |||||||
Equity contracts: | ||||||||
Futures contracts | $ | 2,597,960 | $ | 600,924 | ||||
|
|
|
| |||||
For the year ended August 31, 2014, the average quarter-end number of contracts and notional value of open futures contracts for the Fund were 300 and $15,190,261, respectively.
| 6. | MARKET AND CREDIT RISK |
In the normal course of business, the Fund’s investment activities exposes it to various types of risk associated with the financial instruments and markets in which it invests. The significant types of financial risks the Fund is exposed to include market risk and credit risk. The Fund’s prospectus provides details of these and other types of risk.
BFA uses a “passive” or index approach to try to achieve the Fund’s investment objective following the securities included in its underlying index during upturns as well as downturns. BFA does not take steps to reduce market exposure or to lessen the effects of a declining market. Divergence from the underlying index and the composition of the portfolio is monitored by BFA.
MARKET RISK
Market risk arises mainly from uncertainty about future values of financial instruments influenced by price, currency and interest rate movements. It represents the potential loss the Fund may suffer through holding market positions in the face of market movements. The Fund is exposed to market risk by virtue of its investment in equity and financial derivative instruments. The fair value of securities held by the Fund may decline due to general market conditions, economic trends or events that are not specifically related to the issuers of the securities including local, regional or global political, social or economic instability or to factors that affect a particular industry or group of industries. The extent of the Fund’s exposure to market risk is the market value of the investments held as shown in the Fund’s consolidated schedule of investments.
A diversified portfolio, where this is appropriate and consistent with a fund’s objectives, minimizes the risk that a price change of a particular investment will have a material impact on the NAV of a fund. The investment concentrations within the Fund’s portfolio are disclosed in its consolidated schedule of investments.
The Fund invests a substantial amount of its assets in securities of non-U.S. issuers that trade in non-U.S. markets. This involves certain considerations and risks not typically associated with securities of U.S. issuers. Such risks include, but are not limited to: generally less liquid and less efficient securities markets; generally greater price volatility; exchange rate fluctuations and exchange controls; imposition of restrictions on the expatriation of funds or other assets of the Fund; less publicly available information about issuers; the imposition of withholding or other taxes; higher transaction and custody costs; settlement delays and risk of loss attendant in settlement procedures; difficulties in enforcing contractual obligations; less regulation of securities markets; different accounting, disclosure and reporting requirements; more substantial governmental involvement in the economy; higher inflation rates; greater social, economic and political uncertainties; the risk of nationalization or expropriation of assets; and the risk of war. These risks are heightened for investments in issuers from countries with less developed markets.
NOTES TO CONSOLIDATED FINANCIAL STATEMENTS | 49 |
Table of Contents
Notes to Consolidated Financial Statements (Continued)
iSHARES® CORE MSCI EMERGING MARKETS ETF
The United States and the European Union, along with the regulatory bodies of a number of countries including Japan, Australia and Canada (collectively, “Sanctioning Bodies”), have imposed sectorial economic sanctions on certain Russian individuals and Russian corporate entities which include prohibitions on transacting in or dealing in new debt of longer than 30 or 90 days maturity or new equity of such issuers. Securities held by the Fund issued prior to the date of the sanctions being imposed are not currently subject to any restrictions under the sanctions. However, compliance with each of these sanctions may impair the ability of a Fund to buy, sell, hold, receive or deliver the affected securities or other securities of such issuers. The Sanctioning Bodies could also institute broader sanctions on Russia. These sanctions, or even the threat of further sanctions, may result in the decline of the value and liquidity of Russian securities, a weakening of the ruble or other adverse consequences to the Russian economy. Current or future sanctions may result in Russia taking counter measures or retaliatory actions, which may further impair the value and liquidity of Russian securities. These retaliatory measures may include the immediate freeze of Russian assets held by a Fund.
CREDIT RISK
Credit risk is the risk that an issuer or guarantor of debt instruments or the counterparty to a financial transaction, including derivatives contracts, repurchase agreements or loans of portfolio securities, is unable or unwilling to make timely interest and/or principal payments or to otherwise honor its obligations. BFA and its affiliates manage counterparty credit risk by entering into transactions only with counterparties that it believes have the financial resources to honor their obligations and by monitoring the financial stability of those counterparties. Financial assets, which potentially expose the Fund to issuer and counterparty credit risks, consist principally of financial instruments and receivables due from counterparties. The extent of the Fund’s exposure to credit and counterparty risks with respect to those financial assets is approximated by their value recorded in the consolidated statement of assets and liabilities.
| 7. | INCOME TAX INFORMATION |
The Fund is treated as an entity separate from the Company’s other funds for federal income tax purposes. It is the policy of the Fund to qualify as a regulated investment company by complying with the provisions applicable to regulated investment companies, as defined under Subchapter M of the Internal Revenue Code of 1986, as amended, and to annually distribute substantially all of its ordinary income and any net capital gains (taking into account any capital loss carryforwards) sufficient to relieve it from all, or substantially all, federal income and excise taxes. Accordingly, no provision for federal income taxes is required.
U.S. GAAP requires that certain components of net assets be adjusted to reflect permanent differences between financial and tax reporting. These reclassifications have no effect on net assets or net asset values per share. The following permanent differences as of August 31, 2014, attributable to passive foreign investment companies and foreign currency transactions, were reclassified to the following accounts:
| Paid-in Capital | Undistributed Net Investment Income/Distributions | Undistributed Net Realized Gain/Accumulated Net Realized Loss | ||||||||
| $ | — | $ | (842,615) | $ | 842,615 | |||||
| 50 | 2014 iSHARES ANNUAL REPORTTO SHAREHOLDERS |
Table of Contents
Notes to Consolidated Financial Statements (Continued)
iSHARES® CORE MSCI EMERGING MARKETS ETF
The tax character of distributions paid during the years ended August 31, 2014 and August 31, 2013 was as follows:
| 2014 | 2013 | |||||||
Ordinary income | $ | 69,107,942 | $ | 14,713,922 | ||||
As of August 31, 2014, the tax components of accumulated net earnings (losses) were as follows:
| Undistributed Ordinary Income | Capital Loss | Net Unrealized Gains (Losses) a | Qualified Late-Year Losses b | Total | ||||||||||||||
| $ | 44,472,499 | $ | (6,567,880 | ) | $ | 390,530,151 | $ | (18,769,662 | ) | $ | 409,665,108 | |||||||
| a | The difference between book-basis and tax-basis unrealized gains (losses) was attributable primarily to the tax deferral of losses on wash sales, the realization for tax purposes of unrealized gains (losses) on certain futures contracts and the realization for tax purposes of unrealized gains on investments in passive foreign investment companies. |
| b | The Fund has elected to defer certain qualified late-year losses and recognize such losses in the next taxable year. |
As of August 31, 2014, the Fund had non-expiring capital loss carryforwards in the amount of $6,567,880 available to offset future realized capital gains.
The Fund may own shares in certain foreign investment entities, referred to, under U.S. tax law, as “passive foreign investment companies.” The Fund may elect to mark-to-market annually the shares of each passive foreign investment company and would be required to distribute to shareholders any such marked-to-market gains.
As of August 31, 2014, the cost of investments for federal income tax purposes was $5,507,178,998. Net unrealized appreciation was $390,728,141, of which $615,721,781 represented gross unrealized appreciation on securities and $224,993,640 represented gross unrealized depreciation on securities.
Management has analyzed tax laws and regulations and their application to the Fund as of August 31, 2014, inclusive of the open tax return years, and does not believe there are any uncertain tax positions that require recognition of a tax liability in the Fund’s consolidated financial statements.
| 8. | LINE OF CREDIT |
The Fund along with certain other iShares funds, is a party to a $150 million credit agreement with State Street Bank and Trust Company, which expires October 28, 2015. The line of credit may be used for temporary or emergency purposes, including redemptions, settlement of trades and rebalancing of portfolio holdings. The credit agreement has the following terms: a commitment fee of 0.08% per annum on the unused portion of the credit agreement and interest at a rate equal to the higher of (a) the one-month LIBOR plus 1.00% per annum or (b) the U.S. Federal Funds rate plus 1.00% per annum on amounts borrowed. The commitment fee is allocated to each fund participating in the credit agreement based on each fund’s pro-rata share of the aggregate average daily value of assets invested in local securities of certain foreign markets.
For the year ended August 31, 2014, the Fund’s maximum amount borrowed, the average borrowings and the weighted average interest rate under the credit agreement were $7,500,000, $269,863 and 1.16%, respectively.
NOTES TO CONSOLIDATED FINANCIAL STATEMENTS | 51 |
Table of Contents
Notes to Consolidated Financial Statements (Continued)
iSHARES® CORE MSCI EMERGING MARKETS ETF
| 9. | SUBSEQUENT EVENTS |
Management has evaluated the impact of all subsequent events on the Fund through the date the consolidated financial statements were available to be issued and has determined that there were no subsequent events requiring adjustment or disclosure in the consolidated financial statements.
| 52 | 2014 iSHARES ANNUAL REPORTTO SHAREHOLDERS |
Table of Contents
Report of Independent Registered Public Accounting Firm
To the Shareholders and Board of Directors of
iShares, Inc.:
In our opinion, the accompanying consolidated statement of assets and liabilities, including the consolidated schedule of investments, and the related consolidated statements of operations and of changes in net assets and the consolidated financial highlights present fairly, in all material respects, the financial position of iShares Core MSCI Emerging Markets ETF and its subsidiary (the “Fund”) at August 31, 2014, the results of its operations, the changes in its net assets and its financial highlights for each of the periods presented, in conformity with accounting principles generally accepted in the United States of America. These consolidated financial statements and consolidated financial highlights (hereafter referred to as “financial statements”) are the responsibility of the Fund’s management; our responsibility is to express an opinion on these financial statements based on our audits. We conducted our audits of these financial statements in accordance with the standards of the Public Company Accounting Oversight Board (United States). Those standards require that we plan and perform the audit to obtain reasonable assurance about whether the financial statements are free of material misstatement. An audit includes examining, on a test basis, evidence supporting the amounts and disclosures in the financial statements, assessing the accounting principles used and significant estimates made by management, and evaluating the overall financial statement presentation. We believe that our audits, which included confirmation of securities at August 31, 2014 by correspondence with the custodian, transfer agent and brokers, provide a reasonable basis for our opinion.
PricewaterhouseCoopers LLP
San Francisco, California
October 22, 2014
REPORTOF INDEPENDENT REGISTERED PUBLIC ACCOUNTING FIRM | 53 |
Table of Contents
iSHARES® CORE MSCI EMERGING MARKETS ETF
For the fiscal period ended August 31, 2014, the Fund earned foreign source income of $113,199,006 and paid foreign taxes of $12,943,122 which it intends to pass through to its shareholders pursuant to Section 853 of the Internal Revenue Code (the “Code”).
Under Section 854(b)(2) of the Code, the Fund hereby designates the maximum amount of $64,386,981 as qualified dividend income for purposes of the maximum rate under Section 1(h)(11) of the Code for the fiscal period ended August 31, 2014.
In February 2015, shareholders will receive Form 1099-DIV which will include their share of qualified dividend income distributed during the calendar year 2014. Shareholders are advised to check with their tax advisers for information on the treatment of these amounts on their income tax returns.
| 54 | 2014 iSHARES ANNUAL REPORTTO SHAREHOLDERS |
Table of Contents
Board Review and Approval of Investment Advisory
Contract
iSHARES® CORE MSCI EMERGING MARKETS ETF
Under Section 15(c) of the Investment Company Act of 1940 (the “1940 Act”), the Company’s Board of Directors (the “Board”), including a majority of Directors who are not “interested persons” of the Company (as that term is defined in the 1940 Act) (the “Independent Directors”), is required annually to consider and approve the Investment Advisory Contract between the Company and BFA (the “Advisory Contract”) on behalf of the Fund. The Independent Directors requested, and BFA provided, such information as the Independent Directors, with advice from independent counsel, deemed reasonably necessary to evaluate the Advisory Contract. A committee of Independent Directors (the “15(c) Committee”), with independent counsel, met with management on March 12, 2014, May 6, 2014, and May 12, 2014, to discuss the types of information the Independent Directors required and the manner in which management would organize and present such information. At a meeting held on May 16, 2014, management presented preliminary information to the Board relating to the continuance of the Advisory Contract, and the Board, including the Independent Directors, reviewed and discussed such information at length. The Independent Directors requested from management certain additional information, which management agreed to provide. At a meeting held on June 12-13, 2014, the Board, including the Independent Directors, reviewed the additional information provided by management in response to these requests. After extensive discussions, the Board, including all of the Independent Directors, approved the continuance of the Advisory Contract for the Fund, based on a review of qualitative and quantitative information provided by BFA, including the additional information management provided at the request of the Independent Directors. The Board noted its satisfaction with the extent and quality of information provided and its frequent interactions with management, as well as the detailed responses and other information provided by BFA. The Board also noted that the Board and BFA agreed to discuss potential enhancements and adjustments to the 15(c) process for the coming year. The Independent Directors were advised by their independent counsel throughout the process, including about the legal standards applicable to their review. In approving the Advisory Contract for the Fund, the Board, including the Independent Directors, considered the following factors, no one of which was controlling, and reached the following conclusions:
Expenses and Performance of the Fund — The Board reviewed statistical information prepared by Lipper Inc. (“Lipper”), an independent provider of investment company data, regarding the expense ratio components, including actual advisory fees, waivers/reimbursements, and gross and net total expenses of the Fund in comparison with the same information for other exchange traded funds (including funds sponsored by an “at cost” service provider) and, in the limited instances where no comparable ETFs existed and the comparison group would not otherwise be reasonable in Lipper’s judgment, pure index institutional mutual funds, objectively selected by Lipper as comprising the Fund’s applicable peer group pursuant to Lipper’s proprietary ETF methodology (the “Lipper Group”). The Board noted that, prior to 2014, Lipper had used a different methodology to determine the Fund’s Lipper group, which included mutual funds, closed-end funds, exchange traded funds, and/or funds with differing investment objective classifications, investment focuses and other characteristics (e.g. actively managed funds and funds sponsored by “at cost” service providers), as applicable. The Board further noted that, after consideration by the 15(c) Committee, the Board determined to use instead Lipper’s proprietary ETF methodology to determine the Fund’s Lipper Group. This determination was based on, among other considerations, the increased number and types of ETFs available for comparative purposes than was the case in prior years. The Board was provided with a detailed description of Lipper’s proprietary ETF methodology used by Lipper to determine the applicable Lipper Group and to prepare this information. At the Board’s request, Lipper provided, and the Board considered, information on the impact to the iShares funds’ comparative fee rankings that were attributable to the change from a pure index group methodology to Lipper’s proprietary ETF methodology. The Board further noted that due to the limitations in providing comparable funds in the Lipper Group, the statistical information provided in Lipper’s report may or may not provide meaningful direct comparisons to the Fund in all instances.
The Board also noted that the investment advisory fee rate and overall expenses for the Fund were lower than the median of the investment advisory fee rates and overall expenses of the funds in its Lipper Group.
In addition, the Board reviewed statistical information prepared by Lipper regarding the performance of the Fund for the one-, three-, five-, ten-year, and since inception periods, as applicable, and the “last quarter” period ended December 31, 2013, and a
BOARD REVIEWAND APPROVALOF INVESTMENT ADVISORY CONTRACT | 55 |
Table of Contents
Board Review and Approval of Investment Advisory
Contract (Continued)
iSHARES® CORE MSCI EMERGING MARKETS ETF
comparison of the Fund’s performance to its performance benchmark index for the same periods. To the extent that any of the comparison funds included in the Lipper Group track the same index as the Fund, Lipper also provided, and the Board reviewed, a comparison of the Fund’s performance to that of such relevant comparison funds for the same periods. The Board noted that the Fund generally performed in line with its respective performance benchmark index over the relevant periods. In considering this information, the Board noted that the Lipper Group may include funds that are not exchange traded funds or index funds, and that may have different investment objectives and/or benchmarks from the Fund. In addition, the Board noted that the Fund seeks to track its own benchmark index and that, during the prior year, the Board received periodic reports on the Fund’s performance in comparison with its relevant benchmark index. Such periodic comparative performance information, including detailed information on certain specific iShares funds requested by the Boards, was also considered.
Based on this review, the other factors considered at the meeting, and their general knowledge of ETF pricing, the Board concluded that the investment advisory fee rate and expense level and the historical performance of the Fund supported the Board’s approval of the continuance of the Advisory Contract for the coming year.
Nature, Extent and Quality of Services Provided by BFA — Based on management’s representations, including information about recent and proposed enhancements to the iShares business, including with respect to shareholder servicing and support, the Board expected that there would be no diminution in the scope of services required of or provided by BFA under the Advisory Contract for the coming year as compared to the scope of services provided by BFA during prior years. In reviewing the scope of these services, the Board considered BFA’s investment philosophy and experience, noting that BFA and its affiliates have committed significant resources over time, including during the past year, to supporting the Fund and its shareholders. The Board acknowledged that resources to support the iShares funds and their shareholders have been added or enhanced in recent years, including in such areas as investor education, product management, customized portfolio consulting support, capital markets support, and proprietary risk and performance analytics tools. The Board also considered BFA’s compliance program and its compliance record with respect to the Fund. In that regard, the Board noted that BFA reports to the Board about portfolio management and compliance matters on a periodic basis in connection with regularly scheduled meetings of the Board, and on other occasions as necessary and appropriate, and has provided information and made appropriate officers available as needed to provide further assistance with these matters. The Board also reviewed the background and experience of the persons responsible for the day-to-day management of the Fund, as well as the resources available to them in managing the Fund. In addition to the above considerations, the Board reviewed and considered detailed presentations regarding BFA’s investment performance, investment and risk management processes and strategies provided at the June 12-13, 2014 meeting and throughout the previous year, and matters related to BFA’s portfolio compliance policies and procedures. The Board noted that the Fund had met its investment objective consistently since its inception date.
Based on review of this information, and the performance information discussed above, the Board concluded that the nature, extent and quality of services provided by BFA to the Fund under the Advisory Contract supported the Board’s approval of the continuance of the Advisory Contract for the coming year.
Costs of Services Provided to the Fund and Profits Realized by BFA and Affiliates — The Board reviewed information about the profitability to BlackRock of the Fund based on the fees payable to BFA and its affiliates (including fees under the Advisory Contract), and all other sources of revenue and expense to BFA and its affiliates from the Fund’s operations for the last calendar year. The Board reviewed BlackRock’s profitability methodology for the iShares funds, noting that the 15(c) Committee had focused on the methodology and proposed presentation during its meetings. The Board discussed the sources of direct and ancillary revenue with management, including the revenues to BTC from securities lending by the Fund. The Board also discussed BFA’s profit margin as reflected in the Fund’s profitability analysis and reviewed information regarding potential economies of scale (as discussed below). Based on this review, the Board concluded that the profits realized by BFA and its
| 56 | 2014 iSHARES ANNUAL REPORTTO SHAREHOLDERS |
Table of Contents
Board Review and Approval of Investment Advisory
Contract (Continued)
iSHARES® CORE MSCI EMERGING MARKETS ETF
affiliates under the Advisory Contract and from other relationships between the Fund and BFA and/or its affiliates, if any, were within a reasonable range in light of the factors considered.
Economies of Scale — The Board reviewed information regarding potential economies of scale or other efficiencies that may result from increases in the Fund’s assets, noting that the issue of economies of scale had been focused on extensively by the 15(c) Committee during its meetings and addressed by management. The Board and the 15(c) Committee reviewed information provided by BFA regarding scale benefits shared with the iShares funds through relatively low fee rates established at inception, breakpoints, waivers, or other fee reductions, as well as through additional investment in the iShares business and the provision of improved or additional infrastructure and services to the iShares funds and their shareholders. The Board and the 15(c) Committee received information regarding BlackRock’s historical profitability, including BFA’s and its affiliates’ costs in providing services. The cost information distinguished between fixed and variable costs, and explained how the level of fixed and variable costs, as well as the nature of such costs, may impact the existence or size of scale benefits. The Board noted that the Advisory Contract for the Fund did not provide for any breakpoints in the Fund’s investment advisory fee rate as the assets of the Fund increase. However, the Board further noted management’s assertion that future economies of scale for the Fund had been taken into consideration by fixing the investment advisory fee rate at the low end of the market place, effectively giving Fund shareholders, from inception, the benefits of a lower fee. The Board noted that it would continue to monitor the sharing of economies of scale to determine the appropriateness of adding breakpoints in the future. Based on this review, as well as the other factors considered at the meeting, the Board, recognizing its responsibility to consider this issue at least annually, concluded that the investment advisory fee rate incorporates potential economies of scale and supported the Board’s approval of the continuance of the Advisory Contract for the coming year.
Fees and Services Provided for Other Comparable Funds/Accounts Managed by BFA and its Affiliates — The Board received and considered information regarding the investment advisory/management fee rates for other funds/accounts in the U.S. for which BFA (or its affiliates) provides investment advisory/management services, including open-end and closed-end funds registered under the 1940 Act (including sub-advised funds), collective trust funds, separately managed accounts, and institutional separate accounts (together, the “Other Accounts”), and acknowledged BFA’s assertion that the iShares funds are fundamentally different investment vehicles from the Other Accounts. The Board noted that BFA and its affiliates do manage Other Accounts with a substantially similar investment objective and strategy as the Fund. The Board further noted that BFA provided the Board with detailed information regarding how the Other Accounts (particularly institutional clients) generally differ from the Fund, including in terms of the different, generally more extensive services provided to the Fund, as well as other significant differences in the approach of BFA and its affiliates to the Fund, on one hand, and Other Accounts, on the other. In that regard, the Board considered that the pricing of services to institutional clients is typically based on a number of factors beyond the nature and extent of the specific services to be provided and often depends on the overall relationship between the client and its affiliates and the adviser and its affiliates. In addition, the Board considered the relative complexity and inherent risks and challenges of managing and providing other services to the Fund, as a publicly traded exchange traded fund, as compared to the Other Accounts that are institutional clients in light of differing regulatory requirements and client-imposed mandates. The Board also considered the “all-inclusive” nature of the Fund’s advisory fee structure, and the Fund expenses borne by BFA under this arrangement. The Board noted that the investment advisory fee rate under the Advisory Contract for the Fund was generally higher than the investment advisory/management fee rates for the Other Accounts that are institutional clients of BFA (or its affiliates) and concluded that the differences appeared to be consistent with the factors discussed.
Other Benefits to BFA and/or its Affiliates — The Board reviewed the “fallout” benefits or ancillary revenue received by BFA and/or its affiliates in connection with the services provided to the Fund by BFA, such as payment of revenue to BTC, the Fund’s securities lending agent, for loaning portfolio securities (which was included in the profit margins reviewed by the Board pursuant to BFA’s profitability methodology), and payment of advisory fees and/or administration fees to BFA and BTC (or their affiliates) in connection with any investments by the Fund in other funds for which BFA (or its affiliates) provides investment advisory services
BOARD REVIEWAND APPROVALOF INVESTMENT ADVISORY CONTRACT | 57 |
Table of Contents
Board Review and Approval of Investment Advisory
Contract (Continued)
iSHARES® CORE MSCI EMERGING MARKETS ETF
and/or administration services. The Board noted that BFA generally does not use soft dollars or consider the value of research or other services that may be provided to BFA (including its affiliates) in selecting brokers for portfolio transactions for the Fund. The Board further noted that any portfolio transactions on behalf of the Fund placed through a BFA affiliate or purchased from an underwriting syndicate in which a BFA affiliate participates, are reported to the Board pursuant to Rule 17e-1 or Rule 10f-3, as applicable, under the 1940 Act. The Board concluded that any such ancillary benefits would not be disadvantageous to the Fund’s shareholders and thus would not alter the Board’s conclusion with respect to the appropriateness of approving the continuance of the Advisory Contract for the coming year.
Based on the considerations described above, the Board determined that the Fund’s investment advisory fee rate under the Advisory Contract does not constitute a fee that is so disproportionately large as to bear no reasonable relationship to the services rendered and that could not have been the product of arm’s-length bargaining, and concluded that it is in the best interest of the Fund and its shareholders to approve the continuance of the Advisory Contract for the coming year.
| 58 | 2014 iSHARES ANNUAL REPORTTO SHAREHOLDERS |
Table of Contents
Supplemental Information (Unaudited)
iSHARES® CORE MSCI EMERGING MARKETS ETF
Section 19(a) Notices
The amounts and sources of distributions reported are only estimates and are not being provided for tax reporting purposes. The actual amounts and sources of the amounts for tax reporting purposes will depend upon the Fund’s investment experience during the year and may be subject to changes based on the tax regulations. Shareholders will receive a Form 1099-DIV each calendar year that will inform them how to report distributions for federal income tax purposes.
| Total Cumulative Distributions for the Fiscal Year | % Breakdown of the Total Cumulative Distributions for the Fiscal Year | |||||||||||||||||||||||||||||
| Net Investment Income | Net Realized Capital Gains | Return of Capital | Total Per Share | Net Investment Income | Net Realized Capital Gains | Return of Capital | Total Per Share | |||||||||||||||||||||||
| $ | 0.905541 | $ | — | $ | — | $ | 0.905541 | 100 | % | — | % | — | % | 100 | % | |||||||||||||||
Premium/Discount Information
The table that follows presents information about the differences between the daily market price on secondary markets for shares of the Fund and the Fund’s net asset value. Net asset value, or “NAV,” is the price per share at which the Fund issues and redeems shares. It is calculated in accordance with the standard formula for valuing mutual fund shares. The “Market Price” of the Fund generally is determined using the midpoint between the highest bid and the lowest offer on the primary stock exchange on which the shares of the Fund are listed for trading, as of the time the Fund’s NAV is calculated. The Fund’s Market Price may be at, above or below its NAV. The NAV of the Fund will fluctuate with changes in the fair value of its portfolio holdings. The Market Price of the Fund will fluctuate in accordance with changes in its NAV, as well as market supply and demand.
Premiums or discounts are the differences (expressed as a percentage) between the NAV and Market Price of the Fund on a given day, generally at the time NAV is calculated. A premium is the amount that the Fund is trading above the reported NAV, expressed as a percentage of the NAV. A discount is the amount that the Fund is trading below the reported NAV, expressed as a percentage of the NAV.
The following information shows the frequency distributions of premiums and discounts for the Fund included in this report. The information shown for the Fund is for each full calendar quarter completed after the inception date of the Fund through the date of the most recent calendar quarter-end.
SUPPLEMENTAL INFORMATION | 59 |
Table of Contents
Supplemental Information (Unaudited) (Continued)
iSHARES® CORE MSCI EMERGING MARKETS ETF
Each line in the table shows the number of trading days in which the Fund traded within the premium/discount range indicated. The number of trading days in each premium/discount range is also shown as a percentage of the total number of trading days in the period covered by the table. All data presented here represents past performance, which cannot be used to predict future results.
iShares Core MSCI Emerging Markets ETF
Period Covered: January 1, 2013 through June 30, 2014
Premium/Discount Range | Number of Days | Percentage of Total Days | ||||||
Greater than 4.0% and Less than 4.5% | 1 | 0.27 | % | |||||
Greater than 1.5% and Less than 2.0% | 7 | 1.86 | ||||||
Greater than 1.0% and Less than 1.5% | 17 | 4.52 | ||||||
Greater than 0.5% and Less than 1.0% | 88 | 23.40 | ||||||
Between 0.5% and –0.5% | 213 | 56.65 | ||||||
Less than –0.5% and Greater than –1.0% | 34 | 9.04 | ||||||
Less than –1.0% and Greater than –1.5% | 11 | 2.93 | ||||||
Less than –1.5% and Greater than –2.0% | 3 | 0.80 | ||||||
Less than –2.0% and Greater than –2.5% | 2 | 0.53 | ||||||
|
|
|
| |||||
| 376 | 100.00 | % | ||||||
|
|
|
| |||||
Regulation under the Alternative Investment Fund Managers Directive
The Alternative Investment Fund Managers Directive (the “Directive”) imposes detailed and prescriptive obligations on fund managers established in the European Union (the “EU”). These do not currently apply to managers established outside the EU, such as BFA. Rather, non-EU managers are only required to comply with certain disclosure, reporting and transparency obligations of the Directive if such managers market a fund to EU investors.
BFA has registered the iShares Core MSCI Emerging Markets ETF (the “Fund”) for marketing to EU investors in the United Kingdom, the Netherlands, Finland, Sweden and Luxembourg.
Report on Remuneration
BFA is required under the Directive to make quantitative disclosures of remuneration. These disclosures are made in line with BlackRock’s interpretation of currently available regulatory guidance on quantitative remuneration disclosures. As market or regulatory practice develops BlackRock may consider it appropriate to make changes to the way in which quantitative remuneration disclosures are calculated. Where such changes are made, this may result in disclosures in relation to a fund not being comparable to the disclosures made in the prior year, or in relation to other BlackRock fund disclosures in that same year.
Disclosures are provided in relation to both (a) the staff of BFA; and (b) staff who are senior management or who have the ability to materially affect the risk profile of the Fund.
All individuals included in the aggregated figures disclosed are rewarded in line with BlackRock’s remuneration policy for their responsibilities across the relevant BlackRock business area. As all individuals have a number of areas of responsibilities, only the portion of remuneration for those individuals’ services attributable to the Fund is included in the aggregate figures disclosed.
| 60 | 2014 iSHARES ANNUAL REPORTTO SHAREHOLDERS |
Table of Contents
Supplemental Information (Unaudited) (Continued)
iSHARES® CORE MSCI EMERGING MARKETS ETF
BlackRock has a clear and well defined pay-for-performance philosophy, and compensation programs which support that philosophy. For senior management, a significant percentage of variable remuneration is deferred over time. All employees are subject to a claw-back policy.
Compensation decisions for employees are made based on full-year financial results and other non-financial goals and objectives. Alongside financial performance, individual compensation is also based on strategic and operating results and other considerations such as management and leadership capabilities. No set formulas are established and no fixed benchmarks are used in determining annual incentive awards.
Bonus pools are reviewed by BlackRock’s independent compensation committee, taking into account both actual and projected financial information together with information provided by the Operational Risk and Regulatory Compliance departments in relation to any activities, incidents or events that warrant consideration in making compensation decisions.
Functions such as Finance, Operational Risk, Legal & Compliance, and Human Resources each have their own organizational structures which are independent of the business units. Functional bonus pools are determined with reference to the performance of each individual function and the remuneration of the senior members of control functions is directly overseen by BlackRock’s independent compensation committee. No individual is involved in setting his or her own remuneration.
The figures disclosed are a sum of each individual’s portion of remuneration attributable to the Fund according to an objective apportionment methodology. Accordingly the figures are not representative of any individual’s actual remuneration or their remuneration structure.
The amount of the total remuneration awarded by BFA to its staff which has been attributed to the iShares Core MSCI Emerging Markets ETF in respect of BFA’s financial year ending December 31, 2013 is USD 942,348. This figure is comprised of fixed remuneration of USD 370,527 and variable remuneration of USD 571,821. There were a total of 436 beneficiaries of the remuneration described above.
The amount of the aggregate remuneration awarded by BFA to its senior management and members of its staff whose actions have a material impact on the risk profile of the iShares Core MSCI Emerging Markets ETF which has been attributed to the Fund in respect of BFA’s financial year ending December 31, 2013 was USD 151,395.
SUPPLEMENTAL INFORMATION | 61 |
Table of Contents
Director and Officer Information
iSHARES®, INC.
The Board of Directors has responsibility for the overall management and operations of the Company, including general supervision of the duties performed by BFA and other service providers. Each Director serves until he or she resigns, is removed, dies, retires or becomes incapacitated. The President, Chief Compliance Officer, Treasurer and Secretary shall each hold office until their successors are chosen and qualify, and all other officers shall hold office until he or she resigns or is removed. Directors who are not “interested persons” (as defined in the 1940 Act) of the Company are referred to as independent directors (“Independent Directors”).
The registered investment companies advised by BFA or its affiliates are organized into one complex of closed-end funds, two complexes of open-end funds and one complex of exchange-traded funds (“Exchange-Traded Fund Complex”) (each, a “BlackRock Fund Complex”). Each Fund is included in the BlackRock Fund Complex referred to as the Exchange-Traded Fund Complex. Each Director also serves as a Trustee of iShares Trust, a Director of iShares MSCI Russia Capped ETF, Inc. and a Trustee of iShares U.S. ETF Trust and, as a result, oversees a total of 312 funds (as of August 31, 2014) within the Exchange-Traded Fund Complex. With the exception of Robert S. Kapito and Mark Wiedman, the address of each Director and officer is c/o BlackRock, Inc., 400 Howard Street, San Francisco, CA 94105. The address of Mr. Kapito and Mr. Wiedman is c/o BlackRock, Inc., Park Avenue Plaza, 55 East 52nd Street, New York, NY 10055. The Board has designated Robert H. Silver as its Independent Chairman. Additional information about the Funds’ Directors and officers may be found in the Funds’ combined Statement of Additional Information, which is available without charge, upon request, by calling toll-free 1-800-iShares (1-800-474-2737).
Interested Directors
| Name (Age) | Position(s) | Principal Occupation(s) During the Past 5 Years | Other Directorships Held by Director | |||
Robert S. Kapitoa (57) | Director (since 2009). | President and Director, BlackRock, Inc. (since 2006); Vice Chairman of BlackRock, Inc. and Head of BlackRock, Inc.’s Portfolio Management Group (since its formation in 1998) and BlackRock, Inc.’s predecessor entities (since 1988); Trustee, University of Pennsylvania (since 2009); President of Board of Directors, Hope & Heroes Children’s Cancer Fund (since 2002); President of the Board of Directors, Periwinkle Theatre for Youth (since 1983). | Trustee of iShares Trust (since 2009); Director of iShares MSCI Russia Capped ETF, Inc. (since 2010); Trustee of iShares U.S. ETF Trust (since 2011); Director of BlackRock, Inc. (since 2006). | |||
Mark Wiedmanb (43) | Director (since 2013). | Managing Director, BlackRock, Inc. (since 2007); Global Head of iShares (since 2011); Head of Corporate Strategy, BlackRock, Inc. (2009-2011). | Trustee of iShares Trust. (since 2013); Director of iShares MSCI Russia Capped ETF, Inc. (since 2013); Trustee of iShares U.S. ETF Trust (since 2013); Director of PennyMac Financial Services, Inc. (since 2008). | |||
| a | Robert S. Kapito is deemed to be an “interested person” (as defined in the 1940 Act) of the Company due to his affiliations with BlackRock, Inc. |
| b | Mark Wiedman is deemed to be an “interested person” (as defined in the 1940 Act) of the Company due to his affiliations with BlackRock, Inc. and its affiliates. |
| 62 | 2014 iSHARES ANNUAL REPORTTO SHAREHOLDERS |
Table of Contents
Director and Officer Information (Continued)
iSHARES®, INC.
Independent Directors (Continued)
| Name (Age) | Position(s) | Principal Occupation(s) During the Past 5 Years | Other Directorships Held by Director | |||
Robert H. Silver (59) | Director (since 2007); Independent Chairman (since 2012). | President and Co-Founder of The Bravitas Group, Inc. (since 2006); Director and Vice Chairman of the YMCA of Greater NYC (2001-2011); Broadway Producer (2006-2011); Co-Founder and Vice President of Parentgiving Inc. (since 2008); Director and Member of the Audit and Compensation Committee of EPAM Systems, Inc. (2006-2009); President and Chief Operating Officer of UBS Financial Services Inc. (formerly Paine Webber Inc.) (2003-2005) and various executive positions with UBS and its affiliates (1988-2005); CPA and Audit Manager of KPMG, LLP (formerly Peat Marwick Mitchell) (1977-1983). | Trustee of iShares Trust (since 2007); Director of iShares MSCI Russia Capped ETF, Inc. (since 2010); Trustee of iShares U.S. ETF Trust (since 2011); Independent Chairman of iShares, Trust, iShares MSCI Russia Capped ETF, Inc. and iShares U.S. ETF Trust (since 2012). | |||
Cecilia H. Herbert (65) | Director (since 2005); Nominating and Governance Committee Chair and Equity Plus Committee Chair (since 2012). | Director (1998-2013) and President (2007-2011) of the Board of Directors, Catholic Charities CYO; Trustee (2002-2011) and Chair of the Finance and Investment Committee (2006-2010) of the Thacher School; Member (since 1992) and Chair (1994-2005) of the Investment Committee, Archdiocese of San Francisco; Trustee and Member of the Investment Committee, WNET, the New York public broadcasting/media company (since 2011). | Trustee of iShares Trust (since 2005); Director of iShares MSCI Russia Capped ETF, Inc. (since 2010); Trustee of iShares U.S. ETF Trust (since 2011); Director of Forward Funds (34 portfolios) (since 2009). | |||
Charles A. Hurty (70) | Director (since 2005); Audit Committee Chair (since 2006). | Retired; Partner, KPMG LLP (1968-2001). | Trustee of iShares Trust (since 2005); Director of iShares MSCI Russia Capped ETF, Inc. (since 2010); Trustee of iShares U.S. ETF Trust (since 2011); Director of GMAM Absolute Return Strategy Fund (1 portfolio) (since 2002); Director of SkyBridge Alternative Investments Multi-Adviser Hedge Fund Portfolios LLC (2 portfolios) (since 2002). | |||
DIRECTORAND OFFICER INFORMATION | 63 |
Table of Contents
Director and Officer Information (Continued)
iSHARES®, INC.
| Name (Age) | Position(s) | Principal Occupation(s) During the Past 5 Years | Other Directorships Held by Director | |||
John E. Kerrigan (59) | Director (since 2005); Fixed Income Plus Committee Chair (since 2012). | Chief Investment Officer, Santa Clara University (since 2002). | Trustee of iShares Trust (since 2005); Director of iShares MSCI Russia Capped ETF, Inc. (since 2010); Trustee of iShares U.S. ETF Trust (since 2011). | |||
John E. Martinez (53) | Director (since 2003); Securities Lending Committee Chair (since 2012). | Director of FirstREX Agreement Corp. (formerly EquityRock, Inc.) (since 2005). | Trustee of iShares Trust (since 2003); Director of iShares MSCI Russia Capped ETF, Inc. (since 2010); Trustee of iShares U.S. ETF Trust (since 2011). | |||
George G.C. Parker (75) | Director (since 2002). | Dean Witter Distinguished Professor of Finance, Emeritus, Stanford University Graduate School of Business (Professor since 1973; Emeritus since 2006). | Trustee of iShares Trust (since 2000); Director of iShares MSCI Russia Capped ETF, Inc. (since 2010); Trustee of iShares U.S. ETF Trust (since 2011); Director of Tejon Ranch Company (since 1999); Director of Threshold Pharmaceuticals (since 2004); Director of Colony Financial, Inc. (since 2009); Director of First Republic Bank (since 2010). | |||
Madhav V. Rajan (50) | Director (since 2011); 15(c) Committee Chair (since 2012). | Robert K. Jaedicke Professor of Accounting and Senior Associate Dean for Academic Affairs and Head of MBA Program, Stanford University Graduate School of Business (since 2001); Professor of Law (by courtesy), Stanford Law School (since 2005); Visiting Professor, University of Chicago (2007-2008). | Trustee of iShares Trust (since 2011); Director of iShares MSCI Russia Capped ETF, Inc. (since 2011); Trustee of iShares U.S. ETF Trust (since 2011); Director, Cavium, Inc. (since 2013). | |||
| 64 | 2014 iSHARES ANNUAL REPORTTO SHAREHOLDERS |
Table of Contents
Director and Officer Information (Continued)
iSHARES®, INC.
Officers
| Name (Age) | Position(s) | Principal Occupation(s) During the Past 5 Years | ||
Manish Mehta (43) | President (since 2013). | Managing Director, BlackRock, Inc. (since 2009); Chief Operating Officer for iShares (since 2009); Head of Strategy and Corporate Development, BGI (2005-2009); Chief of Staff to the CEO, BGI (2005-2009). | ||
Jack Gee (54) | Treasurer and Chief Financial Officer (since 2008). | Managing Director, BlackRock, Inc. (since 2009); Senior Director of Fund Administration of Intermediary Investor Business, BGI (2009); Director of Fund Administration of Intermediary Investor Business, BGI (2004-2009). | ||
Edward B. Baer (45) | Vice President and Chief Legal Officer (since 2012). | Managing Director of Legal & Compliance, BlackRock, Inc. (since 2006); Director of Legal & Compliance, BlackRock, Inc. (2004-2006). | ||
Eilleen M. Clavere (62) | Secretary (since 2007). | Director of Global Fund Administration, BlackRock, Inc. (since 2009); Director of Legal Administration of Intermediary Investor Business, BGI (2006-2009); Legal Counsel and Vice President of Atlas Funds, Atlas Advisers, Inc. and Atlas Securities, Inc. (2005-2006); Counsel at Kirkpatrick & Lockhart LLP (2001-2005). | ||
Scott Radell (45) | Executive Vice President (since 2012). | Managing Director, BlackRock, Inc. (since 2009); Head of Portfolio Solutions, BlackRock, Inc. (since 2009); Head of Portfolio Solutions, BGI (2007-2009); Credit Portfolio Manager, BGI (2005-2007); Credit Research Analyst, BGI (2003-2005). | ||
Amy Schioldager (51) | Executive Vice President (since 2007). | Senior Managing Director, BlackRock, Inc. (since 2009); Global Head of Index Equity, BGI (2008-2009); Global Head of U.S. Indexing, BGI (2006-2008); Head of Domestic Equity Portfolio Management, BGI (2001-2006). | ||
Ira P. Shapiro (51) | Vice President (since 2007). | Managing Director, BlackRock, Inc. (since 2009); Head of Strategic Product Initiatives for iShares (since 2012); Chief Legal Officer, Exchange-Traded Fund Complex (2007-2012); Associate General Counsel, BGI (2004-2009). | ||
DIRECTORAND OFFICER INFORMATION | 65 |
Table of Contents
Notes:
| 66 | 2014 iSHARES ANNUAL REPORTTO SHAREHOLDERS |
Table of Contents
|
For more information visit www.iShares.com or call 1-800-474-2737
This report is intended for the Fund’s shareholders. It may not be distributed to prospective investors unless it is preceded or accompanied by the current prospectus.
Investing involves risk, including possible loss of principal.
The iShares Funds are distributed by BlackRock Investments, LLC (together with its affiliates, “BlackRock”).
The iShares Funds are not sponsored, endorsed, issued, sold or promoted by MSCI Inc., nor does this company make any representation regarding the advisability of investing in the iShares Funds. BlackRock is not affiliated with the company listed above.
A description of the policies that the Fund uses to determine how to vote proxies relating to portfolio securities and information about how the Fund voted proxies relating to portfolio securities during the most recent twelve-month period ending June 30 is available without charge, upon request, by calling toll-free 1-800-474-2737; on the Fund’s website at www.iShares.com; and on the U.S. Securities and Exchange Commission (SEC) website at www.sec.gov.
The Fund files its complete schedule of portfolio holdings with the SEC for the first and third quarters of each fiscal year on Form N-Q. The Fund’s Form N-Q is available on the SEC’s website or may be reviewed and copied at the SEC’s Public Reference Room in Washington, D.C. Information on the operation of the Public Reference Room may be obtained by calling 1-800-SEC-0330. The Fund also discloses its complete schedule of portfolio holdings on a daily and monthly basis on the Fund’s website.
©2014 BlackRock, Inc. All rights reserved. iSHARES and BLACKROCK are registered trademarks of BlackRock, Inc. or its subsidiaries. All other marks are the property of their respective owners.

iS-AR-813-0814
Table of Contents
AUGUST 31, 2014
2014 ANNUAL REPORT
|  |
iShares, Inc.
| Ø | iShares MSCI EMU ETF | EZU | NYSE Arca |
| Ø | iShares MSCI Germany ETF | EWG | NYSE Arca |
| Ø | iShares MSCI Japan ETF | EWJ | NYSE Arca |
Table of Contents
| 5 | ||||
| 12 | ||||
| 12 | ||||
| 13 | ||||
| 13 | ||||
| 17 | ||||
| 19 | ||||
| 25 | ||||
| 29 | ||||
| 32 | ||||
| 43 | ||||
| 44 | ||||
| 45 | ||||
| 56 | ||||
| 61 |
Table of Contents
Management’s Discussion of Fund Performance
iSHARES®, INC.
INTERNATIONAL MARKET OVERVIEW
International equities rose during the 12-month period ended August 31, 2014 (the “reporting period”), as modest economic growth and solid corporate profits offset concerns about global growth, the banking system and geopolitical events. Monetary policy continued to be a driving force for international equities, as several countries took steps to stimulate economic growth (as measured by gross domestic product, or “GDP”). The European Central Bank (“ECB”) cut interest rates several times, the Bank of Japan continued its bond purchasing efforts, and the U.S. Federal Reserve Bank (the “Fed”) reduced its unprecedented stimulus program.
Accommodative monetary policy and improving global growth led to a sustained rally in international equities from September to December 2013. However, events in early 2014 dampened the rally, as slow economic growth in the U.S. and China and the conflict in Ukraine raised concerns for international investors. In the final months of the reporting period, stagnant European growth, a Portuguese bank default and military escalation in Ukraine dampened international markets’ performance, particularly in Europe. Despite these challenges, most international markets finished with a solid return for the reporting period.
North American markets delivered strong gains during the reporting period. The U.S. economy strengthened in the latter half of the reporting period, as the combination of accommodative monetary policy, low inflation, steady job growth and rising corporate profits drove economic growth. Canada and Mexico also generated steady economic growth and rising stock prices during the reporting period.
Asian markets advanced during the reporting period, as investors generally embraced the region’s progress toward economic and political reform. Slow global growth presented new challenges for China and India after rapid economic growth in past decades. China, India and Japan, the three largest economies in the region, pursued dramatic changes to improve their competitive edge in the changing global economy.
China, Asia’s largest economy, continued to transition from an economy based on investment and manufacturing toward one based on consumption and services, which led to slowing economic growth. India underwent substantial political and economic change during the reporting period. The Bank of India made significant progress on curbing inflation, while the Indian government pursued growth-oriented political reform. By contrast, Japan attempted to reignite economic growth with monetary stimulus and political reform after twenty years of economic stagnation.
European equities posted solid gains while trailing developed markets in Asia and North America. Europe took steps toward an economic recovery during the reporting period after enduring a financial crisis and an economic recession. Europe’s uneven path to recovery included an improving credit environment and lower interest rates, as well as declining inflation and stagnant demand. France and Germany were mired in sluggish economic growth, while the United Kingdom expanded at a moderate pace during the reporting period. Spain and Italy experienced dramatically improving credit markets and lower interest rates, helping to revive investors’ interest in Spanish and Italian financial markets. European equity markets declined during the final months of the reporting period, as fear of economic stagnation and declining prices spurred the ECB to consider additional monetary support.
At the highest level, economic crosscurrents rippled across markets, while the ebb and flow of geopolitical risks drove market performance during the reporting period. International markets advanced through the uncertainty, as investors welcomed moderate global growth, low inflation and improving credit conditions.
MANAGEMENT’S DISCUSSIONSOF FUND PERFORMANCE | 5 |
Table of Contents
Management’s Discussion of Fund Performance
iSHARES® MSCI EMU ETF
Performance as of August 31, 2014
| Average Annual Total Returns | Cumulative Total Returns | |||||||||||||||||||||||||
| NAV | MARKET | INDEX | NAV | MARKET | INDEX | |||||||||||||||||||||
1 Year | 18.02% | 17.51% | 18.21% | 18.02% | 17.51% | 18.21% | ||||||||||||||||||||
5 Years | 5.44% | 5.34% | 5.51% | 30.31% | 29.70% | 30.73% | ||||||||||||||||||||
10 Years | 6.22% | 6.11% | 6.36% | 82.92% | 80.90% | 85.25% | ||||||||||||||||||||
GROWTH OF $10,000 INVESTMENT
(AT NET ASSET VALUE)
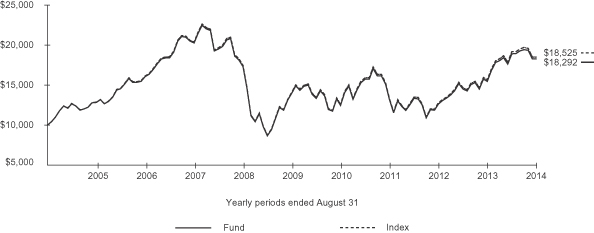
Past performance is no guarantee of future results. Performance results do not reflect the deduction of taxes that a shareholder would pay on fund distributions or on the redemption or sale of fund shares. See “About Fund Performance” on page 12 for more information.
| Shareholder Expenses | ||||||||||||||||||||||||||
| Actual | Hypothetical 5% Return | |||||||||||||||||||||||||
| Beginning Account Value (3/1/14) | Ending Account Value (8/31/14) | Expenses Paid During Period a | Beginning Account Value (3/1/14) | Ending Account Value (8/31/14) | Expenses Paid During Period a | Annualized Expense Ratio | ||||||||||||||||||||
| $ | 1,000.00 | $ | 966.10 | $ | 2.38 | $ | 1,000.00 | $ | 1,022.80 | $ | 2.45 | 0.48% | ||||||||||||||
| a | Expenses are calculated using the Fund’s annualized expense ratio (as disclosed in the table), multiplied by the average account value for the period, multiplied by the number of days in the period (184 days) and divided by the number of days in the year (365 days). See “Shareholder Expenses” on page 12 for more information. |
| 6 | 2014 iSHARES ANNUAL REPORTTO SHAREHOLDERS |
Table of Contents
Management’s Discussion of Fund Performance (Continued)
iSHARES® MSCI EMU ETF
The iShares MSCI EMU ETF (the “Fund”) seeks to track the investment results of an index composed of equities from countries within the European Monetary Union, as represented by the MSCI EMU Index (the “Index”). The Fund invests in a representative sample of securities included in the Index that collectively has an investment profile similar to the Index. Due to the use of representative sampling, the Fund may or may not hold all of the securities that are included in the Index. For the 12-month reporting period ended August 31, 2014, the total return for the Fund was 18.02%, net of fees, while the total return for the Index was 18.21%.
European equities as a group achieved some of the strongest results among global equity markets for the reporting period, despite a slow pace of economic recovery.
After achieving modest levels of growth in the third and fourth quarters of 2013 and the first quarter of 2014, economic growth in the eurozone stagnated in the second quarter of 2014.
France represented 33% of the Index on average during the reporting period. French equities as a group achieved positive returns and contributed significantly to Index results, despite the fragile state of the country’s economic recovery. France’s economy demonstrated uneven growth early in the reporting period before stagnating in the first and second quarters of 2014 amid weak consumer spending and business investment.
Germany comprised an average of 30% of the Index and was the second largest contributor to Index results. Germany experienced uneven economic expansion throughout the reporting period, growing 0.7% in the first quarter of 2014 over the previous quarter, its fastest growth rate in three years, but contracted 0.2% in the second quarter of 2014.
Although it accounted for only 11% of the Index on average, Spain’s equity market’s strong absolute returns resulted in a substantial contribution to overall Index gains for the reporting period. Spain’s economy gained strength throughout the reporting period, growing by 0.6% in the second quarter of 2014, its fastest rate in more than six years. The Italian equity market, which represented 8% of the Index on average, also generated healthy absolute returns.
PORTFOLIO ALLOCATION
As of 8/31/14
| Sector | Percentage of Total Investments* |
Financials | 23.50 | % | ||
Industrials | 13.12 | |||
Consumer Discretionary | 12.66 | |||
Consumer Staples | 10.15 | |||
Health Care | 8.36 | |||
Materials | 8.06 | |||
Energy | 6.86 | |||
Utilities | 6.37 | |||
Telecommunication Services | 5.55 | |||
Information Technology | 5.37 | |||
|
| |||
TOTAL | 100.00 | % | ||
|
|
TEN LARGEST FUND HOLDINGS
As of 8/31/14
| Security | Percentage of Total Investments* |
Total SA (France) | 3.49 | % | ||
Sanofi (France) | 3.22 | |||
Banco Santander SA (Spain) | 2.96 | |||
Bayer AG Registered (Germany) | 2.74 | |||
Siemens AG Registered (Germany) | 2.46 | |||
BASF SE (Germany) | 2.34 | |||
Anheuser-Busch InBev NV (Belgium) | 2.21 | |||
Daimler AG Registered (Germany) | 1.95 | |||
Allianz SE Registered (Germany) | 1.92 | |||
SAP SE (Germany) | 1.77 | |||
|
| |||
TOTAL | 25.06 | % | ||
|
|
| * | Excludes money market funds. |
MANAGEMENT’S DISCUSSIONSOF FUND PERFORMANCE | 7 |
Table of Contents
Management’s Discussion of Fund Performance
iSHARES® MSCI GERMANY ETF
Performance as of August 31, 2014
| Average Annual Total Returns | Cumulative Total Returns | |||||||||||||||||||||||||
| NAV | MARKET | INDEX | NAV | MARKET | INDEX | |||||||||||||||||||||
1 Year | 15.41% | 14.94% | 15.63% | 15.41% | 14.94% | 15.63% | ||||||||||||||||||||
5 Years | 9.10% | 9.00% | 9.18% | 54.58% | 53.88% | 55.17% | ||||||||||||||||||||
10 Years | 9.30% | 9.23% | 9.46% | 143.41% | 141.80% | 146.83% | ||||||||||||||||||||
GROWTH OF $10,000 INVESTMENT
(AT NET ASSET VALUE)
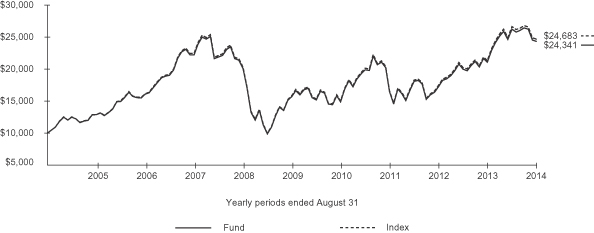
Past performance is no guarantee of future results. Performance results do not reflect the deduction of taxes that a shareholder would pay on fund distributions or on the redemption or sale of fund shares. See “About Fund Performance” on page 12 for more information.
| Shareholder Expenses | ||||||||||||||||||||||||||
| Actual | Hypothetical 5% Return | |||||||||||||||||||||||||
| Beginning Account Value (3/1/14) | Ending Account Value (8/31/14) | Expenses Paid During Period a | Beginning Account Value (3/1/14) | Ending Account Value (8/31/14) | Expenses Paid During Period a | �� | Annualized Expense Ratio | |||||||||||||||||||
| $ | 1,000.00 | $ | 926.50 | $ | 2.33 | $ | 1,000.00 | $ | 1,022.80 | $ | 2.45 | 0.48% | ||||||||||||||
| a | Expenses are calculated using the Fund’s annualized expense ratio (as disclosed in the table), multiplied by the average account value for the period, multiplied by the number of days in the period (184 days) and divided by the number of days in the year (365 days). See “Shareholder Expenses” on page 12 for more information. |
| 8 | 2014 iSHARES ANNUAL REPORTTO SHAREHOLDERS |
Table of Contents
Management’s Discussion of Fund Performance (Continued)
iSHARES® MSCI GERMANY ETF
The iShares MSCI Germany ETF (the “Fund”) seeks to track the investment results of an index composed of German equities, as represented by the MSCI Germany Index (the “Index”). The Fund invests in a representative sample of securities included in the Index that collectively has an investment profile similar to the Index. Due to the use of representative sampling, the Fund may or may not hold all of the securities that are included in the Index. For the 12-month reporting period ended August 31, 2014, the total return for the Fund was 15.41%, net of fees, while the total return for the Index was 15.63%.
German equities, as represented by the Index, achieved positive results for the reporting period but underperformed broad international indices.
Germany experienced uneven economic expansion throughout the reporting period, as the eurozone struggled with economic recovery and a conflict in Ukraine posed a potential threat to German trade. Economic growth as represented by GDP grew 0.7% in the first quarter of 2014 over the previous quarter, its fastest growth rate in three years and the strongest growth rate among eurozone countries, but contracted 0.2% in the second quarter of 2014. Industrial output levels were uneven throughout the reporting period. Factory orders shrank markedly in June 2014 as tensions surrounding the geopolitical crisis in Ukraine mounted, but rebounded in July 2014.
Within the Index, every sector achieved positive results during the reporting period. The consumer discretionary sector, the largest sector weighting in the Index on average, was also the largest contributor to Index results. The industrials and materials sectors also contributed meaningfully, despite the volatility created by the crisis in Ukraine. The health care and financials sectors were also notable contributors. Consumer staples and telecommunication services stocks contributed only modestly to Index returns.
PORTFOLIO ALLOCATION
As of 8/31/14
| Sector | Percentage of Total Investments* |
Consumer Discretionary | 20.80 | % | ||
Financials | 16.94 | |||
Materials | 14.29 | |||
Industrials | 13.88 | |||
Health Care | 13.85 | |||
Information Technology | 7.62 | |||
Utilities | 4.71 | |||
Telecommunication Services | 4.14 | |||
Consumer Staples | 3.77 | |||
|
| |||
TOTAL | 100.00 | % | ||
|
|
TEN LARGEST FUND HOLDINGS
As of 8/31/14
| Security | Percentage of Total Investments* |
Bayer AG Registered | 9.41 | % | ||
Siemens AG Registered | 8.43 | |||
BASF SE | 8.02 | |||
Daimler AG Registered | 6.69 | |||
Allianz SE Registered | 6.61 | |||
SAP SE | 6.08 | |||
Deutsche Bank AG Registered | 4.01 | |||
Deutsche Telekom AG Registered | 3.95 | |||
Bayerische Motoren Werke AG | 3.27 | |||
Linde AG | 3.12 | |||
|
| |||
TOTAL | 59.59 | % | ||
|
|
| * | Excludes money market funds. |
MANAGEMENT’S DISCUSSIONSOF FUND PERFORMANCE | 9 |
Table of Contents
Management’s Discussion of Fund Performance
iSHARES® MSCI JAPAN ETF
Performance as of August 31, 2014
| Average Annual Total Returns | Cumulative Total Returns | |||||||||||||||||||||||||
| NAV | MARKET | INDEX | NAV | MARKET | INDEX | |||||||||||||||||||||
1 Year | 9.39% | 10.11% | 9.80% | 9.39% | 10.11% | 9.80% | ||||||||||||||||||||
5 Years | 4.64% | 4.66% | 5.19% | 25.44% | 25.57% | 28.79% | ||||||||||||||||||||
10 Years | 3.10% | 3.00% | 3.64% | 35.75% | 34.40% | 42.96% | ||||||||||||||||||||
GROWTH OF $10,000 INVESTMENT
(AT NET ASSET VALUE)
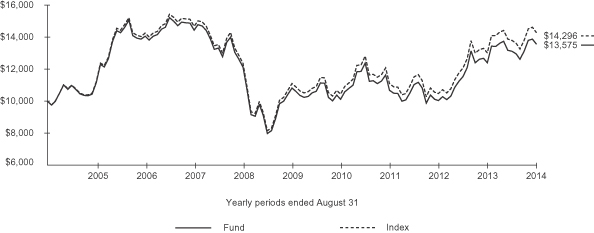
Past performance is no guarantee of future results. Performance results do not reflect the deduction of taxes that a shareholder would pay on fund distributions or on the redemption or sale of fund shares. See “About Fund Performance” on page 12 for more information.
| Shareholder Expenses | ||||||||||||||||||||||||||
| Actual | Hypothetical 5% Return | |||||||||||||||||||||||||
| Beginning Account Value (3/1/14) | Ending Account Value (8/31/14) | Expenses Paid During Period a | Beginning Account Value (3/1/14) | Ending Account Value (8/31/14) | Expenses Paid During Period a | Annualized Expense Ratio | ||||||||||||||||||||
| $ | 1,000.00 | $ | 1,034.00 | $ | 2.46 | $ | 1,000.00 | $ | 1,022.80 | $ | 2.45 | 0.48% | ||||||||||||||
| a | Expenses are calculated using the Fund’s annualized expense ratio (as disclosed in the table), multiplied by the average account value for the period, multiplied by the number of days in the period (184 days) and divided by the number of days in the year (365 days). See “Shareholder Expenses” on page 12 for more information. |
| 10 | 2014 iSHARES ANNUAL REPORTTO SHAREHOLDERS |
Table of Contents
Management’s Discussion of Fund Performance (Continued)
iSHARES® MSCI JAPAN ETF
The iShares MSCI Japan ETF (the “Fund”) seeks to track the investment results of an index composed of Japanese equities, as represented by the MSCI Japan Index (the “Index”). The Fund invests in a representative sample of securities included in the Index that collectively has an investment profile similar to the Index. Due to the use of representative sampling, the Fund may or may not hold all of the securities that are included in the Index. For the 12-month reporting period ended August 31, 2014, the total return for the Fund was 9.39%, net of fees, while the total return for the Index was 9.80%.
Japanese equities, as represented by the Index, achieved positive results for the reporting period, but lagged the performance of broad international equity indices in an environment of considerable market volatility.
Japanese stocks delivered gains early in the reporting period, helped by government initiatives aimed at revitalizing the country’s stagnant economy. During the remainder of the reporting period, conflicting economic data revealed uneven economic growth levels, and an increase in the consumption tax rate curbed consumer spending. Although these events created an uneven market environment that persisted throughout the reporting period, equities finished the reporting period with solid gains overall.
Within the Index, the industrials sector was the largest contributing sector to performance. Industrials stocks as a group achieved gains early in the reporting period as economic conditions strengthened, but lagged in the final months of the reporting period, as the higher consumption tax placed a crimp on consumer demand. The information technology sector was also a meaningful contributor to Index results. Consumer discretionary and consumer staples stocks collectively contributed. Consumer spending spiked to a record high in the first quarter of 2014 in anticipation of the consumption tax increase in April 2014, and then dropped sharply in the second quarter of 2014. The utilities sector detracted modestly from Index results.
PORTFOLIO ALLOCATION
As of 8/31/14
| Sector | Percentage of Total Investments* |
Consumer Discretionary | 20.60 | % | ||
Industrials | 20.28 | |||
Financials | 19.45 | |||
Information Technology | 11.13 | |||
Consumer Staples | 6.86 | |||
Health Care | 6.58 | |||
Materials | 5.87 | |||
Telecommunication Services | 5.66 | |||
Utilities | 2.35 | |||
Energy | 1.22 | |||
|
| |||
TOTAL | 100.00 | % | ||
|
|
TEN LARGEST FUND HOLDINGS
As of 8/31/14
| Security | Percentage of Total Investments* |
Toyota Motor Corp. | 5.72 | % | ||
Mitsubishi UFJ Financial Group Inc. | 2.68 | |||
SoftBank Corp. | 2.51 | |||
Honda Motor Co. Ltd. | 2.01 | |||
Sumitomo Mitsui Financial Group Inc. | 1.88 | |||
Mizuho Financial Group Inc. | 1.60 | |||
Japan Tobacco Inc. | 1.41 | |||
Hitachi Ltd. | 1.39 | |||
Canon Inc. | 1.39 | |||
Takeda Pharmaceutical Co. Ltd. | 1.29 | |||
|
| |||
TOTAL | 21.88 | % | ||
|
|
| * | Excludes money market funds. |
MANAGEMENT’S DISCUSSIONSOF FUND PERFORMANCE | 11 |
Table of Contents
Past performance is no guarantee of future results. Current performance may be lower or higher than the performance data quoted. Performance data current to the most recent month-end is available at www.iShares.com. Performance results assume reinvestment of all dividends and capital gain distributions and do not reflect the deduction of taxes that a shareholder would pay on fund distributions or on the redemption or sale of fund shares. The investment return and principal value of shares will vary with changes in market conditions. Shares may be worth more or less than their original cost when they are redeemed or sold in the market. Performance for certain funds may reflect a waiver of a portion of investment management fees. Without such waiver, performance would have been lower.
Net asset value or “NAV” is the value of one share of a fund as calculated in accordance with the standard formula for valuing mutual fund shares. The price used to calculate market return (“Market Price”) is determined by using the midpoint between the highest bid and the lowest offer on the primary stock exchange on which shares of a fund are listed for trading, as of the time that such fund’s NAV is calculated. Since shares of a fund may not have traded in the secondary market until after the fund’s inception, for the period from inception to the first day of secondary trading, the NAV of the fund is used as a proxy for the Market Price to calculate market returns. Market and NAV returns assume that dividends and capital gain distributions have been reinvested at Market Price and NAV, respectively.
An index is a statistical composite that tracks a specified financial market or sector. Unlike a fund, an index does not actually hold a portfolio of securities and therefore does not incur the expenses incurred by a fund. These expenses negatively impact fund performance. Also, market returns do not include brokerage commissions that may be payable on secondary market transactions. If brokerage commissions were included, market returns would be lower.
As a shareholder of a Fund, you incur two types of costs: (1) transaction costs, including brokerage commissions on purchases and sales of fund shares and (2) ongoing costs, including management fees and other fund expenses. The expense example, which is based on an investment of $1,000 invested on March 1, 2014 and held through August 31, 2014, is intended to help you understand your ongoing costs (in dollars and cents) of investing in a Fund and to compare these costs with the ongoing costs of investing in other funds.
Actual Expenses — The table provides information about actual account values and actual expenses. Annualized expense ratios reflect contractual and voluntary fee waivers, if any. To estimate the expenses that you paid on your account over the period, simply divide your account value by $1,000 (for example, an $8,600 account value divided by $1,000 = 8.6), then multiply the result by the number for your Fund under the heading entitled “Expenses Paid During Period.”
Hypothetical Example for Comparison Purposes — The table also provides information about hypothetical account values and hypothetical expenses based on each Fund’s actual expense ratio and an assumed rate of return of 5% per year before expenses. You may use this information to compare the ongoing costs of investing in your Fund and other funds. To do so, compare this 5% hypothetical example with the 5% hypothetical examples that appear in the shareholder reports of the other funds.
Please note that the expenses shown in the table are meant to highlight your ongoing costs only and do not reflect any transactional costs, such as brokerage commissions paid on purchases and sales of fund shares. Therefore, the hypothetical examples are useful in comparing ongoing costs only and will not help you determine the relative total costs of owning different funds. In addition, if these transactional costs were included, your costs would have been higher.
| 12 | 2014 iSHARES ANNUAL REPORTTO SHAREHOLDERS |
Table of Contents
August 31, 2014
| Security | Shares | Value | ||||||
COMMON STOCKS — 97.93% |
| |||||||
AUSTRIA — 0.75% |
| |||||||
Andritz AG | 156,744 | $ | 8,407,183 | |||||
Erste Group Bank AG | 600,852 | 15,456,870 | ||||||
IMMOEAST AG Escrowa,b | 105,078 | 2 | ||||||
IMMOFINANZ AGa | 2,070,327 | 6,503,979 | ||||||
IMMOFINANZ AG Escrowa,b | 68,575 | 1 | ||||||
OMV AG | 315,636 | 12,223,221 | ||||||
Raiffeisen International Bank Holding AG | 252,532 | 6,486,387 | ||||||
Telekom Austria AG | 238,008 | 2,232,150 | ||||||
Vienna Insurance Group AG | 82,175 | 3,992,467 | ||||||
Voestalpine AG | 241,647 | 10,392,413 | ||||||
|
| |||||||
| 65,694,673 | ||||||||
BELGIUM — 4.07% | ||||||||
Ageas | 476,763 | 16,042,065 | ||||||
Anheuser-Busch InBev NV | 1,724,184 | 192,021,135 | ||||||
Belgacom SA | 326,521 | 11,670,588 | ||||||
Colruyt SA | 152,303 | 7,282,272 | ||||||
Delhaize Brothers and Co. “The Lion” (Delhaize Group) SA | 219,877 | 15,364,449 | ||||||
Groupe Bruxelles Lambert SA | 172,349 | 16,985,498 | ||||||
KBC Groep NVa | 537,719 | 30,721,801 | ||||||
Solvay SA | 126,266 | 19,916,534 | ||||||
Telenet Group Holding NVa | 113,204 | 6,631,026 | ||||||
UCB SA | 269,948 | 26,205,920 | ||||||
Umicore SA | 232,939 | 11,295,847 | ||||||
|
| |||||||
| 354,137,135 | ||||||||
FINLAND — 2.88% | ||||||||
Elisa OYJ | 306,957 | 8,377,590 | ||||||
Fortum OYJ | 953,497 | 23,988,578 | ||||||
Kone OYJ Class B | 670,487 | 28,437,934 | ||||||
Metso OYJ | 241,647 | 9,497,997 | ||||||
Neste Oil OYJc | 276,479 | 5,426,255 | ||||||
Nokia OYJ | 8,030,808 | 67,647,477 | ||||||
Nokian Renkaat OYJc | 243,824 | 7,788,252 | ||||||
Orion OYJ Class B | 213,346 | 8,388,429 | ||||||
Sampo OYJ Class A | 957,851 | 47,224,742 | ||||||
Stora Enso OYJ Class R | 1,184,288 | 10,334,632 | ||||||
UPM-Kymmene OYJ | 1,138,571 | 17,141,869 | ||||||
Wartsila OYJ Abp | 317,842 | 16,017,992 | ||||||
|
| |||||||
| 250,271,747 | ||||||||
FRANCE — 32.60% | ||||||||
Accor SA | 367,913 | 17,921,066 | ||||||
Aeroports de Paris | 63,133 | 8,411,513 | ||||||
| Security | Shares | Value | ||||||
Airbus Group NV | 1,260,483 | $ | 77,710,741 | |||||
Alcatel-Lucenta,c | 6,008,520 | 20,830,764 | ||||||
ALSTOMa | 463,672 | 16,450,521 | ||||||
ArcelorMittal | 2,144,316 | 31,281,267 | ||||||
Arkema SA | 121,912 | 9,170,868 | ||||||
Atos SA | 169,806 | 12,986,194 | ||||||
AXA SA | 3,892,476 | 96,647,162 | ||||||
BNP Paribas SA | 2,268,405 | 153,520,546 | ||||||
Bollore | 10,885 | 6,882,108 | ||||||
Bouygues SA | 411,453 | 15,139,820 | ||||||
Bureau Veritas SA | 474,586 | 11,302,256 | ||||||
Cap Gemini SA | 309,105 | 22,031,059 | ||||||
Carrefour SA | 1,336,678 | 46,455,347 | ||||||
Casino Guichard-Perrachon SA | 121,912 | 14,585,710 | ||||||
Christian Dior SA | 115,381 | 20,570,477 | ||||||
CNP Assurances SA | 370,090 | 7,319,552 | ||||||
Compagnie de Saint-Gobain | 953,526 | 48,518,689 | ||||||
Compagnie Generale des Etablissements Michelin Class B | 398,391 | 44,158,616 | ||||||
Credit Agricole SA | 2,146,464 | 31,906,339 | ||||||
Danone SA | 1,238,713 | 86,704,983 | ||||||
Dassault Systemes SA | 269,948 | 17,921,009 | ||||||
Edenred SA | 437,577 | 13,008,819 | ||||||
Electricite de France SA | 520,303 | 16,958,819 | ||||||
Essilor International SA | 437,577 | 46,525,114 | ||||||
Eurazeo | 80,549 | 6,135,715 | ||||||
Eutelsat Communications SA | 330,904 | 11,064,480 | ||||||
Fonciere des Regions | 60,956 | 6,182,427 | ||||||
GDF Suez | 3,104,344 | 76,649,106 | ||||||
Gecina SA | 60,956 | 8,631,310 | ||||||
Groupe Eurotunnel SA Registered | 1,004,954 | 12,961,922 | ||||||
Icade | 80,549 | 7,508,638 | ||||||
Iliad SA | 56,304 | 12,400,161 | ||||||
Imerys SA | 74,018 | 5,929,739 | ||||||
JCDecaux SA | 143,682 | 5,083,469 | ||||||
Kering | 161,098 | 34,216,980 | ||||||
Klepierre | 215,523 | 10,290,902 | ||||||
L’Air Liquide SA | 738,003 | 94,526,785 | ||||||
L’Oreal SA | 537,719 | 89,243,735 | ||||||
Lafarge SA | 400,568 | 30,760,728 | ||||||
Lagardere SCA | 254,709 | 7,030,460 | ||||||
Legrand SA | 570,374 | 31,607,056 | ||||||
LVMH Moet Hennessy Louis Vuitton SA | 598,675 | 104,131,311 | ||||||
SCHEDULESOF INVESTMENTS | 13 |
Table of Contents
Schedule of Investments (Continued)
iSHARES® MSCI EMU ETF
August 31, 2014
| Security | Shares | Value | ||||||
Natixis | 1,994,132 | $ | 14,052,691 | |||||
Orange | 3,975,115 | 60,318,980 | ||||||
Pernod Ricard SA | 454,993 | 53,782,699 | ||||||
PSA Peugeot Citroen SAa | 840,293 | 11,832,057 | ||||||
Publicis Groupe SA | 389,683 | 29,103,574 | ||||||
Remy Cointreau SAc | 52,248 | 4,162,987 | ||||||
Renault SA | 411,424 | 32,288,058 | ||||||
Rexel SA | 579,082 | 11,555,920 | ||||||
Safran SA | 581,259 | 38,193,677 | ||||||
Sanofi | 2,542,533 | 279,643,599 | ||||||
Schneider Electric SE | 1,116,772 | 94,615,516 | ||||||
SCOR SE | 330,904 | 10,155,697 | ||||||
SES SA Class A FDR | 653,100 | 24,225,020 | ||||||
Societe BIC SA | 60,956 | 8,302,116 | ||||||
Societe Generale | 1,543,493 | 78,385,761 | ||||||
Sodexo | 202,461 | 19,993,126 | ||||||
STMicroelectronics NV | 1,369,275 | 11,496,206 | ||||||
Suez Environnement SA | 603,000 | 11,143,633 | ||||||
Technip SA | 219,877 | 20,418,354 | ||||||
Thales SA | 200,284 | 11,210,782 | ||||||
Total SA | 4,586,881 | 303,239,993 | ||||||
Unibail-Rodamco SE | 208,992 | 56,268,115 | ||||||
Valeo SA | 161,098 | 19,515,880 | ||||||
Vallourec SA | 235,116 | 10,526,528 | ||||||
Veolia Environnement | 899,101 | 16,550,538 | ||||||
Vinci SA | 1,036,252 | 67,906,333 | ||||||
Vivendi SA | 2,590,630 | 67,548,033 | ||||||
Wendel | 67,487 | 8,166,682 | ||||||
Zodiac Aerospace | 400,568 | 13,098,372 | ||||||
|
| |||||||
| 2,836,975,210 | ||||||||
GERMANY — 27.18% | ||||||||
Adidas AG | 448,462 | 33,694,342 | ||||||
Allianz SE Registered | 977,444 | 167,116,137 | ||||||
Axel Springer SE | 84,903 | 5,042,607 | ||||||
BASF SE | 1,967,979 | 202,945,096 | ||||||
Bayer AG Registered | 1,772,049 | 238,199,335 | ||||||
Bayerische Motoren Werke AG | 709,702 | 82,825,022 | ||||||
Beiersdorf AG | 215,732 | 19,036,029 | ||||||
Brenntag AG | 328,727 | 17,439,046 | ||||||
Celesio AG | 108,856 | 3,706,506 | ||||||
Commerzbank AGa | 2,076,829 | 31,514,109 | ||||||
Continental AG | 237,293 | 50,791,390 | ||||||
Daimler AG Registered | 2,063,767 | 169,192,870 | ||||||
Deutsche Bank AG Registered | 2,956,214 | 101,397,829 | ||||||
Deutsche Boerse AG | 413,601 | 29,478,876 | ||||||
| Security | Shares | Value | ||||||
Deutsche Lufthansa AG Registered | 496,356 | $ | 8,613,818 | |||||
Deutsche Post AG Registered | 2,074,652 | 68,004,040 | ||||||
Deutsche Telekom AG Registered | 6,678,920 | 100,115,268 | ||||||
Deutsche Wohnen AG Bearer | 613,885 | 13,883,825 | ||||||
E.ON SE | 4,290,809 | 78,165,151 | ||||||
Fraport AG | 78,372 | 5,326,752 | ||||||
Fresenius Medical Care AG & Co. KGaA | 463,672 | 32,778,892 | ||||||
Fresenius SE & Co. KGaA | 809,844 | 39,607,564 | ||||||
GEA Group AG | 391,860 | 17,771,323 | ||||||
Hannover Rueck SE Registered | 130,620 | 10,875,451 | ||||||
HeidelbergCement AG | 302,603 | 22,886,966 | ||||||
Henkel AG & Co. KGaA | 250,355 | 23,871,882 | ||||||
Hochtief AG | 44,484 | 3,525,035 | ||||||
Hugo Boss AG | 67,244 | 9,446,397 | ||||||
Infineon Technologies AG | 2,418,589 | 28,178,101 | ||||||
K+S AG Registered | 370,090 | 11,533,839 | ||||||
Kabel Deutschland Holding AG | 48,771 | 6,899,502 | ||||||
Lanxess AG | 195,901 | 12,157,595 | ||||||
Linde AG | 398,391 | 79,055,204 | ||||||
MAN SE | 74,018 | 8,799,062 | ||||||
Merck KGaA | 276,450 | 24,116,993 | ||||||
METRO AGa | 348,320 | 12,263,916 | ||||||
Muenchener Rueckversicherungs-Gesellschaft AG Registered | 369,916 | 74,354,877 | ||||||
Osram Licht AGa | 191,576 | 8,029,585 | ||||||
ProSiebenSat.1 Media AG Registered | 470,232 | 18,900,677 | ||||||
QIAGEN NVa | 502,713 | 12,203,861 | ||||||
RTL Group SA | 82,726 | 8,045,012 | ||||||
RWE AG | 1,049,285 | 41,159,488 | ||||||
SAP SE | 1,974,510 | 153,968,846 | ||||||
Siemens AG Registered | 1,700,208 | 213,515,306 | ||||||
Sky Deutschland AGa | 944,818 | 8,366,871 | ||||||
Telefonica Deutschland Holding AGd | 603,029 | 4,596,672 | ||||||
ThyssenKrupp AGa | 970,913 | 27,016,485 | ||||||
United Internet AG Registered | 250,355 | 10,781,754 | ||||||
Volkswagen AG | 63,133 | 14,178,576 | ||||||
|
| |||||||
| 2,365,373,780 | ||||||||
IRELAND — 0.99% | ||||||||
Bank of Irelanda | 58,835,602 | 23,481,976 | ||||||
CRH PLC | 1,580,502 | 36,598,706 | ||||||
| 14 | 2014 iSHARES ANNUAL REPORTTO SHAREHOLDERS |
Table of Contents
Schedule of Investments (Continued)
iSHARES® MSCI EMU ETF
August 31, 2014
| Security | Shares | Value | ||||||
Irish Bank Resolution Corp. Ltd.a,b | 446,666 | $ | 6 | |||||
Kerry Group PLC Class A | 339,612 | 25,610,044 | ||||||
Ryanair Holdings PLCa | 43,520 | 409,985 | ||||||
Ryanair Holdings PLC SP ADRa | 416 | 22,839 | ||||||
|
| |||||||
| 86,123,556 | ||||||||
ITALY — 8.16% | ||||||||
Assicurazioni Generali SpA | 2,503,492 | 51,310,661 | ||||||
Atlantia SpA | 885,787 | 22,541,781 | ||||||
Banca Monte dei Paschi di Siena SpAa | 9,342,702 | 14,004,466 | ||||||
Banco Popolare SCa | 777,160 | 12,151,027 | ||||||
CNH Industrial NV | 2,031,141 | 17,684,523 | ||||||
Enel Green Power SpA | 3,759,563 | 10,399,405 | ||||||
Enel SpA | 14,113,288 | 74,843,447 | ||||||
Eni SpA | 5,453,298 | 136,334,964 | ||||||
Exor SpA | 211,140 | 8,421,282 | ||||||
Fiat SpAa,c | 1,880,899 | 18,432,754 | ||||||
Finmeccanica SpAa | 870,800 | 8,166,768 | ||||||
Intesa Sanpaolo SpA | 24,937,042 | 74,365,785 | ||||||
Intesa Sanpaolo SpA RNC | 2,013,725 | 5,265,171 | ||||||
Luxottica Group SpA | 359,205 | 19,233,341 | ||||||
Mediobanca SpAa | 1,297,492 | 11,365,228 | ||||||
Pirelli & C. SpA | 511,566 | 7,836,700 | ||||||
Prysmian SpA | 437,548 | 8,910,191 | ||||||
Saipem SpAa | 568,168 | 13,515,942 | ||||||
Snam SpA | 4,353,884 | 25,382,832 | ||||||
Telecom Italia SpAa | 21,597,495 | 24,906,422 | ||||||
Telecom Italia SpA RNC | 12,950,654 | 11,941,023 | ||||||
Tenaris SA | 1,014,482 | 22,436,073 | ||||||
Terna SpA | 3,237,112 | 16,714,585 | ||||||
UniCredit SpA | 9,463,245 | 73,418,784 | ||||||
Unione di Banche Italiane SpA | 1,839,507 | 14,404,730 | ||||||
UnipolSai SpA | 1,944,061 | 6,120,115 | ||||||
|
| |||||||
| 710,108,000 | ||||||||
NETHERLANDS — 8.77% | ||||||||
AEGON NV | 3,888,064 | 30,810,095 | ||||||
Akzo Nobel NV | 513,743 | 36,399,823 | ||||||
Altice SAa | 187,222 | 11,985,191 | ||||||
ASML Holding NV | 766,304 | 73,492,654 | ||||||
Corio NV | 148,648 | 8,005,250 | ||||||
Delta Lloyd NV | 433,223 | 10,462,711 | ||||||
Fugro NV CVA | 158,921 | 5,778,576 | ||||||
Gemalto NVc | 169,806 | 16,665,541 | ||||||
Heineken Holding NV | 215,678 | 14,923,306 | ||||||
Heineken NVc | 494,179 | 37,689,004 | ||||||
| Security | Shares | Value | ||||||
ING Groep NV CVAa | 8,257,361 | $ | 113,823,599 | |||||
Koninklijke Ahold NV | 1,996,280 | 34,183,507 | ||||||
Koninklijke DSM NV | 370,090 | 24,773,868 | ||||||
Koninklijke KPN NVa | 6,874,821 | 22,865,178 | ||||||
Koninklijke Philips NV | 2,081,183 | 63,571,554 | ||||||
Koninklijke Vopak NV | 150,213 | 7,720,521 | ||||||
OCI NVa | 180,662 | 6,053,907 | ||||||
Randstad Holding NV | 267,771 | 13,030,798 | ||||||
Reed Elsevier NV | 1,497,776 | 34,229,311 | ||||||
Royal Boskalis Westminster NV CVA | 187,222 | 10,800,235 | ||||||
TNT Express NV | 954,764 | 7,153,316 | ||||||
Unilever NV CVA | 3,491,850 | 145,504,099 | ||||||
Wolters Kluwer NV | 648,746 | 18,013,459 | ||||||
Ziggo NV | 322,196 | 15,363,159 | ||||||
|
| |||||||
| 763,298,662 | ||||||||
PORTUGAL — 0.65% | ||||||||
Banco Comercial Portugues SA Registereda | 75,713,084 | 10,321,982 | ||||||
Energias de Portugal SA | 4,969,975 | 24,117,130 | ||||||
Galp Energia SGPS SA Class B | 827,231 | 14,709,990 | ||||||
Jeronimo Martins SGPS SA | 541,685 | 7,356,264 | ||||||
|
| |||||||
| 56,505,366 | ||||||||
SPAIN — 11.88% | ||||||||
Abertis Infraestructuras SA | 868,623 | 18,317,849 | ||||||
Actividades de Construcciones y | 380,726 | 16,075,338 | ||||||
Amadeus IT Holding SA Class A | 816,346 | 30,430,740 | ||||||
Banco Bilbao Vizcaya Argentaria SA | 12,619,518 | 153,092,603 | ||||||
Banco de Sabadell SA | 7,318,900 | 23,098,535 | ||||||
Banco Popular Espanol SA | 3,801,042 | 23,786,991 | ||||||
Banco Santander SA | 25,755,948 | 257,496,378 | ||||||
Bankia SAa | 9,892,056 | 19,179,893 | ||||||
CaixaBank SA | 3,810,189 | 22,975,984 | ||||||
Distribuidora Internacional de | 1,327,912 | 11,208,400 | ||||||
Enagas SA | 424,953 | 14,200,812 | ||||||
Ferrovial SA | 881,078 | 17,977,015 | ||||||
Gas Natural SDG SA | 751,036 | 23,084,494 | ||||||
Grifols SA | 320,019 | 14,934,776 | ||||||
Iberdrola SA | 10,921,716 | 80,346,297 | ||||||
Inditex SA | 2,338,069 | 67,907,498 | ||||||
International Consolidated Airlines | 2,185,708 | 13,116,793 | ||||||
SCHEDULESOF INVESTMENTS | 15 |
Table of Contents
Schedule of Investments (Continued)
iSHARES® MSCI EMU ETF
August 31, 2014
| Security | Shares | Value | ||||||
Mapfre SA | 1,985,337 | $ | 7,460,842 | |||||
Red Electrica Corporacion SA | 236,372 | 19,954,374 | ||||||
Repsol SA | 2,183,531 | 54,330,428 | ||||||
Telefonica SA | 8,779,696 | 139,584,938 | ||||||
Zardoya Otis SA | 356,970 | 5,191,019 | ||||||
Zardoya Otis SA New | 17,669 | 256,941 | ||||||
|
| |||||||
| 1,034,008,938 | ||||||||
|
| |||||||
TOTAL COMMON STOCKS | ||||||||
(Cost: $8,432,507,407) | 8,522,497,067 | |||||||
PREFERRED STOCKS — 1.91% |
| |||||||
GERMANY — 1.91% |
| |||||||
Bayerische Motoren Werke AG | 117,558 | 11,269,796 | ||||||
Fuchs Petrolub SE | 152,390 | 6,273,758 | ||||||
Henkel AG & Co. KGaA | 383,152 | 40,274,096 | ||||||
Porsche Automobil Holding SE | 328,727 | 29,985,201 | ||||||
Volkswagen AG | 348,320 | 78,387,209 | ||||||
|
| |||||||
| 166,190,060 | ||||||||
|
| |||||||
TOTAL PREFERRED STOCKS | ||||||||
(Cost: $176,832,799) | 166,190,060 | |||||||
SHORT-TERM INVESTMENTS — 1.19% |
| |||||||
MONEY MARKET FUNDS — 1.19% |
| |||||||
BlackRock Cash Funds: Institutional, |
| |||||||
0.14%e,f,g | 96,863,357 | 96,863,357 | ||||||
BlackRock Cash Funds: Prime, | ||||||||
0.11%e,f,g | 6,097,814 | 6,097,814 | ||||||
BlackRock Cash Funds: Treasury, |
| |||||||
0.00%e,f | 955,702 | 955,702 | ||||||
|
| |||||||
| 103,916,873 | ||||||||
|
| |||||||
TOTAL SHORT-TERM INVESTMENTS |
| |||||||
(Cost: $103,916,873) | 103,916,873 | |||||||
|
| |||||||
| Value | ||||||
TOTAL INVESTMENTS | ||||||
(Cost: $8,713,257,079) | $ | 8,792,604,000 | ||||
Other Assets, Less Liabilities — (1.03)% | (89,966,878 | ) | ||||
|
| |||||
NET ASSETS — 100.00% | $ | 8,702,637,122 | ||||
|
| |||||
FDR — Fiduciary Depositary Receipts
SP ADR — Sponsored American Depositary Receipts
| a | Non-income earning security. |
| b | Security valued using Level 3 inputs in accordance with management’s fair valuation policy. See Note 1. |
| c | All or a portion of this security represents a security on loan. See Note 1. |
| d | This security may be resold to qualified institutional buyers under Rule 144A of the Securities Act of 1933. |
| e | Affiliated issuer. See Note 2. |
| f | The rate quoted is the annualized seven-day yield of the fund at period end. |
| g | All or a portion of this security represents an investment of securities lending collateral. See Note 1. |
See notes to financial statements.
| 16 | 2014 iSHARES ANNUAL REPORTTO SHAREHOLDERS |
Table of Contents
Schedule of Investments
August 31, 2014
| Security | Shares | Value | ||||||
COMMON STOCKS — 92.93% |
| |||||||
AIR FREIGHT & LOGISTICS — 2.67% |
| |||||||
Deutsche Post AG Registered | 3,909,816 | $ | 128,158,015 | |||||
|
| |||||||
| 128,158,015 | ||||||||
AIRLINES — 0.34% |
| |||||||
Deutsche Lufthansa AG Registered | 932,328 | 16,179,726 | ||||||
|
| |||||||
| 16,179,726 | ||||||||
AUTO COMPONENTS — 1.98% |
| |||||||
Continental AG | 444,360 | 95,113,055 | ||||||
|
| |||||||
| 95,113,055 | ||||||||
AUTOMOBILES — 10.46% |
| |||||||
Bayerische Motoren Werke AG | 1,337,496 | 156,091,058 | ||||||
Daimler AG Registered | 3,890,496 | 318,952,761 | ||||||
Volkswagen AG | 119,232 | 26,777,438 | ||||||
|
| |||||||
| 501,821,257 | ||||||||
CAPITAL MARKETS — 3.98% |
| |||||||
Deutsche Bank AG Registered | 5,572,992 | 191,153,040 | ||||||
|
| |||||||
| 191,153,040 | ||||||||
CHEMICALS — 12.01% |
| |||||||
BASF SE | 3,711,096 | 382,701,612 | ||||||
K+S AG Registered | 696,072 | 21,693,055 | ||||||
Lanxess AG | 369,840 | 22,952,230 | ||||||
Linde AG | 749,616 | 148,750,965 | ||||||
|
| |||||||
| 576,097,862 | ||||||||
COMMERCIAL BANKS — 1.24% |
| |||||||
Commerzbank AGa | 3,909,816 | 59,328,123 | ||||||
|
| |||||||
| 59,328,123 | ||||||||
CONSTRUCTION & ENGINEERING — 0.14% |
| |||||||
Hochtief AG | 84,456 | 6,692,527 | ||||||
|
| |||||||
| 6,692,527 | ||||||||
CONSTRUCTION MATERIALS — 0.90% |
| |||||||
HeidelbergCement AG | 569,112 | 43,044,012 | ||||||
|
| |||||||
| 43,044,012 | ||||||||
DIVERSIFIED FINANCIAL SERVICES — 1.16% |
| |||||||
Deutsche Boerse AG | 779,976 | 55,591,780 | ||||||
|
| |||||||
| 55,591,780 | ||||||||
DIVERSIFIED TELECOMMUNICATION SERVICES — 4.11% |
| |||||||
Deutsche Telekom AG Registered | 12,588,360 | 188,696,231 | ||||||
Telefonica Deutschland Holding AGb | 1,126,632 | 8,587,908 | ||||||
|
| |||||||
| 197,284,139 | ||||||||
| Security | Shares | Value | ||||||
ELECTRICAL EQUIPMENT — 0.31% |
| |||||||
Osram Licht AGa | 359,904 | $ | 15,084,769 | |||||
|
| |||||||
| 15,084,769 | ||||||||
FOOD & STAPLES RETAILING — 0.48% |
| |||||||
METRO AGa | 655,224 | 23,069,627 | ||||||
|
| |||||||
| 23,069,627 | ||||||||
HEALTH CARE PROVIDERS & SERVICES — 2.99% |
| |||||||
Celesio AG | 204,792 | 6,973,091 | ||||||
Fresenius Medical Care AG & Co. KGaA | 874,368 | 61,812,692 | ||||||
Fresenius SE & Co. KGaA | 1,525,728 | 74,619,765 | ||||||
|
| |||||||
| 143,405,548 | ||||||||
HOUSEHOLD PRODUCTS — 0.94% |
| |||||||
Henkel AG & Co. KGaA | 472,512 | 45,055,024 | ||||||
|
| |||||||
| 45,055,024 | ||||||||
INDUSTRIAL CONGLOMERATES — 8.39% |
| |||||||
Siemens AG Registered | 3,203,808 | 402,340,210 | ||||||
|
| |||||||
| 402,340,210 | ||||||||
INSURANCE — 9.92% |
| |||||||
Allianz SE Registered | 1,844,232 | 315,313,129 | ||||||
Hannover Rueck SE Registered | 243,984 | 20,314,164 | ||||||
Muenchener Rueckversicherungs-Gesellschaft AG Registered | 699,384 | 140,579,513 | ||||||
|
| |||||||
| 476,206,806 | ||||||||
INTERNET SOFTWARE & SERVICES — 0.42% |
| |||||||
United Internet AG Registered | 470,856 | 20,277,820 | ||||||
|
| |||||||
| 20,277,820 | ||||||||
LIFE SCIENCES TOOLS & SERVICES — 0.48% |
| |||||||
QIAGEN NVa | 944,472 | 22,928,003 | ||||||
|
| |||||||
| 22,928,003 | ||||||||
MACHINERY — 1.05% |
| |||||||
GEA Group AG | 739,128 | 33,520,345 | ||||||
MAN SE | 142,416 | 16,930,033 | ||||||
|
| |||||||
| 50,450,378 | ||||||||
MEDIA — 1.85% |
| |||||||
Axel Springer SE | 159,528 | 9,474,776 | ||||||
Kabel Deutschland Holding AG | 89,424 | 12,650,573 | ||||||
ProSiebenSat.1 Media AG Registered | 884,304 | 35,544,039 | ||||||
RTL Group SA | 156,768 | 15,245,515 | ||||||
Sky Deutschland AGa | 1,773,576 | 15,705,968 | ||||||
|
| |||||||
| 88,620,871 | ||||||||
SCHEDULESOF INVESTMENTS | 17 |
Table of Contents
Schedule of Investments (Continued)
iSHARES® MSCI GERMANY ETF
August 31, 2014
| Security | Shares | Value | ||||||
METALS & MINING — 1.06% |
| |||||||
ThyssenKrupp AGa | 1,828,776 | $ | 50,887,257 | |||||
|
| |||||||
| 50,887,257 | ||||||||
MULTI-UTILITIES — 4.69% |
| |||||||
E.ON SE | 8,084,592 | 147,276,040 | ||||||
RWE AG | 1,977,264 | 77,560,600 | ||||||
|
| |||||||
| 224,836,640 | ||||||||
PERSONAL PRODUCTS — 0.75% |
| |||||||
Beiersdorf AG | 407,376 | 35,946,551 | ||||||
|
| |||||||
| 35,946,551 | ||||||||
PHARMACEUTICALS — 10.31% |
| |||||||
Bayer AG Registered | 3,341,256 | 449,132,591 | ||||||
Merck KGaA | 522,192 | 45,555,076 | ||||||
|
| |||||||
| 494,687,667 | ||||||||
REAL ESTATE MANAGEMENT & DEVELOPMENT — 0.54% |
| |||||||
Deutsche Wohnen AG Bearer | 1,155,888 | 26,141,943 | ||||||
|
| |||||||
| 26,141,943 | ||||||||
SEMICONDUCTORS & SEMICONDUCTOR |
| |||||||
Infineon Technologies AG | 4,555,656 | 53,076,291 | ||||||
|
| |||||||
| 53,076,291 | ||||||||
SOFTWARE — 6.05% |
| |||||||
SAP SE | 3,722,688 | 290,288,717 | ||||||
|
| |||||||
| 290,288,717 | ||||||||
TEXTILES, APPAREL & LUXURY GOODS — 1.70% |
| |||||||
Adidas AG | 845,112 | 63,495,887 | ||||||
Hugo Boss AG | 128,064 | 17,990,355 | ||||||
|
| |||||||
| 81,486,242 | ||||||||
TRADING COMPANIES & DISTRIBUTORS — 0.69% |
| |||||||
Brenntag AG | 624,312 | 33,119,902 | ||||||
|
| |||||||
| 33,119,902 | ||||||||
TRANSPORTATION INFRASTRUCTURE — 0.21% |
| |||||||
Fraport AG | 149,040 | 10,129,881 | ||||||
|
| |||||||
| 10,129,881 | ||||||||
|
| |||||||
TOTAL COMMON STOCKS | ||||||||
(Cost: $4,433,161,375) | 4,458,503,683 | |||||||
PREFERRED STOCKS — 6.52% |
| |||||||
AUTOMOBILES — 4.70% |
| |||||||
Bayerische Motoren Werke AG | 219,696 | 21,061,340 | ||||||
Porsche Automobil Holding SE | 618,240 | 56,393,453 | ||||||
Volkswagen AG | 656,880 | 147,826,683 | ||||||
|
| |||||||
| 225,281,476 | ||||||||
| Security | Shares | Value | ||||||
CHEMICALS — 0.24% |
| |||||||
Fuchs Petrolub SE | 286,488 | $ | 11,794,452 | |||||
|
| |||||||
| 11,794,452 | ||||||||
HOUSEHOLD PRODUCTS — 1.58% |
| |||||||
Henkel AG & Co. KGaA | 719,808 | 75,660,877 | ||||||
|
| |||||||
| 75,660,877 | ||||||||
|
| |||||||
TOTAL PREFERRED STOCKS | ||||||||
(Cost: $300,727,302) | 312,736,805 | |||||||
SHORT-TERM INVESTMENTS — 0.03% |
| |||||||
MONEY MARKET FUNDS — 0.03% |
| |||||||
BlackRock Cash Funds: Treasury, |
| |||||||
0.00%c,d | 1,424,248 | 1,424,248 | ||||||
|
| |||||||
| 1,424,248 | ||||||||
|
| |||||||
TOTAL SHORT-TERM INVESTMENTS |
| |||||||
(Cost: $1,424,248) | 1,424,248 | |||||||
|
| |||||||
TOTAL INVESTMENTS |
| |||||||
(Cost: $4,735,312,925) | 4,772,664,736 | |||||||
Other Assets, Less Liabilities — 0.52% |
| 24,769,193 | ||||||
|
| |||||||
NET ASSETS — 100.00% | $ | 4,797,433,929 | ||||||
|
| |||||||
| a | Non-income earning security. |
| b | This security may be resold to qualified institutional buyers under Rule 144A of the Securities Act of 1933. |
| c | Affiliated issuer. See Note 2. |
| d | The rate quoted is the annualized seven-day yield of the fund at period end. |
Financial futures contracts purchased as of August 31, 2014 were as follows:
| Number of Contracts | Issue (Expiration) | Exchange | Notional Value | Unrealized Appreciation (Depreciation) | ||||||||||
| 79 | DAX Index (Sept. 2014) | Eurex | $ | 24,559,182 | $ | (1,190,173) | ||||||||
See notes to financial statements.
| 18 | 2014 iSHARES ANNUAL REPORTTO SHAREHOLDERS |
Table of Contents
Schedule of Investments
August 31, 2014
| Security | Shares | Value | ||||||
COMMON STOCKS — 99.76% |
| |||||||
AIR FREIGHT & LOGISTICS — 0.29% |
| |||||||
Yamato Holdings Co. Ltd. | 2,075,000 | $ | 42,934,134 | |||||
|
| |||||||
| 42,934,134 | ||||||||
AIRLINES — 0.26% |
| |||||||
ANA Holdings Inc.a | 6,225,000 | 15,154,281 | ||||||
Japan Airlines Co. Ltd. | 415,000 | 23,369,592 | ||||||
|
| |||||||
| 38,523,873 | ||||||||
AUTO COMPONENTS — 2.75% |
| |||||||
Aisin Seiki Co. Ltd. | 1,037,700 | 38,407,436 | ||||||
Bridgestone Corp. | 3,527,500 | 121,188,309 | ||||||
Denso Corp. | 2,697,500 | 117,185,518 | ||||||
Koito Manufacturing Co. Ltd. | 622,500 | 17,029,841 | ||||||
NGK Spark Plug Co. Ltd. | 349,200 | 10,201,877 | ||||||
NHK Spring Co. Ltd. | 830,000 | 7,941,666 | ||||||
NOK Corp. | 622,500 | 13,470,472 | ||||||
Stanley Electric Co. Ltd. | 687,300 | 16,295,133 | ||||||
Sumitomo Rubber Industries Inc. | 1,037,500 | 14,840,689 | ||||||
Toyoda Gosei Co. Ltd. | 415,000 | 7,913,703 | ||||||
Toyota Industries Corp. | 830,000 | 39,908,072 | ||||||
|
| |||||||
| 404,382,716 | ||||||||
AUTOMOBILES — 11.01% |
| |||||||
Daihatsu Motor Co. Ltd. | 830,000 | 14,261,443 | ||||||
Fuji Heavy Industries Ltd. | 3,320,000 | 94,453,097 | ||||||
Honda Motor Co. Ltd. | 8,715,000 | 294,708,524 | ||||||
Isuzu Motors Ltd. | 6,225,000 | 43,077,947 | ||||||
Mazda Motor Corp. | 2,905,000 | 68,622,708 | ||||||
Mitsubishi Motors Corp. | 3,527,500 | 40,169,731 | ||||||
Nissan Motor Co. Ltd. | 13,695,000 | 131,696,636 | ||||||
Suzuki Motor Corp. | 2,075,000 | 67,532,127 | ||||||
Toyota Motor Corp. | 14,732,500 | 840,682,100 | ||||||
Yamaha Motor Co. Ltd. | 1,452,500 | 26,914,978 | ||||||
|
| |||||||
| 1,622,119,291 | ||||||||
BEVERAGES — 0.95% |
| |||||||
Asahi Group Holdings Ltd. | 1,867,500 | 58,981,253 | ||||||
Kirin Holdings Co. Ltd. | 4,357,500 | 58,492,889 | ||||||
Suntory Beverage & Food Ltd. | 622,500 | 22,860,254 | ||||||
|
| |||||||
| 140,334,396 | ||||||||
BUILDING PRODUCTS — 1.20% |
| |||||||
Asahi Glass Co. Ltd. | 6,225,000 | 33,760,071 | ||||||
Daikin Industries Ltd. | 1,245,000 | 85,928,190 | ||||||
LIXIL Group Corp. | 1,452,500 | 32,186,119 | ||||||
TOTO Ltd. | 2,075,000 | 25,267,123 | ||||||
|
| |||||||
| 177,141,503 | ||||||||
| Security | Shares | Value | ||||||
CAPITAL MARKETS — 1.43% |
| |||||||
Daiwa Securities Group Inc. | 8,300,000 | $ | 67,600,038 | |||||
Nomura Holdings Inc. | 19,920,000 | 127,974,279 | ||||||
SBI Holdings Inc. | 1,245,010 | 14,764,907 | ||||||
|
| |||||||
| 210,339,224 | ||||||||
CHEMICALS — 3.57% |
| |||||||
Air Water Inc. | 78,000 | 1,228,358 | ||||||
Asahi Kasei Corp. | 6,225,000 | 49,998,941 | ||||||
Daicel Corp. | 2,075,000 | 23,050,007 | ||||||
Hitachi Chemical Co. Ltd. | 622,500 | 11,600,905 | ||||||
JSR Corp. | 1,037,500 | 18,056,505 | ||||||
Kaneka Corp. | 2,075,000 | 12,284,016 | ||||||
Kansai Paint Co. Ltd. | 203,000 | 3,228,147 | ||||||
Kuraray Co. Ltd. | 1,867,500 | 23,261,732 | ||||||
Mitsubishi Chemical Holdings Corp. | 7,262,500 | 36,275,798 | ||||||
Mitsubishi Gas Chemical Co. Inc. | 2,075,000 | 13,442,509 | ||||||
Mitsui Chemicals Inc. | 4,150,000 | 12,264,042 | ||||||
Nippon Paint Co. Ltd. | 800,000 | 19,821,918 | ||||||
Nitto Denko Corp. | 830,000 | 43,543,341 | ||||||
Shin-Etsu Chemical Co. Ltd. | 2,282,500 | 141,847,427 | ||||||
Sumitomo Chemical Co. Ltd. | 8,300,000 | 29,801,222 | ||||||
Taiyo Nippon Sanso Corp. | 2,075,000 | 18,695,673 | ||||||
Teijin Ltd. | 4,150,000 | 10,186,745 | ||||||
Toray Industries Inc. | 8,300,000 | 56,718,198 | ||||||
|
| |||||||
| 525,305,484 | ||||||||
COMMERCIAL BANKS — 9.25% |
| |||||||
Aozora Bank Ltd. | 6,225,000 | 21,272,320 | ||||||
Bank of Kyoto Ltd. (The) | 2,075,000 | 18,276,219 | ||||||
Bank of Yokohama Ltd. (The) | 6,291,000 | 34,741,750 | ||||||
Chiba Bank Ltd. (The) | 4,150,000 | 29,281,898 | ||||||
Chugoku Bank Ltd. (The) | 120,000 | 1,818,164 | ||||||
Fukuoka Financial Group Inc. | 4,156,000 | 20,162,911 | ||||||
Gunma Bank Ltd. (The) | 2,075,000 | 12,244,068 | ||||||
Hachijuni Bank Ltd. (The) | 2,075,000 | 12,543,678 | ||||||
Hiroshima Bank Ltd. (The) | 2,075,000 | 10,026,953 | ||||||
Hokuhoku Financial Group Inc. | 6,225,000 | 12,403,860 | ||||||
Iyo Bank Ltd. (The) | 2,075,000 | 21,072,580 | ||||||
Joyo Bank Ltd. (The) | 4,150,000 | 21,571,931 | ||||||
Mitsubishi UFJ Financial Group Inc. | 68,475,080 | 394,299,397 | ||||||
Mizuho Financial Group Inc. | 123,462,580 | 235,195,116 | ||||||
Resona Holdings Inc. | 11,620,000 | 63,108,283 | ||||||
Seven Bank Ltd. | 3,320,000 | 13,486,451 | ||||||
SCHEDULESOF INVESTMENTS | 19 |
Table of Contents
Schedule of Investments (Continued)
iSHARES® MSCI JAPAN ETF
August 31, 2014
| Security | Shares | Value | ||||||
Shinsei Bank Ltd. | 8,300,000 | $ | 17,497,233 | |||||
Shizuoka Bank Ltd. (The) | 2,831,000 | 29,404,139 | ||||||
Sumitomo Mitsui Financial Group Inc. | 6,847,500 | 276,872,732 | ||||||
Sumitomo Mitsui Trust Holdings Inc. | 18,675,320 | 76,743,458 | ||||||
Suruga Bank Ltd. | 2,075,000 | 39,468,643 | ||||||
Yamaguchi Financial Group Inc. | 73,000 | 718,862 | ||||||
|
| |||||||
| 1,362,210,646 | ||||||||
COMMERCIAL SERVICES & SUPPLIES — 0.86% |
| |||||||
Dai Nippon Printing Co. Ltd. | 2,075,000 | 21,801,632 | ||||||
PARK24 Co. Ltd. | 622,500 | 10,845,887 | ||||||
Secom Co. Ltd. | 1,037,500 | 63,507,364 | ||||||
Toppan Printing Co. Ltd. | 4,150,000 | 30,520,287 | ||||||
|
| |||||||
| 126,675,170 | ||||||||
COMPUTERS & PERIPHERALS — 2.60% |
| |||||||
Brother Industries Ltd. | 1,245,000 | 24,172,547 | ||||||
Canon Inc. | 6,225,050 | 203,676,613 | ||||||
Konica Minolta Holdings Inc. | 3,112,500 | 34,245,440 | ||||||
NEC Corp. | 13,790,000 | 49,114,887 | ||||||
Ricoh Co. Ltd. | 3,735,000 | 40,465,346 | ||||||
Seiko Epson Corp. | 622,500 | 31,578,909 | ||||||
|
| |||||||
| 383,253,742 | ||||||||
CONSTRUCTION & ENGINEERING — 1.03% |
| |||||||
Chiyoda Corp. | 235,000 | 2,574,289 | ||||||
JGC Corp. | 860,000 | 24,926,217 | ||||||
Kajima Corp. | 4,150,000 | 21,252,346 | ||||||
Obayashi Corp. | 4,150,000 | 31,718,727 | ||||||
Shimizu Corp. | 4,150,000 | 34,355,297 | ||||||
Taisei Corp. | 6,225,000 | 37,151,658 | ||||||
|
| |||||||
| 151,978,534 | ||||||||
CONSTRUCTION MATERIALS — 0.18% |
| |||||||
Taiheiyo Cement Corp. | 6,225,000 | 26,066,083 | ||||||
|
| |||||||
| 26,066,083 | ||||||||
CONSUMER FINANCE — 0.26% |
| |||||||
Acom Co. Ltd.b | 2,282,500 | 7,909,708 | ||||||
AEON Financial Service Co. Ltd. | 622,570 | 14,466,805 | ||||||
Credit Saison Co. Ltd. | 830,000 | 16,514,511 | ||||||
|
| |||||||
| 38,891,024 | ||||||||
CONTAINERS & PACKAGING — 0.06% |
| |||||||
Toyo Seikan Group Holdings Ltd. | 622,500 | 8,520,913 | ||||||
|
| |||||||
| 8,520,913 | ||||||||
| Security | Shares | Value | ||||||
DIVERSIFIED CONSUMER SERVICES — 0.10% |
| |||||||
Benesse Holdings Inc. | 415,000 | $ | 14,720,845 | |||||
|
| |||||||
| 14,720,845 | ||||||||
DIVERSIFIED FINANCIAL SERVICES — 1.08% |
| |||||||
Japan Exchange Group Inc. | 1,452,500 | 34,507,099 | ||||||
Mitsubishi UFJ Lease & Finance Co. Ltd. | 3,320,000 | 17,736,921 | ||||||
ORIX Corp. | 7,055,000 | 106,621,264 | ||||||
|
| |||||||
| 158,865,284 | ||||||||
DIVERSIFIED TELECOMMUNICATION SERVICES — 0.95% |
| |||||||
Nippon Telegraph and Telephone Corp. | 2,075,500 | 139,452,183 | ||||||
|
| |||||||
| 139,452,183 | ||||||||
ELECTRIC UTILITIES — 1.35% |
| |||||||
Chubu Electric Power Co. Inc.b | 3,527,500 | 40,797,913 | ||||||
Chugoku Electric Power Co. Inc. (The) | 1,660,000 | 21,923,473 | ||||||
Hokuriku Electric Power Co. | 830,000 | 10,761,996 | ||||||
Kansai Electric Power Co. Inc. (The)b | 3,942,500 | 36,117,604 | ||||||
Kyushu Electric Power Co. Inc.b | 2,282,500 | 23,201,810 | ||||||
Shikoku Electric Power Co. Inc.b | 830,000 | 10,202,724 | ||||||
Tohoku Electric Power Co. Inc. | 2,490,000 | 27,540,165 | ||||||
Tokyo Electric Power Co. Inc.b | 7,885,000 | 28,538,865 | ||||||
|
| |||||||
| 199,084,550 | ||||||||
ELECTRICAL EQUIPMENT — 1.93% |
| |||||||
Fuji Electric Co. Ltd. | 2,075,000 | 10,046,927 | ||||||
Mabuchi Motor Co. Ltd. | 207,500 | 17,657,025 | ||||||
Mitsubishi Electric Corp. | 10,375,000 | 130,030,803 | ||||||
Nidec Corp. | 1,037,500 | 66,243,803 | ||||||
Sumitomo Electric Industries Ltd. | 4,150,000 | 60,840,834 | ||||||
|
| |||||||
| 284,819,392 | ||||||||
ELECTRONIC EQUIPMENT, INSTRUMENTS & |
| |||||||
Citizen Holdings Co. Ltd. | 1,452,500 | 10,332,555 | ||||||
FUJIFILM Holdings Corp. | 2,490,000 | 75,154,209 | ||||||
Hamamatsu Photonics K.K. | 415,000 | 19,754,296 | ||||||
Hirose Electric Co. Ltd. | 207,500 | 26,825,095 | ||||||
Hitachi High-Technologies Corp. | 415,000 | 11,608,894 | ||||||
Hitachi Ltd. | 26,975,000 | 204,224,262 | ||||||
Hoya Corp. | 2,282,500 | 73,878,869 | ||||||
| 20 | 2014 iSHARES ANNUAL REPORTTO SHAREHOLDERS |
Table of Contents
Schedule of Investments (Continued)
iSHARES® MSCI JAPAN ETF
August 31, 2014
| Security | Shares | Value | ||||||
IBIDEN Co. Ltd. | 622,500 | $ | 12,242,071 | |||||
Japan Display Inc.b | 2,075,000 | 10,526,303 | ||||||
Keyence Corp. | 216,926 | 92,974,252 | ||||||
Kyocera Corp. | 1,660,000 | 77,730,856 | ||||||
Murata Manufacturing Co. Ltd. | 1,037,500 | 99,210,906 | ||||||
Nippon Electric Glass Co. Ltd. | 2,075,500 | 10,448,924 | ||||||
Omron Corp. | 1,037,500 | 44,991,457 | ||||||
Shimadzu Corp. | 236,000 | 2,069,558 | ||||||
TDK Corp. | 622,500 | 31,039,611 | ||||||
Yaskawa Electric Corp. | 1,452,500 | 18,693,676 | ||||||
Yokogawa Electric Corp. | 1,037,500 | 12,014,367 | ||||||
|
| |||||||
| 833,720,161 | ||||||||
FOOD & STAPLES RETAILING — 1.70% |
| |||||||
AEON Co. Ltd. | 3,320,000 | 35,921,259 | ||||||
FamilyMart Co. Ltd. | 415,000 | 17,417,336 | ||||||
Lawson Inc. | 415,000 | 29,841,171 | ||||||
Seven & I Holdings Co. Ltd. | 4,150,080 | 166,686,324 | ||||||
|
| |||||||
| 249,866,090 | ||||||||
FOOD PRODUCTS — 1.40% |
| |||||||
Ajinomoto Co. Inc. | 4,150,000 | 67,572,075 | ||||||
Calbee Inc. | 207,800 | 7,181,037 | ||||||
Kikkoman Corp. | 1,501,000 | 32,914,068 | ||||||
Meiji Holdings Co. Ltd. | 415,028 | 34,237,762 | ||||||
NH Foods Ltd. | 94,000 | 1,992,472 | ||||||
Nisshin Seifun Group Inc. | 1,076,750 | 12,427,427 | ||||||
Nissin Foods Holdings Co. Ltd. | 415,000 | 23,809,020 | ||||||
Toyo Suisan Kaisha Ltd. | 103,000 | 3,227,271 | ||||||
Yakult Honsha Co. Ltd. | 415,000 | 22,810,319 | ||||||
|
| |||||||
| 206,171,451 | ||||||||
GAS UTILITIES — 0.85% |
| |||||||
Osaka Gas Co. Ltd. | 10,375,000 | 42,744,381 | ||||||
Toho Gas Co. Ltd. | 2,075,000 | 11,964,432 | ||||||
Tokyo Gas Co. Ltd. | 12,450,000 | 70,815,854 | ||||||
|
| |||||||
| 125,524,667 | ||||||||
HEALTH CARE EQUIPMENT & SUPPLIES — 0.81% |
| |||||||
Olympus Corp.b | 1,245,300 | 44,532,796 | ||||||
Sysmex Corp. | 830,000 | 32,158,155 | ||||||
Terumo Corp. | 1,660,000 | 41,833,566 | ||||||
|
| |||||||
| 118,524,517 | ||||||||
HEALTH CARE PROVIDERS & SERVICES — 0.38% |
| |||||||
Alfresa Holdings Corp. | 207,500 | 12,343,938 | ||||||
Medipal Holdings Corp. | 830,000 | 10,754,007 | ||||||
Miraca Holdings Inc. | 415,000 | 19,334,841 | ||||||
Suzuken Co. Ltd. | 415,000 | 13,841,989 | ||||||
|
| |||||||
| 56,274,775 | ||||||||
| Security | Shares | Value | ||||||
HEALTH CARE TECHNOLOGY — 0.10% |
| |||||||
M3 Inc. | 830,000 | $ | 14,533,089 | |||||
|
| |||||||
| 14,533,089 | ||||||||
HOTELS, RESTAURANTS & LEISURE — 0.35% |
| |||||||
McDonald’s Holdings Co. (Japan) Ltd.a | 415,000 | 10,246,667 | ||||||
Oriental Land Co. Ltd. | 215,500 | 41,996,414 | ||||||
|
| |||||||
| 52,243,081 | ||||||||
HOUSEHOLD DURABLES — 2.84% |
| |||||||
Casio Computer Co. Ltd.a | 1,245,000 | 21,715,743 | ||||||
Iida Group Holdings Co. Ltd. | 830,080 | 11,905,657 | ||||||
Nikon Corp.a | 1,867,500 | 27,153,668 | ||||||
Panasonic Corp. | 12,035,015 | 147,244,589 | ||||||
Rinnai Corp. | 207,500 | 18,436,011 | ||||||
Sekisui Chemical Co. Ltd. | 2,082,000 | 24,650,912 | ||||||
Sekisui House Ltd. | 2,697,500 | 33,963,806 | ||||||
Sharp Corp.a,b | 8,300,000 | 26,205,901 | ||||||
Sony Corp. | 5,602,500 | 107,320,354 | ||||||
|
| |||||||
| 418,596,641 | ||||||||
HOUSEHOLD PRODUCTS — 0.28% |
| |||||||
Unicharm Corp. | 622,500 | 40,932,738 | ||||||
|
| |||||||
| 40,932,738 | ||||||||
INDEPENDENT POWER PRODUCERS & ENERGY |
| |||||||
Electric Power Development Co. Ltd. | 622,500 | 20,433,412 | ||||||
|
| |||||||
| 20,433,412 | ||||||||
INDUSTRIAL CONGLOMERATES — 0.71% |
| |||||||
Seibu Holdings Inc. | 622,500 | 13,404,558 | ||||||
Toshiba Corp. | 20,750,000 | 91,600,808 | ||||||
|
| |||||||
| 105,005,366 | ||||||||
INSURANCE — 2.41% |
| |||||||
Dai-ichi Life Insurance Co. Ltd. (The) | 5,602,500 | 80,382,406 | ||||||
MS&AD Insurance Group Holdings Inc. | 2,726,140 | 61,576,623 | ||||||
NKSJ Holdings Inc. | 1,787,250 | 43,233,954 | ||||||
Sony Financial Holdings Inc. | 1,037,500 | 16,638,350 | ||||||
T&D Holdings Inc. | 3,112,500 | 38,664,689 | ||||||
Tokio Marine Holdings Inc. | 3,735,000 | 114,025,629 | ||||||
|
| |||||||
| 354,521,651 | ||||||||
INTERNET & CATALOG RETAIL — 0.38% |
| |||||||
Rakuten Inc. | 4,357,500 | 56,458,536 | ||||||
|
| |||||||
| 56,458,536 | ||||||||
SCHEDULESOF INVESTMENTS | 21 |
Table of Contents
Schedule of Investments (Continued)
iSHARES® MSCI JAPAN ETF
August 31, 2014
| Security | Shares | Value | ||||||
INTERNET SOFTWARE & SERVICES — 0.39% |
| |||||||
Dena Co. Ltd.a | 507,200 | $ | 6,327,489 | |||||
Gree Inc.a | 622,500 | 4,889,638 | ||||||
Kakaku.com Inc. | 830,000 | 13,031,044 | ||||||
Yahoo! Japan Corp. | 8,092,500 | 32,639,529 | ||||||
|
| |||||||
| 56,887,700 | ||||||||
IT SERVICES — 0.83% |
| |||||||
Fujitsu Ltd. | 10,375,000 | 71,277,254 | ||||||
ITOCHU Techno-Solutions Corp. | 207,500 | 9,237,979 | ||||||
Nomura Research Institute Ltd. | 622,500 | 19,684,387 | ||||||
NTT Data Corp. | 622,500 | 22,350,917 | ||||||
|
| |||||||
| 122,550,537 | ||||||||
LEISURE EQUIPMENT & PRODUCTS — 0.80% |
| |||||||
Bandai Namco Holdings Inc. | 1,037,598 | 29,024,977 | ||||||
Sankyo Co. Ltd. | 207,500 | 7,959,643 | ||||||
Sega Sammy Holdings Inc. | 1,037,500 | 19,804,231 | ||||||
Shimano Inc. | 415,000 | 49,575,492 | ||||||
Yamaha Corp. | 830,000 | 11,920,489 | ||||||
|
| |||||||
| 118,284,832 | ||||||||
MACHINERY — 5.72% |
| |||||||
Amada Co. Ltd. | 2,075,000 | 19,574,530 | ||||||
FANUC Corp. | 1,037,500 | 173,773,885 | ||||||
Hino Motors Ltd. | 1,660,000 | 23,569,332 | ||||||
Hitachi Construction Machinery Co. Ltd. | 622,500 | 12,248,063 | ||||||
IHI Corp. | 6,225,000 | 29,361,794 | ||||||
JTEKT Corp. | 1,245,000 | 19,822,207 | ||||||
Kawasaki Heavy Industries Ltd. | 8,300,000 | 30,919,767 | ||||||
Komatsu Ltd. | 5,187,500 | 117,596,982 | ||||||
Kubota Corp. | 6,225,000 | 89,044,135 | ||||||
Kurita Water Industries Ltd. | 622,500 | 13,991,794 | ||||||
Makita Corp. | 622,500 | 34,814,699 | ||||||
Mitsubishi Heavy Industries Ltd. | 16,600,000 | 102,314,867 | ||||||
Nabtesco Corp. | 415,000 | 9,567,551 | ||||||
NGK Insulators Ltd. | 2,075,000 | 52,331,906 | ||||||
NSK Ltd. | 2,075,000 | 27,604,081 | ||||||
SMC Corp. | 229,500 | 60,078,476 | ||||||
Sumitomo Heavy Industries Ltd. | 2,075,000 | 10,706,069 | ||||||
THK Co. Ltd. | 623,100 | 14,773,021 | ||||||
|
| |||||||
| 842,093,159 | ||||||||
| Security | Shares | Value | ||||||
MARINE — 0.32% |
| |||||||
Mitsui O.S.K. Lines Ltd. | 6,225,000 | $ | 22,830,293 | |||||
Nippon Yusen K.K. | 8,300,000 | 24,448,188 | ||||||
|
| |||||||
| 47,278,481 | ||||||||
MEDIA — 0.49% |
| |||||||
Dentsu Inc. | 1,037,500 | 42,195,095 | ||||||
Hakuhodo DY Holdings Inc. | 1,452,500 | 15,044,424 | ||||||
Toho Co. Ltd. | 622,500 | 14,435,217 | ||||||
|
| |||||||
| 71,674,736 | ||||||||
METALS & MINING — 1.94% |
| |||||||
Daido Steel Co. Ltd. | 2,075,000 | 9,128,123 | ||||||
Hitachi Metals Ltd. | 242,000 | 4,127,872 | ||||||
JFE Holdings Inc. | 2,697,550 | 54,633,924 | ||||||
Kobe Steel Ltd. | 18,675,000 | 30,380,469 | ||||||
Maruichi Steel Tube Ltd. | 207,500 | 5,520,816 | ||||||
Mitsubishi Materials Corp. | 6,225,000 | 21,032,632 | ||||||
Nippon Steel & Sumitomo Metal Corp. | 41,500,705 | 117,608,967 | ||||||
Sumitomo Metal Mining Co. Ltd. | 2,363,000 | 35,905,044 | ||||||
Yamato Kogyo Co. Ltd. | 207,500 | 6,871,059 | ||||||
|
| |||||||
| 285,208,906 | ||||||||
MULTILINE RETAIL — 0.51% |
| |||||||
Don Quijote Holdings Co. Ltd. | 207,500 | 11,005,679 | ||||||
Isetan Mitsukoshi Holdings Ltd. | 1,867,560 | 22,471,483 | ||||||
J. Front Retailing Co. Ltd. | 1,037,500 | 13,162,872 | ||||||
Marui Group Co. Ltd. | 1,245,000 | 10,474,371 | ||||||
Takashimaya Co. Ltd. | 2,075,000 | 17,756,895 | ||||||
|
| |||||||
| 74,871,300 | ||||||||
OIL, GAS & CONSUMABLE FUELS — 1.22% |
| |||||||
Idemitsu Kosan Co. Ltd. | 830,000 | 18,232,276 | ||||||
INPEX Corp. | 4,772,500 | 68,450,931 | ||||||
JX Holdings Inc. | 12,242,595 | 63,024,881 | ||||||
Showa Shell Sekiyu K.K. | 1,037,500 | 11,145,498 | ||||||
TonenGeneral Sekiyu K.K. | 2,075,000 | 18,955,335 | ||||||
|
| |||||||
| 179,808,921 | ||||||||
PAPER & FOREST PRODUCTS — 0.11% |
| |||||||
Oji Holdings Corp. | 4,150,000 | 16,898,012 | ||||||
|
| |||||||
| 16,898,012 | ||||||||
PERSONAL PRODUCTS — 1.11% |
| |||||||
Kao Corp. | 2,905,000 | 125,416,807 | ||||||
Shiseido Co. Ltd. | 2,075,000 | 38,350,099 | ||||||
|
| |||||||
| 163,766,906 | ||||||||
| 22 | 2014 iSHARES ANNUAL REPORTTO SHAREHOLDERS |
Table of Contents
Schedule of Investments (Continued)
iSHARES® MSCI JAPAN ETF
August 31, 2014
| Security | Shares | Value | ||||||
PHARMACEUTICALS — 5.28% |
| |||||||
Astellas Pharma Inc. | 11,827,550 | $ | 170,550,800 | |||||
Chugai Pharmaceutical Co. Ltd. | 1,245,000 | 39,488,617 | ||||||
Daiichi Sankyo Co. Ltd. | 3,527,569 | 62,412,012 | ||||||
Eisai Co. Ltd. | 1,452,500 | 60,757,941 | ||||||
Hisamitsu Pharmaceutical Co. Inc. | 207,500 | 8,249,266 | ||||||
Kyowa Hakko Kirin Co. Ltd. | 2,075,000 | 28,163,354 | ||||||
Mitsubishi Tanabe Pharma Corp. | 1,037,500 | 15,899,312 | ||||||
Ono Pharmaceutical Co. Ltd. | 415,000 | 37,071,762 | ||||||
Otsuka Holdings Co. Ltd. | 2,075,000 | 75,541,705 | ||||||
Santen Pharmaceutical Co. Ltd. | 415,000 | 23,968,812 | ||||||
Shionogi & Co. Ltd. | 1,660,000 | 39,149,059 | ||||||
Sumitomo Dainippon Pharma Co. Ltd. | 830,000 | 11,289,310 | ||||||
Taisho Pharmaceutical Holdings Co. Ltd. | 207,500 | 15,759,494 | ||||||
Takeda Pharmaceutical Co. Ltd. | 4,150,000 | 189,753,092 | ||||||
|
| |||||||
| 778,054,536 | ||||||||
REAL ESTATE INVESTMENT TRUSTS (REITS) — 1.04% |
| |||||||
Japan Prime Realty Investment Corp. | 4,150 | 15,280,117 | ||||||
Japan Real Estate Investment Corp. | 6,225 | 34,275,401 | ||||||
Japan Retail Fund Investment Corp. | 10,375 | 21,791,645 | ||||||
Nippon Building Fund Inc. | 8,300 | 46,259,806 | ||||||
Nippon Prologis REIT Inc. | 6,225 | 15,136,305 | ||||||
United Urban Investment Corp. | 12,450 | 20,109,833 | ||||||
|
| |||||||
| 152,853,107 | ||||||||
REAL ESTATE MANAGEMENT & DEVELOPMENT — 3.94% |
| |||||||
AEON Mall Co. Ltd. | 622,500 | 13,584,324 | ||||||
Daito Trust Construction Co. Ltd. | 415,000 | 51,393,127 | ||||||
Daiwa House Industry Co. Ltd. | 2,917,800 | 55,260,832 | ||||||
Hulic Co. Ltd. | 1,452,500 | 16,498,532 | ||||||
Mitsubishi Estate Co. Ltd. | 6,531,000 | 150,976,527 | ||||||
Mitsui Fudosan Co. Ltd. | 4,856,000 | 154,956,346 | ||||||
Nomura Real Estate Holdings Inc. | 622,500 | 11,247,365 | ||||||
| Security | Shares | Value | ||||||
NTT Urban Development Corp. | 622,500 | $ | 7,142,706 | |||||
Sumitomo Realty & Development Co. Ltd. | 2,075,000 | 80,475,285 | ||||||
Tokyo Tatemono Co. Ltd. | 2,075,000 | 17,776,868 | ||||||
Tokyu Fudosan Holdings Corp. | 2,697,500 | 20,721,038 | ||||||
|
| |||||||
| 580,032,950 | ||||||||
ROAD & RAIL — 3.77% |
| |||||||
Central Japan Railway Co. | 830,000 | 116,488,425 | ||||||
East Japan Railway Co. | 1,867,500 | 145,304,928 | ||||||
Hankyu Hanshin Holdings Inc. | 6,225,000 | 36,732,204 | ||||||
Keikyu Corp. | 2,079,000 | 18,311,450 | ||||||
Keio Corp. | 4,150,000 | 32,078,260 | ||||||
Keisei Electric Railway Co. Ltd. | 270,000 | 2,796,554 | ||||||
Kintetsu Corp. | 8,567,000 | 30,100,159 | ||||||
Nagoya Railroad Co. Ltd. | 4,150,000 | 17,177,648 | ||||||
Nippon Express Co. Ltd. | 4,150,000 | 19,015,257 | ||||||
Odakyu Electric Railway Co. Ltd. | 2,240,000 | 22,122,924 | ||||||
Tobu Railway Co. Ltd. | 6,225,000 | 32,657,506 | ||||||
Tokyu Corp. | 6,225,000 | 43,263,705 | ||||||
West Japan Railway Co. | 830,000 | 39,312,846 | ||||||
|
| |||||||
| 555,361,866 | ||||||||
SEMICONDUCTORS & SEMICONDUCTOR |
| |||||||
Advantest Corp. | 1,037,500 | 12,064,302 | ||||||
Rohm Co. Ltd. | 622,500 | 39,788,227 | ||||||
Tokyo Electron Ltd. | 830,052 | 56,977,435 | ||||||
|
| |||||||
| 108,829,964 | ||||||||
SOFTWARE — 0.88% |
| |||||||
GungHo Online Entertainment Inc.a | 2,282,500 | 12,216,104 | ||||||
Konami Corp. | 622,500 | 14,435,217 | ||||||
Nexon Co. Ltd. | 622,500 | 5,440,920 | ||||||
Nintendo Co. Ltd. | 622,500 | 69,090,100 | ||||||
Oracle Corp. Japan | 207,500 | 8,468,980 | ||||||
Trend Micro Inc. | 622,500 | 20,073,880 | ||||||
|
| |||||||
| 129,725,201 | ||||||||
SPECIALTY RETAIL — 1.20% |
| |||||||
ABC-MART Inc. | 207,500 | 10,646,147 | ||||||
Fast Retailing Co. Ltd. | 257,200 | 80,587,766 | ||||||
Nitori Holdings Co. Ltd. | 415,000 | 24,927,564 | ||||||
Sanrio Co. Ltd.a | 207,500 | 5,934,278 | ||||||
Shimamura Co. Ltd. | 207,500 | 18,735,621 | ||||||
SCHEDULESOF INVESTMENTS | 23 |
Table of Contents
Schedule of Investments (Continued)
iSHARES® MSCI JAPAN ETF
August 31, 2014
| Security | Shares | Value | ||||||
USS Co. Ltd. | 1,245,000 | $ | 20,553,256 | |||||
Yamada Denki Co. Ltd. | 4,772,500 | 15,344,034 | ||||||
|
| |||||||
| 176,728,666 | ||||||||
TEXTILES, APPAREL & LUXURY GOODS — 0.12% |
| |||||||
ASICS Corp. | 830,000 | 17,025,846 | ||||||
|
| |||||||
| 17,025,846 | ||||||||
TOBACCO — 1.40% |
| |||||||
Japan Tobacco Inc. | 6,017,500 | 206,443,375 | ||||||
|
| |||||||
| 206,443,375 | ||||||||
TRADING COMPANIES & DISTRIBUTORS — 3.97% |
| |||||||
ITOCHU Corp. | 8,300,000 | 105,662,512 | ||||||
Marubeni Corp. | 8,300,000 | 60,001,925 | ||||||
Mitsubishi Corp. | 7,677,500 | 159,004,103 | ||||||
Mitsui & Co. Ltd. | 9,337,500 | 152,441,642 | ||||||
Sumitomo Corp. | 6,225,000 | 80,475,285 | ||||||
Toyota Tsusho Corp. | 1,037,500 | 27,414,328 | ||||||
|
| |||||||
| 584,999,795 | ||||||||
TRANSPORTATION INFRASTRUCTURE — 0.16% |
| |||||||
Kamigumi Co. Ltd. | 2,075,000 | 19,334,841 | ||||||
Mitsubishi Logistics Corp. | 242,000 | 3,631,689 | ||||||
|
| |||||||
| 22,966,530 | ||||||||
WIRELESS TELECOMMUNICATION SERVICES — 4.70% |
| |||||||
KDDI Corp. | 3,112,500 | 179,736,127 | ||||||
NTT DOCOMO Inc. | 8,300,000 | 143,693,026 | ||||||
SoftBank Corp. | 5,113,100 | 369,436,671 | ||||||
|
| |||||||
| 692,865,824 | ||||||||
|
| |||||||
TOTAL COMMON STOCKS | ||||||||
(Cost: $15,294,865,365) | 14,693,636,312 | |||||||
SHORT-TERM INVESTMENTS — 0.48% |
| |||||||
MONEY MARKET FUNDS — 0.48% |
| |||||||
BlackRock Cash Funds: Institutional, |
| |||||||
0.14%c,d,e | 65,133,106 | 65,133,106 | ||||||
BlackRock Cash Funds: Prime, |
| |||||||
0.11%c,d,e | 4,100,307 | 4,100,307 | ||||||
BlackRock Cash Funds: Treasury, |
| |||||||
0.00%c,d | 1,483,549 | 1,483,549 | ||||||
|
| |||||||
| 70,716,962 | ||||||||
|
| |||||||
TOTAL SHORT-TERM INVESTMENTS |
| |||||||
(Cost: $70,716,962) | 70,716,962 | |||||||
|
| |||||||
| Value | ||||||
TOTAL INVESTMENTS | ||||||
(Cost: $15,365,582,327) | $ | 14,764,353,274 | ||||
Other Assets, Less Liabilities — (0.24)% | (35,164,571 | ) | ||||
|
| |||||
NET ASSETS — 100.00% | $ | 14,729,188,703 | ||||
|
| |||||
| a | All or a portion of this security represents a security on loan. See Note 1. |
| b | Non-income earning security. |
| c | Affiliated issuer. See Note 2. |
| d | The rate quoted is the annualized seven-day yield of the fund at period end. |
| e | All or a portion of this security represents an investment of securities lending collateral. See Note 1. |
Financial futures contracts purchased as of August 31, 2014 were as follows:
| Number of Contracts | Issue (Expiration) | Exchange | Notional Value | Unrealized Appreciation (Depreciation) | ||||||||||
| 277 | TOPIX Index (Sept. 2014) | Tokyo Stock | $ | 34,023,391 | $ | 906,579 | ||||||||
See notes to financial statements.
| 24 | 2014 iSHARES ANNUAL REPORTTO SHAREHOLDERS |
Table of Contents
Statements of Assets and Liabilities
iSHARES®, INC.
August 31, 2014
| iShares MSCI EMU ETF | iShares MSCI Germany ETF | iShares MSCI Japan ETF | ||||||||||
ASSETS | ||||||||||||
Investments, at cost: | ||||||||||||
Unaffiliated | $ | 8,609,340,206 | $ | 4,733,888,677 | $ | 15,294,865,365 | ||||||
Affiliated (Note 2) | 103,916,873 | 1,424,248 | 70,716,962 | |||||||||
|
|
|
|
|
| |||||||
Total cost of investments | $ | 8,713,257,079 | $ | 4,735,312,925 | $ | 15,365,582,327 | ||||||
|
|
|
|
|
| |||||||
Investments in securities, at fair value (including securities on loana) (Note 1): | ||||||||||||
Unaffiliated | $ | 8,688,687,127 | $ | 4,771,240,488 | $ | 14,693,636,312 | ||||||
Affiliated (Note 2) | 103,916,873 | 1,424,248 | 70,716,962 | |||||||||
|
|
|
|
|
| |||||||
Total fair value of investments | 8,792,604,000 | 4,772,664,736 | 14,764,353,274 | |||||||||
Foreign currency, at valueb | 3,626,885 | 7,773,893 | 29,114,378 | |||||||||
Foreign currency pledged to broker, at valueb | — | 3,128,185 | — | |||||||||
Receivables: | ||||||||||||
Investment securities sold | 22,558,626 | 6,151,067 | 14,479,048 | |||||||||
Dividends and interest | 12,510,237 | 16,970,845 | 10,962,972 | |||||||||
Futures variation margin | — | — | 906,579 | |||||||||
|
|
|
|
|
| |||||||
Total Assets | 8,831,299,748 | 4,806,688,726 | 14,819,816,251 | |||||||||
|
|
|
|
|
| |||||||
LIABILITIES | ||||||||||||
Payables: | ||||||||||||
Investment securities purchased | 21,964,754 | 6,210,170 | 13,401,207 | |||||||||
Due to broker for foreign currency pledged for futures, at valueb | — | — | 167,310 | |||||||||
Collateral for securities on loan (Note 1) | 102,961,171 | — | 69,233,413 | |||||||||
Capital shares redeemed | — | — | 1,793,749 | |||||||||
Futures variation margin | — | 1,190,173 | — | |||||||||
Securities related to in-kind transactions (Note 4) | 109,341 | — | — | |||||||||
Investment advisory fees (Note 2) | 3,627,360 | 1,854,454 | 6,031,869 | |||||||||
|
|
|
|
|
| |||||||
Total Liabilities | 128,662,626 | 9,254,797 | 90,627,548 | |||||||||
|
|
|
|
|
| |||||||
NET ASSETS | $ | 8,702,637,122 | $ | 4,797,433,929 | $ | 14,729,188,703 | ||||||
|
|
|
|
|
| |||||||
Net assets consist of: | ||||||||||||
Paid-in capital | $ | 8,977,029,980 | $ | 4,982,282,108 | $ | 16,376,094,943 | ||||||
Undistributed (distributions in excess of) net investment income | 14,544,730 | — | (28,649,511 | ) | ||||||||
Accumulated net realized loss | (367,769,055 | ) | (220,284,351 | ) | (1,017,265,627 | ) | ||||||
Net unrealized appreciation (depreciation) | 78,831,467 | 35,436,172 | (600,991,102 | ) | ||||||||
|
|
|
|
|
| |||||||
NET ASSETS | $ | 8,702,637,122 | $ | 4,797,433,929 | $ | 14,729,188,703 | ||||||
|
|
|
|
|
| |||||||
Shares outstandingc | 217,700,000 | 165,600,000 | 1,245,000,000 | |||||||||
|
|
|
|
|
| |||||||
Net asset value per share | $ | 39.98 | $ | 28.97 | $ | 11.83 | ||||||
|
|
|
|
|
| |||||||
| a | Securities on loan with values of $97,713,104, $ — and $65,578,777, respectively. See Note 1. |
| b | Cost of foreign currency including currency at broker, if any: $3,685,171, $10,951,325 and $29,459,603, respectively. |
| c | $0.001 par value, number of shares authorized: 1 billion, 382.2 million and 2.1246 billion, respectively. |
See notes to financial statements.
FINANCIAL STATEMENTS | 25 |
Table of Contents
Statements of Operations
iSHARES®, INC.
Year ended August 31, 2014
| iShares MSCI EMU ETF | iShares MSCI Germany ETF | iShares MSCI Japan ETF | ||||||||||
NET INVESTMENT INCOME | ||||||||||||
Dividends — unaffiliateda | $ | 295,418,272 | $ | 135,802,760 | $ | 239,369,752 | ||||||
Interest — affiliated (Note 2) | 646 | 248 | 1,123 | |||||||||
Securities lending income — affiliated (Note 2) | 2,246,562 | 345,427 | 3,275,077 | |||||||||
|
|
|
|
|
| |||||||
Total investment income | 297,665,480 | 136,148,435 | 242,645,952 | |||||||||
|
|
|
|
|
| |||||||
EXPENSES | ||||||||||||
Investment advisory fees (Note 2) | 42,364,200 | 26,930,838 | 64,952,270 | |||||||||
|
|
|
|
|
| |||||||
Total expenses | 42,364,200 | 26,930,838 | 64,952,270 | |||||||||
|
|
|
|
|
| |||||||
Net investment income | 255,301,280 | 109,217,597 | 177,693,682 | |||||||||
|
|
|
|
|
| |||||||
NET REALIZED AND UNREALIZED GAIN (LOSS) | ||||||||||||
Net realized gain (loss) from: | ||||||||||||
Investments — unaffiliated | (157,461,866 | ) | (62,909,047 | ) | (155,435,828 | ) | ||||||
In-kind redemptions — unaffiliated | 430,455,814 | 561,178,992 | 283,190,852 | |||||||||
Futures contracts | — | 5,245,994 | 13,313,282 | |||||||||
Foreign currency transactions | (780,006 | ) | 13,873 | (4,099,999 | ) | |||||||
|
|
|
|
|
| |||||||
Net realized gain | 272,213,942 | 503,529,812 | 136,968,307 | |||||||||
|
|
|
|
|
| |||||||
Net change in unrealized appreciation/depreciation on: | ||||||||||||
Investments | 323,975,354 | 182,699,456 | 664,990,651 | |||||||||
Futures contracts | — | (806,724 | ) | 1,007,675 | ||||||||
Translation of assets and liabilities in foreign currencies | (521,910 | ) | (651,553 | ) | (403,909 | ) | ||||||
|
|
|
|
|
| |||||||
Net change in unrealized appreciation/depreciation | 323,453,444 | 181,241,179 | 665,594,417 | |||||||||
|
|
|
|
|
| |||||||
Net realized and unrealized gain | 595,667,386 | 684,770,991 | 802,562,724 | |||||||||
|
|
|
|
|
| |||||||
NET INCREASE IN NET ASSETS RESULTING FROM OPERATIONS | $ | 850,968,666 | $ | 793,988,588 | $ | 980,256,406 | ||||||
|
|
|
|
|
| |||||||
| a | Net of foreign withholding tax of $37,822,549, $20,734,916 and $23,740,348, respectively. |
See notes to financial statements.
| 26 | 2014 iSHARES ANNUAL REPORTTO SHAREHOLDERS |
Table of Contents
Statements of Changes in Net Assets
iSHARES®, INC.
| iShares MSCI EMU ETF | iShares MSCI Germany ETF | |||||||||||||||
| Year ended August 31, 2014 | Year ended August 31, 2013 | Year ended August 31, 2014 | Year ended August 31, 2013 | |||||||||||||
INCREASE (DECREASE) IN NET ASSETS | ||||||||||||||||
OPERATIONS: | ||||||||||||||||
Net investment income | $ | 255,301,280 | $ | 56,484,613 | $ | 109,217,597 | $ | 69,681,145 | ||||||||
Net realized gain | 272,213,942 | 59,795,938 | 503,529,812 | 181,952,897 | ||||||||||||
Net change in unrealized appreciation/depreciation | 323,453,444 | 153,686,966 | 181,241,179 | 397,729,283 | ||||||||||||
|
|
|
|
|
|
|
| |||||||||
Net increase in net assets resulting from operations | 850,968,666 | 269,967,517 | 793,988,588 | 649,363,325 | ||||||||||||
|
|
|
|
|
|
|
| |||||||||
DISTRIBUTIONS TO SHAREHOLDERS: | ||||||||||||||||
From net investment income | (243,559,586 | ) | (54,004,208 | ) | (111,913,888 | ) | (70,323,492 | ) | ||||||||
|
|
|
|
|
|
|
| |||||||||
Total distributions to shareholders | (243,559,586 | ) | (54,004,208 | ) | (111,913,888 | ) | (70,323,492 | ) | ||||||||
|
|
|
|
|
|
|
| |||||||||
CAPITAL SHARE TRANSACTIONS: | ||||||||||||||||
Proceeds from shares sold | 6,832,263,291 | 3,656,727,115 | 1,689,588,472 | 2,897,813,848 | ||||||||||||
Cost of shares redeemed | (2,277,014,968 | ) | (1,126,936,712 | ) | (2,230,103,855 | ) | (1,618,008,137 | ) | ||||||||
|
|
|
|
|
|
|
| |||||||||
Net increase (decrease) in net assets from capital share transactions | 4,555,248,323 | 2,529,790,403 | (540,515,383 | ) | 1,279,805,711 | |||||||||||
|
|
|
|
|
|
|
| |||||||||
INCREASE IN NET ASSETS | 5,162,657,403 | 2,745,753,712 | 141,559,317 | 1,858,845,544 | ||||||||||||
NET ASSETS | ||||||||||||||||
Beginning of year | 3,539,979,719 | 794,226,007 | 4,655,874,612 | 2,797,029,068 | ||||||||||||
|
|
|
|
|
|
|
| |||||||||
End of year | $ | 8,702,637,122 | $ | 3,539,979,719 | $ | 4,797,433,929 | $ | 4,655,874,612 | ||||||||
|
|
|
|
|
|
|
| |||||||||
Undistributed net investment income included in net assets at end of year | $ | 14,544,730 | $ | 3,542,748 | $ | — | $ | — | ||||||||
|
|
|
|
|
|
|
| |||||||||
SHARES ISSUED AND REDEEMED | ||||||||||||||||
Shares sold | 172,200,000 | 108,500,000 | 57,000,000 | 116,100,000 | ||||||||||||
Shares redeemed | (56,700,000 | ) | (33,600,000 | ) | (73,200,000 | ) | (65,400,000 | ) | ||||||||
|
|
|
|
|
|
|
| |||||||||
Net increase (decrease) in shares outstanding | 115,500,000 | 74,900,000 | (16,200,000 | ) | 50,700,000 | |||||||||||
|
|
|
|
|
|
|
| |||||||||
See notes to financial statements.
FINANCIAL STATEMENTS | 27 |
Table of Contents
Statements of Changes in Net Assets (Continued)
iSHARES®, INC.
| iShares MSCI Japan ETF | ||||||||
| Year ended August 31, 2014 | Year ended August 31, 2013 | |||||||
INCREASE (DECREASE) IN NET ASSETS | ||||||||
OPERATIONS: | ||||||||
Net investment income | $ | 177,693,682 | $ | 88,231,088 | ||||
Net realized gain | 136,968,307 | 326,567,847 | ||||||
Net change in unrealized appreciation/depreciation | 665,594,417 | 632,581,952 | ||||||
|
|
|
| |||||
Net increase in net assets resulting from operations | 980,256,406 | 1,047,380,887 | ||||||
|
|
|
| |||||
DISTRIBUTIONS TO SHAREHOLDERS: | ||||||||
From net investment income | (199,951,249 | ) | (94,344,922 | ) | ||||
|
|
|
| |||||
Total distributions to shareholders | (199,951,249 | ) | (94,344,922 | ) | ||||
|
|
|
| |||||
CAPITAL SHARE TRANSACTIONS: | ||||||||
Proceeds from shares sold | 5,400,567,672 | 9,039,143,715 | ||||||
Cost of shares redeemed | (1,913,626,119 | ) | (4,159,272,055 | ) | ||||
|
|
|
| |||||
Net increase in net assets from capital share transactions | 3,486,941,553 | 4,879,871,660 | ||||||
|
|
|
| |||||
INCREASE IN NET ASSETS | 4,267,246,710 | 5,832,907,625 | ||||||
NET ASSETS | ||||||||
Beginning of year | 10,461,941,993 | 4,629,034,368 | ||||||
|
|
|
| |||||
End of year | $ | 14,729,188,703 | $ | 10,461,941,993 | ||||
|
|
|
| |||||
Distributions in excess of net investment income included in net assets at end of year | $ | (28,649,511 | ) | $ | (6,610,516 | ) | ||
|
|
|
| |||||
SHARES ISSUED AND REDEEMED | ||||||||
Shares sold | 457,800,000 | 831,000,000 | ||||||
Shares redeemed | (166,800,000 | ) | (390,000,000 | ) | ||||
|
|
|
| |||||
Net increase in shares outstanding | 291,000,000 | 441,000,000 | ||||||
|
|
|
| |||||
See notes to financial statements.
| 28 | 2014 iSHARES ANNUAL REPORTTO SHAREHOLDERS |
Table of Contents
iSHARES®, INC.
(For a share outstanding throughout each period)
| iShares MSCI EMU ETF | ||||||||||||||||||||
| Year ended Aug. 31, 2014 | Year ended Aug. 31, 2013 | Year ended Aug. 31, 2012 | Year ended Aug. 31, 2011 | Year ended Aug. 31, 2010 | ||||||||||||||||
Net asset value, beginning of year | $ | 34.64 | $ | 29.09 | $ | 31.55 | $ | 30.75 | $ | 35.64 | ||||||||||
|
|
|
|
|
|
|
|
|
| |||||||||||
Income from investment operations: | ||||||||||||||||||||
Net investment incomea | 1.18 | 0.92 | 1.02 | 1.23 | 0.80 | |||||||||||||||
Net realized and unrealized gain (loss)b | 5.10 | 5.55 | (2.38 | ) | 0.71 | (4.76 | ) | |||||||||||||
|
|
|
|
|
|
|
|
|
| |||||||||||
Total from investment operations | 6.28 | 6.47 | (1.36 | ) | 1.94 | (3.96 | ) | |||||||||||||
|
|
|
|
|
|
|
|
|
| |||||||||||
Less distributions from: | ||||||||||||||||||||
Net investment income | (0.94 | ) | (0.92 | ) | (1.10 | ) | (1.14 | ) | (0.93 | ) | ||||||||||
|
|
|
|
|
|
|
|
|
| |||||||||||
Total distributions | (0.94 | ) | (0.92 | ) | (1.10 | ) | (1.14 | ) | (0.93 | ) | ||||||||||
|
|
|
|
|
|
|
|
|
| |||||||||||
Net asset value, end of year | $ | 39.98 | $ | 34.64 | $ | 29.09 | $ | 31.55 | $ | 30.75 | ||||||||||
|
|
|
|
|
|
|
|
|
| |||||||||||
Total return | 18.02 | % | 22.43 | % | (3.99 | )% | 5.78 | % | (11.19 | )% | ||||||||||
|
|
|
|
|
|
|
|
|
| |||||||||||
Ratios/Supplemental data: | ||||||||||||||||||||
Net assets, end of year (000s) | $ | 8,702,637 | $ | 3,539,980 | $ | 794,226 | $ | 738,233 | $ | 823,972 | ||||||||||
Ratio of expenses to average net assets | 0.48 | % | 0.50 | % | 0.53 | % | 0.52 | % | 0.54 | % | ||||||||||
Ratio of net investment income to average net assets | 2.89 | % | 2.74 | % | 3.55 | % | 3.38 | % | 2.29 | % | ||||||||||
Portfolio turnover ratec | 7 | % | 5 | % | 7 | % | 8 | % | 5 | % | ||||||||||
| a | Based on average shares outstanding throughout each period. |
| b | The amounts reported for a share outstanding may not accord with the change in aggregate gains and losses in securities for the fiscal period due to the timing of capital share transactions in relation to the fluctuating market values of the Fund’s underlying securities. |
| c | Portfolio turnover rates exclude portfolio securities received or delivered as a result of processing capital share transactions in Creation Units. |
See notes to financial statements.
FINANCIAL HIGHLIGHTS | 29 |
Table of Contents
Financial Highlights (Continued)
iSHARES®, INC.
(For a share outstanding throughout each period)
| iShares MSCI Germany ETF | ||||||||||||||||||||
| Year ended Aug. 31, 2014 | Year ended Aug. 31, 2013 | Year ended Aug. 31, 2012 | Year ended Aug. 31, 2011 | Year ended Aug. 31, 2010 | ||||||||||||||||
Net asset value, beginning of year | $ | 25.61 | $ | 21.34 | $ | 21.02 | $ | 19.45 | $ | 20.86 | ||||||||||
|
|
|
|
|
|
|
|
|
| |||||||||||
Income from investment operations: | ||||||||||||||||||||
Net investment incomea | 0.59 | 0.46 | 0.56 | 0.86 | 0.38 | |||||||||||||||
Net realized and unrealized gain (loss)b | 3.40 | 4.24 | 0.34 | 1.38 | (1.49 | ) | ||||||||||||||
|
|
|
|
|
|
|
|
|
| |||||||||||
Total from investment operations | 3.99 | 4.70 | 0.90 | 2.24 | (1.11 | ) | ||||||||||||||
|
|
|
|
|
|
|
|
|
| |||||||||||
Less distributions from: | ||||||||||||||||||||
Net investment income | (0.63 | ) | (0.43 | ) | (0.58 | ) | (0.67 | ) | (0.30 | ) | ||||||||||
|
|
|
|
|
|
|
|
|
| |||||||||||
Total distributions | (0.63 | ) | (0.43 | ) | (0.58 | ) | (0.67 | ) | (0.30 | ) | ||||||||||
|
|
|
|
|
|
|
|
|
| |||||||||||
Net asset value, end of year | $ | 28.97 | $ | 25.61 | $ | 21.34 | $ | 21.02 | $ | 19.45 | ||||||||||
|
|
|
|
|
|
|
|
|
| |||||||||||
Total return | 15.41 | % | 22.11 | % | 4.55 | % | 10.84 | % | (5.35 | )% | ||||||||||
|
|
|
|
|
|
|
|
|
| |||||||||||
Ratios/Supplemental data: | ||||||||||||||||||||
Net assets, end of year (000s) | $ | 4,797,434 | $ | 4,655,875 | $ | 2,797,029 | $ | 2,768,171 | $ | 1,487,881 | ||||||||||
Ratio of expenses to average net assets | 0.48 | % | 0.51 | % | 0.53 | % | 0.51 | % | 0.53 | % | ||||||||||
Ratio of net investment income to average net assets | 1.95 | % | 1.88 | % | 2.72 | % | 3.45 | % | 1.80 | % | ||||||||||
Portfolio turnover ratec | 6 | % | 4 | % | 4 | % | 13 | % | 5 | % | ||||||||||
| a | Based on average shares outstanding throughout each period. |
| b | The amounts reported for a share outstanding may not accord with the change in aggregate gains and losses in securities for the fiscal period due to the timing of capital share transactions in relation to the fluctuating market values of the Fund’s underlying securities. |
| c | Portfolio turnover rates exclude portfolio securities received or delivered as a result of processing capital share transactions in Creation Units. |
See notes to financial statements.
| 30 | 2014 iSHARES ANNUAL REPORTTO SHAREHOLDERS |
Table of Contents
Financial Highlights (Continued)
iSHARES®, INC.
(For a share outstanding throughout each period)
| iShares MSCI Japan ETF | ||||||||||||||||||||
| Year ended Aug. 31, 2014 | Year ended Aug. 31, 2013 | Year ended Aug. 31, 2012 | Year ended Aug. 31, 2011 | Year ended Aug. 31, 2010 | ||||||||||||||||
Net asset value, beginning of year | $ | 10.97 | $ | 9.02 | $ | 9.80 | $ | 9.43 | $ | 10.24 | ||||||||||
|
|
|
|
|
|
|
|
|
| |||||||||||
Income from investment operations: | ||||||||||||||||||||
Net investment incomea | 0.15 | 0.13 | 0.18 | 0.16 | 0.12 | |||||||||||||||
Net realized and unrealized gain (loss)b | 0.88 | 1.97 | (0.77 | ) | 0.37 | (0.77 | ) | |||||||||||||
|
|
|
|
|
|
|
|
|
| |||||||||||
Total from investment operations | 1.03 | 2.10 | (0.59 | ) | 0.53 | (0.65 | ) | |||||||||||||
|
|
|
|
|
|
|
|
|
| |||||||||||
Less distributions from: | ||||||||||||||||||||
Net investment income | (0.17 | ) | (0.15 | ) | (0.19 | ) | (0.16 | ) | (0.16 | ) | ||||||||||
|
|
|
|
|
|
|
|
|
| |||||||||||
Total distributions | (0.17 | ) | (0.15 | ) | (0.19 | ) | (0.16 | ) | (0.16 | ) | ||||||||||
|
|
|
|
|
|
|
|
|
| |||||||||||
Net asset value, end of year | $ | 11.83 | $ | 10.97 | $ | 9.02 | $ | 9.80 | $ | 9.43 | ||||||||||
|
|
|
|
|
|
|
|
|
| |||||||||||
Total return | 9.39 | % | 23.46 | % | (5.96 | )% | 5.54 | % | (6.41 | )% | ||||||||||
|
|
|
|
|
|
|
|
|
| |||||||||||
Ratios/Supplemental data: | ||||||||||||||||||||
Net assets, end of year (000s) | $ | 14,729,189 | $ | 10,461,942 | $ | 4,629,034 | $ | 7,194,509 | $ | 3,942,769 | ||||||||||
Ratio of expenses to average net assets | 0.48 | % | 0.50 | % | 0.53 | % | 0.51 | % | 0.54 | % | ||||||||||
Ratio of net investment income to average net assets | 1.31 | % | 1.18 | % | 1.95 | % | 1.53 | % | 1.20 | % | ||||||||||
Portfolio turnover ratec | 2 | % | 4 | % | 3 | % | 4 | % | 5 | % | ||||||||||
| a | Based on average shares outstanding throughout each period. |
| b | The amounts reported for a share outstanding may not accord with the change in aggregate gains and losses in securities for the fiscal period due to the timing of capital share transactions in relation to the fluctuating market values of the Fund’s underlying securities. |
| c | Portfolio turnover rates exclude portfolio securities received or delivered as a result of processing capital share transactions in Creation Units. |
See notes to financial statements.
FINANCIAL HIGHLIGHTS | 31 |
Table of Contents
iSHARES®, INC.
iShares, Inc. (the “Company”) is registered under the Investment Company Act of 1940, as amended (the “1940 Act”), as an open-end management investment company. The Company was incorporated under the laws of the State of Maryland on September 1, 1994 pursuant to amended and restated Articles of Incorporation.
These financial statements relate only to the following funds (each, a “Fund,” and collectively, the “Funds”):
| iShares ETF | Diversification Classification | |
MSCI EMU | Diversified | |
MSCI Germany | Non-diversified | |
MSCI Japan | Diversified |
The investment objective of each Fund is to seek investment results that correspond generally to the price and yield performance, before fees and expenses, of its underlying index. The investment adviser uses a “passive” or index approach to try to achieve each Fund’s investment objective.
Pursuant to the Company’s organizational documents, the Funds’ officers and directors are indemnified against certain liabilities that may arise out of the performance of their duties to the Funds. Additionally, in the normal course of business, the Funds enter into contracts with service providers that contain general indemnification clauses. The Funds’ maximum exposure under these arrangements is unknown as this would involve future claims that may be made against the Funds that have not yet occurred.
| 1. | SIGNIFICANT ACCOUNTING POLICIES |
The following significant accounting policies are consistently followed by the Funds in the preparation of their financial statements in conformity with accounting principles generally accepted in the United States of America (“U.S. GAAP”). The preparation of financial statements in conformity with U.S. GAAP requires management to make certain estimates and assumptions that affect the reported amounts of assets and liabilities and disclosures of contingent assets and liabilities at the date of the financial statements and the reported amounts of revenue and expenses during the reporting period. Actual results could differ from those estimates. Each Fund is considered an investment company under U.S. GAAP and follows the accounting and reporting guidance applicable to investment companies in the Financial Accounting Standards Board Accounting Standards Codification Topic 946 (ASC 946).
SECURITY VALUATION
Each Fund’s investments are valued at fair value each day that the Fund’s listing exchange is open and, for financial reporting purposes, as of the report date should the reporting period end on a day that the Fund’s listing exchange is not open. U.S. GAAP defines fair value as the price a fund would receive to sell an asset or pay to transfer a liability in an orderly transaction between market participants at the measurement date. The BlackRock Global Valuation Methodologies Committee (the “Global Valuation Committee”) provides oversight of the valuation of investments for the Funds. The investments of each Fund are valued pursuant to policies and procedures developed by the Global Valuation Committee and approved by the Board of Directors of the Company (the “Board”).
| • | Equity investments traded on a recognized securities exchange are valued at that day’s last reported trade price or the official closing price, as applicable, on the exchange where the stock is primarily traded. Equity investments traded on a recognized exchange for which there were no sales on that day are valued at the last traded price. |
| • | Open-end U.S. mutual funds are valued at that day’s published net asset value (NAV). |
| 32 | 2014 iSHARES ANNUAL REPORTTO SHAREHOLDERS |
Table of Contents
Notes to Financial Statements (Continued)
iSHARES®, INC.
| • | Financial futures contracts are valued at that day’s last reported settlement price on the exchange where the contract is traded. |
In the event that application of these methods of valuation results in a price for an investment which is deemed not to be representative of the fair value of such investment or if a price is not available, the investment will be valued based upon other available factors deemed relevant by the Global Valuation Committee, in accordance with policies approved by the Board. These factors include but are not limited to (i) attributes specific to the investment; (ii) the principal market for the investment; (iii) the customary participants in the principal market for the investment; (iv) data assumptions by market participants for the investment, if reasonably available; (v) quoted prices for similar investments in active markets; and (vi) other factors, such as future cash flows, interest rates, yield curves, volatilities, prepayment speeds, loss severities, credit risks and/or default rates. Valuations based on such factors are reported to the Board on a quarterly basis.
The Global Valuation Committee employs various methods for calibrating valuation approaches for investments where an active market does not exist, including regular due diligence of the Company’s pricing vendors, a regular review of key inputs and assumptions, transactional back-testing or disposition analysis to compare unrealized gains and losses to realized gains and losses, reviews of missing or stale prices, reviews of large movements in market values, and reviews of market related activity.
Fair value pricing could result in a difference between the prices used to calculate a Fund’s net asset value and the prices used by the Fund’s underlying index, which in turn could result in a difference between the Fund’s performance and the performance of the Fund’s underlying index.
Various inputs are used in determining the fair value of financial instruments. Inputs may be based on independent market data (“observable inputs”) or they may be internally developed (“unobservable inputs”). These inputs are categorized into a disclosure hierarchy consisting of three broad levels for financial reporting purposes. The level of a value determined for a financial instrument within the fair value hierarchy is based on the lowest level of any input that is significant to the fair value measurement in its entirety. The categorization of a value determined for a financial instrument within the hierarchy is based upon the pricing transparency of the instrument and is not necessarily an indication of the risk associated with investing in the instrument. The three levels of the fair value hierarchy are as follows:
| • | Level 1 — Unadjusted quoted prices in active markets for identical assets or liabilities; |
| • | Level 2 — Inputs other than quoted prices included within Level 1 that are observable for the asset or liability either directly or indirectly, including quoted prices for similar assets or liabilities in active markets, quoted prices for identical or similar assets or liabilities in markets that are not considered to be active, inputs other than quoted prices that are observable for the asset or liability (such as exchange rates, financing terms, interest rates, yield curves, volatilities, prepayment speeds, loss severities, credit risks and default rates) or other market-corroborated inputs; and |
| • | Level 3 — Unobservable inputs for the asset or liability, including the Global Valuation Committee’s assumptions used in determining the fair value of investments. |
Changes in valuation techniques may result in transfers in or out of an assigned level within the disclosure hierarchy. In accordance with the Company’s policy, transfers between different levels of the fair value hierarchy are deemed to have occurred as of the beginning of the reporting period.
NOTESTO FINANCIAL STATEMENTS | 33 |
Table of Contents
Notes to Financial Statements (Continued)
iSHARES®, INC.
The following table summarizes the value of each of the Funds’ investments according to the fair value hierarchy as of August 31, 2014. The breakdown of each Fund’s investments into major categories is disclosed in its respective schedule of investments.
iShares ETF and | Investments | |||||||||||||||
| Level 1 | Level 2 | Level 3 | Total | |||||||||||||
MSCI EMU | ||||||||||||||||
Assets: | ||||||||||||||||
Common Stocks | $ | 8,522,240,117 | $ | 256,941 | $ | 9 | $ | 8,522,497,067 | ||||||||
Preferred Stocks | 166,190,060 | — | — | 166,190,060 | ||||||||||||
Money Market Funds | 103,916,873 | — | — | 103,916,873 | ||||||||||||
|
|
|
|
|
|
|
| |||||||||
| $ | 8,792,347,050 | $ | 256,941 | $ | 9 | $ | 8,792,604,000 | |||||||||
|
|
|
|
|
|
|
| |||||||||
MSCI Germany | ||||||||||||||||
Assets: | ||||||||||||||||
Common Stocks | $ | 4,458,503,683 | $ | — | $ | — | $ | 4,458,503,683 | ||||||||
Preferred Stocks | 312,736,805 | — | — | 312,736,805 | ||||||||||||
Money Market Funds | 1,424,248 | — | — | 1,424,248 | ||||||||||||
|
|
|
|
|
|
|
| |||||||||
| $ | 4,772,664,736 | $ | — | $ | — | $ | 4,772,664,736 | |||||||||
|
|
|
|
|
|
|
| |||||||||
Liabilities: | ||||||||||||||||
Futures Contractsa | $ | (1,190,173 | ) | $ | — | $ | — | $ | (1,190,173 | ) | ||||||
|
|
|
|
|
|
|
| |||||||||
MSCI Japan | ||||||||||||||||
Assets: | ||||||||||||||||
Common Stocks | $ | 14,693,636,312 | $ | — | $ | — | $ | 14,693,636,312 | ||||||||
Money Market Funds | 70,716,962 | — | — | 70,716,962 | ||||||||||||
Futures Contractsa | 906,579 | — | — | 906,579 | ||||||||||||
|
|
|
|
|
|
|
| |||||||||
| $ | 14,765,259,853 | $ | — | $ | — | $ | 14,765,259,853 | |||||||||
|
|
|
|
|
|
|
| |||||||||
| a | Shown at the unrealized appreciation (depreciation) on the contracts. |
SECURITY TRANSACTIONS AND INCOME RECOGNITION
Security transactions are accounted for on trade date. Dividend income and capital gain distributions, if any, are recognized on the ex-dividend date, net of any foreign taxes withheld at source. Any taxes withheld that are reclaimable from foreign tax authorities as of August 31, 2014 are reflected in dividends receivable. Non-cash dividends received in the form of stock in an elective dividend, if any, are recorded as dividend income at fair value. Distributions received by the Funds may include a return of capital that is estimated by management. Such amounts are recorded as a reduction of the cost of investments or reclassified to capital gains. Interest income is accrued daily. Realized gains and losses on investment transactions are determined using the specific identification method.
FOREIGN CURRENCY TRANSLATION
The accounting records of the Funds are maintained in U.S. dollars. Foreign currencies, as well as investment securities and other assets and liabilities denominated in foreign currencies, are translated into U.S. dollars using exchange rates deemed appropriate by the investment adviser. Purchases and sales of securities, income receipts and expense payments are translated into U.S. dollars on the respective dates of such transactions.
| 34 | 2014 iSHARES ANNUAL REPORTTO SHAREHOLDERS |
Table of Contents
Notes to Financial Statements (Continued)
iSHARES®, INC.
Each Fund does not isolate the effect of fluctuations in foreign exchange rates from the effect of fluctuations in the market prices of securities. Such fluctuations are reflected by the Funds as a component of realized and unrealized gains and losses from investments for financial reporting purposes.
FOREIGN TAXES
The Funds may be subject to foreign taxes (a portion of which may be reclaimable) on income, stock dividends, capital gains on investments, or certain foreign currency transactions. All foreign taxes are recorded in accordance with the applicable foreign tax regulations and rates that exist in the foreign jurisdictions in which the Funds invest. These foreign taxes, if any, are paid by the Funds and are reflected in their statements of operations as follows: foreign taxes withheld at source are presented as a reduction of income, foreign taxes on securities lending income are presented as a reduction of securities lending income, foreign taxes on stock dividends are presented as “other foreign taxes,” and foreign taxes on capital gains from sales of investments and foreign taxes on foreign currency transactions are included in their respective net realized gain (loss) categories. Foreign taxes payable or deferred as of August 31, 2014, if any, are disclosed in the Funds’ statements of assets and liabilities.
DISTRIBUTIONS TO SHAREHOLDERS
Dividends and distributions paid by each Fund are recorded on the ex-dividend dates. Distributions are determined on a tax basis and may differ from net investment income and net realized capital gains for financial reporting purposes. Dividends and distributions are paid in U.S. dollars and cannot be automatically reinvested in additional shares of the Funds.
LOANS OF PORTFOLIO SECURITIES
Each Fund may lend its investment securities to approved borrowers, such as brokers, dealers and other financial institutions. The borrower pledges and maintains with the Fund collateral consisting of cash, an irrevocable letter of credit issued by a bank, or securities issued or guaranteed by the U.S. government. The initial collateral received by each Fund is required to have a value of at least 102% of the current value of the loaned securities for securities traded on U.S. exchanges and a value of at least 105% for all other securities. The collateral is maintained thereafter, at a value equal to at least 100% of the current value of the securities on loan. The market value of the loaned securities is determined at the close of each business day of the Funds and any additional required collateral is delivered to the Funds on the next business day. During the term of the loan, each Fund is entitled to all distributions made on or in respect of the loaned securities. Loans of securities are terminable at any time and the borrower, after notice, is required to return borrowed securities within the standard time period for settlement of securities transactions.
Any cash received as collateral for securities on loan may be reinvested in certain short-term instruments either directly on behalf of a fund or through one or more joint accounts or money market funds, including those managed by BlackRock Fund Advisors (“BFA”), the Funds’ investment adviser, or its affiliates. As of August 31, 2014, any securities on loan were collateralized by cash. The cash collateral received was invested in money market funds managed by BFA and is disclosed in the schedules of investments. The value of any securities on loan as of August 31, 2014 and the value of the related collateral are disclosed in the statements of assets and liabilities. Income earned by the Funds from securities lending is disclosed in the statements of operations.
The risks of securities lending include the risk that the borrower may not provide additional collateral when required or may not return the securities when due. To mitigate these risks, the Funds benefit from a borrower default indemnity provided by BlackRock, Inc. (“BlackRock”). BlackRock’s indemnity allows for full replacement of securities lent. Each Fund could suffer a loss if the value of the investments purchased with cash collateral falls below the value of the cash collateral received.
NOTESTO FINANCIAL STATEMENTS | 35 |
Table of Contents
Notes to Financial Statements (Continued)
iSHARES®, INC.
Securities lending transactions are entered into by the Funds under Master Securities Lending Agreements (“MSLA”) which provide the right, in the event of default (including bankruptcy or insolvency) for the non-defaulting party to liquidate the collateral and calculate a net exposure to the defaulting party or request additional collateral. In the event that a borrower defaults, a Fund, as lender, would offset the market value of the collateral received against the market value of the securities loaned. The value of the collateral is typically greater than that of the market value of the securities loaned, leaving the lender with a net amount payable to the defaulting party. However, bankruptcy or insolvency laws of a particular jurisdiction may impose restrictions on or prohibitions against such a right of offset in the event of an MSLA counterparty’s bankruptcy or insolvency. Under the MSLA, the borrower can resell or re-pledge the loaned securities, and a Fund can reinvest cash collateral, or, upon an event of default, resell or re-pledge the collateral.
The following table is a summary of each Fund’s securities lending agreements which are subject to offset under an MSLA as of August 31, 2014:
| iShares ETF | Market Value of Securities on Loan | Cash Collateral Received a | Net Amount | |||||||||
MSCI EMU | $ | 97,713,104 | $ | 97,713,104 | $ | — | ||||||
MSCI Japan | 65,578,777 | 65,578,777 | — | |||||||||
| a | Collateral received in excess of the market value of securities on loan is not presented for financial reporting purposes. The total collateral received is disclosed in each Fund’s statement of assets and liabilities. |
RECENT ACCOUNTING STANDARD
In June 2014, the Financial Accounting Standards Board issued guidance to improve the financial reporting of reverse repurchase agreements and other similar transactions. The guidance will require expanded disclosure for entities that enter into reverse repurchase agreements and similar transactions accounted for as secured borrowings, including securities lending. The guidance is effective for financial statements for fiscal years beginning after December 15, 2014, and interim periods within those fiscal years. Management is evaluating the impact, if any, of this guidance on the Funds’ financial statements and disclosures.
| 2. | INVESTMENT ADVISORY AGREEMENT AND OTHER TRANSACTIONS WITH AFFILIATES |
Pursuant to an Investment Advisory Agreement with the Company, BFA manages the investment of each Fund’s assets. BFA is a California corporation indirectly owned by BlackRock. Under the Investment Advisory Agreement, BFA is responsible for substantially all expenses of the Funds, except interest, taxes, brokerage commissions and other expenses connected with the execution of portfolio transactions, distribution fees, litigation expenses and any extraordinary expenses.
For its investment advisory services to each of the iShares MSCI EMU, iShares MSCI Germany and iShares MSCI Japan ETFs, BFA is entitled to an annual investment advisory fee based on each Fund’s allocable portion of the aggregate of the average daily net assets of the Fund and certain other iShares funds, as follows:
| Investment Advisory Fee | Aggregate Average Daily Net Assets | ||||
| 0.59 | % | First $7 billion | |||
| 0.54 | Over $7 billion, up to and including $11 billion | ||||
| 0.49 | Over $11 billion, up to and including $24 billion | ||||
| 0.44 | Over $24 billion, up to and including $48 billion | ||||
| 0.40 | Over $48 billion, up to and including $72 billion | ||||
| 0.36 | Over $72 billiona | ||||
| a | Breakpoint level was added effective July 1, 2014. |
| 36 | 2014 iSHARES ANNUAL REPORTTO SHAREHOLDERS |
Table of Contents
Notes to Financial Statements (Continued)
iSHARES®, INC.
The U.S. Securities and Exchange Commission has issued an exemptive order which permits BlackRock Institutional Trust Company, N.A. (“BTC”), an affiliate of BFA, to serve as securities lending agent for the Funds, subject to applicable conditions. As securities lending agent, BTC bears all operational costs directly related to securities lending. Effective January 1, 2014, each Fund is responsible for fees in connection with the investment of cash collateral received for securities on loan in a money market fund managed by BFA, however, BTC has agreed to reduce the amount of securities lending income it receives in order to effectively limit the collateral investment fees each Fund bears to an annual rate of 0.04% (the “collateral investment fees”). Securities lending income is equal to the total of income earned from the reinvestment of cash collateral, net of fees and other payments to and from borrowers of securities, and less the collateral investment fees. The Funds retain a portion of securities lending income and remit a remaining portion to BTC as compensation for its services as securities lending agent.
Pursuant to a securities lending agreement effective January 1, 2014, (i) each Fund retains 75% of securities lending income and (ii) these amounts can never be less than 65% of the total of securities lending income plus the collateral investment fees.
In addition, commencing the business day following the date that the aggregate securities lending income plus the collateral investment fees generated across all 1940 Act iShares exchange-traded funds (the “iShares ETF Complex”) in a given calendar year exceeds the aggregate securities lending income generated across the iShares ETF Complex in calendar year 2013 and pursuant to a securities lending agreement, (i) each Fund will receive for the remainder of that calendar year 80% of securities lending income and (ii) these amounts can never be less than 65% of the total of securities lending income plus the collateral investment fees.
For the year ended August 31, 2014, each Fund paid to BTC the following amounts in total for securities lending agent services and collateral investment fees:
| iShares ETF | Fees Paid to BTC | |||
MSCI EMU | $ | 813,389 | ||
MSCI Germany | 155,217 | |||
MSCI Japan | 1,317,838 | |||
Prior to January 1, 2014, each Fund retained 65% of securities lending income and paid no collateral investment fees.
BlackRock Investments, LLC, an affiliate of BFA, is the distributor for each Fund. Pursuant to the distribution agreement, BFA is responsible for any fees or expenses for distribution services provided to the Funds.
Cross trades for the year ended August 31, 2014, if any, were executed by the Funds pursuant to Rule 17a-7 under the 1940 Act. Cross trading is the buying or selling of portfolio securities between funds to which BFA (or an affiliate) serves as investment adviser. At its regularly scheduled quarterly meetings, the Board reviews such transactions as of the most recent calendar quarter for compliance with the requirements and restrictions set forth by Rule 17a-7.
Each Fund may invest its positive cash balances in certain money market funds managed by BFA or an affiliate. The income earned on these temporary cash investments is included in “Interest – affiliated” in the statements of operations.
The PNC Financial Services Group, Inc. is the largest stockholder of BlackRock and is considered to be an affiliate of the Funds for 1940 Act purposes.
Certain directors and officers of the Company are also officers of BTC and/or BFA.
NOTESTO FINANCIAL STATEMENTS | 37 |
Table of Contents
Notes to Financial Statements (Continued)
iSHARES®, INC.
| 3. | INVESTMENT PORTFOLIO TRANSACTIONS |
Purchases and sales of investments (excluding in-kind transactions and short-term investments) for the year ended August 31, 2014 were as follows:
| iShares ETF | Purchases | Sales | ||||||
MSCI EMU | $ | 606,642,740 | $ | 579,892,004 | ||||
MSCI Germany | 347,536,959 | 385,373,160 | ||||||
MSCI Japan | 333,832,396 | 288,411,799 | ||||||
In-kind transactions (see Note 4) for the year ended August 31, 2014 were as follows:
| iShares ETF | In-kind Purchases | In-kind Sales | ||||||
MSCI EMU | $ | 6,790,718,089 | $ | 2,259,100,617 | ||||
MSCI Germany | 1,679,504,170 | 2,178,661,881 | ||||||
MSCI Japan | 5,277,535,787 | 1,859,445,968 | ||||||
| 4. | CAPITAL SHARE TRANSACTIONS |
Capital shares are issued and redeemed by each Fund only in aggregations of a specified number of shares or multiples thereof (“Creation Units”) at net asset value. Except when aggregated in Creation Units, shares of each Fund are not redeemable. Transactions in capital shares for each Fund are disclosed in detail in the statements of changes in net assets.
The consideration for the purchase of Creation Units of a fund in the Company generally consists of the in-kind deposit of a designated portfolio of securities and a specified amount of cash. Certain funds in the Company may be offered in Creation Units solely or partially for cash in U.S. dollars. Investors purchasing and redeeming Creation Units may pay a purchase transaction fee and a redemption transaction fee directly to State Street Bank and Trust Company, the Company’s administrator, to offset transfer and other transaction costs associated with the issuance and redemption of Creation Units, including Creation Units for cash. Investors transacting in Creation Units for cash may also pay an additional variable charge to compensate the relevant fund for certain transaction costs (i.e., stamp taxes, taxes on currency or other financial transactions, and brokerage costs) and market impact expenses relating to investing in portfolio securities. Such variable charges, if any, are included in “Proceeds from shares sold” in the statements of changes in net assets.
From time to time, settlement of securities related to in-kind contributions or in-kind redemptions may be delayed. In such cases, securities related to in-kind contributions are reflected as “Due from custodian” and securities related to in-kind redemptions are reflected as “Securities related to in-kind transactions” in the statements of assets and liabilities.
| 5. | FINANCIAL FUTURES CONTRACTS |
Each Fund may purchase or sell financial futures contracts in an effort to help such Fund track its underlying index. A futures contract is a standardized, exchange-traded agreement to buy and sell a financial instrument at a set price on a future date. Upon entering into a futures contract, the Fund is required to pledge to the executing broker which holds segregated from its own assets, an amount of cash, U.S. government securities or other high-quality debt and equity securities equal to the minimum initial margin requirements of the exchange on which the contract is traded. Pursuant to the contract, the Fund agrees to receive from or pay to the broker an amount of cash equal to the daily fluctuation in value of the contract. Such receipts or payments are known as margin variation and are recorded by the Fund as unrealized appreciation or depreciation. When the contract is closed,
| 38 | 2014 iSHARES ANNUAL REPORTTO SHAREHOLDERS |
Table of Contents
Notes to Financial Statements (Continued)
iSHARES®, INC.
the Fund records a realized gain or loss equal to the difference between the value of the contract at the time it was opened and the value at the time it was closed. Losses may arise if the value of a futures contract decreases due to an unfavorable change in the market rates or values of the underlying instrument during the term of the contract or if the counterparty does not perform under the contract. The use of futures contracts also involves the risk of an imperfect correlation in the movements in the price of futures contracts and the assets underlying such contracts.
The following table shows the value of futures contracts held by the Funds as of August 31, 2014 and the related locations in the statements of assets and liabilities, presented by risk exposure category:
| Assets | ||||||||
| iShares MSCI Germany ETF | iShares MSCI Japan ETF | |||||||
Equity contracts: | ||||||||
Variation margin / Net assets consist of – net unrealized appreciationa | $ | — | $ | 906,579 | ||||
|
|
|
| |||||
| a | Represents cumulative appreciation of futures contracts as reported in the schedules of investments. |
| Liabilities | ||||||||
| iShares MSCI Germany ETF | iShares MSCI Japan ETF | |||||||
Equity contracts: | ||||||||
Variation margin / Net assets consist of – net unrealized depreciationb | $ | 1,190,173 | $ | — | ||||
|
|
|
| |||||
| b | Represents cumulative depreciation of futures contracts as reported in the schedules of investments. |
The following table shows the realized and unrealized gains (losses) on futures contracts held by the Funds during the year ended August 31, 2014 and the related locations in the statements of operations, presented by risk exposure category:
| Net Realized Gain (Loss) | ||||||||
| iShares MSCI Germany ETF | iShares MSCI Japan ETF | |||||||
Equity contracts: | ||||||||
Futures contracts | $ | 5,245,994 | $ | 13,313,282 | ||||
|
|
|
| |||||
| Net Change in Unrealized Appreciation/Depreciation | ||||||||
| iShares MSCI Germany ETF | iShares MSCI Japan ETF | |||||||
Equity contracts: | ||||||||
Futures contracts | $ | (806,724 | ) | $ | 1,007,675 | |||
|
|
|
| |||||
NOTESTO FINANCIAL STATEMENTS | 39 |
Table of Contents
Notes to Financial Statements (Continued)
iSHARES®, INC.
The following table shows the average quarter-end balances of open futures contracts for the year ended August 31, 2014:
| iShares MSCI Germany ETF | iShares MSCI Japan ETF | |||||||
Average number of contracts purchased | 89 | 590 | ||||||
Average value of contracts purchased | $ | 27,994,964 | $ | 70,684,552 | ||||
| 6. | MARKET AND CREDIT RISK |
In the normal course of business, each Fund’s investment activities exposes it to various types of risk associated with the financial instruments and markets in which it invests. The significant types of financial risks each Fund is exposed to include market risk and credit risk. Each Fund’s prospectus provides details of these and other types of risk.
BFA uses a “passive” or index approach to try to achieve each Fund’s investment objective following the securities included in its underlying index during upturns as well as downturns. BFA does not take steps to reduce market exposure or to lessen the effects of a declining market. Divergence from the underlying index and the composition of the portfolio is monitored by BFA.
MARKET RISK
Market risk arises mainly from uncertainty about future values of financial instruments influenced by price, currency and interest rate movements. It represents the potential loss each Fund may suffer through holding market positions in the face of market movements. Each Fund is exposed to market risk by virtue of its investment in equity and financial derivative instruments. The fair value of securities held by the Funds may decline due to general market conditions, economic trends or events that are not specifically related to the issuers of the securities including local, regional or global political, social or economic instability or to factors that affect a particular industry or group of industries. The extent of each Fund’s exposure to market risk is the market value of the investments held as shown in the Fund’s schedule of investments.
A diversified portfolio, where this is appropriate and consistent with a fund’s objectives, minimizes the risk that a price change of a particular investment will have a material impact on the NAV of a fund. The investment concentrations within each Fund’s portfolio are disclosed in its schedule of investments.
Each Fund invests a substantial amount of its assets in securities of non-U.S. issuers that trade in non-U.S. markets. This involves certain considerations and risks not typically associated with securities of U.S. issuers. Such risks include, but are not limited to: generally less liquid and less efficient securities markets; generally greater price volatility; exchange rate fluctuations and exchange controls; imposition of restrictions on the expatriation of funds or other assets of the Fund; less publicly available information about issuers; the imposition of withholding or other taxes; higher transaction and custody costs; settlement delays and risk of loss attendant in settlement procedures; difficulties in enforcing contractual obligations; less regulation of securities markets; different accounting, disclosure and reporting requirements; more substantial governmental involvement in the economy; higher inflation rates; greater social, economic and political uncertainties; the risk of nationalization or expropriation of assets; and the risk of war. These risks are heightened for investments in issuers from countries with less developed markets.
The iShares MSCI Germany ETF and iShares MSCI Japan ETF each invests all or substantially all of its assets in issuers located in a single country. When a fund concentrates its investments in this manner, it assumes the risk that economic, political and social conditions in that country may have a significant impact on its investment performance.
| 40 | 2014 iSHARES ANNUAL REPORTTO SHAREHOLDERS |
Table of Contents
Notes to Financial Statements (Continued)
iSHARES®, INC.
CREDIT RISK
Credit risk is the risk that an issuer or guarantor of debt instruments or the counterparty to a financial transaction, including derivatives contracts, repurchase agreements or loans of portfolio securities, is unable or unwilling to make timely interest and/or principal payments or to otherwise honor its obligations. BFA and its affiliates manage counterparty credit risk by entering into transactions only with counterparties that it believes have the financial resources to honor their obligations and by monitoring the financial stability of those counterparties. Financial assets, which potentially expose the Funds to issuer and counterparty credit risks, consist principally of financial instruments and receivables due from counterparties. The extent of each Fund’s exposure to credit and counterparty risks with respect to those financial assets is approximated by their value recorded in the statement of assets and liabilities.
| 7. | INCOME TAX INFORMATION |
Each Fund is treated as an entity separate from the Company’s other funds for federal income tax purposes. It is the policy of each Fund to qualify as a regulated investment company by complying with the provisions applicable to regulated investment companies, as defined under Subchapter M of the Internal Revenue Code of 1986, as amended, and to annually distribute substantially all of its ordinary income and any net capital gains (taking into account any capital loss carryforwards) sufficient to relieve it from all, or substantially all, federal income and excise taxes. Accordingly, no provision for federal income taxes is required.
U.S. GAAP requires that certain components of net assets be adjusted to reflect permanent differences between financial and tax reporting. These reclassifications have no effect on net assets or net asset values per share. The following permanent differences as of August 31, 2014, attributable to passive foreign investment companies, the expiration of capital loss carryforwards, distributions paid in excess of taxable income, foreign currency transactions and realized gains (losses) from in-kind redemptions, were reclassified to the following accounts:
| iShares ETF | Paid-in Capital | Undistributed Net Investment Income/Distributions in Excess of Net Investment Income | Undistributed Net Realized Gain/Accumulated Net Realized Loss | |||||||||
MSCI EMU | $ | 397,763,659 | $ | (739,712 | ) | $ | (397,023,947 | ) | ||||
MSCI Germany | 518,307,370 | 2,696,291 | (521,003,661 | ) | ||||||||
MSCI Japan | 182,351,676 | 218,572 | (182,570,248 | ) | ||||||||
The tax character of distributions paid during the years ended August 31, 2014 and August 31, 2013 was as follows:
| iShares ETF | 2014 | 2013 | ||||||
MSCI EMU | ||||||||
Ordinary income | $ | 243,559,586 | $ | 54,004,208 | ||||
|
|
|
| |||||
MSCI Germany | ||||||||
Ordinary income | $ | 111,913,888 | $ | 70,323,492 | ||||
|
|
|
| |||||
MSCI Japan | ||||||||
Ordinary income | $ | 199,951,249 | $ | 94,344,922 | ||||
|
|
|
| |||||
NOTESTO FINANCIAL STATEMENTS | 41 |
Table of Contents
Notes to Financial Statements (Continued)
iSHARES®, INC.
As of August 31, 2014, the tax components of accumulated net earnings (losses) were as follows:
| iShares ETF | Undistributed Ordinary Income | Capital Loss Carryforwards | Net Unrealized Gains (Losses) a | Qualified Late-Year Losses b | Total | |||||||||||||||
MSCI EMU | $ | 17,072,939 | $ | (178,341,919 | ) | $ | (97,919,028 | ) | $ | (15,204,850 | ) | $ | (274,392,858 | ) | ||||||
MSCI Germany | — | (117,984,210 | ) | (61,540,149 | ) | (5,323,820 | ) | (184,848,179 | ) | |||||||||||
MSCI Japan | 2,958,257 | (788,481,761 | ) | (802,216,526 | ) | (59,166,210 | ) | (1,646,906,240 | ) | |||||||||||
| a | The difference between book-basis and tax-basis unrealized gains (losses) was attributable primarily to the tax deferral of losses on wash sales, the realization for tax purposes of unrealized gains (losses) on certain futures contracts and the realization for tax purposes of unrealized gains on investments in passive foreign investment companies. |
| b | The Funds have elected to defer certain qualified late-year losses and recognize such losses in the next taxable year. |
As of August 31, 2014, the Funds had capital loss carryforwards available to offset future realized capital gains through the indicated expiration dates as follows:
| iShares ETF | Non- Expiring a | Expiring 2015 | Expiring 2016 | Expiring 2017 | Expiring 2018 | Expiring 2019 | Total | |||||||||||||||||||||
MSCI EMU | $ | 53,431,438 | $ | — | $ | — | $ | 26,644,200 | $ | 68,035,542 | $ | 30,230,739 | $ | 178,341,919 | ||||||||||||||
MSCI Germany | 21,864,809 | 4,227,713 | 3,394,735 | 27,790,050 | 28,490,949 | 32,215,954 | 117,984,210 | |||||||||||||||||||||
MSCI Japan | 287,119,620 | 27,817,841 | 44,443,527 | 116,295,478 | 173,577,101 | 139,228,194 | 788,481,761 | |||||||||||||||||||||
| a | Must be utilized prior to losses subject to expiration. |
The Funds may own shares in certain foreign investment entities, referred to, under U.S. tax law, as “passive foreign investment companies.” The Funds may elect to mark-to-market annually the shares of each passive foreign investment company and would be required to distribute to shareholders any such marked-to-market gains.
As of August 31, 2014, gross unrealized appreciation and gross unrealized depreciation based on cost for federal income tax purposes were as follows:
| iShares ETF | Tax Cost | Gross Unrealized Appreciation | Gross Unrealized Depreciation | Net Unrealized Appreciation (Depreciation) | ||||||||||||
MSCI EMU | $ | 8,890,007,574 | $ | 392,054,030 | $ | (489,457,604 | ) | $ | (97,403,574 | ) | ||||||
MSCI Germany | 4,833,479,419 | 317,979,110 | (378,793,793 | ) | (60,814,683 | ) | ||||||||||
MSCI Japan | 15,566,807,751 | 898,607,379 | (1,701,061,856 | ) | (802,454,477 | ) | ||||||||||
Management has analyzed tax laws and regulations and their application to the Funds as of August 31, 2014, inclusive of the open tax return years, and does not believe there are any uncertain tax positions that require recognition of a tax liability in the Funds’ financial statements.
| 8. | SUBSEQUENT EVENTS |
Management has evaluated the impact of all subsequent events on the Funds through the date the financial statements were available to be issued and has determined that there were no subsequent events requiring adjustment or disclosure in the financial statements.
| 42 | 2014 iSHARES ANNUAL REPORTTO SHAREHOLDERS |
Table of Contents
Report of Independent Registered Public Accounting Firm
To the Shareholders and Board of Directors of
iShares, Inc.:
In our opinion, the accompanying statements of assets and liabilities, including the schedules of investments, and the related statements of operations and of changes in net assets and the financial highlights present fairly, in all material respects, the financial position of iShares MSCI EMU ETF, iShares MSCI Germany ETF and iShares MSCI Japan ETF (the “Funds”) at August 31, 2014, the results of each of their operations, the changes in each of their net assets and their financial highlights for each of the periods presented, in conformity with accounting principles generally accepted in the United States of America. These financial statements and financial highlights (hereafter referred to as “financial statements”) are the responsibility of the Funds’ management; our responsibility is to express an opinion on these financial statements based on our audits. We conducted our audits of these financial statements in accordance with the standards of the Public Company Accounting Oversight Board (United States). Those standards require that we plan and perform the audit to obtain reasonable assurance about whether the financial statements are free of material misstatement. An audit includes examining, on a test basis, evidence supporting the amounts and disclosures in the financial statements, assessing the accounting principles used and significant estimates made by management, and evaluating the overall financial statement presentation. We believe that our audits, which included confirmation of securities at August 31, 2014 by correspondence with the custodian, transfer agent and brokers, provide a reasonable basis for our opinion.
PricewaterhouseCoopers LLP
San Francisco, California
October 22, 2014
REPORTOF INDEPENDENT REGISTERED PUBLIC ACCOUNTING FIRM | 43 |
Table of Contents
iSHARES®, INC.
For the fiscal year ended August 31, 2014, the Funds earned foreign source income and paid foreign taxes which they intend to pass through to their shareholders pursuant to Section 853 of the Internal Revenue Code (the “Code”) as follows:
| iShares ETF | Foreign Source Income Earned | Foreign Taxes Paid | ||||||
MSCI EMU | $ | 333,240,650 | $ | 37,818,554 | ||||
MSCI Germany | 156,537,676 | 20,732,930 | ||||||
MSCI Japan | 263,110,100 | 23,710,513 | ||||||
Under Section 854(b)(2) of the Code, the Funds hereby designate the following maximum amounts as qualified dividend income for purposes of the maximum rate under Section 1(h)(11) of the Code for the fiscal year ended August 31, 2014:
| iShares ETF | Qualified Dividend Income | |||
MSCI EMU | $ | 281,378,140 | ||
MSCI Germany | 132,646,818 | |||
MSCI Japan | 223,661,762 | |||
In February 2015, shareholders will receive Form 1099-DIV which will include their share of qualified dividend income distributed during the calendar year 2014. Shareholders are advised to check with their tax advisers for information on the treatment of these amounts on their income tax returns.
| 44 | 2014 iSHARES ANNUAL REPORTTO SHAREHOLDERS |
Table of Contents
Board Review and Approval of Investment Advisory
Contract
iSHARES®, INC.
I. iShares MSCI EMU ETF
Under Section 15(c) of the Investment Company Act of 1940 (the “1940 Act”), the Company’s Board of Directors (the “Board”), including a majority of Directors who are not “interested persons” of the Company (as that term is defined in the 1940 Act) (the “Independent Directors”), is required annually to consider and approve the Investment Advisory Contract between the Company and BFA (the “Advisory Contract”) on behalf of the Fund. The Independent Directors requested, and BFA provided, such information as the Independent Directors, with advice from independent counsel, deemed reasonably necessary to evaluate the Advisory Contract. A committee of Independent Directors (the “15(c) Committee”), with independent counsel, met with management on March 12, 2014, May 6, 2014, and May 12, 2014, to discuss the types of information the Independent Directors required and the manner in which management would organize and present such information. At a meeting held on May 16, 2014, management presented preliminary information to the Board relating to the continuance of the Advisory Contract, and the Board, including the Independent Directors, reviewed and discussed such information at length. The Independent Directors requested from management certain additional information, which management agreed to provide. At a meeting held on June 12-13, 2014, the Board, including the Independent Directors, reviewed the additional information provided by management in response to these requests. After extensive discussions, the Board, including all of the Independent Directors, approved the continuance of the Advisory Contract for the Fund, based on a review of qualitative and quantitative information provided by BFA, including the additional information management provided at the request of the Independent Directors. The Board noted its satisfaction with the extent and quality of information provided and its frequent interactions with management, as well as the detailed responses and other information provided by BFA. The Board also noted that the Board and BFA agreed to discuss potential enhancements and adjustments to the 15(c) process for the coming year. The Independent Directors were advised by their independent counsel throughout the process, including about the legal standards applicable to their review. In approving the Advisory Contract for the Fund, the Board, including the Independent Directors, considered the following factors, no one of which was controlling, and reached the following conclusions:
Expenses and Performance of the Fund — The Board reviewed statistical information prepared by Lipper Inc. (“Lipper”), an independent provider of investment company data, regarding the expense ratio components, including actual advisory fees, waivers/reimbursements, and gross and net total expenses of the Fund in comparison with the same information for other exchange traded funds (including funds sponsored by an “at cost” service provider) and, in the limited instances where no comparable ETFs existed and the comparison group would not otherwise be reasonable in Lipper’s judgment, pure index institutional mutual funds, objectively selected by Lipper as comprising the Fund’s applicable peer group pursuant to Lipper’s proprietary ETF methodology (the “Lipper Group”). The Board noted that, prior to 2014, Lipper had used a different methodology to determine the Fund’s Lipper group, which included mutual funds, closed-end funds, exchange traded funds, and/or funds with differing investment objective classifications, investment focuses and other characteristics (e.g. actively managed funds and funds sponsored by “at cost” service providers), as applicable. The Board further noted that, after consideration by the 15(c) Committee, the Board determined to use instead Lipper’s proprietary ETF methodology to determine the Fund’s Lipper Group. This determination was based on, among other considerations, the increased number and types of ETFs available for comparative purposes than was the case in prior years. The Board was provided with a detailed description of Lipper’s proprietary ETF methodology used by Lipper to determine the applicable Lipper Group and to prepare this information. At the Board’s request, Lipper provided, and the Board considered, information on the impact to the iShares funds’ comparative fee rankings that were attributable to the change from a pure index group methodology to Lipper’s proprietary ETF methodology. The Board further noted that due to the limitations in providing comparable funds in the Lipper Group, the statistical information provided in Lipper’s report may or may not provide meaningful direct comparisons to the Fund in all instances.
The Board also noted that the investment advisory fee rate and overall expenses for the Fund were lower than the median of the investment advisory fee rates and overall expenses of the funds in its Lipper Group.
BOARD REVIEWAND APPROVALOF INVESTMENT ADVISORY CONTRACT | 45 |
Table of Contents
Board Review and Approval of Investment Advisory
Contract (Continued)
iSHARES®, INC.
In addition, the Board reviewed statistical information prepared by Lipper regarding the performance of the Fund for the one-, three-, five-, ten-year, and since inception periods, as applicable, and the “last quarter” period ended December 31, 2013, and a comparison of the Fund’s performance to its performance benchmark index for the same periods. To the extent that any of the comparison funds included in the Lipper Group track the same index as the Fund, Lipper also provided, and the Board reviewed, a comparison of the Fund’s performance to that of such relevant comparison funds for the same periods. The Board noted that the Fund generally performed in line with its respective performance benchmark index over the relevant periods. In considering this information, the Board noted that the Lipper Group may include funds that are not exchange traded funds or index funds, and that may have different investment objectives and/or benchmarks from the Fund. In addition, the Board noted that the Fund seeks to track its own benchmark index and that, during the prior year, the Board received periodic reports on the Fund’s performance in comparison with its relevant benchmark index. Such periodic comparative performance information, including detailed information on certain specific iShares funds requested by the Boards, was also considered.
Based on this review, the other factors considered at the meeting, and their general knowledge of ETF pricing, the Board concluded that the investment advisory fee rate and expense level and the historical performance of the Fund supported the Board’s approval of the continuance of the Advisory Contract for the coming year.
Nature, Extent and Quality of Services Provided by BFA — Based on management’s representations, including information about recent and proposed enhancements to the iShares business, including with respect to shareholder servicing and support, the Board expected that there would be no diminution in the scope of services required of or provided by BFA under the Advisory Contract for the coming year as compared to the scope of services provided by BFA during prior years. In reviewing the scope of these services, the Board considered BFA’s investment philosophy and experience, noting that BFA and its affiliates have committed significant resources over time, including during the past year, to supporting the Fund and its shareholders. The Board acknowledged that resources to support the iShares funds and their shareholders have been added or enhanced in recent years, including in such areas as investor education, product management, customized portfolio consulting support, capital markets support, and proprietary risk and performance analytics tools. The Board also considered BFA’s compliance program and its compliance record with respect to the Fund. In that regard, the Board noted that BFA reports to the Board about portfolio management and compliance matters on a periodic basis in connection with regularly scheduled meetings of the Board, and on other occasions as necessary and appropriate, and has provided information and made appropriate officers available as needed to provide further assistance with these matters. The Board also reviewed the background and experience of the persons responsible for the day-to-day management of the Fund, as well as the resources available to them in managing the Fund. In addition to the above considerations, the Board reviewed and considered detailed presentations regarding BFA’s investment performance, investment and risk management processes and strategies provided at the June 12-13, 2014 meeting and throughout the previous year, and matters related to BFA’s portfolio compliance policies and procedures. The Board noted that the Fund had met its investment objective consistently since its inception date.
Based on review of this information, and the performance information discussed above, the Board concluded that the nature, extent and quality of services provided by BFA to the Fund under the Advisory Contract supported the Board’s approval of the continuance of the Advisory Contract for the coming year.
Costs of Services Provided to the Fund and Profits Realized by BFA and Affiliates — The Board reviewed information about the profitability to BlackRock of the Fund based on the fees payable to BFA and its affiliates (including fees under the Advisory Contract), and all other sources of revenue and expense to BFA and its affiliates from the Fund’s operations for the last calendar year. The Board reviewed BlackRock’s profitability methodology for the iShares funds, noting that the 15(c) Committee had focused on the methodology and proposed presentation during its meetings. The Board discussed the sources of direct and ancillary revenue with management, including the revenues to BTC from securities lending by the Fund. The Board also discussed BFA’s profit margin as reflected in the Fund’s profitability analysis and reviewed information regarding potential
| 46 | 2014 iSHARES ANNUAL REPORTTO SHAREHOLDERS |
Table of Contents
Board Review and Approval of Investment Advisory
Contract (Continued)
iSHARES®, INC.
economies of scale (as discussed below). Based on this review, the Board concluded that the profits realized by BFA and its affiliates under the Advisory Contract and from other relationships between the Fund and BFA and/or its affiliates, if any, were within a reasonable range in light of the factors considered.
Economies of Scale — The Board reviewed information regarding potential economies of scale or other efficiencies that may result from increases in the Fund’s assets, noting that the issue of economies of scale had been focused on extensively by the 15(c) Committee during its meetings and addressed by management. The Board and the 15(c) Committee reviewed information provided by BFA regarding scale benefits shared with the iShares funds through relatively low fee rates established at inception, breakpoints, waivers, or other fee reductions, as well as through additional investment in the iShares business and the provision of improved or additional infrastructure and services to the iShares funds and their shareholders. The Board and the 15(c) Committee received information regarding BlackRock’s historical profitability, including BFA’s and its affiliates’ costs in providing services. The cost information distinguished between fixed and variable costs, and explained how the level of fixed and variable costs, as well as the nature of such costs, may impact the existence or size of scale benefits. The Board noted that the Advisory Contract for the Fund already provided for breakpoints in the Fund’s investment advisory fee rate, and that, following negotiations, BFA and the Board had agreed to revise the Advisory Contract for the Fund to provide for additional breakpoints, as the assets of the Fund, on an aggregated basis with the assets of certain other iShares funds, increase. The Board noted that the revisions of the Advisory Contract to provide additional breakpoints had been subject to further negotiation after receipt of management’s proposal, and that at the request of the Board, management had modified its initial proposal regarding adding additional breakpoints to the Fund. The Board noted that it would continue to monitor the sharing of economies of scale to determine the appropriateness of adding new or revised breakpoints in the future. Based on this review, as well as the other factors considered at the meeting, the Board, recognizing its responsibility to consider this issue at least annually, concluded that the structure of the investment advisory fee rate reflects appropriate sharing of potential economies of scale with the Fund’s shareholders and supported the Board’s approval of the continuance of the Advisory Contract for the coming year.
Fees and Services Provided for Other Comparable Funds/Accounts Managed by BFA and its Affiliates — The Board received and considered information regarding the investment advisory/management fee rates for other funds/accounts in the U.S. for which BFA (or its affiliates) provides investment advisory/management services, including open-end and closed-end funds registered under the 1940 Act (including sub-advised funds), collective trust funds, separately managed accounts, and institutional separate accounts (together, the “Other Accounts”), and acknowledged BFA’s assertion that the iShares funds are fundamentally different investment vehicles from the Other Accounts. The Board noted that BFA and its affiliates do manage Other Accounts with a substantially similar investment objective and strategy as the Fund. The Board further noted that BFA provided the Board with detailed information regarding how the Other Accounts (particularly institutional clients) generally differ from the Fund, including in terms of the different, generally more extensive services provided to the Fund, as well as other significant differences in the approach of BFA and its affiliates to the Fund, on one hand, and Other Accounts, on the other. In that regard, the Board considered that the pricing of services to institutional clients is typically based on a number of factors beyond the nature and extent of the specific services to be provided and often depends on the overall relationship between the client and its affiliates and the adviser and its affiliates. In addition, the Board considered the relative complexity and inherent risks and challenges of managing and providing other services to the Fund, as a publicly traded exchange traded fund, as compared to the Other Accounts that are institutional clients in light of differing regulatory requirements and client-imposed mandates. The Board also considered the “all-inclusive” nature of the Fund’s advisory fee structure, and the Fund expenses borne by BFA under this arrangement. The Board noted that the investment advisory fee rate under the Advisory Contract for the Fund was generally higher than the investment advisory/management fee rates for the Other Accounts that are institutional clients of BFA (or its affiliates) and concluded that the differences appeared to be consistent with the factors discussed.
Other Benefits to BFA and/or its Affiliates — The Board reviewed the “fallout” benefits or ancillary revenue received by BFA and/or its affiliates in connection with the services provided to the Fund by BFA, such as payment of revenue to BTC, the Fund’s
BOARD REVIEWAND APPROVALOF INVESTMENT ADVISORY CONTRACT | 47 |
Table of Contents
Board Review and Approval of Investment Advisory
Contract (Continued)
iSHARES®, INC.
securities lending agent, for loaning portfolio securities (which was included in the profit margins reviewed by the Board pursuant to BFA’s profitability methodology), and payment of advisory fees and/or administration fees to BFA and BTC (or their affiliates) in connection with any investments by the Fund in other funds for which BFA (or its affiliates) provides investment advisory services and/or administration services. The Board noted that BFA generally does not use soft dollars or consider the value of research or other services that may be provided to BFA (including its affiliates) in selecting brokers for portfolio transactions for the Fund. The Board further noted that any portfolio transactions on behalf of the Fund placed through a BFA affiliate or purchased from an underwriting syndicate in which a BFA affiliate participates, are reported to the Board pursuant to Rule 17e-1 or Rule 10f-3, as applicable, under the 1940 Act. The Board concluded that any such ancillary benefits would not be disadvantageous to the Fund’s shareholders and thus would not alter the Board’s conclusion with respect to the appropriateness of approving the continuance of the Advisory Contract for the coming year.
Based on the considerations described above, the Board determined that the Fund’s investment advisory fee rate under the Advisory Contract does not constitute a fee that is so disproportionately large as to bear no reasonable relationship to the services rendered and that could not have been the product of arm’s-length bargaining, and concluded that it is in the best interest of the Fund and its shareholders to approve the continuance of the Advisory Contract for the coming year.
II. iShares MSCI Germany ETF
Under Section 15(c) of the Investment Company Act of 1940 (the “1940 Act”), the Company’s Board of Directors (the “Board”), including a majority of Directors who are not “interested persons” of the Company (as that term is defined in the 1940 Act) (the “Independent Directors”), is required annually to consider and approve the Investment Advisory Contract between the Company and BFA (the “Advisory Contract”) on behalf of the Fund. The Independent Directors requested, and BFA provided, such information as the Independent Directors, with advice from independent counsel, deemed reasonably necessary to evaluate the Advisory Contract. A committee of Independent Directors (the “15(c) Committee”), with independent counsel, met with management on March 12, 2014, May 6, 2014, and May 12, 2014, to discuss the types of information the Independent Directors required and the manner in which management would organize and present such information. At a meeting held on May 16, 2014, management presented preliminary information to the Board relating to the continuance of the Advisory Contract, and the Board, including the Independent Directors, reviewed and discussed such information at length. The Independent Directors requested from management certain additional information, which management agreed to provide. At a meeting held on June 12-13, 2014, the Board, including the Independent Directors, reviewed the additional information provided by management in response to these requests. After extensive discussions, the Board, including all of the Independent Directors, approved the continuance of the Advisory Contract for the Fund, based on a review of qualitative and quantitative information provided by BFA, including the additional information management provided at the request of the Independent Directors. The Board noted its satisfaction with the extent and quality of information provided and its frequent interactions with management, as well as the detailed responses and other information provided by BFA. The Board also noted that the Board and BFA agreed to discuss potential enhancements and adjustments to the 15(c) process for the coming year. The Independent Directors were advised by their independent counsel throughout the process, including about the legal standards applicable to their review. In approving the Advisory Contract for the Fund, the Board, including the Independent Directors, considered the following factors, no one of which was controlling, and reached the following conclusions:
Expenses and Performance of the Fund — The Board reviewed statistical information prepared by Lipper Inc. (“Lipper”), an independent provider of investment company data, regarding the expense ratio components, including actual advisory fees, waivers/reimbursements, and gross and net total expenses of the Fund in comparison with the same information for other exchange traded funds (including funds sponsored by an “at cost” service provider) and, in the limited instances where no comparable ETFs existed and the comparison group would not otherwise be reasonable in Lipper’s judgment, pure index institutional mutual funds, objectively selected by Lipper as comprising the Fund’s applicable peer group pursuant to Lipper’s
| 48 | 2014 iSHARES ANNUAL REPORTTO SHAREHOLDERS |
Table of Contents
Board Review and Approval of Investment Advisory
Contract (Continued)
iSHARES®, INC.
proprietary ETF methodology (the “Lipper Group”). The Board noted that, prior to 2014, Lipper had used a different methodology to determine the Fund’s Lipper group, which included mutual funds, closed-end funds, exchange traded funds, and/or funds with differing investment objective classifications, investment focuses and other characteristics (e.g. actively managed funds and funds sponsored by “at cost” service providers), as applicable. The Board further noted that, after consideration by the 15(c) Committee, the Board determined to use instead Lipper’s proprietary ETF methodology to determine the Fund’s Lipper Group. This determination was based on, among other considerations, the increased number and types of ETFs available for comparative purposes than was the case in prior years. The Board was provided with a detailed description of Lipper’s proprietary ETF methodology used by Lipper to determine the applicable Lipper Group and to prepare this information. At the Board’s request, Lipper provided, and the Board considered, information on the impact to the iShares funds’ comparative fee rankings that were attributable to the change from a pure index group methodology to Lipper’s proprietary ETF methodology. The Board further noted that due to the limitations in providing comparable funds in the Lipper Group, the statistical information provided in Lipper’s report may or may not provide meaningful direct comparisons to the Fund in all instances.
The Board also noted that the investment advisory fee rate and overall expenses for the Fund were at the median of the investment advisory fee rates and overall expenses of the funds in its Lipper Group.
In addition, the Board reviewed statistical information prepared by Lipper regarding the performance of the Fund for the one-, three-, five-, ten-year, and since inception periods, as applicable, and the “last quarter” period ended December 31, 2013, and a comparison of the Fund’s performance to its performance benchmark index for the same periods. To the extent that any of the comparison funds included in the Lipper Group track the same index as the Fund, Lipper also provided, and the Board reviewed, a comparison of the Fund’s performance to that of such relevant comparison funds for the same periods. The Board noted that the Fund generally performed in line with its respective performance benchmark index over the relevant periods. In considering this information, the Board noted that the Lipper Group may include funds that are not exchange traded funds or index funds, and that may have different investment objectives and/or benchmarks from the Fund. In addition, the Board noted that the Fund seeks to track its own benchmark index and that, during the prior year, the Board received periodic reports on the Fund’s performance in comparison with its relevant benchmark index. Such periodic comparative performance information, including detailed information on certain specific iShares funds requested by the Boards, was also considered.
Based on this review, the other factors considered at the meeting, and their general knowledge of ETF pricing, the Board concluded that the investment advisory fee rate and expense level and the historical performance of the Fund supported the Board’s approval of the continuance of the Advisory Contract for the coming year.
Nature, Extent and Quality of Services Provided by BFA — Based on management’s representations, including information about recent and proposed enhancements to the iShares business, including with respect to shareholder servicing and support, the Board expected that there would be no diminution in the scope of services required of or provided by BFA under the Advisory Contract for the coming year as compared to the scope of services provided by BFA during prior years. In reviewing the scope of these services, the Board considered BFA’s investment philosophy and experience, noting that BFA and its affiliates have committed significant resources over time, including during the past year, to supporting the Fund and its shareholders. The Board acknowledged that resources to support the iShares funds and their shareholders have been added or enhanced in recent years, including in such areas as investor education, product management, customized portfolio consulting support, capital markets support, and proprietary risk and performance analytics tools. The Board also considered BFA’s compliance program and its compliance record with respect to the Fund. In that regard, the Board noted that BFA reports to the Board about portfolio management and compliance matters on a periodic basis in connection with regularly scheduled meetings of the Board, and on other occasions as necessary and appropriate, and has provided information and made appropriate officers available as needed to provide further assistance with these matters. The Board also reviewed the background and experience of the persons responsible for the day-to-day management of the Fund, as well as the resources available to them in managing the Fund. In
BOARD REVIEWAND APPROVALOF INVESTMENT ADVISORY CONTRACT | 49 |
Table of Contents
Board Review and Approval of Investment Advisory
Contract (Continued)
iSHARES®, INC.
addition to the above considerations, the Board reviewed and considered detailed presentations regarding BFA’s investment performance, investment and risk management processes and strategies provided at the June 12-13, 2014 meeting and throughout the previous year, and matters related to BFA’s portfolio compliance policies and procedures. The Board noted that the Fund had met its investment objective consistently since its inception date.
Based on review of this information, and the performance information discussed above, the Board concluded that the nature, extent and quality of services provided by BFA to the Fund under the Advisory Contract supported the Board’s approval of the continuance of the Advisory Contract for the coming year.
Costs of Services Provided to the Fund and Profits Realized by BFA and Affiliates — The Board reviewed information about the profitability to BlackRock of the Fund based on the fees payable to BFA and its affiliates (including fees under the Advisory Contract), and all other sources of revenue and expense to BFA and its affiliates from the Fund’s operations for the last calendar year. The Board reviewed BlackRock’s profitability methodology for the iShares funds, noting that the 15(c) Committee had focused on the methodology and proposed presentation during its meetings. The Board discussed the sources of direct and ancillary revenue with management, including the revenues to BTC from securities lending by the Fund. The Board also discussed BFA’s profit margin as reflected in the Fund’s profitability analysis and reviewed information regarding potential economies of scale (as discussed below). Based on this review, the Board concluded that the profits realized by BFA and its affiliates under the Advisory Contract and from other relationships between the Fund and BFA and/or its affiliates, if any, were within a reasonable range in light of the factors considered.
Economies of Scale — The Board reviewed information regarding potential economies of scale or other efficiencies that may result from increases in the Fund’s assets, noting that the issue of economies of scale had been focused on extensively by the 15(c) Committee during its meetings and addressed by management. The Board and the 15(c) Committee reviewed information provided by BFA regarding scale benefits shared with the iShares funds through relatively low fee rates established at inception, breakpoints, waivers, or other fee reductions, as well as through additional investment in the iShares business and the provision of improved or additional infrastructure and services to the iShares funds and their shareholders. The Board and the 15(c) Committee received information regarding BlackRock’s historical profitability, including BFA’s and its affiliates’ costs in providing services. The cost information distinguished between fixed and variable costs, and explained how the level of fixed and variable costs, as well as the nature of such costs, may impact the existence or size of scale benefits. The Board noted that the Advisory Contract for the Fund already provided for breakpoints in the Fund’s investment advisory fee rate, and that, following negotiations, BFA and the Board had agreed to revise the Advisory Contract for the Fund to provide for additional breakpoints, as the assets of the Fund, on an aggregated basis with the assets of certain other iShares funds, increase. The Board noted that the revisions of the Advisory Contract to provide additional breakpoints had been subject to further negotiation after receipt of management’s proposal, and that at the request of the Board, management had modified its initial proposal regarding adding additional breakpoints to the Fund. The Board noted that it would continue to monitor the sharing of economies of scale to determine the appropriateness of adding new or revised breakpoints in the future. Based on this review, as well as the other factors considered at the meeting, the Board, recognizing its responsibility to consider this issue at least annually, concluded that the structure of the investment advisory fee rate reflects appropriate sharing of potential economies of scale with the Fund’s shareholders and supported the Board’s approval of the continuance of the Advisory Contract for the coming year.
Fees and Services Provided for Other Comparable Funds/Accounts Managed by BFA and its Affiliates — The Board received and considered information regarding the investment advisory/management fee rates for other funds/accounts in the U.S. for which BFA (or its affiliates) provides investment advisory/management services, including open-end and closed-end funds registered under the 1940 Act (including sub-advised funds), collective trust funds, separately managed accounts, and institutional separate accounts (together, the “Other Accounts”), and acknowledged BFA’s assertion that the iShares funds are fundamentally different investment vehicles from the Other Accounts. The Board noted that BFA and its affiliates do not manage
| 50 | 2014 iSHARES ANNUAL REPORTTO SHAREHOLDERS |
Table of Contents
Board Review and Approval of Investment Advisory
Contract (Continued)
iSHARES®, INC.
Other Accounts with a substantially similar investment objective and strategy as the Fund. The Board further noted that BFA provided the Board with detailed information regarding how the Other Accounts (particularly institutional clients) generally differ from the Fund, including in terms of the different, generally more extensive services provided to the Fund, as well as other significant differences in the approach of BFA and its affiliates to the Fund, on one hand, and Other Accounts, on the other. In that regard, the Board considered that the pricing of services to institutional clients is typically based on a number of factors beyond the nature and extent of the specific services to be provided and often depends on the overall relationship between the client and its affiliates and the adviser and its affiliates. In addition, the Board considered the relative complexity and inherent risks and challenges of managing and providing other services to the Fund, as a publicly traded exchange traded fund, as compared to the Other Accounts that are institutional clients in light of differing regulatory requirements and client-imposed mandates. The Board also considered the “all-inclusive” nature of the Fund’s advisory fee structure, and the Fund expenses borne by BFA under this arrangement. The Board noted that the investment advisory fee rate under the Advisory Contract for the Fund was generally higher than the investment advisory/management fee rates for the Other Accounts that are institutional clients of BFA (or its affiliates) and concluded that the differences appeared to be consistent with the factors discussed.
Other Benefits to BFA and/or its Affiliates — The Board reviewed the “fallout” benefits or ancillary revenue received by BFA and/or its affiliates in connection with the services provided to the Fund by BFA, such as payment of revenue to BTC, the Fund’s securities lending agent, for loaning portfolio securities (which was included in the profit margins reviewed by the Board pursuant to BFA’s profitability methodology), and payment of advisory fees and/or administration fees to BFA and BTC (or their affiliates) in connection with any investments by the Fund in other funds for which BFA (or its affiliates) provides investment advisory services and/or administration services. The Board noted that BFA generally does not use soft dollars or consider the value of research or other services that may be provided to BFA (including its affiliates) in selecting brokers for portfolio transactions for the Fund. The Board further noted that any portfolio transactions on behalf of the Fund placed through a BFA affiliate or purchased from an underwriting syndicate in which a BFA affiliate participates, are reported to the Board pursuant to Rule 17e-1 or Rule 10f-3, as applicable, under the 1940 Act. The Board concluded that any such ancillary benefits would not be disadvantageous to the Fund’s shareholders and thus would not alter the Board’s conclusion with respect to the appropriateness of approving the continuance of the Advisory Contract for the coming year.
Based on the considerations described above, the Board determined that the Fund’s investment advisory fee rate under the Advisory Contract does not constitute a fee that is so disproportionately large as to bear no reasonable relationship to the services rendered and that could not have been the product of arm’s-length bargaining, and concluded that it is in the best interest of the Fund and its shareholders to approve the continuance of the Advisory Contract for the coming year.
III. iShares MSCI Japan ETF
Under Section 15(c) of the Investment Company Act of 1940 (the “1940 Act”), the Company’s Board of Directors (the “Board”), including a majority of Directors who are not “interested persons” of the Company (as that term is defined in the 1940 Act) (the “Independent Directors”), is required annually to consider and approve the Investment Advisory Contract between the Company and BFA (the “Advisory Contract”) on behalf of the Fund. The Independent Directors requested, and BFA provided, such information as the Independent Directors, with advice from independent counsel, deemed reasonably necessary to evaluate the Advisory Contract. A committee of Independent Directors (the “15(c) Committee”), with independent counsel, met with management on March 12, 2014, May 6, 2014, and May 12, 2014, to discuss the types of information the Independent Directors required and the manner in which management would organize and present such information. At a meeting held on May 16, 2014, management presented preliminary information to the Board relating to the continuance of the Advisory Contract, and the Board, including the Independent Directors, reviewed and discussed such information at length. The Independent Directors requested from management certain additional information, which management agreed to provide. At a meeting held on June 12-13, 2014, the Board, including the Independent Directors, reviewed the additional information provided by management
BOARD REVIEWAND APPROVALOF INVESTMENT ADVISORY CONTRACT | 51 |
Table of Contents
Board Review and Approval of Investment Advisory
Contract (Continued)
iSHARES®, INC.
in response to these requests. After extensive discussions, the Board, including all of the Independent Directors, approved the continuance of the Advisory Contract for the Fund, based on a review of qualitative and quantitative information provided by BFA, including the additional information management provided at the request of the Independent Directors. The Board noted its satisfaction with the extent and quality of information provided and its frequent interactions with management, as well as the detailed responses and other information provided by BFA. The Board also noted that the Board and BFA agreed to discuss potential enhancements and adjustments to the 15(c) process for the coming year. The Independent Directors were advised by their independent counsel throughout the process, including about the legal standards applicable to their review. In approving the Advisory Contract for the Fund, the Board, including the Independent Directors, considered the following factors, no one of which was controlling, and reached the following conclusions:
Expenses and Performance of the Fund — The Board reviewed statistical information prepared by Lipper Inc. (“Lipper”), an independent provider of investment company data, regarding the expense ratio components, including actual advisory fees, waivers/reimbursements, and gross and net total expenses of the Fund in comparison with the same information for other exchange traded funds (including funds sponsored by an “at cost” service provider) and, in the limited instances where no comparable ETFs existed and the comparison group would not otherwise be reasonable in Lipper’s judgment, pure index institutional mutual funds, objectively selected by Lipper as comprising the Fund’s applicable peer group pursuant to Lipper’s proprietary ETF methodology (the “Lipper Group”). The Board noted that, prior to 2014, Lipper had used a different methodology to determine the Fund’s Lipper group, which included mutual funds, closed-end funds, exchange traded funds, and/or funds with differing investment objective classifications, investment focuses and other characteristics (e.g. actively managed funds and funds sponsored by “at cost” service providers), as applicable. The Board further noted that, after consideration by the 15(c) Committee, the Board determined to use instead Lipper’s proprietary ETF methodology to determine the Fund’s Lipper Group. This determination was based on, among other considerations, the increased number and types of ETFs available for comparative purposes than was the case in prior years. The Board was provided with a detailed description of Lipper’s proprietary ETF methodology used by Lipper to determine the applicable Lipper Group and to prepare this information. At the Board’s request, Lipper provided, and the Board considered, information on the impact to the iShares funds’ comparative fee rankings that were attributable to the change from a pure index group methodology to Lipper’s proprietary ETF methodology. The Board further noted that due to the limitations in providing comparable funds in the Lipper Group, the statistical information provided in Lipper’s report may or may not provide meaningful direct comparisons to the Fund in all instances.
The Board also noted that the investment advisory fee rate and overall expenses for the Fund were lower than the median of the investment advisory fee rates and overall expenses of the funds in its Lipper Group.
In addition, the Board reviewed statistical information prepared by Lipper regarding the performance of the Fund for the one-, three-, five-, ten-year, and since inception periods, as applicable, and the “last quarter” period ended December 31, 2013, and a comparison of the Fund’s performance to its performance benchmark index for the same periods. To the extent that any of the comparison funds included in the Lipper Group track the same index as the Fund, Lipper also provided, and the Board reviewed, a comparison of the Fund’s performance to that of such relevant comparison funds for the same periods. The Board noted that the Fund generally performed in line with its respective performance benchmark index over the relevant periods. In considering this information, the Board noted that the Lipper Group may include funds that are not exchange traded funds or index funds, and that may have different investment objectives and/or benchmarks from the Fund. In addition, the Board noted that the Fund seeks to track its own benchmark index and that, during the prior year, the Board received periodic reports on the Fund’s performance in comparison with its relevant benchmark index. Such periodic comparative performance information, including detailed information on certain specific iShares funds requested by the Boards, was also considered.
| 52 | 2014 iSHARES ANNUAL REPORTTO SHAREHOLDERS |
Table of Contents
Board Review and Approval of Investment Advisory
Contract (Continued)
iSHARES®, INC.
Based on this review, the other factors considered at the meeting, and their general knowledge of ETF pricing, the Board concluded that the investment advisory fee rate and expense level and the historical performance of the Fund supported the Board’s approval of the continuance of the Advisory Contract for the coming year.
Nature, Extent and Quality of Services Provided by BFA — Based on management’s representations, including information about recent and proposed enhancements to the iShares business, including with respect to shareholder servicing and support, the Board expected that there would be no diminution in the scope of services required of or provided by BFA under the Advisory Contract for the coming year as compared to the scope of services provided by BFA during prior years. In reviewing the scope of these services, the Board considered BFA’s investment philosophy and experience, noting that BFA and its affiliates have committed significant resources over time, including during the past year, to supporting the Fund and its shareholders. The Board acknowledged that resources to support the iShares funds and their shareholders have been added or enhanced in recent years, including in such areas as investor education, product management, customized portfolio consulting support, capital markets support, and proprietary risk and performance analytics tools. The Board also considered BFA’s compliance program and its compliance record with respect to the Fund. In that regard, the Board noted that BFA reports to the Board about portfolio management and compliance matters on a periodic basis in connection with regularly scheduled meetings of the Board, and on other occasions as necessary and appropriate, and has provided information and made appropriate officers available as needed to provide further assistance with these matters. The Board also reviewed the background and experience of the persons responsible for the day-to-day management of the Fund, as well as the resources available to them in managing the Fund. In addition to the above considerations, the Board reviewed and considered detailed presentations regarding BFA’s investment performance, investment and risk management processes and strategies provided at the June 12-13, 2014 meeting and throughout the previous year, and matters related to BFA’s portfolio compliance policies and procedures. The Board noted that the Fund had met its investment objective consistently since its inception date.
Based on review of this information, and the performance information discussed above, the Board concluded that the nature, extent and quality of services provided by BFA to the Fund under the Advisory Contract supported the Board’s approval of the continuance of the Advisory Contract for the coming year.
Costs of Services Provided to the Fund and Profits Realized by BFA and Affiliates — The Board reviewed information about the profitability to BlackRock of the Fund based on the fees payable to BFA and its affiliates (including fees under the Advisory Contract), and all other sources of revenue and expense to BFA and its affiliates from the Fund’s operations for the last calendar year. The Board reviewed BlackRock’s profitability methodology for the iShares funds, noting that the 15(c) Committee had focused on the methodology and proposed presentation during its meetings. The Board discussed the sources of direct and ancillary revenue with management, including the revenues to BTC from securities lending by the Fund. The Board also discussed BFA’s profit margin as reflected in the Fund’s profitability analysis and reviewed information regarding potential economies of scale (as discussed below). Based on this review, the Board concluded that the profits realized by BFA and its affiliates under the Advisory Contract and from other relationships between the Fund and BFA and/or its affiliates, if any, were within a reasonable range in light of the factors considered.
Economies of Scale — The Board reviewed information regarding potential economies of scale or other efficiencies that may result from increases in the Fund’s assets, noting that the issue of economies of scale had been focused on extensively by the 15(c) Committee during its meetings and addressed by management. The Board and the 15(c) Committee reviewed information provided by BFA regarding scale benefits shared with the iShares funds through relatively low fee rates established at inception, breakpoints, waivers, or other fee reductions, as well as through additional investment in the iShares business and the provision of improved or additional infrastructure and services to the iShares funds and their shareholders. The Board and the 15(c) Committee received information regarding BlackRock’s historical profitability, including BFA’s and its affiliates’ costs in providing services. The cost information distinguished between fixed and variable costs, and explained how the level of fixed and
BOARD REVIEWAND APPROVALOF INVESTMENT ADVISORY CONTRACT | 53 |
Table of Contents
Board Review and Approval of Investment Advisory
Contract (Continued)
iSHARES®, INC.
variable costs, as well as the nature of such costs, may impact the existence or size of scale benefits. The Board noted that the Advisory Contract for the Fund already provided for breakpoints in the Fund’s investment advisory fee rate, and that, following negotiations, BFA and the Board had agreed to revise the Advisory Contract for the Fund to provide for additional breakpoints, as the assets of the Fund, on an aggregated basis with the assets of certain other iShares funds, increase. The Board noted that the revisions of the Advisory Contract to provide additional breakpoints had been subject to further negotiation after receipt of management’s proposal, and that at the request of the Board, management had modified its initial proposal regarding adding additional breakpoints to the Fund. The Board noted that it would continue to monitor the sharing of economies of scale to determine the appropriateness of adding new or revised breakpoints in the future. Based on this review, as well as the other factors considered at the meeting, the Board, recognizing its responsibility to consider this issue at least annually, concluded that the structure of the investment advisory fee rate reflects appropriate sharing of potential economies of scale with the Fund’s shareholders and supported the Board’s approval of the continuance of the Advisory Contract for the coming year.
Fees and Services Provided for Other Comparable Funds/Accounts Managed by BFA and its Affiliates — The Board received and considered information regarding the investment advisory/management fee rates for other funds/accounts in the U.S. for which BFA (or its affiliates) provides investment advisory/management services, including open-end and closed-end funds registered under the 1940 Act (including sub-advised funds), collective trust funds, separately managed accounts, and institutional separate accounts (together, the “Other Accounts”), and acknowledged BFA’s assertion that the iShares funds are fundamentally different investment vehicles from the Other Accounts. The Board noted that BFA and its affiliates do manage Other Accounts with a substantially similar investment objective and strategy as the Fund. The Board further noted that BFA provided the Board with detailed information regarding how the Other Accounts (particularly institutional clients) generally differ from the Fund, including in terms of the different, generally more extensive services provided to the Fund, as well as other significant differences in the approach of BFA and its affiliates to the Fund, on one hand, and Other Accounts, on the other. In that regard, the Board considered that the pricing of services to institutional clients is typically based on a number of factors beyond the nature and extent of the specific services to be provided and often depends on the overall relationship between the client and its affiliates and the adviser and its affiliates. In addition, the Board considered the relative complexity and inherent risks and challenges of managing and providing other services to the Fund, as a publicly traded exchange traded fund, as compared to the Other Accounts that are institutional clients in light of differing regulatory requirements and client-imposed mandates. The Board also considered the “all-inclusive” nature of the Fund’s advisory fee structure, and the Fund expenses borne by BFA under this arrangement. The Board noted that the investment advisory fee rate under the Advisory Contract for the Fund was generally higher than the investment advisory/management fee rates for the Other Accounts that are institutional clients of BFA (or its affiliates) and concluded that the differences appeared to be consistent with the factors discussed.
Other Benefits to BFA and/or its Affiliates — The Board reviewed the “fallout” benefits or ancillary revenue received by BFA and/or its affiliates in connection with the services provided to the Fund by BFA, such as payment of revenue to BTC, the Fund’s securities lending agent, for loaning portfolio securities (which was included in the profit margins reviewed by the Board pursuant to BFA’s profitability methodology), and payment of advisory fees and/or administration fees to BFA and BTC (or their affiliates) in connection with any investments by the Fund in other funds for which BFA (or its affiliates) provides investment advisory services and/or administration services. The Board noted that BFA generally does not use soft dollars or consider the value of research or other services that may be provided to BFA (including its affiliates) in selecting brokers for portfolio transactions for the Fund. The Board further noted that any portfolio transactions on behalf of the Fund placed through a BFA affiliate or purchased from an underwriting syndicate in which a BFA affiliate participates, are reported to the Board pursuant to Rule 17e-1 or Rule 10f-3, as applicable, under the 1940 Act. The Board concluded that any such ancillary benefits would not be disadvantageous to the Fund’s shareholders and thus would not alter the Board’s conclusion with respect to the appropriateness of approving the continuance of the Advisory Contract for the coming year.
| 54 | 2014 iSHARES ANNUAL REPORTTO SHAREHOLDERS |
Table of Contents
Board Review and Approval of Investment Advisory
Contract (Continued)
iSHARES®, INC.
Based on the considerations described above, the Board determined that the Fund’s investment advisory fee rate under the Advisory Contract does not constitute a fee that is so disproportionately large as to bear no reasonable relationship to the services rendered and that could not have been the product of arm’s-length bargaining, and concluded that it is in the best interest of the Fund and its shareholders to approve the continuance of the Advisory Contract for the coming year.
BOARD REVIEWAND APPROVALOF INVESTMENT ADVISORY CONTRACT | 55 |
Table of Contents
Supplemental Information (Unaudited)
iSHARES®, INC.
Section 19(a) Notices
The amounts and sources of distributions reported are only estimates and are not being provided for tax reporting purposes. The actual amounts and sources of the amounts for tax reporting purposes will depend upon each Fund’s investment experience during the year and may be subject to changes based on the tax regulations. Shareholders will receive a Form 1099-DIV each calendar year that will inform them how to report distributions for federal income tax purposes.
| Total Cumulative Distributions for the Fiscal Year | % Breakdown of the Total Cumulative Distributions for the Fiscal Year | |||||||||||||||||||||||||||||||
| iShares ETF | Net Investment Income | Net Realized Capital Gains | Return of Capital | Total Per Share | Net Investment Income | Net Realized Capital Gains | Return of Capital | Total Per Share | ||||||||||||||||||||||||
MSCI EMU | $ | 0.942598 | $ | — | $ | — | $ | 0.942598 | 100 | % | — | % | — | % | 100 | % | ||||||||||||||||
MSCI Japan | 0.148862 | — | 0.021338 | 0.170200 | 87 | — | 13 | 100 | ||||||||||||||||||||||||
Premium/Discount Information
The tables that follow present information about the differences between the daily market price on secondary markets for shares of a Fund and that Fund’s net asset value. Net asset value, or “NAV,” is the price per share at which each Fund issues and redeems shares. It is calculated in accordance with the standard formula for valuing mutual fund shares. The “Market Price” of each Fund generally is determined using the midpoint between the highest bid and the lowest offer on the primary stock exchange on which the shares of such Fund are listed for trading, as of the time that the Fund’s NAV is calculated. Each Fund’s Market Price may be at, above or below its NAV. The NAV of each Fund will fluctuate with changes in the fair value of its portfolio holdings. The Market Price of each Fund will fluctuate in accordance with changes in its NAV, as well as market supply and demand.
Premiums or discounts are the differences (expressed as a percentage) between the NAV and Market Price of a Fund on a given day, generally at the time NAV is calculated. A premium is the amount that a Fund is trading above the reported NAV, expressed as a percentage of the NAV. A discount is the amount that a Fund is trading below the reported NAV, expressed as a percentage of the NAV.
| 56 | 2014 iSHARES ANNUAL REPORTTO SHAREHOLDERS |
Table of Contents
Supplemental Information (Unaudited) (Continued)
iSHARES®, INC.
The following information shows the frequency distributions of premiums and discounts for each of the Funds included in this report. The information shown for each Fund is for five calendar years through the date of the most recent calendar quarter-end. The specific periods covered for each Fund are disclosed in the table for such Fund.
Each line in the table shows the number of trading days in which the Fund traded within the premium/discount range indicated. The number of trading days in each premium/discount range is also shown as a percentage of the total number of trading days in the period covered by each table. All data presented here represents past performance, which cannot be used to predict future results.
iShares MSCI EMU ETF
Period Covered: January 1, 2009 through June 30, 2014
Premium/Discount Range | Number of Days | Percentage of Total Days | ||||||
Greater than 3.5% | 3 | 0.22 | % | |||||
Greater than 3.0% and Less than 3.5% | 1 | 0.07 | ||||||
Greater than 2.5% and Less than 3.0% | 4 | 0.29 | ||||||
Greater than 2.0% and Less than 2.5% | 9 | 0.65 | ||||||
Greater than 1.5% and Less than 2.0% | 22 | 1.59 | ||||||
Greater than 1.0% and Less than 1.5% | 54 | 3.91 | ||||||
Greater than 0.5% and Less than 1.0% | 211 | 15.27 | ||||||
Between 0.5% and –0.5% | 871 | 63.02 | ||||||
Less than –0.5% and Greater than –1.0% | 119 | 8.61 | ||||||
Less than –1.0% and Greater than –1.5% | 49 | 3.55 | ||||||
Less than –1.5% and Greater than –2.0% | 24 | 1.74 | ||||||
Less than –2.0% and Greater than –2.5% | 8 | 0.58 | ||||||
Less than –2.5% and Greater than –3.0% | 5 | 0.36 | ||||||
Less than –3.0% | 2 | 0.14 | ||||||
|
|
|
| |||||
| 1,382 | 100.00 | % | ||||||
|
|
|
| |||||
SUPPLEMENTAL INFORMATION | 57 |
Table of Contents
Supplemental Information (Unaudited) (Continued)
iSHARES®, INC.
iShares MSCI Germany ETF
Period Covered: January 1, 2009 through June 30, 2014
Premium/Discount Range | Number of Days | Percentage of Total Days | ||||||
Greater than 3.5% | 2 | 0.14 | % | |||||
Greater than 3.0% and Less than 3.5% | 1 | 0.07 | ||||||
Greater than 2.5% and Less than 3.0% | 1 | 0.07 | ||||||
Greater than 2.0% and Less than 2.5% | 12 | 0.87 | ||||||
Greater than 1.5% and Less than 2.0% | 18 | 1.30 | ||||||
Greater than 1.0% and Less than 1.5% | 51 | 3.69 | ||||||
Greater than 0.5% and Less than 1.0% | 187 | 13.54 | ||||||
Between 0.5% and –0.5% | 919 | 66.51 | ||||||
Less than –0.5% and Greater than –1.0% | 113 | 8.18 | ||||||
Less than –1.0% and Greater than –1.5% | 49 | 3.55 | ||||||
Less than –1.5% and Greater than –2.0% | 18 | 1.30 | ||||||
Less than –2.0% and Greater than –2.5% | 6 | 0.43 | ||||||
Less than –2.5% and Greater than –3.0% | 2 | 0.14 | ||||||
Less than –3.0% and Greater than –3.5% | 2 | 0.14 | ||||||
Less than –3.5% | 1 | 0.07 | ||||||
|
|
|
| |||||
| 1,382 | 100.00 | % | ||||||
|
|
|
| |||||
iShares MSCI Japan ETF
Period Covered: January 1, 2009 through June 30, 2014
Premium/Discount Range | Number of Days | Percentage of Total Days | ||||||
Greater than 4.5% | 3 | 0.22 | % | |||||
Greater than 4.0% and Less than 4.5% | 2 | 0.14 | ||||||
Greater than 3.5% and Less than 4.0% | 8 | 0.58 | ||||||
Greater than 3.0% and Less than 3.5% | 3 | 0.22 | ||||||
Greater than 2.5% and Less than 3.0% | 11 | 0.80 | ||||||
Greater than 2.0% and Less than 2.5% | 14 | 1.01 | ||||||
Greater than 1.5% and Less than 2.0% | 57 | 4.12 | ||||||
Greater than 1.0% and Less than 1.5% | 119 | 8.61 | ||||||
Greater than 0.5% and Less than 1.0% | 257 | 18.60 | ||||||
Between 0.5% and –0.5% | 574 | 41.54 | ||||||
Less than –0.5% and Greater than –1.0% | 154 | 11.14 | ||||||
Less than –1.0% and Greater than –1.5% | 75 | 5.43 | ||||||
Less than –1.5% and Greater than –2.0% | 53 | 3.84 | ||||||
Less than –2.0% and Greater than –2.5% | 23 | 1.66 | ||||||
Less than –2.5% and Greater than –3.0% | 14 | 1.01 | ||||||
Less than –3.0% and Greater than –3.5% | 8 | 0.58 | ||||||
Less than –3.5% and Greater than –4.0% | 5 | 0.36 | ||||||
Less than –4.0% | 2 | 0.14 | ||||||
|
|
|
| |||||
| 1,382 | 100.00 | % | ||||||
|
|
|
| |||||
| 58 | 2014 iSHARES ANNUAL REPORTTO SHAREHOLDERS |
Table of Contents
Supplemental Information (Unaudited) (Continued)
iSHARES®, INC.
Regulation under the Alternative Investment Fund Managers Directive
The Alternative Investment Fund Managers Directive (the “Directive”) imposes detailed and prescriptive obligations on fund managers established in the European Union (the “EU”). These do not currently apply to managers established outside the EU, such as BFA. Rather, non-EU managers are only required to comply with certain disclosure, reporting and transparency obligations of the Directive if such managers market a fund to EU investors.
BFA has registered the iShares MSCI Germany ETF and iShares MSCI Japan ETF (each a “Fund”, collectively the “Funds”) for marketing to EU investors in the United Kingdom, the Netherlands, Finland, Sweden and Luxembourg.
Report on Remuneration
BFA is required under the Directive to make quantitative disclosures of remuneration. These disclosures are made in line with BlackRock’s interpretation of currently available regulatory guidance on quantitative remuneration disclosures. As market or regulatory practice develops BlackRock may consider it appropriate to make changes to the way in which quantitative remuneration disclosures are calculated. Where such changes are made, this may result in disclosures in relation to a fund not being comparable to the disclosures made in the prior year, or in relation to other BlackRock fund disclosures in that same year.
Disclosures are provided in relation to both (a) the staff of BFA; and (b) staff who are senior management or who have the ability to materially affect the risk profile of the Funds.
All individuals included in the aggregated figures disclosed are rewarded in line with BlackRock’s remuneration policy for their responsibilities across the relevant BlackRock business area. As all individuals have a number of areas of responsibilities, only the portion of remuneration for those individuals’ services attributable to each Fund is included in the aggregate figures disclosed.
BlackRock has a clear and well defined pay-for-performance philosophy, and compensation programs which support that philosophy. For senior management, a significant percentage of variable remuneration is deferred over time. All employees are subject to a claw-back policy.
Compensation decisions for employees are made based on full-year financial results and other non-financial goals and objectives. Alongside financial performance, individual compensation is also based on strategic and operating results and other considerations such as management and leadership capabilities. No set formulas are established and no fixed benchmarks are used in determining annual incentive awards. Bonus pools are reviewed by BlackRock’s independent compensation committee, taking into account both actual and projected financial information together with information provided by the Operational Risk and Regulatory Compliance departments in relation to any activities, incidents or events that warrant consideration in making compensation decisions.
Functions such as Finance, Operational Risk, Legal & Compliance, and Human Resources each have their own organizational structures which are independent of the business units. Functional bonus pools are determined with reference to the performance of each individual function and the remuneration of the senior members of control functions is directly overseen by BlackRock’s independent compensation committee. No individual is involved in setting his or her own remuneration.
The figures disclosed are a sum of each individual’s portion of remuneration attributable to each Fund according to an objective apportionment methodology. Accordingly the figures are not representative of any individual’s actual remuneration or their remuneration structure.
SUPPLEMENTAL INFORMATION | 59 |
Table of Contents
Supplemental Information (Unaudited) (Continued)
iSHARES®, INC.
The amount of the total remuneration awarded by BFA to its staff which has been attributed to the iShares MSCI Germany ETF in respect of BFA’s financial year ending December 31, 2013 was USD 1,080,388. This figure is comprised of fixed remuneration of USD 424,803 and variable remuneration of USD 655,585. There were a total of 436 beneficiaries of the remuneration described above.
The amount of the aggregate remuneration awarded by BFA to its senior management and members of its staff whose actions have a material impact on the risk profile of the iShares MSCI Germany ETF which has been attributed to the Fund in respect of BFA’s financial year ending December 31, 2013 was USD 173,572.
The amount of the total remuneration awarded by BFA to its staff which has been attributed to the iShares MSCI Japan ETF in respect of BFA’s financial year ending December 31, 2013 was USD 2,850,060. This figure is comprised of fixed remuneration of USD 1,120,630 and variable remuneration of USD 1,729,430. There were a total of 436 beneficiaries of the remuneration described above.
The amount of the aggregate remuneration awarded by BFA to its senior management and members of its staff whose actions have a material impact on the risk profile of the iShares MSCI Japan ETF which has been attributed to the Fund in respect of BFA’s financial year ending December 31, 2013 was USD 457,884.
| 60 | 2014 iSHARES ANNUAL REPORTTO SHAREHOLDERS |
Table of Contents
Director and Officer Information
iSHARES®, INC.
The Board of Directors has responsibility for the overall management and operations of the Company, including general supervision of the duties performed by BFA and other service providers. Each Director serves until he or she resigns, is removed, dies, retires or becomes incapacitated. The President, Chief Compliance Officer, Treasurer and Secretary shall each hold office until their successors are chosen and qualify, and all other officers shall hold office until he or she resigns or is removed. Directors who are not “interested persons” (as defined in the 1940 Act) of the Company are referred to as independent directors (“Independent Directors”).
The registered investment companies advised by BFA or its affiliates are organized into one complex of closed-end funds, two complexes of open-end funds and one complex of exchange-traded funds (“Exchange-Traded Fund Complex”) (each, a “BlackRock Fund Complex”). Each Fund is included in the BlackRock Fund Complex referred to as the Exchange-Traded Fund Complex. Each Director also serves as a Trustee of iShares Trust, a Director of iShares MSCI Russia Capped ETF, Inc. and a Trustee of iShares U.S. ETF Trust and, as a result, oversees a total of 312 funds (as of August 31, 2014) within the Exchange-Traded Fund Complex. With the exception of Robert S. Kapito and Mark Wiedman, the address of each Director and officer is c/o BlackRock, Inc., 400 Howard Street, San Francisco, CA 94105. The address of Mr. Kapito and Mr. Wiedman is c/o BlackRock, Inc., Park Avenue Plaza, 55 East 52nd Street, New York, NY 10055. The Board has designated Robert H. Silver as its Independent Chairman. Additional information about the Funds’ Directors and officers may be found in the Funds’ combined Statement of Additional Information, which is available without charge, upon request, by calling toll-free 1-800-iShares (1-800-474-2737).
Interested Directors
| Name (Age) | Position(s) | Principal Occupation(s) During the Past 5 Years | Other Directorships Held by Director | |||
Robert S. Kapitoa (57) | Director (since 2009). | President and Director, BlackRock, Inc. (since 2006); Vice Chairman of BlackRock, Inc. and Head of BlackRock, Inc.’s Portfolio Management Group (since its formation in 1998) and BlackRock, Inc.’s predecessor entities (since 1988); Trustee, University of Pennsylvania (since 2009); President of Board of Directors, Hope & Heroes Children’s Cancer Fund (since 2002); President of the Board of Directors, Periwinkle Theatre for Youth (since 1983). | Trustee of iShares Trust (since 2009); Director of iShares MSCI Russia Capped ETF, Inc. (since 2010); Trustee of iShares U.S. ETF Trust (since 2011); Director of BlackRock, Inc. (since 2006). | |||
Mark Wiedmanb (43) | Director (since 2013). | Managing Director, BlackRock, Inc. (since 2007); Global Head of iShares (since 2011); Head of Corporate Strategy, BlackRock, Inc. (2009-2011). | Trustee of iShares Trust. (since 2013); Director of iShares MSCI Russia Capped ETF, Inc. (since 2013);Trustee of iShares U.S. ETF Trust (since 2013); Director of PennyMac Financial Services, Inc. (since 2008). | |||
| a | Robert S. Kapito is deemed to be an “interested person” (as defined in the 1940 Act) of the Company due to his affiliations with BlackRock, Inc. |
| b | Mark Wiedman is deemed to be an “interested person” (as defined in the 1940 Act) of the Company due to his affiliations with BlackRock, Inc. and its affiliates. |
DIRECTORAND OFFICER INFORMATION | 61 |
Table of Contents
Director and Officer Information (Continued)
iSHARES®, INC.
Independent Directors
| Name (Age) | Position(s) | Principal Occupation(s) During the Past 5 Years | Other Directorships Held by Director | |||
Robert H. Silver (59) | Director (since 2007); Independent Chairman (since 2012). | President and Co-Founder of The Bravitas Group, Inc. (since 2006); Director and Vice Chairman of the YMCA of Greater NYC (2001-2011); Broadway Producer (2006-2011); Co-Founder and Vice President of Parentgiving Inc. (since 2008); Director and Member of the Audit and Compensation Committee of EPAM Systems, Inc. (2006-2009); President and Chief Operating Officer of UBS Financial Services Inc. (formerly Paine Webber Inc.) (2003-2005) and various executive positions with UBS and its affiliates (1988-2005); CPA and Audit Manager of KPMG, LLP (formerly Peat Marwick Mitchell) (1977-1983). | Trustee of iShares Trust (since 2007); Director of iShares MSCI Russia Capped ETF, Inc. (since 2010); Trustee of iShares U.S. ETF Trust (since 2011); Independent Chairman of iShares, Trust, iShares MSCI Russia Capped ETF, Inc. and iShares U.S. ETF Trust (since 2012). | |||
Cecilia H. Herbert (65) | Director (since 2005); Nominating and Governance Committee Chair and Equity Plus Committee Chair (since 2012). | Director (1998-2013) and President (2007-2011) of the Board of Directors, Catholic Charities CYO; Trustee (2002-2011) and Chair of the Finance and Investment Committee (2006-2010) of the Thacher School; Member (since 1992) and Chair (1994-2005) of the Investment Committee, Archdiocese of San Francisco; Trustee and Member of the Investment Committee, WNET, the New York public broadcasting/media company (since 2011). | Trustee of iShares Trust (since 2005); Director of iShares MSCI Russia Capped ETF, Inc. (since 2010); Trustee of iShares U.S. ETF Trust (since 2011); Director of Forward Funds (34 portfolios) (since 2009). | |||
Charles A. Hurty (70) | Director (since 2005); Audit Committee Chair (since 2006). | Retired; Partner, KPMG LLP (1968-2001). | Trustee of iShares Trust (since 2005); Director of iShares MSCI Russia Capped ETF, Inc. (since 2010); Trustee of iShares U.S. ETF Trust (since 2011); Director of GMAM Absolute Return Strategy Fund (1 portfolio) (since 2002); Director of SkyBridge Alternative Investments Multi-Adviser Hedge Fund Portfolios LLC (2 portfolios) (since 2002). | |||
John E. Kerrigan (59) | Director (since 2005); Fixed Income Plus Committee Chair (since 2012). | Chief Investment Officer, Santa Clara University (since 2002). | Trustee of iShares Trust (since 2005); Director of iShares MSCI Russia Capped ETF, Inc. (since 2010); Trustee of iShares U.S. ETF Trust (since 2011). | |||
| 62 | 2014 iSHARES ANNUAL REPORTTO SHAREHOLDERS |
Table of Contents
Director and Officer Information (Continued)
iSHARES®, INC.
Independent Directors (Continued)
| Name (Age) | Position(s) | Principal Occupation(s) During the Past 5 Years | Other Directorships Held by Director | |||
John E. Martinez (53) | Director (since 2003); Securities Lending Committee Chair (since 2012). | Director of FirstREX Agreement Corp. (formerly EquityRock, Inc.) (since 2005). | Trustee of iShares Trust (since 2003); Director of iShares MSCI Russia Capped ETF, Inc. (since 2010); Trustee of iShares U.S. ETF Trust (since 2011). | |||
George G.C. Parker (75) | Director (since 2002). | Dean Witter Distinguished Professor of Finance, Emeritus, Stanford University Graduate School of Business (Professor since 1973; Emeritus since 2006). | Trustee of iShares Trust (since 2000); Director of iShares MSCI Russia Capped ETF, Inc. (since 2010); Trustee of iShares U.S. ETF Trust (since 2011); Director of Tejon Ranch Company (since 1999); Director of Threshold Pharmaceuticals (since 2004); Director of Colony Financial, Inc. (since 2009); Director of First Republic Bank (since 2010). | |||
Madhav V. Rajan (50) | Director (since 2011); 15(c) Committee Chair (since 2012). | Robert K. Jaedicke Professor of Accounting and Senior Associate Dean for Academic Affairs and Head of MBA Program, Stanford University Graduate School of Business (since 2001); Professor of Law (by courtesy), Stanford Law School (since 2005); Visiting Professor, University of Chicago (2007-2008). | Trustee of iShares Trust (since 2011); Director of iShares MSCI Russia Capped ETF, Inc. (since 2011); Trustee of iShares U.S. ETF Trust (since 2011); Director, Cavium, Inc. (since 2013). | |||
DIRECTORAND OFFICER INFORMATION | 63 |
Table of Contents
Director and Officer Information (Continued)
iSHARES®, INC.
Officers
| Name (Age) | Position(s) | Principal Occupation(s) During the Past 5 Years | ||
Manish Mehta (43) | President (since 2013). | Managing Director, BlackRock, Inc. (since 2009); Chief Operating Officer for iShares (since 2009); Head of Strategy and Corporate Development, BGI (2005-2009); Chief of Staff to the CEO, BGI (2005-2009). | ||
Jack Gee (54) | Treasurer and Chief Financial Officer (since 2008). | Managing Director, BlackRock, Inc. (since 2009); Senior Director of Fund Administration of Intermediary Investor Business, BGI (2009); Director of Fund Administration of Intermediary Investor Business, BGI (2004-2009). | ||
Edward B. Baer (45) | Vice President and Chief Legal Officer (since 2012). | Managing Director of Legal & Compliance, BlackRock, Inc. (since 2006); Director of Legal & Compliance, BlackRock, Inc. (2004-2006). | ||
Eilleen M. Clavere (62) | Secretary (since 2007). | Director of Global Fund Administration, BlackRock, Inc. (since 2009); Director of Legal Administration of Intermediary Investor Business, BGI (2006-2009); Legal Counsel and Vice President of Atlas Funds, Atlas Advisers, Inc. and Atlas Securities, Inc. (2005-2006); Counsel at Kirkpatrick & Lockhart LLP (2001-2005). | ||
Scott Radell (45) | Executive Vice President (since 2012). | Managing Director, BlackRock, Inc. (since 2009); Head of Portfolio Solutions, BlackRock, Inc. (since 2009); Head of Portfolio Solutions, BGI (2007-2009); Credit Portfolio Manager, BGI (2005-2007); Credit Research Analyst, BGI (2003-2005). | ||
Amy Schioldager (51) | Executive Vice President (since 2007). | Senior Managing Director, BlackRock, Inc. (since 2009); Global Head of Index Equity, BGI (2008-2009); Global Head of U.S. Indexing, BGI (2006-2008); Head of Domestic Equity Portfolio Management, BGI (2001-2006). | ||
Ira P. Shapiro (51) | Vice President (since 2007). | Managing Director, BlackRock, Inc. (since 2009); Head of Strategic Product Initiatives for iShares (since 2012); Chief Legal Officer, Exchange-Traded Fund Complex (2007-2012); Associate General Counsel, BGI (2004-2009). | ||
| 64 | 2014 iSHARES ANNUAL REPORTTO SHAREHOLDERS |
Table of Contents
Notes:
NOTES | 65 |
Table of Contents
Notes:
| 66 | 2014 iSHARES ANNUAL REPORTTO SHAREHOLDERS |
Table of Contents
|
For more information visit www.iShares.com or call 1-800-474-2737
This report is intended for the Funds’ shareholders. It may not be distributed to prospective investors unless it is preceded or accompanied by the current prospectus.
Investing involves risk, including possible loss of principal.
The iShares Funds are distributed by BlackRock Investments, LLC (together with its affiliates, “BlackRock”).
The iShares Funds are not sponsored, endorsed, issued, sold or promoted by MSCI Inc., nor does this company make any representation regarding the advisability of investing in the iShares Funds. BlackRock is not affiliated with the company listed above.
A description of the policies that the Funds use to determine how to vote proxies relating to portfolio securities and information about how the Funds voted proxies relating to portfolio securities during the most recent twelve-month period ending June 30 is available without charge, upon request, by calling toll-free 1-800-474-2737; on the Funds’ website at www.iShares.com; and on the U.S. Securities and Exchange Commission (SEC) website at www.sec.gov.
The Funds file their complete schedules of portfolio holdings with the SEC for the first and third quarters of each fiscal year on Form N-Q. The Funds’ Forms N-Q are available on the SEC’s website or may be reviewed and copied at the SEC’s Public Reference Room in Washington, D.C. Information on the operation of the Public Reference Room may be obtained by calling 1-800-SEC-0330. The Funds also disclose their complete schedules of portfolio holdings on a daily and monthly basis on the Funds’ website.
©2014 BlackRock, Inc. All rights reserved. iSHARES and BLACKROCK are registered trademarks of BlackRock, Inc. or its subsidiaries. All other marks are the property of their respective owners.
iS-AR-81-0814

Table of Contents
Item 2. Code of Ethics.
iShares, Inc. (the “Registrant”) adopted a new code of ethics on July 1, 2011 that applies to persons appointed by the Registrant’s Board of Directors as the President and/or Chief Financial Officer, and any persons performing similar functions. For the fiscal year ended August 31, 2014, there were no amendments to any provision of the former and new codes of ethics, nor were there any waivers granted from any provision of the former and new codes of ethics. A copy of the new code of ethics is filed with this Form N-CSR under Item 12(a)(1).
Item 3. Audit Committee Financial Expert.
The Registrant’s Board of Directors has determined that the Registrant has more than one audit committee financial expert, as that term is defined under Item 3(b) and 3(c), serving on its audit committee. The audit committee financial experts serving on the Registrant’s audit committee are Charles A. Hurty, John E. Kerrigan, Robert H. Silver and Madhav V. Rajan, all of whom are independent, as that term is defined under Item 3(a)(2).
Table of Contents
Item 4. Principal Accountant Fees and Services.
The principal accountant fees disclosed in items 4(a), 4(b), 4(c), 4(d) and 4(g) are for the fifty series of the Registrant for which the fiscal year-end is August 31, 2014 (the “Funds”), and whose annual financial statements are reported in Item 1.
| (a) | Audit Fees – The aggregate fees billed for each of the last two fiscal years for professional services rendered by the principal accountant for the audit of the Funds’ annual financial statements or services that are normally provided by the accountant in connection with statutory and regulatory filings or engagements for those fiscal years, were $782,510 for the fiscal year ended August 31, 2013 and $771,700 for the fiscal year ended August 31, 2014. |
| (b) | Audit-Related Fees – There were no fees billed for the fiscal years ended August 31, 2013 and August 31, 2014 for assurance and related services by the principal accountant that were reasonably related to the performance of the audit of the Fund’s financial statements and are not reported under (a) of this Item. |
| (c) | Tax Fees – The aggregate fees billed in each of the last two fiscal years for professional services rendered by the principal accountant for the review of the Funds’ tax returns and excise tax calculations, were $193,500 for the fiscal year ended August 31, 2013 and $183,850 for the fiscal year ended August 31, 2014. |
| (d) | All Other Fees – There were no other fees billed for the fiscal years ended August 31, 2013 and August 31, 2014 for products and services provided by the principal accountant, other than the services reported in (a) through (c) of this Item. |
| (e) | (1) The Registrant’s audit committee charter, as amended, provides that the audit committee is responsible for the approval, prior to appointment, of the engagement of the principal accountant to annually audit and provide their opinion on the Registrant’s financial statements. The audit committee must also approve, prior to appointment, the engagement of the principal accountant to provide non-audit services to the Registrant or to any entity controlling, controlled by or under common control with the Registrant’s investment adviser (“Adviser Affiliate”) that provides ongoing services to the Registrant, if the engagement relates directly to the operations and financial reporting of the Registrant. |
(2) There were no services described in (b) through (d) above (including services required by the audit committee pursuant to paragraph (c)(7)(ii) of Rule 2-01 of Regulation S-X) that were approved by the audit committee pursuant to paragraph (c)(7)(i)(C) of Rule 2-01 of Regulation S-X.
| (f) | None of the hours expended on the principal accountant’s engagement to audit the Funds’ financial statements for the fiscal year ended August 31, 2014 were attributable to work performed by persons other than the principal accountant’s full-time, permanent employees. |
| (g) | The aggregate non-audit fees billed by the Registrant’s principal accountant for services rendered to the Funds, and rendered to the Registrant’s investment adviser, and any Adviser Affiliate that provides ongoing services to the Registrant for the last two fiscal years were, $4,054,391 for the fiscal year ended August 31, 2013 and $3,442,905 for the fiscal year ended August 31, 2014. |
| (h) | The Registrant’s audit committee has considered whether the provision of non-audit services rendered to the Registrant’s investment adviser and any Adviser Affiliate that were not pre-approved pursuant to paragraph (c)(7)(ii) of Rule 2-01 of Regulation S-X, if any, are compatible with maintaining the principal accountant’s independence, and has determined that the provision of these services do not compromise the principal accountant’s independence. |
Item 5. Audit Committee of Listed Registrants.
The Registrant is a listed issuer as defined in Rule 10A-3 under the Exchange Act and has a separately-designated standing audit committee established in accordance with Section 3(a)(58)(A) of the Exchange Act. The Registrant’s audit committee members are Cecilia H. Herbert, Charles A. Hurty, John E. Kerrigan, Robert H. Silver, John E. Martinez and Madhav V. Rajan.
Table of Contents
Item 6. Investments.
(a) Schedules of investments are included as part of the reports to shareholders filed under Item 1 of this Form.
(b) Not applicable.
Item 7. Disclosure of Proxy Voting Policies and Procedures for Closed-End Management Investment Companies.
Not applicable to the Registrant.
Item 8. Portfolio Managers of Closed-End Management Investment Companies.
Not applicable to the Registrant.
Item 9. Purchases of Equity Securities by Closed-End Management Investment Company and Affiliated Purchasers.
Not applicable to the Registrant.
Item 10. Submission of Matters to a Vote of Security Holders.
There were no material changes to the procedures by which shareholders may recommend nominees to the Registrant’s Board of Directors.
Item 11. Controls and Procedures.
| (a) | The President (the Registrant’s Principal Executive Officer) and Chief Financial Officer (the Registrant’s Principal Financial Officer) have concluded that, based on their evaluation as of a date within 90 days of the filing date of this report, the disclosure controls and procedures of the Registrant (as defined in Rule 30a-3(c) under the Investment Company Act of 1940) are reasonably designed to achieve the purposes described in Section 4(a) of the attached certification. |
| (b) | There were no changes in the Registrant’s internal control over financial reporting (as defined in Rule 30a-3(d) under the Investment Company Act of 1940) that occurred during the second fiscal quarter of the period covered by this report that have materially affected, or are reasonably likely to materially affect, the Registrant’s internal control over financial reporting. |
Item 12. Exhibits.
(a) (1) Code of Ethics for Senior Officers that is the subject of Item 2 is attached.
(a) (2) Section 302 Certifications are attached.
(a) (3) Not applicable to the Registrant.
(b) Section 906 Certifications are attached.
Table of Contents
SIGNATURES
Pursuant to the requirements of the Securities Exchange Act of 1934 and the Investment Company Act of 1940, the Registrant has duly caused this report to be signed on its behalf by the undersigned, thereunto duly authorized.
iShares, Inc.
| By: | /s/ Manish Mehta | |
| Manish Mehta, President (Principal Executive Officer) | ||
| Date: | October 27, 2014 |
Pursuant to the requirements of the Securities Exchange Act of 1934 and the Investment Company Act of 1940, this report has been signed below by the following persons on behalf of the Registrant and in the capacities and on the dates indicated.
| By: | /s/ Manish Mehta | |
| Manish Mehta, President (Principal Executive Officer) | ||
| Date: | October 27, 2014 | |
| By: | /s/ Jack Gee | |
| Jack Gee, Treasurer and Chief Financial Officer (Principal Financial Officer) | ||
| Date: | October 27, 2014 | |