Table of Contents
UNITED STATES
SECURITIES AND EXCHANGE COMMISSION
Washington, D.C. 20549
FORM N-CSR
CERTIFIED SHAREHOLDER REPORT OF REGISTERED
MANAGEMENT INVESTMENT COMPANIES
Investment Company Act file number 811-09102
iShares, Inc.
(Exact name of Registrant as specified in charter)
c/o: State Street Bank and Trust Company
200 Clarendon Street, Boston, MA 02116
(Address of principal executive offices) (Zip code)
The Corporation Trust Incorporated
351 West Camden Street, Baltimore, MD 21201
(Name and address of agent for service)
Registrant’s telephone number, including area code: 415-670-2000
Date of fiscal year end: April 30, 2014
Date of reporting period: April 30, 2014
Table of Contents
Item 1. Reports to Stockholders.
Table of Contents
APRIL 30, 2014
2014 ANNUAL REPORT |  |
iShares, Inc.
| Ø | iShares Asia/Pacific Dividend ETF | DVYA | NYSE Arca |
| Ø | iShares Emerging Markets Dividend ETF | DVYE | NYSE Arca |
Table of Contents
| 5 | ||||
| 10 | ||||
| 10 | ||||
| 11 | ||||
| 11 | ||||
| 12 | ||||
| 15 | ||||
| 18 | ||||
| 20 | ||||
| 29 | ||||
| 30 | ||||
| 31 | ||||
| 33 |
Table of Contents
Management’s Discussion of Fund Performance
iSHARES®, INC.
GLOBAL MARKET OVERVIEW
Global stocks gained approximately 15% for the 12-month period ended April 30, 2014 (the “reporting period”). The global equity markets generally benefited from significant liquidity as many central banks around the world maintained or expanded their accommodative monetary policies in an effort to stimulate economic activity. These efforts appeared to find some success during the reporting period as improving economic conditions in many regions of the world provided a favorable backdrop for global stock market performance.
Although global stocks advanced steadily throughout the reporting period, they experienced some meaningful volatility along the way. The global equity markets declined in June 2013 after the U.S. Federal Reserve Bank (the “Fed”) announced plans to scale back its quantitative easing measures before the end of the year. After rebounding in July 2013, global stocks dipped again in August 2013 amid unrest in the Middle East and signs of weaker economic growth worldwide.
Global stocks rallied throughout the fourth quarter of 2013 and into the new year, when a spate of weaker economic data led to a sharp correction in global stocks during the last half of January 2014. However, the disappointing economic news was attributed largely to severe winter weather in the Northern Hemisphere, and the global equity markets recovered over the last three months of the reporting period.
From a regional perspective, European stocks were the best performers, generating returns of more than 20% for the reporting period. Although economic growth remained subdued across the continent, the weakest European economies showed meaningful signs of stabilization during the reporting period. Many southern European countries reported consecutive quarters of positive growth after several years of recession, and their stock markets rallied sharply in response. The leading markets in Europe included Ireland, Italy, and Spain.
U.S. stocks advanced by nearly 20% for the reporting period. The U.S. economy grew at an uneven yet moderate pace, led by improving job growth (the unemployment rate fell to 6.3% in April 2014, its lowest level since September 2008) and a continued recovery in the housing market. The Fed expressed its confidence in the economy’s resilience by tapering its quantitative easing activity beginning in January 2014. The Fed reduced its government bond purchases from $85 billion per month in 2013 to $45 billion per month as of the end of the reporting period.
Stocks in the Asia/Pacific region underperformed, declining by approximately 2% for the reporting period. Slowing economic growth in the region, particularly in emerging markets, contributed to the equity market decline. Japan’s stock market was the most significant laggard amid concerns about the negative impact of a new consumption tax on the Japanese economy. Stock markets in Singapore and Australia also declined during the reporting period, while the New Zealand stock market fared the best.
The top-performing sectors on a global basis included health care, information technology, and industrials. Traditionally a defensive sector of the market, health care benefited from relatively high dividend yields and robust growth from the biotechnology industry. Industrials stocks rallied thanks to improving economic activity in many regions, while the information technology sector enjoyed strong growth and a resurgence in initial public offerings. On the downside, the consumer staples and utilities sectors posted the lowest returns. Both consumer staples and utilities are among the most defensive sectors in the global equity markets.
MANAGEMENT’S DISCUSSIONSOF FUND PERFORMANCE | 5 |
Table of Contents
Management’s Discussion of Fund Performance
iSHARES® ASIA/PACIFIC DIVIDEND ETF
Performance as of April 30, 2014
| Average Annual Total Returns | Cumulative Total Returns | |||||||||||||||||||||||||
| NAV | MARKET | INDEX | NAV | MARKET | INDEX | |||||||||||||||||||||
1 Year | (1.78)% | (1.77)% | (1.53)% | (1.78)% | (1.77)% | (1.53)% | ||||||||||||||||||||
Since Inception | 10.63% | 10.78% | 11.08% | 24.68% | 25.04% | 25.80% | ||||||||||||||||||||
GROWTH OF $10,000 INVESTMENT
(SINCE INCEPTION AT NET ASSET VALUE)
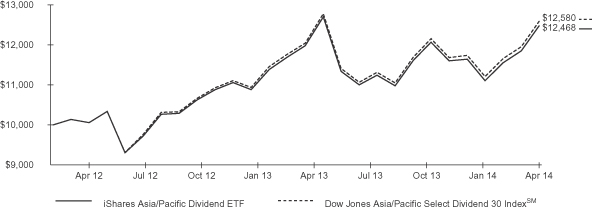
The inception date of the Fund was 2/23/12. The first day of secondary market trading was 2/24/12.
Past performance is no guarantee of future results. Performance results do not reflect the deduction of taxes that a shareholder would pay on fund distributions or on the redemption or sale of fund shares. See “About Fund Performance” on page 10 for more information.
| Shareholder Expenses | ||||||||||||||||||||||||||
| Actual | Hypothetical 5% Return | |||||||||||||||||||||||||
| Beginning Account Value (11/1/13) | Ending Account Value (4/30/14) | Expenses Paid During Period a | Beginning Account Value (11/1/13) | Ending Account Value (4/30/14) | Expenses Paid During Period a | Annualized Expense Ratio | ||||||||||||||||||||
| $ | 1,000.00 | $ | 1,033.70 | $ | 2.47 | $ | 1,000.00 | $ | 1,022.40 | $ | 2.46 | 0.49% | ||||||||||||||
| a | Expenses are calculated using the Fund’s annualized expense ratio (as disclosed in the table), multiplied by the average account value for the period, multiplied by the number of days in the period (181 days) and divided by the number of days in the year (365 days). See “Shareholder Expenses” on page 10 for more information. |
| 6 | 2014 iSHARES ANNUAL REPORTTO SHAREHOLDERS |
Table of Contents
Management’s Discussion of Fund Performance (Continued)
iSHARES® ASIA/PACIFIC DIVIDEND ETF
The iShares Asia/Pacific Dividend ETF (the “Fund”) seeks to track the investment results of an index composed of relatively high dividend paying equities in Asia/Pacific developed markets, as represented by the Dow Jones Asia/Pacific Select Dividend 30 IndexSM (the “Index”). The Fund invests in a representative sample of securities included in the Index that collectively has an investment profile similar to the Index. Due to the use of representative sampling, the Fund may or may not hold all of the securities that are included in the Index. For the 12-month reporting period ended April 30, 2014, the total return for the Fund was -1.78%, net of fees, while the total return for the Index was -1.53%.
As represented by the Index, dividend-paying stocks in the Asia/Pacific region declined modestly for the reporting period, performing in line with the region’s broad equity indexes. Dividend-paying stocks in Asia generally tracked the pattern of the region’s equity markets during the reporting period — a sharp decline early in the reporting period, followed by bouts of volatility until the final three months of the reporting period, when Asian stocks experienced a meaningful rebound. Much of the weakness in Asian equity markets resulted from slowing economic activity in the region.
Dividend-paying stocks in the Asia/Pacific region benefited from continued investor demand for higher-yielding investments. As of April 30, 2014, the average dividend yield of the components in the Index was 5.30%, well above the dividend yields on broad Asia/Pacific stock indexes. However, rising interest rates in several countries — particularly Australia, New Zealand, Singapore, and Hong Kong — made dividend-paying stocks less attractive.
Australia comprised more than half of the Index as of the end of the reporting period. In general, Australia was one of the weaker-performing equity markets in the Asia/Pacific region. New Zealand, which had the best-performing equity market in the region, comprised just over 10% of the Index as of April 30, 2014.
PORTFOLIO ALLOCATION
As of 4/30/14
| Sector | Percentage of Total Investments* |
Financials | 24.25 | % | ||
Telecommunication Services | 21.45 | |||
Industrials | 17.08 | |||
Consumer Discretionary | 14.72 | |||
Energy | 5.68 | |||
Utilities | 4.74 | |||
Consumer Staples | 4.52 | |||
Information Technology | 3.58 | |||
Health Care | 2.08 | |||
Materials | 1.90 | |||
|
| |||
TOTAL | 100.00 | % | ||
|
|
COUNTRY ALLOCATION
As of 4/30/14
| Country | Percentage of Total Investments* |
Australia | 53.78 | % | ||
Hong Kong | 15.66 | |||
New Zealand | 11.06 | |||
Singapore | 10.34 | |||
Japan | 9.16 | |||
|
| |||
TOTAL | 100.00 | % | ||
|
|
| * | Excludes money market funds. |
MANAGEMENT’S DISCUSSIONSOF FUND PERFORMANCE | 7 |
Table of Contents
Management’s Discussion of Fund Performance
iSHARES® EMERGING MARKETS DIVIDEND ETF
Performance as of April 30, 2014
| Average Annual Total Returns | Cumulative Total Returns | |||||||||||||||||||||||||
| NAV | MARKET | INDEX | NAV | MARKET | INDEX | |||||||||||||||||||||
1 Year | (5.86)% | (5.96)% | (6.35)% | (5.86)% | (5.96)% | (6.35)% | ||||||||||||||||||||
Since Inception | (1.53)% | (1.25)% | (1.80)% | (3.31)% | (2.72)% | (3.88)% | ||||||||||||||||||||
GROWTH OF $10,000 INVESTMENT
(SINCE INCEPTION AT NET ASSET VALUE)
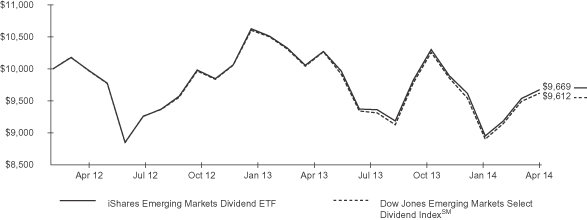
The inception date of the Fund was 2/23/12. The first day of secondary market trading was 2/24/12.
Past performance is no guarantee of future results. Performance results do not reflect the deduction of taxes that a shareholder would pay on fund distributions or on the redemption or sale of fund shares. See “About Fund Performance” on page 10 for more information.
| Shareholder Expenses | ||||||||||||||||||||||||||
| Actual | Hypothetical 5% Return | |||||||||||||||||||||||||
| Beginning Account Value (11/1/13) | Ending Account Value (4/30/14) | Expenses Paid During Period a | Beginning Account Value (11/1/13) | Ending Account Value (4/30/14) | Expenses Paid During Period a | Annualized Expense Ratio | ||||||||||||||||||||
| $ | 1,000.00 | $ | 939.00 | $ | 2.36 | $ | 1,000.00 | $ | 1,022.40 | $ | 2.46 | 0.49% | ||||||||||||||
| a | Expenses are calculated using the Fund’s annualized expense ratio (as disclosed in the table), multiplied by the average account value for the period, multiplied by the number of days in the period (181 days) and divided by the number of days in the year (365 days). See “Shareholder Expenses” on page 10 for more information. |
| 8 | 2014 iSHARES ANNUAL REPORTTO SHAREHOLDERS |
Table of Contents
Management’s Discussion of Fund Performance (Continued)
iSHARES® EMERGING MARKETS DIVIDEND ETF
The iShares Emerging Markets Dividend ETF (the “Fund”) seeks to track the investment results of an index composed of relatively high dividend paying equities in emerging markets, as represented by the Dow Jones Emerging Markets Select Dividend IndexSM (the “Index”). The Fund invests in a representative sample of securities included in the Index that collectively has an investment profile similar to the Index. Due to the use of representative sampling, the Fund may or may not hold all of the securities that are included in the Index. For the 12-month reporting period ended April 30, 2014, the total return for the Fund was -5.86%, net of fees, while the total return for the Index was -6.35%.
As represented by the Index, dividend-paying stocks in emerging markets declined for the reporting period, trailing the performance of the broad emerging market equity indexes. Dividend-paying stocks in emerging markets generally tracked the pattern of emerging markets stocks during the reporting period — a sharp decline early in the reporting period, followed by a rally into the fourth quarter of 2013, and then another meaningful decline through the end of January 2014 before recovering over the final three months of the reporting period.
The primary factor behind the underperformance of dividend-paying stocks in emerging markets for the reporting period was rising interest rates in many emerging markets, including China, Brazil, and South Africa. Higher interest rates make higher-yielding investments such as dividend-paying stocks less attractive. As of April 30, 2014, the average dividend yield of the components in the Index was 5.22%, compared with a dividend yield of approximately 2% on broad emerging market stock indexes.
Taiwan and South Africa, two of the three largest country weightings in the Index, comprised approximately 35% of the Index as of the end of the reporting period. Taiwan and South Africa were both among the best-performing equity markets in emerging markets during the reporting period.
PORTFOLIO ALLOCATION
As of 4/30/14
| Sector | Percentage of Total Investments* |
Telecommunication Services | 19.36 | % | ||
Materials | 16.93 | |||
Financials | 16.81 | |||
Utilities | 11.37 | |||
Consumer Discretionary | 11.28 | |||
Information Technology | 8.49 | |||
Energy | 6.70 | |||
Industrials | 5.51 | |||
Consumer Staples | 3.47 | |||
| 0.08 | ||||
|
| |||
TOTAL | 100.00 | % | ||
|
|
TEN LARGEST COUNTRY ALLOCATIONS
As of 4/30/14
| Country | Percentage of Total Investments* |
Taiwan | 25.45 | |||
Brazil | 15.23 | |||
South Africa | 9.79 | |||
China | 6.98 | |||
Thailand | 6.63 | |||
Malaysia | 5.46 | |||
Turkey | 5.43 | |||
Poland | 4.80 | |||
Indonesia | 4.46 | |||
Czech Republic | 4.16 | |||
|
| |||
TOTAL | 88.39 | % | ||
|
|
| * | Excludes money market funds. |
MANAGEMENT’S DISCUSSIONSOF FUND PERFORMANCE | 9 |
Table of Contents
Past performance is no guarantee of future results. Current performance may be lower or higher than the performance data quoted. Performance data current to the most recent month-end is available at www.iShares.com. Performance results assume reinvestment of all dividends and capital gain distributions and do not reflect the deduction of taxes that a shareholder would pay on fund distributions or on the redemption or sale of fund shares. The investment return and principal value of shares will vary with changes in market conditions. Shares may be worth more or less than their original cost when they are redeemed or sold in the market. Performance for certain funds may reflect a waiver of a portion of investment management fees. Without such waiver, performance would have been lower.
Net asset value or “NAV” is the value of one share of a fund as calculated in accordance with the standard formula for valuing mutual fund shares. The price used to calculate market return (“Market Price”) is determined by using the midpoint between the highest bid and the lowest offer on the primary stock exchange on which shares of a fund are listed for trading, as of the time that such fund’s NAV is calculated. Since shares of a fund may not have traded in the secondary market until after the fund’s inception, for the period from inception to the first day of secondary trading, the NAV of the fund is used as a proxy for the Market Price to calculate market returns. Market and NAV returns assume that dividends and capital gain distributions have been reinvested at Market Price and NAV, respectively.
An index is a statistical composite that tracks a specified financial market or sector. Unlike a fund, an index does not actually hold a portfolio of securities and therefore does not incur the expenses incurred by a fund. These expenses negatively impact fund performance. Also, market returns do not include brokerage commissions that may be payable on secondary market transactions. If brokerage commissions were included, market returns would be lower.
As a shareholder of a Fund, you incur two types of costs: (1) transaction costs, including brokerage commissions on purchases and sales of fund shares and (2) ongoing costs, including management fees and other fund expenses. The expense example, which is based on an investment of $1,000 invested on November 1, 2013 and held through April 30, 2014, is intended to help you understand your ongoing costs (in dollars and cents) of investing in a Fund and to compare these costs with the ongoing costs of investing in other funds.
Actual Expenses — The table provides information about actual account values and actual expenses. To estimate the expenses that you paid on your account over the period, simply divide your account value by $1,000 (for example, an $8,600 account value divided by $1,000 = 8.6), then multiply the result by the number for your Fund under the heading entitled “Expenses Paid During Period.”
Hypothetical Example for Comparison Purposes — The table also provides information about hypothetical account values and hypothetical expenses based on each Fund’s actual expense ratio and an assumed rate of return of 5% per year before expenses. You may use this information to compare the ongoing costs of investing in your Fund and other funds. To do so, compare this 5% hypothetical example with the 5% hypothetical examples that appear in the shareholder reports of the other funds.
Please note that the expenses shown in the table are meant to highlight your ongoing costs only and do not reflect any transactional costs, such as brokerage commissions paid on purchases and sales of fund shares. Therefore, the hypothetical examples are useful in comparing ongoing costs only and will not help you determine the relative total costs of owning different funds. In addition, if these transactional costs were included, your costs would have been higher.
| 10 | 2014 iSHARES ANNUAL REPORTTO SHAREHOLDERS |
Table of Contents
iSHARES® ASIA/PACIFIC DIVIDEND ETF
April 30, 2014
| Security | Shares | Value | ||||||
COMMON STOCKS — 99.61% | ||||||||
AUSTRALIA — 53.57% | ||||||||
ALS Ltd. | 258,332 | $ | 1,795,181 | |||||
Amcor Ltd. | 96,458 | 919,650 | ||||||
Australia and New Zealand Banking Group Ltd. | 50,643 | 1,617,445 | ||||||
Bendigo and Adelaide Bank Ltd. | 151,045 | 1,610,832 | ||||||
Commonwealth Bank of Australia | 19,244 | 1,406,828 | ||||||
David Jones Ltd. | 627,691 | 2,285,636 | ||||||
Metcash Ltd. | 850,323 | 2,190,269 | ||||||
Monadelphous Group Ltd.a | 153,561 | 2,487,087 | ||||||
National Australia Bank Ltd. | 50,915 | 1,665,287 | ||||||
SP AusNet | 1,773,049 | 2,299,945 | ||||||
Suncorp Group Ltd. | 97,716 | 1,178,814 | ||||||
Sydney Airport | 411,910 | 1,610,584 | ||||||
Telstra Corp. Ltd. | 331,024 | 1,601,027 | ||||||
Westpac Banking Corp. | 52,037 | 1,693,306 | ||||||
WorleyParsons Ltd. | 110,194 | 1,716,305 | ||||||
|
| |||||||
| 26,078,196 | ||||||||
HONG KONG — 15.60% | ||||||||
Giordano International Ltd. | 1,798,000 | 1,208,276 | ||||||
Hang Seng Bank Ltd. | 71,400 | 1,163,162 | ||||||
PCCW Ltd. | 3,859,000 | 2,060,695 | ||||||
Sino Land Co. Ltd. | 952,000 | 1,424,405 | ||||||
VTech Holdings Ltd.a | 125,800 | 1,736,213 | ||||||
|
| |||||||
| 7,592,751 | ||||||||
JAPAN — 9.12% | ||||||||
Accordia Golf Co. Ltd.a | 108,800 | 1,395,281 | ||||||
Eisai Co. Ltd. | 26,100 | 1,007,463 | ||||||
NTT DOCOMO Inc. | 62,900 | 998,765 | ||||||
TonenGeneral Sekiyu K.K. | 110,000 | 1,039,158 | ||||||
|
| |||||||
| 4,440,667 | ||||||||
NEW ZEALAND — 11.02% | ||||||||
SKYCITY Entertainment Group Ltd. | 618,545 | 2,247,788 | ||||||
Telecom Corp. of New Zealand Ltd. | 1,308,575 | 3,114,025 | ||||||
|
| |||||||
| 5,361,813 | ||||||||
SINGAPORE — 10.30% | ||||||||
SATS Ltd. | 391,000 | 987,350 | ||||||
Singapore Post Ltd. | 1,241,000 | 1,398,825 | ||||||
Singapore Telecommunications Ltd. | 437,000 | 1,333,261 | ||||||
StarHub Ltd. | 391,582 | 1,294,512 | ||||||
|
| |||||||
| 5,013,948 | ||||||||
|
| |||||||
TOTAL COMMON STOCKS |
| 48,487,375 | ||||||
| Security | Shares | Value | ||||||
SHORT-TERM INVESTMENTS — 9.75% |
| |||||||
MONEY MARKET FUNDS — 9.75% |
| |||||||
BlackRock Cash Funds: Institutional, | ||||||||
0.13%b,c,d | 4,472,832 | $ | 4,472,832 | |||||
BlackRock Cash Funds: Prime, | ||||||||
0.11%b,c,d | 243,416 | 243,416 | ||||||
BlackRock Cash Funds: Treasury, | ||||||||
0.00%b,c | 29,291 | 29,291 | ||||||
|
| |||||||
| 4,745,539 | ||||||||
|
| |||||||
TOTAL SHORT-TERM INVESTMENTS |
| 4,745,539 | ||||||
|
| |||||||
TOTAL INVESTMENTS |
| 53,232,914 | ||||||
Other Assets, Less Liabilities — (9.36)% |
| (4,556,997 | ) | |||||
|
| |||||||
NET ASSETS — 100.00% |
| $ | 48,675,917 | |||||
|
| |||||||
| a | All or a portion of this security represents a security on loan. See Note 1. |
| b | Affiliated issuer. See Note 2. |
| c | The rate quoted is the annualized seven-day yield of the fund at period end. |
| d | All or a portion of this security represents an investment of securities lending collateral. See Note 1. |
See notes to financial statements.
SCHEDULESOF INVESTMENTS | 11 |
Table of Contents
Schedule of Investments
iSHARES® EMERGING MARKETS DIVIDEND ETF
April 30, 2014
| Security | Shares | Value | ||||||
COMMON STOCKS — 89.96% |
| |||||||
BRAZIL — 5.94% |
| |||||||
Banco do Brasil SA | 177,600 | $ | 1,860,273 | |||||
CCR SA | 170,200 | 1,328,884 | ||||||
CPFL Energia SA | 185,000 | 1,565,292 | ||||||
Light SA | 310,800 | 2,475,331 | ||||||
Souza Cruz SA | 155,400 | 1,414,971 | ||||||
Tractebel Energia SA | 133,200 | 1,976,291 | ||||||
|
| |||||||
| 10,621,042 | ||||||||
CHILE — 1.94% |
| |||||||
CAP SA | 71,558 | 1,070,761 | ||||||
CorpBanca SA | 74,800,014 | 877,934 | ||||||
Empresa Nacional de Telecomunicaciones SA | 123,876 | 1,520,473 | ||||||
|
| |||||||
| 3,469,168 | ||||||||
CHINA — 6.92% |
| |||||||
Anta Sports Products Ltd. | 740,000 | 1,082,389 | ||||||
China Shanshui Cement Group Ltd.a | 6,734,000 | 2,597,066 | ||||||
Dongyue Group Ltd.a | 2,664,000 | 1,065,208 | ||||||
Guangzhou R&F Properties Co. Ltd. Class H | 1,243,200 | 1,622,782 | ||||||
PetroChina Co. Ltd. Class H | 1,184,000 | 1,371,408 | ||||||
Shenzhen Investment Ltd.a | 4,884,000 | 1,593,804 | ||||||
Shougang Fushan Resources Group Ltd. | 4,588,000 | 1,378,853 | ||||||
Zhejiang Expressway Co. Ltd. Class H | 1,924,000 | 1,665,199 | ||||||
|
| |||||||
| 12,376,709 | ||||||||
CZECH REPUBLIC — 4.13% |
| |||||||
CEZ AS | 94,276 | 2,831,619 | ||||||
Komercni Banka AS | 7,474 | 1,720,420 | ||||||
Telefonica Czech Republic AS | 186,776 | 2,826,632 | ||||||
|
| |||||||
| 7,378,671 | ||||||||
EGYPT — 0.65% |
| |||||||
Commercial International Bank (Egypt) SAE SP GDR | 232,900 | 1,171,487 | ||||||
|
| |||||||
| 1,171,487 | ||||||||
HUNGARY — 3.25% |
| |||||||
Magyar Telekom Telecommunications PLC | 4,094,716 | 5,819,411 | ||||||
|
| |||||||
| 5,819,411 | ||||||||
| Security | Shares | Value | ||||||
INDIA — 0.40% |
| |||||||
Reliance Industries Ltd. SP GDRa,b | 23,014 | $ | 713,434 | |||||
|
| |||||||
| 713,434 | ||||||||
INDONESIA — 4.43% |
| |||||||
PT AKR Corporindo Tbk | 2,009,000 | 828,866 | ||||||
PT Aneka Tambang (Persero) Tbk | 8,695,000 | 883,676 | ||||||
PT Indo Tambangraya Megah Tbk | 1,124,800 | 2,478,422 | ||||||
PT Matahari Putra Prima Tbk | 15,577,000 | 3,732,067 | ||||||
|
| |||||||
| 7,923,031 | ||||||||
MALAYSIA — 5.42% |
| |||||||
Berjaya Sports Toto Bhd | 1,037,448 | 1,235,851 | ||||||
British American Tobacco (Malaysia) Bhd | 74,000 | 1,386,863 | ||||||
Kuala Lumpur Kepong Bhd | 133,200 | 987,120 | ||||||
Malayan Banking Bhd | 592,000 | 1,794,764 | ||||||
PPB Group Bhd | 118,400 | 596,804 | ||||||
Public Bank Bhd | 162,800 | 1,004,070 | ||||||
Sime Darby Bhd | 407,000 | 1,176,567 | ||||||
Telekom Malaysia Bhd | 791,800 | 1,503,341 | ||||||
|
| |||||||
| 9,685,380 | ||||||||
MOROCCO — 0.19% |
| |||||||
Maroc Telecom SA | 27,107 | 331,005 | ||||||
|
| |||||||
| 331,005 | ||||||||
PHILIPPINES — 0.75% |
| |||||||
Globe Telecom Inc. | 36,285 | 1,348,682 | ||||||
|
| |||||||
| 1,348,682 | ||||||||
POLAND — 4.76% |
| |||||||
KGHM Polska Miedz SA | 66,082 | 2,388,953 | ||||||
Orange Polska SA | 507,344 | 1,732,733 | ||||||
Synthos SA | 2,792,079 | 4,389,786 | ||||||
|
| |||||||
| 8,511,472 | ||||||||
RUSSIA — 1.99% |
| |||||||
Gazprom Neft OAO SP ADR | 125,578 | 2,495,235 | ||||||
Mobile Telesystems OJSC | 145,780 | 1,059,467 | ||||||
|
| |||||||
| 3,554,702 | ||||||||
SOUTH AFRICA — 9.71% |
| |||||||
African Bank Investments Ltd.a | 1,646,796 | 1,949,981 | ||||||
Barloworld Ltd. | 100,936 | 1,098,482 | ||||||
Exxaro Resources Ltd.a | 66,600 | 906,749 | ||||||
Foschini Group Ltd. (The) | 152,070 | 1,566,742 | ||||||
Grindrod Ltd. | 192,844 | 455,963 | ||||||
Kumba Iron Ore Ltd. | 65,120 | 2,313,517 | ||||||
Lewis Group Ltd.a | 361,860 | 2,144,122 | ||||||
| 12 | 2014 iSHARES ANNUAL REPORTTO SHAREHOLDERS |
Table of Contents
Schedule of Investments (Continued)
iSHARES® EMERGING MARKETS DIVIDEND ETF
April 30, 2014
| Security | Shares | Value | ||||||
Nampak Ltd. | 349,354 | $ | 1,300,397 | |||||
PPC Ltd. | 484,626 | 1,408,161 | ||||||
RMB Holdings Ltd. | 242,646 | 1,161,486 | ||||||
Tiger Brands Ltd. | 30,118 | 804,031 | ||||||
Truworths International Ltd. | 164,798 | 1,319,962 | ||||||
Woolworths Holdings Ltd. | 138,972 | 943,534 | ||||||
|
| |||||||
| 17,373,127 | ||||||||
SOUTH KOREA — 2.34% |
| |||||||
Hyundai Marine & Fire Insurance Co. Ltd. | 43,420 | 1,273,228 | ||||||
Korea Gas Corp.c | 13,024 | 778,944 | ||||||
KT Corp. | 36,690 | 1,164,649 | ||||||
KT Corp. SP ADR | 60,976 | 970,128 | ||||||
|
| |||||||
| 4,186,949 | ||||||||
TAIWAN — 25.25% |
| |||||||
AmTRAN Technology Co. Ltd. | 6,734,000 | 4,660,593 | ||||||
ASUSTeK Computer Inc. | 296,000 | 3,058,216 | ||||||
China Bills Finance Corp. | 5,550,000 | 2,150,308 | ||||||
China Steel Corp. | 592,538 | 497,412 | ||||||
Chong Hong Construction Co. | 1,110,000 | 3,061,891 | ||||||
Chunghwa Telecom Co. Ltd. | 518,000 | 1,615,855 | ||||||
Dynapack International Technology Corp. | 888,000 | 2,311,305 | ||||||
Far EasTone Telecommunications Co. Ltd. | 666,000 | 1,440,155 | ||||||
Farglory Land Development Co. Ltd. | 1,184,263 | 1,941,222 | ||||||
Feng Hsin Iron & Steel Co. Ltd. | 962,000 | 1,611,935 | ||||||
Formosa Plastics Corp. | 148,840 | 383,461 | ||||||
Formosan Rubber Group Inc. | 2,146,000 | 2,007,567 | ||||||
Gigabyte Technology Co. Ltd. | 1,480,000 | 2,308,365 | ||||||
Highwealth Construction Corp. | 740,000 | 1,649,182 | ||||||
Huaku Development Co. Ltd. | 592,000 | 1,448,732 | ||||||
Inventec Corp. | 1,184,475 | 1,090,417 | ||||||
Lite-On Technology Corp. | 888,518 | 1,356,404 | ||||||
Novatek Microelectronics Corp. Ltd. | 370,000 | 1,709,219 | ||||||
Oriental Union Chemical Corp. | 1,184,000 | 1,176,237 | ||||||
Taiwan Mobile Co. Ltd. | 518,000 | 1,670,746 | ||||||
TSRC Corp. | 1,036,500 | 1,520,529 | ||||||
U-Ming Marine Transport Corp. | 962,000 | 1,618,306 | ||||||
UPC Technology Corp. | 3,700,980 | 1,642,265 | ||||||
Wistron NeWeb Corp. | 370,664 | 864,122 | ||||||
WPG Holdings Co. Ltd. | 1,924,000 | 2,363,746 | ||||||
|
| |||||||
| 45,158,190 | ||||||||
| Security | Shares | Value | ||||||
THAILAND — 6.50% |
| |||||||
Advanced Information Service PCL NVDR | 236,800 | $ | 1,770,877 | |||||
Charoen Pokphand Foods PCL NVDR | 1,161,800 | 969,363 | ||||||
Intouch Holdings PCL | 695,600 | 1,676,662 | ||||||
Land and Houses PCL NVDRa | 3,796,200 | 1,161,384 | ||||||
PTT Global Chemical PCL NVDR | 651,200 | 1,403,622 | ||||||
Sansiri PCL NVDR | 40,248,600 | 2,375,613 | ||||||
Siam Cement PCL (The) NVDR | 74,000 | 992,460 | ||||||
Thai Oil PCL NVDR | 784,400 | 1,266,530 | ||||||
|
| |||||||
| 11,616,511 | ||||||||
TURKEY — 5.39% |
| |||||||
Ford Otomotiv Sanayi AS | 110,260 | 1,241,948 | ||||||
Tofas Turk Otomobil Fabrikasi AS | 343,582 | 2,093,231 | ||||||
Turk Telekomunikasyon AS | 683,538 | 2,043,448 | ||||||
Turk Traktor ve Ziraat Makineleri AS | 56,314 | 1,613,037 | ||||||
Turkiye Petrol Rafinerileri AS | 118,030 | 2,647,787 | ||||||
|
| |||||||
| 9,639,451 | ||||||||
|
| |||||||
TOTAL COMMON STOCKS |
| |||||||
(Cost: $165,411,537) |
| 160,878,422 | ||||||
PREFERRED STOCKS — 9.17% |
| |||||||
BRAZIL — 9.17% |
| |||||||
AES Tiete SA | 444,000 | 3,478,574 | ||||||
Companhia Energetica de Minas Gerais | 928,964 | 7,061,944 | ||||||
Oi SA | 2,886,000 | 2,763,391 | ||||||
Telefonica Brasil SA | 148,000 | 3,101,779 | ||||||
|
| |||||||
| 16,405,688 | ||||||||
|
| |||||||
TOTAL PREFERRED STOCKS |
| |||||||
(Cost: $17,542,145) |
| 16,405,688 | ||||||
WARRANTS — 0.09% |
| |||||||
THAILAND — 0.09% |
| |||||||
Land and Houses PCL NVDR (Expires 04/29/17)c | 759,240 | 150,159 | ||||||
|
| |||||||
| 150,159 | ||||||||
|
| |||||||
TOTAL WARRANTS |
| |||||||
(Cost: $0) |
| 150,159 | ||||||
SCHEDULESOF INVESTMENTS | 13 |
Table of Contents
Schedule of Investments (Continued)
iSHARES® EMERGING MARKETS DIVIDEND ETF
April 30, 2014
| Security | Shares | Value | ||||||
SHORT-TERM INVESTMENTS — 3.13% |
| |||||||
MONEY MARKET FUNDS — 3.13% |
| |||||||
BlackRock Cash Funds: Institutional, |
| |||||||
0.13%d,e,f | 5,091,899 | $ | 5,091,899 | |||||
BlackRock Cash Funds: Prime, |
| |||||||
0.11%d,e,f | 277,106 | 277,106 | ||||||
BlackRock Cash Funds: Treasury, |
| |||||||
0.00%d,e | 233,731 | 233,731 | ||||||
|
| |||||||
| 5,602,736 | ||||||||
|
| |||||||
TOTAL SHORT-TERM INVESTMENTS |
| |||||||
(Cost: $5,602,736) |
| 5,602,736 | ||||||
|
| |||||||
TOTAL INVESTMENTS |
| |||||||
(Cost: $188,556,418) |
| 183,037,005 | ||||||
Other Assets, Less Liabilities — (2.35)% |
| (4,199,125 | ) | |||||
|
| |||||||
NET ASSETS — 100.00% |
| $ | 178,837,880 | |||||
|
| |||||||
NVDR — Non-Voting Depositary Receipts
SP ADR — Sponsored American Depositary Receipts
SP GDR — Sponsored Global Depositary Receipts
| a | All or a portion of this security represents a security on loan. See Note 1. |
| b | This security may be resold to qualified institutional buyers under Rule 144A of the Securities Act of 1933. |
| c | Non-income earning security. |
| d | Affiliated issuer. See Note 2. |
| e | The rate quoted is the annualized seven-day yield of the fund at period end. |
| f | All or a portion of this security represents an investment of securities lending collateral. See Note 1. |
See notes to financial statements.
| 14 | 2014 iSHARES ANNUAL REPORTTO SHAREHOLDERS |
Table of Contents
Statements of Assets and Liabilities
iSHARES®, INC.
April 30, 2014
| iShares Asia/Pacific Dividend ETF | iShares Emerging Markets Dividend ETF | |||||||
ASSETS | ||||||||
Investments, at cost: | ||||||||
Unaffiliated | $ | 44,445,458 | $ | 182,953,682 | ||||
Affiliated (Note 2) | 4,745,539 | 5,602,736 | ||||||
|
|
|
| |||||
Total cost of investments | $ | 49,190,997 | $ | 188,556,418 | ||||
|
|
|
| |||||
Investments in securities, at fair value (including securities on loana) (Note 1): | ||||||||
Unaffiliated | $ | 48,487,375 | $ | 177,434,269 | ||||
Affiliated (Note 2) | 4,745,539 | 5,602,736 | ||||||
|
|
|
| |||||
Total fair value of investments | 53,232,914 | 183,037,005 | ||||||
Foreign currency, at valueb | 94,886 | 164,001 | ||||||
Receivables: | ||||||||
Due from custodian (Note 4) | — | 164,833 | ||||||
Dividends and interest | 155,250 | 1,077,327 | ||||||
|
|
|
| |||||
Total Assets | 53,483,050 | 184,443,166 | ||||||
|
|
|
| |||||
LIABILITIES | ||||||||
Payables: | ||||||||
Investment securities purchased | 71,737 | 164,833 | ||||||
Collateral for securities on loan (Note 1) | 4,716,248 | 5,369,005 | ||||||
Investment advisory fees (Note 2) | 19,148 | 71,448 | ||||||
|
|
|
| |||||
Total Liabilities | 4,807,133 | 5,605,286 | ||||||
|
|
|
| |||||
NET ASSETS | $ | 48,675,917 | $ | 178,837,880 | ||||
|
|
|
| |||||
Net assets consist of: | ||||||||
Paid-in capital | $ | 47,007,194 | $ | 196,717,883 | ||||
Undistributed net investment income | 170,981 | 253,084 | ||||||
Accumulated net realized loss | (2,543,769 | ) | (12,614,811 | ) | ||||
Net unrealized appreciation (depreciation) | 4,041,511 | (5,518,276 | ) | |||||
|
|
|
| |||||
NET ASSETS | $ | 48,675,917 | $ | 178,837,880 | ||||
|
|
|
| |||||
Shares outstandingc | 850,000 | 3,700,000 | ||||||
|
|
|
| |||||
Net asset value per share | $ | 57.27 | $ | 48.33 | ||||
|
|
|
| |||||
| a | Securities on loan with values of $4,485,242 and $5,057,167, respectively. See Note 1. |
| b | Cost of foreign currency: $94,990 and $163,941, respectively. |
| c | $0.001 par value, number of shares authorized: 500 million and 500 million, respectively. |
See notes to financial statements.
FINANCIAL STATEMENTS | 15 |
Table of Contents
Statements of Operations
iSHARES®, INC.
Year ended April 30, 2014
| iShares Asia/Pacific Dividend ETF | iShares Emerging Markets Dividend ETF | |||||||
NET INVESTMENT INCOME | ||||||||
Dividends — unaffiliateda | $ | 2,243,582 | $ | 7,405,199 | ||||
Interest — affiliated (Note 2) | 12 | 67 | ||||||
Securities lending income — affiliated (Note 2) | 26,781 | 107,548 | ||||||
|
|
|
| |||||
| 2,270,375 | 7,512,814 | |||||||
Less: Other foreign taxes (Note 1) | — | (8,235 | ) | |||||
|
|
|
| |||||
Total investment income | 2,270,375 | 7,504,579 | ||||||
|
|
|
| |||||
EXPENSES | ||||||||
Investment advisory fees (Note 2) | 211,504 | 1,133,588 | ||||||
|
|
|
| |||||
Total expenses | 211,504 | 1,133,588 | ||||||
Less investment advisory fees waived (Note 2) | — | (316,738 | ) | |||||
|
|
|
| |||||
Net expenses | 211,504 | 816,850 | ||||||
|
|
|
| |||||
Net investment income | 2,058,871 | 6,687,729 | ||||||
|
|
|
| |||||
NET REALIZED AND UNREALIZED GAIN (LOSS) | ||||||||
Net realized gain (loss) from: | ||||||||
Investments — unaffiliated | (1,743,328 | ) | (11,120,284 | ) | ||||
In-kind redemptions — unaffiliated | — | 713,091 | ||||||
Foreign currency transactions | (21,409 | ) | (46,033 | ) | ||||
|
|
|
| |||||
Net realized loss | (1,764,737 | ) | (10,453,226 | ) | ||||
|
|
|
| |||||
Net change in unrealized appreciation/depreciation on: | ||||||||
Investments | (1,037,725 | ) | (5,276,442 | ) | ||||
Translation of assets and liabilities in foreign currencies | 201 | (1,727 | ) | |||||
|
|
|
| |||||
Net change in unrealized appreciation/depreciation | (1,037,524 | ) | (5,278,169 | ) | ||||
|
|
|
| |||||
Net realized and unrealized loss | (2,802,261 | ) | (15,731,395 | ) | ||||
|
|
|
| |||||
NET DECREASE IN NET ASSETS RESULTING FROM OPERATIONS | $ | (743,390 | ) | $ | (9,043,666 | ) | ||
|
|
|
| |||||
| a | Net of foreign withholding tax of $76,991 and $1,047,536, respectively. |
See notes to financial statements.
| 16 | 2014 iSHARES ANNUAL REPORTTO SHAREHOLDERS |
Table of Contents
Statements of Changes in Net Assets
iSHARES®, INC.
| iShares Asia/Pacific Dividend ETF | iShares Emerging Markets Dividend ETF | |||||||||||||||
| Year ended April 30, 2014 | Year ended April 30, 2013 | Year ended April 30, 2014 | Year ended April 30, 2013 | |||||||||||||
INCREASE (DECREASE) IN NET ASSETS | ||||||||||||||||
OPERATIONS: | ||||||||||||||||
Net investment income | $ | 2,058,871 | $ | 1,168,768 | $ | 6,687,729 | $ | 2,138,841 | ||||||||
Net realized gain (loss) | (1,764,737 | ) | 538,315 | (10,453,226 | ) | (402,752 | ) | |||||||||
Net change in unrealized appreciation/depreciation | (1,037,524 | ) | 4,873,217 | (5,278,169 | ) | 285,662 | ||||||||||
|
|
|
|
|
|
|
| |||||||||
Net increase (decrease) in net assets resulting from operations | (743,390 | ) | 6,580,300 | (9,043,666 | ) | 2,021,751 | ||||||||||
|
|
|
|
|
|
|
| |||||||||
DISTRIBUTIONS TO SHAREHOLDERS: | ||||||||||||||||
From net investment income | (2,394,460 | ) | (1,041,458 | ) | (7,489,999 | ) | (1,597,355 | ) | ||||||||
|
|
|
|
|
|
|
| |||||||||
Total distributions to shareholders | (2,394,460 | ) | (1,041,458 | ) | (7,489,999 | ) | (1,597,355 | ) | ||||||||
|
|
|
|
|
|
|
| |||||||||
CAPITAL SHARE TRANSACTIONS: | ||||||||||||||||
Proceeds from shares sold | 8,584,794 | 32,603,051 | 79,561,210 | 118,206,938 | ||||||||||||
Cost of shares redeemed | — | (8,098,723 | ) | (15,995,309 | ) | (2,795,867 | ) | |||||||||
|
|
|
|
|
|
|
| |||||||||
Net increase in net assets from capital share transactions | 8,584,794 | 24,504,328 | 63,565,901 | 115,411,071 | ||||||||||||
|
|
|
|
|
|
|
| |||||||||
INCREASE IN NET ASSETS | 5,446,944 | 30,043,170 | 47,032,236 | 115,835,467 | ||||||||||||
NET ASSETS | ||||||||||||||||
Beginning of year | 43,228,973 | 13,185,803 | 131,805,644 | 15,970,177 | ||||||||||||
|
|
|
|
|
|
|
| |||||||||
End of year | $ | 48,675,917 | $ | 43,228,973 | $ | 178,837,880 | $ | 131,805,644 | ||||||||
|
|
|
|
|
|
|
| |||||||||
Undistributed net investment income included in net assets at end of year | $ | 170,981 | $ | 126,222 | $ | 253,084 | $ | 701,298 | ||||||||
|
|
|
|
|
|
|
| |||||||||
SHARES ISSUED AND REDEEMED | ||||||||||||||||
Shares sold | 150,000 | 600,000 | 1,600,000 | 2,200,000 | ||||||||||||
Shares redeemed | — | (150,000 | ) | (350,000 | ) | (50,000 | ) | |||||||||
|
|
|
|
|
|
|
| |||||||||
Net increase in shares outstanding | 150,000 | 450,000 | 1,250,000 | 2,150,000 | ||||||||||||
|
|
|
|
|
|
|
| |||||||||
See notes to financial statements.
FINANCIAL STATEMENTS | 17 |
Table of Contents
iSHARES®, INC.
(For a share outstanding throughout each period)
| iShares Asia/Pacific Dividend ETF | ||||||
| Year ended Apr. 30, 2014 | Year ended Apr. 30, 2013 | Period from to Apr. 30, 2012 | ||||||||||
Net asset value, beginning of period | $ | 61.76 | $ | 52.74 | $ | 51.62 | ||||||
|
|
|
|
|
| |||||||
Income from investment operations: | ||||||||||||
Net investment incomeb | 2.61 | 2.71 | 0.55 | |||||||||
Net realized and unrealized gain (loss)c | (4.04 | ) | 8.86 | 1.14 | ||||||||
|
|
|
|
|
| |||||||
Total from investment operations | (1.43 | ) | 11.57 | 1.69 | ||||||||
|
|
|
|
|
| |||||||
Less distributions from: | ||||||||||||
Net investment income | (3.06 | ) | (2.55 | ) | (0.54 | ) | ||||||
Net realized gain | — | — | (0.01 | ) | ||||||||
Return of capital | — | — | (0.02 | ) | ||||||||
|
|
|
|
|
| |||||||
Total distributions | (3.06 | ) | (2.55 | ) | (0.57 | ) | ||||||
|
|
|
|
|
| |||||||
Net asset value, end of period | $ | 57.27 | $ | 61.76 | $ | 52.74 | ||||||
|
|
|
|
|
| |||||||
Total return | (1.78 | )% | 22.87 | % | 3.32 | %d | ||||||
|
|
|
|
|
| |||||||
Ratios/Supplemental data: | ||||||||||||
Net assets, end of period (000s) | $ | 48,676 | $ | 43,229 | $ | 13,186 | ||||||
Ratio of expenses to average net assetse | 0.49 | % | 0.49 | % | 0.49 | % | ||||||
Ratio of net investment income to average net assetse | 4.77 | % | 4.99 | % | 5.76 | % | ||||||
Portfolio turnover ratef | 33 | % | 32 | % | 1 | % | ||||||
| a | Commencement of operations. |
| b | Based on average shares outstanding throughout each period. |
| c | The amounts reported for a share outstanding may not accord with the change in aggregate gains and losses in securities for the fiscal period due to the timing of capital share transactions in relation to the fluctuating market values of the Fund’s underlying securities. |
| d | Not annualized. |
| e | Annualized for periods of less than one year. |
| f | Portfolio turnover rates exclude portfolio securities received or delivered as a result of processing capital share transactions in Creation Units. |
See notes to financial statements.
| 18 | 2014 iSHARES ANNUAL REPORTTO SHAREHOLDERS |
Table of Contents
Financial Highlights (Continued)
iSHARES®, INC.
(For a share outstanding throughout each period)
iShares Emerging Markets Dividend ETF | ||||||
| Year ended Apr. 30, 2014 | Year ended Apr. 30, 2013 | Period from to Apr. 30, 2012 | ||||||||||
Net asset value, beginning of period | $ | 53.80 | $ | 53.23 | $ | 54.61 | ||||||
|
|
|
|
|
| |||||||
Income from investment operations: | ||||||||||||
Net investment incomeb | 1.96 | 2.02 | 0.74 | |||||||||
Net realized and unrealized gain (loss)c | (5.18 | ) | 0.56 | (1.98 | ) | |||||||
|
|
|
|
|
| |||||||
Total from investment operations | (3.22 | ) | 2.58 | (1.24 | ) | |||||||
|
|
|
|
|
| |||||||
Less distributions from: | ||||||||||||
Net investment income | (2.25 | ) | (2.01 | ) | (0.14 | ) | ||||||
|
|
|
|
|
| |||||||
Total distributions | (2.25 | ) | (2.01 | ) | (0.14 | ) | ||||||
|
|
|
|
|
| |||||||
Net asset value, end of period | $ | 48.33 | $ | 53.80 | $ | 53.23 | ||||||
|
|
|
|
|
| |||||||
Total return | (5.86 | )% | 5.09 | % | (2.27 | )%d | ||||||
|
|
|
|
|
| |||||||
Ratios/Supplemental data: | ||||||||||||
Net assets, end of period (000s) | $ | 178,838 | $ | 131,806 | $ | 15,970 | ||||||
Ratio of expenses to average net assetse | 0.49 | % | 0.49 | % | 0.49 | % | ||||||
Ratio of expenses to average net assets prior to waived feese | 0.68 | % | 0.68 | % | 0.68 | % | ||||||
Ratio of net investment income to average net assetse | 4.01 | % | 3.80 | % | 7.51 | % | ||||||
Portfolio turnover ratef | 44 | % | 41 | % | 2 | % | ||||||
| a | Commencement of operations. |
| b | Based on average shares outstanding throughout each period. |
| c | The amounts reported for a share outstanding may not accord with the change in aggregate gains and losses in securities for the fiscal period due to the timing of capital share transactions in relation to the fluctuating market values of the Fund’s underlying securities. |
| d | Not annualized. |
| e | Annualized for periods of less than one year. |
| f | Portfolio turnover rates exclude portfolio securities received or delivered in Creation Units but include portfolio transactions that are executed as a result of the Fund processing capital share transactions in Creation Units partially for cash in U.S. dollars. Excluding such cash transactions, the portfolio turnover rates for the years ended April 30, 2014 and April 30, 2013 were 39% and 41%, respectively. See Note 4. |
See notes to financial statements.
FINANCIAL HIGHLIGHTS | 19 |
Table of Contents
iSHARES®, INC.
iShares, Inc. (the “Company”) is registered under the Investment Company Act of 1940, as amended (the “1940 Act”), as an open-end management investment company. The Company was incorporated under the laws of the State of Maryland on September 1, 1994 pursuant to amended and restated Articles of Incorporation.
These financial statements relate only to the following funds (each, a “Fund,” and collectively, the “Funds”):
| iShares ETF | Former Name a | Diversification Classification | ||
Asia/Pacific Dividend | iShares Asia/Pacific Dividend 30 Index Fund | Non-diversified | ||
Emerging Markets Dividend | iShares Emerging Markets Dividend Index Fund | Non-diversified |
| a | The Funds changed their names effective July 1, 2013. |
The investment objective of each Fund is to seek investment results that correspond generally to the price and yield performance, before fees and expenses, of its underlying index. The investment adviser uses a “passive” or index approach to try to achieve each Fund’s investment objective.
Non-diversified funds generally hold securities of fewer issuers than diversified funds and may be more susceptible to the risks associated with these particular issuers, or to a single economic, political or regulatory occurrence affecting these issuers.
The Funds invest in securities of non-U.S. issuers that trade in non-U.S. markets. This involves certain considerations and risks not typically associated with securities of U.S. issuers. Such risks include, but are not limited to: generally less liquid and less efficient securities markets; generally greater price volatility; exchange rate fluctuations and exchange controls; imposition of restrictions on the expatriation of funds or other assets of the Funds; less publicly available information about issuers; the imposition of withholding or other taxes; higher transaction and custody costs; settlement delays and risk of loss attendant in settlement procedures; difficulties in enforcing contractual obligations; less regulation of securities markets; different accounting, disclosure and reporting requirements; more substantial governmental involvement in the economy; higher inflation rates; greater social, economic and political uncertainties; the risk of nationalization or expropriation of assets; and the risk of war. These risks are heightened for investments in emerging market and frontier market countries.
The United States and the European Union have imposed economic sanctions on certain Russian individuals and a financial institution. The United States or the European Union could also institute broader sanctions on Russia. These sanctions, or even the threat of further sanctions, may result in the decline of the value and liquidity of Russian securities, a weakening of the ruble or other adverse consequences to the Russian economy. These sanctions could also result in the immediate freeze of Russian securities, impairing the ability of the iShares Emerging Markets Dividend ETF to buy, sell, receive or deliver those securities. Sanctions could also result in Russia taking counter measures or retaliatory actions which may further impair the value and liquidity of Russian securities.
Pursuant to the Company’s organizational documents, the Funds’ officers and directors are indemnified against certain liabilities that may arise out of the performance of their duties to the Funds. Additionally, in the normal course of business, the Funds enter into contracts with service providers that contain general indemnification clauses. The Funds’ maximum exposure under these arrangements is unknown as this would involve future claims that may be made against the Funds that have not yet occurred.
| 1. | SIGNIFICANT ACCOUNTING POLICIES |
The following significant accounting policies are consistently followed by the Funds in the preparation of their financial statements in conformity with accounting principles generally accepted in the United States of America (“U.S. GAAP”). The preparation of financial statements in conformity with U.S. GAAP requires management to make certain estimates and assumptions that affect
| 20 | 2014 iSHARES ANNUAL REPORTTO SHAREHOLDERS |
Table of Contents
Notes to Financial Statements (Continued)
iSHARES®, INC.
the reported amounts of assets and liabilities and disclosures of contingent assets and liabilities at the date of the financial statements and the reported amounts of revenue and expenses during the reporting period. Actual results could differ from those estimates.
SECURITY VALUATION
Each Fund’s investments are valued at fair value each day that the Fund’s listing exchange is open and, for financial reporting purposes, as of the report date should the reporting period end on a day that the Fund’s listing exchange is not open. U.S. GAAP defines fair value as the price a fund would receive to sell an asset or pay to transfer a liability in an orderly transaction between market participants at the measurement date. The BlackRock Global Valuation Methodologies Committee (the “Global Valuation Committee”) provides oversight of the valuation of investments for the Funds. The investments of each Fund are valued pursuant to policies and procedures developed by the Global Valuation Committee and approved by the Board of Directors of the Company (the “Board”).
| • | Equity investments traded on a recognized securities exchange are valued at that day’s last reported trade price or the official closing price, as applicable, on the exchange where the stock is primarily traded. Equity investments traded on a recognized exchange for which there were no sales on that day are valued at the last traded price. |
| • | Open-end U.S. mutual funds are valued at that day’s published net asset value (NAV). |
In the event that application of these methods of valuation results in a price for an investment which is deemed not to be representative of the fair value of such investment or if a price is not available, the investment will be valued based upon other available factors deemed relevant by the Global Valuation Committee, in accordance with policies approved by the Board. These factors include but are not limited to (i) attributes specific to the investment; (ii) the principal market for the investment; (iii) the customary participants in the principal market for the investment; (iv) data assumptions by market participants for the investment, if reasonably available; (v) quoted prices for similar investments in active markets; and (vi) other factors, such as future cash flows, interest rates, yield curves, volatilities, prepayment speeds, loss severities, credit risks and/or default rates. Valuations based on such factors are reported to the Board on a quarterly basis.
The Global Valuation Committee employs various methods for calibrating valuation approaches for investments where an active market does not exist, including regular due diligence of the Company’s pricing vendors, a regular review of key inputs and assumptions, transactional back-testing or disposition analysis to compare unrealized gains and losses to realized gains and losses, reviews of missing or stale prices, reviews of large movements in market values, and reviews of market related activity.
Fair value pricing could result in a difference between the prices used to calculate a Fund’s net asset value and the prices used by the Fund’s underlying index, which in turn could result in a difference between the Fund’s performance and the performance of the Fund’s underlying index.
Various inputs are used in determining the fair value of financial instruments. Inputs may be based on independent market data (“observable inputs”) or they may be internally developed (“unobservable inputs”). These inputs are categorized into a disclosure hierarchy consisting of three broad levels for financial reporting purposes. The level of a value determined for a financial instrument within the fair value hierarchy is based on the lowest level of any input that is significant to the fair value measurement in its entirety. The categorization of a value determined for a financial instrument within the hierarchy is based upon the pricing transparency of the instrument and is not necessarily an indication of the risk associated with investing in the instrument. The three levels of the fair value hierarchy are as follows:
| • | Level 1 — Unadjusted quoted prices in active markets for identical assets or liabilities; |
NOTESTO FINANCIAL STATEMENTS | 21 |
Table of Contents
Notes to Financial Statements (Continued)
iSHARES®, INC.
| • | Level 2 — Inputs other than quoted prices included within Level 1 that are observable for the asset or liability either directly or indirectly, including quoted prices for similar assets or liabilities in active markets, quoted prices for identical or similar assets or liabilities in markets that are not considered to be active, inputs other than quoted prices that are observable for the asset or liability (such as exchange rates, financing terms, interest rates, yield curves, volatilities, prepayment speeds, loss severities, credit risks and default rates) or other market-corroborated inputs; and |
| • | Level 3 — Unobservable inputs for the asset or liability, including the Global Valuation Committee’s assumptions used in determining the fair value of investments. |
Changes in valuation techniques may result in transfers in or out of an assigned level within the disclosure hierarchy. In accordance with the Company’s policy, transfers between different levels of the fair value hierarchy are deemed to have occurred as of the beginning of the reporting period.
The following table summarizes the value of each of the Funds’ investments according to the fair value hierarchy as of April 30, 2014. The breakdown of each Fund’s investments into major categories is disclosed in its respective schedule of investments.
iShares ETF and
| Investments | |||||||||||||||
| Level 1 | Level 2 | Level 3 | Total | |||||||||||||
Asia/Pacific Dividend | ||||||||||||||||
Assets: | ||||||||||||||||
Common Stocks | $ | 48,487,375 | $ | — | $ | — | $ | 48,487,375 | ||||||||
Money Market Funds | 4,745,539 | — | — | 4,745,539 | ||||||||||||
|
|
|
|
|
|
|
| |||||||||
| $ | 53,232,914 | $ | — | $ | — | $ | 53,232,914 | |||||||||
|
|
|
|
|
|
|
| |||||||||
Emerging Markets Dividend | ||||||||||||||||
Assets: | ||||||||||||||||
Common Stocks | $ | 160,878,422 | $ | — | $ | — | $ | 160,878,422 | ||||||||
Preferred Stocks | 16,405,688 | — | — | 16,405,688 | ||||||||||||
Warrants | — | 150,159 | — | 150,159 | ||||||||||||
Money Market Funds | 5,602,736 | — | — | 5,602,736 | ||||||||||||
|
|
|
|
|
|
|
| |||||||||
| $ | 182,886,846 | $ | 150,159 | $ | — | $ | 183,037,005 | |||||||||
|
|
|
|
|
|
|
| |||||||||
SECURITY TRANSACTIONS AND INCOME RECOGNITION
Security transactions are accounted for on trade date. Dividend income is recognized on the ex-dividend date, net of any foreign taxes withheld at source. Any taxes withheld that are reclaimable from foreign tax authorities as of April 30, 2014 are reflected in dividends receivable. Non-cash dividends received in the form of stock in an elective dividend, if any, are recorded as dividend income at fair value. Distributions received by the Funds may include a return of capital that is estimated by management. Such amounts are recorded as a reduction of the cost of investments or reclassified to capital gains. Interest income is accrued daily. Realized gains and losses on investment transactions are determined using the specific identification method.
FOREIGN CURRENCY TRANSLATION
The accounting records of the Funds are maintained in U.S. dollars. Foreign currencies, as well as investment securities and other assets and liabilities denominated in foreign currencies, are translated into U.S. dollars using exchange rates deemed
| 22 | 2014 iSHARES ANNUAL REPORTTO SHAREHOLDERS |
Table of Contents
Notes to Financial Statements (Continued)
iSHARES®, INC.
appropriate by the investment adviser. Purchases and sales of securities, income receipts and expense payments are translated into U.S. dollars on the respective dates of such transactions.
Each Fund does not isolate the effect of fluctuations in foreign exchange rates from the effect of fluctuations in the market prices of securities. Such fluctuations are reflected by the Funds as a component of realized and unrealized gains and losses from investments for financial reporting purposes.
FOREIGN TAXES
The Funds may be subject to foreign taxes (a portion of which may be reclaimable) on income, stock dividends, capital gains on investments, or certain foreign currency transactions. All foreign taxes are recorded in accordance with the applicable foreign tax regulations and rates that exist in the foreign jurisdictions in which the Funds invest. These foreign taxes, if any, are paid by the Funds and are reflected in their statements of operations as follows: foreign taxes withheld at source are presented as a reduction of income, foreign taxes on securities lending income are presented as a reduction of securities lending income, foreign taxes on stock dividends are presented as “other foreign taxes,” and foreign taxes on capital gains from sales of investments and foreign taxes on foreign currency transactions are included in their respective net realized gain (loss) categories. Foreign taxes payable or deferred as of April 30, 2014, if any, are disclosed in the Funds’ statements of assets and liabilities.
DISTRIBUTIONS TO SHAREHOLDERS
Dividends and distributions paid by each Fund are recorded on the ex-dividend dates. Distributions are determined on a tax basis and may differ from net investment income and net realized capital gains for financial reporting purposes. Dividends and distributions are paid in U.S. dollars and cannot be automatically reinvested in additional shares of the Funds.
FEDERAL INCOME TAXES
Each Fund is treated as an entity separate from the Company’s other funds for federal income tax purposes. It is the policy of each Fund to qualify as a regulated investment company by complying with the provisions applicable to regulated investment companies, as defined under Subchapter M of the Internal Revenue Code of 1986, as amended, and to annually distribute substantially all of its ordinary income and any net capital gains (taking into account any capital loss carryforwards) sufficient to relieve it from all, or substantially all, federal income and excise taxes. Accordingly, no provision for federal income taxes is required.
LOANS OF PORTFOLIO SECURITIES
Each Fund may lend its investment securities to approved borrowers, such as brokers, dealers and other financial institutions. The borrower pledges and maintains with the Fund collateral consisting of cash, an irrevocable letter of credit issued by a bank, or securities issued or guaranteed by the U.S. government. The initial collateral received by each Fund is required to have a value of at least 102% of the current value of the loaned securities for securities traded on U.S. exchanges and a value of at least 105% for all other securities. The collateral is maintained thereafter, at a value equal to at least 100% of the current value of the securities on loan. The market value of the loaned securities is determined at the close of each business day of the Funds and any additional required collateral is delivered to the Funds on the next business day. During the term of the loan, the Fund is entitled to all distributions made on or in respect of the loaned securities. Loans of securities are terminable at any time and the borrower, after notice, is required to return borrowed securities within the standard time period for settlement of securities transactions.
NOTESTO FINANCIAL STATEMENTS | 23 |
Table of Contents
Notes to Financial Statements (Continued)
iSHARES®, INC.
Any cash received as collateral for securities on loan may be reinvested in certain short-term instruments either directly on behalf of a fund or through one or more joint accounts or money market funds, including those managed by BlackRock Fund Advisors (“BFA”), the Funds’ investment adviser, or its affiliates. As of April 30, 2014, any securities on loan were collateralized by cash. The cash collateral received was invested in money market funds managed by BFA and is disclosed in the schedules of investments. The value of any securities on loan as of April 30, 2014 and the value of the related collateral are disclosed in the statements of assets and liabilities. Income earned by the Funds from securities lending is disclosed in the statements of operations.
The risks of securities lending include the risk that the borrower may not provide additional collateral when required or may not return the securities when due. To mitigate these risks, the Funds benefit from a borrower default indemnity provided by BlackRock, Inc. (“BlackRock”). BlackRock’s indemnity allows for full replacement of securities lent. Each Fund could suffer a loss if the value of the investments purchased with cash collateral falls below the value of the cash collateral received.
Securities lending transactions are entered into by the Funds under Master Securities Lending Agreements (“MSLA”) which provide the right, in the event of default (including bankruptcy or insolvency) for the non-defaulting party to liquidate the collateral and calculate a net exposure to the defaulting party or request additional collateral. In the event that a borrower defaults, a Fund, as lender, would offset the market value of the collateral received against the market value of the securities loaned. The value of the collateral is typically greater than that of the market value of the securities loaned, leaving the lender with a net amount payable to the defaulting party. However, bankruptcy or insolvency laws of a particular jurisdiction may impose restrictions on or prohibitions against such a right of offset in the event of an MSLA counterparty’s bankruptcy or insolvency. Under the MSLA, the borrower can resell or re-pledge the loaned securities, and a Fund can reinvest cash collateral, or, upon an event of default, resell or re-pledge the collateral
The following table is a summary of each Fund’s securities lending agreements which are subject to offset under an MSLA as of April 30, 2014.
| iShares ETF | Market Value of Securities on Loan | Cash Collateral Received a | Net Amount | |||||||||
Asia/Pacific Dividend | $ | 4,458,242 | $ | 4,458,242 | $ | — | ||||||
Emerging Markets Dividend | 5,057,167 | 5,057,167 | — | |||||||||
| a | Collateral received in excess of the market value of securities on loan is not presented for financial reporting purposes. The total collateral received is disclosed in each Fund’s statement of assets and liabilities. |
| 2. | INVESTMENT ADVISORY AGREEMENT AND OTHER TRANSACTIONS WITH AFFILIATES |
Pursuant to an Investment Advisory Agreement with the Company, BFA manages the investment of each Fund’s assets. BFA is a California corporation indirectly owned by BlackRock. Under the Investment Advisory Agreement, BFA is responsible for substantially all expenses of the Funds, except interest, taxes, brokerage commissions and other expenses connected with the execution of portfolio transactions, distribution fees, litigation expenses and any extraordinary expenses.
For its investment advisory services to each Fund, BFA is entitled to an annual investment advisory fee based on the average daily net assets of each Fund as follows:
| iShares ETF | Investment Advisory Fee | |||
Asia/Pacific Dividend | 0.49 | % | ||
Emerging Markets Dividend | 0.68 | |||
| 24 | 2014 iSHARES ANNUAL REPORTTO SHAREHOLDERS |
Table of Contents
Notes to Financial Statements (Continued)
iSHARES®, INC.
BFA has contractually agreed to waive a portion of its investment advisory fees for the iShares Emerging Markets Dividend ETF through December 31, 2014 in an amount equal to the investment advisory fees payable on the amount of the Funds’ investment in other iShares funds.The Fund did not hold any iShares funds during the year ended April 30, 2014. In addition, BFA has contractually agreed to waive a portion of its investments advisory fee for the Fund through December 31, 2014 in an amount equal to 0.19%. After giving effect to the fee waiver, BFA received an investment advisory fee of 0.49% of the average daily net assets of the Fund.
The U.S. Securities and Exchange Commission has issued an exemptive order which permits BlackRock Institutional Trust Company, N.A. (“BTC”), an affiliate of BFA, to serve as securities lending agent for the Funds, subject to applicable conditions. As securities lending agent, BTC bears all operational costs directly related to securities lending. Effective January 1, 2014, each Fund is responsible for fees in connection with the investment of cash collateral received for securities on loan in a money market fund managed by BFA, however, BTC has agreed to reduce the amount of securities lending income it receives in order to effectively limit the collateral investment fees each Fund bears to an annual rate of 0.04% until December 31, 2014 and 0.05% thereafter (the “collateral investment fees”). Securities lending income is equal to the total of income earned from the reinvestment of cash collateral, net of fees and other payments to and from borrowers of securities, and less the collateral investment fees. The Funds retain a portion of securities lending income and remit a remaining portion to BTC as compensation for its services as securities lending agent.
Pursuant to a securities lending agreement effective January 1, 2014, (i) each Fund retains 75% of securities lending income (commencing January 1, 2015 the amount each Fund will retain is expected to change to 70% of securities lending income) and (ii) these amounts can never be less than 65% of the total of securities lending income plus the collateral investment fees. Prior to January 1, 2014, each Fund retained 65% of securities lending income and paid no collateral investment fees.
For the year ended April 30, 2014, each Fund paid to BTC the following amounts in total for securities lending agent services and collateral investment fees:
| iShares ETF | Fees Paid to BTC | |||
Asia/Pacific Dividend | $ | 11,135 | ||
Emerging Markets Dividend | 50,630 | |||
In addition, commencing the business day following a “Hurdle Date” (the date that the aggregate securities lending income generated across all 1940 Act iShares exchange-traded funds (the “iShares ETF Complex”) in a given calendar year exceeds the aggregate securities lending income generated across the iShares ETF Complex in calendar year 2013 or lesser amount as may be agreed to by the Funds and BTC) and pursuant to a securities lending agreement, (i) each Fund will receive for the remainder of that calendar year 80% of securities lending income (for any Hurdle Date after January 1, 2015, each Fund will retain 75% of securities lending income) and (ii) these amounts can never be less than 65% of the total of securities lending income plus the collateral investment fees.
BlackRock Investments, LLC, an affiliate of BFA, is the distributor for each Fund. Pursuant to the distribution agreement, BFA is responsible for any fees or expenses for distribution services provided to the Funds.
Each Fund may invest its positive cash balances in certain money market funds managed by BFA or an affiliate. The income earned on these temporary cash investments is included in “Interest – affiliated” in the statements of operations.
The PNC Financial Services Group, Inc. is the largest stockholder of BlackRock and is considered to be an affiliate of the Funds for 1940 Act purposes.
NOTESTO FINANCIAL STATEMENTS | 25 |
Table of Contents
Notes to Financial Statements (Continued)
iSHARES®, INC.
The iShares Emerging Markets Dividend ETF, in order to improve its portfolio liquidity and its ability to track its underlying index, may invest in shares of other iShares funds that invest in securities in the Fund’s underlying index.
Certain directors and officers of the Company are also officers of BTC and/or BFA.
| 3. | INVESTMENT PORTFOLIO TRANSACTIONS |
Purchases and sales of investments (excluding in-kind transactions and short-term investments) for the year ended April 30, 2014 were as follows:
| iShares ETF | Purchases | Sales | ||||||
Asia/Pacific Dividend | $ | 14,011,101 | $ | 14,222,275 | ||||
Emerging Markets Dividend | 105,341,922 | 72,037,878 | ||||||
In-kind transactions (see Note 4) for the year ended April 30, 2014 were as follows:
| iShares ETF | In-kind Purchases | In-kind Sales | ||||||
Asia/Pacific Dividend | $ | 8,490,799 | $ | — | ||||
Emerging Markets Dividend | 36,704,275 | 7,983,746 | ||||||
| 4. | CAPITAL SHARE TRANSACTIONS |
Capital shares are issued and redeemed by each Fund only in aggregations of a specified number of shares or multiples thereof (“Creation Units”) at net asset value. Except when aggregated in Creation Units, shares of each Fund are not redeemable. Transactions in capital shares for each Fund are disclosed in detail in the statements of changes in net assets.
The consideration for the purchase of Creation Units of a fund in the Company generally consists of the in-kind deposit of a designated portfolio of securities and a specified amount of cash. Certain funds in the Company may be offered in Creation Units solely or partially for cash in U.S. dollars. Investors purchasing and redeeming Creation Units may pay a purchase transaction fee and a redemption transaction fee directly to State Street Bank and Trust Company, the Company’s administrator, to offset transfer and other transaction costs associated with the issuance and redemption of Creation Units, including Creation Units for cash. Investors transacting in Creation Units for cash may also pay an additional variable charge to compensate the relevant fund for certain transaction costs (i.e., stamp taxes, taxes on currency or other financial transactions, and brokerage costs) and market impact expenses relating to investing in portfolio securities.
From time to time, settlement of securities related to in-kind contributions or in-kind redemptions may be delayed. In such cases, securities related to in-kind contributions are reflected as “Due from custodian” and securities related to in-kind redemptions are reflected as “Securities related to in-kind transactions” in the statements of assets and liabilities.
| 26 | 2014 iSHARES ANNUAL REPORTTO SHAREHOLDERS |
Table of Contents
Notes to Financial Statements (Continued)
iSHARES®, INC.
| 5. | INCOME TAX INFORMATION |
U.S. GAAP requires that certain components of net assets be adjusted to reflect permanent differences between financial and tax reporting. These reclassifications have no effect on net assets or net asset values per share. The following permanent differences as of April 30, 2014, attributable to passive foreign investment companies, foreign currency transactions and realized gains (losses) from in-kind redemptions, were reclassified to the following accounts:
| iShares ETF | Paid-in Capital | Undistributed Net Investment Income/Distributions in Excess of Net Investment Income | Undistributed Net Realized Gain/Accumulated Net Realized Loss | |||||||||
Asia/Pacific Dividend | $ | — | $ | 380,348 | $ | (380,348 | ) | |||||
Emerging Markets Dividend | 501,932 | 354,056 | (855,988 | ) | ||||||||
The tax character of distributions paid during the years ended April 30, 2014 and April 30, 2013 was as follows:
| iShares ETF | 2014 | 2013 | ||||||
Asia/Pacific Dividend | ||||||||
Ordinary income | $ | 2,394,460 | $ | 1,041,458 | ||||
|
|
|
| |||||
Emerging Markets Dividend | ||||||||
Ordinary income | $ | 7,489,999 | $ | 1,597,355 | ||||
|
|
|
| |||||
As of April 30, 2014, the tax components of accumulated net earnings (losses) were as follows:
| iShares ETF | Undistributed Ordinary Income | Capital Loss Carryforwards | Net Unrealized Gains (Losses) a | Qualified Late-Year Losses b | Total | |||||||||||||||
Asia/Pacific Dividend | $ | 170,981 | $ | (397,119 | ) | $ | 3,672,923 | $ | (1,778,062 | ) | $ | 1,668,723 | ||||||||
Emerging Markets Dividend | 1,243,763 | (1,732,762 | ) | (9,124,556 | ) | (8,266,448 | ) | (17,880,003 | ) | |||||||||||
| a | The difference between book-basis and tax-basis unrealized gains (losses) was attributable primarily to the tax deferral of losses on wash sales and the realization for tax purposes of unrealized gains on investments in passive foreign investment companies. |
| b | The Funds have elected to defer certain qualified late-year losses and recognize such losses in the year ending April 30, 2015. |
As of April 30, 2014, the Funds had non-expiring capital loss carryforwards available to offset future realized capital gains as follows:
| iShares ETF | Non- Expiring | |||
Asia/Pacific Dividend | $ | 397,119 | ||
Emerging Markets Dividend | 1,732,762 | |||
The Funds may own shares in certain foreign investment entities, referred to, under U.S. tax law, as “passive foreign investment companies.” The Funds may elect to mark-to-market annually the shares of each passive foreign investment company and would be required to distribute to shareholders any such marked-to-market gains.
NOTESTO FINANCIAL STATEMENTS | 27 |
Table of Contents
Notes to Financial Statements (Continued)
iSHARES®, INC.
As of April 30, 2014, gross unrealized appreciation and gross unrealized depreciation based on cost for federal income tax purposes were as follows:
| iShares ETF | Tax Cost | Gross Unrealized Appreciation | Gross Unrealized Depreciation | Net Unrealized Appreciation (Depreciation) | ||||||||||||
Asia/Pacific Dividend | $ | 49,559,585 | $ | 5,483,350 | $ | (1,810,021 | ) | $ | 3,673,329 | |||||||
Emerging Markets Dividend | 192,162,698 | 10,713,846 | (19,839,539 | ) | (9,125,693 | ) | ||||||||||
Management has analyzed tax laws and regulations and their application to the Funds as of April 30, 2014, inclusive of the open tax return years, and does not believe there are any uncertain tax positions that require recognition of a tax liability in the Funds’ financial statements.
| 6. | SUBSEQUENT EVENTS |
Management has evaluated the impact of all subsequent events on the Funds through the date the financial statements were available to be issued and has determined that there were no subsequent events requiring adjustment or disclosure in the financial statements.
| 28 | 2014 iSHARES ANNUAL REPORTTO SHAREHOLDERS |
Table of Contents
Report of Independent Registered Public Accounting Firm
To the Shareholders and Board of Directors of
iShares, Inc.:
In our opinion, the accompanying statements of assets and liabilities, including the schedules of investments, and the related statements of operations and of changes in net assets and the financial highlights present fairly, in all material respects, the financial position of iShares Asia/Pacific Dividend ETF and iShares Emerging Markets Dividend ETF (the “Funds”) at April 30, 2014, the results of each of their operations, the changes in each of their net assets and their financial highlights for each of the periods presented, in conformity with accounting principles generally accepted in the United States of America. These financial statements and financial highlights (hereafter referred to as “financial statements”) are the responsibility of the Funds’ management; our responsibility is to express an opinion on these financial statements based on our audits. We conducted our audits of these financial statements in accordance with the standards of the Public Company Accounting Oversight Board (United States). Those standards require that we plan and perform the audit to obtain reasonable assurance about whether the financial statements are free of material misstatement. An audit includes examining, on a test basis, evidence supporting the amounts and disclosures in the financial statements, assessing the accounting principles used and significant estimates made by management, and evaluating the overall financial statement presentation. We believe that our audits, which included confirmation of securities at April 30, 2014 by correspondence with the custodian, transfer agent and brokers, provide a reasonable basis for our opinion.
PricewaterhouseCoopers LLP
San Francisco, California
June 19, 2014
REPORTOF INDEPENDENT REGISTERED PUBLIC ACCOUNTING FIRM | 29 |
Table of Contents
iSHARES®, INC.
For the fiscal year ended April 30, 2014, the Funds earned foreign source income and paid foreign taxes which they intend to
pass through to their shareholders pursuant to Section 853 of the Internal Revenue Code (the “Code”) as follows:
| iShares ETF | Foreign Source Income Earned | Foreign Taxes Paid | ||||||
Asia/Pacific Dividend | $ | 2,320,573 | $ | 76,987 | ||||
Emerging Markets Dividend | 8,452,603 | 996,904 | ||||||
Under Section 854(b)(2) of the Code, the Funds hereby designate the following maximum amounts as qualified dividend income for purposes of the maximum rate under Section 1(h)(11) of the Code for the fiscal year ended April 30, 2014:
| iShares ETF | Qualified Dividend Income | |||
Asia/Pacific Dividend | $1,725,605 | |||
Emerging Markets Dividend | 3,846,882 | |||
In February 2015, shareholders will receive Form 1099-DIV which will include their share of qualified dividend income distributed during the calendar year 2014. Shareholders are advised to check with their tax advisers for information on the treatment of these amounts on their income tax returns.
| 30 | 2014 iSHARES ANNUAL REPORTTO SHAREHOLDERS |
Table of Contents
Supplemental Information (Unaudited)
iSHARES®, INC.
Section 19(a) Notices
The amounts and sources of distributions reported are only estimates and are not being provided for tax reporting purposes. The actual amounts and sources of the amounts for tax reporting purposes will depend upon each Fund’s investment experience during the year and may be subject to changes based on the tax regulations. Shareholders will receive a Form 1099-DIV each calendar year that will inform them how to report distributions for federal income tax purposes.
| Total Cumulative Distributions for the Fiscal Year | % Breakdown of the Total Cumulative Distributions for the Fiscal Year | |||||||||||||||||||||||||||||||
| iShares ETF | Net Investment Income | Net Realized Capital Gains | Return of Capital | Total Per Share | Net Investment Income | Net Realized Capital Gains | Return of Capital | Total Per Share | ||||||||||||||||||||||||
Asia/Pacific Dividend | $ | 2.922266 | $ | — | $ | 0.140445 | $ | 3.062711 | 95 | % | — | % | 5 | % | 100 | % | ||||||||||||||||
Emerging Markets Dividend | 2.032053 | — | 0.213900 | 2.245953 | 90 | — | 10 | 100 | ||||||||||||||||||||||||
Premium/Discount Information
The tables that follow present information about the differences between the daily market price on secondary markets for shares of a Fund and that Fund’s net asset value. Net asset value, or “NAV,” is the price per share at which each Fund issues and redeems shares. It is calculated in accordance with the standard formula for valuing mutual fund shares. The “Market Price” of each Fund generally is determined using the midpoint between the highest bid and the lowest offer on the primary stock exchange on which the shares of such Fund are listed for trading, as of the time that the Fund’s NAV is calculated. Each Fund’s Market Price may be at, above or below its NAV. The NAV of each Fund will fluctuate with changes in the fair value of its portfolio holdings. The Market Price of each Fund will fluctuate in accordance with changes in its NAV, as well as market supply and demand.
Premiums or discounts are the differences (expressed as a percentage) between the NAV and Market Price of a Fund on a given day, generally at the time NAV is calculated. A premium is the amount that a Fund is trading above the reported NAV, expressed as a percentage of the NAV. A discount is the amount that a Fund is trading below the reported NAV, expressed as a percentage of the NAV.
The following information shows the frequency distributions of premiums and discounts for each of the Funds included in this report. The information shown for each Fund is for five calendar years (or for each full calender quarter completed after the inception date of such Fund if less than five years) through the date of the most recent calendar quarter-end. The specific periods covered for each Fund are disclosed in the table for such Fund.
SUPPLEMENTAL INFORMATION | 31 |
Table of Contents
Supplemental Information (Unaudited) (Continued)
iSHARES®, INC.
Each line in the table shows the number of trading days in which the Fund traded within the premium/discount range indicated. The number of trading days in each premium/discount range is also shown as a percentage of the total number of trading days in the period covered by each table. All data presented here represents past performance, which cannot be used to predict future results.
iShares Asia/Pacific Dividend ETF
Period Covered: April 1, 2012 through March 31, 2014
Premium/Discount Range | Number of Days | Percentage of Total Days | ||||||
Greater than 3.0% | 1 | 0.20 | % | |||||
Greater than 2.5% and Less than 3.0% | 1 | 0.20 | ||||||
Greater than 2.0% and Less than 2.5% | 1 | 0.20 | ||||||
Greater than 1.5% and Less than 2.0% | 11 | 2.20 | ||||||
Greater than 1.0% and Less than 1.5% | 46 | 9.18 | ||||||
Greater than 0.5% and Less than 1.0% | 143 | 28.54 | ||||||
Between 0.5% and –0.5% | 249 | 49.70 | ||||||
Less than –0.5% and Greater than –1.0% | 32 | 6.39 | ||||||
Less than –1.0% and Greater than –1.5% | 13 | 2.59 | ||||||
Less than –1.5% and Greater than –2.0% | 1 | 0.20 | ||||||
Less than –2.0% and Greater than –2.5% | 2 | 0.40 | ||||||
Less than –2.5% | 1 | 0.20 | ||||||
|
|
|
| |||||
| 501 | 100.00 | % | ||||||
|
|
|
| |||||
iShares Emerging Markets Dividend ETF
Period Covered: April 1, 2012 through March 31, 2014
Premium/Discount Range | Number of Days | Percentage of Total Days | ||||||
Greater than 2.5% | 3 | 0.60 | % | |||||
Greater than 2.0% and Less than 2.5% | 1 | 0.20 | ||||||
Greater than 1.5% and Less than 2.0% | 9 | 1.80 | ||||||
Greater than 1.0% and Less than 1.5% | 56 | 11.18 | ||||||
Greater than 0.5% and Less than 1.0% | 146 | 29.14 | ||||||
Between 0.5% and –0.5% | 226 | 45.11 | ||||||
Less than –0.5% and Greater than –1.0% | 40 | 7.98 | ||||||
Less than –1.0% and Greater than –1.5% | 16 | 3.19 | ||||||
Less than –1.5% and Greater than –2.0% | 2 | 0.40 | ||||||
Less than –2.0% and Greater than –2.5% | 2 | 0.40 | ||||||
|
|
|
| |||||
| 501 | 100.00 | % | ||||||
|
|
|
| |||||
| 32 | 2014 iSHARES ANNUAL REPORTTO SHAREHOLDERS |
Table of Contents
Director and Officer Information
iSHARES®, INC.
The Board of Directors has responsibility for the overall management and operations of the Company, including general supervision of the duties performed by BFA and other service providers. Each Director serves until he or she resigns, is removed, dies, retires or becomes incapacitated. The President, Chief Compliance Officer, Treasurer and Secretary shall each hold office until their successors are chosen and qualified, and all other officers shall hold office until he or she resigns or is removed. Directors who are not “interested persons” (as defined in the 1940 Act) of the Company are referred to as (“Independent Directors”).
The registered investment companies advised by BFA or its affiliates are organized into one complex of closed-end funds, two complexes of open-end funds and one complex of exchange-traded funds (“Exchange-Traded Fund Complex”) (each, a “BlackRock Fund Complex”). Each Fund is included in the BlackRock Fund Complex referred to as the Exchange-Traded Fund Complex. Each Director of iShares, Inc. also serves as a Trustee of iShares Trust, a Director of iShares MSCI Russia Capped ETF, Inc. and a Trustee of iShares U.S. ETF Trust and, as a result, oversees a total of 301 funds (as of April 30, 2014) within the Exchange-Traded Fund Complex. With the exception of Robert S. Kapito and Mark Wiedman, the address of each Director and officer is c/o BlackRock, Inc., 400 Howard Street, San Francisco, CA 94105. The address of Mr. Kapito and Mr. Wiedman is c/o BlackRock, Inc., Park Avenue Plaza, 55 East 52nd Street, New York, NY 10055. The Board has designated Robert H. Silver as its Independent Chairman. Additional information about the Funds’ Directors and officers may be found in the Funds’ combined Statement of Additional Information, which is available without charge, upon request, by calling toll-free 1-800-iShares (1-800-474-2737).
Interested Directors
| Name (Age) | Position(s) (Length of Service) | Principal Occupation(s) During the Past 5 Years | Other Directorships Held by Director | |||
Robert S. Kapitoa (57) | Director (since 2009). | President and Director, BlackRock, Inc. (since 2006); Vice Chairman of BlackRock, Inc. and Head of BlackRock’s Portfolio Management Group (since its formation in 1998) and BlackRock’s predecessor entities (since 1988); Trustee, University of Pennsylvania (since 2009); President of Board of Directors, Hope & Heroes Children’s Cancer Fund (since 2002); President of the Board of Directors, Periwinkle Theatre for Youth (since 1983). | Director of BlackRock, Inc. (since 2006); Trustee of iShares Trust (since 2009); Director of iShares MSCI Russia Capped ETF, Inc. (since 2010); Trustee of iShares U.S. ETF Trust (since 2011). | |||
Mark Wiedmanb (43) | Director (since 2013). | Managing Director, BlackRock, Inc. (since 2009); Chief Operating Officer for iShares (since 2009); Head of Strategy and Corporate Development, BGI (2005-2009); Chief of Staff to the CEO, BGI (2005-2009). | Trustee of iShares Trust. (since 2013); Director of iShares MSCI Russia Capped ETF, Inc. (since 2013);Trustee of iShares U.S. ETF Trust (since 2013); Director of PennyMac Financial Services, Inc. (since 2008). | |||
| a | Robert S. Kapito is deemed to be an “interested person” (as defined in the 1940 Act) of the Company due to his affiliations with BlackRock, Inc. |
| b | Mark Wiedman is deemed to be an “interested person” (as defined in the 1940 Act) of the Company due to his affiliations with BlackRock, Inc. and its affiliates. |
DIRECTORAND OFFICER INFORMATION | 33 |
Table of Contents
Director and Officer Information (Continued)
iSHARES®, INC.
Independent Directors
| Name (Age) | Position(s) (Length of Service) | Principal Occupation(s) During the Past 5 Years | Other Directorships Held by Director | |||
Robert H. Silver (58) | Director (since 2007); Independent Chairman (since 2012). | President and Co-Founder of The Bravitas Group, Inc. (since 2006); Director and Vice Chairman of the YMCA of Greater NYC (2001-2011); Broadway Producer (2006-2011); Co-Founder and Vice President of Parentgiving Inc. (since 2008); Director and Member of the Audit and Compensation Committee of EPAM Systems, Inc. (2006-2009); President and Chief Operating Officer of UBS Financial Services Inc. (formerly Paine Webber Inc.) (2003-2005) and various executive positions with UBS and its affiliates (1988-2005); CPA and Audit Manager of KPMG, LLP (formerly Peat Marwick Mitchell) (1977-1983). | Trustee of iShares Trust (since 2007); Director of iShares MSCI Russia Capped ETF, Inc. (since 2010); Trustee of iShares U.S. ETF Trust (since 2011); Independent Chairman of iShares, Trust, iShares MSCI Russia Capped ETF, Inc. and iShares U.S. ETF Trust (since 2012). | |||
Cecilia H. Herbert (65) | Director (since 2005); Nominating and Governance Committee Chair and Equity Plus Committee Chair (since 2012). | Director (1998-2013) and President (2007-2011) of the Board of Directors, Catholic Charities CYO; Trustee (2002-2011) and Chair of the Finance and Investment Committee (2006-2010) of the Thacher School; Member (since 1992) and Chair (1994-2005) of the Investment Committee, Archdiocese of San Francisco; Trustee and Member of the Investment Committee, WNET, the New York public broadcasting/media company (since 2011). | Trustee of iShares Trust (since 2005); Director of iShares MSCI Russia Capped ETF, Inc. (since 2010); Trustee of iShares U.S. ETF Trust (since 2011); Director of Forward Funds (34 portfolios) (since 2009). | |||
Charles A. Hurty (70) | Director (since 2005); Audit Committee Chair (since 2006). | Retired; Partner, KPMG LLP (1968-2001). | Trustee of iShares Trust (since 2005); Director of iShares MSCI Russia Capped ETF, Inc. (since 2010); Trustee of iShares U.S. ETF Trust (since 2011); Director of GMAM Absolute Return Strategy Fund (1 portfolio) (since 2002); Director of SkyBridge Alternative Investments Multi-Adviser Hedge Fund Portfolios LLC (2 portfolios) (since 2002). | |||
| 34 | 2014 iSHARES ANNUAL REPORTTO SHAREHOLDERS |
Table of Contents
Director and Officer Information (Continued)
iSHARES®, INC.
Independent Directors (Continued)
| Name (Age) | Position(s) (Length of Service) | Principal Occupation(s) During the Past 5 Years | Other Directorships Held by Director | |||
John E. Kerrigan (58) | Director (since 2005); Fixed Income Plus Committee Chair (since 2012). | Chief Investment Officer, Santa Clara University (since 2002). | Trustee of iShares Trust (since 2005); Director of iShares MSCI Russia Capped ETF, Inc. (since 2010); Trustee of iShares U.S. ETF Trust (since 2011). | |||
John E. Martinez (52) | Director (since 2003); Securities Lending Committee Chair (since 2012). | Director of FirstREX Agreement Corp. (formerly EquityRock, Inc.) (since 2005). | Trustee of iShares Trust (since 2003); Director of iShares MSCI Russia Capped ETF, Inc. (since 2010); Trustee of iShares U.S. ETF Trust (since 2011). | |||
George G.C. Parker (75) | Director (since 2002). | Dean Witter Distinguished Professor of Finance, Emeritus, Stanford University Graduate School of Business (Professor since 1973; Emeritus since 2006). | Trustee of iShares Trust (since 2000); Director of iShares MSCI Russia Capped ETF, Inc. (since 2010); Trustee of iShares U.S. ETF Trust (since 2011); Director of Tejon Ranch Company (since 1999); Director of Threshold Pharmaceuticals (since 2004); Director of Colony Financial, Inc. (since 2009); Director of First Republic Bank (since 2010). | |||
Madhav V. Rajan (49) | Director (since 2011); 15(c) Committee Chair (since 2012). | Robert K. Jaedicke Professor of Accounting and Senior Associate Dean for Academic Affairs and Head of MBA Program, Stanford University Graduate School of Business (since 2001); Professor of Law (by courtesy), Stanford Law School (since 2005); Visiting Professor, University of Chicago (2007-2008). | Trustee of iShares Trust (since 2011); Director of iShares MSCI Russia Capped ETF, Inc. (since 2011); Trustee of iShares U.S. ETF Trust (since 2011); Director, Cavium, Inc. (since 2013). | |||
DIRECTORAND OFFICER INFORMATION | 35 |
Table of Contents
Director and Officer Information (Continued)
iSHARES®, INC.
Officers
| Name (Age) | Position(s) (Length of Service) | Principal Occupation(s) During the Past 5 Years | ||
Manish Mehta (43) | President (since 2013). | Managing Director, BlackRock, Inc. (since 2009); Chief Operating Officer for iShares (since 2009); Head of Strategy and Corporate Development, BGI (2005-2009); Chief of Staff to the CEO, BGI (2005-2009). | ||
Jack Gee (54) | Treasurer and Chief Financial Officer (since 2008). | Managing Director, BlackRock (since 2009); Senior Director of Fund Administration of Intermediary Investor Business, BGI (2009); Director of Fund Administration of Intermediary Investor Business, BGI (2004-2009). | ||
Edward B. Baer (45) | Vice President and Chief Legal Officer (since 2012). | Managing Director of Legal & Compliance, BlackRock (since 2006); Director of Legal & Compliance, BlackRock (2004-2006). | ||
Eilleen M. Clavere (61) | Secretary (since 2007). | Director of Global Fund Administration, BlackRock (since 2009); Director of Legal Administration of Intermediary Investor Business, BGI (2006-2009); Legal Counsel and Vice President of Atlas Funds, Atlas Advisers, Inc. and Atlas Securities, Inc. (2005-2006); Counsel at Kirkpatrick & Lockhart LLP (2001-2005). | ||
Scott Radell (45) | Executive Vice President (since 2012). | Managing Director, BlackRock (since 2009); Head of Portfolio Solutions, BlackRock (since 2009); Head of Portfolio Solutions, BGI (2007-2009); Credit Portfolio Manager, BGI (2005-2007); Credit Research Analyst, BGI (2003-2005). | ||
Amy Schioldager (51) | Executive Vice President (since 2007). | Senior Managing Director, BlackRock (since 2009); Global Head of Index Equity, BGI (2008-2009); Global Head of U.S. Indexing, BGI (2006-2008); Head of Domestic Equity Portfolio Management, BGI (2001-2006). | ||
Ira P. Shapiro (51) | Vice President (since 2007). | Managing Director, BlackRock (since 2009); Head of Strategic Product Initiatives for iShares (since 2012); Chief Legal Officer, Exchange-Traded Fund Complex (2007-2012); Associate General Counsel, BGI (2004-2009). | ||
| 36 | 2014 iSHARES ANNUAL REPORTTO SHAREHOLDERS |
Table of Contents
Notes:
NOTES | 37 |
Table of Contents
Notes:
| 38 | 2014 iSHARES ANNUAL REPORTTO SHAREHOLDERS |
Table of Contents
|
For more information visit www.iShares.com or call 1-800-iShares (1-800-474-2737)
This report is intended for the Funds’ shareholders. It may not be distributed to prospective investors unless it is preceded or accompanied by the current prospectus.
Investing involves risk, including possible loss of principal.
The iShares Funds are distributed by BlackRock Investments, LLC (together with its affiliates, “BlackRock”).
The iShares Funds are not sponsored, endorsed, issued, sold or promoted by S&P Dow Jones Indices, LLC, nor does this company make any representation regarding the advisability of investing in the iShares Funds. BlackRock is not affiliated with the company listed above.
A description of the policies that the Funds use to determine how to vote proxies relating to portfolio securities and information about how the Funds voted proxies relating to portfolio securities during the most recent twelve-month period ending June 30 is available without charge, upon request, by calling toll-free 1-800-474-2737; on the Funds’ website at www.iShares.com; and on the U.S. Securities and Exchange Commission (SEC) website at www.sec.gov.
The Funds file their complete schedules of portfolio holdings with the SEC for the first and third quarters of each fiscal year on Form N-Q. The Funds’ Forms N-Q are available on the SEC’s website or may be reviewed and copied at the SEC’s Public Reference Room in Washington, D.C. Information on the operation of the Public Reference Room may be obtained by calling 1-800-SEC-0330. The Funds also disclose their complete schedules of portfolio holdings on a daily and monthly basis on the Funds’ website.
©2014 BlackRock, Inc. All rights reserved. iSHARES and BLACKROCK are registered trademarks of BlackRock, Inc. or its subsidiaries. All other marks are the property of their respective owners.

iS-AR-47-0414
Table of Contents
Item 2. Code of Ethics.
iShares, Inc. (the “Registrant”) adopted a new code of ethics on July 1, 2011 that applies to persons appointed by the Registrant’s Board of Directors as the President and/or Chief Financial Officer, and any persons performing similar functions. For the fiscal year ended April 30, 2014, there were no amendments to any provision of the former and new codes of ethics, nor were there any waivers granted from any provision of the former and new codes of ethics. A copy of the new code of ethics is filed with this Form N-CSR under Item 12(a)(1).
Item 3. Audit Committee Financial Expert.
The Registrant’s Board of Directors has determined that the Registrant has more than one audit committee financial expert, as that term is defined under Item 3(b) and 3(c), serving on its audit committee. The audit committee financial experts serving on the Registrant’s audit committee are Charles A. Hurty, John E. Kerrigan, Robert H. Silver and Madhav V. Rajan, all of whom are independent, as that term is defined under Item 3(a)(2).
Item 4. Principal Accountant Fees and Services.
The principal accountant fees disclosed in items 4(a), 4(b), 4(c), 4(d) and 4(g) are for the two series of the Registrant for which the fiscal year-end is April 30, 2014 (the “Funds”), and whose annual financial statements are reported in Item 1.
| (a) | Audit Fees – The aggregate fees billed for each of the last two fiscal years for professional services rendered by the principal accountant for the audit of the Funds’ annual financial statements or services that are normally provided by the accountant in connection with statutory and regulatory filings or engagements for those fiscal years, were $30,600 for the fiscal year ended April 30, 2013 and $30,000 for the fiscal year ended April 30, 2014. |
| (b) | Audit-Related Fees – There were no fees billed for the fiscal years ended April 30, 2013 and April 30, 2014 for assurance and related services by the principal accountant that were reasonably related to the performance of the audit of the Fund’s financial statements and are not reported under (a) of this Item. |
| (c) | Tax Fees – The aggregate fees billed in each of the last two fiscal years for professional services rendered by the principal accountant for the review of the Funds’ tax returns and excise tax calculations, were $7,740 for the fiscal year ended April 30, 2013 and $7,353 for the fiscal year ended April 30, 2014. |
| (d) | All Other Fees – There were no other fees billed for the fiscal years ended April 30, 2013 and April 30, 2014 for products and services provided by the principal accountant, other than the services reported in (a) through (c) of this Item. |
| (e) | (1) The Registrant’s audit committee charter, as amended, provides that the audit committee is responsible for the approval, prior to appointment, of the engagement of the principal accountant to annually audit and provide their opinion on the Registrant’s financial statements. The audit committee must also approve, prior to appointment, the engagement of the principal accountant to provide non-audit services to the Registrant or to any entity controlling, controlled by or under common control with the Registrant’s investment adviser (“Adviser Affiliate”) that provides ongoing services to the Registrant, if the engagement relates directly to the operations and financial reporting of the Registrant. |
(2) There were no services described in (b) through (d) above (including services required by the audit committee pursuant to paragraph (c)(7)(ii) of Rule 2-01 of Regulation S-X) that were approved by the audit committee pursuant to paragraph (c)(7)(i)(C) of Rule 2-01 of Regulation S-X.
| (f) | None of the hours expended on the principal accountant’s engagement to audit the Funds’ financial statements for the fiscal year ended April 30, 2014 were attributable to work performed by persons other than the principal accountant’s full-time, permanent employees. |
| (g) | The aggregate non-audit fees billed by the Registrant’s principal accountant for services rendered to the Funds, and rendered to the Registrant’s investment adviser, and any Adviser Affiliate that provides ongoing services to the Registrant for the last two fiscal years were, $5,034,102 for the fiscal year ended April 30, 2013 and $3,813,758 for the fiscal year ended April 30, 2014. |
| (h) | The Registrant’s audit committee has considered whether the provision of non-audit services rendered to the Registrant’s investment adviser and any Adviser Affiliate that were not pre-approved pursuant to paragraph (c)(7)(ii) of Rule 2-01 of Regulation S-X, if any, are compatible with maintaining the principal accountant’s independence, and has determined that the provision of these services do not compromise the principal accountant’s independence. |
Item 5. Audit Committee of Listed Registrants.
The Registrant is a listed issuer as defined in Rule 10A-3 under the Exchange Act and has a separately-designated standing audit committee established in accordance with Section 3(a)(58)(A) of the Exchange Act. The Registrant’s audit committee members are Cecilia H. Herbert, Charles A. Hurty, John E. Kerrigan, Robert H. Silver, John E. Martinez and Madhav V. Rajan.
Table of Contents
Item 6. Investments.
(a) Schedules of investments are included as part of the reports to shareholders filed under Item 1 of this Form.
(b) Not applicable.
Item 7. Disclosure of Proxy Voting Policies and Procedures for Closed-End Management Investment Companies.
Not applicable to the Registrant.
Item 8. Portfolio Managers of Closed-End Management Investment Companies.
Not applicable to the Registrant.
Item 9. Purchases of Equity Securities by Closed-End Management Investment Company and Affiliated Purchasers.
Not applicable to the Registrant.
Item 10. Submission of Matters to a Vote of Security Holders.
There were no material changes to the procedures by which shareholders may recommend nominees to the Registrant’s Board of Directors.
Item 11. Controls and Procedures.
| (a) | The President (the Registrant’s Principal Executive Officer) and Chief Financial Officer (the Registrant’s Principal Financial Officer) have concluded that, based on their evaluation as of a date within 90 days of the filing date of this report, the disclosure controls and procedures of the Registrant (as defined in Rule 30a-3(c) under the Investment Company Act of 1940) are reasonably designed to achieve the purposes described in Section 4(a) of the attached certification. |
| (b) | There were no changes in the Registrant’s internal control over financial reporting (as defined in Rule 30a-3(d) under the Investment Company Act of 1940) that occurred during the second fiscal quarter of the period covered by this report that have materially affected, or are reasonably likely to materially affect, the Registrant’s internal control over financial reporting. |
Item 12. Exhibits.
(a) (1) Code of Ethics for Senior Officers that is the subject of Item 2 is attached.
(a) (2) Section 302 Certifications are attached.
(a) (3) Not applicable to the Registrant.
(b) Section 906 Certifications are attached.
Table of Contents
SIGNATURES
Pursuant to the requirements of the Securities Exchange Act of 1934 and the Investment Company Act of 1940, the Registrant has duly caused this report to be signed on its behalf by the undersigned, thereunto duly authorized.
iShares, Inc.
| By: | /s/ Manish Mehta | |
| Manish Mehta, President (Principal Executive Officer) | ||
| Date: | June 23, 2014 |
Pursuant to the requirements of the Securities Exchange Act of 1934 and the Investment Company Act of 1940, this report has been signed below by the following persons on behalf of the Registrant and in the capacities and on the dates indicated.
| By: | /s/ Manish Mehta | |
| Manish Mehta, President (Principal Executive Officer) | ||
| Date: | June 23, 2014 | |
| By: | /s/ Jack Gee | |
| Jack Gee, Treasurer and Chief Financial Officer (Principal Financial Officer) | ||
| Date: | June 23, 2014 | |