UNITED STATES
SECURITIES AND EXCHANGE COMMISSION
Washington, D.C. 20549
FORM N-CSR
CERTIFIED SHAREHOLDER REPORT OF REGISTERED
MANAGEMENT INVESTMENT COMPANIES
Investment Company Act file number 811-08786
Pioneer Variable Contracts Trust
(Exact name of registrant as specified in charter)
60 State Street, Boston, MA 02109
(Address of principal executive offices) (ZIP code)
Christopher J. Kelley, Amundi Asset Management, Inc.,
60 State Street, Boston, MA 02109
(Name and address of agent for service)
Registrant’s telephone number, including area code: (617) 742-7825
Date of fiscal year end: December 31, 2023
Date of reporting period: January 1, 2023 through December 31, 2023
Form N-CSR is to be used by management investment companies to file reports with the Commission not later than 10 days after the transmission to stockholders of any report that is required to be transmitted to stockholders under Rule 30e-1 under the Investment Company Act of 1940 (17 CFR 270.30e-1). The Commission may use the information provided on Form N-CSR in its regulatory, disclosure review, inspection, and policymaking roles.
A registrant is required to disclose the information specified by Form N-CSR, and the Commission will make this information public. A registrant is not required to respond to the collection of information contained in Form N-CSR unless the Form displays a currently valid Office of Management and Budget (“OMB”) control number. Please direct comments concerning the accuracy of the information collection burden estimate and any suggestions for reducing the burden to Secretary, Securities and Exchange Commission, 450 Fifth Street, NW, Washington, DC 20549-0609. The OMB has reviewed this collection of information under the clearance requirements of 44 U.S.C. ss. 3507.
ITEM 1. REPORTS TO STOCKHOLDERS.
Pioneer Variable Contracts Trust
Pioneer Bond
VCT Portfolio
Class I and II Shares
Annual Report | December 31, 2023
Please refer to your contract prospectus to determine the applicable share class offered under your contract.
Pioneer Variable Contracts Trust
Table of Contents
Pioneer Bond VCT Portfolio
This report is authorized for distribution only when preceded or accompanied by a prospectus for the Portfolio being offered.
Pioneer Variable Contracts Trust files a complete schedule of portfolio holdings with the Securities and Exchange Commission for the first and third quarters of each fiscal year as an exhibit to its reports on Form N-PORT. Shareholders may view the filed Form N-PORT by visiting the Commission’s web site at https://www.sec.gov.
| Pioneer Bond VCT Portfolio | Pioneer Variable Contracts Trust |
Portfolio Update 12/31/23
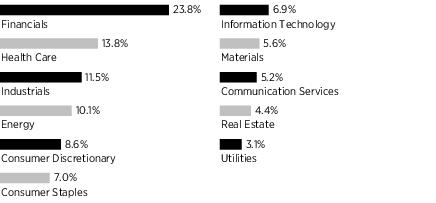
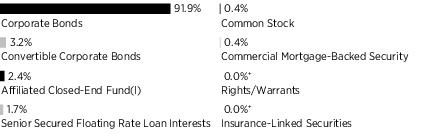
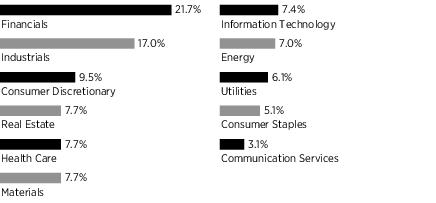
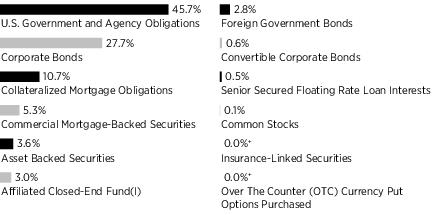
Portfolio Diversification
(As a percentage of total investments)*
+ Amount rounds to less than 0.1%.
5 Largest Holdings
| (As a percentage of total investments)* |
| 1. | U.S. Treasury Bonds, 2.250%, 2/15/52 | 3.97% |
| 2. | Federal Home Loan Mortgage Corp., 5.500%, 8/1/53 | 3.14 |
| 3. | Federal National Mortgage Association, 3.000%, 1/1/54 (TBA) | 2.69 |
| 4. | Pioneer ILS Interval Fund(l) | 2.24 |
| 5. | Federal National Mortgage Association, 2.000%, 1/1/54 (TBA) | 2.20 |
| * | Excludes short-term investments, TBA Sale Commitments and all derivative contracts except for options purchased. The Portfolio is actively managed, and current holdings may be different. The holdings listed should not be considered recommendations to buy or sell any securities. |
| (l) | Pioneer ILS Interval Fund is an affiliated closed-end fund managed by Amundi Asset Management US, Inc. |
Performance Update 12/31/23
Prices and Distributions
| Net Asset Value per Share | 12/31/23 | 12/31/22 |
| Class l | $9.49 | $9.23 |
| Class ll | $9.51 | $9.25 |
| | | |
Distributions per Share
(1/1/23 - 12/31/23) | Net
Investment
Income | Short-Term
Capital Gains | Long-Term
Capital Gains |
| Class l | $0.3664 | $— | $— |
| Class ll | $0.3439 | $— | $— |
Performance of a $10,000 Investment
The following chart shows the change in value of an investment made in Class I and Class II shares of Pioneer Bond VCT Portfolio at net asset value during the periods shown, compared to that of the Bloomberg U.S. Aggregate Bond Index. Portfolio returns are based on net asset value and do not reflect any applicable insurance fees or surrender charges.
 | The Bloomberg U.S. Aggregate Bond Index is an unmanaged, market value-weighted measure of Treasury and agency issues, corporate bond issues and mortgage-backed securities. Index returns are calculated monthly, assume reinvestment of dividends and do not reflect any fees, expenses or sales charges. It is not possible to invest directly in an index. |
Average Annual Total Returns
(As of December 31, 2023)
| | Class l | Class ll | Bloomberg
U.S. Aggregate
Bond Index |
| 10 Years | 2.25% | 2.00% | 1.81% |
| 5 Years | 1.82% | 1.55% | 1.10% |
| 1 Year | 6.96% | 6.68% | 5.53% |
All total returns shown assume reinvestment of distributions at net asset value.
The performance table does not reflect the deduction of taxes that a shareholder would pay on distributions or the redemption of shares.
Call 1-800-225-6292 or visit www.amundi.com/us for the most recent month-end performance results. Current performance may be lower or higher than the performance data quoted.
The performance data quoted represents past performance, which is no guarantee of future results. Investment return and principal value will fluctuate, and shares, when redeemed, may be worth more or less than their original cost.
The returns for the Portfolio do not reflect the deduction of expenses associated with variable products, such as mortality and expense risk charges, separate account charges, and sales charges. These expenses would reduce the overall returns shown.
Performance results reflect any applicable expense waivers in effect during the periods shown. Without such waivers, performance would be lower. Waivers may not be in effect for all portfolios. Certain fee waivers are contractual through a specified period. Otherwise, fee waivers can be rescinded at any time. See the prospectus and financial statements for more information.
| Pioneer Bond VCT Portfolio | Pioneer Variable Contracts Trust |
Comparing Ongoing Portfolio Expenses
As a shareholder in the Portfolio, you incur two types of costs:
| (1) | ongoing costs, including management fees, distribution and/or service (12b-1) fees, and other Portfolio expenses; and |
| (2) | transaction costs, including sales charges (loads) on purchase payments. |
This example is intended to help you understand your ongoing expenses (in dollars) of investing in the Portfolio and to compare these costs with the ongoing costs of investing in other mutual funds offered through your variable annuity contract. The example is based on an investment of $1,000 at the beginning of the Portfolio’s latest six-month period and held throughout the six months.
Using the Tables
Actual Expenses
The first table below provides information about actual account values and actual expenses. You may use the information in this table, together with the amount you invested, to estimate the expenses that you paid over the period as follows:
| (1) | Divide your account value by $1,000
Example: an $8,600 account value ÷ $1,000 = 8.6 |
| (2) | Multiply the result in (1) above by the corresponding share class’s number in the third row under the heading entitled “Expenses Paid During Period” to estimate the expenses you paid on your account during this period. |
Expenses Paid on a $1,000 Investment in Pioneer Bond VCT Portfolio
Based on actual returns from July 1, 2023 through December 31, 2023.
| Share Class | l | ll |
| Beginning Account Value on 7/1/23 | $1,000.00 | $1,000.00 |
| Ending Account Value (after expenses) on 12/31/23 | $1,041.50 | $1,040.10 |
| Expenses Paid During Period* | $ 2.83 | $ 4.11 |
| | |
| * | Expenses are equal to the Portfolio’s annualized net expense ratio of 0.55% and 0.80% for Class I and Class II shares, respectively, multiplied by the average account value over the period, multiplied by 184/365 (to reflect the one-half year period). |
Hypothetical Example for Comparison Purposes
The table below provides information about hypothetical account values and hypothetical expenses based on the Portfolio’s actual expense ratio and an assumed rate of return of 5% per year before expenses, which is not the Portfolio’s actual return. The hypothetical account values and expenses may not be used to estimate the actual ending account balance or expenses you paid for the period.
You may use this information to compare the ongoing costs of investing in the Portfolio and other variable annuities. To do so, compare this 5% hypothetical example with the 5% hypothetical examples that appear in the shareholder reports of the other variable annuities.
Please note that the expenses shown in the tables are meant to highlight your ongoing costs only and do not reflect any transaction costs, such as sales charges (loads) that are charged at the time of the transaction. Therefore, the table below is useful in comparing ongoing costs only and will not help you determine the relative total costs of owning different variable annuities. In addition, if these transaction costs were included, your costs would have been higher.
Expenses Paid on a $1,000 Investment in Pioneer Bond VCT Portfolio
Based on a hypothetical 5% return per year before expenses, reflecting the period from July 1, 2023 through December 31, 2023.
| Share Class | l | ll |
| Beginning Account Value on 7/1/23 | $1,000.00 | $1,000.00 |
| Ending Account Value (after expenses) on 12/31/23 | $1,022.43 | $1,021.17 |
| Expenses Paid During Period* | $ 2.80 | $ 4.08 |
| | |
| * | Expenses are equal to the Portfolio’s annualized net expense ratio of 0.55% and 0.80% for Class I and Class II shares, respectively, multiplied by the average account value over the period, multiplied by 184/365 (to reflect the one-half year period). |
| Pioneer Bond VCT Portfolio | Pioneer Variable Contracts Trust |
Portfolio Management Discussion 12/31/23
Call 1-800-225-6292 or visit www.amundi.com/us for the most recent month-end performance results. Current performance may be lower or higher than the performance data quoted.
The performance data quoted represents past performance, which is no guarantee of future results. Investment return and principal value will fluctuate, and shares, when redeemed, may be worth more or less than their original cost.
The returns for the Portfolio do not reflect the deduction of expenses associated with variable products, such as mortality and expense risk charges, separate account charges, and sales charges. These expenses would reduce the overall returns shown.
Performance results reflect any applicable expense waivers in effect during the periods shown. Without such waivers, performance would be lower. Waivers may not be in effect for all portfolios. Certain fee waivers are contractual through a specified period. Otherwise, fee waivers can be rescinded at any time. See the prospectus and financial statements for more information.
In the following interview, Brad Komenda discusses the factors that affected the performance of Pioneer Bond VCT Portfolio during the 12-month period ended December 31, 2023. Mr. Komenda, a Managing Director and Director of Investment-Grade Corporates, and a portfolio manager at Amundi Asset Management US, Inc. (Amundi US), is responsible for the daily management of the Portfolio, along with Kenneth J. Taubes, Executive Vice President, US, and a portfolio manager at Amundi US, Timothy Rowe, Managing Director, Director of Multisector Fixed Income, and a portfolio manager at Amundi US, and Jonathan Scott, a senior vice president, Deputy Director of Multi-Sector Fixed Income, and a portfolio manager at Amundi US.
| Q: | How did the Portfolio perform during the 12-month period ended December 31, 2023? |
| A: | Pioneer Bond Portfolio VCT Portfolio’s Class I shares returned 6.96% at net asset value during the 12-month period ended December 31, 2023 and Class II shares returned 6.68%, while the Portfolio’s benchmark, the Bloomberg US Aggregate Bond Index (the Bloomberg Index), returned 5.53%. |
| Q: | Which of your investment decisions had the greatest effects on the Portfolio’s performance relative to the Bloomberg Index during the 12-month period ended December 31, 2023? |
| A: | Sector allocation, security selection and yield curve positioning were major factors that contributed to the Portfolio’s outperformance over the year. Sector allocation was a significant contributor to benchmark-relative performance during the period, benefiting from the overweight to credit sectors and underweight to U.S. Treasuries relative to the Fund's benchmark index. In particular, the 32% underweight to U.S. Treasuries, counterbalanced by the 9% allocation to non-agency mortgage-backed securities (MBS), the 8% overweight to the Financials sector, the 1% allocation to collateralized loan obligatiobs (CLOs) and the 2% allocation to insurance-linked securities contributed to the Fund's benchmark-relative outperformance. The 4% overweight to asset backed securities (ABS) also helped. Security selection benefited from strong performance by Portfolio investments in the Industrials and Financials sectors, and investments in commercial mortage backed securities (CMBS). The Industrials sector benefited from outperformance of diverse credits. The Financials sector benefited from an early year rebound in European banks, and CMBS benefited from the relative overweight to multifamily issues, and low exposure to select office properties. The Portfolio's Yield Curve positioning was advantageous due to the preference for short-term and long-term interest rates aligning in the beginning of the year. Additionally, in early August, the curve positioning was adjusted to prioritize the yield difference of longer maturity bonds over shorter maturity bonds. |
| | The relative long duration position of 0.5 years was a detractor to returns as interest rates generally rose until the close of the period. Additionally, the 1% in Treasury Inflation-Protected Securities (TIPS) was a modest detractor during the period, as inflation expectations fell. |
| Q: | Did the Portfolio have any exposure to derivative securities during the 12-month period ended December 31, 2023? |
| A: | Yes, we invested the Portfolio in Treasury futures and in index-based, high-yield credit-default-swap contracts (CDX). We invest in Treasury futures as part of our duration management strategy for the Portfolio. We believe the |
| Pioneer Bond VCT Portfolio | Pioneer Variable Contracts Trust |
| | use of Treasury futures allows us to express our views on duration and yield-curve positioning in an efficient manner. We typically have used the CDX positions as part of our efforts to either increase or reduce the Portfolio’s exposures to both investment-grade and high-yield securities efficiently, as cash-bond transactions take a little more time to execute, and have a higher liquidity cost. The use of derivatives, we think, may allow the Portfolio to potentially benefit from the performance impact of the targeted asset class, while retaining a better liquidity profile, which may help reduce risk. Treasury futures, which we typically utilize to help manage the Portfolio's yield-curve and duration positioning was utilized during the 12-month period. A short high yield CDX exposure was used to hedge credit market exposure over the 12-month period. During the period this investment had a negative effect on the funds overall performance. |
| Q: | What factors affected the Portfolio's yield, or distributions**.to shareholders, during the 12-month period ended December 31, 2023? |
| A: | The Portfolio's monthly distribution rate rose at a modest pace over the year as Treasury yields increased and spreads for credit-oriented areas of the market generally widened until the latter part of the period. The distribution rate declined modestly in December, but remained well above beginning of the year levels, as Treasury yields fell and credit spreads modestly narrowed. |
| Q: | What’s your investment outlook and how is the Portfolio positioned? |
| A: | The Portfolio continues to hold a relatively long duration position compared to the Bloomberg Index, although the Portfolio reduced duration near year end, consistent with the significant decline in the 10-year Treasury yield after its mid-October peak. We continue to believe economic growth may slow in 2024, and the yields may decline over 2024. In addition, the Portfolio continues to maintain curve positioning which favors the yield difference of longer maturity bonds increasing over shorter maturity bonds, with an overweight focused on the 5 to 7 year part of the curve, reflecting our view that shorter maturity yields will fall below those of longer maturity yields as economic growth slows. |
| | The Portfolio continues to have a more cautious view on credit, relative to the history, but continues to hold an overweight to credit relative to the Bloomberg Index. This cautious view, which includes an up in quality bias, reflects the less attractive relative value and the likelihood that economic growth may slow in 2024. Investment grade and high yield corporate spreads continue to reside near the 10th percentile relative to their long term history, and securitized asset spreads have also narrowed. Within corporates, we favor Financials, which we believe offer more attractive value relative to Industrials. We continue to favor securitized credit over corporate credit, based on relative value. Agency MBS offer higher spreads relative to their history; the U.S. housing market has stabilized, and multifamily issues offer value within the CMBS market. |
| | The Fed’s policy “pivot” and the substantial easing of financial conditions since October 2023 have no doubt helped lower the risk of a US economy hard landing/recession in 2024. However, we still view the probability of a |
| ** | Distributions are not guaranteed. |
| Pioneer Bond VCT Portfolio | Pioneer Variable Contracts Trust |
Portfolio Management Discussion 12/31/23 (continued)
A Word About Risk:
All investments are subject to risk, including the possible loss of principal. In the past several years, financial markets have experienced increased volatility and heightened uncertainty. The market prices of securities may go up or down, sometimes rapidly or unpredictably, due to general market conditions, such as real or perceived adverse economic, political, or regulatory conditions, recessions, inflation, changes in interest or currency rates, lack of liquidity in the bond markets, the spread of infectious illness or other public health issues, armed conflict including Russia's military invasion of Ukraine, sanctions against Russia, other nations or individuals or companies and possible countermeasures, market disruptions caused by tariffs, trade disputes or other government actions, or adverse investor sentiment. These conditions may continue, recur, worsen or spread.
The market price of securities may fluctuate when interest rates change. When interest rates rise, the prices of fixed-income securities in the Portfolio will generally fall. Conversely, when interest rates fall, the prices of fixed-income securities in the Portfolio will generally rise.
Investments in the Portfolio are subject to possible loss due to the financial failure of the issuers of the underlying securities and their inability to meet their debt obligations.
Prepayment risk is the chance that an issuer may exercise its right to prepay its security, if falling interest rates prompt the issuer to do so. Forced to reinvest the unanticipated proceeds at lower interest rates, the Portfolio would experience a decline in income and lose the opportunity for additional price appreciation.
Investments in high-yield or lower-rated securities are subject to greater-than- average price volatility, illiquidity and possibility of default.
The securities issued by U.S. government- sponsored entities (i.e., FNMA, Freddie Mac) are neither guaranteed nor issued by the U.S. government.
The Portfolio may invest in mortgage- backed securities, which during times of fluctuating interest rates may increase or decrease more than other fixed-income securities. Mortgage-backed securities are also subject to prepayments.
At times, the Portfolio’s investments may represent industries or industry sectors that are interrelated or have common risks, making the Portfolio more susceptible to any economic, political, or regulatory developments or other risks affecting those industries and sectors.
These risks may increase share price volatility.
| | 2024 recession as higher than normal and elevated relative to other economic outcomes, and the interest rate markets appear to agree. Federal Portfolios rate futures contracts priced in a year-end 2024 Federal Portfolios rate of 3.75% or more than 150 basis points lower than the current Federal Funds rates. While we are comfortable with market pricing of the cumulative rate cuts in 2024, we do not anticipate a rate cut in March 2024 given current economic activity and a view that monthly core personal consumption expenditure (PCE) inflation is likely to reaccelerate in the next few months. We continue to view duration risk as relatively attractive for the Portfolio, but less so than in October and have repositioned the Portfolio accordingly. Investment grade corporate bond spreads reached year-to-date lows of just below 100 basis points in December 2023. We believe that less relative value in the sector may justify an overall lower allocation to spread risk. We prefer to reduce spread risk by shortening duration and moving the Portfolio up in quality within spread sectors, rather than increasing Treasury exposures, as the Fed’s pivot raises the possibility of an elongated time period before spreads materially widen in response to a recessionary environment. Agency MBS remain relatively attractive with spreads still near historical averages. |
Please refer to the Schedule of Investments on pages 7 - 26 for a full listing of Portfolio securities.
Past performance is no guarantee of future results.
Any information in this shareholder report regarding market or economic trends or the factors influencing the Portfolio’s historical or future performance are statements of opinion as of the date of this report.
| Pioneer Bond VCT Portfolio | Pioneer Variable Contracts Trust |
Schedule of Investments 12/31/23
Principal
Amount
USD ($) | | | | | | Value |
| | UNAFFILIATED ISSUERS — 106.5% | |
| | Senior Secured Floating Rate Loan Interests — 0.3% of Net Assets*(a) | |
| | Chemicals-Diversified — 0.0%† | |
| 44,213 | LSF11 A5 HoldCo LLC, Term Loan, 8.97% (Term SOFR + 350 bps), 10/15/28 | $ 44,268 |
| | Total Chemicals-Diversified | $ 44,268 |
| | Chemicals-Specialty — 0.1% | |
| 62,715 | Mativ Holdings, Inc., Term B Loan, 9.22% (Term SOFR + 375 bps), 4/20/28 | $ 62,479 |
| | Total Chemicals-Specialty | $ 62,479 |
| | Electric-Generation — 0.0%† | |
| 58,741 | Generation Bridge Northeast LLC, Term Loan B, 9.606% (Term SOFR + 425 bps), 8/22/29 | $ 59,108 |
| | Total Electric-Generation | $ 59,108 |
| | Electronic Composition — 0.0%† | |
| 48,736 | Energy Acquisition LP, First Lien Initial Term Loan, 9.706% (Term SOFR + 425 bps), 6/26/25 | $ 48,340 |
| | Total Electronic Composition | $ 48,340 |
| | Finance-Leasing Company — 0.1% | |
| 60,817 | Avolon TLB Borrower 1 (US) LLC, Term B-4 Loan, 6.958% (Term SOFR + 150 bps), 2/12/27 | $ 60,935 |
| | Total Finance-Leasing Company | $ 60,935 |
| | Medical-Wholesale Drug Distribution — 0.0%† | |
| 60,317 | Owens & Minor, Inc., Term B-1 Loan, 9.198% (Term SOFR + 375 bps), 3/29/29 | $ 60,518 |
| | Total Medical-Wholesale Drug Distribution | $ 60,518 |
| | Metal Processors & Fabrication — 0.1% | |
| 112,412 | Grinding Media, Inc. (Molycop, Ltd.), First Lien Initial Term Loan, 9.684% (Term SOFR + 400 bps), 10/12/28 | $ 111,850 |
| | Total Metal Processors & Fabrication | $ 111,850 |
| | Total Senior Secured Floating Rate Loan Interests
(Cost $445,522) | $ 447,498 |
|
| |
| | Asset Backed Securities — 7.2% of Net Assets | |
| 281,427(a) | ACREC, Ltd., Series 2021-FL1, Class A, 6.623% (1 Month Term SOFR + 126 bps), 10/16/36 (144A) | $ 275,699 |
| 300,000 | Amur Equipment Finance Receivables XI LLC, Series 2022-2A, Class D, 7.25%, 5/21/29 (144A) | 299,133 |
| 100,000 | Amur Equipment Finance Receivables XII LLC, Series 2023-1A, Class C, 6.36%, 12/20/29 (144A) | 101,403 |
| 250,000(a) | Arbor Realty Commercial Real Estate Notes, Ltd., Series 2021-FL3, Class C, 7.326% (1 Month Term SOFR + 196 bps), 8/15/34 (144A) | 237,631 |
| 265,000(a) | Arbor Realty Commercial Real Estate Notes, Ltd., Series 2022-FL1, Class C, 7.638% (SOFR30A + 230 bps), 1/15/37 (144A) | 255,336 |
| 350,000(a) | Arbor Realty Commercial Real Estate Notes, Ltd., Series 2022-FL2, Class C, 8.812% (1 Month Term SOFR + 345 bps), 5/15/37 (144A) | 344,744 |
| 191,479 | Blackbird Capital II Aircraft Lease, Ltd., Series 2021-1A, Class A, 2.443%, 7/15/46 (144A) | 165,099 |
| 170,000(a) | BSPRT Issuer, Ltd., Series 2022-FL8, Class C, 7.638% (SOFR30A + 230 bps), 2/15/37 (144A) | 164,027 |
| 250,000(a) | Carlyle US CLO, Ltd., Series 2019-4A, Class CR, 8.594% (3 Month Term SOFR + 320 bps), 4/15/35 (144A) | 240,343 |
| 200,000(b) | Cascade Funding Mortgage Trust, Series 2021-HB6, Class M3, 3.735%, 6/25/36 (144A) | 189,746 |
| 200,000 | Cascade MH Asset Trust, Series 2021-MH1, Class M1, 2.992%, 2/25/46 (144A) | 150,688 |
| 100,000 | Cascade MH Asset Trust, Series 2021-MH1, Class M2, 3.693%, 2/25/46 (144A) | 78,192 |
| 125,000(b) | CFMT LLC, Series 2022-HB9, Class M3, 3.25%, 9/25/37 (144A) | 101,667 |
| 200,000 | Commercial Equipment Finance LLC, Series 2021-A, Class C, 3.55%, 12/15/28 (144A) | 191,413 |
| 375,000 | Continental Finance Credit Card ABS Master Trust, Series 2022-A, Class A, 6.19%, 10/15/30 (144A) | 371,784 |
| 136,477 | CoreVest American Finance Trust, Series 2020-3, Class A, 1.358%, 8/15/53 (144A) | 126,546 |
| 100,000 | DataBank Issuer, Series 2021-1A, Class B, 2.65%, 2/27/51 (144A) | 88,638 |
The accompanying notes are an integral part of these financial statements.
7
| Pioneer Bond VCT Portfolio | Pioneer Variable Contracts Trust |
Schedule of Investments 12/31/23 (continued)
Principal
Amount
USD ($) | | | | | | Value |
| | Asset Backed Securities — (continued) | |
| 288,750 | Domino's Pizza Master Issuer LLC, Series 2019-1A, Class A2, 3.668%, 10/25/49 (144A) | $ 263,437 |
| 38,920 | Drive Auto Receivables Trust, Series 2020-2, Class D, 3.05%, 5/15/28 | 38,460 |
| 16,291(c) | Equifirst Mortgage Loan Trust, Series 2003-1, Class IF1, 4.01%, 12/25/32 | 15,094 |
| 300,000 | Exeter Automobile Receivables Trust, Series 2023-5A, Class D, 7.13%, 2/15/30 | 307,995 |
| 400,000(b) | Finance of America HECM Buyout, Series 2022-HB1, Class M3, 5.084%, 2/25/32 (144A) | 366,302 |
| 333,597(c) | Finance of America Structured Securities Trust, Series 2022-S1, Class A1, 2.00%, 2/25/52 (144A) | 314,266 |
| 315,445(c) | Finance of America Structured Securities Trust, Series 2022-S1, Class A2, 3.00%, 2/25/52 (144A) | 289,223 |
| 250,000 | Foundation Finance Trust, Series 2019-1A, Class B, 4.22%, 11/15/34 (144A) | 243,231 |
| 140,000 | GLS Auto Receivables Issuer Trust, Series 2023-4A, Class D, 7.18%, 8/15/29 (144A) | 143,802 |
| 250,000(a) | Goldentree Loan Management US CLO 6, Ltd., Series 2019-6A, Class DR, 8.516% (3 Month Term SOFR + 310 bps), 4/20/35 (144A) | 245,556 |
| 125,000(a) | HGI CRE CLO, Ltd., Series 2021-FL2, Class C, 7.273% (1 Month Term SOFR + 191 bps), 9/17/36 (144A) | 119,673 |
| 195,500 | HOA Funding LLC - HOA, Series 2021-1A, Class A2, 4.723%, 8/20/51 (144A) | 150,957 |
| 78,846 | Home Partners of America Trust, Series 2019-1, Class D, 3.406%, 9/17/39 (144A) | 70,186 |
| 100,000 | HPEFS Equipment Trust, Series 2023-2A, Class D, 6.97%, 7/21/31 (144A) | 102,522 |
| 181,676 | JG Wentworth XLIII LLC, Series 2019-1A, Class A, 3.82%, 8/17/71 (144A) | 154,988 |
| 7,420 | JG Wentworth XXII LLC, Series 2010-3A, Class A, 3.82%, 12/15/48 (144A) | 7,390 |
| 208,288 | Libra Solutions LLC, Series 2022-2A, Class B, 8.85%, 10/15/34 (144A) | 207,455 |
| 210,000(a) | MF1, Ltd., Series 2021-FL7, Class D, 8.023% (1 Month Term SOFR + 266 bps), 10/16/36 (144A) | 195,546 |
| 71,325 | Mosaic Solar Loan Trust, Series 2019-2A, Class A, 2.88%, 9/20/40 (144A) | 63,362 |
| 40,936 | MVW LLC, Series 2020-1A, Class C, 4.21%, 10/20/37 (144A) | 39,309 |
| 200,000 | Nelnet Student Loan Trust, Series 2021-A, Class B1, 2.85%, 4/20/62 (144A) | 163,118 |
| 100,000 | NMEF Funding LLC, Series 2021-A, Class C, 2.58%, 12/15/27 (144A) | 96,955 |
| 250,000(a) | Palmer Square Loan Funding, Ltd., Series 2022-1A, Class C, 7.994% (3 Month Term SOFR + 260 bps), 4/15/30 (144A) | 244,638 |
| 234,808(a) | ReadyCap Lending Small Business Loan Trust, Series 2023-3, Class A, 8.57% (PRIME + 7 bps), 4/25/48 (144A) | 235,969 |
| 280,000 | Republic Finance Issuance Trust, Series 2021-A, Class A, 2.30%, 12/22/31 (144A) | 265,385 |
| 100,000 | Republic Finance Issuance Trust, Series 2021-A, Class C, 3.53%, 12/22/31 (144A) | 89,696 |
| 125,000(b) | Saluda Grade Alternative Mortgage Trust, Series 2022-SEQ2, Class A3, 4.50%, 5/25/55 (144A) | 116,934 |
| 235,000 | SBA Tower Trust, Series 2014-2A, Class C, 3.869%, 10/15/49 (144A) | 231,064 |
| 200,000 | SCF Equipment Leasing LLC, Series 2019-2A, Class C, 3.11%, 6/21/27 (144A) | 195,774 |
| 250,000(a) | Sound Point CLO XXVIII, Ltd., Series 2020-3A, Class D, 9.29% (3 Month Term SOFR + 391 bps), 1/25/32 (144A) | 242,234 |
| 114,985 | SpringCastle America Funding LLC, Series 2020-AA, Class A, 1.97%, 9/25/37 (144A) | 106,067 |
| 350,000(a) | STWD, Ltd., Series 2022-FL3, Class B, 7.288% (SOFR30A + 195 bps), 11/15/38 (144A) | 339,653 |
| 4,328 | Tricolor Auto Securitization Trust, Series 2021-1A, Class D, 1.92%, 5/15/26 (144A) | 4,322 |
| 180,000 | Tricon American Homes Trust, Series 2020-SFR2, Class E1, 2.73%, 11/17/39 (144A) | 157,345 |
| 100,000 | VFI ABS LLC, Series 2023-1A, Class C, 9.26%, 12/24/29 (144A) | 102,028 |
| 45,215 | Welk Resorts LLC, Series 2019-AA, Class D, 4.03%, 6/15/38 (144A) | 43,037 |
| 248,415 | Westgate Resorts LLC, Series 2022-1A, Class C, 2.488%, 8/20/36 (144A) | 236,167 |
| | Total Asset Backed Securities
(Cost $10,104,512) | $ 9,591,229 |
|
| |
| | Collateralized Mortgage Obligations—8.1% of Net Assets | |
| 125,075(b) | Ajax Mortgage Loan Trust, Series 2021-A, Class A1, 1.065%, 9/25/65 (144A) | $ 109,784 |
| 96,485(a) | Bellemeade Re, Ltd., Series 2019-1A, Class M2, 8.17% (1 Month Term SOFR + 281 bps), 3/25/29 (144A) | 97,121 |
| 450,000(b) | BINOM Securitization Trust, Series 2022-RPL1, Class M2, 3.00%, 2/25/61 (144A) | 308,721 |
| 100,000(b) | Bunker Hill Loan Depositary Trust, Series 2020-1, Class A3, 3.253%, 2/25/55 (144A) | 87,865 |
8
The accompanying notes are an integral part of these financial statements.
| Pioneer Bond VCT Portfolio | Pioneer Variable Contracts Trust |
Principal
Amount
USD ($) | | | | | | Value |
| | Collateralized Mortgage Obligations—(continued) | |
| 180,000(b) | CIM Trust, Series 2020-R2, Class M3, 3.00%, 10/25/59 (144A) | $ 131,974 |
| 232,156(b) | CIM Trust, Series 2021-J1, Class B1, 2.659%, 3/25/51 (144A) | 182,722 |
| 400,000(b) | Citigroup Mortgage Loan Trust, Series 2018-RP3, Class M3, 3.25%, 3/25/61 (144A) | 329,188 |
| 93,530(b) | Citigroup Mortgage Loan Trust, Series 2021-INV1, Class B1W, 2.708%, 5/25/51 (144A) | 73,246 |
| 14,299(a) | Connecticut Avenue Securities Trust, Series 2019-R01, Class 2M2, 7.902% (SOFR30A + 256 bps), 7/25/31 (144A) | 14,359 |
| 1,284(a) | Connecticut Avenue Securities Trust, Series 2019-R07, Class 1M2, 7.552% (SOFR30A + 221 bps), 10/25/39 (144A) | 1,284 |
| 24,755(a) | Connecticut Avenue Securities Trust, Series 2020-R02, Class 2M2, 7.452% (SOFR30A + 211 bps), 1/25/40 (144A) | 24,943 |
| 85,000(a) | Connecticut Avenue Securities Trust, Series 2022-R02, Class 2M2, 8.337% (SOFR30A + 300 bps), 1/25/42 (144A) | 86,140 |
| 200,000(b) | CSMC Trust, Series 2021-RPL2, Class M1, 2.75%, 1/25/60 (144A) | 147,214 |
| 150,000(b) | CSMC Trust, Series 2021-RPL2, Class M2, 3.25%, 1/25/60 (144A) | 107,130 |
| 200,000(a) | Eagle Re, Ltd., Series 2023-1, Class M1B, 9.287% (SOFR30A + 395 bps), 9/26/33 (144A) | 200,952 |
| 12,345 | Federal Home Loan Mortgage Corp. REMICs, Series 2944, Class OH, 5.50%, 3/15/35 | 12,374 |
| 172,932(a)(d) | Federal Home Loan Mortgage Corp. REMICs, Series 4091, Class SH, 1.097% (SOFR30A + 644 bps), 8/15/42 | 22,497 |
| 80,686(d) | Federal Home Loan Mortgage Corp. REMICs, Series 4999, Class QI, 4.00%, 5/25/50 | 14,478 |
| 106,866(d) | Federal Home Loan Mortgage Corp. REMICs, Series 5067, Class GI, 4.00%, 12/25/50 | 20,557 |
| 467 | Federal National Mortgage Association REMICs, Series 2009-36, Class HX, 4.50%, 6/25/29 | 461 |
| 550,000 | Federal National Mortgage Association REMICs, Series 2013-61, Class BY, 3.00%, 6/25/43 | 453,354 |
| 71,490(d) | Federal National Mortgage Association REMICs, Series 2020-83, Class EI, 4.00%, 11/25/50 | 14,275 |
| 56,887(a) | Freddie Mac STACR REMIC Trust, Series 2020-DNA5, Class M2, 8.137% (SOFR30A + 280 bps), 10/25/50 (144A) | 57,685 |
| 79 | Government National Mortgage Association, Series 2012-130, Class PA, 3.00%, 4/20/41 | 79 |
| 413,520(d) | Government National Mortgage Association, Series 2019-159, Class CI, 3.50%, 12/20/49 | 72,175 |
| 369,961(a)(d) | Government National Mortgage Association, Series 2020-9, Class SA, 0.000% (1 Month Term SOFR + 324 bps), 1/20/50 | 8,127 |
| 165,000(b) | GS Mortgage-Backed Securities Corp. Trust, Series 2022-PJ4, Class A33, 3.00%, 9/25/52 (144A) | 113,820 |
| 72,173(b) | GS Mortgage-Backed Securities Trust, Series 2020-NQM1, Class A3, 2.352%, 9/27/60 (144A) | 66,166 |
| 322,177(b) | GS Mortgage-Backed Securities Trust, Series 2022-PJ1, Class A4, 2.50%, 5/28/52 (144A) | 256,987 |
| 68,968(a) | Home Re, Ltd., Series 2019-1, Class M1, 7.102% (SOFR30A + 176 bps), 5/25/29 (144A) | 68,978 |
| 41,210(a) | Home Re, Ltd., Series 2020-1, Class M2, 10.702% (SOFR30A + 536 bps), 10/25/30 (144A) | 41,460 |
| 130,000(b) | Homeward Opportunities Fund I Trust, Series 2020-2, Class A3, 3.196%, 5/25/65 (144A) | 123,572 |
| 100,000(b) | Homeward Opportunities Fund I Trust, Series 2020-2, Class M1, 3.897%, 5/25/65 (144A) | 93,030 |
| 162,611(b) | Hundred Acre Wood Trust, Series 2021-INV1, Class B1, 3.225%, 7/25/51 (144A) | 134,046 |
| 433,947(b) | Hundred Acre Wood Trust, Series 2021-INV3, Class A3, 2.50%, 12/25/51 (144A) | 355,362 |
| 100,000(b) | Imperial Fund Mortgage Trust, Series 2021-NQM2, Class B1, 3.295%, 9/25/56 (144A) | 64,844 |
| 100,000(b) | Imperial Fund Mortgage Trust, Series 2021-NQM2, Class M1, 2.489%, 9/25/56 (144A) | 64,453 |
| 360,000 | IMS Ecuadorian Mortgage Trust, Series 2021-1, Class GA, 3.40%, 8/18/43 (144A) | 333,225 |
| 234,396(b) | JP Morgan Mortgage Trust, Series 2019-HYB1, Class B3, 4.863%, 10/25/49 (144A) | 217,486 |
| 142,962(b) | JP Morgan Mortgage Trust, Series 2021-12, Class B1, 3.165%, 2/25/52 (144A) | 115,048 |
| 128,735(b) | JP Morgan Mortgage Trust, Series 2021-13, Class B1, 3.14%, 4/25/52 (144A) | 103,041 |
| 103,102(b) | JP Morgan Mortgage Trust, Series 2021-INV1, Class B1, 2.979%, 10/25/51 (144A) | 81,879 |
| 187,457(b) | JP Morgan Mortgage Trust, Series 2021-INV1, Class B2, 2.979%, 10/25/51 (144A) | 145,772 |
| 215,000(b) | JP Morgan Mortgage Trust, Series 2022-4, Class A5, 3.00%, 10/25/52 (144A) | 148,640 |
| 275,000(b) | JP Morgan Mortgage Trust, Series 2022-LTV1, Class M1, 3.522%, 7/25/52 (144A) | 172,705 |
| 11,545(a) | La Hipotecaria Panamanian Mortgage Trust, Series 2010-1GA, Class A, 3.00% (Panamanian Mortgage Reference Rate - 300 bps), 9/8/39 (144A) | 11,097 |
| 419,691(b) | Mello Mortgage Capital Acceptance, Series 2021-INV2, Class A15, 2.50%, 8/25/51 (144A) | 334,769 |
The accompanying notes are an integral part of these financial statements.
9
| Pioneer Bond VCT Portfolio | Pioneer Variable Contracts Trust |
Schedule of Investments 12/31/23 (continued)
Principal
Amount
USD ($) | | | | | | Value |
| | Collateralized Mortgage Obligations—(continued) | |
| 280,895(b) | Mello Mortgage Capital Acceptance, Series 2021-MTG2, Class B1, 2.669%, 6/25/51 (144A) | $ 216,996 |
| 192,176(b) | Mello Mortgage Capital Acceptance, Series 2022-INV1, Class B1, 3.32%, 3/25/52 (144A) | 153,623 |
| 66,018(b) | MFA Trust, Series 2020-NQM1, Class A3, 2.30%, 8/25/49 (144A) | 60,262 |
| 400,000(b) | Mill City Mortgage Loan Trust, Series 2019-GS2, Class M3, 3.25%, 8/25/59 (144A) | 324,587 |
| 335,225(b) | Morgan Stanley Residential Mortgage Loan Trust, Series 2021-1, Class B2, 2.948%, 3/25/51 (144A) | 260,503 |
| 58,500(b) | New Residential Mortgage Loan Trust, Series 2019-NQM4, Class A1, 2.492%, 9/25/59 (144A) | 53,805 |
| 200,000 | NYMT Loan Trust, Series 2022-CP1, Class M1, 3.215%, 7/25/61 (144A) | 161,344 |
| 82,537(a) | Oaktown Re V, Ltd., Series 2020-2A, Class M2, 10.702% (SOFR30A + 536 bps), 10/25/30 (144A) | 83,905 |
| 325,816(b) | PRMI Securitization Trust, Series 2021-1, Class B1, 2.478%, 4/25/51 (144A) | 246,376 |
| 186,503(b) | Provident Funding Mortgage Trust, Series 2021-J1, Class B1, 2.637%, 10/25/51 (144A) | 149,403 |
| 150,000(a) | Radnor Re, Ltd., Series 2023-1, Class M1A, 8.037% (SOFR30A + 270 bps), 7/25/33 (144A) | 150,955 |
| 332,409(b) | Rate Mortgage Trust, Series 2021-HB1, Class B2, 2.705%, 12/25/51 (144A) | 250,431 |
| 141,565(b) | Rate Mortgage Trust, Series 2021-J3, Class B2, 2.713%, 10/25/51 (144A) | 110,641 |
| 374,308(b) | RCKT Mortgage Trust, Series 2021-2, Class B1A, 2.562%, 6/25/51 (144A) | 292,990 |
| 309,846(b) | RCKT Mortgage Trust, Series 2021-3, Class A25, 2.50%, 7/25/51 (144A) | 247,150 |
| 331,489(b) | RCKT Mortgage Trust, Series 2021-4, Class B1A, 3.007%, 9/25/51 (144A) | 263,902 |
| 400,000(b) | RCKT Mortgage Trust, Series 2022-3, Class A17, 3.00%, 5/25/52 (144A) | 273,785 |
| 66,397(b) | RMF Proprietary Issuance Trust, Series 2019-1, Class A, 2.75%, 10/25/63 (144A) | 58,336 |
| 192,599(b) | RMF Proprietary Issuance Trust, Series 2021-2, Class A, 2.125%, 9/25/61 (144A) | 155,728 |
| 5,059(b) | Sequoia Mortgage Trust, Series 2018-CH3, Class A1, 4.50%, 8/25/48 (144A) | 4,934 |
| 150,000(b) | Sequoia Mortgage Trust, Series 2022-1, Class A7, 2.50%, 2/25/52 (144A) | 95,234 |
| 380,000(a) | STACR Trust, Series 2018-HRP2, Class B1, 9.652% (SOFR30A + 431 bps), 2/25/47 (144A) | 415,402 |
| 140,000(a) | Towd Point Mortgage Trust, Series 2019-HY1, Class B2, 7.62% (1 Month Term SOFR + 226 bps), 10/25/48 (144A) | 134,064 |
| 358,803(b) | Towd Point Mortgage Trust, Series 2021-R1, Class A1, 2.918%, 11/30/60 (144A) | 300,498 |
| 250,000(a) | Triangle Re, Ltd., Series 2023-1, Class M1A, 8.721% (SOFR30A + 340 bps), 11/25/33 (144A) | 249,997 |
| 167,824(b) | UWM Mortgage Trust, Series 2021-INV5, Class B1, 3.237%, 1/25/52 (144A) | 136,413 |
| 101,459(b) | Visio Trust, Series 2019-2, Class A1, 2.722%, 11/25/54 (144A) | 96,573 |
| 100,000(b) | Wells Fargo Mortgage Backed Securities Trust, Series 2022-2, Class A5, 3.00%, 12/25/51 (144A) | 68,595 |
| 345,000(b) | Wells Fargo Mortgage Backed Securities Trust, Series 2022-2, Class A6, 2.50%, 12/25/51 (144A) | 217,268 |
| | Total Collateralized Mortgage Obligations
(Cost $13,136,710) | $ 10,858,785 |
|
| |
| | Commercial Mortgage-Backed Securities—4.3% of Net Assets | |
| 150,000(a) | AREIT Trust, Series 2022-CRE6, Class D, 8.188% (SOFR30A + 285 bps), 1/20/37 (144A) | $ 141,405 |
| 126,124(c)(d) + | Bayview Commercial Asset Trust, Series 2007-2A, Class IO, 0.000%, 7/25/37 (144A) | — |
| 250,000 | Benchmark Mortgage Trust, Series 2018-B8, Class A4, 3.963%, 1/15/52 | 237,250 |
| 200,000(b) | Benchmark Mortgage Trust, Series 2020-IG3, Class B, 3.291%, 9/15/48 (144A) | 102,515 |
| 100,000(b) | Benchmark Mortgage Trust, Series 2022-B34, Class AM, 3.831%, 4/15/55 | 83,113 |
| 500,000(b) | BX Commercial Mortgage Trust, Series 2021-VIV5, Class A, 2.843%, 3/9/44 (144A) | 427,004 |
| 400,000 | BX Trust, Series 2019-OC11, Class A, 3.202%, 12/9/41 (144A) | 353,083 |
| 450,000(a) | BX Trust, Series 2021-ARIA, Class D, 7.372% (1 Month Term SOFR + 201 bps), 10/15/36 (144A) | 428,535 |
| 234,973 | Citigroup Commercial Mortgage Trust, Series 2018-C5, Class A3, 3.963%, 6/10/51 | 224,983 |
| 1,364,909(b)(d) | COMM Mortgage Trust, Series 2014-CR18, Class XA, 0.912%, 7/15/47 | 1,823 |
| 174,868 | COMM Mortgage Trust, Series 2016-CR28, Class AHR, 3.651%, 2/10/49 | 169,328 |
| 225,000(a) | Freddie Mac Multifamily Structured Credit Risk, Series 2021-MN3, Class M2, 9.337% (SOFR30A + 400 bps), 11/25/51 (144A) | 208,467 |
| 150,000(b) | FREMF Mortgage Trust, Series 2017-KW03, Class B, 4.077%, 7/25/27 (144A) | 139,743 |
| 109,062(a) | FREMF Mortgage Trust, Series 2018-KSW4, Class B, 7.895% (SOFR30A + 256 bps), 10/25/28 | 102,119 |
| 100,000(b) | FREMF Mortgage Trust, Series 2019-K88, Class C, 4.383%, 2/25/52 (144A) | 93,981 |
10
The accompanying notes are an integral part of these financial statements.
| Pioneer Bond VCT Portfolio | Pioneer Variable Contracts Trust |
Principal
Amount
USD ($) | | | | | | Value |
| | Commercial Mortgage-Backed Securities—(continued) | |
| 134,133(a) | FREMF Mortgage Trust, Series 2019-KF64, Class B, 7.745% (SOFR30A + 241 bps), 6/25/26 (144A) | $ 128,518 |
| 172,313(a) | FREMF Mortgage Trust, Series 2019-KF66, Class B, 7.845% (SOFR30A + 251 bps), 7/25/29 (144A) | 158,525 |
| 97,156(b) | FRESB Mortgage Trust, Series 2018-SB52, Class A7F, 3.39%, 6/25/25 | 94,575 |
| 655,956(b)(d) | Government National Mortgage Association, Series 2017-21, Class IO, 0.633%, 10/16/58 | 22,509 |
| 250,000(a) | GS Mortgage Securities Corportation Trust, Series 2021-IP, Class D, 7.576% (1 Month Term SOFR + 221 bps), 10/15/36 (144A) | 227,975 |
| 323,000 | ILPT Trust, Series 2019-SURF, Class A, 4.145%, 2/11/41 (144A) | 299,493 |
| 250,000 | JP Morgan Chase Commercial Mortgage Securities Trust, Series 2018-WPT, Class AFX, 4.248%, 7/5/33 (144A) | 219,463 |
| 250,000 | JPMDB Commercial Mortgage Securities Trust, Series 2018-C8, Class A4, 4.211%, 6/15/51 | 236,834 |
| 1,600,000(b)(d) | JPMDB Commercial Mortgage Securities Trust, Series 2018-C8, Class XB, 0.123%, 6/15/51 | 7,852 |
| 225,000 | Key Commercial Mortgage Securities Trust, Series 2019-S2, Class A3, 3.469%, 6/15/52 (144A) | 206,720 |
| 60,000(b) | Morgan Stanley Bank of America Merrill Lynch Trust, Series 2015-C21, Class C, 4.126%, 3/15/48 | 45,993 |
| 250,000(b) | Morgan Stanley Capital I Trust, Series 2018-MP, Class A, 4.276%, 7/11/40 (144A) | 218,322 |
| 150,000(a) | ORL Trust, Series 2023-GLKS, Class A, 7.712% (1 Month Term SOFR + 235 bps), 10/19/36 (144A) | 150,000 |
| 85,000 | Palisades Center Trust, Series 2016-PLSD, Class A, 2.713%, 4/13/33 (144A) | 45,520 |
| 225,000(a) | Ready Capital Mortgage Financing LLC, Series 2021-FL7, Class D, 8.42% (1 Month Term SOFR + 306 bps), 11/25/36 (144A) | 213,567 |
| 325,000(a) | Taubman Centers Commercial Mortgage Trust, Series 2022-DPM, Class B, 8.294% (1 Month Term SOFR + 293 bps), 5/15/37 (144A) | 320,406 |
| 350,000(b) | THPT Mortgage Trust, Series 2023-THL, Class A, 6.994%, 12/10/34 (144A) | 355,730 |
| | Total Commercial Mortgage-Backed Securities
(Cost $6,417,741) | $ 5,665,351 |
|
| |
| | Corporate Bonds — 33.7% of Net Assets | |
| | Aerospace & Defense — 0.4% | |
| 119,000 | Boeing Co., 3.75%, 2/1/50 | $ 92,345 |
| 480,000 | Boeing Co., 3.90%, 5/1/49 | 380,143 |
| 125,000 | Boeing Co., 5.805%, 5/1/50 | 129,444 |
| | Total Aerospace & Defense | $ 601,932 |
| | Airlines — 0.4% | |
| 197,160 | Air Canada 2017-1 Class AA Pass Through Trust, 3.30%, 1/15/30 (144A) | $ 176,934 |
| 40,950 | American Airlines 2021-1 Class B Pass Through Trust, 3.95%, 7/11/30 | 36,346 |
| 85,000 | Delta Air Lines, Inc./SkyMiles IP, Ltd., 4.75%, 10/20/28 (144A) | 83,597 |
| 132,371 | JetBlue 2019-1 Class AA Pass Through Trust, 2.75%, 5/15/32 | 111,661 |
| 49,025 | JetBlue 2020-1 Class A Pass Through Trust, 4.00%, 11/15/32 | 44,879 |
| 58,976 | United Airlines 2020-1 Class B Pass Through Trust, 4.875%, 1/15/26 | 57,126 |
| | Total Airlines | $ 510,543 |
| | Auto Manufacturers — 1.4% | |
| 125,000 | Ford Motor Co., 6.10%, 8/19/32 | $ 126,004 |
| 200,000 | Ford Motor Credit Co. LLC, 3.625%, 6/17/31 | 172,430 |
| 200,000 | Ford Motor Credit Co. LLC, 7.35%, 3/6/30 | 214,860 |
| 216,000 | General Motors Co., 6.60%, 4/1/36 | 231,175 |
| 390,000 | General Motors Financial Co., Inc., 6.10%, 1/7/34 | 401,548 |
| 285,000 | General Motors Financial Co., Inc., 6.40%, 1/9/33 | 303,269 |
| 295,000 | Hyundai Capital America, 5.80%, 4/1/30 (144A) | 303,907 |
| 115,000 | Hyundai Capital America, 6.20%, 9/21/30 (144A) | 121,082 |
| | Total Auto Manufacturers | $ 1,874,275 |
The accompanying notes are an integral part of these financial statements.
11
| Pioneer Bond VCT Portfolio | Pioneer Variable Contracts Trust |
Schedule of Investments 12/31/23 (continued)
Principal
Amount
USD ($) | | | | | | Value |
| | Auto Parts & Equipment — 0.1% | |
| 150,000 | ZF North America Capital, Inc., 6.875%, 4/14/28 (144A) | $ 155,943 |
| | Total Auto Parts & Equipment | $ 155,943 |
| | Banks — 11.3% | |
| 800,000(b) | ABN AMRO Bank NV, 3.324% (5 Year CMT Index + 190 bps), 3/13/37 (144A) | $ 638,773 |
| 535,000(b) | AIB Group Plc, 4.263% (3 Month USD LIBOR + 187 bps), 4/10/25 (144A) | 532,150 |
| 318,000 | Banco Santander Chile, 2.70%, 1/10/25 (144A) | 309,325 |
| 600,000(b) | Banco Santander S.A., 3.225% (1 Year CMT Index + 160 bps), 11/22/32 | 502,429 |
| 200,000 | Banco Santander S.A., 6.938%, 11/7/33 | 222,038 |
| 375,000(b) | Bank of America Corp., 2.572% (SOFR + 121 bps), 10/20/32 | 310,902 |
| 663,000(b) | Bank of America Corp., 2.884% (3 Month Term SOFR + 145 bps), 10/22/30 | 588,092 |
| 150,000(b) | Bank of New York Mellon Corp., 5.834% (SOFR + 207 bps), 10/25/33 | 159,024 |
| 590,000(b) | Bank of Nova Scotia, 4.588% (5 Year CMT Index + 205 bps), 5/4/37 | 527,735 |
| 440,000(b) | Barclays Plc, 5.746% (1 Year CMT Index + 300 bps), 8/9/33 | 445,153 |
| 260,000(b) | Barclays Plc, 6.692% (SOFR + 262 bps), 9/13/34 | 277,940 |
| 255,000(b) | BNP Paribas S.A., 2.159% (SOFR + 122 bps), 9/15/29 (144A) | 221,788 |
| 390,000(b) | BPCE S.A., 3.116% (SOFR + 173 bps), 10/19/32 (144A) | 317,994 |
| 200,000 | BPCE S.A., 4.875%, 4/1/26 (144A) | 195,958 |
| 260,000(b) | CaixaBank S.A., 6.84% (SOFR + 277 bps), 9/13/34 (144A) | 274,538 |
| 250,000(b) | Citigroup, Inc., 2.52% (SOFR + 118 bps), 11/3/32 | 206,079 |
| 185,000(b) | Citigroup, Inc., 4.91% (SOFR + 209 bps), 5/24/33 | 181,127 |
| 365,000(b) | Comerica Bank, 5.332% (SOFR + 261 bps), 8/25/33 | 335,158 |
| 235,000(b) | Goldman Sachs Group, Inc., 2.65% (SOFR + 126 bps), 10/21/32 | 195,828 |
| 286,000(b) | Goldman Sachs Group, Inc., 3.272% (3 Month Term SOFR + 146 bps), 9/29/25 | 281,163 |
| 215,000(b) | Goldman Sachs Group, Inc., 4.223% (3 Month Term SOFR + 156 bps), 5/1/29 | 207,975 |
| 355,000(b) | HSBC Holdings Plc, 2.206% (SOFR + 129 bps), 8/17/29 | 309,889 |
| 375,000(b) | HSBC Holdings Plc, 2.871% (SOFR + 141 bps), 11/22/32 | 311,545 |
| 200,000(b) | HSBC Holdings Plc, 6.161% (SOFR + 197 bps), 3/9/29 | 206,518 |
| 200,000(b) | ING Groep NV, 4.252% (SOFR + 207 bps), 3/28/33 | 187,498 |
| 635,000(b)(e) | ING Groep NV, 4.25% (5 Year CMT Index + 286 bps) | 461,876 |
| 245,000(b) | Intesa Sanpaolo S.p.A., 7.778% (1 Year CMT Index + 390 bps), 6/20/54 (144A) | 252,628 |
| 335,000 | Intesa Sanpaolo S.p.A., 7.80%, 11/28/53 (144A) | 367,820 |
| 305,000(b) | JPMorgan Chase & Co., 2.545% (SOFR + 118 bps), 11/8/32 | 254,485 |
| 90,000(b) | JPMorgan Chase & Co., 4.586% (SOFR + 180 bps), 4/26/33 | 86,953 |
| 200,000(b) | Lloyds Banking Group Plc, 4.976% (1 Year CMT Index + 230 bps), 8/11/33 | 194,782 |
| 310,000(b) | Lloyds Banking Group Plc, 7.953% (1 Year CMT Index + 375 bps), 11/15/33 | 354,359 |
| 205,000(b)(e) | Lloyds Banking Group Plc, 8.00% (5 Year CMT Index + 391 bps) | 205,410 |
| 335,000(b) | Macquarie Group, Ltd., 2.691% (SOFR + 144 bps), 6/23/32 (144A) | 274,893 |
| 195,000(b) | Macquarie Group, Ltd., 2.871% (SOFR + 153 bps), 1/14/33 (144A) | 160,299 |
| 305,000(b) | Morgan Stanley, 5.297% (SOFR + 262 bps), 4/20/37 | 296,795 |
| 60,000(b) | Morgan Stanley, 5.948% (5 Year CMT Index + 243 bps), 1/19/38 | 60,678 |
| 645,000(b)(e) | Nordea Bank Abp, 3.75% (5 Year CMT Index + 260 bps) (144A) | 509,516 |
| 185,000(b) | PNC Financial Services Group, Inc., 6.875% (SOFR + 228 bps), 10/20/34 | 205,375 |
| 210,000(b) | Santander Holdings USA, Inc., 2.49% (SOFR + 125 bps), 1/6/28 | 192,250 |
| 200,000(b) | Societe Generale S.A., 4.027% (1 Year CMT Index + 190 bps), 1/21/43 (144A) | 143,095 |
| 460,000(b) | Standard Chartered Plc, 6.296% (1 Year CMT Index + 258 bps), 7/6/34 (144A) | 482,745 |
| 185,000(b) | Truist Financial Corp., 7.161% (SOFR + 245 bps), 10/30/29 | 199,806 |
| 415,000(b) | UBS Group AG, 2.746% (1 Year CMT Index + 110 bps), 2/11/33 (144A) | 340,393 |
| 200,000(b) | UBS Group AG, 6.301% (1 Year CMT Index + 200 bps), 9/22/34 (144A) | 211,725 |
| 700,000(b) | UniCredit S.p.A., 2.569% (1 Year CMT Index + 230 bps), 9/22/26 (144A) | 658,031 |
12
The accompanying notes are an integral part of these financial statements.
| Pioneer Bond VCT Portfolio | Pioneer Variable Contracts Trust |
Principal
Amount
USD ($) | | | | | | Value |
| | Banks — (continued) | |
| 240,000(b) | UniCredit S.p.A., 5.459% (5 Year CMT Index + 475 bps), 6/30/35 (144A) | $ 225,715 |
| 200,000(b) | UniCredit S.p.A., 7.296% (5 Year USD Swap Rate + 491 bps), 4/2/34 (144A) | 205,617 |
| 595,000(b) | US Bancorp, 2.491% (5 Year CMT Index + 95 bps), 11/3/36 | 461,441 |
| 350,000(b) | Wells Fargo & Co., 6.491% (SOFR + 206 bps), 10/23/34 | 380,761 |
| | Total Banks | $ 15,134,067 |
| | Biotechnology — 0.1% | |
| 170,000 | Amgen, Inc., 5.25%, 3/2/33 | $ 174,290 |
| | Total Biotechnology | $ 174,290 |
| | Chemicals — 0.4% | |
| 236,000 | Albemarle Corp., 5.05%, 6/1/32 | $ 230,334 |
| 329,000 | Albemarle Corp., 5.65%, 6/1/52 | 305,248 |
| | Total Chemicals | $ 535,582 |
| | Commercial Services — 0.9% | |
| 123,000 | Allied Universal Holdco LLC/Allied Universal Finance Corp., 6.625%, 7/15/26 (144A) | $ 122,354 |
| 260,000 | Element Fleet Management Corp., 6.319%, 12/4/28 (144A) | 268,519 |
| 220,000 | Garda World Security Corp., 4.625%, 2/15/27 (144A) | 212,122 |
| 180,000 | Prime Security Services Borrower LLC/Prime Finance, Inc., 6.25%, 1/15/28 (144A) | 178,950 |
| 165,000 | S&P Global, Inc., 5.25%, 9/15/33 (144A) | 172,626 |
| 200,000 | Sotheby's, 7.375%, 10/15/27 (144A) | 192,879 |
| | Total Commercial Services | $ 1,147,450 |
| | Diversified Financial Services — 3.4% | |
| 225,000 | AerCap Ireland Capital DAC/AerCap Global Aviation Trust, 3.30%, 1/30/32 | $ 195,824 |
| 265,000 | Air Lease Corp., 2.10%, 9/1/28 | 231,913 |
| 165,000 | Air Lease Corp., 2.875%, 1/15/32 | 139,616 |
| 215,000 | Air Lease Corp., 3.125%, 12/1/30 | 188,050 |
| 395,000 | Ally Financial, Inc., 4.75%, 6/9/27 | 381,159 |
| 130,000(b) | Ally Financial, Inc., 6.848% (SOFR + 282 bps), 1/3/30 | 133,561 |
| 50,000(b) | Ally Financial, Inc., 6.992% (SOFR + 326 bps), 6/13/29 | 51,638 |
| 60,000 | Ally Financial, Inc., 8.00%, 11/1/31 | 65,730 |
| 245,000 | Ameriprise Financial, Inc., 5.15%, 5/15/33 | 252,448 |
| 30,000 | Avolon Holdings Funding, Ltd., 3.95%, 7/1/24 (144A) | 29,597 |
| 330,000 | Avolon Holdings Funding, Ltd., 6.375%, 5/4/28 (144A) | 336,473 |
| 285,000(b) | Capital One Financial Corp., 2.359% (SOFR + 134 bps), 7/29/32 | 215,919 |
| 125,000(b) | Capital One Financial Corp., 5.247% (SOFR + 260 bps), 7/26/30 | 122,816 |
| 310,000(b) | Capital One Financial Corp., 5.268% (SOFR + 237 bps), 5/10/33 | 304,183 |
| 30,000(b) | Capital One Financial Corp., 5.817% (SOFR + 260 bps), 2/1/34 | 29,854 |
| 140,000(b) | Capital One Financial Corp., 6.377% (SOFR + 286 bps), 6/8/34 | 144,088 |
| 220,000(b) | Charles Schwab Corp., 5.853% (SOFR + 250 bps), 5/19/34 | 227,095 |
| 485,000 | Nomura Holdings, Inc., 2.999%, 1/22/32 | 408,863 |
| 225,000 | Nomura Holdings, Inc., 5.605%, 7/6/29 | 229,801 |
| 140,000 | OneMain Finance Corp., 3.50%, 1/15/27 | 129,562 |
| 404,000 | OneMain Finance Corp., 4.00%, 9/15/30 | 345,725 |
| 90,000 | OneMain Finance Corp., 9.00%, 1/15/29 | 95,151 |
| 283,000 | United Wholesale Mortgage LLC, 5.50%, 4/15/29 (144A) | 267,919 |
| | Total Diversified Financial Services | $ 4,526,985 |
| | Electric — 0.9% | |
| 210,000(b) | Algonquin Power & Utilities Corp., 4.75% (5 Year CMT Index + 325 bps), 1/18/82 | $ 177,450 |
The accompanying notes are an integral part of these financial statements.
13
| Pioneer Bond VCT Portfolio | Pioneer Variable Contracts Trust |
Schedule of Investments 12/31/23 (continued)
Principal
Amount
USD ($) | | | | | | Value |
| | Electric — (continued) | |
| 70,000 | Entergy Louisiana LLC, 4.75%, 9/15/52 | $ 64,341 |
| 130,000 | Monongahela Power Co., 5.85%, 2/15/34 (144A) | 136,405 |
| 185,000 | NextEra Energy Capital Holdings, Inc., 6.051%, 3/1/25 | 186,648 |
| 255,000 | Puget Energy, Inc., 2.379%, 6/15/28 | 227,924 |
| 220,000 | Puget Energy, Inc., 4.10%, 6/15/30 | 201,569 |
| 55,000 | Puget Energy, Inc., 4.224%, 3/15/32 | 49,753 |
| 120,000 | Vistra Operations Co. LLC, 6.95%, 10/15/33 (144A) | 126,292 |
| | Total Electric | $ 1,170,382 |
| | Energy-Alternate Sources — 0.0%† | |
| 35,226 | Alta Wind Holdings LLC, 7.00%, 6/30/35 (144A) | $ 30,381 |
| | Total Energy-Alternate Sources | $ 30,381 |
| | Entertainment — 0.3% | |
| 400,000 | Resorts World Las Vegas LLC/RWLV Capital, Inc., 4.625%, 4/16/29 (144A) | $ 348,584 |
| | Total Entertainment | $ 348,584 |
| | Food — 0.9% | |
| 120,000 | JBS USA LUX S.A./JBS USA Food Co./JBS USA Finance, Inc., 3.00%, 2/2/29 | $ 105,551 |
| 57,000 | JBS USA LUX S.A./JBS USA Food Co./JBS USA Finance, Inc., 3.00%, 5/15/32 | 46,407 |
| 255,000 | JBS USA LUX S.A./JBS USA Food Co./JBS USA Finance, Inc., 5.75%, 4/1/33 | 252,600 |
| 90,000 | JBS USA LUX S.A./JBS USA Food Co./JBS USA Finance, Inc., 6.50%, 12/1/52 | 90,495 |
| 455,000 | Minerva Luxembourg S.A., 4.375%, 3/18/31 (144A) | 375,111 |
| 220,000 | Smithfield Foods, Inc., 2.625%, 9/13/31 (144A) | 170,158 |
| 200,000 | Smithfield Foods, Inc., 3.00%, 10/15/30 (144A) | 164,185 |
| 21,000 | Smithfield Foods, Inc., 5.20%, 4/1/29 (144A) | 20,098 |
| | Total Food | $ 1,224,605 |
| | Gas — 0.5% | |
| 110,000 | Boston Gas Co., 3.15%, 8/1/27 (144A) | $ 103,388 |
| 380,000 | KeySpan Gas East Corp., 5.994%, 3/6/33 (144A) | 386,421 |
| 158,753 | Nakilat, Inc., 6.267%, 12/31/33 (144A) | 165,500 |
| | Total Gas | $ 655,309 |
| | Hand & Machine Tools — 0.2% | |
| 125,000 | Kennametal, Inc., 2.80%, 3/1/31 | $ 105,233 |
| 125,000 | Regal Rexnord Corp., 6.30%, 2/15/30 (144A) | 128,239 |
| | Total Hand & Machine Tools | $ 233,472 |
| | Healthcare-Products — 0.3% | |
| 77,000 | Edwards Lifesciences Corp., 4.30%, 6/15/28 | $ 75,783 |
| 348,000 | Smith & Nephew Plc, 2.032%, 10/14/30 | 288,205 |
| | Total Healthcare-Products | $ 363,988 |
| | Healthcare-Services — 0.1% | |
| 140,000 | Elevance Health, Inc., 4.55%, 5/15/52 | $ 127,728 |
| 65,000 | Elevance Health, Inc., 6.10%, 10/15/52 | 73,685 |
| | Total Healthcare-Services | $ 201,413 |
| | Insurance — 1.9% | |
| 185,000 | Brown & Brown, Inc., 4.20%, 3/17/32 | $ 168,729 |
| 470,000 | CNO Global Funding, 2.65%, 1/6/29 (144A) | 407,144 |
| 100,000(b) | Farmers Exchange Capital III, 5.454% (3 Month USD LIBOR + 345 bps), 10/15/54 (144A) | 84,000 |
14
The accompanying notes are an integral part of these financial statements.
| Pioneer Bond VCT Portfolio | Pioneer Variable Contracts Trust |
Principal
Amount
USD ($) | | | | | | Value |
| | Insurance — (continued) | |
| 340,000(b) | Farmers Insurance Exchange, 4.747% (3 Month USD LIBOR + 323 bps), 11/1/57 (144A) | $ 261,393 |
| 645,000 | Liberty Mutual Insurance Co., 7.697%, 10/15/97 (144A) | 706,201 |
| 155,000 | Metropolitan Life Global Funding I, 5.15%, 3/28/33 (144A) | 157,691 |
| 475,000 | Nationwide Mutual Insurance Co., 4.35%, 4/30/50 (144A) | 380,738 |
| 355,000(b) | Nippon Life Insurance Co., 2.90% (5 Year CMT Index + 260 bps), 9/16/51 (144A) | 292,276 |
| 86,000 | Primerica, Inc., 2.80%, 11/19/31 | 72,744 |
| 26,000 | Teachers Insurance & Annuity Association of America, 6.85%, 12/16/39 (144A) | 29,955 |
| | Total Insurance | $ 2,560,871 |
| | Iron & Steel — 0.0%† | |
| 58,000 | Commercial Metals Co., 4.375%, 3/15/32 | $ 52,052 |
| | Total Iron & Steel | $ 52,052 |
| | Lodging — 0.5% | |
| 55,000 | Marriott International, Inc., 4.90%, 4/15/29 | $ 55,357 |
| 520,000 | Marriott International, Inc., 3.50%, 10/15/32 | 463,609 |
| 100,000 | Marriott International, Inc., 4.625%, 6/15/30 | 98,199 |
| | Total Lodging | $ 617,165 |
| | Machinery-Diversified — 0.2% | |
| 210,000 | CNH Industrial Capital LLC, 4.55%, 4/10/28 | $ 207,161 |
| 100,000 | Nordson Corp., 5.80%, 9/15/33 | 106,146 |
| | Total Machinery-Diversified | $ 313,307 |
| | Mining — 0.4% | |
| 335,000 | AngloGold Ashanti Holdings Plc, 3.75%, 10/1/30 | $ 291,254 |
| 265,000 | First Quantum Minerals, Ltd., 8.625%, 6/1/31 (144A) | 224,587 |
| | Total Mining | $ 515,841 |
| | Multi-National — 0.1% | |
| 230,000 | Banque Ouest Africaine de Developpement, 4.70%, 10/22/31 (144A) | $ 195,564 |
| | Total Multi-National | $ 195,564 |
| | Oil & Gas — 1.2% | |
| 640,000 | Aker BP ASA, 3.10%, 7/15/31 (144A) | $ 547,386 |
| 235,000 | ConocoPhillips Co., 5.55%, 3/15/54 | 249,395 |
| 450,000 | Phillips 66 Co., 3.75%, 3/1/28 | 432,841 |
| 312,000 | Valero Energy Corp., 6.625%, 6/15/37 | 342,000 |
| | Total Oil & Gas | $ 1,571,622 |
| | Pharmaceuticals — 0.4% | |
| 35,000 | CVS Health Corp., 5.25%, 1/30/31 | $ 35,903 |
| 260,000 | CVS Health Corp., 5.25%, 2/21/33 | 265,765 |
| 200,000 | Teva Pharmaceutical Finance Netherlands III BV, 5.125%, 5/9/29 | 191,009 |
| | Total Pharmaceuticals | $ 492,677 |
| | Pipelines — 2.5% | |
| 75,000 | Boardwalk Pipelines LP, 3.60%, 9/1/32 | $ 66,442 |
| 160,000(b) | Enbridge, Inc., 8.50% (5 Year CMT Index + 443 bps), 1/15/84 | 170,183 |
| 40,000 | Energy Transfer LP, 4.15%, 9/15/29 | 38,114 |
| 479,000 | Energy Transfer LP, 4.95%, 5/15/28 | 476,590 |
| 224,000 | Energy Transfer LP, 5.35%, 5/15/45 | 208,038 |
| 140,000 | Energy Transfer LP, 6.00%, 6/15/48 | 141,040 |
The accompanying notes are an integral part of these financial statements.
15
| Pioneer Bond VCT Portfolio | Pioneer Variable Contracts Trust |
Schedule of Investments 12/31/23 (continued)
Principal
Amount
USD ($) | | | | | | Value |
| | Pipelines — (continued) | |
| 125,000 | Energy Transfer LP, 7.375%, 2/1/31 (144A) | $ 131,367 |
| 241,000(b)(e) | Energy Transfer LP, 7.125% (5 Year CMT Index + 531 bps) | 222,076 |
| 280,000 | EnLink Midstream Partners LP, 5.45%, 6/1/47 | 244,300 |
| 134,000 | EnLink Midstream Partners LP, 5.60%, 4/1/44 | 116,623 |
| 545,000 | Kinder Morgan, Inc., 5.45%, 8/1/52 | 521,252 |
| 230,000 | MPLX LP, 4.95%, 3/14/52 | 204,596 |
| 230,000 | NGPL PipeCo LLC, 3.25%, 7/15/31 (144A) | 199,705 |
| 20,000 | Venture Global LNG, Inc., 8.125%, 6/1/28 (144A) | 20,198 |
| 115,000 | Venture Global LNG, Inc., 8.375%, 6/1/31 (144A) | 114,940 |
| 45,000 | Venture Global LNG, Inc., 9.50%, 2/1/29 (144A) | 47,618 |
| 89,000 | Williams Cos., Inc., 7.75%, 6/15/31 | 99,644 |
| 250,000 | Williams Cos., Inc., 7.50%, 1/15/31 | 282,673 |
| | Total Pipelines | $ 3,305,399 |
| | REITs — 1.6% | |
| 255,000 | Healthcare Realty Holdings LP, 3.10%, 2/15/30 | $ 222,921 |
| 47,000 | Highwoods Realty LP, 2.60%, 2/1/31 | 36,532 |
| 15,000 | Highwoods Realty LP, 3.05%, 2/15/30 | 12,393 |
| 41,000 | Highwoods Realty LP, 4.125%, 3/15/28 | 37,757 |
| 285,000 | LXP Industrial Trust, 2.375%, 10/1/31 | 228,822 |
| 165,000 | LXP Industrial Trust, 2.70%, 9/15/30 | 136,661 |
| 498,000 | MPT Operating Partnership LP/MPT Finance Corp., 3.50%, 3/15/31 | 311,363 |
| 500,000 | Simon Property Group LP , 5.50%, 3/8/33 | 516,635 |
| 500,000 | Sun Communities Operating LP , 5.70%, 1/15/33 | 506,157 |
| 180,000 | UDR, Inc., 4.40%, 1/26/29 | 173,439 |
| | Total REITs | $ 2,182,680 |
| | Retail — 1.0% | |
| 55,000 | AutoNation, Inc., 1.95%, 8/1/28 | $ 47,292 |
| 55,000 | AutoNation, Inc., 2.40%, 8/1/31 | 44,086 |
| 245,000 | AutoNation, Inc., 3.85%, 3/1/32 | 217,696 |
| 125,000 | AutoNation, Inc., 4.75%, 6/1/30 | 120,730 |
| 325,000 | Darden Restaurants, Inc., 6.30%, 10/10/33 | 349,386 |
| 375,000 | Dollar Tree, Inc., 2.65%, 12/1/31 | 318,631 |
| 295,000 | Lowe's Cos., Inc., 3.75%, 4/1/32 | 276,081 |
| | Total Retail | $ 1,373,902 |
| | Semiconductors — 0.8% | |
| 35,000 | Broadcom, Inc., 3.137%, 11/15/35 (144A) | $ 28,735 |
| 475,000 | Broadcom, Inc., 3.187%, 11/15/36 (144A) | 384,918 |
| 130,000 | Broadcom, Inc., 4.15%, 4/15/32 (144A) | 122,548 |
| 100,000 | Broadcom, Inc., 4.30%, 11/15/32 | 95,936 |
| 200,000 | Foundry JV Holdco LLC, 5.875%, 1/25/34 (144A) | 205,427 |
| 313,000 | Skyworks Solutions, Inc., 3.00%, 6/1/31 | 267,805 |
| | Total Semiconductors | $ 1,105,369 |
| | Software — 0.3% | |
| 423,000 | Autodesk, Inc., 2.40%, 12/15/31 | $ 361,911 |
| | Total Software | $ 361,911 |
| | Telecommunications — 0.8% | |
| 315,000 | Motorola Solutions, Inc., 2.30%, 11/15/30 | $ 265,973 |
16
The accompanying notes are an integral part of these financial statements.
| Pioneer Bond VCT Portfolio | Pioneer Variable Contracts Trust |
Principal
Amount
USD ($) | | | | | | Value |
| | Telecommunications — (continued) | |
| 150,000 | Motorola Solutions, Inc., 5.60%, 6/1/32 | $ 154,741 |
| 175,000 | T-Mobile USA, Inc., 2.70%, 3/15/32 | 149,135 |
| 165,000 | T-Mobile USA, Inc., 5.05%, 7/15/33 | 166,283 |
| 145,000 | T-Mobile USA, Inc., 5.20%, 1/15/33 | 148,638 |
| 115,000 | T-Mobile USA, Inc., 5.75%, 1/15/34 | 121,974 |
| | Total Telecommunications | $ 1,006,744 |
| | Transportation — 0.1% | |
| 70,000 | Norfolk Southern Corp., 5.95%, 3/15/64 | $ 78,102 |
| | Total Transportation | $ 78,102 |
| | Trucking & Leasing — 0.3% | |
| 95,000 | Penske Truck Leasing Co. LP/PTL Finance Corp., 4.40%, 7/1/27 (144A) | $ 92,627 |
| 275,000 | Penske Truck Leasing Co. LP/PTL Finance Corp., 5.55%, 5/1/28 (144A) | 279,219 |
| 25,000 | Penske Truck Leasing Co. LP/PTL Finance Corp., 6.05%, 8/1/28 (144A) | 25,912 |
| | Total Trucking & Leasing | $ 397,758 |
| | Total Corporate Bonds
(Cost $48,270,737) | $ 45,020,165 |
|
| |
| | Municipal Bonds — 0.1% of Net Assets | |
| | Virginia — 0.1% | |
| 50,000(f) | Virginia Commonwealth Transportation Board, Transportation Capital Projects, 4.00%, 5/15/32 | $ 50,242 |
| | Total Virginia | $ 50,242 |
| | Total Municipal Bonds
(Cost $52,530) | $ 50,242 |
|
| |
Face
Amount
USD ($) | | | | | | |
| | Insurance-Linked Securities — 0.0%† of Net Assets | |
| | Reinsurance Sidecars — 0.0%† | |
| | Multiperil – Worldwide — 0.0%† | |
| 25,723(g)(h) +# | Lorenz Re 2019, 6/30/24 | $ 247 |
| | Total Reinsurance Sidecars | $ 247 |
| | Total Insurance-Linked Securities
(Cost $4,216) | $ 247 |
|
| |
Principal
Amount
USD ($) | | | | | | |
| | U.S. Government and Agency Obligations — 52.2% of Net Assets | |
| 1,585,000 | Federal Home Loan Mortgage Corp., 1.500%, 3/1/42 | $ 1,313,384 |
| 93,051 | Federal Home Loan Mortgage Corp., 2.000%, 3/1/52 | 76,122 |
| 51,188 | Federal Home Loan Mortgage Corp., 2.500%, 2/1/51 | 44,457 |
| 885,171 | Federal Home Loan Mortgage Corp., 2.500%, 5/1/51 | 758,969 |
| 276,912 | Federal Home Loan Mortgage Corp., 2.500%, 4/1/52 | 235,645 |
| 48,632 | Federal Home Loan Mortgage Corp., 2.500%, 5/1/52 | 41,870 |
| 12,722 | Federal Home Loan Mortgage Corp., 3.000%, 10/1/29 | 12,273 |
| 14,830 | Federal Home Loan Mortgage Corp., 3.000%, 9/1/42 | 13,717 |
| 74,012 | Federal Home Loan Mortgage Corp., 3.000%, 11/1/42 | 68,271 |
| 25,653 | Federal Home Loan Mortgage Corp., 3.000%, 4/1/43 | 23,610 |
The accompanying notes are an integral part of these financial statements.
17
| Pioneer Bond VCT Portfolio | Pioneer Variable Contracts Trust |
Schedule of Investments 12/31/23 (continued)
Principal
Amount
USD ($) | | | | | | Value |
| | U.S. Government and Agency Obligations — (continued) | |
| 84,000 | Federal Home Loan Mortgage Corp., 3.000%, 12/1/46 | $ 76,652 |
| 61,246 | Federal Home Loan Mortgage Corp., 3.000%, 8/1/50 | 55,207 |
| 89,265 | Federal Home Loan Mortgage Corp., 3.000%, 1/1/52 | 79,308 |
| 73,760 | Federal Home Loan Mortgage Corp., 3.000%, 8/1/52 | 66,171 |
| 151,306 | Federal Home Loan Mortgage Corp., 3.000%, 9/1/52 | 133,804 |
| 105,224 | Federal Home Loan Mortgage Corp., 3.000%, 4/1/53 | 93,073 |
| 14,563 | Federal Home Loan Mortgage Corp., 3.500%, 7/1/29 | 14,198 |
| 18,978 | Federal Home Loan Mortgage Corp., 3.500%, 10/1/42 | 17,976 |
| 80,248 | Federal Home Loan Mortgage Corp., 3.500%, 7/1/46 | 75,885 |
| 403,000 | Federal Home Loan Mortgage Corp., 3.500%, 12/1/46 | 378,117 |
| 9,000 | Federal Home Loan Mortgage Corp., 3.500%, 3/1/48 | 8,439 |
| 100,310 | Federal Home Loan Mortgage Corp., 3.500%, 4/1/52 | 92,857 |
| 53,000 | Federal Home Loan Mortgage Corp., 4.000%, 10/1/42 | 51,576 |
| 82,000 | Federal Home Loan Mortgage Corp., 4.000%, 5/1/44 | 79,763 |
| 16,603 | Federal Home Loan Mortgage Corp., 4.000%, 4/1/47 | 15,951 |
| 11,889 | Federal Home Loan Mortgage Corp., 4.000%, 6/1/50 | 11,383 |
| 89,811 | Federal Home Loan Mortgage Corp., 4.000%, 9/1/53 | 84,914 |
| 12,000 | Federal Home Loan Mortgage Corp., 5.000%, 5/1/40 | 12,195 |
| 3,000 | Federal Home Loan Mortgage Corp., 5.000%, 3/1/44 | 3,049 |
| 89,903 | Federal Home Loan Mortgage Corp., 5.000%, 9/1/52 | 91,015 |
| 89,566 | Federal Home Loan Mortgage Corp., 5.000%, 10/1/52 | 90,673 |
| 95,788 | Federal Home Loan Mortgage Corp., 5.000%, 4/1/53 | 94,788 |
| 9,000 | Federal Home Loan Mortgage Corp., 5.500%, 6/1/41 | 9,269 |
| 179,263 | Federal Home Loan Mortgage Corp., 5.500%, 7/1/49 | 182,635 |
| 99,617 | Federal Home Loan Mortgage Corp., 5.500%, 3/1/53 | 100,210 |
| 96,106 | Federal Home Loan Mortgage Corp., 5.500%, 7/1/53 | 97,598 |
| 4,523,717 | Federal Home Loan Mortgage Corp., 5.500%, 8/1/53 | 4,542,005 |
| 2,738,725 | Federal Home Loan Mortgage Corp., 5.500%, 11/1/53 | 2,749,797 |
| 2,738,588 | Federal Home Loan Mortgage Corp., 5.500%, 12/1/53 | 2,749,660 |
| 446 | Federal Home Loan Mortgage Corp., 6.000%, 11/1/32 | 462 |
| 1,706 | Federal Home Loan Mortgage Corp., 6.000%, 12/1/32 | 1,763 |
| 3,312 | Federal Home Loan Mortgage Corp., 6.000%, 2/1/33 | 3,443 |
| 2,360 | Federal Home Loan Mortgage Corp., 6.000%, 1/1/34 | 2,458 |
| 473 | Federal Home Loan Mortgage Corp., 6.000%, 12/1/36 | 492 |
| 198,569 | Federal Home Loan Mortgage Corp., 6.000%, 4/1/53 | 203,446 |
| 96,956 | Federal Home Loan Mortgage Corp., 6.000%, 7/1/53 | 98,870 |
| 975 | Federal Home Loan Mortgage Corp., 6.500%, 1/1/29 | 1,003 |
| 502 | Federal Home Loan Mortgage Corp., 6.500%, 4/1/31 | 521 |
| 2,270 | Federal Home Loan Mortgage Corp., 6.500%, 10/1/31 | 2,362 |
| 594 | Federal Home Loan Mortgage Corp., 6.500%, 2/1/32 | 615 |
| 3,762 | Federal Home Loan Mortgage Corp., 6.500%, 4/1/32 | 3,893 |
| 1,604 | Federal Home Loan Mortgage Corp., 6.500%, 7/1/32 | 1,663 |
| 54,966 | Federal Home Loan Mortgage Corp., 6.500%, 1/1/53 | 56,611 |
| 271,504 | Federal Home Loan Mortgage Corp., 6.500%, 2/1/53 | 286,723 |
| 96,640 | Federal Home Loan Mortgage Corp., 6.500%, 8/1/53 | 99,669 |
| 99,694 | Federal Home Loan Mortgage Corp., 6.500%, 8/1/53 | 102,353 |
| 99,625 | Federal Home Loan Mortgage Corp., 6.500%, 8/1/53 | 102,398 |
| 199,293 | Federal Home Loan Mortgage Corp., 6.500%, 8/1/53 | 205,612 |
| 464 | Federal Home Loan Mortgage Corp., 7.000%, 2/1/31 | 479 |
18
The accompanying notes are an integral part of these financial statements.
| Pioneer Bond VCT Portfolio | Pioneer Variable Contracts Trust |
Principal
Amount
USD ($) | | | | | | Value |
| | U.S. Government and Agency Obligations — (continued) | |
| 728 | Federal Home Loan Mortgage Corp., 7.000%, 4/1/32 | $ 756 |
| 550 | Federal Home Loan Mortgage Corp., 7.500%, 8/1/31 | 559 |
| 1,829,000 | Federal National Mortgage Association, 1.500%, 3/1/42 | 1,515,567 |
| 500,000 | Federal National Mortgage Association, 2.000%, 1/1/39 (TBA) | 448,203 |
| 575,257 | Federal National Mortgage Association, 2.000%, 12/1/41 | 491,633 |
| 435,870 | Federal National Mortgage Association, 2.000%, 4/1/42 | 371,742 |
| 300,657 | Federal National Mortgage Association, 2.000%, 11/1/51 | 249,842 |
| 268,799 | Federal National Mortgage Association, 2.000%, 3/1/52 | 219,896 |
| 3,900,000 | Federal National Mortgage Association, 2.000%, 1/1/54 (TBA) | 3,187,031 |
| 7,857 | Federal National Mortgage Association, 2.500%, 7/1/30 | 7,449 |
| 6,906 | Federal National Mortgage Association, 2.500%, 7/1/30 | 6,551 |
| 12,919 | Federal National Mortgage Association, 2.500%, 7/1/30 | 12,249 |
| 100,000 | Federal National Mortgage Association, 2.500%, 1/1/39 (TBA) | 92,117 |
| 30,707 | Federal National Mortgage Association, 2.500%, 2/1/43 | 27,033 |
| 6,705 | Federal National Mortgage Association, 2.500%, 2/1/43 | 5,853 |
| 5,467 | Federal National Mortgage Association, 2.500%, 3/1/43 | 4,814 |
| 5,508 | Federal National Mortgage Association, 2.500%, 8/1/43 | 4,849 |
| 16,408 | Federal National Mortgage Association, 2.500%, 4/1/45 | 14,284 |
| 18,879 | Federal National Mortgage Association, 2.500%, 4/1/45 | 16,434 |
| 8,306 | Federal National Mortgage Association, 2.500%, 4/1/45 | 7,231 |
| 13,302 | Federal National Mortgage Association, 2.500%, 4/1/45 | 11,580 |
| 6,497 | Federal National Mortgage Association, 2.500%, 4/1/45 | 5,656 |
| 8,564 | Federal National Mortgage Association, 2.500%, 4/1/45 | 7,470 |
| 19,962 | Federal National Mortgage Association, 2.500%, 4/1/45 | 17,378 |
| 18,002 | Federal National Mortgage Association, 2.500%, 8/1/45 | 15,671 |
| 309,000 | Federal National Mortgage Association, 2.500%, 8/1/50 | 269,378 |
| 794,975 | Federal National Mortgage Association, 2.500%, 5/1/51 | 686,345 |
| 422,000 | Federal National Mortgage Association, 2.500%, 5/1/51 | 364,800 |
| 845,000 | Federal National Mortgage Association, 2.500%, 11/1/51 | 732,155 |
| 1,739,000 | Federal National Mortgage Association, 2.500%, 1/1/52 | 1,493,950 |
| 85,000 | Federal National Mortgage Association, 2.500%, 2/1/52 | 73,497 |
| 1,202,769 | Federal National Mortgage Association, 2.500%, 4/1/52 | 1,023,654 |
| 1,759,476 | Federal National Mortgage Association, 2.500%, 4/1/52 | 1,495,932 |
| 2,700,000 | Federal National Mortgage Association, 2.500%, 1/1/54 (TBA) | 2,296,687 |
| 4,941 | Federal National Mortgage Association, 3.000%, 3/1/29 | 4,764 |
| 26,871 | Federal National Mortgage Association, 3.000%, 10/1/30 | 25,813 |
| 26,000 | Federal National Mortgage Association, 3.000%, 8/1/45 | 23,766 |
| 110,000 | Federal National Mortgage Association, 3.000%, 2/1/47 | 101,191 |
| 78,959 | Federal National Mortgage Association, 3.000%, 3/1/47 | 72,226 |
| 80,295 | Federal National Mortgage Association, 3.000%, 4/1/47 | 73,079 |
| 96,709 | Federal National Mortgage Association, 3.000%, 8/1/50 | 86,993 |
| 390,974 | Federal National Mortgage Association, 3.000%, 2/1/51 | 351,231 |
| 363,321 | Federal National Mortgage Association, 3.000%, 11/1/51 | 325,441 |
| 417,645 | Federal National Mortgage Association, 3.000%, 1/1/52 | 374,651 |
| 94,464 | Federal National Mortgage Association, 3.000%, 2/1/52 | 84,824 |
| 563,812 | Federal National Mortgage Association, 3.000%, 3/1/52 | 509,743 |
| 95,389 | Federal National Mortgage Association, 3.000%, 5/1/52 | 85,658 |
| 249,804 | Federal National Mortgage Association, 3.000%, 6/1/52 | 220,926 |
| 4,400,000 | Federal National Mortgage Association, 3.000%, 1/1/54 (TBA) | 3,891,766 |
The accompanying notes are an integral part of these financial statements.
19
| Pioneer Bond VCT Portfolio | Pioneer Variable Contracts Trust |
Schedule of Investments 12/31/23 (continued)
Principal
Amount
USD ($) | | | | | | Value |
| | U.S. Government and Agency Obligations — (continued) | |
| 217,409 | Federal National Mortgage Association, 3.000%, 2/1/57 | $ 191,360 |
| 5,008 | Federal National Mortgage Association, 3.500%, 10/1/41 | 4,744 |
| 25,343 | Federal National Mortgage Association, 3.500%, 9/1/45 | 23,652 |
| 72,000 | Federal National Mortgage Association, 3.500%, 10/1/45 | 67,848 |
| 114,000 | Federal National Mortgage Association, 3.500%, 1/1/48 | 106,983 |
| 121,000 | Federal National Mortgage Association, 3.500%, 5/1/49 | 114,167 |
| 168,596 | Federal National Mortgage Association, 3.500%, 3/1/52 | 156,787 |
| 420,294 | Federal National Mortgage Association, 3.500%, 3/1/52 | 387,546 |
| 23,365 | Federal National Mortgage Association, 3.500%, 4/1/52 | 21,438 |
| 90,532 | Federal National Mortgage Association, 3.500%, 4/1/52 | 83,423 |
| 258,705 | Federal National Mortgage Association, 3.500%, 5/1/52 | 239,484 |
| 1,400,000 | Federal National Mortgage Association, 3.500%, 1/1/54 (TBA) | 1,284,281 |
| 118,580 | Federal National Mortgage Association, 3.500%, 8/1/58 | 107,570 |
| 89,423 | Federal National Mortgage Association, 4.000%, 10/1/40 | 87,206 |
| 10,746 | Federal National Mortgage Association, 4.000%, 12/1/40 | 10,479 |
| 154,000 | Federal National Mortgage Association, 4.000%, 4/1/44 | 149,800 |
| 236,000 | Federal National Mortgage Association, 4.000%, 7/1/51 | 224,490 |
| 62,000 | Federal National Mortgage Association, 4.000%, 9/1/51 | 59,213 |
| 500,000 | Federal National Mortgage Association, 4.000%, 1/1/54 (TBA) | 472,871 |
| 35,625 | Federal National Mortgage Association, 4.500%, 5/1/41 | 35,579 |
| 162,931 | Federal National Mortgage Association, 4.500%, 9/1/43 | 162,670 |
| 93,000 | Federal National Mortgage Association, 4.500%, 1/1/44 | 92,880 |
| 76,741 | Federal National Mortgage Association, 4.500%, 3/1/44 | 76,703 |
| 391,000 | Federal National Mortgage Association, 4.500%, 6/1/44 | 390,497 |
| 799,673 | Federal National Mortgage Association, 4.500%, 7/1/44 | 794,362 |
| 55,738 | Federal National Mortgage Association, 4.500%, 8/1/47 | 55,207 |
| 21,869 | Federal National Mortgage Association, 5.000%, 5/1/31 | 22,028 |
| 100,000 | Federal National Mortgage Association, 5.000%, 1/1/39 (TBA) | 100,594 |
| 3,000 | Federal National Mortgage Association, 5.000%, 12/1/44 | 3,049 |
| 183,585 | Federal National Mortgage Association, 5.000%, 10/1/50 | 183,958 |
| 95,242 | Federal National Mortgage Association, 5.000%, 6/1/52 | 94,727 |
| 282,829 | Federal National Mortgage Association, 5.000%, 8/1/52 | 280,063 |
| 95,444 | Federal National Mortgage Association, 5.000%, 4/1/53 | 94,478 |
| 300,000 | Federal National Mortgage Association, 5.000%, 1/1/54 (TBA) | 296,789 |
| 2,363 | Federal National Mortgage Association, 5.500%, 9/1/33 | 2,434 |
| 2,832 | Federal National Mortgage Association, 5.500%, 12/1/34 | 2,909 |
| 8,737 | Federal National Mortgage Association, 5.500%, 10/1/35 | 8,955 |
| 700,000 | Federal National Mortgage Association, 5.500%, 1/1/39 (TBA) | 709,926 |
| 188,512 | Federal National Mortgage Association, 5.500%, 4/1/50 | 192,058 |
| 271,780 | Federal National Mortgage Association, 5.500%, 4/1/50 | 276,893 |
| 96,750 | Federal National Mortgage Association, 5.500%, 1/1/53 | 97,920 |
| 91,255 | Federal National Mortgage Association, 5.500%, 2/1/53 | 92,331 |
| 90,471 | Federal National Mortgage Association, 5.500%, 4/1/53 | 91,076 |
| 92,536 | Federal National Mortgage Association, 5.500%, 4/1/53 | 93,038 |
| 98,862 | Federal National Mortgage Association, 5.500%, 4/1/53 | 99,406 |
| 94,617 | Federal National Mortgage Association, 5.500%, 4/1/53 | 95,513 |
| 98,608 | Federal National Mortgage Association, 5.500%, 7/1/53 | 99,938 |
| 99,000 | Federal National Mortgage Association, 5.500%, 7/1/53 | 100,531 |
| 761,869 | Federal National Mortgage Association, 5.500%, 9/1/53 | 764,949 |
20
The accompanying notes are an integral part of these financial statements.
| Pioneer Bond VCT Portfolio | Pioneer Variable Contracts Trust |
Principal
Amount
USD ($) | | | | | | Value |
| | U.S. Government and Agency Obligations — (continued) | |
| 150,970 | Federal National Mortgage Association, 5.500%, 9/1/53 | $ 151,685 |
| 1,372 | Federal National Mortgage Association, 6.000%, 9/1/29 | 1,419 |
| 453 | Federal National Mortgage Association, 6.000%, 10/1/32 | 467 |
| 1,831 | Federal National Mortgage Association, 6.000%, 11/1/32 | 1,887 |
| 5,092 | Federal National Mortgage Association, 6.000%, 11/1/32 | 5,267 |
| 6,184 | Federal National Mortgage Association, 6.000%, 4/1/33 | 6,371 |
| 2,224 | Federal National Mortgage Association, 6.000%, 5/1/33 | 2,305 |
| 3,274 | Federal National Mortgage Association, 6.000%, 6/1/33 | 3,380 |
| 6,960 | Federal National Mortgage Association, 6.000%, 7/1/34 | 7,181 |
| 884 | Federal National Mortgage Association, 6.000%, 9/1/34 | 913 |
| 400 | Federal National Mortgage Association, 6.000%, 7/1/38 | 411 |
| 105,745 | Federal National Mortgage Association, 6.000%, 1/1/53 | 109,600 |
| 28,568 | Federal National Mortgage Association, 6.000%, 1/1/53 | 29,386 |
| 99,000 | Federal National Mortgage Association, 6.000%, 4/1/53 | 100,731 |
| 193,409 | Federal National Mortgage Association, 6.000%, 5/1/53 | 200,109 |
| 95,747 | Federal National Mortgage Association, 6.000%, 5/1/53 | 98,722 |
| 168,660 | Federal National Mortgage Association, 6.000%, 6/1/53 | 173,967 |
| 96,672 | Federal National Mortgage Association, 6.000%, 7/1/53 | 98,877 |
| 98,289 | Federal National Mortgage Association, 6.000%, 7/1/53 | 101,962 |
| 95,634 | Federal National Mortgage Association, 6.000%, 7/1/53 | 99,815 |
| 99,057 | Federal National Mortgage Association, 6.000%, 7/1/53 | 101,417 |
| 194,000 | Federal National Mortgage Association, 6.000%, 8/1/53 | 199,153 |
| 776,126 | Federal National Mortgage Association, 6.000%, 9/1/53 | 788,050 |
| 380 | Federal National Mortgage Association, 6.500%, 4/1/29 | 393 |
| 513 | Federal National Mortgage Association, 6.500%, 2/1/32 | 539 |
| 1,247 | Federal National Mortgage Association, 6.500%, 3/1/32 | 1,294 |
| 2,121 | Federal National Mortgage Association, 6.500%, 4/1/32 | 2,209 |
| 1,112 | Federal National Mortgage Association, 6.500%, 8/1/32 | 1,148 |
| 742 | Federal National Mortgage Association, 6.500%, 8/1/32 | 768 |
| 11,313 | Federal National Mortgage Association, 6.500%, 7/1/34 | 11,800 |
| 188,774 | Federal National Mortgage Association, 6.500%, 3/1/53 | 196,118 |
| 93,385 | Federal National Mortgage Association, 6.500%, 8/1/53 | 96,155 |
| 99,564 | Federal National Mortgage Association, 6.500%, 8/1/53 | 102,411 |
| 99,703 | Federal National Mortgage Association, 6.500%, 8/1/53 | 102,489 |
| 68,224 | Federal National Mortgage Association, 6.500%, 8/1/53 | 70,043 |
| 297,318 | Federal National Mortgage Association, 6.500%, 9/1/53 | 305,365 |
| 94,899 | Federal National Mortgage Association, 6.500%, 9/1/53 | 97,714 |
| 378 | Federal National Mortgage Association, 7.000%, 11/1/29 | 390 |
| 280 | Federal National Mortgage Association, 7.000%, 7/1/31 | 289 |
| 880 | Federal National Mortgage Association, 7.000%, 1/1/32 | 913 |
| 215 | Federal National Mortgage Association, 7.500%, 2/1/31 | 223 |
| 1,526 | Federal National Mortgage Association, 8.000%, 10/1/30 | 1,593 |
| 500,000 | Government National Mortgage Association, 3.000%, 1/20/54 (TBA) | 452,655 |
| 300,000 | Government National Mortgage Association, 3.500%, 1/20/54 (TBA) | 279,375 |
| 400,000 | Government National Mortgage Association, 5.000%, 1/20/54 (TBA) | 397,188 |
| 300,000 | Government National Mortgage Association, 5.500%, 1/20/54 (TBA) | 302,157 |
| 400,000 | Government National Mortgage Association, 6.000%, 1/20/54 (TBA) | 406,703 |
| 200,000 | Government National Mortgage Association, 6.500%, 1/20/54 (TBA) | 204,727 |
| 82,690 | Government National Mortgage Association I, 3.500%, 11/15/41 | 78,103 |
The accompanying notes are an integral part of these financial statements.
21
| Pioneer Bond VCT Portfolio | Pioneer Variable Contracts Trust |
Schedule of Investments 12/31/23 (continued)
Principal
Amount
USD ($) | | | | | | Value |
| | U.S. Government and Agency Obligations — (continued) | |
| 28,935 | Government National Mortgage Association I, 3.500%, 8/15/42 | $ 27,331 |
| 10,251 | Government National Mortgage Association I, 3.500%, 10/15/42 | 9,685 |
| 31,740 | Government National Mortgage Association I, 3.500%, 1/15/45 | 29,980 |
| 20,605 | Government National Mortgage Association I, 3.500%, 8/15/46 | 19,318 |
| 13,286 | Government National Mortgage Association I, 4.000%, 1/15/25 | 13,105 |
| 48,540 | Government National Mortgage Association I, 4.000%, 8/15/43 | 47,951 |
| 59,684 | Government National Mortgage Association I, 4.000%, 3/15/44 | 57,878 |
| 11,325 | Government National Mortgage Association I, 4.000%, 9/15/44 | 10,982 |
| 24,847 | Government National Mortgage Association I, 4.000%, 4/15/45 | 24,101 |
| 35,347 | Government National Mortgage Association I, 4.000%, 6/15/45 | 34,425 |
| 3,920 | Government National Mortgage Association I, 4.000%, 7/15/45 | 3,792 |
| 6,445 | Government National Mortgage Association I, 4.000%, 8/15/45 | 6,222 |
| 22,622 | Government National Mortgage Association I, 4.500%, 5/15/39 | 22,546 |
| 794 | Government National Mortgage Association I, 4.500%, 8/15/41 | 783 |
| 3,547 | Government National Mortgage Association I, 5.500%, 3/15/33 | 3,585 |
| 4,391 | Government National Mortgage Association I, 5.500%, 7/15/33 | 4,438 |
| 11,012 | Government National Mortgage Association I, 5.500%, 8/15/33 | 11,131 |
| 6,496 | Government National Mortgage Association I, 5.500%, 10/15/34 | 6,547 |
| 2,397 | Government National Mortgage Association I, 6.000%, 4/15/28 | 2,458 |
| 1,861 | Government National Mortgage Association I, 6.000%, 2/15/29 | 1,901 |
| 4,126 | Government National Mortgage Association I, 6.000%, 9/15/32 | 4,250 |
| 1,052 | Government National Mortgage Association I, 6.000%, 10/15/32 | 1,079 |
| 8,723 | Government National Mortgage Association I, 6.000%, 11/15/32 | 8,985 |
| 4,078 | Government National Mortgage Association I, 6.000%, 11/15/32 | 4,154 |
| 2,618 | Government National Mortgage Association I, 6.000%, 1/15/33 | 2,714 |
| 7,404 | Government National Mortgage Association I, 6.000%, 12/15/33 | 7,620 |
| 3,337 | Government National Mortgage Association I, 6.000%, 8/15/34 | 3,439 |
| 6,762 | Government National Mortgage Association I, 6.000%, 8/15/34 | 6,951 |
| 255 | Government National Mortgage Association I, 6.500%, 3/15/26 | 260 |
| 1,131 | Government National Mortgage Association I, 6.500%, 6/15/28 | 1,146 |
| 3,492 | Government National Mortgage Association I, 6.500%, 5/15/29 | 3,588 |
| 1,247 | Government National Mortgage Association I, 6.500%, 5/15/29 | 1,264 |
| 6,790 | Government National Mortgage Association I, 6.500%, 7/15/31 | 7,018 |
| 2,220 | Government National Mortgage Association I, 6.500%, 9/15/31 | 2,302 |
| 4,253 | Government National Mortgage Association I, 6.500%, 10/15/31 | 4,396 |
| 1,765 | Government National Mortgage Association I, 6.500%, 12/15/31 | 1,816 |
| 788 | Government National Mortgage Association I, 6.500%, 12/15/31 | 811 |
| 478 | Government National Mortgage Association I, 6.500%, 4/15/32 | 495 |
| 259 | Government National Mortgage Association I, 6.500%, 4/15/32 | 266 |
| 406 | Government National Mortgage Association I, 6.500%, 6/15/32 | 415 |
| 989 | Government National Mortgage Association I, 6.500%, 6/15/32 | 1,015 |
| 2,519 | Government National Mortgage Association I, 6.500%, 7/15/32 | 2,606 |
| 6,938 | Government National Mortgage Association I, 6.500%, 12/15/32 | 7,156 |
| 5,689 | Government National Mortgage Association I, 7.000%, 7/15/26 | 5,683 |
| 341 | Government National Mortgage Association I, 7.000%, 9/15/27 | 341 |
| 6,495 | Government National Mortgage Association I, 7.000%, 2/15/28 | 6,494 |
| 513 | Government National Mortgage Association I, 7.000%, 11/15/28 | 513 |
| 1,318 | Government National Mortgage Association I, 7.000%, 1/15/29 | 1,338 |
| 910 | Government National Mortgage Association I, 7.000%, 6/15/29 | 909 |
22
The accompanying notes are an integral part of these financial statements.
| Pioneer Bond VCT Portfolio | Pioneer Variable Contracts Trust |
Principal
Amount
USD ($) | | | | | | Value |
| | U.S. Government and Agency Obligations — (continued) | |
| 247 | Government National Mortgage Association I, 7.000%, 7/15/29 | $ 248 |
| 673 | Government National Mortgage Association I, 7.000%, 7/15/29 | 679 |
| 446 | Government National Mortgage Association I, 7.000%, 12/15/30 | 450 |
| 1,102 | Government National Mortgage Association I, 7.000%, 2/15/31 | 1,111 |
| 1,097 | Government National Mortgage Association I, 7.000%, 8/15/31 | 1,145 |
| 1,094 | Government National Mortgage Association I, 7.500%, 10/15/29 | 1,100 |
| 2,157 | Government National Mortgage Association II, 3.500%, 3/20/45 | 1,981 |
| 3,965 | Government National Mortgage Association II, 3.500%, 4/20/45 | 3,729 |
| 12,986 | Government National Mortgage Association II, 3.500%, 4/20/45 | 12,231 |
| 7,352 | Government National Mortgage Association II, 3.500%, 4/20/45 | 6,909 |
| 31,387 | Government National Mortgage Association II, 3.500%, 1/20/46 | 29,645 |
| 14,681 | Government National Mortgage Association II, 3.500%, 3/20/46 | 13,868 |
| 58,541 | Government National Mortgage Association II, 3.500%, 11/20/46 | 55,174 |
| 7,649 | Government National Mortgage Association II, 4.000%, 8/20/39 | 7,497 |
| 9,475 | Government National Mortgage Association II, 4.000%, 7/20/42 | 9,287 |
| 118,126 | Government National Mortgage Association II, 4.000%, 7/20/44 | 115,659 |
| 11,727 | Government National Mortgage Association II, 4.000%, 9/20/44 | 11,480 |
| 12,433 | Government National Mortgage Association II, 4.000%, 3/20/46 | 12,086 |
| 37,430 | Government National Mortgage Association II, 4.000%, 10/20/46 | 36,224 |
| 27,838 | Government National Mortgage Association II, 4.000%, 2/20/48 | 26,707 |
| 35,483 | Government National Mortgage Association II, 4.000%, 4/20/48 | 34,033 |
| 59,858 | Government National Mortgage Association II, 4.000%, 9/20/52 | 57,114 |
| 3,538 | Government National Mortgage Association II, 4.500%, 9/20/41 | 3,539 |
| 19,860 | Government National Mortgage Association II, 4.500%, 5/20/43 | 19,864 |
| 62,739 | Government National Mortgage Association II, 4.500%, 1/20/44 | 62,830 |
| 42,296 | Government National Mortgage Association II, 4.500%, 9/20/44 | 42,345 |
| 16,242 | Government National Mortgage Association II, 4.500%, 10/20/44 | 16,265 |
| 31,339 | Government National Mortgage Association II, 4.500%, 11/20/44 | 31,383 |
| 80,933 | Government National Mortgage Association II, 4.500%, 2/20/48 | 80,101 |
| 163,923 | Government National Mortgage Association II, 4.500%, 9/20/52 | 160,009 |
| 96,520 | Government National Mortgage Association II, 5.500%, 9/20/52 | 97,313 |
| 4,228 | Government National Mortgage Association II, 6.000%, 11/20/33 | 4,427 |
| 636 | Government National Mortgage Association II, 6.500%, 8/20/28 | 652 |
| 1,117 | Government National Mortgage Association II, 6.500%, 12/20/28 | 1,145 |
| 748 | Government National Mortgage Association II, 6.500%, 9/20/31 | 785 |
| 479 | Government National Mortgage Association II, 7.000%, 5/20/26 | 493 |
| 1,975 | Government National Mortgage Association II, 7.000%, 2/20/29 | 2,030 |
| 391 | Government National Mortgage Association II, 7.000%, 1/20/31 | 411 |
| 139 | Government National Mortgage Association II, 7.500%, 8/20/27 | 141 |
| 26 | Government National Mortgage Association II, 8.000%, 8/20/25 | 27 |
| 3,000,000(i) | U.S. Treasury Bills, 1/2/24 | 3,000,000 |
| 600,000(i) | U.S. Treasury Bills, 1/9/24 | 599,388 |
| 8,275,600 | U.S. Treasury Bonds, 2.250%, 2/15/52 | 5,736,672 |
| 1,683,800 | U.S. Treasury Bonds, 3.000%, 2/15/48 | 1,372,100 |
| 1,614,200 | U.S. Treasury Bonds, 4.375%, 8/15/43 | 1,647,745 |
| 1,125,088 | U.S. Treasury Inflation Indexed Bonds, 1.500%, 2/15/53 | 1,018,775 |
| 2,999,300 | U.S. Treasury Notes, 4.625%, 9/30/30 | 3,126,536 |
| | Total U.S. Government and Agency Obligations
(Cost $69,748,007) | $ 69,722,796 |
|
| |
The accompanying notes are an integral part of these financial statements.
23
| Pioneer Bond VCT Portfolio | Pioneer Variable Contracts Trust |
Schedule of Investments 12/31/23 (continued)
| Shares | | | | | | Value |
| | SHORT TERM INVESTMENTS — 0.6% of Net Assets | |
| | Open-End Fund — 0.6% | |
| 769,549(j) | Dreyfus Government Cash Management,
Institutional Shares, 5.25% | $ 769,549 |
| | | | | | | $ 769,549 |
| | TOTAL SHORT TERM INVESTMENTS
(Cost $769,549) | $ 769,549 |
| | TOTAL INVESTMENTS IN UNAFFILIATED ISSUERS — 106.5%
(Cost $148,949,524) | $142,125,862 |
| | | Net
Realized
Gain (Loss)
for the year
ended
12/31/23 | Change in
Unrealized
Appreciation
(Depreciation)
for the year
ended
12/31/23 | Capital
Gain
Distributions
for the year
ended
12/31/23 | Dividend
Income
for the year
ended
12/31/23 | Value |
| | Affiliated Issuer — 2.4% | |
| | Closed-End Fund — 2.4% of Net Assets | |
| 380,919(k) | Pioneer ILS Interval Fund | $— | $142,232 | $— | $367,537 | $ 3,241,623 |
| | Total Investments in Affiliated Issuer — 2.4%
(Cost $3,756,107) | $ 3,241,623 |
Principal
Amount
USD ($) | | | | | | |
| | TBA SALES COMMITMENTS — (7.5)% of Net Assets | |
| | U.S. Government and Agency Obligations — (7.5)% | |
| (10,000,000) | Federal National Mortgage Association, 5.500%, 1/1/54 (TBA) | $ (10,042,188) |
| | TOTAL TBA SALES COMMITMENTS
(Proceeds $10,012,500) | $ (10,042,188) |
|
| |
| | OTHER ASSETS AND LIABILITIES — (1.4)% | $ (1,808,761) |
| | net assets — 100.0% | $133,516,536 |
| | | | | | | |
| (TBA) | “To Be Announced” Securities. |
| bps | Basis Points. |
| CMT | Constant Maturity Treasury Index. |
| FREMF | Freddie Mac Multifamily Fixed-Rate Mortgage Loans. |
| FRESB | Freddie Mac Multifamily Small Balance Certificates. |
| LIBOR | London Interbank Offered Rate. |
| PRIME | U.S. Federal Funds Rate. |
| REIT | Real Estate Investment Trust. |
| REMICs | Real Estate Mortgage Investment Conduits. |
| SOFR | Secured Overnight Financing Rate. |
| SOFR30A | Secured Overnight Financing Rate 30 Day Average. |
| (144A) | The resale of such security is exempt from registration under Rule 144A of the Securities Act of 1933. Such securities may be resold normally to qualified institutional buyers. At December 31, 2023, the value of these securities amounted to $39,949,876, or 29.9% of net assets. |
| (a) | Floating rate note. Coupon rate, reference index and spread shown at December 31, 2023. |
| (b) | The interest rate is subject to change periodically. The interest rate and/or reference index and spread shown at December 31, 2023. |
| (c) | Debt obligation initially issued at one coupon which converts to a higher coupon at a specific date. The rate shown is the rate at December 31, 2023. |
| (d) | Security represents the interest-only portion payments on a pool of underlying mortgages or mortgage-backed securities. |
| (e) | Security is perpetual in nature and has no stated maturity date. |
| (f) | Consists of Revenue Bonds unless otherwise indicated. |
24
The accompanying notes are an integral part of these financial statements.
| Pioneer Bond VCT Portfolio | Pioneer Variable Contracts Trust |
| (g) | Non-income producing security. |
| (h) | Issued as preference shares. |
| (i) | Security issued with a zero coupon. Income is recognized through accretion of discount. |
| (j) | Rate periodically changes. Rate disclosed is the 7-day yield at December 31, 2023. |
| (k) | Pioneer ILS Interval Fund is an affiliated closed-end fund managed by Amundi Asset Management US, Inc., (the “Adviser”). |
| * | Senior secured floating rate loan interests in which the Portfolio invests generally pay interest at rates that are periodically re-determined by reference to a base lending rate plus a premium. These base lending rates are generally (i) the lending rate offered by one or more major European banks, such as LIBOR or SOFR, (ii) the prime rate offered by one or more major United States banks, (iii) the rate of a certificate of deposit or (iv) other base lending rates used by commercial lenders. The interest rate shown is the rate accruing at December 31, 2023. |
| + | Security is valued using significant unobservable inputs (Level 3). |
| † | Amount rounds to less than 0.1%. |
| # | Securities are restricted as to resale. |
| Restricted Securities | Acquisition date | Cost | Value |
| Lorenz Re 2019 | 7/10/2019 | $ 4,216 | $ 247 |
| % of Net assets | | | 0.0% † |
| † | Amount rounds to less than 0.1%. |
FUTURES CONTRACTS
FIXED INCOME INDEX FUTURES CONTRACTS
Number of
Contracts
Long | Description | Expiration
Date | Notional
Amount | Market
Value | Unrealized
Appreciation |
| 29 | U.S. 2 Year Note (CBT) | 3/28/24 | $ 5,908,367 | $ 5,971,508 | $ 63,141 |
| 307 | U.S. 5 Year Note (CBT) | 3/28/24 | 32,624,432 | 33,393,446 | 769,014 |
| | | | $38,532,799 | $39,364,954 | $832,155 |
Number of
Contracts
Short | Description | Expiration
Date | Notional
Amount | Market
Value | Unrealized
(Depreciation) |
| 13 | U.S. 10 Year Note (CBT) | 3/19/24 | $ (1,417,576) | $ (1,467,578) | $ (50,002) |
| 3 | U.S. Long Bond (CBT) | 3/19/24 | (346,961) | (374,813) | (27,852) |
| 30 | U.S. Ultra Bond (CBT) | 3/19/24 | (3,664,737) | (4,007,812) | (343,075) |
| | | | $ (5,429,274) | $ (5,850,203) | $(420,929) |
| TOTAL FUTURES CONTRACTS | $33,103,525 | $33,514,751 | $ 411,226 |
SWAP CONTRACTS
| CENTRALLY CLEARED CREDIT DEFAULT SWAP CONTRACTS – BUY PROTECTION |
Notional
Amount ($)(1) | Reference Obligation/Index | Pay/
Receive(2) | Annual
Fixed Rate | Expiration
Date | Premiums
(Received) | Unrealized
(Depreciation) | Market
Value |
| 8,929,800 | Markit CDX North America High Yield Index Series 41 | Pay | 5.00% | 12/20/28 | $ (81,717) | $ (455,574) | $ (537,291) |
TOTAL CENTRALLY CLEARED CREDIT DEFAULT
SWAP CONTRACTS – BUY PROTECTION | $(81,717) | $(455,574) | $(537,291) |
| | |
| (1) | The notional amount is the maximum amount that a seller of credit protection would be obligated to pay upon occurrence of a credit event. |
| (2) | Pays quarterly. |
Purchases and sales of securities (excluding short-term investments) for the year ended December 31, 2023 were as follows:
| | Purchases | Sales |
| Long-Term U.S. Government Securities | $12,377,973 | $ 8,834,718 |
| Other Long-Term Securities | $54,642,139 | $60,279,791 |
The accompanying notes are an integral part of these financial statements.
25
| Pioneer Bond VCT Portfolio | Pioneer Variable Contracts Trust |
Schedule of Investments 12/31/23 (continued)
At December 31, 2023, the net unrealized depreciation on investments based on cost for federal tax purposes of $142,993,908 was as follows:
| Aggregate gross unrealized appreciation for all investments in which there is an excess of value over tax cost | $2,262,665 |
| Aggregate gross unrealized depreciation for all investments in which there is an excess of tax cost over value | (10,057,341) |
| Net unrealized depreciation | $ (7,794,676) |
Various inputs are used in determining the value of the Portfolio's investments. These inputs are summarized in the three broad levels below.
| Level 1 | – | unadjusted quoted prices in active markets for identical securities. |
| Level 2 | – | other significant observable inputs (including quoted prices for similar securities, interest rates, prepayment speeds, credit risks, etc.). See Notes to Financial Statements — Note 1A. |
| Level 3 | – | significant unobservable inputs (including the Adviser's own assumptions in determining fair value of investments). See Notes to Financial Statements — Note 1A. |
The following is a summary of the inputs used as of December 31, 2023 in valuing the Portfolio's investments:
| | Level 1 | Level 2 | Level 3 | Total |
| Senior Secured Floating Rate Loan Interests | $ — | $ 447,498 | $ — | $ 447,498 |
| Asset Backed Securities | — | 9,591,229 | — | 9,591,229 |
| Collateralized Mortgage Obligations | — | 10,858,785 | — | 10,858,785 |
| Commercial Mortgage-Backed Securities | — | 5,665,351 | —* | 5,665,351 |
| Corporate Bonds | — | 45,020,165 | — | 45,020,165 |
| Municipal Bonds | — | 50,242 | — | 50,242 |
| Insurance-Linked Securities | | | | |
| Reinsurance Sidecars | — | — | 247 | 247 |
| U.S. Government and Agency Obligations | — | 69,722,796 | — | 69,722,796 |
| Open-End Fund | 769,549 | — | — | 769,549 |
| Affiliated Closed-End Fund | 3,241,623 | — | — | 3,241,623 |
| Total Investments in Securities | $ 4,011,172 | $141,356,066 | $247 | $145,367,485 |
| Liabilities | | | | |
| TBA Sales Commitments | $ — | $ (10,042,188) | $ — | $ (10,042,188) |
| Total Liabilities | $ — | $ (10,042,188) | $ — | $ (10,042,188) |
| Other Financial Instruments | | | | |
| Net unrealized appreciation on futures contracts | $ 411,226 | $ — | $ — | $ 411,226 |
| Centrally cleared swap contracts^ | — | (455,574) | — | (455,574) |
| Total Other Financial Instruments | $ 411,226 | $ (455,574) | $ — | $ (44,348) |
| * | Securities valued at $0. |
| ^ | Reflects the unrealized appreciation (depreciation) of the instruments. |
Transfers are calculated on the beginning of period values. During the year ended December 31, 2023, a security valued at $0 was transferred from Level 2 to Level 3, due to valuing the security using unobservable inputs. There were no other transfers in or out of Level 3 during the period.
26
The accompanying notes are an integral part of these financial statements.
| Pioneer Bond VCT Portfolio | Pioneer Variable Contracts Trust |
Statement of Assets and Liabilities 12/31/23
| ASSETS: | |
| Investments in unaffiliated issuers, at value (cost $148,949,524) | $142,125,862 |
| Investments in affiliated issuers, at value (cost $3,756,107) | 3,241,623 |
| Cash | 476,696 |
| Futures collateral | 1,283,678 |
| Swaps collateral | 1,172,599 |
| Variation margin for futures contracts | 46,509 |
| Receivables — | |
| Investment securities sold | 11,098,791 |
| Portfolio shares sold | 1,420 |
| Interest | 978,183 |
| Due from the Adviser | 125 |
| Total assets | $ 160,425,486 |
| LIABILITIES: | |
| Payables — | |
| Investment securities purchased | $15,689,889 |
| Portfolio shares repurchased | 494,185 |
| Trustees' fees | 199 |
| Interest expense | 22,917 |
| Variation margin for centrally cleared swap contracts | 537,291 |
| TBA sale commitments at value | 10,042,188 |
| Management fees | 6,562 |
| Administrative expenses | 5,426 |
| Distribution fees | 3,814 |
| Accrued expenses | 106,479 |
| Total liabilities | $ 26,908,950 |
| NET ASSETS: | |
| Paid-in capital | $156,630,045 |
| Distributable earnings (loss) | (23,113,509) |
| Net assets | $133,516,536 |
| NET ASSET VALUE PER SHARE: | |
| No par value (unlimited number of shares authorized) | |
| Class l (based on $22,518,831/2,372,026 shares) | $ 9.49 |
| Class ll (based on $110,997,705/11,665,768 shares) | $ 9.51 |
The accompanying notes are an integral part of these financial statements.
27
| Pioneer Bond VCT Portfolio | Pioneer Variable Contracts Trust |
FOR THE YEAR ENDED 12/31/23
| INVESTMENT INCOME: | | | |
| Interest from unaffiliated issuers (net of foreign taxes withheld $154) | $ 6,108,084 | | |
| Dividends from affiliated issuers | 367,537 | | |
| Dividends from unaffiliated issuers | 339,321 | | |
| Total Investment Income | | | $ 6,814,942 |
| EXPENSES: | | | |
| Management fees | $ 551,972 | | |
| Administrative expenses | 43,500 | | |
| Distribution fees | | | |
| Class ll | 285,271 | | |
| Custodian fees | 1,495 | | |
| Professional fees | 187,872 | | |
| Printing expense | 11,508 | | |
| Officers' and Trustees' fees | 8,966 | | |
| Insurance expense | 2,885 | | |
| Miscellaneous | 3,293 | | |
| Total expenses | | | $ 1,096,762 |
| Less fees waived and expenses reimbursed by the Adviser | | | (55,468) |
| Net expenses | | | $ 1,041,294 |
| Net investment income | | | $ 5,773,648 |
| REALIZED AND UNREALIZED GAIN (LOSS) ON INVESTMENTS: | | | |
| Net realized gain (loss) on: | | | |
| Reimbursement by the Adviser | $ 5,986 | | |
| Investments in unaffiliated issuers | (5,211,556) | | |
| Futures contracts | (474,062) | | |
| Swap contracts | (1,318,678) | | $ (6,998,310) |
| Change in net unrealized appreciation (depreciation) on: | | | |
| Investments in unaffiliated issuers | $ 9,297,584 | | |
| Investments in affiliated issuers | 142,232 | | |
| TBA sale commitments | (29,688) | | |
| Futures contracts | 439,522 | | |
| Swap contracts | 192,136 | | $10,041,786 |
| Net realized and unrealized gain (loss) on investments | | | $ 3,043,476 |
| Net increase in net assets resulting from operations | | | $ 8,817,124 |
28
The accompanying notes are an integral part of these financial statements.
| Pioneer Bond VCT Portfolio | Pioneer Variable Contracts Trust |
Statements of Changes in Net Assets
| | Year
Ended
12/31/23 | | Year
Ended
12/31/22 |
| FROM OPERATIONS: | | | |
| Net investment income (loss) | $ 5,773,648 | | $ 4,182,721 |
| Net realized gain (loss) on investments | (6,998,310) | | (10,271,507) |
| Change in net unrealized appreciation (depreciation) on investments | 10,041,786 | | (19,453,863) |
| Net increase (decrease) in net assets resulting from operations | $ 8,817,124 | | $ (25,542,649) |
| DISTRIBUTIONS TO SHAREHOLDERS: | | | |
| Class l ($0.37 and $0.43 per share, respectively) | $ (935,943) | | $ (1,188,248) |
| Class ll ($0.34 and $0.41 per share, respectively) | (4,205,994) | | (5,341,714) |
| Tax return of capital | | | |
| Class l ($— and $0.02 per share, respectively) | $ — | | $ (48,119) |
| Class ll ($— and $0.02 per share, respectively) | — | | (206,102) |
| Total distributions to shareholders | $ (5,141,937) | | $ (6,784,183) |
| FROM PORTFOLIO SHARE TRANSACTIONS: | | | |
| Net proceeds from sales of shares | $ 22,010,743 | | $ 13,314,386 |
| Reinvestment of distributions | 5,141,937 | | 6,784,183 |
| Cost of shares repurchased | (39,512,283) | | (29,022,200) |
| Net decrease in net assets resulting from Portfolio share transactions | $ (12,359,603) | | $ (8,923,631) |
| Net decrease in net assets | $ (8,684,416) | | $ (41,250,463) |
| NET ASSETS: | | | |
| Beginning of year | $142,200,952 | | $183,451,415 |
| End of year | $133,516,536 | | $ 142,200,952 |
| | Year
Ended
12/31/23
Shares | | Year
Ended
12/31/23
Amount | | Year
Ended
12/31/22
Shares | | Year
Ended
12/31/22
Amount |
| Class l | | | | | | | |
| Shares sold | 713,790 | | $ 6,663,825 | | 267,792 | | $ 2,712,342 |
| Reinvestment of distributions | 100,986 | | 935,943 | | 127,421 | | 1,236,367 |
| Less shares repurchased | (1,049,678) | | (9,747,861) | | (723,738) | | (7,343,052) |
| Net decrease | (234,902) | | $ (2,148,093) | | (328,525) | | $ (3,394,343) |
| Class ll | | | | | | | |
| Shares sold | 1,650,706 | | $ 15,346,918 | | 1,058,607 | | $ 10,602,044 |
| Reinvestment of distributions | 453,173 | | 4,205,994 | | 571,430 | | 5,547,816 |
| Less shares repurchased | (3,208,823) | | (29,764,422) | | (2,169,084) | | (21,679,148) |
| Net decrease | (1,104,944) | | $(10,211,510) | | (539,047) | | $ (5,529,288) |
The accompanying notes are an integral part of these financial statements.
29
| Pioneer Bond VCT Portfolio | Pioneer Variable Contracts Trust |
| | Year Ended
12/31/23 | | Year Ended
12/31/22 | | Year Ended
12/31/21 | | Year Ended
12/31/20 | | Year Ended
12/31/19 |
| Class l | | | | | | | | | |
| Net asset value, beginning of period | $ 9.23 | | $ 11.27 | | $ 11.78 | | $ 11.17 | | $ 10.56 |
| Increase (decrease) from investment operations: | | | | | | | | | |
| Net investment income (loss)(a) | 0.41 | | 0.28 | | 0.24 | | 0.30 | | 0.33 |
| Net realized and unrealized gain (loss) on investments | 0.22 | | (1.87) | | (0.20) | | 0.65 | | 0.64 |
| Net increase (decrease) from investment operations | $ 0.63 | | $ (1.59) | | $ 0.04 | | $ 0.95 | | $ 0.97 |
| Distributions to shareholders: | | | | | | | | | |
| Net investment income | (0.37) | | (0.22) | | (0.25) | | (0.34) | | (0.36) |
| Net realized gain | — | | (0.21) | | (0.30) | | — | | — |
| Tax return of capital | — | | (0.02) | | — | | — | | — |
| Total distributions | $ (0.37) | | $ (0.45) | | $ (0.55) | | $ (0.34) | | $ (0.36) |
| Net increase (decrease) in net asset value | $ 0.26 | | $ (2.04) | | $ (0.51) | | $ 0.61 | | $ 0.61 |
| Net asset value, end of period | $ 9.49 | | $ 9.23 | | $ 11.27 | | $ 11.78 | | $ 11.17 |
| Total return(b) | 6.96%(c) | | (14.19)% | | 0.38% | | 8.70% | | 9.27% |
| Ratio of net expenses to average net assets | 0.55% | | 0.49% | | 0.57% | | 0.59% | | 0.59% |
| Ratio of net investment income (loss) to average net assets | 4.38% | | 2.85% | | 2.12% | | 2.68% | | 3.03% |
| Portfolio turnover rate | 56% | | 65% | | 61% | | 59% | | 48% |
| Net assets, end of period (in thousands) | $22,519 | | $24,063 | | $33,091 | | $47,089 | | $49,115 |
| Ratios with no waiver of fees and assumption of expenses by the Adviser and no reduction for fees paid indirectly: | | | | | | | | | |
| Total expenses to average net assets | 0.59% | | 0.52% | | 0.60% | | 0.62% | | 0.62% |
| Net investment income (loss) to average net assets | 4.34% | | 2.82% | | 2.09% | | 2.65% | | 3.00% |
| | |
| (a) | The per-share data presented above is based on the average shares outstanding for the period presented. |
| (b) | Assumes initial investment at net asset value at the beginning of each period, reinvestment of all distributions and the complete redemption of the investment at net asset value at the end of each period. |
| (c) | For the year ended December 31, 2023, the Portfolio's total return includes a reimbursement by the Adviser (see Notes to the Financial Statements-Note 1B). The impact on Class I's total return was less than 0.005%. |
NOTE: The above financial highlights do not reflect the deduction of non-portfolio expenses associated with variable insurance products, such as mortality and expense risk charges, separate account charges, and sales charges.
30
The accompanying notes are an integral part of these financial statements.
| Pioneer Bond VCT Portfolio | Pioneer Variable Contracts Trust |
| | Year Ended
12/31/23 | | Year Ended
12/31/22 | | Year Ended
12/31/21 | | Year Ended
12/31/20 | | Year Ended
12/31/19 |
| Class ll | | | | | | | | | |
| Net asset value, beginning of period | $ 9.25 | | $ 11.30 | | $ 11.80 | | $ 11.19 | | $ 10.59 |
| Increase (decrease) from investment operations: | | | | | | | | | |
| Net investment income (loss)(a) | 0.39 | | 0.26 | | 0.21 | | 0.28 | | 0.31 |
| Net realized and unrealized gain (loss) on investments | 0.21 | | (1.88) | | (0.19) | | 0.65 | | 0.62 |
| Net increase (decrease) from investment operations | $ 0.60 | | $ (1.62) | | $ 0.02 | | $ 0.93 | | $ 0.93 |
| Distributions to shareholders: | | | | | | | | | |
| Net investment income | (0.34) | | (0.20) | | (0.22) | | (0.32) | | (0.33) |
| Net realized gain | — | | (0.21) | | (0.30) | | — | | — |
| Tax return of capital | — | | (0.02) | | — | | — | | — |
| Total distributions | $ (0.34) | | $ (0.43) | | $ (0.52) | | $ (0.32) | | $ (0.33) |
| Net increase (decrease) in net asset value | $ 0.26 | | $ (2.05) | | $ (0.50) | | $ 0.61 | | $ 0.60 |
| Net asset value, end of period | $ 9.51 | | $ 9.25 | | $ 11.30 | | $ 11.80 | | $ 11.19 |
| Total return(b) | 6.68%(c) | | (14.45)% | | 0.22% | | 8.42% | | 8.90% |
| Ratio of net expenses to average net assets | 0.80% | | 0.74% | | 0.82% | | 0.84% | | 0.84% |
| Ratio of net investment income (loss) to average net assets | 4.14% | | 2.61% | | 1.86% | | 2.43% | | 2.79% |
| Portfolio turnover rate | 56% | | 65% | | 61% | | 59% | | 48% |
| Net assets, end of period (in thousands) | $110,998 | | $118,138 | | $150,361 | | $140,599 | | $140,895 |
| Ratios with no waiver of fees and assumption of expenses by the Adviser and no reduction for fees paid indirectly: | | | | | | | | | |
| Total expenses to average net assets | 0.84% | | 0.77% | | 0.85% | | 0.87% | | 0.87% |
| Net investment income (loss) to average net assets | 4.10% | | 2.58% | | 1.83% | | 2.40% | | 2.76% |
| | |
| (a) | The per-share data presented above is based on the average shares outstanding for the period presented. |
| (b) | Assumes initial investment at net asset value at the beginning of each period, reinvestment of all distributions and the complete redemption of the investment at net asset value at the end of each period. |
| (c) | For the year ended December 31, 2023, the Portfolio's total return includes a reimbursement by the Adviser (see Notes to the Financial Statements-Note 1B). The impact on Class II's total return was less than 0.005%. |
NOTE: The above financial highlights do not reflect the deduction of non-portfolio expenses associated with variable insurance products, such as mortality and expense risk charges, separate account charges, and sales charges.
The accompanying notes are an integral part of these financial statements.
31
| Pioneer Bond VCT Portfolio | Pioneer Variable Contracts Trust |
Notes to Financial Statements 12/31/23
1. Organization and Significant Accounting Policies
Pioneer Bond VCT Portfolio (the “Portfolio”) is one of 7 portfolios comprising Pioneer Variable Contracts Trust (the “Trust”), a Delaware statutory trust. The Portfolio is registered under the Investment Company Act of 1940, as amended (the "1940 Act") as a diversified, open-end management investment company. The Portfolio seeks current income and total return.
The Portfolio offers two classes of shares designated as Class I and Class II shares. Each class of shares represents an interest in the same portfolio of investments of the Portfolio and has identical rights (based on relative net asset values) to assets and liquidation proceeds. Share classes can bear different rates of class-specific fees and expenses, such as transfer agent and distribution fees. Differences in class-specific fees and expenses will result in differences in net investment income and, therefore, the payment of different dividends from net investment income earned by each class. The Amended and Restated Declaration of Trust of the Trust gives the Board of Trustees the flexibility to specify either per-share voting or dollar-weighted voting when submitting matters for shareholder approval. Under per-share voting, each share of a class of the Portfolio is entitled to one vote. Under dollar-weighted voting,a shareholder’s voting power is determined not by the number of shares owned, but by the dollar value of the shares on the record date. Each share class has exclusive voting rights with respect to matters affecting only that class, including with respect to the distribution plan for that class. There is no distribution plan for Class I shares.
Portfolio shares may be purchased only by insurance companies for the purpose of funding variable annuity and variable life insurance contracts or by qualified pension and retirement plans.
Amundi Asset Management US, Inc., an indirect, wholly owned subsidiary of Amundi and Amundi’s wholly owned subsidiary, Amundi USA, Inc., serves as the Portfolio’s investment adviser (the “Adviser”). Amundi Distributor US, Inc., an affiliate of the Adviser, serves as the Portfolio’s distributor (the “Distributor”).
The Portfolio is required to comply with Rule 18f-4 under the 1940 Act, which governs the use of derivatives by registered investment companies. Rule 18f-4 permits funds to enter into derivatives transactions (as defined in Rule 18f-4) and certain other transactions notwithstanding the restrictions on the issuance of “senior securities” under Section 18 of the 1940 Act. In accordance with Rule 18f-4, the Portfolio has established and maintains a comprehensive derivatives risk management program, has appointed a derivatives risk manager and complies with a relative or absolute limit on fund leverage risk calculated based on value-at-risk ("VaR").
The Portfolio is an investment company and follows investment company accounting and reporting guidance under U.S. Generally Accepted Accounting Principles (“U.S. GAAP”). U.S. GAAP requires the management of the Portfolio to make estimates and assumptions that affect the reported amounts of assets and liabilities, the disclosure of contingent assets and liabilities at the date of the financial statements, and the reported amounts of income, expenses and gain or loss on investments during the reporting period. Actual results could differ from those estimates.
The following is a summary of significant accounting policies followed by the Portfolio in the preparation of its financial statements:
| A. | Security Valuation |
| | The net asset value of the Portfolio is computed once daily, on each day the New York Stock Exchange (“NYSE”) is open, as of the close of regular trading on the NYSE. |
| | Fixed-income securities are valued by using prices supplied by independent pricing services, which consider such factors as market prices, market events, quotations from one or more brokers, Treasury spreads, yields, maturities and ratings, or may use a pricing matrix or other fair value methods or techniques to provide an estimated value of the security or instrument. A pricing matrix is a means of valuing a debt security on the basis of current market prices for other debt securities, historical trading patterns in the market for fixed-income securities and/or other factors. Non-U.S. debt securities that are listed on an exchange will be valued at the bid price obtained from an independent third party pricing service. When independent third party pricing services are unable to supply prices, or when prices or market quotations are considered to be unreliable, the value of that security may be determined using quotations from one or more broker-dealers. |
| | Loan interests are valued at the mean between the last available bid and asked prices from one or more brokers or dealers as obtained from Loan Pricing Corporation, an independent third party pricing service. If price information is not available from Loan Pricing Corporation, or if the price information is deemed to be unreliable, price information will be obtained from an alternative loan interest pricing service. If no reliable price quotes are available from either the primary or alternative pricing service, broker quotes will be solicited. |
| Pioneer Bond VCT Portfolio | Pioneer Variable Contracts Trust |
| | Event-linked bonds are valued at the bid price obtained from an independent third party pricing service. Other insurance-linked securities (including reinsurance sidecars, collateralized reinsurance and industry loss warranties) may be valued at the bid price obtained from an independent pricing service, or through a third party using a pricing matrix, insurance valuation models, or other fair value methods or techniques to provide an estimated value of the instrument. |
| | Equity securities that have traded on an exchange are valued by using the last sale price on the principal exchange where they are traded. Equity securities that have not traded on the date of valuation, or securities for which sale prices are not available, generally are valued using the mean between the last bid and asked prices or, if both last bid and asked prices are not available, at the last quoted bid price. Last sale and bid and asked prices are provided by independent third party pricing services. In the case of equity securities not traded on an exchange, prices are typically determined by independent third party pricing services using a variety of techniques and methods. |
| | The value of foreign securities is translated into U.S. dollars based on foreign currency exchange rate quotations supplied by a third party pricing source. Trading in non-U.S. equity securities is substantially completed each day at various times prior to the close of the NYSE. The values of such securities used in computing the net asset value of the Portfolio's shares are determined as of such times. The Adviser may use a fair value model developed by an independent pricing service to value non-U.S. equity securities. |
| | Futures contracts are generally valued at the closing settlement price established by the exchange on which they are traded. |
| | Swap contracts, including interest rate swaps, caps and floors (other than centrally cleared swap contracts), are valued at the dealer quotations obtained from reputable International Swap Dealers Association members. Centrally cleared swaps are valued at the daily settlement price provided by the central clearing counterparty. |
| | Shares of open-end registered investment companies (including money market mutual funds) are valued at such funds’ net asset value. |
| | Securities or loan interests for which independent pricing services or broker-dealers are unable to supply prices or for which market prices and/or quotations are not readily available or are considered to be unreliable are valued by a fair valuation team comprised of certain personnel of the Adviser. The Adviser is designated as the valuation designee for the Portfolio pursuant to Rule 2a-5 under the 1940 Act. The Adviser’s fair valuation team is responsible for monitoring developments that may impact fair valued securities. |
| | Inputs used when applying fair value methods to value a security may include credit ratings, the financial condition of the company, current market conditions and comparable securities. The Adviser may use fair value methods if it is determined that a significant event has occurred after the close of the exchange or market on which the security trades and prior to the determination of the Portfolio's net asset value. Examples of a significant event might include political or economic news, corporate restructurings, natural disasters, terrorist activity or trading halts. Thus, the valuation of the Portfolio's securities may differ significantly from exchange prices, and such differences could be material. |
| B. | Investment Income and Transactions |
| | Dividend income is recorded on the ex-dividend date, except that certain dividends from foreign securities where the ex-dividend date may have passed are recorded as soon as the Portfolio becomes aware of the ex-dividend data in the exercise of reasonable diligence. |
| | Interest income, including interest on income-bearing cash accounts, is recorded on the accrual basis. Dividend and interest income are reported net of unrecoverable foreign taxes withheld at the applicable country rates and net of income accrued on defaulted securities. |
| | Interest and dividend income payable by delivery of additional shares is reclassified as PIK (payment-in-kind) income upon receipt and is included in interest and dividend income, respectively. |
| | Principal amounts of mortgage-backed securities are adjusted for monthly paydowns. Premiums and discounts related to certain mortgage-backed securities are amortized or accreted in proportion to the monthly paydowns. All discounts/premiums on purchase prices of debt securities are accreted/amortized for financial reporting purposes over the life of the respective securities, and such accretion/amortization is included in interest income. |
| | Security transactions are recorded as of trade date. Gains and losses on sales of investments are calculated on the identified cost method for both financial reporting and federal income tax purposes. |
| Pioneer Bond VCT Portfolio | Pioneer Variable Contracts Trust |
Notes to Financial Statements 12/31/23 (continued)
| | During the fiscal year ended December 31, 2023, the Portfolio realized a loss of $5,986 due to an operational error. The Adviser voluntarily reimbursed the Portfolio for this loss, which is reflected on the Statement of Operations as Reimbursement by the Adviser. |
| C. | Foreign Currency Translation |
| | The books and records of the Portfolio are maintained in U.S. dollars. Amounts denominated in foreign currencies are translated into U.S. dollars using current exchange rates. |
| | Net realized gains and losses on foreign currency transactions, if any, represent, among other things, the net realized gains and losses on foreign currency exchange contracts, disposition of foreign currencies and the difference between the amount of income accrued and the U.S. dollars actually received. Further, the effects of changes in foreign currency exchange rates on investments are not segregated on the Statement of Operations from the effects of changes in the market prices of those securities, but are included with the net realized and unrealized gain or loss on investments. |
| D. | Federal Income Taxes |
| | It is the Portfolio's policy to comply with the requirements of the Internal Revenue Code applicable to regulated investment companies and to distribute all of its net taxable income and net realized capital gains, if any, to its shareholders. Therefore, no provision for federal income taxes is required. As of December 31, 2023, the Portfolio did not accrue any interest or penalties with respect to uncertain tax positions, which, if applicable, would be recorded as an income tax expense on the Statement of Operations. Tax returns filed within the prior three years remain subject to examination by federal and state tax authorities. |
| | The amount and character of income and capital gain distributions to shareholders are determined in accordance with federal income tax rules, which may differ from U.S. GAAP. Distributions in excess of net investment income or net realized gains are temporary over distributions for financial statement purposes resulting from differences in the recognition or classification of income or distributions for financial statement and tax purposes. Capital accounts within the financial statements are adjusted for permanent book/tax differences to reflect tax character, but are not adjusted for temporary differences. |
| | At December 31, 2023, the Portfolio was permitted to carry forward indefinitely $6,017,652 of short-term losses and $8,818,513 of long-term losses. |
| | At December 31, 2023, the Portfolio deferred $482,668 of late year ordinary losses, which will be recognized by the Portfolio as occurring at the start of the next year ending in December 31, 2024. |
| | The tax character of distributions paid during the years ended December 31, 2023 and December 31, 2022, was as follows: |
| | 2023 | 2022 |
| Distributions paid from: | | |
| Ordinary income | $5,141,937 | $3,467,069 |
| Long-term capital gains | — | 3,062,893 |
| Tax return of capital | — | 254,221 |
| Total | $5,141,937 | $6,784,183 |
The following shows the components of distributable earnings (losses) on a federal income tax basis at December 31, 2023:
| | 2023 |
| Distributable earnings/(losses): | |
| Capital loss carryforward | $ (14,836,165) |
| Net unrealized depreciation | (7,794,676) |
| Qualified late year loss deferral | (482,668) |
| Total | $(23,113,509) |
The difference between book-basis and tax-basis unrealized depreciation is attributable to the tax adjustments relating to tax deferral of losses, wash sales, premium and amortization, and the mark to market of futures contracts and credit default swaps.
| Pioneer Bond VCT Portfolio | Pioneer Variable Contracts Trust |
| E. | Portfolio Shares and Class Allocations |
| | The Portfolio records sales and repurchases of its shares as of trade date. Distribution fees for Class II shares are calculated based on the average daily net asset value attributable to Class II shares of the Portfolio (see Note 5). Class I shares do not pay distribution fees. |
| | Income, common expenses (excluding transfer agent and distribution fees) and realized and unrealized gains and losses are calculated at the Portfolio level and allocated daily to each class of shares based on its respective percentage of the adjusted net assets at the beginning of the day. |
| | All expenses and fees paid to the Portfolio’s transfer agent for its services are allocated between the classes of shares based on the number of accounts in each class and the ratable allocation of related out-of-pocket expenses (see Note 4). |
| | The Portfolio declares as daily dividends substantially all of its net investment income. All dividends are paid on a monthly basis. Short-term capital gain distributions, if any, may be declared with the daily dividends. Distributions paid by the Portfolio with respect to each class of shares are calculated in the same manner and at the same time, except that net investment income dividends to Class I and Class II shares can reflect different transfer agent and distribution expense rates. Dividends and distributions to shareholders are recorded on the ex-dividend date. |
| F. | Risks |
| | The value of securities held by the Portfolio may go up or down, sometimes rapidly or unpredictably, due to general market conditions, such as real or perceived adverse economic, political or regulatory conditions, recessions, the spread of infectious illness or other public health issues, inflation, changes in interest rates, armed conflict such as between Russia and Ukraine or in the Middle East, sanctions against Russia, other nations or individuals or companies and possible countermeasures, lack of liquidity in the bond markets or adverse investor sentiment. In the past several years, financial markets have experienced increased volatility, depressed valuations, decreased liquidity and heightened uncertainty. These conditions may continue, recur, worsen or spread. Inflation and interest rates have increased and may rise further. These circumstances could adversely affect the value and liquidity of the Portfolio's investments and negatively impact the Portfolio's performance. |
| | The long-term impact of the COVID-19 pandemic and its subsequent variants on economies, markets, industries and individual issuers, are not known. Some sectors of the economy and individual issuers have experienced or may experience particularly large losses. Periods of extreme volatility in the financial markets, reduced liquidity of many instruments, increased government debt, inflation, and disruptions to supply chains, consumer demand and employee availability, may continue for some time. Following Russia's invasion of Ukraine, Russian securities lost all, or nearly all, their market value. Other securities or markets could be similarly affected by past or future political, geopolitical or other events or conditions. |
| | Governments and central banks, including the U.S. Federal Reserve, have taken extraordinary and unprecedented actions to support local and global economies and the financial markets. These actions have resulted in significant expansion of public debt, including in the U.S. The consequences of high public debt, including its future impact on the economy and securities markets, may not be known for some time. |
| | The U.S. and other countries are periodically involved in disputes over trade and other matters, which may result in tariffs, investment restrictions and adverse impacts on affected companies and securities. For example, the U.S. has imposed tariffs and other trade barriers on Chinese exports, has restricted sales of certain categories of goods to China, and has established barriers to investments in China. Trade disputes may adversely affect the economies of the U.S. and its trading partners, as well as companies directly or indirectly affected and financial markets generally. If the political climate between the U.S. and China does not improve or continues to deteriorate, if China were to attempt unification of Taiwan by force, or if other geopolitical conflicts develop or get worse, economies, markets and individual securities may be severely affected both regionally and globally, and the value of the Portfolio's assets may go down. |
| | At times, the Portfolio’s investments may represent industries or industry sectors that are interrelated or have common risks, making the Portfolio more susceptible to any economic, political, or regulatory developments or other risks affecting those industries and sectors. |
| | The Portfolio's investments in foreign markets and countries with limited developing markets may subject the Portfolio to a greater degree of risk than investments in a developed market. These risks include disruptive political or economic conditions, military conflicts and sanctions, terrorism, sustained economic downturns, financial instability, less liquid trading markets, extreme price volatility, currency risks, reduction of government or central bank support, inadequate |
| Pioneer Bond VCT Portfolio | Pioneer Variable Contracts Trust |
Notes to Financial Statements 12/31/23 (continued)
| | accounting standards, tariffs, tax disputes or other tax burdens, nationalization or expropriation of assets, and the imposition of adverse governmental laws, arbitrary application of laws and regulations or lack of rule of law and investment and repatriation restrictions. Lack of information and less market regulation also may affect the value of these securities. Withholding and other non-U.S. taxes may decrease the Portfolio’s return. Non-U.S. issuers may be located in parts of the world that have historically been prone to natural disasters. Investing in depositary receipts is subject to many of the same risks as investing directly in non-U.S. issuers. Depositary receipts may involve higher expenses and may trade at a discount (or premium) to the underlying security. |
| | Russia launched a large-scale invasion of Ukraine on February 24, 2022. In response to the military action by Russia, various countries, including the U.S., the United Kingdom, and European Union issued broad-ranging economic sanctions against Russia and Belarus and certain companies and individuals. Since then, Russian securities lost all, or nearly all, their market value, and many other issuers, securities and markets have been adversely affected. The United States and other countries may impose sanctions on other countries, companies and individuals in light of Russia’s military invasion. The extent and duration of the military action or future escalation of such hostilities, the extent and impact of existing and future sanctions, market disruptions and volatility, and the result of any diplomatic negotiations cannot be predicted. These and any related events could have a significant impact on the value and liquidity of certain Portfolio investments, on Portfolio performance and the value of an investment in the Portfolio, particularly with respect to securities and commodities, such as oil, natural gas and food commodities, as well as other sectors with exposure to Russian issuers or issuers in other countries affected by the invasion, and are likely to have collateral impacts on market sectors globally. |
| | Normally, the Portfolio invests at least 80% of its net assets (plus the amount of borrowings, if any, for investment purposes) in debt securities issued or guaranteed by the U.S. government, its agencies and instrumentalities, investment grade debt securities (including convertible debt) of corporate or other issuers and cash, cash equivalents and other short-term holdings. |
| | The market prices of the Portfolio's fixed income securities may fluctuate significantly when interest rates change. The value of your investment will generally go down when interest rates rise. A rise in rates tends to have a greater impact on the prices of longer term or duration securities. For example, if interest rates increase by 1%, the value of a Portfolio's portfolio with a portfolio duration of ten years would be expected to decrease by 10%, all other things being equal. In recent years interest rates and credit spreads in the U.S. have been at historic lows. The U.S. Federal Reserve has raised certain interest rates, and interest rates may continue to go up. A general rise in interest rates could adversely affect the price and liquidity of fixed income securities. The maturity of a security may be significantly longer than its effective duration. A security's maturity and other features may be more relevant than its effective duration in determining the security's sensitivity to other factors affecting the issuer or markets generally, such as changes in credit quality or in the yield premium that the market may establish for certain types of securities (sometimes called "credit spread"). In general, the longer its maturity the more a security may be susceptible to these factors. When the credit spread for a fixed income security goes up, or "widens," the value of the security will generally go down. |
| | If an issuer or guarantor of a security held by the Portfolio or a counterparty to a financial contract with the Portfolio defaults on its obligation to pay principal and/or interest, has its credit rating downgraded or is perceived to be less creditworthy, or the credit quality or value of any underlying assets declines, the value of your investment will typically decline. Changes in actual or perceived creditworthiness may occur quickly. The Portfolio could be delayed or hindered in its enforcement of rights against an issuer, guarantor or counterparty. |
| | The Portfolio invests in below-investment-grade (high-yield) debt securities and preferred stocks. Some of these high-yield securities may be convertible into equity securities of the issuer. Debt securities rated below-investment-grade are commonly referred to as “junk bonds” and are considered speculative with respect to the issuer’s capacity to pay interest and repay principal. These securities involve greater risk of loss, are subject to greater price volatility, and may be less liquid and more difficult to value, especially during periods of economic uncertainty or change, than higher rated debt securities. |
| | The Portfolio may invest in mortgage-related and asset-backed securities. The value of mortgage-related and asset-backed securities will be influenced by factors affecting the assets underlying such securities. As a result, during periods of declining asset value, difficult or frozen credit markets, swings in interest rates, or deteriorating economic conditions, mortgage-related and asset-backed securities may decline in value, face valuation difficulties, become more volatile and/or become illiquid. Mortgage-backed securities tend to be more sensitive to changes in interest rate than other types of debt securities. These securities are also subject to prepayment and extension risks. Some of these securities may receive little or no collateral protection from the underlying assets and are thus subject to the risk of default. The risk of |
| Pioneer Bond VCT Portfolio | Pioneer Variable Contracts Trust |
| | such defaults is generally higher in the case of mortgage-backed investments offered by non-governmental issuers and those that include so-called “sub-prime” mortgages. The structure of some of these securities may be complex and there may be less available information than for other types of debt securities. Upon the occurrence of certain triggering events or defaults, the Portfolio may become the holder of underlying assets at a time when those assets may be difficult to sell or may be sold only at a loss. |
| | The Portfolio may invest in credit risk transfer securities. Credit risk transfer securities are unguaranteed and unsecured debt securities issued by government sponsored enterprises and therefore are not directly linked to or backed by the underlying mortgage loans. As a result, in the event that a government sponsored enterprise fails to pay principal or interest on its credit risk transfer securities or goes through a bankruptcy, insolvency or similar proceeding, holders of such credit risk transfer securities have no direct recourse to the underlying mortgage loans and will generally receive recovery on par with other unsecured note holders in such a scenario. The risks associated with an investment in credit risk transfer securities are different than the risks associated with an investment in mortgage-backed securities issued by Fannie Mae and Freddie Mac, or other government sponsored enterprise or issued by a private issuer, because some or all of the mortgage default or credit risk associated with the underlying mortgage loans is transferred to investors. As a result, investors in these securities could lose some or all of their investment in these securities if the underlying mortgage loans default. |
| | The Portfolio may invest in REIT securities, the value of which can fall for a variety of reasons, such as declines in rental income, fluctuating interest rates, poor property management, environmental liabilities, uninsured damage, increased competition, or changes in real estate tax laws. |
| | The Portfolio's investments, payment obligations and financing terms may be based on floating rates, such as LIBOR (London Interbank Offered Rate) or SOFR (Secured Overnight Financing Rate). ICE Benchmark Administration, the administrator of LIBOR, has ceased publication of most LIBOR settings on a representative basis. Actions by regulators have resulted in the establishment of alternative reference rates to LIBOR in most major currencies. In the U.S., a common benchmark replacement is based on the SOFR published by the Federal Reserve Bank of New York, including certain spread adjustments and benchmark replacement conforming changes, although other benchmark replacements (without or without spread adjustments) may be used in certain transactions. The impact of the transition from LIBOR on the Portfolio's transactions and financial markets generally cannot yet be determined. The transition away from LIBOR may lead to increased volatility and illiquidity in markets for instruments that have relied on LIBOR and may adversely affect the Portfolio's performance. |
| | With the increased use of technologies such as the Internet to conduct business, the Portfolio is susceptible to operational, information security and related risks. While the Portfolio’s Adviser has established business continuity plans in the event of, and risk management systems to prevent, limit or mitigate, such cyber-attacks, there are inherent limitations in such plans and systems, including the possibility that certain risks have not been identified. Furthermore, the Portfolio cannot control the cybersecurity plans and systems put in place by service providers to the Portfolio such as the Portfolio's custodian and accounting agent, and the Portfolio’s transfer agent. In addition, many beneficial owners of Portfolio shares hold them through accounts at broker-dealers, retirement platforms and other financial market participants over which neither the Portfolio nor the Adviser exercises control. Each of these may in turn rely on service providers to them, which are also subject to the risk of cyber-attacks. Cybersecurity failures or breaches at the Adviser or the Portfolio’s service providers or intermediaries have the ability to cause disruptions and impact business operations, potentially resulting in financial losses, interference with the Portfolio’s ability to calculate its net asset value, impediments to trading, the inability of Portfolio shareholders to effect share purchases, redemptions or exchanges or receive distributions, loss of or unauthorized access to private shareholder information and violations of applicable privacy and other laws, regulatory fines, penalties, reputational damage, or additional compliance costs. Such costs and losses may not be covered under any insurance. In addition, maintaining vigilance against cyber-attacks may involve substantial costs over time, and system enhancements may themselves be subject to cyber-attacks. |
| | The Portfolio’s prospectus contains unaudited information regarding the Portfolio’s principal risks. Please refer to that document when considering the Portfolio’s principal risks. |
| G. | Restricted Securities |
| | Restricted Securities are subject to legal or contractual restrictions on resale. Restricted securities generally are resold in transactions exempt from registration under the Securities Act of 1933. Private placement securities are generally considered to be restricted except for those securities traded between qualified institutional investors under the provisions of Rule 144A of the Securities Act of 1933. |
| Pioneer Bond VCT Portfolio | Pioneer Variable Contracts Trust |
Notes to Financial Statements 12/31/23 (continued)
| | Disposal of restricted investments may involve negotiations and expenses, and prompt sale at an acceptable price may be difficult to achieve. Restricted investments held by the Portfolio at December 31, 2023 are listed in the Schedule of Investments. |
| H. | Insurance-Linked Securities (“ILS”) |
| | The Portfolio invests in ILS. The Portfolio could lose a portion or all of the principal it has invested in an ILS, and the right to additional interest or dividend payments with respect to the security, upon the occurrence of one or more trigger events, as defined within the terms of an insurance-linked security. Trigger events, generally, are hurricanes, earthquakes, or other natural events of a specific size or magnitude that occur in a designated geographic region during a specified time period, and/or that involve losses or other metrics that exceed a specific amount. There is no way to accurately predict whether a trigger event will occur, and accordingly, ILS carry significant risk. The Portfolio is entitled to receive principal, and interest and/or dividend payments so long as no trigger event occurs of the description and magnitude specified by the instrument. In addition to the specified trigger events, ILS may expose the Portfolio to other risks, including but not limited to issuer (credit) default, adverse regulatory or jurisdictional interpretations and adverse tax consequences. |
| | The Portfolio’s investments in ILS may include event-linked bonds. ILS also may include special purpose vehicles (“SPVs”) or similar instruments structured to comprise a portion of a reinsurer’s catastrophe-oriented business, known as quota share instruments (sometimes referred to as reinsurance sidecars), or to provide reinsurance relating to specific risks to insurance or reinsurance companies through a collateralized instrument, known as collateralized reinsurance. |
| | Structured reinsurance investments also may include industry loss warranties (“ILWs”). A traditional ILW takes the form of a bilateral reinsurance contract, but there are also products that take the form of derivatives, collateralized structures, or exchange-traded instruments. |
| | Where the ILS are based on the performance of underlying reinsurance contracts, the Portfolio has limited transparency into the individual underlying contracts, and therefore must rely upon the risk assessment and sound underwriting practices of the issuer. Accordingly, it may be more difficult for the Adviser to fully evaluate the underlying risk profile of the Portfolio's structured reinsurance investments, and therefore the Portfolio's assets are placed at greater risk of loss than if the Adviser had more complete information. Structured reinsurance instruments generally will be considered illiquid securities by the Portfolio. These securities may be difficult to purchase, sell or unwind. Illiquid securities also may be difficult to value. If the Portfolio is forced to sell an illiquid asset, the Portfolio may be forced to sell at a loss. |
| | Additionally, the Portfolio may gain exposure to ILS by investing in a closed-end interval fund, Pioneer ILS Interval Fund, an affiliate of the Adviser. The Portfolio’s investment in Pioneer ILS Interval Fund at December 31, 2023 is listed in the Schedule of Investments. |
| I. | TBA Purchase and Sale Commitments |
| | The Portfolio may enter into to-be-announced (TBA) purchase or sale commitments (collectively, TBA transactions), pursuant to which it agrees to purchase or sell, respectively, mortgage-backed securities for a fixed unit price, with payment and delivery at a scheduled future date beyond the customary settlement period for such securities. With TBA transactions, the particular securities to be received or delivered by the Portfolio are not identified at the trade date; however, the securities must meet specified terms, including issuer, rate, and mortgage term, and be within industry-accepted “good delivery” standards. The Portfolio may enter into TBA transactions with the intention of taking possession of or relinquishing the underlying securities, may elect to extend the settlement by “rolling” the transaction, and/or may use TBA transactions to gain or reduce interim exposure to underlying securities. Until settlement, the Portfolio maintains liquid assets sufficient to settle its commitment to purchase a TBA or, in the case of a sale commitment, the Portfolio maintains an entitlement to the security to be sold. |
| | To mitigate counterparty risk, the Portfolio has entered into agreements with TBA counterparties that provide for collateral and the right to offset amounts due to or from those counterparties under specified conditions. Subject to minimum transfer amounts, collateral requirements are determined and transfers made based on the net aggregate unrealized gain or loss on all TBA commitments with a particular counterparty. At any time, the Portfolio’s risk of loss from a particular counterparty related to its TBA commitments is the aggregate unrealized gain on appreciated TBAs in excess of unrealized loss on depreciated TBAs and collateral received, if any, from such counterparty. As of December 31, 2023, no collateral was pledged by the Portfolio. Collateral received from counterparties totaled $0 for TBAs. |
| Pioneer Bond VCT Portfolio | Pioneer Variable Contracts Trust |
| J. | Futures Contracts |
| | The Portfolio may enter into futures transactions in order to attempt to hedge against changes in interest rates, securities prices and currency exchange rates or to seek to increase total return. Futures contracts are types of derivatives. |
| | All futures contracts entered into by the Portfolio are traded on a futures exchange. Upon entering into a futures contract, the Portfolio is required to deposit with a broker an amount of cash or securities equal to the minimum "initial margin" requirements of the associated futures exchange. The amount of cash deposited with the broker as collateral at December 31, 2023 is recorded as "Futures collateral" on the Statement of Assets and Liabilities. |
| | Subsequent payments for futures contracts ("variation margin") are paid or received by the Portfolio, depending on the daily fluctuation in the value of the contracts, and are recorded by the Portfolio as unrealized appreciation or depreciation. Cash received from or paid to the broker related to previous margin movement is held in a segregated account at the broker and is recorded as either "Due from broker for futures" or "Due to broker for futures" on the Statement of Assets and Liabilities. When the contract is closed, the Portfolio realizes a gain or loss equal to the difference between the opening and closing value of the contract as well as any fluctuation in foreign currency exchange rates where applicable. Futures contracts are subject to market risk, interest rate risk and currency exchange rate risk. Changes in value of the contracts may not directly correlate to the changes in value of the underlying securities. With futures, there is reduced counterparty credit risk to the Portfolio since futures are exchange-traded and the exchange's clearinghouse, as counterparty to all exchange-traded futures, guarantees the futures against default. |
| | The average notional values of futures contracts long position and futures contracts short position during the year ended December 31, 2023 were $37,101,569 and $9,978,258, respectively. Open futures contracts outstanding at December 31, 2023 are listed in the Schedule of Investments. |
| K. | Credit Default Swap Contracts |
| | A credit default swap is a contract between a buyer of protection and a seller of protection against a pre-defined credit event or an underlying reference obligation, which may be a single security or a basket or index of securities. The Portfolio may buy or sell credit default swap contracts to seek to increase the Portfolio's income, or to attempt to hedge the risk of default on portfolio securities. A credit default swap index is used to hedge risk or take a position on a basket of credit entities or indices. |
| | As a seller of protection, the Portfolio would be required to pay the notional (or other agreed-upon) value of the referenced debt obligation to the counterparty in the event of a default by a U.S. or foreign corporate issuer of a debt obligation, which would likely result in a loss to the Portfolio. In return, the Portfolio would receive from the counterparty a periodic stream of payments during the term of the contract, provided that no event of default occurred. The maximum exposure of loss to the seller would be the notional value of the credit default swaps outstanding. If no default occurs, the Portfolio would keep the stream of payments and would have no payment obligation. The Portfolio may also buy credit default swap contracts in order to hedge against the risk of default of debt securities, in which case the Portfolio would function as the counterparty referenced above. |
| | As a buyer of protection, the Portfolio makes an upfront or periodic payment to the protection seller in exchange for the right to receive a contingent payment. An upfront payment made by the Portfolio, as the protection buyer, is recorded within the "Swap contracts, at value" line item on the Statement of Assets and Liabilities. Periodic payments received or paid by the Portfolio are recorded as realized gains or losses on the Statement of Operations. |
| | Credit default swap contracts are marked-to-market daily using valuations supplied by independent sources, and the change in value, if any, is recorded within the "Swap contracts, at value" line item on the Statement of Assets and Liabilities. Payments received or made as a result of a credit event or upon termination of the contract are recognized, net of the appropriate amount of the upfront payment, as realized gains or losses on the Statement of Operations. |
| | Credit default swap contracts involving the sale of protection may involve greater risks than if the Portfolio had invested in the referenced debt instrument directly. Credit default swap contracts are subject to general market risk, liquidity risk, counterparty risk and credit risk. If the Portfolio is a protection buyer and no credit event occurs, it will lose its investment. If the Portfolio is a protection seller and a credit event occurs, the value of the referenced debt instrument received by the Portfolio, together with the periodic payments received, may be less than the amount the Portfolio pays to the protection buyer, resulting in a loss to the Portfolio. In addition, obligations under sell protection credit default swaps may be partially offset by net amounts received from settlement of buy protection credit default swaps entered into by the Portfolio for the same reference obligation with the same counterparty. |
| Pioneer Bond VCT Portfolio | Pioneer Variable Contracts Trust |
Notes to Financial Statements 12/31/23 (continued)
| | The Portfolio may invest in credit default swap index products ("CDX"). A CDX is a swap on an index of credit default swaps. CDXs allow an investor to manage credit risk or take a position on a basket of credit entities (such as credit default swaps or commercial mortgage-backed securities) in a more efficient manner than transacting in a single-name credit default swap. If a credit event occurs in one of the underlying companies, the protection is paid out via the delivery of the defaulted bond by the buyer of protection in return for a payment of notional value of the defaulted bond by the seller of protection or it may be settled through a cash settlement between the two parties. The underlying company is then removed from the index. If the Portfolio holds a long position in a CDX, the Portfolio would indirectly bear its proportionate share of any expenses paid by a CDX. A fund holding a long position in CDXs typically receives income from principal or interest paid on the underlying securities. By investing in CDXs, the Portfolio could be exposed to liquidity risk, counterparty risk, credit risk of the issuers of the underlying loan obligations and of the CDX markets, and operational risks. If there is a default by the CDX counterparty, the Portfolio will have contractual remedies pursuant to the agreements related to the transaction. CDXs also bear the risk that the Portfolio will not be able to meet its obligation to the counterparty. |
| | Certain swap contracts that are cleared through a central clearinghouse are referred to as centrally cleared swaps. All payments made or received by the Portfolio are pursuant to a centrally cleared swap contract with the central clearing party rather than the original counterparty. Upon entering into a centrally cleared swap contract, the Portfolio is required to make an initial margin deposit, either in cash or in securities. The daily change in value on open centrally cleared contracts is recorded as "Variation margin for centrally cleared swap contracts" on the Statement of Assets and Liabilities. Cash received from or paid to the broker related to previous margin movement is held in a segregated account at the broker and is recorded as either "Due from broker for swaps" or "Due to broker for swaps" on the Statement of Assets and Liabilities. The amount of cash deposited with a broker as collateral at December 31, 2023 is recorded as "Swaps collateral" on the Statement of Assets and Liabilities. |
| | The average notional value of credit default swap contracts buy protection open during the year ended December 31, 2023 was $11,629,960. Open credit default swap contracts at December 31, 2023 are listed in the Schedule of Investments. |
2. Management Agreement
The Adviser manages the Portfolio. Management fees payable under the Portfolio's Investment Management Agreement with the Adviser are calculated daily and paid monthly at the annual rate of 0.40% of the Portfolio's average daily net assets. For the year ended December 31, 2023, the effective management fee (excluding waivers and/or assumption of expenses and waiver of acquired fund fees and expenses) was equivalent to 0.40% of the Portfolio’s average daily net assets.
The Adviser has agreed to waive its management fee with respect to any portion of the Portfolio’s assets invested in Pioneer ILS Interval Fund, an affiliated fund managed by the Adviser. For the year ended December 31, 2023, the Adviser waived $55,468 in management fees with respect to the Portfolio, which is reflected on the Statement of Operations as an expense waiver.
The Adviser has contractually agreed to limit ordinary operating expenses (ordinary operating expenses means all Portfolio expenses other than taxes, brokerage commissions, acquired fund fees and expenses and extraordinary expenses, such as litigation) of the Portfolio to the extent required to reduce Portfolio expenses to 0.62% of the average daily net assets attributable to Class I shares. Class II shares expenses will be reduced only to the extent portfolio-wide expenses are reduced for Class I shares. This expense limitation is in effect through May 1, 2024. There can be no assurance that the Adviser will extend the expense limitation agreement for a class of shares beyond the date referred to above. Fees waived and expenses reimbursed during the year ended December 31, 2023 are reflected on the Statement of Operations.
In addition, under the management and administration agreements, certain other services and costs, including accounting, regulatory reporting and insurance premiums, are paid by the Portfolio as administrative reimbursements. Reflected on the Statement of Assets and Liabilities is $6,562 in management fees payable to the Adviser at December 31, 2023.
3. Compensation of Officers and Trustees
The Portfolio pays an annual fee to its Trustees. The Adviser reimburses the Portfolio for fees paid to the Interested Trustees. Except for the chief compliance officer, the Portfolio does not pay any salary or other compensation to its officers. The Portfolio pays a portion of the chief compliance officer's compensation for his services as the Portfolio's chief compliance officer. Amundi US pays the remaining portion of the chief compliance officer's compensation. For the year ended December 31, 2023, the Portfolio paid $8,966 in Officers' and Trustees' compensation, which is reflected on the Statement of Operations as Officers' and Trustees' fees. At December 31, 2023, on its Statement of Assets and Liabilities, the Portfolio had
| Pioneer Bond VCT Portfolio | Pioneer Variable Contracts Trust |
a payable for Trustees' fees of $199 and a payable for administrative expenses of $5,426, which includes the payable for Officers' compensation. The Portfolio did not have a payable for Trustees' fees.
4. Transfer Agent
BNY Mellon Investment Servicing (US) Inc. serves as the transfer agent to the Portfolio at negotiated rates. Transfer agent fees and payables shown on the Statement of Operations and the Statement of Assets and Liabilities, respectively, include sub-transfer agent expenses incurred through the Portfolio’s omnibus relationship contracts.
5. Distribution Plan
The Portfolio has adopted a distribution plan (the “Plan”) pursuant to Rule 12b-1 under the 1940 Act with respect to Class II shares. Pursuant to the Plan, the Portfolio pays the Distributor a distribution fee of 0.25% of the average daily net assets attributable to Class II shares to compensate the Distributor for (1) distribution services and (2) personal and account maintenance services performed and expenses incurred by the Distributor in connection with the Portfolio’s Class II shares. Reflected on the Statement of Assets and Liabilities is $3,814 in distribution fees payable to the Distributor at December 31, 2023.
6. Additional Disclosures about Derivative Instruments and Hedging Activities
The Portfolio’s use of derivatives may enhance or mitigate the Portfolio’s exposure to the following risks:
Interest rate risk relates to the fluctuations in the value of interest-bearing securities due to changes in the prevailing levels of market interest rates.
Credit risk relates to the ability of the issuer of a financial instrument to make further principal or interest payments on an obligation or commitment that it has to the Portfolio.
Foreign exchange rate risk relates to fluctuations in the value of an asset or liability due to changes in currency exchange rates.
Equity risk relates to the fluctuations in the value of financial instruments as a result of changes in market prices (other than those arising from interest rate risk or foreign exchange rate risk), whether caused by factors specific to an individual investment, its issuer, or all factors affecting all instruments traded in a market or market segment.
Commodity risk relates to the risk that the value of a commodity or commodity index will fluctuate based on increases or decreases in the commodities market and factors specific to a particular industry or commodity.
The fair value of open derivative instruments (not considered to be hedging instruments for accounting disclosure purposes) by risk exposure at December 31, 2023, was as follows:
Statement of Assets
and Liabilities | Interest
Rate Risk | Credit
Risk | Foreign
Exchange
Rate Risk | Equity
Risk | Commodity
Risk |
| Assets | | | | | |
| Net unrealized appreciation on futures contracts* | $411,226 | $ — | $ — | $ — | $ — |
| Total Value | $411,226 | $ — | $— | $— | $— |
| Liabilities | | | | | |
| Centrally cleared swap contracts† | $ — | $455,574 | $ — | $ — | $ — |
| Total Value | $ — | $455,574 | $— | $— | $— |
| | |
| * | Includes cumulative unrealized appreciation (depreciation) of futures contracts as reported in the Schedule of Investments. Only net variation margin is reported within the assets and/or liabilities on the Statement of Assets and Liabilities. |
| † | Includes cumulative unrealized appreciation (depreciation) of centrally cleared swap contracts as reported in the Schedule of Investments. Only net variation margin is reported within the receivables and/or payables on the Statement of Assets and Liabilities. |
| Pioneer Bond VCT Portfolio | Pioneer Variable Contracts Trust |
Notes to Financial Statements 12/31/23 (continued)
The effect of derivative instruments (not considered to be hedging instruments for accounting disclosure purposes) on the Statement of Operations by risk exposure at December 31, 2023 was as follows:
| Statement of Operations | Interest
Rate Risk | Credit
Risk | Foreign
Exchange
Rate Risk | Equity
Risk | Commodity
Risk |
| Net Realized Gain (Loss) on | | | | | |
| Futures contracts | $ (474,062) | $ — | $ — | $ — | $ — |
| Swap contracts | — | (1,318,678) | — | — | — |
| Total Value | $(474,062) | $(1,318,678) | $— | $— | $— |
| Change in Net Unrealized Appreciation (Depreciation) on | | | | | |
| Futures contracts | $ 439,522 | $ — | $ — | $ — | $ — |
| Swap contracts | — | 192,136 | — | — | — |
| Total Value | $ 439,522 | $ 192,136 | $— | $— | $— |
7. Unfunded Loan Commitments
The Portfolio may enter into unfunded loan commitments. Unfunded loan commitments may be partially or wholly unfunded. During the contractual period, the Portfolio is obliged to provide funding to the borrower upon demand. A fee is earned by the Portfolio on the unfunded loan commitment and is recorded as interest income on the Statement of Operations. Unfunded loan commitments are fair valued in accordance with the valuation policy described in Note 1A and unrealized appreciation or depreciation, if any, is recorded on the Statement of Assets and Liabilities.
As of December 31, 2023, the Portfolio had the following unfunded loan commitments outstanding:
| Loan | Principal | Cost | Value | Unrealized
Appreciation
(Depreciation) |
| CSG Elevate II, Inc., Bridge Term Loan | $270,000 | $270,000 | $270,000 | $— |
8. Affiliated Issuers
An affiliated issuer is a company in which the Portfolio has a direct or indirect ownership of, control of, or voting power of 5 percent or more of the outstanding voting shares or any company which is under common ownership or control. At December 31, 2023, the value of the Portfolio’s investment in affiliated issuers was $3,241,623, which represents 2.4% of the Portfolio’s net assets.
Transactions in affiliated issuers by the Portfolio for the year ended December 31, 2023 were as follows:
Name of the
Affiliated Issuer | Value at
December 31,
2022 | Purchases
Costs | Change in
Unrealized
Appreciation
(Depreciation) | Net
Realized
Gain/(Loss) | Dividends
Received
and Reinvested | Sales
Proceeds | Shares
held at
December 31,
2023 | Value at
December 31,
2023 |
| Pioneer ILS Interval Fund | $2,731,854 | $— | $142,232 | $— | $367,537 | $— | 380,919 | $3,241,623 |
Annual and semi-annual reports for the underlying Pioneer funds are available on the funds’ web page(s) at www.amundi.com/us.
| Pioneer Bond VCT Portfolio | Pioneer Variable Contracts Trust |
Report of Independent Registered Public Accounting Firm
To the Board of Trustees of Pioneer Variable Contracts Trust and the Shareholders of
Pioneer Bond VCT Portfolio:
Opinion on the Financial Statements
We have audited the accompanying statement of assets and liabilities of Pioneer Bond VCT Portfolio (the “Portfolio”) (one of the portfolios constituting Pioneer Variable Contracts Trust (the “Trust”)), including the schedule of investments, as of December 31, 2023, and the related statement of operations for the year then ended, the statements of changes in net assets for each of the two years in the period then ended, the financial highlights for each of the five years in the period then ended and the related notes (collectively referred to as the “financial statements”). In our opinion, the financial statements present fairly, in all material respects, the financial position of the Portfolio (one of the portfolios constituting Pioneer Variable Contracts Trust) at December 31, 2023, the results of its operations for the year then ended, the changes in its net assets for each of the two years in the period then ended, and its financial highlights for each of the five years in the period then ended in conformity with U.S. generally accepted accounting principles.
Basis for Opinion
These financial statements are the responsibility of the Trust’s management. Our responsibility is to express an opinion on the Portfolio’s financial statements based on our audits. We are a public accounting firm registered with the Public Company Accounting Oversight Board (United States) ("PCAOB") and are required to be independent with respect to the Trust in accordance with the U.S. federal securities laws and the applicable rules and regulations of the Securities and Exchange Commission and the PCAOB.
We conducted our audits in accordance with the standards of the PCAOB. Those standards require that we plan and perform the audit to obtain reasonable assurance about whether the financial statements are free of material misstatement, whether due to error or fraud. The Trust is not required to have, nor were we engaged to perform, an audit of the Trust’s internal control over financial reporting. As part of our audits, we are required to obtain an understanding of internal control over financial reporting, but not for the purpose of expressing an opinion on the effectiveness of the Trust’s internal control over financial reporting. Accordingly, we express no such opinion.
Our audits included performing procedures to assess the risks of material misstatement of the financial statements, whether due to error or fraud, and performing procedures that respond to those risks. Such procedures included examining, on a test basis, evidence regarding the amounts and disclosures in the financial statements. Our procedures included confirmation of securities owned as of December 31, 2023, by correspondence with the custodian, brokers, and others; when replies were not received from brokers and others, we performed other auditing procedures. Our audits also included evaluating the accounting principles used and significant estimates made by management, as well as evaluating the overall presentation of the financial statements. We believe that our audits provide a reasonable basis for our opinion.
We have served as the auditor of one or more investment companies in the Pioneer family of funds since 2017.
Boston, Massachusetts
February 20, 2024
| Pioneer Bond VCT Portfolio | Pioneer Variable Contracts Trust |
Additional Information (unaudited)
Qualified interest income is exempt from nonresident alien (NRA) tax withholding. The percentage of the Portfolio’s ordinary income distributions derived from qualified interest income was 76.48%.
| Pioneer Bond VCT Portfolio | Pioneer Variable Contracts Trust |
Approval of Renewal of Investment Management Agreement
Amundi Asset Management US, Inc. (“Amundi US”) serves as the investment adviser to Pioneer Bond VCT Portfolio (the “Portfolio”) pursuant to an investment management agreement between Amundi US and the Portfolio. In order for Amundi US to remain the investment adviser of the Portfolio, the Trustees of the Portfolio, including a majority of the Portfolio’s Independent Trustees, must determine annually whether to renew the investment management agreement for the Portfolio.
The contract review process began in January 2023 as the Trustees of the Portfolio agreed on, among other things, an overall approach and timeline for the process. Contract review materials were provided to the Trustees in March 2023, July 2023 and September 2023. In addition, the Trustees reviewed and discussed the Portfolio’s performance at regularly scheduled meetings throughout the year, and took into account other information related to the Portfolio provided to the Trustees at regularly scheduled meetings, in connection with the review of the Portfolio’s investment management agreement.
In March 2023, the Trustees, among other things, discussed the memorandum provided by Portfolio counsel that summarized the legal standards and other considerations that are relevant to the Trustees in their deliberations regarding the renewal of the investment management agreement, and reviewed and discussed the qualifications of the investment management teams for the Portfolio, as well as the level of investment by the Portfolio’s portfolio managers in the Portfolio. In July 2023, the Trustees, among other things, reviewed the Portfolio’s management fees and total expense ratios, the financial statements of Amundi US and its parent companies, profitability analyses provided by Amundi US, and analyses from Amundi US as to possible economies of scale. The Trustees also reviewed the profitability of the institutional business of Amundi US, as compared to that of Amundi US’s fund management business, and considered the differences between the fees and expenses of the Portfolio and the fees and expenses of Amundi US’s institutional accounts, as well as the different services provided by Amundi US to the Portfolio and to the institutional accounts. The Trustees further considered contract review materials, including additional materials received in response to the Trustees’ request, in September 2023.
At a meeting held on September 19, 2023, based on their evaluation of the information provided by Amundi US and third parties, the Trustees of the Portfolio, including the Independent Trustees voting separately, unanimously approved the renewal of the investment management agreement for another year. In approving the renewal of the investment management agreement, the Trustees considered various factors that they determined were relevant, including the factors described below. The Trustees did not identify any single factor as the controlling factor in determining to approve the renewal of the agreement.
Nature, Extent and Quality of Services
The Trustees considered the nature, extent and quality of the services that had been provided by Amundi US to the Portfolio, taking into account the investment objective and strategy of the Portfolio. The Trustees also reviewed Amundi US’s investment approach for the Portfolio and its research process. The Trustees considered Amundi US’ integration of environmental, social and governance (ESG) considerations into its investment research process. The Trustees considered the resources of Amundi US and the personnel of Amundi US who provide investment management services to the Portfolio. They also reviewed the amount of non-Portfolio assets managed by the portfolio managers of the Portfolio. They considered the non-investment resources and personnel of Amundi US that are involved in Amundi US’s services to the Portfolio, including Amundi US’s compliance, risk management, and legal resources and personnel. The Trustees considered the compliance services being provided to the Portfolio by Amundi US and how Amundi US has addressed any compliance issues during the past year. The Trustees noted the substantial attention and high priority given by Amundi US’s senior management to the Pioneer Fund complex.
The Trustees considered that Amundi US supervises and monitors the performance of the Portfolio’s service providers and provides the Portfolio with personnel (including Portfolio officers) and other resources that are necessary for the Portfolio’s business management and operations. The Trustees also considered that, as administrator, Amundi US is responsible for the administration of the Portfolio’s business and other affairs. The Trustees considered that the Portfolio reimburses Amundi US its pro rata share of Amundi US’s costs of providing administration services to the Pioneer Funds.
Based on these considerations, the Trustees concluded that the nature, extent and quality of services that had been provided by Amundi US to the Portfolio were satisfactory and consistent with the terms of the investment management agreement.
Performance of the Portfolio
In considering the Portfolio’s performance, the Trustees regularly review and discuss throughout the year data prepared by Amundi US and information comparing the Portfolio’s performance with the performance of its peer group of funds, as classified by Morningstar, Inc. (Morningstar), and with the performance of the Portfolio’s benchmark index. They also discuss the Portfolio’s performance with Amundi US on a regular basis. The Trustees’ regular reviews and discussions were factored into the Trustees’ deliberations concerning the renewal of the investment management agreement.
| Pioneer Bond VCT Portfolio | Pioneer Variable Contracts Trust |
Approval of Renewal of Investment Management Agreement (continued)
Management Fee and Expenses
The Trustees considered information showing the fees and expenses of the Portfolio in comparison to the management fees of its peer group of funds as classified by Morningstar and also to the expense ratios of a peer group of funds selected on the basis of criteria determined by the Independent Trustees for this purpose using data provided by Strategic Insight Mutual Fund Research and Consulting, LLC (Strategic Insight), an independent third party. The peer group comparisons referred to below are organized in quintiles. Each quintile represents one-fifth of the peer group. In all peer group comparisons referred to below, first quintile is most favorable to the Portfolio’s shareowners. The Trustees noted that they separately review and consider the impact of the Portfolio’s transfer agency and Portfolio- and Amundi US-paid expenses for sub-transfer agency and intermediary arrangements, and that the results of the most recent such review were considered in the consideration of the Portfolio’s expense ratio.
The Trustees considered that the Portfolio’s management fee for the most recent fiscal year was in the first quintile relative to the management fees paid by other funds in its Morningstar category for the comparable period. The Trustees considered that the expense ratio of the Portfolio’s Class II shares for the most recent fiscal year was in the first quintile relative to its Strategic Insight peer group for the comparable period.
The Trustees reviewed management fees charged by Amundi US to institutional and other clients, including publicly offered European funds sponsored by Amundi US’s affiliates, unaffiliated U.S. registered investment companies (in a sub-advisory capacity), and unaffiliated foreign and domestic separate accounts. The Trustees also considered Amundi US’s costs in providing services to the Portfolio and Amundi US’s costs in providing services to the other clients and considered the differences in management fees and profit margins for fund and non-fund services. In evaluating the fees associated with Amundi US’s client accounts, the Trustees took into account the respective demands, resources and complexity associated with the Portfolio and other client accounts. The Trustees noted that, in some instances, the fee rates for those clients were lower than the management fee for the Portfolio and considered that, under the investment management and administration agreements with the Portfolio, Amundi US performs additional services for the Portfolio that it does not provide to those other clients or services that are broader in scope, including oversight of the Portfolio’s other service providers and activities related to compliance and the extensive regulatory and tax regimes to which the Portfolio is subject. The Trustees also considered the entrepreneurial risks associated with Amundi US’s management of the Portfolio.
The Trustees concluded that the management fee payable by the Portfolio to Amundi US was reasonable in relation to the nature and quality of the services provided by Amundi US.
Profitability
The Trustees considered information provided by Amundi US regarding the profitability of Amundi US with respect to the advisory services provided by Amundi US to the Portfolio, including the methodology used by Amundi US in allocating certain of its costs to the management of the Portfolio. The Trustees also considered Amundi US’s profit margin in connection with the overall operation of the Portfolio. They further reviewed the financial results, including the profit margins, realized by Amundi US from non-fund businesses. The Trustees considered Amundi US’s profit margins in comparison to the limited industry data available and noted that the profitability of any adviser was affected by numerous factors, including its organizational structure and method for allocating expenses. The Trustees concluded that Amundi US’s profitability with respect to the management of the Portfolio was not unreasonable.
Economies of Scale
The Trustees considered Amundi US’s views relating to economies of scale in connection with the Pioneer Funds as fund assets grow and the extent to which any such economies of scale are shared with the Portfolio and Portfolio shareholders. The Trustees recognize that economies of scale are difficult to identify and quantify, and that, among other factors that may be relevant, are the following: fee levels, expense subsidization, investment by Amundi US in research and analytical capabilities and Amundi US’s commitment and resource allocation to the Portfolio. The Trustees noted that profitability also may be an indicator of the availability of any economies of scale, although profitability may vary for other reasons including due to reductions in expenses. The Trustees concluded that economies of scale, if any, were being appropriately shared with the Portfolio.
Other Benefits
The Trustees considered the other benefits that Amundi US enjoys from its relationship with the Portfolio. The Trustees considered the character and amount of fees paid or to be paid by the Portfolio, other than under the investment management agreement, for services provided by Amundi US and its affiliates. The Trustees further considered the revenues and profitability of Amundi US’s businesses other than the fund business. To the extent applicable, the Trustees also considered the benefits to the Portfolio and to Amundi US and its affiliates from the use of “soft” commission dollars generated by the Portfolio to pay for research and brokerage services.
| Pioneer Bond VCT Portfolio | Pioneer Variable Contracts Trust |
The Trustees considered that Amundi US is the principal U.S. asset management business of Amundi, which is one of the largest asset managers globally. Amundi’s worldwide asset management business manages over $2.1 trillion in assets (including the Pioneer Funds). The Trustees considered that Amundi US’s relationship with Amundi creates potential opportunities for Amundi US and Amundi that derive from Amundi US’s relationships with the Portfolio, including Amundi’s ability to market the services of Amundi US globally. The Trustees noted that Amundi US has access to additional research and portfolio management capabilities as a result of its relationship with Amundi and Amundi’s enhanced global presence that may contribute to an increase in the resources available to Amundi US. The Trustees considered that Amundi US and the Portfolio receive reciprocal intangible benefits from the relationship, including mutual brand recognition and, for the Portfolio, direct and indirect access to the resources of a large global asset manager. The Trustees concluded that any such benefits received by Amundi US as a result of its relationship with the Portfolio were reasonable.
Conclusion
After consideration of the factors described above as well as other factors, the Trustees, including the Independent Trustees, concluded that the investment management agreement for the Portfolio, including the fees payable thereunder, was fair and reasonable and voted to approve the proposed renewal of the investment management agreement.
| Pioneer Bond VCT Portfolio | Pioneer Variable Contracts Trust |
Trustees, Officers and Service Providers
Trustees and Officers
The Portfolio’s Trustees and officers are listed below, together with their principal occupations and other directorships they have held during at least the past five years. Trustees who are interested persons of the Portfolios within the meaning of the 1940 Act are referred to as Interested Trustees. Trustees who are not interested persons of the Portfolio are referred to as Independent Trustees. Each of the Trustees serves as a Trustee of each of the 47 U.S. registered investment portfolios for which Amundi US serves as investment adviser (the “Pioneer Funds”). The address for all Trustees and all officers of the Portfolios is 60 State Street, Boston, Massachusetts 02109.
The Statement of Additional Information of the Portfolio includes additional information about the Trustees and is available, without charge, upon request, by calling 1-800-225-6292.
Investment Adviser and Administrator
Amundi Asset Management US, Inc.
Custodian and Sub-Administrator
The Bank of New York Mellon Corporation
Independent Registered Public Accounting Firm
Ernst & Young LLP
Principal Underwriter
Amundi Distributor US, Inc.
Legal Counsel
Morgan, Lewis & Bockius LLP
Transfer Agent
BNY Mellon Investment Servicing (US) Inc.
Name, Age and Position
Held With the Trust | Term of Office and
Length of Service | Principal Occupation(s) During At Least The Past Five Years | Other Directorships Held by Trustee During At Least The Past Five Years |
| Independent Trustees |
Thomas J. Perna (73)
Chairman of the Board
and Trustee | Trustee since 2006.
Serves until a successor
trustee is elected or
earlier retirement
or removal. | Private investor (2004 – 2008 and 2013 – present); Chairman (2008 – 2013) and Chief Executive Officer (2008 – 2012), Quadriserv, Inc. (technology products for securities lending industry); and Senior Executive Vice President, The Bank of New York (financial and securities services) (1986 – 2004) | Director, Broadridge Financial
Solutions, Inc. (investor
communications and securities
processing provider for financial
services industry) (2009 – present); Director, Quadriserv, Inc.
(2005 – 2013); and Commissioner,
New Jersey State Civil Service
Commission (2011 – 2015) |
John E. Baumgardner,
Jr. (72)*
Trustee | Trustee since 2019.
Serves until a successor
trustee is elected or
earlier retirement
or removal. | Of Counsel (2019 – present), Partner (1983-2018), Sullivan & Cromwell LLP (law firm). | Chairman, The Lakeville Journal
Company, LLC, (privately-held
community newspaper group)
(2015-present) |
| Pioneer Bond VCT Portfolio | Pioneer Variable Contracts Trust |
Name, Age and Position
Held With the Trust | Term of Office and
Length of Service | Principal Occupation(s) During At Least The Past Five Years | Other Directorships Held by Trustee During At Least The Past Five Years |
| Independent Trustees (continued) |
Diane Durnin (66)
Trustee | Trustee since 2019.
Serves until a successor
trustee is elected or
earlier retirement
or removal. | Managing Director - Head of Product Strategy and Development, BNY Mellon Investment Management (investment management firm) (2012-2018); Vice Chairman – The Dreyfus Corporation (2005 – 2018): Executive Vice President Head of Product, BNY Mellon Investment Management (2007-2012); Executive Director- Product Strategy, Mellon Asset Management (2005-2007); Executive Vice President Head of Products, Marketing and Client Service, Dreyfus Corporation (investment management firm) (2000-2005); Senior Vice President Strategic Product and Business Development, Dreyfus Corporation (1994-2000) | None |
Benjamin M. Friedman (79)
Trustee | Trustee since 2008.
Serves until a successor
trustee is elected or
earlier retirement
or removal. | William Joseph Maier Professor of Political Economy, Harvard University (1972 – present) | Trustee, Mellon Institutional Funds
Investment Trust and Mellon
Institutional Funds Master Portfolio
(oversaw 17 portfolios in fund
complex) (1989 - 2008) |
Craig C. MacKay (60)
Trustee | Trustee since 2021.
Serves until a successor
trustee is elected or
earlier retirement
or removal. | Partner, England & Company, LLC (advisory firm) (2012 – present); Group Head – Leveraged Finance Distribution, Oppenheimer & Company (investment bank) (2006 – 2012); Group Head – Private Finance & High Yield Capital Markets Origination, SunTrust Robinson Humphrey (investment bank) (2003 – 2006); and Founder and Chief Executive Officer, HNY Associates, LLC (investment bank) (1996 – 2003) | Director, Equitable Holdings, Inc. (financial services holding company) (2022 – present); Board Member of Carver Bancorp, Inc. (holding company) and Carver Federal Savings Bank, NA (2017 – present); Advisory Council Member, MasterShares ETF (2016 – 2017); Advisory Council Member, The Deal (financial market information publisher) (2015 – 2016); Board Co-Chairman and Chief Executive Officer, Danis Transportation Company (privately-owned commercial carrier) (2000 – 2003); Board Member and Chief Financial Officer, Customer Access Resources (privately-owned teleservices company) (1998 – 2000); Board Member, Federation of Protestant Welfare Agencies (human services agency) (1993 – present); and Board Treasurer, Harlem Dowling Westside Center (foster care agency) (1999 – 2018) |
Lorraine H. Monchak (67)
Trustee | Trustee since 2017.
(Advisory Trustee from
2014 - 2017). Serves
until a successor trustee
is elected or earlier
retirement or removal. | Chief Investment Officer, 1199 SEIU Funds (healthcare workers union pension funds) (2001 – present); Vice President – International Investments Group, American International Group, Inc. (insurance company) (1993 – 2001); Vice President – Corporate Finance and Treasury Group, Citibank, N.A. (1980 – 1986 and 1990 – 1993); Vice President – Asset/Liability Management Group, Federal Farm Funding Corporation (government-sponsored issuer of debt securities) (1988 – 1990); Mortgage Strategies Group, Shearson Lehman Hutton, Inc. (investment bank) (1987 – 1988); Mortgage Strategies Group, Drexel Burnham Lambert, Ltd. (investment bank) (1986 – 1987) | None |
| Pioneer Bond VCT Portfolio | Pioneer Variable Contracts Trust |
Trustees, Officers and Service Providers (continued)
Name, Age and Position
Held With the Trust | Term of Office and
Length of Service | Principal Occupation(s) During At Least The Past Five Years | Other Directorships Held by Trustee During At Least The Past Five Years |
| Independent Trustees (continued) |
Marguerite A. Piret (75)**
Trustee | Trustee since 1995.
Serves until a successor
trustee is elected or
earlier retirement
or removal. | Chief Financial Officer, American Ag Energy, Inc. (technology for the environment, energy and agriculture) (2019 – present); Chief Operating Officer, North Country Growers LLC (controlled environment agriculture company) (2020 – present); Chief Executive Officer, Green Heat LLC (biofuels company) (2022 – present); President and Chief Executive Officer, Newbury Piret Company (investment banking firm) (1981 – 2019) | Director of New America High
Income Fund, Inc. (closed-end
investment company) (2004 –
present); and Member, Board of
Governors, Investment Company
Institute (2000 – 2006) |
Fred J. Ricciardi (76)
Trustee | Trustee since 2014.
Serves until a successor
trustee is elected or
earlier retirement
or removal. | Private investor (2020 – present); Consultant (investment company services) (2012 – 2020); Executive Vice President, BNY Mellon (financial and investment company services) (1969 – 2012); Director, BNY International Financing Corp. (financial services) (2002 – 2012); Director, Mellon Overseas Investment Corp. (financial services) (2009 – 2012); Director, Financial Models (technology) (2005-2007); Director, BNY Hamilton Funds, Ireland (offshore investment companies) (2004-2007); Chairman/Director, AIB/BNY Securities Services, Ltd., Ireland (financial services) (1999-2006); Chairman, BNY Alternative Investment Services, Inc. (financial services) (2005-2007) | None |
* Mr. Baumgardner is Of Counsel to Sullivan & Cromwell LLP, which acts as counsel to the Independent Trustees of each Pioneer Fund.
** Ms. Piret became a non-voting Advisory Trustee of the Pioneer Funds effective January 22, 2024. |
| Interested Trustees |
Lisa M. Jones (61)***
Trustee, President and Chief
Executive Officer | Trustee since 2017. Serves
until a successor trustee is
elected or earlier retirement
or removal | Director, CEO and President of Amundi US, Inc. (investment management firm) (since September 2014); Director, CEO and President of Amundi Asset Management US, Inc. (since September 2014); Director, CEO and President of Amundi Distributor US, Inc. (since September 2014); Director, CEO and President of Amundi Asset Management US, Inc. (since September 2014); Chair, Amundi US, Inc., Amundi Distributor US, Inc. and Amundi Asset Management US, Inc. (September 2014 – 2018); Managing Director, Morgan Stanley Investment Management (investment management firm) (2010 – 2013); Director of Institutional Business, CEO of International, Eaton Vance Management (investment management firm) (2005 – 2010); Director of Amundi Holdings US, Inc. (since 2017) | Director of Clearwater Analytics (provider of web-based investment accounting software for reporting and reconciliation services) (September 2022 – present) |
Kenneth J. Taubes (64)***,****
Trustee | Trustee since 2014. Serves
until a successor trustee is
elected or earlier retirement
or removal | Director and Executive Vice President (since 2008) and Chief Investment Officer, U.S. (since 2010) of Amundi US, Inc. (investment management firm); Director and Executive Vice President and Chief Investment Officer, U.S. of Amundi US (since 2008); Executive Vice President and Chief Investment Officer, U.S. of Amundi Asset Management US, Inc. (since 2009); Portfolio Manager of Amundi US (since 1999); Director of Amundi Holdings US, Inc. (since 2017) | None |
| Pioneer Bond VCT Portfolio | Pioneer Variable Contracts Trust |
Name, Age and Position
Held With the Trust | Term of Office and
Length of Service | Principal Occupation(s) During At Least The Past Five Years | Other Directorships Held by Trustee During At Least The Past Five Years |
| Interested Trustees (continued) |
*** Ms. Jones and Mr. Taubes are Interested Trustees because they are officers or directors of the Portfolio’s investment adviser and certain of its affiliates.
**** Mr. Taubes retired as a Trustee, effective January 1, 2024. |
| Name, Age and Position Held With the Trust***** | Term of Office and
Length of Service | Principal Occupation(s) During
At Least The Past Five Years | Other Directorships Held by Trustee During At Least The Past Five Years |
| Trust Officers |
Christopher J. Kelley (59)
Secretary and Chief
Legal Officer | Since 2003. Serves at
the discretion of
the Board | Vice President and Associate General Counsel of Amundi US since January 2008; Secretary and Chief Legal Officer of all of the Pioneer Funds since June 2010; Assistant Secretary of all of the Pioneer Funds from September 2003 to May 2010; Vice President and Senior Counsel of Amundi US from July 2002 to December 2007 | None |
Thomas Reyes (61)
Assistant Secretary | Since 2010. Serves at
the discretion of
the Board | Assistant General Counsel of Amundi US since May 2013 and Assistant Secretary of all the Pioneer Funds since June 2010; Counsel of Amundi US from June 2007 to May 2013 | None |
Heather L. Melito-Dezan (47)
Assistant Secretary | Since 2022. Serves at
the discretion of
the Board | Director - Trustee and Board Relationships of Amundi US since September 2019; Assistant Secretary of Amundi US, Inc. since July 2020: Assistant Secretary of Amundi Asset Management US, Inc. since July 2020: Assistant Secretary of Amundi Distributor US, Inc. since July 2020; Assistant Secretary of all the Pioneer Funds since September 2022; Private practice from 2017 – 2019. | None |
Anthony J. Koenig, Jr. (60)
Treasurer and
Chief Financial and
Accounting Officer | Since 2021. Serves at
the discretion of
the Board | Managing Director, Chief Operations Officer and Fund Treasurer of Amundi US since May 2021; Treasurer of all of the Pioneer Funds since May 2021; Assistant Treasurer of all of the Pioneer Funds from January 2021 to May 2021; and Chief of Staff, US Investment Management of Amundi US from May 2008 to January 2021 | None |
Luis I. Presutti (58)
Assistant Treasurer | Since 2000. Serves at
the discretion of
the Board | Director – Fund Treasury of Amundi US since 1999; and Assistant Treasurer of all of the Pioneer Funds since 1999 | None |
Gary Sullivan (65)
Assistant Treasurer | Since 2002. Serves at
the discretion of
the Board | Senior Manager – Fund Treasury of Amundi US since 2012; and Assistant Treasurer of all of the Pioneer Funds since 2002 | None |
Antonio Furtado (41)
Assistant Treasurer | Since 2020. Serves at
the discretion of
the Board | Fund Oversight Manager – Fund Treasury of Amundi US since 2020; Assistant Treasurer of all of the Pioneer Funds since 2020; and Senior Fund Treasury Analyst from 2012 - 2020 | None |
| Pioneer Bond VCT Portfolio | Pioneer Variable Contracts Trust |
Trustees, Officers and Service Providers (continued)
| Name, Age and Position Held With the Trust***** | Term of Office and
Length of Service | Principal Occupation(s) During
At Least The Past Five Years | Other Directorships Held by Trustee During At Least The Past Five Years |
| Trust Officers (continued) |
Michael Melnick (52)
Assistant Treasurer | Since 2021. Serves at
the discretion of
the Board | Vice President - Deputy Fund Treasurer of Amundi US since May 2021; Assistant Treasurer of all of the Pioneer Funds since July 2021; Director of Regulatory Reporting of Amundi US from 2001 – 2021; and Director of Tax of Amundi US from 2000 - 2001 | None |
John Malone (53)
Chief Compliance Officer | Since 2018. Serves at
the discretion of
the Board | Managing Director, Chief Compliance Officer of Amundi US Asset Management; Amundi Asset Management US, Inc.; and the Pioneer Funds since September 2018; Chief Compliance Officer of Amundi Distributor US, Inc. since January 2014. | None |
Brandon Austin (51)
Anti-Money
Laundering Officer | Since 2022. Serves at
the discretion of
the Board | Director, Financial Security – Amundi Asset Management; Anti-Money Laundering Officer of all the Pioneer Funds since March 2022: Director of Financial Security of Amundi US since July 2021; Vice President, Head of BSA, AML and OFAC, Deputy Compliance Manager, Crédit Agricole Indosuez Wealth Management (investment management firm) (2013 – 2021) | None |
| ***** Marco Pirondini has been appointed to serve as an Executive Vice President of the Portfolio and Chief Investment Officer of Amundi US, Inc., effective January 1, 2024. |
Proxy Voting Policies and Procedures of the Portfolio are available without charge, upon request, by calling our toll free number (1-800-225-6292). Information regarding how the Portfolio voted proxies relating to Portfolio securities during the most recent 12-month period ended June 30 is publicly available to shareholders at www.amundi.com/us. This information is also available on the Securities and Exchange Commission’s web site at www.sec.gov.
Pioneer Variable Contracts Trust
Pioneer Equity Income
VCT Portfolio
Class I and II Shares
Annual Report | December 31, 2023
Please refer to your contract prospectus to determine the applicable share class offered under your contract.
Pioneer Variable Contracts Trust
Table of Contents
Pioneer Equity Income VCT Portfolio
This report is authorized for distribution only when preceded or accompanied by a prospectus for the Portfolio being offered.
Pioneer Variable Contracts Trust files a complete schedule of portfolio holdings with the Securities and Exchange Commission for the first and third quarters of each fiscal year as an exhibit to its reports on Form N-PORT. Shareholders may view the filed Form N-PORT by visiting the Commission’s web site at https://www.sec.gov.
| Pioneer Equity Income VCT Portfolio | Pioneer Variable Contracts Trust |
Portfolio Update 12/31/23
Sector Distribution
(As a percentage of total investments)*
5 Largest Holdings
| (As a percentage of total investments)* |
| 1. | Wells Fargo & Co. | 4.46% |
| 2. | Exxon Mobil Corp. | 4.40 |
| 3. | Johnson & Johnson | 3.95 |
| 4. | United Parcel Service, Inc. | 3.32 |
| 5. | Cisco Systems, Inc. | 3.04 |
| | |
| * | Excludes short-term investments and all derivative contracts except for options purchased. The Portfolio is actively managed, and current holdings may be different. The holdings listed should not be considered recommendations to buy or sell any securities. |
Performance Update 12/31/23
Prices and Distributions
| Net Asset Value per Share | 12/31/23 | 12/31/22 |
| Class l | $14.74 | $15.13 |
| Class ll | $15.08 | $15.45 |
| | | |
Distributions per Share
(1/1/23 - 12/31/23) | Net
Investment
Income | Short-Term
Capital Gains | Long-Term
Capital Gains |
| Class l | $0.2870 | $— | $1.1730 |
| Class ll | $0.2479 | $— | $1.1730 |
Performance of a $10,000 Investment
The following chart shows the change in value of an investment made in Class I and Class II shares of Pioneer Equity Income VCT Portfolio at net asset value during the periods shown, compared to that of the Russell 1000 Value Index. Portfolio returns are based on net asset value and do not reflect any applicable insurance fees or surrender charges.
 | The Russell 1000 Value Index is an unmanaged index that measures the performance of large-cap U.S. value stocks. Index returns are calculated monthly, assume reinvestment of dividends and do not reflect any fees, expenses or sales charges. It is not possible to invest directly in an index. |
Average Annual Total Returns
(As of December 31, 2023)
| | Class l | Class ll | Russell 1000
Value Index |
| 10 Years | 8.43% | 8.16% | 8.40% |
| 5 Years | 9.36% | 9.08% | 10.91% |
| 1 Year | 7.47% | 7.17% | 11.46% |
All total returns shown assume reinvestment of distributions at net asset value.
The performance table does not reflect the deduction of taxes that a shareholder would pay on distributions or the redemption of shares.
Call 1-800-225-6292 or visit www.amundi.com/us for the most recent month-end performance results. Current performance may be lower or higher than the performance data quoted.
The performance data quoted represents past performance, which is no guarantee of future results. Investment return and principal value will fluctuate, and shares, when redeemed, may be worth more or less than their original cost.
The returns for the Portfolio do not reflect the deduction of expenses associated with variable products, such as mortality and expense risk charges, separate account charges, and sales charges. These expenses would reduce the overall returns shown.
Performance results reflect any applicable expense waivers in effect during the periods shown. Without such waivers, performance would be lower. Waivers may not be in effect for all portfolios. Certain fee waivers are contractual through a specified period. Otherwise, fee waivers can be rescinded at any time. See the prospectus and financial statements for more information.
| Pioneer Equity Income VCT Portfolio | Pioneer Variable Contracts Trust |
Comparing Ongoing Portfolio Expenses
As a shareholder in the Portfolio, you incur two types of costs:
| (1) | ongoing costs, including management fees, distribution and/or service (12b-1) fees, and other Portfolio expenses; and |
| (2) | transaction costs, including sales charges (loads) on purchase payments. |
This example is intended to help you understand your ongoing expenses (in dollars) of investing in the Portfolio and to compare these costs with the ongoing costs of investing in other mutual funds offered through your variable annuity contract. The example is based on an investment of $1,000 at the beginning of the Portfolio’s latest six-month period and held throughout the six months.
Using the Tables
Actual Expenses
The first table below provides information about actual account values and actual expenses. You may use the information in this table, together with the amount you invested, to estimate the expenses that you paid over the period as follows:
| (1) | Divide your account value by $1,000
Example: an $8,600 account value ÷ $1,000 = 8.6 |
| (2) | Multiply the result in (1) above by the corresponding share class’s number in the third row under the heading entitled “Expenses Paid During Period” to estimate the expenses you paid on your account during this period. |
Expenses Paid on a $1,000 Investment in Pioneer Equity Income VCT Portfolio
Based on actual returns from July 1, 2023 through December 31, 2023.
| Share Class | l | ll |
| Beginning Account Value on 7/1/23 | $1,000.00 | $1,000.00 |
| Ending Account Value (after expenses) on 12/31/23 | $1,037.60 | $1,036.10 |
| Expenses Paid During Period* | $ 4.26 | $ 5.54 |
| | |
| * | Expenses are equal to the Portfolio’s annualized net expense ratio of 0.83% and 1.08% for Class I and Class II shares, respectively, multiplied by the average account value over the period, multiplied by 184/365 (to reflect the one-half year period). |
Hypothetical Example for Comparison Purposes
The table below provides information about hypothetical account values and hypothetical expenses based on the Portfolio’s actual expense ratio and an assumed rate of return of 5% per year before expenses, which is not the Portfolio’s actual return. The hypothetical account values and expenses may not be used to estimate the actual ending account balance or expenses you paid for the period.
You may use this information to compare the ongoing costs of investing in the Portfolio and other variable annuities. To do so, compare this 5% hypothetical example with the 5% hypothetical examples that appear in the shareholder reports of the other variable annuities.
Please note that the expenses shown in the tables are meant to highlight your ongoing costs only and do not reflect any transaction costs, such as sales charges (loads) that are charged at the time of the transaction. Therefore, the table below is useful in comparing ongoing costs only and will not help you determine the relative total costs of owning different variable annuities. In addition, if these transaction costs were included, your costs would have been higher.
Expenses Paid on a $1,000 Investment in Pioneer Equity Income VCT Portfolio
Based on a hypothetical 5% return per year before expenses, reflecting the period from July 1, 2023 through December 31, 2023.
| Share Class | l | ll |
| Beginning Account Value on 7/1/23 | $1,000.00 | $1,000.00 |
| Ending Account Value (after expenses) on 12/31/23 | $1,021.02 | $1,019.76 |
| Expenses Paid During Period* | $ 4.23 | $ 5.50 |
| | |
| * | Expenses are equal to the Portfolio’s annualized net expense ratio of 0.83% and 1.08% for Class I and Class II shares, respectively, multiplied by the average account value over the period, multiplied by 184/365 (to reflect the one-half year period). |
| Pioneer Equity Income VCT Portfolio | Pioneer Variable Contracts Trust |
Portfolio Management Discussion 12/31/23
Call 1-800-225-6292 or visit www.amundi.com/us for the most recent month-end performance results. Current performance may be lower or higher than the performance data quoted.
The performance data quoted represents past performance, which is no guarantee of future results. Investment return and principal value will fluctuate, and shares, when redeemed, may be worth more or less than their original cost.
The returns for the Portfolio do not reflect the deduction of expenses associated with variable products, such as mortality and expense risk charges, separate account charges, and sales charges. These expenses would reduce the overall returns shown.
Performance results reflect any applicable expense waivers in effect during the periods shown. Without such waivers, performance would be lower. Waivers may not be in effect for all portfolios. Certain fee waivers are contractual through a specified period. Otherwise, fee waivers can be rescinded at any time. See the prospectus and financial statements for more information.
* Note to shareholders: John A. Carey will retire from portfolio management effective in May 2024. He remains a member of the Fund's current portfolio management team. In addition, effective May 24, 2023, John Arege became a portfolio manager of the Fund.
In the following interview, John Carey*, Sammi Truong, and John Arege discuss the factors that affected the performance of Pioneer Equity Income VCT Portfolio during the 12-month period ended December 31, 2023. Mr. Carey, Managing Director, Director of Equity Income, US, and a portfolio manager at Amundi Asset Management US, Inc. (Amundi US), is responsible for the day-to-day management of the Portfolio, along with Ms. Truong, a vice president and a portfolio manager at Amundi US, and John Arege, a vice president and portfolio manager at Amundi US.
| Q: | How did the Portfolio perform during the 12-month period ended December 31, 2023? |
| A: | Pioneer Equity Income VCT Portfolio’s Class I shares returned 7.47% at net asset value during the 12-month period ended December 31, 2023 and Class II shares returned 7.17%, while the Portfolio’s benchmark, Russell 1000 Value Index (the Russell Index) returned 11.46%. |
| Q: | Which of your investment decisions had the greatest effects on the Portfolio’s benchmark-relative performance during the 12-month period ended December 31, 2023? |
| A: | The Portfolio underperformed the Russell Index over the 12 months ended December 31, 2023, mainly due to unfavorable stock selection results in the communications services and industrials sectors. Positive stock selection results in the materials and consumer discretionary sectors were not enough to offset headwinds from stock selections in those other sectors. |
| | With regard to individual securities, detractors from the Portfolio’s benchmark-relative returns for the period included not owning Meta Platforms (formerly Facebook), and Alexandria Real Estate Equities. |
| | In the communications services sector, not owning Meta was a significant detractor from benchmark-relative performance for the period. Meta was reclassified as a value stock in 2022 and was present in the benchmark up to the June 2023 Russell Index rebalance. The stock performed well during that period and generated significant negative attribution. We did not own Meta due to it being a non-dividend paying high-growth stock. |
| | Alexandria Real Estate Equities is a real estate investment trust that develops and operates office buildings and laboratories spaces. Alexandria's shares were down despite reporting strong leasing volume due to concerns about rising interest rates impacting its cost of capital and decreased demand for lab spaces from biotech companies. We continue to hold Alexandria Real Estate given its clusters of high-quality life science spaces, management expertise, and diverse tenant base. |
| | On the positive side, the Portfolio's positions in Microsoft and Reliance Steel & Aluminum benefited the Portfolio’s relative returns during the period. Microsoft, a provider of software and cloud services, was the top attributor for the period. Towards the end of 2023, the company reported better than expected growth in its cloud business and saw strong bookings for its commercial Office 365 products. We believe Microsoft can continue to benefit from cloud and hybrid cloud adoptions given its scale and suite of offerings. |
| | Reliance Steel & Aluminum, a company that provides metals processing services and distribution, was among the top contributors for the period. The company saw healthy demand across many of its end-markets and has demonstrated strong operational execution as it managed through supply |
| Pioneer Equity Income VCT Portfolio | Pioneer Variable Contracts Trust |
A Word About Risk:
All investments are subject to risk, including the possible loss of principal. In the past several years, financial markets have experienced increased volatility and heightened uncertainty. The market prices of securities may go up or down, sometimes rapidly or unpredictably, due to general market conditions, such as real or perceived adverse economic, political, or regulatory conditions, recessions, inflation, changes in interest or currency rates, lack of liquidity in the bond markets, the spread of infectious illness or other public health issues, armed conflict including Russia's military invasion of Ukraine, sanctions against Russia, other nations or individuals or companies and possible countermeasures, market disruptions caused by tariffs, trade disputes or other government actions, or adverse investor sentiment. These conditions may continue, recur, worsen or spread.
Investing in foreign and/or emerging markets securities involves risks relating to interest rates, currency exchange rates, economic, social and political conditions, which could increase volatility. These risks are magnified in emerging markets.
The Portfolio invests in REIT securities, the value of which can fall for a variety of reasons, such as declines in rental income, fluctuating interest rates, poor property management, environmental liabilities, uninsured damage, increased competition, or changes in real estate tax laws. At times, the Portfolio’s investments may represent industries or industry sectors that are interrelated or have common risks, making the Portfolio more susceptible to any economic, political, or regulatory developments or other risks affecting those industries and sectors.
These risks may increase share price volatility.
| | chain disruptions and improved margins with increased value-added processing. Reliance Steel has increased its dividend* for 13 consecutive years. |
| Q: | Did the Portfolio have any exposure to derivative securities during the 12 month period that ended December 31, 2023? |
| A: | No, the Portfolio had no exposure to derivatives during the period. |
| Q: | What’s your investment outlook as the Portfolio enters a new fiscal year? |
| A: | As we look ahead, we believe the recent dislocations in the regional banking sector could cause further tightening in financial conditions over the coming months, as banks tighten their lending standards to preserve liquidity. We tend to agree with what has emerged as a consensus opinion, namely that interest rates and inflation have both, for now, peaked and may drift down over the next year. |
| | On the other hand, the extent to which the peaking may be attributable to a softer economy is a subject of debate. The answer to that could have significant meaning for corporate earnings and potentially share price performance in the coming year. Despite a strong but highly volatile 2023 for equities, particularly for growth stocks, we remain cautious that the rebound may be little more than a bear market rally driven by the more speculative parts of the market, and by the recent resurgence in the share prices of mega-cap technology stocks. A mild recession, in our view, is more likely than a “soft landing.” While expectations are for market volatility to remain high over the coming months, we believe the market may look forward to an earnings recovery in 2024 and end the year higher than where it started. |
| | The Portfolio currently has benchmark-relative overweight exposures to the cyclical sectors that we expect to do well during an economic recovery, including the consumer discretionary, energy, and financials sectors. To balance the Portfolio’s cyclical positioning, given the uncertain trajectory of the economic recovery, we also have maintained Portfolio exposures to the more defensive areas of the market, such as the consumer staples sector. |
Please refer to the Schedule of Investments on pages 6 - 9 for a full listing of Portfolio securities.
Past performance is no guarantee of future results.
Any information in this shareholder report regarding market or economic trends or the factors influencing the Portfolio’s historical or future performance are statements of opinion as of the date of this report.
| * | Dividends are not guaranteed. |
| Pioneer Equity Income VCT Portfolio | Pioneer Variable Contracts Trust |
Schedule of Investments 12/31/23
| Shares | | | | | | Value |
| | UNAFFILIATED ISSUERS — 99.2% | |
| | Common Stocks — 98.4% of Net Assets | |
| | Air Freight & Logistics — 3.3% | |
| 16,720 | United Parcel Service, Inc., Class B | $ 2,628,886 |
| | Total Air Freight & Logistics | $ 2,628,886 |
| | Automobile Components — 1.8% | |
| 13,122 | Autoliv, Inc. | $ 1,445,913 |
| | Total Automobile Components | $ 1,445,913 |
| | Automobiles — 1.1% | |
| 75,207 | Ford Motor Co. | $ 916,773 |
| | Total Automobiles | $ 916,773 |
| | Banks — 12.3% | |
| 42,740 | Bank of America Corp. | $ 1,439,056 |
| 9,941 | JPMorgan Chase & Co. | 1,690,964 |
| 11,285 | PNC Financial Services Group, Inc. | 1,747,482 |
| 41,153 | Truist Financial Corp. | 1,519,369 |
| 71,896 | Wells Fargo & Co. | 3,538,721 |
| | Total Banks | $ 9,935,592 |
| | Broadline Retail — 2.0% | |
| 36,178 | eBay, Inc. | $ 1,578,084 |
| | Total Broadline Retail | $ 1,578,084 |
| | Capital Markets — 8.2% | |
| 15,217 | Morgan Stanley | $ 1,418,985 |
| 20,812 | Northern Trust Corp. | 1,756,117 |
| 13,327 | Raymond James Financial, Inc. | 1,485,961 |
| 18,840 | State Street Corp. | 1,459,346 |
| 4,621 | T Rowe Price Group, Inc. | 497,635 |
| | Total Capital Markets | $ 6,618,044 |
| | Chemicals — 2.1% | |
| 18,051 | LyondellBasell Industries NV, Class A | $ 1,716,289 |
| | Total Chemicals | $ 1,716,289 |
| | Communications Equipment — 3.0% | |
| 47,761 | Cisco Systems, Inc. | $ 2,412,886 |
| | Total Communications Equipment | $ 2,412,886 |
| | Consumer Staples Distribution & Retail — 1.7% | |
| 9,817 | Target Corp. | $ 1,398,137 |
| | Total Consumer Staples Distribution & Retail | $ 1,398,137 |
| | Electric Utilities — 1.5% | |
| 20,136 | Xcel Energy, Inc. | $ 1,246,620 |
| | Total Electric Utilities | $ 1,246,620 |
| | Entertainment — 2.2% | |
| 19,837 | Walt Disney Co. | $ 1,791,083 |
| | Total Entertainment | $ 1,791,083 |
| | Food Products — 5.2% | |
| 5,320 | Hershey Co. | $ 991,861 |
| 5,307 | John B Sanfilippo & Son, Inc. | 546,833 |
6
The accompanying notes are an integral part of these financial statements.
| Pioneer Equity Income VCT Portfolio | Pioneer Variable Contracts Trust |
| Shares | | | | | | Value |
| | Food Products — (continued) | |
| 18,246 | Kellanova | $ 1,020,134 |
| 22,056 | Mondelez International, Inc., Class A | 1,597,516 |
| | Total Food Products | $ 4,156,344 |
| | Ground Transportation — 1.4% | |
| 4,637 | Union Pacific Corp. | $ 1,138,940 |
| | Total Ground Transportation | $ 1,138,940 |
| | Health Care Equipment & Supplies — 3.7% | |
| 3,287 | Becton Dickinson & Co. | $ 801,469 |
| 11,836 | Medtronic Plc | 975,050 |
| 4,014 | Stryker Corp. | 1,202,032 |
| | Total Health Care Equipment & Supplies | $ 2,978,551 |
| | Health Care Providers & Services — 1.3% | |
| 10,397 | Cardinal Health, Inc. | $ 1,048,018 |
| | Total Health Care Providers & Services | $ 1,048,018 |
| | Industrial REITs — 1.1% | |
| 6,412 | Prologis, Inc. | $ 854,720 |
| | Total Industrial REITs | $ 854,720 |
| | Insurance — 2.8% | |
| 15,846 | American International Group, Inc. | $ 1,073,566 |
| 23,174 | Sun Life Financial, Inc. | 1,201,804 |
| | Total Insurance | $ 2,275,370 |
| | IT Services — 2.0% | |
| 9,766 | International Business Machines Corp. | $ 1,597,229 |
| | Total IT Services | $ 1,597,229 |
| | Machinery — 5.5% | |
| 4,333 | Deere & Co. | $ 1,732,637 |
| 45,132 | Gorman-Rupp Co. | 1,603,540 |
| 9,785 | Oshkosh Corp. | 1,060,792 |
| | Total Machinery | $ 4,396,969 |
| | Media — 2.9% | |
| 18,902 | Comcast Corp., Class A | $ 828,853 |
| 22,926 | Fox Corp., Class A | 680,214 |
| 24,537 | Interpublic Group of Cos., Inc. | 800,888 |
| | Total Media | $ 2,309,955 |
| | Metals & Mining — 3.4% | |
| 8,482 | Materion Corp. | $ 1,103,763 |
| 19,974 | Newmont Corp. | 826,724 |
| 2,830 | Reliance Steel & Aluminum Co. | 791,494 |
| | Total Metals & Mining | $ 2,721,981 |
| | Multi-Utilities — 1.5% | |
| 21,198 | CMS Energy Corp. | $ 1,230,968 |
| | Total Multi-Utilities | $ 1,230,968 |
| | Office REITs — 0.5% | |
| 3,292 | Alexandria Real Estate Equities, Inc. | $ 417,327 |
| | Total Office REITs | $ 417,327 |
The accompanying notes are an integral part of these financial statements.
7
| Pioneer Equity Income VCT Portfolio | Pioneer Variable Contracts Trust |
Schedule of Investments 12/31/23 (continued)
| Shares | | | | | | Value |
| | Oil, Gas & Consumable Fuels — 10.0% | |
| 5,525 | Chevron Corp. | $ 824,109 |
| 80,997 | Coterra Energy, Inc. | 2,067,043 |
| 34,886 | Exxon Mobil Corp. | 3,487,902 |
| 3,108 | Phillips 66 | 413,799 |
| 19,007 | Shell Plc (A.D.R.) | 1,250,661 |
| | Total Oil, Gas & Consumable Fuels | $ 8,043,514 |
| | Pharmaceuticals — 8.5% | |
| 20,001 | Johnson & Johnson | $ 3,134,957 |
| 13,105 | Merck & Co., Inc. | 1,428,707 |
| 26,268 | Pfizer, Inc. | 756,255 |
| 31,623 | Sanofi S.A. (A.D.R.) | 1,572,612 |
| | Total Pharmaceuticals | $ 6,892,531 |
| | Residential REITs — 1.0% | |
| 8,129 | Camden Property Trust | $ 807,128 |
| | Total Residential REITs | $ 807,128 |
| | Semiconductors & Semiconductor Equipment — 1.9% | |
| 2,532 | Analog Devices, Inc. | $ 502,754 |
| 11,051 | Microchip Technology, Inc. | 996,579 |
| | Total Semiconductors & Semiconductor Equipment | $ 1,499,333 |
| | Specialized REITs — 1.8% | |
| 2,527 | American Tower Corp. | $ 545,529 |
| 6,596 | Digital Realty Trust, Inc. | 887,689 |
| | Total Specialized REITs | $ 1,433,218 |
| | Specialty Retail — 2.8% | |
| 4,810 | Lowe's Cos., Inc. | $ 1,070,466 |
| 13,042 | TJX Cos., Inc. | 1,223,470 |
| | Total Specialty Retail | $ 2,293,936 |
| | Textiles, Apparel & Luxury Goods — 0.7% | |
| 3,793 | Ralph Lauren Corp. | $ 546,951 |
| | Total Textiles, Apparel & Luxury Goods | $ 546,951 |
| | Trading Companies & Distributors — 1.2% | |
| 4,872 | Ferguson Plc | $ 940,637 |
| | Total Trading Companies & Distributors | $ 940,637 |
| | Total Common Stocks
(Cost $64,580,675) | $79,271,927 |
|
| |
8
The accompanying notes are an integral part of these financial statements.
| Pioneer Equity Income VCT Portfolio | Pioneer Variable Contracts Trust |
| Shares | | | | | | Value |
|
| | SHORT TERM INVESTMENTS — 0.8% of Net Assets | |
| | Open-End Fund — 0.8% | |
| 656,139(a) | Dreyfus Government Cash Management,
Institutional Shares, 5.25% | $ 656,139 |
| | | | | | | $ 656,139 |
| | TOTAL SHORT TERM INVESTMENTS
(Cost $656,139) | $ 656,139 |
| | TOTAL INVESTMENTS IN UNAFFILIATED ISSUERS — 99.2%
(Cost $65,236,814) | $79,928,066 |
| | OTHER ASSETS AND LIABILITIES — 0.8% | $ 629,467 |
| | net assets — 100.0% | $ 80,557,533 |
| | | | | | | |
| (A.D.R.) | American Depositary Receipts. |
| REIT | Real Estate Investment Trust. |
| (a) | Rate periodically changes. Rate disclosed is the 7-day yield at December 31, 2023. |
Purchases and sales of securities (excluding short-term investments) for the year ended December 31, 2023, aggregated $68,300,476 and $87,374,086, respectively.
At December 31, 2023, the net unrealized appreciation on investments based on cost for federal tax purposes of $65,399,853 was as follows:
| Aggregate gross unrealized appreciation for all investments in which there is an excess of value over tax cost | $$14,931,145 |
| Aggregate gross unrealized depreciation for all investments in which there is an excess of tax cost over value | (402,932) |
| Net unrealized appreciation | $ 14,528,213 |
Various inputs are used in determining the value of the Portfolio's investments. These inputs are summarized in the three broad levels below.
| Level 1 | – | unadjusted quoted prices in active markets for identical securities. |
| Level 2 | – | other significant observable inputs (including quoted prices for similar securities, interest rates, prepayment speeds, credit risks, etc.). See Notes to Financial Statements — Note 1A. |
| Level 3 | – | significant unobservable inputs (including the Adviser's own assumptions in determining fair value of investments). See Notes to Financial Statements — Note 1A. |
The following is a summary of the inputs used as of December 31, 2023 in valuing the Portfolio's investments:
| | Level 1 | Level 2 | Level 3 | Total |
| Common Stocks | $79,271,927 | $ — | $ — | $79,271,927 |
| Open-End Fund | 656,139 | — | — | 656,139 |
| Total Investments in Securities | $ 79,928,066 | $— | $— | $ 79,928,066 |
During the year ended December 31, 2023, there were no transfers in or out of Level 3.
The accompanying notes are an integral part of these financial statements.
9
| Pioneer Equity Income VCT Portfolio | Pioneer Variable Contracts Trust |
Statement of Assets and Liabilities 12/31/23
| ASSETS: | |
| Investments in unaffiliated issuers, at value (cost $65,236,814) | $79,928,066 |
| Cash | 15,702 |
| Receivables — | |
| Investment securities sold | 506,006 |
| Portfolio shares sold | 26,003 |
| Dividends | 163,284 |
| Interest | 5,382 |
| Total assets | $ 80,644,443 |
| LIABILITIES: | |
| Payables — | |
| Portfolio shares repurchased | $11,026 |
| Trustees' fees | 106 |
| Professional fees | 56,386 |
| Printing expense | 7,505 |
| Management fees | 7,195 |
| Administrative expenses | 3,312 |
| Distribution fees | 862 |
| Accrued expenses | 518 |
| Total liabilities | $ 86,910 |
| NET ASSETS: | |
| Paid-in capital | $51,079,269 |
| Distributable earnings | 29,478,264 |
| Net assets | $ 80,557,533 |
| NET ASSET VALUE PER SHARE: | |
| No par value (unlimited number of shares authorized) | |
| Class l (based on $55,500,471/3,766,268 shares) | $ 14.74 |
| Class ll (based on $25,057,062/1,662,135 shares) | $ 15.08 |
10
The accompanying notes are an integral part of these financial statements.
| Pioneer Equity Income VCT Portfolio | Pioneer Variable Contracts Trust |
FOR THE YEAR ENDED 12/31/23
| INVESTMENT INCOME: | | | |
| Dividends from unaffiliated issuers (net of foreign taxes withheld $27,720) | $ 2,280,309 | | |
| Interest from unaffiliated issuers | 206 | | |
| Total Investment Income | | | $ 2,280,515 |
| EXPENSES: | | | |
| Management fees | $ 553,612 | | |
| Administrative expenses | 30,527 | | |
| Distribution fees | | | |
| Class ll | 63,729 | | |
| Custodian fees | 873 | | |
| Professional fees | 66,255 | | |
| Printing expense | 13,205 | | |
| Officers' and Trustees' fees | 8,360 | | |
| Insurance expense | 1,640 | | |
| Miscellaneous | 32,468 | | |
| Total expenses | | | $ 770,669 |
| Net investment income | | | $ 1,509,846 |
| REALIZED AND UNREALIZED GAIN (LOSS) ON INVESTMENTS: | | | |
| Net realized gain (loss) on: | | | |
| Investments in unaffiliated issuers | $ 14,867,777 | | |
| Other assets and liabilities denominated in foreign currencies | (20,004) | | $ 14,847,773 |
| Change in net unrealized appreciation (depreciation) on: | | | |
| Investments in unaffiliated issuers | $(10,565,196) | | |
| Other assets and liabilities denominated in foreign currencies | 19,448 | | $(10,545,748) |
| Net realized and unrealized gain (loss) on investments | | | $ 4,302,025 |
| Net increase in net assets resulting from operations | | | $ 5,811,871 |
The accompanying notes are an integral part of these financial statements.
11
| Pioneer Equity Income VCT Portfolio | Pioneer Variable Contracts Trust |
Statements of Changes in Net Assets
| | Year
Ended
12/31/23 | | Year
Ended
12/31/22 |
| FROM OPERATIONS: | | | |
| Net investment income (loss) | $ 1,509,846 | | $ 1,689,217 |
| Net realized gain (loss) on investments | 14,847,773 | | 6,517,308 |
| Change in net unrealized appreciation (depreciation) on investments | (10,545,748) | | (17,740,394) |
| Net increase (decrease) in net assets resulting from operations | $ 5,811,871 | | $ (9,533,869) |
| DISTRIBUTIONS TO SHAREHOLDERS: | | | |
| Class l ($1.46 and $2.40 per share, respectively) | $ (5,431,208) | | $ (10,026,418) |
| Class ll ($1.42 and $2.36 per share, respectively) | (2,349,813) | | (3,821,892) |
| Total distributions to shareholders | $ (7,781,021) | | $ (13,848,310) |
| FROM PORTFOLIO SHARE TRANSACTIONS: | | | |
| Net proceeds from sales of shares | $ 4,859,657 | | $ 9,801,229 |
| Reinvestment of distributions | 7,781,021 | | 13,848,310 |
| Cost of shares repurchased | (24,905,859) | | (26,780,325) |
| Net decrease in net assets resulting from Portfolio share transactions | $ (12,265,181) | | $ (3,130,786) |
| Net decrease in net assets | $(14,234,331) | | $ (26,512,965) |
| NET ASSETS: | | | |
| Beginning of year | $ 94,791,864 | | $121,304,829 |
| End of year | $ 80,557,533 | | $ 94,791,864 |
| | Year
Ended
12/31/23
Shares | | Year
Ended
12/31/23
Amount | | Year
Ended
12/31/22
Shares | | Year
Ended
12/31/22
Amount |
| Class l | | | | | | | |
| Shares sold | 90,347 | | $ 1,327,721 | | 128,852 | | $ 2,047,759 |
| Reinvestment of distributions | 378,100 | | 5,431,208 | | 706,472 | | 10,026,418 |
| Less shares repurchased | (1,172,209) | | (17,491,122) | | (897,603) | | (14,759,856) |
| Net decrease | (703,762) | | $(10,732,193) | | (62,279) | | $ (2,685,679) |
| Class ll | | | | | | | |
| Shares sold | 242,903 | | $ 3,531,936 | | 425,966 | | $ 7,753,470 |
| Reinvestment of distributions | 160,073 | | 2,349,813 | | 264,207 | | 3,821,892 |
| Less shares repurchased | (497,677) | | (7,414,737) | | (685,759) | | (12,020,469) |
Net increase
(decrease) | (94,701) | | $ (1,532,988) | | 4,414 | | $ (445,107) |
12
The accompanying notes are an integral part of these financial statements.
| Pioneer Equity Income VCT Portfolio | Pioneer Variable Contracts Trust |
| | Year Ended
12/31/23 | | Year Ended
12/31/22 | | Year Ended
12/31/21 | | Year Ended
12/31/20 | | Year Ended
12/31/19 |
| Class l | | | | | | | | | |
| Net asset value, beginning of period | $ 15.13 | | $ 19.21 | | $ 15.51 | | $ 16.65 | | $ 23.41 |
| Increase (decrease) from investment operations: | | | | | | | | | |
| Net investment income (loss)(a) | 0.27 | | 0.28 | | 0.28 | | 0.28 | | 0.42 |
| Net realized and unrealized gain (loss) on investments | 0.80 | | (1.96) | | 3.68 | | (0.46) | | 4.45 |
| Net increase (decrease) from investment operations | $ 1.07 | | $ (1.68) | | $ 3.96 | | $ (0.18) | | $ 4.87 |
| Distributions to shareholders: | | | | | | | | | |
| Net investment income | (0.29) | | (0.30) | | (0.26) | | (0.39) | | (0.56) |
| Net realized gain | (1.17) | | (2.10) | | — | | (0.57) | | (11.07) |
| Total distributions | $ (1.46) | | $ (2.40) | | $ (0.26) | | $ (0.96) | | $ (11.63) |
| Net increase (decrease) in net asset value | $ (0.39) | | $ (4.08) | | $ 3.70 | | $ (1.14) | | $ (6.76) |
| Net asset value, end of period | $ 14.74 | | $ 15.13 | | $ 19.21 | | $ 15.51 | | $ 16.65 |
| Total return(b) | 7.47% | | (7.76)% | | 25.70% | | (0.04)% | | 25.56% |
| Ratio of net expenses to average net assets | 0.83% | | 0.78% | | 0.80% | | 0.80% | | 0.79% |
| Ratio of net investment income (loss) to average net assets | 1.84% | | 1.70% | | 1.59% | | 1.95% | | 2.18% |
| Portfolio turnover rate | 81% | | 36% | | 28% | | 14% | | 21% |
| Net assets, end of period (in thousands) | $55,500 | | $67,651 | | $87,047 | | $75,613 | | $89,623 |
| | |
| (a) | The per-share data presented above is based on the average shares outstanding for the period presented. |
| (b) | Assumes initial investment at net asset value at the beginning of each period, reinvestment of all distributions and the complete redemption of the investment at net asset value at the end of each period. |
NOTE: The above financial highlights do not reflect the deduction of non-portfolio expenses associated with variable insurance products, such as mortality and expense risk charges, separate account charges, and sales charges.
The accompanying notes are an integral part of these financial statements.
13
| Pioneer Equity Income VCT Portfolio | Pioneer Variable Contracts Trust |
Financial Highlights (continued)
| | Year Ended
12/31/23 | | Year Ended
12/31/22 | | Year Ended
12/31/21 | | Year Ended
12/31/20 | | Year Ended
12/31/19 |
| Class ll | | | | | | | | | |
| Net asset value, beginning of period | $ 15.45 | | $ 19.55 | | $ 15.79 | | $ 16.92 | | $ 23.62 |
| Increase (decrease) from investment operations: | | | | | | | | | |
| Net investment income (loss)(a) | 0.24 | | 0.24 | | 0.24 | | 0.25 | | 0.38 |
| Net realized and unrealized gain (loss) on investments | 0.81 | | (1.98) | | 3.74 | | (0.46) | | 4.49 |
| Net increase (decrease) from investment operations | $ 1.05 | | $ (1.74) | | $ 3.98 | | $ (0.21) | | $ 4.87 |
| Distributions to shareholders: | | | | | | | | | |
| Net investment income | (0.25) | | (0.26) | | (0.22) | | (0.35) | | (0.50) |
| Net realized gain | (1.17) | | (2.10) | | — | | (0.57) | | (11.07) |
| Total distributions | $ (1.42) | | $ (2.36) | | $ (0.22) | | $ (0.92) | | $ (11.57) |
| Net increase (decrease) in net asset value | $ (0.37) | | $ (4.10) | | $ 3.76 | | $ (1.13) | | $ (6.70) |
| Net asset value, end of period | $ 15.08 | | $ 15.45 | | $ 19.55 | | $ 15.79 | | $ 16.92 |
| Total return(b) | 7.17% | | (7.94)% | | 25.33% | | (0.26)% | | 25.23% |
| Ratio of net expenses to average net assets | 1.08% | | 1.03% | | 1.05% | | 1.05% | | 1.04% |
| Ratio of net investment income (loss) to average net assets | 1.61% | | 1.45% | | 1.35% | | 1.70% | | 1.93% |
| Portfolio turnover rate | 81% | | 36% | | 28% | | 14% | | 21% |
| Net assets, end of period (in thousands) | $25,057 | | $27,141 | | $34,258 | | $34,723 | | $38,908 |
| | |
| (a) | The per-share data presented above is based on the average shares outstanding for the period presented. |
| (b) | Assumes initial investment at net asset value at the beginning of each period, reinvestment of all distributions, the complete redemption of the investment at net asset value at the end of each period and no sales charges. Total return would be reduced if sales charges were taken into account. |
NOTE: The above financial highlights do not reflect the deduction of non-portfolio expenses associated with variable insurance products, such as mortality and expense risk charges, separate account charges, and sales charges.
14
The accompanying notes are an integral part of these financial statements.
| Pioneer Equity Income VCT Portfolio | Pioneer Variable Contracts Trust |
Notes to Financial Statements 12/31/23
1. Organization and Significant Accounting Policies
Pioneer Equity Income VCT Portfolio (the “Portfolio”) is one of 7 portfolios comprising Pioneer Variable Contracts Trust (the “Trust”), a Delaware statutory trust. The Portfolio is registered under the Investment Company Act of 1940, as amended (the "1940 Act") as a diversified, open-end management investment company. The investment objectives of the Portfolio are current income and long-term growth of capital from a portfolio consisting primarily of income producing equity securities of U.S. corporations.
The Portfolio offers two classes of shares designated as Class I and Class II shares. Each class of shares represents an interest in the same schedule of investments of the Portfolio and has identical rights (based on relative net asset values) to assets and liquidation proceeds. Share classes can bear different rates of class-specific fees and expenses such as transfer agent and distribution fees. Differences in class-specific fees and expenses will result in differences in net investment income and, therefore, the payment of different dividends from net investment income earned by each class. The Amended and Restated Declaration of Trust of the Trust gives the Board of Trustees the flexibility to specify either per-share voting or dollar-weighted voting when submitting matters for shareholder approval. Under per-share voting, each share of a class of the Portfolio is entitled to one vote. Under dollar-weighted voting, a shareholder’s voting power is determined not by the number of shares owned, but by the dollar value of the shares on the record date. Each share class has exclusive voting rights with respect to matters affecting only that class, including with respect to the distribution plan for that class. There is no distribution plan for Class I shares.
Portfolio shares may be purchased only by insurance companies for the purpose of funding variable annuity and variable life insurance contracts or by qualified pension and retirement plans.
Amundi Asset Management US, Inc., an indirect, wholly owned subsidiary of Amundi and Amundi’s wholly owned subsidiary, Amundi USA, Inc., serves as the Portfolio’s investment adviser (the “Adviser”). Amundi Distributor US, Inc., an affiliate of the Adviser, serves as the Portfolio’s distributor (the “Distributor”).
The Portfolio is required to comply with Rule 18f-4 under the 1940 Act, which governs the use of derivatives by registered investment companies. Rule 18f-4 permits funds to enter into derivatives transactions (as defined in Rule 18f-4) and certain other transactions notwithstanding the restrictions on the issuance of “senior securities” under Section 18 of the 1940 Act. Rule 18f-4 requires a fund to establish and maintain a comprehensive derivatives risk management program, appoint a derivatives risk manager and comply with a relative or absolute limit on fund leverage risk calculated based on value-at-risk (“VaR”), unless the Portfolio uses derivatives in only a limited manner (a "limited derivatives user"). The Portfolio is currently a limited derivatives user for purposes of Rule 18f-4.
The Portfolio is an investment company and follows investment company accounting and reporting guidance under U.S. Generally Accepted Accounting Principles (“U.S. GAAP”). U.S. GAAP requires the management of the Portfolio to make estimates and assumptions that affect the reported amounts of assets and liabilities, the disclosure of contingent assets and liabilities at the date of the financial statements, and the reported amounts of income, expenses and gain or loss on investments during the reporting period. Actual results could differ from those estimates.
The following is a summary of significant accounting policies followed by the Portfolio in the preparation of its financial statements:
| A. | Security Valuation |
| | The net asset value of the Portfolio is computed once daily, on each day the New York Stock Exchange (“NYSE”) is open, as of the close of regular trading on the NYSE. |
| | Equity securities that have traded on an exchange are valued by using the last sale price on the principal exchange where they are traded. Equity securities that have not traded on the date of valuation, or securities for which sale prices are not available, generally are valued using the mean between the last bid and asked prices or, if both last bid and asked prices are not available, at the last quoted bid price. Last sale and bid and asked prices are provided by independent third party pricing services. In the case of equity securities not traded on an exchange, prices are typically determined by independent third party pricing services using a variety of techniques and methods. |
| | The value of foreign securities is translated into U.S. dollars based on foreign currency exchange rate quotations supplied by a third party pricing source. Trading in non-U.S. equity securities is substantially completed each day at various times prior to the close of the NYSE. The values of such securities used in computing the net asset value of the Portfolio's shares are determined as of such times. The Adviser may use a fair value model developed by an independent pricing service to value non-U.S. equity securities. |
| Pioneer Equity Income VCT Portfolio | Pioneer Variable Contracts Trust |
Notes to Financial Statements 12/31/23 (continued)
| | Shares of open-end registered investment companies (including money market mutual funds) are valued at such funds' net asset value. |
| | Securities for which independent pricing services or broker-dealers are unable to supply prices or for which market prices and/or quotations are not readily available or are considered to be unreliable are valued by a fair valuation team comprised of certain personnel of the Adviser. The Adviser is designated as the valuation designee for the Portfolio pursuant to Rule 2a-5 under the 1940 Act. The Adviser’s fair valuation team is responsible for monitoring developments that may impact fair valued securities. |
| | Inputs used when applying fair value methods to value a security may include credit ratings, the financial condition of the company, current market conditions and comparable securities. The Adviser may use fair value methods if it is determined that a significant event has occurred after the close of the exchange or market on which the security trades and prior to the determination of the Portfolio's net asset value. Examples of a significant event might include political or economic news, corporate restructurings, natural disasters, terrorist activity or trading halts. Thus, the valuation of the Portfolio's securities may differ significantly from exchange prices, and such differences could be material. |
| B. | Investment Income and Transactions |
| | Dividend income is recorded on the ex-dividend date, except that certain dividends from foreign securities where the ex-dividend date may have passed are recorded as soon as the Portfolio becomes aware of the ex-dividend data in the exercise of reasonable diligence. |
| | Interest income, including interest on income-bearing cash accounts, is recorded on the accrual basis. Dividend and interest income are reported net of unrecoverable foreign taxes withheld at the applicable country rates and net of income accrued on defaulted securities. |
| | Interest and dividend income payable by delivery of additional shares is reclassified as PIK (payment-in-kind) income upon receipt and is included in interest and dividend income, respectively. |
| | Security transactions are recorded as of trade date. Gains and losses on sales of investments are calculated on the identified cost method for both financial reporting and federal income tax purposes. |
| C. | Foreign Currency Translation |
| | The books and records of the Portfolio are maintained in U.S. dollars. Amounts denominated in foreign currencies are translated into U.S. dollars using current exchange rates. |
| | Net realized gains and losses on foreign currency transactions, if any, represent, among other things, the net realized gains and losses on foreign currency exchange contracts, disposition of foreign currencies and the difference between the amount of income accrued and the U.S. dollars actually received. Further, the effects of changes in foreign currency exchange rates on investments are not segregated on the Statement of Operations from the effects of changes in the market prices of those securities, but are included with the net realized and unrealized gain or loss on investments. |
| D. | Federal Income Taxes |
| | It is the Portfolio's policy to comply with the requirements of the Internal Revenue Code applicable to regulated investment companies and to distribute all of its net taxable income and net realized capital gains, if any, to its shareholders. Therefore, no provision for federal income taxes is required. As of December 31, 2023, the Portfolio did not accrue any interest or penalties with respect to uncertain tax positions, which, if applicable, would be recorded as an income tax expense on the Statement of Operations. Tax returns filed within the prior three years remain subject to examination by federal and state tax authorities. |
| | The amount and character of income and capital gain distributions to shareholders are determined in accordance with federal income tax rules, which may differ from U.S. GAAP. Distributions in excess of net investment income or net realized gains are temporary over distributions for financial statement purposes resulting from differences in the recognition or classification of income or distributions for financial statement and tax purposes. Capital accounts within the financial statements are adjusted for permanent book/tax differences to reflect tax character, but are not adjusted for temporary differences. |
| | A portion of the dividend income recorded by the Portfolio is from distributions by publicly traded real estate investment trusts (“REITs”), and such distributions for tax purposes may also consist of capital gains and return of capital. The actual return of capital and capital gains portions of such distributions will be determined by formal notifications from |
| Pioneer Equity Income VCT Portfolio | Pioneer Variable Contracts Trust |
| | the REITs subsequent to the calendar year-end. Distributions received from the REITs that are determined to be a return of capital are recorded by the Portfolio as a reduction of the cost basis of the securities held and those determined to be capital gain are reflected as such on the Statement of Operations. |
| | The tax character of distributions paid during the years ended December 31, 2023 and December 31, 2022, was as follows: |
| | 2023 | 2022 |
| Distributions paid from: | | |
| Ordinary income | $1,541,918 | $ 1,769,733 |
| Long-term capital gains | 6,239,103 | 12,078,577 |
| Total | $ 7,781,021 | $13,848,310 |
The following shows the components of distributable earnings (losses) on a federal income tax basis at December 31, 2023:
| | 2023 |
| Distributable earnings/(losses): | |
| Undistributed ordinary income | $ 89,436 |
| Undistributed long-term capital gains | 14,860,615 |
| Net unrealized appreciation | 14,528,213 |
| Total | $29,478,264 |
The difference between book-basis and tax-basis net unrealized appreciation is attributable to the tax deferral of losses on wash sales.
| E. | Portfolio Shares and Class Allocations |
| | The Portfolio records sales and repurchases of its shares as of trade date. Distribution fees for Class II shares are calculated based on the average daily net asset value attributable to Class II shares of the Portfolio (see Note 5). Class I shares do not pay distribution fees. |
| | Income, common expenses (excluding transfer agent and distribution fees) and realized and unrealized gains and losses are calculated at the Portfolio level and allocated daily to each class of shares based on its respective percentage of the adjusted net assets at the beginning of the day. |
| | All expenses and fees paid to the Portfolio’s transfer agent for its services are allocated among the classes of shares based on the number of accounts in each class and the ratable allocation of related out-of-pocket expenses (see Note 4). |
| | Dividends and distributions to shareholders are recorded as of the ex-dividend date. Distributions paid by the Portfolio with respect to each class of shares are calculated in the same manner and at the same time, except that net investment income dividends to Class I and Class II shares can reflect different transfer agent and distribution expense rates. |
| F. | Risks |
| | The value of securities held by the Portfolio may go up or down, sometimes rapidly or unpredictably, due to general market conditions, such as real or perceived adverse economic, political or regulatory conditions, recessions, the spread of infectious illness or other public health issues, inflation, changes in interest rates, armed conflict such as between Russia and Ukraine or in the Middle East, sanctions against Russia, other nations or individuals or companies and possible countermeasures, lack of liquidity in the bond markets or adverse investor sentiment. In the past several years, financial markets have experienced increased volatility, depressed valuations, decreased liquidity and heightened uncertainty. These conditions may continue, recur, worsen or spread. Inflation and interest rates have increased and may rise further. These circumstances could adversely affect the value and liquidity of the Portfolio's investments and negatively impact the Portfolio's performance. |
| | The long-term impact of the COVID-19 pandemic and its subsequent variants on economies, markets, industries and individual issuers, are not known. Some sectors of the economy and individual issuers have experienced or may experience particularly large losses. Periods of extreme volatility in the financial markets, reduced liquidity of many instruments, increased government debt, inflation, and disruptions to supply chains, consumer demand and employee |
| Pioneer Equity Income VCT Portfolio | Pioneer Variable Contracts Trust |
Notes to Financial Statements 12/31/23 (continued)
| | availability, may continue for some time. Following Russia's invasion of Ukraine, Russian securities lost all, or nearly all, their market value. Other securities or markets could be similarly affected by past or future political, geopolitical or other events or conditions. |
| | Governments and central banks, including the U.S. Federal Reserve, have taken extraordinary and unprecedented actions to support local and global economies and the financial markets. These actions have resulted in significant expansion of public debt, including in the U.S. The consequences of high public debt, including its future impact on the economy and securities markets, may not be known for some time. |
| | The U.S. and other countries are periodically involved in disputes over trade and other matters, which may result in tariffs, investment restrictions and adverse impacts on affected companies and securities. For example, the U.S. has imposed tariffs and other trade barriers on Chinese exports, has restricted sales of certain categories of goods to China, and has established barriers to investments in China. Trade disputes may adversely affect the economies of the U.S. and its trading partners, as well as companies directly or indirectly affected and financial markets generally. If the political climate between the U.S. and China does not improve or continues to deteriorate, if China were to attempt unification of Taiwan by force, or if other geopolitical conflicts develop or get worse, economies, markets and individual securities may be severely affected both regionally and globally, and the value of the Portfolio's assets may go down. |
| | At times, the Portfolio’s investments may represent industries or industry sectors that are interrelated or have common risks, making the Portfolio more susceptible to any economic, political, or regulatory developments or other risks affecting those industries and sectors. |
| | Normally, the portfolio invests at least 80% of its total assets in income producing equity securities of U.S. issuers. Large companies may fall out of favor with investors and underperform the overall equity market. |
| | The Portfolio’s investments in foreign markets and countries with limited developing markets may subject the Portfolio to a greater degree of risk than investments in a developed market. These risks include disruptive political or economic conditions, military conflicts and sanctions, terrorism, sustained economic downturns, financial instability, less liquid trading markets, extreme price volatility, currency risks, reduction of government or central bank support, inadequate accounting standards, tariffs, tax disputes or other tax burdens, nationalization or expropriation of assets and the imposition of adverse governmental laws, arbitrary application of laws and regulations or lack of rule of law and investment and repatriation restrictions. Lack of information and less market regulation also may affect the value of these securities. Withholding and other non-U.S. taxes may decrease the Portfolio’s return. Non-U.S. issuers may be located in parts of the world that have historically been prone to natural disasters. Investing in depositary receipts is subject to many of the same risks as investing directly in non-U.S. issuers. Depositary receipts may involve higher expenses and may trade at a discount (or premium) to the underlying security. |
| | Russia launched a large-scale invasion of Ukraine on February 24, 2022. In response to the military action by Russia, various countries, including the U.S., the United Kingdom, and European Union issued broad-ranging economic sanctions against Russia and Belarus and certain companies and individuals. Since then, Russian securities have lost all, or nearly all, their market value, and many other issuers, securities and markets have been adversely affected. The United States and other countries may impose sanctions on other countries, companies and individuals in light of Russia’s military invasion. The extent and duration of the military action or future escalation of such hostilities, the extent and impact of existing and future sanctions, market disruptions and volatility, and the result of any diplomatic negotiations cannot be predicted. These and any related events could have a significant impact on the value and liquidity of certain Portfolio investments, on Portfolio performance and the value of an investment in the Portfolio, particularly with respect to securities and commodities, such as oil, natural gas and food commodities, as well as other sectors with exposure to Russian issuers or issuers in other countries affected by the invasion, and are likely to have collateral impacts on market sectors globally. |
| | The Portfolio may invest in REIT securities, the value of which can fall for a variety of reasons, such as declines in rental income, fluctuating interest rates, poor property management, environmental liabilities, uninsured damage, increased competition, or changes in real estate tax laws. |
| | With the increased use of technologies such as the Internet to conduct business, the Portfolio is susceptible to operational, information security and related risks. While the Portfolio’s Adviser has established business continuity plans in the event of, and risk management systems to prevent, limit or mitigate, such cyber-attacks, there are inherent limitations in such plans and systems, including the possibility that certain risks have not been identified. Furthermore, the Portfolio cannot control the cybersecurity plans and systems put in place by service providers to the Portfolio such as |
| Pioneer Equity Income VCT Portfolio | Pioneer Variable Contracts Trust |
| | the Portfolio's custodian and accounting agent, and the Portfolio’s transfer agent. In addition, many beneficial owners of Portfolio shares hold them through accounts at broker-dealers, retirement platforms and other financial market participants over which neither the Portfolio nor the Adviser exercises control. Each of these may in turn rely on service providers to them, which are also subject to the risk of cyber-attacks. Cybersecurity failures or breaches at the Adviser or the Portfolio’s service providers or intermediaries have the ability to cause disruptions and impact business operations, potentially resulting in financial losses, interference with the Portfolio’s ability to calculate its net asset value, impediments to trading, the inability of Portfolio shareholders to effect share purchases, redemptions or exchanges or receive distributions, loss of or unauthorized access to private shareholder information and violations of applicable privacy and other laws, regulatory fines, penalties, reputational damage, or additional compliance costs. Such costs and losses may not be covered under any insurance. In addition, maintaining vigilance against cyber-attacks may involve substantial costs over time, and system enhancements may themselves be subject to cyber-attacks. |
| | The Portfolio’s prospectus contains unaudited information regarding the Portfolio’s principal risks. Please refer to that document when considering the Portfolio’s principal risks. |
2. Management Agreement
The Adviser manages the Portfolio. Management fees payable under the Portfolio's Investment Management Agreement with the Adviser are calculated daily and paid monthly at the annual rate of 0.65% of the Portfolio’s average daily net assets up to $1 billion and 0.60% of the Portfolio’s average daily net assets over $1 billion. For the year ended December 31, 2023, the effective management fee was equivalent to 0.65% of the Portfolio’s average daily net assets.
In addition, under the management and administration agreements, certain other services and costs, including accounting, regulatory reporting and insurance premiums, are paid by the Portfolio as administrative reimbursements.Reflected on the Statement of Assets and Liabilities is $7,195 in management fees payable to the Adviser at December 31, 2023.
3. Compensation of Officers and Trustees
The Portfolio pays an annual fee to its Trustees. The Adviser reimburses the Portfolio for fees paid to the Interested Trustees. Except for the chief compliance officer, the Portfolio does not pay any salary or other compensation to its officers. The Portfolio pays a portion of the chief compliance officer's compensation for his services as the Portfolio's chief compliance officer. Amundi US pays the remaining portion of the chief compliance officer's compensation. For the year ended December 31, 2023, the Portfolio paid $8,360 in Officers' and Trustees' compensation, which is reflected on the Statement of Operations as Officers' and Trustees' fees. At December 31, 2023, on its Statement of Assets and Liabilities, the Portfolio had a payable for Trustees' fees of $106 and a payable for administrative expenses of $3,312, which includes the payable for Officers' compensation.
4. Transfer Agent
BNY Mellon Investment Servicing (US) Inc. serves as the transfer agent to the Portfolio at negotiated rates. Transfer agent fees and payables shown on the Statement of Operations and the Statement of Assets and Liabilities, respectively, include sub-transfer agent expenses incurred through the Portfolio’s omnibus relationship contracts.
5. Distribution Plan
The Portfolio has adopted a distribution plan (the “Plan”) pursuant to Rule 12b-1 under the 1940 Act with respect to Class II shares. Pursuant to the Plan, the Portfolio pays the Distributor a distribution fee of 0.25% of the average daily net assets attributable to Class II shares to compensate the Distributor for (1) distribution services and (2) personal and account maintenance services performed and expenses incurred by the Distributor in connection with the Portfolio’s Class II shares. Reflected on the Statement of Assets and Liabilities is $862 in distribution fees payable to the Distributor at December 31, 2023.
| Pioneer Equity Income VCT Portfolio | Pioneer Variable Contracts Trust |
Report of Independent Registered Public Accounting Firm
To the Board of Trustees of Pioneer Variable Contracts Trust and the Shareholders of Pioneer Equity Income VCT Portfolio:
Opinion on the Financial Statements
We have audited the accompanying statement of assets and liabilities of Pioneer Equity Income VCT Portfolio (the “Portfolio”) (one of the portfolios constituting Pioneer Variable Contracts Trust (the “Trust”)), including the schedule of investments, as of December 31, 2023, and the related statement of operations for the year then ended, the statements of changes in net assets for each of the two years in the period then ended, the financial highlights for each of the five years in the period then ended and the related notes (collectively referred to as the “financial statements”). In our opinion, the financial statements present fairly, in all material respects, the financial position of the Portfolio (one of the portfolios constituting Pioneer Variable Contracts Trust) at December 31, 2023, the results of its operations for the year then ended, the changes in its net assets for each of the two years in the period then ended, and its financial highlights for each of the five years in the period then ended in conformity with U.S. generally accepted accounting principles.
Basis for Opinion
These financial statements are the responsibility of the Trust’s management. Our responsibility is to express an opinion on the Portfolio’s financial statements based on our audits. We are a public accounting firm registered with the Public Company Accounting Oversight Board (United States) ("PCAOB") and are required to be independent with respect to the Trust in accordance with the U.S. federal securities laws and the applicable rules and regulations of the Securities and Exchange Commission and the PCAOB.
We conducted our audits in accordance with the standards of the PCAOB. Those standards require that we plan and perform the audit to obtain reasonable assurance about whether the financial statements are free of material misstatement, whether due to error or fraud. The Trust is not required to have, nor were we engaged to perform, an audit of the Trust’s internal control over financial reporting. As part of our audits, we are required to obtain an understanding of internal control over financial reporting, but not for the purpose of expressing an opinion on the effectiveness of the Trust’s internal control over financial reporting. Accordingly, we express no such opinion.
Our audits included performing procedures to assess the risks of material misstatement of the financial statements, whether due to error or fraud, and performing procedures that respond to those risks. Such procedures included examining, on a test basis, evidence regarding the amounts and disclosures in the financial statements. Our procedures included confirmation of securities owned as of December 31, 2023, by correspondence with the custodian, brokers, and others; when replies were not received from brokers and others, we performed other auditing procedures. Our audits also included evaluating the accounting principles used and significant estimates made by management, as well as evaluating the overall presentation of the financial statements. We believe that our audits provide a reasonable basis for our opinion.
We have served as the auditor of one or more investment companies in the Pioneer family of funds since 2017.
Boston, Massachusetts
February 20, 2024
| Pioneer Equity Income VCT Portfolio | Pioneer Variable Contracts Trust |
Additional Information (unaudited)
For the year ended December 31, 2023, certain dividends paid by the Portfolio may be subject to a maximum tax rate of 20%. The Portfolio intends to designate up to the maximum amount of such dividends allowable, as taxed at a maximum rate of 20%. Complete information will be computed and reported in conjunction with your 2023 Form 1099-DIV.
The Portfolio designated $14,860,783 as long-term capital gains distributions during the year ended December 31, 2023. Distributable long-term gains are based on net realized long-term gains determined on a tax basis and may differ from such amounts for financial reporting purposes.
The qualifying percentage of the Portfolio’s ordinary income dividends for the purpose of the corporate dividends received deduction was 100.00%.
| Pioneer Equity Income VCT Portfolio | Pioneer Variable Contracts Trust |
Approval of Renewal of Investment Management Agreement
Amundi Asset Management US, Inc. (“Amundi US”) serves as the investment adviser to Pioneer Equity Income VCT Portfolio (the “Portfolio”) pursuant to an investment management agreement between Amundi US and the Portfolio. In order for Amundi US to remain the investment adviser of the Portfolio, the Trustees of the Portfolio, including a majority of the Portfolio’s Independent Trustees, must determine annually whether to renew the investment management agreement for the Portfolio.
The contract review process began in January 2023 as the Trustees of the Portfolio agreed on, among other things, an overall approach and timeline for the process. Contract review materials were provided to the Trustees in March 2023, July 2023 and September 2023. In addition, the Trustees reviewed and discussed the Portfolio’s performance at regularly scheduled meetings throughout the year, and took into account other information related to the Portfolio provided to the Trustees at regularly scheduled meetings, in connection with the review of the Portfolio’s investment management agreement.
In March 2023, the Trustees, among other things, discussed the memorandum provided by Portfolio counsel that summarized the legal standards and other considerations that are relevant to the Trustees in their deliberations regarding the renewal of the investment management agreement, and reviewed and discussed the qualifications of the investment management teams for the Portfolio, as well as the level of investment by the Portfolio’s portfolio managers in the Portfolio. In July 2023, the Trustees, among other things, reviewed the Portfolio’s management fees and total expense ratios, the financial statements of Amundi US and its parent companies, profitability analyses provided by Amundi US, and analyses from Amundi US as to possible economies of scale. The Trustees also reviewed the profitability of the institutional business of Amundi US as compared to that of Amundi US’s fund management business, and considered the differences between the fees and expenses of the Portfolio and the fees and expenses of Amundi US’s institutional accounts, as well as the different services provided by Amundi US to the Portfolio and to the institutional accounts. The Trustees further considered contract review materials, including additional materials received in response to the Trustees’ request, in September 2023.
At a meeting held on September 19, 2023, based on their evaluation of the information provided by Amundi US and third parties, the Trustees of the Portfolio, including the Independent Trustees voting separately advised by independent counsel, unanimously approved the renewal of the investment management agreement for another year. In approving the renewal of the investment management agreement, the Trustees considered various factors that they determined were relevant, including the factors described below. The Trustees did not identify any single factor as the controlling factor in determining to approve the renewal of the agreement.
Nature, Extent and Quality of Services
The Trustees considered the nature, extent and quality of the services that had been provided by Amundi US to the Portfolio, taking into account the investment objective and strategy of the Portfolio. The Trustees also reviewed Amundi US’s investment approach for the Portfolio and its research process. The Trustees considered Amundi US’ integration of environmental, social and governance (ESG) considerations into its investment research process. The Trustees considered the resources of Amundi US and the personnel of Amundi US who provide investment management services to the Portfolio. They also reviewed the amount of non-Portfolio assets managed by the portfolio managers of the Portfolio. They considered the non-investment resources and personnel of Amundi US that are involved in Amundi US’s services to the Portfolio, including Amundi US’s compliance, risk management, and legal resources and personnel. The Trustees considered the compliance services being provided to the Fund by Amundi US and how Amundi US has addressed any compliance issues during the past year. The Trustees noted the substantial attention and high priority given by Amundi US’s senior management to the Pioneer Fund complex, including with respect to the increasing regulation to which the Pioneer Funds are subject.
The Trustees considered that Amundi US supervises and monitors the performance of the Portfolio’s service providers and provides the Portfolio with personnel (including Portfolio officers) and other resources that are necessary for the Portfolio’s business management and operations. The Trustees also considered that, as administrator, Amundi US is responsible for the administration of the Portfolio’s business and other affairs. The Trustees considered that the Portfolio reimburses Amundi US its pro rata share of Amundi US’s costs of providing administration services to the Pioneer Funds.
Based on these considerations, the Trustees concluded that the nature, extent and quality of services that had been provided by Amundi US to the Portfolio were satisfactory and consistent with the terms of the investment management agreement.
Performance of the Portfolio
In considering the Portfolio’s performance, the Trustees regularly review and discuss throughout the year data prepared by Amundi US and information comparing the Portfolio’s performance with the performance of its peer group of funds, as classified by Morningstar, Inc. (Morningstar), and with the performance of the Portfolio’s benchmark index. They also discuss the Portfolio’s performance with Amundi US on a regular basis. The Trustees’ regular reviews and discussions were factored into the Trustees’ deliberations concerning the renewal of the investment management agreement.
| Pioneer Equity Income VCT Portfolio | Pioneer Variable Contracts Trust |
Management Fee and Expenses
The Trustees considered information showing the fees and expenses of the Portfolio in comparison to the management fees of its peer group of funds as classified by Morningstar and also to the expense ratios of a peer group of funds selected on the basis of criteria determined by the Independent Trustees for this purpose using data provided by Strategic Insight Mutual Fund Research and Consulting, LLC (Strategic Insight), an independent third party. The peer group comparisons referred to below are organized in quintiles. Each quintile represents one-fifth of the peer group. In all peer group comparisons referred to below, first quintile is most favorable to the Portfolio’s shareowners. The Trustees noted that they separately review and consider the impact of the Portfolio’s transfer agency and Portfolio- and Amundi US-paid expenses for sub-transfer agency and intermediary arrangements, and that the results of the most recent such review were considered in the consideration of the Portfolio’s expense ratio.
The Trustees considered that the Portfolio’s management fee for the most recent fiscal year was in the fourth quintile relative to the management fees paid by other funds in its Morningstar category for the comparable period. The Trustees noted Amundi US’s explanation of the reasons that the Portfolio’s management fee was in the fourth quintile relative to the management fees paid by other funds in its Morningstar category. The Trustees considered that the expense ratio of the Portfolio’s Class I shares for the most recent fiscal year was in the fifth quintile relative to its Strategic Insight peer group for the comparable period. The Trustees noted Amundi US’s explanation of the reasons that the expense ratio of the Portfolio’s Class I shares was in the fifth quintile relative to its Strategic Insight peer group.
The Trustees reviewed management fees charged by Amundi US to institutional and other clients, including publicly offered European funds sponsored by Amundi US’s affiliates, unaffiliated U.S. registered investment companies (in a sub-advisory capacity), and unaffiliated foreign and domestic separate accounts. The Trustees also considered Amundi US’s costs in providing services to the Portfolio and Amundi US’s costs in providing services to the other clients and considered the differences in management fees and profit margins for fund and non-fund services. In evaluating the fees associated with Amundi US’s client accounts, the Trustees took into account the respective demands, resources and complexity associated with the Portfolio and other client accounts. The Trustees noted that, in some instances, the fee rates for those clients were lower than the management fee for the Portfolio and considered that, under the investment management and administration agreements with the Portfolio, Amundi US performs additional services for the Portfolio that it does not provide to those other clients or services that are broader in scope, including oversight of the Portfolio’s other service providers and activities related to compliance and the extensive regulatory and tax regimes to which the Portfolio is subject. The Trustees also considered the entrepreneurial risks associated with Amundi US’s management of the Portfolio.
The Trustees concluded that the management fee payable by the Portfolio to Amundi US was reasonable in relation to the nature and quality of the services provided by Amundi US.
Profitability
The Trustees considered information provided by Amundi US regarding the profitability of Amundi US with respect to the advisory services provided by Amundi US to the Portfolio, including the methodology used by Amundi US in allocating certain of its costs to the management of the Portfolio. The Trustees also considered Amundi US’s profit margin in connection with the overall operation of the Portfolio. They further reviewed the financial results, including the profit margins, realized by Amundi US from non-fund businesses. The Trustees considered Amundi US’s profit margins in comparison to the limited industry data available and noted that the profitability of any adviser was affected by numerous factors, including its organizational structure and method for allocating expenses. The Trustees concluded that Amundi US’s profitability with respect to the management of the Portfolio was not unreasonable.
Economies of Scale
The Trustees considered Amundi US’s views relating to economies of scale in connection with the Pioneer Funds as fund assets grow and the extent to which any such economies of scale are shared with the Portfolio and Portfolio shareholders. The Trustees recognize that economies of scale are difficult to identify and quantify, and that, among other factors that may be relevant, are the following: fee levels, expense subsidization, investment by Amundi US in research and analytical capabilities and Amundi US’s commitment and resource allocation to the Portfolio. The Trustees noted that profitability also may be an indicator of the availability of any economies of scale, although profitability may vary for other reasons including due to reductions in expenses. The Trustees concluded that economies of scale, if any, were being appropriately shared with the Portfolio.
Other Benefits
The Trustees considered the other benefits that Amundi US enjoys from its relationship with the Portfolio. The Trustees considered the character and amount of fees paid or to be paid by the Portfolio, other than under the investment management agreement, for services provided by Amundi US and its affiliates. The Trustees further considered the revenues
| Pioneer Equity Income VCT Portfolio | Pioneer Variable Contracts Trust |
Approval of Renewal of Investment Management Agreement (continued)
and profitability of Amundi US’s businesses other than the fund business. To the extent applicable, the Trustees also considered the benefits to the Portfolio and to Amundi US and its affiliates from the use of “soft” commission dollars generated by the Portfolio to pay for research and brokerage services.
The Trustees considered that Amundi US is the principal U.S. asset management business of Amundi, which is one of the largest asset managers globally. Amundi’s worldwide asset management business manages over $2.1 trillion in assets (including the Pioneer Funds). The Trustees considered that Amundi US’s relationship with Amundi creates potential opportunities for Amundi US and Amundi that derive from Amundi US’s relationships with the Portfolio, including Amundi’s ability to market the services of Amundi US globally. The Trustees noted that Amundi US has access to additional research and portfolio management capabilities as a result of its relationship with Amundi and Amundi’s enhanced global presence that may contribute to an increase in the resources available to Amundi US. The Trustees considered that Amundi US and the Portfolio receive reciprocal intangible benefits from the relationship, including mutual brand recognition and, for the Portfolio, direct and indirect access to the resources of a large global asset manager. The Trustees concluded that any such benefits received by Amundi US as a result of its relationship with the Portfolio were reasonable.
Conclusion
After consideration of the factors described above as well as other factors, the Trustees, including the Independent Trustees, concluded that the investment management agreement for the Portfolio, including the fees payable thereunder, was fair and reasonable and voted to approve the proposed renewal of the investment management agreement.
| Pioneer Equity Income VCT Portfolio | Pioneer Variable Contracts Trust |
Trustees, Officers and Service Providers
Trustees and Officers
The Portfolio’s Trustees and officers are listed below, together with their principal occupations and other directorships they have held during at least the past five years. Trustees who are interested persons of the Portfolios within the meaning of the 1940 Act are referred to as Interested Trustees. Trustees who are not interested persons of the Portfolio are referred to as Independent Trustees. Each of the Trustees serves as a Trustee of each of the 47 U.S. registered investment portfolios for which Amundi US serves as investment adviser (the “Pioneer Funds”). The address for all Trustees and all officers of the Portfolios is 60 State Street, Boston, Massachusetts 02109.
The Statement of Additional Information of the Portfolio includes additional information about the Trustees and is available, without charge, upon request, by calling 1-800-225-6292.
Investment Adviser and Administrator
Amundi Asset Management US, Inc.
Custodian and Sub-Administrator
The Bank of New York Mellon Corporation
Independent Registered Public Accounting Firm
Ernst & Young LLP
Principal Underwriter
Amundi Distributor US, Inc.
Legal Counsel
Morgan, Lewis & Bockius LLP
Transfer Agent
BNY Mellon Investment Servicing (US) Inc.
Name, Age and Position
Held With the Trust | Term of Office and
Length of Service | Principal Occupation(s) During At Least The Past Five Years | Other Directorships Held by Trustee During At Least The Past Five Years |
| Independent Trustees |
Thomas J. Perna (73)
Chairman of the Board
and Trustee | Trustee since 2006.
Serves until a successor
trustee is elected or
earlier retirement
or removal. | Private investor (2004 – 2008 and 2013 – present); Chairman (2008 – 2013) and Chief Executive Officer (2008 – 2012), Quadriserv, Inc. (technology products for securities lending industry); and Senior Executive Vice President, The Bank of New York (financial and securities services) (1986 – 2004) | Director, Broadridge Financial
Solutions, Inc. (investor
communications and securities
processing provider for financial
services industry) (2009 – present); Director, Quadriserv, Inc.
(2005 – 2013); and Commissioner,
New Jersey State Civil Service
Commission (2011 – 2015) |
John E. Baumgardner,
Jr. (72)*
Trustee | Trustee since 2019.
Serves until a successor
trustee is elected or
earlier retirement
or removal. | Of Counsel (2019 – present), Partner (1983-2018), Sullivan & Cromwell LLP (law firm). | Chairman, The Lakeville Journal
Company, LLC, (privately-held
community newspaper group)
(2015-present) |
| Pioneer Equity Income VCT Portfolio | Pioneer Variable Contracts Trust |
Trustees, Officers and Service Providers (continued)
Name, Age and Position
Held With the Trust | Term of Office and
Length of Service | Principal Occupation(s) During At Least The Past Five Years | Other Directorships Held by Trustee During At Least The Past Five Years |
| Independent Trustees (continued) |
Diane Durnin (66)
Trustee | Trustee since 2019.
Serves until a successor
trustee is elected or
earlier retirement
or removal. | Managing Director - Head of Product Strategy and Development, BNY Mellon Investment Management (investment management firm) (2012-2018); Vice Chairman – The Dreyfus Corporation (2005 – 2018): Executive Vice President Head of Product, BNY Mellon Investment Management (2007-2012); Executive Director- Product Strategy, Mellon Asset Management (2005-2007); Executive Vice President Head of Products, Marketing and Client Service, Dreyfus Corporation (investment management firm) (2000-2005); Senior Vice President Strategic Product and Business Development, Dreyfus Corporation (1994-2000) | None |
Benjamin M. Friedman (79)
Trustee | Trustee since 2008.
Serves until a successor
trustee is elected or
earlier retirement
or removal. | William Joseph Maier Professor of Political Economy, Harvard University (1972 – present) | Trustee, Mellon Institutional Funds
Investment Trust and Mellon
Institutional Funds Master Portfolio
(oversaw 17 portfolios in fund
complex) (1989 - 2008) |
Craig C. MacKay (60)
Trustee | Trustee since 2021.
Serves until a successor
trustee is elected or
earlier retirement
or removal. | Partner, England & Company, LLC (advisory firm) (2012 – present); Group Head – Leveraged Finance Distribution, Oppenheimer & Company (investment bank) (2006 – 2012); Group Head – Private Finance & High Yield Capital Markets Origination, SunTrust Robinson Humphrey (investment bank) (2003 – 2006); and Founder and Chief Executive Officer, HNY Associates, LLC (investment bank) (1996 – 2003) | Director, Equitable Holdings, Inc. (financial services holding company) (2022 – present); Board Member of Carver Bancorp, Inc. (holding company) and Carver Federal Savings Bank, NA (2017 – present); Advisory Council Member, MasterShares ETF (2016 – 2017); Advisory Council Member, The Deal (financial market information publisher) (2015 – 2016); Board Co-Chairman and Chief Executive Officer, Danis Transportation Company (privately-owned commercial carrier) (2000 – 2003); Board Member and Chief Financial Officer, Customer Access Resources (privately-owned teleservices company) (1998 – 2000); Board Member, Federation of Protestant Welfare Agencies (human services agency) (1993 – present); and Board Treasurer, Harlem Dowling Westside Center (foster care agency) (1999 – 2018) |
Lorraine H. Monchak (67)
Trustee | Trustee since 2017.
(Advisory Trustee from
2014 - 2017). Serves
until a successor trustee
is elected or earlier
retirement or removal. | Chief Investment Officer, 1199 SEIU Funds (healthcare workers union pension funds) (2001 – present); Vice President – International Investments Group, American International Group, Inc. (insurance company) (1993 – 2001); Vice President – Corporate Finance and Treasury Group, Citibank, N.A. (1980 – 1986 and 1990 – 1993); Vice President – Asset/Liability Management Group, Federal Farm Funding Corporation (government-sponsored issuer of debt securities) (1988 – 1990); Mortgage Strategies Group, Shearson Lehman Hutton, Inc. (investment bank) (1987 – 1988); Mortgage Strategies Group, Drexel Burnham Lambert, Ltd. (investment bank) (1986 – 1987) | None |
| Pioneer Equity Income VCT Portfolio | Pioneer Variable Contracts Trust |
Name, Age and Position
Held With the Trust | Term of Office and
Length of Service | Principal Occupation(s) During At Least The Past Five Years | Other Directorships Held by Trustee During At Least The Past Five Years |
| Independent Trustees (continued) |
Marguerite A. Piret (75)**
Trustee | Trustee since 1995.
Serves until a successor
trustee is elected or
earlier retirement
or removal. | Chief Financial Officer, American Ag Energy, Inc. (technology for the environment, energy and agriculture) (2019 – present); Chief Operating Officer, North Country Growers LLC (controlled environment agriculture company) (2020 – present); Chief Executive Officer, Green Heat LLC (biofuels company) (2022 – present); President and Chief Executive Officer, Newbury Piret Company (investment banking firm) (1981 – 2019) | Director of New America High
Income Fund, Inc. (closed-end
investment company) (2004 –
present); and Member, Board of
Governors, Investment Company
Institute (2000 – 2006) |
Fred J. Ricciardi (76)
Trustee | Trustee since 2014.
Serves until a successor
trustee is elected or
earlier retirement
or removal. | Private investor (2020 – present); Consultant (investment company services) (2012 – 2020); Executive Vice President, BNY Mellon (financial and investment company services) (1969 – 2012); Director, BNY International Financing Corp. (financial services) (2002 – 2012); Director, Mellon Overseas Investment Corp. (financial services) (2009 – 2012); Director, Financial Models (technology) (2005-2007); Director, BNY Hamilton Funds, Ireland (offshore investment companies) (2004-2007); Chairman/Director, AIB/BNY Securities Services, Ltd., Ireland (financial services) (1999-2006); Chairman, BNY Alternative Investment Services, Inc. (financial services) (2005-2007) | None |
* Mr. Baumgardner is Of Counsel to Sullivan & Cromwell LLP, which acts as counsel to the Independent Trustees of each Pioneer Fund.
** Ms. Piret became a non-voting Advisory Trustee of the Pioneer Funds effective January 22, 2024. |
| Interested Trustees |
Lisa M. Jones (61)***
Trustee, President and Chief
Executive Officer | Trustee since 2017. Serves
until a successor trustee is
elected or earlier retirement
or removal | Director, CEO and President of Amundi US, Inc. (investment management firm) (since September 2014); Director, CEO and President of Amundi Asset Management US, Inc. (since September 2014); Director, CEO and President of Amundi Distributor US, Inc. (since September 2014); Director, CEO and President of Amundi Asset Management US, Inc. (since September 2014); Chair, Amundi US, Inc., Amundi Distributor US, Inc. and Amundi Asset Management US, Inc. (September 2014 – 2018); Managing Director, Morgan Stanley Investment Management (investment management firm) (2010 – 2013); Director of Institutional Business, CEO of International, Eaton Vance Management (investment management firm) (2005 – 2010); Director of Amundi Holdings US, Inc. (since 2017) | Director of Clearwater Analytics (provider of web-based investment accounting software for reporting and reconciliation services) (September 2022 – present) |
Kenneth J. Taubes (64)***,****
Trustee | Trustee since 2014. Serves
until a successor trustee is
elected or earlier retirement
or removal | Director and Executive Vice President (since 2008) and Chief Investment Officer, U.S. (since 2010) of Amundi US, Inc. (investment management firm); Director and Executive Vice President and Chief Investment Officer, U.S. of Amundi US (since 2008); Executive Vice President and Chief Investment Officer, U.S. of Amundi Asset Management US, Inc. (since 2009); Portfolio Manager of Amundi US (since 1999); Director of Amundi Holdings US, Inc. (since 2017) | None |
| Pioneer Equity Income VCT Portfolio | Pioneer Variable Contracts Trust |
Trustees, Officers and Service Providers (continued)
Name, Age and Position
Held With the Trust | Term of Office and
Length of Service | Principal Occupation(s) During At Least The Past Five Years | Other Directorships Held by Trustee During At Least The Past Five Years |
| Interested Trustees (continued) |
*** Ms. Jones and Mr. Taubes are Interested Trustees because they are officers or directors of the Portfolio’s investment adviser and certain of its affiliates.
**** Mr. Taubes retired as a Trustee, effective January 1, 2024. |
| Name, Age and Position Held With the Trust***** | Term of Office and
Length of Service | Principal Occupation(s) During
At Least The Past Five Years | Other Directorships Held by Trustee During At Least The Past Five Years |
| Trust Officers |
Christopher J. Kelley (59)
Secretary and Chief
Legal Officer | Since 2003. Serves at
the discretion of
the Board | Vice President and Associate General Counsel of Amundi US since January 2008; Secretary and Chief Legal Officer of all of the Pioneer Funds since June 2010; Assistant Secretary of all of the Pioneer Funds from September 2003 to May 2010; Vice President and Senior Counsel of Amundi US from July 2002 to December 2007 | None |
Thomas Reyes (61)
Assistant Secretary | Since 2010. Serves at
the discretion of
the Board | Assistant General Counsel of Amundi US since May 2013 and Assistant Secretary of all the Pioneer Funds since June 2010; Counsel of Amundi US from June 2007 to May 2013 | None |
Heather L. Melito-Dezan (47)
Assistant Secretary | Since 2022. Serves at
the discretion of
the Board | Director - Trustee and Board Relationships of Amundi US since September 2019; Assistant Secretary of Amundi US, Inc. since July 2020: Assistant Secretary of Amundi Asset Management US, Inc. since July 2020: Assistant Secretary of Amundi Distributor US, Inc. since July 2020; Assistant Secretary of all the Pioneer Funds since September 2022; Private practice from 2017 – 2019. | None |
Anthony J. Koenig, Jr. (60)
Treasurer and
Chief Financial and
Accounting Officer | Since 2021. Serves at
the discretion of
the Board | Managing Director, Chief Operations Officer and Fund Treasurer of Amundi US since May 2021; Treasurer of all of the Pioneer Funds since May 2021; Assistant Treasurer of all of the Pioneer Funds from January 2021 to May 2021; and Chief of Staff, US Investment Management of Amundi US from May 2008 to January 2021 | None |
Luis I. Presutti (58)
Assistant Treasurer | Since 2000. Serves at
the discretion of
the Board | Director – Fund Treasury of Amundi US since 1999; and Assistant Treasurer of all of the Pioneer Funds since 1999 | None |
Gary Sullivan (65)
Assistant Treasurer | Since 2002. Serves at
the discretion of
the Board | Senior Manager – Fund Treasury of Amundi US since 2012; and Assistant Treasurer of all of the Pioneer Funds since 2002 | None |
Antonio Furtado (41)
Assistant Treasurer | Since 2020. Serves at
the discretion of
the Board | Fund Oversight Manager – Fund Treasury of Amundi US since 2020; Assistant Treasurer of all of the Pioneer Funds since 2020; and Senior Fund Treasury Analyst from 2012 - 2020 | None |
| Pioneer Equity Income VCT Portfolio | Pioneer Variable Contracts Trust |
| Name, Age and Position Held With the Trust***** | Term of Office and
Length of Service | Principal Occupation(s) During
At Least The Past Five Years | Other Directorships Held by Trustee During At Least The Past Five Years |
| Trust Officers (continued) |
Michael Melnick (52)
Assistant Treasurer | Since 2021. Serves at
the discretion of
the Board | Vice President - Deputy Fund Treasurer of Amundi US since May 2021; Assistant Treasurer of all of the Pioneer Funds since July 2021; Director of Regulatory Reporting of Amundi US from 2001 – 2021; and Director of Tax of Amundi US from 2000 - 2001 | None |
John Malone (53)
Chief Compliance Officer | Since 2018. Serves at
the discretion of
the Board | Managing Director, Chief Compliance Officer of Amundi US Asset Management; Amundi Asset Management US, Inc.; and the Pioneer Funds since September 2018; Chief Compliance Officer of Amundi Distributor US, Inc. since January 2014. | None |
Brandon Austin (51)
Anti-Money
Laundering Officer | Since 2022. Serves at
the discretion of
the Board | Director, Financial Security – Amundi Asset Management; Anti-Money Laundering Officer of all the Pioneer Funds since March 2022: Director of Financial Security of Amundi US since July 2021; Vice President, Head of BSA, AML and OFAC, Deputy Compliance Manager, Crédit Agricole Indosuez Wealth Management (investment management firm) (2013 – 2021) | None |
| ***** Marco Pirondini has been appointed to serve as an Executive Vice President of the Portfolio and Chief Investment Officer of Amundi US, Inc., effective January 1, 2024. |
Proxy Voting Policies and Procedures of the Portfolio are available without charge, upon request, by calling our toll free number (1-800-225-6292). Information regarding how the Portfolio voted proxies relating to Portfolio securities during the most recent 12-month period ended June 30 is publicly available to shareholders at www.amundi.com/us. This information is also available on the Securities and Exchange Commission’s web site at www.sec.gov.
Pioneer Variable Contracts Trust
Pioneer Select Mid Cap Growth
VCT Portfolio
Class I Shares
Annual Report | December 31, 2023
Pioneer Variable Contracts Trust
Table of Contents
Pioneer Select Mid Cap Growth VCT Portfolio
This report is authorized for distribution only when preceded or accompanied by a prospectus for the Portfolio being offered.
Pioneer Variable Contracts Trust files a complete schedule of portfolio holdings with the Securities and Exchange Commission for the first and third quarters of each fiscal year as an exhibit to its reports on Form N-PORT. Shareholders may view the filed Form N-PORT by visiting the Commission’s web site at https://www.sec.gov.
| Pioneer Select Mid Cap Growth VCT Portfolio | Pioneer Variable Contracts Trust |
Portfolio Update 12/31/23
Sector Distribution
(As a percentage of total investments)*
5 Largest Holdings
| (As a percentage of total investments)* |
| 1. | Advanced Micro Devices, Inc. | 3.07% |
| 2. | Crowdstrike Holdings, Inc. | 2.82 |
| 3. | MSCI, Inc. | 2.82 |
| 4. | Synopsys, Inc. | 2.67 |
| 5. | Chipotle Mexican Grill, Inc. | 2.58 |
| | |
| * | Excludes short-term investments and all derivative contracts except for options purchased. The Portfolio is actively managed, and current holdings may be different. The holdings listed should not be considered recommendations to buy or sell any securities. |
Performance Update 12/31/23
Prices and Distributions
| Net Asset Value per Share | 12/31/23 | 12/31/22 |
| Class l | $22.02 | $18.54 |
| | | |
Distributions per Share
(1/1/23 - 12/31/23) | Net
Investment
Income | Short-Term
Capital Gains | Long-Term
Capital Gains |
| Class l | $— | $— | $— |
Performance of a $10,000 Investment
The following chart shows the change in value of an investment made in Class I shares of Pioneer Select Mid Cap Growth VCT Portfolio at net asset value during the periods shown, compared to that of the Russell Midcap Growth Index. Portfolio returns are based on net asset value and do not reflect any applicable insurance fees or surrender charges.
 | The Russell Midcap Growth Index is an unmanaged index that measures the performance of U.S. mid-cap growth stocks. Index returns are calculated monthly, assume reinvestment of dividends and do not reflect any fees, expenses or sales charges. It is not possible to invest directly in an index. |
Average Annual Total Returns
(As of December 31, 2023)
| | Class l | Russell Midcap
Growth Index |
| 10 Years | 8.68% | 10.57% |
| 5 Years | 10.39% | 13.81% |
| 1 Year | 18.77% | 25.87% |
All total returns shown assume reinvestment of distributions at net asset value.
The performance table does not reflect the deduction of taxes that a shareholder would pay on distributions or the redemption of shares.
Call 1-800-225-6292 or visit www.amundi.com/us for the most recent month-end performance results. Current performance may be lower or higher than the performance data quoted.
The performance data quoted represents past performance, which is no guarantee of future results. Investment return and principal value will fluctuate, and shares, when redeemed, may be worth more or less than their original cost.
The returns for the Portfolio do not reflect the deduction of expenses associated with variable products, such as mortality and expense risk charges, separate account charges, and sales charges. These expenses would reduce the overall returns shown.
Performance results reflect any applicable expense waivers in effect during the periods shown. Without such waivers, performance would be lower. Waivers may not be in effect for all portfolios. Certain fee waivers are contractual through a specified period. Otherwise, fee waivers can be rescinded at any time. See the prospectus and financial statements for more information.
| Pioneer Select Mid Cap Growth VCT Portfolio | Pioneer Variable Contracts Trust |
Comparing Ongoing Portfolio Expenses
As a shareholder in the Portfolio, you incur two types of costs:
| (1) | ongoing costs, including management fees, distribution and/or service (12b-1) fees, and other Portfolio expenses; and |
| (2) | transaction costs, including sales charges (loads) on purchase payments. |
This example is intended to help you understand your ongoing expenses (in dollars) of investing in the Portfolio and to compare these costs with the ongoing costs of investing in other mutual funds offered through your variable annuity contract. The example is based on an investment of $1,000 at the beginning of the Portfolio’s latest six-month period and held throughout the six months.
Using the Tables
Actual Expenses
The first table below provides information about actual account values and actual expenses. You may use the information in this table, together with the amount you invested, to estimate the expenses that you paid over the period as follows:
| (1) | Divide your account value by $1,000
Example: an $8,600 account value ÷ $1,000 = 8.6 |
| (2) | Multiply the result in (1) above by the corresponding share class’s number in the third row under the heading entitled “Expenses Paid During Period” to estimate the expenses you paid on your account during this period. |
Expenses Paid on a $1,000 Investment in Pioneer Select Mid Cap Growth VCT Portfolio
Based on actual returns from July 1, 2023 through December 31, 2023.
| Share Class | l |
| Beginning Account Value on 7/1/23 | $1,000.00 |
| Ending Account Value (after expenses) on 12/31/23 | $1,046.60 |
| Expenses Paid During Period* | $ 4.75 |
| | |
| * | Expenses are equal to the Portfolio’s annualized expense ratio of 0.92% for Class I shares multiplied by the average account value over the period, multiplied by 184/365 (to reflect the one-half year period). |
Hypothetical Example for Comparison Purposes
The table below provides information about hypothetical account values and hypothetical expenses based on the Portfolio’s actual expense ratio and an assumed rate of return of 5% per year before expenses, which is not the Portfolio’s actual return. The hypothetical account values and expenses may not be used to estimate the actual ending account balance or expenses you paid for the period.
You may use this information to compare the ongoing costs of investing in the Portfolio and other variable annuities. To do so, compare this 5% hypothetical example with the 5% hypothetical examples that appear in the shareholder reports of the other variable annuities.
Please note that the expenses shown in the tables are meant to highlight your ongoing costs only and do not reflect any transaction costs, such as sales charges (loads) that are charged at the time of the transaction. Therefore, the table below is useful in comparing ongoing costs only and will not help you determine the relative total costs of owning different variable annuities. In addition, if these transaction costs were included, your costs would have been higher.
Expenses Paid on a $1,000 Investment in Pioneer Select Mid Cap Growth VCT Portfolio
Based on a hypothetical 5% return per year before expenses, reflecting the period from July 1, 2023 through December 31, 2023.
| Share Class | l |
| Beginning Account Value on 7/1/23 | $1,000.00 |
| Ending Account Value (after expenses) on 12/31/23 | $1,020.57 |
| Expenses Paid During Period* | $ 4.69 |
| | |
| * | Expenses are equal to the Portfolio’s annualized expense ratio of 0.92% for Class I shares multiplied by the average account value over the period, multiplied by 184/365 (to reflect the one-half year period). |
| Pioneer Select Mid Cap Growth VCT Portfolio | Pioneer Variable Contracts Trust |
Portfolio Management Discussion 12/31/23
Call 1-800-225-6292 or visit www.amundi.com/us for the most recent month-end performance results. Current performance may be lower or higher than the performance data quoted.
The performance data quoted represents past performance, which is no guarantee of future results. Investment return and principal value will fluctuate, and shares, when redeemed, may be worth more or less than their original cost.
The returns for the Portfolio do not reflect the deduction of expenses associated with variable products, such as mortality and expense risk charges, separate account charges, and sales charges. These expenses would reduce the overall returns shown.
Performance results reflect any applicable expense waivers in effect during the periods shown. Without such waivers, performance would be lower. Waivers may not be in effect for all portfolios. Certain fee waivers are contractual through a specified period. Otherwise, fee waivers can be rescinded at any time. See the prospectus and financial statements for more information.
In the following interview, Ken Winston discusses the market environment and the factors that affected the performance of Pioneer Select Mid Cap Growth VCT Portfolio during the 12-month period ended December 31, 2023. Mr. Winston, a senior vice president at Amundi Asset Management US, Inc. (Amundi US) and lead portfolio manager of the Portfolio, is responsible for the day-to-day management of the Portfolio, along with Shaji John, a senior vice president and a portfolio manager at Amundi US, David Sobell, a senior vice president and portfolio manager at Amundi US and Timothy Stanish*, a managing director and a portfolio manager at Amundi US.
| Q: | How did the Portfolio perform during the 12-month period ended December 31, 2023? |
| A: | Pioneer Select Mid Cap Growth VCT Portfolio’s Class I shares returned 18.77% at net asset value during the 12-month period ended December 31, 2023, while the Portfolio’s benchmark, the Russell Mid Cap Growth Index (the Russell Index) returned 25.87%. |
| Q: | Which of your investment decisions had the greatest effects on the Portfolio’s benchmark-relative performance during the 12-month period ended December 31, 2023? |
| A: | The worst relative performance for the Portfolio over the period came from stock picks in the health care and financials sectors. Positive stock selection results in the information technology and materials sectors were not enough to offset the relative underperformance of stock selections in those other sectors. Sector allocation was neutral to relative performance for the year. |
| | With regard to individual securities, detractors from the Portfolio’s benchmark-relative returns for the period included positions in Insulet Corporation and Replimune Group. |
| | Shares of Insulet, maker of insulin delivery systems, declined during the period and particularly in the third quarter of 2023, despite delivering solid second quarter 2023 results and strong commercial traction, as investor concerns grew over the potential rise in competition from non-direct competitors offering weight loss therapies (GLP-1) that could impact the company’s ability to capture type 2 diabetes patients (T2) in the future. The Portfolio sold the position in October 2023. While we think the company’s T2 US pump penetration today is very low (less than 5%) and may enable the company to capture a share of T2 pump patients despite the GLP-1 headwinds, we believe the negative perception from the GLP-1 headwinds could potentially be long lasting. |
| | The Portfolio’s holdings in Replimune Group, is a clinical-stage biotechnology company that is pioneering a new generation of cancer treatments called oncolytic immunotherapies. Replimune shares declined during the period after the company reported that its experimental combination therapy to treat a common form of skin cancer failed to significantly remove or reduce cancerous lesions in a mid-stage study. The Portfolio exited the Replimune position in the quarter. |
| | On the positive side, the Portfolio's positions in Vertiv and Advanced Micro Devices (AMD) benefited the Portfolio’s relative returns during the period. |
| * | Effective November 2023, Timothy Stanish is a portfolio manager of the Portfolio. |
| Pioneer Select Mid Cap Growth VCT Portfolio | Pioneer Variable Contracts Trust |
| | Share-price increases during the period for Vertiv Holdings contributed significantly to the Portfolio’s positive relative returns. Vertiv is a leading global supplier of power and thermal solutions to data centers. Vertiv shares rose in the period while the company reported financial results that significantly exceeded Street expectations. Vertiv operates in an encouraging demand environment and its record $4.8 billion backlog is a testament to the favorable long-term secular growth across all of its businesses. Underlying industry growth should, in our view, remain robust for several years bolstered by increased data consumption, higher heat-emitting equipment, and the use of Artificial Intelligence. In our view, Vertiv is positioned well to capitalize on each of these secular tailwinds. |
| | Advanced Micro Devices (AMD), a producer of semiconductor products and devices, shares rose early in 2023 as investors anticipated that AMD would challenge NVIDIA** in providing accelerator processing to support the Artificial Intelligence market opportunity. AMD shares rose again after it released strong results and increased guidance in the third quarter generating at least $2 billion in revenues in 2024 from its new data center GPU family (MI300) products that will compete with NVIDIA’s artificial intelligence processing products. AMD's success in the CPU market is largely a result of its innovative design/architecture, strong foundry partnerships, and rival Intel's multiple missteps. AMD has another large opportunity in the potential AI accelerator market, estimated to be above $100 billion by calendar year 2027, where AMD's current share is effectively zero against leader NVIDIA. |
| Q: | Did the Portfolio have any exposure to derivative securities during the 12-month period ended December 31, 2023? |
| A: | No, the Portfolio had no exposure to derivatives during the period. |
| Q: | What’s your investment outlook as the Portfolio enters a new fiscal year? |
| A: | With respect to the equity market outlook - we see some positives and negatives. |
| | On the positive side - the rate of inflation appears to be declining to a point at which the Fed may feel comfortable cutting rates in 2024 in its pursuit of the much sought-after “immaculate disinflation” – an economic policy in which the inflation slows without any meaningful impact on employment. |
| | On the negative side - the soft-landing scenario, which is now the consensus view, will be no easy feat - especially since there are so few examples of a soft landing after monetary tightening of the magnitude that we have seen over the last twelve months. We still see the potential for waning excess consumer savings and the lagged effects of the Fed’s rate-hiking campaign to pinch economic growth and make it harder for companies to grow earnings in the near term. |
| | While we are not forecasting a recession, we maintain our view that this is still a late-cycle investing environment and, as a result, a focus on secular growth companies is still warranted in equity portfolios. |
| | Given concerns about slowing economic growth, we believe that investors will likely come to favor owning stocks of well-positioned, secular growth companies that are not highly dependent on positive macroeconomic |
| ** | NVIDIA was not a Portfolio holding as of December 31, 2023. |
| Pioneer Select Mid Cap Growth VCT Portfolio | Pioneer Variable Contracts Trust |
Portfolio Management Discussion 12/31/23 (continued)
A Word About Risk:
All investments are subject to risk, including the possible loss of principal. In the past several years, financial markets have experienced increased volatility and heightened uncertainty. The market prices of securities may go up or down, sometimes rapidly or unpredictably, due to general market conditions, such as real or perceived adverse economic, political, or regulatory conditions, recessions, inflation, changes in interest or currency rates, lack of liquidity in the bond markets, the spread of infectious illness or other public health issues, armed conflict including Russia’s military invasion of Ukraine, sanctions against Russia, other nations or individuals or companies and possible countermeasures, market disruptions caused by tariffs, trade disputes or other government actions, or adverse investor sentiment. These conditions may continue, recur, worsen or spread.
Investments in mid-sized companies may offer the potential for higher returns, but are also subject to greater short-term price fluctuations than larger, more established companies.
The Portfolio invests in REIT securities, the value of which can fall for a variety of reasons, such as declines in rental income, fluctuating interest rates, poor property management, environmental liabilities, uninsured damage, increased competition, or changes in real estate tax laws.
Investing in foreign and/or emerging market securities involves risks relating to interest rates, currency exchange rates, economic, social and political conditions, which could increase volatility. These risks are magnified in emerging markets.
At times, the Portfolio’s investments may represent industries or industry sectors that are interrelated or have common risks, making the Portfolio more susceptible to any economic, political, or regulatory developments or other risks affecting those industries and sectors.
These risks may increase share price volatility.
| | conditions in order to flourish; that have demonstrated a knack for innovation; and that have exhibited resilient business models and sustainable growth characteristics. Those characteristics typify the types of equities that we seek to hold in the Portfolio. |
Please refer to the Schedule of Investments on pages 7 - 11 for a full listing of Portfolio securities.
Past performance is no guarantee of future results.
Any information in this shareholder report regarding market or economic trends or the factors influencing the Portfolio’s historical or future performance are statements of opinion as of the date of this report.
| Pioneer Select Mid Cap Growth VCT Portfolio | Pioneer Variable Contracts Trust |
Schedule of Investments 12/31/23
| Shares | | | | | | Value |
| | UNAFFILIATED ISSUERS — 99.8% | |
| | Common Stocks — 99.2% of Net Assets | |
| | Aerospace & Defense — 1.5% | |
| 5,044(a) | Axon Enterprise, Inc. | $ 1,303,017 |
| | Total Aerospace & Defense | $ 1,303,017 |
| | Air Freight & Logistics — 0.6% | |
| 8,810(a) | GXO Logistics, Inc. | $ 538,820 |
| | Total Air Freight & Logistics | $ 538,820 |
| | Beverages — 1.3% | |
| 21,144(a) | Celsius Holdings, Inc. | $ 1,152,771 |
| | Total Beverages | $ 1,152,771 |
| | Biotechnology — 5.1% | |
| 3,845(a) | Alnylam Pharmaceuticals, Inc. | $ 735,971 |
| 13,752(a) | Apellis Pharmaceuticals, Inc. | 823,195 |
| 23,907(a) | Natera, Inc. | 1,497,535 |
| 9,459(a) | Prothena Corp. Plc | 343,740 |
| 18,425(a) | Vaxcyte, Inc. | 1,157,090 |
| | Total Biotechnology | $ 4,557,531 |
| | Building Products — 1.5% | |
| 15,598(a) | Trex Co., Inc. | $ 1,291,358 |
| | Total Building Products | $ 1,291,358 |
| | Capital Markets — 4.0% | |
| 4,396 | MSCI, Inc. | $ 2,486,597 |
| 11,950 | Tradeweb Markets, Inc., Class A | 1,086,016 |
| | Total Capital Markets | $ 3,572,613 |
| | Chemicals — 0.7% | |
| 1,876 | Sherwin-Williams Co. | $ 585,124 |
| | Total Chemicals | $ 585,124 |
| | Communications Equipment — 2.3% | |
| 4,636(a) | Arista Networks, Inc. | $ 1,091,824 |
| 2,905 | Motorola Solutions, Inc. | 909,527 |
| | Total Communications Equipment | $ 2,001,351 |
| | Construction Materials — 1.5% | |
| 19,508 | CRH Plc | $ 1,349,173 |
| | Total Construction Materials | $ 1,349,173 |
| | Consumer Staples Distribution & Retail — 0.4% | |
| 5,703(a) | BJ's Wholesale Club Holdings, Inc. | $ 380,162 |
| | Total Consumer Staples Distribution & Retail | $ 380,162 |
| | Containers & Packaging — 0.4% | |
| 61,111(a) | Ranpak Holdings Corp. | $ 355,666 |
| | Total Containers & Packaging | $ 355,666 |
| | Electrical Equipment — 3.7% | |
| 4,388 | Rockwell Automation, Inc. | $ 1,362,386 |
| 40,411 | Vertiv Holdings Co., Class A | 1,940,941 |
| | Total Electrical Equipment | $ 3,303,327 |
The accompanying notes are an integral part of these financial statements.
7
| Pioneer Select Mid Cap Growth VCT Portfolio | Pioneer Variable Contracts Trust |
Schedule of Investments 12/31/23 (continued)
| Shares | | | | | | Value |
| | Electronic Equipment, Instruments & Components — 4.1% | |
| 20,562 | Amphenol Corp., Class A | $ 2,038,311 |
| 51,821(a) | Flex, Ltd. | 1,578,468 |
| | Total Electronic Equipment, Instruments & Components | $ 3,616,779 |
| | Energy Equipment & Services — 0.2% | |
| 10,297 | TechnipFMC Plc | $ 207,382 |
| | Total Energy Equipment & Services | $ 207,382 |
| | Entertainment — 1.4% | |
| 6,647(a) | Spotify Technology S.A. | $ 1,249,038 |
| | Total Entertainment | $ 1,249,038 |
| | Financial Services — 0.6% | |
| 22,263(a) | Flywire Corp. | $ 515,388 |
| | Total Financial Services | $ 515,388 |
| | Ground Transportation — 2.3% | |
| 7,852 | ArcBest Corp. | $ 943,889 |
| 8,393 | TFI International, Inc. | 1,141,280 |
| | Total Ground Transportation | $ 2,085,169 |
| | Health Care Equipment & Supplies — 5.7% | |
| 2,371(a) | IDEXX Laboratories, Inc. | $ 1,316,023 |
| 3,292(a) | Inspire Medical Systems, Inc. | 669,692 |
| 4,137(a) | Penumbra, Inc. | 1,040,621 |
| 8,209 | ResMed, Inc. | 1,412,112 |
| 3,201(a) | Shockwave Medical, Inc. | 609,983 |
| | Total Health Care Equipment & Supplies | $ 5,048,431 |
| | Health Care Providers & Services — 3.6% | |
| 40,857(a) | agilon health, Inc. | $ 512,755 |
| 1,876 | McKesson Corp. | 868,550 |
| 2,948(a) | Molina Healthcare, Inc. | 1,065,142 |
| 22,908(a) | Option Care Health, Inc. | 771,771 |
| | Total Health Care Providers & Services | $ 3,218,218 |
| | Health Care Technology — 1.4% | |
| 6,439(a) | Veeva Systems, Inc., Class A | $ 1,239,636 |
| | Total Health Care Technology | $ 1,239,636 |
| | Hotels, Restaurants & Leisure — 3.1% | |
| 996(a) | Chipotle Mexican Grill, Inc. | $ 2,277,812 |
| 72,378(a) | Genius Sports, Ltd. | 447,296 |
| | Total Hotels, Restaurants & Leisure | $ 2,725,108 |
| | Household Durables — 1.6% | |
| 3,814(a) | TopBuild Corp. | $ 1,427,428 |
| | Total Household Durables | $ 1,427,428 |
| | Insurance — 1.1% | |
| 2,667 | Everest Group, Ltd. | $ 942,998 |
| | Total Insurance | $ 942,998 |
| | Interactive Media & Services — 0.9% | |
| 20,393(a) | Pinterest, Inc., Class A | $ 755,357 |
| | Total Interactive Media & Services | $ 755,357 |
8
The accompanying notes are an integral part of these financial statements.
| Pioneer Select Mid Cap Growth VCT Portfolio | Pioneer Variable Contracts Trust |
| Shares | | | | | | Value |
| | IT Services — 3.7% | |
| 13,670(a) | Cloudflare, Inc., Class A | $ 1,138,164 |
| 5,336(a) | MongoDB, Inc. | 2,181,624 |
| | Total IT Services | $ 3,319,788 |
| | Life Sciences Tools & Services — 3.0% | |
| 11,239 | Agilent Technologies, Inc. | $ 1,562,557 |
| 5,923(a) | Repligen Corp. | 1,064,956 |
| | Total Life Sciences Tools & Services | $ 2,627,513 |
| | Media — 1.7% | |
| 21,123(a) | Trade Desk, Inc., Class A | $ 1,520,011 |
| | Total Media | $ 1,520,011 |
| | Metals & Mining — 0.3% | |
| 5,867 | Teck Resources, Ltd., Class B | $ 247,998 |
| | Total Metals & Mining | $ 247,998 |
| | Oil, Gas & Consumable Fuels — 3.1% | |
| 56,408 | Comstock Resources, Inc. | $ 499,211 |
| 10,434 | Hess Corp. | 1,504,165 |
| 31,620 | Marathon Oil Corp. | 763,939 |
| | Total Oil, Gas & Consumable Fuels | $ 2,767,315 |
| | Professional Services — 6.4% | |
| 10,917 | Booz Allen Hamilton Holding Corp. | $ 1,396,393 |
| 112,956(a) | Clarivate Plc | 1,045,973 |
| 8,449 | Thomson Reuters Corp. | 1,235,413 |
| 8,563 | Verisk Analytics, Inc. | 2,045,358 |
| | Total Professional Services | $ 5,723,137 |
| | Semiconductors & Semiconductor Equipment — 10.3% | |
| 18,339(a) | Advanced Micro Devices, Inc. | $ 2,703,352 |
| 26,997(a) | Allegro MicroSystems, Inc. | 817,199 |
| 1,493 | ASM International NV | 774,570 |
| 8,318 | BE Semiconductor Industries NV | 1,252,973 |
| 25,817(a) | Credo Technology Group Holding, Ltd. | 502,657 |
| 6,747(a) | Lattice Semiconductor Corp. | 465,476 |
| 1,757 | Monolithic Power Systems, Inc. | 1,108,280 |
| 7,084(a) | Onto Innovation, Inc. | 1,083,144 |
| 6,519(a) | Rambus, Inc. | 444,922 |
| | Total Semiconductors & Semiconductor Equipment | $ 9,152,573 |
| | Software — 9.5% | |
| 11,239(a) | Confluent, Inc., Class A | $ 262,993 |
| 9,744(a) | Crowdstrike Holdings, Inc., Class A | 2,487,838 |
| 9,625(a) | Datadog, Inc., Class A | 1,168,283 |
| 1,832(a) | HubSpot, Inc. | 1,063,549 |
| 15,792(a) | Procore Technologies, Inc. | 1,093,122 |
| 4,576(a) | Synopsys, Inc. | 2,356,228 |
| | Total Software | $ 8,432,013 |
| | Specialized REITs — 1.6% | |
| 20,044 | Iron Mountain, Inc. | $ 1,402,679 |
| | Total Specialized REITs | $ 1,402,679 |
The accompanying notes are an integral part of these financial statements.
9
| Pioneer Select Mid Cap Growth VCT Portfolio | Pioneer Variable Contracts Trust |
Schedule of Investments 12/31/23 (continued)
| Shares | | | | | | Value |
| | Specialty Retail — 6.3% | |
| 649(a) | AutoZone, Inc. | $ 1,678,061 |
| 9,323 | Ross Stores, Inc. | 1,290,210 |
| 4,277 | Tractor Supply Co. | 919,683 |
| 3,577(a) | Ulta Beauty, Inc. | 1,752,694 |
| | Total Specialty Retail | $ 5,640,648 |
| | Textiles, Apparel & Luxury Goods — 2.0% | |
| 2,117(a) | Lululemon Athletica, Inc. | $ 1,082,401 |
| 11,625(a) | Skechers USA, Inc., Class A | 724,702 |
| | Total Textiles, Apparel & Luxury Goods | $ 1,807,103 |
| | Trading Companies & Distributors — 2.3% | |
| 1,005 | WESCO International, Inc. | $ 174,750 |
| 2,283 | WW Grainger, Inc. | 1,891,899 |
| | Total Trading Companies & Distributors | $ 2,066,649 |
| | Total Common Stocks
(Cost $60,400,845) | $88,129,272 |
|
| |
| | SHORT TERM INVESTMENTS — 0.6% of Net Assets | |
| | Open-End Fund — 0.6% | |
| 523,415(b) | Dreyfus Government Cash Management,
Institutional Shares, 5.25% | $ 523,415 |
| | | | | | | $ 523,415 |
| | TOTAL SHORT TERM INVESTMENTS
(Cost $523,415) | $ 523,415 |
| | TOTAL INVESTMENTS IN UNAFFILIATED ISSUERS — 99.8%
(Cost $60,924,260) | $88,652,687 |
| | OTHER ASSETS AND LIABILITIES — 0.2% | $ 205,589 |
| | net assets — 100.0% | $88,858,276 |
| | | | | | | |
| REIT | Real Estate Investment Trust. |
| (a) | Non-income producing security. |
| (b) | Rate periodically changes. Rate disclosed is the 7-day yield at December 31, 2023. |
Purchases and sales of securities (excluding short-term investments) for the year ended December 31, 2023, aggregated $64,212,225 and $77,047,799, respectively.
At December 31, 2023, the net unrealized appreciation on investments based on cost for federal tax purposes of $62,622,287 was as follows:
| Aggregate gross unrealized appreciation for all investments in which there is an excess of value over tax cost | $$29,911,727 |
| Aggregate gross unrealized depreciation for all investments in which there is an excess of tax cost over value | (3,881,327) |
| Net unrealized appreciation | $ 26,030,400 |
10
The accompanying notes are an integral part of these financial statements.
| Pioneer Select Mid Cap Growth VCT Portfolio | Pioneer Variable Contracts Trust |
Various inputs are used in determining the value of the Portfolio's investments. These inputs are summarized in the three broad levels below.
| Level 1 | – | unadjusted quoted prices in active markets for identical securities. |
| Level 2 | – | other significant observable inputs (including quoted prices for similar securities, interest rates, prepayment speeds, credit risks, etc.). See Notes to Financial Statements — Note 1A. |
| Level 3 | – | significant unobservable inputs (including the Adviser's own assumptions in determining fair value of investments). See Notes to Financial Statements — Note 1A. |
The following is a summary of the inputs used as of December 31, 2023 in valuing the Portfolio's investments:
| | Level 1 | Level 2 | Level 3 | Total |
| Common Stocks | $88,129,272 | $ — | $ — | $88,129,272 |
| Open-End Fund | 523,415 | — | — | 523,415 |
| Total Investments in Securities | $88,652,687 | $— | $— | $88,652,687 |
During the year ended December 31, 2023, there were no transfers in or out of Level 3.
The accompanying notes are an integral part of these financial statements.
11
| Pioneer Select Mid Cap Growth VCT Portfolio | Pioneer Variable Contracts Trust |
Statement of Assets and Liabilities 12/31/23
| ASSETS: | |
| Investments in unaffiliated issuers, at value (cost $60,924,260) | $88,652,687 |
| Cash | 478 |
| Foreign currencies, at value (cost $4) | 4 |
| Receivables — | |
| Investment securities sold | 769,363 |
| Portfolio shares sold | 19,015 |
| Dividends | 52,416 |
| Interest | 4,300 |
| Other assets | 20,906 |
| Total assets | $89,519,169 |
| LIABILITIES: | |
| Payables — | |
| Investment securities purchased | $531,517 |
| Portfolio shares repurchased | 45,123 |
| Trustees' fees | 131 |
| Professional fees | 49,203 |
| Management fees | 9,078 |
| Administrative expenses | 3,672 |
| Accrued expenses | 22,169 |
| Total liabilities | $ 660,893 |
| NET ASSETS: | |
| Paid-in capital | $64,392,149 |
| Distributable earnings | 24,466,127 |
| Net assets | $88,858,276 |
| NET ASSET VALUE PER SHARE: | |
| No par value (unlimited number of shares authorized) | |
| Class l (based on $88,858,276/4,036,196 shares) | $ 22.02 |
12
The accompanying notes are an integral part of these financial statements.
| Pioneer Select Mid Cap Growth VCT Portfolio | Pioneer Variable Contracts Trust |
FOR THE YEAR ENDED 12/31/23
| INVESTMENT INCOME: | | | |
| Dividends from unaffiliated issuers (net of foreign taxes withheld $1,250) | $ 633,670 | | |
| Interest from unaffiliated issuers | 1,554 | | |
| Total Investment Income | | | $ 635,224 |
| EXPENSES: | | | |
| Management fees | $ 646,141 | | |
| Administrative expenses | 31,860 | | |
| Custodian fees | 890 | | |
| Professional fees | 52,180 | | |
| Printing expense | 24,561 | | |
| Officers' and Trustees' fees | 8,566 | | |
| Insurance expense | 1,620 | | |
| Miscellaneous | 39,642 | | |
| Total expenses | | | $ 805,460 |
| Net investment loss | | | $ (170,236) |
| REALIZED AND UNREALIZED GAIN (LOSS) ON INVESTMENTS: | | | |
| Net realized gain (loss) on: | | | |
| Investments in unaffiliated issuers | $ 2,057,923 | | |
| Class actions | 14,080 | | |
| Other assets and liabilities denominated in foreign currencies | (1,676) | | $ 2,070,327 |
| Change in net unrealized appreciation (depreciation) on: | | | |
| Investments in unaffiliated issuers | $13,099,190 | | |
| Other assets and liabilities denominated in foreign currencies | 12 | | $13,099,202 |
| Net realized and unrealized gain (loss) on investments | | | $15,169,529 |
| Net increase in net assets resulting from operations | | | $14,999,293 |
The accompanying notes are an integral part of these financial statements.
13
| Pioneer Select Mid Cap Growth VCT Portfolio | Pioneer Variable Contracts Trust |
Statements of Changes in Net Assets
| | Year
Ended
12/31/23 | | Year
Ended
12/31/22 |
| FROM OPERATIONS: | | | |
| Net investment income (loss) | $ (170,236) | | $ (254,453) |
| Net realized gain (loss) on investments | 2,070,327 | | (4,516,754) |
| Change in net unrealized appreciation (depreciation) on investments | 13,099,202 | | (37,817,695) |
| Net increase (decrease) in net assets resulting from operations | $ 14,999,293 | | $ (42,588,902) |
| DISTRIBUTIONS TO SHAREHOLDERS: | | | |
| Class l ($— and $5.15 per share, respectively) | $ — | | $ (19,540,646) |
| Total distributions to shareholders | $ — | | $ (19,540,646) |
| FROM PORTFOLIO SHARE TRANSACTIONS: | | | |
| Net proceeds from sales of shares | $ 2,130,905 | | $ 2,176,378 |
| Reinvestment of distributions | — | | 19,540,646 |
| Cost of shares repurchased | (14,380,131) | | (14,372,073) |
| Net increase (decrease) in net assets resulting from Portfolio share transactions | $(12,249,226) | | $ 7,344,951 |
| Net increase (decrease) in net assets | $ 2,750,067 | | $ (54,784,597) |
| NET ASSETS: | | | |
| Beginning of year | $ 86,108,209 | | $140,892,806 |
| End of year | $ 88,858,276 | | $ 86,108,209 |
| | Year
Ended
12/31/23
Shares | | Year
Ended
12/31/23
Amount | | Year
Ended
12/31/22
Shares | | Year
Ended
12/31/22
Amount |
| Class l | | | | | | | |
| Shares sold | 105,028 | | $ 2,130,905 | | 94,726 | | $ 2,176,378 |
| Reinvestment of distributions | — | | — | | 1,128,865 | | 19,540,646 |
| Less shares repurchased | (713,529) | | (14,380,131) | | (616,153) | | (14,372,073) |
Net increase
(decrease) | (608,501) | | $(12,249,226) | | 607,438 | | $ 7,344,951 |
14
The accompanying notes are an integral part of these financial statements.
| Pioneer Select Mid Cap Growth VCT Portfolio | Pioneer Variable Contracts Trust |
| | Year Ended
12/31/23 | | Year Ended
12/31/22 | | Year Ended
12/31/21 | | Year Ended
12/31/20 | | Year Ended
12/31/19 |
| Class l | | | | | | | | | |
| Net asset value, beginning of period | $ 18.54 | | $ 34.90 | | $ 37.52 | | $ 29.12 | | $ 24.82 |
| Increase (decrease) from investment operations: | | | | | | | | | |
| Net investment income (loss)(a) | (0.04) | | (0.06) | | (0.23) | | (0.15) | | (0.09) |
| Net realized and unrealized gain (loss) on investments | 3.52 | | (11.15) | | 3.17 | | 10.76 | | 8.13 |
| Net increase (decrease) from investment operations | $ 3.48 | | $ (11.21) | | $ 2.94 | | $ 10.61 | | $ 8.04 |
| Distributions to shareholders: | | | | | | | | | |
| Net realized gain | — | | (5.15) | | (5.56) | | (2.21) | | (3.74) |
| Total distributions | $ — | | $ (5.15) | | $ (5.56) | | $ (2.21) | | $ (3.74) |
| Net increase (decrease) in net asset value | $ 3.48 | | $ (16.36) | | $ (2.62) | | $ 8.40 | | $ 4.30 |
| Net asset value, end of period | $ 22.02 | | $ 18.54 | | $ 34.90 | | $ 37.52 | | $ 29.12 |
| Total return(b) | 18.77%(c) | | (31.06)% | | 8.07% | | 39.17% | | 33.08% |
| Ratio of net expenses to average net assets | 0.92% | | 0.87% | | 0.89% | | 0.89% | | 0.88% |
| Ratio of net investment income (loss) to average net assets | (0.19)% | | (0.25)% | | (0.62)% | | (0.49)% | | (0.30)% |
| Portfolio turnover rate | 74% | | 84% | | 41% | | 82% | | 58% |
| Net assets, end of period (in thousands) | $88,858 | | $86,108 | | $140,893 | | $153,420 | | $125,592 |
| | |
| (a) | The per-share data presented above is based on the average shares outstanding for the period presented. |
| (b) | Assumes initial investment at net asset value at the beginning of each period, reinvestment of all distributions and the complete redemption of the investment at net asset value at the end of each period. |
| (c) | If the Portfolio had not recognized gains in settlement of class action lawsuits during the year ended December 31, 2023, the total return would have been 18.72%. |
NOTE: The above financial highlights do not reflect the deduction of non-portfolio expenses associated with variable insurance products, such as mortality and expense risk charges, separate account charges, and sales charges.
The accompanying notes are an integral part of these financial statements.
15
| Pioneer Select Mid Cap Growth VCT Portfolio | Pioneer Variable Contracts Trust |
Notes to Financial Statements 12/31/23
1. Organization and Significant Accounting Policies
Pioneer Select Mid Cap Growth VCT Portfolio (the “Portfolio”) is one of 7 portfolios comprising Pioneer Variable Contracts Trust (the “Trust”), a Delaware statutory trust. The Portfolio is registered under the Investment Company Act of 1940, as amended (the "1940 Act") as a diversified, open-end management investment company. The investment objective of the Portfolio is to seek growth of capital.
The Portfolio offers one class of shares designated as Class I shares. There is no distribution plan for Class I shares. The Amended and Restated Declaration of Trust of the Trust gives the Board of Trustees the flexibility to specify either per-share voting or dollar-weighted voting when submitting matters for shareholder approval. Under per-share voting, each share of a class of the Portfolio is entitled to one vote. Under dollar-weighted voting, a shareholder’s voting power is determined not by the number of shares owned, but by the dollar value of the shares on the record date.
Portfolio shares may be purchased only by insurance companies for the purpose of funding variable annuity and variable life insurance contracts or by qualified pension and retirement plans.
Amundi Asset Management US, Inc., an indirect, wholly owned subsidiary of Amundi and Amundi’s wholly owned subsidiary, Amundi USA, Inc., serves as the Portfolio’s investment adviser (the “Adviser”). Amundi Distributor US, Inc., an affiliate of the Adviser, serves as the Portfolio’s distributor (the “Distributor”).
The Portfolio is required to comply with Rule 18f-4 under the 1940 Act, which governs the use of derivatives by registered investment companies. Rule 18f-4 permits funds to enter into derivatives transactions (as defined in Rule 18f-4) and certain other transactions notwithstanding the restrictions on the issuance of “senior securities” under Section 18 of the 1940 Act. Rule 18f-4 requires a fund to establish and maintain a comprehensive derivatives risk management program, appoint a derivatives risk manager and comply with a relative or absolute limit on fund leverage risk calculated based on value-at-risk (“VaR”), unless the Portfolio uses derivatives in only a limited manner (a "limited derivatives user"). The Portfolio is currently a limited derivatives user for purposes of Rule 18f-4.
The Portfolio is an investment company and follows investment company accounting and reporting guidance under U.S. Generally Accepted Accounting Principles (“U.S. GAAP”). U.S. GAAP requires the management of the Portfolio to make estimates and assumptions that affect the reported amounts of assets and liabilities, the disclosure of contingent assets and liabilities at the date of the financial statements, and the reported amounts of income, expenses and gain or loss on investments during the reporting period. Actual results could differ from those estimates.
The following is a summary of significant accounting policies followed by the Portfolio in the preparation of its financial statements:
| A. | Security Valuation |
| | The net asset value of the Portfolio is computed once daily, on each day the New York Stock Exchange (“NYSE”) is open, as of the close of regular trading on the NYSE. |
| | Equity securities that have traded on an exchange are valued by using the last sale price on the principal exchange where they are traded. Equity securities that have not traded on the date of valuation, or securities for which sale prices are not available, generally are valued using the mean between the last bid and asked prices or, if both last bid and asked prices are not available, at the last quoted bid price. Last sale and bid and asked prices are provided by independent third party pricing services. In the case of equity securities not traded on an exchange, prices are typically determined by independent third party pricing services using a variety of techniques and methods. |
| | The value of foreign securities is translated into U.S. dollars based on foreign currency exchange rate quotations supplied by a third party pricing source. Trading in non-U.S. equity securities is substantially completed each day at various times prior to the close of the NYSE. The values of such securities used in computing the net asset value of the Portfolio's shares are determined as of such times. The Adviser may use a fair value model developed by an independent pricing service to value non-U.S. equity securities. |
| | Shares of open-end registered investment companies (including money market mutual funds) are valued at such funds' net asset value. |
| | Securities for which independent pricing services or broker-dealers are unable to supply prices or for which market prices and/or quotations are not readily available or are considered to be unreliable are valued by a fair valuation team comprised of certain personnel of the Adviser. The Adviser is designated as the valuation designee for the Portfolio |
| Pioneer Select Mid Cap Growth VCT Portfolio | Pioneer Variable Contracts Trust |
| | pursuant to Rule 2a-5 under the 1940 Act. The Adviser’s fair valuation team is responsible for monitoring developments that may impact fair valued securities. |
| | Inputs used when applying fair value methods to value a security may include credit ratings, the financial condition of the company, current market conditions and comparable securities. The Adviser may use fair value methods if it is determined that a significant event has occurred after the close of the exchange or market on which the security trades and prior to the determination of the Portfolio's net asset value. Examples of a significant event might include political or economic news, corporate restructurings, natural disasters, terrorist activity or trading halts. Thus, the valuation of the Portfolio's securities may differ significantly from exchange prices, and such differences could be material. |
| B. | Investment Income and Transactions |
| | Dividend income is recorded on the ex-dividend date, except that certain dividends from foreign securities where the ex-dividend date may have passed are recorded as soon as the Portfolio becomes aware of the ex-dividend data in the exercise of reasonable diligence. |
| | Interest income, including interest on income-bearing cash accounts, is recorded on the accrual basis. Dividend and interest income are reported net of unrecoverable foreign taxes withheld at the applicable country rates and net of income accrued on defaulted securities. |
| | Interest and dividend income payable by delivery of additional shares is reclassified as PIK (payment-in-kind) income upon receipt and is included in interest and dividend income, respectively. |
| | Security transactions are recorded as of trade date. Gains and losses on sales of investments are calculated on the identified cost method for both financial reporting and federal income tax purposes. |
| C. | Foreign Currency Translation |
| | The books and records of the Portfolio are maintained in U.S. dollars. Amounts denominated in foreign currencies are translated into U.S. dollars using current exchange rates. |
| | Net realized gains and losses on foreign currency transactions, if any, represent, among other things, the net realized gains and losses on foreign currency exchange contracts, disposition of foreign currencies and the difference between the amount of income accrued and the U.S. dollars actually received. Further, the effects of changes in foreign currency exchange rates on investments are not segregated on the Statement of Operations from the effects of changes in the market prices of those securities, but are included with the net realized and unrealized gain or loss on investments. |
| D. | Federal Income Taxes |
| | It is the Portfolio's policy to comply with the requirements of the Internal Revenue Code applicable to regulated investment companies and to distribute all of its net taxable income and net realized capital gains, if any, to its shareholders. Therefore, no provision for federal income taxes is required. As of December 31, 2023, the Portfolio did not accrue any interest or penalties with respect to uncertain tax positions, which, if applicable, would be recorded as an income tax expense on the Statement of Operations. Tax returns filed within the prior three years remain subject to examination by federal and state tax authorities. |
| | A portion of the dividend income recorded by the Portfolio is from distributions by publicly traded real estate investment trusts (“REITs”), and such distributions for tax purposes may also consist of capital gains and return of capital. The actual return of capital and capital gains portions of such distributions will be determined by formal notifications from the REITs subsequent to the calendar year-end. Distributions received from the REITs that are determined to be a return of capital are recorded by the Portfolio as a reduction of the cost basis of the securities held and those determined to be capital gain are reflected as such on the Statement of Operations. |
| | The amount and character of income and capital gain distributions to shareholders are determined in accordance with federal income tax rules, which may differ from U.S. GAAP. Distributions in excess of net investment income or net realized gains are temporary over distributions for financial statement purposes resulting from differences in the recognition or classification of income or distributions for financial statement and tax purposes. Capital accounts within the financial statements are adjusted for permanent book/tax differences to reflect tax character, but are not adjusted for temporary differences. |
| | At December 31, 2023, the Portfolio deferred $30,904 of short-term and $120,752 of long-term Post-October losses, which will be recognized by the Portfolio as occurring at the start of the next fiscal year ending December 31, 2024. |
| Pioneer Select Mid Cap Growth VCT Portfolio | Pioneer Variable Contracts Trust |
Notes to Financial Statements 12/31/23 (continued)
| | At December 31, 2023, the Portfolio reclassified $185,159 to increase distributable earnings and $185,159 to decrease paid-in capital to reflect permanent book/tax differences. These adjustments have no impact on net assets or the results of operations. |
| | At December 31, 2023, the Portfolio was permitted to carry forward indefinitely $1,412,617 of short-term losses and $0 of long-term losses. |
| | The tax character of distributions paid during the years ended December 31, 2023 and December 31, 2022, was as follows: |
| | 2023 | 2022 |
| Distributions paid from: | | |
| Ordinary income | $ — | $ 948,505 |
| Long-term capital gains | — | 18,592,141 |
| Total | $— | $ 19,540,646 |
The following shows the components of distributable earnings (losses) on a federal income tax basis at December 31, 2023:
| | 2023 |
| Distributable earnings/(losses): | |
| Capital loss carryforward | $ (1,412,617) |
| Net unrealized appreciation | 26,030,400 |
| Qualified late year loss deferral | (151,656) |
| Total | $24,466,127 |
The difference between book-basis and tax-basis net unrealized appreciation is attributable to the tax deferral of losses on wash sales, REIT tax cost adjustments, and the mark to market of forward contracts.
| E. | Portfolio Shares |
| | The Portfolio records sales and repurchases of its shares as of trade date. Dividends and distributions to shareholders are recorded on the ex-dividend date. |
| F. | Risks |
| | The value of securities held by the Portfolio may go up or down, sometimes rapidly or unpredictably, due to general market conditions, such as real or perceived adverse economic, political or regulatory conditions, recessions, the spread of infectious illness or other public health issues, inflation, changes in interest rates, armed conflict such as between Russia and Ukraine or in the Middle East, sanctions against Russia, other nations or individuals or companies and possible countermeasures, lack of liquidity in the bond markets or adverse investor sentiment. In the past several years, financial markets have experienced increased volatility, depressed valuations, decreased liquidity and heightened uncertainty. These conditions may continue, recur, worsen or spread. Inflation and interest rates have increased and may rise further. These circumstances could adversely affect the value and liquidity of the Portfolio's investments and negatively impact the Portfolio's performance. |
| | The long-term impact of the COVID-19 pandemic and its subsequent variants on economies, markets, industries and individual issuers, are not known. Some sectors of the economy and individual issuers have experienced or may experience particularly large losses. Periods of extreme volatility in the financial markets, reduced liquidity of many instruments, increased government debt, inflation, and disruptions to supply chains, consumer demand and employee availability, may continue for some time. Following Russia's invasion of Ukraine, Russian securities lost all, or nearly all, their market value. Other securities or markets could be similarly affected by past or future political, geopolitical or other events or conditions. |
| | Governments and central banks, including the U.S. Federal Reserve, have taken extraordinary and unprecedented actions to support local and global economies and the financial markets. These actions have resulted in significant expansion of public debt, including in the U.S. The consequences of high public debt, including its future impact on the economy and securities markets, may not be known for some time. |
| | The U.S. and other countries are periodically involved in disputes over trade and other matters, which may result in tariffs, investment restrictions and adverse impacts on affected companies and securities. For example, the U.S. has |
| Pioneer Select Mid Cap Growth VCT Portfolio | Pioneer Variable Contracts Trust |
| | imposed tariffs and other trade barriers on Chinese exports, has restricted sales of certain categories of goods to China, and has established barriers to investments in China. Trade disputes may adversely affect the economies of the U.S. and its trading partners, as well as companies directly or indirectly affected and financial markets generally. If the political climate between the U.S. and China does not improve or continues to deteriorate, if China were to attempt unification of Taiwan by force, or if other geopolitical conflicts develop or get worse, economies, markets and individual securities may be severely affected both regionally and globally, and the value of the Portfolio's assets may go down. |
| | At times, the Portfolio’s investments may represent industries or industry sectors that are interrelated or have common risks, making the Portfolio more susceptible to any economic, political, or regulatory developments or other risks affecting those industries and sectors. |
| | Normally, the portfolio invests at least 80% of its net assets in equity securities of mid-size companies. Investments in mid-sized companies may offer the potential for higher returns, but are also subject to greater short-term price fluctuations than investments in larger, more established companies. |
| | The Portfolio’s investments in foreign markets and countries with limited developing markets may subject the Portfolio to a greater degree of risk than investments in a developed market. These risks include disruptive political or economic conditions, military conflicts and sanctions, terrorism, sustained economic downturns, financial instability, less liquid trading markets, extreme price volatility, currency risks, reduction of government or central bank support, inadequate accounting standards, tariffs, tax disputes or other tax burdens, nationalization or expropriation of assets and the imposition of adverse governmental laws, arbitrary application of laws and regulations or lack of rule of law and investment and repatriation restrictions. Lack of information and less market regulation also may affect the value of these securities. Withholding and other non-U.S. taxes may decrease the Portfolio’s return. Non-U.S. issuers may be located in parts of the world that have historically been prone to natural disasters. Investing in depositary receipts is subject to many of the same risks as investing directly in non-U.S. issuers. Depositary receipts may involve higher expenses and may trade at a discount (or premium) to the underlying security. |
| | Russia launched a large-scale invasion of Ukraine on February 24, 2022. In response to the military action by Russia, various countries, including the U.S., the United Kingdom, and European Union issued broad-ranging economic sanctions against Russia and Belarus and certain companies and individuals. Since then, Russian securities have lost all, or nearly all, their market value, and many other issuers, securities and markets have been adversely affected. The United States and other countries may impose sanctions on other countries, companies and individuals in light of Russia’s military invasion. The extent and duration of the military action or future escalation of such hostilities, the extent and impact of existing and future sanctions, market disruptions and volatility, and the result of any diplomatic negotiations cannot be predicted. These and any related events could have a significant impact on the value and liquidity of certain Portfolio investments, on Portfolio performance and the value of an investment in the Portfolio, particularly with respect to securities and commodities, such as oil, natural gas and food commodities, as well as other sectors with exposure to Russian issuers or issuers in other countries affected by the invasion, and are likely to have collateral impacts on market sectors globally. |
| | The Portfolio may invest in REIT securities, the value of which can fall for a variety of reasons, such as declines in rental income, fluctuating interest rates, poor property management, environmental liabilities, uninsured damage, increased competition, or changes in real estate tax laws. |
| | With the increased use of technologies such as the Internet to conduct business, the Portfolio is susceptible to operational, information security and related risks. While the Portfolio’s Adviser has established business continuity plans in the event of, and risk management systems to prevent, limit or mitigate, such cyber-attacks, there are inherent limitations in such plans and systems, including the possibility that certain risks have not been identified. Furthermore, the Portfolio cannot control the cybersecurity plans and systems put in place by service providers to the Portfolio such as the Portfolio's custodian and accounting agent, and the Portfolio’s transfer agent. In addition, many beneficial owners of Portfolio shares hold them through accounts at broker-dealers, retirement platforms and other financial market participants over which neither the Portfolio nor the Adviser exercises control. Each of these may in turn rely on service providers to them, which are also subject to the risk of cyber-attacks. Cybersecurity failures or breaches at the Adviser or the Portfolio’s service providers or intermediaries have the ability to cause disruptions and impact business operations, potentially resulting in financial losses, interference with the Portfolio’s ability to calculate its net asset value, impediments to trading, the inability of Portfolio shareholders to effect share purchases, redemptions or exchanges or receive distributions, loss of or unauthorized access to private shareholder information and violations of applicable privacy and other laws, regulatory fines, penalties, reputational damage, or additional compliance costs. Such costs and |
| Pioneer Select Mid Cap Growth VCT Portfolio | Pioneer Variable Contracts Trust |
Notes to Financial Statements 12/31/23 (continued)
| | losses may not be covered under any insurance. In addition, maintaining vigilance against cyber-attacks may involve substantial costs over time, and system enhancements may themselves be subject to cyber-attacks. |
| | The Portfolio’s prospectus contains unaudited information regarding the Portfolio’s principal risks. Please refer to that document when considering the Portfolio’s principal risks. |
2. Management Agreement
The Adviser manages the Portfolio. Management fees payable under the Portfolio's Investment Management Agreement with the Adviser are calculated daily and paid monthly at the annual rate of 0.74% of the Portfolio’s average daily net assets. For the year ended December 31, 2023, the effective management fee was equivalent to 0.74% of the Portfolio’s average daily net assets.
In addition, under the management and administration agreements, certain other services and costs, including accounting, regulatory reporting and insurance premiums, are paid by the Portfolio as administrative reimbursements. Reflected on the Statement of Assets and Liabilities is $9,078 in management fees payable to the Adviser at December 31, 2023.
3. Compensation of Officers and Trustees
The Portfolio pays an annual fee to its Trustees. The Adviser reimburses the Portfolio for fees paid to the Interested Trustees. Except for the chief compliance officer, the Portfolio does not pay any salary or other compensation to its officers. The Portfolio pays a portion of the chief compliance officer's compensation for his services as the Portfolio's chief compliance officer. Amundi US pays the remaining portion of the chief compliance officer's compensation. For the year ended December 31, 2023, the Portfolio paid $8,566 in Officers' and Trustees' compensation, which is reflected on the Statement of Operations as Officers' and Trustees' fees. At December 31, 2023, on its Statement of Assets and Liabilities, the Portfolio had a payable for Trustees' fees of $131 and a payable for administrative expenses of $3,672, which includes the payable for Officers' compensation.
4. Transfer Agent
BNY Mellon Investment Servicing (US) Inc. serves as the transfer agent to the Portfolio at negotiated rates. Transfer agent fees and payables shown on the Statement of Operations and the Statement of Assets and Liabilities, respectively, include sub-transfer agent expenses incurred through the Portfolio’s omnibus relationship contracts.
| Pioneer Select Mid Cap Growth VCT Portfolio | Pioneer Variable Contracts Trust |
Report of Independent Registered Public Accounting Firm
To the Board of Trustees of Pioneer Variable Contracts Trust and the Shareholders of Pioneer Select Mid Cap Growth VCT Portfolio:
Opinion on the Financial Statements
We have audited the accompanying statement of assets and liabilities of Pioneer Select Mid Cap Growth VCT Portfolio (the “Portfolio”) (one of the portfolios constituting Pioneer Variable Contracts Trust (the “Trust”)), including the schedule of investments, as of December 31, 2023, and the related statement of operations for the year then ended, the statements of changes in net assets for each of the two years in the period then ended, the financial highlights for each of the five years in the period then ended and the related notes (collectively referred to as the “financial statements”). In our opinion, the financial statements present fairly, in all material respects, the financial position of the Portfolio (one of the portfolios constituting Pioneer Variable Contracts Trust) at December 31, 2023, the results of its operations for the year then ended, the changes in its net assets for each of the two years in the period then ended, and its financial highlights for each of the five years in the period then ended in conformity with U.S. generally accepted accounting principles.
Basis for Opinion
These financial statements are the responsibility of the Trust’s management. Our responsibility is to express an opinion on the Portfolio’s financial statements based on our audits. We are a public accounting firm registered with the Public Company Accounting Oversight Board (United States) ("PCAOB") and are required to be independent with respect to the Trust in accordance with the U.S. federal securities laws and the applicable rules and regulations of the Securities and Exchange Commission and the PCAOB.
We conducted our audits in accordance with the standards of the PCAOB. Those standards require that we plan and perform the audit to obtain reasonable assurance about whether the financial statements are free of material misstatement, whether due to error or fraud. The Trust is not required to have, nor were we engaged to perform, an audit of the Trust’s internal control over financial reporting. As part of our audits, we are required to obtain an understanding of internal control over financial reporting, but not for the purpose of expressing an opinion on the effectiveness of the Trust’s internal control over financial reporting. Accordingly, we express no such opinion.
Our audits included performing procedures to assess the risks of material misstatement of the financial statements, whether due to error or fraud, and performing procedures that respond to those risks. Such procedures included examining, on a test basis, evidence regarding the amounts and disclosures in the financial statements. Our procedures included confirmation of securities owned as of December 31, 2023, by correspondence with the custodian, brokers, and others; when replies were not received from brokers and others, we performed other auditing procedures. Our audits also included evaluating the accounting principles used and significant estimates made by management, as well as evaluating the overall presentation of the financial statements. We believe that our audits provide a reasonable basis for our opinion.
We have served as the auditor of one or more investment companies in the Pioneer family of funds since 2017.
Boston, Massachusetts
February 20, 2024
| Pioneer Select Mid Cap Growth VCT Portfolio | Pioneer Variable Contracts Trust |
Approval of Renewal of Investment Management Agreement
Amundi Asset Management US, Inc. (“Amundi US”) serves as the investment adviser to Pioneer Select Mid Cap Growth VCT Portfolio (the “Portfolio”) pursuant to an investment management agreement between Amundi US and the Portfolio. In order for Amundi US to remain the investment adviser of the Portfolio, the Trustees of the Portfolio, including a majority of the Portfolio’s Independent Trustees, must determine annually whether to renew the investment management agreement for the Portfolio.
The contract review process began in January 2023 as the Trustees of the Portfolio agreed on, among other things, an overall approach and timeline for the process. Contract review materials were provided to the Trustees in March 2023, July 2023 and September 2023. In addition, the Trustees reviewed and discussed the Portfolio’s performance at regularly scheduled meetings throughout the year, and took into account other information related to the Portfolio provided to the Trustees at regularly scheduled meetings, in connection with the review of the Portfolio’s investment management agreement.
In March 2023, the Trustees, among other things, discussed the memorandum provided by Portfolio counsel that summarized the legal standards and other considerations that are relevant to the Trustees in their deliberations regarding the renewal of the investment management agreement, and reviewed and discussed the qualifications of the investment management teams for the Portfolio, as well as the level of investment by the Portfolio’s portfolio managers in the Portfolio. In July 2023, the Trustees, among other things, reviewed the Portfolio’s management fees and total expense ratios, the financial statements of Amundi US and its parent companies, profitability analyses provided by Amundi US, and analyses from Amundi US as to possible economies of scale. The Trustees also reviewed the profitability of the institutional business of Amundi US as compared to that of Amundi US’s fund management business, and considered the differences between the fees and expenses of the Portfolio and the fees and expenses of Amundi US’s institutional accounts, as well as the different services provided by Amundi US to the Portfolio and to the institutional accounts. The Trustees further considered contract review materials, including additional materials received in response to the Trustees’ request, in September 2023.
At a meeting held on September 19, 2023, based on their evaluation of the information provided by Amundi US and third parties, the Trustees of the Portfolio, including the Independent Trustees voting separately advised by independent counsel, unanimously approved the renewal of the investment management agreement for another year. In approving the renewal of the investment management agreement, the Trustees considered various factors that they determined were relevant, including the factors described below. The Trustees did not identify any single factor as the controlling factor in determining to approve the renewal of the agreement.
Nature, Extent and Quality of Services
The Trustees considered the nature, extent and quality of the services that had been provided by Amundi US to the Portfolio, taking into account the investment objective and strategy of the Portfolio. The Trustees also reviewed Amundi US’s investment approach for the Portfolio and its research process. The Trustees considered Amundi US’ integration of environmental, social and governance (ESG) considerations into its investment research process. The Trustees considered the resources of Amundi US and the personnel of Amundi US who provide investment management services to the Portfolio. They also reviewed the amount of non-Portfolio assets managed by the portfolio managers of the Portfolio. They considered the non-investment resources and personnel of Amundi US that are involved in Amundi US’s services to the Portfolio, including Amundi US’s compliance, risk management, and legal resources and personnel. The Trustees considered the compliance services being provided to the Portfolio by Amundi US and how Amundi US has addressed any compliance issues during the past year. The Trustees noted the substantial attention and high priority given by Amundi US’s senior management to the Pioneer Fund complex, including with respect to the increasing regulation to which the Pioneer Funds are subject.
The Trustees considered that Amundi US supervises and monitors the performance of the Portfolio’s service providers and provides the Portfolio with personnel (including Portfolio officers) and other resources that are necessary for the Portfolio’s business management and operations. The Trustees also considered that, as administrator, Amundi US is responsible for the administration of the Portfolio’s business and other affairs. The Trustees considered that the Portfolio reimburses Amundi US its pro rata share of Amundi US’s costs of providing administration services to the Pioneer Funds.
Based on these considerations, the Trustees concluded that the nature, extent and quality of services that had been provided by Amundi US to the Portfolio were satisfactory and consistent with the terms of the investment management agreement.
Performance of the Portfolio
In considering the Portfolio’s performance, the Trustees regularly review and discuss throughout the year data prepared by Amundi US and information comparing the Portfolio’s performance with the performance of its peer group of funds, as classified by Morningstar, Inc. (Morningstar), and with the performance of the Portfolio’s benchmark index. They also discuss the Portfolio’s performance with Amundi US on a regular basis. The Trustees’ regular reviews and discussions were factored into the Trustees’ deliberations concerning the renewal of the investment management agreement.
| Pioneer Select Mid Cap Growth VCT Portfolio | Pioneer Variable Contracts Trust |
Management Fee and Expenses
The Trustees considered information showing the fees and expenses of the Portfolio in comparison to the management fees of its peer group of funds as classified by Morningstar and also to the expense ratios of a peer group of funds selected on the basis of criteria determined by the Independent Trustees for this purpose using data provided by Strategic Insight Mutual Fund Research and Consulting, LLC (Strategic Insight), an independent third party. The peer group comparisons referred to below are organized in quintiles. Each quintile represents one-fifth of the peer group. In all peer group comparisons referred to below, first quintile is most favorable to the Portfolio’s shareowners. The Trustees noted that they separately review and consider the impact of the Portfolio’s transfer agency and Portfolio- and Amundi US-paid expenses for sub-transfer agency and intermediary arrangements, and that the results of the most recent such review were considered in the consideration of the Portfolio’s expense ratio.
The Trustees considered that the Portfolio’s management fee for the most recent fiscal year was in the third quintile relative to the management fees paid by other funds in its Morningstar category for the comparable period. The Trustees considered that the expense ratio of the Portfolio’s Class I shares for the most recent fiscal year was in the third quintile relative to its Strategic Insight peer group for the comparable period.
The Trustees reviewed management fees charged by Amundi US to institutional and other clients, including publicly offered European funds sponsored by Amundi US’s affiliates, unaffiliated U.S. registered investment companies (in a sub-advisory capacity), and unaffiliated foreign and domestic separate accounts. The Trustees also considered Amundi US’s costs in providing services to the Portfolio and Amundi US’s costs in providing services to the other clients and considered the differences in management fees and profit margins for fund and non-fund services. In evaluating the fees associated with Amundi US’s client accounts, the Trustees took into account the respective demands, resources and complexity associated with the Portfolio and other client accounts. The Trustees noted that, in some instances, the fee rates for those clients were lower than the management fee for the Portfolio and considered that, under the investment management and administration agreements with the Portfolio, Amundi US performs additional services for the Portfolio that it does not provide to those other clients or services that are broader in scope, including oversight of the Portfolio’s other service providers and activities related to compliance and the extensive regulatory and tax regimes to which the Portfolio is subject. The Trustees also considered the entrepreneurial risks associated with Amundi US’s management of the Portfolio.
The Trustees concluded that the management fee payable by the Portfolio to Amundi US was reasonable in relation to the nature and quality of the services provided by Amundi US.
Profitability
The Trustees considered information provided by Amundi US regarding the profitability of Amundi US with respect to the advisory services provided by Amundi US to the Portfolio, including the methodology used by Amundi US in allocating certain of its costs to the management of the Portfolio. The Trustees also considered Amundi US’s profit margin in connection with the overall operation of the Portfolio. They further reviewed the financial results, including the profit margins, realized by Amundi US from non-fund businesses. The Trustees considered Amundi US’s profit margins in comparison to the limited industry data available and noted that the profitability of any adviser was affected by numerous factors, including its organizational structure and method for allocating expenses. The Trustees concluded that Amundi US’s profitability with respect to the management of the Portfolio was not unreasonable.The Trustees considered information provided by Amundi US regarding the profitability of Amundi US with respect to the advisory services provided by Amundi US to the Portfolio, including the methodology used by Amundi US in allocating certain of its costs to the management of the Portfolio. The Trustees also considered Amundi US’s profit margin in connection with the overall operation of the Portfolio. They further reviewed the financial results, including the profit margins, realized by Amundi US from non-fund businesses. The Trustees considered Amundi US’s profit margins in comparison to the limited industry data available and noted that the profitability of any adviser was affected by numerous factors, including its organizational structure and method for allocating expenses. The Trustees concluded that Amundi US’s profitability with respect to the management of the Portfolio was not unreasonable.
Economies of Scale
The Trustees considered Amundi US’s views relating to economies of scale in connection with the Pioneer Funds as fund assets grow and the extent to which any such economies of scale are shared with the Portfolio and Portfolio shareholders. The Trustees recognize that economies of scale are difficult to identify and quantify, and that, among other factors that may be relevant, are the following: fee levels, expense subsidization, investment by Amundi US in research and analytical capabilities and Amundi US’s commitment and resource allocation to the Portfolio. The Trustees noted that profitability also may be an indicator of the availability of any economies of scale, although profitability may vary for other reasons including due to reductions in expenses. The Trustees concluded that economies of scale, if any, were being appropriately shared with the Portfolio.
| Pioneer Select Mid Cap Growth VCT Portfolio | Pioneer Variable Contracts Trust |
Approval of Renewal of Investment Management Agreement (continued)
Other Benefits
The Trustees considered the other benefits that Amundi US enjoys from its relationship with the Portfolio. The Trustees considered the character and amount of fees paid or to be paid by the Portfolio, other than under the investment management agreement, for services provided by Amundi US and its affiliates. The Trustees further considered the revenues and profitability of Amundi US’s businesses other than the fund business. To the extent applicable, the Trustees also considered the benefits to the Portfolio and to Amundi US and its affiliates from the use of “soft” commission dollars generated by the Portfolio to pay for research and brokerage services.
The Trustees considered that Amundi US is the principal U.S. asset management business of Amundi, which is one of the largest asset managers globally. Amundi’s worldwide asset management business manages over $2.1 trillion in assets (including the Pioneer Funds). The Trustees considered that Amundi US’s relationship with Amundi creates potential opportunities for Amundi US and Amundi that derive from Amundi US’s relationships with the Portfolio, including Amundi’s ability to market the services of Amundi US globally. The Trustees noted that Amundi US has access to additional research and portfolio management capabilities as a result of its relationship with Amundi and Amundi’s enhanced global presence that may contribute to an increase in the resources available to Amundi US. The Trustees considered that Amundi US and the Portfolio receive reciprocal intangible benefits from the relationship, including mutual brand recognition and, for the Portfolio, direct and indirect access to the resources of a large global asset manager. The Trustees concluded that any such benefits received by Amundi US as a result of its relationship with the Portfolio were reasonable.
Conclusion
After consideration of the factors described above as well as other factors, the Trustees, including the Independent Trustees, concluded that the investment management agreement for the Portfolio, including the fees payable thereunder, was fair and reasonable and voted to approve the proposed renewal of the investment management agreement.
| Pioneer Select Mid Cap Growth VCT Portfolio | Pioneer Variable Contracts Trust |
Trustees, Officers and Service Providers
Trustees and Officers
The Portfolio’s Trustees and officers are listed below, together with their principal occupations and other directorships they have held during at least the past five years. Trustees who are interested persons of the Portfolios within the meaning of the 1940 Act are referred to as Interested Trustees. Trustees who are not interested persons of the Portfolio are referred to as Independent Trustees. Each of the Trustees serves as a Trustee of each of the 47 U.S. registered investment portfolios for which Amundi US serves as investment adviser (the “Pioneer Funds”). The address for all Trustees and all officers of the Portfolios is 60 State Street, Boston, Massachusetts 02109.
The Statement of Additional Information of the Portfolio includes additional information about the Trustees and is available, without charge, upon request, by calling 1-800-225-6292.
Investment Adviser and Administrator
Amundi Asset Management US, Inc.
Custodian and Sub-Administrator
The Bank of New York Mellon Corporation
Independent Registered Public Accounting Firm
Ernst & Young LLP
Principal Underwriter
Amundi Distributor US, Inc.
Legal Counsel
Morgan, Lewis & Bockius LLP
Transfer Agent
BNY Mellon Investment Servicing (US) Inc.
Name, Age and Position
Held With the Trust | Term of Office and
Length of Service | Principal Occupation(s) During At Least The Past Five Years | Other Directorships Held by Trustee During At Least The Past Five Years |
| Independent Trustees |
Thomas J. Perna (73)
Chairman of the Board
and Trustee | Trustee since 2006.
Serves until a successor
trustee is elected or
earlier retirement
or removal. | Private investor (2004 – 2008 and 2013 – present); Chairman (2008 – 2013) and Chief Executive Officer (2008 – 2012), Quadriserv, Inc. (technology products for securities lending industry); and Senior Executive Vice President, The Bank of New York (financial and securities services) (1986 – 2004) | Director, Broadridge Financial
Solutions, Inc. (investor
communications and securities
processing provider for financial
services industry) (2009 – present); Director, Quadriserv, Inc.
(2005 – 2013); and Commissioner,
New Jersey State Civil Service
Commission (2011 – 2015) |
John E. Baumgardner,
Jr. (72)*
Trustee | Trustee since 2019.
Serves until a successor
trustee is elected or
earlier retirement
or removal. | Of Counsel (2019 – present), Partner (1983-2018), Sullivan & Cromwell LLP (law firm). | Chairman, The Lakeville Journal
Company, LLC, (privately-held
community newspaper group)
(2015-present) |
| Pioneer Select Mid Cap Growth VCT Portfolio | Pioneer Variable Contracts Trust |
Trustees, Officers and Service Providers (continued)
Name, Age and Position
Held With the Trust | Term of Office and
Length of Service | Principal Occupation(s) During At Least The Past Five Years | Other Directorships Held by Trustee During At Least The Past Five Years |
| Independent Trustees (continued) |
Diane Durnin (66)
Trustee | Trustee since 2019.
Serves until a successor
trustee is elected or
earlier retirement
or removal. | Managing Director - Head of Product Strategy and Development, BNY Mellon Investment Management (investment management firm) (2012-2018); Vice Chairman – The Dreyfus Corporation (2005 – 2018): Executive Vice President Head of Product, BNY Mellon Investment Management (2007-2012); Executive Director- Product Strategy, Mellon Asset Management (2005-2007); Executive Vice President Head of Products, Marketing and Client Service, Dreyfus Corporation (investment management firm) (2000-2005); Senior Vice President Strategic Product and Business Development, Dreyfus Corporation (1994-2000) | None |
Benjamin M. Friedman (79)
Trustee | Trustee since 2008.
Serves until a successor
trustee is elected or
earlier retirement
or removal. | William Joseph Maier Professor of Political Economy, Harvard University (1972 – present) | Trustee, Mellon Institutional Funds
Investment Trust and Mellon
Institutional Funds Master Portfolio
(oversaw 17 portfolios in fund
complex) (1989 - 2008) |
Craig C. MacKay (60)
Trustee | Trustee since 2021.
Serves until a successor
trustee is elected or
earlier retirement
or removal. | Partner, England & Company, LLC (advisory firm) (2012 – present); Group Head – Leveraged Finance Distribution, Oppenheimer & Company (investment bank) (2006 – 2012); Group Head – Private Finance & High Yield Capital Markets Origination, SunTrust Robinson Humphrey (investment bank) (2003 – 2006); and Founder and Chief Executive Officer, HNY Associates, LLC (investment bank) (1996 – 2003) | Director, Equitable Holdings, Inc. (financial services holding company) (2022 – present); Board Member of Carver Bancorp, Inc. (holding company) and Carver Federal Savings Bank, NA (2017 – present); Advisory Council Member, MasterShares ETF (2016 – 2017); Advisory Council Member, The Deal (financial market information publisher) (2015 – 2016); Board Co-Chairman and Chief Executive Officer, Danis Transportation Company (privately-owned commercial carrier) (2000 – 2003); Board Member and Chief Financial Officer, Customer Access Resources (privately-owned teleservices company) (1998 – 2000); Board Member, Federation of Protestant Welfare Agencies (human services agency) (1993 – present); and Board Treasurer, Harlem Dowling Westside Center (foster care agency) (1999 – 2018) |
Lorraine H. Monchak (67)
Trustee | Trustee since 2017.
(Advisory Trustee from
2014 - 2017). Serves
until a successor trustee
is elected or earlier
retirement or removal. | Chief Investment Officer, 1199 SEIU Funds (healthcare workers union pension funds) (2001 – present); Vice President – International Investments Group, American International Group, Inc. (insurance company) (1993 – 2001); Vice President – Corporate Finance and Treasury Group, Citibank, N.A. (1980 – 1986 and 1990 – 1993); Vice President – Asset/Liability Management Group, Federal Farm Funding Corporation (government-sponsored issuer of debt securities) (1988 – 1990); Mortgage Strategies Group, Shearson Lehman Hutton, Inc. (investment bank) (1987 – 1988); Mortgage Strategies Group, Drexel Burnham Lambert, Ltd. (investment bank) (1986 – 1987) | None |
| Pioneer Select Mid Cap Growth VCT Portfolio | Pioneer Variable Contracts Trust |
Name, Age and Position
Held With the Trust | Term of Office and
Length of Service | Principal Occupation(s) During At Least The Past Five Years | Other Directorships Held by Trustee During At Least The Past Five Years |
| Independent Trustees (continued) |
Marguerite A. Piret (75)**
Trustee | Trustee since 1995.
Serves until a successor
trustee is elected or
earlier retirement
or removal. | Chief Financial Officer, American Ag Energy, Inc. (technology for the environment, energy and agriculture) (2019 – present); Chief Operating Officer, North Country Growers LLC (controlled environment agriculture company) (2020 – present); Chief Executive Officer, Green Heat LLC (biofuels company) (2022 – present); President and Chief Executive Officer, Newbury Piret Company (investment banking firm) (1981 – 2019) | Director of New America High
Income Fund, Inc. (closed-end
investment company) (2004 –
present); and Member, Board of
Governors, Investment Company
Institute (2000 – 2006) |
Fred J. Ricciardi (76)
Trustee | Trustee since 2014.
Serves until a successor
trustee is elected or
earlier retirement
or removal. | Private investor (2020 – present); Consultant (investment company services) (2012 – 2020); Executive Vice President, BNY Mellon (financial and investment company services) (1969 – 2012); Director, BNY International Financing Corp. (financial services) (2002 – 2012); Director, Mellon Overseas Investment Corp. (financial services) (2009 – 2012); Director, Financial Models (technology) (2005-2007); Director, BNY Hamilton Funds, Ireland (offshore investment companies) (2004-2007); Chairman/Director, AIB/BNY Securities Services, Ltd., Ireland (financial services) (1999-2006); Chairman, BNY Alternative Investment Services, Inc. (financial services) (2005-2007) | None |
* Mr. Baumgardner is Of Counsel to Sullivan & Cromwell LLP, which acts as counsel to the Independent Trustees of each Pioneer Fund.
** Ms. Piret became a non-voting Advisory Trustee of the Pioneer Funds effective January 22, 2024. |
| Interested Trustees |
Lisa M. Jones (61)***
Trustee, President and Chief
Executive Officer | Trustee since 2017. Serves
until a successor trustee is
elected or earlier retirement
or removal | Director, CEO and President of Amundi US, Inc. (investment management firm) (since September 2014); Director, CEO and President of Amundi Asset Management US, Inc. (since September 2014); Director, CEO and President of Amundi Distributor US, Inc. (since September 2014); Director, CEO and President of Amundi Asset Management US, Inc. (since September 2014); Chair, Amundi US, Inc., Amundi Distributor US, Inc. and Amundi Asset Management US, Inc. (September 2014 – 2018); Managing Director, Morgan Stanley Investment Management (investment management firm) (2010 – 2013); Director of Institutional Business, CEO of International, Eaton Vance Management (investment management firm) (2005 – 2010); Director of Amundi Holdings US, Inc. (since 2017) | Director of Clearwater Analytics (provider of web-based investment accounting software for reporting and reconciliation services) (September 2022 – present) |
Kenneth J. Taubes (64)***,****
Trustee | Trustee since 2014. Serves
until a successor trustee is
elected or earlier retirement
or removal | Director and Executive Vice President (since 2008) and Chief Investment Officer, U.S. (since 2010) of Amundi US, Inc. (investment management firm); Director and Executive Vice President and Chief Investment Officer, U.S. of Amundi US (since 2008); Executive Vice President and Chief Investment Officer, U.S. of Amundi Asset Management US, Inc. (since 2009); Portfolio Manager of Amundi US (since 1999); Director of Amundi Holdings US, Inc. (since 2017) | None |
| Pioneer Select Mid Cap Growth VCT Portfolio | Pioneer Variable Contracts Trust |
Trustees, Officers and Service Providers (continued)
Name, Age and Position
Held With the Trust | Term of Office and
Length of Service | Principal Occupation(s) During At Least The Past Five Years | Other Directorships Held by Trustee During At Least The Past Five Years |
| Interested Trustees (continued) |
*** Ms. Jones and Mr. Taubes are Interested Trustees because they are officers or directors of the Portfolio’s investment adviser and certain of its affiliates.
**** Mr. Taubes retired as a Trustee, effective January 1, 2024. |
| Name, Age and Position Held With the Trust***** | Term of Office and
Length of Service | Principal Occupation(s) During
At Least The Past Five Years | Other Directorships Held by Trustee During At Least The Past Five Years |
| Trust Officers |
Christopher J. Kelley (59)
Secretary and Chief
Legal Officer | Since 2003. Serves at
the discretion of
the Board | Vice President and Associate General Counsel of Amundi US since January 2008; Secretary and Chief Legal Officer of all of the Pioneer Funds since June 2010; Assistant Secretary of all of the Pioneer Funds from September 2003 to May 2010; Vice President and Senior Counsel of Amundi US from July 2002 to December 2007 | None |
Thomas Reyes (61)
Assistant Secretary | Since 2010. Serves at
the discretion of
the Board | Assistant General Counsel of Amundi US since May 2013 and Assistant Secretary of all the Pioneer Funds since June 2010; Counsel of Amundi US from June 2007 to May 2013 | None |
Heather L. Melito-Dezan (47)
Assistant Secretary | Since 2022. Serves at
the discretion of
the Board | Director - Trustee and Board Relationships of Amundi US since September 2019; Assistant Secretary of Amundi US, Inc. since July 2020: Assistant Secretary of Amundi Asset Management US, Inc. since July 2020: Assistant Secretary of Amundi Distributor US, Inc. since July 2020; Assistant Secretary of all the Pioneer Funds since September 2022; Private practice from 2017 – 2019. | None |
Anthony J. Koenig, Jr. (60)
Treasurer and
Chief Financial and
Accounting Officer | Since 2021. Serves at
the discretion of
the Board | Managing Director, Chief Operations Officer and Fund Treasurer of Amundi US since May 2021; Treasurer of all of the Pioneer Funds since May 2021; Assistant Treasurer of all of the Pioneer Funds from January 2021 to May 2021; and Chief of Staff, US Investment Management of Amundi US from May 2008 to January 2021 | None |
Luis I. Presutti (58)
Assistant Treasurer | Since 2000. Serves at
the discretion of
the Board | Director – Fund Treasury of Amundi US since 1999; and Assistant Treasurer of all of the Pioneer Funds since 1999 | None |
Gary Sullivan (65)
Assistant Treasurer | Since 2002. Serves at
the discretion of
the Board | Senior Manager – Fund Treasury of Amundi US since 2012; and Assistant Treasurer of all of the Pioneer Funds since 2002 | None |
Antonio Furtado (41)
Assistant Treasurer | Since 2020. Serves at
the discretion of
the Board | Fund Oversight Manager – Fund Treasury of Amundi US since 2020; Assistant Treasurer of all of the Pioneer Funds since 2020; and Senior Fund Treasury Analyst from 2012 - 2020 | None |
| Pioneer Select Mid Cap Growth VCT Portfolio | Pioneer Variable Contracts Trust |
| Name, Age and Position Held With the Trust***** | Term of Office and
Length of Service | Principal Occupation(s) During
At Least The Past Five Years | Other Directorships Held by Trustee During At Least The Past Five Years |
| Trust Officers (continued) |
Michael Melnick (52)
Assistant Treasurer | Since 2021. Serves at
the discretion of
the Board | Vice President - Deputy Fund Treasurer of Amundi US since May 2021; Assistant Treasurer of all of the Pioneer Funds since July 2021; Director of Regulatory Reporting of Amundi US from 2001 – 2021; and Director of Tax of Amundi US from 2000 - 2001 | None |
John Malone (53)
Chief Compliance Officer | Since 2018. Serves at
the discretion of
the Board | Managing Director, Chief Compliance Officer of Amundi US Asset Management; Amundi Asset Management US, Inc.; and the Pioneer Funds since September 2018; Chief Compliance Officer of Amundi Distributor US, Inc. since January 2014. | None |
Brandon Austin (51)
Anti-Money
Laundering Officer | Since 2022. Serves at
the discretion of
the Board | Director, Financial Security – Amundi Asset Management; Anti-Money Laundering Officer of all the Pioneer Funds since March 2022: Director of Financial Security of Amundi US since July 2021; Vice President, Head of BSA, AML and OFAC, Deputy Compliance Manager, Crédit Agricole Indosuez Wealth Management (investment management firm) (2013 – 2021) | None |
| ***** Marco Pirondini has been appointed to serve as an Executive Vice President of the Portfolio and Chief Investment Officer of Amundi US, Inc., effective January 1, 2024. |
Proxy Voting Policies and Procedures of the Portfolio are available without charge, upon request, by calling our toll free number (1-800-225-6292). Information regarding how the Portfolio voted proxies relating to Portfolio securities during the most recent 12-month period ended June 30 is publicly available to shareholders at www.amundi.com/us. This information is also available on the Securities and Exchange Commission’s web site at www.sec.gov.
Pioneer Variable Contracts Trust
Pioneer High Yield
VCT Portfolio
Class I and II Shares
Annual Report | December 31, 2023
Please refer to your contract prospectus to determine the applicable share class offered under your contract.
Pioneer Variable Contracts Trust
Table of Contents
Pioneer High Yield VCT Portfolio
This report is authorized for distribution only when preceded or accompanied by a prospectus for the Portfolio being offered.
Pioneer Variable Contracts Trust files a complete schedule of portfolio holdings with the Securities and Exchange Commission for the first and third quarters of each fiscal year as an exhibit to its reports on Form N-PORT. Shareholders may view the filed Form N-PORT by visiting the Commission’s web site at https://www.sec.gov.
| Pioneer High Yield VCT Portfolio | Pioneer Variable Contracts Trust |
Portfolio Update 12/31/23
Portfolio Diversification
(As a percentage of total investments)*
+Amount rounds to less than 0.1%.
5 Largest Holdings
| (As a percentage of total investments)* |
| 1. | CCO Holdings LLC/CCO Holdings Capital Corp., 4.500%, 6/1/33 (144A) | 2.47% |
| 2. | Pioneer ILS Interval Fund(l) | 2.37 |
| 3. | Seaspan Corp., 5.500%, 8/1/29 (144A) | 1.34 |
| 4. | Dealer Tire LLC/DT Issuer LLC, 8.000%, 2/1/28 (144A) | 1.28 |
| 5. | Olympus Water US Holding Corp., 9.750%, 11/15/28 (144A) | 1.18 |
| * | Excludes short-term investments and all derivative contracts except for options purchased. The Portfolio is actively managed, and current holdings may be different. The holdings listed should not be considered recommendations to buy or sell any securities. |
| (l) | Pioneer ILS Interval Fund is an affiliated closed-end fund managed by Amundi Asset Management US, Inc. |
Performance Update 12/31/23
Prices and Distributions
| Net Asset Value per Share | 12/31/23 | 12/31/22 |
| Class l | $8.30 | $7.86 |
| Class ll | $8.18 | $7.75 |
| | | |
Distributions per Share
(1/1/23 - 12/31/23) | Net
Investment
Income | Short-Term
Capital Gains | Long-Term
Capital Gains |
| Class l | $0.4462 | $— | $— |
| Class ll | $0.4200 | $— | $— |
Performance of a $10,000 Investment
The following chart shows the change in value of an investment made in Class I and Class II shares of Pioneer High Yield VCT Portfolio at net asset value during the periods shown, compared to that of the ICE Bank of America (BofA) U.S. High Yield Index and the ICE BofA All-Convertibles Speculative Quality Index. Portfolio returns are based on net asset value and do not reflect any applicable insurance fees or surrender charges.
 | The ICE BofA U.S. High Yield Index is an unmanaged, commonly accepted measure of the performance of high-yield securities. The ICE BofA U.S. All-Convertibles Speculative Quality Index is an unmanaged index of high-yield U.S. convertible securities. Index returns are calculated monthly, assume reinvestment of dividends and do not reflect any fees, expenses or sales charges. It is not possible to invest directly in an index. |
Average Annual Total Returns
(As of December 31, 2023)
| | Class l | Class ll | ICE BofA
U.S. High
Yield Index | ICE BofA U.S.
All-Convertibles
Speculative
Quality Index |
| 10 Years | 3.39% | 3.04% | 4.51% | 12.06% |
| 5 Years | 4.15% | 3.85% | 5.21% | 21.21% |
| 1 Year | 11.63% | 11.29% | 13.46% | 7.23% |
All total returns shown assume reinvestment of distributions at net asset value.
The performance table does not reflect the deduction of taxes that a shareholder would pay on distributions or the redemption of shares.
Call 1-800-225-6292 or visit www.amundi.com/us for the most recent month-end performance results. Current performance may be lower or higher than the performance data quoted.
The performance data quoted represents past performance, which is no guarantee of future results. Investment return and principal value will fluctuate, and shares, when redeemed, may be worth more or less than their original cost.
The returns for the Portfolio do not reflect the deduction of expenses associated with variable products, such as mortality and expense risk charges, separate account charges, and sales charges. These expenses would reduce the overall returns shown.
Performance results reflect any applicable expense waivers in effect during the periods shown. Without such waivers, performance would be lower. Waivers may not be in effect for all portfolios. Certain fee waivers are contractual through a specified period. Otherwise, fee waivers can be rescinded at any time. See the prospectus and financial statements for more information.
| Pioneer High Yield VCT Portfolio | Pioneer Variable Contracts Trust |
Comparing Ongoing Portfolio Expenses
As a shareholder in the Portfolio, you incur two types of costs:
| (1) | ongoing costs, including management fees, distribution and/or service (12b-1) fees, and other Portfolio expenses; and |
| (2) | transaction costs, including sales charges (loads) on purchase payments. |
This example is intended to help you understand your ongoing expenses (in dollars) of investing in the Portfolio and to compare these costs with the ongoing costs of investing in other mutual funds offered through your variable annuity contract. The example is based on an investment of $1,000 at the beginning of the Portfolio’s latest six-month period and held throughout the six months.
Using the Tables
Actual Expenses
The first table below provides information about actual account values and actual expenses. You may use the information in this table, together with the amount you invested, to estimate the expenses that you paid over the period as follows:
| (1) | Divide your account value by $1,000
Example: an $8,600 account value ÷ $1,000 = 8.6 |
| (2) | Multiply the result in (1) above by the corresponding share class’s number in the third row under the heading entitled “Expenses Paid During Period” to estimate the expenses you paid on your account during this period. |
Expenses Paid on a $1,000 Investment in Pioneer High Yield VCT Portfolio
Based on actual returns from July 1, 2023 through December 31, 2023.
| Share Class | l | ll |
| Beginning Account Value on 7/1/23 | $1,000.00 | $1,000.00 |
| Ending Account Value (after expenses) on 12/31/23 | $1,069.00 | $1,067.00 |
| Expenses Paid During Period* | $ 4.69 | $ 5.99 |
| | |
| * | Expenses are equal to the Portfolio’s annualized net expense ratio of 0.90% and 1.15% for Class I and Class II shares, respectively, multiplied by the average account value over the period, multiplied by 184/365 (to reflect the one-half year period). |
Hypothetical Example for Comparison Purposes
The table below provides information about hypothetical account values and hypothetical expenses based on the Portfolio’s actual expense ratio and an assumed rate of return of 5% per year before expenses, which is not the Portfolio’s actual return. The hypothetical account values and expenses may not be used to estimate the actual ending account balance or expenses you paid for the period.
You may use this information to compare the ongoing costs of investing in the Portfolio and other variable annuities. To do so, compare this 5% hypothetical example with the 5% hypothetical examples that appear in the shareholder reports of the other variable annuities.
Please note that the expenses shown in the tables are meant to highlight your ongoing costs only and do not reflect any transaction costs, such as sales charges (loads) that are charged at the time of the transaction. Therefore, the table below is useful in comparing ongoing costs only and will not help you determine the relative total costs of owning different variable annuities. In addition, if these transaction costs were included, your costs would have been higher.
Expenses Paid on a $1,000 Investment in Pioneer High Yield VCT Portfolio
Based on a hypothetical 5% return per year before expenses, reflecting the period from July 1, 2023 through December 31, 2023.
| Share Class | l | ll |
| Beginning Account Value on 7/1/23 | $1,000.00 | $1,000.00 |
| Ending Account Value (after expenses) on 12/31/23 | $1,020.67 | $1,019.41 |
| Expenses Paid During Period* | $ 4.58 | $ 5.85 |
| | |
| * | Expenses are equal to the Portfolio’s annualized net expense ratio of 0.90% and 1.15% for Class I and Class II shares, respectively, multiplied by the average account value over the period, multiplied by 184/365 (to reflect the one-half year period). |
| Pioneer High Yield VCT Portfolio | Pioneer Variable Contracts Trust |
Portfolio Management Discussion 12/31/23
Call 1-800-225-6292 or visit www.amundi.com/us for the most recent month-end performance results. Current performance may be lower or higher than the performance data quoted.
The performance data quoted represents past performance, which is no guarantee of future results. Investment return and principal value will fluctuate, and shares, when redeemed, may be worth more or less than their original cost.
The returns for the Portfolio do not reflect the deduction of expenses associated with variable products, such as mortality and expense risk charges, separate account charges, and sales charges. These expenses would reduce the overall returns shown.
Performance results reflect any applicable expense waivers in effect during the periods shown. Without such waivers, performance would be lower. Waivers may not be in effect for all portfolios. Certain fee waivers are contractual through a specified period. Otherwise, fee waivers can be rescinded at any time. See the prospectus and financial statements for more information.
In the following interview, Andrew Feltus, Ken Monaghan, and Matt Shulkin discuss the factors that influenced the performance of Pioneer High Yield VCT Portfolio during the 12-month period ended December 31, 2023. Mr. Feltus, Managing Director, Co-Director of High Yield, and a portfolio manager at Amundi Asset Management US, Inc. (Amundi US); Mr. Monaghan, Managing Director, Co-Director of High Yield, and a portfolio manager at Amundi US; and Mr. Shulkin, a senior vice president and a portfolio manager at Amundi US, are responsible for the day-to-day management of the Portfolio.
| Q: | How did the Portfolio perform during the 12-month period ended December 31, 2023? |
| A: | Pioneer High Yield VCT Portfolio’s Class I shares returned 11.63% at net asset value during the 12-month period ended December 31, 2023 and Class II shares returned 11.29%. During the same period, the Portfolio’s benchmarks, the ICE Bank of America (ICE BofA) US High Yield Index (the US High Yield Index) and the ICE BofA All-Convertibles Speculative Quality Index, returned 13.46% and 7.23%, respectively. |
| Q: | Can you review your principal strategies in managing the Portfolio during the 12-month period ended December 31, 2023, and the degree to which they contributed to or detracted from benchmark-relative returns? |
| A: | The US Federal Reserve’s (the "Fed") actions to combat inflation and the consequent concerns regarding the impact of rate increases on the US economy dominated market commentary during 2023. On top of the concerns about elevated inflation and Fed rate hikes, three US regional banks collapsed during March and geopolitical tensions increased around the world. In spite of these headwinds, the US economy remained resilient in 2023 and defied consensus expectations of a recession. Strong consumption drove growth and benefited from robust employment. Corporate earnings were better than expected, even as higher interest rates pressured borrowing costs for consumers and companies. US inflation moderated faster than expected, with year over year consumer price index data declining from 6.4% in January 2023 to 3.4% at year end. Progress on the inflation front allowed the Fed to pause rate increases after an increase in July and to pivot to a bias towards rate cuts in December. |
| | Considering the macro backdrop, the portfolio managers sought to position the Portfolio defensively during 2023. The defensive positioning was achieved by allocating to cash, bank loans, investment grade corporates, and US Treasuries, and by maintaining a short risk position in credit default index swaps. In total, these defensive allocation decisions detracted from the Portfolio's performance as the high yield market generated strong performance during 2023. Within the high yield rating tiers, the decision to underweight the Portfolio to BB-rated securities while maintaining an overweight to CCC-rated securities and a small overweight to B-rated securities contributed positively to Portfolio performance. |
| | On a security selection basis, the Portfolio experienced positive contributions from overweights to Canadian oil producer Strathcona Resources, Mexican airline Aeromexico and healthcare software provider Athena Health. The leading detractors from performance were the Portfolio’s overweight to cargo airline Western Global, which suffered from the 2023 slowdown in airfreight, |
| Pioneer High Yield VCT Portfolio | Pioneer Variable Contracts Trust |
A Word About Risk:
All investments are subject to risk, including the possible loss of principal. In the past several years, financial markets have experienced increased volatility and heightened uncertainty. The market prices of securities may go up or down, sometimes rapidly or unpredictably, due to general market conditions, such as real or perceived adverse economic, political, or regulatory conditions, recessions, inflation, changes in interest or currency rates, lack of liquidity in the bond markets, the spread of infectious illness or other public health issues, armed conflict including Russia's military invasion of Ukraine, sanctions against Russia, other nations or individuals or companies and possible countermeasures, market disruptions caused by tariffs, trade disputes or other government actions, or adverse investor sentiment. These conditions may continue, recur, worsen or spread.
Investments in high-yield or lower rated securities are subject to greater-than-average price volatility, illiquidity and possibility of default.
The market price of securities may fluctuate when interest rates change. When interest rates rise, the prices of fixed-income securities in the Portfolio will generally fall. Conversely, when interest rates fall, the prices of fixedincome securities in the Portfolio will generally rise.
Investments in the Portfolio are subject to possible loss due to the financial failure of issuers of underlying securities and their inability to meet their debt obligations.
Prepayment risk is the chance that an issuer may exercise its right to prepay its security, if falling interest rates prompt the issuer to do so. Forced to reinvest the unanticipated proceeds at lower interest rates, the Portfolio would experience a decline in income and lose the opportunity for additional price appreciation.
The securities issued by U.S. government sponsored entities (e.g., FNMA, Freddie Mac) are neither guaranteed nor issued by the U.S. government.
The Portfolio may invest in mortgage-backed securities, which during times of fluctuating interest rates may increase or decrease more than other fixed-income securities. Mortgage backed securities are also subject to pre-payments.
The Portfolio may use derivatives, such as options, futures, inverse-floating-rate obligations, swaps, and others, which can be illiquid, may disproportionately increase losses, and have a potentially large impact on Portfolio performance. Derivatives may have a leveraging effect on the Portfolio.
At times, the Portfolio’s investments may represent industries or industry sectors that are interrelated or have common risks, making the Portfolio more susceptible to any economic, political, or regulatory developments or other risks affecting those industries and sectors.
These risks may increase share price volatility.
| | overweight to global copper miner First Quantum and underweight to Carvana, the online used auto dealer. |
| Q: | What factors affected the Portfolio's yield, or distributions* to shareholders, during the 12-month period ended December 31, 2023? |
| A: | The Portfolio's monthly distribution rate remained relatively flat over the first six month, then increased slightly during the second half of the year. Replacement yields for maturing securities was responsible for the additional income generation. |
| Q: | Did the Portfolio have any exposure to derivative securities during the 12-month period ended December 31, 2023? |
| A: | Yes. During the 12-month period, we invested the Portfolio in short-risk index-based, high-yield credit-default-swap contracts (CDX) in an effort to reduce market risk relative to the benchmark. (Short-risk positions typically represent an investor’s belief that the prices of certain securities are likely to decrease in the near future.) The CDX positions had a negative effect on relative returns during the 12-month period. The Portfolio also had exposure to Treasury Index futures contracts during the period, which had a negligible effect on relative performance. |
| Q: | What’s your investment outlook and how is the Portfolio positioned? |
| A: | We believe the Fed’s interest rate increases and the reduction in lending by banks will lead to a weaker US economic environment, even considering the recent easing of financial conditions driven by falling Treasury and corporate bond yields and increases in equity prices. We believe the weak growth will be at or near recessionary levels, although we consider a deep recession to be unlikely. In such an environment, we believe it is likely that defaults will continue to increase, as they have been doing over the last year. With defaults increasing and companies reporting weaker results due to the weaker economy, we believe spreads are likely to widen from the historically tight levels at year end. |
| | Considering this viewpoint, we will continue to seek to position the Portfolio defensively, with less risk overall than its benchmarks. We will continue to seek to position the Portfolio defensively, through holding asset classes such as bank loans and by seeking to purchase attractively priced higher quality bonds. However, our main goal, as always, will be to generate attractive Portfolio performance by focusing on selecting sectors and securities that we believe are likely to outperform. Our team continues to identify relatively attractive investment opportunities which we will strive to implement. |
Please refer to the Schedule of Investments on pages 6 - 15 for a full listing of Portfolio securities.
Past performance is no guarantee of future results.
Any information in this shareholder report regarding market or economic trends or the factors influencing the Portfolio’s historical or future performance are statements of opinion as of the date of this report.
| * | Distributions are not guaranteed. |
| Pioneer High Yield VCT Portfolio | Pioneer Variable Contracts Trust |
Schedule of Investments 12/31/23
Principal
Amount
USD ($) | | | | | | Value |
| | UNAFFILIATED ISSUERS — 96.2% | |
| | Senior Secured Floating Rate Loan Interests — 1.6% of Net Assets*(a) | |
| | Auto Parts & Equipment — 0.6% | |
| 157,211 | First Brands Group LLC, First Lien 2021 Term Loan, 10.881% (Term SOFR + 500 bps), 3/30/27 | $ 156,294 |
| | Total Auto Parts & Equipment | $ 156,294 |
| | Electric-Generation — 0.2% | |
| 53,846 | Generation Bridge Northeast LLC, Term Loan B, 9.606% (Term SOFR + 425 bps), 8/22/29 | $ 54,182 |
| | Total Electric-Generation | $ 54,182 |
| | Metal Processors & Fabrication — 0.4% | |
| 127,075 | Grinding Media, Inc. (Molycop, Ltd.), First Lien Initial Term Loan, 9.684% (Term SOFR + 400 bps), 10/12/28 | $ 126,440 |
| | Total Metal Processors & Fabrication | $ 126,440 |
| | Physical Practice Management — 0.4% | |
| 132,685 | Team Health Holdings, Inc., Extended Term Loan, 10.633% (Term SOFR + 525 bps), 3/2/27 | $ 101,753 |
| | Total Physical Practice Management | $ 101,753 |
| | Total Senior Secured Floating Rate Loan Interests
(Cost $457,232) | $ 438,669 |
|
| |
| Shares | | | | | | |
| | Common Stock — 0.4% of Net Assets | |
| | Passenger Airlines — 0.4% | |
| 6,730(b) + | Grupo Aeromexico SAB de CV | $ 108,197 |
| | Total Passenger Airlines | $ 108,197 |
| | Total Common Stock
(Cost $110,000) | $ 108,197 |
|
| |
Principal
Amount
USD ($) | | | | | | |
| | Commercial Mortgage-Backed Security—0.3% of Net Assets | |
| 99,522(a) | Med Trust, Series 2021-MDLN, Class G, 10.726% (1 Month Term SOFR + 536 bps), 11/15/38 (144A) | $ 95,201 |
| | Total Commercial Mortgage-Backed Security
(Cost $99,522) | $ 95,201 |
|
| |
| | Convertible Corporate Bonds — 2.9% of Net Assets | |
| | Airlines — 0.5% | |
| 92,000 | Air Canada, 4.00%, 7/1/25 | $ 103,241 |
| 44,000 | Spirit Airlines, Inc., 1.00%, 5/15/26 | 30,492 |
| | Total Airlines | $ 133,733 |
| | Biotechnology — 0.2% | |
| 55,000 | Insmed, Inc., 0.75%, 6/1/28 | $ 62,810 |
| | Total Biotechnology | $ 62,810 |
| | Energy-Alternate Sources — 0.3% | |
| 94,000(c) | Enphase Energy, Inc., 3/1/28 | $ 83,604 |
| | Total Energy-Alternate Sources | $ 83,604 |
6
The accompanying notes are an integral part of these financial statements.
| Pioneer High Yield VCT Portfolio | Pioneer Variable Contracts Trust |
Principal
Amount
USD ($) | | | | | | Value |
| | Entertainment — 0.8% | |
| 142,000(c) | DraftKings Holdings, Inc., 3/15/28 | $ 113,813 |
| 127,000 | IMAX Corp., 0.50%, 4/1/26 | 112,713 |
| | Total Entertainment | $ 226,526 |
| | Pharmaceuticals — 0.2% | |
| 64,000 | Revance Therapeutics, Inc., 1.75%, 2/15/27 | $ 48,600 |
| | Total Pharmaceuticals | $ 48,600 |
| | Semiconductors — 0.1% | |
| 40,000 | ON Semiconductor Corp., 0.50%, 3/1/29 (144A) | $ 42,500 |
| | Total Semiconductors | $ 42,500 |
| | Software — 0.8% | |
| 82,000 | Bentley Systems, Inc., 0.375%, 7/1/27 | $ 73,349 |
| 60,000 | Jamf Holding Corp., 0.125%, 9/1/26 | 51,150 |
| 105,000 | Verint Systems, Inc., 0.25%, 4/15/26 | 92,203 |
| | Total Software | $ 216,702 |
| | Total Convertible Corporate Bonds
(Cost $884,242) | $ 814,475 |
|
| |
| | Corporate Bonds — 83.1% of Net Assets | |
| | Advertising — 2.3% | |
| 184,000 | Clear Channel Outdoor Holdings, Inc., 7.50%, 6/1/29 (144A) | $ 152,990 |
| 70,000 | Outfront Media Capital LLC/Outfront Media Capital Corp., 4.25%, 1/15/29 (144A) | 63,166 |
| 20,000 | Outfront Media Capital LLC/Outfront Media Capital Corp., 7.375%, 2/15/31 (144A) | 21,003 |
| 231,000 | Stagwell Global LLC, 5.625%, 8/15/29 (144A) | 212,466 |
| 200,000 | Summer BC Bidco B LLC, 5.50%, 10/31/26 (144A) | 187,200 |
| | Total Advertising | $ 636,825 |
| | Aerospace & Defense — 0.2% | |
| 65,000 | Spirit AeroSystems, Inc., 9.375%, 11/30/29 (144A) | $ 71,128 |
| | Total Aerospace & Defense | $ 71,128 |
| | Airlines — 1.3% | |
| 31,850 | American Airlines 2021-1 Class B Pass Through Trust, 3.95%, 7/11/30 | $ 28,269 |
| 58,333 | American Airlines, Inc./AAdvantage Loyalty IP, Ltd., 5.50%, 4/20/26 (144A) | 57,913 |
| 55,000 | American Airlines, Inc./AAdvantage Loyalty IP, Ltd., 5.75%, 4/20/29 (144A) | 53,612 |
| 201,000 | VistaJet Malta Finance Plc/Vista Management Holding, Inc., 7.875%, 5/1/27 (144A) | 172,877 |
| 75,000 | VistaJet Malta Finance Plc/Vista Management Holding, Inc., 9.50%, 6/1/28 (144A) | 63,473 |
| | Total Airlines | $ 376,144 |
| | Apparel — 0.3% | |
| 75,000 | Hanesbrands, Inc., 9.00%, 2/15/31 (144A) | $ 73,466 |
| | Total Apparel | $ 73,466 |
| | Auto Manufacturers — 2.5% | |
| 85,000 | Ford Motor Co., 5.291%, 12/8/46 | $ 74,899 |
| 55,000 | Ford Motor Co., 6.10%, 8/19/32 | 55,442 |
| 230,000 | Ford Motor Credit Co. LLC, 4.00%, 11/13/30 | 206,376 |
| 300,000 | Ford Motor Credit Co. LLC, 4.134%, 8/4/25 | 291,584 |
| 80,000 | JB Poindexter & Co., Inc., 8.75%, 12/15/31 (144A) | 81,600 |
| | Total Auto Manufacturers | $ 709,901 |
The accompanying notes are an integral part of these financial statements.
7
| Pioneer High Yield VCT Portfolio | Pioneer Variable Contracts Trust |
Schedule of Investments 12/31/23 (continued)
Principal
Amount
USD ($) | | | | | | Value |
| | Auto Parts & Equipment — 0.5% | |
| 130,000 | Adient Global Holdings, Ltd., 8.25%, 4/15/31 (144A) | $ 137,654 |
| | Total Auto Parts & Equipment | $ 137,654 |
| | Banks — 0.2% | |
| 15,000 | Freedom Mortgage Corp., 6.625%, 1/15/27 (144A) | $ 14,315 |
| 30,000 | Freedom Mortgage Corp., 12.25%, 10/1/30 (144A) | 32,933 |
| | Total Banks | $ 47,248 |
| | Building Materials — 2.3% | |
| 133,000 | AmeriTex HoldCo Intermediate LLC, 10.25%, 10/15/28 (144A) | $ 136,325 |
| 165,000 | Builders FirstSource, Inc., 4.25%, 2/1/32 (144A) | 148,827 |
| 210,000 | Camelot Return Merger Sub, Inc., 8.75%, 8/1/28 (144A) | 213,156 |
| 90,000 | Knife River Corp., 7.75%, 5/1/31 (144A) | 95,826 |
| 61,000 | MIWD Holdco II LLC/MIWD Finance Corp., 5.50%, 2/1/30 (144A) | 53,985 |
| | Total Building Materials | $ 648,119 |
| | Chemicals — 3.7% | |
| 304,000 | Mativ Holdings, Inc., 6.875%, 10/1/26 (144A) | $ 291,606 |
| 80,000 | NOVA Chemicals Corp., 8.50%, 11/15/28 (144A) | 83,893 |
| 285,000 | Olympus Water US Holding Corp., 9.75%, 11/15/28 (144A) | 302,497 |
| EUR 153,000 | SCIL IV LLC/SCIL USA Holdings LLC, 9.50%, 7/15/28 (144A) | 179,883 |
| 171,000 | Trinseo Materials Operating SCA/Trinseo Materials Finance, Inc., 5.125%, 4/1/29 (144A) | 69,681 |
| 127,000 | Tronox, Inc., 4.625%, 3/15/29 (144A) | 112,496 |
| | Total Chemicals | $ 1,040,056 |
| | Commercial Services — 5.1% | |
| 215,000 | Allied Universal Holdco LLC/Allied Universal Finance Corp., 9.75%, 7/15/27 (144A) | $ 210,678 |
| 140,000 | Brink's Co., 5.50%, 7/15/25 (144A) | 139,346 |
| 80,000 | Garda World Security Corp., 7.75%, 2/15/28 (144A) | 82,769 |
| 206,000 | Garda World Security Corp., 9.50%, 11/1/27 (144A) | 207,679 |
| 125,000 | Neptune Bidco US, Inc., 9.29%, 4/15/29 (144A) | 116,562 |
| 169,000 | NESCO Holdings II, Inc., 5.50%, 4/15/29 (144A) | 156,256 |
| 120,000 | Prime Security Services Borrower LLC/Prime Finance, Inc., 5.75%, 4/15/26 (144A) | 120,650 |
| 150,000 | Prime Security Services Borrower LLC/Prime Finance, Inc., 6.25%, 1/15/28 (144A) | 149,125 |
| 280,000 | Sotheby's, 7.375%, 10/15/27 (144A) | 270,031 |
| | Total Commercial Services | $ 1,453,096 |
| | Computers — 0.6% | |
| 90,000 | NCR Voyix Corp., 5.00%, 10/1/28 (144A) | $ 85,074 |
| 57,000 | NCR Voyix Corp., 5.125%, 4/15/29 (144A) | 54,184 |
| 45,000 | NCR Voyix Corp., 5.25%, 10/1/30 (144A) | 41,327 |
| | Total Computers | $ 180,585 |
| | Distribution/Wholesale — 1.5% | |
| 331,000 | Dealer Tire LLC/DT Issuer LLC, 8.00%, 2/1/28 (144A) | $ 327,690 |
| 105,000 | Windsor Holdings III LLC, 8.50%, 6/15/30 (144A) | 109,728 |
| | Total Distribution/Wholesale | $ 437,418 |
| | Diversified Financial Services — 5.2% | |
| 172,058(d) | Avation Capital S.A., 8.25% (9.00% PIK or 8.25% Cash), 10/31/26 (144A) | $ 145,819 |
| 25,000 | GGAM Finance, Ltd., 7.75%, 5/15/26 (144A) | 25,312 |
| 150,000 | GGAM Finance, Ltd., 8.00%, 6/15/28 (144A) | 154,125 |
| 216,982(d) | Global Aircraft Leasing Co., Ltd., 6.50% (7.25% PIK or 6.50% Cash), 9/15/24 (144A) | 203,963 |
8
The accompanying notes are an integral part of these financial statements.
| Pioneer High Yield VCT Portfolio | Pioneer Variable Contracts Trust |
Principal
Amount
USD ($) | | | | | | Value |
| | Diversified Financial Services — (continued) | |
| 130,000 | Nationstar Mortgage Holdings, Inc., 5.125%, 12/15/30 (144A) | $ 117,537 |
| 175,000 | OneMain Finance Corp., 3.50%, 1/15/27 | 161,953 |
| 45,000 | OneMain Finance Corp., 7.875%, 3/15/30 | 46,322 |
| 90,000 | OneMain Finance Corp., 9.00%, 1/15/29 | 95,151 |
| 30,000 | PennyMac Financial Services, Inc., 7.875%, 12/15/29 (144A) | 30,881 |
| 237,000 | Provident Funding Associates LP/PFG Finance Corp., 6.375%, 6/15/25 (144A) | 217,447 |
| 108,000 | United Wholesale Mortgage LLC, 5.50%, 4/15/29 (144A) | 102,245 |
| 170,000 | United Wholesale Mortgage LLC, 5.75%, 6/15/27 (144A) | 166,619 |
| | Total Diversified Financial Services | $ 1,467,374 |
| | Electric — 4.4% | |
| 148,000 | Calpine Corp., 4.625%, 2/1/29 (144A) | $ 137,466 |
| 150,000 | Calpine Corp., 5.125%, 3/15/28 (144A) | 143,817 |
| 105,000 | Clearway Energy Operating LLC, 3.75%, 2/15/31 (144A) | 92,485 |
| 65,000 | Clearway Energy Operating LLC, 3.75%, 1/15/32 (144A) | 56,467 |
| 179,000 | Leeward Renewable Energy Operations LLC, 4.25%, 7/1/29 (144A) | 155,907 |
| 166,000 | NRG Energy, Inc., 3.625%, 2/15/31 (144A) | 142,624 |
| 85,000 | Talen Energy Supply LLC, 8.625%, 6/1/30 (144A) | 90,315 |
| 182,000 | Vistra Operations Co. LLC, 4.375%, 5/1/29 (144A) | 169,899 |
| 30,000 | Vistra Operations Co. LLC, 6.95%, 10/15/33 (144A) | 31,573 |
| 205,000 | Vistra Operations Co. LLC, 7.75%, 10/15/31 (144A) | 212,911 |
| | Total Electric | $ 1,233,464 |
| | Electrical Components & Equipments — 1.2% | |
| 112,000 | Energizer Holdings, Inc., 4.75%, 6/15/28 (144A) | $ 103,542 |
| 135,000 | Energizer Holdings, Inc., 6.50%, 12/31/27 (144A) | 135,000 |
| 90,000 | WESCO Distribution, Inc., 7.125%, 6/15/25 (144A) | 90,657 |
| | Total Electrical Components & Equipments | $ 329,199 |
| | Entertainment — 2.3% | |
| 200,000 | Banijay Entertainment SASU, 8.125%, 5/1/29 (144A) | $ 205,907 |
| 100,000 | Light & Wonder International, Inc., 7.00%, 5/15/28 (144A) | 101,018 |
| 100,000 | Light & Wonder International, Inc., 7.25%, 11/15/29 (144A) | 102,391 |
| 25,000 | Light & Wonder International, Inc., 7.50%, 9/1/31 (144A) | 26,076 |
| 150,000 | Mohegan Tribal Gaming Authority, 8.00%, 2/1/26 (144A) | 141,563 |
| 89,000 | Scientific Games Holdings LP/Scientific Games US FinCo, Inc., 6.625%, 3/1/30 (144A) | 84,143 |
| | Total Entertainment | $ 661,098 |
| | Environmental Control — 1.2% | |
| 55,000 | GFL Environmental, Inc., 4.00%, 8/1/28 (144A) | $ 50,842 |
| 198,000 | GFL Environmental, Inc., 4.375%, 8/15/29 (144A) | 182,731 |
| 89,000 | Tervita Corp., 11.00%, 12/1/25 (144A) | 93,450 |
| | Total Environmental Control | $ 327,023 |
| | Food — 0.9% | |
| 50,000 | US Foods, Inc., 4.625%, 6/1/30 (144A) | $ 46,598 |
| 205,000 | US Foods, Inc., 4.75%, 2/15/29 (144A) | 194,698 |
| | Total Food | $ 241,296 |
| | Forest Products & Paper — 0.5% | |
| 173,000 | Mercer International, Inc., 5.125%, 2/1/29 | $ 148,598 |
| | Total Forest Products & Paper | $ 148,598 |
The accompanying notes are an integral part of these financial statements.
9
| Pioneer High Yield VCT Portfolio | Pioneer Variable Contracts Trust |
Schedule of Investments 12/31/23 (continued)
Principal
Amount
USD ($) | | | | | | Value |
| | Healthcare-Services — 2.7% | |
| 165,000 | LifePoint Health, Inc., 5.375%, 1/15/29 (144A) | $ 122,011 |
| 260,000 | ModivCare Escrow Issuer, Inc., 5.00%, 10/1/29 (144A) | 212,508 |
| 150,000 | Prime Healthcare Services, Inc., 7.25%, 11/1/25 (144A) | 146,250 |
| 22,000 | RegionalCare Hospital Partners Holdings, Inc./LifePoint Health, Inc., 9.75%, 12/1/26 (144A) | 21,826 |
| 139,000 | Surgery Center Holdings, Inc., 10.00%, 4/15/27 (144A) | 140,390 |
| 145,000 | US Acute Care Solutions LLC, 6.375%, 3/1/26 (144A) | 121,156 |
| | Total Healthcare-Services | $ 764,141 |
| | Home Builders — 1.7% | |
| 287,000 | Beazer Homes USA, Inc., 6.75%, 3/15/25 | $ 285,565 |
| 89,000 | KB Home, 4.00%, 6/15/31 | 79,711 |
| 125,000 | M/I Homes, Inc., 3.95%, 2/15/30 | 111,250 |
| | Total Home Builders | $ 476,526 |
| | Household Products/Wares — 0.8% | |
| 250,000 | Spectrum Brands, Inc., 3.875%, 3/15/31 (144A) | $ 227,500 |
| | Total Household Products/Wares | $ 227,500 |
| | Iron & Steel — 1.0% | |
| 119,000 | Commercial Metals Co., 4.375%, 3/15/32 | $ 106,797 |
| 215,000 | TMS International Corp., 6.25%, 4/15/29 (144A) | 177,375 |
| | Total Iron & Steel | $ 284,172 |
| | Leisure Time — 4.0% | |
| 195,000 | Carnival Corp., 6.00%, 5/1/29 (144A) | $ 187,630 |
| 30,000 | Carnival Holdings Bermuda, Ltd., 10.375%, 5/1/28 (144A) | 32,653 |
| 140,000 | NCL Corp., Ltd., 5.875%, 3/15/26 (144A) | 136,802 |
| 135,000 | NCL Corp., Ltd., 7.75%, 2/15/29 (144A) | 135,817 |
| 90,000 | NCL Corp., Ltd., 8.125%, 1/15/29 (144A) | 94,012 |
| 130,000 | Royal Caribbean Cruises, Ltd., 5.50%, 4/1/28 (144A) | 128,344 |
| 5,000 | Royal Caribbean Cruises, Ltd., 7.25%, 1/15/30 (144A) | 5,222 |
| 120,000 | Royal Caribbean Cruises, Ltd., 11.625%, 8/15/27 (144A) | 130,580 |
| 136,000 | Viking Cruises, Ltd., 5.875%, 9/15/27 (144A) | 131,240 |
| 69,000 | Viking Cruises, Ltd., 6.25%, 5/15/25 (144A) | 68,814 |
| 80,000 | Viking Ocean Cruises Ship VII, Ltd., 5.625%, 2/15/29 (144A) | 78,000 |
| | Total Leisure Time | $ 1,129,114 |
| | Lodging — 0.8% | |
| 142,000 | Hilton Grand Vacations Borrower Escrow LLC/Hilton Grand Vacations Borrower Esc, 5.00%, 6/1/29 (144A) | $ 131,002 |
| 90,000 | Travel + Leisure Co., 6.625%, 7/31/26 (144A) | 90,788 |
| | Total Lodging | $ 221,790 |
| | Media — 3.8% | |
| 744,000 | CCO Holdings LLC/CCO Holdings Capital Corp., 4.50%, 6/1/33 (144A) | $ 629,527 |
| 35,000 | CCO Holdings LLC/CCO Holdings Capital Corp., 7.375%, 3/1/31 (144A) | 35,923 |
| 200,000 | CSC Holdings LLC, 7.50%, 4/1/28 (144A) | 149,618 |
| 106,000 | Gray Television, Inc., 5.875%, 7/15/26 (144A) | 103,107 |
| 177,000 | McGraw-Hill Education, Inc., 8.00%, 8/1/29 (144A) | 164,610 |
| | Total Media | $ 1,082,785 |
10
The accompanying notes are an integral part of these financial statements.
| Pioneer High Yield VCT Portfolio | Pioneer Variable Contracts Trust |
Principal
Amount
USD ($) | | | | | | Value |
| | Metal Fabricate/Hardware — 0.2% | |
| 75,000 | Park-Ohio Industries, Inc., 6.625%, 4/15/27 | $ 69,375 |
| | Total Metal Fabricate/Hardware | $ 69,375 |
| | Mining — 2.8% | |
| 154,000 | Coeur Mining, Inc., 5.125%, 2/15/29 (144A) | $ 141,698 |
| 250,000 | Constellium SE, 3.75%, 4/15/29 (144A) | 226,840 |
| 171,000 | Eldorado Gold Corp., 6.25%, 9/1/29 (144A) | 161,234 |
| 310,000 | First Quantum Minerals, Ltd., 8.625%, 6/1/31 (144A) | 262,725 |
| | Total Mining | $ 792,497 |
| | Miscellaneous Manufacturing — 0.4% | |
| 124,000 | Trinity Industries, Inc., 7.75%, 7/15/28 (144A) | $ 128,102 |
| | Total Miscellaneous Manufacturing | $ 128,102 |
| | Oil & Gas — 7.1% | |
| 151,000 | Aethon United BR LP/Aethon United Finance Corp., 8.25%, 2/15/26 (144A) | $ 151,755 |
| 170,000 | Baytex Energy Corp., 8.50%, 4/30/30 (144A) | 175,935 |
| 70,000 | CITGO Petroleum Corp., 8.375%, 1/15/29 (144A) | 71,983 |
| 100,000 | Civitas Resources, Inc., 8.375%, 7/1/28 (144A) | 104,394 |
| 45,000 | Civitas Resources, Inc., 8.625%, 11/1/30 (144A) | 47,732 |
| 100,000 | Civitas Resources, Inc., 8.75%, 7/1/31 (144A) | 106,455 |
| 50,000 | Hilcorp Energy I LP/Hilcorp Finance Co., 6.00%, 4/15/30 (144A) | 48,491 |
| 50,000 | Hilcorp Energy I LP/Hilcorp Finance Co., 6.25%, 4/15/32 (144A) | 48,096 |
| 200,000 | Kosmos Energy, Ltd., 7.75%, 5/1/27 (144A) | 186,351 |
| 19,000 | Neptune Energy Bondco Plc, 6.625%, 5/15/25 (144A) | 18,829 |
| 230,000 | Parkland Corp., 4.625%, 5/1/30 (144A) | 211,600 |
| 34,000 | Precision Drilling Corp., 6.875%, 1/15/29 (144A) | 32,787 |
| 200,000 | Shelf Drilling Holdings, Ltd., 9.625%, 4/15/29 (144A) | 195,713 |
| 185,000 | Southwestern Energy Co., 5.375%, 2/1/29 | 180,540 |
| 71,250 | Transocean, Inc., 8.75%, 2/15/30 (144A) | 74,439 |
| 25,000 | Transocean Titan Financing, Ltd., 8.375%, 2/1/28 (144A) | 25,937 |
| 200,000 | Tullow Oil Plc, 10.25%, 5/15/26 (144A) | 178,450 |
| 135,000 | Valaris, Ltd., 8.375%, 4/30/30 (144A) | 138,313 |
| | Total Oil & Gas | $ 1,997,800 |
| | Oil & Gas Services — 0.4% | |
| 120,000 | Enerflex, Ltd., 9.00%, 10/15/27 (144A) | $ 115,758 |
| | Total Oil & Gas Services | $ 115,758 |
| | Packaging & Containers — 2.9% | |
| 299,000 | Clearwater Paper Corp., 4.75%, 8/15/28 (144A) | $ 277,174 |
| 220,000 | OI European Group BV, 4.75%, 2/15/30 (144A) | 205,746 |
| 55,000 | Owens-Brockway Glass Container, Inc., 7.25%, 5/15/31 (144A) | 55,764 |
| 105,000 | Sealed Air Corp., 5.00%, 4/15/29 (144A) | 101,537 |
| 65,000 | Sealed Air Corp., 7.25%, 2/15/31 (144A) | 68,919 |
| 118,000 | TriMas Corp., 4.125%, 4/15/29 (144A) | 106,019 |
| | Total Packaging & Containers | $ 815,159 |
| | Pharmaceuticals — 2.8% | |
| 95,000 | AdaptHealth LLC, 5.125%, 3/1/30 (144A) | $ 74,107 |
| 195,000 | Owens & Minor, Inc., 6.625%, 4/1/30 (144A) | 186,189 |
| 198,000 | P&L Development LLC/PLD Finance Corp., 7.75%, 11/15/25 (144A) | 160,875 |
The accompanying notes are an integral part of these financial statements.
11
| Pioneer High Yield VCT Portfolio | Pioneer Variable Contracts Trust |
Schedule of Investments 12/31/23 (continued)
Principal
Amount
USD ($) | | | | | | Value |
| | Pharmaceuticals — (continued) | |
| 102,000 | Par Pharmaceutical, Inc., 7.50%, 4/1/27 (144A) | $ 65,280 |
| 305,000 | Teva Pharmaceutical Finance Netherlands III BV, 5.125%, 5/9/29 | 291,289 |
| 136,000 + | Tricida, Inc., 5/15/27 | — |
| | Total Pharmaceuticals | $ 777,740 |
| | Pipelines — 5.2% | |
| 146,000 | CQP Holdco LP/BIP-V Chinook Holdco LLC, 5.50%, 6/15/31 (144A) | $ 138,350 |
| 250,000 | CQP Holdco LP/BIP-V Chinook Holdco LLC, 7.50%, 12/15/33 (144A) | 258,989 |
| 53,000 | Delek Logistics Partners LP/Delek Logistics Finance Corp., 6.75%, 5/15/25 | 52,645 |
| 115,000 | Delek Logistics Partners LP/Delek Logistics Finance Corp., 7.125%, 6/1/28 (144A) | 108,623 |
| 120,000 | Energy Transfer LP, 7.375%, 2/1/31 (144A) | 126,112 |
| 5,000 | EnLink Midstream LLC, 5.375%, 6/1/29 | 4,892 |
| 80,000 | EnLink Midstream LLC, 6.50%, 9/1/30 (144A) | 81,678 |
| 40,000 | EnLink Midstream Partners LP, 5.05%, 4/1/45 | 33,100 |
| 116,000 | EnLink Midstream Partners LP, 5.60%, 4/1/44 | 100,958 |
| 74,000 | EQM Midstream Partners LP, 4.75%, 1/15/31 (144A) | 68,868 |
| 88,000 | EQM Midstream Partners LP, 7.50%, 6/1/30 (144A) | 94,602 |
| 100,000 | Genesis Energy LP/Genesis Energy Finance Corp., 8.875%, 4/15/30 | 103,400 |
| 130,000 | Harvest Midstream I LP, 7.50%, 9/1/28 (144A) | 129,230 |
| 20,000 | Venture Global LNG, Inc., 8.125%, 6/1/28 (144A) | 20,198 |
| 110,000 | Venture Global LNG, Inc., 8.375%, 6/1/31 (144A) | 109,943 |
| 40,000 | Venture Global LNG, Inc., 9.50%, 2/1/29 (144A) | 42,327 |
| | Total Pipelines | $ 1,473,915 |
| | REITs — 2.9% | |
| 290,000 | HAT Holdings I LLC/HAT Holdings II LLC , 3.375%, 6/15/26 (144A) | $ 272,562 |
| 195,000 | Iron Mountain, Inc., 7.00%, 2/15/29 (144A) | 200,436 |
| 200,000 | MPT Operating Partnership LP/MPT Finance Corp., 3.50%, 3/15/31 | 125,046 |
| 100,000 | Uniti Group LP/Uniti Fiber Holdings, Inc./CSL Capital LLC, 6.00%, 1/15/30 (144A) | 69,891 |
| 140,000 | Uniti Group LP/Uniti Group Finance, Inc./CSL Capital LLC, 6.50%, 2/15/29 (144A) | 101,032 |
| 60,000 | Uniti Group LP/Uniti Group Finance, Inc./CSL Capital LLC, 10.50%, 2/15/28 (144A) | 60,828 |
| | Total REITs | $ 829,795 |
| | Retail — 3.7% | |
| 169,000 | Asbury Automotive Group, Inc., 4.625%, 11/15/29 (144A) | $ 156,427 |
| 60,000 | Bath & Body Works, Inc., 6.625%, 10/1/30 (144A) | 61,323 |
| 150,000 | Beacon Roofing Supply, Inc., 4.125%, 5/15/29 (144A) | 136,748 |
| 115,000 | Brinker International, Inc., 8.25%, 7/15/30 (144A) | 120,299 |
| 35,000 | Gap, Inc., 3.625%, 10/1/29 (144A) | 29,925 |
| 35,000 | Gap, Inc., 3.875%, 10/1/31 (144A) | 28,830 |
| 177,000 | Ken Garff Automotive LLC, 4.875%, 9/15/28 (144A) | 167,511 |
| 270,000 | LCM Investments Holdings II LLC, 4.875%, 5/1/29 (144A) | 250,807 |
| 91,000 | Staples, Inc., 7.50%, 4/15/26 (144A) | 84,669 |
| | Total Retail | $ 1,036,539 |
| | Software — 0.5% | |
| 150,000 | AthenaHealth Group, Inc., 6.50%, 2/15/30 (144A) | $ 136,077 |
| | Total Software | $ 136,077 |
12
The accompanying notes are an integral part of these financial statements.
| Pioneer High Yield VCT Portfolio | Pioneer Variable Contracts Trust |
Principal
Amount
USD ($) | | | | | | Value |
| | Telecommunications — 1.3% | |
| 260,000 | Altice France S.A., 5.125%, 7/15/29 (144A) | $ 202,285 |
| 185,000 | Windstream Escrow LLC/Windstream Escrow Finance Corp., 7.75%, 8/15/28 (144A) | 162,014 |
| | Total Telecommunications | $ 364,299 |
| | Transportation — 1.9% | |
| 229,000 | Carriage Purchaser, Inc., 7.875%, 10/15/29 (144A) | $ 187,486 |
| 410,000 | Seaspan Corp., 5.50%, 8/1/29 (144A) | 342,997 |
| | Total Transportation | $ 530,483 |
| | Total Corporate Bonds
(Cost $24,329,697) | $23,473,259 |
|
| |
| Shares | | | | | | |
| | Rights/Warrants — 0.0%† of Net Assets | |
| | Health Care Providers & Services — 0.0%† | |
| 80(b)(e) | Option Care Health, Inc., 7/27/25 | $ 298 |
| 80(b)(e) | Option Care Health, Inc., 12/31/25 | 224 |
| | Total Health Care Providers & Services | $ 522 |
| | Trading Companies & Distributors — 0.0%† | |
| 6,300(b)(f) | Avation Plc, 1/1/59 | $ 1,606 |
| | Total Trading Companies & Distributors | $ 1,606 |
| | Total Rights/Warrants
(Cost $—) | $ 2,128 |
|
| |
Face
Amount
USD ($) | | | | | | |
| | Insurance-Linked Securities — 0.0%† of Net Assets# | |
| | Reinsurance Sidecars — 0.0%† | |
| | Multiperil – Worldwide — 0.0%† | |
| 25,723(b)(g) + | Lorenz Re 2019, 6/30/24 | $ 247 |
| | Total Reinsurance Sidecars | $ 247 |
| | Total Insurance-Linked Securities
(Cost $4,216) | $ 247 |
|
| |
| Shares | | | | | | |
| | SHORT TERM INVESTMENTS — 7.9% of Net Assets | |
| | Open-End Fund — 7.9% | |
| 2,240,612(h) | Dreyfus Government Cash Management,
Institutional Shares, 5.25% | $ 2,240,612 |
| | | | | | | $ 2,240,612 |
| | TOTAL SHORT TERM INVESTMENTS
(Cost $2,240,612) | $ 2,240,612 |
| | TOTAL INVESTMENTS IN UNAFFILIATED ISSUERS — 96.2%
(Cost $28,125,521) | $27,172,788 |
The accompanying notes are an integral part of these financial statements.
13
| Pioneer High Yield VCT Portfolio | Pioneer Variable Contracts Trust |
Schedule of Investments 12/31/23 (continued)
| Shares | | Net
Realized
Gain (Loss)
for the year
ended
12/31/23 | Change in
Unrealized
Appreciation
(Depreciation)
for the year
ended
12/31/23 | Capital
Gain
Distributions
for the year
ended
12/31/23 | Dividend
Income
for the year
ended
12/31/23 | Value |
| | Affiliated Issuer — 2.2% | |
| | Closed-End Fund — 2.2% of Net Assets | |
| 71,109(i) | Pioneer ILS Interval Fund | $— | $26,551 | $— | $68,611 | $ 605,133 |
| | Total Investments in Affiliated Issuer — 2.2%
(Cost $727,950) | $ 605,133 |
| | OTHER ASSETS AND LIABILITIES — 1.6% | $ 460,764 |
| | net assets — 100.0% | $28,238,685 |
| | | | | | | |
| bps | Basis Points. |
| REIT | Real Estate Investment Trust. |
| SOFR | Secured Overnight Financing Rate. |
| (144A) | The resale of such security is exempt from registration under Rule 144A of the Securities Act of 1933. Such securities may be resold normally to qualified institutional buyers. At December 31, 2023, the value of these securities amounted to $20,957,798, or 74.2% of net assets. |
| (a) | Floating rate note. Coupon rate, reference index and spread shown at December 31, 2023. |
| (b) | Non-income producing security. |
| (c) | Security issued with a zero coupon. Income is recognized through accretion of discount. |
| (d) | Payment-in-kind (PIK) security which may pay interest in the form of additional principal amount. |
| (e) | Option Care Health, Inc. warrants are exercisable into 160 shares. |
| (f) | Avation Plc warrants are exercisable into 6,300 shares. |
| (g) | Issued as preference shares. |
| (h) | Rate periodically changes. Rate disclosed is the 7-day yield at December 31, 2023. |
| (i) | Pioneer ILS Interval Fund is an affiliated closed-end fund managed by Amundi Asset Management US, Inc., (the “Adviser”). |
| * | Senior secured floating rate loan interests in which the Portfolio invests generally pay interest at rates that are periodically re-determined by reference to a base lending rate plus a premium. These base lending rates are generally (i) the lending rate offered by one or more major European banks, such as LIBOR or SOFR, (ii) the prime rate offered by one or more major United States banks, (iii) the rate of a certificate of deposit or (iv) other base lending rates used by commercial lenders. The interest rate shown is the rate accruing at December 31, 2023. |
| + | Security is valued using significant unobservable inputs (Level 3). |
| † | Amount rounds to less than 0.1%. |
| # | Securities are restricted as to resale. |
| Restricted Securities | Acquisition date | Cost | Value |
| Lorenz Re 2019 | 7/10/2019 | $ 4,216 | $ 247 |
| % of Net assets | | | 0.0% † |
| † | Amount rounds to less than 0.1%. |
SWAP CONTRACTS
| CENTRALLY CLEARED CREDIT DEFAULT SWAP CONTRACTS – BUY PROTECTION |
Notional
Amount ($)(1) | Reference Obligation/Index | Pay/
Receive(2) | Annual
Fixed Rate | Expiration
Date | Premiums
(Received) | Unrealized
(Depreciation) | Market
Value |
| 2,187,900 | Markit CDX North America High Yield Index Series 41 | Pay | 5.00% | 12/20/28 | $ (67,278) | $ (64,364) | $ (131,642) |
TOTAL CENTRALLY CLEARED CREDIT DEFAULT
SWAP CONTRACTS – BUY PROTECTION | $(67,278) | $(64,364) | $(131,642) |
| | |
| (1) | The notional amount is the maximum amount that a seller of credit protection would be obligated to pay upon occurrence of a credit event. |
| (2) | Pays quarterly. |
Purchases and sales of securities (excluding short-term investments) for the year ended December 31, 2023, aggregated $9,801,594 and $10,917,654, respectively.
14
The accompanying notes are an integral part of these financial statements.
| Pioneer High Yield VCT Portfolio | Pioneer Variable Contracts Trust |
At December 31, 2023, the net unrealized depreciation on investments based on cost for federal tax purposes of $28,721,337 was as follows:
| Aggregate gross unrealized appreciation for all investments in which there is an excess of value over tax cost | $542,979 |
| Aggregate gross unrealized depreciation for all investments in which there is an excess of tax cost over value | (1,618,037) |
| Net unrealized depreciation | $(1,075,058) |
Various inputs are used in determining the value of the Portfolio's investments. These inputs are summarized in the three broad levels below.
| Level 1 | – | unadjusted quoted prices in active markets for identical securities. |
| Level 2 | – | other significant observable inputs (including quoted prices for similar securities, interest rates, prepayment speeds, credit risks, etc.). See Notes to Financial Statements — Note 1A. |
| Level 3 | – | significant unobservable inputs (including the Adviser's own assumptions in determining fair value of investments). See Notes to Financial Statements — Note 1A. |
The following is a summary of the inputs used as of December 31, 2023 in valuing the Portfolio's investments:
| | Level 1 | Level 2 | Level 3 | Total |
| Senior Secured Floating Rate Loan Interests | $ — | $ 438,669 | $ — | $ 438,669 |
| Common Stock | — | — | 108,197 | 108,197 |
| Commercial Mortgage-Backed Security | — | 95,201 | — | 95,201 |
| Convertible Corporate Bonds | — | 814,475 | — | 814,475 |
| Corporate Bonds | | | | |
| Pharmaceuticals | — | — | —* | —* |
| All Other Corporate Bonds | — | 23,473,259 | — | 23,473,259 |
| Rights/Warrants | | | | |
| Health Care Providers & Services | — | 522 | — | 522 |
| Trading Companies & Distributors | 1,606 | — | — | 1,606 |
| Insurance-Linked Securities | | | | |
| Reinsurance Sidecars | — | — | 247 | 247 |
| Open-End Fund | 2,240,612 | — | — | 2,240,612 |
| Affiliated Closed-End Fund | 605,133 | — | — | 605,133 |
| Total Investments in Securities | $2,847,351 | $24,822,126 | $108,444 | $27,777,921 |
| Other Financial Instruments | | | | |
| Centrally cleared swap contracts^ | $ — | $ (64,364) | $ — | $ (64,364) |
| Total Other Financial Instruments | $ — | $ (64,364) | $ — | $ (64,364) |
| * | Securities valued at $0. |
| ^ | Reflects the unrealized appreciation (depreciation) of the instruments. |
Transfers are calculated on the beginning of period values. During the year ended December 31, 2023, two securities valued at $68,131 were transferred from Level 2 to Level 3, due to valuing the securities using unobservable inputs. There were no other transfers in or out of Level 3 during the year.
The accompanying notes are an integral part of these financial statements.
15
| Pioneer High Yield VCT Portfolio | Pioneer Variable Contracts Trust |
Statement of Assets and Liabilities 12/31/23
| ASSETS: | |
| Investments in unaffiliated issuers, at value (cost $28,125,521) | $27,172,788 |
| Investments in affiliated issuers, at value (cost $727,950) | 605,133 |
| Cash | 4,109 |
| Foreign currencies, at value (cost $139) | 145 |
| Swaps collateral | 240,171 |
| Receivables — | |
| Investment securities sold | 14,981 |
| Portfolio shares sold | 8,143 |
| Dividends | 209 |
| Interest | 442,902 |
| Due from the Adviser | 375 |
| Total assets | $28,488,956 |
| LIABILITIES: | |
| Payables — | |
| Investment securities purchased | $14,850 |
| Portfolio shares repurchased | 288 |
| Distributions | 7,916 |
| Trustees' fees | 359 |
| Professional fees | 67,245 |
| Printing expense | 13,164 |
| Consulting fees | 10,616 |
| Variation margin for centrally cleared swap contracts | 131,642 |
| Management fees | 2,346 |
| Administrative expenses | 1,094 |
| Distribution fees | 227 |
| Accrued expenses | 524 |
| Total liabilities | $ 250,271 |
| NET ASSETS: | |
| Paid-in capital | $32,366,814 |
| Distributable earnings (loss) | (4,128,129) |
| Net assets | $28,238,685 |
| NET ASSET VALUE PER SHARE: | |
| No par value (unlimited number of shares authorized) | |
| Class l (based on $21,471,532/2,586,903 shares) | $ 8.30 |
| Class ll (based on $6,767,153/827,334 shares) | $ 8.18 |
16
The accompanying notes are an integral part of these financial statements.
| Pioneer High Yield VCT Portfolio | Pioneer Variable Contracts Trust |
FOR THE YEAR ENDED 12/31/23
| INVESTMENT INCOME: | | | |
| Interest from unaffiliated issuers | $ 1,793,486 | | |
| Dividends from affiliated issuers | 68,611 | | |
| Dividends from unaffiliated issuers | 60,398 | | |
| Total Investment Income | | | $ 1,922,495 |
| EXPENSES: | | | |
| Management fees | $ 171,417 | | |
| Administrative expenses | 15,237 | | |
| Distribution fees | | | |
| Class ll | 13,725 | | |
| Custodian fees | 297 | | |
| Professional fees | 125,501 | | |
| Printing expense | 20,853 | | |
| Officers' and Trustees' fees | 8,571 | | |
| Insurance expense | 489 | | |
| Miscellaneous | 942 | | |
| Total expenses | | | $ 357,032 |
| Less fees waived and expenses reimbursed by the Adviser | | | (105,960) |
| Net expenses | | | $ 251,072 |
| Net investment income | | | $ 1,671,423 |
| REALIZED AND UNREALIZED GAIN (LOSS) ON INVESTMENTS: | | | |
| Net realized gain (loss) on: | | | |
| Reimbursement by the Adviser | $ 11,123 | | |
| Investments in unaffiliated issuers | (1,672,184) | | |
| Futures contracts | (1,177) | | |
| Swap contracts | (273,132) | | |
| Other assets and liabilities denominated in foreign currencies | 529 | | $(1,934,841) |
| Change in net unrealized appreciation (depreciation) on: | | | |
| Investments in unaffiliated issuers | $ 3,058,788 | | |
| Investments in affiliated issuers | 26,551 | | |
| Futures contracts | 65 | | |
| Swap contracts | 105,367 | | |
| Other assets and liabilities denominated in foreign currencies | 215 | | $ 3,190,986 |
| Net realized and unrealized gain (loss) on investments | | | $ 1,256,145 |
| Net increase in net assets resulting from operations | | | $ 2,927,568 |
The accompanying notes are an integral part of these financial statements.
17
| Pioneer High Yield VCT Portfolio | Pioneer Variable Contracts Trust |
Statements of Changes in Net Assets
| | Year
Ended
12/31/23 | | Year
Ended
12/31/22 |
| FROM OPERATIONS: | | | |
| Net investment income (loss) | $ 1,671,423 | | $ 1,603,263 |
| Net realized gain (loss) on investments | (1,934,841) | | (838,222) |
| Change in net unrealized appreciation (depreciation) on investments | 3,190,986 | | (4,671,907) |
| Net increase (decrease) in net assets resulting from operations | $ 2,927,568 | | $ (3,906,866) |
| DISTRIBUTIONS TO SHAREHOLDERS: | | | |
| Class l ($0.45 and $0.42 per share, respectively) | $ (1,164,259) | | $ (1,173,513) |
| Class ll ($0.42 and $0.39 per share, respectively) | (293,333) | | (306,326) |
| Tax return of capital | | | |
| Class l ($— and $0.01 per share, respectively) | $ — | | $ (27,983) |
| Class ll ($— and $0.01 per share, respectively) | — | | (7,304) |
| Total distributions to shareholders | $ (1,457,592) | | $ (1,515,126) |
| FROM PORTFOLIO SHARE TRANSACTIONS: | | | |
| Net proceeds from sales of shares | $ 12,925,149 | | $ 9,581,426 |
| Reinvestment of distributions | 1,453,429 | | 1,510,811 |
| Cost of shares repurchased | (15,041,580) | | (21,633,248) |
| Net decrease in net assets resulting from Portfolio share transactions | $ (663,002) | | $ (10,541,011) |
| Net increase (decrease) in net assets | $ 806,974 | | $(15,963,003) |
| NET ASSETS: | | | |
| Beginning of year | $ 27,431,711 | | $ 43,394,714 |
| End of year | $ 28,238,685 | | $ 27,431,711 |
| | Year
Ended
12/31/23
Shares | | Year
Ended
12/31/23
Amount | | Year
Ended
12/31/22
Shares | | Year
Ended
12/31/22
Amount |
| Class l | | | | | | | |
| Shares sold | 227,089 | | $ 1,814,900 | | 243,339 | | $ 2,048,796 |
| Reinvestment of distributions | 144,822 | | 1,161,562 | | 144,342 | | 1,198,515 |
| Less shares repurchased | (461,556) | | (3,687,767) | | (735,304) | | (6,166,306) |
| Net decrease | (89,645) | | $ (711,305) | | (347,623) | | $ (2,918,995) |
| Class ll | | | | | | | |
| Shares sold | 1,416,193 | | $ 11,110,249 | | 922,020 | | $ 7,532,630 |
| Reinvestment of distributions | 36,891 | | 291,867 | | 38,033 | | 312,296 |
| Less shares repurchased | (1,449,210) | | (11,353,813) | | (1,783,458) | | (15,466,942) |
Net increase
(decrease) | 3,874 | | $ 48,303 | | (823,405) | | $ (7,622,016) |
18
The accompanying notes are an integral part of these financial statements.
| Pioneer High Yield VCT Portfolio | Pioneer Variable Contracts Trust |
| | Year Ended
12/31/23 | | Year Ended
12/31/22 | | Year Ended
12/31/21 | | Year Ended
12/31/20 | | Year Ended
12/31/19 |
| Class l | | | | | | | | | |
| Net asset value, beginning of period | $ 7.86 | | $ 9.34 | | $ 9.29 | | $ 9.58 | | $ 8.79 |
| Increase (decrease) from investment operations: | | | | | | | | | |
| Net investment income (loss)(a) | 0.51 | | 0.45 | | 0.43 | | 0.46 | | 0.47 |
| Net realized and unrealized gain (loss) on investments | 0.38 | | (1.50) | | 0.10 | | (0.27) | | 0.78 |
| Net increase (decrease) from investment operations | $ 0.89 | | $ (1.05) | | $ 0.53 | | $ 0.19 | | $ 1.25 |
| Distributions to shareholders: | | | | | | | | | |
| Net investment income | (0.45) | | (0.42) | | (0.48) | | (0.48) | | (0.46) |
| Tax return of capital | — | | (0.01) | | — | | — | | — |
| Total distributions | $ (0.45) | | $ (0.43) | | $ (0.48) | | $ (0.48) | | $ (0.46) |
| Net increase (decrease) in net asset value | $ 0.44 | | $ (1.48) | | $ 0.05 | | $ (0.29) | | $ 0.79 |
| Net asset value, end of period | $ 8.30 | | $ 7.86 | | $ 9.34 | | $ 9.29 | | $ 9.58 |
| Total return(b) | 11.63%(c) | | (11.43)% | | 5.82% | | 2.37% | | 14.44% |
| Ratio of net expenses to average net assets | 0.90% | | 0.90% | | 0.90% | | 1.02% | | 1.03% |
| Ratio of net investment income (loss) to average net assets | 6.38% | | 5.37% | | 4.60% | | 5.15% | | 5.03% |
| Portfolio turnover rate | 40% | | 31% | | 99% | | 90% | | 66% |
| Net assets, end of period (in thousands) | $21,472 | | $21,048 | | $28,234 | | $34,218 | | $35,652 |
| Ratios with no waiver of fees and assumption of expenses by the Adviser and no reduction for fees paid indirectly: | | | | | | | | | |
| Total expenses to average net assets | 1.30% | | 1.13% | | 1.12% | | 1.10% | | 1.07% |
| Net investment income (loss) to average net assets | 5.98% | | 5.14% | | 4.38% | | 5.07% | | 4.99% |
| | |
| (a) | The per-share data presented above is based on the average shares outstanding for the period presented. |
| (b) | Assumes initial investment at net asset value at the beginning of each period, reinvestment of all distributions and the complete redemption of the investment at net asset value at the end of each period. |
| (c) | For the year ended December 31, 2023, the Portfolio's total return includes a reimbursement by the Adviser (see Notes to the Financial Statements-Note 1B). The impact on Class I's total return was less than 0.005%. |
NOTE: The above financial highlights do not reflect the deduction of non-portfolio expenses associated with variable insurance products, such as mortality and expense risk charges, separate account charges, and sales charges.
The accompanying notes are an integral part of these financial statements.
19
| Pioneer High Yield VCT Portfolio | Pioneer Variable Contracts Trust |
Financial Highlights (continued)
| | Year Ended
12/31/23 | | Year Ended
12/31/22 | | Year Ended
12/31/21 | | Year Ended
12/31/20 | | Year Ended
12/31/19 |
| Class ll | | | | | | | | | |
| Net asset value, beginning of period | $ 7.75 | | $ 9.21 | | $ 9.16 | | $ 9.47 | | $ 8.68 |
| Increase (decrease) from investment operations: | | | | | | | | | |
| Net investment income (loss)(a) | 0.49 | | 0.42 | | 0.40 | | 0.42 | | 0.44 |
| Net realized and unrealized gain (loss) on investments | 0.36 | | (1.48) | | 0.10 | | (0.28) | | 0.78 |
| Net increase (decrease) from investment operations | $ 0.85 | | $ (1.06) | | $ 0.50 | | $ 0.14 | | $ 1.22 |
| Distributions to shareholders: | | | | | | | | | |
| Net investment income | (0.42) | | (0.39) | | (0.45) | | (0.45) | | (0.43) |
| Tax return of capital | — | | (0.01) | | — | | — | | — |
| Total distributions | $ (0.42) | | $ (0.40) | | $ (0.45) | | $ (0.45) | | $ (0.43) |
| Net increase (decrease) in net asset value | $ 0.43 | | $ (1.46) | | $ 0.05 | | $ (0.31) | | $ 0.79 |
| Net asset value, end of period | $ 8.18 | | $ 7.75 | | $ 9.21 | | $ 9.16 | | $ 9.47 |
| Total return(b) | 11.29%(c) | | (11.66)% | | 5.56% | | 1.87% | | 14.28% |
| Ratio of net expenses to average net assets | 1.15% | | 1.15% | | 1.15% | | 1.26% | | 1.28% |
| Ratio of net investment income (loss) to average net assets | 6.18% | | 5.06% | | 4.29% | | 4.81% | | 4.79% |
| Portfolio turnover rate | 40% | | 31% | | 99% | | 90% | | 66% |
| Net assets, end of period (in thousands) | $6,767 | | $ 6,384 | | $15,161 | | $8,125 | | $11,642 |
| Ratios with no waiver of fees and assumption of expenses by the Adviser and no reduction for fees paid indirectly: | | | | | | | | | |
| Total expenses to average net assets | 1.55% | | 1.38% | | 1.37% | | 1.33% | | 1.32% |
| Net investment income (loss) to average net assets | 5.78% | | 4.83% | | 4.07% | | 4.74% | | 4.74% |
| | |
| (a) | The per-share data presented above is based on the average shares outstanding for the period presented. |
| (b) | Assumes initial investment at net asset value at the beginning of each period, reinvestment of all distributions and the complete redemption of the investment at net asset value at the end of each period. |
| (c) | For the year ended December 31, 2023, the Portfolio's total return includes a reimbursement by the Adviser (see Notes to the Financial Statements-Note 1B). The impact on Class II's total return was less than 0.005%. |
NOTE: The above financial highlights do not reflect the deduction of non-portfolio expenses associated with variable insurance products, such as mortality and expense risk charges, separate account charges, and sales charges.
20
The accompanying notes are an integral part of these financial statements.
| Pioneer High Yield VCT Portfolio | Pioneer Variable Contracts Trust |
Notes to Financial Statements 12/31/23
1. Organization and Significant Accounting Policies
Pioneer High Yield VCT Portfolio (the “Portfolio”) is one of 7 portfolios comprising Pioneer Variable Contracts Trust (the “Trust”), a Delaware statutory trust. The Portfolio is registered under the Investment Company Act of 1940, as amended (the "1940 Act") as a diversified, open-end management investment company. The investment objective of the Portfolio is to maximize total return through a combination of income and capital appreciation.
The Portfolio offers two classes of shares designated as Class I and Class II shares. Each class of shares represents an interest in the same portfolio of investments of the Portfolio and has identical rights (based on relative net asset values) to assets and liquidation proceeds. Share classes can bear different rates of class-specific fees and expenses, such as transfer agent and distribution fees. Differences in class-specific fees and expenses will result in differences in net investment income and, therefore, the payment of different dividends from net investment income earned by each class. The Amended and Restated Declaration of Trust of the Trust gives the Board of Trustees the flexibility to specify either per-share voting or dollar-weighted voting when submitting matters for shareholder approval. Under per-share voting, each share of a class of the Portfolio is entitled to one vote. Under dollar-weighted voting, a shareholder’s voting power is determined not by the number of shares owned, but by the dollar value of the shares on the record date. Each share class has exclusive voting rights with respect to matters affecting only that class, including with respect to the distribution plan for that class. There is no distribution plan for Class I shares.
Portfolio shares may be purchased only by insurance companies for the purpose of funding variable annuity and variable life insurance contracts or by qualified pension and retirement plans.
Amundi Asset Management US, Inc., an indirect, wholly owned subsidiary of Amundi and Amundi’s wholly owned subsidiary, Amundi USA, Inc., serves as the Portfolio’s investment adviser (the “Adviser”). Amundi Distributor US, Inc., an affiliate of the Adviser, serves as the Portfolio’s distributor (the “Distributor”).
The Portfolio is required to comply with Rule 18f-4 under the 1940 Act, which governs the use of derivatives by registered investment companies. Rule 18f-4 permits funds to enter into derivatives transactions (as defined in Rule 18f-4) and certain other transactions notwithstanding the restrictions on the issuance of “senior securities” under Section 18 of the 1940 Act. In accordance with Rule 18f-4, the Portfolio has established and maintains a comprehensive derivatives risk management program, has appointed a derivatives risk manager and complies with a relative or absolute limit on fund leverage risk calculated based on value-at-risk ("VaR").
The Portfolio is an investment company and follows investment company accounting and reporting guidance under U.S. Generally Accepted Accounting Principles (“U.S. GAAP”). U.S. GAAP requires the management of the Portfolio to make estimates and assumptions that affect the reported amounts of assets and liabilities, the disclosure of contingent assets and liabilities at the date of the financial statements, and the reported amounts of income, expenses and gain or loss on investments during the reporting period. Actual results could differ from those estimates.
The following is a summary of significant accounting policies followed by the Portfolio in the preparation of its financial statements:
| A. | Security Valuation |
| | The net asset value of the Portfolio is computed once daily, on each day the New York Stock Exchange (“NYSE”) is open, as of the close of regular trading on the NYSE. |
| | Fixed-income securities are valued by using prices supplied by independent pricing services, which consider such factors as market prices, market events, quotations from one or more brokers, Treasury spreads, yields, maturities and ratings, or may use a pricing matrix or other fair value methods or techniques to provide an estimated value of the security or instrument. A pricing matrix is a means of valuing a debt security on the basis of current market prices for other debt securities, historical trading patterns in the market for fixed-income securities and/or other factors. Non-U.S. debt securities that are listed on an exchange will be valued at the bid price obtained from an independent third party pricing service. When independent third party pricing services are unable to supply prices, or when prices or market quotations are considered to be unreliable, the value of that security may be determined using quotations from one or more broker-dealers. |
| | Loan interests are valued at the mean between the last available bid and asked prices from one or more brokers or dealers as obtained from Loan Pricing Corporation, an independent third party pricing service. If price information is not available from Loan Pricing Corporation, or if the price information is deemed to be unreliable, price information will be |
| Pioneer High Yield VCT Portfolio | Pioneer Variable Contracts Trust |
Notes to Financial Statements 12/31/23 (continued)
| | obtained from an alternative loan interest pricing service. If no reliable price quotes are available from either the primary or alternative pricing service, broker quotes will be solicited. |
| | Event-linked bonds are valued at the bid price obtained from an independent third party pricing service. Other insurance-linked securities (including reinsurance sidecars, collateralized reinsurance and industry loss warranties) may be valued at the bid price obtained from an independent pricing service, or through a third party using a pricing matrix, insurance valuation models, or other fair value methods or techniques to provide an estimated value of the instrument. |
| | Equity securities that have traded on an exchange are valued by using the last sale price on the principal exchange where they are traded. Equity securities that have not traded on the date of valuation, or securities for which sale prices are not available, generally are valued using the mean between the last bid and asked prices or, if both last bid and asked prices are not available, at the last quoted bid price. Last sale and bid and asked prices are provided by independent third party pricing services. In the case of equity securities not traded on an exchange, prices are typically determined by independent third party pricing services using a variety of techniques and methods. |
| | The value of foreign securities is translated into U.S. dollars based on foreign currency exchange rate quotations supplied by a third party pricing source. Trading in non-U.S. equity securities is substantially completed each day at various times prior to the close of the NYSE. The values of such securities used in computing the net asset value of the Portfolio's shares are determined as of such times. The Adviser may use a fair value model developed by an independent pricing service to value non-U.S. equity securities. |
| | Futures contracts are generally valued at the closing settlement price established by the exchange on which they are traded. |
| | Swap contracts, including interest rate swaps, caps and floors (other than centrally cleared swap contracts), are valued at the dealer quotations obtained from reputable International Swap Dealers Association members. Centrally cleared swaps are valued at the daily settlement price provided by the central clearing counterparty. |
| | Shares of open-end registered investment companies (including money market mutual funds) are valued at such funds' net asset value. Shares of closed-end interval funds that offer their shares at net asset value are valued at such funds’ net asset value. |
| | Securities or loan interests for which independent pricing services or broker-dealers are unable to supply prices or for which market prices and/or quotations are not readily available or are considered to be unreliable are valued by a fair valuation team comprised of certain personnel of the Adviser. The Adviser is designated as the valuation designee for the Portfolio pursuant to Rule 2a-5 under the 1940 Act. The Adviser’s fair valuation team is responsible for monitoring developments that may impact fair valued securities. |
| | Inputs used when applying fair value methods to value a security may include credit ratings, the financial condition of the company, current market conditions and comparable securities. The Adviser may use fair value methods if it is determined that a significant event has occurred after the close of the exchange or market on which the security trades and prior to the determination of the Portfolio's net asset value. Examples of a significant event might include political or economic news, corporate restructurings, natural disasters, terrorist activity or trading halts. Thus, the valuation of the Portfolio's securities may differ significantly from exchange prices, and such differences could be material. |
| B. | Investment Income and Transactions |
| | Dividend income is recorded on the ex-dividend date, except that certain dividends from foreign securities where the ex-dividend date may have passed are recorded as soon as the Portfolio becomes aware of the ex-dividend data in the exercise of reasonable diligence. |
| | Interest income, including interest on income-bearing cash accounts, is recorded on the accrual basis. Dividend and interest income are reported net of unrecoverable foreign taxes withheld at the applicable country rates and net of income accrued on defaulted securities. |
| | Interest and dividend income payable by delivery of additional shares is reclassified as PIK (payment-in-kind) income upon receipt and is included in interest and dividend income, respectively. |
| | Principal amounts of mortgage-backed securities are adjusted for monthly paydowns. Premiums and discounts related to certain mortgage-backed securities are amortized or accreted in proportion to the monthly paydowns. All |
| Pioneer High Yield VCT Portfolio | Pioneer Variable Contracts Trust |
| | discounts/premiums on purchase prices of debt securities are accreted/amortized for financial reporting purposes over the life of the respective securities, and such accretion/amortization is included in interest income. |
| | Security transactions are recorded as of trade date. Gains and losses on sales of investments are calculated on the identified cost method for both financial reporting and federal income tax purposes. |
| | During the fiscal year ended December 31, 2023, the Portfolio realized a loss of $11,123 due to an operational error. The Adviser voluntarily reimbursed the Portfolio for this loss, which is reflected on the Statement of Operations as Reimbursement by the Adviser. |
| C. | Foreign Currency Translation |
| | The books and records of the Portfolio are maintained in U.S. dollars. Amounts denominated in foreign currencies are translated into U.S. dollars using current exchange rates. |
| | Net realized gains and losses on foreign currency transactions, if any, represent, among other things, the net realized gains and losses on foreign currency exchange contracts, disposition of foreign currencies and the difference between the amount of income accrued and the U.S. dollars actually received. Further, the effects of changes in foreign currency exchange rates on investments are not segregated on the Statement of Operations from the effects of changes in the market prices of those securities, but are included with the net realized and unrealized gain or loss on investments. |
| D. | Federal Income Taxes |
| | It is the Portfolio's policy to comply with the requirements of the Internal Revenue Code applicable to regulated investment companies and to distribute all of its net taxable income and net realized capital gains, if any, to its shareholders. Therefore, no provision for federal income taxes is required. As of December 31, 2023, the Portfolio did not accrue any interest or penalties with respect to uncertain tax positions, which, if applicable, would be recorded as an income tax expense on the Statement of Operations. Tax returns filed within the prior three years remain subject to examination by federal and state tax authorities. |
| | The amount and character of income and capital gain distributions to shareholders are determined in accordance with federal income tax rules, which may differ from U.S. GAAP. Distributions in excess of net investment income or net realized gains are temporary over distributions for financial statement purposes resulting from differences in the recognition or classification of income or distributions for financial statement and tax purposes. Capital accounts within the financial statements are adjusted for permanent book/tax differences to reflect tax character, but are not adjusted for temporary differences. |
| | At December 31, 2023, the Portfolio was permitted to carry forward indefinitely $190,212 of short-term losses and $2,842,917 of long-term losses. |
| | At December 31, 2023, the Portfolio deferred $19,942 of late year ordinary losses, which will be recognized by the Portfolio as occurring at the start of the next fiscal year ending December 31, 2024. |
| | The tax character of distributions paid during the years ended December 31, 2023 and December 31, 2022, was as follows: |
| | 2023 | 2022 |
| Distributions paid from: | | |
| Ordinary income | $1,457,592 | $1,479,839 |
| Tax return of capital | — | 35,287 |
| Total | $1,457,592 | $1,515,126 |
The following shows the components of distributable earnings (losses) on a federal income tax basis at December 31, 2023:
| | 2023 |
| Distributable earnings/(losses): | |
| Capital loss carryforward | $ (3,033,129) |
| Net unrealized depreciation | (1,075,058) |
| Qualified late year loss deferral | (19,942) |
| Total | $(4,128,129) |
| Pioneer High Yield VCT Portfolio | Pioneer Variable Contracts Trust |
Notes to Financial Statements 12/31/23 (continued)
The difference between book basis and tax basis unrealized depreciation is attributable to book-tax amortization differences and the mark to market of swaps.
| E. | Portfolio Shares and Class Allocations |
| | The Portfolio records sales and repurchases of its shares as of trade date. Distribution fees for Class II shares are calculated based on the average daily net asset value attributable to Class II shares of the Portfolio (see Note 5). Class I shares do not pay distribution fees. |
| | Income, common expenses (excluding transfer agent and distribution fees) and realized and unrealized gains and losses are calculated at the Portfolio level and allocated daily to each class of shares based on its respective percentage of the adjusted net assets at the beginning of the day. |
| | All expenses and fees paid to the Portfolio’s transfer agent for its services are allocated between the classes of shares based on the number of accounts in each class and the ratable allocation of related out-of-pocket expenses (see Note 4). |
| | The Portfolio declares as daily dividends substantially all of its net investment income. All dividends are paid on a monthly basis. Short-term capital gain distributions, if any, may be declared with the daily dividends. Distributions paid by the Portfolio with respect to each class of shares are calculated in the same manner and at the same time, except that net investment income dividends to Class I and Class II shares can reflect different transfer agent and distribution expense rates. Dividends and distributions to shareholders are recorded on the ex-dividend date. |
| F. | Risks |
| | The value of securities held by the Portfolio may go up or down, sometimes rapidly or unpredictably, due to general market conditions, such as real or perceived adverse economic, political or regulatory conditions, recessions, the spread of infectious illness or other public health issues, inflation, changes in interest rates, armed conflict such as between Russia and Ukraine or in the Middle East, sanctions against Russia, other nations or individuals or companies and possible countermeasures, lack of liquidity in the bond markets or adverse investor sentiment. In the past several years, financial markets have experienced increased volatility, depressed valuations, decreased liquidity and heightened uncertainty. These conditions may continue, recur, worsen or spread. Inflation and interest rates have increased and may rise further. These circumstances could adversely affect the value and liquidity of the Portfolio's investments and negatively impact the Portfolio's performance. |
| | The long-term impact of the COVID-19 pandemic and its subsequent variants on economies, markets, industries and individual issuers, are not known. Some sectors of the economy and individual issuers have experienced or may experience particularly large losses. Periods of extreme volatility in the financial markets, reduced liquidity of many instruments, increased government debt, inflation, and disruptions to supply chains, consumer demand and employee availability, may continue for some time. Following Russia's invasion of Ukraine, Russian securities lost all, or nearly all, their market value. Other securities or markets could be similarly affected by past or future political, geopolitical or other events or conditions. |
| | Governments and central banks, including the U.S. Federal Reserve, have taken extraordinary and unprecedented actions to support local and global economies and the financial markets. These actions have resulted in significant expansion of public debt, including in the U.S. The consequences of high public debt, including its future impact on the economy and securities markets, may not be known for some time. |
| | The U.S. and other countries are periodically involved in disputes over trade and other matters, which may result in tariffs, investment restrictions and adverse impacts on affected companies and securities. For example, the U.S. has imposed tariffs and other trade barriers on Chinese exports, has restricted sales of certain categories of goods to China, and has established barriers to investments in China. Trade disputes may adversely affect the economies of the U.S. and its trading partners, as well as companies directly or indirectly affected and financial markets generally. If the political climate between the U.S. and China does not improve or continues to deteriorate, if China were to attempt unification of Taiwan by force, or if other geopolitical conflicts develop or get worse, economies, markets and individual securities may be severely affected both regionally and globally, and the value of the Portfolio's assets may go down. |
| | At times, the Portfolio’s investments may represent industries or industry sectors that are interrelated or have common risks, making the Portfolio more susceptible to any economic, political, or regulatory developments or other risks affecting those industries and sectors. |
| Pioneer High Yield VCT Portfolio | Pioneer Variable Contracts Trust |
| | The Portfolio’s investments in foreign markets and countries with limited developing markets may subject the Portfolio to a greater degree of risk than investments in a developed market. These risks include disruptive political or economic conditions, military conflicts and sanctions, terrorism, sustained economic downturns, financial instability, less liquid trading markets, extreme price volatility, currency risks, reduction of government or central bank support, inadequate accounting standards, tariffs, tax disputes or other tax burdens, nationalization or expropriation of assets and the imposition of adverse governmental laws, arbitrary application of laws and regulations or lack of rule of law and investment and repatriation restrictions. Lack of information and less market regulation also may affect the value of these securities. Withholding and other non-U.S. taxes may decrease the Portfolio’s return. Non-U.S. issuers may be located in parts of the world that have historically been prone to natural disasters. Investing in depositary receipts is subject to many of the same risks as investing directly in non-U.S. issuers. Depositary receipts may involve higher expenses and may trade at a discount (or premium) to the underlying security. |
| | Russia launched a large-scale invasion of Ukraine on February 24, 2022. In response to the military action by Russia, various countries, including the U.S., the United Kingdom, and European Union issued broad-ranging economic sanctions against Russia and Belarus and certain companies and individuals. Since then, Russian securities have lost all, or nearly all, their market value, and many other issuers, securities and markets have been adversely affected. The United States and other countries may impose sanctions on other countries, companies and individuals in light of Russia’s military invasion. The extent and duration of the military action or future escalation of such hostilities, the extent and impact of existing and future sanctions, market disruptions and volatility, and the result of any diplomatic negotiations cannot be predicted. These and any related events could have a significant impact on the value and liquidity of certain Portfolio investments, on Portfolio performance and the value of an investment in the Portfolio, particularly with respect to securities and commodities, such as oil, natural gas and food commodities, as well as other sectors with exposure to Russian issuers or issuers in other countries affected by the invasion, and are likely to have collateral impacts on market sectors globally. |
| | Normally, the Portfolio invests at least 80% of its total assets in below-investment-grade (high-yield) debt securities and preferred stocks. Some of these high-yield securities may be convertible into equity securities of the issuer. Debt securities rated below-investment-grade are commonly referred to as “junk bonds” and are considered speculative with respect to the issuer's capacity to pay interest and repay principal. These securities involve greater risk of loss, are subject to greater price volatility, and may be less liquid and more difficult to value, especially during periods of economic uncertainty or change, than higher rated debt securities. |
| | The market prices of the Portfolio's fixed income securities may fluctuate significantly when interest rates change. The value of your investment will generally go down when interest rates rise. A rise in rates tends to have a greater impact on the prices of longer term or duration securities. For example, if interest rates increase by 1%, the value of a Portfolio's portfolio with a portfolio duration of ten years would be expected to decrease by 10%, all other things being equal. In recent years interest rates and credit spreads in the U.S. have been at historic lows. The U.S. Federal Reserve has raised certain interest rates, and interest rates may continue to go up. A general rise in interest rates could adversely affect the price and liquidity of fixed income securities. The maturity of a security may be significantly longer than its effective duration. A security's maturity and other features may be more relevant than its effective duration in determining the security's sensitivity to other factors affecting the issuer or markets generally, such as changes in credit quality or in the yield premium that the market may establish for certain types of securities (sometimes called "credit spread"). In general, the longer its maturity the more a security may be susceptible to these factors. When the credit spread for a fixed income security goes up, or "widens," the value of the security will generally go down. |
| | If an issuer or guarantor of a security held by the Portfolio or a counterparty to a financial contract with the Portfolio defaults on its obligation to pay principal and/or interest, has its credit rating downgraded or is perceived to be less creditworthy, or the credit quality or value of any underlying assets declines, the value of your investment will typically decline. Changes in actual or perceived creditworthiness may occur quickly. The Portfolio could be delayed or hindered in its enforcement of rights against an issuer, guarantor or counterparty. |
| | The Portfolio's investments, payment obligations and financing terms may be based on floating rates, such as LIBOR (London Interbank Offered Rate) or SOFR (Secured Overnight Financing Rate). ICE Benchmark Administration, the administrator of LIBOR, has ceased publication of most LIBOR settings on a representative basis. Actions by regulators have resulted in the establishment of alternative reference rates to LIBOR in most major currencies. In the U.S., a common benchmark replacement is based on the SOFR published by the Federal Reserve Bank of New York, including certain spread adjustments and benchmark replacement conforming changes, although other benchmark replacements (without or without spread adjustments) may be used in certain transactions. The impact of the transition from LIBOR on |
| Pioneer High Yield VCT Portfolio | Pioneer Variable Contracts Trust |
Notes to Financial Statements 12/31/23 (continued)
| | the Portfolio's transactions and financial markets generally cannot yet be determined. The transition away from LIBOR may lead to increased volatility and illiquidity in markets for instruments that have relied on LIBOR and may adversely affect the Portfolio's performance. |
| | The Portfolio may invest in REIT securities, the value of which can fall for a variety of reasons, such as declines in rental income, fluctuating interest rates, poor property management, environmental liabilities, uninsured damage, increased competition, or changes in real estate tax laws. |
| | With the increased use of technologies such as the Internet to conduct business, the Portfolio is susceptible to operational, information security and related risks. While the Portfolio’s Adviser has established business continuity plans in the event of, and risk management systems to prevent, limit or mitigate, such cyber-attacks, there are inherent limitations in such plans and systems, including the possibility that certain risks have not been identified. Furthermore, the Portfolio cannot control the cybersecurity plans and systems put in place by service providers to the Portfolio such as the Portfolio's custodian and accounting agent, and the Portfolio’s transfer agent. In addition, many beneficial owners of Portfolio shares hold them through accounts at broker-dealers, retirement platforms and other financial market participants over which neither the Portfolio nor the Adviser exercises control. Each of these may in turn rely on service providers to them, which are also subject to the risk of cyber-attacks. Cybersecurity failures or breaches at the Adviser or the Portfolio’s service providers or intermediaries have the ability to cause disruptions and impact business operations, potentially resulting in financial losses, interference with the Portfolio’s ability to calculate its net asset value, impediments to trading, the inability of Portfolio shareholders to effect share purchases, redemptions or exchanges or receive distributions, loss of or unauthorized access to private shareholder information and violations of applicable privacy and other laws, regulatory fines, penalties, reputational damage, or additional compliance costs. Such costs and losses may not be covered under any insurance. In addition, maintaining vigilance against cyber-attacks may involve substantial costs over time, and system enhancements may themselves be subject to cyber-attacks. |
| | The Portfolio’s prospectus contains unaudited information regarding the Portfolio’s principal risks. Please refer to that document when considering the Portfolio’s principal risks. |
| G. | Restricted Securities |
| | Restricted Securities are subject to legal or contractual restrictions on resale. Restricted securities generally are resold in transactions exempt from registration under the Securities Act of 1933. Private placement securities are generally considered to be restricted except for those securities traded between qualified institutional investors under the provisions of Rule 144A of the Securities Act of 1933. |
| | Disposal of restricted investments may involve negotiations and expenses, and prompt sale at an acceptable price may be difficult to achieve. Restricted investments held by the Portfolio at December 31, 2023 are listed in the Schedule of Investments. |
| H. | Insurance-Linked Securities (“ILS”) |
| | The Portfolio invests in ILS. The Portfolio could lose a portion or all of the principal it has invested in an ILS, and the right to additional interest or dividend payments with respect to the security, upon the occurrence of one or more trigger events, as defined within the terms of an insurance-linked security. Trigger events, generally, are hurricanes, earthquakes, or other natural events of a specific size or magnitude that occur in a designated geographic region during a specified time period, and/or that involve losses or other metrics that exceed a specific amount. There is no way to accurately predict whether a trigger event will occur, and accordingly, ILS carry significant risk. The Portfolio is entitled to receive principal, and interest and/or dividend payments so long as no trigger event occurs of the description and magnitude specified by the instrument. In addition to the specified trigger events, ILS may expose the Portfolio to other risks, including but not limited to issuer (credit) default, adverse regulatory or jurisdictional interpretations and adverse tax consequences. |
| | The Portfolio’s investments in ILS may include event-linked bonds. ILS also may include special purpose vehicles (“SPVs”) or similar instruments structured to comprise a portion of a reinsurer’s catastrophe-oriented business, known as quota share instruments (sometimes referred to as reinsurance sidecars), or to provide reinsurance relating to specific risks to insurance or reinsurance companies through a collateralized instrument, known as collateralized reinsurance. Structured reinsurance investments also may include industry loss warranties (“ILWs”). A traditional ILW takes the form of a bilateral reinsurance contract, but there are also products that take the form of derivatives, collateralized structures, or exchange-traded instruments. |
| Pioneer High Yield VCT Portfolio | Pioneer Variable Contracts Trust |
| | Where the ILS are based on the performance of underlying reinsurance contracts, the Portfolio has limited transparency into the individual underlying contracts, and therefore must rely upon the risk assessment and sound underwriting practices of the issuer. Accordingly, it may be more difficult for the Adviser to fully evaluate the underlying risk profile of the Portfolio's structured reinsurance investments, and therefore the Portfolio's assets are placed at greater risk of loss than if the Adviser had more complete information. Structured reinsurance instruments generally will be considered illiquid securities by the Portfolio. These securities may be difficult to purchase, sell or unwind. Illiquid securities also may be difficult to value. If the Portfolio is forced to sell an illiquid asset, the Portfolio may be forced to sell at a loss. |
| | Additionally, the Portfolio may gain exposure to ILS by investing in a closed-end interval fund, Pioneer ILS Interval Fund, an affiliate of the Adviser. The Portfolio’s investment in Pioneer ILS Interval Fund at December 31, 2023 is listed in the Schedule of Investments. |
| I. | Futures Contracts |
| | The Portfolio may enter into futures transactions in order to attempt to hedge against changes in interest rates, securities prices and currency exchange rates or to seek to increase total return. Futures contracts are types of derivatives. |
| | All futures contracts entered into by the Portfolio are traded on a futures exchange. Upon entering into a futures contract, the Portfolio is required to deposit with a broker an amount of cash or securities equal to the minimum "initial margin" requirements of the associated futures exchange. The amount of cash deposited with the broker as collateral at December 31, 2023 is recorded as "Futures collateral" on the Statement of Assets and Liabilities. |
| | Subsequent payments for futures contracts ("variation margin") are paid or received by the Portfolio, depending on the daily fluctuation in the value of the contracts, and are recorded by the Portfolio as unrealized appreciation or depreciation. Cash received from or paid to the broker related to previous margin movement is held in a segregated account at the broker and is recorded as either "Due from broker for futures" or "Due to broker for futures" on the Statement of Assets and Liabilities. When the contract is closed, the Portfolio realizes a gain or loss equal to the difference between the opening and closing value of the contract as well as any fluctuation in foreign currency exchange rates where applicable. Futures contracts are subject to market risk, interest rate risk and currency exchange rate risk. Changes in value of the contracts may not directly correlate to the changes in value of the underlying securities. With futures, there is reduced counterparty credit risk to the Portfolio since futures are exchange-traded and the exchange's clearinghouse, as counterparty to all exchange-traded futures, guarantees the futures against default. |
| | The average notional values of futures contracts long position and futures contracts short position during the year ended December 31, 2023 were $21,599 and $0, respectively. |
| J. | Credit Default Swap Contracts |
| �� | A credit default swap is a contract between a buyer of protection and a seller of protection against a pre-defined credit event or an underlying reference obligation, which may be a single security or a basket or index of securities. The Portfolio may buy or sell credit default swap contracts to seek to increase the Portfolio's income, or to attempt to hedge the risk of default on portfolio securities. A credit default swap index is used to hedge risk or take a position on a basket of credit entities or indices. |
| | As a seller of protection, the Portfolio would be required to pay the notional (or other agreed-upon) value of the referenced debt obligation to the counterparty in the event of a default by a U.S. or foreign corporate issuer of a debt obligation, which would likely result in a loss to the Portfolio. In return, the Portfolio would receive from the counterparty a periodic stream of payments during the term of the contract, provided that no event of default occurred. The maximum exposure of loss to the seller would be the notional value of the credit default swaps outstanding. If no default occurs, the Portfolio would keep the stream of payments and would have no payment obligation. The Portfolio may also buy credit default swap contracts in order to hedge against the risk of default of debt securities, in which case the Portfolio would function as the counterparty referenced above. |
| | As a buyer of protection, the Portfolio makes an upfront or periodic payment to the protection seller in exchange for the right to receive a contingent payment. An upfront payment made by the Portfolio, as the protection buyer, is recorded within the "Swap contracts, at value" line item on the Statement of Assets and Liabilities. Periodic payments received or paid by the Portfolio are recorded as realized gains or losses on the Statement of Operations. |
| | Credit default swap contracts are marked-to-market daily using valuations supplied by independent sources, and the change in value, if any, is recorded within the "Swap contracts, at value" line item on the Statement of Assets and |
| Pioneer High Yield VCT Portfolio | Pioneer Variable Contracts Trust |
Notes to Financial Statements 12/31/23 (continued)
| | Liabilities. Payments received or made as a result of a credit event or upon termination of the contract are recognized, net of the appropriate amount of the upfront payment, as realized gains or losses on the Statement of Operations. |
| | Credit default swap contracts involving the sale of protection may involve greater risks than if the Portfolio had invested in the referenced debt instrument directly. Credit default swap contracts are subject to general market risk, liquidity risk, counterparty risk and credit risk. If the Portfolio is a protection buyer and no credit event occurs, it will lose its investment. If the Portfolio is a protection seller and a credit event occurs, the value of the referenced debt instrument received by the Portfolio, together with the periodic payments received, may be less than the amount the Portfolio pays to the protection buyer, resulting in a loss to the Portfolio. In addition, obligations under sell protection credit default swaps may be partially offset by net amounts received from settlement of buy protection credit default swaps entered into by the Portfolio for the same reference obligation with the same counterparty. |
| | The Portfolio may invest in credit default swap index products ("CDX"). A CDX is a swap on an index of credit default swaps. CDXs allow an investor to manage credit risk or take a position on a basket of credit entities (such as credit default swaps or commercial mortgage-backed securities) in a more efficient manner than transacting in a single-name credit default swap. If a credit event occurs in one of the underlying companies, the protection is paid out via the delivery of the defaulted bond by the buyer of protection in return for a payment of notional value of the defaulted bond by the seller of protection or it may be settled through a cash settlement between the two parties. The underlying company is then removed from the index. If the Portfolio holds a long position in a CDX, the Portfolio would indirectly bear its proportionate share of any expenses paid by a CDX. A fund holding a long position in CDXs typically receives income from principal or interest paid on the underlying securities. By investing in CDXs, the Portfolio could be exposed to liquidity risk, counterparty risk, credit risk of the issuers of the underlying loan obligations and of the CDX markets, and operational risks. If there is a default by the CDX counterparty, the Portfolio will have contractual remedies pursuant to the agreements related to the transaction. CDXs also bear the risk that the Portfolio will not be able to meet its obligation to the counterparty. |
| | Certain swap contracts that are cleared through a central clearinghouse are referred to as centrally cleared swaps. All payments made or received by the Portfolio are pursuant to a centrally cleared swap contract with the central clearing party rather than the original counterparty. Upon entering into a centrally cleared swap contract, the Portfolio is required to make an initial margin deposit, either in cash or in securities. The daily change in value on open centrally cleared contracts is recorded as "Variation margin for centrally cleared swap contracts" on the Statement of Assets and Liabilities. Cash received from or paid to the broker related to previous margin movement is held in a segregated account at the broker and is recorded as either "Due from broker for swaps" or "Due to broker for swaps" on the Statement of Assets and Liabilities. The amount of cash deposited with a broker as collateral at December 31, 2023 is recorded as "Swaps collateral" on the Statement of Assets and Liabilities. |
| | The average notional value of credit default swap contracts buy protection open during the year ended December 31, 2023 was $2,469,580. Open credit default swap contracts at December 31, 2023 are listed in the Schedule of Investments. |
2. Management Agreement
The Adviser manages the Portfolio. Management fees payable under the Portfolio's Investment Management Agreement with the Adviser are calculated daily and paid monthly at the annual rate of 0.65% of the Portfolio’s average daily net assets up to $1 billion and 0.60% of the Portfolio’s average daily net assets over $1 billion. For the year ended ended December 31, 2023, the effective management fee (excluding waivers and/or assumption of expenses and waiver of acquired fund fees and expenses) was equivalent to 0.65% of the Portfolio’s average daily net assets.
The Adviser has agreed to waive its management fee with respect to any portion of the Portfolio’s assets invested in Pioneer ILS Interval Fund, an affiliated fund managed by the Adviser. For the year ended December 31, 2023, the Adviser waived $9,626 in management fees with respect to the Portfolio, which is reflected on the Statement of Operations as an expense waiver.
The Adviser has contractually agreed to limit ordinary operating expenses (ordinary operating expenses means all Portfolio expenses other than taxes, brokerage commissions, acquired fund fees and expenses and extraordinary expenses, such as litigation) of the Portfolio to the extent required to reduce Portfolio expenses to 0.90% and 1.15% of the average daily net assets attributable to Class I shares and Class II shares respectively. These expense limitation are in effect through May 1, 2024. There can be no assurance that the Adviser will extend the expense limitation agreement for a class of shares beyond the date referred to above. Fees waived and expenses reimbursed during the year ended December 31, 2023, are reflected on the Statement of Operations.
| Pioneer High Yield VCT Portfolio | Pioneer Variable Contracts Trust |
In addition, under the management and administration agreements, certain other services and costs, including accounting, regulatory reporting and insurance premiums, are paid by the Portfolio as administrative reimbursements. Reflected on the Statement of Assets and Liabilities is $2,346 in management fees payable to the Adviser at December 31, 2023.
3. Compensation of Officers and Trustees
The Portfolio pays an annual fee to its Trustees. The Adviser reimburses the Portfolio for fees paid to the Interested Trustees. Except for the chief compliance officer, the Portfolio does not pay any salary or other compensation to its officers. The Portfolio pays a portion of the chief compliance officer's compensation for his services as the Portfolio's chief compliance officer. Amundi US pays the remaining portion of the chief compliance officer's compensation. For the year ended December 31, 2023, the Portfolio paid $8,571 in Officers' and Trustees' compensation, which is reflected on the Statement of Operations as Officers' and Trustees' fees. At December 31, 2023, on its Statement of Assets and Liabilities, the Portfolio had a payable for Trustees' fees of $359 and a payable for administrative expenses of $1,094, which includes the payable for Officers' compensation.
4. Transfer Agent
BNY Mellon Investment Servicing (US) Inc. serves as the transfer agent to the Portfolio at negotiated rates. Transfer agent fees and payables shown on the Statement of Operations and the Statement of Assets and Liabilities, respectively, include sub-transfer agent expenses incurred through the Portfolio’s omnibus relationship contracts.
5. Distribution Plan
The Portfolio has adopted a distribution plan (the “Plan”) pursuant to Rule 12b-1 under the 1940 Act with respect to Class II shares. Pursuant to the Plan, the Portfolio pays the Distributor a distribution fee of 0.25% of the average daily net assets attributable to Class II shares to compensate the Distributor for (1) distribution services and (2) personal and account maintenance services performed and expenses incurred by the Distributor in connection with the Portfolio’s Class II shares. Reflected on the Statement of Assets and Liabilities is $227 in distribution fees payable to the Distributor at December 31, 2023.
6. Additional Disclosures about Derivative Instruments and Hedging Activities
The Portfolio’s use of derivatives may enhance or mitigate the Portfolio’s exposure to the following risks:
Interest rate risk relates to the fluctuations in the value of interest-bearing securities due to changes in the prevailing levels of market interest rates.
Credit risk relates to the ability of the issuer of a financial instrument to make further principal or interest payments on an obligation or commitment that it has to the Portfolio.
Foreign exchange rate risk relates to fluctuations in the value of an asset or liability due to changes in currency exchange rates.
Equity risk relates to the fluctuations in the value of financial instruments as a result of changes in market prices (other than those arising from interest rate risk or foreign exchange rate risk), whether caused by factors specific to an individual investment, its issuer, or all factors affecting all instruments traded in a market or market segment.
Commodity risk relates to the risk that the value of a commodity or commodity index will fluctuate based on increases or decreases in the commodities market and factors specific to a particular industry or commodity.
| Pioneer High Yield VCT Portfolio | Pioneer Variable Contracts Trust |
Notes to Financial Statements 12/31/23 (continued)
The fair value of open derivative instruments (not considered to be hedging instruments for accounting disclosure purposes) by risk exposure at December 31, 2023, was as follows:
Statement of Assets
and Liabilities | Interest
Rate Risk | Credit
Risk | Foreign
Exchange
Rate Risk | Equity
Risk | Commodity
Risk |
| Liabilities | | | | | |
| Centrally cleared swap contracts† | $ — | $64,364 | $ — | $ — | $ — |
| Total Value | $— | $64,364 | $— | $— | $— |
| | |
| † | Includes cumulative unrealized appreciation (depreciation) of centrally cleared swap contracts as reported in the Schedule of Investments. Only net variation margin is reported within the receivables and/or payables on the Statement of Assets and Liabilities. |
The effect of derivative instruments (not considered to be hedging instruments for accounting disclosure purposes) on the Statement of Operations by risk exposure at December 31, 2023 was as follows:
| Statement of Operations | Interest
Rate Risk | Credit
Risk | Foreign
Exchange
Rate Risk | Equity
Risk | Commodity
Risk |
| Net Realized Gain (Loss) on | | | | | |
| Futures contracts | $ (1,177) | $ — | $ — | $ — | $ — |
| Swap contracts | — | (273,132) | — | — | — |
| Total Value | $(1,177) | $(273,132) | $— | $— | $— |
| Change in Net Unrealized Appreciation (Depreciation) on | | | | | |
| Futures contracts | $ 65 | $ — | $ — | $ — | $ — |
| Swap contracts | — | 105,367 | — | — | — |
| Total Value | $ 65 | $ 105,367 | $— | $— | $— |
7. Unfunded Loan Commitments
The Portfolio may enter into unfunded loan commitments. Unfunded loan commitments may be partially or wholly unfunded. During the contractual period, the Portfolio is obliged to provide funding to the borrower upon demand. A fee is earned by the Portfolio on the unfunded loan commitment and is recorded as interest income on the Statement of Operations. Unfunded loan commitments are fair valued in accordance with the valuation policy described in Note 1A and unrealized appreciation or depreciation, if any, is recorded on the Statement of Assets and Liabilities.
As of December 31, 2023, the Portfolio had the following unfunded loan commitment outstanding:
| Loan | Principal | Cost | Value | Unrealized
Appreciation
(Depreciation) |
| CSG Elevate II, Inc., Bridge Term Loan | $205,000 | $205,000 | $205,000 | $— |
8. Affiliated Issuers
An affiliated issuer is a company in which the Portfolio has a direct or indirect ownership of, control of, or voting power of 5 percent or more of the outstanding voting shares or any company which is under common ownership or control. At December 31, 2023, the value of the Portfolio’s investment in affiliated issuers was $605,133, which represents 2.2% of the Portfolio’s net assets.
| Pioneer High Yield VCT Portfolio | Pioneer Variable Contracts Trust |
Transactions in affiliated issuers by the Portfolio for the year ended December 31, 2023 were as follows:
Name of the
Affiliated Issuer | Value at
December 31,
2022 | Purchases
Costs | Change in
Unrealized
Appreciation
(Depreciation) | Net
Realized
Gain/(Loss) | Dividends
Received
and Reinvested | Sales
Proceeds | Shares
held at
December 31,
2023 | Value at
December 31,
2023 |
| Pioneer ILS Interval Fund | $509,971 | $— | $26,551 | $— | $68,611 | $— | 71,109 | $605,133 |
Annual and semi-annual reports for the underlying Pioneer funds are available on the funds’ web page(s) at www.amundi.com/us.
| Pioneer High Yield VCT Portfolio | Pioneer Variable Contracts Trust |
Report of Independent Registered Public Accounting Firm
To the Board of Trustees of Pioneer Variable Contracts Trust and the Shareholders of Pioneer High Yield VCT Portfolio:
Opinion on the Financial Statements
We have audited the accompanying statement of assets and liabilities of Pioneer High Yield VCT Portfolio (the “Portfolio”) (one of the portfolios constituting Pioneer Variable Contracts Trust (the “Trust”)), including the schedule of investments, as of December 31, 2023, and the related statement of operations for the year then ended, the statements of changes in net assets for each of the two years in the period then ended, the financial highlights for each of the five years in the period then ended and the related notes (collectively referred to as the “financial statements”). In our opinion, the financial statements present fairly, in all material respects, the financial position of the Portfolio (one of the portfolios constituting Pioneer Variable Contracts Trust) at December 31, 2023, the results of its operations for the year then ended, the changes in its net assets for each of the two years in the period then ended, and its financial highlights for each of the five years in the period then ended in conformity with U.S. generally accepted accounting principles.
Basis for Opinion
These financial statements are the responsibility of the Trust’s management. Our responsibility is to express an opinion on the Portfolio’s financial statements based on our audits. We are a public accounting firm registered with the Public Company Accounting Oversight Board (United States) ("PCAOB") and are required to be independent with respect to the Trust in accordance with the U.S. federal securities laws and the applicable rules and regulations of the Securities and Exchange Commission and the PCAOB.
We conducted our audits in accordance with the standards of the PCAOB. Those standards require that we plan and perform the audit to obtain reasonable assurance about whether the financial statements are free of material misstatement, whether due to error or fraud. The Trust is not required to have, nor were we engaged to perform, an audit of the Trust’s internal control over financial reporting. As part of our audits, we are required to obtain an understanding of internal control over financial reporting, but not for the purpose of expressing an opinion on the effectiveness of the Trust’s internal control over financial reporting. Accordingly, we express no such opinion.
Our audits included performing procedures to assess the risks of material misstatement of the financial statements, whether due to error or fraud, and performing procedures that respond to those risks. Such procedures included examining, on a test basis, evidence regarding the amounts and disclosures in the financial statements. Our procedures included confirmation of securities owned as of December 31, 2023, by correspondence with the custodian, brokers, and others; when replies were not received from brokers and others, we performed other auditing procedures. Our audits also included evaluating the accounting principles used and significant estimates made by management, as well as evaluating the overall presentation of the financial statements. We believe that our audits provide a reasonable basis for our opinion.
We have served as the auditor of one or more investment companies in the Pioneer family of funds since 2017.
Boston, Massachusetts
February 20, 2024
| Pioneer High Yield VCT Portfolio | Pioneer Variable Contracts Trust |
Additional Information (unaudited)
Qualified interest income is exempt from nonresident alien (NRA) tax withholding. The percentage of the Portfolio’s ordinary income distributions derived from qualified interest income was 71.40%.
| Pioneer High Yield VCT Portfolio | Pioneer Variable Contracts Trust |
Approval of Renewal of Investment Management Agreement
Amundi Asset Management US, Inc. (“Amundi US”) serves as the investment adviser to Pioneer High Yield VCT Portfolio (the “Portfolio”) pursuant to an investment management agreement between Amundi US and the Portfolio. In order for Amundi US to remain the investment adviser of the Portfolio, the Trustees of the Portfolio, including a majority of the Portfolio’s Independent Trustees, must determine annually whether to renew the investment management agreement for the Portfolio.
The contract review process began in January 2023 as the Trustees of the Portfolio agreed on, among other things, an overall approach and timeline for the process. Contract review materials were provided to the Trustees in March 2023, July 2023 and September 2023. In addition, the Trustees reviewed and discussed the Portfolio’s performance at regularly scheduled meetings throughout the year, and took into account other information related to the Portfolio provided to the Trustees at regularly scheduled meetings, in connection with the review of the Portfolio’s investment management agreement.
In March 2023, the Trustees, among other things, discussed the memorandum provided by Portfolio counsel that summarized the legal standards and other considerations that are relevant to the Trustees in their deliberations regarding the renewal of the investment management agreement, and reviewed and discussed the qualifications of the investment management teams for the Portfolio, as well as the level of investment by the Portfolio’s portfolio managers in the Portfolio. In July 2023, the Trustees, among other things, reviewed the Portfolio’s management fees and total expense ratios, the financial statements of Amundi US and its parent companies, profitability analyses provided by Amundi US, and analyses from Amundi US as to possible economies of scale. The Trustees also reviewed the profitability of the institutional business of Amundi US as compared to that of Amundi US’s fund management business, and considered the differences between the fees and expenses of the Portfolio and the fees and expenses of Amundi US’s institutional accounts, as well as the different services provided by Amundi US to the Portfolio and to the institutional accounts. The Trustees further considered contract review materials, including additional materials received in response to the Trustees’ request, in September 2023.
At a meeting held on September 19, 2023, based on their evaluation of the information provided by Amundi US and third parties, the Trustees of the Portfolio, including the Independent Trustees voting separately advised by independent counsel, unanimously approved the renewal of the investment management agreement for another year. In approving the renewal of the investment management agreement, the Trustees considered various factors that they determined were relevant, including the factors described below. The Trustees did not identify any single factor as the controlling factor in determining to approve the renewal of the agreement.
Nature, Extent and Quality of Services
The Trustees considered the nature, extent and quality of the services that had been provided by Amundi US to the Portfolio, taking into account the investment objective and strategy of the Portfolio. The Trustees also reviewed Amundi US’s investment approach for the Portfolio and its research process. The Trustees considered Amundi US’ integration of environmental, social and governance (ESG) considerations into its investment research process. The Trustees considered the resources of Amundi US and the personnel of Amundi US who provide investment management services to the Portfolio. They also reviewed the amount of non-Portfolio assets managed by the portfolio managers of the Portfolio. They considered the non-investment resources and personnel of Amundi US that are involved in Amundi US’s services to the Portfolio, including Amundi US’s compliance, risk management, and legal resources and personnel. The Trustees considered the compliance services being provided to the Portfolio by Amundi US and how Amundi US has addressed any compliance issues during the past year. The Trustees noted the substantial attention and high priority given by Amundi US’s senior management to the Pioneer Fund complex, including with respect to the increasing regulation to which the Pioneer Funds are subject.
The Trustees considered that Amundi US supervises and monitors the performance of the Portfolio’s service providers and provides the Portfolio with personnel (including Portfolio officers) and other resources that are necessary for the Portfolio’s business management and operations. The Trustees also considered that, as administrator, Amundi US is responsible for the administration of the Portfolio’s business and other affairs. The Trustees considered that the Portfolio reimburses Amundi US its pro rata share of Amundi US’s costs of providing administration services to the Pioneer Funds.
Based on these considerations, the Trustees concluded that the nature, extent and quality of services that had been provided by Amundi US to the Portfolio were satisfactory and consistent with the terms of the investment management agreement.
Performance of the Portfolio
In considering the Portfolio’s performance, the Trustees regularly review and discuss throughout the year data prepared by Amundi US and information comparing the Portfolio’s performance with the performance of its peer group of funds, as classified by Morningstar, Inc. (Morningstar), and with the performance of the Portfolio’s benchmark index. They also discuss the Portfolio’s performance with Amundi US on a regular basis. The Trustees’ regular reviews and discussions were factored into the Trustees’ deliberations concerning the renewal of the investment management agreement.
| Pioneer High Yield VCT Portfolio | Pioneer Variable Contracts Trust |
Management Fee and Expenses
The Trustees considered information showing the fees and expenses of the Portfolio in comparison to the management fees of its peer group of funds as classified by Morningstar and also to the expense ratios of a peer group of funds selected on the basis of criteria determined by the Independent Trustees for this purpose using data provided by Strategic Insight Mutual Fund Research and Consulting, LLC (Strategic Insight), an independent third party. The peer group comparisons referred to below are organized in quintiles. Each quintile represents one-fifth of the peer group. In all peer group comparisons referred to below, first quintile is most favorable to the Portfolio’s shareowners. The Trustees noted that they separately review and consider the impact of the Portfolio’s transfer agency and Portfolio- and Amundi US-paid expenses for sub-transfer agency and intermediary arrangements, and that the results of the most recent such review were considered in the consideration of the Portfolio’s expense ratio.
The Trustees considered that the Portfolio’s management fee for the most recent fiscal year was in the fourth quintile relative to the management fees paid by other funds in its Morningstar category for the comparable period. The Trustees noted Amundi US’s explanation of the reasons that the Portfolio’s management fee was in the fourth quintile relative to the management fees paid by other funds in its Morningstar category. The Trustees considered that the expense ratio of the Portfolio’s Class I shares for the most recent fiscal year was in the fifth quintile relative to its Strategic Insight peer group for the comparable period. The Trustees noted Amundi US’s explanation of the reasons that the expense ratio of the Portfolio’s Class I shares was in the fifth quintile relative to its Strategic Insight peer group. The Trustees noted that Amundi US had agreed to waive fees and/or reimburse expenses in order to limit the ordinary operating expenses of the Portfolio for the most recent fiscal year, and that such expense limitation arrangement had not been extended for the upcoming fiscal year.
The Trustees reviewed management fees charged by Amundi US to institutional and other clients, including publicly offered European funds sponsored by Amundi US’s affiliates, unaffiliated U.S. registered investment companies (in a sub-advisory capacity), and unaffiliated foreign and domestic separate accounts. The Trustees also considered Amundi US’s costs in providing services to the Portfolio and Amundi US’s costs in providing services to the other clients and considered the differences in management fees and profit margins for fund and non-fund services. In evaluating the fees associated with Amundi US’s client accounts, the Trustees took into account the respective demands, resources and complexity associated with the Portfolio and other client accounts. The Trustees noted that, in some instances, the fee rates for those clients were lower than the management fee for the Portfolio and considered that, under the investment management and administration agreements with the Portfolio, Amundi US performs additional services for the Portfolio that it does not provide to those other clients or services that are broader in scope, including oversight of the Portfolio’s other service providers and activities related to compliance and the extensive regulatory and tax regimes to which the Portfolio is subject. The Trustees also considered the entrepreneurial risks associated with Amundi US’s management of the Portfolio.
The Trustees concluded that the management fee payable by the Portfolio to Amundi US was reasonable in relation to the nature and quality of the services provided by Amundi US.
Profitability
The Trustees considered information provided by Amundi US regarding the profitability of Amundi US with respect to the advisory services provided by Amundi US to the Portfolio, including the methodology used by Amundi US in allocating certain of its costs to the management of the Portfolio. The Trustees also considered Amundi US’s profit margin in connection with the overall operation of the Portfolio. They further reviewed the financial results, including the profit margins, realized by Amundi US from non-fund businesses. The Trustees considered Amundi US’s profit margins in comparison to the limited industry data available and noted that the profitability of any adviser was affected by numerous factors, including its organizational structure and method for allocating expenses. The Trustees concluded that Amundi US’s profitability with respect to the management of the Portfolio was not unreasonable.
Economies of Scale
The Trustees considered Amundi US’s views relating to economies of scale in connection with the Pioneer Funds as fund assets grow and the extent to which any such economies of scale are shared with the Portfolio and Portfolio shareholders. The Trustees recognize that economies of scale are difficult to identify and quantify, and that, among other factors that may be relevant, are the following: fee levels, expense subsidization, investment by Amundi US in research and analytical capabilities and Amundi US’s commitment and resource allocation to the Portfolio. The Trustees noted that profitability also may be an indicator of the availability of any economies of scale, although profitability may vary for other reasons including due to reductions in expenses. The Trustees concluded that economies of scale, if any, were being appropriately shared with the Portfolio.
| Pioneer High Yield VCT Portfolio | Pioneer Variable Contracts Trust |
Approval of Renewal of Investment Management Agreement (continued)
Other Benefits
The Trustees considered the other benefits that Amundi US enjoys from its relationship with the Portfolio. The Trustees considered the character and amount of fees paid or to be paid by the Portfolio, other than under the investment management agreement, for services provided by Amundi US and its affiliates. The Trustees further considered the revenues and profitability of Amundi US’s businesses other than the fund business. To the extent applicable, the Trustees also considered the benefits to the Portfolio and to Amundi US and its affiliates from the use of “soft” commission dollars generated by the Portfolio to pay for research and brokerage services.
The Trustees considered that Amundi US is the principal U.S. asset management business of Amundi, which is one of the largest asset managers globally. Amundi’s worldwide asset management business manages over $2.1 trillion in assets (including the Pioneer Funds). The Trustees considered that Amundi US’s relationship with Amundi creates potential opportunities for Amundi US and Amundi that derive from Amundi US’s relationships with the Portfolio, including Amundi’s ability to market the services of Amundi US globally. The Trustees noted that Amundi US has access to additional research and portfolio management capabilities as a result of its relationship with Amundi and Amundi’s enhanced global presence that may contribute to an increase in the resources available to Amundi US. The Trustees considered that Amundi US and the Portfolio receive reciprocal intangible benefits from the relationship, including mutual brand recognition and, for the Portfolio, direct and indirect access to the resources of a large global asset manager. The Trustees concluded that any such benefits received by Amundi US as a result of its relationship with the Portfolio were reasonable.
Conclusion
After consideration of the factors described above as well as other factors, the Trustees, including the Independent Trustees, concluded that the investment management agreement for the Portfolio, including the fees payable thereunder, was fair and reasonable and voted to approve the proposed renewal of the investment management agreement.
| Pioneer High Yield VCT Portfolio | Pioneer Variable Contracts Trust |
Trustees, Officers and Service Providers
Trustees and Officers
The Portfolio’s Trustees and officers are listed below, together with their principal occupations and other directorships they have held during at least the past five years. Trustees who are interested persons of the Portfolios within the meaning of the 1940 Act are referred to as Interested Trustees. Trustees who are not interested persons of the Portfolio are referred to as Independent Trustees. Each of the Trustees serves as a Trustee of each of the 47 U.S. registered investment portfolios for which Amundi US serves as investment adviser (the “Pioneer Funds”). The address for all Trustees and all officers of the Portfolios is 60 State Street, Boston, Massachusetts 02109.
The Statement of Additional Information of the Portfolio includes additional information about the Trustees and is available, without charge, upon request, by calling 1-800-225-6292.
Investment Adviser and Administrator
Amundi Asset Management US, Inc.
Custodian and Sub-Administrator
The Bank of New York Mellon Corporation
Independent Registered Public Accounting Firm
Ernst & Young LLP
Principal Underwriter
Amundi Distributor US, Inc.
Legal Counsel
Morgan, Lewis & Bockius LLP
Transfer Agent
BNY Mellon Investment Servicing (US) Inc.
Name, Age and Position
Held With the Trust | Term of Office and
Length of Service | Principal Occupation(s) During At Least The Past Five Years | Other Directorships Held by Trustee During At Least The Past Five Years |
| Independent Trustees |
Thomas J. Perna (73)
Chairman of the Board
and Trustee | Trustee since 2006.
Serves until a successor
trustee is elected or
earlier retirement
or removal. | Private investor (2004 – 2008 and 2013 – present); Chairman (2008 – 2013) and Chief Executive Officer (2008 – 2012), Quadriserv, Inc. (technology products for securities lending industry); and Senior Executive Vice President, The Bank of New York (financial and securities services) (1986 – 2004) | Director, Broadridge Financial
Solutions, Inc. (investor
communications and securities
processing provider for financial
services industry) (2009 – present); Director, Quadriserv, Inc.
(2005 – 2013); and Commissioner,
New Jersey State Civil Service
Commission (2011 – 2015) |
John E. Baumgardner,
Jr. (72)*
Trustee | Trustee since 2019.
Serves until a successor
trustee is elected or
earlier retirement
or removal. | Of Counsel (2019 – present), Partner (1983-2018), Sullivan & Cromwell LLP (law firm). | Chairman, The Lakeville Journal
Company, LLC, (privately-held
community newspaper group)
(2015-present) |
| Pioneer High Yield VCT Portfolio | Pioneer Variable Contracts Trust |
Trustees, Officers and Service Providers (continued)
Name, Age and Position
Held With the Trust | Term of Office and
Length of Service | Principal Occupation(s) During At Least The Past Five Years | Other Directorships Held by Trustee During At Least The Past Five Years |
| Independent Trustees (continued) |
Diane Durnin (66)
Trustee | Trustee since 2019.
Serves until a successor
trustee is elected or
earlier retirement
or removal. | Managing Director - Head of Product Strategy and Development, BNY Mellon Investment Management (investment management firm) (2012-2018); Vice Chairman – The Dreyfus Corporation (2005 – 2018): Executive Vice President Head of Product, BNY Mellon Investment Management (2007-2012); Executive Director- Product Strategy, Mellon Asset Management (2005-2007); Executive Vice President Head of Products, Marketing and Client Service, Dreyfus Corporation (investment management firm) (2000-2005); Senior Vice President Strategic Product and Business Development, Dreyfus Corporation (1994-2000) | None |
Benjamin M. Friedman (79)
Trustee | Trustee since 2008.
Serves until a successor
trustee is elected or
earlier retirement
or removal. | William Joseph Maier Professor of Political Economy, Harvard University (1972 – present) | Trustee, Mellon Institutional Funds
Investment Trust and Mellon
Institutional Funds Master Portfolio
(oversaw 17 portfolios in fund
complex) (1989 - 2008) |
Craig C. MacKay (60)
Trustee | Trustee since 2021.
Serves until a successor
trustee is elected or
earlier retirement
or removal. | Partner, England & Company, LLC (advisory firm) (2012 – present); Group Head – Leveraged Finance Distribution, Oppenheimer & Company (investment bank) (2006 – 2012); Group Head – Private Finance & High Yield Capital Markets Origination, SunTrust Robinson Humphrey (investment bank) (2003 – 2006); and Founder and Chief Executive Officer, HNY Associates, LLC (investment bank) (1996 – 2003) | Director, Equitable Holdings, Inc. (financial services holding company) (2022 – present); Board Member of Carver Bancorp, Inc. (holding company) and Carver Federal Savings Bank, NA (2017 – present); Advisory Council Member, MasterShares ETF (2016 – 2017); Advisory Council Member, The Deal (financial market information publisher) (2015 – 2016); Board Co-Chairman and Chief Executive Officer, Danis Transportation Company (privately-owned commercial carrier) (2000 – 2003); Board Member and Chief Financial Officer, Customer Access Resources (privately-owned teleservices company) (1998 – 2000); Board Member, Federation of Protestant Welfare Agencies (human services agency) (1993 – present); and Board Treasurer, Harlem Dowling Westside Center (foster care agency) (1999 – 2018) |
Lorraine H. Monchak (67)
Trustee | Trustee since 2017.
(Advisory Trustee from
2014 - 2017). Serves
until a successor trustee
is elected or earlier
retirement or removal. | Chief Investment Officer, 1199 SEIU Funds (healthcare workers union pension funds) (2001 – present); Vice President – International Investments Group, American International Group, Inc. (insurance company) (1993 – 2001); Vice President – Corporate Finance and Treasury Group, Citibank, N.A. (1980 – 1986 and 1990 – 1993); Vice President – Asset/Liability Management Group, Federal Farm Funding Corporation (government-sponsored issuer of debt securities) (1988 – 1990); Mortgage Strategies Group, Shearson Lehman Hutton, Inc. (investment bank) (1987 – 1988); Mortgage Strategies Group, Drexel Burnham Lambert, Ltd. (investment bank) (1986 – 1987) | None |
| Pioneer High Yield VCT Portfolio | Pioneer Variable Contracts Trust |
Name, Age and Position
Held With the Trust | Term of Office and
Length of Service | Principal Occupation(s) During At Least The Past Five Years | Other Directorships Held by Trustee During At Least The Past Five Years |
| Independent Trustees (continued) |
Marguerite A. Piret (75)**
Trustee | Trustee since 1995.
Serves until a successor
trustee is elected or
earlier retirement
or removal. | Chief Financial Officer, American Ag Energy, Inc. (technology for the environment, energy and agriculture) (2019 – present); Chief Operating Officer, North Country Growers LLC (controlled environment agriculture company) (2020 – present); Chief Executive Officer, Green Heat LLC (biofuels company) (2022 – present); President and Chief Executive Officer, Newbury Piret Company (investment banking firm) (1981 – 2019) | Director of New America High
Income Fund, Inc. (closed-end
investment company) (2004 –
present); and Member, Board of
Governors, Investment Company
Institute (2000 – 2006) |
Fred J. Ricciardi (76)
Trustee | Trustee since 2014.
Serves until a successor
trustee is elected or
earlier retirement
or removal. | Private investor (2020 – present); Consultant (investment company services) (2012 – 2020); Executive Vice President, BNY Mellon (financial and investment company services) (1969 – 2012); Director, BNY International Financing Corp. (financial services) (2002 – 2012); Director, Mellon Overseas Investment Corp. (financial services) (2009 – 2012); Director, Financial Models (technology) (2005-2007); Director, BNY Hamilton Funds, Ireland (offshore investment companies) (2004-2007); Chairman/Director, AIB/BNY Securities Services, Ltd., Ireland (financial services) (1999-2006); Chairman, BNY Alternative Investment Services, Inc. (financial services) (2005-2007) | None |
* Mr. Baumgardner is Of Counsel to Sullivan & Cromwell LLP, which acts as counsel to the Independent Trustees of each Pioneer Fund.
** Ms. Piret became a non-voting Advisory Trustee of the Pioneer Funds effective January 22, 2024. |
| Interested Trustees |
Lisa M. Jones (61)***
Trustee, President and Chief
Executive Officer | Trustee since 2017. Serves
until a successor trustee is
elected or earlier retirement
or removal | Director, CEO and President of Amundi US, Inc. (investment management firm) (since September 2014); Director, CEO and President of Amundi Asset Management US, Inc. (since September 2014); Director, CEO and President of Amundi Distributor US, Inc. (since September 2014); Director, CEO and President of Amundi Asset Management US, Inc. (since September 2014); Chair, Amundi US, Inc., Amundi Distributor US, Inc. and Amundi Asset Management US, Inc. (September 2014 – 2018); Managing Director, Morgan Stanley Investment Management (investment management firm) (2010 – 2013); Director of Institutional Business, CEO of International, Eaton Vance Management (investment management firm) (2005 – 2010); Director of Amundi Holdings US, Inc. (since 2017) | Director of Clearwater Analytics (provider of web-based investment accounting software for reporting and reconciliation services) (September 2022 – present) |
Kenneth J. Taubes (64)***,****
Trustee | Trustee since 2014. Serves
until a successor trustee is
elected or earlier retirement
or removal | Director and Executive Vice President (since 2008) and Chief Investment Officer, U.S. (since 2010) of Amundi US, Inc. (investment management firm); Director and Executive Vice President and Chief Investment Officer, U.S. of Amundi US (since 2008); Executive Vice President and Chief Investment Officer, U.S. of Amundi Asset Management US, Inc. (since 2009); Portfolio Manager of Amundi US (since 1999); Director of Amundi Holdings US, Inc. (since 2017) | None |
| Pioneer High Yield VCT Portfolio | Pioneer Variable Contracts Trust |
Trustees, Officers and Service Providers (continued)
Name, Age and Position
Held With the Trust | Term of Office and
Length of Service | Principal Occupation(s) During At Least The Past Five Years | Other Directorships Held by Trustee During At Least The Past Five Years |
| Interested Trustees (continued) |
*** Ms. Jones and Mr. Taubes are Interested Trustees because they are officers or directors of the Portfolio’s investment adviser and certain of its affiliates.
**** Mr. Taubes retired as a Trustee, effective January 1, 2024. |
| Name, Age and Position Held With the Trust***** | Term of Office and
Length of Service | Principal Occupation(s) During
At Least The Past Five Years | Other Directorships Held by Trustee During At Least The Past Five Years |
| Trust Officers |
Christopher J. Kelley (59)
Secretary and Chief
Legal Officer | Since 2003. Serves at
the discretion of
the Board | Vice President and Associate General Counsel of Amundi US since January 2008; Secretary and Chief Legal Officer of all of the Pioneer Funds since June 2010; Assistant Secretary of all of the Pioneer Funds from September 2003 to May 2010; Vice President and Senior Counsel of Amundi US from July 2002 to December 2007 | None |
Thomas Reyes (61)
Assistant Secretary | Since 2010. Serves at
the discretion of
the Board | Assistant General Counsel of Amundi US since May 2013 and Assistant Secretary of all the Pioneer Funds since June 2010; Counsel of Amundi US from June 2007 to May 2013 | None |
Heather L. Melito-Dezan (47)
Assistant Secretary | Since 2022. Serves at
the discretion of
the Board | Director - Trustee and Board Relationships of Amundi US since September 2019; Assistant Secretary of Amundi US, Inc. since July 2020: Assistant Secretary of Amundi Asset Management US, Inc. since July 2020: Assistant Secretary of Amundi Distributor US, Inc. since July 2020; Assistant Secretary of all the Pioneer Funds since September 2022; Private practice from 2017 – 2019. | None |
Anthony J. Koenig, Jr. (60)
Treasurer and
Chief Financial and
Accounting Officer | Since 2021. Serves at
the discretion of
the Board | Managing Director, Chief Operations Officer and Fund Treasurer of Amundi US since May 2021; Treasurer of all of the Pioneer Funds since May 2021; Assistant Treasurer of all of the Pioneer Funds from January 2021 to May 2021; and Chief of Staff, US Investment Management of Amundi US from May 2008 to January 2021 | None |
Luis I. Presutti (58)
Assistant Treasurer | Since 2000. Serves at
the discretion of
the Board | Director – Fund Treasury of Amundi US since 1999; and Assistant Treasurer of all of the Pioneer Funds since 1999 | None |
Gary Sullivan (65)
Assistant Treasurer | Since 2002. Serves at
the discretion of
the Board | Senior Manager – Fund Treasury of Amundi US since 2012; and Assistant Treasurer of all of the Pioneer Funds since 2002 | None |
Antonio Furtado (41)
Assistant Treasurer | Since 2020. Serves at
the discretion of
the Board | Fund Oversight Manager – Fund Treasury of Amundi US since 2020; Assistant Treasurer of all of the Pioneer Funds since 2020; and Senior Fund Treasury Analyst from 2012 - 2020 | None |
| Pioneer High Yield VCT Portfolio | Pioneer Variable Contracts Trust |
| Name, Age and Position Held With the Trust***** | Term of Office and
Length of Service | Principal Occupation(s) During
At Least The Past Five Years | Other Directorships Held by Trustee During At Least The Past Five Years |
| Trust Officers (continued) |
Michael Melnick (52)
Assistant Treasurer | Since 2021. Serves at
the discretion of
the Board | Vice President - Deputy Fund Treasurer of Amundi US since May 2021; Assistant Treasurer of all of the Pioneer Funds since July 2021; Director of Regulatory Reporting of Amundi US from 2001 – 2021; and Director of Tax of Amundi US from 2000 - 2001 | None |
John Malone (53)
Chief Compliance Officer | Since 2018. Serves at
the discretion of
the Board | Managing Director, Chief Compliance Officer of Amundi US Asset Management; Amundi Asset Management US, Inc.; and the Pioneer Funds since September 2018; Chief Compliance Officer of Amundi Distributor US, Inc. since January 2014. | None |
Brandon Austin (51)
Anti-Money
Laundering Officer | Since 2022. Serves at
the discretion of
the Board | Director, Financial Security – Amundi Asset Management; Anti-Money Laundering Officer of all the Pioneer Funds since March 2022: Director of Financial Security of Amundi US since July 2021; Vice President, Head of BSA, AML and OFAC, Deputy Compliance Manager, Crédit Agricole Indosuez Wealth Management (investment management firm) (2013 – 2021) | None |
| ***** Marco Pirondini has been appointed to serve as an Executive Vice President of the Portfolio and Chief Investment Officer of Amundi US, Inc., effective January 1, 2024. |
Proxy Voting Policies and Procedures of the Portfolio are available without charge, upon request, by calling our toll free number (1-800-225-6292). Information regarding how the Portfolio voted proxies relating to Portfolio securities during the most recent 12-month period ended June 30 is publicly available to shareholders at www.amundi.com/us. This information is also available on the Securities and Exchange Commission’s web site at www.sec.gov.
Pioneer Variable Contracts Trust
Pioneer Mid Cap Value
VCT Portfolio
Class I and II Shares
Annual Report | December 31, 2023
Please refer to your contract prospectus to determine the applicable share class offered under your contract.
Pioneer Variable Contracts Trust
Table of Contents
Pioneer Mid Cap Value VCT Portfolio
This report is authorized for distribution only when preceded or accompanied by a prospectus for the Portfolio being offered.
Pioneer Variable Contracts Trust files a complete schedule of portfolio holdings with the Securities and Exchange Commission for the first and third quarters of each fiscal year as an exhibit to its reports on Form N-PORT. Shareholders may view the filed Form N-PORT by visiting the Commission’s web site at https://www.sec.gov.
| Pioneer Mid Cap Value VCT Portfolio | Pioneer Variable Contracts Trust |
Portfolio Update 12/31/23
Sector Distribution
(As a percentage of total investments)*
5 Largest Holdings
| (As a percentage of total investments)* |
| 1. | State Street Corp. | 3.58% |
| 2. | Zimmer Biomet Holdings, Inc. | 3.03 |
| 3. | Coterra Energy, Inc. | 2.83 |
| 4. | AerCap Holdings NV | 2.68 |
| 5. | eBay, Inc. | 2.63 |
| | |
| * | Excludes short-term investments and all derivative contracts except for options purchased. The Portfolio is actively managed, and current holdings may be different. The holdings listed should not be considered recommendations to buy or sell any securities. |
Performance Update 12/31/23
Prices and Distributions
| Net Asset Value per Share | 12/31/23 | 12/31/22 |
| Class l | $11.20 | $11.47 |
| Class ll | $11.04 | $11.32 |
| | | |
Distributions per Share
(1/1/23 - 12/31/23) | Net
Investment
Income | Short-Term
Capital Gains | Long-Term
Capital Gains |
| Class l | $0.2323 | $— | $1.3496 |
| Class ll | $0.2005 | $— | $1.3496 |
Performance of a $10,000 Investment
The following chart shows the change in value of an investment made in Class I and Class II shares of Pioneer Mid Cap Value VCT Portfolio at net asset value during the periods shown, compared to that of the Russell Midcap Value Index. Portfolio returns are based on net asset value and do not reflect any applicable insurance fees or surrender charges.
 | The Russell Midcap Value Index is an unmanaged index that measures the performance of U.S. mid-cap value stocks. Index returns are calculated monthly, assume reinvestment of dividends and do not reflect any fees, expenses or sales charges. It is not possible to invest directly in an index. |
Average Annual Total Returns
(As of December 31, 2023)
| | Class l | Class ll | Russell Midcap
Value Index |
| 10 Years | 7.57% | 7.30% | 8.26% |
| 5 Years | 12.54% | 12.26% | 11.16% |
| 1 Year | 12.46% | 12.20% | 12.71% |
All total returns shown assume reinvestment of distributions at net asset value.
The performance table does not reflect the deduction of taxes that a shareholder would pay on distributions or the redemption of shares.
Call 1-800-225-6292 or visit www.amundi.com/us for the most recent month-end performance results. Current performance may be lower or higher than the performance data quoted.
The performance data quoted represents past performance, which is no guarantee of future results. Investment return and principal value will fluctuate, and shares, when redeemed, may be worth more or less than their original cost.
The returns for the Portfolio do not reflect the deduction of expenses associated with variable products, such as mortality and expense risk charges, separate account charges, and sales charges. These expenses would reduce the overall returns shown.
Performance results reflect any applicable expense waivers in effect during the periods shown. Without such waivers, performance would be lower. Waivers may not be in effect for all portfolios. Certain fee waivers are contractual through a specified period. Otherwise, fee waivers can be rescinded at any time. See the prospectus and financial statements for more information.
| Pioneer Mid Cap Value VCT Portfolio | Pioneer Variable Contracts Trust |
Comparing Ongoing Portfolio Expenses
As a shareholder in the Portfolio, you incur two types of costs:
| (1) | ongoing costs, including management fees, distribution and/or service (12b-1) fees, and other Portfolio expenses; and |
| (2) | transaction costs, including sales charges (loads) on purchase payments. |
This example is intended to help you understand your ongoing expenses (in dollars) of investing in the Portfolio and to compare these costs with the ongoing costs of investing in other mutual funds offered through your variable annuity contract. The example is based on an investment of $1,000 at the beginning of the Portfolio’s latest six-month period and held throughout the six months.
Using the Tables
Actual Expenses
The first table below provides information about actual account values and actual expenses. You may use the information in this table, together with the amount you invested, to estimate the expenses that you paid over the period as follows:
| (1) | Divide your account value by $1,000
Example: an $8,600 account value ÷ $1,000 = 8.6 |
| (2) | Multiply the result in (1) above by the corresponding share class’s number in the third row under the heading entitled “Expenses Paid During Period” to estimate the expenses you paid on your account during this period. |
Expenses Paid on a $1,000 Investment in Pioneer Mid Cap Value VCT Portfolio
Based on actual returns from July 1, 2023 through December 31, 2023.
| Share Class | l | ll |
| Beginning Account Value on 7/1/23 | $1,000.00 | $1,000.00 |
| Ending Account Value (after expenses) on 12/31/23 | $1,069.70 | $1,067.70 |
| Expenses Paid During Period* | $ 4.17 | $ 5.47 |
| | |
| * | Expenses are equal to the Portfolio’s annualized net expense ratio of 0.80% and 1.05% for Class I and Class II shares, respectively, multiplied by the average account value over the period, multiplied by 184/365 (to reflect the one-half year period). |
Hypothetical Example for Comparison Purposes
The table below provides information about hypothetical account values and hypothetical expenses based on the Portfolio’s actual expense ratio and an assumed rate of return of 5% per year before expenses, which is not the Portfolio’s actual return. The hypothetical account values and expenses may not be used to estimate the actual ending account balance or expenses you paid for the period.
You may use this information to compare the ongoing costs of investing in the Portfolio and other variable annuities. To do so, compare this 5% hypothetical example with the 5% hypothetical examples that appear in the shareholder reports of the other variable annuities.
Please note that the expenses shown in the tables are meant to highlight your ongoing costs only and do not reflect any transaction costs, such as sales charges (loads) that are charged at the time of the transaction. Therefore, the table below is useful in comparing ongoing costs only and will not help you determine the relative total costs of owning different variable annuities. In addition, if these transaction costs were included, your costs would have been higher.
Expenses Paid on a $1,000 Investment in Pioneer Mid Cap Value VCT Portfolio
Based on a hypothetical 5% return per year before expenses, reflecting the period from July 1, 2023 through December 31, 2023.
| Share Class | l | ll |
| Beginning Account Value on 7/1/23 | $1,000.00 | $1,000.00 |
| Ending Account Value (after expenses) on 12/31/23 | $1,021.17 | $1,019.91 |
| Expenses Paid During Period* | $ 4.08 | $ 5.35 |
| | |
| * | Expenses are equal to the Portfolio’s annualized net expense ratio of 0.80% and 1.05% for Class I and Class II shares, respectively, multiplied by the average account value over the period, multiplied by 184/365 (to reflect the one-half year period). |
| Pioneer Mid Cap Value VCT Portfolio | Pioneer Variable Contracts Trust |
Portfolio Management Discussion 12/31/23
Call 1-800-225-6292 or visit www.amundi.com/us for the most recent month-end performance results. Current performance may be lower or higher than the performance data quoted.
The performance data quoted represents past performance, which is no guarantee of future results. Investment return and principal value will fluctuate, and shares, when redeemed, may be worth more or less than their original cost.
The returns for the Portfolio do not reflect the deduction of expenses associated with variable products, such as mortality and expense risk charges, separate account charges, and sales charges. These expenses would reduce the overall returns shown.
Performance results reflect any applicable expense waivers in effect during the periods shown. Without such waivers, performance would be lower. Waivers may not be in effect for all portfolios. Certain fee waivers are contractual through a specified period. Otherwise, fee waivers can be rescinded at any time. See the prospectus and financial statements for more information.
In the following interview, Timothy Stanish and John Arege discuss the factors that affected the performance of Pioneer Mid Cap Value VCT Portfolio during the 12-month period. Mr. Stanish, Managing Director, Director of Mid Cap Equities, US, and a portfolio manager at Amundi Asset Management US, Inc. (Amundi US), and Mr. Arege, a vice president and a portfolio manager at Amundi US, are responsible for the day-to-day management of the Portfolio
| Q: | How did the Portfolio perform during the 12-month period ended December 31, 2023? |
| A: | Pioneer Mid Cap Value VCT Portfolio’s Class I shares returned 12.46% at net asset value during the 12-month period ended December 31, 2023 and Class II shares returned 12.20%, while the Portfolio’s benchmark, Russell Mid Cap Value Index (the Russell Index) returned 12.71%. |
| Q: | Which of your investment decisions had the greatest effects on the Portfolio’s benchmark-relative performance during the 12-month period ended December 31, 2023? |
| A: | The Portfolio slightly underperformed the Russell Index over the 12 months ended December 31, 2023, with unfavorable stock selection results in the financials and communication services sectors being the biggest detractors from benchmark-relative returns during the period. Positive stock selection results in the consumer staples and information technology sectors were not enough to offset headwinds from stock selection results in those other sectors. |
| | With regard to individual securities, detractors from the Portfolio’s benchmark-relative returns for the period included Truist and Citizens. Both Truist and Citizens, regional banks, underperformed as concerns around deposit flight and unrealized losses permeated the banking space during early 2023. We believe the quality of the deposit franchises at each firm is solid and they can manage any incremental capital regulators might require. We believe both stocks remain undervalued and we continue to hold them in the Portfolio. |
| | On the positive side, the Portfolio’s positions in Expedia and Eaton Corp benefited the Portfolio’s relative returns during the period. |
| | Top contributor for the period Expedia, a provider of online travel services, outperformed on strong earnings, a solid forecast, and the announcement of a large buyback. We continue to think the stock is undervalued given the company’s strong cash flow, improving profitability driven by the scale benefits of its internal IT investments, and clean balance sheet. |
| | Eaton Corp, an electrical equipment manufacturer, continued to operate well following earlier portfolio restructurings and more recently on the back of increased demand for their equipment at data centers. The Portfolio sold the stock as we believed the valuation was no longer attractive. |
| Q: | Did the Portfolio have any exposure to derivative securities during the 12-month period ended December 31, 2023? |
| A: | No, the Portfolio had no exposure to derivatives during the period. |
| Q: | What’s your investment outlook as the Portfolio enters a new fiscal year? |
| Pioneer Mid Cap Value VCT Portfolio | Pioneer Variable Contracts Trust |
| A: | The resilience of the US economy over the past year has been quite remarkable. Rate increases leading up to mid-2023 were about the fastest ever, and inflation, though declining from very high levels, remains considerably above the Federal Reserve’s target of 2%. Investors' view of the equity market gradually shifted over the course of the year from generally cautious, or pessimistic (ourselves included) at the start of 2023, to optimistic by year end. |
| | The US equity market appears to be all in on the possibility of a soft landing. Returns were primarily driven by the “Magnificent 7” through the mid-October 2023 low, but the market recovery was led by a much broader set of stocks. This later point has aided the bullish camp, and generally speaking, we would agree that it is a positive. |
| | We continue to believe that some economic weakness will begin to appear as the cumulative impact of higher interest rates, depleted excess savings, and a difficult political environment all converge during the year. Offsetting these headwinds, in part, will likely be the impact of prior fiscal stimulus such as the Inflation Reduction Act. |
| | The Federal Reserve has become less hawkish over the past 6 months, but it remains more hawkish than most market participants. The market is now pricing in about six rate cuts in 2024, which we would view as unlikely unless the economy slows dramatically. Further interest rate increases remain possible, even if unlikely, particularly if growth continues to surprise to the upside. We would likely view rate cuts as a negative catalyst for the stock market, as the Federal Reserve very rarely cuts interest rates for good reasons. |
| | Earnings estimates for 2024 are about 11% above expectations for 2023, which is roughly flat on 2022. The slight recovery in earnings that began in the third quarter of 2023 is expected to continue for the next couple of years. In the near term, we expect further margin contraction for the majority of companies, and we believe that earnings estimates for the next several quarters remain overly optimistic. A mild recession, in our view, is more likely than a “soft landing,” though the odds of a soft landing may have risen somewhat over the past several months. In either scenario, earnings estimates will likely decline as companies take a more cautious approach given economic uncertainty. If the stock market adequately discounts a potential recession, we would anticipate becoming more constructive. |
| | Against this backdrop, we have maintained the Portfolio’s overweight positions in the financials and energy sectors. The Portfolio is also overweight in the consumer staples and healthcare sectors. We believe we have identified good value ideas in the staples and health care sectors, two areas that struggled in 2023. Corporate profits should, in our view, lead to better share-price performance for the intrinsically undervalued stocks that we favor. We remain overweight banks with sticky deposit bases, footprints in growing geographies, and conservative underwriting cultures and think we are buying these characteristics at compelling valuations. Our exposure to the energy sector takes the form of stock-specific investment cases with minimal reliance upon only the price of oil. The recent capital discipline on display across energy companies is admirable and may lead to significant value creation. |
| Pioneer Mid Cap Value VCT Portfolio | Pioneer Variable Contracts Trust |
Portfolio Management Discussion 12/31/23 (continued)
A Word About Risk:
All investments are subject to risk, including the possible loss of principal. In the past several years, financial markets have experienced increased volatility and heightened uncertainty. The market prices of securities may go up or down, sometimes rapidly or unpredictably, due to general market conditions, such as real or perceived adverse economic, political, or regulatory conditions, recessions, inflation, changes in interest or currency rates, lack of liquidity in the bond markets, the spread of infectious illness or other public health issues or adverse investor sentiment. These conditions may continue, recur, worsen or spread.
Investments in mid-sized companies may offer the potential for higher returns, but are also subject to greater short-term price fluctuations than larger, more established companies.
Investing in foreign and/or emerging markets securities involves risks relating to interest rates, currency exchange rates, economic, social and political conditions, which could increase volatility. These risks are magnified in emerging markets.
The Portfolio invests in REIT securities, the value of which can fall for a variety of reasons, such as declines in rental income, fluctuating interest rates, poor property management, environmental liabilities, uninsured damage, increased competition, or changes in real estate tax laws.
| | We are underweight to the industrials and information technology sectors, primarily based on valuations, which are elevated compared to the rest of the index and compared to historical levels. We think most of the good news is already priced in. |
| | We have increased our exposure to the utilities sector and are now marginally underweight the sector, as the valuations are becoming attractive compared to its long-term history. |
Please refer to the Schedule of Investments on pages 7 - 11 for a full listing of Portfolio securities.
Past performance is no guarantee of future results.
Any information in this shareholder report regarding market or economic trends or the factors influencing the Portfolio’s historical or future performance are statements of opinion as of the date of this report.
| Pioneer Mid Cap Value VCT Portfolio | Pioneer Variable Contracts Trust |
Schedule of Investments 12/31/23
| Shares | | | | | | Value |
| | UNAFFILIATED ISSUERS — 99.8% | |
| | Common Stocks — 98.1% of Net Assets | |
| | Automobile Components — 0.9% | |
| 7,168 | Lear Corp. | $ 1,012,193 |
| | Total Automobile Components | $ 1,012,193 |
| | Automobiles — 1.1% | |
| 97,528 | Ford Motor Co. | $ 1,188,866 |
| | Total Automobiles | $ 1,188,866 |
| | Banks — 8.6% | |
| 46,258 | Citizens Financial Group, Inc. | $ 1,532,990 |
| 19,330 | M&T Bank Corp. | 2,649,756 |
| 129,810 | Regions Financial Corp. | 2,515,718 |
| 73,514 | Truist Financial Corp. | 2,714,137 |
| | Total Banks | $ 9,412,601 |
| | Beverages — 1.0% | |
| 17,824 | Molson Coors Beverage Co., Class B | $ 1,091,007 |
| | Total Beverages | $ 1,091,007 |
| | Broadline Retail — 2.6% | |
| 64,459 | eBay, Inc. | $ 2,811,702 |
| | Total Broadline Retail | $ 2,811,702 |
| | Building Products — 2.1% | |
| 9,411 | Trane Technologies Plc | $ 2,295,343 |
| | Total Building Products | $ 2,295,343 |
| | Capital Markets — 6.8% | |
| 17,459 | Northern Trust Corp. | $ 1,473,190 |
| 18,929 | Raymond James Financial, Inc. | 2,110,584 |
| 49,354 | State Street Corp. | 3,822,961 |
| | Total Capital Markets | $ 7,406,735 |
| | Chemicals — 3.9% | |
| 42,314 | Dow, Inc. | $ 2,320,500 |
| 20,245 | LyondellBasell Industries NV, Class A | 1,924,894 |
| | Total Chemicals | $ 4,245,394 |
| | Commercial Services & Supplies — 1.5% | |
| 18,391 | Brink's Co. | $ 1,617,488 |
| | Total Commercial Services & Supplies | $ 1,617,488 |
| | Communications Equipment — 1.9% | |
| 6,671 | Motorola Solutions, Inc. | $ 2,088,623 |
| | Total Communications Equipment | $ 2,088,623 |
| | Consumer Finance — 1.5% | |
| 14,318 | Discover Financial Services | $ 1,609,343 |
| | Total Consumer Finance | $ 1,609,343 |
| | Consumer Staples Distribution & Retail — 0.7% | |
| 31,466 | Walgreens Boots Alliance, Inc. | $ 821,577 |
| | Total Consumer Staples Distribution & Retail | $ 821,577 |
The accompanying notes are an integral part of these financial statements.
7
| Pioneer Mid Cap Value VCT Portfolio | Pioneer Variable Contracts Trust |
Schedule of Investments 12/31/23 (continued)
| Shares | | | | | | Value |
| | Containers & Packaging — 1.6% | |
| 71,626 | Graphic Packaging Holding Co. | $ 1,765,581 |
| | Total Containers & Packaging | $ 1,765,581 |
| | Electric Utilities — 1.9% | |
| 57,339 | Exelon Corp. | $ 2,058,470 |
| | Total Electric Utilities | $ 2,058,470 |
| | Electrical Equipment — 3.1% | |
| 4,130 | Eaton Corp. Plc | $ 994,587 |
| 24,816 | Emerson Electric Co. | 2,415,341 |
| | Total Electrical Equipment | $ 3,409,928 |
| | Electronic Equipment, Instruments & Components — 1.5% | |
| 7,318 | CDW Corp. | $ 1,663,528 |
| | Total Electronic Equipment, Instruments & Components | $ 1,663,528 |
| | Entertainment — 1.3% | |
| 125,593(a) | Warner Bros Discovery, Inc. | $ 1,429,248 |
| | Total Entertainment | $ 1,429,248 |
| | Financial Services — 0.8% | |
| 13,382(a) | PayPal Holdings, Inc. | $ 821,789 |
| | Total Financial Services | $ 821,789 |
| | Food Products — 2.1% | |
| 40,294 | Kellanova | $ 2,252,838 |
| | Total Food Products | $ 2,252,838 |
| | Ground Transportation — 1.3% | |
| 7,221 | JB Hunt Transport Services, Inc. | $ 1,442,323 |
| | Total Ground Transportation | $ 1,442,323 |
| | Health Care Equipment & Supplies — 6.3% | |
| 42,238 | Dentsply Sirona, Inc. | $ 1,503,250 |
| 27,717 | GE HealthCare Technologies, Inc. | 2,143,078 |
| 26,618 | Zimmer Biomet Holdings, Inc. | 3,239,411 |
| | Total Health Care Equipment & Supplies | $ 6,885,739 |
| | Health Care Providers & Services — 1.2% | |
| 13,396 | Cardinal Health, Inc. | $ 1,350,317 |
| | Total Health Care Providers & Services | $ 1,350,317 |
| | Health Care REITs — 0.6% | |
| 31,741 | Healthpeak Properties, Inc. | $ 628,472 |
| | Total Health Care REITs | $ 628,472 |
| | Hotel & Resort REITs — 0.9% | |
| 50,929 | Host Hotels & Resorts, Inc. | $ 991,588 |
| | Total Hotel & Resort REITs | $ 991,588 |
| | Hotels, Restaurants & Leisure — 1.6% | |
| 11,300(a) | Expedia Group, Inc. | $ 1,715,227 |
| | Total Hotels, Restaurants & Leisure | $ 1,715,227 |
| | Household Durables — 0.8% | |
| 5,648 | Lennar Corp., Class A | $ 841,778 |
| | Total Household Durables | $ 841,778 |
8
The accompanying notes are an integral part of these financial statements.
| Pioneer Mid Cap Value VCT Portfolio | Pioneer Variable Contracts Trust |
| Shares | | | | | | Value |
| | Industrial REITs — 0.9% | |
| 18,833 | First Industrial Realty Trust, Inc. | $ 991,934 |
| | Total Industrial REITs | $ 991,934 |
| | Insurance — 3.6% | |
| 26,436 | American International Group, Inc. | $ 1,791,039 |
| 20,615(a) | Brighthouse Financial, Inc. | 1,090,946 |
| 35,776 | Old Republic International Corp. | 1,051,814 |
| | Total Insurance | $ 3,933,799 |
| | Machinery — 6.0% | |
| 17,012 | AGCO Corp. | $ 2,065,427 |
| 22,957 | Ingersoll Rand, Inc. | 1,775,494 |
| 14,172 | PACCAR, Inc. | 1,383,896 |
| 12,921 | Stanley Black & Decker, Inc. | 1,267,550 |
| | Total Machinery | $ 6,492,367 |
| | Media — 1.7% | |
| 63,075 | Fox Corp., Class A | $ 1,871,435 |
| | Total Media | $ 1,871,435 |
| | Metals & Mining — 2.0% | |
| 34,126 | Alcoa Corp. | $ 1,160,284 |
| 25,635 | Newmont Corp. | 1,061,033 |
| | Total Metals & Mining | $ 2,221,317 |
| | Multi-Utilities — 4.1% | |
| 69,931 | CenterPoint Energy, Inc. | $ 1,997,929 |
| 39,977 | Public Service Enterprise Group, Inc. | 2,444,593 |
| | Total Multi-Utilities | $ 4,442,522 |
| | Oil, Gas & Consumable Fuels — 6.9% | |
| 59,980 | APA Corp. | $ 2,152,082 |
| 14,073 | Chord Energy Corp. | 2,339,355 |
| 118,611 | Coterra Energy, Inc. | 3,026,953 |
| | Total Oil, Gas & Consumable Fuels | $ 7,518,390 |
| | Personal Care Products — 1.2% | |
| 58,457 | Kenvue, Inc. | $ 1,258,579 |
| | Total Personal Care Products | $ 1,258,579 |
| | Residential REITs — 1.5% | |
| 8,528 | AvalonBay Communities, Inc. | $ 1,596,612 |
| | Total Residential REITs | $ 1,596,612 |
| | Retail REITs — 1.1% | |
| 55,723 | Kimco Realty Corp. | $ 1,187,457 |
| | Total Retail REITs | $ 1,187,457 |
| | Semiconductors & Semiconductor Equipment — 1.7% | |
| 17,582 | MKS Instruments, Inc. | $ 1,808,660 |
| | Total Semiconductors & Semiconductor Equipment | $ 1,808,660 |
| | Specialized REITs — 2.6% | |
| 8,651 | Extra Space Storage, Inc. | $ 1,387,015 |
| 29,651 | Gaming and Leisure Properties, Inc. | 1,463,277 |
| | Total Specialized REITs | $ 2,850,292 |
The accompanying notes are an integral part of these financial statements.
9
| Pioneer Mid Cap Value VCT Portfolio | Pioneer Variable Contracts Trust |
Schedule of Investments 12/31/23 (continued)
| Shares | | | | | | Value |
| | Specialty Retail — 1.1% | |
| 14,886 | Best Buy Co., Inc. | $ 1,165,276 |
| | Total Specialty Retail | $ 1,165,276 |
| | Technology Hardware, Storage & Peripherals — 2.2% | |
| 138,699 | Hewlett Packard Enterprise Co. | $ 2,355,109 |
| | Total Technology Hardware, Storage & Peripherals | $ 2,355,109 |
| | Textiles, Apparel & Luxury Goods — 1.3% | |
| 9,803 | Ralph Lauren Corp. | $ 1,413,593 |
| | Total Textiles, Apparel & Luxury Goods | $ 1,413,593 |
| | Trading Companies & Distributors — 2.6% | |
| 38,536(a) | AerCap Holdings NV | $ 2,863,996 |
| | Total Trading Companies & Distributors | $ 2,863,996 |
| | Total Common Stocks
(Cost $90,905,856) | $106,829,036 |
|
| |
| | SHORT TERM INVESTMENTS — 1.7% of Net Assets | |
| | Open-End Fund — 1.7% | |
| 1,868,511(b) | Dreyfus Government Cash Management,
Institutional Shares, 5.25% | $ 1,868,511 |
| | | | | | | $ 1,868,511 |
| | TOTAL SHORT TERM INVESTMENTS
(Cost $1,868,511) | $ 1,868,511 |
| | TOTAL INVESTMENTS IN UNAFFILIATED ISSUERS — 99.8%
(Cost $92,774,367) | $108,697,547 |
| | OTHER ASSETS AND LIABILITIES — 0.2% | $ 265,533 |
| | net assets — 100.0% | $ 108,963,080 |
| | | | | | | |
| REIT | Real Estate Investment Trust. |
| (a) | Non-income producing security. |
| (b) | Rate periodically changes. Rate disclosed is the 7-day yield at December 31, 2023. |
Purchases and sales of securities (excluding short-term investments) for the year ended December 31, 2023, aggregated $49,331,722 and $56,355,725, respectively.
At December 31, 2023, the net unrealized appreciation on investments based on cost for federal tax purposes of $92,920,753 was as follows:
| Aggregate gross unrealized appreciation for all investments in which there is an excess of value over tax cost | $$18,310,143 |
| Aggregate gross unrealized depreciation for all investments in which there is an excess of tax cost over value | (2,533,349) |
| Net unrealized appreciation | $ 15,776,794 |
10
The accompanying notes are an integral part of these financial statements.
| Pioneer Mid Cap Value VCT Portfolio | Pioneer Variable Contracts Trust |
Various inputs are used in determining the value of the Portfolio's investments. These inputs are summarized in the three broad levels below.
| Level 1 | – | unadjusted quoted prices in active markets for identical securities. |
| Level 2 | – | other significant observable inputs (including quoted prices for similar securities, interest rates, prepayment speeds, credit risks, etc.). See Notes to Financial Statements — Note 1A. |
| Level 3 | – | significant unobservable inputs (including the Adviser's own assumptions in determining fair value of investments). See Notes to Financial Statements — Note 1A. |
The following is a summary of the inputs used as of December 31, 2023 in valuing the Portfolio's investments:
| | Level 1 | Level 2 | Level 3 | Total |
| Common Stocks | $106,829,036 | $ — | $ — | $106,829,036 |
| Open-End Fund | 1,868,511 | — | — | 1,868,511 |
| Total Investments in Securities | $108,697,547 | $— | $— | $108,697,547 |
During the year ended December 31, 2023, there were no transfers in or out of Level 3.
The accompanying notes are an integral part of these financial statements.
11
| Pioneer Mid Cap Value VCT Portfolio | Pioneer Variable Contracts Trust |
Statement of Assets and Liabilities 12/31/23
| ASSETS: | |
| Investments in unaffiliated issuers, at value (cost $92,774,367) | $108,697,547 |
| Receivables — | |
| Portfolio shares sold | 128,298 |
| Dividends | 240,151 |
| Interest | 7,245 |
| Total assets | $ 109,073,241 |
| LIABILITIES: | |
| Payables — | |
| Portfolio shares repurchased | $22,375 |
| Trustees' fees | 330 |
| Professional fees | 59,324 |
| Printing expense | 8,754 |
| Management fees | 9,762 |
| Administrative expenses | 4,686 |
| Distribution fees | 2,604 |
| Accrued expenses | 2,326 |
| Total liabilities | $ 110,161 |
| NET ASSETS: | |
| Paid-in capital | $84,745,236 |
| Distributable earnings | 24,217,844 |
| Net assets | $ 108,963,080 |
| NET ASSET VALUE PER SHARE: | |
| No par value (unlimited number of shares authorized) | |
| Class l (based on $33,430,896/2,984,095 shares) | $ 11.20 |
| Class ll (based on $75,532,184/6,840,302 shares) | $ 11.04 |
12
The accompanying notes are an integral part of these financial statements.
| Pioneer Mid Cap Value VCT Portfolio | Pioneer Variable Contracts Trust |
FOR THE YEAR ENDED 12/31/23
| INVESTMENT INCOME: | | | |
| Dividends from unaffiliated issuers (net of foreign taxes withheld $171) | $2,985,281 | | |
| Interest from unaffiliated issuers | 6,044 | | |
| Total Investment Income | | | $ 2,991,325 |
| EXPENSES: | | | |
| Management fees | $ 678,479 | | |
| Administrative expenses | 34,906 | | |
| Distribution fees | | | |
| Class ll | 179,718 | | |
| Custodian fees | 858 | | |
| Professional fees | 57,043 | | |
| Printing expense | 22,274 | | |
| Officers' and Trustees' fees | 8,669 | | |
| Insurance expense | 1,916 | | |
| Miscellaneous | 35,547 | | |
| Total expenses | | | $ 1,019,410 |
| Net investment income | | | $ 1,971,915 |
| REALIZED AND UNREALIZED GAIN (LOSS) ON INVESTMENTS: | | | |
| Net realized gain (loss) on: | | | |
| Investments in unaffiliated issuers | $6,793,864 | | |
| Other assets and liabilities denominated in foreign currencies | (4) | | $ 6,793,860 |
| Change in net unrealized appreciation (depreciation) on: | | | |
| Investments in unaffiliated issuers | $3,362,545 | | |
| Other assets and liabilities denominated in foreign currencies | 7 | | $ 3,362,552 |
| Net realized and unrealized gain (loss) on investments | | | $ 10,156,412 |
| Net increase in net assets resulting from operations | | | $12,128,327 |
The accompanying notes are an integral part of these financial statements.
13
| Pioneer Mid Cap Value VCT Portfolio | Pioneer Variable Contracts Trust |
Statements of Changes in Net Assets
| | Year
Ended
12/31/23 | | Year
Ended
12/31/22 |
| FROM OPERATIONS: | | | |
| Net investment income (loss) | $ 1,971,915 | | $ 1,867,128 |
| Net realized gain (loss) on investments | 6,793,860 | | 11,645,809 |
| Change in net unrealized appreciation (depreciation) on investments | 3,362,552 | | (21,067,107) |
| Net increase (decrease) in net assets resulting from operations | $ 12,128,327 | | $ (7,554,170) |
| DISTRIBUTIONS TO SHAREHOLDERS: | | | |
| Class l ($1.58 and $9.20 per share, respectively) | $ (4,348,003) | | $ (14,720,475) |
| Class ll ($1.55 and $9.05 per share, respectively) | (9,583,586) | | (33,173,156) |
| Total distributions to shareholders | $ (13,931,589) | | $ (47,893,631) |
| FROM PORTFOLIO SHARE TRANSACTIONS: | | | |
| Net proceeds from sales of shares | $ 8,605,580 | | $ 10,673,559 |
| Reinvestment of distributions | 13,931,588 | | 47,893,631 |
| Cost of shares repurchased | (17,809,290) | | (26,124,584) |
| Net increase in net assets resulting from Portfolio share transactions | $ 4,727,878 | | $ 32,442,606 |
| Net increase (decrease) in net assets | $ 2,924,616 | | $ (23,005,195) |
| NET ASSETS: | | | |
| Beginning of year | $106,038,464 | | $129,043,659 |
| End of year | $ 108,963,080 | | $ 106,038,464 |
| | Year
Ended
12/31/23
Shares | | Year
Ended
12/31/23
Amount | | Year
Ended
12/31/22
Shares | | Year
Ended
12/31/22
Amount |
| Class l | | | | | | | |
| Shares sold | 119,388 | | $ 1,331,660 | | 80,858 | | $ 1,253,027 |
| Reinvestment of distributions | 416,875 | | 4,348,003 | | 1,437,546 | | 14,720,475 |
| Less shares repurchased | (473,998) | | (5,210,510) | | (258,792) | | (3,944,018) |
| Net increase | 62,265 | | $ 469,153 | | 1,259,612 | | $ 12,029,484 |
| Class ll | | | | | | | |
| Shares sold | 651,080 | | $ 7,273,920 | | 527,640 | | $ 9,420,532 |
| Reinvestment of distributions | 930,445 | | 9,583,585 | | 3,277,980 | | 33,173,156 |
| Less shares repurchased | (1,146,135) | | (12,598,780) | | (1,382,095) | | (22,180,566) |
| Net increase | 435,390 | | $ 4,258,725 | | 2,423,525 | | $ 20,413,122 |
14
The accompanying notes are an integral part of these financial statements.
| Pioneer Mid Cap Value VCT Portfolio | Pioneer Variable Contracts Trust |
| | Year Ended
12/31/23 | | Year Ended
12/31/22 | | Year Ended
12/31/21 | | Year Ended
12/31/20 | | Year Ended
12/31/19 |
| Class l | | | | | | | | | |
| Net asset value, beginning of period | $ 11.47 | | $ 23.08 | | $ 17.97 | | $ 18.46 | | $ 15.53 |
| Increase (decrease) from investment operations: | | | | | | | | | |
| Net investment income (loss)(a) | 0.23 | | 0.27 | | 0.21 | | 0.17 | | 0.20 |
| Net realized and unrealized gain (loss) on investments | 1.08 | | (2.68) | | 5.10 | | 0.07 | | 4.11 |
| Net increase (decrease) from investment operations | $ 1.31 | | $ (2.41) | | $ 5.31 | | $ 0.24 | | $ 4.31 |
| Distributions to shareholders: | | | | | | | | | |
| Net investment income | (0.23) | | (0.45) | | (0.20) | | (0.20) | | (0.24) |
| Net realized gain | (1.35) | | (8.75) | | — | | (0.53) | | (1.14) |
| Total distributions | $ (1.58) | | $ (9.20) | | $ (0.20) | | $ (0.73) | | $ (1.38) |
| Net increase (decrease) in net asset value | $ (0.27) | | $ (11.61) | | $ 5.11 | | $ (0.49) | | $ 2.93 |
| Net asset value, end of period | $ 11.20 | | $ 11.47 | | $ 23.08 | | $ 17.97 | | $ 18.46 |
| Total return(b) | 12.46% | | (5.64)%(c) | | 29.67% | | 2.14% | | 28.44% |
| Ratio of net expenses to average net assets | 0.80% | | 0.78% | | 0.75% | | 0.74% | | 0.73% |
| Ratio of net investment income (loss) to average net assets | 2.06% | | 1.83% | | 1.01% | | 1.10% | | 1.14% |
| Portfolio turnover rate | 48% | | 66% | | 60% | | 88% | | 93% |
| Net assets, end of period (in thousands) | $33,431 | | $33,516 | | $38,358 | | $32,989 | | $37,384 |
| | |
| (a) | The per-share data presented above is based on the average shares outstanding for the period presented. |
| (b) | Assumes initial investment at net asset value at the beginning of each period, reinvestment of all distributions and the complete redemption of the investment at net asset value at the end of each period. |
| (c) | If the Portfolio had not recognized gains in settlement of class action lawsuits during the year ended December 31, 2022, the total return would have been (5.72)%. |
NOTE: The above financial highlights do not reflect the deduction of non-portfolio expenses associated with variable insurance products, such as mortality and expense risk charges, separate account charges, and sales charges.
The accompanying notes are an integral part of these financial statements.
15
| Pioneer Mid Cap Value VCT Portfolio | Pioneer Variable Contracts Trust |
Financial Highlights (continued)
| | Year Ended
12/31/23 | | Year Ended
12/31/22 | | Year Ended
12/31/21 | | Year Ended
12/31/20 | | Year Ended
12/31/19 |
| Class ll | | | | | | | | | |
| Net asset value, beginning of period | $ 11.32 | | $ 22.78 | | $ 17.74 | | $ 18.23 | | $ 15.35 |
| Increase (decrease) from investment operations: | | | | | | | | | |
| Net investment income (loss)(a) | 0.20 | | 0.23 | | 0.14 | | 0.13 | | 0.15 |
| Net realized and unrealized gain (loss) on investments | 1.07 | | (2.64) | | 5.06 | | 0.06 | | 4.06 |
| Net increase (decrease) from investment operations | $ 1.27 | | $ (2.41) | | $ 5.20 | | $ 0.19 | | $ 4.21 |
| Distributions to shareholders: | | | | | | | | | |
| Net investment income | (0.20) | | (0.30) | | (0.16) | | (0.15) | | (0.19) |
| Net realized gain | (1.35) | | (8.75) | | — | | (0.53) | | (1.14) |
| Total distributions | $ (1.55) | | $ (9.05) | | $ (0.16) | | $ (0.68) | | $ (1.33) |
| Net increase (decrease) in net asset value | $ (0.28) | | $ (11.46) | | $ 5.04 | | $ (0.49) | | $ 2.88 |
| Net asset value, end of period | $ 11.04 | | $ 11.32 | | $ 22.78 | | $ 17.74 | | $ 18.23 |
| Total return(b) | 12.20% | | (5.88)%(c) | | 29.37% | | 1.87% | | 28.08% |
| Ratio of net expenses to average net assets | 1.05% | | 1.03% | | 0.98% | | 0.99% | | 0.98% |
| Ratio of net investment income (loss) to average net assets | 1.81% | | 1.56% | | 0.69% | | 0.85% | | 0.89% |
| Portfolio turnover rate | 48% | | 66% | | 60% | | 88% | | 93% |
| Net assets, end of period (in thousands) | $75,532 | | $72,523 | | $90,686 | | $249,969 | | $247,058 |
| | |
| (a) | The per-share data presented above is based on the average shares outstanding for the period presented. |
| (b) | Assumes initial investment at net asset value at the beginning of each period, reinvestment of all distributions, the complete redemption of the investment at net asset value at the end of each period and no sales charges. Total return would be reduced if sales charges were taken into account. |
| (c) | If the Portfolio had not recognized gains in settlement of class action lawsuits during the year ended December 31, 2022, the total return would have been (5.97)%. |
NOTE: The above financial highlights do not reflect the deduction of non-portfolio expenses associated with variable insurance products, such as mortality and expense risk charges, separate account charges, and sales charges.
16
The accompanying notes are an integral part of these financial statements.
| Pioneer Mid Cap Value VCT Portfolio | Pioneer Variable Contracts Trust |
Notes to Financial Statements 12/31/23
1. Organization and Significant Accounting Policies
Pioneer Mid Cap Value VCT Portfolio (the “Portfolio”) is one of 7 portfolios comprising Pioneer Variable Contracts Trust (the “Trust”), a Delaware statutory trust. The Portfolio is registered under the Investment Company Act of 1940, as amended (the "1940 Act") as a diversified, open-end management investment company. The investment objective of the Portfolio is capital appreciation by investing in a diversified portfolio of securities consisting primarily of common stocks.
The Portfolio offers two classes of shares designated as Class I and Class II shares. Each class of shares represents an interest in the same schedule of investments of the Portfolio and has identical rights (based on relative net asset values) to assets and liquidation proceeds. Share classes can bear different rates of class-specific fees and expenses, such as transfer agent and distribution fees. Differences in class-specific fees and expenses will result in differences in net investment income and, therefore, the payment of different dividends from net investment income earned by each class. The Amended and Restated Declaration of Trust of the Trust gives the Board of Trustees the flexibility to specify either per-share voting or dollar-weighted voting when submitting matters for shareholder approval. Under per-share voting, each share of a class of the Portfolio is entitled to one vote. Under dollar-weighted voting, a shareholder’s voting power is determined not by the number of shares owned, but by the dollar value of the shares on the record date. Each share class has exclusive voting rights with respect to matters affecting only that class, including with respect to the distribution plan for that class. There is no distribution plan for Class I shares.
Portfolio shares may be purchased only by insurance companies for the purpose of funding variable annuity and variable life insurance contracts or by qualified pension and retirement plans.
Amundi Asset Management US, Inc., an indirect, wholly owned subsidiary of Amundi and Amundi’s wholly owned subsidiary, Amundi USA, Inc., serves as the Portfolio’s investment adviser (the “Adviser”). Amundi Distributor US, Inc., an affiliate of the Adviser, serves as the Portfolio’s distributor (the “Distributor”).
The Portfolio is required to comply with Rule 18f-4 under the 1940 Act, which governs the use of derivatives by registered investment companies. Rule 18f-4 permits funds to enter into derivatives transactions (as defined in Rule 18f-4) and certain other transactions notwithstanding the restrictions on the issuance of “senior securities” under Section 18 of the 1940 Act. Rule 18f-4 requires a fund to establish and maintain a comprehensive derivatives risk management program, appoint a derivatives risk manager and comply with a relative or absolute limit on fund leverage risk calculated based on value-at-risk (“VaR”), unless the Portfolio uses derivatives in only a limited manner (a "limited derivatives user"). The Portfolio is currently a limited derivatives user for purposes of Rule 18f-4.
The Portfolio is an investment company and follows investment company accounting and reporting guidance under U.S. Generally Accepted Accounting Principles (“U.S. GAAP”). U.S. GAAP requires the management of the Portfolio to make estimates and assumptions that affect the reported amounts of assets and liabilities, the disclosure of contingent assets and liabilities at the date of the financial statements, and the reported amounts of income, expenses and gain or loss on investments during the reporting period. Actual results could differ from those estimates.
The following is a summary of significant accounting policies followed by the Portfolio in the preparation of its financial statements:
| A. | Security Valuation |
| | The net asset value of the Portfolio is computed once daily, on each day the New York Stock Exchange (“NYSE”) is open, as of the close of regular trading on the NYSE. |
| | Equity securities that have traded on an exchange are valued by using the last sale price on the principal exchange where they are traded. Equity securities that have not traded on the date of valuation, or securities for which sale prices are not available, generally are valued using the mean between the last bid and asked prices or, if both last bid and asked prices are not available, at the last quoted bid price. Last sale and bid and asked prices are provided by independent third party pricing services. In the case of equity securities not traded on an exchange, prices are typically determined by independent third party pricing services using a variety of techniques and methods. |
| | The value of foreign securities is translated into U.S. dollars based on foreign currency exchange rate quotations supplied by a third party pricing source. Trading in non-U.S. equity securities is substantially completed each day at various times prior to the close of the NYSE. The values of such securities used in computing the net asset value of the Portfolio's shares are determined as of such times. The Adviser may use a fair value model developed by an independent pricing service to value non-U.S. equity securities. |
| Pioneer Mid Cap Value VCT Portfolio | Pioneer Variable Contracts Trust |
Notes to Financial Statements 12/31/23 (continued)
| | Shares of open-end registered investment companies (including money market mutual funds) are valued at such funds' net asset value. |
| | Securities for which independent pricing services or broker-dealers are unable to supply prices or for which market prices and/or quotations are not readily available or are considered to be unreliable are valued by a fair valuation team comprised of certain personnel of the Adviser. The Adviser is designated as the valuation designee for the Portfolio pursuant to Rule 2a-5 under the 1940 Act. The Adviser’s fair valuation team is responsible for monitoring developments that may impact fair valued securities. |
| | Inputs used when applying fair value methods to value a security may include credit ratings, the financial condition of the company, current market conditions and comparable securities. The Adviser may use fair value methods if it is determined that a significant event has occurred after the close of the exchange or market on which the security trades and prior to the determination of the Portfolio's net asset value. Examples of a significant event might include political or economic news, corporate restructurings, natural disasters, terrorist activity or trading halts. Thus, the valuation of the Portfolio's securities may differ significantly from exchange prices, and such differences could be material. |
| B. | Investment Income and Transactions |
| | Dividend income is recorded on the ex-dividend date, except that certain dividends from foreign securities where the ex-dividend date may have passed are recorded as soon as the Portfolio becomes aware of the ex-dividend data in the exercise of reasonable diligence. |
| | Interest income, including interest on income-bearing cash accounts, is recorded on the accrual basis. Dividend and interest income are reported net of unrecoverable foreign taxes withheld at the applicable country rates and net of income accrued on defaulted securities. |
| | Interest and dividend income payable by delivery of additional shares is reclassified as PIK (payment-in-kind) income upon receipt and is included in interest and dividend income, respectively. |
| | Security transactions are recorded as of trade date. Gains and losses on sales of investments are calculated on the identified cost method for both financial reporting and federal income tax purposes. |
| C. | Foreign Currency Translation |
| | The books and records of the Portfolio are maintained in U.S. dollars. Amounts denominated in foreign currencies are translated into U.S. dollars using current exchange rates. Net realized gains and losses on foreign currency transactions, if any, represent, among other things, the net realized gains and losses on foreign currency exchange contracts, disposition of foreign currencies and the difference between the amount of income accrued and the U.S. dollars actually received. Further, the effects of changes in foreign currency exchange rates on investments are not segregated on the Statement of Operations from the effects of changes in the market prices of those securities, but are included with the net realized and unrealized gain or loss on investments. |
| D. | Federal Income Taxes |
| | It is the Portfolio's policy to comply with the requirements of the Internal Revenue Code applicable to regulated investment companies and to distribute all of its net taxable income and net realized capital gains, if any, to its shareholders. Therefore, no provision for federal income taxes is required. As of December 31, 2023, the Portfolio did not accrue any interest or penalties with respect to uncertain tax positions, which, if applicable, would be recorded as an income tax expense on the Statement of Operations. Tax returns filed within the prior three years remain subject to examination by federal and state tax authorities. |
| | The amount and character of income and capital gain distributions to shareholders are determined in accordance with federal income tax rules, which may differ from U.S. GAAP. Distributions in excess of net investment income or net realized gains are temporary over distributions for financial statement purposes resulting from differences in the recognition or classification of income or distributions for financial statement and tax purposes. Capital accounts within the financial statements are adjusted for permanent book/tax differences to reflect tax character, but are not adjusted for temporary differences. |
| | A portion of the dividend income recorded by the Portfolio is from distributions by publicly traded real estate investment trusts (“REITs”), and such distributions for tax purposes may also consist of capital gains and return of capital. The actual return of capital and capital gains portions of such distributions will be determined by formal notifications from the REITs subsequent to the calendar year-end. Distributions received from the REITs that are determined to be a return |
| Pioneer Mid Cap Value VCT Portfolio | Pioneer Variable Contracts Trust |
| | of capital are recorded by the Portfolio as a reduction of the cost basis of the securities held and those determined to be capital gain are reflected as such on the Statement of Operations. |
| | At December 31, 2023, the Portfolio reclassified $29,264 to decrease distributable earnings and $29,264 to increase paid-in capital to reflect permanent book/tax differences. These adjustments have no impact on net assets or the results of operations. |
| | The tax character of distributions paid during the years ended December 31, 2023 and December 31, 2022, was as follows: |
| | 2023 | 2022 |
| Distributions paid from: | | |
| Ordinary income | $ 1,878,102 | $17,850,764 |
| Long-term capital gains | 12,053,487 | 30,042,867 |
| Total | $13,931,589 | $47,893,631 |
The following shows the components of distributable earnings (losses) on a federal income tax basis at December 31, 2023:
| | 2023 |
| Distributable earnings/(losses): | |
| Undistributed ordinary income | $ 1,938,799 |
| Undistributed long-term capital gains | 6,502,251 |
| Net unrealized appreciation | 15,776,794 |
| Total | $24,217,844 |
The difference between book-basis and tax-basis net unrealized appreciation is attributable to the tax deferral of losses on wash sales and REIT tax cost adjustments.
| E. | Portfolio Shares and Class Allocations |
| | The Portfolio records sales and repurchases of its shares as of trade date. Distribution fees for Class II shares are calculated based on the average daily net asset value attributable to Class II shares of the Portfolio (see Note 5). Class I shares do not pay distribution fees. |
| | Income, common expenses (excluding transfer agent and distribution fees) and realized and unrealized gains and losses are calculated at the Portfolio level and allocated daily to each class of shares based on its respective percentage of the adjusted net assets at the beginning of the day. |
| | All expenses and fees paid to the Portfolio’s transfer agent for its services are allocated between the classes of shares based on the number of accounts in each class and the ratable allocation of related out-of-pocket expenses (see Note 4). |
| | Dividends and distributions to shareholders are recorded on the ex-dividend date. Distributions paid by the Portfolio with respect to each class of shares are calculated in the same manner and at the same time, except that net investment income dividends to Class I and Class II shares can reflect different transfer agent and distribution expense rates. Dividends and distributions to shareholders are recorded on the ex-dividend date. |
| F. | Risks |
| | The value of securities held by the Portfolio may go up or down, sometimes rapidly or unpredictably, due to general market conditions, such as real or perceived adverse economic, political or regulatory conditions, recessions, the spread of infectious illness or other public health issues, inflation, changes in interest rates, armed conflict such as between Russia and Ukraine or in the Middle East, sanctions against Russia, other nations or individuals or companies and possible countermeasures, lack of liquidity in the bond markets or adverse investor sentiment. In the past several years, financial markets have experienced increased volatility, depressed valuations, decreased liquidity and heightened uncertainty. These conditions may continue, recur, worsen or spread. Inflation and interest rates have increased and may rise further. These circumstances could adversely affect the value and liquidity of the Portfolio's investments and negatively impact the Portfolio's performance. |
| | The long-term impact of the COVID-19 pandemic and its subsequent variants on economies, markets, industries and individual issuers, are not known. Some sectors of the economy and individual issuers have experienced or may |
| Pioneer Mid Cap Value VCT Portfolio | Pioneer Variable Contracts Trust |
Notes to Financial Statements 12/31/23 (continued)
| | experience particularly large losses. Periods of extreme volatility in the financial markets, reduced liquidity of many instruments, increased government debt, inflation, and disruptions to supply chains, consumer demand and employee availability, may continue for some time. Following Russia's invasion of Ukraine, Russian securities lost all, or nearly all, their market value. Other securities or markets could be similarly affected by past or future political, geopolitical or other events or conditions. |
| | Governments and central banks, including the U.S. Federal Reserve, have taken extraordinary and unprecedented actions to support local and global economies and the financial markets. These actions have resulted in significant expansion of public debt, including in the U.S. The consequences of high public debt, including its future impact on the economy and securities markets, may not be known for some time. |
| | The U.S. and other countries are periodically involved in disputes over trade and other matters, which may result in tariffs, investment restrictions and adverse impacts on affected companies and securities. For example, the U.S. has imposed tariffs and other trade barriers on Chinese exports, has restricted sales of certain categories of goods to China, and has established barriers to investments in China. Trade disputes may adversely affect the economies of the U.S. and its trading partners, as well as companies directly or indirectly affected and financial markets generally. If the political climate between the U.S. and China does not improve or continues to deteriorate, if China were to attempt unification of Taiwan by force, or if other geopolitical conflicts develop or get worse, economies, markets and individual securities may be severely affected both regionally and globally, and the value of the Portfolio's assets may go down. |
| | At times, the Portfolio’s investments may represent industries or industry sectors that are interrelated or have common risks, making the Portfolio more susceptible to any economic, political, or regulatory developments or other risks affecting those industries and sectors. |
| | Normally, the Portfolio invests at least 80% of its total assets in equity securities of mid-size companies. Investments in mid-sized companies may offer the potential for higher returns, but are also subject to greater short-term price fluctuations than investments in larger, more established companies. |
| | The Portfolio may invest in REIT securities, the value of which can fall for a variety of reasons, such as declines in rental income, fluctuating interest rates, poor property management, environmental liabilities, uninsured damage, increased competition, or changes in real estate tax laws. |
| | The Portfolio’s investments in foreign markets and countries with limited developing markets may subject the Portfolio to a greater degree of risk than investments in a developed market. These risks include disruptive political or economic conditions, military conflicts and sanctions, terrorism, sustained economic downturns, financial instability, less liquid trading markets, extreme price volatility, currency risks, reduction of government or central bank support, inadequate accounting standards, tariffs, tax disputes or other tax burdens, nationalization or expropriation of assets and the imposition of adverse governmental laws, arbitrary application of laws and regulations or lack of rule of law or currency exchange restrictions. Lack of information and less market regulation also may affect the value of these securities. Withholding and other non-U.S. taxes may decrease the Portfolio’s return. Non-U.S. issuers may be located in parts of the world that have historically been prone to natural disasters. Investing in depositary receipts is subject to many of the same risks as investing directly in non-U.S. issuers. Depositary receipts may involve higher expenses and may trade at a discount (or premium) to the underlying security. |
| | Russia launched a large-scale invasion of Ukraine on February 24, 2022. In response to the military action by Russia, various countries, including the U.S., the United Kingdom, and European Union issued broad-ranging economic sanctions against Russia and Belarus and certain companies and individuals. Since then, Russian securities have lost all, or nearly all, their market value, and many other issuers, securities and markets have been adversely affected. The United States and other countries may impose sanctions on other countries, companies and individuals in light of Russia’s military invasion. The extent and duration of the military action or future escalation of such hostilities, the extent and impact of existing and future sanctions, market disruptions and volatility, and the result of any diplomatic negotiations cannot be predicted. These and any related events could have a significant impact on the value and liquidity of certain Portfolio investments, on Portfolio performance and the value of an investment in the Portfolio, particularly with respect to securities and commodities, such as oil, natural gas and food commodities, as well as other sectors with exposure to Russian issuers or issuers in other countries affected by the invasion, and are likely to have collateral impacts on market sectors globally. |
| | With the increased use of technologies such as the Internet to conduct business, the Portfolio is susceptible to operational, information security and related risks. While the Portfolio’s Adviser has established business continuity |
| Pioneer Mid Cap Value VCT Portfolio | Pioneer Variable Contracts Trust |
| | plans in the event of, and risk management systems to prevent, limit or mitigate, such cyber-attacks, there are inherent limitations in such plans and systems, including the possibility that certain risks have not been identified. Furthermore, the Portfolio cannot control the cybersecurity plans and systems put in place by service providers to the Portfolio such as the Portfolio's custodian and accounting agent, and the Portfolio’s transfer agent. In addition, many beneficial owners of Portfolio shares hold them through accounts at broker-dealers, retirement platforms and other financial market participants over which neither the Portfolio nor the Adviser exercises control. Each of these may in turn rely on service providers to them, which are also subject to the risk of cyber-attacks. Cybersecurity failures or breaches at the Adviser or the Portfolio’s service providers or intermediaries have the ability to cause disruptions and impact business operations, potentially resulting in financial losses, interference with the Portfolio’s ability to calculate its net asset value, impediments to trading, the inability of Portfolio shareholders to effect share purchases, redemptions or exchanges or receive distributions, loss of or unauthorized access to private shareholder information and violations of applicable privacy and other laws, regulatory fines, penalties, reputational damage, or additional compliance costs. Such costs and losses may not be covered under any insurance. In addition, maintaining vigilance against cyber-attacks may involve substantial costs over time, and system enhancements may themselves be subject to cyber-attacks. |
| | The Portfolio’s prospectus contains unaudited information regarding the Portfolio’s principal risks. Please refer to that document when considering the Portfolio’s principal risks. |
2. Management Agreement
The Adviser manages the Portfolio. Management fees payable under the Portfolio’s Investment Management Agreement with the Adviser are calculated daily and paid monthly at the annual rate of 0.65% of the Portfolio’s average daily net assets. For the year ended December 31, 2023, the effective management fee was equivalent to 0.65% of the Portfolio’s average daily net assets.
In addition, under the management and administration agreements, certain other services and costs, including accounting, regulatory reporting and insurance premiums, are paid by the Portfolio as administrative reimbursements. Reflected on the Statement of Assets and Liabilities is $9,762 in management fees payable to the Adviser at December 31, 2023.
3. Compensation of Officers and Trustees
The Portfolio pays an annual fee to its Trustees. The Adviser reimburses the Portfolio for fees paid to the Interested Trustees. Except for the chief compliance officer, the Portfolio does not pay any salary or other compensation to its officers. The Portfolio pays a portion of the chief compliance officer's compensation for his services as the Portfolio's chief compliance officer. Amundi US pays the remaining portion of the chief compliance officer's compensation. For the year ended December 31, 2023, the Portfolio paid $8,669 in Officers' and Trustees' compensation, which is reflected on the Statement of Operations as Officers' and Trustees' fees. At December 31, 2023, on its Statement of Assets and Liabilities, the Portfolio had a payable for Trustees' fees of $330 and a payable for administrative expenses of $4,686, which includes the payable for Officers' compensation.
4. Transfer Agent
BNY Mellon Investment Servicing (US) Inc. serves as the transfer agent to the Portfolio at negotiated rates. Transfer agent fees and payables shown on the Statement of Operations and the Statement of Assets and Liabilities, respectively, include sub-transfer agent expenses incurred through the Portfolio’s omnibus relationship contracts.
5. Distribution Plan
The Portfolio has adopted a distribution plan (the “Plan”) pursuant to Rule 12b-1 under the 1940 Act with respect to Class II shares. Pursuant to the Plan, the Portfolio pays the Distributor a distribution fee of 0.25% of the average daily net assets attributable to Class II shares to compensate the Distributor for (1) distribution services and (2) personal and account maintenance services performed and expenses incurred by the Distributor in connection with the Portfolio’s Class II shares. Reflected on the Statement of Assets and Liabilities is $2,604 in distribution fees payable to the Distributor at December 31, 2023.
| Pioneer Mid Cap Value VCT Portfolio | Pioneer Variable Contracts Trust |
Report of Independent Registered Public Accounting Firm
To the Board of Trustees of Pioneer Variable Contracts Trust and the Shareholders of Pioneer Mid Cap Value VCT Portfolio:
Opinion on the Financial Statements
We have audited the accompanying statement of assets and liabilities of Pioneer Mid Cap Value VCT Portfolio (the “Portfolio”) (one of the portfolios constituting Pioneer Variable Contracts Trust (the “Trust”)), including the schedule of investments, as of December 31, 2023, and the related statement of operations for the year then ended, the statements of changes in net assets for each of the two years in the period then ended, the financial highlights for each of the five years in the period then ended and the related notes (collectively referred to as the “financial statements”). In our opinion, the financial statements present fairly, in all material respects, the financial position of the Portfolio (one of the portfolios constituting Pioneer Variable Contracts Trust) at December 31, 2023, the results of its operations for the year then ended, the changes in its net assets for each of the two years in the period then ended, and its financial highlights for each of the five years in the period then ended in conformity with U.S. generally accepted accounting principles.
Basis for Opinion
These financial statements are the responsibility of the Trust’s management. Our responsibility is to express an opinion on the Portfolio’s financial statements based on our audits. We are a public accounting firm registered with the Public Company Accounting Oversight Board (United States) ("PCAOB") and are required to be independent with respect to the Trust in accordance with the U.S. federal securities laws and the applicable rules and regulations of the Securities and Exchange Commission and the PCAOB.
We conducted our audits in accordance with the standards of the PCAOB. Those standards require that we plan and perform the audit to obtain reasonable assurance about whether the financial statements are free of material misstatement, whether due to error or fraud. The Trust is not required to have, nor were we engaged to perform, an audit of the Trust’s internal control over financial reporting. As part of our audits, we are required to obtain an understanding of internal control over financial reporting, but not for the purpose of expressing an opinion on the effectiveness of the Trust’s internal control over financial reporting. Accordingly, we express no such opinion.
Our audits included performing procedures to assess the risks of material misstatement of the financial statements, whether due to error or fraud, and performing procedures that respond to those risks. Such procedures included examining, on a test basis, evidence regarding the amounts and disclosures in the financial statements. Our procedures included confirmation of securities owned as of December 31, 2023, by correspondence with the custodian, brokers, and others; when replies were not received from brokers and others, we performed other auditing procedures. Our audits also included evaluating the accounting principles used and significant estimates made by management, as well as evaluating the overall presentation of the financial statements. We believe that our audits provide a reasonable basis for our opinion.
We have served as the auditor of one or more investment companies in the Pioneer family of funds since 2017.
Boston, Massachusetts
February 20, 2024
| Pioneer Mid Cap Value VCT Portfolio | Pioneer Variable Contracts Trust |
Additional Information (unaudited)
For the year ended December 31, 2023, certain dividends paid by the Portfolio may be subject to a maximum tax rate of 20%. The Portfolio intends to designate up to the maximum amount of such dividends allowable, as taxed at a maximum rate of 20%. Complete information will be computed and reported in conjunction with your 2023 Form 1099-DIV.
The Portfolio designated $12,053,487 as long-term capital gains distributions during the year ended December 31, 2023. Distributable long-term gains are based on net realized long-term gains determined on a tax basis and may differ from such amounts for financial reporting purposes.
The qualifying percentage of the Portfolio’s ordinary income dividends for the purpose of the corporate dividends received deduction was 100.00%.
| Pioneer Mid Cap Value VCT Portfolio | Pioneer Variable Contracts Trust |
Approval of Renewal of Investment Management Agreement
Amundi Asset Management US, Inc. (“Amundi US”) serves as the investment adviser to Pioneer Mid Cap Value VCT Portfolio (the “Portfolio”) pursuant to an investment management agreement between Amundi US and the Portfolio. In order for Amundi US to remain the investment adviser of the Portfolio, the Trustees of the Portfolio, including a majority of the Portfolio’s Independent Trustees, must determine annually whether to renew the investment management agreement for the Portfolio.
The contract review process began in January 2023 as the Trustees of the Portfolio agreed on, among other things, an overall approach and timeline for the process. Contract review materials were provided to the Trustees in March 2023, July 2023 and September 2023. In addition, the Trustees reviewed and discussed the Portfolio’s performance at regularly scheduled meetings throughout the year, and took into account other information related to the Portfolio provided to the Trustees at regularly scheduled meetings, in connection with the review of the Portfolio’s investment management agreement.
In March 2023, the Trustees, among other things, discussed the memorandum provided by Portfolio counsel that summarized the legal standards and other considerations that are relevant to the Trustees in their deliberations regarding the renewal of the investment management agreement, and reviewed and discussed the qualifications of the investment management teams for the Portfolio, as well as the level of investment by the Portfolio’s portfolio managers in the Portfolio. In July 2023, the Trustees, among other things, reviewed the Portfolio’s management fees and total expense ratios, the financial statements of Amundi US and its parent companies, profitability analyses provided by Amundi US, and analyses from Amundi US as to possible economies of scale. The Trustees also reviewed the profitability of the institutional business of Amundi US as compared to that of Amundi US’s fund management business, and considered the differences between the fees and expenses of the Portfolio and the fees and expenses of Amundi US’s institutional accounts, as well as the different services provided by Amundi US to the Portfolio and to the institutional accounts. The Trustees further considered contract review materials, including additional materials received in response to the Trustees’ request, in September 2023.
At a meeting held on September 19, 2023, based on their evaluation of the information provided by Amundi US and third parties, the Trustees of the Portfolio, including the Independent Trustees voting separately advised by independent counsel, unanimously approved the renewal of the investment management agreement for another year. In approving the renewal of the investment management agreement, the Trustees considered various factors that they determined were relevant, including the factors described below. The Trustees did not identify any single factor as the controlling factor in determining to approve the renewal of the agreement.
Nature, Extent and Quality of Services
The Trustees considered the nature, extent and quality of the services that had been provided by Amundi US to the Portfolio, taking into account the investment objective and strategy of the Portfolio. The Trustees also reviewed Amundi US’s investment approach for the Portfolio and its research process. The Trustees considered Amundi US’ integration of environmental, social and governance (ESG) considerations into its investment research process. The Trustees considered the resources of Amundi US and the personnel of Amundi US who provide investment management services to the Portfolio. They also reviewed the amount of non-Portfolio assets managed by the portfolio managers of the Portfolio. They considered the non-investment resources and personnel of Amundi US that are involved in Amundi US’s services to the Portfolio, including Amundi US’s compliance, risk management, and legal resources and personnel. The Trustees considered the compliance services being provided to the Portfolio by Amundi US and how Amundi US has addressed any compliance issues during the past year. The Trustees noted the substantial attention and high priority given by Amundi US’s senior management to the Pioneer Fund complex, including with respect to the increasing regulation to which the Pioneer Funds are subject.
The Trustees considered that Amundi US supervises and monitors the performance of the Portfolio’s service providers and provides the Portfolio with personnel (including Portfolio officers) and other resources that are necessary for the Portfolio’s business management and operations. The Trustees also considered that, as administrator, Amundi US is responsible for the administration of the Portfolio’s business and other affairs. The Trustees considered that the Portfolio reimburses Amundi US its pro rata share of Amundi US’s costs of providing administration services to the Pioneer Funds.
Based on these considerations, the Trustees concluded that the nature, extent and quality of services that had been provided by Amundi US to the Portfolio were satisfactory and consistent with the terms of the investment management agreement.
Performance of the Portfolio
In considering the Portfolio’s performance, the Trustees regularly review and discuss throughout the year data prepared by Amundi US and information comparing the Portfolio’s performance with the performance of its peer group of funds, as classified by Morningstar, Inc. (Morningstar), and with the performance of the Portfolio’s benchmark index. They also discuss the Portfolio’s performance with Amundi US on a regular basis. The Trustees discussed the Portfolio’s performance with the Adviser on a more frequent basis in light of the Portfolio’s unfavorable performance compared to its benchmark index and
| Pioneer Mid Cap Value VCT Portfolio | Pioneer Variable Contracts Trust |
peers over certain periods. The Trustees noted Amundi US’s explanation for the Fund’s relative performance and the steps taken by Amundi US to address the Portfolio’s performance, including enhancing the investment process used for the Portfolio. The Trustees’ regular reviews and discussions were factored into the Trustees’ deliberations concerning the renewal of the investment management agreement.
Management Fee and Expenses
The Trustees considered information showing the fees and expenses of the Portfolio in comparison to the management fees of its peer group of funds as classified by Morningstar and also to the expense ratios of a peer group of funds selected on the basis of criteria determined by the Independent Trustees for this purpose using data provided by Strategic Insight Mutual Fund Research and Consulting, LLC (Strategic Insight), an independent third party. The peer group comparisons referred to below are organized in quintiles. Each quintile represents one-fifth of the peer group. In all peer group comparisons referred to below, first quintile is most favorable to the Portfolio’s shareowners. The Trustees noted that they separately review and consider the impact of the Portfolio’s transfer agency and Portfolio- and Amundi US-paid expenses for sub-transfer agency and intermediary arrangements, and that the results of the most recent such review were considered in the consideration of the Portfolio’s expense ratio.
The Trustees considered that the Portfolio’s management fee for the most recent fiscal year was in the first quintile relative to the management fees paid by other funds in its Morningstar category for the comparable period. The Trustees considered that the expense ratio of the Portfolio’s Class II shares for the most recent fiscal year was in the third quintile relative to its Strategic Insight peer group for the comparable period.
The Trustees reviewed management fees charged by Amundi US to institutional and other clients, including publicly offered European funds sponsored by Amundi US’s affiliates, unaffiliated U.S. registered investment companies (in a sub-advisory capacity), and unaffiliated foreign and domestic separate accounts. The Trustees also considered Amundi US’s costs in providing services to the Portfolio and Amundi US’s costs in providing services to the other clients and considered the differences in management fees and profit margins for fund and non-fund services. In evaluating the fees associated with Amundi US’s client accounts, the Trustees took into account the respective demands, resources and complexity associated with the Portfolio and other client accounts. The Trustees noted that, in some instances, the fee rates for those clients were lower than the management fee for the Portfolio and considered that, under the investment management and administration agreements with the Portfolio, Amundi US performs additional services for the Portfolio that it does not provide to those other clients or services that are broader in scope, including oversight of the Portfolio’s other service providers and activities related to compliance and the extensive regulatory and tax regimes to which the Portfolio is subject. The Trustees also considered the entrepreneurial risks associated with Amundi US’s management of the Portfolio.
The Trustees concluded that the management fee payable by the Portfolio to Amundi US was reasonable in relation to the nature and quality of the services provided by Amundi US.
Profitability
The Trustees considered information provided by Amundi US regarding the profitability of Amundi US with respect to the advisory services provided by Amundi US to the Portfolio, including the methodology used by Amundi US in allocating certain of its costs to the management of the Portfolio. The Trustees also considered Amundi US’s profit margin in connection with the overall operation of the Portfolio. They further reviewed the financial results, including the profit margins, realized by Amundi US from non-fund businesses. The Trustees considered Amundi US’s profit margins in comparison to the limited industry data available and noted that the profitability of any adviser was affected by numerous factors, including its organizational structure and method for allocating expenses. The Trustees concluded that Amundi US’s profitability with respect to the management of the Portfolio was not unreasonable.
Economies of Scale
The Trustees considered Amundi US’s views relating to economies of scale in connection with the Pioneer Funds as fund assets grow and the extent to which any such economies of scale are shared with the Portfolio and Portfolio shareholders. The Trustees recognize that economies of scale are difficult to identify and quantify, and that, among other factors that may be relevant, are the following: fee levels, expense subsidization, investment by Amundi US in research and analytical capabilities and Amundi US’s commitment and resource allocation to the Portfolio. The Trustees noted that profitability also may be an indicator of the availability of any economies of scale, although profitability may vary for other reasons including due to reductions in expenses. The Trustees concluded that economies of scale, if any, were being appropriately shared with the Portfolio.
| Pioneer Mid Cap Value VCT Portfolio | Pioneer Variable Contracts Trust |
Approval of Renewal of Investment Management Agreement (continued)
Other Benefits
The Trustees considered the other benefits that Amundi US enjoys from its relationship with the Portfolio. The Trustees considered the character and amount of fees paid or to be paid by the Portfolio, other than under the investment management agreement, for services provided by Amundi US and its affiliates. The Trustees further considered the revenues and profitability of Amundi US’s businesses other than the fund business. To the extent applicable, the Trustees also considered the benefits to the Portfolio and to Amundi US and its affiliates from the use of “soft” commission dollars generated by the Portfolio to pay for research and brokerage services.
The Trustees considered that Amundi US is the principal U.S. asset management business of Amundi, which is one of the largest asset managers globally. Amundi’s worldwide asset management business manages over $2.1 trillion in assets (including the Pioneer Funds). The Trustees considered that Amundi US’s relationship with Amundi creates potential opportunities for Amundi US and Amundi that derive from Amundi US’s relationships with the Portfolio, including Amundi’s ability to market the services of Amundi US globally. The Trustees noted that Amundi US has access to additional research and portfolio management capabilities as a result of its relationship with Amundi and Amundi’s enhanced global presence that may contribute to an increase in the resources available to Amundi US. The Trustees considered that Amundi US and the Portfolio receive reciprocal intangible benefits from the relationship, including mutual brand recognition and, for the Portfolio, direct and indirect access to the resources of a large global asset manager. The Trustees concluded that any such benefits received by Amundi US as a result of its relationship with the Portfolio were reasonable.
Conclusion
After consideration of the factors described above as well as other factors, the Trustees, including the Independent Trustees, concluded that the investment management agreement for the Portfolio, including the fees payable thereunder, was fair and reasonable and voted to approve the proposed renewal of the investment management agreement.
| Pioneer Mid Cap Value VCT Portfolio | Pioneer Variable Contracts Trust |
Trustees, Officers and Service Providers
Trustees and Officers
The Portfolio’s Trustees and officers are listed below, together with their principal occupations and other directorships they have held during at least the past five years. Trustees who are interested persons of the Portfolios within the meaning of the 1940 Act are referred to as Interested Trustees. Trustees who are not interested persons of the Portfolio are referred to as Independent Trustees. Each of the Trustees serves as a Trustee of each of the 47 U.S. registered investment portfolios for which Amundi US serves as investment adviser (the “Pioneer Funds”). The address for all Trustees and all officers of the Portfolios is 60 State Street, Boston, Massachusetts 02109.
The Statement of Additional Information of the Portfolio includes additional information about the Trustees and is available, without charge, upon request, by calling 1-800-225-6292.
Investment Adviser and Administrator
Amundi Asset Management US, Inc.
Custodian and Sub-Administrator
The Bank of New York Mellon Corporation
Independent Registered Public Accounting Firm
Ernst & Young LLP
Principal Underwriter
Amundi Distributor US, Inc.
Legal Counsel
Morgan, Lewis & Bockius LLP
Transfer Agent
BNY Mellon Investment Servicing (US) Inc.
Name, Age and Position
Held With the Trust | Term of Office and
Length of Service | Principal Occupation(s) During At Least The Past Five Years | Other Directorships Held by Trustee During At Least The Past Five Years |
| Independent Trustees |
Thomas J. Perna (73)
Chairman of the Board
and Trustee | Trustee since 2006.
Serves until a successor
trustee is elected or
earlier retirement
or removal. | Private investor (2004 – 2008 and 2013 – present); Chairman (2008 – 2013) and Chief Executive Officer (2008 – 2012), Quadriserv, Inc. (technology products for securities lending industry); and Senior Executive Vice President, The Bank of New York (financial and securities services) (1986 – 2004) | Director, Broadridge Financial
Solutions, Inc. (investor
communications and securities
processing provider for financial
services industry) (2009 – present); Director, Quadriserv, Inc.
(2005 – 2013); and Commissioner,
New Jersey State Civil Service
Commission (2011 – 2015) |
John E. Baumgardner,
Jr. (72)*
Trustee | Trustee since 2019.
Serves until a successor
trustee is elected or
earlier retirement
or removal. | Of Counsel (2019 – present), Partner (1983-2018), Sullivan & Cromwell LLP (law firm). | Chairman, The Lakeville Journal
Company, LLC, (privately-held
community newspaper group)
(2015-present) |
| Pioneer Mid Cap Value VCT Portfolio | Pioneer Variable Contracts Trust |
Trustees, Officers and Service Providers (continued)
Name, Age and Position
Held With the Trust | Term of Office and
Length of Service | Principal Occupation(s) During At Least The Past Five Years | Other Directorships Held by Trustee During At Least The Past Five Years |
| Independent Trustees (continued) |
Diane Durnin (66)
Trustee | Trustee since 2019.
Serves until a successor
trustee is elected or
earlier retirement
or removal. | Managing Director - Head of Product Strategy and Development, BNY Mellon Investment Management (investment management firm) (2012-2018); Vice Chairman – The Dreyfus Corporation (2005 – 2018): Executive Vice President Head of Product, BNY Mellon Investment Management (2007-2012); Executive Director- Product Strategy, Mellon Asset Management (2005-2007); Executive Vice President Head of Products, Marketing and Client Service, Dreyfus Corporation (investment management firm) (2000-2005); Senior Vice President Strategic Product and Business Development, Dreyfus Corporation (1994-2000) | None |
Benjamin M. Friedman (79)
Trustee | Trustee since 2008.
Serves until a successor
trustee is elected or
earlier retirement
or removal. | William Joseph Maier Professor of Political Economy, Harvard University (1972 – present) | Trustee, Mellon Institutional Funds
Investment Trust and Mellon
Institutional Funds Master Portfolio
(oversaw 17 portfolios in fund
complex) (1989 - 2008) |
Craig C. MacKay (60)
Trustee | Trustee since 2021.
Serves until a successor
trustee is elected or
earlier retirement
or removal. | Partner, England & Company, LLC (advisory firm) (2012 – present); Group Head – Leveraged Finance Distribution, Oppenheimer & Company (investment bank) (2006 – 2012); Group Head – Private Finance & High Yield Capital Markets Origination, SunTrust Robinson Humphrey (investment bank) (2003 – 2006); and Founder and Chief Executive Officer, HNY Associates, LLC (investment bank) (1996 – 2003) | Director, Equitable Holdings, Inc. (financial services holding company) (2022 – present); Board Member of Carver Bancorp, Inc. (holding company) and Carver Federal Savings Bank, NA (2017 – present); Advisory Council Member, MasterShares ETF (2016 – 2017); Advisory Council Member, The Deal (financial market information publisher) (2015 – 2016); Board Co-Chairman and Chief Executive Officer, Danis Transportation Company (privately-owned commercial carrier) (2000 – 2003); Board Member and Chief Financial Officer, Customer Access Resources (privately-owned teleservices company) (1998 – 2000); Board Member, Federation of Protestant Welfare Agencies (human services agency) (1993 – present); and Board Treasurer, Harlem Dowling Westside Center (foster care agency) (1999 – 2018) |
Lorraine H. Monchak (67)
Trustee | Trustee since 2017.
(Advisory Trustee from
2014 - 2017). Serves
until a successor trustee
is elected or earlier
retirement or removal. | Chief Investment Officer, 1199 SEIU Funds (healthcare workers union pension funds) (2001 – present); Vice President – International Investments Group, American International Group, Inc. (insurance company) (1993 – 2001); Vice President – Corporate Finance and Treasury Group, Citibank, N.A. (1980 – 1986 and 1990 – 1993); Vice President – Asset/Liability Management Group, Federal Farm Funding Corporation (government-sponsored issuer of debt securities) (1988 – 1990); Mortgage Strategies Group, Shearson Lehman Hutton, Inc. (investment bank) (1987 – 1988); Mortgage Strategies Group, Drexel Burnham Lambert, Ltd. (investment bank) (1986 – 1987) | None |
| Pioneer Mid Cap Value VCT Portfolio | Pioneer Variable Contracts Trust |
Name, Age and Position
Held With the Trust | Term of Office and
Length of Service | Principal Occupation(s) During At Least The Past Five Years | Other Directorships Held by Trustee During At Least The Past Five Years |
| Independent Trustees (continued) |
Marguerite A. Piret (75)**
Trustee | Trustee since 1995.
Serves until a successor
trustee is elected or
earlier retirement
or removal. | Chief Financial Officer, American Ag Energy, Inc. (technology for the environment, energy and agriculture) (2019 – present); Chief Operating Officer, North Country Growers LLC (controlled environment agriculture company) (2020 – present); Chief Executive Officer, Green Heat LLC (biofuels company) (2022 – present); President and Chief Executive Officer, Newbury Piret Company (investment banking firm) (1981 – 2019) | Director of New America High
Income Fund, Inc. (closed-end
investment company) (2004 –
present); and Member, Board of
Governors, Investment Company
Institute (2000 – 2006) |
Fred J. Ricciardi (76)
Trustee | Trustee since 2014.
Serves until a successor
trustee is elected or
earlier retirement
or removal. | Private investor (2020 – present); Consultant (investment company services) (2012 – 2020); Executive Vice President, BNY Mellon (financial and investment company services) (1969 – 2012); Director, BNY International Financing Corp. (financial services) (2002 – 2012); Director, Mellon Overseas Investment Corp. (financial services) (2009 – 2012); Director, Financial Models (technology) (2005-2007); Director, BNY Hamilton Funds, Ireland (offshore investment companies) (2004-2007); Chairman/Director, AIB/BNY Securities Services, Ltd., Ireland (financial services) (1999-2006); Chairman, BNY Alternative Investment Services, Inc. (financial services) (2005-2007) | None |
* Mr. Baumgardner is Of Counsel to Sullivan & Cromwell LLP, which acts as counsel to the Independent Trustees of each Pioneer Fund.
** Ms. Piret became a non-voting Advisory Trustee of the Pioneer Funds effective January 22, 2024. |
| Interested Trustees |
Lisa M. Jones (61)***
Trustee, President and Chief
Executive Officer | Trustee since 2017. Serves
until a successor trustee is
elected or earlier retirement
or removal | Director, CEO and President of Amundi US, Inc. (investment management firm) (since September 2014); Director, CEO and President of Amundi Asset Management US, Inc. (since September 2014); Director, CEO and President of Amundi Distributor US, Inc. (since September 2014); Director, CEO and President of Amundi Asset Management US, Inc. (since September 2014); Chair, Amundi US, Inc., Amundi Distributor US, Inc. and Amundi Asset Management US, Inc. (September 2014 – 2018); Managing Director, Morgan Stanley Investment Management (investment management firm) (2010 – 2013); Director of Institutional Business, CEO of International, Eaton Vance Management (investment management firm) (2005 – 2010); Director of Amundi Holdings US, Inc. (since 2017) | Director of Clearwater Analytics (provider of web-based investment accounting software for reporting and reconciliation services) (September 2022 – present) |
Kenneth J. Taubes (64)***,****
Trustee | Trustee since 2014. Serves
until a successor trustee is
elected or earlier retirement
or removal | Director and Executive Vice President (since 2008) and Chief Investment Officer, U.S. (since 2010) of Amundi US, Inc. (investment management firm); Director and Executive Vice President and Chief Investment Officer, U.S. of Amundi US (since 2008); Executive Vice President and Chief Investment Officer, U.S. of Amundi Asset Management US, Inc. (since 2009); Portfolio Manager of Amundi US (since 1999); Director of Amundi Holdings US, Inc. (since 2017) | None |
| Pioneer Mid Cap Value VCT Portfolio | Pioneer Variable Contracts Trust |
Trustees, Officers and Service Providers (continued)
Name, Age and Position
Held With the Trust | Term of Office and
Length of Service | Principal Occupation(s) During At Least The Past Five Years | Other Directorships Held by Trustee During At Least The Past Five Years |
| Interested Trustees (continued) |
*** Ms. Jones and Mr. Taubes are Interested Trustees because they are officers or directors of the Portfolio’s investment adviser and certain of its affiliates.
**** Mr. Taubes retired as a Trustee, effective January 1, 2024. |
| Pioneer Mid Cap Value VCT Portfolio | Pioneer Variable Contracts Trust |
| Name, Age and Position Held With the Trust***** | Term of Office and
Length of Service | Principal Occupation(s) During
At Least The Past Five Years | Other Directorships Held by Trustee During At Least The Past Five Years |
| Trust Officers |
Christopher J. Kelley (59)
Secretary and Chief
Legal Officer | Since 2003. Serves at
the discretion of
the Board | Vice President and Associate General Counsel of Amundi US since January 2008; Secretary and Chief Legal Officer of all of the Pioneer Funds since June 2010; Assistant Secretary of all of the Pioneer Funds from September 2003 to May 2010; Vice President and Senior Counsel of Amundi US from July 2002 to December 2007 | None |
Thomas Reyes (61)
Assistant Secretary | Since 2010. Serves at
the discretion of
the Board | Assistant General Counsel of Amundi US since May 2013 and Assistant Secretary of all the Pioneer Funds since June 2010; Counsel of Amundi US from June 2007 to May 2013 | None |
Heather L. Melito-Dezan (47)
Assistant Secretary | Since 2022. Serves at
the discretion of
the Board | Director - Trustee and Board Relationships of Amundi US since September 2019; Assistant Secretary of Amundi US, Inc. since July 2020: Assistant Secretary of Amundi Asset Management US, Inc. since July 2020: Assistant Secretary of Amundi Distributor US, Inc. since July 2020; Assistant Secretary of all the Pioneer Funds since September 2022; Private practice from 2017 – 2019. | None |
Anthony J. Koenig, Jr. (60)
Treasurer and
Chief Financial and
Accounting Officer | Since 2021. Serves at
the discretion of
the Board | Managing Director, Chief Operations Officer and Fund Treasurer of Amundi US since May 2021; Treasurer of all of the Pioneer Funds since May 2021; Assistant Treasurer of all of the Pioneer Funds from January 2021 to May 2021; and Chief of Staff, US Investment Management of Amundi US from May 2008 to January 2021 | None |
Luis I. Presutti (58)
Assistant Treasurer | Since 2000. Serves at
the discretion of
the Board | Director – Fund Treasury of Amundi US since 1999; and Assistant Treasurer of all of the Pioneer Funds since 1999 | None |
Gary Sullivan (65)
Assistant Treasurer | Since 2002. Serves at
the discretion of
the Board | Senior Manager – Fund Treasury of Amundi US since 2012; and Assistant Treasurer of all of the Pioneer Funds since 2002 | None |
Antonio Furtado (41)
Assistant Treasurer | Since 2020. Serves at
the discretion of
the Board | Fund Oversight Manager – Fund Treasury of Amundi US since 2020; Assistant Treasurer of all of the Pioneer Funds since 2020; and Senior Fund Treasury Analyst from 2012 - 2020 | None |
Michael Melnick (52)
Assistant Treasurer | Since 2021. Serves at
the discretion of
the Board | Vice President - Deputy Fund Treasurer of Amundi US since May 2021; Assistant Treasurer of all of the Pioneer Funds since July 2021; Director of Regulatory Reporting of Amundi US from 2001 – 2021; and Director of Tax of Amundi US from 2000 - 2001 | None |
John Malone (53)
Chief Compliance Officer | Since 2018. Serves at
the discretion of
the Board | Managing Director, Chief Compliance Officer of Amundi US Asset Management; Amundi Asset Management US, Inc.; and the Pioneer Funds since September 2018; Chief Compliance Officer of Amundi Distributor US, Inc. since January 2014. | None |
| Pioneer Mid Cap Value VCT Portfolio | Pioneer Variable Contracts Trust |
Trustees, Officers and Service Providers (continued)
| Name, Age and Position Held With the Trust***** | Term of Office and
Length of Service | Principal Occupation(s) During
At Least The Past Five Years | Other Directorships Held by Trustee During At Least The Past Five Years |
| Trust Officers (continued) |
Brandon Austin (51)
Anti-Money
Laundering Officer | Since 2022. Serves at
the discretion of
the Board | Director, Financial Security – Amundi Asset Management; Anti-Money Laundering Officer of all the Pioneer Funds since March 2022: Director of Financial Security of Amundi US since July 2021; Vice President, Head of BSA, AML and OFAC, Deputy Compliance Manager, Crédit Agricole Indosuez Wealth Management (investment management firm) (2013 – 2021) | None |
| ***** Marco Pirondini has been appointed to serve as an Executive Vice President of the Portfolio and Chief Investment Officer of Amundi US, Inc., effective January 1, 2024. |
Proxy Voting Policies and Procedures of the Portfolio are available without charge, upon request, by calling our toll free number (1-800-225-6292). Information regarding how the Portfolio voted proxies relating to Portfolio securities during the most recent 12-month period ended June 30 is publicly available to shareholders at www.amundi.com/us. This information is also available on the Securities and Exchange Commission’s web site at www.sec.gov.
Pioneer Variable Contracts Trust
Pioneer Fund
VCT Portfolio
Class I and II Shares
Annual Report | December 31, 2023
Please refer to your contract prospectus to determine the applicable share class offered under your contract.
Pioneer Variable Contracts Trust
Table of Contents
Pioneer Fund VCT Portfolio
This report is authorized for distribution only when preceded or accompanied by a prospectus for the Portfolio being offered.
Pioneer Variable Contracts Trust files a complete schedule of portfolio holdings with the Securities and Exchange Commission for the first and third quarters of each fiscal year as an exhibit to its reports on Form N-PORT. Shareholders may view the filed Form N-PORT by visiting the Commission’s web site at https://www.sec.gov.
| Pioneer Fund VCT Portfolio | Pioneer Variable Contracts Trust |
Portfolio Update 12/31/23
Sector Distribution
(As a percentage of total investments)*
5 Largest Holdings
| (As a percentage of total investments)* |
| 1. | Microsoft Corp. | 6.71% |
| 2. | Apple, Inc. | 5.55 |
| 3. | Alphabet, Inc. | 5.50 |
| 4. | Martin Marietta Materials, Inc. | 4.98 |
| 5. | NVIDIA Corp. | 4.52 |
| | |
| * | Excludes short-term investments and all derivative contracts except for options purchased. The Portfolio is actively managed, and current holdings may be different. The holdings listed should not be considered recommendations to buy or sell any securities. |
Performance Update 12/31/23
Prices and Distributions
| Net Asset Value per Share | 12/31/23 | 12/31/22 |
| Class l | $16.01 | $13.05 |
| Class ll | $16.19 | $13.19 |
| | | |
Distributions per Share
(1/1/23 - 12/31/23) | Net
Investment
Income | Short-Term
Capital Gains | Long-Term
Capital Gains |
| Class l | $0.1250 | $— | $0.5987 |
| Class ll | $0.0857 | $— | $0.5987 |
Performance of a $10,000 Investment
The following chart shows the change in value of an investment made in Class I and Class II shares of Pioneer Fund VCT Portfolio at net asset value during the periods shown, compared to that of the Standard & Poor’s 500 Index (the S&P 500). Portfolio returns are based on net asset value and do not reflect any applicable insurance fees or surrender charges.
 | The Standard & Poor’s 500 Index (the S&P 500) is an unmanaged, commonly used measure of the broad U.S. stock market. Index returns are calculated monthly, assume reinvestment of dividends and do not reflect any fees, expenses or sales charges. It is not possible to invest directly in an index. |
Average Annual Total Returns
(As of December 31, 2023)
| | Class l | Class ll | S&P 500 Index |
| 10 Years | 12.22% | 11.94% | 12.03% |
| 5 Years | 16.74% | 16.45% | 15.69% |
| 1 Year | 28.93% | 28.58% | 26.29% |
All total returns shown assume reinvestment of distributions at net asset value.
The performance table does not reflect the deduction of taxes that a shareholder would pay on distributions or the redemption of shares.
Call 1-800-225-6292 or visit www.amundi.com/us for the most recent month-end performance results. Current performance may be lower or higher than the performance data quoted.
The performance data quoted represents past performance, which is no guarantee of future results. Investment return and principal value will fluctuate, and shares, when redeemed, may be worth more or less than their original cost.
The returns for the Portfolio do not reflect the deduction of expenses associated with variable products, such as mortality and expense risk charges, separate account charges, and sales charges. These expenses would reduce the overall returns shown.
Performance results reflect any applicable expense waivers in effect during the periods shown. Without such waivers, performance would be lower. Waivers may not be in effect for all portfolios. Certain fee waivers are contractual through a specified period. Otherwise, fee waivers can be rescinded at any time. See the prospectus and financial statements for more information.
| Pioneer Fund VCT Portfolio | Pioneer Variable Contracts Trust |
Comparing Ongoing Portfolio Expenses
As a shareholder in the Portfolio, you incur two types of costs:
| (1) | ongoing costs, including management fees, distribution and/or service (12b-1) fees, and other Portfolio expenses; and |
| (2) | transaction costs, including sales charges (loads) on purchase payments. |
This example is intended to help you understand your ongoing expenses (in dollars) of investing in the Portfolio and to compare these costs with the ongoing costs of investing in other mutual funds offered through your variable annuity contract. The example is based on an investment of $1,000 at the beginning of the Portfolio’s latest six-month period and held throughout the six months.
Using the Tables
Actual Expenses
The first table below provides information about actual account values and actual expenses. You may use the information in this table, together with the amount you invested, to estimate the expenses that you paid over the period as follows:
| (1) | Divide your account value by $1,000
Example: an $8,600 account value ÷ $1,000 = 8.6 |
| (2) | Multiply the result in (1) above by the corresponding share class’s number in the third row under the heading entitled “Expenses Paid During Period” to estimate the expenses you paid on your account during this period. |
Expenses Paid on a $1,000 Investment in Pioneer Fund VCT Portfolio
Based on actual returns from July 1, 2023 through December 31, 2023.
| Share Class | l | ll |
| Beginning Account Value on 7/1/23 | $1,000.00 | $1,000.00 |
| Ending Account Value (after expenses) on 12/31/23 | $1,134.50 | $1,133.00 |
| Expenses Paid During Period* | $ 4.30 | $ 5.65 |
| | |
| * | Expenses are equal to the Portfolio’s annualized net expense ratio of 0.80% and 1.05% for Class I and Class II shares, respectively, multiplied by the average account value over the period, multiplied by 184/365 (to reflect the one-half year period). |
Hypothetical Example for Comparison Purposes
The table below provides information about hypothetical account values and hypothetical expenses based on the Portfolio’s actual expense ratio and an assumed rate of return of 5% per year before expenses, which is not the Portfolio’s actual return. The hypothetical account values and expenses may not be used to estimate the actual ending account balance or expenses you paid for the period.
You may use this information to compare the ongoing costs of investing in the Portfolio and other variable annuities. To do so, compare this 5% hypothetical example with the 5% hypothetical examples that appear in the shareholder reports of the other variable annuities.
Please note that the expenses shown in the tables are meant to highlight your ongoing costs only and do not reflect any transaction costs, such as sales charges (loads) that are charged at the time of the transaction. Therefore, the table below is useful in comparing ongoing costs only and will not help you determine the relative total costs of owning different variable annuities. In addition, if these transaction costs were included, your costs would have been higher.
Expenses Paid on a $1,000 Investment in Pioneer Fund VCT Portfolio
Based on a hypothetical 5% return per year before expenses, reflecting the period from July 1, 2023 through December 31, 2023.
| Share Class | l | ll |
| Beginning Account Value on 7/1/23 | $1,000.00 | $1,000.00 |
| Ending Account Value (after expenses) on 12/31/23 | $1,021.17 | $1,019.91 |
| Expenses Paid During Period* | $ 4.08 | $ 5.35 |
| | |
| * | Expenses are equal to the Portfolio’s annualized net expense ratio of 0.80% and 1.05% for Class I and Class II shares, respectively, multiplied by the average account value over the period, multiplied by 184/365 (to reflect the one-half year period). |
| Pioneer Fund VCT Portfolio | Pioneer Variable Contracts Trust |
Portfolio Management Discussion 12/31/23
Call 1-800-225-6292 or visit www.amundi.com/us for the most recent month-end performance results. Current performance may be lower or higher than the performance data quoted.
The performance data quoted represents past performance, which is no guarantee of future results. Investment return and principal value will fluctuate, and shares, when redeemed, may be worth more or less than their original cost.
The returns for the Portfolio do not reflect the deduction of expenses associated with variable products, such as mortality and expense risk charges, separate account charges, and sales charges. These expenses would reduce the overall returns shown.
Performance results reflect any applicable expense waivers in effect during the periods shown. Without such waivers, performance would be lower. Waivers may not be in effect for all portfolios. Certain fee waivers are contractual through a specified period. Otherwise, fee waivers can be rescinded at any time. See the prospectus and financial statements for more information.
* Note to shareholders: John A. Carey will retire from portfolio management effective in May 2024. He remains a member of the Fund's current portfolio management team.
In the following discussion, Jeff Kripke discusses the market environment during the 12-month period ended December 31, 2023, and Pioneer Fund VCT Portfolio’s performance during the period. Mr. Kripke, a senior vice president and a portfolio manager at Amundi Asset Management US, Inc. (Amundi US), is responsible for the day-to-day management of the Portfolio, along with James Yu, a vice president and a portfolio manager at Amundi US, Craig Sterling, Managing Director, Director of Core Equity and Head of Equity Research, US, and a portfolio manager at Amundi US, and John Carey*, Managing Director, Director of Equity Income, US, and a portfolio manager at Amundi US.
| Q: | How did the Portfolio perform over the 12-month period ended December 31, 2023? |
| A: | Pioneer Fund VCT Portfolio’s Class I shares returned 28.93% at net asset value during the 12-month period ended December 31, 2023, and Class II shares returned 28.58%, while the Portfolio’s benchmark, the Standard & Poor’s 500 Index (the S&P 500), returned 26.29%. |
| Q: | How would you describe the market for equities during the 12-month period ended December 31, 2023? |
| A: | For the 12-month period ended December 31, 2023, the US equity market showed strong growth and resilience, despite ongoing economic and political uncertainties. The market was buoyed by a combination of factors, including low-interest rates, strong corporate earnings, and a robust consumer sector. |
| | One of the key drivers of the market's growth was the technology sector, which continued to outperform other sectors and drive innovation across a wide range of industries. Current Portfolio holdings such as Apple, Amazon, and Alphabet saw strong growth in their stock prices, and are expected by many to continue to lead the market in the years to come. |
| | Another factor contributing to the market's strength was the ongoing recovery in the housing market, which helped to boost consumer confidence and spending. As more Americans feel secure in their financial situations, they are more likely to invest in the stock market and contribute to its growth. |
| | Despite these positive trends, there are still risks and uncertainties that could impact the market in the years to come. These include ongoing geopolitical tensions, rising interest rates, and the potential for a global economic slowdown. However, many analysts remain optimistic about the market's prospects, and believe that it will continue to show strong growth in the years to come. |
| | The rise in the domestic equity market was particularly concentrated within growth stocks, which dramatically outperformed value stocks for the 12-month period. The broad US equity market, as measured by the S&P 500, registered a total return of 26.29% over the 12-month period. Shares of growth-oriented companies, as measured by the Russell 1000 Growth Index, returned 42.68% as investor exuberance over Artificial Intelligence steered investors towards technology companies, which make up a large portion of the growth index. Value, on the other hand, returned 11.46%, as measured by the Russell 1000 Value Index. |
| Pioneer Fund VCT Portfolio | Pioneer Variable Contracts Trust |
| Q: | Which of your investment decisions either contributed positively to, or detracted from, the Portfolio’s benchmark-relative performance during the 12-month period ended December 31, 2023? |
| A: | The Portfolio outperformed the S&P 500 for the 12 months ended December 31, 2023. The largest contributors to returns during the period were the Portfolio’s underweight in defensive sectors such as consumer staples and utilities, which significantly underperformed the S&P 500. The Portfolio also benefitted from an overweight and security selection in the top performing S&P 500 sector, information technology, as well as security selection in the health care sector where the Portfolio’s exposure to pharmaceuticals aided results. Within the information technology sector, the Portfolio’s semiconductor holdings, in particular, were significant contributors to returns. We have maintained conviction in semiconductors for some time given their connection to artificial intelligence (AI) and the potential tailwind from the reshoring of semiconductor manufacturing to the US and Europe. |
| | The Portfolio’s strong results in 2023, especially after underperforming meaningfully in the first half of the year, is a testament to the disciplined, risk-reward focus of the Portfolio. For example, throughout 2022 and early 2023, the Portfolio built positions in semiconductor stocks given their exposure to Artificial Intelligence (AI), a theme that the Portfolio has favored for years, and what we viewed as attractive valuations. This conviction paid off as semiconductors rose broadly in 2023, as investors flocked to stocks with exposure to AI. As the valuations became more challenging in the second half of the year, we reduced some of the Portfolio's positions, as the risk-reward profile was not as attractive. Another area that demonstrated the Portfolio’s disciplined approach is its exposure to banks. Going into 2023, we had a preference for regional banks, which underperformed broadly due to the liquidity crisis in the US Banking sector. However, in our view, the sell-off in these stocks went too far; therefore, we continued to build the Portfolio's positions, despite the negative market sentiment. This discipline paid off in the second half of the year as bank stocks, and in particular regional banks, were among the top performers in the S&P 500 for the fourth quarter. |
| | Overall, though, the Portfolio’s exposure to banks did hurt Portfolio results for the full year, despite the bounce back in the fourth quarter. In addition, the Portfolio’s lack of exposure to some mega-cap growth stocks that outperformed in 2023 (after underperforming in 2022), such as Meta Platforms, detracted from returns. |
| | With respect to individual securities, the top contributors in the year were NVIDIA and Martin Marietta Materials. Shares of NVIDIA, the leading manufacturer of graphic processing units, increased as a result of investor exuberance over Artificial Intelligence given the importance of the companies GPUs and hardware in various AI technologies. We maintain the Portfolio's position in NVIDIA shares, as we believe AI adoption will continue to accelerate and NVIDIA could be a strong beneficiary given their dominant competitive position in its core markets. |
| | Shares of Martin Marietta Materials, a leading supplier of aggregates and building materials, outperformed during the period, as investors favored |
| Pioneer Fund VCT Portfolio | Pioneer Variable Contracts Trust |
Portfolio Management Discussion 12/31/23 (continued)
| | building materials suppliers due to optimism, they would receive increased government subsidies for “Green Energy” projects as a result of the inflation reduction act, among other bills. The Portfolio continues to hold the shares and we believe heavy non-residential spending (infrastructure) may more than make up for any shortfall elsewhere. In addition, the company could benefit from the move to green energy as its materials are used to rebuild electric grids (solar, wind), and to build sea walls. |
| | Conversely, regional bank shares were the largest individual detractors from Portfolio performance with Truist Financial and Citizens Financial Group detracting the most from returns. During the first half of the year in particular, the fallout from the collapse of two regional US banks and Credit Suisse caused banks and specifically regional banks to underperform. Truist Financial and Citizens Financial Group were the largest detractors from returns in each period in the wake of these collapses. However, we continue to maintain the Portfolio's positions, as we believe these high quality “super-regional” banks are not exposed to the same issues plaguing the failed banks. Truist and Citizens have gone through significant stress testing given their large size and status as systemically important banks in the US. In addition, we believe both have adequate capital reserves and robust liquidity and risk management platforms in place. These regional banks also have diverse deposit bases that consist primarily of traditional retail and small to medium sized businesses that are not as risky, in our view. |
| Q: | Did the Portfolio have any exposure to derivative securities during the 12-month period ended December 31, 2023? |
| A: | No, the Portfolio had no exposure to derivatives during the period. |
| Q: | Could you discuss the Portfolio’s commitment to ESG investing? |
| A: | We integrate environmental, social, and corporate governance (ESG) factors in our fundamental research and investment selection processes. We believe this information helps us gain a more complete understanding of a company and its business. We have historically followed ESG criteria in managing the Portfolio. However, ESG investment criteria were formally incorporated into the Portfolio’s prospectus on July 1, 2018. The Portfolio generally will not invest in companies significantly involved in certain business activities, including but not limited to, the production of alcohol, tobacco products, and certain controversial military weapons, and the operation of thermal coal mines and gambling casinos and other gaming businesses. In addition, Amundi US cosiders pertinent ESG information, including ESG ratings, in seeking to avoid investing the Portfolio in companies perceived to have the most ESG-related risk. |
| Q: | What is your investment outlook as the Portfolio enters a new fiscal year? |
| A: | We are not sure when or if the long-anticipated recession will occur, but we are currently finding value in cyclical areas of the market, such as banks, materials, and to a lesser extent semiconductor stocks. This modest cyclical tilt is the result of our valuation discipline, which favors stocks with what we believe have at least 2:1 upside potential to downside risk, as those stocks have attractive risk-reward profiles, in our view. With this in mind, we believe maintaining a balanced portfolio including cyclical stocks, reasonably priced growth, and some defensive stocks remains the best approach in the |
| Pioneer Fund VCT Portfolio | Pioneer Variable Contracts Trust |
A Word About Risk:
All investments are subject to risk, including the possible loss of principal. In the past several years, financial markets have experienced increased volatility and heightened uncertainty. The market prices of securities may go up or down, sometimes rapidly or unpredictably, due to general market conditions, such as real or perceived adverse economic, political, or regulatory conditions, recessions, inflation, changes in interest or currency rates, lack of liquidity in the bond markets, the spread of infectious illness or other public health issues, armed conflict including Russia's military invasion of Ukraine, sanctions against Russia, other nations or individuals or companies and possible countermeasures, market disruptions caused by tariffs, trade disputes or other government actions, or adverse investor sentiment. These conditions may continue, recur, worsen or spread.
The Portfolio generally excludes corporate issuers that do not meet or exceed minimum ESG standards. Excluding specific issuers limits the universe of investments available to the Portfolio, which may mean forgoing some investment opportunities available to portfolios without similar ESG standards.
At times, the Portfolio’s investments may represent industries or industry sectors that are interrelated or have common risks, making the Portfolio more susceptible to any economic, political, or regulatory developments or other risks affecting those industries and sectors.
These risks may increase share price volatility.
| | current environment. By comparison, we are avoiding equities of hyper-growth, unprofitable companies that we believe are vulnerable to valuation compression if interest rates continue to rise. We also think low quality, distressed value stocks may underperform, especially those with excessive debt loads. |
| | As of the end of December 2023, the Portfolio’s largest overweight positions relative to the benchmark were in the financials and materials sectors. In financials, we continue to favor regional banks, but have also added exposure to some larger banks and financial services companies with exposure to capital markets. We have reduced our information technology position, and particularly our semiconductor positions given their strong performance. However, we continue to favor technology stocks that we believe can benefit from the trend towards AI, including some semiconductor stocks. In materials, we maintain a preference for stocks that are benefitting from the trend towards electrification and the green energy transition. |
| | Notable underweight positions include the consumer (staples and discretionary) and health care sectors, though we have added to the Portfolio’s exposure to the pharmaceuticals sector more recently. Finally, the Portfolio continues to have no exposure to the real estate and utilities sectors, which are interest rate sensitive. |
Please refer to the Schedule of Investments on pages 8 - 10 for a full listing of Portfolio securities.
Past performance is no guarantee of future results.
Any information in this shareholder report regarding market or economic trends or the factors influencing the Portfolio’s historical or future performance are statements of opinion as of the date of this report.
| Pioneer Fund VCT Portfolio | Pioneer Variable Contracts Trust |
Schedule of Investments 12/31/23
| Shares | | | | | | Value |
| | UNAFFILIATED ISSUERS — 99.9% | |
| | Common Stocks — 99.6% of Net Assets | |
| | Banks — 10.2% | |
| 151,604 | Citizens Financial Group, Inc. | $ 5,024,157 |
| 133,321 | Truist Financial Corp. | 4,922,211 |
| 71,992 | US Bancorp | 3,115,814 |
| | Total Banks | $ 13,062,182 |
| | Biotechnology — 5.0% | |
| 2,850(a) | Regeneron Pharmaceuticals, Inc. | $ 2,503,126 |
| 9,383(a) | Vertex Pharmaceuticals, Inc. | 3,817,849 |
| | Total Biotechnology | $ 6,320,975 |
| | Broadline Retail — 3.1% | |
| 25,942(a) | Amazon.com, Inc. | $ 3,941,627 |
| | Total Broadline Retail | $ 3,941,627 |
| | Capital Markets — 5.8% | |
| 14,648 | CME Group, Inc. | $ 3,084,869 |
| 7,734 | Goldman Sachs Group, Inc. | 2,983,545 |
| 2,321 | MSCI, Inc. | 1,312,874 |
| | Total Capital Markets | $ 7,381,288 |
| | Commercial Services & Supplies — 1.1% | |
| 16,819 | Veralto Corp. | $ 1,383,531 |
| | Total Commercial Services & Supplies | $ 1,383,531 |
| | Communications Equipment — 1.9% | |
| 10,279(a) | Arista Networks, Inc. | $ 2,420,807 |
| | Total Communications Equipment | $ 2,420,807 |
| | Construction Materials — 5.8% | |
| 12,665 | Martin Marietta Materials, Inc. | $ 6,318,695 |
| 4,676 | Vulcan Materials Co. | 1,061,499 |
| | Total Construction Materials | $ 7,380,194 |
| | Consumer Staples Distribution & Retail — 4.4% | |
| 44,708(a) | BJ's Wholesale Club Holdings, Inc. | $ 2,980,235 |
| 4,034 | Costco Wholesale Corp. | 2,662,763 |
| | Total Consumer Staples Distribution & Retail | $ 5,642,998 |
| | Electrical Equipment — 2.1% | |
| 29,399 | ABB, Ltd. (A.D.R.) | $ 1,302,376 |
| 4,411 | Rockwell Automation, Inc. | 1,369,527 |
| | Total Electrical Equipment | $ 2,671,903 |
| | Entertainment — 3.6% | |
| 19,856 | Electronic Arts, Inc. | $ 2,716,500 |
| 19,902(a) | Live Nation Entertainment, Inc. | 1,862,827 |
| | Total Entertainment | $ 4,579,327 |
| | Financial Services — 2.6% | |
| 6,614 | Jack Henry & Associates, Inc. | $ 1,080,794 |
| 8,370 | Visa, Inc., Class A | 2,179,129 |
| | Total Financial Services | $ 3,259,923 |
8
The accompanying notes are an integral part of these financial statements.
| Pioneer Fund VCT Portfolio | Pioneer Variable Contracts Trust |
| Shares | | | | | | Value |
| | Ground Transportation — 0.6% | |
| 2,887 | Union Pacific Corp. | $ 709,105 |
| | Total Ground Transportation | $ 709,105 |
| | Hotels, Restaurants & Leisure — 2.2% | |
| 39,072(a) | Planet Fitness, Inc., Class A | $ 2,852,256 |
| | Total Hotels, Restaurants & Leisure | $ 2,852,256 |
| | Interactive Media & Services — 5.5% | |
| 49,967(a) | Alphabet, Inc., Class A | $ 6,979,890 |
| | Total Interactive Media & Services | $ 6,979,890 |
| | IT Services — 5.0% | |
| 7,112 | Accenture Plc, Class A | $ 2,495,672 |
| 14,984(a) | Akamai Technologies, Inc. | 1,773,356 |
| 13,165 | International Business Machines Corp. | 2,153,136 |
| | Total IT Services | $ 6,422,164 |
| | Life Sciences Tools & Services — 1.2% | |
| 6,353 | Danaher Corp. | $ 1,469,703 |
| | Total Life Sciences Tools & Services | $ 1,469,703 |
| | Machinery — 3.4% | |
| 14,509 | Caterpillar, Inc. | $ 4,289,876 |
| | Total Machinery | $ 4,289,876 |
| | Metals & Mining — 6.6% | |
| 117,562 | Freeport-McMoRan, Inc. | $ 5,004,614 |
| 79,369 | Teck Resources, Ltd., Class B | 3,354,928 |
| | Total Metals & Mining | $ 8,359,542 |
| | Oil, Gas & Consumable Fuels — 4.0% | |
| 25,492 | Chevron Corp. | $ 3,802,387 |
| 11,159 | EOG Resources, Inc. | 1,349,681 |
| | Total Oil, Gas & Consumable Fuels | $ 5,152,068 |
| | Pharmaceuticals — 2.2% | |
| 2,537 | Eli Lilly & Co. | $ 1,478,868 |
| 13,426 | Novo Nordisk AS (A.D.R.) | 1,388,920 |
| | Total Pharmaceuticals | $ 2,867,788 |
| | Semiconductors & Semiconductor Equipment — 8.0% | |
| 6,488(a) | Advanced Micro Devices, Inc. | $ 956,396 |
| 3,927 | KLA Corp. | 2,282,765 |
| 1,501 | Lam Research Corp. | 1,175,673 |
| 11,598 | NVIDIA Corp. | 5,743,562 |
| | Total Semiconductors & Semiconductor Equipment | $ 10,158,396 |
| | Software — 7.7% | |
| 2,239(a) | Adobe, Inc. | $ 1,335,787 |
| 22,654 | Microsoft Corp. | 8,518,810 |
| | Total Software | $ 9,854,597 |
| | Specialty Retail — 2.1% | |
| 7,816 | Home Depot, Inc. | $ 2,708,635 |
| | Total Specialty Retail | $ 2,708,635 |
The accompanying notes are an integral part of these financial statements.
9
| Pioneer Fund VCT Portfolio | Pioneer Variable Contracts Trust |
Schedule of Investments 12/31/23 (continued)
| Shares | | | | | | Value |
| | Technology Hardware, Storage & Peripherals — 5.5% | |
| 36,610 | Apple, Inc. | $ 7,048,523 |
| | Total Technology Hardware, Storage & Peripherals | $ 7,048,523 |
| | Total Common Stocks
(Cost $81,644,978) | $126,917,298 |
|
| |
| | SHORT TERM INVESTMENTS — 0.3% of Net Assets | |
| | Open-End Fund — 0.3% | |
| 407,625(b) | Dreyfus Government Cash Management,
Institutional Shares, 5.25% | $ 407,625 |
| | | | | | | $ 407,625 |
| | TOTAL SHORT TERM INVESTMENTS
(Cost $407,625) | $ 407,625 |
| | TOTAL INVESTMENTS IN UNAFFILIATED ISSUERS — 99.9%
(Cost $82,052,603) | $127,324,923 |
| | OTHER ASSETS AND LIABILITIES — 0.1% | $ 188,163 |
| | net assets — 100.0% | $ 127,513,086 |
| | | | | | | |
| (A.D.R.) | American Depositary Receipts. |
| (a) | Non-income producing security. |
| (b) | Rate periodically changes. Rate disclosed is the 7-day yield at December 31, 2023. |
Purchases and sales of securities (excluding short-term investments) for the year ended December 31, 2023, aggregated $75,587,719 and $93,466,353, respectively.
At December 31, 2023, the net unrealized appreciation on investments based on cost for federal tax purposes of $83,370,023 was as follows:
| Aggregate gross unrealized appreciation for all investments in which there is an excess of value over tax cost | $$46,140,022 |
| Aggregate gross unrealized depreciation for all investments in which there is an excess of tax cost over value | (2,185,122) |
| Net unrealized appreciation | $ 43,954,900 |
Various inputs are used in determining the value of the Portfolio's investments. These inputs are summarized in the three broad levels below.
| Level 1 | – | unadjusted quoted prices in active markets for identical securities. |
| Level 2 | – | other significant observable inputs (including quoted prices for similar securities, interest rates, prepayment speeds, credit risks, etc.). See Notes to Financial Statements — Note 1A. |
| Level 3 | – | significant unobservable inputs (including the Adviser's own assumptions in determining fair value of investments). See Notes to Financial Statements — Note 1A. |
The following is a summary of the inputs used as of December 31, 2023 in valuing the Portfolio's investments:
| | Level 1 | Level 2 | Level 3 | Total |
| Common Stocks | $126,917,298 | $ — | $ — | $126,917,298 |
| Open-End Fund | 407,625 | — | — | 407,625 |
| Total Investments in Securities | $127,324,923 | $— | $— | $127,324,923 |
During the year ended December 31, 2023, there were no transfers in or out of Level 3.
10
The accompanying notes are an integral part of these financial statements.
| Pioneer Fund VCT Portfolio | Pioneer Variable Contracts Trust |
Statement of Assets and Liabilities 12/31/23
| ASSETS: | |
| Investments in unaffiliated issuers, at value (cost $82,052,603) | $127,324,923 |
| Cash | 5,794 |
| Receivables — | |
| Investment securities sold | 346,055 |
| Portfolio shares sold | 24,373 |
| Dividends | 185,378 |
| Interest | 2,169 |
| Total assets | $127,888,692 |
| LIABILITIES: | |
| Payables — | |
| Investment securities purchased | $244,260 |
| Portfolio shares repurchased | 42,216 |
| Trustees' fees | 190 |
| Professional fees | 48,720 |
| Printing fees | 13,525 |
| Management fees | 11,407 |
| Administrative expenses | 4,875 |
| Distribution fees | 723 |
| Accrued expenses | 9,690 |
| Total liabilities | $ 375,606 |
| NET ASSETS: | |
| Paid-in capital | $76,438,053 |
| Distributable earnings | 51,075,033 |
| Net assets | $ 127,513,086 |
| NET ASSET VALUE PER SHARE: | |
| No par value (unlimited number of shares authorized) | |
| Class l (based on $106,495,830/6,653,655 shares) | $ 16.01 |
| Class ll (based on $21,017,256/1,298,515 shares) | $ 16.19 |
The accompanying notes are an integral part of these financial statements.
11
| Pioneer Fund VCT Portfolio | Pioneer Variable Contracts Trust |
FOR THE YEAR ENDED 12/31/23
| INVESTMENT INCOME: | | | |
| Dividends from unaffiliated issuers (net of foreign taxes withheld $4,925) | $ 1,959,941 | | |
| Interest from unaffiliated issuers | 1,094 | | |
| Total Investment Income | | | $ 1,961,035 |
| EXPENSES: | | | |
| Management fees | $ 772,330 | | |
| Administrative expenses | 38,675 | | |
| Distribution fees | | | |
| Class ll | 51,068 | | |
| Custodian fees | 924 | | |
| Professional fees | 69,568 | | |
| Printing expense | 24,103 | | |
| Officers' and Trustees' fees | 8,545 | | |
| Insurance expense | 2,151 | | |
| Miscellaneous | 36,461 | | |
| Total expenses | | | $ 1,003,825 |
| Net investment income | | | $ 957,210 |
| REALIZED AND UNREALIZED GAIN (LOSS) ON INVESTMENTS: | | | |
| Net realized gain (loss) on: | | | |
| Investments in unaffiliated issuers | $ 6,993,714 | | |
| Other assets and liabilities denominated in foreign currencies | (877) | | $ 6,992,837 |
| Change in net unrealized appreciation (depreciation) on: | | | |
| Investments in unaffiliated issuers | $22,475,884 | | |
| Other assets and liabilities denominated in foreign currencies | 1,164 | | $22,477,048 |
| Net realized and unrealized gain (loss) on investments | | | $29,469,885 |
| Net increase in net assets resulting from operations | | | $ 30,427,095 |
12
The accompanying notes are an integral part of these financial statements.
| Pioneer Fund VCT Portfolio | Pioneer Variable Contracts Trust |
Statements of Changes in Net Assets
| | Year
Ended
12/31/23 | | Year
Ended
12/31/22 |
| FROM OPERATIONS: | | | |
| Net investment income (loss) | $ 957,210 | | $ 812,448 |
| Net realized gain (loss) on investments | 6,992,837 | | 4,307,131 |
| Change in net unrealized appreciation (depreciation) on investments | 22,477,048 | | (35,705,540) |
| Net increase (decrease) in net assets resulting from operations | $ 30,427,095 | | $ (30,585,961) |
| DISTRIBUTIONS TO SHAREHOLDERS: | | | |
| Class l ($0.73 and $2.83 per share, respectively) | $ (4,942,625) | | $ (18,350,407) |
| Class ll ($0.69 and $2.79 per share, respectively) | (1,002,656) | | (3,744,196) |
| Total distributions to shareholders | $ (5,945,281) | | $ (22,094,603) |
| FROM PORTFOLIO SHARE TRANSACTIONS: | | | |
| Net proceeds from sales of shares | $ 8,255,427 | | $ 8,528,281 |
| Reinvestment of distributions | 5,945,281 | | 22,094,603 |
| Cost of shares repurchased | (26,408,038) | | (21,681,473) |
| Net increase (decrease) in net assets resulting from Portfolio share transactions | $ (12,207,330) | | $ 8,941,411 |
| Net increase (decrease) in net assets | $ 12,274,484 | | $ (43,739,153) |
| NET ASSETS: | | | |
| Beginning of year | $115,238,602 | | $158,977,755 |
| End of year | $ 127,513,086 | | $115,238,602 |
| | Year
Ended
12/31/23
Shares | | Year
Ended
12/31/23
Amount | | Year
Ended
12/31/22
Shares | | Year
Ended
12/31/22
Amount |
| Class l | | | | | | | |
| Shares sold | 324,831 | | $ 4,605,702 | | 163,563 | | $ 2,572,203 |
| Reinvestment of distributions | 345,682 | | 4,942,625 | | 1,430,043 | | 18,350,407 |
| Less shares repurchased | (1,262,432) | | (17,897,349) | | (1,072,180) | | (15,903,332) |
Net increase
(decrease) | (591,919) | | $ (8,349,022) | | 521,426 | | $ 5,019,278 |
| Class ll | | | | | | | |
| Shares sold | 250,602 | | $ 3,649,725 | | 355,269 | | $ 5,956,078 |
| Reinvestment of distributions | 69,421 | | 1,002,656 | | 289,223 | | 3,744,196 |
| Less shares repurchased | (587,612) | | (8,510,689) | | (370,904) | | (5,778,141) |
Net increase
(decrease) | (267,589) | | $ (3,858,308) | | 273,588 | | $ 3,922,133 |
The accompanying notes are an integral part of these financial statements.
13
| Pioneer Fund VCT Portfolio | Pioneer Variable Contracts Trust |
| | Year Ended
12/31/23 | | Year Ended
12/31/22 | | Year Ended
12/31/21 | | Year Ended
12/31/20 | | Year Ended
12/31/19 |
| Class l | | | | | | | | | |
| Net asset value, beginning of period | $ 13.05 | | $ 19.80 | | $ 16.83 | | $ 14.95 | | $ 13.52 |
| Increase (decrease) from investment operations: | | | | | | | | | |
| Net investment income (loss)(a) | 0.12 | | 0.10 | | 0.05 | | 0.11 | | 0.16 |
| Net realized and unrealized gain (loss) on investments | 3.57 | | (4.02) | | 4.49 | | 3.19 | | 3.83 |
| Net increase (decrease) from investment operations | $ 3.69 | | $ (3.92) | | $ 4.54 | | $ 3.30 | | $ 3.99 |
| Distributions to shareholders: | | | | | | | | | |
| Net investment income | (0.13) | | (0.10) | | (0.06) | | (0.11) | | (0.15) |
| Net realized gain | (0.60) | | (2.73) | | (1.51) | | (1.31) | | (2.41) |
| Total distributions | $ (0.73) | | $ (2.83) | | $ (1.57) | | $ (1.42) | | $ (2.56) |
| Net increase (decrease) in net asset value | $ 2.96 | | $ (6.75) | | $ 2.97 | | $ 1.88 | | $ 1.43 |
| Net asset value, end of period | $ 16.01 | | $ 13.05 | | $ 19.80 | | $ 16.83 | | $ 14.95 |
| Total return(b) | 28.93% | | (19.50)% | | 27.98% | | 24.28% | | 31.33% |
| Ratio of net expenses to average net assets | 0.80% | | 0.76% | | 0.79% | | 0.79% | | 0.82% |
| Ratio of net investment income (loss) to average net assets | 0.85% | | 0.65% | | 0.28% | | 0.77% | | 1.08% |
| Portfolio turnover rate | 64% | | 53% | | 87% | | 91% | | 70% |
| Net assets, end of period (in thousands) | $106,496 | | $94,581 | | $133,162 | | $116,401 | | $99,853 |
| | |
| (a) | The per-share data presented above is based on the average shares outstanding for the period presented. |
| (b) | Assumes initial investment at net asset value at the beginning of each period, reinvestment of all distributions and the complete redemption of the investment at net asset value at the end of each period. |
NOTE: The above financial highlights do not reflect the deduction of non-portfolio expenses associated with variable insurance products, such as mortality and expense risk charges, separate account charges, and sales charges.
14
The accompanying notes are an integral part of these financial statements.
| Pioneer Fund VCT Portfolio | Pioneer Variable Contracts Trust |
| | Year Ended
12/31/23 | | Year Ended
12/31/22 | | Year Ended
12/31/21 | | Year Ended
12/31/20 | | Year Ended
12/31/19 |
| Class ll | | | | | | | | | |
| Net asset value, beginning of period | $ 13.19 | | $ 19.97 | | $ 16.97 | | $ 15.06 | | $ 13.60 |
| Increase (decrease) from investment operations: | | | | | | | | | |
| Net investment income (loss)(a) | 0.08 | | 0.06 | | 0.01 | | 0.08 | | 0.12 |
| Net realized and unrealized gain (loss) on investments | 3.61 | | (4.05) | | 4.52 | | 3.21 | | 3.86 |
| Net increase (decrease) from investment operations | $ 3.69 | | $ (3.99) | | $ 4.53 | | $ 3.29 | | $ 3.98 |
| Distributions to shareholders: | | | | | | | | | |
| Net investment income | (0.09) | | (0.06) | | (0.02) | | (0.07) | | (0.11) |
| Net realized gain | (0.60) | | (2.73) | | (1.51) | | (1.31) | | (2.41) |
| Total distributions | $ (0.69) | | $ (2.79) | | $ (1.53) | | $ (1.38) | | $ (2.52) |
| Net increase (decrease) in net asset value | $ 3.00 | | $ (6.78) | | $ 3.00 | | $ 1.91 | | $ 1.46 |
| Net asset value, end of period | $ 16.19 | | $ 13.19 | | $ 19.97 | | $ 16.97 | | $ 15.06 |
| Total return(b) | 28.58% | | (19.68)% | | 27.65% | | 23.96% | | 31.03% |
| Ratio of net expenses to average net assets | 1.05% | | 1.01% | | 1.04% | | 1.04% | | 1.07% |
| Ratio of net investment income (loss) to average net assets | 0.59% | | 0.41% | | 0.03% | | 0.50% | | 0.83% |
| Portfolio turnover rate | 64% | | 53% | | 87% | | 91% | | 70% |
| Net assets, end of period (in thousands) | $21,017 | | $20,657 | | $25,816 | | $18,162 | | $13,638 |
| | |
| (a) | The per-share data presented above is based on the average shares outstanding for the period presented. |
| (b) | Assumes initial investment at net asset value at the beginning of each period, reinvestment of all distributions and the complete redemption of the investment at net asset value at the end of each period. |
NOTE: The above financial highlights do not reflect the deduction of non-portfolio expenses associated with variable insurance products, such as mortality and expense risk charges, separate account charges, and sales charges.
The accompanying notes are an integral part of these financial statements.
15
| Pioneer Fund VCT Portfolio | Pioneer Variable Contracts Trust |
Notes to Financial Statements 12/31/23
1. Organization and Significant Accounting Policies
Pioneer Fund VCT Portfolio (the “Portfolio”) is one of 7 portfolios comprising Pioneer Variable Contracts Trust (the “Trust”), a Delaware statutory trust. The Portfolio is registered under the Investment Company Act of 1940, as amended (the "1940 Act") as a diversified, open-end management investment company. The investment objectives of the Portfolio are reasonable income and capital growth.
The Portfolio offers two classes of shares designated as Class I and Class II shares. Each class of shares represents an interest in the same portfolio of investments of the Portfolio and has identical rights (based on relative net asset values) to assets and liquidation proceeds. Share classes can bear different rates of class-specific fees and expenses, such as transfer agent and distribution fees. Differences in class-specific fees and expenses will result in differences in net investment income and, therefore, the payment of different dividends from net investment income earned by each class. The Amended and Restated Declaration of Trust of the Trust gives the Board of Trustees the flexibility to specify either per-share voting or dollar-weighted voting when submitting matters for shareholder approval. Under per-share voting, each share of a class of the Portfolio is entitled to one vote. Under dollar-weighted voting, a shareholder’s voting power is determined not by the number of shares owned, but by the dollar value of the shares on the record date. Each share class has exclusive voting rights with respect to matters affecting only that class, including with respect to the distribution plan for that class. There is no distribution plan for Class I shares.
Portfolio shares may be purchased only by insurance companies for the purpose of funding variable annuity and variable life insurance contracts or by qualified pension and retirement plans.
Amundi Asset Management US, Inc., an indirect, wholly owned subsidiary of Amundi and Amundi’s wholly owned subsidiary, Amundi USA, Inc., serves as the Portfolio’s investment adviser (the “Adviser”). Amundi Distributor US, Inc., an affiliate of the Adviser, serves as the Portfolio’s distributor (the “Distributor”).
The Portfolio is required to comply with Rule 18f-4 under the 1940 Act, which governs the use of derivatives by registered investment companies. Rule 18f-4 permits funds to enter into derivatives transactions (as defined in Rule 18f-4) and certain other transactions notwithstanding the restrictions on the issuance of “senior securities” under Section 18 of the 1940 Act. Rule 18f-4 requires a fund to establish and maintain a comprehensive derivatives risk management program, appoint a derivatives risk manager and comply with a relative or absolute limit on fund leverage risk calculated based on value-at-risk (“VaR”), unless the Portfolio uses derivatives in only a limited manner (a "limited derivatives user"). The Portfolio is currently a limited derivatives user for purposes of Rule 18f-4.
The Portfolio is an investment company and follows investment company accounting and reporting guidance under U.S. Generally Accepted Accounting Principles (“U.S. GAAP”). U.S. GAAP requires the management of the Portfolio to make estimates and assumptions that affect the reported amounts of assets and liabilities, the disclosure of contingent assets and liabilities at the date of the financial statements, and the reported amounts of income, expenses and gain or loss on investments during the reporting period. Actual results could differ from those estimates.
The following is a summary of significant accounting policies followed by the Portfolio in the preparation of its financial statements:
| A. | Security Valuation |
| | The net asset value of the Portfolio is computed once daily, on each day the New York Stock Exchange (“NYSE”) is open, as of the close of regular trading on the NYSE. |
| | Equity securities that have traded on an exchange are valued by using the last sale price on the principal exchange where they are traded. Equity securities that have not traded on the date of valuation, or securities for which sale prices are not available, generally are valued using the mean between the last bid and asked prices or, if both last bid and asked prices are not available, at the last quoted bid price. Last sale and bid and asked prices are provided by independent third party pricing services. In the case of equity securities not traded on an exchange, prices are typically determined by independent third party pricing services using a variety of techniques and methods. |
| | The value of foreign securities is translated into U.S. dollars based on foreign currency exchange rate quotations supplied by a third party pricing source. Trading in non-U.S. equity securities is substantially completed each day at various times prior to the close of the NYSE. The values of such securities used in computing the net asset value of the Portfolio's shares are determined as of such times. The Adviser may use a fair value model developed by an independent pricing service to value non-U.S. equity securities. |
| Pioneer Fund VCT Portfolio | Pioneer Variable Contracts Trust |
| | Shares of open-end registered investment companies (including money market mutual funds) are valued at such funds' net asset value. |
| | Securities for which independent pricing services or broker-dealers are unable to supply prices or for which market prices and/or quotations are not readily available or are considered to be unreliable are valued by a fair valuation team comprised of certain personnel of the Adviser. The Adviser is designated as the valuation designee for the Portfolio pursuant to Rule 2a-5 under the 1940 Act. The Adviser’s fair valuation team is responsible for monitoring developments that may impact fair valued securities. |
| | Inputs used when applying fair value methods to value a security may include credit ratings, the financial condition of the company, current market conditions and comparable securities. The Adviser may use fair value methods if it is determined that a significant event has occurred after the close of the exchange or market on which the security trades and prior to the determination of the Portfolio's net asset value. Examples of a significant event might include political or economic news, corporate restructurings, natural disasters, terrorist activity or trading halts. Thus, the valuation of the Portfolio's securities may differ significantly from exchange prices, and such differences could be material. |
| B. | Investment Income and Transactions |
| | Dividend income is recorded on the ex-dividend date, except that certain dividends from foreign securities where the ex-dividend date may have passed are recorded as soon as the Portfolio becomes aware of the ex-dividend data in the exercise of reasonable diligence. |
| | Interest income, including interest on income-bearing cash accounts, is recorded on the accrual basis. Dividend and interest income are reported net of unrecoverable foreign taxes withheld at the applicable country rates and net of income accrued on defaulted securities. |
| | Interest and dividend income payable by delivery of additional shares is reclassified as PIK (payment-in-kind) income upon receipt and is included in interest and dividend income, respectively. |
| | Security transactions are recorded as of trade date. Gains and losses on sales of investments are calculated on the identified cost method for both financial reporting and federal income tax purposes. |
| C. | Foreign Currency Translation |
| | The books and records of the Portfolio are maintained in U.S. dollars. Amounts denominated in foreign currencies are translated into U.S. dollars using current exchange rates. |
| | Net realized gains and losses on foreign currency transactions, if any, represent, among other things, the net realized gains and losses on foreign currency exchange contracts, disposition of foreign currencies and the difference between the amount of income accrued and the U.S. dollars actually received. Further, the effects of changes in foreign currency exchange rates on investments are not segregated on the Statement of Operations from the effects of changes in the market prices of those securities, but are included with the net realized and unrealized gain or loss on investments. |
| D. | Federal Income Taxes |
| | It is the Portfolio's policy to comply with the requirements of the Internal Revenue Code applicable to regulated investment companies and to distribute all of its net taxable income and net realized capital gains, if any, to its shareholders. Therefore, no provision for federal income taxes is required. As of December 31, 2023, the Portfolio did not accrue any interest or penalties with respect to uncertain tax positions, which, if applicable, would be recorded as an income tax expense on the Statement of Operations. Tax returns filed within the prior three years remain subject to examination by federal and state tax authorities. |
| | The amount and character of income and capital gain distributions to shareholders are determined in accordance with federal income tax rules, which may differ from U.S. GAAP. Distributions in excess of net investment income or net realized gains are temporary over distributions for financial statement purposes resulting from differences in the recognition or classification of income or distributions for financial statement and tax purposes. Capital accounts within the financial statements are adjusted for permanent book/tax differences to reflect tax character, but are not adjusted for temporary differences. |
| | A portion of the dividend income recorded by the Portfolio is from distributions by publicly traded real estate investment trusts ("REITs"), and such distributions for tax purposes may also consist of capital gains and return of capital. The actual return of capital and capital gains portions of such distributions will be determined by formal notifications from |
| Pioneer Fund VCT Portfolio | Pioneer Variable Contracts Trust |
Notes to Financial Statements 12/31/23 (continued)
| | the REITs subsequent to the calendar year-end. Distributions received from the REITs that are determined to be a return
of capital are recorded by the Portfolio as a reduction of the cost basis of the securities held and those determined to be capital gain are reflected as such on the Statement of Operations. |
| | The tax character of distributions paid during the years ended December 31, 2023 and December 31, 2022, was as follows: |
| | 2023 | 2022 |
| Distributions paid from: | | |
| Ordinary income | $ 970,591 | $ 9,001,013 |
| Long-term capital gains | 4,974,690 | 13,093,590 |
| Total | $5,945,281 | $ 22,094,603 |
The following shows the components of distributable earnings (losses) on a federal income tax basis at December 31, 2023:
| | 2023 |
| Distributable earnings/(losses): | |
| Undistributed ordinary income | $ 1,499,911 |
| Undistributed long-term capital gains | 5,620,221 |
| Other book/tax temporary differences | 1 |
| Net unrealized appreciation | 43,954,900 |
| Total | $ 51,075,033 |
The difference between book-basis and tax-basis net unrealized appreciation is attributable to the tax deferral of losses on wash sales.
| E. | Portfolio Shares and Class Allocations |
| | The Portfolio records sales and repurchases of its shares as of trade date. Distribution fees for Class II shares are calculated based on the average daily net asset value attributable to Class II shares of the Portfolio (see Note 5). Class I shares do not pay distribution fees. |
| | Income, common expenses (excluding transfer agent and distribution fees) and realized and unrealized gains and losses are calculated at the Portfolio level and allocated daily to each class of shares based on its respective percentage of the adjusted net assets at the beginning of the day. |
| | All expenses and fees paid to the Portfolio’s transfer agent for its services are allocated among the classes of shares based on the number of accounts in each class and the ratable allocation of related out-of-pocket expenses (see Note 4). |
| | Dividends and distributions to shareholders are recorded on the ex-dividend date. Distributions paid by the Portfolio with respect to each class of shares are calculated in the same manner and at the same time, except that net investment income dividends to Class I and Class II shares can reflect different transfer agent and distribution expense rates. |
| F. | Risks |
| | The value of securities held by the Portfolio may go up or down, sometimes rapidly or unpredictably, due to general market conditions, such as real or perceived adverse economic, political or regulatory conditions, recessions, the spread of infectious illness or other public health issues, inflation, changes in interest rates, armed conflict such as between Russia and Ukraine or in the Middle East, sanctions against Russia, other nations or individuals or companies and possible countermeasures, lack of liquidity in the bond markets or adverse investor sentiment. In the past several years, financial markets have experienced increased volatility, depressed valuations, decreased liquidity and heightened uncertainty. These conditions may continue, recur, worsen or spread. Inflation and interest rates have increased and may rise further. These circumstances could adversely affect the value and liquidity of the Portfolio's investments and negatively impact the Portfolio's performance. |
| | The long-term impact of the COVID-19 pandemic and its subsequent variants on economies, markets, industries and individual issuers, are not known. Some sectors of the economy and individual issuers have experienced or may experience particularly large losses. Periods of extreme volatility in the financial markets, reduced liquidity of many instruments, increased government debt, inflation, and disruptions to supply chains, consumer demand and employee |
| Pioneer Fund VCT Portfolio | Pioneer Variable Contracts Trust |
| | availability, may continue for some time. Following Russia's invasion of Ukraine, Russian securities lost all, or nearly all, their market value. Other securities or markets could be similarly affected by past or future political, geopolitical or other events or conditions. |
| | Governments and central banks, including the U.S. Federal Reserve, have taken extraordinary and unprecedented actions to support local and global economies and the financial markets. These actions have resulted in significant expansion of public debt, including in the U.S. The consequences of high public debt, including its future impact on the economy and securities markets, may not be known for some time. |
| | The U.S. and other countries are periodically involved in disputes over trade and other matters, which may result in tariffs, investment restrictions and adverse impacts on affected companies and securities. For example, the U.S. has imposed tariffs and other trade barriers on Chinese exports, has restricted sales of certain categories of goods to China, and has established barriers to investments in China. Trade disputes may adversely affect the economies of the U.S. and its trading partners, as well as companies directly or indirectly affected and financial markets generally. If the political climate between the U.S. and China does not improve or continues to deteriorate, if China were to attempt unification of Taiwan by force, or if other geopolitical conflicts develop or get worse, economies, markets and individual securities may be severely affected both regionally and globally, and the value of the Portfolio's assets may go down. |
| | At times, the Portfolio’s investments may represent industries or industry sectors that are interrelated or have common risks, making the Portfolio more susceptible to any economic, political, or regulatory developments or other risks affecting those industries and sectors. The Portfolio’s investments in foreign markets and countries with limited developing markets may subject the Portfolio to a greater degree of risk than investments in a developed market. These risks include disruptive political or economic conditions and the imposition of adverse governmental laws or currency exchange restrictions. |
| | The Portfolio’s investments in foreign markets and countries with limited developing markets may subject the Portfolio to a greater degree of risk than investments in a developed market. These risks include disruptive political or economic conditions, military conflicts and sanctions, terrorism, sustained economic downturns, financial instability, less liquid trading markets, extreme price volatility, currency risks, reduction of government or central bank support, inadequate accounting standards, tariffs, tax disputes or other tax burdens, nationalization or expropriation of assets and the imposition of adverse governmental laws, arbitrary application of laws and regulations or lack of rule of law and investment and repatriation restrictions. Lack of information and less market regulation also may affect the value of these securities. Withholding and other non-U.S. taxes may decrease the Portfolio’s return. Non-U.S. issuers may be located in parts of the world that have historically been prone to natural disasters. Investing in depositary receipts is subject to many of the same risks as investing directly in non-U.S. issuers. Depositary receipts may involve higher expenses and may trade at a discount (or premium) to the underlying security. |
| | The Portfolio may invest in REIT securities, the value of which can fall for a variety of reasons, such as declines in rental income, fluctuating interest rates, poor property management, environmental liabilities, uninsured damage, increased competition, or changes in real estate tax laws. |
| | Russia launched a large-scale invasion of Ukraine on February 24, 2022. In response to the military action by Russia, various countries, including the U.S., the United Kingdom, and European Union issued broad-ranging economic sanctions against Russia and Belarus and certain companies and individuals. Since then, Russian securities have lost all, or nearly all, their market value, and many other issuers, securities and markets have been adversely affected. The United States and other countries may impose sanctions on other countries, companies and individuals in light of Russia’s military invasion. The extent and duration of the military action or future escalation of such hostilities, the extent and impact of existing and future sanctions, market disruptions and volatility, and the result of any diplomatic negotiations cannot be predicted. These and any related events could have a significant impact on the value and liquidity of certain Portfolio investments, on Portfolio performance and the value of an investment in the Portfolio, particularly with respect to securities and commodities, such as oil, natural gas and food commodities, as well as other sectors with exposure to Russian issuers or issuers in other countries affected by the invasion, and are likely to have collateral impacts on market sectors globally. |
| | With the increased use of technologies such as the Internet to conduct business, the Portfolio is susceptible to operational, information security and related risks. While the Portfolio’s Adviser has established business continuity plans in the event of, and risk management systems to prevent, limit or mitigate, such cyber-attacks, there are inherent limitations in such plans and systems, including the possibility that certain risks have not been identified. Furthermore, the Portfolio cannot control the cybersecurity plans and systems put in place by service providers to the Portfolio such as |
| Pioneer Fund VCT Portfolio | Pioneer Variable Contracts Trust |
Notes to Financial Statements 12/31/23 (continued)
| | the Portfolio's custodian and accounting agent, and the Portfolio’s transfer agent. In addition, many beneficial owners of Portfolio shares hold them through accounts at broker-dealers, retirement platforms and other financial market participants over which neither the Portfolio nor the Adviser exercises control. Each of these may in turn rely on service providers to them, which are also subject to the risk of cyber-attacks. Cybersecurity failures or breaches at the Adviser or the Portfolio’s service providers or intermediaries have the ability to cause disruptions and impact business operations, potentially resulting in financial losses, interference with the Portfolio’s ability to calculate its net asset value, impediments to trading, the inability of Portfolio shareholders to effect share purchases, redemptions or exchanges or receive distributions, loss of or unauthorized access to private shareholder information and violations of applicable privacy and other laws, regulatory fines, penalties, reputational damage, or additional compliance costs. Such costs and losses may not be covered under any insurance. In addition, maintaining vigilance against cyber-attacks may involve substantial costs over time, and system enhancements may themselves be subject to cyber-attacks. |
| | The Portfolio’s prospectus contains unaudited information regarding the Portfolio’s principal risks. Please refer to that document when considering the Portfolio’s principal risks. |
2. Management Agreement
The Adviser manages the Portfolio. Management fees payable under the Portfolio's Investment Management Agreement with the Adviser are calculated daily and paid monthly at the annual rate of 0.65% of the Portfolio’s average daily net assets. For the year ended December 31, 2023, the effective management fee was equivalent to 0.65% of the Portfolio’s average daily net assets.
In addition, under the management and administration agreements, certain other services and costs, including accounting, regulatory reporting and insurance premiums, are paid by the Portfolio as administrative reimbursements. Reflected on the Statement of Assets and Liabilities is $11,407 in management fees payable to the Adviser at December 31, 2023.
3. Compensation of Officers and Trustees
The Portfolio pays an annual fee to its Trustees. The Adviser reimburses the Portfolio for fees paid to the Interested Trustees. Except for the chief compliance officer, the Portfolio does not pay any salary or other compensation to its officers. The Portfolio pays a portion of the chief compliance officer's compensation for his services as the Portfolio's chief compliance officer. Amundi US pays the remaining portion of the chief compliance officer's compensation. For the year ended December 31, 2023, the Portfolio paid $8,545 in Officers' and Trustees' compensation, which is reflected on the Statement of Operations as Officers' and Trustees' fees. At December 31, 2023, on its Statement of Assets and Liabilities, the Portfolio had a payable for Trustees' fees of $190 and a payable for administrative expenses of $4,875, which includes the payable for Officers' compensation.
4. Transfer Agent
BNY Mellon Investment Servicing (US) Inc. serves as the transfer agent to the Portfolio at negotiated rates. Transfer agent fees and payables shown on the Statement of Operations and the Statement of Assets and Liabilities, respectively, include sub-transfer agent expenses incurred through the Portfolio’s omnibus relationship contracts.
5. Distribution Plan
The Portfolio has adopted a distribution plan (the “Plan”) pursuant to Rule 12b-1 under the 1940 Act with respect to Class II shares. Pursuant to the Plan, the Portfolio pays the Distributor a distribution fee of 0.25% of the average daily net assets attributable to Class II shares to compensate the Distributor for (1) distribution services and (2) personal and account maintenance services performed and expenses incurred by the Distributor in connection with the Portfolio’s Class II shares. Reflected on the Statement of Assets and Liabilities is $723 in distribution fees payable to the Distributor at December 31, 2023.
| Pioneer Fund VCT Portfolio | Pioneer Variable Contracts Trust |
Report of Independent Registered Public Accounting Firm
To the Board of Trustees of Pioneer Variable Contracts Trust and the Shareholders of Pioneer Fund VCT Portfolio:
Opinion on the Financial Statements
We have audited the accompanying statement of assets and liabilities of Pioneer Fund VCT Portfolio (the “Portfolio”) (one of the portfolios constituting Pioneer Variable Contracts Trust (the “Trust”)), including the schedule of investments, as of December 31, 2023, and the related statement of operations for the year then ended, the statements of changes in net assets for each of the two years in the period then ended, the financial highlights for each of the five years in the period then ended and the related notes (collectively referred to as the “financial statements”). In our opinion, the financial statements present fairly, in all material respects, the financial position of the Portfolio (one of the portfolios constituting Pioneer Variable Contracts Trust) at December 31, 2023, the results of its operations for the year then ended, the changes in its net assets for each of the two years in the period then ended, and its financial highlights for each of the five years in the period then ended in conformity with U.S. generally accepted accounting principles.
Basis for Opinion
These financial statements are the responsibility of the Trust’s management. Our responsibility is to express an opinion on the Portfolio’s financial statements based on our audits. We are a public accounting firm registered with the Public Company Accounting Oversight Board (United States) ("PCAOB") and are required to be independent with respect to the Trust in accordance with the U.S. federal securities laws and the applicable rules and regulations of the Securities and Exchange Commission and the PCAOB.
We conducted our audits in accordance with the standards of the PCAOB. Those standards require that we plan and perform the audit to obtain reasonable assurance about whether the financial statements are free of material misstatement, whether due to error or fraud. The Trust is not required to have, nor were we engaged to perform, an audit of the Trust’s internal control over financial reporting. As part of our audits, we are required to obtain an understanding of internal control over financial reporting, but not for the purpose of expressing an opinion on the effectiveness of the Trust’s internal control over financial reporting. Accordingly, we express no such opinion.
Our audits included performing procedures to assess the risks of material misstatement of the financial statements, whether due to error or fraud, and performing procedures that respond to those risks. Such procedures included examining, on a test basis, evidence regarding the amounts and disclosures in the financial statements. Our procedures included confirmation of securities owned as of December 31, 2023, by correspondence with the custodian, brokers, and others; when replies were not received from brokers and others, we performed other auditing procedures. Our audits also included evaluating the accounting principles used and significant estimates made by management, as well as evaluating the overall presentation of the financial statements. We believe that our audits provide a reasonable basis for our opinion.
We have served as the auditor of one or more investment companies in the Pioneer family of funds since 2017.
Boston, Massachusetts
February 20, 2024
| Pioneer Fund VCT Portfolio | Pioneer Variable Contracts Trust |
Additional Information (unaudited)
For the year ended December 31, 2023, certain dividends paid by the Portfolio may be subject to a maximum tax rate of 20%. The Portfolio intends to designate up to the maximum amount of such dividends allowable as taxed at a maximum rate of 20%. Complete information will be computed and reported in conjunction with your 2023 Form 1099-DIV.
The Portfolio designated $5,620,392 as long-term capital gains distributions during the year ended December 31, 2023. Distributable long-term gains are based on net realized long-term gains determined on a tax basis and may differ from such amounts for financial reporting purposes.
The qualifying percentage of the Portfolio’s ordinary income dividends for the purpose of the corporate dividends received deduction was 100.00%.
| Pioneer Fund VCT Portfolio | Pioneer Variable Contracts Trust |
Approval of Renewal of Investment Management Agreement
Amundi Asset Management US, Inc. (“Amundi US”) serves as the investment adviser to Pioneer Fund VCT Portfolio (the “Portfolio”) pursuant to an investment management agreement between Amundi US and the Portfolio. In order for Amundi US to remain the investment adviser of the Portfolio, the Trustees of the Portfolio, including a majority of the Portfolio’s Independent Trustees, must determine annually whether to renew the investment management agreement for the Portfolio.
The contract review process began in January 2023 as the Trustees of the Portfolio agreed on, among other things, an overall approach and timeline for the process. Contract review materials were provided to the Trustees in March 2023, July 2023 and September 2023. In addition, the Trustees reviewed and discussed the Portfolio’s performance at regularly scheduled meetings throughout the year, and took into account other information related to the Portfolio provided to the Trustees at regularly scheduled meetings, in connection with the review of the Portfolio’s investment management agreement.
In March 2023, the Trustees, among other things, discussed the memorandum provided by Portfolio counsel that summarized the legal standards and other considerations that are relevant to the Trustees in their deliberations regarding the renewal of the investment management agreement, and reviewed and discussed the qualifications of the investment management teams for the Portfolio, as well as the level of investment by the Portfolio’s portfolio managers in the Portfolio. In July 2023, the Trustees, among other things, reviewed the Portfolio’s management fees and total expense ratios, the financial statements of Amundi US and its parent companies, profitability analyses provided by Amundi US, and analyses from Amundi US as to possible economies of scale. The Trustees also reviewed the profitability of the institutional business of Amundi US as compared to that of Amundi US’s fund management business, and considered the differences between the fees and expenses of the Portfolio and the fees and expenses of Amundi US’s institutional accounts, as well as the different services provided by Amundi US to the Portfolio and to the institutional accounts. The Trustees further considered contract review materials, including additional materials received in response to the Trustees’ request, in September 2023.
At a meeting held on September 19, 2023, based on their evaluation of the information provided by Amundi US and third parties, the Trustees of the Portfolio, including the Independent Trustees voting separately advised by independent counsel, unanimously approved the renewal of the investment management agreement for another year. In approving the renewal of the investment management agreement, the Trustees considered various factors that they determined were relevant, including the factors described below. The Trustees did not identify any single factor as the controlling factor in determining to approve the renewal of the agreement.
Nature, Extent and Quality of Services
The Trustees considered the nature, extent and quality of the services that had been provided by Amundi US to the Portfolio, taking into account the investment objective and strategy of the Portfolio. The Trustees also reviewed Amundi US’s investment approach for the Portfolio and its research process. The Trustees considered Amundi US’ integration of environmental, social and governance (ESG) considerations into its investment research process. The Trustees considered the resources of Amundi US and the personnel of Amundi US who provide investment management services to the Portfolio. They also reviewed the amount of non-Portfolio assets managed by the portfolio managers of the Portfolio. They considered the non-investment resources and personnel of Amundi US that are involved in Amundi US’s services to the Portfolio, including Amundi US’s compliance, risk management, and legal resources and personnel. The Trustees considered the compliance services being provided to the Portfolio by Amundi US and how Amundi US has addressed any compliance issues during the past year. The Trustees noted the substantial attention and high priority given by Amundi US’s senior management to the Pioneer Fund complex, including with respect to the increasing regulation to which the Pioneer Funds are subject.
The Trustees considered that Amundi US supervises and monitors the performance of the Portfolio’s service providers and provides the Portfolio with personnel (including Portfolio officers) and other resources that are necessary for the Portfolio’s business management and operations. The Trustees also considered that, as administrator, Amundi US is responsible for the administration of the Portfolio’s business and other affairs. The Trustees considered that the Portfolio reimburses Amundi US its pro rata share of Amundi US’s costs of providing administration services to the Pioneer Funds.
Based on these considerations, the Trustees concluded that the nature, extent and quality of services that had been provided by Amundi US to the Portfolio were satisfactory and consistent with the terms of the investment management agreement.
Performance of the Portfolio
In considering the Portfolio’s performance, the Trustees regularly review and discuss throughout the year data prepared by Amundi US and information comparing the Portfolio’s performance with the performance of its peer group of funds, as classified by Morningstar, Inc. (Morningstar), and with the performance of the Portfolio’s benchmark index. They also discuss the Portfolio’s performance with Amundi US on a regular basis. The Trustees’ regular reviews and discussions were factored into the Trustees’ deliberations concerning the renewal of the investment management agreement.
| Pioneer Fund VCT Portfolio | Pioneer Variable Contracts Trust |
Approval of Renewal of Investment Management Agreement (continued)
Management Fee and Expenses
The Trustees considered information showing the fees and expenses of the Portfolio in comparison to the management fees of its peer group of funds as classified by Morningstar and also to the expense ratios of a peer group of funds selected on the basis of criteria determined by the Independent Trustees for this purpose using data provided by Strategic Insight Mutual Fund Research and Consulting, LLC (Strategic Insight), an independent third party. The peer group comparisons referred to below are organized in quintiles. Each quintile represents one-fifth of the peer group. In all peer group comparisons referred to below, first quintile is most favorable to the Portfolio’s shareowners. The Trustees noted that they separately review and consider the impact of the Portfolio’s transfer agency and Portfolio- and Amundi US-paid expenses for sub-transfer agency and intermediary arrangements, and that the results of the most recent such review were considered in the consideration of the Portfolio’s expense ratio.
The Trustees considered that the Portfolio’s management fee for the most recent fiscal year was in the fourth quintile relative to the management fees paid by other funds in its Morningstar category for the comparable period. The Trustees noted Amundi US’s explanation of the reasons that the Portfolio’s management fee was in the fourth quintile relative to the management fees paid by other funds in its Morningstar category. The Trustees considered that the expense ratio of the Portfolio’s Class I shares for the most recent fiscal year was in the third quintile relative to its Strategic Insight peer group for the comparable period.
The Trustees reviewed management fees charged by Amundi US to institutional and other clients, including publicly offered European funds sponsored by Amundi US’s affiliates, unaffiliated U.S. registered investment companies (in a sub-advisory capacity), and unaffiliated foreign and domestic separate accounts. The Trustees also considered Amundi US’s costs in providing services to the Portfolio and Amundi US’s costs in providing services to the other clients and considered the differences in management fees and profit margins for fund and non-fund services. In evaluating the fees associated with Amundi US’s client accounts, the Trustees took into account the respective demands, resources and complexity associated with the Portfolio and other client accounts. The Trustees noted that, in some instances, the fee rates for those clients were lower than the management fee for the Portfolio and considered that, under the investment management and administration agreements with the Portfolio, Amundi US performs additional services for the Portfolio that it does not provide to those other clients or services that are broader in scope, including oversight of the Portfolio’s other service providers and activities related to compliance and the extensive regulatory and tax regimes to which the Portfolio is subject. The Trustees also considered the entrepreneurial risks associated with Amundi US’s management of the Portfolio.
The Trustees concluded that the management fee payable by the Portfolio to Amundi US was reasonable in relation to the nature and quality of the services provided by Amundi US.
Profitability
The Trustees considered information provided by Amundi US regarding the profitability of Amundi US with respect to the advisory services provided by Amundi US to the Portfolio, including the methodology used by Amundi US in allocating certain of its costs to the management of the Portfolio. The Trustees also considered Amundi US’s profit margin in connection with the overall operation of the Portfolio. They further reviewed the financial results, including the profit margins, realized by Amundi US from non-fund businesses. The Trustees considered Amundi US’s profit margins in comparison to the limited industry data available and noted that the profitability of any adviser was affected by numerous factors, including its organizational structure and method for allocating expenses. The Trustees concluded that Amundi US’s profitability with respect to the management of the Portfolio was not unreasonable.
Economies of Scale
The Trustees considered Amundi US’s views relating to economies of scale in connection with the Pioneer Funds as fund assets grow and the extent to which any such economies of scale are shared with the Portfolio and Portfolio shareholders. The Trustees recognize that economies of scale are difficult to identify and quantify, and that, among other factors that may be relevant, are the following: fee levels, expense subsidization, investment by Amundi US in research and analytical capabilities and Amundi US’s commitment and resource allocation to the Portfolio. The Trustees noted that profitability also may be an indicator of the availability of any economies of scale, although profitability may vary for other reasons including due to reductions in expenses. The Trustees concluded that economies of scale, if any, were being appropriately shared with the Portfolio.
Other Benefits
The Trustees considered the other benefits that Amundi US enjoys from its relationship with the Portfolio. The Trustees considered the character and amount of fees paid or to be paid by the Portfolio, other than under the investment management agreement, for services provided by Amundi US and its affiliates. The Trustees further considered the revenues and profitability of Amundi US’s businesses other than the fund business. To the extent applicable, the Trustees also
| Pioneer Fund VCT Portfolio | Pioneer Variable Contracts Trust |
considered the benefits to the Portfolio and to Amundi US and its affiliates from the use of “soft” commission dollars generated by the Portfolio to pay for research and brokerage services.
The Trustees considered that Amundi US is the principal U.S. asset management business of Amundi, which is one of the largest asset managers globally. Amundi’s worldwide asset management business manages over $2.1 trillion in assets (including the Pioneer Funds). The Trustees considered that Amundi US’s relationship with Amundi creates potential opportunities for Amundi US and Amundi that derive from Amundi US’s relationships with the Portfolio, including Amundi’s ability to market the services of Amundi US globally. The Trustees noted that Amundi US has access to additional research and portfolio management capabilities as a result of its relationship with Amundi and Amundi’s enhanced global presence that may contribute to an increase in the resources available to Amundi US. The Trustees considered that Amundi US and the Portfolio receive reciprocal intangible benefits from the relationship, including mutual brand recognition and, for the Portfolio, direct and indirect access to the resources of a large global asset manager. The Trustees concluded that any such benefits received by Amundi US as a result of its relationship with the Portfolio were reasonable.
Conclusion
After consideration of the factors described above as well as other factors, the Trustees, including the Independent Trustees, concluded that the investment management agreement for the Portfolio, including the fees payable thereunder, was fair and reasonable and voted to approve the proposed renewal of the investment management agreement.
| Pioneer Fund VCT Portfolio | Pioneer Variable Contracts Trust |
Trustees, Officers and Service Providers
Trustees and Officers
The Portfolio’s Trustees and officers are listed below, together with their principal occupations and other directorships they have held during at least the past five years. Trustees who are interested persons of the Portfolios within the meaning of the 1940 Act are referred to as Interested Trustees. Trustees who are not interested persons of the Portfolio are referred to as Independent Trustees. Each of the Trustees serves as a Trustee of each of the 47 U.S. registered investment portfolios for which Amundi US serves as investment adviser (the “Pioneer Funds”). The address for all Trustees and all officers of the Portfolios is 60 State Street, Boston, Massachusetts 02109.
The Statement of Additional Information of the Portfolio includes additional information about the Trustees and is available, without charge, upon request, by calling 1-800-225-6292.
Investment Adviser and Administrator
Amundi Asset Management US, Inc.
Custodian and Sub-Administrator
The Bank of New York Mellon Corporation
Independent Registered Public Accounting Firm
Ernst & Young LLP
Principal Underwriter
Amundi Distributor US, Inc.
Legal Counsel
Morgan, Lewis & Bockius LLP
Transfer Agent
BNY Mellon Investment Servicing (US) Inc.
Name, Age and Position
Held With the Trust | Term of Office and
Length of Service | Principal Occupation(s) During At Least The Past Five Years | Other Directorships Held by Trustee During At Least The Past Five Years |
| Independent Trustees |
Thomas J. Perna (73)
Chairman of the Board
and Trustee | Trustee since 2006.
Serves until a successor
trustee is elected or
earlier retirement
or removal. | Private investor (2004 – 2008 and 2013 – present); Chairman (2008 – 2013) and Chief Executive Officer (2008 – 2012), Quadriserv, Inc. (technology products for securities lending industry); and Senior Executive Vice President, The Bank of New York (financial and securities services) (1986 – 2004) | Director, Broadridge Financial
Solutions, Inc. (investor
communications and securities
processing provider for financial
services industry) (2009 – present); Director, Quadriserv, Inc.
(2005 – 2013); and Commissioner,
New Jersey State Civil Service
Commission (2011 – 2015) |
John E. Baumgardner,
Jr. (72)*
Trustee | Trustee since 2019.
Serves until a successor
trustee is elected or
earlier retirement
or removal. | Of Counsel (2019 – present), Partner (1983-2018), Sullivan & Cromwell LLP (law firm). | Chairman, The Lakeville Journal
Company, LLC, (privately-held
community newspaper group)
(2015-present) |
| Pioneer Fund VCT Portfolio | Pioneer Variable Contracts Trust |
Name, Age and Position
Held With the Trust | Term of Office and
Length of Service | Principal Occupation(s) During At Least The Past Five Years | Other Directorships Held by Trustee During At Least The Past Five Years |
| Independent Trustees (continued) |
Diane Durnin (66)
Trustee | Trustee since 2019.
Serves until a successor
trustee is elected or
earlier retirement
or removal. | Managing Director - Head of Product Strategy and Development, BNY Mellon Investment Management (investment management firm) (2012-2018); Vice Chairman – The Dreyfus Corporation (2005 – 2018): Executive Vice President Head of Product, BNY Mellon Investment Management (2007-2012); Executive Director- Product Strategy, Mellon Asset Management (2005-2007); Executive Vice President Head of Products, Marketing and Client Service, Dreyfus Corporation (investment management firm) (2000-2005); Senior Vice President Strategic Product and Business Development, Dreyfus Corporation (1994-2000) | None |
Benjamin M. Friedman (79)
Trustee | Trustee since 2008.
Serves until a successor
trustee is elected or
earlier retirement
or removal. | William Joseph Maier Professor of Political Economy, Harvard University (1972 – present) | Trustee, Mellon Institutional Funds
Investment Trust and Mellon
Institutional Funds Master Portfolio
(oversaw 17 portfolios in fund
complex) (1989 - 2008) |
Craig C. MacKay (60)
Trustee | Trustee since 2021.
Serves until a successor
trustee is elected or
earlier retirement
or removal. | Partner, England & Company, LLC (advisory firm) (2012 – present); Group Head – Leveraged Finance Distribution, Oppenheimer & Company (investment bank) (2006 – 2012); Group Head – Private Finance & High Yield Capital Markets Origination, SunTrust Robinson Humphrey (investment bank) (2003 – 2006); and Founder and Chief Executive Officer, HNY Associates, LLC (investment bank) (1996 – 2003) | Director, Equitable Holdings, Inc. (financial services holding company) (2022 – present); Board Member of Carver Bancorp, Inc. (holding company) and Carver Federal Savings Bank, NA (2017 – present); Advisory Council Member, MasterShares ETF (2016 – 2017); Advisory Council Member, The Deal (financial market information publisher) (2015 – 2016); Board Co-Chairman and Chief Executive Officer, Danis Transportation Company (privately-owned commercial carrier) (2000 – 2003); Board Member and Chief Financial Officer, Customer Access Resources (privately-owned teleservices company) (1998 – 2000); Board Member, Federation of Protestant Welfare Agencies (human services agency) (1993 – present); and Board Treasurer, Harlem Dowling Westside Center (foster care agency) (1999 – 2018) |
Lorraine H. Monchak (67)
Trustee | Trustee since 2017.
(Advisory Trustee from
2014 - 2017). Serves
until a successor trustee
is elected or earlier
retirement or removal. | Chief Investment Officer, 1199 SEIU Funds (healthcare workers union pension funds) (2001 – present); Vice President – International Investments Group, American International Group, Inc. (insurance company) (1993 – 2001); Vice President – Corporate Finance and Treasury Group, Citibank, N.A. (1980 – 1986 and 1990 – 1993); Vice President – Asset/Liability Management Group, Federal Farm Funding Corporation (government-sponsored issuer of debt securities) (1988 – 1990); Mortgage Strategies Group, Shearson Lehman Hutton, Inc. (investment bank) (1987 – 1988); Mortgage Strategies Group, Drexel Burnham Lambert, Ltd. (investment bank) (1986 – 1987) | None |
| Pioneer Fund VCT Portfolio | Pioneer Variable Contracts Trust |
Trustees, Officers and Service Providers (continued)
Name, Age and Position
Held With the Trust | Term of Office and
Length of Service | Principal Occupation(s) During At Least The Past Five Years | Other Directorships Held by Trustee During At Least The Past Five Years |
| Independent Trustees (continued) |
Marguerite A. Piret (75)**
Trustee | Trustee since 1995.
Serves until a successor
trustee is elected or
earlier retirement
or removal. | Chief Financial Officer, American Ag Energy, Inc. (technology for the environment, energy and agriculture) (2019 – present); Chief Operating Officer, North Country Growers LLC (controlled environment agriculture company) (2020 – present); Chief Executive Officer, Green Heat LLC (biofuels company) (2022 – present); President and Chief Executive Officer, Newbury Piret Company (investment banking firm) (1981 – 2019) | Director of New America High
Income Fund, Inc. (closed-end
investment company) (2004 –
present); and Member, Board of
Governors, Investment Company
Institute (2000 – 2006) |
Fred J. Ricciardi (76)
Trustee | Trustee since 2014.
Serves until a successor
trustee is elected or
earlier retirement
or removal. | Private investor (2020 – present); Consultant (investment company services) (2012 – 2020); Executive Vice President, BNY Mellon (financial and investment company services) (1969 – 2012); Director, BNY International Financing Corp. (financial services) (2002 – 2012); Director, Mellon Overseas Investment Corp. (financial services) (2009 – 2012); Director, Financial Models (technology) (2005-2007); Director, BNY Hamilton Funds, Ireland (offshore investment companies) (2004-2007); Chairman/Director, AIB/BNY Securities Services, Ltd., Ireland (financial services) (1999-2006); Chairman, BNY Alternative Investment Services, Inc. (financial services) (2005-2007) | None |
* Mr. Baumgardner is Of Counsel to Sullivan & Cromwell LLP, which acts as counsel to the Independent Trustees of each Pioneer Fund.
** Ms. Piret became a non-voting Advisory Trustee of the Pioneer Funds effective January 22, 2024. |
| Interested Trustees |
Lisa M. Jones (61)***
Trustee, President and Chief
Executive Officer | Trustee since 2017. Serves
until a successor trustee is
elected or earlier retirement
or removal | Director, CEO and President of Amundi US, Inc. (investment management firm) (since September 2014); Director, CEO and President of Amundi Asset Management US, Inc. (since September 2014); Director, CEO and President of Amundi Distributor US, Inc. (since September 2014); Director, CEO and President of Amundi Asset Management US, Inc. (since September 2014); Chair, Amundi US, Inc., Amundi Distributor US, Inc. and Amundi Asset Management US, Inc. (September 2014 – 2018); Managing Director, Morgan Stanley Investment Management (investment management firm) (2010 – 2013); Director of Institutional Business, CEO of International, Eaton Vance Management (investment management firm) (2005 – 2010); Director of Amundi Holdings US, Inc. (since 2017) | Director of Clearwater Analytics (provider of web-based investment accounting software for reporting and reconciliation services) (September 2022 – present) |
Kenneth J. Taubes (64)***,****
Trustee | Trustee since 2014. Serves
until a successor trustee is
elected or earlier retirement
or removal | Director and Executive Vice President (since 2008) and Chief Investment Officer, U.S. (since 2010) of Amundi US, Inc. (investment management firm); Director and Executive Vice President and Chief Investment Officer, U.S. of Amundi US (since 2008); Executive Vice President and Chief Investment Officer, U.S. of Amundi Asset Management US, Inc. (since 2009); Portfolio Manager of Amundi US (since 1999); Director of Amundi Holdings US, Inc. (since 2017) | None |
| Pioneer Fund VCT Portfolio | Pioneer Variable Contracts Trust |
Name, Age and Position
Held With the Trust | Term of Office and
Length of Service | Principal Occupation(s) During At Least The Past Five Years | Other Directorships Held by Trustee During At Least The Past Five Years |
| Interested Trustees (continued) |
*** Ms. Jones and Mr. Taubes are Interested Trustees because they are officers or directors of the Portfolio’s investment adviser and certain of its affiliates.
**** Mr. Taubes retired as a Trustee, effective January 1, 2024. |
| Name, Age and Position Held With the Trust***** | Term of Office and
Length of Service | Principal Occupation(s) During
At Least The Past Five Years | Other Directorships Held by Trustee During At Least The Past Five Years |
| Trust Officers |
Christopher J. Kelley (59)
Secretary and Chief
Legal Officer | Since 2003. Serves at
the discretion of
the Board | Vice President and Associate General Counsel of Amundi US since January 2008; Secretary and Chief Legal Officer of all of the Pioneer Funds since June 2010; Assistant Secretary of all of the Pioneer Funds from September 2003 to May 2010; Vice President and Senior Counsel of Amundi US from July 2002 to December 2007 | None |
Thomas Reyes (61)
Assistant Secretary | Since 2010. Serves at
the discretion of
the Board | Assistant General Counsel of Amundi US since May 2013 and Assistant Secretary of all the Pioneer Funds since June 2010; Counsel of Amundi US from June 2007 to May 2013 | None |
Heather L. Melito-Dezan (47)
Assistant Secretary | Since 2022. Serves at
the discretion of
the Board | Director - Trustee and Board Relationships of Amundi US since September 2019; Assistant Secretary of Amundi US, Inc. since July 2020: Assistant Secretary of Amundi Asset Management US, Inc. since July 2020: Assistant Secretary of Amundi Distributor US, Inc. since July 2020; Assistant Secretary of all the Pioneer Funds since September 2022; Private practice from 2017 – 2019. | None |
Anthony J. Koenig, Jr. (60)
Treasurer and
Chief Financial and
Accounting Officer | Since 2021. Serves at
the discretion of
the Board | Managing Director, Chief Operations Officer and Fund Treasurer of Amundi US since May 2021; Treasurer of all of the Pioneer Funds since May 2021; Assistant Treasurer of all of the Pioneer Funds from January 2021 to May 2021; and Chief of Staff, US Investment Management of Amundi US from May 2008 to January 2021 | None |
Luis I. Presutti (58)
Assistant Treasurer | Since 2000. Serves at
the discretion of
the Board | Director – Fund Treasury of Amundi US since 1999; and Assistant Treasurer of all of the Pioneer Funds since 1999 | None |
Gary Sullivan (65)
Assistant Treasurer | Since 2002. Serves at
the discretion of
the Board | Senior Manager – Fund Treasury of Amundi US since 2012; and Assistant Treasurer of all of the Pioneer Funds since 2002 | None |
Antonio Furtado (41)
Assistant Treasurer | Since 2020. Serves at
the discretion of
the Board | Fund Oversight Manager – Fund Treasury of Amundi US since 2020; Assistant Treasurer of all of the Pioneer Funds since 2020; and Senior Fund Treasury Analyst from 2012 - 2020 | None |
| Pioneer Fund VCT Portfolio | Pioneer Variable Contracts Trust |
Trustees, Officers and Service Providers (continued)
| Name, Age and Position Held With the Trust***** | Term of Office and
Length of Service | Principal Occupation(s) During
At Least The Past Five Years | Other Directorships Held by Trustee During At Least The Past Five Years |
| Trust Officers (continued) |
Michael Melnick (52)
Assistant Treasurer | Since 2021. Serves at
the discretion of
the Board | Vice President - Deputy Fund Treasurer of Amundi US since May 2021; Assistant Treasurer of all of the Pioneer Funds since July 2021; Director of Regulatory Reporting of Amundi US from 2001 – 2021; and Director of Tax of Amundi US from 2000 - 2001 | None |
John Malone (53)
Chief Compliance Officer | Since 2018. Serves at
the discretion of
the Board | Managing Director, Chief Compliance Officer of Amundi US Asset Management; Amundi Asset Management US, Inc.; and the Pioneer Funds since September 2018; Chief Compliance Officer of Amundi Distributor US, Inc. since January 2014. | None |
Brandon Austin (51)
Anti-Money
Laundering Officer | Since 2022. Serves at
the discretion of
the Board | Director, Financial Security – Amundi Asset Management; Anti-Money Laundering Officer of all the Pioneer Funds since March 2022: Director of Financial Security of Amundi US since July 2021; Vice President, Head of BSA, AML and OFAC, Deputy Compliance Manager, Crédit Agricole Indosuez Wealth Management (investment management firm) (2013 – 2021) | None |
| ***** Marco Pirondini has been appointed to serve as an Executive Vice President of the Portfolio and Chief Investment Officer of Amundi US, Inc., effective January 1, 2024. |
Proxy Voting Policies and Procedures of the Portfolio are available without charge, upon request, by calling our toll free number (1-800-225-6292). Information regarding how the Portfolio voted proxies relating to Portfolio securities during the most recent 12-month period ended June 30 is publicly available to shareholders at www.amundi.com/us. This information is also available on the Securities and Exchange Commission’s web site at www.sec.gov.
Pioneer Variable Contracts Trust
Pioneer Strategic Income
VCT Portfolio
Class I and II Shares
Annual Report | December 31, 2023
Please refer to your contract prospectus to determine the applicable share class offered under your contract.
Pioneer Variable Contracts Trust
Table of Contents
Pioneer Strategic Income VCT Portfolio
This report is authorized for distribution only when preceded or accompanied by a prospectus for the Portfolio being offered.
Pioneer Variable Contracts Trust files a complete schedule of portfolio holdings with the Securities and Exchange Commission for the first and third quarters of each fiscal year as an exhibit to its reports on Form N-PORT. Shareholders may view the filed Form N-PORT by visiting the Commission’s web site at https://www.sec.gov.
| Pioneer Strategic Income VCT Portfolio | Pioneer Variable Contracts Trust |
Portfolio Update 12/31/23
Portfolio Diversification
(As a percentage of total investments)*
+ Amount rounds to less than 0.1%.
5 Largest Holdings
| (As a percentage of total investments)* |
| 1. | U.S. Treasury Notes, 4.625%, 9/30/30 | 5.33% |
| 2. | U.S. Treasury Bills, 1/2/24 | 4.58 |
| 3. | Federal National Mortgage Association, 3.000%, 1/1/54 (TBA) | 3.39 |
| 4. | Pioneer ILS Interval Fund(l) | 3.00 |
| 5. | Federal Home Loan Mortgage Corp., 5.500%, 8/1/53 | 2.50 |
| * | Excludes short-term investments and all derivative contracts except for options purchased. The Portfolio is actively managed, and current holdings may be different. The holdings listed should not be considered recommendations to buy or sell any securities. |
| (l) | Pioneer ILS Interval Fund is an affiliated closed-end fund managed by Amundi Asset Management US, Inc. |
Performance Update 12/31/23
Prices and Distributions
| Net Asset Value per Share | 12/31/23 | 12/31/22 |
| Class l | $8.87 | $8.50 |
| Class ll | $8.85 | $8.49 |
| | | |
Distributions per Share
(1/1/23 - 12/31/23) | Net
Investment
Income | Short-Term
Capital Gains | Long-Term
Capital Gains |
| Class l | $0.3319 | $— | $— |
| Class ll | $0.3097 | $— | $— |
Performance of a $10,000 Investment
The following chart shows the change in value of an investment made in Class I and Class II shares of Pioneer Strategic Income VCT Portfolio at net asset value during the periods shown, compared to that of the Bloomberg U.S. Universal Index. Portfolio returns are based on net asset value and do not reflect any applicable insurance fees or surrender charges.
 | The Bloomberg U.S. Universal Index is an unmanaged index that represents the union of the U.S. Aggregate Index, the US High Yield Corporate Index, the 144A Index, the Eurodollar Index, the Emerging Markets Index, the non-ERISA portion of the CMBS Index, and the CMBS High Yield Index. Municipal debt, private placements and non-dollar-denominated issues are excluded from the Index. Index returns are calculated monthly, assume reinvestment of dividends and do not reflect any fees, expenses or sales charges. It is not possible to invest directly in an index. |
Average Annual Total Returns
(As of December 31, 2023)
| | Class l | Class ll | Bloomberg U.S.
Universal Index |
| 10 Years | 2.67% | 2.41% | 2.08% |
| 5 Years | 2.70% | 2.42% | 1.44% |
| 1 Year | 8.46% | 8.07% | 6.17% |
All total returns shown assume reinvestment of distributions at net asset value.
The performance table does not reflect the deduction of taxes that a shareholder would pay on distributions or the redemption of shares.
Call 1-800-225-6292 or visit www.amundi.com/us for the most recent month-end performance results. Current performance may be lower or higher than the performance data quoted.
The performance data quoted represents past performance, which is no guarantee of future results. Investment return and principal value will fluctuate, and shares, when redeemed, may be worth more or less than their original cost.
The returns for the Portfolio do not reflect the deduction of expenses associated with variable products, such as mortality and expense risk charges, separate account charges, and sales charges. These expenses would reduce the overall returns shown.
Performance results reflect any applicable expense waivers in effect during the periods shown. Without such waivers, performance would be lower. Waivers may not be in effect for all portfolios. Certain fee waivers are contractual through a specified period. Otherwise, fee waivers can be rescinded at any time. See the prospectus and financial statements for more information.
| Pioneer Strategic Income VCT Portfolio | Pioneer Variable Contracts Trust |
Comparing Ongoing Portfolio Expenses
As a shareholder in the Portfolio, you incur two types of costs:
| (1) | ongoing costs, including management fees, distribution and/or service (12b-1) fees, and other Portfolio expenses; and |
| (2) | transaction costs, including sales charges (loads) on purchase payments. |
This example is intended to help you understand your ongoing expenses (in dollars) of investing in the Portfolio and to compare these costs with the ongoing costs of investing in other mutual funds offered through your variable annuity contract. The example is based on an investment of $1,000 at the beginning of the Portfolio’s latest six-month period and held throughout the six months.
Using the Tables
Actual Expenses
The first table below provides information about actual account values and actual expenses. You may use the information in this table, together with the amount you invested, to estimate the expenses that you paid over the period as follows:
| (1) | Divide your account value by $1,000
Example: an $8,600 account value ÷ $1,000 = 8.6 |
| (2) | Multiply the result in (1) above by the corresponding share class’s number in the third row under the heading entitled “Expenses Paid During Period” to estimate the expenses you paid on your account during this period. |
Expenses Paid on a $1,000 Investment in Pioneer Strategic Income VCT Portfolio
Based on actual returns from July 1, 2023 through December 31, 2023.
| Share Class | l | ll |
| Beginning Account Value on 7/1/23 | $1,000.00 | $1,000.00 |
| Ending Account Value (after expenses) on 12/31/23 | $1,048.80 | $1,047.50 |
| Expenses Paid During Period* | $ 3.87 | $ 5.16 |
| | |
| * | Expenses are equal to the Portfolio’s annualized net expense ratio of 0.75% and 1.00% for Class I and Class II shares, respectively, multiplied by the average account value over the period, multiplied by 184/365 (to reflect the one-half year period). |
Hypothetical Example for Comparison Purposes
The table below provides information about hypothetical account values and hypothetical expenses based on the Portfolio’s actual expense ratio and an assumed rate of return of 5% per year before expenses, which is not the Portfolio’s actual return. The hypothetical account values and expenses may not be used to estimate the actual ending account balance or expenses you paid for the period.
You may use this information to compare the ongoing costs of investing in the Portfolio and other variable annuities. To do so, compare this 5% hypothetical example with the 5% hypothetical examples that appear in the shareholder reports of the other variable annuities.
Please note that the expenses shown in the tables are meant to highlight your ongoing costs only and do not reflect any transaction costs, such as sales charges (loads) that are charged at the time of the transaction. Therefore, the table below is useful in comparing ongoing costs only and will not help you determine the relative total costs of owning different variable annuities. In addition, if these transaction costs were included, your costs would have been higher.
Expenses Paid on a $1,000 Investment in Pioneer Strategic Income VCT Portfolio
Based on a hypothetical 5% return per year before expenses, reflecting the period from July 1, 2023 through December 31, 2023.
| Share Class | l | ll |
| Beginning Account Value on 7/1/23 | $1,000.00 | $1,000.00 |
| Ending Account Value (after expenses) on 12/31/23 | $1,021.42 | $1,020.16 |
| Expenses Paid During Period* | $ 3.82 | $ 5.09 |
| | |
| * | Expenses are equal to the Portfolio’s annualized net expense ratio of 0.75% and 1.00% for Class I and Class II shares, respectively, multiplied by the average account value over the period, multiplied by 184/365 (to reflect the one-half year period). |
| Pioneer Strategic Income VCT Portfolio | Pioneer Variable Contracts Trust |
Portfolio Management Discussion 12/31/23
Call 1-800-225-6292 or visit www.amundi.com/us for the most recent month-end performance results. Current performance may be lower or higher than the performance data quoted.
The performance data quoted represents past performance, which is no guarantee of future results. Investment return and principal value will fluctuate, and shares, when redeemed, may be worth more or less than their original cost.
The returns for the Portfolio do not reflect the deduction of expenses associated with variable products, such as mortality and expense risk charges, separate account charges, and sales charges. These expenses would reduce the overall returns shown.
Performance results reflect any applicable expense waivers in effect during the periods shown. Without such waivers, performance would be lower. Waivers may not be in effect for all portfolios. Certain fee waivers are contractual through a specified period. Otherwise, fee waivers can be rescinded at any time. See the prospectus and financial statements for more information.
In the following interview, Jonathan Scott and Andrew Feltus discuss the factors that affected the performance of Pioneer Strategic Income VCT Portfolio during the 12-month period ended December 31, 2023. Mr. Scott, a senior vice president, Deputy Director of Multi-Sector Fixed Income, and a portfolio manager at Amundi Asset Management US, Inc. (Amundi US), Mr. Feltus, Managing Director, Co-Director of High Yield, and a portfolio manager at Amundi US, Brad Komenda, a Managing Director and Director of Investment-Grade Corporates, and a portfolio manager at Amundi US, and Kenneth J. Taubes, Executive Vice President and a portfolio manager at Amundi US, are responsible for the day-today management of the Portfolio.
| Q: | How did the Portfolio perform during the 12-month period ended December 31, 2023? |
| A: | Pioneer Strategic Income VCT Portfolio’s Class I shares returned 8.46% at net asset value during the 12-month period ended December 31, 2023 and Class II shares returned 8.07%, while the Portfolio’s benchmark, the Bloomberg US Universal Index (the Bloomberg Index), returned 6.17%. |
| Q: | Which of your investment decisions had the greatest effects on the Portfolio’s performance relative to the Bloomberg Index during the 12-month period ended December 31, 2023? |
| A: | Sector allocation, security selection and yield curve positioning were major factors that contributed to the Portfolio’s outperformance over the year. |
| | Sector allocation was a significant contributor to benchmark-relative performance during the period, benefiting from the overweight to credit sectors, particularly securitized credit and the underweight to U.S. Treasuries as credit outperformed Treasuries over the year. In particular, the 12% overweight to non-agency mortgage backed securities (MBS) relative to the Portfolio's benchmark index and 25% underweight to U.S. Treasuries contributed to the Portfolio's benchmark-relative outperformance. In addition, the 3% allocation to insurance-linked securities and 3% overweight to asset backed securities (ABS) also helped Portfolio performance during the period. Security selection benefited from strong performance by Portfolio investments in the Financials sector and by investments in commercial mortgage-backed securities (CMBS). The Financials sector benefited from the outperformance of subordinated issues of European banks and a mortgage firm. CMBS benefited by the overweight to multifamily exposures relative to the Bloomberg Index. The Portfolio's yield curve positioning was advantageous due to the preference for short-term and long-term interest rates aligning in the beginning of the year. Additionally, in early August, the curve positioning was adjusted to prioritize the yield difference of longer maturity bonds over shorter maturity bonds. The Portfolio's yield curve positioning benefit more than offset the underperformance of the Portfolio's relative long duration position of 0.5 years over the year. |
| | The more defensive credit quality positioning of the Portfolio during the period detracted from performance as high yield issues outperformed investment grade issues during the period. In addition, the lower quality bias in CMBS detracted. Currency exposure had a modest negative impact over the year as underperformance earlier in the year was offset by strong performance in the fourth quarter when the US dollar fell. |
| Pioneer Strategic Income VCT Portfolio | Pioneer Variable Contracts Trust |
| Q: | Did the Portfolio have any exposure to derivative securities during the 12-month period ended December 31, 2023? |
| A: | Yes, we invested the Portfolio in Treasury futures, index-based, high-yield credit-default-swap contracts (CDX) and forward foreign currency contracts positions. We invest in Treasury futures as part of our duration management strategy for the Portfolio. We believe the use of Treasury futures allows us to express our views on duration and yield-curve positioning in an efficient manner. We typically have used the CDX positions as part of our efforts to either increase or reduce the Portfolio’s exposures to both investment-grade and high-yield securities efficiently, as cash-bond transactions take a little more time to execute, and have a higher liquidity cost. The use of derivatives, we think, may allow the Portfolio to potentially benefit from the performance impact of the targeted asset class, while retaining a better liquidity profile, which may help reduce risk. Treasury futures, which we typically utilize to help manage the Portfolio's yield-curve and duration positioning was utilized during the 12-month period. A short high yield CDX exposure was used to hedge credit market exposure over the 12-month period. The Portfolio’s exposure to foreign forward currency contracts was a technique used as part of our efforts to manage the risks associated with investing the portfolio in non-USD currencies. |
| Q: | What factors affected the Portfolio's yield, or distributions* to shareholders, during the 12-month period ended December 31, 2023? |
| A: | The Portfolio’s monthly distribution rate rose at a modest pace over the year as Treasury yields increased and spreads for credit-oriented areas of the market generally widened until the latter part of the period. The distribution rate declined modestly in November and December, but remained well above beginning of the year levels, as Treasury yields fell and credit spreads modestly narrowed. |
| Q: | What’s your investment outlook and how is the Portfolio positioned? |
| A: | The Portfolio continues to hold a relatively long duration position compared to the Bloomberg Index, although the Portfolio reduced duration near year end, consistent with the significant decline in the 10-year Treasury yield after its mid-October peak. We continue to believe economic growth may slow in 2024, and the yields may decline over 2024. In addition, the Portfolio continues to maintain curve positioning which favors the yield difference of longer maturity bonds increasing over shorter maturity bonds , with an overweight focused on the 5 to 7 year part of the curve, reflecting our view that the curve may cease to be inverted as economic growth slows. |
| | The Portfolio continues to have a more cautious view on credit, relative to its history, but continues to hold an overweight to credit relative to the Bloomberg Index. This cautious view, which includes an up in quality bias, reflects the less attractive relative value and the likelihood that economic growth may slow in 2024. Investment grade and high yield corporate spreads continue to reside near the 10th percentile relative to their long term history, and securitized spreads have also narrowed. Within corporates, we favor Financials, which offer more attractive value relative to Industrials. We |
| * | Distributions are not guaranteed. |
| Pioneer Strategic Income VCT Portfolio | Pioneer Variable Contracts Trust |
Portfolio Management Discussion 12/31/23 (continued)
A Word About Risk:
All investments are subject to risk, including the possible loss of principal. In the past several years, financial markets have experienced increased volatility and heightened uncertainty. The market prices of securities may go up or down, sometimes rapidly or unpredictably, due to general market conditions, such as real or perceived adverse economic, political, or regulatory conditions, recessions, inflation, changes in interest or currency rates, lack of liquidity in the bond markets, the spread of infectious illness or other public health issues, armed conflict including Russia's military invasion of Ukraine, sanctions against Russia, other nations or individuals or companies and possible countermeasures, market disruptions caused by tariffs, trade disputes or other government actions, or adverse investor sentiment. These conditions may continue, recur, worsen or spread.
Investments in high-yield or lower rated securities are subject to greater-thanaverage price volatility, illiquidity and possibility of default.
The market price of securities may fluctuate when interest rates change.When interest rates rise, the prices of fixed income securities in the Portfolio will generally fall. Conversely, when interest rates fall, the prices of fixed income securities in the Portfolio will generally rise.
Investments in the Portfolio are subject to possible loss due to the financial failure of issuers of underlying securities and their inability to meet their debt obligations.
Prepayment risk is the chance that an issuer may exercise its right to prepay its security, if falling interest rates prompt the issuer to do so. Forced to reinvest the unanticipated proceeds at lower interest rates, the Portfolio would experience a decline in income and lose the opportunity for additional price appreciation.
The securities issued by U.S. governmentsponsored entities (e.g., FNMA, Freddie Mac) are neither guaranteed nor issued by the U.S. government.
The Portfolio may invest in mortgagebacked securities, which during times of fluctuating interest rates may increase or decrease more than other fixed-income securities. Mortgage-backed securities are also subject to pre-payments.
Investing in foreign and/or emerging markets securities involves risks relating to interest rates, currency exchange rates, economic, social and political conditions, which could increase volatility. These risks are magnified in emerging markets.
At times, the Portfolio’s investments may represent industries or industry sectors that are interrelated or have common risks, making the Portfolio more susceptible to any economic, political, or regulatory developments or other risks affecting those industries and sectors.
These risks may increase share price volatility.
| | continue to favor securitized credit over corporate credit, based on relative value. Agency MBS offer higher spreads relative to their history, the U.S. housing market has stabilized, and multifamily issues offer value within the CMBS market. |
| | We believe that the US dollar may depreciate over the coming year, as interest rates converge. We may selectively add currency risk to the Portfolio, but continue to have modest currency and emerging market exposures in the Portfolio, in light of a less favorable global growth outlook. |
| | The Fed’s policy “pivot” and the substantial easing of financial conditions since October 2023 have no doubt helped lower the risk of a US economy hard landing/recession in 2024. However, we still view the probability of a 2024 recession as higher than normal and elevated relative to other economic outcomes, and the interest rate markets appear to agree. Federal Funds rate futures contracts priced in a year-end 2024 Federal Funds rate of 3.75% or more than 150 basis points lower than the current Federal Funds rates. While we are comfortable with market pricing of the cumulative rate cuts in 2024, we do not anticipate a rate cut in March given current economic activity and a view that monthly core personal consumption expenditure (PCE) inflation is likely to reaccelerate in the next few months. We continue to view duration risk as relatively attractive for the Portfolio, but less so than in October and have repositioned the Portfolio accordingly. Investment grade corporate bond spreads reached year-to-date lows of just below 100 basis points in December. We believe that less relative value in the sector may justify an overall lower allocation to spread risk. We prefer to reduce spread risk by shortening duration and moving the Portfolio up in quality within spread sectors, rather than increasing Treasury exposures, as the Fed’s pivot raises the possibility of an elongated time period before spreads materially widen in response to a recessionary environment. Agency MBS remain relatively attractive with spreads still near historical averages. |
Please refer to the Schedule of Investments on pages 7 - 22 for a full listing of Portfolio securities.
Past performance is no guarantee of future results.
Any information in this shareholder report regarding market or economic trends or the factors influencing the Portfolio’s historical or future performance are statements of opinion as of the date of this report.
| Pioneer Strategic Income VCT Portfolio | Pioneer Variable Contracts Trust |
Schedule of Investments 12/31/23
Principal
Amount
USD ($) | | | | | | Value |
| | UNAFFILIATED ISSUERS — 104.5% | |
| | Senior Secured Floating Rate Loan Interests — 0.5% of Net Assets*(a) | |
| | Chemicals-Diversified — 0.1% | |
| 19,650 | LSF11 A5 HoldCo LLC, Term Loan, 8.97% (Term SOFR + 350 bps), 10/15/28 | $ 19,675 |
| | Total Chemicals-Diversified | $ 19,675 |
| | Electric-Generation — 0.1% | |
| 24,476 | Generation Bridge Northeast LLC, Term Loan B, 9.606% (Term SOFR + 425 bps), 8/22/29 | $ 24,628 |
| | Total Electric-Generation | $ 24,628 |
| | Electronic Composition — 0.0%† | |
| 12,036 | Energy Acquisition LP, First Lien Initial Term Loan, 9.706% (Term SOFR + 425 bps), 6/26/25 | $ 11,938 |
| | Total Electronic Composition | $ 11,938 |
| | Medical-Wholesale Drug Distribution — 0.1% | |
| 30,158 | Owens & Minor, Inc., Term B-1 Loan, 9.198% (Term SOFR + 375 bps), 3/29/29 | $ 30,259 |
| | Total Medical-Wholesale Drug Distribution | $ 30,259 |
| | Metal Processors & Fabrication — 0.2% | |
| 51,979 | Grinding Media, Inc. (Molycop, Ltd.), First Lien Initial Term Loan, 9.684% (Term SOFR + 400 bps), 10/12/28 | $ 51,719 |
| | Total Metal Processors & Fabrication | $ 51,719 |
| | Recreational Centers — 0.0%† | |
| 15,560 | Fitness International LLC, Term B Loan, 8.706% (Term SOFR + 325 bps), 4/18/25 | $ 15,527 |
| | Total Recreational Centers | $ 15,527 |
| | Total Senior Secured Floating Rate Loan Interests
(Cost $152,298) | $ 153,746 |
|
| |
| Shares | | | | | | |
| | Common Stocks — 0.1% of Net Assets | |
| | Household Durables — 0.0%† | |
| 15,463(b) | Desarrolladora Homex SAB de CV | $ 12 |
| | Total Household Durables | $ 12 |
| | Paper & Forest Products — 0.0%† | |
| 1,032 + | Emerald Plantation Holdings, Ltd. | $ — |
| | Total Paper & Forest Products | $ — |
| | Passenger Airlines — 0.1% | |
| 1,529(b) + | Grupo Aeromexico SAB de CV | $ 24,581 |
| | Total Passenger Airlines | $ 24,581 |
| | Total Common Stocks
(Cost $30,517) | $ 24,593 |
|
| |
Principal
Amount
USD ($) | | | | | | |
| | Asset Backed Securities — 3.9% of Net Assets | |
| 100,000 | Amur Equipment Finance Receivables XII LLC, Series 2023-1A, Class D, 7.48%, 7/22/30 (144A) | $ 101,780 |
| 100,000(a) | Arbor Realty Commercial Real Estate Notes, Ltd., Series 2021-FL3, Class D, 7.676% (1 Month Term SOFR + 231 bps), 8/15/34 (144A) | 93,996 |
| 100,000(a) | Arbor Realty Commercial Real Estate Notes, Ltd., Series 2021-FL4, Class E, 8.876% (1 Month Term SOFR + 351 bps), 11/15/36 (144A) | 91,799 |
| 100,000 | Arivo Acceptance Auto Loan Receivables Trust, Series 2022-2A, Class C, 9.84%, 3/15/29 (144A) | 103,210 |
The accompanying notes are an integral part of these financial statements.
7
| Pioneer Strategic Income VCT Portfolio | Pioneer Variable Contracts Trust |
Schedule of Investments 12/31/23 (continued)
Principal
Amount
USD ($) | | | | | | Value |
| | Asset Backed Securities — (continued) | |
| 100,000 | Cascade MH Asset Trust, Series 2021-MH1, Class B1, 4.573%, 2/25/46 (144A) | $ 82,145 |
| 100,000 | Cologix Canadian Issuer LP, Series 2022-1CAN, Class A2, 4.94%, 1/25/52 (144A) | 70,317 |
| 100,000 | Continental Finance Credit Card ABS Master Trust, Series 2022-A, Class C, 9.33%, 10/15/30 (144A) | 100,046 |
| 16,291(c) | Equifirst Mortgage Loan Trust, Series 2003-1, Class IF1, 4.01%, 12/25/32 | 15,094 |
| 100,000 | NMEF Funding LLC, Series 2022-B, Class C, 8.54%, 6/15/29 (144A) | 98,253 |
| 100,000 | PEAR LLC, Series 2021-1, Class B, 0.000%, 1/15/34 (144A) | 73,509 |
| 150,000 | SBA Tower Trust, Series 2014-2A, Class C, 3.869%, 10/15/49 (144A) | 147,488 |
| 100,000 | VFI ABS LLC, Series 2022-1A, Class D, 6.68%, 11/26/29 (144A) | 95,690 |
| 124,207 | Westgate Resorts LLC, Series 2022-1A, Class D, 3.838%, 8/20/36 (144A) | 117,550 |
| | Total Asset Backed Securities
(Cost $1,252,601) | $ 1,190,877 |
|
| |
| | Collateralized Mortgage Obligations—11.4% of Net Assets | |
| 100,000(d) | Bayview MSR Opportunity Master Fund Trust, Series 2021-2, Class A8, 2.50%, 6/25/51 (144A) | $ 64,574 |
| 100,000(d) | BINOM Securitization Trust, Series 2022-RPL1, Class M3, 3.00%, 2/25/61 (144A) | 66,786 |
| 93,392(d) | CIM Trust, Series 2021-J2, Class B3, 2.672%, 4/25/51 (144A) | 66,630 |
| 94,332(d) | Citigroup Mortgage Loan Trust, Series 2021-INV2, Class B1W, 2.989%, 5/25/51 (144A) | 75,013 |
| 20,000(a) | Connecticut Avenue Securities Trust, Series 2020-SBT1, Class 1M2, 9.102% (SOFR30A + 376 bps), 2/25/40 (144A) | 20,900 |
| 50,000(a) | Connecticut Avenue Securities Trust, Series 2020-SBT1, Class 2M2, 9.102% (SOFR30A + 376 bps), 2/25/40 (144A) | 52,637 |
| 170,000(a) | Connecticut Avenue Securities Trust, Series 2022-R02, Class 2B1, 9.837% (SOFR30A + 450 bps), 1/25/42 (144A) | 175,010 |
| 150,000(a) | Eagle Re, Ltd., Series 2023-1, Class M1B, 9.287% (SOFR30A + 395 bps), 9/26/33 (144A) | 150,714 |
| 78,006(a)(e) | Federal Home Loan Mortgage Corp. REMICs, Series 4087, Class SB, 0.577% (SOFR30A + 592 bps), 7/15/42 | 8,166 |
| 43,018(a)(e) | Federal Home Loan Mortgage Corp. REMICs, Series 4091, Class SH, 1.097% (SOFR30A + 644 bps), 8/15/42 | 5,596 |
| 40,343(e) | Federal Home Loan Mortgage Corp. REMICs, Series 4999, Class QI, 4.00%, 5/25/50 | 7,239 |
| 53,433(e) | Federal Home Loan Mortgage Corp. REMICs, Series 5067, Class GI, 4.00%, 12/25/50 | 10,279 |
| 467 | Federal National Mortgage Association REMICs, Series 2009-36, Class HX, 4.50%, 6/25/29 | 461 |
| 21,538(a)(e) | Federal National Mortgage Association REMICs, Series 2012-14, Class SP, 1.098% (SOFR30A + 644 bps), 8/25/41 | 1,682 |
| 16,221(a)(e) | Federal National Mortgage Association REMICs, Series 2018-43, Class SM, 0.748% (SOFR30A + 609 bps), 6/25/48 | 1,765 |
| 18,672(a)(e) | Federal National Mortgage Association REMICs, Series 2019-33, Class S, 0.598% (SOFR30A + 594 bps), 7/25/49 | 1,422 |
| 17,298(a)(e) | Federal National Mortgage Association REMICs, Series 2019-41, Class PS, 0.598% (SOFR30A + 594 bps), 8/25/49 | 2,140 |
| 17,361(a)(e) | Federal National Mortgage Association REMICs, Series 2019-41, Class SM, 0.598% (SOFR30A + 594 bps), 8/25/49 | 2,146 |
| 94,387(d) | Flagstar Mortgage Trust, Series 2021-7, Class B3, 2.928%, 8/25/51 (144A) | 70,183 |
| 50,000(a) | Freddie Mac STACR REMIC Trust, Series 2020-DNA6, Class B1, 8.337% (SOFR30A + 300 bps), 12/25/50 (144A) | 51,745 |
| 50,000(a) | Freddie Mac STACR REMIC Trust, Series 2020-DNA6, Class B2, 10.987% (SOFR30A + 565 bps), 12/25/50 (144A) | 53,827 |
| 30,000(a) | Freddie Mac STACR REMIC Trust, Series 2020-HQA3, Class B2, 15.452% (SOFR30A + 1,011 bps), 7/25/50 (144A) | 38,121 |
| 45,000(a) | Freddie Mac STACR REMIC Trust, Series 2021-HQA4, Class B1, 9.087% (SOFR30A + 375 bps), 12/25/41 (144A) | 44,916 |
| 95,000(a) | Freddie Mac STACR REMIC Trust, Series 2022-DNA2, Class B1, 10.087% (SOFR30A + 475 bps), 2/25/42 (144A) | 98,269 |
8
The accompanying notes are an integral part of these financial statements.
| Pioneer Strategic Income VCT Portfolio | Pioneer Variable Contracts Trust |
Principal
Amount
USD ($) | | | | | | Value |
| | Collateralized Mortgage Obligations—(continued) | |
| 70,000(a) | Freddie Mac Structured Agency Credit Risk Debt Notes, Series 2020-HQA5, Class B1, 9.337% (SOFR30A + 400 bps), 11/25/50 (144A) | $ 75,885 |
| 80,000(a) | Freddie Mac Structured Agency Credit Risk Debt Notes, Series 2020-HQA5, Class B2, 12.737% (SOFR30A + 740 bps), 11/25/50 (144A) | 89,310 |
| 10,808 | Government National Mortgage Association, Series 2009-83, Class EB, 4.50%, 9/20/39 | 10,738 |
| 79 | Government National Mortgage Association, Series 2012-130, Class PA, 3.00%, 4/20/41 | 79 |
| 143,994(a)(e) | Government National Mortgage Association, Series 2019-117, Class SB, 0.000% (1 Month Term SOFR + 331 bps), 9/20/49 | 2,287 |
| 211,161(e) | Government National Mortgage Association, Series 2019-128, Class IB, 3.50%, 10/20/49 | 35,033 |
| 209,622(e) | Government National Mortgage Association, Series 2019-128, Class ID, 3.50%, 10/20/49 | 34,987 |
| 103,380(e) | Government National Mortgage Association, Series 2019-159, Class CI, 3.50%, 12/20/49 | 18,044 |
| 118,836(a)(e) | Government National Mortgage Association, Series 2020-9, Class SA, 0.000% (1 Month Term SOFR + 324 bps), 1/20/50 | 2,610 |
| 100,000(d) | GS Mortgage-Backed Securities Corp. Trust, Series 2022-PJ4, Class A33, 3.00%, 9/25/52 (144A) | 68,982 |
| 95,005(d) | GS Mortgage-Backed Securities Trust, Series 2022-PJ1, Class B3, 2.832%, 5/28/52 (144A) | 71,052 |
| 92,921(d) | Hundred Acre Wood Trust, Series 2021-INV1, Class B2, 3.225%, 7/25/51 (144A) | 75,834 |
| 93,907(d) | JP Morgan Mortgage Trust, Series 2021-7, Class B3, 2.803%, 11/25/51 (144A) | 69,843 |
| 141,134(d) | JP Morgan Mortgage Trust, Series 2021-8, Class B3, 2.845%, 12/25/51 (144A) | 105,206 |
| 93,729(d) | JP Morgan Mortgage Trust, Series 2021-INV1, Class B3, 2.979%, 10/25/51 (144A) | 70,102 |
| 96,122(d) | JP Morgan Mortgage Trust, Series 2022-3, Class B3, 3.11%, 8/25/52 (144A) | 70,899 |
| 100,000(d) | JP Morgan Mortgage Trust, Series 2022-4, Class A5, 3.00%, 10/25/52 (144A) | 69,135 |
| 95,904(d) | JP Morgan Mortgage Trust, Series 2022-INV1, Class B3, 3.296%, 3/25/52 (144A) | 72,238 |
| 100,000(d) | JP Morgan Mortgage Trust, Series 2022-LTV1, Class M1, 3.522%, 7/25/52 (144A) | 62,802 |
| 61,504(a) | JPMorgan Chase Bank N.A. - JPMWM, Series 2021-CL1, Class M3, 7.137% (SOFR30A + 180 bps), 3/25/51 (144A) | 58,062 |
| 100,000(d) | Mello Mortgage Capital Acceptance, Series 2021-INV2, Class A5, 2.50%, 8/25/51 (144A) | 63,580 |
| 96,584(d) | Mello Mortgage Capital Acceptance, Series 2022-INV2, Class B3, 3.529%, 4/25/52 (144A) | 72,936 |
| 100,000(d) | MFA Trust, Series 2021-RPL1, Class M2, 2.855%, 7/25/60 (144A) | 78,687 |
| 92,583(d) | Oceanview Mortgage Trust, Series 2021-1, Class B2, 2.722%, 5/25/51 (144A) | 72,127 |
| 93,251(d) | Provident Funding Mortgage Trust, Series 2021-J1, Class B3, 2.637%, 10/25/51 (144A) | 70,631 |
| 94,974(d) | Rate Mortgage Trust, Series 2021-HB1, Class B2, 2.705%, 12/25/51 (144A) | 71,552 |
| 93,225(d) | Rate Mortgage Trust, Series 2021-J1, Class B2, 2.705%, 7/25/51 (144A) | 73,185 |
| 98,476(d) | RCKT Mortgage Trust, Series 2022-3, Class B3, 3.188%, 5/25/52 (144A) | 74,505 |
| 100,000(d) | Sequoia Mortgage Trust, Series 2022-1, Class A7, 2.50%, 2/25/52 (144A) | 63,489 |
| 100,000(d) | Towd Point Mortgage Trust, Series 2017-1, Class B3, 3.857%, 10/25/56 (144A) | 77,414 |
| 100,000(d) | Towd Point Mortgage Trust, Series 2017-3, Class B3, 3.907%, 7/25/57 (144A) | 82,498 |
| 100,000(a) | Towd Point Mortgage Trust, Series 2019-HY1, Class B2, 7.62% (1 Month Term SOFR + 226 bps), 10/25/48 (144A) | 95,760 |
| 89,701(d) | Towd Point Mortgage Trust, Series 2021-R1, Class A1, 2.918%, 11/30/60 (144A) | 75,124 |
| 33,148(a) | Triangle Re, Ltd., Series 2021-1, Class M2, 9.37% (1 Month Term SOFR + 401 bps), 8/25/33 (144A) | 33,297 |
| 150,000(a) | Triangle Re, Ltd., Series 2023-1, Class M1A, 8.721% (SOFR30A + 340 bps), 11/25/33 (144A) | 149,998 |
| 91,557(d) | Wells Fargo Mortgage Backed Securities Trust, Series 2020-5, Class B2, 2.914%, 9/25/50 (144A) | 74,553 |
| 100,000(d) | Wells Fargo Mortgage Backed Securities Trust, Series 2022-2, Class A6, 2.50%, 12/25/51 (144A) | 62,976 |
| 96,650(d) | Wells Fargo Mortgage Backed Securities Trust, Series 2022-INV1, Class B3, 3.436%, 3/25/52 (144A) | 73,135 |
| | Total Collateralized Mortgage Obligations
(Cost $4,206,824) | $ 3,498,796 |
|
| |
The accompanying notes are an integral part of these financial statements.
9
| Pioneer Strategic Income VCT Portfolio | Pioneer Variable Contracts Trust |
Schedule of Investments 12/31/23 (continued)
Principal
Amount
USD ($) | | | | | | Value |
| | Commercial Mortgage-Backed Securities—5.7% of Net Assets | |
| 100,000(a) | AREIT Trust, Series 2022-CRE6, Class D, 8.188% (SOFR30A + 285 bps), 1/20/37 (144A) | $ 94,270 |
| 100,000(d) | Benchmark Mortgage Trust, Series 2020-IG3, Class B, 3.291%, 9/15/48 (144A) | 51,258 |
| 50,000(a) | BX Trust, Series 2021-ARIA, Class E, 7.721% (1 Month Term SOFR + 236 bps), 10/15/36 (144A) | 47,239 |
| 65,000(a) | CLNY Trust, Series 2019-IKPR, Class E, 8.196% (1 Month Term SOFR + 284 bps), 11/15/38 (144A) | 58,197 |
| 1,342,812(d)(e) | COMM Mortgage Trust, Series 2014-CR19, Class XA, 0.827%, 8/10/47 | 4,516 |
| 100,000(d) | CSAIL Commercial Mortgage Trust, Series 2015-C1, Class C, 4.25%, 4/15/50 | 77,370 |
| 25,000(d) | CSAIL Commercial Mortgage Trust, Series 2015-C4, Class D, 3.555%, 11/15/48 | 20,809 |
| 100,000(d) | Fontainebleau Miami Beach Trust, Series 2019-FBLU, Class D, 3.963%, 12/10/36 (144A) | 96,735 |
| 75,000(a) | Freddie Mac Multifamily Structured Credit Risk, Series 2021-MN3, Class M2, 9.337% (SOFR30A + 400 bps), 11/25/51 (144A) | 69,489 |
| 49,000(d) | FREMF Mortgage Trust, Series 2017-KW02, Class B, 3.804%, 12/25/26 (144A) | 45,646 |
| 50,000(d) | FREMF Mortgage Trust, Series 2017-KW03, Class B, 4.077%, 7/25/27 (144A) | 46,581 |
| 75,000(d) | FREMF Mortgage Trust, Series 2018-KHG1, Class B, 3.819%, 12/25/27 (144A) | 68,338 |
| 25,000(d) | FREMF Mortgage Trust, Series 2018-KW07, Class B, 4.083%, 10/25/31 (144A) | 21,217 |
| 53,825(d) | FREMF Mortgage Trust, Series 2019-KJ24, Class B, 7.60%, 10/25/27 (144A) | 49,680 |
| 50,000(d) | FREMF Trust, Series 2018-KW04, Class B, 3.926%, 9/25/28 (144A) | 43,695 |
| 100,000(a) | GS Mortgage Securities Corp. Trust, Series 2020-DUNE, Class E, 8.134% (1 Month Term SOFR + 261 bps), 12/15/36 (144A) | 95,846 |
| 100,000(d) | JP Morgan Chase Commercial Mortgage Securities Trust, Series 2020-LOOP, Class F, 3.861%, 12/5/38 (144A) | 56,206 |
| 50,000 | Key Commercial Mortgage Securities Trust, Series 2019-S2, Class A3, 3.469%, 6/15/52 (144A) | 45,938 |
| 100,000 | Morgan Stanley Capital I Trust, Series 2014-150E, Class AS, 4.012%, 9/9/32 (144A) | 74,022 |
| 15,000 | Morgan Stanley Capital I Trust, Series 2016-UBS9, Class D, 3.00%, 3/15/49 (144A) | 11,155 |
| 100,000(d) | Morgan Stanley Capital I Trust, Series 2018-MP, Class A, 4.276%, 7/11/40 (144A) | 87,329 |
| 92,274(a) | Multifamily Connecticut Avenue Securities Trust, Series 2019-01, Class M10, 8.702% (SOFR30A + 336 bps), 10/25/49 (144A) | 89,732 |
| 40,000 | Palisades Center Trust, Series 2016-PLSD, Class A, 2.713%, 4/13/33 (144A) | 21,421 |
| 100,000(d) | RBS Commercial Funding, Inc. Trust, Series 2013-SMV, Class E, 3.584%, 3/11/31 (144A) | 73,199 |
| 50,000(a) | Ready Capital Mortgage Financing LLC, Series 2021-FL7, Class D, 8.42% (1 Month Term SOFR + 306 bps), 11/25/36 (144A) | 47,459 |
| 100,000(d) | Ready Capital Mortgage Trust, Series 2019-5, Class E, 5.309%, 2/25/52 (144A) | 79,761 |
| 100,000 | SLG Office Trust, Series 2021-OVA, Class E, 2.851%, 7/15/41 (144A) | 75,449 |
| 100,000 | SLG Office Trust, Series 2021-OVA, Class F, 2.851%, 7/15/41 (144A) | 70,775 |
| 100,000(d) | THPT Mortgage Trust, Series 2023-THL, Class B, 7.669%, 12/10/34 (144A) | 101,847 |
| 1,000,000(d)(e) | UBS Commercial Mortgage Trust, Series 2018-C9, Class XB, 0.372%, 3/15/51 | 14,329 |
| | Total Commercial Mortgage-Backed Securities
(Cost $2,071,768) | $ 1,739,508 |
|
| |
| | Convertible Corporate Bonds — 0.6% of Net Assets | |
| | Airlines — 0.0%† | |
| 24,000 | Spirit Airlines, Inc., 1.00%, 5/15/26 | $ 16,632 |
| | Total Airlines | $ 16,632 |
| | Entertainment — 0.4% | |
| 122,000(f) | DraftKings Holdings, Inc., 3/15/28 | $ 97,783 |
| 15,000 | IMAX Corp., 0.50%, 4/1/26 | 13,312 |
| | Total Entertainment | $ 111,095 |
10
The accompanying notes are an integral part of these financial statements.
| Pioneer Strategic Income VCT Portfolio | Pioneer Variable Contracts Trust |
Principal
Amount
USD ($) | | | | | | Value |
| | Software — 0.2% | |
| 22,000 | Bentley Systems, Inc., 0.375%, 7/1/27 | $ 19,679 |
| 47,000 | Verint Systems, Inc., 0.25%, 4/15/26 | 41,272 |
| | Total Software | $ 60,951 |
| | Total Convertible Corporate Bonds
(Cost $225,794) | $ 188,678 |
|
| |
| | Corporate Bonds — 29.6% of Net Assets | |
| | Advertising — 0.1% | |
| 15,000 | Outfront Media Capital LLC/Outfront Media Capital Corp., 7.375%, 2/15/31 (144A) | $ 15,752 |
| | Total Advertising | $ 15,752 |
| | Aerospace & Defense — 0.1% | |
| 15,000 | Bombardier, Inc., 7.50%, 2/1/29 (144A) | $ 15,249 |
| 20,000 | Triumph Group, Inc., 9.00%, 3/15/28 (144A) | 21,267 |
| | Total Aerospace & Defense | $ 36,516 |
| | Airlines — 1.2% | |
| 127,645(g) | ABRA Global Finance, 11.50% (5.50% PIK or 6.00% Cash), 3/2/28 (144A) | $ 95,839 |
| 13,650 | American Airlines 2021-1 Class B Pass Through Trust, 3.95%, 7/11/30 | 12,115 |
| 200,000 | Grupo Aeromexico SAB de CV, 8.50%, 3/17/27 (144A) | 193,046 |
| 16,878 | JetBlue 2020-1 Class A Pass Through Trust, 4.00%, 11/15/32 | 15,450 |
| 75,000 | VistaJet Malta Finance Plc/Vista Management Holding, Inc., 6.375%, 2/1/30 (144A) | 52,378 |
| | Total Airlines | $ 368,828 |
| | Auto Manufacturers — 1.8% | |
| 135,000 | Ford Motor Co., 4.346%, 12/8/26 | $ 131,562 |
| 42,000 | Ford Motor Co., 5.291%, 12/8/46 | 37,009 |
| 40,000 | Ford Motor Co., 6.10%, 8/19/32 | 40,321 |
| 125,000 | General Motors Financial Co., Inc., 6.10%, 1/7/34 | 128,701 |
| 165,000 | General Motors Financial Co., Inc., 6.40%, 1/9/33 | 175,577 |
| 30,000 | JB Poindexter & Co., Inc., 8.75%, 12/15/31 (144A) | 30,600 |
| | Total Auto Manufacturers | $ 543,770 |
| | Banks — 10.3% | |
| 200,000(d) | ABN AMRO Bank NV, 3.324% (5 Year CMT Index + 190 bps), 3/13/37 (144A) | $ 159,693 |
| 200,000(d) | Banco Santander S.A., 3.225% (1 Year CMT Index + 160 bps), 11/22/32 | 167,476 |
| 77,000(d) | Bank of Nova Scotia, 4.588% (5 Year CMT Index + 205 bps), 5/4/37 | 68,874 |
| 200,000(d) | Barclays Plc, 7.437% (1 Year CMT Index + 350 bps), 11/2/33 | 223,945 |
| 250,000(d) | BPCE S.A., 3.116% (SOFR + 173 bps), 10/19/32 (144A) | 203,843 |
| KZT 100,000,000 | Development Bank of Kazakhstan JSC, 10.95%, 5/6/26 | 192,047 |
| 25,000 | Freedom Mortgage Corp., 6.625%, 1/15/27 (144A) | 23,859 |
| 5,000 | Freedom Mortgage Corp., 12.25%, 10/1/30 (144A) | 5,489 |
| 220,000(d)(h) | ING Groep NV, 4.25% (5 Year CMT Index + 286 bps) | 160,020 |
| 200,000(d) | Intesa Sanpaolo S.p.A., 4.198% (1 Year CMT Index + 260 bps), 6/1/32 (144A) | 164,914 |
| 200,000(d) | Lloyds Banking Group Plc, 4.976% (1 Year CMT Index + 230 bps), 8/11/33 | 194,782 |
| 100,000(d) | Macquarie Group, Ltd., 2.871% (SOFR + 153 bps), 1/14/33 (144A) | 82,204 |
| 100,000(d) | Morgan Stanley, 5.297% (SOFR + 262 bps), 4/20/37 | 97,310 |
| 20,000(d) | Morgan Stanley, 5.948% (5 Year CMT Index + 243 bps), 1/19/38 | 20,226 |
| 235,000(d)(h) | Nordea Bank Abp, 3.75% (5 Year CMT Index + 260 bps) (144A) | 185,638 |
| 60,000(d) | PNC Financial Services Group, Inc., 6.875% (SOFR + 228 bps), 10/20/34 | 66,608 |
| 200,000(d) | Societe Generale S.A., 4.027% (1 Year CMT Index + 190 bps), 1/21/43 (144A) | 143,095 |
| 200,000(d) | Standard Chartered Plc, 6.296% (1 Year CMT Index + 258 bps), 7/6/34 (144A) | 209,889 |
The accompanying notes are an integral part of these financial statements.
11
| Pioneer Strategic Income VCT Portfolio | Pioneer Variable Contracts Trust |
Schedule of Investments 12/31/23 (continued)
Principal
Amount
USD ($) | | | | | | Value |
| | Banks — (continued) | |
| 55,000(d) | Truist Financial Corp., 7.161% (SOFR + 245 bps), 10/30/29 | $ 59,402 |
| 200,000(d) | UBS Group AG, 4.988% (1 Year CMT Index + 240 bps), 8/5/33 (144A) | 193,366 |
| 200,000(d) | UniCredit S.p.A., 5.459% (5 Year CMT Index + 475 bps), 6/30/35 (144A) | 188,096 |
| 200,000(d) | UniCredit S.p.A., 7.296% (5 Year USD Swap Rate + 491 bps), 4/2/34 (144A) | 205,617 |
| 130,000(d) | Wells Fargo & Co., 6.491% (SOFR + 206 bps), 10/23/34 | 141,425 |
| | Total Banks | $ 3,157,818 |
| | Building Materials — 0.2% | |
| 50,000 | AmeriTex HoldCo Intermediate LLC, 10.25%, 10/15/28 (144A) | $ 51,250 |
| | Total Building Materials | $ 51,250 |
| | Chemicals — 0.3% | |
| 85,000 | Albemarle Corp., 5.05%, 6/1/32 | $ 82,959 |
| 50,000 | Trinseo Materials Operating SCA/Trinseo Materials Finance, Inc., 5.125%, 4/1/29 (144A) | 20,375 |
| | Total Chemicals | $ 103,334 |
| | Commercial Services — 0.8% | |
| 45,000 | Allied Universal Holdco LLC/Allied Universal Finance Corp., 6.625%, 7/15/26 (144A) | $ 44,764 |
| 35,000 | Garda World Security Corp., 4.625%, 2/15/27 (144A) | 33,747 |
| 39,000 | Garda World Security Corp., 6.00%, 6/1/29 (144A) | 34,959 |
| 24,000 | Garda World Security Corp., 9.50%, 11/1/27 (144A) | 24,195 |
| 104,000 | Prime Security Services Borrower LLC/Prime Finance, Inc., 6.25%, 1/15/28 (144A) | 103,393 |
| | Total Commercial Services | $ 241,058 |
| | Diversified Financial Services — 3.9% | |
| 150,000 | AerCap Ireland Capital DAC/AerCap Global Aviation Trust, 3.30%, 1/30/32 | $ 130,549 |
| 24,000 | Ally Financial, Inc., 6.70%, 2/14/33 | 24,028 |
| 30,000(d) | Ally Financial, Inc., 6.848% (SOFR + 282 bps), 1/3/30 | 30,822 |
| 65,000(d) | Ally Financial, Inc., 6.992% (SOFR + 326 bps), 6/13/29 | 67,129 |
| 76,000 | Ally Financial, Inc., 8.00%, 11/1/31 | 83,258 |
| 105,000 | Avolon Holdings Funding, Ltd., 6.375%, 5/4/28 (144A) | 107,059 |
| 60,000(d) | Capital One Financial Corp., 2.359% (SOFR + 134 bps), 7/29/32 | 45,457 |
| 60,000(d) | Capital One Financial Corp., 5.817% (SOFR + 260 bps), 2/1/34 | 59,708 |
| 140,000(d) | Capital One Financial Corp., 6.377% (SOFR + 286 bps), 6/8/34 | 144,088 |
| 50,000(d) | Charles Schwab Corp., 5.853% (SOFR + 250 bps), 5/19/34 | 51,613 |
| 161,346(g) | Global Aircraft Leasing Co., Ltd., 6.50% (7.25% PIK or 6.50% Cash), 9/15/24 (144A) | 151,665 |
| 55,000 | OneMain Finance Corp., 3.50%, 1/15/27 | 50,899 |
| 130,000 | OneMain Finance Corp., 4.00%, 9/15/30 | 111,248 |
| 20,000 | OneMain Finance Corp., 7.875%, 3/15/30 | 20,587 |
| 35,000 | OneMain Finance Corp., 9.00%, 1/15/29 | 37,003 |
| 10,000 | PennyMac Financial Services, Inc., 7.875%, 12/15/29 (144A) | 10,294 |
| 84,000 | United Wholesale Mortgage LLC, 5.50%, 4/15/29 (144A) | 79,524 |
| | Total Diversified Financial Services | $ 1,204,931 |
| | Electric — 0.3% | |
| 75,000(d) | Algonquin Power & Utilities Corp., 4.75% (5 Year CMT Index + 325 bps), 1/18/82 | $ 63,375 |
| 35,000 | Vistra Operations Co. LLC, 6.95%, 10/15/33 (144A) | 36,835 |
| | Total Electric | $ 100,210 |
| | Electrical Components & Equipments — 0.3% | |
| EUR 100,000 | Energizer Gamma Acquisition BV, 3.50%, 6/30/29 (144A) | $ 94,698 |
| | Total Electrical Components & Equipments | $ 94,698 |
12
The accompanying notes are an integral part of these financial statements.
| Pioneer Strategic Income VCT Portfolio | Pioneer Variable Contracts Trust |
Principal
Amount
USD ($) | | | | | | Value |
| | Energy-Alternate Sources — 0.1% | |
| 35,226 | Alta Wind Holdings LLC, 7.00%, 6/30/35 (144A) | $ 30,381 |
| | Total Energy-Alternate Sources | $ 30,381 |
| | Entertainment — 0.6% | |
| 200,000 | Resorts World Las Vegas LLC/RWLV Capital, Inc., 4.625%, 4/16/29 (144A) | $ 174,292 |
| 25,000 | Scientific Games Holdings LP/Scientific Games US FinCo, Inc., 6.625%, 3/1/30 (144A) | 23,636 |
| | Total Entertainment | $ 197,928 |
| | Food — 0.5% | |
| 13,000 | JBS USA LUX S.A./JBS USA Food Co./JBS USA Finance, Inc., 3.00%, 5/15/32 | $ 10,584 |
| 105,000 | JBS USA LUX S.A./JBS USA Food Co./JBS USA Finance, Inc., 5.75%, 4/1/33 | 104,012 |
| 45,000 | JBS USA LUX S.A./JBS USA Food Co./JBS USA Finance, Inc., 6.50%, 12/1/52 | 45,247 |
| | Total Food | $ 159,843 |
| | Gas — 0.4% | |
| 120,000 | KeySpan Gas East Corp., 5.994%, 3/6/33 (144A) | $ 122,028 |
| | Total Gas | $ 122,028 |
| | Hand & Machine Tools — 0.2% | |
| 50,000 | Regal Rexnord Corp., 6.30%, 2/15/30 (144A) | $ 51,296 |
| | Total Hand & Machine Tools | $ 51,296 |
| | Insurance — 0.6% | |
| 120,000(d) | Farmers Insurance Exchange, 4.747% (3 Month USD LIBOR + 323 bps), 11/1/57 (144A) | $ 92,256 |
| 85,000 | Liberty Mutual Group, Inc., 5.50%, 6/15/52 (144A) | 83,719 |
| | Total Insurance | $ 175,975 |
| | Iron & Steel — 0.3% | |
| 24,000 | Commercial Metals Co., 4.375%, 3/15/32 | $ 21,539 |
| 75,000 | TMS International Corp., 6.25%, 4/15/29 (144A) | 61,875 |
| | Total Iron & Steel | $ 83,414 |
| | Leisure Time — 0.2% | |
| 30,000 | NCL Corp., Ltd., 8.125%, 1/15/29 (144A) | $ 31,338 |
| 10,000 | NCL Finance, Ltd., 6.125%, 3/15/28 (144A) | 9,572 |
| 15,000 | Royal Caribbean Cruises, Ltd., 7.25%, 1/15/30 (144A) | 15,666 |
| 5,000 | Viking Ocean Cruises Ship VII, Ltd., 5.625%, 2/15/29 (144A) | 4,875 |
| | Total Leisure Time | $ 61,451 |
| | Lodging — 0.1% | |
| 30,000 | Hilton Grand Vacations Borrower Escrow LLC/Hilton Grand Vacations Borrower Esc, 5.00%, 6/1/29 (144A) | $ 27,676 |
| | Total Lodging | $ 27,676 |
| | Media — 0.4% | |
| 10,000 | CCO Holdings LLC/CCO Holdings Capital Corp., 4.50%, 6/1/33 (144A) | $ 8,461 |
| 125,000 | CCO Holdings LLC/CCO Holdings Capital Corp., 4.75%, 3/1/30 (144A) | 114,221 |
| 15,000 | CCO Holdings LLC/CCO Holdings Capital Corp., 7.375%, 3/1/31 (144A) | 15,395 |
| | Total Media | $ 138,077 |
| | Mining — 0.6% | |
| 115,000 | Coeur Mining, Inc., 5.125%, 2/15/29 (144A) | $ 105,814 |
| 107,000 | IAMGOLD Corp., 5.75%, 10/15/28 (144A) | 92,015 |
| | Total Mining | $ 197,829 |
The accompanying notes are an integral part of these financial statements.
13
| Pioneer Strategic Income VCT Portfolio | Pioneer Variable Contracts Trust |
Schedule of Investments 12/31/23 (continued)
Principal
Amount
USD ($) | | | | | | Value |
| | Multi-National — 0.2% | |
| INR 4,700,000 | European Bank For Reconstruction & Development, 6.25%, 4/11/28 | $ 54,987 |
| | Total Multi-National | $ 54,987 |
| | Oil & Gas — 1.5% | |
| 150,000 | Aker BP ASA, 6.00%, 6/13/33 (144A) | $ 155,806 |
| 55,000 | Baytex Energy Corp., 8.50%, 4/30/30 (144A) | 56,920 |
| 20,000 | CITGO Petroleum Corp., 8.375%, 1/15/29 (144A) | 20,566 |
| 40,000 | Petroleos Mexicanos, 6.70%, 2/16/32 | 33,191 |
| 28,500 | Transocean, Inc., 8.75%, 2/15/30 (144A) | 29,776 |
| 45,000 | Vermilion Energy, Inc., 6.875%, 5/1/30 (144A) | 43,202 |
| 130,000 | YPF S.A., 6.95%, 7/21/27 (144A) | 116,317 |
| | Total Oil & Gas | $ 455,778 |
| | Oil & Gas Services — 0.2% | |
| 50,000 | Enerflex, Ltd., 9.00%, 10/15/27 (144A) | $ 48,233 |
| | Total Oil & Gas Services | $ 48,233 |
| | Pharmaceuticals — 0.4% | |
| 31,000 | Par Pharmaceutical, Inc., 7.50%, 4/1/27 (144A) | $ 19,840 |
| EUR 100,000 | Teva Pharmaceutical Finance Netherlands II BV, 4.375%, 5/9/30 | 103,420 |
| 150,000 + | Tricida, Inc., 5/15/27 | — |
| | Total Pharmaceuticals | $ 123,260 |
| | Pipelines — 1.9% | |
| 58,000(d) | Enbridge, Inc., 8.50% (5 Year CMT Index + 443 bps), 1/15/84 | $ 61,691 |
| 35,000 | Energy Transfer LP, 6.00%, 6/15/48 | 35,260 |
| 19,000 | Energy Transfer LP, 6.10%, 2/15/42 | 19,047 |
| 50,000 | Energy Transfer LP, 7.375%, 2/1/31 (144A) | 52,547 |
| 15,000(d)(h) | Energy Transfer LP, 6.625% (3 Month USD LIBOR + 416 bps) | 12,525 |
| 178,000(d)(h) | Energy Transfer LP, 7.125% (5 Year CMT Index + 531 bps) | 164,023 |
| 9,000 | EnLink Midstream Partners LP, 5.05%, 4/1/45 | 7,448 |
| 135,000 | EnLink Midstream Partners LP, 5.45%, 6/1/47 | 117,787 |
| 34,000 | EnLink Midstream Partners LP, 5.60%, 4/1/44 | 29,591 |
| 5,000 | Venture Global LNG, Inc., 8.125%, 6/1/28 (144A) | 5,049 |
| 50,000 | Venture Global LNG, Inc., 8.375%, 6/1/31 (144A) | 49,974 |
| 15,000 | Venture Global LNG, Inc., 9.50%, 2/1/29 (144A) | 15,873 |
| | Total Pipelines | $ 570,815 |
| | REITs — 0.5% | |
| 6,000 | Highwoods Realty LP, 2.60%, 2/1/31 | $ 4,664 |
| 6,000 | Highwoods Realty LP, 3.05%, 2/15/30 | 4,957 |
| 155,000 | MPT Operating Partnership LP/MPT Finance Corp., 3.50%, 3/15/31 | 96,910 |
| 30,000 | Uniti Group LP/Uniti Group Finance, Inc./CSL Capital LLC, 6.50%, 2/15/29 (144A) | 21,650 |
| 20,000 | Uniti Group LP/Uniti Group Finance, Inc./CSL Capital LLC, 10.50%, 2/15/28 (144A) | 20,276 |
| | Total REITs | $ 148,457 |
| | Retail — 0.5% | |
| 120,000 | Darden Restaurants, Inc., 6.30%, 10/10/33 | $ 129,004 |
| 35,000 | LCM Investments Holdings II LLC, 4.875%, 5/1/29 (144A) | 32,512 |
| | Total Retail | $ 161,516 |
14
The accompanying notes are an integral part of these financial statements.
| Pioneer Strategic Income VCT Portfolio | Pioneer Variable Contracts Trust |
Principal
Amount
USD ($) | | | | | | Value |
| | Software — 0.0%† | |
| 16,000 | AthenaHealth Group, Inc., 6.50%, 2/15/30 (144A) | $ 14,515 |
| | Total Software | $ 14,515 |
| | Telecommunications — 0.7% | |
| 24,000 | Level 3 Financing, Inc., 10.50%, 5/15/30 (144A) | $ 23,273 |
| EUR 100,000 | Lorca Telecom Bondco SA, 4.00%, 9/18/27 (144A) | 107,634 |
| 50,000 | T-Mobile USA, Inc., 5.75%, 1/15/34 | 53,032 |
| 35,000 | Windstream Escrow LLC/Windstream Escrow Finance Corp., 7.75%, 8/15/28 (144A) | 30,651 |
| | Total Telecommunications | $ 214,590 |
| | Transportation — 0.2% | |
| 20,000 | Norfolk Southern Corp., 5.95%, 3/15/64 | $ 22,315 |
| 32,000 | Seaspan Corp., 5.50%, 8/1/29 (144A) | 26,770 |
| | Total Transportation | $ 49,085 |
| | Trucking & Leasing — 0.2% | |
| 45,000 | Penske Truck Leasing Co. LP/PTL Finance Corp., 6.05%, 8/1/28 (144A) | $ 46,642 |
| | Total Trucking & Leasing | $ 46,642 |
| | Total Corporate Bonds
(Cost $9,616,836) | $ 9,051,941 |
|
| |
Face
Amount
USD ($) | | | | | | |
| | Insurance-Linked Securities — 0.0%† of Net Assets# | |
| | Reinsurance Sidecars — 0.0%† | |
| | Multiperil – Worldwide — 0.0%† | |
| 20,578(b)(i) + | Lorenz Re 2019, 6/30/24 | $ 198 |
| | Total Reinsurance Sidecars | $ 198 |
| | Total Insurance-Linked Securities
(Cost $3,372) | $ 198 |
|
| |
Principal
Amount
USD ($) | | | | | | |
| | Foreign Government Bonds — 3.0% of Net Assets | |
| | Argentina — 1.0% | |
| 6,500 | Argentine Republic Government International Bond, 1.000%, 7/9/29 | $ 2,581 |
| 145,500(c) | Argentine Republic Government International Bond, 3.625%, 7/9/35 | 49,661 |
| 250,000 | Ciudad Autonoma De Buenos Aires, 7.500%, 6/1/27 (144A) | 246,250 |
| | Total Argentina | $ 298,492 |
| | Indonesia — 0.4% | |
| IDR 1,784,000,000 | Indonesia Treasury Bond, 6.125%, 5/15/28 | $ 114,284 |
| | Total Indonesia | $ 114,284 |
| | Ivory Coast — 0.6% | |
| EUR 100,000 | Ivory Coast Government International Bond, 4.875%, 1/30/32 (144A) | $ 92,807 |
| EUR 100,000 | Ivory Coast Government International Bond, 5.875%, 10/17/31 (144A) | 98,715 |
| | Total Ivory Coast | $ 191,522 |
The accompanying notes are an integral part of these financial statements.
15
| Pioneer Strategic Income VCT Portfolio | Pioneer Variable Contracts Trust |
Schedule of Investments 12/31/23 (continued)
Principal
Amount
USD ($) | | | | | | Value |
| | Serbia — 0.2% | |
| EUR 100,000 | Serbia International Bond, 2.050%, 9/23/36 (144A) | $ 76,662 |
| | Total Serbia | $ 76,662 |
| | Supranational — 0.6% | |
| INR 4,000,000 | International Bank for Reconstruction & Development, 6.500%, 4/17/30 | $ 47,134 |
| INR 5,500,000 | International Bank for Reconstruction & Development, 6.850%, 4/24/28 | 66,132 |
| KZT 11,000,000 | International Bank for Reconstruction & Development, 12.500%, 2/21/25 | 23,478 |
| COP 200,000,000 | International Finance Corp., 3.590%, 2/26/26 | 44,820 |
| | Total Supranational | $ 181,564 |
| | Uruguay — 0.2% | |
| UYU 1,790,000 | Uruguay Government International Bond, 9.750%, 7/20/33 | $ 46,102 |
| | Total Uruguay | $ 46,102 |
| | Total Foreign Government Bonds
(Cost $1,030,450) | $ 908,626 |
|
| |
| | U.S. Government and Agency Obligations — 48.7% of Net Assets | |
| 263,000 | Federal Home Loan Mortgage Corp., 1.500%, 3/1/42 | $ 217,931 |
| 263,984 | Federal Home Loan Mortgage Corp., 2.500%, 5/1/51 | 226,347 |
| 7,633 | Federal Home Loan Mortgage Corp., 3.000%, 10/1/29 | 7,364 |
| 1,292 | Federal Home Loan Mortgage Corp., 3.000%, 11/1/47 | 1,179 |
| 23,777 | Federal Home Loan Mortgage Corp., 3.500%, 7/1/46 | 22,484 |
| 84,294 | Federal Home Loan Mortgage Corp., 3.500%, 4/1/52 | 78,031 |
| 50,205 | Federal Home Loan Mortgage Corp., 3.500%, 4/1/52 | 46,594 |
| 4,883 | Federal Home Loan Mortgage Corp., 4.000%, 4/1/47 | 4,692 |
| 98,705 | Federal Home Loan Mortgage Corp., 4.500%, 3/1/53 | 95,928 |
| 7,931 | Federal Home Loan Mortgage Corp., 5.000%, 11/1/39 | 8,071 |
| 2,000 | Federal Home Loan Mortgage Corp., 5.000%, 3/1/44 | 2,032 |
| 89,566 | Federal Home Loan Mortgage Corp., 5.000%, 10/1/52 | 90,673 |
| 4,000 | Federal Home Loan Mortgage Corp., 5.500%, 6/1/41 | 4,119 |
| 90,037 | Federal Home Loan Mortgage Corp., 5.500%, 7/1/49 | 91,731 |
| 813,903 | Federal Home Loan Mortgage Corp., 5.500%, 8/1/53 | 817,193 |
| 493,010 | Federal Home Loan Mortgage Corp., 5.500%, 11/1/53 | 495,003 |
| 492,946 | Federal Home Loan Mortgage Corp., 5.500%, 12/1/53 | 494,939 |
| 96,786 | Federal Home Loan Mortgage Corp., 6.500%, 10/1/53 | 99,184 |
| 477,000 | Federal National Mortgage Association, 1.500%, 3/1/42 | 395,257 |
| 100,000 | Federal National Mortgage Association, 2.000%, 1/1/39 (TBA) | 89,641 |
| 115,222 | Federal National Mortgage Association, 2.000%, 12/1/41 | 98,472 |
| 174,348 | Federal National Mortgage Association, 2.000%, 4/1/42 | 148,697 |
| 59,785 | Federal National Mortgage Association, 2.000%, 11/1/51 | 49,680 |
| 400,000 | Federal National Mortgage Association, 2.000%, 1/1/54 (TBA) | 326,875 |
| 100,000 | Federal National Mortgage Association, 2.500%, 1/1/39 (TBA) | 92,117 |
| 238,492 | Federal National Mortgage Association, 2.500%, 5/1/51 | 205,904 |
| 67,000 | Federal National Mortgage Association, 2.500%, 5/1/51 | 57,918 |
| 160,000 | Federal National Mortgage Association, 2.500%, 11/1/51 | 138,633 |
| 174,000 | Federal National Mortgage Association, 2.500%, 1/1/52 | 149,481 |
| 85,000 | Federal National Mortgage Association, 2.500%, 2/1/52 | 73,497 |
| 440,795 | Federal National Mortgage Association, 2.500%, 4/1/52 | 374,770 |
| 600,000 | Federal National Mortgage Association, 2.500%, 1/1/54 (TBA) | 510,375 |
| 10,993 | Federal National Mortgage Association, 3.000%, 10/1/30 | 10,560 |
| 515 | Federal National Mortgage Association, 3.000%, 5/1/46 | 465 |
16
The accompanying notes are an integral part of these financial statements.
| Pioneer Strategic Income VCT Portfolio | Pioneer Variable Contracts Trust |
Principal
Amount
USD ($) | | | | | | Value |
| | U.S. Government and Agency Obligations — (continued) | |
| 836 | Federal National Mortgage Association, 3.000%, 10/1/46 | $ 754 |
| 445 | Federal National Mortgage Association, 3.000%, 1/1/47 | 401 |
| 125,038 | Federal National Mortgage Association, 3.000%, 1/1/52 | 112,166 |
| 168,796 | Federal National Mortgage Association, 3.000%, 3/1/52 | 152,608 |
| 98,988 | Federal National Mortgage Association, 3.000%, 6/1/52 | 87,545 |
| 1,250,000 | Federal National Mortgage Association, 3.000%, 1/1/54 (TBA) | 1,105,615 |
| 84,059 | Federal National Mortgage Association, 3.500%, 3/1/52 | 77,509 |
| 83,826 | Federal National Mortgage Association, 3.500%, 4/1/52 | 77,244 |
| 29,935 | Federal National Mortgage Association, 3.500%, 4/1/52 | 27,781 |
| 86,235 | Federal National Mortgage Association, 3.500%, 5/1/52 | 79,828 |
| 190,000 | Federal National Mortgage Association, 3.500%, 1/1/54 (TBA) | 174,295 |
| 26,082 | Federal National Mortgage Association, 4.000%, 10/1/40 | 25,435 |
| 3,582 | Federal National Mortgage Association, 4.000%, 12/1/40 | 3,493 |
| 17,504 | Federal National Mortgage Association, 4.000%, 11/1/43 | 16,988 |
| 40,000 | Federal National Mortgage Association, 4.000%, 7/1/51 | 38,049 |
| 10,000 | Federal National Mortgage Association, 4.000%, 9/1/51 | 9,550 |
| 100,000 | Federal National Mortgage Association, 4.000%, 1/1/54 (TBA) | 94,574 |
| 100,000 | Federal National Mortgage Association, 4.500%, 1/1/39 (TBA) | 99,500 |
| 11,359 | Federal National Mortgage Association, 4.500%, 5/1/41 | 11,344 |
| 32,586 | Federal National Mortgage Association, 4.500%, 9/1/43 | 32,534 |
| 31,000 | Federal National Mortgage Association, 4.500%, 1/1/44 | 30,960 |
| 45,000 | Federal National Mortgage Association, 4.500%, 6/1/44 | 44,942 |
| 79,967 | Federal National Mortgage Association, 4.500%, 7/1/44 | 79,436 |
| 8,245 | Federal National Mortgage Association, 5.000%, 4/1/30 | 8,278 |
| 9,089 | Federal National Mortgage Association, 5.000%, 1/1/39 | 9,195 |
| 100,000 | Federal National Mortgage Association, 5.000%, 1/1/39 (TBA) | 100,594 |
| 2,000 | Federal National Mortgage Association, 5.000%, 12/1/44 | 2,032 |
| 100,000 | Federal National Mortgage Association, 5.000%, 1/1/54 (TBA) | 98,930 |
| 100,000 | Federal National Mortgage Association, 5.500%, 1/1/39 (TBA) | 101,418 |
| 90,593 | Federal National Mortgage Association, 5.500%, 4/1/50 | 92,298 |
| 90,471 | Federal National Mortgage Association, 5.500%, 4/1/53 | 91,076 |
| 207,604 | Federal National Mortgage Association, 5.500%, 9/1/53 | 208,444 |
| 41,613 | Federal National Mortgage Association, 5.500%, 9/1/53 | 41,811 |
| 56 | Federal National Mortgage Association, 6.000%, 3/1/32 | 58 |
| 96,704 | Federal National Mortgage Association, 6.000%, 5/1/53 | 100,055 |
| 99,057 | Federal National Mortgage Association, 6.000%, 7/1/53 | 101,417 |
| 97,016 | Federal National Mortgage Association, 6.000%, 9/1/53 | 98,506 |
| 68,224 | Federal National Mortgage Association, 6.500%, 8/1/53 | 70,043 |
| 99,106 | Federal National Mortgage Association, 6.500%, 9/1/53 | 101,788 |
| 100,000 | Government National Mortgage Association, 3.000%, 1/20/54 (TBA) | 90,531 |
| 100,000 | Government National Mortgage Association, 3.500%, 1/20/54 (TBA) | 93,125 |
| 100,000 | Government National Mortgage Association, 5.000%, 1/20/54 (TBA) | 99,297 |
| 100,000 | Government National Mortgage Association, 5.500%, 1/20/54 (TBA) | 100,719 |
| 100,000 | Government National Mortgage Association, 6.000%, 1/20/54 (TBA) | 101,676 |
| 100,000 | Government National Mortgage Association, 6.500%, 1/20/54 (TBA) | 102,363 |
| 3,154 | Government National Mortgage Association I, 3.500%, 10/15/42 | 2,980 |
| 444 | Government National Mortgage Association I, 4.000%, 12/15/41 | 429 |
| 59,166 | Government National Mortgage Association I, 4.000%, 4/15/42 | 57,718 |
| 48,540 | Government National Mortgage Association I, 4.000%, 8/15/43 | 47,951 |
The accompanying notes are an integral part of these financial statements.
17
| Pioneer Strategic Income VCT Portfolio | Pioneer Variable Contracts Trust |
Schedule of Investments 12/31/23 (continued)
Principal
Amount
USD ($) | | | | | | Value |
| | U.S. Government and Agency Obligations — (continued) | |
| 3,283 | Government National Mortgage Association I, 4.000%, 3/15/44 | $ 3,186 |
| 7,550 | Government National Mortgage Association I, 4.000%, 9/15/44 | 7,321 |
| 7,032 | Government National Mortgage Association I, 4.000%, 4/15/45 | 6,821 |
| 11,782 | Government National Mortgage Association I, 4.000%, 6/15/45 | 11,475 |
| 1,433 | Government National Mortgage Association I, 4.500%, 9/15/33 | 1,419 |
| 2,870 | Government National Mortgage Association I, 4.500%, 4/15/35 | 2,833 |
| 8,170 | Government National Mortgage Association I, 4.500%, 1/15/40 | 8,143 |
| 31,822 | Government National Mortgage Association I, 4.500%, 3/15/40 | 31,530 |
| 5,801 | Government National Mortgage Association I, 4.500%, 9/15/40 | 5,777 |
| 6,939 | Government National Mortgage Association I, 4.500%, 7/15/41 | 6,871 |
| 1,774 | Government National Mortgage Association I, 5.000%, 4/15/35 | 1,784 |
| 1,572 | Government National Mortgage Association I, 5.500%, 1/15/34 | 1,589 |
| 2,268 | Government National Mortgage Association I, 5.500%, 4/15/34 | 2,293 |
| 657 | Government National Mortgage Association I, 5.500%, 7/15/34 | 664 |
| 3,433 | Government National Mortgage Association I, 5.500%, 6/15/35 | 3,470 |
| 284 | Government National Mortgage Association I, 6.000%, 2/15/33 | 293 |
| 437 | Government National Mortgage Association I, 6.000%, 3/15/33 | 453 |
| 445 | Government National Mortgage Association I, 6.000%, 3/15/33 | 452 |
| 525 | Government National Mortgage Association I, 6.000%, 6/15/33 | 543 |
| 644 | Government National Mortgage Association I, 6.000%, 7/15/33 | 663 |
| 566 | Government National Mortgage Association I, 6.000%, 7/15/33 | 581 |
| 460 | Government National Mortgage Association I, 6.000%, 9/15/33 | 468 |
| 473 | Government National Mortgage Association I, 6.000%, 10/15/33 | 487 |
| 161 | Government National Mortgage Association I, 6.500%, 3/15/29 | 165 |
| 699 | Government National Mortgage Association I, 6.500%, 1/15/30 | 723 |
| 100 | Government National Mortgage Association I, 6.500%, 2/15/32 | 104 |
| 104 | Government National Mortgage Association I, 6.500%, 3/15/32 | 106 |
| 221 | Government National Mortgage Association I, 6.500%, 11/15/32 | 225 |
| 3,965 | Government National Mortgage Association II, 3.500%, 4/20/45 | 3,729 |
| 6,493 | Government National Mortgage Association II, 3.500%, 4/20/45 | 6,116 |
| 7,340 | Government National Mortgage Association II, 3.500%, 3/20/46 | 6,934 |
| 11,727 | Government National Mortgage Association II, 4.000%, 9/20/44 | 11,480 |
| 15,340 | Government National Mortgage Association II, 4.000%, 10/20/46 | 14,846 |
| 13,607 | Government National Mortgage Association II, 4.000%, 1/20/47 | 13,137 |
| 9,279 | Government National Mortgage Association II, 4.000%, 2/20/48 | 8,902 |
| 11,828 | Government National Mortgage Association II, 4.000%, 4/20/48 | 11,344 |
| 4,128 | Government National Mortgage Association II, 4.500%, 9/20/41 | 4,129 |
| 10,820 | Government National Mortgage Association II, 4.500%, 9/20/44 | 10,833 |
| 4,754 | Government National Mortgage Association II, 4.500%, 10/20/44 | 4,761 |
| 9,643 | Government National Mortgage Association II, 4.500%, 11/20/44 | 9,656 |
| 1,193 | Government National Mortgage Association II, 5.500%, 3/20/34 | 1,242 |
| 1,945 | Government National Mortgage Association II, 6.000%, 11/20/33 | 2,036 |
| 1,495,000(f) | U.S. Treasury Bills, 1/2/24 | 1,495,000 |
| 324,200 | U.S. Treasury Bonds, 2.250%, 2/15/52 | 224,736 |
| 470,800 | U.S. Treasury Bonds, 3.000%, 2/15/48 | 383,647 |
| 575,700 | U.S. Treasury Bonds, 4.375%, 8/15/43 | 587,664 |
| 269,110 | U.S. Treasury Inflation Indexed Bonds, 1.500%, 2/15/53 | 243,681 |
18
The accompanying notes are an integral part of these financial statements.
| Pioneer Strategic Income VCT Portfolio | Pioneer Variable Contracts Trust |
Principal
Amount
USD ($) | | | | | | Value |
| | U.S. Government and Agency Obligations — (continued) | |
| 200,000 | U.S. Treasury Notes, 3.875%, 8/15/33 | $ 199,750 |
| 1,670,400 | U.S. Treasury Notes, 4.625%, 9/30/30 | 1,741,261 |
| | Total U.S. Government and Agency Obligations
(Cost $14,831,449) | $14,916,443 |
|
| |
| Shares | | | | | | |
| | SHORT TERM INVESTMENTS — 1.0% of Net Assets | |
| | Open-End Fund — 1.0% | |
| 323,466(j) | Dreyfus Government Cash Management,
Institutional Shares, 5.25% | $ 323,466 |
| | | | | | | $ 323,466 |
| | TOTAL SHORT TERM INVESTMENTS
(Cost $323,466) | $ 323,466 |
Number of
Contracts | Description | Counterparty | Amount | Strike
Price | Expiration
Date | |
| | Over The Counter (OTC) Currency Put Options Purchased — 0.0%† | |
| 800,000 | Put USD Call JPY | Goldman Sachs & Co. | USD 30,406 | USD 125.00 | 1/5/24 | $ — |
| 800,000 | Put USD Call JPY | Goldman Sachs & Co. | USD 26,112 | USD 141.00 | 1/5/24 | 4,405 |
| | Total Over The Counter (OTC) Currency Put Options Purchased
(Premiums paid $ 56,518) | $ 4,405 |
|
| |
| | TOTAL OPTIONS PURCHASED
(Premiums paid $ 56,518) | $ 4,405 |
|
| |
| | TOTAL INVESTMENTS IN UNAFFILIATED ISSUERS — 104.5%
(Cost $33,801,893) | $32,001,277 |
| Shares | | Net
Realized
Gain (Loss)
for the year
ended
12/31/23 | Change in
Unrealized
Appreciation
(Depreciation)
for the year
ended
12/31/23 | Capital
Gain
Distributions
for the year
ended
12/31/23 | Dividend
Income
for the year
ended
12/31/23 | Value |
| | Affiliated Issuer — 3.2% | |
| | Closed-End Fund — 3.2% of Net Assets | |
| 115,065(k) | Pioneer ILS Interval Fund | $— | $42,964 | $— | $111,022 | $ 979,198 |
| | Total Investments in Affiliated Issuer — 3.2%
(Cost $1,147,176) | $ 979,198 |
Principal
Amount
USD ($) | | | | | | |
| | TBA SALES COMMITMENTS — (5.9)% of Net Assets | |
| | U.S. Government and Agency Obligations — (5.9)% | |
| (1,800,000) | Federal National Mortgage Association, 5.500%, 1/1/54 (TBA) | $ (1,807,594) |
| | TOTAL TBA SALES COMMITMENTS
(Proceeds $1,802,250) | $ (1,807,594) |
|
| |
| | OTHER ASSETS AND LIABILITIES — (1.8)% | $ (560,628) |
| | net assets — 100.0% | $30,612,253 |
| | | | | | | |
The accompanying notes are an integral part of these financial statements.
19
| Pioneer Strategic Income VCT Portfolio | Pioneer Variable Contracts Trust |
Schedule of Investments 12/31/23 (continued)
| (TBA) | “To Be Announced” Securities. |
| bps | Basis Points. |
| CMT | Constant Maturity Treasury Index. |
| FREMF | Freddie Mac Multifamily Fixed-Rate Mortgage Loans. |
| LIBOR | London Interbank Offered Rate. |
| REMICs | Real Estate Mortgage Investment Conduits. |
| SOFR | Secured Overnight Financing Rate. |
| SOFR30A | Secured Overnight Financing Rate 30 Day Average. |
| (144A) | The resale of such security is exempt from registration under Rule 144A of the Securities Act of 1933. Such securities may be resold normally to qualified institutional buyers. At December 31, 2023, the value of these securities amounted to $11,651,957, or 38.1% of net assets. |
| (a) | Floating rate note. Coupon rate, reference index and spread shown at December 31, 2023. |
| (b) | Non-income producing security. |
| (c) | Debt obligation initially issued at one coupon which converts to a higher coupon at a specific date. The rate shown is the rate at December 31, 2023. |
| (d) | The interest rate is subject to change periodically. The interest rate and/or reference index and spread shown at December 31, 2023. |
| (e) | Security represents the interest-only portion payments on a pool of underlying mortgages or mortgage-backed securities. |
| (f) | Security issued with a zero coupon. Income is recognized through accretion of discount. |
| (g) | Payment-in-kind (PIK) security which may pay interest in the form of additional principal amount. |
| (h) | Security is perpetual in nature and has no stated maturity date. |
| (i) | Issued as preference shares. |
| (j) | Rate periodically changes. Rate disclosed is the 7-day yield at December 31, 2023. |
| (k) | Pioneer ILS Interval Fund is an affiliated closed-end fund managed by Amundi Asset Management US, Inc., (the “Adviser”). |
| * | Senior secured floating rate loan interests in which the Portfolio invests generally pay interest at rates that are periodically re-determined by reference to a base lending rate plus a premium. These base lending rates are generally (i) the lending rate offered by one or more major European banks, such as LIBOR or SOFR, (ii) the prime rate offered by one or more major United States banks, (iii) the rate of a certificate of deposit or (iv) other base lending rates used by commercial lenders. The interest rate shown is the rate accruing at December 31, 2023. |
| + | Security is valued using significant unobservable inputs (Level 3). |
| † | Amount rounds to less than 0.1%. |
| # | Securities are restricted as to resale. |
| Restricted Securities | Acquisition date | Cost | Value |
| Lorenz Re 2019 | 7/10/2019 | $ 3,372 | $ 198 |
| % of Net assets | | | 0.0% † |
| † | Amount rounds to less than 0.1%. |
FORWARD FOREIGN CURRENCY EXCHANGE CONTRACTS
Currency
Purchased | In
Exchange for | Currency
Sold | Deliver | Counterparty | Settlement
Date | Unrealized
Appreciation
(Depreciation) |
| AUD | 190,000 | USD | 122,684 | Bank of America NA | 1/24/24 | $ 6,906 |
| SEK | 1,700,000 | EUR | 144,356 | HSBC Bank USA NA | 1/26/24 | 9,202 |
| USD | 115,007 | IDR | 1,794,500,000 | HSBC Bank USA NA | 3/22/24 | (1,530) |
| USD | 656,466 | EUR | 595,000 | HSBC Bank USA NA | 3/27/24 | (2,732) |
| USD | 125,918 | KZT | 61,700,000 | JPMorgan Chase Bank NA | 2/2/24 | (8,137) |
| AUD | 407,000 | USD | 265,092 | State Street Bank & Trust Co. | 2/27/24 | 12,779 |
| AUD | 235,000 | USD | 158,053 | State Street Bank & Trust Co. | 3/27/24 | 2,510 |
| EUR | 809,000 | USD | 859,750 | State Street Bank & Trust Co. | 1/24/24 | 34,310 |
| INR | 13,400,000 | USD | 160,306 | State Street Bank & Trust Co. | 2/5/24 | 454 |
| USD | 72,345 | CAD | 100,000 | State Street Bank & Trust Co. | 2/2/24 | (3,161) |
| USD | 79,710 | EUR | 73,000 | State Street Bank & Trust Co. | 2/27/24 | (1,072) |
| TOTAL FORWARD FOREIGN CURRENCY EXCHANGE CONTRACTS | $49,529 |
FUTURES CONTRACTS
FIXED INCOME INDEX FUTURES CONTRACTS
Number of
Contracts
Long | Description | Expiration
Date | Notional
Amount | Market
Value | Unrealized
Appreciation |
| 5 | U.S. 2 Year Note (CBT) | 3/28/24 | $1,018,684 | $1,029,570 | $10,886 |
20
The accompanying notes are an integral part of these financial statements.
| Pioneer Strategic Income VCT Portfolio | Pioneer Variable Contracts Trust |
Number of
Contracts
Long | Description | Expiration
Date | Notional
Amount | Market
Value | Unrealized
Appreciation |
| 65 | U.S. 5 Year Note (CBT) | 3/28/24 | $6,903,361 | $7,070,274 | $166,913 |
| 4 | U.S. 10 Year Note (CBT) | 3/19/24 | 436,041 | 451,563 | 15,522 |
| 3 | U.S. Ultra Bond (CBT) | 3/19/24 | 377,118 | 400,781 | 23,663 |
| | | | $8,735,204 | $8,952,188 | $216,984 |
Number of
Contracts
Short | Description | Expiration
Date | Notional
Amount | Market
Value | Unrealized
(Depreciation) |
| 6 | Euro-Bund | 3/7/24 | $ (885,180) | $ (908,904) | $ (23,724) |
| 1 | U.S. 10 Year Ultra Bond (CBT) | 3/19/24 | (117,977) | (118,016) | (39) |
| | | | $(1,003,157) | $(1,026,920) | $ (23,763) |
| TOTAL FUTURES CONTRACTS | $ 7,732,047 | $ 7,925,268 | $193,221 |
SWAP CONTRACTS
| CENTRALLY CLEARED CREDIT DEFAULT SWAP CONTRACTS – BUY PROTECTION |
Notional
Amount ($)(1) | Reference Obligation/Index | Pay/
Receive(2) | Annual
Fixed Rate | Expiration
Date | Premiums
(Received) | Unrealized
(Depreciation) | Market
Value |
| 1,989,900 | Markit CDX North America High Yield Index Series 41 | Pay | 5.00% | 12/20/28 | $ (18,210) | $ (101,519) | $ (119,729) |
TOTAL CENTRALLY CLEARED CREDIT DEFAULT
SWAP CONTRACTS – BUY PROTECTION | $(18,210) | $(101,519) | $(119,729) |
| TOTAL SWAP CONTRACTS | | $(18,210) | $(101,519) | $(119,729) |
| | |
| (1) | The notional amount is the maximum amount that a seller of credit protection would be obligated to pay upon occurrence of a credit event. |
| (2) | Pays quarterly. |
Principal amounts are denominated in U.S. dollars (“USD”) unless otherwise noted.
| AUD | — Australia Dollar |
| CAD | — Canada Dollar |
| COP | — Colombia Peso |
| EUR | — Euro |
| IDR | — Indonesian Rupiah |
| INR | — Indian Rupee |
| KZT | — Kazakhstan Tenge |
| SEK | — Sweden Krona |
| USD | — United States Dollar |
| UYU | — Uruguay Peso |
Purchases and sales of securities (excluding short-term investments) for the year ended December 31, 2023 were as follows:
| | Purchases | Sales |
| Long-Term U.S. Government Securities | $ 3,650,427 | $ 2,748,083 |
| Other Long-Term Securities | $10,576,482 | $13,855,796 |
At December 31, 2023, the net unrealized depreciation on investments based on cost for federal tax purposes of $33,279,307 was as follows:
| Aggregate gross unrealized appreciation for all investments in which there is an excess of value over tax cost | $861,391 |
| Aggregate gross unrealized depreciation for all investments in which there is an excess of tax cost over value | (2,844,796) |
| Net unrealized depreciation | $(1,983,405) |
The accompanying notes are an integral part of these financial statements.
21
| Pioneer Strategic Income VCT Portfolio | Pioneer Variable Contracts Trust |
Schedule of Investments 12/31/23 (continued)
Various inputs are used in determining the value of the Portfolio's investments. These inputs are summarized in the three broad levels below.
| Level 1 | – | unadjusted quoted prices in active markets for identical securities. |
| Level 2 | – | other significant observable inputs (including quoted prices for similar securities, interest rates, prepayment speeds, credit risks, etc.). See Notes to Financial Statements — Note 1A. |
| Level 3 | – | significant unobservable inputs (including the Adviser's own assumptions in determining fair value of investments). See Notes to Financial Statements — Note 1A. |
The following is a summary of the inputs used as of December 31, 2023 in valuing the Portfolio's investments:
| | Level 1 | Level 2 | Level 3 | Total |
| Senior Secured Floating Rate Loan Interests | $ — | $ 153,746 | $ — | $ 153,746 |
| Common Stocks | | | | |
| Household Durables | 12 | — | — | 12 |
| Paper & Forest Products | — | — | —* | —* |
| Passenger Airlines | — | — | 24,581 | 24,581 |
| Asset Backed Securities | — | 1,190,877 | — | 1,190,877 |
| Collateralized Mortgage Obligations | — | 3,498,796 | — | 3,498,796 |
| Commercial Mortgage-Backed Securities | — | 1,739,508 | — | 1,739,508 |
| Convertible Corporate Bonds | — | 188,678 | — | 188,678 |
| Corporate Bonds | | | | |
| Pharmaceuticals | — | — | —* | —* |
| All Other Corporate Bonds | — | 9,051,941 | — | 9,051,941 |
| Insurance-Linked Securities | | | | |
| Reinsurance Sidecars | — | — | 198 | 198 |
| Foreign Government Bonds | — | 908,626 | — | 908,626 |
| U.S. Government and Agency Obligations | — | 14,916,443 | — | 14,916,443 |
| Open-End Fund | 323,466 | — | — | 323,466 |
| Over The Counter (OTC) Currency Put Options Purchased | — | 4,405 | — | 4,405 |
| Affiliated Closed-End Fund | 979,198 | — | — | 979,198 |
| Total Investments in Securities | $1,302,676 | $ 31,653,020 | $24,779 | $ 32,980,475 |
| Liabilities | | | | |
| TBA Sales Commitments | $ — | $ (1,807,594) | $ — | $ (1,807,594) |
| Total Liabilities | $ — | $ (1,807,594) | $ — | $ (1,807,594) |
| Other Financial Instruments | | | | |
| Net unrealized appreciation on forward foreign currency exchange contracts | $ — | $ 49,529 | $ — | $ 49,529 |
| Net unrealized appreciation on futures contracts | 193,221 | — | — | 193,221 |
| Centrally cleared swap contracts^ | — | (101,519) | — | (101,519) |
| Total Other Financial Instruments | $ 193,221 | $ (51,990) | $ — | $ 141,231 |
| * | Securities valued at $0. |
| ^ | Reflects the unrealized appreciation (depreciation) of the instruments. |
Transfers are calculated on the beginning of period values. During the year ended December 31, 2023, two securities valued at $19,448 were transferred from Level 2 to Level 3, due to valuing the securities using unobservable inputs. There were no other transfers in or out of Level 3 during the year.
22
The accompanying notes are an integral part of these financial statements.
| Pioneer Strategic Income VCT Portfolio | Pioneer Variable Contracts Trust |
Statement of Assets and Liabilities 12/31/23
| ASSETS: | |
| Investments in unaffiliated issuers, at value (cost $33,801,893) | $32,001,277 |
| Investments in affiliated issuers, at value (cost $1,147,176) | 979,198 |
| Cash | 139,648 |
| Foreign currencies, at value (cost $37,356) | 23,314 |
| Futures collateral | 506,005 |
| Swaps collateral | 254,299 |
| Variation margin for futures contracts | 11,931 |
| Unrealized appreciation on forward foreign currency exchange contracts | 66,161 |
| Receivables — | |
| Investment securities sold | 1,806,583 |
| Portfolio shares sold | 2,519 |
| Interest | 263,431 |
| Due from the Adviser | 530 |
| Total assets | $ 36,054,896 |
| LIABILITIES: | |
| Payables — | |
| Investment securities purchased | $3,341,569 |
| Portfolio shares repurchased | 47,508 |
| Distributions | 5,726 |
| Trustees' fees | 323 |
| Interest expense | 4,125 |
| Variation margin for centrally cleared swap contracts | 119,729 |
| TBA sale commitments at value | 1,807,594 |
| Unrealized depreciation on forward foreign currency exchange contracts | 16,632 |
| Reserve for repatriation taxes | 621 |
| Management fees | 2,486 |
| Administrative expenses | 1,243 |
| Distribution fees | 900 |
| Accrued expenses | 94,187 |
| Total liabilities | $ 5,442,643 |
| NET ASSETS: | |
| Paid-in capital | $35,294,950 |
| Distributable earnings (loss) | (4,682,697) |
| Net assets | $ 30,612,253 |
| NET ASSET VALUE PER SHARE: | |
| No par value (unlimited number of shares authorized) | |
| Class l (based on $4,277,602/482,517 shares) | $ 8.87 |
| Class ll (based on $26,334,651/2,976,005 shares) | $ 8.85 |
The accompanying notes are an integral part of these financial statements.
23
| Pioneer Strategic Income VCT Portfolio | Pioneer Variable Contracts Trust |
FOR THE YEAR ENDED 12/31/23
| INVESTMENT INCOME: | | | |
| Interest from unaffiliated issuers (net of foreign taxes withheld $352) | $ 1,567,456 | | |
| Dividends from affiliated issuers | 111,022 | | |
| Dividends from unaffiliated issuers | 91,794 | | |
| Total Investment Income | | | $ 1,770,272 |
| EXPENSES: | | | |
| Management fees | $ 202,515 | | |
| Administrative expenses | 20,415 | | |
| Distribution fees | | | |
| Class ll | 67,348 | | |
| Custodian fees | 422 | | |
| Professional fees | 137,432 | | |
| Printing expense | 17,118 | | |
| Officers' and Trustees' fees | 8,386 | | |
| Insurance expense | 658 | | |
| Miscellaneous | 1,176 | | |
| Total expenses | | | $ 455,470 |
| Less fees waived and expenses reimbursed by the Adviser | | | (154,451) |
| Net expenses | | | $ 301,019 |
| Net investment income | | | $ 1,469,253 |
| REALIZED AND UNREALIZED GAIN (LOSS) ON INVESTMENTS: | | | |
| Net realized gain (loss) on: | | | |
| Reimbursement by the Adviser | $ 2,298 | | |
| Investments in unaffiliated issuers | (1,667,369) | | |
| Forward foreign currency exchange contracts | (10,748) | | |
| Futures contracts | (185,675) | | |
| Swap contracts | (360,560) | | |
| Written options | 12,201 | | |
| Other assets and liabilities denominated in foreign currencies | (28,459) | | $(2,238,312) |
| Change in net unrealized appreciation (depreciation) on: | | | |
| Investments in unaffiliated issuers (net of foreign capital gains tax of $(39)) | $ 2,919,107 | | |
| Investments in affiliated issuers | 42,964 | | |
| TBA sale commitments | (5,344) | | |
| Forward foreign currency exchange contracts | (18,578) | | |
| Futures contracts | 170,109 | | |
| Swap contracts | 79,422 | | |
| Written options | 1,389 | | |
| Other assets and liabilities denominated in foreign currencies | 813 | | $ 3,189,882 |
| Net realized and unrealized gain (loss) on investments | | | $ 951,570 |
| Net increase in net assets resulting from operations | | | $ 2,420,823 |
24
The accompanying notes are an integral part of these financial statements.
| Pioneer Strategic Income VCT Portfolio | Pioneer Variable Contracts Trust |
Statements of Changes in Net Assets
| | Year
Ended
12/31/23 | | Year
Ended
12/31/22 |
| FROM OPERATIONS: | | | |
| Net investment income (loss) | $ 1,469,253 | | $ 1,248,942 |
| Net realized gain (loss) on investments | (2,238,312) | | (1,713,776) |
| Change in net unrealized appreciation (depreciation) on investments | 3,189,882 | | (4,974,285) |
| Net increase (decrease) in net assets resulting from operations | $ 2,420,823 | | $ (5,439,119) |
| DISTRIBUTIONS TO SHAREHOLDERS: | | | |
| Class l ($0.33 and $0.47 per share, respectively) | $ (163,031) | | $ (239,786) |
| Class ll ($0.31 and $0.45 per share, respectively) | (972,415) | | (1,529,549) |
| Tax return of capital | | | |
| Class l ($— and $0.17 per share, respectively) | $ — | | $ (98,197) |
| Class ll ($— and $0.17 per share, respectively) | — | | (594,426) |
| Total distributions to shareholders | $ (1,135,446) | | $ (2,461,958) |
| FROM PORTFOLIO SHARE TRANSACTIONS: | | | |
| Net proceeds from sales of shares | $ 2,922,883 | | $ 7,988,236 |
| Reinvestment of distributions | 1,132,983 | | 2,459,068 |
| Cost of shares repurchased | (7,205,900) | | (14,748,385) |
| Net decrease in net assets resulting from Portfolio share transactions | $ (3,150,034) | | $ (4,301,081) |
| Net decrease in net assets | $ (1,864,657) | | $(12,202,158) |
| NET ASSETS: | | | |
| Beginning of year | $32,476,910 | | $ 44,679,068 |
| End of year | $ 30,612,253 | | $ 32,476,910 |
| | Year
Ended
12/31/23
Shares | | Year
Ended
12/31/23
Amount | | Year
Ended
12/31/22
Shares | | Year
Ended
12/31/22
Amount |
| Class l | | | | | | | |
| Shares sold | 4,727 | | $ 40,947 | | 29,116 | | $ 259,337 |
| Reinvestment of distributions | 18,936 | | 162,646 | | 37,759 | | 337,572 |
| Less shares repurchased | (49,830) | | (429,799) | | (124,268) | | (1,144,953) |
| Net decrease | (26,167) | | $ (226,206) | | (57,393) | | $ (548,044) |
| Class ll | | | | | | | |
| Shares sold | 333,981 | | $ 2,881,936 | | 790,762 | | $ 7,728,899 |
| Reinvestment of distributions | 113,144 | | 970,337 | | 237,899 | | 2,121,496 |
| Less shares repurchased | (787,003) | | (6,776,101) | | (1,431,038) | | (13,603,432) |
| Net decrease | (339,878) | | $(2,923,828) | | (402,377) | | $ (3,753,037) |
The accompanying notes are an integral part of these financial statements.
25
| Pioneer Strategic Income VCT Portfolio | Pioneer Variable Contracts Trust |
| | Year Ended
12/31/23 | | Year Ended
12/31/22 | | Year Ended
12/31/21 | | Year Ended
12/31/20 | | Year Ended
12/31/19 |
| Class l | | | | | | | | | |
| Net asset value, beginning of period | $ 8.50 | | $ 10.44 | | $10.69 | | $10.32 | | $ 9.71 |
| Increase (decrease) from investment operations: | | | | | | | | | |
| Net investment income (loss)(a) | 0.42 | | 0.33 | | 0.28 | | 0.34 | | 0.34 |
| Net realized and unrealized gain (loss) on investments | 0.28 | | (1.63) | | (0.08) | | 0.42 | | 0.61 |
| Net increase (decrease) from investment operations | $ 0.70 | | $ (1.30) | | $ 0.20 | | $ 0.76 | | $ 0.95 |
| Distributions to shareholders: | | | | | | | | | |
| Net investment income | (0.33) | | (0.12) | | (0.35) | | (0.36) | | (0.34) |
| Net realized gain | — | | (0.35) | | (0.10) | | (0.03) | | — |
| Tax return of capital | — | | (0.17) | | — | | — | | — |
| Total distributions | $ (0.33) | | $ (0.64) | | $ (0.45) | | $ (0.39) | | $ (0.34) |
| Net increase (decrease) in net asset value | $ 0.37 | | $ (1.94) | | $ (0.25) | | $ 0.37 | | $ 0.61 |
| Net asset value, end of period | $ 8.87 | | $ 8.50 | | $10.44 | | $10.69 | | $10.32 |
| Total return(b) | 8.46%(c) | | (12.60)% | | 1.89% | | 7.63% | | 9.89% |
| Ratio of net expenses to average net assets | 0.75% | | 0.75% | | 0.75% | | 0.75% | | 0.75% |
| Ratio of net investment income (loss) to average net assets | 4.94% | | 3.58% | | 2.66% | | 3.38% | | 3.38% |
| Portfolio turnover rate | 53% | | 71% | | 65% | | 62% | | 62% |
| Net assets, end of period (in thousands) | $4,278 | | $ 4,326 | | $5,913 | | $6,552 | | $5,962 |
| Ratios with no waiver of fees and assumption of expenses by the Adviser and no reduction for fees paid indirectly: | | | | | | | | | |
| Total expenses to average net assets | 1.25% | | 1.07% | | 1.21% | | 1.31% | | 1.33% |
| Net investment income (loss) to average net assets | 4.44% | | 3.26% | | 2.20% | | 2.82% | | 2.80% |
| | |
| (a) | The per-share data presented above is based on the average shares outstanding for the period presented. |
| (b) | Assumes initial investment at net asset value at the beginning of each period, reinvestment of all distributions and the complete redemption of the investment at net asset value at the end of each period. |
| (c) | For the year ended December 31, 2023, the Portfolio's total return includes a reimbursement by the Adviser (see Notes to the Financial Statements-Note 1B). If the Portfolio had not been reimbursed by the Adviser, the total return would have been 8.34%. |
NOTE: The above financial highlights do not reflect the deduction of non-portfolio expenses associated with variable insurance products, such as mortality and expense risk charges, separate account charges, and sales charges.
26
The accompanying notes are an integral part of these financial statements.
| Pioneer Strategic Income VCT Portfolio | Pioneer Variable Contracts Trust |
| | Year Ended
12/31/23 | | Year Ended
12/31/22 | | Year Ended
12/31/21 | | Year Ended
12/31/20 | | Year Ended
12/31/19 |
| Class ll | | | | | | | | | |
| Net asset value, beginning of period | $ 8.49 | | $ 10.43 | | $ 10.67 | | $ 10.30 | | $ 9.70 |
| Increase (decrease) from investment operations: | | | | | | | | | |
| Net investment income (loss)(a) | 0.40 | | 0.31 | | 0.25 | | 0.32 | | 0.32 |
| Net realized and unrealized gain (loss) on investments | 0.27 | | (1.63) | | (0.07) | | 0.41 | | 0.59 |
| Net increase (decrease) from investment operations | $ 0.67 | | $ (1.32) | | $ 0.18 | | $ 0.73 | | $ 0.91 |
| Distributions to shareholders: | | | | | | | | | |
| Net investment income | (0.31) | | (0.10) | | (0.32) | | (0.33) | | (0.31) |
| Net realized gain | — | | (0.35) | | (0.10) | | (0.03) | | — |
| Tax return of capital | — | | (0.17) | | — | | — | | — |
| Total distributions | $ (0.31) | | $ (0.62) | | $ (0.42) | | $ (0.36) | | $ (0.31) |
| Net increase (decrease) in net asset value | $ 0.36 | | $ (1.94) | | $ (0.24) | | $ 0.37 | | $ 0.60 |
| Net asset value, end of period | $ 8.85 | | $ 8.49 | | $ 10.43 | | $ 10.67 | | $ 10.30 |
| Total return(b) | 8.07%(c) | | (12.83)% | | 1.73% | | 7.37% | | 9.52% |
| Ratio of net expenses to average net assets | 1.00% | | 1.00% | | 1.00% | | 0.99% | | 1.00% |
| Ratio of net investment income (loss) to average net assets | 4.68% | | 3.32% | | 2.40% | | 3.11% | | 3.16% |
| Portfolio turnover rate | 53% | | 71% | | 65% | | 62% | | 62% |
| Net assets, end of period (in thousands) | $26,335 | | $28,151 | | $38,767 | | $38,258 | | $36,647 |
| Ratios with no waiver of fees and assumption of expenses by the Adviser and no reduction for fees paid indirectly: | | | | | | | | | |
| Total expenses to average net assets | 1.50% | | 1.32% | | 1.46% | | 1.55% | | 1.59% |
| Net investment income (loss) to average net assets | 4.18% | | 3.00% | | 1.94% | | 2.55% | | 2.57% |
| | |
| (a) | The per-share data presented above is based on the average shares outstanding for the period presented. |
| (b) | Assumes initial investment at net asset value at the beginning of each period, reinvestment of all distributions and the complete redemption of the investment at net asset value at the end of each period. |
| (c) | For the year ended December 31, 2023, the Portfolio's total return includes a reimbursement by the Adviser (see Notes to the Financial Statements-Note 1B). The impact on Class II's total return was less than 0.005%. |
NOTE: The above financial highlights do not reflect the deduction of non-portfolio expenses associated with variable insurance products, such as mortality and expense risk charges, separate account charges, and sales charges.
The accompanying notes are an integral part of these financial statements.
27
| Pioneer Strategic Income VCT Portfolio | Pioneer Variable Contracts Trust |
Notes to Financial Statements 12/31/23
1. Organization and Significant Accounting Policies
Pioneer Strategic Income VCT Portfolio (the “Portfolio”) is one of 7 portfolios comprising Pioneer Variable Contracts Trust (the “Trust”), a Delaware statutory trust. The Portfolio is registered under the Investment Company Act of 1940, as amended (the "1940 Act") as a diversified, open-end management investment company. The investment objective of the Portfolio is to produce a high level of current income.
The Portfolio offers two classes of shares designated as Class I and Class II shares. Each class of shares represents an interest in the same schedule of investments of the Portfolio and has identical rights (based on relative net asset values) to assets and liquidation proceeds. Share classes can bear different rates of class-specific fees and expenses such as transfer agent and distribution fees. Differences in class-specific fees and expenses will result in differences in net investment income and, therefore, the payment of different dividends from net investment income earned by each class. The Amended and Restated Declaration of Trust of the Trust gives the Board of Trustees the flexibility to specify either per-share voting or dollar-weighted voting when submitting matters for shareholder approval. Under per-share voting, each share of a class of the Portfolio is entitled to one vote. Under dollar-weighted voting, a shareholder’s voting power is determined not by the number of shares owned, but by the dollar value of the shares on the record date. Each share class has exclusive voting rights with respect to matters affecting only that class, including with respect to the distribution plan for that class. There is no distribution plan for Class I shares.
Portfolio shares may be purchased only by insurance companies for the purpose of funding variable annuity and variable life insurance contracts or by qualified pension and retirement plans.
Amundi Asset Management US, Inc., an indirect, wholly owned subsidiary of Amundi and Amundi’s wholly owned subsidiary, Amundi USA, Inc., serves as the Portfolio’s investment adviser (the “Adviser”). Amundi Distributor US, Inc., an affiliate of the Adviser, serves as the Portfolio’s distributor (the “Distributor”).
The Portfolio is required to comply with Rule 18f-4 under the 1940 Act, which governs the use of derivatives by registered investment companies. Rule 18f-4 permits funds to enter into derivatives transactions (as defined in Rule 18f-4) and certain other transactions notwithstanding the restrictions on the issuance of “senior securities” under Section 18 of the 1940 Act. In accordance with Rule 18f-4, the Portfolio has established and maintains a comprehensive derivatives risk management program, has appointed a derivatives risk manager and complies with a relative or absolute limit on fund leverage risk calculated based on value-at-risk ("VaR").
The Portfolio is an investment company and follows investment company accounting and reporting guidance under U.S. Generally Accepted Accounting Principles (“U.S. GAAP”). U.S. GAAP requires the management of the Portfolio to make estimates and assumptions that affect the reported amounts of assets and liabilities, the disclosure of contingent assets and liabilities at the date of the financial statements, and the reported amounts of income, expenses and gain or loss on investments during the reporting period. Actual results could differ from those estimates.
The following is a summary of significant accounting policies followed by the Portfolio in the preparation of its financial statements:
| A. | Security Valuation |
| | The net asset value of the Portfolio is computed once daily, on each day the New York Stock Exchange (“NYSE”) is open, as of the close of regular trading on the NYSE. |
| | Fixed-income securities are valued by using prices supplied by independent pricing services, which consider such factors as market prices, market events, quotations from one or more brokers, Treasury spreads, yields, maturities and ratings, or may use a pricing matrix or other fair value methods or techniques to provide an estimated value of the security or instrument. A pricing matrix is a means of valuing a debt security on the basis of current market prices for other debt securities, historical trading patterns in the market for fixed-income securities and/or other factors. Non-U.S. debt securities that are listed on an exchange will be valued at the bid price obtained from an independent third party pricing service. When independent third party pricing services are unable to supply prices, or when prices or market quotations are considered to be unreliable, the value of that security may be determined using quotations from one or more broker-dealers. |
| | Loan interests are valued at the mean between the last available bid and asked prices from one or more brokers or dealers as obtained from Loan Pricing Corporation, an independent third party pricing service. If price information is not available from Loan Pricing Corporation, or if the price information is deemed to be unreliable, price information will be |
| Pioneer Strategic Income VCT Portfolio | Pioneer Variable Contracts Trust |
| | obtained from an alternative loan interest pricing service. If no reliable price quotes are available from either the primary or alternative pricing service, broker quotes will be solicited. |
| | Event-linked bonds are valued at the bid price obtained from an independent third party pricing service. Other insurance-linked securities (including reinsurance sidecars, collateralized reinsurance and industry loss warranties) may be valued at the bid price obtained from an independent pricing service, or through a third party using a pricing matrix, insurance valuation models, or other fair value methods or techniques to provide an estimated value of the instrument. |
| | Equity securities that have traded on an exchange are valued by using the last sale price on the principal exchange where they are traded. Equity securities that have not traded on the date of valuation, or securities for which sale prices are not available, generally are valued using the mean between the last bid and asked prices or, if both last bid and asked prices are not available, at the last quoted bid price. Last sale and bid and asked prices are provided by independent third party pricing services. In the case of equity securities not traded on an exchange, prices are typically determined by independent third party pricing services using a variety of techniques and methods. |
| | The value of foreign securities is translated into U.S. dollars based on foreign currency exchange rate quotations supplied by a third party pricing source. Trading in non-U.S. equity securities is substantially completed each day at various times prior to the close of the NYSE. The values of such securities used in computing the net asset value of the Portfolio's shares are determined as of such times. The Adviser may use a fair value model developed by an independent pricing service to value non-U.S. equity securities. |
| | Forward foreign currency exchange contracts are valued daily using the foreign exchange rate or, for longer term forward contract positions, the spot currency rate and the forward points on a daily basis, in each case provided by a third party pricing service. Contracts whose forward settlement date falls between two quoted days are valued by interpolation. |
| | Futures contracts are generally valued at the closing settlement price established by the exchange on which they are traded. |
| | Swap contracts, including interest rate swaps, caps and floors (other than centrally cleared swap contracts), are valued at the dealer quotations obtained from reputable International Swap Dealers Association members. Centrally cleared swaps are valued at the daily settlement price provided by the central clearing counterparty. |
| | Shares of open-end registered investment companies (including money market mutual funds) are valued at such funds' net asset value. Shares of closed-end interval funds that offer their shares at net asset value are valued at such funds’ net asset value. |
| | Securities or loan interests for which independent pricing services or broker-dealers are unable to supply prices or for which market prices and/or quotations are not readily available or are considered to be unreliable are valued by a fair valuation team comprised of certain personnel of the Adviser. The Adviser is designated as the valuation designee for the Portfolio pursuant to Rule 2a-5 under the 1940 Act. The Adviser’s fair valuation team is responsible for monitoring developments that may impact fair valued securities. |
| | Inputs used when applying fair value methods to value a security may include credit ratings, the financial condition of the company, current market conditions and comparable securities. The Adviser may use fair value methods if it is determined that a significant event has occurred after the close of the exchange or market on which the security trades and prior to the determination of the Portfolio's net asset value. Examples of a significant event might include political or economic news, corporate restructurings, natural disasters, terrorist activity or trading halts. Thus, the valuation of the Portfolio's securities may differ significantly from exchange prices, and such differences could be material. |
| B. | Investment Income and Transactions |
| | Dividend income is recorded on the ex-dividend date, except that certain dividends from foreign securities where the ex-dividend date may have passed are recorded as soon as the Portfolio becomes aware of the ex-dividend data in the exercise of reasonable diligence. |
| | Interest income, including interest on income-bearing cash accounts, is recorded on the accrual basis. Dividend and interest income are reported net of unrecoverable foreign taxes withheld at the applicable country rates and net of income accrued on defaulted securities. |
| | Interest and dividend income payable by delivery of additional shares is reclassified as PIK (payment-in-kind) income upon receipt and is included in interest and dividend income, respectively. |
| Pioneer Strategic Income VCT Portfolio | Pioneer Variable Contracts Trust |
Notes to Financial Statements 12/31/23 (continued)
| | Principal amounts of mortgage-backed securities are adjusted for monthly paydowns. Premiums and discounts related to certain mortgage-backed securities are amortized or accreted in proportion to the monthly paydowns. All discounts/premiums on purchase prices of debt securities are accreted/amortized for financial reporting purposes over the life of the respective securities, and such accretion/amortization is included in interest income. |
| | Security transactions are recorded as of trade date. Gains and losses on sales of investments are calculated on the identified cost method for both financial reporting and federal income tax purposes. |
| | During the fiscal year ended December 31, 2023, the Portfolio realized a loss of $2,298 due to an operational error. The Adviser voluntarily reimbursed the Portfolio for this loss, which is reflected on the Statement of Operations as Reimbursement by the Adviser. |
| C. | Foreign Currency Translation |
| | The books and records of the Portfolio are maintained in U.S. dollars. Amounts denominated in foreign currencies are translated into U.S. dollars using current exchange rates. |
| | Net realized gains and losses on foreign currency transactions, if any, represent, among other things, the net realized gains and losses on foreign currency exchange contracts, disposition of foreign currencies and the difference between the amount of income accrued and the U.S. dollars actually received. Further, the effects of changes in foreign currency exchange rates on investments are not segregated on the Statement of Operations from the effects of changes in the market prices of those securities, but are included with the net realized and unrealized gain or loss on investments. |
| D. | Federal Income Taxes |
| | It is the Portfolio's policy to comply with the requirements of the Internal Revenue Code applicable to regulated investment companies and to distribute all of its net taxable income and net realized capital gains, if any, to its shareholders. Therefore, no provision for federal income taxes is required. As of December 31, 2023, the Portfolio did not accrue any interest or penalties with respect to uncertain tax positions, which, if applicable, would be recorded as an income tax expense on the Statement of Operations. Tax returns filed within the prior three years remain subject to examination by federal and state tax authorities. |
| | In addition to meeting the requirements of the Internal Revenue Code, the Portfolio may be required to pay local taxes on the recognition of capital gains and/or the repatriation of foreign currencies in certain countries. During the year ended December 31, 2023, the Portfolio paid no such taxes. |
| | The amount and character of income and capital gain distributions to shareholders are determined in accordance with federal income tax rules, which may differ from U.S. GAAP. Distributions in excess of net investment income or net realized gains are temporary over distributions for financial statement purposes resulting from differences in the recognition or classification of income or distributions for financial statement and tax purposes. Capital accounts within the financial statements are adjusted for permanent book/tax differences to reflect tax character, but are not adjusted for temporary differences. |
| | At December 31, 2023, the Portfolio was permitted to carry forward indefinitely $739,368 of short-term losses and $1,912,147 of long-term losses. |
| | At December 31, 2023, the Portfolio deferred $42,051 of late year ordinary losses, which will be recognized by the Portfolio as occurring at the start of the next fiscal year ending December 31, 2024. |
| | The tax character of distributions paid during the years ended December 31, 2023 and December 31, 2022, was as follows: |
| | 2023 | 2022 |
| Distributions paid from: | | |
| Ordinary income | $1,135,446 | $ 632,134 |
| Long-term capital gains | — | 1,137,201 |
| Tax return of capital | — | 692,623 |
| Total | $1,135,446 | $2,461,958 |
| Pioneer Strategic Income VCT Portfolio | Pioneer Variable Contracts Trust |
The following shows the components of distributable earnings (losses) on a federal income tax basis at December 31, 2023:
| | 2023 |
| Distributable earnings/(losses): | |
| Capital loss carryforward | $ (2,651,515) |
| Other book/tax temporary differences | (5,726) |
| Net unrealized depreciation | (1,983,405) |
| Qualified late year loss deferral | (42,051) |
| Total | $(4,682,697) |
The difference between book-basis and tax-basis net unrealized depreciation is attributable to the tax deferral of losses on wash sales, book-tax amortization differences, and the mark to market of forwards, futures, and swaps.
| E. | Portfolio Shares and Class Allocations |
| | The Portfolio records sales and repurchases of its shares as of trade date. Distribution fees for Class II shares are calculated based on the average daily net asset value attributable to Class II shares of the Portfolio (see Note 5). Class I shares do not pay distribution fees. |
| | Income, common expenses (excluding transfer agent and distribution fees) and realized and unrealized gains and losses are calculated at the Portfolio level and allocated daily to each class of shares based on its respective percentage of the adjusted net assets at the beginning of the day. |
| | All expenses and fees paid to the Portfolio’s transfer agent for its services are allocated between the classes of shares based on the number of accounts in each class and the ratable allocation of related out-of-pocket expenses (see Note 4). |
| | The Portfolio declares as daily dividends substantially all of its net investment income. All dividends are paid on a monthly basis. Short-term capital gain distributions, if any, may be declared with the daily dividends. Distributions paid by the Portfolio with respect to each class of shares are calculated in the same manner and at the same time, except that net investment income dividends to Class I and Class II shares can reflect different transfer agent and distribution expense rates. Dividends and distributions to shareholders are recorded on the ex-dividend date. |
| F. | Risks |
| | The value of securities held by the Portfolio may go up or down, sometimes rapidly or unpredictably, due to general market conditions, such as real or perceived adverse economic, political or regulatory conditions, recessions, the spread of infectious illness or other public health issues, inflation, changes in interest rates, armed conflict such as between Russia and Ukraine or in the Middle East, sanctions against Russia, other nations or individuals or companies and possible countermeasures, lack of liquidity in the bond markets or adverse investor sentiment. In the past several years, financial markets have experienced increased volatility, depressed valuations, decreased liquidity and heightened uncertainty. These conditions may continue, recur, worsen or spread. Inflation and interest rates have increased and may rise further. These circumstances could adversely affect the value and liquidity of the Portfolio's investments and negatively impact the Portfolio's performance. |
| | The long-term impact of the COVID-19 pandemic and its subsequent variants on economies, markets, industries and individual issuers, are not known. Some sectors of the economy and individual issuers have experienced or may experience particularly large losses. Periods of extreme volatility in the financial markets, reduced liquidity of many instruments, increased government debt, inflation, and disruptions to supply chains, consumer demand and employee availability, may continue for some time. Following Russia's invasion of Ukraine, Russian securities lost all, or nearly all, their market value. Other securities or markets could be similarly affected by past or future political, geopolitical or other events or conditions. |
| | Governments and central banks, including the U.S. Federal Reserve, have taken extraordinary and unprecedented actions to support local and global economies and the financial markets. These actions have resulted in significant expansion of public debt, including in the U.S. The consequences of high public debt, including its future impact on the economy and securities markets, may not be known for some time. |
| | The U.S. and other countries are periodically involved in disputes over trade and other matters, which may result in tariffs, investment restrictions and adverse impacts on affected companies and securities. For example, the U.S. has |
| Pioneer Strategic Income VCT Portfolio | Pioneer Variable Contracts Trust |
Notes to Financial Statements 12/31/23 (continued)
| | imposed tariffs and other trade barriers on Chinese exports, has restricted sales of certain categories of goods to China, and has established barriers to investments in China. Trade disputes may adversely affect the economies of the U.S. and its trading partners, as well as companies directly or indirectly affected and financial markets generally. If the political climate between the U.S. and China does not improve or continues to deteriorate, if China were to attempt unification of Taiwan by force, or if other geopolitical conflicts develop or get worse, economies, markets and individual securities may be severely affected both regionally and globally, and the value of the Portfolio's assets may go down. |
| | At times, the Portfolio’s investments may represent industries or industry sectors that are interrelated or have common risks, making the Portfolio more susceptible to any economic, political, or regulatory developments or other risks affecting those industries and sectors. |
| | The Portfolio’s investments in foreign markets and countries with limited developing markets may subject the Portfolio to a greater degree of risk than investments in a developed market. These risks include disruptive political or economic conditions, military conflicts and sanctions, terrorism, sustained economic downturns, financial instability, less liquid trading markets, extreme price volatility, currency risks, reduction of government or central bank support, inadequate accounting standards, tariffs, tax disputes or other tax burdens, nationalization or expropriation of assets and the imposition of adverse governmental laws, arbitrary application of laws and regulations or lack of rule of law and investment and repatriation restrictions. Lack of information and less market regulation also may affect the value of these securities. Withholding and other non-U.S. taxes may decrease the Portfolio’s return. Non-U.S. issuers may be located in parts of the world that have historically been prone to natural disasters. Investing in depositary receipts is subject to many of the same risks as investing directly in non-U.S. issuers. Depositary receipts may involve higher expenses and may trade at a discount (or premium) to the underlying security. |
| | Russia launched a large-scale invasion of Ukraine on February 24, 2022. In response to the military action by Russia, various countries, including the U.S., the United Kingdom, and European Union issued broad-ranging economic sanctions against Russia and Belarus and certain companies and individuals. Since then, Russian securities have lost all, or nearly all, their market value, and many other issuers, securities and markets have been adversely affected. The United States and other countries may impose sanctions on other countries, companies and individuals in light of Russia’s military invasion. The extent and duration of the military action or future escalation of such hostilities, the extent and impact of existing and future sanctions, market disruptions and volatility, and the result of any diplomatic negotiations cannot be predicted. These and any related events could have a significant impact on the value and liquidity of certain Portfolio investments, on Portfolio performance and the value of an investment in the Portfolio, particularly with respect to securities and commodities, such as oil, natural gas and food commodities, as well as other sectors with exposure to Russian issuers or issuers in other countries affected by the invasion, and are likely to have collateral impacts on market sectors globally. |
| | Normally, the Portfolio invests at least 80% of its net assets (plus the amount of borrowings, if any, for investment purposes) in debt securities. The Portfolio has the flexibility to invest in a broad range of issuers and segments of the debt securities market. The Portfolio may invest in investment grade securities of U.S. and non-U.S. issuers. The Portfolio may invest in below-investment-grade (high-yield) debt securities of U.S. and non-U.S. issuers. Some of these high-yield securities may be convertible into equity securities of the issuer. Debt securities rated below-investment-grade are commonly referred to as “junk bonds” and are considered speculative with respect to the issuer’s capacity to pay interest and repay principal. These securities involve greater risk of loss, are subject to greater price volatility, and may be less liquid and more difficult to value, especially during periods of economic uncertainty or change, than higher rated debt securities. |
| | The market prices of the Portfolio's fixed income securities may fluctuate significantly when interest rates change. The value of your investment will generally go down when interest rates rise. A rise in rates tends to have a greater impact on the prices of longer term or duration securities. For example, if interest rates increase by 1%, the value of a Portfolio's portfolio with a portfolio duration of ten years would be expected to decrease by 10%, all other things being equal. In recent years interest rates and credit spreads in the U.S. have been at historic lows. The U.S. Federal Reserve has raised certain interest rates, and interest rates may continue to go up. A general rise in interest rates could adversely affect the price and liquidity of fixed income securities. The maturity of a security may be significantly longer than its effective duration. A security's maturity and other features may be more relevant than its effective duration in determining the security's sensitivity to other factors affecting the issuer or markets generally, such as changes in credit quality or in the yield premium that the market may establish for certain types of securities (sometimes called "credit spread"). In general, the longer its maturity the more a security may be susceptible to these factors. When the credit spread for a fixed income security goes up, or "widens," the value of the security will generally go down. |
| Pioneer Strategic Income VCT Portfolio | Pioneer Variable Contracts Trust |
| | If an issuer or guarantor of a security held by the Portfolio or a counterparty to a financial contract with the Portfolio defaults on its obligation to pay principal and/or interest, has its credit rating downgraded or is perceived to be less creditworthy, or the credit quality or value of any underlying assets declines, the value of your investment will typically decline. Changes in actual or perceived creditworthiness may occur quickly. The Portfolio could be delayed or hindered in its enforcement of rights against an issuer, guarantor or counterparty. |
| | The Portfolio may invest in mortgage-related and asset-backed securities. The value of mortgage-related and asset-backed securities will be influenced by factors affecting the assets underlying such securities. As a result, during periods of declining asset value, difficult or frozen credit markets, swings in interest rates, or deteriorating economic conditions, mortgage-related and asset-backed securities may decline in value, face valuation difficulties, become more volatile and/or become illiquid. Mortgage-backed securities tend to be more sensitive to changes in interest rate than other types of debt securities. These securities are also subject to prepayment and extension risks. Some of these securities may receive little or no collateral protection from the underlying assets and are thus subject to the risk of default. The risk of such defaults is generally higher in the case of mortgage-backed investments offered by non-governmental issuers and those that include so-called “sub-prime” mortgages. The structure of some of these securities may be complex and there may be less available information than for other types of debt securities. Upon the occurrence of certain triggering events or defaults, the Portfolio may become the holder of underlying assets at a time when those assets may be difficult to sell or may be sold only at a loss. |
| | The Portfolio may invest in credit risk transfer securities. Credit risk transfer securities are unguaranteed and unsecured debt securities issued by government sponsored enterprises and therefore are not directly linked to or backed by the underlying mortgage loans. As a result, in the event that a government sponsored enterprise fails to pay principal or interest on its credit risk transfer securities or goes through a bankruptcy, insolvency or similar proceeding, holders of such credit risk transfer securities have no direct recourse to the underlying mortgage loans and will generally receive recovery on par with other unsecured note holders in such a scenario. The risks associated with an investment in credit risk transfer securities are different than the risks associated with an investment in mortgage-backed securities issued by Fannie Mae and Freddie Mac, or other government sponsored enterprise or issued by a private issuer, because some or all of the mortgage default or credit risk associated with the underlying mortgage loans is transferred to investors. As a result, investors in these securities could lose some or all of their investment in these securities if the underlying mortgage loans default. |
| | The Portfolio's investments, payment obligations and financing terms may be based on floating rates, such as LIBOR (London Interbank Offered Rate) or SOFR (Secured Overnight Financing Rate). ICE Benchmark Administration, the administrator of LIBOR, has ceased publication of most LIBOR settings on a representative basis. Actions by regulators have resulted in the establishment of alternative reference rates to LIBOR in most major currencies. In the U.S., a common benchmark replacement is based on the SOFR published by the Federal Reserve Bank of New York, including certain spread adjustments and benchmark replacement conforming changes, although other benchmark replacements (without or without spread adjustments) may be used in certain transactions. The impact of the transition from LIBOR on the Portfolio's transactions and financial markets generally cannot yet be determined. The transition away from LIBOR may lead to increased volatility and illiquidity in markets for instruments that have relied on LIBOR and may adversely affect the Portfolio's performance. |
| | The Portfolio may invest in REIT securities, the value of which can fall for a variety of reasons, such as declines in rental income, fluctuating interest rates, poor property management, environmental liabilities, uninsured damage, increased competition, or changes in real estate tax laws. |
| | With the increased use of technologies such as the Internet to conduct business, the Portfolio is susceptible to operational, information security and related risks. While the Portfolio’s Adviser has established business continuity plans in the event of, and risk management systems to prevent, limit or mitigate, such cyber-attacks, there are inherent limitations in such plans and systems, including the possibility that certain risks have not been identified. Furthermore, the Portfolio cannot control the cybersecurity plans and systems put in place by service providers to the Portfolio such as the Portfolio's custodian and accounting agent, and the Portfolio’s transfer agent. In addition, many beneficial owners of Portfolio shares hold them through accounts at broker-dealers, retirement platforms and other financial market participants over which neither the Portfolio nor the Adviser exercises control. Each of these may in turn rely on service providers to them, which are also subject to the risk of cyber-attacks. Cybersecurity failures or breaches at the Adviser or the Portfolio’s service providers or intermediaries have the ability to cause disruptions and impact business operations, potentially resulting in financial losses, interference with the Portfolio’s ability to calculate its net asset value, impediments to trading, the inability of Portfolio shareholders to effect share purchases, redemptions or exchanges or receive distributions, loss of or unauthorized access to private shareholder information and violations of applicable |
| Pioneer Strategic Income VCT Portfolio | Pioneer Variable Contracts Trust |
Notes to Financial Statements 12/31/23 (continued)
| | privacy and other laws, regulatory fines, penalties, reputational damage, or additional compliance costs. Such costs and losses may not be covered under any insurance. In addition, maintaining vigilance against cyber-attacks may involve substantial costs over time, and system enhancements may themselves be subject to cyber-attacks. |
| | The Portfolio’s prospectus contains unaudited information regarding the Portfolio’s principal risks. Please refer to that document when considering the Portfolio’s principal risks. |
| G. | Restricted Securities |
| | Restricted Securities are subject to legal or contractual restrictions on resale. Restricted securities generally are resold in transactions exempt from registration under the Securities Act of 1933. Private placement securities are generally considered to be restricted except for those securities traded between qualified institutional investors under the provisions of Rule 144A of the Securities Act of 1933. |
| | Disposal of restricted investments may involve negotiations and expenses, and prompt sale at an acceptable price may be difficult to achieve. Restricted investments held by the Portfolio at December 31, 2023 are listed in the Schedule of Investments. |
| H. | Insurance-Linked Securities (“ILS”) |
| | The Portfolio invests in ILS. The Portfolio could lose a portion or all of the principal it has invested in an ILS, and the right to additional interest or dividend payments with respect to the security, upon the occurrence of one or more trigger events, as defined within the terms of an insurance-linked security. Trigger events, generally, are hurricanes, earthquakes, or other natural events of a specific size or magnitude that occur in a designated geographic region during a specified time period, and/or that involve losses or other metrics that exceed a specific amount. There is no way to accurately predict whether a trigger event will occur, and accordingly, ILS carry significant risk. The Portfolio is entitled to receive principal, and interest and/or dividend payments so long as no trigger event occurs of the description and magnitude specified by the instrument. In addition to the specified trigger events, ILS may expose the Portfolio to other risks, including but not limited to issuer (credit) default, adverse regulatory or jurisdictional interpretations and adverse tax consequences. |
| | The Portfolio’s investments in ILS may include event-linked bonds. ILS also may include special purpose vehicles (“SPVs”) or similar instruments structured to comprise a portion of a reinsurer’s catastrophe-oriented business, known as quota share instruments (sometimes referred to as reinsurance sidecars), or to provide reinsurance relating to specific risks to insurance or reinsurance companies through a collateralized instrument, known as collateralized reinsurance. Structured reinsurance investments also may include industry loss warranties (“ILWs”). A traditional ILW takes the form of a bilateral reinsurance contract, but there are also products that take the form of derivatives, collateralized structures, or exchange-traded instruments. |
| | Where the ILS are based on the performance of underlying reinsurance contracts, the Portfolio has limited transparency into the individual underlying contracts, and therefore must rely upon the risk assessment and sound underwriting practices of the issuer. Accordingly, it may be more difficult for the Adviser to fully evaluate the underlying risk profile of the Portfolio's structured reinsurance investments, and therefore the Portfolio's assets are placed at greater risk of loss than if the Adviser had more complete information. Structured reinsurance instruments generally will be considered illiquid securities by the Portfolio. These securities may be difficult to purchase, sell or unwind. Illiquid securities also may be difficult to value. If the Portfolio is forced to sell an illiquid asset, the Portfolio may be forced to sell at a loss. |
| | Additionally, the Portfolio may gain exposure to ILS by investing in a closed-end interval fund, Pioneer ILS Interval Fund, an affiliate of the Adviser. The Portfolio’s investment in Pioneer ILS Interval Fund at December 31, 2023 is listed in the Schedule of Investments. |
| I. | TBA Purchase and Sale Commitments |
| | The Portfolio may enter into to-be-announced (TBA) purchase or sale commitments (collectively, TBA transactions), pursuant to which it agrees to purchase or sell, respectively, mortgage-backed securities for a fixed unit price, with payment and delivery at a scheduled future date beyond the customary settlement period for such securities. With TBA transactions, the particular securities to be received or delivered by the Portfolio are not identified at the trade date; however, the securities must meet specified terms, including issuer, rate, and mortgage term, and be within industry-accepted “good delivery” standards. The Portfolio may enter into TBA transactions with the intention of taking possession of or relinquishing the underlying securities, may elect to extend the settlement by “rolling” the transaction, and/or may use TBA transactions to gain or reduce interim exposure to underlying securities. Until settlement, the |
| Pioneer Strategic Income VCT Portfolio | Pioneer Variable Contracts Trust |
| | Portfolio maintains liquid assets sufficient to settle its commitment to purchase a TBA or, in the case of a sale commitment, the Portfolio maintains an entitlement to the security to be sold. |
| | To mitigate counterparty risk, the Portfolio has entered into agreements with TBA counterparties that provide for collateral and the right to offset amounts due to or from those counterparties under specified conditions. Subject to minimum transfer amounts, collateral requirements are determined and transfers made based on the net aggregate unrealized gain or loss on all TBA commitments with a particular counterparty. At any time, the Portfolio’s risk of loss from a particular counterparty related to its TBA commitments is the aggregate unrealized gain on appreciated TBAs in excess of unrealized loss on depreciated TBAs and collateral received, if any, from such counterparty. As of December 31, 2023, no collateral was pledged by the Portfolio. Collateral received from counterparties totaled $0 for TBAs. |
| J. | Purchased Options |
| | The Portfolio may purchase put and call options to seek to increase total return. Purchased call and put options entitle the Portfolio to buy and sell a specified number of shares or units of a particular security, currency or index at a specified price at a specific date or within a specific period of time. Upon the purchase of a call or put option, the premium paid by the Portfolio is included on the Statement of Assets and Liabilities as an investment. All premiums are marked-to-market daily, and any unrealized appreciation or depreciation is recorded on the Portfolio’s Statement of Operations. As the purchaser of an index option, the Portfolio has the right to receive a cash payment equal to any depreciation in the value of the index below the strike price of the option (in the case of a put) or equal to any appreciation in the value of the index over the strike price of the option (in the case of a call) as of the valuation date of the option. Premiums paid for purchased call and put options which have expired are treated as realized losses on investments on the Statement of Operations. Upon the exercise or closing of a purchased put option, the premium is offset against the proceeds on the sale of the underlying security or financial instrument in order to determine the realized gain or loss on investments. Upon the exercise or closing of a purchased call option, the premium is added to the cost of the security or financial instrument. The risk associated with purchasing options is limited to the premium originally paid. |
| | The average market value of purchased options contracts open during the year ended December 31, 2023 was $13,592. Open purchased options contracts at December 31, 2023 are listed in the Schedule of Investments. |
| K. | Option Writing |
| | The Portfolio may write put and covered call options to seek to increase total return. When an option is written, the Portfolio receives a premium and becomes obligated to purchase or sell the underlying security at a fixed price, upon the exercise of the option. When the Portfolio writes an option, an amount equal to the premium received by the Portfolio is recorded as “Written options outstanding” on the Statement of Assets and Liabilities and is subsequently adjusted to the current value of the option written. Premiums received from writing options that expire unexercised are treated by the Portfolio on the expiration date as realized gains from investments on the Statement of Operations. The difference between the premium and the amount paid on effecting a closing purchase transaction, including brokerage commissions, is also treated as a realized gain on the Statement of Operations, or, if the premium is less than the amount paid for the closing purchase transaction, as a realized loss on the Statement of Operations. If a call option is exercised, the premium is added to the proceeds from the sale of the underlying security in determining whether the Portfolio has realized a gain or loss. The Portfolio as writer of an option bears the market risk of an unfavorable change in the price of the security underlying the written option. |
| | The average market value of written options for the year ended December 31, 2023 was $(5,436). There were no open written options contracts at December 31, 2023. |
| L. | Forward Foreign Currency Exchange Contracts |
| | The Portfolio may enter into forward foreign currency exchange contracts ("contracts") for the purchase or sale of a specific foreign currency at a fixed price on a future date. All contracts are marked-to-market daily at the applicable exchange rates, and any resulting unrealized appreciation or depreciation is recorded in the Portfolio's financial statements. The Portfolio records realized gains and losses at the time a contract is offset by entry into a closing transaction or extinguished by delivery of the currency. Risks may arise upon entering into these contracts from the potential inability of counterparties to meet the terms of the contract and from unanticipated movements in the value of foreign currencies relative to the U.S. dollar (see Note 7). |
| | During the year ended December 31, 2023, the Portfolio had entered into various forward foreign currency exchange contracts that obligated the Portfolio to deliver or take delivery of currencies at specified future maturity dates. |
| Pioneer Strategic Income VCT Portfolio | Pioneer Variable Contracts Trust |
Notes to Financial Statements 12/31/23 (continued)
| | Alternatively, prior to the settlement date of a forward foreign currency exchange contract, the Portfolio may close out such contract by entering into an offsetting contract. |
| | The average market value of forward foreign currency exchange contracts open during the year ended December 31, 2023 was $2,715,579 and $2,539,687 for buys and sells, respectively. Open forward foreign currency exchange contracts outstanding at December 31, 2023 are listed in the Schedule of Investments. |
| M. | Futures Contracts |
| | The Portfolio may enter into futures transactions in order to attempt to hedge against changes in interest rates, securities prices and currency exchange rates or to seek to increase total return. Futures contracts are types of derivatives. |
| | All futures contracts entered into by the Portfolio are traded on a futures exchange. Upon entering into a futures contract, the Portfolio is required to deposit with a broker an amount of cash or securities equal to the minimum "initial margin" requirements of the associated futures exchange. The amount of cash deposited with the broker as collateral at December 31, 2023 is recorded as "Futures collateral" on the Statement of Assets and Liabilities. |
| | Subsequent payments for futures contracts ("variation margin") are paid or received by the Portfolio, depending on the daily fluctuation in the value of the contracts, and are recorded by the Portfolio as unrealized appreciation or depreciation. Cash received from or paid to the broker related to previous margin movement is held in a segregated account at the broker and is recorded as either "Due from broker for futures" or "Due to broker for futures" on the Statement of Assets and Liabilities. When the contract is closed, the Portfolio realizes a gain or loss equal to the difference between the opening and closing value of the contract as well as any fluctuation in foreign currency exchange rates where applicable. Futures contracts are subject to market risk, interest rate risk and currency exchange rate risk. Changes in value of the contracts may not directly correlate to the changes in value of the underlying securities. With futures, there is reduced counterparty credit risk to the Portfolio since futures are exchange-traded and the exchange's clearinghouse, as counterparty to all exchange-traded futures, guarantees the futures against default. |
| | The average notional values of futures contracts long position and futures contracts short position during the year ended December 31, 2023 were $6,650,749 and $1,234,406, respectively. Open futures contracts outstanding at December 31, 2023 are listed in the Schedule of Investments. |
| N. | Credit Default Swap Contracts |
| | A credit default swap is a contract between a buyer of protection and a seller of protection against a pre-defined credit event or an underlying reference obligation, which may be a single security or a basket or index of securities. The Portfolio may buy or sell credit default swap contracts to seek to increase the Portfolio's income, or to attempt to hedge the risk of default on portfolio securities. A credit default swap index is used to hedge risk or take a position on a basket of credit entities or indices. |
| | As a seller of protection, the Portfolio would be required to pay the notional (or other agreed-upon) value of the referenced debt obligation to the counterparty in the event of a default by a U.S. or foreign corporate issuer of a debt obligation, which would likely result in a loss to the Portfolio. In return, the Portfolio would receive from the counterparty a periodic stream of payments during the term of the contract, provided that no event of default occurred. The maximum exposure of loss to the seller would be the notional value of the credit default swaps outstanding. If no default occurs, the Portfolio would keep the stream of payments and would have no payment obligation. The Portfolio may also buy credit default swap contracts in order to hedge against the risk of default of debt securities, in which case the Portfolio would function as the counterparty referenced above. |
| | As a buyer of protection, the Portfolio makes an upfront or periodic payment to the protection seller in exchange for the right to receive a contingent payment. An upfront payment made by the Portfolio, as the protection buyer, is recorded within the "Swap contracts, at value" line item on the Statement of Assets and Liabilities. Periodic payments received or paid by the Portfolio are recorded as realized gains or losses on the Statement of Operations. |
| | Credit default swap contracts are marked-to-market daily using valuations supplied by independent sources, and the change in value, if any, is recorded within the "Swap contracts, at value" line item on the Statement of Assets and Liabilities. Payments received or made as a result of a credit event or upon termination of the contract are recognized, net of the appropriate amount of the upfront payment, as realized gains or losses on the Statement of Operations. |
| | Credit default swap contracts involving the sale of protection may involve greater risks than if the Portfolio had invested in the referenced debt instrument directly. Credit default swap contracts are subject to general market risk, liquidity risk, |
| Pioneer Strategic Income VCT Portfolio | Pioneer Variable Contracts Trust |
| | counterparty risk and credit risk. If the Portfolio is a protection buyer and no credit event occurs, it will lose its investment. If the Portfolio is a protection seller and a credit event occurs, the value of the referenced debt instrument received by the Portfolio, together with the periodic payments received, may be less than the amount the Portfolio pays to the protection buyer, resulting in a loss to the Portfolio. In addition, obligations under sell protection credit default swaps may be partially offset by net amounts received from settlement of buy protection credit default swaps entered into by the Portfolio for the same reference obligation with the same counterparty. |
| | The Portfolio may invest in credit default swap index products ("CDX"). A CDX is a swap on an index of credit default swaps. CDXs allow an investor to manage credit risk or take a position on a basket of credit entities (such as credit default swaps or commercial mortgage-backed securities) in a more efficient manner than transacting in a single-name credit default swap. If a credit event occurs in one of the underlying companies, the protection is paid out via the delivery of the defaulted bond by the buyer of protection in return for a payment of notional value of the defaulted bond by the seller of protection or it may be settled through a cash settlement between the two parties. The underlying company is then removed from the index. If the Portfolio holds a long position in a CDX, the Portfolio would indirectly bear its proportionate share of any expenses paid by a CDX. A fund holding a long position in CDXs typically receives income from principal or interest paid on the underlying securities. By investing in CDXs, the Portfolio could be exposed to liquidity risk, counterparty risk, credit risk of the issuers of the underlying loan obligations and of the CDX markets, and operational risks. If there is a default by the CDX counterparty, the Portfolio will have contractual remedies pursuant to the agreements related to the transaction. CDXs also bear the risk that the Portfolio will not be able to meet its obligation to the counterparty. |
| | Certain swap contracts that are cleared through a central clearinghouse are referred to as centrally cleared swaps. All payments made or received by the Portfolio are pursuant to a centrally cleared swap contract with the central clearing party rather than the original counterparty. Upon entering into a centrally cleared swap contract, the Portfolio is required to make an initial margin deposit, either in cash or in securities. The daily change in value on open centrally cleared contracts is recorded as "Variation margin for centrally cleared swap contracts" on the Statement of Assets and Liabilities. Cash received from or paid to the broker related to previous margin movement is held in a segregated account at the broker and is recorded as either "Due from broker for swaps" or "Due to broker for swaps" on the Statement of Assets and Liabilities. The amount of cash deposited with a broker as collateral at December 31, 2023 is recorded as "Swaps collateral" on the Statement of Assets and Liabilities. |
| | The average notional values of credit default swap contracts buy protection and credit default swap contracts sell protection open during the year ended December 31, 2023 were $3,084,780 and $41,000, respectively. Open credit default swap contracts at December 31, 2023 are listed in the Schedule of Investments. |
2. Management Agreement
The Adviser manages the Portfolio. Management fees payable under the Portfolio's Investment Management Agreement with the Adviser are calculated daily and paid monthly at the annual rate of 0.65% of the Portfolio’s average daily net assets. For the year ended December 31, 2023, the effective management fee (excluding waivers and/or assumption of expenses and waiver of acquired fund fees and expenses) was equivalent to 0.65% of the Portfolio’s average daily net assets.
The Adviser has agreed to waive its management fee with respect to any portion of the Portfolio’s assets invested in Pioneer ILS Interval Fund, an affiliated fund managed by the Adviser. For the year ended December 31, 2023, the Adviser waived $15,576 in management fees with respect to the Portfolio, which is reflected on the Statement of Operations as a fee waiver.
The Adviser has contractually agreed to limit ordinary operating expenses (ordinary operating expenses means all portfolio expenses other than taxes, brokerage commissions, acquired fund expenses and extraordinary expenses, such as litigation) of the Portfolio to the extent required to reduce Portfolio expenses to 0.75% and 1.00%, of the average daily net assets attributable to Class I and Class II shares, respectively. These expense limitations are in effect through May 1, 2024. There can be no assurance that the Adviser will extend the expense limitation agreement for a class of shares beyond the date referred to above. Fees waived and expenses reimbursed during the year ended December 31, 2023 are reflected on the Statement of Operations.
In addition, under the management and administration agreements, certain other services and costs, including accounting, regulatory reporting and insurance premiums, are paid by the Portfolio as administrative reimbursements. Reflected on the Statement of Assets and Liabilities is $2,486 in management fees payable to the Adviser at December 31, 2023.
| Pioneer Strategic Income VCT Portfolio | Pioneer Variable Contracts Trust |
Notes to Financial Statements 12/31/23 (continued)
3. Compensation of Officers and Trustees
The Portfolio pays an annual fee to its Trustees. The Adviser reimburses the Portfolio for fees paid to the Interested Trustees. Except for the chief compliance officer, the Portfolio does not pay any salary or other compensation to its officers. The Portfolio pays a portion of the chief compliance officer's compensation for his services as the Portfolio's chief compliance officer. Amundi US pays the remaining portion of the chief compliance officer's compensation. For the year ended December 31, 2023, the Portfolio paid $8,386 in Officers' and Trustees' compensation, which is reflected on the Statement of Operations as Officers' and Trustees' fees. At December 31, 2023, on its Statement of Assets and Liabilities, the Portfolio had a payable for Trustees' fees of $323 and a payable for administrative expenses of $1,243, which includes the payable for Officers' compensation.
4. Transfer Agent
BNY Mellon Investment Servicing (US) Inc. serves as the transfer agent to the Portfolio at negotiated rates. Transfer agent fees and payables shown on the Statement of Operations and the Statement of Assets and Liabilities, respectively, include sub-transfer agent expenses incurred through the Portfolio’s omnibus relationship contracts.
5. Distribution Plan
The Portfolio has adopted a distribution plan (the “Plan”) pursuant to Rule 12b-1 under the 1940 Act with respect to Class II shares. Pursuant to the Plan, the Portfolio pays the Distributor a distribution fee of 0.25% of the average daily net assets attributable to Class II shares to compensate the Distributor for (1) distribution services and (2) personal and account maintenance services performed and expenses incurred by the Distributor in connection with the Portfolio’s Class II shares. Reflected on the Statement of Assets and Liabilities is $900 in distribution fees payable to the Distributor at December 31, 2023.
6. Master Netting Agreements
The Portfolio has entered into an International Swaps and Derivatives Association, Inc. Master Agreement (“ISDA Master Agreement”) or similar agreement with substantially all of its derivative counterparties. An ISDA Master Agreement is a bilateral agreement between the Portfolio and a counterparty that governs the trading of certain Over the Counter (“OTC”) derivatives and typically contains, among other things, close-out and set- off provisions which apply upon the occurrence of an event of default and/or a termination event as defined under the relevant ISDA Master Agreement. The ISDA Master Agreement may also give a party the right to terminate all transactions traded under such agreement if, among other things, there is deterioration in the credit quality of the other party.
Upon an event of default or a termination of the ISDA Master Agreement, the non-defaulting party has the right to close-out all transactions under such agreement and to net amounts owed under each transaction to determine one net amount payable by one party to the other. The right to close out and net payments across all transactions under the ISDA Master Agreement could result in a reduction of the Portfolio’s credit risk to its counterparty equal to any amounts payable by the Portfolio under the applicable transactions, if any. However, the Portfolio’s right to set-off may be restricted or prohibited by the bankruptcy or insolvency laws of the particular jurisdiction to which each specific ISDA Master Agreement of each counterparty is subject.
The collateral requirements for derivatives transactions under an ISDA Master Agreement are governed by a credit support annex to the ISDA Master Agreement. Collateral requirements are generally determined at the close of business each day and are typically based on changes in market values for each transaction under an ISDA Master Agreement and netted into one amount for such agreement. Generally, the amount of collateral due from or to a counterparty is subject to threshold (a “minimum transfer amount”) before a transfer is required, which may vary by counterparty. Collateral pledged for the benefit of the Portfolio and/or counterparty is held in segregated accounts by the Portfolio’s custodian and cannot be sold, re-pledged, assigned or otherwise used while pledged. Cash that has been segregated to cover the Portfolio’s collateral obligations, if any, will be reported separately on the Statement of Assets and Liabilities as “Swaps collateral”. Securities pledged by the Portfolio as collateral, if any, are identified as such in the Schedule of Investments.
| Pioneer Strategic Income VCT Portfolio | Pioneer Variable Contracts Trust |
Financial instruments subject to an enforceable master netting agreement, such as an ISDA Master Agreement, have been offset on the Statement of Assets and Liabilities. The following charts show gross assets and liabilities of the Portfolio as of December 31, 2023.
| Counterparty | Derivative
Assets
Subject to
Master Netting
Agreement | Derivatives
Available
for Offset | Non-Cash
Collateral
Received(a) | Cash
Collateral
Received(a) | Net Amount
of Derivative
Assets(b) |
| Bank of America NA | $ 6,906 | $ — | $ — | $ — | $ 6,906 |
| Goldman Sachs & Co. | 4,405 | — | — | — | 4,405 |
| HSBC Bank USA NA | 9,202 | (4,262) | — | — | 4,940 |
| JPMorgan Chase Bank NA | — | — | — | — | — |
| State Street Bank & Trust Co. | 50,053 | (4,233) | — | — | 45,820 |
| Total | $ 70,566 | $(8,495) | $— | $— | $ 62,071 |
| Counterparty | Derivative
Liabilities
Subject to
Master Netting
Agreement | Derivatives
Available for
Offset | Non-Cash
Collateral
Pledged(a) | Cash
Collateral
Pledged(a) | Net Amount
of Derivative
Liabilities(c) |
| Bank of America NA | $ — | $ — | $ — | $ — | $ — |
| Goldman Sachs & Co. | — | — | — | — | — |
| HSBC Bank USA NA | 4,262 | (4,262) | — | — | — |
| JPMorgan Chase Bank NA | 8,137 | — | — | — | 8,137 |
| State Street Bank & Trust Co. | 4,233 | (4,233) | — | — | — |
| Total | $16,632 | $(8,495) | $— | $— | $8,137 |
(a) The amount presented here may be less than the total amount of collateral received/pledged as the net amount of derivative assets and liabilities cannot be less than $0.
(b) Represents the net amount due from the counterparty in the event of default.
(c) Represents the net amount payable to the counterparty in the event of default.
7. Additional Disclosures about Derivative Instruments and Hedging Activities
The Portfolio’s use of derivatives may enhance or mitigate the Portfolio’s exposure to the following risks:
Interest rate risk relates to the fluctuations in the value of interest-bearing securities due to changes in the prevailing levels of market interest rates.
Credit risk relates to the ability of the issuer of a financial instrument to make further principal or interest payments on an obligation or commitment that it has to the Portfolio.
Foreign exchange rate risk relates to fluctuations in the value of an asset or liability due to changes in currency exchange rates.
Equity risk relates to the fluctuations in the value of financial instruments as a result of changes in market prices (other than those arising from interest rate risk or foreign exchange rate risk), whether caused by factors specific to an individual investment, its issuer, or all factors affecting all instruments traded in a market or market segment.
| Pioneer Strategic Income VCT Portfolio | Pioneer Variable Contracts Trust |
Notes to Financial Statements 12/31/23 (continued)
Commodity risk relates to the risk that the value of a commodity or commodity index will fluctuate based on increases or decreases in the commodities market and factors specific to a particular industry or commodity.
The fair value of open derivative instruments (not considered to be hedging instruments for accounting disclosure purposes) by risk exposure at December 31, 2023, was as follows:
Statement of Assets
and Liabilities | Interest
Rate Risk | Credit
Risk | Foreign
Exchange
Rate Risk | Equity
Risk | Commodity
Risk |
| Assets | | | | | |
| Options purchased* | $ — | $ — | $ 4,405 | $ — | $ — |
| Unrealized appreciation on forward foreign currency exchange contracts | — | — | 66,161 | — | — |
| Net unrealized appreciation on futures contracts^ | 193,221 | — | — | — | — |
| Total Value | $193,221 | $ — | $ 70,566 | $— | $— |
| Liabilities | | | | | |
| Unrealized depreciation on forward foreign currency exchange contracts | $ — | $ — | $16,632 | $ — | $ — |
| Centrally cleared swap contracts† | — | 101,519 | — | — | — |
| Total Value | $ — | $101,519 | $16,632 | $— | $— |
| | |
| * | Reflects the market value of purchased option contracts (see Note 1J). These amounts are included in investments in unaffiliated issuers, at value, on the Statement of Assets and Liabilities. |
| ^ | Includes cumulative unrealized appreciation (depreciation) of futures contracts as reported in the Schedule of Investments. Only net variation margin is reported within the assets and/or liabilities on the Statement of Assets and Liabilities. |
| † | Includes cumulative unrealized appreciation (depreciation) of centrally cleared swap contracts as reported in the Schedule of Investments. Only net variation margin is reported within the receivables and/or payables on the Statement of Assets and Liabilities. |
| Pioneer Strategic Income VCT Portfolio | Pioneer Variable Contracts Trust |
The effect of derivative instruments (not considered to be hedging instruments for accounting disclosure purposes) on the Statement of Operations by risk exposure at December 31, 2023 was as follows:
| Statement of Operations | Interest
Rate Risk | Credit
Risk | Foreign
Exchange
Rate Risk | Equity
Risk | Commodity
Risk |
| Net Realized Gain (Loss) on | | | | | |
| Futures contracts | $ (185,675) | $ — | $ — | $ — | $ — |
| Forward foreign currency exchange contracts | — | — | (10,748) | — | — |
| Options purchased* | — | — | (12,201) | — | — |
| Options written | — | — | 12,201 | — | — |
| Swap contracts | — | (360,560) | — | — | — |
| Total Value | $(185,675) | $(360,560) | $(10,748) | $— | $— |
| Change in Net Unrealized Appreciation (Depreciation) on | | | | | |
| Futures contracts | $ 170,109 | $ — | $ — | $ — | $ — |
| Forward foreign currency exchange contracts | — | — | (18,578) | — | — |
| Options purchased** | — | — | (43,377) | — | — |
| Options written | — | — | 1,389 | — | — |
| Swap contracts | — | 79,422 | — | — | — |
| Total Value | $ 170,109 | $ 79,422 | $(60,566) | $— | $— |
| | |
| * | Reflects the net realized gain (loss) on purchased option contracts (see Note 1J). These amounts are included in net realized gain (loss) on investments in unaffiliated issuers, on the Statement of Operations. |
| ** | Reflects the change in net unrealized appreciation (depreciation) on purchased option contracts (see Note 1J). These amounts are included in change in net unrealized appreciation (depreciation) on investments in unaffiliated issuers, on the Statement of Operations. |
8. Unfunded Loan Commitments
The Portfolio may enter into unfunded loan commitments. Unfunded loan commitments may be partially or wholly unfunded. During the contractual period, the Portfolio is obliged to provide funding to the borrower upon demand. A fee is earned by the Portfolio on the unfunded loan commitment and is recorded as interest income on the Statement of Operations. Unfunded loan commitments are fair valued in accordance with the valuation policy described in Note 1A and unrealized appreciation or depreciation, if any, is recorded on the Statement of Assets and Liabilities.
As of December 31, 2023, the Portfolio had the following unfunded loan commitment outstanding:
| Loan | Principal | Cost | Value | Unrealized
Appreciation
(Depreciation) |
| CSG Elevate II, Inc., Bridge Term Loan | $95,000 | $95,000 | $95,000 | $— |
| | | | | |
| Pioneer Strategic Income VCT Portfolio | Pioneer Variable Contracts Trust |
Notes to Financial Statements 12/31/23 (continued)
9. Affiliated Issuers
An affiliated issuer is a company in which the Portfolio has a direct or indirect ownership of, control of, or voting power of 5 percent or more of the outstanding voting shares or any company which is under common ownership or control. At December 31, 2023, the value of the Portfolio’s investment in affiliated issuers was $979,198, which represents 3.2% of the Portfolio’s net assets.
Transactions in affiliated issuers by the Portfolio for the year ended December 31, 2023 were as follows:
Name of the
Affiliated Issuer | Value at
December 31,
2022 | Purchases
Costs | Change in
Unrealized
Appreciation
(Depreciation) | Net
Realized
Gain/(Loss) | Dividends
Received
and Reinvested | Sales
Proceeds | Shares
held at
December 31,
2023 | Value at
December 31,
2023 |
| Pioneer ILS Interval Fund | $825,212 | $— | $42,964 | $— | $111,022 | $— | 115,065 | $979,198 |
Annual and semi-annual reports for the underlying Pioneer funds are available on the funds’ web page(s) at www.amundi.com/us.
| Pioneer Strategic Income VCT Portfolio | Pioneer Variable Contracts Trust |
Report of Independent Registered Public Accounting Firm
To the Board of Trustees of Pioneer Variable Contracts Trust and the Shareholders of Pioneer Strategic Income VCT Portfolio:
Opinion on the Financial Statements
We have audited the accompanying statement of assets and liabilities of Pioneer Strategic Income VCT Portfolio (the “Portfolio”) (one of the portfolios constituting Pioneer Variable Contracts Trust (the “Trust”)), including the schedule of investments, as of December 31, 2023, and the related statement of operations for the year then ended, the statements of changes in net assets for each of the two years in the period then ended, the financial highlights for each of the five years in the period then ended and the related notes (collectively referred to as the “financial statements”). In our opinion, the financial statements present fairly, in all material respects, the financial position of the Portfolio (one of the portfolios constituting Pioneer Variable Contracts Trust) at December 31, 2023, the results of its operations for the year then ended, the changes in its net assets for each of the two years in the period then ended, and its financial highlights for each of the five years in the period then ended in conformity with U.S. generally accepted accounting principles.
Basis for Opinion
These financial statements are the responsibility of the Trust’s management. Our responsibility is to express an opinion on the Portfolio’s financial statements based on our audits. We are a public accounting firm registered with the Public Company Accounting Oversight Board (United States) ("PCAOB") and are required to be independent with respect to the Trust in accordance with the U.S. federal securities laws and the applicable rules and regulations of the Securities and Exchange Commission and the PCAOB.
We conducted our audits in accordance with the standards of the PCAOB. Those standards require that we plan and perform the audit to obtain reasonable assurance about whether the financial statements are free of material misstatement, whether due to error or fraud. The Trust is not required to have, nor were we engaged to perform, an audit of the Trust’s internal control over financial reporting. As part of our audits, we are required to obtain an understanding of internal control over financial reporting, but not for the purpose of expressing an opinion on the effectiveness of the Trust’s internal control over financial reporting. Accordingly, we express no such opinion.
Our audits included performing procedures to assess the risks of material misstatement of the financial statements, whether due to error or fraud, and performing procedures that respond to those risks. Such procedures included examining, on a test basis, evidence regarding the amounts and disclosures in the financial statements. Our procedures included confirmation of securities owned as of December 31, 2023, by correspondence with the custodian, brokers, and others; when replies were not received from brokers and others, we performed other auditing procedures. Our audits also included evaluating the accounting principles used and significant estimates made by management, as well as evaluating the overall presentation of the financial statements. We believe that our audits provide a reasonable basis for our opinion.
We have served as the auditor of one or more investment companies in the Pioneer family of funds since 2017.
Boston, Massachusetts
February 20, 2024
| Pioneer Strategic Income VCT Portfolio | Pioneer Variable Contracts Trust |
Additional Information (unaudited)
Qualified interest income is exempt from nonresident alien (NRA) tax withholding. The percentage of the Portfolio’s ordinary income distributions derived from qualified interest income was 68.42%.
| Pioneer Strategic Income VCT Portfolio | Pioneer Variable Contracts Trust |
Approval of Renewal of Investment Management Agreement
Amundi Asset Management US, Inc. (“Amundi US”) serves as the investment adviser to Pioneer Strategic Income VCT Portfolio (the “Portfolio”) pursuant to an investment management agreement between Amundi US and the Portfolio. In order for Amundi US to remain the investment adviser of the Portfolio, the Trustees of the Portfolio, including a majority of the Portfolio’s Independent Trustees, must determine annually whether to renew the investment management agreement for the Portfolio.
The contract review process began in January 2023 as the Trustees of the Portfolio agreed on, among other things, an overall approach and timeline for the process. Contract review materials were provided to the Trustees in March 2023, July 2023 and September 2023. In addition, the Trustees reviewed and discussed the Portfolio’s performance at regularly scheduled meetings throughout the year, and took into account other information related to the Portfolio provided to the Trustees at regularly scheduled meetings, in connection with the review of the Portfolio’s investment management agreement.
In March 2023, the Trustees, among other things, discussed the memorandum provided by Portfolio counsel that summarized the legal standards and other considerations that are relevant to the Trustees in their deliberations regarding the renewal of the investment management agreement, and reviewed and discussed the qualifications of the investment management teams for the Portfolio, as well as the level of investment by the Portfolio’s portfolio managers in the Portfolio. In July 2023, the Trustees, among other things, reviewed the Portfolio’s management fees and total expense ratios, the financial statements of Amundi US and its parent companies, profitability analyses provided by Amundi US, and analyses from Amundi US as to possible economies of scale. The Trustees also reviewed the profitability of the institutional business of Amundi US as compared to that of Amundi US’s fund management business, and considered the differences between the fees and expenses of the Portfolio and the fees and expenses of Amundi US’s institutional accounts, as well as the different services provided by Amundi US to the Portfolio and to the institutional accounts. The Trustees further considered contract review materials, including additional materials received in response to the Trustees’ request, in September 2023.
At a meeting held on September 19, 2023, based on their evaluation of the information provided by Amundi US and third parties, the Trustees of the Portfolio, including the Independent Trustees voting separately advised by independent counsel, unanimously approved the renewal of the investment management agreement for another year. In approving the renewal of the investment management agreement, the Trustees considered various factors that they determined were relevant, including the factors described below. The Trustees did not identify any single factor as the controlling factor in determining to approve the renewal of the agreement.
Nature, Extent and Quality of Services
The Trustees considered the nature, extent and quality of the services that had been provided by Amundi US to the Portfolio, taking into account the investment objective and strategy of the Portfolio. The Trustees also reviewed Amundi US’s investment approach for the Portfolio and its research process. The Trustees considered Amundi US’ integration of environmental, social and governance (ESG) considerations into its investment research process. The Trustees considered the resources of Amundi US and the personnel of Amundi US who provide investment management services to the Portfolio. They also reviewed the amount of non-Portfolio assets managed by the portfolio managers of the Portfolio. They considered the non-investment resources and personnel of Amundi US that are involved in Amundi US’s services to the Portfolio, including Amundi US’s compliance, risk management, and legal resources and personnel. The Trustees considered the compliance services being provided to the Portfolio by Amundi US and how Amundi US has addressed any compliance issues during the past year. The Trustees noted the substantial attention and high priority given by Amundi US’s senior management to the Pioneer Fund complex, including with respect to the increasing regulation to which the Pioneer Funds are subject.
The Trustees considered that Amundi US supervises and monitors the performance of the Portfolio’s service providers and provides the Portfolio with personnel (including Portfolio officers) and other resources that are necessary for the Portfolio’s business management and operations. The Trustees also considered that, as administrator, Amundi US is responsible for the administration of the Portfolio’s business and other affairs. The Trustees considered that the Portfolio reimburses Amundi US its pro rata share of Amundi US’s costs of providing administration services to the Pioneer Funds.
Based on these considerations, the Trustees concluded that the nature, extent and quality of services that had been provided by Amundi US to the Portfolio were satisfactory and consistent with the terms of the investment management agreement.
Performance of the Portfolio
In considering the Portfolio’s performance, the Trustees regularly review and discuss throughout the year data prepared by Amundi US and information comparing the Portfolio’s performance with the performance of its peer group of funds, as classified by Morningstar, Inc. (Morningstar), and with the performance of the Portfolio’s benchmark index. They also discuss the Portfolio’s performance with Amundi US on a regular basis. The Trustees’ regular reviews and discussions were factored into the Trustees’ deliberations concerning the renewal of the investment management agreement.
| Pioneer Strategic Income VCT Portfolio | Pioneer Variable Contracts Trust |
Approval of Renewal of Investment Management Agreement (continued)
Management Fee and Expenses
The Trustees considered information showing the fees and expenses of the Portfolio in comparison to the management fees of its peer group of funds as classified by Morningstar and also to the expense ratios of a peer group of funds selected on the basis of criteria determined by the Independent Trustees for this purpose using data provided by Strategic Insight Mutual Fund Research and Consulting, LLC (Strategic Insight), an independent third party. The peer group comparisons referred to below are organized in quintiles. Each quintile represents one-fifth of the peer group. In all peer group comparisons referred to below, first quintile is most favorable to the Portfolio’s shareowners. The Trustees noted that they separately review and consider the impact of the Portfolio’s transfer agency and Portfolio- and Amundi US-paid expenses for sub-transfer agency and intermediary arrangements, and that the results of the most recent such review were considered in the consideration of the Portfolio’s expense ratio.
The Trustees considered that the Portfolio’s management fee for the most recent fiscal year was in the fifth quintile relative to the management fees paid by other funds in its Morningstar category for the comparable period. The Trustees noted Amundi US’s explanation of the reasons that the Portfolio’s management fee was in the fifth quintile relative to the management fees paid by other funds in its Morningstar category. The Trustees considered that the expense ratio of the Portfolio’s Class II shares for the most recent fiscal year was in the fifth quintile relative to its Strategic Insight peer group for the comparable period. The Trustees noted Amundi US’s explanation of the reasons that the expense ratio of the Portfolio’s Class II shares was in the fifth quintile relative to its Strategic Insight peer group. The Trustees noted that Amundi US had agreed to waive fees and/or reimburse expenses in order to limit the ordinary operating expenses of the Portfolio for the most recent fiscal year, and that such expense limitation arrangement had not been extended for the upcoming fiscal year.
The Trustees reviewed management fees charged by Amundi US to institutional and other clients, including publicly offered European funds sponsored by Amundi US’s affiliates, unaffiliated U.S. registered investment companies (in a sub-advisory capacity), and unaffiliated foreign and domestic separate accounts. The Trustees also considered Amundi US’s costs in providing services to the Portfolio and Amundi US’s costs in providing services to the other clients and considered the differences in management fees and profit margins for fund and non-fund services. In evaluating the fees associated with Amundi US’s client accounts, the Trustees took into account the respective demands, resources and complexity associated with the Portfolio and other client accounts. The Trustees noted that, in some instances, the fee rates for those clients were lower than the management fee for the Portfolio and considered that, under the investment management and administration agreements with the Portfolio, Amundi US performs additional services for the Portfolio that it does not provide to those other clients or services that are broader in scope, including oversight of the Portfolio’s other service providers and activities related to compliance and the extensive regulatory and tax regimes to which the Portfolio is subject. The Trustees also considered the entrepreneurial risks associated with Amundi US’s management of the Portfolio.
The Trustees concluded that the management fee payable by the Portfolio to Amundi US was reasonable in relation to the nature and quality of the services provided by Amundi US.
Profitability
The Trustees considered information provided by Amundi US regarding the profitability of Amundi US with respect to the advisory services provided by Amundi US to the Portfolio, including the methodology used by Amundi US in allocating certain of its costs to the management of the Portfolio. The Trustees also considered Amundi US’s profit margin in connection with the overall operation of the Portfolio. They further reviewed the financial results, including the profit margins, realized by Amundi US from non-fund businesses. The Trustees considered Amundi US’s profit margins in comparison to the limited industry data available and noted that the profitability of any adviser was affected by numerous factors, including its organizational structure and method for allocating expenses. The Trustees concluded that Amundi US’s profitability with respect to the management of the Portfolio was not unreasonable.
Economies of Scale
The Trustees considered Amundi US’s views relating to economies of scale in connection with the Pioneer Funds as fund assets grow and the extent to which any such economies of scale are shared with the Portfolio and Portfolio shareholders. The Trustees recognize that economies of scale are difficult to identify and quantify, and that, among other factors that may be relevant, are the following: fee levels, expense subsidization, investment by Amundi US in research and analytical capabilities and Amundi US’s commitment and resource allocation to the Portfolio. The Trustees noted that profitability also may be an indicator of the availability of any economies of scale, although profitability may vary for other reasons including due to reductions in expenses. The Trustees concluded that economies of scale, if any, were being appropriately shared with the Portfolio.
| Pioneer Strategic Income VCT Portfolio | Pioneer Variable Contracts Trust |
Other Benefits
The Trustees considered the other benefits that Amundi US enjoys from its relationship with the Portfolio. The Trustees considered the character and amount of fees paid or to be paid by the Portfolio, other than under the investment management agreement, for services provided by Amundi US and its affiliates. The Trustees further considered the revenues and profitability of Amundi US’s businesses other than the fund business. To the extent applicable, the Trustees also considered the benefits to the Portfolio and to Amundi US and its affiliates from the use of “soft” commission dollars generated by the Portfolio to pay for research and brokerage services.
The Trustees considered that Amundi US is the principal U.S. asset management business of Amundi, which is one of the largest asset managers globally. Amundi’s worldwide asset management business manages over $2.1 trillion in assets (including the Pioneer Funds). The Trustees considered that Amundi US’s relationship with Amundi creates potential opportunities for Amundi US and Amundi that derive from Amundi US’s relationships with the Portfolio, including Amundi’s ability to market the services of Amundi US globally. The Trustees noted that Amundi US has access to additional research and portfolio management capabilities as a result of its relationship with Amundi and Amundi’s enhanced global presence that may contribute to an increase in the resources available to Amundi US. The Trustees considered that Amundi US and the Portfolio receive reciprocal intangible benefits from the relationship, including mutual brand recognition and, for the Portfolio, direct and indirect access to the resources of a large global asset manager. The Trustees concluded that any such benefits received by Amundi US as a result of its relationship with the Portfolio were reasonable.
Conclusion
After consideration of the factors described above as well as other factors, the Trustees, including the Independent Trustees, concluded that the investment management agreement for the Portfolio, including the fees payable thereunder, was fair and reasonable and voted to approve the proposed renewal of the investment management agreement.
| Pioneer Strategic Income VCT Portfolio | Pioneer Variable Contracts Trust |
Trustees, Officers and Service Providers
Trustees and Officers
The Portfolio’s Trustees and officers are listed below, together with their principal occupations and other directorships they have held during at least the past five years. Trustees who are interested persons of the Portfolios within the meaning of the 1940 Act are referred to as Interested Trustees. Trustees who are not interested persons of the Portfolio are referred to as Independent Trustees. Each of the Trustees serves as a Trustee of each of the 47 U.S. registered investment portfolios for which Amundi US serves as investment adviser (the “Pioneer Funds”). The address for all Trustees and all officers of the Portfolios is 60 State Street, Boston, Massachusetts 02109.
The Statement of Additional Information of the Portfolio includes additional information about the Trustees and is available, without charge, upon request, by calling 1-800-225-6292.
Investment Adviser and Administrator
Amundi Asset Management US, Inc.
Custodian and Sub-Administrator
The Bank of New York Mellon Corporation
Independent Registered Public Accounting Firm
Ernst & Young LLP
Principal Underwriter
Amundi Distributor US, Inc.
Legal Counsel
Morgan, Lewis & Bockius LLP
Transfer Agent
BNY Mellon Investment Servicing (US) Inc.
Name, Age and Position
Held With the Trust | Term of Office and
Length of Service | Principal Occupation(s) During At Least The Past Five Years | Other Directorships Held by Trustee During At Least The Past Five Years |
| Independent Trustees |
Thomas J. Perna (73)
Chairman of the Board
and Trustee | Trustee since 2006.
Serves until a successor
trustee is elected or
earlier retirement
or removal. | Private investor (2004 – 2008 and 2013 – present); Chairman (2008 – 2013) and Chief Executive Officer (2008 – 2012), Quadriserv, Inc. (technology products for securities lending industry); and Senior Executive Vice President, The Bank of New York (financial and securities services) (1986 – 2004) | Director, Broadridge Financial
Solutions, Inc. (investor
communications and securities
processing provider for financial
services industry) (2009 – present); Director, Quadriserv, Inc.
(2005 – 2013); and Commissioner,
New Jersey State Civil Service
Commission (2011 – 2015) |
John E. Baumgardner,
Jr. (72)*
Trustee | Trustee since 2019.
Serves until a successor
trustee is elected or
earlier retirement
or removal. | Of Counsel (2019 – present), Partner (1983-2018), Sullivan & Cromwell LLP (law firm). | Chairman, The Lakeville Journal
Company, LLC, (privately-held
community newspaper group)
(2015-present) |
| Pioneer Strategic Income VCT Portfolio | Pioneer Variable Contracts Trust |
Name, Age and Position
Held With the Trust | Term of Office and
Length of Service | Principal Occupation(s) During At Least The Past Five Years | Other Directorships Held by Trustee During At Least The Past Five Years |
| Independent Trustees (continued) |
Diane Durnin (66)
Trustee | Trustee since 2019.
Serves until a successor
trustee is elected or
earlier retirement
or removal. | Managing Director - Head of Product Strategy and Development, BNY Mellon Investment Management (investment management firm) (2012-2018); Vice Chairman – The Dreyfus Corporation (2005 – 2018): Executive Vice President Head of Product, BNY Mellon Investment Management (2007-2012); Executive Director- Product Strategy, Mellon Asset Management (2005-2007); Executive Vice President Head of Products, Marketing and Client Service, Dreyfus Corporation (investment management firm) (2000-2005); Senior Vice President Strategic Product and Business Development, Dreyfus Corporation (1994-2000) | None |
Benjamin M. Friedman (79)
Trustee | Trustee since 2008.
Serves until a successor
trustee is elected or
earlier retirement
or removal. | William Joseph Maier Professor of Political Economy, Harvard University (1972 – present) | Trustee, Mellon Institutional Funds
Investment Trust and Mellon
Institutional Funds Master Portfolio
(oversaw 17 portfolios in fund
complex) (1989 - 2008) |
Craig C. MacKay (60)
Trustee | Trustee since 2021.
Serves until a successor
trustee is elected or
earlier retirement
or removal. | Partner, England & Company, LLC (advisory firm) (2012 – present); Group Head – Leveraged Finance Distribution, Oppenheimer & Company (investment bank) (2006 – 2012); Group Head – Private Finance & High Yield Capital Markets Origination, SunTrust Robinson Humphrey (investment bank) (2003 – 2006); and Founder and Chief Executive Officer, HNY Associates, LLC (investment bank) (1996 – 2003) | Director, Equitable Holdings, Inc. (financial services holding company) (2022 – present); Board Member of Carver Bancorp, Inc. (holding company) and Carver Federal Savings Bank, NA (2017 – present); Advisory Council Member, MasterShares ETF (2016 – 2017); Advisory Council Member, The Deal (financial market information publisher) (2015 – 2016); Board Co-Chairman and Chief Executive Officer, Danis Transportation Company (privately-owned commercial carrier) (2000 – 2003); Board Member and Chief Financial Officer, Customer Access Resources (privately-owned teleservices company) (1998 – 2000); Board Member, Federation of Protestant Welfare Agencies (human services agency) (1993 – present); and Board Treasurer, Harlem Dowling Westside Center (foster care agency) (1999 – 2018) |
Lorraine H. Monchak (67)
Trustee | Trustee since 2017.
(Advisory Trustee from
2014 - 2017). Serves
until a successor trustee
is elected or earlier
retirement or removal. | Chief Investment Officer, 1199 SEIU Funds (healthcare workers union pension funds) (2001 – present); Vice President – International Investments Group, American International Group, Inc. (insurance company) (1993 – 2001); Vice President – Corporate Finance and Treasury Group, Citibank, N.A. (1980 – 1986 and 1990 – 1993); Vice President – Asset/Liability Management Group, Federal Farm Funding Corporation (government-sponsored issuer of debt securities) (1988 – 1990); Mortgage Strategies Group, Shearson Lehman Hutton, Inc. (investment bank) (1987 – 1988); Mortgage Strategies Group, Drexel Burnham Lambert, Ltd. (investment bank) (1986 – 1987) | None |
| Pioneer Strategic Income VCT Portfolio | Pioneer Variable Contracts Trust |
Trustees, Officers and Service Providers (continued)
Name, Age and Position
Held With the Trust | Term of Office and
Length of Service | Principal Occupation(s) During At Least The Past Five Years | Other Directorships Held by Trustee During At Least The Past Five Years |
| Independent Trustees (continued) |
Marguerite A. Piret (75)**
Trustee | Trustee since 1995.
Serves until a successor
trustee is elected or
earlier retirement
or removal. | Chief Financial Officer, American Ag Energy, Inc. (technology for the environment, energy and agriculture) (2019 – present); Chief Operating Officer, North Country Growers LLC (controlled environment agriculture company) (2020 – present); Chief Executive Officer, Green Heat LLC (biofuels company) (2022 – present); President and Chief Executive Officer, Newbury Piret Company (investment banking firm) (1981 – 2019) | Director of New America High
Income Fund, Inc. (closed-end
investment company) (2004 –
present); and Member, Board of
Governors, Investment Company
Institute (2000 – 2006) |
Fred J. Ricciardi (76)
Trustee | Trustee since 2014.
Serves until a successor
trustee is elected or
earlier retirement
or removal. | Private investor (2020 – present); Consultant (investment company services) (2012 – 2020); Executive Vice President, BNY Mellon (financial and investment company services) (1969 – 2012); Director, BNY International Financing Corp. (financial services) (2002 – 2012); Director, Mellon Overseas Investment Corp. (financial services) (2009 – 2012); Director, Financial Models (technology) (2005-2007); Director, BNY Hamilton Funds, Ireland (offshore investment companies) (2004-2007); Chairman/Director, AIB/BNY Securities Services, Ltd., Ireland (financial services) (1999-2006); Chairman, BNY Alternative Investment Services, Inc. (financial services) (2005-2007) | None |
* Mr. Baumgardner is Of Counsel to Sullivan & Cromwell LLP, which acts as counsel to the Independent Trustees of each Pioneer Fund.
** Ms. Piret became a non-voting Advisory Trustee of the Pioneer Funds effective January 22, 2024. |
| Interested Trustees |
Lisa M. Jones (61)***
Trustee, President and Chief
Executive Officer | Trustee since 2017. Serves
until a successor trustee is
elected or earlier retirement
or removal | Director, CEO and President of Amundi US, Inc. (investment management firm) (since September 2014); Director, CEO and President of Amundi Asset Management US, Inc. (since September 2014); Director, CEO and President of Amundi Distributor US, Inc. (since September 2014); Director, CEO and President of Amundi Asset Management US, Inc. (since September 2014); Chair, Amundi US, Inc., Amundi Distributor US, Inc. and Amundi Asset Management US, Inc. (September 2014 – 2018); Managing Director, Morgan Stanley Investment Management (investment management firm) (2010 – 2013); Director of Institutional Business, CEO of International, Eaton Vance Management (investment management firm) (2005 – 2010); Director of Amundi Holdings US, Inc. (since 2017) | Director of Clearwater Analytics (provider of web-based investment accounting software for reporting and reconciliation services) (September 2022 – present) |
Kenneth J. Taubes (64)***,****
Trustee | Trustee since 2014. Serves
until a successor trustee is
elected or earlier retirement
or removal | Director and Executive Vice President (since 2008) and Chief Investment Officer, U.S. (since 2010) of Amundi US, Inc. (investment management firm); Director and Executive Vice President and Chief Investment Officer, U.S. of Amundi US (since 2008); Executive Vice President and Chief Investment Officer, U.S. of Amundi Asset Management US, Inc. (since 2009); Portfolio Manager of Amundi US (since 1999); Director of Amundi Holdings US, Inc. (since 2017) | None |
| Pioneer Strategic Income VCT Portfolio | Pioneer Variable Contracts Trust |
Name, Age and Position
Held With the Trust | Term of Office and
Length of Service | Principal Occupation(s) During At Least The Past Five Years | Other Directorships Held by Trustee During At Least The Past Five Years |
| Interested Trustees (continued) |
*** Ms. Jones and Mr. Taubes are Interested Trustees because they are officers or directors of the Portfolio’s investment adviser and certain of its affiliates.
**** Mr. Taubes retired as a Trustee, effective January 1, 2024. |
| Name, Age and Position Held With the Trust***** | Term of Office and
Length of Service | Principal Occupation(s) During
At Least The Past Five Years | Other Directorships Held by Trustee During At Least The Past Five Years |
| Trust Officers |
Christopher J. Kelley (59)
Secretary and Chief
Legal Officer | Since 2003. Serves at
the discretion of
the Board | Vice President and Associate General Counsel of Amundi US since January 2008; Secretary and Chief Legal Officer of all of the Pioneer Funds since June 2010; Assistant Secretary of all of the Pioneer Funds from September 2003 to May 2010; Vice President and Senior Counsel of Amundi US from July 2002 to December 2007 | None |
Thomas Reyes (61)
Assistant Secretary | Since 2010. Serves at
the discretion of
the Board | Assistant General Counsel of Amundi US since May 2013 and Assistant Secretary of all the Pioneer Funds since June 2010; Counsel of Amundi US from June 2007 to May 2013 | None |
Heather L. Melito-Dezan (47)
Assistant Secretary | Since 2022. Serves at
the discretion of
the Board | Director - Trustee and Board Relationships of Amundi US since September 2019; Assistant Secretary of Amundi US, Inc. since July 2020: Assistant Secretary of Amundi Asset Management US, Inc. since July 2020: Assistant Secretary of Amundi Distributor US, Inc. since July 2020; Assistant Secretary of all the Pioneer Funds since September 2022; Private practice from 2017 – 2019. | None |
Anthony J. Koenig, Jr. (60)
Treasurer and
Chief Financial and
Accounting Officer | Since 2021. Serves at
the discretion of
the Board | Managing Director, Chief Operations Officer and Fund Treasurer of Amundi US since May 2021; Treasurer of all of the Pioneer Funds since May 2021; Assistant Treasurer of all of the Pioneer Funds from January 2021 to May 2021; and Chief of Staff, US Investment Management of Amundi US from May 2008 to January 2021 | None |
Luis I. Presutti (58)
Assistant Treasurer | Since 2000. Serves at
the discretion of
the Board | Director – Fund Treasury of Amundi US since 1999; and Assistant Treasurer of all of the Pioneer Funds since 1999 | None |
Gary Sullivan (65)
Assistant Treasurer | Since 2002. Serves at
the discretion of
the Board | Senior Manager – Fund Treasury of Amundi US since 2012; and Assistant Treasurer of all of the Pioneer Funds since 2002 | None |
Antonio Furtado (41)
Assistant Treasurer | Since 2020. Serves at
the discretion of
the Board | Fund Oversight Manager �� Fund Treasury of Amundi US since 2020; Assistant Treasurer of all of the Pioneer Funds since 2020; and Senior Fund Treasury Analyst from 2012 - 2020 | None |
| Pioneer Strategic Income VCT Portfolio | Pioneer Variable Contracts Trust |
Trustees, Officers and Service Providers (continued)
| Name, Age and Position Held With the Trust***** | Term of Office and
Length of Service | Principal Occupation(s) During
At Least The Past Five Years | Other Directorships Held by Trustee During At Least The Past Five Years |
| Trust Officers (continued) |
Michael Melnick (52)
Assistant Treasurer | Since 2021. Serves at
the discretion of
the Board | Vice President - Deputy Fund Treasurer of Amundi US since May 2021; Assistant Treasurer of all of the Pioneer Funds since July 2021; Director of Regulatory Reporting of Amundi US from 2001 – 2021; and Director of Tax of Amundi US from 2000 - 2001 | None |
John Malone (53)
Chief Compliance Officer | Since 2018. Serves at
the discretion of
the Board | Managing Director, Chief Compliance Officer of Amundi US Asset Management; Amundi Asset Management US, Inc.; and the Pioneer Funds since September 2018; Chief Compliance Officer of Amundi Distributor US, Inc. since January 2014. | None |
Brandon Austin (51)
Anti-Money
Laundering Officer | Since 2022. Serves at
the discretion of
the Board | Director, Financial Security – Amundi Asset Management; Anti-Money Laundering Officer of all the Pioneer Funds since March 2022: Director of Financial Security of Amundi US since July 2021; Vice President, Head of BSA, AML and OFAC, Deputy Compliance Manager, Crédit Agricole Indosuez Wealth Management (investment management firm) (2013 – 2021) | None |
| ***** Marco Pirondini has been appointed to serve as an Executive Vice President of the Portfolio and Chief Investment Officer of Amundi US, Inc., effective January 1, 2024. |
Proxy Voting Policies and Procedures of the Portfolio are available without charge, upon request, by calling our toll free number (1-800-225-6292). Information regarding how the Portfolio voted proxies relating to Portfolio securities during the most recent 12-month period ended June 30 is publicly available to shareholders at www.amundi.com/us. This information is also available on the Securities and Exchange Commission’s web site at www.sec.gov.
ITEM 2. CODE OF ETHICS.
(a) Disclose whether, as of the end of the period covered by the report, the registrant has adopted a code of ethics that applies to the registrant’s principal executive officer, principal financial officer, principal accounting officer or controller, or persons performing similar functions, regardless of whether these individuals are employed by the registrant or a third party. If the registrant has not adopted such a code of ethics, explain why it has not done so.
The registrant has adopted, as of the end of the period covered by this report, a code of ethics that applies to the registrant’s principal executive officer, principal financial officer, principal accounting officer and controller.
(b) For purposes of this Item, the term “code of ethics” means written standards that are reasonably designed to deter wrongdoing and to promote:
(1) Honest and ethical conduct, including the ethical handling of actual or apparent conflicts of interest between personal and professional relationships;
(2) Full, fair, accurate, timely, and understandable disclosure in reports and documents that a registrant files with, or submits to, the Commission and in other public communications made by the registrant;
(3) Compliance with applicable governmental laws, rules, and regulations;
(4) The prompt internal reporting of violations of the code to an appropriate person or persons identified in the code; and
(5) Accountability for adherence to the code.
(c) The registrant must briefly describe the nature of any amendment, during the period covered by the report, to a provision of its code of ethics that applies to the registrant’s principal executive officer, principal financial officer, principal accounting officer or controller, or persons performing similar functions, regardless of whether these individuals are employed by the registrant or a third party, and that relates to any element of the code of ethics definition enumerated in paragraph (b) of this Item. The registrant must file a copy of any such amendment as an exhibit pursuant to Item 10(a), unless the registrant has elected to satisfy paragraph (f) of this Item by posting its code of ethics on its website pursuant to paragraph (f)(2) of this Item, or by undertaking to provide its code of ethics to any person without charge, upon request, pursuant to paragraph (f)(3) of this Item.
The registrant has made no amendments to the code of ethics during the period covered by this report.
(d) If the registrant has, during the period covered by the report, granted a waiver, including an implicit waiver, from a provision of the code of ethics to the registrant’s principal executive officer, principal financial officer, principal accounting officer or controller, or persons performing similar functions, regardless of whether these individuals are employed by the registrant or a third party, that relates to one or more of the items set forth in paragraph (b) of this Item, the registrant must briefly describe the nature of the waiver, the name of the person to whom the waiver was granted, and the date of the waiver.
Not applicable.
(e) If the registrant intends to satisfy the disclosure requirement under paragraph (c) or (d) of this Item regarding an amendment to, or a waiver from, a provision of its code of ethics that applies to the registrant’s principal executive officer, principal financial officer, principal accounting officer or controller, or persons performing similar functions and that relates to any element of the code of ethics definition enumerated in paragraph (b) of this Item by posting such information on its Internet website, disclose the registrant’s Internet address and such intention.
Not applicable.
(f) The registrant must:
(1) File with the Commission, pursuant to Item 12(a)(1), a copy of its code of ethics that applies to the registrant’s principal executive officer, principal financial officer, principal accounting officer or controller, or persons performing similar functions, as an exhibit to its annual report on this Form N-CSR (see attachment);
(2) Post the text of such code of ethics on its Internet website and disclose, in its most recent report on this Form N-CSR, its Internet address and the fact that it has posted such code of ethics on its Internet website; or
(3) Undertake in its most recent report on this Form N-CSR to provide to any person without charge, upon request, a copy of such code of ethics and explain the manner in which such request may be made. See Item 10(2)
ITEM 3. AUDIT COMMITTEE FINANCIAL EXPERT.
(a) (1) Disclose that the registrant’s Board of Trustees has determined that the registrant either:
(i) Has at least one audit committee financial expert serving on its audit committee; or
(ii) Does not have an audit committee financial expert serving on its audit committee.
The registrant’s Board of Trustees has determined that the registrant has at least one audit committee financial expert.
(2) If the registrant provides the disclosure required by paragraph (a)(1)(i) of this Item, it must disclose the name of the audit committee financial expert and whether that person is “independent.” In order to be considered “independent” for purposes of this Item, a member of an audit committee may not, other than in his or her capacity as a member of the audit committee, the Board of Trustees, or any other board committee:
(i) Accept directly or indirectly any consulting, advisory, or other compensatory fee from the issuer; or
(ii) Be an “interested person” of the investment company as defined in Section 2(a)(19) of the Act (15 U.S.C. 80a-2(a)(19)).
Mr. Fred J. Ricciardi, an independent Trustee, is such an audit committee financial expert.
(3) If the registrant provides the disclosure required by paragraph (a)(1) (ii) of this Item, it must explain why it does not have an audit committee financial expert.
Not applicable.
ITEM 4. PRINCIPAL ACCOUNTANT FEES AND SERVICES.
(a) Disclose, under the caption AUDIT FEES, the aggregate fees billed for each of the last two fiscal years for professional services rendered by the principal accountant for the audit of the registrant’s annual financial statements or services that are normally provided by the accountant in connection with statutory and regulatory filings or engagements for those fiscal years.
The audit fees for the Trust were $252,992 payable to Ernst & Young LLP for the year ended December 31, 2023 and $276,705 for the year ended December 31, 2022.
(b) Disclose, under the caption AUDIT-RELATED FEES, the aggregate fees billed in each of the last two fiscal years for assurance and related services by the principal accountant that are reasonably related to the performance of the audit of the registrant’s financial statements and are not reported under paragraph (a) of this Item. Registrants shall describe the nature of the services comprising the fees disclosed under this category.
The audit-related services fees for the Fund were $3,671 payable to Ernst & Young LLP for the year ended December 31, 2023 and $1,234 for the year ended December 31, 2022.
(c) Disclose, under the caption TAX FEES, the aggregate fees billed in each of the last two fiscal years for professional services rendered by the principal accountant for tax compliance, tax advice, and tax planning. Registrants shall describe the nature of the services comprising the fees disclosed under this category.
The Trust paid aggregate non-audit fees to Ernst & Young LLP for tax services of $73,238 and $70,422 during the fiscal years ended December 31, 2023 and 2022, respectively.
(d) Disclose, under the caption ALL OTHER FEES, the aggregate fees billed in each of the last two fiscal years for products and services provided by the principal accountant, other than the services reported in paragraphs (a) through (c) of this Item. Registrants shall describe the nature of the services comprising the fees disclosed under this category.
There were no other fees in 2023 or 2022.
(e) (1) Disclose the audit committee’s pre-approval policies and procedures described in paragraph (c)(7) of Rule 2-01 of Regulation S-X.
PIONEER FUNDS
APPROVAL OF AUDIT, AUDIT-RELATED, TAX AND OTHER SERVICES
PROVIDED BY THE INDEPENDENT AUDITOR
SECTION I - POLICY PURPOSE AND APPLICABILITY
The Pioneer Funds recognize the importance of maintaining the independence of their outside auditors. Maintaining independence is a shared responsibility involving Amundi Asset Management US, Inc., the audit committee and the independent auditors.
The Funds recognize that a Fund’s independent auditors: 1) possess knowledge of the Funds, 2) are able to incorporate certain services into the scope of the audit, thereby avoiding redundant work, cost and disruption of Fund personnel and processes, and 3) have expertise that has value to the Funds. As a result, there are situations where it is desirable to use the Fund’s independent auditors for services in addition to the annual audit and where the potential for conflicts of interests are minimal. Consequently, this policy, which is intended to comply with Rule 210.2-01(C)(7), sets forth guidelines and procedures to be followed by the Funds when retaining the independent audit firm to perform audit, audit-related tax and other services under those circumstances, while also maintaining independence.
Approval of a service in accordance with this policy for a Fund shall also constitute approval for any other Fund whose pre-approval is required pursuant to Rule 210.2-01(c)(7)(ii).
In addition to the procedures set forth in this policy, any non-audit services that may be provided consistently with Rule 210.2-01 may be approved by the Audit Committee itself and any pre-approval that may be waived in accordance with Rule 210.2-01(c)(7)(i)(C) is hereby waived.
Selection of a Fund’s independent auditors and their compensation shall be determined by the Audit Committee and shall not be subject to this policy.
| | | | |
SERVICE CATEGORY | | SERVICE CATEGORY DESCRIPTION | | SPECIFIC PRE-APPROVED SERVICE SUBCATEGORIES |
| I. AUDIT SERVICES | | Services that are directly related to performing the independent audit of the Funds | | • Accounting research assistance • SEC consultation, registration statements, and reporting |
| | |
| | | | • Tax accrual related matters |
| | |
| | | | • Implementation of new accounting standards |
| | |
| | | | • Compliance letters (e.g. rating agency letters) |
| | |
| | | | • Regulatory reviews and assistance regarding financial matters |
| | |
| | | | • Semi-annual reviews (if requested) |
| | |
| | | | | • Comfort letters for closed end offerings |
| | |
II. AUDIT-RELATED SERVICES | | Services which are not prohibited under Rule | | • AICPA attest and agreed-upon procedures • Technology control assessments |
| | |
| | | 210.2-01(C)(4) (the “Rule”) and are related extensions of the audit services support the audit, or use the knowledge/expertise gained from the audit procedures as a foundation to complete the project. In most cases, if the Audit-Related Services are not performed by the Audit firm, the scope of the Audit Services would likely increase. The Services are typically well-defined and governed by accounting professional standards (AICPA, SEC, etc.) | | • Financial reporting control assessments • Enterprise security architecture assessment |
| | |
| AUDIT COMMITTEE APPROVAL POLICY | | AUDIT COMMITTEE REPORTING POLICY |
• “One-time” pre-approval for the audit period for all pre-approved specific service subcategories. Approval of the independent auditors as auditors for a Fund shall constitute pre approval for these services. | | • A summary of all such services and related fees reported at each regularly scheduled Audit Committee meeting. |
| |
• “One-time” pre-approval for the fund fiscal year within a specified dollar limit for all pre-approved specific service subcategories | | • A summary of all such services and related fees (including comparison to specified dollar limits) reported quarterly. |
| | |
• Specific approval is needed to exceed the pre-approved dollar limit for these services (see general | | |
| |
Audit Committee approval policy below for details on obtaining specific approvals) | | |
| |
• Specific approval is needed to use the Fund’s auditors for Audit-Related Services not denoted as “pre-approved”, or to add a specific service subcategory as “pre-approved” | | |
SECTION III - POLICY DETAIL, CONTINUED
| | | | |
SERVICE CATEGORY | | SERVICE CATEGORY DESCRIPTION | | SPECIFIC PRE-APPROVED SERVICE SUBCATEGORIES |
| III. TAX SERVICES | | Services which are not prohibited by the Rule, | | • Tax planning and support • Tax controversy assistance |
| | |
| | | if an officer of the Fund determines that using the Fund’s auditor to provide these services creates significant synergy in the form of efficiency, minimized disruption, or the ability to maintain a desired level of confidentiality. | | • Tax compliance, tax returns, excise tax returns and support • Tax opinions |
| | |
| AUDIT COMMITTEE APPROVAL POLICY | | AUDIT COMMITTEE REPORTING POLICY | | |
• “One-time” pre-approval for the fund fiscal year within a specified dollar limit | | • A summary of all such services and related fees (including comparison to specified dollar limits) reported quarterly. | | |
• Specific approval is needed to exceed the pre-approved dollar limits for these services (see general Audit Committee approval policy below for details on obtaining specific approvals) • Specific approval is needed to use the Fund’s auditors for tax services not denoted as pre-approved, or to add a specific service subcategory as “pre-approved” | | | | |
SECTION III - POLICY DETAIL, CONTINUED
| | | | |
| SERVICE CATEGORY | | SERVICE CATEGORY DESCRIPTION | | SPECIFIC PRE-APPROVED
SERVICE SUBCATEGORIES |
| IV. OTHER SERVICES | | Services which are not prohibited by the Rule, if an officer of the Fund determines that using the Fund’s auditor to provide these services creates significant synergy in the form of efficiency, minimized disruption, the ability to maintain a desired level of confidentiality, or where the Fund’s auditors posses unique or superior qualifications to provide these services, resulting in superior value and results for the Fund. | | • Business Risk Management support • Other control and regulatory compliance projects |
| A. SYNERGISTIC, UNIQUE QUALIFICATIONS | | |
| | |
| AUDIT COMMITTEE APPROVAL POLICY | | AUDIT COMMITTEE REPORTING POLICY | | |
| | |
• “One-time” pre-approval for the fund fiscal year within a specified dollar limit | | • A summary of all such services and related fees (including comparison to specified dollar limits) reported quarterly. | | |
| | |
• Specific approval is needed to exceed the pre-approved dollar limits for these services (see general Audit Committee approval policy below for details on obtaining specific approvals) | | | | |
| | |
• Specific approval is needed to use the Fund’s auditors for “Synergistic” or “Unique Qualifications” Other Services not denoted as pre-approved to the left, or to add a specific service subcategory as “pre-approved” | | | | |
SECTION III - POLICY DETAIL, CONTINUED
| | | | |
| SERVICE CATEGORY | | SERVICE CATEGORY DESCRIPTION | | SPECIFIC PROHIBITED
SERVICE SUBCATEGORIES |
| PROHIBITED SERVICES | | Services which result in the auditors losing independence status under the Rule. | | 1. Bookkeeping or other services related to the accounting records or financial statements of the audit client* |
| | |
| | | | 2. Financial information systems design and implementation* |
| | |
| | | | 3. Appraisal or valuation services, fairness* opinions, or contribution-in-kind reports |
| | |
| | | | 4. Actuarial services (i.e., setting actuarial reserves versus actuarial audit work)* |
| | |
| | | | 5. Internal audit outsourcing services* |
| | |
| | | | 6. Management functions or human resources |
| | |
| | | | 7. Broker or dealer, investment advisor, or investment banking services |
| | |
| | | | 8. Legal services and expert services unrelated to the audit |
| | |
| | | | | 9. Any other service that the Public Company Accounting Oversight Board determines, by regulation, is impermissible |
| | |
| AUDIT COMMITTEE APPROVAL POLICY | | AUDIT COMMITTEE REPORTING POLICY | | |
• These services are not to be performed with the exception of the(*) services that may be permitted if they would not be subject to audit procedures at the audit client (as defined in rule 2-01(f)(4)) level the firm providing the service. | | • A summary of all services and related fees reported at each regularly scheduled Audit Committee meeting will serve as continual confirmation that has not provided any restricted services. | | |
GENERAL AUDIT COMMITTEE APPROVAL POLICY:
| | • | | For all projects, the officers of the Funds and the Fund’s auditors will each make an assessment to determine that any proposed projects will not impair independence. |
| | • | | Potential services will be classified into the four non-restricted service categories and the “Approval of Audit, Audit-Related, Tax and Other Services” Policy above will be applied. Any services outside the specific pre-approved service subcategories set forth above must be specifically approved by the Audit Committee. |
| | • | | At least quarterly, the Audit Committee shall review a report summarizing the services by service category, including fees, provided by the Audit firm as set forth in the above policy. |
(2) Disclose the percentage of services described in each of paragraphs (b) through (d) of this Item that were approved by the audit committee pursuant to paragraph (c)(7)(i)(C) of Rule 2-01 of Regulation S-X.
Non-Audit Services
Beginning with non-audit service contracts entered into on or after May 6, 2003, the effective date of the new SEC pre-approval rules, the Trust’s audit committee is required to pre-approve services to affiliates defined by SEC rules to the extent that the services are determined to have a direct impact on the operations or financial reporting of the Trust. For the years ended December 31, 2023 and 2022, there were no services provided to an affiliate that required the Trust’s audit committee pre-approval.
(f) If greater than 50 percent, disclose the percentage of hours expended on the principal accountants engagement to audit the registrant’s financial statements for the most recent fiscal year that were attributed to work performed by persons other than the principal accountant’s full-time, permanent employees.
N/A
(g) Disclose the aggregate non-audit fees billed by the registrants accountant for services rendered to the registrant, and rendered to the registrants investment adviser (not including any sub-adviser whose role is primarily portfolio management and is subcontracted with or overseen by another investment adviser), and any entity controlling, controlled by, or under common control with the adviser that provides ongoing services to the registrant for each of the last two fiscal years of the registrant.
The Trust paid aggregate non-audit fees to Ernst & Young LLP for tax services of $73,238 and $70,422 during the fiscal years ended December 31, 2023 and 2022, respectively.
(h) Disclose whether the registrants audit committee of the Board of Trustees has considered whether the provision of non-audit services that were rendered to the registrants investment adviser (not including any subadviser whose role is primarily portfolio management and is subcontracted with or overseen by another investment adviser), and any entity controlling, controlled by, or under common control with the investment adviser that provides ongoing services to the registrant that were not pre-approved pursuant to paragraph (c)(7)(ii) of Rule 2-01 of Regulation S-X is compatible with maintaining the principal accountant’s independence.
The Fund’s audit committee of the Board of Trustees has considered whether the provision of non-audit services that were rendered to the Affiliates (as defined) that were not pre- approved pursuant to paragraph (c)(7)(ii) of Rule 2-01 of Regulation S-X is compatible with maintaining the principal accountant’s independence.
(i) A registrant identified by the Commission pursuant to Section 104(i)(2)(A) of the Sarbanes-Oxley Act of 2002 (15 U.S.C. 7214(i)(2)(A)), as having retained, for the preparation of the audit report on its financial statements included in the Form NCSR, a registered public accounting firm that has a branch or office that is located in a foreign jurisdiction and that the Public Company Accounting Oversight Board has determined it is unable to inspect or investigate completely because of a position taken by an authority in the foreign jurisdiction must electronically submit to the Commission on a supplemental basis documentation that establishes that the registrant is not owned or controlled by a governmental entity in the foreign jurisdiction. The registrant must submit this documentation on or before the due date for this form. A registrant that is owned or controlled by a foreign governmental entity is not required to submit such documentation.
N/A
(j) A registrant that is a foreign issuer, as defined in 17 CFR 240.3b-4, identified by the Commission pursuant to Section 104(i)(2)(A) of the Sarbanes-Oxley Act of 2002 (15 U.S.C. 7214(i)(2)(A)), as having retained, for the preparation of the audit report on its financial statements included in the Form N-CSR, a registered public accounting firm that has a branch or office that is located in a foreign jurisdiction and that the Public Company Accounting Oversight Board has determined it is unable to inspect or investigate completely because of a position taken by an authority in the foreign jurisdiction, for each year in which the registrant is so identified, must provide the below disclosures. Also, any such identified foreign issuer that uses a variable-interest entity or any similar structure that results in additional foreign entities being consolidated in the financial statements of the registrant is required to provide the below disclosures for itself and its consolidated foreign operating entity or entities. A registrant must disclose:
(1) That, for the immediately preceding annual financial statement period, a registered public accounting firm that the PCAOB was unable to inspect or investigate completely, because of a position taken by an authority in the foreign jurisdiction, issued an audit report for the registrant;
N/A
(2) The percentage of shares of the registrant owned by governmental entities in the foreign jurisdiction in which the registrant is incorporated or otherwise organized;
N/A
(3) Whether governmental entities in the applicable foreign jurisdiction with respect to that registered public accounting firm have a controlling financial interest with respect to the registrant; N/A
(4) The name of each official of the Chinese Communist Party who is a member of the board of directors of the registrant or the operating entity with respect to the registrant;
N/A
(5) Whether the articles of incorporation of the registrant (or equivalent organizing document) contains any charter of the Chinese Communist Party, including the text of any such charter.
N/A
ITEM 5. AUDIT COMMITTEE OF LISTED REGISTRANTS
(a) If the registrant is a listed issuer as defined in Rule 10A-3 under the Exchange Act (17 CFR 240.10A-3), state whether or not the registrant has a separately-designated standing audit committee established in accordance with Section 3(a)(58)(A) of the Exchange Act (15 U.S.C. 78c(a)(58)(A)). If the registrant has such a committee, however designated, identify each committee member. If the entire board of directors is acting as the registrant’s audit committee as specified in Section 3(a)(58)(B) of the Exchange Act (15 U.S.C. 78c(a)(58)(B)), so state.
N/A
(b) If applicable, provide the disclosure required by Rule 10A-3(d) under the Exchange Act (17 CFR 240.10A-3(d)) regarding an exemption from the listing standards for audit committees.
N/A
ITEM 6. SCHEDULE OF INVESTMENTS.
File Schedule of Investments in securities of unaffiliated issuers as of the close of the reporting period as set forth in 210.1212 of Regulation S-X [17 CFR 210.12-12], unless the schedule is included as part of the report to shareholders filed under Item 1 of this Form.
Included in Item 1
ITEM 7. DISCLOSURE OF PROXY VOTING POLICIES AND PROCEDURES FOR CLOSED-END MANAGEMENT INVESTMENT COMPANIES.
A closed-end management investment company that is filing an annual report on this Form N-CSR must, unless it invests exclusively in non-voting securities, describe the policies and procedures that it uses to determine how to vote proxies relating to portfolio securities, including the procedures that the company uses when a vote presents a conflict between the interests of its shareholders, on the one hand, and those of the company’s investment adviser; principal underwriter; or any affiliated person (as defined in Section 2(a)(3) of the Investment Company Act of 1940 (15 U.S.C. 80a-2(a)(3)) and the rules thereunder) of the company, its investment adviser, or its principal underwriter, on the other. Include any policies and procedures of the company’s investment adviser, or any other third party, that the company uses, or that are used on the company’s behalf, to determine how to vote proxies relating to portfolio securities.
Not applicable to open-end management investment companies.
ITEM 8. PORTFOLIO MANAGERS OF CLOSED-END MANAGEMENT INVESTMENT COMPANIES.
(a) If the registrant is a closed-end management investment company that is filing an annual report on this Form N-CSR, provide the following information:
(1) State the name, title, and length of service of the person or persons employed by or associated with the registrant or an investment adviser of the registrant who are primarily responsible for the day-to-day management of the registrant’s portfolio (“Portfolio Manager”). Also state each Portfolio Manager’s business experience during the past 5 years.
Not applicable to open-end management investment companies.
ITEM 9. PURCHASES OF EQUITY SECURITIES BY CLOSED-END MANAGEMENT INVESTMENT COMPANY AND AFFILIATED PURCHASERS.
(a) If the registrant is a closed-end management investment company, in the following tabular format, provide the information specified in paragraph (b) of this Item with respect to any purchase made by or on behalf of the registrant or any affiliated purchaser, as defined in Rule 10b-18(a)(3) under the Exchange Act (17 CFR 240.10b-18(a)(3)), of shares or other units of any class of the registrant’s equity securities that is registered by the registrant pursuant to Section 12 of the Exchange Act (15 U.S.C. 781).
Not applicable to open-end management investment companies.
ITEM 10. SUBMISSION OF MATTERS TO A VOTE OF SECURITY HOLDERS.
Describe any material changes to the procedures by which shareholders may recommend nominees to the registrant’s board of directors, where those changes were implemented after the registrant last provided disclosure in response to the requirements of Item 407(c)(2)(iv) of Regulation S-R(17 CFR 229.407)(as required by Item 22(b)(15)) of Schedule 14A (17 CFR 240.14a-101), or this Item.
There have been no material changes to the procedures by which the shareholders may recommend nominees to the registrant’s board of directors since the registrant last provided disclosure in response to the requirements of Item 407(c)(2)(iv) of Regulation S-R of Schedule 14(A) in its definitive proxy statement, or this item.
ITEM 11. CONTROLS AND PROCEDURES.
(a) Disclose the conclusions of the registrant’s principal executive and principal financials officers, or persons performing similar functions, regarding the effectiveness of the registrant’s disclosure controls and procedures (as defined in Rule 30a-3(c) under the Act (17 CFR 270.30a-3(c))) as of a date within 90 days of the filing date of the report that includes the disclosure required by this paragraph, based on the evaluation of these controls and procedures required by Rule 30a-3(b) under the Act (17 CFR 270.30(a)-3(b) and Rules 13a-15(b) or 15d-15(b) under the Exchange Act (17 CFR 240.13a-15(b) or 240.15d-15(b)).
The registrant’s principal executive officer and principal financial officer have concluded that the registrant’s disclosure controls and procedures are effective based on the evaluation of these controls and procedures as of a date within 90 days of the filing date of this report.
(b) Disclose any change in the registrant’s internal control over financial reporting (as defined in Rule 30a-3(d) under the Act (17CFR 270.30a-3(d)) that occurred during the period covered by this report that has materially affected, or is reasonably likely to materially affect, the registrant’s internal control over financial reporting.
There were no significant changes in the registrant’s internal control over financial reporting that occurred during the period covered by this report that have materially affected, or are reasonably likely to materially affect, the registrant’s internal control over financial reporting.
Item 12. Disclosure of Securities Lending Activities for Closed-End Management Investment Companies.
(a) If the registrant is a closed-end management investment company, provide the following dollar amounts of income and compensation related to the securities lending activities of the registrant during its most recent fiscal year:
N/A
(1) Gross income from securities lending activities;
N/A
(2) All fees and/or compensation for each of the following securities lending activities and related services: any share of revenue generated by the securities lending program paid to the securities lending agent(s) (revenue split); fees paid for cash collateral management services (including fees deducted from a pooled cash collateral reinvestment vehicle) that are not included in the revenue split; administrative fees that are not included in the revenue split; fees for indemnification that are not included in the revenue split; rebates paid to borrowers; and any other fees relating to the securities lending program that are not included in the revenue split, including a description of those other fees;
N/A
(3) The aggregate fees/compensation disclosed pursuant to paragraph (2); and
N/A
(4) Net income from securities lending activities (i.e., the dollar amount in paragraph (1) minus the dollar amount in paragraph (3)).
If a fee for a service is included in the revenue split, state that the fee is included in the revenue split.
N/A
(b) If the registrant is a closed-end management investment company, describe the services provided to the registrant by the securities lending agent in the registrants most recent fiscal year.
N/A
ITEM 13. EXHIBITS.
(a) File the exhibits listed below as part of this Form. Letter or number the exhibits in the sequence indicated.
(1) Any code of ethics, or amendment thereto, that is the subject of the disclosure required by Item 2, to the extent that the registrant intends to satisfy the Item 2 requirements through filing of an exhibit.
(2) A separate certification for each principal executive officer and principal financial officer of the registrant as required by Rule 30a-2(a) under the Act (17 CFR 270.30a-2(a)) , exactly as set forth below: Filed herewith.
(b) Certifications pursuant to Rule 30a-2(b) under the 1940 Act and Section 906 of the Sarbanes-Oxley Act of 2002 are attached hereto.
SIGNATURES
[See General Instruction F]
Pursuant to the requirements of the Securities Exchange Act of 1934 and the Investment Company Act of 1940, the registrant has duly caused this report to be signed on its behalf by the undersigned, thereunto duly authorized.
(Registrant) Pioneer Variable Contracts Trust
By (Signature and Title)* /s/ Lisa M. Jones
Lisa M. Jones, Principal Executive Officer
Date March 5, 2024
Pursuant to the requirements of the Securities Exchange Act of 1934 and the Investment Company Act of 1940, this report has been signed below by the following persons on behalf of the registrant and in the capacities and on the dates indicated.
By (Signature and Title)* /s/ Lisa M. Jones
Lisa M. Jones, Principal Executive Officer
Date March 5, 2024
By (Signature and Title)* /s/ Anthony J. Koenig, Jr.
Anthony J. Koenig, Jr., Principal Financial Officer
Date March 5, 2024
| * | Print the name and title of each signing officer under his or her signature. |