Form N-CSR is to be used by management investment companies to file reports with the Commission not later than 10 days after the transmission to stockholders of any report that is required to be transmitted to stockholders under Rule 30e-1 under the Investment Company Act of 1940 (17 CFR 270.30e-1). The Commission may use the information provided on Form N-CSR in its regulatory, disclosure review, inspection, and policymaking roles.
A registrant is required to disclose the information specified by Form N-CSR, and the Commission will make this information public. A registrant is not required to respond to the collection of information contained in Form N-CSR unless the Form displays a currently valid Office of Management and Budget (“OMB”) control number. Please direct comments concerning the accuracy of the information collection burden estimate and any suggestions for reducing the burden to Secretary, Securities and Exchange Commission, 450 Fifth Street, NW, Washington, DC 20549-0609. The OMB has reviewed this collection of information under the clearance requirements of 44 U.S.C. ss. 3507.
Pioneer Variable Contracts Trust
Pioneer Bond
VCT Portfolio
Class I and II Shares
Annual Report | December 31, 2020
Paper copies of the Portfolio’s shareholder reports may no longer be sent by mail, unless you specifically request paper copies of the reports from the insurance company that offers your variable annuity or variable life insurance contract, or from your financial intermediary. Instead, the insurance company may choose to make the reports available on a website, and will notify you by mail each time a shareholder report is posted and provide you with a website link to access the report. Instructions for requesting paper copies will be provided by your insurance company.
You may elect to receive all future Portfolio shareholder reports in paper form, free of charge, from the insurance company. You can inform the insurance company or your financial intermediary that you wish to continue receiving paper copies of your shareholder reports by following the instructions provided by the insurance company, or by contacting your financial intermediary. Your election to receive reports in paper form will apply to all portfolios available under your contract with the insurance company.
Please refer to your contract prospectus to determine the applicable share class offered under your contract.
Pioneer Variable Contracts Trust
| | |
Table of Contents | |
| Pioneer Bond VCT Portfolio | |
| | |
| 2 |
| | |
| 3 |
| | |
| 4 |
| | |
| 9 |
| | |
| 35 |
| | |
| 40 |
| | |
| 49 |
| | |
| 50 |
| | |
| 51 |
| | |
| 54 |
This report is authorized for distribution only when preceded or accompanied by a prospectus for the Portfolio being offered.
Pioneer Variable Contracts Trust files a complete schedule of portfolio holdings with the Securities and Exchange Commission for the first and third quarters of each fiscal year as an exhibit to its reports on Form N-PORT. Shareholders may view the filed Form N-PORT by visiting the Commission’s web site at https://www.sec.gov.
| | |
| Pioneer Bond VCT Portfolio | Pioneer Variable Contracts Trust |
Portfolio Update
12/31/20
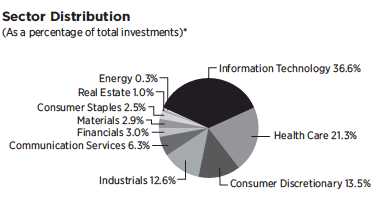
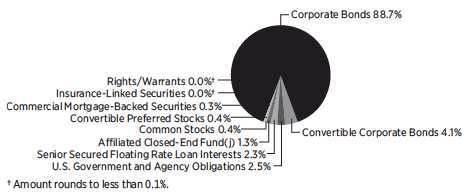
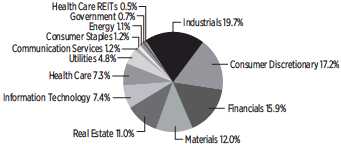
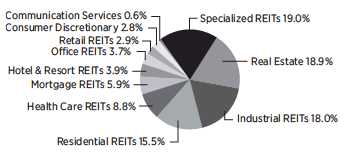
Portfolio Diversification
(As a percentage of total investments)*
† Amount rounds to less than 0.1%.
5 Largest Holdings
(As a percentage of total investments)*
| | | |
1. | U.S. Treasury Bills, 1/26/21 | 5.16% |
2. | U.S. Treasury Note, 0.125%, 10/31/22 | 3.83 |
3. | Fannie Mae, 3.0%, 1/1/51 (TBA) | 1.96 |
4. | Fannie Mae, 2.0%, 1/1/51 | 1.95 |
5. | Fannie Mae, 4.5%, 1/1/51 (TBA) | 1.88 |
| | |
* | Excludes temporary cash investments and all derivative contracts except for options purchased. The Portfolio is actively managed, and current holdings may be different. The holdings listed should not be considered recommendations to buy or sell any securities. |
(j) | Pioneer ILS Interval Fund is an affiliated closed-end fund managed by Amundi Asset Management US, Inc. (the “Adviser”). |
Performance Update 12/31/20
Prices and Distributions
| | | |
| Net Asset Value per Share | 12/31/20 | 12/31/19 |
| Class I | $11.78 | $11.17 |
| Class II | $11.80 | $11.19 |
|
| Net | | |
| Distributions per Share | Investment | Short-Term | Long-Term |
| (1/1/20 – 12/31/20) | Income | Capital Gains | Capital Gains |
| Class I | $0.3430 | $ — | $ — |
| Class II | $0.3155 | $ — | $ — |
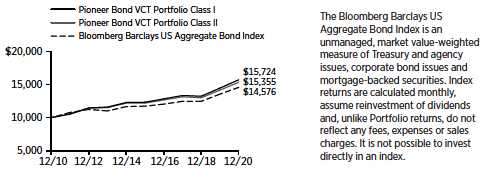
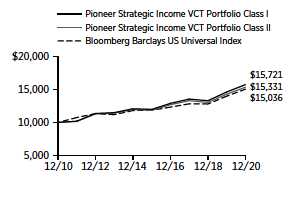
Performance of a $10,000 Investment
The following chart shows the change in value of an investment made in Class I and Class II shares of Pioneer Bond VCT Portfolio at net asset value during the periods shown, compared to that of the Bloomberg Barclays US Aggregate Bond Index. Portfolio returns are based on net asset value and do not reflect any applicable insurance fees or surrender charges.
Average Annual Total Returns
(As of December 31, 2020)| | | | |
| | | Bloomberg Barclays |
| | | US Aggregate |
| Class I | Class II | Bond Index |
10 Years | 4.63% | 4.38% | 3.84% |
5 Years | 4.98% | 4.71% | 4.44% |
1 Year | 8.70% | 8.42% | 7.51% |
All total returns shown assume reinvestment of distributions at net asset value.
The performance table does not reflect the deduction of taxes that a shareowner would pay on distributions or the redemption of shares.
Call 1-800-688-9915 or visit www.amundi.com/us for the most recent month-end performance results. Current performance may be lower or higher than the performance data quoted.
The performance data quoted represents past performance, which is no guarantee of future results. Investment return and principal value will fluctuate, and shares, when redeemed, may be worth more or less than their original cost.
The returns for the Portfolio do not reflect the deduction of expenses associated with variable products, such as mortality and expense risk charges, separate account charges, and sales charges. These expenses would reduce the overall returns shown.
Performance results reflect any applicable expense waivers in effect during the periods shown. Without such waivers, performance would be lower. Waivers may not be in effect for all portfolios. Certain fee waivers are contractual through a specified period. Otherwise, fee waivers can be rescinded at any time. See the prospectus and financial statements for more information.
2
| | |
| Pioneer Bond VCT Portfolio | Pioneer Variable Contracts Trust |
Comparing Ongoing Portfolio Expenses | |
As a shareowner in the Portfolio, you incur two types of costs:
(1) ongoing costs, including management fees, distribution and/or service (12b-1) fees, and other Portfolio expenses; and
(2) transaction costs, including sales charges (loads) on purchase payments.
This example is intended to help you understand your ongoing expenses (in dollars) of investing in the Portfolio and to compare these costs with the ongoing costs of investing in other mutual funds offered through your variable annuity contract. The example is based on an investment of $1,000 at the beginning of the Portfolio’s latest six-month period and held throughout the six months.
Using the Tables
Actual Expenses
The first table below provides information about actual account values and actual expenses. You may use the information in this table, together with the amount you invested, to estimate the expenses that you paid over the period as follows:
1. Divide your account value by $1,000
Example: an $8,600 account value ÷ $1,000 = 8.6
2. Multiply the result in (1) above by the corresponding share class’s number in the third row under the heading entitled “Expenses Paid During Period” to estimate the expenses you paid on your account during this period.
Expenses Paid on a $1,000 Investment in Pioneer Bond VCT Portfolio
Based on actual returns from July 1, 2020 through December 31, 2020.
| | | |
| Share Class |
| I
|
| II
|
Beginning Account Value on 7/1/20 | $1,000.00 | $1,000.00 |
Ending Account Value on 12/31/20 | $1,058.94 | $1,056.62 |
Expenses Paid During Period* | $3.05 | $4.34 |
* Expenses are equal to the Portfolio’s annualized net expense ratio of 0.59% and 0.84% for Class I and Class II shares, respectively, multiplied by the average account value over the period, multiplied by 184/366 (to reflect the one-half year period).
Hypothetical Example for Comparison Purposes
The table below provides information about hypothetical account values and hypothetical expenses based on the Portfolio’s actual expense ratio and an assumed rate of return of 5% per year before expenses, which is not the Portfolio’s actual return. The hypothetical account values and expenses may not be used to estimate the actual ending account balance or expenses you paid for the period.
You may use this information to compare the ongoing costs of investing in the Portfolio and other variable annuities. To do so, compare this 5% hypothetical example with the 5% hypothetical examples that appear in the shareholder reports of the other variable annuities.
Please note that the expenses shown in the tables are meant to highlight your ongoing costs only and do not reflect any transaction costs, such as sales charges (loads) that are charged at the time of the transaction. Therefore, the table below is useful in comparing ongoing costs only and will not help you determine the relative total costs of owning different variable annuities. In addition, if these transaction costs were included, your costs would have been higher.
Expenses Paid on a $1,000 Investment in Pioneer Bond VCT Portfolio
Based on a hypothetical 5% per year return before expenses, reflecting the period from July 1, 2020 through December 31, 2020.
| | | |
| Share Class |
| I
|
| II
|
Beginning Account Value on 7/1/20 | $1,000.00 | $1,000.00 |
Ending Account Value on 12/31/20 | $1,022.17 | $1,020.91 |
Expenses Paid During Period* | $3.00 | $4.27 |
* Expenses are equal to the Portfolio’s annualized net expense ratio of 0.59% and 0.84% for Class I and Class II shares, respectively, multiplied by the average account value over the period, multiplied by 184/366 (to reflect the one-half year period).
3
| | |
| Pioneer Bond VCT Portfolio | Pioneer Variable Contracts Trust |
Portfolio Management Discussion 12/31/20 | |
Call 1-800-688-9915 or visit www.amundi.com/us for the most recent month-end performance results. Current performance may be lower or higher than the performance data quoted.
The performance data quoted represents past performance, which is no guarantee of future results. Investment return and principal value will fluctuate, and shares, when redeemed, may be worth more or less than their original cost.
The returns for the Portfolio do not reflect the deduction of expenses associated with variable products, such as mortality and expense risk charges, separate account charges, and sales charges. These expenses would reduce the overall returns shown.
Performance results reflect any applicable expense waivers in effect during the periods shown. Without such waivers, performance would be lower. Waivers may not be in effect for all portfolios. Certain fee waivers are contractual through a specified period. Otherwise, fee waivers can be rescinded at any time. See the prospectus and financial statements for more information.
In the following interview, Brad Komenda discusses the factors that affected the performance of Pioneer Bond VCT Portfolio during the 12-month period ended December 31, 2020. Mr. Komenda, Senior Vice President, Deputy Director of Investment Grade Corporates, and a portfolio manager at Amundi Asset Management US, Inc. (Amundi US), is responsible for the daily management of the Portfolio, along with Kenneth J. Taubes, Executive Vice President and Chief Investment Officer, US, and a portfolio manager at Amundi US, and Timothy Rowe, Managing Director, Director of Multisector Fixed Income, and a portfolio manager at Amundi US.
Q: How did the Portfolio perform during the 12-month period ended December 31, 2020?
A: Pioneer Bond VCT Portfolio’s Class I shares returned 8.70% at net asset value during the 12-month period ended December 31, 2020, and Class II shares returned 8.42%, while the Portfolio’s benchmark, the Bloomberg Barclays US Aggregate Bond Index (the Bloomberg Barclays Index), returned 7.51%.
Q: How would you describe the investment environment in the fixed-income markets during the 12-month period?
A: After a benign opening to the 2020 calendar year, credit-sensitive fixed-income markets experienced a historic disruption in March, as the emergence of the COVID-19 virus and the related lockdown policies implemented to help curb its spread all but shuttered the global economy. Investors fled riskier assets on a broad scale and moved into so-called “safe havens” such as US Treasuries, which had the effect of driving Treasury yields to all-time lows. Significant selling in US dollar (USD) fixed-income markets eventually stressed market functionality and led to price dislocations in all segments, even Treasury bonds. As the “liquidity grab” by investors gathered pace in mid-March, historical asset-class return relationships broke down and performance became almost entirely correlated. (Correlation is defined as the degree to which assets or asset-class prices have moved in relation to one another. Correlation ranges from -1, always moving in opposite directions; through 0, absolutely independent; to 1, always moving together.)
The liquidity stress was greatest in the securitized credit sectors of non-agency mortgage-backed securities (MBS), asset-backed securities (ABS), and commercial MBS (CMBS), which have traditionally had a narrower buyer base than corporate bonds. Those markets faced forced selling by real estate investment trusts (REITs) and other leveraged investors, and by certain mutual funds, as concerns escalated over the impact of the pandemic on the US employment situation and on the ability of homeowners and businesses to service their mortgages.
The policy response to the market and economic turmoil from both central banks and government authorities was swift, as they sought to keep businesses and consumers from going under. The US Federal Reserve (Fed) slashed the target range of the benchmark federal funds rate to zero in mid-March, resurrected its 2008/2009 financial crisis-era lending facilities,
4
| | |
| Pioneer Bond VCT Portfolio | Pioneer Variable Contracts Trust |
and launched a wide-ranging bond-purchase program. On the fiscal side, the US Congress and the White House agreed upon a $2.2 trillion stimulus package in late March, and later approved additional aid packages in the second quarter.
The extraordinary support from policy makers in the wake of the pandemic had a positive effect on the markets in the second quarter. Investor optimism rose on the prospects that steps taken towards re-opening the economy could support something resembling a “V-shaped” recovery (that is, a swift, sharp rise). The result was a revival of sentiment towards the riskier assets that the market had been so quick to shun at the height of the pandemic crisis. The shift in investors’ appetites allowed credit-sensitive areas of the bond market to recover much of their earlier losses over April and May. June saw the return of some market volatility as well as a widening in credit spreads as COVID-19 cases surged in a few states that had re-opened earlier than others, reigniting shutdown concerns. (Credit spreads are commonly defined as the differences in yield between Treasuries and other types of fixed-income securities with similar maturities.)
After simmering throughout the summer, macroeconomic uncertainty bubbled over during September, weighing on investor sentiment and the performance of riskier assets. The focus on heightened risks revolved around three key areas: stalled negotiations among law makers over another US fiscal stimulus package, a continued rise in COVID-19 cases, and the November US elections. A partisan dispute over when to appoint the late Supreme Court Justice Ginsburg’s replacement further hardened both parties’ negotiating positions on the fiscal stimulus bill, and lowered the odds of broader government support for the economy coming to fruition prior to the November election. At the same time, a notable uptick in European COVID-19 cases reignited fears that the US remained at risk for a second wave of virus cases, and yet another round of economic lockdowns in response. Finally, concerns mounted over the potential for a protracted dispute over the presidential election results as November 3rd drew closer.
In December, towards the end of the 12-month period, the US economic outlook received two “shots in the arm,” as a pair of COVID-19 vaccines were authorized for emergency use by the Food and Drug Administration, and Congress finally agreed upon a $900 billion COVID-19 relief package. The vaccines could help alleviate uncertainty regarding public health in general, and may bring forward the timing of a return to economic normalcy. Meanwhile, the additional fiscal stimulus could offer needed support for many individuals and businesses. Over the final weeks of the 12-month period, investors elected to focus attention on those positive developments and looked beyond another surge in COVID-19 cases as well as data suggesting a slowing in the rate of the economic recovery. As a result, riskier assets rallied once again, and Treasury yields drifted higher into the end of the calendar year.
5
| | |
| Pioneer Bond VCT Portfolio | Pioneer Variable Contracts Trust |
| Portfolio Management Discussion 12/31/20 (continued) | |
For the 12-month period ended December 31, 2020, the investment-grade corporate bond market returned almost 10%, while high-yield corporate bonds returned more than 7%. Long-term Treasuries provided strong positive returns as well, given the steep decline in yields seen over the first quarter of 2020. Securitized assets ended the period in positive territory, too, but lagged the performance of both investment-grade corporates and Treasuries.
Q: What factors influenced the Portfolio’s performance relative to the benchmark Bloomberg Barclays Index during the 12-month period?
A: The Portfolio’s outperformance relative to the benchmark for the 12-month period derived from both security selection and asset allocation results. Meanwhile, the Portfolio’s duration-positioning was the main detractor from relative returns. (Duration is a measure of the sensitivity of the price, or the value of principal, of a fixed-income investment to a change in interest rates, expressed as a number of years.)
Positive contributions to benchmark-relative returns were led by the Portfolio’s positioning with respect to corporate bonds, most notably security selection within the industrials sector. In the aftermath of the first quarter’s liquidity crisis, we took the opportunity to add to the Portfolio’s exposure to high-quality industrial names at discounted prices, and that decision aided the Portfolio’s performance when investors’ sentiment towards riskier assets improved during the second quarter, with the aid of strong policy support from the Fed and the US government. In addition, security selection results in financials as well as an overweight to the sector contributed notably to positive benchmark-relative performance. In the securitized sectors, positive contributions to the Portfolio’s relative performance were led by positioning in agency MBS, where we were able to identify security selection opportunities created by the Fed’s broad-based purchases within the asset class in its effort to drive down borrowing costs.
Duration positioning was the most significant detractor from the Portfolio’s benchmark-relative performance for the 12-month period. We had entered 2020 with the Portfolio positioned for economic recovery, with a below-benchmark overall duration and corresponding sensitivity to interest-rate changes. The Portfolio’s duration stance constrained relative performance as the emergence of COVID-19 derailed the economic outlook.
An overweight to CMBS weighed on the Portfolio’s relative returns during the 12-month period. In particular, market sentiment towards multi-property “conduit” deals, which include exposure to segments of the economy impacted by the pandemic (such as hotels and strip malls), declined. The Portfolio’s allocation to conduit deals is primarily to senior tranches within the sector and, ultimately, we do not believe the holdings will impair performance, despite the transient volatility of the assets. Selection results within ABS were another detractor from benchmark-relative returns, as we have generally focused on using research to help uncover opportunities in credits within the sector that we think could be less well-understood by the broader market. Those types of investments have tended to be less liquid.
6
| | |
| Pioneer Bond VCT Portfolio | Pioneer Variable Contracts Trust |
Q: Did the Portfolio have any investments in derivative securities during the 12-month period ended December 31, 2020? If so, did the derivatives have any material impact on performance?
A: Yes, we invested the Portfolio in Treasury futures and credit-default swaps during the 12-month period. We invest in Treasury futures as part of our duration-management strategy for the Portfolio. We believe the use of Treasury futures allows us to express our views on duration and yield-curve positioning in the most efficient manner. We invest in credit-default swaps to either gain or reduce Portfolio exposure to corporate bonds very quickly, as cash-bond transactions take a little more time to settle and have a higher liquidity cost.
The use of derivatives has allowed the Portfolio to benefit from the performance of the targeted asset classes, while retaining a better liquidity profile, which in turn may help to reduce risk. Treasury futures generally have not had an impact on the Portfolio’s performance, as we have used them primarily for hedging purposes. The credit-based derivatives had a modest effect on the Portfolio’s performance during the 12-month period.
Q: What factors affected the Portfolio’s yield, or distributions* to shareholders, during the 12-month period?
A: The sharp decline in Treasury yields weighed on the Portfolio’s yield during the 12-month period.
Q: What is your investment outlook and how is the Portfolio positioned heading into a new fiscal year?
A: We anticipate accelerating domestic economic growth in 2021 as COVID-19 vaccines are rolled out and consumers slowly regain confidence and reopen their pocketbooks, potentially unleashing a wave of pent-up demand for services such as travel and dining during the second half of the calendar year.
Despite this outlook, we do not expect the Fed to start removing its accommodative monetary policies in 2021, as it has signaled an intense focus on getting the US economy back to full employment. In our view, the Fed has learned from its policy mistakes in 2018 and could be willing to maintain a highly supportive monetary policy environment, even if inflation ticks up above the US central bank’s target rate.
Entering 2021, we have maintained the Portfolio’s conservative positioning with respect to interest-rate risk, with a duration below that of the benchmark Bloomberg Barclays Index. While an accommodative Fed can anchor short-term US yields, we believe the Treasury curve could steepen as domestic economic growth accelerates (and prices rise) over the next year. At the same time, very low government bond yields globally may limit the extent of any increase in long-term US yields.
* Distributions are not guaranteed.
7
| | |
| Pioneer Bond VCT Portfolio | Pioneer Variable Contracts Trust |
| Portfolio Management Discussion 12/31/20 (continued) | |
A Word About Risk:
All investments are subject to risk, including the possible loss of principal. In the past several years, financial markets have experienced increased volatility and heightened uncertainty. The market prices of securities may go up or down, sometimes rapidly or unpredictably, due to general market conditions, such as real or perceived adverse economic, political, or regulatory conditions, recessions, inflation, changes in interest or currency rates, lack of liquidity in the bond markets, the spread of infectious illness or other public health issues or adverse investor sentiment. These conditions may continue, recur, worsen or spread.
When interest rates rise, the prices of fixed- income securities in the Portfolio will generally fall. Conversely, when interest rates fall, the prices of fixed-income securities in the Portfolio will generally rise.
Investments in the Portfolio are subject to possible loss due to the financial failure of the issuers of the underlying securities and their inability to meet their debt obligations.
Prepayment risk is the chance that an issuer may exercise its right to prepay its security, if falling interest rates prompt the issuer to do so. Forced to reinvest the unanticipated proceeds at lower interest rates, the Portfolio would experience a decline in income and lose the opportunity for additional price appreciation.
Investments in high-yield or lower-rated securities are subject to greater-than-average price volatility, illiquidity and possibility of default.
The securities issued by U.S. Government-sponsored entities (i.e., FNMA, Freddie Mac) are neither guaranteed nor issued by the U.S. Government.
The Portfolio may invest in mortgage-backed securities, which during times of fluctuating interest rates may increase or decrease more than other fixed-income securities. Mortgage-backed securities are also subject to prepayments.
At times, the Portfolio’s investments may represent industries or industry sectors that are interrelated or have common risks, making the Portfolio more susceptible to any economic, political, or regulatory developments or other risks affecting those industries and sectors.
These risks may increase share price volatility.
The Portfolio’s positioning has continued to reflect our constructive overall view on credit-based exposures. However, we trimmed the Portfolio’s risk profile as most sectors rallied into year-end. We have maintained a positive outlook for sectors where valuations are still below their pre-pandemic levels and have remained disconnected from the underlying fundamentals, in our view. A backdrop of strong economic growth, accommodative monetary policies, and continued global demand for yield has continued to lend support to the corporate bond market. However, we believe current spreads have broadly reflected those expectations, and thus have continued to highlight the importance of security selection.
We view US housing-related securitized assets as positioned to benefit from solid consumer balance sheets, historically low mortgage rates, tight inventories, and strong demand, driven in part by a pandemic-induced shift in preference toward single-family homes.
While broad exposure to credit risk was a large positive contributor to the Portfolio’s relative returns during 2020, we believe active security selection and sector allocation could be essential ingredients to attaining solid performance in the coming year.
Please refer to the Schedule of Investments on pages 9 to 34 for a full listing of Portfolio securities.
Past performance is no guarantee of future results.
Any information in this shareholder report regarding market or economic trends or the factors influencing the Portfolio’s historical or future performance are statements of opinion as of the date of this report.
8
| | |
| Pioneer Bond VCT Portfolio | Pioneer Variable Contracts Trust |
Schedule of Investments 12/31/20 | |
| | | | |
| Shares | | | Value |
| | | UNAFFILIATED ISSUERS – 101.8% | |
| | | COMMON STOCK – 0.0%† of Net Assets | |
| | | Auto Components – 0.0%† | |
| 89 | | Lear Corp. | $ 14,154 |
| | | Total Auto Components | $ 14,154 |
| | | TOTAL COMMON STOCK | |
| | | (Cost $10,396) | $ 14,154 |
| | | CONVERTIBLE PREFERRED STOCKS – 1.5% of Net Assets | |
| | | Banks – 1.5% | |
| 529(a) | | Bank of America Corp., 7.25% | $ 803,329 |
| 1,274(a) | | Wells Fargo & Co., 7.5% | 1,933,804 |
| | | Total Banks | $ 2,737,133 |
| | | TOTAL CONVERTIBLE PREFERRED STOCKS | |
| | | (Cost $2,469,258) | $ 2,737,133 |
| Principal | | | |
| Amount | | | |
| USD ($) | | | |
| | | ASSET BACKED SECURITIES – 10.0% of Net Assets | |
| 250,000(b) | | 522 Funding CLO I, Ltd., Series 2019-5A, Class D, 4.437% (3 Month USD LIBOR + 420 bps), | |
| | | 1/15/33 (144A) | $ 250,695 |
| 363,256(c) | | Ajax Mortgage Loan Trust, Series 2020-B, Class A1, 1.698%, 5/25/59 (144A) | 366,477 |
| 500,000 | | American Credit Acceptance Receivables Trust, Series 2019-2, Class E, 4.29%, 6/12/25 (144A) | 523,423 |
| 100,000 | | Amur Equipment Finance Receivables VI LLC, Series 2018-2A, Class C, 4.27%, 1/20/23 (144A) | 102,606 |
| 200,000 | | Amur Equipment Finance Receivables VI LLC, Series 2018-2A, Class D, 4.45%, 6/20/23 (144A) | 203,568 |
| 94,415 | | Avid Automobile Receivables Trust, Series 2018-1, Class B, 3.85%, 7/15/24 (144A) | 94,855 |
| 250,000(b) | | Battalion CLO XV, Ltd., Series 2020-15A, Class D, 3.468% (3 Month USD LIBOR + 325 bps), | |
| | | 1/17/33 (144A) | 250,205 |
| 100,000 | | BCC Funding XIV LLC, Series 2018-1A, Class B, 3.39%, 8/21/23 (144A) | 100,858 |
| 250,000(b) | | Benefit Street Partners CLO XIX, Ltd., Series 2019-19A, Class E, 7.257% (3 Month USD | |
| | | LIBOR + 702 bps), 1/15/33 (144A) | 250,268 |
| 250,000(b) | | Carlyle US CLO, Ltd., Series 2019-4A, Class C, 4.237% (3 Month USD LIBOR + 400 bps), 1/15/33 (144A) | 251,634 |
| 400,000 | | CIG Auto Receivables Trust, Series 2019-1A, Class B, 3.59%, 8/15/24 (144A) | 409,417 |
| 160,000 | | Conn’s Receivables Funding LLC, Series 2019-B, Class B, 3.62%, 6/17/24 (144A) | 160,489 |
| 300,000 | | Continental Credit Card ABS LLC, Series 2019-1A, Class A, 3.83%, 8/15/26 (144A) | 308,935 |
| 100,000 | | CoreVest American Finance Trust, Series 2017-1, Class C, 3.756%, 10/15/49 (144A) | 102,687 |
| 348,956 | | CoreVest American Finance Trust, Series 2020-3, Class A, 1.358%, 8/15/53 (144A) | 352,397 |
| 297,000 | | Domino’s Pizza Master Issuer LLC, Series 2019-1A, Class A2, 3.668%, 10/25/49 (144A) | 315,476 |
| 250,000 | | Drive Auto Receivables Trust, Series 2019-1, Class C, 3.78%, 4/15/25 | 254,776 |
| 70,000 | | Drive Auto Receivables Trust, Series 2020-2, Class C, 2.28%, 8/17/26 | 72,266 |
| 50,000 | | Drive Auto Receivables Trust, Series 2020-2, Class D, 3.05%, 5/15/28 | 52,752 |
| 22,984(c) | | Equifirst Mortgage Loan Trust, Series 2003-1, Class IF1, 4.01%, 12/25/32 | 23,573 |
| 73,353 | | FCI Funding LLC, Series 2019-1A, Class A, 3.63%, 2/18/31 (144A) | 74,492 |
| 369,145 | | Finance of America Structured Securities Trust, Series 2019-JR3, Class JR2, 2.0%, 9/25/69 | 390,064 |
| 250,000 | | Foundation Finance Trust, Series 2019-1A, Class B, 4.22%, 11/15/34 (144A) | 253,625 |
| 250,000 | | Foursight Capital Automobile Receivables Trust, Series 2019-1, Class D, 3.27%, 6/16/25 (144A) | 259,160 |
| 220,000 | | Genesis Sales Finance Master Trust, Series 2019-AA, Class A, 4.68%, 8/20/23 (144A) | 220,994 |
| 250,000(b) | | Goldentree Loan Management US CLO 6, Ltd., Series 2019-6A, Class D, 4.068% (3 Month | |
| | | USD LIBOR + 385 bps), 1/20/33 (144A) | 251,828 |
| 95,072 | | Home Partners of America Trust, Series 2019-1, Class D, 3.406%, 9/17/39 (144A) | 98,366 |
| 18,843 | | Icon Brand Holdings LLC, Series 2013-1A, Class A2, 4.352%, 1/25/43 (144A) | 7,444 |
| 100,000(b) | | Invitation Homes Trust, Series 2018-SFR1, Class C, 1.403% (1 Month USD LIBOR + 125 bps), | |
| | | 3/17/37 (144A) | 99,917 |
The accompanying notes are an integral part of these financial statements.
9
| | |
| Pioneer Bond VCT Portfolio | Pioneer Variable Contracts Trust |
| Schedule of Investments 12/31/20 (continued) | |
| | | | |
| Principal | | | |
| Amount | | | |
| USD ($) | | | Value |
| | | ASSET BACKED SECURITIES – (continued) | |
| 159,968(b) | | Invitation Homes Trust, Series 2018-SFR2, Class D, 1.609% (1 Month USD LIBOR + 145 bps), | |
| | | 6/17/37 (144A) | $ 159,621 |
| 240,000(b) | | Invitation Homes Trust, Series 2018-SFR3, Class D, 1.803% (1 Month USD LIBOR + 165 bps), | |
| | | 7/17/37 (144A) | 240,298 |
| 321,843(b) | | Invitation Homes Trust, Series 2018-SFR3, Class E, 2.153% (1 Month USD LIBOR + 200 bps), | |
| | | 7/17/37 (144A) | 321,335 |
| 17,588 | | JG Wentworth XXII LLC, Series 2010-3A, Class A, 3.82%, 12/15/48 (144A) | 18,447 |
| 232,900 | | JG Wentworth XLIII LLC, Series 2019-1A, Class A, 3.82%, 8/17/71 (144A) | 266,071 |
| 250,000(b) | | Madison Park Funding XXXVI, Ltd., Series 2019-36A, Class E, 7.487% (3 Month USD LIBOR + | |
| | | 725 bps), 1/15/33 (144A) | 248,255 |
| 150,000 | | Marlette Funding Trust, Series 2019-2A, Class C, 4.11%, 7/16/29 (144A) | 153,594 |
| 479,277(d) | | Mill City Mortgage Loan Trust, Series 2018-2, Class M1, 3.75%, 5/25/58 (144A) | 523,932 |
| 121,402 | | Mosaic Solar Loan Trust, Series 2019-2A, Class A, 2.88%, 9/20/40 (144A) | 129,342 |
| 136,201 | | MVW LLC, Series 2020-1A, Class C, 4.21%, 10/20/37 (144A) | 143,883 |
| 100,731(b) | | Newtek Small Business Loan Trust, Series 2017-1, Class A, 2.148% (1 Month USD LIBOR + | |
| | | 200 bps), 2/25/43 (144A) | 99,984 |
| 300,000 | | NMEF Funding LLC, Series 2019-A, Class B, 3.06%, 8/17/26 (144A) | 304,906 |
| 930(b) | | NovaStar Mortgage Funding Trust, Series 2005-3, Class M1, 0.823% (1 Month USD LIBOR + | |
| | | 68 bps), 1/25/36 | 929 |
| 130,000 | | Progress Residential Trust, Series 2017-SFR1, Class E, 4.261%, 8/17/34 (144A) | 132,092 |
| 100,000 | | Progress Residential Trust, Series 2018-SFR2, Class D, 4.338%, 8/17/35 (144A) | 101,403 |
| 110,000 | | Progress Residential Trust, Series 2018-SFR2, Class E, 4.656%, 8/17/35 (144A) | 111,855 |
| 190,000 | | Progress Residential Trust, Series 2018-SFR3, Class E, 4.873%, 10/17/35 (144A) | 194,456 |
| 300,000 | | Progress Residential Trust, Series 2019-SFR2, Class E, 4.142%, 5/17/36 (144A) | 309,414 |
| 300,000 | | Republic Finance Issuance Trust, Series 2019-A, Class A, 3.43%, 11/22/27 (144A) | 304,669 |
| 13,488 | | SCF Equipment Leasing LLC, Series 2017-2A, Class A, 3.41%, 12/20/23 (144A) | 13,541 |
| 315,000 | | SCF Equipment Leasing LLC, Series 2019-1A, Class C, 3.92%, 11/20/26 (144A) | 316,581 |
| 200,000 | | SCF Equipment Leasing LLC, Series 2019-2A, Class C, 3.11%, 6/21/27 (144A) | 208,559 |
| 200,000 | | Small Business Lending Trust, Series 2019-A, Class B, 3.42%, 7/15/26 (144A) | 196,015 |
| 250,000(b) | | Sound Point CLO XXV, Ltd., Series 2019-4A, Class D, 4.347% (3 Month USD LIBOR + 411 | |
| | | bps), 1/15/33 (144A) | 250,125 |
| 250,000(b) | | Sound Point CLO XXVIII Ltd., Series 2020-3A, Class D, 0.0% (3 Month USD LIBOR + 365 | |
| | | bps), 1/25/32 (144A) | 250,000 |
| 320,639 | | SpringCastle America Funding LLC, Series 2020-AA, Class A, 1.97%, 9/25/37 (144A) | 322,984 |
| 250,000(b) | | Symphony CLO XXII, Ltd., Series 2020-22A, Class C, 2.368% (3 Month USD LIBOR + 215 | |
| | | bps), 4/18/33 (144A) | 250,095 |
| 250,000(d) | | Towd Point Mortgage Trust, Series 2015-2, Class 1B3, 3.338%, 11/25/60 (144A) | 252,315 |
| 38,118(d) | | Towd Point Mortgage Trust, Series 2015-3, Class A1B, 3.0%, 3/25/54 (144A) | 38,249 |
| 300,000(d) | | Towd Point Mortgage Trust, Series 2015-6, Class B1, 3.91%, 4/25/55 (144A) | 327,141 |
| 300,000(d) | | Towd Point Mortgage Trust, Series 2016-1, Class B1, 3.943%, 2/25/55 (144A) | 320,523 |
| 300,000(d) | | Towd Point Mortgage Trust, Series 2016-2, Class B2, 3.49%, 8/25/55 (144A) | 316,540 |
| 225,000(d) | | Towd Point Mortgage Trust, Series 2016-3, Class B1, 4.099%, 4/25/56 (144A) | 246,520 |
| 300,000(d) | | Towd Point Mortgage Trust, Series 2016-4, Class B1, 3.883%, 7/25/56 (144A) | 322,921 |
| 325,000(d) | | Towd Point Mortgage Trust, Series 2017-2, Class M2, 3.75%, 4/25/57 (144A) | 356,634 |
| 640,000(d) | | Towd Point Mortgage Trust, Series 2017-4, Class M2, 3.25%, 6/25/57 (144A) | 677,432 |
| 500,000(d) | | Towd Point Mortgage Trust, Series 2017-6, Class M1, 3.25%, 10/25/57 (144A) | 537,190 |
| 325,000(d) | | Towd Point Mortgage Trust, Series 2018-3, Class M1, 3.875%, 5/25/58 (144A) | 350,008 |
| 350,000(d) | | Towd Point Mortgage Trust, Series 2018-3, Class M2, 3.875%, 5/25/58 (144A) | 359,829 |
| 78,726(d) | | Towd Point Mortgage Trust, Series 2018-SJ1, Class A1, 4.0%, 10/25/58 (144A) | 79,016 |
The accompanying notes are an integral part of these financial statements.
10
| | |
| Pioneer Bond VCT Portfolio | Pioneer Variable Contracts Trust |
| | | | |
| Principal | | | |
| Amount | | | |
| USD ($) | | | Value |
| | | ASSET BACKED SECURITIES – (continued) | |
| 250,000(d) | | Towd Point Mortgage Trust, Series 2019-4, Class B1B, 3.5%, 10/25/59 (144A) | $ 251,769 |
| 600,000(d) | | Towd Point Mortgage Trust, Series 2019-4, Class M2B, 3.25%, 10/25/59 (144A) | 617,331 |
| 634,000(b) | | Towd Point Mortgage Trust, Series 2019-HY2, Class M2, 2.048% (1 Month USD LIBOR + 190 bps), | |
| | | 5/25/58 (144A) | 638,742 |
| 105,502(d) | | Towd Point Mortgage Trust, Series 2019-HY2, Class XA, 5.0%, 5/25/58 (144A) | 105,463 |
| 250,000(d) | | Towd Point Mortgage Trust, Series 2020-2, Class M1B, 3.0%, 4/25/60 (144A) | 259,685 |
| 310,000 | | Tricon American Homes Trust, Series 2019-SFR1, Class A, 2.75%, 3/17/38 (144A) | 325,882 |
| 180,000 | | Tricon American Homes Trust, Series 2020-SFR2, Class E1, 2.73%, 11/17/39 (144A) | 179,856 |
| 100,000 | | US Auto Funding LLC, Series 2019-1A, Class B, 3.99%, 12/15/22 (144A) | 101,416 |
| 7,578 | | Welk Resorts LLC, Series 2015-AA, Class A, 2.79%, 6/16/31 (144A) | 7,581 |
| 149,574 | | Welk Resorts LLC, Series 2019-AA, Class D, 4.03%, 6/15/38 (144A) | 153,339 |
| 97,709 | | Westgate Resorts LLC, Series 2018-1A, Class C, 4.1%, 12/20/31 (144A) | 96,749 |
| 140,000 | | Westlake Automobile Receivables Trust, Series 2018-3A, Class E, 4.9%, 12/15/23 (144A) | 146,673 |
| 30,318 | | WRG Debt Funding II LLC, Series 2017-1, Class A, 4.458%, 3/15/26 (144A) | 29,908 |
| | | TOTAL ASSET BACKED SECURITIES | |
| | | (Cost $18,228,037) | $ 18,774,345 |
| | | COLLATERALIZED MORTGAGE OBLIGATIONS – 12.8% of Net Assets | |
| 100,000 | | American Homes 4 Rent Trust, Series 2015-SFR1, Class C, 4.11%, 4/17/52 (144A) | $ 107,022 |
| 100,000(d) | | Angel Oak Mortgage Trust I LLC, Series 2019-1, Class M1, 4.5%, 11/25/48 (144A) | 103,820 |
| 230,000(d) | | Angel Oak Mortgage Trust I LLC, Series 2019-2, Class M1, 4.065%, 3/25/49 (144A) | 238,541 |
| 284,268(d) | | Bayview Opportunity Master Fund IVa Trust, Series 2017-SPL5, Class A, 3.5%, 6/28/57 (144A) | 293,920 |
| 128,689(b) | | Bear Stearns ALT-A Trust, Series 2005-7, Class 11A1, 0.688% (1 Month USD LIBOR + 54 bps), 8/25/35 | 129,839 |
| 67,206(b) | | Bellemeade Re, Ltd., Series 2018-1A, Class M1B, 1.748% (1 Month USD LIBOR + 160 bps), 4/25/28 (144A) | 67,101 |
| 275,589(b) | | Bellemeade Re, Ltd., Series 2018-3A, Class M1B, 1.998% (1 Month USD LIBOR + 185 bps), 10/25/28 (144A) | 275,056 |
| 180,000(b) | | Bellemeade Re, Ltd., Series 2018-3A, Class M2, 2.898% (1 Month USD LIBOR + 275 bps), 10/25/28 (144A) | 179,712 |
| 150,000(b) | | Bellemeade Re, Ltd., Series 2019-1A, Class M1B, 1.898% (1 Month USD LIBOR + 175 bps), 3/25/29 (144A) | 149,942 |
| 150,000(b) | | Bellemeade Re, Ltd., Series 2019-1A, Class M2, 2.848% (1 Month USD LIBOR + 270 bps), 3/25/29 (144A) | 147,196 |
| 190,000(b) | | Bellemeade Re, Ltd., Series 2020-3A, Class M1C, 3.848% (1 Month USD LIBOR + 370 bps), 10/25/30 (144A) | 190,800 |
| 150,000(b) | | Bellemeade Re, Ltd., Series 2020-3A, Class M2, 4.998% (1 Month USD LIBOR + 485 bps), 10/25/30 (144A) | 151,610 |
| 210,000(b) | | Bellemeade Re, Ltd., Series 2020-4A, Class M2B, 3.75% (1 Month USD LIBOR + 360 bps), 6/25/30 (144A) | 210,087 |
| 450,000(d) | | BRAVO Residential Funding Trust, Series 2020-RPL1, Class A2, 3.0%, 5/26/59 (144A) | 476,483 |
| 650,000(d) | | BRAVO Residential Funding Trust, Series 2020-RPL2, Class A2, 2.5%, 5/25/59 (144A) | 670,980 |
| 100,000(d) | | Bunker Hill Loan Depositary Trust, Series 2020-1, Class A2, 2.6%, 2/25/55 (144A) | 103,463 |
| 100,000(d) | | Bunker Hill Loan Depositary Trust, Series 2020-1, Class A3, 3.253%, 2/25/55 (144A) | 103,401 |
| 389,984(d) | | CIM Trust, Series 2019-J2, Class B4, 3.837%, 10/25/49 (144A) | 370,340 |
| 100,000(d) | | Citigroup Commercial Mortgage Trust, Series 2018-B2, Class AS, 4.179%, 3/10/51 | 114,272 |
| 284,134(d) | | Citigroup Mortgage Loan Trust, Inc., Series 2018-RP2, Class A1, 3.5%, 2/25/58 (144A) | 299,911 |
| 347,157 | | Citigroup Mortgage Loan Trust, Inc., Series 2020-EXP2, Class A3, 2.5%, 8/25/50 (144A) | 358,683 |
| 261,522(b) | | Connecticut Avenue Securities Trust, Series 2019-R01, Class 2M2, 2.598% (1 Month USD | |
| | | LIBOR + 245 bps), 7/25/31 (144A) | 261,356 |
| 99,304(b) | | Connecticut Avenue Securities Trust, Series 2019-R02, Class 1M2, 2.448% (1 Month USD | |
| | | LIBOR + 230 bps), 8/25/31 (144A) | 99,178 |
| 87,281(b) | | Connecticut Avenue Securities Trust, Series 2019-R03, Class 1M2, 2.298% (1 Month USD | |
| | | LIBOR + 215 bps), 9/25/31 (144A) | 87,175 |
| 271,063(b) | | Connecticut Avenue Securities Trust, Series 2019-R06, Class 2M2, 2.248% (1 Month USD | |
| | | LIBOR + 210 bps), 9/25/39 (144A) | 270,562 |
| 339,670(b) | | Connecticut Avenue Securities Trust, Series 2019-R07, Class 1M2, 2.248% (1 Month USD | |
| | | LIBOR + 210 bps), 10/25/39 (144A) | 338,551 |
The accompanying notes are an integral part of these financial statements.
11
| | |
| Pioneer Bond VCT Portfolio | Pioneer Variable Contracts Trust |
| Schedule of Investments 12/31/20 (continued) | |
| | | | |
| Principal | | | |
| Amount | | | |
| USD ($) | | | Value |
| | | COLLATERALIZED MORTGAGE OBLIGATIONS – (continued) | |
| 120,000(b) | | Connecticut Avenue Securities Trust, Series 2020-R02, Class 2M2, 2.148% (1 Month USD | |
| | | LIBOR + 200 bps), 1/25/40 (144A) | $ 119,154 |
| 160,000(b) | | Connecticut Avenue Securities Trust, Series 2020-SBT1, Class 1M2, 3.798% (1 Month USD | |
| | | LIBOR + 365 bps), 2/25/40 (144A) | 160,573 |
| 200,000(b) | | Connecticut Avenue Securities Trust, Series 2020-SBT1, Class 2M2, 3.798% (1 Month USD | |
| | | LIBOR + 365 bps), 2/25/40 (144A) | 200,995 |
| 157,629(d) | | CSMC Trust, Series 2013-IVR3, Class B4, 3.396%, 5/25/43 (144A) | 158,034 |
| 468,273 | | CSMC Trust, Series 2020-RPL4, Class A1, 2.0%, 1/25/60 (144A) | 481,665 |
| 35,654(d) | | Deephaven Residential Mortgage Trust, Series 2017-3A, Class A1, 2.577%, 10/25/47 (144A) | 36,044 |
| 40,593(d) | | Deephaven Residential Mortgage Trust, Series 2018-1A, Class A1, 2.976%, 12/25/57 (144A) | 40,680 |
| 65,384(b) | | Eagle Re, Ltd., Series 2018-1, Class M1, 1.848% (1 Month USD LIBOR + 170 bps), 11/25/28 (144A) | 65,327 |
| 228,595(b) | | Eagle Re, Ltd., Series 2019-1, Class M1B, 1.948% (1 Month USD LIBOR + 180 bps), 4/25/29 (144A) | 227,529 |
| 150,000(b) | | Eagle Re, Ltd., Series 2020-2, Class M1C, 4.648% (1 Month USD LIBOR + 450 bps), 10/25/30 (144A) | 152,609 |
| 230,000(b) | | Eagle Re, Ltd., Series 2020-2, Class M2, 5.748% (1 Month USD LIBOR + 560 bps), 10/25/30 (144A) | 234,653 |
| 98,895(d) | | EverBank Mortgage Loan Trust, Series 2013-2, Class A, 3.0%, 6/25/43 (144A) | 101,635 |
| 162,955(b) | | Fannie Mae Connecticut Avenue Securities, Series 2016-C05, Class 2M2, 4.598% (1 Month | |
| | | USD LIBOR + 445 bps), 1/25/29 | 169,682 |
| 25,914 | | Federal Home Loan Mortgage Corp. REMICS, Series 2944, Class OH, 5.5%, 3/15/35 | 30,285 |
| 323,846(b)(e) | | Federal Home Loan Mortgage Corp. REMICS, Series 4091, Class SH, 6.391% (1 Month USD | |
| | | LIBOR + 655 bps), 8/15/42 | 69,672 |
| 3,112 | | Federal National Mortgage Association REMICS, Series 2009-36, Class HX, 4.5%, 6/25/29 | 3,278 |
| 550,000 | | Federal National Mortgage Association REMICS, Series 2013-61, Class BY, 3.0%, 6/25/43 | 606,401 |
| 260,000(b) | | Freddie Mac Stacr Remic Trust, Series 2020-DNA2, Class M2, 1.998% (1 Month USD LIBOR + | |
| | | 185 bps), 2/25/50 (144A) | 258,404 |
| 280,000(b) | | Freddie Mac Stacr Remic Trust, Series 2020-DNA3, Class B1, 5.248% (1 Month USD LIBOR + | |
| | | 510 bps), 6/25/50 (144A) | 290,864 |
| 280,000(b) | | Freddie Mac Stacr Remic Trust, Series 2020-DNA4, Class B1, 6.148% (1 Month USD LIBOR + | |
| | | 600 bps), 8/25/50 (144A) | 297,124 |
| 90,000(b) | | Freddie Mac Stacr Remic Trust, Series 2020-DNA4, Class M2, 3.898% (1 Month USD LIBOR + | |
| | | 375 bps), 8/25/50 (144A) | 91,257 |
| 190,000(b) | | Freddie Mac Stacr Remic Trust, Series 2020-DNA5, Class B1, 4.882% (SOFR30A + 480 bps), | |
| | | 10/25/50 (144A) | 197,488 |
| 220,000(b) | | Freddie Mac Stacr Remic Trust, Series 2020-DNA5, Class M2, 2.882% (SOFR30A + 280 bps), | |
| | | 10/25/50 (144A) | 222,811 |
| 120,000(b) | | Freddie Mac Stacr Remic Trust, Series 2020-DNA6, Class B1, 3.077% (SOFR30A + 300 bps), | |
| | | 12/25/50 (144A) | 120,000 |
| 110,000(b) | | Freddie Mac Stacr Remic Trust, Series 2020-DNA6, Class B2, 5.727% (SOFR30A + 565 bps), | |
| | | 12/25/50 (144A) | 111,617 |
| 240,000(b) | | Freddie Mac Stacr Remic Trust, Series 2020-HQA2, Class M2, 3.248% (1 Month USD LIBOR + | |
| | | 310 bps), 3/25/50 (144A) | 241,650 |
| 130,000(b) | | Freddie Mac Stacr Remic Trust, Series 2020-HQA4, Class B1, 5.398% (1 Month USD LIBOR + | |
| | | 525 bps), 9/25/50 (144A) | 135,506 |
| 290,000(b) | | Freddie Mac Stacr Trust, Series 2018-HQA2, Class B1, 4.398% (1 Month USD LIBOR + | |
| | | 425 bps), 10/25/48 (144A) | 296,515 |
| 310,000(b) | | Freddie Mac Stacr Trust, Series 2018-HQA2, Class M2, 2.448% (1 Month USD LIBOR + | |
| | | 230 bps), 10/25/48 (144A) | 306,864 |
| 167,207(b) | | Freddie Mac Stacr Trust, Series 2019-DNA2, Class M2, 2.598% (1 Month USD LIBOR + | |
| | | 245 bps), 3/25/49 (144A) | 166,782 |
| 166,502(b) | | Freddie Mac Stacr Trust, Series 2019-HQA1, Class M2, 2.498% (1 Month USD LIBOR + | |
| | | 235 bps), 2/25/49 (144A) | 166,077 |
| 110,000(b) | | Freddie Mac Stacr Trust, Series 2019-HQA2, Class B2, 11.398% (1 Month USD LIBOR + | |
| | | 1,125 bps), 4/25/49 (144A) | 122,081 |
The accompanying notes are an integral part of these financial statements.
12
| | |
| Pioneer Bond VCT Portfolio | Pioneer Variable Contracts Trust |
| | | | |
| Principal | | | |
| Amount | | | |
| USD ($) | | | Value |
| | | COLLATERALIZED MORTGAGE OBLIGATIONS – (continued) | |
| 91,411(b) | | Freddie Mac Stacr Trust, Series 2019-HQA2, Class M2, 2.198% (1 Month USD LIBOR + 205 bps), | |
| | | 4/25/49 (144A) | $ 90,149 |
| 320,000(b) | | Freddie Mac Structured Agency Credit Risk Debt Notes, Series 2017-DNA2, Class M2, | |
| | | 3.598% (1 Month USD LIBOR + 345 bps), 10/25/29 | 330,492 |
| 410,000(b) | | Freddie Mac Structured Agency Credit Risk Debt Notes, Series 2017-DNA3, Class M2, | |
| | | 2.648% (1 Month USD LIBOR + 250 bps), 3/25/30 | 415,601 |
| 190,000(b) | | Freddie Mac Structured Agency Credit Risk Debt Notes, Series 2020-HQA5, Class B1, | |
| | | 4.082% (SOFR30A + 400 bps), 11/25/50 (144A) | 193,316 |
| 160,000(b) | | Freddie Mac Structured Agency Credit Risk Debt Notes, Series 2020-HQA5, Class B2, | |
| | | 7.482% (SOFR30A + 740 bps), 11/25/50 (144A) | 174,374 |
| 213,052(d) | | FWD Securitization Trust, Series 2019-INV1, Class A1, 2.81%, 6/25/49 (144A) | 218,257 |
| 15,671 | | Government National Mortgage Association, Series 2005-61, Class UZ, 5.25%, 8/16/35 | 16,255 |
| 5,701 | | Government National Mortgage Association, Series 2012-130, Class PA, 3.0%, 4/20/41 | 5,823 |
| 941,272(e) | | Government National Mortgage Association, Series 2019-159, Class CI, 3.5%, 12/20/49 | 102,704 |
| 791,626(b)(e) | | Government National Mortgage Association, Series 2020-9, Class SA, 3.198% (1 Month | |
| | | USD LIBOR + 335 bps), 1/20/50 | 67,924 |
| 500,000(d) | | GS Mortgage-Backed Securities Corp., Series 2020-PJ6, Class A2, 2.5%, 12/30/99 (144A) | 522,070 |
| 338,148(d) | | GS Mortgage-Backed Securities Trust, Series 2020-NQM1, Class A3, 2.352%, 9/27/60 (144A) | 339,348 |
| 68,968(b) | | Home Re, Ltd., Series 2019-1, Class M1, 1.798% (1 Month USD LIBOR + 165 bps), 5/25/29 (144A) | 68,282 |
| 150,000(b) | | Home Re, Ltd., Series 2020-1, Class M1C, 4.298% (1 Month USD LIBOR + 415 bps), 10/25/30 (144A) | 153,344 |
| 150,000(b) | | Home Re, Ltd., Series 2020-1, Class M2, 5.398% (1 Month USD LIBOR + 525 bps), 10/25/30 (144A) | 154,327 |
| 130,000(d) | | Homeward Opportunities Fund I Trust, Series 2020-2, Class A3, 3.196%, 5/25/65 (144A) | 135,102 |
| 100,000(d) | | Homeward Opportunities Fund I Trust, Series 2020-2, Class M1, 3.897%, 5/25/65 (144A) | 103,323 |
| 168,813(d) | | JP Morgan Mortgage Trust, Series 2018-LTV1, Class A3, 4.5%, 4/25/49 (144A) | 171,816 |
| 392,146(d) | | JP Morgan Mortgage Trust, Series 2019-9, Class B1A, 3.313%, 5/25/50 (144A) | 412,795 |
| 180,182(d) | | JP Morgan Mortgage Trust, Series 2019-LTV1, Class A3, 4.0%, 6/25/49 (144A) | 185,025 |
| 246,153(d) | | JP Morgan Mortgage Trust, Series 2020-3, Class B1A, 3.04%, 8/25/50 (144A) | 248,588 |
| 79,765(b) | | La Hipotecaria Panamanian Mortgage Trust, Series 2007-1GA, Class A, 4.5% (Panamanian | |
| | | Mortgage Reference Rate - 125 bps), 12/23/36 (144A) | 82,756 |
| 23,239(b) | | La Hipotecaria Panamanian Mortgage Trust, Series 2010-1GA, Class A, 2.75% (Panamanian | |
| | | Mortgage Reference Rate - 300 bps), 9/8/39 (144A) | 24,024 |
| 278,064(b) | | LSTAR Securities Investment, Ltd., Series 2019-3, Class A1, 1.655% (1 Month USD LIBOR + | |
| | | 150 bps), 4/1/24 (144A) | 275,653 |
| 299,387(d) | | MFA Trust, Series 2020-NQM1, Class A3, 2.3%, 8/25/49 (144A) | 301,268 |
| 823,945(d) | | Mill City Mortgage Loan Trust, Series 2018-4, Class A1B, 3.5%, 4/25/66 (144A) | 876,572 |
| 250,000(d) | | Mill City Mortgage Loan Trust, Series 2019-GS1, Class M1, 3.0%, 7/25/59 (144A) | 266,510 |
| 400,000(d) | | Mill City Mortgage Loan Trust, Series 2019-GS2, Class M3, 3.25%, 8/25/59 (144A) | 415,843 |
| 322,690(b) | | New Residential Mortgage Loan Trust, Series 2018-4A, Class B1, 1.198% (1 Month USD | |
| | | LIBOR + 105 bps), 1/25/48 (144A) | 313,419 |
| 288,509(d) | | New Residential Mortgage Loan Trust, Series 2019-NQM4, Class A1, 2.492%, 9/25/59 (144A) | 293,864 |
| 163,511(d) | | New Residential Mortgage Loan Trust, Series 2019-RPL2, Class A1, 3.25%, 2/25/59 (144A) | 173,269 |
| 150,000(b) | | Oaktown Re V, Ltd., Series 2020-2A, Class M1B, 3.748% (1 Month USD LIBOR + 360 bps), 10/25/30 (144A) | 151,241 |
| 150,000(b) | | Oaktown Re V, Ltd., Series 2020-2A, Class M2, 5.398% (1 Month USD LIBOR + 525 bps), 10/25/30 (144A) | 151,854 |
| 137,371(d) | | PMT Loan Trust, Series 2013-J1, Class A11, 3.5%, 9/25/43 (144A) | 140,145 |
| 7,458(b) | | Radnor Re, Ltd., Series 2018-1, Class M1, 1.548% (1 Month USD LIBOR + 140 bps), 3/25/28 (144A) | 7,457 |
| 197,944(b) | | Radnor Re, Ltd., Series 2019-1, Class M1B, 2.098% (1 Month USD LIBOR + 195 bps), 2/25/29 (144A) | 197,977 |
| 370,000(b) | | Radnor Re, Ltd., Series 2020-1, Class M1C, 1.898% (1 Month USD LIBOR + 175 bps), 2/25/30 (144A) | 365,548 |
| 203,764(d) | | RMF Proprietary Issuance Trust, Series 2019-1, Class A, 2.75%, 10/25/63 (144A) | 204,799 |
| 386,746(d) | | Sequoia Mortgage Trust, Series 2013-5, Class A2, 3.0%, 5/25/43 (144A) | 392,894 |
| 236,646(d) | | Sequoia Mortgage Trust, Series 2013-6, Class A1, 2.5%, 5/25/43 | 242,508 |
The accompanying notes are an integral part of these financial statements.
13
| | |
| Pioneer Bond VCT Portfolio | Pioneer Variable Contracts Trust |
| Schedule of Investments 12/31/20 (continued) | |
| | | | |
| Principal | | | |
| Amount | | | |
| USD ($) | | | Value |
| | | COLLATERALIZED MORTGAGE OBLIGATIONS – (continued) | |
| 116,599(d) | | Sequoia Mortgage Trust, Series 2018-CH3, Class A1, 4.5%, 8/25/48 (144A) | $ 120,622 |
| 50,000(b) | | STACR Trust, Series 2018-DNA2, Class M2, 2.298% (1 Month USD LIBOR + 215 bps), 12/25/30 (144A) | 49,498 |
| 380,000(b) | | STACR Trust, Series 2018-HRP2, Class B1, 4.348% (1 Month USD LIBOR + 420 bps), 2/25/47 (144A) | 385,240 |
| 220,000(b) | | STACR Trust, Series 2018-HRP2, Class M3, 2.548% (1 Month USD LIBOR + 240 bps), 2/25/47 (144A) | 220,280 |
| 320,000(d) | | Towd Point Mortgage Trust, Series 2015-5, Class M1, 3.5%, 5/25/55 (144A) | 335,684 |
| 265,000(d) | | Towd Point Mortgage Trust, Series 2015-6, Class M1, 3.75%, 4/25/55 (144A) | 285,732 |
| 550,000(d) | | Towd Point Mortgage Trust, Series 2019-4, Class M1, 3.5%, 10/25/59 (144A) | 590,839 |
| 150,000(b) | | Traingle Re, Ltd., Series 2020-1, Class M1C, 4.648% (1 Month USD LIBOR + 450 bps), 10/25/30 (144A) | 150,832 |
| 150,000(b) | | Traingle Re, Ltd., Series 2020-1, Class M2, 5.748% (1 Month USD LIBOR + 560 bps), 10/25/30 (144A) | 151,028 |
| 391,864(d) | | Visio Trust, Series 2019-2, Class A1, 2.722%, 11/25/54 (144A) | 405,823 |
| 610,000(d) | | Vista Point Securitization Trust, Series 2020-1, Class A3, 3.201%, 3/25/65 (144A) | 631,087 |
| | | TOTAL COLLATERALIZED MORTGAGE OBLIGATIONS | |
| | | (Cost $23,642,740) | $ 23,995,438 |
| | | COMMERCIAL MORTGAGE-BACKED SECURITIES – 6.1% of Net Assets | |
| 410,000 | | BANK, Series 2017-BNK7, Class AS, 3.748%, 9/15/60 | $ 463,588 |
| 206,720(c)(e) | | Bayview Commercial Asset Trust, Series 2007-2A, Class IO, 0.0%, 7/25/37 (144A) | — |
| 125,000 | | Benchmark Mortgage Trust, Series 2018-B5, Class A3, 3.944%, 7/15/51 | 146,311 |
| 250,000 | | Benchmark Mortgage Trust, Series 2018-B8, Class A4, 3.963%, 1/15/52 | 289,413 |
| 265,000 | | Benchmark Mortgage Trust, Series 2019-B14, Class AS, 3.352%, 12/15/62 | 292,754 |
| 150,000 | | Benchmark Mortgage Trust, Series 2020-B18, Class AM, 2.335%, 7/15/53 | 157,314 |
| 200,000(d) | | Benchmark Mortgage Trust, Series 2020-IG3, Class B, 3.387%, 9/15/48 (144A) | 217,371 |
| 199,817(b) | | BX Commercial Mortgage Trust, Series 2020-BXLP, Class D, 1.409% (1 Month USD LIBOR + | |
| | | 125 bps), 12/15/36 (144A) | 197,573 |
| 400,000 | | BX Trust, Series 2019-OC11, Class A, 3.202%, 12/9/41 (144A) | 438,014 |
| 120,000 | | CD Mortgage Trust, Series 2018-CD7, Class A3, 4.013%, 8/15/51 | 140,179 |
| 140,000 | | CFCRE Commercial Mortgage Trust, Series 2016-C3, Class A2, 3.597%, 1/10/48 | 155,008 |
| 149,356(b) | | CHC Commercial Mortgage Trust, Series 2019-CHC, Class D, 2.209% (1 Month USD LIBOR + | |
| | | 205 bps), 6/15/34 (144A) | 136,639 |
| 250,000(d) | | Citigroup Commercial Mortgage Trust, Series 2014-GC19, Class B, 4.805%, 3/10/47 | 270,907 |
| 250,000(d) | | Citigroup Commercial Mortgage Trust, Series 2014-GC25, Class B, 4.345%, 10/10/47 | 274,838 |
| 125,000(d) | | Citigroup Commercial Mortgage Trust, Series 2015-GC33, Class B, 4.571%, 9/10/58 | 139,104 |
| 250,000 | | Citigroup Commercial Mortgage Trust, Series 2016-P5, Class D, 3.0%, 10/10/49 (144A) | 184,365 |
| 150,000 | | Citigroup Commercial Mortgage Trust, Series 2017-C4, Class A4, 3.471%, 10/12/50 | 170,525 |
| 300,000 | | Citigroup Commercial Mortgage Trust, Series 2019-SMRT, Class A, 4.149%, 1/10/36 (144A) | 326,041 |
| 250,000(b) | | Cold Storage Trust, Series 2020-ICE5, Class D, 2.259% (1 Month USD LIBOR + 210 bps), | |
| | | 11/15/37 (144A) | 250,078 |
| 241,251 | | COMM Mortgage Trust, Series 2012-CR3, Class A3, 2.822%, 10/15/45 | 247,340 |
| 250,000 | | COMM Mortgage Trust, Series 2012-CR4, Class AM, 3.251%, 10/15/45 | 252,212 |
| 200,000(d) | | COMM Mortgage Trust, Series 2013-CR11, Class C, 5.12%, 8/10/50 (144A) | 202,328 |
| 238,711 | | COMM Mortgage Trust, Series 2014-UBS3, Class A3, 3.546%, 6/10/47 | 257,341 |
| 150,000 | | COMM Mortgage Trust, Series 2014-UBS4, Class A4, 3.42%, 8/10/47 | 159,407 |
| 175,000(d) | | COMM Mortgage Trust, Series 2015-DC1, Class B, 4.035%, 2/10/48 | 183,568 |
| 186,523 | | COMM Mortgage Trust, Series 2016-CR28, Class AHR, 3.651%, 2/10/49 | 199,709 |
| 250,000(b) | | Credit Suisse Mortgage Capital Certificates, Series 2019-ICE4, Class E, 2.309% (1 | |
| | | Month USD LIBOR + 215 bps), 5/15/36 (144A) | 248,533 |
| 53,849(b) | | FREMF Mortgage Trust, Series 2014-KF05, Class B, 4.153% (1 Month USD LIBOR + 400 | |
| | | bps), 9/25/22 (144A) | 53,885 |
| 50,100(b) | | FREMF Mortgage Trust, Series 2014-KS02, Class B, 5.153% (1 Month USD LIBOR + 500 | |
| | | bps), 8/25/23 (144A) | 46,092 |
The accompanying notes are an integral part of these financial statements.
14
| | |
| Pioneer Bond VCT Portfolio | Pioneer Variable Contracts Trust |
| | | | |
| Principal | | | |
| Amount | | | |
| USD ($) | | | Value |
| | | COMMERCIAL MORTGAGE-BACKED SECURITIES – (continued) | |
| 125,000(d) | | FREMF Mortgage Trust, Series 2015-K51, Class B, 3.954%, 10/25/48 (144A) | $ 137,849 |
| 90,000(d) | | FREMF Mortgage Trust, Series 2017-K66, Class B, 4.035%, 7/25/27 (144A) | 100,998 |
| 150,000(d) | | FREMF Mortgage Trust, Series 2017-KW03, Class B, 4.059%, 7/25/27 (144A) | 151,890 |
| 100,000(d) | | FREMF Mortgage Trust, Series 2019-K88, Class C, 4.38%, 2/25/52 (144A) | 109,767 |
| 166,964(b) | | FREMF Mortgage Trust, Series 2019-KF64, Class B, 2.453% (1 Month USD LIBOR + 230 | |
| | | bps), 6/25/26 (144A) | 160,868 |
| 173,932(d) | | FRESB Mortgage Trust, Series 2018-SB52, Class A7F, 3.39%, 6/25/25 | 183,966 |
| 1,120,986(d)(e) | | Government National Mortgage Association, Series 2017-21, Class IO, 0.701%, 10/16/58 | 61,513 |
| 200,000 | | GS Mortgage Securities Trust, Series 2015-GC28, Class A5, 3.396%, 2/10/48 | 218,605 |
| 323,000 | | ILPT Trust, Series 2019-SURF, Class A, 4.145%, 2/11/41 (144A) | 378,252 |
| 450,000 | | JP Morgan Chase Commercial Mortgage Securities Trust, Series 2016-JP2, Class A4, 2.822%, 8/15/49 | 492,111 |
| 200,000(d) | | JP Morgan Chase Commercial Mortgage Securities Trust, Series 2018-BCON, Class C, 3.756%, | |
| | | 1/5/31 (144A) | 200,991 |
| 250,000 | | JP Morgan Chase Commercial Mortgage Securities Trust, Series 2018-WPT, Class AFX, | |
| | | 4.248%, 7/5/33 (144A) | 263,552 |
| 150,000(d) | | JPMDB Commercial Mortgage Securities Trust, Series 2016-C2, Class B, 3.99%, 6/15/49 | 156,949 |
| 200,000 | | JPMDB Commercial Mortgage Securities Trust, Series 2016-C4, Class A3, 3.141%, 12/15/49 | 222,488 |
| 100,000(d) | | JPMDB Commercial Mortgage Securities Trust, Series 2016-C4, Class D, 3.088%, 12/15/49 (144A) | 81,247 |
| 250,000 | | JPMDB Commercial Mortgage Securities Trust, Series 2018-C8, Class A4, 4.211%, 6/15/51 | 296,688 |
| 1,600,000(d)(e) | | JPMDB Commercial Mortgage Securities Trust, Series 2018-C8, Class XB, 0.112%, 6/15/51 | 15,457 |
| 225,000 | | Key Commercial Mortgage Securities Trust, Series 2019-S2, Class A3, 3.469%, 6/15/52 (144A) | 243,846 |
| 80,000(d) | | Morgan Stanley Bank of America Merrill Lynch Trust, Series 2015-C21, Class C, 4.142%, 3/15/48 | 73,565 |
| 250,000(d) | | Morgan Stanley Capital I Trust, Series 2018-MP, Class A, 4.276%, 7/11/40 (144A) | 272,257 |
| 137,477(b) | | Multifamily Connecticut Avenue Securities Trust, Series 2019-1, Class M7, 1.848% (1 Month USD | |
| | | LIBOR + 170 bps), 10/15/49 (144A) | 133,635 |
| 175,000 | | Palisades Center Trust, Series 2016-PLSD, Class A, 2.713%, 4/13/33 (144A) | 147,875 |
| 260,000 | | Wells Fargo Commercial Mortgage Trust, Series 2015-NXS3, Class A4, 3.617%, 9/15/57 | 291,098 |
| 250,000 | | Wells Fargo Commercial Mortgage Trust, Series 2016-C32, Class A3, 3.294%, 1/15/59 | 271,010 |
| 200,000 | | Wells Fargo Commercial Mortgage Trust, Series 2016-LC24, Class A3, 2.684%, 10/15/49 | 216,462 |
| 450,000(d) | | Wells Fargo Commercial Mortgage Trust, Series 2018-C43, Class A4, 4.012%, 3/15/51 | 526,733 |
| | | TOTAL COMMERCIAL MORTGAGE-BACKED SECURITIES | |
| | | (Cost $11,104,131) | $ 11,510,109 |
| | | CORPORATE BONDS – 34.7% of Net Assets | |
| | | Advertising – 0.3% | |
| 407,000 | | Interpublic Group of Cos., Inc., 4.75%, 3/30/30 | $ 504,750 |
| 125,000 | | Outfront Media Capital LLC/Outfront Media Capital Corp., 6.25%, 6/15/25 (144A) | 131,875 |
| | | Total Advertising | $ 636,625 |
| | | Aerospace & Defense – 1.5% | |
| 774,000 | | Boeing Co., 3.75%, 2/1/50 | $ 813,931 |
| 480,000 | | Boeing Co., 3.9%, 5/1/49 | 509,382 |
| 430,000 | | Boeing Co., 5.805%, 5/1/50 | 592,602 |
| 470,000 | | Raytheon Technologies Corp., 3.2%, 3/15/24 | 507,641 |
| 270,000 | | Raytheon Technologies Corp., 4.125%, 11/16/28 | 321,884 |
| | | Total Aerospace & Defense | $ 2,745,440 |
The accompanying notes are an integral part of these financial statements.
15
| | |
| Pioneer Bond VCT Portfolio | Pioneer Variable Contracts Trust |
| Schedule of Investments 12/31/20 (continued) | |
| | | | |
| Principal | | | |
| Amount | | | |
| USD ($) | | | Value |
| | | Airlines – 0.9% | |
| 237,864 | | Air Canada 2017-1 Class AA Pass Through Trust, 3.3%, 1/15/30 (144A) | $ 232,741 |
| 396,000 | | Alaska Airlines 2020-1 Class A Pass Through Trust, 4.8%, 8/15/27 (144A) | 436,125 |
| 63,759 | | British Airways 2019-1 Class A Pass Through Trust, 3.35%, 6/15/29 (144A) | 60,424 |
| 157,982 | | British Airways 2019-1 Class AA Pass Through Trust, 3.3%, 12/15/32 (144A) | 157,604 |
| 85,000 | | British Airways 2020-1 Class A Pass Through Trust, 4.25%, 11/15/32 (144A) | 90,844 |
| 80,000 | | British Airways 2020-1 Class B Pass Through Trust, 8.375%, 11/15/28 (144A) | 88,200 |
| 31,043 | | Delta Air Lines 2020-1 Class AA Pass Through Trust, 2.0%, 6/10/28 | 30,977 |
| 85,000 | | Delta Air Lines, Inc./SkyMiles IP, Ltd., 4.75%, 10/20/28 (144A) | 92,779 |
| 156,074 | | JetBlue 2019-1 Class AA Pass Through Trust, 2.75%, 5/15/32 | 155,969 |
| 61,000 | | JetBlue 2020-1 Class A Pass Through Trust, 4.0%, 11/15/32 | 65,840 |
| 210,000 | | Southwest Airlines Co., 2.625%, 2/10/30 | 213,747 |
| | | Total Airlines | $ 1,625,250 |
| | | Auto Manufacturers – 0.9% | |
| 165,000 | | BMW US Capital LLC, 4.15%, 4/9/30 (144A) | $ 199,563 |
| 225,000 | | Ford Motor Credit Co. LLC, 5.584%, 3/18/24 | 242,696 |
| 189,000 | | General Motors Co., 6.6%, 4/1/36 | 255,886 |
| 353,000 | | General Motors Financial Co., Inc., 4.0%, 1/15/25 | 388,548 |
| 400,000 | | Hyundai Capital Services, Inc., 3.0%, 8/29/22 (144A) | 414,792 |
| 255,000 | | Nissan Motor Acceptance Corp., 3.15%, 3/15/21 (144A) | 256,130 |
| | | Total Auto Manufacturers | $ 1,757,615 |
| | | Auto Parts & Equipment – 0.1% | |
| 110,000 | | Lear Corp., 3.5%, 5/30/30 | $ 120,365 |
| | | Total Auto Parts & Equipment | $ 120,365 |
| | | Banks – 6.4% | |
| 535,000(d) | | AIB Group Plc, 4.263% (3 Month USD LIBOR + 187 bps), 4/10/25 (144A) | $ 584,952 |
| 318,000 | | Banco Santander Chile, 2.7%, 1/10/25 (144A) | 336,686 |
| 663,000(d) | | Bank of America Corp., 2.884% (3 Month USD LIBOR + 119 bps), 10/22/30 | 728,047 |
| 250,000(a)(d) | | Barclays Plc, 7.75% (5 Year USD Swap Rate + 484 bps) | 268,750 |
| 200,000(a)(d) | | Barclays Plc, 8.0% (5 Year CMT Index + 567 bps) | 223,000 |
| 200,000(a)(d) | | BNP Paribas SA, 4.5% (5 Year CMT Index + 294 bps) (144A) | 202,106 |
| 805,000(a)(d) | | BNP Paribas SA, 6.625% (5 Year USD Swap Rate + 415 bps) (144A) | 878,456 |
| 200,000 | | BPCE SA, 4.875%, 4/1/26 (144A) | 235,198 |
| 70,000(a)(d) | | Citigroup, Inc., 4.0% (5 Year CMT Index + 360 bps) | 71,837 |
| 325,000(a)(d) | | Citigroup, Inc., 4.7% (SOFRRATE + 323 bps) | 333,967 |
| 574,000(a)(d) | | Credit Suisse Group AG, 5.1% (5 Year CMT Index + 329 bps) (144A) | 596,960 |
| 400,000(a)(d) | | Credit Suisse Group AG, 7.125% (5 Year USD Swap Rate + 511 bps) | 422,500 |
| 410,000 | | Danske Bank AS, 5.375%, 1/12/24 (144A) | 462,546 |
| 200,000(a)(d) | | Danske Bank AS, 6.125% (7 Year USD Swap Rate + 390 bps) | 211,250 |
| 286,000(d) | | Goldman Sachs Group, Inc., 3.272% (3 Month USD LIBOR + 120 bps), 9/29/25 | 313,292 |
| 215,000(d) | | Goldman Sachs Group, Inc., 4.223% (3 Month USD LIBOR + 130 bps), 5/1/29 | 255,068 |
| 150,000 | | HSBC Bank Plc, 7.65%, 5/1/25 | 186,539 |
| 200,000(a)(d) | | Intesa Sanpaolo S.p.A., 7.7% (5 Year USD Swap Rate + 546 bps) (144A) | 227,000 |
| 626,000(a)(d) | | JPMorgan Chase & Co., 4.6% (SOFRRATE + 313 bps) | 646,345 |
| 591,000(a)(d) | | JPMorgan Chase & Co., 5.0% (SOFRRATE + 338 bps) | 621,750 |
| 400,000 | | Lloyds Banking Group Plc, 4.65%, 3/24/26 | 460,355 |
| 435,000(a)(d) | | Natwest Group Plc, 8.625% (5 Year USD Swap Rate + 760 bps) | 451,491 |
The accompanying notes are an integral part of these financial statements.
16
| | |
| Pioneer Bond VCT Portfolio | Pioneer Variable Contracts Trust |
| | | | |
| Principal | | | |
| Amount | | | |
| USD ($) | | | Value |
| | | Banks – (continued) | |
| 200,000(a)(d) | | Societe Generale SA, 5.375% (5 Year CMT Index + 451 bps) (144A) | $ 212,074 |
| 400,000(a)(d) | | Societe Generale SA, 7.375% (5 Year USD Swap Rate + 624 bps) (144A) | 409,612 |
| 400,000 | | Sumitomo Mitsui Financial Group, Inc., 3.202%, 9/17/29 | 437,881 |
| 250,000 | | Truist Bank, 2.25%, 3/11/30 | 262,291 |
| 354,000(a)(d) | | Truist Financial Corp., 5.1% (5 Year CMT Index + 435 bps) | 404,449 |
| 250,000 | | UBS AG, 7.625%, 8/17/22 | 276,683 |
| 400,000(a)(d) | | UBS Group AG, 7.0% (5 Year USD Swap Rate + 434 bps) (144A) | 438,500 |
| 200,000(a)(d) | | UBS Group AG, 7.125% (5 Year USD Swap Rate + 588 bps) | 205,500 |
| 700,000(d) | | UniCredit S.p.A., 2.569% (1 Year CMT Index + 230 bps), 9/22/26 (144A) | 714,458 |
| | | Total Banks | $ 12,079,543 |
| | | Beverages – 1.0% | |
| 991,000 | | Anheuser-Busch InBev Worldwide, Inc., 5.55%, 1/23/49 | $ 1,409,076 |
| 272,000 | | Bacardi, Ltd., 5.3%, 5/15/48 (144A) | 377,307 |
| | | Total Beverages | $ 1,786,383 |
| | | Building Materials – 0.3% | |
| 169,000 | | Carrier Global Corp., 2.7%, 2/15/31 | $ 181,577 |
| 174,000 | | Carrier Global Corp., 2.722%, 2/15/30 | 186,078 |
| 125,000 | | Standard Industries, Inc., 4.375%, 7/15/30 (144A) | 133,716 |
| 10,000 | | Summit Materials LLC/Summit Materials Finance Corp., 5.25%, 1/15/29 (144A) | 10,500 |
| | | Total Building Materials | $ 511,871 |
| | | Chemicals – 0.3% | |
| 375,000 | | Albemarle Wodgina Pty, Ltd., 3.45%, 11/15/29 | $ 399,099 |
| 75,000 | | Ingevity Corp., 3.875%, 11/1/28 (144A) | 75,562 |
| 103,000 | | NOVA Chemicals Corp., 5.25%, 6/1/27 (144A) | 109,749 |
| | | Total Chemicals | $ 584,410 |
| | | Commercial Services – 0.6% | |
| 123,000 | | Allied Universal Holdco LLC/Allied Universal Finance Corp., 6.625%, 7/15/26 (144A) | $ 131,155 |
| 108,000 | | CoStar Group, Inc., 2.8%, 7/15/30 (144A) | 112,216 |
| 200,000 | | ERAC USA Finance LLC, 3.3%, 12/1/26 (144A) | 222,714 |
| 165,000 | | Garda World Security Corp., 4.625%, 2/15/27 (144A) | 166,650 |
| 50,000 | | President & Fellows of Harvard College, 2.3%, 10/1/23 | 52,508 |
| 180,000 | | Prime Security Services Borrower LLC/Prime Finance, Inc., 6.25%, 1/15/28 (144A) | 193,246 |
| 200,000 | | Sotheby’s, 7.375%, 10/15/27 (144A) | 214,250 |
| | | Total Commercial Services | $ 1,092,739 |
| | | Cosmetics/Personal Care – 0.1% | |
| 120,000 | | Edgewell Personal Care Co., 5.5%, 6/1/28 (144A) | $ 128,964 |
| | | Total Cosmetics/Personal Care | $ 128,964 |
| | | Diversified Financial Services – 1.6% | |
| 215,000 | | Air Lease Corp., 3.125%, 12/1/30 | $ 223,811 |
| 315,000 | | Alliance Data Systems Corp., 7.0%, 1/15/26 (144A) | 333,207 |
| 30,000 | | Avolon Holdings Funding, Ltd., 3.95%, 7/1/24 (144A) | 31,685 |
| 170,000 | | Capital One Financial Corp., 3.3%, 10/30/24 | 186,751 |
| 400,000 | | Capital One Financial Corp., 3.75%, 4/24/24 | 438,018 |
| 180,000 | | Capital One Financial Corp., 4.25%, 4/30/25 | 205,454 |
| 400,000(a)(d) | | Charles Schwab Corp., 4.0% (5 Year CMT Index + 308 bps) | 421,000 |
| 148,000(a)(d) | | Charles Schwab Corp., 5.375% (5 Year CMT Index + 497 bps) | 164,835 |
| 450,000 | | GE Capital Funding LLC, 4.55%, 5/15/32 (144A) | 540,053 |
The accompanying notes are an integral part of these financial statements.
17
| | |
| Pioneer Bond VCT Portfolio | Pioneer Variable Contracts Trust |
| Schedule of Investments 12/31/20 (continued) | |
| | | | |
| Principal | | | |
| Amount | | | |
| USD ($) | | | Value |
| | | Diversified Financial Services – (continued) | |
| 65,000 | | Nationstar Mortgage Holdings, Inc., 5.125%, 12/15/30 (144A) | $ 67,939 |
| 70,000 | | Nationstar Mortgage Holdings, Inc., 5.5%, 8/15/28 (144A) | 73,500 |
| 15,000 | | Nationstar Mortgage Holdings, Inc., 6.0%, 1/15/27 (144A) | 15,919 |
| 195,000 | | Visa, Inc., 2.05%, 4/15/30 | 208,556 |
| | | Total Diversified Financial Services | $ 2,910,728 |
| | | Electric – 2.0% | |
| 278,038 | | Adani Renewable Energy RJ, Ltd./Kodangal Solar Parks Pvt, Ltd./Wardha Solar Maharash, | |
| | | 4.625%, 10/15/39 (144A) | $ 287,630 |
| 280,000 | | AES Corp., 2.45%, 1/15/31 (144A) | 283,777 |
| 100,000 | | AES Corp., 3.95%, 7/15/30 (144A) | 113,041 |
| 133,000(c) | | Dominion Energy, Inc., 3.071%, 8/15/24 | 143,577 |
| 135,000 | | Iberdrola International BV, 6.75%, 7/15/36 | 206,931 |
| 5,758 | | Kiowa Power Partners LLC, 5.737%, 3/30/21 (144A) | 5,778 |
| 430,000 | | NextEra Energy Capital Holdings, Inc., 3.55%, 5/1/27 | 489,598 |
| 290,000 | | NRG Energy, Inc., 2.45%, 12/2/27 (144A) | 305,319 |
| 83,000 | | NRG Energy, Inc., 5.75%, 1/15/28 | 90,677 |
| 40,000 | | Pattern Energy Operations LP/Pattern Energy Operations, Inc., 4.5%, 8/15/28 (144A) | 42,200 |
| 240,000 | | Puget Energy, Inc., 4.1%, 6/15/30 | 271,375 |
| 21,429 | | San Diego Gas & Electric Co., 1.914%, 2/1/22 | 21,543 |
| 335,000 | | Sempra Energy, 3.4%, 2/1/28 | 381,539 |
| 58,929 | | Southern California Edison Co., 1.845%, 2/1/22 | 59,056 |
| 335,000 | | Southwestern Electric Power Co., 3.9%, 4/1/45 | 392,347 |
| 470,000 | | Vistra Operations Co. LLC, 3.7%, 1/30/27 (144A) | 518,263 |
| 150,000 | | Xcel Energy, Inc., 3.4%, 6/1/30 | 171,926 |
| | | Total Electric | $ 3,784,577 |
| | | Electronics – 0.2% | |
| 300,000 | | Amphenol Corp., 3.125%, 9/15/21 | $ 304,816 |
| 102,000 | | Amphenol Corp., 3.2%, 4/1/24 | 109,870 |
| 45,000 | | Sensata Technologies, Inc., 3.75%, 2/15/31 (144A) | 46,646 |
| | | Total Electronics | $ 461,332 |
| | | Energy-Alternate Sources – 0.0%† | |
| 46,807 | | Alta Wind Holdings LLC, 7.0%, 6/30/35 (144A) | $ 55,007 |
| | | Total Energy-Alternate Sources | $ 55,007 |
| | | Environmental Control – 0.1% | |
| 100,000 | | Covanta Holding Corp., 5.0%, 9/1/30 | $ 106,994 |
| 72,000 | | Covanta Holding Corp., 6.0%, 1/1/27 | 75,625 |
| | | Total Environmental Control | $ 182,619 |
| | | Food – 0.5% | |
| 75,000 | | Albertsons Cos., Inc./Safeway, Inc./New Albertsons LP/Albertsons LLC, 4.875%, 2/15/30 (144A) | $ 82,641 |
| 204,000 | | JBS USA LUX SA/JBS USA Food Co./JBS USA Finance, Inc., 5.5%, 1/15/30 (144A) | 234,347 |
| 150,000 | | Kellogg Co., 2.1%, 6/1/30 | 157,563 |
| 60,000 | | Pilgrim’s Pride Corp., 5.875%, 9/30/27 (144A) | 65,077 |
| 100,000 | | Smithfield Foods, Inc., 2.65%, 10/3/21 (144A) | 100,884 |
| 200,000 | | Smithfield Foods, Inc., 3.0%, 10/15/30 (144A) | 211,615 |
| 21,000 | | Smithfield Foods, Inc., 5.2%, 4/1/29 (144A) | 25,002 |
| | | Total Food | $ 877,129 |
The accompanying notes are an integral part of these financial statements.
18
| | |
| Pioneer Bond VCT Portfolio | Pioneer Variable Contracts Trust |
| | | | |
| Principal | | | |
| Amount | | | |
| USD ($) | | | Value |
| | | Forest Products & Paper – 0.2% | |
| 80,000 | | Clearwater Paper Corp., 4.75%, 8/15/28 (144A) | $ 82,800 |
| 234,000 | | International Paper Co., 7.3%, 11/15/39 | 374,973 |
| | | Total Forest Products & Paper | $ 457,773 |
| | | Gas – 0.2% | |
| 110,000 | | Boston Gas Co., 3.15%, 8/1/27 (144A) | $ 122,125 |
| 183,677 | | Nakilat, Inc., 6.267%, 12/31/33 (144A) | 229,632 |
| | | Total Gas | $ 351,757 |
| | | Healthcare-Products – 0.6% | |
| 390,000 | | Boston Scientific Corp., 2.65%, 6/1/30 | $ 417,730 |
| 225,000 | | Edwards Lifesciences Corp., 4.3%, 6/15/28 | 266,288 |
| 500,000 | | Smith & Nephew Plc, 2.032%, 10/14/30 | 509,359 |
| | | Total Healthcare-Products | $ 1,193,377 |
| | | Healthcare-Services – 0.9% | |
| 164,000 | | Anthem, Inc., 3.65%, 12/1/27 | $ 189,120 |
| 41,000 | | Anthem, Inc., 4.101%, 3/1/28 | 48,469 |
| 60,000 | | Centene Corp., 4.25%, 12/15/27 | 63,600 |
| 120,000 | | Centene Corp., 4.625%, 12/15/29 | 133,225 |
| 525,000 | | Fresenius Medical Care US Finance III, Inc., 2.375%, 2/16/31 (144A) | 533,585 |
| 378,000 | | HCA, Inc., 3.5%, 9/1/30 | 401,654 |
| 130,000 | | Humana, Inc., 3.95%, 3/15/27 | 149,613 |
| 65,000 | | Legacy LifePoint Health LLC, 6.75%, 4/15/25 (144A) | 69,798 |
| 35,000 | | Molina Healthcare, Inc., 4.375%, 6/15/28 (144A) | 36,837 |
| 130,000 | | Tenet Healthcare Corp., 5.125%, 11/1/27 (144A) | 137,638 |
| | | Total Healthcare-Services | $ 1,763,539 |
| | | Home Builders – 0.1% | |
| 135,000 | | Meritage Homes Corp., 6.0%, 6/1/25 | $ 152,887 |
| | | Total Home Builders | $ 152,887 |
| | | Insurance – 2.1% | |
| 90,000 | | AXA SA, 8.6%, 12/15/30 | $ 140,233 |
| 592,000 | | CNO Financial Group, Inc., 5.25%, 5/30/29 | 714,689 |
| 100,000(d) | | Farmers Exchange Capital III, 5.454% (3 Month USD LIBOR + 345 bps), 10/15/54 (144A) | 122,940 |
| 340,000(d) | | Farmers Insurance Exchange, 4.747% (3 Month USD LIBOR + 323 bps), 11/1/57 (144A) | 363,679 |
| 645,000 | | Liberty Mutual Insurance Co., 7.697%, 10/15/97 (144A) | 1,036,997 |
| 200,000 | | Nationwide Financial Services, Inc., 3.9%, 11/30/49 (144A) | 222,738 |
| 475,000 | | Nationwide Mutual Insurance Co., 4.35%, 4/30/50 (144A) | 557,993 |
| 125,000 | | New York Life Insurance Co., 3.75%, 5/15/50 (144A) | 149,529 |
| 245,000 | | New York Life Insurance Co., 4.45%, 5/15/69 (144A) | 329,209 |
| 178,000(d) | | Prudential Financial, Inc., 3.7% (5 Year CMT Index + 304 bps), 10/1/50 | 188,285 |
| 26,000 | | Teachers Insurance & Annuity Association of America, 6.85%, 12/16/39 (144A) | 40,898 |
| | | Total Insurance | $ 3,867,190 |
| | | Internet – 0.4% | |
| 75,000 | | ANGI Group LLC, 3.875%, 8/15/28 (144A) | $ 76,313 |
| 562,000 | | Expedia Group, Inc., 3.25%, 2/15/30 | 584,896 |
| | | Total Internet | $ 661,209 |
The accompanying notes are an integral part of these financial statements.
19
| | |
| Pioneer Bond VCT Portfolio | Pioneer Variable Contracts Trust |
| Schedule of Investments 12/31/20 (continued) | |
| | | | |
| Principal | | | |
| Amount | | | |
| USD ($) | | | Value |
| | | Iron & Steel – 0.0%† | |
| 60,000 | | Steel Dynamics, Inc., 3.25%, 1/15/31 | $ 67,095 |
| | | Total Iron & Steel | $ 67,095 |
| | | Leisure Time – 0.0%† | |
| 69,000 | | Royal Caribbean Cruises, Ltd., 11.5%, 6/1/25 (144A) | $ 80,664 |
| | | Total Leisure Time | $ 80,664 |
| | | Lodging – 0.7% | |
| 155,000 | | Hilton Domestic Operating Co., Inc., 3.75%, 5/1/29 (144A) | $ 161,617 |
| 150,000 | | Hilton Domestic Operating Co., Inc., 4.0%, 5/1/31 (144A) | 158,267 |
| 520,000 | | Marriott International, Inc., 3.5%, 10/15/32 | 568,664 |
| 100,000 | | Marriott International, Inc., 4.625%, 6/15/30 | 117,348 |
| 40,000 | | Marriott International, Inc., 5.75%, 5/1/25 | 46,788 |
| 220,000 | | Sands China, Ltd., 4.375%, 6/18/30 (144A) | 244,633 |
| | | Total Lodging | $ 1,297,317 |
| | | Media – 0.9% | |
| 275,000 | | CCO Holdings LLC/CCO Holdings Capital Corp., 4.75%, 3/1/30 (144A) | $ 296,725 |
| 270,000 | | Comcast Corp., 4.15%, 10/15/28 | 325,019 |
| 200,000 | | CSC Holdings LLC, 4.625%, 12/1/30 (144A) | 208,750 |
| 148,000 | | Diamond Sports Group LLC/Diamond Sports Finance Co., 6.625%, 8/15/27 (144A) | 89,540 |
| 171,000 | | Gray Television, Inc., 7.0%, 5/15/27 (144A) | 187,245 |
| 30,000 | | Scripps Escrow II, Inc., 3.875%, 1/15/29 (144A) | 31,178 |
| 40,000 | | Sinclair Television Group, Inc., 4.125%, 12/1/30 (144A) | 40,929 |
| 85,000 | | Walt Disney Co., 3.6%, 1/13/51 | 102,892 |
| 325,000 | | Walt Disney Co., 4.7%, 3/23/50 | 459,049 |
| | | Total Media | $ 1,741,327 |
| | | Mining – 0.3% | |
| 416,000 | | Freeport-McMoRan, Inc., 5.45%, 3/15/43 | $ 517,920 |
| | | Total Mining | $ 517,920 |
| | | Miscellaneous Manufacturers – 0.2% | |
| 155,000 | | General Electric Co., 4.25%, 5/1/40 | $ 183,242 |
| 175,000 | | General Electric Co., 4.35%, 5/1/50 | 212,826 |
| | | Total Miscellaneous Manufacturers | $ 396,068 |
| | | Multi-National – 0.5% | |
| 370,000 | | Africa Finance Corp., 4.375%, 4/17/26 (144A) | $ 404,406 |
| 200,000 | | African Export-Import Bank, 3.994%, 9/21/29 (144A) | 214,000 |
| 230,000 | | Banque Ouest Africaine de Developpement, 4.7%, 10/22/31 (144A) | 248,363 |
| | | Total Multi-National | $ 866,769 |
| | | Oil & Gas – 1.1% | |
| 595,000 | | Cenovus Energy, Inc., 6.75%, 11/15/39 | $ 786,646 |
| 200,000 | | CNOOC Finance 2014 ULC, 4.25%, 4/30/24 | 217,106 |
| 150,000 | | MEG Energy Corp., 7.125%, 2/1/27 (144A) | 154,875 |
| 55,000 | | PBF Holding Co. LLC/PBF Finance Corp., 9.25%, 5/15/25 (144A) | 54,225 |
| 185,000 | | Petroleos Mexicanos, 5.35%, 2/12/28 | 183,011 |
| 120,000 | | Phillips 66, 2.15%, 12/15/30 | 121,821 |
| 90,000 | | Phillips 66, 3.85%, 4/9/25 | 100,963 |
| 115,000 | | Valero Energy Corp., 2.15%, 9/15/27 | 117,503 |
| 312,000 | | Valero Energy Corp., 6.625%, 6/15/37 | 415,018 |
| | | Total Oil & Gas | $ 2,151,168 |
The accompanying notes are an integral part of these financial statements.
20
| | |
| Pioneer Bond VCT Portfolio | Pioneer Variable Contracts Trust |
| | | | |
| Principal | | | |
| Amount | | | |
| USD ($) | | | Value |
| | | Pharmaceuticals – 1.0% | |
| 211,000 | | AbbVie, Inc., 4.05%, 11/21/39 | $ 255,357 |
| 200,000 | | Bayer US Finance II LLC, 4.25%, 12/15/25 (144A) | 228,616 |
| 230,000 | | Cardinal Health, Inc., 4.9%, 9/15/45 | 283,137 |
| 23,805 | | CVS Pass-Through Trust, 5.298%, 1/11/27 (144A) | 25,458 |
| 76,658 | | CVS Pass-Through Trust, 5.773%, 1/10/33 (144A) | 90,062 |
| 44,397 | | CVS Pass-Through Trust, 5.926%, 1/10/34 (144A) | 53,848 |
| 118,703 | | CVS Pass-Through Trust, 6.036%, 12/10/28 | 137,907 |
| 103,320 | | CVS Pass-Through Trust, 8.353%, 7/10/31 (144A) | 136,640 |
| 165,000 | | Pfizer, Inc., 2.625%, 4/1/30 | 184,165 |
| 213,000 | | Teva Pharmaceutical Finance Netherlands III BV, 3.15%, 10/1/26 | 204,748 |
| 200,000 | | Teva Pharmaceutical Finance Netherlands III BV, 7.125%, 1/31/25 | 221,060 |
| | | Total Pharmaceuticals | $ 1,820,998 |
| | | Pipelines – 3.7% | |
| 45,000 | | DCP Midstream Operating LP, 3.875%, 3/15/23 | $ 46,350 |
| 170,000 | | DCP Midstream Operating LP, 5.375%, 7/15/25 | 186,799 |
| 100,000 | | DCP Midstream Operating LP, 5.6%, 4/1/44 | 103,122 |
| 40,000 | | Enable Midstream Partners LP, 4.15%, 9/15/29 | 39,688 |
| 136,000 | | Enable Midstream Partners LP, 4.4%, 3/15/27 | 137,239 |
| 479,000 | | Enable Midstream Partners LP, 4.95%, 5/15/28 | 495,189 |
| 360,000 | | Enbridge, Inc., 3.7%, 7/15/27 | 410,300 |
| 140,000 | | Energy Transfer Operating LP, 6.0%, 6/15/48 | 164,967 |
| 40,000 | | Energy Transfer Operating LP, 6.125%, 12/15/45 | 47,252 |
| 125,000 | | Energy Transfer Operating LP, 6.5%, 2/1/42 | 152,498 |
| 340,000(a)(d) | | Energy Transfer Operating LP, 7.125% (5 Year CMT Index + 531 bps) | 323,000 |
| 20,000 | | EnLink Midstream LLC, 5.375%, 6/1/29 | 19,450 |
| 280,000 | | EnLink Midstream Partners LP, 5.45%, 6/1/47 | 225,476 |
| 134,000 | | EnLink Midstream Partners LP, 5.6%, 4/1/44 | 107,535 |
| 145,000 | | Hess Midstream Operations LP, 5.125%, 6/15/28 (144A) | 151,570 |
| 163,000 | | Midwest Connector Capital Co. LLC, 4.625%, 4/1/29 (144A) | 170,866 |
| 340,000 | | MPLX LP, 4.25%, 12/1/27 | 399,218 |
| 110,000 | | MPLX LP, 4.875%, 12/1/24 | 126,235 |
| 175,000 | | MPLX LP, 4.875%, 6/1/25 | 202,137 |
| 205,000 | | MPLX LP, 5.5%, 2/15/49 | 269,947 |
| 450,000 | | Phillips 66 Partners LP, 3.75%, 3/1/28 | 488,204 |
| 185,000(a)(d) | | Plains All American Pipeline LP, 6.125% (3 Month USD LIBOR + 411 bps) | 150,312 |
| 185,000 | | Plains All American Pipeline LP/PAA Finance Corp., 4.9%, 2/15/45 | 196,340 |
| 375,000 | | Sabine Pass Liquefaction LLC, 5.0%, 3/15/27 | 442,149 |
| 224,000 | | Sunoco Logistics Partners Operations LP, 5.35%, 5/15/45 | 246,761 |
| 422,000 | | Sunoco Logistics Partners Operations LP, 5.4%, 10/1/47 | 471,515 |
| 25,000 | | Sunoco Logistics Partners Operations LP, 6.1%, 2/15/42 | 28,927 |
| 300,000 | | Texas Eastern Transmission LP, 3.5%, 1/15/28 (144A) | 328,797 |
| 586,000 | | Williams Cos., Inc., 5.75%, 6/24/44 | 759,484 |
| 89,000 | | Williams Cos., Inc., 7.75%, 6/15/31 | 119,901 |
| | | Total Pipelines | $ 7,011,228 |
| | | Real Estate – 0.1% | |
| 250,000(a)(d) | | AT Securities BV, 5.25% (5 Year USD Swap Rate + 355 bps) | $ 260,875 |
| | | Total Real Estate | $ 260,875 |
The accompanying notes are an integral part of these financial statements.
21
| | |
| Pioneer Bond VCT Portfolio | Pioneer Variable Contracts Trust |
| Schedule of Investments 12/31/20 (continued) | |
| | | | |
| Principal | | | |
| Amount | | | |
| USD ($) | | | Value |
| | | REITs – 2.7% | |
| 155,000 | | Alexandria Real Estate Equities, Inc., 1.875%, 2/1/33 | $ 154,752 |
| 90,000 | | Alexandria Real Estate Equities, Inc., 3.45%, 4/30/25 | 100,073 |
| 25,000 | | Alexandria Real Estate Equities, Inc., 3.95%, 1/15/27 | 28,734 |
| 47,000 | | Alexandria Real Estate Equities, Inc., 4.3%, 1/15/26 | 54,645 |
| 260,000 | | Duke Realty LP, 3.75%, 12/1/24 | 287,122 |
| 100,000 | | Essex Portfolio LP, 3.375%, 4/15/26 | 112,213 |
| 360,000 | | Essex Portfolio LP, 3.5%, 4/1/25 | 398,892 |
| 160,000 | | Healthcare Realty Trust, Inc., 2.05%, 3/15/31 | 160,721 |
| 131,000 | | Healthcare Realty Trust, Inc., 2.4%, 3/15/30 | 136,626 |
| 333,000 | | Healthcare Trust of America Holdings LP, 3.1%, 2/15/30 | 363,747 |
| 200,000 | | Healthcare Trust of America Holdings LP, 3.75%, 7/1/27 | 226,711 |
| 63,000 | | Highwoods Realty LP, 2.6%, 2/1/31 | 64,264 |
| 17,000 | | Highwoods Realty LP, 3.2%, 6/15/21 | 17,118 |
| 290,000 | | Highwoods Realty LP, 3.625%, 1/15/23 | 301,998 |
| 105,000 | | Highwoods Realty LP, 4.125%, 3/15/28 | 118,101 |
| 193,000 | | Iron Mountain, Inc., 4.5%, 2/15/31 (144A) | 202,167 |
| 255,000 | | iStar, Inc., 4.25%, 8/1/25 | 251,812 |
| 110,000 | | iStar, Inc., 4.75%, 10/1/24 | 111,375 |
| 165,000 | | Lexington Realty Trust, 2.7%, 9/15/30 | 171,762 |
| 125,000 | | MPT Operating Partnership LP/MPT Finance Corp., 3.5%, 3/15/31 | 129,063 |
| 318,000 | | MPT Operating Partnership LP/MPT Finance Corp., 4.625%, 8/1/29 | 339,863 |
| 235,000 | | SBA Tower Trust, 3.869%, 10/8/24 (144A) | 251,284 |
| 180,000 | | Simon Property Group LP, 3.25%, 9/13/49 | 184,349 |
| 150,000 | | Simon Property Group LP, 3.8%, 7/15/50 | 167,342 |
| 75,000 | | UDR, Inc., 2.95%, 9/1/26 | 82,320 |
| 201,000 | | UDR, Inc., 4.0%, 10/1/25 | 228,105 |
| 180,000 | | UDR, Inc., 4.4%, 1/26/29 | 214,023 |
| 219,000 | | Uniti Group LP/Uniti Fiber Holdings, Inc./CSL Capital LLC, 7.875%, 2/15/25 (144A) | 235,252 |
| | | Total REITs | $ 5,094,434 |
| | | Retail – 0.4% | |
| 125,000 | | AutoNation, Inc., 4.75%, 6/1/30 | $ 150,417 |
| 201,000 | | Beacon Roofing Supply, Inc., 4.875%, 11/1/25 (144A) | 205,774 |
| 75,000 | | Penske Automotive Group, Inc., 3.5%, 9/1/25 | 76,219 |
| 200,000 | | QVC, Inc., 4.375%, 9/1/28 | 207,230 |
| 35,000 | | QVC, Inc., 4.75%, 2/15/27 | 37,537 |
| | | Total Retail | $ 677,177 |
| | | Semiconductors – 0.5% | |
| 158,000 | | Broadcom, Inc., 4.11%, 9/15/28 | $ 180,829 |
| 100,000 | | Broadcom, Inc., 4.3%, 11/15/32 | 118,549 |
| 475,000 | | Broadcom, Inc., 5.0%, 4/15/30 | 577,415 |
| | | Total Semiconductors | $ 876,793 |
| | | Software – 0.4% | |
| 470,000 | | Citrix Systems, Inc., 3.3%, 3/1/30 | $ 519,254 |
| 295,000 | | Infor, Inc., 1.75%, 7/15/25 (144A) | 306,428 |
| | | Total Software | $ 825,682 |
The accompanying notes are an integral part of these financial statements.
22
| | |
| Pioneer Bond VCT Portfolio | Pioneer Variable Contracts Trust |
| | | | |
| Principal | | | |
| Amount | | | |
| USD ($) | | | Value |
| | | Telecommunications – 0.7% | |
| 255,000 | | Altice France SA, 5.5%, 1/15/28 (144A) | $ 266,605 |
| 40,000 | | CenturyLink, Inc., 4.0%, 2/15/27 (144A) | 41,300 |
| 182,000 | | CommScope Technologies LLC, 5.0%, 3/15/27 (144A) | 179,270 |
| 95,000 | | Level 3 Financing, Inc., 4.625%, 9/15/27 (144A) | 99,221 |
| 55,000 | | Logan Merger Sub, Inc., 5.5%, 9/1/27 (144A) | 57,613 |
| 315,000 | | Motorola Solutions, Inc., 2.3%, 11/15/30 | 321,090 |
| 145,000 | | T-Mobile USA, Inc., 2.55%, 2/15/31 (144A) | 152,260 |
| 195,000 | | T-Mobile USA, Inc., 3.875%, 4/15/30 (144A) | 225,849 |
| | | Total Telecommunications | $ 1,343,208 |
| | | Trucking & Leasing – 0.1% | |
| 95,000 | | Penske Truck Leasing Co. LP/PTL Finance Corp., 3.35%, 11/1/29 (144A) | $ 103,416 |
| 156,000 | | Penske Truck Leasing Co. LP/PTL Finance Corp., 4.2%, 4/1/27 (144A) | 179,477 |
| | | Total Trucking & Leasing | $ 282,893 |
| | | Water – 0.1% | |
| 110,000 | | Essential Utilities, Inc., 3.566%, 5/1/29 | $ 126,346 |
| | | Total Water | $ 126,346 |
| | | TOTAL CORPORATE BONDS | |
| | | (Cost $59,455,702) | $ 65,226,291 |
| | | FOREIGN GOVERNMENT BONDS – 0.7% of Net Assets | |
| | | Mexico – 0.3% | |
| 475,000 | | Mexico Government International Bond, 4.6%, 2/10/48 | $ 556,942 |
| | | Total Mexico | $ 556,942 |
| | | Panama – 0.1% | |
| 200,000 | | Panama Government International Bond, 2.252%, 9/29/32 | $ 206,000 |
| | | Total Panama | $ 206,000 |
| | | Philippines – 0.3% | |
| 200,000 | | Philippine Government International Bond, 2.95%, 5/5/45 | $ 210,632 |
| 200,000 | | Philippine Government International Bond, 5.0%, 1/13/37 | 263,800 |
| | | Total Philippines | $ 474,432 |
| | | TOTAL FOREIGN GOVERNMENT BONDS | |
| | | (Cost $1,108,027) | $ 1,237,374 |
| Face | | | |
| Amount | | | |
| USD ($) | | | |
| | | INSURANCE-LINKED SECURITIES – 0.0%† of Net Assets# | |
| | | Reinsurance Sidecars – 0.0%† | |
| | | Multiperil – Worldwide – 0.0%† | |
| 50,000+(f)(g) | | Lorenz Re 2018, 7/1/21 | $ 595 |
| 25,723+(f)(g) | | Lorenz Re 2019, 6/30/22 | 1,695 |
| | | | $ 2,290 |
| | | Total Reinsurance Sidecars | $ 2,290 |
| | | TOTAL INSURANCE-LINKED SECURITIES | |
| | | (Cost $19,865) | $ 2,290 |
The accompanying notes are an integral part of these financial statements.
23
| | |
| Pioneer Bond VCT Portfolio | Pioneer Variable Contracts Trust |
| Schedule of Investments 12/31/20 (continued) | |
| | | | |
| Principal | | | |
| Amount | | | |
| USD ($) | | | Value |
| | | MUNICIPAL BONDS – 0.0%† of Net Assets(h) | |
| | | Municipal General – 0.0%† | |
| 50,000 | | Virginia Commonwealth Transportation Board, Transportation Capital Projects, 4.0%, 5/15/32 | $ 54,446 |
| | | Total Municipal General | $ 54,446 |
| | | Municipal Higher Education – 0.0%† | |
| 10,000 | | Trustees of Amherst College, 3.794%, 11/1/42 | $ 11,418 |
| | | Total Municipal Higher Education | $ 11,418 |
| | | TOTAL MUNICIPAL BONDS | |
| | | (Cost $62,530) | $ 65,864 |
| | | SENIOR SECURED FLOATING RATE LOAN INTERESTS – 1.2% of Net Assets*(b) | |
| | | Automobile – 0.1% | |
| 64,157 | | American Axle & Manufacturing, Inc., Tranche B Term Loan, 3.0% (LIBOR + 225 bps), 4/6/24 | $ 63,395 |
| 68,333 | | Goodyear Tire & Rubber Co., Second Lien Term Loan, 2.15% (LIBOR + 200 bps), 3/7/25 | 66,661 |
| | | Total Automobile | $ 130,056 |
| | | Beverage, Food & Tobacco – 0.1% | |
| 174,605 | | JBS USA Lux SA (fka JBS USA LLC), New Term Loan, 2.147% (LIBOR + 200 bps), 5/1/26 | $ 173,332 |
| | | Total Beverage, Food & Tobacco | $ 173,332 |
| | | Broadcasting & Entertainment – 0.1% | |
| 99,222 | | Sinclair Television Group, Inc., Tranche B Term Loan, 2.4% (LIBOR + 225 bps), 1/3/24 | $ 98,395 |
| | | Total Broadcasting & Entertainment | $ 98,395 |
| | | Computers & Electronics – 0.0%† | |
| 50,864 | | Energy Acquisition LP (aka Electrical Components International), First Lien Initial Term Loan, | |
| | | 4.397% (LIBOR + 425 bps), 6/26/25 | $ 49,370 |
| | | Total Computers & Electronics | $ 49,370 |
| | | Diversified & Conglomerate Service – 0.0%† | |
| 96,250 | | Team Health Holdings, Inc., Initial Term Loan, 3.75% (LIBOR + 275 bps), 2/6/24 | $ 86,745 |
| | | Total Diversified & Conglomerate Service | $ 86,745 |
| | | Electric & Electrical – 0.0%† | |
| 40,622 | | Rackspace Technology Global, Inc., First Lien Term B Loan, 4.0% (LIBOR + 300 bps), 11/3/23 | $ 40,638 |
| | | Total Electric & Electrical | $ 40,638 |
| | | Electronics – 0.1% | |
| 171,715 | | Scientific Games International, Inc., Initial Term B-5 Loan, 2.897% (LIBOR + 275 bps), 8/14/24 | $ 168,174 |
| 68,430 | | Verint Systems, Inc., Refinancing Term Loan, 2.155% (LIBOR + 200 bps), 6/29/24 | 68,430 |
| | | Total Electronics | $ 236,604 |
| | | Healthcare & Pharmaceuticals – 0.2% | |
| 120,938 | | Alphabet Holding Co., Inc. (aka Nature’s Bounty), First Lien Initial Term Loan, 3.647% | |
| | | (LIBOR + 350 bps), 9/26/24 | $ 120,119 |
| 170,151 | | Endo Luxembourg Finance Co. I S.a.r.l., Initial Term Loan, 5.0% (LIBOR + 425 bps), 4/29/24 | 168,077 |
| | | Total Healthcare & Pharmaceuticals | $ 288,196 |
| | | Healthcare, Education & Childcare – 0.1% | |
| 215,174 | | KUEHG Corp. (fka KC MergerSub, Inc.) (aka KinderCare), Term B-3 Loan, 4.75% (LIBOR + | |
| | | 375 bps), 2/21/25 | $ 205,276 |
| | | Total Healthcare, Education & Childcare | $ 205,276 |
| | | Hotel, Gaming & Leisure – 0.1% | |
| 152,499 | | 1011778 B.C. Unlimited Liability Co. (New Red Finance, Inc.) (aka Burger King/Tim | |
| | | Hortons), Term B-4 Loan, 1.897% (LIBOR + 175 bps), 11/19/26 | $ 150,318 |
| | | Total Hotel, Gaming & Leisure | $ 150,318 |
The accompanying notes are an integral part of these financial statements.
24
| | |
| Pioneer Bond VCT Portfolio | Pioneer Variable Contracts Trust |
| | | | |
| Principal | | | |
| Amount | | | |
| USD ($) | | | Value |
| | | Insurance – 0.1% | |
| 131,409 | | Asurion LLC (fka Asurion Corp.), New Term B-7 Loan, 3.147% (LIBOR + 300 bps), 11/3/24 | $ 130,628 |
| 62,923 | | Confie Seguros Holding II Co., Term B Loan, 5.75% (LIBOR + 475 bps), 4/19/22 | 62,170 |
| | | Total Insurance | $ 192,798 |
| | | Leasing – 0.2% | |
| 52,217 | | Avolon TLB Borrower 1 (US) LLC, Term B-3 Loan, 2.5% (LIBOR + 175 bps), 1/15/25 | $ 51,822 |
| 62,713 | | Avolon TLB Borrower 1 (US) LLC, Term B-4 Loan, 2.25% (LIBOR + 150 bps), 2/12/27 | 61,907 |
| 184,775 | | IBC Capital I, Ltd. (aka Goodpack, Ltd.), First Lien Tranche B-1 Term Loan, 3.986% | |
| | | (LIBOR + 375 bps), 9/11/23 | 183,081 |
| | | Total Leasing | $ 296,810 |
| | | Telecommunications – 0.1% | |
| 99,000 | | CenturyLink, Inc., Term B Loan, 2.397% (LIBOR + 225 bps), 3/15/27 | $ 97,990 |
| 72,369 | | Go Daddy Operating Co. LLC (GD Finance Co., Inc.), Tranche B-2 Term Loan, 1.897% | |
| | | (LIBOR + 175 bps), 2/15/24 | 72,278 |
| 67,466 | | Level 3 Financing, Inc., Tranche B 2027 Term Loan, 1.897% (LIBOR + 175 bps), 3/1/27 | 66,550 |
| | | Total Telecommunications | $ 236,818 |
| | | TOTAL SENIOR SECURED FLOATING RATE LOAN INTERESTS | |
| | | (Cost $2,225,905) | $ 2,185,356 |
| | | U.S. GOVERNMENT AND AGENCY OBLIGATIONS – 34.8% of Net Assets | |
| 266,653 | | Fannie Mae, 1.5%, 12/1/35 | $ 274,468 |
| 300,000 | | Fannie Mae, 1.5%, 2/1/51 (TBA) | 302,767 |
| 1,011,473 | | Fannie Mae, 2.0%, 12/1/35 | 1,057,974 |
| 3,640,000 | | Fannie Mae, 2.0%, 1/1/51 | 3,781,539 |
| 1,200,000 | | Fannie Mae, 2.0%, 2/1/51 (TBA) | 1,244,443 |
| 15,444 | | Fannie Mae, 2.5%, 7/1/30 | 16,438 |
| 16,776 | | Fannie Mae, 2.5%, 7/1/30 | 17,816 |
| 28,719 | | Fannie Mae, 2.5%, 7/1/30 | 30,601 |
| 11,305 | | Fannie Mae, 2.5%, 2/1/43 | 12,100 |
| 47,058 | | Fannie Mae, 2.5%, 2/1/43 | 50,368 |
| 10,842 | | Fannie Mae, 2.5%, 3/1/43 | 11,597 |
| 9,831 | | Fannie Mae, 2.5%, 8/1/43 | 10,509 |
| 9,061 | | Fannie Mae, 2.5%, 4/1/45 | 9,565 |
| 10,792 | | Fannie Mae, 2.5%, 4/1/45 | 11,551 |
| 11,078 | | Fannie Mae, 2.5%, 4/1/45 | 11,858 |
| 25,342 | | Fannie Mae, 2.5%, 4/1/45 | 27,124 |
| 30,019 | | Fannie Mae, 2.5%, 4/1/45 | 32,131 |
| 30,996 | | Fannie Mae, 2.5%, 4/1/45 | 32,992 |
| 42,922 | | Fannie Mae, 2.5%, 4/1/45 | 45,686 |
| 45,989 | | Fannie Mae, 2.5%, 8/1/45 | 49,150 |
| 600,000 | | Fannie Mae, 2.5%, 1/1/51 (TBA) | 632,484 |
| 550,000 | | Fannie Mae, 2.5%, 2/1/51 (TBA) | 578,813 |
| 13,622 | | Fannie Mae, 3.0%, 3/1/29 | 14,498 |
| 56,431 | | Fannie Mae, 3.0%, 10/1/30 | 60,459 |
| 28,411 | | Fannie Mae, 3.0%, 8/1/42 | 30,989 |
| 263,679 | | Fannie Mae, 3.0%, 8/1/42 | 286,411 |
| 64,412 | | Fannie Mae, 3.0%, 9/1/42 | 69,910 |
| 125,050 | | Fannie Mae, 3.0%, 11/1/42 | 135,723 |
| 55,297 | | Fannie Mae, 3.0%, 12/1/42 | 59,776 |
| 60,165 | | Fannie Mae, 3.0%, 4/1/43 | 65,040 |
The accompanying notes are an integral part of these financial statements.
25
| | |
| Pioneer Bond VCT Portfolio | Pioneer Variable Contracts Trust |
| Schedule of Investments 12/31/20 (continued) | |
| | | | |
| Principal | | | |
| Amount | | | |
| USD ($) | | | Value |
| | | U.S. GOVERNMENT AND AGENCY OBLIGATIONS – (continued) | |
| 13,784 | | Fannie Mae, 3.0%, 5/1/43 | $ 14,901 |
| 51,811 | | Fannie Mae, 3.0%, 5/1/43 | 56,520 |
| 147,506 | | Fannie Mae, 3.0%, 5/1/43 | 156,506 |
| 25,541 | | Fannie Mae, 3.0%, 8/1/43 | 27,101 |
| 22,793 | | Fannie Mae, 3.0%, 9/1/43 | 24,239 |
| 24,219 | | Fannie Mae, 3.0%, 3/1/45 | 26,275 |
| 27,408 | | Fannie Mae, 3.0%, 4/1/45 | 29,736 |
| 133,738 | | Fannie Mae, 3.0%, 6/1/45 | 145,827 |
| 3,632,000 | | Fannie Mae, 3.0%, 1/1/51 (TBA) | 3,805,371 |
| 3,000,000 | | Fannie Mae, 3.0%, 2/1/51 (TBA) | 3,145,898 |
| 16,055 | | Fannie Mae, 3.5%, 11/1/40 | 17,335 |
| 7,833 | | Fannie Mae, 3.5%, 10/1/41 | 8,654 |
| 95,841 | | Fannie Mae, 3.5%, 6/1/42 | 104,807 |
| 47,448 | | Fannie Mae, 3.5%, 7/1/42 | 51,457 |
| 34,469 | | Fannie Mae, 3.5%, 8/1/42 | 37,687 |
| 49,769 | | Fannie Mae, 3.5%, 8/1/42 | 54,128 |
| 93,902 | | Fannie Mae, 3.5%, 5/1/44 | 101,235 |
| 47,960 | | Fannie Mae, 3.5%, 12/1/44 | 52,144 |
| 205,672 | | Fannie Mae, 3.5%, 2/1/45 | 227,164 |
| 126,062 | | Fannie Mae, 3.5%, 6/1/45 | 136,730 |
| 157,002 | | Fannie Mae, 3.5%, 8/1/45 | 174,173 |
| 41,013 | | Fannie Mae, 3.5%, 9/1/45 | 45,054 |
| 63,819 | | Fannie Mae, 3.5%, 9/1/45 | 68,157 |
| 159,359 | | Fannie Mae, 3.5%, 9/1/45 | 176,511 |
| 214,911 | | Fannie Mae, 3.5%, 11/1/45 | 238,416 |
| 46,027 | | Fannie Mae, 3.5%, 5/1/46 | 50,321 |
| 12,658 | | Fannie Mae, 3.5%, 10/1/46 | 13,730 |
| 154,304 | | Fannie Mae, 3.5%, 1/1/47 | 168,597 |
| 227,317 | | Fannie Mae, 3.5%, 1/1/47 | 246,428 |
| 172,505 | | Fannie Mae, 3.5%, 12/1/47 | 183,335 |
| 738,000 | | Fannie Mae, 3.5%, 1/1/51 (TBA) | 780,089 |
| 146,648 | | Fannie Mae, 4.0%, 10/1/40 | 165,792 |
| 19,240 | | Fannie Mae, 4.0%, 12/1/40 | 21,752 |
| 3,788 | | Fannie Mae, 4.0%, 11/1/41 | 4,175 |
| 4,348 | | Fannie Mae, 4.0%, 12/1/41 | 4,740 |
| 2,712 | | Fannie Mae, 4.0%, 1/1/42 | 2,975 |
| 37,387 | | Fannie Mae, 4.0%, 1/1/42 | 41,213 |
| 136,976 | | Fannie Mae, 4.0%, 1/1/42 | 150,992 |
| 36,368 | | Fannie Mae, 4.0%, 2/1/42 | 39,903 |
| 36,863 | | Fannie Mae, 4.0%, 4/1/42 | 40,635 |
| 80,385 | | Fannie Mae, 4.0%, 5/1/42 | 87,559 |
| 96,788 | | Fannie Mae, 4.0%, 7/1/42 | 106,374 |
| 256,352 | | Fannie Mae, 4.0%, 8/1/42 | 281,225 |
| 104,558 | | Fannie Mae, 4.0%, 8/1/43 | 113,954 |
| 69,710 | | Fannie Mae, 4.0%, 11/1/43 | 77,351 |
| 14,314 | | Fannie Mae, 4.0%, 4/1/46 | 15,499 |
| 72,785 | | Fannie Mae, 4.0%, 7/1/46 | 78,561 |
| 139,233 | | Fannie Mae, 4.0%, 7/1/46 | 151,496 |
The accompanying notes are an integral part of these financial statements.
26
| | |
| Pioneer Bond VCT Portfolio | Pioneer Variable Contracts Trust |
| | | | |
| Principal | | | |
| Amount | | | |
| USD ($) | | | Value |
| | | U.S. GOVERNMENT AND AGENCY OBLIGATIONS – (continued) | |
| 74,235 | | Fannie Mae, 4.0%, 8/1/46 | $ 80,222 |
| 23,695 | | Fannie Mae, 4.0%, 11/1/46 | 25,545 |
| 34,469 | | Fannie Mae, 4.0%, 11/1/46 | 37,294 |
| 70,824 | | Fannie Mae, 4.0%, 4/1/47 | 77,293 |
| 97,937 | | Fannie Mae, 4.0%, 4/1/47 | 107,145 |
| 16,967 | | Fannie Mae, 4.0%, 6/1/47 | 18,563 |
| 33,685 | | Fannie Mae, 4.0%, 6/1/47 | 36,762 |
| 60,081 | | Fannie Mae, 4.0%, 6/1/47 | 64,656 |
| 66,019 | | Fannie Mae, 4.0%, 6/1/47 | 71,085 |
| 52,015 | | Fannie Mae, 4.0%, 7/1/47 | 55,855 |
| 55,552 | | Fannie Mae, 4.0%, 7/1/47 | 60,183 |
| 131,188 | | Fannie Mae, 4.0%, 12/1/47 | 140,625 |
| 1,483,000 | | Fannie Mae, 4.0%, 1/1/51 (TBA) | 1,583,798 |
| 23,906 | | Fannie Mae, 4.5%, 11/1/40 | 26,731 |
| 3,846 | | Fannie Mae, 4.5%, 4/1/41 | 4,318 |
| 66,977 | | Fannie Mae, 4.5%, 5/1/41 | 74,824 |
| 173,187 | | Fannie Mae, 4.5%, 5/1/41 | 194,469 |
| 192,597 | | Fannie Mae, 4.5%, 5/1/41 | 216,224 |
| 405,523 | | Fannie Mae, 4.5%, 6/1/44 | 453,811 |
| 191,281 | | Fannie Mae, 4.5%, 5/1/49 | 211,001 |
| 137,136 | | Fannie Mae, 4.5%, 4/1/50 | 151,320 |
| 3,355,000 | | Fannie Mae, 4.5%, 1/1/51 (TBA) | 3,635,981 |
| 52,172 | | Fannie Mae, 5.0%, 5/1/31 | 59,193 |
| 4,162 | | Fannie Mae, 5.0%, 6/1/40 | 4,837 |
| 2,491 | | Fannie Mae, 5.0%, 7/1/40 | 2,834 |
| 4,125 | | Fannie Mae, 5.5%, 9/1/33 | 4,789 |
| 5,088 | | Fannie Mae, 5.5%, 12/1/34 | 5,891 |
| 16,719 | | Fannie Mae, 5.5%, 10/1/35 | 19,571 |
| 3,282 | | Fannie Mae, 6.0%, 9/1/29 | 3,747 |
| 858 | | Fannie Mae, 6.0%, 10/1/32 | 977 |
| 2,404 | | Fannie Mae, 6.0%, 11/1/32 | 2,703 |
| 12,447 | | Fannie Mae, 6.0%, 11/1/32 | 13,995 |
| 7,754 | | Fannie Mae, 6.0%, 4/1/33 | 8,930 |
| 4,030 | | Fannie Mae, 6.0%, 5/1/33 | 4,543 |
| 3,966 | | Fannie Mae, 6.0%, 6/1/33 | 4,456 |
| 13,768 | | Fannie Mae, 6.0%, 7/1/34 | 16,222 |
| 1,637 | | Fannie Mae, 6.0%, 9/1/34 | 1,862 |
| 1,684 | | Fannie Mae, 6.0%, 7/1/38 | 1,925 |
| 65 | | Fannie Mae, 6.5%, 7/1/21 | 73 |
| 765 | | Fannie Mae, 6.5%, 4/1/29 | 857 |
| 1,836 | | Fannie Mae, 6.5%, 1/1/32 | 2,077 |
| 1,105 | | Fannie Mae, 6.5%, 2/1/32 | 1,259 |
| 1,585 | | Fannie Mae, 6.5%, 3/1/32 | 1,810 |
| 2,670 | | Fannie Mae, 6.5%, 4/1/32 | 2,992 |
| 1,131 | | Fannie Mae, 6.5%, 8/1/32 | 1,303 |
| 2,048 | | Fannie Mae, 6.5%, 8/1/32 | 2,334 |
| 18,413 | | Fannie Mae, 6.5%, 7/1/34 | 21,442 |
| 622 | | Fannie Mae, 7.0%, 11/1/29 | 624 |
The accompanying notes are an integral part of these financial statements.
27
| | |
| Pioneer Bond VCT Portfolio | Pioneer Variable Contracts Trust |
| Schedule of Investments 12/31/20 (continued) | |
| | | | |
| Principal | | | |
| Amount | | | |
| USD ($) | | | Value |
| | | U.S. GOVERNMENT AND AGENCY OBLIGATIONS – (continued) | |
| 915 | | Fannie Mae, 7.0%, 9/1/30 | $ 918 |
| 356 | | Fannie Mae, 7.0%, 7/1/31 | 366 |
| 1,452 | | Fannie Mae, 7.0%, 1/1/32 | 1,715 |
| 430 | | Fannie Mae, 7.5%, 2/1/31 | 513 |
| 2,879 | | Fannie Mae, 8.0%, 10/1/30 | 3,456 |
| 416,000 | | Federal Home Loan Mortgage Corp., 1.5%, 1/1/36 | 428,193 |
| 1,455,000 | | Federal Home Loan Mortgage Corp., 1.5%, 1/1/51 | 1,470,548 |
| 880,606 | | Federal Home Loan Mortgage Corp., 2.0%, 12/1/35 | 920,916 |
| 32,673 | | Federal Home Loan Mortgage Corp., 3.0%, 10/1/29 | 34,352 |
| 14,639 | | Federal Home Loan Mortgage Corp., 3.0%, 9/1/42 | 15,942 |
| 22,073 | | Federal Home Loan Mortgage Corp., 3.0%, 9/1/42 | 23,963 |
| 122,903 | | Federal Home Loan Mortgage Corp., 3.0%, 11/1/42 | 133,431 |
| 28,000 | | Federal Home Loan Mortgage Corp., 3.0%, 1/1/43 | 30,554 |
| 46,532 | | Federal Home Loan Mortgage Corp., 3.0%, 2/1/43 | 50,775 |
| 66,162 | | Federal Home Loan Mortgage Corp., 3.0%, 2/1/43 | 72,197 |
| 42,263 | | Federal Home Loan Mortgage Corp., 3.0%, 4/1/43 | 45,885 |
| 120,276 | | Federal Home Loan Mortgage Corp., 3.0%, 4/1/43 | 131,182 |
| 45,418 | | Federal Home Loan Mortgage Corp., 3.0%, 5/1/43 | 49,310 |
| 95,626 | | Federal Home Loan Mortgage Corp., 3.0%, 6/1/46 | 103,783 |
| 31,433 | | Federal Home Loan Mortgage Corp., 3.0%, 12/1/46 | 34,035 |
| 43,894 | | Federal Home Loan Mortgage Corp., 3.0%, 12/1/46 | 46,215 |
| 38,352 | | Federal Home Loan Mortgage Corp., 3.5%, 7/1/29 | 41,164 |
| 12,712 | | Federal Home Loan Mortgage Corp., 3.5%, 10/1/40 | 13,817 |
| 31,399 | | Federal Home Loan Mortgage Corp., 3.5%, 5/1/42 | 33,820 |
| 31,079 | | Federal Home Loan Mortgage Corp., 3.5%, 10/1/42 | 33,810 |
| 33,644 | | Federal Home Loan Mortgage Corp., 3.5%, 10/1/42 | 36,802 |
| 153,384 | | Federal Home Loan Mortgage Corp., 3.5%, 6/1/45 | 167,734 |
| 131,528 | | Federal Home Loan Mortgage Corp., 3.5%, 10/1/45 | 143,834 |
| 234,119 | | Federal Home Loan Mortgage Corp., 3.5%, 11/1/45 | 253,636 |
| 143,857 | | Federal Home Loan Mortgage Corp., 3.5%, 7/1/46 | 158,084 |
| 201,269 | | Federal Home Loan Mortgage Corp., 3.5%, 8/1/46 | 219,864 |
| 228,260 | | Federal Home Loan Mortgage Corp., 3.5%, 8/1/46 | 247,331 |
| 260,307 | | Federal Home Loan Mortgage Corp., 3.5%, 12/1/46 | 284,677 |
| 15,396 | | Federal Home Loan Mortgage Corp., 3.5%, 6/1/47 | 16,736 |
| 139,796 | | Federal Home Loan Mortgage Corp., 4.0%, 11/1/41 | 158,097 |
| 108,180 | | Federal Home Loan Mortgage Corp., 4.0%, 10/1/42 | 119,262 |
| 17,787 | | Federal Home Loan Mortgage Corp., 4.0%, 5/1/46 | 19,354 |
| 63,178 | | Federal Home Loan Mortgage Corp., 4.0%, 6/1/46 | 68,300 |
| 102,163 | | Federal Home Loan Mortgage Corp., 4.0%, 7/1/46 | 111,042 |
| 69,851 | | Federal Home Loan Mortgage Corp., 4.0%, 8/1/46 | 75,409 |
| 30,075 | | Federal Home Loan Mortgage Corp., 4.0%, 3/1/47 | 32,572 |
| 45,459 | | Federal Home Loan Mortgage Corp., 4.0%, 4/1/47 | 49,622 |
| 50,197 | | Federal Home Loan Mortgage Corp., 4.0%, 4/1/47 | 54,318 |
| 116,167 | | Federal Home Loan Mortgage Corp., 4.0%, 4/1/47 | 124,965 |
| 131,170 | | Federal Home Loan Mortgage Corp., 4.0%, 4/1/47 | 142,124 |
| 250,620 | | Federal Home Loan Mortgage Corp., 4.0%, 4/1/47 | 269,549 |
| 136,248 | | Federal Home Loan Mortgage Corp., 4.0%, 5/1/47 | 146,495 |
| 16,667 | | Federal Home Loan Mortgage Corp., 4.0%, 6/1/47 | 17,895 |
The accompanying notes are an integral part of these financial statements.
28
| | |
| Pioneer Bond VCT Portfolio | Pioneer Variable Contracts Trust |
| | | | |
| Principal | | | |
| Amount | | | |
| USD ($) | | | Value |
| | | U.S. GOVERNMENT AND AGENCY OBLIGATIONS – (continued) | |
| 34,319 | | Federal Home Loan Mortgage Corp., 4.0%, 7/1/47 | $ 36,939 |
| 112,709 | | Federal Home Loan Mortgage Corp., 4.0%, 10/1/47 | 120,672 |
| 353,781 | | Federal Home Loan Mortgage Corp., 4.5%, 7/1/49 | 383,697 |
| 378,612 | | Federal Home Loan Mortgage Corp., 4.5%, 8/1/49 | 410,567 |
| 142 | | Federal Home Loan Mortgage Corp., 5.0%, 12/1/21 | 148 |
| 2,874 | | Federal Home Loan Mortgage Corp., 5.0%, 9/1/38 | 3,341 |
| 3,161 | | Federal Home Loan Mortgage Corp., 5.0%, 10/1/38 | 3,674 |
| 5,777 | | Federal Home Loan Mortgage Corp., 5.0%, 5/1/39 | 6,720 |
| 15,640 | | Federal Home Loan Mortgage Corp., 5.0%, 12/1/39 | 18,193 |
| 7,775 | | Federal Home Loan Mortgage Corp., 5.5%, 9/1/33 | 9,061 |
| 10,618 | | Federal Home Loan Mortgage Corp., 5.5%, 6/1/41 | 12,479 |
| 344 | | Federal Home Loan Mortgage Corp., 6.0%, 10/1/32 | 386 |
| 2,993 | | Federal Home Loan Mortgage Corp., 6.0%, 11/1/32 | 3,375 |
| 3,655 | | Federal Home Loan Mortgage Corp., 6.0%, 12/1/32 | 4,345 |
| 6,549 | | Federal Home Loan Mortgage Corp., 6.0%, 2/1/33 | 7,830 |
| 2,827 | | Federal Home Loan Mortgage Corp., 6.0%, 1/1/34 | 3,209 |
| 735 | | Federal Home Loan Mortgage Corp., 6.0%, 12/1/36 | 855 |
| 1,982 | | Federal Home Loan Mortgage Corp., 6.5%, 1/1/29 | 2,223 |
| 948 | | Federal Home Loan Mortgage Corp., 6.5%, 4/1/31 | 1,078 |
| 3,888 | | Federal Home Loan Mortgage Corp., 6.5%, 10/1/31 | 4,357 |
| 1,348 | | Federal Home Loan Mortgage Corp., 6.5%, 2/1/32 | 1,512 |
| 1,789 | | Federal Home Loan Mortgage Corp., 6.5%, 3/1/32 | 2,005 |
| 7,150 | | Federal Home Loan Mortgage Corp., 6.5%, 4/1/32 | 8,248 |
| 3,062 | | Federal Home Loan Mortgage Corp., 6.5%, 7/1/32 | 3,507 |
| 160 | | Federal Home Loan Mortgage Corp., 7.0%, 8/1/22 | 161 |
| 621 | | Federal Home Loan Mortgage Corp., 7.0%, 9/1/22 | 627 |
| 956 | | Federal Home Loan Mortgage Corp., 7.0%, 2/1/31 | 1,121 |
| 648 | | Federal Home Loan Mortgage Corp., 7.0%, 3/1/32 | 651 |
| 1,636 | | Federal Home Loan Mortgage Corp., 7.0%, 4/1/32 | 1,892 |
| 28,392 | | Federal Home Loan Mortgage Corp., 7.0%, 10/1/46 | 29,667 |
| 1,244 | | Federal Home Loan Mortgage Corp., 7.5%, 8/1/31 | 1,458 |
| 510,000 | | Government National Mortgage Association, 2.0%, 1/15/51 (TBA) | 533,329 |
| 850,000 | | Government National Mortgage Association, 2.5%, 1/1/51 (TBA) | 899,805 |
| 100,000 | | Government National Mortgage Association, 3.0%, 1/1/51 (TBA) | 104,570 |
| 430,000 | | Government National Mortgage Association, 3.0%, 2/1/51 (TBA) | 449,921 |
| 155,692 | | Government National Mortgage Association I, 3.5%, 11/15/41 | 166,477 |
| 59,189 | | Government National Mortgage Association I, 3.5%, 8/15/42 | 63,365 |
| 27,209 | | Government National Mortgage Association I, 3.5%, 10/15/42 | 29,006 |
| 72,579 | | Government National Mortgage Association I, 3.5%, 1/15/45 | 77,368 |
| 52,379 | | Government National Mortgage Association I, 3.5%, 8/15/46 | 55,563 |
| 72,924 | | Government National Mortgage Association I, 4.0%, 1/15/25 | 79,110 |
| 56,357 | | Government National Mortgage Association I, 4.0%, 8/15/43 | 65,763 |
| 211,430 | | Government National Mortgage Association I, 4.0%, 3/15/44 | 225,583 |
| 18,587 | | Government National Mortgage Association I, 4.0%, 9/15/44 | 20,088 |
| 55,225 | | Government National Mortgage Association I, 4.0%, 4/15/45 | 59,683 |
| 79,747 | | Government National Mortgage Association I, 4.0%, 6/15/45 | 86,277 |
| 9,176 | | Government National Mortgage Association I, 4.0%, 7/15/45 | 10,116 |
| 10,466 | | Government National Mortgage Association I, 4.0%, 8/15/45 | 11,398 |
The accompanying notes are an integral part of these financial statements.
29
| | |
| Pioneer Bond VCT Portfolio | Pioneer Variable Contracts Trust |
| Schedule of Investments 12/31/20 (continued) | |
| | | | |
| Principal | | | |
| Amount | | | |
| USD ($) | | | Value |
| | | U.S. GOVERNMENT AND AGENCY OBLIGATIONS – (continued) | |
| 44,829 | | Government National Mortgage Association I, 4.5%, 5/15/39 | $ 50,753 |
| 2,266 | | Government National Mortgage Association I, 4.5%, 8/15/41 | 2,524 |
| 1,774 | | Government National Mortgage Association I, 5.0%, 9/15/33 | 1,956 |
| 6,624 | | Government National Mortgage Association I, 5.5%, 3/15/33 | 7,410 |
| 7,817 | | Government National Mortgage Association I, 5.5%, 7/15/33 | 9,013 |
| 19,895 | | Government National Mortgage Association I, 5.5%, 8/15/33 | 22,973 |
| 9,959 | | Government National Mortgage Association I, 5.5%, 10/15/34 | 11,219 |
| 7,004 | | Government National Mortgage Association I, 6.0%, 4/15/28 | 8,055 |
| 5,297 | | Government National Mortgage Association I, 6.0%, 2/15/29 | 5,999 |
| 7,131 | | Government National Mortgage Association I, 6.0%, 9/15/32 | 8,343 |
| 1,346 | | Government National Mortgage Association I, 6.0%, 10/15/32 | 1,511 |
| 2,932 | | Government National Mortgage Association I, 6.0%, 10/15/32 | 3,294 |
| 8,992 | | Government National Mortgage Association I, 6.0%, 11/15/32 | 10,629 |
| 14,204 | | Government National Mortgage Association I, 6.0%, 11/15/32 | 16,012 |
| 4,606 | | Government National Mortgage Association I, 6.0%, 1/15/33 | 5,566 |
| 10,490 | | Government National Mortgage Association I, 6.0%, 12/15/33 | 12,108 |
| 7,616 | | Government National Mortgage Association I, 6.0%, 8/15/34 | 9,214 |
| 7,961 | | Government National Mortgage Association I, 6.0%, 8/15/34 | 8,944 |
| 885 | | Government National Mortgage Association I, 6.5%, 3/15/26 | 983 |
| 2,822 | | Government National Mortgage Association I, 6.5%, 6/15/28 | 3,229 |
| 3,062 | | Government National Mortgage Association I, 6.5%, 6/15/28 | 3,400 |
| 332 | | Government National Mortgage Association I, 6.5%, 2/15/29 | 369 |
| 2,869 | | Government National Mortgage Association I, 6.5%, 5/15/29 | 3,332 |
| 8,031 | | Government National Mortgage Association I, 6.5%, 5/15/29 | 9,204 |
| 16,902 | | Government National Mortgage Association I, 6.5%, 7/15/31 | 18,772 |
| 2,999 | | Government National Mortgage Association I, 6.5%, 9/15/31 | 3,390 |
| 5,523 | | Government National Mortgage Association I, 6.5%, 10/15/31 | 6,134 |
| 1,604 | | Government National Mortgage Association I, 6.5%, 12/15/31 | 1,840 |
| 2,213 | | Government National Mortgage Association I, 6.5%, 12/15/31 | 2,457 |
| 324 | | Government National Mortgage Association I, 6.5%, 4/15/32 | 369 |
| 995 | | Government National Mortgage Association I, 6.5%, 4/15/32 | 1,137 |
| 795 | | Government National Mortgage Association I, 6.5%, 6/15/32 | 883 |
| 896 | | Government National Mortgage Association I, 6.5%, 6/15/32 | 995 |
| 1,417 | | Government National Mortgage Association I, 6.5%, 6/15/32 | 1,602 |
| 4,457 | | Government National Mortgage Association I, 6.5%, 7/15/32 | 5,080 |
| 13,159 | | Government National Mortgage Association I, 6.5%, 12/15/32 | 15,587 |
| 12,980 | | Government National Mortgage Association I, 7.0%, 7/15/26 | 13,503 |
| 1,119 | | Government National Mortgage Association I, 7.0%, 9/15/27 | 1,141 |
| 12,760 | | Government National Mortgage Association I, 7.0%, 2/15/28 | 13,321 |
| 3,567 | | Government National Mortgage Association I, 7.0%, 11/15/28 | 3,933 |
| 2,450 | | Government National Mortgage Association I, 7.0%, 1/15/29 | 2,745 |
| 3,442 | | Government National Mortgage Association I, 7.0%, 6/15/29 | 3,749 |
| 593 | | Government National Mortgage Association I, 7.0%, 7/15/29 | 618 |
| 1,817 | | Government National Mortgage Association I, 7.0%, 7/15/29 | 2,025 |
| 588 | | Government National Mortgage Association I, 7.0%, 12/15/30 | 600 |
| 1,541 | | Government National Mortgage Association I, 7.0%, 2/15/31 | 1,575 |
| 2,012 | | Government National Mortgage Association I, 7.0%, 8/15/31 | 2,414 |
| 2,469 | | Government National Mortgage Association I, 7.0%, 5/15/32 | 2,479 |
The accompanying notes are an integral part of these financial statements.
30
| | |
| Pioneer Bond VCT Portfolio | Pioneer Variable Contracts Trust |
| | | | |
| Principal | | | |
| Amount | | | |
| USD ($) | | | Value |
| | | U.S. GOVERNMENT AND AGENCY OBLIGATIONS – (continued) | |
| 134 | | Government National Mortgage Association I, 7.5%, 10/15/22 | $ 138 |
| 80 | | Government National Mortgage Association I, 7.5%, 6/15/23 | 80 |
| 1,684 | | Government National Mortgage Association I, 7.5%, 10/15/29 | 1,752 |
| 6,211 | | Government National Mortgage Association II, 3.5%, 3/20/45 | 6,662 |
| 8,575 | | Government National Mortgage Association II, 3.5%, 4/20/45 | 9,486 |
| 12,497 | | Government National Mortgage Association II, 3.5%, 4/20/45 | 13,639 |
| 22,219 | | Government National Mortgage Association II, 3.5%, 4/20/45 | 24,538 |
| 76,980 | | Government National Mortgage Association II, 3.5%, 1/20/46 | 82,877 |
| 28,920 | | Government National Mortgage Association II, 3.5%, 3/20/46 | 32,516 |
| 150,109 | | Government National Mortgage Association II, 3.5%, 11/20/46 | 161,887 |
| 15,223 | | Government National Mortgage Association II, 4.0%, 8/20/39 | 16,833 |
| 18,245 | | Government National Mortgage Association II, 4.0%, 7/20/42 | 20,179 |
| 250,623 | | Government National Mortgage Association II, 4.0%, 7/20/44 | 276,614 |
| 24,492 | | Government National Mortgage Association II, 4.0%, 9/20/44 | 27,028 |
| 29,376 | | Government National Mortgage Association II, 4.0%, 3/20/46 | 32,232 |
| 90,031 | | Government National Mortgage Association II, 4.0%, 10/20/46 | 98,276 |
| 50,599 | | Government National Mortgage Association II, 4.0%, 2/20/48 | 56,155 |
| 60,344 | | Government National Mortgage Association II, 4.0%, 4/20/48 | 66,999 |
| 6,519 | | Government National Mortgage Association II, 4.5%, 9/20/41 | 7,262 |
| 42,034 | | Government National Mortgage Association II, 4.5%, 5/20/43 | 46,829 |
| 120,990 | | Government National Mortgage Association II, 4.5%, 1/20/44 | 134,799 |
| 83,835 | | Government National Mortgage Association II, 4.5%, 9/20/44 | 88,865 |
| 31,570 | | Government National Mortgage Association II, 4.5%, 10/20/44 | 35,172 |
| 65,616 | | Government National Mortgage Association II, 4.5%, 11/20/44 | 73,252 |
| 267,430 | | Government National Mortgage Association II, 4.5%, 2/20/48 | 291,016 |
| 7,714 | | Government National Mortgage Association II, 6.0%, 11/20/33 | 8,947 |
| 1,497 | | Government National Mortgage Association II, 6.5%, 8/20/28 | 1,712 |
| 2,353 | | Government National Mortgage Association II, 6.5%, 12/20/28 | 2,716 |
| 1,453 | | Government National Mortgage Association II, 6.5%, 9/20/31 | 1,709 |
| 1,677 | | Government National Mortgage Association II, 7.0%, 5/20/26 | 1,840 |
| 4,856 | | Government National Mortgage Association II, 7.0%, 2/20/29 | 5,553 |
| 724 | | Government National Mortgage Association II, 7.0%, 1/20/31 | 851 |
| 379 | | Government National Mortgage Association II, 7.5%, 8/20/27 | 436 |
| 121 | | Government National Mortgage Association II, 8.0%, 8/20/25 | 133 |
| 1,000,000(i) | | U.S. Treasury Bills, 1/7/21 | 999,997 |
| 10,000,000(i) | | U.S. Treasury Bills, 1/26/21 | 9,999,710 |
| 557,653 | | U.S. Treasury Inflation Indexed Bonds, 0.25%, 2/15/50 | 664,312 |
| 934,498 | | U.S. Treasury Inflation Indexed Bonds, 1.0%, 2/15/48 | 1,300,352 |
| 1,763,265 | | U.S. Treasury Inflation Indexed Bonds, 1.0%, 2/15/49 | 2,481,704 |
| 7,425,000 | | U.S. Treasury Notes, 0.125%, 10/31/22 | 7,426,160 |
| 1,537,900 | | U.S. Treasury Notes, 0.25%, 10/31/25 | 1,531,292 |
| | | TOTAL U.S. GOVERNMENT AND AGENCY OBLIGATIONS | |
| | | (Cost $63,404,661) | $ 65,251,334 |
| | | TOTAL INVESTMENTS IN UNAFFILIATED ISSUERS – 101.8% | |
| | | (Cost $181,731,252) | $190,999,688 |
The accompanying notes are an integral part of these financial statements.
31
| | |
| Pioneer Bond VCT Portfolio | Pioneer Variable Contracts Trust |
| Schedule of Investments 12/31/20 (continued) | |
| | | | | | | |
| | | | | | Change | |
| | | | | | in Net | |
| | | | | Net | Unrealized | |
| | | | Dividend | Realized | Appreciation | |
| Shares | | | Income | Gain (Loss) | (Depreciation) | Value |
| | | AFFILIATED ISSUER – 1.5% | | | | |
| | | CLOSED-END FUND – 1.5% of Net Assets | | | | |
| 321,413(j) | | Pioneer ILS Interval Fund | $141,936 | $ — | $54,640 | $ 2,728,793 |
| | | TOTAL CLOSED-END FUND | | | | |
| | | (Cost $3,263,545) | | | | $ 2,728,793 |
| | | TOTAL INVESTMENTS IN AFFILIATED ISSUER – 1.5% | | | |
| | | (Cost $3,263,545) | | | | $ 2,728,793 |
| | | OTHER ASSETS AND LIABILITIES – (3.3)% | | | $ (6,040,670) |
| | | NET ASSETS – 100.0% | | | | $187,687,811 |
| | |
bps | Basis Points. |
CMT | Constant Maturity Treasury Index. |
FREMF | Freddie Mac Multifamily Fixed-Rate Mortgage Loans. |
LIBOR | London Interbank Offered Rate. |
REIT | Real Estate Investment Trust. |
REMICS | Real Estate Mortgage Investment Conduits. |
SOFRRATE | Secured Overnight Financing Rate. |
(144A) | Security is exempt from registration under Rule 144A of the Securities Act of 1933. Such securities may be resold normally to qualified institutional buyers in a transaction exempt from registration. At December 31, 2020, the value of these securities amounted to $67,509,718, or 36.0% of net assets. |
(TBA) | “To Be Announced” Securities. |
† | Amount rounds to less than 0.1%. |
* | Senior secured floating rate loan interests in which the Portfolio invests generally pay interest at rates that are periodically redetermined by reference to a base lending rate plus a premium. These base lending rates are generally (i) the lending rate offered by one or more major European banks, such as LIBOR, (ii) the prime rate offered by one or more major United States banks, (iii) the rate of a certificate of deposit or (iv) other base lending rates used by commercial lenders. The interest rate shown is the rate accruing at December 31, 2020. |
+ | Security that used significant unobservable inputs to determine its value. |
(a) | Security is perpetual in nature and has no stated maturity date. |
(b) | Floating rate note. Coupon rate, reference index and spread shown at December 31, 2020. |
(c) | Debt obligation initially issued at one coupon which converts to a higher coupon at a specific date. The rate shown is the rate at December 31, 2020. |
(d) | The interest rate is subject to change periodically. The interest rate and/or reference index and spread shown at December 31, 2020. |
(e) | Security represents the interest-only portion payments on a pool of underlying mortgages or mortgage-backed securities. |
(f) | Issued as preference shares. |
(g) | Non-income producing security. |
(h) | Consists of Revenue Bonds unless otherwise indicated. |
(i) | Security issued with a zero coupon. Income is recognized through accretion of discount. |
(j) | Pioneer ILS Interval Fund is an affiliated closed-end fund managed by Amundi Asset Management US, Inc. (the “Adviser”). |
# | Securities are restricted as to resale. |
| | | | | | | | |
| Restricted Securities | Acquisition date | | Cost | | | Value | |
Lorenz Re 2018 | 6/26/2018 | | $ | 11,497 | | | $ | 595 | |
Lorenz Re 2019 | 7/10/2019 | | | 8,368 | | | | 1,695 | |
| Total Restricted Securities | | | | | | | $ | 2,290 | |
| | |
| % of Net assets | | | | | | | | 0.0%† |
|
The accompanying notes are an integral part of these financial statements.
32
| | |
| Pioneer Bond VCT Portfolio | Pioneer Variable Contracts Trust |
FUTURES CONTRACTS
FIXED INCOME INDEX FUTURES CONTRACTS
| | | | | | | | | | | | | |
| | | | | | | | | | | | Unrealized | |
| Number of | | | Expiration | | Notional | | | Market | | | Appreciation | |
| Contracts Long | | Description | Date | | Amount | | | Value | | | (Depreciation) | |
| | 32 | | U.S. 2 Year Note (CBT) | 3/31/21 | | $ | 7,064,484 | | | $ | 7,071,250 | | | $ | 6,766 | |
| | 112 | | U.S. 5 Year Note (CBT) | 3/31/21 | | | 14,099,695 | | | | 14,130,375 | | | | 30,680 | |
| | 54 | | U.S. Ultra Bond (CBT) | 3/22/21 | | | 11,690,102 | | | | 11,532,375 | | | | (157,727 | ) |
| | | | | | | $ | 32,854,281 | | | $ | 32,734,000 | | | $ | (120,281 | ) |
| | |
| | | | | | | | | | | | | | | Unrealized | |
| Number of | | | Expiration | | Notional | | | Market | | | Appreciation | |
| Contracts Short | | Description | Date | | Amount | | | Value | | | (Depreciation) | |
| | 74 | | U.S. 10 Year Note (CBT) | 3/22/21 | | $ | (10,207,125 | ) | | $ | (10,217,781 | ) | | $ | (10,656 | ) |
| | 56 | | U.S. 10 Year Ultra | 3/22/21 | | | (8,789,406 | ) | | | (8,756,125 | ) | | | 33,281 | |
| | 9 | | U.S. Long Bond (CBT) | 3/22/21 | | | (1,573,844 | ) | | | (1,558,688 | ) | | | 15,156 | |
| | | | | | | $ | (20,570,375 | ) | | $ | (20,532,594 | ) | | $ | 37,781 | |
| TOTAL FUTURES CONTRACTS | | | $ | 12,283,906 | | | $ | 12,201,406 | | | $ | (82,500 | ) |
| | | | | | | | |
SWAP CONTRACT
|
CENTRALLY CLEARED CREDIT DEFAULT SWAP CONTRACT – SELL PROTECTION
|
| Notional | | Pay/ | Annual | Expiration | Premiums | Unrealized | Market |
Amount ($)(1) | Reference Obligation/Index | Receive(2) | Fixed Rate | Date | (Received) | Appreciation | Value |
| 490,000 | Markit CDX North America High | | | | | | |
| Yield Series 35 | Receive | 5.00% | 12/20/25 | $(136) | $46,650 | $46,514 |
| TOTAL SWAP CONTRACT | | | | $(136) | $46,650 | $46,514 |
(1) The notional amount is the maximum amount that a seller of credit protection would be obligated to pay upon occurrence of a credit event.
(2) Receive quarterly.
Purchases and sales of securities (excluding temporary cash investments) for the year ended December 31, 2020 were as follows:
| | | | | |
| Purchases | | Sales | |
| Long-Term U.S. Government Securities | | $ | 22,209,586 | | | $ | 37,685,727 | |
| Other Long-Term Securities | | $ | 79,378,307 | | | $ | 95,470,372 | |
The Portfolio is permitted to engage in purchase and sale transactions (“cross trades”) with certain funds and accounts for which the Adviser serves as the Portfolio’s investment adviser, as set forth in Rule 17a-7 under the Investment Company Act of 1940, pursuant to procedures adopted by the Board of Trustees. Under these procedures, cross trades are effected at current market prices. During the year ended December 31, 2020, the Portfolio engaged in sales of $18,921 which resulted in a net realized gain/(loss) of $1,069. During the year ended December 31, 2020, the Portfolio did not engage in purchases pursuant to these procedures.
At December 31, 2020, the net unrealized appreciation on investments based on cost for federal tax purposes of $185,191,172 was as follows:
| | | | |
| Aggregate gross unrealized appreciation for all investments in which there is an excess of value over tax cost | | $ | 10,035,771 | |
| Aggregate gross unrealized depreciation for all investments in which there is an excess of tax cost over value | | | (1,534,448 | ) |
| Net unrealized appreciation | | $ | 8,501,323 | |
Various inputs are used in determining the value of the Portfolio’s investments. These inputs are summarized in the three broad levels below.
Level 1 – unadjusted quoted prices in active markets for identical securities.
Level 2 – other significant observable inputs (including quoted prices for similar securities, interest rates, prepayment speeds, credit risks, etc.). See Notes to Financial Statements — Note 1A.
Level 3 – significant unobservable inputs (including the Portfolio’s own assumptions in determining fair value of investments). See Notes to Financial Statements — Note 1A.
The accompanying notes are an integral part of these financial statements.
33
| | |
| Pioneer Bond VCT Portfolio | Pioneer Variable Contracts Trust |
| Schedule of Investments 12/31/20 (continued) | |
The following is a summary of the inputs used as of December 31, 2020, in valuing the Portfolio’s investments:
| | | | | | | | | | | | | |
| | | Level 1 | | | Level 2 | | | Level 3 | | | Total | |
| Common Stock | | $ | 14,154 | | | $ | — | | | $ | — | | | $ | 14,154 | |
| Convertible Preferred Stocks | | | 2,737,133 | | | | — | | | | — | | | | 2,737,133 | |
| Asset Backed Securities | | | — | | | | 18,774,345 | | | | — | | | | 18,774,345 | |
| Collateralized Mortgage Obligations | | | — | | | | 23,995,438 | | | | — | | | | 23,995,438 | |
| Commercial Mortgage-Backed Securities | | | — | | | | 11,510,109 | | | | — | | | | 11,510,109 | |
| Corporate Bonds | | | — | | | | 65,226,291 | | | | — | | | | 65,226,291 | |
| Foreign Government Bonds | | | — | | | | 1,237,374 | | | | — | | | | 1,237,374 | |
| Insurance-Linked Securities | | | | | | | | | | | | | | | | |
| Reinsurance Sidecars | | | | | | | | | | | | | | | | |
| Multiperil - Worldwide | | | — | | | | — | | | | 2,290 | | | | 2,290 | |
| Municipal Bonds | | | — | | | | 65,864 | | | | — | | | | 65,864 | |
| Senior Secured Floating Rate Loan Interests | | | — | | | | 2,185,356 | | | | — | | | | 2,185,356 | |
| U.S. Government and Agency Obligations | | | — | | | | 65,251,334 | | | | — | | | | 65,251,334 | |
| Affiliated Closed-End Fund | | | — | | | | 2,728,793 | | | | — | | | | 2,728,793 | |
| Total Investments in Securities | | $ | 2,751,287 | | | $ | 190,974,904 | | | $ | 2,290 | | | $ | 193,728,481 | |
| | |
| Other Financial Instruments | | | | | | | | | | | | | | | | |
| Net unrealized depreciation on futures contracts | | $ | (82,500 | ) | | $ | — | | | $ | — | | | $ | (82,500 | ) |
| Swap contracts, at value | | | — | | | | 46,514 | | | | — | | | | 46,514 | |
| Total Other Financial Instruments | | $ | (82,500 | ) | | $ | 46,514 | | | $ | — | | | $ | (35,986 | ) |
The following is a reconciliation of assets valued using significant unobservable inputs (Level 3):
| | | | |
| | | Insurance- | |
| | | Linked | |
| | | Securities | |
| Balance as of 12/31/19 | | $ | 27,503 | |
Realized gain (loss)(1) | | | — | |
Change in unrealized appreciation (depreciation)(2) | | | (789 | ) |
| Accrued discounts/premiums | | | — | |
| Purchases | | | — | |
| Sales | | | (24,424 | ) |
| Transfers in to Level 3* | | | — | |
Transfers out of Level 3*
| | | — | |
Balance as of 12/31/20
| | $ | 2,290 | |
(1)
| Realized gain (loss) on these securities is included in net realized gain (loss) on investments in the Statement of Operations. |
(2)
| Unrealized appreciation (depreciation) on these securities is included in change in net unrealized appreciation (depreciation) on investments in the Statement of Operations. |
*
| Transfers are calculated on the beginning of period value. For the year ended December 31, 2020, there were no transfers in or out of Level 3. |
| | |
Net change in unrealized appreciation (depreciation) of Level 3 investments still held and considered Level 3 at December 31, 2020: | | $ | (789 | ) |
The accompanying notes are an integral part of these financial statements.
34
| | |
| Pioneer Bond VCT Portfolio | Pioneer Variable Contracts Trust |
Statement of Assets and Liabilities 12/31/20 | |
| | | | |
| ASSETS: | | | |
| Investments in unaffiliated issuers, at value (cost $181,731,252) | | $ | 190,999,688 | |
| Investments in affiliated issuers, at value (cost $3,263,545) | | | 2,728,793 | |
| Cash | | | 6,424,366 | |
| Futures collateral | | | 199,159 | |
| Swaps collateral | | | 67,547 | |
| Due from broker for futures | | | 604,657 | |
| Variation margin for futures contracts | | | 23,062 | |
| Variation margin for centrally cleared swap contracts | | | 701 | |
| Swap contracts, at value (net premiums paid $(136)) | | | 46,514 | |
| Receivables — | | | | |
| Investment securities sold | | | 7,371,309 | |
| Portfolio shares sold | | | 44,020 | |
| Dividends | | | 9,588 | |
| Interest | | | 908,979 | |
| Other assets | | | 346 | |
| Total assets | | $ | 209,428,729 | |
| | | | | |
| LIABILITIES: | | | | |
| Payables — | | | | |
| Investment securities purchased | | $ | 21,431,733 | |
| Portfolio shares repurchased | | | 38,163 | |
| Trustees’ fees | | | 169 | |
| Swaps collateral | | | 16,308 | |
| Due to broker for swaps | | | 46,380 | |
| Net unrealized depreciation on futures contracts | | | 82,500 | |
| Due to affiliates | | | 8,770 | |
| Accrued expenses | | | 116,895 | |
| Total liabilities | | $ | 21,740,918 | |
| | | | | |
| NET ASSETS: | | | | |
| Paid-in capital | | $ | 174,303,422 | |
| Distributable earnings | | | 13,384,389 | |
| Net assets | | $ | 187,687,811 | |
| | | | | |
| NET ASSET VALUE PER SHARE: | | | | |
No par value (unlimited number of shares authorized) | | | | |
| Class I (based on $47,089,144/3,998,979 shares) | | $ | 11.78 | |
| Class II (based on $140,598,667/11,911,963 shares) | | $ | 11.80 | |
The accompanying notes are an integral part of these financial statements.
35
| | |
| Pioneer Bond VCT Portfolio | Pioneer Variable Contracts Trust |
| Statement of Operations | |
| | |
| | |
| FOR THE YEAR ENDED 12/31/20 | |
| | | | | | | |
| INVESTMENT INCOME: | | | | | | |
| Interest from unaffiliated issuers | | $ | 5,775,265 | | | | |
| Dividends from affiliated issuers | | | 141,936 | | | | |
| Dividends from unaffiliated issuers | | | 105,579 | | | | |
| Total investment income | | | | | | $ | 6,022,780 | |
| EXPENSES: | | | | | | | | |
| Management fees | | $ | 736,394 | | | | | |
| Administrative expense | | | 97,393 | | | | | |
| Distribution fees | | | | | | | | |
| Class II | | | 339,767 | | | | | |
| Custodian fees | | | 88,222 | | | | | |
| Professional fees | | | 57,975 | | | | | |
| Printing expense | | | 27,229 | | | | | |
| Pricing fees | | | 108,538 | | | | | |
| Trustees’ fees | | | 7,944 | | | | | |
| Insurance expense | | | 1,486 | | | | | |
| Miscellaneous | | | 11,566 | | | | | |
| Total expenses | | | | | | $ | 1,476,514 | |
| Less fees waived and expenses reimbursed by the Adviser | | | | | | | (48,073 | ) |
| Net expenses | | | | | | $ | 1,428,441 | |
| Net investment income | | | | | | $ | 4,594,339 | |
| REALIZED AND UNREALIZED GAIN (LOSS) ON INVESTMENTS: | | | | | | | | |
| Net realized gain (loss) on: | | | | | | | | |
| Investments in unaffiliated issuers | | $ | 6,181,167 | | | | | |
| Short sales | | | (151 | ) | | | | |
| Futures contracts | | | (34,283 | ) | | | | |
| Swap contracts | | | 55,824 | | | | | |
| Other assets and liabilities denominated in foreign currencies | | | 9,131 | | | $ | 6,211,688 | |
| Change in net unrealized appreciation (depreciation) on: | | | | | | | | |
| Investments in unaffiliated issuers | | $ | 3,724,594 | | | | | |
| Investments in affiliated issuers | | | 54,640 | | | | | |
| Futures contracts | | | (99,398 | ) | �� | | | |
| Swap contracts | | | 101,268 | | | | | |
| Other assets and liabilities denominated in foreign currencies | | | (8 | ) | | $ | 3,781,096 | |
| Net realized and unrealized gain (loss) on investments | | | | | | $ | 9,992,784 | |
| Net increase in net assets resulting from operations | | | | | | $ | 14,587,123 | |
The accompanying notes are an integral part of these financial statements.
36
| | |
| Pioneer Bond VCT Portfolio | Pioneer Variable Contracts Trust |
| Statements of Changes in Net Assets | |
| | | | | | | |
| | Year Ended | | | Year Ended | |
| | 12/31/20 | | | 12/31/19 | |
| FROM OPERATIONS: | | | | | | |
Net investment income (loss) | | $ | 4,594,339 | | | $ | 5,209,935 | |
Net realized gain (loss) on investments | | | 6,211,688 | | | | 485,111 | |
Change in net unrealized appreciation (depreciation) on investments | | | 3,781,096 | | | | 9,865,428 | |
| Net increase in net assets resulting from operations | | $ | 14,587,123 | | | $ | 15,560,474 | |
| DISTRIBUTIONS TO SHAREOWNERS: | | | | | | | | |
| Class I ($0.34 and $0.36 per share, respectively) | | $ | (1,461,488 | ) | | $ | (1,582,496 | ) |
| Class II ($0.32 and $0.33 per share, respectively) | | | (3,784,139 | ) | | | (4,054,843 | ) |
| Total distributions to shareowners | | $ | (5,245,627 | ) | | $ | (5,637,339 | ) |
| FROM PORTFOLIO SHARE TRANSACTIONS: | | | | | | | | |
Net proceeds from sales of shares | | $ | 29,369,220 | | | $ | 31,325,218 | |
Reinvestment of distributions | | | 5,245,627 | | | | 5,637,339 | |
Cost of shares repurchased | | | (46,368,379 | ) | | | (28,775,440 | ) |
| Net increase (decrease) in net assets resulting from Portfolio | | | | | | | | |
| share transactions | | $ | (11,753,532 | ) | | $ | 8,187,117 | |
| Net increase (decrease) in net assets | | $ | (2,412,036 | ) | | $ | 18,110,252 | |
| NET ASSETS: | | | | | | | | |
Beginning of year | | $ | 190,099,847 | | | $ | 171,989,595 | |
End of year | | $ | 187,687,811 | | | $ | 190,099,847 | |
| | | | | | | | | | | | | |
| | Year Ended | | | Year Ended | | | Year Ended | | | Year Ended | |
| | 12/31/20 | | | 12/31/20 | | | 12/31/19 | | | 12/31/19 | |
| | Shares | | | Amount | | | Shares | | | Amount | |
| Class I | | | | | | | | | | | | |
Shares sold | | | 1,151,890 | | | $ | 12,894,356 | | | | 996,128 | | | $ | 10,900,057 | |
Reinvestment of distributions | | | 129,385 | | | | 1,461,488 | | | | 143,788 | | | | 1,582,496 | |
Less shares repurchased | | | (1,679,925 | ) | | | (18,956,735 | ) | | | (1,109,052 | ) | | | (12,124,372 | ) |
| Net increase (decrease) | | | (398,650 | ) | | $ | (4,600,891 | ) | | | 30,864 | | | $ | 358,181 | |
| Class II | | | | | | | | | | | | | | | | |
Shares sold | | | 1,437,993 | | | $ | 16,474,864 | | | | 1,849,187 | | | $ | 20,425,161 | |
Reinvestment of distributions | | | 334,137 | | | | 3,784,139 | | | | 367,521 | | | | 4,054,843 | |
Less shares repurchased | | | (2,455,724 | ) | | | (27,411,644 | ) | | | (1,510,116 | ) | | | (16,651,068 | ) |
| Net increase (decrease) | | | (683,594 | ) | | $ | (7,152,641 | ) | | | 706,592 | | | $ | 7,828,936 | |
The accompanying notes are an integral part of these financial statements.
37
| | |
| Pioneer Bond VCT Portfolio | Pioneer Variable Contracts Trust |
| Financial Highlights | |
| | | | | | | | | | | | | | | | |
| | | Year Ended | | | Year Ended | | | Year Ended | | | Year Ended | | | Year Ended | |
| | | 12/31/20 | | | 12/31/19 | | | 12/31/18 | | | 12/31/17 | | | 12/31/16* | |
| Class I | | | | | | | | | | | | | | | |
| Net asset value, beginning of period | | $ | 11.17 | | | $ | 10.56 | | | $ | 11.04 | | | $ | 10.96 | | | $ | 10.83 | |
| Increase (decrease) from investment operations: | | | | | | | | | | | | | | | | | | | | |
| Net investment income (loss) (a) | | $ | 0.30 | | | $ | 0.33 | | | $ | 0.33 | | | $ | 0.29 | | | $ | 0.27 | |
| Net realized and unrealized gain (loss) on investments | | | 0.65 | | | | 0.64 | | | | (0.42 | ) | | | 0.14 | | | | 0.18 | |
| Net increase (decrease) from investment operations | �� | $ | 0.95 | | | $ | 0.97 | | | $ | (0.09 | ) | | $ | 0.43 | | | $ | 0.45 | |
| Distributions to shareowners: | | | | | | | | | | | | | | | | | | | | |
| Net investment income | | $ | (0.34 | ) | | $ | (0.36 | ) | | $ | (0.36 | ) | | $ | (0.31 | ) | | $ | (0.31 | ) |
| Net realized gain | | | — | | | | — | | | | (0.03 | ) | | | (0.04 | ) | | | (0.01 | ) |
| Total distributions | | $ | (0.34 | ) | | $ | (0.36 | ) | | $ | (0.39 | ) | | $ | (0.35 | ) | | $ | (0.32 | ) |
| | |
Net increase (decrease) in net asset value
| | $ | 0.61 | | | $ | 0.61 | | | $ | (0.48 | ) | | $ | 0.08 | | | $ | 0.13 | |
| Net asset value, end of period | | $ | 11.78 | | | $ | 11.17 | | | $ | 10.56 | | | $ | 11.04 | | | $ | 10.96 | |
| Total return (b) | | | 8.70 | % | | | 9.27 | % | | | (0.84 | )% | | | 4.01 | % | | | 4.10 | % |
| Ratio of net expenses to average net assets | | | 0.59 | % | | | 0.59 | % | | | 0.61 | % | | | 0.61 | % | | | 0.62 | % |
| Ratio of net investment income (loss) to average net assets | | | 2.68 | % | | | 3.03 | % | | | 3.07 | % | | | 2.59 | % | | | 2.46 | % |
| Portfolio turnover rate | | | 59 | % | | | 48 | % | | | 44 | % | | | 42 | % | | | 50 | % |
| Net assets, end of period (in thousands) | | $ | 47,089 | | | $ | 49,115 | | | $ | 46,125 | | | $ | 49,672 | | | $ | 48,442 | |
| Ratios with no waiver of fees and assumption of expenses by | | | | | | | | | | | | | | | | | | | | |
| the Adviser and no reduction for fees paid indirectly: | | | | | | | | | | | | | | | | | | | | |
| Total expenses to average net assets | | | 0.62 | % | | | 0.62 | % | | | 0.64 | % | | | 0.61 | % | | | 0.68 | % |
| Net investment income (loss) to average net assets | | | 2.65 | % | | | 3.00 | % | | | 3.04 | % | | | 2.59 | % | | | 2.40 | % |
| | |
* | The Portfolio was audited by an independent registered public accounting firm other than Ernst & Young LLP. |
(a) | The per-share data presented above is based on the average shares outstanding for the period presented. |
(b) | Assumes initial investment at net asset value at the beginning of each period, reinvestment of all distributions and the complete redemption of the investment at net asset value at the end of each period. |
|
NOTE: | The above financial highlights do not reflect the deduction of non-portfolio expenses associated with variable insurance products, such as mortality and expense risk charges, separate account charges, and sales charges. |
The accompanying notes are an integral part of these financial statements.
38
| | |
| Pioneer Bond VCT Portfolio | Pioneer Variable Contracts Trust |
| | | | | | | | | | | | | | | | |
| | | Year Ended | | | Year Ended | | | Year Ended | | | Year Ended | | | Year Ended | |
| | | 12/31/20 | | | 12/31/19 | | | | | | 12/31/17 | | | 12/31/16* | |
| Class II | | | | | | | | | | | | | | | |
| Net asset value, beginning of period | | $ | 11.19 | | | $ | 10.59 | | | $ | 11.07 | | | $ | 10.99 | | | $ | 10.85 | |
| Increase (decrease) from investment operations: | | | | | | | | | | | | | | | | | | | | |
| Net investment income (loss) (a) | | $ | 0.28 | | | $ | 0.31 | | | $ | 0.30 | | | $ | 0.26 | | | $ | 0.25 | |
| Net realized and unrealized gain (loss) on investments | | | 0.65 | | | | 0.62 | | | | (0.42 | ) | | | 0.15 | | | | 0.18 | |
| Net increase (decrease) from investment operations | | $ | 0.93 | | | $ | 0.93 | | | $ | (0.12 | ) | | $ | 0.41 | | | $ | 0.43 | |
| Distributions to shareowners: | | | | | | | | | | | | | | | | | | | | |
| Net investment income | | $ | (0.32 | ) | | $ | (0.33 | ) | | $ | (0.33 | ) | | $ | (0.29 | ) | | $ | (0.28 | ) |
| Net realized gain | | | — | | | | — | | | | (0.03 | ) | | | (0.04 | ) | | | (0.01 | ) |
| Total distributions | | $ | (0.32 | ) | | $ | (0.33 | ) | | $ | (0.36 | ) | | $ | (0.33 | ) | | $ | (0.29 | ) |
| | | | | | | | | | | | | | | | | | | | |
| Net increase (decrease) in net asset value | | $ | 0.61 | | | $ | 0.60 | | | $ | (0.48 | ) | | $ | 0.08 | | | $ | 0.14 | |
Net asset value, end of period
| | $ | 11.80 | | | $ | 11.19 | | | $ | 10.59 | | | $ | 11.07 | | | $ | 10.99 | |
| Total return (b) | | | 8.42 | % | | | 8.90 | % | | | (1.08 | )% | | | 3.74 | % | | | 3.92 | % |
| Ratio of net expenses to average net assets | | | 0.84 | % | | | 0.84 | % | | | 0.86 | % | | | 0.86 | % | | | 0.88 | % |
| Ratio of net investment income (loss) to average net assets | | | 2.43 | % | | | 2.79 | % | | | 2.83 | % | | | 2.35 | % | | | 2.21 | % |
| Portfolio turnover rate | | | 59 | % | | | 48 | % | | | 44 | % | | | 42 | % | | | 50 | % |
| Net assets, end of period (in thousands) | | $ | 140,599 | | | $ | 140,985 | | | $ | 125,865 | | | $ | 122,239 | | | $ | 95,484 | |
| Ratios with no waiver of fees and assumption of expenses by | | | | | | | | | | | | | | | | | | | | |
| the Adviser and no reduction for fees paid indirectly: | | | | | | | | | | | | | | | | | | | | |
| Total expenses to average net assets | | | 0.87 | % | | | 0.87 | % | | | 0.89 | % | | | 0.86 | % | | | 0.94 | % |
| Net investment income (loss) to average net assets | | | 2.40 | % | | | 2.76 | % | | | 2.80 | % | | | 2.35 | % | | | 2.16 | % |
| | |
* | The Portfolio was audited by an independent registered public accounting firm other than Ernst & Young LLP. |
(a) | The per-share data presented above is based on the average shares outstanding for the period presented. |
(b) | Assumes initial investment at net asset value at the beginning of each period, reinvestment of all distributions, the complete redemption of the investment at net asset value at the end of each period and no sales charges. Total return would be reduced if sales charges were taken into account. |
|
NOTE: | The above financial highlights do not reflect the deduction of non-portfolio expenses associated with variable insurance products, such as mortality and expense risk charges, separate account charges, and sales charges.
|
The accompanying notes are an integral part of these financial statements.
39
| | |
| Pioneer Bond VCT Portfolio | Pioneer Variable Contracts Trust |
Notes to Financial Statements 12/31/20 | |
1. Organization and Significant Accounting Policies
Pioneer Bond VCT Portfolio (the “Portfolio”) is one of 8 portfolios comprising Pioneer Variable Contracts Trust (the “Trust”), a Delaware statutory trust. The Portfolio is registered under the Investment Company Act of 1940 as a diversified, open-end management investment company. The Portfolio seeks current income and total return.
The Portfolio offers two classes of shares designated as Class I and Class II shares. Each class of shares represents an interest in the same portfolio of investments of the Portfolio and has identical rights (based on relative net asset values) to assets and liquidation proceeds. Share classes can bear different rates of class-specific fees and expenses, such as transfer agent and distribution fees. Differences in class-specific fees and expenses will result in differences in net investment income and, therefore, the payment of different dividends from net investment income earned by each class. The Amended and Restated Declaration of Trust of the Portfolio gives the Board of Trustees the flexibility to specify either per-share voting or dollar-weighted voting when submitting matters for shareowner approval. Under per-share voting, each share of a class of the Portfolio is entitled to one vote. Under dollar-weighted voting, a shareowner’s voting power is determined not by the number of shares owned, but by the dollar value of the shares on the record date. Each share class has exclusive voting rights with respect to matters affecting only that class, including with respect to the distribution plan for that class. There is no distribution plan for Class I shares.
Portfolio shares may be purchased only by insurance companies for the purpose of funding variable annuity and variable life insurance contracts or by qualified pension and retirement plans.
Amundi Asset Management US, Inc., an indirect, wholly owned subsidiary of Amundi and Amundi’s wholly owned subsidiary, Amundi USA, Inc., serves as the Portfolio’s investment adviser (the “Adviser”). Prior to January 1, 2021, the Adviser was named Amundi Pioneer Asset Management, Inc. Amundi Distributor US, Inc., an affiliate of Amundi Asset Management US, Inc., serves as the Portfolio’s distributor (the “Distributor”).
In August 2018, the Financial Accounting Standards Board (FASB) issued Accounting Standards Update 2018-13 “Disclosure Framework - Changes to the Disclosure Requirements for Fair Value Measurement” (“ASU 2018-13”) which modifies disclosure requirements for fair value measurements, principally for Level 3 securities and transfers between levels of the fair value hierarchy. ASU 2018-13 is effective for fiscal years beginning after December 15, 2019 and for interim periods within those fiscal years. The Portfolio has adopted ASU 2018-13 for the year ended December 31, 2020. The impact to the Portfolio’s adoption was limited to changes in the Portfolio’s disclosures regarding fair value, primarily those disclosures related to transfers between levels of the fair value hierarchy and disclosure of the range and weighted average used to develop significant unobservable inputs for Level 3 fair value investments, when applicable.
In March 2020, FASB issued an Accounting Standard Update, ASU 2020-04, Reference Rate Reform (Topic 848) — Facilitation of the Effects of Reference Rate Reform on Financial Reporting (“ASU 2020-04”), which provides optional, temporary relief with respect to the financial reporting of contracts subject to certain types of modifications due to the planned discontinuation of the London Interbank Offered Rate (“LIBOR”) and other LIBOR-based reference rates at the end of 2021. The temporary relief provided by ASU 2020-04 is effective for certain reference rate-related contract modifications that occur during the period from March 12, 2020 through December 31, 2022. Management is evaluating the impact of ASU 2020-04 on the Trust’s investments, derivatives, debt and other contracts that will undergo reference rate-related modifications as a result of the reference rate reform.
The Portfolio is an investment company and follows investment company accounting and reporting guidance under U.S. Generally Accepted Accounting Principles (“U.S. GAAP”). U.S. GAAP requires the management of the Portfolio to make estimates and assumptions that affect the reported amounts of assets and liabilities, the disclosure of contingent assets and liabilities at the date of the financial statements, and the reported amounts of income, expenses and gain or loss on investments during the reporting period. Actual results could differ from those estimates.
The following is a summary of significant accounting policies followed by the Portfolio in the preparation of its financial statements:
A. Security Valuation
The net asset value of the Portfolio is computed once daily, on each day the New York Stock Exchange (“NYSE”) is open, as of the close of regular trading on the NYSE.
Fixed-income securities are valued by using prices supplied by independent pricing services, which consider such factors as market prices, market events, quotations from one or more brokers, Treasury spreads, yields, maturities and ratings, or may use a pricing matrix or other fair value methods or techniques to provide an estimated value of the security or instrument. A pricing matrix is a means of valuing a debt security on the basis of current market prices for other debt securities, historical trading patterns in the market for fixed-income securities and/or other factors. Non-U.S. debt securities that are listed on an
40
| | |
| Pioneer Bond VCT Portfolio | Pioneer Variable Contracts Trust |
exchange will be valued at the bid price obtained from an independent third party pricing service. When independent third party pricing services are unable to supply prices, or when prices or market quotations are considered to be unreliable, the value of that security may be determined using quotations from one or more broker-dealers.
Loan interests are valued in accordance with guidelines established by the Board of Trustees at the mean between the last available bid and asked prices from one or more brokers or dealers as obtained from Loan Pricing Corporation, an independent third party pricing service. If price information is not available from Loan Pricing Corporation, or if the price information is deemed to be unreliable, price information will be obtained from an alternative loan interest pricing service. If no reliable price quotes are available from either the primary or alternative pricing service, broker quotes will be solicited.
Event-linked bonds are valued at the bid price obtained from an independent third party pricing service. Other insurance-linked securities (including reinsurance sidecars, collateralized reinsurance and industry loss warranties) may be valued at the bid price obtained from an independent pricing service, or through a third party using a pricing matrix, insurance industry valuation models, or other fair value methods or techniques to provide an estimated value of the instrument.
Equity securities which may include restricted securities that have traded on an exchange are valued by using the last sale price on the principal exchange where they are traded. Equity securities which may include restricted securities that have not traded on the date of valuation, or securities for which sale prices are not available, generally are valued using the mean between the last bid and asked prices or, if both last bid and asked prices are not available, at the last quoted bid price. Last sale and bid and asked prices are provided by independent third party pricing services. In the case of equity securities which may include restricted securities not traded on an exchange, prices are typically determined by independent third party pricing services using a variety of techniques and methods.
The value of foreign securities is translated into U.S. dollars based on foreign currency exchange rate quotations supplied by a third party pricing source. Trading in non-U.S. equity securities is substantially completed each day at various times prior to the close of the NYSE. The values of such securities used in computing the net asset value of the Portfolio’s shares are determined as of such times. The Portfolio may use a fair value model developed by an independent pricing service to value non-U.S. equity securities.
Futures contracts are generally valued at the closing settlement price established by the exchange on which they are traded.
Swap contracts, including interest rate swaps, caps and floors (other than centrally cleared swap contracts), are valued at the dealer quotations obtained from reputable International Swap Dealers Association members. Centrally cleared swaps are valued at the daily settlement price provided by the central clearing counterparty.
Shares of open-end registered investment companies (including money market mutual funds) are valued at such funds’ net asset value. Shares of exchange-listed closed-end funds are valued by using the last sale price on the principal exchange where they are traded. Shares of closed-end interval funds that offer their shares at net asset value are valued at such funds’ net asset value.
Securities or loan interests for which independent pricing services or broker-dealers are unable to supply prices or for which market prices and/or quotations are not readily available or are considered to be unreliable are valued by a fair valuation team comprised of certain personnel of the Adviser pursuant to procedures adopted by the Portfolio’s Board of Trustees. The Adviser’s fair valuation team uses fair value methods approved by the Valuation Committee of the Board of Trustees. The Adviser’s fair valuation team is responsible for monitoring developments that may impact fair valued securities and for discussing and assessing fair values on an ongoing basis, and at least quarterly, with the Valuation Committee of the Board of Trustees.
Inputs used when applying fair value methods to value a security may include credit ratings, the financial condition of the company, current market conditions and comparable securities. The Portfolio may use fair value methods if it is determined that a significant event has occurred after the close of the exchange or market on which the security trades and prior to the determination of the Portfolio’s net asset value. Examples of a significant event might include political or economic news, corporate restructurings, natural disasters, terrorist activity or trading halts. Thus, the valuation of the Portfolio’s securities may differ significantly from exchange prices, and such differences could be material.
At December 31, 2020, no securities were valued using fair value methods (other than securities valued using prices supplied by independent pricing services, broker-dealers or using a third party insurance industry pricing model).
B. Investment Income and Transactions
Dividend income is recorded on the ex-dividend date, except that certain dividends from foreign securities where the ex-dividend date may have passed are recorded as soon as the Portfolio becomes aware of the ex-dividend data in the exercise of reasonable diligence.
41
| | |
| Pioneer Bond VCT Portfolio | Pioneer Variable Contracts Trust |
| Notes to Financial Statements 12/31/20 (continued) | |
Interest income, including interest on income-bearing cash accounts, is recorded on the accrual basis. Dividend and interest income are reported net of unrecoverable foreign taxes withheld at the applicable country rates and net of income accrued on defaulted securities.
Interest and dividend income payable by delivery of additional shares is reclassified as PIK (payment-in-kind) income upon receipt and is included in interest and dividend income, respectively.
Principal amounts of mortgage-backed securities are adjusted for monthly paydowns. Premiums and discounts related to certain mortgage-backed securities are amortized or accreted in proportion to the monthly paydowns. All discounts/premiums on purchase prices of debt securities are accreted/amortized for financial reporting purposes over the life of the respective securities, and such accretion/amortization is included in interest income.
Security transactions are recorded as of trade date. Gains and losses on sales of investments are calculated on the identified cost method for both financial reporting and federal income tax purposes.
C. Foreign Currency Translation
The books and records of the Portfolio are maintained in U.S. dollars. Amounts denominated in foreign currencies are translated into U.S. dollars using current exchange rates.
Net realized gains and losses on foreign currency transactions, if any, represent, among other things, the net realized gains and losses on foreign currency exchange contracts, disposition of foreign currencies and the difference between the amount of income accrued and the U.S. dollars actually received. Further, the effects of changes in foreign currency exchange rates on investments are not segregated on the Statement of Operations from the effects of changes in the market prices of those securities, but are included with the net realized and unrealized gain or loss on investments.
D. Federal Income Taxes
It is the Portfolio’s policy to comply with the requirements of the Internal Revenue Code applicable to regulated investment companies and to distribute all of its net taxable income and net realized capital gains, if any, to its shareowners. Therefore, no provision for federal income taxes is required. As of December 31, 2020, the Portfolio did not accrue any interest or penalties with respect to uncertain tax positions, which, if applicable, would be recorded as an income tax expense on the Statement of Operations. Tax returns filed within the prior three years remain subject to examination by federal and state tax authorities.
The amount and character of income and capital gain distributions to shareowners are determined in accordance with federal income tax rules, which may differ from U.S. GAAP. Distributions in excess of net investment income or net realized gains are temporary over distributions for financial statement purposes resulting from differences in the recognition or classification of income or distributions for financial statement and tax purposes. Capital accounts within the financial statements are adjusted for permanent book/tax differences to reflect tax character, but are not adjusted for temporary differences.
During the year ended December 31, 2020, a capital loss carryforward of $793,329 was utilized to offset net realized gains by the Portfolio.
The tax character of distributions paid during the years ended December 31, 2020 and December 31, 2019, were as follows:
| | 2020 | | | 2019 | |
| Distributions paid from: | | | | | | |
Ordinary income | | $ | 5,245,627 | | | $ | 5,637,339 | |
| Total | | $ | 5,245,627 | | | $ | 5,637,339 | |
42
| | |
| Pioneer Bond VCT Portfolio | Pioneer Variable Contracts Trust |
The following shows the components of distributable earnings on a federal income tax basis at December 31, 2020:
| | 2020 | |
| Distributable earnings/(losses): | | | |
Undistributed ordinary income | | $ | 1,861,101 | |
Undistributed long term capital gain | | | 3,021,965 | |
Net unrealized appreciation | | | 8,501,323 | |
| Total | | $ | 13,384,389 | |
The difference between book basis and tax basis unrealized appreciation is attributable to the tax adjustments relating to wash sales, premium and amortization, credit default swaps, the mark to market of futures contracts and credit default swaps.
E. Portfolio Shares and Class Allocations
The Portfolio records sales and repurchases of its shares as of trade date. Distribution fees for Class II shares are calculated based on the average daily net asset value attributable to Class II shares of the Portfolio (see Note 5). Class I shares do not pay distribution fees.
Income, common expenses (excluding transfer agent and distribution fees) and realized and unrealized gains and losses are calculated at the Portfolio level and allocated daily to each class of shares based on its respective percentage of adjusted net assets at the beginning of the day.
All expenses and fees paid to the Portfolio’s transfer agent for its services are allocated between the classes of shares based on the number of accounts in each class and the ratable allocation of related out-of-pocket expenses (see Note 4).
The Portfolio declares as daily dividends substantially all of its net investment income. All dividends are paid on a monthly basis. Short-term capital gain distributions, if any, may be declared with the daily dividends. Distributions paid by the Portfolio with respect to each class of shares are calculated in the same manner and at the same time, except that net investment income dividends to Class I and Class II shares can reflect different transfer agent and distribution expense rates. Dividends and distributions to shareowners are recorded on the ex-dividend date.
F. Risks
The value of securities held by the Portfolio may go up or down, sometimes rapidly or unpredictably, due to general market conditions, such as real or perceived adverse economic, political or regulatory conditions, recessions, the spread of infectious illness or other public health issues, inflation, changes in interest rates, lack of liquidity in the bond markets or adverse investor sentiment. In the past several years, financial markets have experienced increased volatility, depressed valuations, decreased liquidity and heightened uncertainty. These conditions may continue, recur, worsen or spread. A general rise in interest rates could adversely affect the price and liquidity of fixed-income securities and could also result in increased redemptions from the Portfolio.
At times, the Portfolio’s investments may represent industries or industry sectors that are interrelated or have common risks, making the Portfolio more susceptible to any economic, political, or regulatory developments or other risks affecting those industries and sectors. The Portfolio’s investments in foreign markets and countries with limited developing markets may subject the Portfolio to a greater degree of risk than investments in a developed market. These risks include disruptive political or economic conditions and the imposition of adverse governmental laws or currency exchange restrictions.
The Portfolio invests in below-investment-grade (high-yield) debt securities and preferred stocks. Some of these high-yield securities may be convertible into equity securities of the issuer. Debt securities rated below-investment-grade are commonly referred to as “junk bonds” and are considered speculative. These securities involve greater risk of loss, are subject to greater price volatility, and are less liquid, especially during periods of economic uncertainty or change, than higher rated debt securities.
The Portfolio’s investments, payment obligations and financing terms may be based on floating rates, such as LIBOR (London Interbank Offered Rate). Plans are underway to phase out the use of LIBOR by the end of 2021. The administrator of LIBOR recently announced a possible delay in the phase out of a majority of the U.S. dollar LIBOR publications until mid-2023, with the remainder of the LIBOR publications to end at the end of 2021. There remains uncertainty regarding the nature of any replacement rate and the impact of the transition from LIBOR on the fund, issuers of instruments in which the Portfolio invests, and financial markets generally.
43
| | |
| Pioneer Bond VCT Portfolio | Pioneer Variable Contracts Trust |
| Notes to Financial Statements 12/31/20 (continued) | |
With the increased use of technologies such as the Internet to conduct business, the Portfolio is susceptible to operational, information security and related risks. While the Portfolio’s Adviser has established business continuity plans in the event of, and risk management systems to prevent, limit or mitigate, such cyber-attacks, there are inherent limitations in such plans and systems, including the possibility that certain risks have not been identified. Furthermore, the Portfolio cannot control the cybersecurity plans and systems put in place by service providers to the Portfolio such as Brown Brothers Harriman & Co., the Portfolio’s custodian and accounting agent, and DST Asset Manager Solutions, Inc., the Portfolio’s transfer agent. In addition, many beneficial owners of Portfolio shares hold them through accounts at broker-dealers, retirement platforms and other financial market participants over which neither the Portfolio nor the Adviser exercises control. Each of these may in turn rely on service providers to them, which are also subject to the risk of cyber-attacks. Cybersecurity failures or breaches at the Adviser or the Portfolio’s service providers or intermediaries have the ability to cause disruptions and impact business operations, potentially resulting in financial losses, interference with the Portfolio’s ability to calculate its net asset value, impediments to trading, the inability of Portfolio shareowners to effect share purchases, redemptions or exchanges or receive distributions, loss of or unauthorized access to private shareowner information and violations of applicable privacy and other laws, regulatory fines, penalties, reputational damage, or additional compliance costs. Such costs and losses may not be covered under any insurance. In addition, maintaining vigilance against cyber-attacks may involve substantial costs over time, and system enhancements may themselves be subject to cyber-attacks.
COVID-19
The respiratory illness COVID-19 caused by a novel coronavirus has resulted in a global pandemic and major disruption to economies and markets around the world, including the United States. Global financial markets have experienced extreme volatility and severe losses, and trading in many instruments has been disrupted. Liquidity for many instruments has been greatly reduced for periods of time. Some interest rates are very low and in some cases yields are negative. Some sectors of the economy and individual issuers have experienced particularly large losses. These circumstances may continue for an extended period of time, and may continue to affect adversely the value and liquidity of the Portfolio’s investments. The ultimate economic fallout from the pandemic, and the long-term impact on economies, markets, industries and individual issuers, are not known. Governments and central banks, including the Federal Reserve in the U.S., have taken extraordinary and unprecedented actions to support local and global economies and the financial markets. These actions have resulted in significant expansion of public debt, including in the U.S. The impact of these measures, and whether they will be effective to mitigate the economic and market disruption, will not be known for some time. The consequences of high public debt, including its future impact on the economy and securities markets, likewise may not be known for some time.
The Portfolio’s prospectus contains unaudited information regarding the Portfolio’s principal risks. Please refer to that document when considering the Portfolio’s principal risks.
G. Restricted Securities
Restricted Securities are subject to legal or contractual restrictions on resale. Restricted securities generally are resold in transactions exempt from registration under the Securities Act of 1933. Private placement securities are generally considered to be restricted except for those securities traded between qualified institutional investors under the provisions of Rule 144A of the Securities Act of 1933.
Disposal of restricted investments may involve negotiations and expenses, and prompt sale at an acceptable price may be difficult to achieve. Restricted investments held by the Portfolio at December 31, 2020 are listed in the Schedule of Investments.
H. Insurance-Linked Securities (“ILS”)
The Portfolio invests in ILS. The Portfolio could lose a portion or all of the principal it has invested in an ILS, and the right to additional interest or dividend payments with respect to the security, upon the occurrence of one or more trigger events, as defined within the terms of an insurance-linked security. Trigger events, generally, are hurricanes, earthquakes, or other natural events of a specific size or magnitude that occur in a designated geographic region during a specified time period, and/or that involve losses or other metrics that exceed a specific amount. There is no way to accurately predict whether a trigger event will occur, and accordingly, ILS carry significant risk. The Portfolio is entitled to receive principal, and interest and/or dividend payments so long as no trigger event occurs of the description and magnitude specified by the instrument. In addition to the specified trigger events, ILS may expose the Portfolio to other risks, including but not limited to issuer (credit) default, adverse regulatory or jurisdictional interpretations and adverse tax consequences.
44
| | |
| Pioneer Bond VCT Portfolio | Pioneer Variable Contracts Trust |
The Portfolio’s investments in ILS may include event-linked bonds. ILS also may include special purpose vehicles (“SPVs”) or similar instruments structured to comprise a portion of a reinsurer’s catastrophe-oriented business, known as quota share instruments (sometimes referred to as reinsurance sidecars), or to provide reinsurance relating to specific risks to insurance or reinsurance companies through a collateralized instrument, known as collateralized reinsurance. Structured reinsurance investments also may include industry loss warranties (“ILWs”). A traditional ILW takes the form of a bilateral reinsurance contract, but there are also products that take the form of derivatives, collateralized structures, or exchange-traded instruments.
Where the ILS are based on the performance of underlying reinsurance contracts, the Portfolio has limited transparency into the individual underlying contracts, and therefore must rely upon the risk assessment and sound underwriting practices of the issuer. Accordingly, it may be more difficult for the Adviser to fully evaluate the underlying risk profile of the Portfolio’s structured reinsurance investments, and therefore the Portfolio’s assets are placed at greater risk of loss than if the Adviser had more complete information. Structured reinsurance instruments generally will be considered illiquid securities by the Portfolio. These securities may be difficult to purchase, sell or unwind. Illiquid securities also may be difficult to value. If the Portfolio is forced to sell an illiquid asset, the Portfolio may be forced to sell at a loss.
Additionally, the Portfolio may gain exposure to ILS by investing in a closed-end interval fund, Pioneer ILS Interval Fund, an affiliate of the Adviser. The Portfolio’s investment in Pioneer ILS Interval Fund at December 31, 2020, is listed in the Schedule of Investments.
I. Futures Contracts
The Portfolio may enter into futures transactions in order to attempt to hedge against changes in interest rates, securities prices and currency exchange rates or to seek to increase total return. Futures contracts are types of derivatives. All futures contracts entered into by the Portfolio are traded on a futures exchange. Upon entering into a futures contract, the Portfolio is required to deposit with a broker an amount of cash or securities equal to the minimum “initial margin” requirements of the associated futures exchange. The amount of cash deposited with the broker as collateral at December 31, 2020, is recorded as “Futures collateral” on the Statement of Assets and Liabilities.
Subsequent payments for futures contracts (“variation margin”) are paid or received by the Portfolio, depending on the daily fluctuation in the value of the contracts, and are recorded by the Portfolio as unrealized appreciation or depreciation. Cash received from or paid to the broker related to previous margin movement is held in a segregated account at the broker and is recorded as either “Due from broker for futures” or “Due to broker for futures” on the Statement of Assets and Liabilities. When the contract is closed, the Portfolio realizes a gain or loss equal to the difference between the opening and closing value of the contract as well as any fluctuation in foreign currency exchange rates where applicable. Futures contracts are subject to market risk, interest rate risk and currency exchange rate risk. Changes in value of the contracts may not directly correlate to the changes in value of the underlying securities. With futures, there is reduced counterparty credit risk to the Portfolio since futures are exchange-traded and the exchange’s clearinghouse, as counterparty to all exchange-traded futures, guarantees the futures against default.
The average market value of futures contracts open during the year ended December 31, 2020, was $3,632,187. Open futures contracts outstanding at December 31, 2020, are listed in the Schedule of Investments.
J. Credit Default Swap Contracts
A credit default swap is a contract between a buyer of protection and a seller of protection against a pre-defined credit event or an underlying reference obligation, which may be a single security or a basket or index of securities. The Portfolio may buy or sell credit default swap contracts to seek to increase the Portfolio’s income, or to attempt to hedge the risk of default on portfolio securities. A credit default swap index is used to hedge risk or take a position on a basket of credit entities or indices.
As a seller of protection, the Portfolio would be required to pay the notional (or other agreed-upon) value of the referenced debt obligation to the counterparty in the event of a default by a U.S. or foreign corporate issuer of a debt obligation, which would likely result in a loss to the Portfolio. In return, the Portfolio would receive from the counterparty a periodic stream of payments during the term of the contract, provided that no event of default occurred. The maximum exposure of loss to the seller would be the notional value of the credit default swaps outstanding. If no default occurs, the Portfolio would keep the stream of payments and would have no payment obligation. The Portfolio may also buy credit default swap contracts in order to hedge against the risk of default of debt securities, in which case the Portfolio would function as the counterparty referenced above.
45
| | |
| Pioneer Bond VCT Portfolio | Pioneer Variable Contracts Trust |
| Notes to Financial Statements 12/31/20 (continued) | |
As a buyer of protection, the Portfolio makes an upfront or periodic payment to the protection seller in exchange for the right to receive a contingent payment. An upfront payment made by the Portfolio, as the protection buyer, is recorded within the “Swap contracts, at value” line item on the Statement of Assets and Liabilities. Periodic payments received or paid by the Portfolio are recorded as realized gains or losses on the Statement of Operations.
Credit default swap contracts are marked-to-market daily using valuations supplied by independent sources, and the change in value, if any, is recorded within the “Swap contracts, at value” line item on the Statement of Assets and Liabilities. Payments received or made as a result of a credit event or upon termination of the contract are recognized, net of the appropriate amount of the upfront payment, as realized gains or losses on the Statement of Operations.
Credit default swap contracts involving the sale of protection may involve greater risks than if the Portfolio had invested in the referenced debt instrument directly. Credit default swap contracts are subject to general market risk, liquidity risk, counterparty risk and credit risk. If the Portfolio is a protection buyer and no credit event occurs, it will lose its investment. If the Portfolio is a protection seller and a credit event occurs, the value of the referenced debt instrument received by the Portfolio, together with the periodic payments received, may be less than the amount the Portfolio pays to the protection buyer, resulting in a loss to the Portfolio. In addition, obligations under sell protection credit default swaps may be partially offset by net amounts received from settlement of buy protection credit default swaps entered into by the Portfolio for the same reference obligation with the same counterparty.
Certain swap contracts that are cleared through a central clearinghouse are referred to as centrally cleared swaps. All payments made or received by the Portfolio are pursuant to a centrally cleared swap contract with the central clearing party rather than the original counterparty. Upon entering into a centrally cleared swap contract, the Portfolio is required to make an initial margin deposit, either in cash or in securities. The daily change in value on open centrally cleared contracts is recorded as “Variation margin for centrally cleared swap contracts” on the Statement of Assets and Liabilities. Cash received from or paid to the broker related to previous margin movement is held in a segregated account at the broker and is recorded as either “Due from broker for swaps” or “Due to broker for swaps” on the Statement of Assets and Liabilities. The amount of cash deposited with a broker as collateral at December 31, 2020, is recorded as “Swaps collateral” on the Statement of Assets and Liabilities.
The average market value of credit default swap contracts open during the year ended December 31, 2020, was $(27,461). Open credit default swap contracts at December 31, 2020, are listed in the Schedule of Investments.
2. Management Agreement
The Adviser manages the Portfolio. Management fees are calculated daily and paid monthly at the annual rate of 0.40% of the Portfolio’s average daily net assets. For the year ended December 31, 2020, the effective management fee (excluding waivers and/or assumption of expenses and acquired fund fees and expenses) was equivalent to 0.40% of the Portfolio’s average daily net assets.
The Adviser has agreed to waive its management fee with respect to any portion of the Portfolio’s assets invested in Pioneer ILS Interval Fund, an affiliated fund managed by the Adviser. For the year ended December 31, 2020, the Adviser waived $48,073 in management fees with respect to the Portfolio, which is reflected on the Statement of Operations as an expense waiver.
The Adviser has contractually agreed to limit ordinary operating expenses (ordinary operating expenses means all Portfolio expenses other than extraordinary expenses, such as litigation, taxes, brokerage commissions and acquired fund fees and expenses) of the Portfolio to the extent required to reduce Portfolio expenses to 0.62% of the average daily net assets attributable to Class I shares. Class II shares expenses will be reduced only to the extent portfolio-wide expenses are reduced for Class I shares. Fees waived and expenses reimbursed during the year ended December 31, 2020, if any, are reflected on the Statement of Operations. This expense limitation is in effect through May 1, 2021. There can be no assurance that the Adviser will extend the expense limitation agreement for a class of shares beyond the date referred to above.
In addition, under the management and administration agreements, certain other services and costs, including accounting, regulatory reporting and insurance premiums, are paid by the Portfolio as administrative reimbursements. Included in “Due to affiliates” reflected on the Statement of Assets and Liabilities is $5,897 in management fees, administrative costs and certain other reimbursements payable to the Adviser at December 31, 2020.
46
| | |
| Pioneer Bond VCT Portfolio | Pioneer Variable Contracts Trust |
3. Compensation of Trustees and Officers
The Portfolio pays an annual fee to its Trustees. The Adviser reimburses the Portfolio for fees paid to the Interested Trustees. The Portfolio does not pay any salary or other compensation to its officers. For the year ended December 31, 2020, the Portfolio paid $7,944 in Trustees’ compensation, which is reflected on the Statement of Operations as Trustees’ fees. At December 31, 2020, the Portfolio had a payable for Trustees’ fees on its Statement of Assets and Liabilities of $169.
4. Transfer Agent
DST Asset Manager Solutions, Inc. serves as the transfer agent to the Portfolio at negotiated rates. Transfer agent fees and payables shown on the Statement of Operations and the Statement of Assets and Liabilities, respectively, include sub-transfer agent expenses incurred through the Portfolio’s omnibus relationship contracts.
5. Distribution Plan
The Portfolio has adopted a distribution plan (the “Plan”) pursuant to Rule 12b-1 of the Investment Company Act of 1940 with respect to its Class II shares. Pursuant to the Plan, the Portfolio pays the Distributor 0.25% of the average daily net assets attributable to Class II shares to compensate the Distributor for (1) distribution services and (2) personal and account maintenance services performed and expenses incurred by the Distributor in connection with the Portfolio’s Class II shares. Included in “Due to affiliates” reflected on the Statement of Assets and Liabilities is $2,873 in distribution fees payable to the Distributor at December 31, 2020.
6. Affiliated Issuers
An affiliated issuer is a company in which the Portfolio has a direct or indirect ownership of, control of, or voting power of 5 percent or more of the outstanding voting shares. At December 31, 2020, the value of the Portfolio’s investment in affiliated issuers was $2,728,793, which represents 1.5% of the Portfolio’s net assets.
Transactions in affiliated issuers by the Portfolio for the year ended were as follows:
| | | Change in |
| | | |
| | | Net Unrealized | Net Realized | | | |
| | | | Appreciation/
| Gain/(Loss)
| | | |
| | | (Depreciation) | From | Dividends | Shares | |
| Value at | | from Investments | Investments | from | held at | Value at |
| Name of the | December 31, | Purchase | in Affiliated | in Affiliated | Investments in | December 31, | December 31, |
| Affiliated Issuer | 2019 | Costs | Issuers | Issuers | Affiliated Issuers | 2020 | 2020 |
Pioneer ILS | | | | | | | |
| Interval Fund | $2,674,153 | $ — | $54,640 | $ — | $141,936 | 321,413 | $2,728,793 |
Annual and semi-annual reports for the underlying Pioneer funds are available on the funds’ web page(s) at www.amundi.com/us.
7. Additional Disclosures about Derivative Instruments and Hedging Activities
The Portfolio’s use of derivatives may enhance or mitigate the Portfolio’s exposure to the following risks:
Interest rate risk relates to the fluctuations in the value of interest-bearing securities due to changes in the prevailing levels of market interest rates.
Credit risk relates to the ability of the issuer of a financial instrument to make further principal or interest payments on an obligation or commitment that it has to the Portfolio.
Foreign exchange rate risk relates to fluctuations in the value of an asset or liability due to changes in currency exchange rates.
Equity risk relates to the fluctuations in the value of financial instruments as a result of changes in market prices (other than those arising from interest rate risk or foreign exchange rate risk), whether caused by factors specific to an individual investment, its issuer, or all factors affecting all instruments traded in a market or market segment.
47
| | |
| Pioneer Bond VCT Portfolio | Pioneer Variable Contracts Trust |
| Notes to Financial Statements 12/31/20 (continued) | |
Commodity risk relates to the risk that the value of a commodity or commodity index will fluctuate based on increases or decreases in the commodities market and factors specific to a particular industry or commodity.
The fair value of open derivative instruments (not considered to be hedging instruments for accounting disclosure purposes) by risk exposure at December 31, 2020, was as follows:
| Statement of Assets | | Interest | | | Credit | | | Foreign | | | Equity | | | Commodity | |
| and Liabilities | | Rate Risk | | | Risk | | | Exchange Rate Risk | | | Risk | | | Risk | |
| Assets | | | | | | | | | | | | | | | |
| Swap contracts, at value | | $ | — | | | $ | 46,514 | | | $ | — | | | $ | — | | | $ | — | |
| Total Value | | $ | — | | | $ | 46,514 | | | $ | — | | | $ | — | | | $ | — | |
| Liabilities | | | | | | | | | | | | | | | | | | | | |
| Net unrealized depreciation | | | | | | | | | | | | | | | | | | | | |
| on futures contracts | | $ | 82,500 | | | $ | — | | | $ | — | | | $ | — | | | $ | — | |
| Total Value | | $ | 82,500 | | | $ | — | | | $ | — | | | $ | — | | | $ | — | |
The effect of derivative instruments (not considered to be hedging instruments for accounting disclosure purposes) on the Statement of Operations by risk exposure at December 31, 2020 was as follows:
| Statement of | | Interest | | | Credit | | | Foreign | | | Equity | | | Commodity | |
| Operations | | Rate Risk | | | Risk | | | Exchange Rate Risk | | | Risk | | | Risk | |
| Net realized | | | | | | | | | | | | | | | |
| gain (loss) on: | | | | | | | | | | | | | | | |
| Futures contracts | | $ | (34,283 | ) | | $ | — | | | $ | — | | | $ | — | | | $ | — | |
| Swap contracts | | | — | | | | 55,824 | | | | — | | | | — | | | | — | |
| Total Value | | $ | (34,283 | ) | | $ | 55,824 | | | $ | — | | | $ | — | | | $ | — | |
| Change in net | | | | | | | | | | | | | | | | | | | | |
| unrealized appreciation | | | | | | | | | | | | | | | | | | | | |
| (depreciation) on: | | | | | | | | | | | | | | | | | | | | |
| Futures contracts | | $ | (99,398 | ) | | $ | — | | | $ | — | | | $ | — | | | $ | — | |
| Swap contracts | | | — | | | | 101,268 | | | | — | | | | — | | | | — | |
| Total Value | | $ | (99,398 | ) | | $ | 101,268 | | | $ | — | | | $ | — | | | $ | — | |
48
| | |
| Pioneer Bond VCT Portfolio | Pioneer Variable Contracts Trust |
Report of Independent Registered Public Accounting Firm | |
To the Board of Trustees of Pioneer Variable Contracts Trust and the Shareholders of Pioneer Bond VCT Portfolio:
Opinion on the Financial Statements
We have audited the accompanying statement of assets and liabilities of Pioneer Bond VCT Portfolio (the “Portfolio”) (one of the portfolios constituting Pioneer Variable Contracts Trust (the “Trust”)), including the schedule of investments, as of December 31, 2020, and the related statement of operations for the year then ended, the statements of changes in net assets for each of the two years in the period then ended, the financial highlights for each of the four years in the period then ended and the related notes (collectively referred to as the “financial statements”). The financial highlights for the period ended December 31, 2016 were audited by another independent registered public accounting firm whose report, dated February 14, 2017, expressed an unqualified opinion on those financial highlights. In our opinion, the financial statements present fairly, in all material respects, the financial position of the Portfolio (one of the portfolios constituting Pioneer Variable Contracts Trust) at December 31, 2020, the results of its operations for the year then ended, the changes in its net assets for each of the two years in the period then ended, and its financial highlights for each of the four years in the period then ended, in conformity with U.S. generally accepted accounting principles.
Basis for Opinion
These financial statements are the responsibility of the Trust’s management. Our responsibility is to express an opinion on the Portfolio’s financial statements based on our audits. We are a public accounting firm registered with the Public Company Accounting Oversight Board (United States) (“PCAOB”) and are required to be independent with respect to the Trust in accordance with the U.S. federal securities laws and the applicable rules and regulations of the Securities and Exchange Commission and the PCAOB.
We conducted our audits in accordance with the standards of the PCAOB. Those standards require that we plan and perform the audit to obtain reasonable assurance about whether the financial statements are free of material misstatement, whether due to error or fraud. The Trust is not required to have, nor were we engaged to perform, an audit of the Trust’s internal control over financial reporting. As part of our audits, we are required to obtain an understanding of internal control over financial reporting, but not for the purpose of expressing an opinion on the effectiveness of the Trust’s internal control over financial reporting. Accordingly, we express no such opinion.
Our audits included performing procedures to assess the risks of material misstatement of the financial statements, whether due to error or fraud, and performing procedures that respond to those risks. Such procedures included examining, on a test basis, evidence regarding the amounts and disclosures in the financial statements. Our procedures included confirmation of securities owned as of December 31, 2020, by correspondence with the custodian and brokers or by other appropriate auditing procedures where replies from brokers were not received. Our audits also included evaluating the accounting principles used and significant estimates made by management, as well as evaluating the overall presentation of the financial statements. We believe that our audits provide a reasonable basis for our opinion.
We have served as the auditor of one or more Amundi Pioneer investment companies since 2017.
Boston, Massachusetts
February 17, 2021
49
| | |
| Pioneer Bond VCT Portfolio | Pioneer Variable Contracts Trust |
Additional Information (unaudited) | |
Qualified interest income is exempt from nonresident alien (NRA) tax withholding. The percentage of the Portfolio’s ordinary income distributions derived from qualified interest income was 77.73%
50
| | |
| Pioneer Bond VCT Portfolio | Pioneer Variable Contracts Trust |
Approval of Investment Management Agreement | |
Amundi Pioneer Asset Management, Inc. (“APAM”) serves as the investment adviser to Pioneer Bond VCT Portfolio (the “Portfolio”) pursuant to an investment management agreement between APAM and the Portfolio. In order for APAM to remain the investment adviser of the Portfolio, the Trustees of the Portfolio must determine annually whether to renew the investment management agreement for the Portfolio.
The contract review process began in January 2020 as the Trustees of the Portfolio agreed on, among other things, an overall approach and timeline for the process. Contract review materials were provided to the Trustees in March 2020, July 2020 and September 2020. In addition, the Trustees reviewed and discussed the Portfolio’s performance at regularly scheduled meetings throughout the year, and took into account other information related to the Portfolio provided to the Trustees at regularly scheduled meetings, in connection with the review of the Portfolio’s investment management agreement.
In March 2020, the Trustees, among other things, discussed the memorandum provided by Fund counsel that summarized the legal standards and other considerations that are relevant to the Trustees in their deliberations regarding the renewal of the investment management agreement, and reviewed and discussed the qualifications of the investment management teams for the Portfolio, as well as the level of investment by the Portfolio’s portfolio managers in the Portfolio. In July 2020, the Trustees, among other things, reviewed the Portfolio’s management fees and total expense ratios, the financial statements of APAM and its parent companies, profitability analyses provided by APAM, and analyses from APAM as to possible economies of scale. The Trustees also reviewed the profitability of the institutional business of APAM and APAM’s affiliate, Amundi Pioneer Institutional Asset Management, Inc. (“APIAM” and, together with APAM, “Amundi Pioneer”), as compared to that of APAM’s fund management business, and considered the differences between the fees and expenses of the Portfolio and the fees and expenses of APAM’s and APIAM’s institutional accounts, as well as the different services provided by APAM to the Portfolio and by APAM and APIAM to the institutional accounts. The Trustees further considered contract review materials, including additional materials received in response to the Trustees’ request, in September 2020.
At a meeting held on September 15, 2020, based on their evaluation of the information provided by APAM and third parties, the Trustees of the Portfolio, including the Independent Trustees voting separately, unanimously approved the renewal of the investment management agreement for another year. In approving the renewal of the investment management agreement, the Trustees considered various factors that they determined were relevant, including the factors described below. The Trustees did not identify any single factor as the controlling factor in determining to approve the renewal of the agreement.
Nature, Extent and Quality of Services
The Trustees considered the nature, extent and quality of the services that had been provided by APAM to the Portfolio, taking into account the investment objective and strategy of the Portfolio. The Trustees also reviewed APAM’s investment approach for the Portfolio and its research process. The Trustees considered the resources of APAM and the personnel of APAM who provide investment management services to the Portfolio. They also reviewed the amount of non-Portfolio assets managed by the portfolio managers of the Portfolio. They considered the non-investment resources and personnel of APAM that are involved in APAM’s services to the Portfolio, including APAM’s compliance, risk management, and legal resources and personnel. The Trustees noted the substantial attention and high priority given by APAM’s senior management to the Pioneer Fund complex. The Trustees considered the implementation and effectiveness of APAM’s business continuity plan in response to the COVID-19 pandemic.
The Trustees considered that APAM supervises and monitors the performance of the Portfolio’s service providers and provides the Portfolio with personnel (including Portfolio officers) and other resources that are necessary for the Portfolio’s business management and operations. The Trustees also considered that, as administrator, APAM is responsible for the administration of the Portfolio’s business and other affairs. The Trustees considered the fees paid to APAM for the provision of administration services.
Based on these considerations, the Trustees concluded that the nature, extent and quality of services that had been provided by APAM to the Portfolio were satisfactory and consistent with the terms of the investment management agreement.
Performance of the Portfolio
In considering the Portfolio’s performance, the Trustees regularly review and discuss throughout the year data prepared by APAM and information comparing the Portfolio’s performance with the performance of its peer group of funds, as classified by Morningstar, Inc. (Morningstar), and with the performance of the Portfolio’s benchmark index. They also discuss the Portfolio’s performance with APAM on a regular basis. The Trustees’ regular reviews and discussions were factored into the Trustees’ deliberations concerning the renewal of the investment management agreement.
51
| | |
| Pioneer Bond VCT Portfolio | Pioneer Variable Contracts Trust |
| Approval of Investment Management Agreement (continued) | |
Management Fee and Expenses
The Trustees considered information showing the fees and expenses of the Portfolio in comparison to the management fees of its peer group of funds as classified by Morningstar and also to the expense ratios of a peer group of funds selected on the basis of criteria determined by the Independent Trustees for this purpose using data provided by Strategic Insight Mutual Fund Research and Consulting, LLC (Strategic Insight), an independent third party. The peer group comparisons referred to below are organized in quintiles. Each quintile represents one-fifth of the peer group. In all peer group comparisons referred to below, first quintile is most favorable to the Portfolio’s shareowners. The Trustees noted that they separately review and consider the impact of the Portfolio’s transfer agency and Portfolio- and APAM-paid expenses for sub-transfer agency and intermediary arrangements, and that the results of the most recent such review were considered in the consideration of the Portfolio’s expense ratio.
The Trustees considered that the Portfolio’s management fee for the most recent fiscal year was in the first quintile relative to the management fees paid by other funds in its Morningstar category for the comparable period. The Trustees considered that the expense ratio of the Portfolio’s Class II shares for the most recent fiscal year was in the third quintile relative to its Strategic Insight peer group for the comparable period. The Trustees noted that APAM had agreed to waive fees and/or reimburse expenses in order to limit the ordinary operating expenses of the Portfolio.
The Trustees reviewed management fees charged by APAM and APIAM to institutional and other clients, including publicly offered European funds sponsored by APAM’s affiliates, unaffiliated U.S. registered investment companies (in a sub-advisory capacity), and unaffiliated foreign and domestic separate accounts. The Trustees also considered APAM’s costs in providing services to the Portfolio and APAM’s and APIAM’s costs in providing services to the other clients and considered the differences in management fees and profit margins for fund and non-fund services. In evaluating the fees associated with APAM’s and APIAM’s client accounts, the Trustees took into account the respective demands, resources and complexity associated with the Portfolio and other client accounts. The Trustees noted that, in some instances, the fee rates for those clients were lower than the management fee for the Portfolio and considered that, under the investment management agreement with the Portfolio, APAM performs additional services for the Portfolio that it does not provide to those other clients or services that are broader in scope, including oversight of the Portfolio’s other service providers and activities related to compliance and the extensive regulatory and tax regimes to which the Portfolio is subject. The Trustees also considered the entrepreneurial risks associated with APAM’s management of the Portfolio.
The Trustees concluded that the management fee payable by the Portfolio to APAM was reasonable in relation to the nature and quality of the services provided by APAM.
Profitability
The Trustees considered information provided by APAM regarding the profitability of APAM with respect to the advisory services provided by APAM to the Portfolio, including the methodology used by APAM in allocating certain of its costs to the management of the Portfolio. The Trustees also considered APAM’s profit margin in connection with the overall operation of the Portfolio. They further reviewed the financial results, including the profit margins, realized by APAM and APIAM from non-fund businesses. The Trustees considered APAM’s profit margins in comparison to the limited industry data available and noted that the profitability of any adviser was affected by numerous factors, including its organizational structure and method for allocating expenses. The Trustees concluded that APAM’s profitability with respect to the management of the Portfolio was not unreasonable.
Economies of Scale
The Trustees considered APAM’s views relating to economies of scale in connection with the Pioneer Funds as fund assets grow and the extent to which any such economies of scale are shared with the Portfolio and Portfolio shareholders. The Trustees recognize that economies of scale are difficult to identify and quantify, and that, among other factors that may be relevant, are the following: fee levels, expense subsidization, investment by APAM in research and analytical capabilities and APAM’s commitment and resource allocation to the Portfolio. The Trustees noted that profitability also may be an indicator of the availability of any economies of scale, although profitability may vary for other reasons including due to reductions in expenses. The Trustees concluded that economies of scale, if any, were being appropriately shared with the Portfolio.
52
| | |
| Pioneer Bond VCT Portfolio | Pioneer Variable Contracts Trust |
Other Benefits
The Trustees considered the other benefits that APAM enjoys from its relationship with the Portfolio. The Trustees considered the character and amount of fees paid or to be paid by the Portfolio, other than under the investment management agreement, for services provided by APAM and its affiliates. The Trustees further considered the revenues and profitability of APAM’s businesses other than the Fund business. To the extent applicable, the Trustees also considered the benefits to the Portfolio and to APAM and its affiliates from the use of “soft” commission dollars generated by the Portfolio to pay for research and brokerage services.
The Trustees considered that Amundi Pioneer is the principal U.S. asset management business of Amundi, which is one of the largest asset managers globally. Amundi’s worldwide asset management business manages over $1.7 trillion in assets (including the Pioneer Funds). The Trustees considered that APAM’s relationship with Amundi creates potential opportunities for APAM, APIAM and Amundi that derive from APAM’s relationships with the Portfolio, including Amundi’s ability to market the services of APAM globally. The Trustees noted that APAM has access to additional research and portfolio management capabilities as a result of its relationship with Amundi and Amundi’s enhanced global presence that may contribute to an increase in the resources available to APAM. The Trustees considered that APAM and the Portfolio receive reciprocal intangible benefits from the relationship, including mutual brand recognition and, for the Portfolio, direct and indirect access to the resources of a large global asset manager. The Trustees concluded that any such benefits received by APAM as a result of its relationship with the Portfolio were reasonable.
Conclusion
After consideration of the factors described above as well as other factors, the Trustees, including the Independent Trustees, concluded that the investment management agreement for the Portfolio, including the fees payable thereunder, was fair and reasonable and voted to approve the proposed renewal of the investment management agreement.
53
| | |
| Pioneer Bond VCT Portfolio | Pioneer Variable Contracts Trust |
Trustees, Officers and Service Providers | |
The Portfolio’s Trustees and officers are listed below, together with their principal occupations and other directorships they have held during at least the past five years. Trustees who are interested persons of the Portfolios within the meaning of the 1940 Act are referred to as Interested Trustees. Trustees who are not interested persons of the Portfolio are referred to as Independent Trustees. Each of the Trustees serves as a Trustee of each of the 45 U.S. registered investment portfolios for which Amundi US serves as investment adviser (the “Pioneer Funds”). The address for all Trustees and all officers of the Portfolios is 60 State Street, Boston, Massachusetts 02109.
| Name, Age and Position | Term of Office and | | Other Directorships |
| Held With the Trust | Length of Service | Principal Occupation | Held by Trustee |
| Independent Trustees: | | | |
| Thomas J. Perna (70) | Trustee since 2006. Serves until a | Private investor (2004 – 2008 and | Director, Broadridge Financial |
Chairman of the Board | successor trustee is elected or | 2013 – present); Chairman (2008 – 2013) | Solutions, Inc. (investor |
and Trustee | earlier retirement or removal. | and Chief Executive Officer (2008 – 2012), | communications and securities |
| | Quadriserv, Inc. (technology products for | processing provider for financial |
| | securities lending industry); and Senior | services industry) (2009 – present); |
| | Executive Vice President, The Bank of New York | Director, Quadriserv, Inc. (2005 – |
| | (financial and securities services) (1986 – 2004) | 2013); and Commissioner, New Jersey |
| | | State Civil Service Commission |
| | | (2011 – 2015) |
John E. Baumgardner,
| Trustee since 2019. Serves until a | Of Counsel (2019 – present), Partner | Chairman, The Lakeville Journal |
Jr. (69)
| successor trustee is elected or | (1983-2018), Sullivan & Cromwell LLP | Company, LLC, (privately-held |
Trustee
| earlier retirement or removal. | (law firm). | community newspaper group) (2015- |
| | | present) |
| Diane Durnin (63) | Trustee since 2019. Serves until a | Managing Director - Head of Product Strategy | None |
Trustee | successor trustee is elected or | and Development, BNY Mellon Investment | |
| earlier retirement or removal. | Management (investment management firm) | |
| | (2012-2018); Vice Chairman – The Dreyfus | |
| | Corporation (2005 – 2018): Executive Vice | |
| | President Head of Product, BNY Mellon | |
| | Investment Management (2007-2012); Executive | |
| | Director- Product Strategy, Mellon Asset | |
| | Management (2005-2007); Executive Vice | |
| | President Head of Products, Marketing and | |
| | Client Service, Dreyfus Corporation (investment | |
| | management firm) (2000-2005); and Senior Vice | |
| | President – Strategic Product and Business | |
| | Development, Dreyfus Corporation (1994-2000) | |
| Benjamin M. Friedman (76) | Trustee since 2008. Serves until a | William Joseph Maier Professor of Political | Trustee, Mellon Institutional Funds |
Trustee | successor trustee is elected or | Economy, Harvard University (1972 – present) | Investment Trust and Mellon |
| earlier retirement or removal. | | Institutional Funds Master Portfolio |
| | | (oversaw 17 portfolios in fund |
| | | complex) (1989 - 2008) |
| Lorraine H. Monchak (64) | Trustee since 2017. (Advisory | Chief Investment Officer, 1199 SEIU Funds | None |
Trustee | Trustee from 2014 - 2017). Serves | (healthcare workers union pension funds) | |
| until a successor trustee is elected | (2001 – present); Vice President – International | |
| or earlier retirement or removal. | Investments Group, American International | |
| | Group, Inc. (insurance company) (1993 – 2001); | |
| | Vice President – Corporate Finance and Treasury | |
| | Group, Citibank, N.A. (1980 – 1986 and | |
| | 1990 – 1993); Vice President – Asset/Liability | |
| | Management Group, Federal Farm Funding | |
| | Corporation (government-sponsored issuer of | |
| | debt securities) (1988 – 1990); Mortgage | |
| | Strategies Group, Shearson Lehman Hutton, Inc. | |
| | (investment bank) (1987 – 1988); and Mortgage | |
| | Strategies Group, Drexel Burnham Lambert, Ltd. | |
| | (investment bank) (1986 – 1987) | |
54
| | |
| Pioneer Bond VCT Portfolio | Pioneer Variable Contracts Trust |
| | | | |
| Name, Age and Position | Term of Office and | | Other Directorships |
| Held With the Trust | Length of Service | Principal Occupation | Held by Trustee |
Independent Trustees: (continued) | | |
| Marguerite A. Piret (72) | Trustee since 1995. Serves until a | Chief Financial Officer, American Ag Energy, | Director of New America High Income |
Trustee | successor trustee is elected or | Inc. (controlled environment and agriculture | Fund, Inc. (closed-end investment |
| earlier retirement or removal. | company) (2016 – present); and President and | company) (2004 – present); and |
| | Chief Executive Officer, Metric Financial Inc. | Member, Board of Governors, |
| | (formerly known as Newbury Piret Company) | Investment Company Institute |
| | (investment banking firm) (1981 – 2019) | (2000 – 2006) |
| Fred J. Ricciardi (73) | Trustee since 2014. Serves until a | Private investor (2020 – present); Consultant | None |
Trustee | successor trustee is elected or | (investment company services) (2012 – 2020); | |
| earlier retirement or removal. | Executive Vice President, BNY Mellon (financial | |
| | and investment company services) (1969 – 2012); | |
| | Director, BNY International Financing Corp. | |
| | (financial services) (2002 – 2012); Director, | |
| | Mellon Overseas Investment Corp. (financial | |
| | services) (2009 – 2012); Director, Financial | |
| | Models (technology) (2005-2007); Director, BNY | |
| | Hamilton Funds, Ireland (offshore investment | |
| | companies) (2004-2007); Chairman/Director, | |
| | AIB/BNY Securities Services, Ltd., Ireland | |
| | (financial services) (1999-2006); and Chairman, | |
| | BNY Alternative Investment Services, Inc. | |
| | (financial services) (2005-2007) | |
| Interested Trustees: | | | |
| Lisa M. Jones (58)* | Trustee since 2017. Serves until a | Director, CEO and President of Amundi US, Inc. | None |
Trustee, President and | successor trustee is elected or | (investment management firm) (since | |
Chief Executive Officer | earlier retirement or removal | September 2014); Director, CEO and President | |
| | of Amundi Asset Management US, Inc. (since | |
| | September 2014); Director, CEO and President of | |
| | Amundi Distributor US, Inc. (since September | |
| | 2014); Director, CEO and President of Amundi | |
| | Asset Management US, Inc. (since September | |
| | 2014); Chair, Amundi US, Inc., Amundi Distributor | |
| | US, Inc. and Amundi Asset Management US, Inc. | |
| | (September 2014 – 2018); Managing Director, | |
| | Morgan Stanley Investment Management | |
| | (investment management firm) (2010 – 2013); | |
| | Director of Institutional Business, CEO of | |
| | International, Eaton Vance Management | |
| | (investment management firm) (2005 – 2010); | |
| | and Director of Amundi Holdings US, Inc. | |
| | (since 2017) | |
| Kenneth J. Taubes (62)* | Trustee since 2014. Serves until a | Director and Executive Vice President | None |
Trustee | successor trustee is elected or | (since 2008) and Chief Investment Officer, U.S. | |
| earlier retirement or removal | (since 2010) of Amundi US, Inc. (investment | |
| | management firm); Director and Executive Vice | |
| | President and Chief Investment Officer, U.S. of | |
| | Amundi US (since 2008); Executive Vice | |
| | President and Chief Investment Officer, U.S. of | |
| | Amundi Asset Management US, Inc. (since 2009); | |
| | Portfolio Manager of Amundi US (since 1999); | |
| | and Director of Amundi Holdings US, Inc. | |
| | (since 2017) | |
* Ms. Jones and Mr. Taubes are Interested Trustees because they are officers or directors of the Portfolio’s investment adviser and certain of its affiliates.
55
| | |
| Pioneer Bond VCT Portfolio | Pioneer Variable Contracts Trust |
| Trustees, Officers and Service Providers (continued) | |
| | | | |
| Name, Age and Position | Term of Office and | | Other Directorships |
| Held With the Trust | Length of Service | Principal Occupation | Held by Officer |
| Fund Officers: | | | |
| Christopher J. Kelley (56) | Since 2003. Serves at the | Vice President and Associate General Counsel | None |
Secretary and Chief | discretion of the Board | of Amundi US since January 2008; Secretary and | |
Legal Officer | | Chief Legal Officer of all of the Pioneer Funds | |
| | since June 2010; Assistant Secretary of all of the | |
| | Pioneer Funds from September 2003 to | |
| | May 2010; Vice President and Senior Counsel of | |
| | Amundi US from July 2002 to December 2007 | |
| Carol B. Hannigan (59) | Since 2010. Serves at the | Fund Governance Director of Amundi US since | None |
Assistant Secretary | discretion of the Board | December 2006 and Assistant Secretary of all | |
| | the Pioneer Funds since June 2010; Manager – | |
| | Fund Governance of Amundi US from | |
| | December 2003 to November 2006; and Senior | |
| | Paralegal of Amundi US from January 2000 to | |
| | November 2003 | |
| Thomas Reyes (58) | Since 2010. Serves at the | Assistant General Counsel of Amundi US since | None |
Assistant Secretary | discretion of the Board | May 2013 and Assistant Secretary of all the | |
| | Pioneer Funds since June 2010; and Counsel of | |
| | Amundi US from June 2007 to May 2013 | |
| Mark E. Bradley (61) | Since 2008. Serves at the | Vice President – Fund Treasury of Amundi US; | None |
Treasurer and Chief Financial | discretion of the Board | Treasurer of all of the Pioneer Funds since | |
and Accounting Officer | | March 2008; Deputy Treasurer of Amundi US | |
| | from March 2004 to February 2008; and Assistant | |
| | Treasurer of all of the Pioneer Funds from | |
| | March 2004 to February 2008 | |
| Anthony J. Koenig, Jr. (57) | Since 2021. Serves at the | Senior Vice President – Fund Treasury of | None |
Assistant Treasurer | discretion of the Board | Amundi US; Assistant Treasurer of all of the | |
| | Pioneer Funds since January 2021; and Chief of | |
| | Staff, US Investment Management of Amundi US | |
| | from May 2008 to January 2021 | |
| Luis I. Presutti (55) | Since 2000. Serves at the | Director – Fund Treasury of Amundi US since | None |
Assistant Treasurer | discretion of the Board | 1999; and Assistant Treasurer of all of the | |
| | Pioneer Funds since 1999 | |
| Gary Sullivan (62) | Since 2002. Serves at the | Senior Manager – Fund Treasury of Amundi US | None |
Assistant Treasurer | discretion of the Board | since 2012; and Assistant Treasurer of all of the | |
| | Pioneer Funds since 2002 | |
| Antonio Furtado (38) | Since 2020. Serves at the | Fund Oversight Manager – Fund Treasury of | None |
Assistant Treasurer | discretion of the Board | Amundi US since 2020; Assistant Treasurer of all | |
| | of the Pioneer Funds since 2020; and Senior Fund | |
| | Treasury Analyst from 2012 - 2020 | |
| John Malone (50) | Since 2018. Serves at the | Managing Director, Chief Compliance Officer of | None |
Chief Compliance Officer | discretion of the Board | Amundi US Asset Management; Amundi Asset | |
| | Management US, Inc.; and the Pioneer Funds | |
| | since September 2018; and Chief Compliance | |
| | Officer of Amundi Distributor US, Inc. since | |
| | January 2014. | |
| Kelly O’Donnell (49) | Since 2006. Serves at the | Vice President – Amundi Asset Management; | None |
Anti-Money | discretion of the Board | and Anti-Money Laundering Officer of all the | |
Laundering Officer | | Pioneer Funds since 2006 | |
56
This page was intentionally left blank.
57
This page was intentionally left blank.
58
This page was intentionally left blank.
59
This page was intentionally left blank.
60
This page was intentionally left blank.
61
Proxy Voting Policies and Procedures of the Portfolio are available without charge, upon request, by calling our toll free number (1-800-225-6292). Information regarding how the Portfolio voted proxies relating to Portfolio securities during the most recent 12-month period ended June 30 is publicly available to shareowners at www.amundi.com/us. This information is also available on the Securities and Exchange Commission’s web site at www.sec.gov.
18656-15-0221
Pioneer Variable Contracts Trust
Pioneer Equity Income
VCT Portfolio
Class I and II Shares
Annual Report | December 31, 2020
Paper copies of the Portfolio’s shareholder reports may no longer be sent by mail, unless you specifically request paper copies of the reports from the insurance company that offers your variable annuity or variable life insurance contract, or from your financial intermediary. Instead, the insurance company may choose to make the reports available on a website, and will notify you by mail each time a shareholder report is posted and provide you with a website link to access the report. Instructions for requesting paper copies will be provided by your insurance company.
You may elect to receive all future Portfolio shareholder reports in paper form, free of charge, from the insurance company. You can inform the insurance company or your financial intermediary that you wish to continue receiving paper copies of your shareholder reports by following the instructions provided by the insurance company, or by contacting your financial intermediary. Your election to receive reports in paper form will apply to all portfolios available under your contract with the insurance company.
Please refer to your contract prospectus to determine the applicable share class offered under your contract.
Pioneer Variable Contracts Trust
| | |
Table of Contents | |
| Pioneer Equity Income VCT Portfolio | |
| | |
| 2 |
| | |
| 3 |
| | |
| 4 |
| | |
| 8 |
| | |
| 13 |
| | |
| 18 |
| | |
| 23 |
| | |
| 24 |
| | |
| 25 |
| | |
| 28 |
This report is authorized for distribution only when preceded or accompanied by a prospectus for the Portfolio being offered.
Pioneer Variable Contracts Trust files a complete schedule of portfolio holdings with the Securities and Exchange Commission for the first and third quarters of each fiscal year as an exhibit to its reports on Form N-PORT. Shareholders may view the filed Form N-PORT by visiting the Commission’s web site at https://www.sec.gov.
| | |
| Pioneer Equity Income VCT Portfolio | Pioneer Variable Contracts Trust |
Portfolio Update
12/31/20
5 Largest Holdings
(As a percentage of total investments)*
1. | Verizon Communications, Inc. | 2.26% |
2. | KLA-Tencor Corp. | 2.19 |
3. | Abbott Laboratories | 2.15 |
4. | Eli Lilly & Co. | 2.02 |
5. | Bank of America Corp. | 1.96 |
* | Excludes temporary cash investments and all derivative contracts except for options pur- chased. The Portfolio is actively managed, and current holdings may be different. The holdings listed should not be considered rec- ommendations to buy or sell any securities. |
| | | | | |
| Performance Update 12/31/20 | | | |
| |
| Prices and Distributions | | | | |
| |
| Net Asset Value per Share | | 12/31/20 | 12/31/19 | |
| Class I | | $15.51 | $16.65 | |
| Class II | | $15.79 | $16.92 | |
| Net | | | |
| Distributions per Share | Investment | Short-Term | Long-Term | |
| (1/1/20 – 12/31/20) | Income | Capital Gains | Capital Gains | |
| Class I | $0.3904 | $ – | $0.5737 | |
| Class II | $0.3513 | $ – | $0.5737 | |
Performance of a $10,000 InvestmentThe following chart shows the change in value of an investment made in Class I and Class II shares of Pioneer Equity Income VCT Portfolio at net asset value during the periods shown, compared to that of the Russell 1000 Value Index. Portfolio returns are based on net asset value and do not reflect any applicable insurance fees or surrender charges.
The Russell 1000 Value Index is an unmanaged index that measures the performance of large-cap U.S. value stocks. Index returns are calculated monthly, assume reinvestment of dividends and, unlike Portfolio returns, do not reflect any fees, expenses or sales charges. It is not possible to invest directly in an index.
| | | | |
| Average Annual Total Returns | | | |
(As of December 31, 2020) | | | |
| | | Russell 1000 |
| Class I | Class II | Value Index |
10 Years | 10.53% | 10.26% | 10.50% |
5 Years | 9.67% | 9.42% | 9.74% |
1 Year | -0.04% | -0.26% | 2.80% |
All total returns shown assume reinvestment of distributions at net asset value.
The performance table does not reflect the deduction of taxes that a shareowner would pay on distributions or the redemption of shares.
Call 1-800-688-9915 or visit www.amundi.com/us for the most recent month-end performance results. Current performance may be lower or higher than the performance data quoted.
The performance data quoted represents past performance, which is no guarantee of future results. Investment return and principal value will fluctuate, and shares, when redeemed, may be worth more or less than their original cost.
The returns for the Portfolio do not reflect the deduction of expenses associated with variable products, such as mortality and expense risk charges, separate account charges, and sales charges. These expenses would reduce the overall returns shown.
Performance results reflect any applicable expense waivers in effect during the periods shown. Without such waivers, performance would be lower. Waivers may not be in effect for all portfolios. Certain fee waivers are contractual through a specified period. Otherwise, fee waivers can be rescinded at any time. See the prospectus and financial statements for more information.
2
| | |
| Pioneer Equity Income VCT Portfolio | Pioneer Variable Contracts Trust |
Comparing Ongoing Portfolio Expenses | |
As a shareowner in the Portfolio, you incur two types of costs:
(1) | ongoing costs, including management fees, distribution and/or service (12b-1) fees, and other Portfolio expenses; and |
(2) | transaction costs, including sales charges (loads) on purchase payments. |
This example is intended to help you understand your ongoing expenses (in dollars) of investing in the Portfolio and to compare these costs with the ongoing costs of investing in other mutual funds offered through your variable annuity contract. The example is based on an investment of $1,000 at the beginning of the Portfolio’s latest six-month period and held throughout the six months.
Using the Tables
Actual Expenses
The first table below provides information about actual account values and actual expenses. You may use the information in this table, together with the amount you invested, to estimate the expenses that you paid over the period as follows:
1. | Divide your account value by $1,000 |
| Example: an $8,600 account value ÷ $1,000 = 8.6 |
2. | Multiply the result in (1) above by the corresponding share class’s number in the third row under the heading entitled “Expenses Paid During Period” to estimate the expenses you paid on your account during this period. |
Expenses Paid on a $1,000 Investment in Pioneer Equity Income VCT Portfolio
Based on actual returns from July 1, 2020 through December 31, 2020.
| Share Class | I | II |
Beginning Account Value on 7/1/20 | $1,000.00 | $1,000.00 |
Ending Account Value on 12/31/20 | $1,173.51 | $1,171.90 |
Expenses Paid During Period* | $4.37 | $5.73 |
* | Expenses are equal to the Portfolio’s annualized net expense ratio of 0.80% and 1.05% for Class I and Class II shares, respectively, multiplied by the average account value over the period, multiplied by 184/366 (to reflect the one-half year period). |
Hypothetical Example for Comparison Purposes
The table below provides information about hypothetical account values and hypothetical expenses based on the Portfolio’s actual expense ratio and an assumed rate of return of 5% per year before expenses, which is not the Portfolio’s actual return. The hypothetical account values and expenses may not be used to estimate the actual ending account balance or expenses you paid for the period.
You may use this information to compare the ongoing costs of investing in the Portfolio and other variable annuities. To do so, compare this 5% hypothetical example with the 5% hypothetical examples that appear in the shareholder reports of the other variable annuities.
Please note that the expenses shown in the tables are meant to highlight your ongoing costs only and do not reflect any transaction costs, such as sales charges (loads) that are charged at the time of the transaction. Therefore, the table below is useful in comparing ongoing costs only and will not help you determine the relative total costs of owning different variable annuities. In addition, if these transaction costs were included, your costs would have been higher.
Expenses Paid on a $1,000 Investment in Pioneer Equity Income VCT Portfolio
Based on a hypothetical 5% per year return before expenses, reflecting the period from July 1, 2020 through December 31, 2020.
| | | |
| Share Class | I | II |
Beginning Account Value on 7/1/20 | $1,000.00 | $1,000.00 |
Ending Account Value on 12/31/20 | $1,021.11 | $1,019.86 |
Expenses Paid During Period* | $4.06 | $5.33 |
* | Expenses are equal to the Portfolio’s annualized net expense ratio of 0.80% and 1.05% for Class I and Class II shares, respectively, multiplied by the average account value over the period, multiplied by 184/366 (to reflect the one-half year period). |
3
| | |
| Pioneer Equity Income VCT Portfolio | Pioneer Variable Contracts Trust |
Portfolio Management Discussion 12/31/20 | |
Call 1-800-688-9915 or visit www.amundi.com/us for the most recent month-end performance results. Current performance may be lower or higher than the performance data quoted.
The performance data quoted represents past performance, which is no guarantee of future results. Investment return and principal value will fluctuate, and shares, when redeemed, may be worth more or less than their original cost.
The returns for the Portfolio do not reflect the deduction of expenses associated with variable products, such as mortality and expense risk charges, separate account charges, and sales charges. These expenses would reduce the overall returns shown.
Performance results reflect any applicable expense waivers in effect during the periods shown. Without such waivers performance would be lower. Waivers may not be in effect for all portfolios. Certain fee waivers are contractual through a specified period. Otherwise, fee waivers can be rescinded at any time. See the prospectus and financial statements for more information.
In the following interview, John A. Carey discusses the market environment for equities and the factors that affected the performance of Pioneer Equity Income VCT Portfolio during the 12-month period ended December 31, 2020. Mr. Carey, Managing Director, Director of Equity Income, US, and a portfolio manager at Amundi Asset Management US, Inc. (Amundi US), is responsible for the day-to-day management of the Portfolio, along with Sammi Truong, a vice president and a portfolio manager at Amundi US, and Walter Hunnewell, Jr., a vice president and a portfolio manager at Amundi US.
Q: How did the Portfolio perform over the 12-month period ended December 31, 2020?
A: Pioneer Equity Income VCT Portfolio’s Class I shares returned -0.04% at net asset value during the 12-month period ended December 31, 2020, and Class II shares returned -0.26%, while the Portfolio’s benchmark, the Russell 1000 Value Index, returned 2.80%.
Q: How would you describe the market for equities during the 12-month period ended December 31, 2020, particularly for the types of equities deemed appropriate for the Portfolio?
A: The 12-month period ended December 31, 2020, was a memorable one. Through the middle of February, the stock market rose moderately and appeared quite stable. Then the COVID-19 virus hit, and the market took a deep plunge as the economy almost completely shut down, unemployment rose dramatically, and prospects for continued growth darkened. The market low was reached on March 23. As abruptly as the market had fallen, however, it turned around and began climbing. The US government stepped in with dramatic personal-income and business support measures, and the Federal Reserve (Fed) dropped the target range of the federal funds rate to near zero, while also undertaking extensive debt purchases to restore confidence in financial markets. Investors also took heart from optimistic predictions for vaccines and treatments for COVID-19 and hoped that the masking, social distancing, and other restrictions enforced or encouraged would be effective in keeping the virus in check in the meantime. By early June, though, skepticism re-emerged, and the market moved largely sideways through the end of October. Concerning investors as well was the upcoming national election in early November and the uncertainties for future public policy. The market then continued its ascent into the last part of the year, as Pfizer and Moderna released interim results showing greater than 90% efficacy for their COVID-19 vaccines — which subsequently received emergency use authorization from the Food and Drug Administration (FDA). (Neither Pfizer nor Moderna was a Portfolio holding as of December 31, 2020.) In addition, the prospects of a Biden presidency as well as full Democratic Party control of Congress raised hopes for passage of another large fiscal stimulus package that would provide relief to the consumer.
A steady theme throughout the time of preoccupation with the pandemic was a preference among investors for companies with growth potential and less dependence on the business cycle — in fact with potential enhanced, if anything, by the new, stay-at-home work routine and “cocooned” life style for many individuals. Despite value stocks rallying late in the year on positive COVID-19 vaccines development, the gulf in performance between growth and
4
| | |
| Pioneer Equity Income VCT Portfolio | Pioneer Variable Contracts Trust |
value stocks was among the widest on record. To illustrate, from December 31, 2019, to December 31, 2020, the Russell 1000 Growth Index showed a total return of 38.49%, versus a return of 2.80% for the Portfolio’s benchmark, the Russell 1000 Value Index, an advantage of almost 36%. During the 12-month period, investors were particularly enamored with the high-growth potential of the so-called FAANG stocks (Facebook, Amazon, Apple, Netflix, and Google [Alphabet]) and their close kin. (None of the FAANG stocks were held in the Portfolio as of December 31, 2020.)
In the Portfolio’s investment universe of value stocks – the non-FAANG world, if you will – there were some companies that attracted investors, notably providers of cleaning supplies, packaged foods, and medical tests, as well as developers of potential treatments and vaccines for COVID-19. Many other value stocks, however, in sectors ranging from consumer cyclicals and financial services to energy and industrials, took a backseat to the favored growth names.
Q: Could you please discuss the main factors that affected the Portfolio’s benchmark-relative performance during the 12-month period ended December 31, 2020, and discuss any investments or strategies that significantly helped or hurt benchmark-relative returns?
A: The Portfolio underperformed the benchmark over the 12-month period. On the plus side, the Portfolio had overweight positions in several of the stocks that sparkled during the market’s pandemic-focused period, which aided benchmark-relative returns. For example, Progressive enjoyed good profits in its auto insurance business line as miles driven declined with the stay-at-home environment; Eli Lilly benefited from testing treatments for patients sick with the COVID-19 virus; Target gained market share with its omni-channel strategy and stores remaining open, having been classified as an essential business; and KLA saw strong backlogs as working-from-home, remote learning, and increased interest in gaming helped drive demand for the products requiring microchips that KLA’s equipment helps to make. We also managed to avoid investing the Portfolio in some of stocks that struggled significantly during the 12-month period, and that avoidance contributed positively to relative performance.
On the negative side, detractors from the Portfolio’s benchmark-relative results included shares of Cedar Fair, which suffered from the total shutdown of its amusement parks; refiners Phillips 66 and Valero Energy, which saw their businesses plummet with the collapse of air travel and the decline in commuting; M&T Bank, which saw COVID-19 have a detrimental effect on its apartment, hospitality, and retail loan books in New York City; and Nordstrom, which opened a major department store in New York City just in time to see the virus arrive in the US, and the resulting restrictions on retailing. In the case of Nordstrom, we sold the Portfolio’s position out of concern that the finances of the company were becoming strained. We have been watching all of the Portfolio’s positions for signs of stress during this difficult time.
5
| | |
| Pioneer Equity Income VCT Portfolio | Pioneer Variable Contracts Trust |
| Portfolio Management Discussion 12/31/20 (continued) | |
Q: Could you highlight some of the more notable changes you made Portfolio during the 12-month period ended December 31, 2020?
A: A sector in which the Portfolio has typically been overweighted, going all the way back to its inception, is utilities. The regulated nature of utilities typically provides investors with above-average confidence in the sustainability of dividend* payments. However, in recent years, as interest rates declined to very low levels and investors became desirous of securities providing higher income yields,utilities stocks, we thought, became expensive, and so we moved the Portfolio to an underweight exposure to the sector versus the Russell 1000 Value Index. During this recent 12-month period, utility stocks performed quite modestly, and we began to see potential opportunities in the sector, and so we added some positions, which resulted in a Portfolio overweight, once again, in utilities versus the benchmark.
Another sector where we were active during the 12-month period was information technology, where we added Portfolio positions in primarily payroll-processing companies and payment-services providers, though we also established a position in a company that provides technology solutions to businesses.
With regard to sales during the 12-month period, we exited some Portfolio positions that we felt could be impaired longer than average as a result of the COVID-19-caused slowdown, including holdings within the energy and industrials sectors, where the effects of the pandemic have been significant.
Q: Did the Portfolio have any exposure to derivatives during the 12-month period ended December 31, 2020?
A: No. The Portfolio had no exposure to derivatives during the period.
Q: The Portfolio typically places emphasis on dividend-paying stocks. How would you describe the environment for dividends during the 12-month period ended December 31, 2020?
A: At a time when companies were clearly worried about the economy and the spread of the virus, many managements were understandably focused on conserving financial resources. Few companies raised their dividends, and some reduced or even omitted dividend payments. While we have customarily focused the Portfolio’s investments on companies with dividends covered by earnings and have, as a result, seen some of the Portfolio’s holdings not only sustain but also regularly increase dividends over time, in the environment which predominated during the 12 months ended December 31, 2020, we saw even companies we had considered to be quite strong financially encounter extremely difficult business conditions.
In a small number of cases, we have continued holding stocks where managements took adverse action on the company’s dividend during the period. Those instances have been ones where we felt that the conditions were beyond the control of management rather than the consequence of management missteps. Nonetheless, we are watching all of the Portfolio’s holdings quite closely and shall take decisions we think are appropriate when financial strains on companies force changes in their business plans.
* | Dividends are not guaranteed. |
6
| | |
| Pioneer Equity Income VCT Portfolio | Pioneer Variable Contracts Trust |
A Word About Risk:
All investments are subject to risk, including the possible loss of principal. In the past several years, financial markets have experienced increased volatility and heightened uncertainty. The market prices of securities may go up or down, sometimes rapidly or unpredictably, due to general market conditions, such as real or perceived adverse economic, political, or regulatory conditions, recessions, inflation, changes in interest or currency rates, lack of liquidity in the bond markets, the spread of infectious illness or other public health issues or adverse investor sentiment. These conditions may continue, recur, worsen or spread.
Investing in foreign and/or emerging markets securities involves risks relating to interest rates, currency exchange rates, economic, and political conditions.
The Portfolio invests in REIT securities, the value of which can fall for a variety of reasons, such as declines in rental income, fluctuating interest rates, poor property management, environmental liabilities, uninsured damage, increased competition, or changes in real estate tax laws.
At times, the Portfolio’s investments may represent industries or industry sectors that are interrelated or have common risks, making the Portfolio more susceptible to any economic, political, or regulatory developments or other risks affecting those industries and sectors.
These risks may increase share price volatility.
We should also say that we shall be watching closely the new political environment in Washington, DC, post the recent election. Changes in federal tax rates on dividend payments could affect companies’ views with respect to the amount of dividend income they believe is beneficial for them to distribute to shareholders. Higher corporate tax rates, too, could reduce the growth of companies’ earnings and dividends.
Q: What is your outlook for equities as the US economy continues to deal with the effects of the COVID-19 situation?
A: Thus far, two vaccines have been approved for emergency use authorization in the US. Assuming the ability to distribute the vaccines and inoculate large numbers of people in the US and elsewhere in the world over the next six months or so (and a smooth process is by no means certain), there will still be many questions about the US economy, in particular, as well as the enduring ramifications of what we have been going through over the past several months. Will work and leisure patterns snap back; will higher costs of doing business persist; what shifts might occur in time horizons for investments; how quickly will people feel comfortable with saving less?
The market bounce-back from the March 23, 2020, nadir was for sure impressive, and the frequent forecasting successes of the market historically have been noteworthy. However, there are no guarantees whatsoever that the market has gauged this or any other situation correctly, or that market participants have taken adequately into account all of the variables and potential outcomes.
As always, we intend during the coming months to focus our attention closely on individual companies and their potential both for meeting the probable challenges and capturing the possible opportunities.
Thank you for your support.
Please refer to the Schedule of Investments on pages 8 to 12 for a full listing of Portfolio securities.
Past performance is no guarantee of future results.
Any information in this shareholder report regarding market or economic trends or the factors influencing the Portfolio’s historical or future performance are statements of opinion as of the date of this report.
7
| | |
| Pioneer Equity Income VCT Portfolio | Pioneer Variable Contracts Trust |
Schedule of Investments 12/31/20 | |
| | | | |
| Shares | | | Value |
| | UNAFFILIATED ISSUERS – 98.9% | |
| | COMMON STOCKS – 98.9% of Net Assets | |
| | Air Freight & Logistics – 0.6% | |
| 6,878 | | CH Robinson Worldwide, Inc. | $ 645,638 |
| | Total Air Freight & Logistics | $ 645,638 |
| | Auto Components – 1.3% | |
| 36,631 | | BorgWarner, Inc. | $ 1,415,422 |
| | Total Auto Components | $ 1,415,422 |
| | Automobiles – 0.5% | |
| 20,507 | | Honda Motor Co. Ltd. (A.D.R.) | $ 579,323 |
| | Total Automobiles | $ 579,323 |
| | Banks – 7.1% | |
| 70,470 | | Bank of America Corp. | $ 2,135,946 |
| 6,804 | | Canadian Imperial Bank of Commerce | 581,538 |
| 11,998 | | JPMorgan Chase & Co. | 1,524,586 |
| 9,164 | | M&T Bank Corp. | 1,166,577 |
| 10,932 | | PNC Financial Services Group, Inc. | 1,628,868 |
| 15,920 | | Truist Financial Corp. | 763,045 |
| | Total Banks | $ 7,800,560 |
| | Capital Markets – 6.6% | |
| 23,842 | | Bank of New York Mellon Corp. | $ 1,011,854 |
| 9,652 | | Charles Schwab Corp. | 511,942 |
| 2,090 | | CME Group, Inc. | 380,485 |
| 20,411 | | Morgan Stanley | 1,398,766 |
| 11,528 | | Northern Trust Corp. | 1,073,718 |
| 12,463 | | State Street Corp. | 907,057 |
| 13,194 | | T Rowe Price Group, Inc. | 1,997,440 |
| | Total Capital Markets | $ 7,281,262 |
| | Chemicals – 3.4% | |
| 12,605 | | Celanese Corp. | $ 1,637,894 |
| 6,299 | | Corteva, Inc. | 243,897 |
| 9,433 | | Dow, Inc. | 523,532 |
| 8,664 | | DuPont de Nemours, Inc. | 616,097 |
| 1,000 | | Ecolab, Inc. | 216,360 |
| 4,251 | | FMC Corp. | 488,567 |
| | Total Chemicals | $ 3,726,347 |
| | Commercial Services & Supplies – 1.2% | |
| 8,777 | | MSA Safety, Inc. | $ 1,311,196 |
| | Total Commercial Services & Supplies | $ 1,311,196 |
| | Communications Equipment – 0.7% | |
| 17,647 | | Cisco Systems, Inc. | $ 789,703 |
| | Total Communications Equipment | $ 789,703 |
| | Distributors – 0.8% | |
| 8,526 | | Genuine Parts Co. | $ 856,266 |
| | Total Distributors | $ 856,266 |
The accompanying notes are an integral part of these financial statements.
| | |
| Pioneer Equity Income VCT Portfolio | Pioneer Variable Contracts Trust |
| | | | |
| Shares | | | Value |
| | Diversified Telecommunication Services – 3.5% | |
| 31,044 | | AT&T, Inc. | $ 892,825 |
| 11,125 | | BCE, Inc. | 476,150 |
| 41,937 | | Verizon Communications, Inc. | 2,463,799 |
| | Total Diversified Telecommunication Services | $ 3,832,774 |
| | Electric Utilities – 3.3% | |
| 35,466 | | Alliant Energy Corp. | $ 1,827,563 |
| 9,587 | | American Electric Power Co., Inc. | 798,310 |
| 7,308 | | NextEra Energy, Inc. | 563,812 |
| 14,750 | | PPL Corp. | 415,950 |
| | Total Electric Utilities | $ 3,605,635 |
| | Electrical Equipment – 0.6% | |
| 8,517 | | Emerson Electric Co. | $ 684,511 |
| | Total Electrical Equipment | $ 684,511 |
| | Electronic Equipment, Instruments & Components – 1.3% | |
| 2,576 | | CDW Corp. | $ 339,491 |
| 9,417 | | TE Connectivity, Ltd. | 1,140,116 |
| | Total Electronic Equipment, Instruments & Components | $ 1,479,607 |
| | Equity Real Estate Investment Trusts (REIT) – 3.3% | |
| 11,749 | | Alexandria Real Estate Equities, Inc. | $ 2,093,907 |
| 7,625 | | Camden Property Trust | 761,890 |
| 3,508 | | Digital Realty Trust, Inc. | 489,401 |
| 3,318 | | Prologis, Inc. | 330,672 |
| | Total Equity Real Estate Investment Trusts (REIT) | $ 3,675,870 |
| | Food & Staples Retailing – 0.3% | |
| 2,181 | | Walmart, Inc. | $ 314,391 |
| | Total Food & Staples Retailing | $ 314,391 |
| | Food Products – 6.8% | |
| 1,764 | | Calavo Growers, Inc. | $ 122,474 |
| 15,931 | | General Mills, Inc. | 936,743 |
| 2,936 | | Hershey Co. | 447,241 |
| 5,388 | | John B Sanfilippo & Son, Inc. | 424,898 |
| 17,375 | | Kellogg Co. | 1,081,246 |
| 13,953 | | Lamb Weston Holdings, Inc. | 1,098,659 |
| 9,732 | | McCormick & Co., Inc., Class VTG | 930,379 |
| 28,704 | | Mondelez International, Inc. | 1,678,323 |
| 6,516 | | Nestle S.A. (A.D.R.) | 767,585 |
| | Total Food Products | $ 7,487,548 |
| | Health Care Equipment & Supplies – 3.6% | |
| 21,402 | | Abbott Laboratories | $ 2,343,305 |
| 2,759 | | Becton Dickinson and Co. | 690,357 |
| 23,096 | | Smith & Nephew Plc (A.D.R.) | 973,958 |
| | Total Health Care Equipment & Supplies | $ 4,007,620 |
The accompanying notes are an integral part of these financial statements.
9
| | |
| Pioneer Equity Income VCT Portfolio | Pioneer Variable Contracts Trust |
| Schedule of Investments 12/31/20 (continued) | |
| | | | |
| Shares | | | Value |
| | Health Care Providers & Services – 3.8% | |
| 8,602 | | AmerisourceBergen Corp. | $ 840,931 |
| 2,106 | | Anthem, Inc. | 676,216 |
| 10,825 | | CVS Health Corp. | 739,347 |
| 2,247 | | Humana, Inc. | 921,877 |
| 8,487 | | Quest Diagnostics, Inc. | 1,011,396 |
| | Total Health Care Providers & Services | $ 4,189,767 |
| | Hotels, Restaurants & Leisure – 0.8% | |
| 20,941 | | Cedar Fair LP | $ 823,819 |
| | Total Hotels, Restaurants & Leisure | $ 823,819 |
| | Household Products – 1.2% | |
| 6,498 | | Clorox Co. | $ 1,312,076 |
| | Total Household Products | $ 1,312,076 |
| | Industrial Conglomerates – 1.3% | |
| 6,686 | | Honeywell International, Inc. | $ 1,422,112 |
| | Total Industrial Conglomerates | $ 1,422,112 |
| | Insurance – 5.0% | |
| 12,395 | | Chubb, Ltd. | $ 1,907,838 |
| 9,606 | | First American Financial Corp. | 495,958 |
| 21,947 | | Lincoln National Corp. | 1,104,154 |
| 45,076 | | Sun Life Financial, Inc. | 2,004,079 |
| | Total Insurance | $ 5,512,029 |
| | IT Services – 2.7% | |
| 2,185 | | Accenture Plc | $ 570,744 |
| 2,788 | | Automatic Data Processing, Inc. | 491,246 |
| 3,419 | | Fidelity National Information Services, Inc. | 483,652 |
| 9,029 | | Leidos Holdings, Inc. | 949,128 |
| 5,644 | | Paychex, Inc. | 525,908 |
| | Total IT Services | $ 3,020,678 |
| | Machinery – 6.0% | |
| 5,271 | | Caterpillar, Inc. | $ 959,427 |
| 60,686 | | Gorman-Rupp Co. | 1,969,261 |
| 21,184 | | Komatsu, Ltd. (A.D.R.) | 586,426 |
| 5,572 | | Oshkosh Corp. | 479,582 |
| 20,537 | | PACCAR, Inc. | 1,771,932 |
| 11,477 | | Timken Co. | 887,861 |
| | Total Machinery | $ 6,654,489 |
| | Media – 1.2% | |
| 17,197 | | Comcast Corp. | $ 901,123 |
| 16,497 | | Interpublic Group of Cos., Inc. | 388,009 |
| | Total Media | $ 1,289,132 |
| | Metals & Mining – 4.9% | |
| 12,842 | | Kaiser Aluminum Corp. | $ 1,270,074 |
| 14,427 | | Materion Corp. | 919,288 |
| 24,798 | | Nucor Corp. | 1,319,006 |
| 15,824 | | Reliance Steel & Aluminum Co. | 1,894,924 |
| | Total Metals & Mining | $ 5,403,292 |
The accompanying notes are an integral part of these financial statements.
10
| | |
| Pioneer Equity Income VCT Portfolio | Pioneer Variable Contracts Trust |
| | | | |
| Shares | | | Value |
| | Multiline Retail – 1.6% | |
| 10,154 | | Target Corp. | $ 1,792,486 |
| | Total Multiline Retail | $ 1,792,486 |
| | Multi-Utilities – 3.3% | |
| 13,617 | | Ameren Corp. | $ 1,062,943 |
| 12,023 | | CMS Energy Corp. | 733,523 |
| 20,589 | | WEC Energy Group, Inc. | 1,894,806 |
| | Total Multi-Utilities | $ 3,691,272 |
| | Oil, Gas & Consumable Fuels – 4.5% | |
| 12,935 | | Chevron Corp. | $ 1,092,361 |
| 16,822 | | ConocoPhillips | 672,712 |
| 26,716 | | Marathon Petroleum Corp. | 1,104,974 |
| 17,584 | | Phillips 66 | 1,229,825 |
| 16,078 | | Valero Energy Corp. | 909,532 |
| | Total Oil, Gas & Consumable Fuels | $ 5,009,404 |
| | Pharmaceuticals – 6.7% | |
| 36,277 | | AstraZeneca Plc (A.D.R.) | $ 1,813,487 |
| 13,074 | | Eli Lilly & Co. | 2,207,414 |
| 22,339 | | Merck & Co., Inc. | 1,827,330 |
| 21,456 | | Novo Nordisk AS (A.D.R.) | 1,498,702 |
| | Total Pharmaceuticals | $ 7,346,933 |
| | Semiconductors & Semiconductor Equipment – 5.8% | |
| 8,754 | | Analog Devices, Inc. | $ 1,293,228 |
| 4,110 | | CMC Materials, Inc. | 621,843 |
| 10,119 | | Intel Corp. | 504,129 |
| 9,239 | | KLA-Tencor Corp. | 2,392,069 |
| 9,813 | | Texas Instruments, Inc. | 1,610,608 |
| | Total Semiconductors & Semiconductor Equipment | $ 6,421,877 |
| | Specialty Retail – 0.6% | |
| 9,607 | | TJX Cos., Inc. | $ 656,062 |
| | Total Specialty Retail | $ 656,062 |
| | Textiles, Apparel & Luxury Goods – 2.3% | |
| 12,640 | | Carter’s, Inc. | $ 1,189,045 |
| 15,545 | | VF Corp. | 1,327,698 |
| | Total Textiles, Apparel & Luxury Goods | $ 2,516,743 |
| | Trading Companies & Distributors – 1.9% | |
| 23,586 | | Fastenal Co. | $ 1,151,705 |
| 80,520 | | Ferguson Plc (A.D.R.) | 975,089 |
| | Total Trading Companies & Distributors | $ 2,126,794 |
| | Water Utilities – 0.4% | |
| 2,814 | | American Water Works Co., Inc. | $ 431,865 |
| | Total Water Utilities | $ 431,865 |
The accompanying notes are an integral part of these financial statements.
11
| | |
| Pioneer Equity Income VCT Portfolio | Pioneer Variable Contracts Trust |
| Schedule of Investments 12/31/20 (continued) | |
| | | | |
| Shares | | | Value |
| | TOTAL COMMON STOCKS | |
| | (Cost $76,033,410) | $109,114,503 |
| | TOTAL INVESTMENTS IN UNAFFILIATED ISSUERS – 98.9% | |
| | (Cost $76,033,410) | $109,114,503 |
| | OTHER ASSETS AND LIABILITIES – 1.1% | $ 1,222,044 |
| | NET ASSETS – 100.0% | $110,336,547 |
REIT Real Estate Investment Trust.
(A.D.R.) American Depositary Receipts.
Purchases and sales of securities (excluding temporary cash investments) for the year ended December 31, 2020, aggregated $14,778,150 and $29,794,471, respectively.
The Portfolio is permitted to engage in purchase and sale transactions (“cross trades”) with certain funds and accounts for which Amundi Asset Management US, Inc. (the “Adviser”) serves as the Portfolio’s investment adviser, as set forth in Rule 17a-7 under the Investment Company Act of 1940, pursuant to procedures adopted by the Board of Trustees. Under these procedures, cross trades are effected at current market prices. During the year ended December 31, 2020, the Portfolio did not engage in any cross trade activity.
At December 31, 2020, the net unrealized appreciation on investments based on cost for federal tax purposes of $75,828,738 was as follows:
| Aggregate gross unrealized appreciation for all investments in which there is an excess of value over tax cost | $ 35,175,681 |
| Aggregate gross unrealized depreciation for all investments in which there is an excess of tax cost over value | (1,889,916) |
| Net unrealized appreciation | $ 33,285,765 |
Various inputs are used in determining the value of the Portfolio’s investments. These inputs are summarized in the three broad levels below.
Level 1 – unadjusted quoted prices in active markets for identical securities.
Level 2 – other significant observable inputs (including quoted prices for similar securities, interest rates, prepayment speeds, credit risks, etc.). See Notes to Financial Statements – Note 1A.
Level 3 – significant unobservable inputs (including the Portfolio’s own assumptions in determining fair value of investments). See Notes to Financial Statements – Note 1A.
The following is a summary of the inputs used as of December 31, 2020, in valuing the Portfolio’s investments:
| | Level 1 | | | Level 2 | | | Level 3 | | | Total | |
| Common Stocks | | $ | 109,114,503 | | | $ | — | | | $ | — | | | $ | 109,114,503 | |
| Total Investments in Securities | | $ | 109,114,503 | | | $ | — | | | $ | — | | | $ | 109,114,503 | |
During the year ended December 31, 2020, there were no transfers in or out of Level 3. |
The accompanying notes are an integral part of these financial statements.
12
| | |
| Pioneer Equity Income VCT Portfolio | Pioneer Variable Contracts Trust |
Statement of Assets and Liabilities 12/31/20 | |
| ASSETS: | | | |
| Investments in unaffiliated issuers, at value (cost $76,033,410) | | $ | 109,114,503 | |
| Cash | | | 1,138,776 | |
| Foreign currencies, at value (cost $6,243) | | | 6,508 | |
| Receivables — | | | | |
| Portfolio shares sold | | | 38,845 | |
| Dividends | | | 231,850 | |
| Interest | | | 8,540 | |
| Other assets | | | 3,381 | |
| Total assets | | $ | 110,542,403 | |
| LIABILITIES: | | | | |
| Payables — | | | | |
| Portfolio shares repurchased | | $ | 145,773 | |
| Trustees’ fees | | | 94 | |
| Administrative fees | | | 9,910 | |
| Professional fees | | | 38,547 | |
| Due to affiliates | | | 6,557 | |
| Accrued expenses | | | 4,975 | |
| Total liabilities | | $ | 205,856 | |
| NET ASSETS: | | | | |
| Paid-in capital | | $ | 80,486,586 | |
| Distributable earnings | | | 29,849,961 | |
| Net assets | | $ | 110,336,547 | |
| NET ASSET VALUE PER SHARE: | | | | |
No par value (unlimited number of shares authorized) | | | | |
| Class I (based on $75,613,487/4,874,012 shares) | | $ | 15.51 | |
| Class II (based on $34,723,060/2,199,159 shares) | | $ | 15.79 | |
The accompanying notes are an integral part of these financial statements.
13
| | |
| Pioneer Equity Income VCT Portfolio | Pioneer Variable Contracts Trust |
| Statement of Operations | |
| FOR THE YEAR ENDED 12/31/20 | | |
| INVESTMENT INCOME: | | | | | | |
| Dividends from unaffiliated issuers (net of foreign taxes withheld $24,097) | | $ | 2,882,553 | | | | |
| Interest from unaffiliated issuers | | | 7,004 | | | | |
| Total investment income | | | | | | $ | 2,889,557 | |
| EXPENSES: | | | | | | | | |
| Management fees | | $ | 682,406 | | | | | |
| Administrative expense | | | 76,918 | | | | | |
| Distribution fees | | | | | | | | |
| Class II | | | 80,412 | | | | | |
| Custodian fees | | | 4,195 | | | | | |
| Professional fees | | | 46,490 | | | | | |
| Printing expense | | | 17,937 | | | | | |
| Trustees’ fees | | | 7,353 | | | | | |
| Insurance expense | | | 256 | | | | | |
| Miscellaneous | | | 2,096 | | | | | |
| Total expenses | | | | | | $ | 918,063 | |
| Net investment income | | | | | | $ | 1,971,494 | |
| REALIZED AND UNREALIZED GAIN (LOSS) ON INVESTMENTS: | | | | | | | | |
| Net realized gain (loss) on: | | | | | | | | |
| Investments in unaffiliated issuers | | $ | (3,592,895 | ) | | | | |
| Other assets and liabilities denominated in foreign currencies | | | (1,009 | ) | | $ | (3,593,904 | ) |
| Change in net unrealized appreciation (depreciation) on: | | | | | | | | |
| Investments in unaffiliated issuers | | $ | (376,591 | ) | | | | |
| Other assets and liabilities denominated in foreign currencies | | | 8,605 | | | $ | (367,986 | ) |
| Net realized and unrealized gain (loss) on investments | | | | | | $ | (3,961,890 | ) |
| Net decrease in net assets resulting from operations | | | | | | $ | (1,990,396 | ) |
The accompanying notes are an integral part of these financial statements.
14
| | |
| Pioneer Equity Income VCT Portfolio | Pioneer Variable Contracts Trust |
| Statements of Changes in Net Assets | |
| | | | | | | |
| | Year Ended | | | Year Ended | |
| | 12/31/20 | | | 12/31/19 | |
| FROM OPERATIONS: | | | | | | |
Net investment income (loss) | | $ | 1,971,494 | | | $ | 2,612,778 | |
Net realized gain (loss) on investments | | | (3,593,904 | ) | | | 5,251,088 | |
Change in net unrealized appreciation (depreciation) on investments | | | (367,986 | ) | | | 20,166,158 | |
| Net increase (decrease) in net assets resulting from operations | | $ | (1,990,396 | ) | | $ | 28,030,024 | |
| DISTRIBUTIONS TO SHAREOWNERS: | | | | | | | | |
| Class I ($0.96 and $11.63 per share, respectively) | | $ | (4,783,755 | ) | | $ | (39,584,740 | ) |
| Class II ($0.92 and $11.57 per share, respectively) | | | (2,044,931 | ) | | | (15,785,052 | ) |
| Total distributions to shareowners | | $ | (6,828,686 | ) | | $ | (55,369,792 | ) |
| FROM PORTFOLIO SHARE TRANSACTIONS: | | | | | | | | |
Net proceeds from sales of shares | | $ | 10,173,594 | | | $ | 8,799,744 | |
Reinvestment of distributions | | | 6,828,686 | | | | 55,369,792 | |
Cost of shares repurchased | | | (26,377,213 | ) | | | (24,080,089 | ) |
| Net increase (decrease) in net assets resulting from Portfolio share transactions | | $ | (9,374,933 | ) | | $ | 40,089,447 | |
| Net increase (decrease) in net assets | | $ | (18,194,015 | ) | | $ | 12,749,679 | |
| NET ASSETS: | | | | | | | | |
Beginning of year | | $ | 128,530,562 | | | $ | 115,780,883 | |
End of year | | $ | 110,336,547 | | | $ | 128,530,562 | |
| | Year Ended | | | Year Ended | | | Year Ended | | | Year Ended | |
| | 12/31/20 | | | 12/31/20 | | | 12/31/19 | | | 12/31/19 | |
| | Shares | | | Amount | | | Shares | | | Amount | |
| Class I | | | | | | | | | | | | |
Shares sold | | | 153,265 | | | $ | 2,184,035 | | | | 117,423 | | | $ | 2,220,426 | |
Reinvestment of distributions | | | 356,246 | | | | 4,783,755 | | | | 2,551,494 | | | | 39,584,740 | |
Less shares repurchased | | | (1,017,480 | ) | | | (14,858,098 | ) | | | (798,898 | ) | | | (14,700,720 | ) |
| Net increase (decrease) | | | (507,969 | ) | | $ | (7,890,308 | ) | | | 1,870,019 | | | $ | 27,104,446 | |
| Class II | | | | | | | | | | | | | | | | |
Shares sold | | | 550,488 | | | $ | 7,989,559 | | | | 360,486 | | | $ | 6,579,318 | |
Reinvestment of distributions | | | 149,550 | | | | 2,044,931 | | | | 1,001,956 | | | | 15,785,052 | |
Less shares repurchased | | | (800,045 | ) | | | (11,519,115 | ) | | | (484,686 | ) | | | (9,379,369 | ) |
| Net increase (decrease) | | | (100,007 | ) | | $ | (1,484,625 | ) | | | 877,756 | | | $ | 12,985,001 | |
The accompanying notes are an integral part of these financial statements.
15
| | |
| Pioneer Equity Income VCT Portfolio | Pioneer Variable Contracts Trust |
| Financial Highlights | |
| | Year Ended | | | Year Ended | | | Year Ended
| | | Year Ended | | | Year Ended | |
| | 12/31/20 | | | 12/31/19 | | | 12/31/18 | | | 12/31/17 | | | 12/31/16* | |
| Class I | | | | | | | | | | | | | |
| |
Net asset value, beginning of period | | $ | 16.65 | | | $ | 23.41 | | | $ | 32.49 | | | $ | 31.25 | | | $ | 28.18 | |
Increase (decrease) from investment operations: | | | | | | | | | | | | | | | | | | | | |
| Net investment income (loss) (a) | | $ | 0.28 | | | $ | 0.42 | | | $ | 0.81 | | | $ | 0.60 | | | $ | 0.67 | |
| Net realized and unrealized gain (loss) on investments | | | (0.46 | ) | | | 4.45 | | | | (2.99 | ) | | | 3.91 | | | | 4.69 | |
| Net increase (decrease) from investment operations | | $ | (0.18 | ) | | $ | 4.87 | | | $ | (2.18 | ) | | $ | 4.51 | | | $ | 5.36 | |
Distributions to shareowners: | | | | | | | | | | | | | | | | | | | | |
| Net investment income | | $ | (0.39 | ) | | $ | (0.56 | ) | | $ | (0.70 | ) | | $ | (0.55 | ) | | $ | (0.61 | ) |
| Net realized gain | | | (0.57 | ) | | | (11.07 | ) | | | (6.20 | ) | | | (2.72 | ) | | | (1.68 | ) |
| Total distributions | | $ | (0.96 | ) | | $ | (11.63 | ) | | $ | (6.90 | ) | | $ | (3.27 | ) | | $ | (2.29 | ) |
Net increase (decrease) in net asset value
| | $ | (1.14 | ) | | $ | (6.76 | ) | | $ | (9.08 | ) | | $ | 1.24 | | | $ | 3.07 | |
Net asset value, end of period
| | $ | 15.51 | | | $ | 16.65 | | | $ | 23.41 | | | $ | 32.49 | | | $ | 31.25 | |
| Total return (b) | | | (0.04 | )% | | | 25.56 | % | | | (8.59 | )%(c) | | | 15.46 | % | | | 19.80 | %(d) |
Ratio of net expenses to average net assets | | | 0.80 | % | | | 0.79 | % | | | 0.79 | % | | | 0.71 | % | | | 0.72 | % |
Ratio of net investment income (loss) to average net assets | | | 1.95 | % | | | 2.18 | % | | | 2.82 | % | | | 1.90 | % | | | 2.31 | % |
Portfolio turnover rate | | | 14 | % | | | 21 | % | | | 28 | % | | | 33 | % | | | 37 | % |
Net assets, end of period (in thousands) | | $ | 75,613 | | | $ | 89,623 | | | $ | 82,212 | | | $ | 105,198 | | | $ | 131,825 | |
* | The Portfolio was audited by an independent registered public accounting firm other than Ernst & Young LLP. |
(a) | The per-share data presented above is based on the average shares outstanding for the period presented. |
(b) | Assumes initial investment at net asset value at the beginning of each period, reinvestment of all distributions, the complete redemption of the investment at net asset value at the end of each period. |
(c) | If the Portfolio had not recognized gains in settlement of class action lawsuits during the year ended December 31, 2018, the total return would have been (8.63)%. |
(d) | If the Portfolio had not recognized gains in settlement of class action lawsuits during the year ended December 31, 2016, the total return would have been 19.76%. |
NOTE: The above financial highlights do not reflect the deduction of non-portfolio expenses associated with variable insurance products, such as mortality and expense risk charges, separate account charges, and sales charges.
The accompanying notes are an integral part of these financial statements.
16
| | |
| Pioneer Equity Income VCT Portfolio | Pioneer Variable Contracts Trust |
| | Year Ended | | | Year Ended | | | Year Ended
| | | Year Ended | | | Year Ended | |
| | 12/31/20 | | | 12/31/19 | | | 12/31/18 | | | 12/31/17 | | | 12/31/16* | |
| Class II | | | | | | | | | | | | | |
| |
Net asset value, beginning of period | | $ | 16.92 | | | $ | 23.62 | | | $ | 32.70 | | | $ | 31.43 | | | $ | 28.33 | |
Increase (decrease) from investment operations: | | | | | | | | | | | | | | | | | | | | |
| Net investment income (loss) (a) | | $ | 0.25 | | | $ | 0.38 | | | $ | 0.50 | | | $ | 0.52 | | | $ | 0.60 | |
| Net realized and unrealized gain (loss) on investments | | | (0.46 | ) | | | 4.49 | | | | (2.75 | ) | | | 3.94 | | | | 4.72 | |
| Net increase (decrease) from investment operations | | $ | (0.21 | ) | | $ | 4.87 | | | $ | (2.25 | ) | | $ | 4.46 | | | $ | 5.32 | |
Distributions to shareowners: | | | | | | | | | | | | | | | | | | | | |
| Net investment income | | $ | (0.35 | ) | | $ | (0.50 | ) | | $ | (0.63 | ) | | $ | (0.47 | ) | | $ | (0.54 | ) |
| Net realized gain | | | (0.57 | ) | | | (11.07 | ) | | | (6.20 | ) | | | (2.72 | ) | | | (1.68 | ) |
| Total distributions | | $ | (0.92 | ) | | $ | (11.57 | ) | | $ | (6.83 | ) | | $ | (3.19 | ) | | $ | (2.22 | ) |
| Net increase (decrease) in net asset value | | $ | (1.13 | ) | | $ | (6.70 | ) | | $ | (9.08 | ) | | $ | 1.27 | | | $ | 3.10 | |
Net asset value, end of period
| | $ | 15.79 | | | $ | 16.92 | | | $ | 23.62 | | | $ | 32.70 | | | $ | 31.43 | |
| Total return (b) | | | (0.26 | )% | | | 25.23 | % | | | (8.77 | )%(c) | | | 15.18 | % | | | 19.53 | %(d) |
Ratio of net expenses to average net assets | | | 1.05 | % | | | 1.04 | % | | | 0.98 | % | | | 0.97 | % | | | 0.96 | % |
Ratio of net investment income (loss) to average net assets | | | 1.70 | % | | | 1.93 | % | | | 1.61 | % | | | 1.65 | % | | | 2.07 | % |
Portfolio turnover rate | | | 14 | % | | | 21 | % | | | 28 | % | | | 33 | % | | | 37 | % |
Net assets, end of period (in thousands) | | $ | 34,723 | | | $ | 38,908 | | | $ | 33,569 | | | $ | 247,973 | | | $ | 230,107 | |
* | The Portfolio was audited by an independent registered public accounting firm other than Ernst & Young LLP. |
(a) | The per-share data presented above is based on the average shares outstanding for the period presented. |
(b) | Assumes initial investment at net asset value at the beginning of each period, reinvestment of all distributions, the complete redemption of the investment at net asset value at the end of each period and no sales charges. Total return would be reduced if sales charges were taken into account. |
(c) | If the Portfolio had not recognized gains in settlement of class action lawsuits during the year ended December 31, 2018, the total return would have been (8.81)%. |
(d) | If the Portfolio had not recognized gains in settlement of class action lawsuits during the year ended December 31, 2016, the total return would have been 19.49%. |
NOTE: The above financial highlights do not reflect the deduction of non-portfolio expenses associated with variable insurance products, such as mortality and expense risk charges, separate account charges, and sales charges.
The accompanying notes are an integral part of these financial statements.
17
| | |
| Pioneer Equity Income VCT Portfolio | Pioneer Variable Contracts Trust |
Notes to Financial Statements 12/31/20 | |
1. Organization and Significant Accounting Policies
Pioneer Equity Income VCT Portfolio (the “Portfolio”) is one of 8 portfolios comprising Pioneer Variable Contracts Trust (the “Trust”), a Delaware statutory trust. The Portfolio is registered under the Investment Company Act of 1940 as a diversified, open-end management investment company. The investment objectives of the Portfolio are current income and long-term growth of capital from a portfolio consisting primarily of income producing equity securities of U.S. corporations.
The Portfolio offers two classes of shares designated as Class I and Class II shares. Each class of shares represents an interest in the same schedule of investments of the Portfolio and has identical rights (based on relative net asset values) to assets and liquidation proceeds. Share classes can bear different rates of class-specific fees and expenses such as transfer agent and distribution fees. Differences in class-specific fees and expenses will result in differences in net investment income and, therefore, the payment of different dividends from net investment income earned by each class. The Amended and Restated Declaration of Trust of the Portfolio gives the Board of Trustees the flexibility to specify either per-share voting or dollar-weighted voting when submitting matters for shareholder approval. Under per-share voting, each share of a class of the Portfolio is entitled to one vote. Under dollar-weighted voting, a shareholder’s voting power is determined not by the number of shares owned, but by the dollar value of the shares on the record date. Each share class has exclusive voting rights with respect to matters affecting only that class, including with respect to the distribution plan for that class. There is no distribution plan for Class I shares.
Portfolio shares may be purchased only by insurance companies for the purpose of funding variable annuity and variable life insurance contracts or by qualified pension and retirement plans.
Amundi Asset Management US, Inc., an indirect, wholly owned subsidiary of Amundi and Amundi’s wholly owned subsidiary, Amundi USA, Inc., serves as the Portfolio’s investment adviser (the “Adviser”). Prior to January 1, 2021, the Adviser was named Amundi Pioneer Asset Management, Inc. Amundi Distributor US, Inc., an affiliate of Amundi Asset Management US, Inc., serves as the Portfolio’s distributor (the “Distributor”).
In August 2018, the Financial Accounting Standards Board (FASB) issued Accounting Standards Update 2018-13 “Disclosure Framework - Changes to the Disclosure Requirements for Fair Value Measurement” (“ASU 2018-13”) which modifies disclosure requirements for fair value measurements, principally for Level 3 securities and transfers between levels of the fair value hierarchy. ASU 2018-13 is effective for fiscal years beginning after December 15, 2019 and for interim periods within those fiscal years. The Portfolio has adopted ASU 2018-13 for the year ended December 31, 2020. The impact to the Portfolio’s adoption was limited to changes in the Portfolio’s disclosures regarding fair value, primarily those disclosures related to transfers between levels of the fair value hierarchy and disclosure of the range and weighted average used to develop significant unobservable inputs for Level 3 fair value investments, when applicable.
The Portfolio is an investment company and follows investment company accounting and reporting guidance under U.S. Generally Accepted Accounting Principles (“U.S. GAAP”). U.S. GAAP requires the management of the Portfolio to make estimates and assumptions that affect the reported amounts of assets and liabilities, the disclosure of contingent assets and liabilities at the date of the financial statements, and the reported amounts of income, expenses and gain or loss on investments during the reporting period. Actual results could differ from those estimates.
The following is a summary of significant accounting policies followed by the Portfolio in the preparation of its financial statements:
A. Security Valuation
The net asset value of the Portfolio is computed once daily, on each day the New York Stock Exchange (“NYSE”) is open, as of the close of regular trading on the NYSE.
Equity securities which may include restricted securities that have traded on an exchange are valued by using the last sale price on the principal exchange where they are traded. Equity securities which may include restricted securities that have not traded on the date of valuation, or securities for which sale prices are not available, generally are valued using the mean between the last bid and asked prices or, if both last bid and asked prices are not available, at the last quoted bid price. Last sale and bid and asked prices are provided by independent third party pricing services. In the case of equity securities which may include restricted securities not traded on an exchange, prices are typically determined by independent third party pricing services using a variety of techniques and methods.
The value of foreign securities is translated into U.S. dollars based on foreign currency exchange rate quotations supplied by a third party pricing source. Trading in non-U.S. equity securities is substantially completed each day at various times prior to the close of the NYSE. The values of such securities used in computing the net asset value of the Portfolio’s shares are determined as of such times. The Portfolio may use a fair value model developed by an independent pricing service to value non-U.S. equity securities.
18
| | |
| Pioneer Equity Income VCT Portfolio | Pioneer Variable Contracts Trust |
Securities for which independent pricing services or broker-dealers are unable to supply prices or for which market prices and/or quotations are not readily available or are considered to be unreliable are valued by a fair valuation team comprised of certain personnel of the Adviser pursuant to procedures adopted by the Portfolio’s Board of Trustees. The Adviser’s fair valuation team uses fair value methods approved by the Valuation Committee of the Board of Trustees. The Adviser’s fair valuation team is responsible for monitoring developments that may impact fair valued securities and for discussing and assessing fair values on an ongoing basis, and at least quarterly, with the Valuation Committee of the Board of Trustees.
Inputs used when applying fair value methods to value a security may include credit ratings, the financial condition of the company, current market conditions and comparable securities. The Portfolio may use fair value methods if it is determined that a significant event has occurred after the close of the exchange or market on which the security trades and prior to the determination of the Portfolio’s net asset value. Examples of a significant event might include political or economic news, corporate restructurings, natural disasters, terrorist activity or trading halts. Thus, the valuation of the Portfolio’s securities may differ significantly from exchange prices, and such differences could be material.
At December 31, 2020, no securities were valued using fair value methods (other than securities valued using prices supplied by independent pricing services, broker-dealers or using a third party insurance industry pricing model).
B. Investment Income and Transactions
Dividend income is recorded on the ex-dividend date, except that certain dividends from foreign securities where the ex-dividend date may have passed are recorded as soon as the Portfolio becomes aware of the ex-dividend data in the exercise of reasonable diligence.
Interest income, including interest on income-bearing cash accounts, is recorded on the accrual basis. Dividend and interest income are reported net of unrecoverable foreign taxes withheld at the applicable country rates and net of income accrued on defaulted securities.
Interest and dividend income payable by delivery of additional shares is reclassified as PIK (payment-in-kind) income upon receipt and is included in interest and dividend income, respectively.
Security transactions are recorded as of trade date. Gains and losses on sales of investments are calculated on the identified cost method for both financial reporting and federal income tax purposes.
C. Foreign Currency Translation
The books and records of the Portfolio are maintained in U.S. dollars. Amounts denominated in foreign currencies are translated into U.S. dollars using current exchange rates.
Net realized gains and losses on foreign currency transactions, if any, represent, among other things, the net realized gains and losses on foreign currency exchange contracts, disposition of foreign currencies and the difference between the amount of income accrued and the U.S. dollars actually received. Further, the effects of changes in foreign currency exchange rates on investments are not segregated on the Statement of Operations from the effects of changes in the market prices of those securities, but are included with the net realized and unrealized gain or loss on investments.
D. Federal Income Taxes
It is the Portfolio’s policy to comply with the requirements of the Internal Revenue Code applicable to regulated investment companies and to distribute all of its net taxable income and net realized capital gains, if any, to its shareowners. Therefore, no provision for federal income taxes is required. As of December 31, 2020, the Portfolio did not accrue any interest or penalties with respect to uncertain tax positions, which, if applicable, would be recorded as an income tax expense on the Statement of Operations. Tax returns filed within the prior three years remain subject to examination by federal and state tax authorities.
The amount and character of income and capital gain distributions to shareowners are determined in accordance with federal income tax rules, which may differ from U.S. GAAP. Distributions in excess of net investment income or net realized gains are temporary over distributions for financial statement purposes resulting from differences in the recognition or classification of income or distributions for financial statement and tax purposes. Capital accounts within the financial statements are adjusted for permanent book/tax differences to reflect tax character, but are not adjusted for temporary differences.
A portion of the dividend income recorded by the Portfolio is from distributions by publicly traded Real Estate Investment Trusts (“REITs”), and such distributions for tax purposes may also consist of capital gains and return of capital. The actual return of capital and capital gains portions of such distributions will be determined by formal notifications from the REITs
19
| | |
| Pioneer Equity Income VCT Portfolio | Pioneer Variable Contracts Trust |
| Notes to Financial Statements 12/31/20 (continued) | |
subsequent to the calendar year-end. Distributions received from the REITs that are determined to be a return of capital are recorded by the Portfolio as a reduction of the cost basis of the securities held and those determined to be capital gain are reflected as such on the Statement of Operations.
At December 31, 2020, the Portfolio reclassified $5,525 to increase distributable earnings and $5,525 to decrease paid-in capital to reflect permanent book/tax differences. These adjustments have no impact on net assets or the results of operations.
At December 31, 2020, the Portfolio was permitted to carry forward indefinitely $983,433 of short-term and $2,522,628 of long-term losses.
The tax character of distributions paid during the years ended December 31, 2020 and December 31, 2019, were as follows:
| | 2020 | | | 2019 | |
| Distributions paid from: | | | | | | |
| Ordinary income | | $ | 2,715,228 | | | $ | 3,252,078 | |
| Long-term capital gain | | | 4,113,458 | | | | 52,117,714 | |
| Total | | $ | 6,828,686 | | | $ | 55,369,792 | |
The following shows the components of distributable earnings on a federal income tax basis at December 31, 2020:
| | | 2020 | |
| Distributable earnings: | | | |
| Undistributed ordinary income | | $ | 77,497 | |
| Capital loss carry forward | | | (3,506,061 | ) |
| Net unrealized appreciation | | | 33,278,525 | |
| Total | | $ | 29,849,961 | |
The difference between book-basis and tax-basis net unrealized appreciation is attributable to the tax deferral of losses on wash sales, the tax basis adjustment on partnerships, REITs and common stocks.
E. Portfolio Shares and Class Allocations
The Portfolio records sales and repurchases of its shares as of trade date. Distribution fees for Class II shares are calculated based on the average daily net asset value attributable to Class II shares of the Portfolio (see Note 4). Class I shares do not pay distribution fees.
Income, common expenses (excluding transfer agent and distribution fees) and realized and unrealized gains and losses are calculated at the Portfolio level and allocated daily to each class of shares based on its respective percentage of adjusted net assets at the beginning of the day.
All expenses and fees paid to the Portfolio’s transfer agent for its services are allocated among the classes of shares based on the number of accounts in each class and the ratable allocation of related out-of-pocket expenses (see Note 3).
Dividends and distributions to shareowners are recorded as of the ex-dividend date. Distributions paid by the Portfolio with respect to each class of shares are calculated in the same manner and at the same time, except that net investment income dividends to Class I and Class II shares can reflect different transfer agent and distribution expense rates.
F. Risks
The value of securities held by the Portfolio may go up or down, sometimes rapidly or unpredictably, due to general market conditions, such as real or perceived adverse economic, political or regulatory conditions, recessions, the spread of infectious illness or other public health issues, inflation, changes in interest rates, lack of liquidity in the bond markets or adverse investor sentiment. In the past several years, financial markets have experienced increased volatility, depressed valuations, decreased liquidity and heightened uncertainty. These conditions may continue, recur, worsen or spread. A general rise in interest rates could adversely affect the price and liquidity of fixed-income securities and could also result in increased redemptions from the Portfolio.
20
| | |
| Pioneer Equity Income VCT Portfolio | Pioneer Variable Contracts Trust |
At times, the Portfolio’s investments may represent industries or industry sectors that are interrelated or have common risks, making the Portfolio more susceptible to any economic, political, or regulatory developments or other risks affecting those industries and sectors. The Portfolio’s investments in foreign markets and countries with limited developing markets may subject the Portfolio to a greater degree of risk than investments in a developed market. These risks include disruptive political or economic conditions and the imposition of adverse governmental laws or currency exchange restrictions.
The Portfolio may invest in REIT securities, the value of which can fall for a variety of reasons, such as declines in rental income, fluctuating interest rates, poor property management, environmental liabilities, uninsured damage, increased competition, or changes in real estate tax laws.
With the increased use of technologies such as the Internet to conduct business, the Portfolio is susceptible to operational, information security and related risks. While the Portfolio’s Adviser has established business continuity plans in the event of, and risk management systems to prevent, limit or mitigate, such cyber-attacks, there are inherent limitations in such plans and systems, including the possibility that certain risks have not been identified. Furthermore, the Portfolio cannot control the cybersecurity plans and systems put in place by service providers to the Portfolio such as Brown Brothers Harriman & Co., the Portfolio’s custodian and accounting agent, and DST Asset Manager Solutions, Inc., the Portfolio’s transfer agent. In addition, many beneficial owners of Portfolio shares hold them through accounts at broker-dealers, retirement platforms and other financial market participants over which neither the Portfolio nor the Adviser exercises control. Each of these may in turn rely on service providers to them, which are also subject to the risk of cyber-attacks. Cybersecurity failures or breaches at the Adviser or the Portfolio’s service providers or intermediaries have the ability to cause disruptions and impact business operations, potentially resulting in financial losses, interference with the Portfolio’s ability to calculate its net asset value, impediments to trading, the inability of Portfolio shareowners to effect share purchases, redemptions or exchanges or receive distributions, loss of or unauthorized access to private shareowner information and violations of applicable privacy and other laws, regulatory fines, penalties, reputational damage, or additional compliance costs. Such costs and losses may not be covered under any insurance. In addition, maintaining vigilance against cyber-attacks may involve substantial costs over time, and system enhancements may themselves be subject to cyber-attacks.
COVID-19
The respiratory illness COVID-19 caused by a novel coronavirus has resulted in a global pandemic and major disruption to economies and markets around the world, including the United States. Global financial markets have experienced extreme volatility and severe losses, and trading in many instruments has been disrupted. Liquidity for many instruments has been greatly reduced for periods of time. Some interest rates are very low and in some cases yields are negative. Some sectors of the economy and individual issuers have experienced particularly large losses. These circumstances may continue for an extended period of time, and may continue to affect adversely the value and liquidity of the Portfolio’s investments. The ultimate economic fallout from the pandemic, and the long-term impact on economies, markets, industries and individual issuers, are not known. Governments and central banks, including the Federal Reserve in the U.S., have taken extraordinary and unprecedented actions to support local and global economies and the financial markets. These actions have resulted in significant expansion of public debt, including in the U.S. The impact of these measures, and whether they will be effective to mitigate the economic and market disruption, will not be known for some time. The consequences of high public debt, including its future impact on the economy and securities markets, likewise may not be known for some time.
The Portfolio’s prospectus contains unaudited information regarding the Portfolio’s principal risks. Please refer to that document when considering the Portfolio’s principal risks.
2. Management Agreement
The Adviser manages the Portfolio. Management fees are calculated daily and paid monthly at the annual rate of 0.65% of the Portfolio’s average daily net assets up to $1 billion and 0.60% of the Portfolio’s average daily net assets over $1 billion. For the year ended December 31, 2020, the effective management fee was equivalent to 0.65% of the Portfolio’s average daily net assets.
In addition, under the management and administration agreements, certain other services and costs, including accounting, regulatory reporting and insurance premiums, are paid by the Portfolio as administrative reimbursements. Included in “Due to affiliates” reflected on the Statement of Assets and Liabilities is $5,855 in management fees, administrative costs and certain other reimbursements payable to the Adviser at December 31, 2020.
21
| | |
| Pioneer Equity Income VCT Portfolio | Pioneer Variable Contracts Trust |
| Notes to Financial Statements 12/31/20 (continued) | |
3. Compensation of Trustees and Officers
The Portfolio pays an annual fee to its Trustees. The Adviser reimburses the Portfolio for fees paid to the Interested Trustees. The Portfolio does not pay any salary or other compensation to its officers. For the year ended December 31, 2020, the Portfolio paid $7,353 in Trustees’ compensation, which is reflected on the Statement of Operations as Trustees’ fees. At December 31, 2020, the Portfolio had a payable for Trustees’ fees on its Statement of Assets and Liabilities of $94.
4. Transfer Agent
DST Asset Manager Solutions, Inc. serves as the transfer agent to the Portfolio at negotiated rates. Transfer agent fees and payables shown on the Statement of Operations and the Statement of Assets and Liabilities, respectively, include sub-transfer agent expenses incurred through the Portfolio’s omnibus relationship contracts.
5. Distribution Plan
The Portfolio has adopted a distribution plan (the “Plan”) pursuant to Rule 12b-1 of the Investment Company Act of 1940 with respect to Class II shares. Pursuant to the Plan, the Portfolio pays the Distributor a distribution fee of 0.25% of the average daily net assets attributable to Class II shares to compensate the Distributor for (1) distribution services and (2) personal and account maintenance services performed and expenses incurred by the Distributor in connection with the Portfolio’s Class II shares. Included in “Due to affiliates” reflected on the Statement of Assets and Liabilities is $702 in distribution fees payable to the Distributor at December 31, 2020.
22
| | |
| Pioneer Equity Income VCT Portfolio | Pioneer Variable Contracts Trust |
Report of Independent Registered Public Accounting Firm |
To the Board of Trustees of Pioneer Variable Contracts Trust and the Shareholders of Pioneer Equity Income VCT Portfolio:
Opinion on the Financial Statements
We have audited the accompanying statement of assets and liabilities of Pioneer Equity Income VCT Portfolio (the “Portfolio”) (one of the portfolios constituting Pioneer Variable Contracts Trust (the “Trust”)), including the schedule of investments, as of December 31, 2020, and the related statement of operations for the year then ended, the statements of changes in net assets for each of the two years in the period then ended, the financial highlights for each of the four years in the period then ended and the related notes (collectively referred to as the “financial statements”). The financial highlights for the period ended December 31, 2016 were audited by another independent registered public accounting firm whose report, dated February 14, 2017, expressed an unqualified opinion on those financial highlights. In our opinion, the financial statements present fairly, in all material respects, the financial position of the Portfolio (one of the portfolios constituting Pioneer Variable Contracts Trust) at December 31, 2020, the results of its operations for the year then ended, the changes in its net assets for each of the two years in the period then ended, and its financial highlights for each of the four years in the period then ended in conformity with U.S. generally accepted accounting principles.
Basis for Opinion
These financial statements are the responsibility of the Trust’s management. Our responsibility is to express an opinion on the Portfolio’s financial statements based on our audits. We are a public accounting firm registered with the Public Company Accounting Oversight Board (United States) (“PCAOB”) and are required to be independent with respect to the Trust in accordance with the U.S. federal securities laws and the applicable rules and regulations of the Securities and Exchange Commission and the PCAOB.
We conducted our audits in accordance with the standards of the PCAOB. Those standards require that we plan and perform the audit to obtain reasonable assurance about whether the financial statements are free of material misstatement, whether due to error or fraud. The Trust is not required to have, nor were we engaged to perform, an audit of the Trust’s internal control over financial reporting. As part of our audits, we are required to obtain an understanding of internal control over financial reporting, but not for the purpose of expressing an opinion on the effectiveness of the Trust’s internal control over financial reporting. Accordingly, we express no such opinion.
Our audits included performing procedures to assess the risks of material misstatement of the financial statements, whether due to error or fraud, and performing procedures that respond to those risks. Such procedures included examining, on a test basis, evidence regarding the amounts and disclosures in the financial statements. Our procedures included confirmation of securities owned as of December 31, 2020, by correspondence with the custodian and brokers or by other appropriate auditing procedures where replies from brokers were not received. Our audits also included evaluating the accounting principles used and significant estimates made by management, as well as evaluating the overall presentation of the financial statements. We believe that our audits provide a reasonable basis for our opinion.
We have served as the auditor of one or more Amundi Pioneer investment companies since 2017.
Boston, Massachusetts
February 17, 2021
23
| | |
| Pioneer Equity Income VCT Portfolio | Pioneer Variable Contracts Trust |
Additional Information (Unaudited) | |
For the year ended December 31, 2020, certain dividends paid by the Portfolio may be subject to a maximum tax rate of 20%. The Portfolio intends to designate up to the maximum amount of such dividends allowable, as taxed at a maximum rate of 20%. Complete information will be computed and reported in conjunction with your 2020 Form 1099-DIV.
The qualifying percentage of the Portfolio’s ordinary income dividends for the purpose of the corporate dividends received deduction was 100%.
24
| | |
| Pioneer Equity Income VCT Portfolio | Pioneer Variable Contracts Trust |
Approval of Investment Management Agreement | |
Amundi Pioneer Asset Management, Inc. (“APAM”) serves as the investment adviser to Pioneer Equity Income VCT Portfolio (the “Portfolio”) pursuant to an investment management agreement between APAM and the Portfolio. In order for APAM to remain the investment adviser of the Portfolio, the Trustees of the Portfolio must determine annually whether to renew the investment management agreement for the Portfolio.
The contract review process began in January 2020 as the Trustees of the Portfolio agreed on, among other things, an overall approach and timeline for the process. Contract review materials were provided to the Trustees in March 2020, July 2020 and September 2020. In addition, the Trustees reviewed and discussed the Portfolio’s performance at regularly scheduled meetings throughout the year, and took into account other information related to the Portfolio provided to the Trustees at regularly scheduled meetings, in connection with the review of the Portfolio’s investment management agreement.
In March 2020, the Trustees, among other things, discussed the memorandum provided by Fund counsel that summarized the legal standards and other considerations that are relevant to the Trustees in their deliberations regarding the renewal of the investment management agreement, and reviewed and discussed the qualifications of the investment management teams for the Portfolio, as well as the level of investment by the Portfolio’s portfolio managers in the Portfolio. In July 2020, the Trustees, among other things, reviewed the Portfolio’s management fees and total expense ratios, the financial statements of APAM and its parent companies, profitability analyses provided by APAM, and analyses from APAM as to possible economies of scale. The Trustees also reviewed the profitability of the institutional business of APAM and APAM’s affiliate, Amundi Pioneer Institutional Asset Management, Inc. (“APIAM” and, together with APAM, “Amundi Pioneer”), as compared to that of APAM’s fund management business, and considered the differences between the fees and expenses of the Portfolio and the fees and expenses of APAM’s and APIAM’s institutional accounts, as well as the different services provided by APAM to the Portfolio and by APAM and APIAM to the institutional accounts. The Trustees further considered contract review materials, including additional materials received in response to the Trustees’ request, in September 2020.
At a meeting held on September 15, 2020, based on their evaluation of the information provided by APAM and third parties, the Trustees of the Portfolio, including the Independent Trustees voting separately, unanimously approved the renewal of the investment management agreement for another year. In approving the renewal of the investment management agreement, the Trustees considered various factors that they determined were relevant, including the factors described below. The Trustees did not identify any single factor as the controlling factor in determining to approve the renewal of the agreement.
Nature, Extent and Quality of Services
The Trustees considered the nature, extent and quality of the services that had been provided by APAM to the Portfolio, taking into account the investment objective and strategy of the Portfolio. The Trustees also reviewed APAM’s investment approach for the Portfolio and its research process. The Trustees considered the resources of APAM and the personnel of APAM who provide investment management services to the Portfolio. They also reviewed the amount of non-Portfolio assets managed by the portfolio managers of the Portfolio. They considered the non-investment resources and personnel of APAM that are involved in APAM’s services to the Portfolio, including APAM’s compliance, risk management, and legal resources and personnel. The Trustees noted the substantial attention and high priority given by APAM’s senior management to the Pioneer Fund complex. The Trustees considered the implementation and effectiveness of APAM’s business continuity plan in response to the COVID-19 pandemic.
The Trustees considered that APAM supervises and monitors the performance of the Portfolio’s service providers and provides the Portfolio with personnel (including Portfolio officers) and other resources that are necessary for the Portfolio’s business management and operations. The Trustees also considered that, as administrator, APAM is responsible for the administration of the Portfolio’s business and other affairs. The Trustees considered the fees paid to APAM for the provision of administration services.
Based on these considerations, the Trustees concluded that the nature, extent and quality of services that had been provided by APAM to the Portfolio were satisfactory and consistent with the terms of the investment management agreement.
Performance of the Portfolio
In considering the Portfolio’s performance, the Trustees regularly review and discuss throughout the year data prepared by APAM and information comparing the Portfolio’s performance with the performance of its peer group of funds, as classified by Morningstar, Inc. (Morningstar), and with the performance of the Portfolio’s benchmark index. They also discuss the Portfolio’s performance with APAM on a regular basis. The Trustees’ regular reviews and discussions were factored into the Trustees’ deliberations concerning the renewal of the investment management agreement.
25
| | |
| Pioneer Equity Income VCT Portfolio | Pioneer Variable Contracts Trust |
| Approval of Investment Management Agreement (continued) |
Management Fee and Expenses
The Trustees considered information showing the fees and expenses of the Portfolio in comparison to the management fees of its peer group of funds as classified by Morningstar and also to the expense ratios of a peer group of funds selected on the basis of criteria determined by the Independent Trustees for this purpose using data provided by Strategic Insight Mutual Fund Research and Consulting, LLC (Strategic Insight), an independent third party. The peer group comparisons referred to below are organized in quintiles. Each quintile represents one-fifth of the peer group. In all peer group comparisons referred to below, first quintile is most favorable to the Portfolio’s shareowners. The Trustees noted that they separately review and consider the impact of the Portfolio’s transfer agency and Portfolio- and APAM-paid expenses for sub-transfer agency and intermediary arrangements, and that the results of the most recent such review were considered in the consideration of the Portfolio’s expense ratio.
The Trustees considered that the Portfolio’s management fee for the most recent fiscal year was in the fourth quintile relative to the management fees paid by other funds in its Morningstar category for the comparable period. The Trustees considered that the expense ratio of the Portfolio’s Class I shares for the most recent fiscal year was in the fourth quintile relative to its Strategic Insight peer group for the comparable period.
The Trustees reviewed management fees charged by APAM and APIAM to institutional and other clients, including publicly offered European funds sponsored by APAM’s affiliates, unaffiliated U.S. registered investment companies (in a sub-advisory capacity), and unaffiliated foreign and domestic separate accounts. The Trustees also considered APAM’s costs in providing services to the Portfolio and APAM’s and APIAM’s costs in providing services to the other clients and considered the differences in management fees and profit margins for fund and non-fund services. In evaluating the fees associated with APAM’s and APIAM’s client accounts, the Trustees took into account the respective demands, resources and complexity associated with the Portfolio and other client accounts. The Trustees noted that, in some instances, the fee rates for those clients were lower than the management fee for the Portfolio and considered that, under the investment management agreement with the Portfolio, APAM performs additional services for the Portfolio that it does not provide to those other clients or services that are broader in scope, including oversight of the Portfolio’s other service providers and activities related to compliance and the extensive regulatory and tax regimes to which the Portfolio is subject. The Trustees also considered the entrepreneurial risks associated with APAM’s management of the Portfolio.
The Trustees concluded that the management fee payable by the Portfolio to APAM was reasonable in relation to the nature and quality of the services provided by APAM.
Profitability
The Trustees considered information provided by APAM regarding the profitability of APAM with respect to the advisory services provided by APAM to the Portfolio, including the methodology used by APAM in allocating certain of its costs to the management of the Portfolio. The Trustees also considered APAM’s profit margin in connection with the overall operation of the Portfolio. They further reviewed the financial results, including the profit margins, realized by APAM and APIAM from non-fund businesses. The Trustees considered APAM’s profit margins in comparison to the limited industry data available and noted that the profitability of any adviser was affected by numerous factors, including its organizational structure and method for allocating expenses. The Trustees concluded that APAM’s profitability with respect to the management of the Portfolio was not unreasonable.
Economies of Scale
The Trustees considered APAM’s views relating to economies of scale in connection with the Pioneer Funds as fund assets grow and the extent to which any such economies of scale are shared with the Portfolio and Portfolio shareholders. The Trustees recognize that economies of scale are difficult to identify and quantify, and that, among other factors that may be relevant, are the following: fee levels, expense subsidization, investment by APAM in research and analytical capabilities and APAM’s commitment and resource allocation to the Portfolio. The Trustees noted that profitability also may be an indicator of the availability of any economies of scale, although profitability may vary for other reasons including due to reductions in expenses. The Trustees concluded that economies of scale, if any, were being appropriately shared with the Portfolio.
Other Benefits
The Trustees considered the other benefits that APAM enjoys from its relationship with the Portfolio. The Trustees considered the character and amount of fees paid or to be paid by the Portfolio, other than under the investment management agreement, for services provided by APAM and its affiliates. The Trustees further considered the revenues and profitability of APAM’s
26
| | |
| Pioneer Equity Income VCT Portfolio | Pioneer Variable Contracts Trust |
businesses other than the Fund business. To the extent applicable, the Trustees also considered the benefits to the Portfolio and to APAM and its affiliates from the use of “soft” commission dollars generated by the Portfolio to pay for research and brokerage services.
The Trustees considered that Amundi Pioneer is the principal U.S. asset management business of Amundi, which is one of the largest asset managers globally. Amundi’s worldwide asset management business manages over $1.7 trillion in assets (including the Pioneer Funds). The Trustees considered that APAM’s relationship with Amundi creates potential opportunities for APAM, APIAM and Amundi that derive from APAM’s relationships with the Portfolio, including Amundi’s ability to market the services of APAM globally. The Trustees noted that APAM has access to additional research and portfolio management capabilities as a result of its relationship with Amundi and Amundi’s enhanced global presence that may contribute to an increase in the resources available to APAM. The Trustees considered that APAM and the Portfolio receive reciprocal intangible benefits from the relationship, including mutual brand recognition and, for the Portfolio, direct and indirect access to the resources of a large global asset manager. The Trustees concluded that any such benefits received by APAM as a result of its relationship with the Portfolio were reasonable.
Conclusion
After consideration of the factors described above as well as other factors, the Trustees, including the Independent Trustees, concluded that the investment management agreement for the Portfolio, including the fees payable thereunder, was fair and reasonable and voted to approve the proposed renewal of the investment management agreement.
27
| | |
| Pioneer Equity Income VCT Portfolio | Pioneer Variable Contracts Trust |
Trustees, Officers and Service Providers | |
The Portfolio’s Trustees and officers are listed below, together with their principal occupations and other directorships they have held during at least the past five years. Trustees who are interested persons of the Portfolios within the meaning of the 1940 Act are referred to as Interested Trustees. Trustees who are not interested persons of the Portfolio are referred to as Independent Trustees. Each of the Trustees serves as a Trustee of each of the 45 U.S. registered investment portfolios for which Amundi US serves as investment adviser (the “Pioneer Funds”). The address for all Trustees and all officers of the Portfolios is 60 State Street, Boston, Massachusetts 02109.
| Name, Age and Position | Term of Office and | | Other Directorships |
| Held With the Trust | Length of Service | Principal Occupation | Held by Trustee |
| Independent Trustees: | | | |
| Thomas J. Perna (70) | Trustee since 2006. Serves until a | Private investor (2004 – 2008 and | Director, Broadridge Financial |
Chairman of the Board | successor trustee is elected or | 2013 – present); Chairman (2008 – 2013) | Solutions, Inc. (investor |
and Trustee | earlier retirement or removal. | and Chief Executive Officer (2008 – 2012), | communications and securities |
| | Quadriserv, Inc. (technology products for | processing provider for financial |
| | securities lending industry); and Senior | services industry) (2009 – present); |
| | Executive Vice President, The Bank of New York | Director, Quadriserv, Inc. (2005 – |
| | (financial and securities services) (1986 – 2004) | 2013); and Commissioner, New Jersey |
| | | State Civil Service Commission |
| | | (2011 – 2015) |
| John E. Baumgardner, Jr. (69) | Trustee since 2019. Serves until a | Of Counsel (2019 – present), Partner | Chairman, The Lakeville Journal |
Trustee | successor trustee is elected or | (1983-2018), Sullivan & Cromwell LLP | Company, LLC, (privately-held |
| earlier retirement or removal. | (law firm). | community newspaper group) (2015- |
| | | present) |
| Diane Durnin (63) | Trustee since 2019. Serves until a | Managing Director - Head of Product Strategy | None |
Trustee | successor trustee is elected or | and Development, BNY Mellon Investment | |
| earlier retirement or removal. | Management (investment management firm) | |
| | (2012-2018); Vice Chairman – The Dreyfus | |
| | Corporation (2005 – 2018): Executive Vice | |
| | President Head of Product, BNY Mellon | |
| | Investment Management (2007-2012); Executive | |
| | Director- Product Strategy, Mellon Asset | |
| | Management (2005-2007); Executive Vice | |
| | President Head of Products, Marketing and | |
| | Client Service, Dreyfus Corporation (investment | |
| | management firm) (2000-2005); and Senior Vice | |
| | President – Strategic Product and Business | |
| | Development, Dreyfus Corporation (1994-2000) | |
| Benjamin M. Friedman (76) | Trustee since 2008. Serves until a | William Joseph Maier Professor of Political | Trustee, Mellon Institutional Funds |
Trustee | successor trustee is elected or | Economy, Harvard University (1972 – present) | Investment Trust and Mellon |
| earlier retirement or removal. | | Institutional Funds Master Portfolio |
| | | (oversaw 17 portfolios in fund |
| | | complex) (1989 - 2008) |
| Lorraine H. Monchak (64) | Trustee since 2017. (Advisory | Chief Investment Officer, 1199 SEIU Funds | None |
Trustee | Trustee from 2014 - 2017). Serves | (healthcare workers union pension funds) | |
| until a successor trustee is elected | (2001 – present); Vice President – International | |
| or earlier retirement or removal. | Investments Group, American International | |
| | Group, Inc. (insurance company) (1993 – 2001); | |
| | Vice President – Corporate Finance and Treasury | |
| | Group, Citibank, N.A. (1980 – 1986 and | |
| | 1990 – 1993); Vice President – Asset/Liability | |
| | Management Group, Federal Farm Funding | |
| | Corporation (government-sponsored issuer of | |
| | debt securities) (1988 – 1990); Mortgage | |
| | Strategies Group, Shearson Lehman Hutton, Inc. | |
| | (investment bank) (1987 – 1988); and Mortgage | |
| | Strategies Group, Drexel Burnham Lambert, Ltd. | |
| | (investment bank) (1986 – 1987) | |
28
| | |
| Pioneer Equity Income VCT Portfolio | Pioneer Variable Contracts Trust |
| | | | |
| Name, Age and Position | Term of Office and | | Other Directorships |
| Held With the Trust | Length of Service | Principal Occupation | Held by Trustee |
Independent Trustees: (continued) | | |
| Marguerite A. Piret (72) | Trustee since 1995. Serves until a | Chief Financial Officer, American Ag Energy, | Director of New America High Income |
Trustee | successor trustee is elected or | Inc. (controlled environment and agriculture | Fund, Inc. (closed-end investment |
| earlier retirement or removal. | company) (2016 – present); and President and | company) (2004 – present); and |
| | Chief Executive Officer, Metric Financial Inc. | Member, Board of Governors, |
| | (formerly known as Newbury Piret Company) | Investment Company Institute |
| | (investment banking firm) (1981 – 2019) | (2000 – 2006) |
| Fred J. Ricciardi (73) | Trustee since 2014. Serves until a | Private investor (2020 – present); Consultant | None |
Trustee | successor trustee is elected or | (investment company services) (2012 – 2020); | |
| earlier retirement or removal. | Executive Vice President, BNY Mellon (financial | |
| | and investment company services) (1969 – 2012); | |
| | Director, BNY International Financing Corp. | |
| | (financial services) (2002 – 2012); Director, | |
| | Mellon Overseas Investment Corp. (financial | |
| | services) (2009 – 2012); Director, Financial | |
| | Models (technology) (2005-2007); Director, BNY | |
| | Hamilton Funds, Ireland (offshore investment | |
| | companies) (2004-2007); Chairman/Director, | |
| | AIB/BNY Securities Services, Ltd., Ireland | |
| | (financial services) (1999-2006); and Chairman, | |
| | BNY Alternative Investment Services, Inc. | |
| | (financial services) (2005-2007) | |
| Interested Trustees: | | | |
| Lisa M. Jones (58)* | Trustee since 2017. Serves until a | Director, CEO and President of Amundi US, Inc. | None |
Trustee, President and | successor trustee is elected or | (investment management firm) (since | |
Chief Executive Officer | earlier retirement or removal | September 2014); Director, CEO and President | |
| | of Amundi Asset Management US, Inc. (since | |
| | September 2014); Director, CEO and President of | |
| | Amundi Distributor US, Inc. (since September | |
| | 2014); Director, CEO and President of Amundi | |
| | Asset Management US, Inc. (since September | |
| | 2014); Chair, Amundi US, Inc., Amundi Distributor | |
| | US, Inc. and Amundi Asset Management US, Inc. | |
| | (September 2014 – 2018); Managing Director, | |
| | Morgan Stanley Investment Management | |
| | (investment management firm) (2010 – 2013); | |
| | Director of Institutional Business, CEO of | |
| | International, Eaton Vance Management | |
| | (investment management firm) (2005 – 2010); | |
| | and Director of Amundi Holdings US, Inc. | |
| | (since 2017) | |
| Kenneth J. Taubes (62)* | Trustee since 2014. Serves until a | Director and Executive Vice President | None |
Trustee | successor trustee is elected or | (since 2008) and Chief Investment Officer, U.S. | |
| earlier retirement or removal | (since 2010) of Amundi US, Inc. (investment | |
| | management firm); Director and Executive Vice | |
| | President and Chief Investment Officer, U.S. of | |
| | Amundi US (since 2008); Executive Vice | |
| | President and Chief Investment Officer, U.S. of | |
| | Amundi Asset Management US, Inc. (since 2009); | |
| | Portfolio Manager of Amundi US (since 1999); | |
| | and Director of Amundi Holdings US, Inc. | |
| | (since 2017) | |
* Ms. Jones and Mr. Taubes are Interested Trustees because they are officers or directors of the Portfolio’s investment adviser and certain of its affiliates.
29
| | |
| Pioneer Equity Income VCT Portfolio | Pioneer Variable Contracts Trust |
| Trustees, Officers and Service Providers (continued) | |
| | | | |
| Name , Age and Position | Term of Office and | | Other Directorships |
| Held With the Trust | Length of Service | Principal Occupation | Held by Officer |
| Fund Officers: | | | |
| Christopher J. Kelley (56) | Since 2003. Serves at the | Vice President and Associate General Counsel | None |
Secretary and Chief | discretion of the Board | of Amundi US since January 2008; Secretary and | |
Legal Officer | | Chief Legal Officer of all of the Pioneer Funds | |
| | since June 2010; Assistant Secretary of all of the | |
| | Pioneer Funds from September 2003 to | |
| | May 2010; Vice President and Senior Counsel of | |
| | Amundi US from July 2002 to December 2007 | |
| Carol B. Hannigan (59) | Since 2010. Serves at the | Fund Governance Director of Amundi US since | None |
Assistant Secretary | discretion of the Board | December 2006 and Assistant Secretary of all | |
| | the Pioneer Funds since June 2010; Manager – | |
| | Fund Governance of Amundi US from | |
| | December 2003 to November 2006; and Senior | |
| | Paralegal of Amundi US from January 2000 to | |
| | November 2003 | |
| Thomas Reyes (58) | Since 2010. Serves at the | Assistant General Counsel of Amundi US since | None |
Assistant Secretary | discretion of the Board | May 2013 and Assistant Secretary of all the | |
| | Pioneer Funds since June 2010; and Counsel of | |
| | Amundi US from June 2007 to May 2013 | |
| Mark E. Bradley (61) | Since 2008. Serves at the | Vice President – Fund Treasury of Amundi US; | None |
Treasurer and Chief Financial | discretion of the Board | Treasurer of all of the Pioneer Funds since | |
and Accounting Officer | | March 2008; Deputy Treasurer of Amundi US | |
| | from March 2004 to February 2008; and Assistant | |
| | Treasurer of all of the Pioneer Funds from | |
| | March 2004 to February 2008 | |
| Anthony J. Koenig, Jr. (57) | Since 2021. Serves at the | Senior Vice President – Fund Treasury of | None |
Assistant Treasurer | discretion of the Board | Amundi US; Assistant Treasurer of all of the | |
| | Pioneer Funds since January 2021; and Chief of | |
| | Staff, US Investment Management of Amundi US | |
| | from May 2008 to January 2021 | |
| Luis I. Presutti (55) | Since 2000. Serves at the | Director – Fund Treasury of Amundi US since | None |
Assistant Treasurer | discretion of the Board | 1999; and Assistant Treasurer of all of the | |
| | Pioneer Funds since 1999 | |
| Gary Sullivan (62) | Since 2002. Serves at the | Senior Manager – Fund Treasury of Amundi US | None |
Assistant Treasurer | discretion of the Board | since 2012; and Assistant Treasurer of all of the | |
| | Pioneer Funds since 2002 | |
| Antonio Furtado (38) | Since 2020. Serves at the | Fund Oversight Manager – Fund Treasury of | None |
Assistant Treasurer | discretion of the Board | Amundi US since 2020; Assistant Treasurer of all | |
| | of the Pioneer Funds since 2020; and Senior Fund | |
| | Treasury Analyst from 2012 - 2020 | |
| John Malone (50) | Since 2018. Serves at the | Managing Director, Chief Compliance Officer of | None |
Chief Compliance Officer | discretion of the Board | Amundi US Asset Management; Amundi Asset | |
| | Management US, Inc.; and the Pioneer Funds | |
| | since September 2018; and Chief Compliance | |
| | Officer of Amundi Distributor US, Inc. since | |
| | January 2014. | |
| Kelly O’Donnell (49) | Since 2006. Serves at the | Vice President – Amundi Asset Management; | None |
Anti-Money | discretion of the Board | and Anti-Money Laundering Officer of all the | |
Laundering Officer | | Pioneer Funds since 2006 | |
30
This page was intentionally left blank.
31
This page was intentionally left blank.
32
This page was intentionally left blank.
33
This page was intentionally left blank.
34
This page was intentionally left blank.
35
This page was intentionally left blank.
36
This page was intentionally left blank.
37
Proxy Voting Policies and Procedures of the Portfolio are available without charge, upon request, by calling our toll free number (1-800-225-6292). Information regarding how the Portfolio voted proxies relating to Portfolio securities during the most recent 12-month period ended June 30 is publicly available to shareowners at www.amundi.com/us. This information is also available on the Securities and Exchange Commission’s web site at www.sec.gov.

18648-15-0221
Pioneer Variable Contracts Trust
Pioneer Select Mid Cap Growth
VCT Portfolio
Class I Shares
Annual Report | December 31, 2020
Paper copies of the Portfolio’s shareholder reports may no longer be sent by mail, unless you specifically request paper copies of the reports from the insurance company that offers your variable annuity or variable life insurance contract, or from your financial intermediary. Instead, the insurance company may choose to make the reports available on a website, and will notify you by mail each time a shareholder report is posted and provide you with a website link to access the report. Instructions for requesting paper copies will be provided by your insurance company.
You may elect to receive all future Portfolio shareholder reports in paper form, free of charge, from the insurance company. You can inform the insurance company or your financial intermediary that you wish to continue receiving paper copies of your shareholder reports by following the instructions provided by the insurance company, or by contacting your financial intermediary. Your election to receive reports in paper form will apply to all portfolios available under your contract with the insurance company.
Please refer to your contract prospectus to determine the applicable share class offered under your contract.
Pioneer Variable Contracts Trust
| | |
| |
| Pioneer Select Mid Cap Growth VCT Portfolio | |
| | |
| 2 |
| | |
| 3 |
| | |
| 4 |
| | |
| 10 |
| | |
| 16 |
| | |
| 20 |
| | |
| 24 |
| | |
| 25 |
| | |
| 26 |
| | |
| 29 |
This report is authorized for distribution only when preceded or accompanied by a prospectus for the Portfolio being offered.
Pioneer Variable Contracts Trust files a complete schedule of portfolio holdings with the Securities and Exchange Commission for the first and third quarters of each fiscal year as an exhibit to its reports on Form N-PORT. Shareholders may view the filed Form N-PORT by visiting the Commission’s web site at https://www.sec.gov.
| | |
| Pioneer Select Mid Cap Growth VCT Portfolio | Pioneer Variable Contracts Trust |
Portfolio Update 12/31/20 | |
5 Largest Holdings
(As a percentage of total investments)*
1. | Micron Technology, Inc. | 1.92% |
2. | Lam Research Corp. | 1.90 |
3. | Synopsys, Inc. | 1.89 |
4. | MSCI, Inc. | 1.86 |
5. | Brinker International, Inc. | 1.80 |
* | Excludes temporary cash investments and all derivative contracts except for options purchased. The Portfolio is actively managed, and current holdings may be different. The holdings listed should not be considered recommendations to buy or sell any securities. |
| | | | | |
| Performance Update 12/31/20 | | | |
| |
| Prices and Distributions | | | | |
| |
| Net Asset Value per Share | | 12/31/20 | 12/31/19 | |
| Class I | | $37.52 | $29.12 | |
| Net | | | |
| Distributions per Share | Investment | Short-Term | Long-Term | |
| (1/1/20 – 12/31/20) | Income | Capital Gains | Capital Gains | |
| Class I | $ – | $ – | $2.2141 | |
Performance of a $10,000 InvestmentThe following chart shows the change in value of an investment made in Class I shares of Pioneer Select Mid Cap Growth VCT Portfolio at net asset value during the periods shown, compared to that of the Russell Midcap Growth Index. Portfolio returns are based on net asset value and do not reflect any applicable insurance fees or surrender charges.
The Russell Midcap Growth Index is an unmanaged index that measures the performance of U.S. mid-cap growth stocks. Index returns are calculated monthly, assume reinvestment of dividends and, unlike Portfolio returns, do not reflect any fees, expenses or sales charges. It is not possible to invest directly in an index.
| | | |
| Average Annual Total Returns | | |
(As of December 31, 2020) | | |
| | Russell Midcap |
| Class I | Growth Index |
10 Years | 14.50% | 15.04% |
5 Years | 18.50% | 18.66% |
1 Year | 39.17% | 35.59% |
All total returns shown assume reinvestment of distributions at net asset value.
The performance table does not reflect the deduction of taxes that a shareowner would pay on distributions or the redemption of shares.
Call 1-800-688-9915 or visit www.amundi.com/us for the most recent month-end performance results. Current performance may be lower or higher than the performance data quoted.
The performance data quoted represents past performance, which is no guarantee of future results. Investment return and principal value will fluctuate, and shares, when redeemed, may be worth more or less than their original cost.
The returns for the Portfolio do not reflect the deduction of expenses associated with variable products, such as mortality and expense risk charges, separate account charges, and sales charges. These expenses would reduce the overall returns shown.
Performance results reflect any applicable expense waivers in effect during the periods shown. Without such waivers, performance would be lower. Waivers may not be in effect for all portfolios. Certain fee waivers are contractual through a specified period. Otherwise, fee waivers can be rescinded at any time. See the prospectus and financial statements for more information.
2
| | |
| Pioneer Select Mid Cap Growth VCT Portfolio | Pioneer Variable Contracts Trust |
Comparing Ongoing Portfolio Expenses | |
As a shareowner in the Portfolio, you incur two types of costs:
(1) | ongoing costs, including management fees, distribution and/or service (12b-1) fees, and other Portfolio expenses; and |
(2) | transaction costs, including sales charges (loads) on purchase payments. |
This example is intended to help you understand your ongoing expenses (in dollars) of investing in the Portfolio and to compare these costs with the ongoing costs of investing in other mutual funds offered through your variable annuity contract. The example is based on an investment of $1,000 at the beginning of the Portfolio’s latest six-month period and held throughout the six months.
Using the Tables
Actual Expenses
The first table below provides information about actual account values and actual expenses. You may use the information in this table, together with the amount you invested, to estimate the expenses that you paid over the period as follows:
1. | Divide your account value by $1,000 |
| Example: an $8,600 account value ÷ $1,000 = 8.6 |
2. | Multiply the result in (1) above by the corresponding share class’s number in the third row under the heading entitled “Expenses Paid During Period” to estimate the expenses you paid on your account during this period. |
Expenses Paid on a $1,000 Investment in Pioneer Select Mid Cap Growth VCT Portfolio
| | |
Based on actual returns from July 1, 2020 through December 31, 2020. | |
|
| Share Class | I |
Beginning Account Value on 7/1/20 | $1,000.00 |
Ending Account Value on 12/31/20 | $1,356.04 |
Expenses Paid During Period* | $5.27 |
* | Expenses are equal to the Portfolio’s annualized expense ratio of 0.89% for Class I shares multiplied by the average account value over the period, multiplied by 184/366 (to reflect the one-half year period). |
Hypothetical Example for Comparison Purposes
The table below provides information about hypothetical account values and hypothetical expenses based on the Portfolio’s actual expense ratio and an assumed rate of return of 5% per year before expenses, which is not the Portfolio’s actual return. The hypothetical account values and expenses may not be used to estimate the actual ending account balance or expenses you paid for the period.
You may use this information to compare the ongoing costs of investing in the Portfolio and other variable annuities. To do so, compare this 5% hypothetical example with the 5% hypothetical examples that appear in the shareholder reports of the other variable annuities.
Please note that the expenses shown in the tables are meant to highlight your ongoing costs only and do not reflect any transaction costs, such as sales charges (loads) that are charged at the time of the transaction. Therefore, the table below is useful in comparing ongoing costs only and will not help you determine the relative total costs of owning different variable annuities. In addition, if these transaction costs were included, your costs would have been higher.
Expenses Paid on a $1,000 Investment in Pioneer Select Mid Cap Growth VCT Portfolio
Based on a hypothetical 5% per year return before expenses, reflecting the period from July 1, 2020 through December 31, 2020.
| | |
| Share Class | I |
Beginning Account Value on 7/1/20 | $1,000.00 |
Ending Account Value on 12/31/20 | $1,020.66 |
Expenses Paid During Period* | $4.52 |
* | Expenses are equal to the Portfolio’s annualized expense ratio of 0.89% for Class I shares multiplied by the average account value over the period, multiplied by 184/366 (to reflect the one-half year period). |
3
| | |
| Pioneer Select Mid Cap Growth VCT Portfolio | Pioneer Variable Contracts Trust |
Portfolio Management Discussion 12/31/20 | |
Call 1-800-688-9915 or visit www.amundi.com/us for the most recent month-end performance results. Current performance may be lower or higher than the performance data quoted.
The performance data quoted represents past performance, which is no guarantee of future results. Investment return and principal value will fluctuate, and shares, when redeemed, may be worth more or less than their original cost.
The returns for the Portfolio do not reflect the deduction of expenses associated with variable products, such as mortality and expense risk charges, separate account charges, and sales charges. These expenses would reduce the overall returns shown.
Performance results reflect any applicable expense waivers in effect during the periods shown. Without such waivers performance would be lower. Waivers may not be in effect for all portfolios. Certain fee waivers are contractual through a specified period. Otherwise, fee waivers can be rescinded at any time. See the prospectus and financial statements for more information.
In the following interview, Ken Winston discusses the market environment and the factors that affected the performance of Pioneer Select Mid Cap Growth VCT Portfolio during the 12-month period ended December 31, 2020. Mr. Winston, a senior vice president at Amundi Asset Management US, Inc. (Amundi US) and lead portfolio manager, is responsible for the day-to-day management of the Portfolio, along with Shaji John, a vice president and a portfolio manager at Amundi US, and David Sobell, a vice president and portfolio manager at Amundi US.
Q: How did the Portfolio perform during the 12-month period ended December 31, 2020?
A: Pioneer Select Mid Cap Growth VCT Portfolio’s Class I shares returned 39.17% at net asset value (NAV) during the 12-month period ended December 31, 2020, while the Portfolio’s benchmark, the Russell Midcap Growth Index (the Russell Index), returned 38.49%.
Q: How would you describe the investment environment in the equity market during the 12-month period ended December 31, 2020?
A: The annual reporting period beginning January 1, 2020, and ending on December 31, 2020, was one of the most volatile 12-month periods in history for domestic equity investors. The period began on a strong note, with domestic equities turning in solidly positive performance from the start of the year through February 19, 2020.
Then, as investors began to react to the COVID-19 pandemic and the potential economic consequences of the lockdowns imposed by state and local governments aimed at containing the rate of infections (“flattening the curve”), equity prices sharply reversed. To illustrate, the S&P 500 Index and the Portfolio’s benchmark, the Russell Index, declined by nearly 34% and 36%, respectively, between February 19 and March 23.
After the market bottomed on March 23, the final nine months of the 12-month period saw domestic equities stage a stunning positive reversal, as the S&P 500 Index and the Russell Index both rallied and ended up posting very strong gains for the calendar year overall, and more than made up for all of the previous losses sustained in February and March.
When all was said and done, the Russell Index had returned 38.49% for the full 12-month period, besting the performance of just about every other domestic equity index, including the S&P 500 Index and the Russell Midcap Value Index, which returned 18.40% and 2.80%, respectively, over the 12 months ended December 31, 2020.
The recovery in equity prices from the market bottom on March 23 was fueled in part by investors’ positive response to unprecedented actions taken by the US Federal Reserve (Fed), which implemented a broad array of programs aimed at limiting the damage caused by the virtual shutting down of the domestic economy due to the pandemic-control measures. The Fed’s initiatives included reducing the target range of the federal funds rate to zero, reintroducing quantitative easing (asset purchases), and creating lending facilities (totaling roughly $3 trillion) in support of households, employers, financial markets, and state and local governments. Additionally, the Trump administration and Congress moved quickly to enact three separate COVID-19
4
| | |
| Pioneer Select Mid Cap Growth VCT Portfolio | Pioneer Variable Contracts Trust |
relief packages, at a total cost of more than $2 trillion, to provide aid to consumers and businesses, and to attempt to replace some of the incomes lost during the COVID-19 crisis.
Additionally, near the end of the 12-month period, two drug companies (Pfizer and Moderna) announced positive results for Phase 3 studies of their COVID-19 vaccine candidates, with each of the studies showing greater than 95% efficacy rates. (Pfizer was not a Portfolio holding during the 12-month period; Moderna is a Portfolio holding.)
Shortly before the end of the 12-month period, some of the vaccine candidates received emergency-use approval from the US Food and Drug Administration (FDA), with the expectation that the vaccines — and potentially other vaccines — would see distribution to the broader US population in the first half of 2021.
Within the Portfolio’s benchmark, the Russell Index, the three best-performing sectors over the 12-month period were communication services, information technology, and health care, which returned 58.84%, 49.73%, and 44.99%, respectively. Meanwhile, energy, consumer staples, and materials were the lagging sectors in the Russell Index for the period, with energy posting the only negative sector return for the full year (-18.18%). Consumer staples, up by 15.32%, and materials, up by 16.49%, were positive for the 12-month period, but underperformed all other sectors besides energy. The energy sector’s significantly negative performance during the 12-month period was due primarily to persistent oil-price volatility and sluggish demand, with the latter particularly affected by the COVID-19 lockdowns and other virus-related restrictions on business and personal activities.
Q: Which of your investment decisions had the greatest effects on the Portfolio’s benchmark-relative performance during the 12-month period ended December 31, 2020?
A: The Portfolio outperformed the Russell Index over the 12-month period, with strong relative returns driven by positive stock selection results. Meanwhile, sector allocation decisions slightly detracted from benchmark-relative returns during the period.
With regard to sector allocation, the main detractors from the Portfolio’s benchmark-relative returns were a slight underweight to the outperforming information technology sector and, more specifically, different weightings within the consumer staples sector over the course of the 12-month period. The Portfolio was underweight to the consumer staples sector during the period featuring the severe equity market downturn between February 19 and March 23, 2020, a timeframe that saw the defensive consumer staples sector substantially outperform all other Russell Index sectors. As a result, the Portfolio’s underweight to the sector during the market sell-off detracted from benchmark-relative returns. Subsequently, we transitioned to a slight overweight position in consumer staples, but after the switch, the sector substantially underperformed all other Russell Index sectors as the overall market recovered from its March lows. Therefore, the switch to an overweight resulted in further detraction from the Portfolio’s benchmark-relative returns during the rebound in the equity market that characterized most of the period’s final nine months.
5
| | |
| Pioneer Select Mid Cap Growth VCT Portfolio | Pioneer Variable Contracts Trust |
| Portfolio Management Discussion 12/31/20 | |
As for stock selection, the biggest benefits to the Portfolio’s benchmark-relative performance over the 12-month period came from selection results in the health care and industrials sectors.
Q: Which individual portfolio holdings had the most significant effects on the Portfolio’s benchmark-relative performance, either positive or negative, during the 12-month period ended December 31, 2020?
A: The top individual positive contributors to the Portfolio’s benchmark-relative performance during the 12-month period were positions in Teladoc Health, Peloton Interactive, and Generac Holdings.
Teladoc Health is a leading provider of virtual access to medical professionals. The company’s share price rose during the period as demand for Teladoc’s services has been accelerating because of the stay-at-home restrictions brought about by COVID-19, which have had the effect of introducing new providers and subscribers to the Teladoc ecosystem, while cementing the company’s position as one of the leading virtual-care intermediaries.
Peloton provides a fitness platform with an integrated hardware/software/content ecosystem serving live, at-home fitness solutions and on-demand classes for its members. Peloton’s shares rose substantially during the 12-month period as the company benefited from the COVID-19 restrictions, which accelerated the trend towards in-home fitness. We believe the company may continue to grow its revenues and earnings over the coming years, while benefiting from several positive factors. These include strong brand recognition (emanating from Peloton’s first-mover advantage and highly engaged subscribers); a growing competitive moat around its business; positive secular tailwinds in the health-and-wellness field; recurring subscription revenues with high gross margins; and an addressable market that has been expanding through new geographies, product verticals, and lower price points.
Generac is a leading manufacturer of a broad range of residential standby and portable generators, with dominant market share in the North America standby generator market as well as leading market share in portable generators. Generac’s shares outperformed during the period as the company benefited from increased demand for its products emanating from the wildfires in California, an active hurricane season in the Atlantic, and the global pandemic, which kept people at home across the country and resulted in greater interest in Generac’s backup power solutions.
While overall stock selection results in the health care sector strongly benefited the Portfolio’s benchmark-relative performance during the 12-month period, some of the largest individual detractors came from that sector. The Portfolio had overweight positions in Reata Pharmaceuticals and Esperion Therapeutics during the period, and an underweight position in Moderna, all of which had negative effects on benchmark-relative returns.
Reata is a clinical-stage biopharmaceutical company focused on development of novel therapies to treat inflammatory and metabolic diseases with unmet needs. Nearly 2,000 patients across a number of indications, from chronic kidney disease to pulmonary hypertension, have received Reata’s leading therapy candidate, and the company has been running extensive clinical studies for multiple indications, with promising late-stage data seen so far.
6
| | |
| Pioneer Select Mid Cap Growth VCT Portfolio | Pioneer Variable Contracts Trust |
Reata’s shares declined during the 12-month period after a steady rise over the previous 12 months (ended December 31, 2019). We have maintained the Portfolio’s position in Reata, and believe the next few years could turn out to be pivotal for the company, as, if a host of readouts and key clinical study initiations prove successful, Reata’s therapies have the potential to address a range of indications.
Esperion is a pharmaceutical company dedicated to the development and commercialization of cost-effective, once-daily oral therapies for the management of LDL cholesterol. Esperion has two products that were FDA-approved in February 2020. The approved therapies focus on two patient populations: patients who cannot tolerate any dose of statins, and patients who have experienced inadequate results in lowering their LDL-C levels by taking statins, regardless of dose. The company began a commercial rollout of the therapies in March 2020 — just as the COVID-19 pandemic hit. Therefore, the COVID-19 situation had a negative effect on the rollout, which contributed to a decline in Esperion’s share price during the 12-month period. We continue to believe that the company’s therapies, and particularly its bempedoic acid franchise, could potentially generate substantial uptake from its patient populations over time, and so we have retained the Portfolio’s position.
Finally, with regard to Moderna, the Portfolio’s underweight position versus the Russell Index was a large detractor from relative performance during the 12-month period. Moderna is a clinical-stage biotech company with messenger RNA (mRNA) drug candidates in preclinical or early human trials for certain indications, including cancer, autoimmune disorders, and viruses such as Zika. Moderna spent most of 2020 making headlines after the company got into the COVID-19 vaccine race early on, and became the first developer to launch a vaccine candidate in human trials in March 2020. On November 16, 2020, Moderna announced positive Phase-3 clinical trial results, in which its vaccine was 95%+ effective in preventing the COVID-19 virus. Based on current expectations, the vaccine could see widespread distribution in the first half of 2021. Moderna’s share price increased dramatically during the 12-month period, and while the Portfolio did have a position in Moderna, the underweight stake compared to the Russell Index’s exposure to the stock detracted from benchmark-relative returns.
Q: Did the Portfolio have any derivatives exposure during the 12-month period ended December 31, 2020?
A: No, the Portfolio had no exposure to derivative securities during the 12-month period.
Q: What is your outlook?
A: We see some positives and negatives with respect to the outlook for domestic equities.
On the positive side, it now seems possible that a COVID-19 vaccine could become available to a substantial portion of the US population by the end of the summer in 2021, which may lead to widespread immunity and a full return to economic normalcy in the second half of 2021. If consumers and businesses are able to “return to normal” at some point in 2021, we believe there may be significant pent-up demand in many areas of the economy that, if unleashed, could drive economic growth.
7
| | |
| Pioneer Select Mid Cap Growth VCT Portfolio | Pioneer Variable Contracts Trust |
| Portfolio Management Discussion 12/31/20 (continued) | |
In addition, accommodative monetary policy from the Fed seems likely to continue through 2021 and into 2022, based on the Fed’s recent pronouncements, and another round of fiscal stimulus legislation from the US government could be unveiled in early 2021, especially given the recent power shift in Washington. A federal infrastructure spending initiative may also happen in 2021, which could potentially provide further economic stimulus.
On the negative side, we believe there are pockets of “euphoria” in the market, which has led to over-valuations in certain stocks and industry segments, which could experience large corrections in 2021 or beyond. Another issue that bears watching is the US government’s already high debt level, which has been ballooning even more so due to the stimulus spending needed to help offset the effects of the pandemic on the economy. There could be a price to pay in the future, with equity markets likely beginning to discount that negative sometime down the road.
Another potential headwind is the possibility that vaccine deployment and the hoped-for return to “normalcy” may occur later than expected. Meanwhile, there could be issues with the vaccine rollout, or a third wave of COVID-19 cases that may take years to contain.
On the government-policy side, the switch to Democratic Party control of both the Executive Branch and Congress during the month of January could lead to tax increases on both businesses and individuals, including a rise in the capital gains tax. A capital gains tax hike could result in an equity market downturn as individuals opt to sell stocks to avoid capital gains, and as business owners curtail hiring and spending to offset higher taxes. Such a scenario could lead to a substantial weakening in economic activity.
In the end, however, we believe investors are likely to favor owning stocks of secular growth companies with reasonable valuations that are not highly dependent on positive macroeconomic conditions in order to flourish; companies that they believe have resilient business models; and companies that can exhibit sustainable growth characteristics and innovation. Those characteristics typify the types of equities that we seek to hold in the Portfolio.
With regard to positioning, at the end of December, the Portfolio’s largest overweights versus the Russell Index were in the consumer discretionary, industrials, and materials sectors, while the largest underweights were in information technology and consumer staples. In the industrials sector, we have continued to favor companies that we believe have resilient business models and that could continue to hold up well in the volatile market environment, such as commercial and professional services companies. The Portfolio’s overweight in consumer discretionary derives from our optimism about increased consumer spending and economic activity; however, as we previously mentioned, we are cautious due to the continuing economic fallout from the COVID-19 crisis.
8
| | |
| Pioneer Select Mid Cap Growth VCT Portfolio | Pioneer Variable Contracts Trust |
A Word About Risk:
All investments are subject to risk, including the possible loss of principal. In the past several years, financial markets have experienced increased volatility and heightened uncertainty. The market prices of securities may go up or down, sometimes rapidly or unpredictably, due to general market conditions, such as real or perceived adverse economic, political, or regulatory conditions, recessions, inflation, changes in interest or currency rates, lack of liquidity in the bond markets, the spread of infectious illness or other public health issues or adverse investor sentiment. These conditions may continue, recur, worsen or spread.
Investments in mid-sized companies may offer the potential for higher returns, but are also subject to greater short-term price fluctuations than investments in larger, more established companies.
When interest rates rise, the prices of fixed-income securities in the Portfolio will generally fall. Conversely, when interest rates fall, the prices of fixed-income securities in the Portfolio will generally rise.
The Portfolio invests in REIT securities, the value of which can fall for a variety of reasons, such as declines in rental income, fluctuating interest rates, poor property management, environmental liabilities, uninsured damage, increased competition, or changes in real estate tax laws.
Investing in foreign and/or emerging markets securities involves risks relating to interest rates, currency exchange rates, economic, and political conditions.
At times, the Portfolio’s investments may represent industries or industry sectors that are interrelated or have common risks, making the Portfolio more susceptible to any economic, political, or regulatory developments or other risks affecting those industries and sectors.
These risks may increase share price volatility.
Please refer to the Schedule of Investments on pages 10 to 15 for a full listing of Portfolio securities.
Past performance is no guarantee of future results.
Any information in this shareholder report regarding market or economic trends or the factors influencing the Portfolio’s historical or future performance are statements of opinion as of the date of this report.
9
| | |
| Pioneer Select Mid Cap Growth VCT Portfolio | Pioneer Variable Contracts Trust |
Schedule of Investments 12/31/20 | |
| | | | |
| Shares | | | Value |
| | UNAFFILIATED ISSUERS – 99.6% | |
| | COMMON STOCKS – 99.6% of Net Assets | |
| | Aerospace & Defense – 1.2% | |
| 6,817 | | HEICO Corp. | $ 902,571 |
| 23,898 | | Spirit AeroSystems Holdings, Inc. | 934,173 |
| | Total Aerospace & Defense | $ 1,836,744 |
| | Biotechnology – 6.9% | |
| 8,351(a) | | Alnylam Pharmaceuticals, Inc. | $ 1,085,380 |
| 19,716(a) | | Esperion Therapeutics, Inc. | 512,616 |
| 6,482(a) | | Exact Sciences Corp. | 858,800 |
| 22,316(a) | | Fate Therapeutics, Inc. | 2,029,194 |
| 20,436(a) | | FibroGen, Inc. | 757,971 |
| 6,610(a) | | Mirati Therapeutics, Inc. | 1,451,820 |
| 7,782(a) | | Moderna, Inc. | 812,986 |
| 17,843(a) | | Natera, Inc. | 1,775,735 |
| 11,725(a) | | Replimune Group, Inc. | 447,309 |
| 10,641(a) | | Sage Therapeutics, Inc. | 920,553 |
| | Total Biotechnology | $ 10,652,364 |
| | Building Products – 0.7% | |
| 12,729(a) | | Trex Co., Inc. | $ 1,065,672 |
| | Total Building Products | $ 1,065,672 |
| | Capital Markets – 2.6% | |
| 6,360 | | MSCI, Inc. | $ 2,839,931 |
| 17,805 | | Tradeweb Markets, Inc. | 1,111,922 |
| | Total Capital Markets | $ 3,951,853 |
| | Chemicals – 1.2% | |
| 5,880 | | Albemarle Corp. | $ 867,418 |
| 57,339 | | Element Solutions, Inc. | 1,016,620 |
| | Total Chemicals | $ 1,884,038 |
| | Commercial Services & Supplies – 0.9% | |
| 11,157(a) | | Copart, Inc. | $ 1,419,728 |
| | Total Commercial Services & Supplies | $ 1,419,728 |
| | Containers & Packaging – 1.3% | |
| 19,554(a) | | Crown Holdings, Inc. | $ 1,959,311 |
| | Total Containers & Packaging | $ 1,959,311 |
| | Distributors – 0.5% | |
| 2,211 | | Pool Corp. | $ 823,598 |
| | Total Distributors | $ 823,598 |
| | Diversified Consumer Services – 0.4% | |
| 12,034(a) | | Terminix Global Holdings, Inc. | $ 613,854 |
| | Total Diversified Consumer Services | $ 613,854 |
| | Diversified Financials – 0.4% | |
| 43,679(a) | | Insu Acquisition Corp. II | $ 679,208 |
| | Total Diversified Financials | $ 679,208 |
The accompanying notes are an integral part of these financial statements.
10
| | |
| Pioneer Select Mid Cap Growth VCT Portfolio | Pioneer Variable Contracts Trust |
| | | | |
| Shares | | | Value |
| | Electrical Equipment – 3.7% | |
| 15,806(a) | | Array Technologies, Inc. | $ 681,871 |
| 4,130 | | EnerSys | 343,038 |
| 12,087(a) | | Generac Holdings, Inc. | 2,748,705 |
| 2,737 | | Rockwell Automation, Inc. | 686,467 |
| 66,902 | | Vertiv Holdings Co. | 1,249,060 |
| | | Total Electrical Equipment | $ 5,709,141 |
| | | Electronic Equipment, Instruments & Components – 2.1% | |
| 7,547 | | CDW Corp. | $ 994,619 |
| 61,013(a) | | Flex Ltd. | 1,097,014 |
| 14,776(a) | | II-VI, Inc. | 1,122,385 |
| | | Total Electronic Equipment, Instruments & Components | $ 3,214,018 |
| | | Entertainment – 2.3% | |
| 5,820(a) | | Roku, Inc. | $ 1,932,357 |
| 5,146(a) | | Spotify Technology S.A. | 1,619,240 |
| | | Total Entertainment | $ 3,551,597 |
| | | Equity Real Estate Investment Trusts (REITs) – 0.4% | |
| 2,339 | | SBA Communications Corp. | $ 659,902 |
| | | Total Equity Real Estate Investment Trusts (REITs) | $ 659,902 |
| | | Food & Staples Retailing – 0.9% | |
| 8,748(a) | | BJ’s Wholesale Club Holdings, Inc. | $ 326,126 |
| 4,126 | | Casey’s General Stores, Inc. | 736,986 |
| 8,201(a) | | Grocery Outlet Holding Corp. | 321,889 |
| | | Total Food & Staples Retailing | $ 1,385,001 |
| | | Food Products – 1.1% | |
| 13,142 | | Conagra Brands, Inc. | $ 476,529 |
| 50,123(a) | | Nomad Foods, Ltd. | 1,274,127 |
| | | Total Food Products | $ 1,750,656 |
| | | Health Care Equipment & Supplies – 6.0% | |
| 2,663(a) | | Align Technology, Inc. | $ 1,423,054 |
| 2,028(a) | | DexCom, Inc. | 749,792 |
| 2,011(a) | | IDEXX Laboratories, Inc. | 1,005,239 |
| 5,546(a) | | Insulet Corp. | 1,417,724 |
| 4,351(a) | | Penumbra, Inc. | 761,425 |
| 10,364 | | ResMed, Inc. | 2,202,972 |
| 3,850 | | Teleflex, Inc. | 1,584,544 |
| | | Total Health Care Equipment & Supplies | $ 9,144,750 |
| | | Health Care Providers & Services – 2.4% | |
| 5,382(a) | | Amedisys, Inc. | $ 1,578,702 |
| 7,990(a) | | Molina Healthcare, Inc. | 1,699,313 |
| 3,445 | | Quest Diagnostics, Inc. | 410,541 |
| | | Total Health Care Providers & Services | $ 3,688,556 |
| | | Health Care Technology – 2.6% | |
| 7,336(a) | | Teladoc Health, Inc. | $ 1,466,907 |
| 9,406(a) | | Veeva Systems, Inc. | 2,560,783 |
| | | Total Health Care Technology | $ 4,027,690 |
The accompanying notes are an integral part of these financial statements.
11
| | |
| Pioneer Select Mid Cap Growth VCT Portfolio | Pioneer Variable Contracts Trust |
| Schedule of Investments 12/31/20 (continued) | |
| | | | |
| Shares | | | Value |
| | Hotels, Restaurants & Leisure – 4.6% | |
| 48,689 | | Brinker International, Inc. | $ 2,754,337 |
| 1,044(a) | | Chipotle Mexican Grill, Inc. | 1,447,725 |
| 16,410(a) | | DraftKings, Inc. | 764,050 |
| 8,530(a) | | Penn National Gaming, Inc. | 736,736 |
| 17,536 | | Wendy’s Co. | 384,389 |
| 3,517 | | Wingstop, Inc. | 466,178 |
| 4,604 | | Wynn Resorts Ltd. | 519,469 |
| | | Total Hotels, Restaurants & Leisure | $ 7,072,884 |
| | | Household Durables – 0.9% | |
| 6,936 | | Dr Horton, Inc. | $ 478,029 |
| 4,905(a) | | TopBuild Corp. | 902,913 |
| | | Total Household Durables | $ 1,380,942 |
| | | Household Products – 0.5% | |
| 3,419 | | Clorox Co. | $ 690,364 |
| | | Total Household Products | $ 690,364 |
| | | Industrials – 0.2% | |
| 1,456 | | Kansas City Southern | $ 297,213 |
| | | Total Industrials | $ 297,213 |
| | | Information Technology – 3.5% | |
| 18,544 | | Amphenol Corp. | $ 2,424,999 |
| 6,139 | | Lam Research Corp. | 2,899,265 |
| | | Total Information Technology | $ 5,324,264 |
| | | Interactive Media & Services – 4.3% | |
| 4,762(a) | | Charles River Laboratories International, Inc. | $ 1,189,833 |
| 10,286(a) | | IAC/InterActiveCorp | 1,947,654 |
| 7,315(a) | | Match Group, Inc. | 1,105,955 |
| 16,049(a) | | Pinterest, Inc. | 1,057,629 |
| 23,844(a) | | Twitter, Inc. | 1,291,153 |
| | | Total Interactive Media & Services | $ 6,592,224 |
| | | Internet & Direct Marketing Retail – 1.3% | |
| 5,214(a) | | Etsy, Inc. | $ 927,623 |
| 2,090(a) | | Stamps.com, Inc. | 410,037 |
| 2,635(a) | | Wayfair, Inc. | 595,009 |
| | | Total Internet & Direct Marketing Retail | $ 1,932,669 |
| | | IT Services – 8.2% | |
| 8,529(a) | | Akamai Technologies, Inc. | $ 895,460 |
| 10,498 | | Booz Allen Hamilton Holding Corp. | 915,216 |
| 5,390(a) | | EPAM Systems, Inc. | 1,931,506 |
| 31,883 | | Genpact, Ltd. | 1,318,681 |
| 6,158 | | Global Payments, Inc. | 1,326,556 |
| 5,343(a) | | Okta, Inc. | 1,358,511 |
| 300(a) | | Shopify, Inc. | 338,472 |
| 4,480(a) | | Square, Inc. | 975,027 |
| 7,331(a) | | Twilio, Inc. | 2,481,544 |
| 5,179(a) | | WEX, Inc. | 1,054,082 |
| | | Total IT Services | $ 12,595,055 |
The accompanying notes are an integral part of these financial statements.
12
| | |
| Pioneer Select Mid Cap Growth VCT Portfolio | Pioneer Variable Contracts Trust |
| | | | |
| Shares | | | Value |
| | Leisure Products – 1.6% | |
| 16,281(a) | | Peloton Interactive, Inc. | $ 2,470,153 |
| | | Total Leisure Products | $ 2,470,153 |
| | | Life Sciences Tools & Services – 2.0% | |
| 8,143(a) | | 10X Genomics, Inc. | $ 1,153,049 |
| 8,446 | | Agilent Technologies, Inc. | 1,000,767 |
| 36,246(a) | | Pacific Biosciences of California, Inc. | 940,221 |
| | | Total Life Sciences Tools & Services | $ 3,094,037 |
| | | Machinery – 0.9% | |
| 10,087(a) | | Middleby Corp. | $ 1,300,416 |
| | | Total Machinery | $ 1,300,416 |
| | | Materials – 0.4% | |
| 22,171 | | Freeport-McMoRan, Inc. | $ 576,889 |
| | | Total Materials | $ 576,889 |
| | | Media – 0.4% | |
| 5,920 | | Nexstar Media Group, Inc. | $ 646,405 |
| | | Total Media | $ 646,405 |
| | | Multiline Retail – 1.0% | |
| 6,895 | | Dollar General Corp. | $ 1,450,018 |
| | | Total Multiline Retail | $ 1,450,018 |
| | | Oil, Gas & Consumable Fuels – 0.3% | |
| 6,766(a) | | Renewable Energy Group, Inc. | $ 479,168 |
| | | Total Oil, Gas & Consumable Fuels | $ 479,168 |
| | | Pharmaceuticals – 0.5% | |
| 6,188(a) | | Reata Pharmaceuticals, Inc. | $ 764,961 |
| | | Total Pharmaceuticals | $ 764,961 |
| | | Professional Services – 4.9% | |
| 92,403(a) | | Clarivate Analytics Plc | $ 2,745,293 |
| 1,725(a) | | CoStar Group, Inc. | 1,594,383 |
| 5,707 | | Thomson Reuters Corp. | 467,346 |
| 11,484 | | TransUnion | 1,139,443 |
| 7,885 | | Verisk Analytics, Inc. | 1,636,847 |
| | | Total Professional Services | $ 7,583,312 |
| | | Real Estate Management & Development – 0.6% | |
| 15,335(a) | | CBRE Group, Inc. | $ 961,811 |
| | | Total Real Estate Management & Development | $ 961,811 |
| | | Semiconductors & Semiconductor Equipment – 6.5% | |
| 18,739 | | Cohu, Inc. | $ 715,455 |
| 16,625 | | Marvell Technology Group, Ltd. | 790,352 |
| 39,050(a) | | Micron Technology, Inc. | 2,935,779 |
| 9,273 | | MKS Instruments, Inc. | 1,395,123 |
| 7,164 | | NXP Semiconductors NV | 1,139,148 |
| 6,079(a) | | Qorvo, Inc. | 1,010,755 |
| 2,134(a) | | SolarEdge Technologies, Inc. | 681,002 |
| 9,104 | | Xilinx, Inc. | 1,290,674 |
| | | Total Semiconductors & Semiconductor Equipment | $ 9,958,288 |
The accompanying notes are an integral part of these financial statements.
13
| | |
| Pioneer Select Mid Cap Growth VCT Portfolio | Pioneer Variable Contracts Trust |
| Schedule of Investments 12/31/20 (continued) | |
| | | | |
| Shares | | | Value |
| | Software – 16.2% | |
| 5,365(a) | | ANSYS, Inc. | $ 1,951,787 |
| 6,024(a) | | Atlassian Corp. Plc | 1,408,833 |
| 5,360(a) | | Avalara, Inc. | 883,810 |
| 5,873(a) | | Crowdstrike Holdings, Inc. | 1,244,019 |
| 8,731(a) | | DocuSign, Inc. | 1,940,901 |
| 7,399(a) | | Guidewire Software, Inc. | 952,473 |
| 4,999(a) | | Palo Alto Networks, Inc. | 1,776,595 |
| 2,198(a) | | Paycom Software, Inc. | 994,046 |
| 16,622(a) | | RealPage, Inc. | 1,450,103 |
| 4,341(a) | | RingCentral, Inc. | 1,645,109 |
| 2,504(a) | | ServiceNow, Inc. | 1,378,277 |
| 9,240(a) | | Splunk, Inc. | 1,569,784 |
| 11,656 | | SS&C Technologies Holdings, Inc. | 847,974 |
| 11,172(a) | | Synopsys, Inc. | 2,896,229 |
| 2,045(a) | | Trade Desk, Inc. | 1,638,045 |
| 15,742(a) | | Zendesk, Inc. | 2,252,995 |
| | Total Software | $ 24,830,980 |
| | Specialty Retail – 2.2% | |
| 910(a) | | AutoZone, Inc. | $ 1,078,750 |
| 4,848(a) | | Burlington Stores, Inc. | 1,267,994 |
| 10,343(a) | | Floor & Decor Holdings, Inc. | 960,348 |
| | Total Specialty Retail | $ 3,307,092 |
| | Textiles, Apparel & Luxury Goods – 1.0% | |
| 4,342(a) | | Lululemon Athletica, Inc. | $ 1,511,146 |
| | Total Textiles, Apparel & Luxury Goods | $ 1,511,146 |
| | TOTAL COMMON STOCKS | |
| | (Cost $92,803,685) | $152,837,972 |
| | TOTAL INVESTMENTS IN UNAFFILIATED ISSUERS – 99.6% | |
| | (Cost $92,803,685) | $152,837,972 |
| | OTHER ASSETS AND LIABILITIES – 0.4% | $ 581,966 |
| | NET ASSETS – 100.0% | $153,419,938 |
REIT Real Estate Investment Trust.
(a) Non-income producing security.
Purchases and sales of securities (excluding temporary cash investments) for the year ended December 31, 2020, aggregated $103,126,311 and $120,074,658, respectively.
The Portfolio is permitted to engage in purchase and sale transactions (“cross trades”) with certain funds and accounts for which Amundi Asset Management US, Inc. (the “Adviser”) serves as the Portfolio’s investment adviser, as set forth in Rule 17a-7 under the Investment Company Act of 1940, pursuant to procedures adopted by the Board of Trustees. Under these procedures, cross trades are effected at current market prices. During the year ended December 31, 2020, the Portfolio did not engage in any cross trade activity.
At December 31, 2020, the net unrealized appreciation on investments based on cost for federal tax purposes of $93,688,625 was as follows:
| Aggregate gross unrealized appreciation for all investments in which there is an excess of value over tax cost | $ 60,912,642 |
| Aggregate gross unrealized depreciation for all investments in which there is an excess of tax cost over value | (1,763,295) |
| Net unrealized appreciation | $ 59,149,347 |
The accompanying notes are an integral part of these financial statements.
14
| | |
| Pioneer Select Mid Cap Growth VCT Portfolio | Pioneer Variable Contracts Trust |
Various inputs are used in determining the value of the Portfolio’s investments. These inputs are summarized in the three broad levels below.
Level 1 – unadjusted quoted prices in active markets for identical securities.
Level 2 – other significant observable inputs (including quoted prices for similar securities, interest rates, prepayment speeds, credit risks, etc.). See Notes to Financial Statements — Note 1A.
Level 3 – significant unobservable inputs (including the Portfolio’s own assumptions in determining fair value of investments). See Notes to Financial Statements — Note 1A.
The following is a summary of the inputs used as of December 31, 2020, in valuing the Portfolio’s investments: | | | |
| | Level 1 | | | Level 2 | | | Level 3 | | | Total | |
| Common Stocks | | $ | 152,837,972 | | | $ | — | | | $ | — | | | $ | 152,837,972 | |
| Total Investments in Securities | | $ | 152,837,972 | | | $ | — | | | $ | — | | | $ | 152,837,972 | |
During the year ended December 31, 2020, there were no transfers in or out of Level 3. | | | | |
The accompanying notes are an integral part of these financial statements.
15
| | |
| Pioneer Select Mid Cap Growth VCT Portfolio | Pioneer Variable Contracts Trust |
Statement of Assets and Liabilities 12/31/20 | |
| ASSETS: | | | |
| Investments in unaffiliated issuers, at value (cost $92,803,685) | | $ | 152,837,972 | |
| Cash | | | 64,318 | |
| Receivables — | | | | |
| Investment securities sold | | | 914,189 | |
| Portfolio shares sold | | | 240,732 | |
| Dividends | | | 21,074 | |
| Due from the Adviser | | | 20,906 | |
| Other assets | | | 1,472 | |
| Total assets | | $ | 154,100,663 | |
| LIABILITIES: | | | | |
| Payables — | | | | |
| Investment securities purchased | | $ | 548,999 | |
| Portfolio shares repurchased | | | 58,773 | |
| Trustees’ fees | | | 321 | |
| Professional fees | | | 37,439 | |
| Due to affiliates | | | 9,426 | |
| Accrued expenses | | | 25,767 | |
| Total liabilities | | $ | 680,725 | |
| NET ASSETS: | | | | |
| Paid-in capital | | $ | 73,348,989 | |
| Distributable earnings | | | 80,070,949 | |
| Net assets | | $ | 153,419,938 | |
| NET ASSET VALUE PER SHARE: | | | | |
No par value (unlimited number of shares authorized) | | | | |
| Class I (based on $153,419,938/4,089,339 shares) | | $ | 37.52 | |
The accompanying notes are an integral part of these financial statements.
16
| | |
| Pioneer Select Mid Cap Growth VCT Portfolio | Pioneer Variable Contracts Trust |
| Statement of Operations | |
| FOR THE YEAR ENDED 12/31/20 | | | | | | |
| INVESTMENT INCOME: | | | | | | |
| Dividends from unaffiliated issuers (net of foreign taxes withheld $5,338) | | $ | 498,994 | | | | |
| Interest from unaffiliated | | | 2,206 | | | | |
| Total investment income | | | | | | $ | 501,200 | |
| EXPENSES: | | | | | | | | |
| Management fees | | $ | 932,209 | | | | | |
| Administrative expense | | | 75,291 | | | | | |
| Custodian fees | | | 31,368 | | | | | |
| Professional fees | | | 45,985 | | | | | |
| Printing expense | | | 28,891 | | | | | |
| Pricing fees | | | 4 | | | | | |
| Trustees’ fees | | | 7,669 | | | | | |
| Miscellaneous | | | 3,005 | | | | | |
| Total expenses | | | | | | $ | 1,124,422 | |
| Net investment income/(loss) | | | | | | $ | (623,222 | ) |
| REALIZED AND UNREALIZED GAIN (LOSS) ON INVESTMENTS: | | | | | | | | |
| Net realized gain (loss) on: | | | | | | | | |
| Investments in unaffiliated issuers | | $ | 21,458,571 | | | | | |
| Other assets and liabilities denominated in foreign currencies | | | (1,169 | ) | | $ | 21,457,402 | |
| Change in net unrealized appreciation (depreciation) on: | | | | | | | | |
| Investments in unaffiliated issuers | | $ | 23,666,446 | | | $ | 23,666,446 | |
| Net realized and unrealized gain (loss) on investments | | | | | | $ | 45,123,848 | |
| Net increase in net assets resulting from operations | | | | | | $ | 44,500,626 | |
The accompanying notes are an integral part of these financial statements.
17
| | |
| Pioneer Select Mid Cap Growth VCT Portfolio | Pioneer Variable Contracts Trust |
| Statements of Changes in Net Assets | |
| | | | | | | |
| | Year Ended | | | Year Ended | |
| | 12/31/20 | | | 12/31/19 | |
| FROM OPERATIONS: | | | | | | |
Net investment income (loss) | | $ | (623,222 | ) | | $ | (378,501 | ) |
Net realized gain (loss) on investments | | | 21,457,402 | | | | 8,985,771 | |
Change in net unrealized appreciation (depreciation) on investments | | | 23,666,446 | | | | 25,611,439 | |
| Net increase in net assets resulting from operations | | $ | 44,500,626 | | | $ | 34,218,709 | |
| DISTRIBUTIONS TO SHAREOWNERS: | | | | | | | | |
| Class I ($2.21 and $3.74 per share, respectively) | | $ | (9,090,931 | ) | | $ | (15,315,280 | ) |
| Total distributions to shareowners | | $ | (9,090,931 | ) | | $ | (15,315,280 | ) |
| FROM PORTFOLIO SHARE TRANSACTIONS: | | | | | | | | |
Net proceeds from sales of shares | | $ | 5,665,634 | | | $ | 7,635,206 | |
Reinvestment of distributions | | | 9,090,931 | | | | 15,315,280 | |
Cost of shares repurchased | | | (22,338,514 | ) | | | (21,711,414 | ) |
| Net increase (decrease) in net assets resulting from Portfolio | | | | | | | | |
| share transactions | | $ | (7,581,949 | ) | | $ | 1,239,072 | |
| Net increase in net assets | | $ | 27,827,746 | | | $ | 20,142,501 | |
| NET ASSETS: | | | | | | | | |
Beginning of year | | $ | 125,592,192 | | | $ | 105,449,691 | |
End of year | | $ | 153,419,938 | | | $ | 125,592,192 | |
| | | | | | | | | | | | | |
| | Year Ended | | | Year Ended | | | Year Ended | | | Year Ended | |
| | 12/31/20 | | | 12/31/20 | | | 12/31/19 | | | 12/31/19 | |
| | Shares | | | Amount | | | Shares | | | Amount | |
| Class I | | | | | | | | | | | | |
Shares sold | | | 187,263 | | | $ | 5,665,634 | | | | 274,819 | | | $ | 7,635,206 | |
Reinvestment of distributions | | | 329,024 | | | | 9,090,931 | | | | 550,118 | | | | 15,315,280 | |
Less shares repurchased | | | (739,340 | ) | | | (22,338,514 | ) | | | (760,302 | ) | | | (21,711,414 | ) |
| Net increase (decrease) | | | (223,053 | ) | | $ | (7,581,949 | ) | | | 64,635 | | | $ | 1,239,072 | |
The accompanying notes are an integral part of these financial statements.
18
| | |
| Pioneer Select Mid Cap Growth VCT Portfolio | Pioneer Variable Contracts Trust |
| Financial Highlights | |
| | Year Ended | | | Year Ended | | | Year Ended | | | Year Ended | | | Year Ended | |
| | 12/31/20 | | | 12/31/19 | | | 12/31/18 | | | 12/31/17 | | | 12/31/16* | |
| Class I | | | | | | | | | | | | | |
| |
Net asset value, beginning of period | | $ | 29.12 | | | $ | 24.82 | | | $ | 30.23 | | | $ | 23.56 | | | $ | 26.11 | |
Increase (decrease) from investment operations: | | | | | | | | | | | | | | | | | | | | |
| Net investment income (loss) (a) | | $ | (0.15 | ) | | $ | (0.09 | ) | | $ | (0.10 | ) | | $ | (0.05 | ) | | $ | 0.01 | |
| Net realized and unrealized gain (loss) on investments | | | 10.76 | | | | 8.13 | | | | (1.22 | ) | | | 7.07 | | | | 0.88 | |
| Net increase (decrease) from investment operations | | $ | 10.61 | | | $ | 8.04 | | | $ | (1.32 | ) | | $ | 7.02 | | | $ | 0.89 | |
Distributions to shareowners: | | | | | | | | | | | | | | | | | | | | |
| Net investment income | | $ | — | | | $ | — | | | $ | — | | | $ | (0.02 | ) | | $ | — | |
| Net realized gain | | | (2.21 | ) | | | (3.74 | ) | | | (4.09 | ) | | | (0.33 | ) | | | (3.44 | ) |
| Total distributions | | $ | (2.21 | ) | | $ | (3.74 | ) | | $ | (4.09 | ) | | $ | (0.35 | ) | | $ | (3.44 | ) |
Net increase (decrease) in net asset value
| | $ | 8.40 | | | $ | 4.30 | | | $ | (5.41 | ) | | $ | 6.67 | | | $ | (2.55 | ) |
Net asset value, end of period
| | $ | 37.52 | | | $ | 29.12 | | | $ | 24.82 | | | $ | 30.23 | | | $ | 23.56 | |
| Total return (b) | | | 39.17 | % | | | 33.08 | % | | | (6.48 | )% | | | 30.03 | % | | | 3.74 | %(c) |
Ratio of net expenses to average net assets | | | 0.89 | % | | | 0.88 | % | | | 0.90 | % | | | 0.88 | % | | | 0.86 | % |
Ratio of net investment income (loss) to average net assets | | | (0.49 | )% | | | (0.30 | )% | | | (0.33 | )% | | | (0.20 | )% | | | 0.06 | % |
Portfolio turnover rate | | | 82 | % | | | 58 | % | | | 83 | % | | | 85 | % | | | 97 | % |
Net assets, end of period (in thousands) | | $ | 153,420 | | | $ | 125,592 | | | $ | 105,450 | | | $ | 123,007 | | | $ | 109,926 | |
* | The Portfolio was audited by an independent registered public accounting firm other than Ernst & Young LLP. |
(a) | The per-share data presented above is based on the average shares outstanding for the period presented. |
(b) | Assumes initial investment at net asset value at the beginning of each period, reinvestment of all distributions and the complete redemption of the investment at net asset value at the end of each period. |
(c) | If the Portfolio had not recognized gains in settlement of class action lawsuits during the year ended December 31, 2016, the total return would have been 3.65%. |
NOTE: The above financial highlights do not reflect the deduction of non-portfolio expenses associated with variable insurance products, such as mortality and expense risk charges, separate account charges, and sales charges.
The accompanying notes are an integral part of these financial statements.
19
| | |
| Pioneer Select Mid Cap Growth VCT Portfolio | Pioneer Variable Contracts Trust |
Notes to Financial Statements 12/31/20 | |
1. Organization and Significant Accounting Policies
Pioneer Select Mid Cap Growth VCT Portfolio (the “Portfolio”) is one of 8 portfolios comprising Pioneer Variable Contracts Trust (the “Trust”), a Delaware statutory trust. The Portfolio is registered under the Investment Company Act of 1940 as a diversified, open-end management investment company. The investment objective of the Portfolio is to seek growth of capital.
The Portfolio offers one class of shares designated as Class I shares. There is no distribution plan for Class I shares.
Portfolio shares may be purchased only by insurance companies for the purpose of funding variable annuity and variable life insurance contracts or by qualified pension and retirement plans.
Amundi Asset Management US, Inc., an indirect, wholly owned subsidiary of Amundi and Amundi’s wholly owned subsidiary, Amundi USA, Inc., serves as the Portfolio’s investment adviser (the “Adviser”). Prior to January 1, 2021, the Adviser was named Amundi Pioneer Asset Management, Inc. Amundi Distributor US, Inc., an affiliate of Amundi Asset Management US, Inc., serves as the Portfolio’s distributor (the “Distributor”).
In August 2018, the Financial Accounting Standards Board (FASB) issued Accounting Standards Update 2018-13 “Disclosure Framework - Changes to the Disclosure Requirements for Fair Value Measurement” (“ASU 2018-13”) which modifies disclosure requirements for fair value measurements, principally for Level 3 securities and transfers between levels of the fair value hierarchy. ASU 2018-13 is effective for fiscal years beginning after December 15, 2019 and for interim periods within those fiscal years. The Portfolio has adopted ASU 2018-13 for the year ended December 31, 2020. The impact to the Portfolio’s adoption was limited to changes in the Portfolio’s disclosures regarding fair value, primarily those disclosures related to transfers between levels of the fair value hierarchy and disclosure of the range and weighted average used to develop significant unobservable inputs for Level 3 fair value investments, when applicable.
The Portfolio is an investment company and follows investment company accounting and reporting guidance under U.S. Generally Accepted Accounting Principles (“U.S. GAAP”). U.S. GAAP requires the management of the Portfolio to make estimates and assumptions that affect the reported amounts of assets and liabilities, the disclosure of contingent assets and liabilities at the date of the financial statements, and the reported amounts of income, expenses and gain or loss on investments during the reporting period. Actual results could differ from those estimates.
The following is a summary of significant accounting policies followed by the Portfolio in the preparation of its financial statements:
A. Security Valuation
The net asset value of the Portfolio is computed once daily, on each day the New York Stock Exchange (“NYSE”) is open, as of the close of regular trading on the NYSE.
Equity securities which may include restricted securities that have traded on an exchange are valued by using the last sale price on the principal exchange where they are traded. Equity securities which may include restricted securities that have not traded on the date of valuation, or securities for which sale prices are not available, generally are valued using the mean between the last bid and asked prices or, if both last bid and asked prices are not available, at the last quoted bid price. Last sale and bid and asked prices are provided by independent third party pricing services. In the case of equity securities which may include restricted securities not traded on an exchange, prices are typically determined by independent third party pricing services using a variety of techniques and methods.
The value of foreign securities is translated into U.S. dollars based on foreign currency exchange rate quotations supplied by a third party pricing source. Trading in non-U.S. equity securities is substantially completed each day at various times prior to the close of the NYSE. The values of such securities used in computing the net asset value of the Portfolio’s shares are determined as of such times. The Portfolio may use a fair value model developed by an independent pricing service to value non-U.S. equity securities.
Securities for which independent pricing services or broker-dealers are unable to supply prices or for which market prices and/or quotations are not readily available or are considered to be unreliable are valued by a fair valuation team comprised of certain personnel of the Adviser pursuant to procedures adopted by the Portfolio’s Board of Trustees. The Adviser’s fair valuation team uses fair value methods approved by the Valuation Committee of the Board of Trustees. The Adviser’s fair valuation team is responsible for monitoring developments that may impact fair valued securities and for discussing and assessing fair values on an ongoing basis, and at least quarterly, with the Valuation Committee of the Board of Trustees.
20
| | |
| Pioneer Select Mid Cap Growth VCT Portfolio | Pioneer Variable Contracts Trust |
Inputs used when applying fair value methods to value a security may include credit ratings, the financial condition of the company, current market conditions and comparable securities. The Portfolio may use fair value methods if it is determined that a significant event has occurred after the close of the exchange or market on which the security trades and prior to the determination of the Portfolio’s net asset value. Examples of a significant event might include political or economic news, corporate restructurings, natural disasters, terrorist activity or trading halts. Thus, the valuation of the Portfolio’s securities may differ significantly from exchange prices, and such differences could be material.
At December 31, 2020, no securities were valued using fair value methods (other than securities valued using prices supplied by independent pricing services, broker-dealers or using a third party insurance industry pricing model).
B. Investment Income and Transactions
Dividend income is recorded on the ex-dividend date, except that certain dividends from foreign securities where the ex-dividend date may have passed are recorded as soon as the Portfolio becomes aware of the ex-dividend data in the exercise of reasonable diligence.
Interest income, including interest on income-bearing cash accounts, is recorded on the accrual basis. Dividend and interest income are reported net of unrecoverable foreign taxes withheld at the applicable country rates and net of income accrued on defaulted securities.
Interest and dividend income payable by delivery of additional shares is reclassified as PIK (payment-in-kind) income upon receipt and is included in interest and dividend income, respectively.
Security transactions are recorded as of trade date. Gains and losses on sales of investments are calculated on the identified cost method for both financial reporting and federal income tax purposes.
C. Foreign Currency Translation
The books and records of the Portfolio are maintained in U.S. dollars. Amounts denominated in foreign currencies are translated into U.S. dollars using current exchange rates.
Net realized gains and losses on foreign currency transactions, if any, represent, among other things, the net realized gains and losses on foreign currency exchange contracts, disposition of foreign currencies and the difference between the amount of income accrued and the U.S. dollars actually received. Further, the effects of changes in foreign currency exchange rates on investments are not segregated on the Statement of Operations from the effects of changes in the market prices of those securities, but are included with the net realized and unrealized gain or loss on investments.
D. Federal Income Taxes
It is the Portfolio’s policy to comply with the requirements of the Internal Revenue Code applicable to regulated investment companies and to distribute all of its net taxable income and net realized capital gains, if any, to its shareowners. Therefore, no provision for federal income taxes is required. As of December 31, 2020, the Portfolio did not accrue any interest or penalties with respect to uncertain tax positions, which, if applicable, would be recorded as an income tax expense on the Statement of Operations. Tax returns filed within the prior three years remain subject to examination by federal and state tax authorities.
A portion of the dividend income recorded by the Portfolio is from distributions by publicly traded Real Estate Investment Trusts (“REITs”), and such distributions for tax purposes may also consist of capital gains and return of capital. The actual return of capital and capital gains portions of such distributions will be determined by formal notifications from the REITs subsequent to the calendar year-end. Distributions received from the REITs that are determined to be a return of capital are recorded by the Portfolio as a reduction of the cost basis of the securities held and those determined to be capital gain are reflected as such on the Statement of Operations.
The amount and character of income and capital gain distributions to shareowners are determined in accordance with federal income tax rules, which may differ from U.S. GAAP. Distributions in excess of net investment income or net realized gains are temporary over distributions for financial statement purposes resulting from differences in the recognition or classification of income or distributions for financial statement and tax purposes. Capital accounts within the financial statements are adjusted for permanent book/tax differences to reflect tax character, but are not adjusted for temporary differences.
21
| | |
| Pioneer Select Mid Cap Growth VCT Portfolio | Pioneer Variable Contracts Trust |
| Notes to Financial Statements 12/31/20 (continued) | |
The tax character of distributions paid during the years ended December 31, 2020 and December 31, 2019, were as follows:
| | | 2020 | | | 2019 | |
| Distributions paid from: | | | | | | |
| Long-term capital gain | | $ | 9,090,931 | | | $ | 15,315,280 | |
| Total | | $ | 9,090,931 | | | $ | 15,315,280 | |
The following shows the components of distributable earnings (losses) on a federal income tax basis at December 31, 2020:
| | | 2020 | |
| Distributable earnings/(losses): | | | |
| Undistributed ordinary income | | $ | 1,333,388 | |
| Undistributed long-term capital gain | | | 19,588,214 | |
| Net unrealized appreciation | | | 59,149,347 | |
| Total | | $ | 80,070,949 | |
The difference between book-basis and tax-basis net unrealized appreciation is attributable to the tax deferral of losses on wash sales.
E. Portfolio Shares
The Portfolio records sales and repurchases of its shares as of trade date. Dividends and distributions to shareowners are recorded on the ex-dividend date.
F. Risks
The value of securities held by the Portfolio may go up or down, sometimes rapidly or unpredictably, due to general market conditions, such as real or perceived adverse economic, political or regulatory conditions, recessions, the spread of infectious illness or other public health issues, inflation, changes in interest rates, lack of liquidity in the bond markets or adverse investor sentiment. In the past several years, financial markets have experienced increased volatility, depressed valuations, decreased liquidity and heightened uncertainty. These conditions may continue, recur, worsen or spread. A general rise in interest rates could adversely affect the price and liquidity of fixed-income securities and could also result in increased redemptions from the Portfolio.
At times, the Portfolio’s investments may represent industries or industry sectors that are interrelated or have common risks, making the Portfolio more susceptible to any economic, political, or regulatory developments or other risks affecting those industries and sectors. The Portfolio’s investments in foreign markets and countries with limited developing markets may subject the Portfolio to a greater degree of risk than investments in a developed market. These risks include disruptive political or economic conditions and the imposition of adverse governmental laws or currency exchange restrictions.
Investments in mid-sized companies may offer the potential for higher returns, but are also subject to greater short-term price fluctuations than investments in larger, more established companies. Investing in foreign and/or emerging markets securities involves risks relating to interest rates, currency exchange rates and economic and political conditions.
The Portfolio may invest in REIT securities, the value of which can fall for a variety of reasons, such as declines in rental income, fluctuating interest rates, poor property management, environmental liabilities, uninsured damage, increased competition, or changes in real estate tax laws.
With the increased use of technologies such as the Internet to conduct business, the Portfolio is susceptible to operational, information security and related risks. While the Portfolio’s Adviser has established business continuity plans in the event of, and risk management systems to prevent, limit or mitigate, such cyber-attacks, there are inherent limitations in such plans and systems, including the possibility that certain risks have not been identified. Furthermore, the Portfolio cannot control the cybersecurity plans and systems put in place by service providers to the Portfolio such as Brown Brothers
22
| | |
| Pioneer Select Mid Cap Growth VCT Portfolio | Pioneer Variable Contracts Trust |
Harriman & Co., the Portfolio’s custodian and accounting agent, and DST Asset Manager Solutions, Inc., the Portfolio’s transfer agent. In addition, many beneficial owners of Portfolio shares hold them through accounts at broker-dealers, retirement platforms and other financial market participants over which neither the Portfolio nor the Adviser exercises control. Each of these may in turn rely on service providers to them, which are also subject to the risk of cyber-attacks. Cybersecurity failures or breaches at the Adviser or the Portfolio’s service providers or intermediaries have the ability to cause disruptions and impact business operations, potentially resulting in financial losses, interference with the Portfolio’s ability to calculate its net asset value, impediments to trading, the inability of Portfolio shareowners to effect share purchases, redemptions or exchanges or receive distributions, loss of or unauthorized access to private shareowner information and violations of applicable privacy and other laws, regulatory fines, penalties, reputational damage, or additional compliance costs. Such costs and losses may not be covered under any insurance. In addition, maintaining vigilance against cyber-attacks may involve substantial costs over time, and system enhancements may themselves be subject to cyber-attacks.
COVID-19
The respiratory illness COVID-19 caused by a novel coronavirus has resulted in a global pandemic and major disruption to economies and markets around the world, including the United States. Global financial markets have experienced extreme volatility and severe losses, and trading in many instruments has been disrupted. Liquidity for many instruments has been greatly reduced for periods of time. Some interest rates are very low and in some cases yields are negative. Some sectors of the economy and individual issuers have experienced particularly large losses. These circumstances may continue for an extended period of time, and may continue to affect adversely the value and liquidity of the Portfolio’s investments. The ultimate economic fallout from the pandemic, and the long-term impact on economies, markets, industries and individual issuers, are not known. Governments and central banks, including the Federal Reserve in the U.S., have taken extraordinary and unprecedented actions to support local and global economies and the financial markets. These actions have resulted in significant expansion of public debt, including in the U.S. The impact of these measures, and whether they will be effective to mitigate the economic and market disruption, will not be known for some time. The consequences of high public debt, including its future impact on the economy and securities markets, likewise may not be known for some time.
The Portfolio’s prospectus contains unaudited information regarding the Portfolio’s principal risks. Please refer to that document when considering the Portfolio’s principal risks.
2. Management Agreement
The Adviser manages the Portfolio. Management fees are calculated daily and paid monthly at the annual rate of 0.74% of the Portfolio’s average daily net assets. For the year ended December 31, 2020, the effective management fee was equivalent to 0.74% of the Portfolio’s average daily net assets.
In addition, under the management and administration agreements, certain other services and costs, including accounting, regulatory reporting and insurance premiums, are paid by the Portfolio as administrative reimbursements. Included in “Due to affiliates” reflected on the Statement of Assets and Liabilities is $9,426 in management fees, administrative costs and certain other reimbursements payable to the Adviser at December 31, 2020.
3. Compensation of Trustees and Officers
The Portfolio pays an annual fee to its Trustees. The Adviser reimburses the Portfolio for fees paid to the Interested Trustees. The Portfolio does not pay any salary or other compensation to its officers. For the year ended December 31, 2020, the Portfolio paid $7,669 in Trustees’ compensation, which is reflected on the Statement of Operations as Trustees’ fees. At December 31, 2020, the Portfolio had a payable for Trustees’ fees on its Statement of Assets and Liabilities of $321.
4. Transfer Agent
DST Asset Manager Solutions, Inc. serves as the transfer agent to the Portfolio at negotiated rates. Transfer agent fees and payables shown on the Statement of Operations and the Statement of Assets and Liabilities, respectively, include sub-transfer agent expenses incurred through the Portfolio’s omnibus relationship contracts.
23
| | |
| Pioneer Select Mid Cap Growth VCT Portfolio | Pioneer Variable Contracts Trust |
Report of Independent Registered Public Accounting Firm | |
To the Board of Trustees of Pioneer Variable Contracts Trust and the Shareholders of Pioneer Select Mid Cap Growth VCT Portfolio:
Opinion on the Financial Statements
We have audited the accompanying statement of assets and liabilities of Pioneer Select Mid Cap Growth VCT Portfolio (the “Portfolio”) (one of the portfolios constituting Pioneer Variable Contracts Trust (the “Trust”)), including the schedule of investments, as of December 31, 2020, and the related statement of operations for the year then ended, the statements of changes in net assets for each of the two years in the period then ended, the financial highlights for each of the four years in the period then ended and the related notes (collectively referred to as the “financial statements”). The financial highlights for the period ended December 31, 2016 were audited by another independent registered public accounting firm whose report, dated February 14, 2017, expressed an unqualified opinion on those financial highlights. In our opinion, the financial statements present fairly, in all material respects, the financial position of the Portfolio (one of the portfolios constituting Pioneer Variable Contracts Trust) at December 31, 2020, the results of its operations for the year then ended, the changes in its net assets for each of the two years in the period then ended, and its financial highlights for each of the four years in the period then ended in conformity with U.S. generally accepted accounting principles.
Basis for Opinion
These financial statements are the responsibility of the Trust’s management. Our responsibility is to express an opinion on the Portfolio’s financial statements based on our audits. We are a public accounting firm registered with the Public Company Accounting Oversight Board (United States) (“PCAOB”) and are required to be independent with respect to the Trust in accordance with the U.S. federal securities laws and the applicable rules and regulations of the Securities and Exchange Commission and the PCAOB.
We conducted our audits in accordance with the standards of the PCAOB. Those standards require that we plan and perform the audit to obtain reasonable assurance about whether the financial statements are free of material misstatement, whether due to error or fraud. The Trust is not required to have, nor were we engaged to perform, an audit of the Trust’s internal control over financial reporting. As part of our audits, we are required to obtain an understanding of internal control over financial reporting, but not for the purpose of expressing an opinion on the effectiveness of the Trust’s internal control over financial reporting. Accordingly, we express no such opinion.
Our audits included performing procedures to assess the risks of material misstatement of the financial statements, whether due to error or fraud, and performing procedures that respond to those risks. Such procedures included examining, on a test basis, evidence regarding the amounts and disclosures in the financial statements. Our procedures included confirmation of securities owned as of December 31, 2020, by correspondence with the custodian and brokers or by other appropriate auditing procedures where replies from brokers were not received. Our audits also included evaluating the accounting principles used and significant estimates made by management, as well as evaluating the overall presentation of the financial statements. We believe that our audits provide a reasonable basis for our opinion.
We have served as the auditor of one or more Amundi Pioneer investment companies since 2017.
Boston, Massachusetts
February 17, 2021
24
| | |
| Pioneer Select Mid Cap Growth VCT Portfolio | Pioneer Variable Contracts Trust |
Additional Information (Unaudited) | |
For the year ended December 31, 2020, certain dividends paid by the Portfolio may be subject to a maximum tax rate of 20%. The Portfolio intends to designate up to the maximum amount of such dividends allowable as taxed at a maximum rate of 20%. Complete information will be computed and reported in conjunction with your 2020 Form 1099-DIV.
The qualifying percentage of the Portfolio’s ordinary income dividends for the purpose of the corporate dividends received deduction was 100.0%.
25
| | |
| Pioneer Select Mid Cap Growth VCT Portfolio | Pioneer Variable Contracts Trust |
Approval of Investment Management Agreement | |
Amundi Pioneer Asset Management, Inc. (“APAM”) serves as the investment adviser to Pioneer Select Mid Cap Growth VCT Portfolio (the “Portfolio”) pursuant to an investment management agreement between APAM and the Portfolio. In order for APAM to remain the investment adviser of the Portfolio, the Trustees of the Portfolio must determine annually whether to renew the investment management agreement for the Portfolio.
The contract review process began in January 2020 as the Trustees of the Portfolio agreed on, among other things, an overall approach and timeline for the process. Contract review materials were provided to the Trustees in March 2020, July 2020 and September 2020. In addition, the Trustees reviewed and discussed the Portfolio’s performance at regularly scheduled meetings throughout the year, and took into account other information related to the Portfolio provided to the Trustees at regularly scheduled meetings, in connection with the review of the Portfolio’s investment management agreement.
In March 2020, the Trustees, among other things, discussed the memorandum provided by Fund counsel that summarized the legal standards and other considerations that are relevant to the Trustees in their deliberations regarding the renewal of the investment management agreement, and reviewed and discussed the qualifications of the investment management teams for the Portfolio, as well as the level of investment by the Portfolio’s portfolio managers in the Portfolio. In July 2020, the Trustees, among other things, reviewed the Portfolio’s management fees and total expense ratios, the financial statements of APAM and its parent companies, profitability analyses provided by APAM, and analyses from APAM as to possible economies of scale. The Trustees also reviewed the profitability of the institutional business of APAM and APAM’s affiliate, Amundi Pioneer Institutional Asset Management, Inc. (“APIAM” and, together with APAM, “Amundi Pioneer”), as compared to that of APAM’s fund management business, and considered the differences between the fees and expenses of the Portfolio and the fees and expenses of APAM’s and APIAM’s institutional accounts, as well as the different services provided by APAM to the Portfolio and by APAM and APIAM to the institutional accounts. The Trustees further considered contract review materials, including additional materials received in response to the Trustees’ request, in September 2020.
At a meeting held on September 15, 2020, based on their evaluation of the information provided by APAM and third parties, the Trustees of the Portfolio, including the Independent Trustees voting separately, unanimously approved the renewal of the investment management agreement for another year. In approving the renewal of the investment management agreement, the Trustees considered various factors that they determined were relevant, including the factors described below. The Trustees did not identify any single factor as the controlling factor in determining to approve the renewal of the agreement.
Nature, Extent and Quality of Services
The Trustees considered the nature, extent and quality of the services that had been provided by APAM to the Portfolio, taking into account the investment objective and strategy of the Portfolio. The Trustees also reviewed APAM’s investment approach for the Portfolio and its research process. The Trustees considered the resources of APAM and the personnel of APAM who provide investment management services to the Portfolio. They also reviewed the amount of non-Portfolio assets managed by the portfolio managers of the Portfolio. They considered the non-investment resources and personnel of APAM that are involved in APAM’s services to the Portfolio, including APAM’s compliance, risk management, and legal resources and personnel. The Trustees noted the substantial attention and high priority given by APAM’s senior management to the Pioneer Fund complex. The Trustees considered the implementation and effectiveness of APAM’s business continuity plan in response to the COVID-19 pandemic.
The Trustees considered that APAM supervises and monitors the performance of the Portfolio’s service providers and provides the Portfolio with personnel (including Portfolio officers) and other resources that are necessary for the Portfolio’s business management and operations. The Trustees also considered that, as administrator, APAM is responsible for the administration of the Portfolio’s business and other affairs. The Trustees considered the fees paid to APAM for the provision of administration services.
Based on these considerations, the Trustees concluded that the nature, extent and quality of services that had been provided by APAM to the Portfolio were satisfactory and consistent with the terms of the investment management agreement.
Performance of the Portfolio
In considering the Portfolio’s performance, the Trustees regularly review and discuss throughout the year data prepared by APAM and information comparing the Portfolio’s performance with the performance of its peer group of funds, as classified by Morningstar, Inc. (Morningstar), and with the performance of the Portfolio’s benchmark index. They also discuss the Portfolio’s performance with APAM on a regular basis. The Trustees’ regular reviews and discussions were factored into the Trustees’ deliberations concerning the renewal of the investment management agreement.
26
| | |
| Pioneer Select Mid Cap Growth VCT Portfolio | Pioneer Variable Contracts Trust |
Management Fee and Expenses
The Trustees considered information showing the fees and expenses of the Portfolio in comparison to the management fees of its peer group of funds as classified by Morningstar and also to the expense ratios of a peer group of funds selected on the basis of criteria determined by the Independent Trustees for this purpose using data provided by Strategic Insight Mutual Fund Research and Consulting, LLC (Strategic Insight), an independent third party. The peer group comparisons referred to below are organized in quintiles. Each quintile represents one-fifth of the peer group. In all peer group comparisons referred to below, first quintile is most favorable to the Portfolio’s shareowners. The Trustees noted that they separately review and consider the impact of the Portfolio’s transfer agency and Portfolio- and APAM-paid expenses for sub-transfer agency and intermediary arrangements, and that the results of the most recent such review were considered in the consideration of the Portfolio’s expense ratio.
The Trustees considered that the Portfolio’s management fee for the most recent fiscal year was in the fourth quintile relative to the management fees paid by other funds in its Morningstar category for the comparable period. The Trustees considered that the expense ratio of the Portfolio’s Class I shares for the most recent fiscal year was in the second quintile relative to its Strategic Insight peer group for the comparable period.
The Trustees reviewed management fees charged by APAM and APIAM to institutional and other clients, including publicly offered European funds sponsored by APAM’s affiliates, unaffiliated U.S. registered investment companies (in a sub-advisory capacity), and unaffiliated foreign and domestic separate accounts. The Trustees also considered APAM’s costs in providing services to the Portfolio and APAM’s and APIAM’s costs in providing services to the other clients and considered the differences in management fees and profit margins for fund and non-fund services. In evaluating the fees associated with APAM’s and APIAM’s client accounts, the Trustees took into account the respective demands, resources and complexity associated with the Portfolio and other client accounts. The Trustees noted that, in some instances, the fee rates for those clients were lower than the management fee for the Portfolio and considered that, under the investment management agreement with the Portfolio, APAM performs additional services for the Portfolio that it does not provide to those other clients or services that are broader in scope, including oversight of the Portfolio’s other service providers and activities related to compliance and the extensive regulatory and tax regimes to which the Portfolio is subject. The Trustees also considered the entrepreneurial risks associated with APAM’s management of the Portfolio.
The Trustees concluded that the management fee payable by the Portfolio to APAM was reasonable in relation to the nature and quality of the services provided by APAM.
Profitability
The Trustees considered information provided by APAM regarding the profitability of APAM with respect to the advisory services provided by APAM to the Portfolio, including the methodology used by APAM in allocating certain of its costs to the management of the Portfolio. The Trustees also considered APAM’s profit margin in connection with the overall operation of the Portfolio. They further reviewed the financial results, including the profit margins, realized by APAM and APIAM from non-fund businesses. The Trustees considered APAM’s profit margins in comparison to the limited industry data available and noted that the profitability of any adviser was affected by numerous factors, including its organizational structure and method for allocating expenses. The Trustees concluded that APAM’s profitability with respect to the management of the Portfolio was not unreasonable.
Economies of Scale
The Trustees considered APAM’s views relating to economies of scale in connection with the Pioneer Funds as fund assets grow and the extent to which any such economies of scale are shared with the Portfolio and Portfolio shareholders. The Trustees recognize that economies of scale are difficult to identify and quantify, and that, among other factors that may be relevant, are the following: fee levels, expense subsidization, investment by APAM in research and analytical capabilities and APAM’s commitment and resource allocation to the Portfolio. The Trustees noted that profitability also may be an indicator of the availability of any economies of scale, although profitability may vary for other reasons including due to reductions in expenses. The Trustees concluded that economies of scale, if any, were being appropriately shared with the Portfolio.
27
| | |
| Pioneer Select Mid Cap Growth VCT Portfolio | Pioneer Variable Contracts Trust |
| Approval of Investment Management Agreement (continued) | |
Other Benefits
The Trustees considered the other benefits that APAM enjoys from its relationship with the Portfolio. The Trustees considered the character and amount of fees paid or to be paid by the Portfolio, other than under the investment management agreement, for services provided by APAM and its affiliates. The Trustees further considered the revenues and profitability of APAM’s businesses other than the Fund business. To the extent applicable, the Trustees also considered the benefits to the Portfolio and to APAM and its affiliates from the use of “soft” commission dollars generated by the Portfolio to pay for research and brokerage services.
The Trustees considered that Amundi Pioneer is the principal U.S. asset management business of Amundi, which is one of the largest asset managers globally. Amundi’s worldwide asset management business manages over $1.7 trillion in assets (including the Pioneer Funds). The Trustees considered that APAM’s relationship with Amundi creates potential opportunities for APAM, APIAM and Amundi that derive from APAM’s relationships with the Portfolio, including Amundi’s ability to market the services of APAM globally. The Trustees noted that APAM has access to additional research and portfolio management capabilities as a result of its relationship with Amundi and Amundi’s enhanced global presence that may contribute to an increase in the resources available to APAM. The Trustees considered that APAM and the Portfolio receive reciprocal intangible benefits from the relationship, including mutual brand recognition and, for the Portfolio, direct and indirect access to the resources of a large global asset manager. The Trustees concluded that any such benefits received by APAM as a result of its relationship with the Portfolio were reasonable.
Conclusion
After consideration of the factors described above as well as other factors, the Trustees, including the Independent Trustees, concluded that the investment management agreement for the Portfolio, including the fees payable thereunder, was fair and reasonable and voted to approve the proposed renewal of the investment management agreement.
28
| | |
| Pioneer Select Mid Cap Growth VCT Portfolio | Pioneer Variable Contracts Trust |
Trustees, Officers and Service Providers | |
The Portfolio’s Trustees and officers are listed below, together with their principal occupations and other directorships they have held during at least the past five years. Trustees who are interested persons of the Portfolios within the meaning of the 1940 Act are referred to as Interested Trustees. Trustees who are not interested persons of the Portfolio are referred to as Independent Trustees. Each of the Trustees serves as a Trustee of each of the 45 U.S. registered investment portfolios for which Amundi US serves as investment adviser (the “Pioneer Funds”). The address for all Trustees and all officers of the Portfolios is 60 State Street, Boston, Massachusetts 02109.
| | | | |
| Name, Age and Position | Term of Office and | | Other Directorships |
| Held With the Trust | Length of Service | Principal Occupation | Held by Trustee |
| Independent Trustees: | | | |
| Thomas J. Perna (70) | Trustee since 2006. Serves until a | Private investor (2004 – 2008 and | Director, Broadridge Financial |
Chairman of the Board | successor trustee is elected or | 2013 – present); Chairman (2008 – 2013) | Solutions, Inc. (investor |
and Trustee | earlier retirement or removal. | and Chief Executive Officer (2008 – 2012), | communications and securities |
| | Quadriserv, Inc. (technology products for | processing provider for financial |
| | securities lending industry); and Senior | services industry) (2009 – present); |
| | Executive Vice President, The Bank of New York | Director, Quadriserv, Inc. (2005 – |
| | (financial and securities services) (1986 – 2004) | 2013); and Commissioner, New Jersey |
| | | State Civil Service Commission |
| | | (2011 – 2015) |
John E. Baumgardner,
| Trustee since 2019. Serves until a | Of Counsel (2019 – present), Partner | Chairman, The Lakeville Journal |
| Jr. (69) | successor trustee is elected or | (1983-2018), Sullivan & Cromwell LLP | Company, LLC, (privately-held |
Trustee
| earlier retirement or removal. | (law firm). | community newspaper group) (2015- |
| | | present) |
| Diane Durnin (63) | Trustee since 2019. Serves until a | Managing Director - Head of Product Strategy | None |
Trustee | successor trustee is elected or | and Development, BNY Mellon Investment | |
| earlier retirement or removal. | Management (investment management firm) | |
| | (2012-2018); Vice Chairman – The Dreyfus | |
| | Corporation (2005 – 2018): Executive Vice | |
| | President Head of Product, BNY Mellon | |
| | Investment Management (2007-2012); Executive | |
| | Director- Product Strategy, Mellon Asset | |
| | Management (2005-2007); Executive Vice | |
| | President Head of Products, Marketing and | |
| | Client Service, Dreyfus Corporation (investment | |
| | management firm) (2000-2005); and Senior Vice | |
| | President – Strategic Product and Business | |
| | Development, Dreyfus Corporation (1994-2000) | |
| Benjamin M. Friedman (76) | Trustee since 2008. Serves until a | William Joseph Maier Professor of Political | Trustee, Mellon Institutional Funds |
Trustee | successor trustee is elected or | Economy, Harvard University (1972 – present) | Investment Trust and Mellon |
| earlier retirement or removal. | | Institutional Funds Master Portfolio |
| | | (oversaw 17 portfolios in fund |
| | | complex) (1989 - 2008) |
| Lorraine H. Monchak (64) | Trustee since 2017. (Advisory | Chief Investment Officer, 1199 SEIU Funds | None |
Trustee | Trustee from 2014 - 2017). Serves | (healthcare workers union pension funds) | |
| until a successor trustee is elected | (2001 – present); Vice President – International | |
| or earlier retirement or removal. | Investments Group, American International | |
| | Group, Inc. (insurance company) (1993 – 2001); | |
| | Vice President – Corporate Finance and Treasury | |
| | Group, Citibank, N.A. (1980 – 1986 and | |
| | 1990 – 1993); Vice President – Asset/Liability | |
| | Management Group, Federal Farm Funding | |
| | Corporation (government-sponsored issuer of | |
| | debt securities) (1988 – 1990); Mortgage | |
| | Strategies Group, Shearson Lehman Hutton, Inc. | |
| | (investment bank) (1987 – 1988); and Mortgage | |
| | Strategies Group, Drexel Burnham Lambert, Ltd. | |
| | (investment bank) (1986 – 1987) | |
29
| | |
| Pioneer Select Mid Cap Growth VCT Portfolio | Pioneer Variable Contracts Trust |
| Trustees, Officers and Service Providers (continued) | |
| | | | |
| Name, Age and Position | Term of Office and | | Other Directorships |
| Held With the Trust | Length of Service | Principal Occupation | Held by Trustee |
Independent Trustees: (continued) | | |
| Marguerite A. Piret (72) | Trustee since 1995. Serves until a | Chief Financial Officer, American Ag Energy, | Director of New America High Income |
Trustee | successor trustee is elected or | Inc. (controlled environment and agriculture | Fund, Inc. (closed-end investment |
| earlier retirement or removal. | company) (2016 – present); and President and | company) (2004 – present); and |
| | Chief Executive Officer, Metric Financial Inc. | Member, Board of Governors, |
| | (formerly known as Newbury Piret Company) | Investment Company Institute |
| | (investment banking firm) (1981 – 2019) | (2000 – 2006) |
| Fred J. Ricciardi (73) | Trustee since 2014. Serves until a | Private investor (2020 – present); Consultant | None |
Trustee | successor trustee is elected or | (investment company services) (2012 – 2020); | |
| earlier retirement or removal. | Executive Vice President, BNY Mellon (financial | |
| | and investment company services) (1969 – 2012); | |
| | Director, BNY International Financing Corp. | |
| | (financial services) (2002 – 2012); Director, | |
| | Mellon Overseas Investment Corp. (financial | |
| | services) (2009 – 2012); Director, Financial | |
| | Models (technology) (2005-2007); Director, BNY | |
| | Hamilton Funds, Ireland (offshore investment | |
| | companies) (2004-2007); Chairman/Director, | |
| | AIB/BNY Securities Services, Ltd., Ireland | |
| | (financial services) (1999-2006); and Chairman, | |
| | BNY Alternative Investment Services, Inc. | |
| | (financial services) (2005-2007) | |
| Interested Trustees: | | | |
| Lisa M. Jones (58)* | Trustee since 2017. Serves until a | Director, CEO and President of Amundi US, Inc. | None |
Trustee, President and | successor trustee is elected or | (investment management firm) (since | |
Chief Executive Officer | earlier retirement or removal | September 2014); Director, CEO and President | |
| | of Amundi Asset Management US, Inc. (since | |
| | September 2014); Director, CEO and President of | |
| | Amundi Distributor US, Inc. (since September | |
| | 2014); Director, CEO and President of Amundi | |
| | Asset Management US, Inc. (since September | |
| | 2014); Chair, Amundi US, Inc., Amundi Distributor | |
| | US, Inc. and Amundi Asset Management US, Inc. | |
| | (September 2014 – 2018); Managing Director, | |
| | Morgan Stanley Investment Management | |
| | (investment management firm) (2010 – 2013); | |
| | Director of Institutional Business, CEO of | |
| | International, Eaton Vance Management | |
| | (investment management firm) (2005 – 2010); | |
| | and Director of Amundi Holdings US, Inc. | |
| | (since 2017) | |
| Kenneth J. Taubes (62)* | Trustee since 2014. Serves until a | Director and Executive Vice President | None |
Trustee | successor trustee is elected or | (since 2008) and Chief Investment Officer, U.S. | |
| earlier retirement or removal | (since 2010) of Amundi US, Inc. (investment | |
| | management firm); Director and Executive Vice | |
| | President and Chief Investment Officer, U.S. of | |
| | Amundi US (since 2008); Executive Vice | |
| | President and Chief Investment Officer, U.S. of | |
| | Amundi Asset Management US, Inc. (since 2009); | |
| | Portfolio Manager of Amundi US (since 1999); | |
| | and Director of Amundi Holdings US, Inc. | |
| | (since 2017) | |
* Ms. Jones and Mr. Taubes are Interested Trustees because they are officers or directors of the Portfolio’s investment adviser and certain of its affiliates.
30
| | |
| Pioneer Select Mid Cap Growth VCT Portfolio | Pioneer Variable Contracts Trust |
| | | | |
| Name , Age and Position | Term of Office and | | Other Directorships |
| Held With the Trust | Length of Service | Principal Occupation | Held by Officer |
| Fund Officers: | | | |
| Christopher J. Kelley (56) | Since 2003. Serves at the | Vice President and Associate General Counsel | None |
Secretary and Chief | discretion of the Board | of Amundi US since January 2008; Secretary and | |
Legal Officer | | Chief Legal Officer of all of the Pioneer Funds | |
| | since June 2010; Assistant Secretary of all of the | |
| | Pioneer Funds from September 2003 to | |
| | May 2010; Vice President and Senior Counsel of | |
| | Amundi US from July 2002 to December 2007 | |
| Carol B. Hannigan (59) | Since 2010. Serves at the | Fund Governance Director of Amundi US since | None |
Assistant Secretary | discretion of the Board | December 2006 and Assistant Secretary of all | |
| | the Pioneer Funds since June 2010; Manager – | |
| | Fund Governance of Amundi US from | |
| | December 2003 to November 2006; and Senior | |
| | Paralegal of Amundi US from January 2000 to | |
| | November 2003 | |
| Thomas Reyes (58) | Since 2010. Serves at the | Assistant General Counsel of Amundi US since | None |
Assistant Secretary | discretion of the Board | May 2013 and Assistant Secretary of all the | |
| | Pioneer Funds since June 2010; and Counsel of | |
| | Amundi US from June 2007 to May 2013 | |
| Mark E. Bradley (61) | Since 2008. Serves at the | Vice President – Fund Treasury of Amundi US; | None |
Treasurer and Chief Financial | discretion of the Board | Treasurer of all of the Pioneer Funds since | |
and Accounting Officer | | March 2008; Deputy Treasurer of Amundi US | |
| | from March 2004 to February 2008; and Assistant | |
| | Treasurer of all of the Pioneer Funds from | |
| | March 2004 to February 2008 | |
| Anthony J. Koenig, Jr. (57) | Since 2021. Serves at the | Senior Vice President – Fund Treasury of | None |
Assistant Treasurer | discretion of the Board | Amundi US; Assistant Treasurer of all of the | |
| | Pioneer Funds since January 2021; and Chief of | |
| | Staff, US Investment Management of Amundi US | |
| | from May 2008 to January 2021 | |
| Luis I. Presutti (55) | Since 2000. Serves at the | Director – Fund Treasury of Amundi US since | None |
Assistant Treasurer | discretion of the Board | 1999; and Assistant Treasurer of all of the | |
| | Pioneer Funds since 1999 | |
| Gary Sullivan (62) | Since 2002. Serves at the | Senior Manager – Fund Treasury of Amundi US | None |
Assistant Treasurer | discretion of the Board | since 2012; and Assistant Treasurer of all of the | |
| | Pioneer Funds since 2002 | |
| Antonio Furtado (38) | Since 2020. Serves at the | Fund Oversight Manager – Fund Treasury of | None |
Assistant Treasurer | discretion of the Board | Amundi US since 2020; Assistant Treasurer of all | |
| | of the Pioneer Funds since 2020; and Senior Fund | |
| | Treasury Analyst from 2012 - 2020 | |
| John Malone (50) | Since 2018. Serves at the | Managing Director, Chief Compliance Officer of | None |
Chief Compliance Officer | discretion of the Board | Amundi US Asset Management; Amundi Asset | |
| | Management US, Inc.; and the Pioneer Funds | |
| | since September 2018; and Chief Compliance | |
| | Officer of Amundi Distributor US, Inc. since | |
| | January 2014. | |
| Kelly O’Donnell (49) | Since 2006. Serves at the | Vice President – Amundi Asset Management; | None |
Anti-Money | discretion of the Board | and Anti-Money Laundering Officer of all the | |
Laundering Officer | | Pioneer Funds since 2006 | |
31
This page was intentionally left blank.
32
This page was intentionally left blank.
33
This page was intentionally left blank.
34
This page was intentionally left blank.
35
This page was intentionally left blank.
36
This page was intentionally left blank.
37
Proxy Voting Policies and Procedures of the Portfolio are available without charge, upon request, by calling our toll free number (1-800-225-6292). Information regarding how the Portfolio voted proxies relating to Portfolio securities during the most recent 12-month period ended June 30 is publicly available to shareowners at www.amundi.com/us. This information is also available on the Securities and Exchange Commission’s web site at www.sec.gov.
18655-15-0221
Pioneer Variable Contracts Trust
Pioneer High Yield
VCT PortfolioClass I and II Shares
Annual Report | December 31, 2020
Paper copies of the Portfolio’s shareholder reports may no longer be sent by mail, unless you specifically request paper copies of the reports from the insurance company that offers your variable annuity or variable life insurance contract, or from your financial intermediary. Instead, the insurance company may choose to make the reports available on a website, and will notify you by mail each time a shareholder report is posted and provide you with a website link to access the report. Instructions for requesting paper copies will be provided by your insurance company.
You may elect to receive all future Portfolio shareholder reports in paper form, free of charge, from the insurance company. You can inform the insurance company or your financial intermediary that you wish to continue receiving paper copies of your shareholder reports by following the instructions provided by the insurance company, or by contacting your financial intermediary. Your election to receive reports in paper form will apply to all portfolios available under your contract with the insurance company.
Please refer to your contract prospectus to determine the applicable share class offered under your contract.
Pioneer Variable Contracts Trust
| | |
Table of Contents | |
| Pioneer High Yield VCT Portfolio | |
| | |
| 2 |
| | |
| 3 |
| | |
| 4 |
| | |
| 8 |
| | |
| 21 |
| | |
| 26 |
| | |
| 36 |
| | |
| 37 |
| | |
| 38 |
| | |
| 41 |
This report is authorized for distribution only when preceded or accompanied by a prospectus for the Portfolio being offered.
Pioneer Variable Contracts Trust files a complete schedule of portfolio holdings with the Securities and Exchange Commission for the first and third quarters of each fiscal year as an exhibit to its reports on Form N-PORT. Shareholders may view the filed Form N-PORT by visiting the Commission’s web site at https://www.sec.gov.
| | |
| Pioneer High Yield VCT Portfolio | Pioneer Variable Contracts Trust |
Portfolio Update 12/31/20 | |
Portfolio Diversification
(As a percentage of total investments)*
5 Largest Holdings
(As a percentage of total investments)*
1. | U.S. Treasury Bills, 1/26/21 | 2.47% |
2. | CCO Holdings LLC/CCO Holdings | |
| Capital Corp., 5.5%, 5/1/26 (144A)
| 1.32
|
3. | Pioneer ILS Interval Fund (j) | 1.26 |
4. | Teva Pharmaceutical Finance | |
| Netherlands III BV, 2.8%, 7/21/23 | 1.11 |
5. | American Axle & Manufacturing, | |
| Inc., 6.25%, 3/15/26 | 1.04 |
* | Excludes temporary cash investments and all derivative contracts except for options purchased. The Portfolio is actively managed, and current holdings may be different. The holdings listed should not be considered recommendations to buy or sell any securities. |
(j) | Pioneer ILS Interval Fund is an affiliated closed-end fund managed by Amundi Asset Management US, Inc. (the “Adviser”). |
| | | | | |
| Performance Update 12/31/20 | | | |
| |
| Prices and Distributions | | | | |
| |
| Net Asset Value per Share | | 12/31/20 | 12/31/19 | |
| Class I | | $9.29 | $9.58 | |
| Class II | | $9.16 | $9.47 | |
| Net | | | |
| Distributions per Share | Investment | Short-Term | Long-Term | |
| (1/1/20 – 12/31/20) | Income | Capital Gains | Capital Gains | |
| Class I | $0.4770 | $ — | $ — | |
| Class II | $0.4498 | $ — | $ — | |
Performance of a $10,000 InvestmentThe following chart shows the change in value of an investment made in Class I and Class II shares of Pioneer High Yield VCT Portfolio at net asset value during the periods shown, compared to that of the ICE Bank of America (BofA) US High Yield Index and the ICE BofA All-Convertibles Speculative Quality Index. Portfolio returns are based on net asset value and do not reflect any applicable insurance fees or surrender charges.
The ICE BofA US High Yield Index is an unmanaged, commonly accepted measure of the performance of high-yield securities. The ICE BofA All-Convertibles Speculative Quality Index is an unmanaged index of high-yield U.S. convertible securities. Index returns are calculated monthly, assume reinvestment of dividends and, unlike Portfolio returns, do not reflect any fees, expenses or sales charges. It is not possible to invest directly in an index.
| Average Annual Total Returns | | | |
(As of December 31, 2020) | | | | |
| | | ICE | ICE BofA |
| | | BofA | All-Convertibles |
| | | US High | Speculative |
| Class I | Class II | Yield Index | Quality Index |
10 Years | 5.84% | 5.48% | 6.62% | 16.16% |
5 Years | 6.78% | 6.36% | 8.43% | 28.43% |
| 1 Year | 2.37% | 1.87% | 6.17% | 115.31% |
All total returns shown assume reinvestment of distributions at net asset value.
The performance table does not reflect the deduction of taxes that a shareowner would pay on distributions or the redemption of shares.
Call 1-800-688-9915 or visit www.amundi.com/us for the most recent month-end performance results. Current performance may be lower or higher than the performance data quoted.
The performance data quoted represents past performance, which is no guarantee of future results. Investment return and principal value will fluctuate, and shares, when redeemed, may be worth more or less than their original cost.
The returns for the Portfolio do not reflect the deduction of expenses associated with variable products, such as mortality and expense risk charges, separate account charges, and sales charges. These expenses would reduce the overall returns shown.
Performance results reflect any applicable expense waivers in effect during the periods shown. Without such waivers performance would be lower. Waivers may not be in effect for all portfolios. Certain fee waivers are contractual through a specified period. Otherwise, fee waivers can be rescinded at any time. See the prospectus and financial statements for more information.
2
| | |
| Pioneer High Yield VCT Portfolio | Pioneer Variable Contracts Trust |
Comparing Ongoing Portfolio Expenses | |
As a shareowner in the Portfolio, you incur two types of costs:
(1) | ongoing costs, including management fees, distribution and/or service (12b–1) fees, and other Portfolio expenses; and |
(2) | transaction costs, including sales charges (loads) on purchase payments. |
This example is intended to help you understand your ongoing expenses (in dollars) of investing in the Portfolio and to compare these costs with the ongoing costs of investing in other mutual funds offered through your variable annuity contract. The example is based on an investment of $1,000 at the beginning of the Portfolio’s latest six-month period and held throughout the six months.
Using the Tables
Actual Expenses
The first table below provides information about actual account values and actual expenses. You may use the information in this table, together with the amount you invested, to estimate the expenses that you paid over the period as follows:
1. | Divide your account value by $1,000 |
| Example: an $8,600 account value ÷ $1,000 = 8.6 |
2. | Multiply the result in (1) above by the corresponding share class’s number in the third row under the heading entitled “Expenses Paid During Period” to estimate the expenses you paid on your account during this period. |
Expenses Paid on a $1,000 Investment in Pioneer High Yield VCT Portfolio
Based on actual returns from July 1, 2020 through December 31, 2020.
| Share Class | I | II |
Beginning Account Value on 7/1/20 | $1,000.00 | $1,000.00 |
Ending Account Value on 12/31/20 | $1,114.53 | $1,112.12 |
Expenses Paid During Period* | $ 5.47 | $ 6.69 |
* | Expenses are equal to the Portfolio’s annualized expense ratio of 1.03%, 1.26% for Class I and Class II respectively, multiplied by the average account value over the period, multiplied by 184/366 (to reflect the one-half year period). |
Hypothetical Example for Comparison Purposes
The table below provides information about hypothetical account values and hypothetical expenses based on the Portfolio’s actual expense ratio and an assumed rate of return of 5% per year before expenses, which is not the Portfolio’s actual return. The hypothetical account values and expenses may not be used to estimate the actual ending account balance or expenses you paid for the period.
You may use this information to compare the ongoing costs of investing in the Portfolio and other variable annuities. To do so, compare this 5% hypothetical example with the 5% hypothetical examples that appear in the shareholder reports of the other variable annuities.
Please note that the expenses shown in the tables are meant to highlight your ongoing costs only and do not reflect any transaction costs, such as sales charges (loads) that are charged at the time of the transaction. Therefore, the table below is useful in comparing ongoing costs only and will not help you determine the relative total costs of owning different variable annuities. In addition, if these transaction costs were included, your costs would have been higher.
Expenses Paid on a $1,000 Investment in Pioneer High Yield VCT Portfolio
Based on a hypothetical 5% per year return before expenses, reflecting the period from July 1, 2020 through December 31, 2020.
| Share Class | I | II |
Beginning Account Value on 7/1/20 | $1,000.00 | $1,000.00 |
Ending Account Value on 12/31/20 | $1,019.96 | $1,018.80 |
Expenses Paid During Period* | $ 5.23 | $ 6.39 |
* | Expenses are equal to the Portfolio’s annualized expense ratio of 1.03%, 1.26% for Class I and Class II respectively, multiplied by the average account value over the period, multiplied by 184/366 (to reflect the one-half year period). |
3
| | |
| Pioneer High Yield VCT Portfolio | Pioneer Variable Contracts Trust |
Portfolio Management Discussion 12/31/20 | |
Call 1-800-688-9915 or visit www.amundi.com/us for the most recent month-end performance results. Current performance may be lower or higher than the performance data quoted.
The performance data quoted represents past performance, which is no guarantee of future results. Investment return and principal value will fluctuate, and shares, when redeemed, may be worth more or less than their original cost.
The returns for the Portfolio do not reflect the deduction of expenses associated with variable products, such as mortality and expense risk charges, separate account charges, and sales charges. These expenses would reduce the overall returns shown.
Performance results reflect any applicable expense waivers in effect during the periods shown. Without such waivers, performance would be lower. Waivers may not be in effect for all portfolios. Certain fee waivers are contractual through a specified period. Otherwise, fee waivers can be rescinded at any time. See the prospectus and financial statements for more information.
In the following interview, portfolio managers Andrew Feltus, Matthew Shulkin, and Ken Monaghan discuss the factors that influenced Pioneer High Yield VCT Portfolio’s performance for the 12-month period ended December 31, 2020. Mr. Feltus, Managing Director, Co-Director of High Yield, and a portfolio manager at Amundi Asset Management US, Inc. (Amundi US), Mr. Shulkin, a senior vice president and a portfolio manager at Amundi US, and Mr. Monaghan, Co-Director of High Yield and a portfolio manager at Amundi US, are responsible for the daily management of the Portfolio.
Q: How did the Portfolio perform during the 12-month period ended December 31, 2020?
A: Pioneer High Yield VCT Portfolio’s Class I shares returned 2.37% at net asset value during the 12-month period ended December 31, 2020, and Class II shares returned 1.87%. During the same period, the Portfolio’s benchmarks, the ICE Bank of America (ICE BofA) US High Yield Index and the ICE BofA All-Convertibles Speculative Quality Index, returned 6.17% and 115.31%, respectively.
Q: Could you please describe the market environment in the high-yield market during the 12-month period ended December 31, 2020?
A: After a benign opening to 2020, financial markets experienced an historic disruption beginning mid-February, as the emergence of the COVID-19 virus all but shuttered the global economy. Investors fled riskier assets during the late winter and early spring on a wide scale and moved into so-called “safe havens,” thus driving US Treasury yields to all-time lows.
The response to the pandemic crisis was swift, as central banks and governments around the globe sought to keep businesses and consumers from going under. The US Federal Reserve (Fed) slashed its benchmark overnight lending rate target range to zero in mid-March, resurrected its 2008/2009 financial crisis-era lending facilities, and launched a wide-ranging bond-purchase program. On the fiscal side, the US Congress and the White House agreed on a $2.2 trillion stimulus package in late March, and added further stimulus during the summer months.
The extraordinary support from policy makers in the wake of the pandemic’s initial effects on the economy heartened investors entering the second quarter of 2020, and the markets rallied. As the second quarter progressed, market participants became increasingly optimistic that steps toward re-opening the economy would support something resembling a “V-shaped” economic recovery (a sharp, swift rise). The outgrowth of those attitudes was a resurgence in positive sentiment towards riskier assets, which allowed credit-sensitive areas of the bond market to recover much of their earlier losses by the early part of the summer, even as rising COVID-19 case counts in a number of US states increased concerns of a second wave of infections.
After simmering throughout the summer, macroeconomic uncertainty bubbled over during September, weighing on investor sentiment and the performance of riskier assets. The focus on heightened risks revolved around three key areas: stalled negotiations among law makers over another US fiscal stimulus package, a continued rise in COVID-19 cases, and the November US elections.
4
| | |
| Pioneer High Yield VCT Portfolio | Pioneer Variable Contracts Trust |
A partisan dispute over when to appoint the late Supreme Court Justice Ginsburg’s replacement further hardened both parties’ negotiating positions on the fiscal stimulus bill, and lowered the odds of broader government support for the economy coming to fruition prior to the November election. At the same time, a notable uptick in European COVID-19 cases reignited fears that the US remained at risk for the second wave of virus cases mentioned earlier, and yet another round of economic lockdowns in response. Finally, concerns mounted over the potential for a protracted dispute over the presidential election results as November 3rd drew closer.
In December, towards the end of the 12-month period, the US economic outlook received two “shots in the arm,” as a pair of COVID-19 vaccines were authorized for emergency use by the Food and Drug Administration, and Congress finally agreed upon a $900 billion COVID-19 relief package. The vaccines could help alleviate uncertainty regarding public health in general, and may bring forward the timing of a return to economic normalcy. Meanwhile, the additional fiscal stimulus could offer needed support for many individuals and businesses. Over the final weeks of the 12-month period, investors elected to focus attention on those positive developments and looked beyond another surge in COVID-19 cases as well as data suggesting a slowing in the rate of the economic recovery. As a result, riskier assets rallied once again, and Treasury yields drifted higher into the end of the calendar year.
Q:Can you review your principal strategies in managing the Portfolio during the 12-month period ended December 31, 2020, and the degree to which they contributed to or detracted from benchmark-relative returns?
A: In broad terms, at the beginning of the 12-month period, we had positioned the Portfolio to possibly benefit from continued consumer strength, given generally sound household balance sheets and a backdrop of nearly full employment and rising wages as 2020 got underway. With regard to sector allocations at that time, the Portfolio had overweight exposures to airline, gaming, and leisure credits. We had continued to avoid investments in retail credits for the most part, given the secular challenges, such as e-commerce, that the sector has faced. The positioning worked well for the Portfolio early in the 12-month period, but ultimately weighed on benchmark-relative performance for the full fiscal year as the economy and, specifically, the consumer-focused sectors, effectively closed or dealt with severe restrictions during the COVID-19 crisis.
In terms of credit quality, the Portfolio’s underweight to higher-quality issues versus its primary benchmark, the ICE BofA US High Yield Index, mainly in the BB-ratings range of the high-yield market, acted as a constraint on relative performance in the first half of the fiscal year, but was essentially a neutral factor for relative returns over the second half of the period. In sector terms, strong performance among the Portfolio’s holdings of convertible bonds (an asset class that registered a massive gain during 2020) and telecommunications-related credits failed to offset the negative effects on relative results of the Portfolio’s overweight to energy services, as the energy sector in general faced significant headwinds over the 12-month period.
5
| | |
| Pioneer High Yield VCT Portfolio | Pioneer Variable Contracts Trust |
| Portfolio Management Discussion 12/31/20 (continued) | |
A Word About Risk:
All investments are subject to risk, including the possible loss of principal. In the past several years, financial markets have experienced increased volatility and heightened uncertainty. The market prices of securities may go up or down, sometimes rapidly or unpredictably, due to general market conditions, such as real or perceived adverse economic, political, or regulatory conditions, recessions, inflation, changes in interest or currency rates, lack of liquidity in the bond markets, the spread of infectious illness or other public health issues or adverse investor sentiment. These conditions may continue, recur, worsen or spread.
Investments in high-yield or lower-rated securities are subject to greater-than-average price volatility, illiquidity and possibility of default.
When interest rates rise, the prices of fixed-income securities in the Portfolio will generally fall. Conversely, when interest rates fall the prices of fixed-income securities in the Portfolio will generally rise. Investments in the Portfolio are subject to possible loss due to the financial failure of the issuers of underlying securities and their inability to meet their debt obligations.
Prepayment risk is the chance that an issuer may exercise its right to prepay its security, if falling interest rates prompt the issuer to do so. Forced to reinvest the unanticipated proceeds at lower interest rates, the Portfolio would experience a decline in income and lose the opportunity for additional price appreciation.
The Portfolio may invest in mortgage-backed securities, which during times of fluctuating interest rates may increase or decrease more than other fixed-income securities. Mortgage-backed securities are also subject to prepayments.
The Portfolio may use derivatives, such as options, futures, inverse floating rate obligations, swaps, and other instruments, which can be illiquid, may disproportionately increase losses, and have a potentially large impact on Portfolio performance. Derivatives may have a leveraging effect on the Portfolio.
At times, the Portfolio’s investments may represent industries or industry sectors that are interrelated or have common risks, making the Portfolio more susceptible to any economic, political, or regulatory developments or other risks affecting those industries and sectors.
These risks may increase share price volatility.
At the individual security level, leading positive contributors to the Portfolio’s benchmark-relative performance during the 12-month period included a position in Cenovus Energy, a Canadian oil sands company. We increased the Portfolio’s exposure to the Cenovus credit after it was downgraded to high-yield status in March, and performance benefited after a subsequent upgrade back to investment-grade status following a merger. VistaJet was another position that benefited the Portfolio’s relative returns during the period, as the private jet company saw demand increase notably in the wake of the COVID-19 pandemic. Finally, the convertible bonds of Exact Sciences, the producer of a home colon cancer test, aided the Portfolio’s returns; the company saw demand for the colon cancer test rise as patients preferred a stay-at-home approach to treatment.
Leading detractors from the Portfolio’s relative returns during the 12-month period included a position in PBF Energy, one of the largest independent US refinery operators. As noted earlier, energy credits struggled during the period as the sector was the worst performer, by far, across many different market segments, from equities to fixed-income securities. The companies within energy that lagged the most during the 12-month period tended to be those with high costs or high leverage. Outside of energy, market sentiment with respect to regional sports network Diamond Sports suffered as live sporting events were cancelled for several months after COVID-19 first emerged in the US. Finally, a lack of Portfolio exposure to Ford Motor also weighed on relative returns as the automaker’s bonds rallied at the start of the second quarter.
Q: Can you discuss the factors that affected the Portfolio’s income-generation (or yield), either positively or negatively, during the 12-month period ended December 31, 2020?
A: The Portfolio’s income-generation remained relatively stable over the 12-month period. Holding positions in convertible securities and bank loans can result in a lower yield compared to a portfolio composed entirely of high-yield bonds. However, we view those allocations as potentially beneficial to the Portfolio’s total return profile.
Q: Did the Portfolio have any exposure to derivatives during the 12-month period ended December 31, 2020? If so, did the derivatives have a material effect on the Portfolio’s performance?
A: We utilized index-based credit-default-swap investments during the 12-month period in an effort to maintain the desired level of Portfolio exposure to the high-yield market and to potentially generate income, while also seeking to maintain sufficient liquidity to make opportunistic purchases and help meet any unanticipated shareholder redemption requests. The derivatives strategy had a neutral effect on the Portfolio’s performance.
6
| | |
| Pioneer High Yield VCT Portfolio | Pioneer Variable Contracts Trust |
Q: What is your assessment of the current climate for high yield investing?
A: We anticipate accelerating domestic economic growth in 2021 as COVID-19 vaccines are rolled out and consumers slowly regain confidence and reopen their pocketbooks, potentially unleashing a wave of pent-up demand for services such as travel and dining during the second half of the calendar year.
Despite this outlook, we do not expect the Fed to start removing its accommodative monetary policies in 2021, as it has signaled an intense focus on getting the US economy back to full employment. In our view, the Fed has learned from its policy mistakes in 2018 and could be willing to maintain a highly supportive monetary policy environment, even if inflation ticks up above the US central bank’s target rate.
We have maintained a positive outlook for high-yield credit spreads relative to Treasuries for the short term, but do not anticipate significant tightening over the course of 2021. (Credit spreads are commonly defined as the differences in yield between Treasuries and other types of fixed-income securities with similar maturities.)
We view security and sector selection as likely to be the critical determinants of performance in the coming year, with positioning in the sectors that have been most sensitive to the effects of COVID-19 particularly important as the economy begins to transition to more normal conditions. In that vein, while we have remained cautious with respect to investments in industries such as cruise lines and theaters, we view the hotel, airline, and gaming segments of the market as having been able to adapt relatively well to the pandemic-related conditions.
Please refer to the Schedule of Investments on pages 8 to 20 for a full listing of Portfolio securities.
Past performance is no guarantee of future results.
Any information in this shareholder report regarding market or economic trends or the factors influencing the Portfolio’s historical or future performance are statements of opinion as of the date of this report.
7
| | |
| Pioneer High Yield VCT Portfolio | Pioneer Variable Contracts Trust |
Schedule of Investments 12/31/20 | |
| | | | |
| Shares | | | Value |
| | UNAFFILIATED ISSUERS – 94.5% | |
| | COMMON STOCK – 0.4% of Net Assets | |
| | Energy Equipment & Services – 0.4% | |
| 8,535(a) | | FTS International, Inc. | $ 163,872 |
| | Total Energy Equipment & Services | $ 163,872 |
| | TOTAL COMMON STOCK | |
| | (Cost $238,628) | $ 163,872 |
| | CONVERTIBLE PREFERRED STOCK – 0.3% of Net Assets | |
| | Banks – 0.3% | |
| 95(b) | | Wells Fargo & Co., 7.5% | $ 144,201 |
| | Total Banks | $ 144,201 |
| | TOTAL CONVERTIBLE PREFERRED STOCK | |
| | (Cost $125,547) | $ 144,201 |
| Principal | | | |
| Amount | | | |
| USD ($) | | | |
| | COMMERCIAL MORTGAGE-BACKED SECURITY – 0.3% of Net Assets | |
| 108,907(c) | | Banc of America Commercial Mortgage Trust, Series 2007-4, Class H, 5.867%, 2/10/51 (144A) | $ 106,729 |
| | TOTAL COMMERCIAL MORTGAGE-BACKED SECURITY | |
| | (Cost $107,220) | $ 106,729 |
| | CONVERTIBLE CORPORATE BONDS – 4.0% of Net Assets | |
| | Airlines – 0.6% | |
| 170,000 | | Air Canada, 4.0%, 7/1/25 (144A) | $ 250,750 |
| | Total Airlines | $ 250,750 |
| | Biotechnology – 0.4% | |
| 162,000 | | Insmed, Inc., 1.75%, 1/15/25 | $ 181,798 |
| | Total Biotechnology | $ 181,798 |
| | Commercial Services – 0.2% | |
| 64,935 | | Macquarie Infrastructure Corp., 2.0%, 10/1/23 | $ 64,611 |
| | Total Commercial Services | $ 64,611 |
| | Computers – 0.3% | |
| 125,000 | | Pure Storage, Inc., 0.125%, 4/15/23 | $ 137,452 |
| | Total Computers | $ 137,452 |
| | Engineering & Construction – 0.3% | |
| 115,000 | | Dycom Industries, Inc., 0.75%, 9/15/21 | $ 118,606 |
| | Total Engineering & Construction | $ 118,606 |
| | Healthcare-Products – 0.3% | |
| 120,000 | | Integra LifeSciences Holdings Corp., 0.5%, 8/15/25 (144A) | $ 132,050 |
| | Total Healthcare-Products | $ 132,050 |
| | Internet – 0.4% | |
| 115,000 | | Palo Alto Networks, Inc., 0.375%, 6/1/25 (144A) | $ 151,435 |
| | Total Internet | $ 151,435 |
| | Leisure Time – 0.2% | |
| 60,000 | | Royal Caribbean Cruises, Ltd., 4.25%, 6/15/23 (144A) | $ 79,755 |
| | Total Leisure Time | $ 79,755 |
| | Media – 0.2% | |
| 112,000 | | DISH Network Corp., 3.375%, 8/15/26 | $ 106,762 |
| | Total Media | $ 106,762 |
The accompanying notes are an integral part of these financial statements.
8
| | |
| Pioneer High Yield VCT Portfolio | Pioneer Variable Contracts Trust |
| | | | |
| Principal | | | |
| Amount | | | |
| USD ($) | | | Value |
| | Pharmaceuticals – 0.8% | |
| 130,000 | | Revance Therapeutics, Inc., 1.75%, 2/15/27 (144A) | $ 145,795 |
| 117,000 | | Teva Pharmaceutical Finance Co. LLC, 0.25%, 2/1/26 | 116,415 |
| 136,000 | | Tricida, Inc., 3.5%, 5/15/27 (144A) | 68,190 |
| | Total Pharmaceuticals | $ 330,400 |
| | Software – 0.3% | |
| 103,000 | | Akamai Technologies, Inc., 0.125%, 5/1/25 | $ 127,478 |
| | Total Software | $ 127,478 |
| | TOTAL CONVERTIBLE CORPORATE BONDS | |
| | (Cost $1,499,271) | $ 1,681,097 |
| | CORPORATE BONDS – 84.9% of Net Assets | |
| | Advertising – 1.7% | |
| 412,000 | | MDC Partners, Inc., 6.5%, 5/1/24 (144A) | $ 417,665 |
| 243,000 | | Outfront Media Capital LLC/Outfront Media Capital Corp., 5.625%, 2/15/24 | 246,037 |
| 60,000 | | Outfront Media Capital LLC/Outfront Media Capital Corp., 6.25%, 6/15/25 (144A) | 63,300 |
| | Total Advertising | $ 727,002 |
| | Aerospace & Defense – 0.3% | |
| 71,000 | | Howmet Aerospace, Inc., 6.875%, 5/1/25 | $ 83,070 |
| 35,000 | | Triumph Group, Inc., 8.875%, 6/1/24 (144A) | 38,413 |
| | Total Aerospace & Defense | $ 121,483 |
| | Airlines – 1.1% | |
| 197,000 | | Delta Air Lines, Inc., 3.75%, 10/28/29 | $ 190,942 |
| 20,000 | | Delta Air Lines, Inc., 7.375%, 1/15/26 | 22,846 |
| 60,000 | | Delta Air Lines, Inc./SkyMiles IP, Ltd., 4.75%, 10/20/28 (144A) | 65,491 |
| 165,000 | | Mileage Plus Holdings LLC/Mileage Plus Intellectual Property Assets, Ltd., 6.5%, 6/20/27 (144A) | 177,375 |
| | Total Airlines | $ 456,654 |
| | Apparel – 0.2% | |
| 75,000 | | Wolverine World Wide, Inc., 6.375%, 5/15/25 (144A) | $ 79,875 |
| | Total Apparel | $ 79,875 |
| | Auto Manufacturers – 3.0% | |
| 150,000 | | Allison Transmission, Inc., 3.75%, 1/30/31 (144A) | $ 153,469 |
| 200,000 | | Ford Motor Credit Co. LLC, 3.375%, 11/13/25 | 205,472 |
| 305,000 | | Ford Motor Credit Co. LLC, 3.815%, 11/2/27 | 313,387 |
| 300,000 | | Ford Motor Credit Co. LLC, 4.134%, 8/4/25 | 314,625 |
| 254,000 | | JB Poindexter & Co., Inc., 7.125%, 4/15/26 (144A) | 268,605 |
| | Total Auto Manufacturers | $ 1,255,558 |
| | Auto Parts & Equipment – 1.7% | |
| 408,000 | | American Axle & Manufacturing, Inc., 6.25%, 3/15/26 | $ 420,240 |
| 202,000 | | Dealer Tire LLC/DT Issuer LLC, 8.0%, 2/1/28 (144A) | 212,692 |
| 58,000 | | Goodyear Tire & Rubber Co., 9.5%, 5/31/25 | 65,557 |
| 20,000 | | Meritor, Inc., 4.5%, 12/15/28 (144A) | 20,500 |
| | Total Auto Parts & Equipment | $ 718,989 |
| | Banks – 2.2% | |
| 182,000 | | Freedom Mortgage Corp., 8.125%, 11/15/24 (144A) | $ 189,848 |
| 152,000 | | Freedom Mortgage Corp., 8.25%, 4/15/25 (144A) | 158,840 |
| 200,000(b)(c) | | Intesa Sanpaolo S.p.A., 7.7% (5 Year USD Swap Rate + 546 bps) (144A) | 227,000 |
The accompanying notes are an integral part of these financial statements.
9
| | |
| Pioneer High Yield VCT Portfolio | Pioneer Variable Contracts Trust |
| Schedule of Investments 12/31/20 (continued) | |
| | | | |
| Principal | | | |
| Amount | | | |
| USD ($) | | | Value |
| | Banks – (continued) | |
| 106,000(b)(c) | | JPMorgan Chase & Co., 4.6% (SOFRRATE + 313 bps) | $ 109,445 |
| 237,000 | | Provident Funding Associates LP/PFG Finance Corp., 6.375%, 6/15/25 (144A) | 242,925 |
| | Total Banks | $ 928,058 |
| | Building Materials – 2.9% | |
| 20,000 | | Builders FirstSource, Inc., 5.0%, 3/1/30 (144A) | $ 21,662 |
| 158,000 | | Builders FirstSource, Inc., 6.75%, 6/1/27 (144A) | 171,384 |
| 195,000 | | Cornerstone Building Brands, Inc., 6.125%, 1/15/29 (144A) | 207,187 |
| 60,000 | | CP Atlas Buyer, Inc., 7.0%, 12/1/28 (144A) | 62,400 |
| 40,000 | | Forterra Finance LLC/FRTA Finance Corp., 6.5%, 7/15/25 (144A) | 43,000 |
| 100,000 | | JELD-WEN, Inc., 6.25%, 5/15/25 (144A) | 108,000 |
| 280,000 | | Patrick Industries, Inc., 7.5%, 10/15/27 (144A) | 305,200 |
| 45,000 | | Standard Industries, Inc., 4.375%, 7/15/30 (144A) | 48,138 |
| 25,000 | | Standard Industries, Inc., 5.0%, 2/15/27 (144A) | 26,125 |
| 203,000 | | Summit Materials LLC/Summit Materials Finance Corp., 5.125%, 6/1/25 (144A) | 206,553 |
| 10,000 | | Summit Materials LLC/Summit Materials Finance Corp., 5.25%, 1/15/29 (144A) | 10,500 |
| | Total Building Materials | $ 1,210,149 |
| | Chemicals – 2.9% | |
| 200,000 | | Element Solutions, Inc., 3.875%, 9/1/28 (144A) | $ 205,750 |
| 103,000 | | Hexion, Inc., 7.875%, 7/15/27 (144A) | 110,210 |
| 110,000 | | Ingevity Corp., 3.875%, 11/1/28 (144A) | 110,825 |
| 65,000 | | Kraton Polymers LLC/Kraton Polymers Capital Corp., 4.25%, 12/15/25 (144A) | 66,307 |
| 45,000 | | NOVA Chemicals Corp., 5.25%, 6/1/27 (144A) | 47,948 |
| 200,000 | | OCI NV, 4.625%, 10/15/25 (144A) | 207,500 |
| 134,000 | | Olin Corp., 5.0%, 2/1/30 | 142,710 |
| 155,000 | | Tronox, Inc., 6.5%, 5/1/25 (144A) | 165,850 |
| 175,000 | | Tronox, Inc., 6.5%, 4/15/26 (144A) | 182,219 |
| | Total Chemicals | $ 1,239,319 |
| | Coal – 0.9% | |
| 400,000 | | SunCoke Energy Partners LP/SunCoke Energy Partners Finance Corp., 7.5%, 6/15/25 (144A) | $ 397,080 |
| | Total Coal | $ 397,080 |
| | Commercial Services – 4.2% | |
| 95,000 | | Allied Universal Holdco LLC/Allied Universal Finance Corp., 6.625%, 7/15/26 (144A) | $ 101,298 |
| 215,000 | | Allied Universal Holdco LLC/Allied Universal Finance Corp., 9.75%, 7/15/27 (144A) | 234,350 |
| 105,000 | | APX Group, Inc., 6.75%, 2/15/27 (144A) | 112,875 |
| 140,000 | | Brink’s Co., 5.5%, 7/15/25 (144A) | 149,450 |
| 85,000 | | Cardtronics, Inc./Cardtronics USA, Inc., 5.5%, 5/1/25 (144A) | 87,869 |
| 323,000 | | Garda World Security Corp., 9.5%, 11/1/27 (144A) | 357,723 |
| 36,000 | | Herc Holdings, Inc., 5.5%, 7/15/27 (144A) | 38,160 |
| 120,000 | | Prime Security Services Borrower LLC/Prime Finance, Inc., 5.75%, 4/15/26 (144A) | 131,400 |
| 260,000 | | Prime Security Services Borrower LLC/Prime Finance, Inc., 6.25%, 1/15/28 (144A) | 279,133 |
| 80,000 | | Sotheby’s, 7.375%, 10/15/27 (144A) | 85,700 |
| 75,000 | | United Rentals North America, Inc., 3.875%, 11/15/27 | 78,563 |
| 124,000 | | United Rentals North America, Inc., 5.25%, 1/15/30 | 137,640 |
| | Total Commercial Services | $ 1,794,161 |
| | Computers – 0.8% | |
| 80,000 | | Booz Allen Hamilton, Inc., 3.875%, 9/1/28 (144A) | $ 82,400 |
| 45,000 | | Dell International LLC/EMC Corp., 6.2%, 7/15/30 (144A) | 58,497 |
The accompanying notes are an integral part of these financial statements.
10
| | |
| Pioneer High Yield VCT Portfolio | Pioneer Variable Contracts Trust |
| | | | | |
| Principal | | | |
| Amount | | | |
| USD ($) | | | Value |
| | | Computers – (continued) | |
| 20,000 | | Diebold Nixdorf, Inc., 9.375%, 7/15/25 (144A) | $ 22,400 |
| 90,000 | | NCR Corp., 5.0%, 10/1/28 (144A) | 94,950 |
| 45,000 | | NCR Corp., 5.25%, 10/1/30 (144A) | 48,262 |
| 20,000 | | NCR Corp., 8.125%, 4/15/25 (144A) | 22,273 |
| | | Total Computers | $ 328,782 |
| | | Diversified Financial Services – 1.9% | |
| 145,000 | | Alliance Data Systems Corp., 4.75%, 12/15/24 (144A) | $ 146,450 |
| 360,000 | | Avation Capital SA., 6.5%, 5/15/21 (144A) | 262,800 |
| 202,068(d) | | Global Aircraft Leasing Co., Ltd., 6.5% (7.25% PIK or 6.50% cash), 9/15/24 (144A) | 180,346 |
| 110,000 | | Nationstar Mortgage Holdings, Inc., 5.125%, 12/15/30 (144A) | 114,974 |
| 60,000 | | Nationstar Mortgage Holdings, Inc., 5.5%, 8/15/28 (144A) | 63,000 |
| 30,000 | | Nationstar Mortgage Holdings, Inc., 6.0%, 1/15/27 (144A) | 31,837 |
| | | Total Diversified Financial Services | $ 799,407 |
| | | Electric – 2.9% | |
| 50,000 | | Calpine Corp., 4.625%, 2/1/29 (144A) | $ 51,414 |
| 50,000 | | Calpine Corp., 5.0%, 2/1/31 (144A) | 52,250 |
| 155,000 | | Calpine Corp., 5.125%, 3/15/28 (144A) | 163,055 |
| 65,000 | | Clearway Energy Operating LLC, 4.75%, 3/15/28 (144A) | 69,713 |
| 137,000 | | Clearway Energy Operating LLC, 5.75%, 10/15/25 | 144,192 |
| 60,000 | | NRG Energy, Inc., 3.375%, 2/15/29 (144A) | 61,428 |
| 85,000 | | NRG Energy, Inc., 3.625%, 2/15/31 (144A) | 87,448 |
| 25,000 | | Pattern Energy Operations LP/Pattern Energy Operations, Inc., 4.5%, 8/15/28 (144A) | 26,375 |
| 175,000 | | Talen Energy Supply LLC, 7.625%, 6/1/28 (144A) | 188,563 |
| 235,000 | | Talen Energy Supply LLC, 10.5%, 1/15/26 (144A) | 209,040 |
| 183,000 | | Vistra Operations Co. LLC, 5.625%, 2/15/27 (144A) | 194,646 |
| | | Total Electric | $ 1,248,124 |
| | | Electrical Components & Equipment – 1.0% | |
EUR | 100,000 | | Belden, Inc., 3.875%, 3/15/28 (144A) | $ 127,068 |
| 112,000 | | Energizer Holdings, Inc., 4.75%, 6/15/28 (144A) | 117,880 |
| 90,000 | | WESCO Distribution, Inc., 7.125%, 6/15/25 (144A) | 98,985 |
| 60,000 | | WESCO Distribution, Inc., 7.25%, 6/15/28 (144A) | 68,237 |
| | | Total Electrical Components & Equipment | $ 412,170 |
| | | Electronics – 0.1% | |
| 55,000 | | Sensata Technologies, Inc., 3.75%, 2/15/31 (144A) | $ 57,012 |
| | | Total Electronics | $ 57,012 |
| | | Engineering & Construction – 1.2% | |
| 140,000 | | KBR, Inc., 4.75%, 9/30/28 (144A) | $ 145,950 |
| 340,000 | | PowerTeam Services LLC, 9.033%, 12/4/25 (144A) | 378,287 |
| | | Total Engineering & Construction | $ 524,237 |
| | | Entertainment – 2.5% | |
| 257,000 | | Caesars Entertainment, Inc., 8.125%, 7/1/27 (144A) | $ 284,505 |
| 200,000 | | Enterprise Development Authority, 12.0%, 7/15/24 (144A) | 225,250 |
| 35,000 | | Penn National Gaming, Inc., 5.625%, 1/15/27 (144A) | 36,531 |
| 100,000 | | Scientific Games International, Inc., 7.0%, 5/15/28 (144A) | 107,521 |
| 100,000 | | Scientific Games International, Inc., 7.25%, 11/15/29 (144A) | 109,750 |
The accompanying notes are an integral part of these financial statements.
11
| | |
| Pioneer High Yield VCT Portfolio | Pioneer Variable Contracts Trust |
| Schedule of Investments 12/31/20 (continued) | |
| | | | |
| Principal | | | |
| Amount | | | |
| USD ($) | | | Value |
| | Entertainment – (continued) | |
| 242,000 | | Scientific Games International, Inc., 8.25%, 3/15/26 (144A) | $ 260,779 |
| 40,000 | | SeaWorld Parks & Entertainment, Inc., 9.5%, 8/1/25 (144A) | 43,425 |
| | Total Entertainment | $ 1,067,761 |
| | Environmental Control – 1.3% | |
| 330,000 | | Covanta Holding Corp., 6.0%, 1/1/27 | $ 346,615 |
| 55,000 | | GFL Environmental, Inc., 4.0%, 8/1/28 (144A) | 55,412 |
| 145,000 | | Tervita Corp., 11.0%, 12/1/25 (144A) | 156,026 |
| | Total Environmental Control | $ 558,053 |
| | Food – 2.0% | |
| 65,000 | | Albertsons Cos., Inc./Safeway, Inc./New Albertsons LP/Albertsons LLC, 3.5%, 3/15/29 (144A) | $ 65,772 |
| 30,000 | | Albertsons Cos., Inc./Safeway, Inc./New Albertsons LP/Albertsons LLC, 5.75%, 3/15/25 | 30,900 |
| 253,000 | | FAGE International SA./FAGE USA Dairy Industry, Inc., 5.625%, 8/15/26 (144A) | 259,325 |
| 82,000 | | Ingles Markets, Inc., 5.75%, 6/15/23 | 82,820 |
| 94,000 | | JBS USA LUX SA./JBS USA Finance, Inc., 6.75%, 2/15/28 (144A) | 105,609 |
| 250,000 | | Simmons Foods, Inc., 5.75%, 11/1/24 (144A) | 255,312 |
| 55,000 | | United Natural Foods, Inc., 6.75%, 10/15/28 (144A) | 57,543 |
| | Total Food | $ 857,281 |
| | Forest Products & Paper – 1.4% | |
| 145,000 | | Clearwater Paper Corp., 4.75%, 8/15/28 (144A) | $ 150,075 |
| 133,000 | | Mercer International, Inc., 7.375%, 1/15/25 | 138,405 |
| 285,000 | | Schweitzer-Mauduit International, Inc., 6.875%, 10/1/26 (144A) | 302,100 |
| | Total Forest Products & Paper | $ 590,580 |
| | Healthcare-Products – 0.2% | |
| 70,000 | | Varex Imaging Corp., 7.875%, 10/15/27 (144A) | $ 74,550 |
| | Total Healthcare-Products | $ 74,550 |
| | Healthcare-Services – 2.7% | |
| 65,000 | | CHS/Community Health Systems, Inc., 5.625%, 3/15/27 (144A) | $ 69,891 |
| 30,000 | | CHS/Community Health Systems, Inc., 6.0%, 1/15/29 (144A) | 32,408 |
| 65,000 | | Legacy LifePoint Health LLC, 6.75%, 4/15/25 (144A) | 69,798 |
| 75,000 | | Lifepoint Health, Inc., 5.375%, 1/15/29 (144A) | 74,839 |
| 100,000 | | Prime Healthcare Services, Inc., 7.25%, 11/1/25 (144A) | 106,250 |
| 30,000 | | Providence Service Corp., 5.875%, 11/15/25 (144A) | 31,725 |
| 22,000 | | RegionalCare Hospital Partners Holdings, Inc./LifePoint Health, Inc., 9.75%, 12/1/26 (144A) | 24,200 |
| 57,000 | | Surgery Center Holdings, Inc., 6.75%, 7/1/25 (144A) | 57,997 |
| 293,000 | | Surgery Center Holdings, Inc., 10.0%, 4/15/27 (144A) | 323,765 |
| 146,000 | | US Renal Care, Inc., 10.625%, 7/15/27 (144A) | 161,330 |
| 169,000 | | West Street Merger Sub, Inc., 6.375%, 9/1/25 (144A) | 173,225 |
| | Total Healthcare-Services | $ 1,125,428 |
| | Holding Companies-Diversified – 0.7% | |
| 275,000 | | VistaJet Malta Finance Plc/XO Management Holding, Inc., 10.5%, 6/1/24 (144A) | $ 281,875 |
| | Total Holding Companies-Diversified | $ 281,875 |
| | Home Builders – 4.1% | |
| 125,000 | | Beazer Homes USA, Inc., 5.875%, 10/15/27 | $ 131,562 |
| 182,000 | | Beazer Homes USA, Inc., 6.75%, 3/15/25 | 189,498 |
| 85,000 | | Beazer Homes USA, Inc., 7.25%, 10/15/29 | 95,837 |
| 150,000 | | Brookfield Residential Properties, Inc./Brookfield Residential US Corp., 4.875%, 2/15/30 (144A) | 155,063 |
| 108,000 | | Brookfield Residential Properties, Inc./Brookfield Residential US Corp., 6.25%, 9/15/27 (144A) | 114,885 |
The accompanying notes are an integral part of these financial statements.
12
| | |
| Pioneer High Yield VCT Portfolio | Pioneer Variable Contracts Trust |
| | | | |
| Principal | | | |
| Amount | | | |
| USD ($) | | | Value |
| | Home Builders – (continued) | |
| 80,000 | | Empire Communities Corp., 7.0%, 12/15/25 (144A) | $ 84,309 |
| 307,000 | | KB Home, 6.875%, 6/15/27 | 359,958 |
| 195,000 | | M/I Homes, Inc., 4.95%, 2/1/28 | 206,417 |
| 147,000 | | Taylor Morrison Communities, Inc., 5.875%, 6/15/27 (144A) | 166,598 |
| 115,000 | | TRI Pointe Group, Inc., 5.7%, 6/15/28 | 129,835 |
| 55,000 | | Williams Scotsman International, Inc., 4.625%, 8/15/28 (144A) | 56,925 |
| 30,000 | | Winnebago Industries, Inc., 6.25%, 7/15/28 (144A) | 32,250 |
| | Total Home Builders | $ 1,723,137 |
| | Household Products/Wares – 0.8% | |
| 40,000 | | Central Garden & Pet Co., 4.125%, 10/15/30 | $ 41,700 |
| 105,000 | | Spectrum Brands, Inc., 5.5%, 7/15/30 (144A) | 113,138 |
| 190,000 | | Spectrum Brands, Inc., 5.75%, 7/15/25 | 196,194 |
| | Total Household Products/Wares | $ 351,032 |
| | Housewares – 0.1% | |
| 30,000 | | CD&R Smokey Buyer, Inc., 6.75%, 7/15/25 (144A) | $ 32,063 |
| | Total Housewares | $ 32,063 |
| | Internet – 1.0% | |
| 90,000 | | ANGI Group LLC, 3.875%, 8/15/28 (144A) | $ 91,575 |
| 110,000 | | Netflix, Inc., 3.625%, 6/15/25 (144A) | 117,781 |
| 97,000 | | Netflix, Inc., 4.875%, 4/15/28 | 109,387 |
| 90,000 | | Netflix, Inc., 5.375%, 11/15/29 (144A) | 106,088 |
| | Total Internet | $ 424,831 |
| | Iron & Steel – 1.5% | |
| 200,000 | | Carpenter Technology Corp., 6.375%, 7/15/28 | $ 220,709 |
| 320,000 | | Cleveland-Cliffs, Inc., 6.75%, 3/15/26 (144A) | 345,600 |
| 15,000 | | Cleveland-Cliffs, Inc., 9.875%, 10/17/25 (144A) | 17,644 |
| 55,000 | | Commercial Metals Co., 5.375%, 7/15/27 | 57,887 |
| | Total Iron & Steel | $ 641,840 |
| | Leisure Time – 1.2% | |
| 65,000 | | Carnival Corp., 7.625%, 3/1/26 (144A) | $ 70,817 |
| 35,000 | | Carnival Corp., 10.5%, 2/1/26 (144A) | 40,775 |
| 85,000 | | NCL Corp., Ltd., 5.875%, 3/15/26 (144A) | 89,405 |
| 30,000 | | Royal Caribbean Cruises, Ltd., 9.125%, 6/15/23 (144A) | 32,550 |
| 73,000 | | Royal Caribbean Cruises, Ltd., 11.5%, 6/1/25 (144A) | 85,340 |
| 109,000 | | Viking Cruises, Ltd., 5.875%, 9/15/27 (144A) | 106,600 |
| 69,000 | | Viking Cruises, Ltd., 6.25%, 5/15/25 (144A) | 67,620 |
| | Total Leisure Time | $ 493,107 |
| | Lodging – 1.8% | |
| 100,000 | | Boyd Gaming Corp., 8.625%, 6/1/25 (144A) | $ 111,219 |
| 105,000 | | Hilton Domestic Operating Co., Inc., 3.75%, 5/1/29 (144A) | 109,482 |
| 100,000 | | Hilton Domestic Operating Co., Inc., 4.0%, 5/1/31 (144A) | 105,511 |
| 36,000 | | Hyatt Hotels Corp., 4.375%, 9/15/28 | 39,570 |
| 95,000 | | Hyatt Hotels Corp., 5.375%, 4/23/25 | 107,361 |
| 45,000 | | Hyatt Hotels Corp., 5.75%, 4/23/30 | 55,318 |
| 137,000 | | Station Casinos LLC, 4.5%, 2/15/28 (144A) | 138,028 |
| 90,000 | | Wyndham Destinations, Inc., 6.625%, 7/31/26 (144A) | 103,050 |
| | Total Lodging | $ 769,539 |
The accompanying notes are an integral part of these financial statements.
13
| | |
| Pioneer High Yield VCT Portfolio | Pioneer Variable Contracts Trust |
| Schedule of Investments 12/31/20 (continued) | |
| | | | |
| Principal | | | |
| Amount | | | |
| USD ($) | | | Value |
| | Media – 5.1% | |
| 175,000 | | CCO Holdings LLC/CCO Holdings Capital Corp., 5.125%, 5/1/27 (144A) | $ 185,708 |
| 515,000 | | CCO Holdings LLC/CCO Holdings Capital Corp., 5.5%, 5/1/26 (144A) | 533,669 |
| 146,000 | | Clear Channel Worldwide Holdings, Inc., 9.25%, 2/15/24 | 147,825 |
| 200,000 | | CSC Holdings LLC, 5.375%, 2/1/28 (144A) | 213,500 |
| 208,000 | | CSC Holdings LLC, 5.5%, 5/15/26 (144A) | 216,320 |
| 200,000 | | CSC Holdings LLC, 7.5%, 4/1/28 (144A) | 225,000 |
| 260,000 | | Diamond Sports Group LLC/Diamond Sports Finance Co., 6.625%, 8/15/27 (144A) | 157,300 |
| 106,000 | | Gray Television, Inc., 5.875%, 7/15/26 (144A) | 111,167 |
| 50,000 | | Scripps Escrow II, Inc., 5.375%, 1/15/31 (144A) | 52,125 |
| 70,000 | | Sinclair Television Group, Inc., 4.125%, 12/1/30 (144A) | 71,626 |
| 230,000 | | Sinclair Television Group, Inc., 5.5%, 3/1/30 (144A) | 239,200 |
| | Total Media | $ 2,153,440 |
| | Mining – 2.0% | |
| 39,000 | | Coeur Mining, Inc., 5.875%, 6/1/24 | $ 39,292 |
| 200,000 | | First Quantum Minerals, Ltd., 7.25%, 4/1/23 (144A) | 206,135 |
| 130,000 | | Hecla Mining Co., 7.25%, 2/15/28 | 142,025 |
| 77,000 | | Hudbay Minerals, Inc., 6.125%, 4/1/29 (144A) | 82,968 |
| 123,000 | | Joseph T Ryerson & Son, Inc., 8.5%, 8/1/28 (144A) | 139,298 |
| 130,000 | | Novelis Corp., 4.75%, 1/30/30 (144A) | 140,057 |
| 92,000 | | Novelis Corp., 5.875%, 9/30/26 (144A) | 96,140 |
| | Total Mining | $ 845,915 |
| | Miscellaneous Manufacturers – 0.6% | |
| 128,000 | | Bombardier, Inc., 6.0%, 10/15/22 (144A) | $ 125,651 |
| 60,000 | | Hillenbrand, Inc., 5.75%, 6/15/25 | 64,800 |
| 79,000 | | Koppers, Inc., 6.0%, 2/15/25 (144A) | 81,370 |
| | Total Miscellaneous Manufacturers | $ 271,821 |
| | Oil & Gas – 6.2% | |
| 160,000 | | Aker BP ASA, 3.75%, 1/15/30 (144A) | $ 168,049 |
| 300,000 | | Baytex Energy Corp., 8.75%, 4/1/27 (144A) | 190,896 |
| 175,000 | | Cenovus Energy, Inc., 5.375%, 7/15/25 | 197,304 |
| 167,000 | | Cenovus Energy, Inc., 6.75%, 11/15/39 | 220,790 |
| 40,000 | | EQT Corp., 5.0%, 1/15/29 | 42,173 |
| 296,000 | | Indigo Natural Resources LLC, 6.875%, 2/15/26 (144A) | 302,660 |
| 42,000 | | MEG Energy Corp., 6.5%, 1/15/25 (144A) | 43,262 |
| 163,000 | | MEG Energy Corp., 7.0%, 3/31/24 (144A) | 164,630 |
| 25,000 | | MEG Energy Corp., 7.125%, 2/1/27 (144A) | 25,812 |
| 219,000 | | Neptune Energy Bondco Plc, 6.625%, 5/15/25 (144A) | 216,650 |
| 172,000 | | Occidental Petroleum Corp., 4.4%, 4/15/46 | 149,892 |
| 35,000 | | Occidental Petroleum Corp., 5.5%, 12/1/25 | 36,491 |
| 104,000 | | Parkland Corp., 5.875%, 7/15/27 (144A) | 112,448 |
| 30,000 | | Parsley Energy LLC/Parsley Finance Corp., 5.25%, 8/15/25 (144A) | 31,245 |
| 20,000 | | Parsley Energy LLC/Parsley Finance Corp., 5.625%, 10/15/27 (144A) | 21,890 |
| 300,000 | | PBF Holding Co. LLC/PBF Finance Corp., 6.0%, 2/15/28 | 171,375 |
| 95,000 | | PBF Holding Co. LLC/PBF Finance Corp., 9.25%, 5/15/25 (144A) | 93,661 |
| 350,000 | | Shelf Drilling Holdings, Ltd., 8.25%, 2/15/25 (144A) | 161,000 |
| 260,339 | | Transocean Sentry, Ltd., 5.375%, 5/15/23 (144A) | 236,909 |
| 37,000 | | Transocean, Inc., 8.0%, 2/1/27 (144A) | 17,436 |
| | Total Oil & Gas | $ 2,604,573 |
14
The accompanying notes are an integral part of these financial statements.
| | |
| Pioneer High Yield VCT Portfolio | Pioneer Variable Contracts Trust |
| | | | |
| Principal | | | |
| Amount | | | |
| USD ($) | | | Value |
| | Oil & Gas Services – 1.0% | |
| 80,000 | | Archrock Partners LP/Archrock Partners Finance Corp., 6.25%, 4/1/28 (144A) | $ 83,277 |
| 152,000 | | Archrock Partners LP/Archrock Partners Finance Corp., 6.875%, 4/1/27 (144A) | 163,590 |
| 89,000 | | Exterran Energy Solutions LP/EES Finance Corp., 8.125%, 5/1/25 | 74,315 |
| 120,000 | | SESI LLC, 7.75%, 9/15/24 | 38,400 |
| 74,000 | | USA Compression Partners LP/USA Compression Finance Corp., 6.875%, 9/1/27 | 79,001 |
| | Total Oil & Gas Services | $ 438,583 |
| | Packaging & Containers – 1.5% | |
| 254,000 | | Crown Cork & Seal Co., Inc., 7.375%, 12/15/26 | $ 309,245 |
| 324,000 | | Greif, Inc., 6.5%, 3/1/27 (144A) | 342,630 |
| | Total Packaging & Containers | $ 651,875 |
| | Pharmaceuticals – 3.0% | |
| 75,000 | | Bausch Health Cos., Inc., 5.0%, 1/30/28 (144A) | $ 77,290 |
| 80,000 | | Bausch Health Cos., Inc., 5.5%, 11/1/25 (144A) | 82,903 |
| 96,000 | | Bausch Health Cos., Inc., 7.0%, 1/15/28 (144A) | 105,523 |
| 96,000 | | Bausch Health Cos., Inc., 7.25%, 5/30/29 (144A) | 107,915 |
| 105,000 | | Endo Dac/Endo Finance LLC/Endo Finco, Inc., 6.0%, 6/30/28 (144A) | 89,250 |
| 83,000 | | Endo Dac/Endo Finance LLC/Endo Finco, Inc., 9.5%, 7/31/27 (144A) | 92,649 |
| 110,000 | | P&L Development LLC/PLD Finance Corp., 7.75%, 11/15/25 (144A) | 118,250 |
| 139,000 | | Par Pharmaceutical, Inc., 7.5%, 4/1/27 (144A) | 150,815 |
| 456,000 | | Teva Pharmaceutical Finance Netherlands III BV, 2.8%, 7/21/23 | 451,486 |
| | Total Pharmaceuticals | $ 1,276,081 |
| | Pipelines – 5.2% | |
| 325,000 | | American Midstream Partners LP/American Midstream Finance Corp., 9.5%, 12/15/21 (144A) | $ 322,562 |
| 30,000 | | DCP Midstream Operating LP, 3.875%, 3/15/23 | 30,900 |
| 49,000 | | DCP Midstream Operating LP, 4.95%, 4/1/22 | 50,470 |
| 200,000 | | DCP Midstream Operating LP, 5.375%, 7/15/25 | 219,764 |
| 165,000 | | Delek Logistics Partners LP/Delek Logistics Finance Corp., 6.75%, 5/15/25 | 160,050 |
| 220,000(b)(c) | | Energy Transfer Operating LP, 7.125% (5 Year CMT Index + 531 bps) | 209,000 |
| 5,000 | | EnLink Midstream LLC, 5.375%, 6/1/29 | 4,862 |
| 40,000 | | EnLink Midstream Partners LP, 5.05%, 4/1/45 | 31,876 |
| 79,000 | | EnLink Midstream Partners LP, 5.45%, 6/1/47 | 63,616 |
| 116,000 | | EnLink Midstream Partners LP, 5.6%, 4/1/44 | 93,090 |
| 80,000 | | Genesis Energy LP/Genesis Energy Finance Corp., 8.0%, 1/15/27 | 79,216 |
| 111,000 | | Global Partners LP/GLP Finance Corp., 7.0%, 8/1/27 | 118,770 |
| 128,000 | | Harvest Midstream I LP, 7.5%, 9/1/28 (144A) | 136,160 |
| 285,000 | | Northriver Midstream Finance LP, 5.625%, 2/15/26 (144A) | 294,348 |
| 135,000 | | NuStar Logistics LP, 6.375%, 10/1/30 | 152,928 |
| 135,000 | | PBF Logistics LP/PBF Logistics Finance Corp., 6.875%, 5/15/23 | 129,263 |
| 100,000 | | Tallgrass Energy Partners LP/Tallgrass Energy Finance Corp., 6.0%, 3/1/27 (144A) | 103,625 |
| | Total Pipelines | $ 2,200,500 |
| | REITs – 2.2% | |
| 51,000 | | Iron Mountain, Inc., 4.5%, 2/15/31 (144A) | $ 53,422 |
| 105,000 | | iStar, Inc., 4.25%, 8/1/25 | 103,687 |
| 195,000 | | iStar, Inc., 4.75%, 10/1/24 | 197,437 |
| 205,000 | | MPT Operating Partnership LP/MPT Finance Corp., 3.5%, 3/15/31 | 211,663 |
| 146,000 | | MPT Operating Partnership LP/MPT Finance Corp., 4.625%, 8/1/29 | 156,038 |
The accompanying notes are an integral part of these financial statements.
15
| | |
| Pioneer High Yield VCT Portfolio | Pioneer Variable Contracts Trust |
| Schedule of Investments 12/31/20 (continued) | |
| | | | |
| Principal | | | |
| Amount | | | |
| USD ($) | | | Value |
| | REITs – (continued) | |
| 93,000 | | Uniti Group LP/Uniti Fiber Holdings, Inc./CSL Capital LLC, 7.875%, 2/15/25 (144A) | $ 99,902 |
| 110,000 | | Uniti Group LP/Uniti Group Finance, Inc./CSL Capital LLC, 8.25%, 10/15/23 | 110,825 |
| | Total REITs | $ 932,974 |
| | Retail – 3.9% | |
| 150,000 | | AAG FH LP/AAG FH Finco, Inc., 9.75%, 7/15/24 (144A) | $ 142,500 |
| 93,000 | | Asbury Automotive Group, Inc., 4.5%, 3/1/28 | 96,952 |
| 97,000 | | Asbury Automotive Group, Inc., 4.75%, 3/1/30 | 104,032 |
| 287,000 | | Beacon Roofing Supply, Inc., 4.875%, 11/1/25 (144A) | 293,816 |
| 55,000 | | IRB Holding Corp., 7.0%, 6/15/25 (144A) | 60,088 |
| 60,000 | | Ken Garff Automotive LLC, 4.875%, 9/15/28 (144A) | 62,400 |
| 60,000 | | L Brands, Inc., 6.625%, 10/1/30 (144A) | 66,750 |
| 304,000 | | Michaels Stores, Inc., 8.0%, 7/15/27 (144A) | 326,800 |
| 90,000 | | Penske Automotive Group, Inc., 3.5%, 9/1/25 | 91,463 |
| 155,000 | | QVC, Inc., 4.375%, 9/1/28 | 160,603 |
| 140,000 | | QVC, Inc., 4.75%, 2/15/27 | 150,150 |
| 91,000 | | Staples, Inc., 7.5%, 4/15/26 (144A) | 95,029 |
| | Total Retail | $ 1,650,583 |
| | Software – 0.4% | |
| 150,000 | | Rackspace Technology Global, Inc., 5.375%, 12/1/28 (144A) | $ 157,155 |
| | Total Software | $ 157,155 |
| | Telecommunications – 2.4% | |
| 200,000 | | Altice France Holding SA., 6.0%, 2/15/28 (144A) | $ 202,500 |
| 80,000 | | CenturyLink, Inc., 4.0%, 2/15/27 (144A) | 82,600 |
| 200,000 | | CenturyLink, Inc., 4.5%, 1/15/29 (144A) | 203,500 |
| 78,000 | | CommScope Technologies LLC, 6.0%, 6/15/25 (144A) | 79,755 |
| 63,000 | | CommScope, Inc., 8.25%, 3/1/27 (144A) | 67,252 |
| 200,000 | | LogMeIn, Inc., 5.5%, 9/1/27 (144A) | 209,500 |
| 185,000 | | Windstream Escrow LLC/Windstream Escrow Finance Corp., 7.75%, 8/15/28 (144A) | 186,295 |
| | Total Telecommunications | $ 1,031,402 |
| | Transportation – 0.9% | |
| 75,000 | | Watco Cos., LLC/Watco Finance Corp., 6.5%, 6/15/27 (144A) | $ 81,188 |
| 250,000 | | Western Global Airlines LLC, 10.375%, 8/15/25 (144A) | 278,750 |
| | Total Transportation | $ 359,938 |
| | Trucking & Leasing – 0.2% | |
| 85,000 | | Fortress Transportation & Infrastructure Investors LLC, 9.75%, 8/1/27 (144A) | $ 97,431 |
| | Total Trucking & Leasing | $ 97,431 |
| | TOTAL CORPORATE BONDS | |
| | (Cost $34,558,908) | $ 35,961,408 |
| Face | | | |
| Amount | | | |
| USD ($) | | | |
| | INSURANCE-LINKED SECURITIES – 0.0%† of Net Assets# | |
| | Multiperil – Worldwide – 0.0%† | |
| 50,000+(a)(e) | | Lorenz Re 2018, 7/1/21 | $ 595 |
| 25,723+(a)(e) | | Lorenz Re 2019, 6/30/22 | 1,695 |
| | Total Reinsurance Sidecars | $ 2,290 |
| | TOTAL INSURANCE-LINKED SECURITIES | |
| | (Cost $19,865) | $ 2,290 |
The accompanying notes are an integral part of these financial statements.
16
| | |
| Pioneer High Yield VCT Portfolio | Pioneer Variable Contracts Trust |
| | | | |
| Principal | | | |
| Amount | | | |
| USD ($) | | | Value |
| | | SENIOR SECURED FLOATING RATE LOAN INTERESTS – 2.2% of Net Assets*(f) | |
| | Aerospace & Defense – 0.3% | |
| 140,000 | | Grupo Aeromexico, Sociedad Anonima Bursatil De Capital Variable, DIP Tranche 1 Term | |
| | Loan, 9.0% (LIBOR + 800 bps), 12/31/21 | $ 142,625 |
| 9,010(k) | | Grupo Aeromexico, Sociedad Anonima Bursatil De Capital Variable, Partially unfunded DIP Tranche 2 | |
| | Term Loan, 15.5% (LIBOR + 1,450 bps), 12/31/21 | 9,246 |
| | Total Aerospace & Defense | $ 151,871 |
| | Diversified & Conglomerate Service – 0.6% | |
| 98,748 | | First Brands Group LLC, First Lien Tranche B-3 Term Loan, 8.5% (LIBOR + 750 bps), 2/2/24 | $ 98,656 |
| 153,406 | | Team Health Holdings, Inc., Initial Term Loan, 3.75% (LIBOR + 275 bps), 2/6/24 | 138,257 |
| | Total Diversified & Conglomerate Service | $ 236,913 |
| | Healthcare, Education & Childcare – 0.4% | |
| 114,603 | | LifePoint Health, Inc. (fka Regionalcare Hospital Partners Holdings, Inc.), First Lien Term B Loan, | |
| | 3.897% (LIBOR + 375 bps), 11/16/25 | $ 114,525 |
| 64,513 | | Surgery Center Holdings, Inc., 2020 Incremental Term Loan, 9.0% (LIBOR + 800 bps), 8/31/24 | 66,448 |
| | Total Healthcare, Education & Childcare | $ 180,973 |
| | Securities & Trusts – 0.5% | |
| 215,400 | | Spectacle Gary Holdings LLC, Closing Date Term Loan, 11.0% (LIBOR + 900 bps), 12/23/25 | $ 215,400 |
| 15,600 | | Spectacle Gary Holdings LLC, Delayed Draw Term Loan, 11.0%, 12/23/25 | 15,600 |
| | Total Securities & Trusts | $ 231,000 |
| | Telecommunications – 0.2% | |
| 96,870 | | Commscope, Inc., Initial Term Loan, 3.397% (LIBOR + 325 bps), 4/6/26 | $ 96,437 |
| | Total Telecommunications | $ 96,437 |
| | Utilities – 0.2% | |
| 59,700 | | PG&E Corp., Term Loan, 5.5% (LIBOR + 450 bps), 6/23/25 | $ 60,521 |
| | Total Utilities | $ 60,521 |
| | TOTAL SENIOR SECURED FLOATING RATE LOAN INTERESTS | |
| | (Cost $930,614) | $ 957,715 |
| | U.S. GOVERNMENT AND AGENCY OBLIGATION – 2.4% of Net Assets | |
| 1,000,000(g) | | U.S. Treasury Bills, 1/26/21 | $ 999,971 |
| | TOTAL U.S. GOVERNMENT AND AGENCY OBLIGATION | |
| | (Cost $999,940) | $ 999,971 |
| Shares | | | |
| | RIGHTS/WARRANTS – 0.0%† of Net Assets | |
| | Health Care Providers & Services – 0.0%† | |
| 80+^(a)(h) | | Option Care Health, Inc. 6/30/25 | $ 91 |
| 80+^(a)(h) | | Option Care Health, Inc. 6/30/25 | 71 |
| | Total Health Care Providers & Services | $ 162 |
| | Transportation – 0.0%† | |
| 1,007+^(a)(i) | | Syncreon Group, 10/01/24 | $ — |
| | Total Transportation | $ — |
| | TOTAL RIGHTS/WARRANTS | |
| | (Cost $0) | $ 162 |
| | TOTAL INVESTMENTS IN UNAFFILIATED ISSUERS – 94.5% | |
| | (Cost $38,479,993) | $ 40,017,445 |
The accompanying notes are an integral part of these financial statements.
17
| | |
| Pioneer High Yield VCT Portfolio | Pioneer Variable Contracts Trust |
| Schedule of Investments 12/31/20 (continued) | |
| | | | | | | |
| | | | | Change | |
| | | | | in Net | |
| | | | Net | Unrealized | |
| | | Dividend | Realized | Appreciation | |
| Shares | | | Income | Gain (Loss) | (Depreciation) | Value |
| | | AFFILIATED ISSUER – 1.2% | | | | |
| | CLOSED-END FUND – 1.2% of Net Assets | | | | |
| 60,000(j) | | Pioneer ILS Interval Fund | $26,496 | $(132,800) | $153,023 | $ 509,400 |
| | TOTAL CLOSED-END FUND | | | | |
| | (Cost $636,000) | | | | $ 509,400 |
| | TOTAL INVESTMENTS IN AFFILIATED ISSUER – 1.2% | | | |
| | (Cost $636,000) | | | | $ 509,400 |
| | OTHER ASSETS AND LIABILITIES – 4.3% | | | | $ 1,815,873 |
| | NET ASSETS – 100.0% | | | | $ 42,342,718 |
bps | Basis Points. |
CMT | Constant Maturity Treasury. |
LIBOR | London Interbank Offered Rate. |
REIT | Real Estate Investment Trust. |
SOFRRATE | Secured Overnight Financing Rate. |
(144A)
| Security is exempt from registration under Rule 144A of the Securities Act of 1933. Such securities may be resold normally to qualified institutional buyers in a transaction exempt from registration. At December 31, 2020, the value of these securities amounted to $26,990,344, or 63.7% of net assets. |
† | Amount rounds to less than 0.1%. |
* | Senior secured floating rate loan interests in which the Portfolio invests generally pay interest at rates that are periodically redetermined by |
| reference to a base lending rate plus a premium. These base lending rates are generally (i) the lending rate offered by one or more major |
| European banks, such as LIBOR, (ii) the prime rate offered by one or more major United States banks, (iii) the rate of a certificate of deposit or |
| (iv) other base lending rates used by commercial lenders. The interest rate shown is the rate accruing at December 31, 2020. |
+ | Security that used significant unobservable inputs to determine its value. |
^ | Security is valued using fair value methods (other than supplied by independent pricing services). |
(a) | Non-income producing security. |
(b) | Security is perpetual in nature and has no stated maturity date. |
(c) | The interest rate is subject to change periodically. The interest rate and/or reference index and spread shown at December 31, 2020. |
(d) | Payment-in-kind (PIK) security which may pay interest in the form of additional principal amount. |
(e) | Issued as preference shares. |
(f) | Floating rate note. Coupon rate, reference index and spread shown at December 31, 2020. |
(g) | Security issued with a zero coupon. Income is recognized through accretion of discount. |
(h) | Option Care Health, Inc. warrants are exercisable into 160 shares. |
(i) | Syncreon Group warrants are exercisable into 1,007 shares. |
(j) | Pioneer ILS Interval Fund is an affiliated closed-end fund managed by Amundi Asset Management US, Inc., (the “Adviser”). |
(k) | Security is partially funded. See Notes to the Financial Statements — Note 8. |
# | Securities are restricted as to resale. |
| Acquisition | | |
| Restricted Securities | date | Cost | Value |
Lorenz Re 2018 | 6/26/2018 | $11,497 | $ 595 |
Lorenz Re 2019 | 7/10/2019 | 8,368 | 1,695 |
| Total Restricted Securities | | | $2,290 |
| % of Net assets | | | 0.0%† |
† Amount rounds to less than 0.1%. | | | |
The accompanying notes are an integral part of these financial statements.
18
| | |
| Pioneer High Yield VCT Portfolio | Pioneer Variable Contracts Trust |
| | | | | | | |
FORWARD FOREIGN CURRENCY EXCHANGE CONTRACTS
| | |
| Currency | | Currency | | | Settlement | Unrealized |
| Purchased | In Exchange for | Sold | Deliver | Counterparty | Date | Depreciation |
USD | 114,041 | EUR | (96,125) | State Street Bank & Trust Co. | 2/25/21 | $(3,475) |
| TOTAL FORWARD FOREIGN CURRENCY EXCHANGE CONTRACTS | | | $(3,475) |
| SWAP CONTRACTS | | | | | | |
| CENTRALLY CLEARED CREDIT DEFAULT SWAP CONTRACTS – SELL PROTECTION | | |
| | | | | Premiums | | |
| Notional | | Pay/ | Annual | Expiration | Paid/ | Unrealized | Market |
Amount ($)(1) | Reference Obligation/Index | Receive(2) | Fixed Rate | Date | (Received) | Appreciation
| Value |
680,000 | Markit CDX North America High Yield Index | | | | | | |
| Series 27 | Receive | 5.00% | 12/20/25 | $41,922 | $22,355 | $64,277 |
309,616 | Markit CDX North America High Yield Index | | | | | | |
| Series 31 | Receive | 5.00% | 12/20/21 | (2,451) | 13,889 | 11,438 |
231,400 | Markit CDX North America High Yield Index | | | | | | |
| Series 32 | Receive | 5.00% | 6/20/24 | 11,707 | 8,409 | 20,116 |
| TOTAL CENTRALLY CLEARED CREDIT DEFAULT SWAP CONTRACTS – SELL PROTECTION | | $51,178 | $44,653 | $95,831 |
| TOTAL SWAP CONTRACTS | | | | $51,178 | $44,653 | $95,831 |
| (1) | The notional amount is the maximum amount that a seller of credit protection would be obligated to pay upon occurrence of a credit event. |
| (2) | Receives Quarterly. |
Principal amounts are denominated in U.S. dollars (“USD”) unless otherwise noted.
EUR — Euro
Purchases and sales of securities (excluding temporary cash investments) for the year ended December 31, 2020 were as follows:
| | | |
| Purchases | Sales |
| Long-Term U.S. Government Securities | $ 1,803,668 | $ 1,804,419 |
| Other Long-Term Securities | $33,594,002 | $35,655,909 |
The Portfolio is permitted to engage in purchase and sale transactions (“cross trades”) with certain funds and accounts for which the Adviser serves as the Portfolio’s investment adviser, as set forth in Rule 17a-7 under the Investment Company Act of 1940, pursuant to procedures adopted by the Board of Trustees. Under these procedures, cross trades are effected at current market prices. During the year ended December 31, 2020, the Portfolio engaged in purchases of $498,546 and sales of $1,644,199 pursuant to these procedures, which resulted in a net realized gain/(loss) of $11,588.
At December 31, 2020, the net unrealized appreciation on investments based on cost for federal tax purposes of $39,208,491 was as follows:
| | | | |
| Aggregate gross unrealized appreciation for all investments in which there is an excess of value over tax cost | | $ | 2,529,173 | |
| Aggregate gross unrealized depreciation for all investments in which there is an excess of tax cost over value | | | (1,118,463 | ) |
| Net unrealized appreciation | | $ | 1,410,710 | |
Various inputs are used in determining the value of the Portfolio’s investments. These inputs are summarized in the three broad levels below.
Level 1 – unadjusted quoted prices in active markets for identical securities.
Level 2 – other significant observable inputs (including quoted prices for similar securities, interest rates, prepayment speeds, credit risks, etc.). See Notes to Financial Statements — Note 1A.
Level 3 – significant unobservable inputs (including the Portfolio’s own assumptions in determining fair value of investments). See Notes to Financial Statements — Note 1A.
The accompanying notes are an integral part of these financial statements.
19
| | |
| Pioneer High Yield VCT Portfolio | Pioneer Variable Contracts Trust |
| Schedule of Investments 12/31/20 (continued) | |
| | | | | | |
The following is a summary of the inputs used as of December 31, 2020, in valuing the Portfolio’s investments: |
| | Level 1 | | | Level 2 | | | Level 3 | | | Total | |
| Common Stock | | $ | 163,872 | | | $ | — | | | $ | — | | | $ | 163,872 | |
| Convertible Preferred Stock | | | 144,201 | | | | — | | | | — | | | | 144,201 | |
| Commercial Mortgage-Backed Security | | | — | | | | 106,729 | | | | — | | | | 106,729 | |
| Convertible Corporate Bonds | | | — | | | | 1,681,097 | | | | — | | | | 1,681,097 | |
| Corporate Bonds | | | — | | | | 35,961,408 | | | | — | | | | 35,961,408 | |
| Insurance-Linked Securities | | | | | | | | | | | | | | | | |
| Reinsurance Sidecars | | | | | | | | | | | | | | | | |
| Multiperil - Worldwide | | | — | | | | — | | | | 2,290 | | | | 2,290 | |
| Senior Secured Floating Rate Loan Interests | | | — | | | | 957,715 | | | | — | | | | 957,715 | |
| U.S. Government and Agency Obligation | | | — | | | | 999,971 | | | | — | | | | 999,971 | |
| Rights/Warrants | | | — | | | | — | | | | 162 | * | | | 162 | |
| Affiliated Closed-End Fund | | | — | | | | 509,400 | | | | — | | | | 509,400 | |
| Total Investments in Securities | | $ | 308,073 | | | $ | 40,216,320 | | | $ | 2,452 | | | $ | 40,526,845 | |
| Other Financial Instruments | | | | | | | | | | | | | | | | |
| Net unrealized depreciation on forward foreign currency exchange contracts | | $ | — | | | $ | (3,475 | ) | | $ | — | | | $ | (3,475 | ) |
| Swap contracts, at value | | | — | | | | 95,831 | | | | — | | | | 95,831 | |
| Total Other Financial Instruments | | $ | — | | | $ | 92,356 | | | $ | — | | | $ | 92,356 | |
* Includes security that is valued at $0.
|
The following is a reconciliation of assets valued using significant unobservable inputs (Level 3):
| | Insurance- | | | | | | | |
| | Linked | | | Rights/ | | | | |
| | Securities | | | Warrants | | | Total | |
| Balance as of 12/31/19 | | $ | 27,503 | | | $ | 185 | * | | $ | 27,688 | |
Realized gain (loss)(1) | | | — | | | | — | | | | — | |
Change in unrealized appreciation (depreciation)(2) | | | (789 | ) | | | (23 | ) | | | (812 | ) |
| Accrued discounts/premiums | | | — | | | | — | | | | — | |
| Purchases | | | — | | | | — | | | | — | |
| Sales | | | (24,424 | ) | | | — | | | | (24,424 | ) |
| Transfers in to Level 3** | | | — | | | | — | | | | — | |
| Transfer out of Level 3** | | | — | | | | — | | | | — | |
| Balance as of 12/31/20 | | $ | 2,290 | | | $ | 162 | * | | $ | 2,452 | |
(1) | Realized gain (loss) on these securities is included in the realized gain (loss) from investments on the Statement of Operations. |
(2) | Unrealized appreciation (depreciation) on these securities is included in the change in unrealized appreciation (depreciation) from investments on the Statement of Operations. |
* | Includes security that is valued at $0. |
** | Transfers are calculated on the beginning of period value. For the year ended December 31, 2020, there were no transfers in or out of Level 3. |
| | |
Net change in unrealized appreciation (depreciation) of Level 3 investments still held and considered Level 3 at December 31, 2020: | $(812) |
The accompanying notes are an integral part of these financial statements.
20
| | |
| Pioneer High Yield VCT Portfolio | Pioneer Variable Contracts Trust |
Statement of Assets and Liabilities 12/31/20 | |
| ASSETS: | | | |
| Investments in unaffiliated issuers, at value (cost $38,479,993) | | $ | 40,017,445 | |
| Investments in affiliated issuers, at value (cost $636,000) | | | 509,400 | |
| Cash | | | 1,032,973 | |
| Swaps collateral | | | 104,157 | |
| Variation margin for centrally cleared swap contracts | | | 1,222 | |
| Swap contracts, at value (net premiums paid $51,178) | | | 95,831 | |
| Unrealized appreciation on unfunded loan commitments | | | 1,096 | |
| Receivables — | | | | |
| Investment securities sold | | | 273,774 | |
| Portfolio shares sold | | | 25,447 | |
| Interest | | | 562,935 | |
| Due from the Adviser | | | 12,001 | |
| Other assets | | | 1,132 | |
| Total assets | | $ | 42,637,413 | |
| LIABILITIES: | | | | |
| Payables — | | | | |
| Investment securities purchased | | $ | 80,000 | |
| Portfolio shares repurchased | | | 32,084 | |
| Trustees’ fees | | | 55 | |
| Administrative fees | | | 9,272 | |
| Professional fees | | | 53,653 | |
| Due to broker for swaps | | | 96,032 | |
| Net unrealized depreciation on forward foreign currency exchange contracts | | | 3,475 | |
| Due to affiliates | | | 12,695 | |
| Accrued expenses | | | 7,429 | |
| Total liabilities | | $ | 294,695 | |
| NET ASSETS: | | | | |
| Paid-in capital | | $ | 42,787,030 | |
| Distributable earnings (loss) | | | (444,312 | ) |
| Net assets | | $ | 42,342,718 | |
| NET ASSET VALUE PER SHARE: | | | | |
No par value (unlimited number of shares authorized) | | | | |
| Class I (based on $34,217,626/3,681,304 shares) | | $ | 9.29 | |
| Class II (based on $8,125,092/886,728 shares) | | $ | 9.16 | |
The accompanying notes are an integral part of these financial statements.
21
| | |
| Pioneer High Yield VCT Portfolio | Pioneer Variable Contracts Trust |
| Statement of Operations | |
| FOR THE YEAR ENDED 12/31/20 | | | | | | |
| INVESTMENT INCOME: | | | | | | |
| Interest from unaffiliated issuers | | $ | 2,548,963 | | | | |
| Dividends from affiliated issuers | | | 26,496 | | | | |
| Dividends from unaffiliated issuers | | | 7,125 | | | | |
| Total investment income | | | | | | $ | 2,582,584 | |
| EXPENSES: | | | | | | | | |
| Management fees | | $ | 272,812 | | | | | |
| Administrative expense | | | 64,535 | | | | | |
| Distribution fees | | | | | | | | |
| Class II | | | 22,480 | | | | | |
| Custodian fees | | | 12,928 | | | | | |
| Professional fees | | | 60,166 | | | | | |
| Printing expense | | | 21,594 | | | | | |
| Pricing fees | | | 19,415 | | | | | |
| Trustees’ fees | | | 7,252 | | | | | |
| Insurance expense | | | 70 | | | | | |
| Miscellaneous | | | 1,105 | | | | | |
| Total expenses | | | | | | $ | 482,357 | |
| Less fees waived and expenses reimbursed by the Adviser | | | | | | | (31,864 | ) |
| Net expenses | | | | | | $ | 450,493 | |
| Net investment income | | | | | | $ | 2,132,091 | |
| REALIZED AND UNREALIZED GAIN (LOSS) ON INVESTMENTS: | | | | | | | | |
| Net realized gain (loss) on: | | | | | | | | |
| Investments in unaffiliated issuers | | $ | (1,819,139 | ) | | | | |
| Investments in affiliated issuers | | | (132,800 | ) | | | | |
| Forward foreign currency exchange contracts | | | 176 | | | | | |
| Swap contracts | | | (123,822 | ) | | | | |
| Other assets and liabilities denominated in foreign currencies | | | 8 | | | $ | (2,075,577 | ) |
| Change in net unrealized appreciation (depreciation) on: | | | | | | | | |
| Investments in unaffiliated issuers | | $ | 559,742 | | | | | |
| Investments in affiliated issuers | | | 153,023 | | | | | |
| Forward foreign currency exchange contracts | | | (3,475 | ) | | | | |
| Swap contracts | | | 2,112 | | | | | |
| Unfunded loan commitments | | | 501 | | | | | |
| Other assets and liabilities denominated in foreign currencies | | | 18 | | | $ | 711,921 | |
| Net realized and unrealized gain (loss) on investments | | | | | | $ | (1,363,656 | ) |
| Net increase in net assets resulting from operations | | | | | | $ | 768,435 | |
The accompanying notes are an integral part of these financial statements.
22
| | |
| Pioneer High Yield VCT Portfolio | Pioneer Variable Contracts Trust |
| Statements of Changes in Net Assets | |
| | | | | | | |
| | Year Ended | | | Year Ended | |
| | 12/31/20 | | | 12/31/19 | |
| FROM OPERATIONS: | | | | | | |
Net investment income (loss) | | $ | 2,132,091 | | | $ | 2,215,343 | |
Net realized gain (loss) on investments | | | (2,075,577 | ) | | | 28,367 | |
Change in net unrealized appreciation (depreciation) on investments | | | 711,921 | | | | 3,690,363 | |
| Net increase in net assets resulting from operations | | $ | 768,435 | | | $ | 5,934,073 | |
| DISTRIBUTIONS TO SHAREOWNERS: | | | | | | | | |
| Class I ($0.48 and $0.46 per share, respectively) | | $ | (1,780,149 | ) | | $ | (1,691,026 | ) |
| Class II ($0.45 and $0.43 per share, respectively) | | | (456,509 | ) | | | (470,273 | ) |
| Total distributions to shareowners | | $ | (2,236,658 | ) | | $ | (2,161,299 | ) |
| FROM PORTFOLIO SHARE TRANSACTIONS: | | | | | | | | |
Net proceeds from sales of shares | | $ | 16,972,174 | | | $ | 8,990,878 | |
Reinvestment of distributions | | | 2,236,658 | | | | 2,161,299 | |
Cost of shares repurchased | | | (22,691,653 | ) | | | (9,191,664 | ) |
| Net increase (decrease) in net assets resulting from Portfolio share transactions | | $ | (3,482,821 | ) | | $ | 1,960,513 | |
| Net increase (decrease) in net assets | | $ | (4,951,044 | ) | | $ | 5,733,287 | |
| NET ASSETS: | | | | | | | | |
Beginning of year | | $ | 47,293,762 | | | $ | 41,560,475 | |
End of year | | $ | 42,342,718 | | | $ | 47,293,762 | |
| | | | | | | | | | | | | |
| | Year Ended | | | Year Ended | | | Year Ended | | | Year Ended | |
| | 12/31/20 | | | 12/31/20 | | | 12/31/19 | | | 12/31/19 | |
| | Shares | | | Amount | | | Shares | | | Amount | |
| Class I | | | | | | | | | | | | |
Shares sold | | | 480,687 | | | $ | 4,158,198 | | | | 321,322 | | | $ | 3,003,575 | |
Reinvestment of distributions | | | 202,848 | | | | 1,780,149 | | | | 181,308 | | | | 1,691,026 | |
Less shares repurchased | | | (723,721 | ) | | | (6,405,539 | ) | | | (591,036 | ) | | | (5,476,479 | ) |
| Net decrease | | | (40,186 | ) | | $ | (467,192 | ) | | | (88,406 | ) | | $ | (781,878 | ) |
| Class II | | | | | | | | | | | | | | | | |
Shares sold | | | 1,476,731 | | | $ | 12,813,976 | | | | 651,310 | | | $ | 5,987,303 | |
Reinvestment of distributions | | | 53,056 | | | | 456,509 | | | | 51,030 | | | | 470,273 | |
Less shares repurchased | | | (1,872,863 | ) | | | (16,286,114 | ) | | | (403,548 | ) | | | (3,715,185 | ) |
| Net increase (decrease) | | | (343,076 | ) | | $ | (3,015,629 | ) | | | 298,792 | | | $ | 2,742,391 | |
The accompanying notes are an integral part of these financial statements.
23
| | |
| Pioneer High Yield VCT Portfolio | Pioneer Variable Contracts Trust |
| Financial Highlights | |
| | Year Ended | | | Year Ended | | | Year Ended | | | Year Ended | | | Year Ended | |
| | 12/31/20 | | | 12/31/19 | | | 12/31/18 | | | 12/31/17 | | | 12/31/16* | |
| Class I | | | | | | | | | | | | | |
| |
Net asset value, beginning of period | | $ | 9.58 | | | $ | 8.79 | | | $ | 9.53 | | | $ | 9.31 | | | $ | 8.55 | |
Increase (decrease) from investment operations: | | | | | | | | | | | | | | | | | | | | |
| Net investment income (loss) (a) | | $ | 0.46 | | | $ | 0.47 | | | $ | 0.44 | | | $ | 0.43 | | | $ | 0.46 | |
| Net realized and unrealized gain (loss) on investments | | | (0.27 | ) | | | 0.78 | | | | (0.74 | ) | | | 0.22 | | | | 0.74 | |
| Net increase (decrease) from investment operations | | $ | 0.19 | | | $ | 1.25 | | | $ | (0.30 | ) | | $ | 0.65 | | | $ | 1.20 | |
Distributions to shareowners: | | | | | | | | | | | | | | | | | | | | |
| Net investment income | | $ | (0.48 | ) | | $ | (0.46 | ) | | $ | (0.44 | ) | | $ | (0.43 | ) | | $ | (0.44 | ) |
| Total distributions | | $ | (0.48 | ) | | $ | (0.46 | ) | | $ | (0.44 | ) | | $ | (0.43 | ) | | $ | (0.44 | ) |
Net increase (decrease) in net asset value
| | $ | (0.29 | ) | | $ | 0.79 | | | $ | (0.74 | ) | | $ | 0.22 | | | $ | 0.76 | |
Net asset value, end of period
| | $ | 9.29 | | | $ | 9.58 | | | $ | 8.79 | | | $ | 9.53 | | | $ | 9.31 | |
| Total return (b) | | | 2.37 | % | | | 14.44 | % | | | (3.30 | )% | | | 7.14 | % | | | 14.35 | % |
Ratio of net expenses to average net assets | | | 1.02 | % | | | 1.03 | % | | | 1.03 | % | | | 0.91 | % | | | 0.92 | % |
Ratio of net investment income (loss) to average net assets | | | 5.15 | % | | | 5.03 | % | | | 4.76 | % | | | 4.57 | % | | | 5.24 | % |
Portfolio turnover rate | | | 90 | % | | | 66 | % | | | 45 | % | | | 44 | % | | | 57 | % |
Net assets, end of period (in thousands) | | $ | 34,218 | | | $ | 35,652 | | | $ | 33,476 | | | $ | 42,728 | | | $ | 48,953 | |
Ratios with no waiver of fees and assumption of expenses by | | | | | | | | | | | | | | | | | | | | |
| the Adviser and no reduction for fees paid indirectly: | | | | | | | | | | | | | | | | | | | | |
| Total expenses to average net assets | | | 1.10 | % | | | 1.07 | % | | | 1.07 | % | | | 0.91 | % | | | 0.92 | % |
| Net investment income (loss) to average net assets | | | 5.07 | % | | | 4.99 | % | | | 4.72 | % | | | 4.57 | % | | | 5.24 | % |
* | The Portfolio was audited by an independent registered public accounting firm other than Ernst & Young LLP. |
(a) | The per-share data presented above is based on the average shares outstanding for the period presented. |
(b) | Assumes initial investment at net asset value at the beginning of each period, reinvestment of all distributions and the complete redemption of the investment at net asset value at the end of each period. |
NOTE: The above financial highlights do not reflect the deduction of non-portfolio expenses associated with variable insurance products, such as mortality and expense risk charges, separate account charges, and sales charges.
The accompanying notes are an integral part of these financial statements.
24
| | |
| Pioneer High Yield VCT Portfolio | Pioneer Variable Contracts Trust |
| | Year Ended | | | Year Ended | | | Year Ended | | | Year Ended | | | Year Ended
| |
| | 12/31/20 | | | 12/31/19 | | | 12/31/18 | | | 12/31/17 | | | 12/31/16* | |
| Class II | | | | | | | | | | | | | |
| |
| Net asset value, beginning of period | | $ | 9.47 | | | $ | 8.68 | | | $ | 9.45 | | | $ | 9.23 | | | $ | 8.49 | |
| Increase (decrease) from investment operations: | | | | | | | | | | | | | | | | | | | | |
| Net investment income (loss) (a) | | $ | 0.42 | | | $ | 0.44 | | | $ | 0.41 | | | $ | 0.41 | | | $ | 0.43 | |
| Net realized and unrealized gain (loss) on investments | | | (0.28 | ) | | | 0.78 | | | | (0.77 | ) | | | 0.22 | | | | 0.72 | |
| Net increase (decrease) from investment operations | | $ | 0.14 | | | $ | 1.22 | | | $ | (0.36 | ) | | $ | 0.63 | | | $ | 1.15 | |
| Distributions to shareowners: | | | | | | | | | | | | | | | | | | | | |
| Net investment income | | $ | (0.45 | ) | | $ | (0.43 | ) | | $ | (0.41 | ) | | $ | (0.41 | ) | | $ | (0.41 | ) |
| Total distributions | | $ | (0.45 | ) | | $ | (0.43 | ) | | $ | (0.41 | ) | | $ | (0.41 | ) | | $ | (0.41 | ) |
Net increase (decrease) in net asset value
| | $ | (0.31 | ) | | $ | 0.79 | | | $ | (0.77 | ) | | $ | 0.22 | | | $ | 0.74 | |
Net asset value, end of period
| | $ | 9.16 | | | $ | 9.47 | | | $ | 8.68 | | | $ | 9.45 | | | $ | 9.23 | |
| Total return (b) | | | 1.87 | % | | | 14.28 | % | | | (3.94 | )% | | | 6.89 | %(c) | | | 13.89 | % |
| Ratio of net expenses to average net assets | | | 1.26 | % | | | 1.28 | % | | | 1.28 | % | | | 1.16 | % | | | 1.16 | % |
| Ratio of net investment income (loss) to average net assets | | | 4.81 | % | | | 4.79 | % | | | 4.50 | % | | | 4.31 | % | | | 4.91 | % |
| Portfolio turnover rate | | | 90 | % | | | 66 | % | | | 45 | % | | | 44 | % | | | 57 | % |
| Net assets, end of period (in thousands) | | $ | 8,125 | | | $ | 11,642 | | | $ | 8,085 | | | $ | 11,594 | | | $ | 11,529 | |
| Ratios with no waiver of fees and assumption of expenses by | | | | | | | | | | | | | | | | | | | | |
| the Adviser and no reduction for fees paid indirectly: | | | | | | | | | | | | | | | | | | | | |
| Total expenses to average net assets | | | 1.33 | % | | | 1.32 | % | | | 1.32 | % | | | 1.16 | % | | | 1.16 | % |
| Net investment income (loss) to average net assets | | | 4.74 | % | | | 4.74 | % | | | 4.45 | % | | | 4.31 | % | | | 4.91 | % |
* | The Portfolio was audited by an independent registered public accounting firm other than Ernst & Young LLP. |
(a) | The per-share data presented above is based on the average shares outstanding for the period presented. |
(b) | Assumes initial investment at net asset value at the beginning of each period, reinvestment of all distributions and the complete redemption of the investment at net asset value at the end of each period. |
(c) | If the Portfolio had not recognized gains in settlement of class action lawsuits during the year ended December 31, 2017, the total return would have been 6.83%. |
NOTE: The above financial highlights do not reflect the deduction of non-portfolio expenses associated with variable insurance products, such as mortality and expense risk charges, separate account charges, and sales charges.
The accompanying notes are an integral part of these financial statements.
25
| | |
| Pioneer High Yield VCT Portfolio | Pioneer Variable Contracts Trust |
Notes to Financial Statements 12/31/20 | |
1. Organization and Significant Accounting Policies
Pioneer High Yield VCT Portfolio (the “Portfolio”) is one of 8 portfolios comprising Pioneer Variable Contracts Trust (the “Trust”), a Delaware statutory trust. The Portfolio is registered under the Investment Company Act of 1940 as a diversified, open-end management investment company. The investment objective of the Portfolio is to maximize total return through a combination of income and capital appreciation.
The Portfolio offers two classes of shares designated as Class I and Class II shares. Each class of shares represents an interest in the same portfolio of investments of the Portfolio and has identical rights (based on relative net asset values) to assets and liquidation proceeds. Share classes can bear different rates of class-specific fees and expenses, such as transfer agent and distribution fees. Differences in class-specific fees and expenses will result in differences in net investment income and, therefore, the payment of different dividends from net investment income earned by each class. The Amended and Restated Declaration of Trust of the Portfolio gives the Board of Trustees the flexibility to specify either per-share voting or dollar-weighted voting when submitting matters for shareowner approval. Under per-share voting, each share of a class of the Portfolio is entitled to one vote. Under dollar-weighted voting, a shareowner’s voting power is determined not by the number of shares owned, but by the dollar value of the shares on the record date. Each share class has exclusive voting rights with respect to matters affecting only that class, including with respect to the distribution plan for that class. There is no distribution plan for Class I shares.
Portfolio shares may be purchased only by insurance companies for the purpose of funding variable annuity and variable life insurance contracts or by qualified pension and retirement plans.
Amundi Asset Management US, Inc., an indirect, wholly owned subsidiary of Amundi and Amundi’s wholly owned subsidiary, Amundi USA, Inc., serves as the Portfolio’s investment adviser (the “Adviser”). Prior to January 1, 2021, the Adviser was named Amundi Pioneer Asset Management, Inc. Amundi Distributor US, Inc., an affiliate of Amundi Asset Management US, Inc., serves as the Portfolio’s distributor (the “Distributor”).
In August 2018, the Financial Accounting Standards Board (FASB) issued Accounting Standards Update 2018-13 “Disclosure Framework - Changes to the Disclosure Requirements for Fair Value Measurement” (“ASU 2018-13”) which modifies disclosure requirements for fair value measurements, principally for Level 3 securities and transfers between levels of the fair value hierarchy. ASU 2018-13 is effective for fiscal years beginning after December 15, 2019 and for interim periods within those fiscal years. The Portfolio adopted with ASU 2018-13 for the year ended December 31, 2020. The impact to the Portfolio’s adoption was limited to changes in the Portfolio’s disclosures regarding fair value, primarily those disclosures related to transfers between levels of the fair value hierarchy and disclosure of the range and weighted average used to develop significant unobservable inputs for Level 3 fair value investments, when applicable.
In March 2020, FASB issued an Accounting Standard Update, ASU 2020-04, Reference Rate Reform (Topic 848) — Facilitation of the Effects of Reference Rate Reform on Financial Reporting (“ASU 2020-04”), which provides optional, temporary relief with respect to the financial reporting of contracts subject to certain types of modifications due to the planned discontinuation of the London Interbank Offered Rate (“LIBOR”) and other LIBOR-based reference rates at the end of 2021. The temporary relief provided by ASU 2020-04 is effective for certain reference rate-related contract modifications that occur during the period from March 12, 2020 through December 31, 2022. Management is evaluating the impact of ASU 2020-04 on the Trust’s investments, derivatives, debt and other contracts that will undergo reference rate-related modifications as a result of the reference rate reform.
The Portfolio is an investment company and follows investment company accounting and reporting guidance under U.S. Generally Accepted Accounting Principles (“U.S. GAAP”). U.S. GAAP requires the management of the Portfolio to make estimates and assumptions that affect the reported amounts of assets and liabilities, the disclosure of contingent assets and liabilities at the date of the financial statements, and the reported amounts of income, expenses and gain or loss on investments during the reporting period. Actual results could differ from those estimates.
The following is a summary of significant accounting policies followed by the Portfolio in the preparation of its financial statements:
A. Security Valuation
The net asset value of the Portfolio is computed once daily, on each day the New York Stock Exchange (“NYSE”) is open, as of the close of regular trading on the NYSE.
Fixed-income securities are valued by using prices supplied by independent pricing services, which consider such factors as market prices, market events, quotations from one or more brokers, Treasury spreads, yields, maturities and ratings, or may use a pricing matrix or other fair value methods or techniques to provide an estimated value of the security or instrument. A
26
| | |
| Pioneer High Yield VCT Portfolio | Pioneer Variable Contracts Trust |
pricing matrix is a means of valuing a debt security on the basis of current market prices for other debt securities, historical trading patterns in the market for fixed-income securities and/or other factors. Non-U.S. debt securities that are listed on an exchange will be valued at the bid price obtained from an independent third party pricing service. When independent third party pricing services are unable to supply prices, or when prices or market quotations are considered to be unreliable, the value of that security may be determined using quotations from one or more broker-dealers.
Loan interests are valued in accordance with guidelines established by the Board of Trustees at the mean between the last available bid and asked prices from one or more brokers or dealers as obtained from Loan Pricing Corporation, an independent third party pricing service. If price information is not available from Loan Pricing Corporation, or if the price information is deemed to be unreliable, price information will be obtained from an alternative loan interest pricing service. If no reliable price quotes are available from either the primary or alternative pricing service, broker quotes will be solicited.
Event-linked bonds are valued at the bid price obtained from an independent third party pricing service. Other insurance-linked securities (including reinsurance sidecars, collateralized reinsurance and industry loss warranties) may be valued at the bid price obtained from an independent pricing service, or through a third party using a pricing matrix, insurance industry valuation models, or other fair value methods or techniques to provide an estimated value of the instrument.
Equity securities which may include restricted securities that have traded on an exchange are valued by using the last sale price on the principal exchange where they are traded. Equity securities which may include restricted securities that have not traded on the date of valuation, or securities for which sale prices are not available, generally are valued using the mean between the last bid and asked prices or, if both last bid and asked prices are not available, at the last quoted bid price. Last sale and bid and asked prices are provided by independent third party pricing services. In the case of equity securities which may include restricted securities not traded on an exchange, prices are typically determined by independent third party pricing services using a variety of techniques and methods.
The value of foreign securities is translated into U.S. dollars based on foreign currency exchange rate quotations supplied by a third party pricing source. Trading in non-U.S. equity securities is substantially completed each day at various times prior to the close of the NYSE. The values of such securities used in computing the net asset value of the Portfolio’s shares are determined as of such times. The Portfolio may use a fair value model developed by an independent pricing service to value non-U.S. equity securities.
Forward foreign currency exchange contracts are valued daily using the foreign exchange rate or, for longer term forward contract positions, the spot currency rate and the forward points on a daily basis, in each case provided by a third party pricing service. Contracts whose forward settlement date falls between two quoted days are valued by interpolation.
Swap contracts, including interest rate swaps, caps and floors (other than centrally cleared swap contracts), are valued at the dealer quotations obtained from reputable International Swap Dealers Association members. Centrally cleared swaps are valued at the daily settlement price provided by the central clearing counterparty.
Shares of open-end registered investment companies (including money market mutual funds) are valued at such funds’ net asset value. Shares of exchange-listed closed-end funds are valued by using the last sale price on the principal exchange where they are traded. Shares of closed-end interval funds that offer their shares at net asset value are valued such fund’s net asset value.
Securities or loan interests for which independent pricing services or broker-dealers are unable to supply prices or for which market prices and/or quotations are not readily available or are considered to be unreliable are valued by a fair valuation team comprised of certain personnel of the Adviser pursuant to procedures adopted by the Portfolio’s Board of Trustees. The Adviser’s fair valuation team uses fair value methods approved by the Valuation Committee of the Board of Trustees. The Adviser’s fair valuation team is responsible for monitoring developments that may impact fair valued securities and for discussing and assessing fair values on an ongoing basis, and at least quarterly, with the Valuation Committee of the Board of Trustees.
Inputs used when applying fair value methods to value a security may include credit ratings, the financial condition of the company, current market conditions and comparable securities. The Portfolio may use fair value methods if it is determined that a significant event has occurred after the close of the exchange or market on which the security trades and prior to the determination of the Portfolio’s net asset value. Examples of a significant event might include political or economic news, corporate restructurings, natural disasters, terrorist activity or trading halts. Thus, the valuation of the Portfolio’s securities may differ significantly from exchange prices, and such differences could be material.
At December 31, 2020, three securities were valued using fair value methods (in addition to securities valued using prices supplied by independent pricing services, broker-dealers or using a third party insurance pricing model) representing 0.0% of net assets. The value of these fair valued securities was $162.
27
| | |
| Pioneer High Yield VCT Portfolio | Pioneer Variable Contracts Trust |
| Notes to Financial Statements 12/31/20 (continued) | |
B. Investment Income and Transactions
Dividend income is recorded on the ex-dividend date, except that certain dividends from foreign securities where the ex-dividend date may have passed are recorded as soon as the Portfolio becomes aware of the ex-dividend data in the exercise of reasonable diligence.
Interest income, including interest on income-bearing cash accounts, is recorded on the accrual basis. Dividend and interest income are reported net of unrecoverable foreign taxes withheld at the applicable country rates and net of income accrued on defaulted securities.
Interest and dividend income payable by delivery of additional shares is reclassified as PIK (payment-in-kind) income upon receipt and is included in interest and dividend income, respectively.
Principal amounts of mortgage-backed securities are adjusted for monthly paydowns. Premiums and discounts related to certain mortgage-backed securities are amortized or accreted in proportion to the monthly paydowns. All discounts/premiums on purchase prices of debt securities are accreted/amortized for financial reporting purposes over the life of the respective securities, and such accretion/amortization is included in interest income.
Security transactions are recorded as of trade date. Gains and losses on sales of investments are calculated on the identified cost method for both financial reporting and federal income tax purposes.
C. Foreign Currency Translation
The books and records of the Portfolio are maintained in U.S. dollars. Amounts denominated in foreign currencies are translated into U.S. dollars using current exchange rates.
Net realized gains and losses on foreign currency transactions, if any, represent, among other things, the net realized gains and losses on foreign currency exchange contracts, disposition of foreign currencies and the difference between the amount of income accrued and the U.S. dollars actually received. Further, the effects of changes in foreign currency exchange rates on investments are not segregated on the Statement of Operations from the effects of changes in the market prices of those securities, but are included with the net realized and unrealized gain or loss on investments.
D. Federal Income Taxes
It is the Portfolio’s policy to comply with the requirements of the Internal Revenue Code applicable to regulated investment companies and to distribute all of its net taxable income and net realized capital gains, if any, to its shareowners. Therefore, no provision for federal income taxes is required. As of December 31, 2020, the Portfolio did not accrue any interest or penalties with respect to uncertain tax positions, which, if applicable, would be recorded as an income tax expense on the Statement of Operations. Tax returns filed within the prior three years remain subject to examination by federal and state tax authorities.
The amount and character of income and capital gain distributions to shareowners are determined in accordance with federal income tax rules, which may differ from U.S. GAAP. Distributions in excess of net investment income or net realized gains are temporary over distributions for financial statement purposes resulting from differences in the recognition or classification of income or distributions for financial statement and tax purposes. Capital accounts within the financial statements are adjusted for permanent book/tax differences to reflect tax character, but are not adjusted for temporary differences.
At December 31, 2020, the Portfolio was permitted to carry forward indefinitely $584,398 of short-term and $1,700,927 of long-term losses.
The tax character of distributions paid during the years ended December 31, 2020 and December 31, 2019, were as follows:
| | 2020 | | | 2019 | |
| Distributions paid from: | | | | | | |
| Ordinary income | | $ | 2,236,658 | | | $ | 2,161,299 | |
| Total | | $ | 2,236,658 | | | $ | 2,161,299 | |
28
| | |
| Pioneer High Yield VCT Portfolio | Pioneer Variable Contracts Trust |
The following shows the components of distributable earnings (losses) on a federal income tax basis at December 31, 2020:
| | | | |
| | | 2019 | |
| Distributable earnings/(losses): | | | |
| Undistributed ordinary income | | $ | 429,171 | |
| Capital loss carryforward | | | (2,285,325 | ) |
| Net unrealized appreciation | | | 1,411,842 | |
| Total | | $ | (444,312 | ) |
The difference between book basis and tax basis unrealized appreciation is attributable to the tax deferral of losses on wash sales, the mark to market of swaps and forward currency, and adjustments relating to credit default swaps and catastrophe bonds.
E. Portfolio Shares and Class Allocations
The Portfolio records sales and repurchases of its shares as of trade date. Distribution fees for Class II shares are calculated based on the average daily net asset value attributable to Class II shares of the Portfolio (see Note 5). Class I shares do not pay distribution fees.
Income, common expenses (excluding transfer agent and distribution fees) and realized and unrealized gains and losses are calculated at the Portfolio level and allocated daily to each class of shares based on its respective percentage of the adjusted net assets at the beginning of the day.
All expenses and fees paid to the Portfolio’s transfer agent for its services are allocated among the classes of shares based on the number of accounts in each class and the ratable allocation of related out-of-pocket expenses (see Note 4).
The Portfolio declares as daily dividends substantially all of its net investment income. All dividends are paid on a monthly basis. Short-term capital gain distributions, if any, may be declared with the daily dividends. Distributions paid by the Portfolio with respect to each class of shares are calculated in the same manner and at the same time, except that net investment income dividends to Class I and Class II shares can reflect different transfer agent and distribution expense rates. Dividends and distributions to shareowners are recorded on the ex-dividend date.
F. Risks
The value of securities held by the Portfolio may go up or down, sometimes rapidly or unpredictably, due to general market conditions, such as real or perceived adverse economic, political or regulatory conditions, recessions, the spread of infectious illness or other public health issues, inflation, changes in interest rates, lack of liquidity in the bond markets or adverse investor sentiment. In the past several years, financial markets have experienced increased volatility, depressed valuations, decreased liquidity and heightened uncertainty. These conditions may continue, recur, worsen or spread. A general rise in interest rates could adversely affect the price and liquidity of fixed-income securities and could also result in increased redemptions from the Portfolio.
At times, the Portfolio’s investments may represent industries or industry sectors that are interrelated or have common risks, making the Portfolio more susceptible to any economic, political, or regulatory developments or other risks affecting those industries and sectors. The Portfolio’s investments in foreign markets and countries with limited developing markets may subject the Portfolio to a greater degree of risk than investments in a developed market. These risks include disruptive political or economic conditions and the imposition of adverse governmental laws or currency exchange restrictions.
The Portfolio invests in below-investment-grade (high-yield) debt securities and preferred stocks. Some of these high-yield securities may be convertible into equity securities of the issuer. Debt securities rated below-investment-grade are commonly referred to as “junk bonds” and are considered speculative. These securities involve greater risk of loss, are subject to greater price volatility, and are less liquid, especially during periods of economic uncertainty or change, than higher rated debt securities.
The Portfolio’s investments, payment obligations and financing terms may be based on floating rates, such as LIBOR (London Interbank Offered Rate). Plans are underway to phase out the use of LIBOR by the end of 2021. The administrator of LIBOR recently announced a possible delay in the phase out of a majority of the U.S. dollar LIBOR publications until mid-2023, with the remainder of the LIBOR publications to end at the end of 2021. There remains uncertainty regarding the nature of any replacement rate and the impact of the transition from LIBOR on the fund, issuers of instruments in which the fund invests, and financial markets generally.
29
| | |
| Pioneer High Yield VCT Portfolio | Pioneer Variable Contracts Trust |
| Notes to Financial Statements 12/31/20 (continued) | |
With the increased use of technologies such as the Internet to conduct business, the Portfolio is susceptible to operational, information security and related risks. While the Portfolio’s Adviser has established business continuity plans in the event of, and risk management systems to prevent, limit or mitigate, such cyber-attacks, there are inherent limitations in such plans and systems, including the possibility that certain risks have not been identified. Furthermore, the Portfolio cannot control the cybersecurity plans and systems put in place by service providers to the Portfolio such as Brown Brothers Harriman & Co., the Portfolio’s custodian and accounting agent, and DST Asset Manager Solutions, Inc., the Portfolio’s transfer agent. In addition, many beneficial owners of Portfolio shares hold them through accounts at broker-dealers, retirement platforms and other financial market participants over which neither the Portfolio nor the Adviser exercises control. Each of these may in turn rely on service providers to them, which are also subject to the risk of cyber-attacks. Cybersecurity failures or breaches at the Adviser or the Portfolio’s service providers or intermediaries have the ability to cause disruptions and impact business operations, potentially resulting in financial losses, interference with the Portfolio’s ability to calculate its net asset value, impediments to trading, the inability of Portfolio shareowners to effect share purchases, redemptions or exchanges or receive distributions, loss of or unauthorized access to private shareowner information and violations of applicable privacy and other laws, regulatory fines, penalties, reputational damage, or additional compliance costs. Such costs and losses may not be covered under any insurance. In addition, maintaining vigilance against cyber-attacks may involve substantial costs over time, and system enhancements may themselves be subject to cyber-attacks.
COVID-19
The respiratory illness COVID-19 caused by a novel coronavirus has resulted in a global pandemic and major disruption to economies and markets around the world, including the United States. Global financial markets have experienced extreme volatility and severe losses, and trading in many instruments has been disrupted. Liquidity for many instruments has been greatly reduced for periods of time. Some interest rates are very low and in some cases yields are negative. Some sectors of the economy and individual issuers have experienced particularly large losses. These circumstances may continue for an extended period of time, and may continue to affect adversely the value and liquidity of the Portfolio’s investments. The ultimate economic fallout from the pandemic, and the long-term impact on economies, markets, industries and individual issuers, are not known. Governments and central banks, including the Federal Reserve in the U.S., have taken extraordinary and unprecedented actions to support local and global economies and the financial markets. These actions have resulted in significant expansion of public debt, including in the U.S. The impact of these measures, and whether they will be effective to mitigate the economic and market disruption, will not be known for some time. The consequences of high public debt, including its future impact on the economy and securities markets, likewise may not be known for some time.
The Portfolio’s prospectus contains unaudited information regarding the Portfolio’s principal risks. Please refer to that document when considering the Portfolio’s principal risks.
G. Restricted Securities
Restricted Securities are subject to legal or contractual restrictions on resale. Restricted securities generally are resold in transactions exempt from registration under the Securities Act of 1933. Private placement securities are generally considered to be restricted except for those securities traded between qualified institutional investors under the provisions of Rule 144A of the Securities Act of 1933.
Disposal of restricted investments may involve negotiations and expenses, and prompt sale at an acceptable price may be difficult to achieve. Restricted investments held by the Portfolio at December 31, 2020 are listed in the Schedule of Investments.
H. Insurance-Linked Securities (“ILS”)
The Portfolio invests in ILS. The Portfolio could lose a portion or all of the principal it has invested in an ILS, and the right to additional interest or dividend payments with respect to the security, upon the occurrence of one or more trigger events, as defined within the terms of an insurance-linked security. Trigger events, generally, are hurricanes, earthquakes, or other natural events of a specific size or magnitude that occur in a designated geographic region during a specified time period, and/or that involve losses or other metrics that exceed a specific amount. There is no way to accurately predict whether a trigger event will occur, and accordingly, ILS carry significant risk. The Portfolio is entitled to receive principal, and interest and/or dividend payments so long as no trigger event occurs of the description and magnitude specified by the instrument. In addition to the specified trigger events, ILS may expose the Portfolio to other risks, including but not limited to issuer (credit) default, adverse regulatory or jurisdictional interpretations and adverse tax consequences.
30
| | |
| Pioneer High Yield VCT Portfolio | Pioneer Variable Contracts Trust |
The Portfolio’s investments in ILS may include event-linked bonds. ILS also may include special purpose vehicles (“SPVs”) or similar instruments structured to comprise a portion of a reinsurer’s catastrophe-oriented business, known as quota share instruments (sometimes referred to as reinsurance sidecars), or to provide reinsurance relating to specific risks to insurance or reinsurance companies through a collateralized instrument, known as collateralized reinsurance. Structured reinsurance investments also may include industry loss warranties (“ILWs”). A traditional ILW takes the form of a bilateral reinsurance contract, but there are also products that take the form of derivatives, collateralized structures, or exchange-traded instruments.
Where the ILS are based on the performance of underlying reinsurance contracts, the Portfolio has limited transparency into the individual underlying contracts, and therefore must rely upon the risk assessment and sound underwriting practices of the issuer. Accordingly, it may be more difficult for the Adviser to fully evaluate the underlying risk profile of the Portfolio’s structured reinsurance investments, and therefore the Portfolio’s assets are placed at greater risk of loss than if the Adviser had more complete information. Structured reinsurance instruments generally will be considered illiquid securities by the Portfolio. These securities may be difficult to purchase, sell or unwind. Illiquid securities also may be difficult to value. If the Portfolio is forced to sell an illiquid asset, the Portfolio may be forced to sell at a loss.
Additionally, the Portfolio may gain exposure to ILS by investing in a closed-end interval fund, Pioneer ILS Interval Fund, an affiliate of the Adviser. The Portfolio’s investment in Pioneer ILS Interval Fund at December 31, 2020, is listed in the Schedule of Investments.
I. Forward Foreign Currency Exchange Contracts
The Portfolio may enter into forward foreign currency exchange contracts (“contracts”) for the purchase or sale of a specific foreign currency at a fixed price on a future date. All contracts are marked-to-market daily at the applicable exchange rates, and any resulting unrealized appreciation or depreciation is recorded in the Portfolio’s financial statements. The Portfolio records realized gains and losses at the time a contract is offset by entry into a closing transaction or extinguished by delivery of the currency. Risks may arise upon entering into these contracts from the potential inability of counterparties to meet the terms of the contract and from unanticipated movements in the value of foreign currencies relative to the U.S. dollar (see Note 7).
During the year ended December 31, 2020, the Portfolio had entered into various forward foreign currency exchange contracts that obligated the Portfolio to deliver or take delivery of currencies at specified future maturity dates. Alternatively, prior to the settlement date of a forward foreign currency exchange contract, the Portfolio may close out such contract by entering into an offsetting contract.
The average market value of forward foreign currency exchange contracts open during the year ended December 31, 2020, was $(53,442). Open forward foreign currency exchange contracts outstanding at December 31, 2020, are listed in the Schedule of Investments.
J. Credit Default Swap Contracts
A credit default swap is a contract between a buyer of protection and a seller of protection against a pre-defined credit event or an underlying reference obligation, which may be a single security or a basket or index of securities. The Portfolio may buy or sell credit default swap contracts to seek to increase the Portfolio’s income, or to attempt to hedge the risk of default on portfolio securities. A credit default swap index is used to hedge risk or take a position on a basket of credit entities or indices.
As a seller of protection, the Portfolio would be required to pay the notional (or other agreed-upon) value of the referenced debt obligation to the counterparty in the event of a default by a U.S. or foreign corporate issuer of a debt obligation, which would likely result in a loss to the Portfolio. In return, the Portfolio would receive from the counterparty a periodic stream of payments during the term of the contract, provided that no event of default occurred. The maximum exposure of loss to the seller would be the notional value of the credit default swaps outstanding. If no default occurs, the Portfolio would keep the stream of payments and would have no payment obligation. The Portfolio may also buy credit default swap contracts in order to hedge against the risk of default of debt securities, in which case the Portfolio would function as the counterparty referenced above.
As a buyer of protection, the Portfolio makes an upfront or periodic payment to the protection seller in exchange for the right to receive a contingent payment. An upfront payment made by the Portfolio, as the protection buyer, is recorded within the “Swap contracts, at value” line item on the Statement of Assets and Liabilities. Periodic payments received or paid by the Portfolio are recorded as realized gains or losses on the Statement of Operations.
31
| | |
| Pioneer High Yield VCT Portfolio | Pioneer Variable Contracts Trust |
| Notes to Financial Statements 12/31/20 (continued) | |
Credit default swap contracts are marked-to-market daily using valuations supplied by independent sources, and the change in value, if any, is recorded within the “Swap contracts, at value” line item on the Statement of Assets and Liabilities. Payments received or made as a result of a credit event or upon termination of the contract are recognized, net of the appropriate amount of the upfront payment, as realized gains or losses on the Statement of Operations.
Credit default swap contracts involving the sale of protection may involve greater risks than if the Portfolio had invested in the referenced debt instrument directly. Credit default swap contracts are subject to general market risk, liquidity risk, counterparty risk and credit risk. If the Portfolio is a protection buyer and no credit event occurs, it will lose its investment. If the Portfolio is a protection seller and a credit event occurs, the value of the referenced debt instrument received by the Portfolio, together with the periodic payments received, may be less than the amount the Portfolio pays to the protection buyer, resulting in a loss to the Portfolio. In addition, obligations under sell protection credit default swaps may be partially offset by net amounts received from settlement of buy protection credit default swaps entered into by the Portfolio for the same reference obligation with the same counterparty.
Certain swap contracts that are cleared through a central clearinghouse are referred to as centrally cleared swaps. All payments made or received by the Portfolio are pursuant to a centrally cleared swap contract with the central clearing party rather than the original counterparty. Upon entering into a centrally cleared swap contract, the Portfolio is required to make an initial margin deposit, either in cash or in securities. The daily change in value on open centrally cleared contracts is recorded as “Variation margin for centrally cleared swap contracts” on the Statement of Assets and Liabilities. Cash received from or paid to the broker related to previous margin movement is held in a segregated account at the broker and is recorded as either “Due from broker for swaps” or “Due to broker for swaps” on the Statement of Assets and Liabilities. The amount of cash deposited with a broker as collateral at December 31, 2020, is recorded as “Swaps collateral” on the Statement of Assets and Liabilities.
The average market value of credit default swap contracts open during the year ended December 31, 2020, was $(14,346). Open credit default swap contracts at December 31, 2020, are listed in the Schedule of Investments.
2. Management Agreement
The Adviser manages the Portfolio. Management fees are calculated daily and paid monthly at the annual rate of 0.65% of the Portfolio’s average daily net assets up to $1 billion and 0.60% of the Portfolio’s average daily net assets over $1 billion. For the year ended December 31, 2020, the effective management fee (excluding waivers and/or assumption of expenses and acquired fund fees and expenses) was equivalent to 0.65% of the Portfolio’s average daily net assets.
The Adviser has agreed to waive its management fee with respect to any portion of the Portfolio’s assets invested in Pioneer ILS Interval Fund, an affiliated fund managed by the Adviser. For the year ended December 31, 2020, the Adviser waived $12,855 in management fees with respect to the Portfolio, which is reflected on the Statement of Operations as an expense waiver.
Effective October 1, 2020, the Adviser has contractually agreed to limit ordinary operating expenses (ordinary operating expenses means all Portfolio expenses other than extraordinary expenses, such as litigation, taxes, brokerage commissions and acquired fund fees and expenses) of the Portfolio to the extent required to reduce Portfolio expenses to 0.90% and 1.15% of the average daily net assets attributable to Class I shares and Class II shares respectively. Fees waived and expenses reimbursed during the year ended December 31, 2020, if any, are reflected on the Statement of Operations. This expense limitation are in effect through May 1, 2022. There can be no assurance that the Adviser will extend the expense limitation agreement for a class of shares beyond the date referred to above.
In addition, under the management and administration agreements, certain other services and costs, including accounting, regulatory reporting and insurance premiums, are paid by the Portfolio as administrative reimbursements. Included in “Due to affiliates” reflected on the Statement of Assets and Liabilities is $12,529 in management fees, administrative costs and certain other reimbursements payable to the Adviser at December 31, 2020.
3. Compensation of Trustees and Officers
The Portfolio pays an annual fee to its Trustees. The Adviser reimburses the Portfolio for fees paid to the Interested Trustees. The Portfolio does not pay any salary or other compensation to its officers. For the year ended December 31, 2020, the Portfolio paid $7,252 in Trustees’ compensation, which is reflected on the Statement of Operations as Trustees’ fees. At December 31, 2020, the Portfolio had a payable for Trustees’ fees on its Statement of Assets and Liabilities of $55.
32
| | |
| Pioneer High Yield VCT Portfolio | Pioneer Variable Contracts Trust |
4. Transfer Agent
DST Asset Manager Solutions, Inc. serves as the transfer agent to the Portfolio at negotiated rates. Transfer agent fees and payables shown on the Statement of Operations and the Statement of Assets and Liabilities, respectively, include sub-transfer agent expenses incurred through the Portfolio’s omnibus relationship contracts.
5. Distribution Plan
The Portfolio has adopted a distribution plan (the “Plan”) pursuant to Rule 12b-1 of the Investment Company Act of 1940 with respect to its Class II shares. Pursuant to the Plan, the Portfolio pays the Distributor 0.25% of the average daily net assets attributable to Class II shares to compensate the Distributor for (1) distribution services and (2) personal and account maintenance services performed and expenses incurred by the Distributor in connection with the Portfolio’s Class II shares. Included in “Due to affiliates” reflected on the Statement of Assets and Liabilities is $166 in distribution fees payable to the Distributor at December 31, 2020.
6. Master Netting Agreements
The Portfolio has entered into an International Swaps and Derivatives Association, Inc. Master Agreement (“ISDA Master Agreement”) or similar agreement with substantially all of its derivative counterparties. An ISDA Master Agreement is a bilateral agreement between the Portfolio and a counterparty that governs the trading of certain Over the Counter (“OTC”) derivatives and typically contains, among other things, close-out and set-off provisions which apply upon the occurrence of an event of default and/or a termination event as defined under the relevant ISDA Master Agreement. The ISDA Master Agreement may also give a party the right to terminate all transactions traded under such agreement if, among other things, there is deterioration in the credit quality of the other party.
Upon an event of default or a termination of the ISDA Master Agreement, the non-defaulting party has the right to close-out all transactions under such agreement and to net amounts owed under each transaction to determine one net amount payable by one party to the other. The right to close out and net payments across all transactions under the ISDA Master Agreement could result in a reduction of the Portfolio’s credit risk to its counterparty equal to any amounts payable by the Portfolio under the applicable transactions, if any. However, the Portfolio’s right to set-off may be restricted or prohibited by the bankruptcy or insolvency laws of the particular jurisdiction to which each specific ISDA Master Agreement of each counterparty is subject.
The collateral requirements for derivatives transactions under an ISDA Master Agreement are governed by a credit support annex to the ISDA Master Agreement. Collateral requirements are generally determined at the close of business each day and are typically based on changes in market values for each transaction under an ISDA Master Agreement and netted into one amount for such agreement. Generally, the amount of collateral due from or to a counterparty is subject to threshold (a “minimum transfer amount”) before a transfer is required, which may vary by counterparty. Collateral pledged for the benefit of the Portfolio and/or counterparty is held in segregated accounts by the Portfolio’s custodian and cannot be sold, re-pledged, assigned or otherwise used while pledged. Cash that has been segregated to cover the Portfolio’s collateral obligations, if any, will be reported separately on the Statement of Assets and Liabilities as “Swaps collateral”. Securities pledged by the Portfolio as collateral, if any, are identified as such in the Schedule of Investments.
Financial instruments subject to an enforceable master netting agreement, such as an ISDA Master Agreement, have been offset on the Statement of Assets and Liabilities. The following charts show gross assets and liabilities of the Portfolio as of December 31, 2020.
| Derivative | | | | |
| Assets | | | | |
| Subject to | Derivatives | Non-Cash | | Net Amount of |
| Master Netting | Available | Collateral | Cash Collateral | Derivative |
| Counterparty | Agreement | for Offset | Received (a) | Received (a) | Assets (b) |
State Street Bank & | | | | | |
| Trust Co. | $ — | $ — | $ — | $ — | $ — |
| Total | $ — | $ — | $ — | $ — | $ — |
33
| | |
| Pioneer High Yield VCT Portfolio | Pioneer Variable Contracts Trust |
| Notes to Financial Statements 12/31/20 (continued) | |
| Derivative | | | | |
| Liabilities | | | | |
| Subject to | Derivatives | Non-Cash | | Net Amount of |
| Master Netting | Available | Collateral | Cash Collateral | Derivative |
| Counterparty | Agreement | for Offset | Pledged (a) | Pledged (a) | Liabilities (c) |
State Street Bank & | | | | | |
| Trust Co. | $3,475 | $ — | $ — | $ — | $3,475 |
| Total | $3,475 | $ — | $ — | $ — | $3,475 |
(a) | The amount presented here may be less than the total amount of collateral received/pledged as the net amount of derivative assets and liabilities cannot be less than $0. |
(b) | Represents the net amount due from the counterparty in the event of default. |
(c) | Represents the net amount payable to the counterparty in the event of default. |
7. Additional Disclosures about Derivative Instruments and Hedging Activities
The Portfolio’s use of derivatives may enhance or mitigate the Portfolio’s exposure to the following risks:
Interest rate risk relates to the fluctuations in the value of interest-bearing securities due to changes in the prevailing levels of market interest rates.
Credit risk relates to the ability of the issuer of a financial instrument to make further principal or interest payments on an obligation or commitment that it has to the Portfolio.
Foreign exchange rate risk relates to fluctuations in the value of an asset or liability due to changes in currency exchange rates.
Equity risk relates to the fluctuations in the value of financial instruments as a result of changes in market prices (other than those arising from interest rate risk or foreign exchange rate risk), whether caused by factors specific to an individual investment, its issuer, or all factors affecting all instruments traded in a market or market segment.
Commodity risk relates to the risk that the value of a commodity or commodity index will fluctuate based on increases or decreases in the commodities market and factors specific to a particular industry or commodity.
The fair value of open derivative instruments (not considered to be hedging instruments for accounting disclosure purposes) by risk exposure at December 31, 2020, was as follows:
| Statement of Assets | Interest | Credit | Foreign | Equity | Commodity |
| and Liabilities | Rate Risk | Risk | Exchange Rate Risk | Risk | Risk |
| Assets | | | | | |
| Swap contracts, | | | | | |
| at value | $ — | $95,831 | $ — | $ — | $ — |
| Total Value | $ — | $95,831 | $ — | $ — | $ — |
| Liabilities | | | | | |
| Net unrealized depreciation | | | | | |
| on forward foreign | | | | | |
| currency exchange | | | | | |
| contracts | $ — | $ — | $3,475 | $ — | $ — |
| Total Value | $ — | $ — | $3,475 | $ — | $ — |
34
| | |
| Pioneer High Yield VCT Portfolio | Pioneer Variable Contracts Trust |
The effect of derivative instruments (not considered to be hedging instruments for accounting disclosure purposes) on the Statement of Operations by risk exposure at December 31, 2020, was as follows:
| Statement of | Interest | Credit | Foreign | Equity | Commodity |
| Operations | Rate Risk | Risk | Exchange Rate Risk | Risk | Risk |
| Net realized | | | | | |
| gain (loss) on: | | | | | |
| Forward foreign | | | | | |
| currency exchange | | | | | |
| contracts | $ — | $ — | $ 176 | $ — | $ — |
| Swap contracts | — | (123,822) | — | — | — |
| Total Value | $ — | $(123,822) | $ 176 | $ — | $ — |
| Change in net | | | | | |
| unrealized appreciation | | | | | |
| (depreciation) on: | | | | | |
| Forward foreign | | | | | |
| currency exchange | | | | | |
| contracts | $ — | $ — | $(3,475) | $ — | $ — |
| Swap contracts | — | 2,112 | — | — | — |
| Total Value | $ — | $ 2,112 | $(3,475) | $ — | $ — |
8. Unfunded Loan Commitments
The Portfolio may enter into unfunded loan commitments. Unfunded loan commitments may be partially or wholly unfunded. During the contractual period, the Portfolio is obliged to provide funding to the borrower upon demand. A fee is earned by the Portfolio on the unfunded loan commitment and is recorded as interest income on the Statement of Operations. Unfunded loan commitments are fair valued in accordance with the valuation policy described in Footnote 1A and unrealized appreciation or depreciation, if any, is recorded on the Statement of Assets and Liabilities.
As of December 31, 2020, the Portfolio had the following unfunded loan commitments outstanding:
| | | | Unrealized |
| Loan | Principal | Cost | Value | Appreciation |
Grupo Aeromexico, Sociedad Anonima Bursatil | | | | |
| De Capital Variable, DIP Tranche 2 Term Loan | $31,738 | $31,476 | $32,572 | $1,096 |
9. Affiliated Issuer
An affiliated issuer is a company in which the Portfolio has a direct or indirect ownership of, control of, or voting power of 5 percent or more of the outstanding voting shares. At December 31, 2020, the value of the Portfolio’s investment in affiliated issuers was $509,400, which represents 1.2% of the Portfolio’s net assets.
Transactions in affiliated issuers by the Portfolio for the year ended were as follows:
| | | Change in | Net Realized | | | |
| | | Net Unrealized | Gain/(Loss) | | | |
| | | Appreciation/ | From | Dividends | Shares | |
| Value at | | (Depreciation) | Investments | from | held at | Value at |
| Name of the | December 31, | Purchase | from Investments | in Affiliated | Investments in | December 31, | December 31, |
| Affiliated Issuer | 2019 | Costs | in Affiliated Issuers | Issuers | Affiliated Issuers | 2020 | 2020 |
Pioneer ILS | | | | | | | |
| Interval Fund | $1,020,377 | $(531,200) | $153,023 | $(132,800) | $26,496 | 60,000 | $509,400 |
Annual and semi-annual reports for the underlying Pioneer funds are available on the funds’ web page(s) at www.amundi.com/us.
35
| | |
| Pioneer High Yield VCT Portfolio | Pioneer Variable Contracts Trust |
Report of Independent Registered Public Accounting Firm | |
To the Board of Trustees of Pioneer Variable Contracts Trust and the Shareholders of Pioneer High Yield VCT Portfolio:
Opinion on the Financial Statements
We have audited the accompanying statement of assets and liabilities of Pioneer High Yield VCT Portfolio (the “Portfolio”) (one of the portfolios constituting Pioneer Variable Contracts Trust (the “Trust”)), including the schedule of investments, as of December 31, 2020, and the related statement of operations for the year then ended, the statements of changes in net assets for each of the two years in the period then ended, the financial highlights for each of the four years in the period then ended and the related notes (collectively referred to as the “financial statements”). The financial highlights for the period ended December 31, 2016 were audited by another independent registered public accounting firm whose report, dated February 14, 2017, expressed an unqualified opinion on those financial highlights. In our opinion, the financial statements present fairly, in all material respects, the financial position of the Portfolio (one of the portfolios constituting Pioneer Variable Contracts Trust) at December 31, 2020, the results of its operations for the year then ended, the changes in its net assets for each of the two years in the period then ended, and its financial highlights for each of the four years in the period then ended, in conformity with U.S. generally accepted accounting principles.
Basis for Opinion
These financial statements are the responsibility of the Trust’s management. Our responsibility is to express an opinion on the Portfolio’s financial statements based on our audits. We are a public accounting firm registered with the Public Company Accounting Oversight Board (United States) (“PCAOB”) and are required to be independent with respect to the Trust in accordance with the U.S. federal securities laws and the applicable rules and regulations of the Securities and Exchange Commission and the PCAOB.
We conducted our audits in accordance with the standards of the PCAOB. Those standards require that we plan and perform the audit to obtain reasonable assurance about whether the financial statements are free of material misstatement, whether due to error or fraud. The Trust is not required to have, nor were we engaged to perform, an audit of the Trust’s internal control over financial reporting. As part of our audits, we are required to obtain an understanding of internal control over financial reporting, but not for the purpose of expressing an opinion on the effectiveness of the Trust’s internal control over financial reporting. Accordingly, we express no such opinion.
Our audits included performing procedures to assess the risks of material misstatement of the financial statements, whether due to error or fraud, and performing procedures that respond to those risks. Such procedures included examining, on a test basis, evidence regarding the amounts and disclosures in the financial statements. Our procedures included confirmation of securities owned as of December 31, 2020, by correspondence with the custodian and brokers or by other appropriate auditing procedures where replies from brokers were not received. Our audits also included evaluating the accounting principles used and significant estimates made by management, as well as evaluating the overall presentation of the financial statements. We believe that our audits provide a reasonable basis for our opinion.
We have served as the auditor of one or more Amundi Pioneer investment companies since 2017.
Boston, Massachusetts
February 17, 2021
36
| | |
| Pioneer High Yield VCT Portfolio | Pioneer Variable Contracts Trust |
Additional Information (Unaudited) | |
Qualified interest income is exempt from nonresident alien (NRA) tax withholding. The percentage of the Portfolio’s ordinary income distributions derived from qualified interest income was 75.10%.
37
| | |
| Pioneer High Yield VCT Portfolio | Pioneer Variable Contracts Trust |
Approval of Investment Management Agreement | |
Amundi Pioneer Asset Management, Inc. (“APAM”) serves as the investment adviser to Pioneer High Yield VCT Portfolio (the “Portfolio”) pursuant to an investment management agreement between APAM and the Portfolio. In order for APAM to remain the investment adviser of the Portfolio, the Trustees of the Portfolio must determine annually whether to renew the investment management agreement for the Portfolio.
The contract review process began in January 2020 as the Trustees of the Portfolio agreed on, among other things, an overall approach and timeline for the process. Contract review materials were provided to the Trustees in March 2020, July 2020 and September 2020. In addition, the Trustees reviewed and discussed the Portfolio’s performance at regularly scheduled meetings throughout the year, and took into account other information related to the Portfolio provided to the Trustees at regularly scheduled meetings, in connection with the review of the Portfolio’s investment management agreement.
In March 2020, the Trustees, among other things, discussed the memorandum provided by Fund counsel that summarized the legal standards and other considerations that are relevant to the Trustees in their deliberations regarding the renewal of the investment management agreement, and reviewed and discussed the qualifications of the investment management teams for the Portfolio, as well as the level of investment by the Portfolio’s portfolio managers in the Portfolio. In July 2020, the Trustees, among other things, reviewed the Portfolio’s management fees and total expense ratios, the financial statements of APAM and its parent companies, profitability analyses provided by APAM, and analyses from APAM as to possible economies of scale. The Trustees also reviewed the profitability of the institutional business of APAM and APAM’s affiliate, Amundi Pioneer Institutional Asset Management, Inc. (“APIAM” and, together with APAM, “Amundi Pioneer”), as compared to that of APAM’s fund management business, and considered the differences between the fees and expenses of the Portfolio and the fees and expenses of APAM’s and APIAM’s institutional accounts, as well as the different services provided by APAM to the Portfolio and by APAM and APIAM to the institutional accounts. The Trustees further considered contract review materials, including additional materials received in response to the Trustees’ request, in September 2020.
At a meeting held on September 15, 2020, based on their evaluation of the information provided by APAM and third parties, the Trustees of the Portfolio, including the Independent Trustees voting separately, unanimously approved the renewal of the investment management agreement for another year. In approving the renewal of the investment management agreement, the Trustees considered various factors that they determined were relevant, including the factors described below. The Trustees did not identify any single factor as the controlling factor in determining to approve the renewal of the agreement.
Nature, Extent and Quality of Services
The Trustees considered the nature, extent and quality of the services that had been provided by APAM to the Portfolio, taking into account the investment objective and strategy of the Portfolio. The Trustees also reviewed APAM’s investment approach for the Portfolio and its research process. The Trustees considered the resources of APAM and the personnel of APAM who provide investment management services to the Portfolio. They also reviewed the amount of non-Portfolio assets managed by the portfolio managers of the Portfolio. They considered the non-investment resources and personnel of APAM that are involved in APAM’s services to the Portfolio, including APAM’s compliance, risk management, and legal resources and personnel. The Trustees noted the substantial attention and high priority given by APAM’s senior management to the Pioneer Fund complex. The Trustees considered the implementation and effectiveness of APAM’s business continuity plan in response to the COVID-19 pandemic.
The Trustees considered that APAM supervises and monitors the performance of the Portfolio’s service providers and provides the Portfolio with personnel (including Portfolio officers) and other resources that are necessary for the Portfolio’s business management and operations. The Trustees also considered that, as administrator, APAM is responsible for the administration of the Portfolio’s business and other affairs. The Trustees considered the fees paid to APAM for the provision of administration services.
Based on these considerations, the Trustees concluded that the nature, extent and quality of services that had been provided by APAM to the Portfolio were satisfactory and consistent with the terms of the investment management agreement.
Performance of the Portfolio
In considering the Portfolio’s performance, the Trustees regularly review and discuss throughout the year data prepared by APAM and information comparing the Portfolio’s performance with the performance of its peer group of funds, as classified by Morningstar, Inc. (Morningstar), and with the performance of the Portfolio’s benchmark index. They also discuss the Portfolio’s performance with APAM on a regular basis. The Trustees’ regular reviews and discussions were factored into the Trustees’ deliberations concerning the renewal of the investment management agreement.
38
| | |
| Pioneer High Yield VCT Portfolio | Pioneer Variable Contracts Trust |
Management Fee and Expenses
The Trustees considered information showing the fees and expenses of the Portfolio in comparison to the management fees of its peer group of funds as classified by Morningstar and also to the expense ratios of a peer group of funds selected on the basis of criteria determined by the Independent Trustees for this purpose using data provided by Strategic Insight Mutual Fund Research and Consulting, LLC (Strategic Insight), an independent third party. The peer group comparisons referred to below are organized in quintiles. Each quintile represents one-fifth of the peer group. In all peer group comparisons referred to below, first quintile is most favorable to the Portfolio’s shareowners. The Trustees noted that they separately review and consider the impact of the Portfolio’s transfer agency and Portfolio- and APAM-paid expenses for sub-transfer agency and intermediary arrangements, and that the results of the most recent such review were considered in the consideration of the Portfolio’s expense ratio.
The Trustees considered that the Portfolio’s management fee for the most recent fiscal year was in the fifth quintile relative to the management fees paid by other funds in its Morningstar category for the comparable period. The Trustees noted the resource commitment necessary to manage a high yield fund that invests more significantly in convertible securities and invests across a broader group of sectors than a traditional high yield fund. The Trustees considered that the expense ratio of the Portfolio’s Class I shares for the most recent fiscal year was in the fifth quintile relative to its Strategic Insight peer group for the comparable period. The Trustees noted the Portfolio’s relatively small asset size compared to most of the other funds in its peer group. The Trustees considered that non-management fee operating expenses generally are spread over a smaller asset base than the other funds in the peer group, which results in these fees being significantly higher as a percentage of assets.
The Trustees reviewed management fees charged by APAM and APIAM to institutional and other clients, including publicly offered European funds sponsored by APAM’s affiliates, unaffiliated U.S. registered investment companies (in a sub-advisory capacity), and unaffiliated foreign and domestic separate accounts. The Trustees also considered APAM’s costs in providing services to the Portfolio and APAM’s and APIAM’s costs in providing services to the other clients and considered the differences in management fees and profit margins for fund and non-fund services. In evaluating the fees associated with APAM’s and APIAM’s client accounts, the Trustees took into account the respective demands, resources and complexity associated with the Portfolio and other client accounts. The Trustees noted that, in some instances, the fee rates for those clients were lower than the management fee for the Portfolio and considered that, under the investment management agreement with the Portfolio, APAM performs additional services for the Portfolio that it does not provide to those other clients or services that are broader in scope, including oversight of the Portfolio’s other service providers and activities related to compliance and the extensive regulatory and tax regimes to which the Portfolio is subject. The Trustees also considered the entrepreneurial risks associated with APAM’s management of the Portfolio.
The Trustees concluded that the management fee payable by the Portfolio to APAM was reasonable in relation to the nature and quality of the services provided by APAM.
Profitability
The Trustees considered information provided by APAM regarding the profitability of APAM with respect to the advisory services provided by APAM to the Portfolio, including the methodology used by APAM in allocating certain of its costs to the management of the Portfolio. The Trustees also considered APAM’s profit margin in connection with the overall operation of the Portfolio. They further reviewed the financial results, including the profit margins, realized by APAM and APIAM from non-fund businesses. The Trustees considered APAM’s profit margins in comparison to the limited industry data available and noted that the profitability of any adviser was affected by numerous factors, including its organizational structure and method for allocating expenses. The Trustees concluded that APAM’s profitability with respect to the management of the Portfolio was not unreasonable.
Economies of Scale
The Trustees considered APAM’s views relating to economies of scale in connection with the Pioneer Funds as fund assets grow and the extent to which any such economies of scale are shared with the Portfolio and Portfolio shareholders. The Trustees recognize that economies of scale are difficult to identify and quantify, and that, among other factors that may be relevant, are the following: fee levels, expense subsidization, investment by APAM in research and analytical capabilities and APAM’s commitment and resource allocation to the Portfolio. The Trustees noted that profitability also may be an indicator of the availability of any economies of scale, although profitability may vary for other reasons including due to reductions in expenses. The Trustees concluded that economies of scale, if any, were being appropriately shared with the Portfolio.
39
| | |
| Pioneer High Yield VCT Portfolio | Pioneer Variable Contracts Trust |
| Approval of Investment Management Agreement (continued) | |
Other Benefits
The Trustees considered the other benefits that APAM enjoys from its relationship with the Portfolio. The Trustees considered the character and amount of fees paid or to be paid by the Portfolio, other than under the investment management agreement, for services provided by APAM and its affiliates. The Trustees further considered the revenues and profitability of APAM’s businesses other than the Fund business. To the extent applicable, the Trustees also considered the benefits to the Portfolio and to APAM and its affiliates from the use of “soft” commission dollars generated by the Portfolio to pay for research and brokerage services.
The Trustees considered that Amundi Pioneer is the principal U.S. asset management business of Amundi, which is one of the largest asset managers globally. Amundi’s worldwide asset management business manages over $1.7 trillion in assets (including the Pioneer Funds). The Trustees considered that APAM’s relationship with Amundi creates potential opportunities for APAM, APIAM and Amundi that derive from APAM’s relationships with the Portfolio, including Amundi’s ability to market the services of APAM globally. The Trustees noted that APAM has access to additional research and portfolio management capabilities as a result of its relationship with Amundi and Amundi’s enhanced global presence that may contribute to an increase in the resources available to APAM. The Trustees considered that APAM and the Portfolio receive reciprocal intangible benefits from the relationship, including mutual brand recognition and, for the Portfolio, direct and indirect access to the resources of a large global asset manager. The Trustees concluded that any such benefits received by APAM as a result of its relationship with the Portfolio were reasonable.
Conclusion
After consideration of the factors described above as well as other factors, the Trustees, including the Independent Trustees, concluded that the investment management agreement for the Portfolio, including the fees payable thereunder, was fair and reasonable and voted to approve the proposed renewal of the investment management agreement.
40
| | |
| Pioneer High Yield VCT Portfolio | Pioneer Variable Contracts Trust |
Trustees, Officers and Service Providers | |
The Portfolio’s Trustees and officers are listed below, together with their principal occupations and other directorships they have held during at least the past five years. Trustees who are interested persons of the Portfolios within the meaning of the 1940 Act are referred to as Interested Trustees. Trustees who are not interested persons of the Portfolio are referred to as Independent Trustees. Each of the Trustees serves as a Trustee of each of the 45 U.S. registered investment portfolios for which Amundi US serves as investment adviser (the “Pioneer Funds”). The address for all Trustees and all officers of the Portfolios is 60 State Street, Boston, Massachusetts 02109.
| | | | |
| Name, Age and Position | Term of Office and | | Other Directorships |
| Held With the Trust | Length of Service | Principal Occupation | Held by Trustee |
| Independent Trustees: | | | |
| Thomas J. Perna (70) | Trustee since 2006. Serves until a | Private investor (2004 – 2008 and | Director, Broadridge Financial |
Chairman of the Board | successor trustee is elected or | 2013 – present); Chairman (2008 – 2013) | Solutions, Inc. (investor |
and Trustee | earlier retirement or removal. | and Chief Executive Officer (2008 – 2012), | communications and securities |
| | Quadriserv, Inc. (technology products for | processing provider for financial |
| | securities lending industry); and Senior | services industry) (2009 – present); |
| | Executive Vice President, The Bank of New York | Director, Quadriserv, Inc. (2005 – |
| | (financial and securities services) (1986 – 2004) | 2013); and Commissioner, New Jersey |
| | | State Civil Service Commission |
| | | (2011 – 2015) |
| John E. Baumgardner, Jr. (69) | Trustee since 2019. Serves until a | Of Counsel (2019 – present), Partner | Chairman, The Lakeville Journal |
Trustee | successor trustee is elected or | (1983-2018), Sullivan & Cromwell LLP | Company, LLC, (privately-held |
| earlier retirement or removal. | (law firm). | community newspaper group) (2015- |
| | | present) |
| Diane Durnin (63) | Trustee since 2019. Serves until a | Managing Director - Head of Product Strategy | None |
Trustee | successor trustee is elected or | and Development, BNY Mellon Investment | |
| earlier retirement or removal. | Management (investment management firm) | |
| | (2012-2018); Vice Chairman – The Dreyfus | |
| | Corporation (2005 – 2018): Executive Vice | |
| | President Head of Product, BNY Mellon | |
| | Investment Management (2007-2012); Executive | |
| | Director- Product Strategy, Mellon Asset | |
| | Management (2005-2007); Executive Vice | |
| | President Head of Products, Marketing and | |
| | Client Service, Dreyfus Corporation (investment | |
| | management firm) (2000-2005); and Senior Vice | |
| | President – Strategic Product and Business | |
| | Development, Dreyfus Corporation (1994-2000) | |
| Benjamin M. Friedman (76) | Trustee since 2008. Serves until a | William Joseph Maier Professor of Political | Trustee, Mellon Institutional Funds |
Trustee | successor trustee is elected or | Economy, Harvard University (1972 – present) | Investment Trust and Mellon |
| earlier retirement or removal. | | Institutional Funds Master Portfolio |
| | | (oversaw 17 portfolios in fund |
| | | complex) (1989 - 2008) |
| Lorraine H. Monchak (64) | Trustee since 2017. (Advisory | Chief Investment Officer, 1199 SEIU Funds | None |
Trustee | Trustee from 2014 - 2017). Serves | (healthcare workers union pension funds) | |
| until a successor trustee is elected | (2001 – present); Vice President – International | |
| or earlier retirement or removal. | Investments Group, American International | |
| | Group, Inc. (insurance company) (1993 – 2001); | |
| | Vice President – Corporate Finance and Treasury | |
| | Group, Citibank, N.A. (1980 – 1986 and | |
| | 1990 – 1993); Vice President – Asset/Liability | |
| | Management Group, Federal Farm Funding | |
| | Corporation (government-sponsored issuer of | |
| | debt securities) (1988 – 1990); Mortgage | |
| | Strategies Group, Shearson Lehman Hutton, Inc. | |
| | (investment bank) (1987 – 1988); and Mortgage | |
| | Strategies Group, Drexel Burnham Lambert, Ltd. | |
| | (investment bank) (1986 – 1987) | |
41
| | |
| Pioneer High Yield VCT Portfolio | Pioneer Variable Contracts Trust |
| Trustees, Officers and Service Providers (continued) | |
| | | | |
| Name, Age and Position | Term of Office and | | Other Directorships |
| Held With the Trust | Length of Service | Principal Occupation | Held by Trustee |
Independent Trustees: (continued) | | |
| Marguerite A. Piret (72) | Trustee since 1995. Serves until a | Chief Financial Officer, American Ag Energy, | Director of New America High Income |
Trustee | successor trustee is elected or | Inc. (controlled environment and agriculture | Fund, Inc. (closed-end investment |
| earlier retirement or removal. | company) (2016 – present); and President and | company) (2004 – present); and |
| | Chief Executive Officer, Metric Financial Inc. | Member, Board of Governors, |
| | (formerly known as Newbury Piret Company) | Investment Company Institute |
| | (investment banking firm) (1981 – 2019) | (2000 – 2006) |
| Fred J. Ricciardi (73) | Trustee since 2014. Serves until a | Private investor (2020 – present); Consultant | None |
Trustee | successor trustee is elected or | (investment company services) (2012 – 2020); | |
| earlier retirement or removal. | Executive Vice President, BNY Mellon (financial | |
| | and investment company services) (1969 – 2012); | |
| | Director, BNY International Financing Corp. | |
| | (financial services) (2002 – 2012); Director, | |
| | Mellon Overseas Investment Corp. (financial | |
| | services) (2009 – 2012); Director, Financial | |
| | Models (technology) (2005-2007); Director, BNY | |
| | Hamilton Funds, Ireland (offshore investment | |
| | companies) (2004-2007); Chairman/Director, | |
| | AIB/BNY Securities Services, Ltd., Ireland | |
| | (financial services) (1999-2006); and Chairman, | |
| | BNY Alternative Investment Services, Inc. | |
| | (financial services) (2005-2007) | |
| Interested Trustees: | | | |
| Lisa M. Jones (58)* | Trustee since 2017. Serves until a | Director, CEO and President of Amundi US, Inc. | None |
Trustee, President and | successor trustee is elected or | (investment management firm) (since | |
Chief Executive Officer | earlier retirement or removal | September 2014); Director, CEO and President | |
| | of Amundi Asset Management US, Inc. (since | |
| | September 2014); Director, CEO and President of | |
| | Amundi Distributor US, Inc. (since September | |
| | 2014); Director, CEO and President of Amundi | |
| | Asset Management US, Inc. (since September | |
| | 2014); Chair, Amundi US, Inc., Amundi Distributor | |
| | US, Inc. and Amundi Asset Management US, Inc. | |
| | (September 2014 – 2018); Managing Director, | |
| | Morgan Stanley Investment Management | |
| | (investment management firm) (2010 – 2013); | |
| | Director of Institutional Business, CEO of | |
| | International, Eaton Vance Management | |
| | (investment management firm) (2005 – 2010); | |
| | and Director of Amundi Holdings US, Inc. | |
| | (since 2017) | |
| Kenneth J. Taubes (62)* | Trustee since 2014. Serves until a | Director and Executive Vice President | None |
Trustee | successor trustee is elected or | (since 2008) and Chief Investment Officer, U.S. | |
| earlier retirement or removal | (since 2010) of Amundi US, Inc. (investment | |
| | management firm); Director and Executive Vice | |
| | President and Chief Investment Officer, U.S. of | |
| | Amundi US (since 2008); Executive Vice | |
| | President and Chief Investment Officer, U.S. of | |
| | Amundi Asset Management US, Inc. (since 2009); | |
| | Portfolio Manager of Amundi US (since 1999); | |
| | and Director of Amundi Holdings US, Inc. | |
| | (since 2017) | |
* Ms. Jones and Mr. Taubes are Interested Trustees because they are officers or directors of the Portfolio’s investment adviser and certain of its affiliates.
42
| | |
| Pioneer High Yield VCT Portfolio | Pioneer Variable Contracts Trust |
| | | | |
| Name , Age and Position | Term of Office and | | Other Directorships |
| Held With the Trust | Length of Service | Principal Occupation | Held by Officer |
| Fund Officers: | | | |
| Christopher J. Kelley (56) | Since 2003. Serves at the | Vice President and Associate General Counsel | None |
Secretary and Chief | discretion of the Board | of Amundi US since January 2008; Secretary and | |
Legal Officer | | Chief Legal Officer of all of the Pioneer Funds | |
| | since June 2010; Assistant Secretary of all of the | |
| | Pioneer Funds from September 2003 to | |
| | May 2010; Vice President and Senior Counsel of | |
| | Amundi US from July 2002 to December 2007 | |
| Carol B. Hannigan (59) | Since 2010. Serves at the | Fund Governance Director of Amundi US since | None |
Assistant Secretary | discretion of the Board | December 2006 and Assistant Secretary of all | |
| | the Pioneer Funds since June 2010; Manager – | |
| | Fund Governance of Amundi US from | |
| | December 2003 to November 2006; and Senior | |
| | Paralegal of Amundi US from January 2000 to | |
| | November 2003 | |
| Thomas Reyes (58) | Since 2010. Serves at the | Assistant General Counsel of Amundi US since | None |
Assistant Secretary | discretion of the Board | May 2013 and Assistant Secretary of all the | |
| | Pioneer Funds since June 2010; and Counsel of | |
| | Amundi US from June 2007 to May 2013 | |
| Mark E. Bradley (61) | Since 2008. Serves at the | Vice President – Fund Treasury of Amundi US; | None |
Treasurer and Chief Financial | discretion of the Board | Treasurer of all of the Pioneer Funds since | |
and Accounting Officer | | March 2008; Deputy Treasurer of Amundi US | |
| | from March 2004 to February 2008; and Assistant | |
| | Treasurer of all of the Pioneer Funds from | |
| | March 2004 to February 2008 | |
| Anthony J. Koenig, Jr. (57) | Since 2021. Serves at the | Senior Vice President – Fund Treasury of | None |
Assistant Treasurer | discretion of the Board | Amundi US; Assistant Treasurer of all of the | |
| | Pioneer Funds since January 2021; and Chief of | |
| | Staff, US Investment Management of Amundi US | |
| | from May 2008 to January 2021 | |
| Luis I. Presutti (55) | Since 2000. Serves at the | Director – Fund Treasury of Amundi US since | None |
Assistant Treasurer | discretion of the Board | 1999; and Assistant Treasurer of all of the | |
| | Pioneer Funds since 1999 | |
| Gary Sullivan (62) | Since 2002. Serves at the | Senior Manager – Fund Treasury of Amundi US | None |
Assistant Treasurer | discretion of the Board | since 2012; and Assistant Treasurer of all of the | |
| | Pioneer Funds since 2002 | |
| Antonio Furtado (38) | Since 2020. Serves at the | Fund Oversight Manager – Fund Treasury of | None |
Assistant Treasurer | discretion of the Board | Amundi US since 2020; Assistant Treasurer of all | |
| | of the Pioneer Funds since 2020; and Senior Fund | |
| | Treasury Analyst from 2012 - 2020 | |
| John Malone (50) | Since 2018. Serves at the | Managing Director, Chief Compliance Officer of | None |
Chief Compliance Officer | discretion of the Board | Amundi US Asset Management; Amundi Asset | |
| | Management US, Inc.; and the Pioneer Funds | |
| | since September 2018; and Chief Compliance | |
| | Officer of Amundi Distributor US, Inc. since | |
| | January 2014. | |
| Kelly O’Donnell (49) | Since 2006. Serves at the | Vice President – Amundi Asset Management; | None |
Anti-Money | discretion of the Board | and Anti-Money Laundering Officer of all the | |
Laundering Officer | | Pioneer Funds since 2006 | |
43
This page was intentionally left blank.
44
This page was intentionally left blank.
45
Proxy Voting Policies and Procedures of the Portfolio are available without charge, upon request, by calling our toll free number (1-800-225-6292). Information regarding how the Portfolio voted proxies relating to Portfolio securities during the most recent 12-month period ended June 30 is publicly available to shareowners at www.amundi.com/us. This information is also available on the Securities and Exchange Commission’s web site at www.sec.gov.
18662-15-0221
Pioneer Variable Contracts Trust
Pioneer Mid Cap Value
VCT PortfolioClass I and II Shares
Annual Report | December 31, 2020
Paper copies of the Portfolio’s shareholder reports may no longer be sent by mail, unless you specifically request paper copies of the reports from the insurance company that offers your variable annuity or variable life insurance contract, or from your financial intermediary. Instead, the insurance company may choose to make the reports available on a website, and will notify you by mail each time a shareholder report is posted and provide you with a website link to access the report. Instructions for requesting paper copies will be provided by your insurance company.
You may elect to receive all future Portfolio shareholder reports in paper form, free of charge, from the insurance company. You can inform the insurance company or your financial intermediary that you wish to continue receiving paper copies of your shareholder reports by following the instructions provided by the insurance company, or by contacting your financial intermediary. Your election to receive reports in paper form will apply to all portfolios available under your contract with the insurance company.
Please refer to your contract prospectus to determine the applicable share class offered under your contract.
Pioneer Variable Contracts Trust
| | |
| |
| Pioneer Mid Cap Value VCT Portfolio | |
| | |
| |
| | |
| |
| | |
| |
| | |
| |
| | |
| |
| | |
| |
| | |
| |
| | |
| |
| | |
| |
| | |
| |
This report is authorized for distribution only when preceded or accompanied by a prospectus for the Portfolio being offered.
Pioneer Variable Contracts Trust files a complete schedule of portfolio holdings with the Securities and Exchange Commission for the first and third quarters of each fiscal year as an exhibit to its reports on Form N-PORT. Shareholders may view the filed Form N-PORT by visiting the Commission’s web site at https://www.sec.gov.
| | |
| Pioneer Mid Cap Value VCT Portfolio | Pioneer Variable Contracts Trust |
Portfolio Update 12/31/20
Sector Distribution
(As a percentage of total investments)*
5 Largest Holdings
(As a percentage of total investments)*
| | | |
1. | Zimmer Biomet Holdings, Inc. | 2.42% |
2. | McKesson Corp. | 2.25 |
3. | Citizens Financial Group, Inc. | 2.18 |
4. | Hartford Financial Services | |
| Group, Inc. | 2.11 |
5. | PACCAR, Inc. | 2.10 |
* | Excludes temporary cash investments and all derivative contracts except for options purchased. The Portfolio is actively managed, and current holdings may be different. The holdings listed should not be considered recommendations to buy or sell any securities. |
| Performance Update 12/31/20 | | |
|
| Prices and Distributions | | | |
|
| Net Asset Value per Share | | 12/31/20 | 12/31/19 |
| Class I | | $17.97 | $18.46 |
| Class II | | $17.74 | $18.23 |
|
| Net | | |
| Distributions per Share | Investment | Short-Term | Long-Term |
| (1/1/20 – 12/31/20) | Income | Capital Gains | Capital Gains |
| Class I | $0.1976 | $ — | $0.5265 |
| Class II | $0.1548 | $ — | $0.5265 |
Performance of a $10,000 Investment
The following chart shows the change in value of an investment made in Class I and Class II shares of Pioneer Mid Cap Value VCT Portfolio at net asset value during the periods shown, compared to that of the Russell Midcap Value Index. Portfolio returns are based on net asset value and do not reflect any applicable insurance fees or surrender charges.
The Russell Midcap Value Index is an unmanaged index that measures the performance of U.S. mid-cap value stocks. Index returns are calculated monthly, assume reinvestment of dividends and, unlike Portfolio returns, do not reflect any fees, expenses or sales charges. It is not possible to invest directly in an index.
| Average Annual Total Returns | | | |
(As of December 31, 2020) | | | |
| | | Russell Midcap |
| Class I | Class II | Value Index |
10 Years | 7.72% | 7.45% | 10.49% |
5 Years | 6.90% | 6.62% | 9.73% |
1 Year | 2.14% | 1.87% | 4.96% |
All total returns shown assume reinvestment of distributions at net asset value.
The performance table does not reflect the deduction of taxes that a shareowner would pay on distributions or the redemption of shares.
Call 1-800-688-9915 or visit www.amundi.com/us for the most recent month-end performance results. Current performance may be lower or higher than the performance data quoted.
The performance data quoted represents past performance, which is no guarantee of future results. Investment return and principal value will fluctuate, and shares, when redeemed, may be worth more or less than their original cost.
The returns for the Portfolio do not reflect the deduction of expenses associated with variable products, such as mortality and expense risk charges, separate account charges, and sales charges. These expenses would reduce the overall returns shown.
Performance results reflect any applicable expense waivers in effect during the periods shown. Without such waivers, performance would be lower. Waivers may not be in effect for all portfolios. Certain fee waivers are contractual through a specified period. Otherwise, fee waivers can be rescinded at any time. See the prospectus and financial statements for more information.
2
| | |
| Pioneer Mid Cap Value VCT Portfolio | Pioneer Variable Contracts Trust |
Comparing Ongoing Portfolio Expenses | |
As a shareowner in the Portfolio, you incur two types of costs:
(1) | ongoing costs, including management fees, distribution and/or service (12b-1) fees, and other Portfolio expenses; and |
(2) | transaction costs, including sales charges (loads) on purchase payments. |
This example is intended to help you understand your ongoing expenses (in dollars) of investing in the Portfolio and to compare these costs with the ongoing costs of investing in other mutual funds offered through your variable annuity contract. The example is based on an investment of $1,000 at the beginning of the Portfolio’s latest six-month period and held throughout the six months.
Using the Tables
Actual Expenses
The first table below provides information about actual account values and actual expenses. You may use the information in this table, together with the amount you invested, to estimate the expenses that you paid over the period as follows:
1. | Divide your account value by $1,000 |
| Example: an $8,600 account value ÷ $1,000 = 8.6 |
2. | Multiply the result in (1) above by the corresponding share class’s number in the third row under the heading entitled “Expenses Paid During Period” to estimate the expenses you paid on your account during this period. |
Expenses Paid on a $1,000 Investment in Pioneer Mid Cap Value VCT Portfolio
Based on actual returns from July 1, 2020 through December 31, 2020.
| | | | | | | |
| Share Class | | | I |
| | II | |
| Beginning Account Value on 7/1/20 | | $ | 1,000.00 | | | $ | 1,000.00 | |
| Ending Account Value on 12/31/20 | | $ | 1,246.22 | | | $ | 1,244.90 | |
| Expenses Paid During Period* | | $ | 4.18 | | | $ | 5.59 | |
* | Expenses are equal to the Portfolio’s annualized net expense ratio of 0.74% and 0.99% for Class I and Class II shares, respectively, multiplied by the average account value over the period, multiplied by 184/366 (to reflect the one-half year period). |
Hypothetical Example for Comparison Purposes
The table below provides information about hypothetical account values and hypothetical expenses based on the Portfolio’s actual expense ratio and an assumed rate of return of 5% per year before expenses, which is not the Portfolio’s actual return. The hypothetical account values and expenses may not be used to estimate the actual ending account balance or expenses you paid for the period.
You may use this information to compare the ongoing costs of investing in the Portfolio and other variable annuities. To do so, compare this 5% hypothetical example with the 5% hypothetical examples that appear in the shareholder reports of the other variable annuities.
Please note that the expenses shown in the tables are meant to highlight your ongoing costs only and do not reflect any transaction costs, such as sales charges (loads) that are charged at the time of the transaction. Therefore, the table below is useful in comparing ongoing costs only and will not help you determine the relative total costs of owning different variable annuities. In addition, if these transaction costs were included, your costs would have been higher.
Expenses Paid on a $1,000 Investment in Pioneer Mid Cap Value VCT Portfolio
Based on a hypothetical 5% per year return before expenses, reflecting the period from July 1, 2020 through December 31, 2020.
| | | | | | | |
| Share Class | | | I |
| | II | |
| Beginning Account Value on 7/1/20 | | $ | 1,000.00 | | | $ | 1,000.00 | |
| Ending Account Value on 12/31/20 | | $ | 1,021.42 | | | $ | 1,020.16 | |
| Expenses Paid During Period* | | $ | 3.76 | | | $ | 5.03 | |
* | Expenses are equal to the Portfolio’s annualized net expense ratio of 0.74% and 0.99% for Class I and Class II shares, respectively, multiplied by the average account value over the period, multiplied by 184/366 (to reflect the one-half year period). |
3
| | |
| Pioneer Mid Cap Value VCT Portfolio | Pioneer Variable Contracts Trust |
Portfolio Management Discussion 12/31/20 | |
Call 1-800-688-9915 or visit www.amundi.com/us for the most recent month-end performance results. Current performance may be lower or higher than the performance data quoted.
The performance data quoted represents past performance, which is no guarantee of future results. Investment return and principal value will fluctuate, and shares, when redeemed, may be worth more or less than their original cost.
The returns for the Portfolio do not reflect the deduction of expenses associated with variable products, such as mortality and expense risk charges, separate account charges, and sales charges. These expenses would reduce the overall returns shown.
Performance results reflect any applicable expense waivers in effect during the periods shown. Without such waivers performance would be lower. Waivers may not be in effect for all portfolios. Certain fee waivers are contractual through a specified period. Otherwise, fee waivers can be rescinded at any time. See the prospectus and financial statements for more information.
The investment environment for domestic mid-cap stocks was extremely volatile during the 12-month period ended December 31, 2020, as mid-cap equities fell sharply early in the period, but had recovered by period-end. In the following interview, Timothy Stanish and Raymond Haddad discuss the factors that affected the performance of Pioneer Mid Cap Value VCT Portfolio during the 12-month period ended December 31, 2020. Mr. Stanish, a vice president, a portfolio EVA (economic value added) analyst, and a portfolio manager at Amundi Asset Management US, Inc. (Amundi US), and Mr. Haddad, a vice president and a portfolio manager at Amundi US, are responsible for the day-to-day management of the Portfolio.
Q: How did the Portfolio perform during the 12-month period ended December 31, 2020?
A: Pioneer Mid Cap Value VCT Portfolio’s Class I shares returned 2.14% at net asset value during the 12-month period ended December 31, 2020, and Class II shares returned 1.87%, while the Portfolio’s benchmark, the Russell Midcap Value Index, returned 4.96%.
Q: How would you describe the investment environment during the 12-month period ended December 31, 2020?
A: The 12-month period featured nearly unprecedented volatility in the US equity markets. Early in the period, investor sentiment was positive, boosted by the January signing of a trade agreement between the US and China and a highly favorable interest-rate policy from the US Federal Reserve (“Fed”). Those factors combined to send domestic equities to record highs. However, the onset of the COVID-19 pandemic sent stocks sharply lower in mid-February and March 2020, as investors fled riskier assets in the wake of virus-containment measures enacted by national, state, and local governments around the world. The measures included the shuttering of businesses deemed non-essential, which brought the global economy to a virtual standstill.
The Fed and the US government responded to the crisis with aggressive monetary and fiscal policy measures aimed at bolstering both the economy and the financial markets. The stimulus efforts generated a sense of optimism among market participants that the economic effects of the pandemic, though severe, could possibly be short-lived. Markets then rallied throughout much of the final three calendar quarters of 2020, as many US businesses reopened, the US economy showed signs of strength, particularly in the third quarter, and the Fed signaled its intentions to keep the target range of the benchmark federal funds rate at near zero for the foreseeable future. Volatility then increased during the autumn months as investors faced an uptick in COVID-19 case counts and uncertainty about the November US presidential election. However, the markets surged higher following the election, and agreement on additional stimulus from the US government near year-end fueled more positive momentum.
Within the US stock market, stocks of small- and mid-cap companies underperformed large-cap stocks by a significant margin over the 12-month period, reflecting investors’ preference for the perceived stability of larger companies. Growth stocks dramatically outperformed value stocks as well,
4
| | |
| Pioneer Mid Cap Value VCT Portfolio | Pioneer Variable Contracts Trust |
extending a streak of outperformance by growth stocks that has now lasted for several years. Although growth stocks have historically struggled during periods of economic weakness, companies in growth-oriented sectors such as information technology actually outperformed over the past year, despite the shuttering of much of the global economy. Companies in those sectors benefited greatly from the work-from-home and shop-from-home phenomena brought on by the pandemic. By contrast, stocks of companies traditionally viewed as defensive performed poorly during the 12-month period, despite their relatively attractive valuations.
Q: How did you position the Portfolio during the 12-month period ended December 31, 2020, and how did the positioning affect performance relative to the benchmark?
A: We continued to emphasize holding stocks of what we view as higher-quality value companies in the Portfolio during the 12-month period, in anticipation of slowing domestic economic growth. We maintained a preference for companies with histories of below-average debt levels, above-average profits, and below-average earnings volatility. Cyclical economic factors have tended to play a less important role in the performance of those types of stocks, and the valuations of those companies have usually held up relatively well when the market environment faced considerable uncertainty. That strategy proved successful during the market pullback in February and March, as the Portfolio outperformed the Russell Index over that timeframe. However, the Portfolio’s security selection results weighed on benchmark-relative returns throughout much of the remainder of the period, as the stock market rebounded sharply after the initial pandemic-related selloff.
From a sector perspective, stock selection results as well as an underweight position in consumer staples were the most significant detractors from the Portfolio’s benchmark-relative performance over the 12-month period. Stock selection results in energy and utilities also notably detracted from relative returns.
The most significant positive contributors to the Portfolio’s relative performance from a sector-allocation standpoint during the period were stock selection results as well as an overweight position in the consumer discretionary sector. Overweight positions in the materials and health care sectors also benefited relative performance, as did an underweight position in utilities.
At the individual security level, the two largest detractors from the Portfolio’s benchmark-relative performance during the period were a position in oil & gas exploration and production company Marathon Oil, and not having any exposure to Newmont Mining. Unprecedented disruptions in the oil market weighed on Marathon’s shares, and the energy sector in general. Another performance detractor versus the Russell Index was our decision to avoid taking a position in gold miner Newmont. Not holding the stock hurt the Portfolio’s relative returns as Newmont’s share price rallied significantly on rising prices for gold and other precious metals.
5
| | |
| Pioneer Mid Cap Value VCT Portfolio | Pioneer Variable Contracts Trust |
| Portfolio Management Discussion 12/31/20 (continued) | |
The top two performers for the Portfolio versus the benchmark during the 12-month period were semiconductor manufacturer Lam Research and health care company West Pharmaceutical Services. Technology-testing specialist Lam Research saw steady growth and continued to generate solid earnings during the period, benefiting from a favorable environment for the semiconductor industry. West Pharmaceutical’s core medical packaging and drug-delivery products enjoyed continued high demand over the period, and the company also advanced COVID-19-related initiatives to generate new growth opportunities.
Q: Did the Portfolio have any exposure to derivative securities during the 12-month period ended December 31, 2020?
A: No, the Portfolio did not invest in any derivatives during the 12-month period.
Q: What is your investment outlook and how have you positioned the Portfolio with regard to that outlook for 2021?
A: As we look ahead to 2021, we expect that ongoing fiscal and monetary stimulus may be necessary to support the US economy. Despite the improvement in most US economic indicators since the steep drop in activity caused by COVID-19 containment measures during the first half of 2020, there remains considerable uncertainty surrounding the future trajectory of the economy.
We believe that the recent approval of COVID-19 vaccines and the beginning of their large-scale distribution could prove to be a key turning point for both the health crisis and the economy. Successful deployment of vaccines on a national scale could spur accelerating economic growth, especially in the hardest-hit sectors of the economy. In our view, such a broadening of performance leadership beyond higher-growth areas of the equity market could diminish the appeal of some stocks that currently have exceptionally high valuations, particularly those that have benefited from the work-from-home and shop-at-home trends brought about by the pandemic.
Conversely, we would anticipate that delays in further efforts to deploy vaccines for COVID-19 could create downside risk by leading to increased government restrictions on social and business activities. In particular, the recent wave of new COVID-19 cases has already led to some reversals of the progress made toward returning both the business community and society at large to more normal conditions.
With regard to positioning, we have significantly increased the Portfolio’s exposure to cyclical stocks shares of companies with more exposures to the ebbs and flows of the economic cycle in anticipation of further stimulus measures, the reopening of previously closed sectors of the economy, and the drawdown of forced savings by consumers, which have increased since March 2020. In addition, we believe there is still value in the sectors that have been hit hardest by the spread of COVID-19.
6
| | |
| Pioneer Mid Cap Value VCT Portfolio | Pioneer Variable Contracts Trust |
A Word About Risk:
All investments are subject to risk, including the possible loss of principal. In the past several years, financial markets have experienced increased volatility and heightened uncertainty. The market prices of securities may go up or down, sometimes rapidly or unpredictably, due to general market conditions, such as real or perceived adverse economic, political, or regulatory conditions, recessions, inflation, changes in interest or currency rates, lack of liquidity in the bond markets, the spread of infectious illness or other public health issues or adverse investor sentiment. These conditions may continue, recur, worsen or spread.
Investments in mid-sized companies may offer the potential for higher returns, but are also subject to greater short-term price fluctuations than larger, more established companies.
Investing in foreign and/or emerging markets securities involves risks relating to interest rates, currency exchange rates, economic, and political conditions.
The Portfolio invests in REIT securities, the value of which can fall for a variety of reasons, such as declines in rental income, fluctuating interest rates, poor property management, environmental liabilities, uninsured damage, increased competition, or changes in real estate tax laws.
When interest rates rise, the prices of fixed-income securities in the Portfolio will generally fall. Conversely, when interest rates fall, the prices of fixed-income securities in the Portfolio will generally rise.
At times, the Portfolio’s investments may represent industries or industry sectors that are interrelated or have common risks, making the Portfolio more susceptible to any economic, political, or regulatory developments or other risks affecting those industries and sectors.
These risks may increase share price volatility.
In managing the Portfolio for the long run, we have remained committed to investing in shares of what we view as high-quality companies, and we see a post-pandemic recovery in economic growth as potentially producing outperformance by traditional value stocks. We have continued to have confidence in our longer-term investment strategy of focusing on reasonably valued stocks of higher-quality companies, and we believe that the strategy is well-suited to the economic and market conditions that we see as likely to prevail in the months and years to come.
Please refer to the Schedule of Investments on pages 8 to 12 for a full listing of Portfolio securities.
Past performance is no guarantee of future results.
Any information in this shareholder report regarding market or economic trends or the factors influencing the Portfolio’s historical or future performance are statements of opinion as of the date of this report.
7
| | |
| Pioneer Mid Cap Value VCT Portfolio | Pioneer Variable Contracts Trust |
Schedule of Investments 12/31/20 | |
| | | | |
| Shares | | | Value |
| | | UNAFFILIATED ISSUERS – 99.9% | |
| | | COMMON STOCKS – 99.2% of Net Assets | |
| | | Aerospace & Defense – 1.0% | |
| 72,432 | | Spirit AeroSystems Holdings, Inc. | $ 2,831,367 |
| | | Total Aerospace & Defense | $ 2,831,367 |
| | | Airlines – 1.2% | |
| 85,902 | | Delta Air Lines, Inc. | $ 3,454,119 |
| | | Total Airlines | $ 3,454,119 |
| | | Auto Components – 0.5% | |
| 35,888 | | BorgWarner, Inc. | $ 1,386,712 |
| | | Total Auto Components | $ 1,386,712 |
| | | Banks – 8.7% | |
| 172,398 | | Citizens Financial Group, Inc. | $ 6,164,953 |
| 111,159 | | East West Bancorp, Inc. | 5,636,873 |
| 101,654 | | First Hawaiian, Inc. | 2,397,001 |
| 36,086 | | First Republic Bank | 5,302,116 |
| 17,254 | | M&T Bank Corp. | 2,196,434 |
| 21,867 | | Signature Bank/New York NY | 2,958,386 |
| | | Total Banks | $ 24,655,763 |
| | | Building Products – 1.8% | |
| 34,385 | | Trane Technologies Plc | $ 4,991,327 |
| | | Total Building Products | $ 4,991,327 |
| | | Capital Markets – 1.3% | |
| 26,767 | | Artisan Partners Asset Management, Inc. | $ 1,347,451 |
| 16,724 | | Nasdaq, Inc. | 2,219,944 |
| | | Total Capital Markets | $ 3,567,395 |
| | | Chemicals – 7.5% | |
| 43,963 | | Celanese Corp. | $ 5,712,552 |
| 131,123 | | Chemours Co. | 3,250,539 |
| 173,562 | | Element Solutions, Inc. | 3,077,254 |
| 150,589 | | Huntsman Corp. | 3,785,808 |
| 37,275 | | PPG Industries, Inc. | 5,375,801 |
| | | Total Chemicals | $ 21,201,954 |
| | | Consumer Durables & Apparel – 0.7% | |
| 93,161 | | Newell Brands, Inc. | $ 1,977,808 |
| | | Total Consumer Durables & Apparel | $ 1,977,808 |
| | | Containers & Packaging – 2.6% | |
| 29,048 | | Ball Corp. | $ 2,706,693 |
| 273,147 | | Graphic Packaging Holding Co. | 4,627,110 |
| | | Total Containers & Packaging | $ 7,333,803 |
| | | Electric Utilities – 2.9% | |
| 78,120 | | Avangrid, Inc. | $ 3,550,554 |
| 46,284 | | Entergy Corp. | 4,620,995 |
| | | Total Electric Utilities | $ 8,171,549 |
| | | Electrical Equipment – 1.6% | |
| 36,780 | | Eaton Corp. Plc | $ 4,418,749 |
| | | Total Electrical Equipment | $ 4,418,749 |
The accompanying notes are an integral part of these financial statements.
8
| | |
| Pioneer Mid Cap Value VCT Portfolio | Pioneer Variable Contracts Trust |
| | | | |
| Shares | | | Value |
| | | Electronic Equipment, Instruments & Components – 3.9% | |
| 20,522 | | CDW Corp. | $ 2,704,594 |
| 80,896 | | Corning, Inc. | 2,912,256 |
| 34,500 | | Dolby Laboratories, Inc. | 3,350,985 |
| 16,061(a) | | Keysight Technologies, Inc. | 2,121,498 |
| | | Total Electronic Equipment, Instruments & Components | $ 11,089,333 |
| | | Equity Real Estate Investment Trusts (REITs) – 10.5% | |
| 9,462 | | Alexandria Real Estate Equities, Inc. | $ 1,686,318 |
| 17,389 | | Camden Property Trust | 1,737,509 |
| 90,687 | | Cousins Properties, Inc. | 3,038,014 |
| 36,096 | | Duke Realty Corp. | 1,442,757 |
| 35,788 | | Hannon Armstrong Sustainable Infrastructure Capital, Inc. | 2,270,033 |
| 47,610 | | Healthpeak Properties, Inc. | 1,439,250 |
| 102,642 | | Host Hotels & Resorts, Inc. | 1,501,652 |
| 40,630 | | Omega Healthcare Investors, Inc. | 1,475,682 |
| 63,150 | | Outfront Media, Inc. | 1,235,214 |
| 164,528 | | Park Hotels & Resorts, Inc. | 2,821,655 |
| 28,056 | | Safehold, Inc. | 2,033,779 |
| 26,768 | | Sun Communities, Inc. | 4,067,398 |
| 54,101 | | UDR, Inc. | 2,079,101 |
| 116,089 | | VICI Properties, Inc. | 2,960,270 |
| | | Total Equity Real Estate Investment Trusts (REITs) | $ 29,788,632 |
| | | Food & Staples Retailing – 0.8% | |
| 31,030 | | Sysco Corp. | $ 2,304,288 |
| | | Total Food & Staples Retailing | $ 2,304,288 |
| | | Food Products – 0.4% | |
| 29,345 | | Kraft Heinz Co. | $ 1,017,098 |
| | | Total Food Products | $ 1,017,098 |
| | | Health Care Equipment & Supplies – 5.0% | |
| 39,234(a) | | Hologic, Inc. | $ 2,857,412 |
| 14,673 | | STERIS Plc | 2,781,121 |
| 6,264 | | West Pharmaceutical Services, Inc. | 1,774,654 |
| 44,315 | | Zimmer Biomet Holdings, Inc. | 6,828,498 |
| | | Total Health Care Equipment & Supplies | $ 14,241,685 |
| | | Health Care Providers & Services – 2.2% | |
| 36,582 | | McKesson Corp. | $ 6,362,341 |
| | | Total Health Care Providers & Services | $ 6,362,341 |
| | | Hotels, Restaurants & Leisure – 6.0% | |
| 24,954 | | Darden Restaurants, Inc. | $ 2,972,521 |
| 26,470 | | Hilton Worldwide Holdings, Inc. | 2,945,052 |
| 260,401 | | International Game Technology Plc | 4,411,193 |
| 91,702 | | MGM Resorts International | 2,889,530 |
| 143,668(a) | | Norwegian Cruise Line Holdings, Ltd. | 3,653,477 |
| | | Total Hotels, Restaurants & Leisure | $ 16,871,773 |
| | | Household Durables – 1.9% | |
| 36,384 | | Lennar Corp. | $ 2,773,552 |
| 14,750 | | Whirlpool Corp. | 2,662,228 |
| | | Total Household Durables | $ 5,435,780 |
The accompanying notes are an integral part of these financial statements.
9
| | |
| Pioneer Mid Cap Value VCT Portfolio | Pioneer Variable Contracts Trust |
| Schedule of Investments 12/31/20 (continued) | |
| | | | |
| Shares | | | Value |
| | | Insurance – 5.9% | |
| 12,095 | | Assurant, Inc. | $ 1,647,581 |
| 66,407 | | Brown & Brown, Inc. | 3,148,356 |
| 121,702 | | Hartford Financial Services Group, Inc. | 5,960,964 |
| 41,595 | | Lincoln National Corp. | 2,092,644 |
| 190,244 | | Old Republic International Corp. | 3,749,709 |
| | | Total Insurance | $ 16,599,254 |
| | | Internet & Direct Marketing Retail – 1.3% | |
| 28,858 | | Expedia, Inc. | $ 3,820,799 |
| | | Total Internet & Direct Marketing Retail | $ 3,820,799 |
| | | IT Services – 0.9% | |
| 28,056 | | Booz Allen Hamilton Holding Corp. | $ 2,445,922 |
| | | Total IT Services | $ 2,445,922 |
| | | Machinery – 11.0% | |
| 39,135 | | AGCO Corp. | $ 4,034,427 |
| 65,575 | | Allison Transmission Holdings, Inc. | 2,828,250 |
| 29,847 | | Donaldson Co., Inc. | 1,667,850 |
| 44,816 | | Flowserve Corp. | 1,651,470 |
| 118,885(a) | | Ingersoll Rand, Inc. | 5,416,401 |
| 62,457 | | Otis Worldwide Corp. | 4,218,970 |
| 68,702 | | PACCAR, Inc. | 5,927,609 |
| 17,013 | | Stanley Black & Decker, Inc. | 3,037,841 |
| 29,059 | | Timken Co. | 2,248,004 |
| | | Total Machinery | $ 31,030,822 |
| | | Materials – 0.6% | |
| 15,862(a) | | Crown Holdings, Inc. | $ 1,589,372 |
| | | Total Materials | $ 1,589,372 |
| | | Media – 1.2% | |
| 77,424(a) | | Liberty Media Corp.-Liberty SiriusXM | $ 3,368,718 |
| | | Total Media | $ 3,368,718 |
| | | Metals & Mining – 1.4% | |
| 32,716 | | Reliance Steel & Aluminum Co. | $ 3,917,741 |
| | | Total Metals & Mining | $ 3,917,741 |
| | | Multiline Retail – 0.9% | |
| 12,210 | | Dollar General Corp. | $ 2,567,763 |
| | | Total Multiline Retail | $ 2,567,763 |
| | | Multi-Utilities – 1.9% | |
| 92,420 | | Public Service Enterprise Group, Inc. | $ 5,388,086 |
| | | Total Multi-Utilities | $ 5,388,086 |
| | | Oil, Gas & Consumable Fuels – 1.1% | |
| 74,618 | | Marathon Petroleum Corp. | $ 3,086,200 |
| | | Total Oil, Gas & Consumable Fuels | $ 3,086,200 |
| | | Real Estate Management & Development – 0.9% | |
| 42,043(a) | | CBRE Group, Inc. | $ 2,636,937 |
| | | Total Real Estate Management & Development | $ 2,636,937 |
| | | Road & Rail – 3.1% | |
| 39,060 | | JB Hunt Transport Services, Inc. | $ 5,337,549 |
| 17,247 | | Kansas City Southern | 3,520,630 |
| | | Total Road & Rail | $ 8,858,179 |
The accompanying notes are an integral part of these financial statements.
10
| | |
| Pioneer Mid Cap Value VCT Portfolio | Pioneer Variable Contracts Trust |
| | | | |
| Shares | | | Value |
| | | Semiconductors & Semiconductor Equipment – 1.0% | |
| 5,818 | | Lam Research Corp. | $ 2,747,667 |
| | | Total Semiconductors & Semiconductor Equipment | $ 2,747,667 |
| | | Software – 1.0% | |
| 28,255(a) | | Manhattan Associates, Inc. | $ 2,971,861 |
| | | Total Software | $ 2,971,861 |
| | | Specialty Retail – 3.8% | |
| 70,388(a) | | AutoNation, Inc. | $ 4,912,378 |
| 63,547 | | Foot Locker, Inc. | 2,569,841 |
| 3,272(a) | | O’Reilly Automotive, Inc. | 1,480,809 |
| 69,386(a) | | Urban Outfitters, Inc. | 1,776,282 |
| | | Total Specialty Retail | $ 10,739,310 |
| | | Technology Hardware, Storage & Peripherals – 0.6% | |
| 45,236(a) | | NCR Corp. | $ 1,699,517 |
| | | Total Technology Hardware, Storage & Peripherals | $ 1,699,517 |
| | | Textiles, Apparel & Luxury Goods – 2.1% | |
| 40,250 | | Columbia Sportswear Co. | $ 3,517,045 |
| 23,746 | | Ralph Lauren Corp. | 2,463,410 |
| | | Total Textiles, Apparel & Luxury Goods | $ 5,980,455 |
| | | TOTAL COMMON STOCKS | |
| | | (Cost $223,122,933) | $280,550,079 |
| Principal | | | |
| Amount | | | |
| USD ($) | | | |
| | | U.S. GOVERNMENT AND AGENCY OBLIGATION – 0.7% of Net Assets(b) | |
| 2,000,000(b) | | U.S. Treasury Floating Rate Note, 0.249% (3 Month U.S. Treasury Bill Money Market | |
| | | Yield + 15 bps), 1/31/22 | $ 2,001,972 |
| | | TOTAL U.S. GOVERNMENT AND AGENCY OBLIGATION | |
| | | (Cost $2,002,132) | $ 2,001,972 |
| | | TOTAL INVESTMENTS IN UNAFFILIATED ISSUERS – 99.9% | |
| | | (Cost $225,125,065) | $282,552,051 |
| | | OTHER ASSETS AND LIABILITIES – 0.1% | $ 406,441 |
| | | NET ASSETS – 100.0% | $282,958,492 |
| |
| bps | Basis Points. |
| REIT | Real Estate Investment Trust. |
| (a) | Non-income producing security. |
| (b) | Floating rate note. Coupon rate, reference index and spread shown at December 31, 2020. |
| | |
Purchases and sales of securities (excluding temporary cash investments) for the year ended December 31, 2020 were as follows: |
| | Purchases | | | Sales | |
| Long-Term U.S. Government Securities | | $ | 4,004,265 | | | $ | 1,996,092 | |
| Other Long-Term Securities | | $ | 215,696,167 | | | $ | 220,734,481 | |
The accompanying notes are an integral part of these financial statements.
11
| | |
| Pioneer Mid Cap Value VCT Portfolio | Pioneer Variable Contracts Trust |
| Schedule of Investments 12/31/20 (continued) | |
The Portfolio is permitted to engage in purchase and sale transactions (“cross trades”) with certain funds and accounts for which Amundi Asset Management US, Inc. (the “Adviser”) serves as the Portfolio’s investment adviser, as set forth in Rule 17a-7 under the Investment Company Act of 1940, pursuant to procedures adopted by the Board of Trustees. Under these procedures, cross trades are effected at current market prices. During the year ended December 31, 2020, the Portfolio did not engage in any cross trade activity.
At December 31, 2020, the net unrealized appreciation on investments based on cost for federal tax purposes of $225,762,548 was as follows:
| | | | |
| Aggregate gross unrealized appreciation for all investments in which there is an excess of value over tax cost | | $ | 58,444,493 | |
| Aggregate gross unrealized depreciation for all investments in which there is an excess of tax cost over value | | | (1,654,990 | ) |
| Net unrealized appreciation | | $ | 56,789,503 | |
Various inputs are used in determining the value of the Portfolio’s investments. These inputs are summarized in the three broad levels below.
Level 1 – unadjusted quoted prices in active markets for identical securities.
Level 2 – other significant observable inputs (including quoted prices for similar securities, interest rates, prepayment speeds, credit risks, etc.). See Notes to Financial Statements — Note 1A.
Level 3 – significant unobservable inputs (including the Portfolio’s own assumptions in determining fair value of investments). See Notes to Financial Statements — Note 1A.
| |
The following is a summary of the inputs used as of December 31, 2020, in valuing the Portfolio’s investments: |
| | | | | | | | | | | | | |
| | Level 1 | | | Level 2 | | | Level 3 | | | Total | |
| Common Stocks | | $ | 280,550,079 | | | $ | — | | | $ | — | | | $ | 280,550,079 | |
| U.S. Government and Agency Obligation | | | — | | | | 2,001,972 | | | | — | | | | 2,001,972 | |
| Total Investments in Securities | | $ | 280,550,079 | | | $ | 2,001,972 | | | $ | — | | | $ | 282,552,051 | |
|
During the year ended December 31, 2020, there were no transfers in or out of Level 3. |
The accompanying notes are an integral part of these financial statements.
12
| | |
| Pioneer Mid Cap Value VCT Portfolio | Pioneer Variable Contracts Trust |
Statement of Assets and Liabilities 12/31/20 | |
| | | | |
| ASSETS: | | | |
| Investments in unaffiliated issuers, at value (cost $225,125,065) | | $ | 282,552,051 | |
| Cash | | | 1,188,358 | |
| Receivables — | | | | |
| Portfolio shares sold | | | 3,821 | |
| Dividends | | | 352,594 | |
| Interest | | | 835 | |
| Other assets | | | 247 | |
| Total assets | | $ | 284,097,906 | |
| | | | | |
| LIABILITIES: | | | | |
| Payables — | | | | |
| Investment securities purchased | | $ | 951,450 | |
| Portfolio shares repurchased | | | 95,036 | |
| Professional fees | | | 52,109 | |
| Due to affiliates | | | 20,371 | |
| Accrued expenses | | | 20,448 | |
| Total liabilities | | $ | 1,139,414 | |
| | | | | |
| NET ASSETS: | | | | |
| Paid-in capital | | $ | 228,108,403 | |
| Distributable earnings | | | 54,850,089 | |
| Net assets | | $ | 282,958,492 | |
| | | | | |
| NET ASSET VALUE PER SHARE: | | | | |
No par value (unlimited number of shares authorized) | | | | |
| Class I (based on $32,989,085/1,836,248 shares) | | $ | 17.97 | |
| Class II (based on $249,969,407/14,092,373 shares) | | $ | 17.74 | |
The accompanying notes are an integral part of these financial statements.
13
| | |
| Pioneer Mid Cap Value VCT Portfolio | Pioneer Variable Contracts Trust |
| Statement of Operations | |
| | | | | | | |
| FOR THE YEAR ENDED 12/31/20 | | | | | | |
| INVESTMENT INCOME: | | | | | | |
| Dividends from unaffiliated issuers | | $ | 4,662,751 | | | | |
| Interest from unaffiliated issuers | | | 19,110 | | | | |
| Total investment income | | | | | | $ | 4,681,861 | |
| EXPENSES: | | | | | | | | |
| Management fees | | $ | 1,653,249 | | | | | |
| Administrative expense | | | 111,450 | | | | | |
| Distribution fees | | | | | | | | |
| Class II | | | 559,205 | | | | | |
| Custodian fees | | | 11,926 | | | | | |
| Professional fees | | | 63,381 | | | | | |
| Printing expense | | | 20,604 | | | | | |
| Pricing fees | | | 58 | | | | | |
| Trustees’ fees | | | 7,867 | | | | | |
| Insurance expense | | | 443 | | | | | |
| Miscellaneous | | | 11,005 | | | | | |
| Total expenses | | | | | | $ | 2,439,188 | |
| Net investment income | | | | | | $ | 2,242,673 | |
| REALIZED AND UNREALIZED GAIN (LOSS) ON INVESTMENTS: | | | | | | | | |
| Net realized gain (loss) on: | | | | | | | | |
| Investments in unaffiliated issuers | | | | | | $ | (4,437,300 | ) |
| Change in net unrealized appreciation (depreciation) on: | | | | | | | | |
| Investments in unaffiliated issuers | | | | | | $ | 10,121,721 | |
| Net realized and unrealized gain (loss) on investments | | | | | | $ | 5,684,421 | |
| Net increase in net assets resulting from operations | | | | | | $ | 7,927,094 | |
The accompanying notes are an integral part of these financial statements.
14
| | |
| Pioneer Mid Cap Value VCT Portfolio | Pioneer Variable Contracts Trust |
| Statements of Changes in Net Assets | |
| | | | | | | |
| | Year Ended | | | Year Ended | |
| | 12/31/20 | | | 12/31/19 | |
| FROM OPERATIONS: | | | | | | |
Net investment income (loss) | | $ | 2,242,673 | | | $ | 2,622,399 | |
Net realized gain (loss) on investments | | | (4,437,300 | ) | | | 8,844,533 | |
Change in net unrealized appreciation (depreciation) on investments | | | 10,121,721 | | | | 58,123,072 | |
| Net increase in net assets resulting from operations | | $ | 7,927,094 | | | $ | 69,590,004 | |
| DISTRIBUTIONS TO SHAREOWNERS: | | | | | | | | |
| Class I ($0.73 and $1.38 per share, respectively) | | $ | (1,370,948 | ) | | $ | (2,769,330 | ) |
| Class II ($0.68 and $1.33 per share, respectively) | | | (9,892,768 | ) | | | (18,372,047 | ) |
| Total distributions to shareowners | | $ | (11,263,716 | ) | | $ | (21,141,377 | ) |
| FROM PORTFOLIO SHARE TRANSACTIONS: | | | | | | | | |
Net proceeds from sales of shares | | $ | 28,775,060 | | | $ | 9,343,094 | |
Reinvestment of distributions | | | 11,263,715 | | | | 21,141,377 | |
Cost of shares repurchased | | | (38,185,994 | ) | | | (51,860,053 | ) |
| Net increase (decrease) in net assets resulting from Portfolio share transactions | | $ | 1,852,781 | | | $ | (21,375,582 | ) |
| Net increase (decrease) in net assets | | $ | (1,483,841 | ) | | $ | 27,073,045 | |
| NET ASSETS: | | | | | | | | |
Beginning of year | | $ | 284,442,333 | | | $ | 257,369,288 | |
End of year | | $ | 282,958,492 | | | $ | 284,442,333 | |
| | | | | | | | | | | | | |
| | Year Ended | | | Year Ended | | | Year Ended | | | Year Ended | |
| | 12/31/20 | | | 12/31/20 | | | 12/31/19 | | | 12/31/19 | |
| | Shares | | | Amount | | | Shares | | | Amount | |
| Class I | | | | | | | | | | | | |
Shares sold | | | 155,710 | | | $ | 2,367,823 | | | | 71,437 | | | $ | 1,266,186 | |
Reinvestment of distributions | | | 93,198 | | | | 1,370,947 | | | | 160,914 | | | | 2,769,330 | |
Less shares repurchased | | | (437,701 | ) | | | (6,992,205 | ) | | | (364,444 | ) | | | (6,430,449 | ) |
| Net decrease | | | (188,793 | ) | | $ | (3,253,435 | ) | | | (132,093 | ) | | $ | (2,394,933 | ) |
| Class II | | | | | | | | | | | | | | | | |
Shares sold | | | 1,796,718 | | | $ | 26,407,237 | | | | 470,625 | | | $ | 8,076,908 | |
Reinvestment of distributions | | | 680,383 | | | | 9,892,768 | | | | 1,079,439 | | | | 18,372,047 | |
Less shares repurchased | | | (1,936,058 | ) | | | (31,193,789 | ) | | | (2,583,598 | ) | | | (45,429,604 | ) |
| Net increase (decrease) | | | 541,043 | | | $ | 5,106,216 | | | | (1,033,534 | ) | | $ | (18,980,649 | ) |
The accompanying notes are an integral part of these financial statements.
15
| | |
| Pioneer Mid Cap Value VCT Portfolio | Pioneer Variable Contracts Trust |
| Financial Highlights | |
| | | | | | | | | | | | | | | | |
| | Year Ended | | | Year Ended | | | Year Ended | | | Year Ended | | | Year Ended | |
| | 12/31/20 | | | 12/31/19 | | | 12/31/18 | | | 12/31/17 | | | 12/31/16* | |
| Class I | | | | | | | | | | | | | | | |
Net asset value, beginning of period | | $ | 18.46 | | | $ | 15.53 | | | $ | 21.11 | | | $ | 20.49 | | | $ | 18.88 | |
Increase (decrease) from investment operations: | | | | | | | | | | | | | | | | | | | | |
| Net investment income (loss) (a) | | $ | 0.17 | | | $ | 0.20 | | | $ | 0.23 | | | $ | 0.13 | | | $ | 0.17 | |
| Net realized and unrealized gain (loss) on investments | | | 0.07 | | | | 4.11 | | | | (4.01 | ) | | | 2.36 | | | | 2.81 | |
| Net increase (decrease) from investment operations | | $ | 0.24 | | | $ | 4.31 | | | $ | 3.78 | | | $ | 2.49 | | | $ | 2.98 | |
Distributions to shareowners: | | | | | | | | | | | | | | | | | | | | |
| Net investment income | | $ | (0.20 | ) | | $ | (0.24 | ) | | $ | (0.14 | ) | | $ | (0.18 | ) | | $ | (0.14 | ) |
| Net realized gain | | | (0.53 | ) | | | (1.14 | ) | | | (1.66 | ) | | | (1.69 | ) | | | (1.23 | ) |
| Total distributions | | $ | (0.73 | ) | | $ | (1.38 | ) | | $ | (1.80 | ) | | $ | (1.87 | ) | | $ | (1.37 | ) |
Net increase (decrease) in net asset value
| | $ | (0.49 | ) | | $ | 2.93 | | | $ | (5.58 | ) | | $ | 0.62 | | | $ | 1.61 | |
Net asset value, end of period | | $ | 17.97 | | | $ | 18.46 | | | $ | 15.53 | | | $ | 21.11 | | | $ | 20.49 | |
| Total return (b) | | | 2.14 | % | | | 28.44 | % | | | (19.34 | )% | | | 13.17 | % | | | 16.56 | % |
Ratio of net expenses to average net assets | | | 0.74 | % | | | 0.73 | % | | | 0.73 | % | | | 0.71 | % | | | 0.71 | % |
Ratio of net investment income (loss) to average net assets | | | 1.10 | % | | | 1.14 | % | | | 1.19 | % | | | 0.64 | % | | | 0.91 | % |
Portfolio turnover rate | | | 88 | % | | | 93 | % | | | 81 | % | | | 61 | % | | | 75 | % |
Net assets, end of period (in thousands) | | $ | 32,989 | | | $ | 37,384 | | | $ | 33,506 | | | $ | 48,082 | | | $ | 68,552 | |
* | The Portfolio was audited by an independent registered public accounting firm other than Ernst & Young LLP. |
(a) | The per-share data presented above is based on the average shares outstanding for the period presented. |
(b) | Assumes initial investment at net asset value at the beginning of each period, reinvestment of all distributions and the complete redemption of the investment at net asset value at the end of each period. |
NOTE: The above financial highlights do not reflect the deduction of non-portfolio expenses associated with variable insurance products, such as mortality and expense risk charges, separate account charges, and sales charges.
The accompanying notes are an integral part of these financial statements.
16
| | |
| Pioneer Mid Cap Value VCT Portfolio | Pioneer Variable Contracts Trust |
| | | | | | | | | | | | | | | | |
| | Year Ended | | | Year Ended | | | Year Ended | | | Year Ended | | | Year Ended | |
| | 12/31/20 | | | 12/31/19 | | | 12/31/18 | | | 12/31/17 | | | 12/31/16* | |
| Class II | | | | | | | | | | | | | | | |
| Net asset value, beginning of period | | $ | 18.23 | | | $ | 15.35 | | | $ | 20.87 | | | $ | 20.28 | | | $ | 18.70 | |
| Increase (decrease) from investment operations: | | | | | | | | | | | | | | | | | | | | |
| Net investment income (loss) (a) | | $ | 0.13 | | | $ | 0.15 | | | $ | 0.18 | | | $ | 0.08 | | | $ | 0.12 | |
| Net realized and unrealized gain (loss) on investments | | | 0.06 | | | | 4.06 | | | | (3.95 | ) | | | 2.33 | | | | 2.78 | |
| Net increase (decrease) from investment operations | | $ | 0.19 | | | $ | 4.21 | | | $ | (3.77 | ) | | $ | 2.41 | | | $ | 2.90 | |
| Distributions to shareowners: | | | | | | | | | | | | | | | | | | | | |
| Net investment income | | $ | (0.15 | ) | | $ | (0.19 | ) | | $ | (0.09 | ) | | $ | (0.13 | ) | | $ | (0.09 | ) |
| Net realized gain | | | (0.53 | ) | | | (1.14 | ) | | | (1.66 | ) | | | (1.69 | ) | | | (1.23 | ) |
| Total distributions | | $ | (0.68 | ) | | $ | (1.33 | ) | | $ | (1.75 | ) | | $ | (1.82 | ) | | $ | (1.32 | ) |
| Net increase (decrease) in net asset value | | $ | (0.49 | ) | | $ | 2.88 | | | $ | (5.52 | ) | | $ | 0.59 | | | $ | 1.58 | |
Net asset value, end of period
| | $ | 17.74 | | | $ | 18.23 | | | $ | 15.35 | | | $ | 20.87 | | | $ | 20.28 | |
| Total return (b) | | | 1.87 | % | | | 28.08 | % | | | (19.49 | )% | | | 12.87 | % | | | 16.23 | % |
| Ratio of net expenses to average net assets | | | 0.99 | % | | | 0.98 | % | | | 0.98 | % | | | 0.96 | % | | | 0.96 | % |
| Ratio of net investment income (loss) to average net assets | | | 0.85 | % | | | 0.89 | % | | | 0.95 | % | | | 0.39 | % | | | 0.67 | % |
| Portfolio turnover rate | | | 88 | % | | | 93 | % | | | 81 | % | | | 61 | % | | | 75 | % |
| Net assets, end of period (in thousands) | | $ | 249,969 | | | $ | 247,058 | | | $ | 223,863 | | | $ | 298,671 | | | $ | 294,399 | |
* | The Portfolio was audited by an independent registered public accounting firm other than Ernst & Young LLP. |
(a) | The per-share data presented above is based on the average shares outstanding for the period presented. |
(b) | Assumes initial investment at net asset value at the beginning of each period, reinvestment of all distributions, the complete redemption of the investment at net asset value at the end of each period and no sales charges. Total return would be reduced if sales charges were taken into account. |
NOTE: The above financial highlights do not reflect the deduction of non-portfolio expenses associated with variable insurance products, such as mortality and expense risk charges, separate account charges, and sales charges.
The accompanying notes are an integral part of these financial statements.
17
| | |
| Pioneer Mid Cap Value VCT Portfolio | Pioneer Variable Contracts Trust |
Notes to Financial Statements 12/31/20 | |
1. Organization and Significant Accounting Policies
Pioneer Mid Cap Value VCT Portfolio (the “Portfolio”) is one of 8 portfolios comprising Pioneer Variable Contracts Trust (the “Trust”), a Delaware statutory trust. The Portfolio is registered under the Investment Company Act of 1940 as a diversified, open-end management investment company. The investment objective of the Portfolio is capital appreciation by investing in a diversified portfolio of securities consisting primarily of common stocks.
The Portfolio offers two classes of shares designated as Class I and Class II shares. Each class of shares represents an interest in the same schedule of investments of the Portfolio and has identical rights (based on relative net asset values) to assets and liquidation proceeds. Share classes can bear different rates of class-specific fees and expenses, such as transfer agent and distribution fees. Differences in class-specific fees and expenses will result in differences in net investment income and, therefore, the payment of different dividends from net investment income earned by each class. The Amended and Restated Declaration of Trust of the Portfolio gives the Board of Trustees the flexibility to specify either per-share voting or dollar-weighted voting when submitting matters for shareowner approval. Under per-share voting, each share of a class of the Portfolio is entitled to one vote. Under dollar-weighted voting, a shareowner’s voting power is determined not by the number of shares owned, but by the dollar value of the shares on the record date. Each share class has exclusive voting rights with respect to matters affecting only that class, including with respect to the distribution plan for that class. There is no distribution plan for Class I shares.
Portfolio shares may be purchased only by insurance companies for the purpose of funding variable annuity and variable life insurance contracts or by qualified pension and retirement plans.
Amundi Asset Management US, Inc., an indirect, wholly owned subsidiary of Amundi and Amundi’s wholly owned subsidiary, Amundi USA, Inc., serves as the Portfolio’s investment adviser (the “Adviser”). Prior to January 1, 2021, the Adviser was named Amundi Pioneer Asset Management, Inc. Amundi Distributor US, Inc., an affiliate of Amundi Asset Management US, Inc., serves as the Portfolio’s distributor (the “Distributor”).
In August 2018, the Financial Accounting Standards Board (FASB) issued Accounting Standards Update 2018-13 “Disclosure Framework - Changes to the Disclosure Requirements for Fair Value Measurement” (“ASU 2018-13”) which modifies disclosure requirements for fair value measurements, principally for Level 3 securities and transfers between levels of the fair value hierarchy. ASU 2018-13 is effective for fiscal years beginning after December 15, 2019 and for interim periods within those fiscal years. The Portfolio has adopted ASU 2018-13 for the year ended December 31, 2020. The impact to the Portfolio’s adoption was limited to changes in the Portfolio’s disclosures regarding fair value, primarily those disclosures related to transfers between levels of the fair value hierarchy and disclosure of the range and weighted average used to develop significant unobservable inputs for Level 3 fair value investments, when applicable.
The Portfolio is an investment company and follows investment company accounting and reporting guidance under U.S. Generally Accepted Accounting Principles (“U.S. GAAP”). U.S. GAAP requires the management of the Portfolio to make estimates and assumptions that affect the reported amounts of assets and liabilities, the disclosure of contingent assets and liabilities at the date of the financial statements, and the reported amounts of income, expenses and gain or loss on investments during the reporting period. Actual results could differ from those estimates.
The following is a summary of significant accounting policies followed by the Portfolio in the preparation of its financial statements:
A. Security Valuation
The net asset value of the Portfolio is computed once daily, on each day the New York Stock Exchange (“NYSE”) is open, as of the close of regular trading on the NYSE.
Equity securities which may include restricted securities that have traded on an exchange are valued by using the last sale price on the principal exchange where they are traded. Equity securities which may include restricted securities that have not traded on the date of valuation, or securities for which sale prices are not available, generally are valued using the mean between the last bid and asked prices or, if both last bid and asked prices are not available, at the last quoted bid price. Last sale and bid and asked prices are provided by independent third party pricing services. In the case of equity securities which may include restricted securities not traded on an exchange, prices are typically determined by independent third party pricing services using a variety of techniques and methods.
Fixed-income securities are valued by using prices supplied by independent pricing services, which consider such factors as market prices, market events, quotations from one or more brokers, Treasury spreads, yields, maturities and ratings, or may use a pricing matrix or other fair value methods or techniques to provide an estimated value of the security or instrument. A pricing matrix is a means of valuing a debt security on the basis of current market prices for other debt securities, historical trading patterns in the market for fixed-income securities and/or other factors. Non-U.S. debt securities that are listed on an
18
| | |
| Pioneer Mid Cap Value VCT Portfolio | Pioneer Variable Contracts Trust |
exchange will be valued at the bid price obtained from an independent third party pricing service. When independent third party pricing services are unable to supply prices, or when prices or market quotations are considered to be unreliable, the value of that security may be determined using quotations from one or more broker-dealers.
Securities for which independent pricing services or broker-dealers are unable to supply prices or for which market prices and/or quotations are not readily available or are considered to be unreliable are valued by a fair valuation team comprised of certain personnel of the Adviser pursuant to procedures adopted by the Portfolio’s Board of Trustees. The Adviser’s fair valuation team uses fair value methods approved by the Valuation Committee of the Board of Trustees. The Adviser’s fair valuation team is responsible for monitoring developments that may impact fair valued securities and for discussing and assessing fair values on an ongoing basis, and at least quarterly, with the Valuation Committee of the Board of Trustees.
Inputs used when applying fair value methods to value a security may include credit ratings, the financial condition of the company, current market conditions and comparable securities. The Portfolio may use fair value methods if it is determined that a significant event has occurred after the close of the exchange or market on which the security trades and prior to the determination of the Portfolio’s net asset value. Examples of a significant event might include political or economic news, corporate restructurings, natural disasters, terrorist activity or trading halts. Thus, the valuation of the Portfolio’s securities may differ significantly from exchange prices, and such differences could be material.
At December 31, 2020, no securities were valued using fair value methods (other than securities valued using prices supplied by independent pricing services, broker-dealers or using a third party insurance industry pricing model).
B. Investment Income and Transactions
Dividend income is recorded on the ex-dividend date, except that certain dividends from foreign securities where the ex-dividend date may have passed are recorded as soon as the Portfolio becomes aware of the ex-dividend data in the exercise of reasonable diligence.
Interest income, including interest on income-bearing cash accounts, is recorded on the accrual basis. Dividend and interest income are reported net of unrecoverable foreign taxes withheld at the applicable country rates and net of income accrued on defaulted securities.
Interest and dividend income payable by delivery of additional shares is reclassified as PIK (payment-in-kind) income upon receipt and is included in interest and dividend income, respectively.
Security transactions are recorded as of trade date. Gains and losses on sales of investments are calculated on the identified cost method for both financial reporting and federal income tax purposes.
C. Federal Income Taxes
It is the Portfolio’s policy to comply with the requirements of the Internal Revenue Code applicable to regulated investment companies and to distribute all of its net taxable income and net realized capital gains, if any, to its shareowners. Therefore, no provision for federal income taxes is required. As of December 31, 2020, the Portfolio did not accrue any interest or penalties with respect to uncertain tax positions, which, if applicable, would be recorded as an income tax expense on the Statement of Operations. Tax returns filed within the prior three years remain subject to examination by federal and state tax authorities.
A portion of the dividend income recorded by the Portfolio is from distributions by publicly traded Real Estate Investment Trusts (“REITs”), and such distributions for tax purposes may also consist of capital gains and return of capital. The actual return of capital and capital gains portions of such distributions will be determined by formal notifications from the REITs subsequent to the calendar year-end. Distributions received from the REITs that are determined to be a return of capital are recorded by the Portfolio as a reduction of the cost basis of the securities held and those determined to be capital gain are reflected as such on the Statement of Operations.
The amount and character of income and capital gain distributions to shareowners are determined in accordance with federal income tax rules, which may differ from U.S. GAAP. Distributions in excess of net investment income or net realized gains are temporary over distributions for financial statement purposes resulting from differences in the recognition or classification of income or distributions for financial statement and tax purposes. Capital accounts within the financial statements are adjusted for permanent book/tax differences to reflect tax character, but are not adjusted for temporary differences.
At December 31, 2020, the Portfolio was permitted to carry forward indefinitely $4,179,688 of short-term losses.
19
| | |
| Pioneer Mid Cap Value VCT Portfolio | Pioneer Variable Contracts Trust |
| Notes to Financial Statements 12/31/20 (continued) | |
The tax character of distributions paid during the years ended December 31, 2020 and December 31, 2019, were as follows:
| | | | | |
| | 2020 | | 2019 | |
| Distributions paid from: | | | | |
| Ordinary income | | $ | 2,621,881 | | | $ | 3,122,155 | |
| Long-term capital gain | | | 8,641,835 | | | | 18,019,222 | |
| Total distributions | | $ | 11,263,716 | | | $ | 21,141,377 | |
The following shows the components of distributable earnings on a federal income tax basis at December 31, 2020:
| | | |
| | 2020 | |
| Distributable earnings/(losses): | | |
| Undistributed ordinary income | | $ | 2,240,275 | |
| Undistributed long-term capital gain | | | (4,179,688 | ) |
| Unrealized depreciation | | | 56,789,502 | |
| Total | | $ | 54,850,089 | |
The difference between book basis and tax basis unrealized appreciation is attributable to the tax deferral of losses on wash sales.
D. Portfolio Shares and Class Allocations
The Portfolio records sales and repurchases of its shares as of trade date. Distribution fees for Class II shares are calculated based on the average daily net asset value attributable to Class II shares of the Portfolio (see Note 5). Class I shares do not pay distribution fees.
Income, common expenses (excluding transfer agent and distribution fees) and realized and unrealized gains and losses are calculated at the Portfolio level and allocated daily to each class of shares based on its respective percentage of adjusted net assets at the beginning of the day.
All expenses and fees paid to the Portfolio’s transfer agent for its services are allocated between the classes of shares based on the number of accounts in each class and the ratable allocation of related out-of-pocket expenses (see Note 4).
Dividends and distributions to shareowners are recorded on the ex-dividend date. Distributions paid by the Portfolio with respect to each class of shares are calculated in the same manner and at the same time, except that net investment income dividends to Class I and Class II shares can reflect different transfer agent and distribution expense rates. Dividends and distributions to shareowners are recorded on the ex-dividend date.
E. Risks
The value of securities held by the Portfolio may go up or down, sometimes rapidly or unpredictably, due to general market conditions, such as real or perceived adverse economic, political or regulatory conditions, recessions, the spread of infectious illness or other public health issues, inflation, changes in interest rates, lack of liquidity in the bond markets or adverse investor sentiment. In the past several years, financial markets have experienced increased volatility, depressed valuations, decreased liquidity and heightened uncertainty. These conditions may continue, recur, worsen or spread. A general rise in interest rates could adversely affect the price and liquidity of fixed-income securities and could also result in increased redemptions from the Portfolio.
Investments in mid-sized companies may offer the potential for higher returns, but are also subject to greater short-term price fluctuations than investments in larger, more established companies. Investing in foreign and/or emerging markets securities involves risks relating to interest rates, currency exchange rates and economic and political conditions.
The Portfolio may invest in REIT securities, the value of which can fall for a variety of reasons, such as declines in rental income, fluctuating interest rates, poor property management, environmental liabilities, uninsured damage, increased competition, or changes in real estate tax laws.
20
| | |
| Pioneer Mid Cap Value VCT Portfolio | Pioneer Variable Contracts Trust |
At times, the Portfolio’s investments may represent industries or industry sectors that are interrelated or have common risks, making the Portfolio more susceptible to any economic, political, or regulatory developments or other risks affecting those industries and sectors. The Portfolio’s investments in foreign markets and countries with limited developing markets may subject the Portfolio to a greater degree of risk than investments in a developed market. These risks include disruptive political or economic conditions and the imposition of adverse governmental laws or currency exchange restrictions.
With the increased use of technologies such as the Internet to conduct business, the Portfolio is susceptible to operational, information security and related risks. While the Portfolio’s Adviser has established business continuity plans in the event of, and risk management systems to prevent, limit or mitigate, such cyber-attacks, there are inherent limitations in such plans and systems, including the possibility that certain risks have not been identified. Furthermore, the Portfolio cannot control the cybersecurity plans and systems put in place by service providers to the Portfolio such as Brown Brothers Harriman & Co., the Portfolio’s custodian and accounting agent, and DST Asset Manager Solutions, Inc., the Portfolio’s transfer agent. In addition, many beneficial owners of Portfolio shares hold them through accounts at broker-dealers, retirement platforms and other financial market participants over which neither the Portfolio nor the Adviser exercises control. Each of these may in turn rely on service providers to them, which are also subject to the risk of cyber-attacks. Cybersecurity failures or breaches at the Adviser or the Portfolio’s service providers or intermediaries have the ability to cause disruptions and impact business operations, potentially resulting in financial losses, interference with the Portfolio’s ability to calculate its net asset value, impediments to trading, the inability of Portfolio shareowners to effect share purchases, redemptions or exchanges or receive distributions, loss of or unauthorized access to private shareowner information and violations of applicable privacy and other laws, regulatory fines, penalties, reputational damage, or additional compliance costs. Such costs and losses may not be covered under any insurance. In addition, maintaining vigilance against cyber-attacks may involve substantial costs over time, and system enhancements may themselves be subject to cyber-attacks.
COVID-19
The respiratory illness COVID-19 caused by a novel coronavirus has resulted in a global pandemic and major disruption to economies and markets around the world, including the United States. Global financial markets have experienced extreme volatility and severe losses, and trading in many instruments has been disrupted. Liquidity for many instruments has been greatly reduced for periods of time. Some interest rates are very low and in some cases yields are negative. Some sectors of the economy and individual issuers have experienced particularly large losses. These circumstances may continue for an extended period of time, and may continue to affect adversely the value and liquidity of the Portfolio’s investments. The ultimate economic fallout from the pandemic, and the long-term impact on economies, markets, industries and individual issuers, are not known. Governments and central banks, including the Federal Reserve in the U.S., have taken extraordinary and unprecedented actions to support local and global economies and the financial markets. These actions have resulted in significant expansion of public debt, including in the U.S. The impact of these measures, and whether they will be effective to mitigate the economic and market disruption, will not be known for some time. The consequences of high public debt, including its future impact on the economy and securities markets, likewise may not be known for some time.
The Portfolio’s prospectus contains unaudited information regarding the Portfolio’s principal risks. Please refer to that document when considering the Portfolio’s principal risks.
2. Management Agreement
The Adviser manages the Portfolio. Management fees are calculated daily and paid monthly at the annual rate of 0.65% of the Portfolio’s average daily net assets. For the year ended December 31, 2020, the effective management fee was equivalent to 0.65% of the Portfolio’s average daily net assets.
In addition, under the management and administration agreements, certain other services and costs, including accounting, regulatory reporting and insurance premiums, are paid by the Portfolio as administrative reimbursements. Included in “Due to affiliates” reflected on the Statement of Assets and Liabilities is $15,278 in management fees, administrative costs and certain other reimbursements payable to the Adviser at December 31, 2020.
21
| | |
| Pioneer Mid Cap Value VCT Portfolio | Pioneer Variable Contracts Trust |
| Notes to Financial Statements 12/31/20 (continued) | |
3. Compensation of Trustees and Officers
The Portfolio pays an annual fee to its Trustees. The Adviser reimburses the Portfolio for fees paid to the Interested Trustees. The Portfolio does not pay any salary or other compensation to its officers. For the year ended December 31, 2020, the Portfolio paid $7,867 in Trustees’ compensation, which is reflected on the Statement of Operations as Trustees’ fees. At December 31, 2020, the Portfolio had a payable for Trustees’ fees on its Statement of Assets and Liabilities of $0.
4. Transfer Agent
DST Asset Manager Solutions, Inc. serves as the transfer agent to the Portfolio at negotiated rates. Transfer agent fees and payables shown on the Statement of Operations and the Statement of Assets and Liabilities, respectively, include sub-transfer agent expenses incurred through the Portfolio’s omnibus relationship contracts.
5. Distribution Plan
The Portfolio has adopted a distribution plan (the “Plan”) pursuant to Rule 12b-1 of the Investment Company Act of 1940 with respect to Class II shares. Pursuant to the Plan, the Portfolio pays the Distributor 0.25% of the average daily net assets attributable to Class II shares to compensate the Distributor for (1) distribution services and (2) personal and account maintenance services performed and expenses incurred by the Distributor in connection with the Portfolio’s Class II shares. Included in “Due to affiliates” reflected on the Statement of Assets and Liabilities is $5,093 in distribution fees payable to the Distributor at December 31, 2020.
22
| | |
| Pioneer Mid Cap Value VCT Portfolio | Pioneer Variable Contracts Trust |
Report of Independent Registered Public Accounting Firm |
To the Board of Trustees of Pioneer Variable Contracts Trust and the Shareholders of Pioneer Mid Cap Value VCT Portfolio:
Opinion on the Financial Statements
We have audited the accompanying statement of assets and liabilities of Pioneer Mid Cap Value VCT Portfolio (the “Portfolio”) (one of the portfolios constituting Pioneer Variable Contracts Trust (the “Trust”)), including the schedule of investments, as of December 31, 2020, and the related statement of operations for the year then ended, the statements of changes in net assets for each of the two years in the period then ended, the financial highlights for each of the four years in the period then ended and the related notes (collectively referred to as the “financial statements”). The financial highlights for the period ended December 31, 2016 were audited by another independent registered public accounting firm whose report, dated February 14, 2017, expressed an unqualified opinion on those financial highlights. In our opinion, the financial statements present fairly, in all material respects, the financial position of the Portfolio (one of the portfolios constituting Pioneer Variable Contracts Trust) at December 31, 2020, the results of its operations for the year then ended, the changes in its net assets for each of the two years in the period then ended, and its financial highlights for each of the four years in the period then ended in conformity with U.S. generally accepted accounting principles.
Basis for Opinion
These financial statements are the responsibility of the Trust’s management. Our responsibility is to express an opinion on the Portfolio’s financial statements based on our audits. We are a public accounting firm registered with the Public Company Accounting Oversight Board (United States) (“PCAOB”) and are required to be independent with respect to the Trust in accordance with the U.S. federal securities laws and the applicable rules and regulations of the Securities and Exchange Commission and the PCAOB.
We conducted our audits in accordance with the standards of the PCAOB. Those standards require that we plan and perform the audit to obtain reasonable assurance about whether the financial statements are free of material misstatement, whether due to error or fraud. The Trust is not required to have, nor were we engaged to perform, an audit of the Trust’s internal control over financial reporting. As part of our audits, we are required to obtain an understanding of internal control over financial reporting, but not for the purpose of expressing an opinion on the effectiveness of the Trust’s internal control over financial reporting. Accordingly, we express no such opinion.
Our audits included performing procedures to assess the risks of material misstatement of the financial statements, whether due to error or fraud, and performing procedures that respond to those risks. Such procedures included examining, on a test basis, evidence regarding the amounts and disclosures in the financial statements. Our procedures included confirmation of securities owned as of December 31, 2020, by correspondence with the custodian and brokers or by other appropriate auditing procedures where replies from brokers were not received. Our audits also included evaluating the accounting principles used and significant estimates made by management, as well as evaluating the overall presentation of the financial statements. We believe that our audits provide a reasonable basis for our opinion.
We have served as the auditor of one or more Amundi Pioneer investment companies since 2017.
Boston, Massachusetts
February 17, 2021
23
| | |
| Pioneer Mid Cap Value VCT Portfolio | Pioneer Variable Contracts Trust |
Additional Information (Unaudited) | |
For the year ended December 31, 2020, certain dividends paid by the Portfolio may be subject to a maximum tax rate of 20%. The Portfolio intends to designate up to the maximum amount of such dividends allowable, as taxed at a maximum rate of 20%. Complete information will be computed and reported in conjunction with your 2020 Form 1099-DIV.
The qualifying percentage of the Portfolio’s ordinary income dividends for the purpose of the corporate dividends received deduction was 100%.
24
| | |
| Pioneer Mid Cap Value VCT Portfolio | Pioneer Variable Contracts Trust |
Approval of Investment Management Agreement | |
Amundi Pioneer Asset Management, Inc. (“APAM”) serves as the investment adviser to Pioneer Mid Cap Value VCT Portfolio (the “Portfolio”) pursuant to an investment management agreement between APAM and the Portfolio. In order for APAM to remain the investment adviser of the Portfolio, the Trustees of the Portfolio must determine annually whether to renew the investment management agreement for the Portfolio.
The contract review process began in January 2020 as the Trustees of the Portfolio agreed on, among other things, an overall approach and timeline for the process. Contract review materials were provided to the Trustees in March 2020, July 2020 and September 2020. In addition, the Trustees reviewed and discussed the Portfolio’s performance at regularly scheduled meetings throughout the year, and took into account other information related to the Portfolio provided to the Trustees at regularly scheduled meetings, in connection with the review of the Portfolio’s investment management agreement.
In March 2020, the Trustees, among other things, discussed the memorandum provided by Fund counsel that summarized the legal standards and other considerations that are relevant to the Trustees in their deliberations regarding the renewal of the investment management agreement, and reviewed and discussed the qualifications of the investment management teams for the Portfolio, as well as the level of investment by the Portfolio’s portfolio managers in the Portfolio. In July 2020, the Trustees, among other things, reviewed the Portfolio’s management fees and total expense ratios, the financial statements of APAM and its parent companies, profitability analyses provided by APAM, and analyses from APAM as to possible economies of scale. The Trustees also reviewed the profitability of the institutional business of APAM and APAM’s affiliate, Amundi Pioneer Institutional Asset Management, Inc. (“APIAM” and, together with APAM, “Amundi Pioneer”), as compared to that of APAM’s fund management business, and considered the differences between the fees and expenses of the Portfolio and the fees and expenses of APAM’s and APIAM’s institutional accounts, as well as the different services provided by APAM to the Portfolio and by APAM and APIAM to the institutional accounts. The Trustees further considered contract review materials, including additional materials received in response to the Trustees’ request, in September 2020.
At a meeting held on September 15, 2020, based on their evaluation of the information provided by APAM and third parties, the Trustees of the Portfolio, including the Independent Trustees voting separately, unanimously approved the renewal of the investment management agreement for another year. In approving the renewal of the investment management agreement, the Trustees considered various factors that they determined were relevant, including the factors described below. The Trustees did not identify any single factor as the controlling factor in determining to approve the renewal of the agreement.
Nature, Extent and Quality of Services
The Trustees considered the nature, extent and quality of the services that had been provided by APAM to the Portfolio, taking into account the investment objective and strategy of the Portfolio. The Trustees also reviewed APAM’s investment approach for the Portfolio and its research process. The Trustees considered the resources of APAM and the personnel of APAM who provide investment management services to the Portfolio. They also reviewed the amount of non-Portfolio assets managed by the portfolio managers of the Portfolio. They considered the non-investment resources and personnel of APAM that are involved in APAM’s services to the Portfolio, including APAM’s compliance, risk management, and legal resources and personnel. The Trustees noted the substantial attention and high priority given by APAM’s senior management to the Pioneer Fund complex. The Trustees considered the implementation and effectiveness of APAM’s business continuity plan in response to the COVID-19 pandemic.
The Trustees considered that APAM supervises and monitors the performance of the Portfolio’s service providers and provides the Portfolio with personnel (including Portfolio officers) and other resources that are necessary for the Portfolio’s business management and operations. The Trustees also considered that, as administrator, APAM is responsible for the administration of the Portfolio’s business and other affairs. The Trustees considered the fees paid to APAM for the provision of administration services.
Based on these considerations, the Trustees concluded that the nature, extent and quality of services that had been provided by APAM to the Portfolio were satisfactory and consistent with the terms of the investment management agreement.
Performance of the Portfolio
In considering the Portfolio’s performance, the Trustees regularly review and discuss throughout the year data prepared by APAM and information comparing the Portfolio’s performance with the performance of its peer group of funds, as classified by Morningstar, Inc. (Morningstar), and with the performance of the Portfolio’s benchmark index. They also discuss the Portfolio’s performance with APAM on a regular basis. The Trustees’ regular reviews and discussions were factored into the Trustees’ deliberations concerning the renewal of the investment management agreement.
25
| | |
| Pioneer Mid Cap Value VCT Portfolio | Pioneer Variable Contracts Trust |
| Approval of Investment Management Agreement (continued) |
Management Fee and Expenses
The Trustees considered information showing the fees and expenses of the Portfolio in comparison to the management fees of its peer group of funds as classified by Morningstar and also to the expense ratios of a peer group of funds selected on the basis of criteria determined by the Independent Trustees for this purpose using data provided by Strategic Insight Mutual Fund Research and Consulting, LLC (Strategic Insight), an independent third party. The peer group comparisons referred to below are organized in quintiles. Each quintile represents one-fifth of the peer group. In all peer group comparisons referred to below, first quintile is most favorable to the Portfolio’s shareowners. The Trustees noted that they separately review and consider the impact of the Portfolio’s transfer agency and Portfolio- and APAM-paid expenses for sub-transfer agency and intermediary arrangements, and that the results of the most recent such review were considered in the consideration of the Portfolio’s expense ratio.
The Trustees considered that the Portfolio’s management fee for the most recent fiscal year was in the second quintile relative to the management fees paid by other funds in its Morningstar category for the comparable period. The Trustees considered that the expense ratio of the Portfolio’s Class II shares for the most recent fiscal year was in the first quintile relative to its Strategic Insight peer group for the comparable period.
The Trustees reviewed management fees charged by APAM and APIAM to institutional and other clients, including publicly offered European funds sponsored by APAM’s affiliates, unaffiliated U.S. registered investment companies (in a sub-advisory capacity), and unaffiliated foreign and domestic separate accounts. The Trustees also considered APAM’s costs in providing services to the Portfolio and APAM’s and APIAM’s costs in providing services to the other clients and considered the differences in management fees and profit margins for fund and non-fund services. In evaluating the fees associated with APAM’s and APIAM’s client accounts, the Trustees took into account the respective demands, resources and complexity associated with the Portfolio and other client accounts. The Trustees noted that, in some instances, the fee rates for those clients were lower than the management fee for the Portfolio and considered that, under the investment management agreement with the Portfolio, APAM performs additional services for the Portfolio that it does not provide to those other clients or services that are broader in scope, including oversight of the Portfolio’s other service providers and activities related to compliance and the extensive regulatory and tax regimes to which the Portfolio is subject. The Trustees also considered the entrepreneurial risks associated with APAM’s management of the Portfolio.
The Trustees concluded that the management fee payable by the Portfolio to APAM was reasonable in relation to the nature and quality of the services provided by APAM.
Profitability
The Trustees considered information provided by APAM regarding the profitability of APAM with respect to the advisory services provided by APAM to the Portfolio, including the methodology used by APAM in allocating certain of its costs to the management of the Portfolio. The Trustees also considered APAM’s profit margin in connection with the overall operation of the Portfolio. They further reviewed the financial results, including the profit margins, realized by APAM and APIAM from non-fund businesses. The Trustees considered APAM’s profit margins in comparison to the limited industry data available and noted that the profitability of any adviser was affected by numerous factors, including its organizational structure and method for allocating expenses. The Trustees concluded that APAM’s profitability with respect to the management of the Portfolio was not unreasonable.
Economies of Scale
The Trustees considered APAM’s views relating to economies of scale in connection with the Pioneer Funds as fund assets grow and the extent to which any such economies of scale are shared with the Portfolio and Portfolio shareholders. The Trustees recognize that economies of scale are difficult to identify and quantify, and that, among other factors that may be relevant, are the following: fee levels, expense subsidization, investment by APAM in research and analytical capabilities and APAM’s commitment and resource allocation to the Portfolio. The Trustees noted that profitability also may be an indicator of the availability of any economies of scale, although profitability may vary for other reasons including due to reductions in expenses. The Trustees concluded that economies of scale, if any, were being appropriately shared with the Portfolio.
26
| | |
| Pioneer Mid Cap Value VCT Portfolio | Pioneer Variable Contracts Trust |
Other Benefits
The Trustees considered the other benefits that APAM enjoys from its relationship with the Portfolio. The Trustees considered the character and amount of fees paid or to be paid by the Portfolio, other than under the investment management agreement, for services provided by APAM and its affiliates. The Trustees further considered the revenues and profitability of APAM’s businesses other than the Fund business. To the extent applicable, the Trustees also considered the benefits to the Portfolio and to APAM and its affiliates from the use of “soft” commission dollars generated by the Portfolio to pay for research and brokerage services.
The Trustees considered that Amundi Pioneer is the principal U.S. asset management business of Amundi, which is one of the largest asset managers globally. Amundi’s worldwide asset management business manages over $1.7 trillion in assets (including the Pioneer Funds). The Trustees considered that APAM’s relationship with Amundi creates potential opportunities for APAM, APIAM and Amundi that derive from APAM’s relationships with the Portfolio, including Amundi’s ability to market the services of APAM globally. The Trustees noted that APAM has access to additional research and portfolio management capabilities as a result of its relationship with Amundi and Amundi’s enhanced global presence that may contribute to an increase in the resources available to APAM. The Trustees considered that APAM and the Portfolio receive reciprocal intangible benefits from the relationship, including mutual brand recognition and, for the Portfolio, direct and indirect access to the resources of a large global asset manager. The Trustees concluded that any such benefits received by APAM as a result of its relationship with the Portfolio were reasonable.
Conclusion
After consideration of the factors described above as well as other factors, the Trustees, including the Independent Trustees, concluded that the investment management agreement for the Portfolio, including the fees payable thereunder, was fair and reasonable and voted to approve the proposed renewal of the investment management agreement.
27
| | |
| Pioneer Mid Cap Value VCT Portfolio | Pioneer Variable Contracts Trust |
Trustees, Officers and Service Providers | |
The Portfolio’s Trustees and officers are listed below, together with their principal occupations and other directorships they have held during at least the past five years. Trustees who are interested persons of the Portfolios within the meaning of the 1940 Act are referred to as Interested Trustees. Trustees who are not interested persons of the Portfolio are referred to as Independent Trustees. Each of the Trustees serves as a Trustee of each of the 45 U.S. registered investment portfolios for which Amundi US serves as investment adviser (the “Pioneer Funds”). The address for all Trustees and all officers of the Portfolios is 60 State Street, Boston, Massachusetts 02109.
| | | | |
| Name, Age and Position | Term of Office and | | Other Directorships |
| Held With the Trust | Length of Service | Principal Occupation | Held by Trustee |
| Independent Trustees: |
| Thomas J. Perna (70) | Trustee since 2006. Serves until a | Private investor (2004 – 2008 and | Director, Broadridge Financial |
Chairman of the Board | successor trustee is elected or | 2013 – present); Chairman (2008 – 2013) | Solutions, Inc. (investor |
and Trustee | earlier retirement or removal. | and Chief Executive Officer (2008 – 2012), | communications and securities |
| | Quadriserv, Inc. (technology products for | processing provider for financial |
| | securities lending industry); and Senior | services industry) (2009 – present); |
| | Executive Vice President, The Bank of New York | Director, Quadriserv, Inc. (2005 – |
| | (financial and securities services) (1986 – 2004) | 2013); and Commissioner, New Jersey |
| | | State Civil Service Commission |
| | | (2011 – 2015) |
| John E. Baumgardner, Jr. (69) | Trustee since 2019. Serves until a | Of Counsel (2019 – present), Partner | Chairman, The Lakeville Journal |
Trustee | successor trustee is elected or | (1983-2018), Sullivan & Cromwell LLP | Company, LLC, (privately-held |
| earlier retirement or removal. | (law firm). | community newspaper group) (2015- |
| | | present) |
| Diane Durnin (63) | Trustee since 2019. Serves until a | Managing Director - Head of Product Strategy | None |
Trustee | successor trustee is elected or | and Development, BNY Mellon Investment | |
| earlier retirement or removal. | Management (investment management firm) | |
| | (2012-2018); Vice Chairman – The Dreyfus | |
| | Corporation (2005 – 2018): Executive Vice | |
| | President Head of Product, BNY Mellon | |
| | Investment Management (2007-2012); Executive | |
| | Director- Product Strategy, Mellon Asset | |
| | Management (2005-2007); Executive Vice | |
| | President Head of Products, Marketing and | |
| | Client Service, Dreyfus Corporation (investment | |
| | management firm) (2000-2005); and Senior Vice | |
| | President – Strategic Product and Business | |
| | Development, Dreyfus Corporation (1994-2000) | |
| Benjamin M. Friedman (76) | Trustee since 2008. Serves until a | William Joseph Maier Professor of Political | Trustee, Mellon Institutional Funds |
Trustee | successor trustee is elected or | Economy, Harvard University (1972 – present) | Investment Trust and Mellon |
| earlier retirement or removal. | | Institutional Funds Master Portfolio |
| | | (oversaw 17 portfolios in fund |
| | | complex) (1989 - 2008) |
| Lorraine H. Monchak (64) | Trustee since 2017. (Advisory | Chief Investment Officer, 1199 SEIU Funds | None |
Trustee | Trustee from 2014 - 2017). Serves | (healthcare workers union pension funds) | |
| until a successor trustee is elected | (2001 – present); Vice President – International | |
| or earlier retirement or removal. | Investments Group, American International | |
| | Group, Inc. (insurance company) (1993 – 2001); | |
| | Vice President – Corporate Finance and Treasury | |
| | Group, Citibank, N.A. (1980 – 1986 and | |
| | 1990 – 1993); Vice President – Asset/Liability | |
| | Management Group, Federal Farm Funding | |
| | Corporation (government-sponsored issuer of | |
| | debt securities) (1988 – 1990); Mortgage | |
| | Strategies Group, Shearson Lehman Hutton, Inc. | |
| | (investment bank) (1987 – 1988); and Mortgage | |
| | Strategies Group, Drexel Burnham Lambert, Ltd. | |
| | (investment bank) (1986 – 1987) | |
28
| | |
| Pioneer Mid Cap Value VCT Portfolio | Pioneer Variable Contracts Trust |
| | | | |
| Name, Age and Position | Term of Office and | | Other Directorships |
| Held With the Trust | Length of Service | Principal Occupation | Held by Trustee |
Independent Trustees: (continued)
|
| Marguerite A. Piret (72) | Trustee since 1995. Serves until a | Chief Financial Officer, American Ag Energy, | Director of New America High Income |
Trustee | successor trustee is elected or | Inc. (controlled environment and agriculture | Fund, Inc. (closed-end investment |
| earlier retirement or removal. | company) (2016 – present); and President and | company) (2004 – present); and |
| | Chief Executive Officer, Metric Financial Inc. | Member, Board of Governors, |
| | (formerly known as Newbury Piret Company) | Investment Company Institute |
| | (investment banking firm) (1981 – 2019) | (2000 – 2006) |
| Fred J. Ricciardi (73) | Trustee since 2014. Serves until a | Private investor (2020 – present); Consultant | None |
Trustee | successor trustee is elected or | (investment company services) (2012 – 2020); | |
| earlier retirement or removal. | Executive Vice President, BNY Mellon (financial | |
| | and investment company services) (1969 – 2012); | |
| | Director, BNY International Financing Corp. | |
| | (financial services) (2002 – 2012); Director, | |
| | Mellon Overseas Investment Corp. (financial | |
| | services) (2009 – 2012); Director, Financial | |
| | Models (technology) (2005-2007); Director, BNY | |
| | Hamilton Funds, Ireland (offshore investment | |
| | companies) (2004-2007); Chairman/Director, | |
| | AIB/BNY Securities Services, Ltd., Ireland | |
| | (financial services) (1999-2006); and Chairman, | |
| | BNY Alternative Investment Services, Inc. | |
| | (financial services) (2005-2007) | |
| Interested Trustees: |
| Lisa M. Jones (58)* | Trustee since 2017. Serves until a | Director, CEO and President of Amundi US, Inc. | None |
Trustee, President and | successor trustee is elected or | (investment management firm) (since | |
Chief Executive Officer | earlier retirement or removal | September 2014); Director, CEO and President | |
| | of Amundi Asset Management US, Inc. (since | |
| | September 2014); Director, CEO and President of | |
| | Amundi Distributor US, Inc. (since September | |
| | 2014); Director, CEO and President of Amundi | |
| | Asset Management US, Inc. (since September | |
| | 2014); Chair, Amundi US, Inc., Amundi Distributor | |
| | US, Inc. and Amundi Asset Management US, Inc. | |
| | (September 2014 – 2018); Managing Director, | |
| | Morgan Stanley Investment Management | |
| | (investment management firm) (2010 – 2013); | |
| | Director of Institutional Business, CEO of | |
| | International, Eaton Vance Management | |
| | (investment management firm) (2005 – 2010); | |
| | and Director of Amundi Holdings US, Inc. | |
| | (since 2017) | |
| Kenneth J. Taubes (62)* | Trustee since 2014. Serves until a | Director and Executive Vice President | None |
Trustee | successor trustee is elected or | (since 2008) and Chief Investment Officer, U.S. | |
| earlier retirement or removal | (since 2010) of Amundi US, Inc. (investment | |
| | management firm); Director and Executive Vice | |
| | President and Chief Investment Officer, U.S. of | |
| | Amundi US (since 2008); Executive Vice | |
| | President and Chief Investment Officer, U.S. of | |
| | Amundi Asset Management US, Inc. (since 2009); | |
| | Portfolio Manager of Amundi US (since 1999); | |
| | and Director of Amundi Holdings US, Inc. | |
| | (since 2017) | |
* | Ms. Jones and Mr. Taubes are Interested Trustees because they are officers or directors of the Portfolio’s investment adviser and certain of its affiliates. |
29
| | |
| Pioneer Mid Cap Value VCT Portfolio | Pioneer Variable Contracts Trust |
| Trustees, Officers and Service Providers (continued) | |
| | | | |
| Name , Age and Position | Term of Office and | | Other Directorships |
| Held With the Trust | Length of Service | Principal Occupation | Held by Officer |
| Fund Officers: |
| Christopher J. Kelley (56) | Since 2003. Serves at the | Vice President and Associate General Counsel | None |
Secretary and Chief | discretion of the Board | of Amundi US since January 2008; Secretary and | |
Legal Officer | | Chief Legal Officer of all of the Pioneer Funds | |
| | since June 2010; Assistant Secretary of all of the | |
| | Pioneer Funds from September 2003 to | |
| | May 2010; Vice President and Senior Counsel of | |
| | Amundi US from July 2002 to December 2007 | |
| Carol B. Hannigan (59) | Since 2010. Serves at the | Fund Governance Director of Amundi US since | None |
Assistant Secretary | discretion of the Board | December 2006 and Assistant Secretary of all | |
| | the Pioneer Funds since June 2010; Manager – | |
| | Fund Governance of Amundi US from | |
| | December 2003 to November 2006; and Senior | |
| | Paralegal of Amundi US from January 2000 to | |
| | November 2003 | |
| Thomas Reyes (58) | Since 2010. Serves at the | Assistant General Counsel of Amundi US since | None |
Assistant Secretary | discretion of the Board | May 2013 and Assistant Secretary of all the | |
| | Pioneer Funds since June 2010; and Counsel of | |
| | Amundi US from June 2007 to May 2013 | |
| Mark E. Bradley (61) | Since 2008. Serves at the | Vice President – Fund Treasury of Amundi US; | None |
Treasurer and Chief Financial | discretion of the Board | Treasurer of all of the Pioneer Funds since | |
and Accounting Officer | | March 2008; Deputy Treasurer of Amundi US | |
| | from March 2004 to February 2008; and Assistant | |
| | Treasurer of all of the Pioneer Funds from | |
| | March 2004 to February 2008 | |
| Anthony J. Koenig, Jr. (57) | Since 2021. Serves at the | Senior Vice President – Fund Treasury of | None |
Assistant Treasurer | discretion of the Board | Amundi US; Assistant Treasurer of all of the | |
| | Pioneer Funds since January 2021; and Chief of | |
| | Staff, US Investment Management of Amundi US | |
| | from May 2008 to January 2021 | |
| Luis I. Presutti (55) | Since 2000. Serves at the | Director – Fund Treasury of Amundi US since | None |
Assistant Treasurer | discretion of the Board | 1999; and Assistant Treasurer of all of the | |
| | Pioneer Funds since 1999 | |
| Gary Sullivan (62) | Since 2002. Serves at the | Senior Manager – Fund Treasury of Amundi US | None |
Assistant Treasurer | discretion of the Board | since 2012; and Assistant Treasurer of all of the | |
| | Pioneer Funds since 2002 | |
| Antonio Furtado (38) | Since 2020. Serves at the | Fund Oversight Manager – Fund Treasury of | None |
Assistant Treasurer | discretion of the Board | Amundi US since 2020; Assistant Treasurer of all | |
| | of the Pioneer Funds since 2020; and Senior Fund | |
| | Treasury Analyst from 2012 - 2020 | |
| John Malone (50) | Since 2018. Serves at the | Managing Director, Chief Compliance Officer of | None |
Chief Compliance Officer | discretion of the Board | Amundi US Asset Management; Amundi Asset | |
| | Management US, Inc.; and the Pioneer Funds | |
| | since September 2018; and Chief Compliance | |
| | Officer of Amundi Distributor US, Inc. since | |
| | January 2014. | |
| Kelly O’Donnell (49) | Since 2006. Serves at the | Vice President – Amundi Asset Management; | None |
Anti-Money | discretion of the Board | and Anti-Money Laundering Officer of all the | |
Laundering Officer | | Pioneer Funds since 2006 | |
30
This page was intentionally left blank.
31
This page was intentionally left blank.
32
This page was intentionally left blank.
33
This page was intentionally left blank.
34
This page was intentionally left blank.
35
This page was intentionally left blank.
36
This page was intentionally left blank.
37
Proxy Voting Policies and Procedures of the Portfolio are available without charge, upon request, by calling our toll free number (1-800-225-6292). Information regarding how the Portfolio voted proxies relating to Portfolio securities during the most recent 12-month period ended June 30 is publicly available to shareowners at www.amundi.com/us. This information is also available on the Securities and Exchange Commission’s web site at www.sec.gov.
18647-15-0221
Pioneer Variable Contracts Trust
Pioneer Fund
VCT Portfolio
Class I and II SharesAnnual Report | December 31, 2020
Paper copies of the Portfolio’s shareholder reports may no longer be sent by mail, unless you specifically request paper copies of the reports from the insurance company that offers your variable annuity or variable life insurance contract, or from your financial intermediary. Instead, the insurance company may choose to make the reports available on a website, and will notify you by mail each time a shareholder report is posted and provide you with a website link to access the report. Instructions for requesting paper copies will be provided by your insurance company.
You may elect to receive all future Portfolio shareholder reports in paper form, free of charge, from the insurance company. You can inform the insurance company or your financial intermediary that you wish to continue receiving paper copies of your shareholder reports by following the instructions provided by the insurance company, or by contacting your financial intermediary. Your election to receive reports in paper form will apply to all portfolios available under your contract with the insurance company.
Please refer to your contract prospectus to determine the applicable share class offered under your contract.
Pioneer Variable Contracts Trust
| | |
| |
| Pioneer Fund VCT Portfolio | |
| | |
| |
| | |
| |
| | |
| |
| | |
| |
| | |
| |
| | |
| |
| | |
| |
| | |
| |
| | |
| |
| | |
| |
This report is authorized for distribution only when preceded or accompanied by a prospectus for the Portfolio being offered.
Pioneer Variable Contracts Trust files a complete schedule of portfolio holdings with the Securities and Exchange Commission for the first and third quarters of each fiscal year as an exhibit to its reports on Form N-PORT. Shareholders may view the filed Form N-PORT by visiting the Commission’s web site at https://www.sec.gov.
| | |
| Pioneer Fund VCT Portfolio | Pioneer Variable Contracts Trust |
Portfolio Update 12/31/20 | |
Sector Distribution
(As a percentage of total investments)*
5 Largest Holdings
(As a percentage of total investments)*
| | | |
1. | Apple, Inc. | 5.49% |
2. | Visa, Inc. | 5.31 |
3. | Microsoft Corp. | 5.20 |
4. | Amazon.com, Inc. | 4.84 |
5. | Alphabet, Inc. | 4.35 |
* | Excludes temporary cash investments and all derivative contracts except for options purchased. The Portfolio is actively managed, and current holdings may be different. The holdings listed should not be considered recommendations to buy or sell any securities. |
Performance Update 12/31/20
Prices and Distributions
| | | | |
| Net Asset Value per Share | | 12/31/20 | 12/31/19 |
| Class I | | $16.83 | $14.95 |
| Class II | | $16.97 | $15.06 |
|
| Net | | |
| Distributions per Share | Investment | Short-Term | Long-Term |
| (1/1/20 – 12/31/20) | Income | Capital Gains | Capital Gains |
| Class I | $0.1151 | $0.2050 | $1.1021 |
| Class II | $0.0745 | $0.2050 | $1.1021 |
Performance of a $10,000 InvestmentThe following chart shows the change in value of an investment made in Class I and Class II shares of Pioneer Fund VCT Portfolio at net asset value during the periods shown, compared to that of the Standard & Poor’s 500 Index (the S&P 500). Portfolio returns are based on net asset value and do not reflect any applicable insurance fees or surrender charges.
Average Annual Total Returns
(As of December 31, 2020)| | | | |
| Class I | Class II | S&P 500 Index |
10 Years | 12.86% | 12.58% | 13.88% |
5 Years | 16.53% | 16.25% | 15.22% |
1 Year | 24.28% | 23.96% | 18.40% |
All total returns shown assume reinvestment of distributions at net asset value.
The performance table does not reflect the deduction of taxes that a shareowner would pay on distributions or the redemption of shares.
Call 1-800-688-9915 or visit www.amundi.com/us for the most recent month-end performance results. Current performance may be lower or higher than the performance data quoted.
The performance data quoted represents past performance, which is no guarantee of future results. Investment return and principal value will fluctuate, and shares, when redeemed, may be worth more or less than their original cost.
The returns for the Portfolio do not reflect the deduction of expenses associated with variable products, such as mortality and expense risk charges, separate account charges, and sales charges. These expenses would reduce the overall returns shown.
Performance results reflect any applicable expense waivers in effect during the periods shown. Without such waivers, performance would be lower. Waivers may not be in effect for all portfolios. Certain fee waivers are contractual through a specified period. Otherwise, fee waivers can be rescinded at any time. See the prospectus and financial statements for more information.
2
| | |
| Pioneer Fund VCT Portfolio | Pioneer Variable Contracts Trust |
Comparing Ongoing Portfolio Expenses | |
As a shareowner in the Portfolio, you incur two types of costs:
(1) | ongoing costs, including management fees, distribution and/or service (12b-1) fees, and other Portfolio expenses; and |
(2) | transaction costs, including sales charges (loads) on purchase payments. |
This example is intended to help you understand your ongoing expenses (in dollars) of investing in the Portfolio and to compare these costs with the ongoing costs of investing in other mutual funds offered through your variable annuity contract. The example is based on an investment of $1,000 at the beginning of the Portfolio’s latest six-month period and held throughout the six months.
Using the Tables
Actual Expenses
The first table below provides information about actual account values and actual expenses. You may use the information in this table, together with the amount you invested, to estimate the expenses that you paid over the period as follows:
1. | Divide your account value by $1,000 |
| Example: an $8,600 account value ÷ $1,000 = 8.6 |
2. | Multiply the result in (1) above by the corresponding share class’s number in the third row under the heading entitled “Expenses Paid During Period” to estimate the expenses you paid on your account during this period. |
Expenses Paid on a $1,000 Investment in Pioneer Fund VCT Portfolio
Based on actual returns from July 1, 2020 through December 31, 2020.
| | | | | | | |
| Share Class | | | I |
| | II | |
| Beginning Account Value on 7/1/20 | | $ | 1,000.00 | | | $ | 1,000.00 | |
| Ending Account Value on 12/31/20 | | $ | 1,239.95 | | | $ | 1,238.61 | |
| Expenses Paid During Period* | | $ | 4.45 | | | $ | 5.85 | |
* | Expenses are equal to the Portfolio’s annualized net expense ratio of 0.79% and 1.04% for Class I and Class II shares, respectively, multiplied by the average account value over the period, multiplied by 184/366 (to reflect the one-half year period). |
Hypothetical Example for Comparison Purposes
The table below provides information about hypothetical account values and hypothetical expenses based on the Portfolio’s actual expense ratio and an assumed rate of return of 5% per year before expenses, which is not the Portfolio’s actual return. The hypothetical account values and expenses may not be used to estimate the actual ending account balance or expenses you paid for the period.
You may use this information to compare the ongoing costs of investing in the Portfolio and other variable annuities. To do so, compare this 5% hypothetical example with the 5% hypothetical examples that appear in the shareholder reports of the other variable annuities.
Please note that the expenses shown in the tables are meant to highlight your ongoing costs only and do not reflect any transaction costs, such as sales charges (loads) that are charged at the time of the transaction. Therefore, the table below is useful in comparing ongoing costs only and will not help you determine the relative total costs of owning different variable annuities. In addition, if these transaction costs were included, your costs would have been higher.
Expenses Paid on a $1,000 Investment in Pioneer Fund VCT Portfolio
Based on a hypothetical 5% per year return before expenses, reflecting the period from July 1, 2020 through December 31, 2020.
| | | | | | | |
| Share Class | | | I |
| | II | |
| Beginning Account Value on 7/1/20 | | $ | 1,000.00 | | | $ | 1,000.00 | |
| Ending Account Value on 12/31/20 | | $ | 1,021.17 | | | $ | 1,019.91 | |
| Expenses Paid During Period* | | $ | 4.01 | | | $ | 5.28 | |
* | Expenses are equal to the Portfolio’s annualized net expense ratio of 0.79% and 1.04% for Class I and Class II shares, respectively, multiplied by the average account value over the period, multiplied by 184/366 (to reflect the one-half year period). |
3
| | |
| Pioneer Fund VCT Portfolio | Pioneer Variable Contracts Trust |
Portfolio Management Discussion 12/31/20 | |
Call 1-800-688-9915 or visit www.amundi.com/us for the most recent month-end performance results. Current performance may be lower or higher than the performance data quoted.
The performance data quoted represents past performance, which is no guarantee of future results. Investment return and principal value will fluctuate, and shares, when redeemed, may be worth more or less than their original cost.
The returns for the Portfolio do not reflect the deduction of expenses associated with variable products, such as mortality and expense risk charges, separate account charges, and sales charges. These expenses would reduce the overall returns shown.
Performance results reflect any applicable expense waivers in effect during the periods shown. Without such waivers performance would be lower. Waivers may not be in effect for all portfolios. Certain fee waivers are contractual through a specified period. Otherwise, fee waivers can be rescinded at any time. See the prospectus and financial statements for more information.
In the following discussion, Jeff Kripke discusses the market environment during the 12-month period ended December 31, 2020, and Pioneer Fund VCT Portfolio’s performance during the period. Mr. Kripke, a senior vice president and a portfolio manager at Amundi Asset Management US, Inc. (Amundi US), is responsible for the day-to-day management of the Portfolio, along with James Yu, a vice president and associate portfolio manager at Amundi US, Craig Sterling, Managing Director, Director of Core Equity and Director of Equity Research, US, and a portfolio manager at Amundi US, and John Carey, Managing Director, Director of Equity Income, US, and a portfolio manager at Amundi US.
Q: How did the Portfolio perform over the 12-month period ended December 31, 2020?
A: Pioneer Fund VCT Portfolio’s Class I shares returned 24.28% at net asset value during the 12-month period ended December 31, 2020, and Class II shares returned 23.96%, while the Portfolio’s benchmark, the Standard & Poor’s 500 Index (the S&P 500), returned 18.40%.
Q: How would you describe the market environment for equities during the 12-month period ended December 31, 2020?
A: The Portfolio’s benchmark, the S&P 500, returned more than 18% for the full calendar year, closing at a record high on the last trading day of December for only the eighth time since 1928. On the face of it, this seemed like a highly improbable outcome, in our view. COVID-19 infection rates, which declined during the summer after climbing to 35,000 new daily cases in early April, spiked during the holiday season, reaching over 280,000 new daily cases on December 11, 2020. New case numbers climbed even higher in early January 2021. The S&P 500, having declined by more than 30% in a little over a month in February and March of 2020 due to the economic effects of the initial COVID-19 containment measures, which included lockdowns and business closings, rose by 70% from those lows through the end of the 12-month period, despite the exponential increase in daily virus infection rates.
There were four primary catalysts for the S&P 500’s recovery after the March 2020 low point. First, there was unprecedented fiscal and monetary stimulus from the US government and the Federal Reserve (Fed), which lent support to the economy and kept interest rates low. As a result, unemployment, which peaked at 14.7% in April, had fallen back to 6.7% at the end of November. Spending on autos and homes rose as people took advantage of the low-interest-rate environment, and sought refuge in suburban or rural areas. Second, the five largest stocks in the S&P 500 (based on market capitalization), which are technology and tech-oriented companies, benefited from the stay-at-home environment created by the efforts to contain the spread of the virus, as online gaming, video usage, and online retailing surged. That resulted in a partial decoupling of the stock market from the larger economy, as the share prices of those five companies rose by anywhere from 30% to 82% for the full 12 months ended December 31, 2020. Third,
4
| | |
| Pioneer Fund VCT Portfolio | Pioneer Variable Contracts Trust |
Moderna and Pfizer (neither of which is a portfolio holding) announced in November that their vaccines were more than 90% effective in preventing COVID-19 infections. The two companies subsequently received emergency-use authorization from the FDA in December, allowing the vaccination process to begin and sparking a more optimistic tone among market participants. Finally, the economy largely remained open in the fourth quarter of the year (October through December), despite the rise in COVID-19 infections, as states tried to balance social-interaction restrictions with the need for economic activity.
Though stocks declined in late October due to concerns about the US elections, they rebounded in early November with the declaration of a winner and emerging clarity about possible future policy actions coming out of Washington.
From a style perspective, growth stocks trounced value over the full 12 months ended December 31, 2020, as a number of growth stocks were among the stay-at-home beneficiaries we mentioned earlier. The Russell 1000 Growth Index returned 38% for the full calendar year, compared with the modest 3% gain by the Russell 1000 Value Index. Technology and technology-related stocks led the market in 2020, as the information technology sector within the S&P 500 soared by 43%. Meanwhile, energy stocks were easily the worst performers of 2020, as the sector plummeted by 33% due to falling oil demand amid ample supply.
Q: Which of your investment decisions either contributed positively to, or detracted from, the Portfolio’s benchmark-relative performance during the 12-month period ended December 31, 2020?
A: The key to the Portfolio’s success relative to the benchmark for the full 12-month period was strict adherence to our investment philosophy and process, as we seek to invest in attractively valued equities of companies that we believe have sustainable businesses from competitive, financial, and environmental, social, and governance (ESG) perspectives.
Relative performance for the full 12-month period benefited from sector allocation decisions, despite a Portfolio underweight to information technology, which was the top-performing sector in the S&P 500 (returning 43% for the year, as noted earlier, compared with 18% for the overall benchmark). The underweight to information technology was by far the biggest drag on benchmark-relative returns during the 12-month period, but positive allocation results in other sectors offset the shortfall from information technology. For example, an overweight in the technology-related communication services sector helped the Portfolio’s relative returns for the full 12 months. However, most of the performance benefits at the sector allocation level came from the Portfolio’s underweights, for valuation reasons, to “bond proxy” sectors such as consumer staples and utilities, as well as an underweight in energy, due to ESG and oil-price concerns we have had about the sector.
5
| | |
| Pioneer Fund VCT Portfolio | Pioneer Variable Contracts Trust |
| Portfolio Management Discussion 12/31/20 (continued) | |
Positive security selection results versus the S&P 500 in the two consumer sectors, industrials, and information technology also boosted the Portfolio’s benchmark-relative performance during the 12-month period, more than making up for negative selection results in health care, materials, and real estate.
The Portfolio’s exposure to five secular themes during the year – 5G, artificial intelligence, autonomy (robotics), cloud computing, and “internet of things” – was another positive contributor to benchmark-relative results. A differentiator in how we integrate themes into the Portfolio’s investment process is that we seek to own shares of companies that provide services such as cloud computing, but also of companies that are aggressive adopters of the technologies related to those themes. Leading banks, for instance, have been using artificial intelligence to improve the customer experience and reduce costs. This approach to integrating themes into our investment process means that it can apply to value as well as growth stocks. Spending related to those investment themes has accelerated during the pandemic.
In our view, one of the benefits of investing in a large-cap core portfolio such as this one is that we have the ability to migrate across the growth and value spectrums in search of stocks that we believe have the best risk-return potential, regardless of whether a stock falls under the growth or value category. The challenge for active managers like us is successfully executing that migration. Over the course of 2020, we reduced the Portfolio’s active (benchmark-relative) exposure to communication services and information technology, and to the bond proxy sectors, and increased allocations to cyclical sectors, such as industrials, in anticipation of a full economic recovery. The positive effects of those shifts were evident in the 12-month sector allocation results discussed previously.
Q: Which individual holdings factored into the Portfolio’s benchmark-relative performance during the 12-month period ended December 31, 2020, either positively or negatively?
A: The Portfolio’s position in NVIDIA, which manufactures graphic-processing units used in computer games, driverless cars, and data centers, was the top positive contributor to relative returns during the 12-month period. We believe the company is a good example of the integrated approach we take in assessing the sustainability of a business as part of our ESG investment process. One of NVIDIA’s most notable practices related to ESG is the use of artificial intelligence in an effort to eliminate unintended biases in the employee recruiting process, which has contributed not only to a favorable ESG profile, but also to better hiring outcomes.
Another top performer for the Portfolio over the 12-month period was United Parcel Service (UPS), which reported much better-than-expected results driven by an increase in package deliveries in the stay-at-home environment
6
| | |
| Pioneer Fund VCT Portfolio | Pioneer Variable Contracts Trust |
created by COVID-19. We believe that new CEO, Carol Tome, who recently joined UPS after 24 years with Home Depot, could deliver on her promise to make the company “better, not bigger,” by investing in technology, reducing inefficiencies by streamlining service offerings, and increasing profit margins. The company has been improving its ESG profile by increasing its fleet of renewable natural-gas vehicles.
On the negative side, a position in Wells Fargo was the top detractor from the Portfolio’s benchmark-relative performance in 2020. Under the leadership of Charles Scharf, who was appointed CEO in 2019, Wells Fargo is at the beginning stages of what we believe could be a transformation into a company that operates more efficiently, more profitably, and more responsibly from an ESG perspective. This transformation, in our opinion, could be positive for the stock price, but will require some patience, as corporate initiatives will take time to execute. The company is an example of our approach to ESG investing, which is to hold shares of companies that have solid ESG ratings, but also – as in the case of Wells Fargo – to hold shares of companies that have lower-than-average ESG ratings, but are actively working to improve them.
Finally, shares of oilfield services giant Schlumberger slumped and detracted from the Portfolio’s relative returns over the 12-month period, as oil prices declined due to continued supply/demand concerns. The stock is a Portfolio holding in spite of overall ESG concerns in the energy sector, because we believe the company’s services could be critical in the energy industry’s quest to become more efficient in the production of oil and natural gas. Schlumberger’s training and environmental management systems have been strong, which has helped to mitigate the inherent ESG risks of operating in the energy sector.
Q: Did the Portfolio have any exposure to derivative investments during the 12-month period ended December 31, 2020?
A: No, the Portfolio had no exposure to derivatives during the 12-month period.
Q: Could you discuss the Portfolio’s commitment to ESG investing?
A: ESG refers to the three central factors in measuring the sustainability and ethical impact of an investment in a company or business. We have historically followed an ESG-friendly approach when building the Portfolio. We use specific screening criteria to exclude investments from the Portfolio in companies that fail to meet certain ESG standards across all industries. Per the prospectus, the Portfolio generally will not invest in companies significantly involved in certain business activities, including but not limited to, the production of alcohol, tobacco products, and certain controversial military weapons, and the operation of coal mines, gambling casinos and
7
| | |
| Pioneer Fund VCT Portfolio | Pioneer Variable Contracts Trust |
| Portfolio Management Discussion 12/31/20 (continued) | |
other gaming businesses. In addition, we view the “governance” aspect of ESG as critically important, as we believe companies that take steps to better manage risk exposure than their competitors can help reduce volatility and lead to solid performance during more difficult periods for both the economy and the markets.
Q: What is your outlook for equities as the Portfolio enters a new fiscal year, and how would you characterize the Portfolio’s current positioning?
A: While the near-term economic outlook remains challenging due to the current wave of COVID-19 cases, we believe the distribution of vaccines from Pfizer and Moderna is paving the way for a potentially robust economic recovery in 2021, particularly in the second half of the year, once we get closer to possible attainment of herd immunity. We expect that a majority of adults in the US could receive the vaccine during the first half of 2021, and that hospitalization rates could begin to decline in late February or March. Gradual lifting of limitations on economic and social activity could potentially occur, and businesses that suffered the most from those limitations may in turn begin to recover. Additional fiscal stimulus from the government could also help support the economy until there is a wide-ranging rollout of the vaccination process.
Though we still see significant valuation risk in financial markets, as evidenced by the performance of ultra-high-growth stocks and IPOs, we believe there are attractively valued opportunities in equities, especially in cyclical stocks that could benefit from a strong economy in the second half of 2021. Speculative activity is quite apparent, in our view, not only in the ultra-high-growth and largely unprofitable companies, but also in recent IPOs.
Consistent with these views, we have overweighted the Portfolio to the industrials sector, while underweighting it to bond-proxy sectors, such as consumer staples and utilities, which we believe are likely to underperform if economic growth recovers and interest rates begin to rise.
8
| | |
| Pioneer Fund VCT Portfolio | Pioneer Variable Contracts Trust |
A Word About Risk:
All investments are subject to risk, including the possible loss of principal. In the past several years, financial markets have experienced increased volatility and heightened uncertainty. The market prices of securities may go up or down, sometimes rapidly or unpredictably, due to general market conditions, such as real or perceived adverse economic, political, or regulatory conditions, recessions, inflation, changes in interest or currency rates, lack of liquidity in the bond markets, the spread of infectious illness or other public health issues or adverse investor sentiment. These conditions may continue, recur, worsen or spread.
The Portfolio generally excludes corporate issuers that do not meet or exceed minimum ESG standards. Excluding specific issuers limits the universe of investments available to the Portfolio, which may mean forgoing some investment opportunities available to portfolios without similar ESG standards.
At times, the Portfolio’s investments may represent industries or industry sectors that are interrelated or have common risks, making the Portfolio more susceptible to any economic, political, or regulatory developments or other risks affecting those industries and sectors.
These risks may increase share price volatility.
Please refer to the Schedule of Investments on pages 10 to 12 for a full listing of Portfolio securities.
Past performance is no guarantee of future results.
Any information in this shareholder report regarding market or economic trends or the factors influencing the Portfolio’s historical or future performance are statements of opinion as of the date of this report.
9
| | |
| Pioneer Fund VCT Portfolio | Pioneer Variable Contracts Trust |
Schedule of Investments 12/31/20 | |
| | | | |
| Shares | | | Value |
| | | UNAFFILIATED ISSUERS – 98.1% | |
| | | COMMON STOCKS – 98.1% of Net Assets | |
| | | Air Freight & Logistics – 5.0% | |
| 5,791 | | FedEx Corp. | $ 1,503,460 |
| 31,326 | | United Parcel Service, Inc., Class B | 5,275,298 |
| | | Total Air Freight & Logistics | $ 6,778,758 |
| | | Banks – 5.2% | |
| 174,601 | | Bank of America Corp. | $ 5,292,156 |
| 56,284 | | Wells Fargo & Co. | 1,698,651 |
| | | Total Banks | $ 6,990,807 |
| | | Beverages – 1.8% | |
| 43,762 | | Coca-Cola Co. | $ 2,399,908 |
| | | Total Beverages | $ 2,399,908 |
| | | Biotechnology – 0.8% | |
| 2,740(a) | | Biogen, Inc. | $ 670,917 |
| 701(a) | | Regeneron Pharmaceuticals, Inc. | 338,660 |
| | | Total Biotechnology | $ 1,009,577 |
| | | Building Products – 1.7% | |
| 60,239 | | Carrier Global Corp. | $ 2,272,215 |
| | | Total Building Products | $ 2,272,215 |
| | | Capital Markets – 4.7% | |
| 3,862 | | BlackRock, Inc. | $ 2,786,588 |
| 15,515 | | CME Group, Inc. | 2,824,506 |
| 2,299 | | S&P Global, Inc. | 755,750 |
| | | Total Capital Markets | $ 6,366,844 |
| | | Chemicals – 3.4% | |
| 42,505 | | International Flavors & Fragrances, Inc. | $ 4,626,244 |
| | | Total Chemicals | $ 4,626,244 |
| | | Diversified Telecommunication Services – 0.0%† | |
| 226 | | Verizon Communications, Inc. | $ 13,278 |
| | | Total Diversified Telecommunication Services | $ 13,278 |
| | | Energy Equipment & Services – 2.7% | |
| 165,745 | | Schlumberger, Ltd. | $ 3,618,213 |
| | | Total Energy Equipment & Services | $ 3,618,213 |
| | | Entertainment – 1.8% | |
| 13,290(a) | | Walt Disney Co. | $ 2,407,882 |
| | | Total Entertainment | $ 2,407,882 |
| | | Food & Staples Retailing – 1.2% | |
| 11,056 | | Walmart, Inc. | $ 1,593,722 |
| | | Total Food & Staples Retailing | $ 1,593,722 |
| | | Health Care – 1.6% | |
| 13,343 | | Zoetis, Inc. | $ 2,208,267 |
| | | Total Health Care | $ 2,208,267 |
| | | Health Care Equipment & Supplies – 3.3% | |
| 10,941 | | Danaher Corp. | $ 2,430,433 |
| 17,491 | | Medtronic PLC | 2,048,896 |
| | | Total Health Care Equipment & Supplies | $ 4,479,329 |
The accompanying notes are an integral part of these financial statements.
10
| | |
| Pioneer Fund VCT Portfolio | Pioneer Variable Contracts Trust |
| | | | |
| Shares | | | Value |
| | Hotels, Restaurants & Leisure – 3.1% | |
| 23,792(a) | | Shake Shack, Inc. | $ 2,017,086 |
| 20,407 | | Starbucks Corp. | 2,183,141 |
| | Total Hotels, Restaurants & Leisure | $ 4,200,227 |
| | Information Technology – 1.3% | |
| 13,790 | | Amphenol Corp. | $ 1,803,318 |
| | Total Information Technology | $ 1,803,318 |
| | Insurance – 2.3% | |
| 62,623 | | Hartford Financial Services Group, Inc. | $ 3,067,275 |
| | Total Insurance | $ 3,067,275 |
| | Interactive Media & Services – 5.1% | |
| 3,275(a) | | Alphabet, Inc. | $ 5,739,896 |
| 4,203(a) | | Facebook, Inc. | 1,148,091 |
| | Total Interactive Media & Services | $ 6,887,987 |
| | Internet & Direct Marketing Retail – 5.3% | |
| 2,917(a) | | Alibaba Group Holding, Ltd. (A.D.R.) | $ 678,873 |
| 1,961(a) | | Amazon.com, Inc. | 6,386,840 |
| | Total Internet & Direct Marketing Retail | $ 7,065,713 |
| | IT Services – 6.6% | |
| 17,188(a) | | Akamai Technologies, Inc. | $ 1,804,568 |
| 32,043 | | Visa, Inc. | 7,008,766 |
| | Total IT Services | $ 8,813,334 |
| | Life Sciences Tools & Services – 1.5% | |
| 16,942 | | Agilent Technologies, Inc. | $ 2,007,458 |
| | Total Life Sciences Tools & Services | $ 2,007,458 |
| | Machinery – 3.2% | |
| 16,807 | | Caterpillar, Inc. | $ 3,059,210 |
| 17,644 | | Otis Worldwide Corp. | 1,191,852 |
| | Total Machinery | $ 4,251,062 |
| | Pharmaceuticals – 4.9% | |
| 160,977(a) | | Elanco Animal Health, Inc. | $ 4,937,165 |
| 19,780 | | Merck & Co., Inc. | 1,618,004 |
| | Total Pharmaceuticals | $ 6,555,169 |
| | Road & Rail – 2.9% | |
| 18,746 | | Union Pacific Corp. | $ 3,903,292 |
| | Total Road & Rail | $ 3,903,292 |
| | Semiconductors & Semiconductor Equipment – 7.9% | |
| 34,169 | | Analog Devices, Inc. | $ 5,047,786 |
| 7,609 | | Lam Research Corp. | 3,593,503 |
| 3,916 | | NVIDIA Corp. | 2,044,935 |
| | Total Semiconductors & Semiconductor Equipment | $ 10,686,224 |
| | Software – 5.6% | |
| 4,342(a) | | C3.ai, Inc. | $ 602,452 |
| 30,880 | | Microsoft Corp. | 6,868,330 |
| | Total Software | $ 7,470,782 |
The accompanying notes are an integral part of these financial statements.
11
| | |
| Pioneer Fund VCT Portfolio | Pioneer Variable Contracts Trust |
| Schedule of Investments 12/31/20 (continued) | |
| | | | |
| Shares | | | Value |
| | Software & Services – 3.9% | |
| 14,872 | | Mastercard, Inc. | $ 5,308,412 |
| | Total Software & Services | $ 5,308,412 |
| | Specialty Retail – 3.0% | |
| 5,932 | | Home Depot, Inc. | $ 1,575,658 |
| 8,733(a) | | Ulta Beauty, Inc. | 2,507,768 |
| | Total Specialty Retail | $ 4,083,426 |
| | Technology Hardware, Storage & Peripherals – 5.4% | |
| 54,638 | | Apple, Inc. | $ 7,249,916 |
| | Total Technology Hardware, Storage & Peripherals | $ 7,249,916 |
| | Textiles, Apparel & Luxury Goods – 2.9% | |
| 27,952 | | NIKE, Inc., Class B | $ 3,954,369 |
| | Total Textiles, Apparel & Luxury Goods | $ 3,954,369 |
| | TOTAL COMMON STOCKS | |
| | (Cost $88,198,409) | $132,073,008 |
| | TOTAL INVESTMENTS IN UNAFFILIATED ISSUERS – 98.1% | |
| | (Cost $88,198,409) | $132,073,008 |
| | OTHER ASSETS AND LIABILITIES – 1.9% | $ 2,489,591 |
| | NET ASSETS – 100.0% | $134,562,599 |
| | |
(A.D.R.) | American Depositary Receipts. |
† | Amount rounds to less than 0.1%. |
(a) | Non-income producing security. |
Purchases and sales of securities (excluding temporary cash investments) for the year ended December 31, 2020, aggregated $103,805,873 and $109,734,925, respectively.
The Portfolio is permitted to engage in purchase and sale transactions (“cross trades”) with certain funds and accounts for which the Amundi Asset Management US, Inc. (the “Adviser”) serves as the Portfolio’s investment adviser, as set forth in Rule 17a-7 under the Investment Company Act of 1940, pursuant to procedures adopted by the Board of Trustees. Under these procedures, cross trades are effected at current market prices. During the year ended December 31, 2020, the Portfolio did not engage in any cross trade activity.
At December 31, 2020, the net unrealized appreciation on investments based on cost for federal tax purposes of $88,764,244 was as follows:
| | | | |
| Aggregate gross unrealized appreciation for all investments in which there is an excess of value over tax cost | | $ | 44,369,761 | |
| Aggregate gross unrealized depreciation for all investments in which there is an excess of tax cost over value | | | (1,060,997 | ) |
| Net unrealized appreciation | | $ | 43,308,764 | |
Various inputs are used in determining the value of the Portfolio’s investments. These inputs are summarized in the three broad levels below.
Level 1 – unadjusted quoted prices in active markets for identical securities.
Level 2 – other significant observable inputs (including quoted prices for similar securities, interest rates, prepayment speeds, credit risks, etc.). See Notes to Financial Statements — Note 1A.
Level 3 – significant unobservable inputs (including the Portfolio’s own assumptions in determining fair value of investments). See Notes to Financial Statements — Note 1A.
The following is a summary of the inputs used as of December 31, 2020, in valuing the Portfolio’s investments:
| | | | | | | | | | | | | |
| | | Level 1 | | | Level 2 | | | Level 3 | | | Total | |
| Common Stocks | | $ | 132,073,008 | | | $ | — | | | $ | — | | | $ | 132,073,008 | |
| Total Investments in Securities | | $ | 132,073,008 | | | $ | — | | | $ | — | | | $ | 132,073,008 | |
During the year ended December 31, 2020, there were no transfers in or out of Level 3.
The accompanying notes are an integral part of these financial statements.
12
| | |
| Pioneer Fund VCT Portfolio | Pioneer Variable Contracts Trust |
Statement of Assets and Liabilities 12/31/20 | |
| | | | |
| ASSETS: | | | |
| Investments in unaffiliated issuers, at value (cost $88,198,409) | | $ | 132,073,008 | |
| Cash | | | 1,074,953 | |
| Receivables — | | | | |
| Investment securities sold | | | 2,210,373 | |
| Portfolio shares sold | | | 1,379,425 | |
| Dividends | | | 151,155 | |
| Other assets | | | 2,598 | |
| Total assets | | $ | 136,891,512 | |
| | | | | |
| LIABILITIES: | | | | |
| Payables — | | | | |
| Investment securities purchased | | $ | 2,221,072 | |
| Portfolio shares repurchased | | | 47,003 | |
| Trustees’ fees | | | 36 | |
| Due to affiliates | | | 7,513 | |
| Accrued expenses | | | 53,289 | |
| Total liabilities | | $ | 2,328,913 | |
| | | | | |
| NET ASSETS: | | | | |
| Paid-in capital | | $ | 79,221,192 | |
| Distributable earnings | | | 55,341,407 | |
| Net assets | | $ | 134,562,599 | |
| | | | | |
| NET ASSET VALUE PER SHARE: | | | | |
No par value (unlimited number of shares authorized) | | | | |
| Class I (based on $116,401,095/6,916,189 shares) | | $ | 16.83 | |
| Class II (based on $18,161,504/1,070,350 shares) | | $ | 16.97 | |
The accompanying notes are an integral part of these financial statements.
13
| | |
| Pioneer Fund VCT Portfolio | Pioneer Variable Contracts Trust |
| Statement of Operations | |
| | | | | | | |
| FOR THE YEAR ENDED 12/31/20 | | | | | | |
| | | | | | | |
| INVESTMENT INCOME: | | | | | | |
| Dividends from unaffiliated issuers (net of foreign taxes withheld $(14,565)) | | $ | 1,796,249 | | | | |
| Interest from unaffiliated issuers | | | 6,171 | | | | |
| Total investment income | | | | | | $ | 1,802,420 | |
| EXPENSES: | | | | | | | | |
| Management fees | | $ | 750,925 | | | | | |
| Administrative expense | | | 79,377 | | | | | |
| Distribution fees | | | | | | | | |
| Class II | | | 37,500 | | | | | |
| Custodian fees | | | 15,454 | | | | | |
| Professional fees | | | 40,556 | | | | | |
| Printing expense | | | 21,645 | | | | | |
| Pricing fees | | | 61 | | | | | |
| Trustees’ fees | | | 7,187 | | | | | |
| Insurance expense | | | 202 | | | | | |
| Miscellaneous | | | 262 | | | | | |
| Total expenses | | | | | | $ | 953,169 | |
| Net investment income | | | | | | $ | 849,251 | |
| REALIZED AND UNREALIZED GAIN (LOSS) ON INVESTMENTS: | | | | | | | | |
| Net realized gain (loss) on: | | | | | | | | |
| Investments in unaffiliated issuers | | $ | 11,579,458 | | | | | |
| Other assets and liabilities denominated in foreign currencies | | | (748 | ) | | $ | 11,578,710 | |
| Change in net unrealized appreciation (depreciation) on: | | | | | | | | |
| Investments in unaffiliated issuers | | $ | 13,526,115 | | | | | |
| Other assets and liabilities denominated in foreign currencies | | | 915 | | | $ | 13,527,030 | |
| Net realized and unrealized gain (loss) on investments | | | | | | $ | 25,105,740 | |
| Net increase in net assets resulting from operations | | | | | | $ | 25,954,991 | |
The accompanying notes are an integral part of these financial statements.
14
| | |
| Pioneer Fund VCT Portfolio | Pioneer Variable Contracts Trust |
| Statements of Changes in Net Assets | |
| | | | | | | |
| | Year Ended | | | Year Ended | |
| | 12/31/20 | | | 12/31/19 | |
| FROM OPERATIONS: | | | | | | |
Net investment income (loss) | | $ | 849,251 | | | $ | 1,114,293 | |
Net realized gain (loss) on investments | | | 11,578,710 | | | | 9,594,131 | |
Change in net unrealized appreciation (depreciation) on investments | | | 13,527,030 | | | | 17,794,075 | |
| Net increase in net assets resulting from operations | | $ | 25,954,991 | | | $ | 28,502,499 | |
| DISTRIBUTIONS TO SHAREOWNERS: | | | | | | | | |
| Class I ($1.42 and $2.56 per share, respectively) | | $ | (9,128,227 | ) | | $ | (15,278,833 | ) |
| Class II ($1.38 and $2.52 per share, respectively) | | | (1,308,500 | ) | | | (2,001,964 | ) |
| Total distributions to shareowners | | $ | (10,436,727 | ) | | $ | (17,280,797 | ) |
| FROM PORTFOLIO SHARE TRANSACTIONS: | | | | | | | | |
Net proceeds from sales of shares | | $ | 15,433,978 | | | $ | 8,389,230 | |
Reinvestment of distributions | | | 10,436,727 | | | | 17,280,797 | |
Cost of shares repurchased | | | (20,317,379 | ) | | | (19,012,750 | ) |
| Net increase in net assets resulting from Portfolio share transactions | | $ | 5,553,326 | | | $ | 6,657,277 | |
| Net increase in net assets | | $ | 21,071,590 | | | $ | 17,878,979 | |
| NET ASSETS: | | | | | | | | |
Beginning of year | | $ | 113,491,009 | | | $ | 95,612,030 | |
End of year | | $ | 134,562,599 | | | $ | 113,491,009 | |
| | | | | | | | | | | | | |
| | Year Ended | | | Year Ended | | | Year Ended | | | Year Ended | |
| | 12/31/20 | | | 12/31/20 | | | 12/31/19 | | | 12/31/19 | |
| | Shares | | | Amount | | | Shares | | | Amount | |
| Class I | | | | | | | | | | | | |
Shares sold | | | 638,060 | | | $ | 9,584,681 | | | | 326,293 | | | $ | 4,706,777 | |
Reinvestment of distributions | | | 663,204 | | | | 9,128,227 | | | | 1,114,770 | | | | 15,278,833 | |
Less shares repurchased | | | (1,064,140 | ) | | | (15,621,508 | ) | | | (1,003,955 | ) | | | (14,429,994 | ) |
| Net increase | | | 237,124 | | | $ | 3,091,400 | | | | 437,108 | | | $ | 5,555,616 | |
| Class II | | | | | | | | | | | | | | | | |
Shares sold | | | 383,975 | | | $ | 5,849,297 | | | | 254,279 | | | $ | 3,682,453 | |
Reinvestment of distributions | | | 94,337 | | | | 1,308,500 | | | | 145,124 | | | | 2,001,964 | |
Less shares repurchased | | | (313,716 | ) | | | (4,695,871 | ) | | | (320,051 | ) | | | (4,582,756 | ) |
| Net increase | | | 164,596 | | | $ | 2,461,926 | | | | 79,352 | | | $ | 1,101,661 | |
The accompanying notes are an integral part of these financial statements.
15
| | |
| Pioneer Fund VCT Portfolio | Pioneer Variable Contracts Trust |
| Financial Highlights | |
| | | | | | | | | | | | | | | | |
| | Year Ended | | | Year Ended | | | Year Ended | | | Year Ended | | | Year Ended | |
| | 12/31/20 | | | 12/31/19 | | | 12/31/18 | | | 12/31/17 | | | 12/31/16* | |
| Class I | | | | | | | | | | | | | | | |
Net asset value, beginning of period | | $ | 14.95 | | | $ | 13.52 | | | $ | 18.29 | | | $ | 17.72 | | | $ | 19.75 | |
Increase (decrease) from investment operations: | | | | | | | | | | | | | | | | | | | | |
| Net investment income (loss) (a) | | $ | 0.11 | | | $ | 0.16 | | | $ | 0.18 | | | $ | 0.21 | | | $ | 0.24 | |
| Net realized and unrealized gain (loss) on investments | | | 3.19 | | | | 3.83 | | | | (0.24 | ) | | | 3.31 | | | | 1.46 | |
| Net increase (decrease) from investment operations | | $ | 3.30 | | | $ | 3.99 | | | $ | (0.06 | ) | | $ | 3.52 | | | $ | 1.70 | |
Distributions to shareowners: | | | | | | | | | | | | | | | | | | | | |
| Net investment income | | $ | (0.11 | ) | | $ | (0.15 | ) | | $ | (0.19 | ) | | $ | (0.21 | ) | | $ | (0.24 | ) |
| Net realized gain | | | (1.31 | ) | | | (2.41 | ) | | | (4.52 | ) | | | (2.74 | ) | | | (3.49 | ) |
| Total distributions | | $ | (1.42 | ) | | $ | (2.56 | ) | | $ | (4.71 | ) | | $ | (2.95 | ) | | $ | (3.73 | ) |
Net increase (decrease) in net asset value
| | $ | 1.88 | | | $ | 1.43 | | | $ | (4.77 | ) | | $ | 0.57 | | | $ | (2.03 | ) |
Net asset value, end of period | | $ | 16.83 | | | $ | 14.95 | | | $ | 13.52 | | | $ | 18.29 | | | $ | 17.72 | |
| Total return (b) | | | 24.28 | % | | | 31.33 | % | | | (1.51 | )%(c) | | | 21.72 | % | | | 9.81 | % |
Ratio of net expenses to average net assets | | | 0.79 | % | | | 0.82 | % | | | 0.82 | % | | | 0.77 | % | | | 0.75 | % |
Ratio of net investment income (loss) to average net assets | | | 0.77 | % | | | 1.08 | % | | | 1.12 | % | | | 1.16 | % | | | 1.32 | % |
Portfolio turnover rate | | | 91 | % | | | 70 | % | | | 58 | % | | | 59 | % | | | 60 | % |
Net assets, end of period (in thousands) | | $ | 116,401 | | | $ | 99,853 | | | $ | 84,375 | | | $ | 101,056 | | | $ | 121,626 | |
* | The Portfolio was audited by an independent registered public accounting firm other than Ernst & Young LLP. |
(a) | The per-share data presented above is based on the average shares outstanding for the period presented. |
(b) | Assumes initial investment at net asset value at the beginning of each period, reinvestment of all distributions and the complete redemption of the investment at net asset value at the end of each period. |
(c) | If the Portfolio had not recognized gains in settlement of class action lawsuits during the year ended December 31, 2018, the total return would have been (1.55)%. |
NOTE: The above financial highlights do not reflect the deduction of non-portfolio expenses associated with variable insurance products, such as mortality and expense risk charges, separate account charges, and sales charges.
The accompanying notes are an integral part of these financial statements.
16
| | |
| Pioneer Fund VCT Portfolio | Pioneer Variable Contracts Trust |
| | | | | | | | | | | | | | | | |
| | Year Ended | | | Year Ended | | | Year Ended | | | Year Ended
| | | Year Ended | |
| | 12/31/20 | | | 12/31/19 | | | 12/31/18 | | | 12/31/17 | | | 12/31/16* | |
| Class II | | | | | | | | | | | | | | | |
| Net asset value, beginning of period | | $ | 15.06 | | | $ | 13.60 | | | $ | 18.35 | | | $ | 17.78 | | | $ | 19.79 | |
| Increase (decrease) from investment operations: | | | | | | | | | | | | | | | | | | | | |
| Net investment income (loss) (a) | | $ | 0.08 | | | $ | 0.12 | | | $ | 0.14 | | | $ | 0.16 | | | $ | 0.19 | |
| Net realized and unrealized gain (loss) on investments | | | 3.21 | | | | 3.86 | | | | (0.24 | ) | | | 3.32 | | | | 1.48 | |
| Net increase (decrease) from investment operations | | $ | 3.29 | | | $ | 3.98 | | | $ | (0.10 | ) | | $ | 3.48 | | | $ | 1.67 | |
| Distributions to shareowners: | | | | | | | | | | | | | | | | | | | | |
| Net investment income | | $ | (0.07 | ) | | $ | (0.11 | ) | | $ | (0.13 | ) | | $ | (0.17 | ) | | $ | (0.19 | ) |
| Net realized gain | | | (1.31 | ) | | | (2.41 | ) | | | (4.52 | ) | | | (2.74 | ) | | | (3.49 | ) |
| Total distributions | | $ | (1.38 | ) | | $ | (2.52 | ) | | $ | (4.65 | ) | | $ | (2.91 | ) | | $ | (3.68 | ) |
Net increase (decrease) in net asset value
| | $ | 1.91 | | | $ | 1.46 | | | $ | (4.75 | ) | | $ | 0.57 | | | $ | (2.01 | ) |
Net asset value, end of period | | $ | 16.97 | | | $ | 15.06 | | | $ | 13.60 | | | $ | 18.35 | | | $ | 17.78 | |
| Total return (b) | | | 23.96 | % | | | 31.03 | % | | | (1.74 | )%(c) | | | 21.36 | % | | | 9.62 | % |
| Ratio of net expenses to average net assets | | | 1.04 | % | | | 1.07 | % | | | 1.07 | % | | | 1.02 | % | | | 1.00 | % |
| Ratio of net investment income (loss) to average net assets | | | 0.50 | % | | | 0.83 | % | | | 0.88 | % | | | 0.91 | % | | | 1.07 | % |
| Portfolio turnover rate | | | 91 | % | | | 70 | % | | | 58 | % | | | 59 | % | | | 60 | % |
| Net assets, end of period (in thousands) | | $ | 18,162 | | | $ | 13,638 | | | $ | 11,237 | | | $ | 13,060 | | | $ | 15,328 | |
* | The Portfolio was audited by an independent registered public accounting firm other than Ernst & Young LLP. |
(a) | The per-share data presented above is based on the average shares outstanding for the period presented. |
(b) | Assumes initial investment at net asset value at the beginning of each period, reinvestment of all distributions and the complete redemption of the investment at net asset value at the end of each period. |
(c) | If the Portfolio had not recognized gains in settlement of class action lawsuits during the year ended December 31, 2018, the total return would have been (1.78)%. |
NOTE: The above financial highlights do not reflect the deduction of non-portfolio expenses associated with variable insurance products, such as mortality and expense risk charges, separate account charges, and sales charges.
The accompanying notes are an integral part of these financial statements.
17
| | |
| Pioneer Fund VCT Portfolio | Pioneer Variable Contracts Trust |
Notes to Financial Statements 12/31/20 | |
1. Organization and Significant Accounting Policies
Pioneer Fund VCT Portfolio (the “Portfolio”) is one of 8 portfolios comprising Pioneer Variable Contracts Trust (the “Trust”), a Delaware statutory trust. The Portfolio is registered under the Investment Company Act of 1940 as a diversified, open-end management investment company. The investment objectives of the Portfolio are reasonable income and capital growth.
The Portfolio offers two classes of shares designated as Class I and Class II shares. Each class of shares represents an interest in the same portfolio of investments of the Portfolio and has identical rights (based on relative net asset values) to assets and liquidation proceeds. Share classes can bear different rates of class-specific fees and expenses, such as transfer agent and distribution fees. Differences in class-specific fees and expenses will result in differences in net investment income and, therefore, the payment of different dividends from net investment income earned by each class. The Amended and Restated Declaration of Trust of the Portfolio gives the Board of Trustees the flexibility to specify either per-share voting or dollar-weighted voting when submitting matters for shareowner approval. Under per-share voting, each share of a class of the Portfolio is entitled to one vote. Under dollar-weighted voting, a shareowner’s voting power is determined not by the number of shares owned, but by the dollar value of the shares on the record date. Each share class has exclusive voting rights with respect to matters affecting only that class, including with respect to the distribution plan for that class. There is no distribution plan for Class I shares.
Portfolio shares may be purchased only by insurance companies for the purpose of funding variable annuity and variable life insurance contracts or by qualified pension and retirement plans.
Amundi Asset Management US, Inc., an indirect, wholly owned subsidiary of Amundi and Amundi’s wholly owned subsidiary, Amundi USA, Inc., serves as the Portfolio’s investment adviser (the “Adviser”). Prior to January 1, 2021, the Adviser was named Amundi Pioneer Asset Management, Inc. Amundi Distributor US, Inc., an affiliate of Amundi Asset Management US, Inc., serves as the Portfolio’s distributor (the “Distributor”).
In August 2018, the Financial Accounting Standards Board (FASB) issued Accounting Standards Update 2018-13 “Disclosure Framework - Changes to the Disclosure Requirements for Fair Value Measurement” (“ASU 2018-13”) which modifies disclosure requirements for fair value measurements, principally for Level 3 securities and transfers between levels of the fair value hierarchy. ASU 2018-13 is effective for fiscal years beginning after December 15, 2019 and for interim periods within those fiscal years. The Portfolio has adopted ASU 2018-13 for the year ended December 31, 2020. The impact to the Portfolio’s adoption was limited to changes in the Portfolio’s disclosures regarding fair value, primarily those disclosures related to transfers between levels of the fair value hierarchy and disclosure of the range and weighted average used to develop significant unobservable inputs for Level 3 fair value investments, when applicable.
The Portfolio is an investment company and follows investment company accounting and reporting guidance under U.S. Generally Accepted Accounting Principles (“U.S. GAAP”). U.S. GAAP requires the management of the Portfolio to make estimates and assumptions that affect the reported amounts of assets and liabilities, the disclosure of contingent assets and liabilities at the date of the financial statements, and the reported amounts of income, expenses and gain or loss on investments during the reporting period. Actual results could differ from those estimates.
The following is a summary of significant accounting policies followed by the Portfolio in the preparation of its financial statements:
A. Security Valuation
The net asset value of the Portfolio is computed once daily, on each day the New York Stock Exchange (“NYSE”) is open, as of the close of regular trading on the NYSE.
Equity securities which may include restricted securities that have traded on an exchange are valued by using the last sale price on the principal exchange where they are traded. Equity securities which may include restricted securities that have not traded on the date of valuation, or securities for which sale prices are not available, generally are valued using the mean between the last bid and asked prices or, if both last bid and asked prices are not available, at the last quoted bid price. Last sale and bid and asked prices are provided by independent third party pricing services. In the case of equity securities which may include restricted securities not traded on an exchange, prices are typically determined by independent third party pricing services using a variety of techniques and methods.
18
| | |
| Pioneer Fund VCT Portfolio | Pioneer Variable Contracts Trust |
Securities for which independent pricing services or broker-dealers are unable to supply prices or for which market prices and/or quotations are not readily available or are considered to be unreliable are valued by a fair valuation team comprised of certain personnel of the Adviser pursuant to procedures adopted by the Portfolio’s Board of Trustees. The Adviser’s fair valuation team uses fair value methods approved by the Valuation Committee of the Board of Trustees. The Adviser’s fair valuation team is responsible for monitoring developments that may impact fair valued securities and for discussing and assessing fair values on an ongoing basis, and at least quarterly, with the Valuation Committee of the Board of Trustees.
Inputs used when applying fair value methods to value a security may include credit ratings, the financial condition of the company, current market conditions and comparable securities. The Portfolio may use fair value methods if it is determined that a significant event has occurred after the close of the exchange or market on which the security trades and prior to the determination of the Portfolio’s net asset value. Examples of a significant event might include political or economic news, corporate restructurings, natural disasters, terrorist activity or trading halts. Thus, the valuation of the Portfolio’s securities may differ significantly from exchange prices, and such differences could be material.
At December 31, 2020, no securities were valued using fair value methods (other than securities valued using prices supplied by independent pricing services, broker-dealers or using a third party insurance industry pricing model).
B. Investment Income and Transactions
Dividend income is recorded on the ex-dividend date, except that certain dividends from foreign securities where the ex-dividend date may have passed are recorded as soon as the Portfolio becomes aware of the ex-dividend data in the exercise of reasonable diligence.
Interest income, including interest on income-bearing cash accounts, is recorded on the accrual basis. Dividend and interest income are reported net of unrecoverable foreign taxes withheld at the applicable country rates and net of income accrued on defaulted securities.
Interest and dividend income payable by delivery of additional shares is reclassified as PIK (payment-in-kind) income upon receipt and is included in interest and dividend income, respectively.
Security transactions are recorded as of trade date. Gains and losses on sales of investments are calculated on the identified cost method for both financial reporting and federal income tax purposes.
C. Foreign Currency Translation
The books and records of the Portfolio are maintained in U.S. dollars. Amounts denominated in foreign currencies are translated into U.S. dollars using current exchange rates.
Net realized gains and losses on foreign currency transactions, if any, represent, among other things, the net realized gains and losses on foreign currency exchange contracts, disposition of foreign currencies and the difference between the amount of income accrued and the U.S. dollars actually received. Further, the effects of changes in foreign currency exchange rates on investments are not segregated on the Statement of Operations from the effects of changes in the market prices of those securities, but are included with the net realized and unrealized gain or loss on investments.
D. Federal Income Taxes
It is the Portfolio’s policy to comply with the requirements of the Internal Revenue Code applicable to regulated investment companies and to distribute all of its net taxable income and net realized capital gains, if any, to its shareowners. Therefore, no provision for federal income taxes is required. As of December 31, 2020, the Portfolio did not accrue any interest or penalties with respect to uncertain tax positions, which, if applicable, would be recorded as an income tax expense on the Statement of Operations. Tax returns filed within the prior three years remain subject to examination by federal and state tax authorities.
The amount and character of income and capital gain distributions to shareowners are determined in accordance with federal income tax rules, which may differ from U.S. GAAP. Distributions in excess of net investment income or net realized gains are temporary over distributions for financial statement purposes resulting from differences in the recognition or classification of income or distributions for financial statement and tax purposes. Capital accounts within the financial statements are adjusted for permanent book/tax differences to reflect tax character, but are not adjusted for temporary differences.
19
| | |
| Pioneer Fund VCT Portfolio | Pioneer Variable Contracts Trust |
| Notes to Financial Statements 12/31/20 (continued) | |
A portion of the dividend income recorded by the Portfolio is from distributions by publicly traded Real Estate Investment Trusts (“REITs”), and such distributions for tax purposes may also consist of capital gains and return of capital. The actual return of capital and capital gains portions of such distributions will be determined by formal notifications from the REITs subsequent to the calendar year-end. Distributions received from the REITs that are determined to be a return of capital are recorded by the Portfolio as a reduction of the cost basis of the securities held and those determined to be capital gain are reflected as such on the Statement of Operations.
The tax character of distributions paid during the years ended December 31, 2020 and December 31, 2019, were as follows:
| | | | | | | |
| | 2020 | | | 2019 | |
| Distributions paid from: | | | | | | |
| Ordinary income | | $ | 2,349,207 | | | $ | 1,973,369 | |
| Long-term capital gain | | | 8,087,520 | | | | 15,307,428 | |
| Total | | $ | 10,436,727 | | | $ | 17,280,797 | |
The following shows the components of distributable earnings on a federal income tax basis at December 31, 2020.
| | | | |
| | 2020 | |
| Distributable Earnings: | | | |
| Undistributed long-term capital gain | | $ | 9,551,896 | |
| Undistributed ordinary income | | | 2,479,934 | |
| Net unrealized appreciation | | | 43,309,577 | |
| Total | | $ | 55,341,407 | |
The difference between book-basis and tax-basis net unrealized appreciation is attributable to the tax deferral of losses on wash sales and the tax basis adjustments on REITs and common stocks.
E. Portfolio Shares and Class Allocations
The Portfolio records sales and repurchases of its shares as of trade date. Distribution fees for Class II shares are calculated based on the average daily net asset value attributable to Class II shares of the Portfolio (see Note 5). Class I shares do not pay distribution fees.
Income, common expenses (excluding transfer agent and distribution fees) and realized and unrealized gains and losses are calculated at the Portfolio level and allocated daily to each class of shares based on its respective percentage of the adjusted net assets at the beginning of the day.
All expenses and fees paid to the Portfolio’s transfer agent for its services are allocated among the classes of shares based on the number of accounts in each class and the ratable allocation of related out-of-pocket expenses (see Note 4).
Dividends and distributions to shareowners are recorded on the ex-dividend date. Distributions paid by the Portfolio with respect to each class of shares are calculated in the same manner and at the same time, except that net investment income dividends to Class I and Class II shares can reflect different transfer agent and distribution expense rates.
F. Risks
The value of securities held by the Portfolio may go up or down, sometimes rapidly or unpredictably, due to general market conditions, such as real or perceived adverse economic, political or regulatory conditions, recessions, the spread of infectious illness or other public health issues, inflation, changes in interest rates, lack of liquidity in the bond markets or adverse investor sentiment. In the past several years, financial markets have experienced increased volatility, depressed valuations, decreased liquidity and heightened uncertainty. These conditions may continue, recur, worsen or spread. A general rise in interest rates could adversely affect the price and liquidity of fixed-income securities and could also result in increased redemptions from the Portfolio.
At times, the Portfolio’s investments may represent industries or industry sectors that are interrelated or have common risks, making the Portfolio more susceptible to any economic, political, or regulatory developments or other risks affecting those industries and sectors. The Portfolio’s investments in foreign markets and countries with limited developing markets may subject the Portfolio to a greater degree of risk than investments in a developed market. These risks include disruptive political or economic conditions and the imposition of adverse governmental laws or currency exchange restrictions.
20
| | |
| Pioneer Fund VCT Portfolio | Pioneer Variable Contracts Trust |
The Portfolio may invest in REIT securities, the value of which can fall for a variety of reasons, such as declines in rental income, fluctuating interest rates, poor property management, environmental liabilities, uninsured damage, increased competition, or changes in real estate tax laws.
With the increased use of technologies such as the Internet to conduct business, the Portfolio is susceptible to operational, information security and related risks. While the Portfolio’s Adviser has established business continuity plans in the event of, and risk management systems to prevent, limit or mitigate, such cyber-attacks, there are inherent limitations in such plans and systems, including the possibility that certain risks have not been identified. Furthermore, the Portfolio cannot control the cybersecurity plans and systems put in place by service providers to the Portfolio such as Brown Brothers Harriman & Co., the Portfolio’s custodian and accounting agent, and DST Asset Manager Solutions, Inc., the Portfolio’s transfer agent. In addition, many beneficial owners of Portfolio shares hold them through accounts at broker-dealers, retirement platforms and other financial market participants over which neither the Portfolio nor the Adviser exercises control. Each of these may in turn rely on service providers to them, which are also subject to the risk of cyber-attacks. Cybersecurity failures or breaches at the Adviser or the Portfolio’s service providers or intermediaries have the ability to cause disruptions and impact business operations, potentially resulting in financial losses, interference with the Portfolio’s ability to calculate its net asset value, impediments to trading, the inability of Portfolio shareowners to effect share purchases, redemptions or exchanges or receive distributions, loss of or unauthorized access to private shareowner information and violations of applicable privacy and other laws, regulatory fines, penalties, reputational damage, or additional compliance costs. Such costs and losses may not be covered under any insurance. In addition, maintaining vigilance against cyber-attacks may involve substantial costs over time, and system enhancements may themselves be subject to cyber-attacks.
COVID-19
The respiratory illness COVID-19 caused by a novel coronavirus has resulted in a global pandemic and major disruption to economies and markets around the world, including the United States. Global financial markets have experienced extreme volatility and severe losses, and trading in many instruments has been disrupted. Liquidity for many instruments has been greatly reduced for periods of time. Some interest rates are very low and in some cases yields are negative. Some sectors of the economy and individual issuers have experienced particularly large losses. These circumstances may continue for an extended period of time, and may continue to affect adversely the value and liquidity of the Portfolio’s investments. The ultimate economic fallout from the pandemic, and the long-term impact on economies, markets, industries and individual issuers, are not known. Governments and central banks, including the Federal Reserve in the U.S., have taken extraordinary and unprecedented actions to support local and global economies and the financial markets. These actions have resulted in significant expansion of public debt, including in the U.S. The impact of these measures, and whether they will be effective to mitigate the economic and market disruption, will not be known for some time. The consequences of high public debt, including its future impact on the economy and securities markets, likewise may not be known for some time.
The Portfolio’s prospectus contains unaudited information regarding the Portfolio’s principal risks. Please refer to that document when considering the Portfolio’s principal risks.
2. Management Agreement
The Adviser manages the Portfolio. Management fees are calculated daily and paid monthly at the annual rate of 0.65% of the Portfolio’s average daily net assets. For the year ended December 31, 2020, the effective management fee was equivalent to 0.65% of the Portfolio’s average daily net assets.
In addition, under the management and administration agreements, certain other services and costs, including accounting, regulatory reporting and insurance premiums, are paid by the Portfolio as administrative reimbursements. Included in “Due to affiliates” reflected on the Statement of Assets and Liabilities is $7,142 in management fees, administrative costs and certain other reimbursements payable to the Adviser at December 31, 2020.
3. Compensation of Trustees and Officers
The Portfolio pays an annual fee to its Trustees. The Adviser reimburses the Portfolio for fees paid to the Interested Trustees. The Portfolio does not pay any salary or other compensation to its officers. For the year ended December 31, 2020, the Portfolio paid $7,187 in Trustees’ compensation, which is reflected on the Statement of Operations as Trustees’ fees. At December 31, 2020, the Portfolio had a payable for Trustees’ fees on its Statement of Assets and Liabilities of $36.
21
| | |
| Pioneer Fund VCT Portfolio | Pioneer Variable Contracts Trust |
| Notes to Financial Statements 12/31/20 (continued) | |
4. Transfer Agent
DST Asset Manager Solutions, Inc. serves as the transfer agent to the Portfolio at negotiated rates. Transfer agent fees and payables shown on the Statement of Operations and the Statement of Assets and Liabilities, respectively, include sub-transfer agent expenses incurred through the Portfolio’s omnibus relationship contracts.
5. Distribution Plan
The Portfolio has adopted a distribution plan (the “Plan”) pursuant to Rule 12b-1 of the Investment Company Act of 1940 with respect to its Class II shares. Pursuant to the Plan, the Portfolio pays the Distributor a distribution fee of 0.25% of the average daily net assets attributable to Class II shares to compensate the Distributor for (1) distribution services and (2) personal and account maintenance services performed and expenses incurred by the Distributor in connection with the Portfolio’s Class II shares. Included in “Due to affiliates” reflected on the Statement of Assets and Liabilities is $371 in distribution fees payable to the Distributor at December 31, 2020.
22
| | |
| Pioneer Fund VCT Portfolio | Pioneer Variable Contracts Trust |
Report of Independent Registered Public Accounting Firm | |
To the Board of Trustees of Pioneer Variable Contracts Trust and the Shareholders of Pioneer Fund VCT Portfolio:
Opinion on the Financial Statements
We have audited the accompanying statement of assets and liabilities of Pioneer Fund VCT Portfolio (the “Portfolio”) (one of the portfolios constituting Pioneer Variable Contracts Trust (the “Trust”)), including the schedule of investments, as of December 31, 2020, and the related statement of operations for the year then ended, the statements of changes in net assets for each of the two years in the period then ended, the financial highlights for each of the four years in the period then ended and the related notes (collectively referred to as the “financial statements”). The financial highlights for the period ended December 31, 2016 were audited by another independent registered public accounting firm whose report, dated February 14, 2017, expressed an unqualified opinion on those financial highlights. In our opinion, the financial statements present fairly, in all material respects, the financial position of the Portfolio (one of the portfolios constituting Pioneer Variable Contracts Trust) at December 31, 2020, the results of its operations for the year then ended, the changes in its net assets for each of the two years in the period then ended, and its financial highlights for each of the four years in the period then ended in conformity with U.S. generally accepted accounting principles.
Basis for Opinion
These financial statements are the responsibility of the Trust’s management. Our responsibility is to express an opinion on the Portfolio’s financial statements based on our audits. We are a public accounting firm registered with the Public Company Accounting Oversight Board (United States) (“PCAOB”) and are required to be independent with respect to the Trust in accordance with the U.S. federal securities laws and the applicable rules and regulations of the Securities and Exchange Commission and the PCAOB.
We conducted our audits in accordance with the standards of the PCAOB. Those standards require that we plan and perform the audit to obtain reasonable assurance about whether the financial statements are free of material misstatement, whether due to error or fraud. The Trust is not required to have, nor were we engaged to perform, an audit of the Trust’s internal control over financial reporting. As part of our audits, we are required to obtain an understanding of internal control over financial reporting, but not for the purpose of expressing an opinion on the effectiveness of the Trust’s internal control over financial reporting. Accordingly, we express no such opinion.
Our audits included performing procedures to assess the risks of material misstatement of the financial statements, whether due to error or fraud, and performing procedures that respond to those risks. Such procedures included examining, on a test basis, evidence regarding the amounts and disclosures in the financial statements. Our procedures included confirmation of securities owned as of December 31, 2020, by correspondence with the custodian and brokers or by other appropriate auditing procedures where replies from brokers were not received. Our audits also included evaluating the accounting principles used and significant estimates made by management, as well as evaluating the overall presentation of the financial statements. We believe that our audits provide a reasonable basis for our opinion.
We have served as the auditor of one or more Amundi Pioneer investment companies since 2017.
Boston, Massachusetts
February 17, 2021
23
| | |
| Pioneer Fund VCT Portfolio | Pioneer Variable Contracts Trust |
Additional Information (Unaudited) | |
For the year ended December 31, 2020, certain dividends paid by the Portfolio may be subject to a maximum tax rate of 20%. The Portfolio intends to designate up to the maximum amount of such dividends allowable, as taxed at a maximum rate of 20%. Complete information will be computed and reported in conjunction with your 2020 Form 1099-DIV.
The qualifying percentage of the Portfolio’s ordinary income dividends for the purpose of the corporate dividends received deduction was 69.77%.
24
| | |
| Pioneer Fund VCT Portfolio | Pioneer Variable Contracts Trust |
Approval of Investment Management Agreement | |
Amundi Pioneer Asset Management, Inc. (“APAM”) serves as the investment adviser to Pioneer Equity Income VCT Portfolio (the “Portfolio”) pursuant to an investment management agreement between APAM and the Portfolio. In order for APAM to remain the investment adviser of the Portfolio, the Trustees of the Portfolio must determine annually whether to renew the investment management agreement for the Portfolio.
The contract review process began in January 2020 as the Trustees of the Portfolio agreed on, among other things, an overall approach and timeline for the process. Contract review materials were provided to the Trustees in March 2020, July 2020 and September 2020. In addition, the Trustees reviewed and discussed the Portfolio’s performance at regularly scheduled meetings throughout the year, and took into account other information related to the Portfolio provided to the Trustees at regularly scheduled meetings, in connection with the review of the Portfolio’s investment management agreement.
In March 2020, the Trustees, among other things, discussed the memorandum provided by Fund counsel that summarized the legal standards and other considerations that are relevant to the Trustees in their deliberations regarding the renewal of the investment management agreement, and reviewed and discussed the qualifications of the investment management teams for the Portfolio, as well as the level of investment by the Portfolio’s portfolio managers in the Portfolio. In July 2020, the Trustees, among other things, reviewed the Portfolio’s management fees and total expense ratios, the financial statements of APAM and its parent companies, profitability analyses provided by APAM, and analyses from APAM as to possible economies of scale. The Trustees also reviewed the profitability of the institutional business of APAM and APAM’s affiliate, Amundi Pioneer Institutional Asset Management, Inc. (“APIAM” and, together with APAM, “Amundi Pioneer”), as compared to that of APAM’s fund management business, and considered the differences between the fees and expenses of the Portfolio and the fees and expenses of APAM’s and APIAM’s institutional accounts, as well as the different services provided by APAM to the Portfolio and by APAM and APIAM to the institutional accounts. The Trustees further considered contract review materials, including additional materials received in response to the Trustees’ request, in September 2020.
At a meeting held on September 15, 2020, based on their evaluation of the information provided by APAM and third parties, the Trustees of the Portfolio, including the Independent Trustees voting separately, unanimously approved the renewal of the investment management agreement for another year. In approving the renewal of the investment management agreement, the Trustees considered various factors that they determined were relevant, including the factors described below. The Trustees did not identify any single factor as the controlling factor in determining to approve the renewal of the agreement.
Nature, Extent and Quality of Services
The Trustees considered the nature, extent and quality of the services that had been provided by APAM to the Portfolio, taking into account the investment objective and strategy of the Portfolio. The Trustees also reviewed APAM’s investment approach for the Portfolio and its research process. The Trustees considered the resources of APAM and the personnel of APAM who provide investment management services to the Portfolio. They also reviewed the amount of non-Portfolio assets managed by the portfolio managers of the Portfolio. They considered the non-investment resources and personnel of APAM that are involved in APAM’s services to the Portfolio, including APAM’s compliance, risk management, and legal resources and personnel. The Trustees noted the substantial attention and high priority given by APAM’s senior management to the Pioneer Fund complex. The Trustees considered the implementation and effectiveness of APAM’s business continuity plan in response to the COVID-19 pandemic.
The Trustees considered that APAM supervises and monitors the performance of the Portfolio’s service providers and provides the Portfolio with personnel (including Portfolio officers) and other resources that are necessary for the Portfolio’s business management and operations. The Trustees also considered that, as administrator, APAM is responsible for the administration of the Portfolio’s business and other affairs. The Trustees considered the fees paid to APAM for the provision of administration services.
Based on these considerations, the Trustees concluded that the nature, extent and quality of services that had been provided by APAM to the Portfolio were satisfactory and consistent with the terms of the investment management agreement.
Performance of the Portfolio
In considering the Portfolio’s performance, the Trustees regularly review and discuss throughout the year data prepared by APAM and information comparing the Portfolio’s performance with the performance of its peer group of funds, as classified by Morningstar, Inc. (Morningstar), and with the performance of the Portfolio’s benchmark index. They also discuss the Portfolio’s performance with APAM on a regular basis. The Trustees’ regular reviews and discussions were factored into the Trustees’ deliberations concerning the renewal of the investment management agreement.
25
| | |
| Pioneer Fund VCT Portfolio | Pioneer Variable Contracts Trust |
| Approval of Investment Management Agreement (continued) | |
Management Fee and Expenses
The Trustees considered information showing the fees and expenses of the Portfolio in comparison to the management fees of its peer group of funds as classified by Morningstar and also to the expense ratios of a peer group of funds selected on the basis of criteria determined by the Independent Trustees for this purpose using data provided by Strategic Insight Mutual Fund Research and Consulting, LLC (Strategic Insight), an independent third party. The peer group comparisons referred to below are organized in quintiles. Each quintile represents one-fifth of the peer group. In all peer group comparisons referred to below, first quintile is most favorable to the Portfolio’s shareowners. The Trustees noted that they separately review and consider the impact of the Portfolio’s transfer agency and Portfolio- and APAM-paid expenses for sub-transfer agency and intermediary arrangements, and that the results of the most recent such review were considered in the consideration of the Portfolio’s expense ratio.
The Trustees considered that the Portfolio’s management fee for the most recent fiscal year was in the fourth quintile relative to the management fees paid by other funds in its Morningstar category for the comparable period. The Trustees considered that the expense ratio of the Portfolio’s Class I shares for the most recent fiscal year was in the fourth quintile relative to its Strategic Insight peer group for the comparable period.
The Trustees reviewed management fees charged by APAM and APIAM to institutional and other clients, including publicly offered European funds sponsored by APAM’s affiliates, unaffiliated U.S. registered investment companies (in a sub-advisory capacity), and unaffiliated foreign and domestic separate accounts. The Trustees also considered APAM’s costs in providing services to the Portfolio and APAM’s and APIAM’s costs in providing services to the other clients and considered the differences in management fees and profit margins for fund and non-fund services. In evaluating the fees associated with APAM’s and APIAM’s client accounts, the Trustees took into account the respective demands, resources and complexity associated with the Portfolio and other client accounts. The Trustees noted that, in some instances, the fee rates for those clients were lower than the management fee for the Portfolio and considered that, under the investment management agreement with the Portfolio, APAM performs additional services for the Portfolio that it does not provide to those other clients or services that are broader in scope, including oversight of the Portfolio’s other service providers and activities related to compliance and the extensive regulatory and tax regimes to which the Portfolio is subject. The Trustees also considered the entrepreneurial risks associated with APAM’s management of the Portfolio.
The Trustees concluded that the management fee payable by the Portfolio to APAM was reasonable in relation to the nature and quality of the services provided by APAM.
Profitability
The Trustees considered information provided by APAM regarding the profitability of APAM with respect to the advisory services provided by APAM to the Portfolio, including the methodology used by APAM in allocating certain of its costs to the management of the Portfolio. The Trustees also considered APAM’s profit margin in connection with the overall operation of the Portfolio. They further reviewed the financial results, including the profit margins, realized by APAM and APIAM from non-fund businesses. The Trustees considered APAM’s profit margins in comparison to the limited industry data available and noted that the profitability of any adviser was affected by numerous factors, including its organizational structure and method for allocating expenses. The Trustees concluded that APAM’s profitability with respect to the management of the Portfolio was not unreasonable.
Economies of Scale
The Trustees considered APAM’s views relating to economies of scale in connection with the Pioneer Funds as fund assets grow and the extent to which any such economies of scale are shared with the Portfolio and Portfolio shareholders. The Trustees recognize that economies of scale are difficult to identify and quantify, and that, among other factors that may be relevant, are the following: fee levels, expense subsidization, investment by APAM in research and analytical capabilities and APAM’s commitment and resource allocation to the Portfolio. The Trustees noted that profitability also may be an indicator of the availability of any economies of scale, although profitability may vary for other reasons including due to reductions in expenses. The Trustees concluded that economies of scale, if any, were being appropriately shared with the Portfolio.
26
| | |
| Pioneer Fund VCT Portfolio | Pioneer Variable Contracts Trust |
Other Benefits
The Trustees considered the other benefits that APAM enjoys from its relationship with the Portfolio. The Trustees considered the character and amount of fees paid or to be paid by the Portfolio, other than under the investment management agreement, for services provided by APAM and its affiliates. The Trustees further considered the revenues and profitability of APAM’s businesses other than the Fund business. To the extent applicable, the Trustees also considered the benefits to the Portfolio and to APAM and its affiliates from the use of “soft” commission dollars generated by the Portfolio to pay for research and brokerage services.
The Trustees considered that Amundi Pioneer is the principal U.S. asset management business of Amundi, which is one of the largest asset managers globally. Amundi’s worldwide asset management business manages over $1.7 trillion in assets (including the Pioneer Funds). The Trustees considered that APAM’s relationship with Amundi creates potential opportunities for APAM, APIAM and Amundi that derive from APAM’s relationships with the Portfolio, including Amundi’s ability to market the services of APAM globally. The Trustees noted that APAM has access to additional research and portfolio management capabilities as a result of its relationship with Amundi and Amundi’s enhanced global presence that may contribute to an increase in the resources available to APAM. The Trustees considered that APAM and the Portfolio receive reciprocal intangible benefits from the relationship, including mutual brand recognition and, for the Portfolio, direct and indirect access to the resources of a large global asset manager. The Trustees concluded that any such benefits received by APAM as a result of its relationship with the Portfolio were reasonable.
Conclusion
After consideration of the factors described above as well as other factors, the Trustees, including the Independent Trustees, concluded that the investment management agreement for the Portfolio, including the fees payable thereunder, was fair and reasonable and voted to approve the proposed renewal of the investment management agreement.
27
| | |
| Pioneer Fund VCT Portfolio | Pioneer Variable Contracts Trust |
Trustees, Officers and Service Providers | |
The Portfolio’s Trustees and officers are listed below, together with their principal occupations and other directorships they have held during at least the past five years. Trustees who are interested persons of the Portfolios within the meaning of the 1940 Act are referred to as Interested Trustees. Trustees who are not interested persons of the Portfolio are referred to as Independent Trustees. Each of the Trustees serves as a Trustee of each of the 45 U.S. registered investment portfolios for which Amundi US serves as investment adviser (the “Pioneer Funds”). The address for all Trustees and all officers of the Portfolios is 60 State Street, Boston, Massachusetts 02109.
| | | | |
| Name, Age and Position | Term of Office and | | Other Directorships |
| Held With the Trust | Length of Service | Principal Occupation | Held by Trustee |
| Independent Trustees: | |
| Thomas J. Perna (70) | Trustee since 2006. Serves until a | Private investor (2004 – 2008 and | Director, Broadridge Financial |
Chairman of the Board | successor trustee is elected or | 2013 – present); Chairman (2008 – 2013) | Solutions, Inc. (investor |
and Trustee | earlier retirement or removal. | and Chief Executive Officer (2008 – 2012), | communications and securities |
| | Quadriserv, Inc. (technology products for | processing provider for financial |
| | securities lending industry); and Senior | services industry) (2009 – present); |
| | Executive Vice President, The Bank of New York | Director, Quadriserv, Inc. (2005 – |
| | (financial and securities services) (1986 – 2004) | 2013); and Commissioner, New Jersey |
| | | State Civil Service Commission |
| | | (2011 – 2015) |
| John E. Baumgardner, Jr. (69) | Trustee since 2019. Serves until a | Of Counsel (2019 – present), Partner | Chairman, The Lakeville Journal |
Trustee | successor trustee is elected or | (1983-2018), Sullivan & Cromwell LLP | Company, LLC, (privately-held |
| earlier retirement or removal. | (law firm). | community newspaper group) (2015- |
| | | present) |
| Diane Durnin (63) | Trustee since 2019. Serves until a | Managing Director - Head of Product Strategy | None |
Trustee | successor trustee is elected or | and Development, BNY Mellon Investment | |
| earlier retirement or removal. | Management (investment management firm) | |
| | (2012-2018); Vice Chairman – The Dreyfus | |
| | Corporation (2005 – 2018): Executive Vice | |
| | President Head of Product, BNY Mellon | |
| | Investment Management (2007-2012); Executive | |
| | Director- Product Strategy, Mellon Asset | |
| | Management (2005-2007); Executive Vice | |
| | President Head of Products, Marketing and | |
| | Client Service, Dreyfus Corporation (investment | |
| | management firm) (2000-2005); and Senior Vice | |
| | President – Strategic Product and Business | |
| | Development, Dreyfus Corporation (1994-2000) | |
| Benjamin M. Friedman (76) | Trustee since 2008. Serves until a | William Joseph Maier Professor of Political | Trustee, Mellon Institutional Funds |
Trustee | successor trustee is elected or | Economy, Harvard University (1972 – present) | Investment Trust and Mellon |
| earlier retirement or removal. | | Institutional Funds Master Portfolio |
| | | (oversaw 17 portfolios in fund |
| | | complex) (1989 - 2008) |
| Lorraine H. Monchak (64) | Trustee since 2017. (Advisory | Chief Investment Officer, 1199 SEIU Funds | None |
Trustee | Trustee from 2014 - 2017). Serves | (healthcare workers union pension funds) | |
| until a successor trustee is elected | (2001 – present); Vice President – International | |
| or earlier retirement or removal. | Investments Group, American International | |
| | Group, Inc. (insurance company) (1993 – 2001); | |
| | Vice President – Corporate Finance and Treasury | |
| | Group, Citibank, N.A. (1980 – 1986 and | |
| | 1990 – 1993); Vice President – Asset/Liability | |
| | Management Group, Federal Farm Funding | |
| | Corporation (government-sponsored issuer of | |
| | debt securities) (1988 – 1990); Mortgage | |
| | Strategies Group, Shearson Lehman Hutton, Inc. | |
| | (investment bank) (1987 – 1988); and Mortgage | |
| | Strategies Group, Drexel Burnham Lambert, Ltd. | |
| | (investment bank) (1986 – 1987) | |
28
| | |
| Pioneer Fund VCT Portfolio | Pioneer Variable Contracts Trust |
| | | | |
| Name, Age and Position | Term of Office and | | Other Directorships |
| Held With the Trust | Length of Service | Principal Occupation | Held by Trustee |
Independent Trustees: (continued) | |
| Marguerite A. Piret (72) | Trustee since 1995. Serves until a | Chief Financial Officer, American Ag Energy, | Director of New America High Income |
Trustee | successor trustee is elected or | Inc. (controlled environment and agriculture | Fund, Inc. (closed-end investment |
| earlier retirement or removal. | company) (2016 – present); and President and | company) (2004 – present); and |
| | Chief Executive Officer, Metric Financial Inc. | Member, Board of Governors, |
| | (formerly known as Newbury Piret Company) | Investment Company Institute |
| | (investment banking firm) (1981 – 2019) | (2000 – 2006) |
| Fred J. Ricciardi (73) | Trustee since 2014. Serves until a | Private investor (2020 – present); Consultant | None |
Trustee | successor trustee is elected or | (investment company services) (2012 – 2020); | |
| earlier retirement or removal. | Executive Vice President, BNY Mellon (financial | |
| | and investment company services) (1969 – 2012); | |
| | Director, BNY International Financing Corp. | |
| | (financial services) (2002 – 2012); Director, | |
| | Mellon Overseas Investment Corp. (financial | |
| | services) (2009 – 2012); Director, Financial | |
| | Models (technology) (2005-2007); Director, BNY | |
| | Hamilton Funds, Ireland (offshore investment | |
| | companies) (2004-2007); Chairman/Director, | |
| | AIB/BNY Securities Services, Ltd., Ireland | |
| | (financial services) (1999-2006); and Chairman, | |
| | BNY Alternative Investment Services, Inc. | |
| | (financial services) (2005-2007) | |
Interested Trustees:
| |
| Lisa M. Jones (58)* | Trustee since 2017. Serves until a | Director, CEO and President of Amundi US, Inc. | None |
Trustee, President and | successor trustee is elected or | (investment management firm) (since | |
Chief Executive Officer | earlier retirement or removal | September 2014); Director, CEO and President | |
| | of Amundi Asset Management US, Inc. (since | |
| | September 2014); Director, CEO and President of | |
| | Amundi Distributor US, Inc. (since September | |
| | 2014); Director, CEO and President of Amundi | |
| | Asset Management US, Inc. (since September | |
| | 2014); Chair, Amundi US, Inc., Amundi Distributor | |
| | US, Inc. and Amundi Asset Management US, Inc. | |
| | (September 2014 – 2018); Managing Director, | |
| | Morgan Stanley Investment Management | |
| | (investment management firm) (2010 – 2013); | |
| | Director of Institutional Business, CEO of | |
| | International, Eaton Vance Management | |
| | (investment management firm) (2005 – 2010); | |
| | and Director of Amundi Holdings US, Inc. | |
| | (since 2017) | |
| Kenneth J. Taubes (62)* | Trustee since 2014. Serves until a | Director and Executive Vice President | None |
Trustee | successor trustee is elected or | (since 2008) and Chief Investment Officer, U.S. | |
| earlier retirement or removal | (since 2010) of Amundi US, Inc. (investment | |
| | management firm); Director and Executive Vice | |
| | President and Chief Investment Officer, U.S. of | |
| | Amundi US (since 2008); Executive Vice | |
| | President and Chief Investment Officer, U.S. of | |
| | Amundi Asset Management US, Inc. (since 2009); | |
| | Portfolio Manager of Amundi US (since 1999); | |
| | and Director of Amundi Holdings US, Inc. | |
| | (since 2017) | |
* | Ms. Jones and Mr. Taubes are Interested Trustees because they are officers or directors of the Portfolio’s investment adviser and certain of its affiliates. |
29
| | |
| Pioneer Fund VCT Portfolio | Pioneer Variable Contracts Trust |
| Trustees, Officers and Service Providers (continued) | |
| | | | |
| Name , Age and Position | Term of Office and | | Other Directorships |
| Held With the Trust | Length of Service | Principal Occupation | Held by Officer |
| Fund Officers: | | |
| Christopher J. Kelley (56) | Since 2003. Serves at the | Vice President and Associate General Counsel | None |
Secretary and Chief | discretion of the Board | of Amundi US since January 2008; Secretary and | |
Legal Officer | | Chief Legal Officer of all of the Pioneer Funds | |
| | since June 2010; Assistant Secretary of all of the | |
| | Pioneer Funds from September 2003 to | |
| | May 2010; Vice President and Senior Counsel of | |
| | Amundi US from July 2002 to December 2007 | |
| Carol B. Hannigan (59) | Since 2010. Serves at the | Fund Governance Director of Amundi US since | None |
Assistant Secretary | discretion of the Board | December 2006 and Assistant Secretary of all | |
| | the Pioneer Funds since June 2010; Manager – | |
| | Fund Governance of Amundi US from | |
| | December 2003 to November 2006; and Senior | |
| | Paralegal of Amundi US from January 2000 to | |
| | November 2003 | |
| Thomas Reyes (58) | Since 2010. Serves at the | Assistant General Counsel of Amundi US since | None |
Assistant Secretary | discretion of the Board | May 2013 and Assistant Secretary of all the | |
| | Pioneer Funds since June 2010; and Counsel of | |
| | Amundi US from June 2007 to May 2013 | |
| Mark E. Bradley (61) | Since 2008. Serves at the | Vice President – Fund Treasury of Amundi US; | None |
Treasurer and Chief Financial | discretion of the Board | Treasurer of all of the Pioneer Funds since | |
and Accounting Officer | | March 2008; Deputy Treasurer of Amundi US | |
| | from March 2004 to February 2008; and Assistant | |
| | Treasurer of all of the Pioneer Funds from | |
| | March 2004 to February 2008 | |
| Anthony J. Koenig, Jr. (57) | Since 2021. Serves at the | Senior Vice President – Fund Treasury of | None |
Assistant Treasurer | discretion of the Board | Amundi US; Assistant Treasurer of all of the | |
| | Pioneer Funds since January 2021; and Chief of | |
| | Staff, US Investment Management of Amundi US | |
| | from May 2008 to January 2021 | |
| Luis I. Presutti (55) | Since 2000. Serves at the | Director – Fund Treasury of Amundi US since | None |
Assistant Treasurer | discretion of the Board | 1999; and Assistant Treasurer of all of the | |
| | Pioneer Funds since 1999 | |
| Gary Sullivan (62) | Since 2002. Serves at the | Senior Manager – Fund Treasury of Amundi US | None |
Assistant Treasurer | discretion of the Board | since 2012; and Assistant Treasurer of all of the | |
| | Pioneer Funds since 2002 | |
| Antonio Furtado (38) | Since 2020. Serves at the | Fund Oversight Manager – Fund Treasury of | None |
Assistant Treasurer | discretion of the Board | Amundi US since 2020; Assistant Treasurer of all | |
| | of the Pioneer Funds since 2020; and Senior Fund | |
| | Treasury Analyst from 2012 - 2020 | |
| John Malone (50) | Since 2018. Serves at the | Managing Director, Chief Compliance Officer of | None |
Chief Compliance Officer | discretion of the Board | Amundi US Asset Management; Amundi Asset | |
| | Management US, Inc.; and the Pioneer Funds | |
| | since September 2018; and Chief Compliance | |
| | Officer of Amundi Distributor US, Inc. since | |
| | January 2014. | |
| Kelly O’Donnell (49) | Since 2006. Serves at the | Vice President – Amundi Asset Management; | None |
Anti-Money | discretion of the Board | and Anti-Money Laundering Officer of all the | |
Laundering Officer | | Pioneer Funds since 2006 | |
30
This page was intentionally left blank.
31
This page was intentionally left blank.
32
This page was intentionally left blank.
33
This page was intentionally left blank.
34
This page was intentionally left blank.
35
This page was intentionally left blank.
36
This page was intentionally left blank.
37
Proxy Voting Policies and Procedures of the Portfolio are available without charge, upon request, by calling our toll free number (1-800-225-6292). Information regarding how the Portfolio voted proxies relating to Portfolio securities during the most recent 12-month period ended June 30 is publicly available to shareowners at www.amundi.com/us. This information is also available on the Securities and Exchange Commission’s web site at www.sec.gov.
18649-15-0221
Pioneer Variable Contracts Trust
Pioneer Real Estate Shares
VCT Portfolio
Class I and II SharesAnnual Report | December 31, 2020
Paper copies of the Portfolio’s shareholder reports may no longer be sent by mail, unless you specifically request paper copies of the reports from the insurance company that offers your variable annuity or variable life insurance contract, or from your financial intermediary. Instead, the insurance company may choose to make the reports available on a website, and will notify you by mail each time a shareholder report is posted and provide you with a website link to access the report. Instructions for requesting paper copies will be provided by your insurance company.
You may elect to receive all future Portfolio shareholder reports in paper form, free of charge, from the insurance company. You can inform the insurance company or your financial intermediary that you wish to continue receiving paper copies of your shareholder reports by following the instructions provided by the insurance company, or by contacting your financial intermediary. Your election to receive reports in paper form will apply to all portfolios available under your contract with the insurance company.
Please refer to your contract prospectus to determine the applicable share class offered under your contract.
Pioneer Variable Contracts Trust
| | |
| |
| Pioneer Real Estate VCT Portfolio | |
| | |
| |
| | |
| |
| | |
| |
| | |
| |
| | |
| |
| | |
| |
| | |
| |
| | |
| |
| | |
| |
This report is authorized for distribution only when preceded or accompanied by a prospectus for the Portfolio being offered.
Pioneer Variable Contracts Trust files a complete schedule of portfolio holdings with the Securities and Exchange Commission for the first and third quarters of each fiscal year as an exhibit to its reports on Form N-PORT. Shareholders may view the filed Form N-PORT by visiting the Commission’s web site at https://www.sec.gov.
| | |
| Pioneer Real Estate VCT Portfolio | Pioneer Variable Contracts Trust |
Portfolio Update 12/31/20 | |
Sector Distribution
(As a percentage of total investments)*
5 Largest Holdings
(As a percentage of total investments)*
| | | |
| 1. | Prologis, Inc. | 8.11% |
| 2. | Equinix, Inc. | 8.04 |
| 3. | Hannon Armstrong Sustainable | |
| Infrastructure Capital, Inc. | 5.93 |
| 4. | Sun Communities, Inc. | 5.20 |
| 5. | Innovative Industrial | |
| Properties, Inc. | 3.81 |
* | Excludes temporary cash investments and all derivative contracts except for options purchased. The Portfolio is actively managed, and current holdings may be different. The holdings listed should not be considered recommendations to buy or sell any securities. |
Performance Update 12/31/20
Prices and Distributions| | | | |
| Net Asset Value per Share | | 12/31/20 | 12/31/19 |
| Class I | | $7.63 | $11.35 |
| Class II | | $7.67 | $11.40 |
|
| Net | | | |
| Distributions per Share | Investment | Short-Term | Long-Term | Tax Return |
| (1/1/20 – 12/31/20) | Income | Capital Gains | Capital Gains | of Capital |
| Class I | $0.0623 | $0.0100 | $2.4666 | $0.0861 |
| Class II | $0.0476 | $0.0100 | $2.4666 | $0.0861 |
Performance of a $10,000 InvestmentThe following chart shows the change in value of an investment made in Class I and Class II shares of Pioneer Real Estate Shares VCT Portfolio at net asset value during the periods shown, compared to that of the Morgan Stanley Capital International (MSCI) US REIT Index. Portfolio returns are based on net asset value and do not reflect applicable insurance fees and surrender charges.
Average Annual Total Returns
(As of December 31, 2020)| | | | |
| | | MSCI US |
| Class I | Class II | REIT Index |
10 Years | 8.01% | 7.74% | 8.30% |
5 Years | 3.87% | 3.61% | 4.84% |
1 Year | -7.34% | -7.62% | -7.57% |
All total returns shown assume reinvestment of distributions at net asset value.
The performance table does not reflect the deduction of taxes that a shareowner would pay on distributions or the redemption of Amundi shares.
Effective January 1, 2018, the Adviser became directly responsible for portfolio management of the Portfolio. The performance shown for periods prior to January 1, 2018 reflects the investment strategies employed during those periods.
Call 1-800-688-9915 or visit www.amundi.com/us for the most recent month-end performance results. Current performance may be lower or higher than the performance data quoted.
The performance data quoted represents past performance, which is no guarantee of future results. Investment return and principal value will fluctuate, and shares, when redeemed, may be worth more or less than their original cost.
The returns for the Portfolio do not reflect the deduction of expenses associated with variable products, such as mortality and expense risk charges, separate account charges, and sales charges. These expenses would reduce the overall returns shown.
Performance results reflect any applicable expense waivers in effect during the periods shown. Without such waivers, performance would be lower. Waivers may not be in effect for all portfolios. Certain fee waivers are contractual through a specified period. Otherwise, fee waivers can be rescinded at any time. See the prospectus and financial statements for more information.
2
| | |
| Pioneer Real Estate VCT Portfolio | Pioneer Variable Contracts Trust |
Comparing Ongoing Portfolio Expenses | |
As a shareowner in the Portfolio, you incur two types of costs:
(1) | ongoing costs, including management fees, distribution and/or service (12b-1) fees, and other Portfolio expenses; and |
(2) | transaction costs, including sales charges (loads) on purchase payments. |
This example is intended to help you understand your ongoing expenses (in dollars) of investing in the Portfolio and to compare these costs with the ongoing costs of investing in other mutual funds offered through your variable annuity contract. The example is based on an investment of $1,000 at the beginning of the Portfolio’s latest six-month period and held throughout the six months.
Using the Tables
Actual Expenses
The first table below provides information about actual account values and actual expenses. You may use the information in this table, together with the amount you invested, to estimate the expenses that you paid over the period as follows:
1. | Divide your account value by $1,000 |
| Example: an $8,600 account value ÷ $1,000 = 8.6 |
2. | Multiply the result in (1) above by the corresponding share class’s number in the third row under the heading entitled “Expenses Paid During Period” to estimate the expenses you paid on your account during this period. |
Expenses Paid on a $1,000 Investment in Pioneer Real Estate Shares VCT Portfolio
Based on actual returns from July 1, 2020 through December 31, 2020.
| | | | | | | |
| Share Class | | | I |
| | II | |
| Beginning Account Value on 7/1/20 | | $ | 1,000.00 | | | $ | 1,000.00 | |
| Ending Account Value on 12/31/20 | | $ | 1,139.45 | | | $ | 1,137.82 | |
| Expenses Paid During Period* | | $ | 7.85 | | | $ | 9.19 | |
* | Expenses are equal to the Portfolio’s annualized expense ratio of 1.46% and 1.71%, for Class I and Class II shares, respectively, multiplied by the average account value over the period, multiplied by 184/366 (to reflect the one-half year period). |
Hypothetical Example for Comparison Purposes
The table below provides information about hypothetical account values and hypothetical expenses based on the Portfolio’s actual expense ratio and an assumed rate of return of 5% per year before expenses, which is not the Portfolio’s actual return. The hypothetical account values and expenses may not be used to estimate the actual ending account balance or expenses you paid for the period.
You may use this information to compare the ongoing costs of investing in the Portfolio and other variable annuities. To do so, compare this 5% hypothetical example with the 5% hypothetical examples that appear in the shareholder reports of the other variable annuities.
Please note that the expenses shown in the tables are meant to highlight your ongoing costs only and do not reflect any transaction costs, such as sales charges (loads) that are charged at the time of the transaction. Therefore, the table below is useful in comparing ongoing costs only and will not help you determine the relative total costs of owning different variable annuities. In addition, if these transaction costs were included, your costs would have been higher.
Expenses Paid on a $1,000 Investment in Pioneer Real Estate Shares VCT Portfolio
Based on a hypothetical 5% per year return before expenses, reflecting the period from July 1, 2020 through December 31, 2020.
| | | | | | | |
| Share Class | | | I |
| | II | |
| Beginning Account Value on 7/1/20 | | $ | 1,000.00 | | | $ | 1,000.00 | |
| Ending Account Value on 12/31/20 | | $ | 1,017.80 | | | $ | 1,016.54 | |
| Expenses Paid During Period* | | $ | 7.41 | | | $ | 8.67 | |
* | Expenses are equal to the Portfolio’s annualized expense ratio of 1.46% and 1.71%, for Class I and Class II shares, respectively, multiplied by the average account value over the period, multiplied by 184/366 (to reflect the one-half year period). |
3
| | |
| Pioneer Real Estate VCT Portfolio | Pioneer Variable Contracts Trust |
Portfolio Management Discussion 12/31/20 | |
Call 1-800-688-9915 or visit www.amundi.com/us for the most recent month-end performance results. Current performance may be lower or higher than the performance data quoted.
The performance data quoted represents past performance, which is no guarantee of future results. Investment return and principal value will fluctuate, and shares, when redeemed, may be worth more or less than their original cost.
The returns for the Portfolio do not reflect the deduction of expenses associated with variable products, such as mortality and expense risk charges, separate account charges, and sales charges. These expenses would reduce the overall returns shown.
Performance results reflect any applicable expense waivers in effect during the periods shown. Without such waivers performance would be lower. Waivers may not be in effect for all portfolios. Certain fee waivers are contractual through a specified period. Otherwise, fee waivers can be rescinded at any time. See the prospectus and financial statements for more information.
In the following interview, Raymond Haddad discusses the market environment for real estate investment trusts (REITs) and other real estate-related investments and the factors that influenced the performance of Pioneer Real Estate Shares VCT Portfolio during the 12-month reporting period ended December 31, 2020. Mr. Haddad, a vice president and portfolio manager at Amundi Asset Management US, Inc. (Amundi US), is responsible for the day-to-day management of the Portfolio.
Q: How did the Portfolio perform during the 12-month period ended December 31, 2020?
A: Pioneer Real Estate Shares VCT Portfolio’s Class I shares returned -7.34% at net asset value during the 12-month period ended December 31, 2020, and Class II shares returned -7.62%, while the Portfolio’s benchmark, the Morgan Stanley Capital International (MSCI) US Real Estate Investment Trust (REIT) Index1, returned -7.57%.
Q: How would you describe the market environment for REIT investors during the 12-month period ended December 31, 2020?
A: The 12-month reporting period was quite volatile, marked by historic swings in market performance within and across asset classes. With the COVID-19 situation raising concerns about the resilience of the commercial real estate market practically overnight during the spring of 2020, REITs that had flourished prior to the pandemic declined in value in the first and third quarters of the calendar year, along with other riskier assets. The REIT asset class rallied in the second and fourth quarters of 2020, but not as much as other equity sectors. As a result, REITs underperformed the broader equity markets and finished in negative territory for the full 12-month period.
Q: Which investments detracted from the Portfolio’s benchmark-relative performance during the 12-month period ended December 31, 2020?
A: Sector allocation decisions within residential and health care REITs detracted from the Portfolio’s benchmark-relative results for the 12-month period. With regard to residential REITs, our decision to overweight the Portfolio to manufactured housing and take an underweight position in coastal apartment REITs (relative to the MSCI US REIT Index) weighed on relative performance. In 2020, manufactured housing, which is a secular play based on housing affordability concerns and supply constraints in the US, underperformed the traditional apartment-building rental market, a segment that generated solid returns for the 12-month period.
1 The MSCI information may only be used for your internal use, may not be reproduced or re-disseminated in any form and may not be used as a basis for or a component of any financial instruments or products or indices. None of the MSCI information is intended to constitute investment advice or a recommendation to make (or refrain from making) any kind of investment decision and may not be relied on as such. Historical data and analysis should not be taken as an indication or guarantee of any future performance analysis, forecast or prediction. The MSCI information is provided on an “as is” basis and the user of this information assumes the entire risk of any use made of this information. MSCI, each of its affiliates and each other person involved in or related to compiling, computing or creating any MSCI information (collectively, the “MSCI Parties”) expressly disclaims all warranties (including, without limitation, any warranties of originality, accuracy, completeness, timeliness, non-infringement, merchantability and fitness for a particular purpose) with respect to this information. Without limiting any of the foregoing, in no event shall any MSCI Party have any liability for any direct, indirect, special, incidental, punitive, consequential (including, without limitation, lost profits) or any other damages.
4
| | |
| Pioneer Real Estate VCT Portfolio | Pioneer Variable Contracts Trust |
In health care, our decision to be more defensive and overweight the Portfolio to medical office buildings, while underweighting nursing homes, detracted from benchmark-relative performance over the 12-month period. During the pandemic, nursing homes have faced challenges that have led to weak rental pricing, lower admission rates, and an oversupply of new facilities. During the sharp market sell-off in the first quarter of 2020, our strategy was beneficial. However, with the government stimulus packages passed during mid-2020 came dollars earmarked for nursing homes. As a result, investors bid up the prices of those REITs during the rallies in the second and fourth quarters. Due to that development, the Portfolio’s lower-than-benchmark exposure to nursing homes ended up as a headwind for relative returns over the full 12-month period.
The two positions that detracted the most from the Portfolio’s benchmark-relative performance during the 12-month period were Digital Realty Trust and Gaming & Leisure Properties. Digital Realty Trust is a data-center REIT. The sector in general performed well during the year due to the work-from-home environment caused by the pandemic, and Digital Realty initially rode that wave. However, the stock price pulled back over the final months of the year as investors’ appetites began shifting towards value stocks in the more cyclical sectors. Gaming & Leisure Properties, not surprisingly, was hard-hit by the pandemic-related shutdowns and/or capacity limitations applied to businesses where consumers have tended to spend discretionary income, such as resorts and casinos.
Q: Which investments aided the Portfolio’s benchmark-relative performance during the 12-month period ended December 31, 2020?
A: Positive benchmark-relative performance during the period derived from security selection results. At the individual security level, the Portfolio’s largest positive performance contributors were not components of the MSCI US REIT Index. A position in Hannon Armstrong Sustainable Infrastructure (HASI) was the top individual performer for the Portfolio during the 12-month period. HASI is a mortgage REIT dedicated to investments in climate change solutions and infrastructure. We have viewed HASI as a “defensive” play within REITs, as the company has continued to benefit from the secular trends of alternative energy and climate change-related investments. We eventually reduced the Portfolio’s position to pursue other opportunities that we believed offered better value.
Another strong positive contributor to the Portfolio’s benchmark-relative returns for the 12-month period was a position in Innovative Industrial Properties (IIPR), one of the largest medicinal cannabis warehouse owners in the US. Due to the nature of warehouse operators’ businesses, access to capital through traditional banking channels has not been widely accessible to them. Enter IIPR, which provides capital in the form of purchasing warehouses from customers, and then leasing those warehouses back to them in a lease-buyback arrangement. Continued limited access to capital for cannabis warehouse operators, coupled with a fast-growing end-demand
5
| | |
| Pioneer Real Estate VCT Portfolio | Pioneer Variable Contracts Trust |
| Portfolio Management Discussion 12/31/20 (continued) | |
A Word About Risk:
All investments are subject to risk, including the possible loss of principal. In the past several years, financial markets have experienced increased volatility and heightened uncertainty. The market prices of securities may go up or down, sometimes rapidly or unpredictably, due to general market conditions, such as real or perceived adverse economic, political, or regulatory conditions, recessions, inflation, changes in interest or currency rates, lack of liquidity in the bond markets, the spread of infectious illness or other public health issues or adverse investor sentiment. These conditions may continue, recur, worsen or spread.
The Portfolio invests in REIT securities, the value of which can fall for a variety of reasons, such as declines in rental income, fluctuating interest rates, poor property management, environmental liabilities, uninsured damage, increased competition, or changes in real estate tax laws.
The Portfolio invests in a limited number of securities and, as a result, the Portfolio’s performance may be more volatile than the performance of other portfolios holding more securities.
Investing in foreign and/or emerging markets securities involves risks relating to interest rates, currency exchange rates, economic, and political conditions.
When interest rates rise, the prices of fixed-income securities in the Portfolio will generally fall. Conversely, when interest rates fall, the prices of fixed-income securities in the Portfolio will generally rise.
At times, the Portfolio’s investments may represent industries or industry sectors that are interrelated or have common risks, making the Portfolio more susceptible to any economic, political, or regulatory developments or other risks affecting those industries and sectors.
These risks may increase share price volatility.
market, has allowed IIPR to increase its footprint and earnings. IIPR also has applied its business model to other growing industries, including solar and wind within the renewable energy segment.
Q: Did the Portfolio have exposure to any derivative securities during the 12-month period ended December 31, 2020?
A: No, the Portfolio had no exposure to derivative investments during the 12-month period.
Q: What is your view of the REIT market as 2021 begins, and how have you positioned the Portfolio?
A: The availability of COVID-19 vaccines has, in our view, significantly reduced the downside risk of a prolonged economic lockdown and social-distancing measures. In addition, President Biden and the new Congress have committed to passing a $1.9 trillion stimulus plan to support individuals, businesses, and state and local governments, while expanding and expediting COVID-19 relief efforts. We believe those developments could help the US economy recover faster and ease the negative sentiment within the REIT sector toward property types that have struggled during the pandemic.
During the fourth quarter of 2020, we increased the Portfolio’s exposure to economically sensitive, cyclical subsectors that we believe could perform well as the US economy moves toward fully reopening in 2021. As part of the strategy, we moved the Portfolio to overweight positions (relative to the benchmark) in smaller-cap retail REITs and hotels. We also added select positions in nursing homes to the Portfolio.
As always, we will continue to seek out what we believe are high-quality REIT companies with resilient business models, strong balance sheets, ample liquidity, and will strive to avoid investing in situations where we believe the market has overestimated a company’s future growth potential.
Please refer to the Schedule of Investments on pages 7 to 9 for a full listing of Portfolio securities.
Past performance is no guarantee of future results.
Any information in this shareholder report regarding market or economic trends or the factors influencing the Portfolio’s historical or future performance are statements of opinion as of the date of this report.
6
| | |
| Pioneer Real Estate VCT Portfolio | Pioneer Variable Contracts Trust |
Schedule of Investments 12/31/20 | |
| | | | |
| Shares | | | Value |
| | UNAFFILIATED ISSUERS – 97.9% | |
| | COMMON STOCKS – 97.9% of Net Assets | |
| | Diversified Consumer Services – 0.7% | |
| 5,095 | | Carriage Services, Inc. | $ 159,575 |
| | Total Diversified Consumer Services | $ 159,575 |
| | Equity Real Estate Investment Trusts (REITs) – 0.5% | |
| 7,294 | | RLJ Lodging Trust | $ 103,210 |
| | Total Equity Real Estate Investment Trusts (REITs) | $ 103,210 |
| | Equity Real Estate Investment Trusts (REITs) – 92.8% | |
| 3,982 | | Agree Realty Corp. | $ 265,122 |
| 4,540 | | Alexandria Real Estate Equities, Inc. | 809,119 |
| 5,503 | | American Campus Communities, Inc. | 235,363 |
| 14,462 | | American Homes 4 Rent | 433,860 |
| 12,024 | | Brixmor Property Group, Inc. | 198,997 |
| 3,443 | | Camden Property Trust | 344,025 |
| 14,838 | | Cedar Realty Trust, Inc. | 150,309 |
| 8,114 | | Chatham Lodging Trust | 87,631 |
| 10,184 | | Cousins Properties, Inc. | 341,164 |
| 7,347 | | Douglas Emmett, Inc. | 214,385 |
| 4,069 | | EastGroup Properties, Inc. | 561,766 |
| 2,467 | | Equinix, Inc. | 1,761,882 |
| 6,291 | | Equity LifeStyle Properties, Inc. | 398,598 |
| 6,460 | | Essential Properties Realty Trust, Inc. | 136,952 |
| 4,374 | | Extra Space Storage, Inc. | 506,772 |
| 11,028 | | Four Corners Property Trust, Inc. | 328,304 |
| 8,048 | | Gaming & Leisure Properties, Inc. | 341,235 |
| 10,704 | | Global Medical REIT, Inc. | 139,794 |
| 20,501 | | Hannon Armstrong Sustainable Infrastructure Capital, Inc. | 1,300,378 |
| 12,156 | | Healthpeak Properties, Inc. | 367,476 |
| 3,078 | | Highwoods Properties, Inc. | 121,981 |
| 10,662 | | Independence Realty Trust, Inc. | 143,191 |
| 4,557 | | Innovative Industrial Properties, Inc. | 834,523 |
| 778(a) | | Jones Lang LaSalle, Inc. | 115,432 |
| 11,748 | | Kimco Realty Corp. | 176,338 |
| 1,436 | | Lamar Advertising Co. | 119,504 |
| 1,087 | | Life Storage, Inc. | 129,777 |
| 19,888 | | Macerich Co. | 212,205 |
| 22,963 | | Medical Properties Trust, Inc. | 500,364 |
| 7,811 | | MGM Growth Properties LLC | 244,484 |
| 2,708 | | Mid-America Apartment Communities, Inc. | 343,077 |
| 2,154 | | National Health Investors, Inc. | 148,992 |
| 18,277 | | National Storage Affiliates Trust | 658,520 |
| 15,124 | | New Senior Investment Group, Inc. | 78,342 |
| 9,901 | | Omega Healthcare Investors, Inc. | 359,604 |
| 18,838 | | Park Hotels & Resorts, Inc. | 323,072 |
| 6,285 | | Pebblebrook Hotel Trust | 118,158 |
| 17,841 | | Prologis, Inc. | 1,778,034 |
| 28,623 | | Retail Properties of America, Inc. | 245,013 |
| 8,906 | | Rexford Industrial Realty, Inc. | 437,374 |
| 4,129 | | Ryman Hospitality Properties, Inc. | 279,781 |
| 16,136 | | Sabra Health Care Real Estate Investment Trust, Inc. | 280,282 |
The accompanying notes are an integral part of these financial statements.
7
| | |
| Pioneer Real Estate VCT Portfolio | Pioneer Variable Contracts Trust |
| Schedule of Investments 12/31/20 (continued) | |
| | | | |
| Shares | | | Value |
| | Equity Real Estate Investment Trusts (REITs) – (continued) | |
| 9,817 | | Safehold, Inc. | $ 711,634 |
| 10,878 | | SITE Centers Corp. | 110,085 |
| 9,870 | | STORE Capital Corp. | 335,383 |
| 7,500 | | Sun Communities, Inc. | 1,139,625 |
| 13,506 | | Tanger Factory Outlet Centers, Inc. | 134,520 |
| 5,848 | | Terreno Realty Corp. | 342,167 |
| 15,245 | | UDR, Inc. | 585,865 |
| 5,557 | | Ventas, Inc. | 272,515 |
| 17,597 | | VICI Properties, Inc. | 448,724 |
| 8,757 | | Xenia Hotels & Resorts, Inc. | 133,106 |
| | Total Equity Real Estate Investment Trusts (REITs) | $20,784,804 |
| | Hotels, Restaurants & Leisure – 0.3% | |
| 1,849 | | BJ’s Restaurants, Inc. | $ 71,168 |
| | Total Hotels, Restaurants & Leisure | $ 71,168 |
| | Interactive Media & Services – 0.6% | |
| 1,011(a) | | Zillow Group, Inc., Class C | $ 131,228 |
| | Total Interactive Media & Services | $ 131,228 |
| | Real Estate Management & Development – 1.3% | |
| 6,041(a) | | Cushman & Wakefield Plc | $ 89,588 |
| 12,219 | | Newmark Group, Inc. | 89,076 |
| 8,940(a) | | Realogy Holdings Corp. | 117,293 |
| | Total Real Estate Management & Development | $ 295,957 |
| | Specialty Retail – 1.7% | |
| 6,074 | | American Eagle Outfitters, Inc. | $ 121,905 |
| 2,671 | | L Brands, Inc. | 99,335 |
| 6,172(a) | | Urban Outfitters, Inc. | 158,003 |
| | Total Specialty Retail | $ 379,243 |
| | TOTAL COMMON STOCKS | |
| | (Cost $16,399,557) | $21,925,185 |
| | TOTAL INVESTMENTS IN UNAFFILIATED ISSUERS – 97.9% | |
| | (Cost $ 16,399,557) | $21,925,185 |
| | OTHER ASSETS AND LIABILITIES – 2.1% | $ 481,597 |
| | NET ASSETS – 100.0% | $22,406,782 |
| | |
REIT | Real Estate Investment Trust. |
(a) | Non-income producing security. |
Purchases and sales of securities (excluding temporary cash investments) for the year ended December 31, 2020, aggregated $34,320,950 and $36,918,500, respectively.
The Portfolio is permitted to engage in purchase and sale transactions (“cross trades”) with certain funds and accounts for which Amundi Asset Management US, Inc. (the “Adviser”) serves as the Portfolio’s investment adviser, as set forth in Rule 17a-7 under the Investment Company Act of 1940, pursuant to procedures adopted by the Board of Trustees. Under these procedures, cross trades are effected at current market prices. During the year ended December 31, 2020, the Portfolio did not engage in any cross trade activity.
At December 31, 2020, the net unrealized appreciation on investments based on cost for federal tax purposes of $16,478,825 was as follows:
| | | | |
| Aggregate gross unrealized appreciation for all investments in which there is an excess of value over tax cost | | $ | 5,552,814 | |
| Aggregate gross unrealized depreciation for all investments in which there is an excess of tax cost over value | | | (106,454 | ) |
| Net unrealized appreciation | | $ | 5,446,360 | |
The accompanying notes are an integral part of these financial statements.
8
| | |
| Pioneer Real Estate VCT Portfolio | Pioneer Variable Contracts Trust |
The following is a summary of the inputs used as of December 31, 2020, in valuing the Portfolio’s investments:
| | | | | | | | | | | | | |
| | | Level 1 | | | Level 2 | | | Level 3 | | | Total | |
| Common Stocks | | $ | 21,925,185 | | | $ | — | | | $ | — | | | $ | 21,925,185 | |
| Total Investments in Securities | | $ | 21,925,185 | | | $ | — | | | $ | — | | | $ | 21,925,185 | |
During the year ended December 31, 2020, there were no transfer between in or out of Level 3.
The accompanying notes are an integral part of these financial statements.
9
| | |
| Pioneer Real Estate VCT Portfolio | Pioneer Variable Contracts Trust |
Statement of Assets and Liabilities 12/31/20 | |
| | | | |
| ASSETS: | | | |
| Investments in unaffiliated issuers, at value (cost $16,399,557) | | $ | 21,925,185 | |
| Cash | | | 468,773 | |
| Receivables — | | | | |
| Portfolio shares sold | | | 3,869 | |
| Dividends | | | 80,815 | |
| Other assets | | | 711 | |
| Total assets | | $ | 22,479,353 | |
| | | | | |
| LIABILITIES: | | | | |
| Payables — | | | | |
| Portfolio shares repurchased | | $ | 5,728 | |
| Trustees’ fees | | | 154 | |
| Administrative fees | | | 8,984 | |
| Professional fees | | | 42,353 | |
| Shareowner communications expense | | | 3,675 | |
| Printing expense | | | 7,573 | |
| Due to affiliates | | | 1,702 | |
| Accrued expenses | | | 2,402 | |
| Total liabilities | | $ | 72,571 | |
| | | | | |
| NET ASSETS: | | | | |
| Paid-in capital | | $ | 19,564,654 | |
| Distributable earnings | | | 2,842,128 | |
| Net assets | | $ | 22,406,782 | |
| | | | | |
| NET ASSET VALUE PER SHARE: | | | | |
No par value (unlimited number of shares authorized) | | | | |
| Class I (based on $5,884,849/771,471 shares) | | $ | 7.63 | |
| Class II (based on $16,521,933/2,154,170 shares) | | $ | 7.67 | |
The accompanying notes are an integral part of these financial statements.
10
| | |
| Pioneer Real Estate VCT Portfolio | Pioneer Variable Contracts Trust |
| Statement of Operations | |
| FOR THE YEAR ENDED 12/31/20 | |
| | | | | | | |
| INVESTMENT INCOME: | | | | | | |
| Dividends from unaffiliated issuers | | $ | 495,174 | | | | |
| Interest from unaffiliated issuers | | | 270 | | | | |
| Total investment income | | | | | | $ | 495,444 | |
| EXPENSES: | | | | | | | | |
| Management fees | | $ | 178,402 | | | | | |
| Administrative expense | | | 57,829 | | | | | |
| Distribution fees | | | | | | | | |
| Class II | | | 41,314 | | | | | |
| Custodian fees | | | 8,113 | | | | | |
| Professional fees | | | 51,166 | | | | | |
| Printing expense | | | 21,084 | | | | | |
| Trustees’ fees | | | 7,412 | | | | | |
| Miscellaneous | | | 1,127 | | | | | |
| Total expenses | | | | | | $ | 366,447 | |
| Net investment income | | | | | | $ | 128,997 | |
| REALIZED AND UNREALIZED GAIN (LOSS) ON INVESTMENTS: | | | | | | | | |
| Net realized gain (loss) on: | | | | | | | | |
| Investments in unaffiliated issuers | | $ | (2,658,235 | ) | | | | |
| Other assets and liabilities denominated in foreign currencies | | | (4 | ) | | $ | (2,658,239 | ) |
| Change in net unrealized appreciation (depreciation) on: | | | | | | | | |
| Investments in unaffiliated issuers | | $ | 407,422 | | | | | |
| Other assets and liabilities denominated in foreign currencies | | | 3 | | | $ | 407,425 | |
| Net realized and unrealized gain (loss) on investments | | | | | | $ | (2,250,814 | ) |
| Net decrease in net assets resulting from operations | | | | | | $ | (2,121,817 | ) |
The accompanying notes are an integral part of these financial statements.
11
| | |
| Pioneer Real Estate VCT Portfolio | Pioneer Variable Contracts Trust |
| Statements of Changes in Net Assets | |
| | | | | | | |
| | Year Ended | | | Year Ended | |
| | 12/31/20 | | | 12/31/19 | |
| FROM OPERATIONS: | | | | | | |
Net investment income (loss) | | $ | 128,997 | | | $ | 301,514 | |
Net realized gain (loss) on investments | | | (2,658,239 | ) | | | 5,889,488 | |
Change in net unrealized appreciation (depreciation) on investments | | | 407,425 | | | | 413,370 | |
| Net increase (decrease) in net assets resulting from operations | | $ | (2,121,817 | ) | | $ | 6,604,372 | |
| DISTRIBUTIONS TO SHAREOWNERS: | | | | | | | | |
| Class I ($2.54 and $4.52 per share, respectively) | | $ | (1,496,545 | ) | | $ | (2,104,467 | ) |
| Class II ($2.52 and $4.48 per share, respectively) | | | (4,189,955 | ) | | | (6,245,831 | ) |
Tax return of capital: | | | | | | | | |
| Class I ($0.09 and $— per share, respectively) | | | (57,589 | ) | | | — | |
| Class II ($0.09 and $— per share, respectively) | | | (163,361 | ) | | | — | |
| Total distributions to shareowners | | $ | (5,907,450 | ) | | $ | (8,350,298 | ) |
| FROM PORTFOLIO SHARE TRANSACTIONS: | | | | | | | | |
Net proceeds from sales of shares | | $ | 1,406,759 | | | $ | 1,074,630 | |
Reinvestment of distributions | | | 5,907,450 | | | | 8,350,298 | |
Cost of shares repurchased | | | (3,955,339 | ) | | | (5,205,290 | ) |
| Net increase in net assets resulting from Portfolio share transactions | | $ | 3,358,870 | | | $ | 4,219,638 | |
| Net increase (decrease) in net assets | | $ | (4,670,397 | ) | | $ | 2,473,712 | |
| NET ASSETS: | | | | | | | | |
Beginning of year | | $ | 27,077,179 | | | $ | 24,603,467 | |
End of year | | $ | 22,406,782 | | | $ | 27,077,179 | |
| | | | | | | | | | | | | |
| | Year Ended | | | Year Ended | | | Year Ended | | | Year Ended | |
| | 12/31/20 | | | 12/31/20 | | | 12/31/19 | | | 12/31/19 | |
| | Shares | | | Amount | | | Shares | | | Amount | |
| Class I | | | | | | | | | | | | |
Shares sold | | | 34,380 | | | $ | 274,499 | | | | 7,479 | | | $ | 92,554 | |
Reinvestment of distributions | | | 221,074 | | | | 1,554,134 | | | | 191,133 | | | | 2,104,467 | |
Less shares repurchased | | | (92,700 | ) | | | (767,176 | ) | | | (84,895 | ) | | | (1,071,717 | ) |
| Net increase | | | 162,754 | | | $ | 1,061,457 | | | | 113,717 | | | $ | 1,125,304 | |
| Class II | | | | | | | | | | | | | | | | |
Shares sold | | | 133,758 | | | $ | 1,132,260 | | | | 78,397 | | | $ | 982,076 | |
Reinvestment of distributions | | | 615,229 | | | | 4,353,316 | | | | 565,627 | | | | 6,245,831 | |
Less shares repurchased | | | (364,158 | ) | | | (3,188,163 | ) | | | (336,900 | ) | | | (4,133,573 | ) |
| Net increase | | | 384,829 | | | $ | 2,297,413 | | | | 307,124 | | | $ | 3,094,334 | |
The accompanying notes are an integral part of these financial statements.
12
| | |
| Pioneer Real Estate VCT Portfolio | Pioneer Variable Contracts Trust |
| Financial Highlights | |
| | | | | | | | | | | | | | | | |
| | Year Ended | | | Year Ended | | | Year Ended | | | Year Ended | | | Year Ended | |
| | 12/31/20 | | | 12/31/19 | | | 12/31/18 | | | 12/31/17 | | | 12/31/16* | |
| Class I | | | | | | | | | | | | | | | |
Net asset value, beginning of period | | $ | 11.35 | | | $ | 12.55 | | | $ | 15.40 | | | $ | 16.37 | | | $ | 19.53 | |
Increase (decrease) from investment operations: | | | | | | | | | | | | | | | | | | | | |
| Net investment income (loss) (a) | | $ | 0.06 | | | $ | 0.16 | | | $ | 0.25 | | | $ | 0.26 | | | $ | 0.26 | |
| Net realized and unrealized gain (loss) on investments | | | (1.15 | ) | | | 3.16 | | | | (1.26 | ) | | | 0.28 | | | | 0.95 | |
| Net increase (decrease) from investment operations | | $ | (1.09 | ) | | $ | 3.32 | | | $ | (1.01 | ) | | $ | 0.54 | | | $ | 1.21 | |
Distributions to shareowners: | | | | | | | | | | | | | | | | | | | | |
| Net investment income | | $ | (0.06 | ) | | $ | (0.19 | ) | | $ | (0.25 | ) | | $ | (0.26 | ) | | $ | (0.27 | ) |
| Net realized gain | | | (2.48 | ) | | | (4.33 | ) | | | (1.59 | ) | | | (1.25 | ) | | | (4.10 | ) |
| Tax return of capital | | | (0.09 | ) | | | — | | | | — | | | | — | | | | — | |
| Total distributions | | $ | (2.63 | ) | | $ | (4.52 | ) | | $ | (1.84 | ) | | $ | (1.51 | ) | | $ | (4.37 | ) |
| Net increase (decrease) in net asset value | | $ | (3.72 | ) | | $ | (1.20 | ) | | $ | (2.85 | ) | | $ | (0.97 | ) | | $ | (3.16 | ) |
Net asset value, end of period
| | $ | 7.63 | | | $ | 11.35 | | | $ | 12.55 | | | $ | 15.40 | | | $ | 16.37 | |
| Total return (b) | | | (7.34 | )% | | | 28.16 | % | | | (7.24 | )% | | | 3.50 | % | | | 6.05 | % |
Ratio of net expenses to average net assets | | | 1.46 | % | | | 1.33 | % | | | 1.37 | % | | | 1.12 | % | | | 1.06 | % |
Ratio of net investment income (loss) to average net assets | | | 0.77 | % | | | 1.29 | % | | | 1.76 | % | | | 1.63 | % | | | 1.42 | % |
Portfolio turnover rate | | | 155 | % | | | 125 | % | | | 154 | % | | | 8 | % | | | 9 | % |
Net assets, end of period (in thousands) | | $ | 5,885 | | | $ | 6,910 | | | $ | 6,210 | | | $ | 7,824 | | | $ | 8,993 | |
* | The Portfolio was audited by an independent registered public accounting firm other than Ernst & Young LLP. |
(a) | The per-share data presented above is based on the average shares outstanding for the period presented. |
(b) | Assumes initial investment at net asset value at the beginning of each period, reinvestment of all distributions and the complete redemption of the investment at net asset value at the end of each period. |
NOTE: The above financial highlights do not reflect the deduction of non-portfolio expenses associated with variable insurance products, such as mortality and expense risk charges, separate account charges, and sales charges.
The accompanying notes are an integral part of these financial statements.
13
| | |
| Pioneer Real Estate VCT Portfolio | Pioneer Variable Contracts Trust |
| Financial Highlights (continued) | |
| | | | | | | | | | | | | | | | |
| | Year Ended | | | Year Ended | | | Year Ended | | | Year Ended | | | Year Ended | |
| | 12/31/20 | | | 12/31/19 | | | 12/31/18 | | | 12/31/17 | | | 12/31/16* | |
| Class II | | | | | | | | | | | | | | | |
| Net asset value, beginning of period | | $ | 11.40 | | | $ | 12.58 | | | $ | 15.44 | | | $ | 16.40 | | | $ | 19.55 | |
| Increase (decrease) from investment operations: | | | | | | | | | | | | | | | | | | | | |
| Net investment income (loss) (a) | | $ | 0.04 | | | $ | 0.13 | | | $ | 0.21 | | | $ | 0.22 | | | $ | 0.21 | |
| Net realized and unrealized gain (loss) on investments | | | (1.16 | ) | | | 3.17 | | | | (1.27 | ) | | | 0.29 | | | | 0.96 | |
| Net increase (decrease) from investment operations | | $ | (1.12 | ) | | $ | 3.30 | | | $ | (1.06 | ) | | $ | 0.51 | | | $ | 1.17 | |
| Distributions to shareowners: | | | | | | | | | | | | | | | | | | | | |
| Net investment income | | $ | (0.04 | ) | | $ | (0.15 | ) | | $ | (0.21 | ) | | $ | (0.22 | ) | | $ | (0.22 | ) |
| Net realized gain | | | (2.48 | ) | | | (4.33 | ) | | | (1.59 | ) | | | (1.25 | ) | | | (4.10 | ) |
| Tax return of capital | | | (0.09 | ) | | | — | | | | — | | | | — | | | | — | |
| Total distributions | | $ | (2.61 | ) | | $ | (4.48 | ) | | $ | (1.80 | ) | | $ | (1.47 | ) | | $ | (4.32 | ) |
| Net increase (decrease) in net asset value | | $ | (3.73 | ) | | $ | (1.18 | ) | | $ | (2.86 | ) | | $ | (0.96 | ) | | $ | (3.15 | ) |
Net asset value, end of period
| | $ | 7.67 | | | $ | 11.40 | | | $ | 12.58 | | | $ | 15.44 | | | $ | 16.40 | |
| Total return (b) | | | (7.62 | )% | | | 27.91 | % | | | (7.54 | )% | | | 3.30 | % | | | 5.82 | % |
| Ratio of net expenses to average net assets | | | 1.71 | % | | | 1.58 | % | | | 1.62 | % | | | 1.37 | % | | | 1.31 | % |
| Ratio of net investment income (loss) to average net assets | | | 0.51 | % | | | 1.04 | % | | | 1.51 | % | | | 1.37 | % | | | 1.18 | % |
| Portfolio turnover rate | | | 155 | % | | | 125 | % | | | 154 | % | | | 8 | % | | | 9 | % |
| Net assets, end of period (in thousands) | | $ | 16,522 | | | $ | 20,167 | | | $ | 18,393 | | | $ | 23,592 | | | $ | 28,116 | |
* | The Portfolio was audited by an independent registered public accounting firm other than Ernst & Young LLP. |
(a) | The per-share data presented above is based on the average shares outstanding for the period presented. |
(b) | Assumes initial investment at net asset value at the beginning of each period, reinvestment of all distributions, the complete redemption of the investment at net asset value at the end of each period and no sales charges. Total return would be reduced if sales charges were taken into account. |
NOTE: The above financial highlights do not reflect the deduction of non-portfolio expenses associated with variable insurance products, such as mortality and expense risk charges, separate account charges, and sales charges.
The accompanying notes are an integral part of these financial statements.
14
| | |
| Pioneer Real Estate VCT Portfolio | Pioneer Variable Contracts Trust |
Notes to Financial Statements 12/31/20 | |
1. Organization and Significant Accounting Policies
Pioneer Real Estate Shares VCT Portfolio (the “Portfolio”) is one of 8 portfolios comprising Pioneer Variable Contracts Trust (the “Trust”), a Delaware statutory trust. The Portfolio is registered under the Investment Company Act of 1940 as a diversified, open-end management investment company. The investment objective of the Portfolio is to pursue long-term capital growth, with current income as a secondary objective.
The Portfolio offers two classes of shares designated as Class I and Class II shares. Each class of shares represents an interest in the same schedule of investments of the Portfolio and has identical rights (based on relative net asset values) to assets and liquidation proceeds. Share classes can bear different rates of class-specific fees and expenses, such as transfer agent and distribution fees. Differences in class-specific fees and expenses will result in differences in net investment income and, therefore, the payment of different dividends from net investment income earned by each class. The Amended and Restated Declaration of Trust of the Portfolio gives the Board of Trustees the flexibility to specify either per-share voting or dollar-weighted voting when submitting matters for shareowner approval. Under per-share voting, each share of a class of the Portfolio is entitled to one vote. Under dollar-weighted voting, a shareowner’s voting power is determined not by the number of shares owned, but by the dollar value of the shares on the record date. Each share class has exclusive voting rights with respect to matters affecting only that class, including with respect to the distribution plan for that class. There is no distribution plan for Class I shares.
Portfolio shares may be purchased only by insurance companies for the purpose of funding variable annuity and variable life insurance contracts or by qualified pension and retirement plans.
Amundi Asset Management US, Inc., an indirect, wholly owned subsidiary of Amundi and Amundi’s wholly owned subsidiary, Amundi USA, Inc., serves as the Portfolio’s investment adviser (the “Adviser”). Prior to January 1, 2021, the Adviser was named Amundi Pioneer Asset Management, Inc. Amundi Distributor US, Inc., an affiliate of Amundi Asset Management US, Inc., serves as the Portfolio’s distributor (the “Distributor”).
In August 2018, the Financial Accounting Standards Board (FASB) issued Accounting Standards Update 2018-13 “Disclosure Framework – Changes to the Disclosure Requirements for Fair Value Measurement” (“ASU 2018-13”) which modifies disclosure requirements for fair value measurements, principally for Level 3 securities and transfers between levels of the fair value hierarchy. ASU 2018-13 is effective for fiscal years beginning after December 15, 2019 and for interim periods within those fiscal years. The Portfolio has adopted ASU 2018-13 for the year ended December 31, 2020. The impact to the Portfolio’s adoption was limited to changes in the Portfolio’s disclosures regarding fair value, primarily those disclosures related to transfers between levels of the fair value hierarchy and disclosure of the range and weighted average used to develop significant unobservable inputs for Level 3 fair value investments, when applicable.
The Portfolio is an investment company and follows investment company accounting and reporting guidance under U.S. Generally Accepted Accounting Principles (“U.S. GAAP”). U.S. GAAP requires the management of the Portfolio to make estimates and assumptions that affect the reported amounts of assets and liabilities, the disclosure of contingent assets and liabilities at the date of the financial statements, and the reported amounts of income, expenses and gain or loss on investments during the reporting period. Actual results could differ from those estimates.
The following is a summary of significant accounting policies followed by the Portfolio in the preparation of its financial statements:
A. Security Valuation
The net asset value of the Portfolio is computed once daily, on each day the New York Stock Exchange (“NYSE”) is open, as of the close of regular trading on the NYSE.
Equity securities which may include restricted securities that have traded on an exchange are valued by using the last sale price on the principal exchange where they are traded. Equity securities which may include restricted securities that have not traded on the date of valuation, or securities for which sale prices are not available, generally are valued using the mean between the last bid and asked prices or, if both last bid and asked prices are not available, at the last quoted bid price. Last sale and bid and asked prices are provided by independent third party pricing services. In the case of equity securities which may include restricted securities not traded on an exchange, prices are typically determined by independent third party pricing services using a variety of techniques and methods.
The value of foreign securities is translated into U.S. dollars based on foreign currency exchange rate quotations supplied by a third party pricing source. Trading in non-U.S. equity securities is substantially completed each day at various times prior to the close of the NYSE. The values of such securities used in computing the net asset value of the Portfolio’s shares are determined as of such times. The Portfolio may use a fair value model developed by an independent pricing service to value non-U.S. equity securities.
15
| | |
| Pioneer Real Estate VCT Portfolio | Pioneer Variable Contracts Trust |
| Notes to Financial Statements 12/31/20 (continued) | |
Securities for which independent pricing services or broker-dealers are unable to supply prices or for which market prices and/or quotations are not readily available or are considered to be unreliable are valued by a fair valuation team comprised of certain personnel of the Adviser pursuant to procedures adopted by the Portfolio’s Board of Trustees. The Adviser’s fair valuation team uses fair value methods approved by the Valuation Committee of the Board of Trustees. The Adviser’s fair valuation team is responsible for monitoring developments that may impact fair valued securities and for discussing and assessing fair values on an ongoing basis, and at least quarterly, with the Valuation Committee of the Board of Trustees.
Inputs used when applying fair value methods to value a security may include credit ratings, the financial condition of the company, current market conditions and comparable securities. The Portfolio may use fair value methods if it is determined that a significant event has occurred after the close of the exchange or market on which the security trades and prior to the determination of the Portfolio’s net asset value. Examples of a significant event might include political or economic news, corporate restructurings, natural disasters, terrorist activity or trading halts. Thus, the valuation of the Portfolio’s securities may differ significantly from exchange prices, and such differences could be material.
At December 31, 2020, no securities were valued using fair value methods (other than securities valued using prices supplied by independent pricing services, broker-dealers or using a third party insurance industry pricing model).
B. Investment Income and Transactions
Dividend income is recorded on the ex-dividend date, except that certain dividends from foreign securities where the ex-dividend date may have passed are recorded as soon as the Portfolio becomes aware of the ex-dividend data in the exercise of reasonable diligence.
Interest income, including interest on income-bearing cash accounts, is recorded on the accrual basis. Dividend and interest income are reported net of unrecoverable foreign taxes withheld at the applicable country rates and net of income accrued on defaulted securities.
Interest and dividend income payable by delivery of additional shares is reclassified as PIK (payment-in-kind) income upon receipt and is included in interest and dividend income, respectively.
Security transactions are recorded as of trade date. Gains and losses on sales of investments are calculated on the identified cost method for both financial reporting and federal income tax purposes.
C. Foreign Currency Translation
The books and records of the Portfolio are maintained in U.S. dollars. Amounts denominated in foreign currencies are translated into U.S. dollars using current exchange rates.
Net realized gains and losses on foreign currency transactions, if any, represent, among other things, the net realized gains and losses on foreign currency exchange contracts, disposition of foreign currencies and the difference between the amount of income accrued and the U.S. dollars actually received. Further, the effects of changes in foreign currency exchange rates on investments are not segregated on the Statement of Operations from the effects of changes in the market prices of those securities, but are included with the net realized and unrealized gain or loss on investments.
D. Federal Income Taxes
It is the Portfolio’s policy to comply with the requirements of the Internal Revenue Code applicable to regulated investment companies and to distribute all of its net taxable income and net realized capital gains, if any, to its shareowners. Therefore, no provision for federal income taxes is required. As of December 31, 2020, the Portfolio did not accrue any interest or penalties with respect to uncertain tax positions, which, if applicable, would be recorded as an income tax expense on the Statement of Operations. Tax returns filed within the prior three years remain subject to examination by federal and state tax authorities.
A portion of the dividend income recorded by the Portfolio is from distributions by publicly traded Real Estate Investment Trusts (“REITs”), and such distributions for tax purposes may also consist of capital gains and return of capital. The actual return of capital and capital gains portions of such distributions will be determined by formal notifications from the REITs subsequent to the calendar year-end. Distributions received from the REITs that are determined to be a return of capital are recorded by the Portfolio as a reduction of the cost basis of the securities held and those determined to be capital gain are reflected as such on the Statement of Operations.
16
| | |
| Pioneer Real Estate VCT Portfolio | Pioneer Variable Contracts Trust |
The amount and character of income and capital gain distributions to shareowners are determined in accordance with federal income tax rules, which may differ from U.S. GAAP. Distributions in excess of net investment income or net realized gains are temporary over distributions for financial statement purposes resulting from differences in the recognition or classification of income or distributions for financial statement and tax purposes. Capital accounts within the financial statements are adjusted for permanent book/tax differences to reflect tax character, but are not adjusted for temporary differences.
At December 31, 2020, the Portfolio was permitted to carry forward indefinitely $2,665,498 of short-term losses.
The tax character of distributions paid during the years ended December 31, 2020 and December 31, 2019, were as follows:
| | | | | | | |
| | | 2020 | | | 2019 | |
| Distributions paid from: | | | | | | |
| Ordinary income | | $ | 151,038 | | | $ | 544,443 | |
| Long-term capital gain | | | 5,535,462 | | | | 7,805,855 | |
| Tax return of capital | | | 220,950 | | | | — | |
| Total | | $ | 5,907,450 | | | $ | 8,350,298 | |
The following shows the components of distributable earnings on a federal income tax basis at December 31, 2020:
| | | | |
| | | 2020 | |
| Distributable earnings/(losses): | | | |
| Capital loss carryforward | | $ | (2,665,498 | ) |
| Net unrealized appreciation | | | 5,507,626 | |
| Total | | $ | 2,842,128 | |
The difference between book basis and tax basis unrealized appreciation is attributable to the tax deferral of losses on wash sales.
E. Portfolio Shares and Class Allocations
The Portfolio records sales and repurchases of its shares as of trade date. Distribution fees for Class II shares are calculated based on the average daily net asset value attributable to Class II shares of the Portfolio (see Note 5). Class I shares do not pay distribution fees.
Income, common expenses (excluding transfer agent and distribution fees) and realized and unrealized gains and losses are calculated at the Portfolio level and allocated daily to each class of shares based on its respective percentage of adjusted net assets at the beginning of the day.
All expenses and fees paid to the Portfolio’s transfer agent for its services are allocated between the classes of shares based on the number of accounts in each class and the ratable allocation of related out-of-pocket expenses (see Note 4).
Dividends and distributions to shareowners are recorded on the ex-dividend date. Distributions paid by the Portfolio with respect to each class of shares are calculated in the same manner and at the same time, except that net investment income dividends to Class I and Class II shares can reflect different transfer agent and distribution expense rates.
F. Risks
The value of securities held by the Portfolio may go up or down, sometimes rapidly or unpredictably, due to general market conditions, such as real or perceived adverse economic, political or regulatory conditions, recessions, the spread of infectious illness or other public health issues, inflation, changes in interest rates, lack of liquidity in the bond markets or adverse investor sentiment. In the past several years, financial markets have experienced increased volatility, depressed valuations, decreased liquidity and heightened uncertainty. These conditions may continue, recur, worsen or spread. A general rise in interest rates could adversely affect the price and liquidity of fixed-income securities and could also result in increased redemptions from the Portfolio.
17
| | |
| Pioneer Real Estate VCT Portfolio | Pioneer Variable Contracts Trust |
| Notes to Financial Statements 12/31/20 (continued) | |
At times, the Portfolio’s investments may represent industries or industry sectors that are interrelated or have common risks, making the Portfolio more susceptible to any economic, political, or regulatory developments or other risks affecting those industries and sectors. The Portfolio’s investments in foreign markets and countries with limited developing markets may subject the Portfolio to a greater degree of risk than investments in a developed market. These risks include disruptive political or economic conditions and the imposition of adverse governmental laws or currency exchange restrictions.
Because the Portfolio may invest a substantial portion of its assets in REITs, the Portfolio may be subject to certain risks associated with direct investments in REITs. REITs may be affected by changes in the value of their underlying properties and by defaults by borrowers or tenants. REITs depend generally on their ability to generate cash flow to make distributions to shareowners, and certain REITs have self-liquidation provisions by which mortgages held may be paid in full and distributions of capital return may be made at any time. In addition, the performance of a REIT may be affected by its failure to qualify for tax-free pass-through of income under the Internal Revenue Code or its failure to maintain exemption from registration under the Investment Company Act of 1940.
With the increased use of technologies such as the Internet to conduct business, the Portfolio is susceptible to operational, information security and related risks. While the Portfolio’s Adviser has established business continuity plans in the event of, and risk management systems to prevent, limit or mitigate, such cyber-attacks, there are inherent limitations in such plans and systems, including the possibility that certain risks have not been identified. Furthermore, the Portfolio cannot control the cybersecurity plans and systems put in place by service providers to the Portfolio such as Brown Brothers Harriman & Co., the Portfolio’s custodian and accounting agent, and DST Asset Manager Solutions, Inc., the Portfolio’s transfer agent. In addition, many beneficial owners of Portfolio shares hold them through accounts at broker-dealers, retirement platforms and other financial market participants over which neither the Portfolio nor the Adviser exercises control. Each of these may in turn rely on service providers to them, which are also subject to the risk of cyber-attacks. Cybersecurity failures or breaches at the Adviser or the Portfolio’s service providers or intermediaries have the ability to cause disruptions and impact business operations, potentially resulting in financial losses, interference with the Portfolio’s ability to calculate its net asset value, impediments to trading, the inability of Portfolio shareowners to effect share purchases, redemptions or exchanges or receive distributions, loss of or unauthorized access to private shareowner information and violations of applicable privacy and other laws, regulatory fines, penalties, reputational damage, or additional compliance costs. Such costs and losses may not be covered under any insurance. In addition, maintaining vigilance against cyber-attacks may involve substantial costs over time, and system enhancements may themselves be subject to cyber-attacks.
COVID-19
The respiratory illness COVID-19 caused by a novel coronavirus has resulted in a global pandemic and major disruption to economies and markets around the world, including the United States. Global financial markets have experienced extreme volatility and severe losses, and trading in many instruments has been disrupted. Liquidity for many instruments has been greatly reduced for periods of time. Some interest rates are very low and in some cases yields are negative. Some sectors of the economy and individual issuers have experienced particularly large losses. These circumstances may continue for an extended period of time, and may continue to affect adversely the value and liquidity of the Portfolio’s investments. The ultimate economic fallout from the pandemic, and the long-term impact on economies, markets, industries and individual issuers, are not known. Governments and central banks, including the Federal Reserve in the U.S., have taken extraordinary and unprecedented actions to support local and global economies and the financial markets. These actions have resulted in significant expansion of public debt, including in the U.S. The impact of these measures, and whether they will be effective to mitigate the economic and market disruption, will not be known for some time. The consequences of high public debt, including its future impact on the economy and securities markets, likewise may not be known for some time.
The Portfolio’s prospectus contains unaudited information regarding the Portfolio’s principal risks. Please refer to that document when considering the Portfolio’s principal risks.
18
| | |
| Pioneer Real Estate VCT Portfolio | Pioneer Variable Contracts Trust |
2. Management Agreement
The Adviser manages the Portfolio. Management fees are calculated daily and paid monthly at the annual rate of 0.80% of the Portfolio’s average daily net assets up to $500 million and 0.75% of the Portfolio’s average daily net assets over $500 million. For the year ended December 31, 2020, the effective management fee was equivalent to 0.80% of the Portfolio’s average daily net assets.
In addition, under the management and administration agreements, certain other services and costs, including accounting, regulatory reporting and insurance premiums, are paid by the Portfolio as administrative reimbursements. Included in “Due to affiliates” reflected on the Statement of Assets and Liabilities is $1,366 in management fees, administrative costs and certain other reimbursements payable to the Adviser at December 31, 2020.
3. Compensation of Trustees and Officers
The Portfolio pays an annual fee to its Trustees. The Adviser reimburses the Portfolio for fees paid to the Interested Trustees. The Portfolio does not pay any salary or other compensation to its officers. For the year ended December 31, 2020, the Portfolio paid $7,412 in Trustees’ compensation, which is reflected on the Statement of Operations as Trustees’ fees. At December 31, 2020, the Portfolio had a payable for Trustees’ fees on its Statement of Assets and Liabilities of $154.
4. Transfer Agent
DST Asset Manager Solutions, Inc. serves as the transfer agent to the Portfolio at negotiated rates. Transfer agent fees and payables shown on the Statement of Operations and the Statement of Assets and Liabilities, respectively, include sub-transfer agent expenses incurred through the Portfolio’s omnibus relationship contracts.
5. Distribution Plan
The Portfolio has adopted a distribution plan (the “Plan”) pursuant to Rule 12b-1 of the Investment Company Act of 1940 with respect to Class II shares. Pursuant to the Plan, the Portfolio pays the Distributor a distribution fee of 0.25% of the average daily net assets attributable to Class II shares to compensate the Distributor for (1) distribution services and (2) personal and account maintenance services performed and expenses incurred by the Distributor in connection with the Portfolio’s Class II shares. Included in “Due to affiliates” reflected on the Statement of Assets and Liabilities is $336 in distribution fees payable to the Distributor at December 31, 2020.
19
| | |
| Pioneer Real Estate VCT Portfolio | Pioneer Variable Contracts Trust |
Report of Independent Registered Public Accounting Firm | |
To the Board of Trustees of Pioneer Variable Contracts Trust and the Shareholders of Pioneer Real Estate Shares VCT Portfolio:
Opinion on the Financial Statements
We have audited the accompanying statement of assets and liabilities of Pioneer Real Estate Shares VCT Portfolio (the “Portfolio”) (one of the portfolios constituting Pioneer Variable Contracts Trust (the “Trust”)), including the schedule of investments, as of December 31, 2020, and the related statement of operations for the year then ended, the statements of changes in net assets for each of two years in the period then ended, the financial highlights for each of four years in the period then ended and the related notes (collectively referred to as the “financial statements”). The financial highlights for the period ended December 31, 2016 were audited by another independent registered public accounting firm whose report, dated February 14, 2017, expressed an unqualified opinion on those financial highlights. In our opinion, the financial statements present fairly, in all material respects, the financial position of the Portfolio (one of the portfolios constituting Pioneer Variable Contracts Trust) at December 31, 2020, the results of its operations for the year then ended, the changes in its net assets for each of the two years in the period then ended, and its financial highlights for each of the four years in the period then ended in conformity with U.S. generally accepted accounting principles.
Basis for Opinion
These financial statements are the responsibility of the Trust’s management. Our responsibility is to express an opinion on the Portfolio’s financial statements based on our audits. We are a public accounting firm registered with the Public Company Accounting Oversight Board (United States) (“PCAOB”) and are required to be independent with respect to the Trust in accordance with the U.S. federal securities laws and the applicable rules and regulations of the Securities and Exchange Commission and the PCAOB.
We conducted our audits in accordance with the standards of the PCAOB. Those standards require that we plan and perform the audit to obtain reasonable assurance about whether the financial statements are free of material misstatement, whether due to error or fraud. The Trust is not required to have, nor were we engaged to perform, an audit of the Trust’s internal control over financial reporting. As part of our audits, we are required to obtain an understanding of internal control over financial reporting, but not for the purpose of expressing an opinion on the effectiveness of the Trust’s internal control over financial reporting. Accordingly, we express no such opinion.
Our audits included performing procedures to assess the risks of material misstatement of the financial statements, whether due to error or fraud, and performing procedures that respond to those risks. Such procedures included examining, on a test basis, evidence regarding the amounts and disclosures in the financial statements. Our procedures included confirmation of securities owned as of December 31, 2020, by correspondence with the custodian and brokers or by other appropriate auditing procedures where replies from brokers were not received. Our audits also included evaluating the accounting principles used and significant estimates made by management, as well as evaluating the overall presentation of the financial statements. We believe that our audits provide a reasonable basis for our opinion.
We have served as the auditor of one or more Amundi Pioneer investment companies since 2017.
Boston, Massachusetts
February 17, 2021
20
| | |
| Pioneer Real Estate VCT Portfolio | Pioneer Variable Contracts Trust |
Approval of Investment Management Agreement | |
Amundi Pioneer Asset Management, Inc. (“APAM”) serves as the investment adviser to Pioneer Real Estate Shares VCT Portfolio (the “Portfolio”) pursuant to an investment management agreement between APAM and the Portfolio. In order for APAM to remain the investment adviser of the Portfolio, the Trustees of the Portfolio must determine annually whether to renew the investment management agreement for the Portfolio.
The contract review process began in January 2020 as the Trustees of the Portfolio agreed on, among other things, an overall approach and timeline for the process. Contract review materials were provided to the Trustees in March 2020, July 2020 and September 2020. In addition, the Trustees reviewed and discussed the Portfolio’s performance at regularly scheduled meetings throughout the year, and took into account other information related to the Portfolio provided to the Trustees at regularly scheduled meetings, in connection with the review of the Portfolio’s investment management agreement.
In March 2020, the Trustees, among other things, discussed the memorandum provided by Fund counsel that summarized the legal standards and other considerations that are relevant to the Trustees in their deliberations regarding the renewal of the investment management agreement, and reviewed and discussed the qualifications of the investment management teams for the Portfolio, as well as the level of investment by the Portfolio’s portfolio managers in the Portfolio. In July 2020, the Trustees, among other things, reviewed the Portfolio’s management fees and total expense ratios, the financial statements of APAM and its parent companies, profitability analyses provided by APAM, and analyses from APAM as to possible economies of scale. The Trustees also reviewed the profitability of the institutional business of APAM and APAM’s affiliate, Amundi Pioneer Institutional Asset Management, Inc. (“APIAM” and, together with APAM, “Amundi Pioneer”), as compared to that of APAM’s fund management business, and considered the differences between the fees and expenses of the Portfolio and the fees and expenses of APAM’s and APIAM’s institutional accounts, as well as the different services provided by APAM to the Portfolio and by APAM and APIAM to the institutional accounts. The Trustees further considered contract review materials, including additional materials received in response to the Trustees’ request, in September 2020.
At a meeting held on September 15, 2020, based on their evaluation of the information provided by APAM and third parties, the Trustees of the Portfolio, including the Independent Trustees voting separately, unanimously approved the renewal of the investment management agreement for another year. In approving the renewal of the investment management agreement, the Trustees considered various factors that they determined were relevant, including the factors described below. The Trustees did not identify any single factor as the controlling factor in determining to approve the renewal of the agreement.
Nature, Extent and Quality of Services
The Trustees considered the nature, extent and quality of the services that had been provided by APAM to the Portfolio, taking into account the investment objective and strategy of the Portfolio. The Trustees also reviewed APAM’s investment approach for the Portfolio and its research process. The Trustees considered the resources of APAM and the personnel of APAM who provide investment management services to the Portfolio. They also reviewed the amount of non-Portfolio assets managed by the portfolio managers of the Portfolio. They considered the non-investment resources and personnel of APAM that are involved in APAM’s services to the Portfolio, including APAM’s compliance, risk management, and legal resources and personnel. The Trustees noted the substantial attention and high priority given by APAM’s senior management to the Pioneer Fund complex. The Trustees considered the implementation and effectiveness of APAM’s business continuity plan in response to the COVID-19 pandemic.
The Trustees considered that APAM supervises and monitors the performance of the Portfolio’s service providers and provides the Portfolio with personnel (including Portfolio officers) and other resources that are necessary for the Portfolio’s business management and operations. The Trustees also considered that, as administrator, APAM is responsible for the administration of the Portfolio’s business and other affairs. The Trustees considered the fees paid to APAM for the provision of administration services.
Based on these considerations, the Trustees concluded that the nature, extent and quality of services that had been provided by APAM to the Portfolio were satisfactory and consistent with the terms of the investment management agreement.
Performance of the Portfolio
In considering the Portfolio’s performance, the Trustees regularly review and discuss throughout the year data prepared by APAM and information comparing the Portfolio’s performance with the performance of its peer group of funds, as classified by Morningstar, Inc. (Morningstar), and with the performance of the Portfolio’s benchmark index. They also discuss the Portfolio’s performance with APAM on a regular basis. The Trustees’ regular reviews and discussions were factored into the Trustees’ deliberations concerning the renewal of the investment management agreement.
21
| | |
| Pioneer Real Estate VCT Portfolio | Pioneer Variable Contracts Trust |
| Approval of Investment Management Agreement (continued) | |
Management Fee and Expenses
The Trustees considered information showing the fees and expenses of the Portfolio in comparison to the management fees of its peer group of funds as classified by Morningstar and also to the expense ratios of a peer group of funds selected on the basis of criteria determined by the Independent Trustees for this purpose using data provided by Strategic Insight Mutual Fund Research and Consulting, LLC (Strategic Insight), an independent third party. The peer group comparisons referred to below are organized in quintiles. Each quintile represents one-fifth of the peer group. In all peer group comparisons referred to below, first quintile is most favorable to the Portfolio’s shareowners. The Trustees noted that they separately review and consider the impact of the Portfolio’s transfer agency and Portfolio- and APAM-paid expenses for sub-transfer agency and intermediary arrangements, and that the results of the most recent such review were considered in the consideration of the Portfolio’s expense ratio.
The Trustees considered that the Portfolio’s management fee for the most recent fiscal year was in the fifth quintile relative to the management fees paid by other funds in its Morningstar category for the comparable period. The Trustees noted the resource commitment necessary to manage a real estate fund that invests more significantly in non-U.S. securities than its peers. The Trustees considered that the expense ratio of the Portfolio’s Class II shares for the most recent fiscal year was in the fifth quintile relative to its Strategic Insight peer group for the comparable period. The Trustees noted the Portfolio’s relatively small asset size compared to most of the other funds in its peer group. The Trustees considered that non-management fee operating expenses generally are spread over a smaller asset base than the other funds in the peer group, which results in these fees being significantly higher as a percentage of assets.
The Trustees reviewed management fees charged by APAM and APIAM to institutional and other clients, including publicly offered European funds sponsored by APAM’s affiliates, unaffiliated U.S. registered investment companies (in a sub-advisory capacity), and unaffiliated foreign and domestic separate accounts. The Trustees also considered APAM’s costs in providing services to the Portfolio and APAM’s and APIAM’s costs in providing services to the other clients and considered the differences in management fees and profit margins for fund and non-fund services. In evaluating the fees associated with APAM’s and APIAM’s client accounts, the Trustees took into account the respective demands, resources and complexity associated with the Portfolio and other client accounts. The Trustees noted that, in some instances, the fee rates for those clients were lower than the management fee for the Portfolio and considered that, under the investment management agreement with the Portfolio, APAM performs additional services for the Portfolio that it does not provide to those other clients or services that are broader in scope, including oversight of the Portfolio’s other service providers and activities related to compliance and the extensive regulatory and tax regimes to which the Portfolio is subject. The Trustees also considered the entrepreneurial risks associated with APAM’s management of the Portfolio.
The Trustees concluded that the management fee payable by the Portfolio to APAM was reasonable in relation to the nature and quality of the services provided by APAM.
Profitability
The Trustees considered information provided by APAM regarding the profitability of APAM with respect to the advisory services provided by APAM to the Portfolio, including the methodology used by APAM in allocating certain of its costs to the management of the Portfolio. The Trustees also considered APAM’s profit margin in connection with the overall operation of the Portfolio. They further reviewed the financial results, including the profit margins, realized by APAM and APIAM from non-fund businesses. The Trustees considered APAM’s profit margins in comparison to the limited industry data available and noted that the profitability of any adviser was affected by numerous factors, including its organizational structure and method for allocating expenses. The Trustees concluded that APAM’s profitability with respect to the management of the Portfolio was not unreasonable.
Economies of Scale
The Trustees considered APAM’s views relating to economies of scale in connection with the Pioneer Funds as fund assets grow and the extent to which any such economies of scale are shared with the Portfolio and Portfolio shareholders. The Trustees recognize that economies of scale are difficult to identify and quantify, and that, among other factors that may be relevant, are the following: fee levels, expense subsidization, investment by APAM in research and analytical capabilities and APAM’s commitment and resource allocation to the Portfolio. The Trustees noted that profitability also may be an indicator of the availability of any economies of scale, although profitability may vary for other reasons including due to reductions in expenses. The Trustees concluded that economies of scale, if any, were being appropriately shared with the Portfolio.
22
| | |
| Pioneer Real Estate VCT Portfolio | Pioneer Variable Contracts Trust |
Other Benefits
The Trustees considered the other benefits that APAM enjoys from its relationship with the Portfolio. The Trustees considered the character and amount of fees paid or to be paid by the Portfolio, other than under the investment management agreement, for services provided by APAM and its affiliates. The Trustees further considered the revenues and profitability of APAM’s businesses other than the Fund business. To the extent applicable, the Trustees also considered the benefits to the Portfolio and to APAM and its affiliates from the use of “soft” commission dollars generated by the Portfolio to pay for research and brokerage services.
The Trustees considered that Amundi Pioneer is the principal U.S. asset management business of Amundi, which is one of the largest asset managers globally. Amundi’s worldwide asset management business manages over $1.7 trillion in assets (including the Pioneer Funds). The Trustees considered that APAM’s relationship with Amundi creates potential opportunities for APAM, APIAM and Amundi that derive from APAM’s relationships with the Portfolio, including Amundi’s ability to market the services of APAM globally. The Trustees noted that APAM has access to additional research and portfolio management capabilities as a result of its relationship with Amundi and Amundi’s enhanced global presence that may contribute to an increase in the resources available to APAM. The Trustees considered that APAM and the Portfolio receive reciprocal intangible benefits from the relationship, including mutual brand recognition and, for the Portfolio, direct and indirect access to the resources of a large global asset manager. The Trustees concluded that any such benefits received by APAM as a result of its relationship with the Portfolio were reasonable.
Conclusion
After consideration of the factors described above as well as other factors, the Trustees, including the Independent Trustees, concluded that the investment management agreement for the Portfolio, including the fees payable thereunder, was fair and reasonable and voted to approve the proposed renewal of the investment management agreement.
23
| | |
| Pioneer Real Estate VCT Portfolio | Pioneer Variable Contracts Trust |
Trustees, Officers and Service Providers | |
The Portfolio’s Trustees and officers are listed below, together with their principal occupations and other directorships they have held during at least the past five years. Trustees who are interested persons of the Portfolios within the meaning of the 1940 Act are referred to as Interested Trustees. Trustees who are not interested persons of the Portfolio are referred to as Independent Trustees. Each of the Trustees serves as a Trustee of each of the 45 U.S. registered investment portfolios for which Amundi US serves as investment adviser (the “Pioneer Funds”). The address for all Trustees and all officers of the Portfolios is 60 State Street, Boston, Massachusetts 02109.
| | | | |
| Name, Age and Position | Term of Office and | | Other Directorships |
| Held With the Trust | Length of Service | Principal Occupation | Held by Trustee |
Independent Trustees:
|
| Thomas J. Perna (70) | Trustee since 2006. Serves until a | Private investor (2004 – 2008 and | Director, Broadridge Financial |
Chairman of the Board | successor trustee is elected or | 2013 – present); Chairman (2008 – 2013) | Solutions, Inc. (investor |
and Trustee | earlier retirement or removal. | and Chief Executive Officer (2008 – 2012), | communications and securities |
| | Quadriserv, Inc. (technology products for | processing provider for financial |
| | securities lending industry); and Senior | services industry) (2009 – present); |
| | Executive Vice President, The Bank of New York | Director, Quadriserv, Inc. (2005 – |
| | (financial and securities services) (1986 – 2004) | 2013); and Commissioner, New Jersey |
| | | State Civil Service Commission |
| | | (2011 – 2015) |
| John E. Baumgardner, Jr. (69) | Trustee since 2019. Serves until a | Of Counsel (2019 – present), Partner | Chairman, The Lakeville Journal |
Trustee | successor trustee is elected or | (1983-2018), Sullivan & Cromwell LLP | Company, LLC, (privately-held |
| earlier retirement or removal. | (law firm). | community newspaper group) (2015- |
| | | present) |
| Diane Durnin (63) | Trustee since 2019. Serves until a | Managing Director - Head of Product Strategy | None |
Trustee | successor trustee is elected or | and Development, BNY Mellon Investment | |
| earlier retirement or removal. | Management (investment management firm) | |
| | (2012-2018); Vice Chairman – The Dreyfus | |
| | Corporation (2005 – 2018): Executive Vice | |
| | President Head of Product, BNY Mellon | |
| | Investment Management (2007-2012); Executive | |
| | Director- Product Strategy, Mellon Asset | |
| | Management (2005-2007); Executive Vice | |
| | President Head of Products, Marketing and | |
| | Client Service, Dreyfus Corporation (investment | |
| | management firm) (2000-2005); and Senior Vice | |
| | President – Strategic Product and Business | |
| | Development, Dreyfus Corporation (1994-2000) | |
| Benjamin M. Friedman (76) | Trustee since 2008. Serves until a | William Joseph Maier Professor of Political | Trustee, Mellon Institutional Funds |
Trustee | successor trustee is elected or | Economy, Harvard University (1972 – present) | Investment Trust and Mellon |
| earlier retirement or removal. | | Institutional Funds Master Portfolio |
| | | (oversaw 17 portfolios in fund |
| | | complex) (1989 - 2008) |
| Lorraine H. Monchak (64) | Trustee since 2017. (Advisory | Chief Investment Officer, 1199 SEIU Funds | None |
Trustee | Trustee from 2014 - 2017). Serves | (healthcare workers union pension funds) | |
| until a successor trustee is elected | (2001 – present); Vice President – International | |
| or earlier retirement or removal. | Investments Group, American International | |
| | Group, Inc. (insurance company) (1993 – 2001); | |
| | Vice President – Corporate Finance and Treasury | |
| | Group, Citibank, N.A. (1980 – 1986 and | |
| | 1990 – 1993); Vice President – Asset/Liability | |
| | Management Group, Federal Farm Funding | |
| | Corporation (government-sponsored issuer of | |
| | debt securities) (1988 – 1990); Mortgage | |
| | Strategies Group, Shearson Lehman Hutton, Inc. | |
| | (investment bank) (1987 – 1988); and Mortgage | |
| | Strategies Group, Drexel Burnham Lambert, Ltd. | |
| | (investment bank) (1986 – 1987) | |
24
| | |
| Pioneer Real Estate VCT Portfolio | Pioneer Variable Contracts Trust |
| | | | |
| Name, Age and Position | Term of Office and | | Other Directorships |
| Held With the Trust | Length of Service | Principal Occupation | Held by Trustee |
Independent Trustees: (continued) |
| Marguerite A. Piret (72) | Trustee since 1995. Serves until a | Chief Financial Officer, American Ag Energy, | Director of New America High Income |
Trustee | successor trustee is elected or | Inc. (controlled environment and agriculture | Fund, Inc. (closed-end investment |
| earlier retirement or removal. | company) (2016 – present); and President and | company) (2004 – present); and |
| | Chief Executive Officer, Metric Financial Inc. | Member, Board of Governors, |
| | (formerly known as Newbury Piret Company) | Investment Company Institute |
| | (investment banking firm) (1981 – 2019) | (2000 – 2006) |
| Fred J. Ricciardi (73) | Trustee since 2014. Serves until a | Private investor (2020 – present); Consultant | None |
Trustee | successor trustee is elected or | (investment company services) (2012 – 2020); | |
| earlier retirement or removal. | Executive Vice President, BNY Mellon (financial | |
| | and investment company services) (1969 – 2012); | |
| | Director, BNY International Financing Corp. | |
| | (financial services) (2002 – 2012); Director, | |
| | Mellon Overseas Investment Corp. (financial | |
| | services) (2009 – 2012); Director, Financial | |
| | Models (technology) (2005-2007); Director, BNY | |
| | Hamilton Funds, Ireland (offshore investment | |
| | companies) (2004-2007); Chairman/Director, | |
| | AIB/BNY Securities Services, Ltd., Ireland | |
| | (financial services) (1999-2006); and Chairman, | |
| | BNY Alternative Investment Services, Inc. | |
| | (financial services) (2005-2007) | |
Interested Trustees:
|
| Lisa M. Jones (58)* | Trustee since 2017. Serves until a | Director, CEO and President of Amundi US, Inc. | None |
Trustee, President and | successor trustee is elected or | (investment management firm) (since | |
Chief Executive Officer | earlier retirement or removal | September 2014); Director, CEO and President | |
| | of Amundi Asset Management US, Inc. (since | |
| | September 2014); Director, CEO and President of | |
| | Amundi Distributor US, Inc. (since September | |
| | 2014); Director, CEO and President of Amundi | |
| | Asset Management US, Inc. (since September | |
| | 2014); Chair, Amundi US, Inc., Amundi Distributor | |
| | US, Inc. and Amundi Asset Management US, Inc. | |
| | (September 2014 – 2018); Managing Director, | |
| | Morgan Stanley Investment Management | |
| | (investment management firm) (2010 – 2013); | |
| | Director of Institutional Business, CEO of | |
| | International, Eaton Vance Management | |
| | (investment management firm) (2005 – 2010); | |
| | and Director of Amundi Holdings US, Inc. | |
| | (since 2017) | |
| Kenneth J. Taubes (62)* | Trustee since 2014. Serves until a | Director and Executive Vice President | None |
Trustee | successor trustee is elected or | (since 2008) and Chief Investment Officer, U.S. | |
| earlier retirement or removal | (since 2010) of Amundi US, Inc. (investment | |
| | management firm); Director and Executive Vice | |
| | President and Chief Investment Officer, U.S. of | |
| | Amundi US (since 2008); Executive Vice | |
| | President and Chief Investment Officer, U.S. of | |
| | Amundi Asset Management US, Inc. (since 2009); | |
| | Portfolio Manager of Amundi US (since 1999); | |
| | and Director of Amundi Holdings US, Inc. | |
| | (since 2017) | |
* | Ms. Jones and Mr. Taubes are Interested Trustees because they are officers or directors of the Portfolio’s investment adviser and certain of its affiliates. |
25
| | |
| Pioneer Real Estate VCT Portfolio | Pioneer Variable Contracts Trust |
| Trustees, Officers and Service Providers (continued) | |
| | | | |
| Name , Age and Position | Term of Office and | | Other Directorships |
| Held With the Trust | Length of Service | Principal Occupation | Held by Officer |
Fund Officers:
|
| Christopher J. Kelley (56) | Since 2003. Serves at the | Vice President and Associate General Counsel | None |
Secretary and Chief | discretion of the Board | of Amundi US since January 2008; Secretary and | |
Legal Officer | | Chief Legal Officer of all of the Pioneer Funds | |
| | since June 2010; Assistant Secretary of all of the | |
| | Pioneer Funds from September 2003 to | |
| | May 2010; Vice President and Senior Counsel of | |
| | Amundi US from July 2002 to December 2007 | |
| Carol B. Hannigan (59) | Since 2010. Serves at the | Fund Governance Director of Amundi US since | None |
Assistant Secretary | discretion of the Board | December 2006 and Assistant Secretary of all | |
| | the Pioneer Funds since June 2010; Manager – | |
| | Fund Governance of Amundi US from | |
| | December 2003 to November 2006; and Senior | |
| | Paralegal of Amundi US from January 2000 to | |
| | November 2003 | |
| Thomas Reyes (58) | Since 2010. Serves at the | Assistant General Counsel of Amundi US since | None |
Assistant Secretary | discretion of the Board | May 2013 and Assistant Secretary of all the | |
| | Pioneer Funds since June 2010; and Counsel of | |
| | Amundi US from June 2007 to May 2013 | |
| Mark E. Bradley (61) | Since 2008. Serves at the | Vice President – Fund Treasury of Amundi US; | None |
Treasurer and Chief Financial | discretion of the Board | Treasurer of all of the Pioneer Funds since | |
and Accounting Officer | | March 2008; Deputy Treasurer of Amundi US | |
| | from March 2004 to February 2008; and Assistant | |
| | Treasurer of all of the Pioneer Funds from | |
| | March 2004 to February 2008 | |
| Anthony J. Koenig, Jr. (57) | Since 2021. Serves at the | Senior Vice President – Fund Treasury of | None |
Assistant Treasurer | discretion of the Board | Amundi US; Assistant Treasurer of all of the | |
| | Pioneer Funds since January 2021; and Chief of | |
| | Staff, US Investment Management of Amundi US | |
| | from May 2008 to January 2021 | |
| Luis I. Presutti (55) | Since 2000. Serves at the | Director – Fund Treasury of Amundi US since | None |
Assistant Treasurer | discretion of the Board | 1999; and Assistant Treasurer of all of the | |
| | Pioneer Funds since 1999 | |
| Gary Sullivan (62) | Since 2002. Serves at the | Senior Manager – Fund Treasury of Amundi US | None |
Assistant Treasurer | discretion of the Board | since 2012; and Assistant Treasurer of all of the | |
| | Pioneer Funds since 2002 | |
| Antonio Furtado (38) | Since 2020. Serves at the | Fund Oversight Manager – Fund Treasury of | None |
Assistant Treasurer | discretion of the Board | Amundi US since 2020; Assistant Treasurer of all | |
| | of the Pioneer Funds since 2020; and Senior Fund | |
| | Treasury Analyst from 2012 - 2020 | |
| John Malone (50) | Since 2018. Serves at the | Managing Director, Chief Compliance Officer of | None |
Chief Compliance Officer | discretion of the Board | Amundi US Asset Management; Amundi Asset | |
| | Management US, Inc.; and the Pioneer Funds | |
| | since September 2018; and Chief Compliance | |
| | Officer of Amundi Distributor US, Inc. since | |
| | January 2014. | |
| Kelly O’Donnell (49) | Since 2006. Serves at the | Vice President – Amundi Asset Management; | None |
Anti-Money | discretion of the Board | and Anti-Money Laundering Officer of all the | |
Laundering Officer | | Pioneer Funds since 2006 | |
26
This page was intentionally left blank.
27
This page was intentionally left blank.
28
This page was intentionally left blank.
29
Proxy Voting Policies and Procedures of the Portfolio are available without charge, upon request, by calling our toll free number (1-800-225-6292). Information regarding how the Portfolio voted proxies relating to Portfolio securities during the most recent 12-month period ended June 30 is publicly available to shareowners at www.amundi.com/us. This information is also available on the Securities and Exchange Commission’s web site at www.sec.gov.
18653-15-0221
Pioneer Variable Contracts Trust
Pioneer Strategic Income
VCT Portfolio
Class I and II Shares
Annual Report | December 31, 2020
Paper copies of the Portfolio’s shareholder reports may no longer be sent by mail, unless you specifically request paper copies of the reports from the insurance company that offers your variable annuity or variable life insurance contract, or from your financial intermediary. Instead, the insurance company may choose to make the reports available on a website, and will notify you by mail each time a shareholder report is posted and provide you with a website link to access the report. Instructions for requesting paper copies will be provided by your insurance company.
You may elect to receive all future Portfolio shareholder reports in paper form, free of charge, from the insurance company. You can inform the insurance company or your financial intermediary that you wish to continue receiving paper copies of your shareholder reports by following the instructions provided by the insurance company, or by contacting your financial intermediary. Your election to receive reports in paper form will apply to all portfolios available under your contract with the insurance company.
Please refer to your contract prospectus to determine the applicable share class offered under your contract.
Pioneer Variable Contracts Trust
| | |
| |
| Pioneer Strategic Income VCT Portfolio | |
| | |
| 2 |
| | |
| 3 |
| | |
| 4 |
| | |
| 9 |
| | |
| 31 |
| | |
| 36 |
| | |
| 48 |
| | |
| 49 |
| | |
| 50 |
| | |
| 53 |
This report is authorized for distribution only when preceded or accompanied by a prospectus for the Portfolio being offered.
Pioneer Variable Contracts Trust files a complete schedule of portfolio holdings with the Securities and Exchange Commission for the first and third quarters of each fiscal year as an exhibit to its reports on Form N-PORT. Shareholders may view the filed Form N-PORT by visiting the Commission’s web site at https://www.sec.gov.
| |
| Pioneer Strategic Income VCT Portfolio | Pioneer Variable Contracts Trust
|
Portfolio Update 12/31/20 |
Portfolio Diversification
(As a percentage of total investments)*
5 Largest Holdings
(As a percentage of total investments)*
1. | U.S. Treasury Bills, 1/7/21 | 6.62% |
2. | U.S. Treasury Bills, 1/28/21 | 3.09 |
3. | Fannie Mae, 3.0%, 1/1/51 (TBA) | 2.32 |
4. | U.S. Treasury Bills, 1/26/21 | 2.21 |
5. | U.S. Treasury Note, | |
| 0.125%, 10/31/22 | 2.15 |
* | Excludes temporary cash investments and all derivative contracts except for options purchased. The Portfolio is actively managed, and current holdings may be different. The holdings listed should not be considered recommendations to buy or sell any securities. |
(q) | Pioneer ILS Interval Fund is an affiliated closed-end fund managed by Amundi Asset Management US, Inc. (the “Adviser”). |
Performance Update 12/31/20
Prices and Distributions| Net Asset Value per Share | | 12/31/20 | 12/31/19 |
| Class I | | $10.69 | $10.32 |
| Class II | | $10.67 | $10.30 |
|
| Net | | |
| Distributions per Share | Investment | Short-Term | Long-Term |
| (1/1/20 – 12/31/20) | Income | Capital Gains | Capital Gains |
| Class I | $0.3570 | $0.0174 | $0.0145 |
| Class II | $0.3315 | $0.0174 | $0.0145 |
Performance of a $10,000 InvestmentThe following chart shows the change in value of an investment made in Class I and Class II shares of Pioneer Strategic Income VCT Portfolio at net asset value during the periods shown, compared to that of the Bloomberg Barclays US Universal Index. Portfolio returns are based on net asset value and do not reflect any applicable insurance fees or surrender charges.
The Bloomberg Barclays US Universal Index is an unmanaged index that represents the union of the U.S. Aggregate Index, the US High Yield Corporate Index, the 144A Index, the Eurodollar Index, the Emerging Markets Index, the non-ERISA portion of the CMBS Index, and the CMBS High Yield Index. Municipal debt, private placements and non-dollar-denominated issues are excluded from the Index. Index returns are calculated monthly, assume reinvestment of dividends and, unlike Portfolio returns, do not reflect any fees, expenses or sales charges. It is not possible to invest directly in an index.
Average Annual Total Returns
(As of December 31, 2020) | | | Bloomberg |
| | | Barclays US |
| Class I | Class II | Universal Index |
10 Years | 4.63% | 4.37% | 4.16% |
5 Years | 5.59% | 5.33% | 4.87% |
1 Year | 7.63% | 7.37% | 7.58% |
All total returns shown assume reinvestment of distributions at net asset value.
Call 1-800-688-9915 or visit www.amundi.com/us for the most recent month-end performance results. Current performance may be lower or higher than the performance data quoted.
The performance data quoted represents past performance, which is no guarantee of future results. Investment return and principal value will fluctuate, and shares, when redeemed, may be worth more or less than their original cost.
The returns for the Portfolio do not reflect the deduction of expenses associated with variable products, such as mortality and expense risk charges, separate account charges, and sales charges. These expenses would reduce the overall returns shown.
Performance results reflect any applicable expense waivers in effect during the periods shown. Without such waivers performance would be lower. Waivers may not be in effect for all portfolios. Certain fee waivers are contractual through a specified period. Otherwise, fee waivers can be rescinded at any time. See the prospectus and financial statements for more information.
2
| Pioneer Strategic Income VCT Portfolio | Pioneer Variable Contracts Trust
|
Comparing Ongoing
Portfolio Expenses
As a shareowner in the Portfolio, you incur two types of costs:
(1) | ongoing costs, including management fees, distribution and/or service (12b-1) fees, and other Portfolio expenses; and |
(2) | transaction costs, including sales charges (loads) on purchase payments. |
This example is intended to help you understand your ongoing expenses (in dollars) of investing in the Portfolio and to compare these costs with the ongoing costs of investing in other mutual funds offered through your variable annuity contract. The example is based on an investment of $1,000 at the beginning of the Portfolio’s latest six-month period and held throughout the six months.
Using the Tables
Actual Expenses
The first table below provides information about actual account values and actual expenses. You may use the information in this table, together with the amount you invested, to estimate the expenses that you paid over the period as follows:
1. | Divide your account value by $1,000 |
| Example: an $8,600 account value ÷ $1,000 = 8.6 |
2. | Multiply the result in (1) above by the corresponding share class’s number in the third row under the heading entitled “Expenses Paid During Period” to estimate the expenses you paid on your account during this period. |
Expenses Paid on a $1,000 Investment in Pioneer Strategic Income VCT Portfolio
Based on actual returns from July 1, 2020 through December 31, 2020.
| | | |
| Share Class | I | II |
Beginning Account Value on 7/1/20 | $1,000.00 | $1,000.00 |
Ending Account Value on 12/31/20 | $1,089.04 | $1,085.64 |
Expenses Paid During Period* | $3.94 | $5.19 |
* | Expenses are equal to the Portfolio’s annualized expense ratio of 0.75% and 0.99%, for Class I and Class II shares, respectively, multiplied by the average account value over the period, multiplied by 184/366 (to reflect the one-half year period). |
Hypothetical Example for Comparison Purposes
The table below provides information about hypothetical account values and hypothetical expenses based on the Portfolio’s actual expense ratio and an assumed rate of return of 5% per year before expenses, which is not the Portfolio’s actual return. The hypothetical account values and expenses may not be used to estimate the actual ending account balance or expenses you paid for the period.
You may use this information to compare the ongoing costs of investing in the Portfolio and other variable annuities. To do so, compare this 5% hypothetical example with the 5% hypothetical examples that appear in the shareholder reports of the other variable annuities.
Please note that the expenses shown in the tables are meant to highlight your ongoing costs only and do not reflect any transaction costs, such as sales charges (loads) that are charged at the time of the transaction. Therefore, the table below is useful in comparing ongoing costs only and will not help you determine the relative total costs of owning different variable annuities. In addition, if these transaction costs were included, your costs would have been higher.
Expenses Paid on a $1,000 Investment in Pioneer Strategic Income VCT Portfolio
Based on a hypothetical 5% per year return before expenses, reflecting the period from July 1, 2020 through December 31, 2020.
| Share Class | I | II |
Beginning Account Value on 7/1/20 | $1,000.00 | $1,000.00 |
Ending Account Value on 12/31/20 | $1,021.37 | $1,020.16 |
Expenses Paid During Period* | $3.81 | $5.03 |
* | Expenses are equal to the Portfolio’s annualized expense ratio of 0.75% and 0.99%, for Class I and Class II shares, respectively, multiplied by the average account value over the period, multiplied by 184/366 (to reflect the one-half year period). |
3
| |
| Pioneer Strategic Income VCT Portfolio | Pioneer Variable Contracts Trust
|
Portfolio Management Discussion 12/31/20 | |
Call 1-800-688-9915 or visit www.amundi.com/us for the most recent month-end performance results. Current performance may be lower or higher than the performance data quoted.
The performance data quoted represents past performance, which is no guarantee of future results. Investment return and principal value will fluctuate, and shares, when redeemed, may be worth more or less than their original cost.
The returns for the Portfolio do not reflect the deduction of expenses associated with variable products, such as mortality and expense risk charges, separate account charges, and sales charges. These expenses would reduce the overall returns shown.
Performance results reflect any applicable expense waivers in effect during the periods shown. Without such waivers performance would be lower. Waivers may not be in effect for all portfolios. Certain fee waivers are contractual through a specified period. Otherwise, fee waivers can be rescinded at any time. See the prospectus and financial statements for more information.
In the following interview, Jonathan Scott and Andrew Feltus discuss the factors that affected the performance of Pioneer Strategic Income VCT Portfolio during the 12-month period ended December 31, 2020. Mr. Scott, a Vice President and portfolio manager at Amundi Asset Management US, Inc. (Amundi US), Mr. Feltus, Managing Director, Co-Director of High Yield, and a portfolio manager at Amundi US, and Kenneth J. Taubes, Executive Vice President and Chief Investment Officer, US, and a portfolio manager at Amundi US, are responsible for the day-to-day management of the Portfolio.
Q: How did the Portfolio perform during the 12-month period ended December 31, 2020?
A: Pioneer Strategic Income VCT Portfolio’s Class I shares returned 7.63% at net asset value during the 12-month period ended December 31, 2020, and Class II shares returned 7.37%, while the Portfolio’s benchmark, the Bloomberg Barclays US Universal Index (the Bloomberg Barclays Index), returned 7.58%.
Q: How would you describe the investment environment in the fixed-income markets during the 12-month period ended December 31, 2020?
A: After a benign opening to the 2020 calendar year, credit-sensitive fixed-income markets experienced a historic disruption in March, as the emergence of the COVID-19 virus and the related lockdown policies implemented to help curb its spread all but shuttered the global economy. Investors fled riskier assets on a broad scale and moved into so-called “safe havens” such as US Treasuries, which had the effect of driving Treasury yields to all-time lows. Significant selling in US dollar (USD) fixed-income markets eventually stressed market functionality and led to price dislocations in all segments, even Treasury bonds. As the “liquidity grab” by investors gathered pace in mid-March, historical asset-class return relationships broke down, and performance became almost entirely correlated. (Correlation is defined as the degree to which assets or asset-class prices have moved in relation to one another. Correlation ranges from -1, always moving in opposite directions; through 0, absolutely independent; to 1, always moving together.)
The liquidity stress was greatest in the securitized credit sectors of nonagency mortgage-backed securities (MBS), asset-backed securities (ABS), and commercial MBS (CMBS), which have traditionally had a narrower buyer base than corporate bonds. Those markets faced forced selling by real estate investment trusts (REITs) and other leveraged investors, and by certain mutual funds, as concerns escalated over the impact of the pandemic on the US employment situation and on the ability of homeowners and businesses to service their mortgages.
The policy response to the market and economic turmoil from both central banks and government authorities was swift, as they sought to keep businesses and consumers from going under. The US Federal Reserve (Fed) slashed the target range of the benchmark federal funds rate to zero in mid-March, resurrected its 2008/2009 financial crisis-era lending facilities, and launched a wide-ranging bond-purchase program. On the fiscal side, the US Congress and the White House agreed upon a $2.2 trillion stimulus package in late March, and later approved additional aid packages in the second quarter.
4
| Pioneer Strategic Income VCT Portfolio | Pioneer Variable Contracts Trust
|
The extraordinary support from policy makers in the wake of the pandemic had a positive effect on the markets in the second quarter. Investor optimism rose on the prospects that steps taken towards re-opening the economy could support something resembling a “V-shaped” recovery (that is, a swift, sharp rise). The result was a revival of sentiment towards the riskier assets that the market had been so quick to shun at the height of the pandemic crisis. The shift in investors’ appetites allowed credit-sensitive areas of the bond market to recover much of their earlier losses over April and May. June saw the return of some market volatility as well as a widening in credit spreads as COVID-19 cases surged in a few states that had re-opened earlier than others, reigniting shutdown concerns. (Credit spreads, or spreads, are commonly defined as the differences in yield between Treasuries and other types of fixed-income securities with similar maturities.)
After simmering throughout the summer, macroeconomic uncertainty bubbled over during September, weighing on investor sentiment and the performance of riskier assets. The focus on heightened risks revolved around three key areas: stalled negotiations among law makers over another US fiscal stimulus package, a continued rise in COVID-19 cases, and the November US elections. A partisan dispute over when to appoint the late Supreme Court Justice Ginsburg’s replacement further hardened both parties’ negotiating positions on the fiscal stimulus bill, and lowered the odds of broader government support for the economy coming to fruition prior to the November election. At the same time, a notable uptick in European COVID-19 cases reignited fears that the US remained at risk for a second wave of virus cases, and yet another round of economic lockdowns in response. Finally, concerns mounted over the potential for a protracted dispute over the presidential election results as November 3rd drew closer.
In December, towards the end of the 12-month period, the US economic outlook received two “shots in the arm,” as a pair of COVID-19 vaccines were authorized for emergency use by the Food and Drug Administration, and Congress finally agreed upon a $900 billion COVID relief package. The vaccines could help alleviate uncertainty regarding public health in general, and may bring forward the timing of a return to economic normalcy. Meanwhile, the additional fiscal stimulus could offer needed support for many individuals and businesses. Over the final weeks of the 12-month period, investors elected to focus attention on those positive developments and looked beyond another surge in COVID-19 cases as well as data suggesting a slowing in the rate of the economic recovery. As a result, riskier assets rallied once again, and Treasury yields drifted higher into the end of the calendar year.
For the 12-month period ended December 31, 2020, the investment-grade corporate bond market returned almost 10%, while high-yield corporate bonds returned more than 7%. Long-term Treasuries provided strong positive returns as well, given the steep decline in yields seen over the first quarter of 2020. Securitized assets ended the period in positive territory, too, but lagged the performance of both investment-grade corporates and Treasuries.
5
| Pioneer Strategic Income VCT Portfolio | Pioneer Variable Contracts Trust
|
| Portfolio Management Discussion 12/31/20 (continued) |
Q: What factors influenced the Portfolio’s performance relative to the Bloomberg Barclays Index during the 12-month period ended December 31, 2020?
A: As a multisector fixed-income strategy, we managed the Portfolio with the aim of potentially delivering strong returns, while experiencing volatility similar to its benchmark, by investing across a diversified* range of investment-grade and non-investment-grade global fixed-income asset classes. We seek to add value through both sector allocation and security selection, focusing on sectors that trade at a yield advantage relative to US Treasuries, including corporate bonds, agency mortgage-backed securities (MBS), securitized assets, and emerging markets, which have typically offered higher risk-adjusted returns than Treasuries as well as greater security selection opportunities.
We take a dynamic approach to sector allocation, and so we will at times increase the Portfolio’s risk profile when we believe that market conditions may be offering significant compensation in exchange for the additional risk, and we may reduce the risk profile when we feel that values in the market are less attractive.
The Portfolio’s performance was basically in line with the benchmark’s for the 12-month period. Asset allocation decisions were the primary driver of positive relative returns, while security selection also contributed positively to benchmark-relative performance. The main detractor from the Portfolio’s benchmark-relative results was duration positioning versus the Bloomberg Barclays Index. (Duration is a measure of the sensitivity of the price, or the value of principal, of a fixed-income investment to a change in interest rates, expressed as a number of years.) The Fund’s derivatives exposures, which are discussed later, also detracted from benchmark-relative performance.
With regard to asset allocation, the Fund’s exposures to corporate bonds, both investment grade and high yield, aided relative performance during the 12-month period.
In the wake of the first quarter’s market disruption, we added what we felt were attractively priced bonds in long-duration investment-grade corporates to the Portfolio, taking advantage of new issuance as companies sought to shore up liquidity in order to weather the economic crisis. As investment-grade spreads moved back toward pre-crisis levels, we trimmed the allocation in favor of high-yield corporates, where we saw better value. Both moves aided relative performance as first investment-grade, and later high-yield corporates, experienced solid returns over the full 12-month period. The Portfolio’s exposure to credit-risk-transfer issues within agency MBS aided relative performance. The Portfolio’s non-US dollar (USD) allocations were another positive contributor to relative returns, as the USD declined versus other major currencies over the 12-month period.
With regard to duration positioning, we had maintained an overall Portfolio duration and corresponding sensitivity to interest-rate changes in a range modestly below that of the Bloomberg Barclays Index. That positioning was a drag on benchmark-relative returns during a 12-month period featuring declining interest rates and Treasury yields.
* Diversification does not assure a profit nor protect against loss.
6
| Pioneer Strategic Income VCT Portfolio | Pioneer Variable Contracts Trust
|
Q: Did the Portfolio have any exposure to derivatives during the 12-month period ended December 31, 2020? If so, did the derivatives have any material impact on performance?
A: Yes, the Portfolio invested in three types of derivatives: credit-default swaps, forward foreign currency transactions (currency forwards and options), and Treasury futures. The exposure to Treasury futures was part of our strategy to maintain a shorter-than-benchmark duration in the Portfolio, which had a negative impact on relative results during the period. We used the investments in credit-default swaps to manage the Portfolio’s exposure to credit-sensitive sectors; the swaps resulted in a negative effect on relative performance. Finally, we used currency forwards and options as a technique to help manage the risks associated with the Portfolio’s non-USD allocations; the tactic had a mixed effect on benchmark-relative results, as hedge positions helped performance, while longer exposures detracted, but did help to lower Portfolio volatility.
Q: What factors affected the Portfolio’s yield, or distributions** to shareholders, during the 12-month period ended December 31, 2020?
A: The sharp decline in Treasury yields during the 12-month period had a negative effect on the Portfolio’s yield/distributions as the fiscal year progressed.
Q: What is your investment outlook and how is the Portfolio positioned heading into a new fiscal year?
A: We anticipate accelerating domestic economic growth in 2021 as COVID-19 vaccines are rolled out and consumers slowly regain confidence and reopen their pocketbooks, potentially unleashing a wave of pent-up demand for services such as travel and dining during the second half of the calendar year.
Consumers, in general, have built up high levels of savings throughout 2020, while incomes have rebounded quickly from the trough of earlier in the year.
Despite this outlook, we do not expect the Fed to start removing its accommodative monetary policies in 2021, as it has signaled an intense focus on getting the US economy back to full employment. In our view, the Fed has learned from its policy mistakes in 2018 and could be willing to maintain a highly supportive monetary policy environment, even if inflation ticks up above the US central bank’s target rate.
While an accommodative Fed can anchor short-term US yields, we believe the Treasury curve could steepen as domestic economic growth accelerates (and prices rise) over the next year. At the same time, very low government bond yields globally may limit the extent of any increase in long-term US yields.
We believe active security selection and sector allocation could be essential ingredients to the Portfolio’s performance in the coming year. We have maintained a positive outlook for sectors where valuations are still below their pre-pandemic levels and have remained disconnected from the underlying fundamentals, in our view. A backdrop of strong economic growth, accommodative monetary policies, and continued global demand for yield has
** Distributions are not guaranteed. |
7
| Pioneer Strategic Income VCT Portfolio | Pioneer Variable Contracts Trust
|
| Portfolio Management Discussion 12/31/20 (continued) |
A Word About Risk:
All investments are subject to risk, including the possible loss of principal. In the past several years, financial markets have experienced increased volatility and heightened uncertainty. The market prices of securities may go up or down, sometimes rapidly or unpredictably, due to general market conditions, such as real or perceived adverse economic, political, or regulatory conditions, recessions, inflation, changes in interest or currency rates, lack of liquidity in the bond markets, the spread of infectious illness or other public health issues or adverse investor sentiment. These conditions may continue, recur, worsen or spread.
Investments in high-yield or lower-rated securities are subject to greater-than-average price volatility, illiquidity and possibility of default.
When interest rates rise, the prices of fixed-income securities in the Portfolio will generally fall. Conversely, when interest rates fall the prices of fixed-income securities in the Portfolio will generally rise.
Investments in the Portfolio are subject to possible loss due to the financial failure of the issuers of the underlying securities and their inability to meet their debt obligations.
Prepayment risk is the chance that an issuer may exercise its right to prepay its security, if falling interest rates prompt the issuer to do so. Forced to reinvest the unanticipated proceeds at lower interest rates, the Portfolio would experience a decline in income and lose the opportunity for additional price appreciation.
The securities issued by U.S. government sponsored entities (i.e., FNMA, Freddie Mac) are neither guaranteed nor issued by the U.S. government.
The Portfolio may invest in mortgage-backed securities, which during times of fluctuating interest rates may increase or decrease more than other fixed-income securities. Mortgage-backed securities are also subject to prepayments.
Investing in foreign and/or emerging markets securities involves risks relating to interest rates, currency exchange rates, economic, and political conditions.
At times, the Portfolio’s investments may represent industries or industry sectors that are interrelated or have common risks, making the Portfolio more susceptible to any economic, political, or regulatory developments or other risks affecting those industries and sectors.
These risks may increase share price volatility.
continued to lend support to the corporate bond market. However, we believe current spreads have broadly reflected those expectations, and thus have continued to highlight the importance of security selection.
We view US housing-related securitized assets as positioned to benefit from solid consumer balance sheets, historically low mortgage rates, tight inventories, and strong demand, driven in part by a pandemic-induced shift in preference toward single-family homes.
In our view, the USD could likely continue to depreciate going forward. Lower yields and higher deficits in the US may put pressure on the USD, and such USD cycles have typically lasted for extended periods. As a result, we believe there is value in emerging markets currencies and bonds as well as in developed markets, but we have focused the Portfolio’s investments on countries where we expect economic growth to rebound.
Please refer to the Schedule of Investments on pages 9 to 30 for a full listing of Portfolio securities.
Past performance is no guarantee of future results.
Any information in this shareholder report regarding market or economic trends or the factors influencing the Portfolio’s historical or future performance are statements of opinion as of the date of this report.
8
| Pioneer Strategic Income VCT Portfolio | Pioneer Variable Contracts Trust
|
Schedule of Investments 12/31/20 |
| | | | |
| Shares | | | Value |
| | | UNAFFILIATED ISSUERS — 99.3% | |
| | | COMMON STOCKS — 0.0%† of Net Assets | |
| | | Auto Components — 0.0%† | |
| 22 | | Lear Corp. | $ 3,499 |
| | | Total Auto Components | $ 3,499 |
| | | Household Durables — 0.0%† | |
| 15,463(a) | | Desarrolladora Homex SAB de CV | $ 32 |
| | | Total Household Durables | $ 32 |
| | | Paper & Forest Products — 0.0%† | |
| 1,032 | | Emerald Plantation Holdings, Ltd. | $ 41 |
| | | Total Paper & Forest Products | $ 41 |
| | | TOTAL COMMON STOCKS | |
| | | (Cost $8,087) | $ 3,572 |
| | | CONVERTIBLE PREFERRED STOCKS — 1.8% of Net Assets | |
| | | Banks — 1.8% | |
| 106(b) | | Bank of America Corp., 7.25% | $ 160,970 |
| 418(b) | | Wells Fargo & Co., 7.5% | 634,482 |
| | | Total Banks | $ 795,452 |
| | | TOTAL CONVERTIBLE PREFERRED STOCKS | |
| | | (Cost $697,292) | $ 795,452 |
| Principal | | | |
| Amount | | | |
| USD ($) | | | |
| | | ASSET BACKED SECURITIES — 6.3% of Net Assets | |
| 100,000 | | Conn’s Receivables Funding LLC, Series 2019-B, Class C, 4.6%, 6/17/24 (144A) | $ 100,250 |
| 22,984(c) | | Equifirst Mortgage Loan Trust, Series 2003-1, Class IF1, 4.01%, 12/25/32 | 23,573 |
| 138,429 | | Finance of America Structured Securities Trust, Series 2019-JR3, Class JR2, 2.0%, 9/25/69 | 146,274 |
| 29,325 | | Hardee’s Funding LLC, Series 2018-1A, Class A2II, 4.959%, 6/20/48 (144A) | 31,271 |
| 37,686 | | Icon Brand Holdings LLC, Series 2013-1A, Class A2, 4.352%, 1/25/43 (144A) | 14,888 |
| 100,000 | | Progress Residential Trust, Series 2018-SFR3, Class F, 5.368%, 10/17/35 (144A) | 102,183 |
| 100,000 | | Republic Finance Issuance Trust, Series 2019-A, Class B, 3.93%, 11/22/27 (144A) | 100,429 |
| 100,000 | | Small Business Lending Trust, Series 2019-A, Class C, 4.31%, 7/15/26 (144A) | 90,888 |
| 100,000(d) | | Towd Point Mortgage Trust, Series 2015-2, Class 1B3, 3.338%, 11/25/60 (144A) | 100,926 |
| 150,000(d) | | Towd Point Mortgage Trust, Series 2015-6, Class B1, 3.91%, 4/25/55 (144A) | 163,571 |
| 150,000(d) | | Towd Point Mortgage Trust, Series 2016-1, Class B1, 3.943%, 2/25/55 (144A) | 160,261 |
| 100,000(d) | | Towd Point Mortgage Trust, Series 2016-2 , Class B2, 3.49%, 8/25/55 (144A) | 105,513 |
| 100,000(d) | | Towd Point Mortgage Trust, Series 2016-3, Class B1, 4.099%, 4/25/56 (144A) | 109,565 |
| 125,000(d) | | Towd Point Mortgage Trust, Series 2016-4, Class B1, 3.883%, 7/25/56 (144A) | 134,550 |
| 150,000(d) | | Towd Point Mortgage Trust, Series 2017-1, Class B2, 3.866%, 10/25/56 (144A) | 160,472 |
| 100,000(d) | | Towd Point Mortgage Trust, Series 2017-2, Class M2, 3.75%, 4/25/57 (144A) | 109,733 |
| 150,000(d) | | Towd Point Mortgage Trust, Series 2017-3, Class M2, 3.75%, 7/25/57 (144A) | 162,558 |
| 175,000(d) | | Towd Point Mortgage Trust, Series 2017-4, Class B1, 3.518%, 6/25/57 (144A) | 184,746 |
| 165,000(d) | | Towd Point Mortgage Trust, Series 2017-6, Class A2, 3.0%, 10/25/57 (144A) | 175,623 |
| 155,000(d) | | Towd Point Mortgage Trust, Series 2017-6, Class M1, 3.25%, 10/25/57 (144A) | 166,529 |
| 100,000(d) | | Towd Point Mortgage Trust, Series 2018-3, Class M1, 3.875%, 5/25/58 (144A) | 107,695 |
| 100,000(d) | | Towd Point Mortgage Trust, Series 2019-4, Class B1B, 3.5%, 10/25/59 (144A) | 100,708 |
| 150,000(d) | | Towd Point Mortgage Trust, Series 2019-4, Class M2B, 3.25%, 10/25/59 (144A) | 154,333 |
| 100,000(d) | | Towd Point Mortgage Trust, Series 2020-2, Class M1B, 3.0%, 4/25/60 (144A) | 103,874 |
| | | TOTAL ASSET BACKED SECURITIES | |
| | | (Cost $2,722,640) | $ 2,810,413 |
The accompanying notes are an integral part of these financial statements.
9
| Pioneer Strategic Income VCT Portfolio | Pioneer Variable Contracts Trust
|
| Schedule of Investments 12/31/20 (continued) |
| | | | |
| Principal | | | |
| Amount | | | |
| USD ($) | | | Value |
| | | COLLATERALIZED MORTGAGE OBLIGATIONS — 8.6% of Net Assets | |
| 85,000(d) | | Bayview Opportunity Master Fund IVa Trust, Series 2017-RT5, Class B1, 4.0%, 5/28/69 (144A) | $ 92,338 |
| 40,000(d) | | Bayview Opportunity Master Fund IVa Trust, Series 2017-SPL5, Class B1, 4.0%, 6/28/57 (144A) | 43,129 |
| 97,343(d) | | BRAVO Residential Funding Trust, Series 2020-RPL2, Class A1, 2.0%, 5/25/59 (144A) | 100,255 |
| 135,000(d) | | Citigroup Mortgage Loan Trust, Inc., Series 2018-RP1, Class M1, 3.0%, 9/25/64 (144A) | 144,522 |
| 74,262(d) | | Citigroup Mortgage Loan Trust, Inc., Series 2018-RP2, Class A1, 3.5%, 2/25/58 (144A) | 78,386 |
| 108,487 | | Citigroup Mortgage Loan Trust, Inc., Series 2020-EXP2, Class A3, 2.5%, 8/25/50 (144A) | 112,089 |
| 100,000(e) | | Connecticut Avenue Securities Trust, Series 2019-R02, Class 1B1, 4.298% (1 Month USD | |
| | | LIBOR + 415 bps), 8/25/31 (144A) | 100,125 |
| 30,000(e) | | Connecticut Avenue Securities Trust, Series 2019-R04, Class 2B1, 5.398% (1 Month USD | |
| | | LIBOR + 525 bps), 6/25/39 (144A) | 30,561 |
| 100,000(e) | | Connecticut Avenue Securities Trust, Series 2019-R06, Class 2B1, 3.898% (1 Month USD | |
| | | LIBOR + 375 bps), 9/25/39 (144A) | 96,520 |
| 30,000(e) | | Connecticut Avenue Securities Trust, Series 2020-SBT1, Class 1M2, 3.798% (1 Month USD | |
| | | LIBOR + 365 bps), 2/25/40 (144A) | 30,107 |
| 50,000(e) | | Connecticut Avenue Securities Trust, Series 2020-SBT1, Class 2M2, 3.798% (1 Month USD | |
| | | LIBOR + 365 bps), 2/25/40 (144A) | 50,249 |
| 35,303(d) | | CSMC Trust, Series 2015-1, Class B4, 3.942%, 1/25/45 (144A) | 36,687 |
| 150,000(e) | | Eagle Re, Ltd., Series 2019-1, Class B1, 4.648% (1 Month USD LIBOR + 450 bps), 4/25/29 (144A) | 147,173 |
| 150,000(e) | | Eagle Re, Ltd., Series 2020-2, Class B1, 7.148% (1 Month USD LIBOR + 700 bps), 10/25/30 (144A) | 149,888 |
| 73,310(e) | | Fannie Mae Connecticut Avenue Securities, Series 2018-C06, Class 1M2, 2.148% (1 Month USD | |
| | | LIBOR + 200 bps), 3/25/31 | 72,838 |
| 143,362(e)(f) | | Federal Home Loan Mortgage Corp. REMICS, Series 4087, Class SB, 5.871% (1 Month USD | |
| | | LIBOR + 603 bps), 7/15/42 | 28,405 |
| 80,559(e)(f) | | Federal Home Loan Mortgage Corp. REMICS, Series 4091, Class SH, 6.391% (1 Month USD | |
| | | LIBOR + 655 bps), 8/15/42 | 17,331 |
| 61,647(e)(f) | | Federal National Mortgage Association REMICS, Series 2012-14, Class SP, 6.402% (1 Month USD | |
| | | LIBOR + 655 bps), 8/25/41 | 8,124 |
| 50,168(e)(f) | | Federal National Mortgage Association REMICS, Series 2018-43, Class SM, 6.052% (1 Month USD | |
| | | LIBOR + 620 bps), 6/25/48 | 7,408 |
| 69,450(e)(f) | | Federal National Mortgage Association REMICS, Series 2019-33, Class S, 5.902% (1 Month USD | |
| | | LIBOR + 605 bps), 7/25/49 | 12,215 |
| 58,289(e)(f) | | Federal National Mortgage Association REMICS, Series 2019-41, Class PS, 5.902% (1 Month USD | |
| | | LIBOR + 605 bps), 8/25/49 | 7,407 |
| 55,439(e)(f) | | Federal National Mortgage Association REMICS, Series 2019-41, Class SM, 5.902% (1 Month USD | |
| | | LIBOR + 605 bps), 8/25/49 | 7,910 |
| 3,112 | | Federal National Mortgage Association REMICS, Series 2009-36, Class HX, 4.5%, 6/25/29 | 3,278 |
| 78,139 | | Finance of America Structured Securities Trust, Series 2018-A, Class JR2, 1.646%, 12/26/68 (144A) | 84,826 |
| 40,000(e) | | Fannie Mae Connecticut Avenue Securities, Series 2018-C03, Class 1B1, 3.898% (1 Month USD | |
| | | LIBOR + 375 bps), 10/25/30 | 40,328 |
| 30,000(e) | | Freddie Mac Stacr Remic Trust, Series 2020-DNA2, Class B1, 2.648% (1 Month USD | |
| | | LIBOR + 250 bps), 2/25/50 (144A) | 29,381 |
| 80,000(e) | | Freddie Mac Stacr Remic Trust, Series 2020-DNA3, Class B1, 5.248% (1 Month USD | |
| | | LIBOR + 510 bps), 6/25/50 (144A) | 83,104 |
| 70,000(e) | | Freddie Mac Stacr Remic Trust, Series 2020-DNA4, Class B1, 6.148% (1 Month USD | |
| | | LIBOR + 600 bps), 8/25/50 (144A) | 74,281 |
| 40,000(e) | | Freddie Mac Stacr Remic Trust, Series 2020-DNA4, Class B2, 10.148% (1 Month USD | |
| | | LIBOR + 1,000 bps), 8/25/50 (144A) | 48,039 |
| 100,000(e) | | Freddie Mac Stacr Remic Trust, Series 2020-DNA5, Class B2, 11.582% (SOFR30A + | |
| | | 1,150 bps), 10/25/50 (144A) | 122,359 |
The accompanying notes are an integral part of these financial statements.
10
| Pioneer Strategic Income VCT Portfolio | Pioneer Variable Contracts Trust
|
| | | | |
| Principal | | | |
| Amount | | | |
| USD ($) | | | Value |
| | | COLLATERALIZED MORTGAGE OBLIGATIONS (continued) | |
| 50,000(e) | | Freddie Mac Stacr Remic Trust, Series 2020-DNA6, Class B1, 3.077% (SOFR30A + 300 bps), | |
| | | 12/25/50 (144A) | $ 50,000 |
| 50,000(e) | | Freddie Mac Stacr Remic Trust, Series 2020-DNA6, Class B2, 5.727% (SOFR30A + 565 bps), | |
| | | 12/25/50 (144A) | 50,735 |
| 50,000(e) | | Freddie Mac Stacr Remic Trust, Series 2020-HQA2, Class M2, 3.248% (1 Month USD | |
| | | LIBOR + 310 bps), 3/25/50 (144A) | 50,344 |
| 30,000(e) | | Freddie Mac Stacr Remic Trust, Series 2020-HQA3, Class B2, 10.148% (1 Month USD | |
| | | LIBOR + 1,000 bps), 7/25/50 (144A) | 35,314 |
| 150,000(e) | | Freddie Mac Stacr Trust, Series 2018-HQA2, Class B1, 4.398% (1 Month USD | |
| | | LIBOR + 425 bps), 10/25/48 (144A) | 153,370 |
| 100,000(e) | | Freddie Mac Stacr Trust, Series 2018-HQA2, Class M2, 2.448% (1 Month USD | |
| | | LIBOR + 230 bps), 10/25/48 (144A) | 98,988 |
| 72,392(e) | | Freddie Mac Stacr Trust, Series 2019-HQA1, Class M2, 2.498% (1 Month USD | |
| | | LIBOR + 235 bps), 2/25/49 (144A) | 72,207 |
| 60,000(e) | | Freddie Mac Stacr Trust, Series 2019-HRP1, Class B1, 4.198% (1 Month USD | |
| | | LIBOR + 405 bps), 2/25/49 (144A) | 57,012 |
| 100,000(e) | | Freddie Mac Structured Agency Credit Risk Debt Notes, Series 2020-HQA5, Class B1, | |
| | | 4.082% (SOFR30A + 400 bps), 11/25/50 (144A) | 101,745 |
| 80,000(e) | | Freddie Mac Structured Agency Credit Risk Debt Notes, Series 2020-HQA5, Class B2, | |
| | | 7.482% (SOFR30A + 740 bps), 11/25/50 (144A) | 87,187 |
| 22,136 | | Government National Mortgage Association, Series 2009-83, Class EB, 4.5%, 9/20/39 | 24,991 |
| 5,701 | | Government National Mortgage Association, Series 2012-130, Class PA, 3.0%, 4/20/41 | 5,823 |
| 153,626(e)(f) | | Government National Mortgage Association, Series 2019-90, Class SA, 3.148% (1 Month USD | |
| | | LIBOR + 330 bps), 7/20/49 | 13,813 |
| 318,971(f) | | Government National Mortgage Association, Series 2019-110, Class PI, 3.5%, 9/20/49 | 23,340 |
| 326,721(e)(f) | | Government National Mortgage Association, Series 2019-117, Class SB, 3.268% (1 Month USD | |
| | | LIBOR + 342 bps), 9/20/49 | 26,276 |
| 325,751(e)(f) | | Government National Mortgage Association, Series 2019-121, Class SA, 3.198% (1 Month USD | |
| | | LIBOR + 335 bps), 10/20/49 | 28,992 |
| 500,534(f) | | Government National Mortgage Association, Series 2019-128, Class IB, 3.5%, 10/20/49 | 53,516 |
| 791,596(f) | | Government National Mortgage Association, Series 2019-128, Class ID, 3.5%, 10/20/49 | 57,964 |
| 235,318(f) | | Government National Mortgage Association, Series 2019-159, Class CI, 3.5%, 12/20/49 | 25,676 |
| 254,280(e)(f) | | Government National Mortgage Association, Series 2020-9, Class SA, 3.198% (1 Month USD | |
| | | LIBOR + 335 bps), 1/20/50 | 21,818 |
| 100,000(e) | | Home Partners of America Trust, Series 2017-1, Class D, 2.053% (1 Month USD | |
| | | LIBOR + 190 bps), 7/17/34 (144A) | 99,875 |
| 19,982(d) | | JP Morgan Mortgage Trust, Series 2014-1, Class B4, 3.706%, 1/25/44 (144A) | 20,528 |
| 43,409(d) | | JP Morgan Mortgage Trust, Series 2018-LTV1, Class A3, 4.5%, 4/25/49 (144A) | 44,181 |
| 39,039(d) | | JP Morgan Mortgage Trust, Series 2019-LTV1, Class A3, 4.0%, 6/25/49 (144A) | 40,089 |
| 100,000(d) | | Mill City Mortgage Loan Trust, Series 2019-GS1, Class M1, 3.0%, 7/25/59 (144A) | 106,604 |
| 100,000(d) | | Mill City Mortgage Loan Trust, Series 2019-GS2, Class M3, 3.25%, 8/25/59 (144A) | 103,961 |
| 81,755(d) | | New Residential Mortgage Loan Trust, Series 2019-RPL2, Class A1, 3.25%, 2/25/59 (144A) | 86,635 |
| 96,347(d) | | Sequoia Mortgage Trust, Series 2013-5, Class A2, 3.0%, 5/25/43 (144A) | 97,879 |
| 38,169(d) | | Sequoia Mortgage Trust, Series 2013-6, Class A1, 2.5%, 5/25/43 | 39,114 |
| 60,000(d) | | Towd Point Mortgage Trust, Series 2015-5, Class M1, 3.5%, 5/25/55 (144A) | 62,941 |
| 70,000(d) | | Towd Point Mortgage Trust, Series 2015-6, Class M1, 3.75%, 4/25/55 (144A) | 75,476 |
| 150,000(d) | | Towd Point Mortgage Trust, Series 2019-4, Class M1, 3.5%, 10/25/59 (144A) | 161,138 |
| | | TOTAL COLLATERALIZED MORTGAGE OBLIGATIONS | |
| | | (Cost $3,964,610) | $ 3,836,795 |
The accompanying notes are an integral part of these financial statements.
11
| Pioneer Strategic Income VCT Portfolio | Pioneer Variable Contracts Trust
|
| Schedule of Investments 12/31/20 (continued) |
| | | | |
| Principal | | | |
| Amount | | | |
| USD ($) | | | Value |
| | | COMMERCIAL MORTGAGE-BACKED SECURITIES — 6.2% of Net Assets | |
| 40,000 | | Benchmark Mortgage Trust, Series 2018-B5, Class A3, 3.944%, 7/15/51 | $ 46,819 |
| 100,000(d) | | Benchmark Mortgage Trust, Series 2020-IG3, Class B, 3.387%, 9/15/48 (144A) | 108,686 |
| 30,000 | | CD Mortgage Trust, Series 2018-CD7, Class A3, 4.013%, 8/15/51 | 35,045 |
| 40,000 | | CFCRE Commercial Mortgage Trust, Series 2016-C3, Class A2, 3.597%, 1/10/48 | 44,288 |
| 99,570(e) | | CHC Commercial Mortgage Trust, Series 2019-CHC, Class E, 2.509% (1 Month USD | |
| | | LIBOR + 235 bps), 6/15/34 (144A) | 86,487 |
| 150,000 | | Citigroup Commercial Mortgage Trust, Series 2018-B2, Class A3, 3.744%, 3/10/51 | 172,039 |
| 65,000(e) | | CLNY Trust, Series 2019-IKPR, Class E, 2.88% (1 Month USD | |
| | | LIBOR + 272 bps), 11/15/38 (144A) | 56,861 |
| 100,000(e) | | Cold Storage Trust, Series 2020-ICE5, Class D, 2.259% (1 Month USD | |
| | | LIBOR + 210 bps), 11/15/37 (144A) | 100,031 |
| 25,000 | | COMM Mortgage Trust, Series 2012-CR4, Class AM, 3.251%, 10/15/45 | 25,221 |
| 100,000(d) | | COMM Mortgage Trust, Series 2013-CR11, Class C, 5.12%, 8/10/50 (144A) | 101,164 |
| 100,000(d) | | COMM Mortgage Trust, Series 2015-CR24, Class D, 3.463%, 8/10/48 | 88,779 |
| 75,000(d) | | COMM Mortgage Trust, Series 2015-DC1, Class B, 4.035%, 2/10/48 | 78,672 |
| 100,000(d) | | CSAIL Commercial Mortgage Trust, Series 2015-C1, Class C, 4.264%, 4/15/50 | 91,213 |
| 25,000(d) | | CSAIL Commercial Mortgage Trust, Series 2015-C4, Class D, 3.563%, 11/15/48 | 23,871 |
| 100,000(d) | | FREMF Mortgage Trust, Series 2016-K52, Class B, 3.925%, 1/25/49 (144A) | 110,424 |
| 30,000(d) | | FREMF Mortgage Trust, Series 2017-K66, Class B, 4.035%, 7/25/27 (144A) | 33,666 |
| 49,000(d) | | FREMF Mortgage Trust, Series 2017-KW02, Class B, 3.783%, 12/25/26 (144A) | 49,675 |
| 50,000(d) | | FREMF Mortgage Trust, Series 2017-KW03, Class B, 4.059%, 7/25/27 (144A) | 50,630 |
| 75,000(d) | | FREMF Mortgage Trust, Series 2018-KHG1, Class B, 3.812%, 12/25/27 (144A) | 76,274 |
| 76,000(d) | | FREMF Mortgage Trust, Series 2018-KW06, Class B, 4.224%, 6/25/28 (144A) | 79,695 |
| 25,000(d) | | FREMF Mortgage Trust, Series 2018-KW07, Class B, 4.081%, 10/25/31 (144A) | 25,788 |
| 75,000(d) | | FREMF Mortgage Trust, Series 2019-K88, Class C, 4.38%, 2/25/52 (144A) | 82,325 |
| 89,364(d) | | FREMF Mortgage Trust, Series 2019-KJ24, Class B, 7.6%, 10/25/27 (144A) | 74,530 |
| 50,000(d) | | FREMF Mortgage Trust, Series 2020-K106, Class B, 3.585%, 3/25/53 (144A) | 55,202 |
| 50,000(d) | | FREMF Trust, Series 2018-KW04, Class B, 3.911%, 9/25/28 (144A) | 50,660 |
| 100,000(e) | | GS Mortgage Securities Corp. Trust, Series 2020-DUNE, Class E, 2.659% (1 Month USD | |
| | | LIBOR + 250 bps), 12/15/36 (144A) | 87,468 |
| 100,000(e) | | GS Mortgage Securities Corp. Trust, Series 2020-DUNE, Class G, 4.159% (1 Month USD | |
| | | LIBOR + 400 bps), 12/15/36 (144A) | 82,623 |
| 50,000(d) | | JP Morgan Chase Commercial Mortgage Securities Trust, Series 2015-JP1, Class C, 4.722%, 1/15/49 | 55,429 |
| 50,000 | | JP Morgan Chase Commercial Mortgage Securities Trust, Series 2018-WPT, Class BFX, | |
| | | 4.549%, 7/5/33 (144A) | 52,061 |
| 100,000(e) | | JP Morgan Chase Commercial Mortgage Securities Trust, Series 2019-BKWD, Class E, 2.759% | |
| | | (1 Month USD LIBOR + 260 bps), 9/15/29 (144A) | 95,235 |
| 100,000(d) | | JP Morgan Chase Commercial Mortgage Securities Trust, Series 2020-LOOP, Class F, | |
| | | 3.861%, 12/5/38 (144A) | 78,027 |
| 50,000 | | Key Commercial Mortgage Securities Trust, Series 2019-S2, Class A3, 3.469%, 6/15/52 (144A) | 54,188 |
| 100,000 | | Morgan Stanley Capital I Trust, Series 2014-150E, Class AS, 4.012%, 9/9/32 (144A) | 105,785 |
| 15,000 | | Morgan Stanley Capital I Trust, Series 2016-UBS9, Class D, 3.0%, 3/15/49 (144A) | 12,180 |
| 100,000(d) | | Morgan Stanley Capital I Trust, Series 2018-MP, Class A, 4.276%, 7/11/40 (144A) | 108,903 |
| 100,000(e) | | Multifamily Connecticut Avenue Securities Trust, Series 2019-01, Class M10, 3.398% (1 Month USD | |
| | | LIBOR + 325 bps), 10/15/49 (144A) | 93,163 |
| 75,000 | | Palisades Center Trust, Series 2016-PLSD, Class A, 2.713%, 4/13/33 (144A) | 63,375 |
| 100,000(d) | | Ready Capital Mortgage Trust, Series 2019-5, Class E, 5.394%, 2/25/52 (144A) | 78,269 |
The accompanying notes are an integral part of these financial statements.
12
| Pioneer Strategic Income VCT Portfolio | Pioneer Variable Contracts Trust
|
| | | | |
| Principal | | | |
| Amount | | | |
| USD ($) | | | Value |
| | | COMMERCIAL MORTGAGE-BACKED SECURITIES (continued) | |
| 36,540(d) | | Sutherland Commercial Mortgage Loans, Series 2018-SBC7, Class A, 4.72%, 5/25/39 (144A) | $ 36,909 |
| 1,000,000(d)(f) | | UBS Commercial Mortgage Trust, Series 2018-C9, Class XB, 0.326%, 3/15/51 | 25,217 |
| | | TOTAL COMMERCIAL MORTGAGE-BACKED SECURITIES | |
| | | (Cost $2,820,127) | $ 2,776,877 |
| | | CONVERTIBLE CORPORATE BONDS — 0.7% of Net Assets | |
| | | Airlines — 0.4% | |
| 118,000 | | Air Canada, 4.0%, 7/1/25 (144A) | $ 174,050 |
| | | Total Airlines | $ 174,050 |
| | | Biotechnology — 0.1% | |
| 54,000 | | Insmed, Inc., 1.75%, 1/15/25 | $ 60,600 |
| | | Total Biotechnology | $ 60,600 |
| | | Pharmaceuticals — 0.2% | |
| 19,000 | | Jazz Investments I, Ltd., 1.5%, 8/15/24 | $ 20,267 |
| 31,000 | | Teva Pharmaceutical Finance Co. LLC, 0.25%, 2/1/26 | 30,845 |
| 75,000 | | Tricida, Inc., 3.5%, 5/15/27 (144A) | 37,605 |
| | | Total Pharmaceuticals | $ 88,717 |
| | | TOTAL CONVERTIBLE CORPORATE BONDS | |
| | | (Cost $295,294) | $ 323,367 |
| | | CORPORATE BONDS — 35.8% of Net Assets | |
| | | Advertising — 0.1% | |
| 55,000 | | Outfront Media Capital LLC/Outfront Media Capital Corp., 6.25%, 6/15/25 (144A) | $ 58,025 |
| | | Total Advertising | $ 58,025 |
| | | Aerospace & Defense — 0.9% | |
| 237,000 | | Boeing Co., 3.75%, 2/1/50 | $ 249,227 |
| 85,000 | | Boeing Co., 5.805%, 5/1/50 | 117,142 |
| 45,000 | | Howmet Aerospace, Inc., 6.875%, 5/1/25 | 52,650 |
| | | Total Aerospace & Defense | $ 419,019 |
| | | Airlines — 1.1% | |
| 23,111 | | Air Canada 2013-1 Class B Pass Through Trust, 5.375%, 5/15/21 (144A) | $ 23,165 |
| 133,000 | | Alaska Airlines 2020-1 Class A Pass Through Trust, 4.8%, 8/15/27 (144A) | 146,477 |
| 23,791 | | British Airways 2019-1 Class A Pass Through Trust, 3.35%, 6/15/29 (144A) | 22,546 |
| 54,306 | | British Airways 2019-1 Class AA Pass Through Trust, 3.3%, 12/15/32 (144A) | 54,176 |
| 30,000 | | British Airways 2020-1 Class A Pass Through Trust, 4.25%, 11/15/32 (144A) | 32,063 |
| 30,000 | | British Airways 2020-1 Class B Pass Through Trust, 8.375%, 11/15/28 (144A) | 33,075 |
| 10,671 | | Delta Air Lines 2020-1 Class AA Pass Through Trust, 2.0%, 6/10/28 | 10,648 |
| 53,952 | | JetBlue 2019-1 Class AA Pass Through Trust, 2.75%, 5/15/32 | 53,915 |
| 21,000 | | JetBlue 2020-1 Class A Pass Through Trust, 4.0%, 11/15/32 | 22,666 |
| 80,000 | | Mileage Plus Holdings LLC/Mileage Plus Intellectual Property Assets, Ltd., 6.5%, 6/20/27 (144A) | 86,000 |
| | | Total Airlines | $ 484,731 |
| | | Auto Manufacturers — 0.9% | |
| 135,000 | | Ford Motor Co., 4.346%, 12/8/26 | $ 143,775 |
| 21,000 | | Ford Motor Co., 5.291%, 12/8/46 | 21,945 |
| 152,000 | | General Motors Co., 6.6%, 4/1/36 | 205,792 |
| 20,000(b)(d) | | General Motors Financial Co., Inc., 5.7% (5 Year CMT Index + 500 bps) | 22,050 |
| | | Total Auto Manufacturers | $ 393,562 |
The accompanying notes are an integral part of these financial statements.
13
| Pioneer Strategic Income VCT Portfolio | Pioneer Variable Contracts Trust
|
| Schedule of Investments 12/31/20 (continued) |
| | | | | |
| Principal | | | |
| Amount | | | |
| USD ($) | | | Value |
| | | Auto Parts & Equipment — 0.2% | |
| 24,000 | | Goodyear Tire & Rubber Co., 9.5%, 5/31/25 | $ 27,127 |
| 45,000 | | Lear Corp., 3.5%, 5/30/30 | 49,240 |
| | | Total Auto Parts & Equipment | $ 76,367 |
| | | Banks — 6.6% | |
| 43,000(d) | | Banco de Credito del Peru, 6.875% (3 Month USD LIBOR + 771 bps), 9/16/26 (144A) | $ 44,828 |
ARS | 1,000,000(e) | | Banco de la Ciudad de Buenos Aires, 38.15% (BADLARPP + 399 bps), 12/5/22 | 11,573 |
| 210,000(b)(d) | | BNP Paribas SA, 6.625% (5 Year USD Swap Rate + 415 bps) (144A) | 229,162 |
| 15,000(b)(d) | | Citigroup, Inc., 4.0% (5 Year CMT Index + 360 bps) | 15,394 |
| 140,000(b)(d) | | Citigroup, Inc., 4.7% (SOFRRATE + 323 bps) | 143,863 |
| 400,000(b)(d) | | Credit Suisse Group AG, 5.1% (5 Year CMT Index + 329 bps) (144A) | 416,000 |
| 210,000(b)(d) | | Danske Bank AS, 6.125% (USD Swap Rate + 390 bps) | 221,812 |
| 32,000 | | Freedom Mortgage Corp., 8.25%, 4/15/25 (144A) | 33,440 |
| 160,000(b)(d) | | JPMorgan Chase & Co., 4.6% (SOFRRATE + 313 bps) | 165,200 |
| 195,000(b)(d) | | JPMorgan Chase & Co., 5.0% (SOFRRATE + 338 bps) | 205,146 |
| 200,000 | | Lloyds Banking Group Plc, 4.65%, 3/24/26 | 230,178 |
| 200,000(b)(d) | | Natwest Group Plc, 8.625% (5 Year USD Swap Rate + 760 bps) | 207,582 |
| 200,000 | | QNB Finansbank AS, 4.875%, 5/19/22 (144A) | 203,970 |
EUR | 283,675(b) | | Stichting AK Rabobank Certificaten, 6.5% | 458,108 |
| 115,000(b)(d) | | Truist Financial Corp., 5.1% (5 Year CMT Index + 435 bps) | 131,389 |
| 200,000(b)(d) | | UBS Group AG, 7.0% (5 Year USD Swap Rate + 434 bps) (144A) | 219,250 |
| | | Total Banks | $ 2,936,895 |
| | | Beverages — 0.8% | |
| 53,000 | | Anheuser-Busch InBev Worldwide, Inc., 5.55%, 1/23/49 | $ 75,359 |
| 200,000 | | Bacardi, Ltd., 5.3%, 5/15/48 (144A) | 277,431 |
| | | Total Beverages | $ 352,790 |
| | | Building Materials — 0.2% | |
| 68,000 | | Standard Industries, Inc., 4.375%, 7/15/30 (144A) | $ 72,742 |
| 5,000 | | Standard Industries, Inc., 5.0%, 2/15/27 (144A) | 5,225 |
| 5,000 | | Summit Materials LLC/Summit Materials Finance Corp., 5.25%, 1/15/29 (144A) | 5,250 |
| | | Total Building Materials | $ 83,217 |
| | | Chemicals — 0.7% | |
EUR | 100,000 | | INEOS Finance Plc, 2.875%, 5/1/26 (144A) | $ 123,618 |
| 35,000 | | Ingevity Corp., 3.875%, 11/1/28 (144A) | 35,262 |
| 28,000 | | NOVA Chemicals Corp., 5.25%, 6/1/27 (144A) | 29,835 |
| 50,000 | | Tronox, Inc., 6.5%, 5/1/25 (144A) | 53,500 |
| 47,000 | | Tronox, Inc., 6.5%, 4/15/26 (144A) | 48,939 |
| | | Total Chemicals | $ 291,154 |
| | | Commercial Services — 0.8% | |
| 45,000 | | Allied Universal Holdco LLC/Allied Universal Finance Corp., 6.625%, 7/15/26 (144A) | $ 47,984 |
| 45,000 | | Brink’s Co., 5.5%, 7/15/25 (144A) | 48,038 |
| 35,000 | | CoStar Group, Inc., 2.8%, 7/15/30 (144A) | 36,366 |
| 35,000 | | Garda World Security Corp., 4.625%, 2/15/27 (144A) | 35,350 |
| 38,000 | | Garda World Security Corp., 9.5%, 11/1/27 (144A) | 42,085 |
| 35,000 | | Prime Security Services Borrower LLC/Prime Finance, Inc., 5.75%, 4/15/26 (144A) | 38,325 |
| 104,000 | | Prime Security Services Borrower LLC/Prime Finance, Inc., 6.25%, 1/15/28 (144A) | 111,653 |
| | | Total Commercial Services | $ 359,801 |
The accompanying notes are an integral part of these financial statements.
14
| Pioneer Strategic Income VCT Portfolio | Pioneer Variable Contracts Trust
|
| | | | | |
| Principal | | | |
| Amount | | | |
| USD ($) | | | Value |
| | | Computers — 0.1% | |
| 25,000 | | NCR Corp., 5.0%, 10/1/28 (144A) | $ 26,375 |
| 10,000 | | NCR Corp., 5.25%, 10/1/30 (144A) | 10,725 |
| 5,000 | | NCR Corp., 8.125%, 4/15/25 (144A) | 5,568 |
| | | Total Computers | $ 42,668 |
| | | Cosmetics/Personal Care — 0.1% | |
| 55,000 | | Edgewell Personal Care Co., 5.5%, 6/1/28 (144A) | $ 59,109 |
| | | Total Cosmetics/Personal Care | $ 59,109 |
| | | Diversified Financial Services — 1.3% | |
| 70,000 | | Air Lease Corp., 3.125%, 12/1/30 | $ 72,869 |
| 95,000 | | Alliance Data Systems Corp., 7.0%, 1/15/26 (144A) | 100,491 |
| 10,000 | | Avolon Holdings Funding, Ltd., 3.95%, 7/1/24 (144A) | 10,562 |
| 140,000(b)(d) | | Charles Schwab Corp., 4.0% (5 Year CMT Index + 308 bps) | 147,350 |
| 43,000(b)(d) | | Charles Schwab Corp., 5.375% (5 Year CMT Index + 497 bps) | 47,891 |
| 150,256(g) | | Global Aircraft Leasing Co., Ltd., 6.50%, (7.25% PIK or 6.50% cash), 9/15/24 (144A) | 134,103 |
| 30,000 | | Nationstar Mortgage Holdings, Inc., 5.125%, 12/15/30 (144A) | 31,357 |
| 35,000 | | Nationstar Mortgage Holdings, Inc., 5.5%, 8/15/28 (144A) | 36,750 |
| 10,000 | | Nationstar Mortgage Holdings, Inc., 6.0%, 1/15/27 (144A) | 10,612 |
| | | Total Diversified Financial Services | $ 591,985 |
| | | Electric — 2.0% | |
| 20,000 | | AES Corp., 3.95%, 7/15/30 (144A) | $ 22,608 |
| 15,000 | | Calpine Corp., 4.625%, 2/1/29 (144A) | 15,424 |
| 15,000 | | Calpine Corp., 5.0%, 2/1/31 (144A) | 15,675 |
| 65,000 | | Iberdrola International BV, 6.75%, 7/15/36 | 99,634 |
| 47,000 | | New York State Electric & Gas Corp., 3.3%, 9/15/49 (144A) | 50,730 |
| 17,000 | | NextEra Energy Operating Partners LP, 4.5%, 9/15/27 (144A) | 19,027 |
| 30,000 | | NRG Energy, Inc., 2.45%, 12/2/27 (144A) | 31,585 |
| 15,000 | | NRG Energy, Inc., 3.375%, 2/15/29 (144A) | 15,357 |
| 20,000 | | NRG Energy, Inc., 3.625%, 2/15/31 (144A) | 20,576 |
| 200,000 | | NRG Energy, Inc., 4.45%, 6/15/29 (144A) | 231,930 |
| 10,000 | | Pattern Energy Operations LP/Pattern Energy Operations, Inc., 4.5%, 8/15/28 (144A) | 10,550 |
| 60,000 | | Puget Energy, Inc., 4.1%, 6/15/30 | 67,844 |
| 65,000 | | Southern California Edison Co., 4.875%, 3/1/49 | 85,778 |
| 150,000 | | Vistra Operations Co. LLC, 3.7%, 1/30/27 (144A) | 165,403 |
| 19,000 | | Vistra Operations Co. LLC, 4.3%, 7/15/29 (144A) | 21,565 |
| | | Total Electric | $ 873,686 |
| | | Electrical Components & Equipment — 0.4% | |
EUR | 100,000 | | Belden, Inc., 2.875%, 9/15/25 (144A) | $ 123,026 |
| 25,000 | | Energizer Holdings, Inc., 4.75%, 6/15/28 (144A) | 26,312 |
| 15,000 | | WESCO Distribution, Inc., 7.25%, 6/15/28 (144A) | 17,059 |
| | | Total Electrical Components & Equipment | $ 166,397 |
| | | Electronics — 0.0% | |
| 20,000 | | Sensata Technologies, Inc., 3.75%, 2/15/31 (144A) | $ 20,732 |
| | | Total Electronics | $ 20,732 |
The accompanying notes are an integral part of these financial statements.
15
| Pioneer Strategic Income VCT Portfolio | Pioneer Variable Contracts Trust
|
| Schedule of Investments 12/31/20 (continued) |
| | | | |
| Principal | | | |
| Amount | | | |
| USD ($) | | | Value |
| | Energy-Alternate Sources — 0.2% | |
| 46,807 | | Alta Wind Holdings LLC, 7.0%, 6/30/35 (144A) | $ 55,007 |
| 19,000 | | TerraForm Power Operating LLC, 4.75%, 1/15/30 (144A) | 20,330 |
| | Total Energy-Alternate Sources | $ 75,337 |
| | Engineering & Construction — 0.3% | |
| 40,000 | | KBR, Inc., 4.75%, 9/30/28 (144A) | $ 41,700 |
| 75,000 | | PowerTeam Services LLC, 9.033%, 12/4/25 (144A) | 83,446 |
| | Total Engineering & Construction | $ 125,146 |
| | Entertainment — 0.2% | |
| 40,000 | | Caesars Entertainment, Inc., 6.25%, 7/1/25 (144A) | $ 42,600 |
| 15,000 | | Scientific Games International, Inc., 7.0%, 5/15/28 (144A) | 16,128 |
| 15,000 | | Scientific Games International, Inc., 7.25%, 11/15/29 (144A) | 16,462 |
| 31,000 | | Scientific Games International, Inc., 8.25%, 3/15/26 (144A) | 33,406 |
| | Total Entertainment | $ 108,596 |
| | Environmental Control — 0.3% | |
| 45,000 | | Covanta Holding Corp., 5.0%, 9/1/30 | $ 48,147 |
| 56,000 | | Covanta Holding Corp., 6.0%, 1/1/27 | 58,819 |
| 15,000 | | GFL Environmental, Inc., 4.0%, 8/1/28 (144A) | 15,113 |
| 30,000 | | Tervita Corp., 11.0%, 12/1/25 (144A) | 32,281 |
| | Total Environmental Control | $ 154,360 |
| | Food — 1.2% | |
| 40,000 | | Albertsons Cos., Inc./Safeway, Inc./New Albertsons LP/Albertsons LLC, 3.5%, 3/15/29 (144A) | $ 40,475 |
| 30,000 | | Albertsons Cos., Inc./Safeway, Inc./New Albertsons LP/Albertsons LLC, 4.875%, 2/15/30 (144A) | 33,057 |
| 50,000 | | JBS USA LUX SA/JBS USA Finance, Inc., 6.75%, 2/15/28 (144A) | 56,175 |
| 39,000 | | JBS USA LUX SA/JBS USA Food Co./JBS USA Finance, Inc., 5.5%, 1/15/30 (144A) | 44,802 |
| 200,000 | | Minerva Luxembourg SA, 5.875%, 1/19/28 (144A) | 215,752 |
| 30,000 | | Pilgrim’s Pride Corp., 5.875%, 9/30/27 (144A) | 32,538 |
| 25,000 | | Smithfield Foods, Inc., 2.65%, 10/3/21 (144A) | 25,221 |
| 70,000 | | Smithfield Foods, Inc., 3.0%, 10/15/30 (144A) | 74,065 |
| 7,000 | | Smithfield Foods, Inc., 5.2%, 4/1/29 (144A) | 8,334 |
| | Total Food | $ 530,419 |
| | Forest Products & Paper — 0.3% | |
| 40,000 | | Clearwater Paper Corp., 4.75%, 8/15/28 (144A) | $ 41,400 |
| 53,000 | | International Paper Co., 7.3%, 11/15/39 | 84,930 |
| | Total Forest Products & Paper | $ 126,330 |
| | Healthcare-Services — 0.8% | |
| 20,000 | | Centene Corp., 4.25%, 12/15/27 | $ 21,200 |
| 35,000 | | Centene Corp., 4.625%, 12/15/29 | 38,857 |
| 76,000 | | HCA, Inc., 3.5%, 9/1/30 | 80,756 |
| 20,000 | | Legacy LifePoint Health LLC, 6.75%, 4/15/25 (144A) | 21,476 |
| 50,000 | | MEDNAX, Inc., 5.25%, 12/1/23 (144A) | 50,615 |
| 15,000 | | Molina Healthcare, Inc., 4.375%, 6/15/28 (144A) | 15,788 |
| 50,000 | | NYU Langone Hospitals, 4.428%, 7/1/42 | 56,203 |
| 10,000 | | Providence Service Corp., 5.875%, 11/15/25 (144A) | 10,575 |
| 13,000 | | RegionalCare Hospital Partners Holdings, Inc./LifePoint Health, Inc., 9.75%, 12/1/26 (144A) | 14,300 |
The accompanying notes are an integral part of these financial statements.
16
| Pioneer Strategic Income VCT Portfolio | Pioneer Variable Contracts Trust
|
| | | | |
| Principal | | | |
| Amount | | | |
| USD ($) | | | Value |
| | | Healthcare-Services (continued) | |
| 31,000 | | US Renal Care, Inc., 10.625%, 7/15/27 (144A) | $ 34,255 |
| 16,000 | | West Street Merger Sub, Inc., 6.375%, 9/1/25 (144A) | 16,400 |
| | | Total Healthcare-Services | $ 360,425 |
| | | Home Builders — 0.1% | |
| 9,000 | | KB Home, 6.875%, 6/15/27 | $ 10,552 |
| 19,000 | | Meritage Homes Corp., 6.0%, 6/1/25 | 21,518 |
| | | Total Home Builders | $ 32,070 |
| | | Household Products/Wares — 0.0%† | |
| 10,000 | | Central Garden & Pet Co., 4.125%, 10/15/30 | $ 10,425 |
| | | Total Household Products/Wares | $ 10,425 |
| | | Housewares — 0.0%† | |
| 5,000 | | CD&R Smokey Buyer, Inc., 6.75%, 7/15/25 (144A) | $ 5,344 |
| | | Total Housewares | $ 5,344 |
| | | Industrial Services — 0.2% | |
| 110,000 | | Gol Finance SA, 8.0%, 6/30/26 | $ 108,488 |
| | | Total Industrial Services | $ 108,488 |
| | | Insurance — 1.5% | |
| 85,000 | | AXA SA, 8.6%, 12/15/30 | $ 132,443 |
| 132,000 | | CNO Financial Group, Inc., 5.25%, 5/30/29 | 159,356 |
| 60,000(d) | | Farmers Exchange Capital III, 5.454% (3 Month USD LIBOR + 345 bps), 10/15/54 (144A) | 73,764 |
| 120,000(d) | | Farmers Insurance Exchange, 4.747% (3 Month USD LIBOR + 323 bps), 11/1/57 (144A) | 128,357 |
| 105,000 | | Nationwide Mutual Insurance Co., 4.35%, 4/30/50 (144A) | 123,346 |
| 51,000(d) | | Prudential Financial, Inc., 3.7% (5 Year CMT Index + 304 bps), 10/1/50 | 53,947 |
| | | Total Insurance | $ 671,213 |
| | | Internet — 0.6% | |
| 35,000 | | ANGI Group LLC, 3.875%, 8/15/28 (144A) | $ 35,612 |
| 121,000 | | Expedia Group, Inc., 3.25%, 2/15/30 | 125,930 |
| 100,000 | | Expedia Group, Inc., 3.8%, 2/15/28 | 107,413 |
| | | Total Internet | $ 268,955 |
| | | Iron & Steel — 0.1% | |
| 20,000 | | Cleveland-Cliffs, Inc., 6.75%, 3/15/26 (144A) | $ 21,600 |
| 10,000 | | Cleveland-Cliffs, Inc., 9.875%, 10/17/25 (144A) | 11,762 |
| 20,000 | | Steel Dynamics, Inc., 3.25%, 1/15/31 | 22,365 |
| | | Total Iron & Steel | $ 55,727 |
| | | Leisure Time — 0.3% | |
| 15,000 | | Carnival Corp., 7.625%, 3/1/26 (144A) | $ 16,342 |
| 29,000 | | Royal Caribbean Cruises, Ltd., 11.5%, 6/1/25 (144A) | 33,903 |
| 94,000 | | VOC Escrow, Ltd., 5.0%, 2/15/28 (144A) | 93,295 |
| | | Total Leisure Time | $ 143,540 |
| | | Lodging — 0.7% | |
| 40,000 | | Hilton Domestic Operating Co., Inc., 3.75%, 5/1/29 (144A) | $ 41,708 |
| 40,000 | | Hilton Domestic Operating Co., Inc., 4.0%, 5/1/31 (144A) | 42,204 |
| 5,000 | | Hilton Domestic Operating Co., Inc., 5.75%, 5/1/28 (144A) | 5,438 |
The accompanying notes are an integral part of these financial statements.
17
| Pioneer Strategic Income VCT Portfolio | Pioneer Variable Contracts Trust
|
| Schedule of Investments 12/31/20 (continued) |
| | | | | |
| Principal | | | |
| Amount | | | |
| USD ($) | | | Value |
| | | Lodging (continued) | |
| 180,000 | | Marriott International, Inc., 3.5%, 10/15/32 | $ 196,845 |
| 25,000 | | Marriott International, Inc., 4.625%, 6/15/30 | 29,337 |
| 10,000 | | Marriott International, Inc., 5.75%, 5/1/25 | 11,697 |
| | | Total Lodging | $ 327,229 |
| | | Media — 0.9% | |
| 50,000 | | CCO Holdings LLC/CCO Holdings Capital Corp., 4.75%, 3/1/30 (144A) | $ 53,950 |
| 200,000 | | CSC Holdings LLC, 5.5%, 4/15/27 (144A) | 212,000 |
| 66,000 | | Diamond Sports Group LLC/Diamond Sports Finance Co., 6.625%, 8/15/27 (144A) | 39,930 |
| 69,000 | | Gray Television, Inc., 7.0%, 5/15/27 (144A) | 75,555 |
| 10,000 | | Scripps Escrow II, Inc., 3.875%, 1/15/29 (144A) | 10,393 |
| 20,000 | | Sinclair Television Group, Inc., 4.125%, 12/1/30 (144A) | 20,464 |
| | | Total Media | $ 412,292 |
| | | Mining — 0.7% | |
| 168,000 | | Freeport-McMoRan, Inc., 5.45%, 3/15/43 | $ 209,160 |
| 47,000 | | IAMGOLD Corp., 5.75%, 10/15/28 (144A) | 47,705 |
| 41,000 | | Joseph T Ryerson & Son, Inc., 8.5%, 8/1/28 (144A) | 46,433 |
| | | Total Mining | $ 303,298 |
| | | Miscellaneous Manufacturers — 0.3% | |
| 14,000 | | Amsted Industries, Inc., 5.625%, 7/1/27 (144A) | $ 14,875 |
| 50,000 | | General Electric Co., 4.25%, 5/1/40 | 59,110 |
| 55,000 | | General Electric Co., 4.35%, 5/1/50 | 66,888 |
| | | Total Miscellaneous Manufacturers | $ 140,873 |
| | | Multi-National — 1.0% | |
| 200,000 | | African Export-Import Bank, 3.994%, 9/21/29 (144A) | $ 214,000 |
IDR
| 1,997,800,000
| | European Bank for Reconstruction & Development, 6.45%, 12/13/22 | 147,624 |
IDR | 980,000,000 | | Inter-American Development Bank, 7.875%, 3/14/23 | 74,850 |
| | | Total Multi-National | $ 436,474 |
| | | Oil & Gas — 1.8% | |
| 275,000 | | Cenovus Energy, Inc., 6.75%, 11/15/39 | $ 363,576 |
| 10,000 | | EQT Corp., 5.0%, 1/15/29 | 10,543 |
| 21,000 | | MEG Energy Corp., 6.5%, 1/15/25 (144A) | 21,631 |
| 27,000 | | MEG Energy Corp., 7.0%, 3/31/24 (144A) | 27,270 |
| 30,000 | | MEG Energy Corp., 7.125%, 2/1/27 (144A) | 30,975 |
| 62,000 | | Occidental Petroleum Corp., 4.4%, 4/15/46 | 54,031 |
| 30,000 | | PBF Holding Co. LLC/PBF Finance Corp., 9.25%, 5/15/25 (144A) | 29,577 |
| 42,000 | | Petroleos Mexicanos, 5.35%, 2/12/28 | 41,548 |
| 25,000 | | Petroleos Mexicanos, 6.875%, 10/16/25 (144A) | 27,372 |
| 25,000 | | Precision Drilling Corp., 7.125%, 1/15/26 (144A) | 21,750 |
| 35,000 | | Valero Energy Corp., 2.15%, 9/15/27 | 35,762 |
| 79,000 | | Valero Energy Corp., 6.625%, 6/15/37 | 105,085 |
| 30,000 | | YPF SA, 6.95%, 7/21/27 (144A) | 21,600 |
ARS | 175,000 | | YPF SA, 16.5%, 5/9/22 (144A) | 1,457 |
| | | Total Oil & Gas | $ 792,177 |
| | | Oil & Gas Services — 0.0%† | |
| 18,000 | | USA Compression Partners LP/USA Compression Finance Corp., 6.875%, 9/1/27 | $ 19,216 |
| | | Total Oil & Gas Services | $ 19,216 |
The accompanying notes are an integral part of these financial statements.
18
| Pioneer Strategic Income VCT Portfolio | Pioneer Variable Contracts Trust
|
| | | | |
| Principal | | | |
| Amount | | | |
| USD ($) | | | Value |
| | Packaging & Containers — 0.4% | |
| 100,000 | | Ball Corp., 2.875%, 8/15/30 | $ 99,750 |
| 65,000 | | Greif, Inc., 6.5%, 3/1/27 (144A) | 68,737 |
| | Total Packaging & Containers | $ 168,487 |
| | Pharmaceuticals — 1.0% | |
| 53,000 | | AbbVie, Inc., 4.05%, 11/21/39 | $ 64,142 |
| 7,000 | | Bausch Health Americas, Inc., 8.5%, 1/31/27 (144A) | 7,785 |
| 15,000 | | Bausch Health Cos., Inc., 5.0%, 1/30/28 (144A) | 15,458 |
| 45,000 | | Cardinal Health, Inc., 4.9%, 9/15/45 | 55,396 |
| 31,360 | | CVS Pass-Through Trust, 5.773%, 1/10/33 (144A) | 36,844 |
| 51,610 | | CVS Pass-Through Trust, 6.036%, 12/10/28 | 59,960 |
| 17,220 | | CVS Pass-Through Trust, 8.353%, 7/10/31 (144A) | 22,773 |
| 31,000 | | Par Pharmaceutical, Inc., 7.5%, 4/1/27 (144A) | 33,635 |
| 142,000 | | Teva Pharmaceutical Finance Netherlands III BV, 3.15%, 10/1/26 | 136,499 |
| | Total Pharmaceuticals | $ 432,492 |
| | Pipelines — 2.7% | |
| 16,000 | | DCP Midstream Operating LP, 5.6%, 4/1/44 | $ 16,500 |
| 30,000 | | Enable Midstream Partners LP, 4.15%, 9/15/29 | 29,766 |
| 70,000 | | Enable Midstream Partners LP, 4.4%, 3/15/27 | 70,638 |
| 122,000 | | Enable Midstream Partners LP, 4.95%, 5/15/28 | 126,123 |
| 30,000 | | Energy Transfer Operating LP, 5.875%, 1/15/24 | 33,723 |
| 35,000 | | Energy Transfer Operating LP, 6.0%, 6/15/48 | 41,242 |
| 10,000 | | Energy Transfer Operating LP, 6.125%, 12/15/45 | 11,813 |
| 21,000 | | Energy Transfer Operating LP, 6.5%, 2/1/42 | 25,620 |
| 15,000(b)(d) | | Energy Transfer Operating LP, 6.625% (3 Month USD LIBOR + 416 bps) | 12,675 |
| 140,000(b)(d) | | Energy Transfer Operating LP, 7.125% (5 Year CMT Index + 531 bps) | 133,000 |
| 4,000 | | EnLink Midstream LLC, 5.375%, 6/1/29 | 3,890 |
| 9,000 | | EnLink Midstream Partners LP, 5.05%, 4/1/45 | 7,172 |
| 135,000 | | EnLink Midstream Partners LP, 5.45%, 6/1/47 | 108,711 |
| 34,000 | | EnLink Midstream Partners LP, 5.6%, 4/1/44 | 27,285 |
| 30,000 | | Hess Midstream Operations LP, 5.125%, 6/15/28 (144A) | 31,359 |
| 38,000 | | Midwest Connector Capital Co. LLC, 4.625%, 4/1/29 (144A) | 39,834 |
| 125,000 | | Phillips 66 Partners LP, 3.75%, 3/1/28 | 135,612 |
| 45,000(b)(d) | | Plains All American Pipeline LP, 6.125% (3 Month USD LIBOR + 411 bps) | 36,562 |
| 45,000 | | Plains All American Pipeline LP/PAA Finance Corp., 4.9%, 2/15/45 | 47,758 |
| 38,000 | | Sunoco Logistics Partners Operations LP, 5.4%, 10/1/47 | 42,459 |
| 19,000 | | Sunoco Logistics Partners Operations LP, 6.1%, 2/15/42 | 21,985 |
| 65,000 | | Williams Cos., Inc., 5.75%, 6/24/44 | 84,243 |
| 95,000 | | Williams Cos., Inc., 7.5%, 1/15/31 | 129,143 |
| | Total Pipelines | $ 1,217,113 |
| | REITs — 2.0% | |
| 40,000 | | GLP Capital LP/GLP Financing II, Inc., 4.0%, 1/15/30 | $ 43,450 |
| 54,000 | | Highwoods Realty LP, 2.6%, 2/1/31 | 55,084 |
| 45,000 | | Highwoods Realty LP, 4.125%, 3/15/28 | 50,615 |
The accompanying notes are an integral part of these financial statements.
19
| Pioneer Strategic Income VCT Portfolio | Pioneer Variable Contracts Trust
|
| Schedule of Investments 12/31/20 (continued) |
| | | | |
| Principal | | | |
| Amount | | | |
| USD ($) | | | Value |
| | REITs (continued) | |
| 64,000 | | Iron Mountain, Inc., 4.5%, 2/15/31 (144A) | $ 67,040 |
| 120,000 | | iStar, Inc., 4.25%, 8/1/25 | 118,500 |
| 30,000 | | iStar, Inc., 4.75%, 10/1/24 | 30,375 |
| 40,000 | | Lexington Realty Trust, 2.7%, 9/15/30 | 41,639 |
| 65,000 | | MPT Operating Partnership LP/MPT Finance Corp., 3.5%, 3/15/31 | 67,113 |
| 86,000 | | MPT Operating Partnership LP/MPT Finance Corp., 4.625%, 8/1/29 | 91,912 |
| 150,000 | | SBA Tower Trust, 3.869%, 10/8/24 (144A) | 160,394 |
| 40,000 | | Simon Property Group LP, 3.25%, 9/13/49 | 40,967 |
| 55,000 | | Simon Property Group LP, 3.8%, 7/15/50 | 61,359 |
| 73,000 | | Uniti Group LP/Uniti Fiber Holdings, Inc./CSL Capital LLC, 7.875%, 2/15/25 (144A) | 78,417 |
| 8,000 | | VICI Properties LP/VICI Note Co., Inc., 4.125%, 8/15/30 (144A) | 8,445 |
| | Total REITs | $ 915,310 |
| | Retail — 0.7% | |
| 15,000 | | Asbury Automotive Group, Inc., 4.5%, 3/1/28 | $ 15,637 |
| 15,000 | | Asbury Automotive Group, Inc., 4.75%, 3/1/30 | 16,087 |
| 30,000 | | AutoNation, Inc., 4.75%, 6/1/30 | 36,100 |
| 81,000 | | Beacon Roofing Supply, Inc., 4.875%, 11/1/25 (144A) | 82,924 |
| 30,000 | | Penske Automotive Group, Inc., 3.5%, 9/1/25 | 30,488 |
| 105,000 | | QVC, Inc., 4.375%, 9/1/28 | 108,796 |
| 10,000 | | QVC, Inc., 4.75%, 2/15/27 | 10,725 |
| | Total Retail | $ 300,757 |
| | Software — 0.5% | |
| 215,000 | | Citrix Systems, Inc., 3.3%, 3/1/30 | $ 237,531 |
| | Total Software | $ 237,531 |
| | Telecommunications — 0.7% | |
| 25,000 | | CenturyLink, Inc., 4.0%, 2/15/27 (144A) | $ 25,812 |
| 45,000 | | CenturyLink, Inc., 4.5%, 1/15/29 (144A) | 45,787 |
| 50,000 | | CommScope Technologies LLC, 5.0%, 3/15/27 (144A) | 49,250�� |
| 55,000 | | Level 3 Financing, Inc., 4.625%, 9/15/27 (144A) | 57,444 |
| 45,000 | | Logan Merger Sub, Inc., 5.5%, 9/1/27 (144A) | 47,138 |
| 13,000 | | Millicom International Cellular SA, 6.25%, 3/25/29 (144A) | 14,625 |
| 30,000 | | Sprint Corp., 7.25%, 9/15/21 | 31,215 |
| 35,000 | | Windstream Escrow LLC/Windstream Escrow Finance Corp., 7.75%, 8/15/28 (144A) | 35,245 |
| | Total Telecommunications | $ 306,516 |
| | Transportation — 0.1% | |
| 60,000 | | Western Global Airlines LLC, 10.375%, 8/15/25 (144A) | $ 66,900 |
| | Total Transportation | $ 66,900 |
| | TOTAL CORPORATE BONDS | |
| | (Cost $14,887,166) | $16,063,178 |
| | FOREIGN GOVERNMENT BONDS — 5.1% of Net Assets | |
| | Argentina — 0.6% | |
| 145,500(c) | | Argentine Republic Government International Bond, 0.125%, 7/9/35 | $ 53,108 |
| 6,500 | | Argentine Republic Government International Bond, 1.0%, 7/9/29 | 2,819 |
| 250,000 | | Ciudad Autonoma De Buenos Aires, 7.5%, 6/1/27 (144A) | 206,878 |
| | Total Argentina | $ 262,805 |
The accompanying notes are an integral part of these financial statements.
20
| Pioneer Strategic Income VCT Portfolio | Pioneer Variable Contracts Trust
|
| | | | | |
| Principal | | | |
| Amount | | | |
| USD ($) | | | Value |
| | | Dominican Republic — 0.4% | |
| 150,000 | | Dominican Republic International Bond, 4.875%, 9/23/32 (144A) | $ 166,127 |
| | | Total Dominican Republic | $ 166,127 |
| | | Egypt — 0.3% | |
EGP | 1,754,000 | | Egypt Government Bond, 15.7%, 11/7/27 | $ 118,596 |
| | | Total Egypt | $ 118,596 |
| | | Indonesia — 0.3% | |
IDR
| 1,784,000,000 | | Indonesia Treasury Bond, 6.125%, 5/15/28 | $ 128,664 |
| | | Total Indonesia | $ 128,664 |
| | | Ivory Coast — 0.3% | |
EUR | 100,000 | | Ivory Coast Government International Bond, 5.875%, 10/17/31 (144A) | $ 134,823 |
| | | Total Ivory Coast | $ 134,823 |
| | | Mexico — 1.5% | |
MXN | 5,490,000 | | Mexican Bonos, 8.5%, 5/31/29 | $ 336,252 |
MXN | 1,475,341 | | Mexican Udibonos, 2.0%, 6/9/22 | 74,989 |
| 200,000 | | Mexico Government International Bond, 5.0%, 4/27/51 | 249,000 |
| | | Total Mexico | $ 660,241 |
| | | Morocco — 0.4% | |
| 200,000 | | Morocco Government International Bond, 4.0%, 12/15/50 (144A) | $ 206,100 |
| | | Total Morocco | $ 206,100 |
| | | Peru — 0.0%† | |
| 20,000 | | Peruvian Government International Bond, 2.783%, 1/23/31 | $ 21,930 |
| | | Total Peru | $ 21,930 |
| | | Philippines — 0.6% | |
| 200,000 | | Philippine Government International Bond, 5.0%, 1/13/37 | $ 263,800 |
| | | Total Philippines | $ 263,800 |
| | | Qatar — 0.5% | |
| 200,000 | | Qatar Government International Bond, 3.4%, 4/16/25 (144A) | $ 220,500 |
| | | Total Qatar | $ 220,500 |
| | | Uruguay — 0.2% | |
UYU | 4,429,000 | | Uruguay Government International Bond, 9.875%, 6/20/22 (144A) | $ 108,777 |
| | | Total Uruguay | $ 108,777 |
| | | TOTAL FOREIGN GOVERNMENT BONDS | |
| | | (Cost $2,255,066) | $ 2,292,363 |
| Face | | | |
| Amount | | | |
| USD ($) | | | |
| | | INSURANCE-LINKED SECURITIES — 0.0%† of Net Assets# | |
| | | Reinsurance Sidecars — 0.0%† | |
| | | Multiperil – Worldwide — 0.0%† | |
| 40,000+(a)(h) | | Lorenz Re 2018, 7/1/21 | $ 476 |
| 20,578+(a)(h) | | Lorenz Re 2019, 6/30/22 | 1,356 |
| | | Total Reinsurance Sidecars | $ 1,832 |
| | | TOTAL INSURANCE-LINKED SECURITIES | |
| | | (Cost $15,893) | $ 1,832 |
The accompanying notes are an integral part of these financial statements.
21
| Pioneer Strategic Income VCT Portfolio | Pioneer Variable Contracts Trust
|
| Schedule of Investments 12/31/20 (continued) |
| | | | |
| Principal | | | |
| Amount | | | |
| USD ($) | | | Value |
| | | MUNICIPAL BONDS — 0.2% of Net Assets(i) | |
| | | Municipal General Obligation — 0.2% | |
| 100,000(j)(k) | | Commonwealth of Puerto Rico, 8.0%, 7/1/35 | $ 68,000 |
| | | Total Municipal General Obligation | $ 68,000 |
| | | Municipal Higher Education — 0.0%† | |
| 10,000 | | Trustees of Amherst College, 3.794%, 11/1/42 | $ 11,418 |
| | | Total Municipal Higher Education | $ 11,418 |
| | | TOTAL MUNICIPAL BONDS | |
| | | (Cost $78,083) | $ 79,418 |
| | | SENIOR SECURED FLOATING RATE LOAN INTERESTS — 1.7% of Net Assets*(e) | |
| | | Aerospace & Defense — 0.1% | |
| 1,802(q) | | Grupo Aeromexico, Sociedad Anonima Bursatil De Capital Variable, Partially unfunded DIP Tranche 2 | |
| | | Term Loan, 3.817% (LIBOR + 1450 bps), 12/31/21 | $ 1,849 |
| 30,000 | | Grupo Aeromexico, Sociedad Anonima Bursatil De Capital Variable, Senior Secured Tranche 1, | |
| | | 9.0% (LIBOR + 800 bps), 12/31/21 | 30,563 |
| | | Total Aerospace & Defense | $ 32,412 |
| | | Automobile — 0.1% | |
| 33,442 | | Navistar, Inc., Tranche B Term Loan, 3.66% (LIBOR + 350 bps), 11/6/24 | $ 33,463 |
| | | Total Automobile | $ 33,463 |
| | | Broadcasting & Entertainment — 0.1% | |
| 60,776 | | Sinclair Television Group, Inc., Tranche B Term Loan, 2.4% (LIBOR + 225 bps), 1/3/24 | $ 60,269 |
| | | Total Broadcasting & Entertainment | $ 60,269 |
| | | Computers & Electronics — 0.0%† | |
| 12,561 | | Energy Acquisition LP (aka Electrical Components International), First Lien Initial Term Loan, | |
| | | 4.397% (LIBOR + 425 bps), 6/26/25 | $ 12,192 |
| | | Total Computers & Electronics | $ 12,192 |
| | | Finance — 0.2% | |
| 110,000 | | Bank of Industry Ltd., 0.06% (LIBOR + 600bps), 3/15/21 | $ 108,867 |
| | | Total Finance | $ 108,867 |
| | | Healthcare & Pharmaceuticals — 0.1% | |
| 32,357 | | Alphabet Holding Co., Inc. (aka Nature’s Bounty), First Lien Initial Term Loan, 3.647% | |
| | | (LIBOR + 350 bps), 9/26/24 | $ 32,138 |
| | | Total Healthcare & Pharmaceuticals | $ 32,138 |
| | | Healthcare, Education & Childcare — 0.3% | |
| 35,382 | | Alliance HealthCare Services, Inc., First Lien Initial Term Loan, 5.5% (LIBOR + 450 bps), 10/24/23 | $ 32,104 |
| 71,484 | | KUEHG Corp. (fka KC MergerSub, Inc.) (aka KinderCare), Term B-3 Loan, 4.75% (LIBOR + | |
| | | 375 bps), 2/21/25 | 68,196 |
| 46,883 | | LifePoint Health, Inc. (fka Regionalcare Hospital Partners Holdings, Inc.), First Lien Term B Loan, | |
| | | 3.897% (LIBOR + 375 bps), 11/16/25 | 46,851 |
| | | Total Healthcare, Education & Childcare | $ 147,151 |
| | | Hotel, Gaming & Leisure — 0.2% | |
| 70,494 | | 1011778 B.C. Unlimited Liability Co. (New Red Finance, Inc.) (aka Burger King/Tim Hortons), | |
| | | Term B-4 Loan, 1.897% (LIBOR + 175 bps), 11/19/26 | $ 69,486 |
| | | Total Hotel, Gaming & Leisure | $ 69,486 |
The accompanying notes are an integral part of these financial statements.
22
| Pioneer Strategic Income VCT Portfolio | Pioneer Variable Contracts Trust
|
| | | | |
| Principal | | | |
| Amount | | | |
| USD ($) | | | Value |
| | | Insurance — 0.6% | |
| 101,112 | | Confie Seguros Holding II Co., Term B Loan, 5.75% (LIBOR + 475 bps), 4/19/22 | $ 99,902 |
| 65,305 | | Integro Parent, Inc., First Lien Initial Term Loan, 6.75% (LIBOR + 575 bps), 10/31/22 | 63,346 |
| 96,750 | | USI, Inc. (fka Compass Investors, Inc.), 2017 New Term Loan, 3.254% (LIBOR + 300 bps), 5/16/24 | 95,531 |
| | | Total Insurance | $ 258,779 |
| | | Leisure & Entertainment — 0.0%† | |
| 39,505(j) | | 24 Hour Fitness Worldwide, Inc., Term Loan, 3.647% (LIBOR + 350bps/PRIME +250), 5/30/25 | $ 1,087 |
| 15,560 | | Fitness International LLC, Term B Loan, 4.25% (LIBOR + 325 bps), 4/17/25 | 14,150 |
| | | Total Leisure & Entertainment | $ 15,237 |
| | | Retail — 0.0%† | |
| 14,775 | | Staples, Inc., 2019 Refinancing New Term B-2 Loan, 4.714% (LIBOR + 450 bps), 9/12/24 | $ 14,541 |
| | | Total Retail | $ 14,541 |
| | | TOTAL SENIOR SECURED FLOATING RATE LOAN INTERESTS | |
| | | (Cost $820,427) | $ 784,535 |
| | | U.S. GOVERNMENT AND AGENCY OBLIGATIONS — 32.9% of Net Assets | |
| 42,944 | | Fannie Mae, 1.5%, 12/1/35 | $ 44,203 |
| 50,000 | | Fannie Mae, 1.5%, 2/1/51 (TBA) | 50,461 |
| 133,272 | | Fannie Mae, 2.0%, 12/1/35 | 139,399 |
| 770,000 | | Fannie Mae, 2.0%, 1/1/51 | 799,941 |
| 130,000 | | Fannie Mae, 2.0%, 2/1/51 (TBA) | 134,815 |
| 200,000 | | Fannie Mae, 2.5%, 2/1/51 (TBA) | 210,477 |
| 23,085 | | Fannie Mae, 3.0%, 10/1/30 | 24,733 |
| 59,975 | | Fannie Mae, 3.0%, 5/1/43 | 63,634 |
| 1,238 | | Fannie Mae, 3.0%, 5/1/46 | 1,329 |
| 1,608 | | Fannie Mae, 3.0%, 10/1/46 | 1,745 |
| 780 | | Fannie Mae, 3.0%, 1/1/47 | 846 |
| 4,162 | | Fannie Mae, 3.0%, 7/1/49 | 4,528 |
| 1,003,000 | | Fannie Mae, 3.0%, 1/1/51 (TBA) | 1,050,878 |
| 200,000 | | Fannie Mae, 3.0%, 2/1/51 (TBA) | 209,727 |
| 40,665 | | Fannie Mae, 3.5%, 6/1/45 | 44,106 |
| 47,808 | | Fannie Mae, 3.5%, 9/1/45 | 52,953 |
| 12,658 | | Fannie Mae, 3.5%, 10/1/46 | 13,730 |
| 42,156 | | Fannie Mae, 3.5%, 1/1/47 | 44,979 |
| 71,208 | | Fannie Mae, 3.5%, 1/1/47 | 77,194 |
| 401,000 | | Fannie Mae, 3.5%, 2/1/51 (TBA) | 423,870 |
| 42,772 | | Fannie Mae, 4.0%, 10/1/40 | 48,356 |
| 6,413 | | Fannie Mae, 4.0%, 12/1/40 | 7,251 |
| 21,577 | | Fannie Mae, 4.0%, 11/1/43 | 23,942 |
| 27,384 | | Fannie Mae, 4.0%, 11/1/43 | 30,183 |
| 19,831 | | Fannie Mae, 4.0%, 4/1/47 | 21,642 |
| 29,381 | | Fannie Mae, 4.0%, 4/1/47 | 32,143 |
| 11,228 | | Fannie Mae, 4.0%, 6/1/47 | 12,254 |
| 15,872 | | Fannie Mae, 4.0%, 7/1/47 | 17,195 |
| 290,000 | | Fannie Mae, 4.0%, 1/1/51 (TBA) | 309,711 |
| 41,893 | | Fannie Mae, 4.5%, 11/1/40 | 46,844 |
| 21,355 | | Fannie Mae, 4.5%, 5/1/41 | 23,857 |
The accompanying notes are an integral part of these financial statements.
23
| Pioneer Strategic Income VCT Portfolio | Pioneer Variable Contracts Trust
|
| Schedule of Investments 12/31/20 (continued) |
| | | | |
| Principal | | | |
| Amount | | | |
| USD ($) | | | Value |
| | U.S. GOVERNMENT AND AGENCY OBLIGATIONS (continued) | |
| 55,337 | | Fannie Mae, 4.5%, 6/1/44 | $ 61,926 |
| 128,881 | | Fannie Mae, 4.5%, 5/1/49 | 142,168 |
| 187,227 | | Fannie Mae, 4.5%, 4/1/50 | 206,593 |
| 650,000 | | Fannie Mae, 4.5%, 1/1/51 (TBA) | 704,438 |
| 20,301 | | Fannie Mae, 5.0%, 4/1/30 | 23,032 |
| 17,282 | | Fannie Mae, 5.0%, 1/1/39 | 20,074 |
| 4,162 | | Fannie Mae, 5.0%, 6/1/40 | 4,837 |
| 109 | | Fannie Mae, 6.0%, 3/1/32 | 128 |
| 67,000 | | Federal Home Loan Mortgage Corp., 1.5%, 1/1/36 | 68,964 |
| 240,000 | | Federal Home Loan Mortgage Corp., 1.5%, 1/1/51 | 242,565 |
| 115,294 | | Federal Home Loan Mortgage Corp., 2.0%, 12/1/35 | 120,571 |
| 19,604 | | Federal Home Loan Mortgage Corp., 3.0%, 10/1/29 | 20,611 |
| 14,631 | | Federal Home Loan Mortgage Corp., 3.0%, 12/1/46 | 15,405 |
| 36,954 | | Federal Home Loan Mortgage Corp., 3.0%, 2/1/47 | 40,285 |
| 47,293 | | Federal Home Loan Mortgage Corp., 3.0%, 2/1/47 | 49,768 |
| 1,627 | | Federal Home Loan Mortgage Corp., 3.0%, 11/1/47 | 1,775 |
| 38,751 | | Federal Home Loan Mortgage Corp., 3.5%, 11/1/45 | 41,981 |
| 42,624 | | Federal Home Loan Mortgage Corp., 3.5%, 7/1/46 | 46,840 |
| 13,370 | | Federal Home Loan Mortgage Corp., 4.0%, 4/1/47 | 14,595 |
| 14,873 | | Federal Home Loan Mortgage Corp., 4.0%, 4/1/47 | 16,094 |
| 38,159 | | Federal Home Loan Mortgage Corp., 4.0%, 4/1/47 | 41,345 |
| 173 | | Federal Home Loan Mortgage Corp., 5.0%, 5/1/34 | 201 |
| 602 | | Federal Home Loan Mortgage Corp., 5.0%, 6/1/35 | 666 |
| 3,831 | | Federal Home Loan Mortgage Corp., 5.0%, 10/1/38 | 4,453 |
| 15,983 | | Federal Home Loan Mortgage Corp., 5.0%, 11/1/39 | 18,591 |
| 7,964 | | Federal Home Loan Mortgage Corp., 5.5%, 6/1/41 | 9,359 |
| 50,000 | | Government National Mortgage Association, 2.0%, 1/15/51 (TBA) | 52,287 |
| 110,000 | | Government National Mortgage Association, 2.5%, 1/1/51 (TBA) | 116,445 |
| 8,372 | | Government National Mortgage Association I, 3.5%, 10/15/42 | 8,925 |
| 3,426 | | Government National Mortgage Association I, 4.0%, 12/15/41 | 3,687 |
| 101,550 | | Government National Mortgage Association I, 4.0%, 4/15/42 | 108,138 |
| 56,357 | | Government National Mortgage Association I, 4.0%, 8/15/43 | 65,763 |
| 5,256 | | Government National Mortgage Association I, 4.0%, 3/15/44 | 5,680 |
| 12,391 | | Government National Mortgage Association I, 4.0%, 9/15/44 | 13,392 |
| 15,630 | | Government National Mortgage Association I, 4.0%, 4/15/45 | 16,891 |
| 26,582 | | Government National Mortgage Association I, 4.0%, 6/15/45 | 28,759 |
| 3,962 | | Government National Mortgage Association I, 4.5%, 9/15/33 | 4,421 |
| 6,849 | | Government National Mortgage Association I, 4.5%, 4/15/35 | 7,571 |
| 16,482 | | Government National Mortgage Association I, 4.5%, 1/15/40 | 18,660 |
| 61,154 | | Government National Mortgage Association I, 4.5%, 3/15/40 | 68,781 |
| 12,313 | | Government National Mortgage Association I, 4.5%, 9/15/40 | 13,764 |
| 11,868 | | Government National Mortgage Association I, 4.5%, 7/15/41 | 13,283 |
| 3,109 | | Government National Mortgage Association I, 5.0%, 4/15/35 | 3,583 |
| 2,888 | | Government National Mortgage Association I, 5.5%, 1/15/34 | 3,332 |
| 4,119 | | Government National Mortgage Association I, 5.5%, 4/15/34 | 4,709 |
| 1,197 | | Government National Mortgage Association I, 5.5%, 7/15/34 | 1,377 |
The accompanying notes are an integral part of these financial statements.
24
| Pioneer Strategic Income VCT Portfolio | Pioneer Variable Contracts Trust
|
| | | | |
| Principal | | | |
| Amount | | | |
| USD ($) | | | Value |
| | U.S. GOVERNMENT AND AGENCY OBLIGATIONS (continued) | |
| 4,002 | | Government National Mortgage Association I, 5.5%, 6/15/35 | $ 4,443 |
| 407 | | Government National Mortgage Association I, 6.0%, 2/15/33 | 487 |
| 611 | | Government National Mortgage Association I, 6.0%, 3/15/33 | 688 |
| 758 | | Government National Mortgage Association I, 6.0%, 3/15/33 | 917 |
| 1,053 | | Government National Mortgage Association I, 6.0%, 6/15/33 | 1,238 |
| 876 | | Government National Mortgage Association I, 6.0%, 7/15/33 | 995 |
| 961 | | Government National Mortgage Association I, 6.0%, 7/15/33 | 1,132 |
| 154 | | Government National Mortgage Association I, 6.0%, 9/15/33 | 173 |
| 638 | | Government National Mortgage Association I, 6.0%, 9/15/33 | 716 |
| 1,078 | | Government National Mortgage Association I, 6.0%, 10/15/33 | 1,265 |
| 4,009 | | Government National Mortgage Association I, 6.0%, 8/15/34 | 4,511 |
| 303 | | Government National Mortgage Association I, 6.5%, 3/15/29 | 336 |
| 967 | | Government National Mortgage Association I, 6.5%, 1/15/30 | 1,074 |
| 220 | | Government National Mortgage Association I, 6.5%, 2/15/32 | 253 |
| 236 | | Government National Mortgage Association I, 6.5%, 3/15/32 | 274 |
| 396 | | Government National Mortgage Association I, 6.5%, 11/15/32 | 473 |
| 43 | | Government National Mortgage Association I, 7.0%, 3/15/31 | 44 |
| 8,575 | | Government National Mortgage Association II, 3.5%, 4/20/45 | 9,486 |
| 11,110 | | Government National Mortgage Association II, 3.5%, 4/20/45 | 12,269 |
| 14,460 | | Government National Mortgage Association II, 3.5%, 3/20/46 | 16,258 |
| 24,492 | | Government National Mortgage Association II, 4.0%, 9/20/44 | 27,028 |
| 36,898 | | Government National Mortgage Association II, 4.0%, 10/20/46 | 40,277 |
| 36,244 | | Government National Mortgage Association II, 4.0%, 1/20/47 | 39,283 |
| 16,866 | | Government National Mortgage Association II, 4.0%, 2/20/48 | 18,718 |
| 20,115 | | Government National Mortgage Association II, 4.0%, 4/20/48 | 22,333 |
| 7,605 | | Government National Mortgage Association II, 4.5%, 9/20/41 | 8,473 |
| 21,446 | | Government National Mortgage Association II, 4.5%, 9/20/44 | 22,733 |
| 9,240 | | Government National Mortgage Association II, 4.5%, 10/20/44 | 10,294 |
| 20,189 | | Government National Mortgage Association II, 4.5%, 11/20/44 | 22,539 |
| 2,233 | | Government National Mortgage Association II, 5.5%, 3/20/34 | 2,608 |
| 3,548 | | Government National Mortgage Association II, 6.0%, 11/20/33 | 4,115 |
| 3,000,000(l) | | U.S. Treasury Bills, 1/7/21 | 2,999,993 |
| 1,000,000(l) | | U.S. Treasury Bills, 1/26/21 | 999,971 |
| 1,400,000(l) | | U.S. Treasury Bills, 1/28/21 | 1,399,946 |
| 335,341 | | U.S. Treasury Inflation Indexed Bonds, 0.25%, 2/15/50 | 399,480 |
| 501,567 | | U.S. Treasury Inflation Indexed Bonds, 1.0%, 2/15/48 | 697,929 |
| 383,903 | | U.S. Treasury Inflation Indexed Bonds, 1.0%, 2/15/49 | 540,324 |
| 975,000 | | U.S. Treasury Notes, 0.125%, 10/31/22 | 975,152 |
| | TOTAL U.S. GOVERNMENT AND AGENCY OBLIGATIONS | |
| | (Cost $14,239,915) | $14,731,867 |
The accompanying notes are an integral part of these financial statements.
25
| Pioneer Strategic Income VCT Portfolio | Pioneer Variable Contracts Trust
|
| Schedule of Investments 12/31/20 (continued) |
| | | | | | | | |
| Number of | | | | | Strike | Expiration | |
| Contracts | | Description | Counterparty | Amount | Price | Date | Value |
| | OVER THE COUNTER (OTC) CALL OPTIONS PURCHASED — 0.0% | |
| 3,182^(m) | | Desarrolladora Homex | Bank of New York | MXN — | MXN — (o) | 10/23/22 | $ — |
| | SAB de CV | Mellon Corp. | | | | |
| 3,182^(n) | | Desarrolladora Homex | Bank of New York | MXN — | MXN — (o) | 10/23/22 | — |
| | SAB de CV | Mellon Corp. | | | | |
| | | | | | | $ — |
| | TOTAL OVER THE COUNTER (OTC) CALL OPTIONS PURCHASED | |
| | (Premiums paid $0) | | | | | $ — |
| | | OVER THE COUNTER (OTC) CURRENCY PUT OPTIONS PURCHASED — 0.0%† |
| 330,000 | | Put EUR Call USD | Bank of America NA | USD 5,140 | USD 1.11 | 3/8/21 | $ 10 |
| 175,000 | | Put EUR Call USD | Bank of America NA | EUR 2,896 | EUR 1.11 | 6/4/21 | 121 |
| 350,000 | | Put EUR Call USD | Goldman Sachs | EUR 1,558 | EUR 1.21 | 1/29/21 | 1,321 |
| | | International | | | | |
| 350,000 | | Put EUR Call USD | JPMorgan Chase | EUR 2,272 | EUR 1.15 | 5/17/21 | 657 |
| | | Bank NA | | | | |
| 440,000 | | Put USD Call JPY | JPMorgan Chase | USD 4,603 | USD 101.10 | 2/3/21 | 878 |
| | | Bank NA | | | | |
| | | | | | | $ 2,987 |
| | | TOTAL OVER THE COUNTER (OTC) CURRENCY PUT OPTIONS PURCHASED |
| | (Premiums paid $16,469) | | | | | $ 2,987 |
| | TOTAL OPTIONS PURCHASED | | | | |
| | (Premiums paid $16,469) | | | | | $ 2,987 |
| | TOTAL INVESTMENTS IN UNAFFILIATED ISSUERS — 99.3% | | |
| | (Cost $42,821,069) | | | | | $44,502,656 |
| | | | | | Change | |
| | | | | | in Net | |
| | | | | Net | Unrealized | |
| | | | Dividend | Realized
| Appreciation | |
| Shares | | | | Income | Gain (Loss)
| (Depreciation) | |
| | AFFILIATED ISSUER — 1.8% | | | | |
| | CLOSED-END FUND — 1.8% of Net Assets | | | |
| 97,089(p) | | Pioneer ILS Interval Fund | | $42,875 | $ — | $16,505 | $ 824,287 |
| | TOTAL CLOSED-END FUND | | | | |
| | (Cost $998,388) | | | | | $ 824,287 |
| | TOTAL INVESTMENTS IN AFFILIATED ISSUER — 1.8% | | |
| | (Cost $998,388) | | | | | $ 824,287 |
| Number of | | | | | Strike | Expiration | |
| Contracts | | Description | Counterparty | Amount | Price | Date | |
| | | OVER THE COUNTER (OTC) CURRENCY CALL OPTIONS WRITTEN — (0.0)%† |
| (330,000) | | Call EUR Put USD | Bank of America NA | USD 5,140 | USD 1.20 | 3/8/21 | $ (8,473) |
| (175,000) | | Call EUR Put USD | Bank of America NA | EUR 2,896 | EUR 1.17 | 6/4/21 | (10,320) |
| (350,000) | | Call EUR Put USD | Goldman Sachs | EUR 1,558 | EUR 1.25 | 1/29/21 | (995) |
| | | International | | | | |
The accompanying notes are an integral part of these financial statements.
26
| Pioneer Strategic Income VCT Portfolio | Pioneer Variable Contracts Trust
|
| | | | | | | | |
| Number of | | | | | Strike | Expiration | |
| Contracts | | Description | Counterparty | Amount | Price | Date | Value |
| | OVER THE COUNTER (OTC) CURRENCY CALL OPTIONS WRITTEN (continued) | |
| (350,000) | | Call EUR Put USD | JPMorgan Chase | EUR 2,272 | EUR 1.24 | 5/17/21 | $ (4,799) |
| | | Bank NA | | | | |
| (440,000) | | Call USD Put JPY | JPMorgan Chase | USD 4,603 | USD 107.94 | 2/3/21 | (53) |
| | | Bank NA | | | | |
| | | | | | | $ (24,640) |
| | | TOTAL OVER THE COUNTER (OTC) CURRENCY CALL OPTIONS WRITTEN | | | | |
| | (Premiums received $(16,469)) | | | | $ (24,640) |
| | OTHER ASSETS AND LIABILITIES — (1.1)% | | | $ (492,661) |
| | NET ASSETS — 100.0% | | | | $44,809,642 |
| | |
bps | Basis Points. |
BADLARPP | Argentine Deposit Rate Badlar Private Banks 30-35 Days. |
CMT | Constant Maturity Treasury Index. |
FREMF | Freddie Mac Multifamily Fixed-Rate Mortgage Loans. |
LIBOR | London Interbank Offered Rate. |
REIT | Real Estate Investment Trust. |
REMICS | Real Estate Mortgage Investment Conduits. |
SOFRRATE | Secured Overnight Financing Rate. |
(144A) | Security is exempt from registration under Rule 144A of the Securities Act of 1933. Such securities may be resold normally to qualified |
| institutional buyers in a transaction exempt from registration. At December 31, 2020, the value of these securities amounted to $16,780,088, or |
| 37.4% of net assets. |
(TBA) | “To Be Announced” Securities. |
† | Amount rounds to less than 0.1%. |
* | Senior secured floating rate loan interests in which the Portfolio invests generally pay interest at rates that are periodically redetermined by |
| reference to a base lending rate plus a premium. These base lending rates are generally (i) the lending rate offered by one or more major |
| European banks, such as LIBOR, (ii) the prime rate offered by one or more major United States banks, (iii) the rate of a certificate of deposit or |
| (iv) other base lending rates used by commercial lenders. The interest rate shown is the rate accruing at December 31, 2020. |
+ | Security that used significant unobservable inputs to determine its value. |
^ | Security is valued using fair value methods (other than prices supplied by independent pricing services or broker-dealers). See Notes to |
| Financial Statements — Note 1A. |
(a) | Non-income producing security. |
(b) | Security is perpetual in nature and has no stated maturity date. |
(c) | Debt obligation initially issued at one coupon which converts to a higher coupon at a specific date. The rate shown is the rate at December 31, 2020. |
(d) | The interest rate is subject to change periodically. The interest rate and/or reference index and spread shown at December 31, 2020. |
(e) | Floating rate note. Coupon rate, reference index and spread shown at December 31, 2020. |
(f) | Security represents the interest-only portion payments on a pool of underlying mortgages or mortgage-backed securities. |
(g) | Payment-in-kind (PIK) security which may pay interest in the form of additional principal amount. |
(h) | Issued as preference shares. |
(i) | Consists of Revenue Bonds unless otherwise indicated. |
(j) | Security is in default. |
(k) | Represents a General Obligation Bond. |
(l) | Security issued with a zero coupon. Income is recognized through accretion of discount. |
(m) | Option does not become effective until underlying company’s outstanding common shares reach a market capitalization of MXN 12.5 Billion. |
(n) | Option does not become effective until underlying company’s outstanding common shares reach a market capitalization of MXN 14.5 Billion. |
(o) | Strike price is 1 Mexican Peso (MXN). |
(p) | Pioneer ILS Interval Fund is an affiliated closed-end fund managed by Amundi Asset Management US, Inc., (the “Adviser”). |
(q) | Security is partially funded. See Notes to the Financial Statements - Note 8. |
# | Securities are restricted as to resale. |
The accompanying notes are an integral part of these financial statements.
27
| Pioneer Strategic Income VCT Portfolio | Pioneer Variable Contracts Trust
|
| Schedule of Investments 12/31/20 (continued) |
| | | | |
| Restricted Securities | Acquisition date | Cost | Value |
Lorenz Re 2018 | 6/26/2018 | $9,199 | $ 476 |
Lorenz Re 2019 | 7/10/2019 | 6,694 | 1,356 |
| Total Restricted Securities | | | $1,832 |
| % of Net assets | | | 0.0%† |
† Amount rounds to less than 0.1%.
FORWARD FOREIGN CURRENCY EXCHANGE CONTRACTS
| | | | | | | | | |
| In | | | | | | | Unrealized |
| Currency | Exchange | | Currency | | | | Settlement | Appreciation |
| Purchased | for | | Sold | Deliver | | Counterparty | Date | (Depreciation) |
SGD | 299,729 | | USD | (225,133) | | Bank of America NA | 3/4/21 | $ 1,609 |
NOK | 1,861,465 | | EUR | (170,110) | | Bank of New York Mellon Corp. | 1/7/21 | 9,054 |
NOK | 2,930,100 | | USD | (313,615) | | Bank of New York Mellon Corp. | 2/2/21 | 27,617 |
PLN | 420,000 | | EUR | (93,696) | | Brown Brothers Harriman & Co. | 2/23/21 | (2,090) |
USD | 48,571 | | EUR | (40,000) | | Brown Brothers Harriman & Co. | 2/25/21 | (330) |
USD | 38,845 | | EUR | (32,000) | | Citibank NA | 2/25/21 | (276) |
AUD | 587,765 | | USD | (428,605) | | Goldman Sachs International | 2/26/21 | 24,424 |
EGP | 795,790 | | USD | (49,830) | | Goldman Sachs International | 3/2/21 | (60) |
GHS | 579,382 | | USD | (95,568) | | Goldman Sachs International | 2/26/21 | 944 |
SEK | 2,136,507 | | EUR | (208,861) | | Goldman Sachs International | 3/3/21 | 4,733 |
USD | 84,575 | | RUB | (6,405,000) | | Goldman Sachs International | 2/26/21 | (1,304) |
CZK | 2,357,000 | | USD | (102,248) | | HSBC Bank USA NA | 1/27/21 | 7,463 |
EUR | 113,000 | | USD | (138,097) | | HSBC Bank USA NA | 3/26/21 | 139 |
RUB | 6,405,000 | | USD | (83,344) | | HSBC Bank USA NA | 2/26/21 | 2,535 |
EUR | 788,800 | | USD | (935,362) | | JPMorgan Chase Bank NA | 1/26/21 | 28,364 |
KRW | 260,944,130 | | USD | (235,520) | | JPMorgan Chase Bank NA | 3/4/21 | 4,424 |
PEN | 790,000 | | USD | (220,289) | | JPMorgan Chase Bank NA | 2/26/21 | (2,000) |
SEK | 5,004,326 | | USD | (575,032) | | JPMorgan Chase Bank NA | 1/27/21 | 33,991 |
USD | 103,150 | | EUR | (85,000) | | JPMorgan Chase Bank NA | 1/26/21 | (699) |
INR | 16,000,000 | | USD | (215,459) | | State Street Bank & Trust Co. | 1/29/21 | 2,947 |
USD | 109,387 | | EUR | (92,000) | | State Street Bank & Trust Co. | 1/26/21 | (3,015) |
USD | 170,100 | | MXN | (3,595,300) | | State Street Bank & Trust Co. | 1/27/21 | (10,094) |
TOTAL FORWARD FOREIGN CURRENCY EXCHANGE CONTRACTS
| | | | $128,376 |
FUTURES CONTRACTS
FIXED INCOME INDEX FUTURES CONTRACTS
| | | | | | | | | | | | | |
| | | | | | | | | | | | Unrealized | |
| Number of | | | Expiration | | Notional | | | Market | | | Appreciation | |
| Contracts Long | | Description | Date | | Amount | | | Value | | | (Depreciation) | |
| | 1
| | U.S. 2 Year Note (CBT) | 3/31/21 | | $ | 220,766 | | | $ | 220,977 | | | $ | 211 | |
| | 12 | | U.S. Ultra Bond (CBT) | 3/22/21 | | | 2,595,563 | | | | 2,562,750 | | | | (32,813 | ) |
| | | | | | | $ | 2,816,329 | | | $ | 2,783,727 | | | $ | (32,602 | ) |
| | |
| | | | | | | | | | | | | | | Unrealized | |
| Number of | | | Expiration | | Notional | | | Market | | | Appreciation | |
| Contracts Short | | Description | Date | | Amount | | | Value | | | (Depreciation) | |
| | 9 | | Euro-Bobl | 3/8/21 | | $ | (1,483,747 | ) | | $ | (1,485,615 | ) | | $ | (1,868 | ) |
| | 17 | | Euro-Bund | 3/8/21 | | | (3,675,181 | ) | | | (3,687,575 | ) | | | (12,394 | ) |
| | 4
| | U.S. 10 Year Note (CBT) | 3/22/21 | | | (551,585 | ) | | | (552,312 | ) | | | (727 | ) |
| | 11 | | U.S. 10 Year Ultra | 3/22/21 | | | (1,726,648 | ) | | | (1,719,953 | ) | | | 6,695 | |
| | 6 | | U.S. Long Bond (CBT) | 3/22/21 | | | (1,049,188 | ) | | | (1,039,125 | ) | | | 10,063 | |
| | | | | | | $ | (8,486,349 | ) | | $ | (8,484,580 | ) | | $ | 1,769 | |
| TOTAL FUTURES CONTRACTS | | | $ | (5,670,020 | ) | | $ | (5,700,853 | ) | | $ | (30,833 | ) |
The accompanying notes are an integral part of these financial statements.
28
| Pioneer Strategic Income VCT Portfolio | Pioneer Variable Contracts Trust
|
| | | | | | | | |
| SWAP CONTRACT | | | | | | | |
| CENTRALLY CLEARED CREDIT DEFAULT SWAP CONTRACT – SELL PROTECTION | | | | |
| Notional | | Pay/ | Annual | Expiration | Premiums | Unrealized | Market |
Amount ($)(1) | Reference Obligation/Index | Receive(2) | Fixed Rate | Date | (Received) | Appreciation | Value |
| 2,100,000 | Markit CDX North America | Receive | 5.00% | 12/20/25 | $(583) | $199,378 | $198,795 |
| Investment Grade Index Series 33 | | | | | | |
| TOTAL CENTRALLY CLEARED CREDIT DEFAULT SWAP CONTRACT - SELL PROTECTION | | $(583) | $199,378 | $198,795 |
| TOTAL SWAP CONTRACT | | | | $(583) | $199,378 | $198,795 |
(1) | The notional amount is the maximum amount that a seller of credit protection would be obligated to pay upon occurrence of a credit event. |
(2) | Receives quarterly. |
| Principal amounts are denominated in U.S. dollars (“USD”) unless otherwise noted. |
| ARS — | Argentine Peso |
| AUD — | Australian Dollar |
| CZK — | Czech Koruna |
| EGP — | Egyptian Pound |
| EUR — | Euro |
| GHS — | Ghanaian Cedi |
| IDR — | Indonesian Rupiah |
| INR — | Indian Rupee |
| KRW — | Korean Won |
| MXN — | Mexican Peso |
| NOK — | Norwegian Krone |
| PEN — | Peruvian Sol |
| PLN — | Polish Zloty |
| RUB — | Russian Ruble |
| SEK — | Swedish Krona |
| SGD — | Singapore Dollar |
| UYU — | Uruguayan Peso |
| | | |
| Purchases and sales of securities (excluding temporary cash investments) for the year ended December 31, 2020 were as follows: |
| Purchases | Sales |
| Long-Term U.S. Government Securities | $ 3,236,906 | $ 7,327,623 |
| Other Long-Term Securities | $19,614,359 | $21,418,280 |
The Portfolio is permitted to engage in purchase and sale transactions (“cross trades”) with certain funds and accounts for which Amundi Asset Management US, Inc. (the “Adviser”) serves as the Portfolio’s investment adviser, as set forth in Rule 17a-7 under the Investment Company Act of 1940, pursuant to procedures adopted by the Board of Trustees. Under these procedures, cross trades are effected at current market prices. During the year ended December 31, 2020, the Portfolio engaged in purchases of $7,088 and sales of $64,577 pursuant to these procedures, which resulted in a net realized gain/(loss) of $1,270.
| | |
| At December 31, 2020, the net unrealized appreciation on investments based on cost for federal tax purposes of $44,099,203 was as follows: |
| Aggregate gross unrealized appreciation for all investments in which there is an excess of value over tax cost | $ 2,832,750 |
| Aggregate gross unrealized depreciation for all investments in which there is an excess of tax cost over value | (1,333,312) |
| Net unrealized appreciation | $ 1,499,438 |
Various inputs are used in determining the value of the Portfolio’s investments. These inputs are summarized in the three broad levels below.
Level 1 - unadjusted quoted prices in active markets for identical securities.
Level 2 - other significant observable inputs (including quoted prices for similar securities, interest rates, prepayment speeds, credit risks, etc.). See Notes to Financial Statements — Note 1A.
Level 3 - significant unobservable inputs (including the Portfolio’s own assumptions in determining fair value of investments). See Notes to Financial Statements — Note 1A.
The accompanying notes are an integral part of these financial statements.
29
| Pioneer Strategic Income VCT Portfolio | Pioneer Variable Contracts Trust
|
| Schedule of Investments 12/31/20 (continued) |
| |
The following is a summary of the inputs used as of December 31, 2020, in valuing the Portfolio’s investments: |
| | Level 1 | | | Level 2 | | | Level 3 | | | Total | |
| Common Stocks | | | | | | | | | | | | |
| Paper & Forest Products | | $ | — | | | $ | 41 | | | $ | — | | | $ | 41 | |
| All Other Common Stocks | | | 3,531 | | | | — | | | | — | | | | 3,531 | |
| Convertible Preferred Stocks | | | 795,452 | | | | — | | | | — | | | | 795,452 | |
| Asset Backed Securities | | | — | | | | 2,810,413 | | | | — | | | | 2,810,413 | |
| Collateralized Mortgage Obligations | | | — | | | | 3,836,795 | | | | — | | | | 3,836,795 | |
| Commercial Mortgage-Backed Securities | | | — | | | | 2,776,877 | | | | — | | | | 2,776,877 | |
| Convertible Corporate Bonds | | | — | | | | 323,367 | | | | — | | | | 323,367 | |
| Corporate Bonds | | | — | | | | 16,063,178 | | | | — | | | | 16,063,178 | |
| Foreign Government Bonds | | | — | | | | 2,292,363 | | | | — | | | | 2,292,363 | |
| Insurance-Linked Securities | | | | | | | | | | | | | | | | |
| Reinsurance Sidecars | | | | | | | | | | | | | | | | |
| Multiperil - Worldwide | | | — | | | | — | | | | 1,832 | | | | 1,832 | |
| Municipal Bonds | | | — | | | | 79,418 | | | | — | | | | 79,418 | |
| Senior Secured Floating Rate Loan Interests | | | — | | | | 784,535 | | | | — | | | | 784,535 | |
| U.S. Government and Agency Obligations | | | — | | | | 14,731,867 | | | | — | | | | 14,731,867 | |
| Over The Counter (OTC) Call Option Purchased | | | — | | | | — | * | | | — | | | | — | * |
| Over The Counter (OTC) Currency Put Option Purchased | | | — | | | | 2,987 | | | | — | | | | 2,987 | |
| Affiliated Closed-End Fund | | | — | | | | 824,287 | | | | — | | | | 824,287 | |
| Total Investments in Securities | | $ | 798,983 | | | $ | 44,526,128 | | | $ | 1,832 | | | $ | 45,326,943 | |
| Other Financial Instruments | | | | | | | | | | | | | | | | |
| Over The Counter (OTC) Currency Call Option Written | | $ | — | | | $ | (24,640 | ) | | $ | — | | | $ | (24,640 | ) |
| Net unrealized appreciation on forward foreign currency | | | | | | | | | | | | | | | | |
| exchange contracts | | | — | | | | 128,376 | | | | — | | | | 128,376 | |
| Net unrealized depreciation on futures contracts | | | (30,833 | ) | | | — | | | | — | | | | (30,833 | ) |
| Swap contracts, at value | | | — | | | | 198,795 | | | | — | | | | 198,795 | |
| Total Other Financial Instruments | | $ | (30,833 | ) | | $ | 302,531 | | | $ | — | | | $ | 271,698 | |
* Securities valued at $0. |
The following is a reconciliation of assets valued using significant unobservable inputs (Level 3):
| | | | |
| | Insurance- | |
| | Linked | |
| | Securities | |
| Balance as of 12/31/19 | | $ | 22,002 | |
Realized gain (loss)(1) | | | — | |
Change in unrealized appreciation (depreciation)(2) | | | (631 | ) |
| Accrued discounts/premiums | | | — | |
| Purchases | | | — | |
| Sales | | | (19,539 | ) |
| Transfers in to Level 3** | | | — | |
| Transfers out of Level 3** | | | — | |
Balance as of 12/31/20
| | $ | 1,832 | |
(1)
| Realized gain (loss) on these securities is included in the realized gain (loss) from investments on the Statement of Operations. |
(2)
| Unrealized appreciation (depreciation) on these securities is included in change in net unrealized appreciation (depreciation) on investments in the Statement of Operations. |
** | Transfers are calculated on the beginning of period value. For the year ended December 31, 2020, there were no transfers in or out of Level 3. |
| | |
Net change in unrealized appreciation (depreciation) of Level 3 investments still held and considered Level 3 at December 31, 2020: | $(631) |
The accompanying notes are an integral part of these financial statements.
30
| Pioneer Strategic Income VCT Portfolio | Pioneer Variable Contracts Trust
|
Statement of Assets and Liabilities 12/31/20 |
| | | | |
| ASSETS: | | | |
| Investments in unaffiliated issuers, at value (cost $42,821,069) | | $ | 44,502,656 | |
| Investments in affiliated issuers, at value (cost $998,388) | | | 824,287 | |
| Cash | | | 1,470,727 | |
| Foreign currencies, at value (cost $5,632) | | | 3,372 | |
| Futures collateral | | | 65,171 | |
| Swaps collateral | | | 219,600 | |
| Due from broker for futures | | | 260,339 | |
| Variation margin for futures contracts | | | 4,117 | |
| Variation margin for centrally cleared swap contracts | | | 3,003 | |
| Net unrealized appreciation on forward foreign currency exchange contracts | | | 128,376 | |
| Swap contracts, at value (net premiums received $(583)) | | | 198,795 | |
| Unrealized appreciation on unfunded loan commitments | | | 219 | |
| Receivables — | | | | |
| Investment securities sold | | | 1,236,920 | |
| Portfolio shares sold | | | 500 | |
| Dividends | | | 1,921 | |
| Interest | | | 270,771 | |
| Due from the Adviser | | | 24,040 | |
| Other assets | | | 145 | |
| Total assets | | $ | 49,214,959 | |
| LIABILITIES: | | | | |
| Payables — | | | | |
| Investment securities purchased | | $ | 4,006,540 | |
| Portfolio shares repurchased | | | 16,597 | |
| Trustees’ fees | | | 158 | |
| Due to broker for swaps | | | 198,771 | |
| Written options outstanding (net premiums received $(16,469)) | | | 24,640 | |
| Net unrealized depreciation on futures contracts | | | 30,833 | |
| Reserve for repatriation taxes | | | 5,801 | |
| Due to affiliates | | | 23,875 | |
| Accrued expenses | | | 98,102 | |
| Total liabilities | | $ | 4,405,317 | |
| NET ASSETS: | | | | |
| Paid-in capital | | $ | 42,544,493 | |
| Distributable earnings | | | 2,265,149 | |
| Net assets | | $ | 44,809,642 | |
| NET ASSET VALUE PER SHARE: | | | | |
No par value (unlimited number of shares authorized) | | | | |
| Class I (based on $6,552,046/612,996 shares) | | $ | 10.69 | |
| Class II (based on $38,257,596/3,585,219 shares) | | $ | 10.67 | |
The accompanying notes are an integral part of these financial statements.
31
| Pioneer Strategic Income VCT Portfolio | Pioneer Variable Contracts Trust
|
| Statement of Operations |
| |
| FOR THE YEAR ENDED 12/31/20 |
| | | | | | | |
| INVESTMENT INCOME: | | | | | | |
| Interest from unaffiliated issuers (net of foreign taxes withheld $8,560) | | $ | 1,638,520 | | | | |
| Dividends from affiliated issuers | | | 42,875 | | | | |
| Dividends from unaffiliated issuers (net of foreign taxes withheld $3,554) | | | 24,242 | | | | |
| Total investment income | | | | | | $ | 1,705,637 | |
| EXPENSES: | | | | | | | | |
| Management fees | | $ | 269,687 | | | | | |
| Administrative expense | | | 64,430 | | | | | |
| Distribution fees | | | | | | | | |
| Class II | | | 89,282 | | | | | |
| Custodian fees | | | 65,520 | | | | | |
| Professional fees | | | 68,325 | | | | | |
| Printing expense | | | 18,424 | | | | | |
| Pricing fees | | | 43,977 | | | | | |
| Trustees’ fees | | | 7,400 | | | | | |
| Insurance expense | | | 22 | | | | | |
| Miscellaneous | | | 3,756 | | | | | |
| Total expenses | | | | | | $ | 630,823 | |
| Less fees waived and expenses reimbursed by the Adviser | | | | | | | (232,227 | ) |
| Net expenses | | | | | | $ | 398,596 | |
| Net investment income | | | | | | $ | 1,307,041 | |
| REALIZED AND UNREALIZED GAIN (LOSS) ON INVESTMENTS: | | | | | | | | |
| Net realized gain (loss) on: | | | | | | | | |
| Investments in unaffiliated issuers | | $ | 895,609 | | | | | |
| Written options | | | 10,461 | | | | | |
| Forward foreign currency exchange contracts | | | 121,918 | | | | | |
| Futures contracts | | | (331,723 | ) | | | | |
| Swap contracts | | | (58,026 | ) | | | | |
| Short sales | | | (179 | ) | | | | |
| Other assets and liabilities denominated in foreign currencies | | | (20,483 | ) | | $ | 617,577 | |
| Change in net unrealized appreciation (depreciation) on: | | | | | | | | |
| Investments in unaffiliated issuers (net of foreign capital gains tax of ($3,162)) | | $ | 575,428 | | | | | |
| Investments in affiliated issuers | | | 16,505 | | | | | |
| Written options | | | (15,501 | ) | | | | |
| Forward foreign currency exchange contracts | | | 77,577 | | | | | |
| Futures contracts | | | (63,244 | ) | | | | |
| Swap contracts | | | 206,061 | | | | | |
| Unfunded loan commitments | | | 219 | | | | | |
| Other assets and liabilities denominated in foreign currencies | | | (1,044 | ) | | $ | 796,001 | |
| Net realized and unrealized gain (loss) on investments | | | | | | $ | 1,413,578 | |
| Net increase in net assets resulting from operations | | | | | | $ | 2,720,619 | |
The accompanying notes are an integral part of these financial statements.
32
| Pioneer Strategic Income VCT Portfolio | Pioneer Variable Contracts Trust
|
| Statements of Changes in Net Assets |
| | | | | | | |
| | Year Ended | | | Year Ended | |
| | 12/31/20 | | | 12/31/19 | |
| FROM OPERATIONS: | | | | | | |
Net investment income (loss) | | $ | 1,307,041 | | | $ | 1,314,179 | |
Net realized gain (loss) on investments | | | 617,577 | | | | 195,032 | |
Change in net unrealized appreciation (depreciation) on investments | | | 796,001 | | | | 2,267,572 | |
| Net increase in net assets resulting from operations | | $ | 2,720,619 | | | $ | 3,776,783 | |
| DISTRIBUTIONS TO SHAREOWNERS: | | | | | | | | |
| Class I ($0.39 and $0.34 per share, respectively) | | $ | (221,198 | ) | | $ | (219,924 | ) |
| Class II ($0.36 and $0.31 per share, respectively) | | | (1,278,984 | ) | | | (1,071,742 | ) |
| Total distributions to shareowners | | $ | (1,500,182 | ) | | $ | (1,291,666 | ) |
| FROM PORTFOLIO SHARE TRANSACTIONS: | | | | | | | | |
Net proceeds from sales of shares | | $ | 15,191,829 | | | $ | 15,868,473 | |
Reinvestment of distributions | | | 1,500,182 | | | | 1,291,666 | |
Cost of shares repurchased | | | (15,711,900 | ) | | | (19,996,552 | ) |
| Net increase (decrease) in net assets resulting from Portfolio | | | | | | | | |
| share transactions | | $ | 980,111 | | | $ | (2,836,413 | ) |
| Net increase (decrease) in net assets | | $ | 2,200,548 | | | $ | (351,296 | ) |
| NET ASSETS: | | | | | | | | |
Beginning of year | | $ | 42,609,094 | | | $ | 42,960,390 | |
End of year | | $ | 44,809,642 | | | $ | 42,609,094 | |
| | Year Ended | | | Year Ended | | | Year Ended | | | Year Ended | |
| | 12/31/20 | | | 12/31/20 | | | 12/31/19 | | | 12/31/19 | |
| | Shares | | | Amount | | | Shares | | | Amount | |
| Class I | | | | | | | | | | | | |
Shares sold | | | 89,934 | | | $ | 931,452 | | | | 32,007 | | | $ | 324,180 | |
Reinvestment of distributions | | | 21,812 | | | | 221,198 | | | | 21,851 | | | | 219,924 | |
Less shares repurchased | | | (76,209 | ) | | | (769,467 | ) | | | (536,402 | ) | | | (5,308,250 | ) |
| Net increase (decrease) | | | 35,537 | | | $ | 383,183 | | | | (482,544 | ) | | $ | (4,764,146 | ) |
| Class II | | | | | | | | | | | | | | | | |
Shares sold | | | 1,404,551 | | | $ | 14,260,377 | | | | 1,537,078 | | | $ | 15,544,293 | |
Reinvestment of distributions | | | 126,398 | | | | 1,278,984 | | | | 106,260 | | | | 1,071,742 | |
Less shares repurchased | | | (1,502,700 | ) | | | (14,942,433 | ) | | | (1,455,291 | ) | | | (14,688,302 | ) |
| Net increase | | | 28,249 | | | $ | 596,928 | | | | 188,047 | | | $ | 1,927,733 | |
The accompanying notes are an integral part of these financial statements.
33
| Pioneer Strategic Income VCT Portfolio | Pioneer Variable Contracts Trust
|
| | Year Ended | | | Year Ended | | | Year Ended | | | Year Ended | | | Year Ended
| |
| | 12/31/20 | | | 12/31/19 | | | 12/31/18 | | | 12/31/17 | | | 12/31/16* | |
| Class I | | | | | | | | | | | | | | | |
Net asset value, beginning of period | | $ | 10.32 | | | $ | 9.71 | | | $ | 10.28 | | | $ | 10.16 | | | $ | 9.78 | |
Increase (decrease) from investment operations: | | | | | | | | | | | | | | | | | | | | |
| Net investment income (loss) (a) | | $ | 0.34 | | | $ | 0.34 | | | $ | 0.34 | | | $ | 0.35 | | | $ | 0.38 | |
| Net realized and unrealized gain (loss) on investments | | | 0.42 | | | | 0.61 | | | | (0.52 | ) | | | 0.15 | | | | 0.35 | |
| Net increase (decrease) from investment operations | | $ | 0.76 | | | $ | 0.95 | | | $ | (0.18 | ) | | $ | 0.50 | | | $ | 0.73 | |
Distributions to shareowners: | | | | | | | | | | | | | | | | | | | | |
| Net investment income | | $ | (0.36 | ) | | $ | (0.34 | ) | | $ | (0.28 | ) | | $ | (0.37 | ) | | $ | (0.35 | ) |
| Net realized gain | | | (0.03 | ) | | | — | | | | (0.07 | ) | | | (0.01 | ) | | | — | |
| Tax return of capital | | | — | | | | — | | | | (0.04 | ) | | | — | | | | — | |
| Total distributions | | $ | (0.39 | ) | | $ | (0.34 | ) | | $ | (0.39 | ) | | $ | (0.38 | ) | | $ | (0.35 | ) |
| | | | | | | | | | | | | | | | | | | | | |
Net increase (decrease) in net asset value
| | $ | 0.37 | | | $ | 0.61 | | | $ | (0.57 | ) | | $ | 0.12 | | | $ | 0.38 | |
Net asset value, end of period
| | $ | 10.69 | | | $ | 10.32 | | | $ | 9.71 | | | $ | 10.28 | | | $ | 10.16 | |
| Total return (b) | | | 7.63 | % | | | 9.89 | % | | | (1.78 | )% | | | 4.99 | %(c) | | | 7.58 | % |
Ratio of net expenses to average net assets | | | 0.75 | % | | | 0.75 | % | | | 0.75 | % | | | 0.75 | % | | | 0.75 | % |
Ratio of net investment income (loss) to average net assets | | | 3.38 | % | | | 3.38 | % | | | 3.41 | % | | | 3.43 | % | | | 3.76 | % |
Portfolio turnover rate | | | 62 | % | | | 62 | % | | | 37 | % | | | 48 | % | | | 61 | % |
Net assets, end of period (in thousands) | | $ | 6,552 | | | $ | 5,962 | | | $ | 10,296 | | | $ | 10,886 | | | $ | 10,890 | |
Ratios with no waiver of fees and assumption of expenses by | | | | | | | | | | | | | | | | | | | | |
| the Adviser and no reduction for fees paid indirectly: | | | | | | | | | | | | | | | | | | | | |
| Total expenses to average net assets | | | 1.31 | % | | | 1.33 | % | | | 1.32 | % | | | 1.18 | % | | | 1.17 | % |
| Net investment income (loss) to average net assets | | | 2.82 | % | | | 2.80 | % | | | 2.84 | % | | | 3.00 | % | | | 3.34 | % |
* | The Portfolio was audited by an independent registered public accounting firm other than Ernst & Young LLP. |
(a) | The per-share data presented above is based on the average shares outstanding for the periods presented. |
(b) | Assumes initial investment at net asset value at the beginning of each period, reinvestment of all distributions and the complete redemption of the investment at net asset value at the end of each period. |
(c) | If the Portfolio had not recognized gains in settlement of class action lawsuits during the year ended December 31, 2017, the total return would have been 4.94%. |
NOTE: The above financial highlights do not reflect the deduction of non-portfolio expenses associated with variable insurance products, such as mortality and expense risk charges, separate account charges, and sales charges.
The accompanying notes are an integral part of these financial statements.
34
| Pioneer Strategic Income VCT Portfolio | Pioneer Variable Contracts Trust
|
| | Year Ended | | | Year Ended | | | Year Ended | | | Year Ended | | | Year Ended | |
| | 12/31/20 | | | 12/31/19 | | | 12/31/18 | | | 12/31/17 | | | 12/31/16* | |
| Class II | | | | | | | | | | | | | |
| |
| Net asset value, beginning of period | | $ | 10.30 | | | $ | 9.70 | | | $ | 10.26 | | | $ | 10.14 | | | $ | 9.76 | |
| Increase (decrease) from investment operations: | | | | | | | | | | | | | | | | | | | | |
| Net investment income (loss) (a) | | $ | 0.32 | | | $ | 0.32 | | | $ | 0.31 | | | $ | 0.33 | | | $ | 0.35 | |
| Net realized and unrealized gain (loss) on investments | | | 0.41 | | | | 0.59 | | | | (0.50 | ) | | | 0.14 | | | | 0.36 | |
| Net increase (decrease) from investment operations | | $ | 0.73 | | | $ | 0.91 | | | $ | (0.19 | ) | | $ | 0.47 | | | $ | 0.71 | |
| Distributions to shareowners: | | | | | | | | | | | | | | | | | | | | |
| Net investment income | | $ | (0.33 | ) | | $ | (0.31 | ) | | $ | (0.26 | ) | | $ | (0.34 | ) | | $ | (0.33 | ) |
| Net realized gain | | | (0.03 | ) | | | — | | | | (0.07 | ) | | | (0.01 | ) | | | — | |
| Tax return of capital | | | — | | | | — | | | | (0.04 | ) | | | — | | | | — | |
| Total distributions | | $ | (0.36 | ) | | $ | (0.31 | ) | | $ | (0.37 | ) | | $ | (0.35 | ) | | $ | (0.33 | ) |
| | |
Net increase (decrease) in net asset value
| | $ | 0.37 | | | $ | 0.60 | | | $ | (0.56 | ) | | $ | 0.12 | | | $ | 0.38 | |
Net asset value, end of period
| | $ | 10.67 | | | $ | 10.30 | | | $ | 9.70 | | | $ | 10.26 | | | $ | 10.14 | |
| Total return (b) | | | 7.37 | % | | | 9.52 | % | | | (1.93 | )% | | | 4.74 | % | | | 7.32 | % |
| Ratio of net expenses to average net assets | | | 0.99 | % | | | 1.00 | % | | | 1.00 | % | | | 1.00 | % | | | 1.00 | % |
| Ratio of net investment income (loss) to average net assets | | | 3.11 | % | | | 3.16 | % | | | 3.16 | % | | | 3.18 | % | | | 3.51 | % |
| Portfolio turnover rate | | | 62 | % | | | 62 | % | | | 37 | % | | | 48 | % | | | 61 | % |
| Net assets, end of period (in thousands) | | $ | 38,258 | | | $ | 36,647 | | | $ | 32,664 | | | $ | 35,585 | | | $ | 34,020 | |
| Ratios with no waiver of fees and assumption of expenses by | | | | | | | | | | | | | | | | | | | | |
| the Adviser and no reduction for fees paid indirectly: | | | | | | | | | | | | | | | | | | | | |
| Total expenses to average net assets | | | 1.55 | % | | | 1.59 | % | | | 1.57 | % | | | 1.43 | % | | | 1.42 | % |
| Net investment income (loss) to average net assets | | | 2.55 | % | | | 2.57 | % | | | 2.59 | % | | | 2.75 | % | | | 3.09 | % |
* | The Portfolio was audited by an independent registered public accounting firm other than Ernst & Young LLP. |
(a) | The per-share data presented above is based on the average shares outstanding for the periods presented. |
(b) | Assumes initial investment at net asset value at the beginning of each period, reinvestment of all distributions and the complete redemption of the investment at net asset value at the end of each period. |
NOTE: The above financial highlights do not reflect the deduction of non-portfolio expenses associated with variable insurance products, such as mortality and expense risk charges, separate account charges, and sales charges.
The accompanying notes are an integral part of these financial statements.
35
| Pioneer Strategic Income VCT Portfolio | Pioneer Variable Contracts Trust
|
Notes to Financial Statements 12/31/20 |
1. Organization and Significant Accounting Policies
Pioneer Strategic Income VCT Portfolio (the “Portfolio”) is one of 8 portfolios comprising Pioneer Variable Contracts Trust (the “Trust”), a Delaware statutory trust. The Portfolio is registered under the Investment Company Act of 1940 as a diversified, open-end management investment company. The investment objective of the Portfolio is to produce a high level of current income.
The Portfolio offers two classes of shares designated as Class I and Class II shares. Each class of shares represents an interest in the same schedule of investments of the Portfolio and has identical rights (based on relative net asset values) to assets and liquidation proceeds. Share classes can bear different rates of class-specific fees and expenses, such as transfer agent and distribution fees. Differences in class-specific fees and expenses will result in differences in net investment income and, therefore, the payment of different dividends from net investment income earned by each class. The Amended and Restated Declaration of Trust of the Portfolio gives the Board of Trustees the flexibility to specify either per-share voting or dollar-weighted voting when submitting matters for shareowner approval. Under per-share voting, each share of a class of the Portfolio is entitled to one vote. Under dollar-weighted voting, a shareowner’s voting power is determined not by the number of shares owned, but by the dollar value of the shares on the record date. Each share class has exclusive voting rights with respect to matters affecting only that class, including with respect to the distribution plan for that class. There is no distribution plan for Class I shares.
Portfolio shares may be purchased only by insurance companies for the purpose of funding variable annuity and variable life insurance contracts, or by qualified pension and retirement plans.
Amundi Asset Management US, Inc., an indirect, wholly owned subsidiary of Amundi and Amundi’s wholly owned subsidiary, Amundi USA, Inc., serves as the Portfolio’s investment adviser (the “Adviser”). Prior to January 1, 2021, the Adviser was named Amundi Pioneer Asset Management, Inc. Amundi Distributor US, Inc., an affiliate of Amundi Asset Management US, Inc., serves as the Portfolio’s distributor (the “Distributor”).
In August 2018, the Financial Accounting Standards Board (FASB) issued Accounting Standards Update 2018-13 “Disclosure Framework - Changes to the Disclosure Requirements for Fair Value Measurement” (“ASU 2018-13”) which modifies disclosure requirements for fair value measurements, principally for Level 3 securities and transfers between levels of the fair value hierarchy. ASU 2018-13 is effective for fiscal years beginning after December 15, 2019 and for interim periods within those fiscal years. The Portfolio has adopted ASU 2018-13 for the year ended December 31, 2020. The impact to the Portfolio’s adoption was limited to changes in the Portfolio’s disclosures regarding fair value, primarily those disclosures related to transfers between levels of the fair value hierarchy and disclosure of the range and weighted average used to develop significant unobservable inputs for Level 3 fair value investments, when applicable.
In March 2020, FASB issued an Accounting Standard Update, ASU 2020-04, Reference Rate Reform (Topic 848) — Facilitation of the Effects of Reference Rate Reform on Financial Reporting (“ASU 2020-04”), which provides optional, temporary relief with respect to the financial reporting of contracts subject to certain types of modifications due to the planned discontinuation of the London Interbank Offered Rate (“LIBOR”) and other LIBOR-based reference rates at the end of 2021. The temporary relief provided by ASU 2020-04 is effective for certain reference rate-related contract modifications that occur during the period from March 12, 2020 through December 31, 2022. Management is evaluating the impact of ASU 2020-04 on the Trust’s investments, derivatives, debt and other contracts that will undergo reference rate-related modifications as a result of the reference rate reform.
The Portfolio is an investment company and follows investment company accounting and reporting guidance under U.S. Generally Accepted Accounting Principles (“U.S. GAAP”). U.S. GAAP requires the management of the Portfolio to make estimates and assumptions that affect the reported amounts of assets and liabilities, the disclosure of contingent assets and liabilities at the date of the financial statements, and the reported amounts of income, expenses and gain or loss on investments during the reporting period. Actual results could differ from those estimates.
The following is a summary of significant accounting policies followed by the Portfolio in the preparation of its financial statements:
A. Security Valuation
The net asset value of the Portfolio is computed once daily, on each day the New York Stock Exchange (“NYSE”) is open, as of the close of regular trading on the NYSE.
Fixed-income securities are valued by using prices supplied by independent pricing services, which consider such factors as market prices, market events, quotations from one or more brokers, Treasury spreads, yields, maturities and ratings, or may use a pricing matrix or other fair value methods or techniques to provide an estimated value of the security or instrument. A pricing matrix is a means of valuing a debt security on the basis of current market prices for other debt securities, historical trading patterns in the market for fixed-income securities and/or other factors. Non-U.S. debt securities that are listed on an
36
| Pioneer Strategic Income VCT Portfolio | Pioneer Variable Contracts Trust
|
exchange will be valued at the bid price obtained from an independent third party pricing service. When independent third party pricing services are unable to supply prices, or when prices or market quotations are considered to be unreliable, the value of that security may be determined using quotations from one or more broker-dealers.
Loan interests are valued in accordance with guidelines established by the Board of Trustees at the mean between the last available bid and asked prices from one or more brokers or dealers as obtained from Loan Pricing Corporation, an independent third party pricing service. If price information is not available from Loan Pricing Corporation, or if the price information is deemed to be unreliable, price information will be obtained from an alternative loan interest pricing service. If no reliable price quotes are available from either the primary or alternative pricing service, broker quotes will be solicited.
Equity securities which may include restricted securities that have traded on an exchange are valued by using the last sale price on the principal exchange where they are traded. Equity securities which may include restricted securities that have not traded on the date of valuation, or securities for which sale prices are not available, generally are valued using the mean between the last bid and asked prices or, if both last bid and asked prices are not available, at the last quoted bid price. Last sale and bid and asked prices are provided by independent third party pricing services. In the case of equity securities which may include restricted securities not traded on an exchange, prices are typically determined by independent third party pricing services using a variety of techniques and methods.
The value of foreign securities is translated into U.S. dollars based on foreign currency exchange rate quotations supplied by a third party pricing source. Trading in non-U.S. equity securities is substantially completed each day at various times prior to the close of the NYSE. The values of such securities used in computing the net asset value of the Portfolio’s shares are determined as of such times. The Portfolio may use a fair value model developed by an independent pricing service to value non-U.S. equity securities.
Event-linked bonds are valued at the bid price obtained from an independent third party pricing service. Other insurance-linked securities (including reinsurance sidecars, collateralized reinsurance and industry loss warranties) may be valued at the bid price obtained from an independent pricing service, or through a third party using a pricing matrix, insurance industry valuation models, or other fair value methods or techniques to provide an estimated value of the instrument.
Options contracts are generally valued at the mean between the last bid and ask prices on the principal exchange where they are traded. Over-the-counter (“OTC”) options and options on swaps (“swaptions”) are valued using prices supplied by independent pricing services, which consider such factors as market prices, market events, quotations from one or more brokers, Treasury spreads, yields, maturities and ratings, or may use a pricing matrix or other fair value methods or techniques to provide an estimated value of the security or instrument.
Forward foreign currency exchange contracts are valued daily using the foreign exchange rate or, for longer term forward contract positions, the spot currency rate and the forward points on a daily basis, in each case provided by a third party pricing service. Contracts whose forward settlement date falls between two quoted days are valued by interpolation.
Futures contracts are generally valued at the closing settlement price established by the exchange on which they are traded.
Swap contracts, including interest rate swaps, caps and floors (other than centrally cleared swap contracts), are valued at the dealer quotations obtained from reputable International Swap Dealers Association members. Centrally cleared swaps are valued at the daily settlement price provided by the central clearing counterparty.
Shares of open-end registered investment companies (including money market mutual funds) are valued at such funds’ net asset value. Shares of exchange-listed closed-end funds are valued by using the last sale price on the principal exchange where they are traded. Shares of closed-end interval funds that offer their shares at net asset value are valued such fund’s net asset value.
Securities or loan interests for which independent pricing services or broker-dealers are unable to supply prices or for which market prices and/or quotations are not readily available or are considered to be unreliable are valued by a fair valuation team comprised of certain personnel of the Adviser pursuant to procedures adopted by the Portfolio’s Board of Trustees. The Adviser’s fair valuation team uses fair value methods approved by the Valuation Committee of the Board of Trustees. The Adviser’s fair valuation team is responsible for monitoring developments that may impact fair valued securities and for discussing and assessing fair values on an ongoing basis, and at least quarterly, with the Valuation Committee of the Board of Trustees.
Inputs used when applying fair value methods to value a security may include credit ratings, the financial condition of the company, current market conditions and comparable securities. The Portfolio may use fair value methods if it is determined that a significant event has occurred after the close of the exchange or market on which the security trades and prior to the determination of the Portfolio’s net asset value. Examples of a significant event might include political or economic news, corporate restructurings, natural disasters, terrorist activity or trading halts. Thus, the valuation of the Portfolio’s securities may differ significantly from exchange prices, and such differences could be material.
37
| Pioneer Strategic Income VCT Portfolio | Pioneer Variable Contracts Trust
|
| Notes to Financial Statements 12/31/20 (continued) |
At December 31, 2020, two securities were valued using fair value methods (in addition to securities valued using prices supplied by independent pricing services, broker-dealers or using a third party insurance pricing model) representing 0% of net assets. The value of these fair valued securities was $0.
B. Investment Income and Transactions
Dividend income is recorded on the ex-dividend date, except that certain dividends from foreign securities where the ex-dividend date may have passed are recorded as soon as the Portfolio becomes aware of the ex-dividend data in the exercise of reasonable diligence.
Interest income, including interest on income-bearing cash accounts, is recorded on the accrual basis. Dividend and interest income are reported net of unrecoverable foreign taxes withheld at the applicable country rates and net of income accrued on defaulted securities.
Interest and dividend income payable by delivery of additional shares is reclassified as PIK (payment-in-kind) income upon receipt and is included in interest and dividend income, respectively.
Principal amounts of mortgage-backed securities are adjusted for monthly paydowns. Premiums and discounts related to certain mortgage-backed securities are amortized or accreted in proportion to the monthly paydowns. All discounts/premiums on purchase prices of debt securities are accreted/amortized for financial reporting purposes over the life of the respective securities, and such accretion/amortization is included in interest income.
Security transactions are recorded as of trade date. Gains and losses on sales of investments are calculated on the identified cost method for both financial reporting and federal income tax purposes.
C. Foreign Currency Translation
The books and records of the Portfolio are maintained in U.S. dollars. Amounts denominated in foreign currencies are translated into U.S. dollars using current exchange rates.
Net realized gains and losses on foreign currency transactions, if any, represent, among other things, the net realized gains and losses on foreign currency exchange contracts, disposition of foreign currencies and the difference between the amount of income accrued and the U.S. dollars actually received. Further, the effects of changes in foreign currency exchange rates on investments are not segregated on the Statement of Operations from the effects of changes in the market prices of those securities, but are included with the net realized and unrealized gain or loss on investments.
D. Federal Income Taxes
It is the Portfolio’s policy to comply with the requirements of the Internal Revenue Code applicable to regulated investment companies and to distribute all of its net taxable income and net realized capital gains, if any, to its shareowners. Therefore, no provision for federal income taxes is required. As of December 31, 2020, the Portfolio did not accrue any interest or penalties with respect to uncertain tax positions, which, if applicable, would be recorded as an income tax expense on the Statement of Operations. Tax returns filed within the prior three years remain subject to examination by federal and state tax authorities.
In addition to meeting the requirements of the Internal Revenue Code, the Portfolio may be required to pay local taxes on the recognition of capital gains and/or the repatriation of foreign currencies in certain countries. During the year ended December 31, 2020, the Portfolio paid no such taxes. At December 31, 2020, the Portfolio had a payable for the reserve for repatriation taxes on its Statement of Assets and Liabilities of $5,801.
The amount and character of income and capital gain distributions to shareowners are determined in accordance with federal income tax rules, which may differ from U.S. GAAP. Distributions in excess of net investment income or net realized gains are temporary over distributions for financial statement purposes resulting from differences in the recognition or classification of income or distributions for financial statement and tax purposes. Capital accounts within the financial statements are adjusted for permanent book/tax differences to reflect tax character, but are not adjusted for temporary differences.
The tax character of distributions paid during the years ended December 31, 2020 and December 31, 2019, were as follows:
| | 2020 | 2019 |
| Distributions paid from: | | |
| Ordinary income | $1,440,804 | $1,291,666 |
| Long-term capital gain | 59,378 | |
| Total | $1,500,182 | $1,291,666 |
38
| Pioneer Strategic Income VCT Portfolio | Pioneer Variable Contracts Trust
|
The following shows the components of distributable earnings (losses) on a federal income tax basis at December 31, 2020:
| | |
| 2020 |
| Distributable earnings: | |
| Undistributed ordinary income | $ 349,240 |
| Undistributed long term capital gain | 423,541 |
| Net unrealized appreciation | 1,492,368 |
| Total | $2,265,149 |
The difference between book basis and tax basis unrealized appreciation is attributable to the tax deferral of losses on wash sales, the mark to market of swaps, forward currency and futures contracts, and adjustments relating to credit default swaps and catastrophe bonds.
E. Portfolio Shares and Class Allocations
The Portfolio records sales and repurchases of its shares as of trade date. Distribution fees for Class II shares are calculated based on the average daily net asset value attributable to Class II shares of the Portfolio (see Note 5). Class I shares do not pay distribution fees.
Income, common expenses and realized and unrealized gains and losses are calculated at the Portfolio level and allocated daily to each class of shares based on its respective percentage of adjusted net assets at the beginning of the day.
All expenses and fees paid to the Portfolio’s transfer agent for its services are allocated between the classes of shares based on the number of accounts in each class and the ratable allocation of related out-of-pocket expenses (see Note 4).
The Portfolio declares as daily dividends substantially all of its net investment income. All dividends are paid on a monthly basis. Short-term capital gain distributions, if any, may be declared with the daily dividends. Distributions paid by the Portfolio with respect to each class of shares are calculated in the same manner and at the same time, except that net investment income dividends to Class I and Class II shares can reflect different transfer agent and distribution expense rates. Dividends and distributions to shareowners are recorded on the ex-dividend date.
F. Risks
The value of securities held by the Portfolio may go up or down, sometimes rapidly or unpredictably, due to general market conditions, such as real or perceived adverse economic, political or regulatory conditions, recessions, the spread of infectious illness or other public health issues, inflation, changes in interest rates, lack of liquidity in the bond markets or adverse investor sentiment. In the past several years, financial markets have experienced increased volatility, depressed valuations, decreased liquidity and heightened uncertainty. These conditions may continue, recur, worsen or spread. A general rise in interest rates could adversely affect the price and liquidity of fixed-income securities and could also result in increased redemptions from the Portfolio.
At times, the Portfolio’s investments may represent industries or industry sectors that are interrelated or have common risks, making the Portfolio more susceptible to any economic, political, or regulatory developments or other risks affecting those industries and sectors. The Portfolio’s investments in foreign markets and countries with limited developing markets may subject the Portfolio to a greater degree of risk than investments in a developed market. These risks include disruptive political or economic conditions and the imposition of adverse governmental laws or currency exchange restrictions.
The Portfolio invests in below-investment-grade (high-yield) debt securities and preferred stocks. Some of these high-yield securities may be convertible into equity securities of the issuer. Debt securities rated below-investment-grade are commonly referred to as “junk bonds” and are considered speculative. These securities involve greater risk of loss, are subject to greater price volatility, and are less liquid, especially during periods of economic uncertainty or change, than higher rated debt securities.
The Portfolio’s investments, payment obligations and financing terms may be based on floating rates, such as LIBOR (London Interbank Offered Rate). Plans are underway to phase out the use of LIBOR by the end of 2021. The administrator of LIBOR recently announced a possible delay in the phase out of a majority of the U.S. dollar LIBOR publications until mid-2023, with the remainder of the LIBOR publications to end at the end of 2021. There remains uncertainty regarding the nature of any replacement rate and the impact of the transition from LIBOR on the Portfolio, issuers of instruments in which the Portfolio invests, and financial markets generally.
39
| Pioneer Strategic Income VCT Portfolio | Pioneer Variable Contracts Trust
|
| Notes to Financial Statements 12/31/20 (continued) |
With the increased use of technologies such as the Internet to conduct business, the Portfolio is susceptible to operational, information security and related risks. While the Portfolio’s Adviser has established business continuity plans in the event of, and risk management systems to prevent, limit or mitigate, such cyber-attacks, there are inherent limitations in such plans and systems, including the possibility that certain risks have not been identified. Furthermore, the Portfolio cannot control the cybersecurity plans and systems put in place by service providers to the Portfolio such as Brown Brothers Harriman & Co., the Portfolio’s custodian and accounting agent, and DST Asset Manager Solutions, Inc., the Portfolio’s transfer agent. In addition, many beneficial owners of Portfolio shares hold them through accounts at broker-dealers, retirement platforms and other financial market participants over which neither the Portfolio nor the Adviser exercises control. Each of these may in turn rely on service providers to them, which are also subject to the risk of cyber-attacks. Cybersecurity failures or breaches at the Adviser or the Portfolio’s service providers or intermediaries have the ability to cause disruptions and impact business operations, potentially resulting in financial losses, interference with the Portfolio’s ability to calculate its net asset value, impediments to trading, the inability of Portfolio shareowners to effect share purchases, redemptions or exchanges or receive distributions, loss of or unauthorized access to private shareowner information and violations of applicable privacy and other laws, regulatory fines, penalties, reputational damage, or additional compliance costs. Such costs and losses may not be covered under any insurance. In addition, maintaining vigilance against cyber-attacks may involve substantial costs over time, and system enhancements may themselves be subject to cyber-attacks.
COVID-19
The respiratory illness COVID-19 caused by a novel coronavirus has resulted in a global pandemic and major disruption to economies and markets around the world, including the United States. Global financial markets have experienced extreme volatility and severe losses, and trading in many instruments has been disrupted. Liquidity for many instruments has been greatly reduced for periods of time. Some interest rates are very low and in some cases yields are negative. Some sectors of the economy and individual issuers have experienced particularly large losses. These circumstances may continue for an extended period of time, and may continue to affect adversely the value and liquidity of the Portfolio’s investments. The ultimate economic fallout from the pandemic, and the long-term impact on economies, markets, industries and individual issuers, are not known. Governments and central banks, including the Federal Reserve in the U.S., have taken extraordinary and unprecedented actions to support local and global economies and the financial markets. These actions have resulted in significant expansion of public debt, including in the U.S. The impact of these measures, and whether they will be effective to mitigate the economic and market disruption, will not be known for some time. The consequences of high public debt, including its future impact on the economy and securities markets, likewise may not be known for some time.
The Portfolio’s prospectus contains unaudited information regarding the Portfolio’s principal risks. Please refer to that document when considering the Portfolio’s principal risks.
G. Restricted Securities
Restricted Securities are subject to legal or contractual restrictions on resale. Restricted securities generally are resold in transactions exempt from registration under the Securities Act of 1933. Private placement securities are generally considered to be restricted except for those securities traded between qualified institutional investors under the provisions of Rule 144A of the Securities Act of 1933.
Disposal of restricted investments may involve negotiations and expenses, and prompt sale at an acceptable price may be difficult to achieve. Restricted investments held by the Portfolio at December 31, 2020 are listed in the Schedule of Investments.
H. Insurance-Linked Securities (“ILS”)
The Portfolio invests in ILS. The Portfolio could lose a portion or all of the principal it has invested in an ILS, and the right to additional interest or dividend payments with respect to the security, upon the occurrence of one or more trigger events, as defined within the terms of an insurance-linked security. Trigger events, generally, are hurricanes, earthquakes, or other natural events of a specific size or magnitude that occur in a designated geographic region during a specified time period, and/or that involve losses or other metrics that exceed a specific amount. There is no way to accurately predict whether a trigger event will occur, and accordingly, ILS carry significant risk. The Portfolio is entitled to receive principal, and interest and/or dividend payments so long as no trigger event occurs of the description and magnitude specified by the instrument. In addition to the specified trigger events, ILS may expose the Portfolio to other risks, including but not limited to issuer (credit) default, adverse regulatory or jurisdictional interpretations and adverse tax consequences.
40
| Pioneer Strategic Income VCT Portfolio | Pioneer Variable Contracts Trust
|
The Portfolio’s investments in ILS may include event-linked bonds. ILS also may include special purpose vehicles (“SPVs”) or similar instruments structured to comprise a portion of a reinsurer’s catastrophe-oriented business, known as quota share instruments (sometimes referred to as reinsurance sidecars), or to provide reinsurance relating to specific risks to insurance or reinsurance companies through a collateralized instrument, known as collateralized reinsurance. Structured reinsurance investments also may include industry loss warranties (“ILWs”). A traditional ILW takes the form of a bilateral reinsurance contract, but there are also products that take the form of derivatives, collateralized structures, or exchange-traded instruments.
Where the ILS are based on the performance of underlying reinsurance contracts, the Portfolio has limited transparency into the individual underlying contracts, and therefore must rely upon the risk assessment and sound underwriting practices of the issuer. Accordingly, it may be more difficult for the Adviser to fully evaluate the underlying risk profile of the Portfolio’s structured reinsurance investments, and therefore the Portfolio’s assets are placed at greater risk of loss than if the Adviser had more complete information. Structured reinsurance instruments generally will be considered illiquid securities by the Portfolio. These securities may be difficult to purchase, sell or unwind. Illiquid securities also may be difficult to value. If the Portfolio is forced to sell an illiquid asset, the Portfolio may be forced to sell at a loss.
Additionally, the Portfolio may gain exposure to ILS by investing in a closed-end interval fund, Pioneer ILS Interval Fund, an affiliate of the Adviser. The Portfolio’s investment in Pioneer ILS Interval Fund at December 31, 2020, is listed in the Schedule of Investments.
I. Purchased Options
The Portfolio may purchase put and call options to seek to increase total return. Purchased call and put options entitle the Portfolio to buy and sell a specified number of shares or units of a particular security, currency or index at a specified price at a specific date or within a specific period of time. Upon the purchase of a call or put option, the premium paid by the Portfolio is included on the Statement of Assets and Liabilities as an investment. All premiums are marked-to-market daily, and any unrealized appreciation or depreciation is recorded on the Portfolio’s Statement of Operations. As the purchaser of an index option, the Portfolio has the right to receive a cash payment equal to any depreciation in the value of the index below the strike price of the option (in the case of a put) or equal to any appreciation in the value of the index over the strike price of the option (in the case of a call) as of the valuation date of the option. Premiums paid for purchased call and put options which have expired are treated as realized losses on investments on the Statement of Operations. Upon the exercise or closing of a purchased put option, the premium is offset against the proceeds on the sale of the underlying security or financial instrument in order to determine the realized gain or loss on investments. Upon the exercise or closing of a purchased call option, the premium is added to the cost of the security or financial instrument. The risk associated with purchasing options is limited to the premium originally paid.
The average market value of purchased options contracts open during the year ended December 31, 2020, was $5,245. Open purchased options at December 31, 2020, are listed in the Schedule of Investments.
J. Option Writing
The Portfolio may write put and covered call options to seek to increase total return. When an option is written, the Portfolio receives a premium and becomes obligated to purchase or sell the underlying security at a fixed price, upon the exercise of the option. When the Portfolio writes an option, an amount equal to the premium received by the Portfolio is recorded as “Written options outstanding” on the Statement of Assets and Liabilities and is subsequently adjusted to the current value of the option written. Premiums received from writing options that expire unexercised are treated by the Portfolio on the expiration date as realized gains from investments on the Statement of Operations. The difference between the premium and the amount paid on effecting a closing purchase transaction, including brokerage commissions, is also treated as a realized gain on the Statement of Operations, or, if the premium is less than the amount paid for the closing purchase transaction, as a realized loss on the Statement of Operations. If a call option is exercised, the premium is added to the proceeds from the sale of the underlying security in determining whether the Portfolio has realized a gain or loss. The Portfolio as writer of an option bears the market risk of an unfavorable change in the price of the security underlying the written option.
The average market value of written options for the year ended December 31, 2020, was $(9,210). Open written options contracts at December 31, 2020, are listed in the Schedule of Investments.
K. Forward Foreign Currency Exchange Contracts
The Portfolio may enter into forward foreign currency exchange contracts (“contracts”) for the purchase or sale of a specific foreign currency at a fixed price on a future date. All contracts are marked-to-market daily at the applicable exchange rates, and any resulting unrealized appreciation or depreciation is recorded in the Portfolio’s financial statements. The Portfolio records realized gains and losses at the time a contract is offset by entry into a closing transaction or extinguished by
41
| Pioneer Strategic Income VCT Portfolio | Pioneer Variable Contracts Trust
|
| Notes to Financial Statements 12/31/20 (continued) |
delivery of the currency. Risks may arise upon entering into these contracts from the potential inability of counterparties to meet the terms of the contract and from unanticipated movements in the value of foreign currencies relative to the U.S. dollar (see Note 7).
During the year ended December 31, 2020, the Portfolio had entered into various forward foreign currency exchange contracts that obligated the Portfolio to deliver or take delivery of currencies at specified future maturity dates. Alternatively, prior to the settlement date of a forward foreign currency exchange contract, the Portfolio may close out such contract by entering into an offsetting contract.
The average market value of forward foreign currency exchange contracts open during the year ended December 31, 2020, was $2,301,459. Open forward foreign currency exchange contracts outstanding at December 31, 2020, are listed in the Schedule of Investments.
L. Futures Contracts
The Portfolio may enter into futures transactions in order to attempt to hedge against changes in interest rates, securities prices and currency exchange rates or to seek to increase total return. Futures contracts are types of derivatives. All futures contracts entered into by the Portfolio are traded on a futures exchange. Upon entering into a futures contract, the Portfolio is required to deposit with a broker an amount of cash or securities equal to the minimum “initial margin” requirements of the associated futures exchange. The amount of cash deposited with the broker as collateral at December 31, 2020, is recorded as “Futures collateral” on the Statement of Assets and Liabilities.
Subsequent payments for futures contracts (“variation margin”) are paid or received by the Portfolio, depending on the daily fluctuation in the value of the contracts, and are recorded by the Portfolio as unrealized appreciation or depreciation. Cash received from or paid to the broker related to previous margin movement is held in a segregated account at the broker and is recorded as either “Due from broker for futures” or “Due to broker for futures” on the Statement of Assets and Liabilities. When the contract is closed, the Portfolio realizes a gain or loss equal to the difference between the opening and closing value of the contract as well as any fluctuation in foreign currency exchange rates where applicable. Futures contracts are subject to market risk, interest rate risk and currency exchange rate risk. Changes in value of the contracts may not directly correlate to the changes in value of the underlying securities. With futures, there is reduced counterparty credit risk to the Portfolio since futures are exchange-traded and the exchange’s clearinghouse, as counterparty to all exchange-traded futures, guarantees the futures against default.
The average market value of futures contracts open during the year ended December 31, 2020, was $(7,777,336). Open futures contracts outstanding at December 31, 2020, are listed in the Schedule of Investments.
M. Credit Default Swap Contracts
A credit default swap is a contract between a buyer of protection and a seller of protection against a pre-defined credit event or an underlying reference obligation, which may be a single security or a basket or index of securities. The Portfolio may buy or sell credit default swap contracts to seek to increase the Portfolio’s income, or to attempt to hedge the risk of default on portfolio securities. A credit default swap index is used to hedge risk or take a position on a basket of credit entities or indices.
As a seller of protection, the Portfolio would be required to pay the notional (or other agreed-upon) value of the referenced debt obligation to the counterparty in the event of a default by a U.S. or foreign corporate issuer of a debt obligation, which would likely result in a loss to the Portfolio. In return, the Portfolio would receive from the counterparty a periodic stream of payments during the term of the contract, provided that no event of default occurred. The maximum exposure of loss to the seller would be the notional value of the credit default swaps outstanding. If no default occurs, the Portfolio would keep the stream of payments and would have no payment obligation. The Portfolio may also buy credit default swap contracts in order to hedge against the risk of default of debt securities, in which case the Portfolio would function as the counterparty referenced above.
As a buyer of protection, the Portfolio makes an upfront or periodic payment to the protection seller in exchange for the right to receive a contingent payment. An upfront payment made by the Portfolio, as the protection buyer, is recorded within the “Swap contracts, at value” line item on the Statement of Assets and Liabilities. Periodic payments received or paid by the Portfolio are recorded as realized gains or losses on the Statement of Operations.
Credit default swap contracts are marked-to-market daily using valuations supplied by independent sources, and the change in value, if any, is recorded within the “Swap contracts, at value” line item on the Statement of Assets and Liabilities. Payments received or made as a result of a credit event or upon termination of the contract are recognized, net of the appropriate amount of the upfront payment, as realized gains or losses on the Statement of Operations.
42
| Pioneer Strategic Income VCT Portfolio | Pioneer Variable Contracts Trust
|
Credit default swap contracts involving the sale of protection may involve greater risks than if the Portfolio had invested in the referenced debt instrument directly. Credit default swap contracts are subject to general market risk, liquidity risk, counterparty risk and credit risk. If the Portfolio is a protection buyer and no credit event occurs, it will lose its investment. If the Portfolio is a protection seller and a credit event occurs, the value of the referenced debt instrument received by the Portfolio, together with the periodic payments received, may be less than the amount the Portfolio pays to the protection buyer, resulting in a loss to the Portfolio. In addition, obligations under sell protection credit default swaps may be partially offset by net amounts received from settlement of buy protection credit default swaps entered into by the Portfolio for the same reference obligation with the same counterparty.
Certain swap contracts that are cleared through a central clearinghouse are referred to as centrally cleared swaps. All payments made or received by the Portfolio are pursuant to a centrally cleared swap contract with the central clearing party rather than the original counterparty. Upon entering into a centrally cleared swap contract, the Portfolio is required to make an initial margin deposit, either in cash or in securities. The daily change in value on open centrally cleared contracts is recorded as “Variation margin for centrally cleared swap contracts” on the Statement of Assets and Liabilities. Cash received from or paid to the broker related to previous margin movement is held in a segregated account at the broker and is recorded as either “Due from broker for swaps” or “Due to broker for swaps” on the Statement of Assets and Liabilities. The amount of cash deposited with a broker as collateral at December 31, 2020, is recorded as “Swaps collateral” on the Statement of Assets and Liabilities.
The average market value of credit default swap contracts open during the year ended December 31, 2020, was $30,952. Open credit default swap contracts at December 31, 2020, are listed in the Schedule of Investments.
2. Management Agreement
The Adviser manages the Portfolio. Management fees are calculated daily and paid monthly at the annual rate of 0.65% of the Portfolio’s average daily net assets. For the year ended December 31, 2020, the effective management fee (excluding waivers and/or assumption of acquired fund fees and expenses) was equivalent to 0.65% of the Portfolio’s average daily net assets.
The Adviser has agreed to waive its management fee with respect to any portion of the Portfolio’s assets invested in Pioneer ILS Interval Fund, an affiliated fund managed by the Adviser. For the year ended December 31, 2020, the Adviser waived $14,521 in management fees with respect to the Portfolio, which is reflected on the Statement of Operations as an expense waiver.
The Adviser has contractually agreed to limit ordinary operating expenses (ordinary operating expenses means all portfolio expenses other than extraordinary expenses, such as litigation, taxes, brokerage commissions and acquired fund expenses) of the Portfolio to the extent required to reduce Portfolio expenses to 0.75% and 1.00%, of the average daily net assets attributable to Class I and Class II shares, respectively. Fees waived and expenses reimbursed for the year ended December 31, 2020, are reflected on the Statement of Operations. These expense limitations are in effect through May 1, 2021. There can be no assurance that the Adviser will extend the expense limitation agreement for a class of shares beyond the date referred to above.
In addition, under the management and administration agreements, certain other services and costs, including accounting, regulatory reporting and insurance premiums, are paid by the Portfolio as administrative reimbursements. Included in “Due to affiliates” reflected on the Statement of Assets and Liabilities is $23,094 in management fees, administrative costs and certain other reimbursements payable to the Adviser at December 31, 2020.
3. Compensation of Trustees and Officers
The Portfolio pays an annual fee to its Trustees. The Adviser reimburses the Portfolio for fees paid to the Interested Trustees. The Portfolio does not pay any salary or other compensation to its officers. For the year ended December 31, 2020, the Portfolio paid $7,400 in Trustees’ compensation, which is reflected on the Statement of Operations as Trustees’ fees. At December 31, 2020, the Portfolio had a payable for Trustees’ fees on its Statement of Assets and Liabilities of $158.
4. Transfer Agent
DST Asset Manager Solutions, Inc. serves as the transfer agent to the Portfolio at negotiated rates. Transfer agent fees and payables shown on the Statement of Operations and the Statement of Assets and Liabilities, respectively, include sub-transfer agent expenses incurred through the Portfolio’s omnibus relationship contracts.
43
| Pioneer Strategic Income VCT Portfolio | Pioneer Variable Contracts Trust
|
| Notes to Financial Statements 12/31/20 (continued) |
5. Distribution Plan
The Portfolio has adopted a distribution plan (the “Plan”) pursuant to Rule 12b-1 of the Investment Company Act of 1940 with respect to Class II shares. Pursuant to the Plan, the Portfolio pays the Distributor 0.25% of the average daily net assets attributable to Class II shares to compensate the Distributor for (1) distribution services and (2) personal and account maintenance services performed and expenses incurred by the Distributor in connection with the Portfolio’s Class II shares. Included in “Due to affiliates” reflected on the Statement of Assets and Liabilities is $781 in distribution fees payable to the Distributor at December 31, 2020.
6. Master Netting Agreements
The Portfolio has entered into an International Swaps and Derivatives Association, Inc. Master Agreement (“ISDA Master Agreement”) or similar agreement with substantially all of its derivative counterparties. An ISDA Master Agreement is a bilateral agreement between the Portfolio and a counterparty that governs the trading of certain Over the Counter (“OTC”) derivatives and typically contains, among other things, close-out and set-off provisions which apply upon the occurrence of an event of default and/or a termination event as defined under the relevant ISDA Master Agreement. The ISDA Master Agreement may also give a party the right to terminate all transactions traded under such agreement if, among other things, there is deterioration in the credit quality of the other party.
Upon an event of default or a termination of the ISDA Master Agreement, the non-defaulting party has the right to close-out all transactions under such agreement and to net amounts owed under each transaction to determine one net amount payable by one party to the other. The right to close out and net payments across all transactions under the ISDA Master Agreement could result in a reduction of the Portfolio’s credit risk to its counterparty equal to any amounts payable by the Portfolio under the applicable transactions, if any. However, the Portfolio’s right to set-off may be restricted or prohibited by the bankruptcy or insolvency laws of the particular jurisdiction to which each specific ISDA Master Agreement of each counterparty is subject.
The collateral requirements for derivatives transactions under an ISDA Master Agreement are governed by a credit support annex to the ISDA Master Agreement. Collateral requirements are generally determined at the close of business each day and are typically based on changes in market values for each transaction under an ISDA Master Agreement and netted into one amount for such agreement. Generally, the amount of collateral due from or to a counterparty is subject to threshold (a “minimum transfer amount”) before a transfer is required, which may vary by counterparty. Collateral pledged for the benefit of the Portfolio and/or counterparty is held in segregated accounts by the Portfolio’s custodian and cannot be sold, re-pledged, assigned or otherwise used while pledged. Cash that has been segregated to cover the Portfolio’s collateral obligations, if any, will be reported separately on the Statement of Assets and Liabilities as “Swaps collateral”. Securities pledged by the Portfolio as collateral, if any, are identified as such in the Schedule of Investments.
Financial instruments subject to an enforceable master netting agreement, such as an ISDA Master Agreement, have been offset on the Statement of Assets and Liabilities. The following charts show gross assets and liabilities of the Portfolio as of December 31, 2020.
| | | Derivative | | | | | | | | | | | | | |
| | | Assets | | | | | | | | | | | | | |
| | | Subject to | | | Derivatives | | | Non-Cash | | | | | | Net Amount of | |
| | | Master Netting | | | Available | | | Collateral | | | Cash Collateral | | | Derivative | |
| Counterparty | | Agreement | | | for Offset | | | Received (a) | | | Received (a) | | | Assets (b) | |
| Bank of America NA | | $ | 1,740 | | | $ | (1,740 | ) | | $ | — | | | $ | — | | | $ | — | |
| Bank of New York Mellon Corp. | | | 36,671 | | | | — | | | | — | | | | — | | | | 36,671 | |
| Brown Brothers Harriman & Co. | | | — | | | | — | | | | — | | | | — | | | | — | |
| Citibank NA | | | — | | | | — | | | | — | | | | — | | | | — | |
| Goldman Sachs International | | | 31,422 | | | | (2,359 | ) | | | — | | | | — | | | | 29,063 | |
| JPMorgan Chase Bank NA | | | 68,314 | | | | (7,551 | ) | | | — | | | | — | | | | 60,763 | |
| HSBC Bank USA NA | | | 10,137 | | | | — | | | | — | | | | — | | | | 10,137 | |
| State Street Bank & Trust Co. | | | 2,947 | | | | (2,947 | ) | | | — | | | | — | | | | — | |
| Total | | $ | 151,231 | | | $ | (14,597 | ) | | $ | — | | | $ | — | | | $ | 136,634 | |
44
| Pioneer Strategic Income VCT Portfolio | Pioneer Variable Contracts Trust
|
| | | Derivative | | | | | | | | | | | | | |
| | | Liabilities | | | | | | | | | | | | | |
| | | Subject to | | | Derivatives | | | Non-Cash | | | | | | Net Amount of | |
| | | Master Netting | | | Available | | | Collateral | | | Cash Collateral | | | Derivative | |
| Counterparty | | Agreement | | | for Offset | | | Pledged (a) | | | Pledged (a) | | | Liabilities (c) | |
| Bank of America NA | | $ | 18,793 | | | $ | (1,740 | ) | | $ | — | | | $ | — | | | $ | 17,053 | |
| Bank of New York Mellon Corp. | | | — | | | | — | | | | — | | | | — | | | | — | |
| Brown Brothers Harriman & Co. | | | 2,420 | | | | — | | | | — | | | | — | | | | 2,420 | |
| Citibank NA | | | 276 | | | | — | | | | — | | | | — | | | | 276 | |
| Goldman Sachs International | | | 2,359 | | | | (2,359 | ) | | | — | | | | — | | | | — | |
| JPMorgan Chase Bank NA | | | 7,551 | | | | (7,551 | ) | | | — | | | | — | | | | — | |
| HSBC Bank USA NA | | | — | | | | — | | | | — | | | | — | | | | — | |
| State Street Bank & Trust Co. | | | 13,109 | | | | (2,947 | ) | | | — | | | | — | | | | 10,162 | |
| Total | | $ | 44,508 | | | $ | (14,597 | ) | | $ | — | | | $ | — | | | $ | 29,911 | |
(a) | The amount presented here may be less than the total amount of collateral received/pledged, as the net amount of derivative assets and liabilities cannot be less than $0. |
(b) | Represents the net amount due from the counterparty in the event of default. |
(c) | Represents the net amount payable to the counterparty in the event of default. |
7. Additional Disclosures about Derivative Instruments and Hedging Activities
The Portfolio’s use of derivatives may enhance or mitigate the Portfolio’s exposure to the following risks:
Interest rate risk relates to the fluctuations in the value of interest-bearing securities due to changes in the prevailing levels of market interest rates.
Credit risk relates to the ability of the issuer of a financial instrument to make further principal or interest payments on an obligation or commitment that it has to the Portfolio.
Foreign exchange rate risk relates to fluctuations in the value of an asset or liability due to changes in currency exchange rates.
Equity risk relates to the fluctuations in the value of financial instruments as a result of changes in market prices (other than those arising from interest rate risk or foreign exchange rate risk), whether caused by factors specific to an individual investment, its issuer, or all factors affecting all instruments traded in a market or market segment.
Commodity risk relates to the risk that the value of a commodity or commodity index will fluctuate based on increases or decreases in the commodities market and factors specific to a particular industry or commodity.
The fair value of open derivative instruments (not considered to be hedging instruments for accounting disclosure purposes) by risk exposure at December 31, 2020, was as follows:
| | | | | | | | | Foreign | | | | | | | |
| Statement of Assets | | Interest | | | Credit | | | Exchange | | | Equity | | | Commodity | |
| and Liabilities | | Rate Risk | | | Risk | | | Rate Risk | | | Risk | | | Risk | |
| Assets | | | | | | | | | | | | | | | |
| Call options purchased* | | $ | — | | | $ | — | | | $ | — | | | $ | — | ** | | $ | — | |
| Currency put options | | | | | | | | | | | | | | | | | | | | |
| purchased* | | | — | | | | — | | | | 2,987 | | | | — | | | | — | |
| Net unrealized | | | | | | | | | | | | | | | | | | | | |
| appreciation on | | | | | | | | | | | | | | | | | | | | |
| forward foreign | | | | | | | | | | | | | | | | | | | | |
| currency contracts | | | — | | | | — | | | | 128,376 | | | | — | | | | — | |
| Swap contracts, at value | | | — | | | | 198,795 | | | | | | | | — | | | | — | |
| Total Value | | $ | — | | | $ | 198,795 | | | $ | 131,363 | | | $ | — | ** | | $ | — | |
45
| Pioneer Strategic Income VCT Portfolio | Pioneer Variable Contracts Trust
|
| Notes to Financial Statements 12/31/20 (continued) |
| | | | | | | | | Foreign | | | | | | | |
| Statement of Assets | | Interest | | | Credit | | | Exchange | | | Equity | | | Commodity | |
| and Liabilities | | Rate Risk | | | Risk | | | Rate Risk | | | Risk | | | Risk | |
| Liabilities | | | | | | | | | | | | | | | |
| Written options | | | | | | | | | | | | | | | |
| outstanding | | $ | — | | | $ | — | | | $ | 24,640 | | | $ | — | | | $ | — | |
| Net unrealized | | | | | | | | | | | | | | | | | | | | |
| depreciation on | | | | | | | | | | | | | | | | | | | | |
| futures contracts | | | 30,833 | | | | — | | | | — | | | | — | | | | — | |
| Total Value | | $ | 30,833 | | | $ | — | | | $ | 24,640 | | | $ | — | | | $ | — | |
* | Reflects the market value of purchased option contracts (see Note 1I). These amounts are included in investments in unaffiliated issuers, at value, on the Statement of Assets and Liabilities. |
** | Includes securities that are valued at $0. |
The effect of derivative instruments (not considered to be hedging instruments for accounting disclosure purposes) on the Statement of Operations by risk exposure at December 31, 2020 was as follows:
| | | | | | | | | Foreign | | | | | | | |
| Statement of | | Interest | | | Credit | | | Exchange | | | Equity | | | Commodity | |
| Operations | | Rate Risk | | | Risk | | | Rate Risk | | | Risk | | | Risk | |
| Net realized | | | | | | | | | | | | | | | |
| gain (loss) on: | | | | | | | | | | | | | | | |
| Currency put | | | | | | | | | | | | | | | |
| options purchased* | | $ | — | | | $ | — | | | $ | (10,461 | ) | | $ | — | | | $ | — | |
| Written options | | | — | | | | — | | | | 10,461 | | | | — | | | | — | |
| Forward foreign | | | | | | | | | | | | | | | | | | | | |
| currency exchange | | | | | | | | | | | | | | | | | | | | |
| contracts | | | — | | | | — | | | | 121,918 | | | | — | | | | — | |
| Futures contracts | | | (331,723 | ) | | | — | | | | — | | | | — | | | | — | |
| Swap contracts | | | — | | | | (58,026 | ) | | | — | | | | — | | | | — | |
| Total Value | | $ | (331,723 | ) | | $ | (58,026 | ) | | $ | 121,918 | | | $ | — | | | $ | — | |
| Change in net | | | | | | | | | | | | | | | | | | | | |
| unrealized appreciation | | | | | | | | | | | | | | | | | | | | |
| (depreciation) on: | | | | | | | | | | | | | | | | | | | | |
| Currency put | | | | | | | | | | | | | | | | | | | | |
| options purchased** | | $ | — | | | $ | — | | | $ | (8,837 | ) | | $ | — | | | $ | — | |
| Written options | | | — | | | | — | | | | (15,501 | ) | | | — | | | | — | |
| Forward foreign | | | | | | | | | | | | | | | | | | | | |
| currency exchange | | | | | | | | | | | | | | | | | | | | |
| contracts | | | — | | | | — | | | | 77,577 | | | | — | | | | — | |
| Futures contracts | | | (63,244 | ) | | | — | | | | — | | | | — | | | | — | |
| Swap contracts | | | — | | | | 206,061 | | | | — | | | | — | | | | — | |
| Total Value | | $ | (63,244 | ) | | $ | 206,061 | | | $ | 53,239 | | | $ | — | | | $ | — | |
* | Reflects the net realized gain (loss) on purchased option contracts (see Note 1I). These amounts are included in net realized gain (loss) on investments in unaffiliated issuers, on the Statement of Operations. |
** | Reflects the change in net unrealized appreciation (depreciation) on purchased option contracts (see Note 1I). These amounts are included in change in net unrealized appreciation (depreciation) on Investments in unaffiliated issuers, on the Statement of Operations. |
8. Unfunded Loan Commitments
The Portfolio may enter into unfunded loan commitments. Unfunded loan commitments may be partially or wholly unfunded. During the contractual period, the Portfolio is obliged to provide funding to the borrower upon demand. A fee is earned by the Portfolio on the unfunded loan commitment and is recorded as interest income on the Statement of Operations. Unfunded loan commitments are fair valued in accordance with the valuation policy described in Footnote 1A and unrealized appreciation or depreciation, if any, is recorded on the Statement of Assets and Liabilities.
46
| Pioneer Strategic Income VCT Portfolio | Pioneer Variable Contracts Trust
|
As of December 31, 2020, the Portfolio had the following unfunded loan commitment outstanding:
| | | | | Unrealized |
| Loan | Principal | Cost | Value | Appreciation |
| Grupo Aeromexico, Sociedad Anonima | | | | |
| Bursatil De Capital Variable, DIP | | | | |
| Tranche 2 Term Loan | $6,348 | $6,295 | $6,514 | $219 |
| Total Value | $6,348 | $6,295 | $6,514 | $219 |
9. Affiliated Issuers
An affiliated issuer is a company in which the Portfolio has a direct or indirect ownership of, control of, or voting power of 5 percent or more of the outstanding voting shares. At December 31, 2020, the value of the Portfolio’s investment in affiliated issuers was $824,287, which represents 1.8% of the Portfolio’s net assets.
Transactions in affiliated issuers by the Portfolio for the year ended were as follows:
| | | | Change in | Net Realized | | | |
| | | | Net Unrealized | Gain/(Loss) | | | |
| | | | Appreciation/ | From | Dividends | Shares | |
| | Value at | | (Depreciation) | Investments | from | held at | Value at |
| Name of the | December 31, | Purchase | from Investments | in Affiliated | Investments in | December 31, | December 31, |
| Affiliated Issuer | 2019 | Costs | in Affiliated Issuers | Issuers | Affiliated Issuers | 2020 | 2020 |
| Pioneer ILS | | | | | | | |
| Interval Fund | $807,782 | $ — | $16,505 | $ — | $42,875 | 97,089 | $824,287 |
Annual and semi-annual reports for the underlying Pioneer funds are available on the funds’ web page(s) at www.amundi.com/us.
47
| Pioneer Strategic Income VCT Portfolio | Pioneer Variable Contracts Trust
|
Report of Independent Registered Public Accounting Firm |
To the Board of Trustees of Pioneer Variable Contracts Trust and the Shareholders of Pioneer Strategic Income VCT Portfolio:
Opinion on the Financial Statements
We have audited the accompanying statement of assets and liabilities of Pioneer Strategic Income VCT Portfolio (the “Portfolio”) (one of the portfolios constituting Pioneer Variable Contracts Trust (the “Trust”)), including the schedule of investments, as of December 31, 2020, and the related statement of operations for the year then ended, the statements of changes in net assets for each of the two years in the period then ended, the financial highlights for each of the four years in the period then ended and the related notes (collectively referred to as the “financial statements”). The financial highlights for the period ended December 31, 2016 were audited by another independent registered public accounting firm whose report, dated February 14, 2017, expressed an unqualified opinion on those financial highlights. In our opinion, the financial statements present fairly, in all material respects, the financial position of the Portfolio (one of the portfolios constituting Pioneer Variable Contracts Trust) at December 31, 2020, the results of its operations for the year then ended, the changes in its net assets for each of the two years in the period then ended, and its financial highlights for each of the four years in the period then ended in conformity with U.S. generally accepted accounting principles.
Basis for Opinion
These financial statements are the responsibility of the Trust’s management. Our responsibility is to express an opinion on the Portfolio’s financial statements based on our audits. We are a public accounting firm registered with the Public Company Accounting Oversight Board (United States) (“PCAOB”) and are required to be independent with respect to the Trust in accordance with the U.S. federal securities laws and the applicable rules and regulations of the Securities and Exchange Commission and the PCAOB.
We conducted our audits in accordance with the standards of the PCAOB. Those standards require that we plan and perform the audit to obtain reasonable assurance about whether the financial statements are free of material misstatement, whether due to error or fraud. The Trust is not required to have, nor were we engaged to perform, an audit of the Trust’s internal control over financial reporting. As part of our audits, we are required to obtain an understanding of internal control over financial reporting, but not for the purpose of expressing an opinion on the effectiveness of the Trust’s internal control over financial reporting. Accordingly, we express no such opinion.
Our audits included performing procedures to assess the risks of material misstatement of the financial statements, whether due to error or fraud, and performing procedures that respond to those risks. Such procedures included examining, on a test basis, evidence regarding the amounts and disclosures in the financial statements. Our procedures included confirmation of securities owned as of December 31, 2020, by correspondence with the custodian and brokers or by other appropriate auditing procedures where replies from brokers were not received. Our audits also included evaluating the accounting principles used and significant estimates made by management, as well as evaluating the overall presentation of the financial statements. We believe that our audits provide a reasonable basis for our opinion.
We have served as the auditor of one or more Amundi Pioneer investment companies since 2017.
Boston, Massachusetts
February 17, 2021
48
| Pioneer Strategic Income VCT Portfolio | Pioneer Variable Contracts Trust
|
Additional Information (Unaudited) |
Qualified interest income is exempt from nonresident alien (NRA) tax withholding. The percentage of the Portfolio’s ordinary income distributions derived from qualified interest income was 62.85%.
49
| Pioneer Strategic Income VCT Portfolio | Pioneer Variable Contracts Trust
|
Approval of Investment Management Agreement |
Amundi Pioneer Asset Management, Inc. (“APAM”) serves as the investment adviser to Pioneer Strategic Income VCT Portfolio (the “Portfolio”) pursuant to an investment management agreement between APAM and the Portfolio. In order for APAM to remain the investment adviser of the Portfolio, the Trustees of the Portfolio must determine annually whether to renew the investment management agreement for the Portfolio.
The contract review process began in January 2020 as the Trustees of the Portfolio agreed on, among other things, an overall approach and timeline for the process. Contract review materials were provided to the Trustees in March 2020, July 2020 and September 2020. In addition, the Trustees reviewed and discussed the Portfolio’s performance at regularly scheduled meetings throughout the year, and took into account other information related to the Portfolio provided to the Trustees at regularly scheduled meetings, in connection with the review of the Portfolio’s investment management agreement.
In March 2020, the Trustees, among other things, discussed the memorandum provided by Fund counsel that summarized the legal standards and other considerations that are relevant to the Trustees in their deliberations regarding the renewal of the investment management agreement, and reviewed and discussed the qualifications of the investment management teams for the Portfolio, as well as the level of investment by the Portfolio’s portfolio managers in the Portfolio. In July 2020, the Trustees, among other things, reviewed the Portfolio’s management fees and total expense ratios, the financial statements of APAM and its parent companies, profitability analyses provided by APAM, and analyses from APAM as to possible economies of scale. The Trustees also reviewed the profitability of the institutional business of APAM and APAM’s affiliate, Amundi Pioneer Institutional Asset Management, Inc. (“APIAM” and, together with APAM, “Amundi Pioneer”), as compared to that of APAM’s fund management business, and considered the differences between the fees and expenses of the Portfolio and the fees and expenses of APAM’s and APIAM’s institutional accounts, as well as the different services provided by APAM to the Portfolio and by APAM and APIAM to the institutional accounts. The Trustees further considered contract review materials, including additional materials received in response to the Trustees’ request, in September 2020.
At a meeting held on September 15, 2020, based on their evaluation of the information provided by APAM and third parties, the Trustees of the Portfolio, including the Independent Trustees voting separately, unanimously approved the renewal of the investment management agreement for another year. In approving the renewal of the investment management agreement, the Trustees considered various factors that they determined were relevant, including the factors described below. The Trustees did not identify any single factor as the controlling factor in determining to approve the renewal of the agreement.
Nature, Extent and Quality of Services
The Trustees considered the nature, extent and quality of the services that had been provided by APAM to the Portfolio, taking into account the investment objective and strategy of the Portfolio. The Trustees also reviewed APAM’s investment approach for the Portfolio and its research process. The Trustees considered the resources of APAM and the personnel of APAM who provide investment management services to the Portfolio. They also reviewed the amount of non-Portfolio assets managed by the portfolio managers of the Portfolio. They considered the non-investment resources and personnel of APAM that are involved in APAM’s services to the Portfolio, including APAM’s compliance, risk management, and legal resources and personnel. The Trustees noted the substantial attention and high priority given by APAM’s senior management to the Pioneer Fund complex. The Trustees considered the implementation and effectiveness of APAM’s business continuity plan in response to the COVID-19 pandemic.
The Trustees considered that APAM supervises and monitors the performance of the Portfolio’s service providers and provides the Portfolio with personnel (including Portfolio officers) and other resources that are necessary for the Portfolio’s business management and operations. The Trustees also considered that, as administrator, APAM is responsible for the administration of the Portfolio’s business and other affairs. The Trustees considered the fees paid to APAM for the provision of administration services.
Based on these considerations, the Trustees concluded that the nature, extent and quality of services that had been provided by APAM to the Portfolio were satisfactory and consistent with the terms of the investment management agreement.
Performance of the Portfolio
In considering the Portfolio’s performance, the Trustees regularly review and discuss throughout the year data prepared by APAM and information comparing the Portfolio’s performance with the performance of its peer group of funds, as classified by Morningstar, Inc. (Morningstar), and with the performance of the Portfolio’s benchmark index. They also discuss the Portfolio’s performance with APAM on a regular basis. The Trustees’ regular reviews and discussions were factored into the Trustees’ deliberations concerning the renewal of the investment management agreement.
50
| Pioneer Strategic Income VCT Portfolio | Pioneer Variable Contracts Trust
|
Management Fee and Expenses
The Trustees considered information showing the fees and expenses of the Portfolio in comparison to the management fees of its peer group of funds as classified by Morningstar and also to the expense ratios of a peer group of funds selected on the basis of criteria determined by the Independent Trustees for this purpose using data provided by Strategic Insight Mutual Fund Research and Consulting, LLC (Strategic Insight), an independent third party. The peer group comparisons referred to below are organized in quintiles. Each quintile represents one-fifth of the peer group. In all peer group comparisons referred to below, first quintile is most favorable to the Portfolio’s shareowners. The Trustees noted that they separately review and consider the impact of the Portfolio’s transfer agency and Portfolio- and APAM-paid expenses for sub-transfer agency and intermediary arrangements, and that the results of the most recent such review were considered in the consideration of the Portfolio’s expense ratio.
The Trustees considered that the Portfolio’s management fee for the most recent fiscal year was in the fifth quintile relative to the management fees paid by other funds in its Morningstar category for the comparable period. The Trustees considered that the expense ratio of the Portfolio’s Class II shares for the most recent fiscal year was in the fourth quintile relative to its Strategic Insight peer group for the comparable period. The Trustees noted the Portfolio’s relatively small asset size compared to most of the other funds in its peer group. The Trustees considered that non-management fee operating expenses generally are spread over a smaller asset base than the other funds in the peer group, which results in these fees being significantly higher as a percentage of assets. The Trustees noted that APAM had agreed to waive fees and/or reimburse expenses in order to limit the ordinary operating expenses of the Portfolio.
The Trustees reviewed management fees charged by APAM and APIAM to institutional and other clients, including publicly offered European funds sponsored by APAM’s affiliates, unaffiliated U.S. registered investment companies (in a sub-advisory capacity), and unaffiliated foreign and domestic separate accounts. The Trustees also considered APAM’s costs in providing services to the Portfolio and APAM’s and APIAM’s costs in providing services to the other clients and considered the differences in management fees and profit margins for fund and non-fund services. In evaluating the fees associated with APAM’s and APIAM’s client accounts, the Trustees took into account the respective demands, resources and complexity associated with the Portfolio and other client accounts. The Trustees noted that, in some instances, the fee rates for those clients were lower than the management fee for the Portfolio and considered that, under the investment management agreement with the Portfolio, APAM performs additional services for the Portfolio that it does not provide to those other clients or services that are broader in scope, including oversight of the Portfolio’s other service providers and activities related to compliance and the extensive regulatory and tax regimes to which the Portfolio is subject. The Trustees also considered the entrepreneurial risks associated with APAM’s management of the Portfolio.
The Trustees concluded that the management fee payable by the Portfolio to APAM was reasonable in relation to the nature and quality of the services provided by APAM.
Profitability
The Trustees considered information provided by APAM regarding the profitability of APAM with respect to the advisory services provided by APAM to the Portfolio, including the methodology used by APAM in allocating certain of its costs to the management of the Portfolio. The Trustees also considered APAM’s profit margin in connection with the overall operation of the Portfolio. They further reviewed the financial results, including the profit margins, realized by APAM and APIAM from non-fund businesses. The Trustees considered APAM’s profit margins in comparison to the limited industry data available and noted that the profitability of any adviser was affected by numerous factors, including its organizational structure and method for allocating expenses. The Trustees concluded that APAM’s profitability with respect to the management of the Portfolio was not unreasonable.
Economies of Scale
The Trustees considered APAM’s views relating to economies of scale in connection with the Pioneer Funds as fund assets grow and the extent to which any such economies of scale are shared with the Portfolio and Portfolio shareholders. The Trustees recognize that economies of scale are difficult to identify and quantify, and that, among other factors that may be relevant, are the following: fee levels, expense subsidization, investment by APAM in research and analytical capabilities and APAM’s commitment and resource allocation to the Portfolio. The Trustees noted that profitability also may be an indicator of the availability of any economies of scale, although profitability may vary for other reasons including due to reductions in expenses. The Trustees concluded that economies of scale, if any, were being appropriately shared with the Portfolio.
51
| Pioneer Strategic Income VCT Portfolio | Pioneer Variable Contracts Trust
|
| Approval of Investment Management Agreement (continued) |
Other Benefits
The Trustees considered the other benefits that APAM enjoys from its relationship with the Portfolio. The Trustees considered the character and amount of fees paid or to be paid by the Portfolio, other than under the investment management agreement, for services provided by APAM and its affiliates. The Trustees further considered the revenues and profitability of APAM’s businesses other than the Fund business. To the extent applicable, the Trustees also considered the benefits to the Portfolio and to APAM and its affiliates from the use of “soft” commission dollars generated by the Portfolio to pay for research and brokerage services.
The Trustees considered that Amundi Pioneer is the principal U.S. asset management business of Amundi, which is one of the largest asset managers globally. Amundi’s worldwide asset management business manages over $1.7 trillion in assets (including the Pioneer Funds). The Trustees considered that APAM’s relationship with Amundi creates potential opportunities for APAM, APIAM and Amundi that derive from APAM’s relationships with the Portfolio, including Amundi’s ability to market the services of APAM globally. The Trustees noted that APAM has access to additional research and portfolio management capabilities as a result of its relationship with Amundi and Amundi’s enhanced global presence that may contribute to an increase in the resources available to APAM. The Trustees considered that APAM and the Portfolio receive reciprocal intangible benefits from the relationship, including mutual brand recognition and, for the Portfolio, direct and indirect access to the resources of a large global asset manager. The Trustees concluded that any such benefits received by APAM as a result of its relationship with the Portfolio were reasonable.
Conclusion
After consideration of the factors described above as well as other factors, the Trustees, including the Independent Trustees, concluded that the investment management agreement for the Portfolio, including the fees payable thereunder, was fair and reasonable and voted to approve the proposed renewal of the investment management agreement.
52
| Pioneer Strategic Income VCT Portfolio | Pioneer Variable Contracts Trust
|
Trustees, Officers and Service Providers |
The Portfolio’s Trustees and officers are listed below, together with their principal occupations and other directorships they have held during at least the past five years. Trustees who are interested persons of the Portfolios within the meaning of the 1940 Act are referred to as Interested Trustees. Trustees who are not interested persons of the Portfolio are referred to as Independent Trustees. Each of the Trustees serves as a Trustee of each of the 45 U.S. registered investment portfolios for which Amundi US serves as investment adviser (the “Pioneer Funds”). The address for all Trustees and all officers of the Portfolios is 60 State Street, Boston, Massachusetts 02109.
| | | | |
| Name, Age and Position | Term of Office and | | Other Directorships |
| Held With the Trust | Length of Service | Principal Occupation | Held by Trustee |
| Independent Trustees: | | | |
| Thomas J. Perna (70) | Trustee since 2006. Serves until a | Private investor (2004 – 2008 and | Director, Broadridge Financial |
Chairman of the Board | successor trustee is elected or | 2013 – present); Chairman (2008 – 2013) | Solutions, Inc. (investor |
and Trustee | earlier retirement or removal. | and Chief Executive Officer (2008 – 2012), | communications and securities |
| | Quadriserv, Inc. (technology products for | processing provider for financial |
| | securities lending industry); and Senior | services industry) (2009 – present); |
| | Executive Vice President, The Bank of New York | Director, Quadriserv, Inc. (2005 – |
| | (financial and securities services) (1986 – 2004) | 2013); and Commissioner, New Jersey |
| | | State Civil Service Commission |
| | | (2011 – 2015) |
| John E. Baumgardner, Jr. (69) | Trustee since 2019. Serves until a | Of Counsel (2019 – present), Partner | Chairman, The Lakeville Journal |
Trustee | successor trustee is elected or | (1983-2018), Sullivan & Cromwell LLP | Company, LLC, (privately-held |
| earlier retirement or removal. | (law firm). | community newspaper group) (2015- |
| | | present) |
| Diane Durnin (63) | Trustee since 2019. Serves until a | Managing Director - Head of Product Strategy | None |
Trustee | successor trustee is elected or | and Development, BNY Mellon Investment | |
| earlier retirement or removal. | Management (investment management firm) | |
| | (2012-2018); Vice Chairman – The Dreyfus | |
| | Corporation (2005 – 2018): Executive Vice | |
| | President Head of Product, BNY Mellon | |
| | Investment Management (2007-2012); Executive | |
| | Director- Product Strategy, Mellon Asset | |
| | Management (2005-2007); Executive Vice | |
| | President Head of Products, Marketing and | |
| | Client Service, Dreyfus Corporation (investment | |
| | management firm) (2000-2005); and Senior Vice | |
| | President – Strategic Product and Business | |
| | Development, Dreyfus Corporation (1994-2000) | |
| Benjamin M. Friedman (76) | Trustee since 2008. Serves until a | William Joseph Maier Professor of Political | Trustee, Mellon Institutional Funds |
Trustee | successor trustee is elected or | Economy, Harvard University (1972 – present) | Investment Trust and Mellon |
| earlier retirement or removal. | | Institutional Funds Master Portfolio |
| | | (oversaw 17 portfolios in fund |
| | | complex) (1989 - 2008) |
| Lorraine H. Monchak (64) | Trustee since 2017. (Advisory | Chief Investment Officer, 1199 SEIU Funds | None |
Trustee | Trustee from 2014 - 2017). Serves | (healthcare workers union pension funds) | |
| until a successor trustee is elected | (2001 – present); Vice President – International | |
| or earlier retirement or removal. | Investments Group, American International | |
| | Group, Inc. (insurance company) (1993 – 2001); | |
| | Vice President – Corporate Finance and Treasury | |
| | Group, Citibank, N.A. (1980 – 1986 and | |
| | 1990 – 1993); Vice President – Asset/Liability | |
| | Management Group, Federal Farm Funding | |
| | Corporation (government-sponsored issuer of | |
| | debt securities) (1988 – 1990); Mortgage | |
| | Strategies Group, Shearson Lehman Hutton, Inc. | |
| | (investment bank) (1987 – 1988); and Mortgage | |
| | Strategies Group, Drexel Burnham Lambert, Ltd. | |
| | (investment bank) (1986 – 1987) | |
53
| Pioneer Strategic Income VCT Portfolio | Pioneer Variable Contracts Trust
|
| Trustees, Officers and Service Providers (continued) |
| | | | |
| Name, Age and Position | Term of Office and | | Other Directorships |
| Held With the Trust | Length of Service | Principal Occupation | Held by Trustee |
Independent Trustees: (continued) | | |
| Marguerite A. Piret (72) | Trustee since 1995. Serves until a | Chief Financial Officer, American Ag Energy, | Director of New America High Income |
Trustee | successor trustee is elected or | Inc. (controlled environment and agriculture | Fund, Inc. (closed-end investment |
| earlier retirement or removal. | company) (2016 – present); and President and | company) (2004 – present); and |
| | Chief Executive Officer, Metric Financial Inc. | Member, Board of Governors, |
| | (formerly known as Newbury Piret Company) | Investment Company Institute |
| | (investment banking firm) (1981 – 2019) | (2000 – 2006) |
| Fred J. Ricciardi (73) | Trustee since 2014. Serves until a | Private investor (2020 – present); Consultant | None |
Trustee | successor trustee is elected or | (investment company services) (2012 – 2020); | |
| earlier retirement or removal. | Executive Vice President, BNY Mellon (financial | |
| | and investment company services) (1969 – 2012); | |
| | Director, BNY International Financing Corp. | |
| | (financial services) (2002 – 2012); Director, | |
| | Mellon Overseas Investment Corp. (financial | |
| | services) (2009 – 2012); Director, Financial | |
| | Models (technology) (2005-2007); Director, BNY | |
| | Hamilton Funds, Ireland (offshore investment | |
| | companies) (2004-2007); Chairman/Director, | |
| | AIB/BNY Securities Services, Ltd., Ireland | |
| | (financial services) (1999-2006); and Chairman, | |
| | BNY Alternative Investment Services, Inc. | |
| | (financial services) (2005-2007) | |
| Interested Trustees: | | | |
| Lisa M. Jones (58)* | Trustee since 2017. Serves until a | Director, CEO and President of Amundi US, Inc. | None |
Trustee, President and | successor trustee is elected or | (investment management firm) (since | |
Chief Executive Officer | earlier retirement or removal | September 2014); Director, CEO and President | |
| | of Amundi Asset Management US, Inc. (since | |
| | September 2014); Director, CEO and President of | |
| | Amundi Distributor US, Inc. (since September | |
| | 2014); Director, CEO and President of Amundi | |
| | Asset Management US, Inc. (since September | |
| | 2014); Chair, Amundi US, Inc., Amundi Distributor | |
| | US, Inc. and Amundi Asset Management US, Inc. | |
| | (September 2014 – 2018); Managing Director, | |
| | Morgan Stanley Investment Management | |
| | (investment management firm) (2010 – 2013); | |
| | Director of Institutional Business, CEO of | |
| | International, Eaton Vance Management | |
| | (investment management firm) (2005 – 2010); | |
| | and Director of Amundi Holdings US, Inc. | |
| | (since 2017) | |
| Kenneth J. Taubes (62)* | Trustee since 2014. Serves until a | Director and Executive Vice President | None |
Trustee | successor trustee is elected or | (since 2008) and Chief Investment Officer, U.S. | |
| earlier retirement or removal | (since 2010) of Amundi US, Inc. (investment | |
| | management firm); Director and Executive Vice | |
| | President and Chief Investment Officer, U.S. of | |
| | Amundi US (since 2008); Executive Vice | |
| | President and Chief Investment Officer, U.S. of | |
| | Amundi Asset Management US, Inc. (since 2009); | |
| | Portfolio Manager of Amundi US (since 1999); | |
| | and Director of Amundi Holdings US, Inc. | |
| | (since 2017) | |
* | Ms. Jones and Mr. Taubes are Interested Trustees because they are officers or directors of the Portfolio’s investment adviser and certain of its affiliates. |
54
| Pioneer Strategic Income VCT Portfolio | Pioneer Variable Contracts Trust
|
| | | | |
| Name , Age and Position | Term of Office and | | Other Directorships |
| Held With the Trust | Length of Service | Principal Occupation | Held by Officer |
| Fund Officers: | | | |
| Christopher J. Kelley (56) | Since 2003. Serves at the | Vice President and Associate General Counsel | None |
Secretary and Chief | discretion of the Board | of Amundi US since January 2008; Secretary and | |
Legal Officer | | Chief Legal Officer of all of the Pioneer Funds | |
| | since June 2010; Assistant Secretary of all of the | |
| | Pioneer Funds from September 2003 to | |
| | May 2010; Vice President and Senior Counsel of | |
| | Amundi US from July 2002 to December 2007 | |
| Carol B. Hannigan (59) | Since 2010. Serves at the | Fund Governance Director of Amundi US since | None |
Assistant Secretary | discretion of the Board | December 2006 and Assistant Secretary of all | |
| | the Pioneer Funds since June 2010; Manager – | |
| | Fund Governance of Amundi US from | |
| | December 2003 to November 2006; and Senior | |
| | Paralegal of Amundi US from January 2000 to | |
| | November 2003 | |
| Thomas Reyes (58) | Since 2010. Serves at the | Assistant General Counsel of Amundi US since | None |
Assistant Secretary | discretion of the Board | May 2013 and Assistant Secretary of all the | |
| | Pioneer Funds since June 2010; and Counsel of | |
| | Amundi US from June 2007 to May 2013 | |
| Mark E. Bradley (61) | Since 2008. Serves at the | Vice President – Fund Treasury of Amundi US; | None |
Treasurer and Chief Financial | discretion of the Board | Treasurer of all of the Pioneer Funds since | |
and Accounting Officer | | March 2008; Deputy Treasurer of Amundi US | |
| | from March 2004 to February 2008; and Assistant | |
| | Treasurer of all of the Pioneer Funds from | |
| | March 2004 to February 2008 | |
| Anthony J. Koenig, Jr. (57) | Since 2021. Serves at the | Senior Vice President – Fund Treasury of | None |
Assistant Treasurer | discretion of the Board | Amundi US; Assistant Treasurer of all of the | |
| | Pioneer Funds since January 2021; and Chief of | |
| | Staff, US Investment Management of Amundi US | |
| | from May 2008 to January 2021 | |
| Luis I. Presutti (55) | Since 2000. Serves at the | Director – Fund Treasury of Amundi US since | None |
Assistant Treasurer | discretion of the Board | 1999; and Assistant Treasurer of all of the | |
| | Pioneer Funds since 1999 | |
| Gary Sullivan (62) | Since 2002. Serves at the | Senior Manager – Fund Treasury of Amundi US | None |
Assistant Treasurer | discretion of the Board | since 2012; and Assistant Treasurer of all of the | |
| | Pioneer Funds since 2002 | |
| Antonio Furtado (38) | Since 2020. Serves at the | Fund Oversight Manager – Fund Treasury of | None |
Assistant Treasurer | discretion of the Board | Amundi US since 2020; Assistant Treasurer of all | |
| | of the Pioneer Funds since 2020; and Senior Fund | |
| | Treasury Analyst from 2012 - 2020 | |
| John Malone (50) | Since 2018. Serves at the | Managing Director, Chief Compliance Officer of | None |
Chief Compliance Officer | discretion of the Board | Amundi US Asset Management; Amundi Asset | |
| | Management US, Inc.; and the Pioneer Funds | |
| | since September 2018; and Chief Compliance | |
| | Officer of Amundi Distributor US, Inc. since | |
| | January 2014. | |
| Kelly O’Donnell (49) | Since 2006. Serves at the | Vice President – Amundi Asset Management; | None |
Anti-Money | discretion of the Board | and Anti-Money Laundering Officer of all the | |
Laundering Officer | | Pioneer Funds since 2006 | |
55
This page was intentionally left blank.
56
This page was intentionally left blank.
57
This page was intentionally left blank.
58
This page was intentionally left blank.
59
This page was intentionally left blank.
60
This page was intentionally left blank.
61
Proxy Voting Policies and Procedures of the Portfolio are available without charge, upon request, by calling our toll free number (1-800-225-6292). Information regarding how the Portfolio voted proxies relating to Portfolio securities during the most recent 12-month period ended June 30 is publicly available to shareowners at www.amundi.com/us. This information is also available on the Securities and Exchange Commission’s web site at www.sec.gov.
20364-14-0221
ITEM 2. CODE OF ETHICS.
(a) Disclose whether, as of the end of the period covered by the report, the registrant has adopted a code of ethics that applies to the registrant’s principal executive officer, principal financial officer, principal accounting officer or controller, or persons performing similar functions, regardless of whether these individuals are employed by the registrant or a third party. If the registrant has not adopted such a code of ethics, explain why it has not done so.
The registrant has adopted, as of the end of the period covered by this report, a code of ethics that applies to the registrant’s principal executive officer, principal financial officer, principal accounting officer and controller.
(b) For purposes of this Item, the term “code of ethics” means written standards that are reasonably designed to deter wrongdoing and to promote:
(1) Honest and ethical conduct, including the ethical handling of actual or apparent conflicts of interest between personal and professional relationships;
(2) Full, fair, accurate, timely, and understandable disclosure in reports and documents that a registrant files with, or submits to, the Commission and in other public communications made by the registrant;
(3) Compliance with applicable governmental laws, rules, and regulations;
(4) The prompt internal reporting of violations of the code to an appropriate person or persons identified in the code; and
(5) Accountability for adherence to the code.
(c) The registrant must briefly describe the nature of any amendment, during the period covered by the report, to a provision of its code of ethics that applies to the registrant’s principal executive officer, principal financial officer, principal accounting officer or controller, or persons performing similar functions, regardless of whether these individuals are employed by the registrant or a third party, and that relates to any element of the code of ethics definition enumerated in paragraph (b) of this Item. The registrant must file a copy of any such amendment as an exhibit pursuant to Item 10(a), unless the registrant has elected to satisfy paragraph (f) of this Item by posting its code of ethics on its website pursuant to paragraph (f)(2) of this Item, or by undertaking to provide its code of ethics to any person without charge, upon request, pursuant to paragraph (f)(3) of this Item.
The registrant has made no amendments to the code of ethics during the period covered by this report.
(d) If the registrant has, during the period covered by the report, granted a waiver, including an implicit waiver, from a provision of the code of ethics to the registrant’s principal executive officer, principal financial officer, principal accounting officer or controller, or persons performing similar functions, regardless of whether these individuals are employed by the registrant or a third party, that relates to one or more of the items set forth in paragraph (b) of this Item, the registrant must briefly describe the nature of the waiver, the name of the person to whom the waiver was granted, and the date of the waiver.
Not applicable.
(e) If the registrant intends to satisfy the disclosure requirement under paragraph (c) or (d) of this Item regarding an amendment to, or a waiver from, a provision of its code of ethics that applies to the registrant’s principal executive officer, principal financial officer, principal accounting officer or controller, or persons performing similar functions and that relates to any element of the code of ethics definition enumerated in paragraph (b) of this Item by posting such information on its Internet website, disclose the registrant’s Internet address and such intention.
Not applicable.
(f) The registrant must:
(1) File with the Commission, pursuant to Item 12(a)(1), a copy of its code of ethics that applies to the registrant’s principal executive officer, principal financial officer, principal accounting officer or controller, or persons performing similar functions, as an exhibit to its annual report on this Form N-CSR (see attachment);
(2) Post the text of such code of ethics on its Internet website and disclose, in its most recent report on this Form N-CSR, its Internet address and the fact that it has posted such code of ethics on its Internet website; or
(3) Undertake in its most recent report on this Form N-CSR to provide to any person without charge, upon request, a copy of such code of ethics and explain the manner in which such request may be made. See Item 10(2)
ITEM 3. AUDIT COMMITTEE FINANCIAL EXPERT.
(a) (1) Disclose that the registrant’s board of trustees has determined that the registrant either:
(i) Has at least one audit committee financial expert serving on its audit committee; or
(ii) Does not have an audit committee financial expert serving on its audit committee.
The registrant’s Board of Trustees has determined that the registrant has at least one audit committee financial expert.
(2) If the registrant provides the disclosure required by paragraph (a)(1)(i) of this Item, it must disclose the name of the audit committee financial expert and whether that person is “independent.” In order to be considered “independent” for purposes of this Item, a member of an audit committee may not, other than in his or her capacity as a member of the audit committee, the board of trustees, or any other board committee:
(i) Accept directly or indirectly any consulting, advisory, or other compensatory fee from the issuer; or
(ii) Be an “interested person” of the investment company as defined in Section 2(a)(19) of the Act (15 U.S.C. 80a-2(a)(19)).
Mr. Fred J. Ricciardi, an independent trustee, is such an audit committee financial expert.
(3) If the registrant provides the disclosure required by paragraph (a)(1) (ii) of this Item, it must explain why it does not have an audit committee financial expert.
Not applicable.
ITEM 4. PRINCIPAL ACCOUNTANT FEES AND SERVICES.
(a) Disclose, under the caption AUDIT FEES, the aggregate fees billed for each of the last two fiscal years for professional services rendered by the principal accountant for the audit of the registrant’s annual financial statements or services that are normally provided by the accountant in connection with statutory and regulatory filings or engagements for those fiscal years.
The audit fees for the Trust were $257,400 payable to Ernst & Young LLP for the year ended December 31, 2020 and $245,000 for the year ended December 31, 2019.
(b) Disclose, under the caption AUDIT-RELATED FEES, the aggregate fees billed in each of the last two fiscal years for assurance and related services by the principal accountant that are reasonably related to the performance of the audit of the registrant’s financial statements and are not reported under paragraph (a) of this Item. Registrants shall describe the nature of the services comprising the fees disclosed under this category.
There were no audit-related services in 2020 or 2019.
(c) Disclose, under the caption TAX FEES, the aggregate fees billed in each of the last two fiscal years for professional services rendered by the principal accountant for tax compliance, tax advice, and tax planning. Registrants shall describe the nature of the services comprising the fees disclosed under this category.
The Trust paid aggregate non-audit fees to Ernst & Young LLP for tax services of $65,508 and $64,224 during the fiscal years ended December 31, 2020 and 2019, respectively.
(d) Disclose, under the caption ALL OTHER FEES, the aggregate fees billed in each of the last two fiscal years for products and services provided by the principal accountant, other than the services reported in paragraphs (a) through (c) of this Item. Registrants shall describe the nature of the services comprising the fees disclosed under this category.
There were no other fees in 2020 or 2019.
(e) (1) Disclose the audit committee’s pre-approval policies and procedures described in paragraph (c)(7) of Rule 2-01 of Regulation S-X.
PIONEER FUNDS
APPROVAL OF AUDIT, AUDIT-RELATED, TAX AND OTHER SERVICES
PROVIDED BY THE INDEPENDENT AUDITOR
SECTION I - POLICY PURPOSE AND APPLICABILITY
The Pioneer Funds recognize the importance of maintaining the independence of their outside auditors. Maintaining independence is a shared responsibility involving Amundi Pioneer Asset Management, Inc, the audit committee and the independent auditors.
The Funds recognize that a Fund’s independent auditors: 1) possess knowledge of the Funds, 2) are able to incorporate certain services into the scope of the audit, thereby avoiding redundant work, cost and disruption of Fund personnel and processes, and 3) have expertise that has value to the Funds. As a result, there are situations where it is desirable to use the Fund’s independent auditors for services in addition to the annual audit and where the potential for conflicts of interests are minimal. Consequently, this policy, which is intended to comply with Rule 210.2-01(C)(7), sets forth guidelines and procedures to be followed by the Funds when retaining the independent audit firm to perform audit, audit-related tax and other services under those circumstances, while also maintaining independence.
Approval of a service in accordance with this policy for a Fund shall also constitute approval for any other Fund whose pre-approval is required pursuant to Rule 210.2-01(c)(7)(ii).
In addition to the procedures set forth in this policy, any non-audit services that may be provided consistently with Rule 210.2-01 may be approved by the Audit Committee itself and any pre-approval that may be waived in accordance with Rule 210.2-01(c)(7)(i)(C) is hereby waived.
Selection of a Fund’s independent auditors and their compensation shall be determined by the Audit Committee and shall not be subject to this policy.
| | | |
| SECTION II - POLICY |
| |
SERVICE CATEGORY | SERVICE CATEGORY DESCRIPTION | SPECIFIC PRE-APPROVED SERVICE SUBCATEGORIES |
| | | |
I. AUDIT SERVICES | Services that are directly | o Accounting research assistance |
| | related to performing the | o SEC consultation, registration |
| | independent audit of the Funds | statements, and reporting |
| | | o Tax accrual related matters |
| | | o Implementation of new accounting standards |
| | | o Compliance letters (e.g. rating agency letters) |
| | | o Regulatory reviews and assistance |
| | | regarding financial matters |
| | | o Semi-annual reviews (if requested) |
| | | o Comfort letters for closed end offerings |
II. AUDIT-RELATED | Services which are not | o AICPA attest and agreed-upon procedures |
SERVICES | prohibited under Rule | o Technology control assessments |
| | 210.2-01(C)(4) (the “Rule”) | o Financial reporting control assessments |
| | and are related extensions of | o Enterprise security architecture |
| | the audit services support the | assessment |
| | audit, or use the knowledge/expertise | |
| | gained from the audit procedures as a | |
| | foundation to complete the project. | |
| | In most cases, if the Audit-Related | |
| | Services are not performed by the | |
| | Audit firm, the scope of the Audit | |
| | Services would likely increase. | |
| | The Services are typically well-defined | |
| | and governed by accounting | |
| | professional standards (AICPA, | |
| | SEC, etc.) | |
| | |
AUDIT COMMITTEE APPROVAL POLICY | AUDIT COMMITTEE REPORTING POLICY |
| o “One-time” pre-approval | o A summary of all such |
| for the audit period for all | services and related fees |
| pre-approved specific service | reported at each regularly |
| subcategories. Approval of the | scheduled Audit Committee |
| independent auditors as | meeting. |
| auditors for a Fund shall | |
| constitute pre approval for | |
| these services. | |
| |
| o “One-time” pre-approval | o A summary of all such |
| for the fund fiscal year within | services and related fees |
| a specified dollar limit | (including comparison to |
| for all pre-approved | specified dollar limits) |
| specific service subcategories | reported quarterly. |
| |
| o Specific approval is | |
| needed to exceed the | |
| pre-approved dollar limit for | |
| these services (see general | |
| Audit Committee approval policy | |
| below for details on obtaining | |
| specific approvals) | |
| |
| o Specific approval is | |
| needed to use the Fund’s | |
| auditors for Audit-Related | |
| Services not denoted as | |
| “pre-approved”, or | |
| to add a specific service | |
| subcategory as “pre-approved” | |
SECTION III - POLICY DETAIL, CONTINUED
| | |
SERVICE CATEGORY | SERVICE CATEGORY DESCRIPTION | SPECIFIC PRE-APPROVED SERVICE |
| | | SUBCATEGORIES |
III. TAX SERVICES | Services which are not | o Tax planning and support |
| | prohibited by the Rule, | o Tax controversy assistance |
| | if an officer of the Fund | o Tax compliance, tax returns, excise |
| | determines that using the | tax returns and support |
| | Fund’s auditor to provide | o Tax opinions |
| | these services creates | |
| | significant synergy in | |
| | the form of efficiency, | |
| | minimized disruption, or | |
| | the ability to maintain a | |
| | desired level of | |
| | confidentiality. | |
| | |
| AUDIT COMMITTEE APPROVAL POLICY | AUDIT COMMITTEE REPORTING POLICY |
o “One-time” pre-approval | o A summary of |
for the fund fiscal year | all such services and |
within a specified dollar limit | related fees |
| | (including comparison |
| | to specified dollar |
| | limits) reported |
| | quarterly. |
| |
o Specific approval is | |
| needed to exceed the | |
| pre-approved dollar limits for | |
| these services (see general | |
| Audit Committee approval policy | |
| below for details on obtaining | |
| specific approvals) | |
| |
o Specific approval is | |
| needed to use the Fund’s | |
| auditors for tax services not | |
| denoted as pre-approved, or to | |
| add a specific service subcategory as | |
| “pre-approved” | |
SECTION III - POLICY DETAIL, CONTINUED
| |
SERVICE CATEGORY | SERVICE CATEGORY DESCRIPTION | SPECIFIC PRE-APPROVED SERVICE |
| | | SUBCATEGORIES |
IV. OTHER SERVICES | Services which are not | o Business Risk Management support |
| | prohibited by the Rule, | o Other control and regulatory |
A. SYNERGISTIC, | if an officer of the Fund | compliance projects |
UNIQUE QUALIFICATIONS | determines that using the | |
| | Fund’s auditor to provide | |
| | these services creates | |
| | significant synergy in | |
| | the form of efficiency, | |
| | minimized disruption, | |
| | the ability to maintain a | |
| | desired level of | |
| | confidentiality, or where | |
| | the Fund’s auditors | |
| | posses unique or superior | |
| | qualifications to provide | |
| | these services, resulting | |
| | in superior value and | |
| | results for the Fund. | |
| | |
AUDIT COMMITTEE APPROVAL POLICY | AUDIT COMMITTEE REPORTING POLICY |
o “One-time” pre-approval | o A summary of |
| for the fund fiscal year within | all such services and |
| a specified dollar limit | related fees |
| | (including comparison |
| | to specified dollar |
| | limits) reported |
| | quarterly. |
o Specific approval is | |
| needed to exceed the | |
| pre-approved dollar limits for | |
| these services (see general | |
| Audit Committee approval policy | |
| below for details on obtaining | |
| specific approvals) | |
| |
o Specific approval is | |
| needed to use the Fund’s | |
| auditors for “Synergistic” or | |
| “Unique Qualifications” Other | |
| Services not denoted as | |
| pre-approved to the left, or to | |
| add a specific service | |
| subcategory as “pre-approved” | |
SECTION III - POLICY DETAIL, CONTINUED
| |
SERVICE CATEGORY | SERVICE CATEGORY DESCRIPTION | SPECIFIC PROHIBITED SERVICE |
| | | SUBCATEGORIES |
PROHIBITED SERVICES | Services which result | 1. Bookkeeping or other services |
| | in the auditors losing | related to the accounting records or |
| | independence status | financial statements of the audit |
| | under the Rule. | client* |
| | | 2. Financial information systems design |
| | | and implementation* |
| | | 3. Appraisal or valuation services, |
| | | fairness* opinions, or |
| | | contribution-in-kind reports |
| | | 4. Actuarial services (i.e., setting |
| | | actuarial reserves versus actuarial |
| | | audit work)* |
| | | 5. Internal audit outsourcing services* |
| | | 6. Management functions or human |
| | | resources |
| | | 7. Broker or dealer, investment |
| | | advisor, or investment banking services |
| | | 8. Legal services and expert services |
| | | unrelated to the audit |
| | | 9. Any other service that the Public |
| | | Company Accounting Oversight Board |
| | | determines, by regulation, is |
| | | impermissible |
| | |
AUDIT COMMITTEE APPROVAL POLICY | AUDIT COMMITTEE REPORTING POLICY |
o These services are not to be | o A summary of all |
| performed with the exception of the(*) | services and related |
| services that may be permitted | fees reported at each |
| if they would not be subject to audit | regularly scheduled |
| procedures at the audit client (as | Audit Committee meeting |
| defined in rule 2-01(f)(4)) level | will serve as continual |
| the firm providing the service. | confirmation that has |
| | not provided any |
| | restricted services. |
GENERAL AUDIT COMMITTEE APPROVAL POLICY:
o For all projects, the officers of the Funds and the Fund’s auditors will each make an assessment to determine that any proposed projects will not impair independence.
o Potential services will be classified into the four non-restricted service categories and the “Approval of Audit, Audit-Related, Tax and Other Services” Policy above will be applied. Any services outside the specific pre-approved service subcategories set forth above must be specifically approved by the Audit Committee.
o At least quarterly, the Audit Committee shall review a report summarizing the services by service category, including fees, provided by the Audit firm as set forth in the above policy.
(2) Disclose the percentage of services described in each of paragraphs (b) through (d) of this Item that were approved by the audit committee pursuant to paragraph (c)(7)(i)(C) of Rule 2-01 of Regulation S-X.
Non-Audit Services
Beginning with non-audit service contracts entered into on or after May 6, 2003, the effective date of the new SEC pre-approval rules, the Trust’s audit committee is required to pre-approve services to affiliates defined by SEC rules to the extent that the services are determined to have a direct impact on the operations or financial reporting of the Trust. For the years ended December 31, 2020 and 2019, there were no services provided to an affiliate that required the Trust’s audit committee pre-approval.
(f) If greater than 50 percent, disclose the percentage of hours expended on the principal accountants engagement to audit the registrant’s financial statements for the most recent fiscal year that were attributed to work performed by persons other than the principal accountant’s full-time, permanent employees.
N/A
(g) Disclose the aggregate non-audit fees billed by the registrants accountant for services rendered to the registrant, and rendered to the registrants investment adviser (not including any sub-adviser whose role is primarily portfolio management and is subcontracted with or overseen by another investment adviser), and any entity controlling, controlled by, or under common control with the adviser that provides ongoing services to the registrant for each of the last two fiscal years of the registrant.
The Trust paid aggregate non-audit fees to Ernst & Young LLP for tax services of $ 65,508 and $ 64,224 during the fiscal years ended December 31, 2020 and 2019, respectively.
(h) Disclose whether the registrants audit committee of the board of trustees has considered whether the provision of non-audit services that were rendered to the registrants investment adviser (not including any subadviser whose role is primarily portfolio management and is subcontracted with or overseen by another investment adviser), and any entity controlling, controlled by, or under common control with the investment adviser that provides ongoing services to the registrant that were not pre-approved pursuant to paragraph (c)(7)(ii) of Rule 2-01 of Regulation S-X is compatible with maintaining the principal accountant’s independence.
The Fund’s audit committee of the Board of Trustees has considered whether the provision of non-audit services that were rendered to the Affiliates (as defined) that were not pre- approved pursuant to paragraph (c)(7)(ii) of Rule 2-01 of Regulation S-X is compatible with maintaining the principal accountant’s independence.
ITEM 5. AUDIT COMMITTEE OF LISTED REGISTRANTS
(a) If the registrant is a listed issuer as defined in Rule 10A-3 under the Exchange Act (17 CFR 240.10A-3), state whether or not the registrant has a separately-designated standing audit committee established in accordance with Section 3(a)(58)(A) of the Exchange Act (15 U.S.C. 78c(a)(58)(A)). If the registrant has such a committee, however designated, identify each committee member. If the entire board of directors is acting as the registrant’s audit committee as specified in Section 3(a)(58)(B) of the Exchange Act (15 U.S.C. 78c(a)(58)(B)), so state.
N/A
(b) If applicable, provide the disclosure required by Rule 10A-3(d) under the Exchange Act (17 CFR 240.10A-3(d)) regarding an exemption from the listing standards for audit committees.
N/A
ITEM 6. SCHEDULE OF INVESTMENTS.
File Schedule of Investments in securities of unaffiliated issuers as of the close of the reporting period as set forth in 210.1212 of Regulation S-X [17 CFR 210.12-12], unless the schedule is included as part of the report to shareholders filed under Item 1 of this Form.
Included in Item 1
ITEM 7. DISCLOSURE OF PROXY VOTING POLICIES AND PROCEDURES FOR CLOSED-END MANAGEMENT INVESTMENT COMPANIES.
A closed-end management investment company that is filing an annual report on this Form N-CSR must, unless it invests exclusively in non-voting securities, describe the policies and procedures that it uses to determine how to vote proxies relating to portfolio securities, including the procedures that the company uses when a vote presents a conflict between the interests of its shareholders, on the one hand, and those of the company’s investment adviser; principal underwriter; or any affiliated person (as defined in Section 2(a)(3) of the Investment Company Act of 1940 (15 U.S.C. 80a-2(a)(3)) and the rules thereunder) of the company, its investment adviser, or its principal underwriter, on the other. Include any policies and procedures of the company’s investment adviser, or any other third party, that the company uses, or that are used on the company’s behalf, to determine how to vote proxies relating to portfolio securities.
N/A
ITEM 8. PORTFOLIO MANAGERS OF CLOSED-END MANAGEMENT INVESTMENT COMPANIES.
(a) If the registrant is a closed-end management investment company that is filing an annual report on this Form N-CSR, provide the following information:
(1) State the name, title, and length of service of the person or persons employed by or associated with the registrant or an investment adviser of the registrant who are primarily responsible for the day-to-day management of the registrant’s portfolio (“Portfolio Manager”). Also state each Portfolio Manager’s business experience during the past 5 years.
N/A
ITEM 9. PURCHASES OF EQUITY SECURITIES BY CLOSED-END MANAGEMENT INVESTMENT COMPANY AND AFFILIATED PURCHASERS.
(a) If the registrant is a closed-end management investment company, in the following tabular format, provide the information specified in paragraph (b) of this Item with respect to any purchase made by or on behalf of the registrant or any affiliated purchaser, as defined in Rule 10b-18(a)(3) under the Exchange Act (17 CFR 240.10b-18(a)(3)), of shares or other units of any class of the registrant’s equity securities that is registered by the registrant pursuant to Section 12 of the Exchange Act (15 U.S.C. 781).
N/A
ITEM 10. SUBMISSION OF MATTERS TO A VOTE OF SECURITY HOLDERS.
Describe any material changes to the procedures by which shareholders may recommend nominees to the registrant’s board of directors, where those changes were implemented after the registrant last provided disclosure in response to the requirements of Item 407(c)(2)(iv) of Regulation S-R(17 CFR 229.407)(as required by Item 22(b)(15)) of Schedule 14A (17 CFR 240.14a-101), or this Item.
There have been no material changes to the procedures by which the shareholders may recommend nominees to the registrant’s board of directors since the registrant last provided disclosure in response to the requirements of Item 407(c)(2)(iv) of Regulation S-R of Schedule 14(A) in its definitive proxy statement, or this item.
ITEM 11. CONTROLS AND PROCEDURES.
(a) Disclose the conclusions of the registrant’s principal executive and principal financials officers, or persons performing similar functions, regarding the effectiveness of the registrant’s disclosure controls and procedures (as defined in Rule 30a-3(c) under the Act (17 CFR 270.30a-3(c))) as of a date within 90 days of the filing date of the report that includes the disclosure required by this paragraph, based on the evaluation of these controls and procedures required by Rule 30a-3(b) under the Act (17 CFR 270.30(a)-3(b) and Rules 13a-15(b) or 15d-15(b) under the Exchange Act (17 CFR 240.13a-15(b) or 240.15d-15(b)).
The registrant’s principal executive officer and principal financial officer have concluded that the registrant’s disclosure controls and procedures are effective based on the evaluation of these controls and procedures as of a date within 90 days of the filing date of this report.
(b) Disclose any change in the registrant’s internal control over financial reporting (as defined in Rule 30a-3(d) under the Act (17CFR 270.30a-3(d)) that occured during the second fiscal quarter of the period covered by this report that has materially affected, or is reasonably likely to materially affect, the registrant’s internal control over financial reporting.
There were no significant changes in the registrant’s internal control over financial reporting that occurred during the second fiscal quarter of the period covered by this report that have materially affected, or are reasonably likely to materially affect, the registrant’s internal control over financial reporting.
Item 12. Disclosure of Securities Lending Activities for Closed-End Management Investment Companies.
(a) If the registrant is a closed-end management investment company, provide the following dollar amounts of income and compensation related to the securities lending activities of the registrant during its most recent fiscal year:
N/A
(1) Gross income from securities lending activities;
N/A
(2) All fees and/or compensation for each of the following securities lending activities and related services: any share of revenue generated by the securities lending program paid to the securities lending agent(s) (revenue split); fees paid for cash collateral management services (including fees deducted from a pooled cash collateral reinvestment vehicle) that are not included in the revenue split; administrative fees that are not included in the revenue split; fees for indemnification that are not included in the revenue split; rebates paid to borrowers; and any other fees relating to the securities lending program that are not included in the revenue split, including a description of those other fees;
N/A
(3) The aggregate fees/compensation disclosed pursuant to paragraph (2); and
N/A
(4) Net income from securities lending activities (i.e., the dollar amount in paragraph (1) minus the dollar amount in paragraph (3)).
If a fee for a service is included in the revenue split, state that the fee is included in the revenue split.
N/A
(b) If the registrant is a closed-end management investment company, describe the services provided to the registrant by the securities lending agent in the registrants most recent fiscal year.
N/A
ITEM 13. EXHIBITS.
(a) File the exhibits listed below as part of this Form. Letter or number the exhibits in the sequence indicated.
SIGNATURES
[See General Instruction F]
Pursuant to the requirements of the Securities Exchange Act of 1934 and the Investment Company Act of 1940, the registrant has duly caused this report to be signed on its behalf by the undersigned, thereunto duly authorized.
(Registrant) Pioneer Variable Contracts Trust
By (Signature and Title)* /s/ Lisa M. Jones
Lisa M. Jones, President & Chief Executive Officer
Date March 4, 2021
Pursuant to the requirements of the Securities Exchange Act of 1934 and the Investment Company Act of 1940, this report has been signed below by the following persons on behalf of the registrant and in the capacities and on the dates indicated.
By (Signature and Title)* /s/ Lisa M. Jones
Lisa M. Jones, President & Chief Executive Officer
Date March 4, 2021
By (Signature and Title)* /s/ Mark E. Bradley
Mark E. Bradley, Treasurer & Chief Accounting & Financial Officer
Date March 4, 2021
* Print the name and title of each signing officer under his or her signature.