Exhibit 99(c)(3)

| John Q. Hammons Hotels, Inc. Presentation to the Special Committee of the Board of Directors December 6, 2004 Confidential Presentation to: |
| Table of Contents Situation Overview Management Financial Projections Preliminary Valuation Analysis |

| Situation Overview |

| Situation Overview The amount offered to minority shareholders is the market value of 5.667mm minority class A shares (4.664mm class A outstanding as of 11/9/04 plus 1.003mm related to options, calculated under the treasury method) at an offer price of $13.00 per share. Enterprise value includes net debt as of October 1, 2004. The "1 Day" trading date prior to announcement was October 15, 2004. Key Transaction Terms Situation Overview 1 |
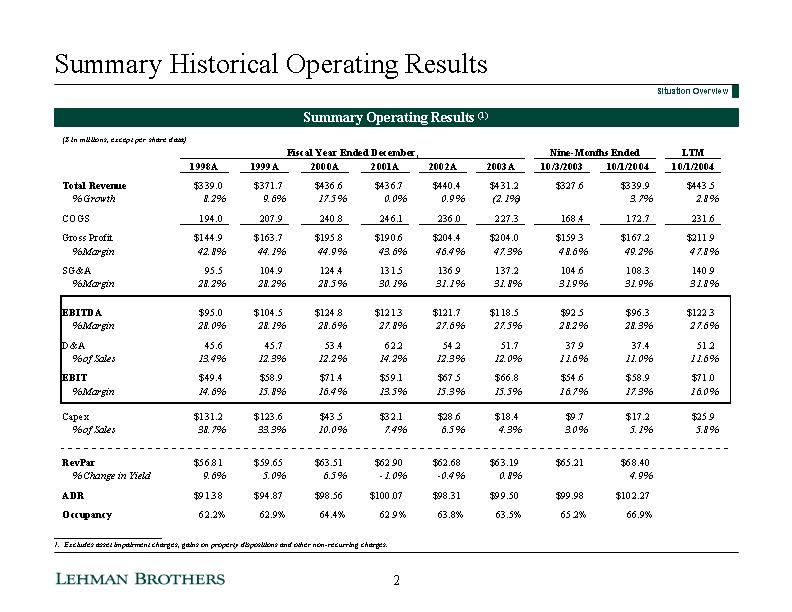
| Summary Historical Operating Results Summary Operating Results (1) ___________________________ 1. Excludes asset impairment charges, gains on property dispositions and other non-recurring charges. Situation Overview 2 |
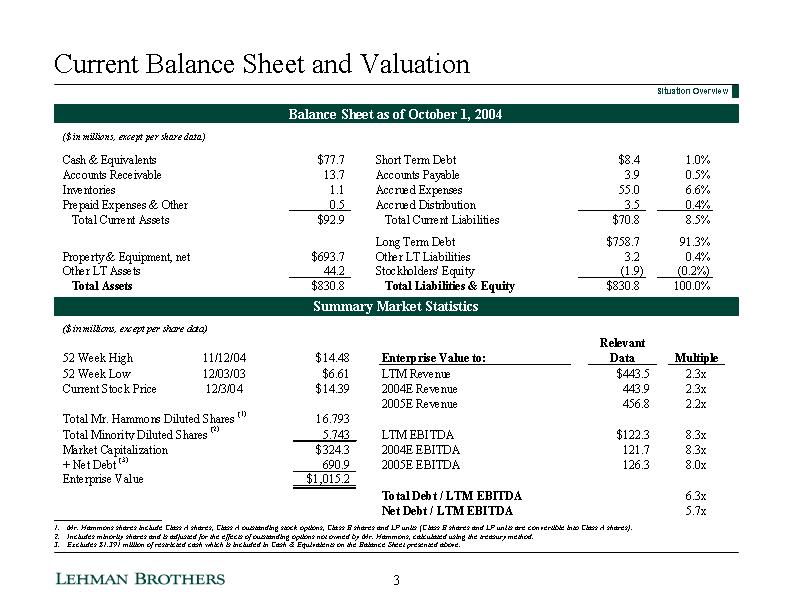
| Current Balance Sheet and Valuation Balance Sheet as of October 1, 2004 Summary Market Statistics ___________________________ Mr. Hammons shares include Class A shares, Class A outstanding stock options, Class B shares and LP units (Class B shares and LP units are convertible into Class A shares). Includes minority shares and is adjusted for the effects of outstanding options not owned by Mr. Hammons, calculated using the treasury method. Excludes $1.391 million of restricted cash which is included in Cash & Equivalents on the Balance Sheet presented above. Situation Overview 3 |
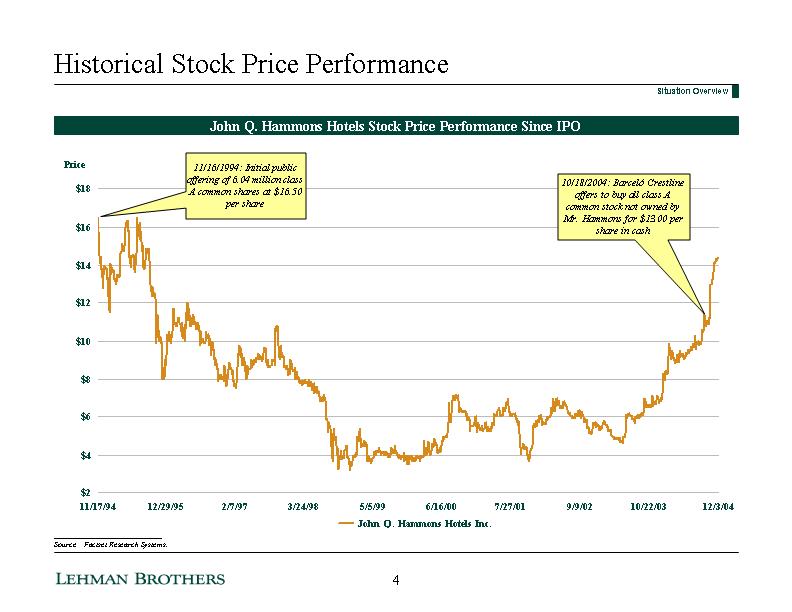
| Historical Stock Price Performance John Q. Hammons Hotels Stock Price Performance Since IPO ___________________________ Source: Factset Research Systems. 10/18/2004: Barcelo Crestline offers to buy all class A common stock not owned by Mr. Hammons for $13.00 per share in cash 11/16/1994: Initial public offering of 6.04 million class A common shares at $16.50 per share Situation Overview 4 |
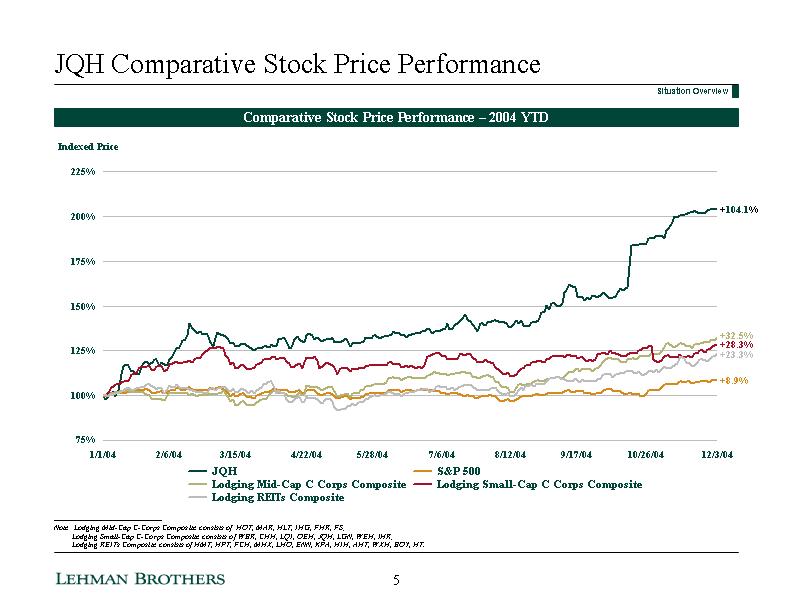
| JQH Comparative Stock Price Performance Comparative Stock Price Performance - 2004 YTD +104.1% +32.5% +28.3% +23.3% +8.9% ___________________________ Note: Lodging Mid-Cap C-Corps Composite consists of HOT, MAR, HLT, IHG, FHR, FS; Lodging Small-Cap C-Corps Composite consists of WBR, CHH, LQI, OEH, JQH, LGN, WEH, IHR; Lodging REITs Composite consists of HMT, HPT, FCH, MHX, LHO, ENN, KPA, HIH, AHT, WXH, BOY, HT. Situation Overview 5 |
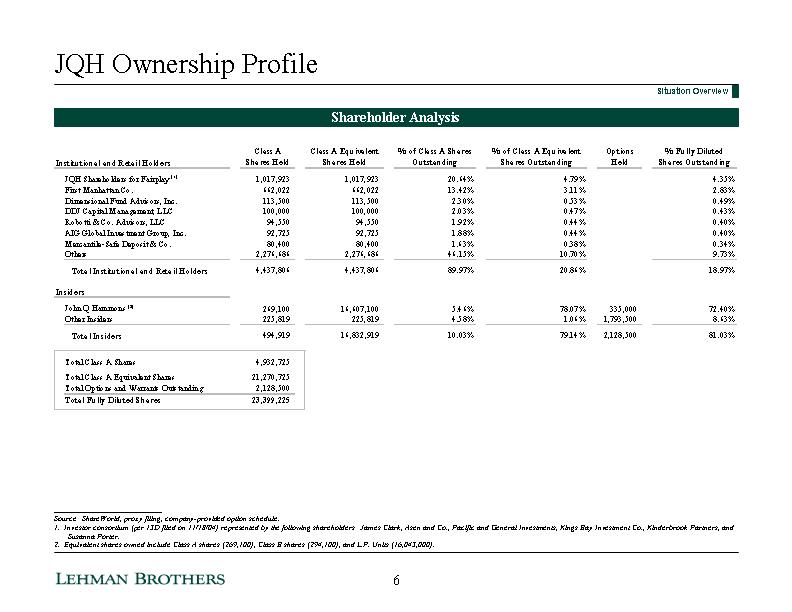
| JQH Ownership Profile Shareholder Analysis ___________________________ Source: ShareWorld, proxy filing, company-provided option schedule. 1. Investor consortium (per 13D filed on 11/18/04) represented by the following shareholders: James Clark, Asen and Co., Pacific and General Investments, Kings Bay Investment Co., Kinderbrook Partners, and Susanna Porter. 2. Equivalent shares owned include Class A shares (269,100), Class B shares (294,100), and L.P. Units (16,043,000). Situation Overview 6 |
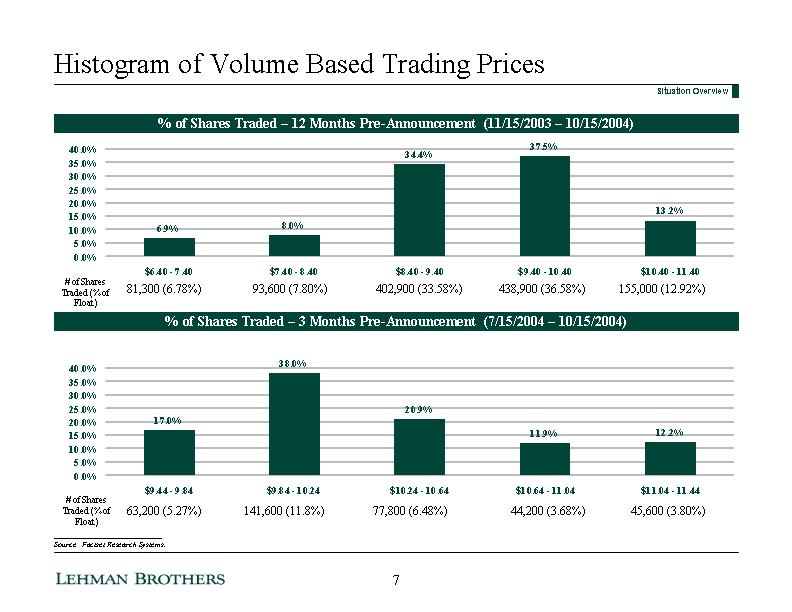
| Histogram of Volume Based Trading Prices % of Shares Traded - 12 Months Pre-Announcement (11/15/2003 - 10/15/2004) % of Shares Traded - 3 Months Pre-Announcement (7/15/2004 - 10/15/2004) # of Shares Traded (% of Float) # of Shares Traded (% of Float) Bin Volume $6.40 - 7.40 0.06938636 $7.40 - 8.40 0.07988393 $8.40 - 9.40 0.3438594 $9.40 - 10.40 0.3745839 $10.40 - 11.40 0.1322864 Bin Volume $9.44 - 9.84 0.16971 $9.84 - 10.24 0.3802363 $10.24 - 10.64 0.2089151 $10.64 - 11.04 0.1186896 $11.04 - 11.44 0.122449 81,300 (6.78%) 93,600 (7.80%) 402,900 (33.58%) 438,900 (36.58%) 155,000 (12.92%) 63,200 (5.27%) 141,600 (11.8%) 77,800 (6.48%) 44,200 (3.68%) 45,600 (3.80%) ___________________________ Source: Factset Research Systems. Situation Overview 7 |

| Management Financial Projections |

| Historical & Projected JQH & Lodging Industry RevPAR US Lodging Industry John Q Hammons 1997 0.055 0.053 1998 0.026 0.0959 1999 0.029 0.0499 2000 0.068 0.0647 2001 -0.079 -0.0096 2002 -0.025 -0.0035 2003 0.002 0.0082 2004 0.063 0.0489 2005 0.05 0.042 2006 0.045 0.046 Historical and Projected JQH and Lodging Industry RevPAR Growth ___________________________ Source: Company filings, Company projections and PwC research. Management Financial Projections 8 |

| Historical & Projected EBITDA Margin & RevPAR Growth Comparable Company Historical and Projected EBITDA Margin Comparable Company Historical and Projected RevPar Growth (Y-O-Y) ___________________________ Source: Company filings, Wall Street research. Management Financial Projections Company FelCor MeriStar Equity Inns Winston John Q Hammons 1998 0 0 0 0.366488104240128 0.291382828933248 1999 0.280650130380509 0.280244072591551 0 0.367484034858695 0.293282647118233 2000 0.274290906691778 0.284936626177139 0.372806397829711 0.285812380031793 2001 0.258574998579323 0.246960054862806 0.364062638237636 0.348953456652683 0.277676295865414 2002 0.23259676514975 0.247731008567702 0.299812583445977 0.327702728501501 0.276400724374404 2003 0.201491672785431 0.195751771082938 0.29896736957391 0.288556406092941 0.274733601549003 2004E 0.208488579296938 0.201850709438618 0.301467671558905 0.313634979857979 0.274085639285354 2005E 0.213408269771176 0.211259563777549 0.329297820823245 0.367127180025095 0.276489812351852 Company FelCor MeriStar Equity Inns Winston John Q Hammons 1998 0 0 0 0 0 1999 5.70342205323193E-03 6.68630338733431E-02 -1.09447004608295E-02 0 5.01848917062864E-02 2000 6.90708157626871E-02 7.27498619547211E-02 4.46515239759271E-02 1.00878012329535E-02 6.47216633132126E-02 2001 -0.11126224156692 -0.107322094968472 -2.93625720126371E-02 -5.43739596818938E-02 -9.44881889763782E-03 2002 -7.92776247321703E-02 -8.18797751189276E-02 -2.08692322420064E-02 -5.08507725405838E-03 -3.49761526232117E-03 2003 -0.026097074468085 1.78991992463495E-02 -8.21274931560423E-03 7.27344210733261E-03 8.13656668793872E-03 2004E 0.096774193548387 0.146074348295542 0.03 6.55737704918034E-02 4.89001424275994E-02 2005E 7.00280112044818E-02 9.09825033647376E-02 0.028 4.08424908424907E-02 2.71575135787567E-02 9 |
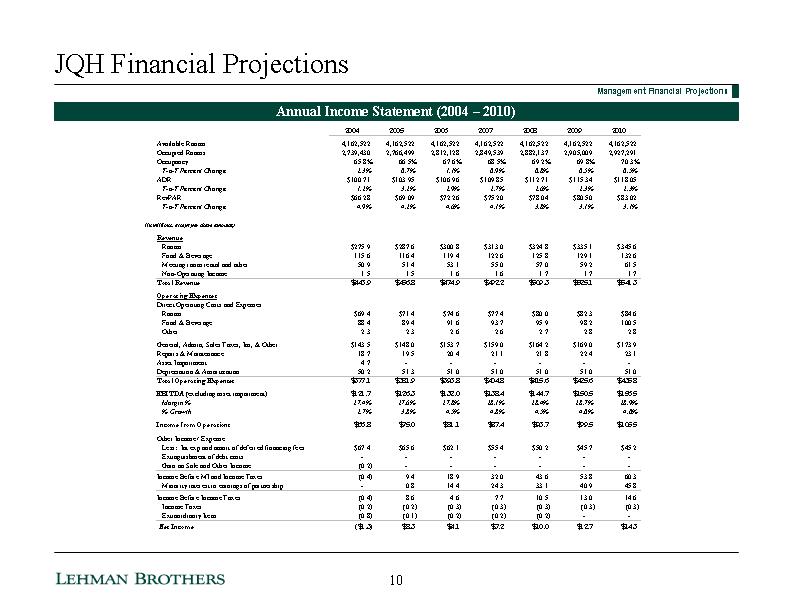
| JQH Financial Projections Annual Income Statement (2004 - 2010) Management Financial Projections 10 |
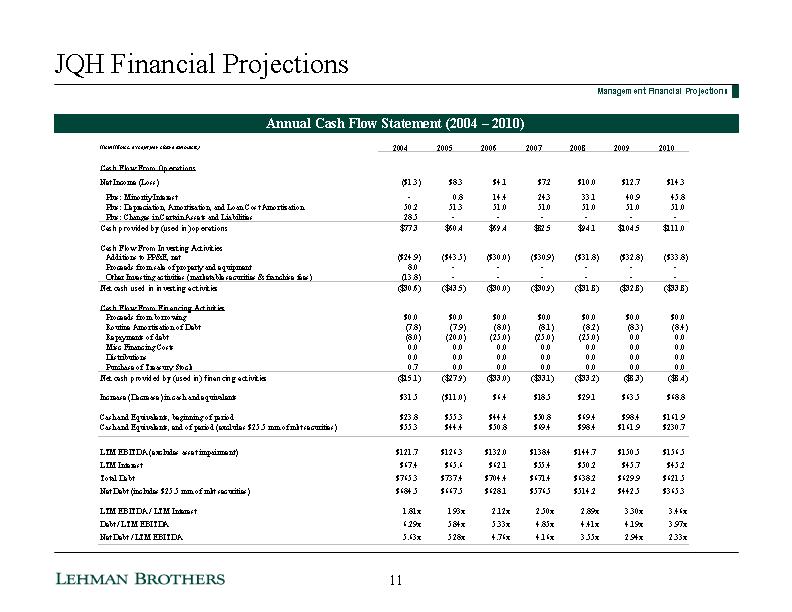
| Annual Cash Flow Statement (2004 - 2010) JQH Financial Projections Management Financial Projections 11 |
| Preliminary Valuation Analysis |
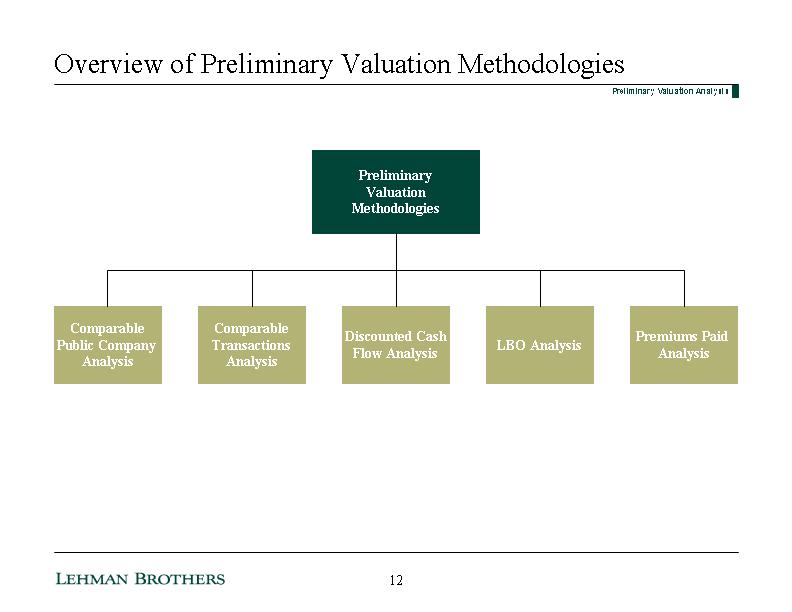
| Overview of Preliminary Valuation Methodologies Preliminary Valuation Methodologies Comparable Transactions Analysis Comparable Public Company Analysis Discounted Cash Flow Analysis LBO Analysis Premiums Paid Analysis Preliminary Valuation Analysis 12 |
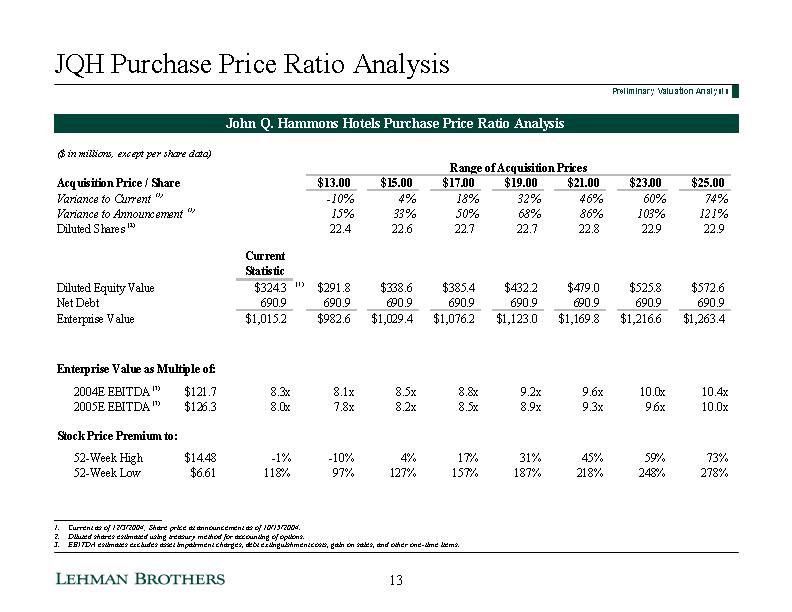
| JQH Purchase Price Ratio Analysis Preliminary Valuation Analysis John Q. Hammons Hotels Purchase Price Ratio Analysis ___________________________ Current as of 12/3/2004; Share price at announcement as of 10/15/2004. Diluted shares estimated using treasury method for accounting of options. EBITDA estimates excludes asset impairment charges, debt extinguishment costs, gain on sales, and other one-time items. 13 |

| Barcelo Crestline Offer: $13.00 / Share John Q. Hammons Hotels Valuation Summary John Q. Hammons Hotels Estimated Enterprise and Per Share Valuation Range Preliminary Valuation Analysis Implied Enterprise Value Share Price $915 $1,028 $1,140 $1,252 Enterprise Value $1,074 - 1,200 2005 EBITDA Multiple 8.5x - 9.5x Enterprise Value $1,100 - 1,223 2005 EBITDA Multiple 9.0x - 10.0x Enterprise Value $1,073 - 1,162 Terminal EBITDA Multiple 7.5x - 8.5x Enterprise Value $1,005 - 1,072 Terminal EBITDA Multiple 7.5x - 8.5x Enterprise Value $997 - 1,058 Premium to Share Price: 24.6% - 44.6% Enterprise Value $1,011 - 1,052 Premium to Share Price: 26.0% - 42.1% ($ in millions, except per share data) Low Spread High Premiums Paid Analysis - Cash Minority Squeeze-Out Transactions 14.2503 1.82050735644739 16.0708 Premiums Paid Analysis - Lodging Transactions 13.6581892166836 2.6992487998453 16.3574380165289 LBO Analysis 14 3 17 Discounted Cash Flow Analysis 17 4 21 Comparable Transactions Analysis 18.2466935260634 5.44760663579905 23.6943001618625 Comparable Company Analysis 17.0546038692708 5.6278082429881 22.6824121122589 14 |

| Comparable Company Analysis Comparable Company Analysis ___________________________ Source: Company filings and equity research. Preliminary Valuation Analysis 15 |

| Comparable Company Value Summary Implied Value of John Q. Hammons Hotels ___________________________ Note: Net debt of $691 million as of 10/1/04. Preliminary Valuation Analysis 16 |
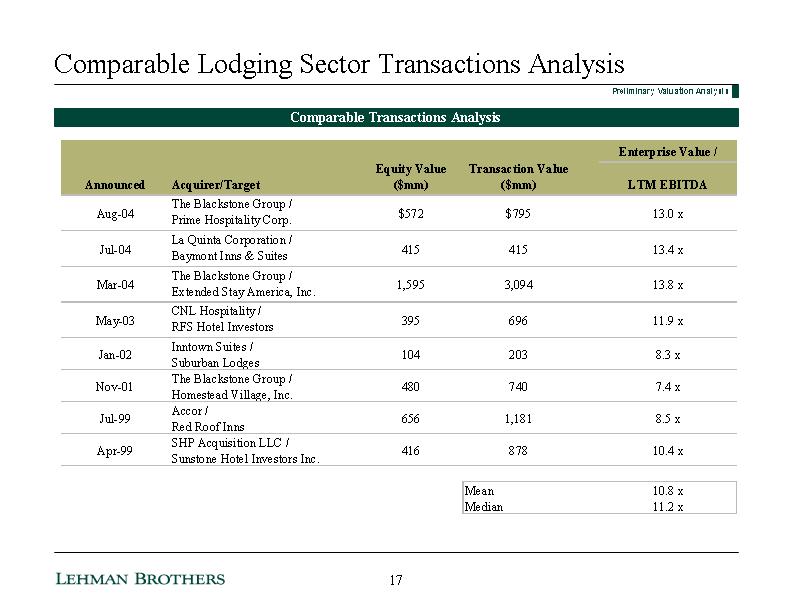
| Comparable Lodging Sector Transactions Analysis Comparable Transactions Analysis Preliminary Valuation Analysis 17 |
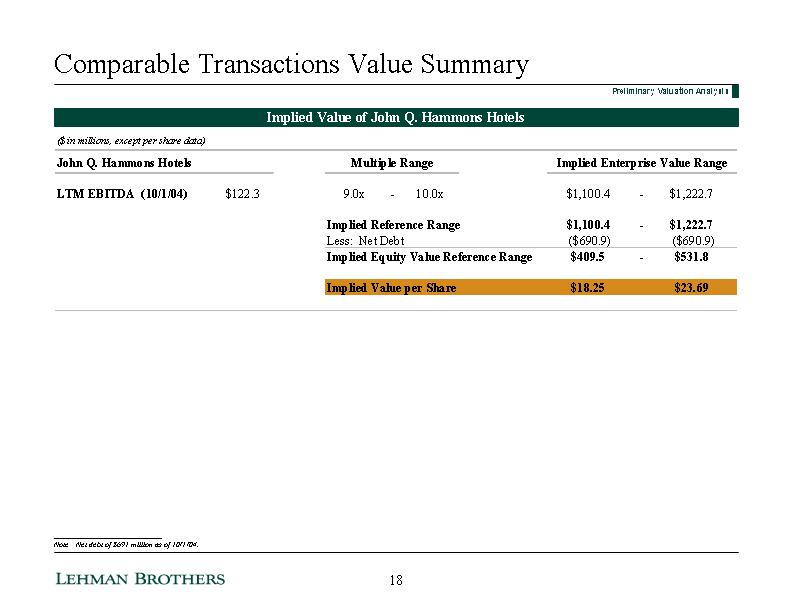
| Comparable Transactions Value Summary Implied Value of John Q. Hammons Hotels ___________________________ Note: Net debt of $691 million as of 10/1/04. Preliminary Valuation Analysis 18 |
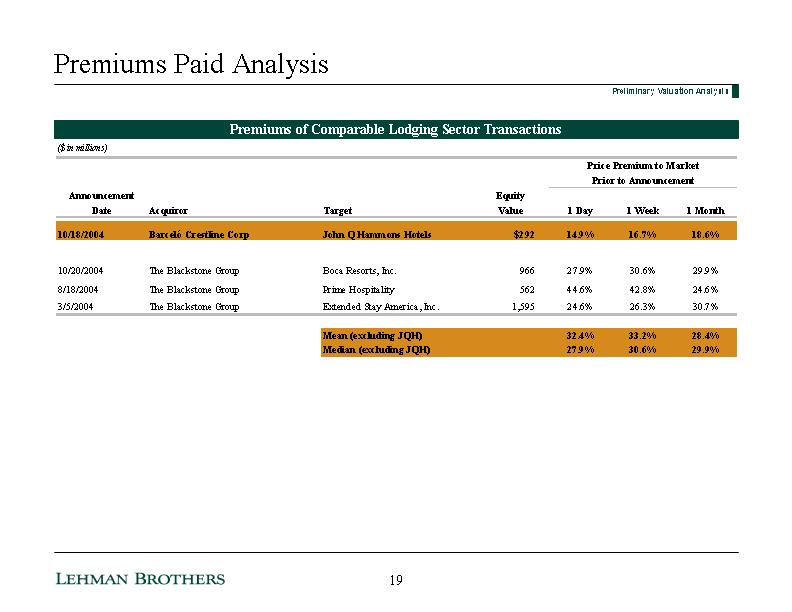
| Premiums Paid Analysis Premiums of Comparable Lodging Sector Transactions Preliminary Valuation Analysis 19 |

| Premiums Paid Analysis Implied Value of John Q. Hammons Hotels - Lodging Sector Transactions _______________________________ 1. Includes 3 lodging sector transactions in 2004. 2. Based on closing share price as of 10/15/04 of $11.31. 3. Based on closing share price as of 10/11/04 of $11.14. 4. Based on closing share price as of 9/17/04 of $10.96. Preliminary Valuation Analysis 20 |
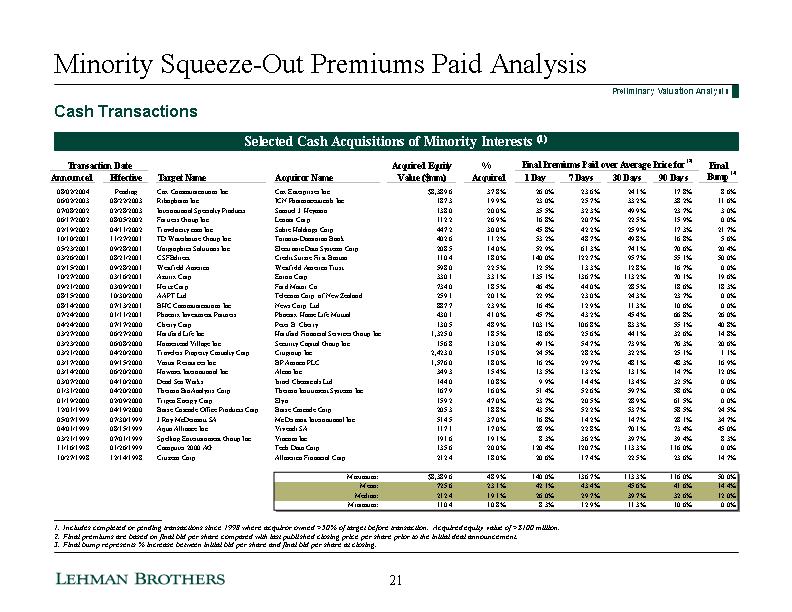
| Minority Squeeze-Out Premiums Paid Analysis Preliminary Valuation Analysis ___________________________ Includes completed or pending transactions since 1998 where acquiror owned >50% of target before transaction. Acquired equity value of >$100 million. Final premiums are based on final bid per share compared with last published closing price per share prior to the initial deal announcement. Final bump represents % increase between initial bid per share and final bid per share at closing. Cash Transactions Selected Cash Acquisitions of Minority Interests (1) 21 |
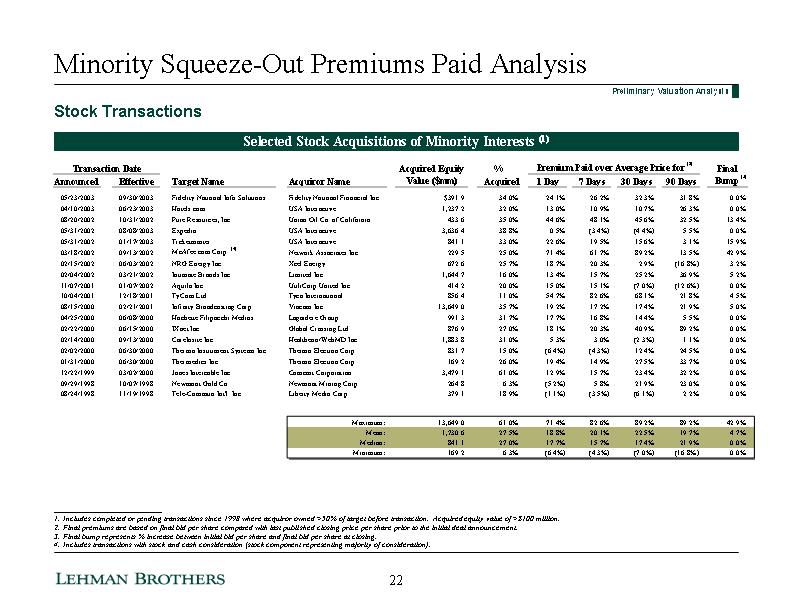
| Minority Squeeze-Out Premiums Paid Analysis Preliminary Valuation Analysis ___________________________ Includes completed or pending transactions since 1998 where acquiror owned >50% of target before transaction. Acquired equity value of >$100 million. Final premiums are based on final bid per share compared with last published closing price per share prior to the initial deal announcement. Final bump represents % increase between initial bid per share and final bid per share at closing. Includes transactions with stock and cash consideration (stock component representing majority of consideration). Stock Transactions Selected Stock Acquisitions of Minority Interests (1) 22 |
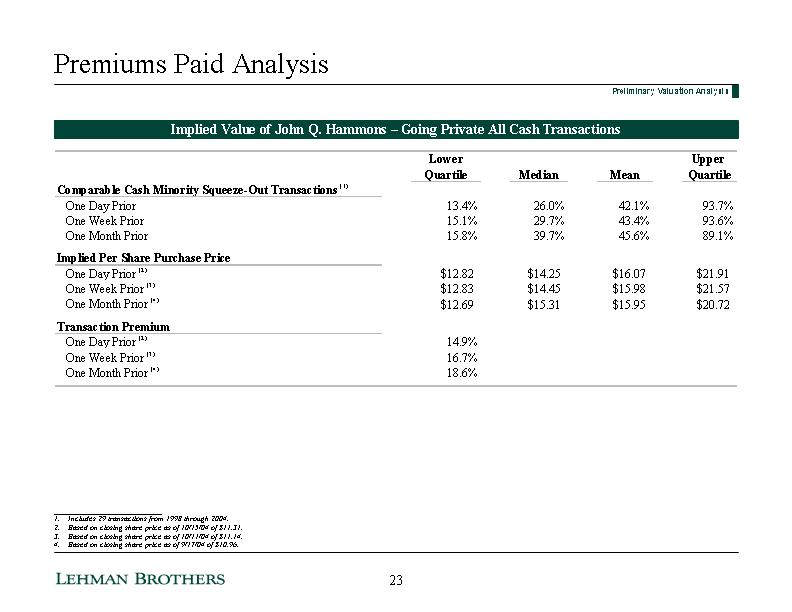
| Premiums Paid Analysis Implied Value of John Q. Hammons - Going Private All Cash Transactions ___________________________ 1. Includes 29 transactions from 1998 through 2004. 2. Based on closing share price as of 10/15/04 of $11.31. 3. Based on closing share price as of 10/11/04 of $11.14. 4. Based on closing share price as of 9/17/04 of $10.96. Preliminary Valuation Analysis 23 |
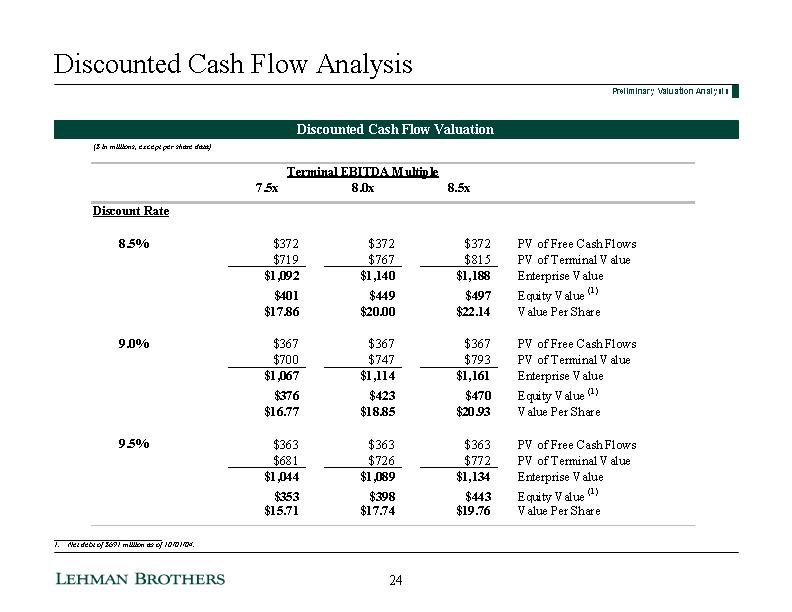
| Discounted Cash Flow Analysis Discounted Cash Flow Valuation ___________________________ 1. Net debt of $691 million as of 10/01/04. ($ in millions, except per share data) Preliminary Valuation Analysis 24 |
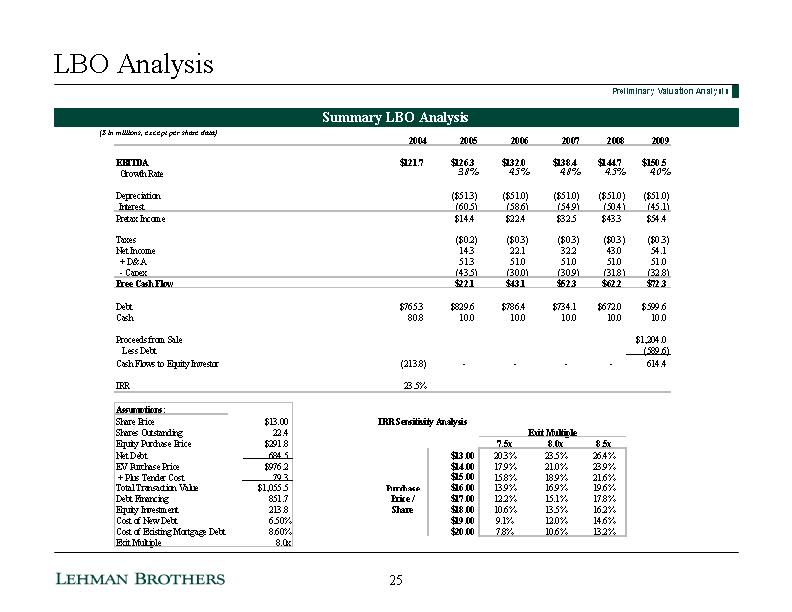
| LBO Analysis ($ in millions, except per share data) Summary LBO Analysis Preliminary Valuation Analysis 25 |