SECURITIES AND EXCHANGE COMMISSION
Washington, D.C. 20549
FORM 6-K
REPORT OF FOREIGN ISSUER
Pursuant to Rule 13a-16 or 15d-16
of the Securities Exchange Act of 1934
For the month of: August 2006
ADECCO SA
(Exact name of Registrant as specified in its charter)
Commission # 0-25004
Sägereistrasse 10
CH-8152 Glattbrugg
Switzerland
+41 1 878 88 88
(Address of principal executive offices)
[Indicate by check mark whether the registrant files or will file annual reports under cover Form 20-F or 40-F]
Form 20-F X Form 40-F
[Indicate by check mark whether the registrant by furnishing the information contained in this Form is also thereby furnishing the information to the Commission pursuant to Rule 12g3-2(b) under the Securities Exchange Act of 1934]
Yes No X
Attached:
| - | Adecco further accelerates organic revenue growth and increases net income by 35% in Q2 2006 |
Press Release
Adecco further accelerates organic revenue growth and increases net income by 35% in Q2 2006
Q2 HIGHLIGHTS (Q2 06 vs. Q2 05)
| • | Revenues of EUR 5.1 billion, up 13% (10% organically1) |
| • | Professional2 revenues up 19% (11% organically), Office and Industrial 11% (9% organically) |
| • | Gross margin improvement of 50 bps to 17.2% |
| • | Operating income of EUR 202 million up 29% (24% organically) |
| • | Operating margin improvement of 50 bps to 3.9% |
| • | Net income of EUR 135 million, up 35% |
Chéserex, Switzerland – August 11, 2006:The Adecco Group, the worldwide leader in Human Resource services, today announced results for the second quarter 2006. For the period April to June 2006 net income increased by 35% to EUR 135 million compared to EUR 100 million a year earlier. Revenues were up 13% to EUR 5.1 billion from EUR 4.5 billion in the same period last year.
Klaus J. Jacobs, Chairman, Adecco Group said: “I am pleased with the continued good performance of Adecco in the second quarter. We grew revenues 10% organically with encouraging profitability improvements.”
Dieter Scheiff, Chief Executive Officer, Adecco Group commented: “I see high structural growth potential in the global human resources market, particularly in the area of professional staffing. With the strategy introduced at the beginning of the year, I feel that we are well positioned to capitalise upon this opportunity thereby reaching our long-term goals of 7 to 9% annual revenue growth as well as an operating margin of over 5% by 2009.”
| 1 | Organic growth is a non US GAAP measure and excludes the impact of currency and acquisitions. |
| 2 | Professional business refers to Adecco’s Information Technology, Engineering & Technical, Finance & Legal, Medical & Science, Sales, Marketing & Events and Human Capital Solutions business. |
Adecco SA – Q2 2006 Results | Page 1 of 10 | 11/8/2006 |
Press Release
FINANCIAL PERFORMANCE
Sales
Group sales for the second quarter of 2006 were EUR 5.1 billion, a 13% increase compared to the same quarter last year. Organically, excluding the impact of currency and acquisitions, revenues were up 10%. In the quarter there was a negative impact of 2% from fewer trading days compared to the same period last year.
Gross Profit
Gross margin improved 50 bps to 17.2% versus the second quarter of 2005, as a result of the growing contribution from the professional staffing and permanent placement business and improved gross margins in the temporary business. Acquisitions contributed a 40 bps enhancement to the Group’s gross margin. In the Office and Industrial business, Adecco enhanced gross margin to 15.6% (Q2 2005: 15.2%), while in the professional business gross margin was raised to 25.3% (Q2 2005: 24.8%).
Selling, General and Administrative Expenses (SG&A)
SG&A were up 13% for the quarter on a reported basis. SG&A as a percentage of sales dropped 10 bps to 13.2% (Q2 2005: 13.3%) and by 40 bps when excluding acquisitions. Organically SG&A grew 7%, the office network 6% (+400 offices) and FTEs 5% (+1,700 FTEs) compared to the same quarter last year.
Operating Income
Operating income for the second quarter 2006 was EUR 202 million, an increase of 29% (24% organically). Operating income margin improved to 3.9% versus 3.4% for the same period last year.
Interest Expenses and Other Income / (Expenses), net
Interest expenses were EUR 12 million in the period, which is EUR 1 million less than in the second quarter 2005. Interest expenses are expected to be approximately EUR 55 million for the full year 2006. Other Income / (Expenses), net were EUR 3 million. This is a EUR 6 million improvement versus the same quarter last year mainly due to lower hedging expenses.
Provision for Income Taxes
The effective tax rate in the second quarter was 29% compared with 28% in the same period last year. For the full year 2006, Adecco continues to expect an effective tax rate of approximately 29%.
Net Income and EPS
Net income was up 35% to EUR 135 million in the second quarter of the year (Q2 2005: EUR 100 million), which represents a net income margin improvement of 40 bps to 2.6%. Basic EPS was EUR 0.72 (Q2 2005: EUR 0.54).
Balance Sheet, Cash-flow, and Net Debt1
The Group generated EUR 241 million of operating cash flow in the first six months of 2006, compared with EUR 66 million in H1 2005. The main reasons for this increase are a higher net income as well as the timing of cash payments due to an additional trading week in previous periods. Net debt increased by EUR 483 million to EUR 907 million at the end of June 2006 compared to the year end of 2005. This increase was mainly due to the purchase of DIS AG (EUR 552 million net of cash acquired) and treasury shares (EUR 43 million) as well as the payment of dividends (EUR 79 million net of withholding tax), partially compensated by the operating cash flow. In the first six months of 2006 DSO improved 1 day to 59 days compared to same period last year. DIS AG was consolidated as of March 31, 2006.
Currency Impact
Currency fluctuations had a minor impact on the second quarter’s revenues and operating income.
| 1 | Net debt is a non-US GAAP measure and comprises short-term and long-term debt less cash and cash equivalents and short-term investments. |
Adecco SA – Q2 2006 Results | Page 2 of 10 | 11/8/2006 |
Press Release
GEOGRAPHICAL PERFORMANCE
InFrance Adecco accelerated revenue growth to 8% to EUR 1.7 billion in the second quarter of 2006, which is in line with the French staffing market. Gross margin was down 30 bps in the quarter. SG&A increased by 7%. As a result operating margin declined by 20 bps to 3.5% compared to the same quarter last year. Altedia had a 10 bps positive impact on France’s operating margin.
In theUSA & Canada Adecco continued its focus on profitable accounts, which resulted in 2% revenue growth in constant currency. Lower workers compensation expenses, combined with a 30% revenue addition in the higher margin Finance & Legal business, resulted in 180 bps higher gross margin and 15% operating profit growth in constant currency. Operating margin improved to 4.1% compared to 3.7% in the second quarter last year.
In the second quarter of 2006,UK & Ireland added 19% in revenues in constant currency. Operating margin of 3.2% declined by 40 bps compared to the second quarter of 2005. The successful expansion of Adecco’s managed service business resulted in above market revenue growth in Office and Industrial as well as in Information Technology. Demand for staffing services in the engineering and finance sectors also remained strong. As previously announced, the back office consolidation incurred additional costs, which had a negative impact on profitability in the quarter.
InJapanrevenues grew 9% in constant currency, while operating margin expanded to 6.4% (Q2 2005: 4.9%). The strong economy combined with a general shortage of human capital and good permanent placement revenues led to a better gross margin.
InGermany and theNordics Adecco added 137% and 38% in constant currency (28% and 34% organically) to revenues. Revenues were partially driven by changes in regional legislation and higher acceptance levels of temporary staffing, but also mirrored a generally more robust economy.Italy andIberia grew revenues by 12% and 28% (Iberia: 8% organically) respectively.
Adecco SA – Q2 2006 Results | Page 3 of 10 | 11/8/2006 |
Press Release
BUSINESS LINE PERFORMANCE
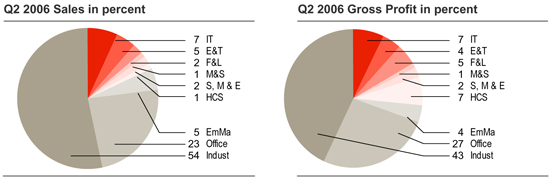
Adecco’sOffice and Industrial businesses, which represented 23% and 54% of revenues in the quarter respectively, grew 9% and 12% in constant currency (7% and 9% organically) to EUR 3.9 billion. In the Office business, demand was strong in Japan, UK & Ireland and the Nordics. The sales growth acceleration in the Industrial business compared to Q1 2006 is mainly due to the recovery of the French market as well as sustained performance in Germany, the UK & Ireland and the Nordics.
InInformation Technology (IT) Adecco increased revenues by 16% in constant currency (14% organically) compared to the second quarter of 2005. The strong performance in the UK & Ireland more than compensated for the revenue decline in the USA & Canada. IT reflected 7% of revenues and gross profit in the second quarter of 2006.
Adecco’sEngineering & Technical (E&T) business grew revenues by 20% in constant currency (5% organically) in the second quarter. Demand continued to be good in the UK & Ireland, while revenue growth in the USA & Canada was flat.
InFinance & Legal (F&L) Adecco achieved a revenue growth of 27% in constant currency (19% organically). The business line contributed 2% to Group’s revenues, but 5% to Group’s gross profit. Demand for finance and legal professionals continued to be strong in the USA & Canada as well as in the UK & Ireland.
Adecco’sHuman Capital Solutions (HCS) business grew revenues by 15% in constant currency and declined 1% when excluding the impact of acquisitions and currency. This compares to an organic 6% decline in Q1 2006.Sales, Marketing & Events (S,M&E) andMedical & Science (M&S)added in constant currency 18% (6% organically) and 15% to revenues respectively.
Approximately 40% of DIS revenues were consolidated in Engineering & Technical, Information Technology and Finance & Legal.
MANAGEMENT OUTLOOK
Current trading conditions combined with the key indicators for the global staffing services market continue to point to a favourable growth for the industry. The Group therefore remains committed to its objective of revenue growth, at or above market rates, of at least 7-9% per annum on average for the coming years providing no material changes to the macroeconomic environment. At the same time management continues to be confident that the focus on professional business fields and on key regions will allow Adecco to continuously improve operating income margin to over 5% by 2009. There are no impacts expected for differences in trading days for the remainder of the year.
Adecco SA – Q2 2006 Results | Page 4 of 10 | 11/8/2006 |
Press Release
Subsequent events
Dieter Scheiff (54) took office as the new Chief Executive Officer (CEO) of the Adecco Group as of August 1, 2006. Dieter Scheiff took over from Klaus J. Jacobs, who has been CEO of Adecco since November 22, 2005. Klaus J. Jacobs remains Chairman of the Adecco Group.
Financial Agenda 2006
| Investor Strategy Days 2006 | September 28 & 29, 2006 | |||
| Q3 2006 results | November 3, 2006 |
Forward-looking statements
Information in this release may involve guidance, expectations, beliefs, plans, intentions or strategies regarding the future. These forward-looking statements involve risks and uncertainties. All forward-looking statements included in this release are based on information available to Adecco S.A. as of the date of this release, and we assume no duty to update any such forward-looking statements. The forward-looking statements in this release are not guarantees of future performance and actual results could differ materially from our current expectations. Numerous factors could cause or contribute to such differences. Factors that could affect the Company’s forward-looking statements include, among other things: global GDP trends and the demand for temporary work; changes in regulation of temporary work; intense competition in the markets in which the Company competes; changes in the Company’s ability to attract and retain qualified temporary personnel; the resolution of US unemployment tax reviews, the resolution of the French anti-trust investigation and the resolution of the US class action; and any adverse developments in existing commercial relationships, disputes or legal and tax proceedings.
Please refer to the Company’s most recent Annual Report on Form 20-F and other reports filed with or submitted to the US Securities and Exchange Commission from time to time, for further discussion of the factors and risks associated with our business.
About Adecco
Adecco S.A. is a Fortune Global 500 company and the global leader in HR services. The Adecco Group network connects over 700,000 associates with business clients each day through its network of over33,000 employees and6,600 offices in over70 countries and territories around the world. Registered in Switzerland, and managed by a multinational team with expertise in markets spanning the globe, the Adecco Group delivers an unparalleled range of flexible staffing and career resources to corporate clients and qualified associates.
Adecco S.A. is registered in Switzerland (ISIN: CH001213860) and listed on the Swiss Stock Exchange with trading on Virt-x (SWX/VIRT-X:ADEN), the New York Stock Exchange (NYSE:ADO) and Euronext Paris—Premier Marché (EURONEXT: ADE).
Contacts:
Adecco Corporate Investor Relations
Investor.relations@adecco.com or +41 (0) 44 878 8925
Adecco Corporate Press Office
| Press.office@adecco.com | or +41 (0) 44 878 8832 |
There will be an audio webcast of the analyst presentation at 11 am CET, details of which can be found at our Investor Relations section athttp://webcast.adecco.com.
Adecco SA – Q2 2006 Results | Page 5 of 10 | 11/8/2006 |
Press Release
Annexes
Consolidated statements of operations
EUR millions, | Q2 2006 | Q2 2005 | Variance % | H1 2006 | H1 2005 | Variance % | ||||||||||||||||||
except share and per share amounts | EUR | Constant | EUR | Constant | ||||||||||||||||||||
Revenues | 5,133 | 4,540 | 13 | % | 13 | % | 9,812 | 8,626 | 14 | % | 12 | % | ||||||||||||
Direct costs of services | (4,249 | ) | (3,780 | ) | (8,116 | ) | (7,189 | ) | ||||||||||||||||
| Gross profit | 884 | 760 | 16 | % | 16 | % | 1,696 | 1,437 | 18 | % | 16 | % | ||||||||||||
Gross margin | 17.2 | % | 16.7 | % | 17.3 | % | 16.7 | % | ||||||||||||||||
Selling, general and administrative expenses | (679 | ) | (602 | ) | 13 | % | 12 | % | (1,341 | ) | (1,171 | ) | 14 | % | 12 | % | ||||||||
As a percentage of revenues | 13.2 | % | 13.3 | % | 13.7 | % | 13.6 | % | ||||||||||||||||
Amortisation of intangible assets | (3 | ) | (1 | ) | (4 | ) | (1 | ) | ||||||||||||||||
| Operating income | 202 | 157 | 29 | % | 29 | % | 351 | 265 | 32 | % | 31 | % | ||||||||||||
Operating income margin | 3.9 | % | 3.4 | % | 3.6 | % | 3.1 | % | ||||||||||||||||
Interest expense | (12 | ) | (13 | ) | (24 | ) | (28 | ) | ||||||||||||||||
Other income/(expenses), net | 3 | (3 | ) | 7 | (3 | ) | ||||||||||||||||||
Income applicable to minority interests | (2 | ) | (1 | ) | (2 | ) | (1 | ) | ||||||||||||||||
Income before income taxes | 191 | 140 | 37 | % | 332 | 233 | 43 | % | ||||||||||||||||
Provision for income taxes | (56 | ) | (40 | ) | (97 | ) | (70 | ) | ||||||||||||||||
Net income | 135 | 100 | 35 | % | 235 | 163 | 44 | % | ||||||||||||||||
Net income margin | 2.6 | % | 2.2 | % | 2.4 | % | 1.9 | % | ||||||||||||||||
Basic earnings per share data: | ||||||||||||||||||||||||
Basic earnings per share | 0.72 | 0.54 | 1.26 | 0.87 | ||||||||||||||||||||
Basic weighted-average shares | 186,737,660 | 187,153,755 | 186,638,343 | 187,243,094 | ||||||||||||||||||||
Diluted earnings per share data: | ||||||||||||||||||||||||
Diluted earnings per share | 0.70 | 0.52 | 1.21 | 0.85 | ||||||||||||||||||||
Diluted weighted-average shares | 196,906,094 | 195,632,137 | 196,796,667 | 195,837,960 | ||||||||||||||||||||
Adecco SA – Q2 2006 Results | Page 6 of 10 | 11/8/2006 |
Press Release
Annexes
Revenues and operating income by geographies
EUR millions | Q2 2006 | Q2 2005 | Variance % | H1 2006 | H1 2005 | Variance % | ||||||||||||||||||
| EUR | Constant | EUR | Constant | |||||||||||||||||||||
| Revenues | ||||||||||||||||||||||||
France1 | 1,741 | 1,610 | 8 | % | 8 | % | 3,222 | 3,024 | 7 | % | 7 | % | ||||||||||||
USA & Canada | 922 | 875 | 5 | % | 2 | % | 1,870 | 1,707 | 9 | % | 2 | % | ||||||||||||
UK & Ireland | 448 | 380 | 18 | % | 19 | % | 894 | 732 | 22 | % | 22 | % | ||||||||||||
Japan | 365 | 351 | 4 | % | 9 | % | 727 | 693 | 5 | % | 8 | % | ||||||||||||
Italy | 303 | 271 | 12 | % | 12 | % | 571 | 514 | 11 | % | 11 | % | ||||||||||||
Iberia1 | 268 | 209 | 28 | % | 28 | % | 515 | 372 | 38 | % | 38 | % | ||||||||||||
Benelux | 232 | 207 | 12 | % | 12 | % | 453 | 395 | 15 | % | 15 | % | ||||||||||||
Nordics1 | 194 | 139 | 39 | % | 38 | % | 354 | 251 | 41 | % | 40 | % | ||||||||||||
Germany1 | 202 | 85 | 137 | % | 137 | % | 308 | 162 | 90 | % | 90 | % | ||||||||||||
Australia & New Zealand | 97 | 110 | -11 | % | -9 | % | 200 | 214 | -6 | % | -7 | % | ||||||||||||
Switzerland | 103 | 97 | 6 | % | 8 | % | 186 | 170 | 9 | % | 11 | % | ||||||||||||
Emerging Markets | 258 | 206 | 25 | % | 22 | % | 512 | 392 | 31 | % | 23 | % | ||||||||||||
Adecco Group1 | 5,133 | 4,540 | 13 | % | 13 | % | 9,812 | 8,626 | 14 | % | 12 | % | ||||||||||||
| Operating Income2 | ||||||||||||||||||||||||
France | 60 | 59 | 2 | % | 2 | % | 105 | 106 | -1 | % | -1 | % | ||||||||||||
USA & Canada | 39 | 33 | 18 | % | 15 | % | 68 | 51 | 31 | % | 24 | % | ||||||||||||
UK & Ireland | 14 | 14 | 5 | % | 5 | % | 30 | 24 | 25 | % | 24 | % | ||||||||||||
Japan | 24 | 17 | 34 | % | 41 | % | 45 | 30 | 47 | % | 52 | % | ||||||||||||
Italy | 17 | 18 | -5 | % | -5 | % | 34 | 32 | 5 | % | 5 | % | ||||||||||||
Iberia | 17 | 15 | 23 | % | 23 | % | 31 | 24 | 33 | % | 33 | % | ||||||||||||
Benelux | 8 | 6 | 15 | % | 15 | % | 17 | 10 | 60 | % | 60 | % | ||||||||||||
Nordics | 11 | 7 | 58 | % | 57 | % | 21 | 8 | 167 | % | 164 | % | ||||||||||||
Germany | 14 | 5 | 220 | % | 220 | % | 23 | 9 | 177 | % | 177 | % | ||||||||||||
Australia & New Zealand | 3 | 2 | 3 | % | 8 | % | 3 | 5 | -44 | % | -44 | % | ||||||||||||
Switzerland | 8 | 8 | 7 | % | 9 | % | 14 | 14 | 6 | % | 8 | % | ||||||||||||
Emerging Markets | 13 | 5 | 171 | % | 176 | % | 17 | 11 | 65 | % | 58 | % | ||||||||||||
Total Operating Units | 228 | 189 | 21 | % | 22 | % | 408 | 324 | 26 | % | 25 | % | ||||||||||||
Corporate Expenses | (23 | ) | (31 | ) | (53 | ) | (58 | ) | ||||||||||||||||
Amortisation of Intangibles | (3 | ) | (1 | ) | (4 | ) | (1 | ) | ||||||||||||||||
Adecco Group | 202 | 157 | 29 | % | 29 | % | 351 | 265 | 32 | % | 31 | % | ||||||||||||
| 1) | In Q2 revenues increased organically in France by 8% (H1: 6%); Iberia by 8% (H1: 9%); Nordics by 34% (H1: 38%); Germany by 28% (H1: 33%) and Adecco Group by 10% (H1: 9%). |
| 2) | Contribution (Operating income before amortisation) on the operating unit level. |
Adecco SA – Q2 2006 Results | Page 7 of 10 | 11/8/2006 |
Press Release
Annexes
Revenues breakdown and revenue growth by business line
in % of total revenues | Q2 2006 | Q2 2005 | Variance % | H1 2006 | H1 2005 | Variance % | ||||||||||||||||||
| EUR | Constant | EUR | Constant | |||||||||||||||||||||
| Revenues1,2 | ||||||||||||||||||||||||
Office | 23 | % | 24 | % | 8 | % | 9 | % | 24 | % | 25 | % | 10 | % | 9 | % | ||||||||
Industrial | 54 | % | 54 | % | 12 | % | 12 | % | 52 | % | 53 | % | 12 | % | 11 | % | ||||||||
Total Office and Industrial | 77 | % | 78 | % | 11 | % | 11 | % | 76 | % | 78 | % | 11 | % | 10 | % | ||||||||
Information Technology | 7 | % | 7 | % | 17 | % | 16 | % | 7 | % | 7 | % | 23 | % | 18 | % | ||||||||
Engineering & Technical | 5 | % | 4 | % | 20 | % | 20 | % | 5 | % | 4 | % | 17 | % | 13 | % | ||||||||
Finance & Legal | 2 | % | 2 | % | 28 | % | 27 | % | 3 | % | 2 | % | 24 | % | 20 | % | ||||||||
Medical & Science | 1 | % | 1 | % | 15 | % | 15 | % | 1 | % | 1 | % | 11 | % | 11 | % | ||||||||
Sales, Marketing & Events | 2 | % | 2 | % | 17 | % | 18 | % | 2 | % | 2 | % | 24 | % | 25 | % | ||||||||
Human Capital Solutions | 1 | % | 1 | % | 16 | % | 15 | % | 1 | % | 1 | % | 32 | % | 27 | % | ||||||||
Total Professional Business Lines | 18 | % | 17 | % | 19 | % | 18 | % | 19 | % | 17 | % | 22 | % | 18 | % | ||||||||
Emerging Markets | 5 | % | 5 | % | 25 | % | 22 | % | 5 | % | 5 | % | 31 | % | 23 | % | ||||||||
Adecco Group | 100 | % | 100 | % | 13 | % | 13 | % | 100 | % | 100 | % | 14 | % | 12 | % | ||||||||
| 1) | Breakdown of revenues is based on dedicated branches. |
| 2) | In Q2 revenues increased organically in Office by 7% (H1: 8%); Industrial by 9% (H1: 8%); Total Office & Industrial by 9% (H1: 8%); Information Technology by 14% (H1: 17%); Engineering & Technical by 5% (H1: 6%); Finance & Legal by 19% (H1: 16%); Medical & Science by 15% (H1: 11%); Sales, Marketing & Events by 6% (H1: 9%); Human Capital Solutions by -1% (H1: -3%); Total Professional Business Lines by 11% (H1: 12%); Emerging Markets by 21% (H1: 23%) and Adecco Group by 10% (H1: 9%). |
Adecco SA – Q2 2006 Results | Page 8 of 10 | 11/8/2006 |
Press Release
Annexes
Consolidated balance sheets
EUR millions | June 30 2006 | Dec 31 2005 | ||||
| Assets | ||||||
Current assets: | ||||||
– Cash and cash equivalents | 543 | 468 | ||||
– Short-term investments | 20 | 380 | ||||
– Trade accounts receivable, net | 3,917 | 3,659 | ||||
– Other current assets | 289 | 298 | ||||
Total current assets | 4,769 | 4,805 | ||||
Property, equipment, and leasehold improvements, net | 237 | 240 | ||||
Other assets | 299 | 312 | ||||
Intangible assets, net | 171 | 48 | ||||
Goodwill | 1,884 | 1,434 | ||||
Total assets | 7,360 | 6,839 | ||||
| Liabilities and shareholders’ equity | ||||||
| Liabilities | ||||||
Current liabilities: | ||||||
– Accounts payable and accrued expenses | 3,507 | 3,287 | ||||
– Short-term debt and current maturities of long-term debt | 51 | 550 | ||||
Total current liabilities | 3,558 | 3,837 | ||||
Long-term debt, less current maturities | 1,419 | 722 | ||||
Other liabilities | 194 | 143 | ||||
Total liabilities | 5,171 | 4,702 | ||||
Minority interests | 37 | 20 | ||||
| Shareholders’ equity | ||||||
Common shares | 117 | 117 | ||||
Additional paid-in capital | 2,078 | 2,045 | ||||
Treasury stock, at cost | (102 | ) | (59 | ) | ||
Retained earnings / accumulated deficit | 90 | (25 | ) | |||
Accumulated other comprehensive income/(loss), net | (31 | ) | 39 | |||
Total shareholders’ equity | 2,152 | 2,117 | ||||
Total liabilities and shareholders’ equity | 7,360 | 6,839 | ||||
Adecco SA – Q2 2006 Results | Page 9 of 10 | 11/8/2006 |
Press Release
Annexes
Consolidated statements of cash flows
EUR millions | 2006 H1 | 2005 H1 | ||||
| Cash flows from operating activities | ||||||
Net income | 235 | 163 | ||||
Adjustments to reconcile net income to cash flows from operating activities: | ||||||
– Depreciation and amortisation | 51 | 53 | ||||
– Other charges | 28 | 30 | ||||
Changes in operating assets and liabilities, net of acquisitions: | ||||||
– Trade accounts receivable | (250 | ) | (199 | ) | ||
– Accounts payable and accrued expenses | 168 | 13 | ||||
– Other assets and liabilities | 9 | 6 | ||||
Cash flows from operating activities | 241 | 66 | ||||
| Cash flows from/(used in) investing activities | ||||||
Capital expenditures, net of proceeds | (38 | ) | (32 | ) | ||
Acquisition of DIS, net of cash acquired | (552 | ) | — | |||
Acquisition of Altedia, net of cash acquired | — | (88 | ) | |||
Deposit for Altedia squeeze out | — | (8 | ) | |||
Acquisition of Humangroup, net of cash acquired | — | (57 | ) | |||
Purchase of short-term investments | (24 | ) | (162 | ) | ||
Proceeds from sale of short-term investments | 378 | 304 | ||||
Cash settlements on derivative instruments | — | (2 | ) | |||
Other investing activities, net | (20 | ) | (4 | ) | ||
Cash flows from/(used in) investing activities | (256 | ) | (49 | ) | ||
| Cash flows from/(used in) financing activities | ||||||
Net increase/(decrease) in short-term debt | 27 | (8 | ) | |||
Borrowings of long-term debt, net of issuance costs | 694 | — | ||||
Repayment of long-term debt | (517 | ) | (101 | ) | ||
Dividends paid, net of witholding tax | (79 | ) | (79 | ) | ||
Cash settlements on derivative instruments | (15 | ) | (13 | ) | ||
Purchase of treasury shares | (43 | ) | (59 | ) | ||
Common stock options exercised | 33 | 1 | ||||
Other financing activities | (3 | ) | 1 | |||
Cash flows from/(used in) financing activities | 97 | (258 | ) | |||
Effect of exchange rate changes on cash | (7 | ) | 18 | |||
Net increase/(decrease) in cash and cash equivalents | 75 | (223 | ) | |||
Cash and cash equivalents: | ||||||
– Beginning of year | 468 | 879 | ||||
– End of period | 543 | 656 | ||||
Adecco SA – Q2 2006 Results | Page 10 of 10 | 11/8/2006 |
SIGNATURES
Pursuant to the requirements of the Securities Exchange Act of 1934, the registrant has duly caused this report to be signed on its behalf by the undersigned, thereunto duly authorized.
| ADECCO SA | ||||
| (Registrant) | ||||
| Dated: 14 August 2006 | By: | /s/ Dominik de Daniel | ||
| Dominik de Daniel | ||||
| Chief Financial Officer | ||||
| Dated: 14 August 2006 | By: | /s/ Hans R. Brütsch | ||
| Hans R. Brütsch | ||||
| Corporate Secretary | ||||