UNITED STATES
SECURITIES AND EXCHANGE COMMISSION
Washington, D.C. 20549
FORM N-CSR
CERTIFIED SHAREHOLDER REPORT OF REGISTERED
MANAGEMENT INVESTMENT COMPANIES
Investment Company Act file number: (811- 7237 )
Exact name of registrant as specified in charter: Putnam Investment Funds
Address of principal executive offices: One Post Office Square, Boston, Massachusetts 02109
| Name and address of agent for service: | Beth S. Mazor, Vice President |
| | One Post Office Square |
| | Boston, Massachusetts 02109 |
| |
| Copy to: | John W. Gerstmayr, Esq. |
| | Ropes & Gray LLP |
| | One International Place |
| | Boston, Massachusetts 02110 |
| |
| Registrant’s telephone number, including area code: | (617) 292-1000 |
Date of fiscal year end: April 30, 2007
Date of reporting period: May 1, 2006— October 31, 2006
Item 1. Report to Stockholders:
The following is a copy of the report transmitted to stockholders pursuant to Rule 30e-1 under the Investment Company Act of 1940:
What makes Putnam different?

In 1830, Massachusetts Supreme Judicial Court Justice Samuel Putnam established The Prudent Man Rule, a legal foundation for responsible money management.
THE PRUDENT MAN RULE
All that can be required of a trustee to invest is that he shall conduct himself faithfully and exercise a sound discretion. He is to observe how men of prudence, discretion, and intelligence manage their own affairs, not in regard to speculation, but in regard to the permanent disposition of their funds, considering the probable income, as well as the probable safety of the capital to be invested.

A time-honored tradition in money management
Since 1937, our values have been rooted in a profound sense of responsibility for the money entrusted to us.
A prudent approach to investing
We use a research-driven team approach to seek consistent, dependable, superior investment results over time, although there is no guarantee a fund will meet its objectives.
Funds for every investment goal
We offer a broad range of mutual funds and other financial products so investors and their financial representatives can build diversified portfolios.
A commitment to doing what’s right for investors
We have below-average expenses and stringent investor protections, and provide a wealth of information about the Putnam funds.
Industry-leading service
We help investors, along with their financial representatives, make informed investment decisions with confidence.
Putnam Capital
Opportunities
Fund
10| 31| 06
Semiannual Report
| Message from the Trustees | 2 |
| About the fund | 4 |
| Report from the fund managers | 7 |
| Performance | 12 |
| Expenses | 15 |
| Portfolio turnover | 17 |
| Risk | 18 |
| Your fund’s management | 19 |
| Terms and definitions | 22 |
| Trustee approval of management contract | 24 |
| Other information for shareholders | 29 |
| Financial statements | 30 |
| Brokerage commissions | 59 |
Cover photograph: © Marco Cristofori
Message from the Trustees
Dear Fellow Shareholder
Beginning in May 2006, leading economic indicators began to point toward slower growth and sparked a correction that undercut much of the market advance achieved in previous months. However, once the Federal Reserve (the Fed) halted its series of interest-rate increases in August, the combination of continued strong corporate profits and a fall in energy and commodity prices contributed to a more favorable market environment. In addition, U.S. export growth is currently strong, thanks to robust economic growth abroad. Growth in exports, combined with the effects of lower energy and commodity prices and recent stock market gains, may offset the economic impact of the housing sector’s continuing slowdown. This may set the stage for stronger domestic economic growth in 2007, which would bode well for markets going forward.
We would like to take this opportunity to announce that a new independent Trustee, Kenneth R. Leibler, has joined your fund’s Board of Trustees. Mr. Leibler has had a distinguished career as a leader in the investment management industry. He is the founding Chairman of the Boston Options Exchange, the nation’s newest electronic marketplace for the trading of derivative securities. He currently serves as a Trustee of Beth Israel Deaconess Hospital in Boston; a lead director of Ruder Finn Group, a global communications and advertising firm; and a director of the Optimum Funds group.
We would also like to announce the retirement of one of your fund’s Trustees, John Mullin, an independent Trustee of the Putnam funds since 1997. We thank him for his service.
2
In the following pages, members of your fund’s management team discuss the fund’s performance and strategies for the fiscal period ended October 31, 2006, and provide their outlook for the months ahead. As always, we thank you for your support of the Putnam funds.
Putnam Capital Opportunities Fund: seeking
overlooked, underpriced small and midsize companies

Every company, whatever its industry, growth rate, or size, has an underlying value. It can be based on the firm’s physical assets (factories, inventory, staff) or on less easily quantifiable measures (long-term competitive advantage, management team expertise, or research and development efforts). A stock’s price, however, may or may not accurately reflect the company’s underlying value.
A stock may be mispriced for many reasons, such as when the company has problems that concern its management, industry, or product line. Temporary factors, such as a cyclical industry downturn or a one-time inventory issue, may also cause a stock to be undervalued.
In addition, unlike the widely followed large, blue-chip companies, smaller companies are less likely to be covered by industry researchers. This lack of coverage can lead to the undervaluation of these stocks. It is up to the fund’s management team to uncover the reasons behind a stock’s valuation and to determine whether the market’s generally held assumptions are on target.
To uncover undervalued stocks with the long-term potential for growth, the members of Putnam Capital Opportunities Fund’s management team draw on their experience as well as on the expertise of Putnam’s equity analysts. Because the fund is managed in Putnam’s blend style, the team is not focused solely on either growth- or value-style stocks and can choose from a broad universe of over 2,500 U.S. small and midsize companies. This flexibility means the fund’s portfolio is broadly diversified, which can help reduce the risk of investing in these companies.
The fund invests some or all of its assets in small and/or midsize companies. Such investments increase the risk of greater price fluctuations.
Investor overreaction
can mean investment
opportunities
An important factor in the analysis performed by the management team of Putnam Capital Opportunities Fund is “behavioral insight.” When an event that negatively affects a company occurs, such as a temporary inventory shortage or a change in management, investors may overreact, either by selling off the stock or buying it in large quantities. This overreaction can skew a stock’s price out of proportion to the real impact of the event. The result can develop into a buying or a selling opportunity for astute investment managers.
The portfolio managers and analysts of Putnam Capital Opportunities Fund determine behavioral rankings as part of their detailed stock-by-stock valuation process. Their process integrates sophisticated quantitative models, behavioral insights, and an in-depth analysis of each company’s fundamental worth.
Putnam Capital Opportunities Fund holdings have
spanned sectors and industries over time.
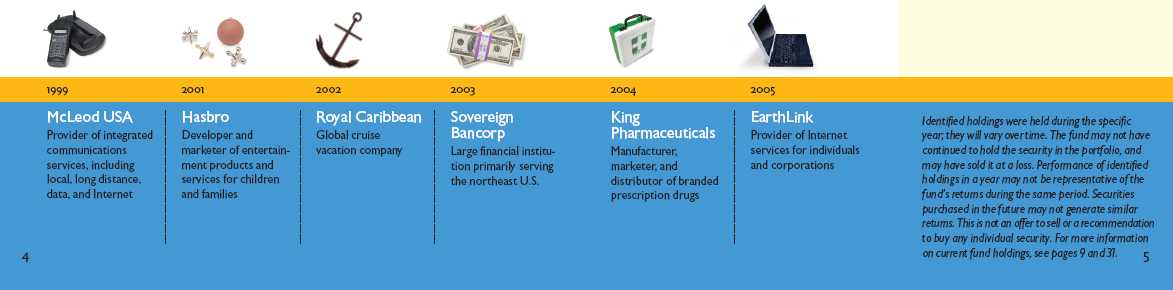
Putnam Capital Opportunities Fund invests primarily in small and midsize companies, seeking opportunities in stocks with potential that has been relatively unnoticed by investors. The fund targets companies believed to be worth more than their current stock prices may indicate, and can own stocks with both growth and value characteristics. The fund may be appropriate for investors who are seeking long-term growth potential from stocks of small and midsize companies.
Highlights
• For the six months ended October 31, 2006, Putnam Capital Opportunities Fund’s class A shares returned 1.51% before sales charges.
• The fund’s benchmark, the Russell 2500 Index, returned 0.42% .
• The average return for the fund’s Lipper category, Small-Cap Core Funds, was –1.17% .
• Additional fund performance, comparative performance, and Lipper data can be found in the performance section beginning on page 12.
Performance
Total return for class A shares for periods ended 10/31/06
| | Average annual return | Cumulative return |
| | NAV | POP | NAV | POP |
|
| Life of fund (inception: 6/1/98) | 9.50% | 8.81% | 114.81% | 103.56% |
|
| 5 years | 12.19 | 10.99 | 77.75 | 68.44 |
|
| 3 years | 15.68 | 13.61 | 54.80 | 46.64 |
|
| 1 year | 18.52 | 12.31 | 18.52 | 12.31 |
|
| 6 months | — | — | 1.51 | –3.84 |
|
Data is historical. Past performance does not guarantee future results. More recent returns may be less or more than those shown. Investment return and principal value will fluctuate, and you may have a gain or a loss when you sell your shares. Performance assumes reinvestment of distributions and does not account for taxes. Returns at NAV do not reflect a sales charge of 5.25% . For the most recent month-end performance, visit www.putnam.com. For a portion of the period, this fund limited expenses, without which returns would have been lower. A 1% short-term trading fee may apply.
6
Report from the fund managers
The period in review
We are pleased to report that, although returns were modest, your fund outperformed its benchmark and the average return for funds in its Lipper peer group for the six months ended October 31, 2006. This is based on results at net asset value (NAV, or before sales charges). Stock selection across a number of sectors contributed positively to performance. In particular, holdings in the technology and health-care sectors helped boost fund returns relative to the index. Although holdings in the financial and consumer staples sectors detracted from returns somewhat, the fund’s overall performance was competitive. We believe this reflects our continued emphasis on stocks of companies with low price-to-earnings ratios, high cash flow, and improving fundamentals, as well as our valuation discipline and the fund’s flexibility to invest in both growth- and value-style stocks.
Market overview
During the six months ended October 31, 2006, the broad stock market delivered modest gains, and major stock indexes reached milestone levels. However, returns for stocks of many small and midsize companies — the focus of your fund’s portfolio — were generally flat for the period. Within the small- and mid-cap universe, value-style stocks outperformed growth-style stocks. Early in the period, the stock market was fairly volatile as investors worried about inflation, slowing economic growth, and the outlook for interest rates. These concerns were tempered later in the period, and the broad market rebounded solidly. In the final month of the period, the Dow Jones Industrial Average closed at its highest level since January 2000, a psychological boost for investors. For the next three days, the Dow closed at a record high, and on October 19, it surpassed 12,000 for the first time in the history of the index. Also during the peri od, the S&P 500 and Nasdaq Composite indexes reached their highest levels in more than five years. Among the factors contributing to the strength were
7
falling oil prices and the belief that inflation is under control, with the economy slowing but not heading for a recession. This optimism was due in part to the Fed’s decisions — in August, September, and October — to hold short-term interest rates steady after raising them 17 consecutive times.
Strategy overview
We continue to adhere to our disciplined strategy of targeting companies that we believe have sound business models and steadily growing cash flows. In selecting stocks for the portfolio, we carefully assess the underlying value of each company’s business. While a company’s stock price may fluctuate, this underlying value is crucial in determining its long-term growth potential. We target small and midsize U.S. companies across a wide range of industries, and we have the flexibility to invest in both growth- and value-style stocks. In seeking stocks whose current prices do not reflect the company’s fundamental, long-term value, we analyze factors such as future earnings-growth potential and the ability to generate cash over the long term. We strive to take advantage of situations in which a stock becomes overvalued or undervalued as a result of short-term factors. We also evaluate the attractiveness of a company compared with other firms in its industry. When we have determined that a stock is being fairly priced by the market, we reduce or eliminate the fund’s position in that
Market sector performance
These indexes provide an overview of performance in different market sectors for the six months ended 10/31/06.
| Equities | |
| Russell 2500 Index (stocks of small and midsize companies) | 0.42% |
|
| Russell 1000 Growth Index (large-company growth stocks) | 3.53% |
|
| Russell 1000 Value Index (large-company value stocks) | 7.61% |
|
| S&P 500 Index (broad stock market) | 6.11% |
|
| Bonds | |
| Lehman Aggregate Bond Index (broad bond market) | 4.60% |
|
| Lehman Municipal Bond Index (tax-exempt bonds) | 4.12% |
|
| Lehman Global Aggregate Bond Index (international bonds) | 3.64% |
|
8
stock and reinvest the proceeds in securities that appear to have greater potential for long-term appreciation.
Your fund’s holdings
One of the top contributors to performance for the semiannual period was the stock of BMC Software, whose business software helps companies manage their computer systems. We believe BMC’s success was the result of investors becoming convinced that the company could continue to generate strong free-cash flow. Another software company, MicroStrategy, continued to gain market share in the business intelligence software market, and contributed to the fund’s performance for the period. Also gaining ground was the stock of data storage company Brocade Communications Systems. The company benefited from strong demand and growth in the data storage market. Another portfolio highlight was the stock of toy manufacturer Hasbro. Hasbro’s game business profitability rebounded sharply, exceeding expectations and offsetting disappointing sales for Star Wars-related items.
One of the top detractors from performance for the period was Career Education Corporation, which provides post-secondary education services in the United States, France, Canada, and the United Kingdom. The company suffered a decline in enrollment as the economy recovered and fewer people sought job-training programs. This stock
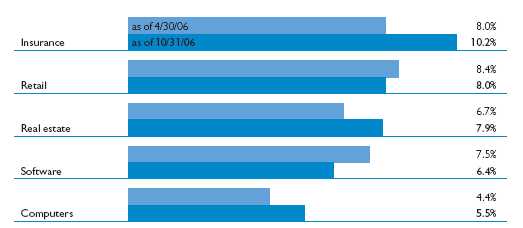
Comparison of top industry weightings
This chart shows how the fund’s top weightings have changed over the last six months.
Weightings are shown as a percentage of net assets. Holdings will vary over time.
9
remained in the portfolio at the close of the period, as we believe this is a short-term challenge for a fundamentally strong business. Another disappointment for the period was Corus Bankshares, the holding company for Corus Bank. The downturn in the real-estate market had a negative impact on Corus, which concentrates on real-estate lending, particularly in the condominium market. Corus also remained in the portfolio at period-end; the company has a longer history than many of its competitors and, in our view, it appears poised to perform well within its industry. We also maintained a position in Citrix Systems, which declined during the period as investors reacted negatively to a slowdown in its core business. Although we believe the company still offers long-term value, we reduced the fund’s posi tion significantly.
Please note that the holdings discussed in this report may not have been held by the fund for the entire period. Portfolio composition is subject to review in accordance with the fund’s investment strategy and may vary in the future.
Top holdings
This table shows the fund’s top holdings, and the percentage of the fund’s net assets that each represented, as of 10/31/06. The fund’s holdings will change over time.
| Holding (percent of fund’s net assets) | Industry |
|
| MicroStrategy, Inc. (2.4%) | Software |
|
| Hasbro, Inc. (2.3%) | Toys |
|
| Emulex Corp. (2.1%) | Computers |
|
| Steel Dynamics, Inc. (2.1%) | Metals |
|
| Autoliv, Inc. (Sweden) (2.1%) | Trucks and parts |
|
| W.R. Berkley Corp. (2.0%) | Insurance |
|
| Watson Pharmaceuticals, Inc. (2.0%) | Pharmaceuticals |
|
| Brocade Communications Systems, Inc. (2.0%) | Computers |
|
| AmerUs Group Co. (2.0%) | Insurance |
|
| FirstFed Financial Corp. (1.9%) | Banking |
|
10
The outlook for your fund
The following commentary reflects anticipated developments that could affect your fund over the next six months, as well as your management team’s plans for responding to them.
As we reached the midpoint of the fund’s fiscal year, investors continued to pay close attention to Fed policy and the potential threats of inflation and an economic slowdown. However, the prospects for a “soft landing” for the economy had improved, thanks in part to a drop in long-term interest rates and energy costs, which could help offset economic weakness. As the robust health of the U.S. corporate sector is increasingly recognized by investors, U.S. stock valuations have become more competitive with those in overseas markets.
As always, when we consider the outlook for your fund, we are more concerned with the long-term potential of individual companies than with short-term developments in the economy or the markets. While the market as a whole is affected by world events and economic cycles, we believe investors’ long-term goals are best served by our bottom-up approach to stock selection, which relies heavily on research and analysis. Regardless of the direction the market takes in the months ahead, our strategy and focus remain the same. We will continue to conduct intensive research in order to identify a wide array of companies with the potential to reward investors over time.
The views expressed in this report are exclusively those of Putnam Management. They are not meant as investment advice.
The fund invests some or all of its assets in small and/or midsize companies. Such investments increase the risk of fluctuations in the value of your investment.
11
Your fund’s performance
This section shows your fund’s performance for periods ended October 31, 2006, the end of the first half of its current fiscal year. In accordance with regulatory requirements for mutual funds, we also include performance as of the most recent calendar quarter-end. Performance should always be considered in light of a fund’s investment strategy. Data represents past performance. Past performance does not guarantee future results. More recent returns may be less or more than those shown. Investment return and principal value will fluctuate, and you may have a gain or a loss when you sell your shares. For the most recent month-end performance, please visit www.putnam.com or call Putnam at 1-800-225-1581. Class Y shares are generally only available to corporate and institutional clients. See the Terms and Definitions section in this report for definitions of the share classes offered by your fund.
| Fund performance | | | | | | | | |
| Total return for periods ended 10/31/06 | | | | | | | |
|
| |
| | Class A | | Class B | | Class C | | Class M | | Class R | Class Y |
| (inception dates) | (6/1/98) | | (6/29/98) | | (7/26/99) | | (6/29/98) | | (1/21/03) | (10/2/00) |
| | NAV | POP | NAV | CDSC | NAV | CDSC | NAV | POP | NAV | NAV |
|
| Annual average | 114.81% | 103.56% | 102.07% | 102.07% | 102.08% | 102.08% | 106.01% | 99.21% | 110.52% | 118.51% |
| (life of fund) | 9.50 | 8.81 | 8.71 | 8.71 | 8.71 | 8.71 | 8.96 | 8.53 | 9.24 | 9.73 |
|
| 5 years | 77.75 | 68.44 | 71.39 | 69.39 | 71.27 | 71.27 | 73.37 | 67.67 | 75.65 | 80.18 |
| Annual average | 12.19 | 10.99 | 11.38 | 11.12 | 11.36 | 11.36 | 11.63 | 10.89 | 11.93 | 12.50 |
|
| 3 years | 54.80 | 46.64 | 51.44 | 48.44 | 51.32 | 51.32 | 52.54 | 47.53 | 53.61 | 56.04 |
| Annual average | 15.68 | 13.61 | 14.84 | 14.07 | 14.81 | 14.81 | 15.11 | 13.84 | 15.38 | 15.99 |
|
| 1 year | 18.52 | 12.31 | 17.69 | 12.70 | 17.63 | 16.63 | 18.00 | 14.16 | 18.23 | 18.79 |
|
| 6 months | 1.51 | -3.84 | 1.18 | -3.82 | 1.17 | 0.17 | 1.33 | -2.00 | 1.44 | 1.72 |
|
Performance assumes reinvestment of distributions and does not account for taxes. Returns at public offering price (POP) for class A and M shares reflect a sales charge of 5.25% and 3.25%, respectively. Class B share returns reflect the applicable contingent deferred sales charge (CDSC), which is 5% in the first year, declining to 1% in the sixth year, and is eliminated thereafter. Class C shares reflect a 1% CDSC the first year that is eliminated thereafter. Class R and Y shares have no initial sales charge or CDSC. Performance for class B, C, M, R, and Y shares before their inception is derived from the historical performance of class A shares, adjusted for the applicable sales charge (or CDSC) and, except for class Y shares, the higher operating expenses for such shares.
For a portion of the period, this fund limited expenses, without which returns would have been lower.
A 1% short-term trading fee may be applied to shares exchanged or sold within 90 days of purchase.
12
| Comparative index returns | | |
| For periods ended 10/31/06 | | |
|
| |
| | | Lipper Small-Cap |
| | Russell 2500 | Core Funds |
| | Index | category average* |
|
| Life of fund | 113.53% | 115.26% |
| Annual average | 9.43 | 9.11 |
|
| 5 years | 95.57 | 91.18 |
| Annual average | 14.36 | 13.61 |
|
| 3 years | 51.91 | 50.07 |
| Annual average | 14.96 | 14.38 |
|
| 1 year | 17.69 | 16.40 |
|
| 6 months | 0.42 | –1.17 |
|
Index and Lipper results should be compared to fund performance at net asset value.
* Over the 6-month and 1-, 3-, 5-, and life-of-fund periods ended 10/31/06, there were 720, 689, 526, 415, and 205 funds, respectively, in this Lipper category.
Fund price and distribution* information
For the six-month period ended 10/31/06
| | Class A | Class B | Class C | Class M | Class R | Class Y |
| Share value: | NAV | POP | NAV | NAV | NAV | POP | NAV | NAV |
|
| 4/30/06 | $12.60 | $13.30 | $11.83 | $11.94 | $12.07 | $12.48 | $12.49 | $12.79 |
|
| 10/31/06 | 12.79 | 13.50 | 11.97 | 12.08 | 12.23 | 12.64 | 12.67 | 13.01 |
|
* The fund made no distributions during the period.
13
| Fund performance as of most recent calendar quarter | | |
| Total return for periods ended 9/30/06 | | | | | | | |
|
| |
| | Class A | | Class B | | Class C | | Class M | | Class R | Class Y |
| (inception dates) | (6/1/98) | | (6/29/98) | | (7/26/99) | | (6/29/98) | | (1/21/03) | (10/2/00) |
| | NAV | POP | NAV | CDSC | NAV | CDSC | NAV | POP | NAV | NAV |
|
| Annual average | 104.74% | 94.01% | 92.62% | 92.62% | 92.72% | 92.72% | 96.41% | 89.93% | 100.55% | 108.09% |
| (life of fund) | 8.98 | 8.27 | 8.18 | 8.18 | 8.19 | 8.19 | 8.43 | 8.00 | 8.71 | 9.19 |
|
| 5 years | 77.16 | 67.86 | 70.62 | 68.62 | 70.73 | 70.73 | 72.77 | 67.25 | 74.96 | 79.41 |
| Annual average | 12.12 | 10.91 | 11.28 | 11.02 | 11.29 | 11.29 | 11.56 | 10.83 | 11.84 | 12.40 |
|
| 3 years | 58.14 | 49.86 | 54.66 | 51.66 | 54.69 | 54.69 | 55.84 | 50.70 | 56.86 | 59.35 |
| Annual average | 16.51 | 14.44 | 15.64 | 14.89 | 15.65 | 15.65 | 15.94 | 14.65 | 16.19 | 16.80 |
|
| 1 year | 11.03 | 5.23 | 10.25 | 5.57 | 10.26 | 9.32 | 10.51 | 6.89 | 10.78 | 11.31 |
|
| 6 months | –3.02 | –8.14 | –3.39 | –8.22 | –3.36 | –4.32 | –3.24 | –6.35 | –3.13 | –2.90 |
|
14
Your fund’s expenses
As a mutual fund investor, you pay ongoing expenses, such as management fees, distribution fees (12b-1 fees), and other expenses. In the most recent six-month period, your fund limited these expenses; had it not done so, expenses would have been higher. Using the information below, you can estimate how these expenses affect your investment and compare them with the expenses of other funds. You may also pay one-time transaction expenses, including sales charges (loads) and redemption fees, which are not shown in this section and would have resulted in higher total expenses. For more information, see your fund’s prospectus or talk to your financial advisor.
Review your fund’s expenses
The table below shows the expenses you would have paid on a $1,000 investment in Putnam Capital Opportunities Fund from May 1, 2006, to October 31, 2006. It also shows how much a $1,000 investment would be worth at the close of the period, assuming actual returns and expenses.
| | Class A | Class B | Class C | Class M | Class R | Class Y |
|
| Expenses paid per $1,000* | $ 6.20 | $ 9.99 | $ 9.99 | $ 8.73 | $ 7.46 | $ 4.93 |
|
| Ending value (after expenses) | $1,015.10 | $1,011.80 | $1,011.70 | $1,013.30 | $1,014.40 | $1,017.20 |
|
* Expenses for each share class are calculated using the fund’s annualized expense ratio for each class, which represents the ongoing expenses as a percentage of average net assets for the six months ended 10/31/06. The expense ratio may differ for each share class (see the last table in this section). Expenses are calculated by multiplying the expense ratio by the average account value for the period; then multiplying the result by the number of days in the period; and then dividing that result by the number of days in the year.
Estimate the expenses you paid
To estimate the ongoing expenses you paid for the six months ended October 31, 2006, use the calculation method below. To find the value of your investment on May 1, 2006, go to www.putnam.com and log on to your account. Click on the “Transaction History” tab in your Daily Statement and enter 05/01/2006 in both the “from” and “to” fields. Alternatively, call Putnam at 1-800-225-1581.

15
Compare expenses using the SEC’s method
The Securities and Exchange Commission (SEC) has established guidelines to help investors assess fund expenses. Per these guidelines, the table below shows your fund’s expenses based on a $1,000 investment, assuming a hypothetical 5% annualized return. You can use this information to compare the ongoing expenses (but not transaction expenses or total costs) of investing in the fund with those of other funds. All mutual fund shareholder reports will provide this information to help you make this comparison. Please note that you cannot use this information to estimate your actual ending account balance and expenses paid during the period.
| | Class A | Class B | Class C | Class M | Class R | Class Y |
|
| Expenses paid per $1,000* | $ 6.21 | $ 10.01 | $ 10.01 | $ 8.74 | $ 7.48 | $ 4.94 |
|
| Ending value (after expenses) | $1,019.06 | $1,015.27 | $1,015.27 | $1,016.53 | $1,017.80 | $1,020.32 |
|
* Expenses for each share class are calculated using the fund’s annualized expense ratio for each class, which represents the ongoing expenses as a percentage of average net assets for the six months ended 10/31/06. The expense ratio may differ for each share class (see the last table in this section). Expenses are calculated by multiplying the expense ratio by the average account value for the period; then multiplying the result by the number of days in the period; and then dividing that result by the number of days in the year.
Compare expenses using industry averages
You can also compare your fund’s expenses with the average of its peer group, as defined by Lipper, an independent fund-rating agency that ranks funds relative to others that Lipper considers to have similar investment styles or objectives. The expense ratio for each share class shown below indicates how much of your fund’s net assets have been used to pay ongoing expenses during the period.
| | Class A | Class B | Class C | Class M | Class R | Class Y |
|
| Your fund’s annualized | | | | | | |
| expense ratio | 1.22% | 1.97% | 1.97% | 1.72% | 1.47% | 0.97% |
|
| Average annualized expense | | | | | | |
| ratio for Lipper peer group* | 1.49% | 2.24% | 2.24% | 1.99% | 1.74% | 1.24% |
|
* Simple average of the expenses of all front-end load funds in the fund’s Lipper peer group, calculated in accordance with Lipper’s standard method for comparing fund expenses (excluding 12b-1 fees and without giving effect to any expense offset and brokerage service arrangements that may reduce fund expenses). This average reflects each fund’s expenses for its most recent fiscal year available to Lipper as of 9/30/06. To facilitate comparison, Putnam has adjusted this average to reflect the 12b-1 fees carried by each class of shares other than class Y shares, which do not incur 12b-1 fees. The peer group may include funds that are significantly smaller or larger than the fund, which may limit the comparability of the fund’s expenses to the simple average, which typically is higher than the asset-weighted average.
16
Your fund’s
portfolio turnover
Putnam funds are actively managed by teams of experts who buy and sell securities based on intensive analysis of companies, industries, economies, and markets. Portfolio turnover is a measure of how often a fund’s managers buy and sell securities for your fund. A portfolio turnover of 100%, for example, means that the managers sold and replaced securities valued at 100% of a fund’s assets within a one-year period. Funds with high turnover may be more likely to generate capital gains and dividends that must be distributed to shareholders as taxable income. High turnover may also cause a fund to pay more brokerage commissions and other transaction costs, which may detract from performance.
Turnover comparisons
Percentage of holdings that change every year
| | 2006 | 2005 | 2004 | 2003 | 2002 |
|
| Putnam Capital | | | | | |
| Opportunities Fund | 60% | 71% | 135% | 91% | 120% |
|
| Lipper Small-Cap Core | | | | | |
| Funds category average | 82% | 86% | 86% | 88% | 101% |
|
Turnover data for the fund is calculated based on the fund’s fiscal-year period, which ends on April 30. Turnover data for the fund’s Lipper category is calculated based on the average of the turnover of each fund in the category for its fiscal year ended during the indicated year. Fiscal years vary across funds in the Lipper category, which may limit the comparability of the fund’s portfolio turnover rate to the Lipper average. Comparative data for 2006 is based on information available as of 10/31/06.
17
Your fund’s risk
This risk comparison is designed to help you understand how your fund compares with other funds. The comparison utilizes a risk measure developed by Morningstar, an independent fund-rating agency. This risk measure is referred to as the fund’s Overall Morningstar Risk.
Your fund’s Overall Morningstar® Risk

Your fund’s Overall Morningstar Risk is shown alongside that of the average fund in its broad asset class, as determined by Morningstar. The risk bar broadens the comparison by translating the fund’s Overall Morningstar Risk into a percentile, which is based on the fund’s ranking among all funds rated by Morningstar as of September 30, 2006. A higher Overall Morningstar Risk generally indicates that a fund’s monthly returns have varied more widely.
Morningstar determines a fund’s Overall Morningstar Risk by assessing variations in the fund’s monthly returns — with an emphasis on downside variations — over 3-, 5-, and 10-year periods, if available. Those measures are weighted and averaged to produce the fund’s Overall Morningstar Risk. The information shown is provided for the fund’s class A shares only; information for other classes may vary. Overall Morningstar Risk is based on historical data and does not indicate future results. Morningstar does not purport to measure the risk associated with a current investment in a fund, either on an absolute basis or on a relative basis. Low Overall Morningstar Risk does not mean that you cannot lose money on an investment in a fund. Copyright 2006 Morningstar, Inc. All Rights Reserved. The information contained herein (1) is proprietary to Morningstar and/or its content providers; (2) may not be copied or distributed; and (3) is not warranted to be accurate, complete, or timely. Neither Morningstar nor its content providers are responsible for any damages or losses arising from any use of this information.
18
Your fund’s management
Your fund is managed by the members of the Putnam U.S. Small- and Mid-Cap Core Team. Joseph Joseph is the Portfolio Leader of the fund. John Ferry, Gerald Moore, and Franz Valencia are Portfolio Members. The Portfolio Leader and Portfolio Members coordinate the team’s management of the fund.
For a complete listing of the members of the Putnam U.S. Small- and Mid-Cap Core Team, including those who are not Portfolio Leaders or Portfolio Members of your fund, visit Putnam’s Individual Investor Web site at www.putnam.com.
Investment team fund ownership
The table below shows how much the fund’s current Portfolio Leader and Portfolio Members have invested in the fund and in all Putnam mutual funds (in dollar ranges). Information shown is as of October 31, 2006, and October 31, 2005.
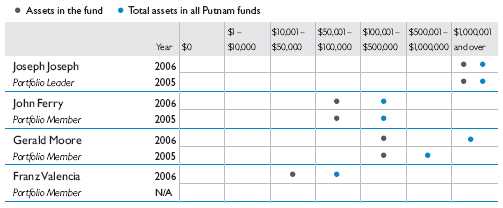
N/A indicates the individual was not a Portfolio Leader or Portfolio Member as of 10/31/05.
Trustee and Putnam employee fund ownership
As of October 31, 2006, all of the Trustees on the Board of the Putnam funds owned fund shares. The table below shows the approximate value of investments in the fund and all Putnam funds as of that date by the Trustees and Putnam employees. These amounts include investments by the Trustees’ and employees’ immediate family members and investments through retirement and deferred compensation plans.
| | | Total assets in |
| | Assets in the fund | all Putnam funds |
|
| Trustees | $ 301,000 | $ 92,000,000 |
|
| Putnam employees | $7,477,000 | $427,000,000 |
|
19
Fund manager compensation
The total 2005 fund manager compensation that is attributable to your fund is approximately $2,300,000. This amount includes a portion of 2005 compensation paid by Putnam Management to the fund managers listed in this section for their portfolio management responsibilities, calculated based on the fund assets they manage taken as a percentage of the total assets they manage. The compensation amount also includes a portion of the 2005 compensation paid to the Chief Investment Officer of the team and the Group Chief Investment Officer of the fund’s broader investment category for their oversight responsibilities, calculated based on the fund assets they oversee taken as a percentage of the total assets they oversee. This amount does not include compensation of other personnel involved in research, trading, administration, systems, compliance, or fund operations; nor does it include non-compensation costs. These percentages are determined as of the fund’s fis cal period-end. For personnel who joined Putnam Management during or after 2005, the calculation reflects annualized 2005 compensation or an estimate of 2006 compensation, as applicable.
Other Putnam funds managed by the Portfolio Leader and Portfolio Members
Joseph Joseph is also a Portfolio Leader of Putnam International Capital Opportunities Fund and a Portfolio Member of Putnam Capital Appreciation Fund.
John Ferry is also a Portfolio Member of Putnam International Capital Opportunities Fund.
Franz Valencia is also a Portfolio Member of Putnam International Capital Opportunities Fund.
Joseph Joseph, John Ferry, Gerald Moore, and Franz Valencia may also manage other accounts and variable trust funds advised by Putnam Management or an affiliate.
20
Changes in your fund’s Portfolio Leader and Portfolio Members
During the year ended October 31, 2006, Portfolio Member Franz Valencia joined and Portfolio Member Tinh Bui left your fund’s management team.
Putnam fund ownership by Putnam’s Executive Board
The table below shows how much the members of Putnam’s Executive Board have invested in all Putnam mutual funds (in dollar ranges). Information shown is as of October 31, 2006, and October 31, 2005.
| | | $1 – | $10,001 – | $50,001 – | $100,001 – | $500,001 – | $1,000,001 |
| | Year | $0 | $10,000 | $50,000 | $100,000 | $500,000 | $1,000,000 | and over |
|
| Philippe Bibi | 2006 | | | | | | • |
|
|
| Chief Technology Officer | 2005 | | | | | | • |
|
| Joshua Brooks | 2006 | | | | | | • |
|
|
| Deputy Head of Investments | 2005 | | | | | | • |
|
| William Connolly | 2006 | | | | | | • |
|
|
| Head of Retail Management | 2005 | | | | | | • |
|
| Kevin Cronin | 2006 | | | | | | • |
|
|
| Head of Investments | 2005 | | | | | | • |
|
| Charles Haldeman, Jr. | 2006 | | | | | | • |
|
|
| President and CEO | 2005 | | | | | | • |
|
| Amrit Kanwal | 2006 | | | | | • |
|
|
| Chief Financial Officer | 2005 | | | | | • |
|
| Steven Krichmar | 2006 | | | | | • |
|
|
| Chief of Operations | 2005 | | | | | | • |
|
| Francis McNamara, III | 2006 | | | | | | • |
|
|
| General Counsel | 2005 | | | | | | • |
|
| Jeffrey Peters | 2006 | | | | | | • |
|
|
| Head of International Business | N/A | | | | | |
|
| Richard Robie, III | 2006 | | | | | • |
|
|
| Chief Administrative Officer | 2005 | | | | | • |
|
| Edward Shadek | 2006 | | | | | | • |
|
|
| Deputy Head of Investments | 2005 | | | | | | • |
|
| Sandra Whiston | 2006 | | | | | • |
|
|
| Head of Institutional Management | 2005 | | | | | • |
|
| |
| N/A indicates the individual was not a member of Putnam’s Executive Board as of 10/31/05. | | |
21
Terms and definitions
Important terms
Total return shows how the value of the fund’s shares changed over time, assuming you held the shares through the entire period and reinvested all distributions in the fund.
Net asset value (NAV) is the price, or value, of one share of a mutual fund, without a sales charge. NAVs fluctuate with market conditions. NAV is calculated by dividing the net assets of each class of shares by the number of outstanding shares in the class.
Public offering price (POP) is the price of a mutual fund share plus the maximum sales charge levied at the time of purchase. POP performance figures shown here assume the 5.25% maximum sales charge for class A shares and 3.25% for class M shares.
Contingent deferred sales charge (CDSC) is generally a charge applied at the time of the redemption of class B or C shares and assumes redemption at the end of the period. Your fund’s class B CDSC declines from a 5% maximum during the first year to 1% during the sixth year. After the sixth year, the CDSC no longer applies. The CDSC for class C shares is 1% for one year after purchase.
Share classes
Class A shares are generally subject to an initial sales charge and no CDSC (except on certain redemptions of shares bought without an initial sales charge).
Class B shares are not subject to an initial sales charge. They may be subject to a CDSC.
Class C shares are not subject to an initial sales charge and are subject to a CDSC only if the shares are redeemed during the first year.
Class M shares have a lower initial sales charge and a higher 12b-1 fee than class A shares and no CDSC (except on certain redemptions of shares bought without an initial sales charge).
Class R shares are not subject to an initial sales charge or CDSC and are available only to certain defined contribution plans.
Class Y shares are not subject to an initial sales charge or CDSC, and carry no 12b-1 fee. They are only available to eligible purchasers, including eligible defined contribution plans or corporate IRAs.
22
Comparative indexes
Lehman Aggregate Bond Index is an unmanaged index of U.S. investment-grade fixed-income securities.
Lehman Global Aggregate Bond Index is an unmanaged index of global investment-grade fixed-income securities.
Lehman Municipal Bond Index is an unmanaged index of long-term fixed-rate investment-grade tax-exempt bonds.
Russell 1000 Growth Index is an unmanaged index of those companies in the large-cap Russell 1000 Index chosen for their growth orientation.
Russell 1000 Value Index is an unmanaged index of those companies in the large-cap Russell 1000 Index chosen for their value orientation.
Russell 2500 Index is an unmanaged index of the 2,500 small and midsize companies in the Russell 3000 Index.
S&P 500 Index is an unmanaged index of common stock performance.
Indexes assume reinvestment of all distributions and do not account for fees. Securities and performance of a fund and an index will differ. You cannot invest directly in an index.
Lipper is a third-party industry-ranking entity that ranks mutual funds. Its rankings do not reflect sales charges. Lipper rankings are based on total return at net asset value relative to other funds that have similar current investment styles or objectives as determined by Lipper. Lipper may change a fund’s category assignment at its discretion. Lipper category averages reflect performance trends for funds within a category.
23
Trustee approval of
management contract
General conclusions
The Board of Trustees of the Putnam funds oversees the management of each fund and, as required by law, determines annually whether to approve the continuance of your fund’s management contract with Putnam Management. In this regard, the Board of Trustees, with the assistance of its Contract Committee consisting solely of Trustees who are not “interested persons” (as such term is defined in the Investment Company Act of 1940, as amended) of the Putnam funds (the “Independent Trustees”), requests and evaluates all information it deems reasonably necessary under the circumstances. Over the course of several months ending in June 2006, the Contract Committee met four times to consider the information provided by Putnam Management and other information developed with the assistance of the Board’s independent counsel and independent staff. The Contract Committee reviewed and discussed key aspects of this information with all of the Independe nt Trustees. Upon completion of this review, the Contract Committee recommended, and the Independent Trustees approved, the continuance of your fund’s management contract, effective July 1, 2006.
This approval was based on the following conclusions:
• That the fee schedule in effect for your fund represents reasonable compensation in light of the nature and quality of the services being provided to the fund, the fees paid by competitive funds and the costs incurred by Putnam Management in providing such services, and
• That such fee schedule represents an appropriate sharing between fund shareholders and Putnam Management of such economies of scale as may exist in the management of the fund at current asset levels.
These conclusions were based on a comprehensive consideration of all information provided to the Trustees and were not the result of any single factor. Some of the factors that figured particularly in the Trustees’ deliberations and how the Trustees considered these factors are described below, although individual Trustees may have evaluated the information presented differently, giving different weights to various factors. It is also important to recognize that the fee arrangements for your fund and the other Putnam funds are the result of many years of review and discussion between the Independent Trustees and Putnam Management, that certain aspects of such arrangements may receive greater scrutiny in some years than others, and that the Trustees’ conclusions may be based, in part, on their consideration of these same arrangements in prior years.
24
Management fee schedules and categories; total expenses
The Trustees reviewed the management fee schedules in effect for all Putnam funds, including fee levels and breakpoints, and the assignment of funds to particular fee categories. In reviewing fees and expenses, the Trustees generally focused their attention on material changes in circumstances-for example, changes in a fund’s size or investment style, changes in Putnam Management’s operating costs, or changes in competitive practices in the mutual fund industry-that suggest that consideration of fee changes might be warranted. The Trustees concluded that the circumstances did not warrant changes to the management fee structure of your fund, which had been carefully developed over the years, re-examined on many occasions and adjusted where appropriate. The Trustees focused on two areas of particular interest, as discussed further below:
• Competitiveness. The Trustees reviewed comparative fee and expense information for competitive funds, which indicated that, in a custom peer group of competitive funds selected by Lipper Inc., your fund ranked in the 1st percentile in management fees and in the 10th percentile in total expenses (less any applicable 12b-1 fees) as of December 31, 2005 (the first percentile being the least expensive funds and the 100th percentile being the most expensive funds). (Because the fund’s custom peer group is smaller than the fund’s broad Lipper Inc. peer group, this expense information may differ from the Lipper peer expense information found elsewhere in this report.) The Trustees noted that expense ratios for a number of Putnam funds, which show the percentage of fund assets used to pay for management and administrative services, distribution (12b-1) fees and other expenses, had been increasing recently as a result of declining net assets and the natural operation of fee breakpoints.
The Trustees noted that the expense ratio increases described above were currently being controlled by expense limitations implemented in January 2004 and which Putnam Management, in consultation with the Contract Committee, has committed to maintain at least through 2007. These expense limitations give effect to a commitment by Putnam Management that the expense ratio of each open-end fund would be no higher than the average expense ratio of the competitive funds included in the fund’s relevant Lipper universe (exclusive of any applicable 12b-1 charges in each case). The Trustees observed that this commitment to limit fund expenses has served shareholders well since its inception. In order to ensure that the expenses of the Putnam funds continue to meet evolving competitive standards, the Trustees requested, and Putnam Management agreed, to implement an additional expense limitation for certain funds for the twelve months beginning January 1, 2007 equal to the average expense ratio (exclusive of 12b-1 charges) of a custom peer group of competitive funds selected by Lipper based on the size of the fund. This additional expense limitation will be applied to those open-end funds that had above-average expense ratios (exclusive of 12b-1 charges) based on the Lipper custom peer group data for the period ended December 31, 2005. This additional expense limitation will not be applied to your fund.
25
• Economies of scale. Your fund currently has the benefit of breakpoints in its management fee that provide shareholders with significant economies of scale, which means that the effective management fee rate of a fund (as a percentage of fund assets) declines as a fund grows in size and crosses specified asset thresholds. Conversely, as a fund shrinks in size-as has been the case for many Putnam funds in recent years-these breakpoints result in increasing fee levels. In recent years, the Trustees have examined the operation of the existing breakpoint structure during periods of both growth and decline in asset levels. The Trustees concluded that the fee schedules in effect for the funds represented an appropriate sharing of economies of scale at current asset levels. In reaching this conclusion, the Trustees considered the Contract Committee’s stated intent to continue to work with Putnam Management to plan for an eventual resumption in the growth of assets, including a study of potential economies that might be produced under various growth assumptions.
In connection with their review of the management fees and total expenses of the Putnam funds, the Trustees also reviewed the costs of the services to be provided and profits to be realized by Putnam Management and its affiliates from the relationship with the funds. This information included trends in revenues, expenses and profitability of Putnam Management and its affiliates relating to the investment management and distribution services provided to the funds. In this regard, the Trustees also reviewed an analysis of Putnam Management’s revenues, expenses and profitability with respect to the funds’ management contracts, allocated on a fund-by-fund basis. Because many of the costs incurred by Putnam Management in managing the funds are not readily identifiable to particular funds, the Trustees observed that the methodology for allocating costs is an important factor in evaluating Putnam Management’s costs and profitability, both as to the Putnam funds in the aggregate and as to individual funds. The Trustees reviewed Putnam Management’s cost allocation methodology with the assistance of independent consultants and concluded that this methodology was reasonable and well-considered.
Investment performance
The quality of the investment process provided by Putnam Management represented a major factor in the Trustees’ evaluation of the quality of services provided by Putnam Management under your fund’s management contract. The Trustees were assisted in their review of the Putnam funds’ investment process and performance by the work of the Investment Process Committee of the Trustees and the Investment Oversight Committee of the Trustees, which meet on a regular monthly basis with the funds’ portfolio teams throughout the year. The Trustees concluded that Putnam Management generally provides a high-quality investment process-as measured by the experience and skills of the individuals assigned to the management of fund portfolios, the resources made available to such personnel, and in general the ability of Putnam Management to attract and retain high-quality personnel-but also recognize that this does not guarantee favorable investment results for every fund in every time period. The Trustees considered the investment performance of each fund over multiple time periods
26
and considered information comparing each fund’s performance with various benchmarks and with the performance of competitive funds.
The Trustees noted the satisfactory investment performance of many Putnam funds. They also noted the disappointing investment performance of certain funds in recent years and discussed with senior management of Putnam Management the factors contributing to such underperformance and actions being taken to improve performance. The Trustees recognized that, in recent years, Putnam Management has made significant changes in its investment personnel and processes and in the fund product line to address areas of underperformance. In particular, they noted the important contributions of Putnam Management’s leadership in attracting, retaining and supporting high-quality investment professionals and in systematically implementing an investment process that seeks to merge the best features of fundamental and quantitative analysis. The Trustees indicated their intention to continue to monitor performance trends to assess the effectiveness of these changes and to evaluate whether additional changes to address areas of underperformance are warranted.
In the case of your fund, the Trustees considered that your fund’s class A share cumulative total return performance at net asset value was in the following percentiles of its Lipper Inc. peer group (Lipper Small-Cap Core Funds) for the one-, three- and five-year periods ended March 31, 2006 (the first percentile being the best performing funds and the 100th percentile being the worst performing funds):
| One-year period | Three-year period | Five-year period |
|
| 25th | 60th | 86th |
(Because of the passage of time, these performance results may differ from the performance results for more recent periods shown elsewhere in this report. Over the one-, three- and five-year periods ended March 31, 2006, there were 626, 493, and 373 funds, respectively, in your fund’s Lipper peer group.* Past performance is no guarantee of future performance.)
The Trustees noted the disappointing performance for your fund for the five-year period ended March 31, 2006. In this regard, the Trustees considered that Putnam Management had clarified the fund’s investment philosophy and had made changes to the fund’s investment team that it believed would strengthen the investment process by focusing on a blend of quantitative techniques and fundamental analysis.
As a general matter, the Trustees concluded that cooperative efforts between the Trustees and Putnam Management represent the most effective way to address investment performance problems. The Trustees noted that investors in the Putnam funds have, in effect, placed their trust in the Putnam organization, under the oversight of the funds’ Trustees, to make appropriate
* The percentile rankings for your fund’s class A share annualized total return performance in the Lipper Small-Cap Core Funds category for the one- and five-year periods ended September 30, 2006, were 17% and 74%, respectively. Over the one- and five-year periods ended September 30, 2006, the fund ranked 110th out of 657 and 293rd out of 397 funds, respectively. Note that this more recent information was not available when the Trustees approved the continuance of your fund’s management contract.
27
decisions regarding the management of the funds. Based on the responsiveness of Putnam Management in the recent past to Trustee concerns about investment performance, the Trustees concluded that it is preferable to seek change within Putnam Management to address performance shortcomings. In the Trustees’ view, the alternative of terminating a management contract and engaging a new investment adviser for an underperforming fund would entail significant disruptions and would not provide any greater assurance of improved investment performance.
Brokerage and soft-dollar allocations; other benefits
The Trustees considered various potential benefits that Putnam Management may receive in connection with the services it provides under the management contract with your fund. These include benefits related to brokerage and soft-dollar allocations, whereby a portion of the commissions paid by a fund for brokerage may be used to acquire research services that may be useful to Putnam Management in managing the assets of the fund and of other clients. The Trustees indicated their continued intent to monitor the potential benefits associated with the allocation of fund brokerage to ensure that the principle of seeking “best price and execution” remains paramount in the portfolio trading process.
The Trustees’ annual review of your fund’s management contract also included the review of its distributor’s contract and distribution plan with Putnam Retail Management Limited Partnership and the custodian agreement and investor servicing agreement with Putnam Fiduciary Trust Company, all of which provide benefits to affiliates of Putnam Management.
Comparison of retail and institutional fee schedules
The information examined by the Trustees as part of their annual contract review has included for many years information regarding fees charged by Putnam Management and its affiliates to institutional clients such as defined benefit pension plans, college endowments, etc. This information included comparison of such fees with fees charged to the funds, as well as a detailed assessment of the differences in the services provided to these two types of clients. The Trustees observed, in this regard, that the differences in fee rates between institutional clients and the mutual funds are by no means uniform when examined by individual asset sectors, suggesting that differences in the pricing of investment management services to these types of clients reflect to a substantial degree historical competitive forces operating in separate market places. The Trustees considered the fact that fee rates across all asset sectors are higher on average for mutual funds than for ins titutional clients, as well as the differences between the services that Putnam Management provides to the Putnam funds and those that it provides to institutional clients of the firm, but did not rely on such comparisons to any significant extent in concluding that the management fees paid by your fund are reasonable.
28
Other information
for shareholders
Important notice regarding delivery of shareholder documents
In accordance with SEC regulations, Putnam sends a single copy of annual and semiannual shareholder reports, prospectuses, and proxy statements to Putnam shareholders who share the same address, unless a shareholder requests otherwise. If you prefer to receive your own copy of these documents, please call Putnam at 1-800-225-1581, and Putnam will begin sending individual copies within 30 days.
Proxy voting
Putnam is committed to managing our mutual funds in the best interests of our shareholders. The Putnam funds’ proxy voting guidelines and procedures, as well as information regarding how your fund voted proxies relating to portfolio securities during the 12-month period ended June 30, 2006, are available on the Putnam Individual Investor Web site, www.putnam.com/individual, and on the SEC’s Web site, www.sec.gov. If you have questions about finding forms on the SEC’s Web site, you may call the SEC at 1-800-SEC-0330. You may also obtain the Putnam funds’ proxy voting guidelines and procedures at no charge by calling Putnam’s Shareholder Services at 1-800-225-1581.
Fund portfolio holdings
The fund will file a complete schedule of its portfolio holdings with the SEC for the first and third quarters of each fiscal year on Form N-Q. Shareholders may obtain the fund’s Forms N-Q on the SEC’s Web site at www.sec.gov. In addition, the fund’s Forms N-Q may be reviewed and copied at the SEC’s Public Reference Room in Washington, D.C. You may call the SEC at 1-800-SEC-0330 for information about the SEC’s Web site or the operation of the Public Reference Room.
29
Financial statements
A guide to financial statements
These sections of the report, as well as the accompanying Notes, constitute the fund’s financial statements.
The fund’s portfolio lists all the fund’s investments and their values as of the last day of the reporting period. Holdings are organized by asset type and industry sector, country, or state to show areas of concentration and diversification.
Statement of assets and liabilities shows how the fund’s net assets and share price are determined. All investment and noninvestment assets are added together. Any unpaid expenses and other liabilities are subtracted from this total. The result is divided by the number of shares to determine the net asset value per share, which is calculated separately for each class of shares. (For funds with preferred shares, the amount subtracted from total assets includes the liquidation preference of preferred shares.)
Statement of operations shows the fund’s net investment gain or loss. This is done by first adding up all the fund’s earnings — from dividends and interest income — and subtracting its operating expenses to determine net investment income (or loss). Then, any net gain or loss the fund realized on the sales of its holdings — as well as any unrealized gains or losses over the period — is added to or subtracted from the net investment result to determine the fund’s net gain or loss for the fiscal period.
Statement of changes in net assets shows how the fund’s net assets were affected by the fund’s net investment gain or loss, by distributions to shareholders, and by changes in the number of the fund’s shares. It lists distributions and their sources (net investment income or realized capital gains) over the current reporting period and the most recent fiscal year-end. The distributions listed here may not match the sources listed in the Statement of operations because the distributions are determined on a tax basis and may be paid in a different period from the one in which they were earned. Dividend sources are estimated at the time of declaration. Actual results may vary. Any non-taxable return of capital cannot be determined until final tax calculations are completed after the end of the fund’s fiscal year.
Financial highlights provide an overview of the fund’s investment results, per-share distributions, expense ratios, net investment income ratios, and portfolio turnover in one summary table, reflecting the five most recent reporting periods. In a semiannual report, the highlight table also includes the current reporting period.
30
| The fund’s portfolio 10/31/06 (Unaudited) | | | |
|
| |
| |
| |
| COMMON STOCKS (98.8%)* | | | |
|
| | Shares | | Value |
|
| Advertising and Marketing Services (0.2%) | | | |
| Digitas, Inc. † (S) | 144,360 | $ | 1,524,442 |
| Nu Skin Enterprises, Inc. Class A (S) | 15,047 | | 287,699 |
| | | | 1,812,141 |
|
| |
| Aerospace and Defense (0.1%) | | | |
| Alliant Techsystems, Inc. † | 4,920 | | 379,873 |
| Teledyne Technologies, Inc. † | 5,300 | | 221,116 |
| | | | 600,989 |
|
| |
| Agriculture (—%) | | | |
| Delta & Pine Land Co. | 5,600 | | 226,856 |
|
| |
| Airlines (1.4%) | | | |
| Alaska Air Group, Inc. † | 86,998 | | 3,492,970 |
| Continental Airlines, Inc. Class B † (S) | 79,700 | | 2,939,336 |
| ExpressJet Holdings, Inc. † (S) | 1,228,937 | | 9,757,760 |
| | | | 16,190,066 |
|
| |
| Automotive (1.5%) | | | |
| Carlisle Cos., Inc. (S) | 1,770 | | 148,131 |
| Group 1 Automotive, Inc. (S) | 9,200 | | 527,252 |
| Lear Corp. (S) | 2,606 | | 78,727 |
| Tenneco Automotive, Inc. † (S) | 676,255 | | 15,350,989 |
| TRW Automotive Holdings Corp. † | 10,035 | | 257,398 |
| | | | 16,362,497 |
|
| |
| Banking (3.7%) | | | |
| Anchor BanCorp Wisconsin, Inc. | 26,827 | | 779,056 |
| Bank of Hawaii Corp. | 3,140 | | 163,814 |
| Bankunited Financial Corp. Class A (S) | 39,900 | | 1,076,103 |
| Center Financial Corp. (S) | 10,450 | | 252,472 |
| City Bank (S) | 13,747 | | 738,764 |
| City Holding Co. (S) | 26,003 | | 1,019,318 |
| Corus Bankshares, Inc. (S) | 613,848 | | 12,602,299 |
| Cullen/Frost Bankers, Inc. (S) | 3,506 | | 189,885 |
| East West Bancorp, Inc. | 4,076 | | 148,815 |
| First Citizens BancShares, Inc. Class A | 1,250 | | 234,750 |
| First Regional Bancorp † (S) | 4,980 | | 158,663 |
| FirstFed Financial Corp. † (S) | 347,869 | | 21,487,868 |
| Frontier Financial Corp. (S) | 3,139 | | 91,062 |
| International Bancshares Corp. (S) | 9,843 | | 301,983 |
| ITLA Capital Corp. | 1,590 | | 90,821 |
| Lakeland Financial Corp. (S) | 4,200 | | 108,864 |
| PFF Bancorp, Inc. | 1,361 | | 42,205 |
| Provident Financial Holdings, Inc. | 9,098 | | 275,396 |
| Republic Bancorp, Inc. Class A (S) | 8,905 | | 190,389 |
31
| COMMON STOCKS (98.8%)* continued | | | |
|
| | Shares | | Value |
|
| Banking continued | | | |
| Southwest Bancorp, Inc. (S) | 18,096 | $ | 490,583 |
| Wilmington Trust Corp. | 10,124 | | 420,956 |
| | | | 40,864,066 |
|
| |
| Basic Materials (—%) | | | |
| Ameron International Corp. | 5,000 | | 366,250 |
| Chaparral Steel Co. (S) | 3,860 | | 160,537 |
| | | | 526,787 |
|
| |
| Biotechnology (1.3%) | | | |
| Albany Molecular Research, Inc. † | 126,141 | | 1,502,339 |
| Applera Corp.- Applied Biosystems Group | 268,310 | | 10,007,963 |
| Diversa Corp. † (S) | 80,394 | | 748,468 |
| Savient Pharmaceuticals, Inc. † (S) | 288,100 | | 2,192,441 |
| | | | 14,451,211 |
|
| |
| Broadcasting (0.2%) | | | |
| Media General, Inc. Class A (S) | 2,900 | | 107,590 |
| Sinclair Broadcast Group, Inc. Class A | 191,000 | | 1,722,820 |
| | | | 1,830,410 |
|
| |
| Building Materials (—%) | | | |
| Lennox International, Inc. | 7,300 | | 196,808 |
|
| |
| Chemicals (2.5%) | | | |
| Arch Chemicals, Inc. | 8,607 | | 287,990 |
| FMC Corp. | 54,773 | | 3,754,689 |
| Georgia Gulf Corp. | 697,464 | | 14,918,755 |
| Hercules, Inc. † | 27,630 | | 502,866 |
| Huntsman Corp. † | 19,460 | | 336,074 |
| Lubrizol Corp. (The) | 3,800 | | 171,000 |
| NewMarket Corp. (S) | 94,280 | | 6,062,204 |
| Olin Corp. | 8,553 | | 147,967 |
| PolyOne Corp. † (S) | 38,200 | | 313,240 |
| PW Eagle, Inc. (S) | 39,800 | | 1,411,706 |
| Valspar Corp. (S) | 8,070 | | 216,195 |
| | | | 28,122,686 |
|
| |
| Coal (—%) | | | |
| Foundation Coal Holdings, Inc. | 5,200 | | 190,892 |
|
| |
| Commercial and Consumer Services (2.1%) | | | |
| CBIZ, Inc. † (S) | 47,200 | | 332,288 |
| Chemed Corp. | 97,769 | | 3,469,822 |
| Consolidated Graphics, Inc. † | 52,502 | | 3,264,049 |
| Escala Group, Inc. † (S) | 26,800 | | 135,608 |
| infoUSA, Inc. | 82,088 | | 902,147 |
| Jackson Hewitt Tax Service, Inc. (S) | 162,812 | | 5,633,295 |
| MoneyGram International, Inc. | 7,644 | | 261,501 |
| Pre-Paid Legal Services, Inc. (S) | 4,340 | | 184,233 |
32
| COMMON STOCKS (98.8%)* continued | | | |
|
| | Shares | | Value |
|
| Commercial and Consumer Services continued | | | |
| Spherion Corp. † (S) | 106,400 | $ | 771,400 |
| Tech Data Corp. † | 211,700 | | 8,330,395 |
| | | | 23,284,738 |
|
| |
| Communications Equipment (0.1%) | | | |
| F5 Networks, Inc. † | 3,530 | | 233,651 |
| Tekelec † (S) | 27,400 | | 404,150 |
| | | | 637,801 |
|
| |
| Computers (5.5%) | | | |
| Adaptec, Inc. † (S) | 147,000 | | 665,910 |
| ANSYS, Inc. † | 9,063 | | 416,898 |
| Blackbaud, Inc. (S) | 12,037 | | 300,925 |
| Brocade Communications Systems, Inc. † (S) | 2,785,528 | | 22,590,632 |
| Catapult Communications Corp. † (S) | 33,710 | | 294,288 |
| Checkpoint Systems, Inc. † (S) | 84,800 | | 1,544,208 |
| Emulex Corp. † | 1,256,940 | | 23,630,471 |
| Kronos, Inc. † (S) | 38,200 | | 1,294,980 |
| Logitech International SA (Switzerland) † (S) | 6,218 | | 163,539 |
| Magma Design Automation, Inc. † (S) | 75,772 | | 705,437 |
| Micros Systems, Inc. † | 85,440 | | 4,244,659 |
| MTS Systems Corp. | 16,700 | | 555,943 |
| SPSS, Inc. † (S) | 46,844 | | 1,296,173 |
| Trident Microsystems, Inc. † (S) | 190,810 | | 4,033,723 |
| | | | 61,737,786 |
|
| |
| Conglomerates (0.1%) | | | |
| AMETEK, Inc. | 7,880 | | 367,838 |
| Crane Co. | 5,417 | | 210,938 |
| SPX Corp. | 4,260 | | 245,035 |
| | | | 823,811 |
|
| |
| Construction (0.1%) | | | |
| Builders FirstSource, Inc. † (S) | 31,520 | | 498,646 |
| Eagle Materials, Inc. | 3,820 | | 140,194 |
| Florida Rock Industries, Inc. (S) | 4,680 | | 200,772 |
| | | | 839,612 |
|
| |
| Consumer Cyclicals (0.2%) | | | |
| CSS Industries, Inc. (S) | 16,918 | | 531,394 |
| Hooker Furniture Corp. | 4,500 | | 63,630 |
| Yankee Candle Co., Inc. (The) (S) | 62,608 | | 2,119,281 |
| | | | 2,714,305 |
33
| COMMON STOCKS (98.8%)* continued | | | |
|
| | Shares | | Value |
|
| Consumer Finance (1.0%) | | | |
| Accredited Home Lenders Holding Co. † (S) | 152,400 | $ | 4,663,440 |
| AmeriCredit Corp. † (S) | 81,900 | | 2,094,183 |
| Asta Funding, Inc. (S) | 62,095 | | 2,113,714 |
| Encore Capital Group, Inc. † (S) | 4,500 | | 63,000 |
| World Acceptance Corp. † (S) | 51,189 | | 2,558,938 |
| | | | 11,493,275 |
|
| |
| Consumer Goods (1.1%) | | | |
| American Greetings Corp. Class A | 6,530 | | 156,132 |
| Blyth Industries, Inc. | 124,644 | | 2,981,484 |
| Chattem, Inc. † | 219,810 | | 9,324,340 |
| Elizabeth Arden, Inc. † | 3,600 | | 62,784 |
| | | | 12,524,740 |
|
| |
| Consumer Services (0.9%) | | | |
| Alderwoods Group, Inc. (Canada) † (S) | 127,275 | | 2,531,500 |
| Labor Ready, Inc. † | 443,710 | | 7,769,362 |
| | | | 10,300,862 |
|
| |
| Distribution (—%) | | | |
| BlueLinx Holdings, Inc. | 30,800 | | 330,484 |
| Huttig Building Products, Inc. † | 40,044 | | 214,636 |
| | | | 545,120 |
|
| |
| Electric Utilities (0.2%) | | | |
| Alliant Energy Corp. (S) | 7,247 | | 277,922 |
| CenterPoint Energy, Inc. (S) | 10,570 | | 163,624 |
| Great Plains Energy, Inc. (S) | 17,156 | | 558,256 |
| OGE Energy Corp. | 6,720 | | 259,258 |
| Puget Energy, Inc. | 12,000 | | 286,560 |
| Westar Energy, Inc. | 12,300 | | 311,436 |
| | | | 1,857,056 |
|
| |
| Electrical Equipment (0.3%) | | | |
| GrafTech International, Ltd. † | 56,100 | | 339,405 |
| Insteel Industries, Inc. (S) | 124,300 | | 2,229,942 |
| Rofin-Sinar Technologies, Inc. † | 4,550 | | 280,189 |
| | | | 2,849,536 |
|
| |
| Electronics (2.1%) | | | |
| Ansoft Corp. † (S) | 45,398 | | 1,210,311 |
| DSP Group, Inc. † (S) | 6,570 | | 142,700 |
| General Cable Corp. † (S) | 10,860 | | 408,336 |
| Greatbatch, Inc. † (S) | 62,607 | | 1,408,031 |
| LSI Logic Corp. † | 133,000 | | 1,336,650 |
| Methode Electronics, Inc. Class A | 84,789 | | 938,614 |
| Omnivision Technologies, Inc. † (S) | 444,391 | | 7,296,900 |
| QLogic Corp. † | 11,478 | | 236,217 |
| Stoneridge, Inc. † | 51,403 | | 365,989 |
| Synopsys, Inc. † | 195,860 | | 4,408,809 |
34
| COMMON STOCKS (98.8%)* continued | | | |
|
| | Shares | | Value |
|
| Electronics continued | | | |
| TriQuint Semiconductor, Inc. † (S) | 522,200 | $ | 2,349,900 |
| TTM Technologies, Inc. † | 132,954 | | 1,615,391 |
| Varian, Inc. † | 7,740 | | 362,929 |
| Zoran Corp. † (S) | 91,800 | | 1,277,856 |
| | | | 23,358,633 |
|
| |
| Energy (2.3%) | | | |
| Grey Wolf, Inc. † (S) | 40,300 | | 282,100 |
| Lone Star Technologies, Inc. † | 113,236 | | 5,467,034 |
| NATCO Group, Inc. † | 2,483 | | 82,287 |
| Parker Drilling Co. † | 2,121,694 | | 17,376,674 |
| Tidewater, Inc. | 3,328 | | 165,501 |
| Trico Marine Services, Inc. † | 77,550 | | 2,644,455 |
| | | | 26,018,051 |
|
| |
| Financial (1.7%) | | | |
| Advanta Corp. Class B | 10,790 | | 423,400 |
| Asset Acceptance Capital Corp. † (S) | 36,962 | | 658,293 |
| Independent Bank Corp. | 33,831 | | 808,561 |
| Radian Group, Inc. (S) | 320,368 | | 17,075,614 |
| | | | 18,965,868 |
|
| |
| Food (—%) | | | |
| American Italian Pasta Co. Class A † (S) | 59,300 | | 444,157 |
|
| |
| Forest Products and Packaging (1.1%) | | | |
| Albany International Corp. (S) | 37,674 | | 1,266,223 |
| Graphic Packaging Corp. † | 59,551 | | 232,249 |
| Louisiana-Pacific Corp. (S) | 224,991 | | 4,450,322 |
| Neenah Paper, Inc. | 9,400 | | 346,202 |
| Universal Forest Products, Inc. | 125,140 | | 5,678,853 |
| | | | 11,973,849 |
|
| |
| Gaming & Lottery (—%) | | | |
| Dover Downs Gaming & Entertainment, Inc. (S) | 33,300 | | 471,861 |
|
| |
| Health Care Services (1.7%) | | | |
| American Dental Partners, Inc. † (S) | 52,098 | | 1,015,911 |
| AMICAS, Inc. † | 96,342 | | 303,477 |
| AMN Healthcare Services, Inc. † (S) | 6,455 | | 163,247 |
| Healthways, Inc. † (S) | 8,330 | | 352,776 |
| Lincare Holdings, Inc. † | 315,000 | | 10,571,400 |
| Manor Care, Inc. | 63,925 | | 3,067,761 |
| Molina Healthcare, Inc. † (S) | 1,960 | | 76,891 |
| Odyssey Healthcare, Inc. † | 63,998 | | 847,974 |
| Pediatrix Medical Group, Inc. † | 6,290 | | 282,610 |
| Sierra Health Services, Inc. † (S) | 70,500 | | 2,413,920 |
| Universal Health Services, Inc. Class B | 6,340 | | 335,703 |
| WellCare Health Plans, Inc. † | 1,530 | | 89,888 |
| | | | 19,521,558 |
35
| COMMON STOCKS (98.8%)* continued | | | |
|
| | Shares | | Value |
|
| Homebuilding (—%) | | | |
| NVR, Inc. † (S) | 170 | $ | 95,455 |
| Winnebago Industries, Inc. | 4,100 | | 136,489 |
| | | | 231,944 |
|
| |
| Household Furniture and Appliances (0.5%) | | | |
| American Woodmark Corp. (S) | 75,400 | | 2,789,046 |
| Conn’s, Inc. † (S) | 4,985 | | 119,740 |
| Furniture Brands International, Inc. (S) | 9,300 | | 172,980 |
| Kimball International, Inc. Class B | 51,386 | | 1,276,942 |
| Select Comfort Corp. † (S) | 42,028 | | 898,559 |
| Tempur-Pedic International, Inc. † (S) | 6,500 | | 128,310 |
| | | | 5,385,577 |
|
| |
| Insurance (10.2%) | | | |
| American Financial Group, Inc. | 4,955 | | 237,146 |
| American Physicians Capital, Inc. † | 14,813 | | 810,419 |
| AmerUs Group Co. | 324,371 | | 22,212,926 |
| CNA Surety Corp. † | 52,513 | | 1,068,114 |
| Commerce Group, Inc. | 142,550 | | 4,219,480 |
| Delphi Financial Group Class A (S) | 98,250 | | 3,856,313 |
| Direct General Corp. | 17,913 | | 236,272 |
| FBL Financial Group, Inc. Class A | 5,400 | | 190,890 |
| Harleysville Group, Inc. | 75,300 | | 2,716,824 |
| HCC Insurance Holdings, Inc. (S) | 624,326 | | 21,014,813 |
| Hilb, Rogal & Hamilton Co. | 54,299 | | 2,167,616 |
| Infinity Property & Casualty Corp. | 53,038 | | 2,281,695 |
| Mercury General Corp. | 897 | | 46,438 |
| Midland Co. (The) (S) | 15,843 | | 740,502 |
| National Interstate Corp. (S) | 23,643 | | 666,260 |
| Odyssey Re Holdings Corp. (S) | 46,900 | | 1,662,605 |
| Ohio Casualty Corp. | 9,438 | | 258,884 |
| Presidential Life Corp. (S) | 4,400 | | 103,840 |
| Safety Insurance Group, Inc. (S) | 14,093 | | 704,791 |
| Selective Insurance Group (S) | 80,686 | | 4,457,902 |
| Stancorp Financial Group | 89,374 | | 4,083,498 |
| State Auto Financial Corp. | 2,625 | | 84,341 |
| Triad Guaranty, Inc. † (S) | 136,872 | | 7,050,277 |
| W.R. Berkley Corp. | 618,987 | | 22,815,861 |
| Zenith National Insurance Corp. (S) | 211,707 | | 9,848,610 |
| | | | 113,536,317 |
|
| |
| Investment Banking/Brokerage (1.0%) | | | |
| A.G. Edwards, Inc. | 9,396 | | 536,042 |
| Affiliated Managers Group † (S) | 6,420 | | 642,899 |
| Eaton Vance Corp. (S) | 178,454 | | 5,539,212 |
| IndyMac Bancorp, Inc. (S) | 88,800 | | 4,035,960 |
| | | | 10,754,113 |
36
| COMMON STOCKS (98.8%)* continued | | | |
|
| | Shares | | Value |
|
| Leisure (—%) | | | |
| K2, Inc. † | 11,700 | $ | 159,822 |
| Polaris Industries, Inc. (S) | 7,033 | | 301,153 |
| Thor Industries, Inc. (S) | 1,700 | | 74,494 |
| | | | 535,469 |
|
| |
| Machinery (1.8%) | | | |
| Applied Industrial Technologies, Inc. (S) | 65,943 | | 1,895,202 |
| Cascade Corp. (S) | 165,559 | | 8,476,621 |
| Kennametal, Inc. (S) | 2,530 | | 156,126 |
| Manitowoc Co., Inc. (The) (S) | 113,100 | | 6,206,928 |
| Regal-Beloit Corp. | 38,400 | | 1,898,880 |
| Terex Corp. † | 5,376 | | 278,262 |
| Wabtec Corp. | 39,900 | | 1,252,461 |
| | | | 20,164,480 |
|
| |
| Manufacturing (0.8%) | | | |
| Graco, Inc. (S) | 17,600 | | 717,376 |
| IDEX Corp. | 4,730 | | 221,837 |
| Myers Industries, Inc. | 9,600 | | 173,952 |
| Teleflex, Inc. | 131,910 | | 8,204,802 |
| | | | 9,317,967 |
|
| |
| Medical Technology (1.4%) | | | |
| Bausch & Lomb, Inc. | 30,707 | | 1,644,053 |
| Edwards Lifesciences Corp. † (S) | 10,120 | | 434,452 |
| Hillenbrand Industries, Inc. | 74,576 | | 4,376,120 |
| Immucor, Inc. † (S) | 291,831 | | 8,034,107 |
| LCA-Vision, Inc. (S) | 3,200 | | 112,416 |
| Medical Action Industries, Inc. † (S) | 12,595 | | 334,649 |
| Mentor Corp. (S) | 8,249 | | 386,053 |
| PerkinElmer, Inc. | 14,470 | | 309,079 |
| Steris Corp. | 1,424 | | 34,703 |
| | | | 15,665,632 |
|
| |
| Metal Fabricators (—%) | | | |
| USEC, Inc. (S) | 37,689 | | 420,609 |
|
| |
| Metals (4.2%) | | | |
| A.M. Castle & Co. | 62,787 | | 2,099,597 |
| AK Steel Holding Corp. † (S) | 496,045 | | 7,405,952 |
| Cleveland-Cliffs, Inc. (S) | 3,530 | | 149,284 |
| Quanex Corp. (S) | 417,688 | | 13,996,725 |
| Shiloh Industries, Inc. † (S) | 6,400 | | 94,976 |
| Steel Dynamics, Inc. (S) | 391,792 | | 23,550,617 |
| | | | 47,297,151 |
37
| COMMON STOCKS (98.8%)* continued | | | |
|
| | Shares | | Value |
|
| Natural Gas Utilities (0.1%) | | | |
| Atmos Energy Corp. | 19,821 | $ | 609,099 |
| Energen Corp. (S) | 6,416 | | 274,733 |
| MDU Resources Group, Inc. | 5,317 | | 136,541 |
| National Fuel Gas Co. (S) | 3,804 | | 142,270 |
| | | | 1,162,643 |
|
| |
| Office Equipment & Supplies (0.3%) | | | |
| Herman Miller, Inc. (S) | 10,310 | | 353,427 |
| John H. Harland Co. (S) | 3,749 | | 153,297 |
| Steelcase, Inc. | 156,957 | | 2,600,777 |
| | | | 3,107,501 |
|
| |
| Oil & Gas (4.0%) | | | |
| Bois d’Arc Energy, Inc. † (S) | 9,300 | | 149,544 |
| Callon Petroleum Co. † (S) | 66,285 | | 1,019,463 |
| Cimarex Energy Co. (S) | 3,770 | | 135,795 |
| Comstock Resources, Inc. † | 4,135 | | 115,367 |
| Giant Industries, Inc. † (S) | 231,300 | | 18,730,674 |
| Harvest Natural Resources, Inc. † | 180,556 | | 2,005,977 |
| Houston Exploration Co. † (S) | 1,300 | | 70,408 |
| Meridian Resource Corp. † | 100,220 | | 336,739 |
| Penn Virginia Corp. | 2,200 | | 157,410 |
| Plains Exploration & Production Co. † | 6,386 | | 270,064 |
| Pogo Producing Co. | 6,691 | | 299,422 |
| St. Mary Land & Exploration Co. | 181,206 | | 6,757,172 |
| Swift Energy Co. † | 2,630 | | 122,874 |
| Tesoro Corp. (S) | 3,038 | | 194,250 |
| Todco Class A † (S) | 431,492 | | 14,726,822 |
| | | | 45,091,981 |
|
| |
| Pharmaceuticals (5.4%) | | | |
| Alpharma, Inc. Class A | 382,705 | | 8,446,299 |
| Bradley Pharmaceuticals, Inc. † (S) | 17,980 | | 312,852 |
| Endo Pharmaceuticals Holdings, Inc. † | 96,236 | | 2,746,575 |
| Enzon, Inc. † (S) | 88,297 | | 755,822 |
| King Pharmaceuticals, Inc. † (S) | 828,646 | | 13,863,248 |
| Medicis Pharmaceutical Corp. Class A (S) | 88,641 | | 3,105,981 |
| Mylan Laboratories, Inc. | 332,238 | | 6,810,879 |
| New River Pharmaceuticals, Inc. † (S) | 3,310 | | 168,347 |
| Perrigo Co. | 6,730 | | 120,400 |
| Sciele Pharma, Inc. † (S) | 46,200 | | 1,007,622 |
| Watson Pharmaceuticals, Inc. † | 847,374 | | 22,802,834 |
| | | | 60,140,859 |
|
| |
| Publishing (0.1%) | | | |
| Journal Register Co. | 101,700 | | 801,396 |
| Lee Enterprises, Inc. (S) | 12,100 | | 345,213 |
| | | | 1,146,609 |
38
| COMMON STOCKS (98.8%)* continued | | | |
|
| | Shares | | Value |
|
| Railroads (0.1%) | | | |
| GATX Corp. | 19,462 | $ | 847,959 |
|
| |
| Real Estate (7.9%) | | | |
| Anthracite Capital, Inc. (R) | 226,043 | | 3,236,936 |
| Apartment Investment & Management Co. Class A (R) | 1,600 | | 91,712 |
| CB Richard Ellis Group, Inc. Class A † | 32,896 | | 987,867 |
| CBL & Associates Properties (R) (S) | 419,046 | | 18,324,882 |
| Douglas Emmett, Inc. † (R) (S) | 3,632 | | 86,623 |
| Equity Inns, Inc. (R) (S) | 667,060 | | 11,193,267 |
| FelCor Lodging Trust, Inc. (R) (S) | 337,300 | | 7,002,348 |
| First Industrial Realty Trust (R) (S) | 16,116 | | 740,853 |
| Highland Hospitality Corp. (R) | 708,748 | | 9,794,897 |
| Hospitality Properties Trust (R) (S) | 190,854 | | 9,248,785 |
| Innkeepers USA Trust (R) (S) | 63,056 | | 1,081,410 |
| Kite Realty Group Trust (R) | 6,880 | | 126,179 |
| LaSalle Hotel Properties (R) | 6,522 | | 275,555 |
| Lexington Corporate Properties Trust (R) (S) | 16,217 | | 345,422 |
| LTC Properties, Inc. (R) (S) | 104,036 | | 2,819,376 |
| Macerich Co. (The) (R) | 545 | | 43,791 |
| Medical Properties Trust, Inc. (R) (S) | 91,300 | | 1,239,854 |
| Mid-America Apartment Communities, Inc. (R) (S) | 4,380 | | 278,787 |
| National Health Investors, Inc. (R) (S) | 223,538 | | 7,184,511 |
| National Retail Properties, Inc. (R) (S) | 95,944 | | 2,155,862 |
| Nationwide Health Properties, Inc. (R) (S) | 96,102 | | 2,761,971 |
| NorthStar Realty Finance Corp. (R) | 152,000 | | 2,302,800 |
| Omega Healthcare Investors, Inc. (R) | 183,300 | | 3,094,104 |
| RAIT Investment Trust (R) (S) | 70,328 | | 2,114,060 |
| Resource Capital Corp. | 410 | | 6,753 |
| Saul Centers, Inc. (R) (S) | 4,730 | | 229,878 |
| SL Green Realty Corp. (R) (S) | 2,482 | | 300,446 |
| Tanger Factory Outlet Centers (R) (S) | 7,823 | | 291,798 |
| Taubman Centers, Inc. (R) | 4,215 | | 197,684 |
| Thornburg Mortgage, Inc. (R) (S) | 1,300 | | 33,384 |
| Ventas, Inc. (R) (S) | 5,879 | | 229,163 |
| | | | 87,820,958 |
|
| |
| Regional Bells (0.1%) | | | |
| Cincinnati Bell, Inc. † (S) | 204,500 | | 959,105 |
|
| |
| Restaurants (0.9%) | | | |
| Denny’s Corp. † | 42,492 | | 180,591 |
| Domino’s Pizza, Inc. (S) | 331,777 | | 9,017,699 |
| Luby’s, Inc. † | 68,704 | | 687,727 |
| | | | 9,886,017 |
|
| |
| Retail (8.0%) | | | |
| American Eagle Outfitters, Inc. (S) | 3,360 | | 153,888 |
| Blair Corp. | 4,953 | | 156,020 |
| Books-A-Million, Inc. (S) | 67,400 | | 1,347,326 |
| Brown Shoe Co., Inc. | 73,600 | | 2,867,456 |
39
| COMMON STOCKS (98.8%)* continued | | | |
|
| | Shares | | Value |
|
| Retail continued | | | |
| Buckle, Inc. (The) (S) | 56,172 | $ | 2,223,288 |
| Cato Corp. (The) Class A | 353,828 | | 8,099,123 |
| CSK Auto Corp. † | 162,115 | | 2,528,994 |
| Dollar Tree Stores, Inc. † | 179,350 | | 5,575,992 |
| Ingles Markets, Inc. Class A | 20,023 | | 569,454 |
| NBTY, Inc. † | 9,200 | | 255,944 |
| Payless ShoeSource, Inc. † | 317,105 | | 8,482,559 |
| Perry Ellis International, Inc. † | 3,480 | | 127,229 |
| Rent-A-Center, Inc. † (S) | 415,942 | | 11,962,492 |
| Systemax, Inc. † (S) | 56,092 | | 609,720 |
| Timberland Co. (The) Class A † (S) | 312,844 | | 9,025,549 |
| Toro Co. (The) | 371,911 | | 16,051,679 |
| Tween Brands, Inc. † | 30,970 | | 1,295,165 |
| USANA Health Sciences, Inc. † (S) | 9,000 | | 404,280 |
| Wilsons The Leather Experts, Inc. † | 13,525 | | 36,382 |
| Wolverine World Wide, Inc. (S) | 609,637 | | 17,289,305 |
| | | | 89,061,845 |
|
| |
| Schools (1.3%) | | | |
| Career Education Corp. † | 643,520 | | 14,337,626 |
| Corinthian Colleges, Inc. † | 20,500 | | 251,125 |
| ITT Educational Services, Inc. † | 1,030 | | 71,019 |
| | | | 14,659,770 |
|
| |
| Semiconductor (0.2%) | | | |
| Advanced Energy Industries, Inc. † | 55,055 | | 865,465 |
| Asyst Technologies, Inc. † | 47,859 | | 355,592 |
| ChipMOS TECHNOLOGIES Bermuda, Ltd. (Taiwan) † (S) | 19,416 | | 113,389 |
| Micrel, Inc. † (S) | 16,350 | | 182,466 |
| Novellus Systems, Inc. † (S) | 5,750 | | 158,988 |
| | | | 1,675,900 |
|
| |
| Shipping (1.0%) | | | |
| Arkansas Best Corp. (S) | 66,400 | | 2,721,072 |
| Con-way, Inc. | 8,450 | | 398,587 |
| General Maritime Corp. (S) | 7,480 | | 273,319 |
| Overseas Shipholding Group (S) | 115,627 | | 7,232,469 |
| Ryder System, Inc. (S) | 3,214 | | 169,217 |
| Wabash National Corp. (S) | 6,523 | | 91,518 |
| | | | 10,886,182 |
|
| |
| Software (6.4%) | | | |
| BMC Software, Inc. † # | 542,555 | | 16,444,842 |
| Citrix Systems, Inc. † | 71,203 | | 2,102,625 |
| Hyperion Solutions Corp. † | 519,521 | | 19,430,085 |
| MicroStrategy, Inc. † (S) | 220,847 | | 26,358,089 |
| Red Hat, Inc. † (S) | 6,530 | | 106,961 |
| SYNNEX Corp. † | 63,200 | | 1,418,840 |
| Websense, Inc. † | 218,872 | | 5,990,527 |
| | | | 71,851,969 |
40
| COMMON STOCKS (98.8%)* continued | | | |
|
| | Shares | | Value |
|
| Staffing (0.2%) | | | |
| Heidrick & Struggles International, Inc. † (S) | 8,260 | $ | 337,586 |
| Hewitt Associates, Inc. Class A † | 80,800 | | 2,022,424 |
| | | | 2,360,010 |
|
| |
| Technology (0.1%) | | | |
| Amkor Technologies, Inc. † (S) | 73,100 | | 505,121 |
| ON Semiconductor Corp. † (S) | 29,300 | | 182,246 |
| | | | 687,367 |
|
| |
| Technology Services (2.6%) | | | |
| Acxiom Corp. (S) | 445,070 | | 11,015,483 |
| BISYS Group, Inc. (The) † | 106,200 | | 1,172,448 |
| Global Payments, Inc. | 5,609 | | 245,169 |
| Sohu.com, Inc. (China) † (S) | 54,600 | | 1,247,064 |
| SonicWall, Inc. † | 161,406 | | 1,694,763 |
| Tyler Technologies, Inc. † (S) | 84,600 | | 1,200,474 |
| United Online, Inc. (S) | 960,697 | | 12,988,623 |
| | | | 29,564,024 |
|
| |
| Telecommunications (2.6%) | | | |
| ADTRAN, Inc. (S) | 148,010 | | 3,424,951 |
| Brightpoint, Inc. † | 16,440 | | 198,924 |
| CenturyTel, Inc. (S) | 369,900 | | 14,884,776 |
| Commonwealth Telephone Enterprises, Inc. | 1,392 | | 58,269 |
| j2 Global Communications, Inc. † (S) | 117,000 | | 3,210,480 |
| NeuStar, Inc. Class A † (S) | 3,900 | | 113,958 |
| Premiere Global Services, Inc. † | 26,009 | | 216,395 |
| Syniverse Holdings, Inc. † | 14,860 | | 219,185 |
| USA Mobility, Inc. (S) | 95,800 | | 2,431,404 |
| UTStarcom, Inc. † (S) | 376,664 | | 4,056,671 |
| | | | 28,815,013 |
|
| |
| Textiles (1.5%) | | | |
| Columbia Sportswear Co. (S) | 196,336 | | 10,963,402 |
| Jones Apparel Group, Inc. | 42,175 | | 1,408,645 |
| Kellwood Co. (S) | 153,625 | | 4,700,925 |
| | | | 17,072,972 |
|
| |
| Tobacco (—%) | | | |
| Alliance One International, Inc. † (S) | 89,600 | | 431,872 |
|
| |
| Toys (2.3%) | | | |
| Hasbro, Inc. | 981,939 | | 25,451,859 |
|
| |
| Transportation Services (0.3%) | | | |
| HUB Group, Inc. Class A † (S) | 89,934 | | 2,442,607 |
| Pacer International, Inc. | 12,916 | | 396,392 |
| | | | 2,838,999 |
41
| COMMON STOCKS (98.8%)* continued | | | |
|
| | Shares | | Value |
|
| Trucks & Parts (2.1%) | | | |
| Autoliv, Inc. (Sweden) | 405,624 | $ | 23,067,837 |
| Noble International, Ltd. (S) | 41,195 | | 733,683 |
| | | | 23,801,520 |
|
| Waste Management (—%) | | | |
| Darling International, Inc. † | 21,567 | | 92,307 |
|
| Total common stocks (cost $937,867,969) | | $ | 1,104,462,528 |
|
| |
| SHORT-TERM INVESTMENTS (19.9%)* | | | |
|
| | Principal amount/shares | | Value |
|
| Short-term investments held as collateral for loaned | | | |
| securities with yields ranging from 5.27% to 5.44% | | | |
| and due dates ranging from November 1, 2006 | | | |
| to December 22, 2006 (d) | $ 215,492,275 | $ | 214,896,136 |
| Putnam Prime Money Market Fund (e) | 7,445,210 | | 7,445,210 |
|
| Total short-term investments (cost $222,341,346) | | $ | 222,341,346 |
|
| |
| TOTAL INVESTMENTS | | | |
| Total investments (cost $1,160,209,315) | | $ | 1,326,803,874 |
* Percentages indicated are based on net assets of $1,117,703,402.
† Non-income-producing security.
# A portion of this security was pledged and segregated with the custodian to cover margin requirements for futures contracts at October 31, 2006.
(d) See Note 1 to the financial statements.
(e) See Note 5 to the financial statements regarding investments in Putnam Prime Money Market Fund.
(R) Real Estate Investment Trust.
(S) Securities on loan, in part or in entirety, at October 31, 2006.
At October 31, 2006, liquid assets totaling $9,436,770 have been designated as collateral for open futures contracts.
| FUTURES CONTRACTS OUTSTANDING at 10/31/06 (Unaudited) | | |
|
| | Number of | | Expiration | Unrealized |
| | contracts | Value | date | appreciation |
|
| Russell 2000 Index Mini (Long) | 67 | $5,165,700 | Dec-06 | $15,946 |
| S&P MidCap 400 Index E-Mini (Long) | 41 | 3,233,670 | Dec-06 | 533 |
| S&P 500 Index (Long) | 3 | 1,037,400 | Dec-06 | 889 |
|
| Total | | | | $17,368 |
The accompanying notes are an integral part of these financial statements.
42
| Statement of assets and liabilities 10/31/06 (Unaudited) | |
|
| |
| ASSETS | |
| Investment in securities, at value, including $209,742,822 of securities on loan (Note 1): | |
| Unaffiliated issuers (identified cost $1,152,764,105) | $1,319,358,664 |
| Affiliated issuers (identified cost $7,445,210) (Note 5) | 7,445,210 |
|
| Cash | 76 |
|
| Dividends, interest and other receivables | 898,037 |
|
| Receivable for shares of the fund sold | 752,631 |
|
| Receivable for securities sold | 11,672,310 |
|
| Receivable for variation margin (Note 1) | 17,368 |
|
| Total assets | 1,340,144,296 |
|
| |
| LIABILITIES | |
| Payable for securities purchased | 3,324,065 |
|
| Payable for shares of the fund repurchased | 1,542,961 |
|
| Payable for compensation of Manager (Notes 2 and 5) | 1,608,845 |
|
| Payable for investor servicing and custodian fees (Note 2) | 521,414 |
|
| Payable for Trustee compensation and expenses (Note 2) | 89,816 |
|
| Payable for administrative services (Note 2) | 3,953 |
|
| Payable for distribution fees (Note 2) | 300,152 |
|
| Collateral on securities loaned, at value (Note 1) | 214,896,136 |
|
| Other accrued expenses | 153,552 |
|
| Total liabilities | 222,440,894 |
|
| Net assets | $1,117,703,402 |
|
| |
| REPRESENTED BY | |
| Paid-in capital (Unlimited shares authorized) (Notes 1 and 4) | $824,880,887 |
|
| Undistributed net investment income (Note 1) | 406,964 |
|
| Accumulated net realized gain on investments (Note 1) | 125,803,624 |
|
| Net unrealized appreciation of investments | 166,611,927 |
|
| Total — Representing net assets applicable to capital shares outstanding | $1,117,703,402 |
| |
| (Continued on next page) | |
43
| Statement of assets and liabilities (Continued) | |
|
| |
| COMPUTATION OF NET ASSET VALUE AND OFFERING PRICE | |
|
| Net asset value and redemption price per class A share | |
| ($476,422,972 divided by 37,241,832 shares) | $12.79 |
|
| Offering price per class A share | |
| (100/94.75 of $12.79)* | $13.50 |
|
| Net asset value and offering price per class B share | |
| ($189,156,618 divided by 15,805,483 shares)** | $11.97 |
|
| Net asset value and offering price per class C share | |
| ($32,775,615 divided by 2,713,089 shares)** | $12.08 |
|
| Net asset value and redemption price per class M share | |
| ($15,600,856 divided by 1,275,735 shares) | $12.23 |
|
| Offering price per class M share | |
| (100/96.75 of $12.23)* | $12.64 |
|
| Net asset value, offering price and redemption price per class R share | |
| ($1,737,140 divided by 137,114 shares) | $12.67 |
|
| Net asset value, offering price and redemption price per class Y share | |
| ($402,010,201 divided by 30,899,953 shares) | $13.01 |
* On single retail sales of less than $50,000. On sales of $50,000 or more the offering price is reduced.
** Redemption price per share is equal to net asset value less any applicable contingent deferred sales charge.
The accompanying notes are an integral part of these financial statements.
44
| Statement of operations Six months ended 10/31/06 (Unaudited) | |
|
| |
| INVESTMENT INCOME | |
|
| Dividends | $ 6,340,307 |
|
| Interest (including interest income of $519,326 from investments in affiliated issuers) (Note 5) | 524,507 |
|
| Securities lending | 458,299 |
|
| Total investment income | 7,323,113 |
|
| |
| EXPENSES | |
| Compensation of Manager (Note 2) | 3,231,538 |
|
| Investor servicing fees (Note 2) | 1,713,738 |
|
| Custodian fees (Note 2) | 185,932 |
|
| Trustee compensation and expenses (Note 2) | 25,085 |
|
| Administrative services (Note 2) | 12,513 |
|
| Distribution fees — Class A (Note 2) | 566,725 |
|
| Distribution fees — Class B (Note 2) | 1,007,129 |
|
| Distribution fees — Class C (Note 2) | 160,476 |
|
| Distribution fees — Class M (Note 2) | 58,812 |
|
| Distribution fees — Class R (Note 2) | 3,748 |
|
| Other | 143,760 |
|
| Non-recurring costs (Notes 2 and 6) | 6,182 |
|
| Costs assumed by Manager (Notes 2 and 6) | (6,182) |
|
| Fees waived and reimbursed by Manager (Note 5) | (12,142) |
|
| Total expenses | 7,097,314 |
|
| Expense reduction (Note 2) | (175,516) |
|
| Net expenses | 6,921,798 |
|
| Net investment income | 401,315 |
|
| Net realized gain on investments (Notes 1 and 3) | 59,914,058 |
|
| Net realized gain on futures contracts (Note 1) | 774,635 |
|
| Net unrealized depreciation of investments and futures contracts during the period | (45,645,092) |
|
| Net gain on investments | 15,043,601 |
|
| Net increase in net assets resulting from operations | $ 15,444,916 |
The accompanying notes are an integral part of these financial statements.
45
| Statement of changes in net assets | | | |
|
| |
| INCREASE (DECREASE) IN NET ASSETS | | | | |
|
| | | Six months ended | | Year ended |
| | | 10/31/06* | | 4/30/06 |
|
| Operations: | | | | |
| Net investment income | $ | 401,315 | | $ | 279,740 |
|
| Net realized gain on investments | | 60,688,693 | | 162,613,915 |
|
| Net unrealized appreciation (depreciation) of investments | | (45,645,092) | | 152,840,033 |
|
| Net increase in net assets resulting from operations | | 15,444,916 | | 315,733,688 |
|
| Distributions to shareholders: (Note 1) | | | | |
|
| From ordinary income | | | | |
|
| Net investment income | | | | |
|
| Class A | | — | | (2,378,814) |
|
| Class M | | — | | (27,093) |
|
| Class R | | — | | (4,731) |
|
| Class Y | | — | | (2,850,412) |
|
| Net realized short-term gain on investments | | | | |
|
| Class A | | — | | (8,473,439) |
|
| Class B | | — | | (4,691,896) |
|
| Class C | | — | | (676,494) |
|
| Class M | | — | | (391,336) |
|
| Class R | | — | | (18,089) |
|
| Class Y | | — | | (7,058,166) |
|
| From net realized long-term gain on investments | | | | |
|
| Class A | | — | | (53,969,291) |
|
| Class B | | — | | (29,883,772) |
|
| Class C | | — | | (4,308,744) |
|
| Class M | | — | | (2,492,510) |
|
| Class R | | — | | (115,216) |
|
| Class Y | | — | | (44,955,087) |
|
| Redemption fees (Note 1) | | 1,036 | | 4,906 |
|
| Increase (decrease) from capital share transactions (Note 4) | | (46,043,678) | | 28,884,858 |
|
| Total increase (decrease) in net assets | | (30,597,726) | | 182,328,362 |
|
| |
| NET ASSETS | | | | |
| Beginning of period | | 1,148,301,128 | | 965,972,766 |
|
| End of period (including undistributed net investment | | | | |
| income of $406,964 and $5,649, respectively) | $ | 1,117,703,402 | | $ | 1,148,301,128 |
* Unaudited
The accompanying notes are an integral part of these financial statements.
46
This page left blank intentionally.
47
| Financial highlights | (For a common share outstanding throughout the period) | | | | | | | | | |
|
| |
| INVESTMENT OPERATIONS: | | | | | LESS DISTRIBUTIONS: | | | | | | RATIOS AND SUPPLEMENTAL DATA: | |
|
| | | | | Net | | | | | | | | Total | | | Ratio of net | |
| | Net asset | | | realized and | Total | From | From | From | | | Net asset | return | Net | Ratio of | investment | |
| | value, | Net | | unrealized | from | net | net realized | return | | | value, | at net | assets, | expenses to | income (loss) | Portfolio |
| | beginning | investment | | gain (loss) on | investment | investment | gain on | of | Total | Redemption | end | asset | end of period | average net | to average | turnover |
| Period ended | of period | income (loss)(a) | | investments | operations | income | investments | capital | distributions | fees | of period | value (%)(b) | (in thousands) | assets (%)(c) | net assets (%) | (%) |
|
| CLASS A | | | | | | | | | | | | | | | | |
| October 31, 2006** | $12.60 | .01(d) | .18 | .19 | — | — | — | — | —(e) | $12.79 | 1.51* | $476,423 | .62* (d) | .08* (d) | 32.81* |
| April 30, 2006 | 10.97 | .02(d,g) | 3.60 | 3.62 | (.07) | (1.92) | — | (1.99) | —(e) | 12.60 | 34.85 | 476,325 | 1.20(d,g) | .13(d,g) | 60.27 |
| April 30, 2005 | 10.16 | .06(d,f) | .75 | .81 | — | — | — | — | —(e) | 10.97 | 7.97 | 378,942 | 1.23(d) | .51(d,f) | 70.94 |
| April 30, 2004 | 7.74 | .01 | | 2.41 | 2.42 | — | — | — | — | — | 10.16 | 31.27 | 397,300 | 1.19 | .10 | 134.62 |
| April 30, 2003 | 10.67 | —(e) | (2.78) | (2.78) | — | (.15) | —(e) | (.15) | — | 7.74 | (26.09) | 378,331 | 1.17 | (.01) | 90.52 |
| April 30, 2002 | 10.18 | (.03) | | .62 | .59 | — | (.10) | — | (.10) | — | 10.67 | 5.82 | 375,990 | 1.10 | (.31) | 119.64 |
|
| |
| CLASS B | | | | | | | | | | | | | | | | |
| October 31, 2006** | $11.83 | (.03)(d) | .17 | .14 | — | — | — | — | —(e) | $11.97 | 1.18* | $189,157 | .99* (d) | (.30)* (d) | 32.81* |
| April 30, 2006 | 10.42 | (.07)(d,g) | 3.40 | 3.33 | — | (1.92) | — | (1.92) | —(e) | 11.83 | 33.73 | 228,590 | 1.95(d,g) | (.61)(d,g) | 60.27 |
| April 30, 2005 | 9.71 | (.02)(d,f) | .73 | .71 | — | — | — | — | —(e) | 10.42 | 7.31 | 218,327 | 1.98(d) | (.23)(d,f) | 70.94 |
| April 30, 2004 | 7.46 | (.06) | | 2.31 | 2.25 | — | — | — | — | — | 9.71 | 30.16 | 271,803 | 1.94 | (.64) | 134.62 |
| April 30, 2003 | 10.37 | (.06) | | (2.70) | (2.76) | — | (.15) | —(e) | (.15) | — | 7.46 | (26.65) | 272,147 | 1.92 | (.79) | 90.52 |
| April 30, 2002 | 9.96 | (.10) | | .61 | .51 | — | (.10) | — | (.10) | — | 10.37 | 5.14 | 360,549 | 1.85 | (1.06) | 119.64 |
|
| |
| CLASS C | | | | | | | | | | | | | | | | |
| October 31, 2006** | $11.94 | (.03)(d) | .17 | .14 | — | — | — | — | —(e) | $12.08 | 1.17* | $32,776 | .99* (d) | (.30)* (d) | 32.81* |
| April 30, 2006 | 10.50 | (.07)(d,g) | 3.43 | 3.36 | — | (1.92) | — | (1.92) | —(e) | 11.94 | 33.76 | 34,354 | 1.95(d,g) | (.62)(d,g) | 60.27 |
| April 30, 2005 | 9.79 | (.02)(d,f) | .73 | .71 | — | — | — | — | —(e) | 10.50 | 7.25 | 29,854 | 1.98(d) | (.23)(d,f) | 70.94 |
| April 30, 2004 | 7.52 | (.06) | | 2.33 | 2.27 | — | — | — | — | — | 9.79 | 30.19 | 35,584 | 1.94 | (.65) | 134.62 |
| April 30, 2003 | 10.45 | (.06) | | (2.72) | (2.78) | — | (.15) | —(e) | (.15) | — | 7.52 | (26.64) | 34,709 | 1.92 | (.76) | 90.52 |
| April 30, 2002 | 10.04 | (.10) | | .61 | .51 | — | (.10) | — | (.10) | — | 10.45 | 5.10 | 35,600 | 1.85 | (1.05) | 119.64 |
|
| |
| CLASS M | | | | | | | | | | | | | | | | |
| October 31, 2006** | $12.07 | (.02)(d) | .18 | .16 | — | — | — | — | —(e) | $12.23 | 1.33* | $15,601 | .87* (d) | (.18)* (d) | 32.81* |
| April 30, 2006 | 10.59 | (.04)(d,g) | 3.46 | 3.42 | (.02) | (1.92) | — | (1.94) | —(e) | 12.07 | 34.05 | 17,785 | 1.70(d,g) | (.36)(d,g) | 60.27 |
| April 30, 2005 | 9.85 | —(d,e,f) | .74 | .74 | — | — | — | — | —(e) | 10.59 | 7.51 | 15,802 | 1.73(d) | .02(d,f) | 70.94 |
| April 30, 2004 | 7.55 | (.04) | | 2.34 | 2.30 | — | — | — | — | — | 9.85 | 30.46 | 18,501 | 1.69 | (.40) | 134.62 |
| April 30, 2003 | 10.46 | (.06) | | (2.70) | (2.76) | — | (.15) | —(e) | (.15) | — | 7.55 | (26.42) | 15,789 | 1.67 | (.54) | 90.52 |
| April 30, 2002 | 10.02 | (.08) | | .62 | .54 | — | (.10) | — | (.10) | — | 10.46 | 5.41 | 22,563 | 1.60 | (.81) | 119.64 |
|
| |
| CLASS R | | | | | | | | | | | | | | | | |
| October 31, 2006** | $12.49 | (.01)(d) | .19 | .18 | — | — | — | — | —(e) | $12.67 | 1.44* | $1,737 | .74* (d) | (.05)* (d) | 32.81* |
| April 30, 2006 | 10.92 | (.03)(d,g) | 3.59 | 3.56 | (.07) | (1.92) | — | (1.99) | —(e) | 12.49 | 34.37 | 1,390 | 1.45(d,g) | (.21)(d,g) | 60.27 |
| April 30, 2005 | 10.13 | .02(d,f) | .77 | .79 | — | — | — | — | —(e) | 10.92 | 7.80 | 457 | 1.48(d) | .16(d,f) | 70.94 |
| April 30, 2004 | 7.74 | (.02) | | 2.41 | 2.39 | — | — | — | — | — | 10.13 | 30.88 | 51 | 1.44 | (.18) | 134.62 |
| April 30, 2003† | 7.67 | (.01) | | .08 | .07 | — | — | — | — | — | 7.74 | .91* | 1 | .39* | (.07)* | 90.52 |
|
| |
| CLASS Y | | | | | | | | | | | | | | | | |
| October 31, 2006** | $12.79 | .02(d) | .20 | .22 | — | — | — | — | —(e) | $13.01 | 1.72* | $402,010 | .49* (d) | .20* (d) | 32.81* |
| April 30, 2006 | 11.12 | .05(d,g) | 3.65 | 3.70 | (.11) | (1.92) | — | (2.03) | —(e) | 12.79 | 35.06 | 389,857 | .95(d,g) | .38(d,g) | 60.27 |
| April 30, 2005 | 10.26 | .08(d,f) | .78 | .86 | — | — | — | — | —(e) | 11.12 | 8.38 | 322,592 | .98(d) | .76(d,f) | 70.94 |
| April 30, 2004 | 7.81 | .03 | | 2.42 | 2.45 | — | — | — | — | — | 10.26 | 31.37 | 324,942 | .94 | .31 | 134.62 |
| April 30, 2003 | 10.73 | .02 | | (2.79) | (2.77) | — | (.15) | —(e) | (.15) | — | 7.81 | (25.85) | 233,163 | .92 | .24 | 90.52 |
| April 30, 2002 | 10.20 | (.01) | | .64 | .63 | — | (.10) | — | (.10) | — | 10.73 | 6.20 | 238,866 | .85 | (.05) | 119.64 |
|
See notes to financial highlights at the end of this section.
The accompanying notes are an integral part of these financial statements.
Financial highlights (Continued)
* Not annualized.
** Unaudited.
† For the period January 21, 2003 (commencement of operations) to April 30, 2003.
(a) Per share net investment income (loss) has been determined on the basis of the weighted average number of shares outstanding during the period.
(b) Total return assumes dividend reinvestment and does not reflect the effect of sales charges.
(c) Includes amounts paid through expense offset and brokerage service arrangements (Note 2).
(d) Reflects waivers of certain fund expenses in connection with investments in Putnam Prime Money Market Fund during the period. As a result of such waivers, the expenses of each class, as a percentage of its average net assets, reflect a reduction of the following amounts (Note 5):
| | 10/31/06 | 4/30/06 | 4/30/05 |
|
| Class A | <0.01% | <0.01% | <0.01% |
|
| Class B | <0.01 | <0.01 | <0.01 |
|
| Class C | <0.01 | <0.01 | <0.01 |
|
| Class M | <0.01 | <0.01 | <0.01 |
|
| Class R | <0.01 | <0.01 | <0.01 |
|
| Class Y | <0.01 | <0.01 | <0.01 |
|
(e) Amount represents less than $0.01 per share.
(f) Reflects a non-recurring accrual related to Putnam Management’s settlement with the SEC regarding brokerage allocation practices, which amounted to the following amounts:
| | | Percentage |
| | | of average |
| | Per share | net assets |
|
| Class A | <$0.01 | 0.03% |
|
| Class B | <0.01 | 0.03 |
|
| Class C | <0.01 | 0.03 |
|
| Class M | <0.01 | 0.03 |
|
| Class R | 0.01 | 0.09 |
|
| Class Y | <0.01 | 0.03 |
|
(g) Reflects a non-recurring reimbursement from Putnam Investments relating to the calculation of certain amounts paid by the fund to Putnam in previous years for transfer agent services, which amounted to less than $0.01 per share and 0.03% of average net assets for the period ended April 30, 2006 (Note 6).
The accompanying notes are an integral part of these financial statements.
50
Notes to financial statements 10/31/06 (Unaudited)
Note 1: Significant accounting policies
Putnam Capital Opportunities Fund (the “fund”) is a series of Putnam Investment Funds (the “trust”), a Massachusetts business trust, which is registered under the Investment Company Act of 1940, as amended, as a diversified, open-end management investment company. The fund invests primarily in common stocks of U.S. companies that Putnam Investment Management, LLC (“Putnam Management”), the fund’s manager, an indirect wholly-owned subsidiary of Putnam, LLC, believes have favorable investment potential, such as stocks of companies with stock prices that reflect a value lower than that which Putnam Management places on the company. Putnam Management may also consider other factors it believes will cause the stock price to rise.
The fund offers class A, class B, class C, class M, class R and class Y shares. Class A and class M shares are sold with a maximum front-end sales charge of 5.25% and 3.25%, respectively, and generally do not pay a contingent deferred sales charge. Class B shares, which convert to class A shares after approximately eight years, do not pay a front-end sales charge and are subject to a contingent deferred sales charge, if those shares are redeemed within six years of purchase. Class C shares have a one-year 1.00% contingent deferred sales charge and do not convert to class A shares. Class R shares, which are offered to qualified employee-benefit plans, are sold without a front-end sales charge or a contingent deferred sales charge. The expenses for class A, class B, class C, class M and class R shares may differ based on the distribution fee of each class, which is identified in Note 2. Class Y shares, which are sold at net asset value, are generally subject to the sa me expenses as class A, class B, class C, class M and class R shares, but do not bear a distribution fee. Class Y shares are sold to certain eligible purchasers including certain defined contribution plans (including corporate IRAs), bank trust departments, trust companies, other Putnam funds and products, and certain college savings plans.
Effective October 2, 2006, a 1.00% redemption fee may apply on any shares purchased on or after such date that are redeemed (either by selling or exchanging into another fund) within 90 days of purchase. The redemption fee is accounted for as an addition to paid-in-capital. Prior to October 2, 2006 a 2.00% redemption fee applied to any shares that were redeemed (either by selling or exchanging into another fund) within 5 days of purchase.
Investment income, realized and unrealized gains and losses and expenses of the fund are borne pro-rata based on the relative net assets of each class to the total net assets of the fund, except that each class bears expenses unique to that class (including the distribution fees applicable to such classes). Each class votes as a class only with respect to its own distribution plan or other matters on which a class vote is required by law or determined by the Trustees. Shares of each class would receive their pro-rata share of the net assets of the fund, if the fund were liquidated. In addition, the Trustees declare separate dividends on each class of shares.
In the normal course of business, the fund enters into contracts that may include agreements to indemnify another party under given circumstances. The fund’s maximum exposure under these arrangements is unknown as this would involve future claims that may be, but have not yet been, made against the fund. However, the fund expects the risk of material loss to be remote.
The following is a summary of significant accounting policies consistently followed by the fund in the preparation of its financial statements. The preparation of financial statements is in conformity with accounting principles generally accepted in the United States of America and requires management to make estimates and assumptions that affect the reported amounts of assets and liabilities in the financial statements and the reported amounts of increases and decreases in net assets from operations during the reporting period. Actual results could differ from those estimates.
51
A) Security valuation Investments for which market quotations are readily available are valued at the last reported sales price on their principal exchange, or official closing price for certain markets. If no sales are reported — as in the case of some securities traded over-the-counter — a security is valued at its last reported bid price. Many securities markets and exchanges outside the U.S. close prior to the close of the New York Stock Exchange and therefore the closing prices for securities in such markets or on such exchanges may not fully reflect events that occur after such close but before the close of the New York Stock Exchange. Accordingly, on certain days, the fund will fair value foreign equity securities taking into account multiple factors, including movements in the U.S. securities markets. The number of days on which fair value prices will be used will depend on market activity and it is possible that fair value prices will be used by the fund to a significant extent. Securities quoted in foreign currencies, if any, are translated into U.S. dollars at the current exchange rate. Certain investments, including certain restricted securities, are also valued at fair value following procedures approved by the Trustees. Such valuations and procedures are reviewed periodically by the Trustees. The fair value of securities is generally determined as the amount that the fund could reasonably expect to realize from an orderly disposition of such securities over a reasonable period of time. By its nature, a fair value price is a good faith estimate of the value of a security at a given point in time and does not reflect an actual market price, which may be different by a material amount.
B) Joint trading account Pursuant to an exemptive order from the Securities and Exchange Commission, the fund may transfer uninvested cash balances, including cash collateral received under security lending arrangements, into a joint trading account along with the cash of other registered investment companies and certain other accounts managed by Putnam Management. These balances may be invested in issues of high-grade short-term investments having maturities of up to 397 days for collateral received under security lending arrangements and up to 90 days for other cash investments.
C) Repurchase agreements The fund, or any joint trading account, through its custodian, receives delivery of the underlying securities, the market value of which at the time of purchase is required to be in an amount at least equal to the resale price, including accrued interest. Collateral for certain tri-party repurchase agreements is held at the counterparty’s custodian in a segregated account for the benefit of the fund and the counterparty. Putnam Management is responsible for determining that the value of these underlying securities is at all times at least equal to the resale price, including accrued interest.
D) Security transactions and related investment income Security transactions are recorded on the trade date (the date the order to buy or sell is executed). Gains or losses on securities sold are determined on the identified cost basis.
Interest income is recorded on the accrual basis. Dividend income, net of applicable withholding taxes, is recognized on the ex-dividend date except that certain dividends from foreign securities, if any, are recognized as soon as the fund is informed of the ex-dividend date. Non-cash dividends, if any, are recorded at the fair market value of the securities received. Dividends representing a return of capital or capital gains, if any, are reflected as a reduction of cost and/or as a realized gain.
E) Futures and options contracts The fund may use futures and options contracts to hedge against changes in the values of securities the fund owns or expects to purchase, or for other investment purposes. The fund may also write options on swaps or securities it owns or in which it may invest to increase its current returns.
The potential risk to the fund is that the change in value of futures and options contracts may not correspond to the change in value of the hedged instruments. In addition, losses may arise from changes in the value of the underlying instruments, if there is an illiquid secondary market for the
52
contracts, or if the counterparty to the contract is unable to perform. Risks may exceed amounts recognized on the statement of assets and liabilities. When the contract is closed, the fund records a realized gain or loss equal to the difference between the value of the contract at the time it was opened and the value at the time it was closed. Realized gains and losses on purchased options are included in realized gains and losses on investment securities. If a written call option is exercised, the premium originally received is recorded as an addition to sales proceeds. If a written put option is exercised, the premium originally received is recorded as a reduction to the cost of investments.
Futures contracts are valued at the quoted daily settlement prices established by the exchange on which they trade. The fund and the broker agree to exchange an amount of cash equal to the daily fluctuation in the value of the futures contract. Such receipts or payments are known as “variation margin.” Exchange traded options are valued at the last sale price or, if no sales are reported, the last bid price for purchased options and the last ask price for written options. Options traded over-the-counter are valued using prices supplied by dealers. Futures and written option contracts outstanding at period end, if any, are listed after the fund’s portfolio.
F) Securities lending The fund may lend securities, through its agents, to qualified borrowers in order to earn additional income. The loans are collateralized by cash and/or securities in an amount at least equal to the market value of the securities loaned. The market value of securities loaned is determined daily and any additional required collateral is allocated to the fund on the next business day. The risk of borrower default will be borne by the fund’s agents; the fund will bear the risk of loss with respect to the investment of the cash collateral. Income from securities lending is included in investment income on the statement of operations. At October 31, 2006, the value of securities loaned amounted to $209,742,822. The fund received cash collateral of $214,896,136 which is pooled with collateral of other Putnam funds into 42 issues of high grade short-term investments.
G) Federal taxes It is the policy of the fund to distribute all of its taxable income within the prescribed time and otherwise comply with the provisions of the Internal Revenue Code of 1986 (the “Code”) applicable to regulated investment companies. It is also the intention of the fund to distribute an amount sufficient to avoid imposition of any excise tax under Section 4982 of the Code, as amended. Therefore, no provision has been made for federal taxes on income, capital gains or unrealized appreciation on securities held nor for excise tax on income and capital gains.
The aggregate identified cost on a tax basis is $1,160,317,722, resulting in gross unrealized appreciation and depreciation of $213,147,719 and $46,661,567, respectively, or net unrealized appreciation of $166,486,152.
H) Distributions to shareholders Distributions to shareholders from net investment income are recorded by the fund on the ex-dividend date. Distributions from capital gains, if any, are recorded on the ex-dividend date and paid at least annually. The amount and character of income and gains to be distributed are determined in accordance with income tax regulations, which may differ from generally accepted accounting principles. Dividend sources are estimated at the time of declaration. Actual results may vary. Any non-taxable return of capital cannot be determined until final tax calculations are completed after the end of the fund’s fiscal year. Reclassifications are made to the fund’s capital accounts to reflect income and gains available for distribution (or available capital loss carryovers) under income tax regulations.
I) Expenses of the trust Expenses directly charged or attributable to any fund will be paid from the assets of that fund. Generally, expenses of the trust will be allocated among and charged to the assets of each fund on a basis that the Trustees deem fair and equitable, which may be based on the relative assets of each fund or the
53
nature of the services performed and relative applicability to each fund.
Note 2: Management fee, administrative services and other transactions
Putnam Management is paid for management and investment advisory services quarterly based on the average net assets of the fund. Such fee is based on the following annual rates: 0.65% of the first $500 million of average net assets, 0.55% of the next $500 million, 0.50% of the next $500 million, 0.45% of the next $5 billion, 0.425% of the next $5 billion, 0.405% of the next $5 billion, 0.39% of the next $5 billion and 0.38% thereafter.
Putnam Management has agreed to waive fees and reimburse expenses of the fund through April 30, 2007 to the extent necessary to ensure that the fund’s expenses do not exceed the simple average of the expenses of all front-end load funds viewed by Lipper Inc. as having the same investment classification or objective as the fund. The expense reimbursement is based on a comparison of the fund’s expenses with the average annualized operating expenses of the funds in its Lipper peer group for each calendar quarter during the fund’s last fiscal year, excluding 12b-1 fees and without giving effect to any expense offset and brokerage service arrangements that may reduce fund expenses. For the period ended October 31, 2006, Putnam Management did not waive any of its management fee from the fund.
For the period ended October 31, 2006, Putnam Management has assumed $6,182 of legal, shareholder servicing and communication, audit and Trustee fees incurred by the fund in connection with certain legal and regulatory matters (including those described in Note 6).
The fund reimburses Putnam Management an allocated amount for the compensation and related expenses of certain officers of the fund and their staff who provide administrative services to the fund. The aggregate amount of all such reimbursements is determined annually by the Trustees.
Custodial functions for the fund’s assets are provided by Putnam Fiduciary Trust Company (“PFTC”), a subsidiary of Putnam, LLC. PFTC receives fees for custody services based on the fund’s asset level, the number of its security holdings and transaction volumes. Putnam Investor Services, a division of PFTC, provides investor servicing agent functions to the fund. Putnam Investor Services receives fees for investor servicing based on the number of shareholder accounts in the fund and the level of defined contribution plan assets in the fund. During the period ended October 31, 2006, the fund incurred $1,899,670 for these services.
The fund has entered into an arrangement with PFTC whereby credits realized as a result of uninvested cash balances are used to reduce a portion of the fund’s expenses. The fund also reduced expenses through brokerage service arrangements. For the six months ended October 31, 2006, the fund’s expenses were reduced by $175,516 under these arrangements.
Each independent Trustee of the fund receives an annual Trustee fee, of which $455, as a quarterly retainer, has been allocated to the fund, and an additional fee for each Trustees meeting attended. Trustees receive additional fees for attendance at certain committee meetings, industry seminars and for certain compliance-related matters. Trustees also are reimbursed for expenses they incur relating to their services as Trustees. George Putnam, III, who is not an independent Trustee, also receives the foregoing fees for his services as Trustee.
The fund has adopted a Trustee Fee Deferral Plan (the “Deferral Plan”) which allows the Trustees to defer the receipt of all or a portion of Trustees fees payable on or after July 1, 1995. The deferred fees remain invested in certain Putnam funds until distribution in accordance with the Deferral Plan.
The fund has adopted an unfunded noncontributory defined benefit pension plan (the “Pension Plan”) covering all Trustees of the fund who have served as a Trustee for at least five years and were first elected prior to 2004. Benefits under the
54
Pension Plan are equal to 50% of the Trustee’s average annual attendance and retainer fees for the three years ended December 31, 2005. The retirement benefit is payable during a Trustee’s lifetime, beginning the year following retirement, for the number of years of service through December 31, 2006. Pension expense for the fund is included in Trustee compensation and expenses in the statement of operations. Accrued pension liability is included in Payable for Trustee compensation and expenses in the statement of assets and liabilities. The Trustees have terminated the Pension Plan with respect to any Trustee first elected after 2003.
The fund has adopted distribution plans (the “Plans”) with respect to its class A, class B, class C, class M and class R shares pursuant to Rule 12b-1 under the Investment Company Act of 1940. The purpose of the Plans is to compensate Putnam Retail Management, a wholly-owned subsidiary of Putnam, LLC and Putnam Retail Management GP, Inc., for services provided and expenses incurred in distributing shares of the fund. The Plans provide for payments by the fund to Putnam Retail Management at an annual rate of up 0.35%, 1.00%, 1.00%, 1.00% and 1.00% of the average net assets attributable to class A, class B, class C, class M and class R shares, respectively. The Trustees have approved payment by the fund at an annual rate of 0.25%, 1.00%, 1.00%, 0.75% and 0.50% of the average net assets attributable to class A, class B, class C, class M and class R shares, respectively.
For the six months ended October 31, 2006, Putnam Retail Management, acting as underwriter, received net commissions of $20,301 and $346 from the sale of class A and class M shares, respectively, and received $75,891 and $413 in contingent deferred sales charges from redemptions of class B and class C shares, respectively. A deferred sales charge of up to 1.00% and 0.65% is assessed on certain redemptions of class A and class M shares, respectively. For the six months ended October 31, 2006, Putnam Retail Management, acting as underwriter, received $13 and no monies on class A and class M redemptions, respectively.
Note 3: Purchases and sales of securities
During the six months ended October 31, 2006, cost of purchases and proceeds from sales of investment securities other than short-term investments aggregated $353,603,360 and $401,930,118, respectively. There were no purchases or sales of U.S. government securities.
Note 4: Capital shares
At October 31, 2006, there was an unlimited number of shares of beneficial interest authorized. Transactions in capital shares were as follows:
| CLASS A | Shares | | Amount |
|
| Six months ended 10/31/06: | | |
| Shares sold | 4,696,480 | | $ | 56,131,983 |
|
| Shares issued | | | |
| in connection | | | |
| with reinvestment | | | |
| of distributions | — | | — |
|
| | 4,696,480 | | 56,131,983 |
|
| Shares | | | |
| repurchased | (5,267,438) | | (63,069,303) |
|
| Net decrease | (570,958) | | $ | (6,937,320) |
| |
| Year ended 4/30/06: | | | |
| Shares sold | 9,178,285 | | $ | 112,536,682 |
|
| Shares issued | | | |
| in connection | | | |
| with reinvestment | | | |
| of distributions | 5,496,123 | | 62,820,686 |
|
| | 14,674,408 | | 175,357,368 |
|
| Shares | | | |
| repurchased | (11,392,357) | | (139,517,727) |
|
| Net increase | 3,282,051 | | $ | 35,839,641 |
55
| CLASS B | Shares | Amount |
|
| Six months ended 10/31/06: | |
| Shares sold | 622,389 | $ 7,022,353 |
|
| Shares issued | | |
| in connection | | |
| with reinvestment | | |
| of distributions | — | — |
|
| | 622,389 | 7,022,353 |
|
| Shares | | |
| repurchased | (4,141,737) | (46,264,726) |
|
| Net decrease | (3,519,348) | $(39,242,373) |
| |
| Year ended 4/30/06: | | |
| Shares sold | 1,851,415 | $ 21,412,487 |
|
| Shares issued | | |
| in connection | | |
| with reinvestment | | |
| of distributions | 3,029,753 | 32,630,440 |
|
| | 4,881,168 | 54,042,927 |
|
| Shares | | |
| repurchased | (6,518,286) | (75,368,372) |
|
| Net decrease | (1,637,118) | $(21,325,445) |
|
| |
| CLASS C | Shares | Amount |
|
| Six months ended 10/31/06: | |
| Shares sold | 145,872 | $ 1,656,840 |
|
| Shares issued | | |
| in connection | | |
| with reinvestment | | |
| of distributions | — | — |
|
| | 145,872 | 1,656,840 |
|
| Shares | | |
| repurchased | (309,828) | (3,511,827) |
|
| Net decrease | (163,956) | $(1,854,987) |
| |
| Year ended 4/30/06: | | |
| Shares sold | 373,734 | $ 4,345,956 |
|
| Shares issued | | |
| in connection | | |
| with reinvestment | | |
| of distributions | 398,078 | 4,327,109 |
|
| | 771,812 | 8,673,065 |
|
| Shares | | |
| repurchased | (738,070) | (8,584,040) |
|
| Net increase | 33,742 | $ 89,025 |
| CLASS M | Shares | Amount |
|
| Six months ended 10/31/06: | |
| Shares sold | 88,298 | $ 1,017,786 |
|
| Shares issued | | |
| in connection | | |
| with reinvestment | | |
| of distributions | — | — |
|
| | 88,298 | 1,017,786 |
|
| Shares | | |
| repurchased | (285,794) | (3,284,945) |
|
| Net decrease | (197,496) | $(2,267,159) |
| |
| Year ended 4/30/06: | | |
| Shares sold | 449,356 | $ 5,338,860 |
|
| Shares issued | | |
| in connection | | |
| with reinvestment | | |
| of distributions | 259,069 | 2,844,576 |
|
| | 708,425 | 8,183,436 |
|
| Shares | | |
| repurchased | (727,770) | (8,427,003) |
|
| Net decrease | (19,345) | $ (243,567) |
|
| |
| CLASS R | Shares | Amount |
|
| Six months ended 10/31/06: | |
| Shares sold | 29,485 | $347,009 |
|
| Shares issued | | |
| in connection | | |
| with reinvestment | | |
| of distributions | — | — |
|
| | 29,485 | 347,009 |
|
| Shares | | |
| repurchased | (3,666) | (44,055) |
|
| Net increase | 25,819 | $302,954 |
| |
| Year ended 4/30/06: | | |
| Shares sold | 65,189 | $790,534 |
|
| Shares issued | | |
| in connection | | |
| with reinvestment | | |
| of distributions | 12,162 | 138,036 |
|
| | 77,351 | 928,570 |
|
| Shares | | |
| repurchased | (7,916) | (97,816) |
|
| Net increase | 69,435 | $830,754 |
56
| CLASS Y | Shares | | Amount |
|
| Six months ended 10/31/06: | | |
| Shares sold | 4,759,676 | | $ | 57,685,394 |
|
| Shares issued | | | |
| in connection | | | |
| with reinvestment | | | |
| of distributions | — | | — |
|
| | 4,759,676 | | 57,685,394 |
|
| Shares | | | |
| repurchased | (4,329,557) | | (53,730,187) |
|
| Net increase | 430,119 | | $ | 3,955,207 |
| |
| Year ended 4/30/06: | | | |
| Shares sold | 8,164,798 | | $ | 100,601,794 |
|
| Shares issued | | | |
| in connection | | | |
| with reinvestment | | | |
| of distributions | 4,729,626 | | 54,863,665 |
|
| | 12,894,424 | | 155,465,459 |
|
| Shares | | | |
| repurchased | (11,436,001) | | (141,771,009) |
|
| Net increase | 1,458,423 | | $ | 13,694,450 |
Note 5: Investment in Putnam Prime Money Market Fund
The fund invests in Putnam Prime Money Market Fund, an open-end management investment company managed by Putnam Management. Investments in Putnam Prime Money Market Fund are valued at its closing net asset value each business day. Management fees paid by the fund are reduced by an amount equal to the management and administrative services fees paid by Putnam Prime Money Market Fund with respect to assets invested by the fund in Putnam Prime Money Market Fund. For the period ended October 31, 2006, management fees paid were reduced by $12,142 relating to the fund’s investment in Putnam Prime Money Market Fund. Income distributions earned by the fund are recorded as income in the statement of operations and totaled $519,326 for the period ended October 31, 2006. During the period ended October 31, 2006, cost of purchases and proceeds of sales of investments in Putnam Prime Money Market Fund aggregated $110,953,253 and $115,517, 761, respectively.
Note 6: Regulatory matters and litigation
Putnam Management has entered into agreements with the Securities and Exchange Commission and the Massachusetts Securities Division settling charges connected with excessive short-term trading by Putnam employees and, in the case of the charges brought by the Massachusetts Securities Division, by participants in some Putnam-administered 401(k) plans. Pursuant to these settlement agreements, Putnam Management will pay a total of $193.5 million in penalties and restitution, with $153.5 million being paid to certain open-end funds and their shareholders. The amount will be allocated to shareholders and funds pursuant to a plan developed by an independent consultant, and will be paid following approval of the plan by the SEC and the Massachusetts Securities Division.
The Securities and Exchange Commission’s and Massachusetts Securities Division’s allegations and related matters also serve as the general basis for numerous lawsuits, including purported class action lawsuits filed against Putnam Management and certain related parties, including certain Putnam funds. Putnam Management will bear any costs incurred by Putnam funds in connection with these lawsuits. Putnam Management believes that the likelihood that the pending private lawsuits and purported class action lawsuits will have a material adverse financial impact on the fund is remote, and the pending actions are not likely to materially affect its ability to provide investment management services to its clients, including the Putnam funds.
In connection with a settlement between Putnam and the fund’s Trustees in September 2o06, the fund received $299,511 from Putnam to address issues relating to the calculation of certain amounts paid by the Putnam mutual funds to Putnam for transfer agent services.
57
Putnam Management and Putnam Retail Management are named as defendants in a civil suit in which the plaintiffs allege that the management and distribution fees paid by certain Putnam funds were excessive and seek recovery under the Investment Company Act of 1940. Putnam Management and Putnam Retail Management have contested the plaintiffs’ claims and the matter is currently pending in the U.S. District Court for the District of Massachusetts. Based on currently available information, Putnam Management believes that this action is without merit and that it is unlikely to have a material effect on Putnam Management’s and Putnam Retail Management’s ability to provide services to their clients, including the fund.
Note 7: New accounting pronouncements
In June 2006, the Financial Accounting Standards Board (“FASB”) issued Interpretation No. 48, Accounting for Uncertainty in Income Taxes (the “Interpretation”). The Interpretation prescribes a minimum threshold for financial statement recognition of the benefit of a tax position taken or expected to be taken by a filer in the filer’s tax return. The Interpretation will become effective for fiscal years beginning after December 15, 2006 but will also apply to tax positions reflected in the fund’s financial statements as of that date. No determination has been made whether the adoption of the Interpretation will require the fund to make any adjustments to its net assets or have any other effect on the fund’s financial statements.
In September 2006, the FASB issued Statement of Financial Accounting Standards No. 157, Fair Value Measurements (the “Standard”). The Standard defines fair value, sets out a framework for measuring fair value and requires additional disclosures about fair value measurements. The Standard applies to fair value measurements already required or permitted by existing standards. The Standard is effective for financial statements issued for fiscal years beginning after November 15, 2007 and interim periods within those fiscal years. Putnam Management is currently evaluating what impact the adoption of the Standard will have on the fund’s financial statements.
58
Brokerage commissions
(Unaudited)
Brokerage commissions are paid to firms that execute trades on behalf of your fund. When choosing these firms, Putnam is required by law to seek the best execution of the trades, taking all relevant factors into consideration, including expected quality of execution and commission rate. Listed below are the largest relationships based upon brokerage commissions for your fund and the other funds in Putnam’s U.S. Small- and Mid-Cap group for the year ended October 31, 2006. The other Putnam mutual funds in this group are Putnam Discovery Growth Fund, Putnam Mid Cap Value Fund, Putnam New Opportunities Fund, Putnam OTC & Emerging Growth Fund, Putnam Small Cap Growth Fund, Putnam Small Cap Value Fund, Putnam Vista Fund, Putnam VT Capital Opportunities Fund, Putnam VT Discovery Growth Fund, Putnam VT Mid Cap Value Fund, Putnam VT New Opportunities Fund, Putnam VT OTC & Emerging Growth Fund, Putnam VT Small Cap Value Fund, and Putnam VT Vista Fund.
The top five firms that received brokerage commissions for trades executed for the U.S. Small-and Mid-Cap group are (in descending order) Citigroup Global Markets, Goldman Sachs, Credit Suisse First Boston, Lehman Brothers, and Bear Stearns & Company. Commissions paid to these firms together represented approximately 37% of the total brokerage commissions paid for the year ended October 31, 2006.
Commissions paid to the next 10 firms together represented approximately 39% of the total brokerage commissions paid during the period. These firms are (in alphabetical order) Bank of America, CIBC World Markets, Deutsche Bank Securities, JPMorgan Clearing, Merrill Lynch, Morgan Stanley Dean Witter, RBC Capital Markets, SG Cowen, UBS Warburg, and Wachovia Securities.
Additional information about brokerage commissions is available on the Securities and Exchange Commission (SEC) Web site at www.sec.gov. Putnam funds disclose commissions by firm to the SEC in semiannual filings on Form N-SAR.
59
Putnam puts your
interests first
In January 2004, Putnam began introducing a number of voluntary initiatives designed to reduce fund expenses, provide investors with more useful information, and help safeguard the interests of all Putnam investors. Visit www.putnam.com for details.
Cost-cutting initiatives
Reduced sales charges The maximum sales charge for class A shares has been reduced to 5.25% for equity funds (formerly 5.75%) and 3.75% for most income funds (formerly 4.50%) . The maximum sales charge for class M shares has been reduced to 3.25% for equity funds (formerly 3.50%) .*
Lower class B purchase limit To help ensure that investors are in the most cost-effective share class, the maximum amount that can be invested in class B shares has been reduced to $100,000. (Larger trades or accumulated amounts will be refused.)
Ongoing expenses will be limited Through calendar 2007, total ongoing expenses, including management fees for all funds, will be maintained at or below the average of each fund’s industry peers in its Lipper load-fund universe. For more information, please see the Statement of Additional information.
Improved disclosure
Putnam fund prospectuses and shareholder reports have been revised to disclose additional information that will help shareholders compare funds and weigh their costs and risks along with their potential benefits. Shareholders will find easy-to-understand information about fund expense ratios, portfolio manager compensation, risk comparisons, turnover comparisons, brokerage commissions, and employee and trustee ownership of Putnam funds. Disclosure of breakpoint discounts has also been enhanced to alert investors to potential cost savings.
Protecting investors’ interests
Short-term trading fee introduced To discourage short-term trading, which can interfere with a fund’s long-term strategy, a 1% short-term trading fee may be imposed on any Putnam fund shares (other than money market funds) redeemed or exchanged within seven calendar days of purchase (for certain funds, this fee applies for 90 days).
* The maximum sales charge for class A shares of Putnam Limited Duration Government Income Fund and Putnam Floating Rate Income Fund remains 3.25% .
60
Fund information
Founded over 65 years ago, Putnam Investments was built around the concept that a balance between risk and reward is the hallmark of a well-rounded financial program. We manage over 100 mutual funds in growth, value, blend, fixed income, and international.
Investment Manager
Putnam Investment
Management, LLC
One Post Office Square
Boston, MA 02109
Marketing Services
Putnam Retail Management
One Post Office Square
Boston, MA 02109
Custodian
Putnam Fiduciary
Trust Company
Legal Counsel
Ropes & Gray LLP
Trustees
John A. Hill, Chairman
Jameson Adkins Baxter,
Vice Chairman
Charles B. Curtis
Myra R. Drucker
Charles E. Haldeman, Jr.
Paul L. Joskow
Elizabeth T. Kennan
Kenneth R. Leibler
Robert E. Patterson
George Putnam, III
W. Thomas Stephens
Richard B. Worley
Officers
George Putnam, III
President
Charles E. Porter
Executive Vice President,
Principal Executive Officer,
Associate Treasurer, and
Compliance Liaison
Jonathan S. Horwitz
Senior Vice President
and Treasurer
Steven D. Krichmar
Vice President and
Principal Financial Officer
Michael T. Healy
Assistant Treasurer and
Principal Accounting Officer
Beth S. Mazor
Vice President
James P. Pappas
Vice President
Richard S. Robie, III
Vice President
Francis J. McNamara, III
Vice President and
Chief Legal Officer
Charles A. Ruys de Perez
Vice President and
Chief Compliance Officer
Mark C. Trenchard
Vice President and
BSA Compliance Officer
Judith Cohen
Vice President, Clerk and
Assistant Treasurer
Wanda M. McManus
Vice President, Senior Associate
Treasurer and Assistant Clerk
Nancy E. Florek
Vice President, Assistant Clerk,
Assistant Treasurer and
Proxy Manager
This report is for the information of shareholders of Putnam Capital Opportunities Fund. It may also be used as sales literature when preceded or accompanied by the current prospectus, the most recent copy of Putnam’s Quarterly Performance Summary, and Putnam’s Quarterly Ranking Summary. For more recent performance, please visit www.putnam.com. Investors should carefully consider the investment objective, risks, charges, and expenses of a fund, which are described in its prospectus. For this and other information or to request a prospectus, call 1-800-225-1581 toll free. Please read the prospectus carefully before investing. The fund’s Statement of Additional Information contains additional information about the fund’s Trustees and is available without charge upon request by calling 1-800-225-1581.

Item 2. Code of Ethics:
Not applicable
Item 3. Audit Committee Financial Expert:
Not applicable
Item 4. Principal Accountant Fees and Services:
Not applicable
Item 5. Audit Committee of Listed Registrants
Not applicable
Item 6. Schedule of Investments:
The registrant’s schedule of investments in unaffiliated issuers is included in the report to shareholders in Item 1 above.
Item 7. Disclosure of Proxy Voting Policies and Procedures For Closed-End Management
Investment Companies:
Not applicable
Item 8. Portfolio Managers of Closed-End Investment Companies
Not Applicable
Item 9. Purchases of Equity Securities by Closed-End Management Investment Companies and
Affiliated Purchasers:
Not applicable
Item 10. Submission of Matters to a Vote of Security Holders:
Not applicable
Item 11. Controls and Procedures:
(a) The registrant's principal executive officer and principal financial officer have concluded, based on their evaluation of the effectiveness of the design and operation of the registrant's disclosure controls and procedures as of a date within 90 days of the filing date of this report, that the design and operation of such procedures are generally effective to provide reasonable assurance that information required to be disclosed by the registrant in this report is recorded, processed, summarized and reported within the time periods specified in the Commission's rules and forms.
(b) Changes in internal control over financial reporting: Not applicable
Item 12. Exhibits:
(a)(1) Not applicable
(a)(2) Separate certifications for the principal executive officer and principal financial officer of the registrant as required by Rule 30a-2(a) under the Investment Company Act of 1940, as amended, are filed herewith.
(b) The certifications required by Rule 30a-2(b) under the Investment Company Act of 1940, as amended, are filed herewith.
SIGNATURES
Pursuant to the requirements of the Securities Exchange Act of 1934 and the Investment Company Act of 1940, the registrant has duly caused this report to be signed on its behalf by the undersigned, thereunto duly authorized.
Putnam Investment Funds
By (Signature and Title):
/s/Michael T. Healy
Michael T. Healy
Principal Accounting Officer
Date: December 28, 2006
Pursuant to the requirements of the Securities Exchange Act of 1934 and the Investment Company Act of 1940, this report has been signed below by the following persons on behalf of the registrant and in the capacities and on the dates indicated.
By (Signature and Title):
/s/Charles E. Porter
Charles E. Porter
Principal Executive Officer
Date: December 28, 2006
By (Signature and Title):
/s/Steven D. Krichmar
Steven D. Krichmar
Principal Financial Officer
Date: December 28, 2006
UNITED STATES
SECURITIES AND EXCHANGE COMMISSION
Washington, D.C. 20549
FORM N-CSR
CERTIFIED SHAREHOLDER REPORT OF REGISTERED
MANAGEMENT INVESTMENT COMPANIES
Investment Company Act file number: (811- 7237 )
Exact name of registrant as specified in charter: Putnam Investment Funds
Address of principal executive offices: One Post Office Square, Boston, Massachusetts 02109
| Name and address of agent for service: | Beth S. Mazor, Vice President |
| | One Post Office Square |
| | Boston, Massachusetts 02109 |
| |
| Copy to: | John W. Gerstmayr, Esq. |
| | Ropes & Gray LLP |
| | One International Place |
| | Boston, Massachusetts 02110 |
| |
| Registrant’s telephone number, including area code: | (617) 292-1000 |
Date of fiscal year end: April 30, 2007
Date of reporting period: May 1, 2006— October 31, 2006
Item 1. Report to Stockholders:
The following is a copy of the report transmitted to stockholders pursuant to Rule 30e-1 under the Investment Company Act of 1940:
What makes Putnam different?

In 1830, Massachusetts Supreme Judicial Court Justice Samuel Putnam established The Prudent Man Rule, a legal foundation for responsible money management.
THE PRUDENT MAN RULE
All that can be required of a trustee to invest is that he shall conduct himself faithfully and exercise a sound discretion. He is to observe how men of prudence, discretion, and intelligence manage their own affairs, not in regard to speculation, but in regard to the permanent disposition of their funds, considering the probable income, as well as the probable safety of the capital to be invested.

A time-honored tradition
in money management |
Since 1937, our values have been rooted in a profound sense of responsibility for the money entrusted to us.
A prudent approach to investing
We use a research-driven team approach to seek consistent, dependable, superior investment results over time, although there is no guarantee a fund will meet its objectives.
Funds for every investment goal
We offer a broad range of mutual funds and other financial products so investors and their financial representatives can build diversified portfolios.
A commitment to doing
what’s right for investors |
We have below-average expenses and stringent investor protections, and provide a wealth of information about the Putnam funds.
Industry-leading service
We help investors, along with their financial representatives, make informed investment decisions with confidence.
10| 31| 06
Semiannual Report |
| Message from the Trustees | 2 |
| About the fund | 4 |
| Report from the fund managers | 7 |
| Performance | 13 |
| Expenses | 15 |
| Portfolio turnover | 17 |
| Risk | 18 |
| Your fund’s management | 19 |
| Terms and definitions | 22 |
| Trustee approval of management contract | 24 |
| Other information for shareholders | 29 |
| Financial statements | 30 |
| Brokerage commissions | 51 |
Cover photograph: © White-Packert Photography
Message from the Trustees
Dear Fellow Shareholder
Beginning in May 2006, leading economic indicators began to point toward slower growth and sparked a correction that undercut much of the market advance achieved in previous months. However, once the Federal Reserve (the Fed) halted its series of interest-rate increases in August, the combination of continued strong corporate profits and a fall in energy and commodity prices contributed to a more favorable market environment. In addition, U.S. export growth is currently strong, thanks to robust economic growth abroad. Growth in exports, combined with the effects of lower energy and commodity prices and recent stock market gains, may offset the economic impact of the housing sector’s continuing slowdown. This may set the stage for stronger domestic economic growth in 2007, which would bode well for markets going forward.
We would like to take this opportunity to announce that a new independent Trustee, Kenneth R. Leibler, has joined your fund’s Board of Trustees. Mr. Leibler has had a distinguished career as a leader in the investment management industry. He is the founding Chairman of the Boston Options Exchange, the nation’s newest electronic marketplace for the trading of derivative securities. He currently serves as a Trustee of Beth Israel Deaconess Hospital in Boston; a lead director of Ruder Finn Group, a global communications and advertising firm; and a director of the Optimum Funds group.
We would also like to announce the retirement of one of your fund’s Trustees, John Mullin, an independent Trustee of the Putnam funds since 1997. We thank him for his service.
2
In the following pages, members of your fund’s management team discuss the fund’s performance and strategies for the fiscal period ended October 31, 2006, and provide their outlook for the months ahead. As always, we thank you for your support of the Putnam funds.

Putnam Mid Cap Value Fund: seeking undervalued
companies before their potential is recognized

Hidden opportunities —and a measure of patience — are key ingredients in the investment strategy of Putnam Mid Cap Value Fund. The fund invests in stocks of midsize companies, which tend to be followed by fewer Wall Street analysts than stocks of larger companies. For firms with strong research capabilities, such as Putnam, these stocks can represent attractive opportunities. With support from a team of dedicated stock analysts, the fund’s management team seeks to identify promising midsize companies before the market recognizes their potential.
Another advantage of midsize companies is that they tend to be more agile than large companies, while offering a greater degree of stability than smaller, less mature companies. Most midsize companies have developed a solid infrastructure, including professional management and a comprehensive business plan. Most have also weathered a full economic cycle.
Because Putnam Mid Cap Value Fund is managed in the value style, its managers also take another important factor into consideration: The stocks they purchase must be attractively priced in relation to the company’s earnings and growth potential. A value stock’s price may be low because the company’s potential is being underestimated or because the company is in an industry that is currently out of favor with investors. Often, companies in the portfolio are undergoing positive changes that may improve their earnings and growth potential. Catalysts for change can include restructuring, introduction of new products, new management, acquisitions, or streamlining of operations to cut costs.
Of course, such changes can take time. As noted in the fund’s first annual report to shareholders in April 2000, “Once the stock is in the portfolio, patience is called for while waiting for the positive change that can lift the stock’s share price. Accordingly, investors should understand that this fund is most appropriate for those with long-term investment horizons.”
The fund invests some or all of its assets in small and/or midsize companies. Such investments increase the risk of greater fluctuations in the value of your investment. Value investing seeks under-priced stocks, but there is no guarantee that a stock’s price will rise.
In-depth analysis is key to
successful stock selection. |
Drawing on the expertise of a dedicated team of stock analysts, the fund’s management team seeks attractive value stocks. Once a stock is selected for the portfolio, it is regularly assessed by members of the team to ensure that it continues to meet their criteria, including:
Valuation They carefully consider how each stock is valued, seeking stocks whose valuations are attractive relative to the company’s profitability potential.
Change They focus on company fundamentals against the broader context of industry trends to identify whether individual companies possess a catalyst for positive change.
Quality They look for high-quality companies, seeking characteristics such as sound balance sheets, profitable business models, and competent management.
Putnam Mid Cap Value Fund holdings
have spanned industries over time. |
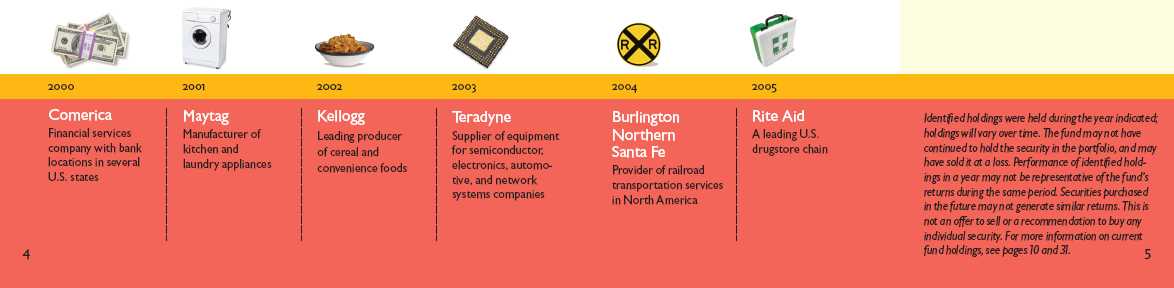
Putnam Mid Cap Value Fund seeks capital appreciation by employing a strategy of identifying undervalued, high-quality companies among the market’s mid-capitalization offerings. The fund targets smaller companies that have recently grown to midsize and larger companies in industries that have recently fallen out of favor. Current income is a secondary objective.
Highlights
• For the six months ended October 31, 2006, Putnam Mid Cap Value Fund’s class A shares returned 1.13% without sales charges.
• The fund’s benchmark, the Russell Midcap Value Index, returned 6.10% .
• The average return for the fund’s Lipper category, Mid-Cap Value Funds, was 2.66% .
• Additional fund performance, comparative performance, and Lipper data can be found in the performance section beginning on page 13.
Performance
Total return for class A shares for periods ended 10/31/06 |
| | Average annual return | Cumulative return |
| | NAV | POP | NAV | POP |
|
| Life of fund (inception: 11/1/99) | 14.31% | 13.44% | 155.29% | 141.91% |
|
| 5 years | 13.40 | 12.17 | 87.51 | 77.59 |
|
| 3 years | 15.90 | 13.83 | 55.68 | 47.51 |
|
| 1 year | 18.84 | 12.60 | 18.84 | 12.60 |
|
| 6 months | — | — | 1.13 | –4.17 |
|
Data is historical. Past performance does not guarantee future results. More recent returns may be less or more than those shown. Investment return and principal value will fluctuate, and you may have a gain or a loss when you sell your shares. Performance assumes reinvestment of distributions and does not account for taxes. Returns at NAV do not reflect a sales charge of 5.25% . For the most recent month-end performance, visit www.putnam.com. For a portion of the period, this fund limited expenses, without which returns would have been lower.
A 1% short-term trading fee may apply.
6
Report from the fund managers
The period in review
While stock selection in the consumer cyclicals and technology sectors contributed positively to performance during the semiannual period, our weightings in several other sectors hindered the fund’s results and led to the fund’s underperformance of both its benchmark and the average for its Lipper category. Compared to the benchmark, the fund was overweighted in energy stocks, and was affected by the sector’s weakness when energy prices fell in conjunction with growing concerns about the health of the economy. Conversely, the fund’s underweight position in real estate investment trusts (REITs), which outperformed the overall index, limited the fund’s ability to benefit from their appreciation during the period. Given an uncertain economic and market environment, investors became more attracted to the defensive nature of these securities. Utilities stocks were also buoyed by this trend, but the fund was underweighted in this sector as well. We neverthele ss believe that from a long-term perspective, these underweights were appropriate decisions at the time since they enabled us to focus fund assets on other sectors that we believe have the potential to deliver stronger performance.
Market overview
The six-month period covered by this report was marked by uncertainty about the direction of the economy. The Fed continued to raise short-term interest rates through the end of June, but then paused at its subsequent meetings in August, September, and October. In his July testimony before Congress, new Fed Chairman Ben Bernanke contended that slowing economic growth would temper the core inflation that had started to rise in the second quarter of 2006, in part due to high energy prices. Investors were left to ascertain the direction of the economy against a backdrop of a softening housing market — one of the main drivers of economic growth during the past few years — and sustained high levels of consumer debt. As the period progressed, core inflation receded
7
somewhat and employment reports were rather weak, lending credence to the Fed’s theory that the economy might slow enough to dissuade the Fed from resuming its tightening program in the near term.
Despite the underlying uncertainty about the economy, the equity markets rose steadily, largely buoyed by corporate profits that remained quite healthy by historical standards. Companies used these profits to reward investors and further fueled the economy by increasing their capital spending, boosting dividends, and initiating share-repurchase programs that helped support share prices. In addition, with corporate sales and profit margins nearing peak levels and companies boasting healthy balance sheets, many firms looked to consolidate through mergers and acquisitions. By doing so, the companies hoped to bolster their growth, improve their competitive positioning, or achieve some combination of the two. Although share prices continue to rise, we were able to find attractive investment opportunities among mid-cap companies throughout the period.
Strategy overview
We continued to focus on bottom-up stock picking, believing that security selection should help the fund outperform its benchmark over time. With profit margins approaching peak levels and underlying uncertainty about the future direction of the economy, we
Market sector performance
These indexes provide an overview of performance in different market sectors for the
six months ended 10/31/06. |
| Equities | |
|
| Russell Midcap Value Index (midsize-company value stocks) | 6.10% |
|
| Russell Midcap Growth Index (midsize-company growth stocks) | –0.58% |
|
| Russell 2000 Index (small-company stocks) | 0.90% |
|
| S&P 500 Index (broad stock market) | 6.11% |
|
| Bonds | |
|
| Lehman Aggregate Bond Index (broad bond market) | 4.60% |
|
| Lehman Credit Index (corporate bonds) | 5.31% |
|
| JPMorgan Global High Yield Index (global high-yield corporate bonds) | 4.67% |
|
8
looked for attractively valued stocks of companies that offered an internal catalyst that could help them grow profits regardless of the economic backdrop. Otherwise, we searched out opportunities along the mid-cap value continuum that fell into three broad categories. First, we invested in out-of-favor stocks of companies with compelling turnaround stories. Second, we liked companies with improving business fundamentals whose stocks were selling at cheap valuations that did not reflect the firms’ earnings growth potential. Third, we selected reasonably priced shares of corporations offering strong future business prospects. Overall, we balanced our approach to ensure we followed your fund’s mid-cap value mandate.
As we’ve done previously, we scoured the mid-cap universe for attractive value opportunities across all industry sectors and did not restrict our selections to stocks that are part of the benchmark. The fund’s overweight position in the energy sector dampened relative returns, because energy prices fell at the same time that concerns arose about the health of the worldwide economy going forward. However, we continued to feel that the imbalance between supply and demand — particularly among companies in the natural gas industry —provided a solid underpinning for many of these stocks over the long term. While many investors gravitated toward the defensive attributes of REITs and utilities — including high
Comparison of top industry weightings
This chart shows how the fund’s top weightings have changed over the last six months. Weightings
are shown as a percentage of net assets. Holdings will vary over time. |

9
dividend yields and predictable earnings — we underweighted these areas to pursue what we felt were better alternatives elsewhere.
Your fund’s holdings
As noted earlier, the weakness of your fund’s energy holdings was a key factor in the fund’s underperformance relative to its benchmark. Investors became less enamored with energy shares as oil, gasoline, and natural gas prices pulled back from historically high levels, inventories grew, and concerns arose about the strength of the global economy. Among the stocks that suffered was National Oilwell Varco, which services oil and natural gas companies by supplying parts and equipment for drilling rigs. However, we have maintained the fund’s position because we believe the company is poised to benefit from a combination of continued demand and underinvestment in new capacity in recent years. Coal supplier CONSOL Energy also slipped, as coal became a less attractive alternative when other energ y prices fell. Other investments that dampened performance included an overweight in Omnicare, which manages pharmacies for nursing homes. The stock suffered from uncertainty about how changes in reimbursement might influence the company’s future earnings. In our opinion, Omnicare has solid business fundamentals and could benefit from synergies resulting from a recent
Top holdings
This table shows the fund’s top holdings, and the percentage of the fund’s net assets that each represented, as of 10/31/06. The fund’s holdings will change over time.
| Holding (percent of fund’s net assets) | Industry |
|
| Whirlpool Corp. (3.0%) | Household furniture and appliances |
|
| McAfee, Inc. (2.7%) | Software |
|
| OfficeMax, Inc. (2.6%) | Retail |
|
| Interpublic Group of Companies, Inc. (The) (2.5%) | Media |
|
| Alberto-Culver Co. (2.3%) | Consumer goods |
|
| Liz Claiborne, Inc. (2.2%) | Textiles |
|
| Terex Corp. (2.1%) | Machinery |
|
| Jabil Circuit, Inc. (1.9%) | Electronics |
|
| Ross Stores, Inc. (1.9%) | Retail |
|
| CB Richard Ellis Group, Inc. Class A (1.8%) | Real estate |
|
10
acquisition, so we have maintained the fund’s position. An out-of-benchmark position in electronics contract manufacturer Jabil Circuit declined after the company missed its second-quarter earnings target. Furthermore, trucking company Con-way — another investment not included in the benchmark —and specialty chemicals provider Chemtura both declined after the firms lost customers when they tried unsuccessfully to raise their prices. In spite of the difficulties encountered by these three companies, we continued to hold Jabil, Con-Way, and Chemtura.
On the positive side, your fund’s performance relative to the benchmark was bolstered by strong stock selection in the consumer cyclicals area. There, our overweight position in office products retailer OfficeMax was a key contributor. The stock recovered as the company’s new management team implemented a turnaround plan. Other consumer cyclical stocks on the rebound included out-of-benchmark clothing retailer Abercrombie & Fitch, which overcame concerns that the company was carrying too much inventory, and toy manufacturer Mattel. Mattel bounced back from oversold levels after sales of its Barbie dolls showed signs of improving at the same time that demand for the company’s other products remained relatively strong. In the capital goods group, our overweight in crane manufacturer Terex also helped, after the company proved resilient to worries that an economic downturn would hurt business. Finally, out-of-benchmark technology company Logitech, which manufactures peripheral equipment for use with computers, benefited from new product introductions, strong demand for laptop computers, and consumers’ increased interest in the company’s wireless peripheral products.
Please note that the holdings discussed in this report may not have been held by the fund for the entire period. Portfolio composition is subject to review in accordance with the fund’s investment strategy and may vary in the future.
11
The outlook for your fund
The following commentary reflects anticipated developments that could affect your fund over the next six months, as well as your management team’s plans for responding to them.
While the uncertainty that marked the markets during the past six months didn’t keep stocks from generally rising, it clouds our outlook for the second half of the fiscal year. Significant questions remain about the direction of the economy, inflation, and future Fed interest-rate policy. Given this ambiguity, we intend to construct the portfolio one stock at a time, rather than allowing macroeconomic predictions to determine the portfolio weightings. To that end, we plan to look for attractively valued stocks of companies with some sort of internal catalyst that will help them remain immune to the vagaries of the economy.
Our approach will continue to revolve around the long-term prospects of individual companies more than developments in the economy and the markets over the short term. While the performance of the overall market will be influenced by many factors, we will use fundamental research and analysis to create a diversified portfolio of companies that we believe have the potential to increase in value over time.
The views expressed in this report are exclusively those of Putnam Management. They are not meant as investment advice.
The fund invests some or all of its assets in small and/or midsize companies. Such investments increase the risk of greater fluctuations in the value of your investment. Value investing seeks underpriced stocks, but there is no guarantee that a stock’s price will rise.
12
Your fund’s performance
This section shows your fund’s performance for periods ended October 31, 2006, the end of the first half of its current fiscal year. In accordance with regulatory requirements for mutual funds, we also include performance as of the most recent calendar quarter-end. Performance should always be considered in light of a fund’s investment strategy. Data represents past performance. Past performance does not guarantee future results. More recent returns may be less or more than those shown. Investment return and principal value will fluctuate, and you may have a gain or a loss when you sell your shares. For the most recent month-end performance, please visit www.putnam.com or call Putnam at 1-800-225-1581. Class Y shares are generally only available to corporate and institutional clients. See the Terms and Definitions section in this report for definitions of the share classes offered by your fund.
Fund performance
Total return for periods ended 10/31/06 |
| | | Class A | | Class B | | Class C | | Class M | | Class R | Class Y |
| (inception dates) | | (11/1/99) | | (1/16/01) | | (1/16/01) | | (1/16/01) | | (4/1/03) | (4/2/02) |
| | | NAV | POP | NAV | CDSC | NAV | CDSC | NAV | POP | NAV | NAV |
|
| Life of fund | | 155.29% | 141.91% | 142.31% | 142.31% | 142.22% | 142.22% | 146.60% | 138.51% | 150.98% | 158.15% |
| Annual average | | 14.31 | 13.44 | 13.47 | 13.47 | 13.46 | 13.46 | 13.75 | 13.21 | 14.04 | 14.50 |
|
| 5 years | | 87.51 | 77.59 | 80.61 | 78.61 | 80.58 | 80.58 | 82.79 | 76.79 | 85.14 | 89.61 |
| Annual average | | 13.40 | 12.17 | 12.55 | 12.30 | 12.55 | 12.55 | 12.82 | 12.07 | 13.11 | 13.65 |
|
| 3 years | | 55.68 | 47.51 | 52.20 | 49.20 | 52.20 | 52.20 | 53.40 | 48.44 | 54.46 | 56.88 |
| Annual average | | 15.90 | 13.83 | 15.03 | 14.27 | 15.03 | 15.03 | 15.33 | 14.07 | 15.59 | 16.20 |
|
| 1 year | | 18.84 | 12.60 | 17.95 | 12.95 | 17.95 | 16.95 | 18.24 | 14.40 | 18.52 | 19.14 |
|
| 6 months | | 1.13 | –4.17 | 0.78 | –4.22 | 0.71 | –0.29 | 0.83 | –2.48 | 0.95 | 1.25 |
|
Performance assumes reinvestment of distributions and does not account for taxes. Returns at public offering price (POP) for class A and M shares reflect a sales charge of 5.25% and 3.25%, respectively. Class B share returns reflect the applicable contingent deferred sales charge (CDSC), which is 5% in the first year, declining to 1% in the sixth year, and is eliminated thereafter. Class C shares reflect a 1% CDSC in the first year that is eliminated thereafter. Class R and Y shares have no initial sales charge or CDSC. Performance for class B, C, M, R, and Y shares before their inception is derived from the historical performance of class A shares, adjusted for the applicable sales charge (or CDSC) and, except for class Y shares, the higher operating expenses for such shares.
For a portion of the period, this fund limited expense, without which returns would have been lower.
A 1% short-term trading fee may be applied to shares exchanged or sold within 7 days of purchase.
Fund price and distribution* information
For the six-month period ended 10/31/06
| | | Class A | | Class B | Class C | Class M | | Class R | Class Y |
| Share value: | | NAV | POP | NAV | NAV | NAV | POP | NAV | NAV |
|
| 4/30/06 | | $15.91 | $16.79 | $15.46 | $15.47 | $15.63 | $16.16 | $15.77 | $15.94 |
|
| 10/31/06 | | 16.09 | 16.98 | 15.58 | 15.58 | 15.76 | 16.29 | 15.92 | 16.14 |
|
* The fund did not make any distributions during the period.
13
Comparative index returns
For periods ended 10/31/06
| | | Lipper Mid-Cap |
| | Russell Midcap | Value Funds |
| | Value Index | category average* |
|
| Life of fund | 146.35% | 137.91% |
| Annual average | 13.75 | 12.95 |
|
| 5 years | 123.33 | 100.88 |
| Annual average | 17.43 | 14.71 |
|
| 3 years | 72.44 | 56.37 |
| Annual average | 19.92 | 16.00 |
|
| 1 year | 20.51 | 16.81 |
|
| 6 months | 6.10 | 2.66 |
|
Index and Lipper results should be compared to fund performance at net asset value.
* Over the 6-month and 1-year, 3-year, 5-year, and life-of-fund periods ended 10/31/06, there were 300, 283, 215, 152, and 83 funds, respectively, in this Lipper category.
Fund performance as of most recent calendar quarter
Total return for periods ended 9/30/06 |
| | | Class A | | Class B | | Class C | | Class M | | Class R | Class Y |
| (inception dates) | | (11/1/99) | | (1/16/01) | | (1/16/01) | | (1/16/01) | | (4/1/03) | (4/2/02) |
| | | NAV | POP | NAV | CDSC | NAV | CDSC | NAV | POP | NAV | NAV |
|
| Life of fund | | 141.96% | 129.28% | 129.87% | 129.87% | 129.79% | 129.79% | 133.92% | 126.26% | 138.05% | 144.72% |
| Annual average | | 13.62 | 12.74 | 12.78 | 12.78 | 12.78 | 12.78 | 13.07 | 12.52 | 13.35 | 13.81 |
|
| 5 years | | 83.21 | 73.57 | 76.63 | 74.63 | 76.60 | 76.60 | 78.94 | 73.05 | 81.00 | 85.30 |
| Annual average | | 12.87 | 11.66 | 12.05 | 11.80 | 12.05 | 12.05 | 12.34 | 11.59 | 12.60 | 13.13 |
|
| 3 years | | 57.35 | 49.08 | 53.91 | 50.91 | 53.91 | 53.91 | 55.09 | 50.02 | 56.24 | 58.57 |
| Annual average | | 16.31 | 14.24 | 15.46 | 14.70 | 15.46 | 15.46 | 15.75 | 14.48 | 16.04 | 16.61 |
|
| 1 year | | 8.48 | 2.79 | 7.74 | 2.93 | 7.67 | 6.71 | 7.96 | 4.46 | 8.24 | 8.78 |
|
| 6 months | | –1.99 | –7.13 | –2.38 | –7.26 | –2.38 | –3.35 | –2.22 | –5.38 | –2.14 | –1.86 |
|
14
Your fund’s expenses
As a mutual fund investor, you pay ongoing expenses, such as management fees, distribution fees (12b-1 fees), and other expenses. In the most recent six-month period, your fund limited these expenses; had it not done so, expenses would have been higher. Using the information below, you can estimate how these expenses affect your investment and compare them with the expenses of other funds. You may also pay one-time transaction expenses, including sales charges (loads) and redemption fees, which are not shown in this section and would have resulted in higher total expenses. For more information, see your fund’s prospectus or talk to your financial advisor.
Review your fund’s expenses
The table below shows the expenses you would have paid on a $1,000 investment in Putnam Mid Cap Value Fund from May 1, 2006, to October 31, 2006. It also shows how much a $1,000 investment would be worth at the close of the period, assuming actual returns and expenses.
| | Class A | Class B | Class C | Class M | Class R | Class Y |
|
| Expenses paid per $1,000* | $ 6.08 | $ 9.87 | $ 9.87 | $ 8.61 | $ 7.34 | $ 4.82 |
|
| Ending value (after expenses) | $1,011.30 | $1,007.80 | $1,007.10 | $1,008.30 | $1,009.50 | $1,012.50 |
|
* Expenses for each share class are calculated using the fund’s annualized expense ratio for each class, which represents the ongoing expenses as a percentage of average net assets for the six months ended 10/31/06. The expense ratio may differ for each share class (see the last table in this section). Expenses are calculated by multiplying the expense ratio by the average account value for the period; then multiplying the result by the number of days in the period; and then dividing that result by the number of days in the year.
Estimate the expenses you paid
To estimate the ongoing expenses you paid for the six months ended October 31, 2006, use the calculation method below. To find the value of your investment on May 1, 2006, go to www.putnam.com and log on to your account. Click on the “Transaction History” tab in your Daily Statement and enter 05/01/2006 in both the “from” and “to” fields. Alternatively, call Putnam at 1-800-225-1581.
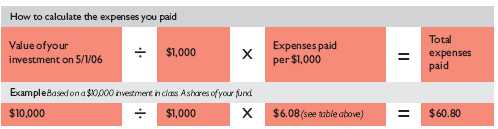
15
Compare expenses using the SEC’s method
The Securities and Exchange Commission (SEC) has established guidelines to help investors assess fund expenses. Per these guidelines, the table below shows your fund’s expenses based on a $1,000 investment, assuming a hypothetical 5% annualized return. You can use this information to compare the ongoing expenses (but not transaction expenses or total costs) of investing in the fund with those of other funds. All mutual fund shareholder reports will provide this information to help you make this comparison. Please note that you cannot use this information to estimate your actual ending account balance and expenses paid during the period.
| | Class A | Class B | Class C | Class M | Class R | Class Y |
|
| Expenses paid per $1,000* | $ 6.11 | $ 9.91 | $ 9.91 | $ 8.64 | $ 7.38 | $ 4.84 |
|
| Ending value (after expenses) | $1,019.16 | $1,015.38 | $1,015.38 | $1,016.64 | $1,017.90 | $1,020.42 |
|
* Expenses for each share class are calculated using the fund’s annualized expense ratio for each class, which represents the ongoing expenses as a percentage of average net assets for the six months ended 10/31/06. The expense ratio may differ for each share class (see the last table in this section). Expenses are calculated by multiplying the expense ratio by the average account value for the period; then multiplying the result by the number of days in the period; and then dividing that result by the number of days in the year.
Compare expenses using industry averages
You can also compare your fund’s expenses with the average of its peer group, as defined by Lipper, an independent fund-rating agency that ranks funds relative to others that Lipper considers to have similar investment styles or objectives. The expense ratio for each share class shown below indicates how much of your fund’s net assets have been used to pay ongoing expenses during the period.
| | Class A | Class B | Class C | Class M | Class R | Class Y |
|
| Your fund’s annualized | | | | | | |
| expense ratio | 1.20% | 1.95% | 1.95% | 1.70% | 1.45% | 0.95% |
|
| Average annualized expense | | | | | | |
| ratio for Lipper peer group* | 1.35% | 2.10% | 2.10% | 1.85% | 1.60% | 1.10% |
|
* Simple average of the expenses of all front-end load funds in the fund’s Lipper peer group, calculated in accordance with Lipper’s standard method for comparing fund expenses (excluding 12b-1 fees and without giving effect to any expense offset and brokerage service arrangements that may reduce fund expenses). This average reflects each fund’s expenses for its most recent fiscal year available to Lipper as of 9/30/06. To facilitate comparison, Putnam has adjusted this average to reflect the 12b-1 fees carried by each class of shares other than class Y shares, which do not incur 12b-1 fees. The peer group may include funds that are significantly smaller or larger than the fund, which may limit the comparability of the fund’s expenses to the simple average, which typically is higher than the asset-weighted average.
16
Your fund’s
portfolio turnover |
Putnam funds are actively managed by teams of experts who buy and sell securities based on intensive analysis of companies, industries, economies, and markets. Portfolio turnover is a measure of how often a fund’s managers buy and sell securities for your fund. A portfolio turnover of 100%, for example, means that the managers sold and replaced securities valued at 100% of a fund’s assets within a one-year period. Funds with high turnover may be more likely to generate capital gains and dividends that must be distributed to shareholders as taxable income. High turnover may also cause a fund to pay more brokerage commissions and other transaction costs, which may detract from performance.
Turnover comparisons
Percentage of holdings that change every year |
| | 2006 | 2005 | 2004 | 2003 | 2002 |
|
| Putnam Mid Cap Value Fund | 64% | 89% | 84% | 45% | 53% |
|
| Lipper Mid-Cap Value Funds | | | | | |
| category average | 79% | 90% | 74% | 82% | 102% |
|
Turnover data for the fund is calculated based on the fund’s fiscal-year period, which ends on April 30. Turnover data for the fund’s Lipper category is calculated based on the average of the turnover of each fund in the category for its fiscal year ended during the indicated year. Fiscal years vary across funds in the Lipper category, which may limit the comparability of the fund’s portfolio turnover rate to the Lipper average. Comparative data for 2006 is based on information available as of 10/31/06.
17
Your fund’s risk
This risk comparison is designed to help you understand how your fund compares with other funds. The comparison utilizes a risk measure developed by Morningstar, an independent fund-rating agency. This risk measure is referred to as the fund’s Overall Morningstar Risk.
Your fund’s Overall Morningstar® Risk
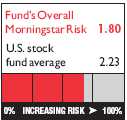
Your fund’s Overall Morningstar Risk is shown alongside that of the average fund in its broad asset class, as determined by Morningstar. The risk bar broadens the comparison by translating the fund’s Overall Morningstar Risk into a percentile, which is based on the fund’s ranking among all funds rated by Morningstar as of September 30, 2006. A higher Overall Morningstar Risk generally indicates that a fund’s monthly returns have varied more widely.
Morningstar determines a fund’s Overall Morningstar Risk by assessing variations in the fund’s monthly returns — with an emphasis on downside variations — over 3-, 5-, and 10-year periods, if available. Those measures are weighted and averaged to produce the fund’s Overall Morningstar Risk. The information shown is provided for the fund’s class A shares only; information for other classes may vary. Overall Morningstar Risk is based on historical data and does not indicate future results. Morningstar does not purport to measure the risk associated with a current investment in a fund, either on an absolute basis or on a relative basis. Low Overall Morningstar Risk does not mean that you cannot lose money on an investment in a fund. Copyright 2006 Morningstar, Inc. All Rights Reserved. The information contained herein (1) is proprietary to Morningstar and/or its content providers; (2) may not be copied or distributed; and (3) is not warranted to be accurate, complete, or timely. Neither Morningstar nor its content providers are responsible for any damages or losses arising from any use of this information.
18
Your fund’s management
Your fund is managed by the members of the Putnam Small- and Mid-Cap Value Team. James Polk and Edward Shadek are Portfolio Leaders of the fund. The Portfolio Leaders coordinate the team’s management of the fund.
For a complete listing of the members of the Putnam Small- and Mid-Cap Value Team, including those who are not Portfolio Leaders or Portfolio Members of your fund, visit Putnam’s Individual Investor Web site at www.putnam.com.
Investment team fund ownership
The table below shows how much the fund’s current Portfolio Leaders have invested in the fund and in all Putnam mutual funds (in dollar ranges). Information shown is as of October 31, 2006, and October 31, 2005.
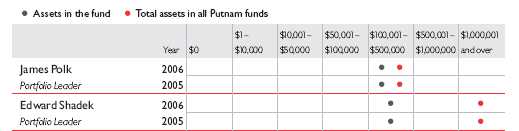
Trustee and Putnam employee fund ownership
As of October 31, 2006, all of the Trustees on the Board of the Putnam funds owned fund shares. The table below shows the approximate value of investments in the fund and all Putnam funds as of that date by the Trustees and Putnam employees. These amounts include investments by the Trustees’ and employees’ immediate family members and investments through retirement and deferred compensation plans.
| | | Total assets in |
| | Assets in the fund | all Putnam funds |
|
| Trustees | $ 142,000 | $ 92,000,000 |
|
| Putnam employees | $7,343,000 | $427,000,000 |
|
19
Fund manager compensation
The total 2005 fund manager compensation that is attributable to your fund is approximately $2,300,000. This amount includes a portion of 2005 compensation paid by Putnam Management to the fund managers listed in this section for their portfolio management responsibilities, calculated based on the fund assets they manage taken as a percentage of the total assets they manage. The compensation amount also includes a portion of the 2005 compensation paid to the Chief Investment Officer of the team and the Group Chief Investment Officer of the fund’s broader investment category for their oversight responsibilities, calculated based on the fund assets they oversee taken as a percentage of the total assets they oversee. This amount does not include compensation of other personnel involved in research, trading, administration, systems, compliance, or fund operations; nor does it include non-compensation costs. These percentages are determined as of the fund’s fiscal period-end. For personnel who joined Putnam Management during or after 2005, the calculation reflects annualized 2005 compensation or an estimate of 2006 compensation, as applicable.
Other Putnam funds managed by the Portfolio Leaders
Edward Shadek is also a Portfolio Leader of Putnam Small Cap Value Fund.
James Polk and Edward Shadek may also manage other accounts and variable trust funds advised by Putnam Management or an affiliate.
Changes in your fund’s Portfolio Leaders
Your fund’s Portfolio Leaders did not change during the year ended October 31, 2006.
20
Putnam fund ownership by Putnam’s Executive Board
The table below shows how much the members of Putnam’s Executive Board have invested in all Putnam mutual funds (in dollar ranges). Information shown is as of October 31, 2006, and October 31, 2005.
| | | | $1 – | $10,001 – | $50,001 – | $100,001 – | $500,001 – | $1,000,001 |
| | Year | $0 | $10,000 | $50,000 | $100,000 | $500,000 | $1,000,000 | and over |
|
| Philippe Bibi | 2006 | | | | | | | • |
|
|
| Chief Technology Officer | 2005 | | | | | | | • |
|
| Joshua Brooks | 2006 | | | | | | | • |
|
|
| Deputy Head of Investments | 2005 | | | | | | | • |
|
| William Connolly | 2006 | | | | | | | • |
|
|
| Head of Retail Management | 2005 | | | | | | | • |
|
| Kevin Cronin | 2006 | | | | | | | • |
|
|
| Head of Investments | 2005 | | | | | | | • |
|
| Charles Haldeman, Jr. | 2006 | | | | | | | • |
|
|
| President and CEO | 2005 | | | | | | | • |
|
| Amrit Kanwal | 2006 | | | | | | • | |
|
|
| Chief Financial Officer | 2005 | | | | | | • | |
|
| Steven Krichmar | 2006 | | | | | | • | |
|
|
| Chief of Operations | 2005 | | | | | | | • |
|
| Francis McNamara, III | 2006 | | | | | | | • |
|
|
| General Counsel | 2005 | | | | | | | • |
|
| Jeffrey Peters | 2006 | | | | | | | • |
|
|
| Head of International Business | N/A | | | | | | | |
|
| Richard Robie, III | 2006 | | | | | | • | |
|
|
| Chief Administrative Officer | 2005 | | | | | | • | |
|
| Edward Shadek | 2006 | | | | | | | • |
|
|
| Deputy Head of Investments | 2005 | | | | | | | • |
|
| Sandra Whiston | 2006 | | | | | | • | |
|
|
| Head of Institutional Management | 2005 | | | | | | • | |
|
N/A indicates the individual was not a member of Putnam’s Executive Board as of 10/31/05.
21
Terms and definitions
Important terms
Total return shows how the value of the fund’s shares changed over time, assuming you held the shares through the entire period and reinvested all distributions in the fund.
Net asset value (NAV) is the price, or value, of one share of a mutual fund, without a sales charge. NAVs fluctuate with market conditions. NAV is calculated by dividing the net assets of each class of shares by the number of outstanding shares in the class.
Public offering price (POP) is the price of a mutual fund share plus the maximum sales charge levied at the time of purchase. POP performance figures shown here assume the 5.25% maximum sales charge for class A shares and 3.25% for class M shares.
Contingent deferred sales charge (CDSC) is generally a charge applied at the time of the redemption of class B or C shares and assumes redemption at the end of the period. Your fund’s class B CDSC declines from a 5% maximum during the first year to 1% during the sixth year. After the sixth year, the CDSC no longer applies. The CDSC for class C shares is 1% for one year after purchase.
Share classes
Class A shares are generally subject to an initial sales charge and no CDSC (except on certain redemptions of shares bought without an initial sales charge).
Class B shares are not subject to an initial sales charge. They may be subject to a CDSC. Class C shares are not subject to an initial sales charge and are subject to a CDSC only if the shares are redeemed during the first year.
Class M shares have a lower initial sales charge and a higher 12b-1 fee than class A shares and no CDSC (except on certain redemptions of shares bought without an initial sales charge).
Class R shares are not subject to an initial sales charge or CDSC and are available only to certain defined contribution plans.
Class Y shares are not subject to an initial sales charge or CDSC, and carry no 12b-1 fee. They are only available to eligible purchasers, including eligible defined contribution plans or corporate IRAs.
22
Comparative indexes
JPMorgan Global High Yield Index is an unmanaged index of global high-yield fixed-income securities.
Lehman Aggregate Bond Index is an unmanaged index of U.S. investment-grade fixed-income securities.
Lehman Credit Index is an unmanaged index of investment-grade corporate bonds.
Russell 2000 Index is an unmanaged index of the 2,000 smallest companies in the Russell 3000 Index.
Russell Midcap Growth Index is an unmanaged index of those companies in the Russell Midcap Index chosen for their growth orientation.
Russell Midcap Value Index is an unmanaged index of those companies in the Russell Midcap Index chosen for their value orientation.
S&P 500 Index is an unmanaged index of common stock performance.
Indexes assume reinvestment of all distributions and do not account for fees. Securities and performance of a fund and an index will differ. You cannot invest directly in an index.
Lipper is a third-party industry-ranking entity that ranks mutual funds. Its rankings do not reflect sales charges. Lipper rankings are based on total return at net asset value relative to other funds that have similar current investment styles or objectives as determined by Lipper. Lipper may change a fund’s category assignment at its discretion. Lipper category averages reflect performance trends for funds within a category.
23
Trustee approval of
management contract |
General conclusions
The Board of Trustees of the Putnam funds oversees the management of each fund and, as required by law, determines annually whether to approve the continuance of your fund’s management contract with Putnam Management. In this regard, the Board of Trustees, with the assistance of its Contract Committee consisting solely of Trustees who are not “interested persons” (as such term is defined in the Investment Company Act of 1940, as amended) of the Putnam funds (the “Independent Trustees”), requests and evaluates all information it deems reasonably necessary under the circumstances. Over the course of several months ending in June 2006, the Contract Committee met four times to consider the information provided by Putnam Management and other information developed with the assistance of the Board’s independent counsel and independent staff. The Contract Committee reviewed and discussed key aspects of this information with all of the Independe nt Trustees. Upon completion of this review, the Contract Committee recommended, and the Independent Trustees approved, the continuance of your fund’s management contract, effective July 1, 2006.
This approval was based on the following conclusions:
• That the fee schedule in effect for your fund represents reasonable compensation in light of the nature and quality of the services being provided to the fund, the fees paid by competitive funds and the costs incurred by Putnam Management in providing such services, and
• That such fee schedule represents an appropriate sharing between fund shareholders and Putnam Management of such economies of scale as may exist in the management of the fund at current asset levels.
These conclusions were based on a comprehensive consideration of all information provided to the Trustees and were not the result of any single factor. Some of the factors that figured particularly in the Trustees’ deliberations and how the Trustees considered these factors are described below, although individual Trustees may have evaluated the information presented differently, giving different weights to various factors. It is also important to recognize that the fee arrangements for your fund and the other Putnam funds are the result of many years of review and discussion between the Independent Trustees and Putnam Management, that certain aspects of such arrangements may receive greater scrutiny in some years than others, and that the Trustees’ conclusions may be based, in part, on their consideration of these same arrangements in prior years.
24
Management fee schedules and categories; total expenses
The Trustees reviewed the management fee schedules in effect for all Putnam funds, including fee levels and breakpoints, and the assignment of funds to particular fee categories. In reviewing fees and expenses, the Trustees generally focused their attention on material changes in circumstances — for example, changes in a fund’s size or investment style, changes in Putnam Management’s operating costs, or changes in competitive practices in the mutual fund industry —that suggest that consideration of fee changes might be warranted. The Trustees concluded that the circumstances did not warrant changes to the management fee structure of your fund, which had been carefully developed over the years, re-examined on many occasions and adjusted where appropriate. The Trustees focused on two areas of particular interest, as discussed further below:
• Competitiveness. The Trustees reviewed comparative fee and expense information for competitive funds, which indicated that, in a custom peer group of competitive funds selected by Lipper Inc., your fund ranked in the 17th percentile in management fees and in the 34th percentile in total expenses (less any applicable 12b-1 fees) as of December 31, 2005 (the first percentile being the least expensive funds and the 100th percentile being the most expensive funds). (Because the fund’s custom peer group is smaller than the fund’s broad Lipper Inc. peer group, this expense information may differ from the Lipper peer expense information found elsewhere in this report.) The Trustees noted that expense ratios for a number of Putnam funds, which show the percentage of fund assets used to pay for management and administrative services, distribution (12b-1) fees and other expenses, had been increa sing recently as a result of declining net assets and the natural operation of fee breakpoints.
The Trustees noted that the expense ratio increases described above were currently being controlled by expense limitations implemented in January 2004 and which Putnam Management, in consultation with the Contract Committee, has committed to maintain at least through 2007. These expense limitations give effect to a commitment by Putnam Management that the expense ratio of each open-end fund would be no higher than the average expense ratio of the competitive funds included in the fund’s relevant Lipper universe (exclusive of any applicable 12b-1 charges in each case). The Trustees observed that this commitment to limit fund expenses has served shareholders well since its inception. In order to ensure that the expenses of the Putnam funds continue to meet evolving competitive standards, the Trustees requested, and Putnam Management agreed, to implement an additional expense limitation for certain funds for the twelve months beginning January 1, 2007 equal to the average expense ratio (exclusive of 12b-1 charges) of a custom peer group of competitive funds selected by Lipper based on the size of the fund. This additional expense limitation will be applied to those open-end funds that had above-average expense ratios (exclusive of 12b-1 charges) based on the Lipper custom peer group data for the period ended December 31, 2005. This additional expense limitation will not be applied to your fund.
• Economies of scale. Your fund currently has the benefit of breakpoints in its management fee that provide shareholders with significant economies of scale, which means that the effective
25
management fee rate of a fund (as a percentage of fund assets) declines as a fund grows in size and crosses specified asset thresholds. Conversely, as a fund shrinks in size — as has been the case for many Putnam funds in recent years — these breakpoints result in increasing fee levels. In recent years, the Trustees have examined the operation of the existing breakpoint structure during periods of both growth and decline in asset levels. The Trustees concluded that the fee schedules in effect for the funds represented an appropriate sharing of economies of scale at current asset levels. In reaching this conclusion, the Trustees considered the Contract Committee’s stated intent to continue to work with Putnam Management to plan for an eventual resumption in the growth of assets, including a study of potential economies that might be produced under various growth assumptions.
In connection with their review of the management fees and total expenses of the Putnam funds, the Trustees also reviewed the costs of the services to be provided and profits to be realized by Putnam Management and its affiliates from the relationship with the funds. This information included trends in revenues, expenses and profitability of Putnam Management and its affiliates relating to the investment management and distribution services provided to the funds. In this regard, the Trustees also reviewed an analysis of Putnam Management’s revenues, expenses and profitability with respect to the funds’ management contracts, allocated on a fund-by-fund basis. Because many of the costs incurred by Putnam Management in managing the funds are not readily identifiable to particular funds, the Trustees observed that the methodology for allocating costs is an important factor in evaluating Putnam Management’s costs and profitability, both as to the Putnam funds in the aggregate and as to individual funds. The Trustees reviewed Putnam Management’s cost allocation methodology with the assistance of independent consultants and concluded that this methodology was reasonable and well-considered.
Investment performance
The quality of the investment process provided by Putnam Management represented a major factor in the Trustees’ evaluation of the quality of services provided by Putnam Management under your fund’s management contract. The Trustees were assisted in their review of the Putnam funds’ investment process and performance by the work of the Investment Process Committee of the Trustees and the Investment Oversight Committee of the Trustees, which meet on a regular monthly basis with the funds’ portfolio teams throughout the year. The Trustees concluded that Putnam Management generally provides a high-quality investment process — as measured by the experience and skills of the individuals assigned to the management of fund portfolios, the resources made available to such personnel, and in general the ability of Putnam Management to attract and retain high-quality personnel — but also recognize that this does not guarantee favorable investment results for every fund in every time period. The Trustees considered the investment performance of each fund over multiple time periods and considered information comparing each fund’s performance with various benchmarks and with the performance of competitive funds.
26
The Trustees noted the satisfactory investment performance of many Putnam funds. They also noted the disappointing investment performance of certain funds in recent years and discussed with senior management of Putnam Management the factors contributing to such underperformance and actions being taken to improve performance. The Trustees recognized that, in recent years, Putnam Management has made significant changes in its investment personnel and processes and in the fund product line to address areas of underperformance. In particular, they noted the important contributions of Putnam Management’s leadership in attracting, retaining and supporting high-quality investment professionals and in systematically implementing an investment process that seeks to merge the best features of fundamental and quantitative analysis. The Trustees indicated their intention to continue to monitor performance trends to assess the effectiveness of these changes and to evaluate whether additional changes to address areas of underperformance are warranted.
In the case of your fund, the Trustees considered that your fund’s class A share cumulative total return performance at net asset value was in the following percentiles of its Lipper Inc. peer group (Lipper Mid-Cap Value Funds) for the one-, three- and five-year periods ended March 31, 2006 (the first percentile being the best performing funds and the 100th percentile being the worst performing funds):
| One-year period | Three-year period | Five-year period |
|
| 15th | 61st | 45th |
(Because of the passage of time, these performance results may differ from the performance results for more recent periods shown elsewhere in this report. Over the one-, three- and five-year periods ended March 31, 2006, there were 263, 214, and 139 funds, respectively, in your fund’s Lipper peer group.* Past performance is no guarantee of future performance.)
As a general matter, the Trustees concluded that cooperative efforts between the Trustees and Putnam Management represent the most effective way to address investment performance problems. The Trustees noted that investors in the Putnam funds have, in effect, placed their trust in the Putnam organization, under the oversight of the funds’ Trustees, to make appropriate decisions regarding the management of the funds. Based on the responsiveness of Putnam Management in the recent past to Trustee concerns about investment performance, the Trustees concluded that it is preferable to seek change within Putnam Management to address performance shortcomings. In the Trustees’ view, the alternative of terminating a management contract and engaging a new investment adviser for an underperforming fund would entail significant disruptions and would not provide any greater assurance of improved investment performance.
* The percentile rankings for your fund’s class A share annualized total return performance in the Lipper Mid-Cap Value Funds category for the one- and five-year periods ended September 30, 2006, were 56% and 61%, respectively. Over the one- and five-year periods ended September 30, 2006, the fund ranked 160 out of 286 and 92 out of 151, respectively. Note that this more recent information was not available when the Trustees approved the continuance of your fund’s management contract.
27
Brokerage and soft-dollar allocations; other benefits
The Trustees considered various potential benefits that Putnam Management may receive in connection with the services it provides under the management contract with your fund. These include benefits related to brokerage and soft-dollar allocations, whereby a portion of the commissions paid by a fund for brokerage may be used to acquire research services that may be useful to Putnam Management in managing the assets of the fund and of other clients. The Trustees indicated their continued intent to monitor the potential benefits associated with the allocation of fund brokerage to ensure that the principle of seeking “best price and execution” remains paramount in the portfolio trading process.
The Trustees’ annual review of your fund’s management contract also included the review of its distributor’s contract and distribution plan with Putnam Retail Management Limited Partnership and the custodian agreement and investor servicing agreement with Putnam Fiduciary Trust Company, all of which provide benefits to affiliates of Putnam Management.
Comparison of retail and institutional fee schedules
The information examined by the Trustees as part of their annual contract review has included for many years information regarding fees charged by Putnam Management and its affiliates to institutional clients such as defined benefit pension plans, college endowments, etc. This information included comparison of such fees with fees charged to the funds, as well as a detailed assessment of the differences in the services provided to these two types of clients. The Trustees observed, in this regard, that the differences in fee rates between institutional clients and the mutual funds are by no means uniform when examined by individual asset sectors, suggesting that differences in the pricing of investment management services to these types of clients reflect to a substantial degree historical competitive forces operating in separate market places. The Trustees considered the fact that fee rates across all asset sectors are higher on average for mutual funds than for institutional clients, as well as the differences between the services that Putnam Management provides to the Putnam funds and those that it provides to institutional clients of the firm, but did not rely on such comparisons to any significant extent in concluding that the management fees paid by your fund are reasonable.
28
Other information
for shareholders |
Important notice regarding delivery of shareholder documents
In accordance with SEC regulations, Putnam sends a single copy of annual and semiannual shareholder reports, prospectuses, and proxy statements to Putnam shareholders who share the same address, unless a shareholder requests otherwise. If you prefer to receive your own copy of these documents, please call Putnam at 1-800-225-1581, and Putnam will begin sending individual copies within 30 days.
Proxy voting
Putnam is committed to managing our mutual funds in the best interests of our shareholders. The Putnam funds’ proxy voting guidelines and procedures, as well as information regarding how your fund voted proxies relating to portfolio securities during the 12-month period ended June 30, 2006, are available on the Putnam Individual Investor Web site, www.putnam.com/individual, and on the SEC’s Web site, www.sec.gov. If you have questions about finding forms on the SEC’s Web site, you may call the SEC at 1-800-SEC-0330. You may also obtain the Putnam funds’ proxy voting guidelines and procedures at no charge by calling Putnam’s Shareholder Services at 1-800-225-1581.
Fund portfolio holdings
The fund will file a complete schedule of its portfolio holdings with the SEC for the first and third quarters of each fiscal year on Form N-Q. Shareholders may obtain the fund’s Forms N-Q on the SEC’s Web site at www.sec.gov. In addition, the fund’s Forms N-Q may be reviewed and copied at the SEC’s Public Reference Room in Washington, D.C. You may call the SEC at 1-800-SEC-0330 for information about the SEC’s Web site or the operation of the Public Reference Room.
29
Financial statements
A guide to financial statements
These sections of the report, as well as the accompanying Notes, constitute the fund’s financial statements.
The fund’s portfolio lists all the fund’s investments and their values as of the last day of the reporting period. Holdings are organized by asset type and industry sector, country, or state to show areas of concentration and diversification.
Statement of assets and liabilities shows how the fund’s net assets and share price are determined. All investment and noninvestment assets are added together. Any unpaid expenses and other liabilities are subtracted from this total. The result is divided by the number of shares to determine the net asset value per share, which is calculated separately for each class of shares. (For funds with preferred shares, the amount subtracted from total assets includes the liquidation preference of preferred shares.)
Statement of operations shows the fund’s net investment gain or loss. This is done by first adding up all the fund’s earnings — from dividends and interest income — and subtracting its operating expenses to determine net investment income (or loss). Then, any net gain or loss the fund realized on the sales of its holdings — as well as any unrealized gains or losses over the period — is added to or subtracted from the net investment result to determine the fund’s net gain or loss for the fiscal period.
Statement of changes in net assets shows how the fund’s net assets were affected by the fund’s net investment gain or loss, by distributions to shareholders, and by changes in the number of the fund’s shares. It lists distributions and their sources (net investment income or realized capital gains) over the current reporting period and the most recent fiscal year-end. The distributions listed here may not match the sources listed in the Statement of operations because the distributions are determined on a tax basis and may be paid in a different period from the one in which they were earned. Dividend sources are estimated at the time of declaration. Actual results may vary. Any non-taxable return of capital cannot be determined until final tax calculations are completed after the end of the fund’s fiscal year.
Financial highlights provide an overview of the fund’s investment results, per-share distributions, expense ratios, net investment income ratios, and portfolio turnover in one summary table, reflecting the five most recent reporting periods. In a semiannual report, the highlight table also includes the current reporting period.
30
The fund’s portfolio 10/31/06 (Unaudited)
| COMMON STOCKS (99.5%)* | | | |
|
| | Shares | | Value |
|
| Aerospace and Defense (1.3%) | | | |
| L-3 Communications Holdings, Inc. | 149,800 | $ | 12,061,896 |
|
| |
| Banking (9.8%) | | | |
| City National Corp. | 199,900 | | 13,305,344 |
| Colonial Bancgroup, Inc. | 460,800 | | 10,985,472 |
| Comerica, Inc. | 126,500 | | 7,361,035 |
| Compass Bancshares, Inc. | 184,800 | | 10,396,848 |
| Cullen/Frost Bankers, Inc. (S) | 180,200 | | 9,759,632 |
| First Citizens BancShares, Inc. Class A | 82,200 | | 15,437,160 |
| TCF Financial Corp. | 364,800 | | 9,495,744 |
| Webster Financial Corp. | 290,700 | | 14,046,624 |
| Zions Bancorp. | 50,270 | | 4,041,708 |
| | | | 94,829,567 |
|
| |
| Building Materials (1.5%) | | | |
| Sherwin-Williams Co. (The) | 250,700 | | 14,848,961 |
|
| |
| Chemicals (0.7%) | | | |
| Chemtura Corp. | 831,200 | | 7,131,696 |
|
| |
| Coal (0.5%) | | | |
| CONSOL Energy, Inc. (S) | 128,400 | | 4,544,076 |
|
| |
| Communications Equipment (1.1%) | | | |
| Avaya, Inc. † (S) | 811,100 | | 10,390,191 |
|
| |
| Computers (1.5%) | | | |
| Logitech International SA (Switzerland) † (S) | 537,892 | | 14,147,083 |
|
| |
| Consumer Goods (4.4%) | | | |
| Alberto-Culver Co. | 427,695 | | 21,731,183 |
| Clorox Co. | 116,800 | | 7,540,608 |
| Newell Rubbermaid, Inc. | 455,100 | | 13,097,778 |
| | | | 42,369,569 |
|
| |
| Distribution (0.3%) | | | |
| W.W. Grainger, Inc. | 45,477 | | 3,309,816 |
|
| |
| Electric Utilities (6.3%) | | | |
| Ameren Corp. (S) | 78,200 | | 4,230,620 |
| American Electric Power Co., Inc. | 222,100 | | 9,201,603 |
| Edison International | 293,100 | | 13,025,364 |
| Energy East Corp. (S) | 196,500 | | 4,776,915 |
| PG&E Corp. | 155,300 | | 6,699,642 |
| PPL Corp. | 228,800 | | 7,898,176 |
| Progress Energy, Inc. (S) | 119,280 | | 5,486,880 |
| Wisconsin Energy Corp. | 196,900 | | 9,045,586 |
| | | | 60,364,786 |
31
| COMMON STOCKS (99.5%)* continued | | | |
|
| | Shares | | Value |
|
| Electrical Equipment (1.4%) | | | |
| WESCO International, Inc. † (S) | 206,000 | $ | 13,445,620 |
|
| |
| Electronics (4.6%) | | | |
| Amphenol Corp. Class A | 129,400 | | 8,786,260 |
| Avnet, Inc. † | 721,800 | | 17,092,224 |
| Jabil Circuit, Inc. (S) | 645,400 | | 18,529,434 |
| | | | 44,407,918 |
|
| |
| Energy (2.6%) | | | |
| National-Oilwell Varco, Inc. † | 270,900 | | 16,362,360 |
| Pride International, Inc. † | 297,500 | | 8,213,975 |
| | | | 24,576,335 |
|
| |
| Financial (3.1%) | | | |
| Assurant, Inc. (S) | 288,400 | | 15,187,144 |
| Nasdaq Stock Market, Inc. (The) † | 410,300 | | 14,660,019 |
| | | | 29,847,163 |
|
| |
| Health Care Services (5.1%) | | | |
| AmerisourceBergen Corp. | 252,200 | | 11,903,840 |
| DaVita, Inc. † | 169,700 | | 9,440,411 |
| Omnicare, Inc. (S) | 369,300 | | 13,989,084 |
| Triad Hospitals, Inc. † | 362,400 | | 13,419,672 |
| | | | 48,753,007 |
|
| |
| Household Furniture and Appliances (3.0%) | | | |
| Whirlpool Corp. | 330,700 | | 28,747,751 |
|
| |
| Insurance (2.3%) | | | |
| Everest Re Group, Ltd. (Barbados) | 127,900 | | 12,685,122 |
| Phoenix Companies, Inc. (The) | 584,300 | | 9,255,312 |
| | | | 21,940,434 |
|
| |
| Investment Banking/Brokerage (3.8%) | | | |
| Bear Stearns Cos., Inc. (The) | 63,700 | | 9,640,995 |
| Nuveen Investments, Inc. Class A | 265,900 | | 13,108,870 |
| Waddell & Reed Financial, Inc. Class A (S) | 562,100 | | 14,333,550 |
| | | | 37,083,415 |
|
| |
| Machinery (2.1%) | | | |
| Terex Corp. † | 388,200 | | 20,093,232 |
|
| |
| Media (2.5%) | | | |
| Interpublic Group of Companies, Inc. (The) † (S) | 2,239,800 | | 24,436,218 |
|
| |
| Metals (3.1%) | | | |
| Freeport-McMoRan Copper & Gold, Inc. Class B | 251,600 | | 15,216,768 |
| United States Steel Corp. | 219,800 | | 14,858,480 |
| | | | 30,075,248 |
32
| COMMON STOCKS (99.5%)* continued | | | |
|
| | Shares | | Value |
|
| Natural Gas Utilities (1.6%) | | | |
| Equitable Resources, Inc. | 188,500 | $ | 7,638,020 |
| National Fuel Gas Co. | 202,300 | | 7,566,020 |
| | | | 15,204,040 |
|
| �� |
| Oil & Gas (4.4%) | | | |
| EOG Resources, Inc. | 96,200 | | 6,400,186 |
| Hess Corp. | 116,900 | | 4,956,560 |
| Newfield Exploration Co. † | 427,200 | | 17,425,488 |
| Questar Corp. | 166,800 | | 13,590,864 |
| | | | 42,373,098 |
|
| |
| Pharmaceuticals (1.0%) | | | |
| Mylan Laboratories, Inc. | 447,500 | | 9,173,750 |
|
| |
| Power Producers (1.3%) | | | |
| AES Corp. (The) † | 568,600 | | 12,503,514 |
|
| |
| Real Estate (10.8%) | | | |
| CB Richard Ellis Group, Inc. Class A † | 588,000 | | 17,657,640 |
| CBL & Associates Properties (R) | 174,600 | | 7,635,258 |
| Colonial Properties Trust (R) | 244,900 | | 12,340,511 |
| Douglas Emmett, Inc. † (R) | 204,975 | | 4,888,654 |
| Equity Office Properties Trust (R) | 159,100 | | 6,761,750 |
| General Growth Properties, Inc. (R) | 320,500 | | 16,633,950 |
| Hospitality Properties Trust (R) | 318,900 | | 15,453,894 |
| Host Marriott Corp. (R) | 583,200 | | 13,448,592 |
| Thornburg Mortgage, Inc. (R) (S) | 371,900 | | 9,550,392 |
| | | | 104,370,641 |
|
| |
| Retail (10.5%) | | | |
| Abercrombie & Fitch Co. Class A | 89,700 | | 6,875,505 |
| Office Depot, Inc. † | 213,000 | | 8,943,870 |
| OfficeMax, Inc. | 531,600 | | 25,293,528 |
| RadioShack Corp. | 775,800 | | 13,840,272 |
| Rite Aid Corp. † (S) | 3,125,100 | | 14,625,468 |
| Ross Stores, Inc. | 614,800 | | 18,093,564 |
| Timberland Co. (The) Class A † | 454,425 | | 13,110,161 |
| | | | 100,782,368 |
|
| |
| Shipping (1.2%) | | | |
| Con-way, Inc. | 255,380 | | 12,046,275 |
|
| |
| Software (2.7%) | | | |
| McAfee, Inc. † | 912,900 | | 26,410,197 |
|
| |
| Technology Services (0.6%) | | | |
| Computer Sciences Corp. † | 116,200 | | 6,141,170 |
33
| COMMON STOCKS (99.5%)* continued | | | | |
|
| | | Shares | | Value |
|
| Textiles (2.2%) | | | | |
| Liz Claiborne, Inc. | | 495,400 | $ | 20,891,018 |
|
| Toys (1.1%) | | | | |
| Mattel, Inc. | | 463,900 | | 10,498,057 |
|
| Trucks & Parts (1.1%) | | | | |
| Autoliv, Inc. (Sweden) | | 193,200 | | 10,987,284 |
|
| Total common stocks (cost $793,116,561) | | | $ | 958,785,394 |
|
| |
| PURCHASED OPTIONS OUTSTANDING (—%)* | | | |
|
| | Contract | Expiration date/ | | |
| | amount | strike price | | Value |
|
| McAfee, Inc. (Put) | $182,580 | Nov 06/22.50 | $ | 1,826 |
| Omnicare, Inc. (Put) | 23,930 | Dec 06/40.00 | | 66,781 |
| Terex Corp. (Put) | 37,000 | Nov 06/50.00 | | 39,035 |
|
| Total purchased options outstanding (cost $117,891) | | $ | 107,642 |
|
| |
| SHORT-TERM INVESTMENTS (10.1%)* | | | | |
|
| | | Principal amount/shares | | Value |
|
| Short-term investments held as collateral for loaned | | | |
| securities with yields ranging from 5.27% to 5.44% | | | |
| and due dates ranging from November 1, 2006 | | | |
| to December 22, 2006 (d) | $ | 84,914,356 | $ | 84,679,448 |
| Putnam Prime Money Market Fund (e) | | 12,615,410 | | 12,615,410 |
|
| Total short-term investments (cost $97,294,858) | | $ | 97,294,858 |
|
| |
| TOTAL INVESTMENTS | | | | |
| Total investments (cost $890,529,310) | | | $ | 1,056,187,894 |
* Percentages indicated are based on net assets of $963,400,145.
† Non-income-producing security.
(S) Securities on loan, in part or in entirety, at October 31, 2006.
(R) Real Estate Investment Trust.
(d) See Note 1 to the financial statements.
(e) See Note 5 to the financial statements regarding investments in Putnam Prime Money Market Fund.
At October 31, 2006, liquid assets totaling $19,579,571 have been designated as collateral for open written options contracts.
34
| WRITTEN OPTIONS OUTSTANDING at 10/31/06 (premiums received $985,862) (Unaudited) | | |
|
| | Contract | Expiration date/ | | |
| | amount | strike price | | Value |
|
| CONSOL Energy, Inc. (Call) | $ 20,850 | Nov 06/38.28 | $ | 9,626 |
| EOG Resources, Inc. (Call) | 9,620 | Nov 06/72.56 | | 3,633 |
| McAfee, Inc.(Call) | 182,580 | Nov 06/25.00 | | 741,274 |
| McAfee, Inc. (Put) | 182,580 | Nov 06/25.00 | | 12,781 |
| Newfield Exploration, Co. (Call) | 42,720 | Nov 06/42.65 | | 29,904 |
| Omnicare, Inc. (Call) | 23,930 | Dec 06/45.00 | | 2,970 |
| Omnicare, Inc. (Put) | 23,930 | Dec 06/45.00 | | 166,718 |
| Pride International, Inc. (Call) | 29,750 | Nov 06/30.54 | | 7,273 |
| Terex Corp. (Call) | 37,000 | Nov 06/55.00 | | 24,790 |
| Terex Corp. (Put) | 37,000 | Dec 06/55.00 | | 139,305 |
|
| Total | | | $ | 1,138,274 |
The accompanying notes are an integral part of these financial statements.
35
Statement of assets and liabilities 10/31/06 (Unaudited)
| ASSETS | | |
|
| Investment in securities, at value, including $80,852,088 of securities on loan (Note 1): | | |
| Unaffiliated issuers (identified cost $877,913,900) | $ | 1,043,572,484 |
| Affiliated issuers (identified cost $12,615,410) (Note 5) | | 12,615,410 |
|
| Dividends, interest and other receivables | | 801,612 |
|
| Receivable for shares of the fund sold | | 707,641 |
|
| Receivable for securities sold | | 11,881,865 |
|
| Total assets | | 1,069,579,012 |
|
| |
| LIABILITIES | | |
|
| Payable to subcustodian (Note 2) | | 707,735 |
|
| Payable for securities purchased | | 15,062,329 |
|
| Payable for shares of the fund repurchased | | 2,104,165 |
|
| Payable for compensation of Manager (Notes 2 and 5) | | 1,529,822 |
|
| Payable for investor servicing and custodian fees (Note 2) | | 379,901 |
|
| Payable for Trustee compensation and expenses (Note 2) | | 62,229 |
|
| Payable for administrative services (Note 2) | | 3,249 |
|
| Payable for distribution fees (Note 2) | | 377,078 |
|
| Written options outstanding, at value (premiums received $985,862) (Notes 1 and 3) | | 1,138,274 |
|
| Collateral on securities loaned, at value (Note 1) | | 84,679,448 |
|
| Other accrued expenses | | 134,637 |
|
| Total liabilities | | 106,178,867 |
|
| Net assets | $ | 963,400,145 |
|
| |
| REPRESENTED BY | | |
|
| Paid-in capital (Unlimited shares authorized) (Notes 1 and 4) | $ | 703,108,894 |
|
| Undistributed net investment income (Note 1) | | 790,927 |
|
| Accumulated net realized gain on investments (Note 1) | | 93,994,152 |
|
| Net unrealized appreciation of investments | | 165,506,172 |
|
| Total — Representing net assets applicable to capital shares outstanding | $ | 963,400,145 |
(Continued on next page)
36
Statement of assets and liabilities (Continued)
| COMPUTATION OF NET ASSET VALUE AND OFFERING PRICE | |
|
| Net asset value and redemption price per class A share | |
| ($619,722,608 divided by 38,520,512 shares) | $16.09 |
|
| Offering price per class A share | |
| (100/94.75 of $16.09)* | $16.98 |
|
| Net asset value and offering price per class B share | |
| ($239,143,072 divided by 15,351,396 shares)** | $15.58 |
|
| Net asset value and offering price per class C share | |
| ($40,486,942 divided by 2,597,973 shares)** | $15.58 |
|
| Net asset value and redemption price per class M share | |
| ($13,888,270 divided by 881,232 shares) | $15.76 |
|
| Offering price per class M share | |
| (100/96.75 of $15.76)* | $16.29 |
|
| Net asset value, offering price and redemption price per class R share | |
| ($3,852,464 divided by 241,930 shares) | $15.92 |
|
| Net asset value, offering price and redemption price per class Y share | |
| ($46,306,789 divided by 2,868,423 shares) | $16.14 |
* On single retail sales of less than $50,000. On sales of $50,000 or more the offering price is reduced.
** Redemption price per share is equal to net asset value less any applicable contingent deferred sales charge. |
The accompanying notes are an integral part of these financial statements.
37
Statement of operations Six months ended 10/31/06 (Unaudited)
| INVESTMENT INCOME | | |
|
| Dividends | $ | 6,896,126 |
|
| Interest (including interest income of $380,690 | | |
| from investments in affiliated issuers) (Note 5) | | 365,409 |
|
| Securities lending | | 68,748 |
|
| Total investment income | | 7,330,283 |
|
| |
| EXPENSES | | |
|
| Compensation of Manager (Note 2) | | 3,086,719 |
|
| Investor servicing fees (Note 2) | | 1,179,865 |
|
| Custodian fees (Note 2) | | 76,129 |
|
| Trustee compensation and expenses (Note 2) | | 26,095 |
|
| Administrative services (Note 2) | | 11,720 |
|
| Distribution fees — Class A (Note 2) | | 745,365 |
|
| Distribution fees — Class B (Note 2) | | 1,239,499 |
|
| Distribution fees — Class C (Note 2) | | 192,553 |
|
| Distribution fees — Class M (Note 2) | | 50,550 |
|
| Distribution fees — Class R (Note 2) | | 8,218 |
|
| Other | | 127,068 |
|
| Non-recurring costs (Notes 2 and 6) | | 5,271 |
|
| Costs assumed by Manager (Notes 2 and 6) | | (5,271) |
|
| Fees waived and reimbursed by Manager (Note 5) | | (8,801) |
|
| Total expenses | | 6,734,980 |
|
| Expense reduction (Note 2) | | (155,100) |
|
| Net expenses | | 6,579,880 |
|
| Net investment income | | 750,403 |
|
| Net realized gain on investments (Notes 1 and 3) | | 54,878,352 |
|
| Net realized loss on futures contracts (Note 1) | | (778,852) |
|
| Net unrealized depreciation of investments, futures contracts | | |
| and written options during the period | | (47,212,552) |
|
| Net gain on investments | | 6,886,948 |
|
| Net increase in net assets resulting from operations | $ | 7,637,351 |
The accompanying notes are an integral part of these financial statements.
38
Statement of changes in net assets
| INCREASE (DECREASE) IN NET ASSETS | | | |
|
| | | Six months ended | Year ended |
| | | 10/31/06* | 4/30/06 |
|
| Operations: | | | |
| Net investment income | $ | 750,403 | $ 289,315 |
|
| Net realized gain on investments | | 54,099,500 | 89,346,509 |
|
| Net unrealized appreciation (depreciation) of investments | | (47,212,552) | 129,442,131 |
|
| Net increase in net assets resulting from operations | | 7,637,351 | 219,077,955 |
|
| Distributions to shareholders: (Note 1) | | | |
|
| From ordinary income | | | |
|
| Net investment income | | | |
|
| Class A | | — | (417,188) |
|
| Class R | | — | (1,787) |
|
| Class Y | | — | (114,255) |
|
| Net realized short-term gain on investments | | | |
|
| Class A | | — | (6,168,545) |
|
| Class B | | — | (3,094,909) |
|
| Class C | | — | (416,442) |
|
| Class M | | — | (147,718) |
|
| Class R | | — | (16,837) |
|
| Class Y | | — | (435,140) |
|
| From net realized long-term gain on investments | | | |
|
| Class A | | — | (52,312,022) |
|
| Class B | | — | (26,246,209) |
|
| Class C | | — | (3,531,610) |
|
| Class M | | — | (1,252,713) |
|
| Class R | | — | (142,781) |
|
| Class Y | | — | (3,690,186) |
|
| Redemption fees (Note 1) | | 956 | 3,087 |
|
| Increase (decrease) from capital share transactions (Note 4) | | (38,452,613) | 77,702,282 |
|
| Total increase (decrease) in net assets | | (30,814,306) | 198,794,982 |
|
| |
| NET ASSETS | | | |
|
| Beginning of period | 994,214,451 | 795,419,469 |
|
| End of period (including undistributed net investment | | | |
| income of $790,927 and $40,524, respectively) | $963,400,145 | $994,214,451 |
* Unaudited
The accompanying notes are an integral part of these financial statements.
39
Financial highlights (For a common share outstanding throughout the period)
| INVESTMENT OPERATIONS: | | | | LESS DISTRIBUTIONS: | | | | | RATIOS AND SUPPLEMENTAL DATA: | |
| | | | | | | | | | | | | | |
| | | | Net | | | | | �� | | Total | | | Ratio of net | |
| | Net asset | | realized and | Total | From | From | | | Net asset | return | Net | Ratio of | investment | |
| | value, | Net | unrealized | from | net | net realized | | | value, | at net | assets, | expenses to | income (loss) | Portfolio |
| | beginning | investment | gain (loss) on | investment | investment | gain on | Total | Redemption | end | asset | end of period | average net | to average | turnover |
| Period ended | of period | income (loss)(a) | investments | operations | income | investments | distributions | fees | of period | value (%)(b) | (in thousands) | assets (%)(c) | net assets (%) | (%) |
|
| CLASS A | | | | | | | | | | | | | | |
| October 31, 2006** | $15.91 | .03(d) | .15 | .18 | — | — | — | —(g) | $16.09 | 1.13* | $619,723 | .61*(d) | .19*(d) | 36.64* |
| April 30, 2006 | 13.88 | .04(d,e) | 3.70 | 3.74 | (.01) | (1.70) | (1.71) | —(g) | 15.91 | 28.18 | 614,761 | 1.22(d,e) | .28(d,e) | 63.63 |
| April 30, 2005 | 12.53 | .03(d,f) | 1.51 | 1.54 | —(g) | (.19) | (.19) | —(g) | 13.88 | 12.31 | 455,115 | 1.30(d) | .21(d,f) | 88.96 |
| April 30, 2004 | 9.67 | .05 | 2.82 | 2.87 | (.01) | — | (.01) | — | 12.53 | 29.72 | 378,117 | 1.28 | .46 | 83.90 |
| April 30, 2003 | 12.00 | .05 | (2.17) | (2.12) | (.06) | (.15) | (.21) | — | 9.67 | (17.67) | 293,124 | 1.28 | .54 | 44.93 |
| April 30, 2002 | 10.71 | .05 | 1.37 | 1.42 | (.08) | (.05) | (.13) | — | 12.00 | 13.40 | 298,662 | 1.24 | .38 | 52.73 |
|
| |
| CLASS B | | | | | | | | | | | | | | |
| October 31, 2006** | $15.46 | (.03)(d) | .15 | .12 | — | — | — | —(g) | $15.58 | .78* | $239,143 | .98*(d) | (.18)*(d) | 36.64* |
| April 30, 2006 | 13.62 | (.07)(d,e) | 3.61 | 3.54 | — | (1.70) | (1.70) | —(g) | 15.46 | 27.18 | 276,306 | 1.97(d,e) | (.46)(d,e) | 63.63 |
| April 30, 2005 | 12.39 | (.07)(d,f) | 1.49 | 1.42 | — | (.19) | (.19) | —(g) | 13.62 | 11.47 | 259,429 | 2.05(d) | (.52)(d,f) | 88.96 |
| April 30, 2004 | 9.62 | (.03) | 2.80 | 2.77 | — | — | — | — | 12.39 | 28.79 | 271,485 | 2.03 | (.28) | 83.90 |
| April 30, 2003 | 11.96 | (.02) | (2.17) | (2.19) | —(g) | (.15) | (.15) | — | 9.62 | (18.28) | 228,248 | 2.03 | (.22) | 44.93 |
| April 30, 2002 | 10.70 | (.04) | 1.37 | 1.33 | (.02) | (.05) | (.07) | — | 11.96 | 12.50 | 263,306 | 1.99 | (.40) | 52.73 |
|
| |
| CLASS C | | | | | | | | | | | | | | |
| October 31, 2006** | $15.47 | (.03)(d) | .14 | .11 | — | — | — | —(g) | $15.58 | .71* | $40,487 | .98*(d) | (.19)*(d) | 36.64* |
| April 30, 2006 | 13.62 | (.07)(d,e) | 3.62 | 3.55 | — | (1.70) | (1.70) | —(g) | 15.47 | 27.26 | 39,800 | 1.97(d,e) | (.47)(d,e) | 63.63 |
| April 30, 2005 | 12.39 | (.07)(d,f) | 1.49 | 1.42 | — | (.19) | (.19) | —(g) | 13.62 | 11.47 | 30,903 | 2.05(d) | (.52)(d,f) | 88.96 |
| April 30, 2004 | 9.62 | (.03) | 2.80 | 2.77 | — | — | — | — | 12.39 | 28.79 | 30,149 | 2.03 | (.29) | 83.90 |
| April 30, 2003 | 11.96 | (.02) | (2.17) | (2.19) | —(g) | (.15) | (.15) | — | 9.62 | (18.29) | 25,611 | 2.03 | (.22) | 44.93 |
| April 30, 2002 | 10.69 | (.04) | 1.38 | 1.34 | (.02) | (.05) | (.07) | — | 11.96 | 12.56 | 30,286 | 1.99 | (.39) | 52.73 |
|
| |
| CLASS M | | | | | | | | | | | | | | |
| October 31, 2006** | $15.63 | (.01)(d) | .14 | .13 | — | — | — | —(g) | $15.76 | .83* | $13,888 | .86*(d) | (.06)*(d) | 36.64* |
| April 30, 2006 | 13.71 | (.03)(d,e) | 3.65 | 3.62 | — | (1.70) | (1.70) | —(g) | 15.63 | 27.61 | 14,075 | 1.72(d,e) | (.21)(d,e) | 63.63 |
| April 30, 2005 | 12.44 | (.04)(d,f) | 1.50 | 1.46 | — | (.19) | (.19) | —(g) | 13.71 | 11.74 | 13,306 | 1.80(d) | (.28)(d,f) | 88.96 |
| April 30, 2004 | 9.64 | —(g) | 2.80 | 2.80 | — | — | — | — | 12.44 | 29.05 | 12,513 | 1.78 | (.03) | 83.90 |
| April 30, 2003 | 11.97 | —(g) | (2.16) | (2.16) | (.02) | (.15) | (.17) | — | 9.64 | (18.04) | 10,478 | 1.78 | .03 | 44.93 |
| April 30, 2002 | 10.70 | (.01) | 1.37 | 1.36 | (.04) | (.05) | (.09) | — | 11.97 | 12.79 | 14,159 | 1.74 | (.15) | 52.73 |
|
| |
| CLASS R | | | | | | | | | | | | | | |
| October 31, 2006** | $15.77 | .01(d) | .14 | .15 | — | — | — | —(g) | $15.92 | .95* | $3,852 | .73*(d) | .06*(d) | 36.64* |
| April 30, 2006 | 13.81 | (.01)(d,e) | 3.69 | 3.68 | (.02) | (1.70) | (1.72) | —(g) | 15.77 | 27.86 | 2,959 | 1.47(d,e) | (.03)(d,e) | 63.63 |
| April 30, 2005 | 12.50 | (.03)(d,f) | 1.54 | 1.51 | (.01) | (.19) | (.20) | —(g) | 13.81 | 12.06 | 345 | 1.55(d) | (.18)(d,f) | 88.96 |
| April 30, 2004 | 9.67 | .03 | 2.82 | 2.85 | (.02) | — | (.02) | — | 12.50 | 29.43 | 15 | 1.53 | .21 | 83.90 |
| April 30, 2003† | 9.00 | —(g) | .67 | .67 | — | — | — | — | 9.67 | 7.44* | 1 | .13* | .02* | 44.93 |
|
| |
| CLASS Y | | | | | | | | | | | | | | |
| October 31, 2006** | $15.94 | .05(d) | .15 | .20 | — | — | — | —(g) | $16.14 | 1.25* | $46,307 | .48*(d) | .32*(d) | 36.64* |
| April 30, 2006 | 13.90 | .08(d,e) | 3.71 | 3.79 | (.05) | (1.70) | (1.75) | —(g) | 15.94 | 28.50 | 46,314 | .97(d,e) | .52(d,e) | 63.63 |
| April 30, 2005 | 12.55 | .06(d,f) | 1.51 | 1.57 | (.03) | (.19) | (.22) | —(g) | 13.90 | 12.53 | 36,322 | 1.05(d) | .45(d,f) | 88.96 |
| April 30, 2004 | 9.68 | .08 | 2.83 | 2.91 | (.04) | — | (.04) | — | 12.55 | 30.06 | 24,872 | 1.03 | .71 | 83.90 |
| April 30, 2003 | 12.00 | .08 | (2.17) | (2.09) | (.08) | (.15) | (.23) | — | 9.68 | (17.44) | 15,852 | 1.03 | .79 | 44.93 |
| April 30, 2002†† | 12.34 | —(g) | (.34) | (.34) | — | — | — | — | 12.00 | (2.76)* | 17,236 | .08* | —*(h) | 52.73 |
|
See notes to financial highlights at the end of this section.
The accompanying notes are an integral part of these financial statements.
Financial highlights (Continued)
* Not annualized.
** Unaudited.
†For the period April 1, 2003 (commencement of operations) to April 30, 2003.
††For the period April 2, 2002 (commencement of operations) to April 30, 2002.
(a) Per share net investment income (loss) has been determined on the basis of the weighted average number of shares outstanding during the period.
(b) Total return assumes dividend reinvestment and does not reflect the effect of sales charges.
(c) Includes amounts paid through expense offset and brokerage service arrangements (Note 2).
(d) Reflects waivers of certain fund expenses in connection with investments in Putnam Prime Money Market Fund during the period. As a result of such waivers, the expenses of each class, as a percentage of its average net assets, reflect a reduction of the following amounts (Note 5):
| | 10/31/06 | 4/30/06 | 4/30/05 |
|
| Class A | <0.01% | <0.01% | <0.01% |
|
| Class B | <0.01 | <0.01 | <0.01 |
|
| Class C | <0.01 | <0.01 | <0.01 |
|
| Class M | <0.01 | <0.01 | <0.01 |
|
| Class R | <0.01 | <0.01 | <0.01 |
|
| Class Y | <0.01 | <0.01 | <0.01 |
|
(e) Reflects a non-recurring accrual related to a reimbursement to the fund from Putnam Investments relating to the calculation of certain amounts paid by the fund to Putnam in previous years for transfer agent services, which amounted to less than $0.01 per share and 0.01% of average net assets for the period ended April 30, 2006 (Note 6).
(f) Reflects a non-recurring accrual related to Putnam Management’s settlement with the SEC regarding brokerage allocation practices. As a result, the expenses of each class reflect a reduction of the following amounts:
| | | Percentage |
| | | of average |
| | Per share | net assets |
|
| Class A | <$0.01 | 0.01% |
|
| Class B | <0.01 | 0.01 |
|
| Class C | <0.01 | 0.01 |
|
| Class M | <0.01 | 0.01 |
|
| Class R | <0.01 | 0.01 |
|
| Class Y | <0.01 | 0.01 |
|
(g) Amount represents less than $0.01 per share.
(h) Amount represents less than 0.01% .
The accompanying notes are an integral part of these financial statements.
42
Notes to financial statements 10/31/06 (Unaudited)
Note 1: Significant accounting policies
Putnam Mid Cap Value Fund (the “fund”) is one of a series of Putnam Investment Funds (the “trust”), which is registered under the Investment Company Act of 1940, as amended, as a diversified, open-end management investment company. The fund seeks capital appreciation by investing primarily in common stocks of midsize companies which Putnam Investment Management, LLC (“Putnam Management”), the fund’s manager, an indirect wholly-owned subsidiary of Putnam, LLC, believes are currently undervalued. The fund seeks current income as a secondary objective.
The fund offers class A, class B, class C, class M, class R and class Y shares. Class A and class M shares are sold with a maximum front-end sales charge of 5.25% and 3.25%, respectively, and generally do not pay a contingent deferred sales charge. Class B shares, which convert to class A shares after approximately eight years, do not pay a front-end sales charge and are subject to a contingent deferred sales charge, if those shares are redeemed within six years of purchase. Class C shares have a one-year 1.00% contingent deferred sales charge and do not convert to class A shares. Class R shares, which are offered to qualified employee-benefit plans, are sold without a front-end sales charge or a contingent deferred sales charge. The expenses for class A, class B, class C, class M and class R shares may differ based on the distribution fee of each class, which is identified in Note 2. Class Y shares, which are sold at net asset value, are generally subject to the sa me expenses as class A, class B, class C, class M and class R shares, but do not bear a distribution fee. Class Y shares are sold to certain eligible purchasers including certain defined contribution plans (including corporate IRAs), bank trust departments and trust companies.
Effective October 2, 2006, a 1.00% redemption fee may apply on any shares purchased on or after such date that are redeemed (either by selling or exchanging into another fund) within 7 days of purchase. The redemption fee is accounted for as an addition to paid-in-capital. Prior to October 2, 2006 a 2.00% redemption fee applied to any shares that were redeemed (either by selling or exchanging into another fund) within 5 days of purchase.
Investment income, realized and unrealized gains and losses and expenses of the fund are borne pro-rata based on the relative net assets of each class to the total net assets of the fund, except that each class bears expenses unique to that class (including the distribution fees applicable to such classes). Each class votes as a class only with respect to its own distribution plan or other matters on which a class vote is required by law or determined by the Trustees. Shares of each class would receive their pro-rata share of the net assets of the fund, if the fund were liquidated. In addition, the Trustees declare separate dividends on each class of shares.
In the normal course of business, the fund enters into contracts that may include agreements to indemnify another party under given circumstances. The fund’s maximum exposure under these arrangements is unknown as this would involve future claims that may be, but have not yet been, made against the fund. However, the fund expects the risk of material loss to be remote.
The following is a summary of significant accounting policies consistently followed by the fund in the preparation of its financial statements. The preparation of financial statements is in conformity with accounting principles generally accepted in the United States of America and requires management to make estimates and assumptions that affect the reported amounts of assets and liabilities in the financial statements and the reported amounts of increases and decreases in net assets from operations during the reporting period. Actual results could differ from those estimates.
A) Security valuation Investments for which market quotations are readily available are valued at the last reported sales price on their principal exchange, or official closing price for certain markets. If no sales are reported — as in the case
43
of some securities traded over-the-counter — a security is valued at its last reported bid price. Many securities markets and exchanges outside the U.S. close prior to the close of the New York Stock Exchange and therefore the closing prices for securities in such markets or on such exchanges may not fully reflect events that occur after such close but before the close of the New York Stock Exchange. Accordingly, on certain days, the fund will fair value foreign equity securities taking into account multiple factors, including movements in the U.S. securities markets. The number of days on which fair value prices will be used will depend on market activity and it is possible that fair value prices will be used by the fund to a significant extent. Securities quoted in foreign currencies, if any, are translated into U.S. dollars at the current exchange rate. Certain investments, including certain restricted securities, are also valued at fair value following proc edures approved by the Trustees. Such valuations and procedures are reviewed periodically by the Trustees. The fair value of securities is generally determined as the amount that the fund could reasonably expect to realize from an orderly disposition of such securities over a reasonable period of time. By its nature, a fair value price is a good faith estimate of the value of a security at a given point in time and does not reflect an actual market price, which may be different by a material amount.
B) Joint trading account Pursuant to an exemptive order from the Securities and Exchange Commission, the fund may transfer uninvested cash balances, including cash collateral received under security lending arrangements, into a joint trading account along with the cash of other registered investment companies and certain other accounts managed by Putnam Management. These balances may be invested in issues of high-grade short-term investments having maturities of up to 397 days for collateral received under security lending arrangements and up to 90 days for other cash investments.
C) Repurchase agreements The fund, or any joint trading account, through its custodian, receives delivery of the underlying securities, the market value of which at the time of purchase is required to be in an amount at least equal to the resale price, including accrued interest. Collateral for certain tri-party repurchase agreements is held at the counterparty’s custodian in a segregated account for the benefit of the fund and the counterparty. Putnam Management is responsible for determining that the value of these underlying securities is at all times at least equal to the resale price, including accrued interest.
D) Security transactions and related investment income Security transactions are recorded on the trade date (the date the order to buy or sell is executed). Gains or losses on securities sold are determined on the identified cost basis.
Interest income is recorded on the accrual basis. Dividend income, net of applicable withholding taxes, is recognized on the ex-dividend date except that certain dividends from foreign securities, if any, are recognized as soon as the fund is informed of the ex-dividend date. Non-cash dividends, if any, are recorded at the fair market value of the securities received. Dividends representing a return of capital or capital gains, if any, are reflected as a reduction of cost and/or as a realized gain.
E) Futures and options contracts The fund may use futures and options contracts to hedge against changes in the values of securities the fund owns or expects to purchase, or for other investment purposes. The fund may also write options on swaps or securities it owns or in which it may invest to increase its current returns.
The potential risk to the fund is that the change in value of futures and options contracts may not correspond to the change in value of the hedged instruments. In addition, losses may arise from changes in the value of the underlying instruments, if there is an illiquid secondary market for the contracts, or if the counterparty to the contract is unable to perform. Risks may exceed
44
amounts recognized on the statement of assets and liabilities. When the contract is closed, the fund records a realized gain or loss equal to the difference between the value of the contract at the time it was opened and the value at the time it was closed. Realized gains and losses on purchased options are included in realized gains and losses on investment securities. If a written call option is exercised, the premium originally received is recorded as an addition to sales proceeds. If a written put option is exercised, the premium originally received is recorded as a reduction to the cost of investments.
Futures contracts are valued at the quoted daily settlement prices established by the exchange on which they trade. The fund and the broker agree to exchange an amount of cash equal to the daily fluctuation in the value of the futures contract. Such receipts or payments are known as “variation margin.” Exchange traded options are valued at the last sale price or, if no sales are reported, the last bid price for purchased options and the last ask price for written options. Options traded over-the-counter are valued using prices supplied by dealers. Futures and written option contracts outstanding at period end, if any, are listed after the fund’s portfolio.
F) Securities lending The fund may lend securities, through its agents, to qualified borrowers in order to earn additional income. The loans are collateralized by cash and/or securities in an amount at least equal to the market value of the securities loaned. The market value of securities loaned is determined daily and any additional required collateral is allocated to the fund on the next business day. The risk of borrower default will be borne by the fund’s agents; the fund will bear the risk of loss with respect to the investment of the cash collateral. Income from securities lending is included in investment income on the statement of operations. At October 31, 2006, the value of securities loaned amounted to $80,852,088. The fund received cash collateral of $84,679,448 which is pooled with collateral of other Putnam funds into 42 issues of high grade short-term investments.
G) Federal taxes It is the policy of the fund to distribute all of its taxable income within the prescribed time and otherwise comply with the provisions of the Internal Revenue Code of 1986 (the “Code”) applicable to regulated investment companies. It is also the intention of the fund to distribute an amount sufficient to avoid imposition of any excise tax under Section 4982 of the Code, as amended. Therefore, no provision has been made for federal taxes on income, capital gains or unrealized appreciation on securities held nor for excise tax on income and capital gains.
The aggregate identified cost on a tax basis is $891,055,784, resulting in gross unrealized appreciation and depreciation of $175,748,198 and $10,616,088, respectively, or net unrealized appreciation of $165,132,110.
H) Distributions to shareholders Distributions to shareholders from net investment income are recorded by the fund on the ex-dividend date. Distributions from capital gains, if any, are recorded on the ex-dividend date and paid at least annually. The amount and character of income and gains to be distributed are determined in accordance with income tax regulations, which may differ from generally accepted accounting principles. Dividend sources are estimated at the time of declaration. Actual results may vary. Any non-taxable return of capital cannot be determined until final tax calculations are completed after the end of the fund’s fiscal year. Reclassifications are made to the fund’s capital accounts to reflect income and gains available for distribution (or available capital loss carryovers) under income tax regulations.
I) Expenses of the trust Expenses directly charged or attributable to any fund will be paid from the assets of that fund. Generally, expenses of the trust will be allocated among and charged to the assets of each fund on a basis that the Trustees deem fair and equitable, which may be based on the relative assets of each fund or the nature of the services performed and relative applicability to each fund.
45
Note 2: Management fee, administrative
services and other transactions
Putnam Management is paid for management and investment advisory services quarterly based on the average net assets of the fund. Such fee is based on the following annual rates: 0.70% of the first $500 million of average net assets, 0.60% of the next $500 million, 0.55% of the next $500 million, 0.50% of the next $5 billion, 0.475% of the next $5 billion, 0.455% of the next $5 billion, 0.44% of the next $5 billion and 0.43% thereafter.
Putnam Management has agreed to waive fees and reimburse expenses of the fund through April 30, 2007, to the extent necessary to ensure that the fund’s expenses do not exceed the simple average of the expenses of all front-end load funds viewed by Lipper Inc. as having the same investment classification or objective as the fund. The expense reimbursement is based on a comparison of the fund’s expenses with the average annualized operating expenses of the funds in its Lipper peer group for each calendar quarter during the fund’s last fiscal year, excluding 12b-1 fees and without giving effect to any expense offset and brokerage service arrangements that may reduce fund expenses. For the six months ended October 31, 2006, Putnam Management did not waive any of its management fee from the fund.
For the six months ended October 31, 2006, Putnam Management has assumed $5,271 of legal, shareholder servicing and communication, audit and Trustee fees incurred by the fund in connection with certain legal and regulatory matters (including those described in Note 6).
The fund reimburses Putnam Management an allocated amount for the compensation and related expenses of certain officers of the fund and their staff who provide administrative services to the fund. The aggregate amount of all such reimbursements is determined annually by the Trustees.
Custodial functions for the fund’s assets are provided by Putnam Fiduciary Trust Company (“PFTC”), a subsidiary of Putnam, LLC. PFTC receives fees for custody services based on the fund’s asset level, the number of its security holdings and transaction volumes. Putnam Investor Services, a division of PFTC, provides investor servicing agent functions to the fund. Putnam Investor Services receives fees for investor servicing based on the number of shareholder accounts in the fund and the level of defined contribution plan assets in the fund. During the six months ended October 31, 2006, the fund incurred $1,255,994 for these services.
Under the subcustodian contract between the subcustodian bank and PFTC, the subcustodian bank has a lien on the securities of the fund to the extent permitted by the fund’s investment restrictions to cover any advances made by the subcustodian bank for the settlement of securities purchased by the fund. At October 31, 2006, the payable to the subcustodian bank represents the amount due for cash advanced for the settlement of securities purchased.
The fund has entered into an arrangement with PFTC whereby credits realized as a result of uninvested cash balances are used to reduce a portion of the fund’s expenses. The fund also reduced expenses through brokerage service arrangements. For the six months ended October 31, 2006, the fund’s expenses were reduced by $155,100 under these arrangements.
Each independent Trustee of the fund receives an annual Trustee fee, of which $426, as a quarterly retainer, has been allocated to the fund, and an additional fee for each Trustees meeting attended. Trustees receive additional fees for attendance at certain committee meetings, industry seminars and for certain compliance-related matters. Trustees also are reimbursed for expenses they incur relating to their services as Trustees. George Putnam, III, who is not an independent Trustee, also receives the foregoing fees for his services as Trustee.
46
The fund has adopted a Trustee Fee Deferral Plan (the “Deferral Plan”) which allows the Trustees to defer the receipt of all or a portion of Trustees fees payable on or after July 1, 1995. The deferred fees remain invested in certain Putnam funds until distribution in accordance with the Deferral Plan.
The fund has adopted an unfunded noncontributory defined benefit pension plan (the “Pension Plan”) covering all Trustees of the fund who have served as a Trustee for at least five years and were first elected prior to 2004. Benefits under the Pension Plan are equal to 50% of the Trustee’s average annual attendance and retainer fees for the three years ended December 31, 2005. The retirement benefit is payable during a Trustee’s lifetime, beginning the year following retirement, for the number of years of service through December 31, 2006. Pension expense for the fund is included in Trustee compensation and expenses in the statement of operations. Accrued pension liability is included in Payable for Trustee compensation and expenses in the statement of assets and liabilities. The Trustees have terminated the Pension Plan with respect to any Trustee first elected after 2003.
The fund has adopted distribution plans (the “Plans”) with respect to its class A, class B, class C, class M and class R shares pursuant to Rule 12b-1 under the Investment Company Act of 1940. The purpose of the Plans is to compensate Putnam Retail Management, a wholly-owned subsidiary of Putnam, LLC and Putnam Retail Management GP, Inc., for services provided and expenses incurred in distributing shares of the fund. The Plans provide for payments by the fund to Putnam Retail Management at an annual rate of up to 0.35%, 1.00%, 1.00%, 1.00% and 1.00% of the average net assets attributable to class A, class B, class C, class M and class R shares, respectively. The Trustees have approved payment by the fund at an annual rate of 0.25%, 1.00%, 1.00%, 0.75% and 0.50% of the average net assets attributable to class A, class B, class C, class M and class R shares, respectively.
For the six months ended October 31, 2006, Putnam Retail Management, acting as underwriter, received net commissions of $37,402 and $337 from the sale of class A and class M shares, respectively, and received $99,073 and $1,081 in contingent deferred sales charges from redemptions of class B and class C shares, respectively.
A deferred sales charge of up to 1.00% and 0.65% is assessed on certain redemptions of class A and class M shares, respectively. For the six months ended October 31, 2006, Putnam Retail Management, acting as underwriter, received $80 and no monies on class A and class M redemptions, respectively.
Note 3: Purchases and sales of securities
During the six months ended October 31, 2006, cost of purchases and proceeds from sales of investment securities other than short-term investments aggregated $342,455,579 and $381,979,156, respectively. There were no purchases or sales of U.S. government securities.
| | | Contract | | Premiums |
| | | Amounts | | Received |
|
| Written options | | | | |
| outstanding at | | | | |
| beginning of period | $ | — | $ | — |
|
| Options opened | | 589,960 | | 985,862 |
| Options exercised | | — | | — |
| Options expired | | — | | — |
| Options closed | | — | | — |
|
| Written options | | | | |
| outstanding at | | | | |
| end of period | $ | 589,960 | $ | 985,862 |
Note 4: Capital shares
At October 31, 2006, there was an unlimited number of shares of beneficial interest authorized. Transactions in capital shares were as follows:
47
| CLASS A | Shares | | Amount |
|
| Six months ended 10/31/06: | | |
| Shares sold | 4,988,543 | $ | 75,863,356 |
|
| Shares issued | | | |
| in connection | | | |
| with reinvestment | | | |
| of distributions | — | | — |
|
| | 4,988,543 | | 75,863,356 |
|
| Shares | | | |
| repurchased | (5,107,908) | | (77,711,745) |
|
| Net decrease | (119,365) | $ | (1,848,389) |
| |
| Year ended 4/30/06: | | | |
| Shares sold | 12,147,827 | $ | 184,101,966 |
|
| Shares issued | | | |
| in connection | | | |
| with reinvestment | | | |
| of distributions | 3,897,253 | | 56,315,295 |
|
| | 16,045,080 | | 240,417,261 |
|
| Shares | | | |
| repurchased | (10,191,765) | | (153,395,104) |
|
| Net increase | 5,853,315 | $ | 87,022,157 |
|
| |
| CLASS B | Shares | | Amount |
|
| Six months ended 10/31/06: | | |
| Shares sold | 862,497 | $ | 12,763,018 |
|
| Shares issued | | | |
| in connection | | | |
| with reinvestment | | | |
| of distributions | — | | — |
|
| | 862,497 | | 12,763,018 |
|
| Shares | | | |
| repurchased | (3,379,891) | | (49,761,034) |
|
| Net decrease | (2,517,394) | $ | (36,998,016) |
| |
| Year ended 4/30/06: | | | |
| Shares sold | 2,922,967 | $ | 43,228,667 |
|
| Shares issued | | | |
| in connection | | | |
| with reinvestment | | | |
| of distributions | 1,919,676 | | 27,048,245 |
|
| | 4,842,643 | | 70,276,912 |
|
| Shares | | | |
| repurchased | (6,024,761) | | (89,151,120) |
|
| Net decrease | (1,182,118) | $ | (18,874,208) |
| CLASS C | Shares | | Amount |
|
| Six months ended 10/31/06: | | |
| Shares sold | 286,276 | $ | 4,247,832 |
|
| Shares issued | | | |
| in connection | | | |
| with reinvestment | | | |
| of distributions | — | | — |
|
| | 286,276 | | 4,247,832 |
|
| Shares | | | |
| repurchased | (261,126) | | (3,859,371) |
|
| Net increase | 25,150 | $ | 388,461 |
| |
| Year ended 4/30/06: | | | |
| Shares sold | 622,128 | $ | 9,221,260 |
|
| Shares issued | | | |
| in connection | | | |
| with reinvestment | | | |
| of distributions | 242,003 | | 3,409,829 |
|
| | 864,131 | | 12,631,089 |
|
| Shares | | | |
| repurchased | (559,821) | | (8,294,096) |
|
| Net increase | 304,310 | $ | 4,336,993 |
|
| |
| CLASS M | Shares | | Amount |
|
| Six months ended 10/31/06: | | |
| Shares sold | 76,300 | $ | 1,134,546 |
|
| Shares issued | | | |
| in connection | | | |
| with reinvestment | | | |
| of distributions | — | | — |
|
| | 76,300 | | 1,134,546 |
|
| Shares | | | |
| repurchased | (95,842) | | (1,438,548) |
|
| Net decrease | (19,542) | $ | (304,002) |
| |
| Year ended 4/30/06: | | | |
| Shares sold | 182,107 | $ | 2,720,581 |
|
| Shares issued | | | |
| in connection | | | |
| with reinvestment | | | |
| of distributions | 95,380 | | 1,356,297 |
|
| | 277,487 | | 4,076,878 |
|
| Shares | | | |
| repurchased | (347,069) | | (5,147,717) |
|
| Net decrease | (69,582) | $ | (1,070,839) |
48
| CLASS R | Shares | | Amount |
|
| Six months ended 10/31/06: | | |
| Shares sold | 98,681 | | $1,504,944 |
|
| Shares issued | | | |
| in connection | | | |
| with reinvestment | | | |
| of distributions | — | | — |
|
| | 98,681 | | 1,504,944 |
|
| Shares | | | |
| repurchased | (44,441) | | (664,450) |
|
| Net increase | 54,240 | | $ 840,494 |
| |
| Year ended 4/30/06: | | | |
| Shares sold | 177,070 | | $2,667,028 |
|
| Shares issued | | | |
| in connection | | | |
| with reinvestment | | | |
| of distributions | 11,256 | | 161,405 |
|
| | 188,326 | | 2,828,433 |
|
| Shares | | | |
| repurchased | (25,611) | | (387,610) |
|
| Net increase | 162,715 | | $2,440,823 |
|
| |
| CLASS Y | Shares | | Amount |
| Six months ended 10/31/06: | | |
| Shares sold | 374,552 | $ | 5,749,633 |
|
| Shares issued | | | |
| in connection | | | |
| with reinvestment | | | |
| of distributions | — | | — |
|
| | 374,552 | | 5,749,633 |
|
| Shares | | | |
| repurchased | (410,842) | | (6,280,794) |
|
| Net decrease | (36,290) | $ | (531,161) |
| |
| Year ended 4/30/06: | | | |
| Shares sold | 1,404,408 | $ | 21,185,949 |
|
| Shares issued | | | |
| in connection | | | |
| with reinvestment | | | |
| of distributions | 292,991 | | 4,239,581 |
|
| | 1,697,399 | | 25,425,530 |
|
| Shares | | | |
| repurchased | (1,404,970) | | (21,578,174) |
|
| Net increase | 292,429 | $ | 3,847,356 |
Note 5: Investment in Putnam Prime
Money Market Fund |
The fund invests in Putnam Prime Money Market Fund, an open-end management investment company managed by Putnam Management. Investments in Putnam Prime Money Market Fund are valued at its closing net asset value each business day. Management fees paid by the fund are reduced by an amount equal to the management and administrative services fees paid by Putnam Prime Money Market Fund with respect to assets invested by the fund in Putnam Prime Money Market Fund. For the period ended October 31, 2006, management fees paid were reduced by $8,801 relating to the fund’s investment in Putnam Prime Money Market Fund. Income distributions earned by the fund are recorded as income in the statement of operations and totaled $380,690 for the period ended October 31, 2006. During the period ended October 31, 2006, cost of purchases and proceeds of sales of investments in Putnam Prime Money Market Fund aggregated $156,765,196 and $155,378,172, respectively.
Note 6: Regulatory matters and litigation
Putnam Management has entered into agreements with the Securities and Exchange Commission and the Massachusetts Securities Division settling charges connected with excessive short-term trading by Putnam employees and, in the case of the charges brought by the Massachusetts Securities Division, by participants in some Putnam-administered 401(k) plans. Pursuant to these settlement agreements, Putnam Management will pay a total of $193.5 million in penalties and restitution, with $153.5 million being paid to certain open-end funds and their shareholders. The amount will be allocated to shareholders and funds pursuant to a plan developed by an independent consultant, and will be paid following approval of the plan by the SEC and the Massachusetts Securities Division.
The Securities and Exchange Commission’s and Massachusetts Securities Division’s allegations and related matters also serve as the general basis for
49
numerous lawsuits, including purported class action lawsuits filed against Putnam Management and certain related parties, including certain Putnam funds. Putnam Management will bear any costs incurred by Putnam funds in connection with these lawsuits. Putnam Management believes that the likelihood that the pending private lawsuits and purported class action lawsuits will have a material adverse financial impact on the fund is remote, and the pending actions are not likely to materially affect its ability to provide investment management services to its clients, including the Putnam funds.
In connection with a settlement between Putnam and the fund's Trustees in September 2006, the fund received $92,713 from Putnam to address issues relating to the calculation of certain amounts paid by the Putnam mutual funds to Putnam for transfer agent services.
Putnam Management and Putnam Retail Management are named as defendants in a civil suit in which the plaintiffs allege that the management and distribution fees paid by certain Putnam funds were excessive and seek recovery under the Investment Company Act of 1940. Putnam Management and Putnam Retail Management have contested the plaintiffs’ claims and the matter is currently pending in the U.S. District Court for the District of Massachusetts. Based on currently available information, Putnam Management believes that this action is without merit and that it is unlikely to have a material effect on Putnam Management’s and Putnam Retail Management’s ability to provide services to their clients, including the fund.
Note 7: New accounting pronouncements
In June 2006, the Financial Accounting Standards Board (“FASB”) issued Interpretation No. 48, Accounting for Uncertainty in Income Taxes (the “Interpretation”). The Interpretation prescribes a minimum threshold for financial statement recognition of the benefit of a tax position taken or expected to be taken by a filer in the filer’s tax return. The Interpretation will become effective for fiscal years beginning after December 15, 2006 but will also apply to tax positions reflected in the fund’s financial statements as of that date. No determination has been made whether the adoption of the Interpretation will require the fund to make any adjustments to its net assets or have any other effect on the fund’s financial statements.
In September 2006, the FASB issued Statement of Financial Accounting Standards No. 157, Fair Value Measurements (the “Standard”). The Standard defines fair value, sets out a framework for measuring fair value and requires additional disclosures about fair value measurements. The Standard applies to fair value measurements already required or permitted by existing standards. The Standard is effective for financial statements issued for fiscal years beginning after November 15, 2007 and interim periods within those fiscal years. Putnam Management is currently evaluating what impact the adoption of the Standard will have on the fund’s financial statements.
50
Brokerage commissions
(Unaudited) |
Brokerage commissions are paid to firms that execute trades on behalf of your fund. When choosing these firms, Putnam is required by law to seek the best execution of the trades, taking all relevant factors into consideration, including expected quality of execution and commission rate. Listed below are the largest relationships based upon brokerage commissions for your fund and the other funds in Putnam’s U.S. Small- and Mid-Cap group for the year ended October 31, 2006. The other Putnam mutual funds in this group are Putnam Capital Opportunities Fund, Putnam Discovery Growth Fund, Putnam New Opportunities Fund, Putnam OTC & Emerging Growth Fund, Putnam Small Cap Growth Fund, Putnam Small Cap Value Fund, Putnam Vista Fund, Putnam VT Capital Opportunities Fund, Putnam VT Discovery Growth Fund, Putnam VT Mid Cap Value Fund, Putnam VT New Opportunities Fund, Putnam VT OTC & Emerging Growth Fund, Putnam VT Small Cap Value Fund, and Putnam VT Vista Fund.
The top five firms that received brokerage commissions for trades executed for the U.S. Small-and Mid-Cap group are (in descending order) Citigroup Global Markets, Goldman Sachs, Credit Suisse First Boston, Lehman Brothers, and Bear Stearns & Company. Commissions paid to these firms together represented approximately 37% of the total brokerage commissions paid for the year ended October 31, 2006.
Commissions paid to the next 10 firms together represented approximately 37% of the total brokerage commissions paid during the period. These firms are (in alphabetical order) Bank of America, CIBC World Markets, Deutsche Bank Securities, JPMorgan Clearing, Merrill Lynch, Morgan Stanley Dean Witter, RBC Capital Markets, SG Cowen, UBS Warburg, and Wachovia Securities.
Additional information about brokerage commissions is available on the Securities and Exchange Commission (SEC) Web site at www.sec.gov. Putnam funds disclose commissions by firm to the SEC in semiannual filings on Form N-SAR.
51
Putnam puts your
interests first |
In January 2004, Putnam began introducing a number of voluntary initiatives designed to reduce fund expenses, provide investors with more useful information, and help safeguard the interests of all Putnam investors. Visit www.putnam.com for details.
Cost-cutting initiatives
Reduced sales charges The maximum sales charge for class A shares has been reduced to 5.25% for equity funds (formerly 5.75%) and 3.75% for most income funds (formerly 4.50%) . The maximum sales charge for class M shares has been reduced to 3.25% for equity funds (formerly 3.50%) .*
Lower class B purchase limit To help ensure that investors are in the most cost-effective share class, the maximum amount that can be invested in class B shares has been reduced to $100,000. (Larger trades or accumulated amounts will be refused.)
Ongoing expenses will be limited Through calendar 2007, total ongoing expenses, including management fees for all funds, will be maintained at or below the average of each fund’s industry peers in its Lipper load-fund universe. For more information, please see the Statement of Additional information.
Improved disclosure
Putnam fund prospectuses and shareholder reports have been revised to disclose additional information that will help shareholders compare funds and weigh their costs and risks along with their potential benefits. Shareholders will find easy-to-understand information about fund expense ratios, portfolio manager compensation, risk comparisons, turnover comparisons, brokerage commissions, and employee and trustee ownership of Putnam funds. Disclosure of breakpoint discounts has also been enhanced to alert investors to potential cost savings.
Protecting investors’ interests
Short-term trading fee introduced To discourage short-term trading, which can interfere with a fund’s long-term strategy, a 1% short-term trading fee may be imposed on any Putnam fund shares (other than money market funds) redeemed or exchanged within seven calendar days of purchase (for certain funds, this fee applies for 90 days).
* The maximum sales charge for class A shares of Putnam Limited Duration Government Income Fund and Putnam Floating Rate Income Fund remains 3.25% .
52
Fund information
Founded over 65 years ago, Putnam Investments was built around the concept that a balance between risk and reward is the hallmark of a well-rounded financial program. We manage over 100 mutual funds in growth, value, blend, fixed income, and international.
| Investment Manager | George Putnam, III | Richard S. Robie, III |
| Putnam Investment | W. Thomas Stephens | Vice President |
| Management, LLC | Richard B. Worley | |
| One Post Office Square | | Francis J. McNamara, III |
| Boston, MA 02109 | Officers | Vice President and |
| George Putnam, III | Chief Legal Officer |
| Marketing Services | President | |
| Putnam Retail Management | | Charles A. Ruys de Perez |
| One Post Office Square | Charles E. Porter | Vice President and |
| Boston, MA 02109 | Executive Vice President, | Chief Compliance Officer |
| Principal Executive Officer, | |
| Custodian | Associate Treasurer, and | Mark C. Trenchard |
| Putnam Fiduciary | Compliance Liaison | Vice President and |
| Trust Company | | BSA Compliance Officer |
| Jonathan S. Horwitz | |
| Legal Counsel | Senior Vice President | Judith Cohen |
| Ropes & Gray LLP | and Treasurer | Vice President, Clerk and |
| | Assistant Treasurer |
| Trustees | Steven D. Krichmar | |
| John A. Hill, Chairman | Vice President and | Wanda M. McManus |
| Jameson Adkins Baxter, | Principal Financial Officer | Vice President, Senior Associate |
| Vice Chairman | | Treasurer and Assistant Clerk |
| Charles B. Curtis | Michael T. Healy | |
| Myra R. Drucker | Assistant Treasurer and | Nancy E. Florek |
| Charles E. Haldeman, Jr. | Principal Accounting Officer | Vice President, Assistant Clerk, |
| Paul L. Joskow | | Assistant Treasurer |
| Elizabeth T. Kennan | Beth S. Mazor | and Proxy Manager |
| Kenneth R. Leibler | Vice President | |
| Robert E. Patterson | | |
| James P. Pappas | |
| Vice President | |
| | |
This report is for the information of shareholders of Putnam Mid Cap Value Fund. It may also be used as sales literature when preceded or accompanied by the current prospectus, the most recent copy of Putnam’s Quarterly Performance Summary, and Putnam’s Quarterly Ranking Summary. For more recent performance, please visit www.putnam.com. Investors should carefully consider the investment objective, risks, charges, and expenses of a fund, which are described in its prospectus. For this and other information or to request a prospectus, call 1-800-225-1581 toll free. Please read the prospectus carefully before investing. The fund’s Statement of Additional Information contains additional information about the fund’s Trustees and is available without charge upon request by calling 1-800-225-1581.

Item 2. Code of Ethics:
Not applicable
Item 3. Audit Committee Financial Expert:
Not applicable
Item 4. Principal Accountant Fees and Services:
Not applicable
Item 5. Audit Committee of Listed Registrants
Not applicable
Item 6. Schedule of Investments:
The registrant’s schedule of investments in unaffiliated issuers is included in the report to shareholders in Item 1 above.
Item 7. Disclosure of Proxy Voting Policies and Procedures For Closed-End Management
Investment Companies:
Not applicable
Item 8. Portfolio Managers of Closed-End Investment Companies
Not Applicable
Item 9. Purchases of Equity Securities by Closed-End Management Investment Companies and
Affiliated Purchasers:
Not applicable
Item 10. Submission of Matters to a Vote of Security Holders:
Not applicable
Item 11. Controls and Procedures:
(a) The registrant's principal executive officer and principal financial officer have concluded, based on their evaluation of the effectiveness of the design and operation of the registrant's disclosure controls and procedures as of a date within 90 days of the filing date of this report, that the design and operation of such procedures are generally effective to provide reasonable assurance that information required to be disclosed by the registrant in this report is recorded, processed, summarized and reported within the time periods specified in the Commission's rules and forms.
(b) Changes in internal control over financial reporting: Not applicable
Item 12. Exhibits:
(a)(1) Not applicable
(a)(2) Separate certifications for the principal executive officer and principal financial officer of the registrant as required by Rule 30a-2(a) under the Investment Company Act of 1940, as amended, are filed herewith.
(b) The certifications required by Rule 30a-2(b) under the Investment Company Act of 1940, as amended, are filed herewith.
SIGNATURES
Pursuant to the requirements of the Securities Exchange Act of 1934 and the Investment Company Act of 1940, the registrant has duly caused this report to be signed on its behalf by the undersigned, thereunto duly authorized.
Putnam Investment Funds
By (Signature and Title):
/s/Michael T. Healy
Michael T. Healy
Principal Accounting Officer
Date: December 28, 2006
Pursuant to the requirements of the Securities Exchange Act of 1934 and the Investment Company Act of 1940, this report has been signed below by the following persons on behalf of the registrant and in the capacities and on the dates indicated.
By (Signature and Title):
/s/Charles E. Porter
Charles E. Porter
Principal Executive Officer
Date: December 28, 2006
By (Signature and Title):
/s/Steven D. Krichmar
Steven D. Krichmar
Principal Financial Officer
Date: December 28, 2006