UNITED STATES
SECURITIES AND EXCHANGE COMMISSION
Washington, D.C. 20549
FORM N-CSR
CERTIFIED SHAREHOLDER REPORT OF REGISTERED
MANAGEMENT INVESTMENT COMPANIES
| Investment Company Act file number: (811- 07237 ) |
| |
| Exact name of registrant as specified in charter: Putnam Investment Funds |
| |
| Address of principal executive offices: One Post Office Square, Boston, Massachusetts 02109 |
| |
| Name and address of agent for service: | Beth S. Mazor, Vice President |
| | One Post Office Square |
| | Boston, Massachusetts 02109 |
| |
| Copy to: | John W. Gerstmayr, Esq. |
| | Ropes & Gray LLP |
| | One International Place |
| | Boston, Massachusetts 02110 |
| |
| Registrant’s telephone number, including area code: | (617) 292-1000 |
Date of fiscal year end: August 31, 2007
Date of reporting period: September 1, 2006— February 28, 2007
Item 1. Report to Stockholders:
The following is a copy of the report transmitted to stockholders pursuant to Rule 30e-1 under the Investment Company Act of 1940:
What makes Putnam different?

In 1830, Massachusetts Supreme Judicial Court Justice Samuel Putnam established The Prudent Man Rule, a legal foundation for responsible money management.
THE PRUDENT MAN RULE
All that can be required of a trustee to invest is that he shall conduct himself faithfully and exercise a sound discretion. He is to observe how men of prudence, discretion, and intelligence manage their own affairs, not in regard to speculation, but in regard to the permanent disposition of their funds, considering the probable income, as well as the probable safety of the capital to be invested.

A time-honored tradition
in money management
Since 1937, our values have been rooted in a profound sense of responsibility for the money entrusted to us.
A prudent approach to investing
We use a research-driven team approach to seek consistent, dependable, superior investment results over time, although there is no guarantee a fund will meet its objectives.
Funds for every investment goal
We offer a broad range of mutual funds and other financial products so investors and their financial representatives can build diversified portfolios.
A commitment to doing
what’s right for investors
We have below-average expenses and stringent investor protections, and provide a wealth of information about the Putnam funds.
Industry-leading service
We help investors, along with their financial representatives, make informed investment decisions with confidence.
Putnam
International Capital
Opportunities Fund
2| 28| 07
Semiannual Report
| Message from the Trustees | 2 |
| About the fund | 4 |
| Report from the fund managers | 7 |
| Performance | 13 |
| Expenses | 16 |
| Portfolio turnover | 18 |
| Risk | 19 |
| Your fund’s management | 20 |
| Terms and definitions | 23 |
| Trustee approval of management contract | 25 |
| Other information for shareholders | 32 |
| Financial statements | 34 |
| Brokerage commissions | 66 |
Cover photograph: © Marco Cristofori
Message from the Trustees
Dear Fellow Shareholder
From our present vantage point, it has become apparent that certain sectors of the U.S. economy have slowed somewhat, although the global economy continues to demonstrate healthy growth. In recent weeks, financial markets have reflected increased uncertainty about the effects of the housing market decline and tighter credit standards by mortgage lenders on the U.S. economy. However, we believe that the U.S. economy is flexible enough to adapt to these challenges, just as it has adapted to other challenges that have arisen in the course of the recent economic expansion.
As you may have heard, on February 1, 2007, Marsh & McLennan Companies, Inc. announced that it had signed a definitive agreement to sell its ownership interest in Putnam Investments Trust, the parent company of Putnam Management and its affiliates, to Great-West Lifeco Inc. Great-West Lifeco Inc. is a financial services holding company with operations in Canada, the United States, and Europe and is a member of the Power Financial Corporation group of companies. This transaction is subject to regulatory approvals and other conditions, including the approval of new management contracts by shareholders of a substantial number of Putnam funds at shareholder meetings scheduled for May 15, 2007. Proxy solicitation materials related to these meetings, which provide detailed information regarding the proposed transaction, were recently mailed. We currently expect the transaction to be completed by the middle of 2007.
Putnam’s team of investment and business professionals will continue to be led by Putnam President and Chief Executive Officer Ed Haldeman. Your Trustees have been actively involved through every step of the discussions, and we will continue in our role of overseeing the Putnam funds on your behalf.
2
We would like to take this opportunity to announce that a new independent Trustee, Kenneth R. Leibler, has joined your fund’s Board of Trustees. Mr. Leibler has had a distinguished career as a leader in the investment management industry. He is a founding partner of and advisor to the Boston Options Exchange; a Trustee of Beth Israel Deaconess Hospital in Boston; a lead director of Ruder Finn Group, a global communications and advertising firm; and a director of Northeast Utilities.
In the following pages, members of your fund’s management team discuss the fund’s performance and strategies for the fiscal period ended February 28, 2007, and provide their outlook for the months ahead. As always, we thank you for your support of the Putnam funds.

Putnam International Capital Opportunities Fund:
targeting smaller international companies
In international economies, as in the United States, small and midsize companies can offer attractive long-term investment potential. Smaller companies can seize new opportunities quickly or occupy profitable business niches. International markets may be particularly fertile ground because, compared to the United States, relatively fewer research analysts cover small and midsize companies overseas.
Putnam International Capital Opportunities Fund has invested in these companies since 1996. Though stocks of small and midsize international companies carry the risk of greater price fluctuations, they may also offer potentially strong gains.
While investing in companies located in different economic and political systems involves risk, it may also give your money a chance to grow, even during a downturn in the U.S. economy. That’s because international economies generally follow a different business cycle than the United States. In foreign markets, interest rates are managed by institutions like the European Central Bank or the Bank of Japan. Also, while foreign currencies such as the euro, the yen, and the pound fluctuate in value, your investment may benefit if these currencies strengthen against the U.S. dollar.
With thousands of smaller-company securities around the world to choose from, the management team relies on the proprietary research of Putnam analysts to select fund holdings. For access to information about international companies, Putnam has analysts in London and Tokyo, as well as in Boston.

Reflecting Putnam’s blend strategy, the portfolio can hold both value and growth stocks without a bias toward either style, which may help keep the fund diversified given the risks of changing market conditions. In addition to the markets of Europe, Japan, and Canada, the fund can invest in emerging markets, which may offer faster rates of economic growth despite greater risk of both volatility and illiquid securities. In all its decisions, the management team is guided by Putnam’s risk controls, which call for regular review of fund holdings and the discipline to sell stocks when they reach what the team considers their true worth.
For more than 10 years, the fund has helped investors benefit from investing in small and midsize international companies.
In-depth analysis is key to
successful stock selection.
Drawing on the expertise of a dedicated team of stock analysts, the fund’s management team seeks stocks that are believed to be mispriced by the market. Once a stock is selected for the portfolio, it is regularly assessed by members of the team to ensure that it continues to meet their criteria, including:
Quality They look for high-quality companies, seeking characteristics such as solid management teams and sound business models that create strong cash flows.
Valuation They carefully consider how each stock is valued, seeking stocks whose valuations are attractive relative to the company’s growth potential.
Cash flow They examine each company’s financials, particularly the amount of cash a company generates relative to the earnings that it reports, and target those believed to offer attractive and sustainable cash flow.
Putnam International Capital Opportunities Fund’s holdings
have spanned many sectors and international markets.
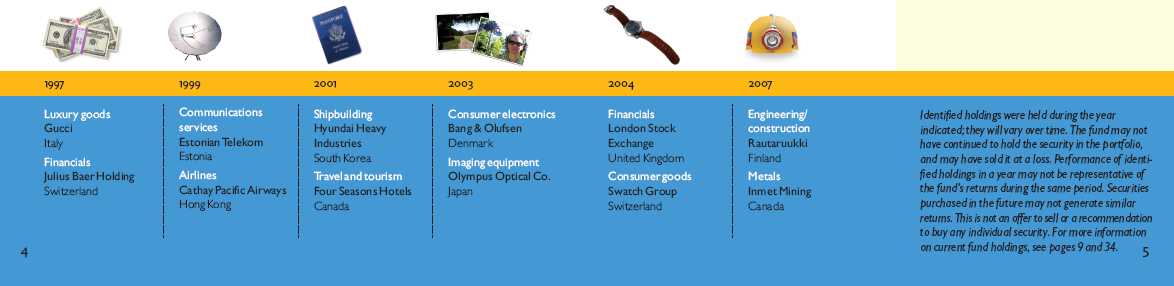
Putnam International Capital Opportunities Fund seeks long-term capital appreciation by investing primarily in the stocks of small and midsize companies in a variety of countries outside the United States. The fund’s management team looks for stocks that it considers mispriced by the market, and can invest in stocks with growth or value characteristics without a bias toward either style. The fund may be appropriate for investors seeking long-term growth of capital who can accept the additional risks of investing in international small and midsize stocks.
Highlights
• Putnam International Capital Opportunities Fund’s class A shares returned 18.56% without sales charges for the six months ended February 28, 2007.
• The fund’s benchmark, the S&P/Citigroup World Ex-U.S. Extended Market Index, returned 16.67% .
• The fund’s Lipper peer group, International Small/Mid-Cap Core Funds, had an average return of 16.28% .
• Additional fund performance, comparative performance, and Lipper data can be found in the performance section beginning on page 13.
Performance
Total return for class A shares for periods ended 2/28/07
Since the fund’s inception (12/28/95), average annual return is 16.56% at NAV and 16.00% at POP.
| | | Average annual return | | | | Cumulative return | |
| | NAV | POP | | NAV | POP |
|
| 10 years | 16.18% | 15.55% | | 348.21% | 324.50% |
|
| 5 years | 20.12 | 18.84 | | 150.13 | 137.05 |
|
| 3 years | 25.47 | 23.24 | | 97.54 | 87.16 |
|
| 1 year | 26.91 | 20.24 | | 26.91 | 20.24 |
|
| 6 months | — | — | | 18.56 | 12.34 |
|
Data is historical. Past performance does not guarantee future results. More recent returns may be less or more than those shown. Investment return and principal value will fluctuate, and you may have a gain or a loss when you sell your shares. Performance assumes reinvestment of distributions and does not account for taxes. Returns at POP reflect a maximum sales charge of 5.25% . For the most recent month-end performance, visit www.putnam.com. A 1% short-term trading fee may apply.
6
Report from the fund managers
The period in review
We are pleased to report that Putnam International Capital Opportunities Fund delivered a robust return for the first half of its fiscal year, which ended February 28, 2007. Based on results at net asset value (NAV, or without sales charges) your fund finished ahead of both its benchmark, the S&P/Citigroup World Ex-U.S. Extended Market Index, and the average of its Lipper peer group, International Small/Mid-Cap Core Funds. We attribute this outperformance to our stock selections across numerous sectors and markets, but in particular, to the portfolio’s focus on the metals and mining industry. Strong prices and continuing strong demand for a variety of metals made this the strongest-performing industry in the fund’s benchmark. Not only did the fund have a significant overweight position in metals and mining — relative to the benchmark — but our stock selections in this area proved quite rewarding. The U.S. dollar had mixed results during the period, weake ning against the euro and the British pound but strengthening relative to the yen and the Canadian dollar. Consequently, the fund’s foreign currency positioning had an overall neutral effect on results.
Market overview
The current global expansion remains one of the most solid and pervasive of recent history. It continued throughout the semiannual period, with international markets maintaining their recent strength and stocks benefiting from the pace of global economic activity. During the period, the International Monetary Fund (IMF) raised its estimates of current economic growth, and both Europe and Japan, two of the slowest-growing regions, showed signs of acceleration. Monetary policy has been tightened in several countries to prevent a rise in inflation, but at this point it does not appear to have slowed economic activity, as it did in the United States.
Merger-and-acquisition (M&A) activity and private equity funds also played a key role in international markets by financing management-led buyouts or through direct acquisitions.
7
This trend drove stocks higher as investors sought to anticipate which companies might be the next targets and bid up their prices. These conditions, combined with strong profits from international companies, contributed to a broad advance for international stocks, and in particular for the small- and mid-cap stocks your fund targets.
However, in the final week of February, market volatility suddenly spiked, reflecting concerns that weakness in the U.S. housing market could undermine consumer spending. Given the magnitude of imports coming into the United States, a decline in consumer spending here could have international ramifications. As of the end of the period, though, changes in spending patterns within the United States did not appear likely to derail the global expansion.
Strategy overview
Your fund’s strategy is designed to identify mid- and small-capitalization stocks of international companies that we judge are worth more than their current prices indicate. It is founded on the philosophy that although stock prices can fluctuate over time, each company has an inherent business value that remains fairly constant. Our goal is to own stocks when we believe they are priced below this inherent worth and poised to appreciate. We determine a stock’s value by discounting its future cash flows. We compare, rank, and select stocks for the portfolio with analysis that integrates
Market sector performance
These indexes provide an overview of performance in different market sectors for the
six months ended 2/28/07.
| Equities | |
|
| S&P/Citigroup World Ex-U.S. Extended Market Index (EMI) | |
| (international stocks of small companies) | 16.67% |
|
| MSCI EAFE Index (international stocks) | 12.17% |
|
| S&P 500 Index (broad stock market) | 8.93% |
|
| Bonds | |
|
| Lehman Aggregate Bond Index (broad bond market) | 3.66% |
|
| Lehman Government Bond Index (U.S. Treasury and agency securities) | 3.18% |
|
| JPMorgan Global High Yield Index (global high-yield corporate bonds) | 8.34% |
|
8
fundamental and quantitative methods, which allows us to select the stocks with the characteristics we desire. This process determines both our stock selections and the portfolio’s country and sector weightings. Another element of our process is a disciplined trading approach. Generally speaking, we consider our trading decisions over many days before actually making trades, to avoid hasty judgments.
During the fiscal period, the fund’s country weightings remained similar to those discussed in the most recent annual report. Compared to the benchmark, the portfolio had a significant overweight position in Japan and smaller overweights in Canada and South Korea. We found a wider variety of undervalued stocks in these markets than in Europe, where the fund had underweight positions in the United Kingdom and Germany, in particular. With regard to sectors, we maintained an overweight position in basic materials, which reflected our focus on individual metal and mining stocks.
Your fund’s holdings
In The Graduate, protagonist Benjamin Braddock received one word of advice from a mentor regarding where to invest his career energies: “Plastics.” Today, that word of advice might be “metals,” as the construction of cities, industry, and transportation infrastructure in Asia is creating long-term demand for metal products. Among the stocks that
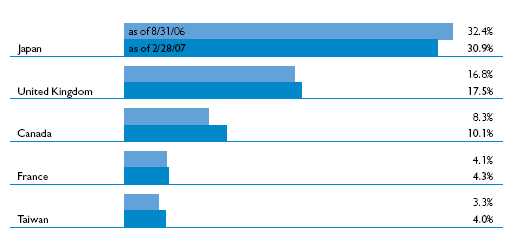
Comparison of top country weightings
This chart shows how the fund’s top weightings have changed over the last six months. Weightings are shown as a percentage of net assets. Holdings will vary over time.
9
benefited from this trend and contributed handsomely to your fund’s results during the period were Pacific Metals and Yamato Kogyo of Japan, as well as Rautaruukki of Finland. Pacific Metals is Japan’s largest producer of ferronickel, a metal used in making stainless steel. Yamato Kogyo manufactures a variety of cast steel products, including materials for railway tracks and shipbuilding components. Rautaruukki is a major supplier of stainless steel, aluminum, and other components used in construction projects, including retail, industrial, and office buildings, as well as bridges and retaining walls for highways.
Another stock that contributed to the fund’s results was Orient Overseas, based in Hong Kong. This company operates a fleet of cargo ships and owns and leases port facilities. It has increased its capacity for trade between Asia and Europe, while gaining market share and raising rates charged to customers. It performed particularly well during the period, benefiting from rising international cargo trade as well as the completion of negotiations to sell four of its ports for approximately $2.4 billion, a much higher price than investors had previously anticipated.
Fortunately, strong performance was not limited to stocks thriving on trade and development in Asia. Your fund’s broad diversification also enabled it to benefit from opportunities in other regions and industries. An example is
Top holdings
This table shows the fund’s top holdings, and the percentage of the fund’s net assets that each represented, as of 2/28/07. The fund’s holdings will change over time.
| Holding (percent of fund's net assets) | Country | Industry |
|
| Yamato Kogyo Co., Ltd. (1.2%) | Japan | Metals |
|
| Northern Rock PLC (1.2%) | United Kingdom | Banking |
|
| U-Ming Marine Transport Corp. (1.2%) | Taiwan | Shipping |
|
| Pacific Metals Co., Ltd. (1.1%) | Japan | Metals |
|
| Methanex Corp. (1.1%) | Canada | Chemicals |
|
| Brother Industries, Ltd. (1.1%) | Japan | Electronics |
|
| Tokai Tokyo Securities Co., Ltd. (1.0%) | Japan | Investment banking/ |
| | | brokerage |
|
| Berkeley Group Holdings PLC (1.0%) | United Kingdom | Homebuilding |
|
| Orient Overseas International, Ltd. (1.0%) | Hong Kong | Shipping |
|
| Shire PLC (1.0%) | United Kingdom | Pharmaceuticals |
|
10
JM AB, a Swedish company that develops and markets housing in Scandinavia, which also outperformed the index. JM focuses its operations on building new homes in growing cities and towns, especially in areas surrounding universities.
Some of the fund’s holdings did not perform up to our expectations during the period. Sankyo of Japan is an example. This company makes Pachinko and Pachislo game machines, which are similar to pinball machines, and very popular in arcades around Japan. We believe the company has a competitive advantage in the industry and a strong balance sheet. Recently, though, Sankyo’s sales volume has been disappointing, as it had to delay shipments of new games to its customers. This sparked investor concerns that Sankyo was losing ground to competitors, which drove down the stock price. We have a different view. As Sankyo ships new games, we believe it will be able to reassert its leadership, improve earnings, and regain value.
In the United Kingdom, Northern Rock had flat results, lagging the index by a wide margin. This company’s primary business is providing residential mortgages. The U.K. housing market has been weak lately, and the Bank of England raised interest rates twice more during the period, on top of several previous rate increases. Although the company beat earnings expectations during the period, the market fears that new companies entering the U.K. mortgage market will increase price competition in the industry and consequently squeeze Northern Rock’s profit margins. We have kept the stock in the fund’s portfolio because we believe that once these temporary factors are behind it, Northern Rock can maintain a profit margin that the market is likely to reward.
Please note that the holdings discussed in this report may not have been held by the fund for the entire period. Portfolio composition is subject to review in accordance with the fund’s investment strategy and may vary in the future.
11
The outlook for your fund
The following commentary reflects anticipated developments that could affect your fund over the next six months, as well as your management team’s plans for responding to them.
While we do not make market forecasts, we can at least note that the key trends that have been propelling international stock markets do not appear likely to change substantially over the near term. In 2006, the world economy grew at a faster rate than the United States economy, and given the recent U.S. slowdown, we continue to believe that international markets can offer more attractive growth rates. While the end of your fund’s semiannual period coincided with an increase in global market volatility, we do not see this as a threat to the underlying strength of business activity in international markets. In short, we still consider it a favorable time to invest in international small- and mid-cap stocks.
We can also report that the portfolio continues to hold stocks that we believe have attractive capital appreciation potential because their current valuations do not fully reflect the future cash flows they can generate. In terms of positioning relative to the benchmark, the fund has overweight positions in Japan and Canada and is underweighted in the United Kingdom, Germany, Spain, and Australia. In terms of sectors, we expect the fund’s overweight position in basic materials to remain in place over the near term. Although this sector has performed well for a long period, we believe that many basic materials stocks remain undervalued.
As always, we continue our efforts to identify small- and mid-cap stocks priced below their worth in all international markets and sectors, and to position the fund to benefit from their growth potential.
The views expressed in this report are exclusively those of Putnam Management. They are not meant as investment advice.
International investing involves certain risks, such as currency fluctuations, economic instability, and political developments. Additional risks may be associated with emerging-market securities, including illiquidity and volatility. The fund invests some or all of its assets in small and/or midsize companies. Such investments increase the risk of greater price fluctuations.
12
Your fund’s performance
This section shows your fund’s performance for periods ended February 28, 2007, the end of the first half of its current fiscal year. In accordance with regulatory requirements for mutual funds, we also include performance as of the most recent calendar quarter-end and expense information taken from the fund’s current prospectus. Performance should always be considered in light of a fund’s investment strategy. Data represents past performance. Past performance does not guarantee future results. More recent returns may be less or more than those shown. Investment return and principal value will fluctuate, and you may have a gain or a loss when you sell your shares. For the most recent month-end performance, please visit www.putnam.com or call Putnam at 1-800-225-1581. Class Y shares are generally only available to corporate and institutional clients. See the Terms and Definitions section in this report for definitions of the share classes offered by yo ur fund.
Fund performance
Total return for periods ended 2/28/07
| | | | Class A | | | Class B | | | Class C | | | Class M | | | Class R | | Class Y |
| (inception dates) | | | (12/28/95) | | | (10/30/96) | | | (7/26/99) | | | (10/30/96) | | | (1/21/03) | | (2/1/00) |
| | | | NAV | | POP | | NAV | | CDSC | | NAV | | CDSC | | NAV | | POP | | NAV | | NAV |
|
| Annual average | | | | | | | | | | | |
| (life of fund) | | 16.56% | 16.00% | 15.69% | 15.69% | 15.70% | 15.70% | 15.98% | 15.63% | 16.30% | 16.75% |
|
| 10 years | | 348.21 | 324.50 | 315.07 | 315.07 | 315.88 | 315.88 | 326.29 | 312.39 | 338.32 | 356.16 |
| Annual average | | 16.18 | 15.55 | 15.30 | 15.30 | 15.32 | 15.32 | 15.60 | 15.22 | 15.93 | 16.39 |
|
| 5 years | | 150.13 | 137.05 | 140.87 | 138.87 | 140.76 | 140.76 | 144.00 | 136.04 | 147.55 | 153.18 |
| Annual average | | 20.12 | 18.84 | 19.22 | 19.02 | 19.21 | 19.21 | 19.53 | 18.74 | 19.88 | 20.42 |
|
| 3 years | | 97.54 | 87.16 | 93.14 | 90.14 | 93.13 | 93.13 | 94.57 | 88.24 | 96.33 | 99.02 |
| Annual average | | 25.47 | 23.24 | 24.53 | 23.89 | 24.53 | 24.53 | 24.84 | 23.47 | 25.22 | 25.79 |
|
| 1 year | | 26.91 | 20.24 | 25.96 | 20.96 | 25.92 | 24.92 | 26.28 | 22.20 | 26.61 | 27.23 |
|
| 6 months | | 18.56 | 12.34 | 18.12 | 13.12 | 18.11 | 17.11 | 18.29 | 14.47 | 18.42 | 18.73 |
|
Performance assumes reinvestment of distributions and does not account for taxes. Returns at public offering price (POP) for class A and M shares reflect a maximum sales charge of 5.25% and 3.25%, respectively. Class B share returns reflect the applicable contingent deferred sales charge (CDSC), which is 5% in the first year, declining to 1% in the sixth year, and is eliminated thereafter. Class C shares reflect a 1% CDSC for the first year and is eliminated thereafter. Class R and Y shares have no initial sales charge or CDSC. Performance for class B, C, M, R, and Y shares before their inception is derived from the historical performance of class A shares, adjusted for the applicable sales charge (or CDSC) and, except for class Y shares, the higher operating expenses for such shares.
A 1% short-term trading fee may be applied to shares exchanged or sold within 90 days of purchase.
13
Comparative index returns
For periods ended 2/28/07
| | S&P/Citigroup World | Lipper International |
| | Ex-U.S. Extended | Small/Mid-Cap Core |
| | Market Index (EMI) | Funds category average* |
|
| Annual average | | |
| (life of fund) | 10.43% | 13.62% |
|
| 10 years | 183.93 | 266.62 |
| Annual average | 11.00 | 13.62 |
|
| 5 years | 199.13 | 170.90 |
| Annual average | 24.50 | 21.92 |
|
| 3 years | 95.76 | 80.51 |
| Annual average | 25.10 | 21.64 |
|
| 1 year | 23.68 | 21.38 |
|
| 6 months | 16.67 | 16.28 |
|
Index and Lipper results should be compared to fund performance at net asset value.
* Over the 6-month and 1-, 3-, 5-, and 10-year periods ended 2/28/07, there were 55, 49, 46, 32, and 14 funds, respectively, in this Lipper category.
Fund price and distribution information
For the six-month period ended 2/28/07
| Distributions* | Class A | Class B | Class C | Class M | Class R | Class Y |
|
| Number | 1 | 1 | 1 | 1 | 1 | 1 |
|
| Income | $0.744 | $0.466 | $0.498 | $0.574 | $0.728 | $0.823 |
|
| Capital gains | — | — | — | — | — | — |
|
| Total | $0.744 | $0.466 | $0.498 | $0.574 | $0.728 | $0.823 |
|
| Share value: | NAV | POP | NAV | NAV | NAV | POP | NAV | NAV |
|
| 8/31/06 | $33.00 | $34.83 | $32.15 | $32.57 | $32.57 | $33.66 | $32.78 | $33.10 |
|
| 2/28/07 | 38.35 | 40.47 | 37.49 | 37.95 | 37.93 | 39.20 | 38.06 | 38.44 |
|
* Dividend sources are estimated and may vary based on final tax calculations after the fund’s fiscal year-end.
14
Fund performance as of most recent calendar quarter
Total return for periods ended 3/31/07
| | | Class A | | | Class B | | | Class C | | | Class M | | | Class R | | Class Y |
| (inception dates) | | (12/28/95) | | | (10/30/96) | | | (7/26/99) | | | (10/30/96) | | | (1/21/03) | | (2/1/00) |
| | NAV | POP | NAV | CDSC | NAV | CDSC | NAV | POP | NAV | NAV |
|
| Annual average | | | | | | | | | | |
| (life of fund) | 16.71% | 16.16% | 15.84% | 15.84% | 15.85% | 15.85% | 16.13% | 15.79% | 16.45% | 16.90% |
|
| 10 years | 363.86 | 339.60 | 329.71 | 329.71 | 330.56 | 330.56 | 340.97 | 326.52 | 353.46 | 372.18 |
| Annual average | 16.58 | 15.96 | 15.70 | 15.70 | 15.72 | 15.72 | 16.00 | 15.61 | 16.32 | 16.79 |
|
| 5 years | 133.32 | 121.05 | 124.59 | 122.58 | 124.61 | 124.61 | 127.50 | 120.16 | 130.90 | 136.13 |
| Annual average | 18.47 | 17.19 | 17.57 | 17.35 | 17.57 | 17.57 | 17.87 | 17.10 | 18.22 | 18.75 |
|
| 3 years | 97.35 | 87.02 | 92.99 | 89.99 | 92.99 | 92.99 | 94.43 | 88.10 | 96.08 | 98.88 |
| Annual average | 25.43 | 23.21 | 24.50 | 23.85 | 24.50 | 24.50 | 24.81 | 23.44 | 25.16 | 25.76 |
|
| 1 year | 25.19 | 18.62 | 24.24 | 19.24 | 24.22 | 23.22 | 24.53 | 20.48 | 24.87 | 25.49 |
|
| 6 months | 21.04 | 14.70 | 20.60 | 15.60 | 20.62 | 19.62 | 20.78 | 16.85 | 20.93 | 21.24 |
|
Fund’s annual operating expenses
For the fiscal year ended 8/31/06
| | | Class A | Class B | Class C | Class M | Class R | Class Y |
|
| Total annual fund | | | | | | | |
| operating expenses | | 1.57% | 2.32% | 2.32% | 2.07% | 1.82% | 1.32% |
|
Expense information in this table may differ from that shown in the next section and in the financial highlights of this report.
15
Your fund’s expenses
As a mutual fund investor, you pay ongoing expenses, such as management fees, distribution fees (12b-1 fees), and other expenses. In the most recent six-month period, your fund limited these expenses; had it not done so, expenses would have been higher. Using the information below, you can estimate how these expenses affect your investment and compare them with the expenses of other funds. You may also pay one-time transaction expenses, including sales charges (loads) and redemption fees, which are not shown in this section and would have resulted in higher total expenses. For more information, see your fund’s prospectus or talk to your financial advisor.
Review your fund’s expenses
The table below shows the expenses you would have paid on a $1,000 investment in Putnam International Capital Opportunities Fund from September 1, 2006, to February 28, 2007. It also shows how much a $1,000 investment would be worth at the close of the period, assuming actual returns and expenses.
| | Class A | Class B | Class C | Class M | Class R | Class Y |
|
| Expenses paid per $1,000* | $ 8.35 | $ 12.38 | $ 12.38 | $ 11.04 | $ 9.69 | $ 7.00 |
|
| Ending value (after expenses) | $1,185.60 | $1,181.20 | $1,181.10 | $1,182.90 | $1,184.20 | $1,187.30 |
|
* Expenses for each share class are calculated using the fund’s annualized expense ratio for each class, which represents the ongoing expenses as a percentage of average net assets for the six months ended 2/28/07. The expense ratio may differ for each share class (see the last table in this section). Expenses are calculated by multiplying the expense ratio by the average account value for the period; then multiplying the result by the number of days in the period; and then dividing that result by the number of days in the year.
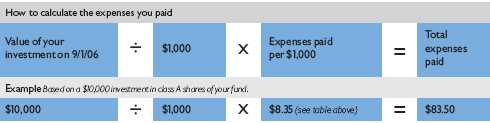
Estimate the expenses you paid
To estimate the ongoing expenses you paid for the six months ended February 28, 2007, use the calculation method below. To find the value of your investment on September 1, 2006, go to www.putnam.com and log on to your account. Click on the “Transaction History” tab in your Daily Statement and enter 09/01/2006 in both the “from” and “to” fields. Alternatively, call Putnam at 1-800-225-1581.
16
Compare expenses using the SEC’s method
The Securities and Exchange Commission (SEC) has established guidelines to help investors assess fund expenses. Per these guidelines, the table below shows your fund’s expenses based on a $1,000 investment, assuming a hypothetical 5% annualized return. You can use this information to compare the ongoing expenses (but not transaction expenses or total costs) of investing in the fund with those of other funds. All mutual fund shareholder reports will provide this information to help you make this comparison. Please note that you cannot use this information to estimate your actual ending account balance and expenses paid during the period.
| | Class A | Class B | Class C | Class M | Class R | Class Y |
|
| Expenses paid per $1,000* | $ 7.70 | $ 11.43 | $ 11.43 | $ 10.19 | $ 8.95 | $ 6.46 |
|
| Ending value (after expenses) | $1,017.16 | $1,013.44 | $1,013.44 | $1,014.68 | $1,015.92 | $1,018.40 |
|
* Expenses for each share class are calculated using the fund’s annualized expense ratio for each class, which represents the ongoing expenses as a percentage of average net assets for the six months ended 2/28/07. The expense ratio may differ for each share class (see the last table in this section). Expenses are calculated by multiplying the expense ratio by the average account value for the period; then multiplying the result by the number of days in the period; and then dividing that result by the number of days in the year.
Compare expenses using industry averages
You can also compare your fund’s expenses with the average of its peer group, as defined by Lipper, an independent fund-rating agency that ranks funds relative to others that Lipper considers to have similar investment styles or objectives. The expense ratio for each share class shown below indicates how much of your fund’s average net assets have been used to pay ongoing expenses during the period.
| | Class A | Class B | Class C | Class M | Class R | Class Y |
|
| Your fund's annualized | | | | | | |
| expense ratio | 1.54% | 2.29% | 2.29% | 2.04% | 1.79% | 1.29% |
|
| Average annualized expense | | | | | | |
| ratio for Lipper peer group* | 1.63% | 2.38% | 2.38% | 2.13% | 1.88% | 1.38% |
|
* Simple average of the expenses of all front-end load funds in the fund’s Lipper peer group, calculated in accordance with Lipper’s standard method for comparing fund expenses (excluding 12b-1 fees and without giving effect to any expense offset and brokerage service arrangements that may reduce fund expenses). This average reflects each fund’s expenses for its most recent fiscal year available to Lipper as of 12/31/06. To facilitate comparison, Putnam has adjusted this average to reflect the 12b-1 fees carried by each class of shares other than class Y shares, which do not incur 12b-1 fees. The peer group may include funds that are significantly smaller or larger than the fund, which may limit the comparability of the fund’s expenses to the simple average, which typically is higher than the asset-weighted average.
17
Your fund’s
portfolio turnover
Putnam funds are actively managed by teams of experts who buy and sell securities based on
intensive analysis of companies, industries, economies, and markets. Portfolio turnover is a
measure of how often a fund’s managers buy and sell securities for your fund. A portfolio
turnover of 100%, for example, means that the managers sold and replaced securities valued
at 100% of a fund’s assets within a one-year period. Funds with high turnover may be more
likely to generate capital gains and dividends that must be distributed to shareholders as
taxable income. High turnover may also cause a fund to pay more brokerage commissions
and other transaction costs, which may detract from performance.
Turnover comparisons
Percentage of holdings that change every year
| | | 2006 | 2005 | 2004 | 2003 | 2002 |
|
| Putnam International Capital | | | | | | |
| Opportunities Fund | | 45% | 64% | 68% | 93% | 91% |
|
| Lipper International Small/Mid-Cap | | | | | | |
| Core Funds category average | | 63% | 60% | 58% | 60% | 59% |
|
Turnover data for the fund is calculated based on the fund’s fiscal-year period, which ends on August 31. Turnover data for the fund’s Lipper category is calculated based on the average of the turnover of each fund in the category for its fiscal year ended during the indicated year. Fiscal years vary across funds in the Lipper category, which may limit the comparability of the fund’s portfolio turnover rate to the Lipper average. Comparative data for 2006 is based on information available as of 12/31/06.
18
Your fund’s risk
This risk comparison is designed to help you understand how your fund compares with other funds. The comparison utilizes a risk measure developed by Morningstar, an independent fund-rating agency. This risk measure is referred to as the fund’s Morningstar Risk.
Your fund’s Morningstar® Risk
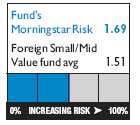
Your fund’s Morningstar Risk is shown alongside that of the average fund in its Morningstar category. The risk bar broadens the comparison by translating the fund’s Morningstar Risk into a percentile, which is based on the fund’s ranking among all funds rated by Morningstar as of March 31, 2007. A higher Morningstar Risk generally indicates that a fund’s monthly returns have varied more widely.
Morningstar determines a fund’s Morningstar Risk by assessing variations in the fund’s monthly returns — with an emphasis on downside variations — over a 3-year period, if available. Those measures are weighted and averaged to produce the fund’s Morningstar Risk. The information shown is provided for the fund’s class A shares only; information for other classes may vary. Morningstar Risk is based on historical data and does not indicate future results. Morningstar does not purport to measure the risk associated with a current investment in a fund, either on an absolute basis or on a relative basis. Low Morningstar Risk does not mean that you cannot lose money on an investment in a fund. Copyright 2007 Morningstar, Inc. All Rights Reserved. The information contained herein (1) is proprietary to Morningstar and/or its content providers; (2) may not be copied or distributed; and (3) is not warranted to be accurate, complete, or timely. Neither Morningstar nor its content providers are responsible for any damages or losses arising from any use of this information.
19
Your fund’s management
Your fund is managed by the members of the Putnam International Small- and Mid-Cap Core Team. Joseph Joseph is the Portfolio Leader. Randy Farina, John Ferry, Karan Sodhi, and Franz Valencia are Portfolio Members of the fund. The Portfolio Leader and Portfolio Members coordinate the team’s management of the fund.
For a complete listing of the members of the Putnam International Small- and Mid-Cap Core Team, including those who are not Portfolio Leaders or Portfolio Members of your fund, visit Putnam’s Individual Investor Web site at www.putnam.com.
Investment team fund ownership
The table below shows how much the fund’s current Portfolio Leader and Portfolio Members have invested in the fund and in all Putnam mutual funds (in dollar ranges). Information shown is as of February 28, 2007 and February 28, 2006.

N/A indicates the individual was not a Portfolio Leader or Portfolio Member as of 2/28/06.
Trustee and Putnam employee fund ownership
As of February 28, 2007, all of the Trustees of the Putnam funds owned fund shares. The table below shows the approximate value of investments in the fund and all Putnam funds as of that date by the Trustees and Putnam employees. These amounts include investments by the Trustees’ and employees’ immediate family members and investments through retirement and deferred compensation plans.
| | | Total assets in |
| | Assets in the fund | all Putnam funds |
|
| Trustees | $ 873,000 | $101,000,000 |
|
| Putnam employees | $21,555,000 | $459,000,000 |
|
20
Fund manager compensation
The total 2006 fund manager compensation that is attributable to your fund is approximately $2,600,000. This amount includes a portion of 2006 compensation paid by Putnam Management to the fund managers listed in this section for their portfolio management responsibilities, calculated based on the fund assets they manage taken as a percentage of the total assets they manage. The compensation amount also includes a portion of the 2006 compensation paid to the Chief Investment Officer of the team and the Group Chief Investment Officer of the fund’s broader investment category for their oversight responsibilities, calculated based on the fund assets they oversee taken as a percentage of the total assets they oversee. This amount does not include compensation of other personnel involved in research, trading, administration, systems, compliance, or fund operations; nor does it include non-compensation costs. These percentages are determined as of the fund’s fis cal period-end. For personnel who joined Putnam Management during or after 2006, the calculation reflects annualized 2006 compensation or an estimate of 2007 compensation, as applicable.
Other Putnam funds managed by the Portfolio Leader
and Portfolio Members
Joseph Joseph is also a Portfolio Leader of Putnam Capital Opportunities Fund and a Portfolio Member of Putnam Capital Appreciation Fund.
John Ferry is also a Portfolio Member of Putnam Capital Opportunities Fund.
Franz Valencia is also a Portfolio Member of Putnam Capital Opportunities Fund.
Joseph Joseph, Randy Farina, John Ferry, Karan Sodhi, and Franz Valencia may also manage other accounts and variable trust funds advised by Putnam Management or an affiliate.
Changes in your fund’s Portfolio Leader and Portfolio Members
During the year ended February 28, 2007, Portfolio Member Franz Valencia joined, and Portfolio Member Christopher Crawford left, your fund’s management team.
21
Putnam fund ownership by Putnam’s Executive Board
The table below shows how much the members of Putnam’s Executive Board have invested in all Putnam mutual funds (in dollar ranges). Information shown is as of February 28, 2007, and February 28, 2006.
| | | | $1 – | $10,001 – | $50,001 – | $100,001 – | $500,001 – | $1,000,001 |
| | Year | $0 | $10,000 | $50,000 | $100,000 | $500,000 | $1,000,000 | and over |
|
| Philippe Bibi | 2007 | | | | | | | • |
|
| Chief Technology Officer | 2006 | | | | | | | • |
|
| Joshua Brooks | 2007 | | | | | | | • |
|
| Deputy Head of Investments | 2006 | | | | | | | • |
|
| William Connolly | 2007 | | | | | | | • |
|
| Head of Retail Management | 2006 | | | | | | | • |
|
| Kevin Cronin | 2007 | | | | | | | • |
|
| Head of Investments | 2006 | | | | | | | • |
|
| Charles Haldeman, Jr. | 2007 | | | | | | | • |
|
| President and CEO | 2006 | | | | | | | • |
|
| Amrit Kanwal | 2007 | | | | | | • | |
|
| Chief Financial Officer | 2006 | | | | | • | | |
|
| Steven Krichmar | 2007 | | | | | | | • |
|
| Chief of Operations | 2006 | | | | | | • | |
|
| Francis McNamara, III | 2007 | | | | | | | • |
|
| General Counsel | 2006 | | | | | | | • |
|
| Jeffrey Peters | 2007 | | | | | | | • |
|
| Head of International Business | N/A | | | | | | | |
|
| Richard Robie, III | 2007 | | | | | | • | |
|
| Chief Administrative Officer | 2006 | | | | | | • | |
|
| Edward Shadek | 2007 | | | | | | | • |
|
| Deputy Head of Investments | 2006 | | | | | | | • |
|
| Sandra Whiston | 2007 | | | | | | | • |
|
| Head of Institutional Management | 2006 | | | | | | • | |
|
N/A indicates the individual was not a member of Putnam’s Executive Board as of 2/28/06.
22
Terms and definitions
Important terms
Total return shows how the value of the fund’s shares changed over time, assuming you held the shares through the entire period and reinvested all distributions in the fund.
Net asset value (NAV) is the price, or value, of one share of a mutual fund, without a sales charge. NAVs fluctuate with market conditions. NAV is calculated by dividing the net assets of each class of shares by the number of outstanding shares in the class.
Public offering price (POP) is the price of a mutual fund share plus the maximum sales charge levied at the time of purchase. POP performance figures shown here assume the 5.25% maximum sales charge for class A shares and 3.25% for class M shares.
Contingent deferred sales charge (CDSC) is generally a charge applied at the time of the redemption of class B or C shares and assumes redemption at the end of the period. Your fund’s class B CDSC declines from a 5% maximum during the first year to 1% during the sixth year. After the sixth year, the CDSC no longer applies. The CDSC for class C shares is 1% for one year after purchase.
Share classes
Class A shares are generally subject to an initial sales charge and no CDSC (except on certain redemptions of shares bought without an initial sales charge).
Class B shares are not subject to an initial sales charge. They may be subject to a CDSC.
Class C shares are not subject to an initial sales charge and are subject to a CDSC only if the shares are redeemed during the first year.
Class M shares have a lower initial sales charge and a higher 12b-1 fee than class A shares and no CDSC (except on certain redemptions of shares bought without an initial sales charge).
Class R shares are not subject to an initial sales charge or CDSC and are available only to certain defined contribution plans.
Class Y shares are not subject to an initial sales charge or CDSC, and carry no 12b-1 fee. They are only available to eligible purchasers, including eligible defined contribution plans or corporate IRAs.
23
Comparative indexes
JPMorgan Global High Yield Index is an unmanaged index of global high-yield fixed-income securities.
Lehman Aggregate Bond Index is an unmanaged index of U.S. investment-grade fixed-income securities.
Lehman Government Bond Index is an unmanaged index of U.S. Treasury and agency securities.
Morgan Stanley Capital International (MSCI) EAFE Index is an unmanaged index of equity securities from developed countries in Western Europe, the Far East, and Australasia.
S&P/Citigroup World Ex-U.S. Extended Market Index (EMI) is an unmanaged index of small-cap stocks from developed countries, excluding the United States.
S&P 500 Index is an unmanaged index of common stock performance.
Indexes assume reinvestment of all distributions and do not account for fees. Securities and performance of a fund and an index will differ. You cannot invest directly in an index.
Lipper is a third-party industry-ranking entity that ranks mutual funds. Its rankings do not reflect sales charges. Lipper rankings are based on total return at net asset value relative to other funds that have similar current investment styles or objectives as determined by Lipper. Lipper may change a fund’s category assignment at its discretion. Lipper category averages reflect performance trends for funds within a category.
24
Trustee approval of
management contract
General conclusions
The Board of Trustees of the Putnam funds oversees the management of each fund and, as required by law, determines annually whether to approve the continuance of your fund’s management contract with Putnam Management. In this regard, the Board of Trustees, with the assistance of its Contract Committee consisting solely of Trustees who are not “interested persons” (as such term is defined in the Investment Company Act of 1940, as amended) of the Putnam funds (the “Independent Trustees”), requests and evaluates all information it deems reasonably necessary under the circumstances. Over the course of several months ending in June 2006, the Contract Committee met four times to consider the information provided by Putnam Management and other information developed with the assistance of the Board’s independent counsel and independent staff. The Contract Committee reviewed and discussed key aspects of this information with all of the Independe nt Trustees. Upon completion of this review, the Contract Committee recommended, and the Independent Trustees approved, the continuance of your fund’s management contract, effective July 1, 2006.
This approval was based on the following conclusions:
• That the fee schedule in effect for your fund represented reasonable compensation in light of the nature and quality of the services being provided to the fund, the fees paid by competitive funds and the costs incurred by Putnam Management in providing such services, and
• That such fee schedule represented an appropriate sharing between fund shareholders and Putnam Management of such economies of scale as may exist in the management of the fund at current asset levels.
These conclusions were based on a comprehensive consideration of all information provided to the Trustees and were not the result of any single factor. Some of the factors that figured particularly in the Trustees’ deliberations and how the Trustees considered these factors are described below, although individual Trustees may have evaluated the information presented differently, giving different weights to various factors. It is also important to recognize that the fee arrangements for your fund and the other Putnam funds are the result of many years of review and discussion between the Independent Trustees and Putnam Management, that certain aspects of such arrangements may receive greater scrutiny in some years than others, and that the Trustees’ conclusions may be based, in part, on their consideration of these same arrangements in prior years.
25
Management fee schedules and categories; total expenses
The Trustees reviewed the management fee schedules in effect for all Putnam funds, including fee levels and breakpoints, and the assignment of funds to particular fee categories. In reviewing fees and expenses, the Trustees generally focused their attention on material changes in circumstances — for example, changes in a fund’s size or investment style, changes in Putnam Management’s operating costs, or changes in competitive practices in the mutual fund industry — that suggest that consideration of fee changes might be warranted. The Trustees concluded that the circumstances did not warrant changes to the management fee structure of your fund, which had been carefully developed over the years, re-examined on many occasions and adjusted where appropriate. The Trustees focused on two areas of particular interest, as discussed further below:
• Competitiveness. The Trustees reviewed comparative fee and expense information for competitive funds, which indicated that, in a custom peer group of competitive funds selected by Lipper Inc., your fund ranked in the 38th percentile in management fees and in the 21st percentile in total expenses (less any applicable 12b-1 fees) as of December 31, 2005 (the first percentile being the least expensive funds and the 100th percentile being the most expensive funds). (Because the fund’s custom peer group is smaller than the fund’s broad Lipper Inc. peer group, this expense information may differ from the Lipper peer expense information found elsewhere in this report.) The Trustees noted that expense ratios for a number of Putnam funds, which show the percentage of fund assets used to pay for management and administrative services, distribution (12b-1) fees and other expenses, had been increasing recently as a result of declining net assets and the natural operation of fee breakpoints.
The Trustees noted that the expense ratio increases described above were currently being controlled by expense limitations implemented in January 2004 and which Putnam Management, in consultation with the Contract Committee, has committed to maintain at least through 2007. These expense limitations give effect to a commitment by Putnam Management that the expense ratio of each open-end fund would be no higher than the average expense ratio of the competitive funds included in the fund’s relevant Lipper universe (exclusive of any applicable 12b-1 charges in each case). The Trustees observed that this commitment to limit fund expenses has served shareholders well since its inception. In order to ensure that the expenses of the Putnam funds continue to meet evolving competitive standards, the Trustees requested, and Putnam Management agreed, to implement an additional expense limitation for certain funds for the twelve months beginning January 1, 2007 equal to the average expense ratio (exclusive of 12b-1 charges) of a custom peer group of competitive funds selected by Lipper based on the size of the fund. This additional expense limitation will be applied to those open-end funds that had above-average expense ratios (exclusive of 12b-1 charges) based on the Lipper custom peer group data for the period ended December 31, 2005. This additional expense limitation will not be applied to your fund.
26
• Economies of scale. Your fund currently has the benefit of breakpoints in its management fee that provide shareholders with significant economies of scale, which means that the effective management fee rate of a fund (as a percentage of fund assets) declines as a fund grows in size and crosses specified asset thresholds. Conversely, as a fund shrinks in size — as has been the case for many Putnam funds in recent years — these breakpoints result in increasing fee levels. In recent years, the Trustees have examined the operation of the existing breakpoint structure during periods of both growth and decline in asset levels. The Trustees concluded that the fee schedules in effect for the funds represented an appropriate sharing of economies of scale at current asset levels. In reaching this conclusion, the Trustees considered the Contract Committee’s stated intent to con tinue to work with Putnam Management to plan for an eventual resumption in the growth of assets, including a study of potential economies that might be produced under various growth assumptions.
In connection with their review of the management fees and total expenses of the Putnam funds, the Trustees also reviewed the costs of the services to be provided and profits to be realized by Putnam Management and its affiliates from the relationship with the funds. This information included trends in revenues, expenses and profitability of Putnam Management and its affiliates relating to the investment management and distribution services provided to the funds. In this regard, the Trustees also reviewed an analysis of Putnam Management’s revenues, expenses and profitability with respect to the funds’ management contracts, allocated on a fund-by-fund basis. Because many of the costs incurred by Putnam Management in managing the funds are not readily identifiable to particular funds, the Trustees observed that the methodology for allocating costs is an important factor in evaluating Putnam Management’s costs and profitability, both as to the Putnam fu nds in the aggregate and as to individual funds. The Trustees reviewed Putnam Management’s cost allocation methodology with the assistance of independent consultants and concluded that this methodology was reasonable and well-considered.
Investment performance
The quality of the investment process provided by Putnam Management represented a major factor in the Trustees’ evaluation of the quality of services provided by Putnam Management under your fund’s management contract. The Trustees were assisted in their review of the Putnam funds’ investment process and performance by the work of the Investment Process Committee of the Trustees and the Investment Oversight Committees of the Trustees, which meet on a regular monthly basis with the funds’ portfolio teams throughout the year. The Trustees concluded that Putnam Management generally provides a high-quality investment process — as measured by the experience and skills of the individuals assigned to the management of fund portfolios, the resources made available to such personnel, and in general the ability of Putnam Management to attract and retain high-quality personnel — but also recognize that this does not guarantee favorable investment results for every fund in every time period. The Trustees considered the investment performance of each fund over multiple time periods
27
and considered information comparing each fund’s performance with various benchmarks and with the performance of competitive funds.
The Trustees noted the satisfactory investment performance of many Putnam funds. They also noted the disappointing investment performance of certain funds in recent years and discussed with senior management of Putnam Management the factors contributing to such underperfor-mance and actions being taken to improve performance. The Trustees recognized that, in recent years, Putnam Management has made significant changes in its investment personnel and processes and in the fund product line to address areas of underperformance. In particular, they noted the important contributions of Putnam Management’s leadership in attracting, retaining and supporting high-quality investment professionals and in systematically implementing an investment process that seeks to merge the best features of fundamental and quantitative analysis. The Trustees indicated their intention to continue to monitor performance trends to assess the effectiveness of these changes and to evaluate whether additional changes to address areas of underperformance are warranted.
In the case of your fund, the Trustees considered that your fund’s class A share cumulative total return performance at net asset value was in the following percentiles of its Lipper Inc. peer group (Lipper International Small/Mid-Cap Core Funds) for the one-, three- and five-year periods ended March 31, 2006 (the first percentile being the best performing funds and the 100th percentile being the worst performing funds):
| One-year period | Three-year period | Five-year period |
|
| 30th | 36th | 87th |
(Because of the passage of time, these performance results may differ from the performance results for more recent periods shown elsewhere in this report. Over the one-, three- and five-year periods ended March 31, 2006, there were 53, 50, and 28 funds, respectively, in your fund’s Lipper peer group.* Past performance is no guarantee of future performance.)
The Trustees noted the disappointing performance for your fund for the five-year period ended March 31, 2006. In this regard, the Trustees considered that Putnam Management had made changes to the fund’s investment team that it believed would strengthen the investment process by focusing on a blend of quantitative techniques and fundamental analysis.
As a general matter, the Trustees concluded that cooperative efforts between the Trustees and Putnam Management represent the most effective way to address investment performance problems. The Trustees noted that investors in the Putnam funds have, in effect, placed their trust in the Putnam organization, under the oversight of the funds’ Trustees, to make appropriate
* The percentile rankings for your fund’s class A share annualized total return performance in the Lipper International Small/Mid-Cap Core Funds category for the one-, five- and ten-year periods ended March 31, 2007, were 12%, 76%, and 20%, respectively. Over the one-, five- and ten-year periods ended March 31, 2007, the fund ranked 6 out of 49, 25 out of 32, and 3 out of 14 funds, respectively. Note that this more recent information was not available when the Trustees approved the continuance of your fund’s management contract.
28
decisions regarding the management of the funds. Based on the responsiveness of Putnam Management in the recent past to Trustee concerns about investment performance, the Trustees concluded that it is preferable to seek change within Putnam Management to address performance shortcomings. In the Trustees’ view, the alternative of terminating a management contract and engaging a new investment adviser for an underperforming fund would entail significant disruptions and would not provide any greater assurance of improved investment performance.
Brokerage and soft-dollar allocations; other benefits
The Trustees considered various potential benefits that Putnam Management may receive in connection with the services it provides under the management contract with your fund. These include benefits related to brokerage and soft-dollar allocations, whereby a portion of the commissions paid by a fund for brokerage may be used to acquire research services that may be useful to Putnam Management in managing the assets of the fund and of other clients. The Trustees indicated their continued intent to monitor the potential benefits associated with the allocation of fund brokerage to ensure that the principle of seeking “best price and execution” remains paramount in the portfolio trading process.
The Trustees’ annual review of your fund’s management contract also included the review of its distributor’s contract and distribution plan with Putnam Retail Management Limited Partnership and the custodian agreement and investor servicing agreement with Putnam Fiduciary Trust Company, all of which provide benefits to affiliates of Putnam Management.
Comparison of retail and institutional fee schedules
The information examined by the Trustees as part of their annual contract review has included for many years information regarding fees charged by Putnam Management and its affiliates to institutional clients such as defined benefit pension plans, college endowments, etc. This information included comparison of such fees with fees charged to the funds, as well as a detailed assessment of the differences in the services provided to these two types of clients. The Trustees observed, in this regard, that the differences in fee rates between institutional clients and the funds are by no means uniform when examined by individual asset sectors, suggesting that differences in the pricing of investment management services to these types of clients reflect to a substantial degree historical competitive forces operating in separate market places. The Trustees considered the fact that fee rates across all asset sectors are higher on average for funds than for institutional clients, as well as the differences between the services that Putnam Management provides to the Putnam funds and those that it provides to institutional clients of the firm, but did not rely on such comparisons to any significant extent in concluding that the management fees paid by your fund are reasonable.
29
Approval of the sub-management contract between Putnam
Management and Putnam Investments Limited
In September 2006, the Trustees approved a sub-management contract between Putnam Management and Putnam Investments Limited, an affiliate of Putnam Management. The Contract Committee reviewed information provided by Putnam Management and PIL and, upon completion of this review, recommended, and the Independent Trustees approved, your fund’s sub-management contract, effective December 30, 2006.
The Trustees considered numerous factors they believe relevant in approving your fund’s sub-management contract, including Putnam Management’s belief that the interest of shareholders would be best served by utilizing investment professionals in Putnam’s London office to manage a portion of your fund’s assets and PIL’s expertise in managing assets invested in European markets. The Trustees also considered that United Kingdom securities laws require a sub-advisory relationship between Putnam Management and PIL in order for Putnam’s investment professionals in London to be involved in the management of your fund. The Trustees noted that Putnam Management, and not your fund, would pay the sub-management fee to PIL for its services and that the sub-management relationship with PIL will not reduce the nature, quality or overall level of service provided to your fund.
Approval of new management and sub-management contracts in
connection with pending change in control
As discussed in the “Message from the Trustees” at the beginning of this shareholder report, on February 1, 2007, Marsh & McLennan Companies, Inc. announced that it had signed a definitive agreement to sell its ownership interest in Putnam Investments Trust, the parent company of Putnam Management and its affiliates, to Great-West Lifeco Inc., a member of the Power Financial Corporation group of companies. This transaction is subject to regulatory approvals and other conditions, including the approval of new management contracts by shareholders of a substantial number of Putnam funds at shareholder meetings scheduled for May 15, 2007. Proxy solicitation materials related to these meetings, which provide detailed information regarding the transaction, were recently mailed. The transaction is currently expected to be completed by the middle of 2007.
At an in-person meeting on February 8-9, 2007, the Trustees considered the approval of new management contracts for each Putnam fund (and, in the case of your fund, a new sub-management contract) proposed to become effective upon the closing of the transaction, and the filing of a preliminary proxy statement. At an in-person meeting on March 8-9, 2007, the Trustees considered the approval of the final forms of the proposed new management contracts for each Putnam fund (and, in the case of your fund, the new sub-management contract) and the proxy statement. They reviewed the terms of the proposed new management contracts and the differences between the proposed new management contracts and the current management contracts. They noted that the terms of the proposed new management contracts were substantially identical to the current
30
management contracts, except for certain changes developed at the initiative of the Trustees and designed largely to address inconsistencies among various of the existing contracts, which had been developed and implemented at different times in the past. They noted, in the case of your fund, that the terms of the proposed new sub-management contract were identical to the current sub-management contract, except for the effective date. In considering the approval of the proposed new management contracts (and, in the case of your fund, the new sub-management contract), the Trustees also considered, as discussed further in the proxy statement, various matters relating to the transaction. Finally, in considering the proposed new management contracts (and, in the case of your fund, the new sub-management contract), the Trustees also took into account their deliberations and conclusions (discussed above in the preceding paragraphs of the “Trustee Approval of Management Contract” section) in connection with the most recent annual approval of the continuance of the Putnam funds’ management (and, in the case of your fund, sub-management) contracts effective July 1, 2006, and the extensive materials that they had reviewed in connection with that approval process. Based upon the foregoing considerations, on March 9, 2007, the Trustees, including all of the Independent Trustees, unanimously approved the proposed new management contracts (and, in the case of your fund, the new sub-management contract) and determined to recommend their approval to the shareholders of the Putnam funds.
31
Other information
for shareholders
Important notice regarding delivery of shareholder documents
In accordance with SEC regulations, Putnam sends a single copy of annual and semiannual shareholder reports, prospectuses, and proxy statements to Putnam shareholders who share the same address, unless a shareholder requests otherwise. If you prefer to receive your own copy of these documents, please call Putnam at 1-800-225-1581, and Putnam will begin sending individual copies within 30 days.
Proxy voting
Putnam is committed to managing our mutual funds in the best interests of our shareholders. The Putnam funds’ proxy voting guidelines and procedures, as well as information regarding how your fund voted proxies relating to portfolio securities during the 12-month period ended June 30, 2006, are available on the Putnam Individual Investor Web site, www.putnam.com/individual, and on the SEC’s Web site, www.sec.gov. If you have questions about finding forms on the SEC’s Web site, you may call the SEC at 1-800-SEC-0330. You may also obtain the Putnam funds’ proxy voting guidelines and procedures at no charge by calling Putnam’s Shareholder Services at 1-800-225-1581.
Fund portfolio holdings
The fund will file a complete schedule of its portfolio holdings with the SEC for the first and third quarters of each fiscal year on Form N-Q. Shareholders may obtain the fund’s Forms N-Q on the SEC’s Web site at www.sec.gov. In addition, the fund’s Forms N-Q may be reviewed and copied at the SEC’s Public Reference Room in Washington, D.C. You may call the SEC at 1-800-SEC-0330 for information about the SEC’s Web site or the operation of the Public Reference Room.
32
Putnam’s policy on confidentiality
In order to conduct business with our shareholders, we must obtain certain personal information such as account holders’ addresses, telephone numbers, Social Security numbers, and the names of their financial advisors. We use this information to assign an account number and to help us maintain accurate records of transactions and account balances. It is our policy to protect the confidentiality of your information, whether or not you currently own shares of our funds, and in particular, not to sell information about you or your accounts to outside marketing firms. We have safeguards in place designed to prevent unauthorized access to our computer systems and procedures to protect personal information from unauthorized use. Under certain circumstances, we share this information with outside vendors who provide services to us, such as mailing and proxy solicitation. In those cases, the service providers enter into confidentiality agreements with us, and we provide only the information necessary to process transactions and perform other services related to your account. We may also share this information with our Putnam affiliates to service your account or provide you with information about other Putnam products or services. It is also our policy to share account information with your financial advisor, if you’ve listed one on your Putnam account. If you would like clarification about our confidentiality policies or have any questions or concerns, please don’t hesitate to contact us at 1-800-225-1581, Monday through Friday, 8:30 a.m. to 7:00 p.m., or Saturdays from 9:00 a.m. to 5:00 p.m. Eastern Time.
33
Financial statements
A guide to financial statements
These sections of the report, as well as the accompanying Notes, constitute the fund’s financial statements.
The fund’s portfolio lists all the fund’s investments and their values as of the last day of the reporting period. Holdings are organized by asset type and industry sector, country, or state to show areas of concentration and diversification.
Statement of assets and liabilities shows how the fund’s net assets and share price are determined. All investment and noninvestment assets are added together. Any unpaid expenses and other liabilities are subtracted from this total. The result is divided by the number of shares to determine the net asset value per share, which is calculated separately for each class of shares. (For funds with preferred shares, the amount subtracted from total assets includes the liquidation preference of preferred shares.)
Statement of operations shows the fund’s net investment gain or loss. This is done by first adding up all the fund’s earnings — from dividends and interest income — and subtracting its operating expenses to determine net investment income (or loss). Then, any net gain or loss the fund realized on the sales of its holdings — as well as any unrealized gains or losses over the period — is added to or subtracted from the net investment result to determine the fund’s net gain or loss for the fiscal period.
Statement of changes in net assets shows how the fund’s net assets were affected by the fund’s net investment gain or loss, by distributions to shareholders, and by changes in the number of the fund’s shares. It lists distributions and their sources (net investment income or realized capital gains) over the current reporting period and the most recent fiscal year-end. The distributions listed here may not match the sources listed in the Statement of operations because the distributions are determined on a tax basis and may be paid in a different period from the one in which they were earned. Dividend sources are estimated at the time of declaration. Actual results may vary. Any non-taxable return of capital cannot be determined until final tax calculations are completed after the end of the fund’s fiscal year.
Financial highlights provide an overview of the fund’s investment results, per-share distributions, expense ratios, net investment income ratios, and portfolio turnover in one summary table, reflecting the five most recent reporting periods. In a semiannual report, the highlight table also includes the current reporting period.
34
The fund’s portfolio 2/28/07 (Unaudited)
| COMMON STOCKS (98.9%)* | | | |
|
| | Shares | | Value |
|
| Australia (2.3%) | | | |
| Adelaide Brighton, Ltd. | 1,719,989 | $ | 4,470,389 |
| ARC Energy, Ltd. † | 712,248 | | 701,208 |
| Caltex Australia, Ltd. | 183,212 | | 3,222,169 |
| Flight Centre, Ltd. | 64,974 | | 864,321 |
| Gloucester Coal, Ltd. | 673,209 | | 1,977,718 |
| Incitec Pivot, Ltd. | 214,956 | | 7,432,241 |
| Just Group, Ltd. | 429,890 | | 1,259,523 |
| Kingsgate Consolidated, Ltd. | 123,019 | | 356,554 |
| MacArthur Coal, Ltd. | 125,000 | | 479,452 |
| Perilya, Ltd. | 1,113,610 | | 3,876,690 |
| Sunland Group, Ltd. | 320,000 | | 970,323 |
| Tap Oil, Ltd. † | 450,945 | | 546,953 |
| Tower Australia Group, Ltd. † | 802,601 | | 1,788,924 |
| Zinifex, Ltd. | 1,067,849 | | 14,062,153 |
| | | | 42,008,618 |
|
| |
| Austria (0.5%) | | | |
| Andritz AG | 41,551 | | 8,744,870 |
|
| |
| Belgium (0.7%) | | | |
| Cumerio | 82,407 | | 2,137,935 |
| Gimv NV | 43,887 | | 2,765,871 |
| Mobistar SA | 1,344 | | 113,319 |
| Omega Pharma SA | 102,873 | | 7,916,116 |
| Option NV † (S) | 8,210 | | 149,944 |
| | | | 13,083,185 |
|
| |
| Bermuda (1.3%) | | | |
| Aspen Insurance Holdings, Ltd. | 261,514 | | 6,930,121 |
| Axis Capital Holdings, Ltd. | 308,162 | | 10,418,957 |
| Hiscox, Ltd. | 1,227,310 | | 6,236,941 |
| | | | 23,586,019 |
|
| |
| Brazil (—%) | | | |
| Gerdau SA (Preference) | 22,413 | | 382,963 |
|
| |
| Canada (10.1%) | | | |
| Addax Petroleum Corp. | 280,900 | | 8,130,368 |
| Agrium, Inc. | 287,993 | | 11,054,302 |
| Algoma Steel, Inc. † | 149,800 | | 6,449,277 |
| AUR Resources, Inc. | 989,854 | | 17,731,887 |
| Axcan Pharma, Inc. † | 31,500 | | 499,906 |
| Baytex Energy Trust | 98,000 | | 1,732,074 |
| Biovail Corp. | 607,600 | | 12,588,412 |
| Boardwalk Real Estate Investment Trust (R) | 5,980 | | 255,153 |
| Canaccord Capital, Inc. | 443,382 | | 7,711,321 |
| Canadian Western Bank | 173,100 | | 3,578,929 |
35
| COMMON STOCKS (98.9%)* continued | | | |
|
| | Shares | | Value |
|
| Canada continued | | | |
| Centerra Gold, Inc. † | 246,800 | $ | 2,521,813 |
| CGI Group, Inc. † | 536,000 | | 4,528,157 |
| Cognos, Inc. † | 1,924 | | 72,864 |
| Corus Entertainment, Inc. Class B | 18,129 | | 721,130 |
| Focus Energy Trust | 29,700 | | 443,913 |
| Gerdau Ameristeel Corp. | 578,300 | | 6,329,406 |
| Home Capital Group, Inc. | 8,400 | | 261,804 |
| Inmet Mining Corp. | 277,246 | | 13,979,647 |
| InnVest Real Estate Investment Trust (R) | 32,700 | | 405,989 |
| Iteration Energy, Ltd. † | 284,500 | | 1,121,458 |
| Laurentian Bank of Canada | 7,400 | | 197,544 |
| Lundin Mining Corp. † | 221,454 | | 2,412,419 |
| Methanex Corp. | 810,436 | | 20,442,806 |
| Norbord, Inc. | 1,003,316 | | 7,592,430 |
| Northbridge Financial Corp. | 257,300 | | 6,710,261 |
| Northern Orion Resources, Inc. † | 808,600 | | 3,394,806 |
| Northgate Minerals Corp. † | 2,198,400 | | 7,857,471 |
| Sino-Forest Corp. † | 1,067,400 | | 8,725,390 |
| SNC-Lavalin Group, Inc. | 279,334 | | 8,584,236 |
| Teck Cominco, Ltd. Class B | 158,460 | | 11,175,529 |
| Transat A.T., Inc. Class A | 41,640 | | 1,191,342 |
| Transat A.T., Inc. Class B | 274,900 | | 7,759,255 |
| Zargon Energy Trust | 96,000 | | 2,099,769 |
| | | | 188,261,068 |
|
| |
| Denmark (0.6%) | | | |
| Amagerbanken A/S | 9,100 | | 613,521 |
| Biomar A/S | 46,920 | | 2,165,865 |
| D/S Norden | 2,674 | | 2,513,864 |
| Ringkjoebing Landbobank A/S | 4,670 | | 975,936 |
| SimCorp A/S | 18,030 | | 3,807,232 |
| Solar Holdings A/S Class B | 8,800 | | 1,146,650 |
| Sydbank A/S | 10,140 | | 529,985 |
| | | | 11,753,053 |
|
| |
| Finland (1.1%) | | | |
| Jaakko Poyry Group OYJ | 100,874 | | 1,745,002 |
| Olvi Oyj Class A | 1,316 | | 39,850 |
| Ramirent OYJ | 59,376 | | 4,342,967 |
| Rautaruukki OYJ | 312,653 | | 14,215,277 |
| | | | 20,343,096 |
|
| |
| France (4.3%) | | | |
| Air France-KLM | 361,697 | | 15,662,767 |
| Bail Investissement Fonciere | 2,916 | | 264,633 |
| BioMerieux | 4,079 | | 338,539 |
| Bonduelle SCA | 12,114 | | 1,497,987 |
| Business Objects SA † | 2,652 | | 96,068 |
| Camaieu | 4,651 | | 1,581,066 |
36
| COMMON STOCKS (98.9%)* continued | | | |
|
| | Shares | | Value |
|
| France continued | | | |
| Cap Gemini SA | 77,498 | $ | 5,401,350 |
| Ciments Francais Class A | 2,788 | | 588,653 |
| CNP Assurances | 105,188 | | 11,760,429 |
| Compagnie Plastic-Omnium SA | 20,773 | | 1,004,047 |
| Etam Developpement SA | 28,094 | | 2,090,772 |
| Kaufman & Broad SA | 25,619 | | 1,842,242 |
| Nexity | 7,844 | | 626,339 |
| Publicis Group SA | 20,268 | | 906,254 |
| Societe BIC SA | 14,965 | | 1,020,723 |
| Thales SA | 257,062 | | 13,197,582 |
| Valeo SA | 62,060 | | 3,044,029 |
| Vallourec SA | 74,837 | | 18,456,090 |
| | | | 79,379,570 |
|
| |
| Germany (1.5%) | | | |
| Altana AG | 63,579 | | 3,853,906 |
| Bechtle AG | 14,257 | | 404,892 |
| Continental AG | 98,318 | | 12,246,427 |
| Deutsche Beteiligungs AG | 9,899 | | 301,879 |
| Deutsche Boerse AG | 3,616 | | 725,869 |
| Deutsche Lufthansa AG | 230,694 | | 6,244,091 |
| ElringKlinger AG | 11,075 | | 780,137 |
| Fuchs Petrolub AG (Preference) | 4,913 | | 363,984 |
| Hypo Real Estate Holding | 5,144 | | 325,228 |
| Mobilcom AG † (S) | 19,591 | | 556,620 |
| Norddeutsche Affinerie AG | 12,216 | | 371,730 |
| Puma AG Rudolf Dassier Sport | 1,379 | | 489,672 |
| Villeroy & Boch AG (Preference) | 16,748 | | 299,741 |
| | | | 26,964,176 |
|
| |
| Greece (0.8%) | | | |
| Attica Holdings SA | 229,380 | | 1,329,748 |
| Babis Vovos International Construction SA | 174,894 | | 6,935,482 |
| Heracles General Cement Co. | 6,880 | | 150,323 |
| Metka SA | 209,140 | | 2,937,954 |
| Mytilineos Holdings SA | 85,397 | | 3,819,592 |
| | | | 15,173,099 |
|
| |
| Guernsey (0.6%) | | | |
| Amdocs, Ltd. † (S) | 333,675 | | 11,548,492 |
|
| |
| Hong Kong (2.2%) | | | |
| ASM Pacific Technology | 22,500 | | 131,325 |
| Beijing Enterprises Holdings, Ltd. | 892,000 | | 2,169,288 |
| CNPC Hong Kong, Ltd. | 6,160,000 | | 2,933,071 |
| Dah Sing Financial Group | 22,400 | | 195,108 |
| Industrial & Commercial Bank of China | 150,000 | | 324,088 |
| Midland Holdings, Ltd. | 6,158,000 | | 3,736,086 |
| Orient Overseas International, Ltd. | 2,316,660 | | 18,918,288 |
| SmarTone Telecommunications Holdings, Ltd. | 1,693,500 | | 1,712,423 |
37
| COMMON STOCKS (98.9%)* continued | | | |
|
| | Shares | | Value |
|
| Hong Kong continued | | | |
| Solomon Systech International, Ltd. | 39,576,000 | $ | 7,801,021 |
| Truly International Holdings | 434,000 | | 433,295 |
| VTech Holdings, Ltd. | 39,000 | | 253,837 |
| Wheelock and Co., Ltd. | 830,000 | | 1,752,915 |
| | | | 40,360,745 |
|
| |
| India (0.4%) | | | |
| Canara Bank | 364,691 | | 1,717,186 |
| Satyam Computer Services., Ltd. | 21,260 | | 199,009 |
| Tata Iron & Steel Co., Ltd. | 631,522 | | 6,312,367 |
| | | | 8,228,562 |
|
| |
| Ireland (0.3%) | | | |
| DCC PLC | 71,852 | | 2,423,709 |
| FBD Holdings PLC | 59,067 | | 3,197,988 |
| Paddy Power PLC | 28,106 | | 636,078 |
| | | | 6,257,775 |
|
| |
| Italy (3.7%) | | | |
| Azimut Holding SpA | 36,852 | | 499,684 |
| Banche Popolari Unite Scpa | 12,213 | | 345,929 |
| Banco di Desio e della Brianza SpA | 276,289 | | 3,100,369 |
| Compagnie Industriali Riunite (CIR) SpA | 2,851,806 | | 10,956,606 |
| Credito Emiliano SpA | 35,248 | | 533,629 |
| Cremonini SpA | 367,615 | | 1,283,154 |
| Danieli & Co. SpA | 155,804 | | 3,206,926 |
| Ergo Previdenza SpA | 223,664 | | 1,650,756 |
| Fondiaria-Sai SpA | 3,922 | | 137,582 |
| Italcementi SpA | 23,933 | | 718,635 |
| Milano Assicurazioni SpA | 1,518,000 | | 12,687,200 |
| Navigazione Montanari SpA | 431,002 | | 2,208,190 |
| Parmalat Finanziaria SpA † (F) (S) | 5,785,367 | | 765 |
| Pirelli & C Real Estate SpA | 4,169 | | 294,732 |
| Premafin Finanziaria SpA | 376,500 | | 1,216,585 |
| Recordati SpA | 387,088 | | 3,028,971 |
| Sai-Soc Assicuratrice Industriale SpA (SAI) | 265,400 | | 12,089,855 |
| Trevi Finanziaria SpA | 119,812 | | 1,625,770 |
| Unipol SpA | 3,147,500 | | 12,126,729 |
| | | | 67,712,067 |
|
| |
| Japan (30.9%) | | | |
| ABC-Mart, Inc. | 146,600 | | 3,531,485 |
| ADEKA Corp. | 28,800 | | 328,872 |
| Aderans Co., Ltd. | 12,600 | | 324,825 |
| Aeon Credit Service Co., Ltd. | 10,100 | | 192,080 |
| Aica Kogyo Co., Ltd. | 15,000 | | 207,928 |
| Airport Facilities Co., Ltd. | 166,900 | | 1,063,668 |
| Alpine Electronics, Inc. | 19,600 | | 370,265 |
| Aplus Co., Ltd. † | 117,500 | | 207,569 |
38
| COMMON STOCKS (98.9%)* continued | | | |
|
| | Shares | | Value |
|
| Japan continued | | | |
| Ardepro Co., Ltd. | 5,093 | $ | 1,713,307 |
| Asahi Industries Co., Ltd. | 711 | | 1,610,582 |
| Asahi Soft Drinks Co., Ltd. | 231,000 | | 3,475,446 |
| ASKUL Corp. | 45,400 | | 943,995 |
| Axell Corp. | 52 | | 159,107 |
| BML, Inc. | 138,700 | | 2,702,253 |
| Brother Industries, Ltd. | 1,478,000 | | 19,488,463 |
| CAC Corp. | 163,800 | | 1,377,576 |
| Canon Electronics, Inc. | 181,400 | | 6,071,710 |
| Canon Sales Co., Inc. | 632,700 | | 13,770,624 |
| Capcom Co., Ltd. (S) | 644,200 | | 10,084,172 |
| Century Leasing System, Inc. | 242,800 | | 3,402,607 |
| Chiyoda Co., Ltd. | 119,600 | | 2,835,584 |
| Chori Co., Ltd. † | 313,000 | | 605,841 |
| Chubu Steel Plate Co., Ltd. | 121,500 | | 1,679,085 |
| Circle K Sunkus Co., Ltd. | 65,000 | | 1,205,942 |
| Cleanup Corp. | 36,100 | | 339,305 |
| Daiichi Sankyo Co., Ltd. | 418,800 | | 13,486,840 |
| Daiichikosho Co., Ltd. | 322,700 | | 3,834,978 |
| Daishi Bank, Ltd. (The) | 38,000 | | 163,486 |
| Daishinku Corp. | 234,000 | | 1,580,306 |
| Daiwa Industries, Ltd. | 1,375,000 | | 9,471,938 |
| Data Communication System Co., Ltd. | 21,900 | | 749,683 |
| Doutor Coffee Co., Ltd. | 286,100 | | 5,404,729 |
| Eighteenth Bank, Ltd. (The) | 48,000 | | 247,080 |
| ESPEC Corp. | 21,600 | | 271,483 |
| FamilyMart Co., Ltd. | 10,000 | | 274,702 |
| FCC Co., Ltd. | 79,600 | | 1,944,417 |
| Foster Electric Co., Ltd. | 392,000 | | 4,569,081 |
| Fujicco Co., Ltd. | 58,000 | | 650,055 |
| Fujimi, Inc. | 64,900 | | 2,002,240 |
| Fujitsu General, Ltd. † | 235,000 | | 498,563 |
| Future System Consulting Corp. (S) | 3,551 | | 2,746,315 |
| Fuyo General Lease Co., Ltd. | 265,910 | | 9,776,929 |
| Geomatec Co., Ltd. | 15,800 | | 110,844 |
| Hachijuni Bank, Ltd. (The) | 34,000 | | 247,147 |
| Happinet Corp. | 3,000 | | 45,491 |
| HASEKO Corp. † | 3,360,000 | | 12,921,985 |
| Higashi-Nippon Bank, Ltd. (The) | 7,000 | | 35,500 |
| Hisamitsu Pharmaceutical Co., Inc. | 371,900 | | 11,347,807 |
| Hitachi Construction Machinery Co., Ltd. | 12,400 | | 355,304 |
| Hitachi Systems & Services, Ltd. | 63,700 | | 1,367,577 |
| Hokuetsu Bank, Ltd. (The) | 548,000 | | 1,426,625 |
| Hosiden, Corp. | 56,400 | | 714,594 |
| Ichiyoshi Securities Co., Ltd. | 11,600 | | 193,154 |
| Icom, Inc. | 35,100 | | 1,097,709 |
| Iyo Bank Ltd. (The) | 19,000 | | 189,342 |
| Japan Aviation Electronics Industry, Ltd. | 207,000 | | 2,629,710 |
| Japan Business Computer Co., Ltd. | 13,900 | | 136,404 |
39
| COMMON STOCKS (98.9%)* continued | | | |
|
| | Shares | | Value |
|
| Japan continued | | | |
| JFE Shoji Holdings, Inc. | 37,000 | $ | 195,774 |
| Joint Corp. | 59,900 | | 2,409,974 |
| Juroku Bank, Ltd. (The) | 41,000 | | 243,623 |
| Kaga Electronics Co., Ltd. | 73,600 | | 1,244,189 |
| Kaken Pharmaceutical Co., Ltd. | 35,000 | | 291,100 |
| Kaneka Corp. | 1,050,000 | | 9,806,863 |
| Kansai Paint Co., Ltd. | 34,000 | | 296,289 |
| Keihin Corp. | 619,800 | | 14,930,522 |
| Keiyo Bank, Ltd. (The) | 48,000 | | 307,531 |
| Kenedix, Inc. | 31 | | 163,503 |
| Kenwood Corp. | 4,255,000 | | 6,725,425 |
| Kimoto Co., Ltd. (S) | 234,100 | | 1,422,685 |
| Kintetsu World Express, Inc. | 6,600 | | 206,407 |
| KK DaVinci Advisors † | 11,372 | | 13,456,851 |
| Koa Corp. | 112,900 | | 1,657,572 |
| Kobayashi Pharmaceutical Co., Ltd. | 303,900 | | 11,584,727 |
| Kumagai Gumi Co., Ltd. | 2,090,000 | | 4,345,702 |
| Lasertec Corp. | 77,900 | | 1,846,923 |
| Lawson, Inc. | 321,700 | | 12,344,840 |
| Leopalace21 Corp. | 6,300 | | 199,687 |
| Lintec Corp. | 16,000 | | 295,495 |
| Mars Engineering Corp. (S) | 448,500 | | 9,420,358 |
| Meiko Network Japan Co., Ltd. | 149,600 | | 766,272 |
| Mikuni Coca-Cola Bottling Co., Ltd. | 37,500 | | 396,522 |
| Mitsubishi Plastics, Inc. (S) | 878,000 | | 3,027,842 |
| Mochida Pharmaceutical Co., Ltd | 131,000 | | 1,195,841 |
| Moshi Moshi Hotline, Inc. | 60,050 | | 2,487,068 |
| NGK Spark Plug Co., Ltd. | 420,000 | | 7,969,741 |
| Nice Corp. | 347,000 | | 1,331,570 |
| Nifco, Inc. | 350,600 | | 9,008,740 |
| Nihon Eslead Corp. | 13,300 | | 335,563 |
| Nihon Kohden Corp. | 407,300 | | 8,572,200 |
| Nikkiso Co., Ltd. | 264,000 | | 2,001,589 |
| Nippo Corp. | 132,000 | | 1,046,539 |
| Nippon Kanzai Co., Ltd. | 39,800 | | 1,083,222 |
| Nippon Seiki Co., Ltd. | 13,100 | | 317,230 |
| Nippon Shinyaku Co., Ltd. | 99,000 | | 829,254 |
| Nippon Thompson Co., Ltd. | 128,000 | | 1,189,012 |
| Nissan Diesel Motor Co., Ltd. (S) | 43,000 | | 195,174 |
| Nissin Kogyo Co., Ltd. | 563,000 | | 14,894,683 |
| Nittetsu Mining Co., Ltd. | 218,000 | | 1,840,774 |
| Nitto Kohki Co., Ltd. | 37,700 | | 863,553 |
| Noritake Co., Ltd. | 325,000 | | 1,634,477 |
| Noritsu Koki Co., Ltd. | 103,200 | | 1,831,798 |
| Oita Bank, Ltd. (The) (Private) | 23,000 | | 163,883 |
| Okamura Corp. | 381,000 | | 4,131,713 |
| Okinawa Cellular Telephone Co. | 50 | | 160,595 |
| Ono Pharmaceutical Co., Ltd. | 156,600 | | 8,471,304 |
| Onward Kashiyama Co., Ltd. | 692,000 | | 9,668,464 |
40
| COMMON STOCKS (98.9%)* continued | | | |
|
| | Shares | | Value |
|
| Japan continued | | | |
| Optex Co., Ltd. | 1,900 | $ | 40,550 |
| Osaka Steel Co., Ltd. | 144,800 | | 3,120,953 |
| Otsuka Kagu, Ltd. | 83,300 | | 2,731,840 |
| Pacific Metals Co., Ltd. | 1,472,000 | | 20,541,560 |
| Pal Co., Ltd. | 7,320 | | 253,054 |
| Ricoh Leasing Co., Ltd. | 229,100 | | 5,770,586 |
| Riso Kagaku Corp. | 36,200 | | 789,418 |
| Sanei-International Co., Ltd. | 16,800 | | 613,439 |
| Sankyo Co., Ltd. | 262,500 | | 11,781,548 |
| Santen Pharmaceutical Co., Ltd. | 524,600 | | 14,366,529 |
| Sanyo Shinpan Finance Co., Ltd. | 70,400 | | 1,782,166 |
| Seikagaku Corp. | 257,900 | | 2,748,812 |
| Shimano, Inc. | 134,500 | | 4,069,901 |
| Shin-Estu Polymer Co., Ltd. | 36,000 | | 447,299 |
| Shinkawa, Ltd. | 70,500 | | 1,623,806 |
| Shinko Shoji Co., Ltd. | 120,600 | | 1,774,699 |
| Shinwa Co., Ltd. | 12,090 | | 259,560 |
| Showa Corp. | 324,000 | | 5,192,325 |
| Sinanen Co., Ltd. | 70,000 | | 389,316 |
| SMK Corp. | 92,000 | | 601,099 |
| Stanley Eelctric Co., Ltd. | 547,100 | | 10,890,208 |
| Sumisho Lease Co., Ltd. (S) | 126,400 | | 7,350,452 |
| Sumitomo Real Estate Sales Co., Ltd. | 2,300 | | 194,793 |
| Suzuken Co., Ltd. | 2,900 | | 103,930 |
| Tachi-S Co., Ltd. | 54,600 | | 495,650 |
| Taiyo Ink Manufacturing Co., Ltd. | 25,200 | | 1,439,878 |
| Takamatsu Corp. | 48,200 | | 818,883 |
| Takara Leben Co., Ltd. | 7,700 | | 113,375 |
| Tamron Co., Ltd. | 239,400 | | 5,129,566 |
| Tanabe Seiyaku Co., Ltd. | 1,300,000 | | 17,558,955 |
| Toa Corp. | 171,000 | | 1,360,079 |
| Tokai Rika Co., Ltd. | 325,600 | | 7,994,827 |
| Tokai Tokyo Securities Co., Ltd. | 3,213,000 | | 19,471,904 |
| Token Corp. | 7,300 | | 464,001 |
| Tokyo Steel Manufacturing Co., Ltd. | 636,500 | | 10,636,130 |
| Tokyu Livable, Inc. | 1,500 | | 118,798 |
| Toppan Forms Co., Ltd. | 47,300 | | 627,682 |
| Toshiba TEC Corp. | 558,000 | | 3,438,272 |
| Toyo Securities Co., Ltd. | 1,763,000 | | 8,926,016 |
| Toyo Suisan Kaisha, Ltd. | 200,000 | | 3,676,781 |
| Toyota Auto Body Co., Ltd. | 67,300 | | 1,299,810 |
| Trend Micro, Inc. | 4,000 | | 113,262 |
| UFJ Central Leasing Co., Ltd. | 48,300 | | 2,384,177 |
| Uni-Charm Corp. | 8,000 | | 477,390 |
| Urban Corp. | 780,300 | | 12,729,093 |
| Yamagata Bank, Ltd. (The) | 19,000 | | 103,584 |
| Yamato Kogyo Co., Ltd. | 721,600 | | 22,872,116 |
| Yamazen Corp. | 246,000 | | 1,806,897 |
| Yoshimoto Kogyo Co., Ltd. | 169,000 | | 2,871,186 |
41
| COMMON STOCKS (98.9%)* continued | | | |
|
| | Shares | | Value |
|
| Japan continued | | | |
| Yuasa Trading Co., Ltd. | 600,000 | $ | 1,151,213 |
| Zuken, Inc. | 38,500 | | 359,260 |
| | | | 572,871,600 |
|
| |
| Liechtenstein (—%) | | | |
| Verwalt & Privat-Bank AG | 2,441 | | 597,717 |
|
| |
| Malaysia (0.1%) | | | |
| Tanjong PLC | 390,000 | | 1,604,113 |
|
| |
| Netherland Antilles (0.2%) | | | |
| Orthofix International NV † | 84,100 | | 4,130,992 |
|
| |
| Netherlands (1.1%) | | | |
| Beter BED Holdings NV | 123,224 | | 3,670,071 |
| Corio NV | 6,054 | | 561,278 |
| Eurocommercial Properties NV CVA (Commanditaire | | | |
| Vennootschap op Aandelen) (R) | 6,596 | | 366,946 |
| Koninklijke DSM NV | 19,666 | | 851,929 |
| Macintosh Retail Group NV | 43,749 | | 1,688,021 |
| Stork NV | 264,436 | | 13,655,842 |
| | | | 20,794,087 |
|
| |
| New Zealand (—%) | | | |
| Fletcher Building, Ltd. | 34,170 | | 254,528 |
|
| |
| Norway (1.8%) | | | |
| ABG Sundal Collier ASA | 903,000 | | 1,922,624 |
| Acta Holding ASA | 1,442,800 | | 7,877,466 |
| EDB Business Partner ASA | 155,600 | | 1,369,170 |
| Sparebank 1 SR Bank | 10,200 | | 322,016 |
| Sparebanken Midt-Norge | 156,230 | | 2,102,880 |
| Sparebanken Nord-Norge | 33,400 | | 806,513 |
| Tandberg ASA | 60,710 | | 1,085,126 |
| TGS Nopec Geophysical Co. ASA † | 628,300 | | 12,929,985 |
| Veidekke ASA | 79,400 | | 4,121,397 |
| | | | 32,537,177 |
|
| |
| Portugal (—%) | | | |
| Jeronimo Martins, SGPS, SA | 22,595 | | 547,414 |
| Semapa-Sociedade de Investimento e Gestao | 10,696 | | 156,169 |
| | | | 703,583 |
|
| |
| Singapore (1.6%) | | | |
| Ascendas Real Estate Investment Trust (R) | 203,000 | | 320,177 |
| KS Energy Services, Ltd. | 1,176,000 | | 2,124,188 |
| Marco Polo Developments, Ltd. | 190,000 | | 343,194 |
| MMI Holdings, Ltd. | 8,717,000 | | 7,986,780 |
| MMI Holdings, Ltd. 144A | 2,500,000 | | 2,290,576 |
| MobileOne Asia, Ltd. | 3,466,110 | | 4,718,265 |
42
| COMMON STOCKS (98.9%)* continued | | | |
|
| | Shares | | Value |
|
| Singapore continued | | | |
| Neptune Orient Lines, Ltd. | 1,178,000 | $ | 2,266,571 |
| SembCorp Industries, Ltd. | 2,633,820 | | 7,618,773 |
| Unisteel Technology, Ltd. | 946,000 | | 1,634,450 |
| Wing Tai Holdings, Ltd. | 500,000 | | 890,052 |
| | | | 30,193,026 |
|
| |
| South Korea (3.4%) | | | |
| Amorepacific Corp. | 338 | | 51,163 |
| Binggrae Co., Ltd. | 98,740 | | 3,754,931 |
| Cheil Communications, Inc. | 26,494 | | 6,416,648 |
| Daeduck Electronics Co. | 47,570 | | 387,574 |
| Daegu Bank | 23,550 | | 401,506 |
| Daewoong Pharmaceutical Co., Ltd. | 3,150 | | 197,753 |
| Dong Wha Pharmaceutical Industrial Co., Ltd. | 5,890 | | 175,186 |
| Hanjin Shipping | 9,550 | | 322,594 |
| Honam Petrochemical, Corp. | 125,887 | | 10,831,577 |
| Hyundai Heavy Industries | 72,453 | | 12,391,048 |
| Hyundai Marine & Fire Insurance Co. | 85,790 | | 1,166,467 |
| Hyundai Mipo Dockyard | 1,642 | | 266,864 |
| INI Steel Co. | 245,110 | | 8,644,202 |
| Interflex Co., Ltd. | 420,619 | | 2,555,705 |
| Jeonbuk Bank | 18,793 | | 173,677 |
| Jeonbuk Bank (Rights) (F) | 3,006 | | 7,600 |
| Korea Investment Holdings Co., Ltd. | 2,700 | | 134,799 |
| Kwang Dong Pharmaceutical Co., Ltd. | 324,360 | | 1,002,642 |
| LG Home Shopping, Inc. | 90,944 | | 7,197,077 |
| LG Petrochemical Co., Ltd. | 15,400 | | 481,761 |
| LG Telecom, Ltd. † | 23,524 | | 286,116 |
| LS Industrial Systems Co., Ltd. | 85,900 | | 2,641,603 |
| NHN Corp. | 2,650 | | 363,129 |
| Pusan Bank | 22,520 | | 312,180 |
| Samsung Heavy Industries Co., Ltd. | 75,290 | | 1,847,460 |
| | | | 62,011,262 |
|
| |
| Spain (2.1%) | | | |
| Antena 3 de Television SA | 538,605 | | 12,040,415 |
| Duro Felguera SA | 269,449 | | 2,894,640 |
| Fomento de Construcciones y Contratas SA | 28,811 | | 2,985,038 |
| Gestevision Telecinco SA | 543,099 | | 15,056,698 |
| Iberia Lineas Aereas de Espana SA | 104,145 | | 438,134 |
| Indra Sistemas SA Class A | 7,112 | | 163,279 |
| Tubos Reunidos SA | 136,425 | | 3,187,067 |
| Viscofan SA | 110,998 | | 2,285,000 |
| | | | 39,050,271 |
|
| |
| Sweden (2.4%) | | | |
| AddTech AB Class B | 57,300 | | 1,139,663 |
| Carnegie AB | 25,300 | | 530,282 |
| Intrum Justita AB | 350,800 | | 4,628,199 |
43
| COMMON STOCKS (98.9%)* continued | | | |
|
| | Shares | | Value |
|
| Sweden continued | | | |
| JM AB | 428,316 | $ | 12,714,920 |
| Saab AB Class B | 196,900 | | 5,250,414 |
| Skanska AB Class B | 597,212 | | 12,224,139 |
| SKF AB Class B | 147,886 | | 2,741,638 |
| Ssab Svenskt Stal AB Class A | 12,400 | | 331,715 |
| Ssab Svenskt Stal AB Class B | 190,400 | | 4,854,090 |
| Swedish Match AB | 48,536 | | 837,507 |
| | | | 45,252,567 |
|
| |
| Switzerland (3.4%) | | | |
| Baloise Holding AG Class R | 141,851 | | 14,445,475 |
| Bank Sarasin & Cie AG Class B | 574 | | 2,144,781 |
| Banque Cantonale Vaudoise (BCV) | 25,218 | | 11,969,788 |
| Bellevue Group AG | 7,847 | | 566,929 |
| Charles Voegele Holding AG † | 40,977 | | 3,850,795 |
| Daetwyler Holding AG | 12 | | 62,975 |
| Geberit International AG | 485 | | 799,852 |
| George Fischer AG † | 15,947 | | 10,327,477 |
| Helvetia Patria Holding | 23,132 | | 9,009,699 |
| Huber & Suhner AG | 8,652 | | 1,588,250 |
| Kuehne & Nagel International AG | 6,357 | | 484,708 |
| Logitech International SA † | 9,476 | | 248,260 |
| Phoenix Mecano AG | 4,308 | | 2,105,502 |
| Rieter Holding AG | 945 | | 478,154 |
| St. Galler Kantonalbank | 5,423 | | 2,586,157 |
| Vontobel Holding AG | 8,756 | | 418,077 |
| Zehnder Group AG Class B | 765 | | 1,629,968 |
| | | | 62,716,847 |
|
| |
| Taiwan (4.0%) | | | |
| Altek Corp. | 2,553,000 | | 4,905,294 |
| ChipMOS TECHNOLOGIES Bermuda, Ltd. † (S) | 20,522 | | 153,710 |
| Faraday Technology Corp. | 3,525,060 | | 9,822,447 |
| Greatek Electronics, Inc. | 10,305,006 | | 14,216,498 |
| Hung Poo Real Estate Development Corp. | 1,377,000 | | 1,441,994 |
| Micro-Star International Co., Ltd. | 8,454,650 | | 6,415,731 |
| Microelectronics Technology † | 6,719,000 | | 3,028,598 |
| Novatek Microelectronics Corp., Ltd. | 23,307 | | 115,315 |
| Phoenixtec Power Co., Ltd. | 486,000 | | 511,890 |
| Quanta Storage, Inc. | 2,043,000 | | 2,880,478 |
| Sincere Navigation | 4,878,200 | | 7,181,445 |
| TSRC Corp. | 2,769,000 | | 2,012,978 |
| U-Ming Marine Transport Corp. | 14,222,000 | | 21,411,783 |
| | | | 74,098,161 |
|
| |
| United Kingdom (17.5%) | | | |
| 888 Holdings PLC | 1,151,549 | | 2,303,739 |
| Aberdeen Asset Management PLC | 96,246 | | 360,289 |
| Alexon Group PLC | 545,335 | | 2,033,610 |
44
| COMMON STOCKS (98.9%)* continued | | | |
|
| | Shares | | Value |
|
| United Kingdom continued | | | |
| Amlin PLC | 2,392,191 | $ | 14,205,383 |
| Amstrad PLC | 190,047 | | 586,795 |
| Anite Group PLC | 1,085,553 | | 1,731,583 |
| Antofagasta PLC | 1,613,110 | | 14,620,993 |
| Atkins (WS) PLC | 16,941 | | 295,385 |
| Aveva Group PLC | 112,523 | | 1,926,841 |
| Beazley Group PLC | 7,532 | | 22,181 |
| Berkeley Group Holdings PLC † | 645,227 | | 19,179,412 |
| Bespak PLC | 123,724 | | 1,862,996 |
| Bradford & Bingley PLC | 47,915 | | 410,710 |
| Brit Insurance Holdings PLC | 1,868,096 | | 11,299,032 |
| British Airways PLC † | 1,305,101 | | 13,774,644 |
| British Energy Group PLC † | 229,000 | | 1,854,625 |
| British Polythene Industries | 13,847 | | 135,081 |
| Cattles PLC | 1,358,458 | | 11,548,027 |
| Chaucer Holdings PLC | 3,479,993 | | 6,752,096 |
| Close Brothers Group PLC | 740,924 | | 14,994,278 |
| CLS Holdings PLC † | 87,132 | | 1,112,293 |
| Countrywide PLC | 753,168 | | 8,431,780 |
| Dana Petroleum PLC † | 397,687 | | 7,750,486 |
| Davis Service Group PLC | 946,749 | | 9,579,911 |
| DTZ Holdings PLC | 165,574 | | 2,202,101 |
| Electronics Boutique PLC | 414,866 | | 1,138,183 |
| Erinaceous Group PLC | 495,842 | | 2,867,211 |
| French Connection Group PLC | 454,246 | | 1,863,571 |
| Friends Provident PLC | 3,690,233 | | 14,882,817 |
| Greggs PLC | 2,445 | | 216,264 |
| Halfords Group PLC | 106,424 | | 763,690 |
| Henderson Group PLC | 122,261 | | 327,818 |
| HMV Group PLC | 2,935,442 | | 7,982,793 |
| Holidaybreak PLC | 102,465 | | 1,534,116 |
| ICAP PLC | 45,441 | | 418,717 |
| Imperial Chemical Industries PLC | 15,499 | | 140,313 |
| Investec PLC | 151,155 | | 1,836,681 |
| Keller Group PLC | 214,254 | | 3,705,198 |
| Kensington Group PLC | 245,124 | | 4,038,878 |
| Kier Group PLC | 115,647 | | 5,118,445 |
| Latchways PLC | 10,000 | | 208,252 |
| Liontrust Asset Management PLC | 103,155 | | 817,590 |
| London Scottish Bank PLC | 864,887 | | 1,987,095 |
| Lookers PLC | 709,459 | | 2,593,449 |
| Man Group PLC | 1,097,834 | | 11,807,581 |
| McBride PLC | 180,959 | | 768,489 |
| Micro Focus International PLC | 50,000 | | 236,290 |
| Next PLC | 18,708 | | 749,456 |
| Northern Rock PLC | 991,021 | | 22,009,197 |
| RAB Capital PLC | 2,687,377 | | 4,969,361 |
| Regus Group PLC † | 3,268,956 | | 7,683,624 |
| Rentokil Initial PLC | 68,761 | | 199,525 |
45
| COMMON STOCKS (98.9%)* continued | | | |
|
| | Shares | | Value |
|
| United Kingdom continued | | | |
| Resolution PLC | 166,153 | $ | 2,045,711 |
| RPC Group PLC | 258,559 | | 1,399,751 |
| Severfield-Rowen PLC | 116,562 | | 4,261,418 |
| Shire PLC | 883,530 | | 18,664,361 |
| St. Ives PLC | 545,883 | | 3,376,898 |
| St. James’s Place PLC | 456,166 | | 4,121,236 |
| SurfControl PLC GDR † | 115,200 | | 1,069,137 |
| TT electronics PLC | 742,986 | | 3,259,989 |
| Tullow Oil PLC | 1,934,187 | | 13,890,742 |
| Vedanta Resources PLC | 168,692 | | 4,091,827 |
| Vitafort International CP | 18,496 | | 434,678 |
| Vitec Group PLC | 82,737 | | 937,446 |
| William Hill PLC | 1,359,784 | | 16,855,524 |
| Wolfson Microelectronics PLC † | 11,414 | | 66,739 |
| | | | 324,314,332 |
|
| |
| Total common stocks (cost $1,408,502,769) | | $ 1,834,917,621 |
|
| |
| |
| SHORT-TERM INVESTMENTS (5.0%)* | | | |
|
| | Principal amount/shares | | Value |
|
| Interest in $667,000,000 joint tri-party repurchase | | | |
| agreement dated February 28, 2007 with Bank | | | |
| of America Securities, LLC, due March 1, 2007 | | | |
| with respect to various U.S. Government obligations | | | |
| — maturity value of $23,240,440 for an effective | | | |
| yield of 5.33% (collateralized by Fannie Mae with a | | | |
| yield of 5.00% and a due date of June 1, 2035 | | | |
| valued at $680,340,000) | $23,237,000 | $ | 23,237,000 |
| Putnam Prime Money Market Fund (e) | 50,048,107 | | 50,048,107 |
| Short-term investments held as collateral for loaned | | | |
| securities with yields ranging from 5.24% to 5.46% | | | |
| and due dates ranging from March 1, 2007 to April 29, 2007 (d) | 16,874,509 | | 16,865,767 |
| U.S. Treasury Bills 4.92%, March 29, 2007 # | 3,519,000 | | 3,505,493 |
|
| |
| Total short-term investments (cost $93,656,367) | | $ | 93,656,367 |
|
| |
| |
| TOTAL INVESTMENTS | | | |
| Total investments (cost $1,502,159,136) | | $1,928,573,988 |
46
* Percentages indicated are based on net assets of $1,855,782,365.
† Non-income-producing security.
# This security was pledged and segregated with the custodian to cover margin requirements for futures contracts at February 28, 2007.
(d) See Note 1 to the financial statements.
(e) See Note 5 to the financial statements regarding investments in Putnam Prime Money Market Fund.
(F) Security is valued at fair value following procedures approved by the Trustees. On February 28, 2007, fair value pricing was also used for certain foreign securities in the portfolio (Note 1).
(R) Real Estate Investment Trust.
(S) Securities on loan, in part or in entirety, at February 28, 2007.
At February 28, 2007, liquid assets totaling $48,081,916 have been designated as collateral for open forward contracts and futures contracts.
144A after the name of an issuer represents securities exempt from registration under Rule 144A under the Securities Act of 1933, as amended. These securities may be resold in transactions exempt from registration, normally to qualified institutional buyers.
GDR after the name of a foreign holding stands for Global Depository Receipts representing ownership of foreign securities on deposit with a custodian bank.
The fund had the following industry concentration greater than 10% at February 28, 2007 (as a percentage of net assets):
Metals 11.0%
| FORWARD CURRENCY CONTRACTS TO BUY at 2/28/07 (aggregate face value $655,971,058) Unaudited) |
|
| | | | | | Unrealized |
| | | Aggregate | | Delivery | appreciation/ |
| | Value | face value | | date | (depreciation) |
|
| Australian Dollar | $74,405,962 | $73,577,717 | | 4/18/07 | $ 828,245 |
| British Pound | 47,574,501 | 47,730,097 | | 3/22/07 | (155,596) |
| Canadian Dollar | 23,007,623 | 23,087,160 | | 4/18/07 | (79,537) |
| Euro | 403,914,315 | 406,337,632 | | 3/22/07 | (2,423,317) |
| Japanese Yen | 9,641,716 | 9,514,873 | | 5/16/07 | 126,843 |
| Norwegian Krone | 24,351,392 | 24,073,360 | | 3/22/07 | 278,032 |
| Swedish Krona | 6,194,605 | 6,245,433 | | 3/22/07 | (50,828) |
| Swiss Franc | 64,530,797 | 65,404,786 | | 3/22/07 | (873,989) |
|
| Total | | | | | $(2,350,147) |
|
| |
| FORWARD CURRENCY CONTRACTS TO SELL at 2/28/07 (aggregate face value $617,488,546) (Unaudited) |
|
| | | | | | Unrealized |
| | | Aggregate | | Delivery | appreciation/ |
| | Value | face value | | date | (depreciation) |
|
| Australian Dollar | $23,197,474 | $23,172,991 | | 4/18/07 | $ (24,483) |
| British Pound | 39,844,557 | 39,765,005 | | 3/22/07 | (79,552) |
| Canadian Dollar | 59,406,516 | 59,211,952 | | 4/18/07 | (194,564) |
| Euro | 5,033,044 | 4,936,752 | | 3/22/07 | (96,292) |
| Hong Kong Dollar | 36,417,161 | 36,460,206 | | 5/16/07 | 43,045 |
| Japanese Yen | 386,819,860 | 378,086,707 | | 5/16/07 | (8,733,153) |
| Norwegian Krone | 14,277,441 | 14,273,394 | | 3/22/07 | (4,047) |
| Swedish Krona | 30,617,508 | 30,835,222 | | 3/22/07 | 217,714 |
| Swiss Franc | 30,739,803 | 30,746,317 | | 3/22/07 | 6,514 |
|
| Total | | | | | $(8,864,818) |
47
| FUTURES CONTRACTS OUTSTANDING at 2/28/07 (Unaudited) | | | |
|
| | | | | | | Unrealized |
| | | Number of | | | Expiration | appreciation/ |
| | | contracts | Value | | date | (depreciation) |
|
| Russell 2000 Index Mini (Long) | | 96 | $7,629,120 | | Mar-07 | $(281,239) |
| S&P ASX 200 Index (Long) | | 42 | 4,798,138 | | Mar-07 | 68,077 |
| Dow Jones Euro Stoxx 50 Index (Long) | | 81 | 4,386,922 | | Mar-07 | (169,304) |
| Tokyo Price Index (Long) | | 14 | 2,066,689 | | Mar-07 | 24,797 |
| FTSE 100 Index (Long) | | 16 | 1,934,400 | | Mar-07 | (62,370) |
|
| Total | | | | | | $(420,039) |
The accompanying notes are an integral part of these financial statements.
48
Statement of assets and liabilities 2/28/07 (Unaudited)
| ASSETS | |
|
| Investment in securities, at value, including $15,780,505 | |
| of securities on loan (Note 1): | |
| Unaffiliated issuers (identified cost $1,452,111,029) | $1,878,525,881 |
| Affiliated issuers (identified cost $50,048,107) (Note 5) | 50,048,107 |
|
| Cash | 3,846 |
|
| Foreign currency (cost $6,375,305) (Note 1) | 6,396,069 |
|
| Dividends, interest and other receivables | 2,652,604 |
|
| Receivable for shares of the fund sold | 4,948,904 |
|
| Receivable for securities sold | 17,153,929 |
|
| Receivable for open forward currency contracts (Note 1) | 2,227,035 |
|
| Receivable for closed forward currency contracts (Note 1) | 2,533,655 |
|
| Total assets | 1,964,490,030 |
|
| |
| LIABILITIES | |
|
| Payable for securities purchased | 61,269,603 |
|
| Payable for shares of the fund repurchased | 5,627,957 |
|
| Payable for compensation of Manager (Notes 2 and 5) | 3,946,020 |
|
| Payable for investor servicing and custodian fees (Note 2) | 658,766 |
|
| Payable for Trustee compensation and expenses (Note 2) | 126,325 |
|
| Payable for administrative services (Note 2) | 2,251 |
|
| Payable for distribution fees (Note 2) | 909,534 |
|
| Payable for variation margin (Note 1) | 1,374,178 |
|
| Payable for open forward currency contracts (Note 1) | 13,442,000 |
|
| Payable for closed forward currency contracts (Note 1) | 4,259,996 |
|
| Collateral on securities loaned, at value (Note 1) | 16,865,767 |
|
| Other accrued expenses | 225,268 |
|
| Total liabilities | 108,707,665 |
|
| Net assets | $1,855,782,365 |
|
| |
| REPRESENTED BY | |
|
| Paid-in capital (Unlimited shares authorized) (Notes 1 and 4) | $1,464,743,152 |
|
| Distributions in excess of net investment income (Note 1) | (13,218,202) |
|
| Accumulated net realized loss on investments | |
| and foreign currency transactions (Note 1) | (10,694,099) |
|
| Net unrealized appreciation of investments | |
| and assets and liabilities in foreign currencies | 414,951,514 |
|
| Total — Representing net assets applicable to capital shares outstanding | $1,855,782,365 |
(Continued on next page)
49
Statement of assets and liabilities (Continued)
| COMPUTATION OF NET ASSET VALUE AND OFFERING PRICE | |
|
| Net asset value and redemption price per class A share | |
| ($1,195,515,416 divided by 31,173,130 shares) | $38.35 |
|
| Offering price per class A share | |
| (100/94.75 of $38.35)* | $40.47 |
|
| Net asset value and offering price per class B share | |
| ($446,913,257 divided by 11,921,245 shares)** | $37.49 |
|
| Net asset value and offering price per class C share | |
| ($97,443,042 divided by 2,567,338 shares)** | $37.95 |
|
| Net asset value and redemption price per class M share | |
| ($27,334,930 divided by 720,753 shares) | $37.93 |
|
| Offering price per class M share | |
| (100/96.75 of $37.93)* | $39.20 |
|
| Net asset value, offering price and redemption price per class R share | |
| ($3,380,354 divided by 88,821 shares) | $38.06 |
|
| Net asset value, offering price and redemption price per class Y share | |
| ($85,195,366 divided by 2,216,463 shares) | $38.44 |
* On single retail sales of less than $50,000. On sales of $50,000 or more the offering price is reduced.
** Redemption price per share is equal to net asset value less any applicable contingent deferred sales charge.
The accompanying notes are an integral part of these financial statements.
50
Statement of operations Six months ended 2/28/07 (Unaudited)
| INVESTMENT INCOME | |
|
| Dividends (net of foreign tax of $916,478) | $ 11,561,563 |
|
| Interest (including interest income of $977,162 | |
| from investments in affiliated issuers) (Note 5) | 1,107,860 |
|
| Securities lending | 166,474 |
|
| Total investment income | 12,835,897 |
|
| |
| EXPENSES | |
|
| Compensation of Manager (Note 2) | 7,588,672 |
|
| Investor servicing fees (Note 2) | 2,005,221 |
|
| Custodian fees (Note 2) | 1,016,722 |
|
| Trustee compensation and expenses (Note 2) | 31,108 |
|
| Administrative services (Note 2) | 23,827 |
|
| Distribution fees — Class A (Note 2) | 1,309,203 |
|
| Distribution fees — Class B (Note 2) | 2,175,410 |
|
| Distribution fees — Class C (Note 2) | 431,911 |
|
| Distribution fees — Class M (Note 2) | 94,420 |
|
| Distribution fees — Class R (Note 2) | 4,642 |
|
| Other | 191,350 |
|
| Fees waived by Manager (Note 5) | (17,197) |
|
| Total expenses | 14,855,289 |
|
| Expense reduction (Note 2) | (161,106) |
|
| Net expenses | 14,694,183 |
|
| Net investment loss | (1,858,286) |
|
| Net realized gain on investments (net of foreign tax of $14,882) (Notes 1 and 3) | 169,299,309 |
|
| Net realized gain on futures contracts (Note 1) | 3,256,872 |
|
| Net realized gain on foreign currency transactions (Note 1) | 40,098,294 |
|
| Net unrealized depreciation of assets and liabilities | |
| in foreign currencies during the period | (16,900,216) |
|
| Net unrealized appreciation of investments | |
| and futures contracts during the period | 91,709,723 |
|
| Net gain on investments | 287,463,982 |
|
| Net increase in net assets resulting from operations | $285,605,696 |
The accompanying notes are an integral part of these financial statements.
51
Statement of changes in net assets
| INCREASE IN NET ASSETS | | | |
|
| | Six months ended | | Year ended |
| | 2/28/07* | | 8/31/06 |
|
| Operations: | | | |
| Net investment income (loss) | $ (1,858,286) | | $ 9,073,372 |
|
| Net realized gain on investments | | | |
| and foreign currency transactions | 212,654,475 | | 243,582,473 |
|
| Net unrealized appreciation of investments | | | |
| and assets and liabilities in foreign currencies | 74,809,507 | | 57,312,620 |
|
| Net increase in net assets resulting from operations | 285,605,696 | | 309,968,465 |
|
| Distributions to shareholders: (Note 1) | | | |
|
| From ordinary income | | | |
|
| Net investment income | | | |
|
| Class A | (21,783,297) | | (10,783,327) |
|
| Class B | (5,792,526) | | (2,983,761) |
|
| Class C | (1,222,110) | | (500,408) |
|
| Class M | (408,813) | | (208,190) |
|
| Class R | (39,705) | | (7,473) |
|
| Class Y | (1,980,382) | | (971,300) |
|
| Redemption fees (Note 1) | 65,546 | | 106,716 |
|
| Increase (decrease) from capital share transactions (Note 4) | 49,410,570 | | (68,499,662) |
|
| Total increase in net assets | 303,854,979 | | 226,121,060 |
|
| |
| NET ASSETS | | | |
|
| Beginning of period | 1,551,927,386 | 1,325,806,326 |
|
| End of period (including distributions in excess of net | | | |
| investment income of $13,218,202 and undistributed | | | |
| net investment income of $19,866,917, respectively) | $1,855,782,365 | $1,551,927,386 |
* Unaudited
The accompanying notes are an integral part of these financial statements.
52
This page left blank intentionally.
53
Financial highlights (For a common share outstanding throughout the period)
| INVESTMENT OPERATIONS: | | | | LESS DISTRIBUTIONS: | | | | RATIOS AND SUPPLEMENTAL DATA: | |
|
| | | | Net | | | | | | Total | | | Ratio of net | |
| | Net asset | | realized and | Total | From | | | Net asset | return | Net | Ratio of | investment | |
| | value, | Net | unrealized | from | net | | | value, | at net | assets, | expenses to | income (loss) | Portfolio |
| | beginning | investment | gain (loss) on | investment | investment | Total | Redemption | end | asset | end of period | average net | to average | turnover |
| Period ended | of period | income (loss)(a) | investments | operations | income | distributions | fees | of period | value (%)(b) | (in thousands) | assets (%)(c) | net assets (%) | (%) |
|
| CLASS A | | | | | | | | | | | | | |
| February 28, 2007** | $33.00 | | —(d, e) | 6.09 | 6.09 | (.74) | (.74) | | —(e) | $38.35 | 18.56* | $1,195,515 | | .76* (d) | | —* (d,h) | 29.40* |
| August 31, 2006 | 26.80 | | .27(d,f) | 6.33 | 6.60 | (.40) | (.40) | | —(e) | 33.00 | 24.88(f) | 943,421 | | 1.54(d,f) | | .89(d,f) | 44.79 |
| August 31, 2005 | 20.47 | | .18(d,g) | 6.49 | 6.67 | (.34) | (.34) | | —(e) | 26.80 | 32.83(g) | 744,751 | | 1.60(d) | | .77(d,g) | 63.85 |
| August 31, 2004 | 16.31 | | .13(d) | 4.32 | 4.45 | (.29) | (.29) | | —(e) | 20.47 | 27.49 | 594,971 | | 1.62(d) | | .67(d) | 68.13 |
| August 31, 2003 | 15.00 | | .16 | 1.27 | 1.43 | (.12) | (.12) | | —(e) | 16.31 | 9.67 | 703,809 | | 1.65 | | 1.13 | 93.27 |
| August 31, 2002 | 16.82 | | .10 | (1.80) | (1.70) | (.12) | (.12) | | — | 15.00 | (10.17) | 751,623 | | 1.54 | | .60 | 90.87 |
|
| |
| CLASS B | | | | | | | | | | | | | |
| February 28, 2007** | $32.15 | | (.12)(d) | 5.93 | 5.81 | (.47) | (.47) | | —(e) | $37.49 | 18.12* | $446,913 | | 1.14* (d) | | (.36)* (d) | 29.40* |
| August 31, 2006 | 26.11 | | .04(d,f) | 6.19 | 6.23 | (.19) | (.19) | | —(e) | 32.15 | 23.98(f) | 425,910 | | 2.29(d,f ) | | .13(d,f) | 44.79 |
| August 31, 2005 | 19.96 | | —(d,e,g) | 6.33 | 6.33 | (.18) | (.18) | | —(e) | 26.11 | 31.82(g) | 432,291 | | 2.35(d) | | .01(d,g) | 63.85 |
| August 31, 2004 | 15.91 | | (.01)(d) | 4.22 | 4.21 | (.16) | (.16) | | —(e) | 19.96 | 26.58 | 402,796 | | 2.37(d) | | (.05)(d) | 68.13 |
| August 31, 2003 | 14.63 | | .05 | 1.23 | 1.28 | — | — | | —(e) | 15.91 | 8.75 | 429,457 | | 2.40 | | .37 | 93.27 |
| August 31, 2002 | 16.42 | | (.02) | (1.77) | (1.79) | — | — | | — | 14.63 | (10.90) | 478,348 | | 2.29 | | (.15) | 90.87 |
|
| |
| CLASS C | | | | | | | | | | | | | |
| February 28, 2007** | $32.57 | | (.13)(d) | 6.01 | 5.88 | (.50) | (.50) | | —(e) | $37.95 | 18.11* | $97,443 | | 1.14* (d) | | (.37)* (d) | 29.40* |
| August 31, 2006 | 26.46 | | .04(d,f) | 6.27 | 6.31 | (.20) | (.20) | | —(e) | 32.57 | 23.95(f) | 79,202 | | 2.29(d,f) | | .13(d,f) | 44.79 |
| August 31, 2005 | 20.22 | | —(d,e,g) | 6.41 | 6.41 | (.17) | (.17) | | —(e) | 26.46 | 31.80(g) | 71,006 | | 2.35(d) | | .01(d,g) | 63.85 |
| August 31, 2004 | 16.08 | | (.02)(d) | 4.29 | 4.27 | (.13) | (.13) | | —(e) | 20.22 | 26.62 | 64,866 | | 2.37(d) | | (.10)(d) | 68.13 |
| August 31, 2003 | 14.78 | | .05 | 1.25 | 1.30 | —(e) | — | | —(e) | 16.08 | 8.81 | 85,732 | | 2.40 | | .34 | 93.27 |
| August 31, 2002 | 16.59 | | (.03) | (1.78) | (1.81) | — | — | | — | 14.78 | (10.91) | 102,078 | | 2.29 | | (.16) | 90.87 |
|
| |
| CLASS M | | | | | | | | | | | | | |
| February 28, 2007** | $32.57 | | (.09)(d) | 6.02 | 5.93 | (.57) | (.57) | | —(e) | $37.93 | 18.29* | $27,335 | | 1.01* (d) | | (.24)* (d) | 29.40* |
| August 31, 2006 | 26.47 | | .11(d,f) | 6.27 | 6.38 | (.28) | (.28) | | —(e) | 32.57 | 24.26(f) | 23,720 | | 2.04(d,f) | | .38(d,f) | 44.79 |
| August 31, 2005 | 20.23 | | .06(d,g) | 6.41 | 6.47 | (.23) | (.23) | | —(e) | 26.47 | 32.12(g) | 20,121 | | 2.10(d) | | .27(d,g) | 63.85 |
| August 31, 2004 | 16.11 | | .02(d) | 4.29 | 4.31 | (.19) | (.19) | | —(e) | 20.23 | 26.91 | 16,535 | | 2.12(d) | | .10(d) | 68.13 |
| August 31, 2003 | 14.79 | | .08 | 1.26 | 1.34 | (.02) | (.02) | | —(e) | 16.11 | 9.12 | 21,987 | | 2.15 | | .61 | 93.27 |
| August 31, 2002 | 16.58 | | .02 | (1.79) | (1.77) | (.02) | (.02) | | — | 14.79 | (10.68) | 23,904 | | 2.04 | | .11 | 90.87 |
|
| |
| CLASS R | | | | | | | | | | | | | |
| February 28, 2007** | $32.78 | | (.07)(d) | 6.08 | 6.01 | (.73) | (.73) | | —(e) | $38.06 | 18.42* | $3,380 | | .89* (d) | | (.18)* (d) | 29.40* |
| August 31, 2006 | 26.68 | | .18(d,f) | 6.32 | 6.50 | (.40) | (.40) | | —(e) | 32.78 | 24.61(f) | 1,216 | | 1.79(d,f) | | .59(d,f) | 44.79 |
| August 31, 2005 | 20.45 | | .13(d,g) | 6.47 | 6.60 | (.37) | (.37) | | —(e) | 26.68 | 32.53(g) | 304 | | 1.85(d) | | .52(d,g) | 63.85 |
| August 31, 2004 | 16.29 | | .15(d) | 4.28 | 4.43 | (.27) | (.27) | | —(e) | 20.45 | 27.35 | 11 | | 1.87(d) | | .75(d) | 68.13 |
| August 31, 2003† | 14.04 | | .07 | 2.18 | 2.25 | — | — | | —(e) | 16.29 | 16.03* | 1 | | 1.16* | | .53* | 93.27 |
|
| |
| CLASS Y | | | | | | | | | | | | | |
| February 28, 2007** | $33.10 | | .05(d) | 6.11 | 6.16 | (.82) | (.82) | | —(e) | $38.44 | 18.73* | $85,195 | | .64* (d) | | .13* (d) | 29.40* |
| August 31, 2006 | 26.88 | | .35(d,f) | 6.34 | 6.69 | (.47) | (.47) | | —(e) | 33.10 | 25.17(f) | 78,458 | | 1.29(d,f) | | 1.14(d,f) | 44.79 |
| August 31, 2005 | 20.53 | | .24(d,g) | 6.51 | 6.75 | (.40) | (.40) | | —(e) | 26.88 | 33.13(g) | 57,334 | | 1.35(d) | | 1.01(d,g) | 63.85 |
| August 31, 2004 | 16.35 | | .19 | 4.33 | 4.52 | (.34) | (.34) | | —(e) | 20.53 | 27.89 | 58,630 | | 1.37(d) | | 1.00(d) | 68.13 |
| August 31, 2003 | 15.05 | | .21 | 1.25 | 1.46 | (.16) | (.16) | | —(e) | 16.35 | 9.90 | 55,942 | | 1.40 | | 1.43 | 93.27 |
| August 31, 2002 | 16.90 | | .15 | (1.84) | (1.69) | (.16) | (.16) | | — | 15.05 | (10.02) | 48,386 | | 1.29 | | .87 | 90.87 |
|
| See notes to financial highlights at the end of this section. | | | | | | | | | | | |
The accompanying notes are an integral part of these financial statements.
Financial highlights (Continued)
* Not annualized.
** Unaudited.
† For the period January 21, 2003 (commencement of operations) to August 31, 2003.
(a) Per share net investment income (loss) has been determined on the basis of the weighted average number of shares outstanding during the period.
(b) Total return assumes dividend reinvestment and does not reflect the effect of sales charges.
(c) Includes amounts paid through expense offset and brokerage service arrangements (Note 2).
(d) Reflects waivers of certain fund expenses in connection with investments in Putnam Prime Money Market Fund during the period. As a result of such waivers, the expenses of each class, reflect a reduction of the following amounts (Note 5):
| | Percentage |
| | of average |
| | net assets |
|
| February 28, 2007 | <0.01% |
|
| August 31, 2006 | <0.01 |
|
| August 31, 2005 | 0.01 |
|
| August 31, 2004 | 0.04 |
|
(e) Amount represents less than $0.01 per share.
(f) Reflects a non-recurring reimbursement from Putnam Investments relating to the calculation of certain amounts paid by the fund to Putnam in previous years for transfer agent services, which amounted to $0.01 per share and 0.02% of average net assets for the period ended August 31, 2006 (Note 6):
(g) Reflects a non-recurring accrual related to Putnam Management’s settlement with the SEC regarding brokerage allocation practices, which amounted to the following amounts:
| | | Percentage |
| | | of average |
| | Per share | net assets |
|
| Class A | $0.01 | 0.02% |
|
| Class B | 0.01 | 0.02 |
|
| Class C | 0.01 | 0.02 |
|
| Class M | 0.01 | 0.02 |
|
| Class R | 0.01 | 0.03 |
|
| Class Y | 0.01 | 0.02 |
|
(h) Amount represents less than 0.01% .
The accompanying notes are an integral part of these financial statements.
56
Notes to financial statements 2/28/07 (Unaudited)
Note 1: Significant accounting policies
Putnam International Capital Opportunities Fund (“the fund”) is a series of Putnam Investment Funds (the “trust”), a Massachusetts business trust, which is registered under the Investment Company Act of 1940, as amended, as a diversified, open-end management investment company. The fund seeks long-term capital appreciation by investing primarily in equity securities of small-and mid-capitalization companies whose principle place of business is located outside of the United States or whose securities are principally traded on foreign markets.
The fund offers class A, class B, class C, class M, class R and class Y shares. Class A and class M shares are sold with a maximum front-end sales charge of 5.25% and 3.25%, respectively, and generally do not pay a contingent deferred sales charge. Class B shares, which convert to class A shares after approximately eight years, do not pay a front-end sales charge and are subject to a contingent deferred sales charge, if those shares are redeemed within six years of purchase. Class C shares have a one-year 1.00% contingent deferred sales charge and do not convert to class A shares. Class R shares, which are offered to qualified employee-benefit plans, are sold without a front-end sales charge or a contingent deferred sales charge. The expenses for class A, class B, class C, class M and class R shares may differ based on the distribution fee of each class, which is identified in Note 2. Class Y shares, which are sold at net asset value, are generally subject to the sa me expenses as class A, class B, class C, class M and class R shares, but do not bear a distribution fee. Class Y shares are sold to certain eligible purchasers including certain defined contribution plans (including corporate IRAs), bank trust departments, trust companies and certain college savings plans.
Effective October 2, 2006, a 1.00% redemption fee may apply on any shares purchased on or after such date that are redeemed (either by selling or exchanging into another fund) within 90 days of purchase. The redemption fee is accounted for as an addition to paid-in-capital. Prior to October 2, 2006, a 2.00% redemption fee applied to any shares that were redeemed (either by selling or exchanging into another fund) within 5 days of purchase. A 1.00% redemption fee applied to any shares that were redeemed (either by selling or exchanging into another fund) within 6-90 days of purchase.
Investment income, realized and unrealized gains and losses and expenses of the fund are borne pro-rata based on the relative net assets of each class to the total net assets of the fund, except that each class bears expenses unique to that class (including the distribution fees applicable to such classes). Each class votes as a class only with respect to its own distribution plan or other matters on which a class vote is required by law or determined by the Trustees. Shares of each class would receive their pro-rata share of the net assets of the fund, if the fund were liquidated. In addition, the Trustees declare separate dividends on each class of shares.
In the normal course of business, the fund enters into contracts that may include agreements to indemnify another party under given circumstances. The fund’s maximum exposure under these arrangements is unknown as this would involve future claims that may be, but have not yet been, made against the fund. However, the fund expects the risk of material loss to be remote.
The following is a summary of significant accounting policies consistently followed by the fund in the preparation of its financial statements. The preparation of financial statements is in conformity with accounting principles generally accepted in the United States of America and requires management to make estimates and assumptions that affect the reported amounts of assets and liabilities in the financial statements and the reported amounts of increases and decreases in net assets from operations during the reporting period. Actual results could differ from those estimates.
A) Security valuation Investments for which market quotations are readily available are valued
57
at the last reported sales price on their principal exchange, or official closing price for certain markets. If no sales are reported — as in the case of some securities traded over-the-counter — a security is valued at its last reported bid price. Many securities markets and exchanges outside the U.S. close prior to the close of the New York Stock Exchange and therefore the closing prices for securities in such markets or on such exchanges may not fully reflect events that occur after such close but before the close of the New York Stock Exchange. Accordingly, on certain days, the fund will fair value foreign equity securities taking into account multiple factors, including movements in the U.S. securities markets. The number of days on which fair value prices will be used will depend on market activity and it is possible that fair value prices will be used by the fund to a significant extent. At February 28, 2007, fair value pricing was used for certain foreign securities in the portfolio. Securities quoted in foreign currencies, if any, are translated into U.S. dollars at the current exchange rate. Certain investments, including certain restricted securities, are also valued at fair value following procedures approved by the Trustees. Such valuations and procedures are reviewed periodically by the Trustees. The fair value of securities is generally determined as the amount that the fund could reasonably expect to realize from an orderly disposition of such securities over a reasonable period of time. By its nature, a fair value price is a good faith estimate of the value of a security at a given point in time and does not reflect an actual market price, which may be different by a material amount.
B) Joint trading account Pursuant to an exemptive order from the Securities and Exchange Commission (the “SEC”), the fund may transfer uninvested cash balances, including cash collateral received under security lending arrangements, into a joint trading account along with the cash of other registered investment companies and certain other accounts managed by Putnam Investment Management, LLC (“Putnam Management”), the fund’s manager, an indirect wholly-owned subsidiary of Putnam, LLC. These balances may be invested in issues of high-grade short-term investments having maturities of up to 397 days for collateral received under security lending arrangements and up to 90 days for other cash investments.
C) Repurchase agreements The fund, or any joint trading account, through its custodian, receives delivery of the underlying securities, the market value of which at the time of purchase is required to be in an amount at least equal to the resale price, including accrued interest. Collateral for certain tri-party repurchase agreements is held at the counterparty’s custodian in a segregated account for the benefit of the fund and the counterparty. Putnam Management is responsible for determining that the value of these underlying securities is at all times at least equal to the resale price, including accrued interest.
D) Security transactions and related investment income Security transactions are recorded on the trade date (the date the order to buy or sell is executed). Gains or losses on securities sold are determined on the identified cost basis.
Interest income is recorded on the accrual basis. Dividend income, net of applicable withholding taxes, is recognized on the ex-dividend date except that certain dividends from foreign securities, if any, are recognized as soon as the fund is informed of the ex-dividend date. Non-cash dividends, if any, are recorded at the fair market value of the securities received. Dividends representing a return of capital or capital gains, if any, are reflected as a reduction of cost and/or as a realized gain.
E) Foreign currency translation The accounting records of the fund are maintained in U.S. dollars. The market value of foreign securities, currency holdings, and other assets and liabilities are recorded in the books and records of the fund after translation to U.S. dollars based on the exchange rates on that day. The cost of each security is determined using historical exchange rates. Income and withholding taxes are translated at prevailing exchange rates when earned or
58
incurred. The fund does not isolate that portion of realized or unrealized gains or losses resulting from changes in the foreign exchange rate on investments from fluctuations arising from changes in the market prices of the securities. Such gains and losses are included with the net realized and unrealized gain or loss on investments. Net realized gains and losses on foreign currency transactions represent net realized exchange gains or losses on closed forward currency contracts, disposition of foreign currencies, currency gains and losses realized between the trade and settlement dates on securities transactions and the difference between the amount of investment income and foreign withholding taxes recorded on the fund’s books and the U.S. dollar equivalent amounts actually received or paid. Net unrealized appreciation and depreciation of assets and liabilities in foreign currencies arise from changes in the value of open forward currency contracts and asse ts and liabilities other than investments at the period end, resulting from changes in the exchange rate. Investments in foreign securities involve certain risks, including those related to economic instability, unfavorable political developments, and currency fluctuations, not present with domestic investments.
The fund may be subject to taxes imposed by governments of countries in which it invests. Such taxes are generally based on either income or gains earned or repatriated. The fund accrues and applies such taxes to net investment income, net realized gains and net unrealized gains as income and/or capital gains are earned.
F) Forward currency contracts The fund may buy and sell forward currency contracts, which are agreements between two parties to buy and sell currencies at a set price on a future date. These contracts are used to protect against a decline in value relative to the U.S. dollar of the currencies in which its portfolio securities are denominated or quoted (or an increase in the value of a currency in which securities a fund intends to buy are denominated, when a fund holds cash reserves and short term investments), or for other investment purposes. The U.S. dollar value of forward currency contracts is determined using current forward currency exchange rates supplied by a quotation service. The market value of the contract will fluctuate with changes in currency exchange rates. The contract is marked to market daily and the change in market value is recorded as an unrealized gain or loss. Whe n the contract is closed, the fund records a realized gain or loss equal to the difference between the value of the contract at the time it was opened and the value at the time it was closed. The fund could be exposed to risk if the value of the currency changes unfavorably, if the counterparties to the contracts are unable to meet the terms of their contracts or if the fund is unable to enter into a closing position. Risks may exceed amounts recognized on the statement of assets and liabilities. Forward currency contracts outstanding at period end, if any, are listed after the fund’s portfolio.
G) Futures and options contracts The fund may use futures and options contracts to hedge against changes in the values of securities the fund owns or expects to purchase, or for other investment purposes. The fund may also write options on swaps or securities it owns or in which it may invest to increase its current returns.
The potential risk to the fund is that the change in value of futures and options contracts may not correspond to the change in value of the hedged instruments. In addition, losses may arise from changes in the value of the underlying instruments, if there is an illiquid secondary market for the contracts, or if the counterparty to the contract is unable to perform. Risks may exceed amounts recognized on the statement of assets and liabilities. When the contract is closed, the fund records a realized gain or loss equal to the difference between the value of the contract at the time it was opened and the value at the time it was closed. Realized gains and losses on purchased options are included in realized gains and losses on investment securities. If a written call option is exercised, the premium originally received is recorded as an addition to sales
59
proceeds. If a written put option is exercised, the premium originally received is recorded as a reduction to the cost of investments.
Futures contracts are valued at the quoted daily settlement prices established by the exchange on which they trade. The fund and the broker agree to exchange an amount of cash equal to the daily fluctuation in the value of the futures contract. Such receipts or payments are known as “variation margin.” Exchange traded options are valued at the last sale price or, if no sales are reported, the last bid price for purchased options and the last ask price for written options. Options traded over-the-counter are valued using prices supplied by dealers. Futures and written option contracts outstanding at period end, if any, are listed after the fund’s portfolio.
H) Security lending The fund may lend securities, through its agents, to qualified borrowers in order to earn additional income. The loans are collateralized by cash and/or securities in an amount at least equal to the market value of the securities loaned. The market value of securities loaned is determined daily and any additional required collateral is allocated to the fund on the next business day. The risk of borrower default will be borne by the fund’s agents; the fund will bear the risk of loss with respect to the investment of the cash collateral. Income from securities lending is included in investment income on the statement of operations. At February 28, 2007, the value of securities loaned amounted to $15,780,505. The fund received cash collateral of $16,865,767 which is pooled with collateral of other Putnam funds into 29 issues of high grade short-term investments.
I) Federal taxes It is the policy of the fund to distribute all of its taxable income within the prescribed time and otherwise comply with the provisions of the Internal Revenue Code of 1986 (the “Code”) applicable to regulated investment companies. It is also the intention of the fund to distribute an amount sufficient to avoid imposition of any excise tax under Section 4982 of the Code, as amended. Therefore, no provision has been made for federal taxes on income, capital gains or unrealized appreciation on securities held nor for excise tax on income and capital gains.
At August 31, 2006, the fund had a capital loss carryover of $223,183,529 available to the extent allowed by the Code to offset future net capital gain, if any. The amount of the carryover and the expiration dates are:
| Loss Carryover | Expiration |
|
| $122,077,495 | August 31, 2010 |
|
| 101,106,034 | August 31, 2011 |
|
The aggregate identified cost on a tax basis is $1,502,179,762, resulting in gross unrealized appreciation and depreciation of $496,059,573 and $69,665,347, respectively, or net unrealized appreciation of $426,394,226.
J) Distributions to shareholders Distributions to shareholders from net investment income are recorded by the fund on the ex-dividend date. Distributions from capital gains, if any, are recorded on the ex-dividend date and paid at least annually. The amount and character of income and gains to be distributed are determined in accordance with income tax regulations, which may differ from generally accepted accounting principles. Dividend sources are estimated at the time of declaration. Actual results may vary. Any non-taxable return of capital cannot be determined until final tax calculations are completed after the end of the fund’s fiscal year. Reclassifications are made to the fund’s capital accounts to reflect income and gains available for distribution (or available capital loss carryovers) under income tax regulations.
K) Expenses of the trust Expenses directly charged or attributable to any fund will be paid from the assets of that fund. Generally, expenses of the trust will be allocated among and charged to the assets of each fund on a basis that the Trustees deem fair and equitable, which may be
60
based on the relative assets of each fund or the nature of the services performed and relative applicability to each fund.
Note 2: Management fee, administration
services and other transactions
Putnam Management is paid for management and investment advisory services quarterly based on the average net assets of the fund. Such fee is based on the following annual rates: 1.00% of the first $500 million of average net assets, 0.90% of the next $500 million, 0.85% of the next $500 million, 0.80% of the next $5 billion, 0.775% of the next $5 billion, 0.755% of the next $5 billion, 0.74% of the next $5 billion and 0.73% thereafter.
Putnam Management has agreed to waive fees and reimburse expenses of the fund through August 31, 2007 to the extent necessary to ensure that the fund’s expenses do not exceed the simple average of the expenses of all front-end load funds viewed by Lipper Inc. as having the same investment classification or objective as the fund. The expense reimbursement is based on a comparison of the fund’s expenses with the average annualized operating expenses of the funds in its Lipper peer group for each calendar quarter during the fund’s last fiscal year, excluding 12b-1 fees and without giving effect to any expense offset and brokerage service arrangements that may reduce fund expenses. For the period ended February 28, 2007, Putnam Management did not waive any of its management fee from the fund.
Effective December 30, 2006, Putnam Investments Limited (“PIL”), an affiliate of Putnam Management, is authorized by the Trustees to manage a separate portion of the assets of the fund as determined by Putnam Management from time to time. Putnam Management pays a quarterly sub-management fee to PIL for its services at an annual rate of 0.35% of the average net assets of the portion of the fund managed by PIL.
The fund reimburses Putnam Management an allocated amount for the compensation and related expenses of certain officers of the fund and their staff who provide administrative services to the fund. The aggregate amount of all such reimbursements is determined annually by the Trustees.
Custodial functions for the fund’s assets were provided by Putnam Fiduciary Trust Company (“PFTC”), a subsidiary of Putnam, LLC, and by State Street Bank and Trust Company. Custody fees are based on the fund’s asset level, the number of its security holdings and transaction volumes. Putnam Investor Services, a division of PFTC, provided investor servicing agent functions to the fund. Putnam Investor Services received fees for investor servicing based on the number of shareholder accounts in the fund and the level of defined contribution plan assets in the fund. During the period ended February 28, 2007, the fund incurred $3,020,705 for custody and investor servicing agent functions provided by PFTC.
The fund has entered into arrangements with PFTC and State Street Bank and Trust Company whereby credits realized as a result of uninvested cash balances are used to reduce a portion of the fund’s expenses. The fund also reduced expenses through brokerage service arrangements. For the six months ended February 28, 2007, the fund’s expenses were reduced by $161,106 under these arrangements.
Each independent Trustee of the fund receives an annual Trustee fee, of which $570, as a quarterly retainer, has been allocated to the fund, and an additional fee for each Trustees meeting attended. Trustees receive additional fees for attendance at certain committee meetings, industry seminars and for certain compliance-related matters. Trustees also are reimbursed for expenses they incur relating to their services as Trustees. George Putnam, III, who is not an independent Trustee, also receives the foregoing fees for his services as Trustee.
The fund has adopted a Trustee Fee Deferral Plan (the “Deferral Plan”) which allows the Trustees to defer the receipt of all or a portion of Trustees fees payable on or after July 1, 1995. The deferred fees remain invested in certain Putnam funds until distribution in accordance with the Deferral Plan.
61
The fund has adopted an unfunded noncontributory defined benefit pension plan (the “Pension Plan”) covering all Trustees of the fund who have served as a Trustee for at least five years and were first elected prior to 2004. Benefits under the Pension Plan are equal to 50% of the Trustee’s average annual attendance and retainer fees for the three years ended December 31, 2005. The retirement benefit is payable during a Trustee’s lifetime, beginning the year following retirement, for the number of years of service through December 31, 2006. Pension expense for the fund is included in Trustee compensation and expenses in the statement of operations. Accrued pension liability is included in Payable for Trustee compensation and expenses in the statement of assets and liabilities. The Trustees have terminated the Pension Plan with respect to any Trustee first elected after 2003.
The fund has adopted distribution plans (the “Plans”) with respect to its class A, class B, class C, class M and class R shares pursuant to Rule 12b-1 under the Investment Company Act of 1940. The purpose of the Plans is to compensate Putnam Retail Management, a wholly-owned subsidiary of Putnam, LLC and Putnam Retail Management GP, Inc., for services provided and expenses incurred in distributing shares of the fund. The Plans provide for payments by the fund to Putnam Retail Management at an annual rate of up to 0.35%, 1.00%, 1.00%, 1.00% and 1.00% of the average net assets attributable to class A, class B, class C, class M and class R shares, respectively. The Trustees have approved payment by the fund at an annual rate of 0.25%, 1.00%, 1.00%, 0.75% and 0.50% of the average net assets attributable to class A, class B, class C, class M and class R shares, respectively.
For the six months ended February 28, 2007, Putnam Retail Management, acting as underwriter, received net commissions of $62,397 and $287 from the sale of class A and class M shares, respectively, and received $80,190 and $4,922 in contingent deferred sales charges from redemptions of class B and class C shares, respectively.
A deferred sales charge of up to 1.00% and 0.65% is assessed on certain redemptions of class A and class M shares, respectively. For the six months ended February 28, 2007, Putnam Retail Management, acting as underwriter, received $424 and no monies, on class A and class M redemptions, respectively.
Note 3: Purchases and sales of securities
During the six months ended February 28, 2007, cost of purchases and proceeds from sales of investment securities other than short-term investments aggregated $545,712,672 and $486,297,272, respectively. There were no purchases or sales of U.S. government securities.
Note 4: Capital shares
At February 28, 2007, there was an unlimited number of shares of beneficial interest authorized. Transactions in capital shares were as follows:
62
| CLASS A | Shares | | Amount |
|
| Six months ended 2/28/07: | | |
| Shares sold | 5,165,911 | $ | 186,262,114 |
|
| Shares issued | | | |
| in connection | | | |
| with reinvestment | | | |
| of distributions | 554,582 | | 20,380,895 |
|
| | 5,720,493 | | 206,643,009 |
|
| Shares | | | |
| repurchased | (3,135,142) | (111,928,125) |
|
| Net increase | 2,585,351 | $ | 94,714,884 |
| |
| Year ended 8/31/06: | | | |
| Shares sold | 8,039,973 | $ | 247,724,211 |
|
| Shares issued | | | |
| in connection | | | |
| with reinvestment | | | |
| of distributions | 357,443 | | 10,144,235 |
|
| | 8,397,416 | | 257,868,446 |
|
| Shares | | | |
| repurchased | (7,599,781) | (228,546,560) |
|
| Net increase | 797,635 | $ | 29,321,886 |
|
| |
| CLASS B | Shares | | Amount |
| Six months ended 2/28/07: | | |
| Shares sold | 577,856 | $ | 20,130,932 |
|
| Shares issued | | | |
| in connection | | | |
| with reinvestment | | | |
| of distributions | 144,454 | | 5,197,450 |
|
| | 722,310 | | 25,328,382 |
|
| Shares | | | |
| repurchased | (2,048,520) | | (71,512,754) |
|
| Net decrease | (1,326,210) | $ | (46,184,372) |
| |
| Year ended 8/31/06: | | | |
| Shares sold | 1,312,175 | $ | 39,234,514 |
|
| Shares issued | | | |
| in connection | | | |
| with reinvestment | | | |
| of distributions | 96,050 | | 2,669,236 |
|
| | 1,408,225 | | 41,903,750 |
|
| Shares | | | |
| repurchased | (4,714,157) | | (140,046,056) |
|
| Net decrease | (3,305,932) | $ | (98,142,306) |
| CLASS C | Shares | | Amount |
| Six months ended 2/28/07: | | |
| Shares sold | 348,640 | $ | 12,521,788 |
|
| Shares issued | | | |
| in connection | | | |
| with reinvestment | | | |
| of distributions | 27,921 | | 1,016,867 |
|
| | 376,561 | | 13,538,655 |
|
| Shares | | | |
| repurchased | (240,767) | | (8,513,196) |
|
| Net increase | 135,794 | $ | 5,025,459 |
| |
| Year ended 8/31/06: | | | |
| Shares sold | 341,640 | $ | 10,435,384 |
|
| Shares issued | | | |
| in connection | | | |
| with reinvestment | | | |
| of distributions | 14,713 | | 414,315 |
|
| | 356,353 | | 10,849,699 |
|
| Shares | | | |
| repurchased | (608,311) | | (18,162,914) |
|
| Net decrease | (251,958) | $ | (7,313,215) |
|
| |
| CLASS M | Shares | | Amount |
|
| Six months ended 2/28/07: | | |
| Shares sold | 42,548 | $ | 1,521,508 |
|
| Shares issued | | | |
| in connection | | | |
| with reinvestment | | | |
| of distributions | 10,524 | | 382,846 |
|
| | 53,072 | | 1,904,354 |
|
| Shares | | | |
| repurchased | (60,506) | | (2,123,531) |
|
| Net decrease | (7,434) | $ | (219,177) |
| |
| Year ended 8/31/06: | | | |
| Shares sold | 133,027 | $ | 4,036,067 |
|
| Shares issued | | | |
| in connection | | | |
| with reinvestment | | | |
| of distributions | 6,854 | | 192,678 |
|
| | 139,881 | | 4,228,745 |
|
| Shares | | | |
| repurchased | (171,823) | | (5,183,666) |
|
| Net decrease | (31,942) | $ | (954,921) |
63
| CLASS R | Shares | | Amount |
|
| Six months ended 2/28/07: | | |
| Shares sold | 58,544 | $ | 2,147,869 |
|
| Shares issued | | | |
| in connection | | | |
| with reinvestment | | | |
| of distributions | 970 | | 33,386 |
|
| | 59,514 | | 2,181,255 |
|
| Shares | | | |
| repurchased | (7,790) | | (276,053) |
|
| Net increase | 51,724 | $ | 1,905,202 |
| |
| Year ended 8/31/06: | | | |
| Shares sold | 33,640 | $ | 1,017,174 |
|
| Shares issued | | | |
| in connection | | | |
| with reinvestment | | | |
| of distributions | 263 | | 7,434 |
|
| | 33,903 | | 1,024,608 |
|
| Shares | | | |
| repurchased | (8,218) | | (256,866) |
|
| Net increase | 25,685 | $ | 767,742 |
|
| |
| CLASS Y | Shares | | Amount |
|
| Six months ended 2/28/07: | | |
| Shares sold | 383,473 | $ | 13,865,898 |
|
| Shares issued | | | |
| in connection | | | |
| with reinvestment | | | |
| of distributions | 53,800 | | 1,980,382 |
|
| | 437,273 | | 15,846,280 |
|
| Shares | | | |
| repurchased | (590,883) | | (21,677,706) |
|
| Net decrease | (153,610) | $ | (5,831,426) |
| |
| Year ended 8/31/06: | | | |
| Shares sold | 798,498 | $ | 24,640,328 |
|
| Shares issued | | | |
| in connection | | | |
| with reinvestment | | | |
| of distributions | 34,189 | | 971,300 |
|
| | 832,687 | | 25,611,628 |
|
| Shares | | | |
| repurchased | (595,859) | | (17,790,476) |
|
| Net increase | 236,828 | $ | 7,821,152 |
Note 5: Investment in Putnam Prime
Money Market Fund
The fund invests in Putnam Prime Money Market Fund, an open-end management investment company managed by Putnam Management. Investments in Putnam Prime Money Market Fund are valued at its closing net asset value each business day. Management fees paid by the fund are reduced by an amount equal to the management and administrative services fees paid by Putnam Prime Money Market Fund with respect to assets invested by the fund in Putnam Prime Money Market Fund. For the period ended February 28, 2007, management fees paid were reduced by $17,197 relating to the fund’s investment in Putnam Prime Money Market Fund. Income distributions earned by the fund are recorded as income in the statement of operations and totaled $977,162 for the period ended February 28, 2007. During the period ended February 28, 2007, cost of purchases and proceeds of sales of investments in Putnam Prime Money Market Fund aggregated $192,318,451 and $169,978,617, respectively.
Note 6: Regulatory matters and litigation
In late 2003 and 2004, Putnam Management settled charges brought by the Securities and Exchange Commission (the “SEC”) and the Massachusetts Securities Division (“MSD”) in connection with excessive short-term trading by certain former Putnam employees and, in the case of charges brought by the MSD, excessive short-term trading by participants in some Putnam-administered 401(k) plans. Putnam Management agreed to pay $193.5 million in penalties and restitution, of which $153.5 million will be distributed to certain open-end Putnam funds and their shareholders after the SEC and MSD approve a distribution plan being developed by an independent consultant. The allegations of the SEC and MSD and related matters have served as the general basis for certain lawsuits, including purported class action lawsuits filed against Putnam Management and, in a limited number of cases, against some Putnam funds. Putnam Management believes that these lawsuits
will have no material adverse effect on the funds or on Putnam Management’s ability to provide investment management services. In addition, Putnam Management has agreed to bear any costs incurred by the Putnam funds as a result of these matters.
In connection with a settlement between Putnam and the fund’s Trustees in September 2006, the fund received $329,079 from Putnam to address issues relating to the calculation of certain amounts paid by the Putnam mutual funds to Putnam for transfer agent services.
Putnam Management and Putnam Retail Management are named as defendants in a civil suit in which the plaintiffs allege that the management and distribution fees paid by certain Putnam funds were excessive and seek recovery under the Investment Company Act of 1940. Putnam Management and Putnam Retail Management have contested the plaintiffs’ claims and the matter is currently pending in the U.S. District Court for the District of Massachusetts. Based on currently available information, Putnam Management believes that this action is without merit and that it is unlikely to have a material effect on Putnam Management’s and Putnam Retail Management’s ability to provide services to their clients, including the fund.
Note 7: New accounting pronouncements
In June 2006, the Financial Accounting Standards Board (“FASB”) issued Interpretation No. 48, Accounting for Uncertainty in Income Taxes (the “Interpretation”). The Interpretation prescribes a minimum threshold for financial statement recognition of the benefit of a tax position taken or expected to be taken by a filer in the filer’s tax return. The Interpretation will become effective for fiscal years beginning after December 15, 2006 but will also apply to tax positions reflected in the fund’s financial statements as of that date. No determination has been made whether the adoption of the Interpretation will require the fund to make any adjustments to its net assets or have any other effect on the fund’s financial statements. The effects of implementing this pronouncement, if any, will be noted in the fund’s nex t semiannual financial statements.
In September 2006, the FASB issued Statement of Financial Accounting Standards No. 157, Fair Value Measurements (the “Standard”). The Standard defines fair value, sets out a framework for measuring fair value and requires additional disclosures about fair value measurements. The Standard applies to fair value measurements already required or permitted by existing standards. The Standard is effective for financial statements issued for fiscal years beginning after November 15, 2007 and interim periods within those fiscal years. Putnam Management is currently evaluating what impact the adoption of the Standard will have on the fund’s financial statements.
65
Brokerage commissions (Unaudited)
Brokerage commissions are paid to firms that execute trades on behalf of your fund. When choosing these firms, Putnam is required by law to seek the best execution of the trades, taking all relevant factors into consideration, including expected quality of execution and commission rate. Listed below are the largest relationships based upon brokerage commissions for your fund and the other funds in Putnam’s International group for the year ended February 28, 2007. The other Putnam mutual funds in this group are Putnam Europe Equity Fund, Putnam Global Equity Fund, Putnam International Equity Fund, Putnam International Growth and Income Fund, Putnam International New Opportunities Fund, Putnam VT Global Equity Fund, Putnam VT International Equity Fund, Putnam VT International Growth and Income Fund, and Putnam VT International New Opportunities Fund.
The top five firms that received brokerage commissions for trades executed for the International group are (in descending order) Credit Suisse First Boston, Goldman Sachs, Citigroup Global Markets, UBS Warburg, and Merrill Lynch. Commissions paid to these firms together represented approximately 55% of the total brokerage commissions paid for the year ended February 28, 2007.
Commissions paid to the next 10 firms together represented approximately 31% of the total brokerage commissions paid during the period. These firms are (in alphabetical order) ABN AMRO U.S., Cazenove, Deutsche Bank Securities, Dresdner Kleinwort Wasserstein, Hong Kong Shanghai Banking Corp., JPMorgan Clearing, Lehman Brothers, Macquarie, Morgan Stanley Dean Witter, and Nomura Securities.
Additional information about brokerage commissions is available on the Securities and Exchange Commission (SEC) Web site at www.sec.gov. Putnam funds disclose commissions by firm to the SEC in semiannual filings on Form N-SAR.
66
Putnam puts your
interests first
In January 2004, Putnam began introducing a number of voluntary initiatives designed to reduce fund expenses, provide investors with more useful information, and help safeguard the interests of all Putnam investors. Visit www.putnam.com for details.
Cost-cutting initiatives
Reduced sales charges The maximum sales charge for class A shares has been reduced to 5.25% for equity funds (formerly 5.75%) and 3.75% for most income funds (formerly 4.50%) . The maximum sales charge for class M shares has been reduced to 3.25% for equity funds (formerly 3.50%) .
* Lower class B purchase limit To help ensure that investors are in the most cost-effective share class, the maximum amount that can be invested in class B shares has been reduced to $100,000. (Larger trades or accumulated amounts will be refused.)
Ongoing expenses will be limited Through calendar 2007, total ongoing expenses, including management fees for all funds, will be maintained at or below the average of each fund’s industry peers in its Lipper load-fund universe. For more information, please see the Statement of Additional information.
Improved disclosure
Putnam fund prospectuses and shareholder reports have been revised to disclose additional information that will help shareholders compare funds and weigh their costs and risks along with their potential benefits. Shareholders will find easy-to-understand information about fund expense ratios, portfolio manager compensation, risk comparisons, turnover comparisons, brokerage commissions, and employee and trustee ownership of Putnam funds. Disclosure of breakpoint discounts has also been enhanced to alert investors to potential cost savings.
Protecting investors’ interests
Short-term trading fee introduced To discourage short-term trading, which can interfere with a fund’s long-term strategy, a 1% short-term trading fee may be imposed on any Putnam fund shares (other than money market funds) redeemed or exchanged within seven calendar days of purchase (for certain funds, this fee applies for 90 days).
* The maximum sales charge for class A shares of Putnam Limited Duration Government Income Fund and Putnam Floating Rate Income Fund remains 3.25% .
67
Services for shareholders
Investor services
Help your investment grow Set up a program for systematic investing from a Putnam fund or from your own savings or checking account. (Regular investing does not guarantee a profit or protect against loss in a declining market.)
Switch funds easily* You can move money from one Putnam fund to another within the same class of shares without a service charge.
Access your money easily You can have checks sent regularly or redeem shares any business day at the then-current net asset value, which may be more or less than the original cost of the shares. Class B and class C shares carry a sales charge that is applied to certain withdrawals.
How to buy additional shares You may buy shares through your financial advisor or directly from Putnam. To open an account by mail, send a check made payable to the name of the fund along with a completed fund application. To add to an existing account, complete the investment slip found at the top of your Confirmation of Activity statement and return it with a check payable to your fund.
For more information
Visit www.putnam.com A secure section of our Web site contains complete information on your account, including balances and transactions, updated daily. You may also conduct transactions, such as exchanges, additional investments, and address changes. Log on today to get your password.
Call us toll free at 1-800-225-1581 Ask a helpful Putnam representative or your financial advisor for details about any of these or other services, or see your prospectus.
*This privilege is subject to change or termination. An exchange of funds may result in a taxable event. In addition, a 1% redemption fee will be applied to shares exchanged or sold within 7 days of purchase, and, for certain funds, this fee applies on total assets redeemed or exchanged within 90 days of purchase.
68
Fund information
Founded over 65 years ago, Putnam Investments was built around the concept that a balance between risk and reward is the hallmark of a well-rounded financial program. We manage over 100 mutual funds in growth, value, blend, fixed income, and international.
| Investment Manager | Officers | Francis J. McNamara, III |
| Putnam Investment | George Putnam, III | Vice President and |
| Management, LLC | President | Chief Legal Officer |
| One Post Office Square | | |
| Boston, MA 02109 | Charles E. Porter | Robert R. Leveille |
| Executive Vice President, | Chief Compliance Officer |
| Marketing Services | | |
| Putnam Retail Management | Principal Executive Officer, | Mark C. Trenchard |
| One Post Office Square | Associate Treasurer and | Vice President and |
| Boston, MA 02109 | Compliance Liaison | BSA Compliance Officer |
| | |
| Custodians | Jonathan S. Horwitz | Judith Cohen |
| Putnam Fiduciary Trust | Senior Vice President | Vice President, Clerk and |
| Company, State Street Bank | and Treasurer | Assistant Treasurer |
| and Trust Company | | |
| Steven D. Krichmar | Wanda M. McManus |
| Legal Counsel | Vice President and | Vice President, Senior Associate |
| Ropes & Gray LLP | Principal Financial Officer | Treasurer and Assistant Clerk |
| | |
| Trustees | Janet C. Smith | Nancy E. Florek |
| John A. Hill, Chairman | Vice President, Principal | Vice President, Assistant Clerk, |
| Jameson Adkins Baxter, | Accounting Officer and | Assistant Treasurer and |
| Vice Chairman | Assistant Treasurer | Proxy Manager |
| Charles B. Curtis | | |
| Myra R. Drucker | Susan G. Malloy | |
| Charles E. Haldeman, Jr. | Vice President and | |
| Paul L. Joskow | Assistant Treasurer | |
| Elizabeth T. Kennan | | |
| Kenneth R. Leibler | Beth S. Mazor | |
| Robert E. Patterson | Vice President | |
| George Putnam, III | | |
| W. Thomas Stephens | James P. Pappas | |
| Richard B. Worley | Vice President | |
| | |
| Richard S. Robie, III | |
| Vice President | |
This report is for the information of shareholders of Putnam International Capital Opportunities Fund. It may also be used as sales literature when preceded or accompanied by the current prospectus, the most recent copy of Putnam’s Quarterly Performance Summary, and Putnam’s Quarterly Ranking Summary. For more recent performance, please visit www.putnam.com. Investors should carefully consider the investment objective, risks, charges, and expenses of a fund, which are described in its prospectus. For this and other information or to request a prospectus, call 1-800-225-1581 toll free. Please read the prospectus carefully before investing. The fund’s Statement of Additional Information contains additional information about the fund’s Trustees and is available without charge upon request by calling 1-800-225-1581.

Item 2. Code of Ethics:
Not applicable
Item 3. Audit Committee Financial Expert:
Not applicable
Item 4. Principal Accountant Fees and Services:
Not applicable
Item 5. Audit Committee of Listed Registrants
Not applicable
Item 6. Schedule of Investments:
The registrant’s schedule of investments in unaffiliated issuers is included in the report to shareholders in Item 1 above.
Item 7. Disclosure of Proxy Voting Policies and Procedures For Closed-End Management Investment Companies:
Not applicable
Item 8. Portfolio Managers of Closed-End Investment Companies
Not Applicable
Item 9. Purchases of Equity Securities by Closed-End Management Investment Companies and Affiliated Purchasers:
Not applicable
Item 10. Submission of Matters to a Vote of Security Holders:
Not applicable
Item 11. Controls and Procedures:
(a) The registrant's principal executive officer and principal financial officer have concluded, based on their evaluation of the effectiveness of the design and operation of the registrant's disclosure controls and procedures as of a date within 90 days of the filing date of this report, that the design and operation of such procedures are generally effective to provide reasonable assurance that information required to be disclosed by the registrant in this report is recorded, processed, summarized and reported within the time periods specified in the Commission's rules and forms.
(b) Changes in internal control over financial reporting:
Effective January 1, 2007, the fund retained State Street Bank and Trust Company ("State Street") as its custodian. Putnam Fiduciary Trust Company, the fund's previous custodian, is managing the transfer of the fund's assets to State Street. This transfer is expected to be completed for all Putnam funds during the first half of 2007, with PFTC remaining as custodian with respect to fund assets until the assets are transferred. Also effective January 1, 2007, the fund's investment manager, Putnam
Investment Management, LLC entered into a Master Sub-Accounting Services Agreement with State Street, under which the investment manager has delegated to State Street responsibility for providing certain administrative, pricing, and bookkeeping services for the fund.
Item 12. Exhibits:
(a)(1) Not applicable
(a)(2) Separate certifications for the principal executive officer and principal financial officer of the registrant as required by Rule 30a-2(a) under the Investment Company Act of 1940, as amended, are filed herewith.
(b) The certifications required by Rule 30a-2(b) under the Investment Company Act of 1940, as amended, are filed herewith.
SIGNATURES
Pursuant to the requirements of the Securities Exchange Act of 1934 and the Investment Company Act of 1940, the registrant has duly caused this report to be signed on its behalf by the undersigned, thereunto duly authorized.
Putnam Investment Funds
By (Signature and Title):
/s/Janet C. Smith
Janet C. Smith
Principal Accounting Officer
Date: April 27, 2007
Pursuant to the requirements of the Securities Exchange Act of 1934 and the Investment Company Act of 1940, this report has been signed below by the following persons on behalf of the registrant and in the capacities and on the dates indicated.
By (Signature and Title):
/s/Charles E. Porter
Charles E. Porter
Principal Executive Officer
Date: April 27, 2007
By (Signature and Title):
/s/Steven D. Krichmar
Steven D. Krichmar
Principal Financial Officer
Date: April 27, 2007
UNITED STATES
SECURITIES AND EXCHANGE COMMISSION
Washington, D.C. 20549
FORM N-CSR
CERTIFIED SHAREHOLDER REPORT OF REGISTERED
MANAGEMENT INVESTMENT COMPANIES
| Investment Company Act file number: (811- 07237) |
| |
| Exact name of registrant as specified in charter: Putnam Investment Funds |
| |
| Address of principal executive offices: One Post Office Square, Boston, Massachusetts 02109 |
| |
| Name and address of agent for service: | Beth S. Mazor, Vice President |
| | One Post Office Square |
| | Boston, Massachusetts 02109 |
| |
| Copy to: | John W. Gerstmayr, Esq. |
| | Ropes & Gray LLP |
| | One International Place |
| | Boston, Massachusetts 02110 |
| |
| Registrant’s telephone number, including area code: | (617) 292-1000 |
Date of fiscal year end: August 31, 2007
Date of reporting period: September 1, 2006— February 28, 2007
Item 1. Report to Stockholders:
The following is a copy of the report transmitted to stockholders pursuant to Rule 30e-1 under the Investment Company Act of 1940:
What makes Putnam different?

In 1830, Massachusetts Supreme Judicial Court Justice Samuel Putnam established The Prudent Man Rule, a legal foundation for responsible money management.
THE PRUDENT MAN RULE
All that can be required of a trustee to invest is that he shall conduct himself faithfully and exercise a sound discretion. He is to observe how men of prudence, discretion, and intelligence manage their own affairs, not in regard to speculation, but in regard to the permanent disposition of their funds, considering the probable income, as well as the probable safety of the capital to be invested.

A time-honored tradition
in money management
Since 1937, our values have been rooted in a profound sense of responsibility for the money entrusted to us.
A prudent approach to investing
We use a research-driven team approach to seek consistent, dependable, superior investment results over time, although there is no guarantee a fund will meet its objectives.
Funds for every investment goal
We offer a broad range of mutual funds and other financial products so investors and their financial representatives can build diversified portfolios.
A commitment to doing
what’s right for investors
We have below-average expenses and stringent investor protections, and provide a wealth of information about the Putnam funds.
Industry-leading service
We help investors, along with their financial representatives, make informed investment decisions with confidence.
Putnam
New Value
Fund
2| 28| 07
Semiannual Report
| Message from the Trustees | 2 |
| About the fund | 4 |
| Report from the fund managers | 7 |
| Performance | 13 |
| Expenses | 16 |
| Portfolio turnover | 18 |
| Risk | 19 |
| Your fund’s management | 20 |
| Terms and definitions | 23 |
| Trustee approval of management contract | 25 |
| Other information for shareholders | 31 |
| Financial statements | 32 |
| Brokerage commissions | 52 |
Cover photograph: © White-Packert Photography
Message from the Trustees
Dear Fellow Shareholder
From our present vantage point, it has become apparent that certain sectors of the U.S. economy have slowed somewhat, although the global economy continues to demonstrate healthy growth. In recent weeks, financial markets have reflected increased uncertainty about the effects of the housing market decline and tighter credit standards by mortgage lenders on the U.S. economy. However, we believe that the U.S. economy is flexible enough to adapt to these challenges, just as it has adapted to other challenges that have arisen in the course of the recent economic expansion.
As you may have heard, on February 1, 2007, Marsh & McLennan Companies, Inc. announced that it had signed a definitive agreement to sell its ownership interest in Putnam Investments Trust, the parent company of Putnam Management and its affiliates, to Great-West Lifeco Inc. Great-West Lifeco Inc. is a financial services holding company with operations in Canada, the United States, and Europe and is a member of the Power Financial Corporation group of companies. This transaction is subject to regulatory approvals and other conditions, including the approval of new management contracts by shareholders of a substantial number of Putnam funds at shareholder meetings scheduled for May 15, 2007. Proxy solicitation materials related to these meetings, which provide detailed information regarding the proposed transaction, were recently mailed. We currently expect the transaction to be completed by the middle of 2007.
Putnam’s team of investment and business professionals will continue to be led by Putnam President and Chief Executive Officer Ed Haldeman. Your Trustees have been actively involved through every step of the discussions, and we will continue in our role of overseeing the Putnam funds on your behalf.
2
We would like to take this opportunity to announce that a new independent Trustee, Kenneth R. Leibler, has joined your fund’s Board of Trustees. Mr. Leibler has had a distinguished career as a leader in the investment management industry. He is a founding partner of and advisor to the Boston Options Exchange; a Trustee of Beth Israel Deaconess Hospital in Boston; a lead director of Ruder Finn Group, a global communications and advertising firm; and a director of Northeast Utilities.
In the following pages, members of your fund’s management team discuss the fund’s performance and strategies for the fiscal period ended February 28, 2007, and provide their outlook for the months ahead. As always, we thank you for your support of the Putnam funds.

Putnam New Value Fund: targeting large-company
stocks that are significantly undervalued
Putnam New Value Fund targets large-company stocks whose prices are significantly below what management believes to be their true worth. Each of these companies is subjected to close investigation to determine why the market has bid down its stock price and what factors might propel the stock price back to fair value.
The fund’s management team begins by using quantitative analysis to find stocks that are attractively priced relative to their earnings, dividends, and future revenue. The team also looks for signals of positive change — corporate restructuring, the introduction of new products or services, an improving balance sheet, and positive momentum in earnings estimates. This kind of fundamental analysis helps the team identify promising companies before their true long-term worth is recognized by the market.
Putnam New Value Fund generally targets large companies with at least $1 billion in revenue and a 10-year business history. Those parameters help focus the fund’s managers on well-established companies that are less likely to fail. Among those companies, the team seeks out special or unique situations in which the companies’ stocks are trading at steep discounts relative to their longer-term prospects.
Typically, Putnam New Value Fund holds 65 to 75 stocks, making the impact of each stock on the fund’s performance significant. The fund’s leaner, more aggressive portfolio and value investment strategy have made for a potent combination since the fund’s inception.
The fund invests some or all of its assets in small and/or midsize companies. Such investments increase the risk of greater price fluctuations. The fund invests in fewer issuers or concentrates its investments by region or sector, and involves more risk than a fund that invests more broadly. Value investing seeks underpriced stocks, but there is no guarantee that a stock’s price will rise.
Since its inception in
January 1995, Putnam New
Value Fund has sought to
achieve capital apprecia-
tion by investing in the
stocks of undervalued
companies poised for
positive change.
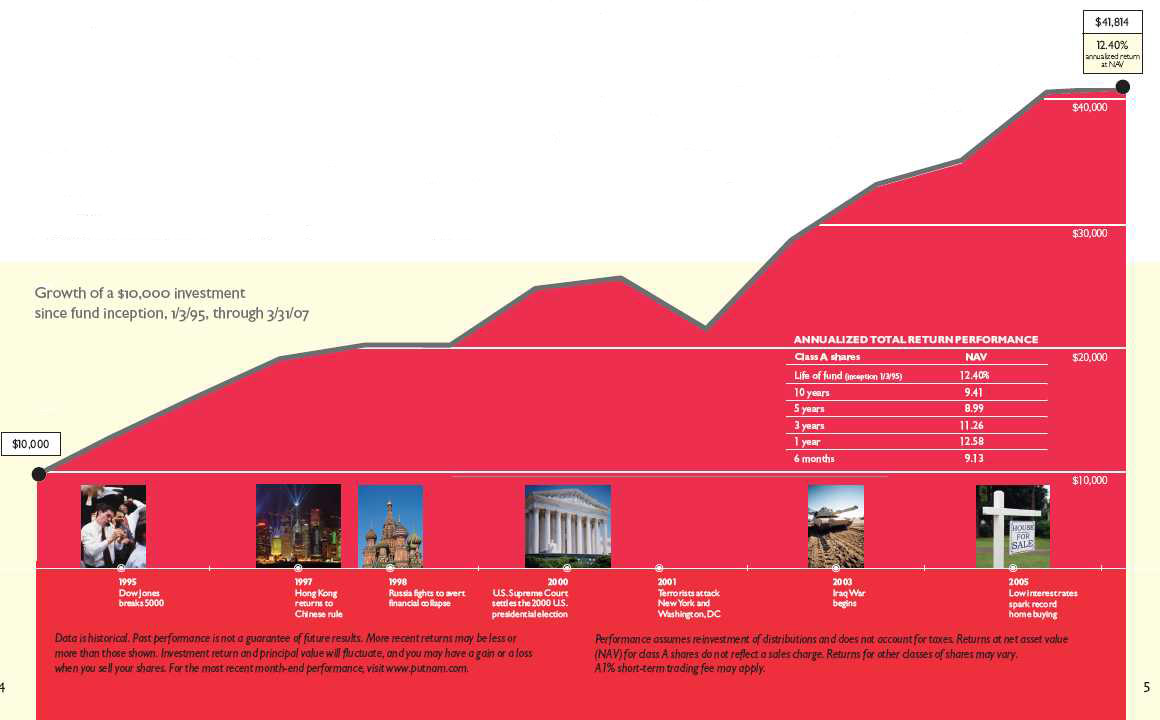
Putnam New Value Fund seeks long-term capital appreciation by investing in common stocks of midsize and large companies that Putnam Investments believes are undervalued or out of favor, but are likely to appreciate over time. The portfolio may be appropriate for investors who seek strong long-term reward potential and are willing to assume proportionate risk.
Highlights
• For the six months ended February 28, 2007, Putnam New Value Fund’s class A shares returned 10.12% without sales charges.
• During the same period, the fund’s benchmark, the Russell 3000 Value Index, returned 9.87% .
• The average return for the fund’s Lipper category, Multi-Cap Value Funds, was 10.00% .
• Additional fund performance, comparative performance, and Lipper data can be found in the performance section beginning on page 13.
Performance
Total return for class A shares for periods ended 2/28/07
Since the fund’s inception (1/3/95), average annual return is 12.39% at NAV and 11.89% at POP.
| | Average annual return | Cumulative return |
| | NAV | | POP | | NAV | | POP | |
|
| 10 years | 8.90% | | 8.32% | | 134.65% | | 122.40% | |
|
| 5 years | 9.95 | | 8.77 | | 60.71 | | 52.23 | |
|
| 3 years | 10.70 | | 8.74 | | 35.67 | | 28.57 | |
|
| 1 year | 12.81 | | 6.90 | | 12.81 | | 6.90 | |
|
| 6 months | — | | — | | 10.12 | | 4.32 | |
|
Data is historical. Past performance does not guarantee future results. More recent returns may be less or more than those shown. Investment return and principal value will fluctuate, and you may have a gain or a loss when you sell your shares. Performance assumes reinvestment of distributions and does not account for taxes. Returns at POP reflect a maximum sales charge of 5.25% . For the most recent month-end performance, visit www.putnam.com. For a portion of the period, this fund limited expenses, without which returns would have been lower. A 1% short-term trading fee may apply.
6
Report from the fund managers
The period in review
We are pleased to report that your fund delivered solid returns for the first six months of its 2007 fiscal year, keeping close pace with its benchmark, the Russell 3000 Value Index, and the average of its Lipper peer group, Multi-Cap Value Funds, based on results at net asset value (NAV, or without sales charges). Within a positive market environment for stocks overall, our strong security selection in consumer staples, conglomerates, and energy contributed substantially to these results. At the same time, fund performance was held back by less successful stock selection in the financial, health care, and communications services sectors. The portfolio’s smaller-than-benchmark position in communications services also dampened performance, as did the fact that AT&T, a key component of the benchmark index that performed well during the period, was not represented in the fund’s portfolio.
Market overview
Several factors helped drive solid gains in global stock markets during the six months ended February 28, 2007, especially continued growth in corporate profits. The positive business fundamentals and earnings prospects of many value-oriented companies enabled them to participate in the market’s upward march. Steady global economic growth encouraged companies to invest in productivity improvements, hire more employees, and take advantage of their stronger balance sheets to pay down debt, repurchase shares, or engage in consolidation activity. Furthermore, increased merger-and-acquisition activity buoyed the stock prices of many companies when they — or in some cases, their competitors — were mentioned as possible candidates for acquisition or buyout.
Two other key factors in the period’s gains were the moderation of raw materials costs and the diminished prospect of further increases in short-term interest rates by the Federal Reserve (the Fed). Oil and natural gas prices came down from historical highs, and other non-fuel commodities declined in tandem. These were welcome developments to investors,
7
many of whom had feared earlier that higher raw materials costs would translate into broader-based inflation, which, in turn, might prompt additional rate increases by the Fed.
However, on the second-to-last day of the semiannual period, the market backdrop changed dramatically. Reacting to sell-offs in overseas markets, the S&P 500 Index lost about 3.5% of its value. It is possible that this decline signals an increase in market volatility, as the positive market cycle of the past few years appeared to be reaching maturity. After such an extended period of broad gains in the stock market, it is not unusual for volatility to pick up as companies find it harder to beat earnings expectations. This prompts investors to move quickly in and out of stocks and sectors in search of better performance, contributing to more rapid changes in stock prices.
Strategy overview
Our approach to picking stocks for your fund remained consistent: we continued to choose stocks that we felt were significantly undervalued. During much of the period, a by-product of this process — combining bottom-up, fundamental, and quantitative analysis — led us to establish a notable position in what we believed to be undervalued large- and mega-cap growth stocks. (The “mega-cap” category comprises the largest of the large-company stocks).
Our analysis has shown us that over the past several years, many large- and mega-cap companies with lower-than-expected growth rates have been neglected in the
Market sector performance
These indexes provide an overview of performance in different market sectors for the
six months ended 2/28/07.
| Equities | |
|
| Russell 3000 Value Index (multi-cap value stocks) | 9.87% |
|
| Russell 1000 Growth Index (large-company growth stocks) | 9.54% |
|
| Russell Midcap Growth Index (midsize-company growth stocks) | 13.12% |
|
| S&P 500 Index (broad stock market) | 8.93% |
|
| Bonds | |
|
| Lehman Aggregate Bond Index (broad bond market) | 3.66% |
|
| Lehman Municipal Bond Index (tax-exempt bonds) | 2.89% |
|
| Lehman Credit Index (corporate bonds) | 4.52% |
|
8
market’s predilection for small- and mid-cap stocks. As a result, we are currently perceiving better relative value among these stocks than in other areas of the market. It’s important to reiterate that this move didn’t arise from a decision to target stocks from a particular market capitalization. Rather, we believe that successful value investing arises from targeting the best, low-priced opportunities when they arise, and in this case, many large- and mega-cap blue-chip companies offered the best appreciation potential because they had become so undervalued in our view.
Toward the end of the period, though, the portfolio became a bit more balanced across market capitalizations, as we found new value opportunities across a wider spectrum of companies. At the same time, we maintained large positions in large- and mega-cap stocks, because they continued to be attractive. Overall, these holdings delivered mixed performance during the period, but we believe they have the potential to become more rewarding over the long term.
Your fund’s holdings
As noted earlier, our stock selection was particularly effective in the consumer staples, conglomerates, and energy sectors during the period. Conglomerate Tyco International, which is not a component of the fund’s benchmark index, was one of the top performers, as investors came to look more favorably on the firm’s plan to break up into three separate companies. A larger-than-benchmark position in
Comparison of top industry weightings
This chart shows how the fund’s top weightings have changed over the last six months.
Weightings are shown as a percentage of net assets. Holdings will vary over time.
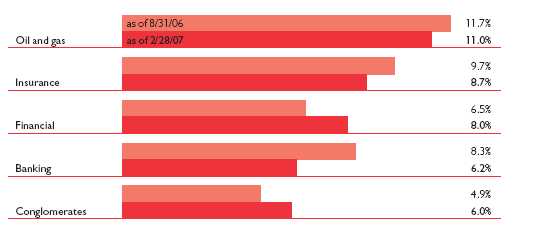
9
diversified chemicals manufacturer Rohm & Haas also proved fruitful, as declining oil prices reduced the company’s manufacturing costs. In a similar vein, falling oil prices led to lower costs for the resin Mattel uses to manufacture toys. This, along with stabilizing sales of Mattel’s Barbie dolls, helped the firm keep pace with its turnaround program, and the company’s improved prospects were reflected in a higher stock price.
Another top performer was funeral service firm Service Corporation International, which fortified its competitive position by acquiring its rival, Alderwoods Group. The fund’s long-term position in aerospace and defense manufacturer Lockheed Martin— another company that is not a component of the benchmark — also contributed to the fund’s return, as it benefited from sustained spending on defense by the U.S. government. We’ve started to reduce the fund’s position, as we believe Lockheed’s share price has become more fully valued. Idearc, the yellow pages business spun off by Verizon, also provided strong performance. As is often the case with spin-offs, Idearc entered the market at a depressed valuation, as investors were uncertain ab out the future prospects of the company. The valuation remained quite low for some time, encouraging us to increase our stake. The market recently has been more attracted to the
Top holdings
This table shows the fund’s top holdings, and the percentage of the fund’s net assets that each
comprised, as of 2/28/07. The fund’s holdings will change over time.
| Holding (percent of fund’s net assets) | Industry |
|
| Bank of America Corp. (4.0%) | Banking |
|
| Exxon Mobil Corp. (3.9%) | Oil and gas |
|
| Pfizer, Inc. (3.5%) | Pharmaceuticals |
|
| Citigroup, Inc. (3.4%) | Financial |
|
| Chubb Corp. (The) (2.9%) | Insurance |
|
| Tyco International, Ltd. (Bermuda) (2.9%) | Conglomerates |
|
| JPMorgan Chase & Co. (2.5%) | Financial |
|
| Altria Group, Inc. (2.4%) | Tobacco |
|
| Berkshire Hathaway, Inc. Class B (2.3%) | Insurance |
|
| IBM Corp. (2.2%) | Computers |
|
10
company’s business fundamentals, leading to gains in its share price.
Each period brings with it some disappointments, and this six-month timeframe was no exception. One investment decision that hurt fund performance was our conclusion that AT&T might not be able to hold its own in the extremely competitive telecommunications industry. We consequently avoided AT&T stock, but when investors became enamored with the company’s ability to cut costs following its consolidations with SBC, Cingular, and BellSouth, they drove up the stock price and the fund did not participate in the resulting gains.
In addition, some of the undervalued large- and mega-cap growth stocks we recently added to the portfolio did not perform as well as we anticipated. These fund holdings included Southwest Airlines, pharmaceutical giant Pfizer, and property and casualty insurance firm Chubb. Although Southwest Airlines and Chubb executed their business plans well and posted solid financial results, both stocks underperformed in relative terms. For its part, Pfizer stock dropped precipitously at the beginning of December 2006 when the firm announced it had halted research on its new cholesterol-fighting drug, torce-trapib. This medication had been designed to succeed Pfizer’s Lipitor, the best-selling prescription drug in the world, when its patent expires in 2010. However, Pfizer stopped development of the new drug because of disappointing clinical trial results. We believe all three stocks still have the potential to appreciate and are maintaining the fund’s positions.
Please note that the holdings discussed in this report may not have been held by the fund for the entire period. Portfolio composition is subject to review in accordance with the fund’s investment strategy and may vary in the future.
11
The outlook for your fund
The following commentary reflects anticipated developments that could affect your fund over the next six months, as well as your management team’s plans for responding to them.
Although the first half of your fund’s 2007 fiscal year was marked by steady gains, we believe the market’s drop at the end of the period hints at the possibility of increased volatility going forward. With the Fed currently on hold, there is more uncertainty about the direction of the economy, inflation, and the markets. In our opinion, this lack of clarity could breed more instability, particularly as firms try to achieve the kind of earnings progress necessary to sustain or improve their valuations, which, in many cases, already reflect optimistic outlooks.
That’s not to say we’re pessimistic about what the market has to offer in the months ahead. On the contrary, we believe that the abrupt changes in valuations that occur in more volatile markets may well reveal more long-term value opportunities. We believe we are prepared to take advantage of short-term price dislocations as they occur. Going forward, we advise shareholders that the fund’s performance may become more uneven over the near term. However, it is important to remember that market shifts may hold the potential for rewarding results over the long term.
The views expressed in this report are exclusively those of Putnam Management. They are not meant as investment advice.
The fund invests some or all of its assets in small and/or midsize companies. Such investments increase the risk of greater price fluctuations. This fund invests in fewer issuers or concentrates its investments by region or sector, and involves more risk than a fund that invests more broadly. Value investing seeks underpriced stocks, but there is no guarantee that a stock’s price will rise.
12
Your fund’s performance
This section shows your fund’s performance for periods ended February 28, 2007, the end of the first half of its current fiscal year. In accordance with regulatory requirements for mutual funds, we also include performance as of the most recent calendar quarter-end and expense information taken from the fund’s current prospectus. Performance should always be considered in light of a fund’s investment strategy. Data represents past performance. Past performance does not guarantee future results. More recent returns may be less or more than those shown. Investment return and principal value will fluctuate, and you may have a gain or a loss when you sell your shares. For the most recent month-end performance, please visit www.putnam.com or call Putnam at 1-800-225-1581. Class Y shares are generally only available to corporate and institutional clients. See the Terms and Definitions section in this report for definitions of the share classes offered by yo ur fund.
Fund performance
Total return for periods ended 2/28/07
| | | Class A | | | | Class B | | | | Class C | | | | Class M | | | | Class R | | Class Y |
| (inception dates) | | (1/3/95) | | | | (2/26/96) | | | | (7/26/99) | | | | (2/26/96) | | | | (12/1/03) | | (7/3/01) |
| | | NAV | | POP | | NAV | | CDSC | | NAV | | CDSC | | NAV | | POP | | NAV | | NAV |
|
| Annual average | | | | | | | | | | | | | | | | | | | | |
| (life of fund) | | 12.39% | | 11.89% | | 11.54% | | 11.54% | | 11.53% | | 11.53% | | 11.83% | | 11.52% | | 12.11% | | 12.53% |
|
| 10 years | | 134.65 | | 122.40 | | 117.30 | | 117.30 | | 117.49 | | 117.49 | | 123.16 | | 115.91 | | 128.85 | | 138.14 |
| Annual average | | 8.90 | | 8.32 | | 8.07 | | 8.07 | | 8.08 | | 8.08 | | 8.36 | | 8.00 | | 8.63 | | 9.06 |
|
| 5 years | | 60.71 | | 52.23 | | 54.68 | | 52.68 | | 54.68 | | 54.68 | | 56.79 | | 51.67 | | 58.73 | | 62.74 |
| Annual average | | 9.95 | | 8.77 | | 9.12 | | 8.83 | | 9.12 | | 9.12 | | 9.41 | | 8.69 | | 9.68 | | 10.23 |
|
| 3 years | | 35.67 | | 28.57 | | 32.65 | | 29.65 | | 32.64 | | 32.64 | | 33.62 | | 29.25 | | 34.57 | | 36.69 |
| Annual average | | 10.70 | | 8.74 | | 9.88 | | 9.04 | | 9.87 | | 9.87 | | 10.14 | | 8.93 | | 10.40 | | 10.98 |
|
| 1 year | | 12.81 | | 6.90 | | 11.99 | | 6.99 | | 11.94 | | 10.94 | | 12.29 | | 8.63 | | 12.53 | | 13.12 |
|
| 6 months | | 10.12 | | 4.32 | | 9.69 | | 4.69 | | 9.69 | | 8.69 | | 9.84 | | 6.28 | | 9.95 | | 10.25 |
|
Performance assumes reinvestment of distributions and does not account for taxes. Returns at public offering price (POP) for class A and M shares reflect a maximum sales charge of 5.25% and 3.25%, respectively. Class B share returns reflect the applicable contingent deferred sales charge (CDSC), which is 5% in the first year, declining to 1% in the sixth year, and is eliminated thereafter. Class C shares reflect a 1% CDSC for the first year and is eliminated thereafter. Class R and Y shares have no initial sales charge or CDSC. Performance for class B, C, M, R, and Y shares before their inception is derived from the historical performance of class A shares, adjusted for the applicable sales charge (or CDSC) and, except for class Y shares, the higher operating expenses for such shares.
For a portion of the period, this fund limited expenses, without which returns would have been lower.
A 1% short-term trading fee may be applied to shares exchanged or sold within 7 days of purchase.
13
Comparative index returns
For periods ended 2/28/07
| | | Lipper Multi-Cap |
| | Russell 3000 | Value Funds |
| | Value Index | category average* |
|
| Annual average | | |
| (life of fund) | 13.70% | 11.80% |
|
| 10 years | 169.97 | 141.87 |
| Annual average | 10.44 | 9.09 |
|
| 5 years | 70.34 | 56.90 |
| Annual average | 11.24 | 9.37 |
|
| 3 years | 46.55 | 37.47 |
| Annual average | 13.59 | 11.15 |
|
| 1 year | 16.40 | 13.52 |
|
| 6 months | 9.87 | 10.00 |
|
Index and Lipper results should be compared to fund performance at net asset value.
* Over the 6-month and 1-, 3-, 5-, and 10-year periods ended 2/28/07, there were 468, 438, 345, 255, and 90 funds, respectively,
in this Lipper category.
Fund price and distribution information
For the six-month period ended 2/28/07
| Distributions* | Class A | Class B | Class C | Class M | Class R | Class Y |
|
| Number | 1 | 1 | 1 | 1 | 1 | 1 |
|
| Income | $0.190 | $0.020 | $0.054 | $0.091 | $0.173 | $0.237 |
|
| Capital gains | | | | | | |
|
| Long-term | 1.012 | 1.012 | 1.012 | 1.012 | 1.012 | 1.012 |
|
| Short-term | 0.372 | 0.372 | 0.372 | 0.372 | 0.372 | 0.372 |
|
| Total | $1.574 | $1.404 | $1.438 | $1.475 | $1.557 | $1.621 |
|
| Share value: | NAV | POP | NAV | NAV | NAV | POP | NAV | NAV |
| 8/31/06 | $18.88 | $19.93 | $18.54 | $18.47 | $18.79 | $19.42 | $18.73 | $18.92 |
|
| 2/28/07 | 19.20 | 20.26 | 18.92 | 18.81 | 19.15 | 19.79 | 19.02 | 19.22 |
|
* Dividend sources are estimated and may vary based on final tax calculations after the fund’s fiscal year-end.
14
Fund performance as of most recent calendar quarter
Total return for periods ended 3/31/07
| | Class A | | Class B | | Class C | | Class M | | Class R | Class Y |
| (inception dates) | (1/3/95) | | (2/26/96) | | (7/26/99) | | (2/26/96) | | (12/1/03) | (7/3/01) |
| | NAV | POP | NAV | CDSC | NAV | CDSC | NAV | POP | NAV | NAV |
| Annual average | | | | | | | | | | |
| (life of fund) | 12.40% | 11.90% | 11.55% | 11.55% | 11.54% | 11.54% | 11.84% | 11.53% | 12.12% | 12.54% |
|
| 10 years | 145.75 | 132.83 | 127.72 | 127.72 | 127.75 | 127.75 | 133.82 | 126.29 | 139.74 | 149.53 |
| Annual average | 9.41 | 8.82 | 8.58 | 8.58 | 8.58 | 8.58 | 8.86 | 8.51 | 9.14 | 9.58 |
|
| 5 years | 53.76 | 45.68 | 48.16 | 46.16 | 48.15 | 48.15 | 50.10 | 45.26 | 51.92 | 55.78 |
| Annual average | 8.99 | 7.82 | 8.18 | 7.89 | 8.18 | 8.18 | 8.46 | 7.75 | 8.72 | 9.27 |
|
| 3 years | 37.73 | 30.50 | 34.71 | 31.71 | 34.71 | 34.71 | 35.67 | 31.29 | 36.72 | 38.83 |
| Annual average | 11.26 | 9.28 | 10.44 | 9.62 | 10.44 | 10.44 | 10.70 | 9.50 | 10.99 | 11.56 |
|
| 1 year | 12.58 | 6.64 | 11.81 | 6.81 | 11.76 | 10.76 | 12.06 | 8.39 | 12.30 | 12.95 |
|
| 6 months | 9.13 | 3.39 | 8.74 | 3.74 | 8.74 | 7.74 | 8.84 | 5.33 | 9.01 | 9.32 |
|
Fund’s annual operating expenses
For the fiscal year ended 8/31/06
| | | Class A | Class B | Class C | Class M | Class R | Class Y |
|
| Total annual fund | | | | | | | |
| operating expenses | | 1.14% | 1.89% | 1.89% | 1.64% | 1.39% | 0.89% |
|
Expense information in this table may differ from that shown in the next section and in the financial highlights of this report.
15
Your fund’s expenses
As a mutual fund investor, you pay ongoing expenses, such as management fees, distribution fees (12b-1 fees), and other expenses. In the most recent six-month period, your fund limited these expenses; had it not done so, expenses would have been higher. Using the information below, you can estimate how these expenses affect your investment and compare them with the expenses of other funds. You may also pay one-time transaction expenses, including sales charges (loads) and redemption fees, which are not shown in this section and would have resulted in higher total expenses. For more information, see your fund’s prospectus or talk to your financial advisor.
Review your fund’s expenses
The table below shows the expenses you would have paid on a $1,000 investment in Putnam New Value Fund from September 1, 2006, to February 28, 2007. It also shows how much a $1,000 investment would be worth at the close of the period, assuming actual returns and expenses.
| | | Class A | Class B | Class C | Class M | Class R | Class Y |
|
| Expenses paid per $1,000* | | $ 5.84 | $ 9.72 | $ 9.72 | $ 8.43 | $ 7.13 | $ 4.54 |
|
| Ending value (after expenses) | | $1,101.20 | $1,096.90 | $1,096.90 | $1,098.40 | $1,099.50 | $1,102.50 |
|
* Expenses for each share class are calculated using the fund’s annualized expense ratio for each class, which represents the ongoing expenses as a percentage of average net assets for the six months ended 2/28/07. The expense ratio may differ for each share class (see the last table in this section). Expenses are calculated by multiplying the expense ratio by the average account value for the period; then multiplying the result by the number of days in the period; and then dividing that result by the number of days in the year.
Estimate the expenses you paid
To estimate the ongoing expenses you paid for the six months ended February 28, 2007, use the calculation method below. To find the value of your investment on September 1, 2006, go to www.putnam.com and log on to your account. Click on the “Transaction History” tab in your Daily Statement and enter 09/01/2006 in both the “from” and “to” fields. Alternatively, call Putnam at 1-800-225-1581.
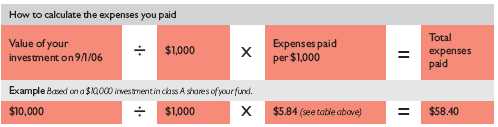
16
Compare expenses using the SEC’s method
The Securities and Exchange Commission (SEC) has established guidelines to help investors assess fund expenses. Per these guidelines, the table below shows your fund’s expenses based on a $1,000 investment, assuming a hypothetical 5% annualized return. You can use this information to compare the ongoing expenses (but not transaction expenses or total costs) of investing in the fund with those of other funds. All mutual fund shareholder reports will provide this information to help you make this comparison. Please note that you cannot use this information to estimate your actual ending account balance and expenses paid during the period.
| | Class A | Class B | Class C | Class M | Class R | Class Y |
|
| Expenses paid per $1,000* | $ 5.61 | $ 9.35 | $ 9.35 | $ 8.10 | $ 6.85 | $ 4.36 |
|
| Ending value (after expenses) | $1,019.24 | $1,015.52 | $1,015.52 | $1,016.76 | $1,018.00 | $1,020.48 |
|
* Expenses for each share class are calculated using the fund’s annualized expense ratio for each class, which represents the ongoing expenses as a percentage of average net assets for the six months ended 2/28/07. The expense ratio may differ for each share class (see the last table in this section). Expenses are calculated by multiplying the expense ratio by the average account value for the period; then multiplying the result by the number of days in the period; and then dividing that result by the number of days in the year.
Compare expenses using industry averages
You can also compare your fund’s expenses with the average of its peer group, as defined by Lipper, an independent fund-rating agency that ranks funds relative to others that Lipper considers to have similar investment styles or objectives. The expense ratio for each share class shown below indicates how much of your fund’s average net assets have been used to pay ongoing expenses during the period.
| | Class A | Class B | Class C | Class M | Class R | Class Y |
|
| Your fund’s annualized | | | | | | |
| expense ratio | 1.12% | 1.87% | 1.87% | 1.62% | 1.37% | 0.87% |
|
| Average annualized expense | | | | | | |
| ratio for Lipper peer group* | 1.33% | 2.08% | 2.08% | 1.83% | 1.58% | 1.08% |
|
* Simple average of the expenses of all front-end load funds in the fund’s Lipper peer group, calculated in accordance with Lipper’s standard method for comparing fund expenses (excluding 12b-1 fees and without giving effect to any expense offset and brokerage service arrangements that may reduce fund expenses). This average reflects each fund’s expenses for its most recent fiscal year available to Lipper as of 12/31/06. To facilitate comparison, Putnam has adjusted this average to reflect the 12b-1 fees carried by each class of shares other than class Y shares, which do not incur 12b-1 fees. The peer group may include funds that are significantly smaller or larger than the fund, which may limit the comparability of the fund’s expenses to the simple average, which typically is higher than the asset-weighted average.
17
Your fund’s
portfolio turnover
Putnam funds are actively managed by teams of experts who buy and sell securities based on intensive analysis of companies, industries, economies, and markets. Portfolio turnover is a measure of how often a fund’s managers buy and sell securities for your fund. A portfolio turnover of 100%, for example, means that the managers sold and replaced securities valued at 100% of a fund’s assets within a one-year period. Funds with high turnover may be more likely to generate capital gains and dividends that must be distributed to shareholders as taxable income. High turnover may also cause a fund to pay more brokerage commissions and other transaction costs, which may detract from performance.
Turnover comparisons
Percentage of holdings that change every year
| | 2006 | 2005 | 2004 | 2003 | 2003 |
|
| Putnam New Value Fund | 56% | 52% | 54% | 57% | 68% |
|
| Lipper Multi-Cap Value Funds | | | | | |
| category average | 70% | 60% | 59% | 66% | 64% |
|
Turnover data for the fund is calculated based on the fund’s fiscal-year period, which ends on August 31. Turnover data for the fund’s Lipper category is calculated based on the average of the turnover of each fund in the category for its fiscal year ended during the indicated year. Fiscal years vary across funds in the Lipper category, which may limit the comparability of the fund’s portfolio turnover rate to the Lipper average. Comparative data for 2006 is based on information available as of 12/31/06.
18
Your fund’s risk
This risk comparison is designed to help you understand how your fund compares with other funds. The comparison utilizes a risk measure developed by Morningstar, an independent fund-rating agency. This risk measure is referred to as the fund’s Morningstar Risk.
Your fund’s Morningstar® Risk
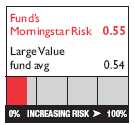
Your fund’s Morningstar Risk is shown alongside that of the average fund in its Morningstar category. The risk bar broadens the comparison by translating the fund’s Morningstar Risk into a percentile, which is based on the fund’s ranking among all funds rated by Morningstar as of March 31, 2007. A higher Morningstar Risk generally indicates that a fund’s monthly returns have varied more widely.
Morningstar determines a fund’s Morningstar Risk by assessing variations in the fund’s monthly returns — with an emphasis on downside variations — over a 3-year period, if available. Those measures are weighted and averaged to produce the fund’s Morningstar Risk. The information shown is provided for the fund’s class A shares only; information for other classes may vary. Morningstar Risk is based on historical data and does not indicate future results. Morningstar does not purport to measure the risk associated with a current investment in a fund, either on an absolute basis or on a relative basis. Low Morningstar Risk does not mean that you cannot lose money on an investment in a fund. Copyright 2007 Morningstar, Inc. All Rights Reserved. The information contained herein (1) is proprietary to Morningstar and/or its content providers; (2) may not be copied or distributed; and (3) is not warranted to be accurate, complete, or timely. Neither Morningstar nor its content providers are responsible for any damages or losses arising from any use of this information.
19
Your fund’s management
Your fund is managed by the members of the Putnam Large-Cap Value Team. David King is the Portfolio Leader and Michael Abata is a Portfolio Member of your fund. The Portfolio Leader and Portfolio Member coordinate the team’s management of the fund.
For a complete listing of the members of the Putnam Large-Cap Value Team, including those who are not Portfolio Leaders or Portfolio Members of your fund, visit Putnam’s Individual Investor Web site at www.putnam.com.
Investment team fund ownership
The table below shows how much the fund’s current Portfolio Leader and Portfolio Member have invested in the fund and in all Putnam mutual funds (in dollar ranges). Information shown is as of February 28, 2007, and February 28, 2006.

Trustee and Putnam employee fund ownership
As of February 28, 2007, all of the Trustees of the Putnam funds owned fund shares. The table below shows the approximate value of investments in the fund and all Putnam funds as of that date by the Trustees and Putnam employees. These amounts include investments by the Trustees’ and employees’ immediate family members and investments through retirement and deferred compensation plans.
| | | Total assets in |
| | Assets in the fund | all Putnam funds |
|
| Trustees | $ 775,000 | $101,000,000 |
|
| Putnam employees | $15,770,00 | $459,000,000 |
|
20
Fund manager compensation
The total 2006 fund manager compensation that is attributable to your fund is approximately $760,000. This amount includes a portion of 2006 compensation paid by Putnam Management to the fund managers listed in this section for their portfolio management responsibilities, calculated based on the fund assets they manage taken as a percentage of the total assets they manage. The compensation amount also includes a portion of the 2006 compensation paid to the Group Chief Investment Officer of the fund’s broader investment category for his oversight responsibilities, calculated based on the fund assets he oversees taken as a percentage of the total assets he oversees. This amount does not include compensation of other personnel involved in research, trading, administration, systems, compliance, or fund operations; nor does it include non-compensation costs. These percentages are determined as of the fund’s fiscal period-end. For personnel who joined Putnam Man agement during or after 2006, the calculation reflects annualized 2006 compensation or an estimate of 2007 compensation, as applicable.
Other Putnam funds managed by the Portfolio Leader
and Portfolio Member
David King is also a Portfolio Leader of Putnam Convertible Income-Growth Trust and Putnam High Income Securities Fund. He is also a Portfolio Member of The Putnam Fund for Growth and Income.
Michael Abata is also a Portfolio Leader of Putnam Classic Equity Fund.
David King and Michael Abata may also manage other accounts and variable trust funds advised by Putnam Management or an affiliate.
Changes in your fund’s Portfolio Leader and Portfolio Member
Your fund’s Portfolio Leader and Portfolio Member did not change during the year ended February 28, 2007.
21
Putnam fund ownership by Putnam’s Executive Board
The table below shows how much the members of Putnam’s Executive Board have invested in all Putnam mutual funds (in dollar ranges). Information shown is as of February 28, 2007, and February 28, 2006.
| | | | $1 – | $10,001 – | $50,001 – | $100,001 – | $500,001 – | $1,000,001 |
| | Year | $0 | $10,000 | $50,000 | $100,000 | $500,000 | $1,000,000 | and over |
|
| Philippe Bibi | 2007 | | | | | | | • |
|
| Chief Technology Officer | 2006 | | | | | | | • |
|
| Joshua Brooks | 2007 | | | | | | | • |
|
| Deputy Head of Investments | 2006 | | | | | | | • |
|
| William Connolly | 2007 | | | | | | | • |
|
| Head of Retail Management | 2006 | | | | | | | • |
|
| Kevin Cronin | 2007 | | | | | | | • |
|
| Head of Investments | 2006 | | | | | | | • |
|
| Charles Haldeman, Jr. | 2007 | | | | | | | • |
|
| President and CEO | 2006 | | | | | | | • |
|
| Amrit Kanwal | 2007 | | | | | | • | |
|
| Chief Financial Officer | 2006 | | | | | • | | |
|
| Steven Krichmar | 2007 | | | | | | | • |
|
| Chief of Operations | 2006 | | | | | | • | |
|
| Francis McNamara, III | 2007 | | | | | | | • |
|
| General Counsel | 2006 | | | | | | | • |
|
| Jeffrey Peters | 2007 | | | | | | | • |
|
| Head of International Business | N/A | | | | | | | |
|
| Richard Robie, III | 2007 | | | | | | • | |
|
| Chief Administrative Officer | 2006 | | | | | | • | |
|
| Edward Shadek | 2007 | | | | | | | • |
|
| Deputy Head of Investments | 2006 | | | | | | | • |
|
| Sandra Whiston | 2007 | | | | | | | • |
|
| Head of Institutional Management | 2006 | | | | | | • | |
|
N/A indicates the individual was not a member of Putnam’s Executive Board as of 2/28/06.
22
Terms and definitions
Important terms
Total return shows how the value of the fund’s shares changed over time, assuming you held the shares through the entire period and reinvested all distributions in the fund.
Net asset value (NAV) is the price, or value, of one share of a mutual fund, without a sales charge. NAVs fluctuate with market conditions. NAV is calculated by dividing the net assets of each class of shares by the number of outstanding shares in the class.
Public offering price (POP) is the price of a mutual fund share plus the maximum sales charge levied at the time of purchase. POP performance figures shown here assume the 5.25% maximum sales charge for class A shares and 3.25% for class M shares.
Contingent deferred sales charge (CDSC) is generally a charge applied at the time of the redemption of class B or C shares and assumes redemption at the end of the period. Your fund’s class B CDSC declines from a 5% maximum during the first year to 1% during the sixth year. After the sixth year, the CDSC no longer applies. The CDSC for class C shares is 1% for one year after purchase.
Share classes
Class A shares are generally subject to an initial sales charge and no CDSC (except on certain redemptions of shares bought without an initial sales charge).
Class B shares are not subject to an initial sales charge. They may be subject to a CDSC.
Class C shares are not subject to an initial sales charge and are subject to a CDSC only if the shares are redeemed during the first year.
Class M shares have a lower initial sales charge and a higher 12b-1 fee than class A shares and no CDSC (except on certain redemptions of shares bought without an initial sales charge).
Class R shares are not subject to an initial sales charge or CDSC and are available only to certain defined contribution plans.
Class Y shares are not subject to an initial sales charge or CDSC, and carry no 12b-1 fee. They are only available to eligible purchasers, including eligible defined contribution plans or corporate IRAs.
23
Comparative indexes
Lehman Aggregate Bond Index is an unmanaged index of U.S. investment-grade fixed-income securities.
Lehman Credit Index is an unmanaged index of investment-grade corporate bonds.
Lehman Municipal Bond Index is an unmanaged index of long-term fixed-rate investment-grade tax-exempt bonds.
Russell Midcap Growth Index is an unmanaged index of those companies in the Russell Midcap Index chosen for their growth orientation.
Russell 1000 Growth Index is an unmanaged index of those companies in the large-cap Russell 1000 Index chosen for their growth orientation.
Russell 3000 Value Index is an unmanaged index of those companies in the Russell 3000 Index chosen for their value orientation.
S&P 500 Index is an unmanaged index of common stock performance.
Indexes assume reinvestment of all distributions and do not account for fees. Securities and performance of a fund and an index will differ. You cannot invest directly in an index.
Lipper is a third-party industry-ranking entity that ranks mutual funds. Its rankings do not reflect sales charges. Lipper rankings are based on total return at net asset value relative to other funds that have similar current investment styles or objectives as determined by Lipper. Lipper may change a fund’s category assignment at its discretion. Lipper category averages reflect performance trends for funds within a category.
24
Trustee approval of
management contract
General conclusions
The Board of Trustees of the Putnam funds oversees the management of each fund and, as required by law, determines annually whether to approve the continuance of your fund’s management contract with Putnam Management. In this regard, the Board of Trustees, with the assistance of its Contract Committee consisting solely of Trustees who are not “interested persons” (as such term is defined in the Investment Company Act of 1940, as amended) of the Putnam funds (the “Independent Trustees”), requests and evaluates all information it deems reasonably necessary under the circumstances. Over the course of several months ending in June 2006, the Contract Committee met four times to consider the information provided by Putnam Management and other information developed with the assistance of the Board’s independent counsel and independent staff. The Contract Committee reviewed and discussed key aspects of this information with all of the Independe nt Trustees. Upon completion of this review, the Contract Committee recommended, and the Independent Trustees approved, the continuance of your fund’s management contract, effective July 1, 2006.
This approval was based on the following conclusions:
• That the fee schedule in effect for your fund represented reasonable compensation in light of the nature and quality of the services being provided to the fund, the fees paid by competitive funds and the costs incurred by Putnam Management in providing such services, and
• That such fee schedule represented an appropriate sharing between fund shareholders and Putnam Management of such economies of scale as may exist in the management of the fund at current asset levels.
These conclusions were based on a comprehensive consideration of all information provided to the Trustees and were not the result of any single factor. Some of the factors that figured particularly in the Trustees’ deliberations and how the Trustees considered these factors are described below, although individual Trustees may have evaluated the information presented differently, giving different weights to various factors. It is also important to recognize that the fee arrangements for your fund and the other Putnam funds are the result of many years of review and discussion between the Independent Trustees and Putnam Management, that certain aspects of such arrangements may receive greater scrutiny in some years than others, and that the Trustees’ conclusions may be based, in part, on their consideration of these same arrangements in prior years.
25
Management fee schedules and categories; total expenses
The Trustees reviewed the management fee schedules in effect for all Putnam funds, including fee levels and breakpoints, and the assignment of funds to particular fee categories. In reviewing fees and expenses, the Trustees generally focused their attention on material changes in circumstances — for example, changes in a fund’s size or investment style, changes in Putnam Management’s operating costs, or changes in competitive practices in the mutual fund industry — that suggest that consideration of fee changes might be warranted. The Trustees concluded that the circumstances did not warrant changes to the management fee structure of your fund, which had been carefully developed over the years, re-examined on many occasions and adjusted where appropriate. The Trustees focused on two areas of particular interest, as discussed further below:
• Competitiveness. The Trustees reviewed comparative fee and expense information for competitive funds, which indicated that, in a custom peer group of competitive funds selected by Lipper Inc., your fund ranked in the 24th percentile in management fees and in the 24th percentile in total expenses (less any applicable 12b-1 fees) as of December 31, 2005 (the first percentile being the least expensive funds and the 100th percentile being the most expensive funds). (Because the fund’s custom peer group is smaller than the fund’s broad Lipper Inc. peer group, this expense information may differ from the Lipper peer expense information found elsewhere in this report.) The Trustees noted that expense ratios for a number of Putnam funds, which show the percentage of fund assets used to pay for management and administrative services, distribution (12b-1) fees and other expenses, had been increa sing recently as a result of declining net assets and the natural operation of fee breakpoints.
The Trustees noted that the expense ratio increases described above were currently being controlled by expense limitations implemented in January 2004 and which Putnam Management, in consultation with the Contract Committee, has committed to maintain at least through 2007. These expense limitations give effect to a commitment by Putnam Management that the expense ratio of each open-end fund would be no higher than the average expense ratio of the competitive funds included in the fund’s relevant Lipper universe (exclusive of any applicable 12b-1 charges in each case). The Trustees observed that this commitment to limit fund expenses has served shareholders well since its inception. In order to ensure that the expenses of the Putnam funds continue to meet evolving competitive standards, the Trustees requested, and Putnam Management agreed, to implement an additional expense limitation for certain funds for the twelve months beginning January 1, 2007 equal to the average expense ratio (exclusive of 12b-1 charges) of a custom peer group of competitive funds selected by Lipper based on the size of the fund. This additional expense limitation will be applied to those open-end funds that had above-average expense ratios (exclusive of 12b-1 charges) based on the Lipper custom peer group data for the period ended December 31, 2005. This additional expense limitation will not be applied to your fund.
26
• Economies of scale. Your fund currently has the benefit of breakpoints in its management fee that provide shareholders with significant economies of scale, which means that the effective management fee rate of a fund (as a percentage of fund assets) declines as a fund grows in size and crosses specified asset thresholds. Conversely, as a fund shrinks in size — as has been the case for many Putnam funds in recent years — these breakpoints result in increasing fee levels. In recent years, the Trustees have examined the operation of the existing breakpoint structure during periods of both growth and decline in asset levels. The Trustees concluded that the fee schedules in effect for the funds represented an appropriate sharing of economies of scale at current asset levels. In reaching this conclusion, the Trustees considered the Contract Committee’s stated intent to continue to work with Putnam Management to plan for an eventual resumption in the growth of assets, including a study of potential economies that might be produced under various growth assumptions.
In connection with their review of the management fees and total expenses of the Putnam funds, the Trustees also reviewed the costs of the services to be provided and profits to be realized by Putnam Management and its affiliates from the relationship with the funds. This information included trends in revenues, expenses and profitability of Putnam Management and its affiliates relating to the investment management and distribution services provided to the funds. In this regard, the Trustees also reviewed an analysis of Putnam Management’s revenues, expenses and profitability with respect to the funds’ management contracts, allocated on a fund-by-fund basis. Because many of the costs incurred by Putnam Management in managing the funds are not readily identifiable to particular funds, the Trustees observed that the methodology for allocating costs is an important factor in evaluating Putnam Management’s costs and profitability, both as to the Putnam funds in the aggregate and as to individual funds. The Trustees reviewed Putnam Management’s cost allocation methodology with the assistance of independent consultants and concluded that this methodology was reasonable and well-considered.
Investment performance
The quality of the investment process provided by Putnam Management represented a major factor in the Trustees’ evaluation of the quality of services provided by Putnam Management under your fund’s management contract. The Trustees were assisted in their review of the Putnam funds’ investment process and performance by the work of the Investment Process Committee of the Trustees and the Investment Oversight Committees of the Trustees, which meet on a regular monthly basis with the funds’ portfolio teams throughout the year. The Trustees concluded that Putnam Management generally provides a high-quality investment process — as measured by the experience and skills of the individuals assigned to the management of fund portfolios, the resources made available to such personnel, and in general the ability of Putnam Management to attract and retain high-quality personnel — but also recognize that this does not guarantee favorable investment results for every fund in every time period. The Trustees considered the investment performance of each fund over multiple time periods
27
and considered information comparing each fund’s performance with various benchmarks and with the performance of competitive funds.
The Trustees noted the satisfactory investment performance of many Putnam funds. They also noted the disappointing investment performance of certain funds in recent years and discussed with senior management of Putnam Management the factors contributing to such underperfor-mance and actions being taken to improve performance. The Trustees recognized that, in recent years, Putnam Management has made significant changes in its investment personnel and processes and in the fund product line to address areas of underperformance. In particular, they noted the important contributions of Putnam Management’s leadership in attracting, retaining and supporting high-quality investment professionals and in systematically implementing an investment process that seeks to merge the best features of fundamental and quantitative analysis. The Trustees indicated their intention to continue to monitor performance trends to assess the effectiveness of these changes and to evaluate whether additional changes to address areas of underperformance are warranted.
In the case of your fund, the Trustees considered that your fund’s class A share cumulative total return performance at net asset value was in the following percentiles of its Lipper Inc. peer group (Lipper Multi-Cap Value Funds) for the one-, three- and five-year periods ended March 31, 2006 (the first percentile being the best performing funds and the 100th percentile being the worst performing funds):
| One-year period | Three-year period | Five-year period |
|
| 71st | 36th | 41st |
(Because of the passage of time, these performance results may differ from the performance results for more recent periods shown elsewhere in this report. Over the one-, three- and five-year periods ended March 31, 2006, there were 477, 370, and 248 funds, respectively, in your fund’s Lipper peer group. Past performance is no guarantee of future performance.)
As a general matter, the Trustees concluded that cooperative efforts between the Trustees and Putnam Management represent the most effective way to address investment performance problems. The Trustees noted that investors in the Putnam funds have, in effect, placed their trust in the Putnam organization, under the oversight of the funds’ Trustees, to make appropriate decisions regarding the management of the funds. Based on the responsiveness of Putnam Management in the recent past to Trustee concerns about investment performance, the Trustees concluded that it is preferable to seek change within Putnam Management to address performance shortcomings. In the Trustees’ view, the alternative of terminating a
* The percentile rankings for your fund’s class A share annualized total return performance in the Lipper Multi-Cap Value Funds category for the one-, five- and ten-year periods ended March 31, 2007, were 61%, 41%, and 59%, respectively. Over the one-, five- and ten-year periods ended March 31, 2007, the fund ranked 258th out of 425, 102nd out of 249, and 52nd out of 88 funds, respectively. Note that this more recent information was not available when the Trustees approved the continuance of your fund’s management contract.
28
management contract and engaging a new investment adviser for an underperforming fund would entail significant disruptions and would not provide any greater assurance of improved investment performance.
Brokerage and soft-dollar allocations; other benefits
The Trustees considered various potential benefits that Putnam Management may receive in connection with the services it provides under the management contract with your fund. These include benefits related to brokerage and soft-dollar allocations, whereby a portion of the commissions paid by a fund for brokerage may be used to acquire research services that may be useful to Putnam Management in managing the assets of the fund and of other clients. The Trustees indicated their continued intent to monitor the potential benefits associated with the allocation of fund brokerage to ensure that the principle of seeking “best price and execution” remains paramount in the portfolio trading process.
The Trustees’ annual review of your fund’s management contract also included the review of its distributor’s contract and distribution plan with Putnam Retail Management Limited Partnership and the custodian agreement and investor servicing agreement with Putnam Fiduciary Trust Company, all of which provide benefits to affiliates of Putnam Management.
Comparison of retail and institutional fee schedules
The information examined by the Trustees as part of their annual contract review has included for many years information regarding fees charged by Putnam Management and its affiliates to institutional clients such as defined benefit pension plans, college endowments, etc. This information included comparison of such fees with fees charged to the funds, as well as a detailed assessment of the differences in the services provided to these two types of clients. The Trustees observed, in this regard, that the differences in fee rates between institutional clients and the funds are by no means uniform when examined by individual asset sectors, suggesting that differences in the pricing of investment management services to these types of clients reflect to a substantial degree historical competitive forces operating in separate market places. The Trustees considered the fact that fee rates across all asset sectors are higher on average for funds than for institutional cli ents, as well as the differences between the services that Putnam Management provides to the Putnam funds and those that it provides to institutional clients of the firm, but did not rely on such comparisons to any significant extent in concluding that the management fees paid by your fund are reasonable.
29
Approval of new management contracts in connection with pending
change in control
As discussed in the “Message from the Trustees” at the beginning of this shareholder report, on February 1, 2007, Marsh & McLennan Companies, Inc. announced that it had signed a definitive agreement to sell its ownership interest in Putnam Investments Trust, the parent company of Putnam Management and its affiliates, to Great-West Lifeco Inc., a member of the Power Financial Corporation group of companies. This transaction is subject to regulatory approvals and other conditions, including the approval of new management contracts by shareholders of a substantial number of Putnam funds at shareholder meetings scheduled for May 15, 2007. Proxy solicitation materials related to these meetings, which provide detailed information regarding the transaction, were recently mailed. The transaction is currently expected to be completed by the middle of 2007.
At an in-person meeting on February 8-9, 2007, the Trustees considered the approval of new management contracts for each Putnam fund proposed to become effective upon the closing of the transaction, and the filing of a preliminary proxy statement. At an in-person meeting on March 8-9, 2007, the Trustees considered the approval of the final forms of the proposed new management contracts for each Putnam fund and the proxy statement. They reviewed the terms of the proposed new management contracts and the differences between the proposed new management contracts and the current management contracts. They noted that the terms of the proposed new management contracts were substantially identical to the current management contracts, except for certain changes developed at the initiative of the Trustees and designed largely to address inconsistencies among various of the existing contracts, which had been developed and implemented at different times in the past. In considering the approval of the proposed new management contracts, the Trustees also considered, as discussed further in the proxy statement, various matters relating to the transaction. Finally, in considering the proposed new management contracts, the Trustees also took into account their deliberations and conclusions (discussed above in the preceding paragraphs of the “Trustee Approval of Management Contract” section) in connection with the most recent annual approval of the continuance of the Putnam funds’ management contracts effective July 1, 2006, and the extensive materials that they had reviewed in connection with that approval process. Based upon the foregoing considerations, on March 9, 2007, the Trustees, including all of the Independent Trustees, unanimously approved the proposed new management contracts and determined to recommend their approval to the shareholders of the Putnam funds.
30
Other information
for shareholders
Important notice regarding delivery of shareholder documents
In accordance with SEC regulations, Putnam sends a single copy of annual and semiannual shareholder reports, prospectuses, and proxy statements to Putnam shareholders who share the same address, unless a shareholder requests otherwise. If you prefer to receive your own copy of these documents, please call Putnam at 1-800-225-1581, and Putnam will begin sending individual copies within 30 days.
Proxy voting
Putnam is committed to managing our mutual funds in the best interests of our shareholders. The Putnam funds’ proxy voting guidelines and procedures, as well as information regarding how your fund voted proxies relating to portfolio securities during the 12-month period ended June 30, 2006, are available on the Putnam Individual Investor Web site, www.putnam.com/individual, and on the SEC’s Web site, www.sec.gov. If you have questions about finding forms on the SEC’s Web site, you may call the SEC at 1-800-SEC-0330. You may also obtain the Putnam funds’ proxy voting guidelines and procedures at no charge by calling Putnam’s Shareholder Services at 1-800-225-1581.
Fund portfolio holdings
The fund will file a complete schedule of its portfolio holdings with the SEC for the first and third quarters of each fiscal year on Form N-Q. Shareholders may obtain the fund’s Forms N-Q on the SEC’s Web site at www.sec.gov. In addition, the fund’s Forms N-Q may be reviewed and copied at the SEC’s Public Reference Room in Washington, D.C. You may call the SEC at 1-800-SEC-0330 for information about the SEC’s Web site or the operation of the Public Reference Room.
31
Financial statements
A guide to financial statements
These sections of the report, as well as the accompanying Notes, constitute the fund’s financial statements.
The fund’s portfolio lists all the fund’s investments and their values as of the last day of the reporting period. Holdings are organized by asset type and industry sector, country, or state to show areas of concentration and diversification.
Statement of assets and liabilities shows how the fund’s net assets and share price are determined. All investment and noninvestment assets are added together. Any unpaid expenses and other liabilities are subtracted from this total. The result is divided by the number of shares to determine the net asset value per share, which is calculated separately for each class of shares. (For funds with preferred shares, the amount subtracted from total assets includes the liquidation preference of preferred shares.)
Statement of operations shows the fund’s net investment gain or loss. This is done by first adding up all the fund’s earnings — from dividends and interest income — and subtracting its operating expenses to determine net investment income (or loss). Then, any net gain or loss the fund realized on the sales of its holdings — as well as any unrealized gains or losses over the period — is added to or subtracted from the net investment result to determine the fund’s net gain or loss for the fiscal period.
Statement of changes in net assets shows how the fund’s net assets were affected by the fund’s net investment gain or loss, by distributions to shareholders, and by changes in the number of the fund’s shares. It lists distributions and their sources (net investment income or realized capital gains) over the current reporting period and the most recent fiscal year-end. The distributions listed here may not match the sources listed in the Statement of operations because the distributions are determined on a tax basis and may be paid in a different period from the one in which they were earned. Dividend sources are estimated at the time of declaration. Actual results may vary. Any non-taxable return of capital cannot be determined until final tax calculations are completed after the end of the fund’s fiscal year.
Financial highlights provide an overview of the fund’s investment results, per-share distributions, expense ratios, net investment income ratios, and portfolio turnover in one summary table, reflecting the five most recent reporting periods. In a semiannual report, the highlight table also includes the current reporting period.
32
The fund’s portfolio 2/28/07 (Unaudited)
| COMMON STOCKS (99.8%)* | | | |
|
| | Shares | | Value |
|
| Aerospace and Defense (2.0%) | | | |
| Boeing Co. (The) | 231,600 | $ | 20,211,732 |
| Lockheed Martin Corp. | 205,200 | | 19,961,856 |
| | | | 40,173,588 |
|
| |
| Airlines (1.3%) | | | |
| Southwest Airlines Co. | 1,707,197 | | 25,829,891 |
|
| |
| Banking (6.2%) | | | |
| Bank of America Corp. | 1,597,700 | | 81,274,999 |
| Commerce Bancorp, Inc. | 436,200 | | 14,577,804 |
| PNC Financial Services Group | 426,900 | | 31,296,039 |
| | | | 127,148,842 |
|
| |
| Beverage (1.4%) | | | |
| Molson Coors Brewing Co. Class B | 213,900 | | 18,061,716 |
| Pepsi Bottling Group, Inc. (The) | 329,400 | | 10,211,400 |
| | | | 28,273,116 |
|
| |
| Building Materials (0.7%) | | | |
| Masco Corp. (S) | 479,400 | | 14,310,090 |
|
| |
| Chemicals (4.0%) | | | |
| E.I. du Pont de Nemours & Co. | 537,100 | | 27,257,825 |
| Huntsman Corp. | 560,900 | | 11,470,405 |
| Rohm & Haas Co. | 807,545 | | 42,686,829 |
| | | | 81,415,059 |
|
| |
| Computers (4.2%) | | | |
| Dell, Inc. † | 461,100 | | 10,536,135 |
| Hewlett-Packard Co. | 745,400 | | 29,353,852 |
| IBM Corp. | 482,900 | | 44,914,529 |
| | | | 84,804,516 |
|
| |
| Conglomerates (6.0%) | | | |
| Honeywell International, Inc. (S) | 467,800 | | 21,724,632 |
| Textron, Inc. | 449,369 | | 41,472,265 |
| Tyco International, Ltd. (Bermuda) | 1,933,300 | | 59,603,639 |
| | | | 122,800,536 |
|
| |
| Consumer Finance (4.2%) | | | |
| Capital One Financial Corp. | 545,800 | | 42,070,264 |
| Countrywide Financial Corp. (S) | 1,119,100 | | 42,839,148 |
| | | | 84,909,412 |
|
| |
| Consumer Services (0.9%) | | | |
| Service Corporation International | 1,545,300 | | 18,126,369 |
33
| COMMON STOCKS (99.8%)* continued | | | |
|
| | Shares | | Value |
|
| Containers (0.6%) | | | |
| Crown Holdings, Inc. † | 575,500 | $ | 13,144,420 |
|
| |
| Electric Utilities (4.8%) | | | |
| Dominion Resources, Inc. | 120,900 | | 10,340,577 |
| Edison International | 718,800 | | 33,726,096 |
| PG&E Corp. | 673,700 | | 31,273,154 |
| Sierra Pacific Resources † (S) | 1,240,500 | | 21,535,080 |
| | | | 96,874,907 |
|
| |
| Electronics (1.6%) | | | |
| Intel Corp. | 1,649,700 | | 32,746,545 |
|
| |
| Financial (8.0%) | | | |
| Citigroup, Inc. | 1,380,300 | | 69,567,120 |
| JPMorgan Chase & Co. | 1,019,200 | | 50,348,480 |
| MGIC Investment Corp. | 701,700 | | 42,347,595 |
| | | | 162,263,195 |
|
| |
| Health Care Services (2.7%) | | | |
| Cardinal Health, Inc. | 294,000 | | 20,606,460 |
| CIGNA Corp. | 82,800 | | 11,799,000 |
| McKesson Corp. | 395,400 | | 22,047,504 |
| | | | 54,452,964 |
|
| |
| Homebuilding (1.0%) | | | |
| Lennar Corp. | 406,400 | | 20,011,136 |
|
| |
| Household Furniture and Appliances (0.7%) | | | |
| Whirlpool Corp. | 171,800 | | 15,154,478 |
|
| |
| Insurance (8.7%) | | | |
| ACE, Ltd. (Bermuda) (S) | 517,300 | | 29,051,568 |
| Berkshire Hathaway, Inc. Class B † | 13,507 | | 47,585,161 |
| Chubb Corp. (The) | 1,167,692 | | 59,610,675 |
| Genworth Financial, Inc. Class A | 1,160,500 | | 41,046,885 |
| | | | 177,294,289 |
|
| |
| Investment Banking/Brokerage (2.0%) | | | |
| Bear Stearns Cos., Inc. (The) | 270,500 | | 41,180,920 |
|
| |
| Lodging/Tourism (1.0%) | | | |
| Carnival Corp. | 437,300 | | 20,299,466 |
|
| |
| Machinery (1.1%) | | | |
| Ingersoll-Rand Co., Ltd. Class A (Bermuda) | 510,100 | | 22,092,431 |
|
| |
| Medical Technology (1.0%) | | | |
| Boston Scientific Corp. † | 1,237,600 | | 20,185,256 |
34
| COMMON STOCKS (99.8%)* continued | | | |
|
| | Shares | | Value |
|
| Metals (2.0%) | | | |
| Freeport-McMoRan Copper & Gold, Inc. Class B | 334,200 | $ | 19,186,422 |
| Phelps Dodge Corp. | 171,000 | | 21,359,610 |
| | | | 40,546,032 |
|
| |
| Natural Gas Utilities (0.5%) | | | |
| Southern Union Co. | 371,382 | | 10,881,493 |
|
| |
| Oil & Gas (11.0%) | | | |
| BP PLC ADR (United Kingdom) | 333,000 | | 20,526,120 |
| Devon Energy Corp. | 405,300 | | 26,632,263 |
| Exxon Mobil Corp. | 1,121,000 | | 80,353,280 |
| Hess Corp. | 418,100 | | 22,180,205 |
| Marathon Oil Corp. | 370,100 | | 33,582,874 |
| Newfield Exploration Co. † | 375,941 | | 16,248,170 |
| Valero Energy Corp. | 422,400 | | 24,351,360 |
| | | | 223,874,272 |
|
| |
| Pharmaceuticals (4.0%) | | | |
| Pfizer, Inc. | 2,857,700 | | 71,328,192 |
| Watson Pharmaceuticals, Inc. † (S) | 380,200 | | 10,022,072 |
| | | | 81,350,264 |
|
| |
| Photography/Imaging (0.5%) | | | |
| Xerox Corp. † | 630,100 | | 10,881,827 |
|
| |
| Publishing (2.1%) | | | |
| Idearc, Inc. | 655,965 | | 22,302,810 |
| R. R. Donnelley & Sons Co. (S) | 581,900 | | 21,053,142 |
| | | | 43,355,952 |
|
| |
| Railroads (0.9%) | | | |
| Norfolk Southern Corp. | 383,100 | | 18,158,940 |
|
| |
| Regional Bells (1.8%) | | | |
| Verizon Communications, Inc. | 966,600 | | 36,179,838 |
|
| |
| Restaurants (0.7%) | | | |
| McDonald’s Corp. | 344,700 | | 15,070,284 |
|
| |
| Retail (4.8%) | | | |
| Big Lots, Inc. † (S) | 814,008 | | 20,374,620 |
| Home Depot, Inc. (The) | 1,036,800 | | 41,057,280 |
| OfficeMax, Inc. | 383,900 | | 19,924,410 |
| Supervalu, Inc. (S) | 461,310 | | 17,050,018 |
| | | | 98,406,328 |
|
| |
| Schools (0.6%) | | | |
| Career Education Corp. † | 409,200 | | 12,104,136 |
|
| |
| Software (0.5%) | | | |
| Oracle Corp. † | 633,200 | | 10,403,476 |
35
| COMMON STOCKS (99.8%)* continued | | | | |
|
| | | Shares | | Value |
|
| Telecommunications (1.8%) | | | | |
| Embarq Corp. | | 211,400 | $ | 11,700,990 |
| Sprint Nextel Corp. | | 1,257,200 | | 24,238,816 |
| | | | | 35,939,806 |
|
| Tobacco (2.4%) | | | | |
| Altria Group, Inc. | | 590,900 | | 49,801,052 |
|
| Toys (1.1%) | | | | |
| Mattel, Inc. | | 881,000 | | 22,914,810 |
|
| Waste Management (1.0%) | | | | |
| Waste Management, Inc. | | 596,900 | | 20,324,445 |
|
| Total common stocks (cost $1,633,864,450) | | | $ | 2,033,684,381 |
|
| |
| SHORT-TERM INVESTMENTS (2.6%)* | | | | |
|
| | | Principal amount/shares | | Value |
| Short-term investments held as collateral for loaned | | | | |
| securities with yields ranging from 5.29% to 5.46% | | | | |
| and due dates ranging from March 1, 2007 to | | | | |
| April 29, 2007 (d) | $ | 47,325,465 | $ | 47,237,149 |
| Putnam Prime Money Market Fund (e) | | 6,012,237 | | 6,012,237 |
|
| Total short-term investments (cost $53,249,386) | | | $ | 53,249,386 |
|
| |
| TOTAL INVESTMENTS | | | | |
| Total investments (cost $1,687,113,836) | | | $ | 2,086,933,767 |
* Percentages indicated are based on net assets of $2,036,852,081.
† Non-income-producing security.
(d) See Note 1 to the financial statements.
(e) See Note 5 to the financial statements regarding investments in Putnam Prime Money Market Fund.
(S) Securities on loan, in part or in entirety, at February 28, 2007.
ADR after the name of a foreign holding stands for American Depository Receipts, representing ownership of foreign securities on deposit with a custodian bank.
The accompanying notes are an integral part of these financial statements.
36
Statement of assets and liabilities 2/28/07 (Unaudited)
| ASSETS | |
|
| Investment in securities, at value, including $45,884,454 of securities on loan (Note 1): | |
| Unaffiliated issuers (identified cost $1,681,101,599) | $2,080,921,530 |
| Affiliated issuers (identified cost $6,012,237) (Note 5) | 6,012,237 |
|
| Dividends, interest and other receivables | 4,962,493 |
|
| Receivable for shares of the fund sold | 1,759,634 |
|
| Receivable for securities sold | 5,339,771 |
|
| Total assets | 2,098,995,665 |
|
| |
| LIABILITIES | |
|
| Payable for securities purchased | 6,377,115 |
|
| Payable for shares of the fund repurchased | 3,690,320 |
|
| Payable for compensation of Manager (Notes 2 and 5) | 2,998,173 |
|
| Payable for investor servicing and custodian fees (Note 2) | 462,941 |
|
| Payable for Trustee compensation and expenses (Note 2) | 158,365 |
|
| Payable for administrative services (Note 2) | 3,327 |
|
| Payable for distribution fees (Note 2) | 975,166 |
|
| Collateral on securities loaned, at value (Note 1) | 47,237,149 |
|
| Other accrued expenses | 241,028 |
|
| Total liabilities | 62,143,584 |
|
| Net assets | $2,036,852,081 |
|
| |
| REPRESENTED BY | |
|
| Paid-in capital (Unlimited shares authorized) (Notes 1 and 4) | $1,572,771,177 |
|
| Undistributed net investment income (Note 1) | 3,628,653 |
|
| Accumulated net realized gain on investments (Note 1) | 60,632,320 |
|
| Net unrealized appreciation of investments | 399,819,931 |
|
| Total — Representing net assets applicable to capital shares outstanding | $2,036,852,081 |
(Continued on next page)
37
Statement of assets and liabilities (Continued)
| COMPUTATION OF NET ASSET VALUE AND OFFERING PRICE | |
|
| Net asset value and redemption price per class A share | |
| ($1,405,901,695 divided by 73,232,226 shares) | $19.20 |
|
| Offering price per class A share | |
| (100/94.75 of $19.20)* | $20.26 |
|
| Net asset value and offering price per class B share | |
| ($395,144,311 divided by 20,886,796 shares)** | $18.92 |
|
| Net asset value and offering price per class C share | |
| ($70,036,937 divided by 3,722,440 shares)** | $18.81 |
|
| Net asset value and redemption price per class M share | |
| ($33,688,526 divided by 1,759,312 shares) | $19.15 |
|
| Offering price per class M share | |
| (100/96.75 of $19.15)* | $19.79 |
|
| Net asset value, offering price and redemption price per class R share | |
| ($2,543,771 divided by 133,712 shares) | $19.02 |
|
| Net asset value, offering price and redemption price per class Y share | |
| ($129,536,841 divided by 6,740,309 shares) | $19.22 |
* On single retail sales of less than $50,000. On sales of $50,000 or more the offering price is reduced.
** Redemption price per share is equal to net asset value less any applicable contingent deferred sales charge.
The accompanying notes are an integral part of these financial statements.
38
Statement of operations Six months ended 2/28/07 (Unaudited)
| INVESTMENT INCOME | |
|
| Dividends | $ 21,496,011 |
|
| Interest (including interest income of $269,556 | |
| from investments in affiliated issuers) (Note 5) | 308,014 |
|
| Securities lending | 27,207 |
|
| Total investment income | 21,831,232 |
|
| |
| EXPENSES | |
|
| Compensation of Manager (Note 2) | 5,934,065 |
|
| Investor servicing fees (Note 2) | 2,595,666 |
|
| Custodian fees (Note 2) | 75,616 |
|
| Trustee compensation and expenses (Note 2) | 30,934 |
|
| Administrative services (Note 2) | 27,197 |
|
| Distribution fees — Class A (Note 2) | 1,721,729 |
|
| Distribution fees — Class B (Note 2) | 2,098,212 |
|
| Distribution fees — Class C (Note 2) | 346,848 |
|
| Distribution fees — Class M (Note 2) | 125,709 |
|
| Distribution fees — Class R (Note 2) | 5,211 |
|
| Other | 201,755 |
|
| Fees waived and reimbursed by Manager (Note 5) | (4,691) |
|
| Total expenses | 13,158,251 |
|
| Expense reduction (Note 2) | (150,869) |
|
| Net expenses | 13,007,382 |
|
| Net investment income | 8,823,850 |
|
| Net realized gain on investments (Notes 1 and 3) | 109,098,507 |
|
| Net unrealized appreciation of investments during the period | 74,632,908 |
|
| Net gain on investments | 183,731,415 |
|
| Net increase in net assets resulting from operations | $192,555,265 |
The accompanying notes are an integral part of these financial statements.
39
Statement of changes in net assets
| INCREASE IN NET ASSETS | | | | |
|
| | Six months ended | | Year ended |
| | | 2/28/07* | | 8/31/06 |
|
| Operations: | | | | |
| Net investment income | $ | 8,823,850 | $ | 16,888,194 |
|
| Net realized gain on investments | | 109,098,507 | | 130,458,085 |
|
| Net unrealized appreciation of investments | | 74,632,908 | | 1,668,368 |
|
| Net increase in net assets resulting from operations | | 192,555,265 | | 149,014,647 |
|
| Distributions to shareholders: (Note 1) | | | | |
|
| From ordinary income | | | | |
|
| Net investment income | | | | |
|
| Class A | | (12,985,658) | | (12,627,408) |
|
| Class B | | (424,096) | | (1,189,532) |
|
| Class C | | (191,579) | | (264,019) |
|
| Class M | | (152,553) | | (163,384) |
|
| Class R | | (18,817) | | (9,734) |
|
| Class Y | | (1,443,687) | | (1,677,607) |
|
| Net realized short-term gain on investments | | | | |
|
| Class A | | (25,424,551) | | (5,862,725) |
|
| Class B | | (7,888,193) | | (2,517,382) |
|
| Class C | | (1,319,767) | | (292,997) |
|
| Class M | | (623,623) | | (161,609) |
|
| Class R | | (40,461) | | (4,687) |
|
| Class Y | | (2,266,041) | | (644,144) |
|
| From net realized long-term gain on investments | | | | |
|
| Class A | | (69,165,715) | | (46,772,951) |
|
| Class B | | (21,459,277) | | (20,083,731) |
|
| Class C | | (3,590,335) | | (2,337,534) |
|
| Class M | | (1,696,524) | | (1,289,317) |
|
| Class R | | (110,071) | | (37,389) |
|
| Class Y | | (6,164,605) | | (5,138,998) |
|
| Redemption fees (Note 1) | | 1,295 | | 4,785 |
|
| Increase (decrease) from capital share transactions (Note 4) | | 49,067,001 | | (15,124,740) |
|
| Total increase in net assets | | 86,658,008 | | 32,819,544 |
|
| |
| NET ASSETS | | | | |
|
| Beginning of period | | 1,950,194,073 | | 1,917,374,529 |
|
| End of period (including undistributed net investment | | | | |
| income of $3,628,653 and $10,021,193, respectively) | $2,036,852,081 | | $1,950,194,073 |
* Unaudited
The accompanying notes are an integral part of these financial statements.
40
This page left blank intentionally.
41
Financial highlights (For a common share outstanding throughout the period)
| INVESTMENT OPERATIONS: | | | | LESS DISTRIBUTIONS: | | | | | RATIOS AND SUPPLEMENTAL DATA: | |
|
| | | | Net | | | | | | | Total | | | Ratio of net | |
| | Net asset | | realized and | Total | From | From | | | Net asset | return | Net | Ratio of | investment | |
| | value, | Net | unrealized | from | net | net realized | | | value, | at net | assets, | expenses to | income (loss) | Portfolio |
| | beginning | investment | gain (loss) on | investment | investment | gain on | Total | Redemption | end | asset | end of period | average net | to average | turnover |
| Period ended | of period | income (loss)(a) | investments | operations | income | investments | distributions | fees | of period | value (%)(b) | (in thousands) | assets (%)(c) | net assets (%) | (%) |
|
| CLASS A | | | | | | | | | | | | | | | |
| February 28, 2007** | $18.88 | | .10(d) | 1.79 | 1.89 | (.19) | (1.38) | (1.57) | —(e) | $19.20 | 10.12* | $1,405,902 | | .56*(d) | .52*(d) | 29.33* |
| August 31, 2006 | 18.43 | | .20(d,g) | 1.27 | 1.47 | (.20) | (.82) | (1.02) | —(e) | 18.88 | 8.20 | 1,309,486 | | 1.13(d,g) | 1.07(d,g) | 56.00 |
| August 31, 2005 | 16.21 | | .17(d,f) | 2.18 | 2.35 | (.13) | — | (.13) | —(e) | 18.43 | 14.56(f) | 1,165,377 | | 1.13(d) | .94(d,f) | 51.72 |
| August 31, 2004 | 13.88 | | .11(d) | 2.36 | 2.47 | (.14) | — | (.14) | —(e) | 16.21 | 17.92 | 731,954 | | 1.19(d) | .75(d) | 54.46 |
| August 31, 2003 | 12.22 | | .13 | 1.61 | 1.74 | (.08) | — | (.08) | — | 13.88 | 14.30 | 688,610 | | 1.18 | 1.05 | 57.16 |
| August 31, 2002 | 14.58 | | .12 | (2.02) | (1.90) | (.10) | (.36) | (.46) | — | 12.22 | (13.45) | 633,088 | | 1.09 | .86 | 68.12 |
|
| |
| CLASS B | | | | | | | | | | | | | | |
| February 28, 2007** | $18.54 | | .03(d) | 1.75 | 1.78 | (.02) | (1.38) | (1.40) | —(e) | $18.92 | 9.69* | $395,144 | | .93*(d) | .14*(d) | 29.33* |
| August 31, 2006 | 18.10 | | .06(d,g) | 1.24 | 1.30 | (.04) | (.82) | (.86) | —(e) | 18.54 | 7.38 | 426,865 | | 1.88(d,g) | .31(d,g) | 56.00 |
| August 31, 2005 | 15.93 | | .03(d,f) | 2.16 | 2.19 | (.02) | — | (.02) | —(e) | 18.10 | 13.75(f) | 530,586 | | 1.88(d) | .19(d,f) | 51.72 |
| August 31, 2004 | 13.66 | | —(d,e) | 2.31 | 2.31 | (.04) | — | (.04) | —(e) | 15.93 | 16.97 | 490,299 | | 1.94(d) | (.01)(d) | 54.46 |
| August 31, 2003 | 12.03 | | .04 | 1.59 | 1.63 | — | — | — | — | 13.66 | 13.55 | 424,745 | | 1.93 | .32 | 57.16 |
| August 31, 2002 | 14.39 | | .02 | (2.01) | (1.99) | (.01) | (.36) | (.37) | — | 12.03 | (14.15) | 457,303 | | 1.84 | .12 | 68.12 |
|
| |
| CLASS C | | | | | | | | | | | | | | |
| February 28, 2007** | $18.47 | | .03(d) | 1.74 | 1.77 | (.05) | (1.38) | (1.43) | —(e) | $18.81 | 9.69* | $70,037 | | .93*(d) | .15*(d) | 29.33* |
| August 31, 2006 | 18.08 | | .06(d,g) | 1.23 | 1.29 | (.08) | (.82) | (.90) | —(e) | 18.47 | 7.34 | 65,906 | | 1.88(d,g) | .32(d,g) | 56.00 |
| August 31, 2005 | 15.91 | | .03(d,f) | 2.16 | 2.19 | (.02) | — | (.02) | —(e) | 18.08 | 13.79(f) | 55,887 | | 1.88(d) | .19(d,f ) | 51.72 |
| August 31, 2004 | 13.64 | | —(d,e) | 2.31 | 2.31 | (.04) | — | (.04) | —(e) | 15.91 | 16.98 | 34,594 | | 1.94(d) | —(d,h) | 54.46 |
| August 31, 2003 | 12.02 | | .04 | 1.58 | 1.62 | — | — | — | — | 13.64 | 13.48 | 31,770 | | 1.93 | .31 | 57.16 |
| August 31, 2002 | 14.39 | | .02 | (2.00) | (1.98) | (.03) | (.36) | (.39) | — | 12.02 | (14.11) | 32,446 | | 1.84 | .11 | 68.12 |
|
| |
| CLASS M | | | | | | | | | | | | | | |
| February 28, 2007** | $18.79 | | .05(d) | 1.78 | 1.83 | (.09) | (1.38) | (1.47) | —(e) | $19.15 | 9.84* | $33,689 | | .81*(d) | .27*(d) | 29.33* |
| August 31, 2006 | 18.34 | | .10(d,g) | 1.26 | 1.36 | (.09) | (.82) | (.91) | —(e) | 18.79 | 7.63 | 32,174 | | 1.63(d,g) | .57(d,g) | 56.00 |
| August 31, 2005 | 16.13 | | .08(d,f) | 2.18 | 2.26 | (.05) | — | (.05) | —(e) | 18.34 | 14.01(f) | 35,182 | | 1.63(d) | .44(d,f) | 51.72 |
| August 31, 2004 | 13.81 | | .04(d) | 2.35 | 2.39 | (.07) | — | (.07) | —(e) | 16.13 | 17.33 | 29,774 | | 1.69(d) | .25(d) | 54.46 |
| August 31, 2003 | 12.14 | | .07 | 1.60 | 1.67 | — | — | — | — | 13.81 | 13.76 | 32,334 | | 1.68 | .56 | 57.16 |
| August 31, 2002 | 14.48 | | .05 | (2.00) | (1.95) | (.03) | (.36) | (.39) | — | 12.14 | (13.81) | 35,610 | | 1.59 | .37 | 68.12 |
|
| |
| CLASS R | | | | | | | | | | | | | | |
| February 28, 2007** | $18.73 | | .08(d) | 1.76 | 1.84 | (.17) | (1.38) | (1.55) | —(e) | $19.02 | 9.95* | $2,544 | | .68*(d) | .42*(d) | 29.33* |
| August 31, 2006 | 18.33 | | .16(d,g) | 1.25 | 1.41 | (.19) | (.82) | (1.01) | —(e) | 18.73 | 7.92 | 1,574 | | 1.38(d,g) | .86(d,g) | 56.00 |
| August 31, 2005 | 16.18 | | 1.12(d,f) | 2.19 | 2.31 | (.16) | — | (.16) | —(e) | 18.33 | 14.33(f) | 711 | | 1.38(d) | .65(d,f) | 51.72 |
| August 31, 2004† | 14.82 | | .06(d) | 1.44 | 1.50 | (.14) | — | (.14) | —(e) | 16.18 | 10.24* | 3 | | 1.08*(d) | .37*(d) | 54.46 |
|
| |
| CLASS Y | | | | | | | | | | | | | | |
| February 28, 2007** | $18.92 | | .13(d) | 1.79 | 1.92 | (.24) | (1.38) | (1.62) | —(e) | $19.22 | 10.25* | $129,537 | | .43*(d) | .65*(d) | 29.33* |
| August 31, 2006 | 18.46 | | .25(d,g) | 1.27 | 1.52 | (.24) | (.82) | (1.06) | —(e) | 18.92 | 8.48 | 114,189 | | .88(d,g) | 1.33(d,g) | 56.00 |
| August 31, 2005 | 16.23 | | .21(d,f) | 2.19 | 2.40 | (.17) | — | (.17) | —(e) | 18.46 | 14.85(f) | 129,631 | | .88(d) | 1.19(d,f) | 51.72 |
| August 31, 2004 | 13.90 | | .16(d) | 2.35 | 2.51 | (.18) | — | (.18) | —(e) | 16.23 | 18.19 | 97,378 | | .94(d) | .99(d) | 54.46 |
| August 31, 2003 | 12.23 | | .15 | 1.63 | 1.78 | (.11) | — | (.11) | — | 13.90 | 14.67 | 72,965 | | .93 | 1.27 | 57.16 |
| August 31, 2002 | 14.59 | | .15 | (2.02) | (1.87) | (.13) | (.36) | (.49) | — | 12.23 | (13.25) | 51,298 | | .84 | 1.08 | 68.12 |
|
See notes to financial highlights at the end of this section.
The accompanying notes are an integral part of these financial statements.
Financial highlights (Continued)
* Not annualized.
** Unaudited.
† For the period 12/1/03 (commencement of operations) to 8/31/04.
(a) Per share net investment income (loss) has been determined on the basis of the weighted average number of shares outstanding during the period.
(b) Total return assumes dividend reinvestment and does not reflect the effect of sales charges.
(c) Includes amounts paid through expense offset and brokerage service arrangements (Note 2).
(d) Reflects waivers of certain fund expenses in connection with investments in Putnam Prime Money Market Fund during the period. As a result of such waivers, the expenses of each class reflect a reduction of the following amounts (Note 5):
| | | Percentage |
| | | of average |
| | | net assets |
|
| February 28, 2007 | | <0.01% |
|
| August 31, 2006 | | <0.01 |
|
| August 31, 2005 | | <0.01 |
|
| August 31, 2004 | | <0.01 |
|
(e) Amount represents less than $0.01 per share.
(f) Reflects a non-recurring accrual related to Putnam Management’s settlement with the SEC regarding brokerage allocation practices, which amounted to the following amounts:
| | | Percentage |
| | | of average |
| | Per share | net assets |
|
| Class A | $0.01 | 0.03% |
|
| Class B | 0.01 | 0.03 |
|
| Class C | 0.01 | 0.03 |
|
| Class M | 0.01 | 0.03 |
|
| Class R | 0.01 | 0.05 |
|
| Class Y | 0.01 | 0.03 |
|
(g) Reflects a non-recurring reimbursement from Putnam Investments relating to the calculation of certain amounts paid by the fund to Putnam in previous years for transfer agent services, which amounted to less than $0.01 per share and 0.01% of average net assets for the period ended August 31, 2006 (Note 6).
(h) Amount represents less than 0.01% .
The accompanying notes are an integral part of these financial statements.
44
Notes to financial statements 2/28/07 (Unaudited)
Note 1: Significant accounting policies
Putnam New Value Fund (the “fund”) is a series of Putnam Investment Funds (the “trust”), a Massachusetts business trust, which is registered under the Investment Company Act of 1940, as amended, as a diversified, open-end management investment company. The objective of the fund is to seek long-term capital appreciation by investing primarily in common stocks of U.S. companies which Putnam Investment Management, LLC (“Putnam Management”), the fund’s manager, an indirect wholly-owned subsidiary of Putnam, LLC, believes are currently undervalued by the market.
The fund offers class A, class B, class C, class M, class R and class Y shares. Class A and class M shares are sold with a maximum front-end sales charge of 5.25% and 3.25%, respectively, and generally do not pay a contingent deferred sales charge. Class B shares, which convert to class A shares after approximately eight years, do not pay a front-end sales charge and are subject to a contingent deferred sales charge, if those shares are redeemed within six years of purchase. Class C shares have a one-year 1.00% contingent deferred sales charge and do not convert to class A shares. Class R shares, which are offered to qualified employee-benefit plans, are sold without a front-end sales charge or a contingent deferred sales charge. The expenses for class A, class B, class C, class M and class R shares may differ based on the distribution fee of each class, which is identified in Note 2. Class Y shares, which are sold at net asset value, are generally subject to the same expenses as class A, class B, class C, c lass M and class R shares, but do not bear a distribution fee. Class Y shares are sold to certain eligible purchasers including certain defined contribution plans (including corporate IRAs), bank trust departments, trust companies and certain college savings plans.
Effective October 2, 2006, a 1.00% redemption fee may apply on any shares purchased on or after such date that are redeemed (either by selling or exchanging into another fund) within 7 days of purchase. The redemption fee is accounted for as an addition to paid-in-capital. Prior to October 2, 2006, a 2.00% redemption fee applied to any shares that were redeemed (either by selling or exchanging into another fund) within 5 days of purchase.
Investment income, realized and unrealized gains and losses and expenses of the fund are borne pro-rata based on the relative net assets of each class to the total net assets of the fund, except that each class bears expenses unique to that class (including the distribution fees applicable to such classes). Each class votes as a class only with respect to its own distribution plan or other matters on which a class vote is required by law or determined by the Trustees. Shares of each class would receive their pro-rata share of the net assets of the fund, if the fund were liquidated. In addition, the Trustees declare separate dividends on each class of shares.
In the normal course of business, the fund enters into contracts that may include agreements to indemnify another party under given circumstances. The fund’s maximum exposure under these arrangements is unknown as this would involve future claims that may be, but have not yet been, made against the fund. However, the fund expects the risk of material loss to be remote.
The following is a summary of significant accounting policies consistently followed by the fund in the preparation of its financial statements. The preparation of financial statements is in conformity with accounting principles generally accepted in the United States of America and requires management to make estimates and assumptions that affect the reported amounts of assets and liabilities in the financial statements and the reported amounts of increases and decreases in net assets from operations during the reporting period. Actual results could differ from those estimates.
A) Security valuation Investments for which market quotations are readily available are valued at the last reported sales price on their principal exchange, or official closing price for certain markets. If no sales are reported— as in the case of
45
some securities traded over-the-counter— a security is valued at its last reported bid price. Many securities markets and exchanges outside the U.S. close prior to the close of the New York Stock Exchange and therefore the closing prices for securities in such markets or on such exchanges may not fully reflect events that occur after such close but before the close of the New York Stock Exchange. Accordingly, on certain days, the fund will fair value foreign equity securities taking into account multiple factors, including movements in the U.S. securities markets. The number of days on which fair value prices will be used will depend on market activity and it is possible that fair value prices will be used by the fund to a significant extent. Securities quoted in foreign currencies, if any, are translated into U.S. dollars at the current exchange rate. Certain investments, including certain restricted securities, are also valued at fair value following procedur es approved by the Trustees. Such valuations and procedures are reviewed periodically by the Trustees. The fair value of securities is generally determined as the amount that the fund could reasonably expect to realize from an orderly disposition of such securities over a reasonable period of time. By its nature, a fair value price is a good faith estimate of the value of a security at a given point in time and does not reflect an actual market price, which may be different by a material amount.
B) Joint trading account Pursuant to an exemptive order from the Securities and Exchange Commission (the “SEC”), the fund may transfer uninvested cash balances, including cash collateral received under security lending arrangements, into a joint trading account along with the cash of other registered investment companies and certain other accounts managed by Putnam Management. These balances may be invested in issues of high-grade short-term investments having maturities of up to 397 days for collateral received under security lending arrangements and up to 90 days for other cash investments.
C) Repurchase agreements The fund, or any joint trading account, through its custodian, receives delivery of the underlying securities, the market value of which at the time of purchase is required to be in an amount at least equal to the resale price, including accrued interest. Collateral for certain tri-party repurchase agreements is held at the counterparty’s custodian in a segregated account for the benefit of the fund and the coun-terparty. Putnam Management is responsible for determining that the value of these underlying securities is at all times at least equal to the resale price, including accrued interest.
D) Security transactions and related investment income Security transactions are recorded on the trade date (the date the order to buy or sell is executed). Gains or losses on securities sold are determined on the identified cost basis.
Interest income is recorded on the accrual basis. Dividend income, net of applicable withholding taxes, is recognized on the ex-dividend date except that certain dividends from foreign securities, if any, are recognized as soon as the fund is informed of the ex-dividend date. Non-cash dividends, if any, are recorded at the fair market value of the securities received. Dividends representing a return of capital or capital gains, if any, are reflected as a reduction of cost and/or as a realized gain.
E) Security lending The fund may lend securities, through its agents, to qualified borrowers in order to earn additional income. The loans are collateralized by cash and/or securities in an amount at least equal to the market value of the securities loaned. The market value of securities loaned is determined daily and any additional required collateral is allocated to the fund on the next business day. The risk of borrower default will be borne by the fund’s agents; the fund will bear the risk of loss with respect to the investment of the cash collateral. Income from securities lending is included in investment income on the statement of operations. At February 28, 2007, the value of securities loaned amounted to $45,884,454. The fund received cash collateral of $47,237,149 which is pooled with collateral of other Putnam funds into 28 issues of high grade short-term investments.
46
F) Federal taxes It is the policy of the fund to distribute all of its taxable income within the prescribed time and otherwise comply with the provisions of the Internal Revenue Code of 1986 (the “Code”) applicable to regulated investment companies. It is also the intention of the fund to distribute an amount sufficient to avoid imposition of any excise tax under Section 4982 of the Code, as amended. Therefore, no provision has been made for federal taxes on income, capital gains or unrealized appreciation on securities held nor for excise tax on income and capital gains.
The aggregate identified cost on a tax basis is $1,698,660,209, resulting in gross unrealized appreciation and depreciation of $411,176,010 and $22,902,452, respectively, or net unrealized appreciation of $388,273,558.
G) Distributions to shareholders Distributions to shareholders from net investment income are recorded by the fund on the ex-dividend date. Distributions from capital gains, if any, are recorded on the ex-dividend date and paid at least annually. The amount and character of income and gains to be distributed are determined in accordance with income tax regulations, which may differ from generally accepted accounting principles. Dividend sources are estimated at the time of declaration. Actual results may vary. Any non-taxable return of capital cannot be determined until final tax calculations are completed after the end of the fund’s fiscal year. Reclassifications are made to the fund’s capital accounts to reflect income and gains available for distribution (or available capital loss carryovers) under income tax regulations.
H) Expenses of the trust Expenses directly charged or attributable to any fund will be paid from the assets of that fund. Generally, expenses of the trust will be allocated among and charged to the assets of each fund on a basis that the Trustees deem fair and equitable, which may be based on the relative assets of each fund or the nature of the services performed and relative applicability to each fund.
Note 2: Management fee, administrative
services and other transactions
Putnam Management is paid for management and investment advisory services quarterly based on the average net assets of the fund. Such fee is based on the following annual rates: 0.70% of the first $500 million of average net assets, 0.60% of the next $500 million, 0.55% of the next $500 million, 0.50% of the next $5 billion, 0.475% of the next $5 billion, 0.455% of the next $5 billion, 0.44% of the next $5 billion and 0.43% thereafter.
Putnam Management has agreed to waive fees and reimburse expenses of the fund through August 31, 2007 to the extent necessary to ensure that the fund’s expenses do not exceed the simple average of the expenses of all front-end load funds viewed by Lipper, Inc. as having the same investment classification or objective as the fund. The expense reimbursement is based on a comparison of the fund’s expenses with the average annualized operating expenses of the funds in its Lipper peer group for each calendar quarter during the fund’s last fiscal year, excluding 12b-1 fees and without giving effect to any expense offset and brokerage service arrangements that may reduce fund expenses. For the period ended February 28, 2007, Putnam Management did not waive any of its management fee from the fund.
The fund reimburses Putnam Management an allocated amount for the compensation and related expenses of certain officers of the fund and their staff who provide administrative services to the fund. The aggregate amount of all such reimbursements is determined annually by the Trustees.
Custodial functions for the fund’s assets were provided by Putnam Fiduciary Trust Company (“PFTC”), a subsidiary of Putnam, LLC and by State Street Bank and Trust Company. Custody fees are based on the fund’s asset level, the number of its security holdings and transaction volumes. Putnam Investor Services, a division of PFTC, provided investor servicing agent functions to the fund. Putnam Investor Services received fees for investor servicing based on the number of shareholder
47
accounts in the fund and the level of defined contribution plan assets in the fund. During the period ended February 28, 2007, the fund incurred $2,663,831 for custody and investor servicing agent functions provided by PFTC.
The fund has entered into arrangements with PFTC and State Street Bank and Trust Company whereby credits realized as a result of uninvested cash balances are used to reduce a portion of the fund’s expenses. The fund also reduced expenses through brokerage service arrangements. For the six months ended February 28, 2007, the fund’s expenses were reduced by $150,869 under these arrangements.
Each independent Trustee of the fund receives an annual Trustee fee, of which $636, as a quarterly retainer, has been allocated to the fund, and an additional fee for each Trustees meeting attended. Trustees receive additional fees for attendance at certain committee meetings, industry seminars and for certain compliance-related matters. Trustees also are reimbursed for expenses they incur relating to their services as Trustees. George Putnam, III, who is not an independent Trustee, also receives the foregoing fees for his services as Trustee.
The fund has adopted a Trustee Fee Deferral Plan (the “Deferral Plan”) which allows the Trustees to defer the receipt of all or a portion of Trustees fees payable on or after July 1, 1995. The deferred fees remain invested in certain Putnam funds until distribution in accordance with the Deferral Plan.
The fund has adopted an unfunded noncontributory defined benefit pension plan (the “Pension Plan”) covering all Trustees of the fund who have served as a Trustee for at least five years and were first elected prior to 2004. Benefits under the Pension Plan are equal to 50% of the Trustee’s average annual attendance and retainer fees for the three years ended December 31, 2005. The retirement benefit is payable during a Trustee’s lifetime, beginning the year following retirement, for the number of years of service through December 31, 2006. Pension expense for the fund is included in Trustee compensation and expenses in the statement of operations. Accrued pension liability is included in Payable for Trustee compensation and expenses in the statement of assets and liabilities. The Trustees have terminated the Pension Plan with respect to any Trustee first elected after 2003.
The fund has adopted distribution plans (the “Plans”) with respect to its class A, class B, class C, class M and class R shares pursuant to Rule 12b-1 under the Investment Company Act of 1940. The purpose of the Plans is to compensate Putnam Retail Management, a wholly-owned subsidiary of Putnam, LLC and Putnam Retail Management GP, Inc., for services provided and expenses incurred in distributing shares of the fund. The Plans provide for payments by the fund to Putnam Retail Management at an annual rate of up to 0.35%, 1.00%, 1.00%, 1.00% and 1.00% of the average net assets attributable to class A, class B, class C, class M and class R shares, respectively. The Trustees have approved payment by the fund at an annual rate of 0.25%, 1.00%, 1.00%, 0.75% and 0.50% of the average net assets attributable to class A, class B, class C, class M and class R shares, respectively.
For the six months ended February 28, 2007, Putnam Retail Management, acting as underwriter, received net commissions of $55,799 and $475 from the sale of class A and class M shares, respectively, and received $139,712 and $3,080 in contingent deferred sales charges from redemptions of class B and class C shares, respectively. A deferred sales charge of up to 1.00% and 0.65% is assessed on certain redemptions of class A and class M shares, respectively. For the six months ended February 28, 2007, Putnam Retail Management, acting as underwriter, received $658 and no monies on class A and class M redemptions, respectively.
Note 3: Purchases and sales of securities
During the six months ended February 28, 2007, cost of purchases and proceeds from sales of investment securities other than short-term investments aggregated $593,286,987 and
48
$683,078,182, respectively. There were no purchases or sales of U.S. government securities.
Note 4: Capital shares
At February 28, 2007, there was an unlimited number of shares of beneficial interest authorized. Transactions in capital shares were as follows:
| CLASS A | Shares | Amount |
|
| Six months ended 2/28/07: | |
| Shares sold | 6,728,734 | $ 131,406,384 |
|
| Shares issued | | |
| in connection | | |
| with reinvestment | | |
| of distributions | 5,385,835 | 102,277,011 |
|
| | 12,114,569 | 233,683,395 |
|
| Shares | | |
| repurchased | (8,245,890) | (160,832,677) |
|
| Net increase | 3,868,679 | $ 72,850,718 |
| |
| Year ended 8/31/06: | | |
| Shares sold | 19,532,435 | $ 359,920,724 |
|
| Shares issued | | |
| in connection | | |
| with reinvestment | | |
| of distributions | 3,437,437 | 61,977,000 |
|
| | 22,969,872 | 421,897,724 |
|
| Shares | | |
| repurchased | (16,823,344) | (310,332,764) |
|
| Net increase | 6,146,528 | $ 111,564,960 |
| CLASS B | Shares | Amount |
|
| Six months ended 2/28/07: | |
| Shares sold | 949,666 | $ 18,246,439 |
|
| Shares issued | | |
| in connection | | |
| with reinvestment | | |
| of distributions | 1,473,886 | 27,635,372 |
|
| | 2,423,552 | 45,881,811 |
|
| Shares | | |
| repurchased | (4,566,756) | (87,833,118) |
|
| Net decrease | (2,143,204) | $ (41,951,307) |
| |
| Year ended 8/31/06: | | |
| Shares sold | 3,806,966 | $ 69,024,067 |
|
| Shares issued | | |
| in connection | | |
| with reinvestment | | |
| of distributions | 1,229,123 | 21,878,392 |
|
| | 5,036,089 | 90,902,459 |
|
| Shares | | |
| repurchased | (11,324,664) | (205,351,238) |
|
| Net decrease | (6,288,575) | $(114,448,779) |
|
| |
| CLASS C | Shares | Amount |
|
| Six months ended 2/28/07: | |
| Shares sold | 338,021 | $ 6,470,691 |
|
| Shares issued | | |
| in connection | | |
| with reinvestment | | |
| of distributions | 223,535 | 4,168,931 |
|
| | 561,556 | 10,639,622 |
|
| Shares | | |
| repurchased | (407,038) | (7,777,628) |
|
| Net increase | 154,518 | $ 2,861,994 |
| |
| Year ended 8/31/06: | | |
| Shares sold | 1,130,973 | $ 20,419,770 |
|
| Shares issued | | |
| in connection | | |
| with reinvestment | | |
| of distributions | 137,847 | 2,445,388 |
|
| | 1,268,820 | 22,865,158 |
|
| Shares | | |
| repurchased | (792,483) | (14,350,473) |
|
| Net increase | 476,337 | $ 8,514,685 |
49
| CLASS M | Shares | Amount |
|
| Six months ended 2/28/07: | |
| Shares sold | 82,168 | $ 1,601,182 |
|
| Shares issued | | |
| in connection | | |
| with reinvestment | | |
| of distributions | 127,601 | 2,420,600 |
|
| | 209,769 | 4,021,782 |
|
| Shares | | |
| repurchased | (162,988) | (3,166,201) |
|
| Net increase | 46,781 | $ 855,581 |
| |
| Year ended 8/31/06: | | |
| Shares sold | 208,204 | $ 3,831,518 |
|
| Shares issued | | |
| in connection | | |
| with reinvestment | | |
| of distributions | 86,926 | 1,565,531 |
|
| | 295,130 | 5,397,049 |
|
| Shares | | |
| repurchased | (501,226) | (9,174,726) |
|
| Net decrease | (206,096) | $(3,777,677) |
|
| |
| CLASS R | Shares | Amount |
| Six months ended 2/28/07: | |
| Shares sold | 50,479 | $ 988,618 |
|
| Shares issued | | |
| in connection | | |
| with reinvestment | | |
| of distributions | 8,993 | 169,349 |
|
| | 59,472 | 1,157,967 |
|
| Shares | | |
| repurchased | (9,821) | (191,867) |
|
| Net increase | 49,651 | $ 966,100 |
| |
| Year ended 8/31/06: | | |
| Shares sold | 80,257 | $1,471,214 |
|
| Shares issued | | |
| in connection | | |
| with reinvestment | | |
| of distributions | 2,891 | 51,810 |
|
| | 83,148 | 1,523,024 |
|
| Shares | | |
| repurchased | (37,894) | (697,543) |
|
| Net increase | 45,254 | $ 825,481 |
| CLASS Y | Shares | Amount |
|
| Six months ended 2/28/07: | |
| Shares sold | 692,346 | $ 13,564,113 |
|
| Shares issued | | |
| in connection | | |
| with reinvestment | | |
| of distributions | 519,704 | 9,874,333 |
|
| | 1,212,050 | 23,438,446 |
|
| Shares | | |
| repurchased | (508,044) | (9,954,531) |
|
| Net increase | 704,006 | $ 13,483,915 |
| |
| Year ended 8/31/06: | | |
| Shares sold | 1,301,941 | $ 24,027,374 |
|
| Shares issued | | |
| in connection | | |
| with reinvestment | | |
| of distributions | 336,491 | 6,066,933 |
|
| | 1,638,432 | 30,094,307 |
|
| Shares | | |
| repurchased | (2,622,619) | (47,897,717) |
|
| Net decrease | (984,187) | $(17,803,410) |
Note 5: Investment in Putnam Prime
Money Market Fund
The fund invests in Putnam Prime Money Market Fund, an open-end management investment company managed by Putnam Management. Investments in Putnam Prime Money Market Fund are valued at its closing net asset value each business day. Management fees paid by the fund are reduced by an amount equal to the management and administrative services fees paid by Putnam Prime Money Market Fund with respect to assets invested by the fund in Putnam Prime Money Market Fund. For the period ended February 28, 2007, management fees paid were reduced by $4,691 relating to the fund’s investment in Putnam Prime Money Market Fund. Income distributions earned by the fund are recorded as income in the statement of operations and totaled $269,556 for the period ended February 28, 2007. During the period ended February 28, 2007, cost of purchases and proceeds of sales of investments in
50
Putnam Prime Money Market Fund aggregated $160,674,815 and $163,318,451, respectively.
Note 6: Regulatory matters and litigation
In late 2003 and 2004, Putnam Management settled charges brought by the Securities and Exchange Commission (the “SEC”) and the Massachusetts Securities Division (“MSD”) in connection with excessive short-term trading by certain former Putnam employees and, in the case of charges brought by the MSD, excessive short-term trading by participants in some Putnam-administered 401(k) plans. Putnam Management agreed to pay $193.5 million in penalties and restitution, of which $153.5 million will be distributed to certain open-end Putnam funds and their shareholders after the SEC and MSD approve a distribution plan being developed by an independent consultant. The allegations of the SEC and MSD and related matters have served as the general basis for certain lawsuits, including purported class action lawsuits filed against Putnam Management and, in a limited number of cases, against some Putnam funds. Putnam Management believes that these lawsuits will ha ve no material adverse effect on the funds or on Putnam Management’s ability to provide investment management services. In addition, Putnam Management has agreed to bear any costs incurred by the Putnam funds as a result of these matters.
In connection with a settlement between Putnam and the fund’s Trustees in September 2006, the fund received $242,856 from Putnam to address issues relating to the calculation of certain amounts paid by the Putnam mutual funds to Putnam for transfer agent services.
Putnam Management and Putnam Retail Management are named as defendants in a civil suit in which the plaintiffs allege that the management and distribution fees paid by certain Putnam funds were excessive and seek recovery under the Investment Company Act of 1940. Putnam Management and Putnam Retail Management have contested the plaintiffs’ claims and the matter is currently pending in the U.S. District Court for the District of Massachusetts. Based on currently available information, Putnam Management believes that this action is without merit and that it is unlikely to have a material effect on Putnam Management’s and Putnam Retail Management’s ability to provide services to their clients, including the fund.
Note 7: New accounting pronouncements
In June 2006, the Financial Accounting Standards Board (“FASB”) issued Interpretation No. 48, Accounting for Uncertainty in Income Taxes (the “Interpretation”). The Interpretation prescribes a minimum threshold for financial statement recognition of the benefit of a tax position taken or expected to be taken by a filer in the filer’s tax return. The Interpretation will become effective for fiscal years beginning after December 15, 2006 but will also apply to tax positions reflected in the fund’s financial statements as of that date. No determination has been made whether the adoption of the Interpretation will require the fund to make any adjustments to its net assets or have any other effect on the fund’s financial statements. The effects of implementing this pronouncement, if any, will be noted in the fund’s next semiannual financial statements.
In September 2006, the FASB issued Statement of Financial Accounting Standards No. 157, Fair Value Measurements (the “Standard”). The Standard defines fair value, sets out a framework for measuring fair value and requires additional disclosures about fair value measurements. The Standard applies to fair value measurements already required or permitted by existing standards. The Standard is effective for financial statements issued for fiscal years beginning after November 15, 2007 and interim periods within those fiscal years. Putnam Management is currently evaluating what impact the adoption of the Standard will have on the fund’s financial statements.
51
Brokerage commissions
(Unaudited)
Brokerage commissions are paid to firms that execute trades on behalf of your fund. When choosing these firms, Putnam is required by law to seek the best execution of the trades, taking all relevant factors into consideration, including expected quality of execution and commission rate. Listed below are the largest relationships based upon brokerage commissions for your fund and the other funds in Putnam’s Large-Cap Value group for the year ended February 28, 2007. The other Putnam mutual funds in this group are The George Putnam Fund of Boston, Putnam Classic Equity Fund, Putnam Convertible Income-Growth Trust, Putnam Equity Income Fund, The Putnam Fund for Growth and Income, Putnam VT Equity Income Fund, Putnam VT The George Putnam Fund of Boston, Putnam VT Growth and Income Fund, and Putnam VT New Value Fund.
The top five firms that received brokerage commissions for trades executed for the Large-Cap Value group are (in descending order) Goldman Sachs, Citigroup Global Markets, Merrill Lynch, UBS Warburg, and Deutsche Bank Securities. Commissions paid to these firms together represented approximately 47% of the total brokerage commissions paid for the year ended February 28, 2007.
Commissions paid to the next 10 firms together represented approximately 35% of the total brokerage commissions paid during the period. These firms are (in alphabetical order) Bank of America, Bear Stearns & Company, Credit Suisse First Boston, JP Morgan Clearing, Lazard Freres & Co., Lehman Brothers, Morgan Stanley Dean Witter, RBC Capital Markets, Sanford Bernstein, and Wachovia Securities.
Additional information about brokerage commissions is available on the Securities and Exchange Commission (SEC) Web site at www.sec.gov. Putnam funds disclose commissions by firm to the SEC in semiannual filings on Form N-SAR.
52
Fund information
Founded over 65 years ago, Putnam Investments was built around the concept that a balance between risk and reward is the hallmark of a well-rounded financial program. We manage over 100 mutual funds in growth, value, blend, fixed income, and international.
| Investment Manager | Officers | Francis J. McNamara, III |
| Putnam Investment | George Putnam, III | Vice President and |
| Management, LLC | President | Chief Legal Officer |
| One Post Office Square | | |
| Boston, MA 02109 | Charles E. Porter | Robert R. Leveille |
| Executive Vice President, | Chief Compliance Officer |
| Marketing Services | Principal Executive Officer, | |
| Putnam Retail Management | Associate Treasurer and | Mark C. Trenchard |
| One Post Office Square | Compliance Liaison | Vice President and |
| Boston, MA 02109 | | BSA Compliance Officer |
| Jonathan S. Horwitz | |
| Custodians | Senior Vice President | Judith Cohen |
| Putnam Fiduciary Trust | and Treasurer | Vice President, Clerk and |
| Company, State Street Bank | | Assistant Treasurer |
| and Trust Company | Steven D. Krichmar | |
| Vice President and | Wanda M. McManus |
| Legal Counsel | Principal Financial Officer | Vice President, Senior Associate |
| Ropes & Gray LLP | | Treasurer and Assistant Clerk |
| Janet C. Smith | |
| Trustees | Vice President, Principal | Nancy E. Florek |
| John A. Hill, Chairman | Accounting Officer and | Vice President, Assistant Clerk, |
| Jameson Adkins Baxter, | Assistant Treasurer | Assistant Treasurer and |
| Vice Chairman | | Proxy Manager |
| Charles B. Curtis | Susan G. Malloy | |
| Myra R. Drucker | Vice President and | |
| Charles E. Haldeman, Jr. | Assistant Treasurer | |
| Paul L. Joskow | | |
| Elizabeth T. Kennan | Beth S. Mazor | |
| Kenneth R. Leibler | Vice President | |
| Robert E. Patterson | | |
| George Putnam, III | James P. Pappas | |
| W. Thomas Stephens | Vice President | |
| Richard B. Worley | | |
| Richard S. Robie, III | |
| Vice President | |
This report is for the information of shareholders of Putnam New Value Fund. It may also be used as sales literature when preceded or accompanied by the current prospectus, the most recent copy of Putnam’s Quarterly Performance Summary, and Putnam’s Quarterly Ranking Summary. For more recent performance, please visit www.putnam.com. Investors should carefully consider the investment objective, risks, charges, and expenses of a fund, which are described in its prospectus. For this and other information or to request a prospectus, call 1-800-225-1581 toll free. Please read the prospectus carefully before investing. The fund’s Statement of Additional Information contains additional information about the fund’s Trustees and is available without charge upon request by calling 1-800-225-1581.

Item 2. Code of Ethics:
Not applicable
Item 3. Audit Committee Financial Expert:
Not applicable
Item 4. Principal Accountant Fees and Services:
Not applicable
Item 5. Audit Committee of Listed Registrants
Not applicable
Item 6. Schedule of Investments:
The registrant’s schedule of investments in unaffiliated issuers is included in the report to shareholders in Item 1 above.
Item 7. Disclosure of Proxy Voting Policies and Procedures For Closed-End Management
Investment Companies:
Not applicable
Item 8. Portfolio Managers of Closed-End Investment Companies
Not Applicable
Item 9. Purchases of Equity Securities by Closed-End Management Investment Companies and
Affiliated Purchasers:
Not applicable
Item 10. Submission of Matters to a Vote of Security Holders:
Not applicable
Item 11. Controls and Procedures:
(a) The registrant's principal executive officer and principal financial officer have concluded, based on their evaluation of the effectiveness of the design and operation of the registrant's disclosure controls and procedures as of a date within 90 days of the filing date of this report, that the design and operation of such procedures are generally effective to provide reasonable assurance that information required to be disclosed by the registrant in this report is recorded, processed, summarized and reported within the time periods specified in the Commission's rules and forms.
(b) Changes in internal control over financial reporting: Effective January 1, 2007, the fund retained State Street Bank and Trust Company ("State Street") as its custodian. Putnam Fiduciary Trust Company, the fund's previous custodian, is managing the transfer of the fund's assets to State Street. This transfer is expected to be completed for all Putnam funds during the first half of 2007, with PFTC remaining as custodian with respect to fund assets until the assets are transferred. Also effective January 1, 2007, the fund's investment manager, Putnam
Investment Management, LLC entered into a Master Sub-Accounting Services Agreement with State Street, under which the investment manager has delegated to State Street responsibility for providing certain administrative, pricing, and bookkeeping services for the fund.
Item 12. Exhibits:
(a)(1) Not applicable
(a)(2) Separate certifications for the principal executive officer and principal financial officer of the registrant as required by Rule 30a-2(a) under the Investment Company Act of 1940, as amended, are filed herewith.
(b) The certifications required by Rule 30a-2(b) under the Investment Company Act of 1940, as amended, are filed herewith.
SIGNATURES
Pursuant to the requirements of the Securities Exchange Act of 1934 and the Investment Company Act of 1940, the registrant has duly caused this report to be signed on its behalf by the undersigned, thereunto duly authorized.
Putnam Investment Funds
By (Signature and Title):
/s/Janet C. Smith
Janet C. Smith
Principal Accounting Officer
Date: April 27, 2007
Pursuant to the requirements of the Securities Exchange Act of 1934 and the Investment Company Act of 1940, this report has been signed below by the following persons on behalf of the registrant and in the capacities and on the dates indicated.
By (Signature and Title):
/s/Charles E. Porter
Charles E. Porter
Principal Executive Officer
Date: April 27, 2007
By (Signature and Title):
/s/Steven D. Krichmar
Steven D. Krichmar
Principal Financial Officer
Date: April 27, 2007