EXHIBIT 99.5
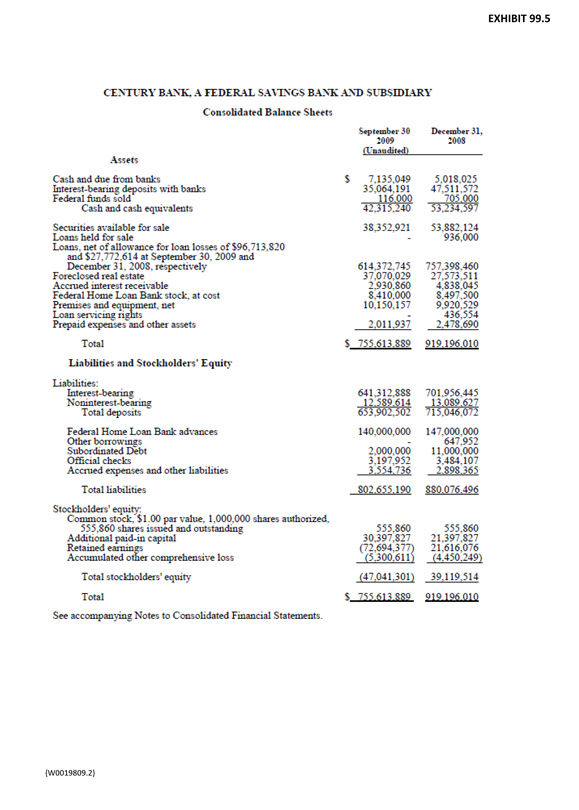
CENTURY BANK, A FEDERAL SAVINGS BANK AND SUBSIDIARY
Consolidated Balance Sheets
September 30 2009 (Unaudited) December 31, 2008 Assets
Cash and due from banks $7,135,049 5,018,025
Interest-bearing deposits with banks 35,064,191 47,511,572
Federal funds sold 116,000 705,000
Cash and cash equivalents 42,315,240 53,234,597
Securities, available for sale 38,352,921 53,882,124
Loans held for sale - 936,000
Loans, net of allowance for loan losses of $96,713,820 and $27,772,614 at September 30, 2009 and December 31, 2008, respectively 614,372,745 757,398,460
Foreclosed real estate 37,070,029 27,573,511
Accrued interest receivable 2,930,860 4,838,045
Federal Home Loan Bank stock at cost 8,410,000 8,497,500
Premises and equipment, net 10,150,157 9,920,529
Loan servicing rights - 436,554
Prepaid expenses and other assets 2,011,937 2,478,690
Total $755,613,889 919,196,010
Liabilities and Stockholders’ Equity
Liabilities:
Interest-bearing 641,312,888 701,956,445
Noninterest bearing 12,589,614 13,089,627
Total deposits 653,902,502 715,046,072
Federal Home Loan Bank advances 140,000,000 147,000,000
Other borrowings - 647,952
Subordinated Debt 2,000,000 11,000,000
Official checks 3,197,952 3,484,107
Accrued expenses and other liabilities 3,554,736 2,898,365
Total liabilities 802,655,190 880,076,496
Stockholders’ equity:
Common stock $1.00 par value, 1,000,000 shares authorized
555,860 shares issued and outstanding 555,860 555,860
Additional paid-in capital 30,397,827 21,397,827
Retained earnings (72,694,377) 21,616,076
Accumulated other comprehensive loss (5,300,611) (4,450,249)
Total stockholders’ equity (47,041,301) 39,119,514
Total $755,613,889 919,196,010
See accompanying Notes to Consolidated Financial Statements.
{W0019809.2}
CENTURY BANK, A FEDERAL SAVINGS BANK AND SUBSIDIARY
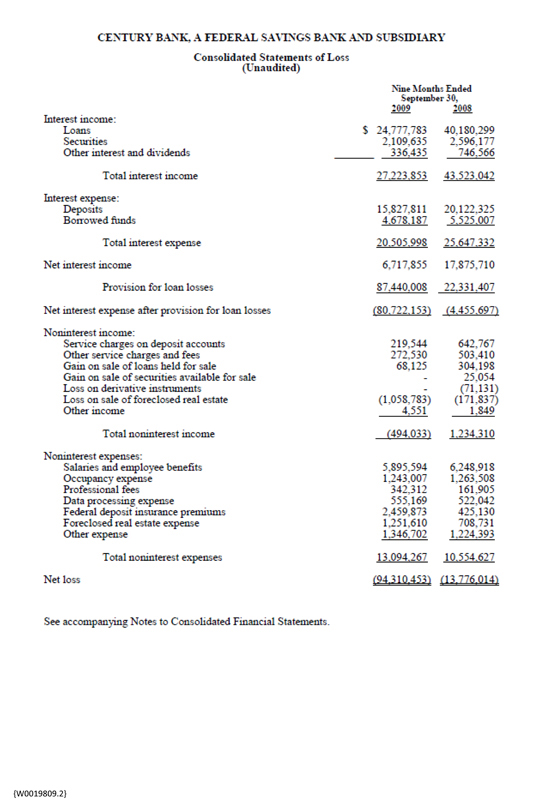
Consolidated Statements of Loss
(Unaudited)
Nine Months Ended September 30, 2009 2008
Interest income:
Loans $ 24,777,783 40,180,299
Securities 2,109,635 2,596,177
Other interest and dividends 336,435 746,566
Total interest income 27,223,853 43,523,042
Interest expense:
Deposits 15,827,811 20,122,325
Borrowed funds 4,678,187 5,525,007
Total interest expense 20,505,998 23,647,332
Net interest income 6,717,855 17,875,710
Provision for loan losses 87,440,008 22,331,407
Net interest expense after provision for loan losses (80,722,153) (4,455,697)
Noninterest income:
Service charges on deposit accounts 219,544 642,767
Other service charges and fees 272,530 503,410
Gain on sale of loans held for sale 68,125 304,198
Gain on sale of securities available for sale - 25,054
Loss on derivative instruments - (71,131)
Loss on sale of foreclosed real estate (1,058,783) (171,837)
Other income 4,551 1,849
Total noninterest income (494,033) 1,234,310
Noninterest expenses:
Salaries and employee benefits 5,895,594 6,248,918
Occupancy expense 1,243,007 1,263,508
Professional fees 342,312 161,905
Data processing expense 555,169 522,042
Federal deposit insurance premiums 2,459,873 425,130
Foreclosed real estate expense 1,251,610 708,731
Other expense 1,346,702 1,224,393
Total noninterest expenses 13,094,267 10,554,627
Net loss (94,310,453) (13,776,014)
See accompanying Notes to Consolidated Financial Statements.
{W0019809.2}
CENTURY BANK, A FEDERAL SAVINGS BANK AND SUBSIDIARY
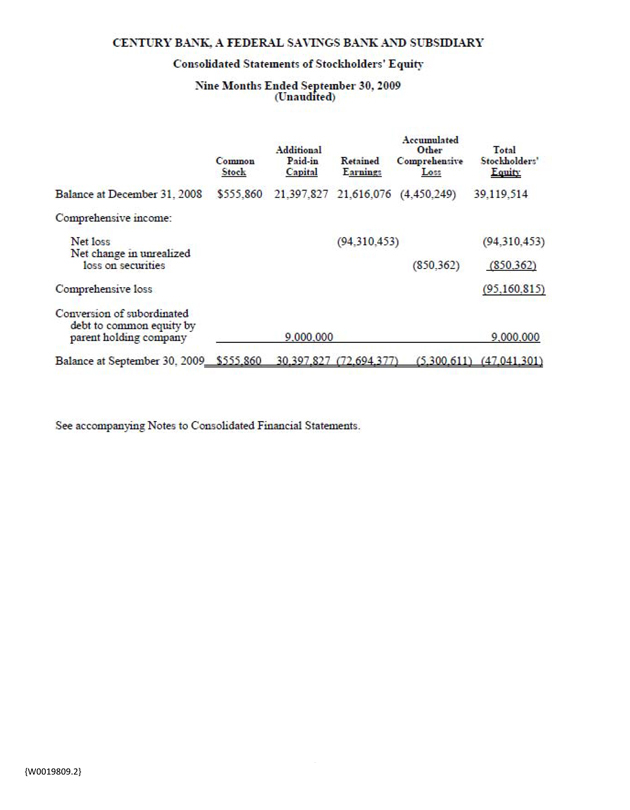
Consolidated Statements of Stockholders’ Equity
Nine Mouths Ended September 30, 2009
(Unaudited)
Common Stock
Additional Paid-in Capital
Retained Earnings
Accumulated Other Comprehensive Loss
Total Stockholders Equity
Balance at December 31, 2008 $555,860 21,397,827 21,616,076 (4,450,249) 39,119,514
Comprehensive income:
Net loss (94,310,453) (94,310,453)
Net change in unrealized loss on securities (850,362) (850.362)
Comprehensive loss (95,160,815)
Conversion of subordinated debt to common equity by parent holding company 9,000,000 9,000,000
Balance at September 30, 2009 $555,860 30,397,827 (72,694,377) 5,300,611 47,041,301
See accompanying Notes to Consolidated Financial Statements.
{W0019809.2}
CENTURY BANK, A FEDERAL SAVINGS BANK AND SUBSIDIARY
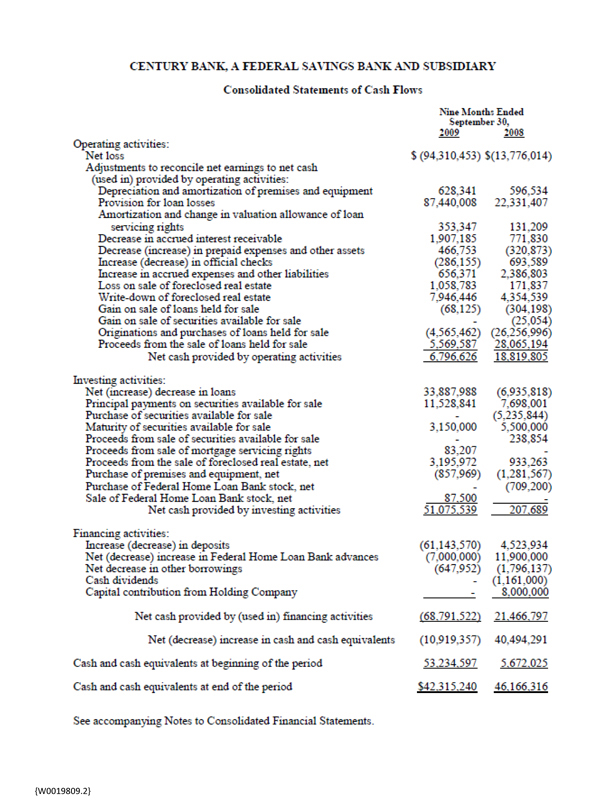
Consolidated Statements of Cash Flows
Nine Month Ended September 30
2009 2008
Operating activities:
Net loss $ (94,310,453) $(13,776,014)
Adjustments to reconcile net earnings to net cash (used in) provided by operating activities:
Depreciation and amortization of premises and equipment 628,341 596.534
Provision for loan losses 87,440,008 22,331,407
Amortization and change in valuation allowance of loan servicing rights 353,347 131,209
Decrease in accrued interest receivable 1,907,185 771,830
Decrease (increase) in prepaid expenses and other assets 466,753 (320,873)
Increase (decrease) in official checks (286,155) 693,589
Increase in accrued expenses and other liabilities 656,371 2,336,803
Loss on sale of foreclosed real estate 1,058,783 171,837
Write-down of foreclosed real estate 7,946,446 4,354,539
Gain on sale of loans held for sale (68,125) (304,198)
Gain on sale of securities available for sale - (25,054)
Originations and purchases of loans held for sale (4,565,462) (26,256,996)
Proceeds from the sale of loans held for sale 5,569,587 28,065,194
Net cash provided by operating activities 6,796.626 18,819,805
Investing activities:
Net (increase) decrease in loan: 33,887,988 (6,935,818)
Principal payments on securities available for sale 11,528,841 7,698,001
Purchase of securities available for sale - (5,235,844)
Maturity of securities available for sale 3,150,000 5,500,000
Proceeds from sale of securities available for sale - 238,854
Proceeds from sale of mortgage servicing rights 83,207 -
Proceeds from the sale of foreclosed real estate, net 3,195,972 933,263
Purchase of premises and equipment, net (857,969) (1,281,567)
Purchase of Federal Home Loan Bank stock, net - (709,200)
Sale of Federal Home Loan Bank stock, net 87,500 -
Net cash provided by investing activities 51,075,539 207,689
Financing activities:
Increase (decrease) in deposits (61,143,570) 4,523,934
Net (decrease) increase in Federal Home Loan Bank advances (7,000,000) 11,900,000
Net decrease in other borrowings (647,952) (1,796,137)
Cash dividends - (1,161,000)
Capital contribution from Holding Company - 8,000,000
Net cash provided by (used in) financing activities (68,791,522) 21,466,797
Net (decrease) increase in cash and cash equivalents (10,919,357) 40,494,291
Cash and cash equivalents at beginning of the period 53,234,597 5,672,025
Cash and cash equivalents at end of the period $42,315,240 46,166,316
See accompanying Notes to Consolidated Financial Statements.
{W0019809.2}

CENTURY BANK. A FEDERAL SAVINGS BANK AND SUBSIDIARY
Notes to the Consolidated Financial Statements (Unaudited)
Note 1—General
The consolidated financial statements in this report have been prepared in accordance with the standards of Generally Accepted Accounting Principles, and have not been audited. These financial statements do not include all of the information and footnotes required by U.S. generally accepted accounting principles for complete financial statements. In the opinion of management, all adjustments necessary to present fairly the financial position and the results of operations for the interim periods have been made. All such adjustments are of a normal recurring nature. The results of operations for interim periods are not necessarily indicative of the results of operations which Century Bank (the “Bank”) may achieve for future interim periods or for an entire year.
Note 2—Cash and Cash Flows
Cash on hand, cash items in process of collection, amounts due front banks, and federal funds sold are included in cash and cash equivalents. The following supplemental cash flow information addresses certain cash payments and noncash transactions for the nine months ended September 30, 2009 and 2008, respectively:
Nine Months
Ended September 30,
2009 2008
Supplemental information on cash payments:
Interest paid $20,618,851 $25,397,817
Supplemental information on noncash transactions:
Transfer of loans to other real estate owned and repossession: 21,697,719 20,008,383
Note 3—Comprehensive Loss
The primary component of the difference between net loss and comprehensive loss for the Bank is the change in fair value on available-for-sale securities. Total comprehensive loss for the nine months ended September 30, 2009 and 2008, respectively, was as follows:
Nine Months
Ended September 30, 2009 2008
Net loss $ (94,310,453) $ (13,776.014)
Change in fair value of securities available-for-sale net of tax
(850,362) (3,853,680)
Comprehensive loss, net of tax $ (95,160,815) $ (17,629,694)
Note 4 – Accounting Estimates
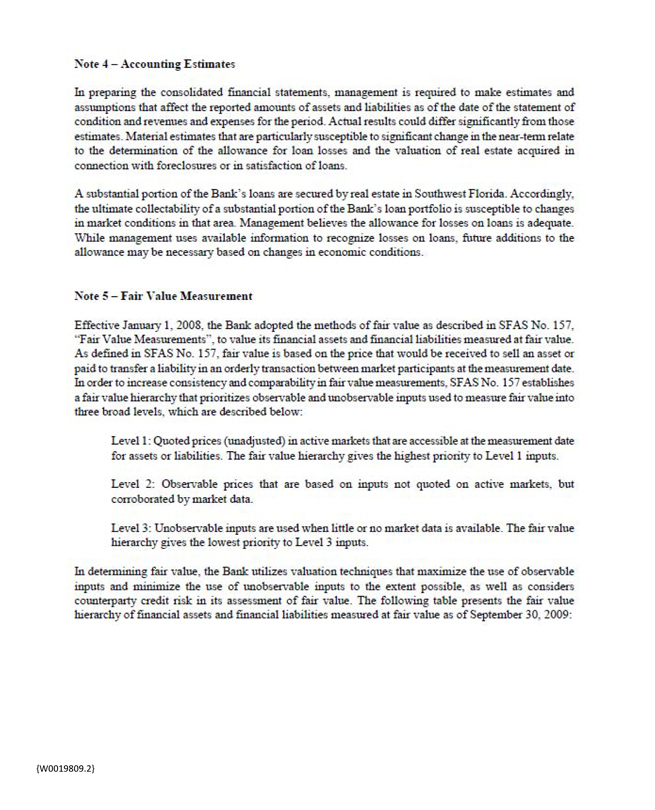
In preparing the consolidated financial statements, management is required to make estimates and assumptions that affect the reported amounts of assets and liabilities as of the dare of the statement of condition and revenues and expenses for the period. Actual results could differ significantly from those estimates. Material estimates that are particularly susceptible to significant change in the near-term relate to the determination of the allowance for loan losses and the valuation of real estate acquired in connection with foreclosures or in satisfaction of loans.
A substantial portion of the Bank’s loans are secured by real estate in Southwest Florida. Accordingly, the ultimate collectability of a substantial portion of the Bank’s loan portfolio is susceptible to changes in market conditions in that area. Management believer the allowance for losses on loans is adequate. While management uses available information to recognize losses on loans, future additions to the allowance may be necessary based on changes in economic conditions.
Note 5 – Fair Value Measurement
Effective January 1, 2008, the Bank adopted the methods of fair value as described in SFAS No. 157. “Fair Value Measurements”, to value its financial assets and financial liabilities measured at fair value. As defined in SFAS No. 157, fair value is based on the price that would be received to sell an asset or paid to transfer a liability in an orderly transaction between market participants at the measurement date. In order to increase consistency and comparability in fair value measurements. SFAS No. 157 establishes a fair value hierarchy that prioritizes observable and unobservable inputs used to measure fair value into three broad levels, which are described below:
Level 1: Quoted prices (unadjusted) in active markets that are accessible at the measurement date for assets or liabilities. The fair value hierarchy gives the highest priority to Level 1 inputs.
Level 2: Observable prices that are based on inputs not quoted on active markets, but corroborated by market data.
Level 3: Unobservable inputs are used when little or no market data is available. The fair value hierarchy gives the lowest priority to Level 3 inputs.
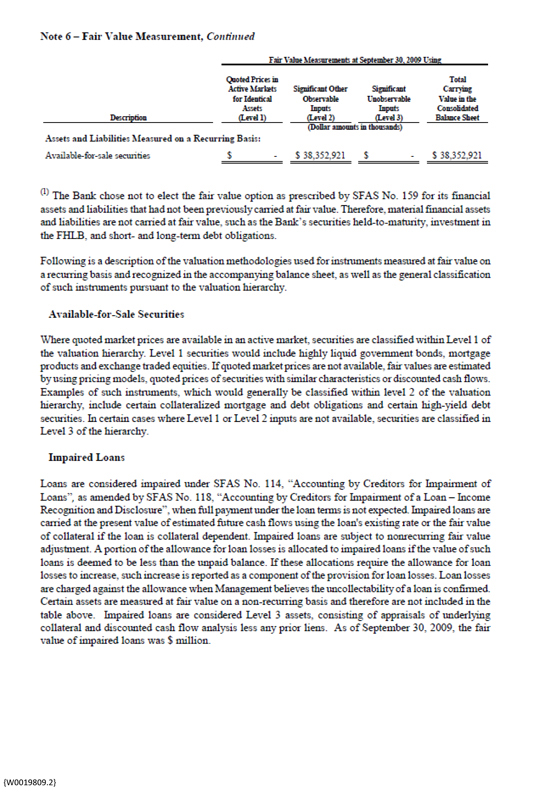
In determining fair value, the Bank utilizes valuation techniques that maximize the use of observable inputs and minimize the use of unobservable inputs to the extent possible, as well as considers counterparty credit risk in its assessment of fair value. The following table presents the fair value hierarchy of financial assets and financial liabilities measured at fair value as of September 30, 2009:
Note 6 – Fair Value Measurement, Continued
Fair Value Measurement at September 30, 2009 Using
Quoted Prices in Active Markets for Identical Assets (Level 1)
Significant Other Observable Inputs (Level 2)
Significant Unobservable Inputs (Level 3)
Total Carrying Value in the Consolidated Balance Sheet
Assets and Liabilities Measured on a Recurring Basis:
Available-for-sale securities $ - $ 38,352,921 $ - $ 38,352,921
(1) The Bank chose not to elect the fair value option as prescribed by SFAS No. 159 for its financial assets and liabilities that had not been previously carried at fair value. Therefore, material financial assets and liabilities are not carried at fair value, such as the Bank’s securities held-to-maturity, investment in the FHLB, and short-and long-term debt obligations.
Following is a description of the valuation methodologies used for instruments measured at fair value on a recurring basis and recognized in the accompanying balance sheet, as well as the general classification
of such instruments pursuant to the valuation hierarchy.
Available-for-Sale Securities
Where quoted market prices are available in an active market, securities are classified within Level 1 of the valuation hierarchy. Level 1 securities would include highly liquid government bonds, mortgage products and exchange traded equities. If quoted market prices are not available, fair values are estimated by using pricing models, quoted prices of securities with similar characteristics or discounted cash flows. Examples of such instruments, which would generally be classified within level 2 of the valuation hierarchy, include certain collateralized mortgage and debt obligations and certain high-yield debt securities. In certain cases where Level 1 or Level 2 inputs are not available, securities are classified in Level 3 of the hierarchy.
Impaired Loans
Loans are considered impaired under SFAS No. 114. “Accounting by Creditors for Impairment of Loans”, as amended by SFAS No. 118. “Accounting by Creditors for Impairment of a Loan-Income Recognition and Disclosure”, when full payment under the loan terms is not expected. Impaired loans are carried at the present value of estimated future cash flows using the loan’s existing rate or the fair value of collateral if the loan is collateral dependent. Impaired loans are subject to nonrecurring fair value adjustment. A portion of the allowance for loan losses is allocated to impaired loans if the value of such loans is deemed to be less than the unpaid balance. If these allocations require the allowance for loan losses to increase, such increase is reported as a component of the provision for loan losses. Loan losses are charged against the allowance when Management believes the uncollectability of a loan is confirmed. Certain assets are measured at fair value on a non-recurring basis and therefore are not included in the table above. Impaired loans are considered Level 3 assets, consisting of appraisals of underlying collateral and discounted cash flow analysis less any prior hens. As of September 30, 2009, the fair value of impaired loans was $ million.
Note 7 – Recent Accounting Pronouncements
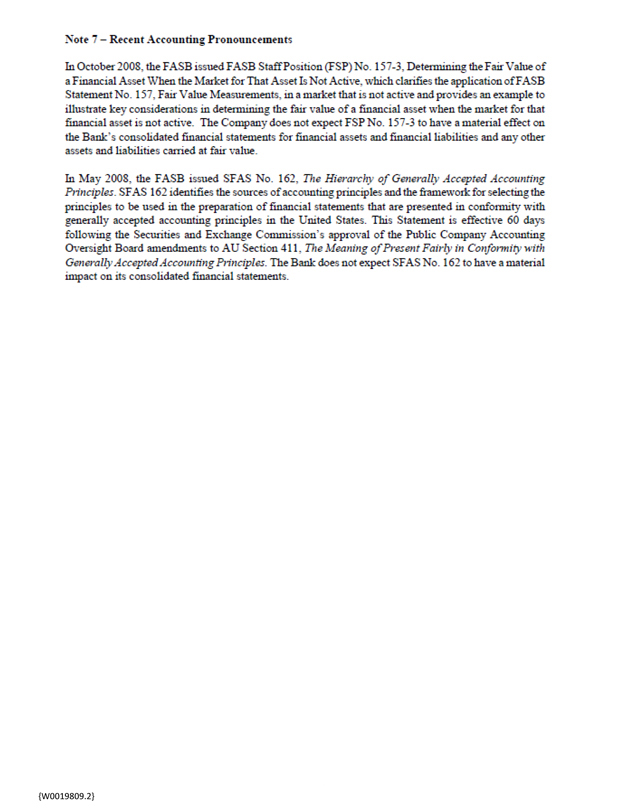
In October 2008, the FASB issued FASB Staff Position (FSP) No. 157-3, Determining the Fair Value of a Financial Asset When the Market for That Asset Is Not Active, which clarifies the application of FASB Statement No. 157. Fail Value Measurements, in a market that is not active and provides an example to illustrate key considerations in determining the fair value of a financial asset when the market for that financial asset is not active. The Company does not expect FSP No. 157-3 to have a material effect on the Bank’s consolidated financial statements for financial assets and financial liabilities and any other assets and liabilities carried at fair value.
In May 2008, the FASB issued SFAS No. 162, The Hierarchy of Generally Accepted Accounting Principles. SFAS 162 identifies the sources of accounting principles and the framework for selecting the principles to be used in the preparation of financial statements that are presented in conformity with generally accepted accounting principles in the United States. This Statement is effective 60 days following the Securities and Exchange Commission’s approval of the Public Company Accounting Overnight Board amendments to AU Section 411. The Meaning of Present Fairly in Conformity with Generally Accepted Accounting Principles. The Bank does not expect SFAS No. 162 to have a material impact on its consolidated financial statements.


