UNITED STATES
SECURITIES AND EXCHANGE COMMISSION
Washington, D.C. 20549
FORM N-CSR
CERTIFIED SHAREHOLDER REPORT OF REGISTERED
MANAGEMENT INVESTMENT COMPANIES
Investment Company Act file number 811-08932
Artisan Funds, Inc.
(Exact name of registrant as specified in charter)
| 875 East Wisconsin Avenue, Suite 800 Milwaukee, | WI 53202 | |
| (Address of principal executive offices) | (Zip Code) | |
Janet D. Olsen Artisan Funds, Inc. 875 East Wisconsin Avenue, #800 Milwaukee, Wisconsin 53202 | Kevin J. McCarthy Bell, Boyd & Lloyd LLC Three First National Plaza, #3100 Chicago, IL 60602 |
(Name and address of agents for service)
Registrant’s telephone number, including area code: (414) 390-6100
Date of fiscal year end: 09/30
Date of reporting period: 03/31/05
Item 1. Reports to Shareholders.

SEMIANNUAL
R E P O R T
MARCH 31, 2005
ARTISAN INTERNATIONAL FUND
ARTISAN INTERNATIONAL SMALL CAP FUND
ARTISAN INTERNATIONAL VALUE FUND
ARTISAN MID CAP FUND
ARTISAN MID CAP VALUE FUND
ARTISAN SMALL CAP FUND
ARTISAN SMALL CAP VALUE FUND

ARTISAN FUNDS, INC.
INVESTOR SHARES
ARTISAN FUNDS
P.O. BOX 8412
BOSTON, MA 02266-8412
This report and the unaudited financial statements contained herein are provided for the general information of the shareholders of Artisan Funds. This report is not authorized for distribution to prospective investors unless preceded or accompanied by an effective prospectus. For more complete information on any Fund, including fees and expenses, please call 800.344.1770 or visit our website at www.artisanfunds.com for a free prospectus. Read it carefully before you invest or send money.
Company discussions are for illustration only and are not intended as recommendations of individual stocks. The discussions present information about the companies believed to be accurate, and the views of the portfolio managers, as of March 31, 2005. That information and those views may change, and the Funds disclaim any obligation to advise shareholders of any such changes. Artisan International Fund and Artisan Mid Cap Fund offer institutional classes of shares for institutional investors meeting certain minimum investment requirements. A report on each institutional class is available under separate cover.
Artisan Funds offered through Artisan Distributors LLC, member NASD.
| 02 | MANAGEMENT’S DISCUSSION OF FUND PERFORMANCE | |
| 02 | Artisan International Fund | |
| 06 | Artisan International Small Cap Fund | |
| 10 | Artisan International Value Fund | |
| 14 | Artisan Mid Cap Fund | |
| 18 | Artisan Mid Cap Value Fund | |
| 22 | Artisan Small Cap Fund | |
| 26 | Artisan Small Cap Value Fund | |
| 30 | SCHEDULES OF INVESTMENTS | |
| 30 | Artisan International Fund | |
| 33 | Artisan International Small Cap Fund | |
| 36 | Artisan International Value Fund | |
| 38 | Artisan Mid Cap Fund | |
| 41 | Artisan Mid Cap Value Fund | |
| 43 | Artisan Small Cap Fund | |
| 46 | Artisan Small Cap Value Fund | |
| 50 | STATEMENTS OF ASSETS AND LIABILITIES | |
| 52 | STATEMENTS OF OPERATIONS |
AVERAGE ANNUAL TOTAL RETURNS (as of 3/31/05)
| 1-Year | 3-Year | 5-Year | 10-Year | Since Inception | |||||||||||
Artisan International Fund (inception 12/28/95) | 10.41 | % | 6.74 | % | -4.73 | % | NA | 12.90 | % | ||||||
Artisan International Small Cap Fund (inception 12/21/01) | 21.03 | 26.04 | NA | NA | 25.44 | ||||||||||
Artisan International Value Fund (inception 9/23/02) | 22.95 | NA | NA | NA | 37.32 | ||||||||||
Artisan Mid Cap Fund (inception 6/27/97) | 5.80 | 4.29 | 1.66 | NA | 18.35 | ||||||||||
Artisan Mid Cap Value Fund (inception 3/28/01) | 23.56 | 18.13 | NA | NA | 16.86 | ||||||||||
Artisan Small Cap Fund (inception 3/28/95) | 8.89 | 6.58 | 3.18 | 9.45 | % | 9.50 | |||||||||
Artisan Small Cap Value Fund (inception 9/29/97) | 19.38 | 14.99 | 17.88 | NA | 13.54 |
The performance quoted represents past performance, which does not guarantee future results. The investment return and principal value of an investment in a Fund will fluctuate, so that an investor’s shares in the Fund, when redeemed, may be worth more or less than their original cost. Current performance may be lower or higher than the performance data quoted. For current to most recent month-end performance information, visit www.artisanfunds.com or call 800.344.1770. The performance information shown for Artisan International Fund, Artisan International Small Cap Fund and Artisan International Value Fund does not reflect the deduction of a 2% redemption fee on shares held by an investor for 90 days or less and, if reflected, the fee would reduce the performance quoted. Artisan International Small Cap Fund’s investments in initial public offerings (IPOs) made a material contribution to the Fund’s performance. IPO investments are not an integral component of the Fund’s investment process and may not be available in the future.
Artisan International Fund, International Small Cap Fund & International Value Fund: International investments involve special risks, including currency fluctuation, lower liquidity, different accounting methods and economic and political systems and higher transaction costs. These risks typically are greater in emerging markets. Artisan International Fund and International Small Cap Fund invest in growth stocks, which may underperform other asset types during a given period. Artisan International Small Cap Fund invests in the stocks of smaller companies, which tend to be more volatile and less liquid than those of larger companies, have underperformed the stocks of larger companies during some periods and tend to have a shorter history of operations than larger companies. Artisan International Value Fund invests in value stocks, which may underperform other asset types during a given period. In addition, the Fund may invest a significant portion of its assets in small and medium-sized companies, which tend to be more volatile and less liquid than those of large companies, have underperformed the stocks of larger companies during some periods and tend to have a shorter history of operations than larger companies.
Artisan Mid Cap Fund & Mid Cap Value Fund: Stocks of medium-sized companies tend to be more volatile than those of larger companies and have underperformed the stocks of small and large companies during some periods. Artisan Mid Cap Fund invests primarily in growth stocks, which may underperform other asset types during a given period. Artisan Mid Cap Value Fund invests primarily in value stocks, which may underperform other asset types during a given period.
Artisan Small Cap Fund & Small Cap Value Fund: Stocks of smaller companies tend to be more volatile and less liquid than those of larger companies, have underperformed the stocks of larger companies during some periods and tend to have a shorter history of operations than larger companies. Artisan Small Cap Fund invests primarily in growth stocks, which may underperform other asset types during a given period. Artisan Small Cap Value Fund invests primarily in value stocks, which may underperform other asset types during a given period.
ARTISAN INTERNATIONAL FUND (ARTIX)
| HIGHLIGHTS | ||
•During the six months ended March 31, 2005, Artisan International Fund (up 14.58%) slightly outperformed the MSCI EAFE® Growth Index (up 14.13%), but slightly trailed the MSCI EAFE® Index (up 15.13%). •The Fund benefited from the strength of its media holdings in the consumer discretionary sector and good security selection in the financial sector. | •The Fund generated positive returns in every sector, but holdings in the technology and industrials sectors trailed those of similar stocks in the MSCI EAFE® Index. | |
| INVESTMENT APPROACH | ||
| We use a bottom-up investment process to construct a portfolio of international growth companies of all market capitalizations. The investment team conducts its own fundamental analysis with particular emphasis on: | 1) well-managed companies focused on increasing shareholder value; 2) sustainable growth prospects; 3) reasonable valuations; or 4) dominant or increasing market shares or direct exposure to an identified theme. | |
| PERFORMANCE REVIEW | ||
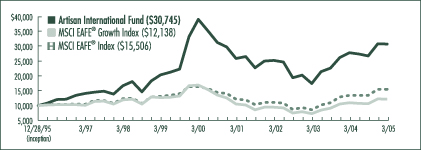
| Over the long-term, Artisan International Fund has outpaced the MSCI EAFE® Index by a wide margin. | ||
GROWTH OF AN ASSUMED $10,000 INVESTMENT (12/28/95 to 3/31/05)
AVERAGE ANNUAL TOTAL RETURNS (as of 3/31/05)
| Fund / Index | 1-Year | 3-Year | 5-Year | Since Inception | ||||||||
Artisan International Fund | 10.41 | % | 6.74 | % | -4.73 | % | 12.90 | % | ||||
MSCI EAFE® Growth Index | 10.71 | 8.63 | -6.47 | 2.12 | ||||||||
MSCI EAFE® Index | 15.06 | 11.64 | -1.15 | 4.85 |
The performance quoted represents past performance, which does not guarantee future results. The investment return and principal value of an investment in the Fund will fluctuate, so that an investor’s shares in the Fund, when redeemed, may be worth more or less than their original cost. Current performance may be lower or higher than the performance data quoted. For current to most recent month-end performance information, visit www.artisanfunds.com or call 800.344.1770. The graph and table above do not reflect the deduction of taxes that a shareholder would pay on distributions or sale of Fund shares. The performance shown does not reflect the deduction of a 2% redemption fee on shares held by an investor for 90 days or less and, if reflected, the fee would reduce the performance quoted. See page 82 for a description of each index.
02
TWO
INVESTING ENVIRONMENT
The semiannual reporting period ended March 31, 2005 was clearly a tale of two halves for international equity markets. The first three months were characterized by strong equity returns as the price of oil retreated. Global economic growth expectations, though slower, pointed to ongoing expansion. During the second half of the period, the rally fizzled out as the price of oil reversed course and inflation worries in the United States sent long-term interest rates on an upward path.
For U.S.-based international investors, the dollar was clearly an important factor during the period as it decreased versus a variety of currencies. The decline resulted in favorable currency conversions, which further enhanced returns, including those of the Fund.
Investors favored international small-cap stocks during the six-month period, continuing an extended run of outperformance relative to larger stocks. Emerging market stocks outperformed developed markets, even after accounting for a considerable pullback in the group at the end of the period when U.S. interest rates started to move higher. Though the advantage was relatively small, value stocks outpaced growth stocks.
PERFORMANCE DISCUSSION
Within the portfolio, we benefited from the performance of our holdings in the financial and consumer discretionary sectors, certain positions in the materials and energy sectors and our low relative exposure to pharmaceutical companies. The portfolio was negatively impacted, relative to our benchmark, by our technology and industrials positions. On a regional basis, our security selection in Japan was strong. Relative performance gains and losses in other areas around the world were mostly modest.
SECTOR REVIEW
Credit Suisse Group (CSG), Nikko Cordial Corp., Julius Baer Holding, Ltd., ORIX Corp. and Kookmin Bank were among our leading performers in the financial sector. CSG released a favorable earnings report due to lower loss provisions and strong fixed income trading. Nikko Cordial rose early in the period due in part to a solid financial report and news that Mizuho Financial Group, Inc. planned to buy a stake in the company, but we reduced our position as Nikko Cordial’s commissions and trading profits fell later in the period. Swiss private bank Julius Baer rose due to good operating results, speculation that it might seek a buyer and news that the controlling Baer family would give up control of the company. At ORIX, profit growth accelerated in real estate related finance and lease financing and asset quality improved.
TOP 10 HOLDINGS
| Company Name | Country | % | |||
UBS AG | Switzerland | 3.4 | % | ||
Fortis | Netherlands | 3.2 | |||
Kingfisher PLC | United Kingdom | 2.7 | |||
Tesco PLC | United Kingdom | 2.5 | |||
ITV PLC | United Kingdom | 2.5 | |||
Telefonaktiebolaget LM Ericsson | Sweden | 2.4 | |||
China Mobile (Hong Kong) Limited | China | 2.3 | |||
Sega Sammy Holdings, Inc. | Japan | 2.3 | |||
Nestle S.A. | Switzerland | 2.3 | |||
Credit Saison Co., Ltd. | Japan | 2.3 | |||
Total | 25.9 | % |
As a percentage of total net assets as of 3/31/05. Top 10 Holdings are determined by issuer.
In the insurance industry, we cut our exposure to German insurer Allianz AG by about half and sold our position in German reinsurer Muenchener Rueckversicherungs-Gesellschaft AG (Munich Re). Some of that capital was used to fund the purchases of Korean banks Shinhan Financial Group Co., Ltd. and Hana Bank. We also increased our position in Kookmin Bank, another Korean bank. With our Korean banks, we were attracted to the potential for improvements in asset quality and profitability and a shifting focus on consumer-related businesses.
In the consumer discretionary sector, we benefited from the performance of our media stocks and amusement/game machines manufacturer Sega Sammy Holdings Inc. In the media industry, British media company ITV PLC benefited from an announced increase in earnings due in part to cost cutting efforts. Reports that it had successfully renegotiated better than expected deals with
03
THREE
major advertisers also likely positively impacted the company’s share price. British satellite television provider British Sky Broadcasting Group PLC (BSkyB) showed improvement in subscriber growth and its shares traded at an attractive price relative to the company’s estimated earnings growth potential. Another winner was French outdoor advertiser JC Decaux S.A. It reported robust organic growth and better earnings driven by improvements in the profitability of street furniture and billboard activities.
SECTOR DIVERSIFICATION
| Sector | 9/30/04 | 3/31/05 | ||||
Consumer Discretionary | 23.9 | % | 23.3 | % | ||
Consumer Staples | 11.9 | 10.6 | ||||
Energy | 8.2 | 6.0 | ||||
Financials | 26.8 | 33.4 | ||||
Healthcare | 4.5 | 2.6 | ||||
Industrials | 4.7 | 4.4 | ||||
Information Technology | 6.4 | 6.5 | ||||
Materials | 4.8 | 2.1 | ||||
Telecommunication Services | 6.9 | 10.2 | ||||
Utilities | 0.7 | 0.3 | ||||
Other assets less liabilities | 1.2 | 0.6 | ||||
Total | 100.0 | % | 100.0 | % |
As a percentage of total net assets.
During the period, we purchased shares of Sega Sammy Holdings, Inc. after having owned small positions in Sega Corporation and Sammy Corporation individually prior to their merger. It contributed to performance due in part to positive expectations about management’s restructuring efforts and emphasis on profits. Swiss food giant Nestle S.A. and British foodservice group Compass Group PLC also performed well during the semiannual period. Nestle announced a share buyback program for the first time in its 132 year history. Compass was under pressure in the months leading up to the semiannual reporting period due to negative cash flow expectations resulting in part from new payment terms with suppliers. That news, coupled with concerns about the sustainability of catering margins, led us to sell our position. British home improvement retailer Kingfisher PLC was a laggard due in part to slower consumer spending. Interest rate hikes by the Bank of England were partly to blame.
Within the materials and energy sectors, Canadian natural gas company EnCana Corporation, Swiss specialty chemical manufacturer Clariant AG and German industrial gases company Linde AG were standouts. EnCana reported a surge in profits driven by an asset sale, higher realized prices and stronger production. Clariant and Linde also released solid financial results. We reduced our positions in EnCana and Clariant and we sold our position in Linde into the share price strength.
Swedish wireless network provider Telefonaktiebolaget LM Ericsson (Ericsson) and Dutch semiconductor equipment company ASML Holding N.V. account for the majority of our technology assets. Ericsson fell during the period due to higher than expected costs. ASML, which struggled for most of calendar year 2004, bounced back amid improving demand for semiconductors.
Our outperformance in healthcare and underperformance in the industrials sectors were partly a function of our allocations to each group. Although we believed that healthcare was attractive long-term due to demographics, we became concerned during the period about the fundamentals of most pharmaceutical companies because of drug development costs, higher litigation risks, patent protection and generics competition. We benefited from our relatively small investment in pharmaceutical companies during the period, as the industry trailed the benchmark return. In the industrials sector, we invested in a few companies where we had a level of confidence in the long-term growth characteristics, but overall we believed that the sector was too cyclical. In contrast to the healthcare sector, our performance compared to the MSCI EAFE® Index was negatively impacted by our underweight position in the sector, as it was one of the better performing groups.
COUNTRY REVIEW
Japan lagged many other developed markets during the period as reports indicated that economic growth had stalled and fears about higher taxes started to surface. However,
04
FOUR
positive signs emerged as the country’s largest banks cut bad loans, and both profit margins and sales growth generally showed signs of improvement. Despite the general weakness of Japanese equities, we were able to generate a positive relative gain with good security selection. Several of our solid individual performers were noted above including Sega Sammy Holdings, Nikko Cordial and ORIX.
REGION ALLOCATION
| Region | 9/30/04 | 3/31/05 | ||||
Europe | 65.6 | % | 61.3 | % | ||
Asia/Pacific | 25.0 | 32.1 | ||||
Latin America | 5.3 | 3.2 | ||||
North America | 2.9 | 2.8 |
As a percentage of total net assets.
TOP 5 COUNTRY ALLOCATIONS
| Country | % | ||
Japan | 19.4 | % | |
United Kingdom | 12.6 | ||
Switzerland | 10.8 | ||
France | 6.1 | ||
Netherlands | 5.9 |
As a percentage of total net assets as of 3/31/05.
The primary factors that influenced performance in Europe were a rising euro, which has stymied exports, and rising unemployment and oil prices that have tempered consumer spending and investment demand. However, the European Central Bank kept monetary policy very flexible, European manufacturing showed some improvement and many European stocks appeared to be attractively priced. The performance of our stocks in Europe was slightly ahead of the benchmark’s return in the region. Our selection in Switzerland was particularly strong due to the performances of previously mentioned Clariant, Credit Suisse Group, Julius Baer and Nestle.
Our emerging markets stocks did not keep pace with our investments in developed markets and trailed the MSCI EAFE® Index, though they collectively advanced over 13%. Our Russian oil stocks were the main source of underperformance, due in part to government tax claims that created negative sentiment for the country. One standout was Czech wireless provider Cesky Telecom, A.S., the price of which increased over 40%. It benefited from news about potential bidders for the government’s more than 50% stake in the company.
FUND CHANGES
The biggest changes to the overall composition of the portfolio during the period were an increase in our financial and telecommunication weights and a reduction in our European exposure.
The U.K. and Germany accounted for virtually all of the decrease in Europe, but this was an extension of our bottom-up security selection process, not a macroeconomic call. The sales that contributed to a lower weight in Europe included Munich Re, Compass Group, Linde, German stock exchange owner Deutsche Boerse AG, Swiss pharmaceuticals company Serono S.A., French energy company Total S.A., British beverage company Diageo PLC, Dutch consumer products company Unilever N.V. and British chemicals company Imperial Chemical Industries PLC. Three of our largest purchases in the region were French telecommunications provider France Telecom SA, Dutch financial services company ING Groep N.V. and France-based supermarket/hypermarket operator Carrefour SA.
The increase in our financials weight reflects the purchases of Hana Bank, Shinhan Financial Group and ING Groep and the additions to Kookmin Bank, ORIX, Credit Saison Co., Ltd. and Mizuho Financial Group, Inc. The change in our telecommunications weight was mainly due to the purchase of France Telecom and additions to Chinese wireless provider China Mobile (Hong Kong) Limited.
FUND STATISTICS
Net Assets | $ 11.2 billion | ||
Number of Holdings | 110 | ||
Weighted Average Market Cap | $ 31.0 billion | ||
Weighted Average Growth Rate (3-5 yr) | 11.3 | % | |
Weighted Harmonic Average P/E (2005E) | 15.1X |
Source: FactSet/Artisan Partners. All statistics are as of 3/31/05. Net Assets includes Investor Shares and Institutional Shares.
05
FIVE
ARTISAN INTERNATIONAL SMALL CAP FUND (ARTJX)
| HIGHLIGHTS | ||
• During the six months ended March 31, 2005, Artisan International Small Cap Fund (up 23.32%) outperformed the MSCI EAFE® Small Cap Index (up 22.63%). | • The main driver behind the Fund’s strong performance during the period was good security selection in the consumer discretionary and financial sectors. • The telecommunications sector was an area of weakness in the Fund. | |
| INVESTMENT APPROACH | ||
| We use a bottom-up investment process to construct a portfolio of smaller international growth companies. The investment team conducts its own fundamental analysis with particular emphasis on: | 1) well-managed companies focused on increasing shareholder value; 2) sustainable growth prospects; 3) reasonable valuations; and 4) strong or increasing market shares or direct exposure to an identified theme. | |
| PERFORMANCE SUMMARY | ||
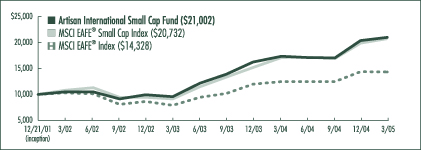
| Artisan International Small Cap Fund reached its three-year anniversary during the period and has outperformed the MSCI EAFE® Small Cap Index over the trailing three years and since inception. | ||
GROWTH OF AN ASSUMED $10,000 INVESTMENT (12/21/01 to 3/31/05)
AVERAGE ANNUAL TOTAL RETURNS (as of 3/31/05)
| Fund / Index | 1-Year | 3-Year | Since Inception | ||||||
Artisan International Small Cap Fund | 21.03 | % | 26.04 | % | 25.44 | % | |||
MSCI EAFE® Small Cap Index | 21.32 | 24.26 | 24.94 | ||||||
MSCI EAFE® Index | 15.06 | 11.64 | 11.61 |
The performance quoted represents past performance, which does not guarantee future results. The investment return and principal value of an investment in the Fund will fluctuate, so that an investor’s shares in the Fund, when redeemed, may be worth more or less than their original cost. Current performance may be lower or higher than the performance data quoted. For current to most recent month-end performance information, visit www.artisanfunds.com or call 800.344.1770. The graph and table above do not reflect the deduction of taxes that a shareholder would pay on distributions or sale of Fund shares. The performance shown does not reflect the deduction of a 2% redemption fee on shares held by an investor for 90 days or less and, if reflected, the fee would reduce the performance quoted. The Fund’s investments in initial public offerings (IPOs) made a material contribution to the Fund’s performance. IPO investments are not an integral component of the Fund’s investment process and may not be available in the future. See pages 82 and 83 for a description of each index.
06
SIX
MARKET OVERVIEW
International small-cap stocks had a strong showing during the six months ended March 31, 2005. As a group, they outperformed larger international stocks, emerging market stocks and U.S. small-cap stocks. Early in the period, all of those asset classes recorded solid gains, as a retreat in the price of oil seemed to create a level of optimism. The climate changed near the turn of the calendar year, when the price of oil reversed course and the prospect of rising inflation in the U.S. raised concern that the Federal Reserve might quicken its interest rate hikes. Nevertheless, international small-cap stocks were able to shrug off most of the impact from those influences.
For U.S.-based international investors, the dollar was clearly an important factor during the period as it decreased versus a variety of currencies. The decline resulted in favorable currency conversions, which further enhanced returns, including those of the Fund.
Within the MSCI EAFE® Small Cap Index, energy stocks, industrials and financials were among the best performing groups. The technology, consumer discretionary and healthcare sectors were the worst performers, though every sector recorded double-digit gains. Regionally, France, Spain and Sweden were among the leaders in Europe. In a sign of the overall strength of international small-caps during the period, Japan advanced nearly 14%, but was a laggard.
PERFORMANCE DISCUSSION
Our strongest gains compared to the MSCI EAFE® Small Cap Index were found in the financial and consumer discretionary sectors, where our security selection was particularly good. Our technology and healthcare stocks also performed well. The telecommunications sector weighed on our performance. By country, we benefited most from our positioning in Japan, while our returns in the U.K. were not as good as the Index.
SECTOR REVIEW
In the financial sector, top holding Banco Latinoamericano de Exportaciones, S.A. (BLX) outperformed the average financial stock, advancing over 33%. BLX is considerably overcapitalized, which raised expectations for an additional capital distribution, such as a special dividend. We believed that the market recognized its financial strength and earnings growth potential due to improvements made in the company’s Argentine credit portfolio. BanColombia S.A., a retail and commercial bank in Colombia, was another leading performer, advancing nearly 65%. It released better than expected earnings results as the company maintained a solid share of loans and deposits. There was also speculation in the market that BanColombia might be part of a three-way merger with mortgage bank Conavi and investment bank Corfinsura. We sold our position into the share price strength.
TOP 10 HOLDINGS
| Company Name | Country | % | |||
Banco Latinoamericano de Exportaciones, S.A., E Shares | Panama | 4.6 | % | ||
Buhrmann NV | Netherlands | 3.1 | |||
Nexity | France | 2.8 | |||
Elekta AB, B shares | Sweden | 2.7 | |||
Fraser & Neave Limited | Singapore | 2.6 | |||
Sulzer AG | Switzerland | 2.6 | |||
AO VimpelCom (ADR) | Russia | 2.4 | |||
Creed Corporation | Japan | 2.3 | |||
John Fairfax Holdings Limited | Australia | 2.1 | |||
Intertek Group PLC | United Kingdom | 2.1 | |||
Total | 27.3 | % |
As a percentage of total net assets as of 3/31/05. Top 10 Holdings are determined by issuer.
National Finance Public Company Limited (Thai financial services), Euler Hermes (French credit insurer) and Creed Corporation (Japanese real estate investment advisor) each announced solid financial results, which contributed to their share price gains. Euler Hermes was purchased during the period. French property developer Nexity was another purchase that turned in an immediate gain. We added Nexity to the portfolio because we believed that the company’s position in the highly fragmented property market, where barriers to entry are high, created the potential for good organic growth.
We had a number of winners in the consumer sectors. Two of our leading gainers were
07
SEVEN
Swedish residential and commercial property developer JM AB and Brazilian cosmetics company Natura Cosmeticos S.A. JM announced a substantial capital distribution to shareholders and reported solid earnings. The potential for additional divestments from its property portfolio also raised the possibility of an additional cash distribution to shareholders. Management at Natura drove strong sales growth with product innovation and international expansion.
SECTOR DIVERSIFICATION
| Sector | 9/30/04 | 3/31/05 | ||||
Consumer Discretionary | 27.6 | % | 21.6 | % | ||
Consumer Staples | 11.6 | 4.7 | ||||
Energy | 5.2 | 5.1 | ||||
Financials | 13.9 | 24.9 | ||||
Healthcare | 8.0 | 5.8 | ||||
Industrials | 13.1 | 21.4 | ||||
Information Technology | 3.3 | 3.1 | ||||
Materials | 3.1 | 4.9 | ||||
Telecommunication Services | 5.8 | 5.0 | ||||
Utilities | 1.8 | 2.0 | ||||
Other assets less liabilities | 6.6 | 1.5 | ||||
Total | 100.0 | % | 100.0 | % |
As a percentage of total net assets.
Several of our media holdings posted strong returns. Canadian media and entertainment company Corus Entertainment, Inc., Spanish publishing company Recoletos Grupo de Comunicacion, S.A. and Portuguese media company Impresa-Sociedade Gestora de Participacoes, S.A. were three of the leaders. Corus released a good earnings report due to better profitability in TV and radio as it reined in costs. Recoletos increased due to a buyout offer from a consortium that included members of Recoletos’ management team. We sold our shares in the company. Impresa reported a solid increase in advertising revenues with sales mainly driven by its TV and newspaper divisions. Although U.K. broadcaster SMG PLC was hurt by disappointing sales and profitability levels in radio, we maintained our position.
The portfolio experienced good results in the healthcare sector due in large part to the strength of German generic drug manufacturer Stada Arzneimittel AG and Swedish radiation surgery equipment manufacturer Elekta AB. Stada increased on speculation that there may be further consolidation in the generics industry and we sold our position. Elekta benefited from its announced acquisition of IMPAC Medical Systems, Inc. and strong order growth. The acquisition was expected to provide the company with better access to U.S. hospitals, strengthening the company’s market position. Dental implant manufacturer Straumann AG, which has logged impressive gains in the last two calendar years, took pause during the period as growth expectations fell. Because we have held Straumann through its success during the last two years, we realized some gains as we trimmed our position.
We only owned a select few technology companies. However, we outperformed in the technology sector due to the performance of FINETEC Corporation, which more than doubled during the period. FINETEC develops materials such as cryogenic insulation products that carry and store liquefied natural gas and rigid polyurethane foam to utilize as refrigerants. It renewed contract terms with customers, allowing the company to pass on raw material price increases raising expectations for strong and stable earnings growth going forward.
Two telecommunications companies that we liked were Brazilian wireless provider Telesp Celular Participacoes S.A. and Russian wireless provider AO VimpelCom. Both stocks fell during the period. Telesp Celular generated good sales, but client acquisition costs rose due to more expensive marketing efforts. VimpelCom suffered from negative sentiment driven by Russian government tax claims.
COUNTRY REVIEW
Japan lagged many other developed markets during the period as reports indicated that economic growth had stalled and fears about higher taxes started to surface. However, positive signs emerged as the country’s largest banks have cut bad loans, and both profit margins and sales growth generally have shown signs of improvement. We turned in a
08
EIGHT
positive relative gain by being less exposed to Japan than the benchmark and with good security selection. Creed and home improvement retailer Komeri Company, Ltd. were two of our leading performers.
REGION ALLOCATION
| Region | 9/30/04 | 3/31/05 | ||||
Europe | 56.5 | % | 53.6 | % | ||
Asia/Pacific | 25.1 | 33.7 | ||||
Latin America | 8.3 | 8.1 | ||||
North America | 3.5 | 2.6 | ||||
Other | 0.0 | 0.5 |
As a percentage of total net assets.
TOP 5 COUNTRY ALLOCATIONS
| Country | % | ||
Switzerland | 12.6 | % | |
Japan | 9.7 | ||
France | 8.0 | ||
Hong Kong | 6.1 | ||
Republic of Korea | 5.0 |
As a percentage of total net assets as of 3/31/05.
The primary factors that influenced performance in Europe were a rising euro, which has stymied exports, and rising unemployment and oil prices that have tempered consumer spending and investment demand. However, the European Central Bank kept monetary policy very flexible, European manufacturing showed some improvement and many European stocks appeared to be attractively priced. Our overall performance in Europe was slightly ahead of the benchmark’s return in the region. However, our stocks in the U.K. were a source of weakness, as they did not keep pace with the benchmark country return.
FUND CHANGES
The largest changes to the composition of the portfolio were an increase in our financial and industrial weights and a reduction in our consumer holdings. The impact of our transactions was a decreased weight in Europe and an increased weight in the Pacific Basin.
The majority of the change in our consumer allocation stemmed from the sales of certain media positions. Among those sold were Recoletos Grupo de Comunicacion, S.A., Gestevision Telecinco, S.A. and Capital Radio PLC. Other transactions in the consumer sectors included the sale of French consumer products company Clarins S.A. and a significant reduction in Belgian discount food retailer Colruyt N.V. Clarins and Colruyt each reported solid results during the period. We were not, however, just sellers in the consumer sectors, as we added Japanese food supermarket chain Ozeki Company, Ltd., Norwegian phone directories publisher Findexa Ltd. and Spanish property development company Fadesa Inmobiliaria, S.A.
In addition to those noted above, in the financials sector we added several real estate companies in the Far East, as well as Swiss insurance company Baloise Holding and Japanese small business lender SFCG Co., Ltd. We liked that Baloise management has focused on underwriting improvements, increasing profitability and strengthening the company’s balance sheet. We believed that SFCG could experience a meaningful increase in return on equity driven by loan growth and better profitability and also think that bad debts will decrease.
The purchase of Dutch office products distributor Buhrmann NV was the main driver behind the increase in our industrials weight. Buhrmann was our second largest holding as of March 31, 2005. On the surface, office products may appear to be an unexciting venture. However, we believed there was ample opportunity for Buhrmann to grow through market share gains, market expansion, new product areas and new customers.
FUND STATISTICS
Net Assets | $ 665.8 million | |
Number of Holdings | 85 | |
Median Market Cap | $ 1.4 billion | |
Weighted Average Market Cap | $ 2.0 billion | |
Weighted Average Growth Rate (3-5 yr) | 12.4% | |
Weighted Harmonic Average P/E (2005E) | 15.0X |
Source: FactSet/Artisan Partners. All statistics are as of 3/31/05.
09
NINE
ARTISAN INTERNATIONAL VALUE FUND (ARTKX)
| HIGHLIGHTS | ||
• During the six months ended March 31, 2005, Artisan International Value Fund (up 16.85%) outperformed the MSCI EAFE® Index (up 15.13%) and the MSCI EAFE® Value Index (up 16.11%). | • The primary driver of strong performance compared to both benchmarks was good security selection. • A pair of our smaller positions did not keep pace with the benchmarks, slightly offsetting the strong relative results in the rest of the portfolio. | |
| INVESTMENT APPROACH | ||
| We use a bottom-up investment process to construct a portfolio of undervalued non-U.S. companies. We conduct our own in-depth fundamental research with the goal of investing in companies at prices that reflect a significant discount to our estimate of | economic value. Attention is also given to a company’s balance sheet, historic returns on its capital and management team. Assessing the tradeoffs among these factors is at the heart of our investment process. | |
| PERFORMANCE REVIEW | ||
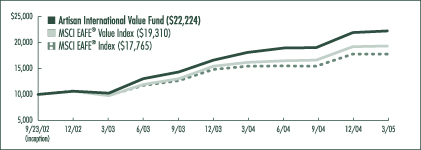
| Since inception, Artisan International Value Fund has advanced 122.24% on a cumulative basis and 37.32% on an annualized basis, exceeding the results of both benchmarks. | ||
GROWTH OF AN ASSUMED $10,000 INVESTMENT (9/23/02 to 3/31/05)
AVERAGE ANNUAL TOTAL RETURNS (as of 3/31/05)
| Fund / Index | 1-Year | Since Inception | ||||
Artisan International Value Fund | 22.95 | % | 37.32 | % | ||
MSCI EAFE® Value Index | 19.38 | 29.87 | ||||
MSCI EAFE® Index | 15.06 | 25.64 |
The performance quoted represents past performance, which does not guarantee future results. The investment return and principal value of an investment in the Fund will fluctuate, so that an investor’s shares in the Fund, when redeemed, may be worth more or less than their original cost. Current performance may be lower or higher than the performance data quoted. For current to most recent month-end performance information, visit www.artisanfunds.com or call 800.344.1770. The performance shown does not reflect the deduction of a 2% redemption fee on shares held by an investor for 90 days or less and, if reflected, the fee would reduce the performance quoted. The graph and table above do not reflect the deduction of taxes that a shareholder would pay on distributions or sale of Fund shares. See pages 82 and 83 for a description of each index.
10
TEN
INVESTING ENVIRONMENT
Equity markets performed well during the six months ended March 31, 2005 mainly due to a significant bout of investor optimism in the last three months of 2004. In the first quarter of 2005, the environment became much less benign as concerns over rising interest rates in the U.S., a slowdown in economic growth and rising crude oil prices took center stage. Nonetheless, returns were positive in most markets of the world during the full six-month period.
REGION ALLOCATION
| Region | 9/30/04 | 3/31/05 | ||||
Europe | 70.1 | % | 69.7 | % | ||
Asia/Pacific | 20.2 | 18.6 | ||||
Latin America | 1.8 | 0.8 | ||||
North America | 2.0 | 4.5 |
As a percentage of total net assets.
TOP 5 COUNTRY ALLOCATIONS
| Country | % | ||
United Kingdom | 28.6 | % | |
Switzerland | 12.7 | ||
Germany | 9.4 | ||
Japan | 9.1 | ||
France | 7.9 |
As a percentage of total net assets as of 3/31/05.
PERFORMANCE DISCUSSION
We are value investors and our primary task is the purchase of shares in companies that are selling at a meaningful discount to our estimate of intrinsic value. As a result, the efforts of our operation are centered around monitoring the economic success or failure of the businesses owned in the portfolio and the consequent impact on intrinsic value. Hence, the vast majority of the discussion to follow is focused on our portfolio holdings. There are, however, certain macroeconomic impacts on performance that occur from time to time, which are important to consider. For example, the strength of foreign currencies has provided a positive impact to performance over the last six months, continuing the trend of recent years. While we do not generally try to manage the Fund’s exposure to currencies, we may defensively hedge where the Fund has exposure to a currency that we deem to be significantly overvalued. Currently the portfolio is unhedged.
In terms of company specifics, there were a number of stocks that had a significant impact on the Fund’s total return during the period.
| • | Euronext N.V.’s primary business is the management of the French, Dutch, Belgian and Portugese stock exchanges. Euronext also owns the London International Financial Futures Exchange. In mid-December 2004, the London Stock Exchange (LSE) received a bid from Deutsche Boerse AG, operator of the German Stock Exchange. Shortly thereafter, Euronext also approached the LSE with an offer to purchase the company. A somewhat complex series of events followed with the end result being that Deutsche Boerse withdrew its offer leaving Euronext as the sole bidder. During this process, the share price of Euronext increased significantly in anticipation of either a successful bid for the LSE or simply due to the increased attention on its own relatively attractive valuation. |
| • | Cementir S.p.A. is an Italian cement producer with operations in Italy and Turkey. In October 2004, it completed the acquisition of the largest cement producer in Denmark. The acquisition doubled the company’s size, provided access to new markets and put to use its significant cash resources. Investors viewed the transaction very favorably because it appeared likely to increase the company’s earnings per share. During the period, Cementir continued to benefit from positive sentiment surrounding the acquisition, contributing meaningfully to the Fund’s share price appreciation during the six-month period. |
| • | Diageo PLC is the world’s largest spirits company and has been one of the largest holdings in the Fund almost since inception. We bought it because it has a stable of top tier brands and we believed it was one of the best managed packaged goods companies in the world, as evidenced by the company’s attractive returns, strong cash flow and modest but steady revenue growth. Over the last six months the share price increased by |
11
ELEVEN
almost 13%. In addition, the company announced a dividend late in the period amounting to 1.6% of the share price as measured at the beginning of the period. |
| • | Unilever PLC is an Anglo-Dutch consumer products company. After falling significantly during the months leading up to September 30, 2004, the share price rebounded during the period under review. Though the company has reported disappointing sales and earnings, the co-Chairman management structure under which the company operated for decades changed. Management of the company has been divided between a non-executive Chairman and a single operating CEO. We viewed that change as a positive first step towards better management of what we believe is a strong stable of consumer brands. |
TOP 10 HOLDINGS
| Company Name | Country | % | |||
Diageo PLC | United Kingdom | 4.9 | % | ||
Wolters Kluwer N.V. | Netherlands | 4.1 | |||
Pfeiffer Vacuum Technology AG | Germany | 4.0 | |||
Countrywide PLC | United Kingdom | 4.0 | |||
Meitec Corporation | Japan | 3.9 | |||
Unilever PLC (ADR) | United Kingdom | 3.6 | |||
Clariant AG | Switzerland | 3.5 | |||
Vodafone Group PLC (ADR) | United Kingdom | 3.5 | |||
Signet Group PLC | United Kingdom | 3.3 | |||
Euronext N.V. | France | 3.2 | |||
Total | 38.0 | % |
As a percentage of total net assets as of 3/31/05. Top 10 Holdings are determined by issuer.
| • | Brit Insurance Holdings PLC is a U.K.-based international general insurance and reinsurance company. The company underwrites both direct insurance and re-insurance through a Lloyd’s syndicate and through its U.K. regulated subsidiary. In early September 2004 the company reported good operating results including significant growth in premiums and positive underwriting profits. The halo from that good news continued into this reporting period, with the share price increasing by almost 17% since October 1st. |
| • | Rinker Group, Ltd. is an Australian-based construction materials company with significant operations in the U.S. Its major markets in the U.S. include Florida and Arizona, two states which were benefiting from high levels of housing demand. As a result, Rinker’s profits have increased significantly. The share price increased by more than one-third over the last six months. |
There were no companies that had a meaningful negative impact on the portfolio’s absolute returns in the last six months. We retained relatively small investments in the shares of Carpetright PLC, whose shares declined by a small amount, and Willis Group Holdings Limited, whose shares underperformed on a relative basis.
FUND CHANGES
Since our annual report on September 30, 2004, we acquired shares in four companies that we continued to hold as of the end of the period: Zinifex Ltd., Heidelberger Druckmaschinen AG, Willis Group Holdings Limited and Renault S.A. A brief discussion of each of these companies is provided below.
Zinifex, based in Australia, is a miner and refiner of zinc and lead. The main assets that make up Zinifex used to be part of a company called Pasminco. As Pasminco, the company had a troubled history due to its acquisition strategy, currency hedging and a heavily leveraged balance sheet. Those factors, combined with the inherent volatility of commodity metal prices, eventually proved to be its undoing and the company went bankrupt in September of 2001. Over the past few years, with the help of a new management team, the company quietly restructured itself. It emerged from bankruptcy in 2004 and sold shares to the public. There were a few things we liked about this investment. First of all, the IPO did not generate much enthusiasm given its tarnished history and we were able to buy Zinifex at what we estimated to be a meaningful discount to its economic value. Second, unlike most metal prices, which have rocketed to multi-year highs, zinc prices have basically remained within their historical range due in large part to the existence of high zinc inventories. Finally, we liked the company’s low level of debt and its commitment to making shareholder returns a top priority.
12
TWELVE
SECTOR DIVERSIFICATION
| Sector | 9/30/04 | 3/31/05 | ||||
Consumer Discretionary | 18.2 | % | 20.2 | % | ||
Consumer Staples | 17.1 | 13.7 | ||||
Energy | 0.4 | — | ||||
Financials | 23.0 | 24.3 | ||||
Healthcare | 2.6 | 2.7 | ||||
Industrials | 10.8 | 14.7 | ||||
Information Technology | — | — | ||||
Materials | 14.5 | 11.7 | ||||
Telecommunication Services | 6.5 | �� | 5.3 | |||
Utilities | 1.0 | 1.0 | ||||
Other assets less liabilities | 5.9 | 6.4 | ||||
Total | 100.0 | % | 100.0 | % |
As a percentage of total net assets.
Heidelberger Druckmaschinen is a world-leading manufacturer of sheetfed printing presses with a market share of nearly three times its nearest competitor. Over the last few years, prices for printing machines have fallen significantly due to a cyclical decline in demand. As a consequence, Heidelberger’s profits were wiped out and the share price suffered a significant decline. The company responded to the weaker market by cutting costs aggressively and exiting its struggling web systems and digital businesses. Without losses from those businesses and with a lower fixed cost structure following the company’s cost cutting initiatives, we believed that a modest recovery in demand could allow the company to return to a higher level of profitability. Combined with a sound balance sheet, we thought that the shares offered an attractive risk-reward tradeoff.
Willis Group Holdings is the world’s third largest provider of insurance brokerage services. We think insurance brokerage is an extremely desirable business characterized by high margins and strong cash flow generation. We have long admired the economics of Willis and Chairman Joseph Plumeri II and his management team. In October, New York Attorney General Eliot Spitzer launched an investigation into fraud and anti-competitive practices of the brokerage industry. We believed that the outcome of the investigation may lead to a shift in market share that could benefit Willis Group. Unfortunately, during the process of building our position the share price increased, leaving us with a smaller investment than we would have liked.
Renault S.A. is a French manufacturer of cars and light commercial vehicles and, through its alliance with Nissan, is one of the top five manufacturers worldwide. It owns over 40% of Nissan, the number two ranked car manufacturer in Japan and a significant player in the United States, and 20% of Volvo AB. In many respects, Renault is a textbook example of a value stock. As of December 31, 2004, the market capitalization of Renault was 17.5 billion euros and its stake in Nissan was valued at approximately 16 billion euros. Its 20% stake in Volvo AB was worth approximately 2.5 billion euros. As a result, we were effectively paying nothing for Renault’s profitable car manufacturing business and its profitable finance division. By our calculations, we thought those assets were worth at least 7 billion euros. We would also note that Renault and Nissan had strong balance sheets, a highly attractive quality given the cyclical and capital-intensive nature of the automotive industry.
We sold five companies since our last report. Tate & Lyle PLC, Statoil ASA, Schindler Holding AG, Schering AG and Ichiyoshi Securities Co., Ltd. were sold after each reached our assessment of intrinsic value.
FUND STATISTICS
Net Assets | $ 648.7 million | |
Number of Holdings | 44 | |
Median Market Cap | $ 2.1 billion | |
Weighted Average Market Cap | $ 14.0 billion | |
Median P/B Value | 2.1X | |
Weighted Harmonic Average P/E (2005E) | 14.6X |
Source: FactSet/Artisan Partners. All statistics are as of 3/31/05.
13
THIRTEEN
| HIGHLIGHTS | ||
• During the six months ended March 31, 2005, Artisan Mid Cap Fund (up 9.64%) trailed the Russell Midcap® Index (up 13.37%) and the Russell Midcap® Growth Index (up 12.04%). • Security selection in the technology sector was a leading contributor to performance compared to both benchmarks. | • Though returns were positive, the performance of the Fund’s stocks in the healthcare sector did not keep pace with those in the benchmarks. | |
| INVESTMENT APPROACH | ||
| We use a bottom-up investment process to identify well-managed mid-sized companies whose growth and profit potential are not yet fully recognized by investors. Specifically, we spend most of our time answering three questions about a company before we will invest in it: | 1) Does the company exhibit franchise characteristics? 2) Is the company positioned for long-term growth and at an early stage in its profit cycle? 3) Is the stock of the company trading at a reasonable discount to our estimate of its private market value? | |
| PERFORMANCE REVIEW | ||
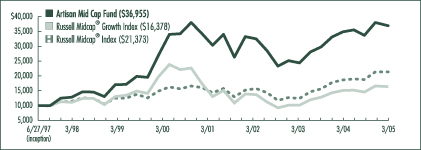
| Artisan Mid Cap Fund has outperformed the Russell Midcap® Growth Index during the trailing five-year and since inception periods. | ||
GROWTH OF AN ASSUMED $10,000 INVESTMENT (6/27/97 to 3/31/05)
AVERAGE ANNUAL TOTAL RETURNS (as of 3/31/05)
| Fund / Index | 1-Year | 3-Year | 5-Year | Since Inception | ||||||||
Artisan Mid Cap Fund | 5.80 | % | 4.29 | % | 1.66 | % | 18.35 | % | ||||
Russell Midcap® Growth Index | 8.31 | 6.19 | -7.30 | 6.56 | ||||||||
Russell Midcap® Index | 14.05 | 10.53 | 5.49 | 10.28 |
The performance quoted represents past performance, which does not guarantee future results. The investment return and principal value of an investment in the Fund will fluctuate, so that an investor’s shares in the Fund, when redeemed, may be worth more or less than their original cost. Current performance may be lower or higher than the performance data quoted. For current to most recent month-end performance information, visit www.artisanfunds.com or call 800.344.1770. The graph and table above do not reflect the deduction of taxes that a shareholder would pay on distributions or sale of Fund shares. See page 83 for a description of each index.
14
FOURTEEN
INVESTING ENVIRONMENT
The six months ended March 31, 2005 was a good period to own mid-cap stocks. Returns were heavily weighted to the front half of the period. Most sectors in the Russell Midcap® Index and the Russell Midcap® Growth Index posted double-digit gains. Coming into the period we were cautiously optimistic, given the continued fundamental improvement being enjoyed by much of corporate America. Balance sheets were healthier, earnings growth expectations were solid and, importantly, catalysts were in place with the potential to increase capital spending across large segments of the economy. In addition, the relative weakness of the dollar offered potential benefits to American exporters. Even the consumer remained healthy despite the absence of any new fiscal and monetary stimulus and only modest job growth.
With that support, two drivers of the early rally in equities were an incumbent victory in the presidential election and a decline in the price of oil. However, as the period wore on investors moved into a more defensive mode as oil moved higher, inflation worries started to pick up and the Federal Reserve kept on its path to push short-term interest rates higher.
In the Russell Midcap® Index and the Russell Midcap® Growth Index, energy, utilities, materials and technology were among the favored sectors. The consumer staples sector also did relatively well. The financial sector was the worst relative performer. Producer durable and transportation stocks trailed as well, though the disparity was less pronounced.
PERFORMANCE DISCUSSION
The Fund generated a solid absolute return, advancing nearly 10%, but trailed the benchmark indices. Our technology related stocks were one of the leading contributors to performance compared to both benchmarks. The portfolio also had several winners in the retail industry, though gains in those consumer related stocks were offset by weakness in others. Our stocks in the healthcare sector underperformed similar companies in the indices.
Many of our technology related holdings are exposed to the favorable secular trend we internally refer to as the digital lifestyle. Broadly speaking, it is the convergence of digital technology and mobility. Companies exposed to this trend in technology can be found across many sectors in the portfolio. Macromedia, Inc., Seagate Technology, VeriSign, Inc., CheckFree Corporation and Western Wireless Corporation were our leading performers within that trend. Each company’s stock price advanced in excess of 40% during the period. Macromedia, which develops software tools for the delivery of content across the Internet, reported strong results from its division targeting software development for mobile devices. Hard disk drive manufacturer Seagate Technology saw momentum build in its consumer division due to growing demand for devices such as MP3 players, cell phones and digital cameras. VeriSign, a leading provider of infrastructure services that allow users to conduct business securely over the Internet, reported revenues well ahead of expectations. Its recently acquired Jamba! business was the primary source of the upside, due to robust demand for wireless downloads. CheckFree is the leading provider of online bill payment solutions. It has benefited from growth in the adoption of online bill payment as banks continue to offer the service in an effort to defend and gain consumer market share. Wireless phone service provider Western Wireless jumped due to a premium acquisition offer from Alltel Corporation, another wireless provider. We sold out of our shares in Western subsequent to the announcement.
TOP 10 HOLDINGS
| Company Name | % | ||
Constellation Brands, Inc. | 2.3 | % | |
Air Products and Chemicals, Inc. | 2.1 | ||
Yahoo! Inc. | 1.9 | ||
Danaher Corporation | 1.8 | ||
Allergan, Inc. | 1.8 | ||
Willis Group Holdings Limited | 1.8 | ||
Invitrogen Corporation | 1.8 | ||
Smith International, Inc. | 1.6 | ||
ITT Industries, Inc. | 1.6 | ||
Chico’s FAS, Inc. | 1.6 | ||
Total | 18.3 | % |
As a percentage of total net assets as of 3/31/05. Top 10 Holdings are determined by issuer.
15
FIFTEEN
Jabil Circuit, Inc. and Lam Research Corporation were two additional winners among our technology related positions. Jabil Circuit, which is a leading provider of electronics manufacturing services, continued to generate strong growth and its profitability levels were strong versus comparable companies. Semiconductor equipment manufacturer Lam Research was able to drive market share gains due to strong order growth for semiconductor manufacturing equipment, particularly among Japanese and other Asian customers.
Another trend that we tend to think about across the portfolio is the impact of economic growth in China. China’s dynamic growth in recent years has had a significant impact on many industries, most notably those sensitive to commodity prices. We concur with those who believe the case for continued economic growth in China is very strong, and in a few special situations, we have made limited investments in commodity sensitive companies such as Peabody Energy Corporation and Devon Energy Corporation. However, we have made more investments in companies we thought could benefit from that growth in other ways.
Clean water, reliable power and better means of transport are three of the most basic demands of a growing society. Some of our holdings that address those demands performed well during the period, including Air Products and Chemicals, Inc., Precision Castparts Corp., Joy Global Inc. and ITT Industries, Inc. In addition, we initiated positions in several other companies within that profile that we thought could benefit from China’s growth. Among those purchases were The AES Corporation and Pentair, Inc. Diversified industrial and consumer products company Danaher Corporation was one stock within this group that did not perform as well. We used the softness as an opportunity to increase our position.
FUND STATISTICS
Net Assets | $ 5.9 billion | ||
Number of Holdings | 108 | ||
Median Market Cap | $ 6.0 billion | ||
Weighted Average Market Cap | $ 8.7 billion | ||
Weighted Average Growth Rate (3-5 yr) | 17.8 | % | |
Weighted Harmonic Average P/E (2005E) | 20.2X |
Source: FactSet/Artisan Partners. All statistics are as of 3/31/05. Net assets includes Investor Shares and Institutional Shares.
In the retail industry, our relative gains were primarily due to American Eagle Outfitters, Inc., Chico’s FAS, Inc. and CarMax, Inc. Teen apparel retailer American Eagle had a strong series of sales results as its merchandising proved to be “trend right”, which led to higher profits. Chico’s, a private label women’s clothing retailer with a loyal customer base, reported impressive sales results during the period, and its new clothing concepts started to add meaningfully to the strength of its core brand. Used car retailer CarMax added a sub-prime lending partner, which management believed would boost sales.
Beverage company Constellation Brands, Inc. was another leader in the consumer sectors. Its gain was due in part to the announced acquisition of premium wine producer Mondavi, a deal that could lead to cost synergies and accelerated profit growth. Constellation also demonstrated the strength of its current profit cycle by reporting a solid increase in profits. It was our top holding as of March 31, 2005. Offsetting the relative strength of Constellation Brands were Yahoo! Inc. and leading Spanish language media company Univision Communications Inc. Because we believed in the long-term prospects of both, we increased our position in each. Two underperformers in which we did not increase our weighting were Iron Mountain Incorporated and Lamar Advertising Company. (We tend to think of both companies as more directly tied to business spending than consumer spending, but the benchmarks classify them in the consumer discretionary sector.) Iron Mountain is the global leader in records and information management. It dropped due to a conservative outlook for earnings and cash flow in 2005 and some reservations about the company’s decision to attack the digital portion of the marketplace aggressively. Outdoor advertiser Lamar Advertising posted decent revenue growth, but higher expenses negatively impacted profitability.
In the healthcare sector, drug developer Millennium Pharmaceuticals, Inc. radiation therapy systems manufacturer Varian Medical Systems, Inc. and medical device maker Boston Scientific Corporation negatively impacted our results. Millennium provided a disappointing
16
SIXTEEN
outlook for one of its key drugs causing us to lose confidence in its prospects and we sold our position. Varian is the worldwide market leader, but U.S. order growth has slowed as customers evaluated their next-generation systems. We remained confident in growth outside the U.S., so we purchased additional shares on weakness. Boston Scientific’s share price decreased due to management’s intentions to increase spending to spur growth. We did not disagree with that approach, but ultimately sold our shares due to competitive concerns.
Healthcare benefits provider Aetna Inc., pharmacy benefit manager Caremark Rx, Inc. and biology tool kit provider Invitrogen Corporation were three standout performers for the period. Aetna benefited from good membership growth and earnings and generally positive sentiment for managed care providers due to, among other things, the re-election of President Bush. Caremark reported solid earnings due to strong demand for mail-order prescriptions and higher generic drug utilization. Invitrogen executed well and delivered solid growth due to robust demand.
FUND CHANGES
Two important changes to the Fund during the period were a reduction in the number of holdings (from 116 to 108) and an increase in the amount of assets we had committed to our largest twenty positions (from 27.2% to 33.1%). Our largest positions are those companies where our conviction is highest. We were provided the opportunity to make those adjustments in the first three months of 2005 when the market was being driven by a fair amount of uncertainty. During that time frame we also had the opportunity to introduce several new companies into the portfolio that we have researched extensively in the past. Those new purchases included The AES Corporation, CACI International Inc., Electronic Arts Inc., Cognizant Technology Solutions Corporation, Marvell Technology Group Ltd. and Zebra Technologies Corporation.
SECTOR DIVERSIFICATION
| Sector | 9/30/04 | 3/31/05 | ||||
Auto & Transportation | 4.0 | % | 1.3 | % | ||
Consumer Discretionary | 24.9 | 22.1 | ||||
Consumer Staples | 2.1 | 3.4 | ||||
Financial Services | 10.3 | 11.6 | ||||
Healthcare | 16.6 | 14.7 | ||||
Integrated Oils | — | — | ||||
Materials & Processing | 8.1 | 8.6 | ||||
Other | 2.4 | 3.9 | ||||
Other Energy | 5.0 | 5.3 | ||||
Producer Durables | 8.1 | 7.4 | ||||
Technology | 14.9 | 19.7 | ||||
Utilities | 0.9 | 0.5 | ||||
Other assets less liabilities | 2.7 | 1.5 | ||||
Total | 100.0 | % | 100.0 | % |
As a percentage of total net assets.
On a sector basis, the main changes to the composition of the portfolio were an increase in our technology weight and reductions in the auto and transportation and consumer discretionary sectors. In addition to the purchases of CACI International, Cognizant Technology Solutions, Marvell Technology and Zebra Technologies, we also initiated positions in NCR Corporation, Comverse Technology, Inc. and MEMC Electronic Materials, Inc. We increased our allocations to Juniper Networks, Inc., Altera Corporation and Broadcom Corporation.
In the transportation sector we sold overnight delivery company FedEx Corporation, truckmaker PACCAR Inc and low-fare airline JetBlue Airways Corporation. FedEx and PACCAR were sold after reaching our price targets. JetBlue was sold due to our concerns about increased competition in certain markets and pressure from high oil prices. In the consumer discretionary sector, we sold satellite television provider EchoStar Communications Corporation due to slowing subscriber growth. We sold technology consultant Accenture Ltd. and IT solutions provider CDW Corporation in favor of better alternatives.
17
SEVENTEEN
ARTISAN MID CAP VALUE FUND (ARTQX)
| HIGHLIGHTS | ||
• For the six months ended March 31, 2005, Artisan Mid Cap Value Fund (up 16.89%) outperformed the Russell Midcap® Value Index (up 14.34%) and the Russell Midcap® Index (up 13.37%). • Strong security selection in the financials sector and impressive returns for our energy | stocks were the primary catalysts behind the Fund’s outperformance during the period. • Our stocks in the consumer discretionary sector posted solid gains, but were unable to keep pace with the benchmark sector return. | |
| INVESTMENT APPROACH | ||
| Our goal is to invest in companies that are priced below our estimate of the value of the business and that provide a controlled level of risk. It is important to complement stock price value with a company that is financially strong and possesses favorable economics. Our focus is on individual companies, rather than on economic or market trends. | The Fund often finds investment opportunities in companies that are in the midst of a turnaround, are in transition, are experiencing declining earnings and/or have earnings short-falls. | |
| PERFORMANCE REVIEW | ||
| The three years ended March 31, 2005 has been a strong period for mid-cap value stocks. Artisan Mid Cap Value Fund has outperformed its benchmark with strong security selection. | ||
GROWTH OF AN ASSUMED $10,000 INVESTMENT (3/28/01 to 3/31/05)
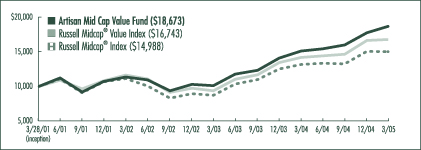
AVERAGE ANNUAL TOTAL RETURNS (as of 3/31/05)
| Fund / Index | 1-Year | 3-Year | Since Inception | ||||||
Artisan Mid Cap Value Fund | 23.56 | % | 18.13 | % | 16.86 | % | |||
Russell Midcap® Value Index | 18.34 | 12.96 | 13.72 | ||||||
Russell Midcap® Index | 14.05 | 10.53 | 10.62 |
The performance quoted represents past performance, which does not guarantee future results. The investment return and principal value of an investment in the Fund will fluctuate, so that an investor’s shares in the Fund, when redeemed, may be worth more or less than their original cost. Current performance may be lower or higher than the performance data quoted. For current to most recent month-end performance information, visit www.artisanfunds.com or call 800.344.1770. The graph and table above do not reflect the deduction of taxes that a shareholder would pay on distributions or sale of Fund shares. See page 83 for a description of each index.
18
EIGHTEEN
INVESTING ENVIRONMENT
The six-month period ended March 31, 2005 was a strong period for mid-cap stocks as the Russell Midcap® Value Index and the Russell Midcap® Index increased 14.34% and 13.37%, respectively. Those returns outpaced large- and small-cap stocks. The key to the relative strength of mid-cap stocks during the period was not their gains early in the period, but rather their ability to hold onto gains in the latter half, when markets struggled. The Fund was able to outpace both benchmarks as it rose 16.89%.
Oil and natural gas prices stammered back and forth during the period and speculation in both commodities likely exaggerated the volatility. However, point-to-point, oil and natural gas increased mostly due to demand from emerging countries such as China. As a result, energy stocks were the leading performers in the Russell Midcap® Value Index and the Russell Midcap® Index. An increase in interest rates left financial stocks as the laggard, although they posted a gain. All other major sectors surged over 10%, with healthcare stocks among the leaders.
PERFORMANCE DISCUSSION
The largest pockets of strength in the Fund compared to both indices were our security selection in the financial and transportation sectors, and our investments in the energy sector. Every sector contributed positively to performance, but our worst performance relative to the Russell Midcap® Value Index was in the consumer discretionary sector.
In the financials sector, The Student Loan Corporation, which was our largest holding as of March 31, 2005, was our leading contributor relative to the benchmarks. Other winners included SunGard Data Systems Inc., Nuveen Investments, Inc. and insurers PartnerRe Ltd. and White Mountains Insurance Group, Ltd. We believed Student Loan was positioned well to benefit from several long-term demographics trends, its loan portfolio growth has been solid and it has traded at a meaningful discount to industry leader SLM Corporation (Sallie Mae) despite its strong financial profile. During the period, it appeared that the market recognized the valuation discrepancy, as Student Loan’s share price increased over 47% while Sallie Mae’s price moved just short of 12%. SunGard, which provides electronic processing for the financial services industry, benefited from an announced takeout offer from a buyout group that represented a significant premium to the company’s share price. Asset manager Nuveen Investments had a leading municipal bond franchise and had an industry leading level of profitability that was rewarded during the period. PartnerRe and White Mountains recorded solid increases in book value and increased their dividends, despite 2004 being a tough year for catastrophic losses. Mortgage lender Countrywide Financial Corporation was one stock in the sector that underperformed. We believe the market looked past its growing service portfolio and punished Countrywide in anticipation of increasing interest rates. Even though it pulled back, Countrywide was an excellent performer and its growth pushed the company’s market cap and valuation higher, so we trimmed our position.
TOP 10 HOLDINGS
| Company Name | % | ||
The Student Loan Corporation | 4.9 | % | |
EOG Resources, Inc. | 4.5 | ||
Pioneer Natural Resources Company | 3.6 | ||
Noble Energy, Inc. | 3.4 | ||
White Mountains Insurance Group, Ltd. | 3.4 | ||
Alleghany Corporation | 3.1 | ||
Apache Corporation | 3.0 | ||
XTO Energy Inc. | 2.8 | ||
SunGard Data Systems, Inc. | 2.8 | ||
Old Republic International Corporation | 2.6 | ||
Total | 34.1 | % |
As a percentage of total net assets as of 3/31/05. Top 10 Holdings are determined by issuer.
In a relatively tough period for REITs and banks, we were served well compared to both benchmarks by owning just one. As of March 31, 2005, REITs and banks made up over 16% of the Russell Midcap® Value Index and both industries likely were hurt by rising interest rates and inflation expectations. We believed the risk/reward tradeoff for both was poor given profit growth expectations and generally high valuation levels.
19
NINETEEN
During the period, we continued to have an outsized position in energy stocks compared to the Russell Midcap® Index and the Russell Midcap® Value Index because we believed that an ongoing imbalance between the supply and demand for energy commodities would allow energy companies to generate strong earnings and cash flows. In our view, energy stock prices had become increasingly vulnerable to short-term commodity price movements, as market participants had begun to make bets on movements in oil and gas prices. Although we did not think that was the best way to assess value in energy stocks over the long-term, we used the volatility created by speculation in the sector to our advantage by selling stocks that reached our target selling ranges, such as Diamond Offshore Drilling, Inc. and Equitable Resources, Inc., and trimming back on others such as Apache Corporation and XTO Energy Inc. Our energy weight was slightly higher as of March 31 when compared to September 30, but the change was due in large part to the purchase of Noble Energy, Inc. We thought Noble Energy was attractive based on our three criteria for controlling risk, its production potential and its improved asset quality following a recent acquisition.
FUND STATISTICS
Net Assets | $ 1.1 billion | |
Number of Holdings | 44 | |
Median Market Cap | $3.6 billion | |
Weighted Average Market Cap | $5.2 billion | |
Weighted Harmonic Average P/E (2005E) | 13.9X |
Source: FactSet/Artisan Partners. All statistics are as of 3/31/05.
During the period, our leading performers in the energy sector were EOG Resources, Inc. and XTO Energy, the share prices of which advanced roughly 48% and 35%, respectively. Both companies reported strong production results, which drove excellent cash flows and earnings. In addition, their dividend payouts increased and they announced stock splits. We pared back XTO Energy slightly and slightly increased our position in EOG Resources.
In the auto and transportation sector, good security selection drove a solid relative gain compared to both benchmarks. Tidewater Inc., which supplies boats and operates a fleet of offshore service vessels for the energy industry, benefited from an upturn in offshore drilling activity that drove better pricing, vessel utilization and longer contract terms. We sold our position in the company after it reached our target selling range. We used the increase in trucker Swift Transportation Co., Inc. to sell our position because of our declining confidence in the company’s ability to execute. BorgWarner Inc., which supplies systems and components for automotive powertrain applications, released a positive earnings report early in the period and we sold the stock because it reached our target price. Those three sales reduced our auto and transportation sector exposure to 0% as of March 31.
Pharmacy benefit manager Medco Health Solutions, Inc. and engineering and consulting services firm Jacobs Engineering Group Inc. rose fairly consistently for most of the period. Medco is a market leader in mail-order pharmacy prescriptions due in part to its advanced and proprietary technology infrastructure. During the period, it cut costs by increasing the amount of mail-order prescriptions and generic drug orders. We sold our position into the share price strength. Jacobs moved higher due to market share gains and an upturn in several cyclical industries, which drove a stronger order backlog. We believed it was at the beginning of a favorable cycle and increased our position.
Residential furniture manufacturer Furniture Brands International, Inc. was the main reason for our weak relative results in the consumer discretionary sector. It has an experienced management team and industry-leading sourcing capabilities, but the pressure of imports led to soft sales. The share prices of auto parts retailer AutoZone, Inc. and rent-to-own merchandise store operator Rent-A-Center, Inc. each increased during the period, but trailed the benchmark returns. We purchased additional shares in both companies. Casual dining company Darden Restaurants, Inc. and character franchise Marvel Enterprises, Inc. outpaced the returns of both benchmarks and offset some of the negative impact of Furniture Brands. Darden continued to benefit from the strength of the Olive Garden® brand and a recovery in its Red Lobster® brand. Marvel aggressively
20
TWENTY
repurchased stock and consumer demand for its characters increased leading to high margin revenue licensing opportunities.
FUND CHANGES
The strong increase in stock prices during the period left our research list fairly short. Additionally, companies moved into our target selling range at a relatively fast clip. Stock price gains and our desire to trim back positions with growing downside risks did not always coincide perfectly with the presentation of new buy ideas. As a result, the selling activity in the portfolio outpaced the buying activity, resulting in fewer holdings.
SECTOR DIVERSIFICATION
| Sector | 9/30/04 | 3/31/05 | ||||
Auto & Transportation | 3.5 | % | — | |||
Consumer Discretionary | 22.9 | 24.5 | % | |||
Consumer Staples | 1.3 | — | ||||
Financial Services | 29.3 | 28.8 | ||||
Healthcare | 5.7 | 1.5 | ||||
Integrated Oils | — | — | ||||
Materials & Processing | 5.0 | 4.6 | ||||
Other | 0.3 | — | ||||
Other Energy | 18.3 | 19.3 | ||||
Producer Durables | — | — | ||||
Technology | 6.0 | 11.3 | ||||
Utilities | 1.5 | 1.7 | ||||
Other assets less liabilities | 6.2 | 8.3 | ||||
Total | 100.0 | % | 100.0 | % |
As a percentage of total net assets.
In addition to Noble Energy, our new purchases included toy manufacturer Hasbro, Inc., electronic components distributor Avnet, Inc., specialty jewelry and accessories retailer Claire’s Stores, Inc., infrastructure software company BEA Systems, Inc. and commercial insurer CNA Financial Corporation. We were attracted to Hasbro’s strong brands, strong financial condition and good free cash flow generation. Avnet historically was guilty of growing sales at any price, but seemed more focused on long-term profitability. Claire’s generated strong cash flows, had no debt and possessed a number of competitive advantages in a large demographic group. BEA produced strong cash flows, had been buying back shares and had a solid balance sheet. At CNA we were intrigued by the company’s turnaround efforts and believed that its share price offered a compelling risk/reward scenario.
The combination of the BEA Systems and Avnet purchases and additions to other positions such as BMC Software, Inc., Siebel Systems, Inc. and Synopsys, Inc., increased our exposure to the technology sector, but this was not a sector play. Our process emphasizes individual investment opportunities based on valuation, business economics and financial strength. The broad composition of the portfolio will always be a residual of our security selection process, which uncovered opportunities in the technology sector. One position we did not increase was technology consultant BearingPoint, Inc. To our disappointment, management has found many ways to stymie the company’s value.
We funded our new purchases with new cash flows into the Fund, sales already mentioned and the sales of Loews Corporation-Carolina Group and Wesco Financial Corporation, both of which reached our assessment of full value. Deteriorating fundamentals along with the potential for substantial additional debt to acquire Hollywood Entertainment Corporation increased the risk profile of Blockbuster Inc., leading to its sale. King Pharmaceuticals, Inc. was also sold due to what we believed was an increasing risk profile. We sold our position in holding company Loews Corporation because its stock price appreciation helped close the discount to the value of its assets and we were less attracted to its underlying holdings (Diamond Offshore Drilling and Carolina Group).
21
TWENTY-ONE
ARTISAN SMALL CAP FUND (ARTSX)
| HIGHLIGHTS | ||
• Small-cap stocks started the six-month period ended March 31, 2005 with a flurry, but closed on a down note. During the period, Artisan Small Cap Fund (up 9.25%) led both the Russell 2000® Index (up 8.00%) and Russell 2000® Growth Index (up 7.23%) due in large part to good stock selection. | • The healthcare and producer durables sectors were two areas of strong relative performance versus both benchmarks. • In the consumer discretionary sector our retail stocks performed well. However, we underperformed in the sector compared to both benchmarks. | |
| INVESTMENT APPROACH | ||
| We use a bottom-up investment process to identify well-managed small companies whose growth and profit potential are not yet fully recognized by investors. During the security selection process, our analysis is aimed at addressing four questions about a company: | 1) Is the company growing earnings? 2) Does the company have a competitive advantage? 3) Is the company investing capital wisely? 4) Is the company’s stock trading at a reasonable price? | |
| PERFORMANCE REVIEW | ||
| During the semiannual reporting period, Artisan Small Cap Fund reached its 10-year anniversary. Since inception, the Fund has outperformed the Russell 2000® Growth Index. | ||
GROWTH OF AN ASSUMED $10,000 INVESTMENT (3/28/95 to 3/31/05)
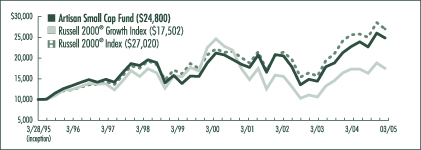
AVERAGE ANNUAL TOTAL RETURNS (as of 3/31/05)
| Fund / Index | 1-Year | 3-Year | 5-Year | 10-Year | Since Inception | ||||||||||
Artisan Small Cap Fund | 8.89 | % | 6.58 | % | 3.18 | % | 9.45 | % | 9.50 | % | |||||
Russell 2000® Growth Index | 0.87 | 4.01 | -6.60 | 5.80 | 5.75 | ||||||||||
Russell 2000® Index | 5.41 | 8.05 | 4.01 | 10.43 | 10.44 |
The performance quoted represents past performance, which does not guarantee future results. The investment return and principal value of an investment in the Fund will fluctuate, so that an investor’s shares in the Fund, when redeemed, may be worth more or less than their original cost. Current performance may be lower or higher than the performance data quoted. For current to most recent month-end performance information, visit www.artisanfunds.com or call 800.344.1770. The graph and table above do not reflect the deduction of taxes that a shareholder would pay on distributions or sale of Fund shares. See page 83 for a description of each index.
22
TWENTY-TWO
INVESTING ENVIRONMENT
During the first three months of the period, every sector in the Russell 2000® Index moved considerably higher and high volatility stocks, low priced stocks and those without earnings were among the leading performers. The second half of the period was a difficult period for equities, particularly small-cap stocks and growth stocks, as the market struggled with the hangover effects of the first three months. Consequently, the leading performers reversed course and high volatility stocks, low priced stocks and stocks without earnings could all be found among the worst performing groups. The market’s focus on better quality stocks proved positive for our strategy. As a result, we closed out the six-month period with a gain of 9.25%, outpacing the Russell 2000® Growth Index and the Russell 2000® Index, which increased 7.23% and 8.00%, respectively.
The one economic influence that seemed to factor into investment decisions for most of the period was the price of oil. For nearly two years the price of oil has trended higher and in the first half of the period it seemed as though there might be some relief, which likely contributed to the market’s euphoria. However, the relief proved short-lived and oil actually closed the period higher than where it began. As a result, energy stocks were the leading performers in both benchmarks. Other winners included the consumer discretionary and utilities sectors. The financial and healthcare sectors were laggards, though every sector posted a positive return. Financial stocks came under pressure as long-term interest rates moved higher due in part to inflation concerns. The healthcare sector was primarily hurt by the poor performance of biotechnology stocks and drug stocks, which declined more than 10% in both benchmarks.
PERFORMANCE DISCUSSION
Within the portfolio our gains compared to both benchmarks during the six-month period could primarily be attributed to good stock selection. Among the leading relative performers were our stocks in the healthcare and producer durables sectors, though we had good results in most sectors. One group of stocks that underperformed was our consumer discretionary holdings.
TOP 10 HOLDINGS
| Company Name | % | ||
SFBC International, Inc. | 1.7 | % | |
The Advisory Board Company | 1.6 | ||
VCA Antech, Inc. | 1.6 | ||
PSS World Medical, Inc. | 1.6 | ||
Wright Medical Group, Inc. | 1.5 | ||
School Specialty, Inc. | 1.5 | ||
SS&C Technologies, Inc. | 1.5 | ||
Cymer, Inc. | 1.5 | ||
Aeroflex Incorporated | 1.5 | ||
Tekelec | 1.5 | ||
Total | 15.5 | % |
As a percentage of total net assets as of 3/31/05. Top 10 Holdings are determined by issuer.
In the healthcare sector, we benefited from a combination of good stock performance and a lack of exposure to biotechnology stocks. We have generally avoided biotechnology stocks because many of the biotechnology companies within our market cap range are in the product development stage. Our process emphasizes companies that are producing positive cash flows and generating or soon will be generating earnings. Many early stage biotechnology companies are doing just the opposite—they are consuming cash and losing money. We find it difficult to assess the value of companies with those characteristics and believe we are better off investing elsewhere.
Our leading gainers in the sector included short-stay surgical facility operator United Surgical Partners International, Inc., risk assessment services and lab testing company LabOne, Inc., medical products distributor PSS World Medical, Inc. and respiratory products company Respironics, Inc. All four companies reported solid financial results during the period. PSS was a top ten holding as of March 31, 2005.
Rayovac Corporation (now known as Spectrum Brands, Inc.), which advanced nearly 58% during the period, was the primary source of our outperformance in the producer durables sector. Once known just for its battery business, Rayovac has clearly shifted to a broader business strategy through acquisitions
23
TWENTY-THREE
in the lawn and garden and pet supply industries and an electric razors company. The transactions demonstrated management’s commitment to growth and have added to earnings or are expected to add to earnings while decreasing the company’s reliance on revenues from batteries. The strong increase in the company’s share price pushed it up to our target price range and we sold our position. Flat panel display equipment provider Applied Films Corporation, air compressor manufacturer Gardner Denver, Inc. and MTC Technologies, Inc., a provider of intelligence operations and program management services focused on defense, also posted strong gains. Applied Films reported an improved outlook for orders, Gardner Denver experienced solid order growth in its core business and is anticipated to receive a solid earnings contribution from several recent acquisitions, and MTC Technologies benefited from a strong order backlog and positive expectations for growth in 2005.
FUND STATISTICS
Net Assets | $ 603.5 million | ||
Number of Holdings | 81 | ||
Median Market Cap | $ 775.8 million | ||
Weighted Average Market Cap | $ 881.6 million | ||
Weighted Average Growth Rate (3-5 yr) | 18.9 | % | |
Weighted Harmonic Average P/E (2005E) | 19.0X |
Source: FactSet/Artisan Partners. All statistics are as of 3/31/05.
Other winners in the portfolio were found across many other sectors. In the financial sector, The First Marblehead Corporation, which provides outsourcing services for private student lending, reported a strong increase in revenues as it continued to benefit from growth in student loan originations. Its gains pushed the stock into mid-cap territory and we sold our position. Our energy stocks generally benefited from the tailwind of rising energy prices. Additionally, Pioneer Drilling Company reported a substantial increase in revenues and earnings. Magnum Hunter Resources, Inc. rose due to an announced takeout offer from Cimarex Energy Co., a Denver oil and gas producer. Logistics and transportation provider Pacer International, Inc. moved higher due to strong earnings results and improving business volumes. ElkCorp, a roofing and building products company, moved higher when it announced that its fiscal second quarter earnings would be stronger than expected due to improved pricing and better volume across the majority of its markets. We sold our shares in ElkCorp into its advance. Our only full position in the utilities sector was Alamosa Holdings, Inc., a Sprint PCS wireless affiliate, and it rose nearly 53% during the period. One driver of its share price performance was strong revenues highlighted by solid subscriber additions. Alamosa’s strong increase drove the stock up to our target price and we sold our position.
In the consumer discretionary sector, our retailers collectively advanced almost 26% during the period driven by strong gains in Central Garden & Pet Company (lawn and garden and pet supply products), Too, Inc. (“tween” girls clothing) and Hibbett Sporting Goods, Inc. (sporting goods stores). We sold Too into the share price strength. Unfortunately, those successes were offset by weakness at Autobytel Inc. and FindWhat.com. Online automotive marketer Autobytel cut its profit estimate for 2005. We expected to see lower earnings as a result of higher expenses, but not from a rise in customer acquisition costs, and we sold our position. FindWhat.com, which offers performance-based Internet advertising, released forecasts for revenues and earnings that disappointed the market, leading to its decline. We believed that management’s aim to lower poor quality traffic would be beneficial long-term and purchased additional shares.
The overall performance of our technology stocks was in line to slightly lower than the sector return within our benchmarks during the six months ended March 31, 2005. So, collectively, there is not much to report. However, the sector does represent the Fund’s largest commitment and we felt a review of some individual performance results would be worthwhile.
During the period several of our software stocks performed very well, led by Serena Software Inc., Progress Software Corporation and Ascential Software Corporation, which
24
TWENTY-FOUR
increased 42%, 32% and 38%, respectively. Serena and Progress each reported very good financial results and offered positive expectations for future growth. Ascential Software, a purchase in December 2004, benefited from a premium takeout offer by International Business Machines Corporation (IBM). On the other hand, Aeroflex Incorporated, Sierra Wireless, Inc. and Dot Hill Systems Corp. performed poorly. Aeroflex shares were under pressure following a conservative outlook by management early in the period. We thought management’s commitment to a strong return on investments and strong bookings created upside potential, so we added to our position. We were expecting some softness in Sierra Wireless, but a surprisingly weak outlook for PC card sales raised concerns about its future prospects and we sold our shares. We lost confidence in Dot Hill management and sold our position.
FUND CHANGES
During the period, several of our larger purchases were found in the healthcare and financial sectors, which caused a slight pick-up in our weights in those sectors. In the healthcare sector we added SFBC International, Inc., a contract research organization to pharmaceutical and biotechnology companies; Sierra Health Services, Inc., a managed care provider; Salix Pharmaceuticals, Ltd., a specialty pharmaceutical company focused on drugs used in the treatment of gastrointestinal diseases; I-Flow Corporation, a developer and marketer of a variety of pain management therapies; and (though not classified as healthcare) HealthExtras, Inc., a pharmacy benefit manager. In the financial sector we added Ohio Casualty Corporation, property-casualty insurance; Platinum Underwriters Holdings, Ltd., property-casualty reinsurance; optionsXpress Holdings, Inc., an online broker specializing in options; and WCI Communities, Inc., a public homebuilder and Florida landowner focused on the luxury home market and lifestyle.
SECTOR DIVERSIFICATION
| Sector | 9/30/04 | 3/31/05 | ||||
Auto & Transportation | 4.0 | % | 3.7 | % | ||
Consumer Discretionary | 25.2 | 22.6 | ||||
Consumer Staples | — | — | ||||
Financial Services | 10.8 | 14.3 | ||||
Healthcare | 13.5 | 14.9 | ||||
Integrated Oils | — | — | ||||
Materials & Processing | 3.8 | 6.6 | ||||
Other | — | — | ||||
Other Energy | 5.0 | 4.9 | ||||
Producer Durables | 8.7 | 6.8 | ||||
Technology | 23.5 | 23.1 | ||||
Utilities | 1.1 | — | ||||
Other assets less liabilities | 4.4 | 3.1 | ||||
Total | 100.0 | % | 100.0 | % |
As a percentage of total net assets.
Other purchases included Cymer, Inc., a semiconductor equipment supplier; Universal Technical Institute, Inc., a provider of technical education training; SiRF Technology Holdings, Inc., a GPS semiconductor supplier; Skyworks Solutions, Inc., a wireless semiconductor company; Brookstone, Inc., a multi-channel retailer with predominately proprietary merchandise; and Trex Company, Inc., a non-wood decking manufacturer.
Those new purchases were partially funded by the sales noted above of ElkCorp, Alamosa Holdings, Rayovac, First Marblehead, Dot Hill Systems and Sierra Wireless. We also sold Inter-Tel Incorporated and Technitrol, Inc. after each had reached our target prices. We sold Omnicell, Inc. because we were concerned that the costs the company was incurring to achieve market share gains would continue to reduce profitability.
25
TWENTY-FIVE
ARTISAN SMALL CAP VALUE FUND (ARTVX)
| HIGHLIGHTS | ||
• For the six months ended March 31, 2005, Artisan Small Cap Value Fund (up 12.95%) outperformed the Russell 2000® Index (up 8.00%) and the Russell 2000® Value Index (up 8.70%). • The strong performance of our energy stocks and our lack of exposure to banks and REITs, which were under pressure during the period, | were the main reasons we were able to outpace the benchmarks. • Relative returns were hurt by our selections in the materials sector and our underweight position in utilities stocks relative to the Russell 2000® Value Index. | |
| INVESTMENT APPROACH | ||
| Our goal is to invest in companies that are priced below our estimate of the value of the business and that provide a controlled level of risk. It is important to complement stock price value with a company that is financially strong and possesses favorable economics. Our focus is on individual companies, rather than on economic or market trends. | The Fund often finds investment opportunities in companies that are in the midst of a turnaround, are undiscovered or unsponsored, have hidden assets and/or are in the process of a major change. | |
| PERFORMANCE REVIEW | ||
| Artisan Small Cap Value Fund has accumulated a solid long-term track record by outperforming its benchmarks over the trailing one, three and five years and since inception. | ||
GROWTH OF AN ASSUMED $10,000 INVESTMENT (9/29/97 to 3/31/05)
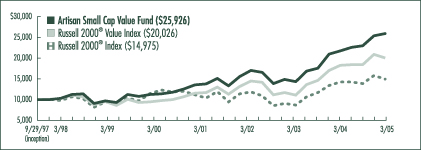
AVERAGE ANNUAL TOTAL RETURNS (as of 3/31/05)
| Fund / Index | 1-Year | 3-Year | 5-Year | Since Inception | ||||||||
Artisan Small Cap Value Fund | 19.38 | % | 14.99 | % | 17.88 | % | 13.54 | % | ||||
Russell 2000® Value Index | 9.79 | 11.48 | 15.42 | 9.70 | ||||||||
Russell 2000® Index | 5.41 | 8.05 | 4.01 | 5.53 |
The performance quoted represents past performance, which does not guarantee future results. The investment return and principal value of an investment in the Fund will fluctuate, so that an investor’s shares in the Fund, when redeemed, may be worth more or less than their original cost. Current performance may be lower or higher than the performance data quoted. For current to most recent month-end performance information, visit www.artisanfunds.com or call 800.344.1770. The graph and table above do not reflect the deduction of taxes that a shareholder would pay on distributions or sale of Fund shares. See page 83 for a description of each index.
26
TWENTY-SIX
INVESTING ENVIRONMENT
The market started the six months ended March 31, 2005 with a considerable amount of optimism, but closed the period with a fair amount of uncertainty. The price of oil declined early in the period, which probably provided some relief to inflation concerns. Not much else changed, though, so we were perplexed at the increase in stock valuations early in the period. Nevertheless, that optimism was soon replaced with uncertainty about rising interest rates, the threat of inflation and higher oil prices. Small-cap stocks outperformed their large- and mid-cap brethren early, only to fall behind both late. However, for a six-month time frame, gains were more than respectable. The Russell 2000® Value Index and the Russell 2000® Index advanced 8.70% and 8.00%, respectively. The Fund gained 12.95%, outpacing both benchmarks.
For the full period, the best gains in both benchmarks could be found in the energy sector. After an early pullback, oil and natural gas prices closed higher on March 31 than September 30. All other sectors also moved higher, but outside of the energy sector, the consumer staples, materials and utilities sectors were among the leaders. The worst performers were interest rate sensitive financials and the healthcare and technology sectors, although even they ended in positive territory.
PERFORMANCE DISCUSSION
Amid the uncertainty late in the period, market participants became more risk averse and it was during that more discriminating time frame that the Fund tacked on most of its gains compared to the benchmarks. The portfolio benefited most from its exposure to energy stocks, but relative gains were also strong in the consumer discretionary and financial sectors. Relative returns were hurt by our selections in the materials sector and our underweight position in utilities stocks.
In the energy sector we have maintained an outsized position compared to the Russell 2000® Index and the Russell 2000® Value Index because we have believed that an ongoing imbalance between the supply and demand for oil and gas would allow energy companies to generate strong earnings and cash flows. During the period, our holdings in the energy sector continued to benefit from a rise in oil and natural gas prices. We used the run-up to our advantage by selling stocks that reached our target selling ranges and trimming back on others. As a result, our position in energy stocks fell during the period.
TOP 10 HOLDINGS
| Company Name | % | ||
Plains Exploration & Production Company | 3.8 | % | |
Hilb Rogal and Hobbs Company | 3.3 | ||
Zale Corporation | 3.3 | ||
Kellwood Company | 3.2 | ||
Movie Gallery, Inc. | 2.9 | ||
Stewart Information Services Corporation | 2.8 | ||
Furniture Brands International, Inc. | 2.7 | ||
ADVO, Inc. | 2.5 | ||
Stone Energy Corporation | 2.4 | ||
Superior Industries International, Inc. | 2.3 | ||
Total | 29.2 | % |
As a percentage of total net assets as of 3/31/05. Top 10 Holdings are determined by issuer.
Among our leading performers in the sector were Plains Exploration & Production Company (PXP), Forest Oil Corporation, Range Resources Corporation and Energy Partners, Ltd. We believed the main drivers of PXP’s performance were its low-risk drilling opportunities, production growth potential, long-lived reserve base, substantial cash flows and solid balance sheet. In addition, PXP continued to trade at a compelling valuation level. PXP was our top holding as of the end of the period. Forest Oil continued to execute its four-point strategy of cost reduction, balance sheet improvement, niche acquisitions and reduced frontier exploration spending. We reduced our position in Forest into the share price strength. Range Resources made an acquisition at what we believed was a reasonable price and the acquired assets were expected to add to production growth and earnings. We pared back our holdings. Energy Partners also announced an acquisition expected to drive additional growth, reported record production in its third quarter report and management reiterated its expectation for solid production growth in the coming years. We sold our position into the share price strength.
27
TWENTY-SEVEN
FUND STATISTICS
Net Assets | $ 1.5 billion | |
Number of Holdings | 104 | |
Median Market Cap | $ 834.4 million | |
Weighted Average Market Cap | $ 1.1 billion | |
Median P/B Value | 1.7X |
Source: FactSet/Artisan Partners. All statistics are as of 3/31/05.
Our strong relative performance in the financials sector was driven by a solid gain in Nevada landowner and water resource development company PICO Holdings, Inc. and our lack of exposure to banks and REITs. PICO reported a good increase in book value. We have generally avoided buying banks and REITs because we believed the majority of stocks in those industries represented a relatively poor risk/reward tradeoff given profit growth expectations and the interest rate environment. Late in the period it appeared that the market shared our sentiment, as interest rates moved higher and both groups were driven down. Even with the adjustment, our opinion of both industries did not change. As of March 31, 2005 our total investment in both industries was less than 1%.
In the consumer discretionary sector, our leading performer was rural movie rental retailer Movie Gallery, Inc., which increased almost 64% on expectations that it would acquire Hollywood Entertainment Corporation (another portfolio holding that we sold during the period). Movie Gallery and Hollywood have complementary store locations. Movie Gallery is focused on rural areas while Hollywood is focused on suburban/urban markets. Footwear retailer Payless ShoeSource, Inc. was another winner in the sector. It announced its best same-store sales in several years and the company’s initiatives aimed at focusing on the core Payless business appeared to take hold. Payless advanced almost 56%. Publishing company ProQuest Company also advanced strongly due to improved earnings and the closing of a highly attractive acquisition.
Apparel manufacturer Kellwood Company and our furniture manufacturers Ethan Allen Interiors Inc. and Furniture Brands International, Inc. offset some of the success within the sector. Fundamentally, our opinions of all three companies were not influenced by the share price weakness during the period and we purchased additional shares in each one. At Kellwood, we continued to have faith in the company’s transition to a more profitable business mix. We liked Ethan Allen’s implementation of everyday low pricing and its efforts to improve store productivity. Long-term we thought Furniture Brands’ industry-leading sourcing capabilities and experienced management team could reap financial rewards.
Three other stocks that posted solid gains were commercial lighting manufacturer The Genlyte Group Incorporated, trucker USF Corporation and eyeglass lens manufacturer SOLA International Inc. Genlyte had strong market share and a management team committed to maintaining a high level of profitability. During the period, management’s commitment drove a solid increase in profits and we trimmed our position. USF jumped after receiving a premium takeover offer from Yellow Roadway Corporation, the largest U.S. trucker. SOLA also received an acquisition offer at a premium to the outstanding share price and we sold our shares.
Within the materials sector, our results were hurt by the performance of Griffon Corporation, Integrated Electrical Services, Inc. and Simpson Manufacturing Co., Inc. Griffon, which makes garage doors among other items, was purchased during the period because it possessed the core characteristics we like to see in a company: strong cash generation, solid balance sheet and an attractive valuation. We used the share price decline to build our position. Integrated Electrical, an electrical contractor, fell due in part to concerns about the company reducing its bids on certain large projects. Simpson, which produces fasteners and connectors, was hurt by short-term weather issues and raw materials costs. Two positive performers in the sector were Washington Group International, Inc. (WGII), a full service provider of engineering and construction services, and Quanex Corporation, a maker of steel bars. WGII continued to grow its backlog and the number of higher margin contracts and new work orders increased. Quanex reported a
28
TWENTY-EIGHT
huge increase in profits as demand from heavy-duty truck customers was strong.
The relative strength of utilities stocks in a rising rate environment was a bit of a mystery. Higher rates have historically encouraged income-sensitive investors to move away from utility stocks and into higher yielding bonds. We did not purchase any new positions in the sector, but sold our position in NUI Corp., which was being acquired, and maintained our position in the rest of our stocks.
FUND CHANGES
During the period, we continued to leverage the sentiment shifts in the market into opportunistic portfolio adjustments by applying our strict valuation discipline. As we noted earlier, we sold several of our energy positions and pared back many others, bringing our overall weight in the energy sector down. In addition to Energy Partners, we sold Atwood Oceanics, Inc., Key Energy Services, Inc., Veritas DGC Inc. and Global Power Equipment Group Inc.
Outside of the energy sector, our largest sales were BorgWarner Inc., Jones Lang LaSalle Incorporated, Heartland Express, Inc., Scottish Re Group Limited, IHOP Corp., DoubleClick Inc. and Jackson Hewitt Tax Service Inc.
Our exposure to technology stocks has been limited for a good portion of the last twelve months. However, recent volatility and uncertainty in the sector pushed several stocks into the high end of our target buying range. As a result, we initiated small positions in several stocks with the largest concentration of new purchases in the software industry. Our new additions included Ascential Software Corporation, CIBER, Inc., Keane, Inc., Manhattan Associates, Inc. and Gartner, Inc. Our largest technology position as of March 31, 2005 was Gartner, the world’s
SECTOR DIVERSIFICATION
| Sector | 9/30/04 | 3/31/05 | ||||
Auto & Transportation | 7.1 | % | 4.2 | % | ||
Consumer Discretionary | 25.7 | 31.6 | ||||
Consumer Staples | — | — | ||||
Financial Services | 14.6 | 13.1 | ||||
Healthcare | 2.0 | 2.3 | ||||
Integrated Oils | — | — | ||||
Materials & Processing | 11.1 | 9.3 | ||||
Other | — | — | ||||
Other Energy | 20.5 | 18.0 | ||||
Producer Durables | 4.1 | 3.2 | ||||
Technology | 3.1 | 8.7 | ||||
Utilities | 5.9 | 4.2 | ||||
Other assets less liabilities | 5.9 | 5.4 | ||||
Total | 100.0 | % | 100.0 | % |
As a percentage of total net assets.
largest provider of research and consulting services focused solely on technology. We thought its new CEO, the potential for an improvement in profitability and the company’s solid balance sheet made it an attractive investment.
We also bought respiratory and neurological medical devices manufacturer Viasys Healthcare Inc. and home textiles and accessories retailer Linens ‘n Things, Inc. Viasys has undertaken a restructuring initiative aimed at improving profitability and streamlining operations, along with introducing several new products. The company had good free cash flow and a net cash position. Linens ‘n Things’ valuation became attractive due to inconsistent earnings and we believed its new President and COO was laying the foundation for long-term sustainable operational improvements.
29
TWENTY-NINE
ARTISAN INTERNATIONAL FUND (ARTIX)
Schedule of Investments – March 31, 2005 (Unaudited)
Shares Held | Value | ||||
| COMMON AND PREFERRED STOCKS - 99.4% | |||||
| AUSTRALIA - 0.2% | |||||
Publishing & Broadcasting Limited | 1,601,320 | $ | 19,032,799 | ||
| AUSTRIA - 0.2% | |||||
Erste Bank der oesterreichischen Sparkassen AG | 400,400 | 20,943,214 | |||
| BELGIUM - 1.3% | |||||
InBev NV | 4,244,104 | 148,599,152 | |||
| BRAZIL - 0.7% | |||||
Banco Bradesco S.A. (ADR) | 20,300 | 588,700 | |||
Banco Itau Holding Financiera S.A., Preferred (ADR) | 100 | 8,115 | |||
Telesp Celular Participacoes S.A., Preferred (ADR)(1) | 13,653,068 | 81,645,347 | |||
| 82,242,162 | |||||
| CANADA - 2.8% | |||||
Corus Entertainment, Inc., Class B | 3,015,450 | 72,912,220 | |||
EnCana Corporation | 2,347,300 | 165,768,239 | |||
Nortel Networks Corporation(1) | 19,127,819 | 52,218,946 | |||
Research In Motion Limited(1) | 229,900 | 17,568,958 | |||
| 308,468,363 | |||||
| CHINA - 3.2% | |||||
China Merchants Holdings International Company Limited | 11,590,000 | 22,735,834 | |||
China Mobile (Hong Kong) Limited | 74,544,400 | 256,797,877 | |||
Citic Pacific Limited | 18,818,400 | 55,011,510 | |||
Cosco Pacific Limited | 8,576,000 | 18,637,622 | |||
| 353,182,843 | |||||
| CZECH REPUBLIC - 1.1% | |||||
Cesky Telecom, A.S. | 6,856,378 | 128,122,308 | |||
| DENMARK - 0.8% | |||||
Novo Nordisk A/S, Class B | 1,563,250 | 87,039,131 | |||
| FRANCE - 6.1% | |||||
Air Liquide S.A. | 125,887 | 23,156,291 | |||
Carrefour S.A. | 2,246,598 | 119,228,185 | |||
France Telecom S.A. | 4,550,465 | 136,261,601 | |||
JC Decaux S.A.(1) | 6,538,942 | 178,513,712 | |||
Shares Held | Value | ||||
| FRANCE (CONTINUED) | |||||
LVMH Moet Hennessy Louis Vuitton S.A. | 524,627 | $ | 39,240,287 | ||
M6 Metropole Television | 1,260,034 | 35,281,070 | |||
PagesJaunes S.A.(1) | 4,330,398 | 106,319,645 | |||
Vivendi Universal S.A. | 1,295,100 | 39,670,964 | |||
| 677,671,755 | |||||
| GERMANY - 4.6% | |||||
Allianz AG | 817,238 | 103,766,871 | |||
Bayerische Hypo-und Vereinsbank AG(1) | 5,432,794 | 132,892,621 | |||
Commerzbank AG(1) | 4,917,000 | 106,699,256 | |||
KDG Investors, L.P.(1)(2)(3) | - | 57,000 | |||
Merck KGaA | 462,162 | 32,950,549 | |||
ProSiebenSat.1 Media AG, Preferred | 7,134,353 | 133,729,929 | |||
| 510,096,226 | |||||
| HONG KONG - 3.1% | |||||
Cheung Kong (Holdings) Limited | 8,361,900 | 73,975,870 | |||
Hang Lung Group Limited | 1,566,700 | 2,741,918 | |||
Hang Lung Properties Limited | 24,150,000 | 35,143,824 | |||
Henderson Land Development Company Limited | 1,248,900 | 5,556,396 | |||
Hong Kong & China Gas Company Limited | 17,578,150 | 34,595,337 | |||
HSBC Holdings PLC | 6,827,600 | 108,548,987 | |||
Sun Hung Kai Properties Limited | 9,463,400 | 85,843,944 | |||
| 346,406,276 | |||||
| ITALY - 5.0% | |||||
Assicurazioni Generali S.p.A | 4,898,421 | 158,110,672 | |||
Banca Intesa S.p.A | 22,484,597 | 114,255,444 | |||
Eni S.p.A. | 4,693,717 | 121,871,899 | |||
Mediobanca S.p.A | 1,060,500 | 18,407,592 | |||
Saipem S.p.A. | 11,882,804 | 150,648,051 | |||
| 563,293,658 | |||||
| JAPAN - 19.4% | |||||
Canon Inc. | 992,200 | 53,204,794 | |||
Credit Saison Co., Ltd. | 6,999,700 | 251,970,922 | |||
East Japan Railway Company | 13,631 | 73,220,703 | |||
Fuji Television Network, Inc. | 21,198 | 50,014,865 | |||
Honda Motor Co., Ltd. | 4,204,200 | 210,543,262 | |||
Japan Tobacco, Inc | 4,932 | 54,733,564 | |||
Jupiter Telecommunications Co., Ltd.(1) | 67,932 | 54,165,681 | |||
Keyence Corp. | 380,350 | 88,108,682 | |||
Mitsubishi Corp. | 5,866,200 | 75,987,614 | |||
Mizuho Financial Group, Inc. | 36,430 | 172,246,666 | |||
Nikko Cordial Corp. | 19,295,150 | 96,448,759 | |||
30
THIRTY
Shares Held | Value | ||||
| JAPAN (CONTINUED) | |||||
Nomura Holdings, Inc. | 3,849,000 | $ | 53,842,208 | ||
ORIX Corp. | 1,537,500 | 196,005,083 | |||
Promise Co., Ltd. | 1,901,583 | 129,987,908 | |||
Sega Sammy Holdings, Inc. | 4,161,400 | 253,029,264 | |||
SMC Corp. | 798,200 | 90,293,444 | |||
Sumitomo Metal Industries, Ltd. | 22,944,800 | 41,297,644 | |||
The Sumitomo Trust & Banking Co., Ltd. | 15,557,500 | 101,414,646 | |||
Tokyo Broadcasting System, Inc. | 2,192,000 | 42,723,865 | |||
Tokyu Corp. | 14,866,400 | 77,499,931 | |||
| 2,166,739,505 | |||||
| LUXEMBOURG - 0.5% | |||||
RTL Group | 772,286 | 58,364,994 | |||
| MEXICO - 2.5% | |||||
Grupo Televisa S.A. (ADR) | 3,054,300 | 179,592,840 | |||
Wal-Mart de Mexico S.A. de C.V., Series V | 29,419,200 | 103,232,193 | |||
| 282,825,033 | |||||
| NETHERLANDS - 5.9% | |||||
ASML Holding N.V.(1) | 9,719,985 | 164,178,294 | |||
ASML Holding N.V., NY Shares(1)(4) | 1,471,500 | 24,677,055 | |||
Fortis | 12,360,376 | 352,661,014 | |||
ING Groep N.V. | 4,032,301 | 121,790,831 | |||
| 663,307,194 | |||||
| NORWAY - 1.1% | |||||
Stolt Offshore S.A.(1) | 524,900 | 4,050,659 | |||
Telenor ASA | 12,702,300 | 114,260,863 | |||
| 118,311,522 | |||||
| PORTUGAL - 0.6% | |||||
Banco Comercial Portugues, S.A. | 24,374,509 | 66,353,051 | |||
| REPUBLIC OF KOREA - 2.7% | |||||
Hana Bank | 2,648,840 | 73,035,470 | |||
Kookmin Bank | 3,401,365 | 151,897,492 | |||
Shinhan Financial Group Co., Ltd. | 2,596,920 | 69,558,074 | |||
Woori Finance Holdings Co., Ltd. | 420,220 | 4,138,060 | |||
| 298,629,096 | |||||
| RUSSIA - 2.4% | |||||
AFK Sistema - 144A (GDR)(1) | 2,558,761 | 41,579,866 | |||
Gazprom (ADR) | 187,546 | 6,320,300 | |||
LUKOIL (ADR) | 1,178,078 | 159,629,569 | |||
Sibneft (ADR)(1) | 3,882,279 | 60,796,489 | |||
| 268,326,224 | |||||
| SINGAPORE - 2.4% | |||||
DBS Group Holdings Limited | 8,909,497 | 80,418,904 | |||
Keppel Corporation Limited | 1,687,500 | 11,142,662 | |||
Shares Held | Value | ||||
| SINGAPORE (CONTINUED) | |||||
Singapore Airlines Limited | 9,778,000 | $ | 70,488,081 | ||
Singapore Telecommunications Limited | 66,787,970 | 104,384,651 | |||
| 266,434,298 | |||||
| SPAIN - 5.9% | |||||
Altadis, S.A. | 1,910,301 | 78,128,034 | |||
Banco Bilbao Vizcaya Argentaria, S.A. | 7,298,603 | 118,832,466 | |||
Banco Santander Central Hispano, S.A. | 7,145,800 | 86,980,555 | |||
Industria de Diseno Textil, S.A. | 2,646,813 | 79,154,677 | |||
Promotora de Informaciones, S.A. | 7,320,664 | 147,945,690 | |||
Telefonica, S.A. | 8,661,080 | 150,895,763 | |||
| 661,937,185 | |||||
| SWEDEN - 2.4% | |||||
Telefonaktiebolaget LM Ericsson, Class B(1) | 57,674,100 | 162,315,206 | |||
Telefonaktiebolaget LM Ericsson (ADR)(1) | 3,715,650 | 104,781,330 | |||
| 267,096,536 | |||||
| SWITZERLAND - 10.8% | |||||
Clariant AG | 9,579,379 | 165,389,554 | |||
Credit Suisse Group | 3,933,727 | 168,886,653 | |||
Julius Baer Holding, Ltd., Class B | 247,116 | 85,691,535 | |||
Nestle S.A. | 921,190 | 252,045,840 | |||
Roche Holding AG | 1,409,678 | 151,097,964 | |||
Swiss Life Holding(1) | 37,500 | 5,637,306 | |||
UBS AG | 4,429,991 | 374,088,952 | |||
| 1,202,837,804 | |||||
| TAIWAN - 1.0% | |||||
Chunghwa Telecom Co., Ltd., (ADR) | 5,101,200 | 108,094,428 | |||
| THAILAND - 0.1% | |||||
Advanced Info Service Public Company Limited(2) | 5,588,500 | 14,285,532 | |||
| UNITED KINGDOM - 12.6% | |||||
Allied Domecq PLC | 5,865,573 | 59,135,576 | |||
British Sky Broadcasting Group PLC | 22,223,768 | 243,794,488 | |||
Carnival PLC | 1,013,135 | 55,637,409 | |||
ITV PLC | 113,943,807 | 274,539,523 | |||
Kingfisher PLC | 54,309,212 | 296,346,265 | |||
Pearson PLC | 6,429,200 | 78,364,725 | |||
Smith & Nephew PLC | 2,568,962 | 24,152,091 | |||
Tesco PLC | 47,454,568 | 283,828,305 | |||
William Morrison Supermarkets PLC | 24,081,022 | 89,193,858 | |||
| 1,404,992,240 | |||||
Total common and preferred stocks | 11,093,632,529 | ||||
31
THIRTY-ONE
| Par Amount | Value | |||||
| SHORT-TERM INVESTMENTS (CASH EQUIVALENTS) - 0.0%(5) | ||||||
| Repurchase agreement with State Street Bank and Trust Company, 2.50%, dated 3/31/05, due 4/1/05, maturity value $6,175,429, collateralized by $6,298,812 market value Federal Home Loan Mortgage Corporation Note, 2.875%, due 5/15/07 (Cost $6,175,000) | $ | 6,175,000 | $ | 6,175,000 | ||
Total investments - 99.4% | 11,099,807,529 | |||||
Other assets less liabilities - 0.6% | 62,544,421 | |||||
Total net assets - 100.0%(6) | $ | 11,162,351,950 | ||||
| (1) | Non-income producing security. |
| (2) | Valued at a fair value in accordance with procedures established by the Board of Directors of Artisan Funds. In total, securities valued at a fair value in accordance with procedures established by the Board of Directors of Artisan Funds were $14,342,532 or 0.1% of total net assets. |
| (3) | Private investment partnership that is restricted as to resale. Total Investment cost of $10 million, made through capital contributions on 3/6/00, 7/10/00, and 5/15/01. Value at March 31, 2005 represents less than 0.1% of total net assets. |
| (4) | Principally traded in the United States. |
| (5) | Represents less than 0.1% of total net assets. |
| (6) | Percentages for the various classifications relate to total net assets. |
(ADR) American Depository Receipt
(GDR) Global Depository Receipt
| PORTFOLIO DIVERSIFICATION - MARCH 31, 2005 (Unaudited) | ||||||
| Value | Percentage | |||||
Consumer Discretionary | $ | 2,594,809,492 | 23.3 | % | ||
Consumer Staples | 1,188,124,707 | 10.6 | ||||
Energy | 669,085,206 | 6.0 | ||||
Financials | 3,729,369,980 | 33.4 | ||||
Healthcare | 295,239,735 | 2.6 | ||||
Industrials | 495,017,401 | 4.4 | ||||
Information Technology | 721,218,946 | 6.5 | ||||
Materials | 229,843,490 | 2.1 | ||||
Telecommunication Services | 1,136,328,235 | 10.2 | ||||
Utilities | 34,595,337 | 0.3 | ||||
Total common and preferred stocks | 11,093,632,529 | 99.4 | ||||
Total short-term investments | 6,175,000 | 0.0 | (5) | |||
Total investments | 11,099,807,529 | 99.4 | ||||
Other assets less liabilities | 62,544,421 | 0.6 | ||||
Total net assets | $ | 11,162,351,950 | 100.0 | % | ||
The accompanying notes are an integral part of the financial statements.
32
THIRTY-TWO
ARTISAN INTERNATIONAL SMALL CAP FUND (ARTJX)
Schedule of Investments – March 31, 2005 (Unaudited)
| Shares Held | Value | ||||
| COMMON AND PREFERRED STOCKS - 98.5% | |||||
| AUSTRALIA - 2.9% | |||||
APN News & Media Limited | 1,438,649 | $ | 5,666,448 | ||
John Fairfax Holdings Limited | 4,308,548 | 13,908,911 | |||
| 19,575,359 | |||||
| AUSTRIA - 2.0% | |||||
Wienerberger AG | 290,425 | 13,218,146 | |||
| BELGIUM - 0.3% | |||||
Colruyt N.V. | 13,435 | 2,086,413 | |||
| BRAZIL - 3.5% | |||||
Diagnosticos da America - 144A (ADR)(1)(2) | 79,100 | 2,399,894 | |||
Natura Cosmeticos S.A. | 343,800 | 9,348,270 | |||
Submarino S.A. - 144A (GDR)(1)(2) | 250,000 | 4,047,500 | |||
Telesp Celular Participacoes S.A., Preferred (ADR)(1) | 1,229,143 | 7,350,275 | |||
| 23,145,939 | |||||
| CANADA - 2.6% | |||||
Aur Resources Inc. | 1,201,100 | 7,009,809 | |||
Corus Entertainment, Inc., Class B | 435,400 | 10,527,775 | |||
| 17,537,584 | |||||
| CHINA - 2.1% | |||||
Beijing Capital International Airport Company Limited | 19,540,600 | 7,265,607 | |||
China Oilfield Services Limited | 9,497,100 | 3,287,690 | |||
Sinopec Zhenhai Refining and Chemical Company Limited | 3,064,100 | 3,300,033 | |||
| 13,853,330 | |||||
| FINLAND - 1.3% | |||||
Metso Oyj | 489,600 | 8,771,123 | |||
| FRANCE - 8.0% | |||||
Bonduelle S.C.A. | 33,650 | 3,160,306 | |||
Euler Hermes S.A. | 77,939 | 6,435,762 | |||
Ipsos | 68,412 | 7,134,509 | |||
JC Decaux S.A.(1) | 328,958 | 8,980,583 | |||
Nexity(1) | 538,894 | 18,623,840 | |||
Remy Cointreau S.A. | 212,603 | 8,910,064 | |||
| 53,245,064 | |||||
| Shares Held | Value | ||||
| GERMANY - 0.6% | |||||
Grenkeleasing AG | 89,736 | $ | 4,071,369 | ||
| HONG KONG - 6.1% | |||||
Aeon Stores (Hong Kong) Co. Limited | 737,100 | 878,912 | |||
China Power International Development Limited | 1,586,800 | 564,574 | |||
China Resources Power Holdings Company Limited | 4,764,850 | 2,245,136 | |||
Emperor Entertainment Hotel Limited(1) | 38,321,200 | 8,254,379 | |||
Hong Kong Exchanges & Clearing Limited | 1,886,000 | 4,884,601 | |||
Midland Realty Holdings Limited | 10,711,100 | 6,660,577 | |||
Panva Gas Holdings Limited(1) | 25,783,800 | 10,826,654 | |||
Singamas Container Holdings Limited | 7,315,400 | 6,377,978 | |||
| 40,692,811 | |||||
| INDIA - 0.1% | |||||
Sify Limited (ADR)(1) | 146,843 | 637,299 | |||
| ITALY - 3.8% | |||||
Gruppo Editoriale L’Espresso S.p.A. | 1,610,496 | 10,099,186 | |||
Immsi S.p.A | 2,906,817 | 6,390,712 | |||
RCS MediaGroup S.p.A. | 1,299,200 | 7,157,653 | |||
Socotherm S.p.A.(1) | 166,607 | 1,786,095 | |||
| 25,433,646 | |||||
| JAPAN - 9.7% | |||||
Creed Corporation | 6,160 | 15,280,798 | |||
Japan Petroleum Exploration | 161,900 | 6,613,093 | |||
Komeri Company, Ltd. | 383,700 | 10,144,451 | |||
NTT Urban Development Corporation | 1,929 | 8,904,737 | |||
Ozeki Company, Ltd. | 226,700 | 6,173,310 | |||
Park24 Company, Ltd. | 390,800 | 7,289,005 | |||
SFGC Company, Ltd. | 31,527 | 7,673,736 | |||
Toho Company, Ltd. | 155,300 | 2,537,402 | |||
| 64,616,532 | |||||
| MALAYSIA - 0.9% | |||||
AMMB Holdings Berhad | 7,660,540 | 5,664,768 | |||
AMMB Holdings Berhad - Rights(1)(2) | 1,532,108 | - | |||
| 5,664,768 | |||||
| MOROCCO - 0.5% | |||||
Maroc Telecom - 144A(1) | 349,300 | 3,350,704 | |||
33
THIRTY-THREE
| Shares Held | Value | ||||
| NETHERLANDS - 4.1% | |||||
Buhrmann NV | 2,061,641 | $ | 20,845,551 | ||
Eurocommercial Properties NV | 46,000 | 1,545,605 | |||
VastNed Retail NV | 72,614 | 5,120,649 | |||
| 27,511,805 | |||||
| NORWAY - 4.2% | |||||
Findexa Ltd. | 1,922,900 | 7,525,730 | |||
Petroleum Geo-Services ASA(1) | 94,520 | 6,227,597 | |||
Smedvig ASA, B shares | 468,800 | 7,398,231 | |||
Stolt Offshore S.A.(1) | 897,500 | 6,926,018 | |||
| 28,077,576 | |||||
| PANAMA - 4.6% | |||||
Banco Latinoamericano de Exportaciones, S.A., E Shares(3) | 1,512,114 | 30,907,610 | |||
| PHILIPPINES - 0.5% | |||||
SM Investments Corporation(1) | 771,270 | 3,208,934 | |||
| PORTUGAL - 3.8% | |||||
CIMPOR-Cimentos de Portugal, | 951,674 | 5,341,729 | |||
Impresa, S.G.P.S., S.A.(1) | 1,094,784 | 7,876,389 | |||
Sonae, S.G.P.S., S.A. | 7,961,600 | 11,971,927 | |||
| 25,190,045 | |||||
| REPUBLIC OF KOREA - 5.0% | |||||
FINETEC Corporation(4) | 1,201,124 | 11,236,512 | |||
Gwangju Shinsegae Company, Ltd. | 21,080 | 1,467,608 | |||
Hanil Cement Company, Ltd. | 107,405 | 6,409,397 | |||
Kangwon Land, Inc. | 827,226 | 12,381,916 | |||
Shinsegae Food System Company, Ltd. | 47,284 | 1,583,118 | |||
| 33,078,551 | |||||
| RUSSIA - 4.3% | |||||
AO VimpelCom (ADR)(1) | 465,900 | 16,036,278 | |||
Mechel Steel Group OAO (ADR)(1) | 223,400 | 5,980,418 | |||
Uralsvyazinform (ADR)(2) | 882,800 | 6,338,504 | |||
| 28,355,200 | |||||
| SINGAPORE - 3.2% | |||||
Fraser & Neave Limited | 1,865,320 | 17,175,747 | |||
LMA International NV(1) | 3,248,000 | 1,770,831 | |||
Yellow Pages (Singapore) Limited(1) | 1,842,000 | 2,164,761 | |||
| 21,111,339 | |||||
| Shares Held | Value | ||||
| SPAIN - 1.1% | |||||
Fadesa Inmobiliaria, S.A.(1) | 345,818 | $ | 7,576,001 | ||
| SWEDEN - 4.1% | |||||
Elekta AB, B shares(1) | 498,724 | 17,985,634 | |||
JM AB | 265,500 | 8,955,260 | |||
| 26,940,894 | |||||
| SWITZERLAND - 12.6% | |||||
Baloise Holding AG | 137,200 | 6,595,878 | |||
Bank Sarasin & Cie AG, B Shares | 6,351 | 12,053,652 | |||
Bobst Group AG | 239,755 | 9,922,555 | |||
Logitech International S.A.(1) | 150,434 | 9,150,181 | |||
Schindler Holding AG, Participation Certificates | 34,661 | 12,837,944 | |||
Straumann AG | 44,448 | 9,625,042 | |||
Sulzer AG | 39,798 | 17,136,382 | |||
Synthes, Inc. | 60,855 | 6,767,037 | |||
| 84,088,671 | |||||
| THAILAND - 3.2% | |||||
Bangkok Bank Public Company Limited | 1,816,500 | 5,200,613 | |||
Land and Houses Public Company Limited - Foreign Shares | 18,206,600 | 4,049,014 | |||
Land and Houses Public Company Limited - Local Shares | 18,422,500 | 3,979,298 | |||
National Finance Public Company Limited(2) | 23,568,700 | 8,133,370 | |||
| 21,362,295 | |||||
| UNITED KINGDOM - 3.4% | |||||
Intertek Group PLC | 938,500 | 13,718,245 | |||
SMG PLC | 4,234,021 | 8,641,333 | |||
| 22,359,578 | |||||
Total common and preferred stocks | 655,668,586 | ||||
34
THIRTY-FOUR
| Par Amount | Value | |||||
SHORT-TERM INVESTMENTS (CASH EQUIVALENTS) - 1.4% | ||||||
| Repurchase agreement with State Street Bank and Trust Company, 2.50%, dated 3/31/05, due 4/1/05, maturity value $9,236,641, collateralized by $9,421,655 market value Federal National Mortgage Association Note, 3.00%, due 8/15/07 (Cost $9,236,000) | $ | 9,236,000 | $ | 9,236,000 | ||
Total investments - 99.9% | 664,904,586 | |||||
Other assets less liabilities - 0.1% | 852,776 | |||||
Total net assets - 100.0%(5) | $ | 665,757,362 | ||||
| (1) | Non-income producing security. |
| (2) | Valued at fair value in accordance with procedures established by the Board of Directors of Artisan Funds. In total, securities valued at a fair value in accordance with procedures established by the Board of Directors of Artisan Funds were $20,919,268 or 3.1% of total net assets. |
| (3) | Principally traded in the United States. |
| (4) | Affiliated company as defined by the Investment Company Act of 1940. See Note 6 to the financial statements. |
| (5) | Percentages for the various classifications relate to total net assets. |
(ADR) American Depository Receipt
(GDR) Global Depository Receipt
| PORTFOLIO DIVERSIFICATION - MARCH 31, 2005 (Unaudited) | ||||||
| Value | Percentage | |||||
Consumer Discretionary | $ | 143,535,879 | 21.6 | % | ||
Consumer Staples | 31,261,481 | 4.7 | ||||
Energy | 33,752,662 | 5.1 | ||||
Financials | 165,611,590 | 24.9 | ||||
Healthcare | 38,548,438 | 5.8 | ||||
Industrials | 142,316,993 | 21.4 | ||||
Information Technology | 21,023,992 | 3.1 | ||||
Materials | 32,905,426 | 4.9 | ||||
Telecommunication Services | 33,075,761 | 5.0 | ||||
Utilities | 13,636,364 | 2.0 | ||||
Total common and preferred stocks | 655,668,586 | 98.5 | ||||
Total short-term investments | 9,236,000 | 1.4 | ||||
Total investments | 664,904,586 | 99.9 | ||||
Other assets less liabilities | 852,776 | 0.1 | ||||
Total net assets | $ | 665,757,362 | 100.0 | % | ||
The accompanying notes are an integral part of the financial statements.
35
THIRTY-FIVE
ARTISAN INTERNATIONAL VALUE FUND (ARTKX)
Schedule of Investments – March 31, 2005 (Unaudited)
Shares Held | Value | ||||
| COMMON AND PREFERRED STOCKS - 93.6% | |||||
| AUSTRALIA - 2.4% | |||||
Rinker Group, Ltd. | 458,804 | $ | 3,826,810 | ||
Rinker Group, Ltd. (ADR) | 11,790 | 987,884 | |||
Zinifex Ltd.(1) | 4,778,128 | 10,959,737 | |||
| 15,774,431 | |||||
| FRANCE - 7.9% | |||||
Euronext N.V. | 585,166 | 20,822,226 | |||
Renault S.A. | 183,293 | 16,370,835 | |||
Vivendi Universal S.A. | 450,673 | 13,804,828 | |||
| 50,997,889 | |||||
| GERMANY - 9.4% | |||||
Heidelberger Druckmaschinen AG | 645,386 | 20,622,542 | |||
Henkel KGaA | 167,927 | 14,236,525 | |||
Pfeiffer Vacuum Technology AG(2) | 517,862 | 26,248,019 | |||
| 61,107,086 | |||||
| HONG KONG - 3.1% | |||||
Asia Satellite Telecommunications | 3,239,000 | 6,187,757 | |||
Guoco Group, Ltd. | 1,387,000 | 13,959,895 | |||
| 20,147,652 | |||||
| ITALY - 3.7% | |||||
Caltagirone Editore S.p.A. | 605,029 | 5,607,741 | |||
Cementir S.p.A. | 3,134,487 | 18,365,833 | |||
| 23,973,574 | |||||
| JAPAN - 9.1% | |||||
Meitec Corporation | 725,700 | 25,311,182 | |||
NIPPONKOA Insurance Company, Ltd. | 2,373,000 | 16,265,551 | |||
Olympus Corporation | 741,000 | 17,275,949 | |||
| 58,852,682 | |||||
| MEXICO - 0.8% | |||||
Grupo Aeroportuario del Sureste S.A. de C.V. (ADR) | 171,190 | 4,801,880 | |||
| NETHERLANDS - 7.4% | |||||
Hunter Douglas N.V. | 311,008 | 15,674,855 | |||
Koninklijke Numico N.V.(1) | 151,703 | 6,206,359 | |||
Wolters Kluwer N.V. | 1,441,608 | 26,330,791 | |||
| 48,212,005 | |||||
Shares Held | Value | ||||
| NEW ZEALAND - 0.9% | |||||
Telecom Corporation of New Zealand, Ltd. | 1,350,394 | $ | 5,822,886 | ||
| REPUBLIC OF KOREA - 3.1% | |||||
Lotte Chilsung Beverage Co., Ltd. | 7,030 | 6,964,234 | |||
Lotte Chilsung Beverage Co., Ltd., Preferred | 580 | 285,574 | |||
Lotte Confectionary Co., Ltd. | 9,338 | 6,354,070 | |||
Samchully Co., Ltd. | 94,920 | 6,645,802 | |||
| 20,249,680 | |||||
| SWITZERLAND - 12.7% | |||||
Clariant AG | 1,311,226 | 22,638,533 | |||
Givaudan S.A. | 29,681 | 19,058,574 | |||
Pargesa Holding AG | 3,951 | 15,030,350 | |||
PubliGroupe S.A. | 22,447 | 7,122,308 | |||
Tamedia AG(1) | 62,962 | 6,211,710 | |||
Zehnder Group AG | 9,138 | 12,537,484 | |||
| 82,598,959 | |||||
| UNITED KINGDOM - 28.6% | |||||
Admiral Group PLC | 869,120 | 5,732,039 | |||
Benfield Group PLC | 2,600,671 | 12,495,405 | |||
Brit Insurance Holdings PLC | 12,025,142 | 18,406,838 | |||
Carpetright PLC | 251,348 | 4,711,846 | |||
Countrywide PLC | 4,189,724 | 25,850,715 | |||
Diageo PLC | 2,243,894 | 31,633,346 | |||
MFI Furniture Group PLC | 6,133,626 | 13,561,481 | |||
Rotork PLC | 666,986 | 5,873,630 | |||
Signet Group PLC | 10,656,022 | 21,647,489 | |||
Unilever PLC (ADR) | 585,825 | 23,433,000 | |||
Vodafone Group PLC (ADR) | 844,150 | 22,420,624 | |||
| 185,766,413 | |||||
| UNITED STATES - 4.5% | |||||
Arch Capital Group Ltd.(1) (3) | 377,810 | 15,127,512 | |||
Willis Group Holdings Limited(3) | 377,900 | 13,933,173 | |||
| 29,060,685 | |||||
Total common and preferred stocks (Cost $546,405,533) | 607,365,822 | ||||
36
THIRTY-SIX
| Par Amount | Value | |||||
| SHORT-TERM INVESTMENTS (CASH EQUIVALENTS) - 5.8% | ||||||
| Repurchase agreement with State Street Bank and Trust Company, 2.50%, dated 3/31/05, due 4/1/05, maturity value $37,476,602, collateralized by $38,226,604 market value Federal National Mortgage Association Note, 5.75%, due 2/15/08 (Cost $37,474,000) | $ | 37,474,000 | $ | 37,474,000 | ||
Total investments - 99.4% | 644,839,822 | |||||
Other assets less liabilities - 0.6% | 3,878,448 | |||||
Total net assets - 100.0%(4) | $ | 648,718,270 | ||||
| (1) | Non-income producing security. |
| (2) | Affiliated company as defined by the Investment Company Act of 1940. See Note 6 to the financial statements. |
| (3) | Principally traded in the United States. |
| (4) | Percentages for the various classifications relate to total net assets. |
(ADR) American Depository Receipt
| PORTFOLIO DIVERSIFICATION - MARCH 31, 2005 (Unaudited) | ||||||
| Value | Percentage | |||||
Consumer Discretionary | $ | 131,043,885 | 20.2 | % | ||
Consumer Staples | 89,113,108 | 13.7 | ||||
Energy | — | — | ||||
Financials | 157,623,704 | 24.3 | ||||
Healthcare | 17,275,949 | 2.7 | ||||
Industrials | 95,394,736 | 14.7 | ||||
Information Technology | — | — | ||||
Materials | 75,837,371 | 11.7 | ||||
Telecommunication Services | 34,431,267 | 5.3 | ||||
Utilities | 6,645,802 | 1.0 | ||||
Total common and preferred stocks | 607,365,822 | 93.6 | ||||
Total short-term investments | 37,474,000 | 5.8 | ||||
Total investments | 644,839,822 | 99.4 | ||||
Other assets less liabilities | 3,878,448 | 0.6 | ||||
Total net assets | $ | 648,718,270 | 100.0 | % | ||
The accompanying notes are an integral part of the financial statements.
37
THIRTY-SEVEN
Schedule of Investments – March 31, 2005 (Unaudited)
Shares Held | Value | ||||
| COMMON STOCKS - 98.5% | |||||
| AUTO & TRANSPORTATION - 1.3% | |||||
Air Transport - 0.7% | |||||
Expeditors International of Washington, Inc. | 818,100 | $ | 43,809,255 | ||
Auto Trucks & Parts - 0.6% | |||||
Oshkosh Truck Corporation | 464,300 | 38,067,957 | |||
| CONSUMER DISCRETIONARY - 22.1% | |||||
Advertising Agencies - 0.8% | |||||
Lamar Advertising Company(1) | 1,172,800 | 47,252,112 | |||
Casinos & Gambling - 0.3% | |||||
Las Vegas Sands Corp.(1) | 370,000 | 16,650,000 | |||
Consumer Electronics - 3.2% | |||||
Electronic Arts Inc.(1) | 555,100 | 28,743,078 | |||
VeriSign, Inc.(1) | 1,750,600 | 50,242,220 | |||
Yahoo! Inc.(1) | 3,238,200 | 109,774,980 | |||
| 188,760,278 | |||||
Education Services - 0.9% | |||||
Corinthian Colleges, Inc.(1) | 3,277,900 | 51,528,588 | |||
Leisure Time - 1.5% | |||||
Royal Caribbean Cruises Ltd. | 2,012,501 | 89,938,670 | |||
Radio & TV Broadcasters - 1.3% | |||||
Univision Communications Inc.(1) | 2,717,800 | 75,255,882 | |||
Restaurants - 2.2% | |||||
Applebee’s International, Inc. | 1,043,500 | 28,758,860 | |||
Starbucks Corporation(1) | 600,800 | 31,037,328 | |||
YUM! Brands, Inc. | 1,360,500 | 70,487,505 | |||
| 130,283,693 | |||||
Retail - 7.9% | |||||
American Eagle Outfitters, Inc. | 1,014,100 | 29,966,655 | |||
CarMax, Inc.(1) | 1,831,700 | 57,698,550 | |||
Chico’s FAS, Inc.(1) | 3,256,868 | 92,039,090 | |||
Dollar General Corporation | 1,029,400 | 22,554,154 | |||
Fisher Scientific International Inc.(1) | 1,503,100 | 85,556,452 | |||
Kohl’s Corporation(1) | 1,179,100 | 60,876,933 | |||
Nordstrom, Inc. | 530,400 | 29,373,552 | |||
Ross Stores, Inc. | 1,617,400 | 47,131,036 | |||
Staples, Inc. | 1,418,900 | 44,596,027 | |||
| 469,792,449 | |||||
Shares Held | Value | ||||
| CONSUMER DISCRETIONARY (CONTINUED) | |||||
Services: Commercial - 4.0% | |||||
Getty Images, Inc.(1) | 1,148,600 | $ | 81,676,946 | ||
Hewitt Associates, Inc.(1) | 2,382,800 | 63,382,480 | |||
Iron Mountain Incorporated(1) | 1,768,300 | 50,997,772 | |||
Robert Half International Inc. | 1,550,805 | 41,809,703 | |||
| 237,866,901 | |||||
| CONSUMER STAPLES - 3.4% | |||||
Beverage: Brewers (Wineries) - 2.3% | |||||
Constellation Brands, Inc.(1) | 2,546,300 | 134,622,881 | |||
Beverage: Soft Drinks - 0.5% | |||||
Cott Corporation(1) | 1,208,200 | 29,274,686 | |||
Drug & Grocery Store Chains - 0.6% | |||||
Whole Foods Market, Inc. | 325,000 | 33,192,250 | |||
| FINANCIAL SERVICES - 11.6% | |||||
Banks: Outside New York City - 1.3% | |||||
Doral Financial Corporation | 793,100 | 17,360,959 | |||
North Fork Bancorporation, Inc. | 1,058,200 | 29,354,468 | |||
Northern Trust Corporation | 690,800 | 30,008,352 | |||
| 76,723,779 | |||||
Diversified Financial Services - 0.6% | |||||
CIT Group Inc. | 950,700 | 36,126,600 | |||
Finance: Small Loan - 0.5% | |||||
The First Marblehead Corporation(1) | 514,200 | 29,581,926 | |||
Financial Data Processing Services & Systems - 2.2% | |||||
CheckFree Corporation(1) | 1,018,000 | 41,493,680 | |||
Paychex, Inc. | 2,673,300 | 87,737,706 | |||
| 129,231,386 | |||||
Financial Miscellaneous - 3.7% | |||||
CapitalSource Inc.(1) | 2,637,000 | 60,651,000 | |||
MGIC Investment Corporation | 875,400 | 53,985,918 | |||
Willis Group Holdings Limited | 2,831,600 | 104,401,092 | |||
| 219,038,010 | |||||
Insurance: Property-Casualty - 0.7% | |||||
RenaissanceRe Holdings Ltd. | 897,200 | 41,899,240 | |||
Rental & Leasing Services: Commercial - 0.8% | |||||
GATX Corporation | 1,417,600 | 47,050,144 | |||
Savings & Loans - 0.8% | |||||
Golden West Financial Corporation | 740,600 | 44,806,300 | |||
38
THIRTY-EIGHT
Shares Held | Value | ||||
| FINANCIAL SERVICES (CONTINUED) | |||||
Securities Brokerage & Services - 1.0% | |||||
The Bear Stearns Companies Inc. | 590,800 | $ | 59,020,920 | ||
| HEALTHCARE - 14.7% | |||||
Biotechnology Research & Production - 2.5% | |||||
Genzyme Corporation(1) | 789,000 | 45,162,360 | |||
Invitrogen Corporation(1) | 1,502,300 | 103,959,160 | |||
| 149,121,520 | |||||
Drugs & Pharmaceuticals - 3.8% | |||||
Allergan, Inc. | 1,532,300 | 106,448,881 | |||
Barr Pharmaceuticals, Inc.(1) | 1,255,900 | 61,325,597 | |||
Eyetech Pharmaceuticals, Inc.(1) | 470,000 | 12,925,000 | |||
MedImmune, Inc.(1) | 1,826,700 | 43,493,727 | |||
| 224,193,205 | |||||
Electronics: Medical Systems - 1.4% | |||||
Varian Medical Systems, Inc.(1) | 2,511,900 | 86,107,932 | |||
Health Care Management Services - 4.0% | |||||
Aetna Inc. | 951,000 | 71,277,450 | |||
Caremark Rx, Inc.(1) | 2,188,300 | 87,050,574 | |||
Cerner Corporation(1) | 1,463,600 | 76,853,636 | |||
| 235,181,660 | |||||
Health Care Services - 0.8% | |||||
Lincare Holdings Inc.(1) | 1,100,000 | 48,653,000 | |||
Medical & Dental Instruments & Supplies - 1.0% | |||||
Zimmer Holdings, Inc.(1) | 775,700 | 60,357,217 | |||
Medical Services - 1.2% | |||||
Coventry Health Care, Inc.(1) | 1,004,100 | 68,419,374 | |||
| MATERIALS & PROCESSING - 8.6% | |||||
Chemicals - 3.8% | |||||
Air Products and Chemicals, Inc. | 1,980,200 | 125,326,858 | |||
Ecolab Inc. | 2,730,100 | 90,229,805 | |||
Nalco Holding Company(1) | 456,600 | 8,597,778 | |||
| 224,154,441 | |||||
Copper - 0.5% | |||||
Freeport-McMoRan Copper & Gold Inc. | 808,600 | 32,028,646 | |||
Diversified Materials & Processing - 1.5% | |||||
American Standard Companies Inc. | 1,969,500 | 91,542,360 | |||
Metal Fabricating - 1.5% | |||||
Precision Castparts Corp. | 1,164,400 | 89,670,444 | |||
Real Estate - 1.3% | |||||
The St. Joe Company | 1,160,800 | 78,121,840 | |||
Shares Held | Value | ||||
| OTHER - 3.9% | |||||
Multi-Sector Companies - 3.9% | |||||
Brunswick Corporation | 964,600 | $ | 45,191,510 | ||
Eaton Corporation | 659,300 | 43,118,220 | |||
ITT Industries, Inc. | 1,070,500 | 96,601,920 | |||
Textron Inc. | 622,700 | 46,465,874 | |||
| 231,377,524 | |||||
| OTHER ENERGY - 5.3% | |||||
Coal - 0.7% | |||||
Peabody Energy Corporation | 856,000 | 39,684,160 | |||
Machinery: Oil Well Equipment & Services - 3.5% | |||||
Noble Corporation | 884,700 | 49,728,987 | |||
Smith International, Inc. | 1,550,800 | 97,281,684 | |||
Weatherford International Ltd.(1) | 1,044,700 | 60,529,918 | |||
| 207,540,589 | |||||
Oil: Crude Producers - 1.1% | |||||
Devon Energy Corporation | 1,316,200 | 62,848,550 | |||
| PRODUCER DURABLES - 7.4% | |||||
Diversified Production - 2.3% | |||||
Danaher Corporation | 2,001,000 | 106,873,410 | |||
Pentair, Inc. | 759,100 | 29,604,900 | |||
| 136,478,310 | |||||
Electrical Equipment & Components - 0.6% | |||||
Molex Incorporated | 1,345,400 | 35,464,744 | |||
Homebuilding - 0.9% | |||||
D.R. Horton, Inc. | 1,727,200 | 50,503,328 | |||
Identification Control & Filter Devices - 0.2% | |||||
Garmin Ltd. | 281,800 | 13,052,976 | |||
Machinery: Industrial/Specialty - 0.7% | |||||
Joy Global Inc. | 1,199,509 | 42,054,785 | |||
Office Furniture & Business Equipment - 0.7% | |||||
Diebold, Incorporated | 813,700 | 44,631,445 | |||
Production Technology Equipment - 0.5% | |||||
Lam Research Corporation(1) | 1,081,200 | 31,203,432 | |||
Telecommunications Equipment - 1.5% | |||||
Andrew Corporation(1) | 4,883,200 | 57,182,272 | |||
Plantronics, Inc. | 783,900 | 29,850,912 | |||
| 87,033,184 | |||||
39
THIRTY-NINE
Shares Held | Value | ||||
| TECHNOLOGY - 19.7% | |||||
Communications Technology - 6.8% | |||||
Avaya Inc.(1) | 2,302,000 | $ | 26,887,360 | ||
Avocent Corporation(1) | 1,084,400 | 27,825,704 | |||
Comverse Technology, Inc.(1) | 1,294,000 | 32,634,680 | |||
Corning Incorporated(1) | 4,158,000 | 46,278,540 | |||
Juniper Networks, Inc.(1) | 3,418,200 | 75,405,492 | |||
NCR Corporation(1) | 2,615,200 | 88,236,848 | |||
Scientific-Atlanta, Inc. | 486,800 | 13,737,496 | |||
Symbol Technologies, Inc. | 3,547,800 | 51,407,622 | |||
TIBCO Software Inc.(1) | 5,332,900 | 39,730,105 | |||
| 402,143,847 | |||||
Computer Services Software | |||||
Adobe Systems Incorporated | 1,113,000 | 74,760,210 | |||
CACI International Inc(1) | 420,900 | 23,246,307 | |||
Cognizant Technology Solutions Corporation(1) | 710,800 | 32,838,960 | |||
Cognos Incorporated(1) | 979,900 | 41,097,006 | |||
Macromedia, Inc.(1) | 1,446,300 | 48,451,050 | |||
Mercury Interactive Corporation(1) | 1,167,700 | 55,325,626 | |||
| 275,719,159 | |||||
Computer Technology - 2.0% | |||||
Network Appliance, Inc.(1) | 1,064,900 | 29,455,134 | |||
Seagate Technology(1) | 2,202,500 | 43,058,875 | |||
Zebra Technologies Corporation(1) | 962,300 | 45,699,627 | |||
| 118,213,636 | |||||
Electronics: Semi-Conductors/ | |||||
Altera Corporation(1) | 4,388,400 | 86,802,552 | |||
Broadcom Corporation(1) | 2,997,100 | 89,673,232 | |||
Jabil Circuit, Inc.(1) | 2,362,800 | 67,387,056 | |||
Linear Technology Corporation | 782,000 | 29,958,420 | |||
Marvell Technology Group Ltd.(1) | 853,100 | 32,707,854 | |||
MEMC Electronic Materials, Inc.(1) | 2,286,800 | 30,757,460 | |||
National Semiconductor Corporation | 1,531,500 | 31,564,215 | |||
| 368,850,789 | |||||
Shares Held | Value | ||||||
| UTILITIES - 0.5% | |||||||
Utilities: Electrical - 0.5% | |||||||
The AES Corporation(1) | 1,942,800 | $ | 31,823,064 | ||||
Total common stocks | 5,835,949,068 | ||||||
| Par Amount | |||||||
SHORT-TERM INVESTMENTS (CASH EQUIVALENTS) - 2.0% | |||||||
Repurchase agreement with State Street Bank and Trust Company, 2.50%, dated 3/31/05, due 4/1/05, maturity value $119,877,324, collateralized by $122,271,236 market value Federal Home Loan Bank Note, 3.375%, due 2/23/07 (Cost $119,869,000) | $ | 119,869,000 | $ | 119,869,000 | |||
Total investments - 100.5% | 5,955,818,068 | ||||||
Other assets less liabilities - (0.5%) | (29,935,123 | ) | |||||
Total net assets - 100.0%(2) | $ | 5,925,882,945 | |||||
| (1) | Non-income producing security. |
| (2) | Percentages for the various classifications relate to total net assets. |
The accompanying notes are an integral part of the financial statements.
40
FORTY
ARTISAN MID CAP VALUE FUND (ARTQX)
Schedule of Investments – March 31, 2005 (Unaudited)
Shares Held | Value | ||||
| COMMON STOCKS - 91.7% | |||||
| CONSUMER DISCRETIONARY - 24.5% | |||||
Hotel/Motel - 0.9% | |||||
Fairmont Hotels & Resorts, Inc. | 309,800 | $ | 10,266,772 | ||
Household Furnishings - 2.5% | |||||
Furniture Brands International, Inc.(1) | 1,314,900 | 28,677,969 | |||
Rental & Leasing Services: Consumer - 2.2% | |||||
Rent-A-Center, Inc.(2) | 903,600 | 24,677,316 | |||
Restaurants - 2.1% | |||||
Darden Restaurants, Inc. | 787,700 | 24,166,636 | |||
Retail - 6.4% | |||||
AutoZone, Inc.(2) | 279,400 | 23,944,580 | |||
Claire’s Stores, Inc. | 1,091,700 | 25,152,768 | |||
Zale Corporation(2) | 830,400 | 24,679,488 | |||
| 73,776,836 | |||||
Services: Commercial - 2.6% | |||||
Convergys Corporation(2) | 1,327,500 | 19,819,575 | |||
Republic Services, Inc. | 295,600 | 9,896,688 | |||
| 29,716,263 | |||||
Shoes - 1.4% | |||||
Reebok International Ltd. | 358,100 | 15,863,830 | |||
Textiles: Apparel Manufacturers - 3.0% | |||||
Liz Claiborne Inc. | 391,500 | 15,710,895 | |||
Polo Ralph Lauren Corporation | 481,900 | 18,697,720 | |||
| 34,408,615 | |||||
Toys - 3.4% | |||||
Hasbro, Inc. | 1,007,300 | 20,599,285 | |||
Marvel Enterprises, Inc.(2) | 949,100 | 18,982,000 | |||
| 39,581,285 | |||||
| FINANCIAL SERVICES - 28.8% | |||||
Finance: Small Loan - 4.9% | |||||
The Student Loan Corporation | 270,200 | 56,474,502 | |||
Financial Data Processing Services & Systems - 5.2% | |||||
Deluxe Corporation | 676,400 | 26,961,304 | |||
SunGard Data Systems Inc.(2) | 938,900 | 32,392,050 | |||
| 59,353,354 | |||||
Shares Held | Value | ||||
| FINANCIAL SERVICES (CONTINUED) | |||||
Insurance: Multi-Line - 7.3% | |||||
Alleghany Corporation(2) | 128,226 | $ | 35,518,646 | ||
CNA Financial Corporation(2) | 662,700 | 18,595,362 | |||
Old Republic International Corporation | 1,282,050 | 29,858,945 | |||
| 83,972,953 | |||||
Insurance: Property-Casualty - 5.6% | |||||
Arch Capital Group Ltd.(2) | 362,073 | 14,497,403 | |||
PartnerRe Ltd. | 172,200 | 11,124,120 | |||
White Mountains Insurance Group, Ltd. | 64,500 | 39,248,250 | |||
| 64,869,773 | |||||
Savings & Loans - 2.0% | |||||
Washington Federal, Inc. | 995,216 | 23,198,485 | |||
Securities Brokerage | |||||
Countrywide Financial Corporation | 483,900 | 15,707,394 | |||
Nuveen Investments, Inc. | 801,900 | 27,521,208 | |||
| 43,228,602 | |||||
| HEALTHCARE - 1.5% | |||||
Health Care Management Services - 1.5% | |||||
Universal Health Services, Inc., Class B | 337,900 | 17,705,960 | |||
| MATERIALS & PROCESSING - 4.6% | |||||
Building: Cement - 0.4% | |||||
Lafarge North America Inc. | 86,300 | 5,044,235 | |||
Engineering & Contracting Services - 2.0% | |||||
Jacobs Engineering Group Inc.(2) | 448,000 | 23,260,160 | |||
Paints & Coatings - 2.2% | |||||
The Sherwin-Williams Company | 569,400 | 25,047,906 | |||
| OTHER ENERGY - 19.3% | |||||
Oil: Crude Producers - 19.3% | |||||
Apache Corporation | 557,446 | 34,132,418 | |||
EOG Resources, Inc. | 1,051,800 | 51,264,732 | |||
Newfield Exploration Company(2) | 311,300 | 23,117,138 | |||
Noble Energy, Inc. | 580,400 | 39,478,808 | |||
Pioneer Natural Resources Company | 965,604 | 41,250,603 | |||
XTO Energy Inc. | 992,943 | 32,608,237 | |||
| 221,851,936 | |||||
41
FORTY-ONE
Shares Held | Value | ||||
| TECHNOLOGY - 11.3% | |||||
Computer Services Software & Systems - 7.2% | |||||
BEA Systems, Inc.(2) | 2,673,000 | $ | 21,303,810 | ||
BearingPoint, Inc.(2) | 1,872,700 | 16,423,579 | |||
BMC Software, Inc.(2) | 1,438,900 | 21,583,500 | |||
Siebel Systems, Inc.(2) | 2,496,900 | 22,796,697 | |||
| 82,107,586 | |||||
Computer Technology - 1.1% | |||||
Synopsys, Inc.(2) | 700,100 | 12,671,810 | |||
Electronics: Semi-Conductors/ Components - 3.0% | |||||
Avnet, Inc.(2) | 1,548,700 | 28,527,054 | |||
National Semiconductor Corporation | 270,300 | 5,570,883 | |||
| 34,097,937 | |||||
| UTILITIES - 1.7% | |||||
Utilities: Electrical - 1.7% | |||||
Westar Energy, Inc. | 873,800 | 18,909,032 | |||
Total common stocks | 1,052,929,753 | ||||
Par Amount | Value | ||||||
| SHORT-TERM INVESTMENTS (CASH EQUIVALENTS) - 8.8% | |||||||
| Repurchase agreement with State Street Bank & Trust Company, 2.50%, dated 3/31/05, due 4/1/05, maturity value $101,489,047, collateralized by $103,512,388 market value Federal National Mortgage Association Note, 2.00%, due 1/15/06 (Cost $101,482,000) | $ | 101,482,000 | $ | 101,482,000 | |||
Total investments - 100.5% | 1,154,411,753 | ||||||
Other assets less liabilities - (0.5%) | (6,060,217 | ) | |||||
Total net assets - 100.0%(3) | $ | 1,148,351,536 | |||||
| (1) | Affiliated company as defined by the Investment Company Act of 1940. See Note 6 to the financial statements. |
| (2) | Non-income producing security. |
| (3) | Percentages for the various classifications relate to total net assets. |
The accompanying notes are an integral part of the financial statements.
42
FORTY-TWO
.
ARTISAN SMALL CAP FUND (ARTSX)
Schedule of Investments – March 31, 2005 (Unaudited)
Shares Held | Value | ||||
| COMMON STOCKS - 96.9% | |||||
| AUTO & TRANSPORTATION - 3.7% | |||||
Air Transport - 1.3% | |||||
AirTran Holdings, Inc.(1) | 890,700 | $ | 8,060,835 | ||
Auto Parts: After Market - 1.0% | |||||
Keystone Automotive Industries, Inc.(1) | 252,500 | 5,847,900 | |||
Transportation: Miscellaneous - 1.4% | |||||
Pacer International, Inc.(1) | 350,800 | 8,380,612 | |||
| CONSUMER DISCRETIONARY - 22.6% | |||||
Consumer Electronics - 1.3% | |||||
FindWhat.com(1) | 768,000 | 7,964,160 | |||
Consumer Products - 1.2% | |||||
RC2 Corporation(1) | 224,400 | 7,629,600 | |||
Education Services - 1.4% | |||||
Universal Technical Institute, Inc.(1) | 233,800 | 8,603,840 | |||
Radio & TV Broadcasters - 1.1% | |||||
Spanish Broadcasting System, Inc.(1) | 656,300 | 6,733,638 | |||
Restaurants - 1.5% | |||||
RARE Hospitality International, Inc.(1) | 286,950 | 8,861,016 | |||
Retail - 8.0% | |||||
Brookstone, Inc.(1) | 478,800 | 7,766,136 | |||
Central Garden & Pet Company(1) | 188,600 | 8,271,996 | |||
Coldwater Creek Inc.(1) | 247,225 | 4,568,718 | |||
Cost Plus, Inc.(1) | 260,000 | 6,988,800 | |||
Hibbett Sporting Goods, Inc.(1) | 206,500 | 6,203,260 | |||
Rush Enterprises, Inc.(1) | 329,600 | 5,168,128 | |||
School Specialty, Inc.(1) | 238,200 | 9,327,912 | |||
| 48,294,950 | |||||
Services: Commercial - 5.7% | |||||
The Advisory Board Company(1) | 224,000 | 9,788,800 | |||
Charles River Associates Incorporated(1) | 143,400 | 7,076,790 | |||
Harris Interactive Inc.(1) | 387,600 | 1,786,836 | |||
Jackson Hewitt Tax Service Inc. | 409,800 | 8,573,016 | |||
Waste Connections, Inc.(1) | 199,650 | 6,937,838 | |||
| 34,163,280 | |||||
Shares Held | Value | ||||
| CONSUMER DISCRETIONARY (CONTINUED) | |||||
Textiles Apparel Manufacturers - 1.1% | |||||
Carter’s, Inc.(1) | 164,800 | $ | 6,550,800 | ||
Wholesalers - 1.3% | |||||
LKQ Corporation(1) | 383,600 | 7,698,852 | |||
| FINANCIAL SERVICES - 14.3% | |||||
Banks: Outside New York City - 3.0% | |||||
Alabama National BanCorporation | 110,100 | 6,814,089 | |||
Main Street Banks, Inc. | 218,000 | 5,772,640 | |||
Texas Capital Bancshares, Inc.(1) | 269,800 | 5,665,800 | |||
| 18,252,529 | |||||
Financial Data Processing Services | |||||
TNS, Inc.(1) | 481,000 | 8,633,950 | |||
Insurance: Multi-Line - 2.5% | |||||
HealthExtras, Inc.(1) | 381,300 | 6,348,645 | |||
Platinum Underwriters Holdings, Ltd. | 285,300 | 8,473,410 | |||
| 14,822,055 | |||||
Insurance: Property-Casualty - 1.4% | |||||
Ohio Casualty Corporation(1) | 379,400 | 8,718,612 | |||
Real Estate Investment Trusts | |||||
La Quinta Corporation(1) | 729,600 | 6,201,600 | |||
Strategic Hotel Capital, Inc. | 391,100 | 5,749,170 | |||
| 11,950,770 | |||||
Savings & Loans - 2.7% | |||||
Bank Mutual Corporation | 679,900 | 8,036,418 | |||
BankAtlantic Bancorp, Inc. | 459,700 | 7,998,780 | |||
| 16,035,198 | |||||
Securities Brokerage & Services - 1.3% | |||||
optionsXpress Holdings, Inc.(1) | 487,700 | 7,895,863 | |||
| HEALTHCARE - 14.9% | |||||
Drugs & Pharmaceuticals - 3.9% | |||||
Impax Laboratories, Inc.(1) | 459,100 | 7,345,600 | |||
Salix Pharmaceuticals, Ltd.(1) | 375,400 | 6,190,346 | |||
SFBC International, Inc.(1) | 284,700 | 10,032,828 | |||
| 23,568,774 | |||||
43
FORTY-THREE
Shares Held | Value | ||||
| HEALTHCARE (CONTINUED) | |||||
Health Care Facilities - 1.3% | |||||
United Surgical Partners | 170,400 | $ | 7,799,208 | ||
Health Care Management | |||||
Sierra Health Services, Inc.(1) | 125,000 | 7,980,000 | |||
Health Care Services - 1.4% | |||||
LabOne, Inc.(1) | 242,700 | 8,368,296 | |||
Medical & Dental Instruments | |||||
I-Flow Corporation(1) | 377,300 | 5,972,659 | |||
PSS World Medical, Inc.(1) | 852,600 | 9,694,062 | |||
Respironics, Inc.(1) | 122,900 | 7,161,383 | |||
Wright Medical Group, Inc.(1) | 388,800 | 9,331,200 | |||
| 32,159,304 | |||||
Medical Services - 1.6% | |||||
VCA Antech, Inc.(1) | 482,100 | 9,752,883 | |||
| MATERIALS & PROCESSING - 6.6% | |||||
Building Materials - 2.5% | |||||
Hughes Supply, Inc. | 256,900 | 7,642,775 | |||
Trex Company, Inc.(1) | 172,700 | 7,669,607 | |||
| 15,312,382 | |||||
Building: Heating & Plumbing - 1.2% | |||||
Interline Brands, Inc.(1) | 367,100 | 7,015,281 | |||
Chemicals - 0.6% | |||||
NuCO2 Inc.(1) | 124,000 | 3,261,200 | |||
Plastics - 1.3% | |||||
Spartech Corporation | 405,500 | 8,049,175 | |||
Real Estate - 1.0% | |||||
WCI Communities, Inc.(1) | 199,300 | 5,994,944 | |||
| OTHER ENERGY - 4.9% | |||||
Machinery: Oil Well Equipment | |||||
W-H Energy Services, Inc.(1) | 285,400 | 6,829,622 | |||
Oil: Crude Producers - 3.8% | |||||
Brigham Exploration Company(1) | 632,300 | 5,836,129 | |||
Magnum Hunter Resources, Inc.(1) | 362,600 | 5,841,486 | |||
Pioneer Drilling Company(1) | 330,400 | 4,549,608 | |||
Unit Corporation(1) | 150,600 | 6,802,602 | |||
| 23,029,825 | |||||
Shares Held | Value | ||||
| PRODUCER DURABLES - 6.8% | |||||
Aerospace - 1.4% | |||||
MTC Technologies, Inc.(1) | 266,400 | $ | 8,658,000 | ||
Identification Control & Filter | |||||
CUNO Incorporated(1) | 30,900 | 1,587,951 | |||
Machinery: Industrial/Specialty - 1.0% | |||||
Gardner Denver, Inc.(1) | 152,800 | 6,037,128 | |||
Machinery: Specialty - 1.4% | |||||
Applied Films Corporation(1) | 378,700 | 8,755,544 | |||
Production Technology | |||||
Axcelis Technologies, Inc.(1) | 996,400 | 7,273,720 | |||
Cymer, Inc.(1) | 334,000 | 8,941,180 | |||
| 16,214,900 | |||||
| TECHNOLOGY - 23.1% | |||||
Communications Technology - 4.2% | |||||
Avocent Corporation(1) | 324,400 | 8,324,104 | |||
Foundry Networks, Inc.(1) | 833,900 | 8,255,610 | |||
Tekelec(1) | 559,600 | 8,920,024 | |||
| 25,499,738 | |||||
Computer Services Software | |||||
Anteon International Corporation(1) | 194,500 | 7,571,885 | |||
Ascential Software Corporation(1) | 286,900 | 5,316,257 | |||
Borland Software Corporation(1) | 797,200 | 6,473,264 | |||
Dendrite International, Inc.(1) | 343,900 | 4,828,356 | |||
Infocrossing, Inc.(1) | 337,900 | 5,352,336 | |||
Macrovision Corporation(1) | 334,100 | 7,614,139 | |||
Magma Design Automation, Inc.(1) | 668,000 | 7,929,160 | |||
Progress Software Corporation(1) | 278,700 | 7,307,514 | |||
Serena Software Inc.(1) | 333,700 | 7,928,712 | |||
SS&C Technologies, Inc. | 399,400 | 9,106,320 | |||
| 69,427,943 | |||||
Computer Technology - 0.7% | |||||
Stratasys, Inc.(1) | 151,400 | 4,289,162 | |||
Electronics - 2.9% | |||||
Aeroflex Incorporated(1) | 957,400 | 8,932,542 | |||
Semtech Corporation(1) | 460,000 | 8,220,200 | |||
| 17,152,742 | |||||
Electronics: Semi-Conductors/ | |||||
DSP Group, Inc.(1) | 282,300 | 7,272,048 | |||
SiRF Technology Holdings, Inc.(1) | 719,400 | 8,028,504 | |||
Skyworks Solutions, Inc.(1) | 1,232,400 | 7,825,740 | |||
| 23,126,292 | |||||
Total common stocks | 584,968,754 | ||||
44
FORTY-FOUR
Par Amount | Value | |||||
| SHORT-TERM INVESTMENTS (CASH EQUIVALENTS) - 2.2% | ||||||
| Repurchase agreement with State Street Bank and Trust Company, 2.50%, dated 3/31/2005, due 4/1/2005, maturity value $13,017,904, collateralized by $13,281,305 market value Federal National Mortgage Association Note, 3.00%, due 8/15/2007 (Cost $13,017,000) | $ | 13,017,000 | $ | 13,017,000 | ||
Total investments - 99.1% | 597,985,754 | |||||
Other assets less liabilities - 0.9% | 5,504,741 | |||||
Total net assets - 100.0%(2) | $ | 603,490,495 | ||||
| (1) | Non-income producing security. |
| (2) | Percentages for the various classifications relate to total net assets. |
The accompanying notes are an integral part of the financial statements.
45
FORTY-FIVE
ARTISAN SMALL CAP VALUE FUND (ARTVX)
Schedule of Investments – March 31, 2005 (Unaudited)
| Shares Held | Value | ||||
| COMMON STOCKS - 94.6% | |||||
| AUTO & TRANSPORTATION - 4.2% | |||||
Auto Parts: After Market - 2.3% | |||||
Superior Industries International, Inc. | 1,325,600 | $ | 35,009,096 | ||
Shipping - 1.4% | |||||
Kirby Corporation(1) | 491,500 | 20,657,745 | |||
Truckers - 0.5% | |||||
USF Corporation | 154,400 | 7,451,344 | |||
| CONSUMER DISCRETIONARY - 31.6% | |||||
Advertising Agencies - 2.5% | |||||
ADVO, Inc. | 1,010,000 | 37,824,500 | |||
Commercial Information Services - 1.3% | |||||
ProQuest Company(1) | 538,400 | 19,463,160 | |||
Consumer Electronics - 0.4% | |||||
United Online, Inc.(1) | 613,500 | 6,423,345 | |||
Entertainment - 3.0% | |||||
Movie Gallery, Inc. | 1,544,900 | 44,307,732 | |||
Household Furnishings - 4.3% | |||||
Ethan Allen Interiors Inc. | 721,200 | 23,078,400 | |||
Furniture Brands International, Inc.(2) | 1,893,100 | 41,288,511 | |||
| 64,366,911 | |||||
Radio & TV Broadcasters - 0.7% | |||||
World Wrestling Entertainment, Inc. | 849,800 | 10,197,600 | |||
Restaurants - 0.7% | |||||
Papa John’s International, Inc.(1) | 323,000 | 11,214,560 | |||
Retail - 8.7% | |||||
1-800 CONTACTS, INC.(1) | 453,400 | 9,462,458 | |||
Brown Shoe Company, Inc. | 237,400 | 8,135,698 | |||
Linens ‘n Things, Inc.(1) | 646,100 | 16,042,663 | |||
Payless ShoeSource, Inc.(1) | 1,816,400 | 28,680,956 | |||
The Pep Boys - Manny, Moe & Jack | 407,800 | 7,169,124 | |||
School Specialty, Inc.(1) | 303,700 | 11,892,892 | |||
Zale Corporation(1) | 1,644,400 | 48,871,568 | |||
| 130,255,359 | |||||
| Shares Held | Value | ||||
| CONSUMER DISCRETIONARY (CONTINUED) | |||||
Services: Commercial - 6.1% | |||||
CDI Corp. | 608,200 | $ | 13,459,466 | ||
Cross Country Healthcare, Inc.(1) | 537,600 | 9,010,176 | |||
FTI Consulting, Inc.(1) | 772,600 | 15,946,464 | |||
Medical Staffing Network Holdings, Inc.(1) | 915,000 | 6,048,150 | |||
Pegasus Solutions, Inc.(1) | 353,400 | 4,177,188 | |||
Tetra Tech, Inc.(1) | 1,137,600 | 14,356,512 | |||
Watson Wyatt & Company | 1,056,200 | 28,728,640 | |||
| 91,726,596 | |||||
Textiles Apparel Manufacturers - 3.2% | |||||
Kellwood Company(2) | 1,683,050 | 48,455,010 | |||
Wholesale & International Trade - 0.2% | |||||
CellStar Corporation(1)(2) | 1,275,200 | 2,971,216 | |||
Wholesalers - 0.5% | |||||
United Stationers Inc.(1) | 179,600 | 8,126,900 | |||
| FINANCIAL SERVICES - 13.1% | |||||
Financial Data Processing Services | |||||
Hypercom Corporation(1) | 2,063,500 | 9,760,355 | |||
John H. Harland Company | 350,600 | 12,046,616 | |||
| 21,806,971 | |||||
Financial Miscellaneous - 3.6% | |||||
LandAmerica Financial Group, Inc. | 256,800 | 12,847,704 | |||
Stewart Information Services Corporation(2) | 1,102,300 | 41,358,296 | |||
| 54,206,000 | |||||
Insurance: Multi-Line - 5.2% | |||||
Hilb Rogal and Hobbs Company | 1,374,500 | 49,207,100 | |||
Hub International Limited | 548,500 | 10,586,050 | |||
PICO Holdings, Inc.(1)(2) | 717,700 | 18,595,607 | |||
| 78,388,757 | |||||
Insurance: Property-Casualty - 1.6% | |||||
Arch Capital Group Ltd.(1) | 276,100 | 11,055,044 | |||
IPC Holdings, Ltd. | 325,200 | 12,773,856 | |||
| 23,828,900 | |||||
Investment Management Companies - 0.8% | |||||
Capital Southwest Corporation | 157,400 | 12,450,340 | |||
Real Estate Investment Trusts | |||||
Eagle Hospitality Properties Trust, Inc. | 689,600 | 6,185,712 | |||
46
FORTY-SIX
| Shares Held | Value | ||||
| HEALTHCARE - 2.3% | |||||
Drugs & Pharmaceuticals - 0.4% | |||||
Par Pharmaceutical Companies, Inc.(1) | 179,500 | $ | 6,002,480 | ||
Electronics: Medical Systems - 0.3% | |||||
Analogic Corporation | 92,500 | 4,000,625 | |||
Medical & Dental Instruments & Supplies - 1.5% | |||||
National Dentex Corporation(1)(2) | 349,400 | 6,883,180 | |||
VIASYS Healthcare Inc.(1) | 862,200 | 16,450,776 | |||
| 23,333,956 | |||||
Medical Services - 0.1% | |||||
America Service Group Inc.(1) | 91,800 | 2,031,534 | |||
| MATERIALS & PROCESSING - 9.3% | |||||
Agriculture Fishing & Ranching - 0.4% | |||||
Delta and Pine Land Company | 248,500 | 6,709,500 | |||
Building Materials - 2.2% | |||||
LSI Industries Inc. | 727,462 | 8,169,398 | |||
Simpson Manufacturing Co., Inc. | 803,700 | 24,834,330 | |||
| 33,003,728 | |||||
Building: Cement - 0.7% | |||||
Eagle Materials Inc. | 86,900 | 7,033,686 | |||
Eagle Materials Inc., Class B | 35,300 | 2,781,640 | |||
| 9,815,326 | |||||
Building: Miscellaneous - 0.6% | |||||
Griffon Corporation(1) | 450,000 | 9,634,500 | |||
Chemicals - 1.9% | |||||
Albermarle Corporation | 407,300 | 14,809,428 | |||
NewMarket Corporation(1) | 378,300 | 7,036,380 | |||
Octel Corp. | 344,000 | 6,374,320 | |||
| 28,220,128 | |||||
Construction - 2.3% | |||||
EMCOR Group, Inc.(1) | 254,000 | 11,892,280 | |||
Washington Group International, Inc.(1) | 500,200 | 22,503,998 | |||
| 34,396,278 | |||||
Copper - 0.3% | |||||
Mueller Industries, Inc. | 168,600 | 4,746,090 | |||
Engineering & Contracting | |||||
Integrated Electrical Services, Inc.(1) | 947,900 | 2,616,204 | |||
Metal Fabricating - 0.5% | |||||
Quanex Corporation | 144,950 | 7,728,734 | |||
Real Estate - 0.2% | |||||
Trammell Crow Company(1) | 114,500 | 2,355,265 | |||
| Shares Held | Value | ||||
| OTHER ENERGY - 18.0% | |||||
Energy: Miscellaneous - 0.8% | |||||
Penn Virginia Corporation | 267,800 | $ | 12,292,020 | ||
Machinery: Oil Well Equipment & Services - 1.0% | |||||
Core Laboratories N.V.(1) | 234,900 | 6,029,883 | |||
Superior Energy Services, Inc.(1) | 505,000 | 8,686,000 | |||
| 14,715,883 | |||||
Oil: Crude Producers - 16.1% | |||||
Cabot Oil & Gas Corporation | 271,550 | 14,975,982 | |||
Cimarex Energy Co.(1) | 464,300 | 18,107,700 | |||
Forest Oil Corporation(1) | 677,358 | 27,432,999 | |||
The Meridian Resource Corporation(1) | 1,380,600 | 7,123,896 | |||
Pioneer Natural Resources Company | 346,061 | 14,783,726 | |||
Plains Exploration & Production Company(1) | 1,629,693 | 56,876,286 | |||
Range Resources Corporation | 600,000 | 14,016,000 | |||
Remington Oil and Gas Corporation(1) | 334,400 | 10,540,288 | |||
St. Mary Land & Exploration Company | 513,500 | 25,700,675 | |||
Spinnaker Exploration Company(1) | 444,500 | 15,793,085 | |||
Stone Energy Corporation(1) | 748,800 | 36,369,216 | |||
| 241,719,853 | |||||
Utilities: Gas Pipelines - 0.1% | |||||
TransMontaigne Inc.(1) | 225,000 | 1,800,000 | |||
| PRODUCER DURABLES - 3.2% | |||||
Electrical Equipment | |||||
General Cable Corporation(1) | 1,124,000 | 13,566,680 | |||
The Genlyte Group Incorporated(1) | 82,900 | 7,458,513 | |||
| 21,025,193 | |||||
Power Transmission Equipment - 0.3% | |||||
Regal-Beloit Corporation | 154,700 | 4,453,813 | |||
Production Technology | |||||
LTX Corporation(1) | 793,500 | 3,523,140 | |||
Telecommunications Equipment - 1.3% | |||||
Belden CDT Inc. | 348,200 | 7,733,522 | |||
Superior Essex Inc.(1) | 624,500 | 11,041,160 | |||
| 18,774,682 | |||||
| TECHNOLOGY - 8.7% | |||||
Communications Technology - 1.0% | |||||
3Com Corporation(1) | 965,700 | 3,437,892 | |||
Black Box Corporation | 295,700 | 11,062,137 | |||
| 14,500,029 | |||||
47
FORTY-SEVEN
| Shares Held | Value | ||||
| TECHNOLOGY (CONTINUED) | |||||
Computer Services Software | |||||
Ascential Software Corporation(1) | 216,900 | $ | 4,019,157 | ||
BearingPoint, Inc.(1) | 1,653,500 | 14,501,195 | |||
Borland Software Corporation(1) | 557,400 | 4,526,088 | |||
CIBER, Inc.(1) | 1,033,500 | 7,513,545 | |||
Gartner, Inc.(1) | 1,523,400 | 14,578,938 | |||
Keane, Inc.(1) | 385,400 | 5,021,762 | |||
Lawson Software, Inc.(1) | 1,626,200 | 9,594,580 | |||
Manhattan Associates, Inc.(1) | 179,600 | 3,658,452 | |||
webMethods, Inc.(1) | 1,606,000 | 8,800,880 | |||
| 72,214,597 | |||||
Computer Technology - 2.4% | |||||
Adaptec, Inc.(1) | 1,375,000 | 6,586,250 | |||
Advanced Digital Information Corporation(1) | 1,766,500 | 14,485,300 | |||
Cray Inc.(1) | 998,800 | 2,546,940 | |||
FileNet Corporation(1) | 163,000 | 3,713,140 | |||
Imation Corp. | 237,400 | 8,249,650 | |||
| 35,581,280 | |||||
Scientific Equipment | |||||
Newport Corporation(1) | 557,700 | 8,081,073 | |||
| UTILITIES - 4.2% | |||||
Utilities: Electrical - 2.7% | |||||
Black Hills Corporation | 491,400 | 16,250,598 | |||
El Paso Electric Company(1) | 601,900 | 11,436,100 | |||
PNM Resources, Inc. | 472,950 | 12,618,306 | |||
| 40,305,004 | |||||
Utilities: Gas Distributors - 0.4% | |||||
SEMCO Energy, Inc. | 1,126,740 | 6,478,755 | |||
Utilities: Telecommunications - 1.1% | |||||
Boston Communications | 582,900 | 4,150,248 | |||
IDT Corporation, Class B(1) | 342,300 | 5,062,617 | |||
IDT Corporation, Class C(1) | 469,800 | 6,671,160 | |||
| �� | 15,884,025 | ||||
Total common stocks | 1,421,261,449 | ||||
| Par Amount | Value | ||||||
| SHORT-TERM INVESTMENTS (CASH EQUIVALENTS) - 7.6% | |||||||
Repurchase agreement with State (Cost $114,501,000) | $ | 114,501,000 | $ | 114,501,000 | |||
Total investments - 102.2% | 1,535,762,449 | ||||||
Other assets less liabilities - (2.2%) | (32,622,562 | ) | |||||
Total net assets - 100.0%(3) | $ | 1,503,139,887 | |||||
| (1) | Non-income producing security. |
| (2) | Affiliated company as defined by the Investment Company Act of 1940. See Note 6 to the financial statements. |
| (3) | Percentage for the various classifications relate to total net assets. |
The accompanying notes are an integral part of the financial statements.
48
FORTY-EIGHT
[THIS PAGE INTENTIONALLY LEFT BLANK]
49
FORTY-NINE
ARTISAN FUNDS, INC.
Statements of Assets and Liabilities – March 31, 2005 (Unaudited)
| INTERNATIONAL | INTERNATIONAL SMALL CAP | ||||||
| ASSETS: | |||||||
Investments in securities, unaffiliated, at value | $ | 11,093,632,529 | $ | 644,432,074 | |||
Investments in securities, affiliated, at value | - | 11,236,512 | |||||
Short-term investments (repurchase agreements), at value | 6,175,000 | 9,236,000 | |||||
Total investments | 11,099,807,529 | 664,904,586 | |||||
Cash | 268 | 715 | |||||
Receivable from investments sold | 69,992,309 | 2,974,133 | |||||
Unrealized gain on foreign currency forward contracts | - | 922 | |||||
Receivable from fund shares sold | 14,476,100 | 522,553 | |||||
Dividends and interest receivable | 28,412,174 | 4,922,175 | |||||
Total assets | 11,212,688,380 | 673,325,084 | |||||
| LIABILITIES: | |||||||
Payable for investments purchased | 34,238,437 | 6,928,629 | |||||
Unrealized loss on foreign currency forward contracts | 36,020 | - | |||||
Payable for fund shares redeemed | 11,459,468 | 178,395 | |||||
Payable for operating expenses | 3,381,899 | 179,905 | |||||
Payable for withholding taxes | 1,220,606 | 280,793 | |||||
Total liabilities | 50,336,430 | 7,567,722 | |||||
Total net assets | $ | 11,162,351,950 | $ | 665,757,362 | |||
| NET ASSETS CONSIST OF: | |||||||
Fund shares issued and outstanding | $ | 10,045,634,106 | $ | 457,646,474 | |||
Net unrealized appreciation (depreciation) on investments and foreign currency related transactions | 2,232,577,984 | 169,116,055 | |||||
Accumulated undistributed net investment income (loss) | (4,424,323 | ) | 1,744,468 | ||||
Accumulated undistributed net realized gains (losses) on investments and foreign currency | (1,111,435,817 | ) | 37,250,365 | ||||
| $ | 11,162,351,950 | $ | 665,757,362 | ||||
| SUPPLEMENTARY INFORMATION: | |||||||
Net assets | |||||||
Investor Shares | $ | 7,218,850,455 | $ | 665,757,362 | |||
Institutional Shares | $ | 3,943,501,495 | |||||
Shares outstanding | |||||||
Investor Shares | 327,858,939 | 36,790,959 | |||||
Institutional Shares | 178,258,618 | ||||||
Net asset value, offering price and redemption price per share | |||||||
Investor Shares | $ | 22.02 | $ | 18.10 | |||
Institutional Shares | $ | 22.12 | |||||
Cost of securities of unaffiliated issuers held | $ | 8,867,189,109 | $ | 489,492,436 | |||
Cost of securities of affiliated issuers held | $ | - | $ | 6,162,006 | |||
50
FIFTY
| INTERNATIONAL VALUE | MID CAP | MID CAP VALUE | SMALL CAP | SMALL CAP VALUE | |||||||||||
| $ | 581,117,803 | $ | 5,835,949,068 | $ | 1,024,251,784 | $ | 584,968,754 | $ | 1,261,709,629 | ||||||
| 26,248,019 | - | 28,677,969 | - | 159,551,820 | |||||||||||
| 37,474,000 | 119,869,000 | 101,482,000 | 13,017,000 | 114,501,000 | |||||||||||
| 644,839,822 | 5,955,818,068 | 1,154,411,753 | 597,985,754 | 1,535,762,449 | |||||||||||
| 484 | 710 | 770 | 453 | 632 | |||||||||||
| 591,436 | 47,542,163 | - | 3,397,264 | - | |||||||||||
| 7,903 | - | - | - | - | |||||||||||
| 4,124,637 | 17,261,889 | 14,459,478 | 5,094,438 | 27,761,357 | |||||||||||
| 2,175,282 | 2,913,383 | 576,770 | 213,484 | 682,351 | |||||||||||
| 651,739,564 | 6,023,536,213 | 1,169,448,771 | 606,691,393 | 1,564,206,789 | |||||||||||
| 2,074,967 | 89,567,038 | 20,714,438 | 2,640,954 | 58,438,586 | |||||||||||
| - | - | - | - | - | |||||||||||
| 788,453 | 6,637,859 | 306,044 | 508,309 | 2,224,466 | |||||||||||
| 110,720 | 1,448,371 | 76,753 | 51,635 | 403,850 | |||||||||||
| 47,154 | - | - | - | - | |||||||||||
| 3,021,294 | 97,653,268 | 21,097,235 | 3,200,898 | 61,066,902 | |||||||||||
| $ | 648,718,270 | $ | 5,925,882,945 | $ | 1,148,351,536 | $ | 603,490,495 | $ | 1,503,139,887 | ||||||
| $ | 579,725,170 | $ | 5,037,763,030 | $ | 1,017,619,555 | $ | 562,214,945 | $ | 1,103,016,864 | ||||||
| 60,947,039 | 962,005,416 | 112,999,821 | 34,186,166 | 300,712,337 | |||||||||||
| 306,262 | (14,083,290 | ) | 743,819 | (1,712,890 | ) | 158,040 | |||||||||
| 7,739,799 | (59,802,211 | ) | 16,988,341 | 8,802,274 | 99,252,646 | ||||||||||
| $ | 648,718,270 | $ | 5,925,882,945 | $ | 1,148,351,536 | $ | 603,490,495 | $ | 1,503,139,887 | ||||||
| $ | 648,718,270 | $ | 4,835,787,161 | $ | 1,148,351,536 | $ | 603,490,495 | $ | 1,503,139,887 | ||||||
| $ | 1,090,095,784 | ||||||||||||||
| 30,430,631 | 168,773,320 | 64,384,762 | 37,738,400 | 83,507,551 | |||||||||||
| 37,640,040 | |||||||||||||||
| $ | 21.32 | $ | 28.65 | $ | 17.84 | $ | 15.99 | $ | 18.00 | ||||||
| $ | 28.96 | ||||||||||||||
| $ | 561,637,602 | $ | 4,993,812,652 | $ | 1,010,007,332 | $ | 563,799,588 | $ | 1,095,746,897 | ||||||
| $ | 22,241,931 | $ | - | $ | 31,404,600 | $ | - | $ | 139,303,215 | ||||||
The accompanying notes are an integral part of the financial statements.
51
FIFTY-ONE
ARTISAN FUNDS, INC.
Statements of Operations – For the Six Months Ended March 31, 2005 (Unaudited)
| INTERNATIONAL | INTERNATIONAL SMALL CAP | |||||||
| INVESTMENT INCOME: | ||||||||
Interest | $ | 1,384,858 | $ | 142,996 | ||||
Dividends, from unaffiliated issuers(1) | 58,907,789 | 6,389,584 | ||||||
Dividends, from affiliated issuers(1) | - | 72,223 | ||||||
Securities lending | 933,495 | - | ||||||
Total investment income | 61,226,142 | 6,604,803 | ||||||
| EXPENSES: | ||||||||
Advisory fees | 50,138,238 | 3,736,181 | ||||||
Transfer agent fees | ||||||||
Investor Shares | 6,465,568 | 461,970 | ||||||
Institutional Shares | 14,051 | |||||||
Shareholder communications | ||||||||
Investor Shares | 713,402 | 51,906 | ||||||
Institutional Shares | 10,813 | |||||||
Custodian fees | 3,032,604 | 237,114 | ||||||
Accounting fees | 37,447 | 27,431 | ||||||
Professional fees | 17,964 | 31,704 | ||||||
Registration fees | ||||||||
Investor Shares | 30,860 | 17,811 | ||||||
Institutional Shares | 8,757 | |||||||
Directors’ fees | 218,152 | 11,998 | ||||||
Other operating expenses | 194,212 | 15,060 | ||||||
Total operating expenses | 60,882,068 | 4,591,175 | ||||||
Net investment income (loss) | 344,074 | 2,013,628 | ||||||
| NET REALIZED AND UNREALIZED GAINS (LOSSES) ON INVESTMENTS: | ||||||||
Net realized gain (loss) on: | ||||||||
Investments(1) | 468,212,897 | 38,714,233 | ||||||
Foreign currency related transactions | (1,377,034 | ) | 81,854 | |||||
| 466,835,863 | 38,796,087 | |||||||
Net increase (decrease) in unrealized appreciation or depreciation on: | ||||||||
Investments | 959,069,474 | 78,694,254 | ||||||
Foreign currency related transactions | (101,847 | ) | (78,418 | ) | ||||
| 958,967,627 | 78,615,836 | |||||||
Net gain (loss) on investments and foreign currency related transactions | 1,425,803,490 | 117,411,923 | ||||||
Net increase (decrease) in net assets resulting from operations | $ | 1,426,147,564 | $ | 119,425,551 | ||||
(1) Fund | Net of foreign taxes withheld on dividends, unaffiliated issuers | Net of foreign taxes withheld on dividends, affiliated issuers | Including net realized gain (loss) on investments from affiliated issuers | ||||
International | $4,511,517 | $ - | $(23,450,941 | ) | |||
International Small Cap | 331,518 | 14,272 | - | ||||
International Value | 72,315 | - | - | ||||
Mid Cap | 17,008 | - | - | ||||
Small Cap Value | - | - | (103,309 | ) |
52
FIFTY-TWO
| INTERNATIONAL VALUE | MID CAP | MID CAP VALUE | SMALL CAP | SMALL CAP VALUE | |||||||||||||
| $ | 298,331 | $ | 1,661,737 | $ | 549,998 | $ | 193,608 | $ | 921,355 | ||||||||
| 3,146,598 | 16,167,002 | 3,200,275 | 541,883 | 5,841,298 | |||||||||||||
| - | - | 267,765 | - | 1,253,898 | |||||||||||||
| - | - | - | - | - | |||||||||||||
| 3,444,929 | 17,828,739 | 4,018,038 | 735,491 | 8,016,551 | |||||||||||||
| 2,163,604 | 26,561,068 | 3,373,906 | 2,112,280 | 6,506,846 | |||||||||||||
| 391,714 | 4,328,689 | 622,341 | 184,441 | 1,105,773 | |||||||||||||
| 10,546 | |||||||||||||||||
| 47,269 | 469,322 | 72,127 | 39,344 | 71,025 | |||||||||||||
| 4,645 | |||||||||||||||||
| 124,160 | 151,746 | 28,830 | 44,561 | 42,207 | |||||||||||||
| 24,001 | 31,411 | 19,193 | 22,255 | 22,432 | |||||||||||||
| 17,598 | 70,718 | 13,327 | 8,721 | 34,460 | |||||||||||||
| 23,243 | 57,281 | 35,125 | 19,570 | 20,831 | |||||||||||||
| 6,600 | |||||||||||||||||
| 7,833 | 115,446 | 11,863 | 7,722 | 26,987 | |||||||||||||
| 10,088 | 104,557 | 13,524 | 9,487 | 27,950 | |||||||||||||
| 2,809,510 | 31,912,029 | 4,190,236 | 2,448,381 | 7,858,511 | |||||||||||||
| 635,419 | (14,083,290 | ) | (172,198 | ) | (1,712,890 | ) | 158,040 | ||||||||||
| 7,787,507 | 142,043,655 | 17,171,461 | 12,591,915 | 117,987,242 | |||||||||||||
| (21,046 | ) | - | - | - | - | ||||||||||||
| 7,766,461 | 142,043,655 | 17,171,461 | 12,591,915 | 117,987,242 | |||||||||||||
| 43,914,150 | 363,799,144 | 81,376,519 | 10,734,958 | 43,548,517 | |||||||||||||
| (34,914 | ) | - | - | - | - | ||||||||||||
| 43,879,236 | 363,799,144 | 81,376,519 | 10,734,958 | 43,548,517 | |||||||||||||
| 51,645,697 | 505,842,799 | 98,547,980 | 23,326,873 | 161,535,759 | |||||||||||||
| $ | 52,281,116 | $ | 491,759,509 | $ | 98,375,782 | $ | 21,613,983 | $ | 161,693,799 | ||||||||
The accompanying notes are an integral part of the financial statements.
53
FIFTY-THREE
ARTISAN FUNDS, INC.
Statements of Changes in Net Assets
| INTERNATIONAL | ||||||||
| Six Months Ended 3/31/2005(1) | Year Ended 9/30/2004 | |||||||
| OPERATIONS: | ||||||||
Net investment income (loss) | $ | 344,074 | $ | 70,075,203 | ||||
Net realized gain (loss) on: | ||||||||
Investments | 468,212,897 | (91,940,847 | ) | |||||
Foreign currency related transactions | (1,377,034 | ) | (5,531,519 | ) | ||||
Net increase (decrease) in unrealized appreciation or depreciation on: | ||||||||
Investments | 959,069,474 | 1,580,915,556 | ||||||
Foreign currency related transactions | (101,847 | ) | (820,070 | ) | ||||
Net increase (decrease) in net assets resulting from operations | 1,426,147,564 | 1,552,698,323 | ||||||
| DISTRIBUTIONS PAID TO SHAREHOLDERS: | ||||||||
Net investment income: | ||||||||
Investor Shares | (39,392,662 | ) | (59,414,982 | ) | ||||
Institutional Shares | (29,943,284 | ) | (42,472,917 | ) | ||||
Net realized gains on investment transactions: | ||||||||
Investor Shares | - | - | ||||||
Institutional Shares | - | - | ||||||
Total distributions paid to shareholders | (69,335,946 | ) | (101,887,899 | ) | ||||
| FUND SHARE ACTIVITIES: | ||||||||
Net increase (decrease) in net assets | 53,260,309 | (597,923,467 | ) | |||||
Total increase (decrease) in net assets | 1,410,071,927 | 852,886,957 | ||||||
Net assets, beginning of period | 9,752,280,023 | 8,899,393,066 | ||||||
Net assets, end of period | $ | 11,162,351,950 | $ | 9,752,280,023 | ||||
Accumulated undistributed net investment income (loss) | $ | (4,424,323 | ) | $ | 64,567,549 | |||
| (1) | Unaudited. |
54
FIFTY-FOUR
| INTERNATIONAL SMALL CAP | INTERNATIONAL VALUE | |||||||||||||
| Six Months Ended 3/31/2005(1) | Year Ended 9/30/2004 | Six Months Ended 3/31/2005(1) | Year Ended 9/30/2004 | |||||||||||
| $ | 2,013,628 | $ | 4,997,343 | $ | 635,419 | $ | 1,668,336 | |||||||
| 38,714,233 | 67,154,595 | 7,787,507 | 3,496,007 | |||||||||||
| 81,854 | (346,102 | ) | (21,046 | ) | (47,257 | ) | ||||||||
| 78,694,254 | 25,704,988 | 43,914,150 | 13,353,539 | |||||||||||
| (78,418 | ) | (7,379 | ) | (34,914 | ) | 12,754 | ||||||||
| 119,425,551 | 97,503,445 | 52,281,116 | 18,483,379 | |||||||||||
| (3,652,844 | ) | (1,142,162 | ) | (1,727,817 | ) | (191,806 | ) | |||||||
| (55,013,278 | ) | (15,685,346 | ) | (3,316,422 | ) | (636,769 | ) | |||||||
| (58,666,122 | ) | (16,827,508 | ) | (5,044,239 | ) | (828,575 | ) | |||||||
| 89,989,265 | 43,008,188 | 383,982,860 | 176,229,783 | |||||||||||
| 150,748,694 | 123,684,125 | 431,219,737 | 193,884,587 | |||||||||||
| 515,008,668 | 391,324,543 | 217,498,533 | 23,613,946 | |||||||||||
| $ | 665,757,362 | $ | 515,008,668 | $ | 648,718,270 | $ | 217,498,533 | |||||||
| $ | 1,744,468 | $ | 3,383,684 | $ | 306,262 | $ | 1,398,660 | |||||||
The accompanying notes are an integral part of the financial statements.
55
FIFTY-FIVE
ARTISAN FUNDS, INC.
Statements of Changes in Net Assets
| MID CAP | ||||||||
| Six Months Ended 3/31/2005(1) | Year Ended 9/30/2004 | |||||||
| OPERATIONS: | ||||||||
Net investment income (loss) | $ | (14,083,290 | ) | $ | (33,613,109 | ) | ||
Net realized gain (loss) on: | ||||||||
Investments | 142,043,655 | 330,560,106 | ||||||
Foreign currency related transactions | - | - | ||||||
Net increase (decrease) in unrealized appreciation or depreciation on: | ||||||||
Investments | 363,799,144 | 172,866,182 | ||||||
Foreign currency related transactions | - | - | ||||||
Net increase (decrease) in net assets resulting from operations | 491,759,509 | 469,813,179 | ||||||
| DISTRIBUTIONS PAID TO SHAREHOLDERS: | ||||||||
Net investment income: | ||||||||
Investor Shares | - | - | ||||||
Institutional Shares | - | - | ||||||
Net realized gains on investment transactions: | ||||||||
Investor Shares | - | - | ||||||
Institutional Shares | - | - | ||||||
Total distributions paid to shareholders | - | - | ||||||
| FUND SHARE ACTIVITIES: | ||||||||
Net increase (decrease) in net assets | 355,424,927 | 1,096,126,727 | ||||||
Total increase (decrease) in net assets | 847,184,436 | 1,565,939,906 | ||||||
Net assets, beginning of period | 5,078,698,509 | 3,512,758,603 | ||||||
Net assets, end of period | $ | 5,925,882,945 | $ | 5,078,698,509 | ||||
Accumulated undistributed net investment income (loss) | $ | (14,083,290 | ) | $ | - | |||
| (1) | Unaudited. |
56
FIFTY-SIX
| MID CAP VALUE | SMALL CAP | SMALL CAP VALUE | ||||||||||||||||||||
| Six Months Ended 3/31/2005(1) | Year Ended 9/30/2004 | Six Months Ended 3/31/2005(1) | Year Ended 9/30/2004 | Six Months Ended 3/31/2005(1) | Year Ended 9/30/2004 | |||||||||||||||||
| $ | (172,198 | ) | $ | 1,036,610 | $ | (1,712,890 | ) | $ | (1,586,397 | ) | $ | 158,040 | $ | (1,766,947 | ) | |||||||
| 17,171,461 | 10,522,572 | 12,591,915 | 27,262,462 | 117,987,242 | 126,320,385 | |||||||||||||||||
| - | - | - | - | - | - | |||||||||||||||||
| 81,376,519 | 22,190,097 | 10,734,958 | 1,847,755 | 43,548,517 | 127,503,467 | |||||||||||||||||
| - | - | - | - | - | - | |||||||||||||||||
| 98,375,782 | 33,749,279 | 21,613,983 | 27,523,820 | 161,693,799 | 252,056,905 | |||||||||||||||||
| (121,029 | ) | - | - | - | - | - | ||||||||||||||||
| (9,206,872 | ) | (1,599,811 | ) | (10,649,591 | ) | - | (123,856,296 | ) | (11,783,598 | ) | ||||||||||||
| (9,327,901 | ) | (1,599,811 | ) | (10,649,591 | ) | - | (123,856,296 | ) | (11,783,598 | ) | ||||||||||||
| 747,023,969 | 202,730,099 | 352,960,065 | 84,168,692 | 272,552,236 | 177,321,270 | |||||||||||||||||
| 836,071,850 | 234,879,567 | 363,924,457 | 111,692,512 | 310,389,739 | 417,594,577 | |||||||||||||||||
| 312,279,686 | 77,400,119 | 239,566,038 | 127,873,526 | 1,192,750,148 | 775,155,571 | |||||||||||||||||
| $ | 1,148,351,536 | $ | 312,279,686 | $ | 603,490,495 | $ | 239,566,038 | $ | 1,503,139,887 | $ | 1,192,750,148 | |||||||||||
| $ | 743,819 | $ | 1,037,046 | $ | (1,712,890 | ) | $ | - | $ | 158,040 | $ | - | ||||||||||
The accompanying notes are an integral part of the financial statements.
57
FIFTY-SEVEN
ARTISAN FUNDS, INC.
Financial Highlights – For a share outstanding throughout each period
Year or Period Ended | Net Asset Value Beginning of Period | Net Investment Income (Loss)(1) | Net Realized and Unrealized Gain (Loss) on Investments | Total Income | Dividends from Net Investment Income | Distributions from Net Realized Gains | ||||||||||||||||||
| ARTISAN INTERNATIONAL FUND | ||||||||||||||||||||||||
| Investor Shares | ||||||||||||||||||||||||
| 3/31/2005 | (4) | $ | 19.33 | $ | (0.01 | ) | $ | 2.82 | $ | 2.81 | $ | (0.12 | ) | $ | - | |||||||||
| 9/30/2004 | 16.54 | 0.12 | 2.85 | 2.97 | (0.18 | ) | - | |||||||||||||||||
| 9/30/2003 | (5) | 15.63 | 0.02 | 0.89 | 0.91 | - | - | |||||||||||||||||
| 6/30/2003 | 18.15 | 0.20 | (2.62 | ) | (2.42 | ) | (0.10 | ) | - | |||||||||||||||
| 6/30/2002 | 19.53 | 0.15 | (1.46 | ) | (1.31 | ) | (0.07 | ) | - | |||||||||||||||
| 6/30/2001 | 30.16 | 0.10 | (7.18 | ) | (7.08 | ) | - | (3.55 | ) | |||||||||||||||
| 6/30/2000 | 18.67 | (0.03 | ) | 12.08 | 12.05 | (0.02 | ) | (0.54 | ) | |||||||||||||||
| Institutional Shares | ||||||||||||||||||||||||
| 3/31/2005 | (4) | $ | 19.44 | $ | 0.01 | $ | 2.83 | $ | 2.84 | $ | (0.16 | ) | $ | - | ||||||||||
| 9/30/2004 | 16.63 | 0.16 | 2.86 | 3.02 | (0.21 | ) | - | |||||||||||||||||
| 9/30/2003 | (5) | 15.71 | 0.03 | 0.89 | 0.92 | - | - | |||||||||||||||||
| 6/30/2003 | 18.24 | 0.25 | (2.65 | ) | (2.40 | ) | (0.13 | ) | - | |||||||||||||||
| 6/30/2002 | 19.62 | 0.18 | (1.46 | ) | (1.28 | ) | (0.10 | ) | - | |||||||||||||||
| 6/30/2001 | 30.22 | 0.16 | (7.21 | ) | (7.05 | ) | - | (3.55 | ) | |||||||||||||||
| 6/30/2000 | 18.70 | 0.03 | 12.09 | 12.12 | (0.06 | ) | (0.54 | ) | ||||||||||||||||
| ARTISAN INTERNATIONAL SMALL CAP FUND | ||||||||||||||||||||||||
| Investor Shares | ||||||||||||||||||||||||
| 3/31/2005 | (4) | $ | 16.40 | $ | 0.06 | $ | 3.53 | $ | 3.59 | $ | (0.12 | ) | $ | (1.77 | ) | |||||||||
| 9/30/2004 | 13.84 | 0.15 | 2.93 | 3.08 | (0.03 | ) | (0.49 | ) | ||||||||||||||||
| 9/30/2003 | (5) | 12.10 | - | (7) | 1.74 | 1.74 | - | - | ||||||||||||||||
| 6/30/2003 | 10.50 | 0.03 | 1.59 | 1.62 | - | (0.02 | ) | |||||||||||||||||
| 6/30/2002 | (8) | 10.00 | - | (7) | 0.50 | (9) | 0.50 | - | - | |||||||||||||||
| ARTISAN INTERNATIONAL VALUE FUND | ||||||||||||||||||||||||
| Investor Shares | ||||||||||||||||||||||||
| 3/31/2005 | (4) | $ | 18.54 | $ | 0.03 | $ | 3.07 | $ | 3.10 | $ | (0.11 | ) | $ | (0.21 | ) | |||||||||
| 9/30/2004 | 14.32 | 0.28 | 4.33 | 4.61 | (0.09 | ) | (0.30 | ) | ||||||||||||||||
| 9/30/2003 | (5) | 13.01 | 0.02 | 1.29 | 1.31 | - | - | |||||||||||||||||
| 6/30/2003 | (10) | 10.00 | 0.09 | 2.92 | 3.01 | - | - | |||||||||||||||||
| (1) | Computed based on average shares outstanding. |
| (2) | Periods less than twelve months (where applicable) are not annualized. |
| (3) | Periods less than twelve months (where applicable) are annualized. |
| (4) | Unaudited. For the six months ended March 31, 2005. |
| (5) | For the period from July 1, 2003 through September 30, 2003. Artisan Funds changed its fiscal year-end from June 30 to September 30 effective September 30, 2003. |
| (6) | The ratios of expenses to average net assets and net investment income (loss) to average net assets exclude expenses waived or reimbursed by the Adviser. Absent expenses waived or reimbursed by the Adviser, the ratios of expenses to average net assets and net investment income (loss) to average net assets would have been as follows: |
| Fund | Period Ended | Ratio of Expenses to Average Net Assets | Ratio of Net Investment Income (Loss) to Average Net Assets | |||||
International Investor Shares | 9/30/2003 | 1.23 | % | 0.49 | % | |||
International Institutional Shares | 9/30/2003 | 1.00 | 0.73 | |||||
International Small Cap Investor Shares | 9/30/2003 | 1.69 | 0.05 | |||||
International Value Investor Shares | 9/30/2003 | 2.80 | (0.34 | ) | ||||
| 6/30/2003 | 5.02 | (1.43 | ) |
| (7) | Amount is between $0.005 and $(0.005) per share. |
58
FIFTY-EIGHT
| Total Distributions | Net Asset of Period | Total Return(2) | Net Assets End of Period (millions) | Ratio of Expenses to Average Net Assets(3) | Ratio of Net Investment Income (Loss) to Average Net Assets(3) | Portfolio Turnover Rate(2) | ||||||||||||||||
| $ | (0.12 | ) | $ | 22.02 | 14.58 | % | $ | 7,218.9 | 1.20 | % | (0.06 | )% | 33.15 | % | ||||||||
| (0.18 | ) | 19.33 | 18.04 | 6,130.2 | 1.22 | 0.64 | 54.96 | |||||||||||||||
| - | 16.54 | 5.82 | 5,544.7 | 1.23 | (6) | 0.49 | (6) | 15.23 | ||||||||||||||
| (0.10 | ) | 15.63 | (13.30 | ) | 5,182.8 | 1.20 | 1.35 | 37.13 | ||||||||||||||
| (0.07 | ) | 18.15 | (6.73 | ) | 5,289.6 | 1.21 | 0.82 | 50.67 | ||||||||||||||
| (3.55 | ) | 19.53 | (24.65 | ) | 3,907.1 | 1.22 | 0.45 | 72.01 | ||||||||||||||
| (0.56 | ) | 30.16 | 65.65 | 3,734.8 | 1.27 | (0.10 | ) | 99.02 | ||||||||||||||
| $ | (0.16 | ) | $ | 22.12 | 14.66 | % | $ | 3,943.5 | 1.00 | % | 0.13 | % | 33.15 | % | ||||||||
| (0.21 | ) | 19.44 | 18.31 | 3,622.1 | 1.01 | 0.85 | 54.96 | |||||||||||||||
| - | 16.63 | 5.86 | 3,354.7 | 1.00 | (6) | 0.73 | (6) | 15.23 | ||||||||||||||
| (0.13 | ) | 15.71 | (13.09 | ) | 2,975.0 | 1.01 | 1.68 | 37.13 | ||||||||||||||
| (0.10 | ) | 18.24 | (6.52 | ) | 2,062.0 | 1.01 | 1.01 | 50.67 | ||||||||||||||
| (3.55 | ) | 19.62 | (24.53 | ) | 1,486.6 | 1.03 | 0.70 | 72.01 | ||||||||||||||
| (0.60 | ) | 30.22 | 65.97 | 1,136.2 | 1.08 | 0.09 | 99.02 | |||||||||||||||
| $ | (1.89 | ) | $ | 18.10 | 23.32 | % | $ | 665.8 | 1.54 | % | 0.67 | % | 30.39 | % | ||||||||
| (0.52 | ) | 16.40 | 22.66 | 515.0 | 1.57 | 0.95 | 81.03 | |||||||||||||||
| - | 13.84 | 14.46 | 391.3 | 1.68 | (6) | 0.06 | (6) | 13.28 | ||||||||||||||
| (0.02 | ) | 12.10 | 15.53 | 238.6 | 1.77 | 0.28 | 62.79 | |||||||||||||||
| - | 10.50 | 5.00 | 74.5 | 2.39 | (0.02 | ) | 25.14 | |||||||||||||||
| $ | (0.32 | ) | $ | 21.32 | 16.85 | % | $ | 648.7 | 1.30 | % | 0.29 | % | 10.26 | % | ||||||||
| (0.39 | ) | 18.54 | 32.81 | 217.5 | 1.56 | 1.61 | 14.66 | |||||||||||||||
| - | 14.32 | 10.07 | 23.6 | 2.00 | (6) | 0.46 | (6) | 9.30 | ||||||||||||||
| - | 13.01 | 30.10 | 16.3 | 2.45 | (6) | 1.14 | (6) | 17.42 | ||||||||||||||
| (8) | For the period from commencement of operations (December 21, 2001) through June 30, 2002. |
| (9) | The amount shown may not correlate with the aggregate gains and losses of portfolio securities due to the timing of subscriptions and redemptions of fund shares. |
| (10) | For the period from commencement of operations (September 23, 2002) through June 30, 2003. |
The accompanying notes are an integral part of the financial statements.
59
FIFTY-NINE
ARTISAN FUNDS, INC.
Financial Highlights – For a share outstanding throughout each period (Continued)
Year or Period Ended | Net Asset | Net Investment Income (Loss)(1) | Net Realized and Unrealized Gain (Loss) on Investments | Total Income (Loss) from Investment Operations | Dividends from Net Investment Income | Distributions from Net Realized Gains | ||||||||||||||||||
| ARTISAN MID CAP FUND | ||||||||||||||||||||||||
| Investor Shares | ||||||||||||||||||||||||
| 3/31/2005 | (4) | $ | 26.13 | $ | (0.08 | ) | $ | 2.60 | $ | 2.52 | $ | - | $ | - | ||||||||||
| 9/30/2004 | 23.11 | (0.20 | ) | 3.22 | 3.02 | - | - | |||||||||||||||||
| 9/30/2003 | (5) | 21.81 | (0.05 | ) | 1.35 | 1.30 | - | - | ||||||||||||||||
| 6/30/2003 | 22.13 | (0.11 | ) | (0.21 | )(7) | (0.32 | ) | - | - | |||||||||||||||
| 6/30/2002 | 26.43 | (0.19 | ) | (4.11 | ) | (4.30 | ) | - | - | |||||||||||||||
| 6/30/2001 | 27.57 | (0.13 | ) | 0.02 | (7) | (0.11 | ) | - | (1.03 | ) | ||||||||||||||
| 6/30/2000 | 16.67 | (0.18 | ) | 11.91 | 11.73 | - | (0.83 | ) | ||||||||||||||||
| Institutional Shares | ||||||||||||||||||||||||
| 3/31/2005 | (4) | $ | 26.38 | $ | (0.05 | ) | $ | 2.63 | $ | 2.58 | $ | - | $ | - | ||||||||||
| 9/30/2004 | 23.28 | (0.14 | ) | 3.24 | 3.10 | - | - | |||||||||||||||||
| 9/30/2003 | (5) | 21.96 | (0.03 | ) | 1.35 | 1.32 | - | - | ||||||||||||||||
| 6/30/2003 | 22.24 | (0.07 | ) | (0.21 | )(7) | (0.28 | ) | - | - | |||||||||||||||
| 6/30/2002 | 26.48 | (0.13 | ) | (4.11 | ) | (4.24 | ) | - | - | |||||||||||||||
| 6/30/2001 | 27.57 | (0.08 | ) | 0.02 | (7) | (0.06 | ) | - | (1.03 | ) | ||||||||||||||
| ARTISAN MID CAP VALUE FUND | ||||||||||||||||||||||||
| Investor Shares | ||||||||||||||||||||||||
| 3/31/2005 | (4) | $ | 15.55 | $ | - | (8) | $ | 2.59 | $ | 2.59 | $ | - | (8) | $ | (0.30 | ) | ||||||||
| 9/30/2004 | 12.22 | 0.10 | 3.47 | 3.57 | - | (0.24 | ) | |||||||||||||||||
| 9/30/2003 | (5) | 11.64 | (0.01 | ) | 0.59 | 0.58 | - | - | ||||||||||||||||
| 6/30/2003 | 10.82 | (0.03 | ) | 0.85 | 0.82 | - | - | |||||||||||||||||
| 6/30/2002 | 11.18 | (0.09 | ) | (0.19 | ) | (0.28 | ) | - | (0.08 | ) | ||||||||||||||
| 6/30/2001 | (9) | 10.00 | (0.01 | ) | 1.19 | 1.18 | - | - | ||||||||||||||||
| ARTISAN SMALL CAP FUND | ||||||||||||||||||||||||
| Investor Shares | ||||||||||||||||||||||||
| 3/31/2005 | (4) | $ | 15.12 | $ | (0.06 | ) | $ | 1.46 | $ | 1.40 | $ | - | $ | (0.53 | ) | |||||||||
| 9/30/2004 | 12.53 | (0.14 | ) | 2.73 | 2.59 | - | - | |||||||||||||||||
| 9/30/2003 | (5) | 11.90 | (0.04 | ) | 0.67 | 0.63 | - | - | ||||||||||||||||
| 6/30/2003 | 11.99 | (0.10 | ) | 0.07 | (7) | (0.03 | ) | - | (0.06 | ) | ||||||||||||||
| 6/30/2002 | 13.99 | (0.13 | ) | (1.81 | ) | (1.94 | ) | - | (0.06 | ) | ||||||||||||||
| 6/30/2001 | 14.69 | (0.09 | ) | 0.05 | (7) | (0.04 | ) | - | (0.66 | ) | ||||||||||||||
| 6/30/2000 | 11.09 | (0.10 | ) | 3.70 | 3.60 | - | - | |||||||||||||||||
| ARTISAN SMALL CAP VALUE FUND | ||||||||||||||||||||||||
| Investor Shares | ||||||||||||||||||||||||
| 3/31/2005 | (4) | $ | 17.63 | $ | - | (8) | $ | 2.15 | $ | 2.15 | $ | - | $ | (1.78 | ) | |||||||||
| 9/30/2004 | 13.67 | (0.03 | ) | 4.19 | 4.16 | - | (0.20 | ) | ||||||||||||||||
| 9/30/2003 | (5) | 13.15 | (0.01 | ) | 0.53 | 0.52 | - | - | ||||||||||||||||
| 6/30/2003 | 13.48 | (0.03 | ) | 0.20 | 0.17 | - | (0.50 | ) | ||||||||||||||||
| 6/30/2002 | 13.05 | (0.01 | ) | 1.16 | 1.15 | (0.01 | ) | (0.71 | ) | |||||||||||||||
| 6/30/2001 | 10.63 | 0.05 | 2.91 | 2.96 | (0.05 | ) | (0.49 | ) | ||||||||||||||||
| 6/30/2000 | 10.59 | 0.06 | 0.36 | 0.42 | (0.03 | ) | (0.35 | ) | ||||||||||||||||
| (1) | Computed based on average shares outstanding. |
| (2) | Periods less than twelve months (where applicable) are not annualized. |
| (3) | Periods less than twelve months (where applicable) are annualized. |
| (4) | Unaudited. For the six months ended March 31, 2005. |
| (5) | For the period from July 1, 2003 through September 30, 2003. Artisan Funds changed its fiscal year-end from June 30 to September 30 effective September 30, 2003. |
| (6) | The ratios of expenses to average net assets and net investment income (loss) to average net assets exclude expenses waived or reimbursed by the Adviser. Absent expenses waived or reimbursed by the Adviser, the ratios of expenses to average net assets and net investment income (loss) to average net assets would have been as follows: |
| Fund | Year or Period Ended | Ratio of Expenses to Average Net Assets | Ratio of Net Investment Income (Loss) to Average Net Assets | |||||
Mid Cap Investor Shares | 9/30/2003 | 1.20 | % | (0.81 | )% | |||
Mid Cap Institutional Shares | 9/30/2003 | 0.98 | (0.59 | ) |
60
SIXTY
| Total Distributions | Net Asset End of Period | Total Return(2) | Net Assets Period | Ratio of Expenses to Average Net Assets(3) | Ratio of Net Investment Income (Loss) to Average Net Assets(3) | Portfolio Turnover Rate(2) | ||||||||||||||||
| $ | - | $ | 28.65 | 9.64 | % | $ | 4,835.8 | 1.16 | % | (0.54 | )% | 41.71 | % | |||||||||
| - | 26.13 | 13.02 | 4,042.7 | 1.19 | (0.77 | ) | 101.09 | |||||||||||||||
| - | 23.11 | 6.01 | 2,583.2 | 1.20 | (6) | (0.81 | )(6) | 26.52 | ||||||||||||||
| - | 21.81 | (1.45 | ) | 2,286.6 | 1.20 | (0.56 | ) | 102.85 | ||||||||||||||
| - | 22.13 | (16.27 | ) | 1,855.5 | 1.22 | (0.77 | ) | 121.14 | ||||||||||||||
| (1.03 | ) | 26.43 | (0.60 | ) | 1,333.6 | 1.31 | (0.52 | ) | 153.95 | |||||||||||||
| (0.83 | ) | 27.57 | 72.88 | 225.0 | 1.40 | (0.79 | ) | 245.69 | ||||||||||||||
| $ | - | $ | 28.96 | 9.78 | % | $ | 1,090.1 | 0.95 | % | (0.32 | )% | 41.71 | % | |||||||||
| - | 26.38 | 13.27 | 1,036.0 | 0.96 | (0.54 | ) | 101.09 | |||||||||||||||
| - | 23.28 | 6.06 | 929.6 | 0.98 | (6) | (0.59 | )(6) | 26.52 | ||||||||||||||
| - | 21.96 | (1.26 | ) | 829.0 | 1.00 | (0.36 | ) | 102.85 | ||||||||||||||
| - | 22.24 | (16.04 | ) | 449.8 | 1.02 | (0.56 | ) | 121.14 | ||||||||||||||
| (1.03 | ) | 26.48 | (0.38 | ) | 212.2 | 1.08 | (0.29 | ) | 153.95 | |||||||||||||
| $ | (0.30 | ) | $ | 17.84 | 16.89 | % | $ | 1,148.4 | 1.23 | % | (0.05 | )% | 25.23 | % | ||||||||
| (0.24 | ) | 15.55 | 29.60 | 312.3 | 1.39 | 0.73 | 53.79 | |||||||||||||||
| - | 12.22 | 4.98 | 77.4 | 1.59 | (6) | (0.31 | )(6) | 11.90 | ||||||||||||||
| - | 11.64 | 7.58 | 64.5 | 1.78 | (0.34 | ) | 45.55 | |||||||||||||||
| (0.08 | ) | 10.82 | (2.37 | ) | 22.0 | 1.95 | (6) | (0.82 | )(6) | 167.70 | ||||||||||||
| - | 11.18 | 11.80 | 13.2 | 1.84 | (6) | (0.52 | )(6) | 40.72 | ||||||||||||||
| $ | (0.53 | ) | $ | 15.99 | 9.25 | % | $ | 603.5 | 1.16 | % | (0.81 | )% | 38.20 | % | ||||||||
| - | 15.12 | 20.67 | 239.6 | 1.27 | (0.95 | ) | 119.40 | |||||||||||||||
| - | 12.53 | 5.29 | 127.9 | 1.44 | (6) | (1.16 | )(6) | 30.18 | ||||||||||||||
| (0.06 | ) | 11.90 | (0.11 | ) | 116.0 | 1.39 | (0.98 | ) | 127.41 | |||||||||||||
| (0.06 | ) | 11.99 | (13.90 | ) | 131.9 | 1.31 | (1.00 | ) | 139.72 | |||||||||||||
| (0.66 | ) | 13.99 | 0.07 | 145.4 | 1.34 | (0.68 | ) | 147.13 | ||||||||||||||
| - | 14.69 | 32.46 | 185.4 | 1.35 | (0.79 | ) | 193.76 | |||||||||||||||
| $ | (1.78 | ) | $ | 18.00 | 12.95 | % | $ | 1,503.1 | 1.17 | % | 0.02 | % | 29.08 | % | ||||||||
| (0.20 | ) | 17.63 | 30.76 | 1,192.8 | 1.18 | (0.17 | ) | 41.31 | ||||||||||||||
| - | 13.67 | 3.95 | 775.2 | 1.20 | (6) | (0.40 | )(6) | 12.20 | ||||||||||||||
| (0.50 | ) | 13.15 | 1.90 | 702.5 | 1.21 | (0.21 | ) | 49.57 | ||||||||||||||
| (0.72 | ) | 13.48 | 9.65 | 623.5 | 1.20 | (0.10 | ) | 33.59 | ||||||||||||||
| (0.54 | ) | 13.05 | 28.81 | 460.3 | 1.20 | 0.45 | 40.77 | |||||||||||||||
| (0.38 | ) | 10.63 | 4.22 | 261.7 | 1.35 | 0.60 | 38.19 | |||||||||||||||
| (6) | (continued) |
| Fund | Year or Period Ended | Ratio of Expenses to Average Net Assets | Ratio of Net Investment Income (Loss) to Average Net Assets | |||||
Mid Cap Value Investor Shares | 9/30/2003 | 1.63 | % | (0.35 | )% | |||
| 6/30/2002 | 2.53 | (1.40 | ) | |||||
| 6/30/2001 | 5.17 | (3.84 | ) | |||||
Small Cap Investor Shares | 9/30/2003 | 1.46 | (1.18 | ) | ||||
Small Cap Value Investor Shares | 9/30/2003 | 1.20 | (0.41 | ) |
| (7) | The amount shown may not correlate with the aggregate gains and losses of portfolio securities due to the timing of subscriptions and redemptions of fund shares. |
| (8) | Amount is between $0.005 and $(0.005) per share. |
| (9) | For the period from commencement of operations (March 28, 2001) through June 30, 2001. |
The accompanying notes are an integral part of the financial statements.
61
SIXTY-ONE
Artisan Funds, Inc.
Notes to Financial Statements – March 31, 2005 (Unaudited)
| (1) | Organization: |
Artisan Funds, Inc. (“Artisan Funds”) was incorporated on January 5, 1995, as a Wisconsin corporation and is registered under the Investment Company Act of 1940, as amended. Artisan Funds is a series comprised of seven open-end, diversified mutual funds (each a “Fund” and collectively the “Funds”):
| Fund Name | Inception Date | |
Artisan International Fund (“International Fund” or “International”) | December 28, 1995 | |
Artisan International Small Cap Fund (“International Small Cap Fund” or “International Small Cap”) | December 21, 2001 | |
Artisan International Value Fund (“International Value Fund” or “International Value”) | September 23, 2002 | |
Artisan Mid Cap Fund (“Mid Cap Fund” or “Mid Cap”) | June 27, 1997 | |
Artisan Mid Cap Value Fund (“Mid Cap Value Fund” or “Mid Cap Value”) | March 28, 2001 | |
Artisan Small Cap Fund (“Small Cap Fund” or “Small Cap”) | March 28, 1995 | |
Artisan Small Cap Value Fund (“Small Cap Value Fund” or “Small Cap Value”) | September 29, 1997 |
Each Fund’s investment objective is to seek long-term capital growth. Each Fund offers shares of capital stock of the class designated Investor Shares. International Fund and Mid Cap Fund began offering a second class of capital shares, Institutional Shares, effective July 1, 1997 and July 1, 2000, respectively. Institutional Shares are sold to institutional investors meeting certain minimum investment requirements. Each class of shares has equal rights with respect to portfolio assets and voting privileges. Each class has exclusive voting rights with respect to any matters involving only that class. Income, non-class specific expenses and realized and unrealized gains and losses are allocated daily to each class of shares based upon the relative net asset value of outstanding shares. Expenses attributable to a particular class of shares, such as transfer agency fees, shareholder communication expenses and registration fees, are allocated directly to that class.
Each class of the Funds has an indefinite number of shares authorized with a $0.01 par value.
| (2) | Summary of significant accounting policies: |
The following is a summary of significant accounting policies of the Funds in effect during the period covered by the financial statements, which are in accordance with U.S. generally accepted accounting principles.
| (a) | Security valuation – The net asset value (“NAV”) of the shares of each class of each Fund was determined as of the close of regular session trading on the |
62
SIXTY-TWO
NOTES TO FINANCIAL STATEMENTS
New York Stock Exchange (“NYSE”) (usually 3:00 p.m., Central time, but sometimes earlier) each day the NYSE was open for regular session trading. The NAV of each class of shares was determined by dividing the value of each Fund’s securities and other assets attributed to that class, less its liabilities attributed to that class, by the number of outstanding shares of that class of that Fund. |
In determining NAV, each equity security traded on a securities exchange, including the Nasdaq Stock Market, was valued at the closing price as of the time of valuation on the exchange or market on which the security was principally traded (the “principal exchange”). The closing price provided by each exchange may differ and may represent information such as last sales price, an official closing price, a closing auction price or other information, depending on exchange or market convention. Absent closing price information for a security from the principal exchange as of the time of valuation, the security was valued using the most recent bid quotation on the principal exchange, except that securities listed on the London Stock Exchange were valued at the mean of the most recent bid and asked quotations as of the time of valuation. Short-term investments maturing within sixty days of the valuation date were valued at amortized cost, which approximates market.
Securities for which prices were not readily available were valued by Artisan Funds’ valuation committee (the “valuation committee”) at a fair value determined in good faith under procedures established by and under the general supervision of Artisan Funds’ Board of Directors (the “Board of Directors”). A price was considered not to be readily available if, among other things, the valuation committee believed that the price determined as described in the preceding paragraph did not reflect a fair value of the security.
International Fund, International Small Cap Fund and International Value Fund generally invest a significant portion, and perhaps as much as substantially all, of their total assets in securities principally traded in markets outside the U.S. Each of the other Funds has the ability to invest in securities principally traded outside the U.S., but did not do so in the period covered by these financial statements. The foreign markets in which the Funds may invest are sometimes open on days when the NYSE is not open and the Funds do not calculate their NAVs, and sometimes are not open on days when the Funds do calculate their NAVs. Even on days on which both the foreign market and the NYSE are open, several hours may have passed between the time when trading in the foreign market closed and the time as of which the Funds calculate their NAVs. That is generally the case for markets in Europe,
63
SIXTY-THREE
NOTES TO FINANCIAL STATEMENTS
Asia, Australia and other far eastern markets; the regular closing time of foreign markets in North and South America is generally the same as the closing time of the NYSE and the time as of which the Funds calculate their NAVs.
The valuation committee concluded that a price determined under the Funds’ valuation procedures was not readily available if, among other things, the valuation committee believed that the value of the security might have been materially affected by events occurring after the close of the market in which the security was principally traded but before the time for determination of NAV (“subsequent event”). A subsequent event might include a company-specific development (for example, announcement of a merger that is made after the close of the foreign market), a development that might affect an entire market or region (for example, imposition of foreign exchange controls by a foreign government) or a potentially global development (such as a terrorist attack that may be expected to have an impact on investor expectations worldwide). Artisan Funds monitored for subsequent events using several tools, including the use of a third party research service to assist in determining estimates of fair values for foreign securities. That service utilized statistical data based on historical performance of securities, markets and other data in developing factors used to estimate a fair value. An indication by any of those tools of a potential material change in the value of securities resulted in a meeting of the valuation committee, which considered whether a subsequent event had occurred and whether local market closing prices continued to represent fair values for potentially affected non-U.S. securities.
Estimates of fair values utilized by the Funds as described above may differ from the value realized on the sale of those securities and the differences may be material to the NAV of the applicable Fund or to the financial statements presented.
| (b) | Income taxes – No provision has been made for federal income taxes since each Fund intends to (i) comply with the provisions of Subchapter M of the Internal Revenue Code applicable to regulated investment companies and (ii) distribute to its shareholders substantially all of its taxable income as well as net realized gains from the sale of investment securities. The Funds may utilize earnings and profits distributed to shareholders on redemptions of Fund shares as part of the dividends paid deduction. |
| (c) | Portfolio transactions – Security and shareholder transactions are recorded on trade date. Net realized gains and losses on securities are computed on specific security lot identification. |
64
SIXTY-FOUR
NOTES TO FINANCIAL STATEMENTS
| (d) | Foreign currency translation – Values of investments, open foreign currency forward contracts, payables for capital gains taxes and cash denominated in foreign currencies were converted into U.S. dollars using a spot market rate of exchange as of 3:00 p.m. (Central time) on the day of valuation. Payables and receivables for securities transactions, dividend and reclaim receivables and other receivables and payables denominated in a foreign currency were converted into U.S. dollars using a spot market rate of exchange as of 11:00 a.m. (Central time) on the day of valuation. Purchases and sales of investments and dividend and interest income are translated into U.S. dollars using a spot market rate of exchange as of 11:00 a.m. (Central time) on the date of such transactions. The portion of security gains or losses resulting from changes in foreign exchange rates is included with net realized and unrealized gain or loss from investments, as appropriate, for both financial reporting and tax purposes. |
International Fund, International Small Cap Fund and International Value Fund may enter into foreign currency forward contracts to hedge the foreign currency exposure on open payables and receivables. The foreign currency forward contracts are recorded at market value and any related realized and unrealized gains and losses are reported as foreign currency related transactions for financial reporting purposes. For tax purposes, these foreign exchange gains and losses are treated as ordinary income or loss. International Fund, International Small Cap Fund and International Value Fund could be exposed to loss if the counterparties fail to perform under these contracts.
Other foreign currency related transaction gains and losses may result from currency gains and losses realized from the difference between the amounts of dividends and foreign withholding taxes recorded on the Funds’ books and the U.S. dollar equivalent of the amounts actually received or paid. The net increase (decrease) in unrealized appreciation or depreciation on foreign currency related transactions arise from changes in the values of assets and liabilities, other than investments in securities, resulting from changes in foreign exchange rates.
| (e) | Repurchase agreements – Each Fund may enter into repurchase agreements with institutions that Artisan Partners Limited Partnership (“the Adviser”) has determined are creditworthy pursuant to criteria adopted by the Board of Directors. Repurchase agreements are recorded at cost plus accrued interest and are collateralized in an amount greater than or equal to the repurchase price plus accrued interest. If the proceeds from any sale of such collateral upon a default on the obligation to repurchase were less than the repurchase price, the Fund would suffer a loss. |
65
SIXTY-FIVE
NOTES TO FINANCIAL STATEMENTS
| (f) | Securities lending – Each Fund may enter into securities lending transactions. During the six months ended March 31, 2005, International Fund earned $933,495 from securities lending transactions. As of March 31, 2005, there were no securities on loan. Each Fund’s risks in entering into securities lending arrangements are that the borrower may not provide additional collateral when required or return the securities when due or, if the borrower defaults, the Fund may experience delays in selling collateral or the collateral may not be sufficient to cover the value of securities lent. |
| (g) | Commission recapture – Each of the Funds may direct portfolio trades to various brokers who have agreed to rebate a portion of the commissions generated. Such rebates are made directly to the applicable Fund as cash payments and are included in net realized gain or loss on investments in the Statements of Operations as follows: |
International | $ | 3,489,389 | |
International Small Cap | 186,373 | ||
International Value | 125,997 | ||
Mid Cap | 606,723 | ||
Mid Cap Value | 62,054 | ||
Small Cap | 83,162 | ||
Small Cap Value | 103,095 |
| (h) | Use of estimates – The preparation of financial statements in conformity with U.S. generally accepted accounting principles requires management to make estimates and assumptions that affect the reported amounts and disclosures in the financial statements. Actual results could differ from those estimates. |
| (i) | Indemnifications – In the normal course of business, the Funds enter into contracts in which the Funds agree to indemnify the other party or parties against various potential costs or liabilities. The Funds’ maximum exposure under these arrangements is unknown. No claim has been made for indemnification pursuant to any such agreement. |
| (j) | Other – Dividend income less foreign taxes withheld, if any, is recorded on the ex-dividend date, except that certain dividends from private placements and foreign securities are recorded as soon after the ex-dividend date as the information becomes available to the Funds. Interest income is reported on the accrual basis. Distributions to shareholders are recorded on the ex-dividend date. Expenses attributable to Artisan Funds are generally allocated to each Fund based on net assets. Expenses attributable to a particular Fund are allocated directly to that Fund. |
66
SIXTY-SIX
NOTES TO FINANCIAL STATEMENTS
The character of income and net realized gains and losses may differ for financial statement and tax purposes and may result in reclassification of permanent differences among certain capital accounts to more appropriately conform financial accounting to tax characterizations of dividend distributions.
International Fund, International Small Cap Fund and International Value Fund generally impose a 2% redemption fee on shares held 90 days or less. Those redemption fees are recorded as a reduction in the cost of shares redeemed and have the primary effect of increasing paid-in capital.
| (3) | Transactions with affiliates: |
The Adviser, with which the officers and certain directors of Artisan Funds are affiliated, provides investment advisory and administrative services to the Funds. In exchange for those services, each Fund (with the exception of International Small Cap Fund) pays a monthly management fee to the Adviser as follows:
Average Daily Net Assets | Annual Rate | ||
Less than $500 million | 1.000 | % | |
$500 million to $750 million | 0.975 | ||
$750 million to $1 billion | 0.950 | ||
Greater than $1 billion | 0.925 |
International Small Cap Fund pays a monthly management fee to the Adviser at an annual rate of 1.250% of average daily net assets.
Shares of Artisan Funds are offered for sale by Artisan Distributors LLC (“Distributors”). Distributors is wholly owned by the Adviser. All distribution expenses relating to the Funds are paid by the Adviser.
Each Fund also incurs other expenses for services such as maintaining shareholder records and furnishing shareholder statements and reports.
Prior to April 1, 2005, each director who was not an interested person of Artisan Funds or the Adviser received an annual retainer of $60,000, plus a fee for each board or committee meeting attended (other than a committee meeting held on the same day as a board meeting) of $3,000 for an in-person meeting and $500 for a telephonic meeting, as well as reimbursement of expenses related to his duties as a director of Artisan Funds. In addition, each chairman of a board committee who was a non-interested director and each non-interested director performing services deemed by the Board of Directors to be substantially equivalent to those of a committee chair received a supplemental annual retainer of $5,000. Those fees were generally allocated to each Fund based on net assets.
67
SIXTY-SEVEN
NOTES TO FINANCIAL STATEMENTS
Effective April 1, 2005, each director who is not an interested person of Artisan Funds or the Adviser receives an annual retainer of $120,000 payable quarterly, as well as reimbursement of expenses related to his duties as a director of Artisan Funds. In addition, the non-interested chair of the board of directors receives an additional annual retainer of $60,000 payable quarterly, and each chair of a board committee who is a non-interested director receives an additional annual retainer of $30,000 payable quarterly.
| (4) | Line of credit arrangements: |
Artisan Funds is party to a line of credit agreement with State Street Bank and Trust Company, under which each Fund may borrow up to the lesser of (a) $75 million or (b) the lesser of (i) 10% of its total assets (after giving effect to the loan) or (ii) the maximum amount the Fund may borrow under the Investment Company Act, the limitations included in the Fund’s prospectus, or any limit or restriction under any law or regulation to which the Fund is subject or any agreement to which the Fund or Artisan Funds is a party; provided that the aggregate borrowings by all Funds may not exceed $100 million. Artisan Funds pays a commitment fee at the annual rate of 0.10% on the unused portion of the line of credit. Interest is charged on any borrowings at the current Federal Funds rate plus 0.50%. The use of the line of credit is generally restricted to temporary borrowing for extraordinary or emergency purposes. There were no borrowings under the line of credit during the six months ended March 31, 2005.
| (5) | Investment transactions: |
The cost of securities purchased and the proceeds from the sale of securities (excluding short-term securities) for the six months ended March 31, 2005 were as follows:
| Fund | Security Purchases | Security Sales | ||||
International | $ | 3,565,804,426 | $ | 3,528,555,080 | ||
International Small Cap | 235,007,180 | 177,752,554 | ||||
International Value | 393,617,888 | 42,512,494 | ||||
Mid Cap | 2,698,247,295 | 2,307,190,377 | ||||
Mid Cap Value | 826,091,735 | 164,395,730 | ||||
Small Cap | 489,244,173 | 156,413,055 | ||||
Small Cap Value | 507,449,876 | 370,464,131 | ||||
68
SIXTY-EIGHT
NOTES TO FINANCIAL STATEMENTS
| (6) | Transactions in securities of affiliates: |
The table below shows information about securities of the Funds’ “affiliates” (as defined below) that were held by the Funds, purchased or sold by the Funds, or from which dividends were received by the Funds during the six months ended March 31, 2005. The Funds identify a company as an affiliate for the purpose of the report if one or more of the Funds owned, in the aggregate, voting securities that it believed represented 5% or more of that company’s outstanding voting securities (as defined by the Investment Company Act of 1940) during the six-month period ended March 31, 2005.
Fund | Security | As of 9/30/04 | Purchase Cost | Sales Cost | Net Realized | Dividend Income | As of 3/31/05 | |||||||||||||||
| Share Balance | Share Balance | Value | ||||||||||||||||||||
| International | Clariant AG(1) | 13,411,333 | $ | - | $ | 82,648,164 | $ | (23,450,941 | ) | $ | - | 9,579,379 | $ | 165,389,554 | ||||||||
International Small Cap | FINETEC Corporation | 1,201,124 | - | - | - | 72,223 | 1,201,124 | 11,236,512 | ||||||||||||||
International Value | Clariant AG(1) | 529,280 | 12,341,084 | - | - | - | 1,311,226 | 22,638,533 | ||||||||||||||
| Pfeiffer Vacuum Technology AG(2) | 165,482 | 16,132,272 | - | - | - | 517,862 | 26,248,019 | |||||||||||||||
| Mid Cap Value | Furniture Brands International, Inc.(2) | 452,700 | 20,434,193 | - | - | 267,765 | 1,314,900 | 28,677,969 | ||||||||||||||
Small Cap Value | CellStar Corporation(3) | 1,194,400 | 573,394 | 463,427 | (181,839 | ) | - | 1,275,200 | 2,971,216 | |||||||||||||
| Furniture Brands International, Inc.(2) | 169,700 | 39,773,150 | - | - | 325,380 | 1,893,100 | 41,288,511 | |||||||||||||||
| Kellwood Corporation(2) | 1,136,750 | 17,175,106 | - | - | 480,432 | 1,683,050 | 48,455,010 | |||||||||||||||
National Dentex Corporation(3) | 229,200 | 106,549 | - | - | - | 349,400 | 6,883,180 | |||||||||||||||
| PICO Holdings, Inc.(3) | 703,100 | 322,844 | 44,079 | 17,791 | - | 717,700 | 18,595,607 | |||||||||||||||
| Stewart Information Services Corporation | 1,005,300 | 4,745,749 | 1,258,836 | 60,739 | 448,086 | 1,102,300 | 41,358,296 | |||||||||||||||
| (1) | Issuer was no longer an affiliate as of March 31, 2005. |
| (2) | Issuer was not an affiliate as of September 30, 2004. |
| (3) | Non-income producing security. |
| (7) | Information for Federal income tax purposes: |
Fund | Cost of Investments | Gross Unrealized Appreciation | Gross Unrealized Depreciation | Net Unrealized Appreciation (Depreciation) on Investments | |||||||||
| International | $ | 8,879,787,744 | $ | 2,319,499,093 | $ | (99,479,308 | ) | $ | 2,220,019,785 | ||||
| International Small Cap | 496,251,258 | 176,516,039 | (7,862,711 | ) | 168,653,328 | ||||||||
| International Value | 584,989,607 | 61,831,012 | (1,980,797 | ) | 59,850,215 | ||||||||
| Mid Cap | 5,015,623,542 | 1,043,250,875 | (103,056,349 | ) | 940,194,526 | ||||||||
| Mid Cap Value | 1,041,538,304 | 118,929,460 | (6,056,011 | ) | 112,873,449 | ||||||||
| Small Cap | 566,721,742 | 54,022,860 | (22,758,848 | ) | 31,264,012 | ||||||||
| Small Cap Value | 1,236,273,260 | 333,058,066 | (33,568,877 | ) | 299,489,189 | ||||||||
69
SIXTY-NINE
NOTES TO FINANCIAL STATEMENTS
The difference between cost amounts for financial reporting and tax purposes is due primarily to timing differences in recognizing certain gains and losses on security transactions (e.g., wash sales).
The tax basis of dividends and long-term capital gain distributions paid during the six months ended March 31, 2005 and the year ended September 30, 2004 was as follows:
| Six Months Ended 3/31/05 | Year Ended 9/30/04 | |||||||||||||
| Ordinary Income Dividends | Long-Term Distributions | Ordinary Income Dividends | Long-Term Capital Gain Distributions | |||||||||||
| International | $ | 69,335,946 | $ | - | $ | 101,887,899 | $ | - | ||||||
| International Small Cap | 38,631,361 | 20,034,761 | 12,868,474 | 3,959,034 | ||||||||||
| International Value | 3,706,870 | 1,337,369 | 828,575 | - | ||||||||||
| Mid Cap | - | - | - | - | ||||||||||
| Mid Cap Value | 4,543,137 | 4,784,764 | 920,430 | 679,381 | ||||||||||
| Small Cap | 715,625 | 9,933,966 | - | - | ||||||||||
| Small Cap Value | 33,641,999 | 90,214,297 | 2,241,194 | 9,542,404 | ||||||||||
Additional tax information as of and for the year ended September 30, 2004 follows:
| As of 9/30/04 | Year Ended 9/30/04 | ||||||||||||||||||
| Undistributed Ordinary Income | Undistributed Long-Term Gain | Net Capital Loss Carryforward(1) | Capital Loss Carryforward Expiration | Capital Loss Carryforward Utilized | Post-October Losses | ||||||||||||||
| International | $ | 69,318,695 | $ | - | $ | 74,827,358 | 2008 | $ | 41,400,656 | $ | 101,585,966 | ||||||||
| 694,241,382 | 2009 | ||||||||||||||||||
| 384,841,928 | 2010 | ||||||||||||||||||
| 202,299,105 | 2011 | ||||||||||||||||||
| International Small Cap | 38,628,418 | 19,236,544 | - | - | 277,712 | ||||||||||||||
| International Value | 3,704,544 | 1,336,782 | - | - | 39,888 | ||||||||||||||
| Mid Cap | - | - | 178,503,906 | 2010 | 321,169,449 | - | |||||||||||||
| Mid Cap Value | 5,458,103 | 4,784,724 | - | - | - | ||||||||||||||
| Small Cap | - | 9,932,799 | - | 17,550,585 | - | ||||||||||||||
| Small Cap Value | 28,429,410 | 78,006,562 | - | 1,664,820 | - | ||||||||||||||
| (1) | The Funds expect to resume paying capital gain distributions in the future to the extent gains are realized in excess of the available carryforwards. |
70
SEVENTY
NOTES TO FINANCIAL STATEMENTS
[THIS PAGE INTENTIONALLY LEFT BLANK]
71
SEVENTY-ONE
NOTES TO FINANCIAL STATEMENTS
| (8) | Fund share activities: |
Capital share transactions for the Funds were as follows:
| INTERNATIONAL | INTERNATIONAL SMALL CAP | |||||||||||
Six months ended March 31, 2005 | Investor Shares | Institutional Shares | Investor Shares | |||||||||
Proceeds from shares issued | $ | 1,020,185,315 | $ | 90,626,264 | $ | 81,670,387 | ||||||
Net asset value of shares issued in reinvestment of dividends and distributions | 35,336,671 | 27,442,945 | 57,876,740 | |||||||||
Cost of shares redeemed(1) | (827,820,037 | ) | (292,510,849 | ) | (49,557,862 | ) | ||||||
Net increase (decrease) from fund share transactions | $ | 227,701,949 | $ | (174,441,640 | ) | $ | 89,989,265 | |||||
Shares sold | 47,542,136 | 4,272,493 | 4,665,106 | |||||||||
Shares issued in reinvestment of dividends and distributions | 1,677,108 | 1,297,539 | 3,597,063 | |||||||||
Shares redeemed | (38,516,298 | ) | (13,672,119 | ) | (2,872,961 | ) | ||||||
Net increase (decrease) in capital shares | 10,702,946 | (8,102,087 | ) | 5,389,208 | ||||||||
| INTERNATIONAL | INTERNATIONAL SMALL CAP | |||||||||||
Year ended September 30, 2004 | Investor Shares | Institutional Shares | Investor Shares | |||||||||
Proceeds from shares issued | $ | 2,536,272,455 | $ | 334,559,000 | $ | 193,292,258 | ||||||
Net asset value of shares issued in reinvestment of dividends and distributions | 54,531,342 | 38,442,969 | 16,704,120 | |||||||||
Cost of shares redeemed(2) | (2,903,431,496 | ) | (658,297,737 | ) | (166,988,190 | ) | ||||||
Net increase (decrease) from fund share transactions | $ | (312,627,699 | ) | $ | (285,295,768 | ) | $ | 43,008,188 | ||||
Shares sold | 134,972,302 | 17,620,515 | 12,511,213 | |||||||||
Shares issued in reinvestment of dividends and distributions | 3,107,199 | 2,183,019 | 1,141,772 | |||||||||
Shares redeemed | (156,104,065 | ) | (35,129,349 | ) | (10,515,918 | ) | ||||||
Net increase (decrease) in capital shares | (18,024,564 | ) | (15,325,815 | ) | 3,137,067 | |||||||
| (1) | Net of redemption fees of $130,274, $74,215, $10,427 and $25,378 for International-Investor Shares, International-Institutional Shares, International Small Cap and International Value, respectively. |
| (2) | Net of redemption fees of $74,205, $41,388, $207,006 and $11,254 for International-Investor Shares, International-Institutional Shares, International Small Cap and International Value, respectively. |
72
SEVENTY-TWO
NOTES TO FINANCIAL STATEMENTS
| INTERNATIONAL VALUE | MID CAP | MID CAP VALUE | SMALL CAP | SMALL CAP VALUE | ||||||||||||||||||
Investor Shares | Investor Shares | Institutional Shares | Investor Shares | Investor Shares | Investor Shares | |||||||||||||||||
| $ | 423,932,910 | $ | 972,121,666 | $ | 27,331,032 | $ | 839,988,095 | $ | 387,456,008 | $ | 278,723,834 | |||||||||||
| 4,945,297 | - | - | 8,873,824 | 8,911,551 | 114,845,085 | |||||||||||||||||
| (44,895,347 | ) | (570,003,080 | ) | (74,024,691 | ) | (101,837,950 | ) | (43,407,494 | ) | (121,016,683 | ) | |||||||||||
| $ | 383,982,860 | $ | 402,118,586 | $ | (46,693,659 | ) | $ | 747,023,969 | $ | 352,960,065 | $ | 272,552,236 | ||||||||||
| 20,585,329 | 34,107,109 | 956,955 | 49,868,591 | 24,034,197 | 15,868,845 | |||||||||||||||||
| 251,285 | - | - | 544,456 | 554,201 | 6,864,620 | |||||||||||||||||
| (2,139,257 | ) | (20,050,432 | ) | (2,586,200 | ) | (6,109,697 | ) | (2,694,372 | ) | (6,896,479 | ) | |||||||||||
| 18,697,357 | 14,056,677 | (1,629,245 | ) | 44,303,350 | 21,894,026 | 15,836,986 | ||||||||||||||||
| INTERNATIONAL VALUE | MID CAP | MID CAP VALUE | SMALL CAP | SMALL CAP VALUE | ||||||||||||||||||
Investor Shares | Investor Shares | Institutional Shares | Investor Shares | Investor Shares | Investor Shares | |||||||||||||||||
| $ | 199,024,062 | $ | 1,972,432,516 | $ | 69,966,247 | $ | 229,241,036 | $ | 119,391,774 | $ | 368,267,157 | |||||||||||
| 788,115 | - | - | 1,567,572 | - | 10,992,907 | |||||||||||||||||
| (23,582,394 | ) | (855,149,594 | ) | (91,122,442 | ) | (28,078,509 | ) | (35,223,082 | ) | (201,938,794 | ) | |||||||||||
| $ | 176,229,783 | $ | 1,117,282,922 | $ | (21,156,195 | ) | $ | 202,730,099 | $ | 84,168,692 | $ | 177,321,270 | ||||||||||
| 11,382,724 | 75,836,138 | 2,793,091 | 15,586,699 | 8,008,103 | 22,595,547 | |||||||||||||||||
| 52,262 | - | - | 121,706 | - | 747,308 | |||||||||||||||||
| (1,350,339 | ) | (32,884,883 | ) | (3,449,277 | ) | (1,960,621 | ) | (2,368,256 | ) | (12,359,689 | ) | |||||||||||
| 10,084,647 | 42,951,255 | (656,186 | ) | 13,747,784 | 5,639,847 | 10,983,166 | ||||||||||||||||
73
SEVENTY-THREE
NOTES TO FINANCIAL STATEMENTS
| (9) | Litigation: |
Artisan Funds and the Adviser are defendants in a lawsuit that seeks certification of a plaintiff class consisting of all persons in the United States who held shares in International Fund for a period of more than 14 days during the five years prior to the filing of the lawsuit. The suit seeks compensatory and punitive damages, as well as interest, costs and attorney’s fees. The lawsuit alleges, in summary, that Artisan Funds and the Adviser exposed long-term International Fund shareholders to trading by market timers by allegedly (a) failing to properly evaluate daily whether a significant event affecting the value of International Fund’s securities had occurred after foreign markets had closed but before the calculation of the Fund’s NAV; (b) failing to implement the Fund’s portfolio valuation and share pricing policies and procedures; (c) allowing portfolio valuation and share policies and procedures that benefited market timers at the expense of long-term shareholders; and (d) failing to know and implement applicable rules and regulations concerning the calculation of NAV.
Artisan Funds and the Adviser removed the lawsuit from state court to federal district court. The federal district court ordered the case remanded to state court. Artisan Funds and the Adviser appealed the remand order to the United States Court of Appeals for the Seventh Circuit and, on April 5, 2005, the Court of Appeals ruled in favor of Artisan Funds and the Adviser. The Court of Appeals reversed the remand order of the district court and ordered the district court to dismiss the plaintiff’s state law claims. The plaintiff has attempted, and has requested permission, to file an amended complaint. In addition, it is possible that the plaintiff may seek review of the Court of Appeals decision by the United States Supreme Court. Artisan Funds and the Adviser will continue to defend the lawsuit, including any further appellate review, vigorously.
Certain legal fees incurred by Artisan Funds in defense of the lawsuit and related insurance recoveries have been allocated to International Fund and are included in professional fees in the Statement of Operations. Artisan Funds does not believe that the pending action will have a material effect on the financial condition of any Fund.
74
SEVENTY-FOUR
As a shareholder of Artisan Funds, you incur two types of costs: (1) transaction costs, including redemption fees; and (2) ongoing costs, including management fees, and other Fund expenses. This example is intended to help you understand your ongoing costs (in dollars) of investing in a Fund and to compare these costs with the ongoing costs of investing in other mutual funds.
The example is based on an investment of $1,000 invested at the beginning of the period and held for the entire period from October 1, 2004 to March 31, 2005.
Actual Expenses
The first line under the name of each Fund in the table below provides information about actual account values and actual expenses. You may use the information in this line, together with the amount you invested, to estimate the expenses that you paid over the period. Simply divide your account value by $1,000 (for example, an $8,600 account value divided by $1,000 = 8.6), then multiply the result by the number in the first line under the name of your Fund under the heading entitled “Expenses Paid During Period” to estimate the expenses you paid on your account during this period.
Hypothetical Example for Comparison Purposes
The second line below each Fund’s name in the table below provides information about hypothetical account values and hypothetical expenses based on each Fund’s actual expense ratio and an assumed rate of return of 5% per year before expenses, which is not the Fund’s actual return. The hypothetical account values and expenses may not be used to estimate the actual ending account balances or expenses you paid for the period. You may use this information to compare the ongoing costs of investing in each Fund and other funds. To do so, compare the 5% hypothetical example with the 5% hypothetical examples that appear in the shareholder reports of the other funds.
Please note that the expenses shown in the table are meant to highlight your ongoing costs only and do not reflect any transactional costs, such as redemption fees. Therefore, the second line of the table is useful in comparing ongoing costs only, and will not help you determine the relative costs of owning different funds. If these transactional costs were included, your costs would have been higher.
| Beginning Account Value 10/1/2004 | Ending Account Value | Expenses Paid During 10/1/2004-3/31/2005 | |||||||
Artisan International Fund - Investor Shares | |||||||||
Actual | $ | 1,000.00 | $ | 1,145.80 | $ | 6.42 | |||
Hypothetical (5% return before expenses) | $ | 1,000.00 | $ | 1,018.95 | $ | 6.04 | |||
Artisan International Fund - Institutional Shares | |||||||||
Actual | $ | 1,000.00 | $ | 1,146.60 | $ | 5.35 | |||
Hypothetical (5% return before expenses) | $ | 1,000.00 | $ | 1,019.95 | $ | 5.04 | |||
Artisan International Small Cap Fund | |||||||||
Actual | $ | 1,000.00 | $ | 1,233.20 | $ | 8.57 | |||
Hypothetical (5% return before expenses) | $ | 1,000.00 | $ | 1,017.25 | $ | 7.75 | |||
Artisan International Value Fund | |||||||||
Actual | $ | 1,000.00 | $ | 1,168.50 | $ | 7.03 | |||
Hypothetical (5% return before expenses) | $ | 1,000.00 | $ | 1,018.45 | $ | 6.54 | |||
75
SEVENTY-FIVE
SHAREHOLDER EXPENSE EXAMPLE
| Beginning Account Value 10/1/2004 | Ending Account Value 3/31/2005 | Expenses Paid During Period* 10/1/2004-3/31/2005 | |||||||
Artisan Mid Cap Fund - Investor Shares | |||||||||
Actual | $ | 1,000.00 | $ | 1,096.40 | $ | 6.06 | |||
Hypothetical (5% return before expenses) | $ | 1,000.00 | $ | 1,019.15 | $ | 5.84 | |||
Artisan Mid Cap Fund - Institutional Shares | |||||||||
Actual | $ | 1,000.00 | $ | 1,097.80 | $ | 4.97 | |||
Hypothetical (5% return before expenses) | $ | 1,000.00 | $ | 1,020.19 | $ | 4.78 | |||
Artisan Mid Cap Value Fund | |||||||||
Actual | $ | 1,000.00 | $ | 1,168.90 | $ | 6.65 | |||
Hypothetical (5% return before expenses) | $ | 1,000.00 | $ | 1,018.80 | $ | 6.19 | |||
Artisan Small Cap Fund | |||||||||
Actual | $ | 1,000.00 | $ | 1,092.50 | $ | 6.05 | |||
Hypothetical (5% return before expenses) | $ | 1,000.00 | $ | 1,019.15 | $ | 5.84 | |||
Artisan Small Cap Value Fund | |||||||||
Actual | $ | 1,000.00 | $ | 1,129.50 | $ | 6.21 | |||
Hypothetical (5% return before expenses) | $ | 1,000.00 | $ | 1,019.10 | $ | 5.89 | |||
| * | Expenses are equal to the Fund’s ratio of expenses to average net assets for the six month period ended March 31, 2005 (shown below); multiplied by the average account value over the period; multiplied by 182/365 (to reflect the one-half year period). |
| Fund | Annualized Ratio of Expenses to Average Net Assets for the Six Month Period Ended March 31, 2005 | ||
Artisan International Fund - Investor Shares | 1.20 | % | |
Artisan International Fund - Institutional Shares | 1.00 | ||
Artisan International Small Cap Fund | 1.54 | ||
Artisan International Value Fund | 1.30 | ||
Artisan Mid Cap Fund - Investor Shares | 1.16 | ||
Artisan Mid Cap Fund - Institutional Shares | 0.95 | ||
Artisan Mid Cap Value Fund | 1.23 | ||
Artisan Small Cap Fund | 1.16 | ||
Artisan Small Cap Value Fund | 1.17 |
76
SEVENTY-SIX
FACTORS CONSIDERED IN RENEWING THE FUNDS’ ADVISORY CONTRACTS
Artisan Partners Limited Partnership (“Artisan Partners”) is responsible for management of the Funds’ investment portfolios and for overall management of the Funds’ business and affairs pursuant to Investment Advisory Agreements dated December 27, 1995 (International Fund); November 7, 2001 (International Small Cap Fund); August 8, 2002 (International Value Fund); April 10, 1997 (Mid Cap Fund); October 26, 2000 (Mid Cap Value Fund); March 27, 1995 (Small Cap Fund) and July 31, 1997 (Small Cap Value Fund) (the “Advisory Agreements”). Artisan Partners is a Delaware limited partnership, the sole general partner of which is Artisan Investment Corporation. Artisan Investment Corporation was incorporated on December 7, 1994 for the sole purpose of acting as general partner of Artisan Partners. Artisan Investment Corporation is controlled by Andrew Ziegler and Carlene Ziegler, who together own 100% of its voting stock. The principal address of Artisan Partners is 875 E. Wisconsin Avenue, Suite 800, Milwaukee, Wisconsin 53202. Artisan Partners also has offices at 100 Pine Street, Suite 2950, San Francisco, California 94111; One Maritime Plaza, Suite 1450, San Francisco, California 94111; Five Concourse Parkway NE, Suite 2120, Atlanta, Georgia 30328; and 65 East 55th Street, 25th Floor, New York, New York 10022.
The Advisory Agreement for each Fund may be continued from year to year only so long as the continuance is approved annually (a) by the vote of a majority of the directors of Artisan Funds who are not “interested persons” of Artisan Funds or Artisan Partners cast in person at a meeting called for the purpose of voting on such approval, and (b) by the board of directors or by the vote of a majority (as defined in the 1940 Act) of the outstanding shares of the Fund. Each Advisory Agreement provides that Artisan Partners shall not be liable for any loss suffered by a Fund or its shareholders as a consequence of any act or omission in connection with investment advisory or portfolio services under the agreement, except by reason of willful misfeasance, bad faith or gross negligence on the part of Artisan Partners in the performance of its duties or from reckless disregard by Artisan Partners of its obligations and duties under the Advisory Agreement. Each Agreement will terminate automatically in the event of its assignment (as defined in the 1940 Act).
The directors of Artisan Funds held a special meeting of the board on October 14, 2004 at which they gave preliminary consideration to information bearing on continuation of each Advisory Agreement for the period from December 1, 2004 through November 30, 2005. The primary purpose of the special meeting was to ensure that the directors had ample opportunity to consider matters they deemed relevant in considering the continuation of the Advisory Agreements, and to request any additional information they considered necessary to their deliberations, without undue time constraints.
In recent years, the board of directors of the Funds considered the continuation of the Advisory Agreements at board meetings in October of each year. However, because Artisan Funds changed its fiscal year-end from June 30 to September 30 effective September 30, 2003, it was determined that certain year-end and other financial information that the board reviewed in prior years would not be available in time for consideration at an October 2004 board meeting. So, at the October 14th meeting, the board approved the continuation of the Advisory Agreements for an interim one-month period (from November 1, 2004 through November 30, 2004) (the “Interim Period”).
The directors met again at a regular meeting on November 4, 2004, at which time they approved the continuation of each Advisory Agreement from December 1, 2004 to November 30, 2005.
77
SEVENTY-SEVEN
FACTORS CONSIDERED IN RENEWING THE FUNDS’ ADVISORY CONTRACTS
Prior to the October 14, 2004 board meeting, independent counsel to the independent directors sent to Artisan Partners a request for information to be provided to the directors in connection with their consideration of continuation of the Advisory Agreements. Artisan Partners provided materials to the directors that included responses to that request, other information Artisan Partners believed was useful in evaluating the continuation of the Advisory Agreements and reports prepared by Lipper Inc. (“Lipper”) relating to each Fund’s performance and expenses compared to the performance and expenses of a relatively small peer group and a larger peer universe of funds determined by Lipper to be comparable. In evaluating the Advisory Agreements, the directors reviewed the available information and discussed with representatives of Artisan Partners each Fund’s operations and the nature and quality of the advisory and other services provided by Artisan Partners to the Funds. The directors had received and reviewed a memorandum from the independent counsel to the Funds’ independent directors regarding the directors’ responsibilities in evaluating the Funds’ investment advisory agreements.
In addition to the third party reports by Lipper Inc. and the memorandum from independent counsel, the directors received and reviewed information concerning the following:
| • | The services performed by Artisan Partners for the Funds, including: a list of services performed by Artisan Partners for the Funds; Artisan Partners’ responsibility for making investment decisions; and Artisan Partners’ research and decision-making processes, including Artisan Partners’ responsibility for compliance with investment objectives, policies and restrictions of the Funds; |
| • | The terms of each Advisory Agreement, including: Artisan Partners’ standard of care; and termination provisions; |
| • | Artisan Partners’ personnel and operations, including: the number and organization of Artisan Partners’ employees; the education and experience of Artisan Partners’ investment personnel; Artisan Partners’ assessment of its ability to attract and retain capable investment and business professionals; the time and attention of Artisan Partners’ personnel devoted to the Funds; and Artisan Partners’ technology and systems; |
| • | Each Fund’s investment performance, including a comparison for various time periods with (1) other Artisan Partners client accounts managed in the same investment strategy, (2) other mutual funds having similar investment objectives, and (3) appropriate market indices; |
| • | Potential for conflicts of interest between the Funds and Artisan Partners and circumstances and actions addressing or bearing on potential conflicts of interest, including: Artisan Partners’ focus on investment management services; the type and number of other clients served by Artisan Partners in each of its investment strategies and the dollar value of assets other than the Funds managed by Artisan Partners; potential advantages and disadvantages in having an investment adviser that has other clients; certain Artisan Partners procedures, including trade allocation and proxy voting; Artisan Partners’ code of ethics, including policies relating to personal securities of employees; and litigation and regulatory matters; |
| • | Potential benefits gained by Artisan Partners or its affiliates and by the Funds from their relationship; |
| • | Brokerage and portfolio transactions, including: use of brokers not affiliated with Artisan Partners for execution of all transactions; use of soft dollars; the Funds’ commission recapture program; and portfolio turnover ratios; |
| • | The advisory fees charged, including: recognition of economies of scale through breakpoints in the fees; a comparison of the fees charged by Artisan Partners to the Funds with the fees charged by Artisan Partners to other accounts managed by Artisan Partners in the same investment |
78
SEVENTY-EIGHT
FACTORS CONSIDERED IN RENEWING THE FUNDS’ ADVISORY CONTRACTS
strategies; and a comparison of the fees charged by Artisan Partners to the Funds with the management fees charged by other investment advisers for managing mutual funds with similar investment objectives and strategies; |
| • | The effect of advisory and other fees on the Funds’ total expenses, including: comparisons of expenses and expense ratios with those of other mutual funds, taking into account comparability factors such as size, account-level charges and investment objective; voluntary expense limitations or reductions and relationship of expenses to expense limitation; fees paid to service providers other than Artisan Partners; |
| • | The financial condition and stability of Artisan Partners; and |
| • | The profitability to Artisan Partners of its relationship with each Fund. |
After discussion and consideration of the information presented at the meeting, the non-interested directors met separately with their independent counsel. The board of directors, including all the “non-interested” directors, unanimously approved the continuation of the Advisory Agreements for the Interim Period at the October 14th special meeting.
The board of directors met again at a regularly scheduled meeting on November 4, 2004. At the November 4th meeting, the directors were provided with information they had requested at the October 14th meeting, and the directors discussed whether any further discussion or review was necessary with respect to the information reviewed or discussion held at the October 14th board meeting. The directors concluded that the October 14th meeting provided a strong basis for considering the continuation of the Advisory Agreements at the November 4th meeting. After reviewing information from the October 14th meeting and other information presented at the November 4th meeting, the independent directors met separately with their independent counsel. Following those discussions, the board approved the continuation of each Advisory Agreement through November 30, 2005 by the unanimous vote of all directors and also by the unanimous vote of all the non-interested directors. In approving the continuation of each Advisory Agreement, the directors reviewed the information detailed above and reached the following conclusions based on the material factors discussed below:
The nature, extent and quality of Artisan Partners’ services. The directors concluded that the nature and extent of Artisan Partners’ services to the Funds were appropriate and consistent with, and in some cases more advantageous to the Funds than, the terms of the Advisory Agreements. The directors concluded that the quality of Artisan Partners’ services has been very good. In reaching their conclusions, the directors considered the following:
| • | Because Artisan Partners’ principal responsibility is management of the Funds’ investment portfolios, the investment performance achieved by Artisan Partners is an important indicator of the quality of the services provided. |
| • | Besides investment management, Artisan Partners provides the Funds with general administration services, including the preparation of regulatory filings, provides services to certain of the Funds’ shareholders and management of the Funds’ relationships with its third party service providers, including its custodian, fund accounting agent, transfer agent, lawyers and auditors. |
| • | The quality of Artisan Partners’ services to the Funds is consistent with or superior to mutual fund industry standards. |
79
SEVENTY-NINE
FACTORS CONSIDERED IN RENEWING THE FUNDS’ ADVISORY CONTRACTS
| • | Artisan Partners has sufficient personnel, with the appropriate education and experience, to serve the Funds effectively, and has demonstrated its continuing ability to attract and retain quality personnel. |
| • | Artisan Partners’ financial condition is sound. |
The investment performance of each Fund. The directors considered for each Fund for periods ended June 30, 2004 short-term and long-term investment performance compared to broad-based and style-specific market indexes, performance for the period January 1, 2004 through September 30, 2004 compared to the same indexes, Morningstar ratings™ (for those Funds rated by Morningstar) and Lipper rankings. The directors concluded that the long-term investment performance of each Fund has been good to excellent. In reaching that conclusion, the directors considered the following:
| • | Each of the Funds invests in a predominantly value-oriented or growth-oriented investment style. International Value Fund, Mid Cap Value Fund and Small Cap Value Fund invest in a predominantly value-oriented style; International Fund, International Small Cap Fund, Mid Cap Fund and Small Cap Fund invest in a predominantly growth-oriented investment style. |
| • | Because of each Fund’s style-specific investment strategy, the investment performance of each Fund and, in particular, its performance compared to a broad-based market index is affected by the relative performance of growth-oriented stocks and value-oriented stocks in the market overall. |
| • | The broad-based and style-specific benchmark indexes against which Fund performance is compared show significant variances in recent years, with the Russell 2000® Value Index significantly outperforming the Russell 2000® Growth Index and the Russell 2000® Index; the Russell Midcap® Value Index significantly outperforming the Russell Midcap® Growth Index and the Russell Midcap® Index; and the Morgan Stanley Capital International Europe, Australasia and Far East (MSCI EAFE®) Value Index significantly outperforming the MSCI EAFE® Growth Index and the MSCI EAFE® Index for the period from January 1, 2000 through September 30, 2004, and for the period January 1, 2004 through September 30, 2004. Under that environment, predominantly value-oriented funds have operated under more favorable market conditions when compared to the broader market and to more growth-oriented funds, and predominantly growth-oriented funds operated under less favorable conditions when compared to the broader market and to more value-oriented funds. |
| • | A fund’s relative performance in the Lipper performance universe may be significantly influenced by the category in which Lipper places the fund. |
| • | The directors also noted that the performance of each Fund, without taking expenses into account, was consistent with the performance, before expenses, of other accounts managed by Artisan Partners in the same investment strategy. |
Cost of services, economies of scale and benefits derived by Artisan Partners. The directors concluded that the overall expense ratio of each class of shares of each Fund was comparable to or more favorable than the expense ratios of its peers and that the fees each Fund pays to Artisan Partners (and Artisan Partners’ corresponding profits) are reasonable in relation to the nature and quality of services provided and in relation to the fees Artisan Partners charges its other clients who have similar investment strategies and objectives (but to whom Artisan Partners generally provides few or no services other than portfolio management). The directors also concluded that shareholders of the Funds (except for Artisan International Small Cap Fund) have benefited or will benefit from economies of scale under the management fee structures in the Advisory Agreements
80
EIGHTY
FACTORS CONSIDERED IN RENEWING THE FUNDS’ ADVISORY CONTRACTS
and that, because International Small Cap Fund closed at such a small asset level, Artisan Partners is not likely to enjoy economies of scale in its management. In reaching those conclusions, the directors considered the following:
| • | The rates of fee paid by each Fund to Artisan Partners have been stable, but the aggregate dollar amounts of the fees paid have increased as the Funds have grown. In return for its services, each Fund, other than Artisan International Small Cap Fund, pays Artisan Partners a monthly fee at the annual rate of 1% of the Fund’s average daily net assets up to $500 million; 0.975 of 1% of the next $250 million; 0.950 of 1% of the next $250 million; and 0.925 of 1% of average daily net assets over $1 billion. Artisan International Small Cap Fund pays Artisan Partners a monthly fee at the annual rate of 1.25% of the Fund’s average daily net assets. |
| • | Artisan Partners has undertaken to reimburse Artisan Mid Cap Value Fund and Artisan International Value Fund for any ordinary operating expenses for a fiscal year in excess of 2.00% of average net assets and to reimburse Artisan International Small Cap Fund for any ordinary operating expenses for a fiscal year in excess of 2.50% of average net assets. Each of those Funds is currently operating within that expense limitation. Similar limitations were in effect for each of the Funds in the periods following their inception. |
Other benefits derived by the Funds or Artisan Partners. The directors concluded that, other than the services provided by Artisan Partners pursuant to the Advisory Agreements and the management fees paid in return, the Funds and Artisan Partners may potentially benefit from their relationship with each other in several ways. For Artisan Partners, the directors concluded there were two principal benefits: (1) the potential conversion of a Fund shareholder to a separate account client; and (2) the acquisition of research products and services in return for commissions (“soft dollars”). The directors concluded that, although Artisan Partners derives or may derive those additional benefits, the Funds also benefit in similar fashion. In reaching those conclusions, the directors considered the following:
| • | Artisan Partners does not solicit the Funds’ shareholders to become separate account clients nor to purchase other goods or services provided by Artisan Partners or its affiliates. Artisan Partners refers potential separate account clients that do not meet Artisan Partners’ minimum separate account size requirements to the Funds. |
| • | Artisan Partners utilizes third-party research products and services and proprietary research from executing brokers paid for with soft dollars paid by the Funds and by other clients of Artisan Partners. Artisan Partners’ use of soft dollars provides Artisan Partners, and thereby the Funds, with access to third party and proprietary research and also helps Artisan Partners maintain important and open relationships with brokers. Use of a Fund’s commissions for soft dollar purposes is on the same terms as every other client account managed by Artisan Partners in the same investment strategy. |
81
EIGHTY-ONE
NOTES ON MANAGEMENT’S DISCUSSION OF FUND PERFORMANCE
The discussions of each Fund included in this report include statistical information about the portfolios of each of the Artisan Funds. Except as otherwise noted, that information is as of March 31, 2005 and that information will vary with changes in a Fund’s portfolio investments. The performance information for each Fund relative to its benchmark index discussed in this Report was prepared by the Adviser using information reported by FactSet Databases (“FactSet”). Artisan Funds may consider an issuer to be from a particular country if (i) its principal securities trading market is in that country; (ii) alone or on a consolidated basis it derives more of its annual revenue from goods produced, sales made or services performed in that country than any other country; or (iii) it is organized under the laws of, or has a principal office in that country. By applying these tests, it is possible that Artisan Funds could deem a particular issuer to be from more than one country.
Definitions of Portfolio Statistics
Median Market Cap provides a measure of the market capitalization value of the companies in a portfolio. Market capitalization is the aggregate value of all a company’s outstanding common stock. Market capitalization is calculated by FactSet using the price as of the most recent month-end multiplied by the number of shares outstanding as shown in the financial statements of the issuer. Equal numbers of companies in the portfolio have market capitalizations higher and lower than the median. Weighted Average Market Cap is the average of the market capitalizations of the companies in the portfolio weighted by the size of each company’s position within the portfolio. Weighted Average Growth Rate is a measure of the rate at which a company’s earnings are expected to grow and is the average of the 3-5 year forecasted growth rates of each company in the portfolio, weighted by the size of the company’s position within the portfolio. Median Price/Book Value measures the median ratio of portfolio stock prices to each stock’s book value of equity per share. Book value is a company’s assets minus its liabilities. Weighted Harmonic Average P/E is the harmonic average, which measures the price/earnings ratio (a measure of how expensive a stock is) of the Fund, excluding negative earners, weighted by the size of the company’s position within the portfolio. The earnings figures used are estimates for the current calendar year. Median P/E measures the median ratio of the portfolio stock prices to each stock’s earnings. The earnings figures used are estimates for the current calendar year.
Descriptions of Indices
Each Fund’s performance is compared in this report to changes in one or more indices, including in all cases a broad-based index of changes in prices of securities in the market in which the Fund invests. All of the indices are unmanaged and their returns include reinvested dividends. Unlike the Funds’ returns, the returns of each index do not include the payment of sales commissions or other expenses that would be incurred in the purchase or sale of the securities included in that index.
The indices to which the Funds are compared are:
Artisan International, Artisan International Small Cap and Artisan International Value Funds – Morgan Stanley Capital International EAFE® Index (MSCI EAFE®) is a market-weighted index of companies in developed markets, excluding the U.S. and Canada. MSCI EAFE’s average annual return since inception of the International Fund is based upon a starting date of December 31, 1995.
Artisan International Fund – Morgan Stanley Capital International EAFE® Growth Index (MSCI EAFE® Growth) is a market-weighted index of companies in developed markets, excluding the U.S. and Canada, with higher price-to-book ratios. MSCI EAFE Growth’s average annual return since inception of the International Fund is based upon a starting date of December 31, 1995.
82
EIGHTY-TWO
NOTES ON MANAGEMENT’S DISCUSSION OF FUND PERFORMANCE
Artisan International Small Cap Fund – Morgan Stanley Capital International EAFE® Small Cap Index (MSCI EAFE® Small Cap) is a market-weighted index of small companies in developed markets, excluding the U.S. and Canada.
Artisan International Value Fund – Morgan Stanley Capital International EAFE® Value Index (MSCI EAFE® Value) is a market-weighted index of companies in developed markets, excluding the U.S. and Canada, with lower price-to-book ratios.
Artisan Mid Cap Fund – Russell Midcap® Index is a market-weighted index of about 800 medium-sized U.S. companies. The Russell Midcap® Growth Index is a market-weighted index of those medium-sized companies included in the Russell Midcap® Index with higher price-to-book and higher forecasted growth values.
Artisan Mid Cap Value Fund – Russell Midcap® Index is a market-weighted index of about 800 medium-sized U.S. companies. The Russell Midcap® Value Index is a market-weighted index of those medium-sized companies included in the Russell Midcap® Index with lower price-to-book ratios and lower forecasted growth values.
Artisan Small Cap Fund – Russell 2000® Index is a market-weighted index of about 2,000 small U.S. companies. Russell 2000® Growth Index is a market-weighted index of those small companies included in the Russell 2000® Index with higher price-to-book ratios and higher forecasted growth values.
Artisan Small Cap Value Fund – Russell 2000® Index is a market-weighted index of about 2,000 small U.S. companies. The Russell 2000® Value Index is a market-weighted index of those small companies included in the Russell 2000® Index with lower price-to-book ratios and lower forecasted growth values.
Trademarks
Trademarks and copyrights relating to the indices and products of portfolio companies mentioned in this report are owned by their respective owners. Except as otherwise indicated, the trademarks, including names, logos, slogans and service marks appearing in this report are the property of Artisan Partners Limited Partnership and may not be copied, reproduced, published or in any way used without written permission.
PROXY VOTING POLICIES AND PROCEDURES
You may obtain a description of Artisan Funds’ proxy voting policies and procedures, without charge, upon request by calling 800.344.1770. That information also is included in Artisan Funds’ statement of additional information, which is available on the Funds’ website at www.artisanfunds.com and the Securities and Exchange Commission’s website at www.sec.gov.
Information relating to how each Artisan Fund voted proxies relating to portfolio securities held during the twelve months ended June 30 is available on the Funds’ website at www.artisanfunds.com and on the Securities and Exchange Commission’s website at www.sec.gov.
83
EIGHTY-THREE
INFORMATION ABOUT PORTFOLIO SECURITIES
Artisan Funds files a complete schedule of portfolio holdings with the Securities and Exchange Commission for the quarters ending December 31 and June 30 (the Funds’ first and third quarters of its fiscal year) on Form N-Q. The Funds’ Forms N-Q, when filed, will be available on the Securities and Exchange Commission’s website at www.sec.gov. You may also review and copy those documents by visiting the Securities and Exchange Commission’s Public Reference Room in Washington, D.C. Information on the operation of the Public Reference Room may be obtained by calling the Securities and Exchange Commission at 800.SEC-0330.
84
EIGHTY-FOUR
 | ARTISAN FUNDS P.O. BOX 8412 BOSTON, MA 02266-8412
800.344.1770 WWW.ARTISANFUNDS.COM |
|


ARTISAN
SEMIANNUAL
REPORT
MARCH 31, 2005
ARTISAN INTERNATIONAL
FUND
_________
ARTISAN MID CAP FUND
Artisan Funds, Inc.
Institutional SHARES
| 01 | MANAGEMENT’S DISCUSSION OF FUND PERFORMANCE | |
| 01 | Artisan International Fund | |
| 05 | Artisan Mid Cap Fund | |
| 09 | SCHEDULES OF INVESTMENTS | |
| 09 | Artisan International Fund | |
| 12 | Artisan Mid Cap Fund | |
| 15 | STATEMENTS OF ASSETS AND LIABILITIES | |
| 16 | STATEMENTS OF OPERATIONS | |
| 17 | STATEMENTS OF CHANGES IN NET ASSETS | |
| 20 | FINANCIAL HIGHLIGHTS |
ARTISAN FUNDS
P.O. BOX 8412
BOSTON, MA 02266-8412
This report and the unaudited financial statements contained herein are provided for the general information of the shareholders of the Institutional Shares of Artisan International Fund and Artisan Mid Cap Fund. This report is not authorized for distribution to prospective investors unless preceded or accompanied by an effective prospectus. For more complete information on any Fund, including fees and expenses, please call 800.399.1770 for a free prospectus. Read it carefully before you invest or send money.
Company discussions are for illustration only and are not intended as recommendations of individual stocks. The discussions present information about the companies believed to be accurate, and the views of the portfolio managers, as of March 31, 2005. That information and those views may change, and the Funds disclaim any obligation to advise shareholders of any such changes.
Artisan Funds offered through Artisan Distributors LLC, member NASD.
ARTISAN INTERNATIONAL FUND INSTITUTIONAL SHARES
| HIGHLIGHTS | ||
•During the six months ended March 31, 2005, Artisan International Fund (up 14.66%) slightly outperformed the MSCI EAFE® Growth Index (up 14.13%), but slightly trailed the MSCI EAFE® Index (up 15.13%). •The Fund benefited from the strength of its media holdings in the consumer | discretionary sector and good security selection in the financial sector. •The Fund generated positive returns in every sector, but holdings in the technology and industrials sectors trailed those of similar stocks in the MSCI EAFE® Index. | |
| INVESTMENT APPROACH | ||
| We use a bottom-up investment process to construct a portfolio of international growth companies of all market capitalizations. The investment team conducts its own fundamental analysis with particular emphasis on: | 1) well-managed companies focused on increasing shareholder value; 2) sustainable growth prospects; 3) reasonable valuations; or 4) dominant or increasing market shares or direct exposure to an identified theme. | |
| PERFORMANCE REVIEW | ||
| Over the long-term, Artisan International Fund has outpaced the MSCI EAFE® Index by a wide margin. | ||
GROWTH OF AN ASSUMED $10,000 INVESTMENT (7/1/97 to 3/31/05)
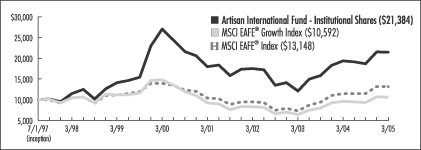
AVERAGE ANNUAL TOTAL RETURNS (as of 3/31/05)
| Fund / Index | 1-Year | 3-Year | 5-Year | Since Inception | ||||||||
Artisan International Fund - Institutional Shares | 10.62 | % | 6.97 | % | -4.55 | % | 10.30 | % | ||||
MSCI EAFE® Growth Index | 10.71 | 8.63 | -6.47 | 0.74 | ||||||||
MSCI EAFE® Index | 15.06 | 11.64 | -1.15 | 3.59 |
The performance quoted represents past performance, which does not guarantee future results. The investment return and principal value of an investment in the Fund will fluctuate, so that an investor’s shares in the Fund, when redeemed, may be worth more or less than their original cost. The inception date shown is inception of the Fund’s Institutional Shares. Current performance may be lower or higher than the performance data quoted. For current to most recent month-end performance information or for performance information for periods before inception of the Fund’s Institutional Shares, call 800.399.1770. The graph and table above do not reflect the deduction of taxes that a shareholder would pay on distributions or sale of Fund shares. The performance shown does not reflect the deduction of a 2% redemption fee on shares held by an investor for 90 days or less and, if reflected, the fee would reduce the performance quoted. See page 38 for a description of each index.
01
ONE
INVESTING ENVIRONMENT
The semiannual reporting period ended March 31, 2005 was clearly a tale of two halves for international equity markets. The first three months were characterized by strong equity returns as the price of oil retreated. Global economic growth expectations, though slower, pointed to ongoing expansion. During the second half of the period, the rally fizzled out as the price of oil reversed course and inflation worries in the United States sent long-term interest rates on an upward path.
For U.S.-based international investors, the dollar was clearly an important factor during the period as it decreased versus a variety of currencies. The decline resulted in favorable currency conversions, which further enhanced returns, including those of the Fund.
Investors favored international small-cap stocks during the six-month period, continuing an extended run of outperformance relative to larger stocks. Emerging market stocks outperformed developed markets, even after accounting for a considerable pullback in the group at the end of the period when U.S. interest rates started to move higher. Though the advantage was relatively small, value stocks outpaced growth stocks.
PERFORMANCE DISCUSSION
Within the portfolio, we benefited from the performance of our holdings in the financial and consumer discretionary sectors, certain positions in the materials and energy sectors and our low relative exposure to pharmaceutical companies. The portfolio was negatively impacted, relative to our benchmark, by our technology and industrials positions. On a regional basis, our security selection in Japan was strong. Relative performance gains and losses in other areas around the world were mostly modest.
SECTOR REVIEW
Credit Suisse Group (CSG), Nikko Cordial Corp., Julius Baer Holding, Ltd., ORIX Corp. and Kookmin Bank were among our leading performers in the financial sector. CSG released a favorable earnings report due to lower loss provisions and strong fixed income trading. Nikko Cordial rose early in the period due in part to a solid financial report and news that Mizuho Financial Group, Inc. planned to buy a stake in the company, but we reduced our position as Nikko Cordial’s commissions and trading profits fell later in the period. Swiss private bank Julius Baer rose due to good operating results, speculation that it might seek a buyer and news that the controlling Baer family would give up control of the company. At ORIX, profit growth accelerated in real estate related finance and lease financing and asset quality improved.
TOP 10 HOLDINGS
| Company Name | Country | % | |||
UBS AG | Switzerland | 3.4 | % | ||
Fortis | Netherlands | 3.2 | |||
Kingfisher PLC | United Kingdom | 2.7 | |||
Tesco PLC | United Kingdom | 2.5 | |||
ITV PLC | United Kingdom | 2.5 | |||
Telefonaktiebolaget LM Ericsson | Sweden | 2.4 | |||
China Mobile (Hong Kong) Limited | China | 2.3 | |||
Sega Sammy Holdings, Inc. | Japan | 2.3 | |||
Nestle S.A. | Switzerland | 2.3 | |||
Credit Saison Co., Ltd. | Japan | 2.3 | |||
Total | 25.9 | % |
As a percentage of total net assets as of 3/31/05. Top 10 Holdings are determined by issuer.
In the insurance industry, we cut our exposure to German insurer Allianz AG by about half and sold our position in German reinsurer Muenchener Rueckversicherungs-Gesellschaft AG (Munich Re). Some of that capital was used to fund the purchases of Korean banks Shinhan Financial Group Co., Ltd. and Hana Bank. We also increased our position in Kookmin Bank, another Korean bank. With our Korean banks, we were attracted to the potential for improvements in asset quality and profitability and a shifting focus on consumer-related businesses.
In the consumer discretionary sector, we benefited from the performance of our media stocks and amusement/game machines manufacturer Sega Sammy Holdings Inc. In the media industry, British media company ITV PLC benefited from an announced increase in earnings due in part to cost cutting efforts. Reports that it had successfully renegotiated better than expected deals with
02
TWO
major advertisers also likely positively impacted the company’s share price. British satellite television provider British Sky Broadcasting Group PLC (BSkyB) showed improvement in subscriber growth and its shares traded at an attractive price relative to the company’s estimated earnings growth potential. Another winner was French outdoor advertiser JC Decaux S.A. It reported robust organic growth and better earnings driven by improvements in the profitability of street furniture and billboard activities.
SECTOR DIVERSIFICATION
| Sector | 9/30/04 | 3/31/05 | ||||
Consumer Discretionary | 23.9 | % | 23.3 | % | ||
Consumer Staples | 11.9 | 10.6 | ||||
Energy | 8.2 | 6.0 | ||||
Financials | 26.8 | 33.4 | ||||
Healthcare | 4.5 | 2.6 | ||||
Industrials | 4.7 | 4.4 | ||||
Information Technology | 6.4 | 6.5 | ||||
Materials | 4.8 | 2.1 | ||||
Telecommunication Services | 6.9 | 10.2 | ||||
Utilities | 0.7 | 0.3 | ||||
Other assets less liabilities | 1.2 | 0.6 | ||||
Total | 100.0 | % | 100.0 | % |
As a percentage of total net assets.
During the period, we purchased shares of Sega Sammy Holdings, Inc. after having owned small positions in Sega Corporation and Sammy Corporation individually prior to their merger. It contributed to performance due in part to positive expectations about management’s restructuring efforts and emphasis on profits. Swiss food giant Nestle S.A. and British foodservice group Compass Group PLC also performed well during the semiannual period. Nestle announced a share buyback program for the first time in its 132 year history. Compass was under pressure in the months leading up to the semiannual reporting period due to negative cash flow expectations resulting in part from new payment terms with suppliers. That news, coupled with concerns about the sustainability of catering margins, led us to sell our position. British home improvement retailer Kingfisher PLC was a laggard due in part to slower consumer spending. Interest rate hikes by the Bank of England were partly to blame.
Within the materials and energy sectors, Canadian natural gas company EnCana Corporation, Swiss specialty chemical manufacturer Clariant AG and German industrial gases company Linde AG were standouts. EnCana reported a surge in profits driven by an asset sale, higher realized prices and stronger production. Clariant and Linde also released solid financial results. We reduced our positions in EnCana and Clariant and we sold our position in Linde into the share price strength.
Swedish wireless network provider Telefonaktiebolaget LM Ericsson (Ericsson) and Dutch semiconductor equipment company ASML Holding N.V. account for the majority of our technology assets. Ericsson fell during the period due to higher than expected costs. ASML, which struggled for most of calendar year 2004, bounced back amid improving demand for semiconductors.
Our outperformance in healthcare and underperformance in the industrials sectors were partly a function of our allocations to each group. Although we believed that healthcare was attractive long-term due to demographics, we became concerned during the period about the fundamentals of most pharmaceutical companies because of drug development costs, higher litigation risks, patent protection and generics competition. We benefited from our relatively small investment in pharmaceutical companies during the period, as the industry trailed the benchmark return. In the industrials sector, we invested in a few companies where we had a level of confidence in the long-term growth characteristics, but overall we believed that the sector was too cyclical. In contrast to the healthcare sector, our performance compared to the MSCI EAFE® Index was negatively impacted by our underweight position in the sector, as it was one of the better performing groups.
COUNTRY REVIEW
Japan lagged many other developed markets during the period as reports indicated that economic growth had stalled and fears about higher taxes started to surface. However,
03
THREE
positive signs emerged as the country’s largest banks cut bad loans, and both profit margins and sales growth generally showed signs of improvement. Despite the general weakness of Japanese equities, we were able to generate a positive relative gain with good security selection. Several of our solid individual performers were noted above including Sega Sammy Holdings, Nikko Cordial and ORIX.
REGION ALLOCATION
| Region | 9/30/04 | 3/31/05 | ||||
Europe | 65.6 | % | 61.3 | % | ||
Asia/Pacific | 25.0 | 32.1 | ||||
Latin America | 5.3 | 3.2 | ||||
North America | 2.9 | 2.8 |
As a percentage of total net assets.
TOP 5 COUNTRY ALLOCATIONS
| Country | % | ||
Japan | 19.4 | % | |
United Kingdom | 12.6 | ||
Switzerland | 10.8 | ||
France | 6.1 | ||
Netherlands | 5.9 |
As a percentage of total net assets as of 3/31/05.
The primary factors that influenced performance in Europe were a rising euro, which has stymied exports, and rising unemployment and oil prices that have tempered consumer spending and investment demand. However, the European Central Bank kept monetary policy very flexible, European manufacturing showed some improvement and many European stocks appeared to be attractively priced. The performance of our stocks in Europe was slightly ahead of the benchmark’s return in the region. Our selection in Switzerland was particularly strong due to the performances of previously mentioned Clariant, Credit Suisse Group, Julius Baer and Nestle.
Our emerging markets stocks did not keep pace with our investments in developed markets and trailed the MSCI EAFE® Index, though they collectively advanced over 13%. Our Russian oil stocks were the main source of underperformance, due in part to government tax claims that created negative sentiment for the country. One standout was Czech wireless provider Cesky Telecom, A.S., the price of which increased over 40%. It benefited from news about potential bidders for the government’s more than 50% stake in the company.
FUND CHANGES
The biggest changes to the overall composition of the portfolio during the period were an increase in our financial and telecommunication weights and a reduction in our European exposure.
The U.K. and Germany accounted for virtually all of the decrease in Europe, but this was an extension of our bottom-up security selection process, not a macroeconomic call. The sales that contributed to a lower weight in Europe included Munich Re, Compass Group, Linde, German stock exchange owner Deutsche Boerse AG, Swiss pharmaceuticals company Serono S.A., French energy company Total S.A., British beverage company Diageo PLC, Dutch consumer products company Unilever N.V. and British chemicals company Imperial Chemical Industries PLC. Three of our largest purchases in the region were French telecommunications provider France Telecom SA, Dutch financial services company ING Groep N.V. and France-based supermarket/hypermarket operator Carrefour SA.
The increase in our financials weight reflects the purchases of Hana Bank, Shinhan Financial Group and ING Groep and the additions to Kookmin Bank, ORIX, Credit Saison Co., Ltd. and Mizuho Financial Group, Inc. The change in our telecommunications weight was mainly due to the purchase of France Telecom and additions to Chinese wireless provider China Mobile (Hong Kong) Limited.
FUND STATISTICS
Net Assets | $11.2 billion | ||
Number of Holdings | 110 | ||
Weighted Average Market Cap | $ 31.0 billion | ||
Weighted Average Growth Rate (3-5 yr) | 11.3 | % | |
Weighted Harmonic Average P/E (2005E) | 15.1X |
Source: FactSet/Artisan Partners. All statistics are as of 3/31/05. Net Assets includes Investor Shares and Institutional Shares.
04
FOUR
INSTITUTIONAL SHARES
| HIGHLIGHTS | ||
• During the six months ended March 31, 2005, Artisan Mid Cap Fund (up 9.78%) trailed the Russell Midcap® Index (up 13.37%) and the Russell Midcap® Growth Index (up 12.04%). • Security selection in the technology sector was a leading contributor to performance compared to both benchmarks. | • Though returns were positive, the performance of the Fund’s stocks in the healthcare sector did not keep pace with those in the benchmarks. | |
| INVESTMENT APPROACH | ||
| We use a bottom-up investment process to identify well-managed mid-sized companies whose growth and profit potential are not yet fully recognized by investors. Specifically, we spend most of our time answering three questions about a company before we will invest in it: | 1) Does the company exhibit franchise characteristics? 2) Is the company positioned for long-term growth and at an early stage in its profit cycle? 3) Is the stock of the company trading at a reasonable discount to our estimate of its private market value? | |
| PERFORMANCE REVIEW | ||
| Artisan Mid Cap Fund has outperformed the Russell Midcap® Growth Index since the Fund’s inception. | ||
GROWTH OF AN ASSUMED $10,000 INVESTMENT (7/1/00 to 3/31/05)
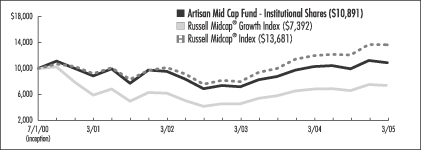
AVERAGE ANNUAL TOTAL RETURNS (as of 3/31/05)
| Fund / Index | 1-Year | 3-Year | Since Inception | ||||||
Artisan Mid Cap Fund - Institutional Shares | 6.04 | % | 4.52 | % | 1.81 | % | |||
Russell Midcap® Growth Index | 8.31 | 6.19 | -6.16 | ||||||
Russell Midcap® Index | 14.05 | 10.53 | 6.82 |
The performance quoted represents past performance, which does not guarantee future results. The investment return and principal value of an investment in the Fund will fluctuate, so that an investor’s shares in the Fund, when redeemed, may be worth more or less than their original cost. The inception date shown is inception of the Fund’s Institutional Shares. Current performance may be lower or higher than the performance data quoted. For current to most recent month-end performance information or for performance information for periods before inception of the Fund’s Institutional Shares, call 800.399.1770. The graph and table above do not reflect the deduction of taxes that a shareholder would pay on distributions or sale of Fund shares. See page 38 for a description of each index.
05
FIVE
INVESTING ENVIRONMENT
The six months ended March 31, 2005 was a good period to own mid-cap stocks. Returns were heavily weighted to the front half of the period, but most sectors in the Russell Midcap® Index and the Russell Midcap® Growth Index posted double-digit gains. Coming into the period we were cautiously optimistic, given the continued fundamental improvement being enjoyed by much of corporate America. Balance sheets were healthier, earnings growth expectations were solid and importantly, catalysts were in place with the potential to increase capital spending across large segments of the economy. In addition, the relative weakness of the dollar offered potential benefits to American exporters. Even the consumer remained healthy despite the absence of any new fiscal and monetary stimulus and only modest job growth.
With that support, two drivers of the early rally in equities were an incumbent victory in the presidential election and a decline in the price of oil. However, as the period wore on investors moved into a more defensive mode as oil moved higher, inflation worries started to pick up and the Federal Reserve kept on its path to push short-term interest rates higher.
In the Russell Midcap® Index and the Russell Midcap® Growth Index, energy, utilities, materials and technology were among the favored sectors. The consumer staples sector also did relatively well. The financial sector was the worst relative performer. Producer durable and transportation stocks trailed as well, though the disparity was less pronounced.
PERFORMANCE DISCUSSION
The Fund generated a solid absolute return, advancing nearly 10%, but trailed the benchmark indices. Our technology related stocks were one of the leading contributors to performance compared to both benchmarks. The portfolio also had several winners in the retail industry, though gains in those consumer related stocks were offset by weakness in others. Our stocks in the healthcare sector underperformed similar companies in the indices.
Many of our technology related holdings are exposed to the favorable secular trend we internally refer to as the digital lifestyle. Broadly speaking, it is the convergence of digital technology and mobility. Companies exposed to this trend in technology can be found across many sectors in the portfolio. Macromedia, Inc., Seagate Technology, VeriSign, Inc., CheckFree Corporation and Western Wireless Corporation were our leading performers within that trend. Each company’s stock price advanced in excess of 40% during the period. Macromedia, which develops software tools for the delivery of content across the Internet, reported strong results from its division targeting software development for mobile devices. Hard disk drive manufacturer Seagate Technology saw momentum build in its consumer division due to growing demand for devices such as MP3 players, cell phones and digital cameras. VeriSign, a leading provider of infrastructure services that allow users to conduct business securely over the Internet, reported revenues well ahead of expectations. Its recently acquired Jamba! business was the primary source of the upside, due to robust demand for wireless downloads. CheckFree is the leading provider of online bill payment solutions. It has benefited from growth in the adoption of online bill payment as banks continue to offer the service in an effort to defend and gain consumer market share. Wireless phone service provider Western Wireless jumped due to a premium acquisition offer from Alltel Corporation, another wireless provider. We sold out of our shares in Western subsequent to the announcement.
TOP 10 HOLDINGS
| Company Name | % | ||
Constellation Brands, Inc. | 2.3 | % | |
Air Products and Chemicals, Inc. | 2.1 | ||
Yahoo! Inc. | 1.9 | ||
Danaher Corporation | 1.8 | ||
Allergan, Inc. | 1.8 | ||
Willis Group Holdings Limited | 1.8 | ||
Invitrogen Corporation | 1.8 | ||
Smith International, Inc. | 1.6 | ||
ITT Industries, Inc. | 1.6 | ||
Chico’s FAS, Inc. | 1.6 | ||
Total | 18.3 | % |
As a percentage of total net assets as of 3/31/05. Top 10 Holdings are determined by issuer.
06
SIX
Jabil Circuit, Inc. and Lam Research Corporation were two additional winners among our technology related positions. Jabil Circuit, which is a leading provider of electronics manufacturing services, continued to generate strong growth and its profitability levels were strong versus comparable companies. Semiconductor equipment manufacturer Lam Research was able to drive market share gains due to strong order growth for semiconductor manufacturing equipment, particularly among Japanese and other Asian customers.
Another trend that we tend to think about across the portfolio is the impact of economic growth in China. China’s dynamic growth in recent years has had a significant impact on many industries, most notably those sensitive to commodity prices. We concur with those who believe the case for continued economic growth in China is very strong, and in a few special situations, we have made limited investments in commodity sensitive companies such as Peabody Energy Corporation and Devon Energy Corporation. However, we have made more investments in companies we thought could benefit from that growth in other ways.
Clean water, reliable power and better means of transport are three of the most basic demands of a growing society. Some of our holdings that address those demands performed well during the period, including Air Products and Chemicals, Inc., Precision Castparts Corp., Joy Global Inc. and ITT Industries, Inc. In addition, we initiated positions in several other companies within that profile that we thought could benefit from China’s growth. Among those purchases were The AES Corporation and Pentair, Inc. Diversified industrial and consumer products company Danaher Corporation was one stock within this group that did not perform as well. We used the softness as an opportunity to increase our position.
FUND STATISTICS
Net Assets | $ 5.9 billion | ||
Number of Holdings | 108 | ||
Median Market Cap | $ 6.0 billion | ||
Weighted Average Market Cap | $ 8.7 billion | ||
Weighted Average Growth Rate (3-5 yr) | 17.8 | % | |
Weighted Harmonic Average P/E (2005E) | 20.2X |
Source: FactSet/Artisan Partners. All statistics are as of 3/31/05. Net assets includes Investor Shares and Institutional Shares.
In the retail industry, our relative gains were primarily due to American Eagle Outfitters, Inc., Chico’s FAS, Inc. and CarMax, Inc. Teen apparel retailer American Eagle had a strong series of sales results as its merchandising proved to be “trend right”, which led to higher profits. Chico’s, a private label women’s clothing retailer with a loyal customer base, reported impressive sales results during the period, and its new clothing concepts started to add meaningfully to the strength of its core brand. Used car retailer CarMax added a sub-prime lending partner, which management believed would boost sales.
Beverage company Constellation Brands, Inc. was another leader in the consumer sectors. Its gain was due in part to the announced acquisition of premium wine producer, Mondavi. The deal was expected to result in cost synergies and accelerated profit growth. Constellation also demonstrated the strength of its current profit cycle by reporting a solid increase in profits. It was our top holding as of March 31, 2005. Offsetting the relative strength of Constellation Brands were Yahoo! Inc. and leading Spanish language media company Univision Communications Inc. We continued to believe in the long-term prospects of both and increased our position in each. Two underperformers in which we did not increase our weighting were Iron Mountain Incorporated and Lamar Advertising Company. (We tend to think of both companies as more directly tied to business spending than consumer spending, but the benchmarks classify them in the consumer discretionary sector.) Iron Mountain is the global leader in records and information management. It dropped due to a conservative outlook for earnings and cash flow in 2005 and some reservations about the company’s decision to attack the digital portion of the marketplace aggressively. Outdoor advertiser Lamar Advertising posted decent revenue growth, but higher expenses negatively impacted profitability.
In the healthcare sector, drug developer Millennium Pharmaceuticals, Inc. radiation therapy systems manufacturer Varian Medical Systems, Inc. and medical device maker Boston Scientific Corporation negatively impacted our results. Millennium provided a disappointing
07
SEVEN
outlook for one of its key drugs causing us to lose confidence in its prospects and we sold our position. Varian is the market leader worldwide, but U.S. order growth has slowed as customers evaluated their next-generation systems. We remained confident in growth outside the U.S., so we purchased additional shares on weakness. Boston decreased due to management’s intentions to increase spending to spur growth. We did not disagree with that approach, but ultimately sold our shares due to competitive concerns.
Healthcare benefits provider Aetna Inc., pharmacy benefit manager Caremark Rx, Inc. and biology tool kit provider Invitrogen Corporation were three standout performers for the period. Aetna benefited from good membership growth and earnings and generally positive sentiment for managed care providers due to, among other things, the re-election of President Bush. Caremark reported solid earnings due to strong demand for mail-order prescriptions and higher generic drug utilization. Invitrogen executed well and delivered solid growth due to robust demand.
FUND CHANGES
Two important changes to the Fund during the period were a reduction in the number of holdings (from 116 to 108) and an increase in the amount of assets we had committed to our largest twenty positions (from 27.2% to 33.1%). Our largest positions are those companies where our conviction is highest. We were provided the opportunity to make those adjustments in the first three months of 2005 when the market was being driven by a fair amount of uncertainty. During that time frame we also had the opportunity to introduce several new companies into the portfolio that we have researched extensively in the past. Those new purchases included The AES Corporation, CACI International Inc., Electronic Arts Inc., Cognizant Technology Solutions Corporation, Marvell Technology Group Ltd. and Zebra Technologies Corporation.
SECTOR DIVERSIFICATION
| Sector | 9/30/04 | 3/31/05 | ||||
Auto & Transportation | 4.0 | % | 1.3 | % | ||
Consumer Discretionary | 24.9 | 22.1 | ||||
Consumer Staples | 2.1 | 3.4 | ||||
Financial Services | 10.3 | 11.6 | ||||
Healthcare | 16.6 | 14.7 | ||||
Integrated Oils | — | — | ||||
Materials & Processing | 8.1 | 8.6 | ||||
Other | 2.4 | 3.9 | ||||
Other Energy | 5.0 | 5.3 | ||||
Producer Durables | 8.1 | 7.4 | ||||
Technology | 14.9 | 19.7 | ||||
Utilities | 0.9 | 0.5 | ||||
Other assets less liabilities | 2.7 | 1.5 | ||||
Total | 100.0 | % | 100.0 | % |
As a percentage of total net assets.
On a sector basis, the main changes to the composition of the portfolio were an increase in our technology weight and reductions in the auto and transportation and consumer discretionary sectors. In addition to the purchases of CACI International, Cognizant Technology Solutions, Marvell Technology and Zebra Technologies, we also initiated positions in NCR Corporation, Comverse Technology, Inc. and MEMC Electronic Materials, Inc. We increased our allocations to Juniper Networks, Inc., Altera Corporation and Broadcom Corporation.
In the transportation sector we sold overnight delivery company FedEx Corporation, truckmaker PACCAR Inc and low-fare airline JetBlue Airways Corporation. FedEx and PACCAR were sold after reaching our price targets. JetBlue was sold due to our concerns about increased competition in certain markets and pressure from high oil prices. In the consumer discretionary sector, we sold satellite television provider EchoStar Communications Corporation due to slowing subscriber growth. We sold technology consultant Accenture Ltd. and IT solutions provider CDW Corporation in favor of better alternatives.
08
EIGHT
Schedule of Investments – March 31, 2005 (Unaudited)
Shares Held | Value | ||||
| COMMON AND PREFERRED STOCKS - 99.4% | |||||
| AUSTRALIA - 0.2% | |||||
Publishing & Broadcasting Limited | 1,601,320 | $ | 19,032,799 | ||
| AUSTRIA - 0.2% | |||||
Erste Bank der oesterreichischen Sparkassen AG | 400,400 | 20,943,214 | |||
| BELGIUM - 1.3% | |||||
InBev NV | 4,244,104 | 148,599,152 | |||
| BRAZIL - 0.7% | |||||
Banco Bradesco S.A. (ADR) | 20,300 | 588,700 | |||
Banco Itau Holding Financiera S.A., Preferred (ADR) | 100 | 8,115 | |||
Telesp Celular Participacoes S.A., Preferred (ADR)(1) | 13,653,068 | 81,645,347 | |||
| 82,242,162 | |||||
| CANADA - 2.8% | |||||
Corus Entertainment, Inc., Class B | 3,015,450 | 72,912,220 | |||
EnCana Corporation | 2,347,300 | 165,768,239 | |||
Nortel Networks Corporation(1) | 19,127,819 | 52,218,946 | |||
Research In Motion Limited(1) | 229,900 | 17,568,958 | |||
| 308,468,363 | |||||
| CHINA - 3.2% | |||||
China Merchants Holdings International Company Limited | 11,590,000 | 22,735,834 | |||
China Mobile (Hong Kong) Limited | 74,544,400 | 256,797,877 | |||
Citic Pacific Limited | 18,818,400 | 55,011,510 | |||
Cosco Pacific Limited | 8,576,000 | 18,637,622 | |||
| 353,182,843 | |||||
| CZECH REPUBLIC - 1.1% | |||||
Cesky Telecom, A.S. | 6,856,378 | 128,122,308 | |||
| DENMARK - 0.8% | |||||
Novo Nordisk A/S, Class B | 1,563,250 | 87,039,131 | |||
| FRANCE - 6.1% | |||||
Air Liquide S.A. | 125,887 | 23,156,291 | |||
Carrefour S.A. | 2,246,598 | 119,228,185 | |||
France Telecom S.A. | 4,550,465 | 136,261,601 | |||
JC Decaux S.A.(1) | 6,538,942 | 178,513,712 | |||
Shares Held | Value | ||||
| FRANCE (CONTINUED) | |||||
LVMH Moet Hennessy Louis Vuitton S.A. | 524,627 | $ | 39,240,287 | ||
M6 Metropole Television | 1,260,034 | 35,281,070 | |||
PagesJaunes S.A.(1) | 4,330,398 | 106,319,645 | |||
Vivendi Universal S.A. | 1,295,100 | 39,670,964 | |||
| 677,671,755 | |||||
| GERMANY - 4.6% | |||||
Allianz AG | 817,238 | 103,766,871 | |||
Bayerische Hypo-und Vereinsbank AG(1) | 5,432,794 | 132,892,621 | |||
Commerzbank AG(1) | 4,917,000 | 106,699,256 | |||
KDG Investors, L.P.(1)(2)(3) | - | 57,000 | |||
Merck KGaA | 462,162 | 32,950,549 | |||
ProSiebenSat.1 Media AG, Preferred | 7,134,353 | 133,729,929 | |||
| 510,096,226 | |||||
| HONG KONG - 3.1% | |||||
Cheung Kong (Holdings) Limited | 8,361,900 | 73,975,870 | |||
Hang Lung Group Limited | 1,566,700 | 2,741,918 | |||
Hang Lung Properties Limited | 24,150,000 | 35,143,824 | |||
Henderson Land Development Company Limited | 1,248,900 | 5,556,396 | |||
Hong Kong & China Gas Company Limited | 17,578,150 | 34,595,337 | |||
HSBC Holdings PLC | 6,827,600 | 108,548,987 | |||
Sun Hung Kai Properties Limited | 9,463,400 | 85,843,944 | |||
| 346,406,276 | |||||
| ITALY - 5.0% | |||||
Assicurazioni Generali S.p.A | 4,898,421 | 158,110,672 | |||
Banca Intesa S.p.A | 22,484,597 | 114,255,444 | |||
Eni S.p.A. | 4,693,717 | 121,871,899 | |||
Mediobanca S.p.A | 1,060,500 | 18,407,592 | |||
Saipem S.p.A. | 11,882,804 | 150,648,051 | |||
| 563,293,658 | |||||
| JAPAN - 19.4% | |||||
Canon Inc. | 992,200 | 53,204,794 | |||
Credit Saison Co., Ltd. | 6,999,700 | 251,970,922 | |||
East Japan Railway Company | 13,631 | 73,220,703 | |||
Fuji Television Network, Inc. | 21,198 | 50,014,865 | |||
Honda Motor Co., Ltd. | 4,204,200 | 210,543,262 | |||
Japan Tobacco, Inc | 4,932 | 54,733,564 | |||
Jupiter Telecommunications Co., Ltd.(1) | 67,932 | 54,165,681 | |||
Keyence Corp. | 380,350 | 88,108,682 | |||
Mitsubishi Corp. | 5,866,200 | 75,987,614 | |||
Mizuho Financial Group, Inc. | 36,430 | 172,246,666 | |||
Nikko Cordial Corp. | 19,295,150 | 96,448,759 | |||
09
NINE
Shares Held | Value | ||||
| JAPAN (CONTINUED) | |||||
Nomura Holdings, Inc. | 3,849,000 | $ | 53,842,208 | ||
ORIX Corp. | 1,537,500 | 196,005,083 | |||
Promise Co., Ltd. | 1,901,583 | 129,987,908 | |||
Sega Sammy Holdings, Inc. | 4,161,400 | 253,029,264 | |||
SMC Corp. | 798,200 | 90,293,444 | |||
Sumitomo Metal Industries, Ltd. | 22,944,800 | 41,297,644 | |||
The Sumitomo Trust & Banking Co., Ltd. | 15,557,500 | 101,414,646 | |||
Tokyo Broadcasting System, Inc. | 2,192,000 | 42,723,865 | |||
Tokyu Corp. | 14,866,400 | 77,499,931 | |||
| 2,166,739,505 | |||||
| LUXEMBOURG - 0.5% | |||||
RTL Group | 772,286 | 58,364,994 | |||
| MEXICO - 2.5% | |||||
Grupo Televisa S.A. (ADR) | 3,054,300 | 179,592,840 | |||
Wal-Mart de Mexico S.A. de C.V., Series V | 29,419,200 | 103,232,193 | |||
| 282,825,033 | |||||
| NETHERLANDS - 5.9% | |||||
ASML Holding N.V.(1) | 9,719,985 | 164,178,294 | |||
ASML Holding N.V., NY Shares(1)(4) | 1,471,500 | 24,677,055 | |||
Fortis | 12,360,376 | 352,661,014 | |||
ING Groep N.V. | 4,032,301 | 121,790,831 | |||
| 663,307,194 | |||||
| NORWAY - 1.1% | |||||
Stolt Offshore S.A.(1) | 524,900 | 4,050,659 | |||
Telenor ASA | 12,702,300 | 114,260,863 | |||
| 118,311,522 | |||||
| PORTUGAL - 0.6% | |||||
Banco Comercial Portugues, S.A. | 24,374,509 | 66,353,051 | |||
| REPUBLIC OF KOREA - 2.7% | |||||
Hana Bank | 2,648,840 | 73,035,470 | |||
Kookmin Bank | 3,401,365 | 151,897,492 | |||
Shinhan Financial Group Co., Ltd. | 2,596,920 | 69,558,074 | |||
Woori Finance Holdings Co., Ltd. | 420,220 | 4,138,060 | |||
| 298,629,096 | |||||
| RUSSIA - 2.4% | |||||
AFK Sistema - 144A (GDR)(1) | 2,558,761 | 41,579,866 | |||
Gazprom (ADR) | 187,546 | 6,320,300 | |||
LUKOIL (ADR) | 1,178,078 | 159,629,569 | |||
Sibneft (ADR)(1) | 3,882,279 | 60,796,489 | |||
| 268,326,224 | |||||
| SINGAPORE - 2.4% | |||||
DBS Group Holdings Limited | 8,909,497 | 80,418,904 | |||
Keppel Corporation Limited | 1,687,500 | 11,142,662 | |||
Shares Held | Value | ||||
| SINGAPORE (CONTINUED) | |||||
Singapore Airlines Limited | 9,778,000 | $ | 70,488,081 | ||
Singapore Telecommunications Limited | 66,787,970 | 104,384,651 | |||
| 266,434,298 | |||||
| SPAIN - 5.9% | |||||
Altadis, S.A. | 1,910,301 | 78,128,034 | |||
Banco Bilbao Vizcaya Argentaria, S.A. | 7,298,603 | 118,832,466 | |||
Banco Santander Central Hispano, S.A. | 7,145,800 | 86,980,555 | |||
Industria de Diseno Textil, S.A. | 2,646,813 | 79,154,677 | |||
Promotora de Informaciones, S.A. | 7,320,664 | 147,945,690 | |||
Telefonica, S.A. | 8,661,080 | 150,895,763 | |||
| 661,937,185 | |||||
| SWEDEN - 2.4% | |||||
Telefonaktiebolaget LM Ericsson, Class B(1) | 57,674,100 | 162,315,206 | |||
Telefonaktiebolaget LM Ericsson (ADR)(1) | 3,715,650 | 104,781,330 | |||
| 267,096,536 | |||||
| SWITZERLAND - 10.8% | |||||
Clariant AG | 9,579,379 | 165,389,554 | |||
Credit Suisse Group | 3,933,727 | 168,886,653 | |||
Julius Baer Holding, Ltd., Class B | 247,116 | 85,691,535 | |||
Nestle S.A. | 921,190 | 252,045,840 | |||
Roche Holding AG | 1,409,678 | 151,097,964 | |||
Swiss Life Holding(1) | 37,500 | 5,637,306 | |||
UBS AG | 4,429,991 | 374,088,952 | |||
| 1,202,837,804 | |||||
| TAIWAN - 1.0% | |||||
Chunghwa Telecom Co., Ltd., (ADR) | 5,101,200 | 108,094,428 | |||
| THAILAND - 0.1% | |||||
Advanced Info Service Public Company Limited(2) | 5,588,500 | 14,285,532 | |||
| UNITED KINGDOM - 12.6% | |||||
Allied Domecq PLC | 5,865,573 | 59,135,576 | |||
British Sky Broadcasting Group PLC | 22,223,768 | 243,794,488 | |||
Carnival PLC | 1,013,135 | 55,637,409 | |||
ITV PLC | 113,943,807 | 274,539,523 | |||
Kingfisher PLC | 54,309,212 | 296,346,265 | |||
Pearson PLC | 6,429,200 | 78,364,725 | |||
Smith & Nephew PLC | 2,568,962 | 24,152,091 | |||
Tesco PLC | 47,454,568 | 283,828,305 | |||
William Morrison Supermarkets PLC | 24,081,022 | 89,193,858 | |||
| 1,404,992,240 | |||||
Total common and preferred stocks | 11,093,632,529 | ||||
10
TEN
| Par Amount | Value | |||||
| SHORT-TERM INVESTMENTS (CASH EQUIVALENTS) - 0.0%(5) | ||||||
| Repurchase agreement with State Street Bank and Trust Company, 2.50%, dated 3/31/05, due 4/1/05, maturity value $6,175,429, collateralized by $6,298,812 market value Federal Home Loan Mortgage Corporation Note, 2.875%, due 5/15/07 (Cost $6,175,000) | $ | 6,175,000 | $ | 6,175,000 | ||
Total investments - 99.4% | 11,099,807,529 | |||||
Other assets less liabilities - 0.6% | 62,544,421 | |||||
Total net assets - 100.0%(6) | $ | 11,162,351,950 | ||||
| (1) | Non-income producing security. |
| (2) | Valued at a fair value in accordance with procedures established by the Board of Directors of Artisan Funds. In total, securities valued at a fair value in accordance with procedures established by the Board of Directors of Artisan Funds were $14,342,532 or 0.1% of total net assets. |
| (3) | Private investment partnership that is restricted as to resale. Total Investment cost of $10 million, made through capital contributions on 3/6/00, 7/10/00, and 5/15/01. Value on March 31, 2005 represents less than 0.1% of total net assets. |
| (4) | Principally traded in the United States. |
| (5) | Represents less than 0.1% of total net assets. |
| (6) | Percentages for the various classifications relate to total net assets. |
(ADR) American Depository Receipt
(GDR) Global Depository Receipt
| PORTFOLIO DIVERSIFICATION - MARCH 31, 2005 (Unaudited) | ||||||
| Value | Percentage | |||||
Consumer Discretionary | $ | 2,594,809,492 | 23.3 | % | ||
Consumer Staples | 1,188,124,707 | 10.6 | ||||
Energy | 669,085,206 | 6.0 | ||||
Financials | 3,729,369,980 | 33.4 | ||||
Healthcare | 295,239,735 | 2.6 | ||||
Industrials | 495,017,401 | 4.4 | ||||
Information Technology | 721,218,946 | 6.5 | ||||
Materials | 229,843,490 | 2.1 | ||||
Telecommunication Services | 1,136,328,235 | 10.2 | ||||
Utilities | 34,595,337 | 0.3 | ||||
Total common and preferred stocks | 11,093,632,529 | 99.4 | ||||
Total short-term investments | 6,175,000 | 0.0 | (5) | |||
Total investments | 11,099,807,529 | 99.4 | ||||
Other assets less liabilities | 62,544,421 | 0.6 | ||||
Total net assets | $ | 11,162,351,950 | 100.0 | % | ||
The accompanying notes are an integral part of the financial statements.
11
ELEVEN
Schedule of Investments – March 31, 2005 (Unaudited)
Shares Held | Value | ||||
| COMMON STOCKS - 98.5% | |||||
| AUTO & TRANSPORTATION - 1.3% | |||||
Air Transport - 0.7% | |||||
Expeditors International of Washington, Inc. | 818,100 | $ | 43,809,255 | ||
Auto Trucks & Parts - 0.6% | |||||
Oshkosh Truck Corporation | 464,300 | 38,067,957 | |||
| CONSUMER DISCRETIONARY - 22.1% | |||||
Advertising Agencies - 0.8% | |||||
Lamar Advertising Company(1) | 1,172,800 | 47,252,112 | |||
Casinos & Gambling - 0.3% | |||||
Las Vegas Sands Corp.(1) | 370,000 | 16,650,000 | |||
Consumer Electronics - 3.2% | |||||
Electronic Arts Inc.(1) | 555,100 | 28,743,078 | |||
VeriSign, Inc.(1) | 1,750,600 | 50,242,220 | |||
Yahoo! Inc.(1) | 3,238,200 | 109,774,980 | |||
| 188,760,278 | |||||
Education Services - 0.9% | |||||
Corinthian Colleges, Inc.(1) | 3,277,900 | 51,528,588 | |||
Leisure Time - 1.5% | |||||
Royal Caribbean Cruises Ltd. | 2,012,501 | 89,938,670 | |||
Radio & TV Broadcasters - 1.3% | |||||
Univision Communications Inc.(1) | 2,717,800 | 75,255,882 | |||
Restaurants - 2.2% | |||||
Applebee’s International, Inc. | 1,043,500 | 28,758,860 | |||
Starbucks Corporation(1) | 600,800 | 31,037,328 | |||
YUM! Brands, Inc. | 1,360,500 | 70,487,505 | |||
| 130,283,693 | |||||
Retail - 7.9% | |||||
American Eagle Outfitters, Inc. | 1,014,100 | 29,966,655 | |||
CarMax, Inc.(1) | 1,831,700 | 57,698,550 | |||
Chico’s FAS, Inc.(1) | 3,256,868 | 92,039,090 | |||
Dollar General Corporation | 1,029,400 | 22,554,154 | |||
Fisher Scientific International Inc.(1) | 1,503,100 | 85,556,452 | |||
Kohl’s Corporation(1) | 1,179,100 | 60,876,933 | |||
Nordstrom, Inc. | 530,400 | 29,373,552 | |||
Ross Stores, Inc. | 1,617,400 | 47,131,036 | |||
Staples, Inc. | 1,418,900 | 44,596,027 | |||
| 469,792,449 | |||||
Shares Held | Value | ||||
| CONSUMER DISCRETIONARY (CONTINUED) | |||||
Services: Commercial - 4.0% | |||||
Getty Images, Inc.(1) | 1,148,600 | $ | 81,676,946 | ||
Hewitt Associates, Inc.(1) | 2,382,800 | 63,382,480 | |||
Iron Mountain Incorporated(1) | 1,768,300 | 50,997,772 | |||
Robert Half International Inc. | 1,550,805 | 41,809,703 | |||
| 237,866,901 | |||||
| CONSUMER STAPLES - 3.4% | |||||
Beverage: Brewers (Wineries) - 2.3% | |||||
Constellation Brands, Inc.(1) | 2,546,300 | 134,622,881 | |||
Beverage: Soft Drinks - 0.5% | |||||
Cott Corporation(1) | 1,208,200 | 29,274,686 | |||
Drug & Grocery Store Chains - 0.6% | |||||
Whole Foods Market, Inc. | 325,000 | 33,192,250 | |||
| FINANCIAL SERVICES - 11.6% | |||||
Banks: Outside New York City - 1.3% | |||||
Doral Financial Corporation | 793,100 | 17,360,959 | |||
North Fork Bancorporation, Inc. | 1,058,200 | 29,354,468 | |||
Northern Trust Corporation | 690,800 | 30,008,352 | |||
| 76,723,779 | |||||
Diversified Financial Services - 0.6% | |||||
CIT Group Inc. | 950,700 | 36,126,600 | |||
Finance: Small Loan - 0.5% | |||||
The First Marblehead Corporation(1) | 514,200 | 29,581,926 | |||
Financial Data Processing Services & Systems - 2.2% | |||||
CheckFree Corporation(1) | 1,018,000 | 41,493,680 | |||
Paychex, Inc. | 2,673,300 | 87,737,706 | |||
| 129,231,386 | |||||
Financial Miscellaneous - 3.7% | |||||
CapitalSource Inc.(1) | 2,637,000 | 60,651,000 | |||
MGIC Investment Corporation | 875,400 | 53,985,918 | |||
Willis Group Holdings Limited | 2,831,600 | 104,401,092 | |||
| 219,038,010 | |||||
Insurance: Property-Casualty - 0.7% | |||||
RenaissanceRe Holdings Ltd. | 897,200 | 41,899,240 | |||
Rental & Leasing Services: Commercial - 0.8% | |||||
GATX Corporation | 1,417,600 | 47,050,144 | |||
Savings & Loans - 0.8% | |||||
Golden West Financial Corporation | 740,600 | 44,806,300 | |||
12
TWELVE
Shares Held | Value | ||||
| FINANCIAL SERVICES (CONTINUED) | |||||
Securities Brokerage & Services - 1.0% | |||||
The Bear Stearns Companies Inc. | 590,800 | $ | 59,020,920 | ||
| HEALTHCARE - 14.7% | |||||
Biotechnology Research & Production - 2.5% | |||||
Genzyme Corporation(1) | 789,000 | 45,162,360 | |||
Invitrogen Corporation(1) | 1,502,300 | 103,959,160 | |||
| 149,121,520 | |||||
Drugs & Pharmaceuticals - 3.8% | |||||
Allergan, Inc. | 1,532,300 | 106,448,881 | |||
Barr Pharmaceuticals, Inc.(1) | 1,255,900 | 61,325,597 | |||
Eyetech Pharmaceuticals, Inc.(1) | 470,000 | 12,925,000 | |||
MedImmune, Inc.(1) | 1,826,700 | 43,493,727 | |||
| 224,193,205 | |||||
Electronics: Medical Systems - 1.4% | |||||
Varian Medical Systems, Inc.(1) | 2,511,900 | 86,107,932 | |||
Health Care Management Services - 4.0% | |||||
Aetna Inc. | 951,000 | 71,277,450 | |||
Caremark Rx, Inc.(1) | 2,188,300 | 87,050,574 | |||
Cerner Corporation(1) | 1,463,600 | 76,853,636 | |||
| 235,181,660 | |||||
Health Care Services - 0.8% | |||||
Lincare Holdings Inc.(1) | 1,100,000 | 48,653,000 | |||
Medical & Dental Instruments & Supplies - 1.0% | |||||
Zimmer Holdings, Inc.(1) | 775,700 | 60,357,217 | |||
Medical Services - 1.2% | |||||
Coventry Health Care, Inc.(1) | 1,004,100 | 68,419,374 | |||
| MATERIALS & PROCESSING - 8.6% | |||||
Chemicals - 3.8% | |||||
Air Products and Chemicals, Inc. | 1,980,200 | 125,326,858 | |||
Ecolab Inc. | 2,730,100 | 90,229,805 | |||
Nalco Holding Company(1) | 456,600 | 8,597,778 | |||
| 224,154,441 | |||||
Copper - 0.5% | |||||
Freeport-McMoRan Copper & Gold Inc. | 808,600 | 32,028,646 | |||
Diversified Materials & Processing - 1.5% | |||||
American Standard Companies Inc. | 1,969,500 | 91,542,360 | |||
Metal Fabricating - 1.5% | |||||
Precision Castparts Corp. | 1,164,400 | 89,670,444 | |||
Real Estate - 1.3% | |||||
The St. Joe Company | 1,160,800 | 78,121,840 | |||
Shares Held | Value | ||||
| OTHER - 3.9% | |||||
Multi-Sector Companies - 3.9% | |||||
Brunswick Corporation | 964,600 | $ | 45,191,510 | ||
Eaton Corporation | 659,300 | 43,118,220 | |||
ITT Industries, Inc. | 1,070,500 | 96,601,920 | |||
Textron Inc. | 622,700 | 46,465,874 | |||
| 231,377,524 | |||||
| OTHER ENERGY - 5.3% | |||||
Coal - 0.7% | |||||
Peabody Energy Corporation | 856,000 | 39,684,160 | |||
Machinery: Oil Well Equipment & Services - 3.5% | |||||
Noble Corporation | 884,700 | 49,728,987 | |||
Smith International, Inc. | 1,550,800 | 97,281,684 | |||
Weatherford International Ltd.(1) | 1,044,700 | 60,529,918 | |||
| 207,540,589 | |||||
Oil: Crude Producers - 1.1% | |||||
Devon Energy Corporation | 1,316,200 | 62,848,550 | |||
| PRODUCER DURABLES - 7.4% | |||||
Diversified Production - 2.3% | |||||
Danaher Corporation | 2,001,000 | 106,873,410 | |||
Pentair, Inc. | 759,100 | 29,604,900 | |||
| 136,478,310 | |||||
Electrical Equipment & Components - 0.6% | |||||
Molex Incorporated | 1,345,400 | 35,464,744 | |||
Homebuilding - 0.9% | |||||
D.R. Horton, Inc. | 1,727,200 | 50,503,328 | |||
Identification Control & Filter Devices - 0.2% | |||||
Garmin Ltd. | 281,800 | 13,052,976 | |||
Machinery: Industrial/Specialty - 0.7% | |||||
Joy Global Inc. | 1,199,509 | 42,054,785 | |||
Office Furniture & Business Equipment - 0.7% | |||||
Diebold, Incorporated | 813,700 | 44,631,445 | |||
Production Technology Equipment - 0.5% | |||||
Lam Research Corporation(1) | 1,081,200 | 31,203,432 | |||
Telecommunications Equipment - 1.5% | |||||
Andrew Corporation(1) | 4,883,200 | 57,182,272 | |||
Plantronics, Inc. | 783,900 | 29,850,912 | |||
| 87,033,184 | |||||
13
THIRTEEN
Shares Held | Value | ||||
| TECHNOLOGY - 19.7% | |||||
Communications Technology - 6.8% | |||||
Avaya Inc.(1) | 2,302,000 | $ | 26,887,360 | ||
Avocent Corporation(1) | 1,084,400 | 27,825,704 | |||
Comverse Technology, Inc.(1) | 1,294,000 | 32,634,680 | |||
Corning Incorporated(1) | 4,158,000 | 46,278,540 | |||
Juniper Networks, Inc.(1) | 3,418,200 | 75,405,492 | |||
NCR Corporation(1) | 2,615,200 | 88,236,848 | |||
Scientific-Atlanta, Inc. | 486,800 | 13,737,496 | |||
Symbol Technologies, Inc. | 3,547,800 | 51,407,622 | |||
TIBCO Software Inc.(1) | 5,332,900 | 39,730,105 | |||
| 402,143,847 | |||||
Computer Services Software | |||||
Adobe Systems Incorporated | 1,113,000 | 74,760,210 | |||
CACI International Inc(1) | 420,900 | 23,246,307 | |||
Cognizant Technology Solutions Corporation(1) | 710,800 | 32,838,960 | |||
Cognos Incorporated(1) | 979,900 | 41,097,006 | |||
Macromedia, Inc.(1) | 1,446,300 | 48,451,050 | |||
Mercury Interactive Corporation(1) | 1,167,700 | 55,325,626 | |||
| 275,719,159 | |||||
Computer Technology - 2.0% | |||||
Network Appliance, Inc.(1) | 1,064,900 | 29,455,134 | |||
Seagate Technology(1) | 2,202,500 | 43,058,875 | |||
Zebra Technologies Corporation(1) | 962,300 | 45,699,627 | |||
| 118,213,636 | |||||
Electronics: Semi-Conductors/ | |||||
Altera Corporation(1) | 4,388,400 | 86,802,552 | |||
Broadcom Corporation(1) | 2,997,100 | 89,673,232 | |||
Jabil Circuit, Inc.(1) | 2,362,800 | 67,387,056 | |||
Linear Technology Corporation | 782,000 | 29,958,420 | |||
Marvell Technology Group Ltd.(1) | 853,100 | 32,707,854 | |||
MEMC Electronic Materials, Inc.(1) | 2,286,800 | 30,757,460 | |||
National Semiconductor Corporation | 1,531,500 | 31,564,215 | |||
| 368,850,789 | |||||
Shares Held | Value | ||||||
| UTILITIES - 0.5% | |||||||
Utilities: Electrical - 0.5% | |||||||
The AES Corporation(1) | 1,942,800 | $ | 31,823,064 | ||||
Total common stocks | 5,835,949,068 | ||||||
| Par Amount | |||||||
SHORT-TERM INVESTMENTS (CASH EQUIVALENTS) - 2.0% | |||||||
Repurchase agreement with State Street Bank and Trust Company, 2.50%, dated 3/31/05, due 4/1/05, maturity value $119,877,324, collateralized by $122,271,236 market value Federal Home Loan Bank Note, 3.375%, due 2/23/07 (Cost $119,869,000) | $ | 119,869,000 | $ | 119,869,000 | |||
Total investments - 100.5% | 5,955,818,068 | ||||||
Other assets less liabilities - (0.5%) | (29,935,123 | ) | |||||
Total net assets - 100.0%(2) | $ | 5,925,882,945 | |||||
| (1) | Non-income producing security. |
| (2) | Percentages for the various classifications relate to total net assets. |
The accompanying notes are an integral part of the financial statements.
14
FOURTEEN
ARTISAN FUNDS, INC.
Statements of Assets and Liabilities – March 31, 2005 (Unaudited)
| INTERNATIONAL | MID CAP | |||||||
| ASSETS: | ||||||||
Investments in securities, unaffiliated, at value | $ | 11,093,632,529 | $ | 5,835,949,068 | ||||
Investments in securities, affiliated, at value | - | - | ||||||
Short-term investments (repurchase agreements), at value | 6,175,000 | 119,869,000 | ||||||
Total investments | 11,099,807,529 | 5,955,818,068 | ||||||
Cash | 268 | 710 | ||||||
Receivable from investments sold | 69,992,309 | 47,542,163 | ||||||
Unrealized gain on foreign currency forward contracts | - | - | ||||||
Receivable from fund shares sold | 14,476,100 | 17,261,889 | ||||||
Dividends and interest receivable | 28,412,174 | 2,913,383 | ||||||
Total assets | 11,212,688,380 | 6,023,536,213 | ||||||
| LIABILITIES: | ||||||||
Payable for investments purchased | 34,238,437 | 89,567,038 | ||||||
Unrealized loss on foreign currency forward contracts | 36,020 | - | ||||||
Payable for fund shares redeemed | 11,459,468 | 6,637,859 | ||||||
Payable for operating expenses | 3,381,899 | 1,448,371 | ||||||
Payable for withholding taxes | 1,220,606 | - | ||||||
Total liabilities | 50,336,430 | 97,653,268 | ||||||
Total net assets | $ | 11,162,351,950 | $ | 5,925,882,945 | ||||
| NET ASSETS CONSIST OF: | ||||||||
Fund shares issued and outstanding | $ | 10,045,634,106 | $ | 5,037,763,030 | ||||
Net unrealized appreciation (depreciation) on investments and foreign currency related transactions | 2,232,577,984 | 962,005,416 | ||||||
Accumulated undistributed net investment income (loss) | (4,424,323 | ) | (14,083,290 | ) | ||||
Accumulated undistributed net realized gains (losses) on investments and foreign currency | (1,111,435,817 | ) | (59,802,211 | ) | ||||
| $ | 11,162,351,950 | $ | 5,925,882,945 | |||||
| SUPPLEMENTARY INFORMATION: | ||||||||
Net assets | ||||||||
Investor Shares | $ | 7,218,850,455 | $ | 4,835,787,161 | ||||
Institutional Shares | $ | 3,943,501,495 | $ | 1,090,095,784 | ||||
Shares outstanding | ||||||||
Investor Shares | 327,858,939 | 168,773,320 | ||||||
Institutional Shares | 178,258,618 | 37,640,040 | ||||||
Net asset value, offering price and redemption price per share | ||||||||
Investor Shares | $ | 22.02 | $ | 28.65 | ||||
Institutional Shares | $ | 22.12 | $ | 28.96 | ||||
Cost of securities of unaffiliated issuers held | $ | 8,867,189,109 | $ | 4,993,812,652 | ||||
Cost of securities of affiliated issuers held | $ | - | $ | - | ||||
The accompanying notes are an integral part of the financial statements.
15
FIFTEEN
ARTISAN FUNDS, INC.
Statements of Operations – For the Six Months Ended March 31, 2005 (Unaudited)
| INTERNATIONAL | MID CAP | |||||||
| INVESTMENT INCOME: | ||||||||
Interest | $ | 1,384,858 | $ | 1,661,737 | ||||
Dividends, from unaffiliated issuers(1) | 58,907,789 | 16,167,002 | ||||||
Dividends, from affiliated issuers(1) | - | - | ||||||
Securities lending | 933,495 | - | ||||||
Total investment income | 61,226,142 | 17,828,739 | ||||||
| EXPENSES: | ||||||||
Advisory fees | 50,138,238 | 26,561,068 | ||||||
Transfer agent fees | ||||||||
Investor Shares | 6,465,568 | 4,328,689 | ||||||
Institutional Shares | 14,051 | 10,546 | ||||||
Shareholder communications | ||||||||
Investor Shares | 713,402 | 469,322 | ||||||
Institutional Shares | 10,813 | 4,645 | ||||||
Custodian fees | 3,032,604 | 151,746 | ||||||
Accounting fees | 37,447 | 31,411 | ||||||
Professional fees | 17,964 | 70,718 | ||||||
Registration fees | ||||||||
Investor Shares | 30,860 | 57,281 | ||||||
Institutional Shares | 8,757 | 6,600 | ||||||
Directors’ fees | 218,152 | 115,446 | ||||||
Other operating expenses | 194,212 | 104,557 | ||||||
Total operating expenses | 60,882,068 | 31,912,029 | ||||||
Net investment income (loss) | 344,074 | (14,083,290 | ) | |||||
| NET REALIZED AND UNREALIZED GAINS (LOSSES) ON INVESTMENTS: | ||||||||
Net realized gain (loss) on: | ||||||||
Investments(1) | 468,212,897 | 142,043,655 | ||||||
Foreign currency related transactions | (1,377,034 | ) | - | |||||
| 466,835,863 | 142,043,655 | |||||||
Net increase (decrease) in unrealized appreciation or depreciation on: | ||||||||
Investments | 959,069,474 | 363,799,144 | ||||||
Foreign currency related transactions | (101,847 | ) | - | |||||
| 958,967,627 | 363,799,144 | |||||||
Net gain (loss) on investments and foreign currency related transactions | 1,425,803,490 | 505,842,799 | ||||||
Net increase (decrease) in net assets resulting from operations | $ | 1,426,147,564 | $ | 491,759,509 | ||||
(1) Fund | Net of foreign taxes withheld on dividends, unaffiliated issuers | Net of foreign taxes withheld on dividends, affiliated issuers | Including net realized gain (loss) on investments from affiliated issuers | ||||
International | $4,511,517 | $ - | $(23,450,941 | ) | |||
Mid Cap | 17,008 | - | - |
The accompanying notes are an integral part of the financial statements.
16
SIXTEEN
ARTISAN FUNDS, INC.
Statements of Changes in Net Assets
| INTERNATIONAL | ||||||||
| Six Months Ended 3/31/2005(1) | Year Ended 9/30/2004 | |||||||
| OPERATIONS: | ||||||||
Net investment income (loss) | $ | 344,074 | $ | 70,075,203 | ||||
Net realized gain (loss) on: | ||||||||
Investments | 468,212,897 | (91,940,847 | ) | |||||
Foreign currency related transactions | (1,377,034 | ) | (5,531,519 | ) | ||||
Net increase (decrease) in unrealized appreciation or depreciation on: | ||||||||
Investments | 959,069,474 | 1,580,915,556 | ||||||
Foreign currency related transactions | (101,847 | ) | (820,070 | ) | ||||
Net increase (decrease) in net assets resulting from operations | 1,426,147,564 | 1,552,698,323 | ||||||
| DISTRIBUTIONS PAID TO SHAREHOLDERS: | ||||||||
Net investment income: | ||||||||
Investor Shares | (39,392,662 | ) | (59,414,982 | ) | ||||
Institutional Shares | (29,943,284 | ) | (42,472,917 | ) | ||||
Net realized gains on investment transactions: | ||||||||
Investor Shares | - | - | ||||||
Institutional Shares | - | - | ||||||
Total distributions paid to shareholders | (69,335,946 | ) | (101,887,899 | ) | ||||
| FUND SHARE ACTIVITIES: | ||||||||
Net increase (decrease) in net assets | 53,260,309 | (597,923,467 | ) | |||||
Total increase (decrease) in net assets | 1,410,071,927 | 852,886,957 | ||||||
Net assets, beginning of period | 9,752,280,023 | 8,899,393,066 | ||||||
Net assets, end of period | $ | 11,162,351,950 | $ | 9,752,280,023 | ||||
Accumulated undistributed net investment income (loss) | $ | (4,424,323 | ) | $ | 64,567,549 | |||
| (1) | Unaudited. |
The accompanying notes are an integral part of the financial statements.
17
SEVENTEEN
ARTISAN FUNDS, INC.
Statements of Changes in Net Assets
| MID CAP | ||||||||
| Six Months Ended 3/31/2005(1) | Year Ended 9/30/2004 | |||||||
| OPERATIONS: | ||||||||
Net investment income (loss) | $ | (14,083,290 | ) | $ | (33,613,109 | ) | ||
Net realized gain (loss) on: | ||||||||
Investments | 142,043,655 | 330,560,106 | ||||||
Foreign currency related transactions | - | - | ||||||
Net increase (decrease) in unrealized appreciation or depreciation on: | ||||||||
Investments | 363,799,144 | 172,866,182 | ||||||
Foreign currency related transactions | - | - | ||||||
Net increase (decrease) in net assets resulting from operations | 491,759,509 | 469,813,179 | ||||||
| DISTRIBUTIONS PAID TO SHAREHOLDERS: | ||||||||
Net investment income: | ||||||||
Investor Shares | - | - | ||||||
Institutional Shares | - | - | ||||||
Net realized gains on investment transactions: | ||||||||
Investor Shares | - | - | ||||||
Institutional Shares | - | - | ||||||
Total distributions paid to shareholders | - | - | ||||||
| FUND SHARE ACTIVITIES: | ||||||||
Net increase (decrease) in net assets | 355,424,927 | 1,096,126,727 | ||||||
Total increase (decrease) in net assets | 847,184,436 | 1,565,939,906 | ||||||
Net assets, beginning of period | 5,078,698,509 | 3,512,758,603 | ||||||
Net assets, end of period | $ | 5,925,882,945 | $ | 5,078,698,509 | ||||
Accumulated undistributed net investment income (loss) | $ | (14,083,290 | ) | $ | - | |||
| (1) | Unaudited. |
The accompanying notes are an integral part of the financial statements.
18
EIGHTEEN
[THIS PAGE INTENTIONALLY LEFT BLANK]
19
NINETEEN
ARTISAN FUNDS, INC.
Financial Highlights – For a share outstanding throughout each period
Year or Period Ended | Net Asset Value Beginning of Period | Net Investment Income (Loss)(1) | Net Realized and Unrealized Gain (Loss) on Investments | Total Income | Dividends from Net Investment Income | Distributions from Net Realized Gains | ||||||||||||||||||
| ARTISAN INTERNATIONAL FUND | ||||||||||||||||||||||||
| Institutional Shares | ||||||||||||||||||||||||
| 3/31/2005 | (4) | $ | 19.44 | $ | 0.01 | $ | 2.83 | $ | 2.84 | $ | (0.16 | ) | $ | - | ||||||||||
| 9/30/2004 | 16.63 | 0.16 | 2.86 | 3.02 | (0.21 | ) | - | |||||||||||||||||
| 9/30/2003 | (5) | 15.71 | 0.03 | 0.89 | 0.92 | - | - | |||||||||||||||||
| 6/30/2003 | 18.24 | 0.25 | (2.65 | ) | (2.40 | ) | (0.13 | ) | - | |||||||||||||||
| 6/30/2002 | 19.62 | 0.18 | (1.46 | ) | (1.28 | ) | (0.10 | ) | - | |||||||||||||||
| 6/30/2001 | 30.22 | 0.16 | (7.21 | ) | (7.05 | ) | - | (3.55 | ) | |||||||||||||||
| 6/30/2000 | 18.70 | 0.03 | 12.09 | 12.12 | (0.06 | ) | (0.54 | ) | ||||||||||||||||
| ARTISAN MID CAP FUND | ||||||||||||||||||||||||
| Institutional Shares | ||||||||||||||||||||||||
| 3/31/2005 | (4) | $ | 26.38 | $ | (0.05 | ) | $ | 2.63 | $ | 2.58 | $ | - | $ | - | ||||||||||
| 9/30/2004 | 23.28 | (0.14 | ) | 3.24 | 3.10 | - | - | |||||||||||||||||
| 9/30/2003 | (5) | 21.96 | (0.03 | ) | 1.35 | 1.32 | - | - | ||||||||||||||||
| 6/30/2003 | 22.24 | (0.07 | ) | (0.21 | )(7) | (0.28 | ) | - | - | |||||||||||||||
| 6/30/2002 | 26.48 | (0.13 | ) | (4.11 | ) | (4.24 | ) | - | - | |||||||||||||||
| 6/30/2001 | 27.57 | (0.08 | ) | 0.02 | (7) | (0.06 | ) | - | (1.03 | ) | ||||||||||||||
| (1) | Computed based on average shares outstanding. |
| (2) | Periods less than twelve months (where applicable) are not annualized. |
| (3) | Periods less than twelve months (where applicable) are annualized. |
| (4) | Unaudited. For the six months ended March 31, 2005. |
| (5) | For the period from July 1, 2003 through September 30, 2003. Artisan Funds changed its fiscal year-end from June 30 to September 30 effective September 30, 2003. |
| (6) | The ratios of expenses to average net assets and net investment income (loss) to average net assets exclude expenses waived or reimbursed by the Adviser. Absent expenses waived or reimbursed by the Adviser, the ratios of expenses to average net assets and net investment income (loss) to average net assets would have been as follows: |
| Fund | Period Ended | Ratio of Expenses to Average Net Assets | Ratio of Net Investment Income (Loss) to Average Net Assets | |||||
International Institutional Shares | 9/30/2003 | 1.00 | % | 0.73 | % | |||
Mid Cap Institutional Shares | 9/30/2003 | 0.98 | (0.59 | ) |
| (7) | The amount shown may not correlate with the aggregate gains and losses of portfolio securities due to the timing of subscriptions and redemptions of fund shares. |
The accompanying notes are an integral part of the financial statements.
20
TWENTY
| Total Distributions | Net Asset of Period | Total Return(2) | Net Assets End of Period (millions) | Ratio of Expenses to Average Net Assets(3) | Ratio of Net Investment Income (Loss) to Average Net Assets(3) | Portfolio Turnover Rate(2) | ||||||||||||||||
| $ | (0.16 | ) | $ | 22.12 | 14.66 | % | $ | 3,943.5 | 1.00 | % | 0.13 | % | 33.15 | % | ||||||||
| (0.21 | ) | 19.44 | 18.31 | 3,622.1 | 1.01 | 0.85 | 54.96 | |||||||||||||||
| - | 16.63 | 5.86 | 3,354.7 | 1.00 | (6) | 0.73 | (6) | 15.23 | ||||||||||||||
| (0.13 | ) | 15.71 | (13.09 | ) | 2,975.0 | 1.01 | 1.68 | 37.13 | ||||||||||||||
| (0.10 | ) | 18.24 | (6.52 | ) | 2,062.0 | 1.01 | 1.01 | 50.67 | ||||||||||||||
| (3.55 | ) | 19.62 | (24.53 | ) | 1,486.6 | 1.03 | 0.70 | 72.01 | ||||||||||||||
| (0.60 | ) | 30.22 | 65.97 | 1,136.2 | 1.08 | 0.09 | 99.02 | |||||||||||||||
| $ | - | $ | 28.96 | 9.78 | % | $ | 1,090.1 | 0.95 | % | (0.32 | )% | 41.71 | % | |||||||||
| - | 26.38 | 13.27 | 1,036.0 | 0.96 | (0.54 | ) | 101.09 | |||||||||||||||
| - | 23.28 | 6.06 | 929.6 | 0.98 | (6) | (0.59 | )(6) | 26.52 | ||||||||||||||
| - | 21.96 | (1.26 | ) | 829.0 | 1.00 | (0.36 | ) | 102.85 | ||||||||||||||
| - | 22.24 | (16.04 | ) | 449.8 | 1.02 | (0.56 | ) | 121.14 | ||||||||||||||
| (1.03 | ) | 26.48 | (0.38 | ) | 212.2 | 1.08 | (0.29 | ) | 153.95 | |||||||||||||
The accompanying notes are an integral part of the financial statements.
21
TWENTY-ONE
Artisan Funds, Inc.
Notes to Financial Statements – March 31, 2005 (Unaudited)
| (1) | Organization: |
Artisan Funds, Inc. (“Artisan Funds”) was incorporated on January 5, 1995, as a Wisconsin corporation and is registered under the Investment Company Act of 1940, as amended. Artisan Funds is a series comprised of seven open-end, diversified mutual funds. Artisan International Fund (“International Fund” or “International”) and Artisan Mid Cap Fund (“Mid Cap Fund” or “Mid Cap”), two series of Artisan Funds (each a “Fund” and collectively the “Funds”), commenced operations on December 28, 1995 and June 27, 1997, respectively. Each Fund’s investment objective is to seek long-term capital growth.
The Funds offer shares of capital stock of two classes—Institutional Shares and Investor Shares. International Fund and Mid Cap Fund began offering Institutional Shares effective July 1, 1997 and July 1, 2000, respectively. Institutional Shares are sold to institutional investors meeting certain minimum investment requirements. Each class of shares has equal rights with respect to portfolio assets and voting privileges. Each class has exclusive voting rights with respect to any matters involving only that class. Income, non-class specific expenses and realized and unrealized gains and losses are allocated daily to each class of shares based upon the relative net asset value of outstanding shares. Expenses attributable to a particular class of shares, such as transfer agency fees, shareholder communication expenses and registration fees, are allocated directly to that class.
Each class of the Funds has an indefinite number of shares authorized with a $0.01 par value.
| (2) | Summary of significant accounting policies: |
The following is a summary of significant accounting policies of the Funds in effect during the period covered by the financial statements, which are in accordance with U.S. generally accepted accounting principles.
| (a) | Security valuation – The net asset value (“NAV”) of the shares of each class of each Fund was determined as of the close of regular session trading on the New York Stock Exchange (“NYSE”) (usually 3:00 p.m., Central time, but sometimes earlier) each day the NYSE was open for regular session trading. The NAV of each class of shares was determined by dividing the value of each Fund’s securities and other assets attributed to that class, less its liabilities attributed to that class, by the number of outstanding shares of that class of that Fund. |
In determining NAV, each equity security traded on a securities exchange, including the Nasdaq Stock Market, was valued at the closing price as of the
22
TWENTY-TWO
NOTES TO FINANCIAL STATEMENTS
time of valuation on the exchange or market on which the security was principally traded (the “principal exchange”). The closing price provided by each exchange may differ and may represent information such as last sales price, an official closing price, a closing auction price or other information, depending on exchange or market convention. Absent closing price information for a security from the principal exchange as of the time of valuation, the security was valued using the most recent bid quotation on the principal exchange, except that securities listed on the London Stock Exchange were valued at the mean of the most recent bid and asked quotations as of the time of valuation. Short-term investments maturing within sixty days of the valuation date were valued at amortized cost, which approximates market.
Securities for which prices were not readily available were valued by Artisan Funds’ valuation committee (the “valuation committee”) at a fair value determined in good faith under procedures established by and under the general supervision of Artisan Funds’ Board of Directors (the “Board of Directors”). A price was considered not to be readily available if, among other things, the valuation committee believed that the price determined as described in the preceding paragraph did not reflect a fair value of the security.
International Fund generally invests a significant portion, and perhaps as much as substantially all, of its total assets in securities principally traded in markets outside the U.S. Mid Cap Fund has the ability to invest in securities principally traded outside the U.S., but did not do so in the period covered by these financial statements. The foreign markets in which the Funds may invest are sometimes open on days when the NYSE is not open and the Funds do not calculate their NAVs, and sometimes are not open on days when the Funds do calculate their NAVs. Even on days on which both the foreign market and the NYSE are open, several hours may have passed between the time when trading in the foreign market closed and the time as of which the Funds calculate their NAVs. That is generally the case for markets in Europe, Asia, Australia and other far eastern markets; the regular closing time of foreign markets in North and South America is generally the same as the closing time of the NYSE and the time as of which the Funds calculate their NAVs.
The valuation committee concluded that a price determined under the Funds’ valuation procedures was not readily available if, among other things, the valuation committee believed that the value of the security might have been materially affected by events occurring after the close of the market in which the security was principally traded but before the time for determination of
23
TWENTY-THREE
NOTES TO FINANCIAL STATEMENTS
NAV (“subsequent event”). A subsequent event might include a company-specific development (for example, announcement of a merger that is made after the close of the foreign market), a development that might affect an entire market or region (for example, imposition of foreign exchange controls by a foreign government) or a potentially global development (such as a terrorist attack that may be expected to have an impact on investor expectations worldwide). Artisan Funds monitored for subsequent events using several tools, including the use of a third party research service to assist in determining estimates of fair values for foreign securities. That service utilized statistical data based on historical performance of securities, markets and other data in developing factors used to estimate a fair value. An indication by any of those tools of a potential material change in the value of securities resulted in a meeting of the valuation committee, which considered whether a subsequent event had occurred and whether local market closing prices continued to represent fair values for potentially affected non-U.S. securities.
Estimates of fair values utilized by the Funds as described above may differ from the value realized on the sale of those securities and the differences may be material to the NAV of the applicable Fund or to the financial statements presented.
| (b) | Income taxes – No provision has been made for federal income taxes since each Fund intends to (i) comply with the provisions of Subchapter M of the Internal Revenue Code applicable to regulated investment companies and (ii) distribute to its shareholders substantially all of its taxable income as well as net realized gains from the sale of investment securities. The Funds may utilize earnings and profits distributed to shareholders on redemptions of Fund shares as part of the dividends paid deduction. |
| (c) | Portfolio transactions – Security and shareholder transactions are recorded on trade date. Net realized gains and losses on securities are computed on specific security lot identification. |
| (d) | Foreign currency translation – Values of investments, open foreign currency forward contracts, payables for capital gains taxes and cash denominated in foreign currencies were converted into U.S. dollars using a spot market rate of exchange as of 3:00 p.m. (Central time) on the day of valuation. Payables and receivables for securities transactions, dividend and reclaim receivables and other receivables and payables denominated in a foreign currency were converted into U.S. dollars using a spot market rate of exchange as of 11:00 a.m. (Central time) on the day of valuation. Purchases and sales of investments and dividend and interest income are translated into U.S. dollars |
24
TWENTY-FOUR
NOTES TO FINANCIAL STATEMENTS
using a spot market rate of exchange as of 11:00 a.m. (Central time) on the date of such transactions. The portion of security gains or losses resulting from changes in foreign exchange rates is included with net realized and unrealized gain or loss from investments, as appropriate, for both financial reporting and tax purposes. |
International Fund may enter into foreign currency forward contracts to hedge the foreign currency exposure on open payables and receivables. The foreign currency forward contracts are recorded at market value and any related realized and unrealized gains and losses are reported as foreign currency related transactions for financial reporting purposes. For tax purposes, these foreign exchange gains and losses are treated as ordinary income or loss. International Fund could be exposed to loss if the counterparties fail to perform under these contracts.
Other foreign currency related transaction gains and losses may result from currency gains and losses realized from the difference between the amounts of dividends and foreign withholding taxes recorded on the Funds’ books and the U.S. dollar equivalent of the amounts actually received or paid. The net increase (decrease) in unrealized appreciation or depreciation on foreign currency related transactions arise from changes in the values of assets and liabilities, other than investments in securities, resulting from changes in foreign exchange rates.
| (e) | Repurchase agreements – Each Fund may enter into repurchase agreements with institutions that Artisan Partners Limited Partnership (“the Adviser”) has determined are creditworthy pursuant to criteria adopted by the Board of Directors. Repurchase agreements are recorded at cost plus accrued interest and are collateralized in an amount greater than or equal to the repurchase price plus accrued interest. If the proceeds from any sale of such collateral upon a default on the obligation to repurchase were less than the repurchase price, the Fund would suffer a loss. |
| (f) | Securities lending – Each Fund may enter into securities lending transactions. During the six months ended March 31, 2005, International Fund earned $933,495 from securities lending transactions. As of March 31, 2005, there were no securities on loan. Each Fund’s risks in entering into securities lending arrangements are that the borrower may not provide additional collateral when required or return the securities when due or, if the borrower defaults, the Fund may experience delays in selling collateral or the collateral may not be sufficient to cover the value of securities lent. |
| (g) | Commission recapture – Each of the Funds may direct portfolio trades to various brokers who have agreed to rebate a portion of the commissions |
25
TWENTY-FIVE
NOTES TO FINANCIAL STATEMENTS
generated. Such rebates are made directly to the applicable Fund as cash payments and are included in net realized gain or loss on investments in the Statements of Operations as follows: |
International | $ | 3,489,389 | |
Mid Cap | 606,723 |
| (h) | Use of estimates – The preparation of financial statements in conformity with U.S. generally accepted accounting principles requires management to make estimates and assumptions that affect the reported amounts and disclosures in the financial statements. Actual results could differ from those estimates. |
| (i) | Indemnifications – In the normal course of business, the Funds enter into contracts in which the Funds agree to indemnify the other party or parties against various potential costs or liabilities. The Funds’ maximum exposure under these arrangements is unknown. No claim has been made for indemnification pursuant to any such agreement. |
| (j) | Other – Dividend income less foreign taxes withheld, if any, is recorded on the ex-dividend date, except that certain dividends from private placements and foreign securities are recorded as soon after the ex-dividend date as the information becomes available to the Funds. Interest income is reported on the accrual basis. Distributions to shareholders are recorded on the ex-dividend date. Expenses attributable to Artisan Funds are generally allocated to each Fund based on net assets. Expenses attributable to a particular Fund are allocated directly to that Fund. |
The character of income and net realized gains and losses may differ for financial statement and tax purposes and may result in reclassification of permanent differences among certain capital accounts to more appropriately conform financial accounting to tax characterizations of dividend distributions.
International Fund generally imposes a 2% redemption fee on shares held 90 days or less. Those redemption fees are recorded as a reduction in the cost of shares redeemed and have the primary effect of increasing paid-in capital.
26
TWENTY-SIX
NOTES TO FINANCIAL STATEMENTS
| (3) | Transactions with affiliates: |
The Adviser, with which the officers and certain directors of Artisan Funds are affiliated, provides investment advisory and administrative services to the Funds. In exchange for those services, each Fund pays a monthly management fee to the Adviser as follows:
Average Daily Net Assets | Annual Rate | ||
Less than $500 million | 1.000 | % | |
$500 million to $750 million | 0.975 | ||
$750 million to $1 billion | 0.950 | ||
Greater than $1 billion | 0.925 |
Shares of Artisan Funds are offered for sale by Artisan Distributors LLC (“Distributors”). Distributors is wholly owned by the Adviser. All distribution expenses relating to the Funds are paid by the Adviser.
Each Fund also incurs other expenses for services such as maintaining shareholder records and furnishing shareholder statements and reports.
Prior to April 1, 2005, each director who was not an interested person of Artisan Funds or the Adviser received an annual retainer of $60,000, plus a fee for each board or committee meeting attended (other than a committee meeting held on the same day as a board meeting) of $3,000 for an in-person meeting and $500 for a telephonic meeting, as well as reimbursement of expenses related to his duties as a director of Artisan Funds. In addition, each chairman of a board committee who was a non-interested director and each non-interested director performing services deemed by the Board of Directors to be substantially equivalent to those of a committee chair received a supplemental annual retainer of $5,000. Those fees were generally allocated to each Fund based on net assets.
Effective April 1, 2005, each director who is not an interested person of Artisan Funds or the Adviser receives an annual retainer of $120,000 payable quarterly, as well as reimbursement of expenses related to his duties as a director of Artisan Funds. In addition, the non-interested chair of the board of directors receives an additional annual retainer of $60,000 payable quarterly and each chair of a board committee who is a non-interested director receives an additional annual retainer of $30,000 payable quarterly.
| (4) | Line of credit arrangements: |
Artisan Funds is party to a line of credit agreement with State Street Bank and Trust Company, under which each Fund may borrow up to the lesser of (a) $75 million or (b) the lesser of (i) 10% of its total assets (after giving effect to the loan) or (ii) the maximum amount the Fund may borrow under the Investment Company Act, the limitations included in the Fund’s prospectus, or any limit or restriction
27
TWENTY-SEVEN
NOTES TO FINANCIAL STATEMENTS
under any law or regulation to which the Fund is subject or any agreement to which the Fund or Artisan Funds is a party; provided that the aggregate borrowings by all Funds may not exceed $100 million. Artisan Funds pays a commitment fee at the annual rate of 0.10% on the unused portion of the line of credit. Interest is charged on any borrowings at the current Federal Funds rate plus 0.50%. The use of the line of credit is generally restricted to temporary borrowing for extraordinary or emergency purposes. There were no borrowings under the line of credit during the six months ended March 31, 2005.
| (5) | Investment transactions: |
The cost of securities purchased and the proceeds from the sale of securities (excluding short-term securities) for the six months ended March 31, 2005 were as follows:
| Fund | Security Purchases | Security Sales | ||||
International | $ | 3,565,804,426 | $ | 3,528,555,080 | ||
Mid Cap | 2,698,247,295 | 2,307,190,377 | ||||
| (6) | Transactions in securities of affiliates: |
The table below shows information about securities of the Funds’ “affiliates” (as defined below) that were held by the Funds, purchased or sold by the Funds, or from which dividends were received by the Funds during the six months ended March 31, 2005. The Funds identify a company as an affiliate for the purpose of the report if one or more of the Funds owned, in the aggregate, voting securities that it believed represented 5% or more of that company’s outstanding voting securities (as defined by the Investment Company Act of 1940) during the six-month period ended March 31, 2005.
Fund | Security | As of 9/30/04 | Purchase Cost | Sales Cost | Net Realized | Dividend Income | As of 3/31/05 | |||||||||||||||
| Share Balance | Share Balance | Value | ||||||||||||||||||||
| International | Clariant AG(1) | 13,411,333 | $ | - | $ | 82,648,164 | $ | (23,450,941 | ) | $ | - | 9,579,379 | $ | 165,389,554 | ||||||||
| (1) | Issuer was no longer an affiliate as of March 31, 2005. |
| (7) | Information for Federal income tax purposes: |
Fund | Cost of Investments | Gross Unrealized Appreciation | Gross Unrealized Depreciation | Net Unrealized Appreciation (Depreciation) on Investments | |||||||||
| International | $ | 8,879,787,744 | $ | 2,319,499,093 | $ | (99,479,308 | ) | $ | 2,220,019,785 | ||||
| Mid Cap | 5,015,623,542 | 1,043,250,875 | (103,056,349 | ) | 940,194,526 | ||||||||
28
TWENTY-EIGHT
NOTES TO FINANCIAL STATEMENTS
The difference between cost amounts for financial reporting and tax purposes is due primarily to timing differences in recognizing certain gains and losses on security transactions (e.g., wash sales).
The tax basis of dividends and long-term capital gain distributions paid during the six months ended March 31, 2005 and the year ended September 30, 2004 was as follows:
| Six Months Ended 3/31/05 | Year Ended 9/30/04 | |||||||||||||
| Ordinary Income Dividends | Long-Term Distributions | Ordinary Income Dividends | Long-Term Capital Gain Distributions | |||||||||||
| International | $ | 69,335,946 | $ | - | $ | 101,887,899 | $ | - | ||||||
| Mid Cap | - | - | - | - | ||||||||||
Additional tax information as of and for the year ended September 30, 2004 follows:
| As of 9/30/04 | Year Ended 9/30/04 | ||||||||||||||||||
| Undistributed Ordinary Income | Undistributed Long-Term Gain | Net Capital Loss Carryforward(1) | Capital Loss Carryforward Expiration | Capital Loss Carryforward Utilized | Post-October Losses | ||||||||||||||
| International | $ | 69,318,695 | $ | - | $ | 74,827,358 | 2008 | $ | 41,400,656 | $ | 101,585,966 | ||||||||
| 694,241,382 | 2009 | ||||||||||||||||||
| 384,841,928 | 2010 | ||||||||||||||||||
| 202,299,105 | 2011 | ||||||||||||||||||
| Mid Cap | - | - | 178,503,906 | 2010 | 321,169,449 | - | |||||||||||||
| (1) | The Funds expect to resume paying capital gain distributions in the future to the extent gains are realized in excess of the available carryforwards. |
29
TWENTY-NINE
NOTES TO FINANCIAL STATEMENTS
| (8) | Fund share activities: |
Capital share transactions for the Funds were as follows:
| INTERNATIONAL | MID CAP | |||||||||||||||
Six months ended March 31, 2005 | Investor Shares | Institutional Shares | Investor Shares | Institutional Shares | ||||||||||||
Proceeds from shares issued | $ | 1,020,185,315 | $ | 90,626,264 | $ | 972,121,666 | $ | 27,331,032 | ||||||||
Net asset value of shares issued in reinvestment of dividends and distributions | 35,336,671 | 27,442,945 | - | - | ||||||||||||
Cost of shares redeemed(1) | (827,820,037 | ) | (292,510,849 | ) | (570,003,080 | ) | (74,024,691 | ) | ||||||||
Net increase (decrease) from fund share transactions | $ | 227,701,949 | $ | (174,441,640 | ) | $ | 402,118,586 | $ | (46,693,659 | ) | ||||||
Shares sold | 47,542,136 | 4,272,493 | 34,107,109 | 956,955 | ||||||||||||
Shares issued in reinvestment of dividends and distributions | 1,677,108 | 1,297,539 | - | - | ||||||||||||
Shares redeemed | (38,516,298 | ) | (13,672,119 | ) | (20,050,432 | ) | (2,586,200 | ) | ||||||||
Net increase (decrease) in capital shares | 10,702,946 | (8,102,087 | ) | 14,056,677 | (1,629,245 | ) | ||||||||||
| INTERNATIONAL | MID CAP | |||||||||||||||
Year ended September 30, 2004 | Investor Shares | Institutional Shares | Investor Shares | Institutional Shares | ||||||||||||
Proceeds from shares issued | $ | 2,536,272,455 | $ | 334,559,000 | $ | 1,972,432,516 | $ | 69,966,247 | ||||||||
Net asset value of shares issued in reinvestment of dividends and distributions | 54,531,342 | 38,442,969 | - | - | ||||||||||||
Cost of shares redeemed(2) | (2,903,431,496 | ) | (658,297,737 | ) | (855,149,594 | ) | (91,122,442 | ) | ||||||||
Net increase (decrease) from fund share transactions | $ | (312,627,699 | ) | $ | (285,295,768 | ) | $ | 1,117,282,922 | $ | (21,156,195 | ) | |||||
Shares sold | 134,972,302 | 17,620,515 | 75,836,138 | 2,793,091 | ||||||||||||
Shares issued in reinvestment of dividends and distributions | 3,107,199 | 2,183,019 | - | - | ||||||||||||
Shares redeemed | (156,104,065 | ) | (35,129,349 | ) | (32,884,883 | ) | (3,449,277 | ) | ||||||||
Net increase (decrease) in capital shares | (18,024,564 | ) | (15,325,815 | ) | 42,951,255 | (656,186 | ) | |||||||||
| (1) | Net of redemption fees of $130,274 and $74,215 for International-Investor Shares and International-Institutional Shares, respectively. |
| (2) | Net of redemption fees of $74,205 and $41,388 for International-Investor Shares and International-Institutional Shares, respectively. |
30
THIRTY
NOTES TO FINANCIAL STATEMENTS
| (9) | Litigation: |
Artisan Funds and the Adviser are defendants in a lawsuit that seeks certification of a plaintiff class consisting of all persons in the United States who held shares in International Fund for a period of more than 14 days during the five years prior to the filing of the lawsuit. The suit seeks compensatory and punitive damages, as well as interest, costs and attorney’s fees. The lawsuit alleges, in summary, that Artisan Funds and the Adviser exposed long-term International Fund shareholders to trading by market timers by allegedly (a) failing to properly evaluate daily whether a significant event affecting the value of International Fund’s securities had occurred after foreign markets had closed but before the calculation of the Fund’s NAV; (b) failing to implement the Fund’s portfolio valuation and share pricing policies and procedures; (c) allowing portfolio valuation and share policies and procedures that benefited market timers at the expense of long-term shareholders; and (d) failing to know and implement applicable rules and regulations concerning the calculation of NAV.
Artisan Funds and the Adviser removed the lawsuit from state court to federal district court. The federal district court ordered the case remanded to state court. Artisan Funds and the Adviser appealed the remand order to the United States Court of Appeals for the Seventh Circuit and, on April 5, 2005, the Court of Appeals ruled in favor of Artisan Funds and the Adviser. The Court of Appeals reversed the remand order of the district court and ordered the district court to dismiss the plaintiff’s state law claims. The plaintiff has attempted, and has requested permission, to file an amended complaint. In addition, it is possible that the plaintiff may seek review of the Court of Appeals’ decision by the United States Supreme Court decision. Artisan Funds and the Adviser will continue to defend the lawsuit, including any further appellate review, vigorously.
Certain legal fees incurred by Artisan Funds in defense of the lawsuit and related insurance recoveries have been allocated to International Fund and are included in professional fees in the Statement of Operations. Artisan Funds does not believe that the pending action will have a material effect on the financial condition of any Fund.
31
THIRTY-ONE
As a shareholder of Artisan Funds, you incur two types of costs: (1) transaction costs, including redemption fees; and (2) ongoing costs, including management fees, and other Fund expenses. This example is intended to help you understand your ongoing costs (in dollars) of investing in a Fund and to compare these costs with the ongoing costs of investing in other mutual funds.
The example is based on an investment of $1,000 invested at the beginning of the period and held for the entire period from October 1, 2004 to March 31, 2005.
Actual Expenses
The first line under the name of each Fund in the table below provides information about actual account values and actual expenses. You may use the information in this line, together with the amount you invested, to estimate the expenses that you paid over the period. Simply divide your account value by $1,000 (for example, an $8,600 account value divided by $1,000 = 8.6), then multiply the result by the number in the first line under the name of your Fund under the heading entitled “Expenses Paid During Period” to estimate the expenses you paid on your account during this period.
Hypothetical Example for Comparison Purposes
The second line below each Fund’s name in the table below provides information about hypothetical account values and hypothetical expenses based on each Fund’s actual expense ratio and an assumed rate of return of 5% per year before expenses, which is not the Fund’s actual return. The hypothetical account values and expenses may not be used to estimate the actual ending account balances or expenses you paid for the period. You may use this information to compare the ongoing costs of investing in each Fund and other funds. To do so, compare the 5% hypothetical example with the 5% hypothetical examples that appear in the shareholder reports of the other funds.
Please note that the expenses shown in the table are meant to highlight your ongoing costs only and do not reflect any transactional costs, such as redemption fees. Therefore, the second line of the table is useful in comparing ongoing costs only, and will not help you determine the relative costs of owning different funds. If these transactional costs were included, your costs would have been higher.
| Beginning Account Value 10/1/2004 | Ending Account Value | Expenses Paid During 10/1/2004-3/31/2005 | |||||||
Artisan International Fund - Institutional Shares | |||||||||
Actual | $ | 1,000.00 | $ | 1,146.60 | $ | 5.35 | |||
Hypothetical (5% return before expenses) | $ | 1,000.00 | $ | 1,019.95 | $ | 5.04 | |||
Artisan Mid Cap Fund - Institutional Shares | |||||||||
Actual | $ | 1,000.00 | $ | 1,097.80 | $ | 4.97 | |||
Hypothetical (5% return before expenses) | $ | 1,000.00 | $ | 1,020.19 | $ | 4.78 | |||
| * | Expenses are equal to the Fund’s ratio of expenses to average net assets for the six month period ended March 31, 2005 (shown below); multiplied by the average account value over the period; multiplied by 182/365 (to reflect the one-half year period). |
| Fund | Annualized Ratio of Expenses to Average Net Assets for the Six Month Period Ended March 31, 2005 | ||
Artisan International Fund - Institutional Shares | 1.00 | % | |
Artisan Mid Cap Fund - Institutional Shares | 0.95 |
32
THIRTY-TWO
FACTORS CONSIDERED IN RENEWING THE FUNDS’ ADVISORY CONTRACTS
Artisan International Fund and Artisan Mid Cap Fund are series of Artisan Funds, Inc. Artisan Funds, Inc. has five other series. Artisan Partners Limited Partnership (“Artisan Partners”) is responsible for management of all of the Funds’ investment portfolios and for overall management of the Funds’ business and affairs pursuant to Investment Advisory Agreements dated December 27, 1995 (International Fund); November 7, 2001 (International Small Cap Fund); August 8, 2002 (International Value Fund); April 10, 1997 (Mid Cap Fund); October 26, 2000 (Mid Cap Value Fund); March 27, 1995 (Small Cap Fund) and July 31, 1997 (Small Cap Value Fund) (the “Advisory Agreements”). Artisan Partners is a Delaware limited partnership, the sole general partner of which is Artisan Investment Corporation. Artisan Investment Corporation was incorporated on December 7, 1994 for the sole purpose of acting as general partner of Artisan Partners. Artisan Investment Corporation is controlled by Andrew Ziegler and Carlene Ziegler, who together own 100% of its voting stock. The principal address of Artisan Partners is 875 E. Wisconsin Avenue, Suite 800, Milwaukee, Wisconsin 53202. Artisan Partners also has offices at 100 Pine Street, Suite 2950, San Francisco, California 94111; One Maritime Plaza, Suite 1450, San Francisco, California 94111; Five Concourse Parkway NE, Suite 2120, Atlanta, Georgia 30328; and 65 East 55th Street, 25th Floor, New York, New York 10022.
The Advisory Agreement for each Fund may be continued from year to year only so long as the continuance is approved annually (a) by the vote of a majority of the directors of Artisan Funds who are not “interested persons” of Artisan Funds or Artisan Partners cast in person at a meeting called for the purpose of voting on such approval, and (b) by the board of directors or by the vote of a majority (as defined in the 1940 Act) of the outstanding shares of the Fund. Each Advisory Agreement provides that Artisan Partners shall not be liable for any loss suffered by a Fund or its shareholders as a consequence of any act or omission in connection with investment advisory or portfolio services under the agreement, except by reason of willful misfeasance, bad faith or gross negligence on the part of Artisan Partners in the performance of its duties or from reckless disregard by Artisan Partners of its obligations and duties under the Advisory Agreement. Each Agreement will terminate automatically in the event of its assignment (as defined in the 1940 Act).
The directors of Artisan Funds held a special meeting of the board on October 14, 2004 at which they gave preliminary consideration to information bearing on continuation of each Advisory Agreement for the period from December 1, 2004 through November 30, 2005. The primary purpose of the special meeting was to ensure that the directors had ample opportunity to consider matters they deemed relevant in considering the continuation of the Advisory Agreements, and to request any additional information they considered necessary to their deliberations, without undue time constraints.
In recent years, the board of directors of the Funds considered the continuation of the Advisory Agreements at board meetings in October of each year. However, because Artisan Funds changed its fiscal year-end from June 30 to September 30 effective September 30, 2003, it was determined that certain year-end and other financial information that the board reviewed in prior years would not be available in time for consideration at an October 2004 board meeting. So, at the October 14th meeting, the board approved the continuation of the Advisory Agreements for an interim one-month period (from November 1, 2004 through November 30, 2004) (the “Interim Period”).
The directors met again at a regular meeting on November 4, 2004, at which time they approved the continuation of each Advisory Agreement from December 1, 2004 to November 30, 2005.
33
THIRTY-THREE
FACTORS CONSIDERED IN RENEWING THE FUNDS’ ADVISORY CONTRACTS
Prior to the October 14, 2004 board meeting, independent counsel to the independent directors sent to Artisan Partners a request for information to be provided to the directors in connection with their consideration of continuation of the Advisory Agreements. Artisan Partners provided materials to the directors that included responses to that request, other information Artisan Partners believed was useful in evaluating the continuation of the Advisory Agreements and reports prepared by Lipper Inc. (“Lipper”) relating to each Fund’s performance and expenses compared to the performance and expenses of a relatively small peer group and a larger peer universe of funds determined by Lipper to be comparable. In evaluating the Advisory Agreements, the directors reviewed the available information and discussed with representatives of Artisan Partners each Fund’s operations and the nature and quality of the advisory and other services provided by Artisan Partners to the Funds. The directors had received and reviewed a memorandum from the independent counsel to the Funds’ independent directors regarding the directors’ responsibilities in evaluating the Funds’ investment advisory agreements.
In addition to the third party reports by Lipper Inc. and the memorandum from independent counsel, the directors received and reviewed information concerning the following:
| • | The services performed by Artisan Partners for the Funds, including: a list of services performed by Artisan Partners for the Funds; Artisan Partners’ responsibility for making investment decisions; and Artisan Partners’ research and decision-making processes, including Artisan Partners’ responsibility for compliance with investment objectives, policies and restrictions of the Funds; |
| • | The terms of each Advisory Agreement, including: Artisan Partners’ standard of care; and termination provisions; |
| • | Artisan Partners’ personnel and operations, including: the number and organization of Artisan Partners’ employees; the education and experience of Artisan Partners’ investment personnel; Artisan Partners’ assessment of its ability to attract and retain capable investment and business professionals; the time and attention of Artisan Partners’ personnel devoted to the Funds; and Artisan Partners’ technology and systems; |
| • | Each Fund’s investment performance, including a comparison for various time periods with (1) other Artisan Partners client accounts managed in the same investment strategy, (2) other mutual funds having similar investment objectives, and (3) appropriate market indices; |
| • | Potential for conflicts of interest between the Funds and Artisan Partners and circumstances and actions addressing or bearing on potential conflicts of interest, including: Artisan Partners’ focus on investment management services; the type and number of other clients served by Artisan Partners in each of its investment strategies and the dollar value of assets other than the Funds managed by Artisan Partners; potential advantages and disadvantages in having an investment adviser that has other clients; certain Artisan Partners procedures, including trade allocation and proxy voting; Artisan Partners’ code of ethics, including policies relating to personal securities of employees; and litigation and regulatory matters; |
| • | Potential benefits gained by Artisan Partners or its affiliates and by the Funds from their relationship; |
| • | Brokerage and portfolio transactions, including: use of brokers not affiliated with Artisan Partners for execution of all transactions; use of soft dollars; the Funds’ commission recapture program; and portfolio turnover ratios; |
| • | The advisory fees charged, including: recognition of economies of scale through breakpoints in the fees; a comparison of the fees charged by Artisan Partners to the Funds with the fees charged by Artisan Partners to other accounts managed by Artisan Partners in the same investment |
34
THIRTY-FOUR
FACTORS CONSIDERED IN RENEWING THE FUNDS’ ADVISORY CONTRACTS
strategies; and a comparison of the fees charged by Artisan Partners to the Funds with the management fees charged by other investment advisers for managing mutual funds with similar investment objectives and strategies; |
| • | The effect of advisory and other fees on the Funds’ total expenses, including: comparisons of expenses and expense ratios with those of other mutual funds, taking into account comparability factors such as size, account-level charges and investment objective; voluntary expense limitations or reductions and relationship of expenses to expense limitation; fees paid to service providers other than Artisan Partners; |
| • | The financial condition and stability of Artisan Partners; and |
| • | The profitability to Artisan Partners of its relationship with each Fund. |
After discussion and consideration of the information presented at the meeting, the non-interested directors met separately with their independent counsel. The board of directors, including all the “non-interested” directors, unanimously approved the continuation of the Advisory Agreements for the Interim Period at the October 14th special meeting.
The board of directors met again at a regularly scheduled meeting on November 4, 2004. At the November 4th meeting, the directors were provided with information they had requested at the October 14th meeting, and the directors discussed whether any further discussion or review was necessary with respect to the information reviewed or discussion held at the October 14th board meeting. The directors concluded that the October 14th meeting provided a strong basis for considering the continuation of the Advisory Agreements at the November 4th meeting. After reviewing information from the October 14th meeting and other information presented at the November 4th meeting, the independent directors met separately with their independent counsel. Following those discussions, the board approved the continuation of each Advisory Agreement through November 30, 2005 by the unanimous vote of all directors and also by the unanimous vote of all the non-interested directors. In approving the continuation of each Advisory Agreement, the directors reviewed the information detailed above and reached the following conclusions based on the material factors discussed below:
The nature, extent and quality of Artisan Partners’ services. The directors concluded that the nature and extent of Artisan Partners’ services to the Funds were appropriate and consistent with, and in some cases more advantageous to the Funds than, the terms of the Advisory Agreements. The directors concluded that the quality of Artisan Partners’ services has been very good. In reaching their conclusions, the directors considered the following:
| • | Because Artisan Partners’ principal responsibility is management of the Funds’ investment portfolios, the investment performance achieved by Artisan Partners is an important indicator of the quality of the services provided. |
| • | Besides investment management, Artisan Partners provides the Funds with general administration services, including the preparation of regulatory filings, provides services to certain of the Funds’ shareholders and management of the Funds’ relationships with its third party service providers, including its custodian, fund accounting agent, transfer agent, lawyers and auditors. |
| • | The quality of Artisan Partners’ services to the Funds is consistent with or superior to mutual fund industry standards. |
| • | Artisan Partners has sufficient personnel, with the appropriate education and experience, to serve the Funds effectively, and has demonstrated its continuing ability to attract and retain quality personnel. |
| • | Artisan Partners’ financial condition is sound. |
35
THIRTY-FIVE
FACTORS CONSIDERED IN RENEWING THE FUNDS’ ADVISORY CONTRACTS
The investment performance of each Fund. The directors considered for each Fund for periods ended June 30, 2004 short-term and long-term investment performance compared to broad-based and style-specific market indexes, performance for the period January 1, 2004 through September 30, 2004 compared to the same indexes, Morningstar ratings™ (for those Funds rated by Morningstar) and Lipper rankings. The directors concluded that the long-term investment performance of each Fund has been good to excellent. In reaching that conclusion, the directors considered the following:
| • | Each of the Funds invests in a predominantly value-oriented or growth-oriented investment style. International Value Fund, Mid Cap Value Fund and Small Cap Value Fund invest in a predominantly value-oriented style; International Fund, International Small Cap Fund, Mid Cap Fund and Small Cap Fund invest in a predominantly growth-oriented investment style. |
| • | Because of each Fund’s style-specific investment strategy, the investment performance of each Fund and, in particular, its performance compared to a broad-based market index is affected by the relative performance of growth-oriented stocks and value-oriented stocks in the market overall. |
| • | The broad-based and style-specific benchmark indexes against which Fund performance is compared show significant variances in recent years, with the Russell 2000® Value Index significantly outperforming the Russell 2000® Growth Index and the Russell 2000® Index; the Russell Midcap® Value Index significantly outperforming the Russell Midcap® Growth Index and the Russell Midcap® Index; and the Morgan Stanley Capital International Europe, Australasia and Far East (MSCI EAFE®) Value Index significantly outperforming the MSCI EAFE® Growth Index and the MSCI EAFE® Index for the period from January 1, 2000 through September 30, 2004, and for the period January 1, 2004 through September 30, 2004. Under that environment, predominantly value-oriented funds have operated under more favorable market conditions when compared to the broader market and to more growth-oriented funds, and predominantly growth-oriented funds operated under less favorable conditions when compared to the broader market and to more value-oriented funds. |
| • | A fund’s relative performance in the Lipper performance universe may be significantly influenced by the category in which Lipper places the fund. |
| • | The directors also noted that the performance of each Fund, without taking expenses into account, was consistent with the performance, before expenses, of other accounts managed by Artisan Partners in the same investment strategy. |
Cost of services, economies of scale and benefits derived by Artisan Partners. The directors concluded that the overall expense ratio of each class of shares of each Fund was comparable to or more favorable than the expense ratios of its peers and that the fees each Fund pays to Artisan Partners (and Artisan Partners’ corresponding profits) are reasonable in relation to the nature and quality of services provided and in relation to the fees Artisan Partners charges its other clients who have similar investment strategies and objectives (but to whom Artisan Partners generally provides few or no services other than portfolio management). The directors also concluded that shareholders of the Funds (except for Artisan International Small Cap Fund) have benefited or will benefit from economies of scale under the management fee structures in the Advisory Agreements and that, because International Small Cap Fund closed at such a small asset level, Artisan Partners is not likely to enjoy economies of scale in its management. In reaching those conclusions, the directors considered the following:
| • | The rates of fee paid by each Fund to Artisan Partners have been stable, but the aggregate dollar amounts of the fees paid have increased as the Funds have grown. In return for its services, |
36
THIRTY-SIX
FACTORS CONSIDERED IN RENEWING THE FUNDS’ ADVISORY CONTRACTS
each Fund, other than Artisan International Small Cap Fund, pays Artisan Partners a monthly fee at the annual rate of 1% of the Fund’s average daily net assets up to $500 million; 0.975 of 1% of the next $250 million; 0.950 of 1% of the next $250 million; and 0.925 of 1% of average daily net assets over $1 billion. Artisan International Small Cap Fund pays Artisan Partners a monthly fee at the annual rate of 1.25% of the Fund’s average daily net assets. |
| • | Artisan Partners has undertaken to reimburse Artisan Mid Cap Value Fund and Artisan International Value Fund for any ordinary operating expenses for a fiscal year in excess of 2.00% of average net assets and to reimburse Artisan International Small Cap Fund for any ordinary operating expenses for a fiscal year in excess of 2.50% of average net assets. Each of those Funds is currently operating within that expense limitation. Similar limitations were in effect for each of the Funds in the periods following their inception. |
Other benefits derived by the Funds or Artisan Partners. The directors concluded that, other than the services provided by Artisan Partners pursuant to the Advisory Agreements and the management fees paid in return, the Funds and Artisan Partners may potentially benefit from their relationship with each other in several ways. For Artisan Partners, the directors concluded there were two principal benefits: (1) the potential conversion of a Fund shareholder to a separate account client; and (2) the acquisition of research products and services in return for commissions (“soft dollars”). The directors concluded that, although Artisan Partners derives or may derive those additional benefits, the Funds also benefit in similar fashion. In reaching those conclusions, the directors considered the following:
| • | Artisan Partners does not solicit the Funds’ shareholders to become separate account clients nor to purchase other goods or services provided by Artisan Partners or its affiliates. Artisan Partners refers potential separate account clients that do not meet Artisan Partners’ minimum separate account size requirements to the Funds. |
| • | Artisan Partners utilizes third-party research products and services and proprietary research from executing brokers paid for with soft dollars paid by the Funds and by other clients of Artisan Partners. Artisan Partners’ use of soft dollars provides Artisan Partners, and thereby the Funds, with access to third party and proprietary research and also helps Artisan Partners maintain important and open relationships with brokers. Use of a Fund’s commissions for soft dollar purposes is on the same terms as every other client account managed by Artisan Partners in the same investment strategy. |
37
THIRTY-SEVEN
NOTES ON MANAGEMENT’S DISCUSSION OF FUND PERFORMANCE
The discussions of each Fund included in this report include statistical information about the portfolios of each of the Artisan Funds. Except as otherwise noted, that information is as of March 31, 2005 and that information will vary with changes in a Fund’s portfolio investments. The performance information for each Fund relative to its benchmark index discussed in this Report was prepared by the Adviser using information reported by FactSet Databases (“FactSet”). Artisan Funds may consider an issuer to be from a particular country if (i) its principal securities trading market is in that country; (ii) alone or on a consolidated basis it derives more of its annual revenue from goods produced, sales made or services performed in that country than any other country; or (iii) it is organized under the laws of, or has a principal office in that country. By applying these tests, it is possible that Artisan Funds could deem a particular issuer to be from more than one country.
Definitions of Portfolio Statistics
Median Market Cap provides a measure of the market capitalization value of the companies in a portfolio. Market capitalization is the aggregate value of all a company’s outstanding common stock. Market capitalization is calculated by FactSet using the price as of the most recent month-end multiplied by the number of shares outstanding as shown in the financial statements of the issuer. Equal numbers of companies in the portfolio have market capitalizations higher and lower than the median. Weighted Average Market Cap is the average of the market capitalizations of the companies in the portfolio weighted by the size of each company’s position within the portfolio. Weighted Average Growth Rate is a measure of the rate at which a company’s earnings are expected to grow and is the average of the 3-5 year forecasted growth rates of each company in the portfolio, weighted by the size of the company’s position within the portfolio. Weighted Harmonic Average P/E is the harmonic average, which measures the price/earnings ratio (a measure of how expensive a stock is) of the Fund, excluding negative earners, weighted by the size of the company’s position within the portfolio. The earnings figures used are estimates for the current calendar year.
Descriptions of Indices
Each Fund’s performance is compared in this report to changes in one or more indices, including in all cases a broad-based index of changes in prices of securities in the market in which the Fund invests. All of the indices are unmanaged and their returns include reinvested dividends. Unlike the Funds’ returns, the returns of each index do not include the payment of sales commissions or other expenses that would be incurred in the purchase or sale of the securities included in that index.
The indices to which the Funds are compared are:
Artisan International Fund – Morgan Stanley Capital International EAFE® Index (MSCI EAFE®) is a market-weighted index of companies in developed markets, excluding the U.S. and Canada. The Morgan Stanley Capital International EAFE® Growth Index (MSCI EAFE® Growth) is a market-weighted index of companies in developed markets, excluding the U.S. and Canada, with higher price-to-book ratios.
Artisan Mid Cap Fund – Russell Midcap® Index is a market-weighted index of about 800 medium-sized U.S. companies. The Russell Midcap® Growth Index is a market-weighted index of those medium-sized companies included in the Russell Midcap® Index with higher price-to-book and higher forecasted growth values.
38
THIRTY-EIGHT
NOTES ON MANAGEMENT’S DISCUSSION OF FUND PERFORMANCE
Trademarks
Trademarks and copyrights relating to the indices and products of portfolio companies mentioned in this report are owned by their respective owners. Except as otherwise indicated, the trademarks, including names, logos, slogans and service marks appearing in this report are the property of Artisan Partners Limited Partnership and may not be copied, reproduced, published or in any way used without written permission.
PROXY VOTING POLICIES AND PROCEDURES
You may obtain a description of Artisan Funds’ proxy voting policies and procedures, without charge, upon request by calling 800.399.1770. That information also is included in Artisan Funds’ statement of additional information, which is available on the Funds’ website at www.artisanfunds.com and the Securities and Exchange Commission’s website at www.sec.gov.
Information relating to how each Artisan Fund voted proxies relating to portfolio securities held during the twelve months ended June 30 is available on the Funds’ website at www.artisanfunds.com and on the Securities and Exchange Commission’s website at www.sec.gov.
INFORMATION ABOUT PORTFOLIO SECURITIES
Artisan Funds files a complete schedule of portfolio holdings with the Securities and Exchange Commission for the quarters ending December 31 and June 30 (the Funds’ first and third quarters of its fiscal year) on Form N-Q. The Funds’ Forms N-Q, when filed, will be available on the Securities and Exchange Commission’s website at www.sec.gov. You may also review and copy those documents by visiting the Securities and Exchange Commission’s Public Reference Room in Washington, D.C. Information on the operation of the Public Reference Room may be obtained by calling the Securities and Exchange Commission at 800.SEC-0330.
39
THIRTY-NINE
 | ARTISAN FUNDS P.O. BOX 8412 BOSTON, MA 02266-8412
800.399.1770 |
Item 2. Code of Ethics.
Not applicable for semi-annual reports.
Item 3. Audit Committee Financial Expert.
Not applicable for semi-annual reports.
Item 4. Principal Accountant Fees and Services.
Not applicable for semi-annual reports.
Item 5. Audit Committee of Listed Registrants.
Not applicable.
Item 6. Schedule of Investments.
The Schedule of Investments in securities of unaffiliated issuers is included as part of the semi-annual report to shareholders filed under Item 1 of this Form.
Item 7. Disclosure of Proxy Voting Policies and Procedures for Closed-End Management Investment Companies.
Not applicable.
Item 8. Portfolio Managers of Closed-End Management Investment Companies.
Not applicable.
Item 9. Purchases of Equity Securities by Closed-End Management Investment Company and Affiliated Purchasers.
Not applicable.
Item 10. Submission of Matters to a Vote of Security Holders.
No material changes to report.
Item 11. Controls and Procedures.
(a) The registrant’s principal executive and principal financial officers have concluded, based on an evaluation of the registrant’s disclosure controls and procedures (as defined in Rule 30a-3(c) under the Investment Company Act of 1940, the “Disclosure Controls”) as of a date within 90 days prior to the filing date (the “Filing Date”) of this Form N-CSR (the “Report”), the Disclosure Controls are effectively designed to ensure that information required to be disclosed by the registrant in the Report is recorded, processed, summarized and reported by the Filing Date, including ensuring that information required to be disclosed in the Report is accumulated and communicated to the registrant’s management, including the registrant’s principal executive officer and principal financial officer, as appropriate to allow timely decisions regarding required disclosure.
(b) There were no changes in the registrant’s internal controls over financial reporting (as defined in Rule 30a-3(d) under the Investment Company Act of 1940) that occurred during the second fiscal quarter of the period covered by this report that have materially affected, or are reasonably likely to materially affect, the registrant’s internal control over financial reporting.
Item 12. Exhibits.
| (a) | (1) | Not applicable for semi-annual reports | ||
| (2) | Certifications of Andrew A. Ziegler, Principal Executive Officer and Lawrence A. Totsky, Principal Financial Officer pursuant to Rule 30a-2(a) under the Investment Company Act of 1940 (17 CFR 270.30a-2(a)), attached hereto as Exhibits (a)(2)(i) and (a)(2)(ii) | |||
| (3) | Not applicable | |||
| (b) | Certification of Andrew A. Ziegler, Principal Executive Officer and Lawrence A. Totsky, Principal Financial Officer pursuant to Section 906 of the Sarbanes-Oxley Act of 2002, attached hereto as Exhibit (b) | |||
SIGNATURES
Pursuant to the requirements of the Securities Exchange Act of 1934 and the Investment Company Act of 1940, the registrant has duly caused this report to be signed on its behalf by the undersigned, thereunto duly authorized.
Artisan Funds, Inc.
| By: | /s/ Andrew A. Ziegler | |
| Andrew A. Ziegler | ||
| Principal Executive Officer | ||
| Date: | June 1, 2005 |
Pursuant to the requirements of the Securities Exchange Act of 1934 and the Investment Company Act of 1940, this report has been signed below by the following persons on behalf of the registrant and in the capacities and on the dates indicated.
| By: | /s/ Andrew A. Ziegler | |
| Andrew A. Ziegler | ||
| Principal Executive Officer | ||
| Date: | June 1, 2005 | |
| By: | /s/ Lawrence A. Totsky | |
| Lawrence A. Totsky | ||
| Principal Financial Officer | ||
| Date: | June 1, 2005 | |