UNITED STATES
SECURITIES AND EXCHANGE COMMISSION
Washington, D.C. 20549
FORM N-CSR
CERTIFIED SHAREHOLDER REPORT OF REGISTERED
MANAGEMENT INVESTMENT COMPANIES
Investment Company Act file number 811-08932
Artisan Funds, Inc.
(Exact name of registrant as specified in charter)
875 East Wisconsin Avenue, Suite 800
Milwaukee, WI 53202
(Address of principal executive offices)
| | |
| Janet D. Olsen | | Kevin J. McCarthy |
| Artisan Funds, Inc. | | Bell, Boyd & Lloyd LLC |
| 875 East Wisconsin Avenue, #800 | | Three First National Plaza, #3100 |
| Milwaukee, Wisconsin 53202 | | Chicago, IL 60602 |
(Name and address of agents for service)
Registrant’s telephone number, including area code: (414) 390-6100
Date of fiscal year end: 09/30/06
Date of reporting period: 03/31/06
Item 1. Reports to Shareholders.

SEMIANNUAL
R E P O R T
MARCH 31, 2006
ARTISAN INTERNATIONAL FUND
ARTISAN INTERNATIONAL SMALL CAP FUND
ARTISAN INTERNATIONAL VALUE FUND
ARTISAN MID CAP FUND
ARTISAN MID CAP VALUE FUND
ARTISAN OPPORTUNISTIC VALUE FUND
ARTISAN SMALL CAP FUND
ARTISAN SMALL CAP VALUE FUND

ARTISAN FUNDS, INC.
INVESTOR SHARES
ARTISAN FUNDS
P.O. BOX 8412
BOSTON, MA 02266-8412
This report and the unaudited financial statements contained herein are provided for the general information of the shareholders of Artisan Funds. Before investing, investors should consider carefully each Fund’s investment objective, risks and charges and expenses. For a prospectus, which contains that information and more information about each Fund, please call 800.344.1770 or visit our website at www.artisanfunds.com. Read it carefully before you invest or send money.
Company discussions are for illustration only and are not intended as recommendations of individual stocks. The discussions present information about the companies believed to be accurate, and the views of the portfolio managers, as of March 31, 2006. That information and those views may change, and the Funds disclaim any obligation to advise shareholders of any such changes. Artisan International Fund and Artisan Mid Cap Fund offer institutional classes of shares for institutional investors meeting certain minimum investment requirements. A report on each institutional class is available under separate cover.
Artisan Funds offered through Artisan Distributors LLC, member NASD.
TABLE OF CONTENTS
AVERAGE ANNUAL TOTAL RETURNS (as of 3/31/06)
| | | | | | | | | | | | | | | |
| | | 1-Year | | | 3-Year | | | 5-Year | | | 10-Year | | | Since
Inception | |
Artisan International Fund (inception 12/28/95) | | 29.32 | % | | 31.58 | % | | 8.90 | % | | 13.81 | % | | 14.40 | % |
Artisan International Small Cap Fund (inception 12/21/01) | | 40.92 | | | 45.72 | | | NA | | | NA | | | 28.90 | |
Artisan International Value Fund (inception 9/23/02) | | 23.69 | | | 39.11 | | | NA | | | NA | | | 33.30 | |
Artisan Mid Cap Fund (inception 6/27/97) | | 20.91 | | | 22.31 | | | 8.01 | | | NA | | | 18.64 | |
Artisan Mid Cap Value Fund (inception 3/28/01) | | 15.84 | | | 28.95 | | | 16.52 | | | NA | | | 16.66 | |
Artisan Small Cap Fund (inception 3/28/95) | | 26.39 | | | 29.52 | | | 12.05 | | | 8.35 | | | 10.94 | |
Artisan Small Cap Value Fund (inception 9/29/97) | | 19.11 | | | 29.24 | | | 17.49 | | | NA | | | 14.18 | |
Artisan Opportunistic Value Fund performance is not included above because it commenced operations on 3/27/06.
The performance quoted represents past performance, which does not guarantee future results. The investment return and principal value of an investment in a Fund will fluctuate, so that an investor’s shares in the Fund, when redeemed, may be worth more or less than their original cost. Current performance may be lower or higher than the performance data quoted. For current to most recent month-end performance information, visit www.artisanfunds.com or call 800.344.1770. The performance information shown for Artisan International Fund, Artisan International Small Cap Fund and Artisan International Value Fund does not reflect the deduction of a 2% redemption fee on shares held by an investor for 90 days or less and, if reflected, the fee would reduce the performance quoted. Artisan International Small Cap Fund’s investments in initial public offerings (IPOs) made a material contribution to the Fund’s performance. IPO investments are not an integral component of the Fund’s investment process and may not be available in the future.
Artisan International Fund, International Small Cap Fund & International Value Fund: International investments involve special risks, including currency fluctuation, lower liquidity, different accounting methods and economic and political systems and higher transaction costs. These risks typically are greater in emerging markets. Artisan International Fund and International Small Cap Fund invest in growth stocks, which may underperform other asset types during a given period. Artisan International Small Cap Fund invests in the stocks of smaller companies, which tend to be more volatile and less liquid than those of larger companies, have underperformed the stocks of larger companies during some periods and tend to have a shorter history of operations than larger companies. Artisan International Value Fund invests in value stocks, which may underperform other asset types during a given period. In addition, the Fund may invest a significant portion of its assets in small and medium-sized companies, which tend to be more volatile and less liquid than those of large companies, have underperformed the stocks of larger companies during some periods and tend to have a shorter history of operations than larger companies.
Artisan Mid Cap Fund, Mid Cap Value Fund & Opportunistic Value Fund: Stocks of medium-sized companies tend to be more volatile than those of larger companies and have underperformed the stocks of small and large companies during some periods. Artisan Mid Cap Fund invests primarily in growth stocks, which may underperform other asset types during a given period. Artisan Mid Cap Value Fund and Artisan Opportunistic Value Fund invest primarily in value stocks, which may underperform other asset types during a given period.
Artisan Small Cap Fund & Small Cap Value Fund: Stocks of smaller companies tend to be more volatile and less liquid than those of larger companies, have underperformed the stocks of larger companies during some periods and tend to have a shorter history of operations than larger companies. Artisan Small Cap Fund invests primarily in growth stocks, which may underperform other asset types during a given period. Artisan Small Cap Value Fund invests primarily in value stocks, which may underperform other asset types during a given period.
ARTISAN INTERNATIONAL FUND (ARTIX)
| | |
| INVESTMENT PROCESS HIGHLIGHTS | | |
Artisan International Fund uses a fundamental stock selection process focused on identifying long-term growth opportunities. Themes. The investment team’s thematic approach identifies catalysts for change and develops investment themes with the objective of capitalizing on them globally. Changing demographics, developing technology, privatization of economic resources and outsourcing are among the long-term catalysts for change that currently form the basis for the team’s investment themes. The team incorporates these catalysts along with sector and regional fundamentals into a long-term global framework for investment analysis and decision-making. Sustainable Growth. The team applies a fundamental approach to identifying the long- term, sustainable growth characteristics of potential investments. The team seeks high quality companies that are well managed, have a dominant or improving market position and competitive advantages compared to industry and regional peers. Valuation. The team assesses the relationship between its estimate of a company’s sustainable growth prospects and its stock price. The team uses multiple valuation metrics to establish price targets. The Fund primarily invests in non-U.S. growth companies of all market capitalizations in developed and emerging markets. |
| | | |
| PERFORMANCE HISTORY | | |
| |
GROWTH OF AN ASSUMED $10,000 INVESTMENT (12/28/95 to 3/31/06)
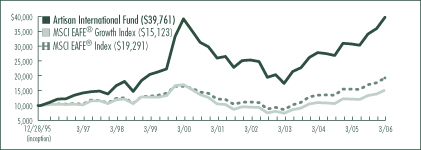
AVERAGE ANNUAL TOTAL RETURNS (as of 3/31/06)
| | | | | | | | | | | | | | | |
| Fund / Index | | 1-Year | | | 3-Year | | | 5-Year | | | 10-Year | | | Since
Inception | |
Artisan International Fund | | 29.32 | % | | 31.58 | % | | 8.90 | % | | 13.81 | % | | 14.40 | % |
MSCI EAFE® Growth Index | | 24.59 | | | 27.17 | | | 7.53 | | | 3.93 | | | 4.11 | |
MSCI EAFE® Index | | 24.41 | | | 31.13 | | | 9.63 | | | 6.49 | | | 6.62 | |
The performance quoted represents past performance, which does not guarantee future results. The investment return and principal value of an investment in the Fund will fluctuate, so that an investor’s shares in the Fund, when redeemed, may be worth more or less than their original cost. Current performance may be lower or higher than the performance data quoted. For current to most recent month-end performance information, visit www.artisanfunds.com or call 800.344.1770. The graph and table above do not reflect the deduction of taxes that a shareholder would pay on distributions or sale of Fund shares. The performance shown does not reflect the deduction of a 2% redemption fee on shares held by an investor for 90 days or less and, if reflected, the fee would reduce the performance quoted. See page 86 for a description of each index.
2
TWO
INVESTING ENVIRONMENT
The backdrop for international equities during the six months ended March 31, 2006 was quite favorable. In general, the growth of the global economy was strong and inflation remained subdued.
The U.S. dollar moved slightly higher versus a number of currencies during the period. The return of the MSCI EAFE® Index for dollar-based investors was 13.86% compared to the 15.88% local return.
Stocks in the financials, industrials, technology and materials sectors gained more than 20%. The price of oil flirted with $70 per barrel, but energy stocks ended the period slightly behind where they started. Telecommunications stocks also lost ground.
PERFORMANCE DISCUSSION
The Fund’s performance was hurt slightly by the increase in the U.S. dollar, but still gained 16.71% during the period, which compared well to the MSCI EAFE® Index. Good security selection was the primary source of the Fund’s relative advantage. Stock selection was particularly strong within our global financials and energy themes. The performance of the stocks in our consumer and media themes and our lack of investment in materials stocks hurt our return compared to the Index.
In our global financials theme, we experienced strong gains in many of our holdings. Three of the leading contributors were Japanese real estate and leasing company ORIX Corporation, Korean bank Kookmin Bank and German bank Commerzbank AG. Their stock prices increased roughly 72%, 46% and 46%, respectively.
In Japan, bank lending started to pick up, employment and wages were in a rising trend and the country seemed poised to end its bout with deflation. All of those factors helped support Japanese stocks in general. During the period, ORIX announced a nearly 50% increase in its full-year profit forecast and its leasing and lending businesses expanded while costs declined. Japanese financial companies Mizuho Financial Group, Inc. and Credit Saison Co., Ltd., also performed well.
Late in the period, Kookmin Bank announced that it was the preferred bidder for Korea Exchange Bank (KEB). The combined company is expected to have a large share of the total loan market in Korea, and should produce long-term cost and revenue synergies. Since the deal is expected to be additive to earnings, the news was well-received by the market. Prior to that announcement, Kookmin and our other Korean banks, Shinhan Financial Group Co., Ltd. and Hana Financial Group Inc. (formerly Hana Bank), were supported by asset quality improvements and reduced levels of non-performing loans.
TOP 10 HOLDINGS
| | | | | |
| Company Name | | Country | | 3/31/06 | |
Credit Saison Co., Ltd. | | Japan | | 3.6 | % |
UBS AG | | Switzerland | | 3.5 | |
ORIX Corp. | | Japan | | 2.7 | |
Fortis | | Netherlands | | 2.7 | |
LUKOIL | | Russia | | 2.7 | |
Sega Sammy Holdings, Inc. | | Japan | | 2.6 | |
Mizuho Financial Group, Inc. | | Japan | | 2.5 | |
Kookmin Bank | | South Korea | | 2.3 | |
Saipem S.p.A. | | Italy | | 2.2 | |
China Mobile (Hong Kong) Limited | | China | | 2.1 | |
Total | | | | 26.9 | % |
As a percentage of total net assets. Top 10 Holdings are determined by issuer.
Two drivers of Commerzbank’s share price performance were optimism about Germany’s economic environment and the company’s announced acquisition of Eurohypo AG. The Eurohypo acquisition was expected to add to earnings, due in part to cost savings. Other winners among our European financials included Swiss global investment services firm UBS AG and Dutch financial services companies Fortis and ING Groep N.V.
During the period, our energy stocks generally performed very well. Within the group, Russian oil producer LUKOIL was the largest contributor to our performance, gaining over 44%. We believe that its above average production rates and proven oil reserves were the reasons it did so well in a tough period for energy stocks. We realized some profits during the period by selling shares into strength, but LUKOIL remained a top ten position as of the end of the period.
3
THREE
Expectations for a surge in capital spending in the energy industry due to tight industry capacity, an aging fleet of rigs and a shortage of offshore rigs contributed to very positive sentiment for energy infrastructure companies. Those factors benefited our positions in Italy-based Saipem S.p.A. and Norwegian driller Acergy S.A. (formerly Stolt Offshore S.A.).
Canadian natural gas provider EnCana Corp. fell roughly 20% during the period, after announcing a drop in profits due to hedging contracts that did not allow the company to participate as much as it could have in the rise of natural gas prices.
SECTOR DIVERSIFICATION
| | | | | | |
| Sector | | 9/30/05 | | | 3/31/06 | |
Consumer Discretionary | | 23.6 | % | | 15.5 | % |
Consumer Staples | | 9.8 | | | 8.7 | |
Energy | | 8.7 | | | 9.3 | |
Financials | | 30.4 | | | 36.5 | |
Healthcare | | 4.1 | | | 4.6 | |
Industrials | | 8.0 | | | 11.1 | |
Information Technology | | 6.8 | | | 5.1 | |
Telecommunication Services | | 6.1 | | | 3.0 | |
Utilities | | 1.2 | | | 5.0 | |
Other assets less liabilities | | 1.3 | | | 1.2 | |
Total | | 100.0 | % | | 100.0 | % |
As a percentage of total net assets.
Two other stocks that positively contributed to the Fund’s return were Siemens AG, a Germany-based conglomerate that manufactures a wide range of industrial and consumer products, and Singapore Airlines Ltd. During the period, Siemens announced the divestment of part of its technology services division, which had been a large drag on earnings. Singapore Airlines benefited from the strength of economic growth in the Far East and its relatively low exposure to competition from discount airlines.
The holdings in our consumer and media themes performed reasonably well, but their returns did not keep pace with similar holdings in the MSCI EAFE® Index. U.K. cruise operator Carnival PLC and Japanese cable and Internet service provider Jupiter Telecommunications Co., Ltd. were two stocks that underperformed. Carnival was hurt by concerns about slower bookings and a reduced earnings forecast. Jupiter Telecom fell in part due to concerns about competition from satellite providers and the potential for higher costs and a decline in profitability.
FUND CHANGES
We sold several securities in our consumer, media and communications themes during the period, while we made a number of new purchases in our energy and financials themes.
We pared back our communications theme because we became more concerned about competition due to the convergence of the various communications platforms. Among the stocks we sold were Telefonaktiebolaget LM Ericsson, Nortel Networks Corporation, Chunghwa Telecom Co., Ltd. and Singapore Telecommunications Limited.
Three of the largest sales in our consumer and media themes were U.K. companies Tesco PLC, a food retailer; British Sky Broadcasting Group PLC, a pay television provider; and ITV PLC, a television broadcaster.
In our energy theme, we added Norwegian driller SeaDrill Ltd. We also extended our energy theme and increased our exposure to the utilities sector. Our attraction to utilities in the medium-term was our belief that those companies could increase revenues at a faster pace than costs. This resulted in larger positions in German power producers RWE AG and E.ON AG and initial investments in Finland-based Fortum Oyj and Russia-based RAO Unified Energy System.
A few of the largest additions in our global financials theme were UniCredito Italiano S.p.A, an Italian bank; Mitsubishi UFJ Financial Group, Inc., a Japanese bank; Barclays PLC, a U.K. bank; Millea Holdings, Inc., a Japanese insurance company; and Wiener Staedtische Allgemeine Versicherung AG, an Austrian insurance company.
REGION ALLOCATION
| | | | | | |
| Region | | 9/30/05 | | | 3/31/06 | |
Europe | | 55.0 | % | | 54.5 | % |
Pacific Basin | | 25.2 | | | 28.6 | |
Emerging Markets | | 15.3 | | | 13.7 | |
Americas | | 3.2 | | | 2.0 | |
As a percentage of total net assets.
4
FOUR
ARTISAN INTERNATIONAL SMALL CAP FUND (ARTJX)
| | |
| INVESTMENT PROCESS HIGHLIGHTS | | |
Artisan International Small Cap Fund uses a fundamental stock selection process focused on identifying long-term growth opportunities among small non-U.S. companies. Themes. The investment team’s thematic approach identifies catalysts for change and develops investment themes with the objective of capitalizing on them globally. Changing demographics, developing technology, privatization of economic resources and outsourcing are among the long-term catalysts for change that currently form the basis for the team’s investment themes. The team incorporates these catalysts along with sector and regional fundamentals into a long-term global framework for investment analysis and decision-making. Sustainable Growth. The team applies a fundamental approach to identifying the long-term, sustainable growth characteristics of potential investments. The team seeks high quality companies that are well managed, have a dominant or improving market position and competitive advantages compared to industry and regional peers. Valuation. The team assesses the relationship between its estimate of a company’s sustainable growth prospects and its stock price. The team uses multiple valuation metrics to establish price targets. The Fund primarily invests in non-U.S. small-cap growth companies in developed and emerging markets with market capitalizations less than $3 billion at the time of investment. |
| | | |
| PERFORMANCE HISTORY | | |
| |
GROWTH OF AN ASSUMED $10,000 INVESTMENT (12/21/01 to 3/31/06)
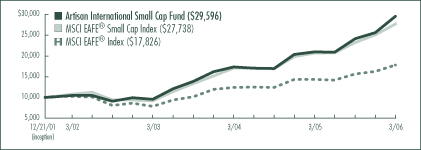
AVERAGE ANNUAL TOTAL RETURNS (as of 3/31/06)
| | | | | | | | | |
| Fund / Index | | 1-Year | | | 3-Year | | | Since
Inception | |
Artisan International Small Cap Fund | | 40.92 | % | | 45.72 | % | | 28.90 | % |
MSCI EAFE® Small Cap Index | | 33.79 | | | 44.73 | | | 26.96 | |
MSCI EAFE® Index | | 24.41 | | | 31.13 | | | 14.48 | |
The performance quoted represents past performance, which does not guarantee future results. The investment return and principal value of an investment in the Fund will fluctuate, so that an investor’s shares in the Fund, when redeemed, may be worth more or less than their original cost. Current performance may be lower or higher than the performance data quoted. For current to most recent month-end performance information, visit www.artisanfunds.com or call 800.344.1770. The graph and table above do not reflect the deduction of taxes that a shareholder would pay on distributions or sale of Fund shares. The performance shown does not reflect the deduction of a 2% redemption fee on shares held by an investor for 90 days or less and, if reflected, the fee would reduce the performance quoted. The Fund’s investments in initial public offerings (IPOs) made a material contribution to the Fund’s performance. IPO investments are not an integral component of the Fund’s investment process and may not be available in the future. See page 86 for a description of each index.
5
FIVE
INVESTING ENVIRONMENT
During the semiannual reporting period ended March 31, 2006, international small-cap stocks benefited from what we believe were three major global trends: an extremely favorable economic environment, a lack of inflationary pressure and increasing corporate restructuring leading to a strong wave of merger and acquisition activity.
All sectors in the MSCI EAFE® Small Cap Index advanced during the period. The leading areas were the materials, energy, financial and industrial sectors, all of which increased more than 20%. The U.S. dollar made a small gain over the six-month period ended March 31, 2006. As a result, the MSCI EAFE® Small Cap Index had a local return of 21.82%, while its dollar-based return was 19.23%.
PERFORMANCE DISCUSSION
The Fund returned 22.27% for the six-month period ended March 31, 2006. Outperformance relative to the MSCI EAFE® Small Cap Index was primarily the result of solid stock selection in the industrial and consumer discretionary sectors. Our overweight position and selection in our energy theme also contributed positively to performance. Our results compared to the Index were hindered by weakness in our healthcare and technology holdings.
Two of our leading contributors in the industrial sector were Metso Oyj and Schindler Holding, which posted share price gains of 52% and 37%, respectively. Metso, based in Finland, is the world’s largest manufacturer of rock-crushers and papermaking machinery. During the period, the company announced plans to acquire Aker Kvaerner ASA, a leader in the pulping and chemical recovery businesses. Metso also reported strong orders in both its paper and minerals divisions.
Schindler Holding AG, based in Switzerland, is the world’s leading manufacturer of escalators and the number two manufacturer of lifts. Schindler experienced strength in Europe, as demand for modernization propelled sales within the region.
Solid selection in our consumer theme was driven in part by the strong returns of real-estate developers Cyrela Brazil Realty S.A. Empreendimentos e Participacoes (Brazil), JM AB (Sweden) and Kaufman & Broad S. A. (France), which posted stock price gains of roughly 116%, 59% and 50%, respectively, generating a sizeable performance contribution. Cyrela Brazil reported a 66% increase in revenue partly due to the launch of several new projects and strong unit sales. JM AB benefited from strong demand in the Scandinavian residential market and increased housing prices. Likewise, Kaufman & Broad reported robust sales for both apartments and single-family homes.
In our energy theme, expectations for capital spending were high due to tight industry capacity, an aging fleet of rigs and a shortage of offshore rigs, all of which contributed to ongoing pricing power. We believe this greatly benefited our infrastructure providers during the period, such as Petroleum Geo-Services ASA and SeaDrill Ltd.
TOP 10 HOLDINGS
| | | | | |
| Company Name | | Country | | 3/31/06 | |
Buhrmann NV | | Netherlands | | 3.6 | % |
Petroleum Geo-Services ASA | | Norway | | 2.8 | |
Sulzer AG | | Switzerland | | 2.8 | |
Creed Corporation | | Japan | | 2.7 | |
Elekta AB | | Sweden | | 2.5 | |
Fraser & Neave Limited | | Singapore | | 2.4 | |
Japan Petroleum Exploration Company, Ltd. | | Japan | | 2.4 | |
Sibir Energy PLC | | United Kingdom | | 2.4 | |
Banco Latinoamericano de Exportaciones, S.A. | | Panama | | 2.2 | |
Commercial International Bank | | Egypt | | 2.0 | |
Total | | | | 25.8 | % |
As a percentage of total net assets. Top 10 Holdings are determined by issuer.
Petroleum Geo-Services is one of the world’s largest providers of oilfield-mapping services. The company pioneered the development of multi-streamer seismic acquisition, which produces efficient, high-quality 3D seismic data for the oil industry. In addition to good market conditions, the company announced plans to spin off its oil-production unit. We slightly trimmed our position into strength.
6
SIX
Drilling services provider SeaDrill completed its acquisition of Smedvig ASA (a holding we sold in January), another Norwegian driller.
Japanese real estate firms Creed Corporation and NTT Urban Development Corporation were two additional standout performers. Creed’s assets under management have increased substantially due in part to an increase in real estate acquisitions. NTT Urban Development’s success was partly due to near full occupancy of its buildings in Tokyo and strong profit growth in the company’s condominium business.
SECTOR DIVERSIFICATION
| | | | | | |
| Sector | | 9/30/05 | | | 3/31/06 | |
Consumer Discretionary | | 12.8 | % | | 8.6 | % |
Consumer Staples | | 4.4 | | | 3.8 | |
Energy | | 10.7 | | | 13.8 | |
Financials | | 24.6 | | | 30.9 | |
Healthcare | | 6.4 | | | 4.0 | |
Industrials | | 22.6 | | | 27.7 | |
Information Technology | | 5.4 | | | 1.9 | |
Materials | | 2.8 | | | 3.4 | |
Telecommunication Services | | 3.1 | | | 2.4 | |
Utilities | | 2.0 | | | 2.1 | |
Other assets less liabilities | | 5.2 | | | 1.4 | |
Total | | 100.0 | % | | 100.0 | % |
As a percentage of total net assets.
In the healthcare and technology sectors, weakness in Straumann Holding AG, Q-Free ASA and Sammy NetWorks Co., Ltd. hindered the Fund’s relative performance. Swiss dental implant manufacturer Straumann experienced disappointing sales, partly due to weakness in Europe. Norway-based Q-Free, which is a leading supplier of electronic toll collection systems, experienced downward pressure on earnings, which was partly driven by higher costs, despite an increase in revenue. We sold our position. In the first three months of 2006, our Japanese stocks such as Japanese Internet game and entertainment content provider Sammy NetWorks were generally weaker due in part to the impact of allegations of accounting fraud and market manipulation against livedoor, a Japanese Internet services company.
REGION ALLOCATION
| | | | | | |
| Region | | 9/30/05 | | | 3/31/06 | |
Europe | | 49.2 | % | | 50.0 | % |
Pacific Basin | | 22.4 | | | 25.9 | |
Emerging Markets | | 22.0 | | | 21.1 | |
Americas | | 1.2 | | | 1.6 | |
As a percentage of total net assets.
FUND CHANGES
During the period, we increased our financial and industrial weights and reduced our consumer holdings.
Most of the change in our consumer allocation stemmed from the sales of certain media positions. Among those sold were Gruppo Editoriale L’Espresso S.p.A., Ipsos, JC Decaux S.A., John Fairfax Holdings Limited and NRJ Group. Other sales in the consumer sectors included French property developer Nexity, Spanish residential developer Fadesa Inmobiliaria, S.A. and Brazilian beauty products company Natura Cosmeticos S.A.
In the financial sector, our purchases included real estate firms (FJ Next Co., Ltd., Patrizia Immobilien AG, Pirelli & C. Real Estate S.p.A., Tian An China Investments Company Limited and Tokyu Community Corp.), insurance companies (SCOR and Toro Assicurazioni S.p.A. (De Agostini Group)) and capital market firms (Azimut Holding S.p.A., D. Carnegie & Co. AB, DAB Bank AG, Indiabulls Financial Services Ltd. and Korea Investment Holdings Co., Ltd.).
The increase to our industrial weighting resulted from the purchases of Japanese employment and staffing solutions firm Pasona Inc., Japanese construction companies Raito Kogyo Co., Ltd. and Sho-Bond Corporation, European machinery companies IMI PLC and Vossloh AG, the operating company of Austria’s Vienna International Airport, Flughafen Wien AG and French holding company Financiere Marc de Lacharriere SA (Fimalac), which is the parent company of Fitch Group Inc., the world’s third largest rating agency.
7
SEVEN
ARTISAN INTERNATIONAL VALUE FUND (ARTKX)
| | |
| INVESTMENT PROCESS HIGHLIGHTS | | |
Artisan International Value Fund uses a bottom-up investment process focused on identifying what the investment team believes are high quality, undervalued businesses that offer the potential for superior risk/reward outcomes. Undervaluation. Determining the intrinsic value of the business is the heart of the team’s research process. As long-term investors, it is the team’s core belief that valuation is the most crucial determinant of stock market return over the long-term. Business quality. The team seeks to invest in companies with a history of generating strong free cash flow, improving returns on capital and strong competitive positions in their industries. This criteria helps rule out businesses that are statistically cheap, but whose values are deteriorating over time. Financial strength. The team believes that investing in companies with strong balance sheets helps to reduce the potential for capital risk and provides company management the ability to build value when attractive opportunities are available. Shareholder-oriented management. The team’s research process attempts to identify management teams with a history of building value for shareholders. The Fund primarily invests in undervalued, non-U.S. companies of all market capitalizations in developed and emerging markets. |
| | | |
| PERFORMANCE HISTORY | | |
| |
GROWTH OF AN ASSUMED $10,000 INVESTMENT (9/23/02 to 3/31/06)
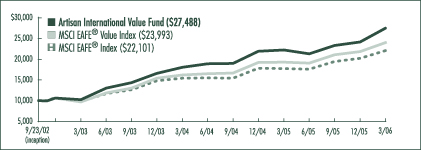
AVERAGE ANNUAL TOTAL RETURNS (as of 3/31/06)
| | | | | | | | | |
| Fund / Index | | 1-Year | | | 3-Year | | | Since
Inception | |
Artisan International Value Fund | | 23.69 | % | | 39.11 | % | | 33.30 | % |
MSCI EAFE® Value Index | | 24.25 | | | 35.08 | | | 28.25 | |
MSCI EAFE® Index | | 24.41 | | | 31.13 | | | 25.29 | |
The performance quoted represents past performance, which does not guarantee future results. The investment return and principal value of an investment in the Fund will fluctuate, so that an investor’s shares in the Fund, when redeemed, may be worth more or less than their original cost. Current performance may be lower or higher than the performance data quoted. For current to most recent month-end performance information, visit www.artisanfunds.com or call 800.344.1770. The graph and table above do not reflect the deduction of taxes that a shareholder would pay on distributions or sale of Fund shares. The performance shown does not reflect the deduction of a 2% redemption fee on shares held by an investor for 90 days or less and, if reflected, the fee would reduce the performance quoted. See page 86 for a description of each index.
8
EIGHT
INVESTING ENVIRONMENT
During the six-month period ended March 31, 2006, stock markets in virtually every country outside the U.S. increased. Among developed markets, Japanese equities led the rally with an advance of 24% in local currency terms. Germany, Switzerland and Sweden were also standouts as each returned at least 16% in local currency terms. Developed market currencies were generally weak compared to the U.S. dollar. As a result, U.S. dollar-based returns were slightly lower than local returns, but strong nonetheless.
PERFORMANCE DISCUSSION
Artisan International Value Fund increased 17.77% in the six months ended March 31, 2006, which compared favorably with the MSCI EAFE® Index, which increased 13.86%.
Four equities that made large positive contributions to the Fund’s performance were Euronext N.V., Pfeiffer Vacuum Technology AG, Heidelberger Druckmaschinen AG and Cementir S.p.A.
Euronext, which operates several European stock exchanges and the London International Financial Futures Exchange, performed well. Its stock price advanced more than 87%. During the period, there were many merger discussions surrounding Euronext and other listed European exchanges. Euronext looks to have played its cards very well and increased significantly. We have significantly reduced our position.
Pfeiffer Vacuum’s share price increased by over 34%. Pfeiffer is a German company that designs, manufactures and services a range of vacuum pumps used in a wide variety of applications including optical glass coating, semiconductor manufacturing, and scientific research. During the period, the company reported a record level of operating profits for its fiscal year ended December 31, 2005. In addition, the company announced a significant increase in its dividend.
Heidelberger Druckmaschinen, the world’s leading manufacturer of sheet-fed printing presses, outperformed, and its share price advanced nearly 29%. It rose in part due to strong earnings results, which were driven by demand from China. In addition, the company announced a significant share repurchase program.
Cementir, an Italian cement company, saw its share price increase roughly 46%. During the period, Cementir won the auction of a significant collection of cement assets in Turkey. The company also announced that its Italian cement operations are starting to recover. This resulted in higher earnings estimates, driving the share price to an all-time high.
Two of the worst performing equities in the portfolio during the period were Vodafone Group PLC and Premiere AG.
Vodafone, the world’s largest mobile telecommunications company, underperformed. Its share price declined by more than -19% during the period. On the positive side, operating results were solid and the company increased its share repurchase objective and dividend. The market, however, focused more on expected profitability declines due to increased competition and costs associated with the launch of third generation mobile services. The market took this information and some concerns over the Japanese division poorly, driving the stock back down to levels close to where we initially began purchasing shares. We took the opportunity to buy more shares.
TOP 10 HOLDINGS
| | | | | |
| Company Name | | Country | | 3/31/06 | |
Diageo PLC | | United Kingdom | | 4.9 | % |
Countrywide PLC | | United Kingdom | | 4.4 | |
Pfeiffer Vacuum Technology AG | | Germany | | 4.4 | |
Givaudan S.A. | | Switzerland | | 3.9 | |
Vodafone Group PLC | | United Kingdom | | 3.8 | |
Meitec Corporation | | Japan | | 3.5 | |
Uni-Charm Corporation | | Japan | | 3.3 | |
Tyco International Ltd. | | United States | | 3.3 | |
MFI Furniture Group PLC | | United Kingdom | | 3.0 | |
Benfield Group PLC | | United Kingdom | | 2.9 | |
Total | | | | 37.4 | % |
As a percentage of total net assets. Top 10 Holdings are determined by issuer.
During the period, we became small shareholders of Premiere. Premiere is the leading provider of pay television in Germany and Austria. At the time of initial purchase, the company dominated the ownership of
9
NINE
premium content, such as movies and sporting events, which is a key competitive advantage in this business. Unfortunately, during a recent auction, management made what looked to be a miscalculation and lost a bid for arguably its most important content, the German Bundesliga soccer matches. As a result, the share price suffered a sizeable decline. We sold our shares at a loss.
SECTOR DIVERSIFICATION
| | | | | | |
| Sector | | 9/30/05 | | | 3/31/06 | |
Consumer Discretionary | | 21.1 | % | | 23.7 | % |
Consumer Staples | | 14.4 | | | 16.7 | |
Financials | | 24.3 | | | 19.6 | |
Healthcare | | 2.6 | | | — | |
Industrials | | 12.5 | | | 14.8 | |
Information Technology | | 1.6 | | | 3.5 | |
Materials | | 10.8 | | | 8.6 | |
Telecommunication Services | | 4.7 | | | 4.7 | |
Utilities | | 1.6 | | | — | |
Other assets less liabilities | | 6.4 | | | 8.4 | |
Total | | 100.0 | % | | 100.0 | % |
As a percentage of total net assets.
FUND CHANGES
We exited nine companies since our last report on September 30, 2005. The list of those sold included Olympus Corporation, Zinifex Ltd., Samchully Co., Ltd., Zehnder Group AG, Admiral Group PLC, Rotork PLC, Hunter Douglas N.V. and RADVision Ltd. Each stock reached or exceeded our estimate of fair value.
Proceeds from our sales were used in part to purchase shares in 11 companies. Tyco International Ltd., GUS PLC, Grupo Modelo, S.A. de C.V. and Amdocs Limited were among our largest additions. As of March 31, 2006, those companies represented 3.3%, 1.9%, 1.8% and 1.7% of the portfolio, respectively.
Tyco is a Bermuda-based conglomerate that was a stock market darling in the late 1990s. The stock collapsed in 2002, however, when an investigation began into the company’s accounting practices. Under the current CEO Edward Breene, the company has reduced debt, simplified the organization and consolidated businesses that former management had hastily acquired. We believed the shares were significantly undervalued.
GUS PLC is a U.K.-based conglomerate operating in retail (Argos) and credit information services (Experian) and, before its spinoff of Burberry, luxury goods. The company has committed to splitting up its unrelated retail and credit operations. At purchase, we were particularly enthusiastic about the credit information business, Experian. We believe it is a high growth business operating in an industry with significant barriers to entry and it has had very attractive operating profit margins.
Grupo Modelo is a Mexico-based brewing company. It has held a more than 50% share of the Mexican beer market and has been the largest exporter of beer, with its popular Corona® brand, to the United States. In recent years, Modelo has restructured its distribution operations, consolidating centers and routes, allowing the company to update equipment and machinery, thus creating efficiencies in product distribution. We purchased the shares at what we believed was an attractive valuation that not only discounted the company’s cash flow stream, but also failed to recognize the considerable value in the company’s balance sheet, which had more than $1.5 billion in net cash.
Amdocs is a leading provider of customer care and billing software to the telecommunications industry. We owned shares in this company several years ago and sold them in 2003 when they hit our fair value estimate. When the stock price fell to a meaningful discount to our fair value estimate, we once again became shareholders.
REGION ALLOCATION
| | | | | | |
| Region | | 9/30/05 | | | 3/31/06 | |
Europe | | 64.4 | % | | 61.0 | % |
Pacific Basin | | 17.4 | | | 13.5 | |
Americas | | 5.7 | | | 10.5 | |
Emerging Markets | | 6.1 | | | 6.6 | |
As a percentage of total net assets.
10
TEN
ARTISAN MID CAP FUND (ARTMX)
| | |
| INVESTMENT PROCESS HIGHLIGHTS | | |
Artisan Mid Cap Fund uses a bottom-up investment process to construct a diversified portfolio of U.S. mid-cap growth companies. Security Selection. The team’s investment process begins by identifying companies that possess franchise characteristics (strong competitive positions), selling at attractive valuations and benefiting from an accelerating trend. The investment team looks for companies that are well positioned for long-term growth, driven by demand for their products and services, at an early enough stage in their profit cycle to benefit from the increased cash flows produced by the profit cycle. Capital Allocation. Based on the investment team’s fundamental analysis of a company’s profit cycle, portfolio holdings develop through three stages. GardenSM investments are small positions in the early part of their profit cycle that will warrant a more sizeable allocation once their profit cycle accelerates. CropSM investments are positions that are being increased to a full weight because they are moving through the strongest part of their profit cycle. HarvestSM investments are positions that are being reduced as they near the team’s estimate of full valuation or their profit cycle begins to decelerate. Broad Diversification. The team looks for investment opportunities across the entire economy so that it can find sustainable growth regardless of the sector or industry. The Fund primarily invests in medium-sized U.S. growth companies. The Fund generally maintains median and weighted average market capitalizations of less than $10 billion. |
| | | |
| PERFORMANCE HISTORY | | |
GROWTH OF AN ASSUMED $10,000 INVESTMENT (6/27/97 to 3/31/06)
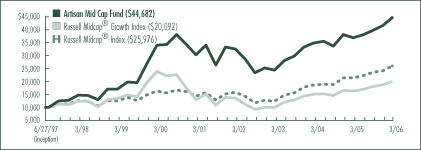
AVERAGE ANNUAL TOTAL RETURNS (as of 3/31/06)
| | | | | | | | | | | | |
| Fund / Index | | 1-Year | | | 3-Year | | | 5-Year | | | Since
Inception | |
Artisan Mid Cap Fund | | 20.91 | % | | 22.31 | % | | 8.01 | % | | 18.64 | % |
Russell Midcap® Growth Index | | 22.68 | | | 25.75 | | | 8.99 | | | 8.29 | |
Russell Midcap® Index | | 21.54 | | | 27.87 | | | 12.52 | | | 11.51 | |
The performance quoted represents past performance, which does not guarantee future results. The investment return and principal value of an investment in the Fund will fluctuate, so that an investor’s shares in the Fund, when redeemed, may be worth more or less than their original cost. Current performance may be lower or higher than the performance data quoted. For current to most recent month-end performance information, visit www.artisanfunds.com or call 800.344.1770. The graph and table above do not reflect the deduction of taxes that a shareholder would pay on distributions or sale of Fund shares. See page 86 for a description of each index.
11
ELEVEN
INVESTING ENVIRONMENT
During the six months ended March 31, 2006, returns generally increased the further you went down the market cap spectrum. The large-cap Russell Top 200® Index gained 5.32%, the Russell Midcap® Index increased 10.14% and the small-cap Russell 2000® Index moved 15.23% higher.
During the period, the Federal Reserve remained on its path to higher interest rates, but the country’s economic performance was generally solid, which was seen in the encouraging sales and profit growth reported by most parts of the economy.
In the Russell Midcap® Index, the best performing sectors were materials, transportation and technology. The energy and utilities sectors were the only groups to post losses, and they were small, at less than 2% each.
PERFORMANCE DISCUSSION
The Fund gained 12.29% during the period, outperforming the Russell Midcap® and Russell Midcap® Growth indices which returned 10.14% and 11.32%, respectively. The main source of our advantage compared to both benchmarks was good security selection. Three areas of particular strength were our healthcare, financial and energy-related stocks, though our performance gains were fairly broad and we had a number of winners in other groups. Relative to the benchmarks, we did not keep pace in the consumer discretionary and technology sectors.
The leading contributor among our healthcare holdings was radiation therapy systems supplier Varian Medical Systems, Inc., the stock price of which increased more than 42%. It reported strong financial results highlighted by impressive growth in orders for the company’s next generation systems in the U.S. and its legacy systems overseas. Drug wholesaler AmerisourceBergen Corporation (ABC) and specialty pharmaceutical company Allergan, Inc. also posted good returns. ABC has been transitioning to a fee-for-services model for drug distribution that has increased cash on hand for share buybacks and debt refinancing. That transition and the strength of its specialty pharmaceutical business supported a strong improvement in earnings. Allergan benefited from the strength of its Botox® brand and expectations for a solid pipeline of new opportunities.
Two of our best performers in the financial sector were student loan outsourcer The First Marblehead Corporation (FMD) and online bill pay software company CheckFree Corporation. FMD extended its relationship with its largest client and announced a sizeable increase in earnings on strong growth in service revenues. CheckFree illustrated the strength of its profit cycle by raising its expectations for future earnings as revenues per transaction increased and e-bill volumes grew.
TOP 10 HOLDINGS
| | | |
| Company Name | | 3/31/06 | |
Smith International, Inc. | | 2.7 | % |
Precision Castparts Corp. | | 2.1 | |
Varian Medical Systems, Inc. | | 2.0 | |
Fisher Scientific International Inc. | | 1.9 | |
Ecolab Inc. | | 1.9 | |
Juniper Networks, Inc. | | 1.8 | |
Electronic Arts Inc. | | 1.8 | |
McDermott International, Inc. | | 1.7 | |
Aon Corporation | | 1.7 | |
Freescale Semiconductor, Inc. | | 1.7 | |
Total | | 19.3 | % |
As a percentage of total net assets. Top 10 Holdings are determined by issuer
Our energy related investments have generally been centered around those companies that we believed were poised to benefit from a lengthy cycle of renewed global spending on energy development and infrastructure. This positioning helped the portfolio in two ways. First, it kept our allocation to crude producers low and crude producers generally declined during the period. Second, it led us to a number of energy infrastructure providers that outperformed. Smith International, Inc., our largest holding as of March 31, 2006, was one of those stocks. Smith International is a worldwide supplier of products and services to the oil and gas exploration and production industry and is a dominant market player in both drill bits and drilling fluids. It benefited from strong earnings growth, positive expectations for increased spending on exploration due to faster depletion rates of existing wells and longer contract terms.
12
TWELVE
Other energy related holdings that performed well included Cooper Cameron Corporation, a leading manufacturer of pressure control systems, equipment and services for oil and gas drilling and production, and worldwide energy services company McDermott International, Inc. Cooper Cameron reported solid earnings supported by an increase in backlog and strong order flow. McDermott International’s marine construction business was expected to benefit from resurgence in offshore drilling activity, and its power generation business from the potential for tighter emissions standards.
Mining equipment provider Joy Global Inc. and logistics company Expeditors International of Washington, Inc. (EXPD) were part of a list of holdings in other sectors that generated solid returns. As a result of the commodities boom, Joy Global has seen aftermarket orders increase at double-digit rates for almost three years. During the period, it reported strong revenues and earnings while further increasing forward estimates. EXPD also reported earnings ahead of expectations on significantly higher revenues and better profit margins.
Our results in the consumer discretionary sector were negatively impacted by weakness in leading Internet media company Yahoo! Inc. and stock photography company Getty Images, Inc. Our investment in Yahoo! has been based on our belief that the company was positioned well over the long-term to benefit from the transition of advertising dollars from offline media to the Internet. However, competition in its Internet search business put pressure on revenues creating some short-term concerns. Getty has a dominant position in the visual content industry, but it was hurt by a revenue report that disappointed the market. We added to our position in Getty on weakness.
In the technology sector, we had a number of strong performers including Network Appliance, Inc., Jabil Circuit, Inc. and Corning Incorporated. However, our results compared to the benchmarks were negatively impacted by disappointments in stocks such as Juniper Networks, Inc. and Intermec, Inc. Juniper Networks, which makes equipment that directs Internet traffic, was hurt by a revenue forecast that disappointed the market. We purchased additional shares on weakness. Intermec, a leading manufacturer of automatic data capture technologies such as bar code and RFID (radio frequency identification) solutions, was hurt in part by higher operating expenses stemming from RFID marketing. We increased the size of our position.
FUND CHANGES
The healthcare sector fell the most as a percentage of portfolio assets due to sales. Our three largest sales in the area were Aetna Inc., healthcare insurance; Caremark Rx, Inc., pharmacy benefit management; and MedImmune, Inc., a biotechnology company with a focus on respiratory diseases. Other significant sales during the period included payroll processor Paychex, Inc. and cruise operator Royal Caribbean Cruises Ltd.
Five of our largest purchases were Advanced Micro Devices, Inc., one of the largest suppliers of computing processors; Investors Financial Services Corp., which provides an array of complex processing services for mutual funds, investment advisors and banks; Alliance Data Systems Corporation, a transaction processing, credit and marketing services provider; Cooper Industries, Ltd., a global manufacturer of tools and electrical products; and Trimble Navigation Limited, a leading innovator of Global Positioning System technology.
SECTOR DIVERSIFICATION
| | | | | | |
| Sector | | 9/30/05 | | | 3/31/06 | |
Auto & Transportation | | 0.9 | % | | 2.4 | % |
Consumer Discretionary | | 17.8 | | | 19.2 | |
Consumer Staples | | 2.8 | | | 1.3 | |
Financial Services | | 11.3 | | | 12.4 | |
Healthcare | | 19.6 | | | 17.7 | |
Materials & Processing | | 7.0 | | | 7.3 | |
Other | | 3.8 | | | 2.6 | |
Other Energy | | 6.8 | | | 5.8 | |
Producer Durables | | 6.7 | | | 4.9 | |
Technology | | 19.0 | | | 21.9 | |
Utilities | | 1.7 | | | 2.6 | |
Other assets less liabilities | | 2.6 | | | 1.9 | |
Total | | 100.0 | % | | 100.0 | % |
As a percentage of total net assets.
13
THIRTEEN
ARTISAN MID CAP VALUE FUND (ARTQX)
| | |
| INVESTMENT PROCESS HIGHLIGHTS | | |
Artisan Mid Cap Value Fund uses a bottom-up investment process to construct a diversified portfolio of U.S. mid-cap value companies that the investment team believes are undervalued, in sound financial condition and have attractive business economics. Attractive valuation. The team values a business using what it believes are reasonable expectations for the long-term earnings power and capitalization rates of that business. This results in a range of values for the company that the team believes would be reasonable. The team generally will purchase a security if the stock price falls below or toward the lower end of that range. Sound financial condition. The team favors companies with an acceptable level of debt and positive cash flow. At a minimum, the team tries to avoid companies that have so much debt that management may be unable to make decisions that would be in the best interests of the companies’ shareholders. Attractive business economics. The team favors cash-producing businesses that it believes are capable of earning acceptable returns on capital over the company’s business cycle. The team believes companies with these characteristics are less likely to experience eroding values over the long-term. The Fund primarily invests in U.S. securities with market capitalizations between $1.5 billion and $10 billion at the time of purchase. |
| | | |
| PERFORMANCE HISTORY | | |
GROWTH OF AN ASSUMED $10,000 INVESTMENT (3/28/01 to 3/31/06)
AVERAGE ANNUAL TOTAL RETURNS (as of 3/31/06)
| | | | | | | | | | | | |
| Fund / Index | | 1-Year | | | 3-Year | | | 5-Year | | | Since
Inception | |
Artisan Mid Cap Value Fund | | 15.84 | % | | 28.95 | % | | 16.52 | % | | 16.66 | % |
Russell Midcap® Value Index | | 20.30 | | | 29.23 | | | 14.69 | | | 15.01 | |
Russell Midcap® Index | | 21.54 | | | 27.87 | | | 12.52 | | | 12.72 | |
The performance quoted represents past performance, which does not guarantee future results. The investment return and principal value of an investment in the Fund will fluctuate, so that an investor’s shares in the Fund, when redeemed, may be worth more or less than their original cost. Current performance may be lower or higher than the performance data quoted. For current to most recent month-end performance information, visit www.artisanfunds.com or call 800.344.1770. The graph and table above do not reflect the deduction of taxes that a shareholder would pay on distributions or sale of Fund shares. See page 86 for a description of each index.
14
FOURTEEN
INVESTING ENVIRONMENT
The six-months ended March 31, 2006 was a strong period for mid-cap stocks as the Russell Midcap® Value and Russell Midcap® indices increased 9.06% and 10.14%, respectively. During the period, market participants priced most sectors in the Russell Midcap® Value Index higher, but the Index was held back by weakness in energy and utility stocks.
PERFORMANCE DISCUSSION
The Fund increased 5.44% during the semiannual period ended March 31, 2006. It was generally supported by the returns of our consumer discretionary and technology stocks during the period. Conversely, our outsized position and selection in energy stocks and selection in the financial sector dragged down returns relative to the Russell Midcap® Value Index.
Claire’s Stores, Inc., Furniture Brands International, Inc., Rent-A-Center, Inc., BEA Systems, Inc. and Ryder System, Inc. were stocks that had a significant positive impact on the portfolio over the six-month period ended March 31, 2006.
Teenage fashion accessory retailer Claire’s Stores increased roughly 50% during the period, contributing positively to our performance. Claire’s Stores benefited from strong sales, particularly in its jewelry category, and announced a share repurchase program. We cut back our position as it entered our target selling range.
Furniture Brands International is one of the largest U.S.-based furniture manufacturers and markets products under brand names such as Broyhill®, Lane®, Thomasville® and Drexel Heritage®. Furniture Brands’ stock struggled in the quarters leading up to September 30, 2005, but reversed course as sentiment improved. During the period, Furniture Brands saw improving sales of its high-end Thomasville® brand, and the company used its strong cash flow to repurchase shares.
Rent-A-Center is the largest rent-to-own operator in the United States with a market share of approximately 38%. Its strong cash flow generation, share repurchase program and relatively low valuation made it an attractive investment. Rent-A-Center reported solid financial results during the period partly due to improving sales trends, which were helped by increased store traffic and promotional offers. Over the past year, the rent-to-own retailer began to benefit from its roll out of larger sized flat panel televisions, such as 42-inch plasma TVs, which grew in popularity among consumers.
Infrastructure software company BEA Systems advanced over 45% during the period, contributing positively to the Fund’s performance. The company benefited from strong sales of its AquaLogicTM platform and double-digit gains in license revenue. We trimmed our position as the stock entered our target selling range.
TOP 10 HOLDINGS
| | | |
| Company Name | | 3/31/06 | |
The Student Loan Corporation | | 4.3 | % |
Nuveen Investments, Inc. | | 3.5 | |
Alleghany Corporation | | 3.1 | |
Pioneer Natural Resources Company | | 3.1 | |
Ryder System, Inc. | | 2.9 | |
White Mountains Insurance Group, Ltd. | | 2.8 | |
Zale Corporation | | 2.7 | |
Avnet, Inc. | | 2.6 | |
Rent-A-Center, Inc. | | 2.6 | |
Liz Claiborne Inc. | | 2.5 | |
Total | | 30.1 | % |
As a percentage of total net assets. Top 10 Holdings are determined by issuer.
Ryder System tacked on an approximate 30% gain during the period. It operates three divisions: Fleet Management Solutions, Supply Chain Solutions and Dedicated Contract Carriage. Ryder has been in a turnaround phase and investments made by the company have weighed on cash flows. During the period, Ryder’s share price surged due in part to a pick up in truck leasing revenues and a strong improvement in margins.
Our outsized investment in energy names worked against us over the past six months, but much of our underperformance came from one name, Pioneer Natural Resources Company. The stock declined in early February after Pioneer reported a significant decline in production. The stock recovered some of its losses later in the period due to takeover speculation.
15
FIFTEEN
Within the financials sector, our underperformance could be partly attributed to our minimal investment in REITs and to weakness in check printing company Deluxe Corporation and tax preparation company H&R Block, Inc. In the Russell Midcap® Value Index, REITs gained over 17% during the period. We continued to believe that the REIT industry had a relatively poor risk/reward tradeoff and kept our investment to a minimum.
Deluxe continued to face pricing pressure and lower demand during the period. A lawsuit filed against H&R Block for fraudulent marketing created headline risk that caused the stock to decline sharply during the period. On the positive side, the company reported better than expected results for the tax season. We added to our position on weakness.
Elsewhere in the portfolio, weakness in computer printer manufacturer Lexmark International, Inc. and auto components manufacturer Lear Corporation hindered the Fund’s relative performance. Lexmark was impacted by acceleration in the competitive landscape of the printer industry. In response, management initiated price cuts to attempt to slow a decline in sales, announced job cuts and became focused on the profitability of the printers the company sells. We decreased our position in the stock and decided to re-evaluate our original thesis as the economics of the company may have changed materially. Lear was partly hurt by higher raw material costs, a weak production environment and the loss of a significant contract.
FUND CHANGES
Two of our larger purchases during the period were Pilgrim’s Pride Corporation and Con-way Inc. (formerly named CNF Inc.). Pilgrim’s Pride is the second-largest chicken producer in the U.S. and Mexico. Concerns about Avian flu outbreaks drove poultry exports down and caused chicken prices to decline to levels not seen in nearly twenty years. This put downward pressure on the shares of chicken producers, including Pilgrim’s Pride, creating an appealing investment opportunity. We were also attracted to the company’s leading market position, solid balance sheet and low P/E valuation.
Con-way is a global provider of transportation and supply chain management services. We believed that Con-way’s valuation understated its potential to improve earnings given the strength of its market position, pricing discipline and superior return on capital.
Our purchases were funded in part by the sales of Siebel Systems, Inc., CNA Financial Corporation, BMC Software, Inc., Jacobs Engineering Group Inc. and Darden Restaurants, Inc. Shares of eBusiness application provider Siebel Systems surged last September when the company accepted an acquisition offer from Oracle Corporation. We sold our shares prior to the completion of the transaction. We were concerned over BMC’s future revenue and use of cash flow. Nonetheless, we were able to sell our position at a profit. Jacobs Engineering Group, a diverse provider of technical services to industrial, government and commercial clients, was sold as its share price moved up to our target selling range due in part to a strong order backlog and higher revenues in most of its markets. The ongoing strength of Darden Restaurants’ Olive Garden® brand and the improved sales growth at its Red Lobster® brand helped push this casual dining company up to our target selling range.
SECTOR DIVERSIFICATION
| | | | | | |
| Sector | | 9/30/05 | | | 3/31/06 | |
Auto & Transportation | | 2.9 | % | | 3.9 | % |
Consumer Discretionary | | 28.7 | | | 31.9 | |
Consumer Staples | | — | | | 2.9 | |
Financial Services | | 27.1 | | | 29.4 | |
Materials & Processing | | 7.0 | | | 5.5 | |
Other Energy | | 14.8 | | | 14.1 | |
Producer Durables | | 3.6 | | | 2.4 | |
Technology | | 7.9 | | | 6.0 | |
Utilities | | 1.0 | | | 0.9 | |
Other assets less liabilities | | 7.0 | | | 3.0 | |
Total | | 100.0 | % | | 100.0 | % |
As a percentage of total net assets.
16
SIXTEEN
ARTISAN OPPORTUNISTIC VALUE FUND (ARTLX)
|
| On March 27, 2006, Artisan Funds introduced its eighth fund—Artisan Opportunistic Value Fund. This semiannual report has been designed to provide an overview of the Fund. We will review the investment process, the investment team and one of our initial holdings to illustrate our process. Because the Fund only had a few days of performance prior to March 31, 2006, we have not reviewed Fund performance here, but will provide a review of performance since the inception of the Fund in the September 2006 Annual Report. |
| | |
| INVESTMENT APPROACH | | |
| Artisan Opportunistic Value Fund pursues long-term capital growth by investing primarily in undervalued U.S. companies across a broad capitalization range. The Fund also has the flexibility to invest a portion of its assets in non-U.S. securities and to take larger positions in a portion of the portfolio. The Fund’s performance is typically benchmarked against the Russell 1000® and Russell 1000® Value indices over a full market cycle. |
| | | |
| INVESTMENT TEAM |
| The co-managers of Artisan Opportunistic Value Fund are George Sertl, CFA, James Kieffer, CFA and Scott Satterwhite, CFA. Mr. Sertl, Mr. Kieffer and Mr. Satterwhite are also co-managers of Artisan Mid Cap Value Fund and Artisan Small Cap Value Fund. |
INVESTMENT PROCESS HIGHLIGHTS
Artisan Opportunistic Value Fund uses a bottom-up investment process to construct a flexible portfolio of value-oriented companies that the team believes are undervalued, in solid financial condition and have attractive business economics.
Attractive valuation. The team values a business using what it believes are reasonable expectations for the long-term earnings power and capitalization rates of that business. This results in a range of values for the company that the team believes would be reasonable. The team generally will purchase a security if the stock price falls below or toward the lower end of that range.
Sound financial condition. The team favors companies with an acceptable level of debt and positive cash flow. At a minimum, the team tries to avoid companies that have so much debt that management may be unable to make decisions that would be in the best interests of the companies’ shareholders.
Attractive business economics. The team favors cash-producing businesses that it believes are capable of earning acceptable returns on capital over the company’s business cycle. The team believes companies with these characteristics are less likely to experience eroding values over the long-term.
The team often finds investment opportunities in companies that have one or more of the following characteristics:
Turnarounds. At times, the team invests in companies that have had poor results due to company-specific and/or industry-wide conditions that it believes will not continue indefinitely.
Companies in transition. A company’s stock price may not always reflect positive change in the business, such as new management, new products or a cyclical uptrend in an industry. The team tries to identify investments for the Fund ahead of broad recognition of changes that may be expected to cause the stock’s price to rise.
Earnings shortfalls. The team may invest in a company in a group or industry that is out of favor, or whose earnings have disappointed, causing its stock price to drop below the team’s estimate of the value of the business, creating the potential for patient investors to benefit when those earnings improve.
17
SEVENTEEN
TOP 10 HOLDINGS
| | | |
| Company Name | | 3/31/06 | |
Apache Corporation | | 4.7 | % |
Wal-Mart Stores, Inc. | | 4.7 | |
The Student Loan Corporation(1) | | 3.9 | |
Berkshire Hathaway Inc. | | 3.9 | |
American International Group, Inc. | | 3.8 | |
NIKE, Inc. | | 3.8 | |
Citigroup Inc.(1) | | 3.8 | |
Microsoft Corporation | | 3.8 | |
Johnson & Johnson | | 3.7 | |
Avnet, Inc. | | 2.8 | |
Total | | 38.9 | % |
As a percentage of total net assets. Top 10 Holdings are determined by issuer.
(1) Citibank, N.A., an indirect wholly-owned subsidiary of Citigroup Inc., is the primary shareholder of The Student Loan Corporation, with an ownership of 80% of The Student Loan Corporation’s outstanding common stock.
EXAMPLE HOLDING
NIKE, Inc. is a holding that we purchased at inception. NIKE creates athletic footwear, apparel, equipment, and accessories for sports and fitness enthusiasts. The company, through its subsidiaries, designs and sells a line of men’s and women’s dress and casual shoes and accessories. NIKE also markets licensed headwear, and designs, markets, and sells hockey equipment.
We purchased NIKE because we believed it was attractively valued, in sound financial condition, with attractive business economics. Our thoughts about each point are summarized below.
VALUATION
| • | | At our initial purchase, we thought that the historically undemanding, low teens P/E at which NIKE was trading understated the company’s normalized earnings power and cash flow generating ability. |
FINANCIAL CONDITION
| • | | NIKE had a combination of net cash on the balance sheet of nearly $5 per share and strong free cash flow that the company could use to pay dividends, engage in share repurchases or pursue other value creating initiatives. |
BUSINESS ECONOMICS
| • | | NIKE outsources its manufacturing needs, and thus has low capital requirements, and has a strong brand franchise. Those two traits have been among the reasons that NIKE has been able to generate a return on equity (a measure of corporate profitability) that has averaged 19% over the last 10 years. |
FLEXIBLE PORTFOLIO CONSTRUCTION
Artisan Opportunistic Value Fund is structured to provide the investment team with broad flexibility to build a high value-added, bottom-up investment portfolio.
| • | | The team can invest in securities with market capitalizations greater than $1.5 billion at the time of purchase. |
| • | | The team can invest up to 25% of the Fund’s assets in non-U.S. securities. |
| • | | The Fund tries to maintain a cash position of no more than 15% of its net assets, although cash flows from shareholder investments and redemptions and purchases and sales of portfolio securities may cause the Fund’s cash position to be larger or smaller. |
| • | | The Fund’s maximum position size is 5% of assets at the time of purchase in 75% of the portfolio, but in the remaining 25% of the portfolio the team can invest up to 10% of Fund assets at the time of purchase in a single position. |
SECTOR DIVERSIFICATION
| | | |
| Sector | | 3/31/06 | |
Consumer Discretionary | | 25.4 | % |
Consumer Staples | | 2.3 | |
Financial Services | | 27.2 | |
Healthcare | | 6.5 | |
Integrated Oils | | 2.3 | |
Materials & Processing | | 2.8 | |
Other | | 5.7 | |
Other Energy | | 4.7 | |
Technology | | 10.3 | |
Utilities | | 1.8 | |
Other assets less liabilities | | 11.0 | |
Total | | 100.0 | % |
As a percentage of total net assets.
18
EIGHTEEN
ARTISAN SMALL CAP FUND (ARTSX)
| | |
| INVESTMENT PROCESS HIGHLIGHTS | | |
Artisan Small Cap Fund uses a bottom-up investment process to construct a diversified portfolio of U.S. small-cap growth companies. Competitive advantages. A sustainable competitive advantage is critical to producing above average growth and profitability. Identifying the source of a company’s competitive advantage lends confidence to the team’s assessment of intrinsic value. Return on invested capital. The team believes that, over time, a company with improving returns on its invested capital will be rewarded with a higher valuation. The team determines how much capital investment is needed to achieve a company’s continued growth and analyzes management’s ability to use that capital in the most effective way to support that growth. Intrinsic value. The team estimates a company’s intrinsic value—the value it thinks a buyer would pay to buy the entire company. The team bases its buy and sell targets for a company’s stock on its intrinsic value estimates. The Fund primarily invests in companies with market capitalizations between $200 million and $1.5 billion that meet its standards for earnings growth and sustainable growth prospects. |
| | | |
| PERFORMANCE HISTORY | | |
GROWTH OF AN ASSUMED $10,000 INVESTMENT (3/28/95 to 3/31/06)
AVERAGE ANNUAL TOTAL RETURNS (as of 3/31/06)
| | | | | | | | | | | | | | | |
| Fund / Index | | 1-Year | | | 3-Year | | | 5-Year | | | 10-Year | | | Since
Inception | |
Artisan Small Cap Fund | | 26.39 | % | | 29.52 | % | | 12.05 | % | | 8.35 | % | | 10.94 | % |
Russell 2000® Growth Index | | 27.84 | | | 28.14 | | | 8.59 | | | 5.51 | | | 7.59 | |
Russell 2000® Index | | 25.85 | | | 29.53 | | | 12.59 | | | 10.15 | | | 11.76 | |
The performance quoted represents past performance, which does not guarantee future results. The investment return and principal value of an investment in the Fund will fluctuate, so that an investor’s shares in the Fund, when redeemed, may be worth more or less than their original cost. Current performance may be lower or higher than the performance data quoted. For current to most recent month-end performance information, visit www.artisanfunds.com or call 800.344.1770. The graph and table above do not reflect the deduction of taxes that a shareholder would pay on distributions or sale of Fund shares. See page 86 for a description of each index.
19
NINETEEN
INVESTING ENVIRONMENT
The six months ended March 31, 2006 was a very good period for small-cap stocks, with the last three months accounting for the lion’s share of performance. There were a number of factors that contributed to the market’s optimism. Earnings growth remained robust, corporate spending continued to pick up, the price of natural gas fell rather significantly and inflation stayed relatively contained.
There were, however, factors that raised caution in the market. The Federal Reserve continued its series of interest rate hikes, which reached 15 in a row as of March 31, 2006. There was also concern because low quality, high valuation and low-priced stocks were among the leading performers in the indices late in the period.
In the Russell 2000® and Russell 2000® Growth indices, the technology, producer durables and materials sectors were among the leading performers as each group gained more than 20%. Most other sectors posted double-digit returns, although energy and utility stocks managed only single-digit gains.
PERFORMANCE DISCUSSION
The Fund gained 12.59% for the six-month period, which compared to the 15.23% and 16.20% returns for the Russell 2000® and Russell 2000® Growth indices, respectively. The financial, consumer discretionary and transportation sectors were areas of strength for the portfolio relative to the benchmarks. The Fund lagged in the technology, healthcare and producer durables sectors.
In the financial sector, three of our leading contributors were The First Marblehead Corporation, HealthExtras, Inc. and optionsXpress Holdings, Inc. The stock price of First Marblehead, a private student loan outsourcer, increased more than 70%. We invested in First Marblehead because we believed that its share price had experienced an unwarranted decline due to market concerns about management changes and the company’s ability to extend its contract with its largest partner. During the period, First Marblehead reported increases in total service revenue and loan volume and extended its contract with arguably its most important strategic partner. Pharmacy benefit manager HealthExtras won a large contract to provide services to 1.3 million BlueCross® BlueShield® members in Iowa and South Dakota. optionsXpress, a leading online brokerage firm specializing in options trading, reported increased trading activity, solid asset growth and good traction in new accounts. We sold our position as it reached our target price.
Children’s clothing retailer The Children’s Place Retail Stores, Inc., sporting goods store operator Hibbett Sporting Goods, Inc. and restaurant owner RARE Hospitality International, Inc. were among our strongest contributors in the consumer discretionary sector. Their stock prices increased roughly 62%, 48% and 35%, respectively. Children’s Place has worked on the repositioning of its merchandise, announced a meaningful improvement in operating margins and continued to take market share in the specialty retail channel. Hibbett reported double-digit growth in sales for its 2006 fiscal year. RARE Hospitality was supported by continued same-store sales improvement at its LongHorn SteakhousesSM and upscale Capital GrilleSM restaurants.
The leading performer among our transportation holdings was aftermarket car parts distributor Keystone Automotive Industries, Inc., the stock price of which gained more than 46%. We invested in Keystone because we believe it has a strong competitive position in a business that is not dependent on the cyclicality of the economy — its business
TOP 10 HOLDINGS
| | | |
| Company Name | | 3/31/06 | |
Bright Horizons Family Solutions, Inc. | | 1.7 | % |
Strayer Education, Inc. | | 1.7 | |
Hornbeck Offshore Services, Inc. | | 1.7 | |
DSP Group, Inc. | | 1.6 | |
California Pizza Kitchen, Inc. | | 1.6 | |
Interline Brands, Inc. | | 1.6 | |
Tekelec | | 1.6 | |
ESCO Technologies Inc. | | 1.6 | |
Avocent Corporation | | 1.6 | |
Waste Connections, Inc. | | 1.6 | |
Total | | 16.3 | % |
As a percentage of total net assets. Top 10 Holdings are determined by issuer.
20
TWENTY
is driven by accident frequency. In addition, the insurance industry’s adoption of generic and aftermarket parts created a solid long-term growth backdrop given the very low current utilization rate. During the period, Keystone benefited from solid sales and earnings and positive expectations for operating improvements. Low-fare airline AirTran Holdings, Inc., aftermarket aircraft parts provider Aviall, Inc. and third-party logistics provider Pacer International, Inc. also performed well. We sold AirTran as it had reached our target price.
Our technology holdings collectively turned in a nice gain for the period, but they fell short of the stellar advance of those in the benchmarks. Two of our most disappointing performers in the sector were network systems manufacturer Tekelec and Dendrite International, Inc., a leading supplier of sales force software and support services to the pharmaceutical industry. Tekelec generally reported good results, but the resignation of the CEO and financial reporting issues pressured the company’s shares. We sold our position in Dendrite because the combination of a restructuring and management change left the company unable to generate the type of earnings growth we like to see.
The main cause of our underperformance in the healthcare sector was pharmaceutical research firm SFBC International, Inc. Its shares came under pressure in November, as the company became the target of negative press reports alleging deficiencies in the U.S. drug-testing industry. We sold our shares, realizing a loss. Symmetry Medical Inc., a manufacturer of medical devices for the orthopedics industry, and PRA International, a contract research organization, also hurt results.
In the producer durables sector, luxury Florida homebuilder WCI Communities was a source of weakness, negatively impacted by an increase in inventory in its markets, causing order growth to slow. We sold our position because of a lack of earnings momentum.
FUND CHANGES
The number of securities we held fell from 84 as of 9/30/05 to 79 as of 3/31/06. The two primary reasons for our sales during the period were stocks reaching our price targets and takeovers or announced takeovers.
Stocks that reached our target prices, other than those already mentioned, included Unit Corporation, Gardner Denver, Inc., Coldwater Creek Inc., TODCO and SiRF Technology Holdings, Inc. Takeovers or announced takeovers resulted in the sales of IDX Systems Corporation (General Electric Company), Anteon International Corporation (General Dynamics Corporation), La Quinta Corporation (private investment firm), Serena Software Inc. (private equity firm), Hughes Supply, Inc. (The Home Depot, Inc.) and Main Street Banks, Inc. (BB&T Corporation). We also sold Axcelis Technologies, Inc. because we were concerned about management’s strategy and the company’s competitive position.
We put the capital from those sales to work in a broad mix of businesses. The consumer discretionary sector happened to increase the most as a percentage of portfolio equities, but our purchases were fairly diverse. We added Bright Horizons Family Solutions, Inc., the nation’s largest provider of early childhood education and family support services to the corporate market; Shuffle Master, Inc., a gaming supply company; Guitar Center, Inc., a retailer that sells guitars, amplifiers, percussion instruments, keyboards, live sound/DJ and recording equipment; United Natural Foods, Inc., a leading wholesale distributor of natural and organic food products; RC2 Corporation, toys and collectibles; and Jack in the Box Inc., fast-food restaurants.
SECTOR DIVERSIFICATION
| | | | | | |
| Sector | | 9/30/05 | | | 3/31/06 | |
Auto & Transportation | | 3.8 | % | | 3.9 | % |
Consumer Discretionary | | 21.2 | | | 26.0 | |
Financial Services | | 14.1 | | | 15.0 | |
Healthcare | | 14.7 | | | 12.2 | |
Materials & Processing | | 3.8 | | | 3.7 | |
Other Energy | | 7.6 | | | 7.2 | |
Producer Durables | | 8.7 | | | 4.7 | |
Technology | | 22.4 | | | 23.0 | |
Other assets less liabilities | | 3.7 | | | 4.3 | |
Total | | 100.0 | % | | 100.0 | % |
As a percentage of total net assets.
21
TWENTY-ONE
ARTISAN SMALL CAP VALUE FUND (ARTVX)
| | |
| INVESTMENT PROCESS HIGHLIGHTS | | |
Artisan Small Cap Value Fund uses a bottom-up investment process to construct a diversified portfolio of U.S. small-cap value companies that the investment team believes are undervalued, in sound financial condition and have attractive business economics. Attractive valuation. The team values a business using what it believes are reasonable expectations for the long-term earnings power and capitalization rates of that business. This results in a range of values for the company that the team believes would be reasonable. The team generally will purchase a security if the stock price falls below or toward the lower end of that range. Sound financial condition. The team favors companies with an acceptable level of debt and positive cash flow. At a minimum, the team tries to avoid companies that have so much debt that management may be unable to make decisions that would be in the best interests of the companies’ shareholders. Attractive business economics. The team favors cash-producing businesses that it believes are capable of earning acceptable returns on capital over the company’s business cycle. The team believes companies with these characteristics are less likely to experience eroding values over the long-term. The Fund primarily invests in U.S. securities with market capitalizations below $1.5 billion at the time of purchase. |
| PERFORMANCE HISTORY |
GROWTH OF AN ASSUMED $10,000 INVESTMENT (9/29/97 to 3/31/06)
AVERAGE ANNUAL TOTAL RETURNS (as of 3/31/06)
| | | | | | | | | | | | |
| Fund / Index | | 1-Year | | | 3-Year | | | 5-Year | | | Since
Inception | |
Artisan Small Cap Value Fund | | 19.11 | % | | 29.24 | % | | 17.49 | % | | 14.18 | % |
Russell 2000® Value Index | | 23.77 | | | 30.75 | | | 16.24 | | | 11.27 | |
Russell 2000® Index | | 25.85 | | | 29.53 | | | 12.59 | | | 7.74 | |
The performance quoted represents past performance, which does not guarantee future results. The investment return and principal value of an investment in the Fund will fluctuate, so that an investor’s shares in the Fund, when redeemed, may be worth more or less than their original cost. Current performance may be lower or higher than the performance data quoted. For current to most recent month-end performance information, visit www.artisanfunds.com or call 800.344.1770. The graph and table above do not reflect the deduction of taxes that a shareholder would pay on distributions or sale of Fund shares. See page 86 for a description of each index.
22
TWENTY-TWO
INVESTING ENVIRONMENT
The six-month period ended March 31, 2006, was a very strong period for small cap stocks as the Russell 2000® Value and Russell 2000® indices increased 14.26% and 15.23%, respectively. Most sectors in the Russell 2000® Value Index posted double-digit returns—materials and technology were two of the leaders. The only two sectors that posted declines during the period were consumer staples and energy.
PERFORMANCE DISCUSSION
The Fund posted a solid return of 9.89% during the semiannual period. Relative to the Russell 2000® Value Index, the Fund was generally supported by the returns of our consumer discretionary and producer durable stocks during the period. Conversely, selection in the technology and financial sectors dragged down returns. Our outsized investment in energy stocks relative to the Index also hindered the Fund’s performance.
Our list of leading contributors for the period included Ethan Allen Interiors Inc., Payless ShoeSource, Inc., Brown Shoe Company, Inc., General Cable Corporation, Belden CDT Inc., Altiris, Inc. and Keane, Inc.
Furniture manufacturer Ethan Allen Interiors tacked on nice gains during the semiannual reporting period due in part to an improvement in sentiment and impressive cash flows that allowed the company to repurchase shares.
Footwear retailers Payless ShoeSource and Brown Shoe Co. contributed meaningfully to our return. Their stock prices advanced about 32% and 59%, respectively. We initially purchased shares in Payless in June 2003 and for more than a year we endured sales disappointments, store closings and management changes. However, we remained patient and, ultimately, the company was able to gain its footing. Brown Shoe reported a sizeable increase in revenues driven primarily by good same store sales at Famous Footwear and a big jump in wholesale revenues due to the acquisition of Bennett Footwear Group. We sold our positions in Payless and Brown Shoe as their stock prices moved into our target selling range.
General Cable and Belden CDT, though not direct competitors in all of their business lines, both operate in the cable and wire industry. Rising raw material costs recently put pressure on the earnings power of each company. However, both companies saw capacity utilization rise and increased prices leading to a rise in profits. We cut our position in General Cable by over half as the stock reached our target selling range.
TOP 10 HOLDINGS
| | | |
| Company Name | | 3/31/06 | |
Stewart Information Services Corporation | | 3.2 | % |
Hilb Rogal and Hobbs Company | | 3.2 | |
Zale Corporation | | 2.8 | |
Watson Wyatt Worldwide, Inc. | | 2.8 | |
St. Mary Land & Exploration Company | | 2.5 | |
Furniture Brands International, Inc. | | 2.5 | |
Cimarex Energy Co. | | 2.3 | |
Plains Exploration & Production Company | | 2.1 | |
Kellwood Company | | 2.1 | |
Ethan Allen Interiors Inc. | | 2.0 | |
Total | | 25.5 | % |
As a percentage of total net assets. Top 10 Holdings are determined by issuer.
Our technology-related holdings did not keep pace with the benchmark, though several of our investments contributed positively to our performance. Two examples were Altiris and Keane, the stock prices of which were up nearly 44% and 38%, respectively. Altiris is a leading provider of software and services that enable organizations to manage information technology assets. The company’s primary focus lies in the desktop personal computer market, though it also provides software for handhelds, laptops and servers. Altiris has expanded its product offerings, improved the utility of its existing products and benefited from its strategic relationship with Dell Inc.
Keane, a leading provider of information technology and business consulting services, reported higher than expected revenue, and gross margins reached their highest level in nearly three years. These results came as the company continued to work on its initiatives to move from a decentralized branch model to a vertical model.
In the financial sector, we experienced weakness from title insurer Stewart Information Services Corporation, which struggled during the period mostly due to a rise in interest rates. We purchased additional shares on that weakness.
23
TWENTY-THREE
Our outsized investment in energy names worked against us this period, but weakness among some of our energy holdings also contributed to underperformance. Two examples were Stone Energy Corporation and Plains Exploration & Production Company. Higher than expected costs negatively impacted Stone Energy and the company offered production guidance that disappointed investors. Plains Exploration reported a decline in reserves. We liked the company for its low-risk drilling opportunities, production growth potential, long-lived reserve base, substantial cash flows and solid balance sheet. We purchased additional shares in Stone Energy, and slightly pared our position in Plains Exploration, though it remained a top ten holding as of March 31, 2006.
Other holdings that hurt performance relative to the Russell 2000® Value Index this period were Movie Gallery, Inc. and ProQuest Company. Movie Gallery struggled with weak sales trends, although the movie release schedule improved during the period. Complicating the investment was the higher risk involved due to the debt incurred to complete the acquisition of Hollywood Entertainment. We continue to believe the company’s liquidity was adequate, but we remain wary of its overall situation. ProQuest, which publishes content for libraries, schools and academic institutions worldwide, fell during the period mostly due to accounting issues.
SECTOR DIVERSIFICATION
| | | | | | |
| Sector | | 9/30/05 | | | 3/31/06 | |
Auto & Transportation | | 4.1 | % | | 2.7 | % |
Consumer Discretionary | | 31.0 | | | 31.2 | |
Consumer Staples | | — | | | 1.5 | |
Financial Services | | 14.4 | | | 13.1 | |
Healthcare | | 2.4 | | | 3.0 | |
Materials & Processing | | 9.3 | | | 11.9 | |
Other Energy | | 16.5 | | | 13.0 | |
Producer Durables | | 3.3 | | | 3.2 | |
Technology | | 11.2 | | | 10.8 | |
Utilities | | 1.9 | | | 2.4 | |
Other assets less liabilities | | 5.9 | | | 7.2 | |
Total | | 100.0 | % | | 100.0 | % |
As a percentage of total net assets.
FUND CHANGES
Some of our purchases during the period included Sanderson Farms, Inc., Valassis Communications, Inc., USA Mobility, Inc. and Lone Star Technologies, Inc., among others. Sanderson Farms is one of the largest chicken companies in the United States. Concerns about Avian flu outbreaks drove poultry exports down and caused chicken prices to decline to levels not seen in nearly twenty years. This put downward pressure on the shares of chicken producers, including Sanderson Farms, creating an appealing investment opportunity.
Valassis Communications is a direct marketing firm whose expertise in media has allowed it to transform from a simple free-standing insert company to a full-service marketing services firm. The company’s long-term customer relationships with many of the nation’s largest advertisers have allowed Valassis to generate strong cash flow and a good return on capital.
USA Mobility, a leading provider of paging products and other wireless messaging and information services in the United States, was formed by the 2004 merger of Arch Wireless, Inc. and Metrocall Holdings, Inc. We believed there were significant synergies to be realized from the merger along with reduced capital needs for the future.
Lone Star Technologies manufactures tubular products used in oil drilling. At the time of purchase, we believed strong levels of drilling activity would keep demand for the company’s products high and allow Lone Star to remain aggressive with its pricing strategy.
In addition to the sales of Payless ShoeSource and Brown Shoe Co., we sold fuel and lubricant additives producer NewMarket Corporation, title insurer LandAmerica Financial Group, Inc. and oil and gas exploration and production companies Spinnaker Exploration Company and Remington Oil and Gas Corporation as they reached our target selling ranges.
24
TWENTY-FOUR
ARTISAN INTERNATIONAL FUND
Schedule of Investments – March 31, 2006 (Unaudited)
| | | | | |
| | | Shares
Held
| | Value
|
| | | | | | |
COMMON AND
PREFERRED STOCKS - 98.8% | | | |
| | | | | | |
| AUSTRIA - 0.7% | | | | | |
Wiener Staedtische Allgemeine Versicherung AG | | 1,390,982 | | $ | 85,968,700 |
| | | | | | |
| BELGIUM - 1.1% | | | | | |
InBev NV | | 2,970,251 | | | 139,300,537 |
| | | | | | |
| BRAZIL - 0.4% | | | | | |
Vivo Participacoes S.A.,
Preferred (ADR)(1) | | 13,530,268 | | | 57,909,547 |
| | | | | | |
| CANADA - 2.0% | | | | | |
EnCana Corporation | | 4,431,500 | | | 206,804,598 |
Research In Motion Limited(1) | | 712,231 | | | 60,454,167 |
Tim Hortons, Inc.(1) | | 116,500 | | | 3,093,075 |
| | | | |
|
|
| | | | | | 270,351,840 |
| CHINA - 2.4% | | | | | |
China Merchants Holdings International Company Limited | | 14,467,600 | | | 41,766,719 |
China Mobile (Hong Kong) Limited | | 54,090,300 | | | 284,074,895 |
| | | | |
|
|
| | | | | | 325,841,614 |
| DENMARK - 0.2% | | | | | |
Vestas Wind Systems A/S(1) | | 911,850 | | | 22,730,354 |
| | | | | | |
| FINLAND - 0.9% | | | | | |
Fortum Oyj | | 4,551,330 | | | 114,833,268 |
| | | | | | |
| FRANCE - 7.3% | | | | | |
Accor S.A. | | 872,454 | | | 50,294,948 |
Alcatel S.A.(1) | | 852,400 | | | 13,191,161 |
Alstom(1) | | 156,781 | | | 13,147,652 |
Axa | | 4,082,265 | | | 143,267,745 |
Carrefour S.A. | | 3,790,879 | | | 201,675,489 |
Electricite de France(1) | | 408,486 | | | 23,167,102 |
LVMH Moet Hennessy Louis Vuitton S.A. | | 1,451,622 | | | 142,315,020 |
PagesJaunes S.A. | | 3,837,345 | | | 107,793,594 |
PPR S.A. | | 1,162,260 | | | 140,355,446 |
Safran S.A. | | 2,716,540 | | | 68,869,425 |
Sanofi-Aventis | | 699,920 | | | 66,583,518 |
| | | | |
|
|
| | | | | | 970,661,100 |
| | | | | |
| | | Shares
Held
| | Value
|
| | | | | | |
| GERMANY - 12.2% | | | | | |
Allianz AG | | 1,433,392 | | $ | 239,331,483 |
Bayerische Motoren Werke (BMW) AG | | 1,964,082 | | | 108,178,805 |
Commerzbank AG | | 4,413,513 | | | 175,859,119 |
Deutsche Lufthansa AG | | 3,023,380 | | | 54,115,529 |
Deutsche Post AG | | 5,677,646 | | | 142,356,557 |
Deutsche Telekom AG | | 1,588,563 | | | 26,797,381 |
E.ON AG | | 1,786,883 | | | 196,642,989 |
Heidelberger Druckmaschinen AG | | 1,142,186 | | | 50,383,333 |
ProSiebenSat.1 Media AG, Preferred | | 3,949,297 | | | 102,897,999 |
RWE AG | | 2,401,340 | | | 209,000,695 |
SAP AG | | 692,479 | | | 150,221,666 |
Siemens AG | | 1,847,512 | | | 172,485,351 |
| | | | |
|
|
| | | | | | 1,628,270,907 |
| HONG KONG - 1.8% | | | | | |
Esprit Holdings Limited | | 2,453,700 | | | 19,100,479 |
MTR Corporation Limited | | 32,839,100 | | | 74,065,362 |
NWS Holdings Limited | | 3,540,200 | | | 6,570,163 |
Sun Hung Kai Properties Limited | | 14,394,400 | | | 146,093,193 |
| | | | |
|
|
| | | | | | 245,829,197 |
| ITALY - 4.8% | | | | | |
Capitalia S.p.A. | | 222,000 | | | 1,845,550 |
Eni S.p.A. | | 4,529,887 | | | 128,894,426 |
Saipem S.p.A. | | 12,807,332 | | | 296,287,460 |
UniCredito Italiano S.p.A. | | 29,943,041 | | | 216,448,723 |
| | | | |
|
|
| | | | | | 643,476,159 |
| JAPAN - 24.2% | | | | | |
Aiful Corporation | | 921,900 | | | 61,016,151 |
Bridgestone Corp. | | 4,786,000 | | | 99,826,933 |
Chugai Pharmaceutical Co., Ltd. | | 7,401,500 | | | 134,258,305 |
Credit Saison Co., Ltd. | | 8,626,000 | | | 477,105,013 |
Japan Tobacco, Inc. | | 37,230 | | | 130,953,441 |
Jupiter Telecommunications Co., Ltd.(1) | | 193,111 | | | 136,506,671 |
Keyence Corp. | | 424,765 | | | 110,431,682 |
Millea Holdings, Inc. | | 6,772 | | | 134,059,133 |
Mitsubishi Estate Co., Ltd. | | 5,299,000 | | | 125,609,261 |
Mitsubishi UFJ Financial Group, Inc. | | 12,875 | | | 196,898,896 |
Mitsui & Co., Ltd. | | 6,778,400 | | | 98,019,004 |
Mitsui Fudosan Co., Ltd. | | 4,692,800 | | | 107,850,671 |
Mizuho Financial Group, Inc. | | 41,219 | | | 337,246,364 |
NTT Data Corp. | | 16,761 | | | 80,600,901 |
ORIX Corp. | | 1,171,050 | | | 364,647,260 |
Sega Sammy Holdings, Inc. | | 8,442,900 | | | 342,880,731 |
SMC Corp. | | 739,900 | | | 115,291,130 |
Sumitomo Mitsui Financial Group, Inc. | | 2,405 | | | 26,563,297 |
Taisei Corporation | | 29,840,800 | | | 142,992,449 |
| | | | |
|
|
| | | | | | 3,222,757,293 |
25
TWENTY-FIVE
| | | | | |
| | | Shares
Held
| | Value
|
| | | | | | |
| LUXEMBOURG - 0.5% | | | | | |
RTL Group | | 772,286 | | $ | 67,899,137 |
| | | | | | |
| MEXICO - 2.8% | | | | | |
Grupo Televisa S.A. (ADR) | | 11,192,100 | | | 222,722,790 |
Wal-Mart de Mexico S.A. de C.V., Series V(1) | | 54,915,600 | | | 145,341,446 |
| | | | |
|
|
| | | | | | 368,064,236 |
| NETHERLANDS - 6.2% | | | | | |
ASML Holding N.V.(1) | | 10,891,359 | | | 222,397,886 |
ASML Holding N.V., NY Shares(1) | | 1,727,200 | | | 35,183,064 |
Fortis | | 9,971,201 | | | 355,741,025 |
ING Groep N.V. | | 4,751,479 | | | 187,713,319 |
Koninklijke Ahold N.V.(1) | | 3,886,432 | | | 30,566,411 |
| | | | |
|
|
| | | | | | 831,601,705 |
| NORWAY - 1.9% | | | | | |
SeaDrill, Ltd.(1) | | 7,468,800 | | | 102,568,359 |
Stolt Offshore S.A.(1)(2) | | 9,731,700 | | | 152,948,776 |
| | | | |
|
|
| | | | | | 255,517,135 |
| PORTUGAL - 0.8% | | | | | |
Banco Comercial Portugues, S.A. | | 32,161,634 | | | 102,504,405 |
| | | | | | |
| RUSSIA - 3.4% | | | | | |
AFK Sistema (GDR)(3) | | 1,387,877 | | | 33,864,199 |
LUKOIL (ADR) | | 4,246,212 | | | 354,134,081 |
RAO Unified Energy System (GDR) | | 1,013,111 | | | 69,195,481 |
| | | | |
|
|
| | | | | | 457,193,761 |
| SINGAPORE - 2.6% | | | | | |
Keppel Corporation Limited | | 17,634,500 | | | 150,605,626 |
Singapore Airlines Limited | | 22,558,900 | | | 195,454,157 |
| | | | |
|
|
| | | | | | 346,059,783 |
| SOUTH KOREA - 4.7% | | | | | |
Hana Financial Group Inc. | | 2,893,124 | | | 136,973,759 |
Kookmin Bank | | 3,539,065 | | | 305,606,786 |
Shinhan Financial Group Co., Ltd. | | 4,206,700 | | | 188,340,315 |
| | | | |
|
|
| | | | | | 630,920,860 |
| SPAIN - 1.2% | | | | | |
Industria de Diseno Textil, S.A. | | 2,733,417 | | | 105,502,804 |
Promotora de Informaciones, S.A. | | 2,763,982 | | | 51,080,334 |
| | | | |
|
|
| | | | | | 156,583,138 |
| SWITZERLAND - 10.9% | | | | | |
Adecco S.A. | | 2,277,595 | | | 127,275,569 |
Nestle S.A. | | 933,705 | | | 277,178,564 |
Nobel Biocare Holding AG | | 150,022 | | | 33,401,515 |
Novartis AG | | 2,558,895 | | | 142,308,049 |
Roche Holding AG | | 1,408,119 | | | 209,654,354 |
Swiss Re | | 2,731,592 | | | 190,885,614 |
Synthes, Inc. | | 31,784 | | | 3,486,451 |
UBS AG | | 4,247,942 | | | 466,617,033 |
| | | | |
|
|
| | | | | | 1,450,807,149 |
| | | | | | | |
| | | Shares
Held
| | Value
| |
| | | | | | | | |
| UNITED KINGDOM - 5.8% | | | | | | | |
Barclays PLC | | | 8,169,644 | | $ | 95,596,132 | |
Cadbury Schweppes PLC | | | 11,149,819 | | | 110,806,040 | |
Carnival PLC | | | 2,025,544 | | | 99,592,745 | |
Centrica PLC | | | 10,649,823 | | | 52,085,924 | |
Kingfisher PLC | | | 54,631,180 | | | 227,324,208 | |
Smith & Nephew PLC | | | 2,545,850 | | | 22,602,335 | |
William Morrison Supermarkets PLC | | | 39,051,158 | | | 128,910,147 | |
WPP Group PLC | | | 2,884,771 | | | 34,607,850 | |
| | | | | |
|
|
|
| | | | | | | 771,525,381 | |
| | | | | |
|
|
|
Total common and preferred stocks
(Cost $9,364,285,717) | | | 13,166,607,206 | |
| | |
| | | Par
Amount
| | | |
SHORT-TERM INVESTMENTS
(CASH EQUIVALENTS) - 1.3% | | | | |
Repurchase agreement with State Street Bank and Trust Company, 4.50%, dated 3/31/06, due 4/3/06, maturity value $170,906,066, collateralized by $101,510,500 market value Federal Home Loan Mortgage Corporation Note, 5.50%, due 11/16/15, and $72,750,000 market value Federal Home Loan Mortgage Corporation Note, 4.75%, due 1/19/16
(Cost $170,842,000) | | $ | 170,842,000 | | | 170,842,000 | |
| | | | | |
|
|
|
| | | | | | | | |
Total investments - 100.1%
(Cost $9,535,127,717) | | | | | | 13,337,449,206 | |
| | | | | | | | |
Other assets less liabilities - (0.1%) | | | (10,070,598 | ) |
| | | | | |
|
|
|
| | | | | | | | |
Total net assets - 100.0%(4) | | | | | $ | 13,327,378,608 | |
| | | | | |
|
|
|
| (1) | Non-income producing security. |
| (2) | Affiliated company as defined by the Investment Company Act of 1940. See Note (6) in Notes to Financial Statements. |
| (3) | Valued at a fair value in accordance with procedures established by the Board of Directors of Artisan Funds. In total, securities valued at a fair value were $33,864,199 or 0.3% of total net assets. |
| (4) | Percentages for the various classifications relate to total net assets. |
(ADR) American Depository Receipt
(GDR) Global Depository Receipt
26
TWENTY-SIX
| | | | | | | |
| PORTFOLIO DIVERSIFICATION - MARCH 31, 2006 (Unaudited) | |
| | | Value
| | | Percentage
| |
Consumer Discretionary | | $ | 2,061,973,569 | | | 15.5 | % |
Consumer Staples | | | 1,164,732,075 | | | 8.7 | |
Energy | | | 1,241,637,700 | | | 9.3 | |
Financials | | | 4,869,788,947 | | | 36.5 | |
Healthcare | | | 612,294,527 | | | 4.6 | |
Industrials | | | 1,476,128,380 | | | 11.1 | |
Information Technology | | | 672,480,527 | | | 5.1 | |
Telecommunication Services | | | 402,646,022 | | | 3.0 | |
Utilities | | | 664,925,459 | | | 5.0 | |
| | |
|
|
| |
|
|
Total common and preferred stocks | | | 13,166,607,206 | | | 98.8 | |
Short-term investments | | | 170,842,000 | | | 1.3 | |
| | |
|
|
| |
|
|
Total investments | | | 13,337,449,206 | | | 100.1 | |
Other assets less liabilities | | | (10,070,598 | ) | | (0.1 | ) |
| | |
|
|
| |
|
|
Total net assets | | $ | 13,327,378,608 | | | 100.0 | % |
| | |
|
|
| |
|
|
| | | | | | |
| CURRENCY EXPOSURE - MARCH 31, 2006 (Unaudited) | |
| | | Value
| | Percentage of
Total Investments
| |
British pound | | $ | 771,525,381 | | 5.8 | % |
Canadian dollar | | | 206,804,598 | | 1.5 | |
Danish krone | | | 22,730,354 | | 0.2 | |
Euro | | | 4,705,915,992 | | 35.3 | |
Hong Kong dollar | | | 571,670,811 | | 4.3 | |
Japanese yen | | | 3,222,757,293 | | 24.2 | |
Mexican peso | | | 145,341,446 | | 1.1 | |
Norwegian krone | | | 255,517,135 | | 1.9 | |
Singapore dollar | | | 346,059,783 | | 2.6 | |
South Korean won | | | 630,920,860 | | 4.7 | |
Swiss franc | | | 1,450,807,149 | | 10.9 | |
US dollar | | | 1,007,398,404 | | 7.5 | |
| | |
|
| |
|
|
Total investments | | $ | 13,337,449,206 | | 100.0 | % |
| | |
|
| |
|
|
The accompanying notes are an integral part of the financial statements.
27
TWENTY-SEVEN
ARTISAN INTERNATIONAL SMALL CAP FUND
Schedule of Investments – March 31, 2006 (Unaudited)
| | | | | |
| | | Shares
Held
| | Value
|
| | | | | | |
COMMON AND
PREFERRED STOCKS - 98.6% | | | | | |
| | | | | | |
| ARGENTINA - 0.4% | | | | | |
BBVA Banco Frances S.A. (ADR)(1) | | 500,900 | | $ | 3,957,110 |
| | | | | | |
| AUSTRIA - 2.5% | | | | | |
Flughafen Wien AG | | 127,899 | | | 10,017,284 |
Wienerberger AG | | 284,122 | | | 14,288,993 |
| | | | |
|
|
| | | | | | 24,306,277 |
| BRAZIL - 1.9% | | | | | |
Cyrela Brazil Realty S.A. Empreendimentos e Participacoes | | 545,600 | | | 9,721,967 |
Universo Online S.A., Preferred(1) | | 449,000 | | | 3,112,292 |
Vivo Participacoes S.A., Preferred (ADR)(1) | | 1,292,543 | | | 5,532,084 |
| | | | |
|
|
| | | | | | 18,366,343 |
| CANADA - 1.6% | | | | | |
Aur Resources Inc. | | 1,244,100 | | | 15,798,264 |
| | | | | | |
| CHINA - 4.0% | | | | | |
Beijing Capital International Airport Company Limited, Series H | | 23,790,600 | | | 13,644,300 |
China Oilfield Services Limited, Series H | | 14,189,100 | | | 7,177,618 |
China Paradise Electronics Retail Limited(1) | | 4,290,000 | | | 2,101,003 |
Parkson Retail Group Limited(1) | | 449,800 | | | 1,362,301 |
Shanghai Electric Group Company Limited, Series H(1) | | 35,254,300 | | | 14,880,217 |
| | | | |
|
|
| | | | | | 39,165,439 |
| EGYPT - 2.0% | | | | | |
Commercial International Bank (GDR) | | 1,613,849 | | | 19,737,373 |
| | | | | | |
| FINLAND - 1.9% | | | | | |
Metso Oyj | | 479,300 | | | 18,499,736 |
| | | | | | |
| FRANCE - 5.5% | | | | | |
Financiere Marc de Lacharriere S.A. | | 103,977 | | | 9,557,439 |
Geodis S.A. | | 106,244 | | | 17,445,860 |
Kaufman & Broad S.A. | | 135,873 | | | 15,905,926 |
SCOR | | 4,367,856 | | | 11,115,686 |
| | | | |
|
|
| | | | | | 54,024,911 |
| GERMANY - 2.5% | | | | | |
DAB Bank AG | | 465,953 | | | 4,856,118 |
Grenkeleasing AG | | 125,064 | | | 8,447,884 |
Heidelberger Druckmaschinen AG | | 17,933 | | | 791,048 |
| | | | | |
| | | Shares
Held
| | Value
|
| | | | | | |
| GERMANY (CONTINUED) | | | | | |
Patrizia Immobilien AG(1) | | 76,700 | | $ | 2,170,356 |
Vossloh AG | | 170,500 | | | 8,706,981 |
| | | | |
|
|
| | | | | | 24,972,387 |
| HONG KONG - 6.7% | | | | | |
Emperor Entertainment Hotel Limited | | 38,876,200 | | | 16,158,438 |
Hengan International Group
Company Limited | | 6,183,900 | | | 9,802,874 |
Hong Kong Exchanges &
Clearing Limited | | 2,326,000 | | | 14,014,486 |
Midland Holdings Limited | | 13,049,100 | | | 7,315,696 |
Panva Gas Holdings Limited(1) | | 33,871,800 | | | 16,151,983 |
Tian An China Investments
Company Limited(1) | | 4,446,400 | | | 3,037,178 |
| | | | |
|
|
| | | | | | 66,480,655 |
| INDIA - 0.6% | | | | | |
Indiabulls Financial Services Ltd. | | 1,069,299 | | | 6,175,502 |
| | | | | | |
| ITALY - 4.9% | | | | | |
Azimut Holding S.p.A. | | 834,618 | | | 10,437,972 |
Pirelli & C. Real Estate S.p.A. | | 188,909 | | | 12,854,379 |
Socotherm S.p.A. | | 989,495 | | | 14,389,428 |
Toro Assicurazioni S.p.A. | | 514,520 | | | 11,005,142 |
| | | | |
|
|
| | | | | | 48,686,921 |
| JAPAN - 16.8% | | | | | |
Creed Corporation | | 5,930 | | | 27,004,928 |
FJ Next Company, Ltd. | | 623,200 | | | 9,477,723 |
Japan Petroleum Exploration Company, Ltd. | | 375,300 | | | 23,436,321 |
Japan Wind Development Company, Ltd. | | 1,974 | | | 3,706,491 |
Komeri Company, Ltd. | | 375,900 | | | 14,052,337 |
NTT Urban Development Corporation | | 2,172 | | | 18,822,770 |
Ozeki Company, Ltd. | | 466,200 | | | 14,061,258 |
Pasona Inc. | | 4,166 | | | 9,804,435 |
Raito Kogyo Company, Ltd. | | 2,059,400 | | | 9,063,460 |
Sammy NetWorks Company, Ltd. | | 966 | | | 8,199,099 |
SFGC Company, Ltd. | | 53,317 | | | 12,063,141 |
Shizuoka Gas Company, Ltd. | | 139,000 | | | 958,947 |
Sho-Bond Corporation | | 914,800 | | | 9,132,455 |
Tokyu Community Corporation | | 204,700 | | | 6,017,519 |
| | | | |
|
|
| | | | | | 165,800,884 |
| MEXICO - 2.4% | | | | | |
Axtel, S.A. de C.V. (ADR)(1)(2) | | 315,529 | | | 5,348,217 |
Empresas ICA S.A. de C.V.(1) | | 6,105,750 | | | 18,684,630 |
| | | | |
|
|
| | | | | | 24,032,847 |
28
TWENTY-EIGHT
| | | | | |
| | | Shares
Held
| | Value
|
| | | | | | |
| NETHERLANDS - 5.5% | | | | | |
Buhrmann NV | | 2,026,269 | | $ | 35,850,782 |
SBM Offshore NV | | 103,372 | | | 10,366,200 |
VastNed Retail NV | | 106,178 | | | 8,518,070 |
| | | | |
|
|
| | | | | | 54,735,052 |
| NORWAY - 6.6% | | | | | |
Fast Search & Transfer ASA(1) | | 2,015,300 | | | 7,534,004 |
Petroleum Geo-Services ASA(1) | | 593,150 | | | 27,650,044 |
SeaDrill, Ltd.(1) | | 972,530 | | | 13,355,667 |
Songa Offshore ASA(1) | | 373,000 | | | 3,272,629 |
Stolt Offshore S.A.(1)(3) | | 872,900 | | | 13,718,979 |
| | | | |
|
|
| | | | | | 65,531,323 |
| OMAN - 0.4% | | | | | |
Bank Muscat SAOG (GDR)(2) | | 391,179 | | | 3,813,995 |
| | | | | | |
| PANAMA - 2.2% | | | | | |
Banco Latinoamericano de Exportaciones, S.A., E Shares | | 1,305,414 | | | 22,205,092 |
| | | | | | |
| PORTUGAL - 0.6% | | | | | |
CIMPOR-Cimentos de Portugal, S.G.P.S., S.A. | | 931,019 | | | 6,216,684 |
| | | | | | |
| RUSSIA - 0.9% | | | | | |
Uralsvyazinform (ADR)(2) | | 1,016,900 | | | 8,460,608 |
| | | | | | |
| SINGAPORE - 2.4% | | | | | |
Fraser & Neave Limited | | 1,928,320 | | | 23,628,886 |
| | | | | | |
| SOUTH AFRICA - 1.4% | | | | | |
Massmart Holdings Limited | | 1,446,005 | | | 13,696,650 |
| | | | | | |
| SOUTH KOREA - 4.4% | | | | | |
FINETEC Corporation(3) | | 971,391 | | | 10,997,634 |
Kangwon Land, Inc. | | 809,256 | | | 15,991,885 |
Korea Investment Holdings
Company Limited(1) | | 345,870 | | | 12,388,098 |
LG Telecom Limited(1) | | 542,884 | | | 4,570,596 |
| | | | |
|
|
| | | | | | 43,948,213 |
| SWEDEN - 5.0% | | | | | |
D. Carnegie & Company AB | | 338,400 | | | 7,125,583 |
Elekta AB, B Shares | | 1,484,472 | | | 24,491,834 |
Gant Company AB(1) | | 36,100 | | | 906,150 |
JM AB | | 257,900 | | | 16,390,897 |
| | | | |
|
|
| | | | | | 48,914,464 |
| SWITZERLAND - 8.6% | | | | | |
Bank Sarasin & Cie AG, B Shares | | 7,184 | | | 19,287,385 |
Bobst Group AG | | 125,115 | | | 5,336,090 |
Schindler Holding AG, Participation Certificates | | 339,070 | | | 18,076,451 |
| | | | | | |
| | | Shares
Held
| | Value
|
| | | | | | | |
| SWITZERLAND (CONTINUED) | | | | | | |
Straumann AG | | | 43,483 | | $ | 9,906,379 |
Sulzer AG | | | 39,908 | | | 27,229,829 |
Ypsomed Holding AG | | | 32,002 | | | 5,356,374 |
| | | | | |
|
|
| | | | | | | 85,192,508 |
| THAILAND - 0.5% | | | | | | |
Bangkok Bank Public Company Limited | | | 1,777,300 | | | 5,303,326 |
| | | | | | | |
| UNITED KINGDOM - 6.4% | | | | | | |
IMI PLC | | | 968,048 | | | 9,519,473 |
Investec PLC | | | 269,027 | | | 13,746,448 |
NETeller PLC(1) | | | 662,652 | | | 8,433,206 |
Queen’s Walk Investment Ltd.(1) | | | 541,400 | | | 8,135,582 |
Sibir Energy PLC(1) | | | 2,829,429 | | | 23,337,985 |
| | | | | |
|
|
| | | | | | | 63,172,694 |
| | | | | |
|
|
Total common and preferred stocks (Cost $655,033,340) | | | | | | 974,824,144 |
| | | Par
Amount
| | |
| SHORT-TERM INVESTMENTS (CASH EQUIVALENTS) - 0.3% | | | | | | |
Repurchase agreement with State Street Bank and Trust Company, 4.50%, dated 3/31/06, due 4/3/06, maturity value $3,460,297, collateralized by $2,696,967 market value Federal National Mortgage Association Note, 5.80%, due 2/9/26, and $835,800 market value Federal National Mortgage Association Note, 6.19%, due 12/19/25
(Cost $3,459,000) | | $ | 3,459,000 | | | 3,459,000 |
| | | | | |
|
|
| | | | | | | |
Total investments - 98.9%
(Cost $658,492,340) | | | | | | 978,283,144 |
| | | | | | | |
Other assets less liabilities - 1.1% | | | | | | 10,871,467 |
| | | | | |
|
|
| | | | | | | |
Total net assets - 100.0%(4) | | | | | $ | 989,154,611 |
| | | | | |
|
|
| (1) | Non-income producing security. |
| (2) | Valued at a fair value in accordance with procedures established by the Board of Directors of Artisan Funds. In total, securities valued at a fair value were $17,622,820 or 1.8% of total net assets. |
| (3) | Affiliated company as defined by the Investment Company Act of 1940. See Note (6) in Notes to Financial Statements. |
| (4) | Percentages for the various classifications relate to total net assets. |
(ADR) American Depository Receipt
(GDR) Global Depository Receipt
29
TWENTY-NINE
| | | | | | |
| PORTFOLIO DIVERSIFICATION - MARCH 31, 2006 (Unaudited) | |
| | | Value
| | Percentage
| |
Consumer Discretionary | | $ | 84,865,672 | | 8 .6 | % |
Consumer Staples | | | 37,560,782 | | 3 .8 | |
Energy | | | 136,704,871 | | 13 .8 | |
Financials | | | 305,192,980 | | 30 .9 | |
Healthcare | | | 39,754,587 | | 4 .0 | |
Industrials | | | 274,158,349 | | 27 .7 | |
Information Technology | | | 18,845,395 | | 1 .9 | |
Materials | | | 33,012,582 | | 3 .4 | |
Telecommunication Services | | | 23,911,505 | | 2 .4 | |
Utilities | | | 20,817,421 | | 2 .1 | |
| | |
|
| |
|
|
Total common and preferred stocks | | | 974,824,144 | | 98 .6 | |
Short-term investments | | | 3,459,000 | | 0 .3 | |
| | |
|
| |
|
|
Total investments | | | 978,283,144 | | 98 .9 | |
Other assets less liabilities | | | 10,871,467 | | 1 .1 | |
| | |
|
| |
|
|
Total net assets | | $ | 989,154,611 | | 100.0 | % |
| | |
|
| |
|
|
| | | | | | |
| CURRENCY EXPOSURE - MARCH 31, 2006 (Unaudited) | |
| | | Value
| | Percentage of
Total Investments
| |
Brazilian real | | $ | 12,834,259 | | 1.3 | % |
British pound | | | 55,037,112 | | 5.6 | |
Canadian dollar | | | 15,798,264 | | 1.6 | |
Euro | | | 239,577,550 | | 24.5 | |
Hong Kong dollar | | | 105,646,094 | | 10.8 | |
Indian rupee | | | 6,175,502 | | 0.6 | |
Japanese yen | | | 165,800,884 | | 17.0 | |
Mexican peso | | | 18,684,630 | | 1.9 | |
Norwegian krone | | | 65,531,323 | | 6.7 | |
Singapore dollar | | | 23,628,886 | | 2.4 | |
South African rand | | | 13,696,650 | | 1.4 | |
South Korean won | | | 43,948,213 | | 4.5 | |
Swedish krona | | | 48,914,464 | | 5.0 | |
Swiss franc | | | 85,192,508 | | 8.7 | |
Thai baht | | | 5,303,326 | | 0.6 | |
US dollar | | | 72,513,479 | | 7.4 | |
| | |
|
| |
|
|
Total investments | | $ | 978,283,144 | | 100.0 | % |
| | |
|
| |
|
|
The accompanying notes are an integral part of the financial statements.
30
THIRTY
ARTISAN INTERNATIONAL VALUE FUND
Schedule of Investments – March 31, 2006 (Unaudited)
| | | | | |
| | | Shares Held
| | Value
|
| | | | | | |
| COMMON STOCKS - 91.6% | | | | | |
| | | | | | |
| BRAZIL - 1.0% | | | | | |
Tim Participacoes S.A. | | 2,066,210,100 | | $ | 8,154,082 |
| | | | | | |
| CANADA - 1.2% | | | | | |
CanWest Global Communications Corporation(1) | | 1,127,000 | | | 9,524,759 |
| | | | | | |
| FRANCE - 6.6% | | | | | |
Euronext N.V. | | 210,843 | | | 17,387,454 |
Renault S.A. | | 154,491 | | | 16,428,541 |
Vivendi Universal S.A. | | 632,597 | | | 21,725,794 |
| | | | |
|
|
| | | | | | 55,541,789 |
| | | | | | |
| GERMANY - 8.3% | | | | | |
Bayerische Motoren Werke (BMW) AG | | 213,402 | | | 11,753,875 |
Heidelberger Druckmaschinen AG | | 470,865 | | | 20,770,477 |
Pfeiffer Vacuum Technology AG(2) | | 547,106 | | | 36,598,158 |
| | | | |
|
|
| | | | | | 69,122,510 |
| | | | | | |
| HONG KONG - 2.4% | | | | | |
Guoco Group, Ltd. | | 1,568,600 | | | 20,115,051 |
| | | | | | |
| ITALY - 1.8% | | | | | |
Cementir S.p.A. | | 2,097,627 | | | 15,124,949 |
| | | | | | |
| JAPAN - 10.6% | | | | | |
Central Japan Railway Company | | 1,052 | | | 10,368,054 |
Meitec Corporation | | 878,800 | | | 28,895,123 |
Sekisui House, Ltd. | | 1,461,700 | | | 21,807,521 |
Uni-Charm Corporation | | 570,000 | | | 27,991,504 |
| | | | |
|
|
| | | | | | 89,062,202 |
| MEXICO - 3.5% | | | | | |
Gruma S.A., Class B | | 3,966,900 | | | 11,556,113 |
Grupo Modelo, S.A. de C.V., Series C | | 4,098,400 | | | 15,065,224 |
Kimberly-Clark de Mexico,
S.A. de C.V., Class A | | 868,600 | | | 2,970,166 |
| | | | |
|
|
| | | | | | 29,591,503 |
| | | | | | |
| NETHERLANDS - 2.7% | | | | | |
Wolters Kluwer N.V. | | 904,763 | | | 22,564,664 |
| | | | | | |
| | | | | |
| | | Shares Held
| | Value
|
| | | | | | |
| NORWAY - 0.8% | | | | | |
Tandberg ASA | | 764,300 | | $ | 6,909,908 |
| | | | | | |
| SINGAPORE - 0.5% | | | | | |
People’s Food Holdings Limited | | 5,454,900 | | | 4,354,873 |
| | | | | | |
| SOUTH KOREA - 2.1% | | | | | |
Lotte Chilsung Beverage Co., Ltd. | | 7,779 | | | 8,646,892 |
Lotte Confectionary Co., Ltd. | | 7,215 | | | 9,081,870 |
| | | | |
|
|
| | | | | | 17,728,762 |
| | | | | | |
| SWITZERLAND - 9.1% | | | | | |
Clariant AG | | 1,546,536 | | | 23,963,508 |
Givaudan S.A. | | 42,625 | | | 32,762,053 |
Pargesa Holding S.A. | | 137,808 | | | 13,287,666 |
Tamedia AG | | 58,403 | | | 5,823,948 |
| | | | |
|
|
| | | | | | 75,837,175 |
| | | | | | |
| UNITED KINGDOM - 31.7% | | | | | |
Benfield Group PLC | | 3,750,729 | | | 24,567,254 |
Brit Insurance Holdings PLC | | 9,569,446 | | | 16,168,733 |
Carpetright PLC | | 811,130 | | | 16,417,838 |
Countrywide PLC | | 4,240,986 | | | 36,896,688 |
Diageo PLC | | 2,580,186 | | | 40,636,698 |
GUS PLC | | 864,608 | | | 15,847,884 |
MFI Furniture Group PLC | | 13,673,279 | | | 25,478,248 |
Signet Group PLC | | 11,752,052 | | | 22,357,715 |
SurfControl PLC(1) | | 827,344 | | | 7,992,093 |
Unilever PLC (ADR) | | 475,720 | | | 19,537,820 |
Vitec Group PLC | | 951,450 | | | 8,219,783 |
Vodafone Group PLC (ADR) | | 1,503,950 | | | 31,432,555 |
| | | | |
|
|
| | | | | | 265,553,309 |
| | | | | | |
| UNITED STATES - 9.3% | | | | | |
Amdocs Limited(1) | | 388,200 | | | 13,998,492 |
Arch Capital Group Ltd.(1) | | 303,910 | | | 17,547,763 |
Tyco International Ltd. | | 1,022,000 | | | 27,471,360 |
Willis Group Holdings Limited | | 536,400 | | | 18,377,064 |
| | | | |
|
|
| | | | | | 77,394,679 |
| | | | |
|
|
Total common stocks
(Cost $621,542,487) | | | | | 766,580,215 |
31
THIRTY-ONE
| | | | | | |
| | | Par Amount
| | Value
|
| | | | | | | |
| SHORT-TERM INVESTMENTS (CASH EQUIVALENTS) - 7.9% | | | | | | |
Repurchase agreement with State Street Bank and Trust Company, 4.50%, dated 3/31/06, due 4/3/06, maturity value $66,514,934, collateralized by $67,822,567 market value Federal Home Loan Mortgage Corporation Note, 5.45%, due 1/22/16 (Cost $66,490,000) | | $ | 66,490,000 | | $ | 66,490,000 |
| | | | | |
|
|
| | | | | | | |
Total investments - 99.5%
(Cost $688,032,487) | | | | | | 833,070,215 |
| | | | | | | |
Other assets less liabilities - 0.5% | | | | | | 4,193,158 |
| | | | | |
|
|
| | | | | | | |
Total net assets - 100.0%(3) | | | | | $ | 837,263,373 |
| | | | | |
|
|
| (1) | Non-income producing security. |
| (2) | Affiliated company as defined by the Investment Company Act of 1940. See Note (6) in Notes to Financial Statements. |
| (3)Percentages | for the various classifications relate to total net assets. |
(ADR) American Depository Receipt
| | | | | | |
| PORTFOLIO DIVERSIFICATION - MARCH 31, 2006 (Unaudited) | |
| | | Value
| | Percentage
| |
Consumer Discretionary | | $ | 197,950,570 | | 23 .7 | % |
Consumer Staples | | | 139,841,160 | | 16 .7 | |
Financials | | | 164,347,673 | | 19 .6 | |
Industrials | | | 124,103,172 | | 14 .8 | |
Information Technology | | | 28,900,493 | | 3 .5 | |
Materials | | | 71,850,510 | | 8 .6 | |
Telecommunication Services | | | 39,586,637 | | 4 .7 | |
| | |
|
| |
|
|
Total common stocks | | | 766,580,215 | | 91 .6 | |
Short-term investments | | | 66,490,000 | | 7 .9 | |
| | |
|
| |
|
|
Total investments | | | 833,070,215 | | 99 .5 | |
Other assets less liabilities | | | 4,193,158 | | 0 .5 | |
| | |
|
| |
|
|
Total net assets | | $ | 837,263,373 | | 100.0 | % |
| | |
|
| |
|
|
| | | | | | | |
| | | | | | |
| CURRENCY EXPOSURE - MARCH 31, 2006 (Unaudited) | |
| | | Value
| | Percentage of Total Investments
| |
Brazilian real | | $ | 8,154,082 | | 1 .0 | % |
British pound | | | 214,582,934 | | 25 .8 | |
Canadian dollar | | | 9,524,759 | | 1 .1 | |
Euro | | | 162,353,912 | | 19 .5 | |
Hong Kong dollar | | | 20,115,051 | | 2 .4 | |
Japanese yen | | | 89,062,202 | | 10 .7 | |
Mexican peso | | | 29,591,503 | | 3 .6 | |
Norwegian krone | | | 6,909,908 | | 0 .8 | |
Singapore dollar | | | 4,354,873 | | 0 .5 | |
South Korean won | | | 17,728,762 | | 2 .1 | |
Swiss franc | | | 75,837,175 | | 9 .1 | |
US dollar | | | 194,855,054 | | 23 .4 | |
| | |
|
| |
|
|
Total investments | | $ | 833,070,215 | | 100.0 | % |
| | |
|
| |
|
|
The accompanying notes are an integral part of the financial statements.
32
THIRTY-TWO
ARTISAN MID CAP FUND
Schedule of Investments – March 31, 2006 (Unaudited)
| | | | | |
| | | Shares Held
| | Value
|
| | | | | | |
| COMMON STOCKS - 98.1% | | | | | |
| | | | | | |
| AUTO & TRANSPORTATION - 2.4% | | | |
Air Transport - 1.4% | | | | | |
Expeditors International of Washington, Inc. | | 974,500 | | $ | 84,187,055 |
| | | | | | |
Auto Parts: Original Equipment - 0.5% | | | |
BorgWarner Inc. | | 543,000 | | | 32,601,720 |
| | | | | | |
Railroad Equipment - 0.5% | | | | | |
Westinghouse Air Brake Technologies Corporation | | 982,400 | | | 32,026,240 |
| | | | | | |
| CONSUMER DISCRETIONARY - 19.2% | | | |
Advertising Agencies - 0.9% | | | | | |
aQuantive, Inc.(1) | | 777,700 | | | 18,307,058 |
Clear Channel Outdoor
Holdings, Inc.(1) | | 1,633,500 | | | 38,305,575 |
| | | | |
|
|
| | | | | | 56,612,633 |
Consumer Electronics - 4.1% | | | | | |
Electronic Arts Inc.(1) | | 2,035,700 | | | 111,393,504 |
VeriSign, Inc.(1) | | 2,690,100 | | | 64,535,499 |
Yahoo! Inc.(1) | | 2,356,000 | | | 76,004,560 |
| | | | |
|
|
| | | | | | 251,933,563 |
Radio & TV Broadcasters - 0.3% | | | |
XM Satellite Radio Holdings Inc., Class A(1) | | 691,900 | | | 15,408,613 |
| | | | | | |
Restaurants - 1.4% | | | | | |
P.F. Chang’s China Bistro, Inc.(1) | | 800,400 | | | 39,451,716 |
YUM! Brands, Inc. | | 920,600 | | | 44,980,516 |
| | | | |
|
|
| | | | | | 84,432,232 |
Retail - 4.6% | | | | | |
Chico’s FAS, Inc.(1) | | 1,889,468 | | | 76,787,979 |
Dick’s Sporting Goods, Inc.(1) | | 340,000 | | | 13,487,800 |
Kohl’s Corporation(1) | | 1,653,200 | | | 87,636,132 |
Office Depot, Inc.(1) | | 1,239,500 | | | 46,158,980 |
The TJX Companies, Inc. | | 1,812,700 | | | 44,991,214 |
Urban Outfitters, Inc.(1) | | 642,200 | | | 15,759,588 |
| | | | |
|
|
| | | | | | 284,821,693 |
| | | | | |
| | | Shares Held
| | Value
|
| | | | | | |
| CONSUMER DISCRETIONARY (CONTINUED) | | | |
Services: Commercial - 6.4% | | | | | |
ChoicePoint Inc.(1) | | 337,700 | | $ | 15,112,075 |
Getty Images, Inc.(1) | | 1,253,600 | | | 93,869,568 |
Hewitt Associates, Inc., Class A(1) | | 2,275,000 | | | 67,658,500 |
Iron Mountain Incorporated(1) | | 1,885,800 | | | 76,827,492 |
NutriSystem, Inc.(1) | | 366,900 | | | 17,435,088 |
Resources Connection, Inc.(1) | | 959,200 | | | 23,893,672 |
Robert Half International Inc. | | 2,671,105 | | | 103,131,364 |
| | | | |
|
|
| | | | | | 397,927,759 |
Textiles Apparel Manufacturers - 0.8% | | | |
Polo Ralph Lauren Corporation, Class A | | 855,700 | | | 51,863,977 |
| | | | | | |
Toys - 0.7% | | | | | |
Marvel Entertainment, Inc.(1)(2) | | 2,280,400 | | | 45,881,648 |
| | | | | | |
| CONSUMER STAPLES - 1.3% | | | | | |
Beverage: Brewers (Wineries) - 1.3% | | | |
Constellation Brands, Inc., Class A(1) | | 3,246,900 | | | 81,334,845 |
| | | | | | |
| FINANCIAL SERVICES - 12.4% | | | | | |
Banks: Outside New York City - 2.4% | | | |
Investors Financial Services Corp. | | 1,392,100 | | | 65,247,727 |
Northern Trust Corporation | | 1,596,500 | | | 83,816,250 |
| | | | |
|
|
| | | | | | 149,063,977 |
Diversified Financial Services - 0.7% | | | |
CB Richard Ellis Group, Inc.(1) | | 563,400 | | | 45,466,380 |
| | | | | | |
Finance: Small Loan - 0.9% | | | | | |
The First Marblehead Corporation | | 1,244,900 | | | 53,841,925 |
| | | | | | |
Financial Data Processing Services & Systems - 2.4% | | | | | |
Alliance Data Systems Corporation(1) | | 1,335,900 | | | 62,480,043 |
CheckFree Corporation(1) | | 1,674,900 | | | 84,582,450 |
| | | | |
|
|
| | | | | | 147,062,493 |
Financial Information Services - 0.7% | | | |
Equifax Inc. | | 1,225,000 | | | 45,619,000 |
| | | | | | |
Financial Miscellaneous - 2.1% | | | |
MGIC Investment Corporation | | 1,346,400 | | | 89,710,632 |
Willis Group Holdings Limited | | 1,070,100 | | | 36,661,626 |
| | | | |
|
|
| | | | | | 126,372,258 |
33
THIRTY-THREE
| | | | | |
| | | Shares Held
| | Value
|
| | | | | | |
| FINANCIAL SERVICES (CONTINUED) | | | |
Insurance: Multi-Line - 1.8% | | | | | |
Aon Corporation | | 2,597,500 | | $ | 107,822,225 |
| | | | | | |
Savings & Loan - 0.5% | | | | | |
Golden West Financial Corporation | | 478,000 | | | 32,456,200 |
| | | | | | |
Securities Brokerage & Services - 0.9% | | | | | |
The Bear Stearns Companies Inc. | | 270,700 | | | 37,546,090 |
Lazard Ltd, Class A | | 345,600 | | | 15,292,800 |
| | | | |
|
|
| | | | | | 52,838,890 |
| HEALTHCARE - 17.7% | | | | | |
Biotechnology Research & Production - 4.1% | | | | | |
Celgene Corporation(1) | | 825,200 | | | 36,490,344 |
Genzyme Corporation(1) | | 1,166,000 | | | 78,378,520 |
Invitrogen Corporation(1) | | 392,000 | | | 27,490,960 |
Millipore Corporation(1) | | 778,900 | | | 56,906,434 |
Neurocrine Biosciences, Inc.(1) | | 486,900 | | | 31,424,526 |
PDL BioPharma, Inc.(1) | | 531,300 | | | 17,426,640 |
Threshold Pharmaceuticals, Inc.(1) | | 312,500 | | | 4,684,375 |
| | | | |
|
|
| | | | | | 252,801,799 |
Drugs & Pharmaceuticals - 4.4% | | | |
Allergan, Inc. | | 930,300 | | | 100,937,550 |
AmerisourceBergen Corporation | | 1,632,500 | | | 78,800,775 |
Forest Laboratories, Inc.(1) | | 1,000,200 | | | 44,638,926 |
Shire PLC (ADR)(3) | | 987,300 | | | 45,899,577 |
| | | | |
|
|
| | | | | | 270,276,828 |
Electronics: Medical Systems - 2.4% | | | |
Intuitive Surgical, Inc.(1) | | 206,900 | | | 24,414,200 |
Varian Medical Systems, Inc.(1) | | 2,211,500 | | | 124,197,840 |
| | | | |
|
|
| | | | | | 148,612,040 |
Health Care Facilities - 0.6% | | | | | |
Laboratory Corporation of America Holdings(1) | | 576,400 | | | 33,707,872 |
| | | | | | |
Health Care Management Services - 1.4% | | | | | |
Cerner Corporation(1) | | 1,795,500 | | | 85,196,475 |
| | | | | | |
Medical & Dental
Instruments & Supplies - 3.3% | | | |
Fisher Scientific International Inc.(1) | | 1,751,900 | | | 119,216,795 |
Gen-Probe Incorporated(1) | | 917,400 | | | 50,567,088 |
St. Jude Medical, Inc.(1) | | 657,400 | | | 26,953,400 |
Ventana Medical Systems, Inc.(1) | | 159,800 | | | 6,674,846 |
| | | | |
|
|
| | | | | | 203,412,129 |
Medical Services - 1.5% | | | | | |
Coventry Health Care, Inc.(1) | | 1,736,450 | | | 93,733,571 |
| | | | | | |
| | | | | |
| | | Shares Held
| | Value
|
| | | | | | |
| MATERIALS & PROCESSING - 7.3% | | | |
Agriculture Fishing & Ranching - 0.6% | | | |
Bunge Limited | | 709,800 | | $ | 39,542,958 |
| | | | | | |
Chemicals - 1.9% | | | | | |
Ecolab Inc. | | 3,070,200 | | | 117,281,640 |
| | | | | | |
Diversified Materials & Processing - 0.8% | | | | | |
American Standard Companies Inc. | | 1,162,400 | | | 49,820,464 |
| | | | | | |
Engineering & Contracting Services - 0.6% | | | | | |
Quanta Services, Inc.(1) | | 2,401,400 | | | 38,470,428 |
| | | | | | |
Metal Fabricating - 2.1% | | | | | |
Precision Castparts Corp. | | 2,181,100 | | | 129,557,340 |
| | | | | | |
Real Estate - 1.3% | | | | | |
The St. Joe Company | | 1,262,900 | | | 79,360,636 |
| | | | | | |
| OTHER - 2.6% | | | | | |
Multi-Sector Companies - 2.6% | | | |
ITT Industries, Inc. | | 924,800 | | | 51,992,256 |
McDermott International, Inc.(1) | | 1,982,400 | | | 107,941,680 |
| | | | |
|
|
| | | | | | 159,933,936 |
| OTHER ENERGY - 5.8% | | | | | |
Coal - 1.8% | | | | | |
CONSOL Energy Inc. | | 859,300 | | | 63,725,688 |
Peabody Energy Corporation | | 966,900 | | | 48,741,429 |
| | | | |
|
|
| | | | | | 112,467,117 |
Machinery: Oil Well
Equipment & Services - 4.0% | | | |
Cooper Cameron Corporation(1) | | 1,920,600 | | | 84,660,048 |
Smith International, Inc. | | 4,234,000 | | | 164,956,640 |
| | | | |
|
|
| | | | | | 249,616,688 |
| PRODUCER DURABLES - 4.9% | | | | | |
Diversified Production - 1.1% | | | |
Danaher Corporation | | 1,107,100 | | | 70,356,205 |
| | | | | | |
Electrical Equipment & Components - 0.9% | | | | | |
Cooper Industries, Ltd., Class A | | 622,000 | | | 54,051,800 |
| | | | | | |
Identification Control & Filter Devices - 1.9% | | | | | |
Agilent Technologies, Inc.(1) | | 1,668,800 | | | 62,663,440 |
Roper Industries, Inc. | | 1,064,700 | | | 51,776,361 |
| | | | |
|
|
| | | | | | 114,439,801 |
34
THIRTY-FOUR
| | | | | |
| | | Shares Held
| | Value
|
| | | | | | |
| PRODUCER DURABLES (CONTINUED) | | | |
Machinery: Industrial/Specialty - 1.0% | | | | | |
Joy Global Inc. | | 1,077,313 | | $ | 64,390,998 |
| | | | | | |
| TECHNOLOGY - 21.9% | | | | | |
Communications Technology - 3.3% | | | |
Comverse Technology, Inc.(1) | | 1,945,200 | | | 45,770,556 |
Corning Incorporated(1) | | 1,727,100 | | | 46,476,261 |
Juniper Networks, Inc.(1) | | 5,861,700 | | | 112,075,704 |
| | | | |
|
|
| | | | | | 204,322,521 |
Computer Services Software
& Systems - 3.4% | | | |
Adobe Systems Incorporated(1) | | 901,756 | | | 31,489,320 |
Autodesk, Inc.(1) | | 1,252,800 | | | 48,257,856 |
Cadence Design Systems, Inc.(1) | | 1,768,600 | | | 32,701,414 |
Cognizant Technology Solutions Corporation, Class A(1) | | 539,000 | | | 32,065,110 |
F5 Networks, Inc.(1) | | 421,500 | | | 30,554,535 |
NAVTEQ Corporation(1) | | 683,200 | | | 34,604,080 |
| | | | |
|
|
| | | | | | 209,672,315 |
Computer Technology - 3.9% | | | |
Intermec, Inc.(1) | | 2,956,800 | | | 90,211,968 |
Network Appliance, Inc.(1) | | 2,282,500 | | | 82,238,475 |
RSA Security Inc.(1) | | 883,600 | | | 15,851,784 |
SanDisk Corporation(1) | | 564,600 | | | 32,475,792 |
Trident Microsystems, Inc.(1) | | 694,300 | | | 20,176,358 |
| | | | |
|
|
| | | | | | 240,954,377 |
Electronics - 1.0% | | | | | |
Avid Technology, Inc.(1) | | 858,100 | | | 37,293,026 |
FLIR Systems, Inc.(1) | | 804,200 | | | 22,847,322 |
| | | | |
|
|
| | | | | | 60,140,348 |
Electronics: Semi-Conductors/
Components - 8.3% | | | |
Advanced Micro Devices, Inc.(1) | | 2,459,100 | | | 81,543,756 |
Broadcom Corporation, Class A(1) | | 1,503,150 | | | 64,875,954 |
Freescale Semiconductor, Inc., Class A(1) | | 3,781,600 | | | 105,166,296 |
Jabil Circuit, Inc.(1) | | 2,033,400 | | | 87,151,524 |
Marvell Technology Group Ltd.(1) | | 1,116,300 | | | 60,391,830 |
Maxim Integrated Products, Inc. | | 2,232,700 | | | 82,944,805 |
Microchip Technology Incorporated | | 872,000 | | | 31,653,600 |
| | | | |
|
|
| | | | | | 513,727,765 |
Electronics: Technology - 2.0% | | | |
Rockwell Automation, Inc. | | 1,062,100 | | | 76,375,611 |
Trimble Navigation Limited(1) | | 1,018,800 | | | 45,896,940 |
| | | | |
|
|
| | | | | | 122,272,551 |
| | | | | | |
| | | | | | | |
| | | Shares Held
| | Value
| |
| | | | | | | | |
| UTILITIES - 2.6% | | | | | | | |
Utilities: Gas Distributors - 1.1% | | | | |
Kinder Morgan, Inc. | | | 738,600 | | $ | 67,943,814 | |
| | | | | | | | |
Utilities:
Telecommunications - 1.5% | | | | |
NII Holdings, Inc.(1) | | | 1,588,400 | | | 93,667,948 | |
| | | | | |
|
|
|
Total common stocks
(Cost $4,581,759,264) | | | | | | 6,059,307,690 | |
| | | Par Amount
| | | |
| SHORT-TERM INVESTMENTS (CASH EQUIVALENTS) - 2.9% | | | | | | | |
Repurchase agreement with State Street Bank and Trust Company, 4.50%, dated 3/31/06, due 4/3/06, maturity value $179,885,432, collateralized by $183,418,454 market value Federal National Mortgage Association Note,
5.80%, due 2/9/26 (Cost $179,818,000) | | $ | 179,818,000 | | | 179,818,000 | |
| | | | | |
|
|
|
| | | | | | | | |
Total investments - 101.0%
(Cost $4,761,577,264) | | | | | | 6,239,125,690 | |
| | | | | | | | |
Other assets less liabilities - (1.0%) | | | (64,395,882 | ) |
| | | | | |
|
|
|
| | | | | | | | |
Total net assets - 100.0%(4) | | $ | 6,174,729,808 | |
| | | | | |
|
|
|
| (1) | Non-income producing security. |
| (2) | Affiliated company as defined by the Investment Company Act of 1940. See Note (6) in Notes to Financial Statements. |
| (3) | The Fund considers the issuer to be from the United Kingdom. See the Fund’s Statement of Additional Information for information on how a particular country is assigned. The security trades on a U.S. exchange. |
| (4) | Percentages for the various classifications relate to total net assets. |
(ADR) American Depository Receipt
The accompanying notes are an integral part of the financial statements.
35
THIRTY-FIVE
ARTISAN MID CAP VALUE FUND
Schedule of Investments – March 31, 2006 (Unaudited)
| | | | | |
| | | Shares
Held
| | Value
|
| | | | | | |
| COMMON STOCKS - 97.0% | | | |
| | | | | | |
| AUTO & TRANSPORTATION - 3.9% | | | |
Auto Parts: Original Equipment - 0.6% | | | | | |
Lear Corporation | | 961,300 | | $ | 17,043,849 |
| | | | | | |
Shipping - 0.8% | | | | | |
Teekay Shipping Corporation | | 638,800 | | | 23,680,316 |
| | | | | | |
Truckers - 2.5% | | | | | |
CNF Inc. | | 574,500 | | | 28,690,530 |
YRC Worldwide, Inc.(1) | | 1,112,200 | | | 42,330,332 |
| | | | |
|
|
| | | | | | 71,020,862 |
| CONSUMER DISCRETIONARY - 31.9% | | | |
Hotel/Motel - 1.9% | | | | | |
Fairmont Hotels & Resorts, Inc.(2) | | 279,900 | | | 12,511,530 |
Hilton Hotels Corporation | | 1,720,900 | | | 43,814,114 |
| | | | |
|
|
| | | | | | 56,325,644 |
Household Furnishings - 6.9% | | | |
Furniture Brands
International, Inc.(3) | | 2,914,300 | | | 71,429,493 |
Leggett & Platt, Incorporated | | 2,867,400 | | | 69,878,538 |
Mohawk Industries, Inc.(1) | | 711,600 | | | 57,440,352 |
| | | | |
|
|
| | | | | | 198,748,383 |
Rental & Leasing Services:
Consumer - 2.6% | | | |
Rent-A-Center, Inc.(1)(3) | | 2,983,400 | | | 76,345,206 |
| | | | | | |
Retail - 8.3% | | | | | |
AutoZone, Inc.(1) | | 569,300 | | | 56,753,517 |
Claire’s Stores, Inc. | | 866,500 | | | 31,462,615 |
Foot Locker, Inc. | | 2,999,200 | | | 71,620,896 |
Zale Corporation(1)(3) | | 2,827,200 | | | 79,246,416 |
| | | | |
|
|
| | | | | | 239,083,444 |
Services: Commercial - 5.7% | | | |
Convergys Corporation(1) | | 2,472,200 | | | 45,018,762 |
Hewitt Associates, Inc., Class A(1) | | 2,034,600 | | | 60,509,004 |
Manpower Inc. | | 1,048,900 | | | 59,976,102 |
| | | | |
|
|
| | | | | | 165,503,868 |
Textiles Apparel Manufacturers - 2.5% | | | |
Liz Claiborne Inc. | | 1,778,600 | | | 72,887,028 |
| | | | | | |
| | | | | |
| | | Shares
Held
| | Value
|
| | | | | | |
| CONSUMER DISCRETIONARY (CONTINUED) | | | |
Toys - 4.0% | | | | | |
Hasbro, Inc. | | 2,329,800 | | $ | 49,158,780 |
Marvel Entertainment, Inc.(1)(3) | | 3,357,700 | | | 67,556,924 |
| | | | |
|
|
| | | | | | 116,715,704 |
| CONSUMER STAPLES - 2.9% | | | | | |
Foods - 2.9% | | | | | |
Pilgrim’s Pride Corporation | | 2,594,600 | | | 56,224,982 |
Tyson Foods, Inc., Class A | | 2,078,200 | | | 28,554,468 |
| | | | |
|
|
| | | | | | 84,779,450 |
| FINANCIAL SERVICES - 29.4% | | | | | |
Finance: Small Loan - 4.3% | | | | | |
The Student Loan Corporation | | 531,800 | | | 123,909,400 |
| | | | | | |
Financial Data Processing Services & Systems - 1.1% | | | | | |
Deluxe Corporation | | 1,224,300 | | | 32,039,931 |
| | | | | | |
Financial Miscellaneous - 3.5% | | | |
Fidelity National Title Group, Inc., Class A | | 564,800 | | | 12,860,496 |
H&R Block, Inc. | | 2,074,600 | | | 44,915,090 |
MBIA Inc. | | 732,700 | | | 44,057,251 |
| | | | |
|
|
| | | | | | 101,832,837 |
Insurance: Multi-Line - 6.7% | | | | | |
Alleghany Corporation(1) | | 311,228 | | | 90,100,506 |
Old Republic International Corporation | | 2,617,687 | | | 57,117,930 |
Torchmark Corporation | | 832,800 | | | 47,552,880 |
| | | | |
|
|
| | | | | | 194,771,316 |
Insurance: Property-Casualty - 3.7% | | | |
Arch Capital Group Ltd.(1) | | 450,473 | | | 26,010,311 |
White Mountains Insurance
Group, Ltd. | | 138,400 | | | 82,278,800 |
| | | | |
|
|
| | | | | | 108,289,111 |
Real Estate Investment Trusts (REITs) - 2.2% | | | | | |
Annaly Mortgage
Management, Inc.(3) | | 5,134,000 | | | 62,326,760 |
| | | | | | |
Rental & Leasing Services: Commercial - 2.9% | | | | | |
Ryder System, Inc. | | 1,872,000 | | | 83,828,160 |
| | | | | | |
36
THIRTY-SIX
| | | | | |
| | | Shares
Held
| | Value
|
| | | | | | |
| FINANCIAL SERVICES (CONTINUED) | | | |
Savings & Loan - 1.5% | | | | | |
Washington Federal, Inc. | | 1,735,016 | | $ | 41,987,387 |
| | | | | | |
Securities Brokerage & Services - 3.5% | | | | | |
Nuveen Investments, Inc., Class A | | 2,119,000 | | | 102,029,850 |
| | | | | | |
| MATERIALS & PROCESSING - 5.5% | | | |
Chemicals - 3.7% | | | | | |
Albemarle Corporation | | 774,800 | | | 35,137,180 |
The Lubrizol Corporation | | 1,649,800 | | | 70,693,930 |
| | | | |
|
|
| | | | | | 105,831,110 |
Paints & Coatings - 1.8% | | | | | |
The Sherwin-Williams Company | | 1,075,490 | | | 53,172,226 |
| | | | | | |
| OTHER ENERGY - 14.1% | | | | | |
Oil: Crude Producers - 14.1% | | | | | |
Apache Corporation | | 944,746 | | | 61,890,311 |
Cimarex Energy Co. | | 1,275,600 | | | 55,182,456 |
Forest Oil Corporation(1) | | 614,100 | | | 22,832,238 |
Mariner Energy, Inc.(1) | | 751,491 | | | 15,413,080 |
Noble Energy, Inc. | | 1,576,000 | | | 69,217,920 |
Pioneer Natural Resources Company | | 2,016,104 | | | 89,212,602 |
Pogo Producing Company | | 1,038,400 | | | 52,179,600 |
XTO Energy Inc. | | 970,942 | | | 42,303,943 |
| | | | |
|
|
| | | | | | 408,232,150 |
| PRODUCER DURABLES - 2.4% | | | | | |
Diversified Production - 1.2% | | | |
Dover Corporation | | 695,800 | | | 33,788,048 |
| | | | | | |
Office Furniture & Business Equipment - 1.2% | | | | | |
Lexmark International, Inc., Class A(1) | | 795,900 | | | 36,117,942 |
| | | | | | |
| TECHNOLOGY - 6.0% | | | | | |
Computer Services Software & Systems - 1.3% | | | | | |
BEA Systems, Inc.(1) | | 2,787,700 | | | 36,602,501 |
| | | | | | |
Computer Technology - 2.1% | | | | | |
Ingram Micro Inc., Class A(1) | | 3,012,700 | | | 60,254,000 |
| | | | | | |
Electronics: Semi-Conductors/Components - 2.6% | | | | | |
Avnet, Inc.(1) | | 3,009,800 | | | 76,388,724 |
| | | | | | |
| | | | | | |
| | | Shares
Held
| | Value
|
| UTILITIES - 0.9% | | | | | | |
Utilities: Electrical - 0.9% | | | | | | |
Westar Energy, Inc. | | | 1,222,900 | | $ | 25,448,549 |
| | | | | |
|
|
Total common stocks
(Cost $2,545,156,367) | | | | | | 2,808,983,756 |
| | |
| | | Par Amount
| | |
| SHORT-TERM INVESTMENTS (CASH EQUIVALENTS) - 3.0% | | | | | | |
Repurchase agreement with State Street Bank and Trust Company, 4.50%, dated 3/31/06, due 4/3/06, maturity value $86,264,337, collateralized by $63,358,967 market value Federal National Mortgage Association Note, 5.80%, due 2/9/26, and $24,601,375 market value Federal National Mortgage Association Note, 6.19%, due 12/19/25
(Cost $86,232,000) | | $ | 86,232,000 | | | 86,232,000 |
| | | | | |
|
|
Total investments - 100.0%
(Cost $2,631,388,367) | | | | | | 2,895,215,756 |
| | | | | | | |
Other assets less liabilities - 0.0%(4) | | | | | | 493,700 |
| | | | | |
|
|
| | | | | | | |
Total net assets - 100.0%(5) | | | | | $ | 2,895,709,456 |
| | | | | |
|
|
| (1) | Non-income producing security. |
| (2) | The Fund considers the issuer to be from Canada. See the Fund’s Statement of Additional Information for information on how a particular country is assigned. The security trades on a U.S. exchange. |
| (3) | Affiliated company as defined by the Investment Company Act of 1940. See Note (6) in Notes to Financial Statements. |
| (4) | Represents less than 0.1% of total net assets. |
| (5) | Percentages for the various classifications relate to total net assets. |
The accompanying notes are an integral part of the financial statements.
37
THIRTY-SEVEN
ARTISAN OPPORTUNISTIC VALUE FUND
Schedule of Investments – March 31, 2006 (Unaudited)
| | | | | |
| | | Shares Held
| | Value
|
| | | | | | |
| COMMON STOCKS - 89.0% | | | | | |
| | | | | | |
| CONSUMER DISCRETIONARY - 25.4% | | | |
Cable Television Services - 3.8% | | | | | |
EchoStar Communications Corporation, Class A(1) | | 6,400 | | $ | 191,168 |
Liberty Media Corporation, Class A(1) | | 23,400 | | | 192,114 |
| | | | |
|
|
| | | | | | 383,282 |
Household Furnishings - 4.6% | | | | | |
Leggett & Platt, Incorporated | | 9,700 | | | 236,389 |
Mohawk Industries, Inc.(1) | | 2,800 | | | 226,016 |
| | | | |
|
|
| | | | | | 462,405 |
Radio & TV Broadcasters - 2.4% | | | | | |
News Corporation, Class A | | 14,300 | | | 237,523 |
| | | | | | |
Rental & Leasing Services:
Consumer - 1.9% | | | |
Rent-A-Center, Inc.(1)(2) | | 7,500 | | | 191,925 |
| | | | | | |
Retail - 6.5% | | | | | |
Foot Locker, Inc. | | 7,900 | | | 188,652 |
Wal-Mart Stores, Inc. | | 10,000 | | | 472,400 |
| | | | |
|
|
| | | | | | 661,052 |
Services: Commercial - 2.4% | | | | | |
Accenture Ltd, Class A | | 7,900 | | | 237,553 |
| | | | | | |
Shoes - 3.8% | | | | | |
NIKE, Inc., Class B | | 4,500 | | | 382,950 |
| | | | | | |
| CONSUMER STAPLES - 2.3% | | | | | |
Tobacco - 2.3% | | | | | |
Altria Group, Inc. | | 3,300 | | | 233,838 |
| | | | | | |
| FINANCIAL SERVICES - 27.2% | | | | | |
Banks: Outside New
York City - 4.7% | | | |
Bank of America Corporation | | 5,200 | | | 236,808 |
SunTrust Banks, Inc. | | 3,300 | | | 240,108 |
| | | | |
|
|
| | | | | | 476,916 |
Diversified Financial Services - 3.8% | | | |
Citigroup Inc. | | 8,100 | | | 382,563 |
| | | | | | |
Finance: Small Loan - 3.9% | | | | | |
The Student Loan Corporation | | 1,700 | | | 396,100 |
| | | | | | |
Financial Miscellaneous - 2.3% | | | | | |
H&R Block, Inc. | | 10,900 | | | 235,985 |
| | | | | | |
Insurance: Multi-Line - 5.7% | | | | | |
The Allstate Corporation | | 3,700 | | | 192,807 |
American International Group, Inc. | | 5,800 | | | 383,322 |
| | | | |
|
|
| | | | | | 576,129 |
| | | | | |
| | | Shares Held
| | Value
|
| | | | | |
| FINANCIAL SERVICES (CONTINUED) | | | |
Insurance: Property-Casualty - 1.9% | | | |
The Progressive Corporation | | 1,800 | | $ | 187,668 |
| | | | | | |
Rental & Leasing Services: Commercial - 2.3% | | | | | |
Ryder System, Inc. | | 5,300 | | | 237,334 |
| | | | | | |
Securities Brokerage & Services - 2.6% | | | |
Countrywide Financial Corporation | | 7,300 | | | 267,910 |
| | | | | | |
| HEALTHCARE - 6.5% | | | | | |
Drugs & Pharmaceuticals - 3.7% | | | |
Johnson & Johnson | | 6,400 | | | 379,008 |
| | | | | | |
Health Care Facilities - 2.8% | | | | | |
HCA Inc. | | 6,200 | | | 283,898 |
| | | | | | |
| INTEGRATED OILS - 2.3% | | | | | |
Oil: Integrated Domestic - 2.3% | | | |
ConocoPhillips | | 3,700 | | | 233,655 |
| | | | | | |
| MATERIALS & PROCESSING - 2.8% | | | |
Chemicals - 2.8% | | | | | |
The Dow Chemical Company | | 7,000 | | | 284,200 |
| | | | | | |
| OTHER - 5.7% | | | | | |
Multi-Sector Companies - 5.7% | | | | | |
3M Company | | 2,500 | | | 189,225 |
Berkshire Hathaway Inc., Class B (1) | | 130 | | | 391,560 |
| | | | |
|
|
| | | | | | 580,785 |
| OTHER ENERGY - 4.7% | | | | | |
Oil: Crude Producers - 4.7% | | | | | |
Apache Corporation | | 7,300 | | | 478,223 |
| | | | | | |
| TECHNOLOGY - 10.3% | | | | | |
Computer Services Software &
Systems - 3.8% |
Microsoft Corporation | | 14,000 | | | 380,940 |
| | | | | | |
Computer Technology - 3.7% |
Dell Inc.(1) | | 6,300 | | | 187,488 |
International Business Machines Corporation | | 2,300 | | | 189,681 |
| | | | |
|
|
| | | | | | 377,169 |
Electronics: Semi-Conductors/Components - 2.8% | | | | | |
Avnet, Inc. (1) | | 11,300 | | | 286,794 |
38
THIRTY-EIGHT
| | | | | | | |
| | | Shares Held
| | Value
| |
| | | | | | | | |
| UTILITIES - 1.8% | | | | | | | |
Utilities: Telecommunications - 1.8% | | | | |
Vodafone Group PLC (ADR)(3) | | | 8,900 | | $ | 186,010 | |
| | | | | |
|
|
|
Total common stocks
(Cost $9,051,079) | | | | | | 9,021,815 | |
| | | Par Amount
| | | |
SHORT-TERM INVESTMENTS
(CASH EQUIVALENTS) - 25.6% | | | | | | | |
Repurchase agreement with State
Street Bank and Trust Company,
4.50%, dated 3/31/06, due
4/3/06, maturity value
$2,597,974, collateralized by $2,651,492 market value
Federal National Mortgage Association Note, 4.25%, due 5/15/09 (Cost $2,597,000) | | $ | 2,597,000 | | | 2,597,000 | |
| | | | | |
|
|
|
| | | | | | | | |
Total investments - 114.6%
(Cost $11,648,079) | | | | | | 11,618,815 | |
| | | | | | | | |
Other assets less liabilities - (14.6%) | | | (1,477,899 | ) |
| | | | | |
|
|
|
| | | | | | | | |
Total net assets - 100.0%(4) | | | | | $ | 10,140,916 | |
| | | | | |
|
|
|
| (1) | Non-income producing security. |
| (2) | Affiliated company as defined by the Investment Company Act of 1940. See Note (6) in Notes to Financial Statements. |
| (3) | The Fund considers the issuer to be from the United Kingdom. See the Fund’s Statement of Additional Information for information on how a particular country is assigned. The security trades on a U.S. exchange. |
| (4) | Percentages for the various classifications relate to total net assets. |
(ADR) American Depository Receipt
The accompanying notes are an integral part of the financial statements.
39
THIRTY-NINE
ARTISAN SMALL CAP FUND
Schedule of Investments – March 31, 2006 (Unaudited)
| | | | | |
| | | Shares
Held
| | Value
|
| | | | | | |
| COMMON STOCKS - 95.7% | | | | | |
| | | | | | |
| AUTO & TRANSPORTATION - 3.9% | | | |
Air Transport - 1.4% | | | | | |
Aviall, Inc.(1) | | 506,800 | | $ | 19,298,944 |
| | | | | | |
Auto Parts: After Market - 1.0% | | | |
Keystone Automotive
Industries, Inc.(1) | | 316,900 | | | 13,376,349 |
| | | | | | |
Transportation Miscellaneous - 1.5% | | | |
Pacer International, Inc. | | 642,400 | | | 20,993,632 |
| | | | | | |
| CONSUMER DISCRETIONARY - 26.0% | | | |
Casinos & Gambling - 1.5% | | | | | |
Shuffle Master, Inc.(1) | | 580,400 | | | 20,743,496 |
| | | | | | |
Consumer Products - 1.0% | | | | | |
RC2 Corporation(1) | | 358,900 | | | 14,287,809 |
| | | | | | |
Education Services - 4.7% | | | | | |
Bright Horizons Family
Solutions, Inc.(1) | | 620,000 | | | 24,012,600 |
Strayer Education, Inc. | | 234,600 | | | 23,990,196 |
Universal Technical Institute, Inc.(1) | | 568,500 | | | 17,111,850 |
| | | | |
|
|
| | | | | | 65,114,646 |
Radio & TV Broadcasters - 0.6% | | | |
Spanish Broadcasting System, Inc., Class A(1) | | 1,396,100 | | | 7,720,433 |
| | | | | | |
Restaurants - 4.0% | | | | | |
California Pizza Kitchen, Inc.(1) | | 692,900 | | | 22,484,605 |
Jack in the Box Inc.(1) | | 318,800 | | | 13,867,800 |
RARE Hospitality
International, Inc.(1) | | 567,850 | | | 19,778,216 |
| | | | |
|
|
| | | | | | 56,130,621 |
Retail - 7.1% | | | | | |
Central Garden & Pet Company(1) | | 409,400 | | | 21,755,516 |
The Children’s Place Retail
Stores, Inc.(1) | | 332,000 | | | 19,222,800 |
Guitar Center, Inc.(1) | | 421,300 | | | 20,096,010 |
Hibbett Sporting Goods, Inc.(1) | | 411,950 | | | 13,590,230 |
Rush Enterprises, Inc., Class A(1) | | 278,400 | | | 4,894,272 |
United Natural Foods, Inc.(1) | | 547,300 | | | 19,139,081 |
| | | | |
|
|
| | | | | | 98,697,909 |
| | | | | |
| | | Shares
Held
| | Value
|
| | | | | | |
| CONSUMER DISCRETIONARY (CONTINUED) | | | |
Services: Commercial - 6.3% | | | | | |
The Advisory Board Company(1) | | 321,200 | | $ | 17,913,324 |
CRA International, Inc.(1) | | 429,400 | | | 21,152,244 |
Hudson Highland Group, Inc.(1) | | 690,800 | | | 13,083,752 |
Jackson Hewitt Tax Service Inc. | | 447,500 | | | 14,132,050 |
Waste Connections, Inc.(1) | | 554,450 | | | 22,072,654 |
| | | | |
|
|
| | | | | | 88,354,024 |
Wholesalers - 0.8% | | | | | |
LKQ Corporation(1) | | 568,400 | | | 11,828,404 |
| | | | | | |
| FINANCIAL SERVICES - 15.0% | | | | | |
Banks: Outside New York City - 1.0% | | | | | |
Alabama National BanCorporation | | 209,900 | | | 14,357,160 |
| | | | | | |
Diversified Financial
Services - 1.2% | | | |
Euronet Worldwide, Inc.(1) | | 451,900 | | | 17,095,377 |
| | | | | | |
Finance: Small Loan - 1.3% | | | | | |
The First Marblehead Corporation | | 435,500 | | | 18,835,375 |
| | | | | | |
Financial Data Processing Services & Systems - 1.5% | | | | | |
TNS, Inc.(1) | | 983,100 | | | 20,822,058 |
| | | | | | |
Insurance: Multi-Line - 4.1% | | | | | |
HealthExtras, Inc.(1) | | 524,700 | | | 18,521,910 |
Max Re Capital Ltd. | | 786,800 | | | 18,725,840 |
Platinum Underwriters
Holdings, Ltd. | | 686,100 | | | 19,965,510 |
| | | | |
|
|
| | | | | | 57,213,260 |
Insurance: Property-Casualty - 1.5% | | | |
Ohio Casualty Corporation | | 642,500 | | | 20,367,250 |
| | | | | | |
Investment Management Companies - 0.4% | | | | | |
National Financial Partners Corp. | | 97,000 | | | 5,482,440 |
| | | | | | |
Real Estate Investment Trusts (REITs) - 1.2% | | | | | |
Strategic Hotels & Resorts, Inc. | | 749,300 | | | 17,443,704 |
40
FORTY
| | | | | |
| | | Shares
Held
| | Value
|
| | | | | | |
| FINANCIAL SERVICES (CONTINUED) | | | |
Savings & Loan - 2.8% | | | | | |
Bank Mutual Corporation | | 862,800 | | $ | 10,215,552 |
BankAtlantic Bancorp, Inc., Class A | | 958,300 | | | 13,789,937 |
BankUnited Financial Corporation, Class A | | 576,200 | | | 15,580,448 |
| | | | |
|
|
| | | | | | 39,585,937 |
| HEALTHCARE - 12.2% | | | | | |
Biotechnology Research & Production - 2.1% | | | | | |
Martek Biosciences Corporation(1) | | 412,800 | | | 13,552,224 |
PRA International(1) | | 658,900 | | | 16,334,131 |
| | | | |
|
|
| | | | | | 29,886,355 |
Drugs & Pharmaceuticals - 1.1% | | | |
Salix Pharmaceuticals, Ltd.(1) | | 907,100 | | | 14,976,221 |
| | | | | | |
Electronics: Medical Systems - 1.4% | | | |
IntraLase Corp.(1) | | 837,200 | | | 19,423,040 |
| | | | | | |
Health Care Facilities - 1.5% | | | | | |
United Surgical Partners International, Inc.(1) | | 576,300 | | | 20,406,783 |
| | | | | | |
Health Care Management Services -0.9% | | | | | |
Sierra Health Services, Inc.(1) | | 314,000 | | | 12,779,800 |
| | | | | | |
Medical & Dental
Instruments & Supplies - 4.4% | | | |
American Medical Systems Holdings, Inc.(1) | | 972,000 | | | 21,870,000 |
PSS World Medical, Inc.(1) | | 1,009,300 | | | 19,469,397 |
Symmetry Medical Inc.(1) | | 934,900 | | | 19,829,229 |
| | | | |
|
|
| | | | | | 61,168,626 |
Medical Services - 0.8% | | | | | |
VCA Antech, Inc.(1) | | 396,500 | | | 11,292,320 |
| | | | | | |
| MATERIALS & PROCESSING - 3.7% | | | |
Building: Heating & Plumbing - 1.6% | | | | | |
Interline Brands, Inc.(1) | | 889,100 | | | 22,431,993 |
| | | | | | |
Building: Roofing & Wallboard -0.9% | | | | | |
Beacon Roofing Supply, Inc.(1) | | 321,900 | | | 13,082,016 |
| | | | | | |
Chemicals - 1.2% | | | | | |
NuCO2 Inc.(1) | | 516,300 | | | 16,387,362 |
| | | | | | |
| OTHER ENERGY - 7.2% | | | | | |
Coal - 1.5% | | | | | |
James River Coal Company(1) | | 600,000 | | | 20,382,000 |
| | | | | |
| | | Shares
Held
| | Value
|
| | | | | | |
| OTHER ENERGY (CONTINUED) | | | | | |
Machinery: Oil Well
Equipment & Services - 4.0% | | | |
Core Laboratories N.V.(1)(2) | | 232,600 | | $ | 11,060,130 |
Hornbeck Offshore Services, Inc.(1) | | 647,500 | | | 23,355,325 |
W-H Energy Services, Inc.(1) | | 483,900 | | | 21,528,711 |
| | | | |
|
|
| | | | | | 55,944,166 |
Offshore Drilling - 0.6% | | | | | |
Hercules Offshore, Inc.(1) | | 256,400 | | | 8,720,164 |
| | | | | | |
Oil: Crude Producers - 1.1% | | | | | |
Brigham Exploration Company(1) | | 1,750,400 | | | 15,333,504 |
| | | | | | |
| PRODUCER DURABLES - 4.7% | | | | | |
Aerospace - 0.6% | | | | | |
MTC Technologies, Inc.(1) | | 305,300 | | | 8,545,347 |
| | | | | | |
Identification Control & Filter Devices - 1.6% | | | | | |
ESCO Technologies Inc.(1) | | 436,300 | | | 22,098,595 |
| | | | | | |
Machinery: Industrial/Specialty - 1.0% | | | | | |
Actuant Corporation | | 218,100 | | | 13,352,082 |
| | | | | | |
Machinery: Specialty - 0.2% | | | | | |
Applied Films Corporation (1) | | 171,100 | | | 3,324,473 |
| | | | | | |
Production Technology Equipment - 1.3% | | | | | |
Varian Semiconductor Equipment Associates, Inc.(1) | | 655,700 | | | 18,412,056 |
| | | | | | |
| TECHNOLOGY—23.0% | | | | | |
Communications Technology - 4.4% | | | |
Avocent Corporation (1) | | 695,800 | | | 22,084,692 |
Ixia(1) | | 1,224,500 | | | 17,461,370 |
Tekelec (1) | | 1,603,800 | | | 22,180,554 |
| | | | |
|
|
| | | | | | 61,726,616 |
Computer Services
Software & Systems - 11.7% | | | |
Epicor Software Corporation(1) | | 1,426,100 | | | 19,152,523 |
F5 Networks, Inc.(1) | | 74,000 | | | 5,364,260 |
Jupitermedia Corporation (1) | | 992,300 | | | 17,841,554 |
Macrovision Corporation(1) | | 739,200 | | | 16,373,280 |
Open Solutions Inc.(1) | | 771,600 | | | 21,072,396 |
Openwave Systems Inc.(1) | | 877,400 | | | 18,934,292 |
Progress Software Corporation(1) | | 634,600 | | | 18,460,514 |
Radware Ltd.(1)(2) | | 672,500 | | | 11,856,175 |
Wind River Systems, Inc. (1) | | 1,450,100 | | | 18,053,745 |
Witness Systems, Inc. (1) | | 623,300 | | | 15,831,820 |
| | | | |
|
|
| | | | | | 162,940,559 |
41
FORTY-ONE
| | | | | | |
| | | Shares
Held
| | Value
|
| TECHNOLOGY (CONTINUED) | | | | | | |
Computer Technology - 1.0% | | | |
Stratasys Inc.(1) | | | 460,400 | | $ | 13,572,592 |
| | | | | | | |
Electronics - 3.0% | | | | | | |
Aeroflex Incorporated (1) | | | 1,484,500 | | | 20,382,185 |
Semtech Corporation (1) | | | 1,170,100 | | | 20,933,089 |
| | | | | |
|
|
| | | | | | | 41,315,274 |
Electronics: Semi-Conductors/
Components - 2.9% | | | |
DSP Group, Inc.(1) | | | 783,800 | | | 22,738,038 |
Tessera Technologies, Inc.(1) | | | 538,000 | | | 17,259,040 |
| | | | | |
|
|
| | | | | | | 39,997,078 |
| | | | | |
|
|
Total common stocks
(Cost $1,130,541,531) | | | | | | 1,335,247,850 |
| | | Par
Amount
| | |
| | | | | | | |
| SHORT-TERM INVESTMENTS (CASH EQUIVALENTS) - 3.3% | | | | | | |
Repurchase agreement with State Street Bank and Trust Company, 4.50%, dated 3/31/06, due 4/3/06, maturity value $45,992,241, collateralized by $46,895,613 market value Federal National Mortgage Association Note, 5.80%, due 2/9/26
(Cost $45,975,000) | | $ | 45,975,000 | | | 45,975,000 |
| | | | | |
|
|
| | | | | | | |
Total investments - 99.0%
(Cost $1,176,516,531) | | | | | | 1,381,222,850 |
| | | | | | | |
Other assets less liabilities - 1.0% | | | | | | 14,570,998 |
| | | | | |
|
|
| | | | | | | |
Total net assets—100.0%(3) | | | | | $ | 1,395,793,848 |
| | | | | |
|
|
| (1) | Non-income producing security. |
| (2) | The Fund considers the issuer to be from outside of the United States. See the Fund’s Statement of Additional Information for information on how a particular country is assigned. The security trades on a U.S. exchange. |
| | |
Security
| | Issuer Country
|
Core Laboratories N.V. | | Netherlands |
Radware Ltd. | | Israel |
| (3) | Percentages for the various classifications relate to total net assets. |
The accompanying notes are an integral part of the financial statements.
42
FORTY-TWO
ARTISAN SMALL CAP VALUE FUND
Schedule of Investments – March 31, 2006 (Unaudited)
| | | | | |
| | | Shares Held
| | Value
|
| | | | | | |
| COMMON STOCKS - 92.8% | | | | | |
| | | | | | |
| AUTO & TRANSPORTATION - 2.7% | | | |
Auto Parts: After Market - 1.5% | | | |
Superior Industries
International, Inc.(1) | | 1,518,200 | | $ | 29,392,352 |
| | | | | | |
Recreational Vehicles & Boats - 0.5% | | | | | |
Arctic Cat Inc. | | 381,600 | | | 9,181,296 |
| | | | | | |
Truckers - 0.7% | | | | | |
Arkansas Best Corporation | | 332,500 | | | 13,007,400 |
| | | | | | |
| CONSUMER DISCRETIONARY - 31.2% | | | |
Advertising Agencies - 2.4% | | | | | |
ADVO, Inc. | | 873,100 | | | 27,939,200 |
Valassis Communications, Inc.(2) | | 651,900 | | | 19,146,303 |
| | | | |
|
|
| | | | | | 47,085,503 |
Commercial Information Services - 0.6% | | | | | |
ProQuest Company(2) | | 597,800 | | | 12,786,942 |
| | | | | | |
Consumer Electronics - 1.3% | | | | | |
EarthLink, Inc.(2) | | 2,649,500 | | | 25,302,725 |
| | | | | | |
Entertainment - 0.3% | | | | | |
Movie Gallery, Inc.(1) | | 2,119,900 | | | 6,402,098 |
| | | | | | |
Household Furnishings - 5.3% | | | |
Ethan Allen Interiors Inc. | | 965,600 | | | 40,574,512 |
Furniture Brands
International, Inc.(1) | | 2,012,900 | | | 49,336,179 |
La-Z-Boy Incorporated | | 917,500 | | | 15,597,500 |
| | | | |
|
|
| | | | | | 105,508,191 |
Radio & TV Broadcasters - 0.7% | | | |
World Wrestling Entertainment, Inc., Class A | | 787,000 | | | 13,300,300 |
| | | | | | |
Rental & Leasing Services: Consumer - 1.8% | | | | | |
Rent-A-Center, Inc.(1)(2) | | 1,392,900 | | | 35,644,311 |
| | | | | | |
| | | | | |
| | | Shares Held
| | Value
|
| | | | | | |
| CONSUMER DISCRETIONARY (CONTINUED) | | | |
Retail - 5.9% | | | | | |
1-800 CONTACTS, INC.(2) | | 658,800 | | $ | 8,860,860 |
Global Imaging Systems, Inc.(2) | | 264,600 | | | 10,049,508 |
The Pep Boys – Manny, Moe & Jack | | 697,100 | | | 10,533,181 |
PETCO Animal Supplies, Inc.(2) | | 1,315,300 | | | 31,001,621 |
Zale Corporation(1)(2) | | 2,005,500 | | | 56,214,165 |
| | | | |
|
|
| | | | | | 116,659,335 |
Services: Commercial - 9.2% | | | | | |
AMN Healthcare Services, Inc.(1)(2) | | 1,773,600 | | | 33,201,792 |
CDI Corp. | | 353,100 | | | 10,158,687 |
Cross Country Healthcare, Inc.(2) | | 930,700 | | | 18,018,352 |
DiamondCluster
International, Inc.(1)(2) | | 1,754,900 | | | 18,777,430 |
Korn/Ferry International(2) | | 716,500 | | | 14,609,435 |
Medical Staffing Network Holdings, Inc.(1)(2) | | 1,548,900 | | | 8,069,769 |
Tetra Tech, Inc.(2) | | 1,272,800 | | | 24,297,752 |
Watson Wyatt Worldwide, Inc. | | 1,675,100 | | | 54,574,758 |
| | | | |
|
|
| | | | | | 181,707,975 |
Textiles Apparel Manufacturers - 2.1% | | | | | |
Kellwood Company(1) | | 1,305,750 | | | 40,987,492 |
| | | | | | |
Toys - 0.6% | | | | | |
Marvel Entertainment, Inc.(1)(2) | | 587,700 | | | 11,824,524 |
| | | | | | |
Wholesalers - 1.0% | | | | | |
United Stationers Inc.(2) | | 382,100 | | | 20,289,510 |
| | | | | | |
| CONSUMER STAPLES - 1.5% | | | | | |
Foods - 1.5% | | | | | |
Sanderson Farms, Inc.(1) | | 1,334,900 | | | 29,901,760 |
| | | | | | |
| FINANCIAL SERVICES - 13.1% | | | | | |
Finance Companies - 0.9% | | | | | |
Assured Guaranty Ltd. | | 732,100 | | | 18,302,500 |
| | | | | | |
Financial Miscellaneous - 3.2% | | | |
Stewart Information Services Corporation(1) | | 1,366,300 | | | 64,325,404 |
| | | | | | |
43
FORTY-THREE
| | | | | |
| | | Shares Held
| | Value
|
| | | | | | |
| FINANCIAL SERVICES (CONTINUED) | | | |
Insurance: Multi-Line - 5.4% | | | | | |
Hilb Rogal & Hobbs Company | | 1,546,900 | | $ | 63,763,218 |
Hub International Limited(3) | | 589,300 | | | 16,512,186 |
Max Re Capital Ltd. | | 129,100 | | | 3,072,580 |
PICO Holdings, Inc.(1)(2) | | 694,600 | | | 22,845,394 |
| | | | |
|
|
| | | | | | 106,193,378 |
Insurance: Property-Casualty - 0.6% | | | | | |
IPC Holdings, Ltd. | | 399,400 | | | 11,203,170 |
| | | | | | |
Investment Management Companies - 1.2% | | | | | |
Capital Southwest Corporation | | 124,400 | | | 11,880,200 |
GAMCO Investors, Inc. | | 317,900 | | | 12,700,105 |
| | | | |
|
|
| | | | | | 24,580,305 |
Real Estate Investment Trusts (REITs) - 1.8% | | | | | |
Annaly Mortgage
Management, Inc.(1) | | 1,424,700 | | | 17,295,858 |
Cousins Properties Incorporated | | 304,500 | | | 10,179,435 |
Eagle Hospitality Properties
Trust, Inc. | | 850,800 | | | 8,576,064 |
| | | | |
|
|
| | | | | | 36,051,357 |
| HEALTHCARE - 3.0% | | | | | |
Electronics: Medical Systems - 1.0% | | | |
Analogic Corporation | | 209,100 | | | 13,842,420 |
Datascope Corp. | | 136,200 | | | 5,388,072 |
| | | | |
|
|
| | | | | | 19,230,492 |
Medical & Dental
Instruments & Supplies - 1.7% | | | |
CONMED Corporation(2) | | 1,231,400 | | | 23,581,310 |
National Dentex Corporation(1)(2) | | 413,500 | | | 9,605,605 |
| | | | |
|
|
| | | | | | 33,186,915 |
Medical Services - 0.3% | | | | | |
America Service Group Inc.(2) | | 444,200 | | | 5,787,926 |
| | | | | | |
| MATERIALS & PROCESSING - 11.9% | | | |
Agriculture Fishing & Ranching - 1.2% | | | | | |
Delta and Pine Land Company | | 660,800 | | | 19,929,728 |
Gold Kist Inc.(2) | | 241,900 | | | 3,057,616 |
| | | | |
|
|
| | | | | | 22,987,344 |
Building Materials - 1.5% | | | | | |
Simpson Manufacturing Co., Inc. | | 689,700 | | | 29,864,010 |
| | | | | | |
Building: Miscellaneous - 0.2% | | | |
Griffon Corporation(2) | | 177,500 | | | 4,409,100 |
| | | | | |
| | | Shares Held
| | Value
|
| | | | | | |
| MATERIALS & PROCESSING (CONTINUED) | | | |
Chemicals - 3.0% | | | | | |
Albemarle Corporation | | 608,500 | | $ | 27,595,475 |
Innospec Inc. | | 197,400 | | | 5,059,362 |
MacDermid, Incorporated | | 610,100 | | | 19,614,715 |
OM Group, Inc.(2) | | 334,400 | | | 7,691,200 |
| | | | |
|
|
| | | | | | 59,960,752 |
Copper - 1.3% | | | | | |
Mueller Industries, Inc. | | 693,900 | | | 24,765,291 |
| | | | | | |
Diversified Materials & Processing - 0.5% | | | | | |
Acuity Brands, Inc. | | 245,400 | | | 9,816,000 |
| | | | | | |
Engineering & Contracting Services - 0.6% | | | | | |
Dycom Industries, Inc.(2) | | 567,000 | | | 12,048,750 |
| | | | | | |
Metal Fabricating - 2.6% | | | | | |
Lone Star Technologies, Inc.(2) | | 347,400 | | | 19,249,434 |
Quanex Corporation | | 221,250 | | | 14,741,888 |
Superior Essex Inc.(2) | | 697,800 | | | 17,752,032 |
| | | | |
|
|
| | | | | | 51,743,354 |
Steel - 1.0% | | | | | |
Schnitzer Steel Industries, Inc., Class A | | 482,200 | | | 20,662,270 |
| | | | | | |
| OTHER ENERGY - 13.0% | | | | | |
Energy Equipment - 0.3% | | | | | |
Global Power Equipment
Group Inc.(2) | | 1,356,400 | | | 5,222,140 |
| | | | | | |
Energy Miscellaneous - 0.5% | | | | | |
Penn Virginia Corporation | | 129,600 | | | 9,201,600 |
| | | | | | |
Machinery: Oil Well
Equipment & Services - 0.6% | | | |
Superior Energy Services, Inc.(2) | | 438,200 | | | 11,739,378 |
| | | | | | |
Oil: Crude Producers - 11.6% | | | | | |
Cabot Oil & Gas Corporation | | 391,025 | | | 18,741,828 |
Cimarex Energy Co. | | 1,047,900 | | | 45,332,154 |
Forest Oil Corporation(2) | | 242,058 | | | 8,999,716 |
Mariner Energy, Inc.(2) | | 598,997 | | | 12,285,428 |
Plains Exploration & Production Company(2) | | 1,078,793 | | | 41,684,562 |
Rosetta Resources Inc.(2) | | 870,400 | | | 15,632,384 |
St. Mary Land & Exploration Company | | 1,209,200 | | | 49,371,636 |
Stone Energy Corporation(2) | | 843,600 | | | 37,228,068 |
| | | | |
|
|
| | | | | | 229,275,776 |
44
FORTY-FOUR
| | | | | |
| | | Shares Held
| | Value
|
| | | | | | |
| PRODUCER DURABLES - 3.2% | | | | | |
Electrical Equipment & Components - 0.7% | | | | | |
General Cable Corporation(2) | | 238,100 | | $ | 7,221,573 |
The Genlyte Group Incorporated(2) | | 99,200 | | | 6,759,488 |
| | | | |
|
|
| | | | | | 13,981,061 |
Production Technology Equipment - 1.2% | | | | | |
LTX Corporation(2) | | 2,254,900 | | | 12,176,460 |
Orbotech, Ltd.(2)(3) | | 489,800 | | | 12,063,774 |
| | | | |
|
|
| | | | | | 24,240,234 |
Telecommunications Equipment - 1.3% | | | | | |
Belden CDT Inc. | | 966,800 | | | 26,325,964 |
| | | | | | |
| TECHNOLOGY - 10.8% | | | | | |
Communications Technology - 2.1% | | | |
Black Box Corporation | | 165,400 | | | 7,947,470 |
CSG Systems International, Inc.(2) | | 1,042,500 | | | 24,248,550 |
TIBCO Software Inc.(2) | | 1,166,300 | | | 9,750,268 |
| | | | |
|
|
| | | | | | 41,946,288 |
Computer Services
Software & Systems - 6.9% | | | |
Altiris, Inc.(2) | | 981,900 | | | 21,611,619 |
Borland Software Corporation(2) | | 1,434,100 | | | 7,744,140 |
CIBER, Inc.(2) | | 1,697,700 | | | 10,831,326 |
Keane, Inc.(2) | | 1,798,900 | | | 28,332,675 |
Lawson Software, Inc.(2) | | 3,748,000 | | | 28,747,160 |
Manhattan Associates, Inc.(2) | | 894,600 | | | 19,681,200 |
Open Text Corporation(2)(3) | | 589,300 | | | 9,682,199 |
webMethods, Inc.(2) | | 1,268,500 | | | 10,680,770 |
| | | | |
|
|
| | | | | | 137,311,089 |
Computer Technology - 1.2% | | | |
Advanced Digital Information Corporation(2) | | 2,778,700 | | | 24,396,986 |
| | | | | | |
Electronics: Semi-Conductors/
Components - 0.6% | | | |
Actel Corporation(2) | | 759,700 | | | 12,109,618 |
| | | | | | |
| UTILITIES - 2.4% | | | | | |
Utilities: Electrical - 0.7% | | | |
El Paso Electric Company(2) | | 703,900 | | | 13,402,256 |
| | | | | | |
Utilities: Gas Distributors - 0.4% | | | |
SEMCO Energy, Inc.(2) | | 1,552,940 | | | 8,603,288 |
| | | | | | |
| | | | | | | |
| | | Shares Held
| | Value
| |
| | | | | | | | |
| UTILITIES (CONTINUED) | | | | | | | |
Utilities: Telecommunications - 1.3% | | | | |
IDT Corporation, Class B(2) | | | 557,500 | | $ | 6,171,525 | |
IDT Corporation, Class C(2) | | | 538,700 | | | 5,898,765 | |
USA Mobility, Inc. | | | 498,300 | | | 14,191,584 | |
| | | | | |
|
|
|
| | | | | | | 26,261,874 | |
| | | | | |
|
|
|
Total common stocks
(Cost $1,469,412,626) | | | | | | 1,838,117,584 | |
| | | Par Amount
| | | |
SHORT-TERM INVESTMENTS
(CASH EQUIVALENTS) - 7.9% | | | | |
Repurchase agreement with State Street Bank and Trust Company, 4.50%, dated 3/31/06, due 4/3/06, maturity value $156,520,673, collateralized by $109,782,871 market value Federal Home Loan Mortgage Corporation Note, 5.45%, due 1/22/16 and $49,812,500 market value Federal National Mortgage Association Note, 5.60%, due 2/8/16 (Cost $156,462,000) | | $ | 156,462,000 | | | 156,462,000 | |
| | | | | |
|
|
|
| | | | | | | | |
Total investments - 100.7%
(Cost $1,625,874,626) | | | | | | 1,994,579,584 | |
| | | | | | | | |
| Other assets less liabilities - (0.7%) | | | (13,117,076 | ) |
| | | | | |
|
|
|
| | | | | | | | |
| Total net assets - 100.0% (4) | | | | | $ | 1,981,462,508 | |
| | | | | |
|
|
|
| (1) | Affiliated company as defined by the Investment Company Act of 1940. See Note (6) in Notes to Financial Statements. |
| (2) | Non-income producing security. |
| (3) | The Fund considers the issuer to be from outside of the United States. See the Fund’s Statement of Additional Information for information on how a particular country is assigned. The security trades on a U.S. exchange. |
| | |
Security
| | Issuer Country
|
Hub International Limited | | Canada |
Open Text Corporation | | Canada |
Orbotech, Ltd. | | Israel |
| (4) | Percentages for the various classifications relate to total net assets. |
The accompanying notes are an integral part of the financial statements.
45
FORTY- FIVE
ARTISAN FUNDS, INC.
Statements of Assets and Liabilities – March 31, 2006 (Unaudited)
| | | | | | | | | | | | |
| | | INTERNATIONAL
| | | INTERNATIONAL SMALL CAP
| | | INTERNATIONAL VALUE
| |
| ASSETS: | | | | | | | | | | | | |
Investments in securities, unaffiliated, at value | | $ | 13,013,658,430 | | | $ | 950,107,531 | | | $ | 729,982,057 | |
Investments in securities, affiliated, at value | | | 152,948,776 | | | | 24,716,613 | | | | 36,598,158 | |
Short-term investments (repurchase agreements), at value | | | 170,842,000 | | | | 3,459,000 | | | | 66,490,000 | |
| | |
|
|
| |
|
|
| |
|
|
|
Total investments | | | 13,337,449,206 | | | | 978,283,144 | | | | 833,070,215 | |
Cash | | | 153 | | | | 361 | | | | 343 | |
Foreign currency | | | 4,580,265 | | | | 533,821 | | | | 1,252,445 | |
Receivable from investments sold | | | 214,265,992 | | | | 17,547,644 | | | | 793,316 | |
Unrealized net gain on foreign currency forward contracts | | | - | | | | - | | | | 661 | |
Receivable from fund shares sold | | | 21,089,834 | | | | 2,219,308 | | | | 4,607,713 | |
Dividends and interest receivable | | | 17,994,655 | | | | 3,767,574 | | | | 2,710,226 | |
Receivable from Adviser | | | - | | | | - | | | | - | |
Other assets | | | 15,456 | | | | 1,055 | | | | 855 | |
| | |
|
|
| |
|
|
| |
|
|
|
Total assets | | | 13,595,395,561 | | | | 1,002,352,907 | | | | 842,435,774 | |
| LIABILITIES: | | | | | | | | | | | | |
Payable for investments purchased | | | 165,393,793 | | | | 11,839,167 | | | | 4,750,786 | |
Unrealized net loss on foreign currency forward contracts | | | 98,062 | | | | 82,222 | | | | - | |
Due to custodian | | | - | | | | 50,973 | | | | - | |
Payable for fund shares redeemed | | | 98,433,709 | | | | 589,683 | | | | 135,285 | |
Payable for operating expenses | | | 2,773,971 | | | | 180,099 | | | | 225,531 | |
Payable for withholding taxes | | | 1,301,962 | | | | 455,097 | | | | 59,944 | |
Payable for deferred directors’ fees | | | 15,456 | | | | 1,055 | | | | 855 | |
| | |
|
|
| |
|
|
| |
|
|
|
Total liabilities | | | 268,016,953 | | | | 13,198,296 | | | | 5,172,401 | |
| | |
|
|
| |
|
|
| |
|
|
|
Total net assets | | $ | 13,327,378,608 | | | $ | 989,154,611 | | | $ | 837,263,373 | |
| | |
|
|
| |
|
|
| |
|
|
|
| NET ASSETS CONSIST OF: | | | | | | | | | | | | |
Fund shares issued and outstanding | | $ | 9,330,909,077 | | | $ | 589,321,471 | | | $ | 660,792,958 | |
Net unrealized appreciation (depreciation) on investments and foreign currency related transactions | | | 3,802,394,870 | | | | 319,571,447 | | | | 145,033,537 | |
Accumulated undistributed net investment income (loss) | | | (112,745,572 | ) | | | (1,752,967 | ) | | | (2,443,330 | ) |
Accumulated undistributed net realized gains on investments and foreign currency related transactions | | | 306,820,233 | | | | 82,014,660 | | | | 33,880,208 | |
| | |
|
|
| |
|
|
| |
|
|
|
| | | $ | 13,327,378,608 | | | $ | 989,154,611 | | | $ | 837,263,373 | |
| | |
|
|
| |
|
|
| |
|
|
|
| SUPPLEMENTARY INFORMATION: | | | | | | | | | | | | |
Net assets | | | | | | | | | | | | |
Investor Shares | | $ | 9,157,591,165 | | | $ | 989,154,611 | | | $ | 837,263,373 | |
Institutional Shares | | $ | 4,169,787,443 | | | | | | | | | |
Shares outstanding (Indefinite number of shares authorized, $0.01 par value) | | | | | | | | | | | | |
Investor Shares | | | 327,047,560 | | | | 43,215,181 | | | | 33,375,024 | |
Institutional Shares | | | 148,183,573 | | | | | | | | | |
Net asset value, offering price and redemption price per share | | | | | | | | | | | | |
Investor Shares | | $ | 28.00 | | | $ | 22.89 | | | $ | 25.09 | |
Institutional Shares | | $ | 28.14 | | | | | | | | | |
Cost of securities of unaffiliated issuers held | | $ | 9,427,036,028 | | | $ | 646,792,844 | | | $ | 664,199,446 | |
Cost of securities of affiliated issuers held | | $ | 108,091,689 | | | $ | 11,699,496 | | | $ | 23,833,041 | |
Cost of foreign currency | | $ | 4,587,637 | | | $ | 531,790 | | | $ | 1,246,360 | |
46
FORTY-SIX
| | | | | | | | | | | | | | | | | |
MID CAP
| | | MID CAP VALUE
| | OPPORTUNISTIC VALUE
| | | SMALL CAP
| | | SMALL CAP VALUE
| |
| | | | | | | | | | | | | | | | | | |
| $ | 6,013,426,042 | | | $ | 2,452,078,957 | | $ | 8,829,890 | | | $ | 1,335,247,850 | | | $ | 1,404,293,451 | |
| | 45,881,648 | | | | 356,904,799 | | | 191,925 | | | | - | | | | 433,824,133 | |
| | 179,818,000 | | | | 86,232,000 | | | 2,597,000 | | | | 45,975,000 | | | | 156,462,000 | |
|
|
| |
|
| |
|
|
| |
|
|
| |
|
|
|
| | 6,239,125,690 | | | | 2,895,215,756 | | | 11,618,815 | | | | 1,381,222,850 | | | | 1,994,579,584 | |
| | 252 | | | | 190 | | | 979 | | | | 581 | | | | 635 | |
| | - | | | | - | | | - | | | | - | | | | - | |
| | 13,741,357 | | | | 26,450,542 | | | - | | | | 15,021,275 | | | | 4,442,029 | |
| | - | | | | - | | | - | | | | - | | | | - | |
| | 9,728,003 | | | | 6,917,141 | | | 2,720,695 | | | | 4,973,787 | | | | 2,807,397 | |
| | 1,778,362 | | | | 2,609,984 | | | 1,675 | | | | 351,762 | | | | 894,946 | |
| | - | | | | - | | | 4,087 | | | | - | | | | - | |
| | 7,631 | | | | 3,483 | | | - | | | | 1,503 | | | | 198,216 | |
|
|
| |
|
| |
|
|
| |
|
|
| |
|
|
|
| | 6,264,381,295 | | | | 2,931,197,096 | | | 14,346,251 | | | | 1,401,571,758 | | | | 2,002,922,807 | |
| | | | | | | | | | | | | | | | | | |
| | 61,982,645 | | | | 29,027,756 | | | 4,199,205 | | | | 3,706,580 | | | | 20,406,958 | |
| | - | | | | - | | | - | | | | - | | | | - | |
| | - | | | | - | | | - | | | | - | | | | - | |
| | 25,460,765 | | | | 5,765,974 | | | 1,297 | | | | 1,783,028 | | | | 407,847 | |
| | 2,200,446 | | | | 690,427 | | | 4,833 | | | | 286,799 | | | | 643,279 | |
| | - | | | | - | | | - | | | | - | | | | - | |
| | 7,631 | | | | 3,483 | | | - | | | | 1,503 | | | | 2,215 | |
|
|
| |
|
| |
|
|
| |
|
|
| |
|
|
|
| | 89,651,487 | | | | 35,487,640 | | | 4,205,335 | | | | 5,777,910 | | | | 21,460,299 | |
|
|
| |
|
| |
|
|
| |
|
|
| |
|
|
|
| $ | 6,174,729,808 | | | $ | 2,895,709,456 | | $ | 10,140,916 | | | $ | 1,395,793,848 | | | $ | 1,981,462,508 | |
|
|
| |
|
| |
|
|
| |
|
|
| |
|
|
|
| | | | | | | | | | | | | | | | | | |
| $ | 4,365,399,958 | | | $ | 2,550,442,275 | | $ | 10,167,533 | | | $ | 1,151,884,582 | | | $ | 1,491,217,448 | |
| | 1,477,548,426 | | | | 263,827,389 | | | (29,264 | ) | | | 204,706,319 | | | | 368,704,958 | |
| | (12,071,067 | ) | | | 3,216,058 | | | 2,647 | | | | (4,633,610 | ) | | | (1,130,014 | ) |
| | 343,852,491 | | | | 78,223,734 | | | - | | | | 43,836,557 | | | | 122,670,116 | |
|
|
| |
|
| |
|
|
| |
|
|
| |
|
|
|
| $ | 6,174,729,808 | | | $ | 2,895,709,456 | | $ | 10,140,916 | | | $ | 1,395,793,848 | | | $ | 1,981,462,508 | |
|
|
| |
|
| |
|
|
| |
|
|
| |
|
|
|
| | | | | | | | | | | | | | | | | | |
| | | | | | | | | | | | | | | | | | |
| $ | 5,219,637,369 | | | $ | 2,895,709,456 | | $ | 10,140,916 | | | $ | 1,395,793,848 | | | $ | 1,981,462,508 | |
| $ | 955,092,439 | | | | | | | | | | | | | | | | |
| | | | | | | | | | | | | | | | | | |
| | 157,156,853 | | | | 146,303,252 | | | 1,016,666 | | | | 71,314,214 | | | | 104,781,979 | |
| | 28,368,472 | | | | | | | | | | | | | | | | |
| | | | | | | | | | | | | | | | | | |
| $ | 33.21 | | | $ | 19.79 | | $ | 9.97 | | | $ | 19.57 | | | $ | 18.91 | |
| $ | 33.67 | | | | | | | | | | | | | | | | |
| $ | 4,718,259,259 | | | $ | 2,298,130,562 | | $ | 11,459,940 | | | $ | 1,176,516,531 | | | $ | 1,231,490,312 | |
| $ | 43,318,005 | | | $ | 333,257,805 | | $ | 188,139 | | | $ | - | | | $ | 394,384,314 | |
| $ | - | | | $ | - | | $ | - | | | $ | - | | | $ | - | |
The accompanying notes are an integral part of the financial statements.
47
FORTY-SEVEN
ARTISAN FUNDS, INC.
Statements of Operations – For the Six Months Ended March 31, 2006 (Unaudited)
| | | | | | | | | | | | |
| | | INTERNATIONAL
| | | INTERNATIONAL SMALL CAP
| | | INTERNATIONAL VALUE
| |
| INVESTMENT INCOME: | | | | | | | | | | | | |
Interest | | $ | 3,201,874 | | | $ | 410,139 | | | $ | 896,905 | |
Dividends, from unaffiliated issuers(2) | | | 45,387,713 | | | | 5,540,655 | | | | 6,859,078 | |
Dividends, from affiliated issuers(2) | | | 1,523,092 | | | | 120,046 | | | | - | |
Securities lending | | | 1,395,872 | | | | 5,664 | | | | - | |
| | |
|
|
| |
|
|
| |
|
|
|
Total investment income | | | 51,508,551 | | | | 6,076,504 | | | | 7,755,983 | |
| | | |
| EXPENSES: | | | | | | | | | | | | |
Advisory fees | | | 56,142,360 | | | | 5,228,913 | | | | 3,370,912 | |
Transfer agent fees | | | | | | | | | | | | |
Investor Shares | | | 7,272,726 | | | | 674,101 | | | | 587,578 | |
Institutional Shares | | | 13,377 | | | | | | | | | |
Shareholder communications | | | | | | | | | | | | |
Investor Shares | | | 495,160 | | | | 35,675 | | | | 42,028 | |
Institutional Shares | | | 40,307 | | | | | | | | | |
Custodian fees | | | 3,332,552 | | | | 311,024 | | | | 158,756 | |
Accounting fees | | | 37,939 | | | | 27,575 | | | | 26,017 | |
Professional fees | | | 222,461 | | | | 21,710 | | | | 21,537 | |
Less insurance recoveries(3) | | | (197,947 | ) | | | - | | | | - | |
| | |
|
|
| |
|
|
| |
|
|
|
Net professional fees | | | 24,514 | | | | 21,710 | | | | 21,537 | |
Registration fees | | | | | | | | | | | | |
Investor Shares | | | 65,603 | | | | 22,566 | | | | 39,215 | |
Institutional Shares | | | 9,698 | | | | | | | | | |
Directors’ fees | | | 258,153 | | | | 17,484 | | | | 13,697 | |
Other operating expenses | | | 552,592 | | | | 16,810 | | | | 15,853 | |
| | |
|
|
| |
|
|
| |
|
|
|
Total operating expenses before amounts waived or paid by the Adviser or the Board of Directors | | | 68,244,981 | | | | 6,355,858 | | | | 4,275,593 | |
Less amounts waived or paid by the Adviser or the Board of Directors | | | - | | | | - | | | | - | |
| | |
|
|
| |
|
|
| |
|
|
|
Net expenses | | | 68,244,981 | | | | 6,355,858 | | | | 4,275,593 | |
| | |
|
|
| |
|
|
| |
|
|
|
Net investment income (loss) | | | (16,736,430 | ) | | | (279,354 | ) | | | 3,480,390 | |
| | | |
| NET REALIZED AND UNREALIZED GAINS (LOSSES) ON INVESTMENTS: | | | | | | | | | | | | |
Net realized gain (loss) on: | | | | | | | | | | | | |
Investments(1) | | | 941,465,807 | | | | 84,077,735 | | | | 40,836,701 | |
Foreign currency related transactions | | | (3,245,721 | ) | | | (198,718 | ) | | | (127,768 | ) |
| | |
|
|
| |
|
|
| |
|
|
|
| | | | 938,220,086 | | | | 83,879,017 | | | | 40,708,933 | |
Net increase (decrease) in unrealized appreciation or depreciation on: | | | | | | | | | | | | |
Investments | | | 996,637,082 | | | | 91,429,790 | | | | 72,930,904 | |
Foreign currency related transactions | | | 392,229 | | | | (27,990 | ) | | | 51,696 | |
| | |
|
|
| |
|
|
| |
|
|
|
| | | | 997,029,311 | | | | 91,401,800 | | | | 72,982,600 | |
| | |
|
|
| |
|
|
| |
|
|
|
Net gain (loss) on investments and foreign currency related transactions | | | 1,935,249,397 | | | | 175,280,817 | | | | 113,691,533 | |
| | |
|
|
| |
|
|
| |
|
|
|
Net increase (decrease) in net assets resulting from operations | | $ | 1,918,512,967 | | | $ | 175,001,463 | | | $ | 117,171,923 | |
| | |
|
|
| |
|
|
| |
|
|
|
| | | | | | | | |
(1) For the period from commencement of operations (March 27, 2006) through March 31, 2006. | |
| | | |
| (2) Fund
| | Net of foreign taxes
withheld on dividends,
unaffiliated issuers
| | Net of foreign taxes
withheld on dividends,
affiliated issuers
| | Including net realized
gain on investments
from affiliated issuers
| |
International | | $4,734,119 | | $114,641 | | | $ 6,196,006 | |
International Small Cap | | 283,041 | | 23,722 | | | - | |
International Value | | 80,431 | | - | | | 63,296 | |
Mid Cap | | 968 | | - | | | 13,461 | |
Mid Cap Value | | 5,671 | | - | | | (3,105,879 | ) |
Opportunistic Value | | - | | - | | | - | |
Small Cap | | - | | - | | | (5,526,235 | ) |
Small Cap Value | | 11,399 | | - | | | (3,118,425 | ) |
48
FORTY-EIGHT
| | | | | | | | | | | | | | | | | |
MID CAP
| | | MID CAP VALUE
| | OPPORTUNISTIC VALUE(1)
| | | SMALL CAP
| | | SMALL CAP VALUE
| |
| | | | | | | | | | | | | | | | | | |
| $ | 3,589,267 | | | $ | 3,515,736 | | $ | 2,043 | | | $ | 1,007,944 | | | $ | 2,227,740 | |
| | 18,436,548 | | | | 15,855,896 | | | 1,350 | | | | 1,154,943 | | | | 3,781,722 | |
| | - | | | | 1,963,938 | | | - | | | | - | | | | 3,213,438 | |
| | - | | | | - | | | - | | | | - | | | | - | |
|
|
| |
|
| |
|
|
| |
|
|
| |
|
|
|
| | 22,025,815 | | | | 21,335,570 | | | 3,393 | | | | 2,162,887 | | | | 9,222,900 | |
| | | | |
| | | | | | | | | | | | | | | | | | |
| | 27,869,765 | | | | 13,168,095 | | | 477 | | | | 5,832,719 | | | | 8,509,448 | |
| | | | | | | | | | | | | | | | | | |
| | 5,264,527 | | | | 2,770,684 | | | 1,672 | | | | 744,590 | | | | 1,561,933 | |
| | 11,258 | | | | | | | | | | | | | | | | |
| | | | | | | | | | | | | | | | | | |
| | 447,327 | | | | 279,500 | | | 350 | | | | 64,281 | | | | 89,848 | |
| | 10,734 | | | | | | | | | | | | | | | | |
| | 109,523 | | | | 48,600 | | | 191 | | | | 29,780 | | | | 34,325 | |
| | 33,647 | | | | 21,318 | | | 537 | | | | 22,573 | | | | 22,997 | |
| | 89,465 | | | | 35,286 | | | 662 | | | | 21,131 | | | | 28,252 | |
| | - | | | | - | | | - | | | | - | | | | - | |
|
|
| |
|
| |
|
|
| |
|
|
| |
|
|
|
| | 89,465 | | | | 35,286 | | | 662 | | | | 21,131 | | | | 28,252 | |
| | | | | | | | | | | | | | | | | | |
| | 36,248 | | | | 117,966 | | | 826 | | | | 36,149 | | | | 40,750 | |
| | 9,343 | | | | | | | | | | | | | | | | |
| | 128,663 | | | | 60,576 | | | 64 | | | | 24,906 | | | | 37,617 | |
| | 86,382 | | | | 44,608 | | | 54 | | | | 20,368 | | | | 27,744 | |
|
|
| |
|
| |
|
|
| |
|
|
| |
|
|
|
| | 34,096,882 | | | | 16,546,633 | | | 4,833 | | | | 6,796,497 | | | | 10,352,914 | |
| | - | | | | - | | | (4,087 | ) | | | - | | | | - | |
|
|
| |
|
| |
|
|
| |
|
|
| |
|
|
|
| | 34,096,882 | | | | 16,546,633 | | | 746 | | | | 6,796,497 | | | | 10,352,914 | |
|
|
| |
|
| |
|
|
| |
|
|
| |
|
|
|
| | (12,071,067 | ) | | | 4,788,937 | | | 2,647 | | | | (4,633,610 | ) | | | (1,130,014 | ) |
| | | | |
| | | | | | | | | | | | | | | | | | |
| | | | | | | | | | | | | | | | | | |
| | 452,597,823 | | | | 86,870,447 | | | - | | | | 54,503,726 | | | | 144,894,849 | |
| | - | | | | - | | | - | | | | - | | | | - | |
|
|
| |
|
| |
|
|
| |
|
|
| |
|
|
|
| | 452,597,823 | | | | 86,870,447 | | | - | | | | 54,503,726 | | | | 144,894,849 | |
| | | | | | | | | | | | | | | | | | |
| | 261,643,388 | | | | 58,658,256 | | | (29,264 | ) | | | 102,811,975 | | | | 30,750,495 | |
| | - | | | | - | | | - | | | | - | | | | - | |
|
|
| |
|
| |
|
|
| |
|
|
| |
|
|
|
| | 261,643,388 | | | | 58,658,256 | | | (29,264 | ) | | | 102,811,975 | | | | 30,750,495 | |
|
|
| |
|
| |
|
|
| |
|
|
| |
|
|
|
| | 714,241,211 | | | | 145,528,703 | | | (29,264 | ) | | | 157,315,701 | | | | 175,645,344 | |
|
|
| |
|
| |
|
|
| |
|
|
| |
|
|
|
| $ | 702,170,144 | | | $ | 150,317,640 | | $ | (26,617 | ) | | $ | 152,682,091 | | | $ | 174,515,330 | |
|
|
| |
|
| |
|
|
| |
|
|
| |
|
|
|
| | | | | | |
(3) For the six months ended March 31, 2006, International Fund incurred $222,461 in total professional fees. As described in Note 9 in Notes to Financial Statements, $197,947 in insurance recoveries were received relating to reimbursement of litigation defense costs, and were recorded as a reduction to professional fees during the six months ended March 31, 2006. |
The accompanying notes are an integral part of the financial statements.
49
FORTY-NINE
ARTISAN FUNDS, INC.
Statements of Changes in Net Assets
| | | | | | | | |
| | | INTERNATIONAL
| |
| | | Six Months Ended
3/31/2006(1)
| | | Year Ended
9/30/2005
| |
| OPERATIONS: | | | | | | | | |
Net investment income (loss) | | $ | (16,736,430 | ) | | $ | 109,690,495 | |
Net realized gain (loss) on: | | | | | | | | |
Investments | | | 941,465,807 | | | | 951,444,475 | |
Foreign currency related transactions | | | (3,245,721 | ) | | | (4,798,062 | ) |
Net increase (decrease) in unrealized appreciation or depreciation on: | | | | | | | | |
Investments | | | 996,637,082 | | | | 1,532,135,303 | |
Foreign currency related transactions | | | 392,229 | | | | (380,101 | ) |
| | |
|
|
| |
|
|
|
Net increase in net assets resulting from operations | | | 1,918,512,967 | | | | 2,588,092,110 | |
| | |
| DISTRIBUTIONS PAID TO SHAREHOLDERS: | | | | | | | | |
Net investment income: | | | | | | | | |
Investor Shares | | | (129,259,816 | ) | | | (39,392,658 | ) |
Institutional Shares | | | (71,446,014 | ) | | | (29,943,284 | ) |
Net realized gains on investment transactions: | | | | | | | | |
Investor Shares | | | - | | | | - | |
Institutional Shares | | | - | | | | - | |
| | |
|
|
| |
|
|
|
Total distributions paid to shareholders | | | (200,705,830 | ) | | | (69,335,942 | ) |
| | |
| FUND SHARE ACTIVITIES: | | | | | | | | |
Net increase (decrease) in net assets resulting from fund share activities | | | (65,428,096 | ) | | | (596,036,624 | ) |
| | |
|
|
| |
|
|
|
Total increase (decrease) in net assets | | | 1,652,379,041 | | | | 1,922,719,544 | |
| | |
|
|
| |
|
|
|
Net assets, beginning of period | | | 11,674,999,567 | | | | 9,752,280,023 | |
| | |
|
|
| |
|
|
|
Net assets, end of period | | $ | 13,327,378,608 | | | $ | 11,674,999,567 | |
| | |
|
|
| |
|
|
|
| | | | | | | | | |
Accumulated undistributed net investment income (loss) | | $ | (112,745,572 | ) | | $ | 104,696,688 | |
| | |
|
|
| |
|
|
|
50
FIFTY
| | | | | | | | | | | | | | | | | | | | | | |
INTERNATIONAL SMALL CAP
| | | INTERNATIONAL VALUE
| | | MID CAP
| |
Six Months Ended
3/31/2006(1)
| | | Year Ended
9/30/2005
| | | Six Months Ended
3/31/2006(1)
| | | Year Ended
9/30/2005
| | | Six Months Ended
3/31/2006 (1)
| | | Year Ended
9/30/2005
| |
| | | | | | | | | | | | | | | | | | | | | | | |
| $ | (279,354 | ) | | $ | 6,598,821 | | | $ | 3,480,390 | | | $ | 6,994,398 | | | $ | (12,071,067 | ) | | $ | (34,016,944 | ) |
| | | | | | | | | | | | | | | | | | | | | | | |
| | 84,077,735 | | | | 74,774,575 | | | | 40,836,701 | | | | 14,858,879 | | | | 452,597,823 | | | | 344,210,655 | |
| | (198,718 | ) | | | (70,491 | ) | | | (127,768 | ) | | | (8,583 | ) | | | - | | | | - | |
| | | | | | | | | | | | | | | | | | | | | | | |
| | 91,429,790 | | | | 137,805,025 | | | | 72,930,904 | | | | 55,053,627 | | | | 261,643,388 | | | | 617,698,766 | |
| | (27,990 | ) | | | (135,597 | ) | | | 51,696 | | | | (70,493 | ) | | | - | | | | - | |
|
|
| |
|
|
| |
|
|
| |
|
|
| |
|
|
| |
|
|
|
| | 175,001,463 | | | | 218,972,333 | | | | 117,171,923 | | | | 76,827,828 | | | | 702,170,144 | | | | 927,892,477 | |
| | | | | |
| | | | | | | | | | | | | | | | | | | | | | | |
| | | | | | | | | | | | | | | | | | | | | | | |
| | (7,528,607 | ) | | | (3,652,844 | ) | | | (13,095,061 | ) | | | (1,728,097 | ) | | | - | | | | - | |
| | | | | | | | | | | | | | | | | | - | | | | - | |
| | | | | | | | | | | | | | | | | | | | | | | |
| | (71,173,967 | ) | | | (55,013,278 | ) | | | (16,600,079 | ) | | | (3,316,422 | ) | | | (209,469,474 | ) | | | - | |
| | | | | | | | | | | | | | | | | | (41,213,795 | ) | | | - | |
|
|
| |
|
|
| |
|
|
| |
|
|
| |
|
|
| |
|
|
|
| | (78,702,574 | ) | | | (58,666,122 | ) | | | (29,695,140 | ) | | | (5,044,519 | ) | | | (250,683,269 | ) | | | - | |
| | | | | |
| | | | | | | | | | | | | | | | | | | | | | | |
| | 111,706,211 | | | | 105,834,632 | | | | 148,572,625 | | | | 311,932,123 | | | | (132,140,871 | ) | | | (151,207,182 | ) |
|
|
| |
|
|
| |
|
|
| |
|
|
| |
|
|
| |
|
|
|
| | 208,005,100 | | | | 266,140,843 | | | | 236,049,408 | | | | 383,715,432 | | | | 319,346,004 | | | | 776,685,295 | |
|
|
| |
|
|
| |
|
|
| |
|
|
| |
|
|
| |
|
|
|
| | 781,149,511 | | | | 515,008,668 | | | | 601,213,965 | | | | 217,498,533 | | | | 5,855,383,804 | | | | 5,078,698,509 | |
|
|
| |
|
|
| |
|
|
| |
|
|
| |
|
|
| |
|
|
|
| $ | 989,154,611 | | | $ | 781,149,511 | | | $ | 837,263,373 | | | $ | 601,213,965 | | | $ | 6,174,729,808 | | | $ | 5,855,383,804 | |
|
|
| |
|
|
| |
|
|
| |
|
|
| |
|
|
| |
|
|
|
| | | | | | | | | | | | | | | | | | | | | | | |
| $ | (1,752,967 | ) | | $ | 6,054,994 | | | $ | (2,443,330 | ) | | $ | 7,171,341 | | | $ | (12,071,067 | ) | | $ | - | |
|
|
| |
|
|
| |
|
|
| |
|
|
| |
|
|
| |
|
|
|
The accompanying notes are an integral part of the financial statements.
51
FIFTY-ONE
ARTISAN FUNDS, INC.
Statements of Changes in Net Assets (Continued)
| | | | | | | | |
| | | MID CAP VALUE
| |
| | | Six Months Ended
3/31/2006(1)
| | | Year Ended
9/30/2005
| |
| OPERATIONS: | | | | | | | | |
Net investment income (loss) | | $ | 4,788,937 | | | $ | (473,600 | ) |
Net realized gain on: | | | | | | | | |
Investments | | | 86,870,447 | | | | 111,731,536 | |
Foreign currency related transactions | | | - | | | | - | |
Net increase (decrease) in unrealized appreciation or depreciation on: | | | | | | | | |
Investments | | | 58,658,256 | | | | 173,545,831 | |
Foreign currency related transactions | | | - | | | | - | |
| | |
|
|
| |
|
|
|
Net increase (decrease) in net assets resulting from operations | | | 150,317,640 | | | | 284,803,767 | |
| | |
| DISTRIBUTIONS PAID TO SHAREHOLDERS: | | | | | | | | |
Net investment income: | | | | | | | | |
Investor Shares | | | (1,572,879 | ) | | | (121,029 | ) |
Net realized gains on investment transactions: | | | | | | | | |
Investor Shares | | | (115,690,210 | ) | | | (9,206,872 | ) |
| | |
|
|
| |
|
|
|
Total distributions paid to shareholders | | | (117,263,089 | ) | | | (9,327,901 | ) |
| | |
| FUND SHARE ACTIVITIES: | | | | | | | | |
Net increase in net assets resulting from fund share activities | | | 91,497,126 | | | | 2,183,402,227 | |
| | |
|
|
| |
|
|
|
Total increase in net assets | | | 124,551,677 | | | | 2,458,878,093 | |
| | |
|
|
| |
|
|
|
Net assets, beginning of period | | | 2,771,157,779 | | | | 312,279,686 | |
| | |
|
|
| |
|
|
|
Net assets, end of period | | $ | 2,895,709,456 | | | $ | 2,771,157,779 | |
| | |
|
|
| |
|
|
|
| | | | | | | | | |
Accumulated undistributed net investment income (loss) | | $ | 3,216,058 | | | $ | - | |
| | |
|
|
| |
|
|
|
| (2) | For the period from commencement of operations (March 27, 2006) through March 31, 2006. |
52
FIFTY-TWO
| | | | | | | | | | | | | | | | | | |
OPPORTUNISTIC VALUE
| | | SMALL CAP
| | | SMALL CAP VALUE
| |
Period Ended
3/31/2006 (1)(2)
| | | Six Months Ended
3/31/2006(1)
| | | Year Ended
9/30/2005
| | | Six Months Ended
3/31/2006(1)
| | | Year Ended
9/30/2005
| |
| | | | | | | | | | | | | | | | | | | |
| $ | 2,647 | | | $ | (4,633,610 | ) | | $ | (4,793,528 | ) | | $ | (1,130,014 | ) | | $ | (2,313,345 | ) |
| | | | | | | | | | | | | | | | | | | |
| | - | | | | 54,503,726 | | | | 35,289,542 | | | | 144,894,849 | | | | 214,241,152 | |
| | - | | | | - | | | | - | | | | - | | | | - | |
| | | | | | | | | | | | | | | | | | | |
| | (29,264 | ) | | | 102,811,975 | | | | 78,443,136 | | | | 30,750,495 | | | | 80,790,643 | |
| | - | | | | - | | | | - | | | | - | | | | - | |
|
|
| |
|
|
| |
|
|
| |
|
|
| |
|
|
|
| | (26,617 | ) | | | 152,682,091 | | | | 108,939,150 | | | | 174,515,330 | | | | 292,718,450 | |
| | | | |
| | | | | | | | | | | | | | | | | | | |
| | | | | | | | | | | | | | | | | | | |
| | - | | | | - | | | | - | | | | - | | | | - | |
| | | | | | | | | | | | | | | | | | | |
| | - | | | | (36,967,423 | ) | | | (10,649,591 | ) | | | (205,122,847 | ) | | | (123,856,296 | ) |
|
|
| |
|
|
| |
|
|
| |
|
|
| |
|
|
|
| | - | | | | (36,967,423 | ) | | | (10,649,591 | ) | | | (205,122,847 | ) | | | (123,856,296 | ) |
| | | | |
| | | | | | | | | | | | | | | | | | | |
| | 10,167,533 | | | | 176,827,762 | | | | 765,395,821 | | | | 291,197,330 | | | | 359,260,393 | |
|
|
| |
|
|
| |
|
|
| |
|
|
| |
|
|
|
| | 10,140,916 | | | | 292,542,430 | | | | 863,685,380 | | | | 260,589,813 | | | | 528,122,547 | |
|
|
| |
|
|
| |
|
|
| |
|
|
| |
|
|
|
| | - | | | | 1,103,251,418 | | | | 239,566,038 | | | | 1,720,872,695 | | | | 1,192,750,148 | |
|
|
| |
|
|
| |
|
|
| |
|
|
| |
|
|
|
| $ | 10,140,916 | | | $ | 1,395,793,848 | | | $ | 1,103,251,418 | | | $ | 1,981,462,508 | | | $ | 1,720,872,695 | |
|
|
| |
|
|
| |
|
|
| |
|
|
| |
|
|
|
| | | | | | | | | | | | | | | | | | | |
| $ | 2,647 | | | $ | (4,633,610 | ) | | $ | - | | | $ | (1,130,014 | ) | | $ | - | |
|
|
| |
|
|
| |
|
|
| |
|
|
| |
|
|
|
The accompanying notes are an integral part of the financial statements.
53
FIFTY-THREE
ARTISAN FUNDS, INC.
Financial Highlights – For a share outstanding throughout each period
The financial highlights table is intended to help you understand the Funds’ financial performance for the past 5 years or, if shorter, the period of a Fund’s operations. Certain information reflects financial results for a single Fund share. The total returns in the table represent the rate that an investor would have earned or lost on an investment in the Fund (assuming reinvestment of all dividends and distributions).
| | | | | | | | | | | | | | | | | | | | | | | | |
Year or
Period
Ended | | |
Net Asset
Value
Beginning
of Period | | Net
Investment
Income
(Loss)(1) | | | Net Realized
and Unrealized
Gain (Loss) on
Investments | | | Total Income
(Loss) from
Investment
Operations | | | Dividends
from Net
Investment
Income | | | Distributions
from Net
Realized Gains | |
| | | | | | | | | | | | | | | | | | | | | | | | | |
| ARTISAN INTERNATIONAL FUND | | | | | |
| Investor Shares | | | | | | | | | | | | | | | | | | | | | | | | |
| 3/31/2006 | (5) | | $ | 24.40 | | $ | (0.04 | ) | | $ | 4.05 | | | $ | 4.01 | | | $ | (0.41 | ) | | $ | - | |
| 9/30/2005 | | | | 19.33 | | | 0.21 | | | | 4.98 | | | | 5.19 | | | | (0.12 | ) | | | - | |
| 9/30/2004 | | | | 16.54 | | | 0.12 | | | | 2.85 | | | | 2.97 | | | | (0.18 | ) | | | - | |
| 9/30/2003 | (6) | | | 15.63 | | | 0.02 | | | | 0.89 | | | | 0.91 | | | | - | | | | - | |
| 6/30/2003 | | | | 18.15 | | | 0.20 | | | | (2.62 | ) | | | (2.42 | ) | | | (0.10 | ) | | | - | |
| 6/30/2002 | | | | 19.53 | | | 0.15 | | | | (1.46 | ) | | | (1.31 | ) | | | (0.07 | ) | | | - | |
| 6/30/2001 | | | | 30.16 | | | 0.10 | | | | (7.18 | ) | | | (7.08 | ) | | | - | | | | (3.55 | ) |
| Institutional Shares | | | | | | | | | | | | | | | | | | | | | | | | |
| 3/31/2006 | (5) | | $ | 24.54 | | $ | (0.02 | ) | | $ | 4.08 | | | $ | 4.06 | | | $ | (0.46 | ) | | $ | - | |
| 9/30/2005 | | | | 19.44 | | | 0.25 | | | | 5.01 | | | | 5.26 | | | | (0.16 | ) | | | - | |
| 9/30/2004 | | | | 16.63 | | | 0.16 | | | | 2.86 | | | | 3.02 | | | | (0.21 | ) | | | - | |
| 9/30/2003 | (6) | | | 15.71 | | | 0.03 | | | | 0.89 | | | | 0.92 | | | | - | | | | - | |
| 6/30/2003 | | | | 18.24 | | | 0.25 | | | | (2.65 | ) | | | (2.40 | ) | | | (0.13 | ) | | | - | |
| 6/30/2002 | | | | 19.62 | | | 0.18 | | | | (1.46 | ) | | | (1.28 | ) | | | (0.10 | ) | | | - | |
| 6/30/2001 | | | | 30.22 | | | 0.16 | | | | (7.21 | ) | | | (7.05 | ) | | | - | | | | (3.55 | ) |
| | | | | | | | | | | | | | | | | | | | | | | | | |
| ARTISAN INTERNATIONAL SMALL CAP FUND | | | | | |
| Investor Shares | | | | | | | | | | | | | | | | | | | | | | | | |
| 3/31/2006 | (5) | | $ | 20.86 | | $ | (0.01 | ) | | $ | 4.12 | | | $ | 4.11 | | | $ | (0.20 | ) | | $ | (1.88 | ) |
| 9/30/2005 | | | | 16.40 | | | 0.19 | | | | 6.16 | | | | 6.35 | | | | (0.12 | ) | | | (1.77 | ) |
| 9/30/2004 | | | | 13.84 | | | 0.15 | | | | 2.93 | | | | 3.08 | | | | (0.03 | ) | | | (0.49 | ) |
| 9/30/2003 | (6) | | | 12.10 | | | - | (7) | | | 1.74 | | | | 1.74 | | | | - | | | | - | |
| 6/30/2003 | | | | 10.50 | | | 0.03 | | | | 1.59 | | | | 1.62 | | | | - | | | | (0.02 | ) |
| 6/30/2002 | (8) | | | 10.00 | | | - | (7) | | | 0.50 | (9) | | | 0.50 | | | | - | | | | - | |
| | | | | | | | | | | | | | | | | | | | | | | | | |
| ARTISAN INTERNATIONAL VALUE FUND | | | | | |
| Investor Shares | | | | | | | | | | | | | | | | | | | | | | | | |
| 3/31/2006 | (5) | | $ | 22.38 | | $ | 0.12 | | | $ | 3.66 | | | $ | 3.78 | | | $ | (0.47 | ) | | $ | (0.60 | ) |
| 9/30/2005 | | | | 18.54 | | | 0.28 | | | | 3.88 | | | | 4.16 | | | | (0.11 | ) | | | (0.21 | ) |
| 9/30/2004 | | | | 14.32 | | | 0.28 | | | | 4.33 | | | | 4.61 | | | | (0.09 | ) | | | (0.30 | ) |
| 9/30/2003 | (6) | | | 13.01 | | | 0.02 | | | | 1.29 | | | | 1.31 | | | | - | | | | - | |
| 6/30/2003 | (10) | | | 10.00 | | | 0.09 | | | | 2.92 | | | | 3.01 | | | | - | | | | - | |
| (1) | Computed based on average shares outstanding. |
| (2) | Periods less than twelve months (where applicable) are not annualized. |
| (3) | Periods less than twelve months (where applicable) are annualized. |
| (4) | The ratios of expenses to average net assets and net investment income (loss) to average net assets exclude expenses waived or paid by the Adviser or the Board of Directors. Absent expenses waived or paid by the Adviser or the Board of Directors, the ratios of expenses to average net assets and net investment income (loss) to average net assets would have been as follows: |
| | | | | | | | |
| Fund | | Year or Period Ended | | Ratio of Expenses to
Average Net Assets | | | Ratio of Net Investment Income
(Loss) to Average Net Assets | |
International Investor Shares | | 9/30/2003 | | 1.23 | % | | 0.49 | % |
International Institutional Shares | | 9/30/2003 | | 1.00 | | | 0.73 | |
International Small Cap Investor Shares | | 9/30/2003 | | 1.69 | | | 0.05 | |
International Value Investor Shares | | 9/30/2003 | | 2.80 | | | (0.34 | ) |
International Value Investor Shares | | 6/30/2003 | | 5.02 | | | (1.43 | ) |
54
FIFTY-FOUR
| | | | | | | | | | | | | | | | | | | | |
Total
Distributions | | | Net Asset
Value
End
of Period | | Total
Return(2) | | | Net Assets
End of
Period
(millions) | | Ratio of
Expenses
to Average
Net Assets(3)(4) | | | Ratio of Net
Investment
Income (Loss)
to Average
Net Assets(3)(4) | | | Portfolio
Turnover
Rate(2) | |
| | | | | | | | | | | | | | | | | | | | | |
| | | | | | | | | | | | | | | | | |
| | | | | | | | | | | | | | | | | | | | | |
| $ | (0.41 | ) | | $ | 28.00 | | 16.71 | % | | $ | 9,157.6 | | 1.19 | % | | (0.34 | )% | | 28.82 | % |
| | (0.12 | ) | | | 24.40 | | 26.97 | | | | 7,686.9 | | 1.19 | | | 0.94 | | | 56.15 | |
| | (0.18 | ) | | | 19.33 | | 18.04 | | | | 6,130.2 | | 1.22 | | | 0.64 | | | 54.96 | |
| | - | | | | 16.54 | | 5.82 | | | | 5,544.7 | | 1.23 | | | 0.49 | | | 15.23 | |
| | (0.10 | ) | | | 15.63 | | (13.30 | ) | | | 5,182.8 | | 1.20 | | | 1.35 | | | 37.13 | |
| | (0.07 | ) | | | 18.15 | | (6.73 | ) | | | 5,289.6 | | 1.21 | | | 0.82 | | | 50.67 | |
| | (3.55 | ) | | | 19.53 | | (24.65 | ) | | | 3,907.1 | | 1.22 | | | 0.45 | | | 72.01 | |
| | | | | | | | | | | | | | | | | | | | | |
| $ | (0.46 | ) | | $ | 28.14 | | 16.83 | % | | $ | 4,169.8 | | 1.00 | % | | (0.15 | )% | | 28.82 | % |
| | (0.16 | ) | | | 24.54 | | 27.21 | | | | 3,988.1 | | 0.99 | | | 1.11 | | | 56.15 | |
| | (0.21 | ) | | | 19.44 | | 18.31 | | | | 3,622.1 | | 1.01 | | | 0.85 | | | 54.96 | |
| | - | | | | 16.63 | | 5.86 | | | | 3,354.7 | | 1.00 | | | 0.73 | | | 15.23 | |
| | (0.13 | ) | | | 15.71 | | (13.09 | ) | | | 2,975.0 | | 1.01 | | | 1.68 | | | 37.13 | |
| | (0.10 | ) | | | 18.24 | | (6.52 | ) | | | 2,062.0 | | 1.01 | | | 1.01 | | | 50.67 | |
| | (3.55 | ) | | | 19.62 | | (24.53 | ) | | | 1,486.6 | | 1.03 | | | 0.70 | | | 72.01 | |
| | | | | | | | | | | | | | | | | | | | | |
| | | | | | | | | | | | | | | | | |
| | | | | | | | | | | | | | | | | | | | | |
| $ | (2.08 | ) | | $ | 22.89 | | 22.27 | % | | $ | 989.2 | | 1.52 | % | | (0.07 | )% | | 30.24 | % |
| | (1.89 | ) | | | 20.86 | | 42.13 | | | | 781.1 | | 1.53 | | | 1.03 | | | 57.25 | |
| | (0.52 | ) | | | 16.40 | | 22.66 | | | | 515.0 | | 1.57 | | | 0.95 | | | 81.03 | |
| | - | | | | 13.84 | | 14.46 | | | | 391.3 | | 1.68 | | | 0.06 | | | 13.28 | |
| | (0.02 | ) | | | 12.10 | | 15.53 | | | | 238.6 | | 1.77 | | | 0.28 | | | 62.79 | |
| | - | | | | 10.50 | | 5.00 | | | | 74.5 | | 2.39 | | | (0.02 | ) | | 25.14 | |
| | | | | | | | | | | | | | | | | | | | | |
| | | | | | | | | | | | | | | | | |
| | | | | | | | | | | | | | | | | | | | | |
| $ | (1.07 | ) | | $ | 25.09 | | 17.77 | % | | $ | 837.3 | | 1.26 | % | | 1.03 | % | | 32.10 | % |
| | (0.32 | ) | | | 22.38 | | 22.71 | | | | 601.2 | | 1.31 | | | 1.33 | | | 53.15 | |
| | (0.39 | ) | | | 18.54 | | 32.81 | | | | 217.5 | | 1.56 | | | 1.61 | | | 14.66 | |
| | - | | | | 14.32 | | 10.07 | | | | 23.6 | | 2.00 | | | 0.46 | | | 9.30 | |
| | - | | | | 13.01 | | 30.10 | | | | 16.3 | | 2.45 | | | 1.14 | | | 17.42 | |
| | (5) | Unaudited. For the six months ended March 31, 2006. |
| | (6) | For the period from July 1, 2003 to September 30, 2003. Artisan Funds changed its fiscal year-end from June 30 to September 30 effective September 30, 2003. |
| | (7) | Amount is between $0.005 and $(0.005) per share. |
| | (8) | For the period from commencement of operations (December 21, 2001) through June 30, 2002. |
| | (9) | The amount shown may not correlate with the aggregate gains and losses of portfolio securities due to the timing of subscriptions and redemptions of fund shares. |
| | (10) | For the period from commencement of operations (September 23, 2002) through June 30, 2003. |
The accompanying notes are an integral part of the financial statements.
55
FIFTY-FIVE
ARTISAN FUNDS, INC.
Financial Highlights – For a share outstanding throughout each period (Continued)
| | | | | | | | | | | | | | | | | | | | | | | | |
Year or
Period
Ended | | | Net Asset
Value
Beginning
of Period | | Net
Investment
Income
(Loss)(1) | | | Net Realized
and Unrealized
Gain (Loss) on
Investments | | | Total Income
(Loss) from
Investment
Operations | | | Dividends
from Net
Investment
Income | | | Distributions
from Net
Realized Gains | |
| | | | | | | | | | | | | | | | | | | | | | | | | |
| ARTISAN MID CAP FUND | | | | | | | | | | | | | | | | | | | | |
| Investor Shares | | | | | | | | | | | | | | | | | | | | | | | | |
| 3/31/2006 | (5) | | $ | 30.84 | | $ | (0.07 | ) | | $ | 3.77 | | | $ | 3.70 | | | $ | - | | | $ | (1.33 | ) |
| 9/30/2005 | | | | 26.13 | | | (0.18 | ) | | | 4.89 | | | | 4.71 | | | | - | | | | - | |
| 9/30/2004 | | | | 23.11 | | | (0.20 | ) | | | 3.22 | | | | 3.02 | | | | - | | | | - | |
| 9/30/2003 | (6) | | | 21.81 | | | (0.05 | ) | | | 1.35 | | | | 1.30 | | | | - | | | | - | |
| 6/30/2003 | | | | 22.13 | | | (0.11 | ) | �� | | (0.21 | )(7) | | | (0.32 | ) | | | - | | | | - | |
| 6/30/2002 | | | | 26.43 | | | (0.19 | ) | | | (4.11 | ) | | | (4.30 | ) | | | - | | | | - | |
| 6/30/2001 | | | | 27.57 | | | (0.13 | ) | | | 0.02 | (7) | | | (0.11 | ) | | | - | | | | (1.03 | ) |
| Institutional Shares | | | | | | | | | | | | | | | | | | | | | | | | |
| 3/31/2006 | (5) | | $ | 31.21 | | $ | (0.03 | ) | | $ | 3.82 | | | $ | 3.79 | | | $ | - | | | $ | (1.33 | ) |
| 9/30/2005 | | | | 26.38 | | | (0.12 | ) | | | 4.95 | | | | 4.83 | | | | - | | | | - | |
| 9/30/2004 | | | | 23.28 | | | (0.14 | ) | | | 3.24 | | | | 3.10 | | | | - | | | | - | |
| 9/30/2003 | (6) | | | 21.96 | | | (0.03 | ) | | | 1.35 | | | | 1.32 | | | | - | | | | - | |
| 6/30/2003 | | | | 22.24 | | | (0.07 | ) | | | (0.21 | )(7) | | | (0.28 | ) | | | - | | | | - | |
| 6/30/2002 | | | | 26.48 | | | (0.13 | ) | | | (4.11 | ) | | | (4.24 | ) | | | - | | | | - | |
| 6/30/2001 | | | | 27.57 | | | (0.08 | ) | | | 0.02 | (7) | | | (0.06 | ) | | | - | | | | (1.03 | ) |
| | | | | | | | | | | | | | | | | | | | | | | | | |
| ARTISAN MID CAP VALUE FUND | | | | | | | | | | | | | | | | | | | | |
| Investor Shares | | | | | | | | | | | | | | | | | | | | | | | | |
| 3/31/2006 | (5) | | $ | 19.60 | | $ | 0.03 | | | $ | 0.99 | | | $ | 1.02 | | | $ | (0.01 | ) | | $ | (0.82 | ) |
| 9/30/2005 | | | | 15.55 | | | (0.01 | ) | | | 4.36 | | | | 4.35 | | | | - | (8) | | | (0.30 | ) |
| 9/30/2004 | | | | 12.22 | | | 0.10 | | | | 3.47 | | | | 3.57 | | | | - | | | | (0.24 | ) |
| 9/30/2003 | (6) | | | 11.64 | | | (0.01 | ) | | | 0.59 | | | | 0.58 | | | | - | | | | - | |
| 6/30/2003 | | | | 10.82 | | | (0.03 | ) | | | 0.85 | | | | 0.82 | | | | - | | | | - | |
| 6/30/2002 | | | | 11.18 | | | (0.09 | ) | | | (0.19 | ) | | | (0.28 | ) | | | - | | | | (0.08 | ) |
| 6/30/2001 | (9) | | | 10.00 | | | (0.01 | ) | | | 1.19 | | | | 1.18 | | | | - | | | | - | |
| | | | | | | | | | | | | | | | | | | | | | | | | |
| ARTISAN OPPORTUNISTIC VALUE FUND | | | | | | | | | | | | | | | | | | | | |
| Investor Shares | | | | | | | | | | | | | | | | | | | | | | | | |
| 3/31/2006 | (10) | | $ | 10.00 | | $ | - | (8) | | $ | (0.03 | )(7) | | $ | (0.03 | ) | | $ | - | | | $ | - | |
| (1) | Computed based on average shares outstanding. |
| (2) | Periods less than twelve months (where applicable) are not annualized. |
| (3) | Periods less than twelve months (where applicable) are annualized. |
| (4) | The ratios of expenses to average net assets and net investment income (loss) to average net assets exclude expenses waived or paid by the Adviser or the Board of Directors. Absent expenses waived or paid by the Adviser or the Board of Directors, the ratios of expenses to average net assets and net investment income (loss) to average net assets would have been as follows: |
| | | | | | | | |
| Fund | | Year or
Period Ended | | Ratio of Expenses to
Average Net Assets | | | Ratio of Net Investment
(Loss) to Average Net Assets | |
Mid Cap Investor Shares | | 9/30/2003 | | 1.20 | % | | (0.81 | )% |
Mid Cap Institutional Shares | | 9/30/2003 | | 0.98 | | | (0.59 | ) |
Mid Cap Value Investor Shares | | 9/30/2003 | | 1.63 | | | (0.35 | ) |
Mid Cap Value Investor Shares | | 6/30/2002 | | 2.53 | | | (1.40 | ) |
Mid Cap Value Investor Shares | | 6/30/2001 | | 5.17 | | | (3.84 | ) |
Opportunistic Value Investor Shares | | 3/31/2006 | | 9.12 | | | (2.72 | ) |
56
FIFTY-SIX
| | | | | | | | | | | | | | | | | | | | |
Total
Distributions | | | Net Asset
Value
End of Period | | Total
Return(2) | | | Net Assets
End of
Period
(millions) | | Ratio of
Expenses
to Average
Net Assets(3)(4) | | | Ratio of Net
Investment
Income (Loss)
to Average
Net Assets(3)(4) | | | Portfolio
Turnover Rate(2) | |
| | | | | | | | | | | | | | | | | | | | | |
| | | | | | | | | | | | | | | | | | | | | |
| | | | | | | | | | | | | | | | | | | | | |
| $ | (1.33 | ) | | $ | 33.21 | | 12.29 | % | | $ | 5,219.6 | | 1.18 | % | | (0.44 | )% | | 37.69 | % |
| | - | | | | 30.84 | | 18.06 | | | | 4,874.0 | | 1.18 | | | (0.63 | ) | | 83.00 | |
| | - | | | | 26.13 | | 13.02 | | | | 4,042.7 | | 1.19 | | | (0.77 | ) | | 101.09 | |
| | - | | | | 23.11 | | 6.01 | | | | 2,583.2 | | 1.20 | | | (0.81 | ) | | 26.52 | |
| | - | | | | 21.81 | | (1.45 | ) | | | 2,286.6 | | 1.20 | | | (0.56 | ) | | 102.85 | |
| | - | | | | 22.13 | | (16.27 | ) | | | 1,855.5 | | 1.22 | | | (0.77 | ) | | 121.14 | |
| | (1.03 | ) | | | 26.43 | | (0.60 | ) | | | 1,333.6 | | 1.31 | | | (0.52 | ) | | 153.95 | |
| | | | | | | | | | | | | | | | | | | | | |
| $ | (1.33 | ) | | $ | 33.67 | | 12.43 | % | | $ | 955.1 | | 0.95 | % | | (0.21 | )% | | 37.69 | % |
| | - | | | | 31.21 | | 18.35 | | | | 981.3 | | 0.95 | | | (0.40 | ) | | 83.00 | |
| | - | | | | 26.38 | | 13.27 | | | | 1,036.0 | | 0.96 | | | (0.54 | ) | | 101.09 | |
| | - | | | | 23.28 | | 6.06 | | | | 929.6 | | 0.98 | | | (0.59 | ) | | 26.52 | |
| | - | | | | 21.96 | | (1.26 | ) | | | 829.0 | | 1.00 | | | (0.36 | ) | | 102.85 | |
| | - | | | | 22.24 | | (16.04 | ) | | | 449.8 | | 1.02 | | | (0.56 | ) | | 121.14 | |
| | (1.03 | ) | | | 26.48 | | (0.38 | ) | | | 212.2 | | 1.08 | | | (0.29 | ) | | 153.95 | |
| | | | | | | | | | | | | | | | | | | | | |
| | | | | | | | | | | | | | | | | | | | | |
| | | | | | | | | | | | | | | | | |
| $ | (0.83 | ) | | $ | 19.79 | | 5.44 | % | | $ | 2,895.7 | | 1.19 | % | | 0.34 | % | | 21.27 | % |
| | (0.30 | ) | | | 19.60 | | 28.42 | | | | 2,771.2 | | 1.22 | | | (0.04 | ) | | 51.60 | |
| | (0.24 | ) | | | 15.55 | | 29.60 | | | | 312.3 | | 1.39 | | | 0.73 | | | 53.79 | |
| | - | | | | 12.22 | | 4.98 | | | | 77.4 | | 1.59 | | | (0.31 | ) | | 11.90 | |
| | - | | | | 11.64 | | 7.58 | | | | 64.5 | | 1.78 | | | (0.34 | ) | | 45.55 | |
| | (0.08 | ) | | | 10.82 | | (2.37 | ) | | | 22.0 | | 1.95 | | | (0.82 | ) | | 167.70 | |
| | - | | | | 11.18 | | 11.80 | | | | 13.2 | | 1.84 | | | (0.52 | ) | | 40.72 | |
| | | | | | | | | | | | | | | | | | | | | |
| | | | | | | | | | | | | | | | | | | | | |
| | | | | | | | | | | | | | | | | | | | | |
| $ | - | | | $ | 9.97 | | (0.20 | )% | | $ | 10.1 | | 1.41 | % | | 5.00 | % | | - | % |
| | (5) | Unaudited. For the six months ended March 31, 2006. |
| | (6) | For the period from July 1, 2003 to September 30, 2003. Artisan Funds changed its fiscal year-end from June 30 to September 30 effective September 30, 2003. |
| | (7) | The amount shown may not correlate with the aggregate gains and losses of portfolio securities due to the timing of subscriptions and redemptions of fund shares. |
| | (8) | Amount is between $0.005 and $(0.005) per share. |
| | (9) | For the period from commencement of operations (March 28, 2001) through June 30, 2001. |
| | (10) | Unaudited. For the period from commencement of operations (March 27, 2006) through March 31, 2006. |
The accompanying notes are an integral part of the financial statements.
57
FIFTY-SEVEN
ARTISAN FUNDS, INC.
Financial Highlights – For a share outstanding throughout each period (Continued)
| | | | | | | | | | | | | | | | | | | | | | | | |
Year or
Period Ended | | | Net Asset
Value
Beginning
of Period | | Net
Investment
Income
(Loss)(1) | | | Net Realized
and Unrealized
Gain (Loss) on
Investments | | | Total Income
(Loss) from
Investment
Operations | | | Dividends
from Net
Investment
Income | | | Distributions
from Net
Realized Gains | |
| | | | | | | | | | | | | | | | | | | | | | | | | |
| ARTISAN SMALL CAP FUND | | | | | | | | | | | | | | | | | | | | |
| Investor Shares | | | | | | | | | | | | | | | | | | | | | | | | |
| 3/31/2006 | (5) | | $ | 17.95 | | $ | (0.07 | ) | | $ | 2.26 | | | $ | 2.19 | | | $ | - | | | $ | (0.57 | ) |
| 9/30/2005 | | | | 15.12 | | | (0.13 | ) | | | 3.49 | | | | 3.36 | | | | - | | | | (0.53 | ) |
| 9/30/2004 | | | | 12.53 | | | (0.14 | ) | | | 2.73 | | | | 2.59 | | | | - | | | | - | |
| 9/30/2003 | (6) | | | 11.90 | | | (0.04 | ) | | | 0.67 | | | | 0.63 | | | | - | | | | - | |
| 6/30/2003 | | | | 11.99 | | | (0.10 | ) | | | 0.07 | (7) | | | (0.03 | ) | | | - | | | | (0.06 | ) |
| 6/30/2002 | | | | 13.99 | | | (0.13 | ) | | | (1.81 | ) | | | (1.94 | ) | | | - | | | | (0.06 | ) |
| 6/30/2001 | | | | 14.69 | | | (0.09 | ) | | | 0.05 | (7) | | | (0.04 | ) | | | - | | | | (0.66 | ) |
| | | | | | | | | | | | | | | | | | | | | | | | | |
| ARTISAN SMALL CAP VALUE FUND | | | | | | | | | | | | | | | | | | | | |
| Investor Shares | | | | | | | | | | | | | | | | | | | | | | | | |
| 3/31/2006 | (5) | | $ | 19.51 | | $ | (0.01 | ) | | $ | 1.73 | | | $ | 1.72 | | | $ | - | | | $ | (2.32 | ) |
| 9/30/2005 | | | | 17.63 | | | (0.03 | ) | | | 3.69 | | | | 3.66 | | | | - | | | | (1.78 | ) |
| 9/30/2004 | | | | 13.67 | | | (0.03 | ) | | | 4.19 | | | | 4.16 | | | | - | | | | (0.20 | ) |
| 9/30/2003 | (6) | | | 13.15 | | | (0.01 | ) | | | 0.53 | | | | 0.52 | | | | - | | | | - | |
| 6/30/2003 | | | | 13.48 | | | (0.03 | ) | | | 0.20 | | | | 0.17 | | | | - | | | | (0.50 | ) |
| 6/30/2002 | | | | 13.05 | | | (0.01 | ) | | | 1.16 | | | | 1.15 | | | | (0.01 | ) | | | (0.71 | ) |
| 6/30/2001 | | | | 10.63 | | | 0.05 | | | | 2.91 | | | | 2.96 | | | | (0.05 | ) | | | (0.49 | ) |
| (1) | Computed based on average shares outstanding. |
| (2) | Periods less than twelve months (where applicable) are not annualized. |
| (3) | Periods less than twelve months (where applicable) are annualized. |
| (4) | The ratios of expenses to average net assets and net investment income (loss) to average net assets exclude expenses waived or paid by the Adviser or the Board of Directors. Absent expenses waived or paid by the Adviser or the Board of Directors, the ratios of expenses to average net assets and net investment income (loss) to average net assets would have been as follows: |
| | | | | | | | |
| Fund | | Year or Period Ended | | Ratio of Expenses to
Average Net Assets | | | Ratio of Net Investment (Loss)
to Average Net Assets | |
Small Cap Investor Shares | | 9/30/2003 | | 1.46 | % | | (1.18 | )% |
Small Cap Value Investor Shares | | 9/30/2003 | | 1.20 | | | (0.41 | ) |
58
FIFTY-EIGHT
| | | | | | | | | | | | | | | | | | | | |
Total
Distributions | | | Net Asset
Value
End
of Period | | Total
Return(2) | | | Net Assets
End of
Period (millions) | | Ratio of
Expenses
to Average
Net Assets(3)(4) | | | Ratio of Net
Investment
Income (Loss)
to Average
Net Assets(3)(4) | | | Portfolio
Turnover
Rate(2) | |
| | | | | | | | | | | | | | | | | | | | | |
| | | | | | | | | | | | | | | | | |
| | | | | | | | | | | | | | | | | | | | | |
| $ | (0.57 | ) | | $ | 19.57 | | 12.59 | % | | $ | 1,395.8 | | 1.13 | % | | (0.77 | )% | | 54.19 | % |
| | (0.53 | ) | | | 17.95 | | 22.64 | | | | 1,103.3 | | 1.18 | | | (0.80 | ) | | 78.60 | |
| | - | | | | 15.12 | | 20.67 | | | | 239.6 | | 1.27 | | | (0.95 | ) | | 119.40 | |
| | - | | | | 12.53 | | 5.29 | | | | 127.9 | | 1.44 | | | (1.16 | ) | | 30.18 | |
| | (0.06 | ) | | | 11.90 | | (0.11 | ) | | | 116.0 | | 1.39 | | | (0.98 | ) | | 127.41 | |
| | (0.06 | ) | | | 11.99 | | (13.90 | ) | | | 131.9 | | 1.31 | | | (1.00 | ) | | 139.72 | |
| | (0.66 | ) | | | 13.99 | | 0.07 | | | | 145.4 | | 1.34 | | | (0.68 | ) | | 147.13 | |
| | | | | | | | | | | | | | | | | | | | | |
| | | | | | | | | | | | | | | | | | | | | |
| | | | | | | | | | | | | | | | | | | | | |
| $ | (2.32 | ) | | $ | 18.91 | | 9.89 | % | | $ | 1,981.5 | | 1.16 | % | | (0.13 | )% | | 27.20 | % |
| | (1.78 | ) | | | 19.51 | | 22.42 | | | | 1,720.9 | | 1.18 | | | (0.16 | ) | | 56.03 | |
| | (0.20 | ) | | | 17.63 | | 30.76 | | | | 1,192.8 | | 1.18 | | | (0.17 | ) | | 41.31 | |
| | - | | | | 13.67 | | 3.95 | | | | 775.2 | | 1.20 | | | (0.40 | ) | | 12.20 | |
| | (0.50 | ) | | | 13.15 | | 1.90 | | | | 702.5 | | 1.21 | | | (0.21 | ) | | 49.57 | |
| | (0.72 | ) | | | 13.48 | | 9.65 | | | | 623.5 | | 1.20 | | | (0.10 | ) | | 33.59 | |
| | (0.54 | ) | | | 13.05 | | 28.81 | | | | 460.3 | | 1.20 | | | 0.45 | | | 40.77 | |
| | (5) | Unaudited. For the six months ended March 31, 2006. |
| | (6) | For the period from July 1, 2003 to September 30, 2003. Artisan Funds changed its fiscal year-end from June 30 to September 30 effective September 30, 2003. |
| | (7) | The amount shown may not correlate with the aggregate gains and losses of portfolio securities due to the timing of subscriptions and redemptions of fund shares. |
The accompanying notes are an integral part of the financial statements.
59
FIFTY-NINE
ARTISAN FUNDS, INC.
Notes to Financial Statements — March 31, 2006 (Unaudited)
Artisan Funds, Inc. (“Artisan Funds”) was incorporated on January 5, 1995, as a Wisconsin corporation and is registered under the Investment Company Act of 1940, as amended. Artisan Funds is a series comprised of eight open-end, diversified mutual funds (each a “Fund” and collectively the “Funds”):
| | |
| Fund Name | | Inception Date |
Artisan International Fund (“International Fund” or “International”) | | December 28, 1995 |
Artisan International Small Cap Fund (“International Small Cap Fund” or “International Small Cap”) | | December 21, 2001 |
Artisan International Value Fund (“International Value Fund” or “International Value”) | | September 23, 2002 |
Artisan Mid Cap Fund (“Mid Cap Fund” or “Mid Cap”) | | June 27, 1997 |
Artisan Mid Cap Value Fund (“Mid Cap Value Fund” or “Mid Cap Value”) | | March 28, 2001 |
Artisan Opportunistic Value Fund (“Opportunistic Value Fund” or “Opportunistic Value”) | | March 27, 2006 |
Artisan Small Cap Fund (“Small Cap Fund” or “Small Cap”) | | March 28, 1995 |
Artisan Small Cap Value Fund (“Small Cap Value Fund” or “Small Cap Value”) | | September 29, 1997 |
Each Fund’s investment objective is to seek long-term capital growth. Each Fund has offered shares of capital stock of the class designated Investor Shares since the commencement of operations. International Fund and Mid Cap Fund began offering Institutional Shares on July 1, 1997 and July 1, 2000, respectively. Institutional Shares are sold to institutional investors meeting certain minimum investment requirements. Each class of shares has equal rights with respect to portfolio assets and voting privileges. Each class has exclusive voting rights with respect to any matters involving only that class. Income, expenses not specific to either class and realized and unrealized gains and losses are allocated daily to each class of shares based upon the relative net asset value of outstanding shares. Expenses attributable to a particular class of shares, such as transfer agency fees, shareholder communication expenses and registration fees, are allocated directly to that class.
| (2) | Summary of significant accounting policies: |
The following is a summary of significant accounting policies of the Funds in effect during the period covered by the financial statements, which are in accordance with United States generally accepted accounting principles.
| | (a) | Security valuation – The net asset value (“NAV”) of the shares of each class of each Fund was determined as of the close of regular session trading on the New York Stock Exchange (“NYSE”) (usually 4:00 p.m., Eastern Time, but sometimes earlier) each day the NYSE was open for regular session trading. |
60
SIXTY
NOTES TO FINANCIAL STATEMENTS
| | The NAV of each class of shares was determined by dividing the value of each Fund’s securities and other assets attributed to that class, less its liabilities attributed to that class, by the number of outstanding shares of that class of that Fund. |
In determining NAV, each equity security traded on a securities exchange, including the Nasdaq Stock Market, was valued at the closing price as of the time of valuation on the exchange or market on which the security was principally traded (the “principal exchange”). The closing price provided by each exchange may differ and may represent information such as last sales price, an official closing price, a closing auction price or other information, depending on exchange or market convention. Absent closing price information for a security from the principal exchange as of the time of valuation, the security was valued using the most recent bid quotation on the principal exchange, except that securities listed on the London Stock Exchange were valued at the mean of the most recent bid and asked quotations as of the time of valuation. Short-term investments maturing within sixty days of the valuation date were valued at amortized cost, which approximates market.
Securities for which prices were not readily available were valued by Artisan Funds’ valuation committee (the “valuation committee”) at a fair value determined in good faith under procedures established by and under the general supervision of Artisan Funds’ Board of Directors (the “Board of Directors”). A price was considered to be not readily available if, among other things, the valuation committee believed that the price determined as described in the preceding paragraph did not reflect a fair value of the security.
International Fund, International Small Cap Fund and International Value Fund generally invest a significant portion, and perhaps as much as substantially all, of their total assets in securities principally traded in markets outside the U.S. Each of the other Funds has the ability to invest in securities principally traded outside the U.S., but did not do so during the six months ended March 31, 2006. The foreign markets in which the Funds may invest are sometimes open on days when the NYSE is not open and the Funds do not calculate their NAVs, and sometimes are not open on days when the Funds do calculate their NAVs. Even on days on which both the foreign market and the NYSE are open, several hours may have passed between the time when trading in the foreign market closed and the time as of which the Funds calculate their NAVs. That is generally the case for markets in Europe, Asia, Australia and other far eastern markets; the regular closing time of foreign markets in North and South America is generally the same as the closing time of the NYSE and the time as of which the Funds calculate their NAVs.
61
SIXTY-ONE
NOTES TO FINANCIAL STATEMENTS
The valuation committee concluded that a price determined under the Funds’ valuation procedures was not readily available if, among other things, the valuation committee believed that the value of the security might have been materially affected by events occurring after the close of the market in which the security was principally traded but before the time for determination of NAV (“subsequent event”). A subsequent event might include a company-specific development (for example, announcement of a merger that is made after the close of the foreign market), a development that might affect an entire market or region (for example, imposition of foreign exchange controls by a foreign government) or a potentially global development (such as a terrorist attack that may be expected to have an impact on investor expectations worldwide) or a significant change in one or more United States securities indexes. Artisan Funds monitored for subsequent events using several tools, including the use of a third party research service to assist in determining estimates of fair values for foreign securities. That service utilized statistical data based on historical performance of securities, markets and other data in developing factors used to estimate a fair value. An indication by any of those tools of a potential material change in the value of securities results in either a meeting of the valuation committee, which considers whether a subsequent event has occurred and whether local market closing prices continue to represent fair values for potentially affected non-U.S. securities, and/or a valuation based on information provided by the third party research service.
Estimates of fair values utilized by the Funds as described above may differ from the value realized on the sale of those securities and the differences may be material to the NAV of the applicable Fund or to the information presented.
| | (b) | Income taxes – No provision has been made for federal income taxes since each Fund intends to (i) comply with the provisions of Subchapter M of the Internal Revenue Code applicable to regulated investment companies and (ii) distribute to its shareholders substantially all of its taxable income as well as net realized gains from the sale of investment securities. The Funds may utilize earnings and profits distributed to shareholders on redemptions of Fund shares as part of the dividends paid deduction. |
| | (c) | Portfolio transactions – Security transactions and shareholder transactions are accounted for no later than one business day after trade date. However, for financial reporting purposes, security transactions and shareholder transactions are recorded on trade date in accordance with United States generally accepted accounting principles. Net realized gains and losses on securities are computed on specific security lot identification. |
62
SIXTY-TWO
NOTES TO FINANCIAL STATEMENTS
| | (d) | Foreign currency translation – Values of investments, open foreign currency forward contracts, payables for capital gains taxes and cash denominated in foreign currencies were translated into U.S. dollars using a spot market rate of exchange as of the time of determination of each Fund’s NAV on the day of valuation. Payables and receivables for securities transactions, dividend and reclaim receivables and other receivables and payables denominated in a foreign currency were translated into U.S. dollars using a spot market rate of exchange as of 12:00 p.m. (Eastern Time) on the day of valuation. Purchases and sales of investments and dividend and interest income are translated into U.S. dollars using a spot market rate of exchange as of 12:00 p.m. (Eastern Time) on the date of such transactions. The portion of security gains or losses resulting from changes in foreign exchange rates is included with net realized and unrealized gain or loss from investments, as appropriate, for both financial and tax purposes. |
International Fund, International Small Cap Fund and International Value Fund may enter into foreign currency forward contracts to hedge the foreign currency exposure on open payables and receivables. The foreign currency forward contracts are recorded at market value and any related realized and unrealized gains and losses are reported as foreign currency related transactions for financial reporting purposes. For tax purposes, these foreign exchange gains and losses are treated as ordinary income or loss. International Fund, International Small Cap Fund and International Value Fund could be exposed to loss if the counterparties fail to perform under these contracts.
Other foreign currency related transaction gains and losses may result from currency gains and losses realized from the difference between the amounts of dividends and foreign withholding taxes recorded on the Funds’ books and the U.S. dollar equivalent of the amounts actually received or paid. The net increase (decrease) in unrealized appreciation or depreciation on foreign currency related transactions arise from changes in the values of assets and liabilities, other than investments in securities, resulting from changes in foreign exchange rates.
| | (e) | Repurchase agreements – Each Fund may enter into repurchase agreements with institutions that Artisan Partners Limited Partnership (“the Adviser”) has determined are creditworthy pursuant to criteria adopted by the Board of Directors. Repurchase agreements are recorded at cost plus accrued interest and are collateralized in an amount greater than or equal to the repurchase price plus accrued interest. Collateral is held by the Funds’ custodian and in the event of default on the obligation of the counterparty to repurchase, the Funds have the right to liquidate the collateral and apply the proceeds in satisfaction of the obligation. If the proceeds from any sale of such collateral were less than the repurchase price, the Fund would suffer a loss. |
63
SIXTY-THREE
NOTES TO FINANCIAL STATEMENTS
| | (f) | Securities lending – Each Fund may enter into securities lending transactions. During the six months ended March 31, 2006, International Fund and International Small Cap Fund earned $1,395,872 and $5,664, respectively, from securities lending transactions. When securities are on loan, the Fund does not receive dividends on the securities loaned, but receives compensation from the borrower in lieu of such dividends. The loans are secured by collateral at least equal, at all times, to the fair value of the securities loaned. Gain or loss in the fair value of the securities loaned that may occur during the term of the loan will be for the account of the applicable Fund. As of March 31, 2006, there were no securities on loan. Each Fund’s risks in entering into securities lending arrangements are that the borrower may not provide additional collateral when required or return the securities when due or, if the borrower defaults, the Fund may experience delays in selling collateral or the collateral may not be sufficient to cover the value of securities lent. |
| | (g) | Commission recapture – Each of the Funds may direct portfolio trades to various brokers that have agreed to rebate a portion of the commissions generated. Such cash rebates are made directly to the applicable Fund and are included in net realized gain or loss on investments in the Statements of Operations as follows: |
| | | |
International | | $ | 2,013,550 |
International Small Cap | | | 139,355 |
International Value | | | 119,081 |
Mid Cap | | | 358,180 |
Mid Cap Value | | | 85,367 |
Opportunistic Value | | | - |
Small Cap | | | 166,187 |
Small Cap Value | | | 116,014 |
| | (h) | Use of estimates – The preparation of financial statements in conformity with United States generally accepted accounting principles requires management to make estimates and assumptions that affect the reported amounts and disclosures in the financial statements. Actual results could differ from those estimates. |
| | (i) | Indemnifications – In the normal course of business, the Funds enter into contracts in which the Funds agree to indemnify the other party or parties against various potential costs or liabilities. The Funds’ maximum exposure under these arrangements is unknown. No claim has been made for indemnification pursuant to any such agreement of the Funds. |
| | (j) | Other – Dividend income less foreign taxes withheld, if any, is recorded on the ex-dividend date, except that certain dividends from private placements |
64
SIXTY-FOUR
NOTES TO FINANCIAL STATEMENTS
| | and foreign securities are recorded as soon after the ex-dividend date as the information becomes available to the Funds. Non-cash dividends included in dividend income, if any, are generally recorded at the fair market value of securities received. Interest income is reported on the accrual basis. Distributions to shareholders are recorded on the ex-dividend date. Expenses attributable to Artisan Funds are generally allocated to each Fund based on net assets. Expenses attributable to a particular Fund are allocated directly to that Fund. |
The character of income and net realized gains and losses may differ for financial statement and tax purposes and may result in reclassification of permanent differences among certain capital accounts to more appropriately conform financial accounting to tax characterizations of dividend distributions.
International Fund, International Small Cap Fund and International Value Fund generally impose a 2% redemption fee on shares held 90 days or less. Those redemption fees are recorded as a reduction in the cost of shares redeemed and have the primary effect of increasing paid-in capital.
| (3) | Transactions with affiliates: |
The Adviser, with which the officers and a director of Artisan Funds are affiliated, provides investment advisory and administrative services to the Funds. In exchange for those services, each Fund (with the exception of International Fund after November 30, 2005, International Small Cap Fund and Opportunistic Value Fund) pays a monthly management fee to the Adviser as follows:
| | | |
Average Daily Net Assets
| | Annual Rate
| |
Less than $500 million | | 1.000 | % |
$500 million to $750 million | | 0.975 | |
$750 million to $1 billion | | 0.950 | |
Greater than $1 billion | | 0.925 | |
Effective December 1, 2005, International Fund pays a monthly management fee to the Advisor as follows:
| | | |
Average Daily Net Assets
| | Annual Rate
| |
Less than $500 million | | 1.000 | % |
$500 million to $750 million | | 0.975 | |
$750 million to $1 billion | | 0.950 | |
$1 billion to $ 12 billion | | 0.925 | |
Greater than $12 billion | | 0.900 | |
65
SIXTY-FIVE
NOTES TO FINANCIAL STATEMENTS
International Small Cap Fund pays a monthly management fee to the Adviser at an annual rate of 1.250% of average daily net assets.
Opportunistic Value Fund pays a monthly management fee to the Adviser as follows:
| | | |
Average Daily Net Assets
| | Annual Rate
| |
Less than $1 billion | | 0.900 | % |
$1 billion to $ 4 billion | | 0.875 | |
$4 billion to $ 8 billion | | 0.850 | |
$8 billion to $ 12 billion | | 0.825 | |
Greater than $12 billion | | 0.800 | |
The Adviser has voluntarily undertaken to reimburse Opportunistic Value Fund for any ordinary operating expenses in excess of 1.50% of average daily net assets, annually.
The officers and director of Artisan Funds who are affiliated with the Adviser receive no compensation from the Funds.
Each director who is not an interested person of Artisan Funds or the Adviser receives an annual retainer of $130,000, payable quarterly, as well as reimbursement of expenses related to his duties as a director of Artisan Funds. In addition, the non- interested chair of the board of directors receives an additional annual retainer of $60,000, payable quarterly, and each chair of a board committee who is a non-interested director receives an additional annual retainer of $30,000, payable quarterly. Those fees were generally allocated to each Fund based on net assets, subject to a minimum allocation of $1,500 to each Fund per quarter. Directors fees for Opportunistic Value Fund have been waived through September 30, 2006.
The Board of Directors has adopted a deferred compensation plan for independent directors that enables directors to elect to defer receipt of all or a portion of the annual compensation they are entitled to receive from the Funds. For purposes of determining the amount owed to the Directors under the plan, deferred amounts are invested in shares of the Artisan Funds as selected by the individual directors. Each Fund purchases shares of the funds selected for deferral by the director in amounts equal to his investment, resulting in a Fund asset equal to the deferred compensation liability. Such assets are included as a component of “Other assets” on the Statement of Assets and Liabilities. Deferral of directors’ fees under the plan will not affect the net assets of the Funds, and will not materially affect the Funds’ assets, liabilities or net investment income per share. Amounts will be deferred until distributed in accordance with the Plan.
66
SIXTY-SIX
NOTES TO FINANCIAL STATEMENTS
Shares of Artisan Funds are offered for sale by Artisan Distributors LLC (“Distributors”). Distributors is wholly owned by the Adviser. All distribution expenses relating to the Funds are paid by the Adviser.
| (4) | Line of credit arrangements: |
Artisan Funds is party to a line of credit agreement with State Street Bank and Trust Company, under which each Fund may borrow up to the lesser of (a) $75 million or (b) the lesser of (i) 10% of its total assets (after giving effect to the loan) or (ii) the maximum amount the Fund may borrow under the Investment Company Act, the limitations included in the Fund’s prospectus, or any limit or restriction under any law or regulation to which the Fund is subject or any agreement to which the Fund or Artisan Funds is a party; provided that the aggregate borrowings by all Funds may not exceed $100 million. Artisan Funds pays a commitment fee at the annual rate of 0.10% on the unused portion of the line of credit. Interest is charged on any borrowings at the current Federal Funds rate plus 0.50%. The use of the line of credit is generally restricted to temporary borrowing for extraordinary or emergency purposes. During the six months ended March 31, 2006, there were no borrowings under the line of credit.
| (5) | Investment transactions: |
The cost of securities purchased and the proceeds from the sale of securities (excluding short-term securities) for the six months ended March 31, 2006 were as follows:
| | | | | | |
| Fund | | Security Purchases | | Security Sales |
International | | $ | 3,467,074,539 | | $ | 3,761,146,250 |
International Small Cap | | | 308,552,543 | | | 249,366,926 |
International Value | | | 295,826,064 | | | 205,834,142 |
Mid Cap | | | 2,194,942,383 | | | 2,554,585,756 |
Mid Cap Value | | | 648,307,164 | | | 563,229,236 |
Opportunistic Value(1) | | | 9,051,079 | | | - |
Small Cap | | | 748,038,570 | | | 631,721,244 |
Small Cap Value | | | 502,350,031 | | | 458,918,540 |
| | (1) | For the period from commencement of operations (March 27, 2006) through March 31, 2006. |
| (6) | Transactions in securities of affiliates: |
The table below shows information about securities of the Funds’ “affiliates” (as defined below) that were held by the Funds, purchased or sold by the Funds, or from which dividends were received by the Funds during the six months ended March 31, 2006. The Funds identify a company as an affiliate for the purpose of this report if one or more of the Funds owned, in the aggregate, voting securities
67
SIXTY-SEVEN
NOTES TO FINANCIAL STATEMENTS
that it believed represented 5% or more of that company’s outstanding voting securities (as defined by the Investment Company Act of 1940) during the six months ended March 31, 2006.
| | | | | | | | | | | | | | | | | | | | | | |
| | | | | As of
9/30/05
| | | | | | | | | | | As of 3/31/06
|
Fund
| | Security
| | Share
Balance
| | Purchase
Cost
| | Sales Cost
| | Net
Realized
Gain (Loss)
| | | Dividend
Income(1)
| | Share
Balance
| | Value
|
| International | | Credit Saison Co., Ltd.(2) | | 8,952,300 | | $ | 6,592,410 | | $ | 17,056,388 | | $ | 5,805,733 | | | $ | 1,523,092 | | 8,626,000 | | $ | 477,105,013 |
| | | Stolt Offshore S.A.(3)(4) | | 7,851,500 | | | 20,763,931 | | | 691,460 | | | 390,273 | | | | - | | 9,731,700 | | | 152,948,776 |
| International Small Cap | | FINETEC Corporation | | 971,391 | | | - | | | - | | | - | | | | 120,046 | | 971,391 | | | 10,997,634 |
| | | Stolt Offshore S.A.(3)(4) | | 872,900 | | | - | | | - | | | - | | | | - | | 872,900 | | | 13,718,979 |
| International Value | | Pfeiffer Vacuum Technology AG | | 467,396 | | | 4,762,491 | | | 548,076 | | | 63,296 | | | | - | | 547,106 | | | 36,598,158 |
| Mid Cap | | Marvel Entertainment, Inc.(3)(4) | | 1,769,000 | | | 8,989,830 | | | 253,099 | | | 13,461 | | | | - | | 2,280,400 | | | 45,881,648 |
| Mid Cap Value | | Annaly Mortgage Management, Inc.(3) | | 1,220,800 | | | 46,492,770 | | | - | | | - | | | | 1,046,420 | | 5,134,000 | | | 62,326,760 |
| | | Furniture Brands International, Inc. | | 3,386,900 | | | - | | | 11,829,614 | | | (3,105,879 | ) | | | 917,518 | | 2,914,300 | | | 71,429,493 |
| | | Marvel Entertainment, Inc.(3)(4) | | 2,176,600 | | | 19,048,789 | | | - | | | - | | | | - | | 3,357,700 | | | 67,556,924 |
| | | Rent-A-Center, Inc.(3)(4) | | 2,776,400 | | | 3,908,498 | | | - | | | - | | | | - | | 2,983,400 | | | 76,345,206 |
| | | Zale Corporation(4) | | 1,888,800 | | | 23,734,599 | | | - | | | - | | | | - | | 2,827,200 | | | 79,246,416 |
| Opportunistic Value(5) | | Rent-A-Center, Inc.(3)(4) | | - | | | 188,139 | | | - | | | - | | | | - | | 7,500 | | | 191,925 |
| Small Cap | | Global Power Equipment Group Inc.(2) | | 1,224,700 | | | 250,468 | | | 10,822,714 | | | (5,324,247 | ) | | | - | | - | | | - |
| | | Stratasys Inc.(2)(3)(4) | | 415,500 | | | 3,375,045 | | | 2,772,417 | | | (201,988 | ) | | | - | | 460,400 | | | 13,572,592 |
| Small Cap Value | | Altiris, Inc.(2)(3)(4) | | 1,277,600 | | | 2,912,733 | | | 8,308,739 | | | 1,480,101 | | | | - | | 981,900 | | | 21,611,619 |
| | | AMN Healthcare Services, Inc.(4) | | 1,579,100 | | | 3,187,321 | | | - | | | - | | | | - | | 1,773,600 | | | 33,201,792 |
| | | Annaly Mortgage Management, Inc.(3) | | - | | | 16,887,916 | | | - | | | - | | | | 261,107 | | 1,424,700 | | | 17,295,858 |
| | | DiamondCluster International, Inc.(3)(4) | | 1,548,000 | | | 1,836,802 | | | 513,331 | | | (21,014 | ) | | | - | | 1,754,900 | | | 18,777,430 |
| | | Eagle Hospitality Properties Trust, Inc.(2)(3) | | 689,200 | | | 1,765,524 | | | 622,295 | | | (113,495 | ) | | | 308,560 | | 850,800 | | | 8,576,064 |
| | | Furniture Brands International, Inc. | | 1,942,800 | | | 1,891,630 | | | 379,784 | | | (38,879 | ) | | | 613,484 | | 2,012,900 | | | 49,336,179 |
| | | Global Power Equipment Group Inc.(2)(4) | | 1,332,000 | | | 110,186 | | | - | | | - | | | | - | | 1,356,400 | | | 5,222,140 |
| | | Kellwood Company | | 1,786,450 | | | 3,770,553 | | | 23,142,807 | | | (4,374,825 | ) | | | 592,304 | | 1,305,750 | | | 40,987,492 |
| | | Marvel Entertainment, Inc.(3)(4) | | - | | | 8,336,981 | | | - | | | - | | | | - | | 587,700 | | | 11,824,524 |
| | | Medical Staffing Network Holdings, Inc.(3)(4) | | 1,510,300 | | | 202,825 | | | - | | | - | | | | - | | 1,548,900 | | | 8,069,769 |
| | | Movie Gallery, Inc. | | 2,081,900 | | | 207,400 | | | - | | | - | | | | - | | 2,119,900 | | | 6,402,098 |
| | | National Dentex Corporation(4) | | 359,400 | | | 1,242,079 | | | - | | | - | | | | - | | 413,500 | | | 9,605,605 |
| | | PICO Holdings, Inc.(4) | | 688,000 | | | 699,183 | | | 416,121 | | | 76,409 | | | | - | | 694,600 | | | 22,845,394 |
| | | Rent-A-Center, Inc.(3)(4) | | 841,700 | | | 10,721,213 | | | - | | | - | | | | - | | 1,392,900 | | | 35,644,311 |
| | | Sanderson Farms, Inc.(3) | | - | | | 32,309,532 | | | - | | | - | | | | 22,812 | | 1,334,900 | | | 29,901,760 |
68
SIXTY-EIGHT
NOTES TO FINANCIAL STATEMENTS
| | | | | | | | | | | | | | | | | | | | | | |
| | | | | As of
9/30/05
| | | | | | | | | | | As of 3/31/06
|
Fund
| | Security
| | Share
Balance
| | Purchase
Cost
| | Sales
Cost
| | Net
Realized
Gain (Loss)
| | | Dividend
Income(1)
| | Share
Balance
| | Value
|
| Small Cap Value | | Stewart Information Services Corporation | | 1,222,900 | | $ | 6,852,571 | | $ | - | | $ | - | | | $ | 941,475 | | 1,366,300 | | $ | 64,325,404 |
| | | Superior Industries International, Inc. | | 1,463,900 | | | 1,294,904 | | | 225,394 | | | (126,722 | ) | | | 473,696 | | 1,518,200 | | | 29,392,352 |
| | | Zale Corporation(4) | | 1,573,000 | | | 11,070,354 | | | - | | | - | | | | - | | 2,005,500 | | | 56,214,165 |
| | (1) | Net of foreign taxes withheld, if any. |
| | (2) | Issuer was no longer an affiliate as of March 31, 2006. |
| | (3) | Issuer was not an affiliate as of September 30, 2005. |
| | (4) | Non-income producing security. |
| | (5) | For the period from commencement of operations (March 27, 2006) through March 31, 2006. |
| (7) | Information for Federal income tax purposes: |
| | | | | | | | | | | | | | |
| Fund | | Cost of
Investments | | Gross Unrealized
Appreciation | | Gross
Unrealized
Depreciation | | | Net Unrealized
Appreciation/
Depreciation | |
International | | $ | 9,783,912,794 | | $ | 3,676,768,077 | | $ | (123,231,665 | ) | | $ | 3,553,536,412 | |
International Small Cap | | | 668,870,740 | | | 320,015,129 | | | (10,602,725 | ) | | | 309,412,404 | |
International Value | | | 701,380,268 | | | 139,459,903 | | | (7,769,956 | ) | | | 131,689,947 | |
Mid Cap | | | 4,775,323,550 | | | 1,490,057,662 | | | (26,255,522 | ) | | | 1,463,802,140 | |
Mid Cap Value | | | 2,631,881,882 | | | 330,286,191 | | | (66,952,317 | ) | | | 263,333,874 | |
Opportunistic Value | | | 11,648,079 | | | 43,306 | | | (72,570 | ) | | | (29,264 | ) |
Small Cap | | | 1,181,818,216 | | | 216,888,650 | | | (17,484,016 | ) | | | 199,404,634 | |
Small Cap Value | | | 1,627,461,919 | | | 446,513,864 | | | (79,396,199 | ) | | | 367,117,665 | |
The difference between cost of investments for financial reporting and cost of investments for Federal income tax is due primarily to timing differences in recognizing certain gains and losses on security transactions (e.g., wash sale loss deferrals and passive foreign investment company transactions).
69
SIXTY-NINE
NOTES TO FINANCIAL STATEMENTS
The tax basis of dividends and long-term capital gain distributions paid during the six months ended March 31, 2006 and the year ended September 30, 2005 were as follows:
| | | | | | | | | | | | |
| | | Six Months Ended 3/31/06
| | Year Ended 9/30/05
|
Fund
| | Ordinary
Income
Dividends
| | Long-Term
Capital Gain
Distributions
| | Ordinary
Income
Dividends
| | Long-Term
Capital Gain
Distributions
|
| International | | $ | 200,705,830 | | $ | - | | $ | 69,335,942 | | $ | - |
| International Small Cap | | | 33,534,989 | | | 45,167,585 | | | 38,631,361 | | | 20,034,761 |
| International Value | | | 20,163,762 | | | 9,531,378 | | | 3,707,149 | | | 1,337,370 |
| Mid Cap | | | 30,312,731 | | | 220,370,538 | | | - | | | - |
| Mid Cap Value | | | 91,428,711 | | | 25,834,378 | | | 4,542,632 | | | 4,785,269 |
| Opportunistic Value(1) | | | - | | | - | | | | | | |
| Small Cap | | | 19,680,637 | | | 17,286,786 | | | 715,625 | | | 9,933,966 |
| Small Cap Value | | | 52,669,430 | | | 152,453,417 | | | 33,641,530 | | | 90,214,766 |
| | (1) | For the period from commencement of operations (March 27, 2006) through March 31, 2006. |
Income and capital gain distributions are determined in accordance with income tax regulations that may differ from accounting principles that are generally accepted in the United States. These differences are due to differing treatments for items such as net short-term gains, wash sale loss deferrals, foreign currency transactions, net investment losses and capital loss carryovers. Gains on redemptions-in-kind for International Fund and Mid Cap Fund of $29,012,833 and $13,451,833, respectively, included in net realized gain (loss) on investments in the Statement of Operations, are not recognized for Federal income tax purposes.
Additional tax information as of and for the year ended September 30, 2005 follows:
| | | | | | | | | | | | | | | | |
| | | As of 9/30/05
| | Year Ended 9/30/05
|
| | Undistributed
Ordinary
Income
| | Undistributed
Long-Term
Gain
| | Net Capital
Loss
Carryforward(1)
| | Capital Loss
Carryforward
Expiration
| | Capital Loss
Carryforward
Utilized
| | Post-
October
Losses
|
| International | | $ | 200,676,648 | | $ | - | | $ | 30,783,169 | | 2009 | | $ | 738,285,571 | | $ - |
| | | | | | | | | | 384,841,928 | | 2010 | | | | | |
| | | | | | | | | | 202,299,105 | | 2011 | | | | | |
| International Small Cap | | | 33,527,660 | | | 43,577,189 | | | - | | | | | - | | - |
| International Value | | | 16,629,783 | | | 7,642,471 | | | - | | | | | - | | - |
| Mid Cap | | | - | | | 158,169,846 | | | - | | | | | 178,503,906 | | - |
| Mid Cap Value | | | 82,288,696 | | | 25,095,097 | | | - | | | | | - | | - |
| Small Cap | | | 15,318,450 | | | 16,198,898 | | | - | | | | | - | | - |
| Small Cap Value | | | 49,851,555 | | | 134,011,790 | | | - | | | | | - | | - |
| | (1) | The Funds expect to resume paying capital gain distributions in the future to the extent gains are realized in excess of the available carryforwards. |
70
SEVENTY
NOTES TO FINANCIAL STATEMENTS
[THIS PAGE INTENTIONALLY LEFT BLANK]
71
SEVENTY-ONE
NOTES TO FINANCIAL STATEMENTS
| (8) | Fund share activities: |
Capital share transactions for the Funds were as follows:
| | | | | | | | | | | | | | |
| | | INTERNATIONAL
| | | INTERNATIONAL
SMALL CAP
| | | |
Six months ended March 31, 2006
| | Investor
Shares
| | | Institutional
Shares
| | | Investor
Shares
| | | |
Proceeds from shares issued | | $ | 1,099,650,952 | | | $ | 218,998,165 | | | $ | 103,929,472 | | | |
Net asset value of shares issued in reinvestment of dividends and distributions | | | 121,588,038 | | | | 67,354,311 | | | | 76,365,043 | | | |
Cost of shares redeemed(2) | | | (917,196,836 | ) | | | (655,822,726 | ) | | | (68,588,304 | ) | | |
| | |
|
|
| |
|
|
| |
|
|
| | |
Net increase (decrease) from fund share transactions | | $ | 304,042,154 | | | $ | (369,470,250 | ) | | $ | 111,706,211 | | | |
| | |
|
|
| |
|
|
| |
|
|
| | |
| | | | |
Shares sold | | | 42,744,845 | | | | 8,595,506 | | | | 4,980,129 | | | |
Shares issued in reinvestment of dividends and distributions | | | 5,049,357 | | | | 2,785,484 | | | | 4,198,188 | | | |
Shares redeemed | | | (35,753,253 | ) | | | (25,698,126 | ) | | | (3,414,425 | ) | | |
| | |
|
|
| |
|
|
| |
|
|
| | |
Net increase (decrease) in capital shares | | | 12,040,949 | | | | (14,317,136 | ) | | | 5,763,892 | | | |
| | |
|
|
| |
|
|
| |
|
|
| | |
| | | |
| | | INTERNATIONAL
| | | INTERNATIONAL
SMALL CAP
| | | |
Year ended September 30, 2005
| | Investor
Shares
| | | Institutional
Shares
| | | Investor
Shares
| | | |
Proceeds from shares issued | | $ | 1,721,409,733 | | | $ | 213,745,441 | | | $ | 162,675,457 | | | |
Net asset value of shares issued in reinvestment of dividends and distributions | | | 35,336,667 | | | | 27,442,945 | | | | 57,876,739 | | | |
Cost of shares redeemed(2) | | | (1,815,852,822 | ) | | | (778,118,588 | ) | | | (114,717,564 | ) | | |
| | |
|
|
| |
|
|
| |
|
|
| | |
Net increase (decrease) from fund share transactions | | $ | (59,106,422 | ) | | $ | (536,930,202 | ) | | $ | 105,834,632 | | | |
| | |
|
|
| |
|
|
| |
|
|
| | |
| | | | |
Shares sold | | | 78,912,846 | | | | 9,680,591 | | | | 8,896,487 | | | |
Shares issued in reinvestment of dividends and distributions | | | 1,677,108 | | | | 1,297,539 | | | | 3,597,063 | | | |
Shares redeemed | | | (82,739,336 | ) | | | (34,838,126 | ) | | | (6,444,012 | ) | | |
| | |
|
|
| |
|
|
| |
|
|
| | |
Net increase (decrease) in capital shares | | | (2,149,382 | ) | | | (23,859,996 | ) | | | 6,049,538 | | | |
| | |
|
|
| |
|
|
| |
|
|
| | |
| (1) | For the period from commencement of operations (March 27, 2006) through March 31, 2006. |
| (2) | Net of redemption fees of |
| | | | | | |
| Fund | | 3/31/2006 | | 9/30/2005 |
International - Investor Shares | | $ | 270,937 | | $ | 326,088 |
International - Institutional Shares | | | 130,187 | | | 179,833 |
International Small Cap - Investor Shares | | | 13,621 | | | 19,830 |
International Value - Investor Shares | | | 15,420 | | | 145,080 |
72
SEVENTY-TWO
NOTES TO FINANCIAL STATEMENTS
| | | | | | | | | | | | | | | | | | | | | | | | | | |
INTERNATIONAL
VALUE
| | | MID CAP
| | | MID CAP
VALUE
| | | OPPORTUNISTIC
VALUE
| | | SMALL CAP
| | | SMALL CAP
VALUE
| |
Investor Shares
| | | Investor Shares
| | | Institutional
Shares
| | | Investor Shares
| | | Investor
Shares(1)
| | | Investor Shares
| | | Investor Shares
| |
| $ | 216,953,747 | | | $ | 522,190,046 | | | $ | 26,112,251 | | | $ | 919,984,012 | | | $ | 10,168,830 | | | $ | 285,359,957 | | | $ | 269,495,359 | |
| | 28,357,890 | | | | 205,964,332 | | | | 40,056,662 | | | | 113,719,066 | | | | - | | | | 29,151,935 | | | | 198,667,437 | |
| | (96,739,012 | ) | | | (762,584,706 | ) | | | (163,879,456 | ) | | | (942,205,952 | ) | | | (1,297 | ) | | | (137,684,130 | ) | | | (176,965,466 | ) |
|
|
| |
|
|
| |
|
|
| |
|
|
| |
|
|
| |
|
|
| |
|
|
|
| $ | 148,572,625 | | | $ | (34,430,328 | ) | | $ | (97,710,543 | ) | | $ | 91,497,126 | | | $ | 10,167,533 | | | $ | 176,827,762 | | | $ | 291,197,330 | |
|
|
| |
|
|
| |
|
|
| |
|
|
| |
|
|
| |
|
|
| |
|
|
|
| | | | | | |
| | 9,386,070 | | | | 16,539,091 | | | | 816,040 | | | | 48,213,103 | | | | 1,016,796 | | | | 15,800,521 | | | | 14,900,163 | |
| | 1,344,769 | | | | 6,671,990 | | | | 1,280,994 | | | | 6,061,606 | | | | - | | | | 1,669,642 | | | | 11,477,024 | |
| | (4,214,895 | ) | | | (24,079,728 | ) | | | (5,167,848 | ) | | | (49,340,010 | ) | | | (130 | ) | | | (7,611,565 | ) | | | (9,783,213 | ) |
|
|
| |
|
|
| |
|
|
| |
|
|
| |
|
|
| |
|
|
| |
|
|
|
| | 6,515,944 | | | | (868,647 | ) | | | (3,070,814 | ) | | | 4,934,699 | | | | 1,016,666 | | | | 9,858,598 | | | | 16,593,974 | |
|
|
| |
|
|
| |
|
|
| |
|
|
| |
|
|
| |
|
|
| |
|
|
|
| | | | | |
INTERNATIONAL
VALUE
| | | MID CAP
| | | MID CAP
VALUE
| | | SMALL CAP
| | | SMALL CAP
VALUE
| | | | |
Investor Shares
| | | Investor Shares
| | | Institutional
Shares
| | | Investor Shares
| | | Investor Shares
| | | Investor Shares
| | | | |
| $ | 613,671,425 | | | $ | 1,448,522,186 | | | $ | 65,819,361 | | | $ | 2,505,178,141 | | | $ | 875,101,149 | | | $ | 492,489,210 | | | | | |
| | 4,945,577 | | | | - | | | | - | | | | 8,873,823 | | | | 8,911,550 | | | | 114,845,085 | | | | | |
| | (306,684,879 | ) | | | (1,366,393,615 | ) | | | (299,155,114 | ) | | | (330,649,737 | ) | | | (118,616,878 | ) | | | (248,073,902 | ) | | | | |
|
|
| |
|
|
| |
|
|
| |
|
|
| |
|
|
| |
|
|
| | | | |
| $ | 311,932,123 | | | $ | 82,128,571 | | | $ | (233,335,753 | ) | | $ | 2,183,402,227 | | | $ | 765,395,821 | | | $ | 359,260,393 | | | | | |
|
|
| |
|
|
| |
|
|
| |
|
|
| |
|
|
| |
|
|
| | | | |
| | | | | | |
| | 29,605,335 | | | | 50,306,407 | | | | 2,231,832 | | | | 138,992,400 | | | | 52,241,425 | | | | 27,512,339 | | | | | |
| | 251,300 | | | | - | | | | - | | | | 544,456 | | | | 554,201 | | | | 6,864,620 | | | | | |
| | (14,730,829 | ) | | | (46,997,550 | ) | | | (10,061,831 | ) | | | (18,249,715 | ) | | | (7,184,384 | ) | | | (13,859,519 | ) | | | | |
|
|
| |
|
|
| |
|
|
| |
|
|
| |
|
|
| |
|
|
| | | | |
| | 15,125,806 | | | | 3,308,857 | | | | (7,829,999 | ) | | | 121,287,141 | | | | 45,611,242 | | | | 20,517,440 | | | | | |
|
|
| |
|
|
| |
|
|
| |
|
|
| |
|
|
| |
|
|
| | | | |
Artisan Funds and the Adviser were defendants in a lawsuit in the Circuit Court of the Third Judicial Circuit, Madison County, Illinois that sought certification of a plaintiff class consisting of all persons in the United States who held shares in International Fund for a period of more than 14 days during the five years prior to the filing of the lawsuit. The suit sought compensatory and punitive damages under state law, as well as interest, costs and attorney’s fees. The lawsuit alleged, in summary, that Artisan Funds and the Adviser exposed long-term International Fund shareholders to trading by market timers by allegedly (a) failing to properly evaluate daily whether a significant event affecting the value of International Fund’s securities had occurred after foreign markets had closed but before the calculation
73
SEVENTY-THREE
NOTES TO FINANCIAL STATEMENTS
of the Fund’s NAV; (b) failing to implement the Fund’s portfolio valuation and share pricing policies and procedures; (c) allowing portfolio valuation and share policies and procedures that benefited market timers at the expense of long-term shareholders; and (d) failing to know and implement applicable rules and regulations concerning the calculation of NAV.
Artisan Funds and the Adviser removed the lawsuit from state court to federal district court. The federal district court ordered the case remanded to Illinois state court. Artisan Funds and the Adviser then appealed the remand order to the United States Court of Appeals for the Seventh Circuit and, on April 5, 2005, the Court of Appeals ruled in favor of Artisan Funds and the Adviser. As a result, the action was dismissed with prejudice in May 2005. The plaintiff subsequently sought and was granted review by the United States Supreme Court on the question of whether the Court of Appeals had jurisdiction to hear the appeal. In the event that the Supreme Court’s decision results in reinstatement of the lawsuit, Artisan Funds and the Adviser intend to continue to defend the lawsuit vigorously.
Certain legal fees incurred by Artisan Funds in defense of the lawsuit and related insurance recoveries of $197,947 have been allocated to International Fund and are included in Professional fees in the Statement of Operations. Artisan Funds does not believe that the action described herein will have a material effect on the financial condition of International Fund.
74
SEVENTY-FOUR
SHAREHOLDER EXPENSE EXAMPLE
As a shareholder of Artisan Funds, you incur two types of costs: (1) transaction costs, including redemption fees; and (2) ongoing costs, including management fees, and other Fund expenses. This example is intended to help you understand your ongoing costs (in dollars) of investing in a Fund and to compare these costs with the ongoing costs of investing in other mutual funds.
The example is based on an investment of $1,000 invested at the beginning of the period and held for the entire period from October 1, 2005 to March 31, 2006.
Actual Expenses
The first line under the name of each Fund in the table below provides information about actual account values and actual expenses. You may use the information in this line, together with the amount you invested, to estimate the expenses that you paid over the period. Simply divide your account value by $1,000 (for example, an $8,600 account value divided by $1,000 = 8.6), then multiply the result by the number in the first line under the name of your Fund under the heading entitled “Expenses Paid During Period” to estimate the expenses you paid on your account during this period.
Hypothetical Example for Comparison Purposes
The second line below each Fund’s name in the table below provides information about hypothetical account values and hypothetical expenses based on each Fund’s actual expense ratio and an assumed rate of return of 5% per year before expenses, which is not the Fund’s actual return. The hypothetical account values and expenses may not be used to estimate the actual ending account balances or expenses you paid for the period. You may use this information to compare the ongoing costs of investing in each Fund and other funds. To do so, compare the 5% hypothetical example with the 5% hypothetical examples that appear in the shareholder reports of the other funds.
Please note that the expenses shown in the table are meant to highlight your ongoing costs only and do not reflect any transactional costs, such as redemption fees. Therefore, the second line of the table is useful in comparing ongoing costs only, and will not help you determine the relative costs of owning different funds. If these transactional costs were included, your costs would have been higher.
| | | | | | | | | |
| | | Beginning
Account Value
10/1/2005 | | Ending
Account Value
3/31/2006 | | Expenses Paid During
Period
10/1/2005-3/31/2006(1) |
Artisan International Fund - Investor Shares | | | | | | | | | |
Actual | | $ | 1,000.00 | | $ | 1,167.10 | | $ | 6.43 |
Hypothetical (5% return before expenses) | | $ | 1,000.00 | | $ | 1,019.00 | | $ | 5.99 |
Artisan International Fund - Institutional Shares | | | | | | | | | |
Actual | | $ | 1,000.00 | | $ | 1,168.28 | | $ | 5.41 |
Hypothetical (5% return before expenses) | | $ | 1,000.00 | | $ | 1,019.95 | | $ | 5.04 |
Artisan International Small Cap Fund - Investor Shares | | | | | | | | | |
Actual | | $ | 1,000.00 | | $ | 1,222.71 | | $ | 8.42 |
Hypothetical (5% return before expenses) | | $ | 1,000.00 | | $ | 1,017.35 | | $ | 7.64 |
75
SEVENTY-FIVE
SHAREHOLDER EXPENSE EXAMPLE
| | | | | | | | | |
| | | Beginning
Account Value
10/1/2005 | | Ending
Account Value
3/31/2006 | | Expenses Paid During
Period
10/1/2005-3/31/2006(1) |
Artisan International Value Fund - Investor Shares | | | | | | | | | |
Actual | | $ | 1,000.00 | | $ | 1,177.74 | | $ | 6.84 |
Hypothetical (5% return before expenses) | | $ | 1,000.00 | | $ | 1,018.65 | | $ | 6.34 |
Artisan Mid Cap Fund - Investor Shares | | | | | | | | | |
Actual | | $ | 1,000.00 | | $ | 1,122.87 | | $ | 6.25 |
Hypothetical (5% return before expenses) | | $ | 1,000.00 | | $ | 1,019.05 | | $ | 5.94 |
Artisan Mid Cap Fund - Institutional Shares | | | | | | | | | |
Actual | | $ | 1,000.00 | | $ | 1,124.34 | | $ | 5.03 |
Hypothetical (5% return before expenses) | | $ | 1,000.00 | | $ | 1,020.19 | | $ | 4.78 |
Artisan Mid Cap Value Fund - Investor Shares | | | | | | | | | |
Actual | | $ | 1,000.00 | | $ | 1,054.41 | | $ | 6.10 |
Hypothetical (5% return before expenses) | | $ | 1,000.00 | | $ | 1,019.00 | | $ | 5.99 |
Artisan Opportunistic Value Fund - Investor Shares(2) | | | | | | | | | |
Actual | | $ | 1,000.00 | | $ | 998.00 | | $ | 0.15 |
Hypothetical (5% return before expenses) | | $ | 1,000.00 | | $ | 1,000.39 | | $ | 0.15 |
Artisan Small Cap Fund - Investor Shares | | | | | | | | | |
Actual | | $ | 1,000.00 | | $ | 1,125.93 | | $ | 5.99 |
Hypothetical (5% return before expenses) | | $ | 1,000.00 | | $ | 1,019.30 | | $ | 5.69 |
Artisan Small Cap Value Fund - Investor Shares | | | | | | | | | |
Actual | | $ | 1,000.00 | | $ | 1,098.89 | | $ | 6.07 |
Hypothetical (5% return before expenses) | | $ | 1,000.00 | | $ | 1,019.15 | | $ | 5.84 |
| (1) | Expenses are equal to the Fund’s ratio of expenses to average net assets for the six-month period ended March 31, 2006 (shown below); multiplied by the average account value over the period; multiplied by 182/365 (to reflect the one-half year period). |
| (2) | The account value and the expenses paid for Opportunistic Value Fund have been presented for the period from commencement of operations (March 27, 2006) through March 31, 2006. Assuming a six month period, the actual account value as of 3/31/2006 and the expenses paid during the six months ended 3/31/2006 would have been as follows: |
| | | | | | | | | | | | | |
| | | | | Beginning
Account Value
10/1/2005 | | Ending
Account Value
3/31/2006 | | Expenses Paid During
Period
10/1/2005-3/31/2006 | | |
| | | Artisan Opportunistic Value Fund - Investor Shares | | | | | | | | | | | |
| | | Actual | | $ | 1,000.00 | | $ | 998 .00 | | $ | 7.02 | | |
| | | Hypothetical (5% return before expenses) | | $ | 1,000.00 | | $ | 1,017.90 | | $ | 7.09 | | |
76
SEVENTY-SIX
SHAREHOLDER EXPENSE EXAMPLE
| | | |
| Fund | | Annualized Ratio of Expenses to Average Net Assets for the Six Month
Period Ended March 31, 2006 | |
Artisan International Fund - Investor Shares | | 1.19 | % |
Artisan International Fund - Institutional Shares | | 1.00 | |
Artisan International Small Cap Fund - Investor Shares | | 1.52 | |
Artisan International Value Fund - Investor Shares | | 1.26 | |
Artisan Mid Cap Fund - Investor Shares | | 1.18 | |
Artisan Mid Cap Fund - Institutional Shares | | 0.95 | |
Artisan Mid Cap Value Fund - Investor Shares | | 1.19 | |
Artisan Opportunistic Value Fund - Investor Shares(1) | | 1.41 | |
Artisan Small Cap Fund - Investor Shares | | 1.13 | |
Artisan Small Cap Value Fund - Investor Shares | | 1.16 | |
| (1) | For the period from commencement of operations (March 27, 2006) through March 31, 2006. |
77
SEVENTY-SEVEN
FACTORS CONSIDERED IN RENEWING THE FUNDS’ ADVISORY CONTRACTS
Artisan Partners Limited Partnership (“Artisan Partners”) is responsible for management of the Funds’ investment portfolios and for overall management of the Funds’ business and affairs pursuant to Investment Advisory Agreements dated December 27, 1995 (International Fund); November 7, 2001 (International Small Cap Fund); August 8, 2002 (International Value Fund); April 10, 1997 (Mid Cap Fund); October 26, 2000 (Mid Cap Value Fund); March 27, 1995 (Small Cap Fund); July 31, 1997 (Small Cap Value Fund) and February 9, 2006 (Opportunistic Value Fund) (the “Advisory Agreements”). Artisan Partners is a Delaware limited partnership the sole general partner of which is Artisan Investment Corporation. Artisan Investment Corporation was incorporated on December 7, 1994 for the sole purpose of acting as general partner of Artisan Partners. Artisan Investment Corporation is controlled by Mr. Ziegler and Ms. Ziegler, who together own 100% of its voting stock. The principal address of Artisan Partners is 875 E. Wisconsin Avenue, Suite 800, Milwaukee, Wisconsin 53202. Artisan Partners also has offices at 100 Pine Street, Suite 2950, San Francisco, California 94111; One Maritime Plaza, Suite 1450, San Francisco, California 94111; Five Concourse Parkway NE, Suite 2120, Atlanta, Georgia 30328; and 65 East 55th Street, 25th Floor, New York, New York 10022.
The Advisory Agreement for each Fund may be continued from year to year only so long as the continuance is approved annually (a) by the vote of a majority of the directors of Artisan Funds who are not “interested persons” of Artisan Funds or Artisan Partners cast in person at a meeting called for the purpose of voting on such approval, and (b) by the board of directors or by the vote of a majority (as defined in the 1940 Act) of the outstanding shares of the Fund. Each Advisory Agreement provides that Artisan Partners shall not be liable for any loss suffered by a Fund or its shareholders as a consequence of any act or omission in connection with investment advisory or portfolio services under the agreement, except by reason of willful misfeasance, bad faith or gross negligence on the part of Artisan Partners in the performance of its duties or from reckless disregard by Artisan Partners of its obligations and duties under the Advisory Agreement. Each Agreement will terminate automatically in the event of its assignment (as defined in the 1940 Act).
The directors of Artisan Funds held a special meeting of the board on October 19th and 20th, 2005 (the “October Special Meeting”), at which meeting they gave preliminary consideration to information bearing on continuation of the Advisory Agreement for each Fund other than Opportunistic Value Fund for the period from December 1, 2005 through November 30, 2006. The board considered the Advisory Agreement for Opportunistic Value Fund, a new series of Artisan Funds that began investment operations on March 27, 2006, at a meeting on February 9, 2006. The primary purpose of the October Special Meeting was to ensure that the directors had ample opportunity to consider matters they deemed relevant in considering the continuation of the Advisory Agreements, and to request any additional information they considered reasonably necessary to their deliberations, without undue time constraints.
The independent directors of Artisan Funds next met in executive session on November 16, 2005 with their independent counsel to further consider the matters reviewed at the October Special Meeting and to reach certain conclusions in connection with the review and approval of the Advisory Agreements. The full board then met at a regular meeting on November 17, 2005, at which time the board unanimously approved the continuation of each Advisory Agreement, except the Advisory Agreement for Opportunistic Value Fund, from December 1, 2005 to November 30, 2006 and an amendment to the Advisory Agreement for International Fund to add an additional
78
SEVENTY-EIGHT
FACTORS CONSIDERED IN RENEWING THE FUNDS’ ADVISORY CONTRACTS
breakpoint as discussed below. At a regularly scheduled meeting on February 9, 2006, the independent directors met in executive session to consider the Advisory Agreement for Opportunistic Value Fund. At that meeting, the full board unanimously approved Opportunistic Value Fund’s Advisory Agreement.
Prior to the October Special Meeting, independent counsel to the independent directors sent to Artisan Partners a request for information to be provided to the directors in connection with their consideration of the continuation of the Advisory Agreements. Artisan Partners provided materials to the directors that included responses to that request, other information Artisan Partners believed was useful in evaluating the continuation of the Advisory Agreements and reports prepared by Lipper Inc. (“Lipper”), an independent source of investment company data, relating to each Fund’s performance and expenses compared to the performance and expenses of a relatively small peer group and a larger peer universe of funds determined by Lipper to be comparable. Artisan Partners also provided additional reports prepared by Lipper comparing certain of the Funds’ performance and expenses to different peer groups and peer universes that Artisan Partners believed were more appropriate for comparative purposes than the peer groups and peer universes selected by Lipper. The directors also received and reviewed a memorandum from their independent counsel regarding the directors’ responsibilities in evaluating the Funds’ investment advisory agreements. Prior to the February 9, 2006 meeting to consider the Advisory Agreement for Opportunistic Value Fund, Artisan Partners provided similar materials to the directors regarding that Fund, including reports prepared by Lipper showing advisory fees and expense ratios for a peer group of funds selected by Lipper compared to the proposed advisory fee and estimated expense ratio for Opportunistic Value Fund.
In evaluating the Advisory Agreements, the directors reviewed the available information and discussed with representatives of Artisan Partners each Fund’s operations, the nature, extent and quality of the advisory and other services provided by Artisan Partners to the Funds, the overall expense ratios of each class of shares of the Funds, and economies of scale and other benefits derived by Artisan Partners from its relationship with the Funds. In addition to the third party reports by Lipper and the memorandum from independent counsel, the directors reviewed information concerning the following:
| • | | The services performed by Artisan Partners for the Funds, including: a list of services performed by Artisan Partners; Artisan Partners’ responsibility for making investment decisions and for observing investment objectives, policies and restrictions of each Artisan Fund; |
| • | | The terms of each Advisory Agreement, including standard of care and termination provisions; |
| • | | Artisan Partners’ personnel and operations, including: the number and organization of Artisan Partners’ employees; the education and experience of Artisan Partners’ investment personnel; Artisan Partners’ assessment of its ability to attract and retain capable investment and business professionals and recent hiring and retention information; Artisan Partners’ research and decision-making processes; policies relating to the assignment of personnel to the various Artisan Funds portfolios; the compensation of Artisan Partners’ personnel with primary responsibility for managing Artisan Funds; the time and attention of Artisan Partners’ personnel devoted to the Funds; and the adequacy and sophistication of Artisan Partners’ technology and systems with respect to investment and administrative matters; |
79
SEVENTY-NINE
FACTORS CONSIDERED IN RENEWING THE FUNDS’ ADVISORY CONTRACTS
| • | | With the exception of Opportunistic Value Fund, which had not yet begun investment operations prior to the approval of its Advisory Agreement, each Fund’s short- and long-term investment performance, including a comparison for various time periods with (1) other Artisan Partners client accounts managed in the same investment strategy, (2) other mutual funds having similar investment objectives, and (3) appropriate market indices; |
| • | | Potential for conflicts of interest between the Funds and Artisan Partners and circumstances and actions addressing or bearing on potential conflicts of interest, including: the type and number of other clients served by Artisan Partners in each of its investment strategies; the basis of sharing personnel, services, research and advice among clients; the basis of decisions by Artisan Partners to buy or sell securities for Artisan Funds and other clients; Artisan Partners’ methodology of allocating investment opportunities, including initial public offerings, among Artisan Funds and other clients; potential advantages and disadvantages in having an investment adviser that has other clients; Artisan Partners’ own investments and possible conflicts with Artisan Funds; Artisan Partners’ code of ethics, including policies relating to personal securities transactions of employees; and litigation and regulatory matters; |
| • | | Potential “fall-out” benefits gained by Artisan Partners or its affiliates and by the Funds from their relationship, including: benefits to Artisan Partners in attracting and retaining other clients and the method of estimating other benefits to Artisan Partners; |
| • | | Brokerage and portfolio transactions, including: the standards and performance in seeking best execution; allocation of soft dollars for research products and services; Artisan Partners’ practices in light of SEC guidance under Section 28(e) of the Securities Exchange Act of 1934; research purchased with Artisan Partners’ funds; portfolio turnover rates; use of brokers who sell Artisan Funds and steps taken to comply with applicable rules; and other benefits from the allocation of brokerage; |
| • | | The advisory fees charged, including: the method of computing fees; recognition of economies of scale through breakpoints in the fees; the frequency of the payment of fees; a comparison of the fees charged by Artisan Partners to the Funds with the fees charged by Artisan Partners to other accounts managed by Artisan Partners in the same investment strategies, including other mutual funds for which Artisan Partners provides sub-advisory services; a comparison of the fees charged by Artisan Partners to the Funds with the management fees charged by other investment advisers for managing mutual funds with similar investment objectives and strategies; and potential cost savings by Artisan Partners, incentives to effect savings and the sharing of savings with Artisan Funds; |
| • | | The effect of advisory and other fees on the Funds’ total expenses, including: comparisons of expenses and expense ratios with those of other mutual funds, taking into account comparability factors such as size, account-level charges and investment objective; voluntary expense limitations or reductions and relationship of expenses to expense limitation; the allocation of certain expenses between Artisan Partners, Distributor and Artisan Funds; and fees paid to service providers other than Artisan Partners, including custodial, transfer agent and shareholder servicing fees; |
| • | | The financial condition and stability of Artisan Partners; and |
| • | | The profitability to Artisan Partners of its relationship with each Fund, except Opportunistic Value Fund, which had not yet begun investment operations prior to the approval of its Advisory Agreement, including the methods of allocating expenses in compiling financial results for Artisan Partners and the effect that different methods would have on the profitability of Artisan Partners. |
80
EIGHTY
FACTORS CONSIDERED IN RENEWING THE FUNDS’ ADVISORY CONTRACTS
At the end of the October Special Meeting after discussion and consideration of the information presented, the independent directors met in executive session with their independent counsel and subsequently requested additional supplemental material concerning the funds for which Artisan Partners serves as subadviser.
On November 16, 2005, the independent directors then again met separately with their independent counsel to review and discuss relevant information regarding the continuation of the Advisory Agreements and the information presented and discussed at the October Special Meeting. With respect to Opportunistic Value Fund, the independent directors met separately with their independent counsel to review and discuss relevant information regarding the approval of the Fund’s Advisory Agreement on February 9, 2006. In the course of this review process, the independent directors reviewed and discussed the following information:
The nature, extent and quality of Artisan Partners’ services. The independent directors reviewed the nature, extent and the quality of Artisan Partners’ services to the Funds and considered the following:
| • | | Because Artisan Partners’ principal responsibility is management of the Funds’ investment portfolios, the investment performance achieved by Artisan Partners is an important indicator of the quality of the services provided. |
| • | | Besides investment management, Artisan Partners provides the Funds with general administration services, including the preparation of regulatory filings, provides services to certain of the Funds’ shareholders and management of the Funds’ relationships with its third party service providers, including its custodian, fund accounting agent, transfer agent, lawyers and auditors. |
| • | | The quality of Artisan Partners’ services to the Funds in absolute terms and relative to mutual fund industry standards. |
| • | | The sufficiency and quality of Artisan Partners personnel. |
| • | | Artisan Partners’ financial condition. |
The investment performance of each Fund. The independent directors reviewed for each Fund (except Opportunistic Value Fund, which had not yet begun investment operations) for periods ended June 30, 2005, short-term and long-term investment performance compared to broad-based and style specific market indexes, performance for the period January 1, 2005 through September 30, 2005 compared to the same indexes, Morningstar ratingsTM (for those Funds rated by Morningstar) and Lipper rankings. The directors concluded that the overall investment performance of each Fund has been good to excellent and that shorter-term performance of the International Equity and Mid Cap Equity Funds was not evidence of any meaningful departure from such overall performance. In reaching that conclusion, the independent directors considered the following:
| • | | Each of the Funds invests in a predominantly value-oriented or growth-oriented investment style. |
| • | | Because of each Fund’s style specific investment strategy, the investment performance of each Fund and, in particular, its performance compared to a broad based market index is affected by the relative performance of growth-oriented stocks and value-oriented stocks in the market overall. |
81
EIGHTY-ONE
FACTORS CONSIDERED IN RENEWING THE FUNDS’ ADVISORY CONTRACTS
| • | | The broad based and style specific benchmark indexes against which Fund performance is compared show significant variances in recent years, and under that environment, predominantly value oriented funds have operated under more favorable market conditions when compared to the broader market and to more growth oriented funds, and predominantly growth oriented funds operated under less favorable conditions when compared to the broader market and to more value oriented funds. |
| • | | A fund’s relative performance in the Lipper performance universe may be significantly influenced by the category in which Lipper places the fund. |
| • | | The performance of each Fund, without taking expenses into account, was consistent with the performance, before expenses, of other accounts managed by Artisan Partners in the same investment strategy. |
Cost of services, economies of scale and benefits derived by Artisan Partners. The directors reviewed the overall expense ratio of each class of shares of each Fund in comparison to the expense ratios of its peers in relation to the nature and quality of services provided and in relation to the fees Artisan Partners charges its other clients who have similar investment strategies and objectives (but to whom Artisan Partners generally provides few or no services other than portfolio management). The directors also considered whether shareholders of the Funds have benefited or will benefit from economies of scale under the management fee structures in the Advisory Agreements, including the fact that since International Small Cap Fund closed at a relatively low asset level, Artisan Partners is not likely to enjoy economies of scale in its management. In their review, the independent directors considered the following:
| • | | The rates of fee paid by each Fund to Artisan Partners have been stable, but the aggregate dollar amounts of the fees paid have increased as the Funds have grown. In return for its services, each Fund, other than International Small Cap Fund and Opportunistic Value Fund, pays Artisan Partners a monthly fee at the annual rate of 1% of the Fund’s average daily net assets up to $500 million; 0.975 of 1% of the next $250 million; 0.950 of 1% of the next $250 million; and 0.925 of 1% of average daily net assets over $1 billion. International Small Cap Fund pays Artisan Partners a monthly fee at the annual rate of 1.25% of the Fund’s average daily net assets. Under the proposed fee schedule for Opportunistic Value Fund, the Fund would pay Artisan Partners a monthly fee at the annual rate of 0.900 of 1% of the Fund’s average daily net assets up to $1 billion; 0.875 of 1% on the next $3 billion; 0.850 of 1% on the next $4 billion; 0.825 of 1% on the next $4 billion; and 0.800 of 1% of average daily net assets over $12 billion. |
| • | | That an additional breakpoint had been proposed by Artisan Partners for International Fund whereby the Fund would pay 0.900 of 1% of the Fund’s average daily net assets over $12 billion. |
| • | | Artisan Partners has voluntarily agreed to reimburse the expenses of Opportunistic Value Fund to the extent they exceeded 1.5% of the Fund’s average daily net assets annually. |
Other benefits derived by the Funds or Artisan Partners. The independent directors then reviewed the potential benefits that Artisan Partners may derive as a result of its relationship with the Funds, other than the services provided by Artisan Partners pursuant to the Advisory Agreements and the management fees paid in return. For Artisan Partners, the directors considered two potential benefits to Artisan Partners: (1) the potential conversion of a Fund shareholder to a separate account client; and (2) the acquisition of research products and services in return for commissions (“soft dollars”). The independent directors noted that, although Artisan Partners
82
EIGHTY-TWO
FACTORS CONSIDERED IN RENEWING THE FUNDS’ ADVISORY CONTRACTS
derives or may derive those additional benefits, the Funds also benefit in similar fashion. In reaching those conclusions, the directors considered the following:
| • | | Artisan Partners does not solicit the Funds’ shareholders to become separate account clients nor to purchase other goods or services provided by Artisan Partners or its affiliates. Artisan Partners refers potential separate account clients that do not meet Artisan Partners’ minimum separate account size requirements to the Funds. |
| • | | Artisan Partners utilizes third-party research products and services and proprietary research from executing brokers paid for with soft dollars paid by the Funds and by other clients of Artisan Partners. Artisan Partners’ use of soft dollars provides Artisan Partners, and thereby the Funds, with access to third party and proprietary research and also helps Artisan Partners maintain important and open relationships with brokers. Use of a Fund’s commissions for soft dollar purposes is on the same terms as every other client account managed by Artisan Partners in the same investment strategy. |
The directors concluded their annual Investment Advisory Agreement contract review at a regularly scheduled meeting on November 17, 2005. At the November 17th meeting, the independent directors and counsel to the independent directors reviewed with the full board the information discussed at the November 16th meeting. The directors then considered whether any further discussion or review was necessary, concluding that the October Special Meeting and the information reviewed by the independent directors at the November 16th meeting provided a strong basis for considering the continuation of the Advisory Agreements for each Fund other than Opportunistic Value Fund. With respect to Opportunistic Value Fund, at the regularly scheduled meeting on February 9, 2006, the board concluded that the information provided and reviewed prior to and during that meeting and during the meeting of the independent directors with counsel to the independent directors provided a strong basis for consideration of the initial approval of the Advisory Agreement for that Fund. The directors reviewed and affirmed each of the following conclusions:
The nature, extent and quality of Artisan Partners’ services. The directors concluded that the nature and extent of Artisan Partners’ services provided to the Funds (and, in the case of Opportunistic Value Fund, expected to be provided) was appropriate and consistent with, and in some cases more advantageous to the Funds than, the terms of the Advisory Agreements. The directors concluded that the quality of Artisan Partners’ services has been excellent and consistent, with no material deficiencies.
The investment performance of each Fund. The directors concluded that the long-term investment performance of each Fund has been good to excellent. The directors concluded that while Opportunistic Value Fund had not yet begun investment operations and had no performance history, the Fund’s proposed investment management team had produced very positive results for Small Cap Value Fund and Mid Cap Value Fund.
Cost of services, economies of scale and benefits derived by Artisan Partners. The directors concluded that the overall expense ratio of each class of shares of each Fund was within an acceptable range of, and often more favorable than, the expense ratios of its peers. The directors concluded that the fees each Fund pays to Artisan Partners (and Artisan Partners’ corresponding profits, other than with respect to Opportunistic Value Fund which had not yet begun investment
83
EIGHTY-THREE
FACTORS CONSIDERED IN RENEWING THE FUNDS’ ADVISORY CONTRACTS
operations) are reasonable in relation to the nature and quality of services provided and in relation to the fees Artisan Partners charges its other clients who have similar investment strategies and objectives (but to whom Artisan Partners generally provides few or no services other than portfolio management). The directors concluded that the overall estimated expense ratio of Opportunistic Value Fund (after giving effect to Artisan Partners’ undertaking to reimburse the Fund for ordinary operating expenses in excess of 1.5% of the Fund’s average net assets annually) was within an acceptable range of the expense ratios of a peer group of funds selected by Lipper. The directors also concluded that shareholders of the Funds (except for International Small Cap Fund) have benefited or will benefit from economies of scale under the management fee structures in the Advisory Agreements, especially noting the new breakpoint proposed for International Fund, and that, because International Small Cap Fund closed at such a small asset level, Artisan Partners is not likely to enjoy economies of scale in its management.
Other benefits derived by the Funds or Artisan Partners. The directors concluded that, other than the services provided by Artisan Partners pursuant to the Advisory Agreements and the management fees paid in return, the Funds and Artisan Partners may potentially benefit from their relationship with each other in several ways. For Artisan Partners, the directors concluded there were two principal benefits: (1) the potential conversion of a Fund shareholder to a separate account client; and (2) the acquisition of research products and services in return for commissions (“soft dollars”). The directors concluded that, although Artisan Partners derives or may derive those additional benefits, the Funds also could benefit from conversions of separate account holdings to fund holdings and did benefit from Artisan Partners’ use of soft dollars with respect to its separate account clients.
At the meeting on November 17, 2005, the board approved by the unanimous vote of all directors and also by the unanimous vote of all the “non-interested” directors, the continuation of the Advisory Agreements for each Fund other than Opportunistic Value Fund through November 30, 2006, including with respect to the International Fund, as amended to add the additional breakpoint discussed above. At the meeting on February 9, 2006, the board approved by the unanimous vote of all directors and also by the unanimous vote of all the “non-interested” directors, the Advisory Agreement for Opportunistic Value Fund through November 30, 2007.
84
EIGHTY-FOUR
NOTES ON MANAGEMENT’S DISCUSSION OF FUND PERFORMANCE
The discussions of each Fund included in this report include statistical information about the portfolios of each of the Funds. Except as otherwise noted, that information is as of March 31, 2006 and that information will vary with changes in a Fund’s portfolio investments. The performance information for each Fund relative to its benchmark index discussed in this Report was prepared by the Adviser using information reported by FactSet Databases (“FactSet”). For the purposes of assigning portfolio securities to a particular country, the Adviser considers an issuer to be from a particular country as designated by its securities information vendors. The Adviser currently uses MSCI as its primary source and FactSet as a secondary source for this information. As a result, Artisan Mid Cap Fund, Artisan Mid Cap Value Fund, Artisan Opportunistic Value Fund, Artisan Small Cap Fund and Artisan Small Cap Value Fund routinely hold securities of issuers organized outside the U.S., but with their primary trading markets in the U.S. In addition, those Funds may hold a limited number of non-U.S. securities that are traded in the U.S., directly or as ADRs. Also based on the designations of the securities information vendors, Artisan International Fund, Artisan International Small Cap Fund and Artisan International Value Fund routinely hold securities of issuers organized within the U.S. and/or issuers with their primary trading markets in the U.S. In the event (i) the Adviser’s securities information vendors do not assign a security to a particular country, or (ii) its primary vendor does not assign a security to a particular country and the secondary vendor has assigned a security to a particular country by using a methodology that is not the same as the methodology the primary vendor uses to assign a country, the Adviser assigns the security to a country using the primary vendor’s published criteria (to the extent available) or the Adviser’s own judgment. The primary information vendor’s criteria include the identity of the jurisdiction of the issuer’s incorporation, the main equity trading market for the issuer’s securities, the geographical distribution of the issuer’s operations and the location of the issuer’s headquarters.
For the purposes of assigning portfolio securities to a particular sector and industry, Artisan Mid Cap Fund, Artisan Mid Cap Value Fund, Artisan Opportunistic Value Fund, Artisan Small Cap Fund and Artisan Small Cap Value Fund assign securities in accordance with the sector and industry classifications provided by The Frank Russell Company (to the extent available). Artisan International Fund, Artisan International Small Cap Fund and Artisan International Value Fund assign securities for these purposes in accordance with the sector and industry classifications provided by MSCI (to the extent available).
Definitions of Portfolio Statistics
Median Market Cap provides a measure of the market capitalization value of the companies in a portfolio. Market capitalization is the aggregate value of all a company’s outstanding common stock. Market capitalization is calculated by FactSet using the price as of the most recent month-end multiplied by the number of shares outstanding as shown in the financial statements of the issuer. Equal numbers of companies in the portfolio have market capitalizations higher and lower than the median. Weighted Average Market Cap is the average of the market capitalizations of the companies in the portfolio weighted by the size of each company’s position within the portfolio. P/B Ratio is a ratio used to compare a stock’s market value to its book value. Book value is a company’s assets minus its liabilities. P/E Ratio is a valuation ratio of a company’s current share price compared to its per-share earnings used to measure of how expensive a stock is.
Descriptions of Indices
Each Fund’s performance is compared in this report to changes in one or more indices, including in all cases a broad-based index of changes in prices of securities in the market in which the Fund
85
EIGHTY-FIVE
NOTES ON MANAGEMENT’S DISCUSSION OF FUND PERFORMANCE
invests. All of the indices are unmanaged and their returns include reinvested dividends. Unlike the Funds’ returns, the returns of each index do not include the payment of sales commissions or other expenses that would be incurred in the purchase or sale of the securities included in that index. An investment cannot be made directly in an index.
The indices to which the Funds are compared are:
Artisan International, Artisan International Small Cap and Artisan International Value Funds – Morgan Stanley Capital International EAFE® Index (MSCI EAFE®) is a market-weighted index of companies in developed markets, excluding the U.S. and Canada. MSCI EAFE’s average annual return since inception of the International Fund is based upon a starting date of December 31, 1995.
Artisan International Fund – Morgan Stanley Capital International EAFE® Growth Index (MSCI EAFE® Growth) is a market-weighted index of companies in developed markets, excluding the U.S. and Canada, with higher price-to-book ratios. MSCI EAFE Growth’s average annual return since inception of the International Fund is based upon a starting date of December 31, 1995.
Artisan International Small Cap Fund – Morgan Stanley Capital International EAFE® Small Cap Index (MSCI EAFE® Small Cap) is a market-weighted index of small companies in developed markets, excluding the U.S. and Canada.
Artisan International Value Fund – Morgan Stanley Capital International EAFE® Value Index (MSCI EAFE® Value) is a market-weighted index of companies in developed markets, excluding the U.S. and Canada, with lower price-to-book ratios.
Artisan Mid Cap Fund – Russell Midcap® Index is a market-weighted index of about 800 medium-sized U.S. companies. The Russell Midcap® Growth Index is a market-weighted index of those medium-sized companies included in the Russell Midcap® Index with higher price-to-book ratios and higher forecasted growth values. The Russell Top 200® Index is a market-weighted index of 200 of the largest U.S. companies.
Artisan Mid Cap Value Fund – Russell Midcap® Index is a market-weighted index of about 800 medium-sized U.S. companies. The Russell Midcap® Value Index is a market-weighted index of those medium-sized companies included in the Russell Midcap® Index with lower price-to-book ratios and lower forecasted growth values.
Artisan Opportunistic Value Fund – Russell 1000® Index is a market-weighted index of about 1,000 large U.S. companies. The Russell 1000® Value Index is a market-weighted index of those large companies included in the Russell 1000® Index with lower price-to-book ratios and lower forecasted growth values.
Artisan Small Cap Fund – Russell 2000® Index is a market-weighted index of about 2,000 small U.S. companies. The Russell 2000® Growth Index is a market-weighted index of those small companies included in the Russell 2000® Index with higher price-to-book ratios and higher forecasted growth values.
Artisan Small Cap Value Fund – Russell 2000® Index is a market-weighted index of about 2,000 small U.S. companies. The Russell 2000® Value Index is a market-weighted index of those small companies included in the Russell 2000® Index with lower price-to-book ratios and lower forecasted growth values.
86
EIGHTY-SIX
NOTES ON MANAGEMENT’S DISCUSSION OF FUND PERFORMANCE
Trademarks
Trademarks and copyrights relating to the indices and products of portfolio companies mentioned in this report are owned by their respective owners. Except as otherwise indicated, the trademarks, including names, logos, slogans and service marks appearing in this report are the property of the Adviser and may not be copied, reproduced, published or in any way used without written permission.
PROXY VOTING POLICIES AND PROCEDURES
You may obtain a description of Artisan Funds’ proxy voting policies and procedures, without charge, upon request by calling 800.344.1770. That information also is included in Artisan Funds’ statement of additional information, which is available on the Funds’ website at www.artisanfunds.com and the Securities and Exchange Commission’s website at www.sec.gov.
Information relating to how each Artisan Fund voted proxies relating to portfolio securities held during the twelve months ended June 30 is available on the Funds’ website at www.artisanfunds.com and on the Securities and Exchange Commission’s website at www.sec.gov.
INFORMATION ABOUT PORTFOLIO SECURITIES
Artisan Funds files a complete schedule of portfolio holdings with the Securities and Exchange Commission for the quarters ending December 31 and June 30 (the first and third quarters of the Funds’ fiscal year) on Form N-Q. The Funds’ Forms N-Q are available on the Securities and Exchange Commission’s website at www.sec.gov. You may also review and copy those documents by visiting the Securities and Exchange Commission’s Public Reference Room in Washington, D.C. Information on the operation of the Public Reference Room may be obtained by calling the Securities and Exchange Commission at 800.SEC.0330.
87
EIGHTY-SEVEN
| | | | |
 | | ARTISAN FUNDS P.O. BOX 8412 BOSTON, MA 02266-8412 800.344.1770 WWW.ARTISANFUNDS.COM | | |


ARTISAN
SEMIANNUAL
REPORT
MARCH 31, 2006
ARTISAN INTERNATIONAL
FUND
_________
ARTISAN MID CAP FUND
Artisan Funds, Inc.
INSTITUTIONAL SHARES
TABLE OF CONTENTS
ARTISAN FUNDS
P.O. BOX 8412
BOSTON, MA 02266-8412
This report and the unaudited financial statements contained herein are provided for the general information of the shareholders of the Institutional Shares of Artisan International Fund and Artisan Mid Cap Fund. Before investing, investors should consider carefully each Fund’s investment objective, risks and charges and expenses. For more complete information on any Fund, including fees and expenses, please call 800.399.1770 for a free prospectus. Read it carefully before you invest or send money.
Company discussions are for illustration only and are not intended as recommendations of individual stocks. The discussions present information about the companies believed to be accurate, and the views of the portfolio managers, as of March 31, 2006. That information and those views may change, and the Funds disclaim any obligation to advise shareholders of any such changes.
Artisan Funds offered through Artisan Distributors LLC, member NASD.
ARTISAN INTERNATIONAL FUND Institutional shares
| | |
| INVESTMENT PROCESS HIGHLIGHTS | | |
Artisan International Fund uses a fundamental stock selection process focused on identifying long-term growth opportunities. Themes. The investment team’s thematic approach identifies catalysts for change and develops investment themes with the objective of capitalizing on them globally. Changing demographics, developing technology, privatization of economic resources and outsourcing are among the long-term catalysts for change that currently form the basis for the team’s investment themes. The team incorporates these catalysts along with sector and regional fundamentals into a long-term global framework for investment analysis and decision-making. Sustainable Growth. The team applies a fundamental approach to identifying the long- term, sustainable growth characteristics of potential investments. The team seeks high quality companies that are well managed, have a dominant or improving market position and competitive advantages compared to industry and regional peers. Valuation. The team assesses the relationship between its estimate of a company’s sustainable growth prospects and its stock price. The team uses multiple valuation metrics to establish price targets. The Fund primarily invests in non-U.S. growth companies of all market capitalizations in developed and emerging markets. |
| | | |
| PERFORMANCE HISTORY | | |
| |
GROWTH OF AN ASSUMED $10,000 INVESTMENT (7/1/97 to 3/31/06)
AVERAGE ANNUAL TOTAL RETURNS (as of 3/31/06)
| | | | | | | | | | | | |
| Fund / Index | | 1-Year | | | 3-Year | | | 5-Year | | | Since
Inception | |
Artisan International Fund – Institutional Shares | | 29.61 | % | | 31.84 | % | | 9.12 | % | | 12.36 | % |
MSCI EAFE® Growth Index | | 24.59 | | | 27.17 | | | 7.53 | | | 3.22 | |
MSCI EAFE® Index | | 24.41 | | | 31.13 | | | 9.63 | | | 5.78 | |
The performance quoted represents past performance, which does not guarantee future results. The investment return and principal value of an investment in the Fund will fluctuate, so that an investor’s shares in the Fund, when redeemed, may be worth more or less than their original cost. The inception date shown is inception of the Fund’s Institutional Shares. Current performance may be lower or higher than the performance data quoted. For current to most recent month-end performance information or for performance information for periods before inception of the Fund’s Institutional Shares, call 800.399.1770. The graph and table above do not reflect the deduction of taxes that a shareholder would pay on distributions or sale of Fund shares. The performance shown does not reflect the deduction of a 2% redemption fee on shares held by an investor for 90 days or less and, if reflected, the fee would reduce the performance quoted. See page 38 for a description of each index.
1
ONE
INVESTING ENVIRONMENT
The backdrop for international equities during the six months ended March 31, 2006 was quite favorable. In general, the growth of the global economy was strong and inflation remained subdued.
The U.S. dollar moved slightly higher versus a number of currencies during the period. The return of the MSCI EAFE® Index for dollar-based investors was 13.86% compared to the 15.88% local return.
Stocks in the financials, industrials, technology and materials sectors gained more than 20%. The price of oil flirted with $70 per barrel, but energy stocks ended the period slightly behind where they started. Telecommunications stocks also lost ground.
PERFORMANCE DISCUSSION
The Fund’s performance was hurt slightly by the increase in the U.S. dollar, but still gained 16.83% during the period, which compared well to the MSCI EAFE® Index. Good security selection was the primary source of the Fund’s relative advantage. Stock selection was particularly strong within our global financials and energy themes. The performance of the stocks in our consumer and media themes and our lack of investment in materials stocks hurt our return compared to the Index.
In our global financials theme, we experienced strong gains in many of our holdings. Three of the leading contributors were Japanese real estate and leasing company ORIX Corporation, Korean bank Kookmin Bank and German bank Commerzbank AG. Their stock prices increased roughly 72%, 46% and 46%, respectively.
In Japan, bank lending started to pick up, employment and wages were in a rising trend and the country seemed poised to end its bout with deflation. All of those factors helped support Japanese stocks in general. During the period, ORIX announced a nearly 50% increase in its full-year profit forecast and its leasing and lending businesses expanded while costs declined. Japanese financial companies Mizuho Financial Group, Inc. and Credit Saison Co., Ltd., also performed well.
Late in the period, Kookmin Bank announced that it was the preferred bidder for Korea Exchange Bank (KEB). The combined company is expected to have a large share of the total loan market in Korea, and should produce long-term cost and revenue synergies. Since the deal is expected to be additive to earnings, the news was well-received by the market. Prior to that announcement, Kookmin and our other Korean banks, Shinhan Financial Group Co., Ltd. and Hana Financial Group Inc. (formerly Hana Bank), were supported by asset quality improvements and reduced levels of non-performing loans.
TOP 10 HOLDINGS
| | | | | |
| Company Name | | Country | | 3/31/06 | |
Credit Saison Co., Ltd. | | Japan | | 3.6 | % |
UBS AG | | Switzerland | | 3.5 | |
ORIX Corp. | | Japan | | 2.7 | |
Fortis | | Netherlands | | 2.7 | |
LUKOIL | | Russia | | 2.7 | |
Sega Sammy Holdings, Inc. | | Japan | | 2.6 | |
Mizuho Financial Group, Inc. | | Japan | | 2.5 | |
Kookmin Bank | | South Korea | | 2.3 | |
Saipem S.p.A. | | Italy | | 2.2 | |
China Mobile (Hong Kong) Limited | | China | | 2.1 | |
Total | | | | 26.9 | % |
As a percentage of total net assets. Top 10 Holdings are determined by issuer.
Two drivers of Commerzbank’s share price performance were optimism about Germany’s economic environment and the company’s announced acquisition of Eurohypo AG. The Eurohypo acquisition was expected to add to earnings, due in part to cost savings. Other winners among our European financials included Swiss global investment services firm UBS AG and Dutch financial services companies Fortis and ING Groep N.V.
During the period, our energy stocks generally performed very well. Within the group, Russian oil producer LUKOIL was the largest contributor to our performance, gaining over 44%. We believe that its above average production rates and proven oil reserves were the reasons it did so well in a tough period for energy stocks. We realized some profits during the period by selling shares into strength, but LUKOIL remained a top ten position as of the end of the period.
2
TWO
Expectations for a surge in capital spending in the energy industry due to tight industry capacity, an aging fleet of rigs and a shortage of offshore rigs contributed to very positive sentiment for energy infrastructure companies. Those factors benefited our positions in Italy-based Saipem S.p.A. and Norwegian driller Acergy S.A. (formerly Stolt Offshore S.A.).
Canadian natural gas provider EnCana Corp. fell roughly 20% during the period, after announcing a drop in profits due to hedging contracts that did not allow the company to participate as much as it could have in the rise of natural gas prices.
SECTOR DIVERSIFICATION
| | | | | | |
| Sector | | 9/30/05 | | | 3/31/06 | |
Consumer Discretionary | | 23.6 | % | | 15.5 | % |
Consumer Staples | | 9.8 | | | 8.7 | |
Energy | | 8.7 | | | 9.3 | |
Financials | | 30.4 | | | 36.5 | |
Healthcare | | 4.1 | | | 4.6 | |
Industrials | | 8.0 | | | 11.1 | |
Information Technology | | 6.8 | | | 5.1 | |
Telecommunication Services | | 6.1 | | | 3.0 | |
Utilities | | 1.2 | | | 5.0 | |
Other assets less liabilities | | 1.3 | | | 1.2 | |
Total | | 100.0 | % | | 100.0 | % |
As a percentage of total net assets.
Two other stocks that positively contributed to the Fund’s return were Siemens AG, a Germany-based conglomerate that manufactures a wide range of industrial and consumer products, and Singapore Airlines Ltd. During the period, Siemens announced the divestment of part of its technology services division, which had been a large drag on earnings. Singapore Airlines benefited from the strength of economic growth in the Far East and its relatively low exposure to competition from discount airlines.
The holdings in our consumer and media themes performed reasonably well, but their returns did not keep pace with similar holdings in the MSCI EAFE® Index. U.K. cruise operator Carnival PLC and Japanese cable and Internet service provider Jupiter Telecommunications Co., Ltd. were two stocks that underperformed. Carnival was hurt by concerns about slower bookings and a reduced earnings forecast. Jupiter Telecom fell in part due to concerns about competition from satellite providers and the potential for higher costs and a decline in profitability.
FUND CHANGES
We sold several securities in our consumer, media and communications themes during the period, while we made a number of new purchases in our energy and financials themes.
We pared back our communications theme because we became more concerned about competition due to the convergence of the various communications platforms. Among the stocks we sold were Telefonaktiebolaget LM Ericsson, Nortel Networks Corporation, Chunghwa Telecom Co., Ltd. and Singapore Telecommunications Limited.
Three of the largest sales in our consumer and media themes were U.K. companies Tesco PLC, a food retailer; British Sky Broadcasting Group PLC, a pay television provider; and ITV PLC, a television broadcaster.
In our energy theme, we added Norwegian driller SeaDrill Ltd. We also extended our energy theme and increased our exposure to the utilities sector. Our attraction to utilities in the medium-term was our belief that those companies could increase revenues at a faster pace than costs. This resulted in larger positions in German power producers RWE AG and E.ON AG and initial investments in Finland-based Fortum Oyj and Russia-based RAO Unified Energy System.
A few of the largest additions in our global financials theme were UniCredito Italiano S.p.A, an Italian bank; Mitsubishi UFJ Financial Group, Inc., a Japanese bank; Barclays PLC, a U.K. bank; Millea Holdings, Inc., a Japanese insurance company; and Wiener Staedtische Allgemeine Versicherung AG, an Austrian insurance company.
REGION ALLOCATION
| | | | | | |
| Region | | 9/30/05 | | | 3/31/06 | |
Europe | | 55.0 | % | | 54.5 | % |
Pacific Basin | | 25.2 | | | 28.6 | |
Emerging Markets | | 15.3 | | | 13.7 | |
Americas | | 3.2 | | | 2.0 | |
As a percentage of total net assets.
3
THREE
ARTISAN MID CAP FUND institutional shares
| | |
| INVESTMENT PROCESS HIGHLIGHTS | | |
Artisan Mid Cap Fund uses a bottom-up investment process to construct a diversified portfolio of U.S. mid-cap growth companies. Security Selection. The team’s investment process begins by identifying companies that possess franchise characteristics (strong competitive positions), selling at attractive valuations and benefiting from an accelerating trend. The investment team looks for companies that are well positioned for long-term growth, driven by demand for their products and services, at an early enough stage in their profit cycle to benefit from the increased cash flows produced by the profit cycle. Capital Allocation. Based on the investment team’s fundamental analysis of a company’s profit cycle, portfolio holdings develop through three stages. GardenSM investments are small positions in the early part of their profit cycle that will warrant a more sizeable allocation once their profit cycle accelerates. CropSM investments are positions that are being increased to a full weight because they are moving through the strongest part of their profit cycle. HarvestSM investments are positions that are being reduced as they near the team’s estimate of full valuation or their profit cycle begins to decelerate. Broad Diversification. The team looks for investment opportunities across the entire economy so that it can find sustainable growth regardless of the sector or industry. The Fund primarily invests in medium-sized U.S. growth companies. The Fund generally maintains median and weighted average market capitalizations of less than $10 billion. |
| | | |
| PERFORMANCE HISTORY | | |
GROWTH OF AN ASSUMED $10,000 INVESTMENT (7/1/00 to 3/31/06)
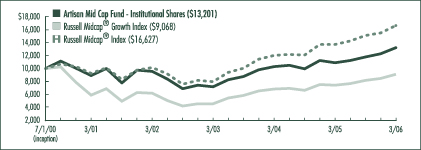
AVERAGE ANNUAL TOTAL RETURNS (as of 3/31/06)
| | | | | | | | | | | | |
| Fund / Index | | 1-Year | | | 3-Year | | | 5-Year | | | Since
Inception | |
Artisan Mid Cap Fund – Institutional Shares | | 21.21 | % | | 22.60 | % | | 8.27 | % | | 4.95 | % |
Russell Midcap® Growth Index | | 22.68 | | | 25.75 | | | 8.99 | | | -1.69 | |
Russell Midcap® Index | | 21.54 | | | 27.87 | | | 12.52 | | | 9.24 | |
The performance quoted represents past performance, which does not guarantee future results. The investment return and principal value of an investment in the Fund will fluctuate, so that an investor’s shares in the Fund, when redeemed, may be worth more or less than their original cost. The inception date shown is inception of the Fund’s Institutional Shares. Current performance may be lower or higher than the performance data quoted. For current to most recent month-end performance information or for performance information for periods before inception of the Fund’s Institutional Shares, call 800.399.1770. The graph and table above do not reflect the deduction of taxes that a shareholder would pay on distributions or sale of Fund shares. See page 38 for a description of each index.
4
FOUR
INVESTING ENVIRONMENT
During the six months ended March 31, 2006, returns generally increased the further you went down the market cap spectrum. The large-cap Russell Top 200® Index gained 5.32%, the Russell Midcap® Index increased 10.14% and the small-cap Russell 2000® Index moved 15.23% higher.
During the period, the Federal Reserve remained on its path to higher interest rates, but the country’s economic performance was generally solid, which was seen in the encouraging sales and profit growth reported by most parts of the economy.
In the Russell Midcap® Index, the best performing sectors were materials, transportation and technology. The energy and utilities sectors were the only groups to post losses, and they were small, at less than 2% each.
PERFORMANCE DISCUSSION
The Fund gained 12.43% during the period, outperforming the Russell Midcap® and Russell Midcap® Growth indices which returned 10.14% and 11.32%, respectively. The main source of our advantage compared to both benchmarks was good security selection. Three areas of particular strength were our healthcare, financial and energy-related stocks, though our performance gains were fairly broad and we had a number of winners in other groups. Relative to the benchmarks, we did not keep pace in the consumer discretionary and technology sectors.
The leading contributor among our healthcare holdings was radiation therapy systems supplier Varian Medical Systems, Inc., the stock price of which increased more than 42%. It reported strong financial results highlighted by impressive growth in orders for the company’s next generation systems in the U.S. and its legacy systems overseas. Drug wholesaler AmerisourceBergen Corporation (ABC) and specialty pharmaceutical company Allergan, Inc. also posted good returns. ABC has been transitioning to a fee-for-services model for drug distribution that has increased cash on hand for share buybacks and debt refinancing. That transition and the strength of its specialty pharmaceutical business supported a strong improvement in earnings. Allergan benefited from the strength of its Botox® brand and expectations for a solid pipeline of new opportunities.
Two of our best performers in the financial sector were student loan outsourcer The First Marblehead Corporation (FMD) and online bill pay software company CheckFree Corporation. FMD extended its relationship with its largest client and announced a sizeable increase in earnings on strong growth in service revenues. CheckFree illustrated the strength of its profit cycle by raising its expectations for future earnings as revenues per transaction increased and e-bill volumes grew.
TOP 10 HOLDINGS
| | | |
| Company Name | | 3/31/06 | |
Smith International, Inc. | | 2.7 | % |
Precision Castparts Corp. | | 2.1 | |
Varian Medical Systems, Inc. | | 2.0 | |
Fisher Scientific International Inc. | | 1.9 | |
Ecolab Inc. | | 1.9 | |
Juniper Networks, Inc. | | 1.8 | |
Electronic Arts Inc. | | 1.8 | |
McDermott International, Inc. | | 1.7 | |
Aon Corporation | | 1.7 | |
Freescale Semiconductor, Inc. | | 1.7 | |
Total | | 19.3 | % |
As a percentage of total net assets. Top 10 Holdings are determined by issuer.
Our energy related investments have generally been centered around those companies that we believed were poised to benefit from a lengthy cycle of renewed global spending on energy development and infrastructure. This positioning helped the portfolio in two ways. First, it kept our allocation to crude producers low and crude producers generally declined during the period. Second, it led us to a number of energy infrastructure providers that outperformed. Smith International, Inc., our largest holding as of March 31, 2006, was one of those stocks. Smith International is a worldwide supplier of products and services to the oil and gas exploration and production industry and is a dominant market player in both drill bits and drilling fluids. It benefited from strong earnings growth, positive expectations for increased spending on
5
FIVE
exploration due to faster depletion rates of existing wells and longer contract terms.
Other energy related holdings that performed well included Cooper Cameron Corporation, a leading manufacturer of pressure control systems, equipment and services for oil and gas drilling and production, and worldwide energy services company McDermott International, Inc. Cooper Cameron reported solid earnings supported by an increase in backlog and strong order flow. McDermott International’s marine construction business was expected to benefit from resurgence in offshore drilling activity, and its power generation business from the potential for tighter emissions standards.
Mining equipment provider Joy Global Inc. and logistics company Expeditors International of Washington, Inc. (EXPD) were part of a list of holdings in other sectors that generated solid returns. As a result of the commodities boom, Joy Global has seen aftermarket orders increase at double-digit rates for almost three years. During the period, it reported strong revenues and earnings while further increasing forward estimates. EXPD also reported earnings ahead of expectations on significantly higher revenues and better profit margins.
Our results in the consumer discretionary sector were negatively impacted by weakness in leading Internet media company Yahoo! Inc. and stock photography company Getty Images, Inc. Our investment in Yahoo! has been based on our belief that the company was positioned well over the long-term to benefit from the transition of advertising dollars from offline media to the Internet. However, competition in its Internet search business put pressure on revenues creating some short-term concerns. Getty has a dominant position in the visual content industry, but it was hurt by a revenue report that disappointed the market. We added to our position in Getty on weakness.
In the technology sector, we had a number of strong performers including Network Appliance, Inc., Jabil Circuit, Inc. and Corning Incorporated. However, our results compared to the benchmarks were negatively impacted by disappointments in stocks such as Juniper Networks, Inc. and Intermec, Inc. Juniper Networks, which makes equipment that directs Internet traffic, was hurt by a revenue forecast that disappointed the market. We purchased additional shares on weakness. Intermec, a leading manufacturer of automatic data capture technologies such as bar code and RFID (radio frequency identification) solutions, was hurt in part by higher operating expenses stemming from RFID marketing. We increased the size of our position.
FUND CHANGES
The healthcare sector fell the most as a percentage of portfolio assets due to sales. Our three largest sales in the area were Aetna Inc., healthcare insurance; Caremark Rx, Inc., pharmacy benefit management; and MedImmune, Inc., a biotechnology company with a focus on respiratory diseases. Other significant sales during the period included payroll processor Paychex, Inc. and cruise operator Royal Caribbean Cruises Ltd.
Five of our largest purchases were Advanced Micro Devices, Inc., one of the largest suppliers of computing processors; Investors Financial Services Corp., which provides an array of complex processing services for mutual funds, investment advisors and banks; Alliance Data Systems Corporation, a transaction processing, credit and marketing services provider; Cooper Industries, Ltd., a global manufacturer of tools and electrical products; and Trimble Navigation Limited, a leading innovator of Global Positioning System technology.
SECTOR DIVERSIFICATION
| | | | | | |
| Sector | | 9/30/05 | | | 3/31/06 | |
Auto & Transportation | | 0.9 | % | | 2.4 | % |
Consumer Discretionary | | 17.8 | | | 19.2 | |
Consumer Staples | | 2.8 | | | 1.3 | |
Financial Services | | 11.3 | | | 12.4 | |
Healthcare | | 19.6 | | | 17.7 | |
Materials & Processing | | 7.0 | | | 7.3 | |
Other | | 3.8 | | | 2.6 | |
Other Energy | | 6.8 | | | 5.8 | |
Producer Durables | | 6.7 | | | 4.9 | |
Technology | | 19.0 | | | 21.9 | |
Utilities | | 1.7 | | | 2.6 | |
Other assets less liabilities | | 2.6 | | | 1.9 | |
Total | | 100.0 | % | | 100.0 | % |
As a percentage of total net assets.
6
SIX
ARTISAN INTERNATIONAL FUND
Schedule of Investments – March 31, 2006 (Unaudited)
| | | | | |
| | | Shares
Held
| | Value
|
| | | | | | |
COMMON AND
PREFERRED STOCKS - 98.8% | | | |
| | | | | | |
| AUSTRIA - 0.7% | | | | | |
Wiener Staedtische Allgemeine Versicherung AG | | 1,390,982 | | $ | 85,968,700 |
| | | | | | |
| BELGIUM - 1.1% | | | | | |
InBev NV | | 2,970,251 | | | 139,300,537 |
| | | | | | |
| BRAZIL - 0.4% | | | | | |
Vivo Participacoes S.A.,
Preferred (ADR)(1) | | 13,530,268 | | | 57,909,547 |
| | | | | | |
| CANADA - 2.0% | | | | | |
EnCana Corporation | | 4,431,500 | | | 206,804,598 |
Research In Motion Limited(1) | | 712,231 | | | 60,454,167 |
Tim Hortons, Inc.(1) | | 116,500 | | | 3,093,075 |
| | | | |
|
|
| | | | | | 270,351,840 |
| CHINA - 2.4% | | | | | |
China Merchants Holdings International Company Limited | | 14,467,600 | | | 41,766,719 |
China Mobile (Hong Kong) Limited | | 54,090,300 | | | 284,074,895 |
| | | | |
|
|
| | | | | | 325,841,614 |
| DENMARK - 0.2% | | | | | |
Vestas Wind Systems A/S(1) | | 911,850 | | | 22,730,354 |
| | | | | | |
| FINLAND - 0.9% | | | | | |
Fortum Oyj | | 4,551,330 | | | 114,833,268 |
| | | | | | |
| FRANCE - 7.3% | | | | | |
Accor S.A. | | 872,454 | | | 50,294,948 |
Alcatel S.A.(1) | | 852,400 | | | 13,191,161 |
Alstom(1) | | 156,781 | | | 13,147,652 |
Axa | | 4,082,265 | | | 143,267,745 |
Carrefour S.A. | | 3,790,879 | | | 201,675,489 |
Electricite de France(1) | | 408,486 | | | 23,167,102 |
LVMH Moet Hennessy Louis Vuitton S.A. | | 1,451,622 | | | 142,315,020 |
PagesJaunes S.A. | | 3,837,345 | | | 107,793,594 |
PPR S.A. | | 1,162,260 | | | 140,355,446 |
Safran S.A. | | 2,716,540 | | | 68,869,425 |
Sanofi-Aventis | | 699,920 | | | 66,583,518 |
| | | | |
|
|
| | | | | | 970,661,100 |
| | | | | |
| | | Shares
Held
| | Value
|
| | | | | | |
| GERMANY - 12.2% | | | | | |
Allianz AG | | 1,433,392 | | $ | 239,331,483 |
Bayerische Motoren Werke (BMW) AG | | 1,964,082 | | | 108,178,805 |
Commerzbank AG | | 4,413,513 | | | 175,859,119 |
Deutsche Lufthansa AG | | 3,023,380 | | | 54,115,529 |
Deutsche Post AG | | 5,677,646 | | | 142,356,557 |
Deutsche Telekom AG | | 1,588,563 | | | 26,797,381 |
E.ON AG | | 1,786,883 | | | 196,642,989 |
Heidelberger Druckmaschinen AG | | 1,142,186 | | | 50,383,333 |
ProSiebenSat.1 Media AG, Preferred | | 3,949,297 | | | 102,897,999 |
RWE AG | | 2,401,340 | | | 209,000,695 |
SAP AG | | 692,479 | | | 150,221,666 |
Siemens AG | | 1,847,512 | | | 172,485,351 |
| | | | |
|
|
| | | | | | 1,628,270,907 |
| HONG KONG - 1.8% | | | | | |
Esprit Holdings Limited | | 2,453,700 | | | 19,100,479 |
MTR Corporation Limited | | 32,839,100 | | | 74,065,362 |
NWS Holdings Limited | | 3,540,200 | | | 6,570,163 |
Sun Hung Kai Properties Limited | | 14,394,400 | | | 146,093,193 |
| | | | |
|
|
| | | | | | 245,829,197 |
| ITALY - 4.8% | | | | | |
Capitalia S.p.A. | | 222,000 | | | 1,845,550 |
Eni S.p.A. | | 4,529,887 | | | 128,894,426 |
Saipem S.p.A. | | 12,807,332 | | | 296,287,460 |
UniCredito Italiano S.p.A. | | 29,943,041 | | | 216,448,723 |
| | | | |
|
|
| | | | | | 643,476,159 |
| JAPAN - 24.2% | | | | | |
Aiful Corporation | | 921,900 | | | 61,016,151 |
Bridgestone Corp. | | 4,786,000 | | | 99,826,933 |
Chugai Pharmaceutical Co., Ltd. | | 7,401,500 | | | 134,258,305 |
Credit Saison Co., Ltd. | | 8,626,000 | | | 477,105,013 |
Japan Tobacco, Inc. | | 37,230 | | | 130,953,441 |
Jupiter Telecommunications Co., Ltd.(1) | | 193,111 | | | 136,506,671 |
Keyence Corp. | | 424,765 | | | 110,431,682 |
Millea Holdings, Inc. | | 6,772 | | | 134,059,133 |
Mitsubishi Estate Co., Ltd. | | 5,299,000 | | | 125,609,261 |
Mitsubishi UFJ Financial Group, Inc. | | 12,875 | | | 196,898,896 |
Mitsui & Co., Ltd. | | 6,778,400 | | | 98,019,004 |
Mitsui Fudosan Co., Ltd. | | 4,692,800 | | | 107,850,671 |
Mizuho Financial Group, Inc. | | 41,219 | | | 337,246,364 |
NTT Data Corp. | | 16,761 | | | 80,600,901 |
ORIX Corp. | | 1,171,050 | | | 364,647,260 |
Sega Sammy Holdings, Inc. | | 8,442,900 | | | 342,880,731 |
SMC Corp. | | 739,900 | | | 115,291,130 |
Sumitomo Mitsui Financial Group, Inc. | | 2,405 | | | 26,563,297 |
Taisei Corporation | | 29,840,800 | | | 142,992,449 |
| | | | |
|
|
| | | | | | 3,222,757,293 |
7
SEVEN
| | | | | |
| | | Shares
Held
| | Value
|
| | | | | | |
| LUXEMBOURG - 0.5% | | | | | |
RTL Group | | 772,286 | | $ | 67,899,137 |
| | | | | | |
| MEXICO - 2.8% | | | | | |
Grupo Televisa S.A. (ADR) | | 11,192,100 | | | 222,722,790 |
Wal-Mart de Mexico S.A. de C.V., Series V(1) | | 54,915,600 | | | 145,341,446 |
| | | | |
|
|
| | | | | | 368,064,236 |
| NETHERLANDS - 6.2% | | | | | |
ASML Holding N.V.(1) | | 10,891,359 | | | 222,397,886 |
ASML Holding N.V., NY Shares(1) | | 1,727,200 | | | 35,183,064 |
Fortis | | 9,971,201 | | | 355,741,025 |
ING Groep N.V. | | 4,751,479 | | | 187,713,319 |
Koninklijke Ahold N.V.(1) | | 3,886,432 | | | 30,566,411 |
| | | | |
|
|
| | | | | | 831,601,705 |
| NORWAY - 1.9% | | | | | |
SeaDrill, Ltd.(1) | | 7,468,800 | | | 102,568,359 |
Stolt Offshore S.A.(1)(2) | | 9,731,700 | | | 152,948,776 |
| | | | |
|
|
| | | | | | 255,517,135 |
| PORTUGAL - 0.8% | | | | | |
Banco Comercial Portugues, S.A. | | 32,161,634 | | | 102,504,405 |
| | | | | | |
| RUSSIA - 3.4% | | | | | |
AFK Sistema (GDR)(3) | | 1,387,877 | | | 33,864,199 |
LUKOIL (ADR) | | 4,246,212 | | | 354,134,081 |
RAO Unified Energy System (GDR) | | 1,013,111 | | | 69,195,481 |
| | | | |
|
|
| | | | | | 457,193,761 |
| SINGAPORE - 2.6% | | | | | |
Keppel Corporation Limited | | 17,634,500 | | | 150,605,626 |
Singapore Airlines Limited | | 22,558,900 | | | 195,454,157 |
| | | | |
|
|
| | | | | | 346,059,783 |
| SOUTH KOREA - 4.7% | | | | | |
Hana Financial Group Inc. | | 2,893,124 | | | 136,973,759 |
Kookmin Bank | | 3,539,065 | | | 305,606,786 |
Shinhan Financial Group Co., Ltd. | | 4,206,700 | | | 188,340,315 |
| | | | |
|
|
| | | | | | 630,920,860 |
| SPAIN - 1.2% | | | | | |
Industria de Diseno Textil, S.A. | | 2,733,417 | | | 105,502,804 |
Promotora de Informaciones, S.A. | | 2,763,982 | | | 51,080,334 |
| | | | |
|
|
| | | | | | 156,583,138 |
| SWITZERLAND - 10.9% | | | | | |
Adecco S.A. | | 2,277,595 | | | 127,275,569 |
Nestle S.A. | | 933,705 | | | 277,178,564 |
Nobel Biocare Holding AG | | 150,022 | | | 33,401,515 |
Novartis AG | | 2,558,895 | | | 142,308,049 |
Roche Holding AG | | 1,408,119 | | | 209,654,354 |
Swiss Re | | 2,731,592 | | | 190,885,614 |
Synthes, Inc. | | 31,784 | | | 3,486,451 |
UBS AG | | 4,247,942 | | | 466,617,033 |
| | | | |
|
|
| | | | | | 1,450,807,149 |
| | | | | | | |
| | | Shares
Held
| | Value
| |
| | | | | | | | |
| UNITED KINGDOM - 5.8% | | | | | | | |
Barclays PLC | | | 8,169,644 | | $ | 95,596,132 | |
Cadbury Schweppes PLC | | | 11,149,819 | | | 110,806,040 | |
Carnival PLC | | | 2,025,544 | | | 99,592,745 | |
Centrica PLC | | | 10,649,823 | | | 52,085,924 | |
Kingfisher PLC | | | 54,631,180 | | | 227,324,208 | |
Smith & Nephew PLC | | | 2,545,850 | | | 22,602,335 | |
William Morrison Supermarkets PLC | | | 39,051,158 | | | 128,910,147 | |
WPP Group PLC | | | 2,884,771 | | | 34,607,850 | |
| | | | | |
|
|
|
| | | | | | | 771,525,381 | |
| | | | | |
|
|
|
Total common and preferred stocks
(Cost $9,364,285,717) | | | 13,166,607,206 | |
| | |
| | | Par
Amount
| | | |
SHORT-TERM INVESTMENTS
(CASH EQUIVALENTS) - 1.3% | | | | |
Repurchase agreement with State Street Bank and Trust Company, 4.50%, dated 3/31/06, due 4/3/06, maturity value $170,906,066, collateralized by $101,510,500 market value Federal Home Loan Mortgage Corporation Note, 5.50%, due 11/16/15, and $72,750,000 market value Federal Home Loan Mortgage Corporation Note, 4.75%, due 1/19/16
(Cost $170,842,000) | | $ | 170,842,000 | | | 170,842,000 | |
| | | | | |
|
|
|
| | | | | | | | |
Total investments - 100.1%
(Cost $9,535,127,717) | | | | | | 13,337,449,206 | |
| | | | | | | | |
Other assets less liabilities - (0.1%) | | | (10,070,598 | ) |
| | | | | |
|
|
|
| | | | | | | | |
Total net assets - 100.0%(4) | | | | | $ | 13,327,378,608 | |
| | | | | |
|
|
|
| (1) | Non-income producing security. |
| (2) | Affiliated company as defined by the Investment Company Act of 1940. See Note (6) in Notes to Financial Statements. |
| (3) | Valued at a fair value in accordance with procedures established by the Board of Directors of Artisan Funds. In total, securities valued at a fair value were $33,864,199 or 0.3% of total net assets. |
| (4) | Percentages for the various classifications relate to total net assets. |
(ADR) American Depository Receipt
(GDR) Global Depository Receipt
8
EIGHT
| | | | | | | |
| PORTFOLIO DIVERSIFICATION - MARCH 31, 2006 (Unaudited) | |
| | | Value
| | | Percentage
| |
Consumer Discretionary | | $ | 2,061,973,569 | | | 15.5 | % |
Consumer Staples | | | 1,164,732,075 | | | 8.7 | |
Energy | | | 1,241,637,700 | | | 9.3 | |
Financials | | | 4,869,788,947 | | | 36.5 | |
Healthcare | | | 612,294,527 | | | 4.6 | |
Industrials | | | 1,476,128,380 | | | 11.1 | |
Information Technology | | | 672,480,527 | | | 5.1 | |
Telecommunication Services | | | 402,646,022 | | | 3.0 | |
Utilities | | | 664,925,459 | | | 5.0 | |
| | |
|
|
| |
|
|
Total common and preferred stocks | | | 13,166,607,206 | | | 98.8 | |
Short-term investments | | | 170,842,000 | | | 1.3 | |
| | |
|
|
| |
|
|
Total investments | | | 13,337,449,206 | | | 100.1 | |
Other assets less liabilities | | | (10,070,598 | ) | | (0.1 | ) |
| | |
|
|
| |
|
|
Total net assets | | $ | 13,327,378,608 | | | 100.0 | % |
| | |
|
|
| |
|
|
| | | | | | |
| CURRENCY EXPOSURE - MARCH 31, 2006 (Unaudited) | |
| | | Value
| | Percentage of
Total Investments
| |
British pound | | $ | 771,525,381 | | 5.8 | % |
Canadian dollar | | | 206,804,598 | | 1.5 | |
Danish krone | | | 22,730,354 | | 0.2 | |
Euro | | | 4,705,915,992 | | 35.3 | |
Hong Kong dollar | | | 571,670,811 | | 4.3 | |
Japanese yen | | | 3,222,757,293 | | 24.2 | |
Mexican peso | | | 145,341,446 | | 1.1 | |
Norwegian krone | | | 255,517,135 | | 1.9 | |
Singapore dollar | | | 346,059,783 | | 2.6 | |
South Korean won | | | 630,920,860 | | 4.7 | |
Swiss franc | | | 1,450,807,149 | | 10.9 | |
US dollar | | | 1,007,398,404 | | 7.5 | |
| | |
|
| |
|
|
Total investments | | $ | 13,337,449,206 | | 100.0 | % |
| | |
|
| |
|
|
The accompanying notes are an integral part of the financial statements.
9
NINE
ARTISAN MID CAP FUND
Schedule of Investments – March 31, 2006 (Unaudited)
| | | | | |
| | | Shares Held
| | Value
|
| | | | | | |
| COMMON STOCKS - 98.1% | | | | | |
| | | | | | |
| AUTO & TRANSPORTATION - 2.4% | | | |
Air Transport - 1.4% | | | | | |
Expeditors International of Washington, Inc. | | 974,500 | | $ | 84,187,055 |
| | | | | | |
Auto Parts: Original Equipment - 0.5% | | | |
BorgWarner Inc. | | 543,000 | | | 32,601,720 |
| | | | | | |
Railroad Equipment - 0.5% | | | | | |
Westinghouse Air Brake Technologies Corporation | | 982,400 | | | 32,026,240 |
| | | | | | |
| CONSUMER DISCRETIONARY - 19.2% | | | |
Advertising Agencies - 0.9% | | | | | |
aQuantive, Inc.(1) | | 777,700 | | | 18,307,058 |
Clear Channel Outdoor
Holdings, Inc.(1) | | 1,633,500 | | | 38,305,575 |
| | | | |
|
|
| | | | | | 56,612,633 |
Consumer Electronics - 4.1% | | | | | |
Electronic Arts Inc.(1) | | 2,035,700 | | | 111,393,504 |
VeriSign, Inc.(1) | | 2,690,100 | | | 64,535,499 |
Yahoo! Inc.(1) | | 2,356,000 | | | 76,004,560 |
| | | | |
|
|
| | | | | | 251,933,563 |
Radio & TV Broadcasters - 0.3% | | | |
XM Satellite Radio Holdings Inc., Class A(1) | | 691,900 | | | 15,408,613 |
| | | | | | |
Restaurants - 1.4% | | | | | |
P.F. Chang’s China Bistro, Inc.(1) | | 800,400 | | | 39,451,716 |
YUM! Brands, Inc. | | 920,600 | | | 44,980,516 |
| | | | |
|
|
| | | | | | 84,432,232 |
Retail - 4.6% | | | | | |
Chico’s FAS, Inc.(1) | | 1,889,468 | | | 76,787,979 |
Dick’s Sporting Goods, Inc.(1) | | 340,000 | | | 13,487,800 |
Kohl’s Corporation(1) | | 1,653,200 | | | 87,636,132 |
Office Depot, Inc.(1) | | 1,239,500 | | | 46,158,980 |
The TJX Companies, Inc. | | 1,812,700 | | | 44,991,214 |
Urban Outfitters, Inc.(1) | | 642,200 | | | 15,759,588 |
| | | | |
|
|
| | | | | | 284,821,693 |
| | | | | |
| | | Shares Held
| | Value
|
| | | | | | |
| CONSUMER DISCRETIONARY (CONTINUED) | | | |
Services: Commercial - 6.4% | | | | | |
ChoicePoint Inc.(1) | | 337,700 | | $ | 15,112,075 |
Getty Images, Inc.(1) | | 1,253,600 | | | 93,869,568 |
Hewitt Associates, Inc., Class A(1) | | 2,275,000 | | | 67,658,500 |
Iron Mountain Incorporated(1) | | 1,885,800 | | | 76,827,492 |
NutriSystem, Inc.(1) | | 366,900 | | | 17,435,088 |
Resources Connection, Inc.(1) | | 959,200 | | | 23,893,672 |
Robert Half International Inc. | | 2,671,105 | | | 103,131,364 |
| | | | |
|
|
| | | | | | 397,927,759 |
Textiles Apparel Manufacturers - 0.8% | | | |
Polo Ralph Lauren Corporation, Class A | | 855,700 | | | 51,863,977 |
| | | | | | |
Toys - 0.7% | | | | | |
Marvel Entertainment, Inc.(1)(2) | | 2,280,400 | | | 45,881,648 |
| | | | | | |
| CONSUMER STAPLES - 1.3% | | | | | |
Beverage: Brewers (Wineries) - 1.3% | | | |
Constellation Brands, Inc., Class A(1) | | 3,246,900 | | | 81,334,845 |
| | | | | | |
| FINANCIAL SERVICES - 12.4% | | | | | |
Banks: Outside New York City - 2.4% | | | |
Investors Financial Services Corp. | | 1,392,100 | | | 65,247,727 |
Northern Trust Corporation | | 1,596,500 | | | 83,816,250 |
| | | | |
|
|
| | | | | | 149,063,977 |
Diversified Financial Services - 0.7% | | | |
CB Richard Ellis Group, Inc.(1) | | 563,400 | | | 45,466,380 |
| | | | | | |
Finance: Small Loan - 0.9% | | | | | |
The First Marblehead Corporation | | 1,244,900 | | | 53,841,925 |
| | | | | | |
Financial Data Processing Services & Systems - 2.4% | | | | | |
Alliance Data Systems Corporation(1) | | 1,335,900 | | | 62,480,043 |
CheckFree Corporation(1) | | 1,674,900 | | | 84,582,450 |
| | | | |
|
|
| | | | | | 147,062,493 |
Financial Information Services - 0.7% | | | |
Equifax Inc. | | 1,225,000 | | | 45,619,000 |
| | | | | | |
Financial Miscellaneous - 2.1% | | | |
MGIC Investment Corporation | | 1,346,400 | | | 89,710,632 |
Willis Group Holdings Limited | | 1,070,100 | | | 36,661,626 |
| | | | |
|
|
| | | | | | 126,372,258 |
10
TEN
| | | | | |
| | | Shares Held
| | Value
|
| | | | | | |
| FINANCIAL SERVICES (CONTINUED) | | | |
Insurance: Multi-Line - 1.8% | | | | | |
Aon Corporation | | 2,597,500 | | $ | 107,822,225 |
| | | | | | |
Savings & Loan - 0.5% | | | | | |
Golden West Financial Corporation | | 478,000 | | | 32,456,200 |
| | | | | | |
Securities Brokerage & Services - 0.9% | | | | | |
The Bear Stearns Companies Inc. | | 270,700 | | | 37,546,090 |
Lazard Ltd, Class A | | 345,600 | | | 15,292,800 |
| | | | |
|
|
| | | | | | 52,838,890 |
| HEALTHCARE - 17.7% | | | | | |
Biotechnology Research & Production - 4.1% | | | | | |
Celgene Corporation(1) | | 825,200 | | | 36,490,344 |
Genzyme Corporation(1) | | 1,166,000 | | | 78,378,520 |
Invitrogen Corporation(1) | | 392,000 | | | 27,490,960 |
Millipore Corporation(1) | | 778,900 | | | 56,906,434 |
Neurocrine Biosciences, Inc.(1) | | 486,900 | | | 31,424,526 |
PDL BioPharma, Inc.(1) | | 531,300 | | | 17,426,640 |
Threshold Pharmaceuticals, Inc.(1) | | 312,500 | | | 4,684,375 |
| | | | |
|
|
| | | | | | 252,801,799 |
Drugs & Pharmaceuticals - 4.4% | | | |
Allergan, Inc. | | 930,300 | | | 100,937,550 |
AmerisourceBergen Corporation | | 1,632,500 | | | 78,800,775 |
Forest Laboratories, Inc.(1) | | 1,000,200 | | | 44,638,926 |
Shire PLC (ADR)(3) | | 987,300 | | | 45,899,577 |
| | | | |
|
|
| | | | | | 270,276,828 |
Electronics: Medical Systems - 2.4% | | | |
Intuitive Surgical, Inc.(1) | | 206,900 | | | 24,414,200 |
Varian Medical Systems, Inc.(1) | | 2,211,500 | | | 124,197,840 |
| | | | |
|
|
| | | | | | 148,612,040 |
Health Care Facilities - 0.6% | | | | | |
Laboratory Corporation of America Holdings(1) | | 576,400 | | | 33,707,872 |
| | | | | | |
Health Care Management Services - 1.4% | | | | | |
Cerner Corporation(1) | | 1,795,500 | | | 85,196,475 |
| | | | | | |
Medical & Dental
Instruments & Supplies - 3.3% | | | |
Fisher Scientific International Inc.(1) | | 1,751,900 | | | 119,216,795 |
Gen-Probe Incorporated(1) | | 917,400 | | | 50,567,088 |
St. Jude Medical, Inc.(1) | | 657,400 | | | 26,953,400 |
Ventana Medical Systems, Inc.(1) | | 159,800 | | | 6,674,846 |
| | | | |
|
|
| | | | | | 203,412,129 |
Medical Services - 1.5% | | | | | |
Coventry Health Care, Inc.(1) | | 1,736,450 | | | 93,733,571 |
| | | | | | |
| | | | | |
| | | Shares Held
| | Value
|
| | | | | | |
| MATERIALS & PROCESSING - 7.3% | | | |
Agriculture Fishing & Ranching - 0.6% | | | |
Bunge Limited | | 709,800 | | $ | 39,542,958 |
| | | | | | |
Chemicals - 1.9% | | | | | |
Ecolab Inc. | | 3,070,200 | | | 117,281,640 |
| | | | | | |
Diversified Materials & Processing - 0.8% | | | | | |
American Standard Companies Inc. | | 1,162,400 | | | 49,820,464 |
| | | | | | |
Engineering & Contracting Services - 0.6% | | | | | |
Quanta Services, Inc.(1) | | 2,401,400 | | | 38,470,428 |
| | | | | | |
Metal Fabricating - 2.1% | | | | | |
Precision Castparts Corp. | | 2,181,100 | | | 129,557,340 |
| | | | | | |
Real Estate - 1.3% | | | | | |
The St. Joe Company | | 1,262,900 | | | 79,360,636 |
| | | | | | |
| OTHER - 2.6% | | | | | |
Multi-Sector Companies - 2.6% | | | |
ITT Industries, Inc. | | 924,800 | | | 51,992,256 |
McDermott International, Inc.(1) | | 1,982,400 | | | 107,941,680 |
| | | | |
|
|
| | | | | | 159,933,936 |
| OTHER ENERGY - 5.8% | | | | | |
Coal - 1.8% | | | | | |
CONSOL Energy Inc. | | 859,300 | | | 63,725,688 |
Peabody Energy Corporation | | 966,900 | | | 48,741,429 |
| | | | |
|
|
| | | | | | 112,467,117 |
Machinery: Oil Well
Equipment & Services - 4.0% | | | |
Cooper Cameron Corporation(1) | | 1,920,600 | | | 84,660,048 |
Smith International, Inc. | | 4,234,000 | | | 164,956,640 |
| | | | |
|
|
| | | | | | 249,616,688 |
| PRODUCER DURABLES - 4.9% | | | | | |
Diversified Production - 1.1% | | | |
Danaher Corporation | | 1,107,100 | | | 70,356,205 |
| | | | | | |
Electrical Equipment & Components - 0.9% | | | | | |
Cooper Industries, Ltd., Class A | | 622,000 | | | 54,051,800 |
| | | | | | |
Identification Control & Filter Devices - 1.9% | | | | | |
Agilent Technologies, Inc.(1) | | 1,668,800 | | | 62,663,440 |
Roper Industries, Inc. | | 1,064,700 | | | 51,776,361 |
| | | | |
|
|
| | | | | | 114,439,801 |
11
ELEVEN
| | | | | |
| | | Shares Held
| | Value
|
| | | | | | |
| PRODUCER DURABLES (CONTINUED) | | | |
Machinery: Industrial/Specialty - 1.0% | | | | | |
Joy Global Inc. | | 1,077,313 | | $ | 64,390,998 |
| | | | | | |
| TECHNOLOGY - 21.9% | | | | | |
Communications Technology - 3.3% | | | |
Comverse Technology, Inc.(1) | | 1,945,200 | | | 45,770,556 |
Corning Incorporated(1) | | 1,727,100 | | | 46,476,261 |
Juniper Networks, Inc.(1) | | 5,861,700 | | | 112,075,704 |
| | | | |
|
|
| | | | | | 204,322,521 |
Computer Services Software
& Systems - 3.4% | | | |
Adobe Systems Incorporated(1) | | 901,756 | | | 31,489,320 |
Autodesk, Inc.(1) | | 1,252,800 | | | 48,257,856 |
Cadence Design Systems, Inc.(1) | | 1,768,600 | | | 32,701,414 |
Cognizant Technology Solutions Corporation, Class A(1) | | 539,000 | | | 32,065,110 |
F5 Networks, Inc.(1) | | 421,500 | | | 30,554,535 |
NAVTEQ Corporation(1) | | 683,200 | | | 34,604,080 |
| | | | |
|
|
| | | | | | 209,672,315 |
Computer Technology - 3.9% | | | |
Intermec, Inc.(1) | | 2,956,800 | | | 90,211,968 |
Network Appliance, Inc.(1) | | 2,282,500 | | | 82,238,475 |
RSA Security Inc.(1) | | 883,600 | | | 15,851,784 |
SanDisk Corporation(1) | | 564,600 | | | 32,475,792 |
Trident Microsystems, Inc.(1) | | 694,300 | | | 20,176,358 |
| | | | |
|
|
| | | | | | 240,954,377 |
Electronics - 1.0% | | | | | |
Avid Technology, Inc.(1) | | 858,100 | | | 37,293,026 |
FLIR Systems, Inc.(1) | | 804,200 | | | 22,847,322 |
| | | | |
|
|
| | | | | | 60,140,348 |
Electronics: Semi-Conductors/
Components - 8.3% | | | |
Advanced Micro Devices, Inc.(1) | | 2,459,100 | | | 81,543,756 |
Broadcom Corporation, Class A(1) | | 1,503,150 | | | 64,875,954 |
Freescale Semiconductor, Inc., Class A(1) | | 3,781,600 | | | 105,166,296 |
Jabil Circuit, Inc.(1) | | 2,033,400 | | | 87,151,524 |
Marvell Technology Group Ltd.(1) | | 1,116,300 | | | 60,391,830 |
Maxim Integrated Products, Inc. | | 2,232,700 | | | 82,944,805 |
Microchip Technology Incorporated | | 872,000 | | | 31,653,600 |
| | | | |
|
|
| | | | | | 513,727,765 |
Electronics: Technology - 2.0% | | | |
Rockwell Automation, Inc. | | 1,062,100 | | | 76,375,611 |
Trimble Navigation Limited(1) | | 1,018,800 | | | 45,896,940 |
| | | | |
|
|
| | | | | | 122,272,551 |
| | | | | | |
| | | | | | | |
| | | Shares Held
| | Value
| |
| | | | | | | | |
| UTILITIES - 2.6% | | | | | | | |
Utilities: Gas Distributors - 1.1% | | | | |
Kinder Morgan, Inc. | | | 738,600 | | $ | 67,943,814 | |
| | | | | | | | |
Utilities:
Telecommunications - 1.5% | | | | |
NII Holdings, Inc.(1) | | | 1,588,400 | | | 93,667,948 | |
| | | | | |
|
|
|
Total common stocks
(Cost $4,581,759,264) | | | | | | 6,059,307,690 | |
| | | Par Amount
| | | |
| SHORT-TERM INVESTMENTS (CASH EQUIVALENTS) - 2.9% | | | | | | | |
Repurchase agreement with State Street Bank and Trust Company, 4.50%, dated 3/31/06, due 4/3/06, maturity value $179,885,432, collateralized by $183,418,454 market value Federal National Mortgage Association Note,
5.80%, due 2/9/26 (Cost $179,818,000) | | $ | 179,818,000 | | | 179,818,000 | |
| | | | | |
|
|
|
| | | | | | | | |
Total investments - 101.0%
(Cost $4,761,577,264) | | | | | | 6,239,125,690 | |
| | | | | | | | |
Other assets less liabilities - (1.0%) | | | (64,395,882 | ) |
| | | | | |
|
|
|
| | | | | | | | |
Total net assets - 100.0%(4) | | $ | 6,174,729,808 | |
| | | | | |
|
|
|
| (1) | Non-income producing security. |
| (2) | Affiliated company as defined by the Investment Company Act of 1940. See Note (6) in Notes to Financial Statements. |
| (3) | The Fund considers the issuer to be from the United Kingdom. See the Fund’s Statement of Additional Information for information on how a particular country is assigned. The security trades on a U.S. exchange. |
| (4) | Percentages for the various classifications relate to total net assets. |
(ADR) American Depository Receipt
The accompanying notes are an integral part of the financial statements.
12
TWELVE
ARTISAN FUNDS, INC.
Statements of Assets and Liabilities – March 31, 2006 (Unaudited)
| | | | | | | | |
| | | INTERNATIONAL
| | | MID CAP
| |
| ASSETS: | | | | | | | | |
Investments in securities, unaffiliated, at value | | $ | 13,013,658,430 | | | $ | 6,013,426,042 | |
Investments in securities, affiliated, at value | | | 152,948,776 | | | | 45,881,648 | |
Short-term investments (repurchase agreements), at value | | | 170,842,000 | | | | 179,818,000 | |
| | |
|
|
| |
|
|
|
Total investments | | | 13,337,449,206 | | | | 6,239,125,690 | |
Cash | | | 153 | | | | 252 | |
Foreign currency | | | 4,580,265 | | | | - | |
Receivable from investments sold | | | 214,265,992 | | | | 13,741,357 | |
Receivable from fund shares sold | | | 21,089,834 | | | | 9,728,003 | |
Dividends and interest receivable | | | 17,994,655 | | | | 1,778,362 | |
Other assets | | | 15,456 | | | | 7,631 | |
| | |
|
|
| |
|
|
|
Total assets | | | 13,595,395,561 | | | | 6,264,381,295 | |
| LIABILITIES: | | | | | | | | |
Payable for investments purchased | | | 165,393,793 | | | | 61,982,645 | |
Unrealized net loss on foreign currency forward contracts | | | 98,062 | | | | - | |
Payable for fund shares redeemed | | | 98,433,709 | | | | 25,460,765 | |
Payable for operating expenses | | | 2,773,971 | | | | 2,200,446 | |
Payable for withholding taxes | | | 1,301,962 | | | | - | |
Payable for deferred directors’ fees | | | 15,456 | | | | 7,631 | |
| | |
|
|
| |
|
|
|
Total liabilities | | | 268,016,953 | | | | 89,651,487 | |
| | |
|
|
| |
|
|
|
Total net assets | | $ | 13,327,378,608 | | | $ | 6,174,729,808 | |
| | |
|
|
| |
|
|
|
| NET ASSETS CONSIST OF: | | | | | | | | |
Fund shares issued and outstanding | | $ | 9,330,909,077 | | | $ | 4,365,399,958 | |
Net unrealized appreciation (depreciation) on investments and foreign currency related transactions | | | 3,802,394,870 | | | | 1,477,548,426 | |
Accumulated undistributed net investment income (loss) | | | (112,745,572 | ) | | | (12,071,067 | ) |
Accumulated undistributed net realized gains on investments and foreign currency related transactions | | | 306,820,233 | | | | 343,852,491 | |
| | |
|
|
| |
|
|
|
| | | $ | 13,327,378,608 | | | $ | 6,174,729,808 | |
| | |
|
|
| |
|
|
|
| SUPPLEMENTARY INFORMATION: | | | | | | | | |
Net assets | | | | | | | | |
Investor Shares | | $ | 9,157,591,165 | | | $ | 5,219,637,369 | |
Institutional Shares | | $ | 4,169,787,443 | | | $ | 955,092,439 | |
Shares outstanding (Indefinite number of shares authorized, $0.01 par value) | | | | | | | | |
Investor Shares | | | 327,047,560 | | | | 157,156,853 | |
Institutional Shares | | | 148,183,573 | | | | 28,368,472 | |
Net asset value, offering price and redemption price per share | | | | | | | | |
Investor Shares | | $ | 28.00 | | | $ | 33.21 | |
Institutional Shares | | $ | 28.14 | | | $ | 33.67 | |
Cost of securities of unaffiliated issuers held | | $ | 9,427,036,028 | | | $ | 4,718,259,259 | |
Cost of securities of affiliated issuers held | | $ | 108,091,689 | | | $ | 43,318,005 | |
Cost of foreign currency | | $ | 4,587,637 | | | $ | - | |
The accompanying notes are an integral part of the financial statements.
13
THIRTEEN
ARTISAN FUNDS, INC.
Statements of Operations – For the Six Months Ended March 31, 2006 (Unaudited)
| | | | | | | | |
| | | INTERNATIONAL
| | | MID CAP
| |
| INVESTMENT INCOME: | | | | | | | | |
Interest | | $ | 3,201,874 | | | $ | 3,589,267 | |
Dividends, from unaffiliated issuers(1) | | | 45,387,713 | | | | 18,436,548 | |
Dividends, from affiliated issuers(1) | | | 1,523,092 | | | | - | |
Securities lending | | | 1,395,872 | | | | - | |
| | |
|
|
| |
|
|
|
Total investment income | | | 51,508,551 | | | | 22,025,815 | |
| EXPENSES: | | | | | | | | |
Advisory fees | | | 56,142,360 | | | | 27,869,765 | |
Transfer agent fees | | | | | | | | |
Investor Shares | | | 7,272,726 | | | | 5,264,527 | |
Institutional Shares | | | 13,377 | | | | 11,258 | |
Shareholder communications | | | | | | | | |
Investor Shares | | | 495,160 | | | | 447,327 | |
Institutional Shares | | | 40,307 | | | | 10,734 | |
Custodian fees | | | 3,332,552 | | | | 109,523 | |
Accounting fees | | | 37,939 | | | | 33,647 | |
Professional fees | | | 222,461 | | | | 89,465 | |
Less insurance recoveries(2) | | | (197,947 | ) | | | - | |
| | |
|
|
| |
|
|
|
Net professional fees | | | 24,514 | | | | 89,465 | |
Registration fees | | | | | | | | |
Investor Shares | | | 65,603 | | | | 36,248 | |
Institutional Shares | | | 9,698 | | | | 9,343 | |
Directors’ fees | | | 258,153 | | | | 128,663 | |
Other operating expenses | | | 552,592 | | | | 86,382 | |
| | |
|
|
| |
|
|
|
Total operating expenses | | | 68,244,981 | | | | 34,096,882 | |
| | |
|
|
| |
|
|
|
Net investment income (loss) | | | (16,736,430 | ) | | | (12,071,067 | ) |
| NET REALIZED AND UNREALIZED GAINS (LOSSES) ON INVESTMENTS: | | | | | | | | |
Net realized gain (loss) on: | | | | | | | | |
Investments(1) | | | 941,465,807 | | | | 452,597,823 | |
Foreign currency related transactions | | | (3,245,721 | ) | | | - | |
| | |
|
|
| |
|
|
|
| | | | 938,220,086 | | | | 452,597,823 | |
Net increase (decrease) in unrealized appreciation or depreciation on: | | | | | | | | |
Investments | | | 996,637,082 | | | | 261,643,388 | |
Foreign currency related transactions | | | 392,229 | | | | - | |
| | |
|
|
| |
|
|
|
| | | | 997,029,311 | | | | 261,643,388 | |
| | |
|
|
| |
|
|
|
Net gain (loss) on investments and foreign currency related transactions | | | 1,935,249,397 | | | | 714,241,211 | |
| | |
|
|
| |
|
|
|
Net increase (decrease) in net assets resulting from operations | | $ | 1,918,512,967 | | | $ | 702,170,144 | |
| | |
|
|
| |
|
|
|
| | | | | | | |
(1) Fund
| | Net of foreign taxes
withheld on dividends,
unaffiliated issuers
| | Net of foreign taxes
withheld on dividends,
affiliated issuers
| | Including net realized
gain on investments
from affiliated issuers
|
International | | $4,734,119 | | $114,641 | | | $6,196,006 |
Mid Cap | | 968 | | - | | | 13,461 |
|
(2) For the six months ended March 31, 2006, International Fund incurred $222,461 in total professional fees. As described in Note 9 in Notes to Financial Statements, $197,947 in insurance recoveries were received relating to reimbursement of litigation defense costs, and were recorded as a reduction to professional fees during the six months ended March 31, 2006. |
The accompanying notes are an integral part of the financial statements.
14
FOURTEEN
ARTISAN FUNDS, INC.
Statements of Changes in Net Assets
| | | | | | | | | | | | | | | | |
| | | INTERNATIONAL
| | | MID CAP
| |
| | | Six Months Ended
3/31/2006(1)
| | | Year Ended
9/30/2005
| | | Six Months Ended
3/31/2006(1)
| | | Year Ended
9/30/2005
| |
| OPERATIONS: | | | | | | | | | | | | | | | | |
Net investment income (loss) | | $ | (16,736,430 | ) | | $ | 109,690,495 | | | $ | (12,071,067 | ) | | $ | (34,016,944 | ) |
Net realized gain (loss) on: | | | | | | | | | | | | | | | | |
Investments | | | 941,465,807 | | | | 951,444,475 | | | | 452,597,823 | | | | 344,210,655 | |
Foreign currency related transactions | | | (3,245,721 | ) | | | (4,798,062 | ) | | | - | | | | - | |
Net increase (decrease) in unrealized appreciation or depreciation on: | | | | | | | | | | | | | | | | |
Investments | | | 996,637,082 | | | | 1,532,135,303 | | | | 261,643,388 | | | | 617,698,766 | |
Foreign currency related transactions | | | 392,229 | | | | (380,101 | ) | | | - | | | | - | |
| | |
|
|
| |
|
|
| |
|
|
| |
|
|
|
Net increase in net assets resulting from operations | | | 1,918,512,967 | | | | 2,588,092,110 | | | | 702,170,144 | | | | 927,892,477 | |
| | | | |
| DISTRIBUTIONS PAID TO SHAREHOLDERS: | | | | | | | | | | | | | | | | |
Net investment income: | | | | | | | | | | | | | | | | |
Investor Shares | | | (129,259,816 | ) | | | (39,392,658 | ) | | | - | | | | - | |
Institutional Shares | | | (71,446,014 | ) | | | (29,943,284 | ) | | | - | | | | - | |
Net realized gains on investment transactions: | | | | | | | | | | | | | | | | |
Investor Shares | | | - | | | | - | | | | (209,469,474 | ) | | | - | |
Institutional Shares | | | - | | | | - | | | | (41,213,795 | ) | | | - | |
| | |
|
|
| |
|
|
| |
|
|
| |
|
|
|
Total distributions paid to shareholders | | | (200,705,830 | ) | | | (69,335,942 | ) | | | (250,683,269 | ) | | | - | |
| | | | |
| FUND SHARE ACTIVITIES: | | | | | | | | | | | | | | | | |
Net increase (decrease) in net assets resulting from fund share activities | | | (65,428,096 | ) | | | (596,036,624 | ) | | | (132,140,871 | ) | | | (151,207,182 | ) |
| | |
|
|
| |
|
|
| |
|
|
| |
|
|
|
Total increase (decrease) in net assets | | | 1,652,379,041 | | | | 1,922,719,544 | | | | 319,346,004 | | | | 776,685,295 | |
| | |
|
|
| |
|
|
| |
|
|
| |
|
|
|
Net assets, beginning of period | | | 11,674,999,567 | | | | 9,752,280,023 | | | | 5,855,383,804 | | | | 5,078,698,509 | |
| | |
|
|
| |
|
|
| |
|
|
| |
|
|
|
Net assets, end of period | | $ | 13,327,378,608 | | | $ | 11,674,999,567 | | | $ | 6,174,729,808 | | | $ | 5,855,383,804 | |
| | |
|
|
| |
|
|
| |
|
|
| |
|
|
|
| | | | | | | | | | | | | | | | | |
Accumulated undistributed net investment income (loss) | | $ | (112,745,572 | ) | | $ | 104,696,688 | | | $ | (12,071,067 | ) | | $ | - | |
| | |
|
|
| |
|
|
| |
|
|
| |
|
|
|
The accompanying notes are an integral part of the financial statements.
15
FIFTEEN
ARTISAN FUNDS, INC.
Financial Highlights – For a share outstanding throughout each period
The financial highlights table is intended to help you understand the Funds’ financial performance for the past 5 years or, if shorter, the period of a Fund’s operations. Certain information reflects financial results for a single Fund share. The total returns in the table represent the rate that an investor would have earned or lost on an investment in the Fund (assuming reinvestment of all dividends and distributions).
| | | | | | | | | | | | | | | | | | | | | | | | |
Year or
Period
Ended | | |
Net Asset
Value
Beginning
of Period | | Net
Investment
Income
(Loss)(1) | | | Net Realized
and Unrealized
Gain (Loss) on
Investments | | | Total Income
(Loss) from
Investment
Operations | | | Dividends
from Net
Investment
Income | | | Distributions
from Net
Realized
Gains | |
| | | | | | | | | | | | | | | | | | | | | | | | | |
| ARTISAN INTERNATIONAL FUND | | | | | |
| Institutional Shares | | | | | | | | | | | | | | | | | | | | | | | | |
| 3/31/2006 | (5) | | $ | 24.54 | | $ | (0.02 | ) | | $ | 4.08 | | | $ | 4.06 | | | $ | (0.46 | ) | | $ | - | |
| 9/30/2005 | | | | 19.44 | | | 0.25 | | | | 5.01 | | | | 5.26 | | | | (0.16 | ) | | | - | |
| 9/30/2004 | | | | 16.63 | | | 0.16 | | | | 2.86 | | | | 3.02 | | | | (0.21 | ) | | | - | |
| 9/30/2003 | (6) | | | 15.71 | | | 0.03 | | | | 0.89 | | | | 0.92 | | | | - | | | | - | |
| 6/30/2003 | | | | 18.24 | | | 0.25 | | | | (2.65 | ) | | | (2.40 | ) | | | (0.13 | ) | | | - | |
| 6/30/2002 | | | | 19.62 | | | 0.18 | | | | (1.46 | ) | | | (1.28 | ) | | | (0.10 | ) | | | - | |
| 6/30/2001 | | | | 30.22 | | | 0.16 | | | | (7.21 | ) | | | (7.05 | ) | | | - | | | | (3.55 | ) |
| | | | | | | | | | | | | | | | | | | | | | | | | |
| ARTISAN MID CAP FUND | | | | | | | | | | | | | | | | | | | | |
| Institutional Shares | | | | | | | | | | | | | | | | | | | | | | | | |
| 3/31/2006 | (5) | | $ | 31.21 | | $ | (0.03 | ) | | $ | 3.82 | | | $ | 3.79 | | | $ | - | | | $ | (1.33 | ) |
| 9/30/2005 | | | | 26.38 | | | (0.12 | ) | | | 4.95 | | | | 4.83 | | | | - | | | | - | |
| 9/30/2004 | | | | 23.28 | | | (0.14 | ) | | | 3.24 | | | | 3.10 | | | | - | | | | - | |
| 9/30/2003 | (6) | | | 21.96 | | | (0.03 | ) | | | 1.35 | | | | 1.32 | | | | - | | | | - | |
| 6/30/2003 | | | | 22.24 | | | (0.07 | ) | | | (0.21 | )(7) | | | (0.28 | ) | | | - | | | | - | |
| 6/30/2002 | | | | 26.48 | | | (0.13 | ) | | | (4.11 | ) | | | (4.24 | ) | | | - | | | | - | |
| 6/30/2001 | | | | 27.57 | | | (0.08 | ) | | | 0.02 | (7) | | | (0.06 | ) | | | - | | | | (1.03 | ) |
| (1) | Computed based on average shares outstanding. |
| (2) | Periods less than twelve months (where applicable) are not annualized. |
| (3) | Periods less than twelve months (where applicable) are annualized. |
| (4) | The ratios of expenses to average net assets and net investment income (loss) to average net assets exclude expenses waived or paid by the Adviser or the Board of Directors. Absent expenses waived or paid by the Adviser or the Board of Directors, the ratios of expenses to average net assets and net investment income (loss) to average net assets would have been as follows: |
| | | | | | | | |
| Fund | | Year or Period Ended | | Ratio of Expenses to
Average Net Assets | | | Ratio of Net Investment Income
(Loss) to Average Net Assets | |
International Institutional Shares | | 9/30/2003 | | 1.00 | % | | 0.73 | % |
Mid Cap Institutional Shares | | 9/30/2003 | | 0.98 | | | (0.59 | ) |
16
SIXTEEN
| | | | | | | | | | | | | | | | | | | | |
Total
Distributions | | | Net Asset
Value
End
of Period | | Total
Return(2) | | | Net Assets
End of
Period
(millions) | | Ratio of
Expenses
to Average
Net Assets(3)(4) | | | Ratio of Net
Investment
Income (Loss)
to Average
Net Assets(3)(4) | | | Portfolio
Turnover
Rate(2) | |
| | | | | | | | | | | | | | | | | | | | | |
| | | | | | | | | | | | | | | | | |
| | | | | | | | | | | | | | | | | | | | | |
| $ | (0.46 | ) | | $ | 28.14 | | 16.83 | % | | $ | 4,169.8 | | 1.00 | % | | (0.15 | )% | | 28.82 | % |
| | (0.16 | ) | | | 24.54 | | 27.21 | | | | 3,988.1 | | 0.99 | | | 1.11 | | | 56.15 | |
| | (0.21 | ) | | | 19.44 | | 18.31 | | | | 3,622.1 | | 1.01 | | | 0.85 | | | 54.96 | |
| | - | | | | 16.63 | | 5.86 | | | | 3,354.7 | | 1.00 | | | 0.73 | | | 15.23 | |
| | (0.13 | ) | | | 15.71 | | (13.09 | ) | | | 2,975.0 | | 1.01 | | | 1.68 | | | 37.13 | |
| | (0.10 | ) | | | 18.24 | | (6.52 | ) | | | 2,062.0 | | 1.01 | | | 1.01 | | | 50.67 | |
| | (3.55 | ) | | | 19.62 | | (24.53 | ) | | | 1,486.6 | | 1.03 | | | 0.70 | | | 72.01 | |
| | | | | | | | | | | | | | | | | | | | | |
| | | | | | | | | | | | | | | | | | | | | |
| | | | | | | | | | | | | | | | | | | | | |
| $ | (1.33 | ) | | $ | 33.67 | | 12.43 | % | | $ | 955.1 | | 0.95 | % | | (0.21 | )% | | 37.69 | % |
| | - | | | | 31.21 | | 18.35 | | | | 981.3 | | 0.95 | | | (0.40 | ) | | 83.00 | |
| | - | | | | 26.38 | | 13.27 | | | | 1,036.0 | | 0.96 | | | (0.54 | ) | | 101.09 | |
| | - | | | | 23.28 | | 6.06 | | | | 929.6 | | 0.98 | | | (0.59 | ) | | 26.52 | |
| | - | | | | 21.96 | | (1.26 | ) | | | 829.0 | | 1.00 | | | (0.36 | ) | | 102.85 | |
| | - | | | | 22.24 | | (16.04 | ) | | | 449.8 | | 1.02 | | | (0.56 | ) | | 121.14 | |
| | (1.03 | ) | | | 26.48 | | (0.38 | ) | | | 212.2 | | 1.08 | | | (0.29 | ) | | 153.95 | |
| | (5) | Unaudited. For the six months ended March 31, 2006. |
| | (6) | For the period from July 1, 2003 to September 30, 2003. Artisan Funds changed its fiscal year-end from June 30 to September 30 effective September 30, 2003. |
| | (7) | The amount shown may not correlate with the aggregate gains and losses of portfolio securities due to the timing of subscriptions and redemptions of fund shares. |
The accompanying notes are an integral part of the financial statements.
17
SEVENTEEN
ARTISAN FUNDS, INC.
Notes to Financial Statements — March 31, 2006 (Unaudited)
Artisan Funds, Inc. (“Artisan Funds”) was incorporated on January 5, 1995, as a Wisconsin corporation and is registered under the Investment Company Act of 1940, as amended. Artisan Funds is a series comprised of eight open-end, diversified mutual funds. Each Fund’s investment objective is to seek long-term capital growth.
The Funds offer shares of capital stock of two classes – Institutional Shares and Investor Shares. Each Fund has offered Investor Shares since the commencement of operations. International Fund and Mid Cap Fund began offering Institutional Shares on July 1, 1997 and July 1, 2000, respectively. Institutional Shares are sold to institutional investors meeting certain minimum investment requirements. Each class of shares has equal rights with respect to portfolio assets and voting privileges. Each class has exclusive voting rights with respect to any matters involving only that class. Income, expenses not specific to either class and realized and unrealized gains and losses are allocated daily to each class of shares based upon the relative net asset value of outstanding shares. Expenses attributable to a particular class of shares, such as transfer agency fees, shareholder communication expenses and registration fees, are allocated directly to that class.
| (2) | Summary of significant accounting policies: |
The following is a summary of significant accounting policies of the Funds in effect during the period covered by the financial statements, which are in accordance with United States generally accepted accounting principles.
| | (a) | Security valuation – The net asset value (“NAV”) of the shares of each class of each Fund was determined as of the close of regular session trading on the New York Stock Exchange (“NYSE”) (usually 4:00 p.m., Eastern Time, but sometimes earlier) each day the NYSE was open for regular session trading. The NAV of each class of shares was determined by dividing the value of each Fund’s securities and other assets attributed to that class, less its liabilities attributed to that class, by the number of outstanding shares of that class of that Fund. |
In determining NAV, each equity security traded on a securities exchange, including the Nasdaq Stock Market, was valued at the closing price as of the time of valuation on the exchange or market on which the security was principally traded (the “principal exchange”). The closing price provided by each exchange may differ and may represent information such as last sales price, an official closing price, a closing auction price or other information,
18
EIGHTEEN
NOTES TO FINANCIAL STATEMENTS
depending on exchange or market convention. Absent closing price information for a security from the principal exchange as of the time of valuation, the security was valued using the most recent bid quotation on the principal exchange, except that securities listed on the London Stock Exchange were valued at the mean of the most recent bid and asked quotations as of the time of valuation. Short-term investments maturing within sixty days of the valuation date were valued at amortized cost, which approximates market.
Securities for which prices were not readily available were valued by Artisan Funds’ valuation committee (the “valuation committee”) at a fair value determined in good faith under procedures established by and under the general supervision of Artisan Funds’ Board of Directors (the “Board of Directors”). A price was considered to be not readily available if, among other things, the valuation committee believed that the price determined as described in the preceding paragraph did not reflect a fair value of the security.
International Fund generally invests a significant portion, and perhaps as much as substantially all, of its total assets in securities principally traded in markets outside the U.S. Mid Cap Fund has the ability to invest in securities principally traded outside the U.S., but did not do so during the six months ended March 31, 2006. The foreign markets in which the Funds may invest are sometimes open on days when the NYSE is not open and the Funds do not calculate their NAVs, and sometimes are not open on days when the Funds do calculate their NAVs. Even on days on which both the foreign market and the NYSE are open, several hours may have passed between the time when trading in the foreign market closed and the time as of which the Funds calculate their NAVs. That is generally the case for markets in Europe, Asia, Australia and other far eastern markets; the regular closing time of foreign markets in North and South America is generally the same as the closing time of the NYSE and the time as of which the Funds calculate their NAVs.
The valuation committee concluded that a price determined under the Funds’ valuation procedures was not readily available if, among other things, the valuation committee believed that the value of the security might have been materially affected by events occurring after the close of the market in which the security was principally traded but before the time for determination of NAV (“subsequent event”). A subsequent event might include a company-specific development (for example, announcement of a merger that is made after the close of the foreign market), a development that might affect an entire market or region (for example, imposition of foreign exchange controls by a foreign government) or a potentially global development (such as a terrorist attack that may be expected to have an impact on investor
19
NINETEEN
NOTES TO FINANCIAL STATEMENTS
expectations worldwide) or a significant change in one or more United States securities indexes. Artisan Funds monitored for subsequent events using several tools, including the use of a third party research service to assist in determining estimates of fair values for foreign securities. That service utilized statistical data based on historical performance of securities, markets and other data in developing factors used to estimate a fair value. An indication by any of those tools of a potential material change in the value of securities results in either a meeting of the valuation committee, which considers whether a subsequent event has occurred and whether local market closing prices continue to represent fair values for potentially affected non-U.S. securities, and/or a valuation based on information provided by the third party research service.
Estimates of fair values utilized by the Funds as described above may differ from the value realized on the sale of those securities and the differences may be material to the NAV of the applicable Fund or to the information presented.
| | (b) | Income taxes – No provision has been made for federal income taxes since each Fund intends to (i) comply with the provisions of Subchapter M of the Internal Revenue Code applicable to regulated investment companies and (ii) distribute to its shareholders substantially all of its taxable income as well as net realized gains from the sale of investment securities. The Funds may utilize earnings and profits distributed to shareholders on redemptions of Fund shares as part of the dividends paid deduction. |
| | (c) | Portfolio transactions – Security transactions and shareholder transactions are accounted for no later than one business day after trade date. However, for financial reporting purposes, security transactions and shareholder transactions are recorded on trade date in accordance with United States generally accepted accounting principles. Net realized gains and losses on securities are computed on specific security lot identification. |
| | (d) | Foreign currency translation – Values of investments, open foreign currency forward contracts, payables for capital gains taxes and cash denominated in foreign currencies were translated into U.S. dollars using a spot market rate of exchange as of the time of determination of each Fund’s NAV on the day of valuation. Payables and receivables for securities transactions, dividend and reclaim receivables and other receivables and payables denominated in a foreign currency were translated into U.S. dollars using a spot market rate of exchange as of 12:00 p.m. (Eastern Time) on the day of valuation. Purchases and sales of investments and dividend and interest income are translated into U.S. dollars using a spot market rate of exchange as of 12:00 p.m. (Eastern |
20
TWENTY
NOTES TO FINANCIAL STATEMENTS
| | Time) on the date of such transactions. The portion of security gains or losses resulting from changes in foreign exchange rates is included with net realized and unrealized gain or loss from investments, as appropriate, for both financial and tax purposes. |
International Fund may enter into foreign currency forward contracts to hedge the foreign currency exposure on open payables and receivables. The foreign currency forward contracts are recorded at market value and any related realized and unrealized gains and losses are reported as foreign currency related transactions for financial reporting purposes. For tax purposes, these foreign exchange gains and losses are treated as ordinary income or loss. International Fund could be exposed to loss if the counterparties fail to perform under these contracts.
Other foreign currency related transaction gains and losses may result from currency gains and losses realized from the difference between the amounts of dividends and foreign withholding taxes recorded on the Funds’ books and the U.S. dollar equivalent of the amounts actually received or paid. The net increase (decrease) in unrealized appreciation or depreciation on foreign currency related transactions arise from changes in the values of assets and liabilities, other than investments in securities, resulting from changes in foreign exchange rates.
| | (e) | Repurchase agreements – Each Fund may enter into repurchase agreements with institutions that Artisan Partners Limited Partnership (“the Adviser”) has determined are creditworthy pursuant to criteria adopted by the Board of Directors. Repurchase agreements are recorded at cost plus accrued interest and are collateralized in an amount greater than or equal to the repurchase price plus accrued interest. Collateral is held by the Funds’ custodian and in the event of default on the obligation of the counterparty to repurchase, the Funds have the right to liquidate the collateral and apply the proceeds in satisfaction of the obligation. If the proceeds from any sale of such collateral were less than the repurchase price, the Fund would suffer a loss. |
| | (f) | Securities lending – Each Fund may enter into securities lending transactions. During the six months ended March 31, 2006, International Fund earned $1,395,872 from securities lending transactions. When securities are on loan, the Fund does not receive dividends on the securities loaned, but receives compensation from the borrower in lieu of such dividends. The loans are secured by collateral at least equal, at all times, to the fair value of the securities loaned. Gain or loss in the fair value of the securities loaned that may occur during the term of the loan will be for the account of the applicable Fund. As of March 31, 2006, there were no securities on loan. Each |
21
TWENTY-ONE
NOTES TO FINANCIAL STATEMENTS
| | Fund’s risks in entering into securities lending arrangements are that the borrower may not provide additional collateral when required or return the securities when due or, if the borrower defaults, the Fund may experience delays in selling collateral or the collateral may not be sufficient to cover the value of securities lent. |
| | (g) | Commission recapture – Each of the Funds may direct portfolio trades to various brokers that have agreed to rebate a portion of the commissions generated. Such cash rebates are made directly to the applicable Fund and are included in net realized gain or loss on investments in the Statements of Operations as follows: |
| | | |
International | | $ | 2,013,550 |
Mid Cap | | | 358,180 |
| | (h) | Use of estimates – The preparation of financial statements in conformity with United States generally accepted accounting principles requires management to make estimates and assumptions that affect the reported amounts and disclosures in the financial statements. Actual results could differ from those estimates. |
| | (i) | Indemnifications – In the normal course of business, the Funds enter into contracts in which the Funds agree to indemnify the other party or parties against various potential costs or liabilities. The Funds’ maximum exposure under these arrangements is unknown. No claim has been made for indemnification pursuant to any such agreement of the Funds. |
| | (j) | Other – Dividend income less foreign taxes withheld, if any, is recorded on the ex-dividend date, except that certain dividends from private placements and foreign securities are recorded as soon after the ex-dividend date as the information becomes available to the Funds. Non-cash dividends included in dividend income, if any, are generally recorded at the fair market value of securities received. Interest income is reported on the accrual basis. Distributions to shareholders are recorded on the ex-dividend date. Expenses attributable to Artisan Funds are generally allocated to each Fund based on net assets. Expenses attributable to a particular Fund are allocated directly to that Fund. |
The character of income and net realized gains and losses may differ for financial statement and tax purposes and may result in reclassification of permanent differences among certain capital accounts to more appropriately conform financial accounting to tax characterizations of dividend distributions.
22
TWENTY-TWO
NOTES TO FINANCIAL STATEMENTS
International Fund generally imposes a 2% redemption fee on shares held 90 days or less. Those redemption fees are recorded as a reduction in the cost of shares redeemed and have the primary effect of increasing paid-in capital.
| (3) | Transactions with affiliates: |
The Adviser, with which the officers and a director of Artisan Funds are affiliated, provides investment advisory and administrative services to the Funds. In exchange for those services, each Fund (with the exception of International Fund after November 30, 2005) pays a monthly management fee to the Adviser as follows:
| | | |
Average Daily Net Assets
| | Annual Rate
| |
Less than $500 million | | 1.000 | % |
$500 million to $750 million | | 0.975 | |
$750 million to $1 billion | | 0.950 | |
Greater than $1 billion | | 0.925 | |
Effective December 1, 2005, International Fund pays a monthly management fee to the Advisor as follows:
| | | |
Average Daily Net Assets
| | Annual Rate
| |
Less than $500 million | | 1.000 | % |
$500 million to $750 million | | 0.975 | |
$750 million to $1 billion | | 0.950 | |
$1 billion to $12 billion | | 0.925 | |
Greater than $12 billion | | 0.900 | |
The officers and director of Artisan Funds who are affiliated with the Adviser receive no compensation from the Funds.
Each director who is not an interested person of Artisan Funds or the Adviser receives an annual retainer of $130,000, payable quarterly, as well as reimbursement of expenses related to his duties as a director of Artisan Funds. In addition, the non- interested chair of the board of directors receives an additional annual retainer of $60,000, payable quarterly, and each chair of a board committee who is a non-interested director receives an additional annual retainer of $30,000, payable quarterly. Those fees were generally allocated to each Fund based on net assets, subject to a minimum allocation of $1,500 to each Fund per quarter.
The Board of Directors has adopted a deferred compensation plan for independent directors that enables directors to elect to defer receipt of all or a portion of the annual compensation they are entitled to receive from the Funds. For purposes of determining the amount owed to the Directors under the plan, deferred amounts are invested in shares of the Artisan Funds as selected by the individual directors. Each Fund purchases shares of the funds selected for deferral by the director in
23
TWENTY-THREE
NOTES TO FINANCIAL STATEMENTS
amounts equal to his investment, resulting in a Fund asset equal to the deferred compensation liability. Such assets are included as a component of “Other assets” on the Statement of Assets and Liabilities. Deferral of directors’ fees under the plan will not affect the net assets of the Funds, and will not materially affect the Funds’ assets, liabilities or net investment income per share. Amounts will be deferred until distributed in accordance with the Plan.
Shares of Artisan Funds are offered for sale by Artisan Distributors LLC (“Distributors”). Distributors is wholly owned by the Adviser. All distribution expenses relating to the Funds are paid by the Adviser.
| (4) | Line of credit arrangements: |
Artisan Funds is party to a line of credit agreement with State Street Bank and Trust Company, under which each Fund may borrow up to the lesser of (a) $75 million or (b) the lesser of (i) 10% of its total assets (after giving effect to the loan) or (ii) the maximum amount the Fund may borrow under the Investment Company Act, the limitations included in the Fund’s prospectus, or any limit or restriction under any law or regulation to which the Fund is subject or any agreement to which the Fund or Artisan Funds is a party; provided that the aggregate borrowings by all Funds may not exceed $100 million. Artisan Funds pays a commitment fee at the annual rate of 0.10% on the unused portion of the line of credit. Interest is charged on any borrowings at the current Federal Funds rate plus 0.50%. The use of the line of credit is generally restricted to temporary borrowing for extraordinary or emergency purposes. During the six months ended March 31, 2006, there were no borrowings under the line of credit.
| (5) | Investment transactions: |
The cost of securities purchased and the proceeds from the sale of securities (excluding short-term securities) for the six months ended March 31, 2006 were as follows:
| | | | | | |
| Fund | | Security Purchases | | Security Sales |
International | | $ | 3,467,074,539 | | $ | 3,761,146,250 |
Mid Cap | | | 2,194,942,383 | | | 2,554,585,756 |
| (6) | Transactions in securities of affiliates: |
The table below shows information about securities of the Funds’ “affiliates” (as defined below) that were held by the Funds, purchased or sold by the Funds, or from which dividends were received by the Funds during the six months ended March 31, 2006. The Funds identify a company as an affiliate for the purpose of this report if one or more of the Funds owned, in the aggregate, voting securities
24
TWENTY-FOUR
NOTES TO FINANCIAL STATEMENTS
that it believed represented 5% or more of that company’s outstanding voting securities (as defined by the Investment Company Act of 1940) during the six months ended March 31, 2006.
| | | | | | | | | | | | | | | | | | | | | |
| | | | | As of
9/30/05
| | | | | | | | | | As of 3/31/06
|
Fund
| | Security
| | Share
Balance
| | Purchase
Cost
| | Sales Cost
| | Net
Realized
Gain (Loss)
| | Dividend
Income(1)
| | Share
Balance
| | Value
|
| International | | Credit Saison Co., Ltd.(2) | | 8,952,300 | | $ | 6,592,410 | | $ | 17,056,388 | | $ | 5,805,733 | | $ | 1,523,092 | | 8,626,000 | | $ | 477,105,013 |
| | | Stolt Offshore S.A.(3)(4) | | 7,851,500 | | | 20,763,931 | | | 691,460 | | | 390,273 | | | - | | 9,731,700 | | | 152,948,776 |
| Mid Cap | | Marvel Entertainment, Inc.(3)(4) | | 1,769,000 | | | 8,989,830 | | | 253,099 | | | 13,461 | | | - | | 2,280,400 | | | 45,881,648 |
| | (1) | Net of foreign taxes withheld, if any. |
| | (2) | Issuer was no longer an affiliate as of March 31, 2006. |
| | (3) | Issuer was not an affiliate as of September 30, 2005. |
| | (4) | Non-income producing security. |
| (7) | Information for Federal income tax purposes: |
| | | | | | | | | | | | | |
Fund
| | Cost of
Investments
| | Gross Unrealized
Appreciation
| | Gross
Unrealized
Depreciation
| | | Net Unrealized
Appreciation/
Depreciation
|
| International | | $ | 9,783,912,794 | | $ | 3,676,768,077 | | $ | (123,231,665 | ) | | $ | 3,553,536,412 |
| Mid Cap | | | 4,775,323,550 | | | 1,490,057,662 | | | (26,255,522 | ) | | | 1,463,802,140 |
The difference between cost of investments for financial reporting and cost of investments for Federal income tax is due primarily to timing differences in recognizing certain gains and losses on security transactions (e.g., wash sale loss deferrals and passive foreign investment company transactions).
The tax basis of dividends and long-term capital gain distributions paid during the six months ended March 31, 2006 and the year ended September 30, 2005 were as follows:
| | | | | | | | | | | | |
| | | Six Months Ended 3/31/06
| | Year Ended 9/30/05
|
Fund
| | Ordinary
Income
Dividends
| | Long-Term
Capital Gain
Distributions
| | Ordinary
Income
Dividends
| | Long-Term
Capital Gain
Distributions
|
| International | | $ | 200,705,830 | | $ | - | | $ | 69,335,942 | | $ | - |
| Mid Cap | | | 30,312,731 | | | 220,370,538 | | | - | | | - |
Income and capital gain distributions are determined in accordance with income tax regulations that may differ from accounting principles that are generally accepted in the United States. These differences are due to differing treatments for items such as net short-term gains, wash sale loss deferrals, foreign currency
25
TWENTY-FIVE
NOTES TO FINANCIAL STATEMENTS
transactions, net investment losses and capital loss carryovers. Gains on redemptions-in-kind for International Fund and Mid Cap Fund of $29,012,833 and $13,451,833, respectively, included in net realized gain (loss) on investments in the Statement of Operations, are not recognized for Federal income tax purposes.
Additional tax information as of and for the year ended September 30, 2005 follows:
| | | | | | | | | | | | | | | | | |
| | | As of 9/30/05
| | Year Ended 9/30/05
|
| | Undistributed
Ordinary
Income
| | Undistributed
Long-Term
Gain
| | Net Capital
Loss
Carryforward(1)
| | Capital Loss
Carryforward
Expiration
| | Capital Loss
Carryforward
Utilized
| | Post-
October
Losses
|
| International | | $ | 200,676,648 | | $ | - | | $ | 30,783,169 | | 2009 | | $ | 738,285,571 | | $ | - |
| | | | | | | | | | 384,841,928 | | 2010 | | | | | | |
| | | | | | | | | | 202,299,105 | | 2011 | | | | | | |
| Mid Cap | | | - | | | 158,169,846 | | | - | | | | | 178,503,906 | | | - |
| | (1) | The Funds expect to resume paying capital gain distributions in the future to the extent gains are realized in excess of the available carryforwards. |
26
TWENTY-SIX
NOTES TO FINANCIAL STATEMENTS
| (8) | Fund share activities: |
Capital share transactions for the Funds were as follows:
| | | | | | | | | | | | | | | | |
| | | INTERNATIONAL
| | | MID CAP
| |
Six months ended March 31, 2006
| | Investor
Shares
| | | Institutional
Shares
| | | Investor Shares
| | | Institutional
Shares
| |
Proceeds from shares issued | | $ | 1,099,650,952 | | | $ | 218,998,165 | | | $ | 522,190,046 | | | $ | 26,112,251 | |
Net asset value of shares issued in reinvestment of dividends and distributions | | | 121,588,038 | | | | 67,354,311 | | | | 205,964,332 | | | | 40,056,662 | |
Cost of shares redeemed(1) | | | (917,196,836 | ) | | | (655,822,726 | ) | | | (762,584,706 | ) | | | (163,879,456 | ) |
| | |
|
|
| |
|
|
| |
|
|
| |
|
|
|
Net increase (decrease) from fund share transactions | | $ | 304,042,154 | | | $ | (369,470,250 | ) | | $ | (34,430,328 | ) | | $ | (97,710,543 | ) |
| | |
|
|
| |
|
|
| |
|
|
| |
|
|
|
| | | | |
Shares sold | | | 42,744,845 | | | | 8,595,506 | | | | 16,539,091 | | | | 816,040 | |
Shares issued in reinvestment of dividends and distributions | | | 5,049,357 | | | | 2,785,484 | | | | 6,671,990 | | | | 1,280,994 | |
Shares redeemed | | | (35,753,253 | ) | | | (25,698,126 | ) | | | (24,079,728 | ) | | | (5,167,848 | ) |
| | |
|
|
| |
|
|
| |
|
|
| |
|
|
|
Net increase (decrease) in capital shares | | | 12,040,949 | | | | (14,317,136 | ) | | | (868,647 | ) | | | (3,070,814 | ) |
| | |
|
|
| |
|
|
| |
|
|
| |
|
|
|
| | |
| | | INTERNATIONAL
| | | MID CAP
| |
Year ended September 30, 2005
| | Investor
Shares
| | | Institutional
Shares
| | | Investor Shares
| | | Institutional
Shares
| |
Proceeds from shares issued | | $ | 1,721,409,733 | | | $ | 213,745,441 | | | $ | 1,448,522,186 | | | $ | 65,819,361 | |
Net asset value of shares issued in reinvestment of dividends and distributions | | | 35,336,667 | | | | 27,442,945 | | | | - | | | | - | |
Cost of shares redeemed(1) | | | (1,815,852,822 | ) | | | (778,118,588 | ) | | | (1,366,393,615 | ) | | | (299,155,114 | ) |
| | |
|
|
| |
|
|
| |
|
|
| |
|
|
|
Net increase (decrease) from fund share transactions | | $ | (59,106,422 | ) | | $ | (536,930,202 | ) | | $ | 82,128,571 | | | $ | (233,335,753 | ) |
| | |
|
|
| |
|
|
| |
|
|
| |
|
|
|
| | | | |
Shares sold | | | 78,912,846 | | | | 9,680,591 | | | | 50,306,407 | | | | 2,231,832 | |
Shares issued in reinvestment of dividends and distributions | | | 1,677,108 | | | | 1,297,539 | | | | - | | | | - | |
Shares redeemed | | | (82,739,336 | ) | | | (34,838,126 | ) | | | (46,997,550 | ) | | | (10,061,831 | ) |
| | |
|
|
| |
|
|
| |
|
|
| |
|
|
|
Net increase (decrease) in capital shares | | | (2,149,382 | ) | | | (23,859,996 | ) | | | 3,308,857 | | | | (7,829,999 | ) |
| | |
|
|
| |
|
|
| |
|
|
| |
|
|
|
| (1) | Net of redemption fees of |
| | | | | | |
| Fund | | 3/31/2006 | | 9/30/2005 |
International - Investor Shares | | $ | 270,937 | | $ | 326,088 |
International - Institutional Shares | | | 130,187 | | | 179,833 |
Artisan Funds and the Adviser were defendants in a lawsuit in the Circuit Court of the Third Judicial Circuit, Madison County, Illinois that sought certification of a plaintiff class consisting of all persons in the United States who held shares in International Fund for a period of more than 14 days during the five years prior to
27
TWENTY-SEVEN
NOTES TO FINANCIAL STATEMENTS
the filing of the lawsuit. The suit sought compensatory and punitive damages under state law, as well as interest, costs and attorney’s fees. The lawsuit alleged, in summary, that Artisan Funds and the Adviser exposed long-term International Fund shareholders to trading by market timers by allegedly (a) failing to properly evaluate daily whether a significant event affecting the value of International Fund’s securities had occurred after foreign markets had closed but before the calculation of the Fund’s NAV; (b) failing to implement the Fund’s portfolio valuation and share pricing policies and procedures; (c) allowing portfolio valuation and share policies and procedures that benefited market timers at the expense of long-term shareholders; and (d) failing to know and implement applicable rules and regulations concerning the calculation of NAV.
Artisan Funds and the Adviser removed the lawsuit from state court to federal district court. The federal district court ordered the case remanded to Illinois state court. Artisan Funds and the Adviser then appealed the remand order to the United States Court of Appeals for the Seventh Circuit and, on April 5, 2005, the Court of Appeals ruled in favor of Artisan Funds and the Adviser. As a result, the action was dismissed with prejudice in May 2005. The plaintiff subsequently sought and was granted review by the United States Supreme Court on the question of whether the Court of Appeals had jurisdiction to hear the appeal. In the event that the Supreme Court’s decision results in reinstatement of the lawsuit, Artisan Funds and the Adviser intend to continue to defend the lawsuit vigorously.
Certain legal fees incurred by Artisan Funds in defense of the lawsuit and related insurance recoveries of $197,947 have been allocated to International Fund and are included in Professional fees in the Statement of Operations. Artisan Funds does not believe that the action described herein will have a material effect on the financial condition of International Fund.
28
TWENTY-EIGHT
SHAREHOLDER EXPENSE EXAMPLE
As a shareholder of Artisan Funds, you incur two types of costs: (1) transaction costs, including redemption fees; and (2) ongoing costs, including management fees, and other Fund expenses. This example is intended to help you understand your ongoing costs (in dollars) of investing in a Fund and to compare these costs with the ongoing costs of investing in other mutual funds.
The example is based on an investment of $1,000 invested at the beginning of the period and held for the entire period from October 1, 2005 to March 31, 2006.
Actual Expenses
The first line under the name of each Fund in the table below provides information about actual account values and actual expenses. You may use the information in this line, together with the amount you invested, to estimate the expenses that you paid over the period. Simply divide your account value by $1,000 (for example, an $8,600 account value divided by $1,000 = 8.6), then multiply the result by the number in the first line under the name of your Fund under the heading entitled “Expenses Paid During Period” to estimate the expenses you paid on your account during this period.
Hypothetical Example for Comparison Purposes
The second line below each Fund’s name in the table below provides information about hypothetical account values and hypothetical expenses based on each Fund’s actual expense ratio and an assumed rate of return of 5% per year before expenses, which is not the Fund’s actual return. The hypothetical account values and expenses may not be used to estimate the actual ending account balances or expenses you paid for the period. You may use this information to compare the ongoing costs of investing in each Fund and other funds. To do so, compare the 5% hypothetical example with the 5% hypothetical examples that appear in the shareholder reports of the other funds.
Please note that the expenses shown in the table are meant to highlight your ongoing costs only and do not reflect any transactional costs, such as redemption fees. Therefore, the second line of the table is useful in comparing ongoing costs only, and will not help you determine the relative costs of owning different funds. If these transactional costs were included, your costs would have been higher.
| | | | | | | | | |
| | | Beginning
Account Value
10/1/2005 | | Ending
Account Value
3/31/2006 | | Expenses Paid During
Period
10/1/2005-3/31/2006(1) |
Artisan International Fund - Institutional Shares | | | | | | | | | |
Actual | | $ | 1,000.00 | | $ | 1,168.28 | | $ | 5.41 |
Hypothetical (5% return before expenses) | | $ | 1,000.00 | | $ | 1,019.95 | | $ | 5.04 |
Artisan Mid Cap Fund - Institutional Shares | | | | | | | | | |
Actual | | $ | 1,000.00 | | $ | 1,124.34 | | $ | 5.03 |
Hypothetical (5% return before expenses) | | $ | 1,000.00 | | $ | 1,020.19 | | $ | 4.78 |
| (1) | Expenses are equal to the Fund’s ratio of expenses to average net assets for the six-month period ended March 31, 2006 (shown below); multiplied by the average account value over the period; multiplied by 182/365 (to reflect the one-half year period). |
| | | | | | | |
| | | Fund | | Annualized Ratio of Expenses to Average Net Assets for the Six Month
Period Ended March 31, 2006 | | | |
| | | Artisan International Fund - Institutional Shares | | 1.00 | % | | |
| | | Artisan Mid Cap Fund - Institutional Shares | | 0.95 | | | |
29
TWENTY-NINE
FACTORS CONSIDERED IN RENEWING THE FUNDS’ ADVISORY CONTRACTS
Artisan International Fund and Artisan Mid Cap Fund are series of Artisan Funds, Inc., which has six other series. Artisan Partners Limited Partnership (“Artisan Partners”) is responsible for management of the Funds’ investment portfolios and for overall management of the Funds’ business and affairs pursuant to Investment Advisory Agreements dated December 27, 1995 (International Fund); November 7, 2001 (International Small Cap Fund); August 8, 2002 (International Value Fund); April 10, 1997 (Mid Cap Fund); October 26, 2000 (Mid Cap Value Fund); March 27, 1995 (Small Cap Fund); July 31, 1997 (Small Cap Value Fund) and February 9, 2006 (Opportunistic Value Fund) (the “Advisory Agreements”). Artisan Partners is a Delaware limited partnership the sole general partner of which is Artisan Investment Corporation. Artisan Investment Corporation was incorporated on December 7, 1994 for the sole purpose of acting as general partner of Artisan Partners. Artisan Investment Corporation is controlled by Mr. Ziegler and Ms. Ziegler, who together own 100% of its voting stock. The principal address of Artisan Partners is 875 E. Wisconsin Avenue, Suite 800, Milwaukee, Wisconsin 53202. Artisan Partners also has offices at 100 Pine Street, Suite 2950, San Francisco, California 94111; One Maritime Plaza, Suite 1450, San Francisco, California 94111; Five Concourse Parkway NE, Suite 2120, Atlanta, Georgia 30328; and 65 East 55th Street, 25th Floor, New York, New York 10022.
The Advisory Agreement for each Fund may be continued from year to year only so long as the continuance is approved annually (a) by the vote of a majority of the directors of Artisan Funds who are not “interested persons” of Artisan Funds or Artisan Partners cast in person at a meeting called for the purpose of voting on such approval, and (b) by the board of directors or by the vote of a majority (as defined in the 1940 Act) of the outstanding shares of the Fund. Each Advisory Agreement provides that Artisan Partners shall not be liable for any loss suffered by a Fund or its shareholders as a consequence of any act or omission in connection with investment advisory or portfolio services under the agreement, except by reason of willful misfeasance, bad faith or gross negligence on the part of Artisan Partners in the performance of its duties or from reckless disregard by Artisan Partners of its obligations and duties under the Advisory Agreement. Each Agreement will terminate automatically in the event of its assignment (as defined in the 1940 Act).
The directors of Artisan Funds held a special meeting of the board on October 19th and 20th, 2005 (the “October Special Meeting”), at which meeting they gave preliminary consideration to information bearing on continuation of the Advisory Agreement for each Fund other than Opportunistic Value Fund for the period from December 1, 2005 through November 30, 2006. The board considered the Advisory Agreement for Opportunistic Value Fund, a new series of Artisan Funds that began investment operations on March 27, 2006, at a meeting on February 9, 2006. The primary purpose of the October Special Meeting was to ensure that the directors had ample opportunity to consider matters they deemed relevant in considering the continuation of the Advisory Agreements, and to request any additional information they considered reasonably necessary to their deliberations, without undue time constraints.
The independent directors of Artisan Funds next met in executive session on November 16, 2005 with their independent counsel to further consider the matters reviewed at the October Special Meeting and to reach certain conclusions in connection with the review and approval of the Advisory Agreements. The full board then met at a regular meeting on November 17, 2005, at which time the board unanimously approved the continuation of each Advisory Agreement, except the Advisory Agreement for Opportunistic Value Fund, from December 1, 2005 to November 30,
30
THIRTY
FACTORS CONSIDERED IN RENEWING THE FUNDS’ ADVISORY CONTRACTS
2006 and an amendment to the Advisory Agreement for International Fund to add an additional breakpoint as discussed below. At a regularly scheduled meeting on February 9, 2006, the independent directors met in executive session to consider the Advisory Agreement for Opportunistic Value Fund. At that meeting, the full board unanimously approved Opportunistic Value Fund’s Advisory Agreement.
Prior to the October Special Meeting, independent counsel to the independent directors sent to Artisan Partners a request for information to be provided to the directors in connection with their consideration of the continuation of the Advisory Agreements. Artisan Partners provided materials to the directors that included responses to that request, other information Artisan Partners believed was useful in evaluating the continuation of the Advisory Agreements and reports prepared by Lipper Inc. (“Lipper”), an independent source of investment company data, relating to each Fund’s performance and expenses compared to the performance and expenses of a relatively small peer group and a larger peer universe of funds determined by Lipper to be comparable. Artisan Partners also provided additional reports prepared by Lipper comparing certain of the Funds’ performance and expenses to different peer groups and peer universes that Artisan Partners believed were more appropriate for comparative purposes than the peer groups and peer universes selected by Lipper. The directors also received and reviewed a memorandum from their independent counsel regarding the directors’ responsibilities in evaluating the Funds’ investment advisory agreements. Prior to the February 9, 2006 meeting to consider the Advisory Agreement for Opportunistic Value Fund, Artisan Partners provided similar materials to the directors regarding that Fund, including reports prepared by Lipper showing advisory fees and expense ratios for a peer group of funds selected by Lipper compared to the proposed advisory fee and estimated expense ratio for Opportunistic Value Fund.
In evaluating the Advisory Agreements, the directors reviewed the available information and discussed with representatives of Artisan Partners each Fund’s operations, the nature, extent and quality of the advisory and other services provided by Artisan Partners to the Funds, the overall expense ratios of each class of shares of the Funds, and economies of scale and other benefits derived by Artisan Partners from its relationship with the Funds. In addition to the third party reports by Lipper and the memorandum from independent counsel, the directors reviewed information concerning the following:
| • | | The services performed by Artisan Partners for the Funds, including: a list of services performed by Artisan Partners; Artisan Partners’ responsibility for making investment decisions and for observing investment objectives, policies and restrictions of each Artisan Fund; |
| • | | The terms of each Advisory Agreement, including standard of care and termination provisions; |
| • | | Artisan Partners’ personnel and operations, including: the number and organization of Artisan Partners’ employees; the education and experience of Artisan Partners’ investment personnel; Artisan Partners’ assessment of its ability to attract and retain capable investment and business professionals and recent hiring and retention information; Artisan Partners’ research and decision-making processes; policies relating to the assignment of personnel to the various Artisan Funds portfolios; the compensation of Artisan Partners’ personnel with primary responsibility for managing Artisan Funds; the time and attention of Artisan Partners’ personnel devoted to the Funds; and the adequacy and sophistication of Artisan Partners’ technology and systems with respect to investment and administrative matters; |
31
THIRTY-ONE
FACTORS CONSIDERED IN RENEWING THE FUNDS’ ADVISORY CONTRACTS
| • | | With the exception of Opportunistic Value Fund, which had not yet begun investment operations prior to the approval of its Advisory Agreement, each Fund’s short- and long-term investment performance, including a comparison for various time periods with (1) other Artisan Partners client accounts managed in the same investment strategy, (2) other mutual funds having similar investment objectives, and (3) appropriate market indices; |
| • | | Potential for conflicts of interest between the Funds and Artisan Partners and circumstances and actions addressing or bearing on potential conflicts of interest, including: the type and number of other clients served by Artisan Partners in each of its investment strategies; the basis of sharing personnel, services, research and advice among clients; the basis of decisions by Artisan Partners to buy or sell securities for Artisan Funds and other clients; Artisan Partners’ methodology of allocating investment opportunities, including initial public offerings, among Artisan Funds and other clients; potential advantages and disadvantages in having an investment adviser that has other clients; Artisan Partners’ own investments and possible conflicts with Artisan Funds; Artisan Partners’ code of ethics, including policies relating to personal securities transactions of employees; and litigation and regulatory matters; |
| • | | Potential “fall-out” benefits gained by Artisan Partners or its affiliates and by the Funds from their relationship, including: benefits to Artisan Partners in attracting and retaining other clients and the method of estimating other benefits to Artisan Partners; |
| • | | Brokerage and portfolio transactions, including: the standards and performance in seeking best execution; allocation of soft dollars for research products and services; Artisan Partners’ practices in light of SEC guidance under Section 28(e) of the Securities Exchange Act of 1934; research purchased with Artisan Partners’ funds; portfolio turnover rates; use of brokers who sell Artisan Funds and steps taken to comply with applicable rules; and other benefits from the allocation of brokerage; |
| • | | The advisory fees charged, including: the method of computing fees; recognition of economies of scale through breakpoints in the fees; the frequency of the payment of fees; a comparison of the fees charged by Artisan Partners to the Funds with the fees charged by Artisan Partners to other accounts managed by Artisan Partners in the same investment strategies, including other mutual funds for which Artisan Partners provides sub-advisory services; a comparison of the fees charged by Artisan Partners to the Funds with the management fees charged by other investment advisers for managing mutual funds with similar investment objectives and strategies; and potential cost savings by Artisan Partners, incentives to effect savings and the sharing of savings with Artisan Funds; |
| • | | The effect of advisory and other fees on the Funds’ total expenses, including: comparisons of expenses and expense ratios with those of other mutual funds, taking into account comparability factors such as size, account-level charges and investment objective; voluntary expense limitations or reductions and relationship of expenses to expense limitation; the allocation of certain expenses between Artisan Partners, Distributor and Artisan Funds; and fees paid to service providers other than Artisan Partners, including custodial, transfer agent and shareholder servicing fees; |
| • | | The financial condition and stability of Artisan Partners; and |
| • | | The profitability to Artisan Partners of its relationship with each Fund, except Opportunistic Value Fund, which had not yet begun investment operations prior to the approval of its Advisory Agreement, including the methods of allocating expenses in compiling financial results for Artisan Partners and the effect that different methods would have on the profitability of Artisan Partners. |
32
THIRTY-TWO
FACTORS CONSIDERED IN RENEWING THE FUNDS’ ADVISORY CONTRACTS
At the end of the October Special Meeting after discussion and consideration of the information presented, the independent directors met in executive session with their independent counsel and subsequently requested additional supplemental material concerning the funds for which Artisan Partners serves as subadviser.
On November 16, 2005, the independent directors then again met separately with their independent counsel to review and discuss relevant information regarding the continuation of the Advisory Agreements and the information presented and discussed at the October Special Meeting. With respect to Opportunistic Value Fund, the independent directors met separately with their independent counsel to review and discuss relevant information regarding the approval of the Fund’s Advisory Agreement on February 9, 2006. In the course of this review process, the independent directors reviewed and discussed the following information:
The nature, extent and quality of Artisan Partners’ services. The independent directors reviewed the nature, extent and the quality of Artisan Partners’ services to the Funds and considered the following:
| • | | Because Artisan Partners’ principal responsibility is management of the Funds’ investment portfolios, the investment performance achieved by Artisan Partners is an important indicator of the quality of the services provided. |
| • | | Besides investment management, Artisan Partners provides the Funds with general administration services, including the preparation of regulatory filings, provides services to certain of the Funds’ shareholders and management of the Funds’ relationships with its third party service providers, including its custodian, fund accounting agent, transfer agent, lawyers and auditors. |
| • | | The quality of Artisan Partners’ services to the Funds in absolute terms and relative to mutual fund industry standards. |
| • | | The sufficiency and quality of Artisan Partners personnel. |
| • | | Artisan Partners’ financial condition. |
The investment performance of each Fund. The independent directors reviewed for each Fund (except Opportunistic Value Fund, which had not yet begun investment operations) for periods ended June 30, 2005, short-term and long-term investment performance compared to broad-based and style specific market indexes, performance for the period January 1, 2005 through September 30, 2005 compared to the same indexes, Morningstar ratingsTM (for those Funds rated by Morningstar) and Lipper rankings. The directors concluded that the overall investment performance of each Fund has been good to excellent and that shorter-term performance of the International Equity and Mid Cap Equity Funds was not evidence of any meaningful departure from such overall performance. In reaching that conclusion, the independent directors considered the following:
| • | | Each of the Funds invests in a predominantly value-oriented or growth-oriented investment style. |
| • | | Because of each Fund’s style specific investment strategy, the investment performance of each Fund and, in particular, its performance compared to a broad based market index is affected by the relative performance of growth-oriented stocks and value-oriented stocks in the market overall. |
33
THIRTY-THREE
FACTORS CONSIDERED IN RENEWING THE FUNDS’ ADVISORY CONTRACTS
| • | | The broad based and style specific benchmark indexes against which Fund performance is compared show significant variances in recent years, and under that environment, predominantly value oriented funds have operated under more favorable market conditions when compared to the broader market and to more growth oriented funds, and predominantly growth oriented funds operated under less favorable conditions when compared to the broader market and to more value oriented funds. |
| • | | A fund’s relative performance in the Lipper performance universe may be significantly influenced by the category in which Lipper places the fund. |
| • | | The performance of each Fund, without taking expenses into account, was consistent with the performance, before expenses, of other accounts managed by Artisan Partners in the same investment strategy. |
Cost of services, economies of scale and benefits derived by Artisan Partners. The directors reviewed the overall expense ratio of each class of shares of each Fund in comparison to the expense ratios of its peers in relation to the nature and quality of services provided and in relation to the fees Artisan Partners charges its other clients who have similar investment strategies and objectives (but to whom Artisan Partners generally provides few or no services other than portfolio management). The directors also considered whether shareholders of the Funds have benefited or will benefit from economies of scale under the management fee structures in the Advisory Agreements, including the fact that since International Small Cap Fund closed at a relatively low asset level, Artisan Partners is not likely to enjoy economies of scale in its management. In their review, the independent directors considered the following:
| • | | The rates of fee paid by each Fund to Artisan Partners have been stable, but the aggregate dollar amounts of the fees paid have increased as the Funds have grown. In return for its services, each Fund, other than International Small Cap Fund and Opportunistic Value Fund, pays Artisan Partners a monthly fee at the annual rate of 1% of the Fund’s average daily net assets up to $500 million; 0.975 of 1% of the next $250 million; 0.950 of 1% of the next $250 million; and 0.925 of 1% of average daily net assets over $1 billion. International Small Cap Fund pays Artisan Partners a monthly fee at the annual rate of 1.25% of the Fund’s average daily net assets. Under the proposed fee schedule for Opportunistic Value Fund, the Fund would pay Artisan Partners a monthly fee at the annual rate of 0.900 of 1% of the Fund’s average daily net assets up to $1 billion; 0.875 of 1% on the next $3 billion; 0.850 of 1% on the next $4 billion; 0.825 of 1% on the next $4 billion; and 0.800 of 1% of average daily net assets over $12 billion. |
| • | | That an additional breakpoint had been proposed by Artisan Partners for International Fund whereby the Fund would pay 0.900 of 1% of the Fund’s average daily net assets over $12 billion. |
| • | | Artisan Partners has voluntarily agreed to reimburse the expenses of Opportunistic Value Fund to the extent they exceeded 1.5% of the Fund’s average daily net assets annually. |
Other benefits derived by the Funds or Artisan Partners. The independent directors then reviewed the potential benefits that Artisan Partners may derive as a result of its relationship with the Funds, other than the services provided by Artisan Partners pursuant to the Advisory Agreements and the management fees paid in return. For Artisan Partners, the directors considered two potential benefits to Artisan Partners: (1) the potential conversion of a Fund shareholder to a separate account client; and (2) the acquisition of research products and services in return for commissions (“soft dollars”). The independent directors noted that, although Artisan Partners
34
THIRTY-FOUR
FACTORS CONSIDERED IN RENEWING THE FUNDS’ ADVISORY CONTRACTS
derives or may derive those additional benefits, the Funds also benefit in similar fashion. In reaching those conclusions, the directors considered the following:
| • | | Artisan Partners does not solicit the Funds’ shareholders to become separate account clients nor to purchase other goods or services provided by Artisan Partners or its affiliates. Artisan Partners refers potential separate account clients that do not meet Artisan Partners’ minimum separate account size requirements to the Funds. |
| • | | Artisan Partners utilizes third-party research products and services and proprietary research from executing brokers paid for with soft dollars paid by the Funds and by other clients of Artisan Partners. Artisan Partners’ use of soft dollars provides Artisan Partners, and thereby the Funds, with access to third party and proprietary research and also helps Artisan Partners maintain important and open relationships with brokers. Use of a Fund’s commissions for soft dollar purposes is on the same terms as every other client account managed by Artisan Partners in the same investment strategy. |
The directors concluded their annual Investment Advisory Agreement contract review at a regularly scheduled meeting on November 17, 2005. At the November 17th meeting, the independent directors and counsel to the independent directors reviewed with the full board the information discussed at the November 16th meeting. The directors then considered whether any further discussion or review was necessary, concluding that the October Special Meeting and the information reviewed by the independent directors at the November 16th meeting provided a strong basis for considering the continuation of the Advisory Agreements for each Fund other than Opportunistic Value Fund. With respect to Opportunistic Value Fund, at the regularly scheduled meeting on February 9, 2006, the board concluded that the information provided and reviewed prior to and during that meeting and during the meeting of the independent directors with counsel to the independent directors provided a strong basis for consideration of the initial approval of the Advisory Agreement for that Fund. The directors reviewed and affirmed each of the following conclusions:
The nature, extent and quality of Artisan Partners’ services. The directors concluded that the nature and extent of Artisan Partners’ services provided to the Funds (and, in the case of Opportunistic Value Fund, expected to be provided) was appropriate and consistent with, and in some cases more advantageous to the Funds than, the terms of the Advisory Agreements. The directors concluded that the quality of Artisan Partners’ services has been excellent and consistent, with no material deficiencies.
The investment performance of each Fund. The directors concluded that the long-term investment performance of each Fund has been good to excellent. The directors concluded that while Opportunistic Value Fund had not yet begun investment operations and had no performance history, the Fund’s proposed investment management team had produced very positive results for Small Cap Value Fund and Mid Cap Value Fund.
Cost of services, economies of scale and benefits derived by Artisan Partners. The directors concluded that the overall expense ratio of each class of shares of each Fund was within an acceptable range of, and often more favorable than, the expense ratios of its peers. The directors concluded that the fees each Fund pays to Artisan Partners (and Artisan Partners’ corresponding profits, other than with respect to Opportunistic Value Fund which had not yet begun investment
35
THIRTY-FIVE
FACTORS CONSIDERED IN RENEWING THE FUNDS’ ADVISORY CONTRACTS
operations) are reasonable in relation to the nature and quality of services provided and in relation to the fees Artisan Partners charges its other clients who have similar investment strategies and objectives (but to whom Artisan Partners generally provides few or no services other than portfolio management). The directors concluded that the overall estimated expense ratio of Opportunistic Value Fund (after giving effect to Artisan Partners’ undertaking to reimburse the Fund for ordinary operating expenses in excess of 1.5% of the Fund’s average net assets annually) was within an acceptable range of the expense ratios of a peer group of funds selected by Lipper. The directors also concluded that shareholders of the Funds (except for International Small Cap Fund) have benefited or will benefit from economies of scale under the management fee structures in the Advisory Agreements, especially noting the new breakpoint proposed for International Fund, and that, because International Small Cap Fund closed at such a small asset level, Artisan Partners is not likely to enjoy economies of scale in its management.
Other benefits derived by the Funds or Artisan Partners. The directors concluded that, other than the services provided by Artisan Partners pursuant to the Advisory Agreements and the management fees paid in return, the Funds and Artisan Partners may potentially benefit from their relationship with each other in several ways. For Artisan Partners, the directors concluded there were two principal benefits: (1) the potential conversion of a Fund shareholder to a separate account client; and (2) the acquisition of research products and services in return for commissions (“soft dollars”). The directors concluded that, although Artisan Partners derives or may derive those additional benefits, the Funds also could benefit from conversions of separate account holdings to fund holdings and did benefit from Artisan Partners’ use of soft dollars with respect to its separate account clients.
At the meeting on November 17, 2005, the board approved by the unanimous vote of all directors and also by the unanimous vote of all the “non-interested” directors, the continuation of the Advisory Agreements for each Fund other than Opportunistic Value Fund through November 30, 2006, including with respect to the International Fund, as amended to add the additional breakpoint discussed above. At the meeting on February 9, 2006, the board approved by the unanimous vote of all directors and also by the unanimous vote of all the “non-interested” directors, the Advisory Agreement for Opportunistic Value Fund through November 30, 2007.
36
THIRTY-SIX
NOTES ON MANAGEMENT’S DISCUSSION OF FUND PERFORMANCE
The discussions of each Fund included in this report include statistical information about the portfolios of each of the Funds. Except as otherwise noted, that information is as of March 31, 2006 and that information will vary with changes in a Fund’s portfolio investments. The performance information for each Fund relative to its benchmark index discussed in this Report was prepared by the Adviser using information reported by FactSet Databases (“FactSet”). For the purposes of assigning portfolio securities to a particular country, the Adviser considers an issuer to be from a particular country as designated by its securities information vendors. The Adviser currently uses MSCI as its primary source and FactSet as a secondary source for this information. As a result, Artisan Mid Cap Fund routinely holds securities of issuers organized outside the U.S., but with their primary trading markets in the U.S. In addition, Artisan Mid Cap Fund may hold a limited number of non-U.S. securities that are traded in the U.S., directly or as ADRs. Also based on the designations of the securities information vendors, Artisan International Fund routinely holds securities of issuers organized within the U.S. and/or issuers with their primary trading markets in the U.S. In the event (i) the Adviser’s securities information vendors do not assign a security to a particular country, or (ii) its primary vendor does not assign a security to a particular country and the secondary vendor has assigned a security to a particular country by using a methodology that is not the same as the methodology the primary vendor uses to assign a country, the Adviser assigns the security to a country using the primary vendor’s published criteria (to the extent available) or the Adviser’s own judgment. The primary information vendor’s criteria include the identity of the jurisdiction of the issuer’s incorporation, the main equity trading market for the issuer’s securities, the geographical distribution of the issuer’s operations and the location of the issuer’s headquarters.
For the purposes of assigning portfolio securities to a particular sector and industry, Artisan Mid Cap Fund assigns securities in accordance with the sector and industry classifications provided by The Frank Russell Company (to the extent available). Artisan International Fund assigns securities for these purposes in accordance with the sector and industry classifications provided by MSCI (to the extent available).
Definitions of Portfolio Statistics
Median Market Cap provides a measure of the market capitalization value of the companies in a portfolio. Market capitalization is the aggregate value of all a company’s outstanding common stock. Market capitalization is calculated by FactSet using the price as of the most recent month-end multiplied by the number of shares outstanding as shown in the financial statements of the issuer. Equal numbers of companies in the portfolio have market capitalizations higher and lower than the median. Weighted Average Market Cap is the average of the market capitalizations of the companies in the portfolio weighted by the size of each company’s position within the portfolio. P/B Ratio is a ratio used to compare a stock’s market value to its book value. Book value is a company’s assets minus its liabilities.
Descriptions of Indices
Each Fund’s performance is compared in this report to changes in one or more indices, including in all cases a broad-based index of changes in prices of securities in the market in which the Fund invests. All of the indices are unmanaged and their returns include reinvested dividends. Unlike the Funds’ returns, the returns of each index do not include the payment of sales commissions or other expenses that would be incurred in the purchase or sale of the securities included in that index. An investment cannot be made directly in an index.
37
THIRTY-SEVEN
NOTES ON MANAGEMENT’S DISCUSSION OF FUND PERFORMANCE
The indices to which the Funds are compared are:
Artisan International Fund – Morgan Stanley Capital International EAFE® Index (MSCI EAFE®) is a market-weighted index of companies in developed markets, excluding the U.S. and Canada. The Morgan Stanley Capital International EAFE® Growth Index (MSCI EAFE® Growth) is a market-weighted index of companies in developed markets, excluding the U.S. and Canada, with higher price-to-book ratios.
Artisan Mid Cap Fund – Russell Midcap® Index is a market-weighted index of about 800 medium-sized U.S. companies. The Russell Midcap® Growth Index is a market-weighted index of those medium-sized companies included in the Russell Midcap® Index with higher price-to-book ratios and higher forecasted growth values. The Russell Top 200® Index is a market-weighted index of 200 of the largest U.S. companies.
Trademarks
Trademarks and copyrights relating to the indices and products of portfolio companies mentioned in this report are owned by their respective owners. Except as otherwise indicated, the trademarks, including names, logos, slogans and service marks appearing in this report are the property of the Adviser and may not be copied, reproduced, published or in any way used without written permission.
PROXY VOTING POLICIES AND PROCEDURES
You may obtain a description of Artisan Funds’ proxy voting policies and procedures, without charge, upon request by calling 800.399.1770. That information also is included in Artisan Funds’ statement of additional information, which is available on the Funds’ website at www.artisanfunds.com and the Securities and Exchange Commission’s website at www.sec.gov.
Information relating to how each Artisan Fund voted proxies relating to portfolio securities held during the twelve months ended June 30 is available on the Funds’ website at www.artisanfunds.com and on the Securities and Exchange Commission’s website at www.sec.gov.
INFORMATION ABOUT PORTFOLIO SECURITIES
Artisan Funds files a complete schedule of portfolio holdings with the Securities and Exchange Commission for the quarters ending December 31 and June 30 (the first and third quarters of the Funds’ fiscal year) on Form N-Q. The Funds’ Forms N-Q are available on the Securities and Exchange Commission’s website at www.sec.gov. You may also review and copy those documents by visiting the Securities and Exchange Commission’s Public Reference Room in Washington, D.C. Information on the operation of the Public Reference Room may be obtained by calling the Securities and Exchange Commission at 800.SEC.0330.
38
THIRTY-EIGHT
| | | | |
 | | ARTISAN FUNDS P.O. BOX 8412 BOSTON, MA 02266-8412 800.399.1770 | | |
Item 2. Code of Ethics.
Not applicable for semiannual reports.
Item 3. Audit Committee Financial Expert.
Not applicable for semiannual reports.
Item 4. Principal Accountant Fees and Services.
Not applicable for semiannual reports.
Item 5. Audit Committee of Listed Registrants.
Not applicable.
Item 6. Schedule of Investments.
The Schedule of Investments in securities of unaffiliated issuers is included as part of the semiannual reports to shareholders filed under Item 1 of this Form.
Item 7. Disclosure of Proxy Voting Policies and Procedures for Closed-End Management Investment Companies.
Not applicable.
Item 8. Portfolio Managers of Closed-End Management Investment Companies.
Not applicable.
Item 9. Purchases of Equity Securities by Closed-End Management Investment Company and Affiliated Purchasers.
Not applicable.
Item 10. Submission of Matters to a Vote of Security Holders.
The registrant has a governance and nominating committee, which is responsible for selecting and nominating persons for election or appointment as members of registrant’s board of directors. At a meeting of the committee held on August 19, 2004, the committee adopted guidelines by which the committee, which is comprised entirely of independent directors, will consider any candidates for board membership (whether recommended by a shareholder, the committee, the board of directors or management personnel). The committee has not made any material changes to those procedures, which were disclosed in response to Item 9 of Form N-CSR filed by the registrant on November 30, 2004.
Item 11. Controls and Procedures.
(a) The registrant’s principal executive and principal financial officers have concluded, based on an evaluation of the registrant’s disclosure controls and procedures (as defined in Rule 30a-3(c) under the Investment Company Act of 1940, the “Disclosure Controls”) as of a date within 90 days prior to the filing date (the “Filing Date”) of this Form N-CSR (the “Report”), the Disclosure Controls are effectively designed to ensure that information required to be disclosed by the registrant in the Report is recorded, processed, summarized and reported by the Filing Date, including ensuring that information required to be disclosed in the Report is accumulated and communicated to the registrant’s management, including the registrant’s principal executive officer and principal financial officer, as appropriate to allow timely decisions regarding required disclosure.
(b) There were no changes in the registrant’s internal controls over financial reporting (as defined in Rule 30a-3(d) under the Investment Company Act of 1940) that occurred during the second fiscal quarter of the period covered by this report that have materially affected, or are reasonably likely to materially affect, the registrant’s internal control over financial reporting.
Item 12. Exhibits.
| | | | |
| (a) | | (1) | | Not applicable for semiannual reports |
| | |
| | (2) | | Certifications of Andrew A. Ziegler, Principal Executive Officer and Lawrence A. Totsky, Principal Financial Officer pursuant to Rule 30a-2(a) under the Investment Company Act of 1940 (17 CFR 270.30a-2(a)), attached hereto as Exhibits (a)(2)(i) and (a)(2)(ii) |
| | |
| (b) | | | | Certification of Andrew A. Ziegler, Principal Executive Officer and Lawrence A. Totsky, Principal Financial Officer pursuant to Section 906 of the Sarbanes-Oxley Act of 2002, attached hereto as Exhibit (b) |
SIGNATURES
Pursuant to the requirements of the Securities Exchange Act of 1934 and the Investment Company Act of 1940, the registrant has duly caused this report to be signed on its behalf by the undersigned, thereunto duly authorized.
Artisan Funds, Inc.
| | |
| By: | | /s/ Andrew A. Ziegler |
| | Andrew A. Ziegler |
| | Principal Executive Officer |
| |
| Date: | | May 30, 2006 |
Pursuant to the requirements of the Securities Exchange Act of 1934 and the Investment Company Act of 1940, this report has been signed below by the following persons on behalf of the registrant and in the capacities and on the dates indicated.
| | |
| By: | | /s/ Andrew A. Ziegler |
| | Andrew A. Ziegler |
| | Principal Executive Officer |
| |
| Date: | | May 30, 2006 |
| |
| By: | | /s/ Lawrence A. Totsky |
| | Lawrence A. Totsky |
| | Principal Financial Officer |
| |
| Date: | | May 30, 2006 |