 The PMI Group, Inc. Supplemental Portfolio Information As of December 31, 2009 Exhibit 99.3 |
 2 The PMI Group, Inc. Definition of Terms 2/28s – refers to loans with interest rates that are fixed for two years and reset to a new interest rate at the end of year two for the remaining term of the loan. ARMs – refers to loans with adjustable interest rates. We consider a loan an ARM if its interest rate may be adjusted prior to the loan’s fifth anniversary. A Quality Loans – we define A quality to include loans with credit scores of 620 and greater. Alt-A Loans – we consider a loan Alt-A if it has a credit score of 620 or greater and the borrower requests and is given the option of providing reduced documentation verifying income, assets, deposit information and/or employment. Captive Reinsurance – refers to agreements in which a portion of risk insured by PMI is reinsured by a captive reinsurance company affiliated with the mortgage originator or investor. Defaults – our primary mortgage insurance master policy defines “default” as the borrower’s failure to pay when due an amount equal to the scheduled monthly mortgage payment under the terms of the mortgage. Generally, the master policies require an insured to notify PMI of a default no later than the last business day of the month following the month in which the borrower becomes three monthly payments in default. For reporting purposes and internal tracking purposes, we do not consider a loan to be in default until the borrower has missed two consecutive payments. Depending upon its scheduled payment date, a loan delinquent for two consecutive monthly payments could be reported to PMI between the 31 and the 60 day after the first missed payment. Flow – generally refers to mortgage insurance offered on a loan-by-loan basis to lenders. GSE Pool – refers to a traditional pool product for mortgage loans sold by PMI’s customers to the GSEs. This product was available from 1997 to 2001. Interest Only Loans – refers to loans that do not reduce principal during the initial deferral period (usually between two and ten years) and therefore do not accumulate equity through loan amortization during the initial deferral period. Approximately 91% of our interest only loans have an initial deferral period of 5 years or greater. The average initial deferral period for loans insured in 2007 was 9 years. Insurance in Force (IIF) – refers to the current principal balance of all outstanding mortgage loans with insurance coverage as of a given date. Less-than-A Quality Loans – we define less-than-A credit quality loans to include loans with credit scores of 619 or below. The majority of our less-than-A-quality loans have credit scores above 575. st th |
 3 The PMI Group, Inc. Definition of Terms Modified Pool Insurance – modified pool insurance may be used in addition to primary mortgage insurance or may be placed on loans that do not require primary insurance. Coverage of modified pool products varies. Some products provide first loss protection by covering a percentage of the losses on individual loans held within the pool of insured loans up to a stated aggregate loss limit (“stop loss limit”) for the entire pool. Some modified pool products offer mezzanine-level coverage by providing for claims payments only after a predetermined cumulative claims level, or deductible, is reached. New Insurance Written (NIW) – refers to the original principal balance of all loans that receive new primary mortgage insurance coverage during a given period. New Risk Written (NRW) – refers to the aggregate dollar amount of each insured mortgage loan’s current principal balance multiplied by the insurance coverage percentage specified in the policy for all loans that receive new primary mortgage insurance coverage during a given period. Old Pool – refers to a traditional pool product for mortgage loans sold by PMI’s customers to capital market participants. Payment Option ARMs – generally refers to loans that provide the borrower an option every month to make a payment consisting of principal and interest, interest only, or an amount established by the lender that may be less than the interest owed. Primary Insurance – refers to mortgage insurance placed on a loan-by-loan basis through our “flow” channel and mortgage insurance issued for mortgage-backed securities and portfolio investors through our “structured transactions” channel. Primary insurance does not include pool or modified pool information. Primary Risk in Force – refers to the aggregate dollar amount of each insured mortgage loan’s current principal balance multiplied by the insurance coverage percentage specified in the policy for insurance policies issued through our “flow” and “structured transactions” channels only. Risk in Force (RIF) – refers to the aggregate dollar amount of each insured mortgage loan’s current principal balance multiplied by the insurance coverage percentage specified in the policy. Structured – generally refers to mortgage insurance offered by PMI that covers large portfolios of mortgage loans and is provided to issuers of mortgage backed securities (“MBS”) and portfolio investors. Traditional Pool – covers the entire loss on a defaulted mortgage loan that exceeds the claim payment under any primary insurance coverage, up to a stated aggregate loss limit, or stop loss, for all of the loans in a pool. PMI is not currently offering traditional pool insurance to its customers. |
 4 The PMI Group, Inc. Contents of Presentation Focus on Particular Portfolio Segments Part 3 Primary Portfolio Characteristics Part 2 Portfolio Categories Part 1 Modified Pool Portfolio Part 5 Primary Portfolio Characteristics by Vintage Part 4 Captive Reinsurance Arrangements Part 6 |
 Portfolio Categories |
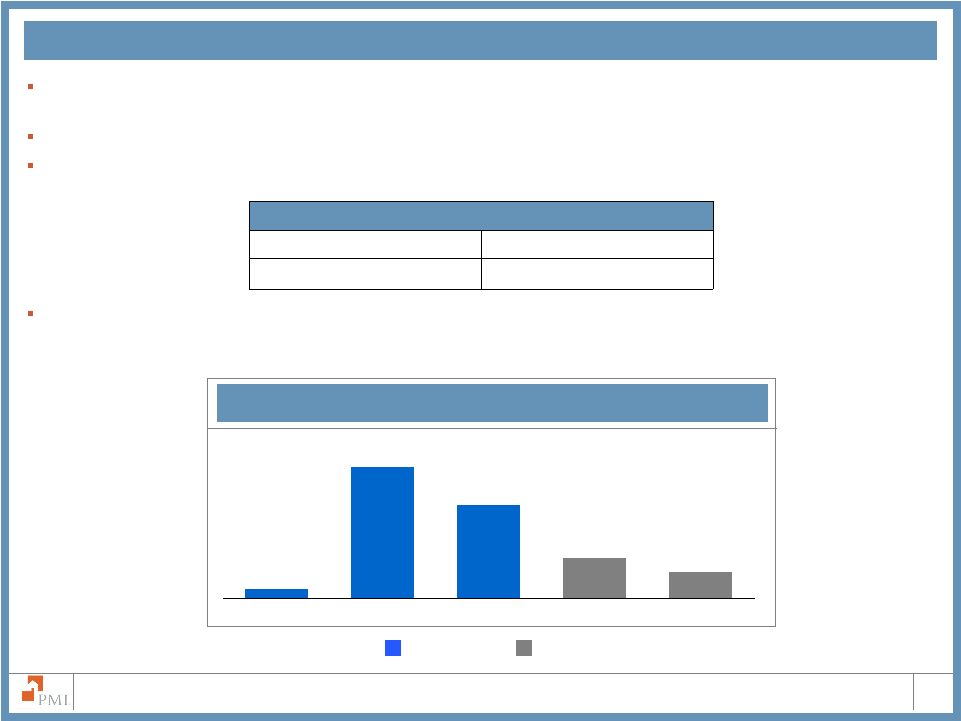
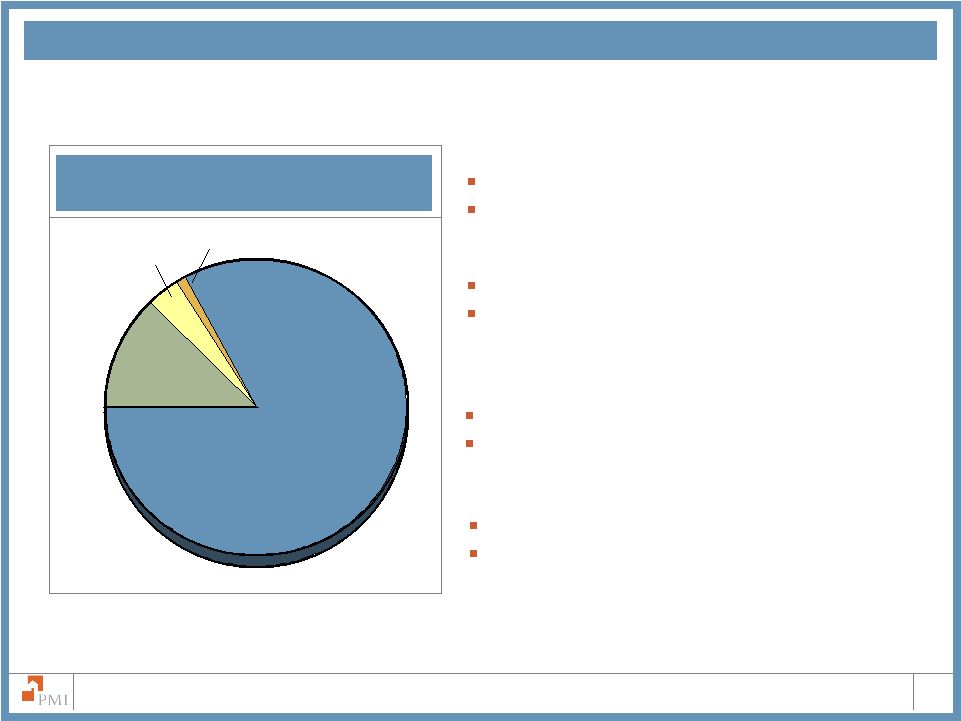 6 The PMI Group, Inc. $27.8 Billion Primary Risk in Force and $1.1 Billion Pool Risk in Force* Primary Flow 83% Primary Structured 13% Modified Pool 3% General Portfolio Categories Primary Flow Insurance $24.1 billion of risk in force Primary mortgage insurance offered to lenders on a loan-by-loan basis Primary Structured Insurance $3.7 billion of risk in force Credit enhancement solutions offered across the credit spectrum to agency and non-agency MBS issuers as well as portfolio investors Modified Pool Risk in Force $0.8 billion of remaining risk in force 1 Insurance offered to agency and non-agency MBS issuers and investors Other Pool $0.3 billion of remaining risk in force 1 Prior to 2002, PMI offered certain pool insurance products, referred to principally as GSE or Old Pool, to lenders, the GSEs and non-agency market Other Pool 1% * At December 31, 2009 Note: Due to rounding, the sum of percentages may not total 100% 1 Remaining risk in force for modified and other pool excludes non-performing risk exposures, for which loss reserves have been established. |
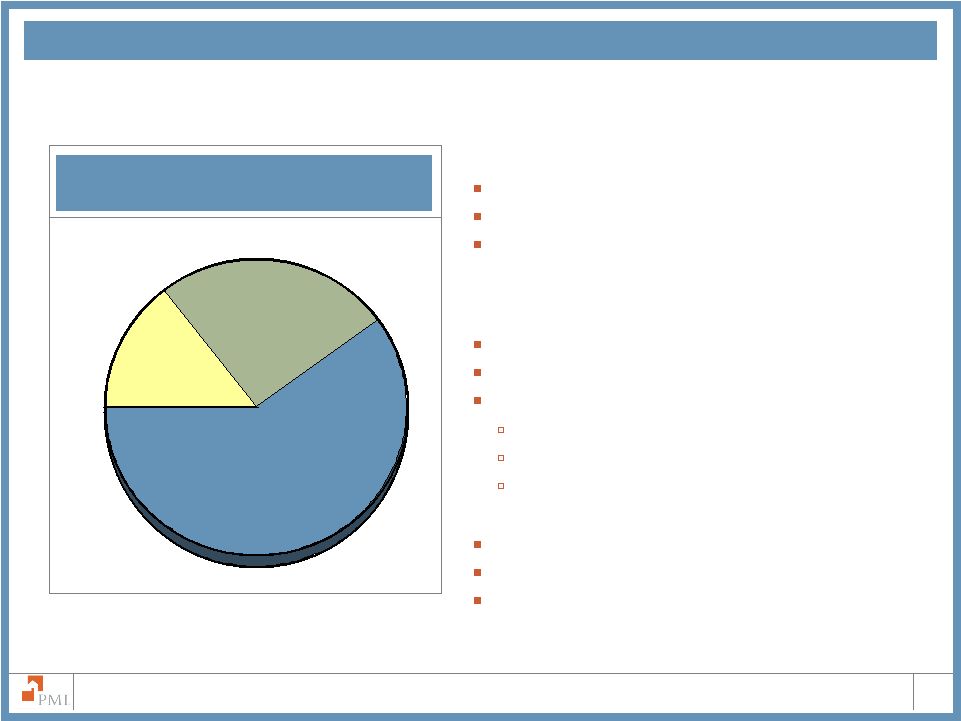 7 The PMI Group, Inc. $27.8 Billion Primary Risk in Force* Legacy: Performing 60% New writings 13% General Portfolio Categories Legacy: Performing $16.7 billion of risk in force Performing risk in force from 1H 2008 and prior Continues to perform through the housing downturn and generates strong annual revenue Legacy: Non-performing $7.1 billion of risk in force Non-performing risk in force from 1H 2008 and prior Key focus of PMI’s loss mitigation efforts PMI’s Homeownership Preservation Initiatives Home Affordable Modification Program (HAMP) Other loan modification programs New writings $4.0 billion of risk in force Risk in force originated in 2H 2008 and 2009 Very high quality business originated under new guidelines and higher premium rates * At December 31, 2009 Note: Due to rounding, the sum of percentages may not total 100% Legacy: Non-performing 26% |
 8 The PMI Group, Inc. New Writings* New writings $4.0 billion of risk in force from $21.0 billion of new insurance written in 2H 2008 and 2009 Very high quality business originated under new guidelines and higher premium rates * At December 31, 2009 1 Condominium includes Townhouses and Cooperatives New writings characteristics as percentage of risk in force Loan Type 99% Fixed Rate Property Type 82% Single Family 17% Condominium 1 Occupancy 95% Owner Occupied 3% Second Home Average FICO of 740 91% FICO 680 and above 70% FICO 720 and above Average Loan to Value of 90% 97% LTV of 95% and below 61% LTV of 90% and below Average loan size of $215,000 |
 Primary Portfolio Characteristics |
 10 The PMI Group, Inc. 2.1% 1.3% 2.7% 7.5% 7.8% 11.9% 15.1% 28.0% 16.2% 7.5% 0% 10% 20% 30% 40% 50% Prior to 2001 2001 2002 2003 2004 2005 2006 2007 2008 2009 $113.7 Billion Primary IIF $27.8 Billion Primary RIF U.S. Portfolio Age Distribution Average Rate (1) (1) Average loan fixed annual mortgage interest rate 2.2% 1.3% 2.8% 7.6% 8.4% 12.4% 15.7% 28.0% 15.0% 6.6% 0% 10% 20% 30% 40% 50% Prior to 2001 2001 2002 2003 2004 2005 2006 2007 2008 2009 6.33% 7.01% 6.99% 6.22% 6.14% 6.04% 6.88% 7.68% 7.78% Note: Due to rounding, the sum of percentages may not total 100% 5.15% |
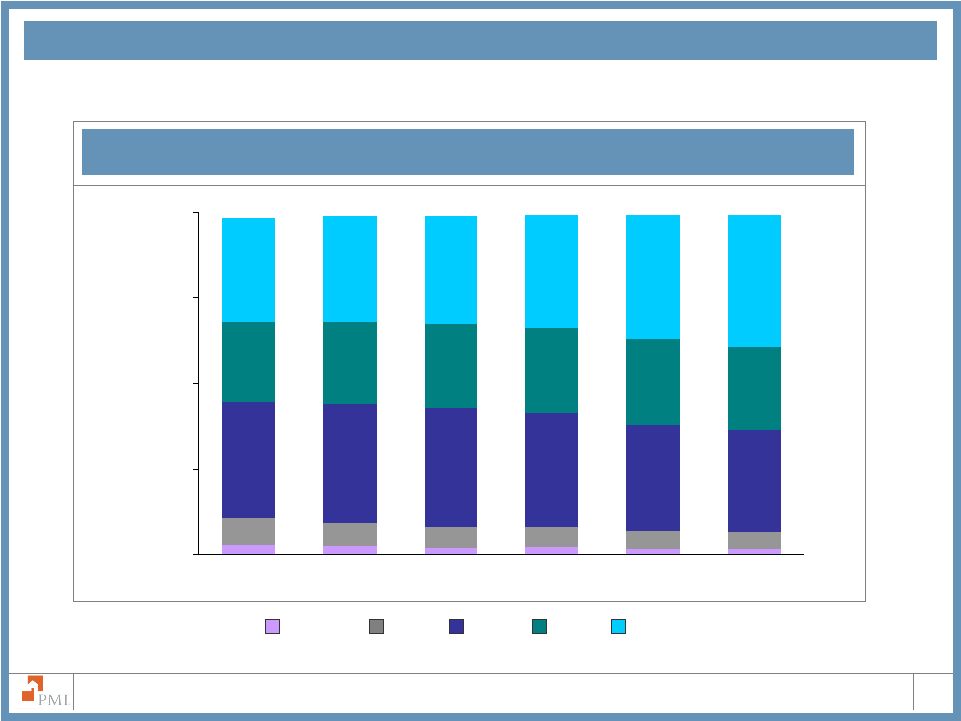 11 The PMI Group, Inc. Primary Risk in Force by FICO Score 7.8% 6.8% 5.9% 5.9% 33.8% 34.6% 34.7% 33.1% 23.4% 24.1% 24.6% 30.3% 30.7% 31.5% 32.7% 36.1% 1.7% 3.0% 2.5% 2.1% 1.8% 2.2% 5.0% 5.2% 29.6% 30.8% 24.6% 25.1% 25.1% 38.2% 0% 25% 50% 75% 100% 2004 2005 2006 2007 2008 2009 Less than 575 720 and above 680 - 719 620 - 679 575 - 619 U.S. Portfolio Credit Score Distribution Excludes unreported FICO scores |
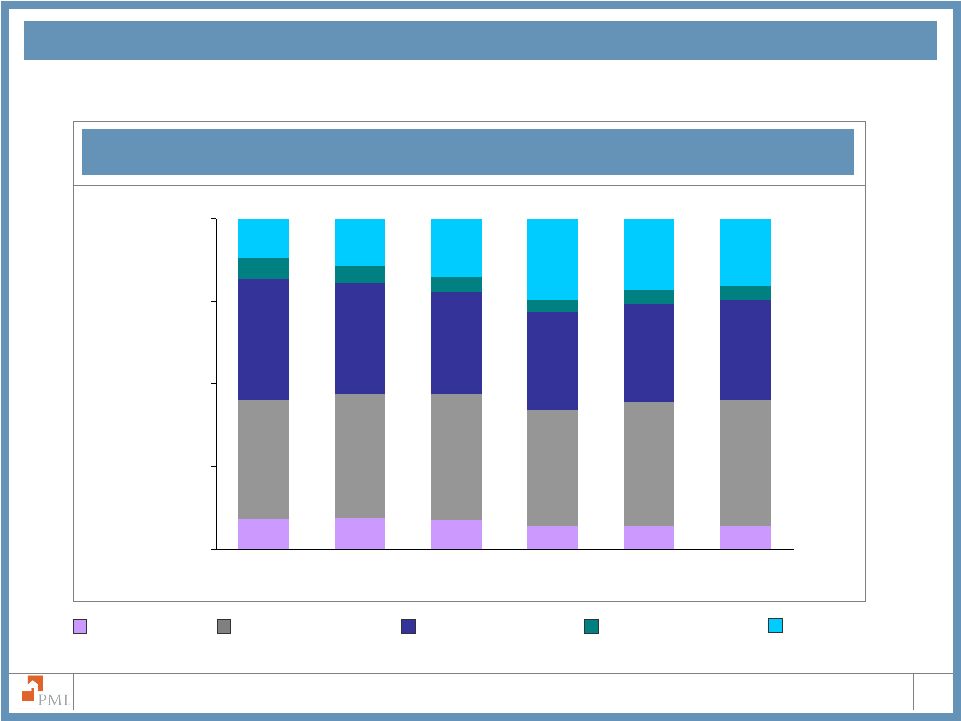 12 The PMI Group, Inc. LTVs between 85.01% and 90% Primary Risk in Force by Loan to Value 9.2% 9.3% 7.0% 7.0% 38.1% 36.4% 33.7% 31.0% 29.5% 30.5% 6.6% 5.3% 4.6% 3.8% 4.0% 11.9% 14.3% 17.6% 20.4% 8.9% 7.1% 35.0% 37.5% 37.9% 37.4% 35.9% 29.9% 4.1% 21.5% 24.6% 0% 25% 50% 75% 100% 2004 2005 2006 2007 2008 2009 LTVs above 97% LTVs between 95.01% and 97% LTVs between 90.01% and 95% LTVs of 85% and below U.S. Portfolio Loan to Value Distribution Note: Due to rounding, the sum of percentages may not total 100% |
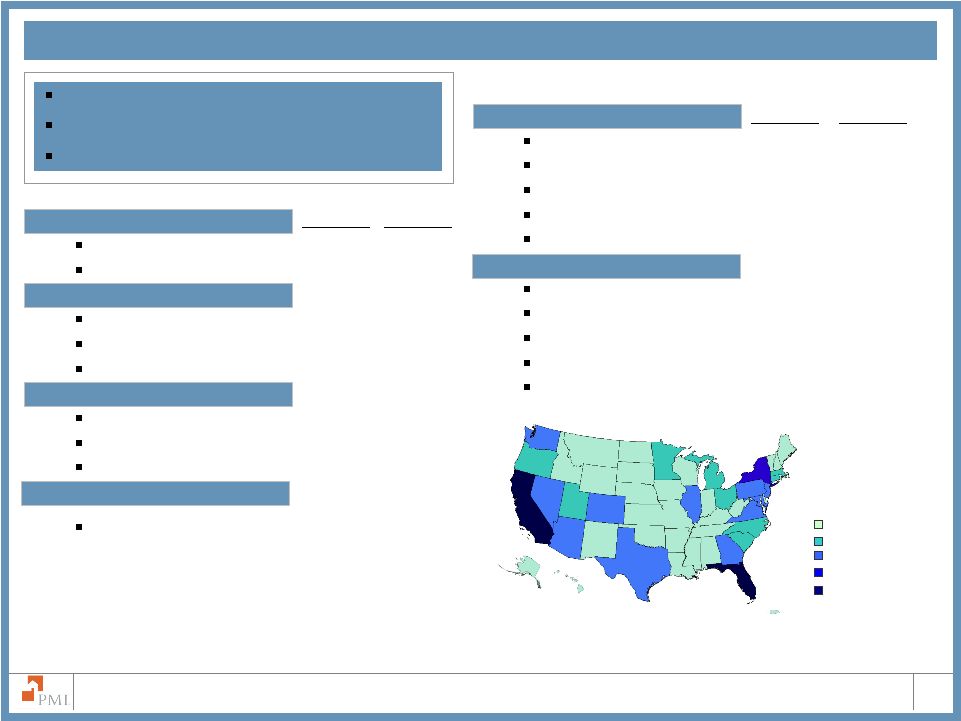
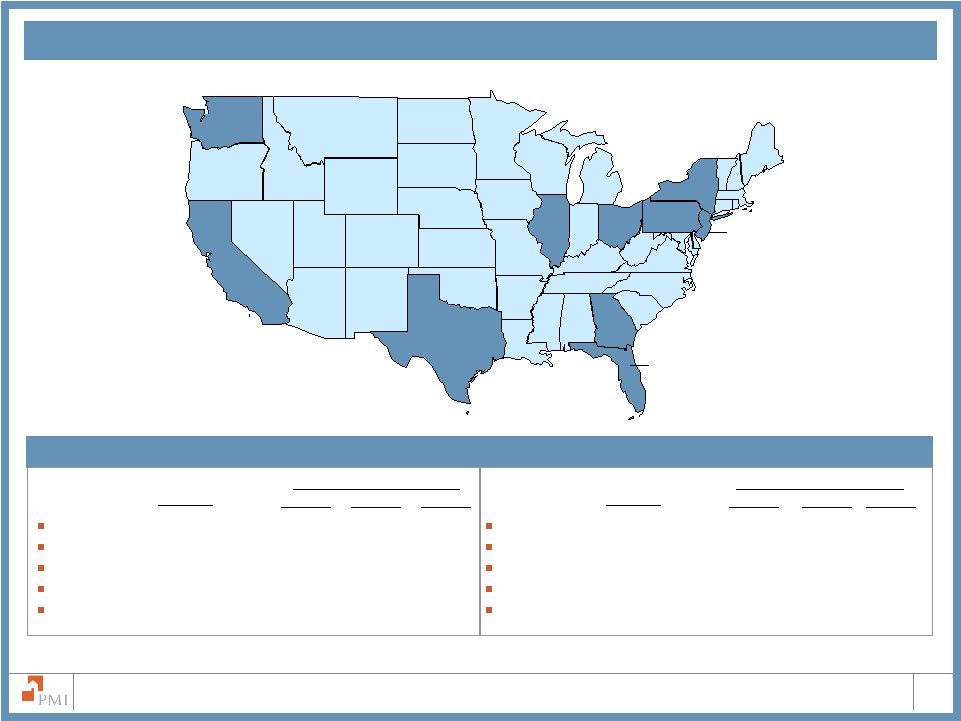 13 The PMI Group, Inc. U.S. Portfolio Geographic Distribution 1 Top ten states as determined by primary RIF on December 31, 2009 2 Default rates as of December 31, 2009, 2008 and 2007 10.1% 7.5% 7.7% 5.2% 3.9% 3.4% 4.0% 3.3% 4.7% 3.2% Florida 10.1% 41.14% 27.79% 10.56% California 7.7% 36.68% 24.68% 10.92% Texas 7.5% 12.97% 9.44% 6.03% Illinois 5.2% 24.96% 14.80% 8.19% Georgia 4.7% 23.15% 14.62% 9.50% % of RIF YE 2009 YE 2008 YE 2007 New York 4.0% 18.50% 11.27% 6.78% Ohio 3.9% 18.04% 13.50% 10.83% Pennsylvania 3.4% 15.46% 10.75% 7.47% New Jersey 3.3% 24.06% 14.17% 7.53% Washington 3.2% 16.50% 8.15% 3.58% % of RIF YE 2009 YE 2008 YE 2007 Top Ten States – Percent of Primary Risk in Force and Default Rates Primary Default Rates Primary Default Rates 2 2 1 1 |
 Focus on Particular Portfolio Segments |
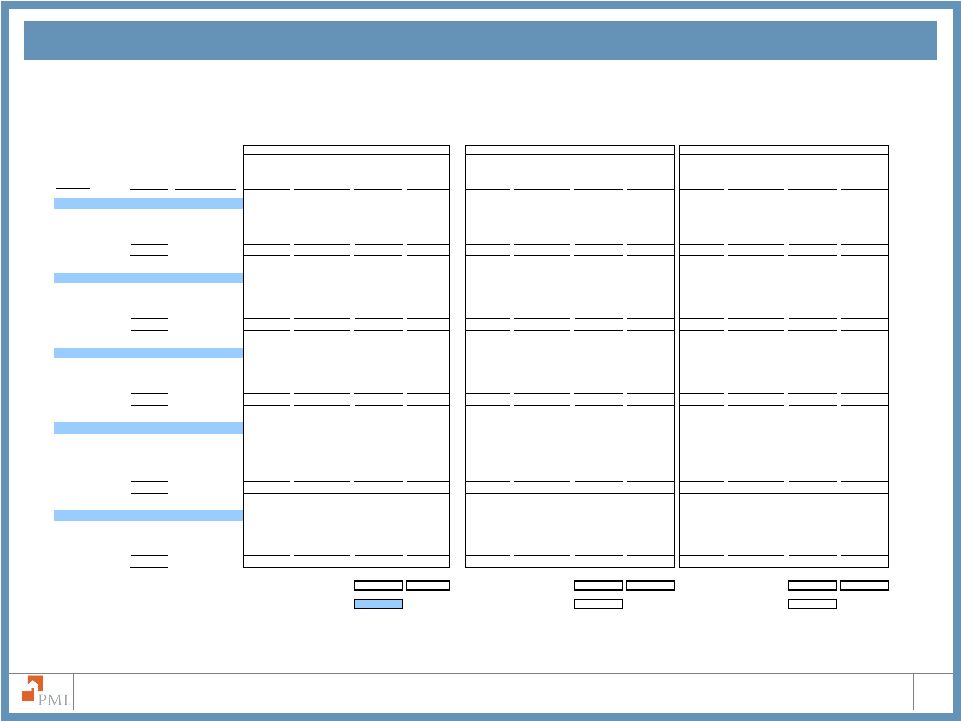
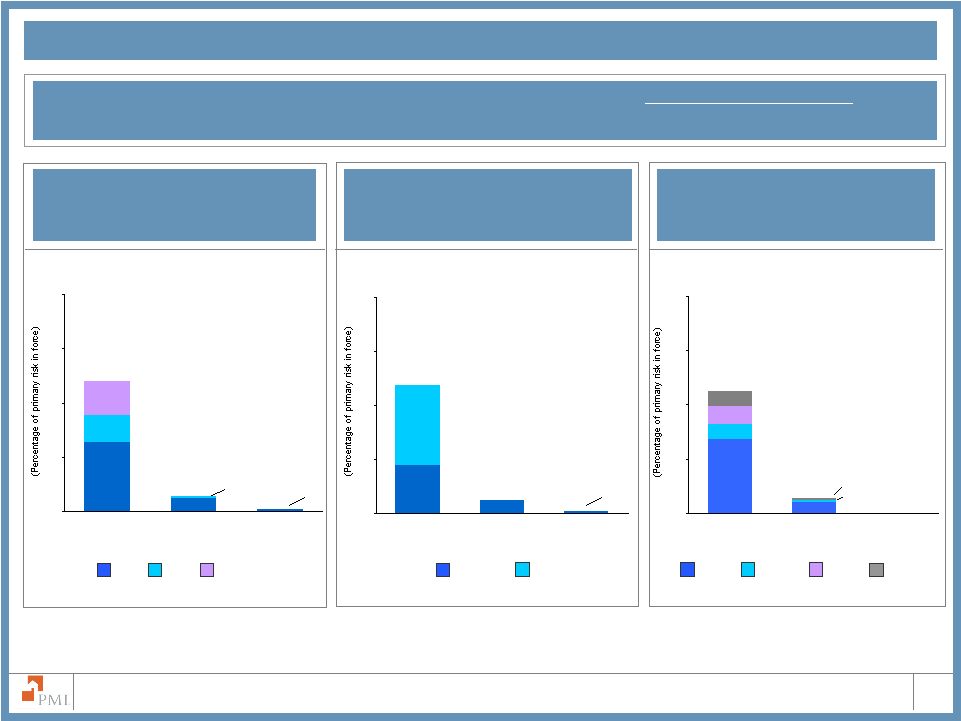 15 The PMI Group, Inc. U.S. Portfolio Interest Rate Adjustments Rate Adjustments by Credit Quality Rate Adjustments of Hybrid Loans and Other ARMs Rate Adjustments in Distressed Geographic Regions Other ARMs 3/27s Prime Alt-A Less than A Quality Note: 2/28s resets in 2009 and 2010 are 0.01% and 0.00%, respectively California All Other Florida Auto States Note: Auto states include Michigan, Ohio, Illinois and Indiana Note: Percentages are of total Primary RIF at December 31, 2009 2010 2011 2012 Total interest rate adjustments as a percentage of primary risk in force: 0.6% 0.1% 0.0% 0.01% 0.01% 0.01% 0.01% 0.01% 0.32% 0.06% 0.12% 0.16% 0.0% 0.3% 0.5% 0.8% 1.0% 2010 2011 2012 0.22% 0.06% 0.37% 0.0% 0.3% 0.5% 0.8% 1.0% 2010 2011 2012 0.34% 0.05% 0.07% 0.08% 0.07% 0.0% 0.3% 0.5% 0.8% 1.0% 2010 2011 2012 ` |
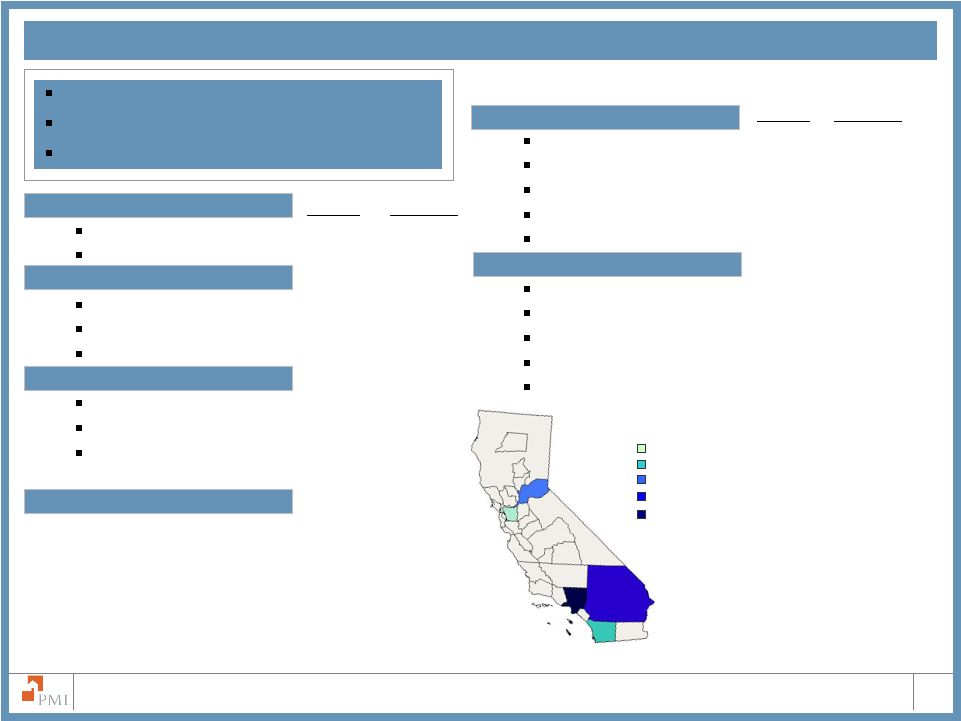 16 The PMI Group, Inc. California at December 31, 2009 1 Condominium includes Townhouses and Cooperatives 2 Excludes unreported FICO scores % of CA RIF % of Total RIF % of Total RIF Note: Due to rounding, the sum of percentages may not total 100% % of CA RIF $2.1 Billion of Total Risk in Force 7.7% of PMI’s Primary Risk in Force $295,038 Average Loan Size MSA Distribution of Total Primary RIF Oakland-Fremont-Hayward, CA– 0.4% San Diego-Carlsbad-San Marcos – 0.6% Sacramento--Arden-Arcade—Roseville – 0.7% Riverside-San Bernardino-Ontario – 1.5% Los Angeles-Long Beach-Glendale – 1.6% FICO Scores 2 720 and above 40.7% 3.1% 680-719 27.7% 2.1% 620-679 28.3% 2.2% 575-619 2.4% 0.2% Less than 575 0.6% 0.0% Loan to Value Above 97.00% 12.5% 1.0% 95.01% to 97.00% 2.0% 0.2% 90.01% to 95.00% 20.6% 1.6% 85.01% to 90.00% 51.6% 4.0% 85.00% and below 13.4% 1.0% Loan Type Fixed Rate 76.7% 5.9% ARM 23.3% 1.8% Property Type 1 Single Family 80.9% 6.2% Condominium 15.4% 1.2% Multi-Family and other 3.6% 0.3% Occupancy Primary Residence 93.2% 7.2% Second Home 2.7% 0.2% Non-owner occupied 4.1% 0.3% Alt-A 30.4% 2.3% |
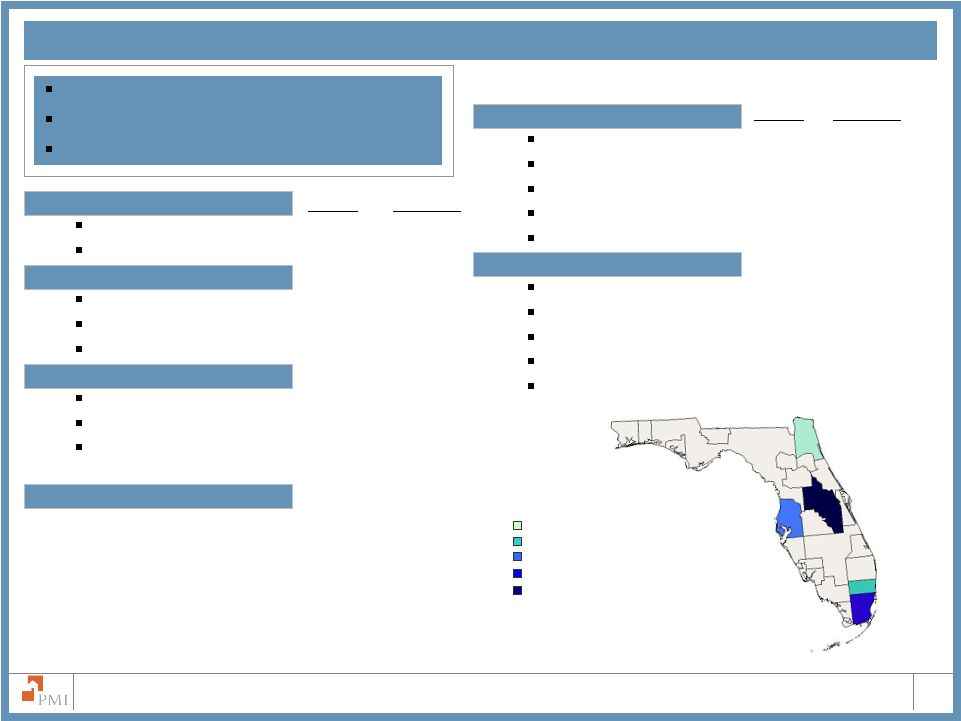 17 The PMI Group, Inc. Florida at December 31, 2009 1 Condominium includes Townhouses and Cooperatives 2 Excludes unreported FICO scores % of FL RIF % of Total RIF % of FL RIF % of Total RIF $2.8 Billion of Total Risk in Force 10.1% of PMI’s Primary Risk in Force $175,966 Average Loan Size Note: Due to rounding, the sum of percentages may not total 100% Map and MSA data have not yet been updated FICO Scores 2 720 and above 35.9% 3.6% 680-719 27.5% 2.8% 620-679 30.8% 3.1% 575-619 4.1% 0.4% Less than 575 1.2% 0.1% Loan to Value Above 97.00% 20.1% 2.0% 95.01% to 97.00% 2.6% 0.3% 90.01% to 95.00% 29.8% 3.0% 85.01% to 90.00% 40.9% 4.1% 85.00% and below 6.6% 0.7% Loan Type Fixed Rate 84.2% 8.5% ARM 15.8% 1.6% Property Type 1 Single Family 71.7% 7.2% Condominium 26.3% 2.6% Multi-Family and other 2.0% 0.2% Occupancy Primary Residence 79.1% 8.0% Second Home 12.2% 1.2% Non-owner occupied 8.7% 0.9% Alt-A 33.9% 3.4% Tampa-St. Petersburg-Clearwater, FL– 1.4% MSA Distribution of Total Primary RIF Jacksonville, FL– 0.7% Fort Lauderdale-Deerfield Beach, FL– 1.1% Miami-Miami Beach-Kendall, FL– 1.5% Orlando-Kissimmee, FL– 1.6% |
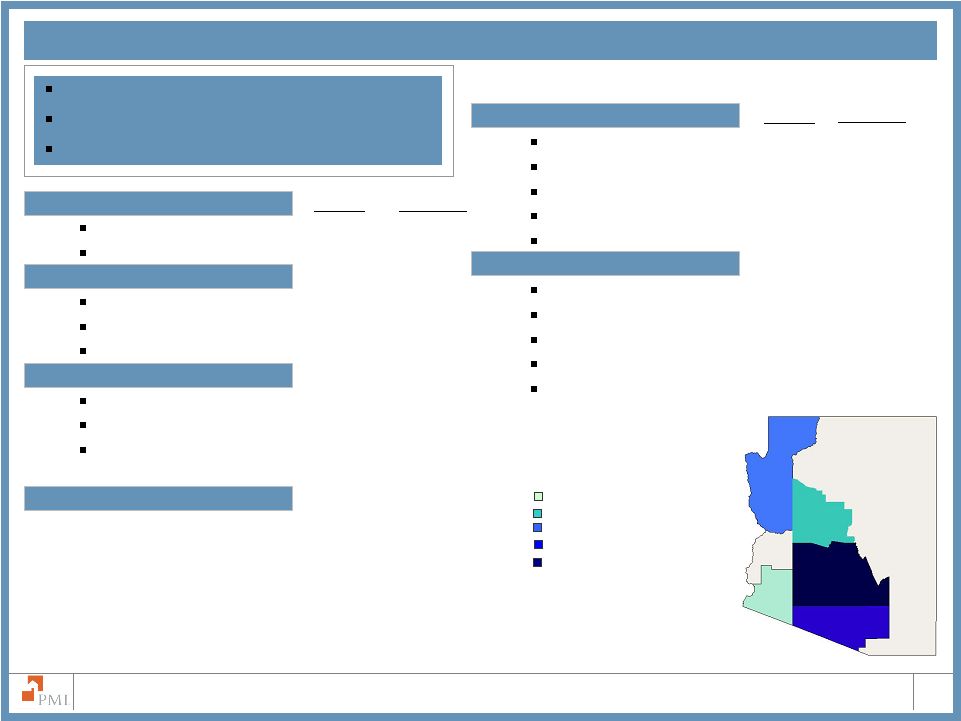 18 The PMI Group, Inc. Loan Type Fixed Rate 89.3% 2.4% ARM 10.7% 0.3% Property Type 1 Single Family 84.9% 2.3% Condominium 11.9% 0.3% Multi-Family and other 3.2% 0.1% Occupancy Primary Residence 85.2% 2.3% Second Home 8.4% 0.2% Non-owner occupied 6.5% 0.2% Alt-A 22.4% 0.6% Arizona at December 31, 2009 1 Condominium includes Townhouses and Cooperatives 2 Excludes unreported FICO scores % of % of AZ RIF Total RIF % of AZ RIF % of Total RIF FICO Scores 2 720 and above 38.1% 1.0% 680-719 26.1% 0.7% 620-679 29.9% 0.8% 575-619 3.7% 0.1% Less than 575 1.0% 0.0% Loan to Value Above 97.00% 27.3% 0.7% 95.01% to 97.00% 2.6% 0.1% 90.01% to 95.00% 24.5% 0.7% 85.01% to 90.00% 38.7% 1.0% 85.00% and below 7.0% 0.2% $0.8 Billion of Total Risk in Force 2.7% of PMI’s Primary Risk in Force $188,149 Average Loan Size Note: Due to rounding, the sum of percentages may not total 100% Lake Havasu City-Kingman, AZ-0.1% Yuma, AZ – 0.1% Prescott, AZ-0.1% Tucson, AZ-0.4% Phoenix-Mesa, AZ – 2.0% MSA Distribution of Total Primary RIF |
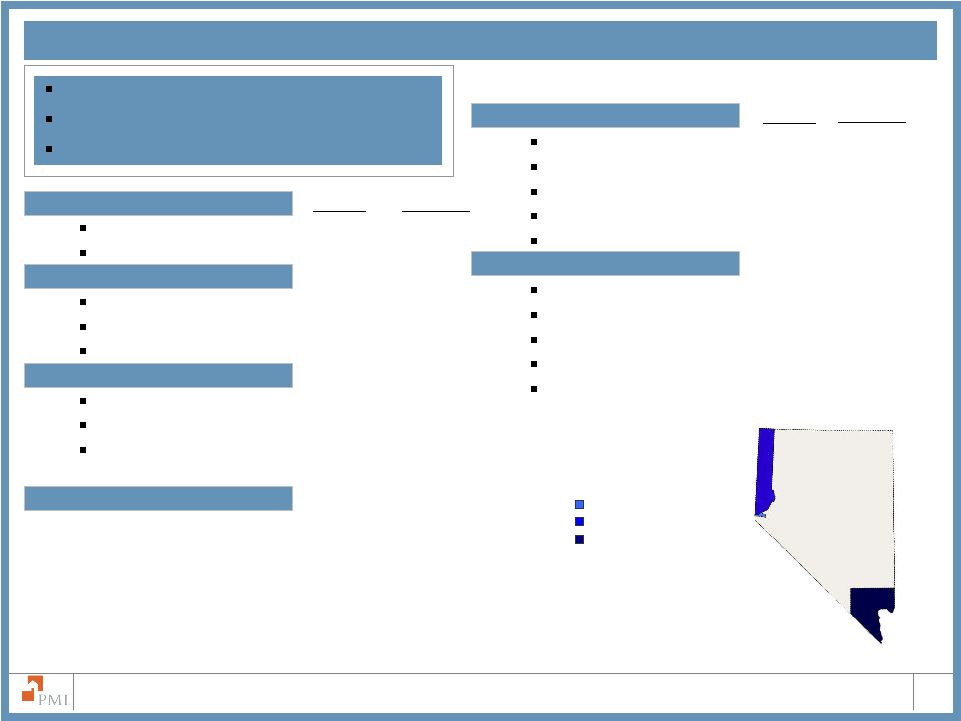 19 The PMI Group, Inc. Loan Type Fixed Rate 82.0% 1.3% ARM 18.0% 0.3% Property Type 1 Single Family 79.1% 1.3% Condominium 19.1% 0.3% Multi-Family and other 1.7% 0.0% Occupancy Primary Residence 82.3% 1.3% Second Home 12.5% 0.2% Non-owner occupied 5.2% 0.1% Alt-A 29.6% 0.5% Nevada at December 31, 2009 1 Condominium includes Townhouses and Cooperatives 2 Excludes unreported FICO scores % of % of NV RIF Total RIF % of NV RIF % of Total RIF FICO Scores 2 720 and above 40.1% 0.7% 680-719 27.0% 0.4% 620-679 29.0% 0.5% 575-619 2.8% 0.0% Less than 575 0.5% 0.0% Loan to Value Above 97.00% 18.9% 0.3% 95.01% to 97.00% 1.6% 0.0% 90.01% to 95.00% 27.6% 0.5% 85.01% to 90.00% 44.5% 0.7% 85.00% and below 7.4% 0.1% $0.5 Billion of Total Risk in Force 1.6% of PMI’s Primary Risk in Force $231,478 Average Loan Size Note: Due to rounding, the sum of percentages may not total 100% Las Vegas-Paradise, NV-1.3% Reno-Sparks, NV-0.2% Carson City, NV-0.01% MSA Distribution of Total Primary RIF |
 20 The PMI Group, Inc. Alt-A at December 31, 2009 1 Condominium includes Townhouses and Cooperatives 2 Excludes unreported FICO scores % of Alt-A RIF % of Total RIF % of Total RIF Loan Type Fixed Rate 76.1% 13.0% ARM 23.9% 4.1% Property Type 1 Single Family 77.7% 13.2% Condominium 15.3% 2.6% Multi-Family and other 7.0% 1.2% Occupancy Primary Residence 80.5% 13.7% Second Home 7.1% 1.2% Non-owner occupied 12.4% 2.1% $4.7 Billion of Total Risk in Force 17.0% of PMI’s Primary Risk in Force $208,822 Average Loan Size Guideline Changes % of Alt-A RIF Note: Due to rounding, the sum of percentages may not total 100% FICO Scores 2 720 and above 37.8% 6.4% 680-719 35.2% 6.0% 620-679 27.0% 4.6% 575-619 0.0% 0.0% Less than 575 0.0% 0.0% Loan to Value Above 97.00% 12.8% 2.2% 95.01% to 97.00% 0.2% 0.0% 90.01% to 95.00% 27.0% 4.6% 85.01% to 90.00% 50.1% 8.5% 85.00% and below 10.0% 1.7% With the exception of previously issued commitments, effective June 1, 2008, PMI no longer insures Alt-A State Distribution of Alt-A RIF 0.00% to 1.00% 1.00% to 2.00% 2.00% to 5.00% 5.00% to 10.00% >10.00% |
 Primary Portfolio Characteristics by Vintage |
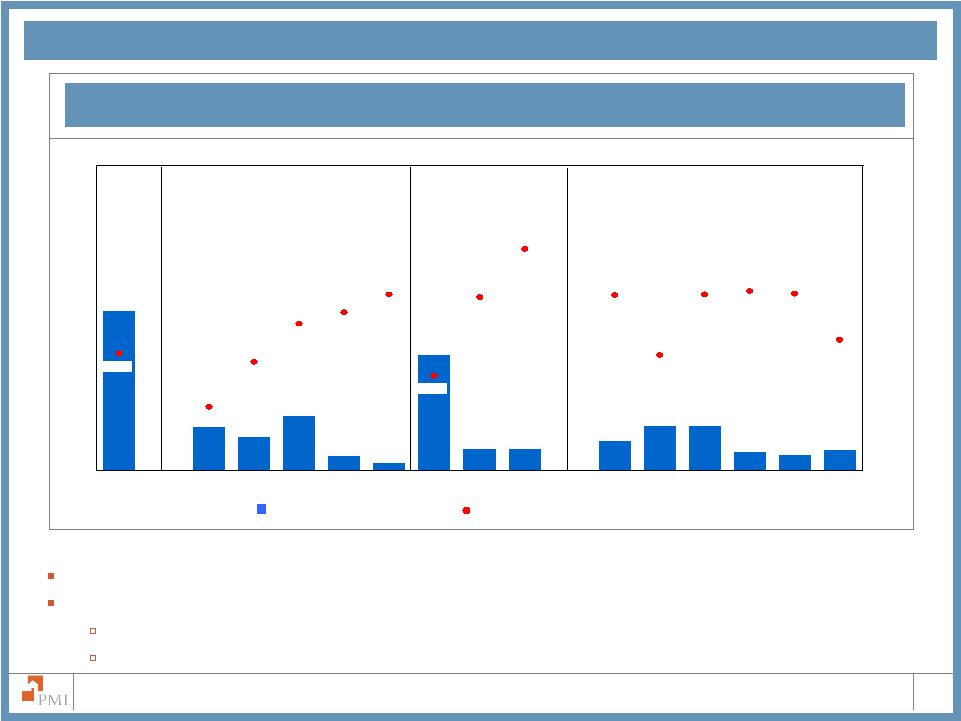
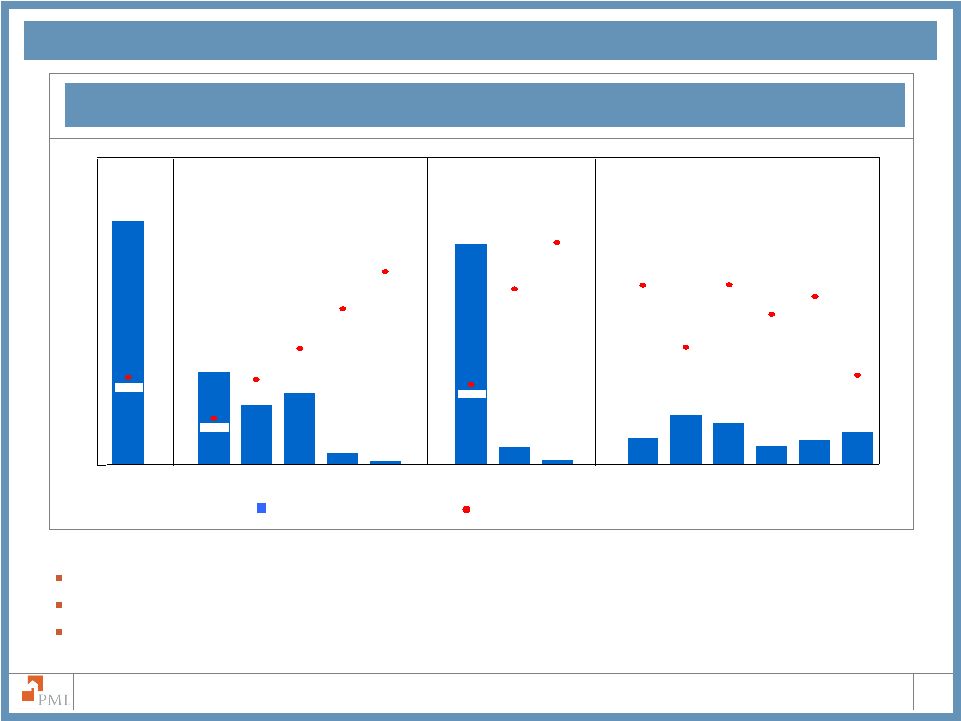 22 The PMI Group, Inc. $25,196 $6,827 $8,216 $10,613 $27,794 $1,392 $5,667 $4,731 $2,133 $2,805 $2,090 $3,043 $485 $504 $3,727 43.0% 28.4% 20.8% 11.4% 21.4% 38.1% 54.3% 43.8% 28.7% 43.9% 36.7% 41.1% 19.6% 21.8% 47.2% Total 720 and above 680 - 719 620 - 679 575 - 619 Less than 575 Fixed Rate ARMs 2/28s Interest Only LTV>97 Alt-A Calif. Florida Auto States Risk Characteristics Risk Characteristics: Total Primary Portfolio Risk in Force (dollars in millions) Default Rate (as measured by policies) Credit Score Total Loan Type Total Primary Portfolio: PMI’s total primary book is primarily driven by the flow channel Loans are primarily fixed rate and owner occupied with FICO scores greater than 620 Certain geographies and select products have exhibited heightened levels of defaults Total Primary Risk in Force as of December 31, 2009 |
 23 The PMI Group, Inc. Primary Portfolio Characteristics Primary RIF as of December 31, 2009 All $ in Millions, except for Average Loan Size Specific Portfolio Characteristics Interest Only LTV > 97% Alt-A California Florida Auto States Avg Loan Size Avg LTV 2 Avg FICO Total Credit Score 1 Loan Type Less than 575 575 - 619 720 and above ARM Total 2/28s Total Portfolio $27,793.9 $485.2 $1,392.0 $8,216.5 $6,826.7 $10,612.8 $25,196.0 $2,090.2 $504.4 Default Rate 21.4% 47.2% 38.1% 28.4% 20.8% 11.4% 19.6% 43.0% 54.3% 2009 Vintage $1,822.8 $0.2 $0.3 $67.6 $321.0 $1,430.8 $1,817.1 $4.7 $0.0 Default Rate 0.6% 0.0% 20.0% 4.6% 1.3% 0.3% 0.6% 5.0% 0.0% 2008 Vintage $4,182.9 $5.0 $48.8 $763.7 $1,090.4 $2,270.8 $4,131.1 $51.6 $0.0 Default Rate 11.7% 57.6% 39.1% 22.4% 13.1% 6.3% 11.6% 24.1% 0.0% 2007 Vintage $7,787.4 $192.2 $518.8 $2,429.8 $1,989.8 $2,635.8 $7,231.6 $513.0 $42.6 Default Rate 30.9% 53.1% 44.2% 35.3% 30.2% 20.1% 29.9% 43.1% 63.2% 2006 Vintage $4,374.0 $56.4 $189.3 $1,558.2 $1,142.6 $1,405.1 $3,513.2 $615.2 $245.5 Default Rate 31.4% 52.5% 42.2% 37.1% 31.9% 21.3% 27.1% 55.7% 65.4% 2005 Vintage $3,447.8 $45.3 $155.6 $1,266.8 $883.1 $1,071.3 $2,734.0 $530.2 $183.3 Default Rate 23.3% 43.7% 36.6% 28.4% 23.0% 14.0% 19.5% 45.4% 42.9% 2004 Vintage and Prior $6,179.0 $186.1 $479.2 $2,130.4 $1,399.7 $1,799.1 $5,768.9 $375.5 $33.1 Default Rate 16.4% 41.6% 32.1% 20.8% 13.0% 7.4% 15.6% 30.5% 42.3% Total Portfolio $3,043.1 $5,667.0 $4,730.9 $2,132.7 $2,805.1 $3,726.6 $161,173 93% 696 Default Rate 43.8% 28.7% 43.9% 36.7% 41.1% 21.8% 2009 Vintage $3.0 $0.0 $2.8 $59.5 $35.2 $221.6 $214,559 90% 751 Default Rate 2.6% 0.0% 18.5% 0.3% 1.7% 0.7% 2008 Vintage $227.1 $248.2 $213.0 $421.3 $211.7 $510.3 $204,577 91% 722 Default Rate 22.7% 23.4% 37.3% 19.9% 28.8% 11.8% 2007 Vintage $1,472.6 $2,688.3 $1,916.4 $752.3 $869.9 $860.5 $186,789 94% 686 Default Rate 48.3% 33.8% 49.6% 52.4% 53.8% 29.2% 2006 Vintage $799.4 $1,150.2 $1,404.3 $374.3 $683.7 $569.8 $172,671 93% 692 Default Rate 47.5% 28.7% 50.1% 62.7% 58.5% 28.9% 2005 Vintage $462.8 $657.2 $731.3 $291.4 $504.7 $514.7 $156,160 92% 693 Default Rate 37.4% 24.3% 40.0% 43.1% 43.1% 22.6% 2004 Vintage and Prior $78.2 $923.1 $463.2 $233.8 $499.9 $1,049.6 $110,488 93% 685 Default Rate 32.3% 21.5% 24.7% 14.7% 20.9% 20.2% 1 Excludes unreported FICO scores 2 At origination Note: Categories are not mutually exclusive except for Credit Score and Loan Type. Vintage refers to the year that the insurance was issued. Fixed Rate 620 - 679 680 - 719 |
 24 The PMI Group, Inc. $22,548 $6,052 $6,969 $9,598 $24,138 $1,061 $4,635 $3,708 $1,712 $2,428 $1,587 $2,351 $290 $0 $3,242 43.2% 27.1% 20.1% 10.9% 20.2% 37.9% 44.0% 28.8% 44.1% 35.2% 40.8% 19.1% 20.1% 50.3% Total 720 and above 680 - 719 620 - 679 575 - 619 Less than 575 Fixed Rate ARMs 2/28s Interest Only LTV>97 Alt-A Calif. Florida Auto States Flow Risk in Force as of December 31, 2009 Risk Characteristics: Flow Risk in Force (dollars in millions) Default Rate (as measured by policies) Credit Score Total Loan Type Risk Characteristics Primary Flow Portfolio: PMI’s primary flow book represents 87% of primary insurance and is primarily owner occupied, fixed rate loans with FICO scores greater than 620 Approximately 93% of flow risk in force is within conforming loan limits Approximately 54% of flow risk in force is in captive reinsurance agreements |
 25 The PMI Group, Inc. Flow Portfolio Characteristics Flow RIF as of December 31, 2009 All $ in Millions, except for Average Loan Size Interest Only LTV > 97% Alt-A California Florida Auto States Avg Loan Size Avg LTV 2 Avg FICO Credit Score 1 Loan Type Less than 575 575 - 619 720 and above ARM 620 - 679 Total 2/28s 1 Excludes unreported FICO scores 2 At origination Note: Categories are not mutually exclusive except for Credit Score and Loan Type. Vintage refers to the year that the insurance was issued. Specific Portfolio Characteristics Total Portfolio $2,351.0 $4,635.1 $3,708.2 $1,711.7 $2,428.5 $3,241.7 $161,875 93% 700 Default Rate 44.0% 28.8% 44.1% 35.2% 40.8% 20.1% 2009 Vintage $3.0 $0.0 $2.8 $59.5 $35.2 $221.6 $214,562 90% 751 Default Rate 2.6% 0.0% 18.5% 0.3% 1.7% 0.7% 2008 Vintage $226.0 $228.0 $211.2 $420.0 $209.9 $505.3 $204,721 91% 722 Default Rate 22.7% 23.2% 37.7% 19.9% 28.6% 11.6% 2007 Vintage $1,267.8 $2,263.3 $1,665.2 $644.0 $722.0 $717.3 $188,342 94% 688 Default Rate 49.4% 35.1% 50.0% 55.1% 57.7% 28.9% 2006 Vintage $496.7 $868.5 $900.7 $216.6 $547.7 $410.4 $172,227 93% 695 Default Rate 47.4% 27.9% 51.8% 60.8% 57.0% 25.3% 2005 Vintage $288.5 $585.4 $540.7 $172.0 $466.2 $426.1 $153,788 93% 696 Default Rate 37.4% 23.3% 40.5% 44.8% 42.7% 21.3% 2004 Vintage and Prior $68.9 $689.9 $387.6 $199.6 $447.4 $960.9 $111,358 93% 690 Default Rate 31.1% 19.7% 24.4% 13.9% 20.5% 19.1% Total Portfolio $24,138.2 $290.2 $1,061.4 $6,969.4 $6,051.5 $9,597.5 $22,548.0 $1,586.8 n/a Default Rate 20.2% 50.3% 37.9% 27.1% 20.1% 10.9% 19.1% 43.2% n/a 2009 Vintage $1,822.7 $0.2 $0.3 $67.6 $321.0 $1,430.7 $1,817.0 $4.7 n/a Default Rate 0.6% 0.0% 20.0% 4.6% 1.3% 0.3% 0.6% 5.0% n/a 2008 Vintage $4,125.3 $4.1 $46.1 $747.2 $1,075.3 $2,248.4 $4,079.1 $46.1 n/a Default Rate 11.6% 52.8% 38.2% 22.2% 13.1% 6.3% 11.5% 24.7% n/a 2007 Vintage $6,476.1 $135.4 $417.8 $2,091.3 $1,693.1 $2,117.5 $6,159.5 $316.4 n/a Default Rate 32.0% 61.8% 47.1% 35.9% 31.6% 21.5% 31.4% 52.6% n/a 2006 Vintage $3,274.5 $24.0 $130.0 $1,100.4 $886.5 $1,111.3 $2,783.9 $490.5 n/a Default Rate 28.8% 54.3% 40.3% 33.2% 29.9% 20.4% 25.8% 57.2% n/a 2005 Vintage $2,931.3 $20.6 $109.9 $1,026.1 $765.8 $983.2 $2,514.4 $416.6 n/a Default Rate 21.9% 48.5% 34.5% 26.6% 22.2% 14.0% 19.3% 44.9% n/a 2004 Vintage and Prior $5,508.2 $105.9 $357.3 $1,936.9 $1,309.8 $1,706.3 $5,194.2 $312.5 n/a Default Rate 15.7% 39.6% 30.4% 20.3% 12.8% 7.4% 15.1% 27.0% n/a 680 - 719 Fixed Rate |
 26 The PMI Group, Inc. Risk Characteristics: Structured Transactions $195 $692 $1,032 $504 $485 $2,648 $377 $421 $1,023 $331 $3,656 $1,015 $1,247 $775 $503 54.3% 43.2% 42.5% 32.1% 23.2% 43.4% 44.1% 43.2% 28.3% 43.1% 38.8% 28.8% 15.7% 26.7% 36.0% Total 720 and above 680 - 719 620 - 679 575 - 619 Less than 575 Fixed Rate ARMs 2/28s Interest Only LTV>97 Alt-A Calif. Florida Auto States ` Risk in Force (dollars in millions) Default Rate (as measured by policies) Credit Score Total Loan Type Risk Characteristics Primary Structured Portfolio: PMI’s primary structured book represents approximately 13% of total primary insurance Highest defaults are reported in the 2/28 hybrid ARMs product, in which: All of the 2/28 hybrid ARM risk in force has passed the interest rate reset date Monthly reporting of notices of default began to decline in August 2007 Structured Transactions Risk in Force as of December 31, 2009 |
 27 The PMI Group, Inc. Structured Portfolio Characteristics Structured RIF as of December 31, 2009 All $ in Millions, except for Average Loan Size 1 Excludes unreported FICO scores 2 At origination Note: All of the 2/28 Hybrid ARMs that PMI has insured are past their rate reset date and monthly reported notices of default for this product peaked in late 2007 Categories are not mutually exclusive except for Credit Score and Loan Type. Vintage refers to the year that the insurance was issued. Interest Only LTV > 97% Alt-A California Florida Auto States Avg Loan Size Avg LTV 2 Avg FICO Credit Score 1 Loan Type Less than 575 575 - 619 720 and above ARM Total 2/28s Specific Portfolio Characteristics Total Portfolio $692.1 $1,031.9 $1,022.7 $421.0 $376.6 $484.9 $156,883 92% 669 Default Rate 43.1% 28.3% 43.2% 44.1% 43.4% 32.1% 2009 Vintage $0.0 $0.0 $0.0 $0.0 $0.0 $0.0 $187,090 88% 722 Default Rate 0.0% 0.0% 0.0% 0.0% 0.0% 0.0% 2008 Vintage $1.1 $20.2 $1.7 $1.3 $1.8 $5.0 $198,071 93% 697 Default Rate 16.7% 25.2% 7.5% 24.1% 42.4% 27.1% 2007 Vintage $204.7 $425.0 $251.2 $108.3 $147.8 $143.2 $180,651 94% 677 Default Rate 41.2% 28.2% 47.1% 38.9% 39.2% 30.3% 2006 Vintage $302.7 $281.8 $503.6 $157.7 $136.0 $159.3 $174,125 91% 680 Default Rate 47.9% 32.1% 47.6% 65.9% 64.4% 38.0% 2005 Vintage $174.3 $71.9 $190.6 $119.4 $38.5 $88.6 $171,814 89% 668 Default Rate 37.6% 34.5% 38.0% 39.6% 48.6% 28.5% 2004 Vintage and Prior $9.3 $233.2 $75.6 $34.2 $52.5 $88.7 $104,576 91% 646 Default Rate 39.7% 25.4% 26.0% 20.1% 23.5% 30.0% Total Portfolio $3,655.7 $195.0 $330.6 $1,247.1 $775.2 $1,015.3 $2,647.9 $503.4 $504.4 Default Rate 28.8% 43.2% 38.8% 36.0% 26.7% 15.7% 23.2% 42.5% 54.3% 2009 Vintage $0.1 $0.0 $0.0 $0.1 $0.0 $0.0 $0.1 $0.0 $0.0 Default Rate 0.0% 0.0% 0.0% 0.0% 0.0% 0.0% 0.0% 0.0% n/a 2008 Vintage $57.5 $0.9 $2.7 $16.4 $15.2 $22.3 $52.0 $5.5 $0.0 Default Rate 17.2% 71.1% 48.7% 26.5% 12.8% 5.0% 17.1% 19.8% n/a 2007 Vintage $1,311.3 $56.8 $101.0 $338.5 $296.7 $518.3 $1,072.2 $196.5 $42.6 Default Rate 26.4% 40.4% 37.0% 32.4% 23.3% 14.1% 22.7% 37.4% 63.2% 2006 Vintage $1,099.4 $32.4 $59.3 $457.9 $256.1 $293.8 $729.3 $124.7 $245.5 Default Rate 40.2% 51.0% 46.6% 47.9% 39.5% 25.3% 32.2% 51.5% 65.4% 2005 Vintage $516.5 $24.7 $45.7 $240.7 $117.3 $88.1 $219.6 $113.6 $183.3 Default Rate 32.4% 39.0% 42.7% 38.4% 30.1% 14.7% 21.8% 47.3% 42.9% 2004 Vintage and Prior $670.8 $80.2 $121.9 $193.5 $89.9 $92.8 $574.7 $63.0 $33.1 Default Rate 21.6% 44.0% 36.7% 24.9% 14.5% 7.1% 18.7% 44.6% 42.3% Fixed Rate 620 - 679 680 - 719 |
 Modified Pool Characteristics by Vintage |
 The PMI Group, Inc. Modified Pool Portfolio Characteristics All $ in Millions Modified Pool: Data shown in this exhibit is an aggregation of unique pools by book years Remaining risk in force for modified pool is $773 million at December 31, 2009 Modified Pool with Deductibles Modified Pool without Deductibles All $ in Millions Modified Pool as of December 31, 2009 2 Remaining risk in force excludes non-performing risk exposures, for which loss reserves have been established. 2004 and Prior 2005 2006 2007 2008 / 2009 Insurance in Force $4,877 $4,105 $8,023 $4,647 n/a Stop Loss Amount $287 $265 $418 $181 n/a Losses Applicable to Deductible $69 $59 $45 $10 n/a Deductible Balance $105 $111 $234 $88 n/a PMI's Claims Paid to Date $0 $0 $0 $0 n/a Reserves for Losses¹ $6 $30 $67 $27 n/a Remaining Risk In Force² $103 $64 $72 $56 n/a 2004 and Prior 2005 2006 2007 2008 / 2009 Insurance in Force $2,139 $1,183 $3,853 n/a n/a Stop Loss Amount $483 $49 $305 n/a n/a PMI's Claims Paid to Date $48 $26 $46 n/a n/a Reserves for Losses¹ $44 $15 $37 n/a n/a Remaining Risk In Force² $247 $9 $223 n/a n/a 29 Established loss reserves for non-performing (i.e. delinquent) modified pool loans, which represents PMI’s estimate of losses for those loans at December 31, 2009. 1 |
 30 The PMI Group, Inc. Modified Pool Portfolio Characteristics Modified Pool IIF as of December 31, 2009 1 Excludes unreported FICO scores 2 Excludes Balloon, Buy Down, and Other 3 At origination Note: PMI did not insure any modified pool contracts with deductible in 2008 or 2009 and did not insure any modified pool contracts without deductible in 2007, 2008 or 2009 Categories are not mutually exclusive except for Credit Score and Loan Type. Vintage refers to the year that the insurance was issued. All $ in Millions, except for Average Loan Size Specific Portfolio Characteristics Specific Portfolio Characteristics Credit Score 1 Loan Type 2 Credit Score 1 Loan Type 2 Total Total Fixed Rate ARM 2/28s Fixed Rate ARM 2/28s Deductible Non Deductible Less than 575 575 - 619 620 - 679 680 - 719 720 and above Less than 575 575 - 619 620 - 679 680 - 719 720 and above Interest Only LTV > 97% Alt-A California Florida Auto States Avg Loan Size Avg LTV 3 Avg FICO Interest Only LTV > 97% Alt-A California Florida Auto States Avg Loan Size Avg LTV 3 Avg FICO Total Portfolio $21,653 $304 $732 $7,169 $6,430 $7,013 $20,047 $1,593 $2 2007 Vintage $4,647 $122 $287 $1,655 $1,499 $1,084 $4,213 $434 $0 2006 Vintage $8,023 $58 $106 $3,170 $2,658 $2,031 $7,885 $136 $1 2005 Vintage $4,105 $5 $50 $1,277 $1,264 $1,507 $3,215 $888 $0 2004 Vintage and Prior $4,877 $119 $289 $1,067 $1,009 $2,390 $4,733 $135 $0 Total Portfolio $5,741 $747 $13,343 $3,591 $2,314 $2,314 $167,240 78 696 2007 Vintage $1,630 $656 $2,687 $779 $460 $475 $196,636 83 681 2006 Vintage $2,918 $37 $5,721 $1,399 $968 $771 $191,736 79 690 2005 Vintage $547 $32 $2,763 $669 $566 $415 $161,696 79 702 2004 Vintage and Prior $647 $22 $2,172 $744 $320 $653 $126,334 73 706 Total Portfolio $7,175 $331 $753 $2,687 $1,686 $1,533 $4,483 $2,643 $0 2006 Vintage $3,853 $321 $712 $1,718 $750 $352 $1,412 $2,441 $0 2005 Vintage $1,183 $0 $5 $247 $352 $565 $1,163 $19 $0 2004 Vintage and Prior $2,139 $10 $36 $722 $584 $616 $1,908 $182 $0 Total Portfolio $769 $1,491 $2,574 $1,143 $633 $834 $147,551 86 672 2006 Vintage $123 $1,427 $166 $431 $380 $643 $153,153 94 648 2005 Vintage $505 $1 $834 $265 $90 $53 $193,329 75 718 2004 Vintage and Prior $141 $64 $1,574 $448 $163 $138 $123,289 78 693 |
 Captive Reinsurance |
 32 The PMI Group, Inc. $101 $149 $350 $491 $34 2007 2008 2009 2010 2011 Captive reinsurers are wholly-owned, bankruptcy remote subsidiaries of originators that provide mezzanine level reinsurance for loans for which PMI has provided primary mortgage insurance coverage. PMI is the named beneficiary on captive trust balances totaling approximately $941 million as of December 31, 2009. At December 31, 2009, approximately 54.0% of flow risk in force was covered by captive reinsurance agreements, including: Based on current expectations of defaults, PMI forecasts approximately the following reductions to total incurred losses as a result of captive reinsurance agreements in 2009 and 2010: Benefit from Captive Reinsurance Agreements PMI’s Captive Reinsurance Agreements (Dollars in Millions) Flow Risk in Force Covered by Captives ~ 55% of LTVs >97%* ~ 60% of less-than-A quality ~ 50% of Alt-A ~ 54% of prime * Captive coverage for LTVs greater than 97% may overlap with other listed categories Actual Projected |
 33 The PMI Group, Inc. PMI’s Captive Reinsurance Agreements PMI Mortgage Insurance Co. Captive Reinsurance Agreements Analysis (Dollars in Millions) Note: Due to rounding, the totals may not equal the sum of each category Original Progression to Book Year RIF Attachment Point 2004 & Prior Total $12,302 0 - 50% $802 $184.9 6,020 50 - 75% 640 161.1 2,608 75 - 99% 534 82.4 6,119 Attached 1,154 259.0 $27,048 $3,129 $687.4 $44.1 $2.8 2005 Total $55 0 - 50% $32 $1.0 0 50 - 75% 0 0.0 50 75 - 99% 22 2.4 4,464 Attached 2,037 456.8 $4,570 $2,091 $460.1 $212.4 $74.6 2006 Total $31 0 - 50% $19 $0.8 7 50 - 75% 4 0.2 20 75 - 99% 11 0.9 3,279 Attached 2,052 488.6 $3,336 $2,087 $490.5 $235.3 $56.7 2007 Total $34 0 - 50% $24 $0.5 0 50 - 75% 0 0.0 10 75 - 99% 8 0.5 4,866 Attached 3,911 667.8 $4,910 $3,943 $668.8 $318.2 $0.0 2008 Total $300 0 - 50% $245 $4.7 432 50 - 75% 366 13.1 9 75 - 99% 8 0.4 1,002 Attached 874 66.8 $1,744 $1,493 $85.0 $23.8 $0.0 Cumulative Captive Benefit (MM) $833.8 $134.2 Total Captive Trust Balances (MM) $940.7 Cumulative December 31, 2009 Incurred Loss Cumulative Paid Loss Captive RIF Incurred Losses Benefit Captive Benefit Current Ever to Date $1,055 $190.1 809 154.4 624 88.5 959 185.8 $3,446 $618.8 $19.7 $1.7 $34 $0.8 4 0.3 34 2.6 2,175 371.9 $2,248 $375.6 $173.5 $36.6 $25 $0.5 16 0.8 0 0.0 2,203 396.1 $2,244 $397.4 $196.4 $14.1 $28 $0.4 0 0.0 8 0.4 4,188 511.9 $4,224 $512.7 $253.1 $0.0 $652 $8.9 355 13.2 148 6.3 437 26.8 $1,593 $55.2 $10.5 $0.0 $653.3 $52.5 $898.0 Current RIF Ever to Date Incurred Losses Paid Loss Incurred Loss Captive June 30, 2009 Cumulative Cumulative Benefit Captive Benefit $1,307 $187.3 1,102 171.1 1,043 141.3 394 79.9 $3,845 $579.7 $10.9 $1.2 $37 $0.7 234 12.6 16 1.3 2,126 295.0 $2,413 $309.7 $128.6 $6.6 $41 $0.9 5 0.2 0 0.0 2,375 326.5 $2,421 $327.5 $158.0 $2.4 $32 $0.3 45 1.5 224 10.1 4,256 397.8 $4,557 $409.7 $187.4 $0.0 $952 $10.5 260 6.6 195 6.8 158 10.4 $1,566 $34.3 $5.2 $0.0 $490.2 $10.1 $860.1 RIF Current December 31, 2008 Cumulative Cumulative Benefit Benefit Incurred Loss Paid Loss Captive Captive Incurred Losses Ever to Date Note: For the combined captive trust arrangements, the weighted average entry point is 4.08% and the weighted average exit point is 11.80%. Original RIF has been recalculated for the impact of rescissions. The cumulative captive benefit on this page is for excess-of-loss (XOL) captive reinsurance agreements only. |
 The PMI Group, Inc. 34 Forward-Looking Statement Statements in this supplement that are not historical facts, or that relate to future plans, events or performance are "forward-looking" statements within the meaning of the Private Securities Litigation Reform Act of 1995. Such statements include our expectations with respect to reductions to incurred losses provided by captive reinsurance arrangements. Readers are cautioned that forward-looking statements by their nature involve risk and uncertainty because they relate to events and depend on circumstances that will occur in the future. Many factors could cause actual results and developments to differ materially from those expressed or implied by forward-looking statements. Such factors include, among others: • Potential significant future losses as a result of changes in economic and market conditions, such as decreases in housing demand, mortgage originations or housing values; a further reduction in the liquidity in the capital markets or further contraction of credit markets; further increases in unemployment rates; changes in interest rates or consumer confidence; and/or changes in credit spreads; • the potential that our actual losses may substantially exceed our current loss reserve estimates or that our underwriting policies may not anticipate all risks and/or the magnitude of potential loss; • our expectation that, as a result of continued losses, we will need to raise significant additional capital and/or achieve significant statutory capital relief in 2009; • the risk that we may be required to cease writing new business in some or all states due to our financial condition and/or our inability to maintain minimum regulatory risk-to-capital and policyholders surplus requirements ; • Some states require a mortgage insurer to immediately cease writing new business if it fails to meet applicable capital adequacy requirements. In other states, including Arizona as of November 24, 2009, PMI’s state of domicile, the applicable regulator has discretion as to whether the mortgage insurer may continue to write new business. The Arizona Department of Insurance is conducting a limited scope examination of PMI to determine, among other things, whether to exercise discretion and permit PMI to continue writing new business in the event that PMI fails to maintain Arizona’s minimum policyholders position. If we fail to meet the minimum policyholders position required by Arizona law and the Arizona Department of Insurance does not exercise discretion to permit PMI to continue to write new business, we would be required to suspend writing new business in all states. Even if an insurance regulator were to exercise discretion in one state, we may be unable to write new business in other states. • We are in discussions with one state regarding its interpretation of that state’s financially hazardous condition regulation generally applicable to licensed insurance companies and that state’s interpretive position that PMI is in violation of that regulation. If we are unsuccessful in those discussions, we may be required to cease writing business in that state. Although no other state has taken a similar interpretative position to date, there can be no assurance that other states, most of which have similar regulations, will not take similar interpretative positions. • Under the terms of our runoff support agreement with Allstate Insurance Company, PMI is subject to restrictions that apply if its risk-to-capital ratio exceeds 23:1. Any failure to meet the capital requirements set forth in the runoff support agreement could, if pursued by Allstate, have a material adverse impact on our financial condition. Cautionary Statement: |
 The PMI Group, Inc. 35 Forward-Looking Statement • In the event that we are unable to write new mortgage insurance in a limited number of states for the reasons discussed above, we working on a plan to enable us to write new mortgage insurance in those states out of an existing subsidiary. There can be no assurance that we will be able to effectuate this plan. • the limitation we have placed on new business; • the potential litigation risk associated with our increased rescission activity and, in the event that we are unsuccessful in defending our rescission decisions, the need to establish loss reserves for, and reassume risk on, delinquent rescinded loans; • the risk that loan modification and other similar programs may not provide material benefits to us; • the aging of our mortgage insurance portfolio and changes in severity or frequency of losses associated with our mortgage insurance policies; • the performance of our insured portfolio of higher risk loans, such as Alternative-A (“Alt-A”) and less than-A loans, and adjustable rate and interest-only loans, which have resulted in increased losses in 2007 and 2008 and are expected to result in further losses; • the risk that Fannie Mae and/or Freddie Mac (collectively, the “GSEs”) determine that we are no longer an eligible provider of mortgage insurance; • changes in persistency rates of our mortgage insurance policies caused by, among other things, changes in refinancing activity and home values; • the risk that we are not able to timely satisfy certain obligations under our credit facility and an event of default occurs; • the risk that the value of the contingent note we received in connection with the sale of PMI Australia is reduced and, therefore, reduces or eliminates the commitments of the lenders under our credit facility and requires us to repay amounts borrowed under the credit facility; • further downgrades or other ratings actions with respect to our credit ratings or insurer financial strength ratings assigned by the major rating agencies; • heightened competition from the Federal Housing Administration and the Veterans’ Administration or other private mortgage insurers; • potential changes in the charters or business practices of the GSEs, the largest purchasers of mortgages; • the potential future impairment of the value of certain securities held in our investment portfolios as a result of the significant volatility in the capital markets; |
 The PMI Group, Inc. 36 Forward-Looking Statement • volatility in our earnings caused by changes in the fair value of our derivative contracts and our need to reevaluate the premium deficiencies in our mortgage insurance business on a quarterly basis; and • heightened regulatory and litigation risks faced by the financial services industry, the mortgage insurance industry and PMI; • Potential additional losses in our European operations as a result of deteriorating economic conditions and the potential that we must make additional capital contributions to those operations, and/or CMG Mortgage Insurance Company, pursuant to capital support agreements. Other risks and uncertainties are discussed in our SEC filings, including in Item 1A of our Quarterly Report on Form 10-Q for the quarter ended September 30, 2009, and our Annual Report on Form 10-K for the year ended December 31, 2008. We undertake no obligation to update forward- looking statements. |
 |