
2006 Second Quarter Results
July 19, 2006
Safe Harbor
“Safe Harbor” Statement under the U.S. Private Securities
Litigation Reform Act of 1995: the matters discussed in this
document may include forward-looking statements that are
subject to risks and uncertainties including, but not limited to:
economic conditions, product demand and semiconductor
equipment industry capacity, worldwide demand and
manufacturing capacity utilization for semiconductors (the
principal product of our customer base), competitive products
and pricing, manufacturing efficiencies, new product
development, ability to enforce patents, the outcome of
intellectual property litigation, availability of raw materials and
critical manufacturing equipment, trade environment, the
prevailing market price for ASML shares, and other risks
indicated in the risk factors included in ASML’s Annual
Report on Form 20-F and other filings with the U.S.
Securities and Exchange Commission.
/ Slide 2

Agenda
Q2 2006: Solid execution
Q2 2006: Technology accomplishments
Q2 2006: Shipment and bookings review
Financial summary
Q3 2006: Outlook
Share buyback program
Company focus for remainder 2006
ASML’s drivers for growth
/ Slide 3
Q2 2006: Solid execution
Growth
Sales of € 942 million, an increase of 50% compared with Q1
2006, strongest quarterly sales in history of the company
Increased market share by winning new 300mm fab
opportunities and with continued success in Japan
Profitability
Posted highest quarterly operating margin of 25.2% and highest
net profit of 17.7% (as a percentage of sales)
Gross margin increased to 40.4% from 40.0% in Q1 2006
Cash generation
Strong cash generation from operations of € 330 million
Bought back 19.9 million shares (4.11% of outstanding shares)
for an aggregate amount of € 314 million of which € 253 million
paid in Q2 2006
/ Slide 4
Q2 2006: Technology accomplishments
Important quarter for our leading immersion products
Brought to market eight TWINSCAN XT:1700i, 45nm volume
production tools, totaling 21 ASML immersion tools worldwide
Shipped one XT:1700i to Japan
As of Q2 2006, three immersion tools are installed in Japan
Customers report stable, low defect performance of XT:1700i
Recent announcement of XT:1900i introduction. Preparations
underway for ramp to volume production by H1 2007
EUV milestones
Two full field 0.25NA tools to be shipped in Q3 2006 – IMEC
and ANT – for use in worldwide customer evaluations and
infrastructure development
/ Slide 5
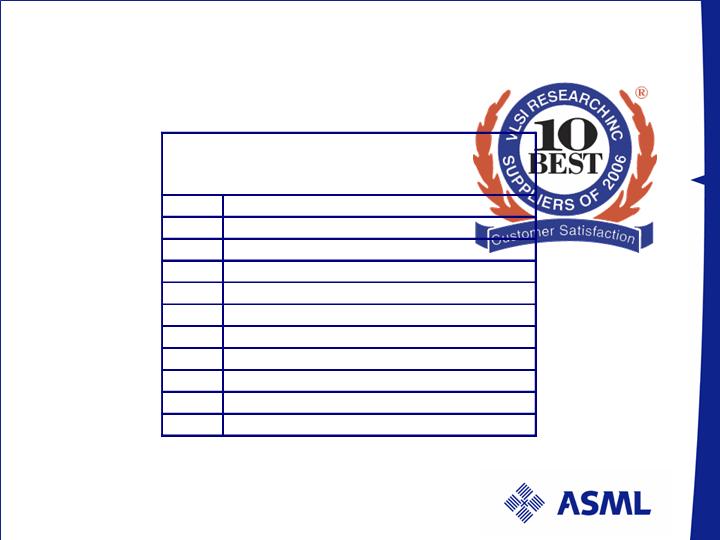
ASML earns top customer satisfaction ratings
four years in a row
/ Slide 6
Source: VLSI Research, June 2006
Top 10 Large Suppliers of
Chip Making Equipment
2006
Rank
Company
1
Varian Semiconductor
2
ASML
3
Hitachi Kokusai Electric Inc.
4
Tokyo Electron Limited
5
Dainippon Screen Mfg. Co., Ltd.
6
Hitachi High
-
Technologies Corp.
7
ASM International N.V.
8
Applied Materials, Inc.
9
Novellus Systems, Inc.
10
ULVAC, Inc.

Q2 2006: Shipment and bookings review
Excellent shipment quarter with record quarterly revenue
Shipped 72 systems with ASP of € 11.7 million from € 10.8 million
in Q1 2006 due to higher percentage of new systems in the mix
including the new XT:1700i tool
Shipped 58 new systems with ASP of € 13.7 million, an increase
from € 13.5 million in Q1 2006
Mix of products contains significant i-line, KrF in addition to ArF
and ArFi to support customer production capacity
Achieved target for unit booking guidance
50% above Q1 2006 at 93 units (78 new)
Backlog value rises by 14.7% over Q1 2006. Current backlog is
127 units and € 1,830 million
The backlog is shipping to about 50 different fabs
Current immersion backlog is 19 units
/ Slide 7

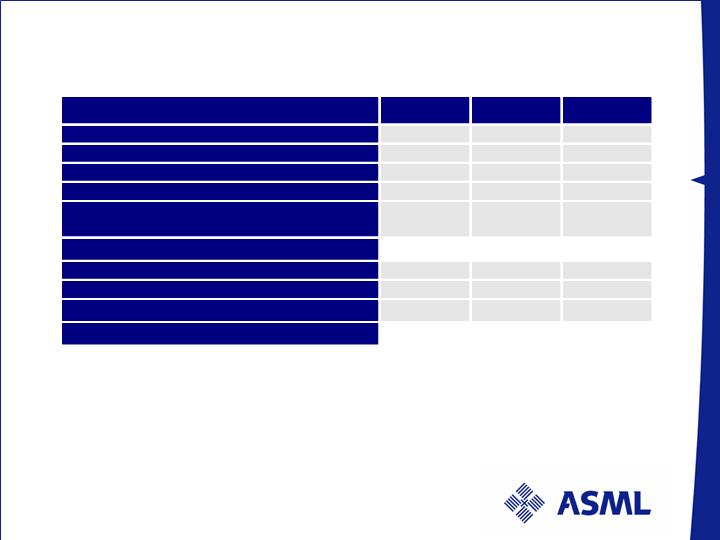
Financial summary
/ Slide 8
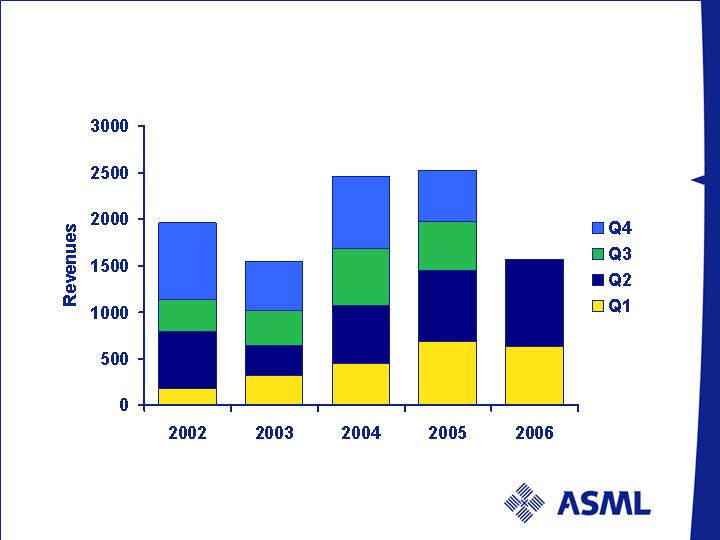
Total revenues M€
179
609
351
820
526
370
329
318
785
611
616
453
548
533
763
685
629
1959
1543
2465
2529
942
/ Slide 9
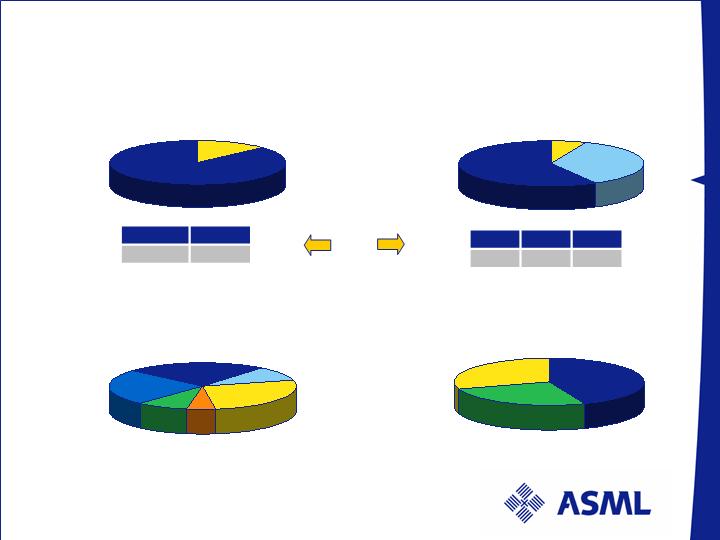
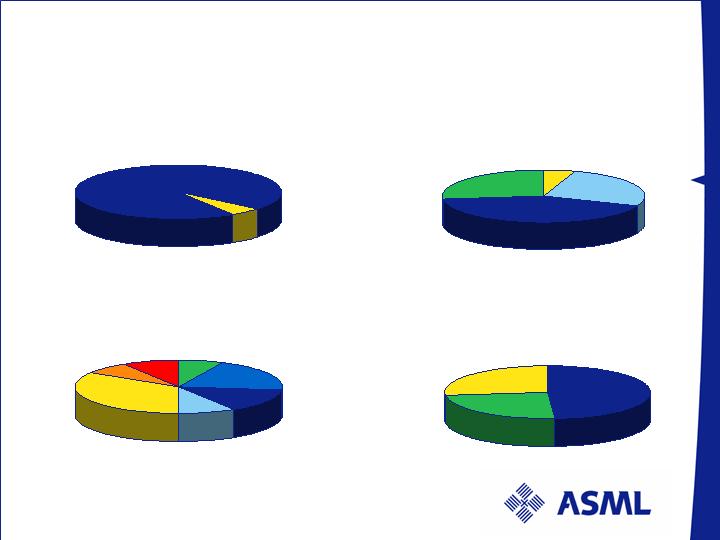
Revenue breakdown: Q2 2006
Value per type
Value per technology
TWINSCAN
87%
Others
13%
Value per region
Value per end-use
Foundry
26%
Memory
44%
IDM
30%
KrF
36%
ArF
58%
i-line
6%
U.S.
25%
Taiwan
24%
Korea
27%
China
9%
Europe
10%
ROW
5%
Numbers have been rounded for readers’ convenience
units
Units
23
49
Others
TWINSCAN
16
31
25
i-line
KrF
ArF
/ Slide 10
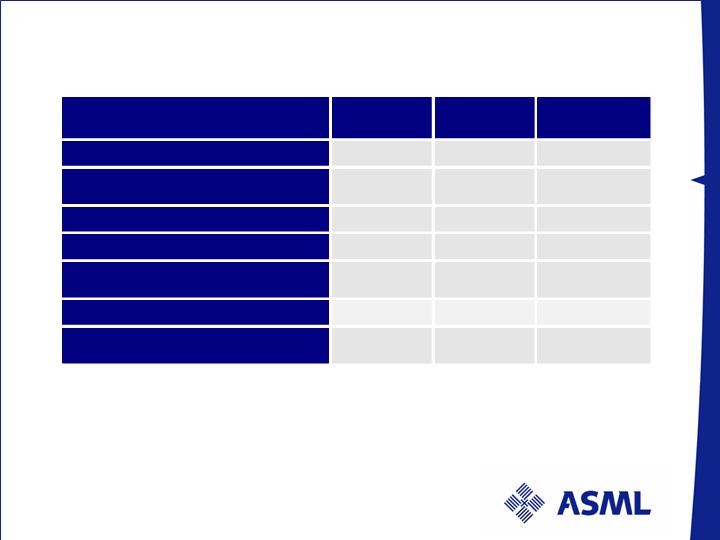
Profit & Loss statement M€
/ Slide 11
Numbers have been rounded for readers’ convenience
Q1 06
Q2 06
YTD
Net sales
629
94
2
157
1
Gross
profit
Gross margin %
252
40.0%
381
40
.
4
%
633
40
.3
%
R&D costs
87
92
179
SG&A costs
50
51
101
Operating income
Operating income %
114
18.2%
238
25
.
2
%
352
22.
4
.
%
Net income
Net income %
80
12.7%
167
1
7
.
7
%
247
15.7.
%
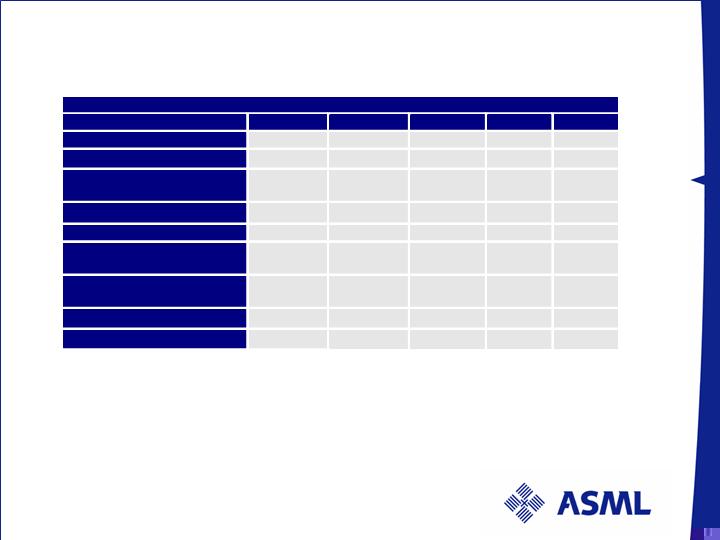
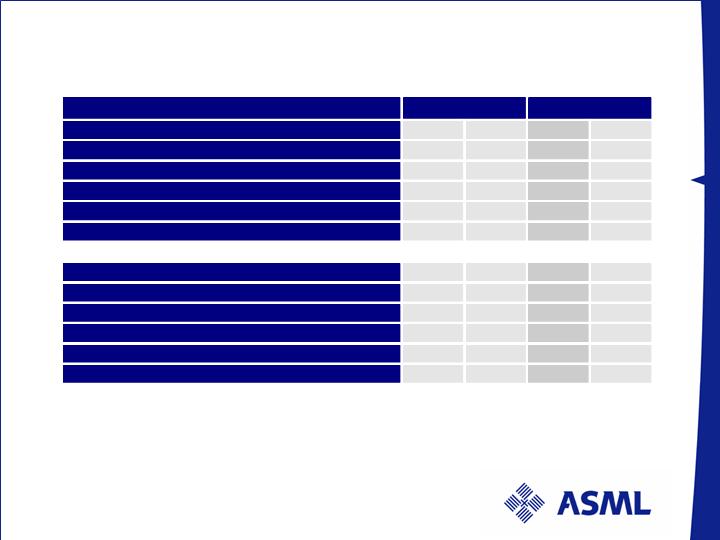
Key financial trends 2005 - 2006
/ Slide 12
Numbers have been rounded for readers’ convenience
Profit & Loss Statement
M€
Q2 05
Q3 05
Q4 05
Q1 06
Q2 06
Units
51
39
47
51
72
Sales
763
533
548
629
94
2
Gross
profit
Gross margin %
299
39.1
%
197
37.0
%
204
37.3
%
251
40.0
%
381
40
.
4
%
R&D
82
80
82
87
92
SG&A
55
48
47
50
51
Operating
income
Operatin
g income %
162
21.2
%
69
12.9
%
75
13.6
%
114
18.2
%
238
25
.
2
%
Net income
Net income %
112
14.6
%
48
9.0
%
52
9.4
%
80
12.7
%
167
17.7
%
ASP New Systems
14.8
15.0
12.5
13.5
13.
7
Booking Units
24
46
55
62
9
3
Cash flow M€
/ Slide 13
Including payment of Euro 253 million for share buyback
2
Including payment of Euro 79 million for prior year taxes
1
Numbers have been rounded for readers’ convenience
Q1 06
Q2 06
YTD
Net income
80
1
67
247
Depreciation and amortization
22
21
43
Changes in tax assets and liabilities
(5
3
)
1
65
12
Effects of changes in inventories
(16
5
)
12
(153
)
Effects of changes in other assets and
liabilities
(102
)
6
5
(3
7
)
Cash fl
ow from operations
(219)
330
111
Cash flow from investing activities
(16)
(13)
(29)
Cash flow from financing activities
7
(246)
²
(239)
²
Effect of changes in exchange rates on cash
(6)
(10)
(16)
Net cash flow
(23
3
)
60
(173)
Current liabilities include USD 575 million principal amount of ASML’s 5.75 percent Convertible Subordinated
Notes due October 15, 2006.
Balance sheet as of July 2, 2006 M€
/ Slide 14
1
Numbers have been rounded for readers’ convenience
ASSETS
March 2006
June
200
6
Cash and cash equivalents
1671
44 %
1731
44
%
Accounts receivable, net
447
12 %
540
14
%
Inventories, net
940
25 %
916
23
%
Other assets
153
4 %
16
7
4
%
Tax assets
297
7 %
273
7
%
Fixed assets
301
8 %
308
8
%
TOTAL ASSE
TS
3809
100%
3935
1
00%
LIABILITIES and SHAREHOLDERS’ EQUITY
Current liabilities
1
1385
36 %
1656
42
%
Convertible subordinated bonds
380
10 %
380
10
%
Long term debts and deferred liabilities
243
7 %
242
6
%
Shareholders’ equity
1801
47 %
165
7
42
%
TOTAL LIABILITIES & SHAREHOLDERS’ EQUITY
3809
100%
3935
1
00%
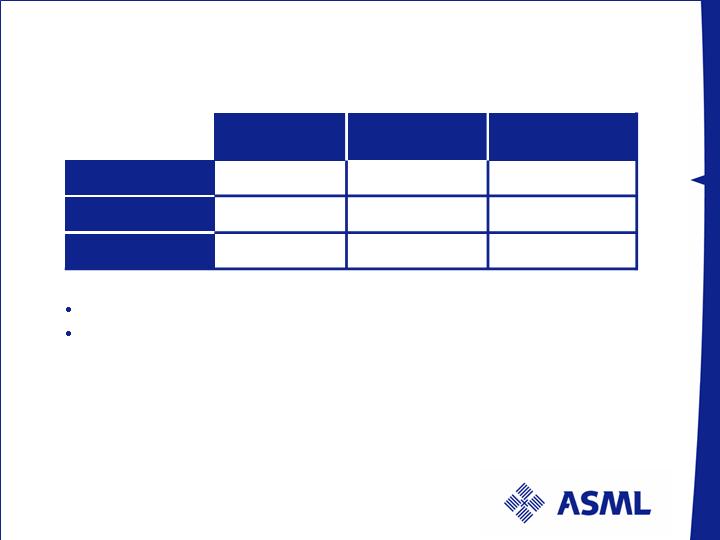
Backlog as of July 2, 2006
88 % of unit backlog carry Q3 + Q4 2006 shipment dates
Q2 net bookings of 93 systems with a value € 1.083 million
including 78 new tools with an ASP of € 13.2 million
Note: Due to possible customer changes in delivery schedules and to cancellation of orders, our backlog at any
particular date is not necessarily indicative of actual sales for any succeeding period
Numbers have been rounded for readers’ convenience
New Systems
Used Systems
Total Backlog
M€ 1.785
M€ 45
M€ 1.830
M€ 15.7
M€ 3.5
M€ 14.4
Backlog
Backlog
114
13
127
Units
Value
ASP
/ Slide 15
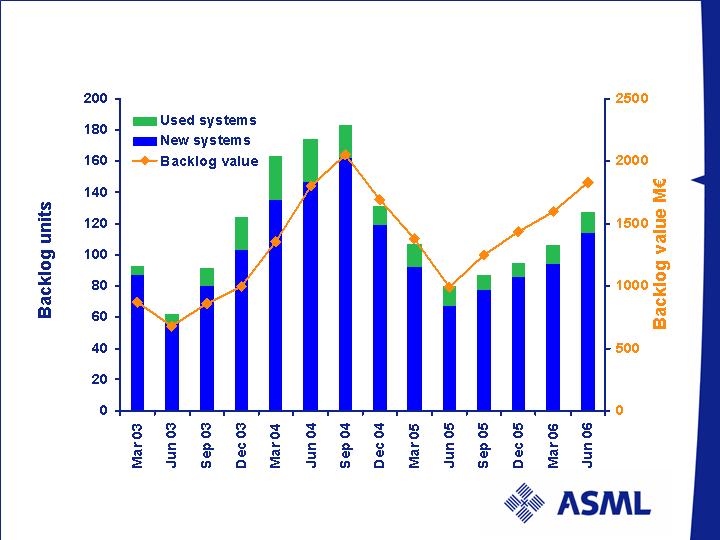
Backlog: litho units and value
/ Slide 16
Backlog lithography per July 2, 2006
Total value € 1,830 million
Value per type
Value per technology
TWINSCAN
95%
Others
5%
I-line
5%
ArF dry
42 %
Value per region
Value per end-use
U.S.
20%
Foundry
24%
Memory
49%
Taiwan
14%
IDM
27%
Korea
34%
KrF
26%
ROW
7%
Europe
9%
ArF immersion
27 %
Numbers have been rounded for readers’ convenience
China
7%
Japan
9%
/ Slide 17

Q3 2006: Outlook
Shipment of 62 systems expected in Q3
ASP for new system shipments expected to be € 14.5 million and
€ 12.5 million for new + refurbished systems
Bookings expected above 62 systems in Q3
Gross margin expected at 39% – 41%
R&D and SG&A are expected to be € 100 million net of credit and
€ 51 million respectively
Build-up of semi’s production capacity based on Billings and
Bookings outlook in line with 10% semi’s value growth and 15%
semi’s unit growth
Strong Flash / DRAM bookings, average IDM bookings and mixed
Foundry bookings
Planning to ship two EUV Alpha Demo Tools in Q3 2006
Reiterating shipment forecast of 20-25 immersion systems in 2006
/ Slide 18

Share buyback program
ASML has completed its announced share buyback
of € 400 million as announced on April 19, 2006. This
represents 25,450,296 million shares or 5.25% of
outstanding shares
ASML has a convertible bond of principal amount
USD 575 million due October 15, 2006. In case these
notes were to convert, resulting funds could be used
for additional share buyback
Purpose of share buyback programs is to return
excess cash to shareholders through reduction of the
number of issued shares
/ Slide 19

Company focus for remainder 2006
Continue execution on key points
Execute on volume production ramp of the TWINSCAN
XT:1700i, hyper NA tool for 45 nm node
Execute on cost of goods reduction
Execute on lead time reduction
Increase the technology leadership gap
Ship 2 EUV Alpha demo tools
Prepare for volume manufacturing and shipment of XT:1900i
starting H1 2007
Develop alternative architectures for cost effective
lithography at 32 nm resolution and beyond
/ Slide 20

ASML’s drivers for growth
Lithography enables customers to shrink devices for lower cost
and/or added functionality
ASML continues to grow its worldwide market share
Technology leadership fueled by R&D strength and scale
Five industry segments work together resulting in milder industry
cycles
Each segment represents different growth drivers, all together
contributing to steady, long term industry growth
ASML’s customers are fully represented in all industry segments
and pervasive in all technologies
ASML has long term ASP growth opportunity
/ Slide 21
Commitment