Citigroup 13th Annual Global Technology
Conference
New York - Sept 7, 2006
Peter Wennink, CFO
Safe Harbor
“Safe Harbor” Statement under the U.S. Private Securities
Litigation Reform Act of 1995: the matters discussed in this
presentation may include forward-looking statements that are
subject to risks and uncertainties including, but not limited to:
economic conditions, product demand and semiconductor
equipment industry capacity, worldwide demand and
manufacturing capacity utilization for semiconductors (the
principal product of our customer base), competitive products
and pricing, manufacturing efficiencies, new product
development, ability to enforce patents, the outcome of
intellectual property litigation, availability of raw materials and
critical manufacturing equipment, trade environment, and
other risks indicated in the risk factors included in ASML’s
Annual Report on Form 20-F and other filings with the U.S.
Securities and Exchange Commission.
/ Slide 2

ASML today
Market Update
Lithography Leadership
Long-Term Trajectory
/ Slide 3

Market Update
Most business drivers point to sustained ASML
revenues mid term
IC Semiconductor unit growth
Inventory, Utilization and Lithography purchasing
intensity
Balanced Segmentation
Market Share opportunity
/ Slide 5
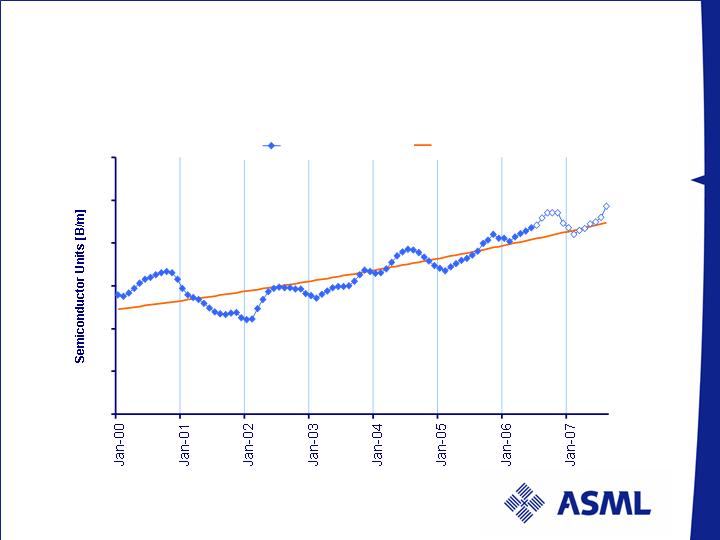
Semiconductor Units history and forecast
2006 Semiconductor growth driven by higher unit sales (+16%)
25% -21% 14% 9% 18% 4% 16% 7%
Source: ASML MCC
Semiconductor unit Forecats
0
10
20
30
40
50
60
Semiconductor Units
Unit Trend
/ Slide 6
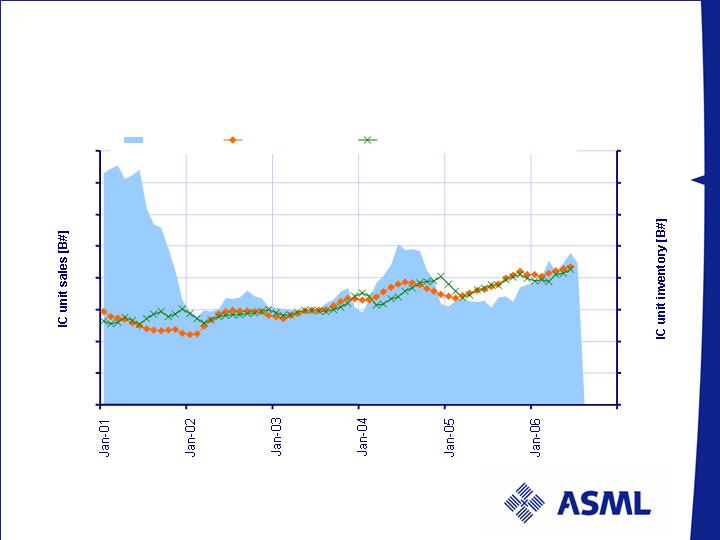
IC unit sales and inventory
Inventories reasonably under control
Source: WSTS, VLSIResearch, ASML
Last data point: June 2006
IC unit sales and inventory
0
10
20
30
40
50
60
70
80
-
10
20
30
40
50
60
70
80
IC inventory
3mma IC unit Sales
3mma IC unit sales corrected for Inventory
/ Slide 7
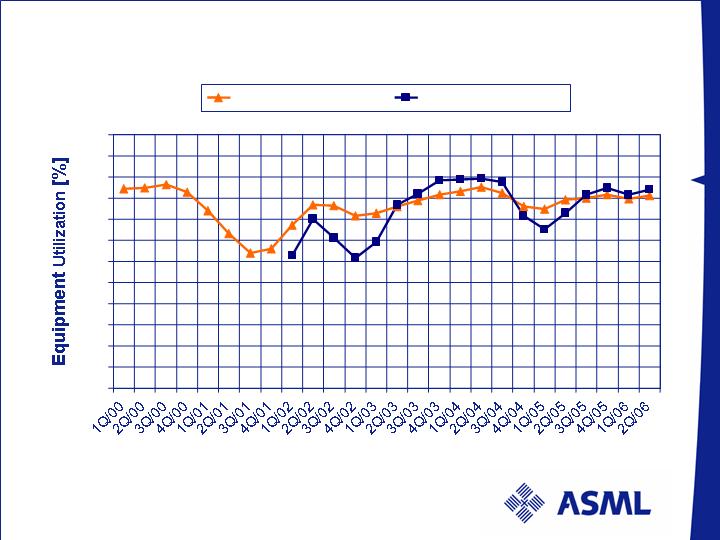
Utilization remains high and is under constant monitor
0
10
20
30
40
50
60
70
80
90
100
110
120
Quarter
Memory utilization
Foundry utilization
Sources: SiCAS (August 2006)
/ Slide 8
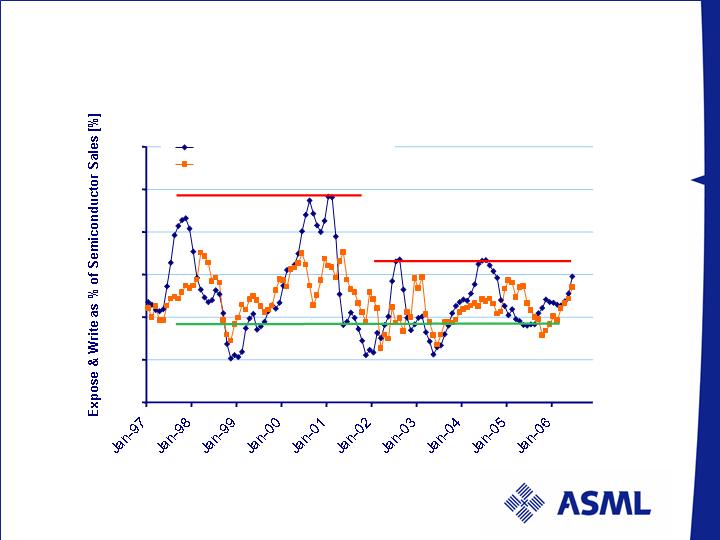
Expose & Write Bookings and Billings as % of Semiconductor
sales
0%
1%
2%
3%
4%
5%
6%
E&W bookings as % of Semi $Sadj 3MMA
E&W billings as % of Semi $ Sadj 3MMA
Litho Bookings and Billings as % of Semiconductor
Revenue Relative spending rising but within controlled range
Source: SEMI, WSTS, ASML
Last data point: June 2006
/ Slide 9
6
90/65
300
Memory/Flash
SP-1
SPANSION
Q1/2007
50
350-180
200
Logic
Fab 11
SMIC
Q1/2007
50
70/45
300
Memory/Flash
M11/R3
HYNIX
Q3/2006
25
45
300
Micro
Fab 32
INTEL
Q4/2006
52
70/55
300
Memory/Flash
Fab 2 (Lehi)
IM Flash
Q3/2006
25
90/65
300
Logic
Fab 2
HHSIS
Q3/2006
40
250/180
200
Logic
Kulim Fab
INFINEON
Q1/2006
40
65/32
300
Logic
RFab
TI
Q4/2007
30
55/45
300
Memory
SAS300
SAMSUNG
Q3/2007
20
65/32
300
Micro
Fab 38
AMD
Q3/2007
25
45
300
Micro
Fab 28
INTEL
Q3/2007
40
70
300
Memory/DRAM
Fab 4
PROMOS
Q3/2007
20
80/45
300
Memory/Flash
Fab 8
SMIC
Q1/2007
12
300
Memory others
Fab 4
MACRONIX
Q1/2007
30
70/45
300
Memory/Flash
Line 15
SAMSUNG
Q2/2006
60
90/65
300
Memory
HSSL300
HYNIX
Q2/2006
45
300
Logic
Fab 15
TSMC
Q3/2007
10
90
300
Memory others
Fukuyama Fab
SHARP
Q2/2007
175
5X/4X
300
Memory/Flash
Fab 4
TOSHIBA
Q4/2007
13
90/65
300
Logic
N3-1F
RENESAS
Q2/2006
30
55/45
300
Memory
Upgr. M11/MPS
SAMSUNG
Q3/2007
10
65
300
Logic
Fab 2
FUJITSU
Q2/2007
60
90/70
300
Memory/DRAM
Fab 12C
POWERCHIP
Q2/2007
60
70/60
300
Memory/DRAM
Fab 3
NANYA
Q2/2007
30
70/45
300
Logic
M6
STMicroelectronics
Q2/2007
50
350/250
200
Image sensors
Zilog Fab
MICRON
Q4/2006
62
90/70
300
Memory/DRAM
Fab 2
INOTERA
Q4/2006
45
110/90
200
Memory
HSSL200
HYNIX
Q1/2006
Max.Capacity
[KWSPM]
Node [nm]
Wafer size [mm]
Main application
Name of Factory
Customer
Quarter/Year
equipment take-in
28 factories planned for the 2006/07 time frame:
7 Flash fabs/9 other Memory fabs/12 Foundry IDM
Source: ASML MCC (update Aug 2006)
/ Slide 10
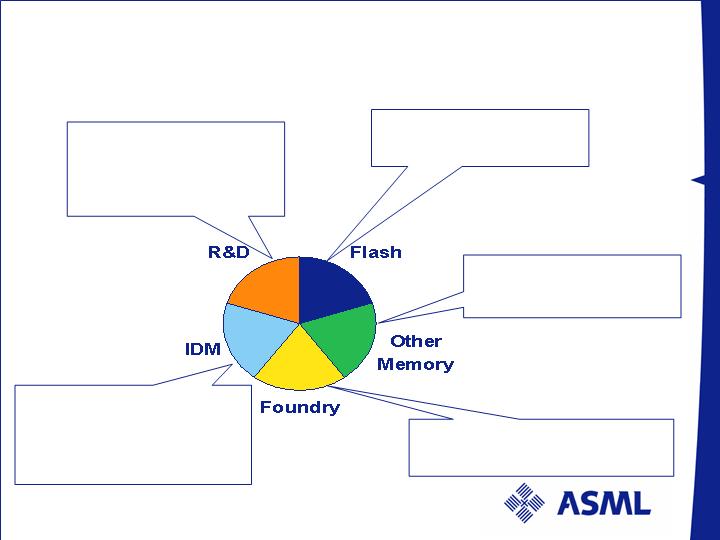
Growth from Multiple independent Segments
Each Segment with its own investment cycle
Flash shrink - 12 to 15
month investment cycle
DRAM – closely follows
Flash investment cycle
Foundries represent classic
supply/demand cycle
Moore’s law, 18 to 24
months - invest for new
product development -
volume to Foundry
Shrink for new
functionality and cost per
function - 12 to 24 month
investment cycle
/ Slide 11
8” & i-line
6” & early i-line
Market share growth opportunity
12” & ArF
KrF &
Step & Scan
Market share gains through:
Immersion lithography
Superior Value of Ownership
ArF, KrF and I-line
Japan
0%
10%
20%
30%
40%
50%
60%
70%
1984
1987
1990
1993
1996
1999
2002
2005
ArF immersion
Source: Gartner Dataquest, ASML
/ Slide 12

Strong Drivers leading to ASML Guidance Upside
(press release 9/06/06)
Q3 ’06 Bookings at about Q2 ‘06 order intake level -
In Q2 ASML booked 93 orders
Strong demand from memory makers
Bookings across ASML 300mm product line
Bookings support customer’s New Fab ramps
75% of new orders will be for shipments in 2007
ASML 2006 revenue growth year-on-year estimated
at approximately 40% over 2005
/ Slide 13

Lithography Leadership
ASML overview
The world’s leading supplier of Lithography equipment
Key facts:
Headquarters: Veldhoven,
the Netherlands
Revenue 2005 ~ €2.5 B
Market cap ~ €7.75 B
Employees 5200
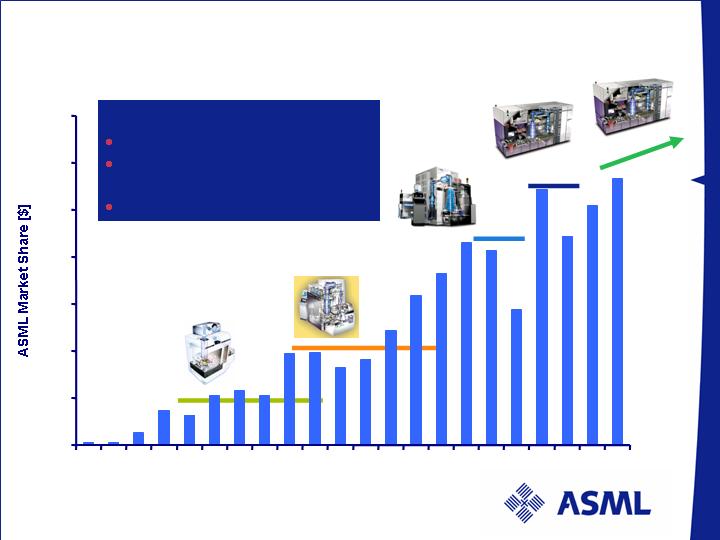
Leaders in Innovation
ASML TWINSCAN
Growing market share (revs)
Dual Stage enables:
Superior T-Put
Superior Overlay
Dataquest
SEMI
VLSIR*
2000
34.6%
32.9%
34.9%
2001
29.0%
31.4%
30.3%
2002
54.3%
56.0%
55.8%
2003
44.4%
48.3%
47.5%
2004
50.9%
52.8%
55.9%
2005
54.8%
57.2%
57.0%
* IC Exposure tools, ASML, Canon, Nikon, Ultratech SVG only.
/ Slide 15
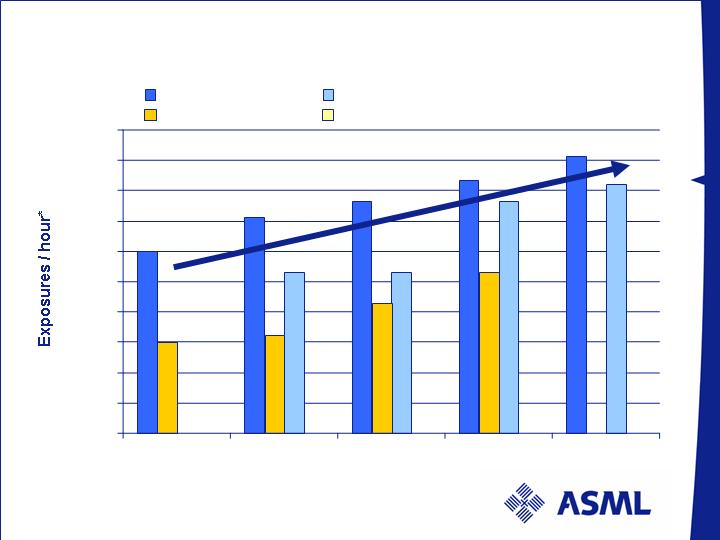
ASML’s Productivity leadership
* 300mm wafers
0
2,000
4,000
6,000
8,000
10,000
12,000
14,000
16,000
18,000
20,000
2003
2004
2005
2006
2007
ASML ArF
ASML ArFi
Competitor ArF
Competitor ArFi
/ Slide 16
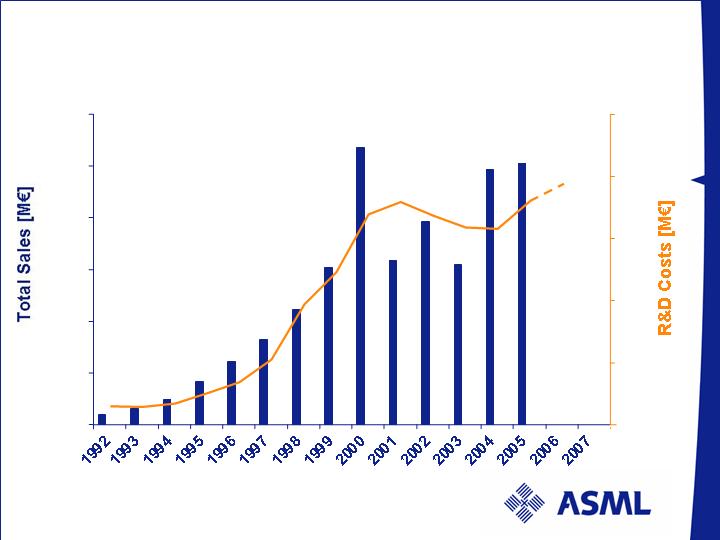
ASML Leadership -
R&D costs versus total sales
0
500
1000
1500
2000
2500
3000
0
100
200
300
400
500
R&D costs exclude settlement with Nikon Corp.
in 2004 and reflect costs for continuing operations
/ Slide 17
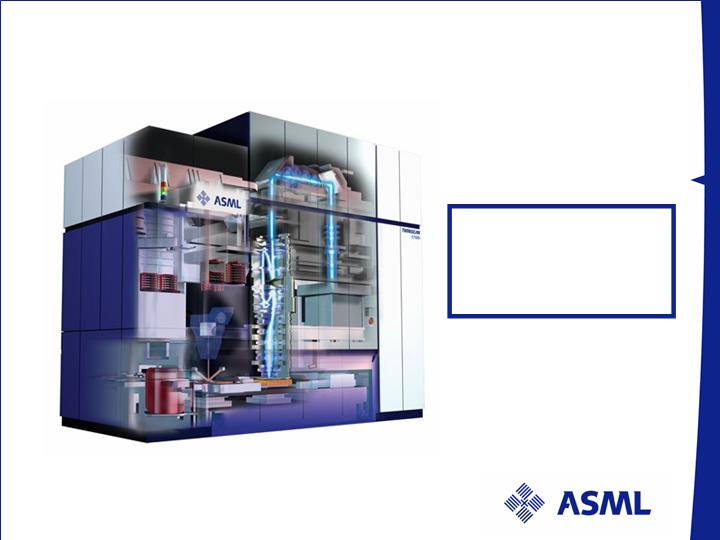
TWINSCAN XT:1700i Enabling 45nm production
ASML wet + dry ArF
market share
68%
Source: ASML – market shares are value based in 2005
/ Slide 18
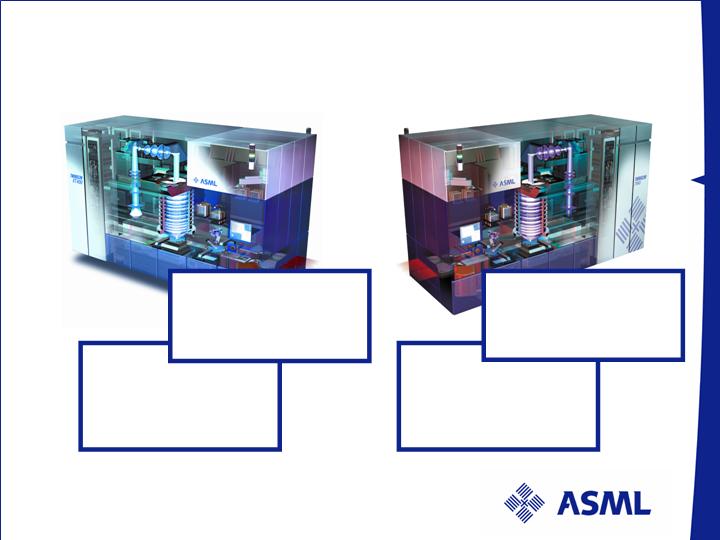
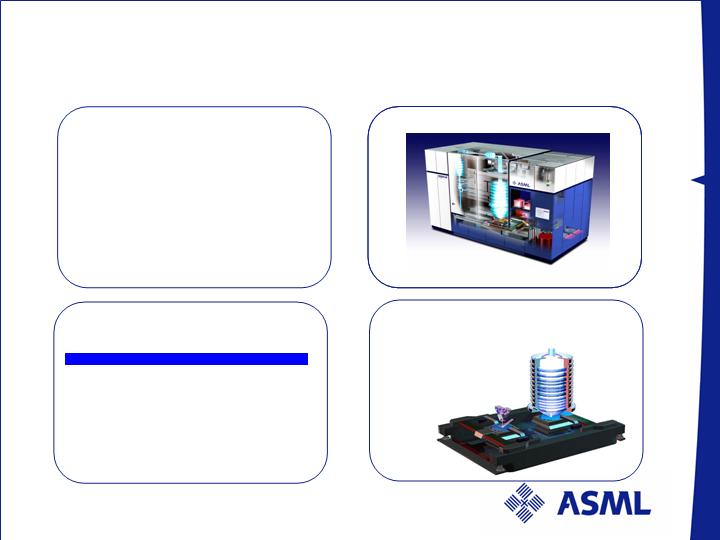
TWINSCAN™ creating value in non and mid
critical applications
XT:400E
Resolution: 350nm
Throughput: 129wph
Lowest CoO in 300mm i-line
XT:760F
Resolution: 130nm
Throughput: 134wph
Superior CoO in 300mm KrF
ASML i-line
market share
29%
ASML KrF
market share
51%
Source: ASML – market shares are value based in 2005
/ Slide 19

Long-Term Trajectory

Lithography Equipment - a growing market with
three major value drivers
Accelerating roadmap
TWINSCAN 1900i
Double exposure
EUV: ADT and production tools
New architecture
Alternative shrink solutions require more litho
tools
Spacer
Tri-dimensional devices
Vertical gate
Performance Overlay-Yield
…leading to a larger % of available CAPEX
/ Slide 21
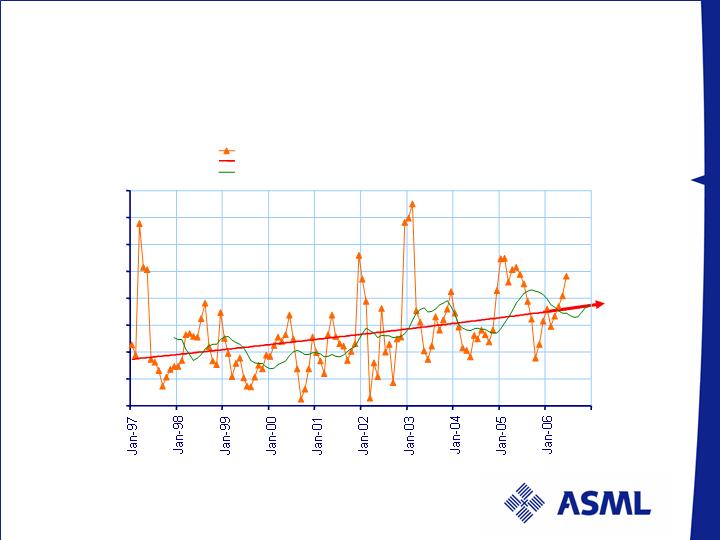
Source: SEMI
Last data point: June 2006
Expose & Write as % of Total Equipment
Litho share of equipment approaching 18% level !
Expose & Write Equipment Sales as % of Total Equipment Sales
10%
12%
14%
16%
18%
20%
22%
24%
26%
Expose & Write as % of Total Equipment
Expon. (Expose & Write as % of Total Equipment)
12 per. Mov. Avg. (Expose & Write as % of Total Equipment)
/ Slide 22
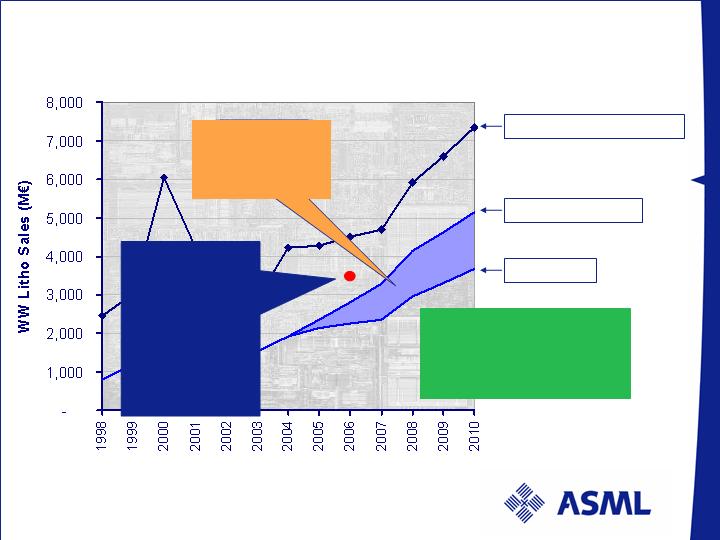
ASML’s growth potential
Average WW litho sales
ASML’s potential
Status quo
Natural growth
potential towards
4-5 B€ range
ASML’s
opportunity
window
ASML press
release:
Revenue
2006
~40%
increase
y-o-y
Assumption: 9% IC unit growth/year
Source: Average of Dataquest,
VLSI Research and ASML fab based model Jan.2006 – NOT ASML guidance
/ Slide 23

ASML is well positioned for value generation
Business Model based on Technology Leadership
enabled by accumulated experience and scale
Semiconductor cycle effect reduced by
Moderate cycles – as forecasted by analyst community for
2006-2007
Market share gains
Variable cost structure allowing significant profitability
through the cycle
/ Slide 24

Commitment