Table of Contents
UNITED STATES
SECURITIES AND EXCHANGE COMMISSION
Washington, D.C. 20549
FORM N-CSR
CERTIFIED SHAREHOLDER REPORT OF REGISTERED
MANAGEMENT INVESTMENT COMPANIES
Investment Company Act file number 811-07257
SEI Institutional Investments Trust
SEI Investments
One Freedom Valley Drive
Oaks, PA 19456
CT Corporation
155 Federal Street
Boston, MA 02110
Registrant’s telephone number, including area code: 1-800-342-5734
Date of fiscal year end: May 31, 2013
Date of reporting period: May 31, 2013
Table of Contents
| Item 1. | Reports to Stockholders. |
Table of Contents

May 31, 2013
ANNUAL REPORT
SEI Institutional Investments Trust
† Large Cap Fund
† Large Cap Diversified Alpha Fund
† Large Cap Disciplined Equity Fund
† Large Cap Index Fund
† Extended Market Index Fund
† Small Cap Fund
† Small Cap II Fund
† Small/Mid Cap Equity Fund
† U.S. Managed Volatility Fund
† International Equity Fund
† World Equity Ex-US Fund
† Screened World Equity Ex-US Fund
† Opportunistic Income Fund
† Core Fixed Income Fund
† High Yield Bond Fund
† Long Duration Fund
† Long Duration Corporate Bond Fund
† Ultra Short Duration Bond Fund
† Emerging Markets Debt Fund
† Real Return Fund
† Dynamic Asset Allocation Fund
† Multi-Asset Real Return Fund

Table of Contents
| 1 | ||||
| 24 | ||||
| 228 | ||||
| 234 | ||||
| 240 | ||||
| 246 | ||||
| 247 | ||||
| 250 | ||||
| 269 | ||||
| 270 | ||||
| 273 | ||||
Board of Trustees Considerations in Approving | 275 | |||
| 278 | ||||
The Trust files its complete schedule of portfolio holdings with the Securities and Exchange Commission for the first and third quarters of each fiscal year on Form N-Q within sixty days after the end of the period. The Trust’s Forms N-Q are available on the Commission’s website at http://www.sec.gov, and may be reviewed and copied at the Commission’s Public Reference Room in Washington, DC. Information on the operation of the Public Reference Room may be obtained by calling 1-800-SEC-0330.
A description of the policies and procedures that the Trust uses to determine how to vote proxies relating to portfolio securities, as well as information relating to how a Fund voted proxies relating to portfolio securities during the most recent 12-month period ended June 30, is available (i) without charge, upon request, by calling 1-800-DIAL-SEI; and (ii) on the Commission’s website at http://www.sec.gov.
Table of Contents
MANAGEMENT’S DISCUSSION AND ANALYSIS OF FUND PERFORMANCE
SEI INSTITUTIONAL INVESTMENTS TRUST — MAY 31, 2013
Large Cap Fund
I. Objective
The Large Cap Fund (the “Fund”) seeks to provide long-term growth of capital and income.
II. Multi-Manager Approach Statement
The Fund uses a multi-manager approach, relying on a number of sub-advisers with differing investment approaches to manage portions of the Fund’s portfolio under the general supervision of SEI Investments Management Corporation (SIMC). The Fund utilized the following sub-advisers as of May 31, 2013: Delaware Investment Fund Advisers, AJO, LP, Brown Advisory LLC, WestEnd Advisors, LSV Asset Management, AQR Capital Management and Waddell & Reed Investment Management Co. There were no sub-adviser changes during the year.
III. Market Commentary
The fiscal year started strong on speculation that the Federal Reserve (Fed) would expand its bond-buying program as economic indicators in the U.S. remained lackluster. European Central Bank President Mario Draghi’s oft-cited comment in late July to do “whatever it takes” to support the euro sent the market higher, as the worst-case scenario within the region was seemingly off the table. Stimulus speculation in the U.S. became a reality on September 13, when the Fed announced it would purchase $40 billion of agency mortgage-backed securities per month on an open-ended basis. This was in addition to the $45 billion per month of Treasurys the Fed was already buying. Despite the expanded stimulus measures, concerns about the health of the global economy and uncertainty regarding the outcome of the American presidential election weighed on the market. Following the election, the looming fiscal cliff in the U.S., a still-poor eurozone outlook, and intensified Israeli-Palestinian tensions all vied for the market’s attention. After a last-minute political agreement on the fiscal cliff, the market rallied sharply in the following months. Improving economic indicators, combined with the Fed’s zero-interest-rate policy, forced investors out on the risk curve, which boosted equity prices (albeit in more defensive issues). Best performing sectors for the fiscal year included Financials, Health Care and Consumer Discretionary, while Utilities, Information Technology (IT) and Telecommunications lagged. Value stocks outperformed their growth counterparts, and small cap stocks bested large cap.
IV. Return vs. Benchmark
For the fiscal year ended May 31, 2013, the Fund outperformed the Russell 1000 Index (the “Index”), returning 28.44%, versus an Index return of 27.62%.
V. Fund Attribution
Solid broad-based stock selection enabled the Fund’s relative outperformance during the fiscal year. Picks within Energy, particularly among refiners, and within IT, specifically hardware & equipment, were the greatest contributors to alpha generation. An underweight to real estate investment trusts was also beneficial. However, Consumer Discretionary was a source of weakness, as a handful of names materially lagged the broader market. An overweight to IT at the expense of better-performing sectors also detracted, while an underweight to Utilities added value.
Large Cap Fund:
AVERAGE ANNUAL TOTAL RETURN1
| One Year Return | Annualized 3 Year Return | Annualized 5 Year Return | Annualized 10 Year Return | Annualized Inception to Date | ||||||||||||||||
| Large Cap Fund, Class A | 28.44% | 16.64% | 5.40% | 7.88% | 7.25% | |||||||||||||||
| Russell 1000 Index | 27.62% | 16.92% | 5.57% | 7.96% | 7.56% | |||||||||||||||
Comparison of Change in the Value of a $100,000 Investment in the Large Cap Fund, Class A, versus the Russell 1000 Index
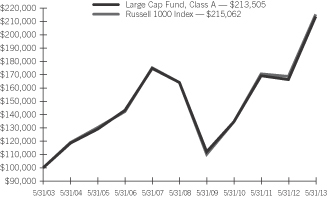
| 1 | For the year ended May 31, 2013. Past performance is not an indication of future performance. Class A shares were offered beginning 6/14/96. Returns shown do not reflect the deduction of taxes that a shareholder would pay on fund distributions or the redemption of fund shares. The returns for certain periods reflect fee waivers and/or reimbursements in effect for that year; absent fee waivers and reimbursements, performance would have been lower. |
| SEI Institutional Investments Trust / Annual Report / May 31, 2013 | 1 |
Table of Contents
MANAGEMENT’S DISCUSSION AND ANALYSIS OF FUND PERFORMANCE
SEI INSTITUTIONAL INVESTMENTS TRUST — MAY 31, 2013
Large Cap Diversified Alpha Fund
I. Objective
The Large Cap Diversified Alpha Fund (the “Fund”) seeks to provide long-term growth of capital and income.
II. Multi-Manager Approach Statement
The Fund uses a multi-manager approach, relying on a number of sub-advisers with differing investment approaches to manage portions of the Fund’s portfolio under the general supervision of SEI Investments Management Corporation (SIMC). The Fund utilized the following sub-advisers as of May 31, 2013: INTECH, Delaware Investment Fund Advisers, AJO, LP, WestEnd Advisors LLC and Tocqueville Asset Management L.P. There were no sub-adviser changes during the year.
III. Market Commentary
The fiscal year started strong on speculation that the Federal Reserve (Fed) would expand its bond-buying program as economic indicators in the U.S. remained lackluster. European Central Bank President Mario Draghi’s oft-cited comment in late July to do “whatever it takes” to support the euro sent the market higher, as the worst-case scenario within the region was seemingly off the table. Stimulus speculation in the U.S. became a reality on September 13, when the Fed announced it would purchase $40 billion of agency mortgage-backed securities per month on an open-ended basis. This was in addition to the $45 billion per month of Treasurys the Fed was already buying. Despite the expanded stimulus measures, concerns about the health of the global economy and uncertainty regarding the outcome of the American presidential election weighed on the market. Following the election, the looming fiscal cliff in the U.S., a still-poor eurozone outlook, and intensified Israeli-Palestinian tensions all vied for the market’s attention. After a last-minute political agreement on the fiscal cliff, the market rallied sharply in the following months. Improving economic indicators, combined with the Fed’s zero-interest-rate policy, forced investors out on the risk curve, which boosted equity prices (albeit in more defensive issues). Best performing sectors for the fiscal year included Financials, Health Care and Consumer Discretionary, while Utilities, Information Technology (IT) and Telecommunications lagged. Value stocks outperformed their growth counterparts, and small cap stocks bested large cap.
IV. Return vs. Benchmark
For the fiscal year ended May 31, 2013, the Fund underperformed the Russell 1000 Index (the “Index”), returning 25.66% versus an Index return of 27.62%.
V. Fund Attribution
The Fund generated strong absolute results but underperformed relative to the benchmark for the year. Stock selection within the Consumer Discretionary sector was the primary driver of relative underperformance, as a handful of names across multiple industry groups materially lagged the broader market. An underweight to and selection within Financials (the best performing sector in the Index) also detracted. Picks within Energy, particularly among the refiners, were sources of strength during the year, as were an underweight to Utilities and selection within Consumer Staples.
Large Cap Diversified Alpha Fund:
AVERAGE ANNUAL TOTAL RETURN1
One Year Return | Annualized 3 Year Return | Annualized 5 Year Return | Annualized Inception to Date | |||||||||||||
| Large Cap Diversified Alpha Fund, Class A | 25.66% | 16.49% | 3.96% | 4.25% | ||||||||||||
| Russell 1000 Index | 27.62% | 16.92% | 5.57% | 5.78% | ||||||||||||
Comparison of Change in the Value of a $100,000 Investment in the Large Cap Diversified Alpha Fund, Class A, versus the Russell 1000 Index
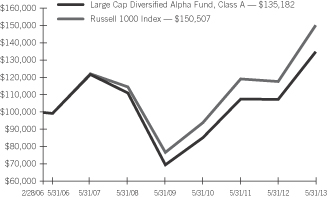
| 1 | For the year ended May 31, 2013. Past performance is no indication of future performance. Class A shares were offered beginning 2/28/06. Returns shown do not reflect the deduction of taxes that a shareholder would pay on fund distributions or the redemption of fund shares. The returns for certain periods reflect fee waivers and/or reimbursements in effect for that year; absent fee waivers and reimbursements, performance would have been lower. |
| 2 | SEI Institutional Investments Trust / Annual Report / May 31, 2013 |
Table of Contents
MANAGEMENT’S DISCUSSION AND ANALYSIS OF FUND PERFORMANCE
SEI INSTITUTIONAL INVESTMENTS TRUST — MAY 31, 2013
Large Cap Disciplined Equity Fund
I. Objective
The Large Cap Disciplined Equity Fund (the “Fund”) seeks to provide capital appreciation.
II. Multi-Manager Approach Statement
The Fund uses a multi-manager approach, relying on a number of sub-advisers with differing investment approaches to manage portions of the Fund’s portfolio under the general supervision of SEI Investments Management Corporation (SIMC). The Fund utilizes the following sub-advisers as of May 31, 2013: Quantitative Management Associates, LLC, Analytic Investors, Inc., Lazard Asset Management LLC, INTECH Investment Management LLC and Oppenheimer Funds, Inc. To achieve its investment goal, the Fund may invest in the SEI LIBOR Plus Portfolio (Portfolio), which is a portfolio of SEI Alpha Strategy Portfolios, LP, a registered open-end investment company that was established to permit certain SEI funds to pursue their respective investment strategies in an efficient manner. The sub-advisers to the Portfolio’s assets are Brookfield Asset Management and Declaration Management & Research.
During the fiscal year ended May 31, 2013, OppenheimerFunds, Inc. was added to the Fund and GE Asset Management was terminated.
III. Market Commentary
The fiscal year started strong on speculation that the Federal Reserve (Fed) would expand its bond-buying program as economic indicators in the U.S. remained lackluster. European Central Bank President Mario Draghi’s oft-cited comment in late July to do “whatever it takes” to support the euro sent the market higher, as the worst-case scenario within the region was seemingly off the table. Stimulus speculation in the U.S. became a reality on September 13, when the Fed announced it would purchase $40 billion of agency mortgage-backed securities per month on an open-ended basis. This was in addition to the $45 billion per month of Treasurys the Fed was already buying. Despite the expanded stimulus measures, concerns about the health of the global economy and uncertainty regarding the outcome of the American presidential election weighed on the market. Following the election, the looming fiscal cliff in the U.S., a still-poor eurozone outlook, and intensified Israeli-Palestinian tensions all vied for the market’s attention. After a last-minute political agreement on the fiscal cliff, the market rallied sharply in the following months. Improving economic indicators, combined with the Fed’s zero-interest-rate policy, forced investors out on the risk curve, which boosted equity prices (albeit in more defensive issues). Best performing sectors for the fiscal year included Financials, Health Care and Consumer
Discretionary, while Utilities, Information Technology (IT) and Telecommunications lagged. Value stocks outperformed their growth counterparts, and small cap stocks bested large cap.
IV. Return vs. Benchmark
For the fiscal year ended May 31, 2013, the Fund outperformed the S&P 500 Index (the “Index”), returning 28.24% versus the Index return of 27.28%.
V. Fund Attribution
The Fund posted positive relative performance in a strong-absolute-return environment. Stock selection within the Consumer Discretionary, Health Care and Industrials sectors was a source of strength, as was an underweight to Utilities, which materially lagged the broader market. Picks within Information Technology, specifically the software & services and semiconductor industry groups, proved challenging for the Fund, as did selection within Consumer Staples.
Large Cap Disciplined Equity Fund:
AVERAGE ANNUAL TOTAL RETURN1
One Year Return | Annualized 3 Year Return | Annualized 5 Year Return | Annualized Inception to Date | |||||||||||||
| Large Cap Disciplined Equity Fund, Class A | 28.24% | 16.71% | 3.75% | 6.37% | ||||||||||||
| S&P 500 Index | 27.28% | 16.87% | 5.43% | 0.16% | ||||||||||||
Comparison of Change in the Value of a $100,000 Investment in the Large Cap Disciplined Equity Fund, Class A, versus the S&P 500 Index
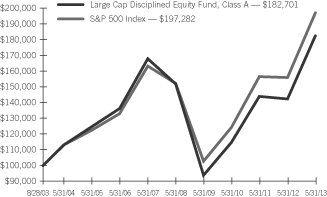
| 1 | For the year ended May 31, 2013. Past performance is not an indication of future performance. Class A shares were offered beginning 8/28/03. Returns shown do not reflect the deduction of taxes that a shareholder would pay on fund distributions or the redemption of fund shares. The returns for certain periods reflect fee waivers and/or reimbursements in effect for that year; absent fee waivers and reimbursements, performance would have been lower. |
| SEI Institutional Investments Trust / Annual Report / May 31, 2013 | 3 |
Table of Contents
MANAGEMENT’S DISCUSSION AND ANALYSIS OF FUND PERFORMANCE
SEI INSTITUTIONAL INVESTMENTS TRUST — MAY 31, 2013
Large Cap Index Fund
I. Objective
The Large Cap Index Fund (the “Fund”) seeks to provide investment results that correspond to the aggregate price and dividend performance of the securities in the Russell 1000 Index.
II. Multi-Manager Approach Statement
The Fund uses a sub-adviser under the supervision of SEI Investments Management Corporation (SIMC). The sole sub-adviser is SSgA Funds Management, Inc. There were no sub-adviser changes during the year.
III. Market Commentary
The fiscal year started strong on speculation that the Federal Reserve (Fed) would expand its bond-buying program as economic indicators in the U.S. remained lackluster. European Central Bank President Mario Draghi’s oft-cited comment in late July to do “whatever it takes” to support the euro sent the market higher, as the worst-case scenario within the region was seemingly off the table. Stimulus speculation in the U.S. became a reality on September 13, when the Fed announced it would purchase $40 billion of agency mortgage-backed securities per month on an open-ended basis. This was in addition to the $45 billion per month of Treasurys the Fed was already buying. Despite the expanded stimulus measures, concerns about the health of the global economy and uncertainty regarding the outcome of the American presidential election weighed on the market. Following the election, the looming fiscal cliff in the U.S., a still-poor eurozone outlook, and intensified Israeli-Palestinian tensions all vied for the market’s attention. After a last-minute political agreement on the fiscal cliff, the market rallied sharply in the following months. Improving economic indicators, combined with the Fed’s zero-interest-rate policy, forced investors out on the risk curve, which boosted equity prices (albeit in more defensive issues). Best performing sectors for the fiscal year included Financials, Health Care and Consumer Discretionary, while Utilities, Information Technology (IT) and Telecommunications lagged. Value stocks outperformed their growth counterparts, and small cap stocks bested large cap.
IV. Return vs. Benchmark
For the fiscal year ended May 31, 2013, the Fund slightly underperformed the Russell 1000 Index (the “Index”), returning 27.55% versus the Index return of 27.62%.
V. Fund Attribution
Incremental underperformance was generated by cash flows. As an index fund, performance is designed to track that of the Index.
Large Cap Index Fund:
AVERAGE ANNUAL TOTAL RETURN1
One Year Return | Annualized 3 Year Return | Annualized 5 Year Return | Annualized 10 Year Return | Annualized Inception to Date | ||||||||||||||||
| Large Cap Index Fund, Class A | 27.55% | 16.89% | 5.54% | 7.90% | 5.63% | |||||||||||||||
| Russell 1000 Index | 27.62% | 16.92% | 5.57% | 7.96% | 5.67% | |||||||||||||||
Comparison of Change in the Value of a $100,000 Investment in the Large Cap Index Fund, Class A, versus the Russell 1000 Index
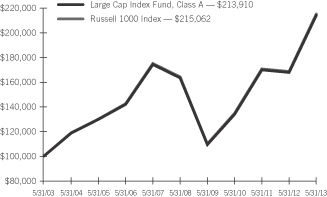
| 1 | For the year ended May 31, 2013. Past performance is not an indication of future performance. Class A shares were offered beginning 4/1/02. Returns shown do not reflect the deduction of taxes that a shareholder would pay on fund distributions or the redemption of fund shares. The returns for certain periods reflect fee waivers and/or reimbursements in effect for that year; absent fee waivers and reimbursements, performance would have been lower. |
| 4 | SEI Institutional Investments Trust / Annual Report / May 31, 2013 |
Table of Contents
MANAGEMENT’S DISCUSSION AND ANALYSIS OF FUND PERFORMANCE
SEI INSTITUTIONAL INVESTMENTS TRUST — MAY 31, 2013
Extended Market Index Fund
I. Objective
The Extended Market Index Fund (the “Fund”) seeks investment results that approximate, as closely as practicable and before expenses, the performance of the Russell Small Cap Completeness Index.
II. Multi-Manager Approach Statement
The Fund uses a sub-adviser to manage the portfolio under the general supervision of SEI Investments Management Corporation (SIMC). As of May 31, 2013, the Fund’s sub-adviser was SSgA Funds Management, Inc.
The Fund was launched in February 2013, and there have been no sub-adviser changes since inception.
III. Market Commentary
The U.S. equity market, as measured by the Russell Small Cap Completeness Index, gained 30% during the fiscal year ending May 31, 2013. The market advanced on increasing optimism about the domestic economy, supported by improving housing and employment conditions and accommodative monetary policy from the U.S. Federal Reserve, as well as the diminishing frequency and impact of Europe’s financial-crisis spasms. Except for a moderate pullback in October and November and a brief pause around the end of March, market activity consistently trended in a positive direction during the Fund’s fiscal year. From a sector perspective, market performance was led by Consumer Discretionary, which gained 41%, followed by Health Care, Industrials and Consumer Staples. The worst-performing sector was Information Technology, which gained nearly 20%. Utilities, Financials and Energy also lagged the broad market.
During the since-inception period for the Fund (February 28, 2013 through May 31, 2013), the Russell Small Cap Completeness Index gained 7.94%. Performance was led by the Telecommunications sector, which gained nearly 16%, followed by Consumer Discretionary and Consumer Staples. The worst-performing sectors were Materials and Energy, which each gained nearly 4%.
IV. Return vs. Benchmark
For the since-inception period from February 28, 2013 to May 31, 2013, the Fund underperformed the Russell Small Cap Completeness Index (the “Index”), returning 7.84% versus the Index return of 7.94%.
V. Fund Attribution
As an index fund, the Fund is designed to track closely the performance of the Index. The slight underperformance during the period is attributable to cash flows.
Extended Market Index Fund:
AVERAGE ANNUAL TOTAL RETURN1
Cumulative Inception to Date | ||||
| Extended Market Index Fund, Class A | 7.84% | |||
| Russell Small Cap Completeness Index | 7.94% | |||
| 1 | For the period ended May 31, 2013. Past performance is not an indication of future performance. Class A shares were offered beginning 2/28/13. Returns shown do not reflect the deduction of taxes that a shareholder would pay on fund distributions or the redemption of fund shares. The returns for certain periods reflect fee waivers and/or reimbursements in effect for that period; absent fee waivers and reimbursements, performance would have been lower. |
| SEI Institutional Investments Trust / Annual Report / May 31, 2013 | 5 |
Table of Contents
MANAGEMENT’S DISCUSSION AND ANALYSIS OF FUND PERFORMANCE
SEI INSTITUTIONAL INVESTMENTS TRUST — MAY 31, 2013
Small Cap Fund
I. Objective
The Small Cap Fund (the “Fund”) seeks to provide capital appreciation.
II. Multi-Manager Approach Statement
The Fund uses a multi-manager approach, relying upon a number of sub-advisers with differing investment philosophies to manage portions of the Fund’s portfolio under the general supervision of SEI Investments Management Corporation (SIMC). The Fund utilized the following sub-advisers as of May 31, 2013: AllianceBernstein, L.P.; AQR Capital Management, LLC; Artisan Partners, LP; Janus Capital Management, LLC; J.P. Morgan Investment Management; Lee Munder Capital Group, LLC; LSV Asset Management; Security Capital Research & Management, Inc.; Robeco Investment Management; Timberline Asset Management, LLC; and William Blair & Company, LLC.
During the fiscal year ended May 31, 2013, Allianz Global Investors Capital, LLC and Wellington Management Company, LLP were removed from the Fund. No sub-advisers were added to the Fund during the year.
III. Market Commentary
The U.S. equity market, as measured by the Russell 2000 Index, gained 31% during the fiscal year ending May 31, 2013. The market advanced on increasing optimism about the domestic economy, supported by improving housing and employment conditions and accommodative monetary policy from the U.S. Federal Reserve, as well as the diminishing frequency and impact of Europe’s financial-crisis spasms. Except for a moderate pullback in October and November and a brief pause around the end of March, market activity consistently trended in a positive direction during the Fund’s fiscal year. From a sector perspective, market performance was led by Consumer Discretionary, which gained nearly 40%, as well as Industrials and Materials. The worst-performing sector was Utilities, which still gained 20%. Telecommunications and Energy also lagged the broad market.
IV. Return vs. Benchmark
For the fiscal year ended May 31, 2013, the Fund underperformed the Russell 2000 Index (the ”Index”), returning 29.71% versus an Index return of 31.07%.
V. Fund Attribution
Sector allocation boosted performance during the period, largely due to the Fund’s pro-cyclical positioning. The portfolio’s overweight in Industrials and underweight in Utilities both contributed meaningfully. Individual stock selection was detrimental to performance in most sectors, particularly Information Technology (IT) and Consumer Discretionary. Within IT, the portfolio’s holdings in the hardware segment were the primary source of underperformance. In Consumer Discretionary, the Fund’s holdings in the retailing and household durables areas performed relatively poorly. The two sectors where stock selection contributed to performance were Financials — where the Fund’s holdings in banks, capital markets and consumer finance outperformed — and (to a lesser extent) Consumer Staples. In factor terms, the Fund’s relatively low exposure to momentum and its higher market-capitalization profile relative to the Index proved detrimental to performance.
Small Cap Fund:
AVERAGE ANNUAL TOTAL RETURN1
One Year Return | Annualized 3 Year Return | Annualized 5 Year Return | Annualized 10 Year Return | Annualized Inception to Date | ||||||||||||||||
| Small Cap Fund, Class A | 29.71% | 14.15% | 5.76% | 9.00% | 7.95% | |||||||||||||||
| Russell 2000 Index | 31.07% | 15.72% | 7.15% | 9.78% | 7.60% | |||||||||||||||
Comparison of Change in the Value of a $100,000 Investment in the Small Cap Fund, Class A, versus the Russell 2000 Index
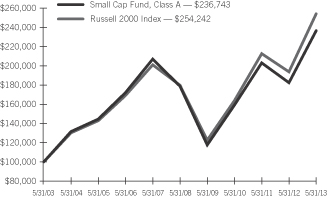
| 1 | For the year ended May 31, 2013. Past performance is not an indication of future performance. Class A shares were offered beginning 6/14/96. Returns shown do not reflect the deduction of taxes that a shareholder would pay on fund distributions or the redemption of fund shares. The returns for certain periods reflect fee waivers and/or reimbursements in effect for that year; absent fee waivers and reimbursements, performance would have been lower. |
| 6 | SEI Institutional Investments Trust / Annual Report / May 31, 2013 |
Table of Contents
MANAGEMENT’S DISCUSSION AND ANALYSIS OF FUND PERFORMANCE
SEI INSTITUTIONAL INVESTMENTS TRUST — MAY 31, 2013
Small Cap II Fund
I. Objective
The Small Cap II Fund (the “Fund”) seeks to provide capital appreciation.
II. Multi-Manager Approach Statement
The Fund uses a multi-manager approach, relying upon a number of sub-advisers with differing investment philosophies to manage portions of the Fund’s portfolio under the general supervision of SEI Investments Management Corporation (SIMC). The Fund utilized the following sub-advisers as of May 31, 2013: AllianceBernstein, LP; AQR Capital Management, LLC; Fiduciary Management Associates, LLC; Lee Munder Capital Group, LLC; and Timberline Asset Management, LLC.
During the fiscal year ended May 31, 2013, Fiduciary Management Associates, LLC was added to the Fund. No sub-advisers were terminated from the Fund during the year.
III. Market Commentary
The U.S. equity market, as measured by the Russell 2000 Index, gained 31% during the fiscal year ending May 31, 2013. The market advanced on increasing optimism about the domestic economy, supported by improving housing and employment conditions and accommodative monetary policy from the U.S. Federal Reserve, as well as the diminishing frequency and impact of Europe’s financial-crisis spasms. Except for a moderate pullback in October and November and a brief pause around the end of March, market activity consistently trended in a positive direction during the Fund’s fiscal year. From a sector perspective, market performance was led by Consumer Discretionary, which gained nearly 40%, as well as Industrials and Materials. The worst-performing sector was Utilities, which still gained 20%. Telecommunications and Energy also lagged the broad market.
IV. Return vs. Benchmark
For the fiscal year ended May 31, 2013, the Fund underperformed the Russell 2000 Index (the “Index”), returning 28.54% versus an Index return of 31.07%.
V. Fund Attribution
Sector allocations added to performance during the period, largely due to the Fund’s pro-cyclical positioning. The portfolio’s overweight position in Industrials contributed meaningfully, as did overweight positions in Consumer Discretionary and Materials and underweight positions in Utilities, Telecommunications and Health Care. Individual stock selection detracted in several sectors, particularly Information Technology (IT) and Consumer Discretionary. Within IT, the portfolio’s holdings in the hardware segment were the primary source of underperformance. In Consumer Discretionary, the Fund’s holdings in the consumer durables, hospitality and retailing areas performed relatively poorly. Stock selection was also a performance headwind in the Energy sector. The two sectors where stock selection contributed meaningfully to performance were Industrials (primarily in the capital goods area) and Financials (within consumer finance and real estate). In factor terms, the Fund’s higher-market-capitalization profile relative to the Index proved to be a moderate drag on performance.
Small Cap II Fund:
AVERAGE ANNUAL TOTAL RETURN1
One Year Return | Annualized Inception to Date | |||||||||
| Small Cap II Fund, Class A | 28.54% | 20.49% | ||||||||
| Russell 2000 Index | 31.07% | 23.83% | ||||||||
Comparison of Change in the Value of a $100,000 Investment in the Small Cap II Fund, Class A, versus the Russell 2000 Index
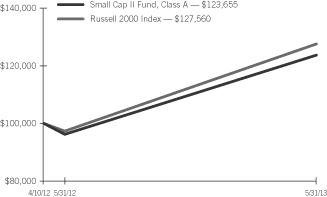
| 1 | For the period ended May 31, 2013. Past performance is not an indication of future performance. Class A shares were offered beginning 4/10/12. Returns shown do not reflect the deduction of taxes that a shareholder would pay on fund distributions or the redemption of fund shares. The returns for certain periods reflect fee waivers and/or reimbursements in effect for that period; absent fee waivers and reimbursements, performance would have been lower. |
| SEI Institutional Investments Trust / Annual Report / May 31, 2013 | 7 |
Table of Contents
MANAGEMENT’S DISCUSSION AND ANALYSIS OF FUND PERFORMANCE
SEI INSTITUTIONAL INVESTMENTS TRUST — MAY 31, 2013
Small/Mid Cap Equity Fund
I. Objective
The Small/Mid Cap Equity Fund (the “Fund”) seeks to provide long-term capital appreciation.
II. Multi-Manager Approach Statement
The Fund uses a multi-manager approach, relying upon a number of sub-advisers with differing investment philosophies to manage portions of the Fund’s portfolio under the general supervision of SEI Investments Management Corporation (SIMC). The Fund utilized the following sub-advisers as of May 31, 2013: AllianceBernstein, LP, Century Capital Management, LLC, Integrity Asset Management, LLC, Janus Capital Management, LLC, Lee Munder Capital Group, LLC, LSV Asset Management, Robeco Investment Management; Security Capital Research & Management, Inc., Timberline Asset Management, LLC, Wellington Management Company, LLP and William Blair & Company, LLC.
During the fiscal year ended May 31, 2013, Allianz Global Investors Capital, LLC was terminated from the Fund, and Timberline Asset Management, LLC was added to the Fund.
III. Market Commentary
The U.S. equity market, as measured by the Russell 2500 Index, gained 32% during the fiscal year ending May 31, 2013. The market advanced on increasing optimism about the domestic economy, supported by improving housing and employment conditions and accommodative monetary policy from the U.S. Federal Reserve, as well as the diminishing frequency and impact of Europe’s financial-crisis spasms. Except for a moderate pullback in October and November and a brief pause around the end of March, market activity consistently trended in a positive direction during the Fund’s fiscal year. From a sector perspective, market performance was led by Consumer Staples, which gained nearly 46%, followed by Consumer Discretionary and Industrials. The worst-performing sectors were Utilities and Information Technology, which each gained approximately 23%.
IV. Return vs. Benchmark
For the fiscal year ended May 31, 2013, the Fund underperformed the Russell 2500 Index (the “Index”), returning 29.49% versus an Index return of 31.63%.
V. Fund Attribution
Individual stock selection was detrimental to performance in most sectors, particularly Health Care and Consumer Discretionary. Within Health Care, the portfolio’s holdings in equipment and services were the primary source of underperformance. In Consumer Discretionary, the Fund’s holdings in retailing performed relatively poorly. Stock selection was also a performance headwind in Consumer Staples, Industrials and Information Technology (IT). The two sectors where stock selection contributed meaningfully to performance were Materials (primarily in metals and mining) and Financials (mainly in banks). Sector allocation had a negligible impact on relative performance, as individual sector effects offset in the aggregate. The Fund benefited from pro-cyclical positioning — specifically an overweight in Industrials and underweight in Utilities — but this was offset by an overweight to the weak IT sector.
Small/Mid Cap Equity Fund:
AVERAGE ANNUAL TOTAL RETURN1
One Year Return | Annualized 3 Year Return | Annualized 5 Year Return | Annualized Inception to Date | |||||||||||||
| Small/Mid Cap Equity Fund, Class A | 29.49% | 15.40% | 6.38% | 8.04% | ||||||||||||
| Russell 2500 Index | 31.63% | 17.08% | 7.61% | 8.80% | ||||||||||||
Comparison of Change in the Value of a $100,000 Investment in the Small/Mid Cap Equity Fund, Class A, versus the Russell 2500 Index
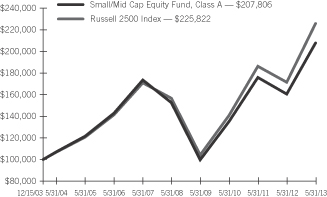
| 1 | For the year ended May 31, 2013. Past performance is not an indication of future performance. Class A shares were offered beginning 12/15/03. Returns shown do not reflect the deduction of taxes that a shareholder would pay on fund distributions or the redemption of fund shares. The returns for certain periods reflect fee waivers and/or reimbursements in effect for that year; absent fee waivers and reimbursements, performance would have been lower. |
| 8 | SEI Institutional Investments Trust / Annual Report / May 31, 2013 |
Table of Contents
MANAGEMENT’S DISCUSSION AND ANALYSIS OF FUND PERFORMANCE
SEI INSTITUTIONAL INVESTMENTS TRUST — MAY 31, 2013
U.S. Managed Volatility Fund
I. Objective
The U.S. Managed Volatility Fund (the “Fund”) seeks capital appreciation with less volatility than the broad U.S. equity markets.
II. Multi-Manager Approach Statement
The Fund uses a multi-manager approach, relying on a number of sub-advisers with differing investment approaches to manage portions of the Fund’s portfolio under the general supervision of SEI Investments Management Corporation (SIMC). The Fund utilized the following sub-advisors as of May 31, 2013: AJO, LP, Analytic Investors LLC and LSV Asset Management. There were no manager changes during the year.
III. Market Commentary
The U.S. equity market, as measured by the Russell 3000 Index, gained 27.88% during the year ending May 31, 2013. Following a selloff in the spring of 2012 due to a softening U.S. economy and continuing issues in Europe, central banks worldwide stepped in with supportive policies and a risk rally unfolded throughout the summer. Due to the presidential election and looming fiscal cliff in the U.S., as well as the ongoing eurozone crisis, investors’ fears and uncertainty increased in autumn, resulting in a slight market drawdown. The rally resumed at the end of 2012 after the U.S. elections and gained momentum in the beginning of 2013 because the fiscal cliff was averted, debt-ceiling negotiations were pushed back, and there was potential for additional easing in Japan. The momentum continued to the end of May. For the fiscal year, value stocks outperformed their growth counterparts. All 10 sectors posted positive performance. Renewed confidence in the economic recovery revived investors’ willingness to take risk. The best-performing sectors were Financials, Consumer Discretionary and Industrials. Interestingly, Health Care also had a good run in the spring of 2013, along with other defensive sectors such as Consumer Staples, Utilities and Telecommunications. Utilities, Information Technology and Telecommunications lagged the market the most throughout the period.
IV. Return vs. Benchmark
For the fiscal year ended May 31, 2013, the Fund underperformed the Russell 3000 Index (the “Index”), returning 24.19% versus the Index return of 27.88%.
V. Fund Attribution
Higher-quality defensive positioning drove the Fund’s relative underperformance. This effect only marginally offset by good stock selection in the lowest-beta names. (Beta is a statistical measure of a security’s volatility relative to the broader market.) The managers target lower-beta names, which are typically characterized by more stable earnings profiles and lower leverage ratios (debt relative to a company’s equity capital), to achieve one of the Fund’s primary objectives of lower return volatility than the overall market.
A lower-risk strategy that includes a focus on mitigating downside risk is expected to lag during strong market rallies, and Fund performance over the last 12 months reflects that. Adjusting for return volatility, the Fund’s results were strong. We believe the Fund’s performance is best viewed in risk-adjusted terms.
From a more traditional sector perspective, underweights in Consumer Discretionary and Financials and an overweight in Utilities worked against performance. These effects were partially offset by an underweight in Information Technology.
U.S. Managed Volatility Fund:
AVERAGE ANNUAL TOTAL RETURN1
One Year Return | Annualized 3 Year Return | Annualized Inception to Date | ||||||||||
| U.S. Managed Volatility Fund, Class A | 24.19% | 18.01% | 15.75% | |||||||||
| Russell 3000 Index | 27.88% | 16.82% | 17.55% | |||||||||
Comparison of Change in the Value of a $100,000 Investment in the US Managed Volatility Fund, Class A, versus the Russell 3000 Index
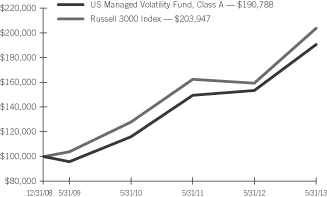
| 1 | For the year ended May 31, 2013. Past performance is not an indication of future performance. Class A shares were offered beginning 12/31/08. Returns shown do not reflect the deduction of taxes that a shareholder would pay on fund distributions or the redemption of fund shares. The returns for certain periods reflect fee waivers and/or reimbursements in effect for that year; absent fee waivers and reimbursements, performance would have been lower. |
| SEI Institutional Investments Trust / Annual Report / May 31, 2013 | 9 |
Table of Contents
MANAGEMENT’S DISCUSSION AND ANALYSIS OF FUND PERFORMANCE
SEI INSTITUTIONAL INVESTMENTS TRUST — MAY 31, 2013
International Equity Fund
I. Objective
The International Equity Fund (the “Fund”) seeks to provide capital appreciation.
II. Multi-Manager Approach Statement
The Fund uses a multi-manager approach, relying upon a number of sub-advisers with differing investment philosophies to manage portions of the Fund’s portfolio under the general supervision of SEI Investments Management Corporation (SIMC). The Fund utilized the following sub-advisers as of May 31, 2013: Acadian Asset Management LLC, Causeway Capital Management LLC, del Rey Global Investors LLC, INTECH Investment Management LLC, Neuberger Berman Management LLC, Schroder Investment Management North America Inc. and Tradewinds Global Investors LLC. There were no manager changes during the year.
III. Market Commentary
Despite uncertainty prevailing among investors, international markets experienced a strong rally during the period under review. The continued promise of central bank intervention served to bolster investor confidence. This was led by European Central Bank (ECB) President Mario Draghi’s promise to do “whatever it takes” to preserve the euro, which was reflected in the ECB’s Outright Monetary Transactions (designed to prop up banks through unlimited purchases of sovereign bonds on the secondary market), as well as the €500 billion European Stability Mechanism (designed to provide financial assistance to member states of the eurozone in financial difficulty). In response to these measures, Europe was the top-performing region for equities. Toward the end of 2012, we saw the election of Shinzo Abe in Japan and the introduction of “Abenomics” — a multi-step plan to boost Japan’s ailing economy through devaluation of the yen and domestic stimulus measures designed to shift the country out of its deflationary malaise. These announcements served to boost investor sentiment toward Japan and sparked a broad uptrend in Japanese equity markets. However, after a few strong months, markets in Japan corrected in May 2013, as investors became somewhat tentative regarding the long-term efficacy of Abe’s pledged actions. Toward the end of the Fund’s fiscal year, the scaling back of central bank bond purchases in the U.S. came into focus, as policy tightening and an economic slowdown in the world’s largest economy could roil global markets. Overall, Europe was the top-performing region in the period, with the remaining developed regions performing roughly equally. Emerging markets lagged well behind but still managed double-digit returns.
IV. Return vs. Benchmark
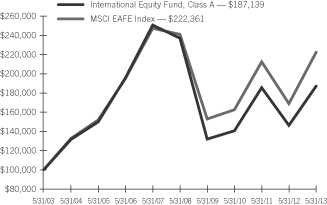
For the fiscal year ended May 31, 2013, the Fund underperformed the MSCI EAFE Index (the “Index”), returning 27.87% versus the Index return of 31.62%.
V. Fund Attribution
The Fund’s underperformance was driven primarily by the effects of region and sector allocations. From a country/regional perspective, the Fund’s overweight allocation to emerging markets detracted from performance. Emerging markets in general lagged well behind their developed-market peers during the period under review, and Fund holdings in South Africa and Brazil had a negative impact. The Fund’s exposure to Canadian equities, primarily represented by precious metals miners, also dragged on results. On the other hand, our managers did well overall with stock selection in Europe, particularly in France and Switzerland. The Fund also benefitted marginally from its overweight allocation to Europe, as our managers continue to find attractive investment opportunities there with the euro-area crisis stabilizing somewhat. Despite the recent rally it experienced, Japan still underperformed for the overall period, and the Fund’s underweight in that country was also positive for performance. Our managers still believe there are long-term structural issues in Japan, even in light of the recent revival of the country’s stock market, so the underweight is likely to persist. From a sector perspective, allocation effects were responsible for the Fund’s underperformance. The underweight to Financials was the greatest drag on results, with the sector up nearly 50% during the period. Additionally, the Fund’s overweight allocation to the Materials sector, mainly through precious metals miners, was a significant detractor. In contrast, strong stock selection in Industrials and Health Care helped mitigate the impact from sector allocation.
International Equity Fund:
AVERAGE ANNUAL TOTAL RETURN1
One Year Return | Annualized 3 Year Return | Annualized 5 Year Return | Annualized 10 Year Return | Annualized Inception to Date | ||||||||||||||||
| International Equity Fund, Class A | 27.87% | 9.96% | (4.61)% | 6.47% | 3.66% | |||||||||||||||
| MSCI EAFE Index | 31.62% | 11.00% | (1.60)% | 8.32% | 4.56% | |||||||||||||||
Comparison of Change in the Value of a $100,000 Investment in the International Equity Fund, Class A, versus the MSCI EAFE Index
| 1 | For the year ended May 31, 2013. Past performance is not an indication of future performance. Class A shares were offered beginning 6/14/96. Returns shown do not reflect the deduction of taxes that a shareholder would pay on fund distributions or the redemption of fund shares. The returns for certain periods reflect fee waivers and/or reimbursements in effect for that year; absent fee waivers and reimbursements, performance would have been lower. |
| 10 | SEI Institutional Investments Trust / Annual Report / May 31, 2013 |
Table of Contents
MANAGEMENT’S DISCUSSION AND ANALYSIS OF FUND PERFORMANCE
SEI INSTITUTIONAL INVESTMENTS TRUST — MAY 31, 2013
World Equity Ex-US Fund
I. Objective
The objective of the World Equity Ex-US Fund (the “Fund”) is to provide capital appreciation.
II. Multi-Manager Approach Statement
The Fund uses a multi-manager approach, relying upon a number of sub-advisers with differing investment philosophies to manage portions of the Fund’s portfolio under the general supervision of SEI Investments Management Corporation (“SIMC”). The Fund utilized the following sub-advisers as of May 31, 2013: Acadian Asset Management LLC, EARNEST Partners LLC, JO Hambro Capital Management Limited, McKinley Capital Management LLC, NFJ Investment Group LLC and Thornburg Investment Management LLC. There were no manager changes during the year.
III. Market Commentary
Despite uncertainty prevailing among investors, international markets experienced a strong rally during the period under review. The continued promise of central bank intervention served to bolster investor confidence. This was led by European Central Bank (“ECB”) President Mario Draghi’s promise to do “whatever it takes” to preserve the euro, which was reflected in the ECB’s Outright Monetary Transactions (designed to prop up banks through unlimited purchases of sovereign bonds on the secondary market), as well as the €500 billion European Stability Mechanism (designed to provide financial assistance to member states of the eurozone in financial difficulty). In response to these measures, Europe was the top-performing region for equities. Toward the end of 2012, we saw the election of Shinzo Abe in Japan and the introduction of “Abenomics” — a multi-step plan to boost Japan’s ailing economy through devaluation of the yen and domestic stimulus measures designed to shift the country out of its deflationary malaise. These announcements served to boost investor sentiment toward Japan and sparked a broad uptrend in Japanese equity markets. However, after a few strong months, markets in Japan corrected in May 2013, as investors became somewhat tentative regarding the long-term efficacy of Abe’s pledged actions. Toward the end of the Fund’s fiscal year, the scaling back of central bank bond purchases in the U.S. came into focus, as policy tightening and an economic slowdown in the world’s largest economy could roil global markets. Overall, Europe was the top-performing region in the period, with the remaining developed regions performing roughly equally. Emerging markets lagged well behind but still managed double-digit returns.
IV. Return vs. Benchmark
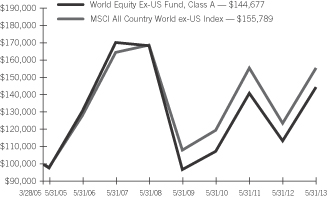
For the fiscal year ended May 31, 2013, the Fund outperformed the MSCI All Country World Ex US Index (the “Index”), returning 27.11% versus the Index return of 25.79%.
V. Fund Attribution
The Fund’s outperformance was driven primarily by stock selection, although portfolio allocation delivered positive effects as well. From a country/regional perspective, the Fund benefited from stock selection across the majority of regions, with the exceptions of Europe and Pacific ex-Japan. The best results for the period came from selection within Canada, specifically Energy and Materials names. Stock selection in emerging markets was also strong, particularly in Indonesia, India, Turkey and South Africa. The Fund’s overweight to Latin America detracted however, as the region (excluding Mexico) lagged well behind the benchmark. From a sector standpoint, stock selection drove performance, with sector allocation also adding to results. While selection was especially strong in the Materials and Energy sectors, we also saw strong results in the Fund’s Industrials and Telecommunications names. The Fund’s underweight to Financials was the most significant detractor, as the sector was up nearly 40% for the period. However, the Fund’s overweights Consumer Discretionary and Health Care bolstered performance, as both of those sectors delivered strong results during the period.
World Equity Ex-US Fund:
AVERAGE ANNUAL TOTAL RETURN1
One Year Return | Annualized 3 Year Return | Annualized 5 Year Return | Annualized Inception to Date | |||||||||||||
| World Equity Ex-US Fund, Class A | 27.11% | 10.35% | (3.03)% | 4.62% | ||||||||||||
| MSCI All Country World Ex-US Index | 25.79% | 9.13% | (1.62)% | 5.57% | ||||||||||||
Comparison of Change in the Value of a $100,000 Investment in the World Ex-US Equity Fund, Class A, versus the MSCI All Country World Ex-US Index
| 1 | For the year ended May 31, 2013. Past performance is not an indication of future performance. Class A shares were offered beginning 3/28/05. Returns shown do not reflect the deduction of taxes that a shareholder would pay on fund distributions or the redemption of fund shares. The returns for certain periods reflect fee waivers and/or reimbursements in effect for that year; absent fee waivers and reimbursements, performance would have been lower. |
| SEI Institutional Investments Trust / Annual Report / May 31, 2013 | 11 |
Table of Contents
MANAGEMENT’S DISCUSSION AND ANALYSIS OF FUND PERFORMANCE
SEI INSTITUTIONAL INVESTMENTS TRUST — MAY 31, 2013
Screened World Equity Ex-US Fund
I. Objective
The Screened World Equity Ex-US Fund (the “Fund”) seeks to provide capital appreciation.
II. Multi-Manager Approach Statement
The Fund uses a multi-manager approach, relying upon a number of sub-advisers with differing investment philosophies to manage portions of the Fund’s portfolio under the general supervision of SEI Investments Management Corporation (SIMC). The Fund utilized the following sub-advisers as of May 31, 2013: Acadian Asset Management LLC, EARNEST Partners LLC, McKinley Capital Management LLC and Thornburg Investment Management LLC. There were no manager changes during the year.
III. Market Commentary
Despite uncertainty prevailing among investors, international markets experienced a strong rally during the period under review. The continued promise of central bank intervention served to bolster investor confidence. This was led by European Central Bank (ECB) President Mario Draghi’s promise to do “whatever it takes” to preserve the euro, which was reflected in the ECB’s Outright Monetary Transactions (designed to prop up banks through unlimited purchases of sovereign bonds on the secondary market), as well as the €500 billion European Stability Mechanism (designed to provide financial assistance to member states of the eurozone in financial difficulty). In response to these measures, Europe was the top-performing region for equities. Toward the end of 2012, we saw the election of Shinzo Abe in Japan and the introduction of “Abenomics” — a multi-step plan to boost Japan’s ailing economy through devaluation of the yen and domestic stimulus measures designed to shift the country out of its deflationary malaise. These announcements served to boost investor sentiment toward Japan and sparked a broad uptrend in Japanese equity markets. However, after a few strong months, markets in Japan corrected in May 2013, as investors became somewhat tentative regarding the long-term efficacy of Abe’s pledged actions. Toward the end of the Fund’s fiscal year, the scaling back of central bank bond purchases in the U.S. came into focus, as policy tightening and an economic slowdown in the world’s largest economy could roil global markets. Overall, Europe was the top-performing region in the period, with the remaining developed regions performing roughly equally. Emerging markets lagged well behind but still managed double-digit returns.
IV. Return vs. Benchmark
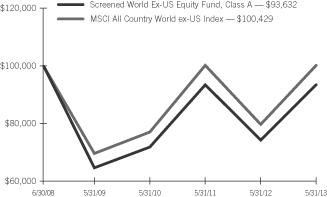
For the fiscal year ended May 31, 2012, the Fund performed in line with the MSCI All Country World Ex US Index (the “Index”), returning 25.69% versus the Index return of 25.79%.
V. Fund Attribution
The Fund marginally underperformed the benchmark by 10 basis points. The Fund’s performance was driven by a combination of stock selection and allocation effects. From a country/regional perspective, the Fund benefited from stock selection across the majority of regions. The exception was Europe, where selection in the Netherlands and Spain negatively impacted results. Stock selection in emerging markets was a strong spot, with particularly good results in Brazil, Mexico, Turkey and South Africa. The underweight to Japan and overweight to China both detracted, as Japan rallied and China lagged during the period. From a sector standpoint, both sector allocation and stock selection had mixed effects on performance. In both the Materials and Energy sectors, underweight allocations and strong stock selection bolstered results, as did stock selection in the Information Technology and Telecommunications sectors. The Fund’s underweight to Financials detracted, as the sector was up nearly 40% for the period. Selection in the Consumer Discretionary sector also dragged on results.
Screened World Equity Ex-US Fund:
AVERAGE ANNUAL TOTAL RETURN1
One Year Return | Annualized 3 Year Return | Annualized Inception to Date | ||||||||||
| Screened World Equity Ex-US Fund, Class A | 25.69% | 9.14% | (1.33)% | |||||||||
| MSCI All Country World Ex-US Index | 25.79% | 9.13% | 0.09% | |||||||||
Comparison of Change in the Value of a $100,000 Investment in the Screened World Ex-US Equity Fund, Class A, versus the MSCI All Country World Ex-US Index
| 1 | For the year ended May 31, 2013. Past performance is not an indication of future performance. Class A shares were offered beginning 6/30/08. Returns shown do not reflect the deduction of taxes that a shareholder would pay on fund distributions or the redemption of fund shares. The returns for certain periods reflect fee waivers and/or reimbursements in effect for that year; absent fee waivers and reimbursements, performance would have been lower. |
| 12 | SEI Institutional Investments Trust / Annual Report / May 31, 2013 |
Table of Contents
MANAGEMENT’S DISCUSSION AND ANALYSIS OF FUND PERFORMANCE
SEI INSTITUTIONAL INVESTMENTS TRUST — MAY 31, 2013
Opportunistic Income Fund
I. Objective
The Opportunistic Income Fund (the “Fund”) seeks to provide capital appreciation and income.
II. Multi-Manager Approach Statement
The Fund uses a multi-manager approach, relying on a number of sub-advisers with differing investment approaches to manage portions of the Fund under the general supervision of SEI Investments Management Corporation (SIMC). The Fund utilized the following sub-advisers as of May 31, 2013: Wellington Management Company, LLC and Ares Management, LLC. No manager changes were made to the Fund during the year.
III. Market Commentary
For the fiscal year ended May 31, 2013, the non-Treasury sectors of the U.S. fixed-income market generally outperformed similar-duration Treasurys, thanks to accommodative policies from global central banks. In 2012, the European Central Bank launched two long-term refinancing operations, which helped alleviate short-term funding pressure in the eurozone. In U.S., the Federal Reserve (Fed) continued its Operation Twist program until December 2012, and started the third quantitative-easing program (QE3) to purchase $85 billion of agency mortgage-backed securities (MBS) and long-term Treasury securities every month. In addition, economic and corporate fundamentals continued to improve, while inflation remained benign in U.S. The housing market experienced strong recovery, with the S&P/Case-Shiller U.S. National Home Price Index up double digits from a year ago. The non-agency MBS market saw strong price appreciation during the Fund’s fiscal year, helped by improving credit fundamentals and attractive valuations. After several years of de-leveraging, corporations (especially financial companies) have much stronger balance sheets and solid earnings. Primary issuance was robust and has been met with strong demand from investors.
The market turned a corner in May 2013, as fears over the Fed’s eventual tapering of QE3 caused a surge in interest rates and triggered a broad market selloff. The 10-year Treasury yield rose by 46 basis points and the 30-year Treasury yield increased by 40 basis points during the month. Agency MBS were hit especially hard. The sharp rise in Treasury yields resulted in significant extension risk (the risk that agency MBS cash flows will occur more slowly than expected), while greater uncertainty around Fed policy caused many real estate investment trusts and overseas investors to sell agency MBS holdings.
IV. Return vs. Benchmark
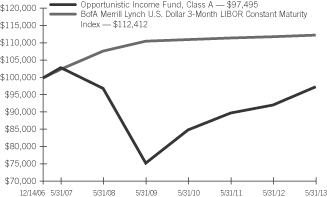
For the fiscal year ended May 31, 2013, the Fund outperformed the BofA Merrill Lynch U.S. Dollar 3-Month LIBOR Constant Maturity Index (the “Index”), returning 5.78% versus the Index return of 0.40%.
V. Fund Attribution
The Fund outperformed its benchmark, benefiting from an allocation to bank loans, as the Credit Suisse Leveraged Loan Index returned
9.04%. Loan performance was driven by investors’ desire for yield and safety along with an aversion to interest-rate risk, which led to record-setting inflows into the asset class. In addition, an allocation to (and security selection within) non-agency MBS, particularly shorter-tenor senior residential MBS, added to performance, as the sector benefited from positive housing fundamentals and improving homeowner metrics. Non-agency MBS benefited from favorable supply/demand technicals and valuations, including attractive loss-adjusted yields. An allocation to seasoned senior commercial MBS tranches added to performance, as that sector benefited from investors’ yield appetite and the Fed’s announcement of its latest round of quantitative easing. The Fund’s allocation to corporates, particularly financials, aided relative performance, as that sector was perceived as a safe haven compared to the industrial/technology and media & telecom sectors, where leveraged buyouts and equity-shareholder friendly activities have increased. Fundamentals in financials continue to improve, with new financial regulations and capital requirements taking hold that should benefit bondholders. The Fund used derivatives (primarily Treasury futures) throughout the one-year period ending May 31, 2013 as a way to manage duration, yield-curve positioning, and spread duration in a more efficient manner.
Opportunistic Income Fund:
AVERAGE ANNUAL TOTAL RETURN1
One Year Return | Annualized 3 Year Return | Annualized 5 Year Return | Annualized Inception to Date | |||||||||||||
| Opportunistic Income Fund, Class A | 5.78% | 4.68% | 0.11% | (0.39)% | ||||||||||||
| BofA Merrill Lynch U.S. Dollar 3-Month LIBOR Constant Maturity Index | 0.40% | 0.39% | 0.84% | 1.83% | ||||||||||||
Comparison of Change in the Value of a $100,000 Investment in the Opportunistic Income Fund, Class A, versus the BofA Merrill Lynch U.S. Dollar 3-Month LIBOR Constant Maturity Index
| 1 | For the year ended May 31, 2013. Past performance is not an indication of future performance. Class A shares were offered beginning 12/14/06. Returns shown do not reflect the deduction of taxes that a shareholder would pay on fund distributions or the redemption of fund shares. The returns for certain periods reflect fee waivers and/or reimbursements in effect for that year; absent fee waivers and reimbursements, performance would have been lower. |
| SEI Institutional Investments Trust / Annual Report / May 31, 2013 | 13 |
Table of Contents
MANAGEMENT’S DISCUSSION AND ANALYSIS OF FUND PERFORMANCE
SEI INSTITUTIONAL INVESTMENTS TRUST — MAY 31, 2013
Core Fixed Income Fund
I. Objective
The Core Fixed Income Fund (the “Fund”) seeks to provide current income consistent with the preservation of capital.
II. Multi-Manager Approach Statement
The Fund uses a multi-manager approach, relying on a number of sub-advisors with differing investment approaches to manage portions of the Fund’s portfolio, under the general supervision of SEI Investments Management Corporation (SIMC). The Fund utilized the following sub-advisers as of May 31, 2013: Metropolitan West Asset Management LLC, JP Morgan Investment Management Inc., Western Asset Management Company, Western Asset Management Company Limited, Wells Capital Management and Jennison Associates LLC. No manager changes were made during the year.
III. Market Commentary
For the fiscal year ended May 31, 2013, the non-Treasury sectors of the U.S. fixed-income market generally outperformed similar-duration Treasurys, thanks to accommodative policies from global central banks. In 2012, the European Central Bank launched two long-term refinancing operations, which helped alleviate short-term funding pressure in the eurozone. In U.S., the Federal Reserve (Fed) continued its Operation Twist program until December 2012, and started the third quantitative-easing program (QE3) to purchase $85 billion of agency mortgage-backed securities (MBS) and long-term Treasury securities every month. In addition, economic and corporate fundamentals continued to improve, while inflation remained benign in U.S. The housing market experienced strong recovery, with the S&P/Case-Shiller U.S. National Home Price Index up double digits from a year ago. The non-agency MBS market saw strong price appreciation during the Fund’s fiscal year, helped by improving credit fundamentals and attractive valuations. After several years of de-leveraging, corporations (especially financial companies) have much stronger balance sheets and solid earnings. Primary issuance was robust and has been met with strong demand from investors.
The market turned a corner in May 2013, as fears over the Fed’s eventual tapering of QE3 caused a surge in interest rates and triggered a broad market selloff. The 10-year Treasury yield rose by 46 basis points and the 30-year Treasury yield increased by 40 basis points during the month. Agency MBS were hit especially hard. The sharp rise in Treasury yields resulted in significant extension risk (the risk that agency MBS cash flows will occur more slowly than expected), while greater uncertainty around Fed policy caused many real estate investment trusts and overseas investors to sell agency MBS holdings.
IV. Return vs. Benchmark
For the fiscal year ended May 31, 2013, the Fund outperformed the Barclays Capital Aggregate Bond Index (the “Index”), returning 3.12% versus the Index return of 0.91%.
V. Fund Attribution
The Fund’s overweight position in corporate bonds, non-agency MBS and commercial MBS (CMBS) were the key drivers of performance. Duration exposure (which was shorter than the benchmark) also had a positive impact on performance, as Treasury yields rose during the period. Treasury futures were utilized to help manage the Fund’s duration and yield-curve exposures.
An overweight to corporate bonds, especially those issued by large financial firms, generated significant outperformance relative to Treasurys. The steep yield curve, combined with improved access to capital markets, allowed the largest U.S. banking institutions to strengthen their balance sheets and sustain profitability over the course of the year. The Fund bought credit protection by utilizing credit default swaps, which assisted in partially hedging systematic risk associated with the portfolio’s corporate exposure.
Non-agency mortgages continued to perform well, as that sector has experienced price appreciation as a result of an improving housing market, principal paydowns, and negative net supply.
The Fund’s overweight to the CMBS sector contributed to performance as well. The Fund bought credit protection by utilizing credit default swaps on a basket of CMBS, which assisted in partially hedging systematic risk associated with the portfolio’s CMBS exposure.
The Fund’s underweight to agency debt detracted from performance.
Core Fixed Income Fund:
AVERAGE ANNUAL TOTAL RETURN1
One Year Return | Annualized 3 Year Return | Annualized 5 Year Return | Annualized 10 Year Return | Annualized Inception to Date | ||||||||||||||||
| Core Fixed Income Fund, Class A | 3.12% | 6.40% | 7.19% | 5.55% | 6.63% | |||||||||||||||
| Barclays Capital Aggregate Bond Index | 0.91% | 4.59% | 5.50% | 4.66% | 6.15% | |||||||||||||||
Comparison of Change in the Value of a $100,000 Investment in the Core Fixed Income Fund, Class A, versus the Barclays Capital Aggregate Bond Index

| 1 | For the year ended May 31, 2013. Past performance is not an indication of future performance. Class A shares were offered beginning 6/14/96. Returns shown do not reflect the deduction of taxes that a shareholder would pay on fund distributions or the redemption of fund shares. The returns for certain periods reflect fee waivers and/or reimbursements in effect for that year; absent fee waivers and reimbursements, performance would have been lower. |
| 14 | SEI Institutional Investments Trust / Annual Report / May 31, 2013 |
Table of Contents
MANAGEMENT’S DISCUSSION AND ANALYSIS OF FUND PERFORMANCE
SEI INSTITUTIONAL INVESTMENTS TRUST — MAY 31, 2013
High Yield Bond Fund
I. Objective
The High Yield Bond Fund (the “Fund”) seeks total return.
II. Multi-Manager Approach Statement
The Fund uses a multi-manager approach, relying on a number of sub-advisers with differing investment approaches to manage portions of the Fund’s portfolio under the general supervision of SEI Investments Management Corporation (SIMC). The Fund utilized the following sub-advisers as of May 31, 2013: Ares Management, LLC, Brigade Capital Management, LLC, Delaware Investment Fund Advisers, Guggenheim Partners Investment Management, LLC and J.P. Morgan Investment Management, Inc. There were no manager changes during the year.
III. Market Commentary
For the fiscal year ended May 31, 2013, the high-yield market, as measured by the BofA Merrill Lynch U.S. High Yield Constrained Index (the “Index”), returned 14.82%. High yield returns were positive in 11 of the 12 months during the Fund’s fiscal year due to a more durable recovery in the U.S. economy, an accommodative Federal Reserve that instituted its third round of quantitative easing, and the successful negotiation of the U.S. fiscal cliff debate. As a result, credit quality narrowed 234 basis points, ending the period at 462 basis points. Yields for high-yield bonds established several new record lows during the year. A new record-low yield of 4.99% was established in early-May 2013, before rising to 5.70% by the end of May. Fundamentals for the high-yield market remain intact and have kept default rates in a low range. The Moody’s U.S. Speculative Default Rate ended the Fund’s fiscal year at 2.9% — slightly below the 3.1% of a year ago. Issuance continued its recent record pace, reaching a new 12-month record with $444 billion issued during the reporting period. Over 60% of new issuance was for refinancing purposes, which helps keep net new issuance in check. With strong fundamentals and technicals, as well as investors’ desire for yield in a record low rate environment, lower-quality bonds outperformed higher-quality bonds. CCC rated securities returned 20.45%, followed by B rated securities (14.52%), and BBB rated securities (12.55%).
Returns were positive and broad based for the high-yield market, with all sectors of the Index generating double-digit returns. An improving economy, combined with stronger operations, benefited finance-related companies, which enabled the insurance and banking sectors
to produce the highest returns at 31.26% and 20.62%, respectively. The worst-performing sector was the capital goods sector, which returned 12.09%.
IV. Return vs. Benchmark
For the fiscal year ended May 31, 2013, the Fund outperformed the BofA Merrill Lynch U.S. High Yield Constrained Index, returning 15.46% versus the Index return of 14.82%.
V. Fund Attribution
The Fund’s allocation to collateralized loan obligations enhanced performance, as strong demand and improving fundamentals drove prices higher. Selection within the energy sector added to returns, as several companies benefitted from both refinancing and acquisition activity. Within in the consumer non-cyclical sector, an allocation to municipal tobacco debt (which outperformed taxable high-yield bonds) benefitted returns. An underweight to BB rated bonds and an overweight CCC rated bonds (which underperformed and outperformed, respectively) were positive. An underweight to the outperforming banking sector and a more defensive portfolio positioning in institutional loans detracted.
High Yield Bond Fund:
AVERAGE ANNUAL TOTAL RETURN1
One Year Return | Annualized 3 Year Return | Annualized 5 Year Return | Annualized Inception to Date | |||||||||||||
| High Yield Bond Fund, Class A | 15.46% | 13.05% | 11.38% | 9.42% | ||||||||||||
| BofA Merrill Lynch U.S. High Yield Constrained Index | 14.82% | 11.85% | 10.76% | 9.23% | ||||||||||||
Comparison of Change in the Value of a $100,000 Investment in the High Yield Bond Fund, Class A, versus the BofA Merrill Lynch U.S. High Yield Constrained Index
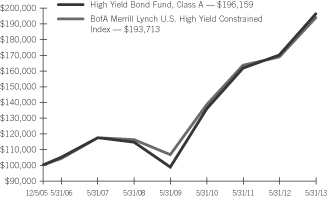
| 1 | For the year ended May 31, 2013. Past performance is not an indication of future performance. Class A shares were offered beginning 12/5/05. Returns shown do not reflect the deduction of taxes that a shareholder would pay on fund distributions or the redemption of fund shares. The returns for certain periods reflect fee waivers and/or reimbursements in effect for that year; absent fee waivers and reimbursements, performance would have been lower. |
| SEI Institutional Investments Trust / Annual Report / May 31, 2013 | 15 |
Table of Contents
MANAGEMENT’S DISCUSSION AND ANALYSIS OF FUND PERFORMANCE
SEI INSTITUTIONAL INVESTMENTS TRUST — MAY 31, 2013
Long Duration Fund
I. Objective
The Long Duration Fund (the “Fund”) seeks to provide return characteristics similar to those of high-quality corporate bonds with a duration range of between nine to fourteen years.
II. Multi-Manager Approach Statement
The Fund uses a multi-manager approach, relying on a number of sub-advisers with differing investment approaches to manage portions of the Fund’s portfolio under the general supervision of SEI Investments Management Corporation (SIMC). The Fund utilized the following sub-advisers as of May 31, 2013: Metropolitan West Asset Management LLC, Jennison Associates LLC, Income Research & Management, and Legal and General Investment Management America Inc. There were no manager changes during the year.
III. Market Commentary
For the fiscal year ended May 31, 2013, the non-Treasury sectors of the U.S. fixed-income market generally outperformed similar-duration Treasurys, thanks to accommodative policies from global central banks. In 2012, the European Central Bank launched two long-term refinancing operations, which helped alleviate short-term funding pressure in the eurozone. In U.S., the Federal Reserve (Fed) continued its Operation Twist program until December 2012, and started the third quantitative-easing program (QE3) to purchase $85 billion of agency mortgage-backed securities (MBS) and long-term Treasury securities every month. In addition, economic and corporate fundamentals continued to improve, while inflation remained benign in U.S. The housing market experienced strong recovery, with the S&P/Case-Shiller U.S. National Home Price Index up double digits from a year ago. The non-agency MBS market saw strong price appreciation during the Fund’s fiscal year, helped by improving credit fundamentals and attractive valuations. After several years of de-leveraging, corporations (especially financial companies) have much stronger balance sheets and solid earnings. Primary issuance was robust and has been met with strong demand from investors.
The market turned a corner in May 2013, as fears over the Fed’s eventual tapering of QE3 caused a surge in interest rates and triggered a broad market selloff. The 10-year Treasury yield rose by 46 basis points and the 30-year Treasury yield increased by 40 basis points during the month. Agency MBS were hit especially hard. The sharp rise in Treasury yields resulted in significant extension risk (the risk that agency MBS cash flows will occur more slowly than expected), while greater uncertainty around Fed policy caused many real estate investment trusts and overseas investors to sell agency MBS holdings.
IV. Return vs. Benchmark
For the fiscal year ended May 31, 2013, the Fund returned 0.78% compared to (0.57)% for its benchmark, which is the Barclays Long U.S. Government/Credit Index.
V. Fund Attribution
The Fund’s outperformance was aided by its overweight exposure to the corporate bond sector. Specifically, an overweight to large financial issuers generated significant outperformance relative to Treasurys. The steep yield curve, combined with improved access to capital markets, allowed the largest U.S. banking institutions to strengthen their balance sheets and sustain profitability over the course of the year. The Fund bought credit protection by utilizing credit default swaps, which assisted in partially hedging systematic risk associated with the portfolio’s corporate exposure.
Duration exposure, which was shorter than the benchmark, also had a positive impact on performance, as Treasury yields rose during the period. The Fund’s curve-flattening position detracted from results. Treasury futures were utilized to help manage the Fund’s duration and yield-curve exposure.
Long Duration Fund:
AVERAGE ANNUAL TOTAL RETURN1,2
One Year Return | Annualized 3 Year Return | Annualized 5 Year Return | Annualized Inception to Date | |||||||||||||
| Long Duration Fund, Class A | 0.78% | 10.75% | 9.05% | 5.90% | ||||||||||||
| Barclays Long US Government/Credit Index | (0.57)% | 10.10% | 9.61% | 7.65% | ||||||||||||
Comparison of Change in the Value of a $100,000 Investment in the Long Duration Fund, Class A, versus the Barclays Long US Government/Credit Index, the 60/40 Hybrid of the BC Long Credit & BC Long Government, the Barclays Long US Credit Index and the Barclays Long US Government Index
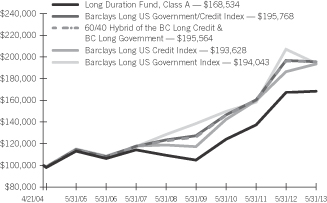
| 1 | For the year ended May 31, 2013. Past performance is not an indication of future performance. Class A shares were offered beginning 4/21/04. Returns shown do not reflect the deduction of taxes that a shareholder would pay on fund distributions or the redemption of fund shares. The returns for certain periods reflect fee waivers and/or reimbursements in effect for that year; absent fee waivers and reimbursements, performance would have been lower. |
| 2 | This table compares the Fund’s average annual total returns to those of a broad-based index and the Fund’s 60/40 Blended Benchmark, which consists of the Barclays Capital U.S. Long Credit Index and the Barclays Capital U.S. Long Government Index. The Fund’s Blended Benchmark is designed to provide a useful comparison to the Fund’s overall performance and more accurately reflects the Fund’s investment strategy than the broad-based index. |
| 16 | SEI Institutional Investments Trust / Annual Report / May 31, 2013 |
Table of Contents
MANAGEMENT’S DISCUSSION AND ANALYSIS OF FUND PERFORMANCE
SEI INSTITUTIONAL INVESTMENTS TRUST — MAY 31, 2013
Long Duration Corporate Bond Fund
I. Objective
The Long Duration Corporate Bond Fund (the “Fund”) seeks to provide return characteristics similar to those of high-quality corporate bonds.
II. Multi-Manager Approach Statement
The Fund uses a multi-manager approach, relying on a number of sub-advisers with differing investment approaches to manage portions of the Fund’s portfolio under the general supervision of SEI Investments Management Corporation (SIMC). The Fund utilized the following sub-advisers as of May 31, 2013: Metropolitan West Asset Management LLC, Jennison Associates LLC, Income Research & Management, and Legal and General Investment Management America Inc. There were no manager changes during the year.
The Fund was launched in June 2012, and there have been no sub-adviser changes since inception.
III. Market Commentary
For the fiscal year ended May 31, 2013, the non-Treasury sectors of the U.S. fixed-income market generally outperformed similar-duration Treasurys, thanks to accommodative policies from global central banks. In 2012, the European Central Bank launched two rounds of Long-Term Refinancing Operations, which helped alleviate short-term funding pressure in the eurozone. In U.S., the Federal Reserve (Fed) continued its Operation Twist program until December 2012, and started the third quantitative-easing program (QE3) to purchase $85 billion of agency mortgage-backed securities (MBS) and long-term Treasury securities every month. In addition, economic and corporate fundamentals continued to improve, while inflation remained benign in U.S. The housing market experienced strong recovery, with the S&P/Case-Shiller U.S. National Home Price Index up double digits from a year ago. The non-agency MBS market saw strong price appreciation during the Fund’s fiscal year, helped by improving credit fundamentals and attractive valuations. After several years of de-leveraging, corporations (especially financial companies) have much stronger balance sheets and solid earnings. Primary issuance was robust and has been met with strong demand from investors.
The market turned a corner in May 2013, as fears over the Fed’s eventual tapering of QE3 caused a surge in interest rates and triggered a broad market selloff. The 10-year Treasury yield rose by 46 basis points and the 30-year Treasury yield increased by 40 basis points during the month. Agency MBS were hit especially hard. The sharp rise in Treasury yields resulted in significant extension risk (the risk that agency MBS cash flows will occur more slowly than expected), while greater uncertainty around Fed policy caused many real estate investment trusts and overseas investors to sell agency MBS holdings.
IV. Return vs. Benchmark
For the since-inception period from June 29, 2012 to May 31, 2013, the Fund returned 3.75% compared to 3.59% for its benchmark, which is the Barclays Long U.S. Corporate Index.
V. Fund Attribution
The Fund’s outperformance was aided by its overweight exposure to large financial issuers, which generated significant outperformance relative to Treasurys. The steep yield curve, combined with improved access to capital markets, allowed the largest U.S. banking institutions to strengthen their balance sheets and sustain profitability over the course of the year. The Fund bought credit protection by utilizing credit default swaps, which assisted in partially hedging systematic risk associated with the portfolio’s corporate exposure.
Duration exposure, which was shorter than the benchmark, also had a positive impact on performance, as Treasury yields rose during the period. The Fund’s curve-flattening position detracted from results. Treasury futures were utilized to help manage the Fund’s duration and yield-curve exposure.
Long Duration Corporate Bond Fund:
AVERAGE ANNUAL TOTAL RETURN1
| Cumulative Inception to Date | ||||
| Long Duration Corporate Bond Fund, Class A | 3.75% | |||
| Barclays Long U.S. Corporate Bond Index | 3.59% | |||
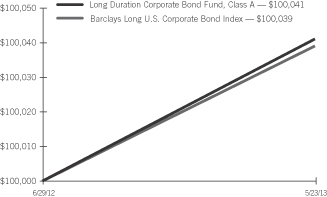
| 1 | For the year ended May 31, 2013. Past performance is not an indication of future performance. Class A shares were offered beginning 6/29/12. Returns shown do not reflect the deduction of taxes that a shareholder would pay on fund distributions or the redemption of fund shares. The returns for certain periods reflect fee waivers and/or reimbursements in effect for that year; absent fee waivers and reimbursements, performance would have been lower. |
| SEI Institutional Investments Trust / Annual Report / May 31, 2013 | 17 |
Table of Contents
MANAGEMENT’S DISCUSSION AND ANALYSIS OF FUND PERFORMANCE
SEI INSTITUTIONAL INVESTMENTS TRUST — MAY 31, 2013
Ultra Short Duration Bond Fund
I. Objective
The Ultra Short Duration Bond Fund (the “Fund”) seeks to provide higher current income than that typically offered by a money market fund while maintaining a high degree of liquidity and a correspondingly higher risk of principal volatility.
II. Multi-Manager Approach Statement
The Fund uses a multi-manager approach, relying on a number of sub-advisers with differing investment approaches to manage portions of the Fund’s portfolio, under the general supervision of SEI Investments Management Corporation (SIMC). The Fund utilized the following sub-advisers as of May 31, 2013: Wellington Management Company, LLP and Logan Circle Partners, L.P. There were no manager changes during the year.
III. Market Review
For the 12 months ending May 31, 2013, the non-Treasury sectors of the U.S. fixed-income market generally outperformed similar-duration Treasurys, thanks to accommodative policies from global central banks. In 2012, the European Central Bank launched two long-term refinancing operations, which helped alleviate short-term funding pressure in the eurozone. In U.S., the Federal Reserve (Fed) continued its Operation Twist program until December 2012, and started the third quantitative-easing program (QE3) to purchase $85 billion of agency mortgage-backed securities (MBS) and long-term Treasury securities every month. In addition, economic and corporate fundamentals continued to improve, while inflation remained benign in U.S. The housing market experienced strong recovery, with the S&P/Case-Shiller U.S. National Home Price Index up double digits from a year ago. The non-agency MBS market saw strong price appreciation during the Fund’s fiscal year, helped by improving credit fundamentals and attractive valuations. After several years of de-leveraging, corporations (especially financial companies) have much stronger balance sheets and solid earnings. Primary issuance was robust and has been met with strong demand from investors.
The market turned a corner in May 2013, as fears over the Fed’s eventual tapering of QE3 caused a surge in interest rates and triggered a broad market selloff. The 10-year Treasury yield rose by 46 basis points and the 30-year Treasury yield increased by 40 basis points during the month. Agency MBS were hit especially hard. The
sharp rise in Treasury yields resulted in significant extension risk (the risk that agency MBS cash flows will occur more slowly than expected), while greater uncertainty around Fed policy caused many real estate investment trusts and overseas investors to sell agency MBS holdings.
IV. Return vs. Benchmark
For the fiscal year ended May 31, 2013, the Fund returned 2.14%, compared to 0.28% for the Barclays Short US Treasury 9-12 Month Index.
V. Fund Attribution
During the period, the Fund’s large allocation to non-Treasury sectors (particularly non-agency mortgage-backed securities, asset-backed securities and corporate securities) outperformed. Allocations to the Fund’s barbell curve position detracted from performance, as the yield curve steepened significantly during the period. During the Fund’s fiscal year, Treasury futures were used to efficiently manage duration and yield-curve exposures.
Ultra Short Duration Bond Fund:
AVERAGE ANNUAL TOTAL RETURN1
One Year Return | Annualized Inception to Date | |||||||
| Ultra Short Duration Bond Fund, Class A | 2.14% | 1.48% | ||||||
| Barclays Short U.S. Treasury 9-12 Month Index | 0.28% | 0.33% | ||||||
Comparison of Change in the Value of a $100,000 Investment in the Ultra Short Duration Bond Fund, Class A, versus the Barclays Short U.S. Treasury 9-12 Month Index
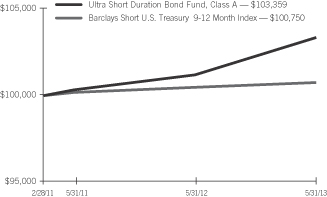
| 1 | For the year ended May 31, 2013. Past performance is not an indication of future performance. Class A shares were offered beginning 2/28/11. Returns shown do not reflect the deduction of taxes that a shareholder would pay on fund distributions or the redemption of fund shares. The returns for certain periods reflect fee waivers and/or reimbursements in effect for that year; absent fee waivers and reimbursements, performance would have been lower. |
| 18 | SEI Institutional Investments Trust / Annual Report / May 31, 2013 |
Table of Contents
MANAGEMENT’S DISCUSSION AND ANALYSIS OF FUND PERFORMANCE
SEI INSTITUTIONAL INVESTMENTS TRUST — MAY 31, 2013
Emerging Markets Debt Fund
I. Objective
The Emerging Markets Debt Fund (the “Fund”) seeks to maximize total return.
II. Multi-Manager Approach Statement
The Fund uses a multi-manager approach, relying on a number of sub-advisers with differing investment approaches to manage portions of the portfolio, under the general supervision of SEI Investments Management Corporation (SIMC). The Fund utilized the following sub-advisers as of May 31, 2013: Ashmore Investment Management Limited and Stone Harbor Investment Partners, L.P. During the year ended May 31, 2013, ING Investment Management was terminated from the Fund in February.
III. Market Commentary
For the fiscal year ending May 31, 2013, emerging markets debt (EMD) posted a 9.77% return after markets rebounded from a period of heightened volatility and received an injection of additional quantitative easing from the U.S. Federal Reserve. The Europe Union provided an improved outlook, China and the U.S. saw growth advancing, and Japan announced its own method of quantitative easing that pushed asset prices higher. Other than a short time around the U.S. elections and a period of risk aversion in May, the broader markets managed to avoid significant volatility during the Fund’s fiscal year.
Local currency debt outperformed external debt, returning 11.58% versus 10.07%, respectively. Local currency debt was blended into the Fund’s benchmark beginning in July 2012. . External debt has received significant inflows and posted strong performance in recent years, local currency debt has lagged and been a lesser beneficiary of market inflows. However, within the past year, local currency debt began to see increased investor appetite. Investors poured into EMD at the fastest rate ever, with a record $94 billion in 2012, most of which came in the second half of the year and continued into the first half of 2013. Issuance was also strong, as dovish central banks pushed down rates, allowing countries and companies around the world to issue debt at record-low yields (especially in the corporate debt market). These technical forces provided strong demand to an already-positive fundamental picture within emerging markets (EM) and contributed to rising asset prices.
Growth in emerging market economies has been solid, both on an absolute basis and relative to developed markets. However, growth targets in EM have been revised down across many regions and countries. Central banks have turned more dovish — not just on lower inflation, but mostly on potentially slower growth. Their agendas have just as much emphasis, if not more, on preserving national growth rates than fighting inflation at the moment. Nonetheless, debt profiles are generally improving, and credit-rating trends continue to improve, as evidenced by significant upgrades in the Philippines and Turkey. A few countries, such as Argentina (where a potential default looms) continue to raise concerns. However, many countries experiencing stress have some access to external markets or are working toward multi-lateral support.
The biggest concerns going forward are whether or not emerging economies will be able to stabilize what looks like moderating growth, and if they can return to a stronger growth environment — particularly with domestic demand as a bigger component. Countries also may soon need to address the potential tapering of quantitative easing in the U.S., the eventual rise of interest rates, and whether or not these factors have a negative impact on the ability to issue debt, refinance, or even pay down debt in the future.
IV. Return vs. Benchmark
For the fiscal year ended May 31, 2013, the Fund outperformed the Blended 50% J.P. Morgan EMBI Global Diversified Index (U.S. Dollar) and 50% J.P. Morgan GBI-EM Global Diversified Index (local currencies), returning 10.64% versus the blended Index return of 9.77%. The Fund’s primary benchmark, the J.P. Morgan EMBI Global Diversified Index, returned 10.07% for the period.
V. Fund Attribution
Adding to the Fund’s relative return for the period were security selection in external debt, an overweight to corporate debt, and security selection in local currency debt. Security selection in local currency in Mexico and Peru, exposure to corporate debt in Russia and Kazakhstan, and an underweight to Lebanon and Chile contributed to relative returns.
While quantitative easing was supportive of rising asset prices, countries within EM were still influenced by their own agendas. In
| SEI Institutional Investments Trust / Annual Report / May 31, 2013 | 19 |
Table of Contents
MANAGEMENT’S DISCUSSION AND ANALYSIS OF FUND PERFORMANCE
SEI INSTITUTIONAL INVESTMENTS TRUST — MAY 31, 2013
Emerging Markets Debt Fund (Concluded)
Mexico, local currency bonds benefited from favorable election results and the expectation that the new administration will eventually deliver on various projects such financial and energy reform. Broader economic data points were fairly positive, and the anticipation of U.S. growth remaining steady contributed to positive returns. Strong growth and stable inflation in Peru, coupled with rising foreign demand for local bonds, was supportive of the local market, and positioning in the short end of the curve contributed to alpha. The corporate debt market began to rally in the latter part of 2012, benefiting higher-beta exposures in Russia and Kazakhstan, which included telecommunications, financials and energy. Lebanese bonds trailed the market, as typically seen in strong rallies, and the Fund held no exposure there. Chile, which trades rich relative to the rest of the market, posted small gains, and Fund managers benefited from avoiding those unattractive valuations. Security selection in Turkish local currency bonds also added, as that country saw an improving current account deficit and expectations of an eventual rate hike that was priced in by the market.
Detracting from relative returns were underweights to Hungarian and Ukrainian dollar bonds and an overweight to local currency debt in South Africa. Exposures to local currency debt in China and Poland were also negative for performance, as was an overweight to cash.
Emerging Markets Debt Fund:
AVERAGE ANNUAL TOTAL RETURN1
| One Year Return | Annualized 3 Year Return | Annualized 5 Year Return | Annualized Inception to Date | |||||||||||||
| Emerging Markets Debt Fund, Class A | 10.64% | 10.50% | 10.21% | 9.63% | ||||||||||||
| J.P. Morgan EMBI Global Diversified Index | 10.07% | 9.85% | 9.04% | 8.62% | ||||||||||||
Comparison of Change in the Value of a $100,000 Investment in the Emerging Market Debt Fund, Class A, versus a Hybrid of the Following Indexes: the J.P. Morgan EMBI Global Diversified Index, and the J.P. Morgan GBI-EM Global Diversified Index
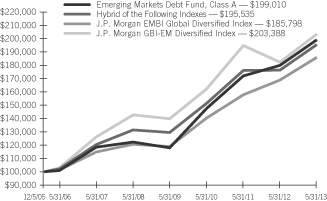
| 1 | For the year ended May 31, 2013. Past performance is not an indication of future performance. Class A shares were offered beginning 12/5/05. Returns shown do not reflect the deduction of taxes that a shareholder would pay on fund distributions or the redemption of fund shares. The returns for certain periods reflect fee waivers and/or reimbursements in effect for that year; absent fee waivers and reimbursements, performance would have been lower. |
| 20 | SEI Institutional Investments Trust / Annual Report / May 31, 2013 |
Table of Contents
MANAGEMENT’S DISCUSSION AND ANALYSIS OF FUND PERFORMANCE
SEI INSTITUTIONAL INVESTMENTS TRUST — MAY 31, 2013
Real Return Fund
I. Objective
The Real Return Fund (the “Fund”) seeks to provide a total return exceeding the rate of inflation.
II. Multi-Manager Approach Statement
The Fund utilized one sub-adviser to manage the Fund under the supervision of SEI Investments Management Corporation (SIMC). Effective May 16, 2013, the Fund terminated Wellington Management Company, LLC and the Fund’s assets are currently managed by SIMC directly.
III. Market Commentary
For the 12 months ending May 31, 2013, the non-Treasury sectors of the U.S. fixed-income market generally outperformed similar-duration Treasurys, thanks to accommodative policies from global central banks. In 2012, the European Central Bank launched two long-term refinancing operations, which helped alleviate short-term funding pressure in the eurozone. In U.S., the Federal Reserve (Fed) continued its Operation Twist program until December 2012, and started the third quantitative-easing program (QE3) to purchase $85 billion of agency mortgage-backed securities (MBS) and long-term Treasury securities every month. In addition, economic and corporate fundamentals continued to improve, while inflation remained benign in U.S. The housing market experienced strong recovery, with the S&P/Case-Shiller U.S. National Home Price Index up double digits from a year ago. The non-agency MBS market saw strong price appreciation during the Fund’s fiscal year, helped by improving credit fundamentals and attractive valuations. After several years of de-leveraging, corporations (especially financial companies) have much stronger balance sheets and solid earnings. Primary issuance was robust and has been met with strong demand from investors.
The market turned a corner in May 2013, as fears over the Fed’s eventual tapering of QE3 caused a surge in interest rates and triggered a broad market selloff. The 10-year Treasury yield rose by 46 basis points and the 30-year Treasury yield increased by 40 basis points during the month. In addition, yields on five-year and 10-year Treasury Inflation-Protected Securities (TIPS) increased 50 and 57 basis points, to (0.89)% and (0.10)%, respectively. This was due to tame inflation expectations, fears of the Fed being less
accommodative and the market implying stronger real economic growth. Despite recent weakness, the five-year TIPS breakeven inflation rate, which is the difference in yield between the nominal Treasury and TIPS, widened from 1.7% to 1.9%, resulting in TIPS outperforming their nominal Treasury counterparts for the one-year period.
IV. Return vs. Benchmark
For the fiscal year ended May 31, 2013, the Fund returned (0.15)%, compared to (0.06)% for the Barclays U.S. Treasury Inflation Notes 1-5 Year Index.
V. Fund Attribution
The Fund performed in line with the benchmark, benefiting from its curve positioning as well as tactical and timely allocations to nominal Treasurys, while security selection detracted from performance.
Real Return Fund:
AVERAGE ANNUAL TOTAL RETURN1
One Year Return | Annualized 3 Year Return | Annualized 5 Year Return | Annualized Inception to Date | |||||||||||||
| Real Return Fund, Class A | (0.15)% | 2.85% | 2.80% | 4.52% | ||||||||||||
| Barclays U.S. Treasury Inflation Notes 1-5 Year Index | (0.06)% | 2.91% | 2.93% | 4.30% | ||||||||||||
Comparison of Change in the Value of a $100,000 Investment in the Real Return Fund, Class A, versus the Barclays U.S. Treasury Inflation Notes 1-5 Year Index and the Barclays U.S. Treasury Inflation Notes 1-10 Year Index
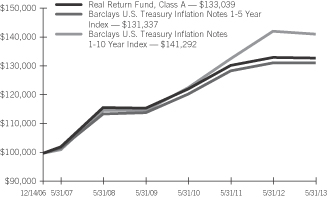
| 1 | For the year ended May 31, 2013. Past performance is not an indication of future performance. Class A shares were offered beginning 12/14/06. Returns shown do not reflect the deduction of taxes that a shareholder would pay on fund distributions or the redemption of fund shares. The returns for certain periods reflect fee waivers and/or reimbursements in effect for that year; absent fee waivers and reimbursements, performance would have been lower. |
| SEI Institutional Investments Trust / Annual Report / May 31, 2013 | 21 |
Table of Contents
MANAGEMENT’S DISCUSSION AND ANALYSIS OF FUND PERFORMANCE
SEI INSTITUTIONAL INVESTMENTS TRUST — MAY 31, 2013
Dynamic Asset Allocation Fund
I. Objective
The Dynamic Asset Allocation Fund (the “Fund”) seeks long-term total return.
II. Multi-Manager Approach Statement
The Fund is directly managed by SEI Investments Management Corporation (SIMC), while utilizing SSgA Funds Management, Inc. (State Street) as a sub-adviser in an execution and beta-management function only. There were no manager changes during the period.
III. Market Commentary
Despite continued negative economic data out of Europe, fears of an ongoing global financial crisis abated, pushing equities significantly higher. In the US, investors welcomed modestly lower unemployment data and an escape from the so-called fiscal cliff by rotating out of safe-haven assets like U.S. Treasurys and into riskier assets.
Accommodative monetary policies from central banks around the world led to an increase in global currency volatility. Perhaps the most glaring example comes from the Bank of Japan. A concerted effort to devalue the yen drove the yen-U.S. dollar exchange rate from 80 in June 2012 to a recent peak over 103. This devaluation (a single dollar can purchase more yen) benefited Japanese exports and helped contribute to the sharp appreciation of Japanese equities this spring.
IV. Return vs. Benchmark
For the fiscal year ended May 31, 2013, the Fund returned 23.75% compared to 27.28% for the S&P 500 Index.
V. Fund Attribution
A short euro/long U.S. dollar theme detracted from performance but served to dampen the overall volatility in the Fund. The largest positive contributor to returns was a long-Japanese-equity (currency hedged), short-Europe ex U.K.-equity trade. In addition, at various times during the year, we’ve hedged the portfolio from extreme downside moves by opportunistically entering and exiting put option trades on the S&P 500 Index. While the net effect of these options trades on returns has been neutral, we’ve been able to reduce the Fund’s exposure to downside tail risks. The Fund uses futures, forwards, swaps and options to achieve its desired tactical exposures.
Dynamic Asset Allocation Fund:
AVERAGE ANNUAL TOTAL RETURN1
One Year Return | Annualized Inception to Date | |||||||
| Dynamic Asset Allocation Fund, Class A | 23.75% | 14.60% | ||||||
| S&P 500 Index | 27.28% | 17.34% | ||||||
Comparison of Change in the Value of a $100,000 Investment in the Dynamic Asset Allocation Fund, Class A, versus the S&P 500 Index
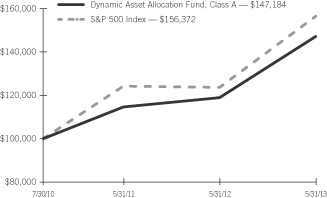
| 1 | For the year ended May 31, 2013. Past performance is not an indication of future performance. Class A shares were offered beginning 7/30/10. Returns shown do not reflect the deduction of taxes that a shareholder would pay on fund distributions or the redemption of fund shares. The returns for certain periods reflect fee waivers and/or reimbursements in effect for that year; absent fee waivers and reimbursements, performance would have been lower. |
| 22 | SEI Institutional Investments Trust / Annual Report / May 31, 2013 |
Table of Contents
MANAGEMENT’S DISCUSSION AND ANALYSIS OF FUND PERFORMANCE
SEI INSTITUTIONAL INVESTMENTS TRUST — MAY 31, 2013
Multi-Asset Real Return Fund
I. Objective:
The Multi-Asset Real Return Fund (the “Fund”) seeks return exceeding the rate of inflation.
II. Multi-Manager Approach Statement:
The Fund uses a multi-manager approach, relying on one or more sub-advisors with differing investment approaches to manage portions of the Fund’s portfolio under the general supervision of SEI Investments Management Corporation (SIMC). SIMC also directly manages a portion of the Fund’s portfolio. The Fund utilized the following sub-advisor as of May 31, 2013: AllianceBernstein L.P. There were no manager changes during the year.
III. Market Commentary:
Global markets favored equities and credit during the fiscal year ending May 31, 2013. The S&P 500 Index returned 26.4%, while the MSCI World Index returned 27.8%. The Barclays US High Yield Index returned 14.8% over this time period. While risk assets rallied in developed markets, emerging markets performance was comparatively muted (the MSCI Emerging Markets Index was up 14.1%). Performance was not as strong for inflation-related assets such as commodities, commodity-related equities and Treasury inflation-protected securities (TIPS). Commodities, as measured by the Dow Jones UBS Commodity Index, returned only 1.8% during the time period. Commodity-related equities as measured by the MSCI AC World Commodity Producers Index returned 8.9%. U.S. TIPS, as measured by the Barclays U.S. TIPS Index, returned (1.8)%. Global markets have not placed a premium on inflation and inflation expectations have declined in many countries. The range of returns among inflation-related assets is explained to some extent by the degree of their relationship to inflation; those with lower inflation sensitivity (commodity equities and real estate investment trusts) fared better than those with higher sensitivity (commodities and TIPS).
IV. Return vs. Benchmark:
For the fiscal year ended May 31, 2013, the Fund outperformed the Barclays U.S. Treasury Inflation Notes 1-5 Year Index (the “Index”), returning 0.07% versus the Index return of (0.06)%.
V. Fund Attribution:
The Fund’s overall outperformance was largely the result of equities and commodities outperforming U.S. TIPS during the period.
While not keeping pace with the broad equity market, natural resource equities and real estate investment trusts (REITS) provided meaningfully higher returns than U.S. TIPS. Commodities provided outperformance to a lesser extent. Top-down decisions, which consisted of over/underweighting different inflation asset types, detracted from returns relative to the Fund’s strategic allocations. Bottom-up security selection was largely additive to performance, with strong security selection in REITS and commodity-related equities. The Fund experienced slight underperformance within commodities, as a passive approach to the asset class has been employed.
Multi-Asset Real Return Fund:
AVERAGE ANNUAL TOTAL RETURN1
One Year Return | Annualized to Date | |||||||
| Multi-Asset Real Return Fund, Class A | 0.07% | (4.04)% | ||||||
| Barclays U.S. Treasury Inflation Notes 1-5 Year Index | (0.06)% | 0.20% | ||||||
Comparison of Change in the Value of a $100,000 Investment in the Multi-Asset Real Return Fund, Class A, versus the Barclays U.S. Treasury Inflation Notes 1-5 Year Index
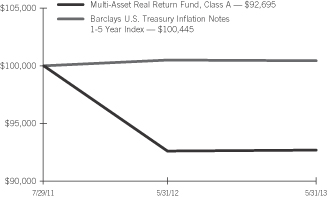
| 1 | For the period ended May 31, 2013. Past performance is not an indication of future performance. Class A shares were offered beginning 7/29/11. Returns shown do not reflect the deduction of taxes that a shareholder would pay on fund distributions or the redemption of fund shares. The returns for certain periods reflect fee waivers and/or reimbursements in effect for that period; absent fee waivers and reimbursements, performance would have been lower. |
| SEI Institutional Investments Trust / Annual Report / May 31, 2013 | 23 |
Table of Contents
SUMMARY SCHEDULE OF INVESTMENTS
Large Cap Fund
May 31, 2013
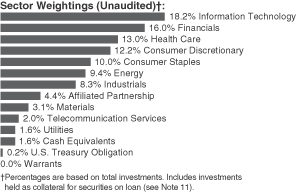
| Description | Percentage of Net Assets (%) | Shares | Market Value ($ Thousands) | |||||||||
COMMON STOCK — 97.3% |
| |||||||||||
Consumer Discretionary — 12.7% |
| |||||||||||
Coach | 0.6 | % | 185,664 | $ | 10,817 | |||||||
Liberty Interactive, Cl A* | 0.6 | 463,575 | 10,407 | |||||||||
NIKE, Cl B | 0.8 | 246,599 | 15,205 | |||||||||
Nordstrom | 0.5 | 169,933 | 9,995 | |||||||||
priceline.com* | 0.5 | 12,300 | 9,889 | |||||||||
Target | 0.7 | 182,565 | 12,688 | |||||||||
Walt Disney | 0.6 | 171,260 | 10,803 | |||||||||
Whirlpool | 0.5 | 76,000 | 9,710 | |||||||||
Other Securities | 7.9 | 151,662 | ||||||||||
|
| |||||||||||
| 241,176 | ||||||||||||
|
| |||||||||||
Consumer Staples — 10.4% |
| |||||||||||
Costco Wholesale | 1.1 | 184,020 | 20,181 | |||||||||
CVS Caremark | 0.9 | 311,594 | 17,942 | |||||||||
Estee Lauder, Cl A | 1.1 | 297,419 | 20,159 | |||||||||
Mead Johnson Nutrition, Cl A | 0.6 | 144,310 | 11,699 | |||||||||
Mondelez International, Cl A | 0.6 | 373,100 | 10,992 | |||||||||
Walgreen | 0.7 | 272,725 | 13,025 | |||||||||
Whole Foods Market | 0.9 | 324,038 | 16,805 | |||||||||
Other Securities | 4.5 | 86,253 | ||||||||||
|
| |||||||||||
| 197,056 | ||||||||||||
|
| |||||||||||
Energy — 9.8% |
| |||||||||||
Chevron | 1.4 | 222,700 | 27,336 | |||||||||
ConocoPhillips | 0.6 | 176,200 | 10,808 | |||||||||
EOG Resources | 0.7 | 100,125 | 12,926 | |||||||||
Exxon Mobil | 1.9 | 398,300 | 36,034 | |||||||||
Kinder Morgan | 0.6 | 305,163 | 11,590 | |||||||||
Marathon Petroleum | 0.7 | 156,400 | 12,903 | |||||||||
Phillips 66 | 0.5 | 147,750 | 9,836 | |||||||||
Other Securities | 3.4 | 63,659 | ||||||||||
|
| |||||||||||
| 185,092 | ||||||||||||
|
| |||||||||||
Financials — 16.6% |
| |||||||||||
American International Group* | 0.6 | 240,650 | 10,699 | |||||||||
Charles Schwab | 0.6 | 558,562 | 11,093 | |||||||||
Citigroup | 1.4 | 525,050 | 27,297 | |||||||||
| Description | Percentage of Net Assets (%) | Shares | Market Value ($ Thousands) | |||||||||
Goldman Sachs Group | 0.5 | % | 60,200 | $ | 9,757 | |||||||
JPMorgan Chase | 1.8 | 629,220 | 34,349 | |||||||||
Travelers | 0.5 | 119,400 | 9,996 | |||||||||
Wells Fargo | 1.3 | 595,600 | 24,152 | |||||||||
Other Securities | 9.9 | 187,260 | ||||||||||
|
| |||||||||||
| 314,603 | ||||||||||||
|
| |||||||||||
Health Care — 13.5% |
| |||||||||||
Amgen | 0.9 | 168,577 | 16,947 | |||||||||
Biogen Idec* | 0.7 | 52,978 | 12,582 | |||||||||
Celgene* | 0.9 | 140,283 | 17,346 | |||||||||
Express Scripts Holding* | 1.0 | 308,447 | 19,161 | |||||||||
Johnson & Johnson | 1.1 | 242,307 | 20,397 | |||||||||
Pfizer | 1.6 | 1,137,730 | 30,980 | |||||||||
Other Securities | 7.3 | 138,407 | ||||||||||
|
| |||||||||||
| 255,820 | ||||||||||||
|
| |||||||||||
Industrials — 8.6% |
| |||||||||||
Fluor (A) | 0.5 | 160,019 | 10,115 | |||||||||
Northrop Grumman | 0.6 | 127,200 | 10,480 | |||||||||
Other Securities | 7.5 | 142,299 | ||||||||||
|
| |||||||||||
| 162,894 | ||||||||||||
|
| |||||||||||
Information Technology — 18.8% |
| |||||||||||
Adobe Systems* | 1.1 | 476,511 | 20,447 | |||||||||
Apple | 1.3 | 55,615 | 25,009 | |||||||||
Cisco Systems | 1.0 | 749,480 | 18,047 | |||||||||
EMC | 0.6 | 425,682 | 10,540 | |||||||||
Google, Cl A* | 1.0 | 21,505 | 18,718 | |||||||||
International Business Machines | 0.6 | 57,264 | 11,912 | |||||||||
Mastercard, Cl A | 1.4 | 47,977 | 27,359 | |||||||||
Oracle | 0.5 | 288,768 | 9,749 | |||||||||
Qualcomm | 1.5 | 450,283 | 28,584 | |||||||||
Teradata* | 0.7 | 222,520 | 12,405 | |||||||||
Visa, Cl A | 0.9 | 94,600 | 16,852 | |||||||||
Other Securities | 8.2 | 157,875 | ||||||||||
|
| |||||||||||
| 357,497 | ||||||||||||
|
| |||||||||||
Materials — 3.2% |
| |||||||||||
LyondellBasell Industries, Cl A, (A) | 0.5 | 145,230 | 9,680 | |||||||||
Other Securities | 2.7 | 51,377 | ||||||||||
|
| |||||||||||
| 61,057 | ||||||||||||
|
| |||||||||||
Telecommunication Services — 2.0% |
| |||||||||||
Crown Castle International* | 1.1 | 302,539 | 21,556 | |||||||||
Other Securities | 0.9 | 17,236 | ||||||||||
|
| |||||||||||
| 38,792 | ||||||||||||
|
| |||||||||||
Utilities — 1.7% |
| |||||||||||
Other Securities | 1.7 | 32,142 | ||||||||||
|
| |||||||||||
Total Common Stock |
| 1,846,129 | ||||||||||
|
| |||||||||||
| 24 | SEI Institutional Investments Trust / Annual Report / May 31, 2013 |
Table of Contents
| Description | Percentage of Net Assets (%) | �� | Shares | Market Value ($ Thousands) | ||||||||
WARRANT — 0.0% |
| |||||||||||
Other Securities | 0.0 | % | $ | 569 | ||||||||
|
| |||||||||||
Total Warrant |
| 569 | ||||||||||
|
| |||||||||||
AFFILIATED PARTNERSHIP — 4.6% |
| |||||||||||
SEI Liquidity Fund, L.P. | 4.6 | 86,698,189 | 86,698 | |||||||||
|
| |||||||||||
Total Affiliated Partnership |
| 86,698 | ||||||||||
|
| |||||||||||
CASH EQUIVALENTS — 1.6% |
| |||||||||||
SEI Daily Income Trust, Prime Obligation Fund, Cl A | 1.5 | 28,990,159 | 28,990 | |||||||||
Other Securities | 0.1 | 2,152 | ||||||||||
|
| |||||||||||
Total Cash Equivalents |
| 31,142 | ||||||||||
|
| |||||||||||
U.S. TREASURY OBLIGATION (C) — 0.2% |
| |||||||||||
Other Securities | 0.2 | 3,142 | ||||||||||
|
| |||||||||||
Total U.S. Treasury Obligation |
| 3,142 | ||||||||||
|
| |||||||||||
Total Investments — 103.7% |
| $ | 1,967,680 | |||||||||
|
| |||||||||||
A list of the open futures contracts held by the Fund at May 31, 2013, is as follows:
| Type of Contract | Number of Contracts Long | Expiration Date | Unrealized Depreciation ($ Thousands) | |||||||||
S&P 500 Index E-MINI | 123 | Jun-2013 | $ | (113 | ) | |||||||
S&P Mid 400 Index E-MINI | 11 | Jun-2013 | (3 | ) | ||||||||
|
| |||||||||||
| $ | (116 | ) | ||||||||||
|
| |||||||||||
For the year ended May 31, 2013, the total amount of all open futures contracts, as presented in the table above, are representative of the volume of activity for this derivative type during the year.
| Percentages | are based on a Net Assets of $1,897,837 ($ Thousands). |
| * | Non-income producing security. |
| ** | The rate reported is the 7-day effective yield as of May 31, 2013. |
| † | Investment in Affiliated Security (see Note 5). |
| (A) | This security or a partial position of this security is on loan at May 31, 2013. The total value of securities on loan at May 31, 2013 was $83,441 ($ Thousands). |
| (B) | This security was purchased with cash collateral held from securities on loan (see Note 11). The total value of such securities as of May 31, 2013 was $86,698 ($ Thousands). |
| (C) | Security, or a portion thereof, has been pledged as collateral on open futures contracts. |
Cl — Class
L.P. — Limited Partnership
S&P — Standard & Poors
The Summary Schedule of Investments does not reflect the complete portfolio holdings. It includes the Fund’s 50 largest holdings and each investment of any issuer that exceeds 1% of the Fund’s net assets. “Other Securities” represent all issues not required to be disclosed under the rules adopted by the U.S. Securities and Exchange Commission (“SEC”). In certain instances, securities for which footnotes listed above may otherwise apply are included in the Other Securities caption. The complete schedule of portfolio holdings is available (i) without charge, upon request, by calling (800) 342-5734; and (ii) on the SEC’s website at http://www.sec.gov.
The following is a list of inputs used as of May 31, 2013, in valuing the Fund’s investments and other financial instruments carried at value ($ Thousands):
| Investments in Securities | Level 1 | Level 2 | Level 3 | Total | ||||||||||||
Common Stock | $ | 1,846,129 | $ | — | $ | — | $ | 1,846,129 | ||||||||
Warrant | 569 | — | — | 569 | ||||||||||||
Affiliated Partnership | — | 86,698 | — | 86,698 | ||||||||||||
Cash Equivalents | 31,142 | — | — | 31,142 | ||||||||||||
U.S. Treasury Obligation | — | 3,142 | — | 3,142 | ||||||||||||
|
|
|
|
|
|
|
| |||||||||
Total Investments in Securities | $ | 1,877,840 | $ | 89,840 | $ | — | $ | 1,967,680 | ||||||||
|
|
|
|
|
|
|
| |||||||||
| Other Financial Instruments | Level 1 | Level 2 | Level 3 | Total | ||||||||||||
Futures Contracts* | $ | (116 | ) | $ | — | $ | — | $ | (116 | ) | ||||||
|
|
|
|
|
|
|
| |||||||||
| * | Futures contracts are valued at the unrealized depreciation on the instrument. |
For the year ended May 31, 2013, there were no transfers between Level 1 and Level 2 assets and liabilities.
For the year ended May 31, 2013, there were no transfers between Level 2 and Level 3 assets and liabilities.
For more information on valuation inputs, see Note 2 — Significant Accounting Policies in Notes to Financial Statements.
Amounts designated as “—” are either $0 or have been rounded to $0.
The accompanying notes are an integral part of the financial statements.
| SEI Institutional Investments Trust / Annual Report / May 31, 2013 | 25 |
Table of Contents
SUMMARY SCHEDULE OF INVESTMENTS
Large Cap Diversified Alpha Fund
May 31, 2013
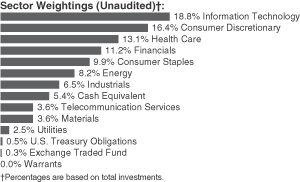
| Description | Percentage of Net Assets (%) | Shares | Market Value ($ Thousands) | |||||||||
COMMON STOCK — 94.8% |
| |||||||||||
Consumer Discretionary — 16.6% |
| |||||||||||
Coach | 0.7 | % | 35,633 | $ | 2,076 | |||||||
Comcast, Cl A | 1.0 | 78,500 | 3,152 | |||||||||
Home Depot | 0.9 | 34,900 | 2,745 | |||||||||
Liberty Interactive, Cl A* | 1.0 | 139,225 | 3,125 | |||||||||
Liberty Media* | 0.2 | 5,200 | 649 | |||||||||
NIKE, Cl B | 1.2 | 59,564 | 3,673 | |||||||||
Nordstrom | 0.7 | 35,057 | 2,062 | |||||||||
priceline.com* | 0.9 | 3,300 | 2,653 | |||||||||
Target | 0.7 | 31,406 | 2,183 | |||||||||
Walt Disney | 1.0 | 50,762 | 3,202 | |||||||||
Other Securities | 8.3 | 25,803 | ||||||||||
|
| |||||||||||
| 51,323 | ||||||||||||
|
| |||||||||||
Consumer Staples — 10.0% |
| |||||||||||
Costco Wholesale | 0.7 | 20,783 | 2,279 | |||||||||
CVS Caremark | 0.7 | 35,010 | 2,016 | |||||||||
Estee Lauder, Cl A | 0.7 | 29,951 | 2,030 | |||||||||
Kimberly-Clark | 0.6 | 17,500 | 1,694 | |||||||||
Mondelez International, Cl A | 0.7 | 68,341 | 2,013 | |||||||||
PepsiCo | 0.7 | 27,625 | 2,231 | |||||||||
Walgreen | 0.9 | 57,200 | 2,732 | |||||||||
Whole Foods Market | 0.7 | 39,244 | 2,035 | |||||||||
Other Securities | 4.3 | 13,949 | ||||||||||
|
| |||||||||||
| 30,979 | ||||||||||||
|
| |||||||||||
Energy — 8.3% |
| |||||||||||
EOG Resources | 1.0 | 25,025 | 3,231 | |||||||||
Exxon Mobil | 1.0 | 35,560 | 3,217 | |||||||||
Kinder Morgan | 0.9 | 76,693 | 2,913 | |||||||||
Marathon Petroleum | 0.7 | 27,600 | 2,277 | |||||||||
Murphy Oil | 0.6 | 27,020 | 1,711 | |||||||||
Other Securities | 4.1 | 12,254 | ||||||||||
|
| |||||||||||
| 25,603 | ||||||||||||
|
| |||||||||||
Financials — 11.3% |
| |||||||||||
Citigroup | 0.7 | 39,600 | 2,059 | |||||||||
| Description | Percentage of Net Assets (%) | Shares | Market Value ($ Thousands) | |||||||||
Goldman Sachs Group | 0.6 | % | 10,800 | $ | 1,750 | |||||||
IntercontinentalExchange* | 0.7 | 11,775 | 2,016 | |||||||||
JPMorgan Chase | 0.6 | 36,100 | 1,971 | |||||||||
Progressive | 0.7 | 84,350 | 2,150 | |||||||||
Other Securities | 8.0 | 25,074 | ||||||||||
|
| |||||||||||
| 35,020 | ||||||||||||
|
| |||||||||||
Health Care — 13.2% |
| |||||||||||
Allergan | 0.7 | 22,700 | 2,258 | |||||||||
Amgen | 1.2 | 38,028 | 3,823 | |||||||||
Biogen Idec* | 0.8 | 9,753 | 2,316 | |||||||||
Celgene* | 1.6 | 39,339 | 4,864 | |||||||||
Express Scripts Holding* | 0.7 | 33,132 | 2,058 | |||||||||
Johnson & Johnson | 1.2 | 42,265 | 3,558 | |||||||||
Pfizer | 0.9 | 104,150 | 2,836 | |||||||||
Other Securities | 6.1 | 19,297 | ||||||||||
|
| |||||||||||
| 41,010 | ||||||||||||
|
| |||||||||||
Industrials — 6.6% |
| |||||||||||
Northrop Grumman | 0.9 | 32,130 | 2,647 | |||||||||
Raytheon | 0.6 | 26,000 | 1,733 | |||||||||
Other Securities | 5.1 | 16,024 | ||||||||||
|
| |||||||||||
| 20,404 | ||||||||||||
|
| |||||||||||
Information Technology — 19.1% |
| |||||||||||
Adobe Systems* | 1.6 | 113,918 | 4,888 | |||||||||
Apple | 1.0 | 7,125 | 3,204 | |||||||||
eBay* | 0.7 | 41,200 | 2,229 | |||||||||
EMC | 0.7 | 87,506 | 2,167 | |||||||||
Google, Cl A* | 1.5 | 5,310 | 4,622 | |||||||||
International Business Machines | 0.7 | 10,003 | 2,081 | |||||||||
Intuit | 0.7 | 35,525 | 2,076 | |||||||||
Mastercard, Cl A | 1.2 | 6,645 | 3,789 | |||||||||
Microsoft | 1.0 | 92,190 | 3,216 | |||||||||
Oracle | 1.0 | 87,007 | 2,937 | |||||||||
Qualcomm | 1.7 | 81,980 | 5,204 | |||||||||
Visa, Cl A | 2.1 | 36,300 | 6,466 | |||||||||
Other Securities | 5.2 | 16,087 | ||||||||||
|
| |||||||||||
| 58,966 | ||||||||||||
|
| |||||||||||
Materials — 3.6% |
| |||||||||||
Other Securities | 3.6 | 11,187 | ||||||||||
|
| |||||||||||
Telecommunication Services — 3.6% |
| |||||||||||
AT&T | 0.6 | 56,500 | 1,977 | |||||||||
Crown Castle International* | 2.0 | 85,138 | 6,066 | |||||||||
Other Securities | 1.0 | 3,223 | ||||||||||
|
| |||||||||||
| 11,266 | ||||||||||||
|
| |||||||||||
Utilities — 2.5% |
| |||||||||||
Other Securities | 2.5 | 7,720 | ||||||||||
|
| |||||||||||
Total Common Stock |
| 293,478 | ||||||||||
|
| |||||||||||
| 26 | SEI Institutional Investments Trust / Annual Report / May 31, 2013 |
Table of Contents
| Description | Percentage of Net Assets (%) | Shares | Market Value ($ Thousands) | |||||||||
EXCHANGE TRADED FUND — 0.3% |
| |||||||||||
Other Securities | 0.3 | % | $ | 866 | ||||||||
|
| |||||||||||
Total Exchange Traded Fund |
| 866 | ||||||||||
|
| |||||||||||
WARRANT — 0.1% |
| |||||||||||
Other Securities | 0.1 | 159 | ||||||||||
|
| |||||||||||
Total Warrant |
| 159 | ||||||||||
|
| |||||||||||
CASH EQUIVALENT — 5.4% |
| |||||||||||
SEI Daily Income Trust, | 5.4 | 16,838,688 | 16,839 | |||||||||
|
| |||||||||||
Total Cash Equivalent |
| 16,839 | ||||||||||
|
| |||||||||||
U.S. TREASURY OBLIGATIONS (A) — 0.5% |
| |||||||||||
Other Securities | 0.5 | 1,580 | ||||||||||
|
| |||||||||||
Total U.S. Treasury Obligations |
| 1,580 | ||||||||||
|
| |||||||||||
Total Investments — 101.1% |
| $ | 312,922 | |||||||||
|
| |||||||||||
A list of the open futures contracts held by the Fund at May 31, 2013, is as follows:
| Type of Contract | Number of Contracts Long | Expiration Date | Unrealized Depreciation ($ Thousands) | |||||||||
Russell 2000 Index E-MINI | 13 | Jun-2013 | $ | (7 | ) | |||||||
S&P 500 Index EMINI | 110 | Jun-2013 | (110 | ) | ||||||||
|
| |||||||||||
| $ | (117 | ) | ||||||||||
|
| |||||||||||
For the year ended May 31, 2013, the total amount of all open futures contracts, as presented in the table above, are representative of the volume of activity for this derivative type during the year.
Percentages are based on a Net Assets of $309,577 ($ Thousands).
| * | Non-income producing security. |
| ** | The rate reported is the 7-day effective yield as of May 31, 2013. |
| † | Investment in Affiliated Security (see Note 5). |
| (A) | Security, or portion thereof, has been pledged as collateral on open futures contracts. |
Cl — Class
S&P — Standard & Poor’s
The Summary Schedule of Investments does not reflect the complete portfolio holdings. It includes the Fund’s 50 largest holdings and each investment of any issuer that exceeds 1% of the Fund’s net assets. “Other Securities” represent all issues not required to be disclosed under the rules adopted by the U.S. Securities and Exchange Commission (“SEC”). In certain instances, securities for which footnotes listed above may otherwise apply are included in the Other Securities caption. The complete schedule of portfolio holdings is available (i) without charge, upon request, by calling (800) 342-5734; and (ii) on the SEC’s website at http://www.sec.gov.
The following is a list of inputs used as of May 31, 2013, in valuing the Fund’s investments and other financial instruments carried at value ($ Thousands):
| Investments in Securities | Level 1 | Level 2 | Level 3 | Total | ||||||||||||
Common Stock | $ | 293,478 | $ | — | $ | — | $ | 293,478 | ||||||||
Exchange Traded Fund | 866 | — | 866 | |||||||||||||
Warrant | 159 | — | — | 159 | ||||||||||||
Cash Equivalent | 16,839 | — | — | 16,839 | ||||||||||||
U.S. Treasury Obligations | — | 1,580 | — | 1,580 | ||||||||||||
|
|
|
|
|
|
|
| |||||||||
Total Investments in Securities | $ | 311,342 | $ | 1,580 | $ | — | $ | 312,922 | ||||||||
|
|
|
|
|
|
|
| |||||||||
| Other Financial Instruments | Level 1 | Level 2 | Level 3 | Total | ||||||||||||
Futures Contracts* | $ | (117 | ) | $ | — | $ | — | $ | (117 | ) | ||||||
|
|
|
|
|
|
|
| |||||||||
| * | Futures contracts are valued at the unrealized depreciation on the instrument. |
For the year ended May 31, 2013, there were no transfers between Level 1 and Level 2 assets and liabilities.
For the year ended May 31, 2013, there were no transfers between Level 2 and Level 3 assets and liabilities.
For more information on valuation inputs, see Note 2 — Significant Accounting Policies in Notes to Financial Statements.
Amounts designated as “—” are either $0 or have been rounded to $0.
The accompanying notes are an integral part of the financial statements.
| SEI Institutional Investments Trust / Annual Report / May 31, 2013 | 27 |
Table of Contents
SUMMARY SCHEDULE OF INVESTMENTS
Large Cap Disciplined Equity Fund
May 31, 2013
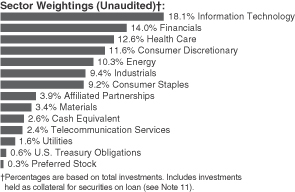
| Description | Percentage of Net Assets (%) | Shares | Market Value ($ Thousands) | |||||||||
COMMON STOCK — 94.5% |
| |||||||||||
Consumer Discretionary — 11.7% |
| |||||||||||
AutoZone* | 0.8 | % | 101,168 | $ | 41,361 | |||||||
Comcast, Cl A | 0.6 | 772,690 | 31,024 | |||||||||
Home Depot | 0.9 | 637,367 | 50,135 | |||||||||
Macy’s | 0.8 | 891,462 | 43,093 | |||||||||
TJX | 0.6 | 665,860 | 33,699 | |||||||||
Other Securities | 8.0 | 450,038 | ||||||||||
|
| |||||||||||
| 649,350 | ||||||||||||
|
| |||||||||||
Consumer Staples — 9.4% |
| |||||||||||
Altria Group | 0.6 | 914,354 | 33,008 | |||||||||
CVS Caremark | 0.7 | 654,608 | 37,692 | |||||||||
Philip Morris International | 1.7 | 1,001,143 | 91,014 | |||||||||
Wal-Mart Stores | 1.1 | 834,879 | 62,483 | |||||||||
Other Securities | 5.3 | 295,265 | ||||||||||
|
| |||||||||||
| 519,462 | ||||||||||||
|
| |||||||||||
Energy — 10.5% |
| |||||||||||
Chevron | 2.5 | 1,125,753 | 138,186 | |||||||||
ConocoPhillips | 1.0 | 871,915 | 53,483 | |||||||||
Exxon Mobil | 1.6 | 943,024 | 85,315 | |||||||||
National Oilwell Varco | 0.7 | 531,770 | 37,383 | |||||||||
Phillips 66 | 0.6 | 473,522 | 31,522 | |||||||||
Schlumberger | 0.6 | 423,127 | 30,901 | |||||||||
Other Securities | 3.5 | 199,017 | ||||||||||
|
| |||||||||||
| 575,807 | ||||||||||||
|
| |||||||||||
Financials — 14.3% |
| |||||||||||
American Express | 1.0 | 721,953 | 54,659 | |||||||||
Bank of America | 0.7 | 2,942,706 | 40,197 | |||||||||
CIT Group* | 0.6 | 738,858 | 34,047 | |||||||||
Citigroup | 1.8 | 1,859,175 | 96,658 | |||||||||
Discover Financial Services | 0.6 | 684,370 | 32,446 | |||||||||
JPMorgan Chase | 1.6 | 1,599,101 | 87,295 | |||||||||
Morgan Stanley | 0.6 | 1,335,490 | 34,589 | |||||||||
US Bancorp | 0.6 | 897,109 | 31,453 | |||||||||
| Description | Percentage of Net Assets (%) | Shares | Market Value ($ Thousands) | |||||||||
Other Securities | 6.8 | % | $ | 374,823 | ||||||||
|
| |||||||||||
| 786,167 | ||||||||||||
|
| |||||||||||
Health Care — 12.9% |
| |||||||||||
AbbVie | 0.6 | 736,092 | 31,424 | |||||||||
Actavis* | 0.5 | 231,040 | 28,485 | |||||||||
Amgen | 0.8 | 417,016 | 41,923 | |||||||||
Baxter International | 0.6 | 429,390 | 30,199 | |||||||||
Covidien | 0.7 | 633,270 | 40,276 | |||||||||
Eli Lilly | 0.7 | 703,058 | 37,374 | |||||||||
Express Scripts Holding* | 0.7 | 615,880 | 38,258 | |||||||||
Johnson & Johnson | 0.9 | 606,506 | 51,056 | |||||||||
Pfizer | 2.1 | 4,164,475 | 113,399 | |||||||||
UnitedHealth Group | 0.7 | 590,470 | 36,981 | |||||||||
Other Securities | 4.6 | 257,107 | ||||||||||
|
| |||||||||||
| 706,482 | ||||||||||||
|
| |||||||||||
Industrials — 9.6% |
| |||||||||||
CSX | 0.6 | 1,235,270 | 31,141 | |||||||||
General Electric | 1.1 | 2,587,775 | 60,347 | |||||||||
United Parcel Service, Cl B | 0.5 | 314,930 | 27,052 | |||||||||
Other Securities | 7.4 | 410,250 | ||||||||||
|
| |||||||||||
| 528,790 | ||||||||||||
|
| |||||||||||
Information Technology — 18.5% |
| |||||||||||
Apple | 3.4 | 410,514 | 184,600 | |||||||||
Cisco Systems | 1.6 | 3,682,273 | 88,669 | |||||||||
eBay* | 0.8 | 809,830 | 43,812 | |||||||||
Google, Cl A* | 1.0 | 61,304 | 53,360 | |||||||||
International Business Machines | 2.2 | 569,653 | 118,499 | |||||||||
Microsoft | 1.8 | 2,803,783 | 97,796 | |||||||||
Oracle | 1.1 | 1,726,249 | 58,278 | |||||||||
Qualcomm | 1.1 | 925,415 | 58,745 | |||||||||
Other Securities | 5.5 | 313,263 | ||||||||||
|
| |||||||||||
| 1,017,022 | ||||||||||||
|
| |||||||||||
Materials — 3.5% |
| |||||||||||
LyondellBasell Industries, Cl A (A) | 0.6 | 458,215 | 30,540 | |||||||||
Monsanto | 0.5 | 280,072 | 28,187 | |||||||||
Vulcan Materials (A) | 0.5 | 512,340 | 27,451 | |||||||||
Other Securities | 1.9 | 104,555 | ||||||||||
|
| |||||||||||
| 190,733 | ||||||||||||
|
| |||||||||||
Telecommunication Services — 2.4% |
| |||||||||||
AT&T | 0.8 | 1,262,671 | 44,181 | |||||||||
Verizon Communications | 0.6 | 708,703 | 34,358 | |||||||||
Other Securities | 1.0 | 54,742 | ||||||||||
|
| |||||||||||
| 133,281 | ||||||||||||
|
| |||||||||||
| 28 | SEI Institutional Investments Trust / Annual Report / May 31, 2013 |
Table of Contents
| Description | Percentage of Net Assets (%) | Shares/Face Amount ($ Thousands) | Market Value ($ Thousands) | |||||||||
Utilities — 1.7% |
| |||||||||||
Other Securities | 1.7 | % | $ | 90,645 | ||||||||
|
| |||||||||||
Total Common Stock |
| 5,197,739 | ||||||||||
|
| |||||||||||
PREFERRED STOCK — 0.3% |
| |||||||||||
Preferred Stock — 0.3% |
| |||||||||||
Other Securities | 0.3 | 14,460 | ||||||||||
|
| |||||||||||
Total Preferred Stock |
| 14,460 | ||||||||||
|
| |||||||||||
AFFILIATED PARTNERSHIPS — 4.0% |
| |||||||||||
SEI LIBOR Plus Portfolio† | 0.2 | 1,137,968 | 8,660 | |||||||||
SEI Liquidity Fund, L.P. | 3.8 | 210,764,245 | 210,764 | |||||||||
|
| |||||||||||
Total Affiliated Partnerships |
| 219,424 | ||||||||||
|
| |||||||||||
CASH EQUIVALENT — 2.7% |
| |||||||||||
SEI Daily Income Trust, | 2.7 | 147,864,259 | 147,864 | |||||||||
|
| |||||||||||
Total Cash Equivalent |
| 147,864 | ||||||||||
|
| |||||||||||
U.S. TREASURY OBLIGATIONS (C) (D) — 0.6% |
| |||||||||||
U.S. Treasury Bills | ||||||||||||
0.087%, 06/20/2013 | 0.0 | $ | 2,400 | 2,400 | ||||||||
0.075%, 06/27/2013 | 0.5 | 28,711 | 28,710 | |||||||||
0.070%, 07/25/2013 | 0.1 | 4,073 | 4,073 | |||||||||
|
| |||||||||||
Total U.S. Treasury Obligations |
| 35,183 | ||||||||||
|
| |||||||||||
Total Investments — 102.1% |
| $ | 5,614,670 | |||||||||
|
| |||||||||||
A list of the open futures contracts held by the Fund at May 31, 2013, is as follows:
| Type of Contract | Number of Contracts Long | Expiration Date | Unrealized Appreciation ($ Thousands) | |||||||||
S&P 500 Index EMINI | 1,194 | Jun-2013 | $ | 446 | ||||||||
S&P Composite Index | 206 | Jun-2013 | 5,594 | |||||||||
|
| |||||||||||
| $ | 6,040 | |||||||||||
|
| |||||||||||
For the year ended May 31, 2013, the total amount of all open futures contracts, as presented in the table above, are representative of the volume of activity for this derivative type during the year.
Percentages are based on a Net Assets of $5,500,315 ($ Thousands).
| * | Non-income producing security. |
| ** | The rate reported is the 7-day effective yield as of May 31, 2013. |
| † | Investment in Affiliated Security (see Note 5). |
| (A) | This security or a partial position of this security is on loan at May 31, 2013. The total value of securities on loan at May 31, 2013 was $202,848 ($ Thousands). |
| (B) | This security was purchased with cash collateral held from securities on loan (see Note 11). The total value of such securities as of May 31, 2013 was $210,764 ($ Thousands). |
| (C) | Security, or portion thereof, has been pledged as collateral on open futures contracts. |
| (D) | The rate reported is the effective yield at time of purchase. |
Cl — Class
LIBOR — London Interbank Offered Rate
L.P. — Limited Partnership
S&P — Standard & Poor’s
The Summary Schedule of Investments does not reflect the complete portfolio holdings. It includes the Fund’s 50 largest unaffiliated holdings and each investment of any issuer that exceeds 1% of the Fund’s net assets. “Other Securities” represent all issues not required to be disclosed under the rules adopted by the U.S. Securities and Exchange Commission (“SEC”). In certain instances, securities for which footnotes listed above may otherwise apply are included in the Other Securities caption. The complete schedule of portfolio holdings is available (i) without charge, upon request, by calling (800) 342-5734; and (ii) on the SEC’s website at http://www.sec.gov.
The following is a list of inputs used as of May 31, 2013, in valuing the Fund’s investments and other financial instruments carried at value ($ Thousands):
| Investments in Securities | Level 1 | Level 2 | Level 3 | Total | ||||||||||||
Common Stock | $ | 5,197,739 | $ | — | $ | — | $ | 5,197,739 | ||||||||
Preferred Stock | 14,460 | — | — | 14,460 | ||||||||||||
Affiliated Partnerships | 8,660 | 210,764 | — | 219,424 | ||||||||||||
Cash Equivalent | 147,864 | — | — | 147,864 | ||||||||||||
U.S. Treasury Obligations | — | 35,183 | — | 35,183 | ||||||||||||
|
|
|
|
|
|
|
| |||||||||
Total Investments in Securities | $ | 5,368,723 | $ | 245,947 | $ | — | $ | 5,614,670 | ||||||||
|
|
|
|
|
|
|
| |||||||||
| Other Financial Instruments | Level 1 | Level 2 | Level 3 | Total | ||||||||||||
Futures Contracts* | $ | 6,040 | $ | — | $ | — | $ | 6,040 | ||||||||
|
|
|
|
|
|
|
| |||||||||
| * | Futures contracts are valued at the unrealized appreciation on the instrument. |
For the year ended May 31, 2013, there were no transfers between Level 1 and Level 2 assets and liabilities.
For the year ended May 31, 2013, there were no transfers between Level 2 and Level 3 assets and liabilities.
For more information on valuation inputs, see Note 2 — Significant Accounting Policies in Notes to Financial Statements.
Amounts designated as “—” are $0 or have been rounded to $0.
The accompanying notes are an integral part of the financial statements.
| SEI Institutional Investments Trust / Annual Report / May 31, 2013 | 29 |
Table of Contents
SUMMARY SCHEDULE OF INVESTMENTS
Large Cap Index Fund
May 31, 2013
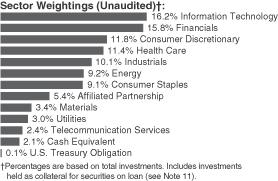
| Description | Percentage of Net Assets (%) | Shares | Market Value ($ Thousands) | |||||||||
COMMON STOCK — 97.4% |
| |||||||||||
Consumer Discretionary — 12.4% |
| |||||||||||
Amazon.com* | 0.6 | % | 47,489 | $ | 12,776 | |||||||
Comcast, Cl A | 0.6 | 352,425 | 14,150 | |||||||||
Home Depot | 0.7 | 200,715 | 15,788 | |||||||||
McDonald’s | 0.6 | 133,480 | 12,890 | |||||||||
News, Cl A | 0.4 | 276,185 | 8,868 | |||||||||
Walt Disney | 0.7 | 234,472 | 14,790 | |||||||||
Other Securities | 8.8 | 196,078 | ||||||||||
|
| |||||||||||
| 275,340 | ||||||||||||
|
| |||||||||||
Consumer Staples — 9.6% |
| |||||||||||
Altria Group | 0.4 | 268,040 | 9,676 | |||||||||
Coca-Cola | 0.9 | 508,640 | 20,341 | |||||||||
CVS Caremark | 0.4 | 168,752 | 9,717 | |||||||||
PepsiCo | 0.8 | 205,052 | 16,562 | |||||||||
Philip Morris International | 0.9 | 223,268 | 20,297 | |||||||||
Procter & Gamble | 1.2 | 358,274 | 27,501 | |||||||||
Wal-Mart Stores | 0.8 | 221,579 | 16,583 | |||||||||
Other Securities | 4.2 | 90,700 | ||||||||||
|
| |||||||||||
| 211,377 | ||||||||||||
|
| |||||||||||
Energy — 9.7% |
| |||||||||||
Chevron | 1.4 | 257,802 | 31,645 | |||||||||
ConocoPhillips | 0.5 | 166,476 | 10,212 | |||||||||
Exxon Mobil | 2.5 | 610,238 | 55,208 | |||||||||
Occidental Petroleum | 0.4 | 106,754 | 9,829 | |||||||||
Schlumberger | 0.6 | 175,163 | 12,792 | |||||||||
Other Securities | 4.3 | 95,820 | ||||||||||
|
| |||||||||||
| 215,506 | ||||||||||||
|
| |||||||||||
Financials — 16.7% |
| |||||||||||
American Express | 0.5 | 131,834 | 9,981 | |||||||||
Bank of America | 0.9 | 1,411,463 | 19,281 | |||||||||
Berkshire Hathaway, Cl B* | 1.2 | 232,900 | 26,567 | |||||||||
Citigroup | 0.9 | 383,904 | 19,959 | |||||||||
| Description | Percentage of Net Assets (%) | Shares | Market Value ($ Thousands) | |||||||||
Goldman Sachs Group | 0.5 | % | 61,275 | $ | 9,932 | |||||||
JPMorgan Chase | 1.2 | 497,734 | 27,171 | |||||||||
SEI (A) | 0.0 | 17,442 | 534 | |||||||||
US Bancorp | 0.4 | 249,797 | 8,758 | |||||||||
Wells Fargo | 1.2 | 640,766 | 25,983 | |||||||||
Other Securities | 9.9 | 221,683 | ||||||||||
|
| |||||||||||
| 369,849 | ||||||||||||
|
| |||||||||||
Health Care — 12.1% |
| |||||||||||
AbbVie | 0.4 | 207,376 | 8,853 | |||||||||
Amgen | 0.5 | 102,358 | 10,290 | |||||||||
Bristol-Myers Squibb | 0.5 | 222,259 | 10,226 | |||||||||
Gilead Sciences* | 0.5 | 199,234 | 10,854 | |||||||||
Johnson & Johnson | 1.4 | 358,909 | 30,213 | |||||||||
Merck | 0.8 | 398,443 | 18,607 | |||||||||
Pfizer | 1.1 | 925,080 | 25,190 | |||||||||
UnitedHealth Group | 0.4 | 136,820 | 8,569 | |||||||||
Other Securities | 6.5 | 144,174 | ||||||||||
|
| |||||||||||
| 266,976 | ||||||||||||
|
| |||||||||||
Industrials — 10.6% |
| |||||||||||
3M | 0.5 | 91,333 | 10,071 | |||||||||
Boeing | 0.4 | 98,691 | 9,772 | |||||||||
General Electric | 1.5 | 1,384,523 | 32,287 | |||||||||
Union Pacific | 0.4 | 62,716 | 9,697 | |||||||||
United Technologies | 0.5 | 119,790 | 11,368 | |||||||||
Other Securities | 7.3 | 162,328 | ||||||||||
|
| |||||||||||
| 235,523 | ||||||||||||
|
| |||||||||||
Information Technology — 17.1% |
| |||||||||||
Apple | 2.5 | 122,045 | 54,881 | |||||||||
Cisco Systems | 0.8 | 702,127 | 16,907 | |||||||||
Google, Cl A* | 1.3 | 33,829 | 29,445 | |||||||||
Intel | 0.7 | 659,758 | 16,019 | |||||||||
International Business Machines | 1.3 | 142,498 | 29,642 | |||||||||
Microsoft | 1.6 | 983,400 | 34,301 | |||||||||
Oracle | 0.7 | 474,320 | 16,013 | |||||||||
Qualcomm | 0.7 | 224,959 | 14,280 | |||||||||
Visa, Cl A | 0.6 | 68,700 | 12,238 | |||||||||
Other Securities | 6.9 | 153,812 | ||||||||||
|
| |||||||||||
| 377,538 | ||||||||||||
|
| |||||||||||
Materials — 3.6% |
| |||||||||||
Other Securities | 3.6 | 79,390 | ||||||||||
|
| |||||||||||
Telecommunication Services — 2.5% |
| |||||||||||
AT&T | 1.1 | 718,333 | 25,134 | |||||||||
Verizon Communications | 0.8 | 372,276 | 18,048 | |||||||||
Other Securities | 0.6 | 12,682 | ||||||||||
|
| |||||||||||
| 55,864 | ||||||||||||
|
| |||||||||||
| 30 | SEI Institutional Investments Trust / Annual Report / May 31, 2013 |
Table of Contents
| Description | Percentage of Net Assets (%) | Shares | Market Value ($ Thousands) | |||||||||
Utilities — 3.1% |
| |||||||||||
Other Securities | 3.1 | % | $ | 69,640 | ||||||||
|
| |||||||||||
Total Common Stock |
| 2,157,003 | ||||||||||
|
| |||||||||||
AFFILIATED PARTNERSHIP — 5.7% |
| |||||||||||
SEI Liquidity Fund, L.P. | 5.7 | 125,066,291 | 125,066 | |||||||||
|
| |||||||||||
Total Affiliated Partnership |
| 125,066 | ||||||||||
|
| |||||||||||
CASH EQUIVALENT — 2.2% |
| |||||||||||
SEI Daily Income Trust, | 2.2 | 48,251,267 | 48,251 | |||||||||
|
| |||||||||||
Total Cash Equivalent |
| 48,251 | ||||||||||
|
| |||||||||||
U.S. TREASURY OBLIGATION (C) — 0.1% |
| |||||||||||
Other Securities | 0.1 | 3,150 | ||||||||||
|
| |||||||||||
Total U.S. Treasury Obligation |
| 3,150 | ||||||||||
|
| |||||||||||
Total Investments — 105.4% |
| $ | 2,333,470 | |||||||||
|
| |||||||||||
A list of the open futures contracts held by the Fund at May 31, 2013, is as follows:
Type of Contract | Number of Contracts Long | Expiration Date | Unrealized Appreciation ($ Thousands) | |||||||||
S&P 500 Index EMINI | 603 | Jun-2013 | $ | 2,707 | ||||||||
S&P Mid 400 Index E-MINI | 46 | Jun-2013 | 342 | |||||||||
|
| |||||||||||
| $ | 3,049 | |||||||||||
|
| |||||||||||
For the year ended May 31, 2013, the total amount of all open futures contracts, as presented in the table above, are representative of the volume of activity for this derivative type during the year.
| Percentages | are based on a Net Assets of $2,214,088 ($ Thousands). |
| * | Non-income producing security. |
| ** | The rate reported is the 7-day effective yield as of May 31, 2013. |
| † | Investment in Affiliated Security (see Note 5). |
| (A) | The Fund may purchase securities of certain companies with which it is affiliated to the extent these companies are represented in its benchmark index. |
| (B) | This security was purchased with cash collateral held from securities on loan (see Note 11). The total value of such securities as of May 31, 2013 was $125,066 ($ Thousands). |
| (C) | Security, or a portion thereof, has been pledged as collateral on open futures contracts. |
Cl — Class
L.P. — Limited Partnership
S&P — Standard & Poor’s
The Summary Schedule of Investments does not reflect the complete portfolio holdings. It includes the Fund’s 50 largest unaffiliated holdings and each investment of any issuer that exceeds 1% of the Fund’s net assets. “Other Securities” represent all issues not required to be disclosed under the rules adopted by the U.S. Securities and Exchange Commission (“SEC”). In certain instances, securities for which footnotes listed above may otherwise apply are included in the Other Securities caption. The complete schedule of
portfolio holdings is available (i) without charge, upon request, by calling (800) 342-5734; and (ii) on the SEC’s website at http://www.sec.gov.
The following is a list of the inputs used as of May 31, 2013, in valuing the Fund’s investments and other financial instruments carried at value ($ Thousands):
| Investments in Securities | Level 1 | Level 2 | Level 3 | Total | ||||||||||||
Common Stock | $ | 2,157,003 | $ | — | $ | — | $ | 2,157,003 | ||||||||
Affiliated Partnership | — | 125,066 | — | 125,066 | ||||||||||||
Cash Equivalent | 48,251 | — | — | 48,251 | ||||||||||||
U.S. Treasury Obligation | — | 3,150 | — | 3,150 | ||||||||||||
|
|
|
|
|
|
|
| |||||||||
Total Investments in Securities | $ | 2,205,254 | $ | 128,216 | $ | — | $ | 2,333,470 | ||||||||
|
|
|
|
|
|
|
| |||||||||
| Other Financial Instruments | Level 1 | Level 2 | Level 3 | Total | ||||||||||||
Futures Contracts* | $ | 3,049 | $ | — | $ | — | $ | 3,049 | ||||||||
|
|
|
|
|
|
|
| |||||||||
| * | Futures contracts are valued at the unrealized appreciation on the instrument. |
For the year ended May 31, 2013, there were no transfers between Level 1 and Level 2 assets and liabilities.
For the year ended May 31, 2013, there were no transfers between Level 2 and Level 3 assets and liabilities.
For more information on valuation inputs, see Note 2 — Significant Accounting Policies in Notes to Financial Statements.
Amounts designated as “—” are $0 or have been rounded to $0.
The accompanying notes are an integral part of the financial statements.
| SEI Institutional Investments Trust / Annual Report / May 31, 2013 | 31 |
Table of Contents
SUMMARY SCHEDULE OF INVESTMENTS
Extended Market Index Fund
May 31, 2013
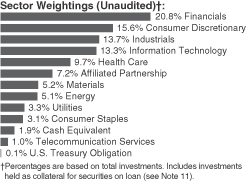
| Description | Percentage of Net Assets (%) | Shares | Market Value ($ Thousands) | |||||||||
COMMON STOCK — 96.6% |
| |||||||||||
Consumer Discretionary — 16.6% |
| |||||||||||
DISH Network, Cl A | 0.2 | % | 10,419 | $ | 402 | |||||||
General Motors (A)* | 0.7 | 37,990 | 1,288 | |||||||||
Las Vegas Sands | 0.7 | 19,704 | 1,141 | |||||||||
Liberty Global, Cl A* | 0.6 | 13,020 | 960 | |||||||||
Liberty Interactive, Cl A* | 0.4 | 26,916 | 604 | |||||||||
Liberty Media* | 0.4 | 5,335 | 666 | |||||||||
LKQ* | 0.2 | 15,104 | 370 | |||||||||
Sirius XM Radio (A) | 0.4 | 193,179 | 672 | |||||||||
Thomson Reuters | 0.4 | 18,885 | 631 | |||||||||
Tractor Supply | 0.2 | 3,660 | 410 | |||||||||
Virgin Media (A) | 0.4 | 14,067 | 699 | |||||||||
Other Securities | 12.0 | 20,962 | ||||||||||
|
| |||||||||||
| 28,805 | ||||||||||||
|
| |||||||||||
Consumer Staples — 3.3% |
| |||||||||||
Bunge | 0.3 | 7,443 | 518 | |||||||||
Church & Dwight | 0.2 | 7,099 | 432 | |||||||||
Green Mountain Coffee Roasters* | 0.3 | 6,979 | 510 | |||||||||
Other Securities | 2.5 | 4,359 | ||||||||||
|
| |||||||||||
| 5,819 | ||||||||||||
|
| |||||||||||
Energy — 5.4% |
| |||||||||||
Concho Resources* | 0.3 | 5,342 | 447 | |||||||||
HollyFrontier | 0.3 | 10,554 | 522 | |||||||||
Oceaneering International | 0.2 | 5,546 | 402 | |||||||||
Other Securities | 4.6 | 8,088 | ||||||||||
|
| |||||||||||
| 9,459 | ||||||||||||
|
| |||||||||||
Financials — 22.1% |
| |||||||||||
Affiliated Managers Group* | 0.3 | 2,611 | 428 | |||||||||
American Capital Agency | 0.3 | 20,221 | 522 | |||||||||
Annaly Capital Management | 0.4 | 49,514 | 672 | |||||||||
CIT Group* | 0.3 | 10,237 | 472 | |||||||||
Digital Realty Trust‡ (A) | 0.2 | 6,574 | 400 | |||||||||
General Growth Properties‡ | 0.3 | 26,875 | 552 | |||||||||
| Description | Percentage of Net Assets (%) | Shares | Market Value ($ Thousands) | |||||||||
Realty Income‡ (A) | 0.3 | % | 10,036 | $ | 456 | |||||||
SEI (B) | 0.1 | 7,119 | 218 | |||||||||
SL Green Realty‡ | 0.2 | 4,440 | 386 | |||||||||
Other Securities | 19.7 | 34,367 | ||||||||||
|
| |||||||||||
| 38,473 | ||||||||||||
|
| |||||||||||
Health Care — 10.3% |
| |||||||||||
BioMarin Pharmaceutical* | 0.2 | 6,246 | 392 | |||||||||
Catamaran* | 0.3 | 10,407 | 512 | |||||||||
Henry Schein* | 0.2 | 4,443 | 428 | |||||||||
Illumina* | 0.3 | 6,279 | 442 | |||||||||
Vertex Pharmaceuticals* | 0.5 | 10,442 | 839 | |||||||||
Other Securities | 8.8 | 15,373 | ||||||||||
|
| |||||||||||
| 17,986 | ||||||||||||
|
| |||||||||||
Industrials — 14.6% |
| |||||||||||
Ametek | 0.3 | 12,295 | 530 | |||||||||
Delta Air Lines | 0.5 | 42,145 | 759 | |||||||||
TransDigm Group | 0.2 | 2,605 | 381 | |||||||||
United Continental Holdings* | 0.3 | 16,952 | 550 | |||||||||
Verisk Analytics, Cl A* | 0.3 | 7,472 | 439 | |||||||||
Other Securities | 13.0 | 22,703 | ||||||||||
|
| |||||||||||
| 25,362 | ||||||||||||
|
| |||||||||||
Information Technology — 14.2% |
| |||||||||||
Alliance Data Systems* (A) | 0.3 | 2,589 | 458 | |||||||||
Ansys* | 0.2 | 4,817 | 359 | |||||||||
Avago Technologies, Cl A | 0.3 | 12,468 | 470 | |||||||||
Cree* | 0.2 | 5,923 | 369 | |||||||||
Equinix* | 0.3 | 2,398 | 486 | |||||||||
Facebook, Cl A* | 0.3 | 21,469 | 523 | |||||||||
LinkedIn, Cl A* | 0.3 | 3,306 | 554 | |||||||||
Maxim Integrated Products | 0.3 | 14,904 | 440 | |||||||||
Trimble Navigation | 0.2 | 12,820 | 358 | |||||||||
Other Securities | 11.8 | 20,636 | ||||||||||
|
| |||||||||||
| 24,653 | ||||||||||||
|
| |||||||||||
Materials — 5.5% |
| |||||||||||
Ashland | 0.2 | 4,008 | 356 | |||||||||
Celanese, Cl A | 0.2 | 7,992 | 394 | |||||||||
Rock Tenn, Cl A | 0.2 | 3,635 | 359 | |||||||||
Other Securities | 4.9 | 8,506 | ||||||||||
|
| |||||||||||
| 9,615 | ||||||||||||
|
| |||||||||||
Telecommunication Services — 1.0% |
| |||||||||||
SBA Communications, Cl A (A)* | 0.3 | 6,219 | 468 | |||||||||
Other Securities | 0.7 | 1,298 | ||||||||||
|
| |||||||||||
| 1,766 | ||||||||||||
|
| |||||||||||
Utilities — 3.6% |
| |||||||||||
American Water Works | 0.2 | 9,018 | 360 | |||||||||
Calpine* | 0.3 | 19,572 | 398 | |||||||||
| 32 | SEI Institutional Investments Trust / Annual Report / May 31, 2013 |
Table of Contents
| Description | Percentage of Net Assets (%) | Shares | Market Value ($ Thousands) | |||||||||
Other Securities | 3.1 | % | $ | 5,424 | ||||||||
|
| |||||||||||
| 6,182 | ||||||||||||
|
| |||||||||||
Total Common Stock |
| 168,120 | ||||||||||
|
| |||||||||||
AFFILIATED PARTNERSHIP — 7.7% |
| |||||||||||
SEI Liquidity Fund, L.P. | 7.7 | 13,400,661 | 13,401 | |||||||||
|
| |||||||||||
Total Affiliated Partnership |
| 13,401 | ||||||||||
|
| |||||||||||
CASH EQUIVALENT — 2.0% |
| |||||||||||
SEI Daily Income Trust, | 2.0 | 3,600,163 | 3,600 | |||||||||
|
| |||||||||||
Total Cash Equivalent |
| 3,600 | ||||||||||
|
| |||||||||||
U.S. TREASURY OBLIGATION (D) — 0.1% |
| |||||||||||
Other Securities | 0.1 | 155 | ||||||||||
|
| |||||||||||
Total U.S. Treasury Obligation |
| 155 | ||||||||||
|
| |||||||||||
Total Investments — 106.4% |
| $ | 185,276 | |||||||||
|
| |||||||||||
A list of the open futures contracts held by the Fund at May 31, 2013, is as follows:
| Type of Contract | Number of Contracts Long | Expiration Date | Unrealized Appreciation ($ Thousands) | |||||||||
Russell 2000 Index E-MINI | 13 | Jun-2013 | $ | 70 | ||||||||
S&P Mid 400 Index E-MINI | 21 | Jun-2013 | 108 | |||||||||
|
| |||||||||||
| $ | 178 | |||||||||||
|
| |||||||||||
For the year ended May 31, 2013, the total amount of all open futures contracts, as presented in the table above, are representative of the volume of activity for this derivative type during the year.
Percentages are based on a Net Assets of $174,107 ($ Thousands).
| * | Non-income producing security. |
| ** | The rate reported is the 7-day effective yield as of May 31, 2013. |
| ‡ | Real Estate Investment Trust. |
| † | Investment in Affiliated Security (see Note 5). |
| (A) | This security or a partial position of this security is on loan at May 31, 2013. The total value of securities on loan at May 31, 2013 was $12,767 ($ Thousands). |
| (B) | The Fund may purchase securities of certain companies with which it is affiliated to the extent these companies are represented in its benchmark index. |
| (C) | This security was purchased with cash collateral held from securities on loan (see Note 11). The total value of such securities as of May 31, 2013 was $13,401 ($ Thousands). |
| (D) | Security, or portion thereof, has been pledged as collateral on open futures contracts. |
Cl — Class
L.P. — Limited Partnership
S&P — Standard & Poor’s
The Summary Schedule of Investments does not reflect the complete portfolio holdings. It includes the Fund’s 50 largest holdings and each investment of any issuer that exceeds 1% of the Fund’s net assets. “Other Securities” represent all issues not required to be disclosed under the rules adopted by the U.S. Securities and Exchange Commission (“SEC”). In certain instances, securities for which footnotes listed above may otherwise apply are included in the Other Securities caption. The complete schedule of portfolio holdings is available (i) without charge, upon request, by calling (800) 342-5734; and (ii) on the SEC’s website at http://www.sec.gov
The following is a list of the inputs used as of May 31, 2013, in valuing the Fund’s investments and other financial instruments carried at value ($ Thousands):
| Investments in Securities | Level 1 | Level 2 | Level 3 | Total | ||||||||||||
Common Stock | $ | 168,120 | $ | — | $ | — | $ | 168,120 | ||||||||
Affiliated Partnership | — | 13,401 | — | 13,401 | ||||||||||||
Cash Equivalent | 3,600 | — | — | 3,600 | ||||||||||||
U.S. Treasury Obligation | — | 155 | — | 155 | ||||||||||||
|
|
|
|
|
|
|
| |||||||||
Total Investments in Securities | $ | 171,720 | $ | 13,556 | $ | — | $ | 185,276 | ||||||||
|
|
|
|
|
|
|
| |||||||||
| Other Financial Instruments | Level 1 | Level 2 | Level 3 | Total | ||||||||||||
Futures Contracts* | $ | 178 | $ | — | $ | — | $ | 178 | ||||||||
|
|
|
|
|
|
|
| |||||||||
| * | Futures contracts are valued at the unrealized appreciation on the instrument. |
For the year ended May 31, 2013, there were no transfers between Level 1 and Level 2 assets and liabilities.
For the year ended May 31, 2013, there were no transfers between Level 2 and Level 3 assets and liabilities.
For more information on valuation inputs, see Note 2 — Significant Accounting Policies in Notes to Financial Statements.
Amounts designated as “—” are $0 or have been rounded to $0.
The accompanying notes are an integral part of the financial statements.
| SEI Institutional Investments Trust / Annual Report / May 31, 2013 | 33 |
Table of Contents
SUMMARY SCHEDULE OF INVESTMENTS
Small Cap Fund
May 31, 2013
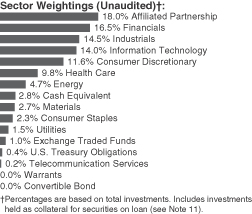
| Description | Percentage of Net Assets (%) | Shares | Market Value ($ Thousands) | |||||||||
COMMON STOCK — 96.1% |
| |||||||||||
Consumer Discretionary — 14.3% |
| |||||||||||
Arctic Cat | 0.3 | % | 54,176 | $ | 2,540 | |||||||
Conn’s* (A) | 0.3 | 43,910 | 2,162 | |||||||||
Francesca’s Holdings (A)* | 0.3 | 84,180 | 2,403 | |||||||||
Hibbett Sports* (A) | 0.3 | 42,277 | 2,411 | |||||||||
HomeAway* (A) | 0.3 | 69,726 | 2,132 | |||||||||
Krispy Kreme Doughnuts* | 0.3 | 124,095 | 2,149 | |||||||||
Libbey (A)* | 0.3 | 101,800 | 2,154 | |||||||||
Matthews International, Cl A (A) | 0.3 | 63,113 | 2,421 | |||||||||
Monro Muffler Brake (A) | 0.3 | 54,701 | 2,572 | |||||||||
Pier 1 Imports (A) | 0.3 | 93,973 | 2,179 | |||||||||
Shutterfly (A)* | 0.3 | 48,200 | 2,349 | |||||||||
Wolverine World Wide (A) | 0.4 | 60,590 | 3,172 | |||||||||
Other Securities | 10.6 | 82,583 | ||||||||||
|
| |||||||||||
| 111,227 | ||||||||||||
|
| |||||||||||
Consumer Staples — 2.8% |
| |||||||||||
Other Securities | 2.8 | 21,950 | ||||||||||
|
| |||||||||||
Energy — 5.9% |
| |||||||||||
Dril-Quip* | 0.4 | 33,432 | 3,024 | |||||||||
Oasis Petroleum* | 0.5 | 97,847 | 3,636 | |||||||||
Other Securities | 5.0 | 38,993 | ||||||||||
|
| |||||||||||
| 45,653 | ||||||||||||
|
| |||||||||||
Financials — 20.3% |
| |||||||||||
CNO Financial Group | 0.5 | 309,005 | 3,813 | |||||||||
Financial Engines (A) | 0.3 | 54,469 | 2,349 | |||||||||
Horace Mann Educators | 0.3 | 103,375 | 2,512 | |||||||||
Kennedy-Wilson Holdings (A) | 0.3 | 133,100 | 2,284 | |||||||||
Meadowbrook Insurance Group (A) | 0.3 | 265,300 | 2,128 | |||||||||
Nelnet, Cl A | 0.4 | 75,200 | 2,937 | |||||||||
Platinum Underwriters Holdings | 0.4 | 56,346 | 3,217 | |||||||||
Simon Property Group‡ | 0.3 | 14,591 | 2,429 | |||||||||
Other Securities | 17.5 | 136,628 | ||||||||||
|
| |||||||||||
| 158,297 | ||||||||||||
|
| |||||||||||
| Description | Percentage of Net Assets (%) | Shares | Market Value ($ Thousands) | |||||||||
Health Care — 12.1% |
| |||||||||||
Acadia Healthcare* | 0.4 | % | 103,338 | $ | 3,451 | |||||||
HealthSouth (A)* | 0.3 | 77,341 | 2,265 | |||||||||
Other Securities | 11.4 | 88,636 | ||||||||||
|
| |||||||||||
| 94,352 | ||||||||||||
|
| |||||||||||
Industrials — 17.9% |
| |||||||||||
Actuant, Cl A (A) | 0.4 | 94,194 | 3,203 | |||||||||
EMCOR Group | 0.4 | 74,220 | 2,950 | |||||||||
FTI Consulting (A)* | 0.4 | 87,203 | 3,313 | |||||||||
G&K Services, Cl A | 0.3 | 48,416 | 2,339 | |||||||||
Genesee & Wyoming, Cl A* | 0.4 | 36,814 | 3,278 | |||||||||
Hexcel* | 0.4 | 102,817 | 3,575 | |||||||||
Middleby* | 0.3 | 13,080 | 2,138 | |||||||||
Old Dominion Freight Line* | 0.4 | 64,181 | 2,764 | |||||||||
Swift Transportation, Cl A | 0.3 | 125,830 | 2,119 | |||||||||
Wabtec | 0.3 | 19,902 | 2,189 | |||||||||
WESCO International (A)* | 0.3 | 28,969 | 2,151 | |||||||||
Other Securities | 14.0 | 109,785 | ||||||||||
|
| |||||||||||
| 139,804 | ||||||||||||
|
| |||||||||||
Information Technology — 17.3% |
| |||||||||||
Broadridge Financial Solutions | 0.3 | 78,375 | 2,127 | |||||||||
Cadence Design | 0.4 | 190,166 | 2,877 | |||||||||
Cavium (A)* | 0.4 | 94,936 | 3,110 | |||||||||
CoStar Group (A)* | 0.3 | 22,444 | 2,509 | |||||||||
Dealertrack Technologies* | 0.4 | 89,300 | 2,879 | |||||||||
Diebold | 0.3 | 71,502 | 2,303 | |||||||||
Envestnet* | 0.4 | 148,275 | 3,407 | |||||||||
Guidewire Software* | 0.4 | 69,206 | 2,835 | |||||||||
Infoblox* | 0.4 | 137,614 | 3,348 | |||||||||
PTC* | 0.3 | 95,989 | 2,410 | |||||||||
SS&C Technologies Holdings* | 0.3 | 81,870 | 2,590 | |||||||||
Other Securities | 13.4 | 104,087 | ||||||||||
|
| |||||||||||
| 134,482 | ||||||||||||
|
| |||||||||||
Materials — 3.4% |
| |||||||||||
Other Securities | 3.4 | 26,187 | ||||||||||
|
| |||||||||||
Telecommunication Services — 0.3% |
| |||||||||||
Other Securities | 0.3 | 1,964 | ||||||||||
|
| |||||||||||
Utilities — 1.8% |
| |||||||||||
Portland General Electric | 0.3 | 79,053 | 2,406 | |||||||||
Other Securities | 1.5 | 11,879 | ||||||||||
|
| |||||||||||
| 14,285 | ||||||||||||
|
| |||||||||||
Total Common Stock |
| 748,201 | ||||||||||
|
| |||||||||||
EXCHANGE TRADED FUNDS — 1.1% |
| |||||||||||
iShares Russell 2000 Growth Index Fund (A) | 0.4 | 31,929 | 3,592 | |||||||||
| 34 | SEI Institutional Investments Trust / Annual Report / May 31, 2013 |
Table of Contents
| Description | Percentage of Net Assets (%) | Shares/Face Amount ($ Thousands) | Market Value ($ Thousands) | |||||||||
iShares Russell 2000 Value Index Fund (A) | 0.5 | % | 45,600 | $ | 3,936 | |||||||
Other Securities | 0.2 | 1,708 | ||||||||||
|
| |||||||||||
Total Exchange Traded Funds |
| 9,236 | ||||||||||
|
| |||||||||||
WARRANTS — 0.0% |
| |||||||||||
Other Securities | 0.0 | 5 | ||||||||||
|
| |||||||||||
Total Warrants |
| 5 | ||||||||||
|
| |||||||||||
CONVERTIBLE BOND — 0.0% |
| |||||||||||
Other Securities | 0.0 | 3 | ||||||||||
|
| |||||||||||
Total Convertible Bond |
| 3 | ||||||||||
|
| |||||||||||
AFFILIATED PARTNERSHIP — 22.2% |
| |||||||||||
SEI Liquidity Fund, L.P. 0.100%**† (B) | 22.2 | 173,278,252 | 173,278 | |||||||||
|
| |||||||||||
Total Affiliated Partnership |
| 173,278 | ||||||||||
|
| |||||||||||
CASH EQUIVALENT — 3.5% |
| |||||||||||
SEI Daily Income Trust, | 3.5 | 27,185,676 | 27,186 | |||||||||
|
| |||||||||||
Total Cash Equivalent |
| 27,186 | ||||||||||
|
| |||||||||||
U.S. TREASURY OBLIGATIONS (C) (D) — 0.5% |
| |||||||||||
U.S. Treasury Bills | 0.5 | $ | 3,450 | 3,450 | ||||||||
Other Securities | 0.0 | 240 | ||||||||||
|
| |||||||||||
Total U.S. Treasury Obligations |
| 3,690 | ||||||||||
|
| |||||||||||
Total Investments — 123.4% |
| $ | 961,599 | |||||||||
|
| |||||||||||
A list of the open futures contracts held by the Fund at May 31, 2013, is as follows:
| Type of Contract | Number of Contracts Long | Expiration Date | Unrealized Depreciation ($ Thousands) | |||||||||
Russell 2000 Index E-MINI | 50 | Jun-2013 | $ | (47 | ) | |||||||
|
| |||||||||||
For the year ended May 31, 2013, the total amount of all open futures contracts, as presented in the table above, are representative of the volume of activity for this derivative type during the year.
Percentages are based on a Net Assets of $778,976 ($ Thousands).
| * | Non-income producing security. |
| ** | The rate reported is the 7-day effective yield as of May 31, 2013. |
| ‡ | Real Estate Investment Trust. |
| † | Investment in Affiliated Security (see Note 5). |
| (A) | This security or a partial position of this security is on loan at May 31, 2013. The total value of securities on loan at May 31, 2013 was $166,755 ($ Thousands). |
| (B) | This security was purchased with cash collateral held from securities on loan (see Note 11). The total value of such securities as of May 31, 2013 was $173,278 ($ Thousands). |
| (C) | Security, or portion thereof, has been pledged as collateral on open futures contracts. |
| (D) | The rate reported is the effective yield at time of purchase. |
Cl — Class
L.P. — Limited Partnership
The Summary Schedule of Investments does not reflect the complete portfolio holdings. It includes the Fund’s 50 largest holdings and each investment of any issuer that exceeds 1% of the Fund’s net assets. “Other Securities” represent all issues not required to be disclosed under the rules adopted by the U.S. Securities and Exchange Commission (“SEC”). In certain instances, securities for which footnotes listed above may otherwise apply are included in the Other Securities caption. The complete schedule of portfolio holdings is available (i) without charge, upon request, by calling (800) 342-5734; and (ii) on the SEC’s website at http://www.sec.gov
The following is a list of the inputs used as of May 31, 2013, in valuing the Fund’s investments and other financial instruments carried at value ($ Thousands):
| Investments in Securities | Level 1 | Level 2 | Level 3(1) | Total | ||||||||||||
Common Stock | $ | 748,096 | $ | 105 | $ | — | $ | 748,201 | ||||||||
Exchange Traded Funds | 9,236 | — | — | 9,236 | ||||||||||||
Warrants | 5 | — | — | 5 | ||||||||||||
Convertible Bond | — | — | 3 | 3 | ||||||||||||
Affiliated Partnership | — | 173,278 | — | 173,278 | ||||||||||||
Cash Equivalent | 27,186 | — | — | 27,186 | ||||||||||||
U.S. Treasury Obligations | — | 3,690 | — | 3,690 | ||||||||||||
|
|
|
|
|
|
|
| |||||||||
Total Investments in Securities | $ | 784,523 | $ | 177,073 | $ | 3 | $ | 961,599 | ||||||||
|
|
|
|
|
|
|
| |||||||||
| Other Financial Instruments | Level 1 | Level 2 | Level 3 | Total | ||||||||||||
Futures Contracts* | $ | (47 | ) | $ | — | $ | — | $ | (47 | ) | ||||||
|
|
|
|
|
|
|
| |||||||||
| (1) | A reconciliation of Level 3 investments is presented when the Fund has a significant amount of Level 3 investments at the beginning and/or end of the period in relation to the net assets. |
| * | Futures contracts are valued at the unrealized depreciation on the instrument. |
For the year ended May 31, 2013, there were no transfers between Level 1 and Level 2 assets and liabilities.
For the year ended May 31, 2013, the transfers out of Level 3 were due to changes in the availability of observable inputs to determine fair value.
For more information on valuation inputs, see Note 2 — Significant Accounting Policies in Notes to Financial Statements.
Amounts designated as “—” are $0 or have been rounded to $0.
The accompanying notes are an integral part of the financial statements.
| SEI Institutional Investments Trust / Annual Report / May 31, 2013 | 35 |
Table of Contents
SUMMARY SCHEDULE OF INVESTMENTS
Small Cap II Fund
May 31, 2013
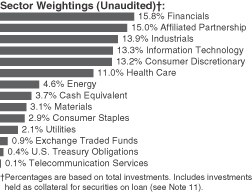
| Description | Percentage of Net Assets (%) | Shares | Market Value ($ Thousands) | |||||||||
COMMON STOCK — 99.1% |
| |||||||||||
Consumer Discretionary — 16.4% |
| |||||||||||
Cabela’s* | 0.4 | % | 12,850 | $ | 862 | |||||||
Francesca’s Holdings (A)* | 0.4 | 28,297 | 808 | |||||||||
HomeAway* | 0.3 | 24,171 | 739 | |||||||||
Movado Group | 0.4 | 21,630 | 781 | |||||||||
Oxford Industries (A) | 0.4 | 12,764 | 838 | |||||||||
Pier 1 Imports (A) | 0.5 | 50,177 | 1,164 | |||||||||
Shutterfly* | 0.5 | 23,327 | 1,137 | |||||||||
Other Securities | 13.5 | 30,004 | ||||||||||
|
| |||||||||||
| 36,333 | ||||||||||||
|
| |||||||||||
Consumer Staples — 3.6% |
| |||||||||||
Other Securities | 3.6 | 7,965 | ||||||||||
|
| |||||||||||
Energy — 5.7% |
| |||||||||||
Oasis Petroleum* | 0.6 | 32,685 | 1,215 | |||||||||
Rosetta Resources* | 0.3 | 15,886 | 744 | |||||||||
Other Securities | 4.8 | 10,577 | ||||||||||
|
| |||||||||||
| 12,536 | ||||||||||||
|
| |||||||||||
Financials — 19.5% |
| |||||||||||
EastGroup Properties‡ | 0.3 | 12,718 | 747 | |||||||||
Endurance Specialty Holdings | 0.5 | 22,079 | 1,111 | |||||||||
Hanover Insurance Group | 0.5 | 22,385 | 1,124 | |||||||||
Horace Mann Educators | 0.5 | 40,786 | 991 | |||||||||
Iberiabank | 0.5 | 22,550 | 1,162 | |||||||||
Platinum Underwriters Holdings | 0.6 | 23,234 | 1,327 | |||||||||
Susquehanna Bancshares | 0.4 | 74,698 | 897 | |||||||||
Other Securities | 16.2 | 35,968 | ||||||||||
|
| |||||||||||
| 43,327 | ||||||||||||
|
| |||||||||||
Health Care — 13.6% |
| |||||||||||
Acadia Healthcare* | 0.5 | 33,767 | 1,127 | |||||||||
Akorn* (A) | 0.4 | 55,172 | 802 | |||||||||
Amsurg, Cl A* | 0.4 | 24,911 | 885 | |||||||||
Analogic | 0.3 | 9,580 | 761 | |||||||||
Charles River Laboratories International* | 0.4 | 17,736 | 768 | |||||||||
| Description | Percentage of Net Assets (%) | Shares | Market Value ($ Thousands) | |||||||||
HealthSouth* | 0.5 | % | 38,552 | $ | 1,129 | |||||||
PAREXEL International* | 0.4 | 19,212 | 878 | |||||||||
Team Health Holdings* | 0.5 | 28,047 | 1,096 | |||||||||
Other Securities | 10.2 | 22,740 | ||||||||||
|
| |||||||||||
| 30,186 | ||||||||||||
|
| |||||||||||
Industrials — 17.2% |
| |||||||||||
Actuant, Cl A (A) | 0.8 | 50,650 | 1,722 | |||||||||
Beacon Roofing Supply (A)* | 0.4 | 21,586 | 890 | |||||||||
Belden | 0.4 | 15,763 | 842 | |||||||||
Chart Industries* | 0.5 | 11,030 | 1,073 | |||||||||
Curtiss-Wright | 0.3 | 21,247 | 773 | |||||||||
Dycom Industries* | 0.4 | 35,320 | 803 | |||||||||
G&K Services, Cl A | 0.4 | 18,895 | 913 | |||||||||
Genesee & Wyoming, Cl A* | 0.7 | 17,628 | 1,570 | |||||||||
Hexcel* | 0.6 | 38,512 | 1,339 | |||||||||
TrueBlue* | 0.3 | 32,610 | 768 | |||||||||
Other Securities | 12.4 | 27,400 | ||||||||||
|
| |||||||||||
| 38,093 | ||||||||||||
|
| |||||||||||
Information Technology — 16.5% |
| |||||||||||
Aspen Technology* | 0.4 | 31,321 | 959 | |||||||||
Cavium (A)* | 0.5 | 34,538 | 1,131 | |||||||||
CoStar Group (A)* | 0.5 | 9,141 | 1,022 | |||||||||
Dealertrack Technologies* | 0.5 | 31,079 | 1,002 | |||||||||
Fairchild Semiconductor International, Cl A* | 0.4 | 56,661 | 822 | |||||||||
Guidewire Software* | 0.4 | 22,148 | 907 | |||||||||
Infoblox* | 0.5 | 43,534 | 1,059 | |||||||||
InvenSense, Cl A* (A) | 0.4 | 71,204 | 917 | |||||||||
OSI Systems* | 0.4 | 13,792 | 798 | |||||||||
PTC* | 0.5 | 40,496 | 1,017 | |||||||||
Semtech* | 0.5 | 31,110 | 1,137 | |||||||||
Tangoe (A)* | 0.4 | 63,324 | 944 | |||||||||
Other Securities | 11.1 | 24,774 | ||||||||||
|
| |||||||||||
| 36,489 | ||||||||||||
|
| |||||||||||
Materials — 3.8% |
| |||||||||||
PolyOne | 0.5 | 42,730 | 1,098 | |||||||||
Other Securities | 3.3 | 7,469 | ||||||||||
|
| |||||||||||
| 8,567 | ||||||||||||
|
| |||||||||||
Telecommunication Services — 0.1% |
| |||||||||||
Other Securities | 0.1 | 242 | ||||||||||
|
| |||||||||||
Utilities — 2.7% |
| |||||||||||
Portland General Electric | 0.6 | 44,710 | 1,361 | |||||||||
Other Securities | 2.1 | 4,557 | ||||||||||
|
| |||||||||||
| 5,918 | ||||||||||||
|
| |||||||||||
Total Common Stock |
| 219,656 | ||||||||||
|
| |||||||||||
| 36 | SEI Institutional Investments Trust / Annual Report / May 31, 2013 |
Table of Contents
| Description | Percentage of Net Assets (%) | Shares | Market Value ($ Thousands) | |||||||||
EXCHANGE TRADED FUNDS — 1.1% |
| |||||||||||
iShares Russell 2000 Growth Index Fund (A) | 0.7 | % | 14,213 | $ | 1,599 | |||||||
iShares Russell 2000 Index Fund (A) | 0.4 | 9,080 | 888 | |||||||||
|
| |||||||||||
Total Exchange Traded Funds |
| 2,487 | ||||||||||
|
| |||||||||||
AFFILIATED PARTNERSHIP — 18.6% |
| |||||||||||
SEI Liquidity Fund, L.P. | 18.6 | 41,129,582 | 41,130 | |||||||||
|
| |||||||||||
Total Affiliated Partnership |
| 41,130 | ||||||||||
|
| |||||||||||
CASH EQUIVALENT — 4.6% |
| |||||||||||
SEI Daily Income Trust, | 4.6 | 10,118,854 | 10,119 | |||||||||
|
| |||||||||||
Total Cash Equivalent |
| 10,119 | ||||||||||
|
| |||||||||||
U.S. TREASURY OBLIGATIONS — 0.5% |
| |||||||||||
Other Securities | 0.5 | 1,183 | ||||||||||
|
| |||||||||||
Total U.S. Treasury Obligations |
| 1,183 | ||||||||||
|
| |||||||||||
Total Investments — 123.9% |
| $ | 274,575 | |||||||||
|
| |||||||||||
Percentages are based on a Net Assets of $221,697 ($ Thousands).
| * | Non-income producing security. |
| ** | The rate reported is the 7-day effective yield as of May 31, 2013. |
| ‡ | Real Estate Investment Trust. |
| † | Investment in Affiliated Security (see Note 5). |
| (A) | This security or a partial position of this security is on loan at May 31, 2013. The total value of securities on loan at May 31, 2013 was $39,632 ($ Thousands). |
| (B) | This security was purchased with cash collateral held from securities on loan (see Note 11). The total value of such securities as of May 31, 2013 was $41,130 ($ Thousands). |
Cl — Class
L.P. — Limited Partnership
The Summary Schedule of Investments does not reflect the complete portfolio holdings. It includes the Fund’s 50 largest holdings and each investment of any issuer that exceeds 1% of the Fund’s net assets. “Other Securities” represent all issues not required to be disclosed under the rules adopted by the U.S. Securities and Exchange Commission (“SEC”). In certain instances, securities for which footnotes listed above may otherwise apply are included in the Other Securities caption. The complete schedule of portfolio holdings is available (i) without charge, upon request, by calling (800) 342-5734; and (ii) on the SEC’s website at http://www.sec.gov
The following is a list of the inputs used as of May 31, 2013, in valuing the Fund’s investments carried at value ($ Thousands):
| Investments in Securities | Level 1 | Level 2 | Level 3 | Total | ||||||||||||
Common Stock | $ | 219,656 | $ | — | $ | — | $ | 219,656 | ||||||||
Exchange Traded Funds | 2,487 | — | — | 2,487 | ||||||||||||
Affiliated Partnership | — | 41,130 | — | 41,130 | ||||||||||||
Cash Equivalent | 10,119 | — | — | 10,119 | ||||||||||||
U.S. Treasury Obligations | — | 1,183 | — | 1,183 | ||||||||||||
|
|
|
|
|
|
|
| |||||||||
Total Investments in Securities | $ | 232,262 | $ | 42,313 | $ | — | $ | 274,575 | ||||||||
|
|
|
|
|
|
|
| |||||||||
During the year ended May 31, 2013, there were no transfers between Level 1 and Level 2 assets and liabilities.
During the year ended May 31, 2013, there were no transfers between Level 2 and Level 3 assets and liabilities.
For more information on valuation inputs, see Note 2 — Significant Accounting Policies in Notes to Financial Statements.
Amounts designated as “—” are $0 or have been rounded to $0.
The accompanying notes are an integral part of the financial statements.
| SEI Institutional Investments Trust / Annual Report / May 31, 2013 | 37 |
Table of Contents
SUMMARY SCHEDULE OF INVESTMENTS
Small/Mid Cap Equity Fund
May 31, 2013
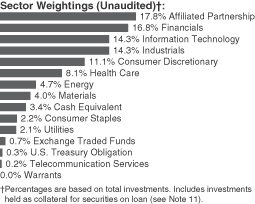
| Description | Percentage of Net Assets (%) | Shares | Market Value ($ Thousands) | |||||||||
COMMON STOCK — 95.0% |
| |||||||||||
Consumer Discretionary — 13.6% |
| |||||||||||
Carter’s | 0.3 | % | 89,303 | $ | 6,436 | |||||||
Francesca’s Holdings* (A) | 0.3 | 240,526 | 6,867 | |||||||||
Hibbett Sports* (A) | 0.4 | 165,200 | 9,421 | |||||||||
Monro Muffler (A) | 0.3 | 125,462 | 5,899 | |||||||||
National CineMedia | 0.3 | 351,023 | 5,831 | |||||||||
Pier 1 Imports (A) | 0.4 | 362,273 | 8,401 | |||||||||
Wolverine World Wide (A) | 0.3 | 117,671 | 6,160 | |||||||||
Other Securities | 11.3 | 243,417 | ||||||||||
|
| |||||||||||
| 292,432 | ||||||||||||
|
| |||||||||||
Consumer Staples — 2.7% |
| |||||||||||
Casey’s General Stores (A) | 0.3 | 114,083 | 6,932 | |||||||||
Other Securities | 2.4 | 49,948 | ||||||||||
| �� |
|
| ||||||||||
| 56,880 | ||||||||||||
|
| |||||||||||
Energy — 5.7% |
| |||||||||||
Dresser-Rand Group* | 0.3 | 105,341 | 6,384 | |||||||||
Gulfport Energy* | 0.3 | 135,751 | 6,474 | |||||||||
Oasis Petroleum* | 0.3 | 174,719 | 6,493 | |||||||||
Other Securities | 4.8 | 103,175 | ||||||||||
|
| |||||||||||
| 122,526 | ||||||||||||
|
| |||||||||||
Financials — 20.5% |
| |||||||||||
American Financial Group | 0.3 | 150,694 | 7,318 | |||||||||
CNO Financial Group | 0.4 | 665,245 | 8,209 | |||||||||
First Horizon National (A) | 0.3 | 646,702 | 7,424 | |||||||||
First Niagara Financial Group | 0.3 | 593,266 | 5,796 | |||||||||
Huntington Bancshares | 0.3 | 801,230 | 6,209 | |||||||||
Lexington Realty Trust‡ (A) | 0.4 | 655,780 | 8,256 | |||||||||
Pebblebrook Hotel Trust‡ | 0.3 | 229,190 | 6,014 | |||||||||
Popular* | 0.3 | 215,812 | 6,475 | |||||||||
Simon Property Group‡ | 0.3 | 45,029 | 7,495 | |||||||||
SVB Financial Group* (A) | 0.3 | 77,621 | 6,007 | |||||||||
Zions Bancorporation (A) | 0.4 | 341,670 | 9,584 | |||||||||
| Description | Percentage of Net Assets (%) | Shares | Market Value ($ Thousands) | |||||||||
Other Securities | 16.9 | % | $ | 363,175 | ||||||||
|
| |||||||||||
| 441,962 | ||||||||||||
|
| |||||||||||
Health Care — 9.9% |
| |||||||||||
HealthSouth* | 0.3 | 245,346 | 7,186 | |||||||||
MEDNAX* (A) | 0.3 | 69,842 | 6,483 | |||||||||
WellCare Health Plans* | 0.3 | 123,611 | 6,445 | |||||||||
Other Securities | 9.0 | 192,940 | ||||||||||
|
| |||||||||||
| 213,054 | ||||||||||||
|
| |||||||||||
Industrials — 17.3% |
| |||||||||||
Actuant, Cl A (A) | 0.3 | 216,480 | 7,360 | |||||||||
Deluxe (A) | 0.3 | 175,740 | 6,573 | |||||||||
DigitalGlobe* | 0.3 | 216,091 | 6,532 | |||||||||
Dycom Industries* | 0.3 | 272,395 | 6,197 | |||||||||
Genesee & Wyoming, Cl A* | 0.5 | 123,606 | 11,007 | |||||||||
Hexcel* | 0.4 | 270,332 | 9,399 | |||||||||
Landstar System | 0.3 | 118,620 | 6,262 | |||||||||
Old Dominion Freight Line* | 0.5 | 258,158 | 11,116 | |||||||||
Owens Corning* | 0.3 | 159,510 | 6,971 | |||||||||
Polypore International* (A) | 0.3 | 178,593 | 6,719 | |||||||||
Regal-Beloit | 0.3 | 92,664 | 6,256 | |||||||||
Sensata Technologies Holding* | 0.3 | 181,300 | 6,364 | |||||||||
TrueBlue* | 0.3 | 253,823 | 5,975 | |||||||||
WESCO International* (A) | 0.4 | 110,647 | 8,216 | |||||||||
Other Securities | 12.5 | 267,827 | ||||||||||
|
| |||||||||||
| 372,774 | ||||||||||||
|
| |||||||||||
Information Technology — 17.5% |
| |||||||||||
Atmel* | 0.4 | 985,922 | 7,759 | |||||||||
Cadence Design Systems* (A) | 0.6 | 893,370 | 13,517 | |||||||||
CoStar Group* (A) | 0.4 | 76,200 | 8,520 | |||||||||
Dealertrack Technologies* | 0.4 | 248,867 | 8,023 | |||||||||
Fairchild Semiconductor International, Cl A* | 0.3 | 467,680 | 6,786 | |||||||||
FleetMatics Group* | 0.3 | 216,192 | 6,432 | |||||||||
PTC* | 0.5 | 421,032 | 10,572 | |||||||||
SS&C Technologies Holdings* | 0.3 | 205,029 | 6,485 | |||||||||
Other Securities | 14.3 | 309,758 | ||||||||||
|
| |||||||||||
| 377,852 | ||||||||||||
|
| |||||||||||
Materials — 4.9% |
| |||||||||||
PolyOne | 0.4 | 365,377 | 9,386 | |||||||||
Other Securities | 4.5 | 96,369 | ||||||||||
|
| |||||||||||
| 105,755 | ||||||||||||
|
| |||||||||||
Telecommunication Services — 0.3% |
| |||||||||||
Other Securities | 0.3 | 6,199 | ||||||||||
|
| |||||||||||
| 38 | SEI Institutional Investments Trust / Annual Report / May 31, 2013 |
Table of Contents
| Description | Percentage of Net Assets (%) | Shares/Face Amount ($ Thousands) | Market Value ($ Thousands) | |||||||||
Utilities — 2.6% |
| |||||||||||
Other Securities | 2.6 | % | $ | 55,366 | ||||||||
|
| |||||||||||
Total Common Stock |
| 2,044,800 | ||||||||||
|
| |||||||||||
EXCHANGE TRADED FUNDS — 0.9% |
| |||||||||||
iShares Russell 2000 | 0.6 | 111,361 | 12,527 | |||||||||
Other Securities | 0.3 | 7,076 | ||||||||||
|
| |||||||||||
Total Exchange Traded Funds |
| 19,603 | ||||||||||
|
| |||||||||||
WARRANT — 0.0% |
| |||||||||||
Other Securities | 0.0 | — | ||||||||||
|
| |||||||||||
Total Warrant |
| — | ||||||||||
|
| |||||||||||
AFFILIATED PARTNERSHIP — 21.7% |
| |||||||||||
SEI Liquidity Fund, L.P. | 21.7 | 467,277,078 | 467,277 | |||||||||
|
| |||||||||||
Total Affiliated Partnership |
| 467,277 | ||||||||||
|
| |||||||||||
CASH EQUIVALENT — 4.1% |
| |||||||||||
SEI Daily Income Trust, | 4.1 | 88,647,658 | 88,648 | |||||||||
|
| |||||||||||
Total Cash Equivalent |
| 88,648 | ||||||||||
|
| |||||||||||
U.S. TREASURY OBLIGATION (C) (D) — 0.3% |
| |||||||||||
U.S. Treasury Bills | 0.3 | $ | 7,267 | 7,267 | ||||||||
|
| |||||||||||
Total U.S. Treasury Obligation |
| 7,267 | ||||||||||
|
| |||||||||||
Total Investments — 122.0% |
| $ | 2,627,595 | |||||||||
|
| |||||||||||
A list of the open futures contracts held by the Fund at May 31, 2013, is as follows:
| Type of Contract | Number of Contracts Long | Expiration Date | Unrealized Appreciation ($ Thousands) | |||||||||
Russell 2000 Index E-MINI | 334 | Jun-2013 | $ | 727 | ||||||||
S&P Mid 400 Index E-MINI | 258 | Jun-2013 | 454 | |||||||||
|
| |||||||||||
| $ | 1,181 | |||||||||||
|
| |||||||||||
For the year ended May 31, 2013, the total amount of all open futures contracts, as presented in the table above, are representative of the volume of activity for this derivative type during the year.
Percentages are based on a Net Assets of $2,153,745 ($ Thousands).
| * | Non-income producing security. |
| ** | The rate reported is the 7-day effective yield as of May 31, 2013. |
| ‡ | Real Estate Investment Trust. |
| † | Investment in Affiliated Security (see Note 5). |
| (A) | This security or a partial position of this security is on loan at May 31, 2013. The total value of securities on loan at May 31, 2013 was $449,160 ($ Thousands). |
| (B) | This security was purchased with cash collateral held from securities on loan (see Note 11). The total value of such securities as of May 31, 2013 was $467,277 ($ Thousands). |
| (C) | All or a portion of this security has been pledged as collateral for open futures contracts. |
| (D) | The rate reported is the effective yield at time of purchase. |
Cl — Class
L.P. — Limited Partnership
S&P — Standard and Poor’s
The Summary Schedule of Investments does not reflect the complete portfolio holdings. It includes the Fund’s 50 largest unaffiliated holdings and each investment of any issuer that exceeds 1% of the Fund’s net assets. “Other Securities” represent all issues not required to be disclosed under the rules adopted by the U.S. Securities and Exchange Commission (“SEC”). In certain instances, securities for which footnotes listed above may otherwise apply are included in the Other Securities caption. The complete schedule of portfolio holdings is available (i) without charge, upon request, by calling (800) 342-5734; and (ii) on the SEC’s website at http://www.sec.gov.
The following is a list of the inputs used as of May 31, 2013, in valuing the Fund’s investments and other financial instruments carried at value ($ Thousands):
| Investments in Securities | Level 1 | Level 2 | Level 3(1) | Total | ||||||||||||
Common Stock | $ | 2,044,684 | $ | — | $ | 116 | $ | 2,044,800 | ||||||||
Exchange Traded Funds | 19,603 | — | — | 19,603 | ||||||||||||
Affiliated Partnership | — | 467,277 | — | 467,277 | ||||||||||||
Cash Equivalent | 88,648 | — | — | 88,648 | ||||||||||||
U.S. Treasury Obligation | — | 7,267 | — | 7,267 | ||||||||||||
|
|
|
|
|
|
|
| |||||||||
Total Investments in Securities | $ | 2,152,935 | $ | 474,544 | $ | 116 | $ | 2,627,595 | ||||||||
|
|
|
|
|
|
|
| |||||||||
| Other Financial Instruments | Level 1 | Level 2 | Level 3 | Total | ||||||||||||
Futures Contracts* | $ | 1,181 | $ | — | $ | — | $ | 1,181 | ||||||||
|
|
|
|
|
|
|
| |||||||||
| (1) | A reconciliation of Level 3 investments is presented when the Fund has a significant amount of Level 3 investments at the beginning and/or end of the year in relation to the net assets. |
| * | Futures contracts are valued at the unrealized appreciation on the instrument. |
For the year ended May 31, 2013, there have been no transfers between Level 1 and Level 2 assets and liabilities.
For the year ended May 31, 2013, there have been no transfers between Level 2 and Level 3 assets and liabilities.
For more information on valuation inputs, see Note 2 — Significant Accounting Policies in Notes to Financial Statements.
Amounts designated as “—” are either $0 or have been rounded to $0.
The accompanying notes are an integral part of the financial statements.
| SEI Institutional Investments Trust / Annual Report / May 31, 2013 | 39 |
Table of Contents
SUMMARY SCHEDULE OF INVESTMENTS
U.S. Managed Volatility Fund
May 31, 2013
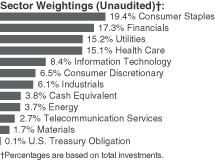
| Description | Percentage of Net Assets (%) | Shares | Market Value ($ Thousands) | |||||||||
COMMON STOCK — 93.1% |
| |||||||||||
Consumer Discretionary — 6.3% |
| |||||||||||
DIRECTV* | 0.8 | % | 147,000 | $ | 8,986 | |||||||
Target | 1.3 | 208,389 | 14,483 | |||||||||
Other Securities | 4.2 | 49,227 | ||||||||||
|
| |||||||||||
| 72,696 | ||||||||||||
|
| |||||||||||
Consumer Staples — 18.8% |
| |||||||||||
Altria Group | 0.7 | 215,520 | 7,780 | |||||||||
Bunge | 0.6 | 97,555 | 6,790 | |||||||||
Campbell Soup | 0.6 | 169,630 | 7,262 | |||||||||
Clorox | 0.9 | 128,686 | 10,691 | |||||||||
ConAgra Foods | 0.6 | 200,300 | 6,748 | |||||||||
CVS Caremark | 0.7 | 137,600 | 7,923 | |||||||||
Dr. Pepper Snapple Group | 0.8 | 190,150 | 8,743 | |||||||||
Hershey | 0.7 | 93,857 | 8,364 | |||||||||
Hormel Foods | 0.9 | 256,770 | 10,225 | |||||||||
Kimberly-Clark | 1.1 | 133,030 | 12,881 | |||||||||
Kroger | 0.9 | 308,441 | 10,385 | |||||||||
Philip Morris International | 0.7 | 83,423 | 7,584 | |||||||||
Walgreen | 0.6 | 144,800 | 6,916 | |||||||||
Wal-Mart Stores | 1.5 | 233,800 | 17,497 | |||||||||
Other Securities | 7.5 | 85,374 | ||||||||||
|
| |||||||||||
| 215,163 | ||||||||||||
|
| |||||||||||
Energy — 3.6% |
| |||||||||||
Chevron | 0.9 | 90,000 | 11,048 | |||||||||
ConocoPhillips | 0.7 | 132,300 | 8,115 | |||||||||
Exxon Mobil | 1.3 | 166,200 | 15,036 | |||||||||
Imperial Oil | 0.2 | 64,400 | 2,508 | |||||||||
Other Securities | 0.5 | 4,606 | ||||||||||
|
| |||||||||||
| 41,313 | ||||||||||||
|
| |||||||||||
Financials — 16.7% |
| |||||||||||
Allied World Assurance | ||||||||||||
Holdings | 0.9 | 111,163 | 9,939 | |||||||||
Everest Re Group | 1.1 | 98,993 | 12,831 | |||||||||
PartnerRe | 1.6 | 201,369 | 18,254 | |||||||||
RenaissanceRe Holdings | 1.2 | 158,845 | 13,654 | |||||||||
Travelers | 0.7 | 96,600 | 8,087 | |||||||||
Validus Holdings | 0.9 | 274,205 | 9,902 | |||||||||
| Description | Percentage of Net Assets (%) | Shares | Market Value ($ Thousands) | |||||||||
Other Securities | 10.3 | % | $ | 119,211 | ||||||||
|
| |||||||||||
| 191,878 | ||||||||||||
|
| |||||||||||
Health Care — 14.6% |
| |||||||||||
Actavis* | 0.6 | 59,283 | 7,309 | |||||||||
AmerisourceBergen | 1.2 | 256,471 | 13,870 | |||||||||
Amgen | 1.4 | 157,640 | 15,847 | |||||||||
Becton Dickinson | 0.9 | 105,488 | 10,403 | |||||||||
Cardinal Health | 0.9 | 210,951 | 9,906 | |||||||||
Johnson & Johnson | 1.3 | 168,942 | 14,222 | |||||||||
McKesson | 1.2 | 122,929 | 13,997 | |||||||||
Pfizer | 0.8 | 349,100 | 9,506 | |||||||||
Other Securities | 6.3 | 72,504 | ||||||||||
|
| |||||||||||
| 167,564 | ||||||||||||
|
| |||||||||||
Industrials — 5.9% |
| |||||||||||
L-3 Communications | ||||||||||||
Holdings, Cl 3 | 0.8 | 111,700 | 9,504 | |||||||||
Lockheed Martin | 0.8 | 82,074 | 8,686 | |||||||||
Northrop Grumman | 0.7 | 102,800 | 8,470 | |||||||||
Raytheon | 0.8 | 144,100 | 9,603 | |||||||||
Other Securities | 2.8 | 31,353 | ||||||||||
|
| |||||||||||
| 67,616 | ||||||||||||
|
| |||||||||||
Information Technology — 8.2% |
| |||||||||||
Amdocs | 1.1 | 363,453 | 12,975 | |||||||||
Cisco Systems | 0.7 | 325,100 | 7,828 | |||||||||
International Business Machines | 1.1 | 59,152 | 12,305 | |||||||||
Microsoft | 0.7 | 227,200 | 7,925 | |||||||||
Other Securities | 4.6 | 52,603 | ||||||||||
|
| |||||||||||
| 93,636 | ||||||||||||
|
| |||||||||||
Materials — 1.7% |
| |||||||||||
Other Securities | 1.7 | 18,917 | ||||||||||
|
| |||||||||||
Telecommunication Services — 2.6% |
| |||||||||||
Verizon Communications | 0.8 | 200,058 | 9,699 | |||||||||
Other Securities | 1.8 | 19,732 | ||||||||||
|
| |||||||||||
| 29,431 | ||||||||||||
|
| |||||||||||
Utilities — 14.7% |
| |||||||||||
American Electric Power | 0.6 | 144,905 | 6,640 | |||||||||
American Water Works | 0.8 | 226,980 | 9,065 | |||||||||
CMS Energy | 0.6 | 266,538 | 7,183 | |||||||||
Consolidated Edison | 0.7 | 138,467 | 7,902 | |||||||||
DTE Energy | 1.1 | 184,975 | 12,321 | |||||||||
Edison International | 1.2 | 294,275 | 13,519 | |||||||||
Pinnacle West Capital | 0.6 | 117,874 | 6,657 | |||||||||
Wisconsin Energy | 0.7 | 185,188 | 7,557 | |||||||||
Other Securities | 8.4 | 98,040 | ||||||||||
|
| |||||||||||
| 168,884 | ||||||||||||
|
| |||||||||||
Total Common Stock |
| 1,067,098 | ||||||||||
|
| |||||||||||
| 40 | SEI Institutional Investments Trust / Annual Report / May 31, 2013 |
Table of Contents
| Description | Percentage of Net Assets (%) | Shares | Market Value ($ Thousands) | |||||||||
CASH EQUIVALENT — 3.7% |
| |||||||||||
SEI Daily Income Trust, | 3.7 | % | 42,175,790 | $ | 42,176 | |||||||
|
| |||||||||||
Total Cash Equivalent |
| 42,176 | ||||||||||
|
| |||||||||||
U.S. TREASURY OBLIGATION (A) — 0.1% |
| |||||||||||
Other Securities | 0.1 | 1,513 | ||||||||||
|
| |||||||||||
Total U.S. Treasury Obligation |
| 1,513 | ||||||||||
|
| |||||||||||
Total Investments — 96.9% |
| $ | 1,110,787 | |||||||||
|
| |||||||||||
A list of the open futures contracts held by the Fund at May 31, 2013, is as follows:
| Type of Contract | Number of Contracts Long | Expiration Date | Unrealized Appreciation ($ Thousands) | |||||||||
S&P 500 Index EMINI | 674 | Jun-2013 | $ | 197 | ||||||||
|
| |||||||||||
For the year ended May 31, 2013, the total amount of all open futures contracts, as presented in the table above, are representative of the volume of activity for this derivative type during the year.
Percentages are based on a Net Assets of $1,145,980 ($ Thousands).
| * | Non-income producing security. |
| ** | The rate reported is the 7-day effective yield as of May 31, 2013. |
| † | Investment in Affiliated Security (see Note 5). |
| (A) | Security, or portion thereof, has been pledged as collateral on open futures contracts. |
Cl — Class
S&P — Standard and Poor’s
The Summary Schedule of Investments does not reflect the complete portfolio holdings. It includes the Fund’s 50 largest holdings and each investment of any issuer that exceeds 1% of the Fund’s net assets. “Other Securities” represent all issues not required to be disclosed under the rules adopted by the U.S. Securities and Exchange Commission (“SEC”). In certain instances, securities for which footnotes listed above may otherwise apply are included in the Other Securities caption. The complete schedule of portfolio holdings is available (i) without charge, upon request, by calling (800) 342-5734; and (ii) on the SEC’s website at http://www.sec.gov.
The following is a list of the inputs used as of May 31, 2013, in valuing the Fund’s investments and other financial instruments carried at value ($ Thousands):
| Investments in Securities | Level 1 | Level 2 | Level 3 | Total | ||||||||||||
Common Stock | $ | 1,067,098 | $ | — | $ | — | $ | 1,067,098 | ||||||||
Cash Equivalent | 42,176 | — | — | 42,176 | ||||||||||||
U.S. Treasury Obligation | — | 1,513 | — | 1,513 | ||||||||||||
|
|
|
|
|
|
|
| |||||||||
Total Investments in Securities | $ | 1,109,274 | $ | 1,513 | $ | — | $ | 1,110,787 | ||||||||
|
|
|
|
|
|
|
| |||||||||
| Other Financial Instruments | Level 1 | Level 2 | Level 3 | Total | ||||||||||||
Futures Contracts* | $ | 197 | $ | — | $ | — | $ | 197 | ||||||||
|
|
|
|
|
|
|
| |||||||||
| * | Futures contracts are valued at the unrealized appreciation on the instrument. |
For the year ended May 31, 2013, there were no significant transfers between Level 1 and Level 2 assets and liabilities.
For the year ended May 31, 2013, there were no significant transfers between Level 2 and Level 3 assets and liabilities.
For more information on valuation inputs, see Note 2 — Significant Accounting Policies in Notes to Financial Statements.
Amounts designated as “—” are $0 or have been rounded to $0.
The accompanying notes are an integral part of the financial statements.
| SEI Institutional Investments Trust / Annual Report / May 31, 2013 | 41 |
Table of Contents
SUMMARY SCHEDULE OF INVESTMENTS
International Equity Fund
May 31, 2013
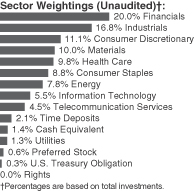
| Description | Percentage of Net Assets (%) | Shares | Market Value ($ Thousands) | |||||||||
COMMON STOCK — 95.2% |
| |||||||||||
Australia — 2.9% |
| |||||||||||
Brambles (A) | 0.5 | % | 139,484 | $ | 1,217 | |||||||
Other Securities | 2.4 | 5,401 | ||||||||||
|
| |||||||||||
| 6,618 | ||||||||||||
|
| |||||||||||
Austria — 0.3% |
| |||||||||||
Other Securities | 0.3 | 717 | ||||||||||
|
| |||||||||||
Belgium — 1.1% |
| |||||||||||
Other Securities | 1.1 | 2,644 | ||||||||||
|
| |||||||||||
Brazil — 0.4% |
| |||||||||||
Other Securities | 0.4 | 946 | ||||||||||
|
| |||||||||||
Canada — 3.8% |
| |||||||||||
Other Securities | 3.8 | 8,719 | ||||||||||
|
| |||||||||||
China — 0.3% |
| |||||||||||
Other Securities | 0.3 | 811 | ||||||||||
|
| |||||||||||
Denmark — 0.9% |
| |||||||||||
Other Securities | 0.9 | 1,990 | ||||||||||
|
| |||||||||||
Finland — 0.3% |
| |||||||||||
Other Securities | 0.3 | 676 | ||||||||||
|
| |||||||||||
France — 11.3% |
| |||||||||||
Arkema (A) | 0.6 | 13,470 | 1,382 | |||||||||
BNP Paribas (A) | 1.1 | 41,970 | 2,449 | |||||||||
Sanofi-Aventis (A) | 2.1 | 44,881 | 4,772 | |||||||||
Schneider Electric (A) | 1.0 | 27,868 | 2,199 | |||||||||
Total (A) | 0.4 | 20,450 | 1,019 | |||||||||
Other Securities | 6.1 | 14,290 | ||||||||||
|
| |||||||||||
| 26,111 | ||||||||||||
|
| |||||||||||
Germany — 9.0% |
| |||||||||||
Bayer (A) | 0.7 | 14,999 | 1,598 | |||||||||
DaimlerChrysler (A) | 0.8 | 28,422 | 1,800 | |||||||||
| Description | Percentage of Net Assets (%) | Shares | Market Value ($ Thousands) | |||||||||
Deutsche Boerse (A) | 0.5 | % | 18,918 | $ | 1,216 | |||||||
HeidelbergCement (A) | 0.5 | 14,666 | 1,102 | |||||||||
Linde (A) | 0.7 | 8,631 | 1,648 | |||||||||
Siemens (A) | 0.9 | 19,052 | 2,003 | |||||||||
Other Securities | 4.9 | 11,397 | ||||||||||
|
| |||||||||||
| 20,764 | ||||||||||||
|
| |||||||||||
Greece — 0.0% |
| |||||||||||
Other Securities | 0.0 | 39 | ||||||||||
|
| |||||||||||
Hong Kong — 3.2% |
| |||||||||||
Other Securities | 3.2 | 7,397 | ||||||||||
|
| |||||||||||
India — 0.4% |
| |||||||||||
Other Securities | 0.4 | 842 | ||||||||||
|
| |||||||||||
Indonesia — 0.1% |
| |||||||||||
Other Securities | 0.1 | 337 | ||||||||||
|
| |||||||||||
Ireland — 0.5% |
| |||||||||||
Other Securities | 0.5 | 1,162 | ||||||||||
|
| |||||||||||
Israel — 1.3% |
| |||||||||||
Check Point Software Technologies | 0.7 | 31,351 | 1,570 | |||||||||
Other Securities | 0.6 | 1,387 | ||||||||||
|
| |||||||||||
| 2,957 | ||||||||||||
|
| |||||||||||
Italy — 1.1% |
| |||||||||||
Other Securities | 1.1 | 2,515 | ||||||||||
|
| |||||||||||
Japan — 15.7% |
| |||||||||||
Astellas Pharma (A) | 0.5 | 20,900 | 1,062 | |||||||||
Daihatsu Motor (A) | 0.1 | 8,000 | 169 | |||||||||
FANUC (A) | 0.7 | 10,500 | 1,538 | |||||||||
Hino Motors (A) | 0.2 | 27,000 | 381 | |||||||||
JGC (A) | 0.5 | 36,000 | 1,188 | |||||||||
KDDI (A) | 0.5 | 23,700 | 1,064 | |||||||||
Nippon Telegraph & Telephone (A) | 0.5 | 22,900 | 1,124 | |||||||||
Seven & I Holdings (A) | 0.5 | 32,100 | 1,085 | |||||||||
SMC (A) | 0.8 | 10,100 | 1,906 | |||||||||
Sumitomo Mitsui Financial Group (A) | 0.6 | 33,800 | 1,327 | |||||||||
Toyota Motor (A) | 1.0 | 38,800 | 2,253 | |||||||||
Toyota Motor ADR | 0.2 | 3,160 | 371 | |||||||||
Other Securities | 9.6 | 22,850 | ||||||||||
|
| |||||||||||
| 36,318 | ||||||||||||
|
| |||||||||||
Jersey — 0.0% |
| |||||||||||
Other Securities | 0.0 | 13 | ||||||||||
|
| |||||||||||
Mexico ��� 0.0% |
| |||||||||||
Other Securities | 0.0 | 96 | ||||||||||
|
| |||||||||||
| 42 | SEI Institutional Investments Trust / Annual Report / May 31, 2013 |
Table of Contents
| Description | Percentage of Net Assets (%) | Shares | Market Value ($ Thousands) | |||||||||
Netherlands — 5.1% |
| |||||||||||
Akzo Nobel (A) | 1.0 | % | 34,413 | $ | 2,195 | |||||||
Koninklijke Ahold (A) | 0.5 | 71,717 | 1,160 | |||||||||
Reed Elsevier (A) | 0.6 | 87,413 | 1,429 | |||||||||
Unilever (A) | 0.7 | 38,739 | 1,578 | |||||||||
Other Securities | 2.3 | 5,567 | ||||||||||
|
| |||||||||||
| 11,929 | ||||||||||||
|
| |||||||||||
New Zealand — 0.1% |
| |||||||||||
Other Securities | 0.1 | 145 | ||||||||||
|
| |||||||||||
Norway — 1.8% |
| |||||||||||
DnB (A) | 0.9 | 124,523 | 2,008 | |||||||||
Statoil (A) | 0.5 | 55,740 | 1,255 | |||||||||
Other Securities | 0.4 | 897 | ||||||||||
|
| |||||||||||
| 4,160 | ||||||||||||
|
| |||||||||||
Portugal — 0.1% |
| |||||||||||
Other Securities | 0.1 | 159 | ||||||||||
|
| |||||||||||
Russia — 0.7% |
| |||||||||||
Other Securities | 0.7 | 1,667 | ||||||||||
|
| |||||||||||
Singapore — 1.2% |
| |||||||||||
Other Securities | 1.2 | 2,782 | ||||||||||
|
| |||||||||||
South Africa — 0.1% |
| |||||||||||
Other Securities | 0.1 | 309 | ||||||||||
|
| |||||||||||
South Korea — 1.8% |
| |||||||||||
Samsung Electronics* (A) | 0.7 | 1,119 | 1,508 | |||||||||
Other Securities | 1.1 | 2,794 | ||||||||||
|
| |||||||||||
| 4,302 | ||||||||||||
|
| |||||||||||
Spain — 0.9% |
| |||||||||||
Other Securities | 0.9 | 2,142 | ||||||||||
|
| |||||||||||
Sweden — 2.4% |
| |||||||||||
Telefonaktiebolaget LM Ericsson, Cl B (A) | 0.5 | 89,580 | 1,049 | |||||||||
Other Securities | 1.9 | 4,631 | ||||||||||
|
| |||||||||||
| 5,680 | ||||||||||||
|
| |||||||||||
Switzerland — 8.7% |
| |||||||||||
Givaudan (A) | 0.8 | 1,455 | 1,868 | |||||||||
Nestle (A) | 0.8 | 30,099 | 1,987 | |||||||||
Novartis (A) | 1.1 | 35,181 | 2,511 | |||||||||
Roche Holding (A) | 1.9 | 17,457 | 4,313 | |||||||||
SGS (A) | 0.5 | 541 | 1,208 | |||||||||
Sulzer (A) | 0.5 | 6,519 | 1,085 | |||||||||
UBS (A) | 0.4 | 59,266 | 1,036 | |||||||||
Zurich Insurance Group (A) | 0.5 | 4,169 | 1,099 | |||||||||
Other Securities | 2.2 | 5,046 | ||||||||||
|
| |||||||||||
| 20,153 | ||||||||||||
|
| |||||||||||
| Description | Percentage of Net Assets (%) | Shares | Market Value ($ Thousands) | |||||||||
Taiwan — 0.1% |
| |||||||||||
Other Securities | 0.1 | % | $ | 157 | ||||||||
|
| |||||||||||
Thailand — 0.0% |
| |||||||||||
Other Securities | 0.0 | 12 | ||||||||||
|
| |||||||||||
Turkey — 0.1% |
| |||||||||||
Other Securities | 0.1 | 150 | ||||||||||
|
| |||||||||||
United Kingdom — 18.5% |
| |||||||||||
Barclays (A) | 0.8 | 371,097 | 1,774 | |||||||||
BG Group (A) | 1.0 | 120,298 | 2,190 | |||||||||
BHP Billiton (A) | 0.6 | 50,472 | 1,448 | |||||||||
British American Tobacco (A) | 0.6 | 24,629 | 1,350 | |||||||||
Diageo (A) | 0.4 | 35,576 | 1,049 | |||||||||
HSBC Holdings | 1.0 | 212,689 | 2,329 | |||||||||
Lloyds Banking Group* (A) | 0.4 | 1,096,961 | 1,017 | |||||||||
Petrofac (A) | 0.6 | 63,155 | 1,281 | |||||||||
Prudential (A) | 0.4 | 61,729 | 1,036 | |||||||||
Rio Tinto (A) | 0.4 | 24,436 | 1,042 | |||||||||
Royal Dutch Shell, Cl A (GBP) (A) | 0.4 | 26,315 | 874 | |||||||||
Royal Dutch Shell, Cl A (A) | 0.4 | 26,128 | 870 | |||||||||
Royal Dutch Shell, Cl B (A) | 0.2 | 15,178 | 522 | |||||||||
Royal Dutch Shell ADR, Cl B | 0.2 | 5,625 | 387 | |||||||||
Tesco (A) | 0.7 | 314,694 | 1,739 | |||||||||
Unilever (A) | 0.4 | 19,874 | 833 | |||||||||
Vodafone Group (A) | 0.6 | 494,036 | 1,429 | |||||||||
Other Securities | 9.4 | 21,724 | ||||||||||
|
| |||||||||||
| 42,894 | ||||||||||||
|
| |||||||||||
United States — 1.0% |
| |||||||||||
Other Securities | 1.0 | 2,237 | ||||||||||
|
| |||||||||||
Total Common Stock |
| 220,550 | ||||||||||
|
| |||||||||||
PREFERRED STOCK — 0.6% |
| |||||||||||
Germany — 0.6% |
| |||||||||||
Other Securities | 0.6 | 1,377 | ||||||||||
|
| |||||||||||
Total Preferred Stock |
| 1,377 | ||||||||||
|
| |||||||||||
RIGHTS — 0.0% |
| |||||||||||
Italy — 0.0% |
| |||||||||||
Other Securities | — | |||||||||||
|
| |||||||||||
Total Rights (Cost $—) ($ Thousands) |
| — | ||||||||||
|
| |||||||||||
CASH EQUIVALENT — 1.4% |
| |||||||||||
SEI Daily Income Trust, Prime Obligation Fund, Cl A | 1.4 | 3,132,179 | 3,132 | |||||||||
|
| |||||||||||
Total Cash Equivalent |
| 3,132 | ||||||||||
|
| |||||||||||
| SEI Institutional Investments Trust / Annual Report / May 31, 2013 | 43 |
Table of Contents
SUMMARY SCHEDULE OF INVESTMENTS
International Equity Fund (Concluded)
May 31, 2013
| Description | Percentage of Net Assets (%) | Face Amount (1) (Thousands) | Market Value ($ Thousands) | |||||||||||
TIME DEPOSITS — 2.1% |
| |||||||||||||
Brown Brothers Harriman | ||||||||||||||
4.150%, 06/01/2013 | ZAR | 6 | $ | 1 | ||||||||||
1.903%, 06/01/2013 | AUD | 43 | 41 | |||||||||||
1.667%, 06/01/2013 | NZD | 27 | 22 | |||||||||||
0.484%, 06/01/2013 | NOK | 9 | 1 | |||||||||||
0.280%, 06/01/2013 | CAD | — | — | |||||||||||
0.100%, 06/01/2013 | SEK | 1 | — | |||||||||||
0.076%, 06/01/2013 | GBP | 27 | 40 | |||||||||||
0.030%, 06/01/2013 | 4,667 | 4,667 | ||||||||||||
0.005%, 06/01/2013 | JPY | 3,205 | 32 | |||||||||||
0.005%, 06/01/2013 | HKD | 87 | 11 | |||||||||||
0.005%, 06/01/2013 | SGD | 1 | 1 | |||||||||||
0.001%, 06/01/2013 | CHF | 41 | 43 | |||||||||||
0.001%, 06/01/2013 | EUR | 78 | 101 | |||||||||||
(0.10)%, 06/01/2013 | DKK | 23 | 4 | |||||||||||
|
| |||||||||||||
Total Time Deposits |
| 4,964 | ||||||||||||
|
| |||||||||||||
U.S. TREASURY OBLIGATION (B) — 0.3% |
| |||||||||||||
Other Securities | 0.3% | 705 | ||||||||||||
|
| |||||||||||||
Total U.S. Treasury Obligation |
| 705 | ||||||||||||
|
| |||||||||||||
Total Investments — 99.6% |
| $ | 230,728 | |||||||||||
|
| |||||||||||||
A list of the open futures contracts held by the Fund at May 31, 2013, is as follows:
| Type of Contract | Number of Contracts Long | Expiration Date | Unrealized Depreciation ($ Thousands) | |||||||||
Hang Seng Index | 1 | Jun-2013 | $ | (2 | ) | |||||||
SPI 200 Index | 4 | Jun-2013 | (5 | ) | ||||||||
Topix Index | 8 | Jun-2013 | (36 | ) | ||||||||
|
| |||||||||||
| $ | (43 | ) | ||||||||||
|
| |||||||||||
For the year ended May 31, 2013, the total amount of all open futures contracts, as presented in the table above, are representative of the volume of activity for this derivative type during the year.
Percentages are based on a Net Assets of $231,661 ($ Thousands).
| * | Non-income producing security. |
| ** | The rate reported is the 7-day effective yield as of May 31, 2013. |
| † | Investment in Affiliated Security (see Note 5). |
| (1) | In U.S. dollars unless otherwise indicated. |
| (A) | Security fair valued using methods determined in good faith by the Valuation Committee of the Board of Trustees. The total market value of such securities as of May 31, 2013 was $199,028 ($ Thousands) and represented 85.9% of Net Assets. |
| (B) | Security, or portion thereof, has been pledged as collateral on open futures contracts. |
ADR — American Depository Receipt
AUD — Australian Dollar
CAD — Canadian Dollar
CHF — Swiss Franc
Cl — Class
DKK — Danish Krone
EUR — Euro
GBP — British Pound Sterling
HKD — Hong Kong Dollar
JPY — Japanese Yen
NOK — Norwegian Krone
NZD — New Zealand Dollar
SEK — Swedish Krone
SGD — Singapore Dollar
SPI — Share Price Index
ZAR — South African Rand
The Summary Schedule of Investments does not reflect the complete portfolio holdings. It includes the Fund’s 50 largest holdings and each investment of any issuer that exceeds 1% of the Fund’s net assets. “Other Securities” represent all issues not required to be disclosed under the rules adopted by the U.S. Securities and Exchange Commission (“SEC”). In certain instances, securities for which footnotes listed above may otherwise apply are included in the Other Securities caption. The complete schedule of portfolio holdings is available (i) without charge, upon request, by calling (800) 342-5734; and (ii) on the SEC’s website at http://www.sec.gov.
The following is a list of the inputs used as of May 31, 2013, in valuing the Fund’s investments and other financial instruments carried at value ($ Thousands):
| Investments in Securities | Level 1 | Level 2 | Level 3 | Total | ||||||||||||
Common Stock | $ | 22,899 | $ | 197,651 | $ | — | $ | 220,550 | ||||||||
Preferred Stock | — | 1,377 | — | 1,377 | ||||||||||||
Cash Equivalent | 3,132 | — | — | 3,132 | ||||||||||||
Time Deposits | 4,964 | — | — | 4,964 | ||||||||||||
U.S. Treasury Obligation | — | 705 | — | 705 | ||||||||||||
|
|
|
|
|
|
|
| |||||||||
Total Investments in Securities | $ | 30,995 | $ | 199,733 | $ | — | $ | 230,728 | ||||||||
|
|
|
|
|
|
|
| |||||||||
| Other Financial Instruments | Level 1 | Level 2 | Level 3 | Total | ||||||||||||
Futures Contracts* | $ | (43 | ) | $ | — | $ | — | $ | (43 | ) | ||||||
|
|
|
|
|
|
|
| |||||||||
| * | Futures contracts are valued at the unrealized depreciation on the instrument. |
For the year ended May 31, 2013, there were transfers between Level 1 and Level 2 assets and liabilities. The primary reason for changes in the classifications between Levels 1 and 2 occurs when foreign equity securities are fair valued using other observable market-based inputs in place of the closing exchange price due to events occurring after the close of the exchange or market on which the investment is principally traded.
For the year ended May 31, 2013, there were transfers between Level 2 and Level 3 assets and liabilities. The transfers were due to changes in the availability of observable inputs used to determine fair value.
For more information on valuation inputs, see Note 2 — Significant Accounting Policies in Notes to Financial Statements.
Amounts designated as “—” are $0 or have been rounded to $0.
The accompanying notes are an integral part of the financial statements.
| 44 | SEI Institutional Investments Trust / Annual Report / May 31, 2013 |
Table of Contents
SUMMARY SCHEDULE OF INVESTMENTS
World Equity Ex-US Fund
May 31, 2013
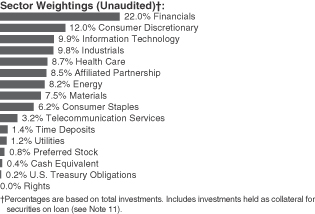
| Description | Percentage of Net Assets (%) | Shares | Market Value ($ Thousands) | |||||||||
COMMON STOCK — 95.5% |
| |||||||||||
Argentina — 0.1% |
| |||||||||||
Other Securities | 0.1 | % | $ | 7,737 | ||||||||
|
| |||||||||||
Australia — 1.8% |
| |||||||||||
Other Securities | 1.8 | 108,722 | ||||||||||
|
| |||||||||||
Austria — 1.1% |
| |||||||||||
Schoeller-Bleckmann Oilfield Equipment (A) | 0.5 | 276,236 | 28,255 | |||||||||
Other Securities | 0.6 | 37,699 | ||||||||||
|
| |||||||||||
| 65,954 | ||||||||||||
|
| |||||||||||
Belgium — 0.3% |
| |||||||||||
Other Securities | 0.3 | 15,581 | ||||||||||
|
| |||||||||||
Brazil — 3.3% |
| |||||||||||
Banco Bradesco ADR (B) | 0.7 | 2,623,461 | 42,316 | |||||||||
Banco do Brasil | 0.5 | 2,421,000 | 28,541 | |||||||||
Cia de Saneamento Basicodo Estado de Sao Paulo ADR (B) | 0.7 | 3,140,670 | 39,949 | |||||||||
Other Securities | 1.4 | 94,872 | ||||||||||
|
| |||||||||||
| 205,678 | ||||||||||||
|
| |||||||||||
Canada — 4.7% |
| |||||||||||
Manulife Financial (B) | 0.5 | 1,821,000 | 28,772 | |||||||||
Valeant Pharmaceuticals International* | 0.5 | 315,020 | 29,074 | |||||||||
Other Securities | 3.7 | 236,018 | ||||||||||
|
| |||||||||||
| 293,864 | ||||||||||||
|
| |||||||||||
Chile — 0.1% |
| |||||||||||
Other Securities | 0.1 | 3,855 | ||||||||||
|
| |||||||||||
| Description | Percentage of Net Assets (%) | Shares | Market Value ($ Thousands) | |||||||||
China — 4.1% |
| |||||||||||
Industrial & Commercial Bank of China (A) | 0.6 | % | 55,654,402 | $ | 38,938 | |||||||
Tencent Holdings (A) | 0.5 | 757,400 | 29,811 | |||||||||
Other Securities | 3.0 | 184,263 | ||||||||||
|
| |||||||||||
| 253,012 | ||||||||||||
|
| |||||||||||
Colombia — 0.3% |
| |||||||||||
Other Securities | 0.3 | 17,394 | ||||||||||
|
| |||||||||||
Czech Republic — 0.2% |
| |||||||||||
Other Securities | 0.2 | 11,712 | ||||||||||
|
| |||||||||||
Denmark — 1.1% |
| |||||||||||
Other Securities | 1.1 | 67,804 | ||||||||||
|
| |||||||||||
Finland — 0.2% |
| |||||||||||
Other Securities | 0.2 | 13,036 | ||||||||||
|
| |||||||||||
France — 3.6% |
| |||||||||||
Other Securities | 3.6 | 221,194 | ||||||||||
|
| |||||||||||
Germany — 7.9% |
| |||||||||||
Adidas (A) | 0.8 | 462,997 | 50,194 | |||||||||
SAP (A) (B) | 0.8 | 637,530 | 47,574 | |||||||||
Siemens (A) | 0.7 | 388,581 | 40,843 | |||||||||
Symrise (A) | 0.5 | 762,589 | 30,989 | |||||||||
Other Securities | 5.1 | 321,179 | ||||||||||
|
| |||||||||||
| 490,779 | ||||||||||||
|
| |||||||||||
Hong Kong — 3.2% |
| |||||||||||
AIA Group (A) | 0.5 | 6,771,340 | 29,935 | |||||||||
Other Securities | 2.7 | 168,285 | ||||||||||
|
| |||||||||||
| 198,220 | ||||||||||||
|
| |||||||||||
India — 1.4% |
| |||||||||||
ICICI Bank ADR | 0.7 | 921,352 | 41,433 | |||||||||
Other Securities | 0.7 | 43,605 | ||||||||||
|
| |||||||||||
| 85,038 | ||||||||||||
|
| |||||||||||
Indonesia — 1.1% |
| |||||||||||
Bank Rakyat Indonesia Persero (A) | 0.5 | 32,579,742 | 29,460 | |||||||||
Other Securities | 0.6 | 35,300 | ||||||||||
|
| |||||||||||
| 64,760 | ||||||||||||
|
| |||||||||||
Ireland — 0.7% |
| |||||||||||
Other Securities | 0.7 | 45,667 | ||||||||||
|
| |||||||||||
Israel — 0.6% |
| |||||||||||
Other Securities | 0.6 | 35,689 | ||||||||||
|
| |||||||||||
| SEI Institutional Investments Trust / Annual Report / May 31, 2013 | 45 |
Table of Contents
SUMMARY SCHEDULE OF INVESTMENTS
World Equity Ex-US Fund (Continued)
May 31, 2013
| Description | Percentage of Net Assets (%) | Shares | Market Value ($ Thousands) | |||||||||
Italy — 0.9% |
| |||||||||||
Other Securities | 0.9 | % | $ | 56,855 | ||||||||
|
| |||||||||||
Japan — 12.8% |
| |||||||||||
Denso (A) | 0.6 | 849,400 | 34,913 | |||||||||
Hitachi (A) | 0.8 | 7,578,300 | 50,746 | |||||||||
KDDI (A) | 0.6 | 859,416 | 38,572 | |||||||||
Komatsu (A) | 0.6 | 1,372,471 | 34,192 | |||||||||
Mitsubishi UFJ Financial Group (A) | 0.5 | 5,588,056 | 32,264 | |||||||||
Mitsui Trust Holdings (A) | 0.6 | 9,067,046 | 36,956 | |||||||||
Softbank (A) | 0.6 | 711,130 | 35,363 | |||||||||
Toyota Motor (A) | 0.7 | 730,109 | 42,389 | |||||||||
Other Securities | 7.8 | 484,261 | ||||||||||
|
| |||||||||||
| 789,656 | ||||||||||||
|
| |||||||||||
Malaysia — 0.1% |
| |||||||||||
Other Securities | 0.1 | 8,289 | ||||||||||
|
| |||||||||||
Mexico — 0.6% |
| |||||||||||
Other Securities | 0.6 | 39,506 | ||||||||||
|
| |||||||||||
Netherlands — 3.6% |
| |||||||||||
Chicago Bridge & Iron | 0.5 | 490,468 | 31,047 | |||||||||
Core Laboratories (B) | 0.7 | 324,577 | 44,714 | |||||||||
LyondellBasell Industries, Cl A (B) | 0.5 | 429,325 | 28,614 | |||||||||
NXP Semiconductor* | 0.5 | 940,980 | 29,029 | |||||||||
Other Securities | 1.4 | 89,022 | ||||||||||
|
| |||||||||||
| 222,426 | ||||||||||||
|
| |||||||||||
New Zealand — 0.0% |
| |||||||||||
Other Securities | 0.0 | 2,367 | ||||||||||
|
| |||||||||||
Norway — 2.0% |
| |||||||||||
DnB (A) | 0.6 | 2,181,356 | 35,174 | |||||||||
Statoil ADR (B) | 0.7 | 1,872,022 | 42,158 | |||||||||
Other Securities | 0.7 | 47,083 | ||||||||||
|
| |||||||||||
| 124,415 | ||||||||||||
|
| |||||||||||
Peru — 0.1% |
| |||||||||||
Other Securities | 0.1 | 5,144 | ||||||||||
|
| |||||||||||
Philippines — 0.0% |
| |||||||||||
Other Securities | 0.0 | 319 | ||||||||||
|
| |||||||||||
Poland — 0.0% |
| |||||||||||
Other Securities | 0.0 | 1,010 | ||||||||||
|
| |||||||||||
Qatar — 0.4% |
| |||||||||||
Other Securities | 0.4 | 25,886 | ||||||||||
|
| |||||||||||
Russia — 0.7% |
| |||||||||||
Other Securities | 0.7 | 42,098 | ||||||||||
|
| |||||||||||
| Description | Percentage of Net Assets (%) | Shares | Market Value ($ Thousands) | |||||||||
Singapore — 1.6% |
| |||||||||||
Other Securities | 1.6 | % | $ | 100,343 | ||||||||
|
| |||||||||||
South Africa — 0.6% |
| |||||||||||
Sasol ADR (B) | 0.5 | 775,100 | 34,399 | |||||||||
Other Securities | 0.1 | 4,168 | ||||||||||
|
| |||||||||||
| 38,567 | ||||||||||||
|
| |||||||||||
South Korea — 3.8% |
| |||||||||||
Samsung Electronics (A) | 1.2 | 55,820 | 75,210 | |||||||||
Other Securities | 2.6 | 159,211 | ||||||||||
|
| |||||||||||
| 234,421 | ||||||||||||
|
| |||||||||||
Spain — 0.6% |
| |||||||||||
Amadeus IT Holding, Cl A (A) (B) | 0.5 | 1,105,901 | 33,656 | |||||||||
Other Securities | 0.1 | 3,171 | ||||||||||
|
| |||||||||||
| 36,827 | ||||||||||||
|
| |||||||||||
Sweden — 2.3% |
| |||||||||||
Getinge, Cl B (A) (B) | 0.5 | 1,073,866 | 31,979 | |||||||||
Other Securities | 1.8 | 113,265 | ||||||||||
|
| |||||||||||
| 145,244 | ||||||||||||
|
| |||||||||||
Switzerland — 6.2% |
| |||||||||||
Credit Suisse Group (A) | 0.5 | 955,914 | 28,155 | |||||||||
Roche Holding (A) | 1.1 | 284,021 | 70,173 | |||||||||
UBS (A) | 0.5 | 1,762,492 | 30,817 | |||||||||
Zurich Insurance Group ADR (B) | 0.6 | 1,348,600 | 35,832 | |||||||||
Other Securities | 3.5 | 221,162 | ||||||||||
|
| |||||||||||
| 386,139 | ||||||||||||
|
| |||||||||||
Taiwan — 1.6% |
| |||||||||||
Other Securities | 1.6 | 95,876 | ||||||||||
|
| |||||||||||
Thailand — 1.1% |
| |||||||||||
Other Securities | 1.1 | 69,763 | ||||||||||
|
| |||||||||||
Turkey — 1.4% |
| |||||||||||
Other Securities | 1.4 | 84,295 | ||||||||||
|
| |||||||||||
United Kingdom — 15.9% |
| |||||||||||
3i Group (A) | 0.5 | 6,029,833 | 30,911 | |||||||||
ARM Holdings ADR (B) | 0.8 | 1,168,359 | 51,268 | |||||||||
AstraZeneca ADR (B) | 0.6 | 716,000 | 36,695 | |||||||||
Barclays (A) | 0.7 | 8,481,991 | 40,542 | |||||||||
Diageo (A) | 0.6 | 1,257,639 | 37,070 | |||||||||
HSBC Holdings | 1.1 | 5,931,891 | 64,950 | |||||||||
Rio Tinto ADR (B) | 0.6 | 906,713 | 38,735 | |||||||||
Royal Dutch Shell, Cl A (A) | 0.7 | 1,358,917 | 45,247 | |||||||||
| 46 | SEI Institutional Investments Trust / Annual Report / May 31, 2013 |
Table of Contents
| Description | Percentage of Net Assets (%) | Shares/Face Amount (1) (Thousands) | Market Value ($ Thousands) | |||||||||
Royal Dutch Shell, Cl A (GBP) (A) | 0.2 | % | 329,219 | $ | 10,933 | |||||||
Royal Dutch Shell ADR, Cl A | 0.5 | 493,300 | 32,740 | |||||||||
Sage Group (A) | 0.5 | 5,074,100 | 27,945 | |||||||||
Shire (A) | 0.6 | 1,032,431 | 33,908 | |||||||||
WPP (A) | 0.7 | 2,405,072 | 40,855 | |||||||||
Other Securities | 7.8 | 493,773 | ||||||||||
|
| |||||||||||
| 985,572 | ||||||||||||
|
| |||||||||||
United States — 3.4% |
| |||||||||||
Other Securities | 3.4 | 212,081 | ||||||||||
|
| |||||||||||
Total Common Stock |
| 5,912,795 | ||||||||||
|
| |||||||||||
PREFERRED STOCK — 0.9% |
| |||||||||||
Brazil — 0.3% |
| |||||||||||
Other Securities | 0.3 | 20,810 | ||||||||||
|
| |||||||||||
Germany — 0.6% |
| |||||||||||
Other Securities | 0.6 | 34,163 | ||||||||||
|
| |||||||||||
Total Preferred Stock |
| 54,973 | ||||||||||
|
| |||||||||||
RIGHTS — 0.0% |
| |||||||||||
Italy — 0.0% |
| |||||||||||
Other Securities | — | |||||||||||
|
| |||||||||||
Total Rights |
| — | ||||||||||
|
| |||||||||||
AFFILIATED PARTNERSHIP — 9.2% |
| |||||||||||
SEI Liquidity Fund, L.P. |
| |||||||||||
0.100%**† (C) | 9.2 | 570,536,741 | 570,537 | |||||||||
|
| |||||||||||
Total Affiliated Partnership |
| 570,537 | ||||||||||
|
| |||||||||||
CASH EQUIVALENT — 0.4% |
| |||||||||||
SEI Daily Income Trust, Prime Obligation Fund, Cl A | ||||||||||||
0.010%**† | 0.4 | 25,307,648 | 25,308 | |||||||||
|
| |||||||||||
Total Cash Equivalent |
| 25,308 | ||||||||||
|
| |||||||||||
TIME DEPOSITS — 1.5% |
| |||||||||||
Brown Brothers Harriman | ||||||||||||
4.150%, 06/01/2013 | ZAR | 56 | 6 | |||||||||
1.903%, 06/01/2013 | AUD | 183 | 175 | |||||||||
1.667%, 06/01/2013 | NZD | 461 | 368 | |||||||||
| Description | Percentage of Net Assets (%) | Face Amount (1) (Thousands)/ Shares | Market Value ($ Thousands) | |||||||||
0.484%, 06/01/2013 | NOK | 2,738 | $ | 465 | ||||||||
0.280%, 06/01/2013 | CAD | 104 | 101 | |||||||||
0.100%, 06/01/2013 | SEK | 4,540 | 683 | |||||||||
0.076%, 06/01/2013 | GBP | 2,746 | 4,163 | |||||||||
0.030%, 06/01/2013 | 81,091 | 81,091 | ||||||||||
0.005%, 06/01/2013 | JPY | 17,860 | 177 | |||||||||
0.005%, 06/01/2013 | HKD | 6,188 | 797 | |||||||||
0.005%, 06/01/2013 | SGD | 385 | 304 | |||||||||
0.001%, 06/01/2013 | CHF | 2,001 | 2,086 | |||||||||
0.001%, 06/01/2013 | EUR | 1,248 | 1,618 | |||||||||
(0.10)%, 06/01/2013 | DKK | 1,309 | 227 | |||||||||
|
| |||||||||||
Total Time Deposits | 92,261 | |||||||||||
|
| |||||||||||
U.S. TREASURY OBLIGATIONS (D) — 0.2% |
| |||||||||||
Other Securities 0.2% |
| 12,288 | ||||||||||
|
| |||||||||||
Total U.S. Treasury Obligations | 12,288 | |||||||||||
|
| |||||||||||
Total Investments — 107.7% | $ | 6,668,162 | ||||||||||
|
| |||||||||||
A list of the open futures contracts held by the Fund at May 31, 2013, is as follows:
| Type of Contract | Number of Contracts Long | Expiration Date | Unrealized Appreciation (Depreciation) ($ Thousands) | |||||||||
DJ Euro Stoxx 50 Index | 1,174 | Jun-2013 | $ | 329 | ||||||||
FTSE 100 Index | 379 | Jun-2013 | 180 | |||||||||
Hang Seng Index | 41 | Jun-2013 | (15 | ) | ||||||||
S&P TSX 60 Index | 113 | Jun-2013 | 119 | |||||||||
SPI 200 Index | 103 | Jun-2013 | (203 | ) | ||||||||
Topix Index | 238 | Jun-2013 | (412 | ) | ||||||||
|
| |||||||||||
| $ | (2 | ) | ||||||||||
|
| |||||||||||
For the year ended May 31, 2013, the total amount of all open futures contracts, as presented in the table above, are representative of the volume of activity for this derivative type during the year.
Percentages are based on a Net Assets of $6,192,852 ($ Thousands).
| * | Non-income producing security. |
| ** | The rate reported is the 7-day effective yield as of May 31, 2013. |
| † | Investment in Affiliated Security (see Note 5). |
| (1) | In U.S. dollars unless otherwise indicated. |
| (A) | Security fair valued using methods determined in good faith by the Valuation Committee of the Board of Trustees. The total market value of such securities as of May 31, 2013 was $4,036,972 ($ Thousands) and represented 65.2% of Net Assets. |
| (B) | This security or a partial position of this security is on loan at May 31, 2013. The total value of securities on loan at May 31, 2013 was $540,135 ($ Thousands). |
| (C) | This security was purchased with cash collateral held from securities on loan (see Note 11). The total value of such securities as of May 31, 2013 was $570,537 ($ Thousands). |
| (D) | Security, or portion thereof, has been pledged with collateral on open futures contracts. |
ADR — American Depositary Receipt
AUD — Australian Dollar
CAD — Canadian Dollar
CHF — Swiss Franc
Cl — Class
DJ — Dow Jones
DKK — Danish Krone
| SEI Institutional Investments Trust / Annual Report / May 31, 2013 | 47 |
Table of Contents
SUMMARY SCHEDULE OF INVESTMENTS
World Equity Ex-US Fund (Concluded)
May 31, 2013
EUR — Euro
FTSE — Financial Times and Stock Exchange
GBP — British Pound Sterling
HKD — Hong Kong Dollar
JPY — Japanese Yen
L.P. — Limited Partnership
NOK — Norwegian Krone
NZD — New Zealand Dollar
S&P — Standard & Poor’s
SEK — Swedish Krona
SGD — Singapore Dollar
SPI — Share Price Index
TSX — Toronto Stock Exchange
ZAR — South African Rand
The Summary Schedule of Investments does not reflect the complete portfolio holdings. It includes the Fund’s 50 largest holdings and each investment of any issuer that exceeds 1% of the Fund’s net assets. “Other Securities” represent all issues not required to be disclosed under the rules adopted by the U.S. Securities and Exchange Commission (“SEC”). In certain instances, securities for which footnotes listed above may otherwise apply are included in the Other Securities caption. The complete schedule of portfolio holdings is available (i) without charge, upon request, by calling (800) 342-5734; and (ii) on the SEC’s website at http://www.sec.gov.
The following is a list of the inputs used as of May 31, 2013, in valuing the Fund’s investments and other financial instruments carried at value ($ Thousands):
| Investments in Securities | Level 1 | Level 2 | Level 3 | Total | ||||||||||||
Common Stock | $ | 1,909,986 | $ | 4,002,809 | $ | — | $ | 5,912,795 | ||||||||
Preferred Stock | 20,810 | 34,163 | — | 54,973 | ||||||||||||
Affiliated Partnership | — | 570,537 | — | 570,537 | ||||||||||||
Cash Equivalent | 25,308 | — | — | 25,308 | ||||||||||||
Time Deposits | 92,261 | — | — | 92,261 | ||||||||||||
U.S. Treasury Obligations | — | 12,288 | — | 12,288 | ||||||||||||
|
|
|
|
|
|
|
| |||||||||
Total Investments in Securities | $ | 2,048,365 | $ | 4,619,797 | $ | — | $ | 6,668,162 | ||||||||
|
|
|
|
|
|
|
| |||||||||
| Other Financial Instruments | Level 1 | Level 2 | Level 3 | Total | ||||||||||||
Futures Contracts* | $ | (2 | ) | $ | — | $ | — | $ | (2 | ) | ||||||
|
|
|
|
|
|
|
| |||||||||
| * | Futures contracts are valued at the unrealized depreciation on the instrument. |
For the year ended May 31, 2013, there were transfers between Level 1 and Level 2 assets and liabilities. The primary reason for changes in the classifications between Levels 1 and 2 occurs when foreign equity securities are fair valued using other observable market-based inputs in place of the closing exchange price due to events occurring after the close of the exchange or market on which the investment is principally traded.
For the year ended May 31, 2013, there were transfers between Level 2 and Level 3 assets and liabilities. The transfers were due to changes in the availability of observable inputs used to determine fair value.
For more information on valuation inputs, see Note 2 — Significant Accounting Policies in Notes to Financial Statements.
Amounts designated as “—” are $0 or have been rounded to $0.
The accompanying notes are an integral part of the financial statements.
| 48 | SEI Institutional Investments Trust / Annual Report / May 31, 2013 |
Table of Contents
SUMMARY SCHEDULE OF INVESTMENTS
Screened World Equity Ex-US Fund
May 31, 2013
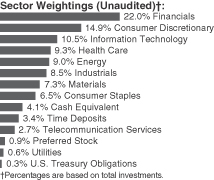
| Description | Percentage of Net Assets (%) | Shares | Market Value ($ Thousands) | |||||||||
COMMON STOCK — 91.4% |
| |||||||||||
Argentina — 0.2% |
| |||||||||||
Other Securities | 0.2 | % | $ | 126 | ||||||||
|
| |||||||||||
Australia — 1.7% |
| |||||||||||
Commonwealth Bank of Australia (A) | 0.6 | 5,747 | 366 | |||||||||
Other Securities | 1.1 | 687 | ||||||||||
|
| |||||||||||
| 1,053 | ||||||||||||
|
| |||||||||||
Austria — 2.1% |
| |||||||||||
OMV (A) | 0.7 | 9,483 | 436 | |||||||||
Schoeller-Bleckmann Oilfield Equipment (A) | 0.6 | 3,719 | 380 | |||||||||
Other Securities | 0.8 | 468 | ||||||||||
|
| |||||||||||
| 1,284 | ||||||||||||
|
| |||||||||||
Belgium — 0.1% |
| |||||||||||
Other Securities | 0.1 | 48 | ||||||||||
|
| |||||||||||
Brazil — 1.5% |
| |||||||||||
Other Securities | 1.5 | 962 | ||||||||||
|
| |||||||||||
Canada — 4.2% |
| |||||||||||
Canadian National Railway | 0.6 | 3,558 | 362 | |||||||||
Other Securities | 3.6 | 2,272 | ||||||||||
|
| |||||||||||
| 2,634 | ||||||||||||
|
| |||||||||||
Chile — 0.1% |
| |||||||||||
Other Securities | 0.1 | 44 | ||||||||||
|
| |||||||||||
China — 5.7% |
| |||||||||||
Industrial & Commercial Bank of China (A) | 1.3 | 1,150,836 | 805 | |||||||||
Other Securities | 4.4 | 2,737 | ||||||||||
|
| |||||||||||
| 3,542 | ||||||||||||
|
| |||||||||||
| Description | Percentage of Net Assets (%) | Shares | Market Value ($ Thousands) | |||||||||
Colombia — 0.4% |
| |||||||||||
Other Securities | 0.4 | % | $ | 241 | ||||||||
|
| |||||||||||
Czech Republic — 0.3% |
| |||||||||||
Other Securities | 0.3 | 167 | ||||||||||
|
| |||||||||||
Denmark — 0.9% |
| |||||||||||
Novo-Nordisk, Cl B (A) | 0.6 | 2,447 | 395 | |||||||||
Other Securities | 0.3 | 157 | ||||||||||
|
| |||||||||||
| 552 | ||||||||||||
|
| |||||||||||
Finland — 1.3% |
| |||||||||||
Other Securities | 1.3 | 793 | ||||||||||
|
| |||||||||||
France — 5.0% |
| |||||||||||
BNP Paribas (A) | 0.6 | 6,604 | 385 | |||||||||
Compagnie Generale des Etablissements Michelin, Cl B (A) | 0.6 | 4,385 | 382 | |||||||||
LVMH Moet Hennessy Louis Vuitton (A) | 0.7 | 2,333 | 411 | |||||||||
Other Securities | 3.1 | 1,939 | ||||||||||
|
| |||||||||||
| 3,117 | ||||||||||||
|
| |||||||||||
Germany — 5.3% |
| |||||||||||
Adidas (A) | 0.5 | 3,090 | 335 | |||||||||
BASF (A) | 0.7 | 4,536 | 438 | |||||||||
Bayer (A) | 0.6 | 3,674 | 391 | |||||||||
Deutsche Bank (A) | 0.6 | 7,753 | 359 | |||||||||
Fresenius Medical Care (A) | 0.5 | 4,992 | 338 | |||||||||
Other Securities | 2.4 | 1,443 | ||||||||||
|
| |||||||||||
| 3,304 | ||||||||||||
|
| |||||||||||
Hong Kong — 3.8% |
| |||||||||||
AIA Group (A) | 0.8 | 105,382 | 466 | |||||||||
Orient Overseas International (A) | 0.5 | 53,000 | 332 | |||||||||
Other Securities | 2.5 | 1,570 | ||||||||||
|
| |||||||||||
| 2,368 | ||||||||||||
|
| |||||||||||
India — 1.0% |
| |||||||||||
ICICI Bank ADR | 1.0 | 13,577 | 611 | |||||||||
Other Securities | 0.0 | 3 | ||||||||||
|
| |||||||||||
| 614 | ||||||||||||
|
| |||||||||||
Indonesia — 0.5% |
| |||||||||||
Other Securities | 0.5 | 287 | ||||||||||
|
| |||||||||||
Ireland — 1.2% |
| |||||||||||
Accenture, Cl A | 0.6 | 4,432 | 364 | |||||||||
ICON* | 0.6 | 11,034 | 379 | |||||||||
|
| |||||||||||
| 743 | ||||||||||||
|
| |||||||||||
Italy — 0.8% |
| |||||||||||
Other Securities | 0.8 | 507 | ||||||||||
|
| |||||||||||
| SEI Institutional Investments Trust / Annual Report / May 31, 2013 | 49 |
Table of Contents
SUMMARY SCHEDULE OF INVESTMENTS
Screened World Equity Ex-US Fund (Continued)
May 31, 2013
| Description | Percentage of Net Assets (%) | Shares | Market Value ($ Thousands) | |||||||||
Japan — 12.9% |
| |||||||||||
Denso (A) | 0.9 | % | 13,500 | $ | 555 | |||||||
Hitachi (A) | 0.8 | 74,000 | 495 | |||||||||
Honda Motor ADR | 0.5 | 8,785 | 330 | |||||||||
Nippon Telegraph & Telephone (A) | 0.6 | 7,100 | 348 | |||||||||
Secom (A) | 0.5 | 6,600 | 331 | |||||||||
Toyota Motor (A) | 1.7 | 18,717 | 1,087 | |||||||||
Other Securities | 7.9 | 4,940 | ||||||||||
|
| |||||||||||
| 8,086 | ||||||||||||
|
| |||||||||||
Malaysia — 0.4% |
| |||||||||||
Other Securities | 0.4 | 266 | ||||||||||
|
| |||||||||||
Mexico — 1.0% |
| |||||||||||
Other Securities | 1.0 | 615 | ||||||||||
|
| |||||||||||
Netherlands — 3.2% |
| |||||||||||
ASML Holding (A) | 0.5 | 4,038 | 333 | |||||||||
Core Laboratories | 1.0 | 4,672 | 643 | |||||||||
European Aeronautic Defense and Space (A) | 0.6 | 6,258 | 359 | |||||||||
Unilever (A) | 0.7 | 10,703 | 436 | |||||||||
Other Securities | 0.4 | 217 | ||||||||||
|
| |||||||||||
| 1,988 | ||||||||||||
|
| |||||||||||
New Zealand — 0.3% |
| |||||||||||
Other Securities | 0.3 | 208 | ||||||||||
|
| |||||||||||
Norway — 1.3% |
| |||||||||||
DnB (A) | 1.0 | 40,386 | 651 | |||||||||
Other Securities | 0.3 | 189 | ||||||||||
|
| |||||||||||
| 840 | ||||||||||||
|
| |||||||||||
Peru — 0.2% |
| |||||||||||
Other Securities | 0.2 | 98 | ||||||||||
|
| |||||||||||
Philippines — 0.2% |
| |||||||||||
Other Securities | 0.2 | 154 | ||||||||||
|
| |||||||||||
Poland — 0.1% |
| |||||||||||
Other Securities | 0.1 | 80 | ||||||||||
|
| |||||||||||
Portugal — 0.0% |
| |||||||||||
Other Securities | 0.0 | 17 | ||||||||||
|
| |||||||||||
Russia — 0.2% |
| |||||||||||
Other Securities | 0.2 | 109 | ||||||||||
|
| |||||||||||
Singapore — 1.3% |
| |||||||||||
DBS Group Holdings (A) | 0.7 | 32,000 | 433 | |||||||||
Other Securities | 0.6 | 373 | ||||||||||
|
| |||||||||||
| 806 | ||||||||||||
|
| |||||||||||
| Description | Percentage of Net Assets (%) | Shares | Market Value ($ Thousands) | |||||||||
South Africa — 0.1% |
| |||||||||||
Other Securities | 0.1 | % | $ | 72 | ||||||||
|
| |||||||||||
South Korea — 3.5% |
| |||||||||||
Samsung Electronics (A) | 1.9 | 879 | 1,184 | |||||||||
Other Securities | 1.6 | 1,030 | ||||||||||
|
| |||||||||||
| 2,214 | ||||||||||||
|
| |||||||||||
Spain — 0.8% |
| |||||||||||
Amadeus IT Holding, Cl A (A) | 0.7 | 15,531 | 473 | |||||||||
Other Securities | 0.1 | 60 | ||||||||||
|
| |||||||||||
| 533 | ||||||||||||
|
| |||||||||||
Sweden — 1.2% |
| |||||||||||
Getinge, Cl B (A) | 0.7 | 14,812 | 441 | |||||||||
Other Securities | 0.5 | 286 | ||||||||||
|
| |||||||||||
| 727 | ||||||||||||
|
| |||||||||||
Switzerland — 6.3% |
| |||||||||||
Novartis ADR | 0.6 | 5,145 | 369 | |||||||||
Novartis (A) | 0.6 | 5,263 | 376 | |||||||||
Roche Holding (A) | 2.1 | 5,498 | 1,358 | |||||||||
Other Securities | 3.0 | 1,848 | ||||||||||
|
| |||||||||||
| 3,951 | ||||||||||||
|
| |||||||||||
Taiwan — 1.7% |
| |||||||||||
Advanced Semiconductor Engineering | 0.5 | 79,236 | 333 | |||||||||
Other Securities | 1.2 | 741 | ||||||||||
|
| |||||||||||
| 1,074 | ||||||||||||
|
| |||||||||||
Thailand — 1.0% |
| |||||||||||
Other Securities | 1.0 | 644 | ||||||||||
|
| |||||||||||
Turkey — 1.3% |
| |||||||||||
Other Securities | 1.3 | 802 | ||||||||||
|
| |||||||||||
United Kingdom — 14.8% |
| |||||||||||
ARM Holdings ADR | 1.2 | 16,794 | 737 | |||||||||
ARM Holdings (A) | 0.2 | 9,442 | 138 | |||||||||
AstraZeneca (A) | 0.5 | 6,527 | 333 | |||||||||
British American Tobacco (A) | 0.7 | 7,716 | 423 | |||||||||
Diageo (A) | 0.9 | 18,393 | 542 | |||||||||
HSBC Holdings | 1.3 | 74,209 | 812 | |||||||||
Reckitt Benckiser Group (A) | 0.6 | 5,588 | 399 | |||||||||
Shire (A) | 0.7 | 14,213 | 467 | |||||||||
Unilever ADR | 0.6 | 8,342 | 350 | |||||||||
Other Securities | 8.1 | 5,058 | ||||||||||
|
| |||||||||||
| 9,259 | ||||||||||||
|
| |||||||||||
United States — 3.5% |
| |||||||||||
Everest Re Group | 0.6 | 3,085 | 400 | |||||||||
| 50 | SEI Institutional Investments Trust / Annual Report / May 31, 2013 |
Table of Contents
| Description | Percentage of Net Assets (%) | Shares/Face Amount (1) (Thousands) | Market Value ($ Thousands) | |||||||||
Schlumberger | 0.5 | % | 4,626 | $ | 338 | |||||||
Other Securities | 2.4 | 1,481 | ||||||||||
|
| |||||||||||
| 2,219 | ||||||||||||
|
| |||||||||||
Total Common Stock |
| 57,148 | ||||||||||
|
| |||||||||||
PREFERRED STOCK — 0.9% |
| |||||||||||
Brazil — 0.8% |
| |||||||||||
Other Securities | 0.8 | 516 | ||||||||||
|
| |||||||||||
Germany — 0.1% |
| |||||||||||
Other Securities | 0.1 | 40 | ||||||||||
|
| |||||||||||
Total Preferred Stock |
| 556 | ||||||||||
|
| |||||||||||
CASH EQUIVALENT — 4.1% |
| |||||||||||
SEI Daily Income Trust, Prime Obligation Fund, Cl A 0.010%**† | 4.1 | 2,589,743 | 2,590 | |||||||||
|
| |||||||||||
Total Cash Equivalent |
| 2,590 | ||||||||||
|
| |||||||||||
TIME DEPOSITS — 3.4% |
| |||||||||||
Brown Brothers Harriman | ||||||||||||
4.150%, 06/01/2013 | ZAR | 1 | — | |||||||||
1.903%, 06/01/2013 | AUD | 53 | 51 | |||||||||
1.667%, 06/01/2013 | NZD | 2 | 2 | |||||||||
0.484%, 06/01/2013 | NOK | 54 | 9 | |||||||||
0.280%, 06/01/2013 | CAD | 15 | 14 | |||||||||
0.100%, 06/01/2013 | SEK | 80 | 12 | |||||||||
0.076%, 06/01/2013 | GBP | 49 | 74 | |||||||||
0.030%, 06/01/2013 | 1,587 | 1,587 | ||||||||||
0.005%, 06/01/2013 | JPY | 4,626 | 46 | |||||||||
0.005%, 06/01/2013 | HKD | 149 | 19 | |||||||||
0.005%, 06/01/2013 | SGD | 17 | 13 | |||||||||
0.001%, 06/01/2013 | CHF | 53 | 55 | |||||||||
0.001%, 06/01/2013 | EUR | 156 | 202 | |||||||||
(0.10)%, 06/01/2013 | DKK | 80 | 14 | |||||||||
|
| |||||||||||
Total Time Deposits |
| 2,098 | ||||||||||
|
| |||||||||||
U.S. TREASURY OBLIGATIONS (B) — 0.3% |
| |||||||||||
Other Securities | 0.3 | 173 | ||||||||||
|
| |||||||||||
Total U.S. Treasury Obligations |
| 173 | ||||||||||
|
| |||||||||||
Total Investments — 100.1% |
| $ | 62,565 | |||||||||
|
| |||||||||||
A list of the open futures contracts held by the Fund at May 31, 2013, is as follows:
| Type of Contract | Number of Contracts Long | Expiration Date | Unrealized Appreciation (Depreciation) ($ Thousands) | |||||||||
DJ Euro Stoxx 50 Index | 22 | Jun-2013 | $ | 35 | ||||||||
FTSE 100 Index | 7 | Jun-2013 | 19 | |||||||||
Hang Seng Index | 1 | Jun-2013 | (2 | ) | ||||||||
S&P TSX 60 Index | 2 | Jun-2013 | (5 | ) | ||||||||
SPI 200 Index | 2 | Jun-2013 | (6 | ) | ||||||||
Topix Index | 4 | Jun-2013 | 40 | |||||||||
|
| |||||||||||
| $ | 81 | |||||||||||
|
| |||||||||||
For the year ended May 31, 2013, the total amount of all open futures contracts, as presented in the table above, are representative of the volume of activity for this derivative type during the year.
Percentages are based on a Net Assets of $62,521 ($ Thousands).
| * | Non-income producing security. |
| ** | The rate reported is the 7-day effective yield as of May 31, 2013. |
| † | Investment in Affiliated Security (see Note 5). |
| (1) | In U.S. dollars unless otherwise indicated. |
| (A) | Security fair valued using methods determined in good faith by the Valuation Committee of the Board of Trustees. The total market value of such securities as of May 31, 2013 was $42,654 ($ Thousands) and represented 68.2% of Net Assets. |
| (B) | Security, or portion thereof, has been pledged as collateral on open futures contracts. |
ADR — American Depositary Receipt
AUD — Australian Dollar
CAD — Canadian Dollar
CHF — Swiss Franc
Cl — Class
DJ — Dow Jones
DKK — Danish Krone
EUR — Euro
FTSE — Financial Times and Stock Exchange
GBP — British Pound Sterling
HKD — Hong Kong Dollar
JPY — Japanese Yen
NOK — Norwegian Krone
NZD — New Zealand Dollar
S&P — Standard & Poor’s
SEK — Swedish Krone
SGD — Singapore Dollar
SPI — Share Price Index
TSX — Toronto Stock Exchange
ZAR — South African Rand
The Summary Schedule of Investments does not reflect the complete portfolio holdings. It includes the Fund’s 50 largest holdings and each investment of any issuer that exceeds 1% of the Fund’s net assets. “Other Securities” represent all issues not required to be disclosed under the rules adopted by the U.S. Securities and Exchange Commission (“SEC”). In certain instances, securities for which footnotes listed above may otherwise apply are included in the Other Securities caption. The complete schedule of portfolio holdings is available (i) without charge, upon request, by calling (800) 342-5734; and (ii) on the SEC’s website at http://www.sec.gov.
| SEI Institutional Investments Trust / Annual Report / May 31, 2013 | 51 |
Table of Contents
SUMMARY SCHEDULE OF INVESTMENTS
Screened World Equity Ex-US Fund (Concluded)
May 31, 2013
The following is a list of the inputs used as of May 31, 2013, in valuing the Fund’s investments and other financial instruments carried at value ($ Thousands):
| Investments in Securities | Level 1 | Level 2 | Level 3 | Total | ||||||||||||
Common Stock | $ | 14,534 | $ | 42,614 | $ | — | $ | 57,148 | ||||||||
Preferred Stock | 516 | 40 | — | 556 | ||||||||||||
Cash Equivalent | 2,590 | — | — | 2,590 | ||||||||||||
Time Deposits | 2,098 | — | — | 2,098 | ||||||||||||
U.S. Treasury Obligations | — | 173 | — | 173 | ||||||||||||
|
|
|
|
|
|
|
| |||||||||
Total Investments in Securities | $ | 19,738 | $ | 42,827 | $ | — | $ | 62,565 | ||||||||
|
|
|
|
|
|
|
| |||||||||
| Other Financial Instruments | Level 1 | Level 2 | Level 3 | Total | ||||||||||||
Futures Contracts* | $ | 81 | $ | — | $ | — | $ | 81 | ||||||||
|
|
|
|
|
|
|
| |||||||||
| * | Futures contracts are valued at the unrealized appreciation on the instrument. |
For the year ended May 31, 2013, there were transfers between Level 1 and Level 2 assets and liabilities. The primary reason for changed in the classifications between Levels 1 and 2 occurs when foreign equity securities are fair valued using other observable market-based inputs in place of the closing exchange price due to events occurring after the close of the exchange or market on which the investment is principally traded.
For the year ended May 31, 2013, there were no transfers between Level 2 and Level 3 assets and liabilities.
For more information on valuation inputs, see Note 2 — Significant Accounting Policies in Notes to Financial Statements.
Amounts designated as “—” are $0 or have been rounded to $0.
The accompanying notes are an integral part of the financial statements.
| 52 | SEI Institutional Investments Trust / Annual Report / May 31, 2013 |
Table of Contents
SCHEDULE OF INVESTMENTS
Opportunistic Income Fund(1)
May 31, 2013
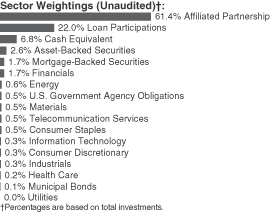
| Description | Face Amount ($ Thousands) | Market Value ($ Thousands) | ||||||
LOAN PARTICIPATIONS — 22.3% |
| |||||||
Acquisitions Cogeco Cable II, | ||||||||
4.500%, 09/20/2019 | $ | 249 | $ | 249 | ||||
Advanstar Communications, 1st Lien | ||||||||
2.540%, 06/02/2014 | 514 | 509 | ||||||
Advantage Sales and Marketing, | ||||||||
8.250%, 06/17/2018 | 738 | 746 | ||||||
4.250%, 12/18/2017 | 1,610 | 1,618 | ||||||
Affinia Group | ||||||||
4.750%, 04/25/2020 | 742 | 744 | ||||||
Affinia Group, Term Loan B1 | ||||||||
3.500%, 04/25/2016 | 305 | 307 | ||||||
Affinion Group Holdings | ||||||||
6.500%, 10/09/2016 | 981 | 957 | ||||||
Air Medical Group Holdings, | ||||||||
6.500%, 06/30/2018 | 1,397 | 1,428 | ||||||
Air Medical Group Holdings, | ||||||||
0.000%, 05/21/2018 (A) | 1,900 | 1,900 | ||||||
Alere, Term Loan B | ||||||||
4.250%, 06/30/2017 | 497 | 503 | ||||||
Alliance Laundry Systems LLC, | ||||||||
4.500%, 12/10/2018 | 1,492 | 1,503 | ||||||
Alliant Holdings, Term Loan, | ||||||||
5.000%, 12/20/2019 | 1,995 | 2,005 | ||||||
Allison Transmission | ||||||||
4.250%, 08/23/2019 | 993 | 1,000 | ||||||
Alpha Natural Resources, | ||||||||
3.500%, 05/31/2020 | 1,250 | 1,245 | ||||||
AMC Entertainment, Term Loan | ||||||||
3.500%, 04/30/2020 | 380 | 381 | ||||||
| Description | Face Amount ($ Thousands) | Market Value ($ Thousands) | ||||||
American Builders & Contract Supply, Term Loan B | ||||||||
3.500%, 04/16/2020 | $ | 1,250 | $ | 1,254 | ||||
American Renal Holdings, Term Loan | ||||||||
8.500%, 02/20/2020 | 1,010 | 1,016 | ||||||
4.500%, 08/20/2019 | 1,350 | 1,353 | ||||||
American Rock Salt, Term Loan B | ||||||||
5.500%, 04/25/2017 | 741 | 745 | ||||||
Apex Tool Group | ||||||||
4.500%, 01/25/2020 | 2,000 | 2,013 | ||||||
Applied Systems, Hybrid Term Loan, 2nd Lien | ||||||||
8.250%, 06/08/2017 | 240 | 242 | ||||||
Applied Systems, Term Loan B | ||||||||
0.000%, 12/08/2016 (A) | 2,000 | 2,017 | ||||||
Aramark US | ||||||||
0.053%, 07/26/2016 | 27 | 28 | ||||||
Aramark, Term Loan | ||||||||
3.698%, 07/26/2016 | 463 | 468 | ||||||
Aramark, Term Loan C | ||||||||
3.784%, 07/26/2016 | 878 | 886 | ||||||
Aramark, Term Loan D | ||||||||
4.000%, 08/22/2019 | 1,000 | 1,011 | ||||||
Arris Group | ||||||||
3.500%, 02/07/2020 | 845 | 844 | ||||||
Asurion, LLC | ||||||||
4.500%, 05/24/2019 | 1,352 | 1,358 | ||||||
August LuxUK Holding, Term Loan | ||||||||
5.250%, 04/27/2018 | 591 | 593 | ||||||
August U.S. Holdings, Term Loan | ||||||||
5.250%, 04/27/2018 | 448 | 450 | ||||||
Avaya, Extended Term Loan B-5 | ||||||||
8.000%, 03/31/2018 | 979 | 934 | ||||||
Avaya, Term Loan B-3 | ||||||||
4.927%, 10/26/2017 | 815 | 731 | ||||||
Bass Pro Group LLC, Term Loan B | ||||||||
4.000%, 11/20/2019 | 980 | 984 | ||||||
Berry Plastics | ||||||||
3.500%, 02/08/2020 | 1,995 | 1,995 | ||||||
Berry Plastics, Term Loan D | ||||||||
3.500%, 02/08/2020 | 5 | 5 | ||||||
Biomet | ||||||||
4.034%, 07/25/2017 | 348 | 350 | ||||||
Biomet, Term Loan B1 | ||||||||
3.954%, 07/25/2017 | 596 | 599 | ||||||
Biomet, Term Loan B2 | ||||||||
4.034%, 07/25/2017 | 446 | 449 | ||||||
Biomet, Term Loan B3 | ||||||||
3.954%, 07/25/2017 | 27 | 27 | ||||||
BJ’s Wholesale Club, Term Loan | ||||||||
4.250%, 09/26/2019 | 1,244 | 1,247 | ||||||
Black Press US Partnership, Tranche B-1 | ||||||||
2.287%, 08/02/2013 | 315 | 312 | ||||||
| SEI Institutional Investments Trust / Annual Report / May 31, 2013 | 53 |
Table of Contents
SCHEDULE OF INVESTMENTS
Opportunistic Income Fund(1) (Continued)
May 31, 2013
| Description | Face Amount ($ Thousands) | Market Value ($ Thousands) | ||||||
Black Press US Partnership, Tranche B-2 | ||||||||
2.287%, 08/02/2013 | $ | 191 | $ | 189 | ||||
Booz Allen Hamilton, Term Loan B | ||||||||
4.500%, 07/31/2019 | 1,194 | 1,202 | ||||||
0.000%, 07/31/2019 (A) | 800 | 805 | ||||||
Boyd Acquisition | ||||||||
4.250%, 11/20/2017 | 998 | 1,005 | ||||||
Bright Horizons Family Solutions LLC, Term Loan | ||||||||
4.000%, 01/30/2020 | 349 | 351 | ||||||
Burlington Coat Factory, Term Loan B | ||||||||
5.500%, 02/23/2017 | 470 | 472 | ||||||
Calpine | ||||||||
4.000%, 04/01/2018 | 294 | 296 | ||||||
Cannery Casino Resorts LLC | ||||||||
6.000%, 10/02/2018 | 299 | 302 | ||||||
CDW, Term Loan | ||||||||
3.500%, 04/29/2020 | 2,000 | 1,993 | ||||||
Cedar Fair L.P. | ||||||||
3.250%, 03/06/2020 | 500 | 504 | ||||||
Cequel Communications | ||||||||
3.500%, 02/14/2019 | 1 | 1 | ||||||
3.500%, 02/10/2019 | 496 | 498 | ||||||
Ceridian, Extended Term Loan | ||||||||
5.948%, 05/09/2017 | 937 | 943 | ||||||
Charter Communications Operating LLC, Term Loan E | ||||||||
0.000%, 04/10/2020 (A) | 1,075 | 1,068 | ||||||
Colfax, Refinanced Term Loan A1 | ||||||||
2.449%, 01/19/2017 | 968 | 970 | ||||||
Colfax, Term Loan A1 | ||||||||
2.448%, 01/19/2017 | 234 | 234 | ||||||
Commscope | ||||||||
3.750%, 01/14/2018 | 543 | 547 | ||||||
Community Health Systems, Term Loan B | ||||||||
3.787%, 01/25/2017 | 839 | 846 | ||||||
3.784%, 01/25/2017 | 22 | 23 | ||||||
CompuCom Systems, Term Loan B | ||||||||
4.250%, 05/07/2020 | 2,700 | 2,710 | ||||||
Constellation Brands, Term Loan B | ||||||||
0.000%, 05/01/2020 (A) | 728 | 729 | ||||||
ConvaTec Dollar | ||||||||
5.000%, 12/22/2016 | 1,224 | 1,238 | ||||||
Cristal Inorganic Chemicals US | ||||||||
6.034%, 11/15/2014 | 333 | 333 | ||||||
Cumulus Media Holdings | ||||||||
0.000%, 09/16/2018 (A) | 500 | 504 | ||||||
Cumulus Media Holdings, Term Loan | ||||||||
4.500%, 09/17/2018 | 1,703 | 1,717 | ||||||
| Description | Face Amount ($ Thousands) | Market Value ($ Thousands) | ||||||
DAE Aviation Holdings, Term Loan B1 | ||||||||
6.250%, 11/02/2018 | $ | 685 | $ | 695 | ||||
David’s Bridal | ||||||||
5.000%, 10/05/2019 | 2,095 | 2,107 | ||||||
Davita, Term Loan B2 | ||||||||
4.000%, 11/01/2019 | 998 | 1,008 | ||||||
Del Monte Foods | ||||||||
4.000%, 03/08/2018 | 1,322 | 1,327 | ||||||
Dex Media West | ||||||||
7.250%, 10/24/2014 | 2,063 | 1,754 | ||||||
Digital Globe | ||||||||
3.750%, 01/25/2020 | 750 | 754 | ||||||
Doncaster PLC, Term Loan | ||||||||
5.500%, 04/09/2020 | 2,000 | 2,013 | ||||||
Dunkin Brands, Term Loan B3 | ||||||||
5.000%, 02/14/2020 | 333 | 334 | ||||||
3.750%, 02/14/2020 | 349 | 351 | ||||||
DuPont Performance Coatings, Term Loan | ||||||||
4.750%, 02/01/2020 | 2,000 | 2,014 | ||||||
Eagle Parent | ||||||||
4.500%, 05/16/2018 | 1,388 | 1,404 | ||||||
Emergency Medical Services | ||||||||
4.000%, 05/25/2018 | 91 | 91 | ||||||
Emergency Medical Services, Initial Term Loan | ||||||||
4.000%, 04/27/2018 | 377 | 379 | ||||||
4.000%, 05/25/2018 | 769 | 773 | ||||||
Endurance International, 2nd Lien | ||||||||
10.250%, 05/09/2020 | 217 | 220 | ||||||
Endurance International, Term Loan, 1st Lien | ||||||||
6.250%, 11/06/2019 | 725 | 730 | ||||||
Energy Transfer Partners | ||||||||
3.750%, 03/24/2017 | 248 | 250 | ||||||
Entravision Communications, Term Loan B | ||||||||
0.000%, 05/29/2020 (A) | 1,000 | 1,000 | ||||||
EP Energy LLC, Term Loan, Tranche 1 | ||||||||
4.500%, 04/26/2019 | 500 | 504 | ||||||
Equinox Fitness Clubs, Term Loan B | ||||||||
4.500%, 01/31/2020 | 1,500 | 1,509 | ||||||
Essential Power LLC, Term Loan | ||||||||
4.500%, 08/08/2019 | 758 | 763 | ||||||
4.250%, 08/08/2019 | 10 | 10 | ||||||
Eze Castle Software LLC, Term Loan, 1st Lien | ||||||||
4.750%, 04/06/2020 | 526 | 534 | ||||||
Federal Mogul | ||||||||
2.138%, 12/29/2014 | 1,319 | 1,289 | ||||||
Federal Mogul, Term Loan C | ||||||||
2.138%, 12/28/2015 | 673 | 658 | ||||||
| 54 | SEI Institutional Investments Trust / Annual Report / May 31, 2013 |
Table of Contents
| Description | Face Amount ($ Thousands) | Market Value ($ Thousands) | ||||||
First Data, Term Loan | ||||||||
4.202%, 03/23/2018 | $ | 1,436 | $ | 1,430 | ||||
Firth Rixson Ltd., Term Loan B | ||||||||
4.250%, 06/30/2017 | 499 | 501 | ||||||
Fortescue Metals Group Ltd. | ||||||||
5.250%, 10/18/2017 | 547 | 550 | ||||||
Freescale Semiconductor | ||||||||
5.000%, 02/13/2020 | 1,352 | 1,358 | ||||||
Generac Power Systems, Term Loan B | ||||||||
6.250%, 05/30/2018 | 570 | 570 | ||||||
0.000%, 05/10/2020 (A) | 600 | 600 | ||||||
Genesys Telecom | ||||||||
4.000%, 02/08/2020 | 900 | 903 | ||||||
Genpact International, Term Loan B | ||||||||
4.250%, 08/17/2019 | 1,758 | 1,773 | ||||||
0.000%, 08/30/2019 (A) | 234 | 236 | ||||||
Gibson Energy, Term Loan B | ||||||||
4.750%, 06/15/2018 | 1,980 | 2,003 | ||||||
Global Cash Access | ||||||||
7.000%, 02/01/2016 | 329 | 330 | ||||||
Gray Television, Term Loan B | ||||||||
4.750%, 10/12/2019 | 964 | 976 | ||||||
Grohe Holdings, Term Loan | ||||||||
6.750%, 05/18/2017 | 1,722 | 1,735 | ||||||
Guitar Center, Term Loan | ||||||||
5.540%, 04/09/2017 | 998 | 995 | ||||||
H.J. Heinz, Term Loan B2 | ||||||||
0.000%, 03/27/2020 (A) | 1,840 | 1,856 | ||||||
Harbor Freight Tools, Term Loan | ||||||||
5.500%, 11/14/2017 | 744 | 754 | ||||||
Harron Communications, Term Loan B | ||||||||
5.000%, 10/06/2017 | 585 | 590 | ||||||
HCA, Term Loan B2 | ||||||||
3.534%, 03/31/2017 | 300 | 300 | ||||||
Hologic, Term Loan B | ||||||||
4.500%, 08/01/2019 | 496 | 499 | ||||||
Houghton International, Term Loan | ||||||||
4.000%, 12/20/2019 | 249 | 249 | ||||||
Hub International | ||||||||
3.694%, 06/13/2017 | 2,126 | 2,136 | ||||||
IMS Health | ||||||||
3.750%, 09/01/2017 | 2,066 | 2,076 | ||||||
Ineos Holdings Ltd., Cov-Lite | ||||||||
4.250%, 05/04/2018 | 2,026 | 2,025 | ||||||
Integra Telecom, Term Loan | ||||||||
6.000%, 02/22/2019 | 940 | 950 | ||||||
Intelesat Jackson Ltd., Term Loan B1 | ||||||||
4.500%, 04/02/2018 | 742 | 746 | ||||||
Intelsat Bermuda, Term Loan | ||||||||
3.205%, 02/01/2014 | 373 | 373 | ||||||
| Description | Face Amount ($ Thousands) | Market Value ($ Thousands) | ||||||
Inventiv Health, Incremental Term Loan B-3 | ||||||||
7.750%, 05/15/2018 | $ | 267 | $ | 264 | ||||
Inventiv Health, Term Loan B | ||||||||
7.500%, 08/04/2016 | 1,600 | 1,580 | ||||||
ION Trading Technologies Ltd., Term Loan | ||||||||
4.500%, 05/22/2020 | 640 | 645 | ||||||
ION Trading Technologies Ltd., Term Loan, Cov-Lite, 2nd Lien | ||||||||
0.000%, 05/21/2021 (A) | 920 | 927 | ||||||
ISS A/S, Term Loan B | ||||||||
0.000%, 04/18/2018 (A) | 277 | 279 | ||||||
J. Crew Group, Term Loan B | ||||||||
4.000%, 03/07/2018 | 1,975 | 1,981 | ||||||
JCPenney, Term Loan B, Cov-Lite, 1st Lien | ||||||||
6.000%, 05/21/2018 | 925 | 937 | ||||||
Kronos, Incremental Term Loan | ||||||||
4.500%, 10/30/2019 | 998 | 1,005 | ||||||
Lamar Media | ||||||||
4.000%, 12/30/2016 | 17 | 17 | ||||||
Language Line, Term Loan B | ||||||||
6.250%, 06/20/2016 | 454 | 449 | ||||||
Lawson Software, Term Loan B | ||||||||
5.250%, 04/05/2018 | 1,142 | 1,153 | ||||||
Leslie’s Poolmart, Term Loan B | ||||||||
5.250%, 10/16/2019 | 1,079 | 1,089 | ||||||
2.000%, 10/11/2019 | 18 | — | ||||||
Level 3 Communications | ||||||||
5.250%, 08/01/2019 | 2,000 | 2,026 | ||||||
Lifepoint Hospitals, Term Loan | ||||||||
2.710%, 07/24/2017 | 359 | 362 | ||||||
Light Tower Fiber, LLC | ||||||||
8.000%, 04/12/2021 | 1,000 | 1,018 | ||||||
4.500%, 04/13/2020 | 1,000 | 1,008 | ||||||
Live Nation Entertainment | ||||||||
4.500%, 11/07/2016 | 961 | 969 | ||||||
LPL Holdings, Term Loan B | ||||||||
0.000%, 03/29/2019 (A) | 1,750 | 1,748 | ||||||
Mediacom Communications, Term Loan H | ||||||||
0.000%, 01/22/2021 (A) | 1,150 | 1,150 | ||||||
MEG Energy | ||||||||
3.750%, 03/21/2020 | 640 | 644 | ||||||
MGM Resorts International, Term Loan B | ||||||||
4.250%, 12/20/2019 | 257 | 258 | ||||||
MGM Resorts International, Term Loan B1 | ||||||||
4.250%, 12/20/2019 | 740 | 742 | ||||||
Michaels Stores | ||||||||
3.750%, 01/24/2020 | 915 | 919 | ||||||
Michaels Stores, Term Loan B | ||||||||
3.750%, 01/28/2020 | 585 | 588 | ||||||
| SEI Institutional Investments Trust / Annual Report / May 31, 2013 | 55 |
Table of Contents
SCHEDULE OF INVESTMENTS
Opportunistic Income Fund(1) (Continued)
May 31, 2013
| Description | Face Amount ($ Thousands) | Market Value ($ Thousands) | ||||||
Midcontinent Communications, | ||||||||
4.000%, 12/31/2016 | $ | 490 | $ | 493 | ||||
MTL Publishing, Term Loan B | ||||||||
4.250%, 06/29/2018 | 998 | 1,004 | ||||||
Navistar International | ||||||||
5.750%, 08/17/2017 | 2,563 | 2,611 | ||||||
NCI Building Maintenance LLC, | ||||||||
8.000%, 05/02/2018 | 138 | 140 | ||||||
NCI Building Systems, Term Loan, 1st Lien | ||||||||
8.000%, 05/02/2018 | 718 | 729 | ||||||
NeimanMarcus Group | ||||||||
4.000%, 05/16/2018 | 1,241 | 1,240 | ||||||
Nelson Education, Term Loan B-1 | ||||||||
2.784%, 07/04/2014 | 782 | 645 | ||||||
NEP Supershooters L.P., Term Loan | ||||||||
4.750%, 01/22/2020 | 449 | 454 | ||||||
NewPage, Term Loan | ||||||||
7.750%, 12/21/2018 | 2,095 | 2,137 | ||||||
Nielsen Finance LLC, CL E Dollar, Term Loan | ||||||||
2.949%, 05/02/2016 | 87 | 87 | ||||||
NRG Energy, Term Loan | ||||||||
3.250%, 07/01/2018 | 1,191 | 1,184 | ||||||
NRG Energy, Term Loan B | ||||||||
0.000%, 07/01/2018 (A) | 250 | 248 | ||||||
NXP | ||||||||
4.500%, 03/03/2017 | 470 | 479 | ||||||
NXP Semiconductors, Incremental Term Loan C | ||||||||
4.750%, 01/10/2020 | 1,995 | 2,035 | ||||||
Ocwen Financial | ||||||||
5.000%, 02/15/2018 | 1,500 | 1,518 | ||||||
Penn National Gaming, Term Loan B | ||||||||
3.750%, 07/16/2018 | 468 | 470 | ||||||
PETCO Animal Supplies, Term Loan B | ||||||||
4.000%, 11/24/2017 | 1,500 | 1,513 | ||||||
Pilot Travel Centers, LLC, Term Loan Tranche B | ||||||||
4.250%, 08/07/2019 | 995 | 985 | ||||||
Pinnacle Foods Group LLC | ||||||||
3.250%, 04/29/2020 | 575 | 575 | ||||||
Pinnacle Foods Group LLC, Term Loan G, 3rd Lien | ||||||||
3.250%, 04/29/2020 | 1 | 1 | ||||||
Progressive Waste Solutions, Term Loan B | ||||||||
3.500%, 10/24/2019 | 150 | 151 | ||||||
| Description | Face Amount ($ Thousands) | Market Value ($ Thousands) | ||||||
Proquest, Term Loan B | ||||||||
6.000%, 04/13/2018 | $ | 495 | $ | 497 | ||||
PVH, Term Loan B, Tranche 1 | ||||||||
3.250%, 02/13/2020 | 700 | 703 | ||||||
Quintiles Transnational, Term Loan B | ||||||||
4.500%, 06/08/2018 | 1,917 | 1,935 | ||||||
Raycom TV Broadcasting, Tranche B | ||||||||
4.250%, 05/31/2017 | 588 | 588 | ||||||
RE/MAX International | ||||||||
5.500%, 04/16/2016 | 663 | 667 | ||||||
Realogy, Extended Synthetic Term Loan | ||||||||
5.370%, 10/10/2016 | 89 | 89 | ||||||
Rice Drilling B LLC, Term Loan, 2nd Lien | ||||||||
8.500%, 10/25/2018 | 2,073 | 2,099 | ||||||
Rite Aid | ||||||||
4.000%, 02/07/2020 | 1,500 | 1,508 | ||||||
Riverbed Technology, Term Loan Tranche 1 | ||||||||
4.000%, 12/13/2019 | 913 | 922 | ||||||
Roundy’s Supermarkets, Term Loan B | ||||||||
5.750%, 02/13/2019 | 989 | 969 | ||||||
Ruby Western Pipeline | ||||||||
3.500%, 03/22/2020 | 873 | 877 | ||||||
Ruby Western Pipeline Holdings, Term Loan | ||||||||
3.500%, 03/27/2020 | 127 | 128 | ||||||
Salem Communications, Term Loan B | ||||||||
4.500%, 03/12/2020 | 1,500 | 1,518 | ||||||
San Juan Cable Holdings, Term Loan B | ||||||||
6.000%, 06/09/2017 | 1,983 | 2,003 | ||||||
Schaeffler AG, Term Loan C, 1st Lien | ||||||||
4.250%, 01/20/2017 | 1,225 | 1,240 | ||||||
Sealed Air, Term Loan B | ||||||||
4.000%, 10/03/2018 | 705 | 713 | ||||||
Seaworld | ||||||||
4.000%, 05/30/2020 | 1,365 | 1,361 | ||||||
Seaworld Parks & Entertainment, Term Loan B | ||||||||
4.000%, 05/30/2020 | 387 | 385 | ||||||
Sedgwick CMS Holdings, Term Loan B | ||||||||
4.000%, 12/31/2016 | 1,090 | 1,102 | ||||||
Seminole Hard Rock Entertainment, Term Loan B | ||||||||
0.000%, 05/08/2020 (A) | 1,000 | 1,002 | ||||||
| 56 | SEI Institutional Investments Trust / Annual Report / May 31, 2013 |
Table of Contents
| Description | Face Amount ($ Thousands) | Market Value ($ Thousands) | ||||||
Sensata Technologies | ||||||||
3.750%, 05/12/2018 | $ | 346 | $ | 349 | ||||
Sequa, Term Loan B | ||||||||
5.250%, 06/19/2017 | 748 | 755 | ||||||
Serta Simmons Holdings, Term Loan B | ||||||||
5.000%, 10/01/2019 | 1,197 | 1,203 | ||||||
Sheridan Healthcare, Term Loan | ||||||||
4.500%, 06/29/2018 | 1,158 | 1,165 | ||||||
Sheridan Holdings, Term Loan | ||||||||
9.000%, 07/01/2019 | 250 | 253 | ||||||
Smart & Final, Cov-Lite Term Loan | ||||||||
5.750%, 11/08/2019 | 998 | 998 | ||||||
Smart Technologies | ||||||||
2.948%, 08/28/2014 | 471 | 443 | ||||||
Sophoros PLC | ||||||||
6.500%, 05/10/2019 | 1,244 | 1,250 | ||||||
Sprouts Farmers Markets LLC, Term Loan | ||||||||
4.500%, 04/23/2020 | 1,200 | 1,200 | ||||||
Standard Aero, Term Loan B2 | ||||||||
6.250%, 11/02/2018 | 310 | 315 | ||||||
Starwood Property Trust, Term Loan B | ||||||||
3.500%, 04/17/2020 | 550 | 550 | ||||||
Sungard Data Systems (Solar Capital) Tranche 1 | ||||||||
4.500%, 01/31/2020 | 299 | 303 | ||||||
SunGard Data Systems, Term Loan E | ||||||||
4.000%, 03/07/2020 | 1,916 | 1,940 | ||||||
Surgical Care Affiliates, LLC, Delayed Term Loan | ||||||||
0.000%, 06/29/2018 (A) | 334 | 334 | ||||||
Surgical Care Affiliates, LLC, Term Loan B | ||||||||
4.284%, 12/29/2017 | 1,393 | 1,393 | ||||||
0.000%, 06/29/2018 (A) | 791 | 794 | ||||||
Syniverse Holdings | ||||||||
5.000%, 04/20/2019 | 1,250 | 1,254 | ||||||
Teine Energy Ltd., Term Loan B | ||||||||
7.500%, 05/17/2019 | 1,667 | 1,671 | ||||||
Telesat Canada, Term Loan B | ||||||||
3.500%, 03/28/2019 | 399 | 401 | ||||||
Terex | ||||||||
4.500%, 04/28/2017 | 373 | 378 | ||||||
Texas Competitive | ||||||||
4.792%, 10/10/2017 | 284 | 205 | ||||||
4.699%, 10/10/2017 | 9 | 6 | ||||||
Texas Competitive, Extended | ||||||||
4.700%, 10/10/2017 | 571 | 413 | ||||||
The Pantry, Term Loan B | ||||||||
5.750%, 08/03/2019 | 995 | 1,005 | ||||||
| Description | Face Amount ($ Thousands) | Market Value ($ Thousands) | ||||||
The Yankee Candle | ||||||||
5.250%, 04/02/2019 | $ | 677 | $ | 677 | ||||
TI Automotive Ltd., Term Loan B | ||||||||
5.500%, 03/27/2019 | 1,012 | 1,020 | ||||||
Time Warner Telecom Holdings, Term Loan B | ||||||||
2.700%, 04/05/2020 | 389 | 390 | ||||||
Trans Union LLC, Term Loan | ||||||||
4.250%, 02/10/2019 | 582 | 585 | ||||||
Trans Union LLC, Term Loan B | ||||||||
0.000%, 02/10/2019 (A) | 500 | 503 | ||||||
TransDigm | ||||||||
3.750%, 02/25/2020 | 986 | 996 | ||||||
Tribune Company, Term Loan Tranche 1 | ||||||||
4.000%, 12/31/2019 | 1,197 | 1,209 | ||||||
Tronox, Term Loan B | ||||||||
4.500%, 02/03/2018 | 1,000 | 1,009 | ||||||
TWCC Holding Weather Channel, Term Loan B | ||||||||
3.500%, 02/13/2017 | 1,788 | 1,801 | ||||||
U.S. Telepacific, Term Loan | ||||||||
5.750%, 02/23/2017 | 982 | 980 | ||||||
Universal Health Services, Term Loan B | ||||||||
3.750%, 11/15/2016 | 210 | 211 | ||||||
Univision Communications, Extended Term Loan B | ||||||||
4.452%, 03/31/2017 | 955 | 955 | ||||||
Univision Communications, Extended Term Loan C-3 | ||||||||
4.000%, 03/01/2020 | 900 | 893 | ||||||
Univision Communications, Term Loan B | ||||||||
4.750%, 02/22/2020 | 1,500 | 1,497 | ||||||
UPC Finance Partnership | ||||||||
3.250%, 06/10/2021 | 1,000 | 999 | ||||||
Valeant Pharmaceuticals | ||||||||
3.500%, 02/13/2019 | 149 | 150 | ||||||
Valeant Pharmaceuticals International | ||||||||
3.500%, 12/11/2019 | 1,995 | 2,006 | ||||||
Vanguard Health Systems, Term Loan B | ||||||||
3.750%, 01/29/2016 | 1,768 | 1,785 | ||||||
Verint Systems, Term Loan B, 1st Lien | ||||||||
4.000%, 09/16/2019 | 798 | 807 | ||||||
Virgin Media Investment, Term Loan B | ||||||||
0.000%, 02/15/2020 (A) | 1,800 | 1,797 | ||||||
VWR Funding, Term Loan B | ||||||||
4.448%, 04/03/2017 | 398 | 400 | ||||||
| SEI Institutional Investments Trust / Annual Report / May 31, 2013 | 57 |
Table of Contents
SCHEDULE OF INVESTMENTS
Opportunistic Income Fund(1) (Continued)
May 31, 2013
| Description | Face Amount ($ Thousands) | Market Value ($ Thousands) | ||||||
VWR Funding, Term Loan B1 | ||||||||
4.198%, 04/03/2017 | $ | 1,571 | $ | 1,584 | ||||
Walter Energy, Term Loan B | ||||||||
5.750%, 04/02/2018 | 1,610 | 1,615 | ||||||
Warner Chilcott, Term Loan B1 | ||||||||
4.250%, 03/15/2018 | 110 | 110 | ||||||
4.250%, 03/14/2018 | 252 | 253 | ||||||
Warner Chilcott, Term Loan B2 | ||||||||
4.250%, 03/14/2018 | 89 | 90 | ||||||
Warner Chilcott, Term Loan B3 | ||||||||
4.250%, 03/15/2018 | 198 | 199 | ||||||
Warner Music Group | ||||||||
0.000%, 04/24/2020 (A) | 133 | 132 | ||||||
Warner Music Group, Delayed Term Loan | ||||||||
0.000%, 07/01/2020 (A) | 859 | 854 | ||||||
Warner Music Group, Term Loan | ||||||||
3.750%, 07/01/2020 | 558 | 560 | ||||||
Waste Industries USA, Term Loan B | ||||||||
4.000%, 03/16/2017 | 1,379 | 1,398 | ||||||
WCA Waste | ||||||||
5.500%, 03/23/2018 | 495 | 497 | ||||||
WCA Waste Systems, Term Loan | ||||||||
4.000%, 03/23/2018 | 432 | 433 | ||||||
West | ||||||||
3.750%, 06/30/2018 | 841 | 847 | ||||||
West, Term Loan B | ||||||||
3.750%, 06/30/2018 | 2 | 2 | ||||||
0.000%, 06/30/2018 (A) | 150 | 151 | ||||||
Wide Open West Finance | ||||||||
4.750%, 03/26/2019 | 721 | 726 | ||||||
Wide Open West Finance, LLC | ||||||||
0.000%, 03/26/2019 (A) | 210 | 211 | ||||||
Windstream, Term Loan B4 | ||||||||
3.500%, 01/23/2020 | 1,995 | 2,001 | ||||||
WP Prism, (Bausch & Lomb), Term Loan, 1st Lien | ||||||||
6.250%, 05/31/2018 | 2,250 | 2,254 | ||||||
Zayo Group, Term Loan B | ||||||||
4.500%, 07/02/2019 | 3,006 | 3,024 | ||||||
|
| |||||||
Total Loan Participations | 222,423 | |||||||
|
| |||||||
CORPORATE OBLIGATIONS — 5.0% |
| |||||||
Consumer Discretionary — 0.3% | ||||||||
Amazon.com | ||||||||
0.650%, 11/27/2015 | 150 | 150 | ||||||
Cedar Fair L.P. | ||||||||
5.250%, 03/15/2021 (B) | 650 | 650 | ||||||
Comcast | ||||||||
5.850%, 11/15/2015 | 100 | 112 | ||||||
| Description | Face Amount ($ Thousands) | Market Value ($ Thousands) | ||||||
Glencore Funding LLC | ||||||||
1.431%, 05/27/2016 (B) (C) | $ | 400 | $ | 400 | ||||
Maytag MTN | ||||||||
6.450%, 08/15/2014 | 350 | 373 | ||||||
Newell Rubbermaid | ||||||||
2.000%, 06/15/2015 | 125 | 127 | ||||||
Sirius XM Radio | ||||||||
4.250%, 05/15/2020 (B) | 400 | 392 | ||||||
Target | ||||||||
0.447%, 07/18/2014 (C) | 200 | 200 | ||||||
Thomson Reuters | ||||||||
0.875%, 05/23/2016 | 400 | 398 | ||||||
Viacom | ||||||||
1.250%, 02/27/2015 | 95 | 95 | ||||||
Volkswagen International Finance | ||||||||
0.874%, 11/20/2014 (B) (C) | 300 | 301 | ||||||
Walt Disney MTN | ||||||||
0.450%, 12/01/2015 | 200 | 200 | ||||||
|
| |||||||
| 3,398 | ||||||||
|
| |||||||
Consumer Staples — 0.5% |
| |||||||
AbbVie | ||||||||
1.033%, 11/06/2015 (B) (C) | 125 | 126 | ||||||
Anheuser-Busch InBev Worldwide | ||||||||
0.800%, 07/15/2015 | 100 | 100 | ||||||
0.637%, 07/14/2014 (C) | 100 | 100 | ||||||
BAT International Finance | ||||||||
1.400%, 06/05/2015 (B) | 300 | 303 | ||||||
Bottling Group LLC | ||||||||
6.950%, 03/15/2014 | 250 | 263 | ||||||
Ceridian | ||||||||
8.875%, 07/15/2019 (B) | 475 | 542 | ||||||
Coca-Cola Enterprises | ||||||||
2.125%, 09/15/2015 | 325 | 333 | ||||||
ConAgra Foods | ||||||||
1.300%, 01/25/2016 | 175 | 176 | ||||||
Costco Wholesale | ||||||||
0.650%, 12/07/2015 | 225 | 226 | ||||||
Elizabeth Arden | ||||||||
7.375%, 03/15/2021 | 100 | 111 | ||||||
ERAC USA Finance LLC | ||||||||
1.400%, 04/15/2016 (B) | 300 | 300 | ||||||
General Mills | ||||||||
0.576%, 01/29/2016 (C) | 300 | 300 | ||||||
Heineken | ||||||||
0.800%, 10/01/2015 (B) | 75 | 75 | ||||||
Kellogg | ||||||||
0.505%, 02/13/2015 (C) | 300 | 301 | ||||||
Kraft Foods Group | ||||||||
1.625%, 06/04/2015 | 125 | 127 | ||||||
Michael Foods Holding PIK | ||||||||
8.500%, 07/15/2018 (B) | 220 | 232 | ||||||
PepsiCo | ||||||||
0.800%, 08/25/2014 | 120 | 121 | ||||||
| 58 | SEI Institutional Investments Trust / Annual Report / May 31, 2013 |
Table of Contents
| Description | Face Amount ($ Thousands) | Market Value ($ Thousands) | ||||||
Reynolds American | ||||||||
1.050%, 10/30/2015 | $ | 50 | $ | 50 | ||||
Reynolds Group Issuer | ||||||||
6.875%, 02/15/2021 | 185 | 197 | ||||||
5.750%, 10/15/2020 | 415 | 421 | ||||||
SABMiller Holdings | ||||||||
1.850%, 01/15/2015 (B) | 300 | 305 | ||||||
|
| |||||||
| 4,709 | ||||||||
|
| |||||||
Energy — 0.6% |
| |||||||
Atlas Pipeline Partners | ||||||||
4.750%, 11/15/2021 (B) | 1,400 | 1,365 | ||||||
BP Capital Markets | ||||||||
0.785%, 05/10/2018 (C) | 400 | 401 | ||||||
Canadian Natural Resources | ||||||||
5.700%, 05/15/2017 | 150 | 173 | ||||||
Energy Transfer Equity | ||||||||
7.500%, 10/15/2020 | 500 | 574 | ||||||
Kinder Morgan Energy Partners | ||||||||
5.000%, 12/15/2013 | 186 | 190 | ||||||
MEG Energy | ||||||||
6.375%, 01/30/2023 (B) | 1,000 | 1,025 | ||||||
Petrobras Global Finance BV | ||||||||
1.894%, 05/20/2016 (C) | 350 | 353 | ||||||
Sabine Pass Liquefaction LLC | ||||||||
5.625%, 02/01/2021 (B) | 1,400 | 1,405 | ||||||
Total Capital Canada | ||||||||
0.657%, 01/15/2016 (C) | 130 | 131 | ||||||
TransCanada PipeLines | ||||||||
0.750%, 01/15/2016 | 250 | 249 | ||||||
Western Refining | ||||||||
6.250%, 04/01/2021 (B) | 185 | 191 | ||||||
|
| |||||||
| 6,057 | ||||||||
|
| |||||||
Financials — 1.7% |
| |||||||
American Express | ||||||||
0.863%, 05/22/2018 (C) | 300 | 300 | ||||||
American Honda Finance | ||||||||
0.648%, 05/26/2016 (B) (C) | 300 | 300 | ||||||
American International Group | ||||||||
4.250%, 09/15/2014 | 150 | 156 | ||||||
Australia & New Zealand Banking Group NY | ||||||||
0.835%, 05/15/2018 (C) | 250 | 250 | ||||||
Bank of America | ||||||||
1.500%, 10/09/2015 | 200 | 201 | ||||||
1.250%, 01/11/2016 | 200 | 199 | ||||||
1.104%, 03/22/2016 (C) | 150 | 150 | ||||||
Bank of Montreal MTN | ||||||||
0.879%, 04/09/2018 (C) | 350 | 352 | ||||||
Bank of New York Mellon MTN | ||||||||
3.100%, 01/15/2015 | 140 | 146 | ||||||
0.714%, 03/06/2018 (C) | 325 | 325 | ||||||
| Description | Face Amount ($ Thousands) | Market Value ($ Thousands) | ||||||
Bank of Nova Scotia | ||||||||
0.950%, 03/15/2016 | $ | 400 | $ | 401 | ||||
BB&T | ||||||||
0.976%, 04/28/2014 (C) | 125 | 126 | ||||||
Berkshire Hathaway Finance | ||||||||
0.609%, 01/10/2014 (C) | 300 | 301 | ||||||
BPCE MTN | ||||||||
1.526%, 04/25/2016 (C) | 275 | 277 | ||||||
Canadian Imperial Bank of Commerce | ||||||||
0.900%, 10/01/2015 | 125 | 125 | ||||||
Capital One | ||||||||
0.734%, 03/22/2016 (C) | 350 | 350 | ||||||
Capital One Financial | ||||||||
2.150%, 03/23/2015 | 150 | 153 | ||||||
Caterpillar Financial Services MTN | ||||||||
1.375%, 05/20/2014 | 95 | 96 | ||||||
Citigroup | ||||||||
4.875%, 05/07/2015 | 225 | 239 | ||||||
0.551%, 06/09/2016 (C) | 150 | 146 | ||||||
Cooperatieve Centrale Raiffeisen- Boerenleenbank BA | ||||||||
0.760%, 03/18/2016 (C) | 400 | 401 | ||||||
Credit Suisse NY | ||||||||
2.200%, 01/14/2014 | 300 | 303 | ||||||
Daimler Finance North America LLC | ||||||||
1.250%, 01/11/2016 (B) | 200 | 200 | ||||||
0.879%, 01/09/2015 (B) (C) | 200 | 201 | ||||||
Ford Motor Credit LLC | ||||||||
1.525%, 05/09/2016 (C) | 250 | 251 | ||||||
General Electric Capital | ||||||||
1.145%, 05/09/2016 (C) | 150 | 152 | ||||||
1.000%, 12/11/2015 | 125 | 126 | ||||||
1.000%, 01/08/2016 | 100 | 100 | ||||||
0.994%, 04/02/2018 (C) | 275 | 277 | ||||||
General Motors Financial | ||||||||
3.250%, 05/15/2018 (B) | 343 | 340 | ||||||
Goldman Sachs Group MTN | ||||||||
1.600%, 11/23/2015 | 150 | 152 | ||||||
1.476%, 04/30/2018 (C) | 350 | 352 | ||||||
Hartford Financial Services Group | ||||||||
4.625%, 07/15/2013 | 306 | 307 | ||||||
HSBC Bank | ||||||||
0.915%, 05/15/2018 (B) (C) | 200 | 199 | ||||||
HSBC USA | ||||||||
2.375%, 02/13/2015 | 150 | 154 | ||||||
Hyundai Capital America | ||||||||
1.625%, 10/02/2015 (B) | 35 | 35 | ||||||
ING Bank | ||||||||
1.675%, 06/09/2014 (B) (C) | 350 | 354 | ||||||
International Lease Finance | ||||||||
6.500%, 09/01/2014 (B) | 200 | 212 | ||||||
Intesa Sanpaolo | ||||||||
3.125%, 01/15/2016 | 200 | 199 | ||||||
| SEI Institutional Investments Trust / Annual Report / May 31, 2013 | 59 |
Table of Contents
SCHEDULE OF INVESTMENTS
Opportunistic Income Fund(1) (Continued)
May 31, 2013
| Description | Face Amount ($ Thousands) | Market Value ($ Thousands) | ||||||
John Deere Capital | ||||||||
0.950%, 06/29/2015 | $ | 150 | $ | 151 | ||||
JPMorgan Chase | ||||||||
1.176%, 01/25/2018 (C) | 200 | 202 | ||||||
0.893%, 02/26/2016 (C) | 125 | 125 | ||||||
JPMorgan Chase Capital XXI | ||||||||
1.223%, 02/02/2037 (C) | 250 | 200 | ||||||
MassMutual Global Funding II | ||||||||
0.657%, 01/14/2014 (B) (C) | 350 | 351 | ||||||
Metropolitan Life Global Funding I | ||||||||
1.700%, 06/29/2015 (B) | 175 | 178 | ||||||
1.500%, 01/10/2018 (B) | 260 | 258 | ||||||
Monumental Global Funding | ||||||||
0.477%, 01/15/2014 (B) (C) | 230 | 230 | ||||||
Morgan Stanley | ||||||||
1.523%, 02/25/2016 (C) | 300 | 301 | ||||||
National Rural Utilities Cooperative Finance MTN | ||||||||
0.356%, 02/18/2014 (C) | 250 | 250 | ||||||
New York Life Global Funding | ||||||||
0.542%, 04/04/2014 (B) (C) | 300 | 301 | ||||||
Nordea Bank | ||||||||
0.735%, 05/13/2016 (B) (C) | 350 | 350 | ||||||
PACCAR Financial MTN | ||||||||
0.545%, 02/08/2016 (C) | 250 | 251 | ||||||
PNC Bank | ||||||||
0.800%, 01/28/2016 | 250 | 250 | ||||||
Principal Life Global Funding II | ||||||||
1.000%, 12/11/2015 (B) | 95 | 95 | ||||||
0.643%, 05/27/2016 (B) (C) | 290 | 290 | ||||||
Reinsurance Group of America | ||||||||
5.625%, 03/15/2017 | 200 | 224 | ||||||
RHP Hotel Properties‡ | ||||||||
5.000%, 04/15/2021 (B) | 435 | 442 | ||||||
Royal Bank of Canada MTN | ||||||||
0.645%, 03/08/2016 (C) | 300 | 300 | ||||||
0.510%, 01/06/2015 (C) | 250 | 250 | ||||||
Royal Bank of Scotland Group | ||||||||
2.550%, 09/18/2015 | 55 | 56 | ||||||
Simon Property Group‡ | ||||||||
6.750%, 05/15/2014 | 200 | 208 | ||||||
Standard Chartered | ||||||||
1.225%, 05/12/2014 (B) (C) | 200 | 202 | ||||||
Svenska Handelsbanken | ||||||||
0.732%, 03/21/2016 (C) | 350 | 351 | ||||||
Toronto-Dominion Bank MTN | ||||||||
0.577%, 07/14/2014 (C) | 105 | 105 | ||||||
0.453%, 05/01/2015 (C) | 250 | 250 | ||||||
Toyota Motor Credit | ||||||||
0.564%, 05/17/2016 (C) | 100 | 100 | ||||||
UBS MTN | ||||||||
5.875%, 07/15/2016 | 250 | 280 | ||||||
Unitrin | ||||||||
6.000%, 05/15/2017 | 110 | 121 | ||||||
| Description | Face Amount ($ Thousands) | Market Value ($ Thousands) | ||||||
Ventas Realty‡ | ||||||||
3.125%, 11/30/2015 | $ | 150 | $ | 158 | ||||
Volkswagen International Finance | ||||||||
1.625%, 08/12/2013 (B) | 100 | 100 | ||||||
Wells Fargo | ||||||||
1.500%, 07/01/2015 | 300 | 304 | ||||||
0.906%, 04/23/2018 (C) | 350 | 352 | ||||||
Westpac Banking | ||||||||
0.526%, 01/29/2015 (B) (C) | 250 | 250 | ||||||
|
| |||||||
| 16,744 | ||||||||
|
| |||||||
Health Care — 0.2% |
| |||||||
Alere | ||||||||
6.500%, 06/15/2020 (B) | 1,200 | 1,206 | ||||||
Biomet | ||||||||
6.500%, 08/01/2020 (B) | 375 | 395 | ||||||
Express Scripts Holding | ||||||||
2.750%, 11/21/2014 | 300 | 308 | ||||||
McKesson | ||||||||
0.950%, 12/04/2015 | 80 | 80 | ||||||
Sanofi | ||||||||
0.594%, 03/28/2014 (C) | 75 | 75 | ||||||
UnitedHealth Group | ||||||||
0.398%, 08/28/2014 (C) | 300 | 301 | ||||||
WellPoint | ||||||||
1.250%, 09/10/2015 | 41 | 41 | ||||||
|
| |||||||
| 2,406 | ||||||||
|
| |||||||
Industrials — 0.3% |
| |||||||
Ardagh Packaging Finance | ||||||||
4.875%, 11/15/2022 (B) | 1,000 | 998 | ||||||
Caterpillar | ||||||||
1.375%, 05/27/2014 | 100 | 101 | ||||||
Clean Harbors | ||||||||
5.250%, 08/01/2020 | 900 | 938 | ||||||
Danaher | ||||||||
1.300%, 06/23/2014 | 160 | 161 | ||||||
Packaging Dynamics | ||||||||
8.750%, 02/01/2016 (B) | 600 | 628 | ||||||
Penske Truck Leasing | ||||||||
2.500%, 07/11/2014 (B) | 15 | 15 | ||||||
Pentair Finance | ||||||||
1.350%, 12/01/2015 | 80 | 80 | ||||||
Precision Castparts | ||||||||
0.700%, 12/20/2015 | 80 | 80 | ||||||
|
| |||||||
| 3,001 | ||||||||
|
| |||||||
Information Technology — 0.4% |
| |||||||
Brocade Communications Systems | ||||||||
4.625%, 01/15/2023 (B) | 750 | 739 | ||||||
Hewlett-Packard | ||||||||
0.673%, 05/30/2014 (C) | 175 | 175 | ||||||
iGATE | ||||||||
9.000%, 05/01/2016 | 1,315 | 1,414 | ||||||
| 60 | SEI Institutional Investments Trust / Annual Report / May 31, 2013 |
Table of Contents
| Description | Face Amount ($ Thousands) | Market Value ($ Thousands) | ||||||
Western Union | ||||||||
2.375%, 12/10/2015 | $ | 30 | $ | 30 | ||||
WEX | ||||||||
4.750%, 02/01/2023 (B) | 1,000 | 997 | ||||||
Xerox | ||||||||
1.094%, 05/16/2014 (C) | 160 | 160 | ||||||
|
| |||||||
| 3,515 | ||||||||
|
| |||||||
Materials — 0.5% |
| |||||||
E.I. du Pont de Nemours | ||||||||
0.704%, 03/25/2014 (C) | 70 | 70 | ||||||
FMG Resources | ||||||||
8.250%, 11/01/2019 (B) | 1,000 | 1,055 | ||||||
6.875%, 02/01/2018 (B) | 500 | 509 | ||||||
Hecla Mining | ||||||||
6.875%, 05/01/2021 (B) | 965 | 934 | ||||||
Hexion US Finance | ||||||||
6.625%, 04/15/2020 (B) | 1,818 | 1,890 | ||||||
Walter Energy | ||||||||
8.500%, 04/15/2021 (B) | 250 | 251 | ||||||
Yara International | ||||||||
5.250%, 12/15/2014 (B) | 100 | 106 | ||||||
|
| |||||||
| 4,815 | ||||||||
|
| |||||||
Telecommunication Services — 0.5% |
| |||||||
AT&T | ||||||||
0.800%, 12/01/2015 | 150 | 150 | ||||||
0.660%, 02/12/2016 (C) | 250 | 250 | ||||||
Cequel Communications Holdings I LLC | ||||||||
6.375%, 09/15/2020 (B) | 875 | 915 | ||||||
Cincinnati Bell | ||||||||
8.750%, 03/15/2018 | 1,000 | 1,025 | ||||||
DIRECTV Holdings LLC | ||||||||
3.550%, 03/15/2015 | 300 | 313 | ||||||
Hughes Satellite Systems | ||||||||
6.500%, 06/15/2019 | 250 | 273 | ||||||
Intelsat Luxembourg | ||||||||
7.750%, 06/01/2021 (B) | 650 | 683 | ||||||
NBCUniversal Enterprise | ||||||||
0.965%, 04/15/2018 (B) (C) | 400 | 404 | ||||||
Softbank | ||||||||
4.500%, 04/15/2020 (B) | 751 | 762 | ||||||
|
| |||||||
| 4,775 | ||||||||
|
| |||||||
Utilities — 0.0% | ||||||||
DTE Energy | ||||||||
0.987%, 06/03/2013 (C) | 76 | 76 | ||||||
Georgia Power | ||||||||
1.300%, 09/15/2013 | 150 | 150 | ||||||
|
| |||||||
| 226 | ||||||||
|
| |||||||
Total Corporate Obligations | 49,646 | |||||||
|
| |||||||
| Description | Face Amount ($ Thousands) | Market Value ($ Thousands) | ||||||
ASSET-BACKED SECURITIES — 2.7% |
| |||||||
Automotive — 1.6% | ||||||||
Ally Auto Receivables Trust, | ||||||||
3.050%, 12/15/2014 (B) | $ | 71 | $ | 71 | ||||
Ally Auto Receivables Trust, | ||||||||
2.090%, 05/15/2015 | 84 | 85 | ||||||
Ally Auto Receivables Trust, | ||||||||
2.450%, 06/15/2016 (B) | 85 | 87 | ||||||
Ally Auto Receivables Trust, | ||||||||
2.230%, 03/15/2016 | 200 | 203 | ||||||
Ally Auto Receivables Trust, | ||||||||
0.990%, 11/16/2015 | 282 | 283 | ||||||
Ally Auto Receivables Trust, | ||||||||
0.710%, 09/15/2014 | 18 | 18 | ||||||
Ally Auto Receivables Trust, | ||||||||
0.590%, 01/17/2017 | 101 | 101 | ||||||
Ally Auto Receivables Trust, | ||||||||
0.700%, 12/21/2015 | 75 | 75 | ||||||
Ally Auto Receivables Trust, | ||||||||
0.630%, 05/15/2017 | 450 | 449 | ||||||
Ally Auto Receivables Trust, | ||||||||
0.720%, 05/20/2016 | 135 | 135 | ||||||
American Credit Acceptance Receivables Trust, | ||||||||
1.640%, 11/15/2016 (B) | 128 | 128 | ||||||
AmeriCredit Automobile Receivables Trust, | ||||||||
1.990%, 10/08/2015 | 180 | 181 | ||||||
AmeriCredit Automobile Receivables Trust, | ||||||||
3.510%, 07/06/2017 | 43 | 44 | ||||||
AmeriCredit Automobile Receivables Trust, | ||||||||
1.170%, 01/08/2016 | 86 | 86 | ||||||
AmeriCredit Automobile Receivables Trust, | ||||||||
0.920%, 03/09/2015 | 7 | 7 | ||||||
| SEI Institutional Investments Trust / Annual Report / May 31, 2013 | 61 |
Table of Contents
SCHEDULE OF INVESTMENTS
Opportunistic Income Fund(1) (Continued)
May 31, 2013
| Description | Face Amount ($ Thousands) | Market Value ($ Thousands) | ||||||
AmeriCredit Automobile Receivables Trust, | ||||||||
0.620%, 06/08/2017 | $ | 125 | $ | 125 | ||||
AmeriCredit Automobile Receivables Trust, | ||||||||
0.490%, 06/08/2016 | 390 | 390 | ||||||
AmeriCredit Automobile Receivables Trust, | ||||||||
0.650%, 12/08/2017 | 260 | 260 | ||||||
ARI Fleet Lease Trust, | ||||||||
0.749%, 03/15/2020 (B) (C) | 59 | 59 | ||||||
ARI Fleet Lease Trust, | ||||||||
0.700%, 12/15/2015 (B) | 175 | 175 | ||||||
Avis Budget Rental Car Funding, | ||||||||
3.630%, 08/20/2014 (B) | 50 | 50 | ||||||
Bank of America Auto Trust, | ||||||||
0.780%, 06/15/2016 | 50 | 50 | ||||||
BMW Vehicle Owner Trust, | ||||||||
0.760%, 08/25/2015 | 115 | 115 | ||||||
CarMax Auto Owner Trust, | ||||||||
2.820%, 12/15/2014 | 114 | 115 | ||||||
CarMax Auto Owner Trust, | ||||||||
2.170%, 07/17/2017 | 150 | 154 | ||||||
CarMax Auto Owner Trust, | ||||||||
0.890%, 09/15/2016 | 45 | 45 | ||||||
CarMax Auto Owner Trust, | ||||||||
0.520%, 07/17/2017 | 75 | 75 | ||||||
CarMax Auto Owner Trust, | ||||||||
1.500%, 08/15/2018 | 55 | 55 | ||||||
CarMax Auto Owner Trust, | ||||||||
0.420%, 03/15/2016 | 105 | 105 | ||||||
CFC LLC, Ser 2013-1A, Cl A | ||||||||
1.650%, 07/17/2017 (B) | 60 | 60 | ||||||
Credit Acceptance Auto Loan Trust, | ||||||||
2.610%, 03/15/2019 (B) | 250 | 253 | ||||||
Credit Acceptance Auto Loan Trust, | ||||||||
2.200%, 09/16/2019 (B) | 460 | 466 | ||||||
| Description | Face Amount ($ Thousands) | Market Value ($ Thousands) | ||||||
Enterprise Fleet Financing LLC, | ||||||||
1.140%, 11/20/2017 (B) | $ | 239 | $ | 240 | ||||
Enterprise Fleet Financing LLC, | ||||||||
0.720%, 04/20/2018 (B) | 250 | 250 | ||||||
Enterprise Fleet Financing LLC, | ||||||||
0.680%, 09/20/2018 (B) | 280 | 280 | ||||||
Fifth Third Auto Trust, | ||||||||
0.450%, 01/15/2016 | 305 | 305 | ||||||
First Investors Auto Owner Trust, | ||||||||
0.900%, 10/15/2018 (B) | 145 | 145 | ||||||
Ford Credit Auto Lease Trust, | ||||||||
1.420%, 01/15/2015 | 150 | 151 | ||||||
Ford Credit Auto Lease Trust, | ||||||||
0.540%, 11/15/2014 | 100 | 100 | ||||||
Ford Credit Auto Lease Trust, | ||||||||
0.460%, 05/15/2015 | 360 | 360 | ||||||
Ford Credit Auto Owner Trust, | ||||||||
2.980%, 08/15/2014 | 22 | 22 | ||||||
Ford Credit Auto Owner Trust, | ||||||||
0.840%, 06/15/2015 | 61 | 61 | ||||||
Ford Credit Auto Owner Trust, | ||||||||
1.880%, 08/15/2017 | 175 | 179 | ||||||
Ford Credit Auto Owner Trust, | ||||||||
0.380%, 11/15/2015 | 150 | 150 | ||||||
Ford Credit Floorplan Master Owner Trust, Ser 2010-5, Cl A1 | ||||||||
1.500%, 09/15/2015 | 200 | 201 | ||||||
Ford Credit Floorplan Master Owner Trust, Ser 2012-1, Cl A | ||||||||
0.669%, 01/15/2016 (C) | 150 | 150 | ||||||
Ford Credit Floorplan Master Owner Trust, Ser 2012-2, Cl A | ||||||||
1.920%, 01/15/2019 | 175 | 179 | ||||||
Ford Credit Floorplan Master Owner Trust, Ser 2012-4, Cl A1 | ||||||||
0.740%, 09/15/2016 | 125 | 125 | ||||||
Ford Credit Floorplan Master Owner Trust, Ser 2012-4, Cl A2 | ||||||||
0.549%, 09/15/2016 (C) | 120 | 120 | ||||||
Ford Credit Floorplan Master Owner Trust, Ser 2013-1, Cl A2 | ||||||||
0.579%, 01/15/2018 (C) | 195 | 195 | ||||||
| 62 | SEI Institutional Investments Trust / Annual Report / May 31, 2013 |
Table of Contents
| Description | Face Amount ($ Thousands) | Market Value ($ Thousands) | ||||||
GE Dealer Floorplan Master Note Trust, Ser 2012-1, Cl A | ||||||||
0.768%, 02/20/2017 (C) | $ | 350 | $ | 352 | ||||
GE Dealer Floorplan Master Note Trust, Ser 2012-3, Cl A | ||||||||
0.688%, 06/20/2017 (C) | 115 | 116 | ||||||
Harley-Davidson Motorcycle Trust, | ||||||||
0.960%, 05/16/2016 | 133 | 134 | ||||||
Harley-Davidson Motorcycle Trust, | ||||||||
0.680%, 04/15/2017 | 175 | 175 | ||||||
Harley Davidson Motorcycle Trust, | ||||||||
0.650%, 07/16/2018 | 300 | 299 | ||||||
Hertz Vehicle Financing LLC, | ||||||||
2.200%, 03/25/2016 (B) | 150 | 153 | ||||||
Honda Auto Receivables Owner Trust, Ser 2011-2, Cl A3 | ||||||||
0.940%, 03/18/2015 | 46 | 47 | ||||||
Honda Auto Receivables Owner Trust, Ser 2012-4, Cl A3 | ||||||||
0.520%, 08/18/2016 | 110 | 110 | ||||||
Huntington Auto Trust, | ||||||||
0.510%, 04/17/2017 | 110 | 110 | ||||||
Hyundai Auto Lease Securitization Trust, Ser 2012-A, Cl A3 | ||||||||
0.920%, 08/17/2015 (B) | 350 | 351 | ||||||
Hyundai Auto Lease Securitization Trust, Ser 2012-A, Cl A4 | ||||||||
1.050%, 04/17/2017 (B) | 300 | 302 | ||||||
Hyundai Auto Receivables Trust, | ||||||||
2.450%, 04/15/2016 | 70 | 72 | ||||||
Hyundai Auto Receivables Trust, | ||||||||
2.270%, 02/15/2017 | 130 | 133 | ||||||
Hyundai Auto Receivables Trust, | ||||||||
0.620%, 09/15/2016 | 50 | 50 | ||||||
Hyundai Auto Receivables Trust, | ||||||||
0.530%, 04/17/2017 | 125 | 125 | ||||||
Hyundai Auto Receivables Trust, | ||||||||
0.400%, 12/15/2015 | 300 | 300 | ||||||
Mercedes-Benz Auto Lease Trust, | ||||||||
0.590%, 02/15/2016 | 290 | 290 | ||||||
Mercedes-Benz Auto Receivables Trust, Ser 2012-1, Cl A3 | ||||||||
0.470%, 10/17/2016 | 260 | 260 | ||||||
| Description | Face Amount ($ Thousands) | Market Value ($ Thousands) | ||||||
Mercedes-Benz Master Owner Trust, Ser 2012-BA, Cl A | ||||||||
0.469%, 11/15/2016 (B) (C) | $ | 150 | $ | 150 | ||||
MMCA Auto Owner Trust, | ||||||||
0.810%, 08/15/2014 (B) | 22 | 22 | ||||||
Nissan Auto Lease Trust, | ||||||||
1.040%, 08/15/2014 | 116 | 116 | ||||||
Nissan Auto Lease Trust, | ||||||||
0.450%, 09/15/2015 | 300 | 300 | ||||||
Nissan Auto Receivables Owner Trust, Ser 2011-B, Cl A3 | ||||||||
0.950%, 02/16/2016 | 85 | 85 | ||||||
Nissan Auto Receivables Owner Trust, Ser 2012-B, Cl A3 | ||||||||
0.460%, 10/17/2016 | 125 | 125 | ||||||
Nissan Auto Receivables Owner Trust, Ser 2013-A, Cl A2 | ||||||||
0.370%, 09/15/2015 | 200 | 200 | ||||||
Nissan Auto Receivables Owner Trust, Ser 2013-A, Cl A3 | ||||||||
0.500%, 05/15/2017 | 150 | 150 | ||||||
Nissan Master Owner Trust Receivables, Ser 2012-A, Cl A | ||||||||
0.669%, 05/15/2017 (C) | 225 | 226 | ||||||
Porsche Innovative Lease Owner Trust, Ser 2011-1, Cl A4 | ||||||||
1.260%, 11/20/2017 (B) | 170 | 171 | ||||||
Porsche Innovative Lease Owner Trust, Ser 2012-1, Cl A3 | ||||||||
0.540%, 12/21/2015 (B) | 126 | 126 | ||||||
Prestige Auto Receivables Trust, | ||||||||
1.090%, 02/15/2018 (B) | 250 | 250 | ||||||
Santander Drive Auto Receivables Trust, Ser 2010-2, Cl C | ||||||||
3.890%, 07/17/2017 | 220 | 226 | ||||||
Santander Drive Auto Receivables Trust, Ser 2011-3, Cl B | ||||||||
2.500%, 12/15/2015 | 150 | 152 | ||||||
Santander Drive Auto Receivables Trust, Ser 2012-1, Cl A2 | ||||||||
1.250%, 04/15/2015 | 29 | 29 | ||||||
Santander Drive Auto Receivables Trust, Ser 2012-3, Cl A2 | ||||||||
0.830%, 04/15/2015 | 238 | 238 | ||||||
Santander Drive Auto Receivables Trust, Ser 2012-5, Cl A3 | ||||||||
0.830%, 12/15/2016 | 128 | 128 | ||||||
Santander Drive Auto Receivables Trust, Ser 2013-1, Cl A2 | ||||||||
0.480%, 02/16/2016 | 175 | 175 | ||||||
| SEI Institutional Investments Trust / Annual Report / May 31, 2013 | 63 |
Table of Contents
SCHEDULE OF INVESTMENTS
Opportunistic Income Fund(1) (Continued)
May 31, 2013
| Description | Face Amount ($ Thousands) | Market Value ($ Thousands) | ||||||
Santander Drive Auto Receivables Trust, Ser 2013-2, Cl A3 | ||||||||
0.700%, 09/15/2017 | $ | 350 | $ | 350 | ||||
SNAAC Auto Receivables Trust, | ||||||||
1.140%, 07/16/2018 (B) | 155 | 155 | ||||||
Toyota Auto Receivables Owner Trust, Ser 2012-A, Cl A3 | ||||||||
0.750%, 02/16/2016 | 100 | 100 | ||||||
Toyota Auto Receivables Owner Trust, Ser 2012-B, Cl A3 | ||||||||
0.460%, 07/15/2016 | 300 | 300 | ||||||
Toyota Auto Receivables Owner Trust, Ser 2013-A, Cl A3 | ||||||||
0.550%, 01/17/2017 | 70 | 70 | ||||||
Volkswagen Auto Lease Trust, | ||||||||
0.870%, 07/20/2015 | 65 | 65 | ||||||
Volkswagen Auto Loan Enhanced Trust, Ser 2011-1, Cl A4 | ||||||||
1.980%, 09/20/2017 | 190 | 194 | ||||||
Volkswagen Auto Loan Enhanced Trust, Ser 2012-1, Cl A2 | ||||||||
0.610%, 10/20/2014 | 9 | 9 | ||||||
Volkswagen Auto Loan Enhanced Trust, Ser 2013-1, Cl A2 | ||||||||
0.370%, 01/20/2016 | 230 | 230 | ||||||
World Omni Auto Receivables Trust, Ser 2012-A, Cl A3 | ||||||||
0.640%, 02/15/2017 | 41 | 41 | ||||||
World Omni Automobile Lease Securitization Trust, | ||||||||
1.780%, 09/15/2016 | 135 | 136 | ||||||
World Omni Automobile Lease Securitization Trust, | ||||||||
0.930%, 11/16/2015 | 20 | 20 | ||||||
World Omni Master Owner Trust, | ||||||||
0.549%, 02/15/2018 (B) (C) | 105 | 105 | ||||||
|
| |||||||
| 15,741 | ||||||||
|
| |||||||
Credit Cards — 0.3% | ||||||||
American Express Credit Account Master Trust, Ser 2007-2, Cl B | ||||||||
0.379%, 09/15/2016 (C) | 245 | 245 | ||||||
American Express Credit Account Master Trust, Ser 2012-2, Cl B | ||||||||
0.990%, 03/15/2018 | 100 | 100 | ||||||
Capital One Multi-Asset Execution Trust, Ser 2013-A2, Cl A2 | ||||||||
0.379%, 02/15/2019 (C) | 325 | 325 | ||||||
| Description | Face Amount ($ Thousands) | Market Value ($ Thousands) | ||||||
Chase Issuance Trust, | ||||||||
0.590%, 08/15/2017 | $ | 225 | $ | 225 | ||||
Citibank Omni Master Trust, | ||||||||
5.350%, 08/15/2018 (B) | 250 | 264 | ||||||
Citibank Omni Master Trust, | ||||||||
2.949%, 08/15/2018 (B) (C) | 300 | 309 | ||||||
Discover Card Execution Note Trust, Ser 2013-A3, Cl A3 | ||||||||
0.378%, 10/15/2018 (C) | 325 | 325 | ||||||
Dryrock Issuance Trust, | ||||||||
0.640%, 08/15/2018 | 350 | 349 | ||||||
GE Capital Credit Card Master Note Trust, Ser 2012-5, Cl A | ||||||||
0.950%, 06/15/2018 | 120 | 120 | ||||||
Golden Credit Card Trust, | ||||||||
0.790%, 09/15/2017 (B) | 125 | 125 | ||||||
Gracechurch Card Funding, | ||||||||
0.899%, 02/15/2017 (B) (C) | 250 | 252 | ||||||
Gracechurch Card Funding, | ||||||||
0.899%, 06/15/2017 (B) (C) | 250 | 252 | ||||||
|
| |||||||
| 2,891 | ||||||||
|
| |||||||
Other Asset-Backed Securities — 0.8% |
| |||||||
Accredited Mortgage Loan Trust, | ||||||||
0.533%, 01/25/2035 (C) | 171 | 168 | ||||||
Ally Master Owner Trust, | ||||||||
0.829%, 05/15/2016 (C) | 340 | 341 | ||||||
Ally Master Owner Trust, | ||||||||
1.810%, 05/15/2016 | 250 | 253 | ||||||
Ally Master Owner Trust, | ||||||||
1.210%, 06/15/2017 | 110 | 111 | ||||||
Ally Master Owner Trust, | ||||||||
0.649%, 02/15/2018 (C) | 125 | 125 | ||||||
Ally Master Owner Trust, | ||||||||
0.649%, 04/15/2018 (C) | 400 | 400 | ||||||
Apidos CLO XII, Ser 2013-12A | ||||||||
1.373%, 04/15/2025 (B) (C) | 500 | 500 | ||||||
Babson CLO, Ser 2013-IA, Cl A | ||||||||
1.312%, 04/20/2025 (B) (C) | 350 | 350 | ||||||
CIFC Funding, Ser 2013-1A, Cl A1 | ||||||||
1.432%, 04/16/2025 (B) (C) | 265 | 265 | ||||||
| 64 | SEI Institutional Investments Trust / Annual Report / May 31, 2013 |
Table of Contents
| Description | Face Amount ($ Thousands) | Market Value ($ Thousands) | ||||||
CNH Equipment Trust, | ||||||||
1.170%, 05/15/2015 | $ | 119 | $ | 119 | ||||
CNH Equipment Trust, | ||||||||
1.190%, 12/15/2016 | 245 | 246 | ||||||
CNH Equipment Trust, | ||||||||
0.940%, 05/15/2017 | 536 | 538 | ||||||
CNH Equipment Trust, | ||||||||
0.860%, 09/15/2017 | 55 | 55 | ||||||
CNH Equipment Trust, | ||||||||
0.570%, 12/15/2017 | 70 | 70 | ||||||
CNH Equipment Trust, | ||||||||
0.440%, 07/15/2016 | 195 | 195 | ||||||
GE Equipment Midticket LLC, | ||||||||
1.000%, 08/24/2015 | 302 | 303 | ||||||
GE Equipment Midticket LLC, | ||||||||
0.600%, 05/23/2016 | 70 | 70 | ||||||
GE Equipment Small Ticket LLC, | ||||||||
0.850%, 11/21/2014 (B) | 131 | 131 | ||||||
GE Equipment Transportation LLC, | ||||||||
0.990%, 11/23/2015 | 321 | 322 | ||||||
GE Equipment Transportation LLC, | ||||||||
0.470%, 04/24/2015 | 250 | 250 | ||||||
GE Equipment Transportation LLC, | ||||||||
0.620%, 07/25/2016 | 335 | 335 | ||||||
HLSS Servicer Advance Receivables Backed Notes, | ||||||||
1.990%, 10/15/2045 (B) | 185 | 189 | ||||||
HLSS Servicer Advance Receivables Backed Notes, | ||||||||
0.898%, 01/15/2044 (B) | 495 | 495 | ||||||
HLSS Servicer Advance Receivables Backed Notes, | ||||||||
1.495%, 01/16/2046 (B) | 101 | 102 | ||||||
HLSS Servicer Advance Receivables Backed Notes, | ||||||||
1.147%, 05/16/2044 (B) | 105 | 105 | ||||||
John Deere Owner Trust 2013, | ||||||||
0.600%, 03/15/2017 | 450 | 449 | ||||||
| Description | Face Amount ($ Thousands) | Market Value ($ Thousands) | ||||||
John Deere Owner Trust, | ||||||||
0.530%, 07/15/2016 | $ | 160 | $ | 160 | ||||
MMAF Equipment Finance LLC, | ||||||||
0.840%, 01/12/2015 (B) | 158 | 158 | ||||||
Octagon Investment Partners XVI, | ||||||||
1.425%, 07/17/2025 (B) (C) | 300 | 300 | ||||||
OHA Credit Partners VIII, | ||||||||
1.395%, 04/20/2025 (B) (C) | 200 | 199 | ||||||
OHA Intrepid Leveraged Loan Fund, Ser 2013-1AR, Cl AR | ||||||||
1.196%, 04/20/2021 (B) (C) | 350 | 350 | ||||||
SLM Student Loan Trust, | ||||||||
1.049%, 12/16/2024 (B) (C) | 80 | 81 | ||||||
Volvo Financial Equipment LLC, | ||||||||
0.740%, 03/15/2017 (B) | 290 | 290 | ||||||
|
| |||||||
| 8,025 | ||||||||
|
| |||||||
Total Asset-Backed Securities | 26,657 | |||||||
|
| |||||||
MORTGAGE-BACKED SECURITIES — 1.4% |
| |||||||
Agency Mortgage-Backed Obligations — 0.8% |
| |||||||
FHLMC TBA | ||||||||
2.500%, 06/15/2027 | 500 | 510 | ||||||
FNMA | ||||||||
6.000%, 09/01/2039 to 04/01/2040 | 282 | 307 | ||||||
FNMA TBA | ||||||||
3.500%, 06/01/2042 | 450 | 466 | ||||||
3.000%, 06/25/2027 | 2,700 | 2,809 | ||||||
2.500%, 06/25/2027 | 2,300 | 2,347 | ||||||
NCUA Guaranteed Notes CMO, | ||||||||
0.653%, 10/07/2020 (C) | 228 | 229 | ||||||
NCUA Guaranteed Notes CMO, | ||||||||
0.758%, 12/08/2020 (C) | 601 | 608 | ||||||
NCUA Guaranteed Notes CMO, | ||||||||
0.648%, 01/08/2020 (C) | 368 | 369 | ||||||
NCUA Guaranteed Notes CMO, | ||||||||
0.600%, 02/06/2020 (C) | 589 | 592 | ||||||
NCUA Guaranteed Notes CMO, | ||||||||
0.583%, 05/07/2020 (C) | 34 | 34 | ||||||
|
| |||||||
| 8,271 | ||||||||
|
| |||||||
| SEI Institutional Investments Trust / Annual Report / May 31, 2013 | 65 |
Table of Contents
SCHEDULE OF INVESTMENTS
Opportunistic Income Fund(1) (Continued)
May 31, 2013
| Description | Face Amount ($ Thousands) | Market Value ($ Thousands) | ||||||
Non-Agency Mortgage-Backed Obligations — 0.6% |
| |||||||
Banc of America Funding, | ||||||||
3.076%, 09/20/2035 (C) | $ | 297 | $ | 254 | ||||
Banc of America Funding, | ||||||||
3.017%, 05/20/2036 (C) | 220 | 197 | ||||||
Banc of America Mortgage Securities, Ser 2005-A, Cl 2A1 | ||||||||
2.945%, 02/25/2035 (C) | 120 | 119 | ||||||
Bear Stearns Commercial Mortgage Securities, | ||||||||
5.405%, 12/11/2040 (C) | 200 | 218 | ||||||
Citigroup Commercial Mortgage Trust, Ser 2012-GC8, Cl A1 | ||||||||
0.685%, 09/10/2045 | 97 | 97 | ||||||
Commercial Mortgage Pass-Through Certificates, | ||||||||
0.299%, 12/15/2020 (B) (C) | 3 | 3 | ||||||
Commercial Mortgage Pass-Through Certificates, | ||||||||
3.156%, 07/10/2046 (B) | 204 | 213 | ||||||
Commercial Mortgage Pass-Through Certificates, | ||||||||
1.116%, 05/15/2045 | 184 | 185 | ||||||
Commercial Mortgage Pass-Through Certificates, | ||||||||
0.704%, 10/15/2045 | 96 | 96 | ||||||
Commercial Mortgage Pass-Through Certificates, | ||||||||
0.673%, 12/10/2045 | 112 | 111 | ||||||
Commercial Mortgage Pass-Through Certificates, | ||||||||
0.824%, 08/15/2045 | 73 | 73 | ||||||
DBUBS Mortgage Trust, | ||||||||
3.742%, 11/10/2046 (B) | 119 | 127 | ||||||
GS Mortgage Securities II, | ||||||||
5.279%, 08/10/2038 (C) | 41 | 41 | ||||||
GS Mortgage Securities II, | ||||||||
3.849%, 12/10/2043 (B) | 117 | 126 | ||||||
GS Mortgage Securities II, | ||||||||
0.662%, 11/10/2045 | 68 | 68 | ||||||
| Description | Face Amount ($ Thousands) | Market Value ($ Thousands) | ||||||
JPMorgan Chase Commercial Mortgage Securities, | ||||||||
3.853%, 06/15/2043 (B) | $ | 117 | $ | 123 | ||||
JPMorgan Chase Commercial Mortgage Securities, | ||||||||
2.749%, 11/15/2043 (B) | 187 | 194 | ||||||
JPMorgan Chase Commercial Mortgage Securities, | ||||||||
1.525%, 07/15/2046 (B) | 60 | 60 | ||||||
JPMorgan Chase Commercial Mortgage Securities, | ||||||||
1.600%, 08/15/2046 | 106 | 107 | ||||||
JPMorgan Chase Commercial Mortgage Securities, | ||||||||
0.670%, 12/15/2047 | 61 | 61 | ||||||
JPMorgan Chase Commercial Mortgage Securities, | ||||||||
0.705%, 10/15/2045 | 50 | 50 | ||||||
JPMorgan Chase Commercial Mortgage Securities, | ||||||||
4.903%, 10/15/2042 | 101 | 102 | ||||||
JPMorgan Mortgage Trust, | ||||||||
Ser 2007-A4, Cl 1A1 | ||||||||
2.887%, 06/25/2037 (C) | 179 | 147 | ||||||
Master Adjustable Rate Mortgages Trust, Ser 2005-6, Cl 5A1 | ||||||||
2.785%, 07/25/2035 (C) | 234 | 207 | ||||||
Morgan Stanley Capital I, | �� | |||||||
5.110%, 06/15/2040 (C) | 86 | 89 | ||||||
Morgan Stanley Re-REMIC Trust, | ||||||||
1.000%, 03/27/2051 | 127 | 125 | ||||||
Springleaf Mortgage Loan Trust, | ||||||||
1.270%, 06/25/2058 (B) (C) | 224 | 225 | ||||||
UBS-Barclays Commercial Mortgage Trust, | ||||||||
0.726%, 08/10/2049 | 110 | 110 | ||||||
UBS-Barclays Commercial Mortgage Trust, Ser 2012-C4 | ||||||||
0.673%, 12/10/2045 | 80 | 79 | ||||||
UBS-Barclays Commercial Mortgage Trust, Ser 2013-C5 | ||||||||
0.779%, 03/10/2046 | 263 | 262 | ||||||
| 66 | SEI Institutional Investments Trust / Annual Report / May 31, 2013 |
Table of Contents
| Description | Face Amount ($ Thousands) | Market Value ($ Thousands) | ||||||
Wachovia Bank Commercial Mortgage Trust, | ||||||||
5.012%, 12/15/2035 (C) | $ | 135 | $ | 136 | ||||
Wachovia Bank Commercial Mortgage Trust, | ||||||||
4.935%, 04/15/2042 | 145 | 154 | ||||||
Wachovia Bank Commercial Mortgage Trust, | ||||||||
5.239%, 10/15/2044 (C) | 131 | 141 | ||||||
Wachovia Bank Commercial Mortgage Trust, Ser C22 | ||||||||
5.290%, 12/15/2044 (C) | 225 | 245 | ||||||
Washington Mutual Mortgage Pass-Through Certificate, | ||||||||
2.521%, 12/25/2035 (C) | 239 | 223 | ||||||
Wells Fargo Commercial Mortgage Trust, Ser 2012-LC5, Cl A1 | ||||||||
0.687%, 10/15/2045 | 112 | 112 | ||||||
WFRBS Commercial Mortgage Trust, Ser 2011-C3, Cl A1 | ||||||||
1.988%, 03/15/2044 (B) | 67 | 68 | ||||||
WFRBS Commercial Mortgage Trust, Ser 2012-C6, Cl A1 | ||||||||
1.081%, 04/15/2045 | 391 | 393 | ||||||
WFRBS Commercial Mortgage Trust, Ser C9, Cl A1 | ||||||||
0.673%, 11/15/2045 | 113 | 113 | ||||||
|
| |||||||
| 5,454 | ||||||||
|
| |||||||
Total Mortgage-Backed Securities | 13,725 | |||||||
|
| |||||||
U.S. GOVERNMENT AGENCY OBLIGATIONS — 0.8% |
| |||||||
FHLB | ||||||||
4.875%, 12/13/2013 | 400 | 410 | ||||||
0.300%, 12/12/2013 | 750 | 751 | ||||||
0.140%, 05/20/2014 | 400 | 400 | ||||||
FHLMC | ||||||||
1.000%, 08/20/2014 to 10/13/2015 | 4,000 | 4,031 | ||||||
0.450%, 01/09/2014 | 500 | 501 | ||||||
FNMA | ||||||||
0.750%, 12/18/2013 | 550 | 552 | ||||||
0.550%, 02/27/2015 | 1,000 | 1,002 | ||||||
NCUA Guaranteed Notes | ||||||||
0.219%, 06/12/2013 (C) | 260 | 260 | ||||||
|
| |||||||
Total U.S. Government Agency Obligations | 7,907 | |||||||
|
| |||||||
| Description | Face Amount ($ Thousands)/ Shares | Market Value ($ Thousands) | ||||||
MUNICIPAL BONDS — 0.1% |
| |||||||
Florida State, Hurricane Catastrophe Fund Finance, | ||||||||
1.298%, 07/01/2016 | $ | 345 | $ | 345 | ||||
New Jersey State, Economic Development Authority, | ||||||||
1.059%, 03/01/2016 | 285 | 284 | ||||||
New Jersey State, Turnpike Authority, Ser B, RB, AMBAC | ||||||||
4.252%, 01/01/2016 | 150 | 154 | ||||||
North Carolina State, Eastern Municipal Power Agency, | ||||||||
4.430%, 01/01/2014 | 150 | 153 | ||||||
Oregon State, School Boards Association, Ser A, GO, | ||||||||
0.000%, 06/30/2015 | 125 | 123 | ||||||
|
| |||||||
Total Municipal Bonds | 1,059 | |||||||
|
| |||||||
AFFILIATED PARTNERSHIP — 62.1% |
| |||||||
SEI LIBOR Plus Portfolio†** | 81,400,036 | 619,454 | ||||||
|
| |||||||
Total Affiliated Partnership |
| 619,454 | ||||||
|
| |||||||
CASH EQUIVALENT — 6.9% |
| |||||||
SEI Daily Income Trust, Prime Obligation Fund, Cl A | ||||||||
0.010%*† | 68,421,403 | 68,421 | ||||||
|
| |||||||
Total Cash Equivalent |
| 68,421 | ||||||
|
| |||||||
Total Investments — 101.3% |
| $ | 1,009,292 | |||||
|
| |||||||
A list of the open futures contracts held by the Fund at May 31, 2013, is as follows:
| Type of Contracts | Number of Contract Short | Expiration Date | Unrealized Appreciation ($ Thousands) | |||||||||
U.S. 10-Year Treasury Note | (27 | ) | Sep-2013 | $ | 2 | |||||||
U.S. 2-Year Treasury Note | (12 | ) | Sep-2013 | 1 | ||||||||
U.S. 5-Year Treasury Note | (5 | ) | Oct-2013 | — | ||||||||
U.S. Long Treasury Bond | (1 | ) | Sep-2013 | — | ||||||||
|
| |||||||||||
| $ | 3 | |||||||||||
|
| |||||||||||
For the year ended May 31, 2013, the total amount of all open futures contracts, as presented in the table above, are representative of the volume of activity for this derivative type during the year.
Percentages are based on a Net Assets of $996,522 ($ Thousands).
| * | The rate reported is the 7-day effective yield as of May 31, 2013. |
| † | Investment in Affiliated security (see Note 5). |
| ‡ | Real Estate Investment Trust. |
| (1) | Effective January 1, 2013 the SIIT Enhanced Libor Opportunities Fund was renamed the SIIT Opportunistic Income Fund. |
| SEI Institutional Investments Trust / Annual Report / May 31, 2013 | 67 |
Table of Contents
SCHEDULE OF INVESTMENTS
Opportunistic Income Fund(1) (Concluded)
May 31, 2013
| (A) | Unsettled bank loan. Interest rate not available. |
| (B) | Securities sold within terms of a private placement memorandum, exempt from registration under Section 144A of the Securities Act of 1933, as amended, and may be sold only to dealers in that program or other “accredited investors.” These securities have been determined to be liquid under guidelines established by the Board of Trustees. |
| (C) | Variable Rate Security — The rate reported on the Schedule of Investments is the rate in effect as of May 31, 2013. The date reported on the Schedule of Investments is the final maturity date. |
| ** | The Fund’s investment in the SEI LIBOR Plus Portfolio, a portfolio of the SEI Alpha Strategy Portfolios, LP represents greater than 50% of the Fund’s total investments. The SEI LIBOR Plus Portfolio seeks to maximize total return consistent with the preservation of capital and prudent investment management. For further financial information, available upon request at no charge, on the SEI LIBOR Plus Portfolio please go to the Securities Exchange Commission’s website at http://www.sec.gov or call 1-800-DIAL-SEI. |
AMBAC — American Municipal Bond Assurance Corporation
Cl — Class
CLO — Collateralized Loan Obligation
CMO — Collateralized Mortgage Obligation
FGIC — Federal Guaranty Company
FHLB — Federal Home Loan Bank
FHLMC — Federal Home Loan Mortgage Corporation
FNMA — Federal National Mortgage Association
GO — General Obligation
LIBOR — London Interbank Offered Rate
L.P. — Limited Partnership
LLC — Limited Liability Company
Ltd. — Limited
MTN — Medium Term Note
NATL-RE — National Public Finance Guarantee Corporation
NCUA — National Credit Union Association
PIK — Payment-in-Kind
PLC — Public Limited Company
RB — Revenue Bond
Re-REMIC — Resecuritization of Real Estate Mortgage Investment Conduit
Ser — Series
TBA — To Be Announced
Amounts designated as “—” are $O or have been rounded to $O.
The following is a list of the inputs used as of May 31, 2013, in valuing the Fund’s investments and other financial instruments carried at value ($ Thousands):
| Investments in Securities | Level 1 | Level 2 | Level 3 | Total | ||||||||||||
Loan Participations | $ | — | $ | 222,423 | $ | — | $ | 222,423 | ||||||||
Corporate Obligations | — | 49,646 | — | 49,646 | ||||||||||||
Asset-Backed Securities | — | 26,657 | — | 26,657 | ||||||||||||
Mortgage-Backed Securities | — | 13,725 | — | 13,725 | ||||||||||||
U.S. Government Agency Obligations | — | 7,907 | — | 7,907 | ||||||||||||
Municipal Bonds | — | 1,059 | — | 1,059 | ||||||||||||
Affiliated Partnership | 619,454 | — | — | 619,454 | ||||||||||||
Cash Equivalent | 68,421 | — | — | 68,421 | ||||||||||||
|
|
|
|
|
|
|
| |||||||||
Total Investments in Securities | $ | 687,875 | $ | 321,417 | $ | — | $ | 1,009,292 | ||||||||
|
|
|
|
|
|
|
| |||||||||
| Other Financial Instruments | Level 1 | Level 2 | Level 3 | Total | ||||||||||||
Futures Contracts* | $ | 3 | $ | — | $ | — | $ | 3 | ||||||||
|
|
|
|
|
|
|
| |||||||||
| * | Futures contracts are valued at the unrealized appreciation on the instrument. |
For the year ended May 31, 2013, there were no transfers between Level 1 and Level 2 assets and liabilities.
For the year ended May 31, 2013, there were no transfers between Level 2 and Level 3 assets and liabilities.
For more information on valuation inputs, see Note 2 — Significant Accounting Policies in Notes to Financial Statements.
Amounts designated as “—” are $0 or have been rounded to $0.
The accompanying notes are an integral part of the financial statements.
| 68 | SEI Institutional Investments Trust / Annual Report / May 31, 2013 |
Table of Contents
SCHEDULE OF INVESTMENTS
Core Fixed Income Fund
May 31, 2013
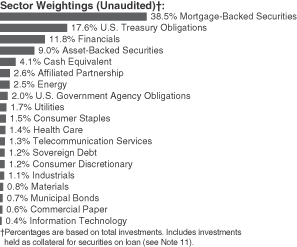
| Description | Face Amount ($ Thousands) | Market Value ($ Thousands) | ||||||
MORTGAGE-BACKED SECURITIES — 42.4% |
| |||||||
Agency Mortgage-Backed Obligations — 34.8% |
| |||||||
FHLMC | ||||||||
11.000%, 02/17/2021 | $ | 671 | $ | 695 | ||||
10.000%, 03/17/2026 to 10/01/2030 | 1,958 | 2,218 | ||||||
8.000%, 06/01/2030 | 4 | 5 | ||||||
7.500%, 08/01/2030 to 09/01/2038 | 1,576 | 1,874 | ||||||
7.000%, 11/01/2015 to 03/01/2039 | 796 | 925 | ||||||
6.500%, 06/01/2017 to 09/01/2039 | 7,750 | 8,695 | ||||||
6.000%, 04/01/2017 to 08/01/2038 | 15,215 | 16,629 | ||||||
5.625%, 11/23/2035 | 1,581 | 1,735 | ||||||
5.500%, 12/01/2013 to 01/01/2039 | 43,698 | 47,412 | ||||||
5.000%, 02/01/2019 to 04/01/2042 | 44,033 | 48,165 | ||||||
4.500%, 07/01/2026 to 11/01/2042 | 18,836 | 20,442 | ||||||
4.000%, 10/01/2025 to 04/01/2043 | 63,636 | 68,411 | ||||||
3.500%, 12/01/2025 to 05/01/2043 | 38,968 | 40,637 | ||||||
3.000%, 07/01/2032 to 04/01/2043 | 20,978 | 21,013 | ||||||
2.234%, 10/01/2036 (A) | 936 | 998 | ||||||
0.500%, 09/14/2015 | 8,600 | 8,594 | ||||||
0.100%, 12/18/2013 | 590 | 590 | ||||||
FHLMC ARM (A) | ||||||||
6.396%, 12/01/2036 | 102 | 109 | ||||||
6.378%, 02/01/2037 | 129 | 139 | ||||||
| Description | Face Amount ($ Thousands) | Market Value ($ Thousands) | ||||||
6.340%, 11/01/2037 | $ | 219 | $ | 238 | ||||
6.133%, 09/01/2036 | 120 | 128 | ||||||
6.101%, 11/01/2036 | 298 | 317 | ||||||
6.012%, 04/01/2037 | 56 | 60 | ||||||
6.007%, 02/01/2037 | 160 | 171 | ||||||
5.769%, 04/01/2038 | 202 | 217 | ||||||
5.565%, 06/01/2037 | 377 | 407 | ||||||
5.542%, 05/01/2036 | 396 | 423 | ||||||
5.055%, 07/01/2036 | 411 | 445 | ||||||
4.989%, 01/01/2035 | 169 | 183 | ||||||
3.344%, 05/01/2036 | 414 | 441 | ||||||
3.287%, 05/01/2037 | 1,271 | 1,357 | ||||||
3.268%, 12/01/2036 | 250 | 268 | ||||||
3.152%, 03/01/2037 | 250 | 267 | ||||||
3.131%, 11/01/2036 | 394 | 419 | ||||||
3.069%, 11/01/2036 | 164 | 176 | ||||||
3.054%, 03/01/2037 | 484 | 517 | ||||||
2.981%, 04/01/2037 | 110 | 118 | ||||||
2.976%, 12/01/2036 | 479 | 511 | ||||||
2.968%, 04/01/2037 | 592 | 632 | ||||||
2.936%, 05/01/2037 | 316 | 339 | ||||||
2.914%, 05/01/2037 | 578 | 622 | ||||||
2.864%, 09/01/2036 | 782 | 838 | ||||||
2.851%, 09/01/2036 | 320 | 340 | ||||||
2.836%, 05/01/2037 | 168 | 178 | ||||||
2.815%, 05/01/2038 | 490 | 526 | ||||||
2.756%, 10/01/2036 | 1,365 | 1,469 | ||||||
2.727%, 01/01/2037 | 1,336 | 1,420 | ||||||
2.725%, 09/01/2036 | 3,722 | 3,995 | ||||||
2.723%, 12/01/2036 | 575 | 617 | ||||||
2.714%, 10/01/2036 | 140 | 150 | ||||||
2.674%, 05/01/2037 | 440 | 472 | ||||||
2.671%, 08/01/2037 | 1,295 | 1,388 | ||||||
2.640%, 11/01/2036 | 403 | 430 | ||||||
2.620%, 12/01/2036 | 793 | 847 | ||||||
2.610%, 02/01/2037 | 868 | 923 | ||||||
2.590%, 10/01/2036 | 702 | 747 | ||||||
2.554%, 10/01/2037 | 639 | 680 | ||||||
2.370%, 05/01/2036 | 311 | 333 | ||||||
2.258%, 04/01/2037 | 227 | 240 | ||||||
2.247%, 08/01/2036 | 1,058 | 1,125 | ||||||
2.222%, 07/01/2036 | 559 | 594 | ||||||
2.184%, 05/01/2037 | 204 | 216 | ||||||
2.183%, 08/01/2037 | 653 | 699 | ||||||
2.160%, 05/01/2037 | 2,348 | 2,476 | ||||||
2.125%, 08/01/2036 | 400 | 424 | ||||||
FHLMC CMO, | ||||||||
9.300%, 04/15/2019 | 10 | 11 | ||||||
FHLMC CMO, | ||||||||
7.000%, 10/15/2021 | 210 | 236 | ||||||
| SEI Institutional Investments Trust / Annual Report / May 31, 2013 | 69 |
Table of Contents
SCHEDULE OF INVESTMENTS
Core Fixed Income Fund (Continued)
May 31, 2013
| Description | Face Amount ($ Thousands) | Market Value ($ Thousands) | ||||||
FHLMC CMO, | ||||||||
6.500%, 08/15/2028 | $ | 819 | $ | 930 | ||||
FHLMC CMO, | ||||||||
7.501%, 02/15/2029 (A) | 292 | 11 | ||||||
FHLMC CMO, | ||||||||
6.000%, 07/15/2029 | 55 | 61 | ||||||
FHLMC CMO, | ||||||||
6.000%, 03/15/2031 | 815 | 914 | ||||||
FHLMC CMO, | ||||||||
6.500%, 05/15/2031 | 569 | 648 | ||||||
FHLMC CMO, | ||||||||
6.500%, 09/15/2031 | 110 | 120 | ||||||
FHLMC CMO, | ||||||||
6.500%, 01/15/2032 | 189 | 216 | ||||||
FHLMC CMO, | ||||||||
6.500%, 04/15/2032 | 1,570 | 1,786 | ||||||
FHLMC CMO, | ||||||||
6.500%, 06/15/2032 | 357 | 395 | ||||||
FHLMC CMO, | ||||||||
6.500%, 06/15/2032 | 780 | 870 | ||||||
FHLMC CMO, | ||||||||
6.976%, 07/25/2032 (A) | 704 | 831 | ||||||
FHLMC CMO, | ||||||||
7.500%, 02/25/2042 | 919 | 1,089 | ||||||
FHLMC CMO, | ||||||||
6.058%, 07/25/2033 (A) | 52 | 60 | ||||||
FHLMC CMO, | ||||||||
14.118%, 01/15/2033 (A) | 352 | 402 | ||||||
FHLMC CMO, | ||||||||
4.500%, 03/15/2018 | 503 | 530 | ||||||
FHLMC CMO, | ||||||||
14.485%, 06/15/2033 (A) | 266 | 305 | ||||||
FHLMC CMO, | ||||||||
14.393%, 09/15/2033 (A) | 256 | 293 | ||||||
FHLMC CMO, | ||||||||
4.000%, 10/15/2033 | 628 | 671 | ||||||
| Description | Face Amount ($ Thousands) | Market Value ($ Thousands) | ||||||
FHLMC CMO, | ||||||||
8.769%, 11/15/2033 (A) | $ | 160 | $ | 172 | ||||
FHLMC CMO, | ||||||||
6.500%, 02/25/2043 | 491 | 579 | ||||||
FHLMC CMO, | ||||||||
7.000%, 02/25/2043 | 613 | 731 | ||||||
FHLMC CMO, | ||||||||
6.500%, 07/25/2043 | 552 | 625 | ||||||
FHLMC CMO, | ||||||||
7.000%, 07/25/2043 | 664 | 758 | ||||||
FHLMC CMO, | ||||||||
7.500%, 07/25/2043 | 560 | 654 | ||||||
FHLMC CMO, | ||||||||
7.500%, 09/25/2043 | 737 | 861 | ||||||
FHLMC CMO, | ||||||||
5.000%, 01/15/2034 | 909 | 1,000 | ||||||
FHLMC CMO, | ||||||||
5.000%, 03/15/2034 | 1,500 | 1,688 | ||||||
FHLMC CMO, | ||||||||
0.000%, 02/15/2033 | 247 | 246 | ||||||
FHLMC CMO, | ||||||||
5.000%, 12/15/2032 | 515 | 526 | ||||||
FHLMC CMO, | ||||||||
0.000%, 12/15/2028 | 129 | 128 | ||||||
FHLMC CMO, | ||||||||
5.500%, 07/15/2033 | 2,000 | 2,222 | ||||||
FHLMC CMO, | ||||||||
7.500%, 10/25/2043 | 769 | 895 | ||||||
FHLMC CMO, | ||||||||
7.000%, 03/25/2044 | 582 | 654 | ||||||
FHLMC CMO, | ||||||||
7.500%, 03/25/2044 | 805 | 940 | ||||||
FHLMC CMO, | ||||||||
5.000%, 05/15/2033 | 470 | 476 | ||||||
FHLMC CMO, | ||||||||
4.000%, 06/15/2018 | 26 | 26 | ||||||
| 70 | SEI Institutional Investments Trust / Annual Report / May 31, 2013 |
Table of Contents
| Description | Face Amount ($ Thousands) | Market Value ($ Thousands) | ||||||
FHLMC CMO, | ||||||||
11.935%, 03/15/2020 (A) | $ | 1,164 | $ | 1,329 | ||||
FHLMC CMO, | ||||||||
0.000%, 03/15/2020 | 159 | 158 | ||||||
FHLMC CMO, | ||||||||
6.000%, 05/15/2035 | 395 | 443 | ||||||
FHLMC CMO, | ||||||||
0.599%, 05/15/2035 (A) | 431 | 433 | ||||||
FHLMC CMO, | ||||||||
0.569%, 10/15/2034 (A) | 585 | 587 | ||||||
FHLMC CMO, | ||||||||
21.203%, 05/15/2035 (A) | 105 | 148 | ||||||
FHLMC CMO, | ||||||||
19.622%, 07/15/2035 (A) | 533 | 738 | ||||||
FHLMC CMO, | ||||||||
23.854%, 06/15/2035 (A) | 121 | 177 | ||||||
FHLMC CMO, | ||||||||
0.549%, 05/15/2033 (A) | 505 | 508 | ||||||
FHLMC CMO, | ||||||||
0.000%, 04/15/2035 | 324 | 310 | ||||||
FHLMC CMO, | ||||||||
0.000%, 01/15/2036 | 621 | 566 | ||||||
FHLMC CMO, | ||||||||
6.000%, 01/15/2036 | 1,807 | 2,022 | ||||||
FHLMC CMO, | ||||||||
0.499%, 01/15/2036 (A) | 338 | 339 | ||||||
FHLMC CMO, | ||||||||
6.000%, 04/15/2036 | 641 | 717 | ||||||
FHLMC CMO, | ||||||||
0.000%, 05/15/2036 | 275 | 264 | ||||||
FHLMC CMO, | ||||||||
0.000%, 05/15/2036 | 480 | 460 | ||||||
FHLMC CMO, | ||||||||
6.000%, 06/15/2036 | 571 | 641 | ||||||
FHLMC CMO, | ||||||||
6.000%, 08/15/2035 | 1,219 | 1,278 | ||||||
| Description | Face Amount ($ Thousands) | Market Value ($ Thousands) | ||||||
FHLMC CMO, | ||||||||
6.500%, 07/15/2036 | $ | 1,441 | $ | 1,617 | ||||
FHLMC CMO, | ||||||||
5.500%, 08/15/2036 | 690 | 755 | ||||||
FHLMC CMO, | ||||||||
6.451%, 08/15/2036 (A) | 769 | 112 | ||||||
FHLMC CMO, | ||||||||
6.391%, 09/15/2036 (A) | 444 | 54 | ||||||
FHLMC CMO, | ||||||||
6.201%, 01/15/2037 (A) | 590 | 63 | ||||||
FHLMC CMO, | ||||||||
5.500%, 06/15/2035 | 684 | 693 | ||||||
FHLMC CMO, | ||||||||
0.000%, 05/15/2037 | 97 | 89 | ||||||
FHLMC CMO, | ||||||||
6.000%, 11/15/2023 | 821 | 839 | ||||||
FHLMC CMO, | ||||||||
0.399%, 11/15/2036 (A) | 83 | 83 | ||||||
FHLMC CMO, | ||||||||
0.379%, 05/15/2036 (A) | 91 | 91 | ||||||
FHLMC CMO, | ||||||||
0.429%, 02/15/2019 (A) | 5,100 | 5,105 | ||||||
FHLMC CMO, | ||||||||
0.000%, 04/15/2037 | 148 | 138 | ||||||
FHLMC CMO, | ||||||||
6.251%, 11/15/2037 (A) | 527 | 83 | ||||||
FHLMC CMO, | ||||||||
5.801%, 11/15/2037 (A) | 571 | 75 | ||||||
FHLMC CMO, | ||||||||
6.221%, 11/15/2037 (A) | 499 | 69 | ||||||
FHLMC CMO, | ||||||||
3.383%, 10/25/2037 (A) | 1,125 | 1,130 | ||||||
FHLMC CMO, | ||||||||
16.952%, 02/15/2038 (A) | 119 | 156 | ||||||
FHLMC CMO, | ||||||||
5.851%, 05/15/2038 (A) | 611 | 85 | ||||||
| SEI Institutional Investments Trust / Annual Report / May 31, 2013 | 71 |
Table of Contents
SCHEDULE OF INVESTMENTS
Core Fixed Income Fund (Continued)
May 31, 2013
| Description | Face Amount ($ Thousands) | Market Value ($ Thousands) | ||||||
FHLMC CMO, | ||||||||
5.831%, 05/15/2038 (A) | $ | 3,214 | $ | 444 | ||||
FHLMC CMO, | ||||||||
6.001%, 06/15/2038 (A) | 2,098 | 342 | ||||||
FHLMC CMO, | ||||||||
6.000%, 06/15/2038 | 303 | 338 | ||||||
FHLMC CMO, | ||||||||
0.000%, 02/15/2037 | 513 | 487 | ||||||
FHLMC CMO, | ||||||||
5.500%, 07/15/2037 | 413 | 33 | ||||||
FHLMC CMO, | ||||||||
19.115%, 06/15/2036 (A) | 313 | 411 | ||||||
FHLMC CMO, | ||||||||
6.500%, 04/15/2039 | 3,767 | 4,234 | ||||||
FHLMC CMO, | ||||||||
2.719%, 02/15/2039 (A) | 239 | 243 | ||||||
FHLMC CMO, | ||||||||
0.000%, 05/15/2036 | 465 | 448 | ||||||
FHLMC CMO, | ||||||||
0.000%, 04/15/2036 | 477 | 444 | ||||||
FHLMC CMO, | ||||||||
0.000%, 04/15/2036 | 341 | 317 | ||||||
FHLMC CMO, | ||||||||
0.000%, 10/15/2039 | 523 | 494 | ||||||
FHLMC CMO, | ||||||||
6.051%, 12/15/2039 (A) | 1,576 | 219 | ||||||
FHLMC CMO, | ||||||||
0.000%, 07/15/2034 | 293 | 276 | ||||||
FHLMC CMO, | ||||||||
0.000%, 01/15/2040 | 385 | 368 | ||||||
FHLMC CMO, | ||||||||
6.031%, 01/15/2040 (A) | 501 | 68 | ||||||
FHLMC CMO, | ||||||||
5.500%, 09/15/2039 | 3,181 | 3,616 | ||||||
FHLMC CMO, | ||||||||
5.000%, 02/15/2030 | 5,995 | 6,181 | ||||||
| Description | Face Amount ($ Thousands) | Market Value ($ Thousands) | ||||||
FHLMC CMO, | ||||||||
16.836%, 02/15/2040 (A) | $ | 400 | $ | 556 | ||||
FHLMC CMO, | ||||||||
5.000%, 03/15/2026 | 3,450 | 3,809 | ||||||
FHLMC CMO, | ||||||||
4.000%, 11/15/2037 | 1,099 | 1,183 | ||||||
FHLMC CMO, | ||||||||
4.500%, 07/15/2039 | 1,525 | 1,672 | ||||||
FHLMC CMO, | ||||||||
5.000%, 04/15/2032 | 1,787 | 234 | ||||||
FHLMC CMO, | ||||||||
7.000%, 12/15/2036 | 2,011 | 2,409 | ||||||
FHLMC CMO, | ||||||||
7.500%, 11/15/2036 | 639 | 738 | ||||||
FHLMC CMO, | ||||||||
5.000%, 08/15/2040 | 1,535 | 254 | ||||||
FHLMC CMO, | ||||||||
4.000%, 03/15/2034 | 1,760 | 113 | ||||||
FHLMC CMO, | ||||||||
5.801%, 10/15/2040 (A) | 1,544 | 391 | ||||||
FHLMC CMO, | ||||||||
4.000%, 08/15/2035 | 1,159 | 45 | ||||||
FHLMC CMO, | ||||||||
4.000%, 08/15/2037 | 1,674 | 154 | ||||||
FHLMC CMO, | ||||||||
4.000%, 10/15/2037 | 1,084 | 104 | ||||||
FHLMC CMO, | ||||||||
4.000%, 11/15/2029 | 1,778 | 158 | ||||||
FHLMC CMO, | ||||||||
3.456%, 01/15/2040 (A) | 2,340 | 130 | ||||||
FHLMC CMO, | ||||||||
6.000%, 04/15/2036 | 1,138 | 1,254 | ||||||
FHLMC CMO, | ||||||||
5.500%, 05/15/2041 (A) | 615 | 645 | ||||||
FHLMC CMO, | ||||||||
3.000%, 02/15/2026 | 1,226 | 1,262 | ||||||
| 72 | SEI Institutional Investments Trust / Annual Report / May 31, 2013 |
Table of Contents
| Description | Face Amount ($ Thousands) | Market Value ($ Thousands) | ||||||
FHLMC CMO, | ||||||||
5.751%, 05/15/2041 (A) | $ | 3,328 | $ | 437 | ||||
FHLMC CMO, | ||||||||
5.704%, 10/15/2038 (A) | 518 | 573 | ||||||
FHLMC CMO, | ||||||||
6.401%, 11/15/2041 (A) | 2,695 | 609 | ||||||
FHLMC CMO, | ||||||||
0.739%, 03/15/2042 (A) | 1,829 | 1,849 | ||||||
FHLMC CMO, | ||||||||
6.411%, 04/15/2042 (A) | 297 | 36 | ||||||
FHLMC CMO, | ||||||||
0.642%, 10/15/2041 (A) | 1,815 | 1,824 | ||||||
FHLMC CMO, | ||||||||
0.604%, 07/15/2037 (A) | 1,638 | 1,634 | ||||||
FHLMC CMO, | ||||||||
5.851%, 09/15/2039 (A) | 1,871 | 392 | ||||||
FHLMC CMO, | ||||||||
5.851%, 04/15/2039 (A) | 3,796 | 765 | ||||||
FHLMC CMO, | ||||||||
5.751%, 06/15/2042 (A) | 563 | 141 | ||||||
FHLMC CMO, | ||||||||
5.801%, 06/15/2042 (A) | 2,309 | 543 | ||||||
FHLMC CMO, | ||||||||
5.801%, 06/15/2042 (A) | 3,832 | 942 | ||||||
FHLMC CMO, | ||||||||
5.801%, 07/15/2042 (A) | 3,342 | 774 | ||||||
FHLMC CMO, | ||||||||
3.000%, 09/15/2031 | 3,910 | 471 | ||||||
FHLMC CMO, | ||||||||
6.401%, 09/15/2042 (A) | 2,596 | 665 | ||||||
FHLMC CMO, | ||||||||
5.901%, 10/15/2042 (A) | 1,343 | 361 | ||||||
FHLMC CMO, | ||||||||
5.951%, 10/15/2042 (A) | 1,247 | 315 | ||||||
FHLMC CMO, | ||||||||
3.500%, 10/15/2032 | 1,562 | 304 | ||||||
| Description | Face Amount ($ Thousands) | Market Value ($ Thousands) | ||||||
FHLMC CMO, | ||||||||
5.951%, 10/15/2042 (A) | $ | 1,655 | $ | 362 | ||||
FHLMC CMO, | ||||||||
5.951%, 11/15/2042 (A) | 1,864 | 483 | ||||||
FHLMC GNMA CMO, | ||||||||
6.250%, 10/25/2023 | 527 | 594 | ||||||
FHLMC Multifamily Structured Pass-Through Certificates CMO, | ||||||||
4.768%, 05/25/2018 | 2,824 | 3,106 | ||||||
FHLMC Multifamily Structured Pass-Through Certificates CMO, | ||||||||
3.320%, 07/25/2020 | 78 | 84 | ||||||
FHLMC Multifamily Structured Pass-Through Certificates CMO, | ||||||||
2.373%, 05/25/2022 | 7,310 | 7,124 | ||||||
FHLMC Multifamily Structured Pass-Through Certificates CMO, | ||||||||
1.046%, 01/25/2020 (A) | 18,526 | 1,057 | ||||||
FHLMC Multifamily Structured Pass-Through Certificates CMO, | ||||||||
1.224%, 04/25/2020 (A) | 12,957 | 825 | ||||||
FHLMC Multifamily Structured Pass-Through Certificates CMO, | ||||||||
1.671%, 06/25/2020 (A) | 10,981 | 983 | ||||||
FHLMC Multifamily Structured Pass-Through Certificates CMO, | ||||||||
1.501%, 08/25/2020 (A) | 6,216 | 488 | ||||||
FHLMC Multifamily Structured Pass-Through Certificates CMO, | ||||||||
1.672%, 07/25/2021 (A) | 6,891 | 749 | ||||||
FHLMC Multifamily Structured Pass-Through Certificates CMO, | ||||||||
1.737%, 10/25/2021 (A) | 2,278 | 240 | ||||||
FHLMC Multifamily Structured Pass-Through Certificates CMO, | ||||||||
1.601%, 12/25/2021 (A) | 3,579 | 344 | ||||||
FHLMC Multifamily Structured Pass-Through Certificates CMO, | ||||||||
1.514%, 06/25/2022 (A) | 5,955 | 629 | ||||||
| SEI Institutional Investments Trust / Annual Report / May 31, 2013 | 73 |
Table of Contents
SCHEDULE OF INVESTMENTS
Core Fixed Income Fund (Continued)
May 31, 2013
| Description | Face Amount ($ Thousands) | Market Value ($ Thousands) | ||||||
FHLMC Multifamily Structured Pass-Through Certificates CMO, | ||||||||
0.905%, 09/25/2022 (A) | $ | 3,194 | $ | 210 | ||||
FHLMC Multifamily Structured Pass-Through Certificates CMO, | ||||||||
1.552%, 02/25/2018 (A) | 27,869 | 1,776 | ||||||
FHLMC Multifamily Structured Pass-Through Certificates CMO, | ||||||||
2.088%, 05/25/2018 (A) | 8,634 | 781 | ||||||
FHLMC Reference REMIC CMO, | ||||||||
6.000%, 05/15/2036 | 3,345 | 3,662 | ||||||
FHLMC STRIPS CMO, | ||||||||
7.501%, 08/15/2036 (A) | 1,458 | 238 | ||||||
FHLMC STRIPS CMO, | ||||||||
4.500%, 07/15/2037 | 3,254 | 246 | ||||||
FHLMC STRIPS CMO, | ||||||||
3.500%, 07/15/2042 | 3,390 | 3,438 | ||||||
FHLMC STRIPS CMO, | ||||||||
0.699%, 08/15/2042 (A) | 2,899 | 2,943 | ||||||
FHLMC TBA | ||||||||
3.500%, 07/15/2041 to 06/01/2042 | 34,600 | 35,659 | ||||||
3.000%, 06/15/2043 to 07/25/2043 | 34,515 | 34,490 | ||||||
2.500%, 06/15/2027 to 06/15/2028 | 27,830 | 28,359 | ||||||
FNMA | ||||||||
8.000%, 04/01/2015 to 11/01/2037 | 632 | 728 | ||||||
7.500%, 06/01/2030 to 04/01/2039 | 2,126 | 2,497 | ||||||
7.000%, 12/01/2015 to 02/01/2039 | 6,285 | 7,330 | ||||||
6.500%, 05/01/2017 to 07/01/2039 | 14,555 | 16,497 | ||||||
6.000%, 06/01/2016 to 11/01/2048 | 56,133 | 61,741 | ||||||
5.500%, 04/01/2014 to 04/01/2040 | 65,235 | 71,309 | ||||||
5.000%, 02/01/2020 to 05/01/2042 | 155,323 | 170,103 | ||||||
4.762%, 02/01/2020 | 736 | 843 | ||||||
4.672%, 07/01/2020 | 746 | 854 | ||||||
4.640%, 01/01/2021 | 975 | 1,116 | ||||||
4.540%, 01/01/2020 | 1,436 | 1,633 | ||||||
4.530%, 12/01/2019 | 3,901 | 4,497 | ||||||
| Description | Face Amount ($ Thousands) | Market Value ($ Thousands) | ||||||
4.500%, 07/01/2020 to 12/01/2042 | $ | 42,617 | $ | 45,902 | ||||
4.399%, 02/01/2020 | 6,000 | 6,804 | ||||||
4.390%, 05/01/2021 | 1,000 | 1,133 | ||||||
4.369%, 02/01/2020 | 1,926 | 2,180 | ||||||
4.368%, 04/01/2020 | 2,166 | 2,454 | ||||||
4.340%, 06/01/2021 | 1,000 | 1,131 | ||||||
4.338%, 11/01/2021 | 6,074 | 6,884 | ||||||
4.317%, 07/01/2021 | 1,270 | 1,439 | ||||||
4.303%, 07/01/2021 | 5,765 | 6,532 | ||||||
4.300%, 04/01/2021 | 1,199 | 1,352 | ||||||
4.260%, 07/01/2021 | 1,000 | 1,126 | ||||||
4.250%, 04/01/2021 | 3,000 | �� | 3,375 | |||||
4.240%, 06/01/2021 | 1,000 | 1,124 | ||||||
4.120%, 04/01/2020 | 1,155 | 1,288 | ||||||
4.066%, 07/01/2020 | 2,471 | 2,759 | ||||||
4.060%, 07/01/2021 | 1,000 | 1,113 | ||||||
4.050%, 01/01/2021 | 1,430 | 1,590 | ||||||
4.000%, 04/01/2019 to 12/01/2042 | 65,842 | 70,448 | ||||||
3.975%, 11/01/2020 | 791 | 879 | ||||||
3.940%, 07/01/2021 | 1,500 | 1,657 | ||||||
3.930%, 01/01/2021 | 1,000 | 1,105 | ||||||
3.820%, 06/01/2017 | 1,909 | 2,073 | ||||||
3.800%, 03/01/2018 | 1,938 | 2,124 | ||||||
3.770%, 09/01/2021 | 3,000 | 3,286 | ||||||
3.740%, 07/01/2020 | 1,370 | 1,496 | ||||||
3.632%, 12/01/2020 | 4,044 | 4,388 | ||||||
3.630%, 01/01/2018 | 2,000 | 2,176 | ||||||
3.590%, 12/01/2020 | 962 | 1,041 | ||||||
3.583%, 09/01/2020 | 6,832 | 7,423 | ||||||
3.520%, 01/01/2018 | 2,943 | 3,194 | ||||||
3.505%, 09/01/2020 | 4,788 | 5,166 | ||||||
3.500%, 01/01/2026 to 06/25/2043 | 144,156 | 149,805 | ||||||
3.430%, 10/01/2020 | 1,929 | 2,070 | ||||||
3.380%, 01/01/2018 | 1,500 | 1,623 | ||||||
3.290%, 10/01/2020 | 1,000 | 1,066 | ||||||
3.230%, 11/01/2020 | 1,488 | 1,580 | ||||||
3.030%, 12/01/2021 | 1,466 | 1,530 | ||||||
3.000%, 03/01/2027 to 05/01/2043 | 98,980 | 99,844 | ||||||
2.970%, 11/01/2018 | 1,437 | 1,525 | ||||||
2.940%, 05/01/2022 | 984 | 1,018 | ||||||
2.790%, 07/01/2022 | 1,000 | 1,023 | ||||||
2.690%, 10/01/2017 | 1,485 | 1,564 | ||||||
2.670%, 07/01/2022 | 985 | 999 | ||||||
2.646%, 10/01/2022 | 8,397 | 8,647 | ||||||
2.600%, 06/01/2022 | 982 | 993 | ||||||
2.500%, 10/01/2022 to 10/01/2042 | 16,996 | 17,160 | ||||||
2.470%, 09/01/2022 | 1,482 | 1,479 | ||||||
2.400%, 12/01/2022 to 02/01/2023 | 3,700 | 3,658 | ||||||
| 74 | SEI Institutional Investments Trust / Annual Report / May 31, 2013 |
Table of Contents
| Description | Face Amount ($ Thousands) | Market Value ($ Thousands) | ||||||
2.390%, 12/01/2022 | $ | 1,750 | $ | 1,730 | ||||
2.380%, 12/01/2022 | 2,000 | 1,960 | ||||||
2.370%, 07/01/2019 to 11/01/2022 | 2,000 | 2,026 | ||||||
2.340%, 12/01/2022 to 01/01/2023 | 4,430 | 4,350 | ||||||
2.320%, 12/01/2022 | 1,488 | 1,465 | ||||||
2.280%, 11/01/2022 | 1,983 | 1,947 | ||||||
2.210%, 12/01/2022 | 3,658 | 3,570 | ||||||
2.200%, 07/01/2019 | 2,467 | 2,537 | ||||||
2.190%, 12/01/2022 | 1,985 | 1,935 | ||||||
2.100%, 06/01/2019 | 1,000 | 1,025 | ||||||
2.030%, 08/01/2019 | 2,030 | 2,058 | ||||||
2.000%, 12/01/2020 | 1,500 | 1,472 | ||||||
1.940%, 07/01/2019 | 1,000 | 1,012 | ||||||
1.690%, 12/01/2019 | 2,000 | 1,980 | ||||||
1.580%, 01/01/2020 | 1,986 | 1,954 | ||||||
1.470%, 12/01/2019 | 1,487 | 1,453 | ||||||
1.400%, 07/01/2017 | 2,500 | 2,526 | ||||||
FNMA ARM (A) | ||||||||
6.200%, 08/01/2036 | 174 | 189 | ||||||
6.171%, 09/01/2036 | 479 | 517 | ||||||
5.841%, 03/01/2037 | 2,325 | 2,519 | ||||||
5.779%, 05/01/2037 | 90 | 96 | ||||||
5.771%, 06/01/2036 | 25 | 26 | ||||||
5.409%, 01/01/2023 | 325 | 356 | ||||||
5.211%, 12/01/2035 | 177 | 190 | ||||||
3.926%, 09/01/2037 | 400 | 430 | ||||||
3.192%, 10/01/2036 | 1,396 | 1,492 | ||||||
3.187%, 10/01/2036 | 212 | 226 | ||||||
3.175%, 11/01/2036 | 375 | 401 | ||||||
3.123%, 09/01/2037 | 14 | 15 | ||||||
2.944%, 05/01/2036 | 199 | 212 | ||||||
2.943%, 06/01/2036 | 824 | 885 | ||||||
2.911%, 08/01/2036 | 336 | 359 | ||||||
2.896%, 11/01/2036 | 549 | 591 | ||||||
2.884%, 07/01/2037 | 210 | 223 | ||||||
2.877%, 07/01/2036 | 444 | 473 | ||||||
2.847%, 07/01/2037 | 644 | 689 | ||||||
2.825%, 06/01/2036 | 771 | 826 | ||||||
2.816%, 12/01/2036 | 780 | 840 | ||||||
2.779%, 06/01/2036 | 395 | 422 | ||||||
2.752%, 09/01/2036 | 232 | 247 | ||||||
2.679%, 10/01/2036 | 328 | 352 | ||||||
2.666%, 05/01/2032 | 2 | 2 | ||||||
2.636%, 04/01/2037 | 562 | 598 | ||||||
2.562%, 11/01/2037 | 542 | 580 | ||||||
2.537%, 02/01/2037 | 639 | 678 | ||||||
2.304%, 11/01/2037 | 295 | 313 | ||||||
2.128%, 05/01/2037 | 1,631 | 1,719 | ||||||
2.027%, 01/01/2037 | 519 | 549 | ||||||
1.955%, 02/01/2037 | 364 | 382 | ||||||
1.917%, 09/01/2036 | 286 | 301 | ||||||
1.836%, 07/01/2037 | 257 | 274 | ||||||
0.944%, 01/01/2019 | 491 | 493 | ||||||
| Description | Face Amount ($ Thousands) | Market Value ($ Thousands) | ||||||
0.644%, 09/01/2022 | $ | 1,170 | $ | 1,174 | ||||
0.594%, 10/01/2022 to 01/01/2023 | 4,241 | 4,250 | ||||||
0.564%, 01/01/2023 | 993 | 997 | ||||||
0.554%, 01/01/2023 | 1,986 | 1,994 | ||||||
0.544%, 01/01/2023 | 4,500 | 4,514 | ||||||
0.494%, 11/01/2022 | 1,978 | 1,983 | ||||||
0.474%, 11/01/2022 | 1,000 | 1,002 | ||||||
FNMA CMO, Ser 1991-113, Cl ZE | ||||||||
7.500%, 09/25/2021 | 165 | 187 | ||||||
FNMA CMO, Ser 1992-143, Cl M | ||||||||
8.000%, 09/25/2022 | 465 | 530 | ||||||
FNMA CMO, Ser 1992-41, Cl MA | ||||||||
8.000%, 08/25/2022 | 559 | 633 | ||||||
FNMA CMO, Ser 1992-69, Cl Z | ||||||||
8.000%, 05/25/2022 | 393 | 456 | ||||||
FNMA CMO, | ||||||||
0.000%, 05/25/2022 | — | — | ||||||
FNMA CMO, Ser 1993-149, Cl SH | ||||||||
11.500%, 08/25/2023 (A) | 166 | 193 | ||||||
FNMA CMO, Ser 1993-75, Cl ZQ | ||||||||
6.500%, 05/25/2023 | 783 | 866 | ||||||
FNMA CMO, Ser 1993-99, Cl Z | ||||||||
7.000%, 07/25/2023 | 804 | 898 | ||||||
FNMA CMO, Ser 1994-31, Cl ZC | ||||||||
6.500%, 02/25/2024 | 619 | 694 | ||||||
FNMA CMO, Ser 1994-63, Cl PK | ||||||||
7.000%, 04/25/2024 | 579 | 659 | ||||||
FNMA CMO, Ser 1997-32, Cl PG | ||||||||
6.500%, 04/25/2027 | 415 | 479 | ||||||
FNMA CMO, Ser 1999-11, Cl Z | ||||||||
5.500%, 03/25/2029 | 609 | 676 | ||||||
FNMA CMO, | ||||||||
0.000%, 10/25/2023 | 176 | 168 | ||||||
FNMA CMO, Ser 2001-50, Cl BA | ||||||||
7.000%, 10/25/2041 | 543 | 632 | ||||||
FNMA CMO, Ser 2001-52, Cl YZ | ||||||||
6.500%, 10/25/2031 | 55 | 63 | ||||||
FNMA CMO, Ser 2001-71, Cl QE | ||||||||
6.000%, 12/25/2016 | 493 | 520 | ||||||
FNMA CMO, Ser 2001-79, Cl BA | ||||||||
7.000%, 03/25/2045 | 411 | 475 | ||||||
FNMA CMO, Ser 2002-10, Cl SB | ||||||||
18.736%, 03/25/2017 (A) | 60 | 73 | ||||||
FNMA CMO, Ser 2002-33, Cl A2 | ||||||||
7.500%, 06/25/2032 | 610 | 744 | ||||||
FNMA CMO, | ||||||||
0.000%, 04/25/2032 | 7 | 7 | ||||||
FNMA CMO, Ser 2002-90, Cl A1 | ||||||||
6.500%, 06/25/2042 | 694 | 811 | ||||||
| SEI Institutional Investments Trust / Annual Report / May 31, 2013 | 75 |
Table of Contents
SCHEDULE OF INVESTMENTS
Core Fixed Income Fund (Continued)
May 31, 2013
| Description | Face Amount ($ Thousands) | Market Value ($ Thousands) | ||||||
FNMA CMO, Ser 2002-95, Cl DB | ||||||||
6.000%, 01/25/2033 | $ | 2,533 | $ | 2,916 | ||||
FNMA CMO, Ser 2003-124, Cl TS | ||||||||
9.800%, 01/25/2034 (A) | 37 | 44 | ||||||
FNMA CMO, | ||||||||
5.000%, 08/25/2023 | 698 | 740 | ||||||
FNMA CMO, Ser 2003-131, Cl SK | ||||||||
15.813%, 01/25/2034 (A) | 384 | 509 | ||||||
FNMA CMO, Ser 2003-17, Cl EQ | ||||||||
5.500%, 03/25/2023 | 2,000 | 2,276 | ||||||
FNMA CMO, Ser 2003-23, Cl EQ | ||||||||
5.500%, 04/25/2023 | 2,000 | 2,285 | ||||||
FNMA CMO, | ||||||||
0.000%, 05/25/2033 | 186 | 175 | ||||||
FNMA CMO, Ser 2003-42, Cl EP | ||||||||
4.000%, 11/25/2022 | 88 | 90 | ||||||
FNMA CMO, Ser 2003-49, Cl YD | ||||||||
5.500%, 06/25/2023 | 565 | 608 | ||||||
FNMA CMO, Ser 2003-56, Cl AZ | ||||||||
5.500%, 08/25/2031 | 178 | 179 | ||||||
FNMA CMO, | ||||||||
5.000%, 01/25/2020 | 2,500 | 2,694 | ||||||
FNMA CMO, Ser 2004-17, Cl H | ||||||||
5.500%, 04/25/2034 | 1,086 | 1,237 | ||||||
FNMA CMO, | ||||||||
0.000%, 03/25/2034 | 441 | 432 | ||||||
FNMA CMO, Ser 2004-52, Cl NE | ||||||||
4.500%, 07/25/2033 | 208 | 215 | ||||||
FNMA CMO, | ||||||||
0.000%, 09/25/2032 | 114 | 113 | ||||||
FNMA CMO, | ||||||||
0.000%, 10/25/2032 | 248 | 246 | ||||||
FNMA CMO, Ser 2004-61, Cl FH | ||||||||
0.993%, 11/25/2032 (A) | 826 | 836 | ||||||
FNMA CMO, | ||||||||
5.500%, 11/25/2025 | 1,500 | 1,672 | ||||||
FNMA CMO, Ser 2005-106, Cl US | ||||||||
23.858%, 11/25/2035 (A) | 734 | 1,102 | ||||||
FNMA CMO, | ||||||||
6.000%, 01/25/2032 | 294 | 297 | ||||||
FNMA CMO, Ser 2005-14, Cl BA | ||||||||
4.500%, 04/25/2019 | 81 | 81 | ||||||
FNMA CMO, Ser 2005-14, Cl BD | ||||||||
4.500%, 03/25/2020 | 1,250 | 1,326 | ||||||
FNMA CMO, Ser 2005-5, Cl PA | ||||||||
5.000%, 01/25/2035 | 898 | 978 | ||||||
| Description | Face Amount ($ Thousands) | Market Value ($ Thousands) | ||||||
FNMA CMO, Ser 2005-64, Cl PL | ||||||||
5.500%, 07/25/2035 | $ | 1,061 | $ | 1,194 | ||||
FNMA CMO, Ser 2005-72, Cl SB | ||||||||
16.392%, 08/25/2035 (A) | 315 | 400 | ||||||
FNMA CMO, Ser 2005-74, Cl CS | ||||||||
19.488%, 05/25/2035 (A) | 393 | 540 | ||||||
FNMA CMO, Ser 2005-74, Cl SK | ||||||||
19.598%, 05/25/2035 (A) | 301 | 414 | ||||||
FNMA CMO, Ser 2005-90, Cl ES | ||||||||
16.392%, 10/25/2035 (A) | 275 | 364 | ||||||
FNMA CMO, | ||||||||
0.000%, 09/25/2035 | 215 | 194 | ||||||
FNMA CMO, Ser 2005-97, Cl HC | ||||||||
5.000%, 02/25/2032 | 589 | 594 | ||||||
FNMA CMO, | ||||||||
6.407%, 11/25/2036 (A) | 1,564 | 343 | ||||||
FNMA CMO, | ||||||||
6.457%, 12/25/2036 (A) | 395 | 67 | ||||||
FNMA CMO, Ser 2006-118, Cl A2 | ||||||||
0.273%, 12/25/2036 (A) | 691 | 653 | ||||||
FNMA CMO, | ||||||||
7.007%, 01/25/2037 (A) | 2,416 | 466 | ||||||
FNMA CMO, | ||||||||
0.000%, 03/25/2036 | 330 | 311 | ||||||
FNMA CMO, Ser 2006-23, Cl FK | ||||||||
0.443%, 04/25/2036 (A) | 367 | 367 | ||||||
FNMA CMO, | ||||||||
0.000%, 04/25/2036 | 349 | 334 | ||||||
FNMA CMO, | ||||||||
0.000%, 03/25/2036 | 404 | 384 | ||||||
FNMA CMO, Ser 2006-31, Cl PD | ||||||||
5.500%, 11/25/2034 | 239 | 245 | ||||||
FNMA CMO, Ser 2006-33, Cl LS | ||||||||
29.280%, 05/25/2036 (A) | 263 | 404 | ||||||
FNMA CMO, Ser 2006-44, Cl FP | ||||||||
0.593%, 06/25/2036 (A) | 373 | 375 | ||||||
FNMA CMO, | ||||||||
0.000%, 12/25/2033 | 176 | 166 | ||||||
FNMA CMO, Ser 2006-46, Cl SW | ||||||||
23.491%, 06/25/2036 (A) | 268 | 382 | ||||||
FNMA CMO, | ||||||||
6.457%, 03/25/2036 (A) | 408 | 80 | ||||||
FNMA CMO, Ser 2006-56, Cl CA | ||||||||
6.000%, 07/25/2036 | 523 | 589 | ||||||
FNMA CMO, Ser 2006-56, Cl FC | ||||||||
0.483%, 07/25/2036 (A) | 428 | 429 | ||||||
| 76 | SEI Institutional Investments Trust / Annual Report / May 31, 2013 |
Table of Contents
| Description | Face Amount ($ Thousands) | Market Value ($ Thousands) | ||||||
FNMA CMO, | ||||||||
0.543%, 07/25/2036 (A) | $ | 521 | $ | 524 | ||||
FNMA CMO, | ||||||||
0.000%, 04/25/2035 | 382 | 358 | ||||||
FNMA CMO, | ||||||||
0.000%, 07/25/2036 | 745 | 676 | ||||||
FNMA CMO, Ser 2006-63, Cl ZH | ||||||||
6.500%, 07/25/2036 | 1,018 | 1,155 | ||||||
FNMA CMO, Ser 2006-78, Cl BZ | ||||||||
6.500%, 08/25/2036 | 665 | 735 | ||||||
FNMA CMO, | ||||||||
6.457%, 10/25/2026 (A) | 1,017 | 150 | ||||||
FNMA CMO, | ||||||||
6.257%, 10/25/2037 (A) | 1,413 | 162 | ||||||
FNMA CMO, Ser 2007-101, Cl A2 | ||||||||
0.443%, 06/27/2036 (A) | 1,394 | 1,382 | ||||||
FNMA CMO, | ||||||||
6.257%, 12/25/2037 (A) | 1,034 | 124 | ||||||
FNMA CMO, Ser 2007-114, Cl A6 | ||||||||
0.393%, 10/27/2037 (A) | 1,600 | 1,600 | ||||||
FNMA CMO, | ||||||||
1.622%, 01/25/2038 (A) | 1,310 | 97 | ||||||
FNMA CMO, Ser 2007-116, Cl PB | ||||||||
5.500%, 08/25/2035 | 4,093 | 4,602 | ||||||
FNMA CMO, Ser 2007-29, Cl SG | ||||||||
22.022%, 04/25/2037 (A) | 251 | 348 | ||||||
FNMA CMO, Ser 2007-43, Cl FL | ||||||||
0.493%, 05/25/2037 (A) | 205 | 206 | ||||||
FNMA CMO, | ||||||||
5.907%, 06/25/2037 (A) | 932 | 148 | ||||||
FNMA CMO, Ser 2007-54, Cl FA | ||||||||
0.593%, 06/25/2037 (A) | 818 | 822 | ||||||
FNMA CMO, Ser 2007-54, Cl PF | ||||||||
0.459%, 06/25/2037 (A) | 793 | 793 | ||||||
FNMA CMO, | ||||||||
6.957%, 07/25/2037 (A) | 1,660 | 370 | ||||||
FNMA CMO, Ser 2007-64, Cl FA | ||||||||
0.663%, 07/25/2037 (A) | 90 | 91 | ||||||
FNMA CMO, | ||||||||
6.427%, 07/25/2037 (A) | 966 | 118 | ||||||
FNMA CMO, | ||||||||
6.507%, 07/25/2037 (A) | 1,234 | 194 | ||||||
| Description | Face Amount ($ Thousands) | Market Value ($ Thousands) | ||||||
FNMA CMO, | ||||||||
6.207%, 07/25/2037 (A) | $ | 1,301 | $ | 201 | ||||
FNMA CMO, | ||||||||
0.000%, 01/25/2036 | 168 | 167 | ||||||
FNMA CMO, Ser 2007-79, Cl SB | ||||||||
23.308%, 08/25/2037 (A) | 115 | 165 | ||||||
FNMA CMO, Ser 2007-85, Cl SG | ||||||||
15.767%, 09/25/2037 (A) | 410 | 522 | ||||||
FNMA CMO, | ||||||||
5.587%, 06/25/2037 (A) | 1,171 | 146 | ||||||
FNMA CMO, | ||||||||
5.717%, 02/25/2038 (A) | 1,213 | 151 | ||||||
FNMA CMO, | ||||||||
6.797%, 03/25/2038 (A) | 678 | 136 | ||||||
FNMA CMO, | ||||||||
6.240%, 03/25/2037 (A) | 12,399 | 1,566 | ||||||
FNMA CMO, Ser 2008-24, Cl DY | ||||||||
5.000%, 04/25/2023 | 1,500 | 1,639 | ||||||
FNMA CMO, Ser 2008-24, Cl NA | ||||||||
6.750%, 06/25/2037 | 262 | 285 | ||||||
FNMA CMO, Ser 2008-24, Cl PF | ||||||||
0.843%, 02/25/2038 (A) | 520 | 526 | ||||||
FNMA CMO, | ||||||||
6.657%, 04/25/2038 (A) | 446 | 68 | ||||||
FNMA CMO, | ||||||||
0.642%, 10/25/2016 (A) | 829 | 7 | ||||||
FNMA CMO, | ||||||||
5.807%, 02/25/2038 (A) | 2,322 | 293 | ||||||
FNMA CMO, Ser 2008-53, Cl CA | ||||||||
5.000%, 07/25/2023 | 3,461 | 3,741 | ||||||
FNMA CMO, Ser 2008-95, Cl BA | ||||||||
5.000%, 01/25/2024 | 643 | 727 | ||||||
FNMA CMO, | ||||||||
3.052%, 12/25/2039 (A) | 590 | 631 | ||||||
FNMA CMO, | ||||||||
6.457%, 03/25/2039 (A) | 559 | 80 | ||||||
FNMA CMO, | ||||||||
5.000%, 07/25/2039 | 707 | 75 | ||||||
FNMA CMO, | ||||||||
0.000%, 01/25/2037 | 1,233 | 1,176 | ||||||
| SEI Institutional Investments Trust / Annual Report / May 31, 2013 | 77 |
Table of Contents
SCHEDULE OF INVESTMENTS
Core Fixed Income Fund (Continued)
May 31, 2013
| Description | Face Amount ($ Thousands) | Market Value ($ Thousands) | ||||||
FNMA CMO, | ||||||||
5.707%, 10/25/2039 (A) | $ | 684 | $ | 87 | ||||
FNMA CMO, | ||||||||
0.000%, 03/25/2037 | 7,036 | 6,899 | ||||||
FNMA CMO, | ||||||||
5.500%, 10/25/2039 | 511 | 63 | ||||||
FNMA CMO, | ||||||||
0.000%, 10/25/2037 | 818 | 766 | ||||||
FNMA CMO, | ||||||||
4.000%, 10/25/2014 | 1,097 | 44 | ||||||
FNMA CMO, | ||||||||
5.987%, 12/25/2039 (A) | 785 | 89 | ||||||
FNMA CMO, Ser 2010-1, Cl WA | ||||||||
6.166%, 02/25/2040 (A) | 519 | 571 | ||||||
FNMA CMO, | ||||||||
6.457%, 09/25/2040 (A) | 3,189 | 518 | ||||||
FNMA CMO, Ser 2010-111, Cl AE | ||||||||
5.500%, 04/25/2038 | 2,078 | 2,266 | ||||||
FNMA CMO, | ||||||||
6.307%, 10/25/2040 (A) | 2,210 | 250 | ||||||
FNMA CMO, | ||||||||
4.000%, 07/25/2040 | 3,600 | 3,898 | ||||||
FNMA CMO, Ser 2010-133, Cl A | ||||||||
5.500%, 05/25/2038 | 1,466 | 1,582 | ||||||
FNMA CMO, | ||||||||
6.337%, 12/25/2040 (A) | 1,821 | 264 | ||||||
FNMA CMO, | ||||||||
4.000%, 02/25/2039 | 759 | 783 | ||||||
FNMA CMO, | ||||||||
6.291%, 01/25/2041 (A) | 2,953 | 472 | ||||||
FNMA CMO, | ||||||||
6.291%, 01/25/2041 (A) | 3,329 | 532 | ||||||
FNMA CMO, Ser 2010-16, Cl WA | ||||||||
6.428%, 03/25/2040 (A) | 602 | 684 | ||||||
FNMA CMO, | ||||||||
6.907%, 02/25/2040 (A) | 948 | 140 | ||||||
FNMA CMO, | ||||||||
6.287%, 04/25/2040 (A) | 3,884 | 650 | ||||||
| Description | Face Amount ($ Thousands) | Market Value ($ Thousands) | ||||||
FNMA CMO, | ||||||||
6.227%, 04/25/2040 (A) | $ | 998 | $ | 140 | ||||
FNMA CMO, | ||||||||
0.000%, 10/25/2035 | 391 | 347 | ||||||
FNMA CMO, Ser 2010-45, Cl BD | ||||||||
4.500%, 11/25/2038 | 1,000 | 1,035 | ||||||
FNMA CMO, Ser 2010-64, Cl DM | ||||||||
5.000%, 06/25/2040 | 1,108 | 1,225 | ||||||
FNMA CMO, | ||||||||
4.807%, 07/25/2040 (A) | 3,017 | 465 | ||||||
FNMA CMO, Ser 2010-M5, Cl A1 | ||||||||
2.259%, 07/25/2020 | 70 | 73 | ||||||
FNMA CMO, | ||||||||
6.407%, 10/25/2040 (A) | 5,395 | 1,264 | ||||||
FNMA CMO, Ser 2011-2, Cl WA | ||||||||
5.716%, 02/25/2051 (A) | 673 | 731 | ||||||
FNMA CMO, | ||||||||
3.071%, 04/25/2041 (A) | 1,969 | 165 | ||||||
FNMA CMO, Ser 2011-43, Cl WA | ||||||||
5.899%, 05/25/2051 (A) | 1,143 | 1,270 | ||||||
FNMA CMO, | ||||||||
6.487%, 07/25/2041 (A) | 2,770 | 386 | ||||||
FNMA CMO, Ser 2011-75, Cl FA | ||||||||
0.743%, 08/25/2041 (A) | 569 | 574 | ||||||
FNMA CMO, | ||||||||
5.757%, 09/25/2041 (A) | 5,688 | 882 | ||||||
FNMA CMO, | ||||||||
5.000%, 05/25/2034 | 4,498 | 645 | ||||||
FNMA CMO, | ||||||||
6.357%, 10/25/2041 (A) | 5,651 | 952 | ||||||
FNMA CMO, Ser 2011-M1, Cl A3 | ||||||||
3.763%, 06/25/2021 | 1,500 | 1,591 | ||||||
FNMA CMO, Ser 2011-M2, Cl A3 | ||||||||
3.764%, 07/25/2021 | 7,500 | 7,956 | ||||||
FNMA CMO, Ser 2011-M4, Cl A2 | ||||||||
3.726%, 06/25/2021 | 2,500 | 2,682 | ||||||
FNMA CMO, Ser 2012-101, Cl FC | ||||||||
0.693%, 09/25/2042 (A) | 975 | 985 | ||||||
FNMA CMO, | ||||||||
5.907%, 07/25/2040 (A) | 2,632 | 598 | ||||||
FNMA CMO, Ser 2012-112, Cl FD | ||||||||
0.693%, 10/25/2042 (A) | 981 | 991 | ||||||
FNMA CMO, Ser 2012-130, Cl DC | ||||||||
3.000%, 12/25/2042 | 22,740 | 23,497 | ||||||
| 78 | SEI Institutional Investments Trust / Annual Report / May 31, 2013 |
Table of Contents
| Description | Face Amount ($ Thousands) | Market Value ($ Thousands) | ||||||
FNMA CMO, | ||||||||
5.957%, 12/25/2042 (A) | $ | 879 | $ | 229 | ||||
FNMA CMO, | ||||||||
5.957%, 12/25/2042 (A) | 1,277 | 327 | ||||||
FNMA CMO, Ser 2012-134, Cl LC | ||||||||
3.000%, 12/25/2042 | 2,049 | 2,106 | ||||||
FNMA CMO, | ||||||||
5.957%, 12/25/2042 (A) | 1,079 | 280 | ||||||
FNMA CMO, Ser 2012-137, Cl CF | ||||||||
0.493%, 08/25/2041 (A) | 1,467 | 1,470 | ||||||
FNMA CMO, | ||||||||
3.000%, 12/25/2027 | 2,652 | 346 | ||||||
FNMA CMO, Ser 2012-14, Cl FB | ||||||||
0.643%, 08/25/2037 (A) | 876 | 880 | ||||||
FNMA CMO, Ser 2012-14, Cl FL | ||||||||
0.643%, 12/25/2040 (A) | 919 | 925 | ||||||
FNMA CMO, | ||||||||
6.257%, 03/25/2042 (A) | 240 | 40 | ||||||
FNMA CMO, | ||||||||
6.357%, 07/25/2039 (A) | 1,385 | 299 | ||||||
FNMA CMO, Ser 2012-28, Cl B | ||||||||
6.500%, 06/25/2039 | 267 | 298 | ||||||
FNMA CMO, | ||||||||
6.407%, 04/25/2042 (A) | 877 | 169 | ||||||
FNMA CMO, Ser 2012-46, Cl BA | ||||||||
6.000%, 05/25/2042 | 3,830 | 4,195 | ||||||
FNMA CMO, Ser 2012-47, Cl HF | ||||||||
0.593%, 05/25/2027 (A) | 4,180 | 4,214 | ||||||
FNMA CMO, | ||||||||
6.357%, 03/25/2039 (A) | 2,751 | 596 | ||||||
FNMA CMO, | ||||||||
5.807%, 06/25/2042 (A) | 874 | 154 | ||||||
FNMA CMO, | ||||||||
6.457%, 02/25/2041 (A) | 834 | 184 | ||||||
FNMA CMO, | ||||||||
0.000%, 03/25/2042 | 197 | 178 | ||||||
FNMA CMO, | ||||||||
6.457%, 03/25/2042 (A) | 2,863 | 526 | ||||||
FNMA CMO, | ||||||||
0.000%, 03/25/2042 | 395 | 356 | ||||||
| Description | Face Amount ($ Thousands) | Market Value ($ Thousands) | ||||||
FNMA CMO, | ||||||||
6.407%, 07/25/2042 (A) | $ | 1,044 | $ | 239 | ||||
FNMA CMO, | ||||||||
5.857%, 05/25/2039 (A) | 191 | 41 | ||||||
FNMA CMO, Ser 2012-89, Cl FD | ||||||||
0.643%, 04/25/2039 (A) | 1,442 | 1,450 | ||||||
FNMA CMO, | ||||||||
3.000%, 09/25/2027 | 10,269 | 1,331 | ||||||
FNMA CMO, | ||||||||
5.907%, 09/25/2042 (A) | 1,248 | 261 | ||||||
FNMA CMO, Ser 2012-97, Cl FB | ||||||||
0.693%, 09/25/2042 (A) | 1,463 | 1,476 | ||||||
FNMA CMO, | ||||||||
0.703%, 08/25/2019 (A) | 2,205 | 2,210 | ||||||
FNMA CMO, | ||||||||
2.840%, 08/25/2022 (A) | 8,258 | 8,458 | ||||||
FNMA CMO, Ser 2012-M15, Cl A | ||||||||
2.657%, 10/25/2022 (A) | 7,082 | 7,087 | ||||||
FNMA CMO, | ||||||||
1.520%, 12/25/2019 | 505 | 509 | ||||||
FNMA CMO, | ||||||||
1.801%, 12/25/2019 | 400 | 401 | ||||||
FNMA CMO, | ||||||||
3.000%, 04/25/2032 | 2,378 | 280 | ||||||
FNMA CMO, Ser 2013-9, Cl BC | ||||||||
6.500%, 07/25/2042 | 6,700 | 7,663 | ||||||
FNMA CMO, Ser 2013-9, Cl CB | ||||||||
5.500%, 04/25/2042 | 5,200 | 5,782 | ||||||
FNMA Grantor Trust CMO, | ||||||||
7.500%, 06/25/2030 | 897 | 1,104 | ||||||
FNMA Grantor Trust CMO, | ||||||||
7.500%, 12/25/2041 | 1,560 | 1,864 | ||||||
FNMA Grantor Trust CMO, | ||||||||
7.000%, 07/25/2042 | 565 | 679 | ||||||
FNMA Grantor Trust CMO, | ||||||||
7.000%, 02/25/2044 | 682 | 796 | ||||||
FNMA Interest STRIPS CMO, | ||||||||
0.000%, 12/01/2024 | 397 | 369 | ||||||
FNMA Interest STRIPS CMO, | ||||||||
0.000%, 09/01/2024 | 258 | 247 | ||||||
| SEI Institutional Investments Trust / Annual Report / May 31, 2013 | 79 |
Table of Contents
SCHEDULE OF INVESTMENTS
Core Fixed Income Fund (Continued)
May 31, 2013
| Description | Face Amount ($ Thousands) | Market Value ($ Thousands) | ||||||
FNMA Interest STRIPS CMO, | ||||||||
7.000%, 01/25/2032 | $ | 601 | $ | 110 | ||||
FNMA Interest STRIPS CMO, | ||||||||
6.500%, 02/01/2033 | 918 | 157 | ||||||
FNMA Interest STRIPS CMO, | ||||||||
3.000%, 11/25/2026 | 6,378 | 530 | ||||||
FNMA Interest STRIPS CMO, | ||||||||
3.500%, 11/25/2041 | 2,371 | 340 | ||||||
FNMA Interest STRIPS CMO, | ||||||||
4.500%, 11/25/2039 | 4,173 | 508 | ||||||
FNMA Interest STRIPS CMO, | ||||||||
3.000%, 04/25/2027 | 4,183 | 378 | ||||||
FNMA Interest STRIPS CMO, | ||||||||
0.693%, 08/25/2042 (A) | 1,451 | 1,442 | ||||||
FNMA TBA | ||||||||
4.500%, 06/14/2042 | 18,830 | 20,119 | ||||||
4.000%, 06/01/2039 | 8,800 | 9,275 | ||||||
3.500%, 07/01/2041 to 07/25/2043 | 88,460 | 91,431 | ||||||
3.000%, 07/01/2042 to 07/25/2043 | 87,375 | 87,548 | ||||||
2.500%, 06/25/2027 to 07/25/2043 | 74,000 | 74,542 | ||||||
2.000%, 07/25/2028 | 13,890 | 13,758 | ||||||
FNMA Whole Loan CMO, | ||||||||
6.862%, 12/25/2042 (A) | 824 | 967 | ||||||
FNMA Whole Loan CMO, | ||||||||
5.750%, 08/25/2033 | 917 | 1,002 | ||||||
FNMA Whole Loan CMO, | ||||||||
5.900%, 07/25/2042 | 1,166 | 1,341 | ||||||
FNMA Whole Loan CMO, | ||||||||
6.500%, 09/25/2042 | 449 | 512 | ||||||
FNMA Whole Loan CMO, | ||||||||
7.000%, 10/25/2042 | 366 | 424 | ||||||
FNMA Whole Loan CMO, | ||||||||
7.000%, 12/25/2033 | 715 | 836 | ||||||
FNMA Whole Loan CMO, | ||||||||
5.750%, 08/25/2034 | 2,000 | 2,139 | ||||||
FNMA Whole Loan CMO, | ||||||||
7.000%, 02/25/2044 | 747 | 877 | ||||||
| Description | Face Amount ($ Thousands) | Market Value ($ Thousands) | ||||||
FNMA Whole Loan CMO, | ||||||||
6.500%, 02/25/2044 | $ | 595 | $ | 694 | ||||
FNMA Whole Loan CMO, | ||||||||
0.413%, 03/25/2045 (A) | 2,015 | 1,999 | ||||||
FNMA Whole Loan CMO, | ||||||||
7.500%, 12/25/2045 | 284 | 338 | ||||||
FNMA Whole Loan CMO, | ||||||||
0.413%, 02/25/2036 (A) | 459 | 456 | ||||||
FNMA Whole Loan CMO, | ||||||||
0.453%, 11/25/2046 (A) | 1,015 | 1,015 | ||||||
FNMA Whole Loan CMO, | ||||||||
38.020%, 07/25/2037 (A) | 49 | 83 | ||||||
FNMA Whole Loan CMO, | ||||||||
6.000%, 12/25/2049 | 1,419 | 1,642 | ||||||
GNMA | ||||||||
9.500%, 12/15/2020 | 5 | 6 | ||||||
7.500%, 10/15/2037 to 09/20/2038 | 929 | 1,093 | ||||||
7.000%, 12/20/2017 to 06/15/2035 | 3,161 | 3,770 | ||||||
6.500%, 01/15/2024 to 02/15/2039 | 5,167 | 5,878 | ||||||
6.000%, 12/15/2023 to 10/20/2040 | 23,454 | 26,321 | ||||||
5.000%, 07/20/2040 to 11/20/2040 | 1,133 | 1,241 | ||||||
4.500%, 01/20/2040 to 07/20/2041 | 21,637 | 23,574 | ||||||
GNMA ARM (A) | ||||||||
1.750%, 04/20/2028 to 07/20/2034 | 502 | 526 | ||||||
1.625%, 03/20/2032 to 03/20/2034 | 268 | 281 | ||||||
1.590%, 01/20/2060 | 1,378 | 1,420 | ||||||
GNMA CMO, Ser 2001-18, Cl WH | ||||||||
31.742%, 04/20/2031 (A) | 88 | 159 | ||||||
GNMA CMO, Ser 2001-22, Cl PS | ||||||||
20.493%, 03/17/2031 (A) | 620 | 980 | ||||||
GNMA CMO, Ser 2001-61, Cl Z | ||||||||
6.500%, 12/20/2031 | 1,455 | 1,696 | ||||||
GNMA CMO, Ser 2002-23, Cl SD | ||||||||
20.415%, 04/16/2032 (A) | 855 | 1,367 | ||||||
GNMA CMO, Ser 2002-51, Cl SG | ||||||||
31.641%, 04/20/2031 (A) | 74 | 139 | ||||||
GNMA CMO, Ser 2002-57, Cl SB | ||||||||
109.527%, 08/16/2032 | 69 | 339 | ||||||
| 80 | SEI Institutional Investments Trust / Annual Report / May 31, 2013 |
Table of Contents
| Description | Face Amount ($ Thousands) | Market Value ($ Thousands) | ||||||
GNMA CMO, Ser 2002-69, Cl SC | ||||||||
16.064%, 02/20/2032 (A) | $ | 74 | $ | 79 | ||||
GNMA CMO, Ser 2003-60, Cl GS | ||||||||
12.086%, 05/16/2033 (A) | 90 | 104 | ||||||
GNMA CMO, Ser 2003-75, Cl ZX | ||||||||
6.000%, 09/16/2033 | 3,673 | 4,156 | ||||||
GNMA CMO, Ser 2003-79, Cl PV | ||||||||
5.500%, 10/20/2023 | 1,087 | 1,174 | ||||||
GNMA CMO, | ||||||||
6.352%, 11/16/2033 (A) | 451 | 87 | ||||||
GNMA CMO, Ser 2004-17, Cl MZ | ||||||||
5.500%, 03/16/2034 | 1,111 | 1,300 | ||||||
GNMA CMO, Ser 2004-28, Cl SV | ||||||||
8.801%, 04/20/2034 (A) | 821 | 901 | ||||||
GNMA CMO, Ser 2004-34, Cl CS | ||||||||
19.393%, 02/20/2034 (A) | 50 | 68 | ||||||
GNMA CMO, | ||||||||
0.000%, 02/20/2034 | 10 | 10 | ||||||
GNMA CMO, Ser 2004-71, Cl ST | ||||||||
7.000%, 09/20/2034 (A) | 228 | 228 | ||||||
GNMA CMO, | ||||||||
0.000%, 01/17/2033 | 45 | 44 | ||||||
GNMA CMO, Ser 2004-87, Cl SB | ||||||||
7.444%, 03/17/2033 (A) | 157 | 170 | ||||||
GNMA CMO, Ser 2004-93, Cl PC | ||||||||
5.000%, 04/16/2034 | 95 | 101 | ||||||
GNMA CMO, | ||||||||
5.901%, 01/20/2035 (A) | 1,003 | 148 | ||||||
GNMA CMO, Ser 2005-7, Cl JM | ||||||||
16.284%, 05/18/2034 (A) | 158 | 186 | ||||||
GNMA CMO, Ser 2005-92, Cl PB | ||||||||
6.000%, 12/20/2035 | 1,000 | 1,196 | ||||||
GNMA CMO, | ||||||||
6.791%, 04/20/2036 (A) | 1,253 | 219 | ||||||
GNMA CMO, | ||||||||
0.000%, 07/20/2036 | 98 | 89 | ||||||
GNMA CMO, | ||||||||
6.452%, 09/20/2033 (A) | 1,292 | 83 | ||||||
GNMA CMO, | ||||||||
6.302%, 06/20/2036 (A) | 845 | 104 | ||||||
GNMA CMO, Ser 2007-17, Cl AF | ||||||||
0.398%, 04/16/2037 (A) | 620 | 622 | ||||||
GNMA CMO, | ||||||||
6.001%, 05/20/2037 (A) | 1,650 | 240 | ||||||
| Description | Face Amount ($ Thousands) | Market Value ($ Thousands) | ||||||
GNMA CMO, | ||||||||
6.001%, 05/20/2037 (A) | $ | 619 | $ | 92 | ||||
GNMA CMO, | ||||||||
6.551%, 07/20/2037 (A) | 904 | 139 | ||||||
GNMA CMO, | ||||||||
6.442%, 07/20/2037 (A) | 561 | 83 | ||||||
GNMA CMO, | ||||||||
6.352%, 11/20/2037 (A) | 633 | 92 | ||||||
GNMA CMO, | ||||||||
6.332%, 12/16/2037 (A) | 9,859 | 1,702 | ||||||
GNMA CMO, | ||||||||
6.451%, 12/20/2037 (A) | 800 | 119 | ||||||
GNMA CMO, | ||||||||
6.331%, 12/20/2037 (A) | 522 | 76 | ||||||
GNMA CMO, | ||||||||
6.002%, 03/20/2037 (A) | 714 | 108 | ||||||
GNMA CMO, | ||||||||
5.631%, 02/20/2038 (A) | 951 | 132 | ||||||
GNMA CMO, | ||||||||
6.962%, 01/16/2038 (A) | 570 | 96 | ||||||
GNMA CMO, | ||||||||
0.000%, 02/17/2033 | 207 | 195 | ||||||
GNMA CMO, | ||||||||
7.502%, 04/16/2038 (A) | 374 | 50 | ||||||
GNMA CMO, | ||||||||
6.001%, 06/20/2038 (A) | 889 | 128 | ||||||
GNMA CMO, | ||||||||
7.101%, 12/20/2038 (A) | 1,347 | 204 | ||||||
GNMA CMO, | ||||||||
6.202%, 06/16/2039 (A) | 1,653 | 193 | ||||||
GNMA CMO, | ||||||||
6.202%, 11/16/2039 (A) | 1,446 | 229 | ||||||
GNMA CMO, | ||||||||
6.201%, 11/20/2039 (A) | 15,683 | 2,167 | ||||||
GNMA CMO, | ||||||||
6.001%, 05/20/2037 (A) | 2,857 | 418 | ||||||
| SEI Institutional Investments Trust / Annual Report / May 31, 2013 | 81 |
Table of Contents
SCHEDULE OF INVESTMENTS
Core Fixed Income Fund (Continued)
May 31, 2013
| Description | Face Amount ($ Thousands) | Market Value ($ Thousands) | ||||||
GNMA CMO, | ||||||||
6.500%, 03/20/2039 | $ | 512 | $ | 90 | ||||
GNMA CMO, | ||||||||
6.500%, 03/20/2039 | 25 | 5 | ||||||
GNMA CMO, | ||||||||
5.500%, 11/16/2037 | 944 | 116 | ||||||
GNMA CMO, | ||||||||
6.072%, 04/20/2039 (A) | 1,358 | 190 | ||||||
GNMA CMO, | ||||||||
6.101%, 03/20/2039 (A) | 666 | 78 | ||||||
GNMA CMO, | ||||||||
7.401%, 09/20/2038 (A) | 525 | 100 | ||||||
GNMA CMO, | ||||||||
6.102%, 03/20/2039 (A) | 1,263 | 173 | ||||||
GNMA CMO, | ||||||||
6.000%, 05/20/2039 | 215 | 35 | ||||||
GNMA CMO, | ||||||||
1.000%, 06/16/2037 (A) | 1,566 | 38 | ||||||
GNMA CMO, | ||||||||
5.881%, 06/20/2039 (A) | 438 | 64 | ||||||
GNMA CMO, | ||||||||
5.751%, 06/20/2039 (A) | 1,128 | 154 | ||||||
GNMA CMO, | ||||||||
6.000%, 04/20/2020 | 1,064 | 1,154 | ||||||
GNMA CMO, | ||||||||
5.841%, 02/20/2039 (A) | 954 | 130 | ||||||
GNMA CMO, | ||||||||
6.000%, 12/20/2038 | 583 | 81 | ||||||
GNMA CMO, | ||||||||
6.201%, 12/20/2038 (A) | 1,748 | 228 | ||||||
GNMA CMO, | ||||||||
6.000%, 08/16/2039 | 2,245 | 2,707 | ||||||
GNMA CMO, | ||||||||
6.602%, 07/16/2039 (A) | 172 | 27 | ||||||
GNMA CMO, | ||||||||
5.852%, 08/16/2039 (A) | 1,162 | 163 | ||||||
| Description | Face Amount ($ Thousands) | Market Value ($ Thousands) | ||||||
GNMA CMO, | ||||||||
6.052%, 08/16/2039 (A) | $ | 1,560 | $ | 227 | ||||
GNMA CMO, | ||||||||
5.000%, 12/20/2019 | 839 | 884 | ||||||
GNMA CMO, | ||||||||
0.000%, 11/16/2037 | 894 | 787 | ||||||
GNMA CMO, | ||||||||
6.102%, 08/16/2038 (A) | 137 | 19 | ||||||
GNMA CMO, | ||||||||
5.901%, 08/20/2039 (A) | 1,099 | 146 | ||||||
GNMA CMO, | ||||||||
5.801%, 09/20/2040 (A) | 2,070 | 316 | ||||||
GNMA CMO, | ||||||||
3.500%, 09/16/2040 | 1,413 | 1,521 | ||||||
GNMA CMO, | ||||||||
5.801%, 09/20/2040 (A) | 1,749 | 274 | ||||||
GNMA CMO, | ||||||||
0.000%, 12/20/2032 | 437 | 416 | ||||||
GNMA CMO, | ||||||||
0.000%, 11/20/2035 | 491 | 447 | ||||||
GNMA CMO, | ||||||||
0.000%, 08/20/2035 | 425 | 369 | ||||||
GNMA CMO, | ||||||||
0.000%, 06/16/2033 | 84 | 84 | ||||||
GNMA CMO, Ser 2010-14, Cl QP | ||||||||
6.000%, 12/20/2039 | 732 | 797 | ||||||
GNMA CMO, | ||||||||
5.802%, 02/16/2040 (A) | 820 | 159 | ||||||
GNMA CMO, | ||||||||
4.000%, 09/16/2037 | 3,898 | 490 | ||||||
GNMA CMO, | ||||||||
0.000%, 12/20/2040 | 1,254 | 1,048 | ||||||
GNMA CMO, | ||||||||
6.431%, 11/20/2038 (A) | 703 | 77 | ||||||
GNMA CMO, | ||||||||
5.952%, 02/20/2040 (A) | 3,630 | 692 | ||||||
| 82 | SEI Institutional Investments Trust / Annual Report / May 31, 2013 |
Table of Contents
| Description | Face Amount ($ Thousands) | Market Value ($ Thousands) | ||||||
GNMA CMO, | ||||||||
6.051%, 02/20/2040 (A) | $ | 825 | $ | 121 | ||||
GNMA CMO, | ||||||||
6.351%, 11/20/2038 (A) | 1,999 | 245 | ||||||
GNMA CMO, | ||||||||
6.301%, 03/20/2039 (A) | 875 | 137 | ||||||
GNMA CMO, | ||||||||
6.192%, 01/16/2040 (A) | 19,010 | 3,064 | ||||||
GNMA CMO, | ||||||||
6.202%, 01/16/2040 (A) | 399 | 66 | ||||||
GNMA CMO, | ||||||||
6.502%, 06/20/2037 (A) | 2,405 | 360 | ||||||
GNMA CMO, | ||||||||
6.352%, 04/16/2034 (A) | 465 | 23 | ||||||
GNMA CMO, Ser 2010-59, Cl LB | ||||||||
4.500%, 10/20/2039 | 2,900 | 3,220 | ||||||
GNMA CMO, Ser 2010-7, Cl EA | ||||||||
5.000%, 06/16/2038 | 895 | 1,017 | ||||||
GNMA CMO, | ||||||||
6.451%, 01/20/2040 (A) | 1,361 | 263 | ||||||
GNMA CMO, | ||||||||
6.502%, 06/20/2035 (A) | 256 | 20 | ||||||
GNMA CMO, | ||||||||
1.198%, 05/20/2060 (A) | 4,965 | 5,067 | ||||||
GNMA CMO, | ||||||||
5.246%, 07/20/2060 (A) | 1,732 | 1,998 | ||||||
GNMA CMO, | ||||||||
0.554%, 08/20/2058 (A) | 6,660 | 6,625 | ||||||
GNMA CMO, | ||||||||
5.000%, 11/16/2041 | 147 | 36 | ||||||
GNMA CMO, | ||||||||
6.452%, 11/16/2041 (A) | 1,051 | 229 | ||||||
GNMA CMO, | ||||||||
5.792%, 12/20/2038 (A) | 956 | 1,057 | ||||||
GNMA CMO, | ||||||||
5.802%, 03/16/2041 (A) | 334 | 33 | ||||||
| Description | Face Amount ($ Thousands) | Market Value ($ Thousands) | ||||||
GNMA CMO, | ||||||||
5.932%, 02/16/2036 (A) | $ | 2,393 | $ | 315 | ||||
GNMA CMO, | ||||||||
6.502%, 12/16/2036 (A) | 1,455 | 203 | ||||||
GNMA CMO, | ||||||||
0.704%, 03/20/2061 (A) | 1,745 | 1,745 | ||||||
GNMA CMO, | ||||||||
3.777%, 01/20/2042 (A) | 934 | 1,014 | ||||||
GNMA CMO, | ||||||||
0.598%, 05/16/2042 (A) | 1,326 | 1,329 | ||||||
GNMA CMO, | ||||||||
3.500%, 02/20/2038 | 2,724 | 419 | ||||||
GNMA CMO, | ||||||||
5.902%, 08/16/2042 (A) | 2,059 | 477 | ||||||
GNMA CMO, | ||||||||
0.654%, 05/20/2062 (A) | 1,449 | 1,448 | ||||||
GNMA CMO, | ||||||||
0.904%, 05/20/2061 (A) | 2,239 | 2,251 | ||||||
GNMA CMO, | ||||||||
0.854%, 05/20/2061 (A) | 1,499 | 1,506 | ||||||
GNMA CMO, | ||||||||
0.674%, 01/20/2061 (A) | 2,482 | 2,480 | ||||||
GNMA CMO, | ||||||||
0.654%, 03/20/2060 (A) | 1,470 | 1,469 | ||||||
GNMA CMO, | ||||||||
0.804%, 10/20/2062 (A) | 1,532 | 1,540 | ||||||
GNMA CMO, | ||||||||
0.634%, 04/20/2060 (A) | 2,440 | 2,437 | ||||||
GNMA CMO, | ||||||||
0.754%, 07/20/2062 (A) | 1,492 | 1,500 | ||||||
GNMA CMO, | ||||||||
0.704%, 10/20/2062 (A) | 3,464 | 3,469 | ||||||
GNMA CMO, | ||||||||
0.784%, 09/20/2062 (A) | 2,432 | 2,438 | ||||||
GNMA CMO, | ||||||||
0.684%, 01/20/2060 (A) | 1,523 | 1,528 | ||||||
| SEI Institutional Investments Trust / Annual Report / May 31, 2013 | 83 |
Table of Contents
SCHEDULE OF INVESTMENTS
Core Fixed Income Fund (Continued)
May 31, 2013
| Description | Face Amount ($ Thousands) | Market Value ($ Thousands) | ||||||
GNMA CMO, | ||||||||
0.654%, 11/20/2059 (A) | $ | 1,382 | $ | 1,384 | ||||
GNMA CMO, | ||||||||
1.650%, 01/20/2063 | 3,639 | 3,611 | ||||||
GNMA CMO, | ||||||||
0.524%, 01/20/2063 (A) | 1,493 | 1,482 | ||||||
GNMA CMO, | ||||||||
0.704%, 01/20/2063 (A) | 1,992 | 1,998 | ||||||
GNMA CMO, | ||||||||
1.650%, 02/20/2063 | 1,506 | 1,492 | ||||||
GNMA TBA | ||||||||
3.500%, 06/15/2041 to 07/20/2043 | 47,420 | 49,722 | ||||||
3.000%, 07/19/2042 to 07/20/2043 | 66,975 | 67,991 | ||||||
NCUA Guaranteed Notes CMO, | ||||||||
0.550%, 12/07/2020 (A) | 186 | 186 | ||||||
NCUA Guaranteed Notes CMO, | ||||||||
2.900%, 10/29/2020 | 1,100 | 1,159 | ||||||
NCUA Guaranteed Notes CMO, | ||||||||
2.650%, 10/29/2020 | 5,618 | 5,874 | ||||||
NCUA Guaranteed Notes CMO, | ||||||||
0.650%, 10/07/2020 (A) | 9,716 | 9,779 | ||||||
NCUA Guaranteed Notes CMO, | ||||||||
0.568%, 11/06/2017 (A) | 4,367 | 4,377 | ||||||
NCUA Guaranteed Notes CMO, | ||||||||
0.668%, 11/05/2020 (A) | 3,208 | 3,222 | ||||||
NCUA Guaranteed Notes CMO, | ||||||||
0.763%, 12/08/2020 (A) | 1,386 | 1,394 | ||||||
NCUA Guaranteed Notes CMO, | ||||||||
0.760%, 12/08/2020 (A) | 489 | 494 | ||||||
NCUA Guaranteed Notes CMO, | ||||||||
2.400%, 12/08/2020 | 335 | 343 | ||||||
NCUA Guaranteed Notes CMO, | ||||||||
0.648%, 01/08/2020 (A) | 74 | 74 | ||||||
NCUA Guaranteed Notes CMO, | ||||||||
0.600%, 02/06/2020 (A) | 847 | 851 | ||||||
|
| |||||||
| 2,256,667 | ||||||||
|
| |||||||
| Description | Face Amount ($ Thousands) | Market Value ($ Thousands) | ||||||
Non-Agency Mortgage-Backed Obligations — 7.6% |
| |||||||
A10 Securitization LLC, | ||||||||
3.492%, 04/15/2024 (B) | $ | 636 | $ | 644 | ||||
AAM ACE Resecuritization Trust, | ||||||||
0.435%, 02/02/2037 (A) (B) | 410 | 397 | ||||||
American General Mortgage Loan Trust, Ser 2009-1, Cl A5 | ||||||||
5.750%, 09/25/2048 (A) (B) | 724 | 729 | ||||||
American General Mortgage Loan Trust, Ser 2009-1, Cl A7 | ||||||||
5.750%, 09/25/2048 (A) (B) | 1,500 | 1,585 | ||||||
American General Mortgage Loan Trust, Ser 2010-1A, Cl A1 | ||||||||
5.150%, 03/25/2058 (A) (B) | 312 | 320 | ||||||
American General Mortgage Loan Trust, Ser 2010-1A, Cl A3 | ||||||||
5.650%, 03/25/2058 (A) (B) | 570 | 599 | ||||||
American Home Mortgage Assets, | ||||||||
1.098%, 11/25/2046 (A) | 1,258 | 739 | ||||||
American Home Mortgage Assets, | ||||||||
0.318%, 03/25/2047 (A) | 79 | 61 | ||||||
ASG Resecuritization Trust, | ||||||||
4.944%, 05/24/2036 (A) (B) | 285 | 293 | ||||||
ASG Resecuritization Trust, | ||||||||
4.944%, 05/24/2036 (A) (B) | 400 | 422 | ||||||
ASG Resecuritization Trust, Ser 2009-3, Cl A65 | ||||||||
2.294%, 03/26/2037 (A) (B) | 1,156 | 1,162 | ||||||
ASG Resecuritization Trust, Ser 2009-4, Cl A60 | ||||||||
6.000%, 06/28/2037 (B) | 701 | 724 | ||||||
ASG Resecuritization Trust, Ser 2010-3, Cl 2A22 | ||||||||
0.397%, 10/28/2036 (A) (B) | 169 | 168 | ||||||
ASG Resecuritization Trust, Ser 2011-1, Cl 3A50 | ||||||||
2.596%, 11/28/2035 (A) (B) | 450 | 443 | ||||||
Banc of America Alternative Loan Trust, Ser 2003-11, Cl 1A1 | ||||||||
6.000%, 01/25/2034 | 269 | 280 | ||||||
Banc of America Alternative Loan Trust, Ser 2003-11, Cl 2A1 | ||||||||
6.000%, 01/25/2034 | 520 | 543 | ||||||
Banc of America Alternative Loan Trust, Ser 2003-7, Cl 1CB1 | ||||||||
5.500%, 09/25/2033 | 362 | 369 | ||||||
Banc of America Alternative Loan Trust, Ser 2003-7, Cl 2A4 | ||||||||
5.000%, 09/25/2018 | 433 | 442 | ||||||
| 84 | SEI Institutional Investments Trust / Annual Report / May 31, 2013 |
Table of Contents
| Description | Face Amount ($ Thousands) | Market Value ($ Thousands) | ||||||
Banc of America Alternative Loan Trust, Ser 2003-9, Cl 1CB2 | ||||||||
5.500%, 11/25/2033 | $ | 337 | $ | 346 | ||||
Banc of America Alternative Loan Trust, Ser 2004-1, Cl 5A1 | ||||||||
5.500%, 02/25/2019 | 308 | 314 | ||||||
Banc of America Alternative Loan Trust, Ser 2004-8, Cl 3A1 | ||||||||
5.500%, 09/25/2019 | 295 | 310 | ||||||
Banc of America Alternative Loan Trust, Ser 2006-8, Cl 3A1 | ||||||||
6.254%, 11/25/2021 (A) | 152 | 150 | ||||||
Banc of America Alternative Loan Trust, Ser 2007-1, Cl 2A1 | ||||||||
6.434%, 04/25/2037 (A) | 388 | 312 | ||||||
Banc of America Commercial Mortgage Trust, | ||||||||
5.414%, 09/10/2047 | 490 | 545 | ||||||
Banc of America Commercial Mortgage, Ser 2004-6, Cl A3 | ||||||||
4.512%, 12/10/2042 | 41 | 41 | ||||||
Banc of America Commercial Mortgage, Ser 2005-2, Cl A5 | ||||||||
4.857%, 07/10/2043 (A) | 6,915 | 7,356 | ||||||
Banc of America Commercial Mortgage, Ser 2005-3, Cl A4 | ||||||||
4.668%, 07/10/2043 | 500 | 533 | ||||||
Banc of America Commercial Mortgage, Ser 2005-3, Cl AM | ||||||||
4.727%, 07/10/2043 | 1,050 | 1,110 | ||||||
Banc of America Commercial Mortgage, Ser 2005-5, Cl A4 | ||||||||
5.115%, 10/10/2045 (A) | 300 | 325 | ||||||
Banc of America Commercial Mortgage, Ser 2005-6, Cl A4 | ||||||||
5.359%, 09/10/2047 (A) | 70 | 76 | ||||||
Banc of America Commercial Mortgage, Ser 2006-1, Cl A4 | ||||||||
5.372%, 09/10/2045 (A) | 2,232 | 2,450 | ||||||
Banc of America Commercial Mortgage, Ser 2006-1, Cl AM | ||||||||
5.421%, 09/10/2045 (A) | 554 | 604 | ||||||
Banc of America Commercial Mortgage, Ser 2006-3, Cl A4 | ||||||||
5.889%, 07/10/2044 (A) | 825 | 923 | ||||||
Banc of America Commercial Mortgage, Ser 2006-4, Cl A4 | ||||||||
5.634%, 07/10/2046 | 800 | 887 | ||||||
Banc of America Commercial Mortgage, Ser 2006-6, Cl A4 | ||||||||
5.356%, 10/10/2045 | 2,617 | 2,885 | ||||||
| Description | Face Amount ($ Thousands) | Market Value ($ Thousands) | ||||||
Banc of America Funding, | ||||||||
6.500%, 06/25/2032 | $ | 21 | $ | 23 | ||||
Banc of America Funding, Ser 2004-2, Cl 1CB1 | ||||||||
5.750%, 09/20/2034 | 337 | 355 | ||||||
Banc of America Funding, Ser 2004-C, Cl 1A1 | ||||||||
5.061%, 12/20/2034 (A) | 198 | 200 | ||||||
Banc of America Funding, Ser 2005-B, Cl 2A1 | ||||||||
2.833%, 04/20/2035 (A) | 3,472 | 3,352 | ||||||
Banc of America Funding, Ser 2006-G, Cl 2A3 | ||||||||
0.368%, 07/20/2036 (A) | 3,587 | 3,493 | ||||||
Banc of America Funding, Ser 2010-R11A, Cl 1A6 | ||||||||
5.538%, 08/26/2035 (A) (B) | 575 | 611 | ||||||
Banc of America Funding, | ||||||||
5.500%, 10/26/2037 (B) | 336 | 349 | ||||||
Banc of America Funding, | ||||||||
3.000%, 10/26/2039 (B) | 1,874 | 1,877 | ||||||
Banc of America Mortgage Securities, Ser 2003-3, Cl 1A7 | ||||||||
5.500%, 05/25/2033 | 527 | 543 | ||||||
Banc of America Mortgage Securities, Ser 2003-3, Cl 2A1 | ||||||||
0.743%, 05/25/2018 (A) | 130 | 125 | ||||||
Banc of America Mortgage Securities, Ser 2003-6, Cl 2A1 | ||||||||
0.643%, 08/25/2018 (A) | 113 | 108 | ||||||
Banc of America Mortgage Securities, Ser 2003-A, Cl 2A2 | ||||||||
3.168%, 02/25/2033 (A) | 4 | 4 | ||||||
Banc of America Mortgage Securities, Ser 2003-E, Cl 2A2 | ||||||||
3.135%, 06/25/2033 (A) | 244 | 247 | ||||||
Banc of America Mortgage Securities, Ser 2004-3, Cl 1A26 | ||||||||
5.500%, 04/25/2034 | 689 | 706 | ||||||
Banc of America Mortgage Securities, Ser 2004-3, Cl 3A1 | ||||||||
5.000%, 04/25/2019 | 121 | 124 | ||||||
Banc of America Mortgage Securities, Ser 2004-5, Cl 4A1 | ||||||||
4.750%, 06/25/2019 | 100 | 103 | ||||||
Banc of America Mortgage Securities, Ser 2004-9, Cl 3A1 | ||||||||
6.500%, 09/25/2032 | 93 | 98 | ||||||
Banc of America Re-Remic Trust, Ser 2012-PARK, Cl A | ||||||||
2.959%, 12/10/2030 (B) | 411 | 405 | ||||||
| SEI Institutional Investments Trust / Annual Report / May 31, 2013 | 85 |
Table of Contents
SCHEDULE OF INVESTMENTS
Core Fixed Income Fund (Continued)
May 31, 2013
| Description | Face Amount ($ Thousands) | Market Value ($ Thousands) | ||||||
Bayview Commercial Asset Trust, Ser 2005-3A, Cl A1 | ||||||||
0.513%, 11/25/2035 (A) (B) | $ | 5,079 | $ | 4,383 | ||||
Bayview Commercial Asset Trust, Ser 2006-4A, Cl A1 | ||||||||
0.423%, 12/25/2036 (A) (B) | 2,230 | 1,895 | ||||||
BB-UBS Trust, | �� | |||||||
3.430%, 11/05/2036 (B) | 400 | 392 | ||||||
BB-UBS Trust, | ||||||||
2.892%, 06/05/2030 (B) | 1,500 | 1,476 | ||||||
BCAP LLC Trust, | ||||||||
5.750%, 06/26/2037 (B) | 535 | 553 | ||||||
BCAP LLC Trust, | ||||||||
5.500%, 04/26/2037 (A) (B) | 655 | 647 | ||||||
BCAP LLC Trust, | ||||||||
5.500%, 11/26/2034 (B) | 667 | 695 | ||||||
BCAP LLC Trust, | ||||||||
4.500%, 01/26/2036 (A) (B) | 581 | 600 | ||||||
BCAP LLC Trust, | ||||||||
5.278%, 04/26/2037 (A) (B) | 695 | 703 | ||||||
BCAP LLC Trust, | ||||||||
5.500%, 11/26/2037 (A) (B) | 148 | 148 | ||||||
BCAP LLC Trust, | ||||||||
5.002%, 04/26/2035 (A) (B) | 208 | 204 | ||||||
BCAP LLC Trust, | ||||||||
2.502%, 07/26/2045 (A) (B) | 861 | 836 | ||||||
BCAP LLC Trust, | ||||||||
1.000%, 01/26/2036 (A) (B) | 248 | 245 | ||||||
BCAP LLC Trust, | ||||||||
0.876%, 02/26/2047 (A) (B) | 292 | 283 | ||||||
BCAP LLC Trust, | ||||||||
5.058%, 05/26/2035 (A) (B) | 700 | 668 | ||||||
BCAP LLC Trust, | ||||||||
1.057%, 09/26/2037 (A) (B) | 920 | 827 | ||||||
BCAP LLC Trust, | ||||||||
5.000%, 08/26/2037 (A) (B) | 793 | 783 | ||||||
| Description | Face Amount ($ Thousands) | Market Value ($ Thousands) | ||||||
BCAP LLC Trust, | ||||||||
0.350%, 05/28/2036 (A) (B) | $ | 798 | $ | 736 | ||||
BCAP LLC Trust, | ||||||||
2.877%, 07/26/2036 (A) (B) | 427 | 426 | ||||||
BCAP LLC Trust, | ||||||||
0.390%, 05/26/2036 (A) (B) | 1,759 | 1,637 | ||||||
BCAP LLC Trust, | ||||||||
0.363%, 08/26/2036 (A) (B) | 718 | 691 | ||||||
BCAP LLC Trust, | ||||||||
2.184%, 05/26/2037 (A) (B) | 679 | 672 | ||||||
Bear Stearns Adjustable Rate Mortgage Trust, | ||||||||
5.075%, 05/25/2034 (A) | 177 | 180 | ||||||
Bear Stearns Adjustable Rate Mortgage Trust, | ||||||||
5.269%, 05/25/2034 (A) | 305 | 300 | ||||||
Bear Stearns Adjustable Rate Mortgage Trust, | ||||||||
2.240%, 08/25/2035 (A) | 359 | 371 | ||||||
Bear Stearns Alt-A Trust, | ||||||||
0.933%, 11/25/2034 (A) | 45 | 44 | ||||||
Bear Stearns Alternative Trust, | ||||||||
2.789%, 04/25/2035 (A) | 209 | 186 | ||||||
Bear Stearns Commercial Mortgage Securities, | ||||||||
4.830%, 08/15/2038 | 5 | 5 | ||||||
Bear Stearns Commercial Mortgage Securities, | ||||||||
5.186%, 05/11/2039 (A) | 1,718 | 1,723 | ||||||
Bear Stearns Commercial Mortgage Securities, | ||||||||
4.945%, 02/11/2041 | 93 | 93 | ||||||
Bear Stearns Commercial Mortgage Securities, | ||||||||
0.223%, 06/11/2041 (A) (B) | 13,276 | 171 | ||||||
Bear Stearns Commercial Mortgage Securities, | ||||||||
4.933%, 02/13/2042 (A) | 161 | 171 | ||||||
| 86 | SEI Institutional Investments Trust / Annual Report / May 31, 2013 |
Table of Contents
| Description | Face Amount ($ Thousands) | Market Value ($ Thousands) | ||||||
Bear Stearns Commercial Mortgage Securities, | ||||||||
5.145%, 10/12/2042 (A) | $ | 8,280 | $ | 8,991 | ||||
Bear Stearns Commercial Mortgage Securities, | ||||||||
5.618%, 03/11/2039 (A) | 300 | 330 | ||||||
Bear Stearns Commercial Mortgage Securities, | ||||||||
5.581%, 04/12/2038 (A) | 4,815 | 5,323 | ||||||
Bear Stearns Commercial Mortgage Securities, | ||||||||
5.537%, 10/12/2041 | 300 | 337 | ||||||
Bear Stearns Commercial Mortgage Securities, | ||||||||
5.405%, 12/11/2040 (A) | 400 | 437 | ||||||
Bear Stearns Commercial Mortgage Securities, | ||||||||
5.714%, 06/11/2040 (A) | 440 | 499 | ||||||
Bear Stearns Commercial Mortgage Securities, | ||||||||
5.888%, 06/11/2050 (A) | 470 | 541 | ||||||
CD Commercial Mortgage Trust, | ||||||||
5.219%, 07/15/2044 (A) | 1,983 | 2,154 | ||||||
CD Commercial Mortgage Trust, | ||||||||
5.219%, 07/15/2044 (A) | 600 | 642 | ||||||
CD Commercial Mortgage Trust, | ||||||||
5.351%, 01/15/2046 (A) | 200 | 218 | ||||||
CD Commercial Mortgage Trust, | ||||||||
5.293%, 12/11/2049 | 134 | 138 | ||||||
CFCRE Commercial Mortgage Trust, Ser 2011-C1, Cl A4 | ||||||||
4.961%, 04/15/2044 (A) (B) | 2,670 | 3,024 | ||||||
Chase Mortgage Finance, Ser 2007-A1, Cl 2A1 | ||||||||
2.990%, 02/25/2037 (A) | 250 | 255 | ||||||
Chase Mortgage Finance, Ser 2007-A1, Cl 9A1 | ||||||||
2.956%, 02/25/2037 (A) | 168 | 171 | ||||||
Chase Mortgage Finance, Ser 2007-A2, Cl 1A1 | ||||||||
2.991%, 07/25/2037 (A) | 405 | 409 | ||||||
| Description | Face Amount ($ Thousands) | Market Value ($ Thousands) | ||||||
Chevy Chase Funding LLC Mortgage-Backed Certificates, Ser 2004-1A, Cl A1 | ||||||||
0.473%, 01/25/2035 (A) (B) | $ | 35 | $ | 30 | ||||
Citicorp Mortgage Securities, Ser 2004-4, Cl A4 | ||||||||
5.500%, 06/25/2034 | 417 | 436 | ||||||
Citigroup Commercial Mortgage Trust, Ser 2005-C3, Cl A4 | ||||||||
4.860%, 05/15/2043 | 2,624 | 2,771 | ||||||
Citigroup Commercial Mortgage Trust, Ser 2005-C3, Cl AM | ||||||||
4.830%, 05/15/2043 (A) | 440 | 465 | ||||||
Citigroup Commercial Mortgage Trust, Ser 2007-C6, Cl A4 | ||||||||
5.696%, 12/10/2049 (A) | 976 | 1,123 | ||||||
Citigroup Commercial Mortgage Trust, Ser 2013-GC11, Cl AAB | ||||||||
2.690%, 04/10/2046 | 638 | 638 | ||||||
Citigroup Mortgage Loan Trust, | ||||||||
3.050%, 02/25/2034 (A) | 68 | 61 | ||||||
Citigroup Mortgage Loan Trust, | ||||||||
4.673%, 05/25/2034 (A) (B) | 742 | 774 | ||||||
Citigroup Mortgage Loan Trust, Ser 2004-UST1, Cl A6 | ||||||||
4.464%, 08/25/2034 (A) | 167 | 168 | ||||||
Citigroup Mortgage Loan Trust, | ||||||||
5.500%, 05/25/2035 | 323 | 337 | ||||||
Citigroup Mortgage Loan Trust, Ser 2008-AR4, Cl 1A1A | ||||||||
2.935%, 11/25/2038 (A) (B) | 761 | 776 | ||||||
Citigroup Mortgage Loan Trust, | ||||||||
2.429%, 09/25/2033 (A) (B) | 503 | 513 | ||||||
Citigroup Mortgage Loan Trust, | ||||||||
5.750%, 05/25/2037 (A) (B) | 782 | 828 | ||||||
Citigroup Mortgage Loan Trust, | ||||||||
6.000%, 06/25/2036 (B) | 1,200 | 1,267 | ||||||
Citigroup Mortgage Loan Trust, | ||||||||
2.610%, 02/25/2035 (A) (B) | 230 | 235 | ||||||
Citigroup Mortgage Loan Trust, | ||||||||
4.000%, 11/25/2036 (B) | 1,972 | 2,042 | ||||||
Citigroup Mortgage Loan Trust, | ||||||||
4.500%, 12/25/2036 (B) | 2,116 | 2,232 | ||||||
Citigroup Mortgage Loan Trust, Ser 2011-3, Cl 1A1 | ||||||||
0.273%, 02/25/2047 (A) (B) | 163 | 162 | ||||||
| SEI Institutional Investments Trust / Annual Report / May 31, 2013 | 87 |
Table of Contents
SCHEDULE OF INVESTMENTS
Core Fixed Income Fund (Continued)
May 31, 2013
| Description | Face Amount ($ Thousands) | Market Value ($ Thousands) | ||||||
Citigroup Mortgage Loan Trust, | ||||||||
0.383%, 02/25/2046 (A) (B) | $ | 541 | $ | 504 | ||||
Citigroup Mortgage Loan Trust, | ||||||||
2.500%, 06/25/2051 (B) | 809 | 801 | ||||||
Citigroup, Ser 2006-CD2, Cl X, IO | ||||||||
0.083%, 01/15/2046 (A) (B) | 69,654 | 109 | ||||||
Citigroup, | ||||||||
0.157%, 12/11/2049 (A) (B) | 40,001 | 308 | ||||||
COBALT CMBS Commercial Mortgage Trust, | ||||||||
5.223%, 08/15/2048 | 1,070 | 1,180 | ||||||
COBALT CMBS Commercial Mortgage Trust, | ||||||||
5.526%, 04/15/2047 (A) | 520 | 586 | ||||||
Commercial Mortgage Pass-Through Certificates, | ||||||||
4.982%, 05/10/2043 (A) | 600 | 638 | ||||||
Commercial Mortgage Pass-Through Certificates, | ||||||||
1.960%, 08/15/2045 (A) | 1,218 | 150 | ||||||
Commercial Mortgage Pass-Through Certificates, | ||||||||
2.822%, 11/15/2045 | 90 | 88 | ||||||
Commercial Mortgage Pass-Through Certificates, | ||||||||
2.138%, 11/17/2026 (A) (B) | 334 | 338 | ||||||
Commercial Mortgage Pass-Through Certificates, | ||||||||
2.739%, 03/10/2046 | 2,182 | 2,210 | ||||||
Commercial Mortgage Pass-Through Certificates, | ||||||||
2.752%, 08/15/2045 | 2,464 | 2,510 | ||||||
Commercial Mortgage Pass-Through Certificates, | ||||||||
2.478%, 01/10/2046 | 1,429 | 1,426 | ||||||
Commercial Mortgage Pass-Through Certificates, | ||||||||
3.424%, 03/10/2031 (B) | 770 | 772 | ||||||
| Description | Face Amount ($ Thousands) | Market Value ($ Thousands) | ||||||
Countrywide Alternative Loan Trust, Ser 2003-20CB, Cl 1A1 | ||||||||
5.500%, 10/25/2033 | $ | 1,623 | $ | 1,714 | ||||
Countrywide Alternative Loan Trust, Ser 2004-27CB, Cl A1 | ||||||||
6.000%, 12/25/2034 | 1,652 | 1,604 | ||||||
Countrywide Alternative Loan Trust, Ser 2004-J1, Cl 1A1 | ||||||||
6.000%, 02/25/2034 | 155 | 158 | ||||||
Countrywide Alternative Loan Trust, Ser 2004-J6, Cl 2A1 | ||||||||
6.500%, 11/25/2031 | 715 | 751 | ||||||
Countrywide Alternative Loan Trust, Ser 2004-J6, Cl PO, PO | ||||||||
0.000%, 11/25/2031 | 233 | 200 | ||||||
Countrywide Alternative Loan Trust, Ser 2005-27, Cl 3A2 | ||||||||
1.276%, 08/25/2035 (A) | 744 | 494 | ||||||
Countrywide Home Loan Mortgage Pass-Through Trust, | ||||||||
5.000%, 10/25/2033 | 643 | 665 | ||||||
Countrywide Home Loan Mortgage Pass-Through Trust, | ||||||||
3.009%, 12/25/2033 (A) | 398 | 405 | ||||||
Countrywide Home Loan Mortgage Pass-Through Trust, | ||||||||
5.250%, 01/25/2034 | 971 | 1,003 | ||||||
Countrywide Home Loan Mortgage Pass-Through Trust, | ||||||||
9.523%, 08/25/2018 (A) | 54 | 57 | ||||||
Countrywide Home Loan Mortgage Pass-Through Trust, | ||||||||
4.922%, 08/25/2034 (A) | 505 | 512 | ||||||
Countrywide Home Loan Mortgage Pass-Through Trust, Ser 2004-20, Cl 2A1 | ||||||||
2.858%, 09/25/2034 (A) | 59 | 50 | ||||||
Countrywide Home Loan Mortgage Pass-Through Trust, Ser 2004-5, Cl 1A4 | ||||||||
5.500%, 06/25/2034 | 585 | 608 | ||||||
Countrywide Home Loan Mortgage Pass-Through Trust, Ser 2004-8, Cl 2A1 | ||||||||
4.500%, 06/25/2019 | 484 | 500 | ||||||
Countrywide Home Loan Mortgage Pass-Through Trust, Ser 2005-20, Cl A7 | ||||||||
5.250%, 12/25/2027 | 673 | 648 | ||||||
| 88 | SEI Institutional Investments Trust / Annual Report / May 31, 2013 |
Table of Contents
| Description | Face Amount ($ Thousands) | Market Value ($ Thousands) | ||||||
Countrywide Home Loan Mortgage Pass-Through Trust, Ser 2005-R3, Cl AF | ||||||||
0.593%, 09/25/2035 (A) (B) | $ | 3,961 | $ | 3,446 | ||||
Credit Suisse Commercial Mortgage Trust, | ||||||||
5.613%, 01/15/2049 (A) | 1,465 | 1,621 | ||||||
Credit Suisse First Boston Mortgage Securities, | ||||||||
5.250%, 11/25/2033 | 761 | 794 | ||||||
Credit Suisse First Boston Mortgage Securities, | ||||||||
5.250%, 11/25/2033 | 328 | 337 | ||||||
Credit Suisse First Boston Mortgage Securities, | ||||||||
7.000%, 12/25/2033 | 222 | 238 | ||||||
Credit Suisse First Boston Mortgage Securities, | ||||||||
6.000%, 11/25/2018 | 352 | 365 | ||||||
Credit Suisse First Boston Mortgage Securities, | ||||||||
5.500%, 09/25/2034 | 528 | 564 | ||||||
Credit Suisse First Boston Mortgage Securities, | ||||||||
5.500%, 12/25/2034 | 559 | 586 | ||||||
Credit Suisse First Boston Mortgage Securities, | ||||||||
2.724%, 06/25/2034 (A) | 504 | 505 | ||||||
Credit Suisse First Boston Mortgage Securities, | ||||||||
4.829%, 11/15/2037 | 445 | 466 | ||||||
Credit Suisse First Boston Mortgage Securities, | ||||||||
4.832%, 04/15/2037 | 1,720 | 1,813 | ||||||
Credit Suisse First Boston Mortgage Securities, | ||||||||
4.730%, 07/15/2037 | 400 | 424 | ||||||
Credit Suisse First Boston Mortgage Securities, | ||||||||
5.100%, 08/15/2038 (A) | 1,831 | 1,963 | ||||||
Credit Suisse Mortgage Capital Certificates, Ser 2006-C2, Cl A3 | ||||||||
5.863%, 03/15/2039 (A) | 825 | 910 | ||||||
| Description | Face Amount ($ Thousands) | Market Value ($ Thousands) | ||||||
Credit Suisse Mortgage Capital Certificates, Ser 2006-C5, Cl A3 | ||||||||
5.311%, 12/15/2039 | $ | 4,998 | $ | 5,560 | ||||
Credit Suisse Mortgage Capital Certificates, | ||||||||
2.811%, 09/26/2046 (A) (B) | 305 | 305 | ||||||
Credit Suisse Mortgage Capital Certificates, | ||||||||
5.340%, 10/26/2037 (A) (B) | 2 | 2 | ||||||
Credit Suisse Mortgage Capital Certificates, | ||||||||
4.250%, 06/25/2050 (A) (B) | 400 | 391 | ||||||
Credit Suisse Mortgage Capital Certificates, | ||||||||
4.750%, 05/27/2037 (B) | 271 | 271 | ||||||
Credit Suisse Mortgage Capital Certificates, | ||||||||
3.500%, 12/27/2036 (A) (B) | 284 | 290 | ||||||
Credit Suisse Mortgage Capital Certificates, Ser 2011-1R, Cl A1 | ||||||||
1.204%, 02/27/2047 (A) (B) | 757 | 753 | ||||||
Credit Suisse Mortgage Capital Certificates, | ||||||||
2.952%, 07/28/2036 (A) (B) | 563 | 554 | ||||||
Credit Suisse Mortgage Capital Certificates, Ser 2011-7R, Cl A1 | ||||||||
1.454%, 08/28/2047 (A) (B) | 911 | 907 | ||||||
Credit Suisse Mortgage Capital Certificates, Ser 2011-9R, Cl A1 | ||||||||
2.204%, 03/27/2046 (A) (B) | 1,707 | 1,716 | ||||||
Credit Suisse Mortgage Capital Certificates, | ||||||||
1.198%, 06/28/2047 (A) (B) | 4,321 | 4,170 | ||||||
Credit Suisse Mortgage Capital Certificates, | ||||||||
3.250%, 07/27/2037 (A) (B) | 997 | 1,015 | ||||||
DBRR Trust, | ||||||||
4.537%, 07/12/2044 (A) (B) | 2,845 | 3,171 | ||||||
DBRR Trust, Ser 2012-EZ1, Cl A | ||||||||
0.946%, 09/25/2045 (B) | 6,838 | 6,854 | ||||||
DBRR Trust, Ser 2013-EZ2, Cl A | ||||||||
0.853%, 02/25/2043 (A) (B) | 6,661 | 6,659 | ||||||
DBUBS Mortgage Trust, | ||||||||
1.450%, 08/10/2044 (A) (B) | 6,566 | 281 | ||||||
| SEI Institutional Investments Trust / Annual Report / May 31, 2013 | 89 |
Table of Contents
SCHEDULE OF INVESTMENTS
Core Fixed Income Fund (Continued)
May 31, 2013
| Description | Face Amount ($ Thousands) | Market Value ($ Thousands) | ||||||
Deutsche Mortgage Securities, | ||||||||
0.334%, 04/26/2037 (A) (B) | $ | 159 | $ | 156 | ||||
Deutsche Mortgage Securities, | ||||||||
1.454%, 06/28/2047 (A) (B) | 9 | 9 | ||||||
Deutsche Securities Alternative Loan Trust, Ser 2005-1, Cl 2A1 | ||||||||
5.635%, 02/25/2020 (A) | 214 | 222 | ||||||
Developers Diversified Realty, | ||||||||
3.807%, 10/14/2022 (B) | 2,593 | 2,674 | ||||||
DSLA Mortgage Loan Trust, | ||||||||
0.598%, 11/19/2044 (A) | 1,611 | 1,010 | ||||||
Extended Stay America Trust, | ||||||||
2.958%, 12/05/2031 (B) | 550 | 549 | ||||||
FDIC Structured Sale Guaranteed Notes, Ser 2010-C1, Cl A | ||||||||
2.980%, 12/06/2020 (B) | 796 | 828 | ||||||
FDIC Structured Sale Guaranteed Notes, Ser 2010-S1, Cl 1A | ||||||||
0.754%, 02/25/2048 (A) (B) | 2,699 | 2,701 | ||||||
First Horizon Alternative Mortgage Securities, Ser 2004-AA3, Cl A1 | ||||||||
2.314%, 09/25/2034 (A) | 453 | 454 | ||||||
First Horizon Asset Securities, | ||||||||
4.500%, 09/25/2018 | 320 | 329 | ||||||
Fontainebleau Miami Beach Trust, Ser 2012-FBLU, Cl A | ||||||||
2.887%, 05/05/2027 (B) | 1,011 | 1,025 | ||||||
GE Business Loan Trust, Ser 2003-2A, Cl A | ||||||||
0.569%, 11/15/2031 (A) (B) | 4,983 | 4,846 | ||||||
GE Business Loan Trust, | ||||||||
0.699%, 11/15/2033 (A) (B) | 1,606 | 1,356 | ||||||
GE Capital Commercial Mortgage, | ||||||||
4.772%, 06/10/2048 (A) | 75 | 79 | ||||||
GE Capital Commercial Mortgage, | ||||||||
4.826%, 06/10/2048 (A) | 1,000 | 1,045 | ||||||
GE Capital Commercial Mortgage, | ||||||||
4.846%, 06/10/2048 (A) | 500 | 517 | ||||||
GMAC Commercial Mortgage Securities, Ser 2003-C3, Cl A4 | ||||||||
5.023%, 04/10/2040 | 1,075 | 1,081 | ||||||
GMAC Commercial Mortgage Securities, Ser 2006-C1, Cl A4 | ||||||||
5.238%, 11/10/2045 (A) | 700 | 752 | ||||||
| Description | Face Amount ($ Thousands) | Market Value ($ Thousands) | ||||||
GMAC Mortgage Loan Trust, | ||||||||
3.390%, 10/19/2033 (A) | $ | 1,208 | $ | 1,244 | ||||
GMAC Mortgage Loan Trust, | ||||||||
5.000%, 10/25/2033 | 408 | 415 | ||||||
GMAC Mortgage Loan Trust, | ||||||||
5.000%, 11/25/2033 | 601 | 611 | ||||||
GMAC Mortgage Loan Trust, | ||||||||
6.500%, 01/25/2035 | 497 | 527 | ||||||
GMAC Mortgage Loan Trust, | ||||||||
5.000%, 01/25/2020 | 188 | 194 | ||||||
Greenwich Capital Commercial Funding, Ser 2004-GG1, Cl A7 | ||||||||
5.317%, 06/10/2036 (A) (C) | 1,524 | 1,557 | ||||||
Greenwich Capital Commercial Funding, Ser 2005-GG3, Cl AJ | ||||||||
4.859%, 08/10/2042 (A) | 220 | 230 | ||||||
Greenwich Capital Commercial Funding, Ser 2005-GG5, Cl A5 | ||||||||
5.224%, 04/10/2037 (A) | 6,568 | 7,102 | ||||||
Greenwich Capital Commercial Funding, Ser 2006-GG7, Cl AM | ||||||||
6.060%, 07/10/2038 (A) | 1,160 | 1,288 | ||||||
GS Mortgage Securities II, | ||||||||
5.553%, 04/10/2038 (A) | 1,000 | 1,099 | ||||||
GS Mortgage Securities II, | ||||||||
0.594%, 11/10/2039 (A) (B) | 10,486 | 180 | ||||||
GS Mortgage Securities II, | ||||||||
2.999%, 08/10/2044 | 55 | 58 | ||||||
GS Mortgage Securities II, | ||||||||
3.707%, 08/10/2044 | 10,105 | 10,738 | ||||||
GS Mortgage Securities II, | ||||||||
1.912%, 08/10/2044 (A) (B) | 2,143 | 175 | ||||||
GS Mortgage Securities II, | ||||||||
3.135%, 06/10/2046 | 2,874 | 2,883 | ||||||
GS Mortgage Securities, | ||||||||
2.706%, 12/10/2027 (B) | 304 | 309 | ||||||
GSMPS Mortgage Loan Trust, | ||||||||
8.000%, 09/19/2027 (A) (B) | 4 | 4 | ||||||
GSMPS Mortgage Loan Trust, | ||||||||
0.543%, 09/25/2035 (A) (B) | 525 | 451 | ||||||
| 90 | SEI Institutional Investments Trust / Annual Report / May 31, 2013 |
Table of Contents
| Description | Face Amount ($ Thousands) | Market Value ($ Thousands) | ||||||
GSMPS Mortgage Loan Trust, | ||||||||
4.935%, 09/25/2035 (A) (B) | $ | 420 | $ | 70 | ||||
GSR Mortgage Loan Trust, | ||||||||
6.000%, 09/25/2034 | 593 | 620 | ||||||
GSR Mortgage Loan Trust, | ||||||||
0.693%, 06/25/2035 (A) | 113 | 106 | ||||||
GSR Mortgage Loan Trust, | ||||||||
5.500%, 01/25/2037 | 107 | 110 | ||||||
Homestar Mortgage Acceptance, | ||||||||
0.643%, 10/25/2034 (A) | 805 | 815 | ||||||
Impac CMB Trust, | ||||||||
0.500%, 05/25/2035 (A) | 384 | 384 | ||||||
Impac Funding LLC, | ||||||||
5.314%, 01/25/2051 (B) | 4,284 | 4,720 | ||||||
Impac Secured Assets CMN Owner Trust, | ||||||||
5.500%, 08/25/2033 | 543 | 570 | ||||||
Impac Secured Assets CMN Owner Trust, | ||||||||
0.543%, 05/25/2036 (A) | 460 | 451 | ||||||
Impac Secured Assets CMN Owner Trust, | ||||||||
0.543%, 08/25/2036 (A) | 1,183 | 1,164 | ||||||
Indymac INDA Mortgage Loan Trust, Ser 2007-AR7, Cl 1A1 | ||||||||
3.221%, 11/25/2037 (A) | 1,230 | 1,125 | ||||||
Indymac Index Mortgage Loan Trust, Ser 2004-AR6, Cl 6A1 | ||||||||
2.836%, 10/25/2034 (A) | 24 | 24 | ||||||
Indymac Index Mortgage Loan Trust, Ser 2004-AR7, Cl A2 | ||||||||
1.053%, 09/25/2034 (A) | 37 | 34 | ||||||
Indymac Index Mortgage Loan Trust, Ser 2004-AR8, Cl 2A2A | ||||||||
0.993%, 11/25/2034 (A) | 57 | 51 | ||||||
JPMorgan Chase Commercial Mortgage Securities, Ser 2003CB6, Cl A2 | ||||||||
5.255%, 07/12/2037 (A) | 264 | 265 | ||||||
JPMorgan Chase Commercial Mortgage Securities, | ||||||||
5.115%, 07/15/2041 | 5,534 | 5,757 | ||||||
| Description | Face Amount ($ Thousands) | Market Value ($ Thousands) | ||||||
JPMorgan Chase Commercial Mortgage Securities, | ||||||||
5.541%, 08/12/2037 (A) | $ | 700 | $ | 745 | ||||
JPMorgan Chase Commercial Mortgage Securities, | ||||||||
4.678%, 07/15/2042 | 220 | 221 | ||||||
JPMorgan Chase Commercial Mortgage Securities, | ||||||||
0.103%, 06/12/2043 (A) | 49,708 | 336 | ||||||
JPMorgan Chase Commercial Mortgage Securities, | ||||||||
5.429%, 12/12/2043 | 9,753 | 10,846 | ||||||
JPMorgan Chase Commercial Mortgage Securities, | ||||||||
5.399%, 05/15/2045 | 580 | 648 | ||||||
JPMorgan Chase Commercial Mortgage Securities, | ||||||||
5.440%, 05/15/2045 | 749 | 836 | ||||||
JPMorgan Chase Commercial Mortgage Securities, | ||||||||
5.134%, 05/15/2047 | 468 | 489 | ||||||
JPMorgan Chase Commercial Mortgage Securities, | ||||||||
0.354%, 05/15/2047 (A) | 800 | 798 | ||||||
JPMorgan Chase Commercial Mortgage Securities, | ||||||||
5.716%, 02/15/2051 | 1,533 | 1,738 | ||||||
JPMorgan Chase Commercial Mortgage Securities, | ||||||||
5.714%, 02/12/2049 (A) | 2,088 | 2,376 | ||||||
JPMorgan Chase Commercial Mortgage Securities, | ||||||||
5.875%, 02/12/2051 (A) | 475 | 550 | ||||||
JPMorgan Chase Commercial Mortgage Securities, | ||||||||
3.300%, 08/05/2032 (B) | 926 | 979 | ||||||
JPMorgan Chase Commercial Mortgage Securities, | ||||||||
4.311%, 08/05/2032 (B) | 1,668 | 1,809 | ||||||
| SEI Institutional Investments Trust / Annual Report / May 31, 2013 | 91 |
Table of Contents
SCHEDULE OF INVESTMENTS
Core Fixed Income Fund (Continued)
May 31, 2013
| Description | Face Amount ($ Thousands) | Market Value ($ Thousands) | ||||||
JPMorgan Chase Commercial Mortgage Securities, | ||||||||
3.149%, 08/15/2046 | $ | 740 | $ | 784 | ||||
JPMorgan Chase Commercial Mortgage Securities, | ||||||||
2.379%, 10/15/2045 | 1,501 | 1,485 | ||||||
JPMorgan Chase Commercial Mortgage Securities, | ||||||||
2.702%, 12/15/2047 | 2,643 | 2,663 | ||||||
JPMorgan Chase Commercial Mortgage Securities, | ||||||||
2.960%, 04/15/2046 | 1,596 | 1,562 | ||||||
JPMorgan Chase Commercial Mortgage Securities, | ||||||||
2.554%, 04/15/2046 | 2,457 | 2,436 | ||||||
JPMorgan Chase Commercial Mortgage Securities, | ||||||||
5.440%, 06/12/2047 | 150 | 169 | ||||||
JPMorgan Mortgage Trust, | ||||||||
3.042%, 07/25/2034 (A) | 127 | 130 | ||||||
JPMorgan Mortgage Trust, | ||||||||
2.290%, 06/25/2034 (A) | 1,721 | 1,747 | ||||||
JPMorgan Mortgage Trust, | ||||||||
3.042%, 09/25/2034 (A) | 115 | 119 | ||||||
JPMorgan Mortgage Trust, | ||||||||
4.799%, 02/25/2035 (A) | 668 | 681 | ||||||
JPMorgan Mortgage Trust, | ||||||||
4.227%, 04/25/2035 (A) | 360 | 360 | ||||||
JPMorgan Mortgage Trust, | ||||||||
2.385%, 06/25/2035 (A) | 2 | 2 | ||||||
JPMorgan Mortgage Trust, | ||||||||
2.751%, 06/25/2035 (A) | 548 | 542 | ||||||
JPMorgan Mortgage Trust, | ||||||||
2.663%, 08/25/2035 (A) | 82 | 83 | ||||||
JPMorgan Mortgage Trust, | ||||||||
3.010%, 08/25/2034 (A) | 959 | 956 | ||||||
JPMorgan Mortgage Trust, | ||||||||
2.903%, 11/25/2033 (A) | 988 | 1,009 | ||||||
| Description | Face Amount ($ Thousands) | Market Value ($ Thousands) | ||||||
JPMorgan Mortgage Trust, | ||||||||
2.984%, 08/25/2034 (A) | $ | 476 | $ | 475 | ||||
JPMorgan Re-REMIC, | ||||||||
5.331%, 09/26/2036 (A) (B) | 359 | 365 | ||||||
JPMorgan Re-REMIC, | ||||||||
1.865%, 08/26/2035 (A) (B) | 262 | 260 | ||||||
LB Commercial Conduit Mortgage Trust, Ser 2007-C3, Cl A3 | ||||||||
6.071%, 07/15/2044 (A) | 844 | 872 | ||||||
LB-UBS Commercial Mortgage Trust, Ser 2004-C7, Cl A5 | ||||||||
4.628%, 10/15/2029 | 169 | 170 | ||||||
LB-UBS Commercial Mortgage Trust, Ser 2004-C8, Cl A6 | ||||||||
4.799%, 12/15/2029 (A) | 434 | 451 | ||||||
LB-UBS Commercial Mortgage Trust, Ser 2006-C1, Cl A4 | ||||||||
5.156%, 02/15/2031 | 350 | 382 | ||||||
LB-UBS Commercial Mortgage Trust, Ser 2006-C1, Cl XCL, IO | ||||||||
0.359%, 02/15/2041 (A) (B) | 23,059 | 204 | ||||||
LB-UBS Commercial Mortgage Trust, Ser 2006-C4, Cl A4 | ||||||||
6.062%, 06/15/2038 (A) | 450 | 504 | ||||||
LB-UBS Commercial Mortgage Trust, Ser 2006-C6, Cl A4 | ||||||||
5.372%, 09/15/2039 | 1,690 | 1,893 | ||||||
LB-UBS Commercial Mortgage Trust, Ser 2007-C1, Cl A3 | ||||||||
5.398%, 02/15/2040 | 258 | 264 | ||||||
LB-UBS Commercial Mortgage Trust, Ser 2007-C1, Cl A4 | ||||||||
5.424%, 02/15/2040 | 134 | 151 | ||||||
LB-UBS Commercial Mortgage Trust, Ser 2007-C1, Cl AM | ||||||||
5.455%, 02/15/2040 | 150 | 167 | ||||||
LB-UBS Commercial Mortgage Trust, Ser 2007-C7, Cl AM | ||||||||
6.216%, 09/15/2045 (A) | 500 | 582 | ||||||
LVII Resecuritization Trust, Ser 2009-3, Cl M3 | ||||||||
5.473%, 11/27/2037 (A) (B) | 300 | 319 | ||||||
Master Adjustable Rate Mortgages Trust, Ser 2004-13, Cl 3A7 | ||||||||
2.630%, 11/21/2034 (A) | 1,509 | 1,569 | ||||||
Master Adjustable Rate Mortgages Trust, Ser 2004-13, Cl 3A7A | ||||||||
2.630%, 11/21/2034 (A) | 11,095 | 11,693 | ||||||
Master Alternative Loans Trust, | ||||||||
5.500%, 05/25/2034 | 1,737 | 1,824 | ||||||
| 92 | SEI Institutional Investments Trust / Annual Report / May 31, 2013 |
Table of Contents
| Description | Face Amount ($ Thousands) | Market Value ($ Thousands) | ||||||
Master Reperforming Loan Trust, | ||||||||
6.000%, 08/25/2034 (B) | $ | 2,560 | $ | 2,637 | ||||
Master Reperforming Loan Trust, | ||||||||
0.553%, 07/25/2035 (A) (B) | 1,145 | 972 | ||||||
Master Seasoned Securities Trust, | ||||||||
2.460%, 10/25/2032 (A) | 113 | 114 | ||||||
MASTR Adjustable Rate Mortgages Trust, | ||||||||
2.809%, 06/25/2034 (A) | 27 | 25 | ||||||
MASTR Alternative Loans Trust, | ||||||||
6.000%, 12/25/2033 | 252 | 266 | ||||||
MASTR Alternative Loans Trust, | ||||||||
6.250%, 07/25/2036 | 684 | 599 | ||||||
MASTR Asset Securitization Trust, | ||||||||
5.250%, 12/25/2033 | 736 | 767 | ||||||
MASTR Asset Securitization Trust, | ||||||||
5.000%, 03/25/2018 | 55 | 57 | ||||||
MASTR Asset Securitization Trust, | ||||||||
5.500%, 04/25/2033 | 257 | 265 | ||||||
MASTR Reperforming Loan Trust, | ||||||||
0.543%, 05/25/2035 (A) (B) | 518 | 433 | ||||||
MASTR Resecuritization Trust, | ||||||||
0.000%, 05/28/2035 (B) | 190 | 152 | ||||||
MASTR Seasoned Securities Trust, Ser 2004-1, Cl 4A1 | ||||||||
2.816%, 10/25/2032 (A) | 13 | 13 | ||||||
Merrill Lynch Mortgage Investors, | ||||||||
2.742%, 07/25/2033 (A) | 141 | 146 | ||||||
Merrill Lynch Mortgage Investors, | ||||||||
2.322%, 12/25/2034 (A) | 511 | 519 | ||||||
Merrill Lynch Mortgage Investors, | ||||||||
0.917%, 04/25/2029 (A) | 347 | 344 | ||||||
Merrill Lynch Mortgage Investors, | ||||||||
2.557%, 02/25/2034 (A) | 152 | 153 | ||||||
Merrill Lynch Mortgage Investors, | ||||||||
5.104%, 02/25/2034 (A) | 1,304 | 1,343 | ||||||
Merrill Lynch Mortgage Investors, | ||||||||
2.542%, 08/25/2034 (A) | 300 | 311 | ||||||
| Description | Face Amount ($ Thousands) | Market Value ($ Thousands) | ||||||
Merrill Lynch Mortgage Investors, | ||||||||
2.181%, 05/25/2029 (A) | $ | 506 | $ | 516 | ||||
Merrill Lynch Mortgage Investors, | ||||||||
1.181%, 09/25/2029 (A) | 398 | 401 | ||||||
Merrill Lynch Mortgage Investors, | ||||||||
2.273%, 04/25/2035 (A) | 51 | 50 | ||||||
Merrill Lynch Mortgage Trust, | ||||||||
4.949%, 07/12/2038 (A) | 1,069 | 1,110 | ||||||
Merrill Lynch Mortgage Trust, | ||||||||
5.047%, 07/12/2038 (A) | 1,335 | 1,440 | ||||||
Merrill Lynch Mortgage Trust, | ||||||||
5.448%, 11/12/2037 (A) | 865 | 933 | ||||||
Merrill Lynch Mortgage Trust, | ||||||||
5.291%, 01/12/2044 (A) | 1,141 | 1,240 | ||||||
Merrill Lynch Mortgage Trust, | ||||||||
5.546%, 01/12/2044 (A) | 480 | 521 | ||||||
Merrill Lynch Mortgage Trust, | ||||||||
2.598%, 02/25/2036 (A) | 299 | 280 | ||||||
Merrill Lynch Mortgage Trust, | ||||||||
5.873%, 05/12/2039 (A) | 505 | 563 | ||||||
Merrill Lynch Mortgage Trust, | ||||||||
5.850%, 06/12/2050 (A) | 2,427 | 2,769 | ||||||
Merrill Lynch/Countrywide Commercial Mortgage Trust, Ser 2006-4, Cl AM | ||||||||
5.204%, 12/12/2049 (A) | 460 | 508 | ||||||
Merrill Lynch/Countrywide Commercial Mortgage Trust, Ser 2006-4, Cl XC, IO | ||||||||
0.182%, 12/12/2049 (A) (B) | 14,804 | 183 | ||||||
Merrill Lynch/Countrywide Commercial Mortgage Trust, Ser 2007-5, Cl A4 | ||||||||
5.378%, 08/12/2048 | 900 | 1,006 | ||||||
Merrill Lynch/Countrywide Commercial Mortgage Trust, Ser 2007-6, Cl A4 | ||||||||
5.485%, 03/12/2051 (A) | 1,080 | 1,213 | ||||||
ML-CFC Commercial Mortgage Trust, Ser 2007-9, Cl A4 | ||||||||
5.700%, 09/12/2049 | 1,930 | 2,198 | ||||||
Morgan Stanley Bank of America Merrill Lynch Trust, | ||||||||
2.825%, 08/15/2045 | 1,481 | 1,498 | ||||||
| SEI Institutional Investments Trust / Annual Report / May 31, 2013 | 93 |
Table of Contents
SCHEDULE OF INVESTMENTS
Core Fixed Income Fund (Continued)
May 31, 2013
| Description | Face Amount ($ Thousands) | Market Value ($ Thousands) | ||||||
Morgan Stanley Bank of America Merrill Lynch Trust, | ||||||||
1.926%, 08/15/2045 (A) (B) | $ | 5,133 | $ | 555 | ||||
Morgan Stanley Bank of America Merrill Lynch Trust, | ||||||||
2.506%, 11/15/2045 | 3,654 | 3,627 | ||||||
Morgan Stanley Bank of America Merrill Lynch Trust, | ||||||||
2.918%, 02/15/2046 | 670 | �� | 656 | |||||
Morgan Stanley Bank of America Merrill Lynch Trust, | ||||||||
2.469%, 02/15/2046 | 681 | 676 | ||||||
Morgan Stanley Bank of America Merrill Lynch Trust, | ||||||||
3.214%, 02/15/2046 | 707 | 696 | ||||||
Morgan Stanley Bank of America Merrill Lynch Trust, | ||||||||
3.102%, 05/15/2046 | 1,277 | 1,264 | ||||||
Morgan Stanley Bank of America Merrill Lynch Trust, | ||||||||
2.657%, 05/15/2046 | 2,023 | 2,023 | ||||||
Morgan Stanley Bank of America Merrill Lynch Trust, | ||||||||
3.456%, 05/15/2046 | 420 | 421 | ||||||
Morgan Stanley Capital I, | ||||||||
4.970%, 04/14/2040 | 1,762 | 1,817 | ||||||
Morgan Stanley Capital I, | ||||||||
5.037%, 01/14/2042 | 132 | 133 | ||||||
Morgan Stanley Capital I, | ||||||||
5.357%, 11/14/2042 (A) | 108 | 108 | ||||||
Morgan Stanley Capital I, | ||||||||
4.890%, 06/12/2047 | 7,400 | 7,943 | ||||||
Morgan Stanley Capital I, | ||||||||
5.162%, 10/12/2052 (A) | 5,645 | 6,134 | ||||||
Morgan Stanley Capital I, | ||||||||
5.818%, 08/12/2041 (A) | 6,350 | 7,144 | ||||||
Morgan Stanley Capital I, | ||||||||
0.226%, 02/12/2044 (A) (B) | 39,048 | 217 | ||||||
| Description | Face Amount ($ Thousands) | Market Value ($ Thousands) | ||||||
Morgan Stanley Capital I, | ||||||||
6.094%, 06/11/2049 (A) | $ | 1,000 | $ | 1,143 | ||||
Morgan Stanley Capital I, | ||||||||
5.816%, 06/11/2042 (A) | 300 | 345 | ||||||
Morgan Stanley Capital I, | ||||||||
3.224%, 07/15/2049 | 1,620 | 1,721 | ||||||
Morgan Stanley Capital I, | ||||||||
4.054%, 07/15/2049 | 340 | 371 | ||||||
Morgan Stanley Capital I, | ||||||||
4.118%, 07/15/2049 | 950 | 1,032 | ||||||
Morgan Stanley Mortgage Loan Trust, Ser 2004-3, Cl 4A | ||||||||
5.671%, 04/25/2034 (A) | 535 | 560 | ||||||
Morgan Stanley Mortgage Loan Trust, Ser 2007-6XS, Cl 2A1S | ||||||||
0.303%, 02/25/2047 (A) | 148 | 136 | ||||||
Morgan Stanley Re-REMIC Trust, | ||||||||
5.000%, 07/17/2056 (B) | 529 | 532 | ||||||
Morgan Stanley Re-REMIC Trust, | ||||||||
3.250%, 12/17/2043 (B) | 29 | 29 | ||||||
Morgan Stanley Re-REMIC Trust, | ||||||||
4.970%, 04/16/2040 (B) | 1,267 | 1,301 | ||||||
Morgan Stanley Re-REMIC Trust, | ||||||||
2.500%, 03/23/2051 (B) | 866 | 874 | ||||||
Morgan Stanley Re-REMIC Trust, | ||||||||
1.000%, 03/27/2051 | 1,164 | 1,151 | ||||||
Morgan Stanley Re-REMIC Trust, | ||||||||
2.000%, 07/27/2049 (B) | 2,634 | 2,667 | ||||||
Morgan Stanley Re-REMIC Trust, | ||||||||
0.250%, 07/27/2049 (B) | 400 | 333 | ||||||
Motel 6 Trust, | ||||||||
1.948%, 10/05/2025 (B) | 4,434 | 4,406 | ||||||
New York Mortgage Trust, | ||||||||
2.861%, 05/25/2036 (A) | 495 | 444 | ||||||
Nomura Resecuritization Trust, | ||||||||
2.560%, 03/26/2036 (A) (B) | 574 | 579 | ||||||
NorthStar Mortgage Trust, Ser 2012-1, Cl A | ||||||||
1.393%, 08/25/2029 (A) (B) | 1,083 | 1,082 | ||||||
| 94 | SEI Institutional Investments Trust / Annual Report / May 31, 2013 |
Table of Contents
| Description | Face Amount ($ Thousands) | Market Value ($ Thousands) | ||||||
Prime Mortgage Trust, | ||||||||
6.000%, 02/25/2034 | $ | 223 | $ | 245 | ||||
Prime Mortgage Trust, | ||||||||
0.000%, 02/25/2034 | 62 | 52 | ||||||
Prime Mortgage Trust, | ||||||||
5.500%, 05/25/2035 (B) | 2,183 | 2,190 | ||||||
RALI Trust, Ser 2005-QO5, Cl A1 | ||||||||
1.176%, 01/25/2046 (A) | 1,221 | 875 | ||||||
RAMP Trust, Ser 2004-SL1, Cl A7 | ||||||||
7.000%, 11/25/2031 | 152 | 160 | ||||||
RAMP Trust, Ser 2005-SL1, Cl A5 | ||||||||
6.500%, 05/25/2032 | 56 | 54 | ||||||
RBSSP Resecuritization Trust, | ||||||||
4.000%, 06/27/2021 (B) | 310 | 312 | ||||||
RBSSP Resecuritization Trust, | ||||||||
4.000%, 05/26/2037 (A) (B) | 675 | 694 | ||||||
RBSSP Resecuritization Trust, | ||||||||
0.343%, 09/26/2036 (A) (B) | 805 | 742 | ||||||
RCMC LLC, Ser 2012-CRE1, Cl A | ||||||||
5.624%, 11/15/2044 (B) | 919 | 917 | ||||||
Residential Accredit Loans, | ||||||||
5.500%, 08/25/2033 | 683 | 703 | ||||||
Residential Accredit Loans, | ||||||||
5.000%, 09/25/2018 | 256 | 263 | ||||||
Residential Accredit Loans, | ||||||||
5.750%, 10/25/2033 | 356 | 380 | ||||||
Residential Accredit Loans, | ||||||||
5.500%, 05/25/2034 | 1,639 | 1,665 | ||||||
Residential Accredit Loans, | ||||||||
1.536%, 09/25/2045 (A) | 862 | 749 | ||||||
Residential Asset Mortgage Products, Ser 2004-SL1, Cl A8 | ||||||||
6.500%, 11/25/2031 | 573 | 591 | ||||||
Residential Asset Mortgage Products, Ser 2004-SL3, Cl A2 | ||||||||
6.500%, 12/25/2031 | 983 | 1,005 | ||||||
Residential Asset Securitization Trust, Ser 2003-A5, Cl A1 | ||||||||
5.500%, 06/25/2033 | 327 | 341 | ||||||
Residential Asset Securitization Trust, Ser 2004-IP2, Cl 2A1 | ||||||||
2.695%, 12/25/2034 (A) | 1,287 | 1,302 | ||||||
| Description | Face Amount ($ Thousands) | Market Value ($ Thousands) | ||||||
Residential Funding Mortgage Securities I, | ||||||||
5.750%, 03/25/2033 | $ | 306 | $ | 310 | ||||
Residential Funding Mortgage Securities I, | ||||||||
5.500%, 05/25/2022 | 5 | 5 | ||||||
Salomon Brothers Mortgage Securities VII, | ||||||||
3.097%, 09/25/2033 (A) | 497 | 506 | ||||||
Sequoia Mortgage Trust, | ||||||||
0.829%, 01/20/2035 (A) | 757 | 643 | ||||||
Sequoia Mortgage Trust, | ||||||||
3.750%, 02/25/2040 (A) | 114 | 113 | ||||||
Sequoia Mortgage Trust, | ||||||||
4.125%, 02/25/2041 (A) | 171 | 175 | ||||||
Springleaf Mortgage Loan Trust, | ||||||||
4.050%, 01/25/2058 (A) (B) | 735 | 759 | ||||||
Springleaf Mortgage Loan Trust, | ||||||||
5.450%, 01/25/2058 (A) (B) | 1,000 | 1,050 | ||||||
Springleaf Mortgage Loan Trust, | ||||||||
2.667%, 09/25/2057 (A) (B) | 333 | 339 | ||||||
Springleaf Mortgage Loan Trust, | ||||||||
6.000%, 09/25/2057 (A) (B) | 700 | 740 | ||||||
Springleaf Mortgage Loan Trust, | ||||||||
2.220%, 10/25/2057 (A) (B) | 1,189 | 1,231 | ||||||
Springleaf Mortgage Loan Trust, | ||||||||
6.000%, 10/25/2057 (A) (B) | 800 | 823 | ||||||
Springleaf Mortgage Loan Trust, | ||||||||
1.570%, 12/25/2059 (A) (B) | 1,630 | 1,638 | ||||||
Springleaf Mortgage Loan Trust, | ||||||||
2.660%, 12/25/2059 (A) (B) | 432 | 438 | ||||||
Springleaf Mortgage Loan Trust, | ||||||||
3.560%, 12/25/2059 (A) (B) | 330 | 336 | ||||||
Springleaf Mortgage Loan Trust, | ||||||||
4.440%, 12/25/2059 (A) (B) | 253 | 263 | ||||||
Springleaf Mortgage Loan Trust, | ||||||||
5.300%, 12/25/2059 (A) (B) | 121 | 126 | ||||||
| SEI Institutional Investments Trust / Annual Report / May 31, 2013 | 95 |
Table of Contents
SCHEDULE OF INVESTMENTS
Core Fixed Income Fund (Continued)
May 31, 2013
| Description | Face Amount ($ Thousands) | Market Value ($ Thousands) | ||||||
Structured Adjustable Rate Mortgage Loan Trust, | ||||||||
4.902%, 06/25/2034 (A) | $ | 592 | $ | 602 | ||||
Structured Adjustable Rate Mortgage Loan Trust, | ||||||||
0.513%, 10/25/2035 (A) | 3,709 | 3,214 | ||||||
Structured Asset Mortgage Investments, | ||||||||
0.858%, 10/19/2034 (A) | 286 | 288 | ||||||
Structured Asset Securities, | ||||||||
2.310%, 10/25/2031 (A) | 53 | 54 | ||||||
Structured Asset Securities, | ||||||||
0.693%, 06/25/2033 (A) | 301 | 293 | ||||||
Structured Asset Securities, | ||||||||
2.591%, 10/25/2033 (A) | 8,258 | 8,412 | ||||||
Structured Asset Securities, | ||||||||
5.445%, 11/25/2033 (A) | 127 | 135 | ||||||
Structured Asset Securities, | ||||||||
5.500%, 10/25/2033 | 621 | 628 | ||||||
Structured Asset Securities, | ||||||||
4.758%, 12/25/2033 (A) | 191 | 194 | ||||||
Structured Asset Securities, | ||||||||
5.540%, 12/25/2033 | 667 | 690 | ||||||
Thornburg Mortgage Securities Trust, Ser 2003-4, Cl A1 | ||||||||
0.833%, 09/25/2043 (A) | 569 | 552 | ||||||
TIAA Seasoned Commercial Mortgage Trust, | ||||||||
5.541%, 08/15/2039 (A) | 2,064 | 2,156 | ||||||
UBS-BAMLL Trust, | ||||||||
3.663%, 06/10/2030 (B) | 866 | 876 | ||||||
UBS-Barclays Commercial Mortgage Trust, | ||||||||
2.788%, 04/10/2046 | 3,380 | 3,393 | ||||||
UBS-Barclays Commercial Mortgage Trust, | ||||||||
1.813%, 05/10/2063 (A) (B) | 3,701 | 374 | ||||||
UBS-Barclays Commercial Mortgage Trust, | ||||||||
3.525%, 05/10/2063 | 416 | 430 | ||||||
| Description | Face Amount ($ Thousands) | Market Value ($ Thousands) | ||||||
UBS-Barclays Commercial Mortgage Trust, | ||||||||
2.728%, 08/10/2049 | $ | 2,058 | $ | 2,072 | ||||
UBS-Barclays Commercial Mortgage Trust, | ||||||||
2.459%, 12/10/2045 | 4,908 | 4,887 | ||||||
UBS-Barclays Commercial Mortgage Trust, | ||||||||
3.317%, 12/10/2045 (B) | 900 | 893 | ||||||
UBS-Barclays Commercial Mortgage Trust, | ||||||||
3.185%, 03/10/2046 | 2,428 | 2,432 | ||||||
UBS-Barclays Commercial Mortgage Trust, | ||||||||
3.244%, 04/10/2046 | 2,395 | 2,403 | ||||||
Vendee Mortgage Trust CMO, | ||||||||
7.250%, 02/15/2023 | 1,945 | 2,273 | ||||||
Vericrest Opportunity Loan Transferee, | ||||||||
2.487%, 02/26/2052 (B) | 1,027 | 1,029 | ||||||
Vericrest Opportunity Loan Transferee, | ||||||||
2.734%, 11/25/2060 (A) (B) | 1,389 | 1,393 | ||||||
VNO Mortgage Trust, | ||||||||
2.996%, 11/15/2030 (B) | 877 | 859 | ||||||
Wachovia Bank Commercial Mortgage Trust, | ||||||||
5.012%, 12/15/2035 (A) | 2,638 | 2,667 | ||||||
Wachovia Bank Commercial Mortgage Trust, | ||||||||
5.118%, 07/15/2042 (A) | 130 | 140 | ||||||
Wachovia Bank Commercial Mortgage Trust, | ||||||||
5.290%, 12/15/2044 (A) | 1,000 | 1,089 | ||||||
Wachovia Bank Commercial Mortgage Trust, | ||||||||
0.045%, 06/15/2045 (A) (B) | 80,884 | 200 | ||||||
Wachovia Bank Commercial Mortgage Trust, | ||||||||
5.342%, 12/15/2043 | 1,100 | 1,238 | ||||||
| 96 | SEI Institutional Investments Trust / Annual Report / May 31, 2013 |
Table of Contents
| Description | Face Amount ($ Thousands) | Market Value ($ Thousands) | ||||||
Wachovia Bank Commercial Mortgage Trust, | ||||||||
5.383%, 12/15/2043 | $ | 560 | $ | 613 | ||||
WaMu Mortgage Pass-Through Certificates, | ||||||||
2.495%, 01/25/2033 (A) | 315 | 322 | ||||||
WaMu Mortgage Pass-Through Certificates, | ||||||||
1.573%, 06/25/2042 (A) | 24 | 23 | ||||||
WaMu Mortgage Pass-Through Certificates, | ||||||||
2.505%, 10/25/2033 (A) | 402 | 414 | ||||||
WaMu Mortgage Pass-Through Certificates, | ||||||||
2.443%, 06/25/2033 (A) | 393 | 405 | ||||||
WaMu Mortgage Pass-Through Certificates, | ||||||||
2.321%, 08/25/2033 (A) | 337 | 342 | ||||||
WaMu Mortgage Pass-Through Certificates, | ||||||||
2.457%, 08/25/2033 (A) | 205 | 210 | ||||||
WaMu Mortgage Pass-Through Certificates, | ||||||||
2.429%, 09/25/2033 (A) | 715 | 732 | ||||||
WaMu Mortgage Pass-Through Certificates, | ||||||||
2.462%, 09/25/2033 (A) | 273 | 280 | ||||||
WaMu Mortgage Pass-Through Certificates, | ||||||||
5.000%, 02/25/2018 | 144 | 146 | ||||||
WaMu Mortgage Pass-Through Certificates, | ||||||||
4.500%, 12/25/2018 | 204 | 210 | ||||||
WaMu Mortgage Pass-Through Certificates, | ||||||||
16.931%, 06/25/2033 (A) | 70 | 85 | ||||||
WaMu Mortgage Pass-Through Certificates, | ||||||||
5.250%, 10/25/2033 | 1,300 | 1,362 | ||||||
WaMu Mortgage Pass-Through Certificates, | ||||||||
2.517%, 06/25/2034 (A) | 200 | 204 | ||||||
| Description | Face Amount ($ Thousands) | Market Value ($ Thousands) | ||||||
WaMu Mortgage Pass-Through Certificates, | ||||||||
2.517%, 06/25/2034 (A) | $ | 263 | $ | 267 | ||||
WaMu Mortgage Pass-Through Certificates, | ||||||||
5.500%, 08/25/2019 | 410 | 426 | ||||||
WaMu Mortgage Pass-Through Certificates, | ||||||||
0.593%, 03/25/2034 (A) | 49 | 48 | ||||||
WaMu Mortgage Pass-Through Certificates, | ||||||||
5.500%, 06/25/2034 | 763 | 794 | ||||||
WaMu Mortgage Pass-Through Certificates, | ||||||||
0.483%, 10/25/2045 (A) | 3,059 | 2,868 | ||||||
WaMu Mortgage Pass-Through Certificates, | ||||||||
0.473%, 11/25/2045 (A) | 4,786 | 4,261 | ||||||
WaMu Mortgage Pass-Through Certificates, | ||||||||
0.483%, 12/25/2045 (A) | 4,525 | 4,220 | ||||||
WaMu Mortgage Pass-Through Certificates, | ||||||||
1.246%, 01/25/2046 (A) | 2,734 | 813 | ||||||
WaMu Mortgage Pass-Through Certificates, | ||||||||
2.499%, 10/25/2046 (A) | 1,085 | 1,010 | ||||||
WaMu Mortgage Pass-Through Certificates, | ||||||||
2.385%, 11/25/2036 (A) | 346 | 293 | ||||||
WaMu Mortgage Pass-Through Certificates, | ||||||||
0.986%, 12/25/2046 (A) | 484 | 196 | ||||||
WaMu Mortgage Pass-Through Certificates, | ||||||||
2.499%, 12/25/2046 (A) | 501 | 481 | ||||||
WaMu Mortgage Pass-Through Certificates, | ||||||||
1.146%, 06/25/2046 (A) | 16 | 9 | ||||||
WaMu Mortgage Pass-Through Certificates, | ||||||||
2.452%, 02/25/2037 (A) | 4,086 | 3,256 | ||||||
| SEI Institutional Investments Trust / Annual Report / May 31, 2013 | 97 |
Table of Contents
SCHEDULE OF INVESTMENTS
Core Fixed Income Fund (Continued)
May 31, 2013
| Description | Face Amount ($ Thousands) | Market Value ($ Thousands) | ||||||
Washington Mutual Alternative Mortgage Pass-Through Certificates, | ||||||||
5.500%, 05/25/2035 | $ | 604 | $ | 165 | ||||
Washington Mutual MSC Mortgage Pass-Through Certificates, | ||||||||
5.750%, 02/25/2033 | 75 | 78 | ||||||
Washington Mutual MSC Mortgage Pass-Through Certificates, | ||||||||
0.000%, 05/25/2033 | 149 | 137 | ||||||
Washington Mutual MSC Mortgage Pass-Through Certificates, | ||||||||
0.000%, 04/25/2033 | 229 | 196 | ||||||
Wells Fargo Mortgage Loan Trust, | ||||||||
2.847%, 08/27/2037 (A) (B) | 408 | 413 | ||||||
Wells Fargo Mortgage-Backed Securities Trust, | ||||||||
5.500%, 01/25/2034 | 316 | 331 | ||||||
Wells Fargo Mortgage-Backed Securities Trust, | ||||||||
4.424%, 10/25/2033 (A) | 5 | 5 | ||||||
Wells Fargo Mortgage-Backed Securities Trust, | ||||||||
4.434%, 11/25/2033 (A) | 414 | 423 | ||||||
Wells Fargo Mortgage-Backed Securities Trust, | ||||||||
4.932%, 02/25/2034 (A) | 282 | 287 | ||||||
Wells Fargo Mortgage-Backed Securities Trust, | ||||||||
4.500%, 05/25/2034 (A) | 70 | 71 | ||||||
Wells Fargo Mortgage-Backed Securities Trust, | ||||||||
2.623%, 12/25/2034 (A) | 562 | 582 | ||||||
Wells Fargo Mortgage-Backed Securities Trust, | ||||||||
2.623%, 12/25/2034 (A) | 375 | 388 | ||||||
Wells Fargo Mortgage-Backed Securities Trust, | ||||||||
3.042%, 12/25/2034 (A) | 181 | 185 | ||||||
| Description | Face Amount ($ Thousands) | Market Value ($ Thousands) | ||||||
Wells Fargo Mortgage-Backed Securities Trust, | ||||||||
2.960%, 12/25/2034 (A) | $ | 271 | $ | 278 | ||||
Wells Fargo Mortgage-Backed Securities Trust, | ||||||||
2.780%, 07/25/2034 (A) | 650 | 665 | ||||||
Wells Fargo Mortgage-Backed Securities Trust, | ||||||||
4.939%, 08/25/2034 (A) | 214 | 221 | ||||||
Wells Fargo Mortgage-Backed Securities Trust, | ||||||||
2.616%, 09/25/2034 (A) | 1,068 | 1,097 | ||||||
Wells Fargo Mortgage-Backed Securities Trust, | ||||||||
2.653%, 10/25/2034 (A) | 508 | 528 | ||||||
Wells Fargo Mortgage-Backed Securities Trust, | ||||||||
2.653%, 10/25/2034 (A) | 406 | 419 | ||||||
Wells Fargo Mortgage-Backed Securities Trust, | ||||||||
5.000%, 01/25/2020 | 177 | 183 | ||||||
Wells Fargo Mortgage-Backed Securities Trust, | ||||||||
5.000%, 11/25/2020 | 133 | 136 | ||||||
Wells Fargo Mortgage-Backed Securities Trust, | ||||||||
5.330%, 08/25/2035 (A) | 424 | 427 | ||||||
Wells Fargo Mortgage-Backed Securities Trust, | ||||||||
2.735%, 06/25/2035 (A) | 751 | 773 | ||||||
Wells Fargo Mortgage-Backed Securities Trust, | ||||||||
2.744%, 10/25/2033 (A) | 231 | 233 | ||||||
Wells Fargo Mortgage-Backed Securities Trust, | ||||||||
5.536%, 11/25/2036 (A) | 562 | 547 | ||||||
Wells Fargo Mortgage-Backed Securities Trust, | ||||||||
2.678%, 04/25/2036 (A) | 652 | 652 | ||||||
Wells Fargo Re-REMIC Trust, | ||||||||
1.750%, 08/20/2021 (B) | 1,075 | 1,075 | ||||||
| 98 | SEI Institutional Investments Trust / Annual Report / May 31, 2013 |
Table of Contents
| Description | Face Amount ($ Thousands) | Market Value ($ Thousands) | ||||||
WF-RBS Commercial Mortgage Trust, Ser 2011-C2, Cl XA, IO | ||||||||
1.139%, 02/15/2044 (A) (B) | $ | 8,149 | $ | 377 | ||||
WF-RBS Commercial Mortgage Trust, Ser 2011-C3, Cl A4 | ||||||||
4.375%, 03/15/2044 (B) | 600 | 662 | ||||||
WF-RBS Commercial Mortgage Trust, Ser 2011-C5, Cl A4 | ||||||||
3.667%, 11/15/2044 | 4,610 | 4,870 | ||||||
WF-RBS Commercial Mortgage Trust, Ser 2012-C7, Cl A2 | ||||||||
3.431%, 06/15/2045 | 4,920 | 5,061 | ||||||
WF-RBS Commercial Mortgage Trust, Ser 2012-C7, Cl XA, IO | ||||||||
1.601%, 06/15/2045 (A) (B) | 3,202 | 341 | ||||||
WF-RBS Commercial Mortgage Trust, Ser 2012-C8, Cl A3 | ||||||||
3.001%, 08/15/2045 | 3,740 | 3,718 | ||||||
|
| |||||||
| 491,089 | ||||||||
|
| |||||||
Total Mortgage-Backed Securities | 2,747,756 | |||||||
|
| |||||||
CORPORATE OBLIGATIONS — 26.0% |
| |||||||
Consumer Discretionary — 1.3% |
| |||||||
CBS | ||||||||
8.875%, 05/15/2019 | 125 | 165 | ||||||
7.875%, 07/30/2030 | 160 | 211 | ||||||
5.750%, 04/15/2020 | 92 | 107 | ||||||
4.850%, 07/01/2042 | 785 | 762 | ||||||
4.300%, 02/15/2021 | 250 | 268 | ||||||
Comcast | ||||||||
6.500%, 01/15/2015 | 2,795 | 3,057 | ||||||
6.500%, 01/15/2017 | 5,055 | 5,968 | ||||||
6.500%, 11/15/2035 | 300 | 380 | ||||||
6.450%, 03/15/2037 | 200 | 252 | ||||||
5.850%, 11/15/2015 | 648 | 727 | ||||||
4.950%, 06/15/2016 | 4,125 | 4,601 | ||||||
4.250%, 01/15/2033 | 390 | 389 | ||||||
Comcast Cable Communications Holdings | ||||||||
9.455%, 11/15/2022 | 850 | 1,262 | ||||||
CVS | ||||||||
5.789%, 01/10/2026 (B) | 1,684 | 1,949 | ||||||
CVS Caremark | ||||||||
6.125%, 09/15/2039 | 140 | 173 | ||||||
4.125%, 05/15/2021 | 360 | 394 | ||||||
2.750%, 12/01/2022 | 230 | 223 | ||||||
CVS Lease Pass-Through | ||||||||
6.036%, 12/10/2028 (B) | 2,321 | 2,659 | ||||||
CVS Pass-Through Trust | ||||||||
5.926%, 01/10/2034 (B) | 323 | 376 | ||||||
5.880%, 01/10/2028 | 157 | 180 | ||||||
| Description | Face Amount ($ Thousands) | Market Value ($ Thousands) | ||||||
Daimler Finance North America LLC | ||||||||
2.625%, 09/15/2016 (B) | $ | 389 | $ | 403 | ||||
1.875%, 09/15/2014 (B) | 3,735 | 3,778 | ||||||
1.875%, 01/11/2018 (B) | 1,521 | 1,514 | ||||||
1.650%, 04/10/2015 (B) | 337 | 341 | ||||||
1.300%, 07/31/2015 (B) | 7,095 | 7,137 | ||||||
DaimlerChrysler | ||||||||
6.500%, 11/15/2013 | 460 | 472 | ||||||
Ford Motor | ||||||||
4.750%, 01/15/2043 | 2,310 | 2,149 | ||||||
Gap | ||||||||
5.950%, 04/12/2021 | 514 | 597 | ||||||
Glencore Funding LLC | ||||||||
4.125%, 05/30/2023 (B) | 1,279 | 1,250 | ||||||
2.500%, 01/15/2019 (B) | 2,130 | 2,090 | ||||||
Historic TW | ||||||||
9.150%, 02/01/2023 | 500 | 712 | ||||||
Johnson Controls | ||||||||
5.250%, 12/01/2041 | 440 | 472 | ||||||
4.250%, 03/01/2021 | 265 | 286 | ||||||
3.750%, 12/01/2021 | 289 | 300 | ||||||
Kohl’s | ||||||||
6.250%, 12/15/2017 | 255 | 298 | ||||||
4.000%, 11/01/2021 (C) | 134 | 139 | ||||||
Lowe’s MTN | ||||||||
7.110%, 05/15/2037 | 400 | 526 | ||||||
5.125%, 11/15/2041 | 48 | 52 | ||||||
LVMH Moet Hennessy Louis Vuitton | ||||||||
1.625%, 06/29/2017 (B) | 2,757 | 2,762 | ||||||
Macy’s Retail Holdings | ||||||||
7.450%, 07/15/2017 | 120 | 146 | ||||||
6.900%, 04/01/2029 | 100 | 122 | ||||||
5.125%, 01/15/2042 | 54 | 55 | ||||||
2.875%, 02/15/2023 (C) | 232 | 222 | ||||||
McDonald’s MTN | ||||||||
5.350%, 03/01/2018 | 1,200 | 1,412 | ||||||
NBC Universal Enterprise | ||||||||
1.974%, 04/15/2019 (B) | 1,730 | 1,758 | ||||||
NBC Universal Media | ||||||||
5.950%, 04/01/2041 | 200 | 241 | ||||||
4.450%, 01/15/2043 | 1,353 | 1,343 | ||||||
4.375%, 04/01/2021 | 150 | 167 | ||||||
Newell Rubbermaid | ||||||||
4.700%, 08/15/2020 | 176 | 192 | ||||||
News America | ||||||||
6.200%, 12/15/2034 | 265 | 307 | ||||||
Nissan Motor Acceptance | ||||||||
1.800%, 03/15/2018 (B) | 255 | 254 | ||||||
Target | ||||||||
4.000%, 06/15/2013 | 325 | 325 | ||||||
Thomson Reuters | ||||||||
4.700%, 10/15/2019 | 250 | 283 | ||||||
| SEI Institutional Investments Trust / Annual Report / May 31, 2013 | 99 |
Table of Contents
SCHEDULE OF INVESTMENTS
Core Fixed Income Fund (Continued)
May 31, 2013
| Description | Face Amount ($ Thousands) | Market Value ($ Thousands) | ||||||
Time Warner | ||||||||
7.700%, 05/01/2032 | $ | 170 | $ | 230 | ||||
7.625%, 04/15/2031 | 3,085 | 4,175 | ||||||
6.500%, 11/15/2036 | 50 | 59 | ||||||
6.250%, 03/29/2041 | 627 | 734 | ||||||
5.375%, 10/15/2041 | 37 | 39 | ||||||
4.750%, 03/29/2021 | 920 | 1,027 | ||||||
4.700%, 01/15/2021 | 670 | 745 | ||||||
Time Warner Cable | ||||||||
8.750%, 02/14/2019 | 1,410 | 1,852 | ||||||
8.250%, 04/01/2019 | 3,745 | 4,824 | ||||||
7.300%, 07/01/2038 | 1,185 | 1,467 | ||||||
6.750%, 07/01/2018 | 120 | 145 | ||||||
6.550%, 05/01/2037 | 3,426 | 3,939 | ||||||
5.875%, 11/15/2040 | 420 | 446 | ||||||
5.500%, 09/01/2041 | 1,228 | 1,247 | ||||||
4.500%, 09/15/2042 | 1,260 | 1,124 | ||||||
4.125%, 02/15/2021 | 160 | 169 | ||||||
Time Warner Entertainment | ||||||||
8.375%, 07/15/2033 | 100 | 136 | ||||||
UBM | ||||||||
5.750%, 11/03/2020 (B) | 970 | 1,011 | ||||||
Viacom | ||||||||
3.875%, 12/15/2021 | 294 | 307 | ||||||
3.250%, 03/15/2023 | 44 | 43 | ||||||
Volkswagen International Finance | ||||||||
1.625%, 08/12/2013 (B) | 100 | 100 | ||||||
Wal-Mart Stores | ||||||||
5.800%, 02/15/2018 | 1,760 | 2,101 | ||||||
Walt Disney MTN | ||||||||
0.450%, 12/01/2015 | 125 | 125 | ||||||
|
| |||||||
| 82,253 | ||||||||
|
| |||||||
Consumer Staples — 1.6% |
| |||||||
Altria Group | ||||||||
9.250%, 08/06/2019 | 2,120 | 2,902 | ||||||
4.750%, 05/05/2021 | 1,260 | 1,396 | ||||||
2.850%, 08/09/2022 | 1,690 | 1,610 | ||||||
Anheuser-Busch InBev Worldwide | ||||||||
7.750%, 01/15/2019 | 7,330 | 9,499 | ||||||
5.375%, 01/15/2020 | 2,360 | 2,793 | ||||||
5.000%, 04/15/2020 | 910 | 1,060 | ||||||
2.500%, 07/15/2022 | 1,840 | 1,770 | ||||||
Avon Products | ||||||||
5.000%, 03/15/2023 | 605 | 639 | ||||||
4.600%, 03/15/2020 | 665 | 703 | ||||||
Bunge Finance | ||||||||
8.500%, 06/15/2019 | 350 | 448 | ||||||
5.900%, 04/01/2017 | 107 | 120 | ||||||
Cargill | ||||||||
6.000%, 11/27/2017 (B) | 500 | 593 | ||||||
CHS | ||||||||
8.000%, 11/15/2019 | 200 | 220 | ||||||
| Description | Face Amount ($ Thousands) | Market Value ($ Thousands) | ||||||
ConAgra Foods | ||||||||
3.200%, 01/25/2023 | $ | 790 | $ | 778 | ||||
2.100%, 03/15/2018 | 86 | 87 | ||||||
1.900%, 01/25/2018 | 1,900 | 1,910 | ||||||
1.300%, 01/25/2016 | 1,416 | 1,425 | ||||||
Diageo Capital | ||||||||
4.828%, 07/15/2020 | 300 | 346 | ||||||
2.625%, 04/29/2023 | 775 | 743 | ||||||
1.125%, 04/29/2018 | 8,790 | 8,608 | ||||||
Diageo Investment | ||||||||
2.875%, 05/11/2022 | 3,730 | 3,720 | ||||||
ERAC USA Finance LLC | ||||||||
6.700%, 06/01/2034 (B) | 221 | 263 | ||||||
5.625%, 03/15/2042 (B) | 1,966 | 2,141 | ||||||
3.300%, 10/15/2022 (B) | 606 | 597 | ||||||
2.750%, 03/15/2017 (B) | 48 | 50 | ||||||
1.400%, 04/15/2016 (B) | 11 | 11 | ||||||
Fomento Economico Mexicano | ||||||||
4.375%, 05/10/2043 | 1,693 | 1,526 | ||||||
2.875%, 05/10/2023 | 625 | 588 | ||||||
GlaxoSmithKline Capital | ||||||||
4.375%, 04/15/2014 | 200 | 207 | ||||||
Heineken | ||||||||
1.400%, 10/01/2017 (B) (C) | 2,435 | 2,404 | ||||||
Imperial Tobacco Finance | ||||||||
2.050%, 02/11/2018 (B) | 790 | 788 | ||||||
Kellogg | ||||||||
3.125%, 05/17/2022 | 178 | 180 | ||||||
1.750%, 05/17/2017 | 805 | 813 | ||||||
Kimberly-Clark | ||||||||
2.400%, 03/01/2022 | 36 | 35 | ||||||
Kraft Foods | ||||||||
6.500%, 08/11/2017 | 300 | 356 | ||||||
6.125%, 02/01/2018 | 380 | 447 | ||||||
5.375%, 02/10/2020 | 2,073 | 2,404 | ||||||
Kraft Foods Group | ||||||||
6.500%, 02/09/2040 | 1,660 | 2,095 | ||||||
6.125%, 08/23/2018 | 700 | 837 | ||||||
5.375%, 02/10/2020 | 2,272 | 2,646 | ||||||
5.000%, 06/04/2042 | 176 | 185 | ||||||
3.500%, 06/06/2022 | 8,635 | 8,877 | ||||||
Kroger | ||||||||
7.500%, 04/01/2031 | 610 | 767 | ||||||
6.150%, 01/15/2020 | 1,025 | 1,226 | ||||||
5.400%, 07/15/2040 | 45 | 48 | ||||||
3.400%, 04/15/2022 (C) | 200 | 203 | ||||||
2.200%, 01/15/2017 | 80 | 82 | ||||||
Lorillard Tobacco | ||||||||
8.125%, 06/23/2019 | 570 | 721 | ||||||
Mallinckrodt International Finance | ||||||||
4.750%, 04/15/2023 (B) | 2,655 | 2,692 | ||||||
Molson Coors Brewing | ||||||||
3.500%, 05/01/2022 | 220 | 225 | ||||||
| 100 | SEI Institutional Investments Trust / Annual Report / May 31, 2013 |
Table of Contents
| Description | Face Amount ($ Thousands) | Market Value ($ Thousands) | ||||||
Novartis Capital | ||||||||
2.400%, 09/21/2022 | $ | 200 | $ | 193 | ||||
PepsiCo | ||||||||
7.900%, 11/01/2018 | 339 | 444 | ||||||
3.000%, 08/25/2021 | 181 | 185 | ||||||
2.750%, 03/05/2022 | 1,370 | 1,360 | ||||||
1.250%, 08/13/2017 | 3,365 | 3,349 | ||||||
0.700%, 08/13/2015 | 2,550 | 2,554 | ||||||
Pernod-Ricard | ||||||||
5.750%, 04/07/2021 (B) | 1,382 | 1,603 | ||||||
4.450%, 01/15/2022 (B) | 3,150 | 3,361 | ||||||
4.250%, 07/15/2022 (B) | 1,775 | 1,867 | ||||||
Pharmacia | ||||||||
8.700%, 10/15/2021 | 350 | 467 | ||||||
Philip Morris International | ||||||||
5.650%, 05/16/2018 | 510 | 605 | ||||||
4.125%, 03/04/2043 | 1,100 | 1,029 | ||||||
2.900%, 11/15/2021 | 1,920 | 1,931 | ||||||
2.625%, 03/06/2023 | 860 | 826 | ||||||
2.500%, 08/22/2022 | 1,780 | 1,706 | ||||||
President and Fellows of Harvard College | ||||||||
3.619%, 10/01/2037 | 635 | 596 | ||||||
Reynolds American | ||||||||
3.250%, 11/01/2022 (C) | 810 | 787 | ||||||
SABMiller | ||||||||
5.500%, 08/15/2013 (B) | 320 | 323 | ||||||
SABMiller Holdings | ||||||||
3.750%, 01/15/2022 (B) | 565 | 594 | ||||||
Safeway | ||||||||
6.350%, 08/15/2017 (C) | 2,406 | 2,770 | ||||||
Teva Pharmaceutical Finance BV | ||||||||
3.650%, 11/10/2021 | 1,020 | 1,061 | ||||||
2.950%, 12/18/2022 | 616 | 601 | ||||||
Teva Pharmaceutical Finance IV BV | ||||||||
3.650%, 11/10/2021 | 260 | 270 | ||||||
Teva Pharmaceutical Finance IV LLC | ||||||||
2.250%, 03/18/2020 | 1,094 | 1,078 | ||||||
Tyson Foods | ||||||||
4.500%, 06/15/2022 | 2,170 | 2,314 | ||||||
Walgreen | ||||||||
3.100%, 09/15/2022 | 234 | 231 | ||||||
Wal-Mart Stores | ||||||||
7.250%, 06/01/2013 | 187 | 187 | ||||||
|
| |||||||
| 107,076 | ||||||||
|
| |||||||
Energy — 2.8% |
| |||||||
Alberta Energy | ||||||||
7.375%, 11/01/2031 | 200 | 248 | ||||||
Anadarko Holding | ||||||||
7.150%, 05/15/2028 | 150 | 181 | ||||||
| Description | Face Amount ($ Thousands) | Market Value ($ Thousands) | ||||||
Anadarko Petroleum | ||||||||
8.700%, 03/15/2019 | $ | 150 | $ | 199 | ||||
7.625%, 03/15/2014 | 450 | 474 | ||||||
6.950%, 06/15/2019 | 90 | 111 | ||||||
6.375%, 09/15/2017 | 3,740 | 4,410 | ||||||
5.950%, 09/15/2016 | 190 | 217 | ||||||
ANR Pipeline | ||||||||
9.625%, 11/01/2021 | 100 | 147 | ||||||
Apache | ||||||||
6.900%, 09/15/2018 | 180 | 224 | ||||||
6.000%, 09/15/2013 | 2,890 | 2,933 | ||||||
5.625%, 01/15/2017 | 370 | 423 | ||||||
4.750%, 04/15/2043 | 115 | 115 | ||||||
3.250%, 04/15/2022 | 76 | 77 | ||||||
2.625%, 01/15/2023 | 231 | 221 | ||||||
Arch Coal | ||||||||
7.000%, 06/15/2019 (C) | 380 | 342 | ||||||
Baker Hughes | ||||||||
7.500%, 11/15/2018 | 2,020 | 2,600 | ||||||
BG Energy Capital | ||||||||
5.125%, 10/15/2041 (B) | 200 | 218 | ||||||
4.000%, 10/15/2021 (B) | 2,775 | 2,985 | ||||||
BP Capital Markets | ||||||||
5.250%, 11/07/2013 | 2,970 | 3,032 | ||||||
3.875%, 03/10/2015 | 630 | 664 | ||||||
3.625%, 05/08/2014 | 100 | 103 | ||||||
3.561%, 11/01/2021 | 210 | 219 | ||||||
3.245%, 05/06/2022 | 1,910 | 1,924 | ||||||
2.750%, 05/10/2023 | 1,565 | 1,491 | ||||||
2.500%, 11/06/2022 | 1,515 | 1,425 | ||||||
1.846%, 05/05/2017 (C) | 429 | 435 | ||||||
1.375%, 11/06/2017 | 132 | 130 | ||||||
Burlington Resources | ||||||||
8.200%, 03/15/2025 | 400 | 556 | ||||||
Canadian Natural Resources | ||||||||
7.200%, 01/15/2032 | 150 | 191 | ||||||
6.450%, 06/30/2033 | 200 | 236 | ||||||
5.700%, 05/15/2017 | 228 | 263 | ||||||
Canadian Oil Sands | ||||||||
6.000%, 04/01/2042 (B) | 1,787 | 1,958 | ||||||
4.500%, 04/01/2022 (B) | 1,004 | 1,055 | ||||||
Cenovus Energy | ||||||||
4.450%, 09/15/2042 | 77 | 74 | ||||||
3.000%, 08/15/2022 | 45 | 44 | ||||||
CNOOC Finance 2013 | ||||||||
3.000%, 05/09/2018 | 2,193 | 2,082 | ||||||
1.750%, 05/09/2018 | 2,040 | 2,008 | ||||||
1.125%, 05/09/2016 | 200 | 200 | ||||||
Conoco Funding | ||||||||
6.950%, 04/15/2029 | 1,135 | 1,504 | ||||||
ConocoPhillips | ||||||||
6.000%, 01/15/2020 | 460 | 563 | ||||||
5.750%, 02/01/2019 | 50 | 60 | ||||||
| SEI Institutional Investments Trust / Annual Report / May 31, 2013 | 101 |
Table of Contents
SCHEDULE OF INVESTMENTS
Core Fixed Income Fund (Continued)
May 31, 2013
| Description | Face Amount ($ Thousands) | Market Value ($ Thousands) | ||||||
DCP Midstream Operating | ||||||||
4.950%, 04/01/2022 | $ | 2,239 | $ | 2,368 | ||||
3.875%, 03/15/2023 | 1,580 | 1,550 | ||||||
3.250%, 10/01/2015 | 810 | 842 | ||||||
2.500%, 12/01/2017 | 2,720 | 2,750 | ||||||
Devon Energy | ||||||||
6.300%, 01/15/2019 | 330 | 391 | ||||||
5.600%, 07/15/2041 (C) | 1,800 | 1,974 | ||||||
4.750%, 05/15/2042 | 157 | 153 | ||||||
3.250%, 05/15/2022 | 2,490 | 2,486 | ||||||
Devon Financing | ||||||||
7.875%, 09/30/2031 | 520 | 699 | ||||||
El Paso | ||||||||
6.950%, 06/01/2028 | 2,250 | 2,231 | ||||||
El Paso Pipeline Partners Operating LLC | ||||||||
6.500%, 04/01/2020 | 3,265 | 3,918 | ||||||
4.100%, 11/15/2015 | 1,855 | 1,984 | ||||||
Encana | ||||||||
6.500%, 05/15/2019 | 250 | 304 | ||||||
5.150%, 11/15/2041 | 2,525 | 2,520 | ||||||
Energen | ||||||||
4.625%, 09/01/2021 | 1,915 | 1,943 | ||||||
Energy Transfer Partners | ||||||||
6.500%, 02/01/2042 | 299 | 337 | ||||||
5.150%, 02/01/2043 | 505 | 488 | ||||||
3.600%, 02/01/2023 | 1,315 | 1,283 | ||||||
Eni | ||||||||
5.700%, 10/01/2040 (B) | 900 | 907 | ||||||
Enterprise Products Operating | ||||||||
6.125%, 10/15/2039 (C) | 170 | 199 | ||||||
5.950%, 02/01/2041 | 250 | 286 | ||||||
4.850%, 03/15/2044 (C) | 500 | 497 | ||||||
Enterprise Products Operating LLC | ||||||||
9.750%, 01/31/2014 | 3,190 | 3,378 | ||||||
5.250%, 01/31/2020 | 70 | 80 | ||||||
3.350%, 03/15/2023 | 2,380 | 2,354 | ||||||
EOG Resources | ||||||||
4.100%, 02/01/2021 | 300 | 332 | ||||||
2.625%, 03/15/2023 | 88 | 85 | ||||||
Halliburton | ||||||||
6.150%, 09/15/2019 | 300 | 372 | ||||||
Hess | ||||||||
8.125%, 02/15/2019 | 2,490 | 3,205 | ||||||
7.875%, 10/01/2029 (C) | 215 | 281 | ||||||
Husky Energy | ||||||||
7.250%, 12/15/2019 | 1,109 | 1,408 | ||||||
Kerr-McGee | ||||||||
6.950%, 07/01/2024 | 3,810 | 4,696 | ||||||
Kinder Morgan Energy Partners | ||||||||
6.000%, 02/01/2017 | 590 | 676 | ||||||
5.000%, 12/15/2013 | 1,030 | 1,054 | ||||||
5.000%, 08/15/2042 | 302 | 299 | ||||||
| Description | Face Amount ($ Thousands) | Market Value ($ Thousands) | ||||||
5.000%, 03/01/2043 | $ | 1,555 | $ | 1,533 | ||||
3.950%, 09/01/2022 | 70 | 72 | ||||||
Marathon Petroleum | ||||||||
6.500%, 03/01/2041 (C) | 838 | 1,008 | ||||||
Murphy Oil | ||||||||
3.700%, 12/01/2022 | 2,170 | 2,114 | ||||||
Nabors Industries | ||||||||
9.250%, 01/15/2019 | 250 | 316 | ||||||
5.000%, 09/15/2020 | 310 | 330 | ||||||
National Oilwell Varco | ||||||||
1.350%, 12/01/2017 | 81 | 80 | ||||||
Newfield Exploration | ||||||||
5.625%, 07/01/2024 | 435 | 457 | ||||||
Noble Energy | ||||||||
4.150%, 12/15/2021 | 2,710 | 2,935 | ||||||
Noble Holding International | ||||||||
5.250%, 03/15/2042 | 119 | 116 | ||||||
3.950%, 03/15/2022 | 40 | 41 | ||||||
Occidental Petroleum | ||||||||
3.125%, 02/15/2022 | 1,430 | 1,452 | ||||||
2.700%, 02/15/2023 | 1,324 | 1,279 | ||||||
1.750%, 02/15/2017 | 153 | 155 | ||||||
ONEOK Partners | ||||||||
2.000%, 10/01/2017 | 1,530 | 1,540 | ||||||
Panhandle Eastern Pipeline | ||||||||
8.125%, 06/01/2019 | 1,161 | 1,446 | ||||||
Pemex Project Funding Master Trust | ||||||||
6.625%, 06/15/2035 | 5,602 | 6,414 | ||||||
Petrobras Global Finance | ||||||||
4.375%, 05/20/2023 | 1,771 | 1,706 | ||||||
Petrobras Global Finance BV | ||||||||
3.000%, 01/15/2019 | 2,395 | 2,336 | ||||||
2.000%, 05/20/2016 | 3,905 | 3,887 | ||||||
1.894%, 05/20/2016 (A) | 6,000 | 6,047 | ||||||
Petrobras International Finance | ||||||||
7.875%, 03/15/2019 | 200 | 241 | ||||||
6.750%, 01/27/2041 | 150 | 159 | ||||||
6.125%, 10/06/2016 | 1,300 | 1,450 | ||||||
5.750%, 01/20/2020 | 1,127 | 1,226 | ||||||
5.375%, 01/27/2021 (C) | 4,680 | 4,948 | ||||||
Petrobras International Finance - Pifco | ||||||||
3.875%, 01/27/2016 | 1,480 | 1,544 | ||||||
3.500%, 02/06/2017 | 3,805 | 3,908 | ||||||
Petro-Canada | ||||||||
7.875%, 06/15/2026 | 100 | 136 | ||||||
6.800%, 05/15/2038 | 3,850 | 4,829 | ||||||
6.050%, 05/15/2018 | 260 | 308 | ||||||
Petroleos Mexicanos | ||||||||
5.500%, 06/27/2044 (B) | 1,185 | 1,161 | ||||||
3.500%, 01/30/2023 (B) | 3,155 | 2,997 | ||||||
Phillips 66 | ||||||||
4.300%, 04/01/2022 | 57 | 61 | ||||||
2.950%, 05/01/2017 | 76 | 80 | ||||||
| 102 | SEI Institutional Investments Trust / Annual Report / May 31, 2013 |
Table of Contents
| Description | Face Amount ($ Thousands) | Market Value ($ Thousands) | ||||||
QEP Resources | ||||||||
5.375%, 10/01/2022 | $ | 550 | $ | 564 | ||||
Rowan | ||||||||
5.400%, 12/01/2042 | 931 | 905 | ||||||
Schlumberger Investment | ||||||||
3.300%, 09/14/2021 (B) | 163 | 170 | ||||||
Shell International Finance | ||||||||
6.375%, 12/15/2038 | 1,180 | 1,580 | ||||||
3.100%, 06/28/2015 | 165 | 174 | ||||||
Shell International Finance BV | ||||||||
4.375%, 03/25/2020 | 80 | 91 | ||||||
4.300%, 09/22/2019 | 1,000 | 1,142 | ||||||
Sinopec Group Overseas Development 2012 | ||||||||
2.750%, 05/17/2017 (B) | 1,150 | 1,179 | ||||||
Spectra Energy Capital LLC | ||||||||
8.000%, 10/01/2019 | 702 | 910 | ||||||
Statoil | ||||||||
5.250%, 04/15/2019 | 460 | 545 | ||||||
4.250%, 11/23/2041 | 80 | 81 | ||||||
3.150%, 01/23/2022 | 100 | 103 | ||||||
3.125%, 08/17/2017 | 200 | 214 | ||||||
2.450%, 01/17/2023 | 159 | 152 | ||||||
Sunoco Logistics Partners Operations | ||||||||
4.950%, 01/15/2043 | 394 | 380 | ||||||
Talisman Energy | ||||||||
7.750%, 06/01/2019 | 1,645 | 2,051 | ||||||
Tennessee Gas Pipeline | ||||||||
8.375%, 06/15/2032 | 2,000 | 2,809 | ||||||
8.000%, 02/01/2016 | 3,205 | 3,745 | ||||||
Texas Eastern Transmission | ||||||||
2.800%, 10/15/2022 (B) | 415 | 402 | ||||||
Tosco | ||||||||
8.125%, 02/15/2030 | 100 | 144 | ||||||
7.800%, 01/01/2027 | 210 | 294 | ||||||
Total Capital | ||||||||
4.125%, 01/28/2021 | 74 | 82 | ||||||
2.300%, 03/15/2016 | 300 | 311 | ||||||
Total Capital Canada | ||||||||
1.450%, 01/15/2018 | 3,715 | 3,693 | ||||||
Total Capital International | ||||||||
2.875%, 02/17/2022 | 138 | 138 | ||||||
1.550%, 06/28/2017 | 150 | 150 | ||||||
0.750%, 01/25/2016 | 45 | 45 | ||||||
TransCanada Pipelines | ||||||||
7.125%, 01/15/2019 | 200 | 251 | ||||||
6.500%, 08/15/2018 | 425 | 522 | ||||||
Transocean | ||||||||
7.350%, 12/15/2041 | 33 | 41 | ||||||
6.500%, 11/15/2020 | 485 | 563 | ||||||
6.375%, 12/15/2021 | 2,746 | 3,205 | ||||||
5.050%, 12/15/2016 | 580 | 643 | ||||||
Valero Energy | ||||||||
7.500%, 04/15/2032 | 710 | 895 | ||||||
| Description | Face Amount ($ Thousands) | Market Value ($ Thousands) | ||||||
Weatherford International | ||||||||
9.875%, 03/01/2039 | $ | 250 | $ | 360 | ||||
6.750%, 09/15/2040 | 200 | 222 | ||||||
5.950%, 04/15/2042 | 50 | 51 | ||||||
4.500%, 04/15/2022 | 717 | 738 | ||||||
Western Gas Partners | ||||||||
5.375%, 06/01/2021 | 574 | 647 | ||||||
Williams | ||||||||
8.750%, 03/15/2032 | 2,162 | 2,887 | ||||||
7.875%, 09/01/2021 | 1,262 | 1,586 | ||||||
7.750%, 06/15/2031 | 339 | 417 | ||||||
7.500%, 01/15/2031 | 9 | 11 | ||||||
Williams Partners | ||||||||
5.250%, 03/15/2020 | 510 | 574 | ||||||
WPX Energy | ||||||||
6.000%, 01/15/2022 | 1,215 | 1,309 | ||||||
|
| |||||||
| 179,960 | ||||||||
|
| |||||||
Financials — 13.0% |
| |||||||
ABB Treasury Center USA | ||||||||
2.500%, 06/15/2016 (B) | 2,795 | 2,903 | ||||||
Abbey National Treasury Services | ||||||||
2.875%, 04/25/2014 | 750 | 764 | ||||||
ACE INA Holdings | ||||||||
5.875%, 06/15/2014 | 290 | 305 | ||||||
5.600%, 05/15/2015 | 380 | 415 | ||||||
2.700%, 03/13/2023 | 400 | 388 | ||||||
Aegon, Ser CMS | ||||||||
2.054%, 07/29/2049 (A) | 2,180 | 1,522 | ||||||
Aflac | ||||||||
8.500%, 05/15/2019 (C) | 165 | 220 | ||||||
6.450%, 08/15/2040 | 92 | 113 | ||||||
4.000%, 02/15/2022 | 227 | 240 | ||||||
AIG SunAmerica Global Financing X | ||||||||
6.900%, 03/15/2032 (B) | 450 | 573 | ||||||
Allstate | ||||||||
7.450%, 05/16/2019 | 2,800 | 3,645 | ||||||
5.000%, 08/15/2014 | 300 | 315 | ||||||
Ally Financial | ||||||||
5.500%, 02/15/2017 | 750 | 802 | ||||||
American Campus Communities Operating Partnership | ||||||||
3.750%, 04/15/2023 | 1,705 | 1,690 | ||||||
American Express | ||||||||
7.000%, 03/19/2018 | 500 | 615 | ||||||
American Express Credit MTN | ||||||||
7.300%, 08/20/2013 | 500 | 507 | ||||||
5.125%, 08/25/2014 | 3,280 | 3,461 | ||||||
2.800%, 09/19/2016 | 389 | 409 | ||||||
1.750%, 06/12/2015 | 4,215 | 4,296 | ||||||
American Honda Finance MTN | ||||||||
7.625%, 10/01/2018 (B) | 150 | 193 | ||||||
3.875%, 09/21/2020 (B) | 2,840 | 3,067 | ||||||
| SEI Institutional Investments Trust / Annual Report / May 31, 2013 | 103 |
Table of Contents
SCHEDULE OF INVESTMENTS
Core Fixed Income Fund (Continued)
May 31, 2013
| Description | Face Amount ($ Thousands) | Market Value ($ Thousands) | ||||||
2.600%, 09/20/2016 (B) | $ | 246 | $ | 257 | ||||
1.000%, 08/11/2015 (B) | 2,400 | 2,416 | ||||||
American International Group | ||||||||
8.250%, 08/15/2018 | 1,370 | 1,741 | ||||||
6.400%, 12/15/2020 | 1,135 | 1,372 | ||||||
6.250%, 03/15/2037 | 3,530 | 3,883 | ||||||
4.875%, 06/01/2022 (C) | 739 | 816 | ||||||
3.750%, 11/30/2013 (B) | 230 | 234 | ||||||
American Tower‡ | ||||||||
5.050%, 09/01/2020 | 1,122 | 1,228 | ||||||
4.500%, 01/15/2018 | 2,395 | 2,615 | ||||||
3.500%, 01/31/2023 | 1,189 | 1,153 | ||||||
American Tower Trust I‡ | ||||||||
1.551%, 03/15/2018 (B) | 135 | 134 | ||||||
Anadarko Finance | ||||||||
7.500%, 05/01/2031 | 313 | 413 | ||||||
ANZ New Zealand International | ||||||||
6.200%, 07/19/2013 (B) | 475 | 478 | ||||||
3.125%, 08/10/2015 (B) | 190 | 199 | ||||||
1.850%, 10/15/2015 (B) | 950 | 971 | ||||||
Aon | ||||||||
6.250%, 09/30/2040 | 79 | 98 | ||||||
3.500%, 09/30/2015 | 46 | 49 | ||||||
3.125%, 05/27/2016 | 235 | 248 | ||||||
Associates Corp of North America | ||||||||
6.950%, 11/01/2018 | 418 | 507 | ||||||
Assurant | ||||||||
4.000%, 03/15/2023 | 920 | 919 | ||||||
2.500%, 03/15/2018 | 1,825 | 1,820 | ||||||
Australia & New Zealand Banking Group | ||||||||
4.875%, 01/12/2021 (B) | 137 | 157 | ||||||
3.250%, 03/01/2016 (B) | 200 | 212 | ||||||
2.400%, 11/23/2016 (B) | 453 | 474 | ||||||
0.580%, 10/29/2049 (A) | 1,400 | 826 | ||||||
Banco Santander Mexico | ||||||||
4.125%, 11/09/2022 (B) | 1,945 | 1,921 | ||||||
Bank of America | ||||||||
7.625%, 06/01/2019 | 175 | 220 | ||||||
7.375%, 05/15/2014 | 980 | 1,040 | ||||||
6.500%, 08/01/2016 | 7,125 | 8,146 | ||||||
6.100%, 06/15/2017 | 6,825 | 7,784 | ||||||
6.000%, 09/01/2017 | 2,100 | 2,420 | ||||||
5.750%, 12/01/2017 | 3,310 | 3,790 | ||||||
5.650%, 05/01/2018 | 1,350 | 1,546 | ||||||
5.625%, 10/14/2016 | 7,865 | 8,858 | ||||||
5.625%, 07/01/2020 | 375 | 433 | ||||||
5.420%, 03/15/2017 | 4,530 | 4,984 | ||||||
5.000%, 05/13/2021 | 75 | 83 | ||||||
4.500%, 04/01/2015 | 6,060 | 6,411 | ||||||
3.875%, 03/22/2017 (C) | 610 | 652 | ||||||
3.300%, 01/11/2023 | 4,132 | 4,003 | ||||||
2.000%, 01/11/2018 | 7,700 | 7,631 | ||||||
1.500%, 10/09/2015 | 6,210 | 6,246 | ||||||
| Description | Face Amount ($ Thousands) | Market Value ($ Thousands) | ||||||
0.580%, 06/15/2017 (A) | $ | 2,710 | $ | 2,603 | ||||
0.560%, 06/15/2016 (A) | 2,700 | 2,623 | ||||||
Bank of Montreal MTN | ||||||||
2.550%, 11/06/2022 | 511 | 492 | ||||||
1.400%, 09/11/2017 | 689 | 684 | ||||||
1.300%, 10/31/2014 (B) | 321 | 325 | ||||||
Bank of New York Mellon MTN | ||||||||
4.600%, 01/15/2020 | 160 | 181 | ||||||
3.550%, 09/23/2021 | 144 | 153 | ||||||
3.100%, 01/15/2015 | 125 | 130 | ||||||
2.950%, 06/18/2015 (C) | 500 | 523 | ||||||
2.400%, 01/17/2017 | 398 | 412 | ||||||
Bank of Nova Scotia | ||||||||
3.400%, 01/22/2015 | 478 | 499 | ||||||
1.650%, 10/29/2015 (B) (C) | 355 | 364 | ||||||
1.375%, 12/18/2017 | 300 | 297 | ||||||
Bank of Tokyo-Mitsubishi UFJ | ||||||||
3.850%, 01/22/2015 (B) | 707 | 741 | ||||||
2.350%, 02/23/2017 (B) | 295 | 303 | ||||||
Barclays Bank MTN | ||||||||
6.050%, 12/04/2017 (B) (C) | 850 | 952 | ||||||
5.200%, 07/10/2014 | 350 | 367 | ||||||
5.000%, 09/22/2016 | 4,970 | 5,562 | ||||||
2.500%, 09/21/2015 (B) (C) | 365 | 379 | ||||||
2.250%, 05/10/2017 (B) (C) | 221 | 230 | ||||||
0.692%, 08/07/2049 (A) | 380 | 213 | ||||||
BB&T MTN | ||||||||
6.850%, 04/30/2019 (C) | 115 | 144 | ||||||
5.700%, 04/30/2014 | 620 | 649 | ||||||
4.900%, 06/30/2017 | 400 | 445 | ||||||
3.950%, 04/29/2016 | 555 | 600 | ||||||
3.375%, 09/25/2013 | 70 | 71 | ||||||
BBVA US Senior SAU | ||||||||
4.664%, 10/09/2015 | 3,520 | 3,661 | ||||||
3.250%, 05/16/2014 | 2,680 | 2,709 | ||||||
Bear Stearns | ||||||||
7.250%, 02/01/2018 | 3,430 | 4,191 | ||||||
6.400%, 10/02/2017 | 3,370 | 3,983 | ||||||
4.650%, 07/02/2018 | 3,000 | 3,358 | ||||||
Berkshire Hathaway | ||||||||
4.500%, 02/11/2043 | 610 | 601 | ||||||
3.750%, 08/15/2021 (C) | 1,213 | 1,295 | ||||||
3.200%, 02/11/2015 | 1,410 | 1,473 | ||||||
3.000%, 02/11/2023 | 915 | 908 | ||||||
2.200%, 08/15/2016 | 75 | 78 | ||||||
Berkshire Hathaway Finance | ||||||||
5.400%, 05/15/2018 (C) | 5,160 | 6,068 | ||||||
4.300%, 05/15/2043 | 920 | 876 | ||||||
3.000%, 05/15/2022 | 426 | 423 | ||||||
2.450%, 12/15/2015 | 187 | 196 | ||||||
BlackRock | ||||||||
6.250%, 09/15/2017 (C) | 570 | 682 | ||||||
3.375%, 06/01/2022 | �� | 180 | 186 | |||||
Blackstone Holdings Finance LLC | ||||||||
5.875%, 03/15/2021 (B) | 1,180 | 1,376 | ||||||
| 104 | SEI Institutional Investments Trust / Annual Report / May 31, 2013 |
Table of Contents
| Description | Face Amount ($ Thousands) | Market Value ($ Thousands) | ||||||
BNP Paribas MTN | ||||||||
2.375%, 09/14/2017 | $ | 2,130 | $ | 2,167 | ||||
Boston Properties‡ | ||||||||
3.850%, 02/01/2023 | 750 | 776 | ||||||
3.125%, 09/01/2023 | 1,790 | 1,734 | ||||||
Branch Banking & Trust | ||||||||
5.625%, 09/15/2016 | 325 | 370 | ||||||
Caisse Centrale Desjardins du Quebec | ||||||||
2.550%, 03/24/2016 (B) (C) | 581 | 609 | ||||||
Canadian Imperial Bank of Commerce | ||||||||
2.600%, 07/02/2015 (B) | 1,000 | 1,042 | ||||||
Capital One Bank USA | ||||||||
3.375%, 02/15/2023 | 300 | 296 | ||||||
Capital One Financial | ||||||||
7.375%, 05/23/2014 | 450 | 479 | ||||||
6.750%, 09/15/2017 | 740 | 892 | ||||||
4.750%, 07/15/2021 (C) | 375 | 418 | ||||||
Caterpillar Financial Services MTN | ||||||||
7.150%, 02/15/2019 | 250 | 318 | ||||||
6.200%, 09/30/2013 | 3,440 | 3,506 | ||||||
5.850%, 09/01/2017 | 580 | 682 | ||||||
2.850%, 06/01/2022 | 155 | 155 | ||||||
CDP Financial | ||||||||
4.400%, 11/25/2019 (B) | 300 | 339 | ||||||
Cedar Brakes I LLC | ||||||||
8.500%, 02/15/2014 (B) | 197 | 201 | ||||||
Charles Schwab | ||||||||
3.225%, 09/01/2022 | 100 | 101 | ||||||
Chase Capital VI | ||||||||
0.899%, 08/01/2028 (A) | 1,050 | 871 | ||||||
Citigroup | ||||||||
8.500%, 05/22/2019 | 600 | 786 | ||||||
8.125%, 07/15/2039 (C) | 400 | 567 | ||||||
6.875%, 03/05/2038 | 3,555 | 4,553 | ||||||
6.500%, 08/19/2013 | 1,470 | 1,488 | ||||||
6.375%, 08/12/2014 | 3,285 | 3,492 | ||||||
6.125%, 05/15/2018 | 830 | 979 | ||||||
6.010%, 01/15/2015 | 1,900 | 2,045 | ||||||
6.000%, 12/13/2013 | 2,920 | 3,003 | ||||||
6.000%, 08/15/2017 | 4,345 | 5,032 | ||||||
5.875%, 01/30/2042 | 985 | 1,148 | ||||||
5.850%, 07/02/2013 | 655 | 658 | ||||||
5.850%, 08/02/2016 | 300 | 339 | ||||||
5.500%, 02/15/2017 | 11,465 | 12,741 | ||||||
5.375%, 08/09/2020 | 2,888 | 3,324 | ||||||
5.000%, 09/15/2014 | 1,740 | 1,820 | ||||||
4.700%, 05/29/2015 (C) | 1,488 | 1,591 | ||||||
4.587%, 12/15/2015 | 114 | 124 | ||||||
4.500%, 01/14/2022 | 1,152 | 1,248 | ||||||
4.450%, 01/10/2017 | 2,609 | 2,853 | ||||||
4.050%, 07/30/2022 | 650 | 650 | ||||||
| Description | Face Amount ($ Thousands) | Market Value ($ Thousands) | ||||||
3.500%, 05/15/2023 | $ | 1,820 | $ | 1,712 | ||||
2.650%, 03/02/2015 | 1,249 | 1,283 | ||||||
1.250%, 01/15/2016 | 230 | 230 | ||||||
0.823%, 08/25/2036 (A) | 3,239 | 2,589 | ||||||
Citigroup Capital III | ||||||||
7.625%, 12/01/2036 | 2,000 | 2,510 | ||||||
CME Group | ||||||||
5.750%, 02/15/2014 (C) | 177 | 183 | ||||||
3.000%, 09/15/2022 | 400 | 392 | ||||||
CNA Financial | ||||||||
5.875%, 08/15/2020 | 274 | 321 | ||||||
5.850%, 12/15/2014 | 200 | 214 | ||||||
Comerica | ||||||||
3.000%, 09/16/2015 | 145 | 152 | ||||||
CommonWealth‡ | ||||||||
6.650%, 01/15/2018 | 255 | 283 | ||||||
5.875%, 09/15/2020 | 95 | 101 | ||||||
Commonwealth Bank of Australia | ||||||||
5.000%, 10/15/2019 (B) | 900 | 1,042 | ||||||
3.750%, 10/15/2014 (B) | 1,810 | 1,887 | ||||||
2.250%, 03/16/2017 (B) (C) | 378 | 393 | ||||||
Commonwealth Bank of Australia NY | ||||||||
1.250%, 09/18/2015 | 2,730 | 2,760 | ||||||
Cooperatieve Centrale Raiffeisen-Boerenleenbank BA | ||||||||
11.000%, 12/31/2049 (A) (B) | 2,043 | 2,738 | ||||||
5.800%, 09/30/2110 (B) | 300 | 331 | ||||||
4.500%, 01/11/2021 | 300 | 330 | ||||||
3.875%, 02/08/2022 | 1,600 | 1,661 | ||||||
3.200%, 03/11/2015 (B) | 700 | 729 | ||||||
Countrywide Financial | ||||||||
6.250%, 05/15/2016 (C) | 1,170 | 1,300 | ||||||
Credit Agricole | ||||||||
8.375%, | 3,250 | 3,628 | ||||||
2.625%, 01/21/2014 (B) | 790 | 799 | ||||||
Credit Suisse NY | ||||||||
6.000%, 02/15/2018 | 7,754 | 8,946 | ||||||
5.500%, 05/01/2014 | 125 | 131 | ||||||
Credit Suisse USA | ||||||||
5.125%, 08/15/2015 | 645 | 706 | ||||||
DDR‡ | ||||||||
4.625%, 07/15/2022 | 2,205 | 2,356 | ||||||
3.375%, 05/15/2023 (C) | 2,075 | 2,001 | ||||||
Deutsche Bank MTN | ||||||||
3.875%, 08/18/2014 | 295 | 306 | ||||||
DnB Boligkreditt | ||||||||
2.100%, 10/14/2015 (B) | 1,057 | 1,091 | ||||||
Equity One‡ | ||||||||
3.750%, 11/15/2022 | 791 | 781 | ||||||
ERAC USA Finance LLC | ||||||||
4.500%, 08/16/2021 (B) | 175 | 189 | ||||||
2.250%, 01/10/2014 (B) | 250 | 252 | ||||||
| SEI Institutional Investments Trust / Annual Report / May 31, 2013 | 105 |
Table of Contents
SCHEDULE OF INVESTMENTS
Core Fixed Income Fund (Continued)
May 31, 2013
| Description | Face Amount ($ Thousands) | Market Value ($ Thousands) | ||||||
ERP Operating‡ | ||||||||
5.750%, 06/15/2017 | $ | 500 | $ | 578 | ||||
5.125%, 03/15/2016 | 1,000 | 1,108 | ||||||
4.625%, 12/15/2021 (C) | 236 | 260 | ||||||
Farmers Exchange Capital | ||||||||
7.200%, 07/15/2048 (B) | 1,788 | 2,179 | ||||||
7.050%, 07/15/2028 (B) | 1,713 | 2,143 | ||||||
Farmers Insurance Exchange | ||||||||
8.625%, 05/01/2024 (B) | 4,253 | 5,859 | ||||||
FDIC Structured Sale Guaranteed Notes | ||||||||
1.491%, 10/25/2013 (B) (D) | 1,570 | 1,569 | ||||||
Federal Realty Investment Trust‡ | ||||||||
3.000%, 08/01/2022 | 885 | 870 | ||||||
First Chicago NBD Institutional Capital I | ||||||||
0.824%, 02/01/2027 (A) | 3,750 | 3,197 | ||||||
First Industrial MTN | ||||||||
7.500%, 12/01/2017 | 1,765 | 2,014 | ||||||
FMR LLC | ||||||||
6.450%, 11/15/2039 (B) | 250 | 300 | ||||||
Ford Motor Credit LLC | ||||||||
8.125%, 01/15/2020 (C) | 1,930 | 2,432 | ||||||
5.875%, 08/02/2021 | 7,633 | 8,694 | ||||||
4.207%, 04/15/2016 | 401 | 427 | ||||||
3.984%, 06/15/2016 | 555 | 589 | ||||||
3.000%, 06/12/2017 | 1,173 | 1,204 | ||||||
2.750%, 05/15/2015 | 1,708 | 1,747 | ||||||
General Electric Capital MTN | ||||||||
6.875%, 01/10/2039 | 2,730 | 3,486 | ||||||
6.750%, 03/15/2032 | 450 | 561 | ||||||
6.375%, 11/15/2067 (A) | 5,735 | 6,115 | ||||||
6.150%, 08/07/2037 | 5,880 | 6,976 | ||||||
6.000%, 08/07/2019 | 920 | 1,104 | ||||||
5.875%, 01/14/2038 (C) | 4,960 | 5,659 | ||||||
5.625%, 09/15/2017 (C) | 800 | 926 | ||||||
5.625%, 05/01/2018 | 6,680 | 7,821 | ||||||
5.500%, 01/08/2020 | 480 | 561 | ||||||
5.400%, 02/15/2017 | 1,800 | 2,044 | ||||||
5.375%, 10/20/2016 | 1,500 | 1,694 | ||||||
5.300%, 02/11/2021 (C) | 1,753 | 1,978 | ||||||
4.625%, 01/07/2021 | 3,640 | 4,020 | ||||||
3.100%, 01/09/2023 (C) | 3,788 | 3,677 | ||||||
2.300%, 04/27/2017 | 600 | 617 | ||||||
2.250%, 11/09/2015 | 180 | 186 | ||||||
2.100%, 12/11/2019 | 356 | 355 | ||||||
1.625%, 07/02/2015 | 3,495 | 3,551 | ||||||
0.755%, 08/15/2036 (A) | 3,035 | 2,463 | ||||||
0.653%, 05/05/2026 (A) | 2,520 | 2,314 | ||||||
0.540%, 09/15/2014 (A) | 4,090 | 4,093 | ||||||
0.404%, 03/20/2014 (A) | 2,000 | 2,000 | ||||||
Glitnir Banki | ||||||||
7.451%, | 500 | — | ||||||
6.693%, 06/15/2016 (B) (F) | 4,480 | — | ||||||
| Description | Face Amount ($ Thousands) | Market Value ($ Thousands) | ||||||
Goldman Sachs Capital II | ||||||||
4.000%, 06/01/2043 (A) | $ | 13,260 | $ | 11,470 | ||||
Goldman Sachs Group MTN | ||||||||
7.500%, 02/15/2019 | 1,520 | 1,884 | ||||||
6.750%, 10/01/2037 | 1,058 | 1,154 | ||||||
6.250%, 09/01/2017 | 1,400 | 1,628 | ||||||
6.250%, 02/01/2041 (C) | 3,655 | 4,278 | ||||||
6.150%, 04/01/2018 | 7,800 | 9,068 | ||||||
6.000%, 05/01/2014 | 690 | 723 | ||||||
6.000%, 06/15/2020 | 2,335 | 2,734 | ||||||
5.950%, 01/18/2018 | 500 | 577 | ||||||
5.750%, 10/01/2016 | 1,505 | 1,706 | ||||||
5.750%, 01/24/2022 | 1,170 | 1,339 | ||||||
5.375%, 03/15/2020 | 2,635 | 2,995 | ||||||
5.250%, 10/15/2013 | 580 | 590 | ||||||
5.250%, 07/27/2021 | 9,480 | 10,561 | ||||||
3.625%, 02/07/2016 | 470 | 497 | ||||||
2.375%, 01/22/2018 (C) | 3,012 | 3,028 | ||||||
0.676%, 07/22/2015 (A) | 45 | 45 | ||||||
GTP Acquisition Partners I LLC | ||||||||
4.347%, 06/15/2016 (B) | 606 | 640 | ||||||
Hartford Financial Services Group | ||||||||
5.125%, 04/15/2022 | 525 | 598 | ||||||
4.300%, 04/15/2043 | 1,325 | 1,250 | ||||||
HBOS MTN | ||||||||
6.750%, 05/21/2018 (B) | 5,100 | 5,724 | ||||||
HBOS Capital Funding | ||||||||
6.071%, 06/30/2049 (A) (B) | 1,220 | 1,113 | ||||||
HCP‡ | ||||||||
6.300%, 09/15/2016 | 940 | 1,085 | ||||||
6.000%, 01/30/2017 | 2,313 | 2,647 | ||||||
5.650%, 12/15/2013 | 2,845 | 2,921 | ||||||
5.375%, 02/01/2021 | 105 | 121 | ||||||
3.750%, 02/01/2019 | 4,394 | 4,689 | ||||||
2.625%, 02/01/2020 | 6,620 | 6,324 | ||||||
Health Care‡ | ||||||||
6.500%, 03/15/2041 | 1,650 | 1,981 | ||||||
5.250%, 01/15/2022 | 1,825 | 2,055 | ||||||
4.950%, 01/15/2021 | 6,340 | 6,998 | ||||||
4.700%, 09/15/2017 | 225 | 250 | ||||||
Healthcare Realty Trust‡ | ||||||||
6.500%, 01/17/2017 | 85 | 97 | ||||||
5.750%, 01/15/2021 | 60 | 68 | ||||||
Highwoods Properties‡ | ||||||||
7.500%, 04/15/2018 | 1,339 | 1,613 | ||||||
Hongkong & Shanghai Banking | ||||||||
0.438%, 07/22/2049 (A) | 195 | 115 | ||||||
HSBC Bank | ||||||||
4.750%, 01/19/2021 (B) | 400 | 451 | ||||||
4.125%, 08/12/2020 (B) | 261 | 284 | ||||||
3.100%, 05/24/2016 (B) | 5,097 | 5,389 | ||||||
1.625%, 07/07/2014 (B) (C) | 728 | 737 | ||||||
0.610%, 06/29/2049 (A) | 1,160 | 684 | ||||||
HSBC Bank USA NY | ||||||||
4.625%, 04/01/2014 | 300 | 310 | ||||||
| 106 | SEI Institutional Investments Trust / Annual Report / May 31, 2013 |
Table of Contents
| Description | Face Amount ($ Thousands) | Market Value ($ Thousands) | ||||||
HSBC Finance | ||||||||
6.676%, 01/15/2021 | $ | 2,800 | $ | 3,320 | ||||
5.500%, 01/19/2016 | 600 | 663 | ||||||
4.750%, 07/15/2013 | 166 | 167 | ||||||
HSBC Holdings | ||||||||
5.100%, 04/05/2021 | 201 | 229 | ||||||
4.875%, 01/14/2022 | 300 | 336 | ||||||
4.000%, 03/30/2022 | 1,660 | 1,760 | ||||||
HSBC USA | ||||||||
2.375%, 02/13/2015 | 2,346 | 2,408 | ||||||
Hutchison Whampoa International 11 | ||||||||
4.625%, 01/13/2022 (B) | 1,735 | 1,838 | ||||||
Hutchison Whampoa International 12 II | ||||||||
3.250%, 11/08/2022 (B) | 294 | 281 | ||||||
Hyundai Capital America | ||||||||
2.125%, 10/02/2017 (B) | 650 | 642 | ||||||
ILFC E-Capital Trust II | ||||||||
6.250%, 12/21/2065 (A) (B) | 1,200 | 1,128 | ||||||
ING Bank | ||||||||
3.750%, 03/07/2017 (B) | 457 | 485 | ||||||
2.000%, 09/25/2015 (B) | 200 | 203 | ||||||
ING US | ||||||||
3.150%, 02/15/2018 (B) (C) | 350 | 356 | ||||||
International Lease Finance | ||||||||
6.750%, 09/01/2016 (B) (C) | 5,590 | 6,324 | ||||||
6.500%, 09/01/2014 (B) | 7,190 | 7,621 | ||||||
Intesa Sanpaolo MTN | ||||||||
3.875%, 01/16/2018 | 400 | 394 | ||||||
3.625%, 08/12/2015 (B) | 940 | 949 | ||||||
3.125%, 01/15/2016 | 860 | 855 | ||||||
Itau Unibanco Holding | ||||||||
5.125%, 05/13/2023 (B) | 1,217 | 1,212 | ||||||
Jefferies Group | ||||||||
8.500%, 07/15/2019 | 90 | 114 | ||||||
6.450%, 06/08/2027 | 590 | 655 | ||||||
6.250%, 01/15/2036 | 400 | 417 | ||||||
3.875%, 11/09/2015 | 171 | 180 | ||||||
John Deere Capital MTN | ||||||||
5.750%, 09/10/2018 | 300 | 359 | ||||||
2.250%, 04/17/2019 | 1,290 | 1,318 | ||||||
1.700%, 01/15/2020 | 65 | 63 | ||||||
1.200%, 10/10/2017 | 196 | 194 | ||||||
JPMorgan Chase | ||||||||
6.400%, 05/15/2038 | 385 | 477 | ||||||
6.000%, 10/01/2017 | 12,995 | 15,168 | ||||||
6.000%, 01/15/2018 | 400 | 467 | ||||||
5.400%, 01/06/2042 | 444 | 498 | ||||||
5.150%, 10/01/2015 | 240 | 261 | ||||||
5.125%, 09/15/2014 | 136 | 143 | ||||||
4.500%, 01/24/2022 | 750 | 813 | ||||||
4.350%, 08/15/2021 | 510 | 549 | ||||||
3.450%, 03/01/2016 | 1,015 | 1,076 | ||||||
| Description | Face Amount ($ Thousands) | Market Value ($ Thousands) | ||||||
3.375%, 05/01/2023 | $ | 2,390 | $ | 2,271 | ||||
3.200%, 01/25/2023 | 2,240 | 2,187 | ||||||
1.625%, 05/15/2018 | 1,565 | 1,536 | ||||||
1.100%, 10/15/2015 | 4,010 | 4,011 | ||||||
0.610%, 06/13/2016 (A) | 4,250 | 4,197 | ||||||
JPMorgan Chase Bank | ||||||||
6.000%, 07/05/2017 | 3,365 | 3,885 | ||||||
JPMorgan Chase Capital XIII | ||||||||
1.234%, 09/30/2034 (A) | 2,150 | 1,784 | ||||||
JPMorgan Chase Capital XXIII | ||||||||
1.275%, 05/15/2047 (A) | 4,697 | 3,711 | ||||||
Kaupthing Bank | ||||||||
7.125%, | 12,000 | 1 | ||||||
KeyBank | ||||||||
5.800%, 07/01/2014 | 600 | 632 | ||||||
Landwirtschaftliche Rentenbank | ||||||||
1.375%, 10/23/2019 | 2,150 | 2,104 | ||||||
Lazard Group | ||||||||
7.125%, 05/15/2015 | 2,575 | 2,820 | ||||||
6.850%, 06/15/2017 | 3,615 | 4,141 | ||||||
Liberty Mutual Group | ||||||||
6.500%, 05/01/2042 (B) | 1,054 | 1,232 | ||||||
5.000%, 06/01/2021 (B) | 95 | 103 | ||||||
Lincoln National | ||||||||
4.850%, 06/24/2021 | 58 | 64 | ||||||
Lloyds TSB Bank MTN | ||||||||
5.800%, 01/13/2020 (B) | 200 | 233 | ||||||
M&T Bank | ||||||||
6.875%, 12/29/2049 (B) | 3,540 | 3,701 | ||||||
Macquarie Bank | ||||||||
5.000%, 02/22/2017 (B) (C) | 652 | 716 | ||||||
Macquarie Group | ||||||||
7.625%, 08/13/2019 (B) | 150 | 180 | ||||||
7.300%, 08/01/2014 (B) | 480 | 511 | ||||||
6.250%, 01/14/2021 (B) | 525 | 581 | ||||||
6.000%, 01/14/2020 (B) (C) | 225 | 246 | ||||||
Manufacturers & Traders Trust | ||||||||
6.625%, 12/04/2017 | 250 | 301 | ||||||
Markel | ||||||||
5.000%, 03/30/2043 | 705 | 691 | ||||||
4.900%, 07/01/2022 | 1,120 | 1,231 | ||||||
3.625%, 03/30/2023 | 800 | 794 | ||||||
Massachusetts Mutual Life Insurance | ||||||||
8.875%, 06/01/2039 (B) | 2,455 | 3,760 | ||||||
5.375%, 12/01/2041 (B) | 66 | 74 | ||||||
MassMutual Global Funding II | ||||||||
3.125%, 04/14/2016 (B) | 100 | 106 | ||||||
2.875%, 04/21/2014 (B) | 122 | 125 | ||||||
2.500%, 10/17/2022 (B) | 363 | 345 | ||||||
Merrill Lynch | ||||||||
6.875%, 04/25/2018 | 980 | 1,169 | ||||||
6.400%, 08/28/2017 | 1,600 | 1,860 | ||||||
5.700%, 05/02/2017 | 600 | 663 | ||||||
| SEI Institutional Investments Trust / Annual Report / May 31, 2013 | 107 |
Table of Contents
SCHEDULE OF INVESTMENTS
Core Fixed Income Fund (Continued)
May 31, 2013
| Description | Face Amount ($ Thousands) | Market Value ($ Thousands) | ||||||
MetLife | ||||||||
7.717%, 02/15/2019 | $ | 1,750 | $ | 2,269 | ||||
6.750%, 06/01/2016 | 2,950 | 3,435 | ||||||
6.400%, 12/15/2036 | 4,360 | 4,927 | ||||||
MetLife Institutional Funding II | ||||||||
1.182%, 04/04/2014 (A) (B) | 153 | 154 | ||||||
Metropolitan Life Global Funding I | ||||||||
5.125%, 06/10/2014 (B) (C) | 1,575 | 1,647 | ||||||
3.875%, 04/11/2022 (B) | 1,125 | 1,189 | ||||||
3.650%, 06/14/2018 (B) | 490 | 532 | ||||||
2.500%, 09/29/2015 (B) | 2,935 | 3,044 | ||||||
2.000%, 01/10/2014 (B) | 200 | 202 | ||||||
1.700%, 06/29/2015 (B) | 497 | 506 | ||||||
1.500%, 01/10/2018 (B) | 2,500 | 2,477 | ||||||
Morgan Stanley MTN | ||||||||
7.300%, 05/13/2019 | 4,160 | 5,097 | ||||||
6.625%, 04/01/2018 | 6,010 | 7,074 | ||||||
6.000%, 05/13/2014 | 5,705 | 5,975 | ||||||
5.950%, 12/28/2017 | 550 | 631 | ||||||
5.750%, 10/18/2016 (C) | 190 | 213 | ||||||
5.750%, 01/25/2021 | 235 | 268 | ||||||
5.625%, 09/23/2019 | 2,170 | 2,458 | ||||||
5.550%, 04/27/2017 | 514 | 574 | ||||||
5.500%, 07/28/2021 (C) | 2,164 | 2,441 | ||||||
5.450%, 01/09/2017 (C) | 350 | 389 | ||||||
5.375%, 10/15/2015 | 100 | 109 | ||||||
4.750%, 03/22/2017 | 300 | 328 | ||||||
4.200%, 11/20/2014 | 1,851 | 1,928 | ||||||
1.750%, 02/25/2016 | 2,750 | 2,755 | ||||||
0.727%, 10/18/2016 (A) | 3,700 | 3,597 | ||||||
Murray Street Investment Trust I | ||||||||
4.647%, 03/09/2017 (C) (H) | 6,290 | 6,856 | ||||||
National Australia Bank | ||||||||
5.350%, 06/12/2013 (B) | 5,545 | 5,551 | ||||||
3.750%, 03/02/2015 (B) | 455 | 478 | ||||||
3.000%, 07/27/2016 (B) | 1,000 | 1,057 | ||||||
1.600%, 08/07/2015 | 1,080 | 1,099 | ||||||
National Bank of Canada | ||||||||
2.200%, 10/19/2016 (B) | 4,350 | 4,538 | ||||||
1.650%, 01/30/2014 (B) | 271 | 273 | ||||||
National Capital Trust II | ||||||||
5.486%, 12/29/2049 (A) (B) | 40 | 41 | ||||||
National City | ||||||||
4.900%, 01/15/2015 | 400 | 426 | ||||||
National City Bank MTN | ||||||||
5.800%, 06/07/2017 | 525 | 606 | ||||||
0.651%, 06/07/2017 (A) | 3,000 | 2,967 | ||||||
National Rural Utilities Cooperative Finance | ||||||||
10.375%, 11/01/2018 | 1,530 | 2,177 | ||||||
2.350%, 06/15/2020 | 1,170 | 1,169 | ||||||
Nationwide Mutual Insurance | ||||||||
9.375%, 08/15/2039 (B) | 460 | 672 | ||||||
6.600%, 04/15/2034 (B) | 2,535 | 2,611 | ||||||
5.810%, 12/15/2024 (A) (B) | 4,407 | 4,506 | ||||||
| Description | Face Amount ($ Thousands) | Market Value ($ Thousands) | ||||||
New York Life Global Funding | ||||||||
3.000%, 05/04/2015 (B) | $ | 400 | $ | 418 | ||||
New York Life Insurance | ||||||||
6.750%, 11/15/2039 (B) | 1,355 | 1,774 | ||||||
Nomura Holdings | ||||||||
6.700%, 03/04/2020 | 298 | 352 | ||||||
4.125%, 01/19/2016 | 150 | 158 | ||||||
Nordea Bank MTN | ||||||||
4.875%, 05/13/2021 (B) (C) | 3,010 | 3,238 | ||||||
3.700%, 11/13/2014 (B) | 900 | 938 | ||||||
1.750%, 10/04/2013 (B) | 200 | 201 | ||||||
1.625%, 05/15/2018 (B) | 500 | 495 | ||||||
Northern Trust | ||||||||
5.500%, 08/15/2013 | 85 | 86 | ||||||
Northwestern Mutual Life Insurance | ||||||||
6.063%, 03/30/2040 (B) | 2,470 | 3,026 | ||||||
Oversea-Chinese Banking | ||||||||
1.625%, 03/13/2015 (B) | 200 | 203 | ||||||
PACCAR Financial MTN | ||||||||
1.600%, 03/15/2017 | 164 | 165 | ||||||
1.550%, 09/29/2014 | 140 | 142 | ||||||
Pacific Life Global Funding MTN | ||||||||
5.000%, 05/15/2017 (B) | 170 | 178 | ||||||
Pacific Life Insurance | ||||||||
9.250%, 06/15/2039 (B) | 560 | 804 | ||||||
PNC Bank | ||||||||
6.000%, 12/07/2017 (C) | 250 | 293 | ||||||
2.700%, 11/01/2022 | 2,327 | 2,200 | ||||||
PNC Funding | ||||||||
5.125%, 02/08/2020 (C) | 340 | 392 | ||||||
2.700%, 09/19/2016 | 88 | 92 | ||||||
Post Apartment Homes | ||||||||
4.750%, 10/15/2017 | 70 | 78 | ||||||
PPF Funding‡ | ||||||||
5.500%, 01/15/2014 (B) | 5,000 | 5,101 | ||||||
Pricoa Global Funding I | ||||||||
5.450%, 06/11/2014 (B) | 300 | 315 | ||||||
1.600%, 05/29/2018 (B) | 150 | 149 | ||||||
Principal Life Global Funding I | ||||||||
5.050%, 03/15/2015 (B) | 750 | 804 | ||||||
Principal Life Income Funding Trusts MTN | ||||||||
5.100%, 04/15/2014 | 600 | 624 | ||||||
Private Export Funding | ||||||||
4.375%, 03/15/2019 | 4,660 | 5,389 | ||||||
2.125%, 07/15/2016 | 4,760 | 4,980 | ||||||
Prudential Holdings | ||||||||
8.695%, 12/18/2023 (B) | 3,060 | 3,918 | ||||||
Prudential Holdings LLC | ||||||||
1.155%, 12/18/2017 (A) (B) | 4,550 | 4,502 | ||||||
Prudential Insurance of America | ||||||||
8.300%, 07/01/2025 (B) | 600 | 803 | ||||||
Reckson Operating Partnership‡ | ||||||||
6.000%, 03/31/2016 | 95 | 104 | ||||||
| 108 | SEI Institutional Investments Trust / Annual Report / May 31, 2013 |
Table of Contents
| Description | Face Amount ($ Thousands) | Market Value ($ Thousands) | ||||||
Royal Bank of Canada MTN | ||||||||
2.300%, 07/20/2016 (C) | $ | 640 | $ | 665 | ||||
1.200%, 09/19/2017 | 1,126 | 1,120 | ||||||
0.625%, 12/04/2015 | 2,970 | 2,960 | ||||||
0.471%, 06/29/2085 (A) | 860 | 532 | ||||||
Royal Bank of Scotland Group | ||||||||
7.640%, 09/29/2017 (A) (C) | 800 | 778 | ||||||
6.400%, 10/21/2019 | 1,950 | 2,305 | ||||||
6.125%, 12/15/2022 | 1,635 | 1,684 | ||||||
2.550%, 09/18/2015 | 4,192 | 4,306 | ||||||
Santander US Debt SAU | ||||||||
3.724%, 01/20/2015 (B) | 2,580 | 2,622 | ||||||
Security Benefit Life Insurance | ||||||||
8.750%, 05/15/2016 (B) | 5,200 | 6,057 | ||||||
Simon Property Group‡ | ||||||||
10.350%, 04/01/2019 | 940 | 1,348 | ||||||
6.750%, 05/15/2014 | 165 | 172 | ||||||
5.650%, 02/01/2020 (C) | 133 | 158 | ||||||
4.375%, 03/01/2021 | 130 | 144 | ||||||
4.125%, 12/01/2021 | 108 | 118 | ||||||
Skandinaviska Enskilda Banken | ||||||||
1.750%, 03/19/2018 (B) | 3,942 | 3,925 | ||||||
SL Green Realty‡ | ||||||||
7.750%, 03/15/2020 | 2,000 | 2,447 | ||||||
SLM MTN | ||||||||
8.450%, 06/15/2018 | 530 | 588 | ||||||
3.875%, 09/10/2015 (C) | 2,360 | 2,407 | ||||||
Societe Generale | ||||||||
0.603%, 11/29/2049 (A) | 680 | 375 | ||||||
0.500%, 11/29/2049 (A) | 180 | 99 | ||||||
Sparebank 1 Boligkreditt | ||||||||
1.750%, 11/15/2019 (B) | 541 | 526 | ||||||
Stadshypotek | ||||||||
1.875%, 10/02/2019 (B) | 6,131 | 6,044 | ||||||
1.250%, 05/23/2018 (B) | 2,840 | 2,791 | ||||||
Standard Chartered | ||||||||
3.950%, 01/11/2023 (B) | 2,115 | 2,049 | ||||||
State Street | ||||||||
4.956%, 03/15/2018 | 2,560 | 2,881 | ||||||
4.300%, 05/30/2014 | 60 | 62 | ||||||
3.100%, 05/15/2023 | 24 | 23 | ||||||
Sumitomo Mitsui Banking | ||||||||
3.150%, 07/22/2015 (B) | 1,010 | 1,056 | ||||||
3.100%, 01/14/2016 (B) | 640 | 672 | ||||||
SunTrust Preferred Capital I | ||||||||
4.000%, 12/31/2049 (A) | 2,533 | 2,204 | ||||||
Svenska Handelsbanken | ||||||||
3.125%, 07/12/2016 | 282 | 299 | ||||||
1.625%, 03/21/2018 | 3,980 | 3,969 | ||||||
Swedbank Hypotek | ||||||||
1.375%, 03/28/2018 (B) | 4,375 | 4,329 | ||||||
Teachers Insurance & Annuity Association of America | ||||||||
6.850%, 12/16/2039 (B) | 1,740 | 2,290 | ||||||
| Description | Face Amount ($ Thousands) | Market Value ($ Thousands) | ||||||
Temasek Financial I MTN | ||||||||
2.375%, 01/23/2023 (B) | $ | 1,660 | $ | 1,554 | ||||
Toronto-Dominion Bank MTN | ||||||||
2.500%, 07/14/2016 | 538 | 562 | ||||||
2.200%, 07/29/2015 (B) | 295 | 305 | ||||||
Toyota Motor Credit MTN | ||||||||
3.400%, 09/15/2021 | 2,690 | 2,808 | ||||||
3.200%, 06/17/2015 | 308 | 323 | ||||||
2.050%, 01/12/2017 | 215 | 220 | ||||||
2.000%, 09/15/2016 | 930 | 959 | ||||||
1.250%, 10/05/2017 | 2,740 | 2,713 | ||||||
Travelers | ||||||||
5.900%, 06/02/2019 | 145 | 178 | ||||||
Travelers Property Casualty | ||||||||
7.750%, 04/15/2026 | 300 | 413 | ||||||
UBS MTN | ||||||||
5.875%, 12/20/2017 | 303 | 355 | ||||||
5.750%, 04/25/2018 | 150 | 177 | ||||||
3.875%, 01/15/2015 | 785 | 824 | ||||||
2.250%, 08/12/2013 | 250 | 251 | ||||||
2.250%, 01/28/2014 | 732 | 739 | ||||||
UDR‡ | ||||||||
6.050%, 06/01/2013 | 370 | 370 | ||||||
5.250%, 01/15/2015 | 75 | 80 | ||||||
4.250%, 06/01/2018 | 2,000 | 2,187 | ||||||
US Bancorp MTN | ||||||||
4.125%, 05/24/2021 | 134 | 147 | ||||||
3.000%, 03/15/2022 | 67 | 68 | ||||||
2.875%, 11/20/2014 | 415 | 429 | ||||||
2.450%, 07/27/2015 | 300 | �� | 311 | |||||
Ventas Realty‡ | ||||||||
4.000%, 04/30/2019 | 3,553 | 3,839 | ||||||
3.250%, 08/15/2022 | 1,305 | 1,277 | ||||||
2.700%, 04/01/2020 | 860 | 819 | ||||||
Vesey Street Investment Trust I | ||||||||
4.404%, 09/01/2016 | 870 | 939 | ||||||
Wachovia | ||||||||
5.750%, 06/15/2017 | 690 | 797 | ||||||
5.750%, 02/01/2018 | 350 | 411 | ||||||
5.250%, 08/01/2014 | 650 | 683 | ||||||
0.616%, 10/28/2015 (A) | 3,210 | 3,186 | ||||||
Wachovia Bank MTN | ||||||||
6.000%, 11/15/2017 | 4,220 | 4,967 | ||||||
0.610%, 03/15/2016 (A) | 1,200 | 1,191 | ||||||
Wachovia Capital Trust III | ||||||||
5.570%, 12/31/2049 (A) | 4,792 | 4,798 | ||||||
WEA Finance | ||||||||
7.125%, 04/15/2018 (B) | 3,655 | 4,474 | ||||||
6.750%, 09/02/2019 (B) | 721 | 885 | ||||||
Wells Fargo | ||||||||
5.625%, 12/11/2017 | 830 | 967 | ||||||
5.000%, 11/15/2014 | 1,085 | 1,150 | ||||||
4.600%, 04/01/2021 | 500 | 561 | ||||||
3.676%, 06/15/2016 (H) | 2,980 | 3,201 | ||||||
| SEI Institutional Investments Trust / Annual Report / May 31, 2013 | 109 |
Table of Contents
SCHEDULE OF INVESTMENTS
Core Fixed Income Fund (Continued)
May 31, 2013
| Description | Face Amount ($ Thousands) | Market Value ($ Thousands) | ||||||
3.500%, 03/08/2022 (C) | $ | 250 | $ | 259 | ||||
3.450%, 02/13/2023 | 1,490 | 1,459 | ||||||
1.500%, 01/16/2018 | 800 | 792 | ||||||
Wells Fargo Bank | ||||||||
4.750%, 02/09/2015 | 300 | 319 | ||||||
Wells Fargo Capital X | ||||||||
5.950%, 12/15/2036 (C) | 860 | 881 | ||||||
Westpac Banking | ||||||||
4.875%, 11/19/2019 | 604 | 698 | ||||||
2.450%, 11/28/2016 (B) (C) | 350 | 367 | ||||||
1.014%, 03/31/2014 (A) (B) | 725 | 729 | ||||||
Woodbourne Capital Trust I | ||||||||
2.610%, 04/08/2049 (A) (B) | 625 | 325 | ||||||
WR Berkley | ||||||||
4.625%, 03/15/2022 | 946 | 1,015 | ||||||
ZFS Finance USA Trust II | ||||||||
6.450%, 12/15/2065 (A) (B) | 6,290 | 6,856 | ||||||
|
| |||||||
| 840,233 | ||||||||
|
| |||||||
Health Care — 1.5% | ||||||||
AbbVie | ||||||||
2.900%, 11/06/2022 (B) | 7,265 | 7,066 | ||||||
2.000%, 11/06/2018 (B) | 2,225 | 2,220 | ||||||
1.750%, 11/06/2017 (B) (C) | 3,237 | 3,227 | ||||||
1.200%, 11/06/2015 (B) | 4,060 | 4,076 | ||||||
Aetna | ||||||||
6.750%, 12/15/2037 | 60 | 77 | ||||||
4.500%, 05/15/2042 | 71 | 70 | ||||||
Amgen | ||||||||
5.750%, 03/15/2040 | 237 | 271 | ||||||
5.700%, 02/01/2019 | 100 | 118 | ||||||
5.650%, 06/15/2042 | 3,435 | 3,861 | ||||||
5.375%, 05/15/2043 (C) | 2,815 | 3,086 | ||||||
5.150%, 11/15/2041 | 3,495 | 3,708 | ||||||
4.850%, 11/18/2014 | 50 | 53 | ||||||
4.500%, 03/15/2020 | 84 | 94 | ||||||
3.875%, 11/15/2021 (C) | 200 | 214 | ||||||
Celgene | ||||||||
3.250%, 08/15/2022 | 2,363 | 2,357 | ||||||
1.900%, 08/15/2017 | 337 | 339 | ||||||
Express Scripts Holding | ||||||||
3.500%, 11/15/2016 | 4,530 | 4,863 | ||||||
2.100%, 02/12/2015 | 2,590 | 2,644 | ||||||
GlaxoSmithKline Capital | ||||||||
5.650%, 05/15/2018 | 1,590 | 1,890 | ||||||
2.850%, 05/08/2022 | 1,620 | 1,616 | ||||||
HCA | ||||||||
7.250%, 09/15/2020 | 1,165 | 1,281 | ||||||
5.750%, 03/15/2014 (C) | 5,548 | 5,701 | ||||||
Hospira MTN | ||||||||
6.400%, 05/15/2015 | 20 | 22 | ||||||
Humana | ||||||||
7.200%, 06/15/2018 | 1,950 | 2,348 | ||||||
3.150%, 12/01/2022 | 640 | 621 | ||||||
| Description | Face Amount ($ Thousands) | Market Value ($ Thousands) | ||||||
Medco Health Solutions | ||||||||
7.125%, 03/15/2018 | $ | 250 | $ | 307 | ||||
2.750%, 09/15/2015 | 135 | 140 | ||||||
Medtronic | ||||||||
4.450%, 03/15/2020 | 1,210 | 1,363 | ||||||
Merck | ||||||||
2.800%, 05/18/2023 | 3,065 | 3,002 | ||||||
2.400%, 09/15/2022 | 156 | 150 | ||||||
1.300%, 05/18/2018 | 2,400 | 2,371 | ||||||
Perrigo | ||||||||
2.950%, 05/15/2023 | 1,455 | 1,407 | ||||||
Pfizer | ||||||||
4.300%, 06/15/2043 | 1,195 | 1,190 | ||||||
3.000%, 06/15/2023 | 1,990 | 1,985 | ||||||
1.500%, 06/15/2018 | 1,990 | 1,988 | ||||||
0.900%, 01/15/2017 | 5,975 | 5,957 | ||||||
Pharmacia | ||||||||
6.500%, 12/01/2018 | 430 | 532 | ||||||
Roche Holdings | ||||||||
6.000%, 03/01/2019 (B) | 1,160 | 1,416 | ||||||
St. Jude Medical | ||||||||
3.250%, 04/15/2023 | 2,135 | 2,098 | ||||||
Stryker | ||||||||
1.300%, 04/01/2018 | 3,615 | 3,575 | ||||||
Thermo Fisher Scientific | ||||||||
3.600%, 08/15/2021 | 710 | 722 | ||||||
3.200%, 03/01/2016 | 1,425 | 1,495 | ||||||
UnitedHealth Group | ||||||||
6.625%, 11/15/2037 | 360 | 457 | ||||||
5.800%, 03/15/2036 | 560 | 655 | ||||||
5.700%, 10/15/2040 | 800 | 927 | ||||||
3.875%, 10/15/2020 | 870 | 934 | ||||||
3.375%, 11/15/2021 | 625 | 647 | ||||||
2.875%, 03/15/2023 | �� | 150 | 146 | |||||
Watson Pharmaceuticals | ||||||||
3.250%, 10/01/2022 | 112 | 110 | ||||||
WellPoint | ||||||||
6.000%, 02/15/2014 | 383 | 397 | ||||||
5.875%, 06/15/2017 | 350 | 406 | ||||||
4.625%, 05/15/2042 | 219 | 217 | ||||||
3.700%, 08/15/2021 | 2,430 | 2,508 | ||||||
3.300%, 01/15/2023 | 133 | 132 | ||||||
3.125%, 05/15/2022 | 3,742 | 3,692 | ||||||
1.250%, 09/10/2015 | 610 | 614 | ||||||
Wyeth | ||||||||
5.950%, 04/01/2037 | 2,260 | 2,768 | ||||||
Zoetis | ||||||||
4.700%, 02/01/2043 (B) | 1,238 | 1,233 | ||||||
3.250%, 02/01/2023 (B) | 340 | 336 | ||||||
|
| |||||||
| 97,700 | ||||||||
|
| |||||||
Industrials — 1.1% | ||||||||
ABB Finance USA | ||||||||
4.375%, 05/08/2042 | 47 | 48 | ||||||
| 110 | SEI Institutional Investments Trust / Annual Report / May 31, 2013 |
Table of Contents
| Description | Face Amount ($ Thousands) | Market Value ($ Thousands) | ||||||
2.875%, 05/08/2022 | $ | 117 | $ | 117 | ||||
1.625%, 05/08/2017 | 81 | 81 | ||||||
ADT | ||||||||
4.875%, 07/15/2042 | 111 | 102 | ||||||
4.125%, 06/15/2023 | 48 | 48 | ||||||
3.500%, 07/15/2022 | 105 | 101 | ||||||
Air 2 US | ||||||||
8.027%, 10/01/2019 (B) | 1,231 | 1,323 | ||||||
Air Canada, Pass-Through Trust, | ||||||||
4.125%, 05/15/2025 (B) | 141 | 144 | ||||||
American Airlines Pass-Through Trust, Ser 2011-2, Cl A | ||||||||
8.625%, 10/15/2021 | 251 | 265 | ||||||
American Airlines, Pass-Through Trust, Ser 2011-1, Cl A | ||||||||
5.250%, 01/31/2021 (C) | 102 | 111 | ||||||
BAE Systems | ||||||||
5.800%, 10/11/2041 (B) | 90 | 102 | ||||||
4.750%, 10/11/2021 (B) | 3,955 | 4,319 | ||||||
BAE Systems Holdings | ||||||||
5.200%, 08/15/2015 (B) | 360 | 389 | ||||||
Boeing | ||||||||
4.875%, 02/15/2020 | 2,440 | 2,834 | ||||||
Burlington Northern Santa Fe | ||||||||
7.290%, 06/01/2036 | 200 | 268 | ||||||
5.650%, 05/01/2017 | 200 | 230 | ||||||
4.375%, 09/01/2042 | 150 | 146 | ||||||
3.450%, 09/15/2021 | 60 | 62 | ||||||
Burlington Northern Santa Fe LLC | ||||||||
5.400%, 06/01/2041 | 200 | 223 | ||||||
4.700%, 10/01/2019 | 375 | 429 | ||||||
3.050%, 09/01/2022 | 300 | 299 | ||||||
Canadian National Railway | ||||||||
5.850%, 11/15/2017 | 150 | 177 | ||||||
5.550%, 05/15/2018 | 385 | 455 | ||||||
Cargill | ||||||||
7.350%, 03/06/2019 (B) | 400 | 506 | ||||||
3.300%, 03/01/2022 (B) | 200 | 203 | ||||||
Caterpillar | ||||||||
2.600%, 06/26/2022 | 123 | 121 | ||||||
Continental Airlines | ||||||||
6.900%, 01/02/2018 | 136 | 149 | ||||||
Continental Airlines | ||||||||
7.256%, 03/15/2020 | 1,071 | 1,216 | ||||||
Continental Airlines, Pass-Through Trust, | ||||||||
5.983%, 04/19/2022 | 2,566 | 2,912 | ||||||
| Description | Face Amount ($ Thousands) | Market Value ($ Thousands) | ||||||
Continental Airlines, Pass-Through Trust, | ||||||||
4.000%, 10/29/2024 | $ | 127 | $ | 131 | ||||
Continental Airlines, Pass-Through Trust, | ||||||||
6.545%, 02/02/2019 | 434 | 487 | ||||||
Continental Airlines, Pass-Through Trust, | ||||||||
8.048%, 11/01/2020 | 2,252 | 2,621 | ||||||
CRH America | ||||||||
6.000%, 09/30/2016 | 154 | 175 | ||||||
CSX | ||||||||
7.375%, 02/01/2019 | 460 | 580 | ||||||
4.250%, 06/01/2021 | 65 | 72 | ||||||
Danaher | ||||||||
3.900%, 06/23/2021 | 266 | 290 | ||||||
Deere | ||||||||
3.900%, 06/09/2042 | 64 | 61 | ||||||
2.600%, 06/08/2022 | 74 | 73 | ||||||
Delta Air Lines, Pass-Through Trust, Ser 2011-1, Cl A | ||||||||
5.300%, 04/15/2019 | 70 | 78 | ||||||
Delta Air Lines, Pass-Through Trust, Ser 2007-1, Cl A | ||||||||
6.821%, 08/10/2022 | 1,521 | 1,773 | ||||||
Delta Air Lines, Pass-Through Trust, Ser 2010-2, Cl A | ||||||||
4.950%, 05/23/2019 (C) | 230 | 252 | ||||||
Delta Air Lines, Pass-Through Trust, Ser 2012-1, Cl A | ||||||||
4.750%, 05/07/2020 | 98 | 108 | ||||||
Eaton | ||||||||
7.625%, 04/01/2024 | 325 | 413 | ||||||
4.150%, 11/02/2042 (B) | 530 | 502 | ||||||
4.000%, 11/02/2032 (B) | 709 | 693 | ||||||
2.750%, 11/02/2022 (B) (C) | 2,090 | 2,029 | ||||||
1.500%, 11/02/2017 (B) | 1,062 | 1,050 | ||||||
Fluor | ||||||||
3.375%, 09/15/2021 | 308 | 318 | ||||||
General Electric | ||||||||
5.250%, 12/06/2017 (C) | 250 | 289 | ||||||
4.125%, 10/09/2042 (C) | 155 | 148 | ||||||
0.850%, 10/09/2015 | 1,060 | 1,062 | ||||||
Illinois Tool Works | ||||||||
3.900%, 09/01/2042 (C) | 960 | 899 | ||||||
Ingersoll-Rand | ||||||||
6.391%, 11/15/2027 | 425 | 492 | ||||||
JetBlue Airways Private Trust, | ||||||||
0.650%, 08/15/2016 (A) | 3,369 | 3,256 | ||||||
| SEI Institutional Investments Trust / Annual Report / May 31, 2013 | 111 |
Table of Contents
SCHEDULE OF INVESTMENTS
Core Fixed Income Fund (Continued)
May 31, 2013
| Description | Face Amount ($ Thousands) | Market Value ($ Thousands) | ||||||
Koninklijke Philips | ||||||||
7.200%, 06/01/2026 | $ | 300 | $ | 381 | ||||
5.750%, 03/11/2018 | 100 | 118 | ||||||
3.750%, 03/15/2022 | 424 | 445 | ||||||
Lockheed Martin | ||||||||
4.070%, 12/15/2042 | 453 | 414 | ||||||
3.350%, 09/15/2021 | 3,435 | 3,520 | ||||||
2.125%, 09/15/2016 | 187 | 192 | ||||||
Norfolk Southern | ||||||||
6.000%, 05/23/2111 | 527 | 618 | ||||||
3.950%, 10/01/2042 | 129 | 118 | ||||||
Northrop Grumman | ||||||||
4.750%, 06/01/2043 | 1,580 | 1,562 | ||||||
3.250%, 08/01/2023 | 11,450 | 11,293 | ||||||
1.850%, 11/15/2015 | 2,380 | 2,464 | ||||||
Owens Corning | ||||||||
4.200%, 12/15/2022 | 1,128 | 1,159 | ||||||
Penske Truck Leasing LP | ||||||||
2.875%, 07/17/2018 (B) | 1,094 | 1,127 | ||||||
Pitney Bowes | ||||||||
5.600%, 03/15/2018 | 100 | 110 | ||||||
Raytheon | ||||||||
3.125%, 10/15/2020 | 720 | 742 | ||||||
Republic Services | ||||||||
3.550%, 06/01/2022 | 125 | 127 | ||||||
Roper Industries | ||||||||
2.050%, 10/01/2018 | 2,220 | 2,211 | ||||||
Ryder System MTN | ||||||||
3.600%, 03/01/2016 | 132 | 139 | ||||||
2.500%, 03/01/2017 | 177 | 180 | ||||||
Union Pacific | ||||||||
4.875%, 01/15/2015 | 497 | 529 | ||||||
4.300%, 06/15/2042 | 100 | 99 | ||||||
4.163%, 07/15/2022 (C) | 437 | 479 | ||||||
Union Pacific Railroad 2003 Pass-Through Trust | ||||||||
4.698%, 01/02/2024 | 154 | 167 | ||||||
United Parcel Service | ||||||||
2.450%, 10/01/2022 | 100 | 97 | ||||||
United Parcel Service of America | ||||||||
8.375%, 04/01/2020 | 140 | 189 | ||||||
United Technologies | ||||||||
8.875%, 11/15/2019 | 400 | 542 | ||||||
5.400%, 05/01/2035 | 640 | 740 | ||||||
4.500%, 06/01/2042 | 1,210 | 1,249 | ||||||
US Airways Pass-Through Trust, | ||||||||
4.625%, 06/03/2025 | 5,270 | 5,415 | ||||||
US Airways Pass-Through Trust, | ||||||||
5.900%, 10/01/2024 | 50 | 56 | ||||||
Waste Management | ||||||||
7.125%, 12/15/2017 | 1,650 | 1,988 | ||||||
4.750%, 06/30/2020 | 299 | 335 | ||||||
| Description | Face Amount ($ Thousands) | Market Value ($ Thousands) | ||||||
2.600%, 09/01/2016 | $ | 1,015 | $ | 1,057 | ||||
|
| |||||||
| 75,094 | ||||||||
|
| |||||||
Information Technology — 0.4% | ||||||||
Apple | ||||||||
2.400%, 05/03/2023 | 4,738 | 4,519 | ||||||
0.523%, 05/03/2018 (A) | 345 | 346 | ||||||
Arrow Electronics | ||||||||
6.875%, 06/01/2018 | 270 | 318 | ||||||
6.000%, 04/01/2020 | 225 | 250 | ||||||
3.375%, 11/01/2015 | 60 | 62 | ||||||
Cisco Systems | ||||||||
5.900%, 02/15/2039 (C) | 250 | 307 | ||||||
5.500%, 01/15/2040 (C) | 500 | 589 | ||||||
eBay | ||||||||
4.000%, 07/15/2042 | 84 | 74 | ||||||
2.600%, 07/15/2022 | 74 | 72 | ||||||
Hewlett-Packard | ||||||||
6.000%, 09/15/2041 | 400 | 404 | ||||||
4.650%, 12/09/2021 | 87 | 90 | ||||||
4.300%, 06/01/2021 | 200 | 201 | ||||||
2.600%, 09/15/2017 (C) | 187 | 190 | ||||||
HP Enterprise Services LLC | ||||||||
7.450%, 10/15/2029 | 500 | 587 | ||||||
Intel | ||||||||
4.800%, 10/01/2041 | 293 | 301 | ||||||
4.000%, 12/15/2032 | 1,730 | 1,670 | ||||||
3.300%, 10/01/2021 | 312 | 323 | ||||||
International Business Machines | ||||||||
7.625%, 10/15/2018 | 365 | 475 | ||||||
4.000%, 06/20/2042 | 169 | 164 | ||||||
1.950%, 07/22/2016 | 126 | 130 | ||||||
1.625%, 05/15/2020 | 7,596 | 7,337 | ||||||
1.250%, 02/06/2017 | 189 | 189 | ||||||
Intuit | ||||||||
5.750%, 03/15/2017 | 765 | 863 | ||||||
Microsoft | ||||||||
4.500%, 10/01/2040 | 61 | 64 | ||||||
1.625%, 09/25/2015 | 405 | 415 | ||||||
0.875%, 11/15/2017 | 54 | 53 | ||||||
National Semiconductor | ||||||||
6.600%, 06/15/2017 | 480 | 574 | ||||||
3.950%, 04/15/2015 | 500 | 530 | ||||||
Oracle | ||||||||
6.500%, 04/15/2038 | 100 | 131 | ||||||
6.125%, 07/08/2039 | 163 | 207 | ||||||
5.375%, 07/15/2040 | 97 | 113 | ||||||
5.000%, 07/08/2019 | 450 | 527 | ||||||
1.200%, 10/15/2017 | 2,240 | 2,221 | ||||||
TSMC Global | ||||||||
1.625%, 04/03/2018 (B) | 3,415 | 3,371 | ||||||
Xerox | ||||||||
8.250%, 05/15/2014 | 320 | 342 | ||||||
4.500%, 05/15/2021 | 80 | 85 | ||||||
| 112 | SEI Institutional Investments Trust / Annual Report / May 31, 2013 |
Table of Contents
| Description | Face Amount ($ Thousands) | Market Value ($ Thousands) | ||||||
2.950%, 03/15/2017 | $ | 165 | $ | 169 | ||||
|
| |||||||
| 28,263 | ||||||||
|
| |||||||
Materials — 0.9% | ||||||||
Barrick | ||||||||
4.100%, 05/01/2023 (B) | 6,280 | 5,970 | ||||||
3.850%, 04/01/2022 | 640 | 612 | ||||||
Barrick Gold | ||||||||
6.950%, 04/01/2019 (C) | 1,530 | 1,810 | ||||||
Barrick North America Finance | ||||||||
5.750%, 05/01/2043 (B) | 980 | 918 | ||||||
Barrick North America Finance LLC | ||||||||
4.400%, 05/30/2021 | 920 | 924 | ||||||
BHP Billiton Finance USA | ||||||||
6.500%, 04/01/2019 | 445 | 554 | ||||||
4.125%, 02/24/2042 | 147 | 145 | ||||||
3.250%, 11/21/2021 | 3,010 | 3,109 | ||||||
Celulosa Arauco y Constitucion | ||||||||
4.750%, 01/11/2022 | 1,150 | 1,175 | ||||||
Cliffs Natural Resources | ||||||||
4.875%, 04/01/2021 (C) | 290 | 278 | ||||||
Codelco | ||||||||
4.750%, 10/15/2014 (B) | 900 | 939 | ||||||
Dow Chemical | ||||||||
8.550%, 05/15/2019 | 377 | 502 | ||||||
5.250%, 11/15/2041 (C) | 1,120 | 1,198 | ||||||
4.250%, 11/15/2020 | 118 | 129 | ||||||
3.000%, 11/15/2022 | 5,405 | 5,240 | ||||||
E.I. du Pont de Nemours | ||||||||
5.600%, 12/15/2036 | 275 | 328 | ||||||
4.900%, 01/15/2041 | 125 | 138 | ||||||
1.950%, 01/15/2016 | 162 | 167 | ||||||
Ecolab | ||||||||
4.350%, 12/08/2021 | 570 | 625 | ||||||
1.450%, 12/08/2017 | 246 | 242 | ||||||
Freeport-McMoRan Copper | ||||||||
3.550%, 03/01/2022 | 2,355 | 2,293 | ||||||
3.100%, 03/15/2020 (B) | 860 | 841 | ||||||
2.375%, 03/15/2018 (B) | 850 | 848 | ||||||
2.150%, 03/01/2017 | 404 | 408 | ||||||
Mosaic | ||||||||
4.875%, 11/15/2041 | 117 | 119 | ||||||
3.750%, 11/15/2021 | 98 | 102 | ||||||
Placer Dome | ||||||||
6.450%, 10/15/2035 | 200 | 207 | ||||||
Potash Corp of Saskatchewan | ||||||||
6.500%, 05/15/2019 | 250 | 307 | ||||||
4.875%, 03/30/2020 | 10 | 11 | ||||||
PPG Industries | ||||||||
9.000%, 05/01/2021 | 515 | 709 | ||||||
6.650%, 03/15/2018 | 645 | 782 | ||||||
Praxair | ||||||||
5.250%, 11/15/2014 | 205 | 219 | ||||||
| Description | Face Amount ($ Thousands) | Market Value ($ Thousands) | ||||||
5.200%, 03/15/2017 | $ | 215 | $ | 245 | ||||
4.375%, 03/31/2014 | 250 | 258 | ||||||
Rio Tinto Finance USA | ||||||||
8.950%, 05/01/2014 | 265 | 285 | ||||||
6.500%, 07/15/2018 | 3,420 | 4,159 | ||||||
4.125%, 05/20/2021 | 770 | 815 | ||||||
3.750%, 09/20/2021 | 1,380 | 1,424 | ||||||
3.500%, 11/02/2020 | 77 | 80 | ||||||
Rock Tenn | ||||||||
4.000%, 03/01/2023 | 580 | 585 | ||||||
3.500%, 03/01/2020 | 570 | 582 | ||||||
Southern Copper | ||||||||
5.250%, 11/08/2042 | 3,910 | 3,389 | ||||||
Stauffer Chemical | ||||||||
7.268%, 04/15/2018 (D) (G) | 860 | 319 | ||||||
7.072%, 04/15/2017 (D) (G) | 350 | 158 | ||||||
Union Carbide | ||||||||
7.750%, 10/01/2096 | 200 | 235 | ||||||
7.500%, 06/01/2025 | 200 | 243 | ||||||
Vale | ||||||||
5.625%, 09/11/2042 | 1,208 | 1,126 | ||||||
Vale Overseas | ||||||||
8.250%, 01/17/2034 | 365 | 446 | ||||||
6.875%, 11/21/2036 | 2,958 | 3,175 | ||||||
4.375%, 01/11/2022 | 4,015 | 3,988 | ||||||
Xstrata Finance Canada | ||||||||
5.800%, 11/15/2016 (B) | 390 | 439 | ||||||
4.250%, 10/25/2022 (B) | 725 | 719 | ||||||
2.700%, 10/25/2017 (B) | 1,900 | 1,920 | ||||||
2.050%, 10/23/2015 (B) | 3,518 | 3,547 | ||||||
|
| |||||||
| 59,986 | ||||||||
|
| |||||||
Telecommunication Services — 1.5% |
| |||||||
America Movil | ||||||||
5.625%, 11/15/2017 | 1,450 | 1,668 | ||||||
5.000%, 03/30/2020 | 740 | 814 | ||||||
3.125%, 07/16/2022 | 3,487 | 3,328 | ||||||
2.375%, 09/08/2016 (C) | 1,368 | 1,405 | ||||||
AT&T | ||||||||
6.550%, 02/15/2039 | 1,710 | 2,104 | ||||||
6.300%, 01/15/2038 | 5,355 | 6,382 | ||||||
5.800%, 02/15/2019 | 500 | 599 | ||||||
5.500%, 02/01/2018 (C) | 3,165 | 3,705 | ||||||
5.350%, 09/01/2040 | 1,431 | 1,531 | ||||||
4.450%, 05/15/2021 | 440 | 491 | ||||||
4.350%, 06/15/2045 (B) | 686 | 636 | ||||||
4.300%, 12/15/2042 (B) | 2,820 | 2,635 | ||||||
3.875%, 08/15/2021 | 860 | 921 | ||||||
2.625%, 12/01/2022 (C) | 2,255 | 2,143 | ||||||
2.500%, 08/15/2015 | 2,170 | 2,248 | ||||||
1.600%, 02/15/2017 | 2,375 | 2,388 | ||||||
0.800%, 12/01/2015 | 3,923 | 3,918 | ||||||
BellSouth | ||||||||
6.875%, 10/15/2031 | 8 | 9 | ||||||
| SEI Institutional Investments Trust / Annual Report / May 31, 2013 | 113 |
Table of Contents
SCHEDULE OF INVESTMENTS
Core Fixed Income Fund (Continued)
May 31, 2013
| Description | Face Amount ($ Thousands) | Market Value ($ Thousands) | ||||||
BellSouth Telecommunications | ||||||||
6.300%, 12/15/2015 | $ | 143 | $ | 149 | ||||
British Telecommunications | ||||||||
5.950%, 01/15/2018 | 1,511 | 1,774 | ||||||
Cellco Partnership | ||||||||
8.500%, 11/15/2018 | 340 | 452 | ||||||
Centel Capital | ||||||||
9.000%, 10/15/2019 | 325 | 395 | ||||||
CenturyLink | ||||||||
7.600%, 09/15/2039 | 360 | 360 | ||||||
6.450%, 06/15/2021 | 540 | 579 | ||||||
Comcast Cable Communications LLC | ||||||||
8.875%, 05/01/2017 | 150 | 192 | ||||||
Comcast Cable Holdings LLC | ||||||||
10.125%, 04/15/2022 | 190 | 268 | ||||||
COX Communications | ||||||||
5.450%, 12/15/2014 | 323 | 346 | ||||||
Cox Enterprises | ||||||||
7.375%, 07/15/2027 (B) | 170 | 215 | ||||||
Crown Castle Towers LLC | ||||||||
3.214%, 08/15/2015 (B) | 290 | 300 | ||||||
Deutsche Telekom International Finance | ||||||||
5.750%, 03/23/2016 | 1,915 | 2,154 | ||||||
Deutsche Telekom International Finance BV | ||||||||
6.000%, 07/08/2019 | 600 | 724 | ||||||
2.250%, 03/06/2017 (B) | 3,130 | 3,194 | ||||||
DIRECTV Holdings | ||||||||
6.000%, 08/15/2040 | 3,000 | 3,204 | ||||||
4.600%, 02/15/2021 | 400 | 431 | ||||||
3.800%, 03/15/2022 | 1,530 | 1,552 | ||||||
Discovery Communications | ||||||||
4.950%, 05/15/2042 | 115 | 116 | ||||||
4.875%, 04/01/2043 | 995 | 992 | ||||||
Discovery Communications LLC | ||||||||
4.375%, 06/15/2021 | 344 | 373 | ||||||
France Telecom | ||||||||
8.500%, 03/01/2031 | 370 | 529 | ||||||
2.750%, 09/14/2016 | 140 | 146 | ||||||
GTE | ||||||||
8.750%, 11/01/2021 | 600 | 806 | ||||||
6.840%, 04/15/2018 | 800 | 971 | ||||||
Intelsat Jackson Holdings | ||||||||
7.250%, 04/01/2019 | 485 | 523 | ||||||
News America | ||||||||
7.300%, 04/30/2028 | 500 | 613 | ||||||
6.650%, 11/15/2037 | 385 | 466 | ||||||
News America Holdings | ||||||||
8.875%, 04/26/2023 | 200 | 270 | ||||||
7.700%, 10/30/2025 | 200 | 256 | ||||||
Nippon Telegraph & Telephone | ||||||||
1.400%, 07/18/2017 | 200 | 199 | ||||||
| Description | Face Amount ($ Thousands) | Market Value ($ Thousands) | ||||||
Pearson Funding Four | ||||||||
3.750%, 05/08/2022 (B) | $ | 974 | $ | 993 | ||||
Qwest | ||||||||
6.750%, 12/01/2021 | 593 | 681 | ||||||
Rogers Communications | ||||||||
3.000%, 03/15/2023 | 1,155 | 1,123 | ||||||
Sprint Capital | ||||||||
8.750%, 03/15/2032 (C) | 390 | 454 | ||||||
TCI Communications | ||||||||
8.750%, 08/01/2015 | 701 | 817 | ||||||
7.125%, 02/15/2028 | 400 | 526 | ||||||
Telecom Italia Capital | ||||||||
6.999%, 06/04/2018 | 500 | 580 | ||||||
6.175%, 06/18/2014 | 65 | 68 | ||||||
5.250%, 11/15/2013 | 370 | 377 | ||||||
Telefonica Chile | ||||||||
3.875%, 10/12/2022 (B) | 1,405 | 1,348 | ||||||
Telefonica Emisiones | ||||||||
6.421%, 06/20/2016 | 100 | 112 | ||||||
Telefonica Emisiones SAU | ||||||||
6.221%, 07/03/2017 | 690 | 777 | ||||||
5.877%, 07/15/2019 | 295 | 329 | ||||||
5.462%, 02/16/2021 | 69 | 74 | ||||||
5.134%, 04/27/2020 | 1,280 | 1,367 | ||||||
4.570%, 04/27/2023 | 1,570 | 1,565 | ||||||
Time Warner Entertainment | ||||||||
8.375%, 03/15/2023 | 232 | 309 | ||||||
Verizon Communications | ||||||||
8.750%, 11/01/2018 | 412 | 549 | ||||||
7.750%, 12/01/2030 | 3,940 | 5,308 | ||||||
6.350%, 04/01/2019 | 1,110 | 1,353 | ||||||
5.850%, 09/15/2035 | 150 | 170 | ||||||
5.500%, 02/15/2018 | 1,710 | 1,986 | ||||||
3.850%, 11/01/2042 | 1,935 | 1,668 | ||||||
3.500%, 11/01/2021 | 920 | 951 | ||||||
2.450%, 11/01/2022 (C) | 470 | 440 | ||||||
Verizon Maryland | ||||||||
7.150%, 05/01/2023 | 600 | 601 | ||||||
Verizon New England | ||||||||
7.875%, 11/15/2029 | 500 | 639 | ||||||
Vodafone Group | ||||||||
5.450%, 06/10/2019 | 226 | 265 | ||||||
2.950%, 02/19/2023 | 4,050 | 3,904 | ||||||
1.625%, 03/20/2017 | 240 | 240 | ||||||
1.500%, 02/19/2018 | 2,675 | 2,643 | ||||||
0.900%, 02/19/2016 | 3,817 | 3,800 | ||||||
Windstream | ||||||||
8.125%, 09/01/2018 | 365 | 396 | ||||||
WPP Finance UK | ||||||||
8.000%, 09/15/2014 | 520 | 565 | ||||||
|
| |||||||
| 96,452 | ||||||||
|
| |||||||
| 114 | SEI Institutional Investments Trust / Annual Report / May 31, 2013 |
Table of Contents
| Description | Face Amount ($ Thousands) | Market Value ($ Thousands) | ||||||
Utilities — 1.9% | ||||||||
AGL Capital | ||||||||
6.375%, 07/15/2016 | $ | 200 | $ | 231 | ||||
5.875%, 03/15/2041 | 73 | 87 | ||||||
5.250%, 08/15/2019 | 170 | 199 | ||||||
4.400%, 06/01/2043 | 2,240 | 2,198 | ||||||
Alabama Power | ||||||||
6.125%, 05/15/2038 | 69 | 86 | ||||||
5.875%, 12/01/2022 | 275 | 333 | ||||||
5.500%, 10/15/2017 | 810 | 945 | ||||||
Alabama Power Capital Trust V | ||||||||
3.384%, 10/01/2042 (A) | 100 | 100 | ||||||
Ameren | ||||||||
8.875%, 05/15/2014 | 2,080 | 2,232 | ||||||
Ameren Illinois | ||||||||
2.700%, 09/01/2022 | 2,400 | 2,359 | ||||||
American Electric Power | ||||||||
1.650%, 12/15/2017 | 2,382 | 2,367 | ||||||
American Water Capital | ||||||||
6.085%, 10/15/2017 | 400 | 470 | ||||||
Appalachian Power | ||||||||
5.950%, 05/15/2033 | 200 | 228 | ||||||
4.600%, 03/30/2021 | 150 | 167 | ||||||
Arizona Public Service | ||||||||
5.050%, 09/01/2041 | 219 | 243 | ||||||
Arizona Public Services | ||||||||
4.500%, 04/01/2042 | 63 | 64 | ||||||
Atmos Energy | ||||||||
4.950%, 10/15/2014 | 260 | 275 | ||||||
Boston Gas | ||||||||
4.487%, 02/15/2042 (B) | 140 | 143 | ||||||
CenterPoint Energy | ||||||||
6.500%, 05/01/2018 | 271 | 327 | ||||||
CenterPoint Energy Resources | ||||||||
6.125%, 11/01/2017 | 320 | 379 | ||||||
4.500%, 01/15/2021 | 246 | 275 | ||||||
Cleveland Electric Illuminating | ||||||||
7.880%, 11/01/2017 | 310 | 382 | ||||||
CMS Energy | ||||||||
2.750%, 05/15/2014 | 1,250 | 1,271 | ||||||
Comision Federal de Electricidad | ||||||||
4.875%, 05/26/2021 (B) | 249 | 269 | ||||||
Consolidated Edison of New York | ||||||||
6.650%, 04/01/2019 | 650 | 814 | ||||||
5.700%, 06/15/2040 | 154 | 190 | ||||||
3.950%, 03/01/2043 | 360 | 343 | ||||||
Consumers Energy | ||||||||
6.700%, 09/15/2019 | 400 | 511 | ||||||
3.950%, 05/15/2043 | 1,360 | 1,315 | ||||||
2.850%, 05/15/2022 | 56 | 57 | ||||||
Dominion Resources | ||||||||
8.875%, 01/15/2019 | 1,945 | 2,610 | ||||||
6.400%, 06/15/2018 | 460 | 558 | ||||||
5.250%, 08/01/2033 | 1,135 | 1,272 | ||||||
| Description | Face Amount ($ Thousands) | Market Value ($ Thousands) | ||||||
5.200%, 08/15/2019 | $ | 370 | $ | 433 | ||||
4.900%, 08/01/2041 | 48 | 51 | ||||||
1.950%, 08/15/2016 | 950 | 974 | ||||||
DPL | ||||||||
7.250%, 10/15/2021 | 8 | 9 | ||||||
DTE Electric | ||||||||
5.400%, 08/01/2014 | 50 | 53 | ||||||
2.650%, 06/15/2022 | 66 | 65 | ||||||
Duke Energy | ||||||||
3.550%, 09/15/2021 | 722 | 753 | ||||||
1.625%, 08/15/2017 | 1,135 | 1,134 | ||||||
Duke Energy Carolinas | ||||||||
4.250%, 12/15/2041 | 120 | 118 | ||||||
3.900%, 06/15/2021 | 200 | 220 | ||||||
Duke Energy Carolinas LLC | ||||||||
6.000%, 01/15/2038 | 48 | 60 | ||||||
5.100%, 04/15/2018 | 385 | 448 | ||||||
4.300%, 06/15/2020 | 195 | 220 | ||||||
Duke Energy Florida | ||||||||
3.850%, 11/15/2042 | 4,160 | 3,853 | ||||||
Duke Energy Indiana | ||||||||
4.200%, 03/15/2042 | 1,595 | 1,547 | ||||||
3.750%, 07/15/2020 | 180 | 195 | ||||||
Duke Energy Progress | ||||||||
5.300%, 01/15/2019 | 400 | 474 | ||||||
5.125%, 09/15/2013 | 790 | 801 | ||||||
4.100%, 05/15/2042 | 935 | 902 | ||||||
3.000%, 09/15/2021 | 111 | 114 | ||||||
2.800%, 05/15/2022 | 121 | 121 | ||||||
Electricite de France | ||||||||
4.600%, 01/27/2020 (B) | 690 | 767 | ||||||
Enel Finance International | ||||||||
5.125%, 10/07/2019 (B) | 500 | 541 | ||||||
Entergy Louisiana LLC | ||||||||
6.500%, 09/01/2018 | 500 | 598 | ||||||
Exelon | ||||||||
5.625%, 06/15/2035 | 2,225 | 2,433 | ||||||
Exelon Generation | ||||||||
5.750%, 10/01/2041 | 86 | 93 | ||||||
4.000%, 10/01/2020 | 588 | 614 | ||||||
FirstEnergy | ||||||||
4.250%, 03/15/2023 | 1,640 | 1,617 | ||||||
2.750%, 03/15/2018 | 650 | 651 | ||||||
FirstEnergy, Ser C | ||||||||
7.375%, 11/15/2031 | 3,765 | 4,250 | ||||||
Florida Gas Transmission LLC | ||||||||
3.875%, 07/15/2022 (B) | 3,600 | 3,761 | ||||||
Florida Power & Light | ||||||||
5.950%, 10/01/2033 | 150 | 189 | ||||||
5.125%, 06/01/2041 | 197 | 229 | ||||||
Georgia Power | ||||||||
4.300%, 03/15/2043 | 785 | 764 | ||||||
Great Plains Energy | ||||||||
4.850%, 06/01/2021 | 27 | 30 | ||||||
| SEI Institutional Investments Trust / Annual Report / May 31, 2013 | 115 |
Table of Contents
SCHEDULE OF INVESTMENTS
Core Fixed Income Fund (Continued)
May 31, 2013
| Description | Face Amount ($ Thousands) | Market Value ($ Thousands) | ||||||
Indiana Michigan Power | ||||||||
7.000%, 03/15/2019 | $ | 170 | $ | 210 | ||||
Jersey Central Power & Light | ||||||||
7.350%, 02/01/2019 | 500 | 622 | ||||||
John Sevier Combined Cycle Generation | ||||||||
4.626%, 01/15/2042 | 253 | 276 | ||||||
Kansas City Power & Light | ||||||||
5.300%, 10/01/2041 | 350 | 377 | ||||||
KCP&L Greater Missouri Operations | ||||||||
8.270%, 11/15/2021 | 2,894 | 3,526 | ||||||
Massachusetts Electric | ||||||||
5.900%, 11/15/2039 (B) | 210 | 255 | ||||||
Metropolitan Edison | ||||||||
3.500%, 03/15/2023 (B) | 5,050 | 5,025 | ||||||
MidAmerican Energy | ||||||||
5.300%, 03/15/2018 | 750 | 876 | ||||||
MidAmerican Energy Holdings | ||||||||
6.500%, 09/15/2037 | 3,200 | 4,059 | ||||||
Mirant Mid Atlantic Pass-Through Trust | ||||||||
10.060%, 12/30/2028 | 229 | 258 | ||||||
Nevada Power | ||||||||
7.125%, 03/15/2019 | 400 | 506 | ||||||
6.500%, 08/01/2018 | 290 | 357 | ||||||
5.450%, 05/15/2041 | 150 | 177 | ||||||
5.375%, 09/15/2040 | 45 | 52 | ||||||
NextEra Energy Capital Holdings | ||||||||
5.350%, 06/15/2013 | 125 | 125 | ||||||
Niagara Mohawk Power | ||||||||
4.881%, 08/15/2019 (B) | 180 | 205 | ||||||
4.119%, 11/28/2042 (B) | 895 | 849 | ||||||
Nisource Finance | ||||||||
6.800%, 01/15/2019 (C) | 3,747 | 4,523 | ||||||
5.800%, 02/01/2042 | 471 | 521 | ||||||
Northern States Power | ||||||||
6.250%, 06/01/2036 | 350 | 457 | ||||||
5.350%, 11/01/2039 | 56 | 67 | ||||||
2.600%, 05/15/2023 | 1,195 | 1,168 | ||||||
Oncor Electric Delivery | ||||||||
6.800%, 09/01/2018 | 4,660 | 5,750 | ||||||
4.550%, 12/01/2041 | 1,500 | 1,513 | ||||||
Pacific Gas & Electric | ||||||||
8.250%, 10/15/2018 | 1,570 | 2,068 | ||||||
5.800%, 03/01/2037 | 750 | 896 | ||||||
5.400%, 01/15/2040 | 156 | 178 | ||||||
4.500%, 12/15/2041 | 180 | 183 | ||||||
4.450%, 04/15/2042 | 2,443 | 2,453 | ||||||
3.250%, 09/15/2021 | 35 | 36 | ||||||
PacifiCorp | ||||||||
6.250%, 10/15/2037 | 310 | 400 | ||||||
5.650%, 07/15/2018 | 600 | 716 | ||||||
5.500%, 01/15/2019 | 400 | 477 | ||||||
| Description | Face Amount ($ Thousands) | Market Value ($ Thousands) | ||||||
PG&E | ||||||||
5.750%, 04/01/2014 | $ | 80 | $ | 83 | ||||
Potomac Electric Power | ||||||||
4.150%, 03/15/2043 | 785 | 784 | ||||||
PPL Capital Funding | ||||||||
4.700%, 06/01/2043 | 1,345 | 1,290 | ||||||
4.200%, 06/15/2022 | 780 | 812 | ||||||
3.400%, 06/01/2023 | 995 | 975 | ||||||
PPL Energy Supply | ||||||||
4.600%, 12/15/2021 | 230 | 243 | ||||||
Progress Energy | ||||||||
6.000%, 12/01/2039 | 200 | 239 | ||||||
3.150%, 04/01/2022 | 809 | 807 | ||||||
PSEG Power | ||||||||
5.125%, 04/15/2020 | 120 | 134 | ||||||
4.150%, 09/15/2021 | 72 | 76 | ||||||
PSEG Power LLC | ||||||||
5.500%, 12/01/2015 | 445 | 492 | ||||||
5.320%, 09/15/2016 | 126 | 141 | ||||||
2.750%, 09/15/2016 | 1,055 | 1,093 | ||||||
Public Service Electric & Gas | ||||||||
5.375%, 11/01/2039 | 97 | 116 | ||||||
3.650%, 09/01/2042 | 113 | 104 | ||||||
2.700%, 05/01/2015 | 135 | 140 | ||||||
Public Service of New Mexico | ||||||||
7.950%, 05/15/2018 | 3,000 | 3,688 | ||||||
Public Service of Oklahoma | ||||||||
5.150%, 12/01/2019 | 220 | 252 | ||||||
Sabine Pass LNG | ||||||||
7.500%, 11/30/2016 | 710 | 792 | ||||||
7.500%, 11/30/2016 (B) | 230 | 245 | ||||||
San Diego Gas & Electric | ||||||||
6.000%, 06/01/2026 | 400 | 512 | ||||||
3.950%, 11/15/2041 | 41 | 40 | ||||||
Sempra Energy | ||||||||
9.800%, 02/15/2019 | 100 | 138 | ||||||
8.900%, 11/15/2013 | 400 | 415 | ||||||
6.500%, 06/01/2016 | 135 | 156 | ||||||
6.000%, 10/15/2039 | 170 | 205 | ||||||
2.875%, 10/01/2022 | 140 | 137 | ||||||
2.000%, 03/15/2014 | 234 | 236 | ||||||
Sierra Pacific Power | ||||||||
5.450%, 09/01/2013 | 500 | 506 | ||||||
Southern | ||||||||
4.150%, 05/15/2014 | 85 | 88 | ||||||
1.950%, 09/01/2016 | 130 | 134 | ||||||
Southern California Edison | ||||||||
6.650%, 04/01/2029 | 200 | 259 | ||||||
5.500%, 03/15/2040 | 170 | 204 | ||||||
4.650%, 04/01/2015 | 200 | 215 | ||||||
Southern Power | ||||||||
5.150%, 09/15/2041 | 44 | 48 | ||||||
Southern Star Central Gas Pipeline | ||||||||
6.000%, 06/01/2016 (B) | 655 | 719 | ||||||
| 116 | SEI Institutional Investments Trust / Annual Report / May 31, 2013 |
Table of Contents
| Description | Face Amount ($ Thousands) | Market Value ($ Thousands) | ||||||
Southern Union | ||||||||
8.250%, 11/15/2029 | $ | 4,295 | $ | 5,468 | ||||
3.292%, 11/01/2066 (A) | 485 | 444 | ||||||
Southwestern Electric Power | ||||||||
6.450%, 01/15/2019 | 672 | 809 | ||||||
3.550%, 02/15/2022 | 1,550 | 1,587 | ||||||
Southwestern Public Service | ||||||||
8.750%, 12/01/2018 | 300 | 394 | ||||||
Texas-New Mexico Power | ||||||||
6.950%, 04/01/2043 (B) | 1,487 | 1,961 | ||||||
Virginia Electric and Power | ||||||||
5.400%, 04/30/2018 | 695 | 820 | ||||||
2.950%, 01/15/2022 | 1,470 | 1,509 | ||||||
Wisconsin Electric Power | ||||||||
3.650%, 12/15/2042 | 183 | 170 | ||||||
2.950%, 09/15/2021 | 14 | 14 | ||||||
|
| |||||||
| 121,237 | ||||||||
|
| |||||||
Total Corporate Obligations |
| 1,688,254 | ||||||
|
| |||||||
ASSET-BACKED SECURITIES — 9.9% |
| |||||||
Automotive — 2.0% | ||||||||
Ally Auto Receivables Trust, | ||||||||
2.090%, 05/15/2015 | 674 | 678 | ||||||
Ally Auto Receivables Trust, | ||||||||
1.550%, 08/17/2015 | 357 | 359 | ||||||
Ally Auto Receivables Trust, | ||||||||
0.910%, 11/17/2014 | 48 | 48 | ||||||
Ally Auto Receivables Trust, | ||||||||
1.350%, 12/15/2015 | 2,758 | 2,775 | ||||||
Ally Auto Receivables Trust, | ||||||||
1.750%, 03/15/2016 | 5,646 | 5,701 | ||||||
Ally Auto Receivables Trust, | ||||||||
1.380%, 01/15/2015 | 71 | 71 | ||||||
Ally Auto Receivables Trust, | ||||||||
2.230%, 03/15/2016 | 6,948 | 7,054 | ||||||
Ally Auto Receivables Trust, | ||||||||
0.710%, 09/15/2014 | 505 | 506 | ||||||
Ally Auto Receivables Trust, | ||||||||
0.930%, 02/16/2016 | 355 | 356 | ||||||
Ally Auto Receivables Trust, | ||||||||
0.480%, 05/15/2015 | 5,872 | 5,874 | ||||||
| Description | Face Amount ($ Thousands) | Market Value ($ Thousands) | ||||||
Ally Auto Receivables Trust, | ||||||||
0.450%, 07/15/2015 | $ | 10,085 | $ | 10,088 | ||||
Ally Auto Receivables Trust, | ||||||||
0.630%, 05/15/2017 | 3,215 | 3,210 | ||||||
Ally Auto Receivables Trust, | ||||||||
0.840%, 02/15/2018 | 3,399 | 3,378 | ||||||
Ally Master Owner Trust, | ||||||||
1.810%, 05/15/2016 | 5,738 | 5,805 | ||||||
Ally Master Owner Trust, | ||||||||
1.440%, 02/15/2017 | 1,960 | 1,982 | ||||||
American Credit Acceptance Receivables Trust, | ||||||||
3.040%, 10/15/2015 (B) | 131 | 132 | ||||||
American Credit Acceptance Receivables Trust, | ||||||||
1.890%, 07/15/2016 (B) | 663 | 667 | ||||||
American Credit Acceptance Receivables Trust, | ||||||||
1.640%, 11/15/2016 (B) | 639 | 639 | ||||||
AmeriCredit Automobile Receivables Trust, | ||||||||
1.140%, 04/08/2015 | 74 | 74 | ||||||
AmeriCredit Automobile Receivables Trust, | ||||||||
1.270%, 04/08/2015 | 39 | 39 | ||||||
AmeriCredit Automobile Receivables Trust, | ||||||||
1.390%, 09/08/2015 | 86 | 87 | ||||||
AmeriCredit Automobile Receivables Trust, | ||||||||
0.910%, 10/08/2015 | 122 | 123 | ||||||
AmeriCredit Automobile Receivables Trust, | ||||||||
0.710%, 12/08/2015 | 347 | 348 | ||||||
AmeriCredit Automobile Receivables Trust, | ||||||||
0.960%, 01/09/2017 | 299 | 300 | ||||||
AmeriCredit Automobile Receivables Trust, | ||||||||
0.490%, 04/08/2016 | 3,089 | 3,089 | ||||||
| SEI Institutional Investments Trust / Annual Report / May 31, 2013 | 117 |
Table of Contents
SCHEDULE OF INVESTMENTS
Core Fixed Income Fund (Continued)
May 31, 2013
| Description | Face Amount ($ Thousands) | Market Value ($ Thousands) | ||||||
AmeriCredit Automobile Receivables Trust, | ||||||||
0.670%, 06/08/2017 | $ | 2,170 | $ | 2,170 | ||||
AmeriCredit Automobile Receivables Trust, | ||||||||
0.510%, 01/08/2016 | 700 | 700 | ||||||
AmeriCredit Automobile Receivables Trust, | ||||||||
0.620%, 06/08/2017 | 232 | 232 | ||||||
Avis Budget Rental Car Funding LLC, Ser 2010-5A, Cl A | ||||||||
3.150%, 03/20/2017 (B) | 440 | 462 | ||||||
Avis Budget Rental Car Funding LLC, Ser 2012-2A, Cl A | ||||||||
2.802%, 05/20/2018 (B) | 1,050 | 1,098 | ||||||
Avis Budget Rental Car Funding LLC, Ser 2013-1A, Cl A | ||||||||
1.920%, 09/20/2019 (B) | 900 | 899 | ||||||
Avis Budget Rental Car Funding, | ||||||||
2.100%, 03/20/2019 (B) | 1,700 | 1,718 | ||||||
Bank of America Auto Trust, | ||||||||
2.180%, 02/15/2017 (B) | 61 | 61 | ||||||
Bank of America Auto Trust, | ||||||||
1.940%, 06/15/2017 | 968 | 974 | ||||||
BMW Vehicle Lease Trust, | ||||||||
0.750%, 02/20/2015 | 342 | 343 | ||||||
California Republic Auto Receivables Trust, | ||||||||
1.180%, 08/15/2017 (B) | 829 | 828 | ||||||
Capital Auto Receivables Asset Trust, Ser 2013-1, Cl A3 | ||||||||
0.790%, 06/20/2017 | 4,777 | 4,767 | ||||||
CarMax Auto Owner Trust, | ||||||||
1.380%, 09/15/2015 | 223 | 223 | ||||||
CarMax Auto Owner Trust, | ||||||||
2.290%, 09/15/2016 | 530 | 540 | ||||||
CarNow Auto Receivables Trust, | ||||||||
2.090%, 01/15/2015 (B) | 49 | 49 | ||||||
CPS Auto Trust, | ||||||||
3.680%, 09/17/2018 (B) | 339 | 348 | ||||||
CPS Auto Trust, | ||||||||
4.210%, 03/15/2019 (B) | 343 | 356 | ||||||
| Description | Face Amount ($ Thousands) | Market Value ($ Thousands) | ||||||
CPS Auto Trust, | ||||||||
2.780%, 06/17/2019 (B) | $ | 151 | $ | 154 | ||||
CPS Auto Trust, | ||||||||
3.090%, 09/16/2019 (B) | 900 | 911 | ||||||
CPS Auto Trust, | ||||||||
1.820%, 12/16/2019 (B) | 588 | 592 | ||||||
CPS Auto Trust, | ||||||||
1.480%, 03/16/2020 (B) | 398 | 399 | ||||||
Credit Acceptance Auto Loan Trust, Ser 2012-2A, Cl A | ||||||||
1.520%, 03/16/2020 (B) | 605 | 608 | ||||||
DT Auto Owner Trust, | ||||||||
0.910%, 11/16/2015 (B) | 178 | 178 | ||||||
Exeter Automobile Receivables Trust, Ser 2012-2A, Cl A | ||||||||
1.300%, 06/15/2017 (B) | 513 | 516 | ||||||
First Investors Auto Owner Trust, | ||||||||
1.470%, 05/15/2018 (B) | 499 | 503 | ||||||
First Investors Auto Owner Trust, | ||||||||
0.900%, 10/15/2018 (B) | 200 | 200 | ||||||
Ford Credit Auto Owner Trust, | ||||||||
0.840%, 08/15/2016 | 351 | 352 | ||||||
Ford Credit Auto Owner Trust, | ||||||||
0.570%, 01/15/2015 | 2,373 | 2,374 | ||||||
Ford Credit Auto Owner Trust, | ||||||||
0.470%, 04/15/2015 | 944 | 945 | ||||||
Ford Credit Auto Owner Trust, | ||||||||
0.380%, 02/15/2016 | 840 | 840 | ||||||
Ford Credit Floorplan Master Owner Trust, Ser 2012-4, Cl A1 | ||||||||
0.740%, 09/15/2016 | 4,875 | 4,887 | ||||||
Harley-Davidson Motorcycle Trust, Ser 2010-1, Cl A3 | ||||||||
1.160%, 02/15/2015 | 2 | 2 | ||||||
Hertz Vehicle Financing LLC, | ||||||||
5.290%, 03/25/2016 (B) | 700 | 749 | ||||||
Hertz Vehicle Financing LLC, | ||||||||
1.830%, 08/25/2019 (B) | 1,300 | 1,295 | ||||||
Honda Auto Receivables Owner Trust, Ser 2010-2, Cl A4 | ||||||||
1.930%, 08/18/2016 | 1,211 | 1,213 | ||||||
| 118 | SEI Institutional Investments Trust / Annual Report / May 31, 2013 |
Table of Contents
| Description | Face Amount ($ Thousands) | Market Value ($ Thousands) | ||||||
Honda Auto Receivables Owner Trust, Ser 2010-3, Cl A4 | ||||||||
0.940%, 12/21/2016 | $ | 4,914 | $ | 4,921 | ||||
Honda Auto Receivables Owner Trust, Ser 2012-1, Cl A3 | ||||||||
0.770%, 01/15/2016 | 108 | 108 | ||||||
Honda Auto Receivables Owner Trust, Ser 2012-1, Cl A4 | ||||||||
0.970%, 04/16/2018 | 56 | 56 | ||||||
Honda Auto Receivables Owner Trust, Ser 2012-3, Cl A2 | ||||||||
0.460%, 12/15/2014 | 2,199 | 2,200 | ||||||
Honda Auto Receivables Owner Trust, Ser 2013-1, Cl A2 | ||||||||
0.350%, 06/22/2015 | 6,410 | 6,410 | ||||||
Huntington Auto Trust, | ||||||||
0.810%, 09/15/2016 | 193 | 194 | ||||||
Hyundai Auto Receivables Trust, Ser 2010-B, Cl A3 | ||||||||
0.970%, 04/15/2015 | 84 | 84 | ||||||
Hyundai Auto Receivables Trust, Ser 2011-A, Cl A3 | ||||||||
1.160%, 04/15/2015 | 144 | 145 | ||||||
Hyundai Auto Receivables Trust, Ser 2011-A, Cl A4 | ||||||||
1.780%, 12/15/2015 | 365 | 370 | ||||||
Hyundai Auto Receivables Trust, Ser 2011-B, Cl A4 | ||||||||
1.650%, 02/15/2017 | 288 | 292 | ||||||
LAI Vehicle Lease Securitization Trust, Ser 2010-A, Cl A | ||||||||
2.550%, 09/15/2016 (B) | 75 | 75 | ||||||
Mercedes-Benz Auto Receivables Trust, Ser 2011-1, Cl A3 | ||||||||
0.850%, 03/16/2015 | 1,681 | 1,684 | ||||||
MMCA Automobile Trust, | ||||||||
2.020%, 10/17/2016 (B) | 1,097 | 1,108 | ||||||
MMCA Automobile Trust, | ||||||||
1.890%, 08/15/2017 (B) | 700 | 706 | ||||||
Nissan Auto Receivables Owner Trust, Ser 2010-A, Cl A3 | ||||||||
0.870%, 07/15/2014 | 49 | 49 | ||||||
Nissan Auto Receivables Owner Trust, Ser 2011-A, Cl A3 | ||||||||
1.180%, 02/16/2015 | 881 | 883 | ||||||
Nissan Auto Receivables Owner Trust, Ser 2012-B, Cl A2 | ||||||||
0.390%, 04/15/2015 | 1,059 | 1,060 | ||||||
Santander Drive Auto Receivables Trust, Ser 2010-A, Cl A4 | ||||||||
2.390%, 06/15/2017 (B) | 400 | 406 | ||||||
| Description | Face Amount ($ Thousands) | Market Value ($ Thousands) | ||||||
Santander Drive Auto Receivables Trust, Ser 2011-2, Cl A3 | ||||||||
1.290%, 02/16/2015 | $ | 468 | $ | 469 | ||||
Santander Drive Auto Receivables Trust, Ser 2011-S2A, Cl B | ||||||||
2.060%, 06/15/2017 (B) | 78 | 78 | ||||||
Santander Drive Auto Receivables Trust, Ser 2011-S2A, Cl D | ||||||||
3.350%, 06/15/2017 (B) | 105 | 106 | ||||||
Santander Drive Auto Receivables Trust, Ser 2012-1, Cl A2 | ||||||||
1.250%, 04/15/2015 | 154 | 154 | ||||||
Santander Drive Auto Receivables Trust, Ser 2012-2, Cl A2 | ||||||||
0.910%, 05/15/2015 | 109 | 109 | ||||||
Santander Drive Auto Receivables Trust, Ser 2012-2, Cl A3 | ||||||||
1.220%, 12/15/2015 | 133 | 134 | ||||||
Santander Drive Auto Receivables Trust, Ser 2012-3, Cl A2 | ||||||||
0.830%, 04/15/2015 | 1,547 | 1,548 | ||||||
Santander Drive Auto Receivables Trust, Ser 2012-3, Cl A3 | ||||||||
1.080%, 04/15/2016 | 165 | 166 | ||||||
Santander Drive Auto Receivables Trust, Ser 2012-5, Cl A2 | ||||||||
0.570%, 12/15/2015 | 1,595 | 1,595 | ||||||
Santander Drive Auto Receivables Trust, Ser 2012-5, Cl A3 | ||||||||
0.830%, 12/15/2016 | 1,331 | 1,335 | ||||||
Santander Drive Auto Receivables Trust, Ser 2012-6, Cl A2 | ||||||||
0.470%, 09/15/2015 | 2,000 | 2,000 | ||||||
Santander Drive Auto Receivables Trust, Ser 2012-6, Cl A3 | ||||||||
0.620%, 07/15/2016 | 1,663 | 1,664 | ||||||
Santander Drive Auto Receivables Trust, Ser 2013-2, Cl A3 | ||||||||
0.700%, 09/15/2017 | 5,911 | 5,907 | ||||||
Santander Drive Auto Receivables Trust, Ser 2013-3, Cl A2 | ||||||||
0.550%, 09/15/2016 | 5,757 | 5,757 | ||||||
SNAAC Auto Receivables Trust, | ||||||||
1.780%, 06/15/2016 (B) | 117 | 118 | ||||||
Toyota Auto Receivables Owner Trust, Ser 2011-A, Cl A4 | ||||||||
1.560%, 05/15/2015 | 415 | 419 | ||||||
Toyota Auto Receivables Owner Trust, Ser 2012-A, Cl A2 | ||||||||
0.570%, 10/15/2014 | 1,592 | 1,593 | ||||||
United Auto Credit Securitization Trust, Ser 2012-1, Cl A2 | ||||||||
1.100%, 03/16/2015 (B) | 295 | 295 | ||||||
| SEI Institutional Investments Trust / Annual Report / May 31, 2013 | 119 |
Table of Contents
SCHEDULE OF INVESTMENTS
Core Fixed Income Fund (Continued)
May 31, 2013
| Description | Face Amount ($ Thousands) | Market Value ($ Thousands) | ||||||
Volkswagen Auto Lease Trust, | ||||||||
0.870%, 07/20/2015 | $ | 687 | $ | 690 | ||||
Volkswagen Auto Loan Enhanced Trust, Ser 2012-1, Cl A3 | ||||||||
0.850%, 08/22/2016 | 426 | 428 | ||||||
Volkswagen Auto Loan Enhanced Trust, Ser 2012-2, Cl A2 | ||||||||
0.330%, 07/20/2015 | 1,981 | 1,981 | ||||||
Westlake Automobile Receivables Trust, Ser 2011-1A, Cl A3 | ||||||||
1.490%, 06/16/2014 (B) | 45 | 45 | ||||||
World Omni Automobile Lease Securitization Trust, | ||||||||
0.710%, 01/15/2015 | 159 | 159 | ||||||
World Omni Automobile Lease Securitization Trust, | ||||||||
0.930%, 11/16/2015 | 181 | 182 | ||||||
|
| |||||||
| 133,552 | ||||||||
|
| |||||||
Credit Cards — 0.9% | ||||||||
American Express Credit Account Master Trust, Ser 2009-2, Cl A | ||||||||
1.449%, 03/15/2017 (A) | 1,127 | 1,143 | ||||||
American Express Credit Account Master Trust, Ser 2012-4, Cl A | ||||||||
0.439%, 05/15/2020 (A) | 5,180 | 5,178 | ||||||
American Express Issuance | ||||||||
0.479%, 02/15/2019 (A) | 4,381 | 4,382 | ||||||
Bank of America Credit Card Trust, Ser 2007-A6, Cl A6 | ||||||||
0.259%, 09/15/2016 (A) | 9,714 | 9,716 | ||||||
Chase Issuance Trust, | ||||||||
1.780%, 09/15/2015 (A) | 5,921 | 5,948 | ||||||
Chase Issuance Trust, | ||||||||
0.299%, 05/16/2016 (A) | 4,159 | 4,159 | ||||||
Chase Issuance Trust, | ||||||||
0.459%, 12/16/2019 (A) | 1,239 | 1,239 | ||||||
Chase Issuance Trust, | ||||||||
0.329%, 08/15/2017 (A) | 8,308 | 8,308 | ||||||
Chase Issuance Trust, | ||||||||
0.540%, 10/16/2017 | 2,377 | 2,370 | ||||||
Chase Issuance Trust, | ||||||||
0.479%, 04/15/2020 (A) | 4,041 | 4,041 | ||||||
| Description | Face Amount ($ Thousands) | Market Value ($ Thousands) | ||||||
Discover Card Execution Note Trust, Ser 2013-A1, Cl A1 | ||||||||
0.499%, 08/17/2020 (A) | $ | 1,768 | $ | 1,764 | ||||
GE Capital Credit Card Master Note Trust, Ser 2011-1, Cl A | ||||||||
0.749%, 01/17/2017 (A) | 1,756 | 1,761 | ||||||
MBNA Credit Card Master Note Trust, Ser 2003-A10, Cl A10 | ||||||||
0.459%, 03/15/2016 (A) | 2,336 | 2,338 | ||||||
World Financial Network Credit Card Master Trust, | ||||||||
0.910%, 03/16/2020 | 4,088 | 4,088 | ||||||
|
| |||||||
| 56,435 | ||||||||
|
| |||||||
Mortgage Related Securities — 1.0% |
| |||||||
Aames Mortgage Trust, | ||||||||
6.531%, 06/25/2032 | 46 | 45 | ||||||
Accredited Mortgage Loan Trust, Ser 2005-3, Cl A2D | ||||||||
0.560%, 09/25/2035 (A) | 1,200 | 1,186 | ||||||
AFC Home Equity Loan Trust, | ||||||||
0.433%, 03/25/2030 (A) | 1,865 | 1,073 | ||||||
Argent Securities, | ||||||||
0.713%, 04/25/2034 (A) | 1,113 | 1,114 | ||||||
Asset-Backed Funding Certificates, | ||||||||
5.010%, 06/25/2035 | 597 | 604 | ||||||
Asset-Backed Funding Certificates, | ||||||||
0.853%, 06/25/2035 (A) | 59 | 58 | ||||||
Asset-Backed Securities Home Equity Loan Trust, | ||||||||
1.174%, 12/15/2033 (A) | 2,714 | 2,563 | ||||||
Asset-Backed Securities Home Equity Loan Trust, | ||||||||
0.703%, 07/25/2035 (A) | 977 | 967 | ||||||
Bear Stearns Asset-Backed Securities Trust, | ||||||||
1.693%, 03/25/2043 (A) | 2,075 | 2,037 | ||||||
Bear Stearns Asset-Backed Securities Trust, | ||||||||
0.583%, 12/25/2035 (A) | 4,488 | 4,360 | ||||||
| 120 | SEI Institutional Investments Trust / Annual Report / May 31, 2013 |
Table of Contents
| Description | Face Amount ($ Thousands) | Market Value ($ Thousands) | ||||||
Bear Stearns Asset-Backed Securities Trust, | ||||||||
0.563%, 08/25/2035 (A) | $ | 5,424 | $ | 5,346 | ||||
Bear Stearns Asset-Backed Securities Trust, | ||||||||
0.413%, 12/25/2035 (A) | 13 | 13 | ||||||
Centex Home Equity, | ||||||||
3.235%, 02/25/2032 | 96 | 95 | ||||||
Centex Home Equity, | ||||||||
3.173%, 06/25/2033 (A) | 65 | 65 | ||||||
Centex Home Equity, | ||||||||
0.443%, 06/25/2036 (A) | 75 | 68 | ||||||
Citicorp Residential Mortgage Securities, | ||||||||
5.775%, 09/25/2036 | 3,949 | 4,016 | ||||||
Citicorp Residential Mortgage Securities, Ser 2007-1, Cl A5 | ||||||||
6.046%, 03/25/2037 | 990 | 927 | ||||||
Conseco Finance Home Loan Trust, Ser 2001-D, Cl A5 | ||||||||
6.690%, 11/15/2032 (A) | 1,247 | 1,252 | ||||||
Contimortgage Home Equity Trust, Ser 1997-2, Cl A9 | ||||||||
7.090%, 04/15/2028 | 1 | 1 | ||||||
Delta Funding Home Equity Loan Trust, Ser 1999-3, Cl A1A | ||||||||
1.019%, 09/15/2029 (A) | 310 | 275 | ||||||
EMC Mortgage Loan Trust, | ||||||||
0.663%, 05/25/2039 (A) (B) | 583 | 543 | ||||||
GSAA Trust, | ||||||||
0.563%, 06/25/2035 (A) | 3,685 | 3,447 | ||||||
Home Equity Asset Trust, | ||||||||
0.303%, 07/25/2037 (A) | 181 | 180 | ||||||
HSBC Home Equity Loan Trust, | ||||||||
0.468%, 01/20/2035 (A) | 3,284 | 3,242 | ||||||
HSBC Home Equity Loan Trust, | ||||||||
0.688%, 01/20/2035 (A) | 349 | 333 | ||||||
HSBC Home Equity Loan Trust, | ||||||||
0.458%, 01/20/2035 (A) | 76 | 75 | ||||||
HSBC Home Equity Loan Trust, | ||||||||
0.358%, 01/20/2036 (A) | 5,445 | 5,340 | ||||||
| Description | Face Amount ($ Thousands) | Market Value ($ Thousands) | ||||||
HSBC Home Equity Loan Trust, | ||||||||
0.378%, 01/20/2036 (A) | $ | 64 | $ | 63 | ||||
HSBC Home Equity Loan Trust, | ||||||||
0.348%, 03/20/2036 (A) | 245 | 243 | ||||||
HSBC Home Equity Loan Trust, | ||||||||
0.348%, 03/20/2036 (A) | 57 | 56 | ||||||
HSBC Home Equity Loan Trust, | ||||||||
5.600%, 03/20/2036 | 35 | 35 | ||||||
HSBC Home Equity Loan Trust, | ||||||||
0.378%, 03/20/2036 (A) | 359 | 359 | ||||||
HSBC Home Equity Loan Trust, | ||||||||
0.398%, 03/20/2036 (A) | 194 | 190 | ||||||
HSBC Home Equity Loan Trust, | ||||||||
0.358%, 07/20/2036 (A) | 9 | 9 | ||||||
HSBC Home Equity Loan Trust, | ||||||||
1.398%, 11/20/2036 (A) | 552 | 551 | ||||||
Lake Country Mortgage | ||||||||
0.543%, 07/25/2034 (A) (B) | 501 | 495 | ||||||
MASTR Asset Backed | ||||||||
0.353%, 08/25/2036 (A) | 1,119 | 514 | ||||||
MASTR Asset-Backed | ||||||||
0.563%, 06/25/2035 (A) | 4,651 | 4,571 | ||||||
Morgan Stanley Mortgage | ||||||||
5.858%, 01/25/2047 | 26 | 19 | ||||||
New Century Home Equity | ||||||||
0.563%, 09/25/2035 (A) | 7,695 | 7,539 | ||||||
Oakwood Mortgage Investors, | ||||||||
6.350%, 03/15/2017 | 6 | 6 | ||||||
Renaissance Home Equity | ||||||||
4.499%, 08/25/2035 | 446 | 448 | ||||||
Residential Asset Securities, | ||||||||
0.563%, 10/25/2035 (A) | 195 | 192 | ||||||
| SEI Institutional Investments Trust / Annual Report / May 31, 2013 | 121 |
Table of Contents
SCHEDULE OF INVESTMENTS
Core Fixed Income Fund (Continued)
May 31, 2013
| Description | Face Amount ($ Thousands) | Market Value ($ Thousands) | ||||||
Residential Funding Mortgage Securities II, | ||||||||
8.290%, 02/25/2025 | $ | 303 | $ | 300 | ||||
RMAT, | ||||||||
2.734%, 08/26/2052 (A) (B) | 799 | 817 | ||||||
Salomon Brothers Mortgage Securities VII, | ||||||||
3.950%, 04/25/2032 (B) | 141 | 139 | ||||||
Saxon Asset Securities Trust, | ||||||||
4.795%, 06/25/2033 | 222 | 226 | ||||||
Security National Mortgage Loan Trust, | ||||||||
0.543%, 04/25/2037 (A) (B) | 626 | 352 | ||||||
Soundview Home Equity Loan Trust, | ||||||||
0.343%, 06/25/2037 (A) | 128 | 73 | ||||||
Structured Asset Securities, | ||||||||
3.450%, 02/25/2032 | 249 | 249 | ||||||
Structured Asset Securities, | ||||||||
4.690%, 02/25/2035 | 934 | 927 | ||||||
Structured Asset Securities, | ||||||||
0.343%, 07/25/2036 (A) | 499 | 488 | ||||||
UCFC Home Equity Loan, | ||||||||
6.905%, 04/15/2030 | 779 | 784 | ||||||
Wells Fargo Home Equity Trust, | ||||||||
5.000%, 10/25/2034 (A) | 5,565 | 5,707 | ||||||
Wells Fargo Home Equity Trust, | ||||||||
0.483%, 08/25/2035 (A) | 12 | 12 | ||||||
|
| |||||||
| 64,589 | ||||||||
|
| |||||||
Other Asset-Backed Securities — 6.0% |
| |||||||
Academic Loan Funding Trust, | ||||||||
0.993%, 12/27/2022 (A) (B) | 364 | 368 | ||||||
Access Group, | ||||||||
0.383%, 08/25/2023 (A) | 2,882 | 2,838 | ||||||
Aircastle Aircraft Lease Backed Trust, | ||||||||
0.508%, 06/14/2037 (A) (B) | 3,563 | 3,305 | ||||||
| Description | Face Amount ($ Thousands) | Market Value ($ Thousands) | ||||||
Ally Master Owner Trust, | ||||||||
2.150%, 01/15/2016 | $ | 3,250 | $ | 3,282 | ||||
Ally Master Owner Trust, | ||||||||
0.999%, 09/15/2016 (A) | 1,603 | 1,614 | ||||||
Ally Master Owner Trust, | ||||||||
0.999%, 02/15/2017 (A) | 4,511 | 4,556 | ||||||
Ally Master Owner Trust, | ||||||||
0.899%, 06/15/2017 (A) | 2,903 | 2,931 | ||||||
Ally Master Owner Trust, | ||||||||
1.540%, 09/15/2019 | 4,175 | 4,161 | ||||||
Alm Loan Funding, | ||||||||
1.696%, 10/19/2024 (A) (B) | 4,350 | 4,368 | ||||||
Ameriquest Mortgage Securities, | ||||||||
0.393%, 08/25/2035 (A) | 22 | 21 | ||||||
Amortizing Residential Collateral Trust CMO, | ||||||||
0.873%, 01/25/2032 (A) | 328 | 303 | ||||||
Apidos CDO II, | ||||||||
2.076%, 12/21/2018 (A) (B) | 1,750 | 1,701 | ||||||
Ascentium Equipment Receivables LLC, | ||||||||
1.830%, 09/15/2019 (B) | 353 | 353 | ||||||
Babcock & Brown Air Funding I, | ||||||||
0.542%, 11/14/2033 (A) (B) | 2,578 | 2,282 | ||||||
Bayview Opportunity Master Fund Trust IIB, | ||||||||
3.475%, 07/28/2032 (A) (B) | 701 | 704 | ||||||
Bayview Opportunity Master Fund Trust IIB, | ||||||||
3.228%, 03/28/2033 (A) (B) | 1,177 | 1,177 | ||||||
Bear Stearns Asset-Backed Securities Trust, | ||||||||
0.593%, 08/25/2043 (A) | 4,600 | 4,516 | ||||||
Brazos Education Loan Authority, | ||||||||
0.893%, 12/26/2035 (A) | 4,920 | 4,933 | ||||||
Brazos Higher Education Authority, | ||||||||
0.294%, 12/26/2024 (A) | 1,183 | 1,165 | ||||||
| 122 | SEI Institutional Investments Trust / Annual Report / May 31, 2013 |
Table of Contents
| Description | Face Amount ($ Thousands) | Market Value ($ Thousands) | ||||||
Brazos Higher Education Authority, | ||||||||
1.473%, 02/25/2035 (A) | $ | 4,835 | $ | 4,952 | ||||
Brazos Higher Education Authority, | ||||||||
1.073%, 02/25/2030 (A) | 3,000 | 3,034 | ||||||
Brazos Higher Education Authority, | ||||||||
1.276%, 10/27/2036 (A) | 3,520 | 3,535 | ||||||
BXG Receivables Note Trust, | ||||||||
2.660%, 12/02/2027 (B) | 431 | 429 | ||||||
Carrington Mortgage Loan Trust, | ||||||||
0.593%, 09/25/2035 (A) | 4,092 | 4,016 | ||||||
Castle Trust, | ||||||||
0.949%, 05/15/2027 (A) (B) | 108 | 102 | ||||||
CenterPoint Energy Transition Bond LLC, | ||||||||
4.192%, 02/01/2020 | 979 | 1,039 | ||||||
Chase Funding Mortgage Loan Asset-Backed Certificates, | ||||||||
4.499%, 11/25/2034 | 216 | 218 | ||||||
Chase Funding Mortgage Loan Asset-Backed Certificates, Ser 2003-6, Cl 1A5 | ||||||||
5.350%, 11/25/2034 | 500 | 494 | ||||||
Chase Funding Mortgage Loan Asset-Backed Certificates, | ||||||||
4.277%, 11/25/2034 | 642 | 648 | ||||||
CIT Education Loan Trust, | ||||||||
0.374%, 03/25/2042 (A) (B) | 3,802 | 3,526 | ||||||
Citicorp Residential Mortgage Securities, | ||||||||
6.036%, 09/25/2036 | 6,465 | 6,165 | ||||||
CNH Equipment Trust, | ||||||||
1.170%, 05/15/2015 | 141 | 141 | ||||||
CNH Equipment Trust, | ||||||||
1.200%, 05/16/2016 | 121 | 121 | ||||||
CNH Equipment Trust, | ||||||||
2.040%, 10/17/2016 | 213 | 217 | ||||||
| Description | Face Amount ($ Thousands) | Market Value ($ Thousands) | ||||||
CNH Equipment Trust, | ||||||||
0.650%, 07/15/2015 | $ | 14 | $ | 14 | ||||
CNH Equipment Trust, | ||||||||
0.940%, 05/15/2017 | 263 | 264 | ||||||
CNH Equipment Trust, | ||||||||
0.440%, 02/16/2016 | 1,187 | 1,187 | ||||||
Concord Funding LLC, | ||||||||
3.145%, 01/15/2017 (B) | 1,350 | 1,350 | ||||||
Conseco Finance Home | ||||||||
8.130%, 08/15/2031 (A) | 635 | 624 | ||||||
Conseco Financial, | ||||||||
7.240%, 06/15/2028 (A) | 15 | 16 | ||||||
Conseco Financial, | ||||||||
6.240%, 12/01/2028 (A) | 114 | 118 | ||||||
Countrywide Asset-Backed Certificates, | ||||||||
0.853%, 04/25/2032 (A) | 53 | 36 | ||||||
Countrywide Asset-Backed Certificates, | ||||||||
0.793%, 06/25/2033 (A) | 115 | 112 | ||||||
Countrywide Asset-Backed Certificates, | ||||||||
0.663%, 02/25/2036 (A) | 8,230 | 8,013 | ||||||
Countrywide Asset-Backed Certificates, | ||||||||
0.653%, 10/25/2035 (A) | 194 | 194 | ||||||
Countrywide Asset-Backed Certificates, | ||||||||
5.602%, 10/25/2046 (A) | 208 | 187 | ||||||
Countrywide Asset-Backed Certificates, | ||||||||
0.523%, 07/25/2036 (A) (B) | 346 | 247 | ||||||
Countrywide Asset-Backed Certificates, | ||||||||
1.093%, 10/25/2047 (A) | 97 | 83 | ||||||
Countrywide Asset-Backed Certificates, | ||||||||
0.393%, 02/25/2037 (A) (B) | 855 | 544 | ||||||
| SEI Institutional Investments Trust / Annual Report / May 31, 2013 | 123 |
Table of Contents
SCHEDULE OF INVESTMENTS
Core Fixed Income Fund (Continued)
May 31, 2013
| Description | Face Amount ($ Thousands) | Market Value ($ Thousands) | ||||||
Countrywide Asset-Backed Certificates, | ||||||||
0.643%, 03/25/2047 (A) (B) | $ | 664 | $ | 361 | ||||
Countrywide Home Equity | ||||||||
0.499%, 02/15/2034 (A) | 567 | 479 | ||||||
Credit Suisse First Boston Mortgage Securities, | ||||||||
5.600%, 09/25/2031 | 153 | 155 | ||||||
Credit-Based Asset Servicing and Securitization LLC, | ||||||||
3.379%, 12/25/2032 | 89 | 87 | ||||||
Credit-Based Asset Servicing and Securitization LLC, | ||||||||
4.123%, 12/25/2036 | 561 | 388 | ||||||
Credit-Based Asset Servicing and Securitization LLC, | ||||||||
4.123%, 12/25/2036 | 1,359 | 1,116 | ||||||
Credit-Based Asset Servicing and Securitization LLC, | ||||||||
0.503%, 05/25/2046 (A) (B) | 10,488 | 7,833 | ||||||
Educational Funding of the South, | ||||||||
0.926%, 04/25/2035 (A) | 3,580 | 3,589 | ||||||
EFS Volunteer No. 2 LLC, | ||||||||
1.554%, 03/25/2036 (A) (B) | 2,500 | 2,548 | ||||||
EFS Volunteer No. 3 LLC, | ||||||||
1.200%, 04/25/2033 (A) (B) | 4,600 | 4,622 | ||||||
Equity One Mortgage | ||||||||
5.050%, 09/25/2033 (A) | 165 | 166 | ||||||
First Franklin Mortgage Loan Asset-Backed Certificates, Ser 2004-FF7, Cl A5 | ||||||||
1.193%, 09/25/2034 (A) | 66 | 64 | ||||||
First Franklin Mortgage Loan Asset-Backed Certificates, Ser 2005-FF8, Cl A2D | ||||||||
0.573%, 09/25/2035 (A) | 3,571 | 3,524 | ||||||
Ford Credit Floorplan Master Owner Trust, | ||||||||
2.120%, 02/15/2016 | 2,675 | 2,706 | ||||||
| Description | Face Amount ($ Thousands) | Market Value ($ Thousands) | ||||||
GE Equipment Midticket LLC, | ||||||||
0.470%, 01/22/2015 | $ | 507 | $ | 507 | ||||
GE Equipment Midticket LLC, | ||||||||
0.600%, 05/23/2016 | 1,000 | 1,000 | ||||||
GE Equipment Midticket LLC, | ||||||||
0.780%, 09/22/2020 | 300 | 300 | ||||||
GE Equipment Transportation LLC, | ||||||||
0.470%, 04/24/2015 | 604 | 604 | ||||||
GE Seaco Finance, | ||||||||
0.448%, 11/17/2020 (A) (B) | 3,450 | 3,406 | ||||||
Green Tree Financial, | ||||||||
7.750%, 07/15/2027 | 116 | 117 | ||||||
Green Tree Financial, | ||||||||
8.970%, 04/25/2038 (A) (B) | 4,111 | 4,576 | ||||||
Green Tree Financial, | ||||||||
8.970%, 04/25/2038 (A) (B) | 3,426 | 3,813 | ||||||
Greenpoint Manufactured Housing, | ||||||||
3.700%, 02/20/2032 (A) | 875 | 787 | ||||||
Greenpoint Manufactured Housing, | ||||||||
3.700%, 03/13/2032 (A) | 1,425 | 1,254 | ||||||
HLSS Servicer Advance Receivables Backed Notes, | ||||||||
1.340%, 10/15/2043 (B) | 927 | 929 | ||||||
HLSS Servicer Advance Receivables Backed Notes, | ||||||||
1.990%, 10/15/2045 (B) | 730 | 744 | ||||||
HLSS Servicer Advance Receivables Backed Notes, | ||||||||
0.898%, 01/15/2044 (B) | 643 | 643 | ||||||
HLSS Servicer Advance Receivables Backed Notes, | ||||||||
1.495%, 01/16/2046 (B) | 539 | 543 | ||||||
HLSS Servicer Advance Receivables Backed Notes, | ||||||||
1.744%, 01/16/2046 (B) | 182 | 183 | ||||||
| 124 | SEI Institutional Investments Trust / Annual Report / May 31, 2013 |
Table of Contents
| Description | Face Amount ($ Thousands) | Market Value ($ Thousands) | ||||||
John Deere Owner Trust, | ||||||||
1.290%, 01/15/2016 | $ | 159 | $ | 159 | ||||
John Deere Owner Trust, | ||||||||
1.960%, 04/16/2018 | 285 | 289 | ||||||
John Deere Owner Trust, | ||||||||
0.430%, 02/17/2015 | 450 | 450 | ||||||
John Deere Owner Trust, | ||||||||
0.690%, 01/15/2019 | 581 | 580 | ||||||
JPMorgan Mortgage Acquisition, | ||||||||
0.323%, 11/25/2036 (A) | 5,385 | 5,283 | ||||||
KeyCorp Student Loan Trust, | ||||||||
0.536%, 10/25/2032 (A) | 2,058 | 2,036 | ||||||
Latitude CLO II, | ||||||||
0.610%, 12/15/2018 (A) (B) | 2,200 | 2,138 | ||||||
Lehman ABS Manufactured Housing Contract Trust, Ser 2001-B, Cl A4 | ||||||||
5.270%, 04/15/2040 | 310 | 334 | ||||||
Lehman XS Trust, | ||||||||
0.453%, 11/25/2035 (A) | 59 | 59 | ||||||
Lehman XS Trust, | ||||||||
0.493%, 12/25/2035 (A) | 2,019 | 903 | ||||||
Long Beach Mortgage Loan Trust, | ||||||||
0.988%, 02/25/2035 (A) | 8,900 | 8,574 | ||||||
Macquarie Equipment | ||||||||
0.610%, 04/20/2015 (B) | 2,000 | 2,002 | ||||||
Madison Avenue Manufactured Housing Contract, | ||||||||
2.443%, 03/25/2032 (A) | 327 | 329 | ||||||
Merrill Lynch First Franklin Mortgage Loan Trust, | ||||||||
0.373%, 06/25/2037 (A) | 104 | 64 | ||||||
Mid-State Trust, | ||||||||
4.864%, 07/15/2038 | 3,174 | 3,391 | ||||||
Mid-State Trust, | ||||||||
6.005%, 08/15/2037 | 493 | 559 | ||||||
Mid-State Trust, | ||||||||
5.787%, 10/15/2040 (B) | 5,583 | 5,918 | ||||||
| Description | Face Amount ($ Thousands) | Market Value ($ Thousands) | ||||||
Nationstar Agency Advance Funding Trust, | ||||||||
0.997%, 02/15/2045 (B) | $ | 337 | $ | 337 | ||||
Nationstar Agency Advance Funding Trust, | ||||||||
1.892%, 02/18/2048 (B) | 132 | 132 | ||||||
Nelnet Student Loan Trust, | ||||||||
0.386%, 10/25/2033 (A) | 5,802 | 5,607 | ||||||
Nelnet Student Loan Trust, | ||||||||
0.384%, 03/23/2037 (A) | 1,112 | 1,073 | ||||||
Nelnet Student Loan Trust, | ||||||||
0.404%, 12/24/2035 (A) | 4,000 | 3,929 | ||||||
Nelnet Student Loan Trust, | ||||||||
0.364%, 11/23/2022 (A) | 5,390 | 5,378 | ||||||
Nelnet Student Loan Trust, | ||||||||
0.356%, 10/26/2026 (A) | 6,677 | 6,659 | ||||||
Nelnet Student Loan Trust, | ||||||||
0.283%, 11/27/2018 (A) | 288 | 287 | ||||||
Nelnet Student Loan Trust, | ||||||||
0.343%, 05/27/2025 (A) | 3,615 | 3,487 | ||||||
Nelnet Student Loan Trust, | ||||||||
0.634%, 03/25/2026 (A) (B) | 10,146 | 10,085 | ||||||
Nelnet Student Loan Trust, | ||||||||
0.993%, 04/25/2046 (A) (B) | 1,326 | 1,345 | ||||||
Neptune Finance CCS, | ||||||||
0.891%, 04/20/2020 (A) (B) | 4,400 | 4,394 | ||||||
Newcastle Investment Trust, | ||||||||
2.450%, 12/10/2033 (B) | 156 | 159 | ||||||
NYMT Residential, | ||||||||
4.250%, 12/25/2017 (A) (B) | 1,500 | 1,500 | ||||||
Octagon Investment Partners XI, | ||||||||
0.533%, 08/25/2021 (A) | 3,750 | 3,661 | ||||||
Origen Manufactured Housing, | ||||||||
0.439%, 05/15/2032 (A) | 11 | 11 | ||||||
Park Place Securities, | ||||||||
1.243%, 12/25/2034 (A) | 2,552 | 2,552 | ||||||
| SEI Institutional Investments Trust / Annual Report / May 31, 2013 | 125 |
Table of Contents
SCHEDULE OF INVESTMENTS
Core Fixed Income Fund (Continued)
May 31, 2013
| Description | Face Amount ($ Thousands) | Market Value ($ Thousands) | ||||||
Park Place Securities, | ||||||||
0.873%, 09/25/2034 (A) | $ | 820 | $ | 808 | ||||
Park Place Securities, | ||||||||
0.813%, 10/25/2034 (A) | 59 | 59 | ||||||
Park Place Securities, | ||||||||
0.873%, 12/25/2034 (A) | 4,460 | 4,452 | ||||||
Park Place Securities, | ||||||||
0.713%, 01/25/2036 (A) | 3,233 | 3,171 | ||||||
Park Place Securities, | ||||||||
0.533%, 09/25/2035 (A) | 1,499 | 1,488 | ||||||
Pennsylvania Higher Education Assistance Agency, | ||||||||
2.400%, 04/25/2045 (A) | 4,150 | 3,312 | ||||||
PennyMac Loan Trust, | ||||||||
5.250%, 09/25/2051 (A) (B) | 47 | 47 | ||||||
PennyMac Loan Trust, | ||||||||
3.422%, 05/28/2052 (A) (B) | 450 | 450 | ||||||
Popular ABS Mortgage | ||||||||
4.655%, 12/25/2034 (A) | 82 | 84 | ||||||
Popular ABS Mortgage | ||||||||
0.503%, 06/25/2047 (A) | 11,530 | 5,830 | ||||||
Race Point CLO, | ||||||||
1.695%, 11/08/2024 (A) (B) | 4,500 | 4,517 | ||||||
RAMP Trust, | ||||||||
6.163%, 08/25/2032 | 3 | 2 | ||||||
RAMP Trust, | ||||||||
5.860%, 11/25/2033 | 647 | 696 | ||||||
RAMP Trust, | ||||||||
5.980%, 12/25/2033 | 497 | 492 | ||||||
Real Estate Asset Trust, | ||||||||
5.750%, 05/25/2049 (B) | 26 | 26 | ||||||
Real Estate Asset Trust, | ||||||||
2.734%, 11/25/2042 (A) (B) | 412 | 412 | ||||||
Residential Asset Mortgage Products, | ||||||||
0.533%, 10/25/2035 (A) | 600 | 588 | ||||||
| Description | Face Amount ($ Thousands) | Market Value ($ Thousands) | ||||||
Residential Asset Mortgage Products, | ||||||||
0.483%, 10/25/2033 (A) | $ | 2,016 | $ | 2,002 | ||||
Residential Asset Mortgage Products, | ||||||||
0.383%, 03/25/2036 (A) | 1,517 | 1,514 | ||||||
Residential Asset Mortgage Products, | ||||||||
0.493%, 03/25/2036 (A) | 1,100 | 1,032 | ||||||
Residential Credit Solutions Trust, | ||||||||
6.000%, 03/25/2041 (B) | 697 | 698 | ||||||
Resort Finance Timeshare, | ||||||||
6.250%, 08/06/2018 | 778 | 778 | ||||||
Resort Finance Timeshare, | ||||||||
5.750%, 09/05/2018 | 546 | 546 | ||||||
RSB Bondco LLC, | ||||||||
5.820%, 06/28/2019 | 2,470 | 2,858 | ||||||
SLC Student Loan Trust, | ||||||||
0.675%, 05/15/2028 (A) | 1,218 | 1,222 | ||||||
SLM Private Education | ||||||||
1.599%, 08/15/2025 (A) (B) | 2,740 | 2,780 | ||||||
SLM Student Loan Trust, | ||||||||
1.030%, 03/15/2033 (A) (B) | 69 | 69 | ||||||
SLM Student Loan Trust, | ||||||||
0.776%, 04/25/2024 (A) (B) | 9,890 | 9,966 | ||||||
SLM Student Loan Trust, | ||||||||
0.376%, 04/25/2025 (A) | 421 | 419 | ||||||
SLM Student Loan Trust, | ||||||||
1.476%, 07/27/2026 (A) | 1,949 | 1,973 | ||||||
SLM Student Loan Trust, | ||||||||
0.376%, 01/25/2023 (A) | 808 | 807 | ||||||
SLM Student Loan Trust, | ||||||||
0.386%, 01/25/2027 (A) | 2,830 | 2,766 | ||||||
SLM Student Loan Trust, | ||||||||
0.346%, 04/25/2022 (A) | 193 | 193 | ||||||
SLM Student Loan Trust, | ||||||||
0.276%, 07/25/2017 (A) | 991 | 989 | ||||||
| 126 | SEI Institutional Investments Trust / Annual Report / May 31, 2013 |
Table of Contents
| Description | Face Amount ($ Thousands) | Market Value ($ Thousands) | ||||||
SLM Student Loan Trust, | ||||||||
0.446%, 07/25/2025 (A) | $ | 1,291 | $ | 1,118 | ||||
SLM Student Loan Trust, | ||||||||
0.826%, 10/25/2017 (A) | 433 | 434 | ||||||
SLM Student Loan Trust, | ||||||||
0.593%, 03/25/2025 (A) | 2,126 | 2,132 | ||||||
SLM Student Loan Trust, | ||||||||
1.393%, 10/25/2034 (A) | 495 | 519 | ||||||
SLM Student Loan Trust, | ||||||||
1.599%, 12/15/2023 (A) (B) | 4,857 | 4,914 | ||||||
SLM Student Loan Trust, | ||||||||
0.943%, 05/26/2026 (A) | 800 | 807 | ||||||
SLM Student Loan Trust, | ||||||||
1.193%, 04/27/2043 (A) | 2,045 | 1,868 | ||||||
SLM Student Loan Trust, | ||||||||
1.299%, 12/15/2021 (A) (B) | 4,354 | 4,387 | ||||||
SLM Student Loan Trust, | ||||||||
1.299%, 08/15/2023 (A) (B) | 3,998 | 4,035 | ||||||
SLM Student Loan Trust, | ||||||||
0.949%, 10/16/2023 (A) (B) | 9,916 | 9,964 | ||||||
SLM Student Loan Trust, | ||||||||
1.949%, 06/15/2045 (A) (B) | 5,352 | 5,534 | ||||||
SLM Student Loan Trust, | ||||||||
1.993%, 11/25/2043 (A) | 1,448 | 1,424 | ||||||
SLM Student Loan Trust, | ||||||||
1.693%, 06/25/2043 (A) | 866 | 824 | ||||||
SLM Student Loan Trust, | ||||||||
0.826%, 10/26/2026 (A) | 5,706 | 5,649 | ||||||
SLM Student Loan Trust, | ||||||||
0.799%, 08/15/2022 (A) (B) | 3,823 | 3,824 | ||||||
SLM Student Loan Trust, | ||||||||
0.850%, 07/15/2022 (A) (B) | 2,489 | 2,492 | ||||||
SLM Student Loan Trust, | ||||||||
1.850%, 06/17/2030 (B) | 6,041 | 5,943 | ||||||
SMS Student Loan Trust, | ||||||||
0.466%, 10/28/2028 (A) | 1,638 | 1,634 | ||||||
| Description | Face Amount ($ Thousands) | Market Value ($ Thousands) | ||||||
SMS Student Loan Trust, | ||||||||
0.476%, 04/28/2029 (A) | $ | 1,471 | $ | 1,468 | ||||
Sound Point CLO, | ||||||||
3.576%, 10/20/2023 (A) (B) | 1,750 | 1,754 | ||||||
South Carolina Student Loan, | ||||||||
0.407%, 12/01/2020 (A) | 3,975 | 3,941 | ||||||
Springleaf Funding Trust, | ||||||||
2.580%, 09/15/2021 (B) | 1,800 | 1,782 | ||||||
SPST, | ||||||||
1.700%, 02/25/2015 | 1,000 | 1,000 | ||||||
Stanwich Mortgage Loan Trust, | ||||||||
2.981%, 09/15/2042 (B) | 1,118 | 1,120 | ||||||
Stanwich Mortgage Loan Trust, | ||||||||
2.981%, 10/18/2042 (B) | 1,845 | 1,848 | ||||||
Stanwich Mortgage Loan Trust, | ||||||||
2.981%, 02/16/2043 (B) | 1,122 | 1,123 | ||||||
Structured Asset Investment | ||||||||
0.463%, 06/25/2035 (A) | 123 | 123 | ||||||
Structured Asset Securities, | ||||||||
0.493%, 05/25/2035 (A) | 2,734 | 2,699 | ||||||
Structured Asset Securities, | ||||||||
0.423%, 07/25/2035 (A) | 65 | 65 | ||||||
Structured Asset Securities, | ||||||||
0.553%, 11/25/2035 (A) | 5,027 | 5,006 | ||||||
Structured Asset Securities, | ||||||||
0.283%, 03/25/2037 (A) | 1,209 | 1,204 | ||||||
SunTrust Student Loan Trust, | ||||||||
0.396%, 01/30/2023 (A) (B) | 5,743 | 5,686 | ||||||
Symphony CLO, | ||||||||
3.528%, 04/16/2022 (A) (B) | 1,500 | 1,503 | ||||||
TAL Advantage LLC, | ||||||||
0.389%, 04/20/2021 (A) (B) | 2,020 | 1,987 | ||||||
TAL Advantage, | ||||||||
4.300%, 10/20/2025 (B) | 742 | 748 | ||||||
TAL Advantage, | ||||||||
4.600%, 01/20/2026 (B) | 460 | 468 | ||||||
| SEI Institutional Investments Trust / Annual Report / May 31, 2013 | 127 |
Table of Contents
SCHEDULE OF INVESTMENTS
Core Fixed Income Fund (Continued)
May 31, 2013
| Description | Face Amount ($ Thousands) | Market Value ($ Thousands) | ||||||
Textainer Marine Containers, | ||||||||
0.450%, 05/15/2020 (A) (B) | $ | 1,480 | $ | 1,466 | ||||
Trafigura Securitisation Finance, | ||||||||
2.599%, 10/15/2015 (A) (B) | 1,190 | 1,213 | ||||||
Trinity Rail Leasing, | ||||||||
5.270%, 08/14/2027 (B) | 171 | 189 | ||||||
Trinity Rail Leasing, | ||||||||
5.900%, 05/14/2036 (B) | 2,276 | 2,571 | ||||||
Trip Rail Master Funding, | ||||||||
4.370%, 07/15/2041 (B) | 3,903 | 4,185 | ||||||
Triton Container Finance, | ||||||||
0.360%, 11/26/2021 (A) (B) | 2,730 | 2,685 | ||||||
Triton Container Finance, | ||||||||
0.330%, 02/26/2019 (A) (B) | 1,094 | 1,084 | ||||||
Triton Container Finance, | ||||||||
4.210%, 05/14/2027 (B) | 2,992 | 3,032 | ||||||
VOLT LLC, | ||||||||
3.475%, 12/25/2017 (B) | 750 | 750 | ||||||
VOLT LLC, | ||||||||
8.836%, 06/26/2017 (B) | 96 | 97 | ||||||
VOLT LLC, | ||||||||
3.475%, 11/27/2017 (B) | 250 | 256 | ||||||
Wells Fargo Home Equity Trust, | ||||||||
0.343%, 05/25/2036 (A) | — | — | ||||||
Wells Fargo Home Equity Trust, | ||||||||
0.283%, 04/25/2037 (A) | 584 | 580 | ||||||
Westgate Resorts LLC, | ||||||||
4.500%, 09/20/2025 (B) | 666 | 684 | ||||||
Westgate Resorts LLC, | ||||||||
3.000%, 01/20/2025 (B) | 785 | 795 | ||||||
Westgate Resorts LLC, | ||||||||
2.500%, 03/20/2025 (B) | 555 | 559 | ||||||
Wind River CLO, | ||||||||
1.380%, 12/19/2016 (A) (B) | 1,900 | 1,893 | ||||||
|
| |||||||
| 387,024 | ||||||||
|
| |||||||
Total Asset-Backed Securities | 641,600 | |||||||
|
| |||||||
| Description | Face Amount ($ Thousands) | Market Value ($ Thousands) | ||||||
U.S. GOVERNMENT AGENCY OBLIGATIONS — 2.2% |
| |||||||
FAMC | ||||||||
2.375%, 07/22/2015 | $ | 170 | $ | 177 | ||||
2.125%, 09/15/2015 | 175 | 182 | ||||||
FFCB | ||||||||
4.625%, 11/03/2014 | 150 | 159 | ||||||
1.500%, 11/16/2015 | 7,830 | 8,041 | ||||||
FHLB | ||||||||
5.500%, 07/15/2036 | 3,810 | 4,938 | ||||||
3.625%, 10/18/2013 | 1,400 | 1,418 | ||||||
2.500%, 05/26/2015 (H) | 7,510 | 7,484 | ||||||
FHLMC | ||||||||
6.750%, 03/15/2031 | 2,570 | 3,758 | ||||||
FICO STRIPS, PO | ||||||||
9.800%, 04/06/2018 | 7,590 | 10,563 | ||||||
9.700%, 04/05/2019 | 5,100 | 7,398 | ||||||
8.600%, 09/26/2019 | 5,655 | 8,000 | ||||||
1.593%, 09/26/2019 (D) | 1,835 | 1,633 | ||||||
1.544%, 04/05/2019 (D) | 1,000 | 899 | ||||||
1.524%, 06/06/2019 (D) | 470 | 424 | ||||||
1.470%, 03/07/2019 (D) | 1,450 | 1,322 | ||||||
1.386%, 11/02/2018 (D) | 9,315 | 8,645 | ||||||
1.350%, 08/03/2018 (D) | 7,800 | 7,295 | ||||||
1.315%, 05/11/2018 (D) | 8,920 | 8,436 | ||||||
1.302%, 04/06/2018 (D) | 2,920 | 2,766 | ||||||
1.281%, 02/08/2018 (D) | 960 | 907 | ||||||
0.000%, 11/30/2017 to 12/06/2018 (D) | 8,695 | 8,008 | ||||||
FNMA | ||||||||
6.250%, 05/15/2029 | 3,730 | 5,135 | ||||||
5.914%, 10/09/2019 (D) | 670 | 581 | ||||||
5.375%, 06/12/2017 | 250 | 294 | ||||||
3.713%, 06/01/2017 (D) | 1,500 | 1,431 | ||||||
0.900%, 08/19/2013 (D) | 11,800 | 11,799 | ||||||
0.120%, 02/24/2014 (D) | 1,090 | 1,089 | ||||||
FNMA, PO | ||||||||
0.000%, 05/15/2030 | 1,800 | 953 | ||||||
Residual Funding Corp. STRIPS | ||||||||
1.593%, 07/15/2020 (D) | 13,965 | 12,219 | ||||||
Residual Funding Principal STRIPS | ||||||||
1.662%, 10/15/2020 | 2,500 | 2,165 | ||||||
Resolution Funding Corp. STRIPS | ||||||||
1.692%, 01/15/2021 | 1,029 | 882 | ||||||
1.472%, 10/15/2019 (D) | 6,200 | 5,558 | ||||||
Tennessee Valley Authority | ||||||||
5.880%, 04/01/2036 | 1,550 | 2,018 | ||||||
5.250%, 09/15/2039 | 2,228 | 2,701 | ||||||
4.625%, 09/15/2060 | 2,761 | 2,922 | ||||||
3.875%, 02/15/2021 | 3,090 | 3,491 | ||||||
Tennessee Valley Authority Principal STRIPS, PO | ||||||||
0.000%, 11/01/2025 (D) | 1,000 | 651 | ||||||
|
| |||||||
Total U.S. Government Agency Obligations |
| 146,342 | ||||||
|
| |||||||
| 128 | SEI Institutional Investments Trust / Annual Report / May 31, 2013 |
Table of Contents
| Description | Face Amount ($ Thousands) (1) | Market Value ($ Thousands) | ||||||
SOVEREIGN DEBT — 1.4% | ||||||||
African Development Bank | ||||||||
8.800%, 09/01/2019 | 700 | $ | 934 | |||||
Andina de Fomento | ||||||||
3.750%, 01/15/2016 | 564 | 599 | ||||||
Federal Republic of Brazil | ||||||||
2.625%, 01/05/2023 | 1,785 | 1,656 | ||||||
FMS Wertmanagement AoeR | ||||||||
1.000%, 11/21/2017 | 1,660 | 1,643 | ||||||
Inter-American Development Bank MTN | ||||||||
3.875%, 10/28/2041 | 1,668 | 1,703 | ||||||
Israel Government AID Bond | ||||||||
5.500%, 09/18/2033 (C) | 1,000 | 1,261 | ||||||
3.299%, 11/01/2024 | 1,000 | 697 | ||||||
Japan Finance Organization for Municipalities | ||||||||
4.000%, 01/13/2021 | 3,600 | 4,062 | ||||||
Kommunalbanken | ||||||||
1.125%, 05/23/2018 (B) | 7,510 | 7,399 | ||||||
Mexican Bonos | ||||||||
8.000%, 06/11/2020 | MXP 85,590 | 7,817 | ||||||
6.500%, 06/09/2022 | MXP 115,650 | 9,687 | ||||||
6.500%, 06/09/2022 | MXP 77,860 | 6,522 | ||||||
Mexico Cetes | ||||||||
4.000%, 06/13/2013 (D) | MXP 1,111,200 | 8,648 | ||||||
Province of Ontario Canada | ||||||||
2.950%, 02/05/2015 | 850 | 885 | ||||||
0.950%, 05/26/2015 | 3,100 | 3,128 | ||||||
Province of Quebec Canada | ||||||||
7.500%, 07/15/2023 | 260 | 356 | ||||||
6.350%, 01/30/2026 | 270 | 354 | ||||||
2.625%, 02/13/2023 | 8,615 | 8,426 | ||||||
Slovakia Government International Bond | ||||||||
4.375%, 05/21/2022 (B) | 3,980 | 4,249 | ||||||
Slovenia Government International Bond | ||||||||
5.850%, 05/10/2023 (B) | 985 | 975 | ||||||
5.500%, 10/26/2022 (B) | 1,816 | 1,762 | ||||||
4.750%, 05/10/2018 (B) | 3,055 | 3,009 | ||||||
Spain Government International Bond MTN | ||||||||
4.000%, 03/06/2018 (B) | 1,180 | 1,195 | ||||||
Svensk Exportkredit | ||||||||
1.750%, 10/20/2015 | 5,600 | 5,746 | ||||||
United Mexican States MTN | ||||||||
6.050%, 01/11/2040 | 394 | 467 | ||||||
5.750%, 10/12/2110 | 4,785 | 4,964 | ||||||
5.625%, 01/15/2017 | 84 | 95 | ||||||
4.750%, 03/08/2044 | 1,098 | 1,090 | ||||||
|
| |||||||
Total Sovereign Debt | 89,329 | |||||||
|
| |||||||
| Description | Face Amount ($ Thousands) | Market Value ($ Thousands) | ||||||
MUNICIPAL BONDS — 0.8% |
| |||||||
American Municipal Power, RB | ||||||||
7.499%, 02/15/2050 | $ | 495 | $ | 669 | ||||
Build America Bonds, GO | ||||||||
7.350%, 07/01/2035 | 230 | 279 | ||||||
City of Houston, Ser A, GO | ||||||||
6.290%, 03/01/2032 | 4,750 | 5,905 | ||||||
City of Los Angeles, Department of Airports, RB | ||||||||
6.582%, 05/15/2039 | 180 | 228 | ||||||
County of Clark, Airport System Revenue, | ||||||||
6.820%, 07/01/2045 | 1,635 | 2,290 | ||||||
Los Angeles, Community College District, Build America Project, GO | ||||||||
6.750%, 08/01/2049 | 1,565 | 2,189 | ||||||
New Jersey, State Turnpike Authority, Build America Project, RB | ||||||||
7.102%, 01/01/2041 | 1,984 | 2,778 | ||||||
New York State, Dormitory Authority, RB | ||||||||
5.600%, 03/15/2040 | 280 | 345 | ||||||
North Texas, Tollway Authority, Build America Project, RB | ||||||||
6.718%, 01/01/2049 | 1,810 | 2,427 | ||||||
Northstar Education Finance, RB | ||||||||
1.032%, 01/29/2046 (A) | 50 | 48 | ||||||
Ohio State University, Build America Project, | ||||||||
4.800%, 06/01/2111 | 1,239 | 1,277 | ||||||
Port Authority of New York & New Jersey, Build America Project, RB | ||||||||
5.647%, 11/01/2040 | 490 | 587 | ||||||
Port Authority of New York & New Jersey, RB | ||||||||
4.458%, 10/01/2062 | 2,670 | 2,605 | ||||||
State of California, Build America Project, GO | ||||||||
7.600%, 11/01/2040 | 1,380 | 2,003 | ||||||
7.300%, 10/01/2039 | 2,620 | 3,602 | ||||||
6.650%, 03/01/2022 | 6,100 | 7,657 | ||||||
6.200%, 10/01/2019 | 80 | 97 | ||||||
State of Illinois, Build America Project, GO | ||||||||
6.200%, 07/01/2021 | 1,500 | 1,692 | ||||||
State of Illinois, GO | ||||||||
5.877%, 03/01/2019 | 1,010 | 1,148 | ||||||
5.665%, 03/01/2018 | 5,162 | 5,840 | ||||||
5.365%, 03/01/2017 | 930 | 1,022 | ||||||
5.100%, 06/01/2033 | 4,600 | 4,615 | ||||||
4.950%, 06/01/2023 | 562 | 591 | ||||||
4.350%, 06/01/2018 | 60 | 64 | ||||||
| SEI Institutional Investments Trust / Annual Report / May 31, 2013 | 129 |
Table of Contents
SCHEDULE OF INVESTMENTS
Core Fixed Income Fund (Continued)
May 31, 2013
| Description | Face Amount ($ Thousands) | Market Value ($ Thousands) | ||||||
Virginia, Housing Development Authority, | ||||||||
6.000%, 06/25/2034 | $ | 360 | $ | 386 | ||||
|
| |||||||
Total Municipal Bonds | 50,344 | |||||||
|
| |||||||
U.S. TREASURY OBLIGATIONS — 19.3% |
| |||||||
U.S. Treasury Bills (D) | ||||||||
0.078%, 11/14/2013 | 8,900 | 8,897 | ||||||
0.073%, 08/22/2013 (I) | 280 | 280 | ||||||
U.S. Treasury Bonds | ||||||||
8.750%, 08/15/2020 | 6,550 | 9,786 | ||||||
8.500%, 02/15/2020 | 1,000 | 1,454 | ||||||
7.625%, 02/15/2025 | 21,635 | 33,446 | ||||||
6.750%, 08/15/2026 | 250 | 369 | ||||||
6.625%, 02/15/2027 | 300 | 441 | ||||||
6.500%, 11/15/2026 | 100 | 145 | ||||||
6.375%, 08/15/2027 | 200 | 289 | ||||||
6.250%, 05/15/2030 | 400 | 586 | ||||||
6.125%, 11/15/2027 | 250 | 354 | ||||||
6.125%, 08/15/2029 | 100 | 144 | ||||||
6.000%, 02/15/2026 | 100 | 138 | ||||||
5.500%, 08/15/2028 | 200 | 269 | ||||||
5.375%, 02/15/2031 | 1,300 | 1,751 | ||||||
5.000%, 05/15/2037 | 650 | 858 | ||||||
4.500%, 02/15/2036 | 2,250 | 2,773 | ||||||
4.500%, 05/15/2038 | 350 | 432 | ||||||
3.500%, 02/15/2039 | 4,000 | 4,210 | ||||||
3.125%, 11/15/2041 | 32,105 | 31,212 | ||||||
3.125%, 02/15/2042 | 76,135 | 73,958 | ||||||
3.125%, 02/15/2043 | 7,045 | 6,820 | ||||||
3.000%, 05/15/2042 (I) | 11,115 | 10,516 | ||||||
2.881%, 11/15/2034 | 1,850 | 901 | ||||||
2.875%, 05/15/2043 (C) | 10,850 | 9,970 | ||||||
2.799%, 05/15/2035 | 1,350 | 644 | ||||||
2.750%, 08/15/2042 | 104,712 | 93,848 | ||||||
2.750%, 11/15/2042 | 35,804 | 32,050 | ||||||
2.625%, 11/15/2020 | 3,000 | 3,205 | ||||||
U.S. Treasury Inflation-Protected Securities | ||||||||
2.125%, 02/15/2040 | 480 | 672 | ||||||
2.125%, 02/15/2041 | 8,455 | 11,701 | ||||||
2.000%, 01/15/2014 | 5,230 | 6,681 | ||||||
2.000%, 07/15/2014 | 8,765 | 11,204 | ||||||
1.625%, 01/15/2015 | 195 | 248 | ||||||
1.250%, 04/15/2014 | 22,535 | 25,164 | ||||||
0.750%, 02/15/2042 | 5,490 | 5,359 | ||||||
0.500%, 04/15/2015 | 25,105 | 27,732 | ||||||
0.125%, 04/15/2017 | 40,545 | 43,302 | ||||||
0.125%, 04/15/2018 | 9,240 | 9,757 | ||||||
| Description | Face Amount ($ Thousands) | Market Value ($ Thousands) | ||||||
U.S. Treasury Notes | ||||||||
4.750%, 02/15/2037 | $ | 1,800 | $ | 2,298 | ||||
4.250%, 08/15/2013 | 11,060 | 11,153 | ||||||
3.625%, 02/15/2021 | 600 | 684 | ||||||
3.500%, 02/15/2018 | 8,435 | 9,420 | ||||||
3.125%, 09/30/2013 | 2,760 | 2,777 | ||||||
3.125%, 05/15/2019 | 279 | 309 | ||||||
3.125%, 05/15/2021 | 1,650 | 1,817 | ||||||
2.750%, 10/31/2013 | 55,415 | 56,015 | ||||||
2.750%, 11/30/2016 | 2,391 | 2,563 | ||||||
2.625%, 06/30/2014 | 8,015 | 8,226 | ||||||
2.625%, 08/15/2020 | 4,100 | 4,389 | ||||||
2.500%, 03/31/2015 | 16,312 | 16,307 | ||||||
2.250%, 01/31/2015 | 610 | 630 | ||||||
2.000%, 02/15/2023 | 40,375 | 39,946 | ||||||
1.750%, 05/31/2016 | 2,405 | 2,492 | ||||||
1.750%, 10/31/2018 | 900 | 928 | ||||||
1.750%, 05/15/2023 | 21,878 | 21,078 | ||||||
1.625%, 11/15/2022 | 10,665 | 10,238 | ||||||
1.500%, 12/31/2013 | 17,180 | 17,317 | ||||||
1.375%, 11/30/2015 | 25,925 | 26,545 | ||||||
1.375%, 09/30/2018 | 390 | 395 | ||||||
1.375%, 05/31/2020 | 17,980 | 17,769 | ||||||
1.250%, 10/31/2015 | 1,650 | 1,684 | ||||||
1.125%, 03/31/2020 (C) | 32,120 | 31,314 | ||||||
1.125%, 04/30/2020 (C) | 39,370 | 38,315 | ||||||
1.000%, 05/31/2018 | 50,929 | 50,802 | ||||||
1.000%, 11/30/2019 | 800 | 779 | ||||||
0.750%, 06/30/2017 | 42,485 | 42,349 | ||||||
0.750%, 10/31/2017 | 19,440 | 19,297 | ||||||
0.750%, 12/31/2017 | 18,040 | 17,865 | ||||||
0.750%, 03/31/2018 | 13,765 | 13,589 | ||||||
0.625%, 04/30/2018 (C) | 31,075 | 30,467 | ||||||
0.375%, 04/15/2015 | 3,407 | 3,412 | ||||||
0.375%, 06/15/2015 | 19,344 | 19,364 | ||||||
0.375%, 11/15/2015 | 400 | 400 | ||||||
0.250%, 01/15/2015 | 31,623 | 31,618 | ||||||
0.250%, 02/28/2015 | 22,345 | 22,334 | ||||||
0.250%, 05/15/2015 | 18,230 | 18,209 | ||||||
0.250%, 05/31/2015 | 10,070 | 10,058 | ||||||
0.250%, 07/15/2015 | 330 | 329 | ||||||
0.250%, 10/15/2015 | 5,888 | 5,870 | ||||||
0.250%, 04/15/2016 | 5,626 | 5,587 | ||||||
0.250%, 05/15/2016 (C) | 14,565 | 14,456 | ||||||
0.125%, 07/31/2014 | 9,259 | 9,254 | ||||||
0.125%, 04/30/2015 | 5,792 | 5,773 | ||||||
U.S. Treasury Strips (D) | ||||||||
6.450%, 02/15/2017 | 19,420 | 18,882 | ||||||
5.261%, 05/15/2036 | 300 | 138 | ||||||
5.193%, 05/15/2029 | 100 | 61 | ||||||
4.969%, 08/15/2030 | 1,550 | 895 | ||||||
4.963%, 02/15/2030 | 1,950 | 1,150 | ||||||
4.917%, 05/15/2026 | 500 | 348 | ||||||
4.886%, 05/15/2028 | 300 | 190 | ||||||
| 130 | SEI Institutional Investments Trust / Annual Report / May 31, 2013 |
Table of Contents
| Description | Face Amount ($ Thousands) | Market Value ($ Thousands) | ||||||
4.863%, 11/15/2031 | $ | 200 | $ | 110 | ||||
4.730%, 05/15/2027 | 2,570 | 1,708 | ||||||
4.587%, 02/15/2024 | 75 | 58 | ||||||
4.576%, 11/15/2029 | 1,450 | 865 | ||||||
4.576%, 05/15/2034 | 500 | 248 | ||||||
4.536%, 08/15/2024 | 200 | 151 | ||||||
4.520%, 05/15/2024 | 800 | 609 | ||||||
4.436%, 11/15/2030 | 2,450 | 1,400 | ||||||
4.357%, 11/15/2024 | 450 | 335 | ||||||
4.245%, 05/15/2030 | 900 | 525 | ||||||
4.093%, 08/15/2033 | 1,150 | 588 | ||||||
4.073%, 08/15/2027 | 3,490 | 2,292 | ||||||
4.037%, 08/15/2028 | 1,500 | 943 | ||||||
4.022%, 05/15/2019 | 2,450 | 2,264 | ||||||
3.855%, 11/15/2033 | 1,750 | 885 | ||||||
3.801%, 11/15/2026 | 1,150 | 782 | ||||||
3.780%, 08/15/2017 | 3,000 | 2,891 | ||||||
3.712%, 08/15/2018 | 800 | 754 | ||||||
3.709%, 05/15/2033 | 2,950 | 1,523 | ||||||
3.649%, 02/15/2032 | 1,350 | 732 | ||||||
3.632%, 11/15/2017 | 6,150 | 5,900 | ||||||
3.569%, 02/15/2034 | 1,350 | 676 | ||||||
3.567%, 02/15/2028 | 2,473 | 1,588 | ||||||
3.538%, 02/15/2027 | 6,800 | 4,570 | ||||||
3.341%, 02/15/2026 | 700 | 493 | ||||||
3.338%, 11/15/2020 (C) | 1,830 | 1,609 | ||||||
3.322%, 02/15/2022 | 1,100 | 921 | ||||||
3.302%, 11/15/2032 | 2,700 | 1,423 | ||||||
3.295%, 08/15/2021 | 4,000 | 3,416 | ||||||
3.262%, 08/15/2020 (C) | 13,150 | 11,663 | ||||||
3.223%, 08/15/2034 | 300 | 147 | ||||||
3.186%, 05/15/2020 | 16,370 | 14,641 | ||||||
3.170%, 08/15/2016 | 5,100 | 5,001 | ||||||
3.168%, 05/15/2031 | 1,930 | 1,080 | ||||||
3.021%, 02/15/2018 | 1,850 | 1,765 | ||||||
3.021%, 02/15/2035 | 2,100 | 1,011 | ||||||
2.971%, 02/15/2016 | 250 | 247 | ||||||
2.890%, 08/15/2026 | 328 | 225 | ||||||
2.841%, 11/15/2021 | 2,650 | 2,239 | ||||||
2.772%, 11/15/2027 (C) | 19,520 | 12,730 | ||||||
2.721%, 02/15/2015 | 200 | 199 | ||||||
2.720%, 08/15/2029 | 2,400 | 1,445 | ||||||
2.656%, 02/15/2029 | 1,800 | 1,107 | ||||||
2.642%, 11/15/2028 | 800 | 497 | ||||||
2.632%, 05/15/2032 | 1,500 | 806 | ||||||
2.453%, 05/15/2023 | 450 | 358 | ||||||
1.774%, 05/15/2021 | 12,450 | 10,734 | ||||||
1.684%, 02/15/2021 | 5,120 | 4,454 | ||||||
1.305%, 02/15/2020 | 1,000 | 902 | ||||||
1.024%, 11/15/2016 | 1,910 | 1,866 | ||||||
0.628%, 05/15/2016 | 1,000 | 984 | ||||||
|
| |||||||
Total U.S. Treasury Obligations |
| 1,254,011 | ||||||
|
| |||||||
| Description | Face Amount ($ Thousands)/ Shares/Contracts | Market Value ($ Thousands) | ||||||
COMMERCIAL PAPER (D) — 0.6% |
| |||||||
Lloyds TSB Bank | $ | 7,990 | $ | 7,987 | ||||
RBS Holdings USA | 15,935 | 15,926 | ||||||
UBS Finance Delaware LLC | 16,290 | 16,288 | ||||||
|
| |||||||
Total Commercial Paper |
| 40,201 | ||||||
|
| |||||||
AFFILIATED PARTNERSHIP — 2.9% |
| |||||||
SEI Liquidity Fund, L.P. 0.100%**† (J) | 185,815,299 | 185,815 | ||||||
|
| |||||||
Total Affiliated Partnership |
| 185,815 | ||||||
|
| |||||||
CASH EQUIVALENT — 4.6% |
| |||||||
SEI Daily Income Trust, Prime Obligation Fund, Cl A | 295,814,055 | 295,814 | ||||||
|
| |||||||
Total Cash Equivalent |
| 295,814 | ||||||
|
| |||||||
Total Investments — 110.1% |
| $ | 7,139,466 | |||||
|
| |||||||
PURCHASED OPTIONS — 0.0% |
| |||||||
August 2013, USD Call | 30,770,000 | $ | 327 | |||||
July 2013 Eurodollar 2-Year Midcurve Put | 228 | 103 | ||||||
|
| |||||||
Total Purchased Options | 430 | |||||||
|
| |||||||
PURCHASED SWAPTION — 0.0% |
| |||||||
April 2014, 3-Month LIBOR Put | 9,005,000 | 267 | ||||||
April 2014, 3-Month LIBOR Put, | 9,005,000 | 267 | ||||||
April 2018, 3-Month LIBOR Put, | 11,750,000 | 1,021 | ||||||
April 2018, 3-Month LIBOR Put, | 11,750,000 | 1,021 | ||||||
| SEI Institutional Investments Trust / Annual Report / May 31, 2013 | 131 |
Table of Contents
SCHEDULE OF INVESTMENTS
Core Fixed Income Fund (Continued)
May 31, 2013
| Description | Contracts | Market Value ($ Thousands) | ||||||
May 2018, 3-Month LIBOR Put, | 13,520,000 | $ | 314 | |||||
|
| |||||||
Total Purchased Swaption | 2,890 | |||||||
|
| |||||||
WRITTEN OPTIONS — 0.0% | ||||||||
July 2013 Eurodollar 2-Year Midcurve Call, | (228 | ) | (19 | ) | ||||
July 2013, U.S. 10 Year Future Option Call | (202 | ) | (129 | ) | ||||
July 2013, U.S. 10-Year Future Option Call | (202 | ) | (19 | ) | ||||
July 2013, U.S. Bond Future Option Call | (144 | ) | (198 | ) | ||||
November 2020, U.S. CPI Urban Consumers NSA Call | (7,020,000 | ) | (8 | ) | ||||
|
| |||||||
Total Written Options |
| $ | (373 | ) | ||||
|
| |||||||
A list of the open futures contracts held by the Fund at May 31, 2013, is as follows:
| Type of Contract | Number of Contracts Long (Short) | Expiration Date | Unrealized Appreciation (Depreciation) ($ Thousands) | |||||||||
90-Day Euro$ | 550 | Dec-2014 | $ | (223 | ) | |||||||
90-Day Euro$ | (550 | ) | Dec-2015 | 591 | ||||||||
U.S. 10-Year Treasury Note | (344 | ) | Jun-2013 | 903 | ||||||||
U.S. 10-Year Treasury Note | (994 | ) | Sep-2013 | 1,133 | ||||||||
U.S. 10-Year Treasury Note | 261 | Sep-2013 | (324 | ) | ||||||||
U.S. 2-Year Treasury Note | (479 | ) | Jun-2013 | 84 | ||||||||
| Type of Contract | Number of Contracts Long (Short) | Expiration Date | Unrealized Appreciation (Depreciation) ($ Thousands) | |||||||||
U.S. 2-Year Treasury Note | (589 | ) | Sep-2013 | $ | 25 | |||||||
U.S. 5-Year Treasury Note | 2 | Jun-2013 | (2 | ) | ||||||||
U.S. 5-Year Treasury Note | (164 | ) | Jun-2013 | 99 | ||||||||
U.S. 5-Year Treasury Note | 471 | Oct-2013 | (318 | ) | ||||||||
U.S. 5-Year Treasury Note | (662 | ) | Oct-2013 | 78 | ||||||||
U.S. Long Treasury Bond | (8 | ) | Jun-2013 | 59 | ||||||||
U.S. Long Treasury Bond | 10 | Sep-2013 | (5 | ) | ||||||||
U.S. Long Treasury Bond | (338 | ) | Sep-2013 | 632 | ||||||||
U.S. Ultra Long Treasury Bond | (323 | ) | Dec-2013 | 265 | ||||||||
|
| |||||||||||
| $ | 2,997 | |||||||||||
|
| |||||||||||
For the year ended May 31, 2013, the total amount of all open futures contracts, as presented in the table above, are representative of the volume of activity for this derivative type during the year.
A list of the open forward foreign currency contracts held by the Fund at May 31, 2013, is as follows:
| Settlement Date | Currency to Deliver (Thousands) | Currency to Receive (Thousands) | Unrealized Appreciation | |||||||||||||||||
6/13/13 | MXP | 111,120 | USD | 8,830 | $ | 180 | ||||||||||||||
8/16/13 | EUR | 31,940 | USD | 41,949 | 543 | |||||||||||||||
8/16/13 | GBP | 10,892 | USD | 16,877 | 375 | |||||||||||||||
8/16/13 | JPY | 2,869,704 | USD | 29,048 | 614 | |||||||||||||||
8/16/13 | USD | 1,985 | EUR | 1,511 | (26 | ) | ||||||||||||||
8/16/13 | USD | 15,896 | JPY | 1,577,950 | (261 | ) | ||||||||||||||
|
| |||||||||||||||||||
| $ | 1,425 | |||||||||||||||||||
|
| |||||||||||||||||||
A list of the counterparties for the open forward foreign currency contracts held by the Fund at May 31, 2013, is as follows:
| Counterparty | Currency to Deliver ($ Thousands) | Currency to Receive ($ Thousands) | Unrealized Appreciation ($ Thousands) | |||||||||
Barclays PLC | $ | (18,224 | ) | $ | 18,545 | $ | 321 | |||||
JPMorgan Chase Bank | (28,185 | ) | 28,556 | 371 | ||||||||
UBS | (66,466 | ) | 67,199 | 733 | ||||||||
|
| |||||||||||
| $ | 1,425 | |||||||||||
|
| |||||||||||
For the year ended May 31, 2013, the total amount of all open forward foreign currency contracts, as presented in the table above, are representative of the volume of activity for this derivative type during the year.
A list of the open swap agreements held by the Fund at May 31, 2013 is as follows:
| Interest Rate Swaps | ||||||||||||||
| Counterparty | Fund Pays | Fund Receives | Termination Date | Notional Amount ($ Thousands) | Net Unrealized Appreciation (Depreciation) ($ Thousands) | |||||||||
| Barclays Bank PLC | 2.48% | 3 Month LIBOR | 11/15/27 | $ | 4,105 | $ | 108 | |||||||
| Barclays Bank PLC | 2.42% | 3 Month LIBOR | 11/15/27 | 4,110 | 143 | |||||||||
| Citigroup | 2.71% | 3-Month LIBOR | 08/15/42 | 8,210 | 808 | |||||||||
| Deutsche Bank | REF: IOS.FN30.450.10 INDEX | 1 Month USD LIBOR | 01/12/41 | 5,960 | 165 | |||||||||
| Barclays Bank PLC | 3.49% | 3-Month LIBOR | 03/15/46 | 8,250 | 257 | |||||||||
| Barclays Bank PLC | 3-Month LIBOR | 3.15% | 03/15/26 | 18,410 | (322 | ) | ||||||||
| Goldman Sachs | 3.13% | 3-Month LIBOR | 04/09/46 | 8,270 | 829 | |||||||||
| Goldman Sachs | 3-Month LIBOR | 2.80% | 04/09/26 | 18,340 | (891 | ) | ||||||||
| Morgan Stanley | REF: IOS.FN30.500.10 INDEX | 1 Month USD LIBOR | 01/12/41 | 3,331 | 22 | |||||||||
|
| |||||||||||||
| $ | 1,119 | |||||||||||||
|
| |||||||||||||
| 132 | SEI Institutional Investments Trust / Annual Report / May 31, 2013 |
Table of Contents
| Credit Default Swaps | ||||||||||||||||||||||||
| Counterparty | Reference Entity/Obligation | Buy/Sell Protection | (Pays)/ Receives Rate | Termination Date | Currency | Notional Amount (Thousands) | Net Unrealized Appreciation (Depreciation) ($ Thousands) | |||||||||||||||||
| BNP Paribas | iTraxx Europe Senior Financials Index | BUY | (1.00 | ) | 06/20/18 | EUR | 2,900 | $ | (53 | ) | ||||||||||||||
| BNP Paribas | iTraxx Europe Senior Financials Index | BUY | (1.00 | ) | 06/20/18 | EUR | 5,000 | (77 | ) | |||||||||||||||
| BNP Paribas | iTraxx Europe Senior Financials Index | BUY | (1.00 | ) | 06/20/18 | EUR | 3,900 | (40 | ) | |||||||||||||||
| Deutsche Bank | Metlife, Inc. | SELL | 1.00 | 06/20/18 | (3,560 | ) | 97 | |||||||||||||||||
|
| |||||||||||||||||||||||
| $ | (73 | ) | ||||||||||||||||||||||
|
| |||||||||||||||||||||||
For the year ended May 31, 2013, the total amount of open swap agreements, as presented in the tables above, are representative of the volume of activity for this derivative type during the year.
Percentages are based on a Net Assets of $6,484,218 ($ Thousands).
| * | Non-income producing security. |
| ** | The rate reported is the 7-day effective yield as of May 31, 2013. |
| (1) | In U.S. Dollar unless otherwise indicated. |
| ‡ | Real Estate Investment Trust. |
| † | Investment in Affiliated Security (see Note 5). |
| (A) | Variable Rate Security — The rate reported on the Schedule of Investments is the rate in effect as of May 31, 2013. The date reported on the Schedule of Investments is the final maturity date. |
| (B) | Securities sold within terms of a private placement memorandum, exempt from registration under Section 144A of the Securities Act of 1933, as amended, and may be sold only to dealers in that program or other “accredited investors.” These securities have been determined to be liquid under guidelines established by the Board of Trustees. |
| (C) | This security or a partial position of this security is on loan at May 31, 2013. The total value of securities on loan at May 31, 2013 was $180,372 ($ Thousands). |
| (D) | The rate reported is the effective yield at time of purchase. |
| (E) | Securities considered illiquid. The total value of such securities as of May 31, 2013 was $1 ($ Thousands) and represented 0.00% of Net Assets. |
| (F) | Security in default on interest payments. |
| (G) | Security fair valued using methods determined in good faith by the Valuation Committee of the Board of Trustees. The total market value of such securities as of May 31, 2013 was $478 ($ Thousands) and represented 0.01% of Net Assets. |
| (H) | Step Bonds —The rate reflected on the Schedule of Investments is the effective yield on May 31, 2013. The coupon on a step bond changes on a specified date. |
| (I) | Security, or portion thereof, has been pledged as collateral on open futures contracts. |
| (J) | This security was purchased with cash collateral held from securities on loan (see Note 11). The total value of such securities as of May 31, 2013 was $185,815 ($ Thousands). |
ABS — Asset-Based Security
AID —Agency for International Development
ARM — Adjustable Rate Mortgage
CDO — Collateralized Debt Obligation
Cl — Class
CLO — Collateralized Loan Obligation
CMBS — Commercial Mortgage-Backed Securities
CMO — Collateralized Mortgage Obligation
CPI — Consumer Price Index
EUR — Euro
FAMC — Federal Agricultural Mortgage Corporation
FDIC — Federal Deposit Insurance Corporation
FFCB — Federal Farm Credit Bank
FHLB — Federal Home Loan Bank
FHLMC — Federal Home Loan Mortgage Corporation
FICO — Financing Corporation
FNMA — Federal National Mortgage Association
GBP — British Pound Sterling
GNMA — Government National Mortgage Association
GO — General Obligation
IO — Interest Only
JPY — Japanese Yen
LIBOR — London Interbank Offered Rate
LLC — Limited Liability Company
L.P. — Limited Partnership
MTN — Medium Term Note
MXP — Mexian Peso
NCUA — National Credit Union Association
NY — New York
PLC — Public Limited Company
PO — Principal Only
RB — Revenue Bond
REMIC — Real Estate Mortgage Investment Conduit
Ser — Series
STRIPS — Separately Traded Registered Interest and Principal Securities
TBA — To Be Announced
USD — U.S. Dollar
The following is a list of the inputs used as of May 31, 2013 in valuing the Fund’s investments and other financial instruments carried at value ($ Thousands):
| Investments in Securities | Level 1 | Level 2 | Level 3(1) | Total | ||||||||||||
Mortgage-Backed Securities | $ | — | $ | 2,747,756 | $ | — | $ | 2,747,756 | ||||||||
Corporate Obligations | — | 1,687,776 | 478 | 1,688,254 | ||||||||||||
Asset-Backed Securities | — | 641,600 | — | 641,600 | ||||||||||||
U.S. Government Agency Obligations | — | 146,342 | — | 146,342 | ||||||||||||
Sovereign Debt | — | 89,329 | — | 89,329 | ||||||||||||
Municipal Bonds | — | 50,344 | — | 50,344 | ||||||||||||
U.S. Treasury Obligations | — | 1,254,011 | — | 1,254,011 | ||||||||||||
Commercial Paper | — | 40,201 | — | 40,201 | ||||||||||||
Affiliated Partnership | — | 185,815 | — | 185,815 | ||||||||||||
Cash Equivalent | 295,814 | — | — | 295,814 | ||||||||||||
|
|
|
|
|
|
|
| |||||||||
Total Investments in Securities | $ | 295,814 | $ | 6,843,174 | $ | 478 | $ | 7,139,466 | ||||||||
|
|
|
|
|
|
|
| |||||||||
| Other Financial Instruments | Level 1 | Level 2 | Level 3 | Total | ||||||||||||
Purchased Options | $ | — | $ | 430 | $ | — | $ | 430 | ||||||||
Purchased Swaptions | — | 2,890 | — | 2,890 | ||||||||||||
Written Options | — | (373 | ) | — | (373 | ) | ||||||||||
Futures Contracts* | 2,997 | — | — | 2,997 | ||||||||||||
Forwards Contracts* | — | 1,425 | — | 1,425 | ||||||||||||
Interest Rate Swaps* | — | 1,119 | — | 1,119 | ||||||||||||
Credit Default Swaps* | — | (73 | ) | — | (73 | ) | ||||||||||
|
|
|
|
|
|
|
| |||||||||
Total Other Financial Instruments | $ | 2,997 | $ | 5,418 | $ | — | $ | 8,415 | ||||||||
|
|
|
|
|
|
|
| |||||||||
| (1) | A reconciliation of Level 3 investments is presented when the Fund has a significant amount of Level 3 investments at the beginning and/or end of the period in relation to the net assets. |
| * | Futures contracts, forwards contracts and swaps are valued at the unrealized appreciation (depreciation) on the instrument. |
For the year ended May 31, 2013, there were no transfers between Level 1 and Level 2 assets and liabilities.
For the year ended May 31, 2013, there were no transfers between Level 2 and Level 3 assets and liabilities.
For more information on valuation inputs, see Note 2 — Significant Accounting Policies in Notes to Financial Statements.
Amounts designated as “—” are $0 or have been rounded to $0.
The accompanying notes are an integral part of the financial statements.
| SEI Institutional Investments Trust / Annual Report / May 31, 2013 | 133 |
Table of Contents
SCHEDULE OF INVESTMENTS
High Yield Bond Fund
May 31, 2013
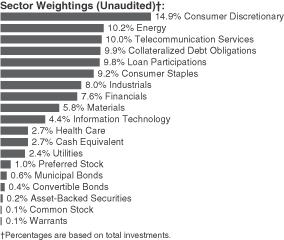
| Description | Face Amount ($ Thousands) | Market Value ($ Thousands) | ||||||
CORPORATE OBLIGATIONS — 74.2% |
| |||||||
Consumer Discretionary — 14.7% |
| |||||||
Academy | ||||||||
9.250%, 08/01/2019 (A) | $ | 715 | $ | 801 | ||||
Adelphia Communications (escrow security) (B) | ||||||||
10.250%, 06/15/2011 | 125 | 1 | ||||||
7.875%, 01/15/2009 | 250 | 2 | ||||||
7.750%, 05/01/2009 | 75 | 1 | ||||||
Adelphia Communications, Ser B (escrow security) | ||||||||
9.500%, 02/15/2004 (B) | 25 | — | ||||||
Affinity Gaming | ||||||||
9.000%, 05/15/2018 (A) | 1,925 | 2,048 | ||||||
Algeco Scotsman Global Finance | ||||||||
10.750%, 10/15/2019 (A) | 2,443 | 2,419 | ||||||
8.500%, 10/15/2018 (A) | 1,365 | 1,420 | ||||||
Allison Transmission | ||||||||
7.125%, 05/15/2019 (A) | 1,956 | 2,103 | ||||||
AMC Entertainment | ||||||||
9.750%, 12/01/2020 | 1,255 | 1,450 | ||||||
8.750%, 06/01/2019 | 680 | 746 | ||||||
AMC Networks | ||||||||
4.750%, 12/15/2022 | 815 | 813 | ||||||
American Axle & Manufacturing | ||||||||
7.750%, 11/15/2019 | 1,465 | 1,670 | ||||||
6.250%, 03/15/2021 | 385 | 401 | ||||||
American Builders & Contractors Supply | ||||||||
5.625%, 04/15/2021 (A) | 1,840 | 1,863 | ||||||
American Standard Americas | ||||||||
10.750%, 01/15/2016 (A) | 1,710 | 1,787 | ||||||
American Tire Distributors | ||||||||
9.750%, 06/01/2017 | 620 | 659 | ||||||
AmeriGas Finance | ||||||||
7.000%, 05/20/2022 | 7,591 | 8,236 | ||||||
| Description | Face Amount ($ Thousands) | Market Value ($ Thousands) | ||||||
Ameristar Casinos | ||||||||
7.500%, 04/15/2021 | $ | 1,375 | $ | 1,499 | ||||
APX Group | ||||||||
6.375%, 12/01/2019 (A) | 2,070 | 2,065 | ||||||
Avis Budget Car Rental | ||||||||
8.250%, 01/15/2019 | 1,905 | 2,074 | ||||||
Beazer Homes USA | ||||||||
7.250%, 02/01/2023 (A) | 430 | 455 | ||||||
Belo | ||||||||
7.750%, 06/01/2027 | 2,025 | 2,187 | ||||||
Bon-Ton Department Stores | ||||||||
8.000%, 06/15/2021 (A) | 1,520 | 1,560 | ||||||
Buffalo Thunder Development Authority | ||||||||
9.375%, 12/15/2014 (A) (B) | 2,050 | 605 | ||||||
Burlington Coat Factory Warehouse | ||||||||
10.000%, 02/15/2019 | 6,240 | 6,965 | ||||||
Burlington Holdings | ||||||||
9.000%, 02/15/2018 (A) | 1,400 | 1,423 | ||||||
Cablevision Systems | ||||||||
8.625%, 09/15/2017 | 300 | 349 | ||||||
7.750%, 04/15/2018 | 900 | 1,017 | ||||||
Caesars Entertainment Operating | ||||||||
11.250%, 06/01/2017 | 1,875 | 1,959 | ||||||
10.000%, 12/15/2018 | 788 | 489 | ||||||
9.000%, 02/15/2020 (A) | 925 | 890 | ||||||
8.500%, 02/15/2020 | 4,205 | 4,005 | ||||||
Caesars Operating Escrow | ||||||||
9.000%, 02/15/2020 (A) | 590 | 568 | ||||||
Carlson Wagonlit | ||||||||
6.875%, 06/15/2019 (A) | 1,365 | 1,437 | ||||||
Carmike Cinemas | ||||||||
7.375%, 05/15/2019 | 950 | 1,047 | ||||||
CDR DB Sub | ||||||||
7.750%, 10/15/2020 (A) | 1,820 | 1,897 | ||||||
Cedar Fair | ||||||||
5.250%, 03/15/2021 (A) | 850 | 850 | ||||||
Checkers Drive-In Restaurants | ||||||||
11.000%, 12/01/2017 (A) | 650 | 700 | ||||||
Chester Downs & Marina | ||||||||
9.250%, 02/01/2020(A) | 4,555 | 4,418 | ||||||
Chrysler Group | ||||||||
8.250%, 06/15/2021 | 3,620 | 4,091 | ||||||
8.000%, 06/15/2019 | 945 | 1,047 | ||||||
Chukchansi Economic Development Authority | ||||||||
9.750%, 05/30/2020 (A) (B) | 2,064 | 1,042 | ||||||
Cinemark USA | ||||||||
7.375%, 06/15/2021 | 640 | 715 | ||||||
5.125%, 12/15/2022 | 1,800 | 1,827 | ||||||
4.875%, 06/01/2023 (A) | 435 | 433 | ||||||
CityCenter Holdings | ||||||||
7.625%, 01/15/2016 | 815 | 866 | ||||||
| 134 | SEI Institutional Investments Trust / Annual Report / May 31, 2013 |
Table of Contents
| Description | Face Amount ($ Thousands) | Market Value ($ Thousands) | ||||||
Claire’s Stores | ||||||||
9.000%, 03/15/2019 (A) | $ | 1,505 | $ | 1,693 | ||||
8.875%, 03/15/2019 | 785 | 842 | ||||||
7.750%, 06/01/2020 (A) | 1,195 | 1,210 | ||||||
Cogeco Cable | ||||||||
4.875%, 05/01/2020 (A) | 1,785 | 1,781 | ||||||
Continental Airlines 2007-1 Cl C Pass-Through Trust | ||||||||
7.339%, 04/19/2014 | 585 | 599 | ||||||
Continental Rubber of America | ||||||||
4.500%, 09/15/2019 (A) | 1,550 | 1,608 | ||||||
CST Brands | ||||||||
5.000%, 05/01/2023 (A) | 350 | 353 | ||||||
Dana Holding | ||||||||
6.750%, 02/15/2021 | 1,304 | 1,402 | ||||||
6.500%, 02/15/2019 | 795 | 847 | ||||||
Dave & Buster’s | ||||||||
11.000%, 06/01/2018 | 1,390 | 1,560 | ||||||
Dave & Buster’s Entertainment | ||||||||
14.028%, 02/15/2016 (A) | 9,645 | 7,475 | ||||||
Delta Air Lines 2011-1 Cl B | ||||||||
7.125%, 10/15/2014 | 2,000 | 2,060 | ||||||
Dex Media PIK | ||||||||
14.000%, 01/29/2017 | 1,301 | 885 | ||||||
Diamond Resorts | ||||||||
12.000%, 08/15/2018 | 1,350 | 1,507 | ||||||
Easton-Bell Sports | ||||||||
9.750%, 12/01/2016 | 1,675 | 1,805 | ||||||
Eldorado Resorts | ||||||||
8.625%, 06/15/2019 (A) | 5,460 | 5,419 | ||||||
Empire Today | ||||||||
11.375%, 02/01/2017 (A) | 1,941 | 1,776 | ||||||
Expedia | ||||||||
5.950%, 08/15/2020 | 1,000 | 1,110 | ||||||
Ferrellgas | ||||||||
6.500%, 05/01/2021 | 2,150 | 2,268 | ||||||
Fifth & Pacific | ||||||||
10.500%, 04/15/2019 | 3,735 | 4,165 | ||||||
Fontainebleau Las Vegas | ||||||||
11.000%, 06/15/2015 (A) (B) | 3,500 | 2 | ||||||
Gestamp Funding Luxembourg | ||||||||
5.625%, 05/31/2020 (A) | 1,760 | 1,703 | ||||||
Goodyear Tire & Rubber | ||||||||
8.750%, 08/15/2020 | 185 | 216 | ||||||
8.250%, 08/15/2020 | 1,205 | 1,342 | ||||||
6.500%, 03/01/2021 | 2,345 | 2,468 | ||||||
Graton Economic Development Authority | ||||||||
9.625%, 09/01/2019 (A) | 4,200 | 4,751 | ||||||
GRD Holdings III | ||||||||
10.750%, 06/01/2019 (A) | 3,475 | 3,831 | ||||||
Greektown Superholdings | ||||||||
13.000%, 07/01/2015 | 1,850 | 1,984 | ||||||
13.000%, 07/01/2015 | 3,390 | 3,636 | ||||||
| Description | Face Amount ($ Thousands) | Market Value ($ Thousands) | ||||||
GWR Operating Partnership | ||||||||
10.875%, 04/01/2017 | $ | 870 | $ | 966 | ||||
Gymboree | ||||||||
9.125%, 12/01/2018 | 1,005 | 974 | ||||||
Hanesbrands | ||||||||
8.000%, 12/15/2016 | 155 | 166 | ||||||
6.375%, 12/15/2020 | 1,282 | 1,413 | ||||||
HD Supply | ||||||||
11.500%, 07/15/2020 | 770 | 905 | ||||||
11.000%, 04/15/2020 | 615 | 739 | ||||||
10.500%, 01/15/2021 | 885 | 918 | ||||||
8.125%, 04/15/2019 | 1,210 | 1,343 | ||||||
7.500%, 07/15/2020 (A) | 5,545 | 5,878 | ||||||
Hillman Group | ||||||||
10.875%, 06/01/2018 | 960 | 1,061 | ||||||
10.875%, 06/01/2018 (A) | 2,305 | 2,547 | ||||||
INTCOMEX | ||||||||
13.250%, 12/15/2014 | 4,358 | 4,402 | ||||||
International Automotive Components Group | ||||||||
9.125%, 06/01/2018 (A) | 1,705 | 1,686 | ||||||
Isle of Capri Casinos | ||||||||
5.875%, 03/15/2021 | 875 | 871 | ||||||
J Crew Group | ||||||||
8.125%, 03/01/2019 | 1,115 | 1,187 | ||||||
Jaguar Land Rover Automotive | ||||||||
8.125%, 05/15/2021 (A) | 1,440 | 1,624 | ||||||
5.625%, 02/01/2023 (A) | 380 | 389 | ||||||
Jarden | ||||||||
7.500%, 05/01/2017 | 330 | 375 | ||||||
7.500%, 01/15/2020 | 605 | 653 | ||||||
JC Penney | ||||||||
7.950%, 04/01/2017 | 290 | 286 | ||||||
6.375%, 10/15/2036 | 710 | 591 | ||||||
5.750%, 02/15/2018 | 210 | 188 | ||||||
L Brands | ||||||||
6.625%, 04/01/2021 | 745 | 851 | ||||||
5.625%, 02/15/2022 | 1,285 | 1,373 | ||||||
Landry’s | ||||||||
9.375%, 05/01/2020 (A) | 1,745 | 1,898 | ||||||
Levi Strauss | ||||||||
6.875%, 05/01/2022 | 860 | 954 | ||||||
Libbey Glass | ||||||||
6.875%, 05/15/2020 | 567 | 614 | ||||||
Lions Gate Entertainment | �� | |||||||
10.250%, 11/01/2016 (A) | 4,515 | 4,871 | ||||||
Live Nation Entertainment | ||||||||
7.000%, 09/01/2020 (A) | 1,880 | 2,037 | ||||||
LKQ | ||||||||
4.750%, 05/15/2023 (A) | 1,570 | 1,566 | ||||||
Logan’s Roadhouse | ||||||||
10.750%, 10/15/2017 | 4,780 | 4,499 | ||||||
M/I Homes | ||||||||
8.625%, 11/15/2018 | 2,150 | 2,376 | ||||||
| SEI Institutional Investments Trust / Annual Report / May 31, 2013 | 135 |
Table of Contents
SCHEDULE OF INVESTMENTS
High Yield Bond Fund (Continued)
May 31, 2013
| Description | Face Amount ($ Thousands) | Market Value ($ Thousands) | ||||||
Marina District Finance | ||||||||
9.875%, 08/15/2018 | $ | 1,640 | $ | 1,761 | ||||
McClatchy | ||||||||
9.000%, 12/15/2022 (A) | 2,805 | 3,029 | ||||||
MDC Partners | ||||||||
6.750%, 04/01/2020 (A) | 6,010 | 6,145 | ||||||
Meritage Homes | ||||||||
7.000%, 04/01/2022 | 330 | 370 | ||||||
MGM Resorts International | ||||||||
11.375%, 03/01/2018 | 2,500 | 3,237 | ||||||
8.625%, 02/01/2019 | 2,765 | 3,270 | ||||||
7.750%, 03/15/2022 | 275 | 313 | ||||||
6.750%, 10/01/2020 (A) | 2,000 | 2,180 | ||||||
6.625%, 12/15/2021 | 1,390 | 1,506 | ||||||
Michaels Stores | ||||||||
11.375%, 11/01/2016 | 323 | 338 | ||||||
11.375%, 11/01/2016 (A) | 14 | 15 | ||||||
7.750%, 11/01/2018 | 1,570 | 1,703 | ||||||
MTR Gaming Group | ||||||||
11.500%, 08/01/2019 | 5,375 | 5,771 | ||||||
NAI Entertainment Holdings | ||||||||
8.250%, 12/15/2017 (A) | 1,375 | 1,485 | ||||||
NCL | ||||||||
5.000%, 02/15/2018 (A) | 478 | 488 | ||||||
New Academy Finance PIK | ||||||||
8.000%, 06/15/2018 (A) | 1,300 | 1,339 | ||||||
New Albertsons | ||||||||
8.000%, 05/01/2031 | 4,940 | 4,100 | ||||||
7.750%, 06/15/2026 | 135 | 112 | ||||||
7.450%, 08/01/2029 | 165 | 134 | ||||||
New Look Bondco I | ||||||||
8.375%, 05/14/2018 (A) | 780 | 760 | ||||||
Party City Holdings | ||||||||
8.875%, 08/01/2020 (A) | 2,985 | 3,351 | ||||||
Peninsula Gaming | ||||||||
8.375%, 02/15/2018 (A) | 2,750 | 2,984 | ||||||
Petco Animal Supplies | ||||||||
9.250%, 12/01/2018 (A) | 985 | 1,074 | ||||||
Pinnacle Entertainment | ||||||||
7.750%, 04/01/2022 | 665 | 725 | ||||||
Quebecor Media Escrow | ||||||||
0.000%, 11/15/2013 (B) | 1,800 | 16 | ||||||
0.000%, 03/15/2016 (B) | 2,175 | 19 | ||||||
Quiksilver | ||||||||
6.875%, 04/15/2015 | 1,630 | 1,630 | ||||||
Radio Systems | ||||||||
8.375%, 11/01/2019 (A) | 760 | 835 | ||||||
Royal Caribbean Cruises | ||||||||
5.250%, 11/15/2022 | 1,325 | 1,378 | ||||||
RSI Home Products | ||||||||
6.875%, 03/01/2018 (A) | 215 | 223 | ||||||
Sabre | ||||||||
8.500%, 05/15/2019 (A) | 3,170 | 3,495 | ||||||
| Description | Face Amount ($ Thousands) | Market Value ($ Thousands) | ||||||
Sally Holdings | ||||||||
6.875%, 11/15/2019 | $ | 2,537 | $ | 2,813 | ||||
5.750%, 06/01/2022 | 530 | 558 | ||||||
Schaeffler Finance | ||||||||
8.500%, 02/15/2019 (A) | 250 | 281 | ||||||
4.750%, 05/15/2021 (A) | 365 | 359 | ||||||
Seminole Hard Rock Entertainment | ||||||||
5.875%, 05/15/2021 (A) | 250 | 248 | ||||||
Seminole Indian Tribe of Florida | ||||||||
7.750%, 10/01/2017 (A) | 2,650 | 2,829 | ||||||
6.535%, 10/01/2020 (A) | 1,450 | 1,588 | ||||||
Seneca Gaming | ||||||||
8.250%, 12/01/2018 (A) | 4,840 | 5,215 | ||||||
Serta Simmons Holdings | ||||||||
8.125%, 10/01/2020 (A) | 4,215 | 4,457 | ||||||
Service International | ||||||||
7.625%, 10/01/2018 | 450 | 531 | ||||||
7.500%, 04/01/2027 | 785 | 883 | ||||||
7.000%, 05/15/2019 | 620 | 670 | ||||||
ServiceMaster | ||||||||
8.000%, 02/15/2020 | 2,700 | 2,778 | ||||||
7.450%, 08/15/2027 | 840 | 739 | ||||||
7.250%, 03/01/2038 | 3,170 | 2,568 | ||||||
7.100%, 03/01/2018 | 750 | 731 | ||||||
Seven Seas Cruises S de RL | ||||||||
9.125%, 05/15/2019 | 1,620 | 1,770 | ||||||
Shingle Springs Tribal Group | ||||||||
9.375%, 06/15/2015 (A) | 3,470 | 3,479 | ||||||
Sirius XM Radio | ||||||||
4.625%, 05/15/2023 (A) | 575 | 552 | ||||||
4.250%, 05/15/2020 (A) | 1,590 | 1,558 | ||||||
Six Flags Entertainment | ||||||||
5.250%, 01/15/2021 (A) | 3,850 | 3,869 | ||||||
Sonic Automotive | ||||||||
5.000%, 05/15/2023 (A) | 380 | 377 | ||||||
Spencer Spirit Holdings | ||||||||
11.000%, 05/01/2017 (A) | 2,660 | 2,899 | ||||||
9.000%, 05/01/2018 (A) | 1,120 | 1,117 | ||||||
Stanadyne Holdings | ||||||||
12.000%, 02/15/2015 (C) | 1,500 | 990 | ||||||
Stanadyne Holdings, Ser 1 | ||||||||
10.000%, 08/15/2014 | 1,580 | 1,546 | ||||||
Steinway Musical Instruments | ||||||||
7.000%, 03/01/2014 (A) | 1,110 | 1,111 | ||||||
Stewart Enterprises | ||||||||
6.500%, 04/15/2019 | 575 | 618 | ||||||
Suburban Propane Partners | ||||||||
7.500%, 10/01/2018 | 1,672 | 1,795 | ||||||
7.375%, 03/15/2020 | 500 | 535 | ||||||
Sugarhouse HSP Gaming Prop Mezz | ||||||||
8.625%, 04/15/2016 (A) | 1,250 | 1,331 | ||||||
Taylor Morrison Communities | ||||||||
7.750%, 04/15/2020 (A) | 1,057 | 1,179 | ||||||
| 136 | SEI Institutional Investments Trust / Annual Report / May 31, 2013 |
Table of Contents
| Description | Face Amount ($ Thousands) | Market Value ($ Thousands) | ||||||
Tempur-Pedic International | ||||||||
6.875%, 12/15/2020 (A) | $ | 1,405 | $ | 1,516 | ||||
Toll Brothers Finance | ||||||||
4.375%, 04/15/2023 | 1,650 | 1,666 | ||||||
Toys R Us | ||||||||
10.375%, 08/15/2017 | 1,755 | 1,917 | ||||||
Travelport | ||||||||
13.875%, 03/01/2016 (A) | 1,308 | 1,354 | ||||||
11.875%, 09/01/2016 | 1,535 | 1,454 | ||||||
TRW Automotive | ||||||||
4.500%, 03/01/2021 (A) | 1,010 | 1,038 | ||||||
UAL 1995 Pass-Through Trust A, Ser 95A1 | ||||||||
0.000%, 04/19/2012 (B) (G) | 415 | 108 | ||||||
UCI International | ||||||||
8.625%, 02/15/2019 | 1,185 | 1,226 | ||||||
Vail Resorts | ||||||||
6.500%, 05/01/2019 | 1,340 | 1,434 | ||||||
Visteon | ||||||||
6.750%, 04/15/2019 | 1,039 | 1,109 | ||||||
WMG Acquisition | ||||||||
11.500%, 10/01/2018 | 2,990 | 3,528 | ||||||
6.000%, 01/15/2021 (A) | 1,375 | 1,451 | ||||||
Wok Acquisition | ||||||||
10.250%, 06/30/2020 (A) | 3,740 | 4,189 | ||||||
Wolverine World Wide | ||||||||
6.125%, 10/15/2020 (A) | 115 | 122 | ||||||
Wynn Las Vegas | ||||||||
7.750%, 08/15/2020 | 3,050 | 3,439 | ||||||
4.250%, 05/30/2023 (A) | 1,075 | 1,045 | ||||||
|
| |||||||
| 317,755 | ||||||||
|
| |||||||
Consumer Staples — 9.1% |
| |||||||
Accellent | ||||||||
10.000%, 11/01/2017 | 1,075 | 1,005 | ||||||
8.375%, 02/01/2017 | 935 | 984 | ||||||
Albea Beauty Holdings | ||||||||
8.375%, 11/01/2019 (A) | 745 | 779 | ||||||
American Achievement | ||||||||
10.875%, 04/15/2016 (A) | 1,095 | 1,111 | ||||||
Apria Healthcare Group | ||||||||
12.375%, 11/01/2014 | 1,509 | 1,560 | ||||||
APX Group | ||||||||
8.750%, 12/01/2020 (A) | 3,995 | 4,055 | ||||||
ARAMARK | ||||||||
5.750%, 03/15/2020 (A) | 3,375 | 3,493 | ||||||
Armored Autogroup | ||||||||
9.250%, 11/01/2018 | 2,700 | 2,568 | ||||||
Ashtead Capital | ||||||||
6.500%, 07/15/2022 (A) | 1,795 | 1,939 | ||||||
Aurora Diagnostics Holdings | ||||||||
10.750%, 01/15/2018 | 5,125 | 3,562 | ||||||
Avis Budget Car Rental | ||||||||
5.500%, 04/01/2023 (A) | 1,695 | 1,712 | ||||||
4.875%, 11/15/2017 (A) | 390 | 404 | ||||||
| Description | Face Amount ($ Thousands) | Market Value ($ Thousands) | ||||||
B&G Foods | ||||||||
4.625%, 06/01/2021 | $ | 1,090 | $ | 1,087 | ||||
Beverages & More | ||||||||
9.625%, 10/01/2014 (A) | 3,900 | 4,007 | ||||||
Biomet | ||||||||
6.500%, 10/01/2020 (A) | 1,500 | 1,519 | ||||||
Brickman Group Holdings | ||||||||
9.125%, 11/01/2018 (A) | 80 | 87 | ||||||
Bumble Bee Holdco SCA PIK | ||||||||
9.625%, 03/15/2018 (A) | 3,750 | 3,994 | ||||||
Bumble Bee Holdings | ||||||||
9.000%, 12/15/2017 (A) | 1,466 | 1,609 | ||||||
CDRT Holding PIK | ||||||||
9.250%, 10/01/2017 (A) | 730 | 750 | ||||||
Central Garden and Pet | ||||||||
8.250%, 03/01/2018 | 6,100 | 6,359 | ||||||
Ceridian | ||||||||
11.000%, 03/15/2021 (A) | 324 | 370 | ||||||
8.875%, 07/15/2019 (A) | 1,800 | 2,052 | ||||||
Chiquita Brands International | ||||||||
7.875%, 02/01/2021 (A) | 315 | 339 | ||||||
CHS | ||||||||
8.000%, 11/15/2019 | 1,810 | 1,991 | ||||||
7.125%, 07/15/2020 | 2,900 | 3,183 | ||||||
5.125%, 08/15/2018 | 535 | 558 | ||||||
Constellation Brands | ||||||||
4.250%, 05/01/2023 | 1,280 | 1,258 | ||||||
3.750%, 05/01/2021 | 747 | 728 | ||||||
Del Monte | ||||||||
7.625%, 02/15/2019 | 6,075 | 6,295 | ||||||
Elan Finance | ||||||||
6.250%, 06/15/2021 (A) | 850 | 854 | ||||||
Elizabeth Arden | ||||||||
7.375%, 03/15/2021 | 240 | 267 | ||||||
Emergency Medical Services | ||||||||
8.125%, 06/01/2019 | 2,246 | 2,448 | ||||||
ESAL GmbH | ||||||||
6.250%, 02/05/2023 (A) | 330 | 328 | ||||||
First Quality Finance | ||||||||
4.625%, 05/15/2021 (A) | 865 | 843 | ||||||
Fleming | ||||||||
10.125%, 04/01/2008 (B) | 974 | — | ||||||
Fresenius Medical Care US Finance II | ||||||||
5.625%, 07/31/2019 (A) | 1,960 | 2,151 | ||||||
Global A&T Electronics | ||||||||
10.000%, 02/01/2019 (A) | 200 | 215 | ||||||
Harbinger Group | ||||||||
7.875%, 07/15/2019 (A) | 3,050 | 3,248 | ||||||
Hawk Acquisition Sub | ||||||||
4.250%, 10/15/2020 (A) | 1,205 | 1,196 | ||||||
HCA | ||||||||
8.000%, 10/01/2018 | 500 | 589 | ||||||
7.500%, 02/15/2022 | 4,535 | 5,283 | ||||||
6.500%, 02/15/2020 | 2,425 | 2,734 | ||||||
| SEI Institutional Investments Trust / Annual Report / May 31, 2013 | 137 |
Table of Contents
SCHEDULE OF INVESTMENTS
High Yield Bond Fund (Continued)
May 31, 2013
| Description | Face Amount ($ Thousands) | Market Value ($ Thousands) | ||||||
5.875%, 03/15/2022 | $ | 2,050 | $ | 2,250 | ||||
4.750%, 05/01/2023 | 1,500 | 1,496 | ||||||
Hertz | ||||||||
7.500%, 10/15/2018 | 1,580 | 1,718 | ||||||
5.875%, 10/15/2020 | 445 | 470 | ||||||
HJ Heinz Finance | ||||||||
7.125%, 08/01/2039 (A) | 665 | 750 | ||||||
Immucor | ||||||||
11.125%, 08/15/2019 | 6,765 | 7,661 | ||||||
INC Research | ||||||||
11.500%, 07/15/2019 (A) | 2,965 | 3,187 | ||||||
Interactive Data | ||||||||
10.250%, 08/01/2018 | 1,030 | 1,158 | ||||||
JBS USA | ||||||||
8.250%, 02/01/2020 (A) | 1,190 | 1,306 | ||||||
Kinetic Concepts | ||||||||
12.500%, 11/01/2019 | 1,160 | 1,195 | ||||||
10.500%, 11/01/2018 | 2,430 | 2,631 | ||||||
Knowledge Universe Education | ||||||||
7.750%, 02/01/2015 (A) | 775 | 748 | ||||||
Land O’ Lakes | ||||||||
6.000%, 11/15/2022 (A) | 340 | 366 | ||||||
Lantheus Medical Imaging | ||||||||
9.750%, 05/15/2017 | 1,440 | 1,373 | ||||||
Laureate Education | ||||||||
9.250%, 09/01/2019 (A) | 2,000 | 2,240 | ||||||
Mead Products | ||||||||
6.750%, 04/30/2020 (A) | 355 | 373 | ||||||
Michael Foods Group | ||||||||
9.750%, 07/15/2018 | 1,160 | 1,293 | ||||||
Michael Foods Holding PIK | ||||||||
8.500%, 07/15/2018 (A) | 1,165 | 1,229 | ||||||
Monitronics International | ||||||||
9.125%, 04/01/2020 | 4,280 | 4,622 | ||||||
MultiPlan | ||||||||
9.875%, 09/01/2018 (A) | 1,265 | 1,417 | ||||||
OnCure Holdings | ||||||||
11.750%, 05/15/2017 (B) | 1,000 | 480 | ||||||
Pantry | ||||||||
8.375%, 08/01/2020 | 1,440 | 1,575 | ||||||
Physio-Control International | ||||||||
9.875%, 01/15/2019 (A) | 400 | 452 | ||||||
Post Holdings | ||||||||
7.375%, 02/15/2022 | 1,270 | 1,414 | ||||||
Radiation Therapy Services | ||||||||
9.875%, 04/15/2017 | 1,125 | 658 | ||||||
8.875%, 01/15/2017 | 665 | 633 | ||||||
Radnet Management | ||||||||
10.375%, 04/01/2018 | 720 | 773 | ||||||
Reynolds Group Issuer | ||||||||
9.875%, 08/15/2019 | 5,630 | 6,137 | ||||||
9.000%, 04/15/2019 | 4,655 | 4,888 | ||||||
6.875%, 02/15/2021 | 1,000 | 1,068 | ||||||
5.750%, 10/15/2020 | 7,900 | 8,019 | ||||||
| Description | Face Amount ($ Thousands) | Market Value ($ Thousands) | ||||||
Rite Aid | ||||||||
9.250%, 03/15/2020 | $ | 6,675 | $ | 7,534 | ||||
7.700%, 02/15/2027 | 2,635 | 2,773 | ||||||
7.500%, 03/01/2017 | 590 | 606 | ||||||
Rural | ||||||||
10.125%, 07/15/2019 (A) | 2,900 | 2,494 | ||||||
ServiceMaster | ||||||||
7.000%, 08/15/2020 | 1,585 | 1,571 | ||||||
Sky Growth Acquisition | ||||||||
7.375%, 10/15/2020 (A) | 2,265 | 2,407 | ||||||
Smithfield Foods | ||||||||
6.625%, 08/15/2022 | 485 | 552 | ||||||
Spectrum Brands | ||||||||
6.750%, 03/15/2020 | 440 | 473 | ||||||
Spectrum Brands Escrow | ||||||||
6.625%, 11/15/2022 (A) | 1,565 | 1,690 | ||||||
6.375%, 11/15/2020 (A) | 885 | 950 | ||||||
STHI Holding | ||||||||
8.000%, 03/15/2018 (A) | 1,275 | 1,390 | ||||||
SUPERVALU | ||||||||
6.750%, 06/01/2021 (A) | 3,895 | 3,705 | ||||||
Symbion PIK | ||||||||
11.000%, 08/23/2015 | 1,162 | 1,173 | ||||||
TransUnion Holding | ||||||||
9.625%, 06/15/2018 | 425 | 458 | ||||||
TransUnion Holding PIK | ||||||||
8.125%, 06/15/2018 (A) | 2,349 | 2,496 | ||||||
United Rentals North America | ||||||||
9.250%, 12/15/2019 | 1,055 | 1,188 | ||||||
8.375%, 09/15/2020 | 575 | 627 | ||||||
8.250%, 02/01/2021 | 5,135 | 5,687 | ||||||
7.625%, 04/15/2022 | 140 | 155 | ||||||
7.375%, 05/15/2020 | 170 | 187 | ||||||
6.125%, 06/15/2023 | 290 | 304 | ||||||
United Surgical Partners International | ||||||||
9.000%, 04/01/2020 | 1,570 | 1,754 | ||||||
US Foods | ||||||||
8.500%, 06/30/2019 | 4,510 | 4,831 | ||||||
US Oncology Escrow | ||||||||
0.000%, 08/15/2017 | 2,130 | 83 | ||||||
Valeant Pharmaceuticals International | ||||||||
7.250%, 07/15/2022 (A) | 1,260 | 1,367 | ||||||
7.000%, 10/01/2020 (A) | 1,275 | 1,374 | ||||||
6.750%, 08/15/2021 (A) | 970 | 1,033 | ||||||
6.375%, 10/15/2020 (A) | 885 | 929 | ||||||
Vanguard Health Holding II | ||||||||
7.750%, 02/01/2019 | 2,300 | 2,461 | ||||||
Vector Group | ||||||||
7.750%, 02/15/2021 (A) | 830 | 886 | ||||||
|
| |||||||
| 196,232 | ||||||||
|
| |||||||
Energy — 10.0% |
| |||||||
Access Midstream Partners | ||||||||
6.125%, 07/15/2022 | 555 | 594 | ||||||
4.875%, 05/15/2023 | 1,720 | 1,698 | ||||||
| 138 | SEI Institutional Investments Trust / Annual Report / May 31, 2013 |
Table of Contents
| Description | Face Amount ($ Thousands) | Market Value ($ Thousands) | ||||||
Antero Resources Finance | ||||||||
6.000%, 12/01/2020 | $ | 1,660 | $ | 1,726 | ||||
Arch Coal | ||||||||
8.750%, 08/01/2016 | 245 | 253 | ||||||
7.250%, 06/15/2021 | 955 | 845 | ||||||
7.000%, 06/15/2019 | 510 | 459 | ||||||
Athlon Holdings | ||||||||
7.375%, 04/15/2021 (A) | 1,075 | 1,118 | ||||||
Atlas Pipeline Partners | ||||||||
6.625%, 10/01/2020 (A) | 1,375 | 1,461 | ||||||
6.625%, 10/01/2020 (A) | 595 | 632 | ||||||
5.875%, 08/01/2023 (A) | 1,850 | 1,887 | ||||||
Atwood Oceanics | ||||||||
6.500%, 02/01/2020 | 438 | 469 | ||||||
Berry Petroleum | ||||||||
6.375%, 09/15/2022 | 430 | 446 | ||||||
Bill Barrett | ||||||||
7.625%, 10/01/2019 | 2,000 | 2,150 | ||||||
Bluewater Holding | ||||||||
3.278%, 07/17/2014 (D) | 1,400 | 1,376 | ||||||
BreitBurn Energy Partners | ||||||||
8.625%, 10/15/2020 | 640 | 704 | ||||||
7.875%, 04/15/2022 (A) | 4,160 | 4,514 | ||||||
Calumet Specialty Products Partners | ||||||||
9.375%, 05/01/2019 | 2,925 | 3,254 | ||||||
Carrizo Oil & Gas | ||||||||
7.500%, 09/15/2020 | 400 | 432 | ||||||
Chaparral Energy | ||||||||
8.250%, 09/01/2021 | 915 | 1,011 | ||||||
7.625%, 11/15/2022 | 730 | 788 | ||||||
Chesapeake Energy | ||||||||
6.625%, 08/15/2020 | 2,835 | 3,154 | ||||||
6.125%, 02/15/2021 | 270 | 294 | ||||||
5.750%, 03/15/2023 | 625 | 650 | ||||||
5.375%, 06/15/2021 | 325 | 331 | ||||||
Chesapeake Oilfield Operating | ||||||||
7.125%, 11/15/2019 (A) | 425 | 446 | ||||||
Comstock Resources | ||||||||
7.750%, 04/01/2019 | 2,200 | 2,327 | ||||||
CONSOL Energy | ||||||||
8.250%, 04/01/2020 | 680 | 751 | ||||||
8.000%, 04/01/2017 | 815 | 872 | ||||||
Continental Resources | ||||||||
5.000%, 09/15/2022 | 455 | 471 | ||||||
Copano Energy | ||||||||
7.750%, 06/01/2018 | 875 | 909 | ||||||
7.125%, 04/01/2021 | 520 | 599 | ||||||
Crestwood Midstream Partners | ||||||||
7.750%, 04/01/2019 | 3,750 | 4,003 | ||||||
7.750%, 04/01/2019 (A) | 300 | 320 | ||||||
Crosstex Energy | ||||||||
8.875%, 02/15/2018 | 2,625 | 2,822 | ||||||
7.125%, 06/01/2022 | 725 | 776 | ||||||
| Description | Face Amount ($ Thousands) | Market Value ($ Thousands) | ||||||
Denbury Resources | ||||||||
8.250%, 02/15/2020 | $ | 909 | $ | 1,018 | ||||
Dresser-Rand Group | ||||||||
6.500%, 05/01/2021 | 600 | 650 | ||||||
Drill Rigs Holdings | ||||||||
6.500%, 10/01/2017 (A) | 1,500 | 1,530 | ||||||
Eagle Rock Energy Partners | ||||||||
8.375%, 06/01/2019 | 6,960 | 7,291 | ||||||
El Paso | ||||||||
7.250%, 06/01/2018 | 740 | 859 | ||||||
7.000%, 06/15/2017 | 270 | 308 | ||||||
EP Energy | ||||||||
9.375%, 05/01/2020 | 1,390 | 1,576 | ||||||
7.750%, 09/01/2022 | 720 | 803 | ||||||
6.875%, 05/01/2019 | 2,665 | 2,878 | ||||||
EV Energy Partners | ||||||||
8.000%, 04/15/2019 | 1,465 | 1,505 | ||||||
Exterran Holdings | ||||||||
7.250%, 12/01/2018 | 4,650 | 4,976 | ||||||
Exterran Partners | ||||||||
6.000%, 04/01/2021 (A) | 2,090 | 2,142 | ||||||
Foresight Energy | ||||||||
9.625%, 08/15/2017 (A) | 2,060 | 2,235 | ||||||
Forest Oil | ||||||||
7.500%, 09/15/2020 (A) | 7,785 | 7,824 | ||||||
7.250%, 06/15/2019 | 995 | 990 | ||||||
FTS International Services | ||||||||
8.125%, 11/15/2018 (A) | 727 | 774 | ||||||
Genesis Energy | ||||||||
5.750%, 02/15/2021 (A) | 1,780 | 1,816 | ||||||
Halcon Resources | ||||||||
8.875%, 05/15/2021 (A) | 7,545 | 7,677 | ||||||
Hercules Offshore | ||||||||
10.500%, 10/15/2017 (A) | 2,055 | 2,209 | ||||||
Hiland Partners | ||||||||
7.250%, 10/01/2020 (A) | 990 | 1,079 | ||||||
Hilcorp Energy I | ||||||||
8.000%, 02/15/2020 (A) | 1,280 | 1,414 | ||||||
7.625%, 04/15/2021 (A) | 125 | 138 | ||||||
James River Coal | ||||||||
7.875%, 04/01/2019 | 410 | 213 | ||||||
Kodiak Oil & Gas | ||||||||
8.125%, 12/01/2019 | 2,630 | 2,959 | ||||||
5.500%, 01/15/2021 (A) | 555 | 576 | ||||||
Laredo Petroleum | ||||||||
9.500%, 02/15/2019 | 3,475 | 3,935 | ||||||
7.375%, 05/01/2022 | 980 | 1,078 | ||||||
Legacy Reserves | ||||||||
8.000%, 12/01/2020 (A) | 2,250 | 2,368 | ||||||
6.625%, 12/01/2021 (A) | 2,620 | 2,561 | ||||||
Linn Energy | ||||||||
8.625%, 04/15/2020 | 1,230 | 1,347 | ||||||
7.750%, 02/01/2021 | 580 | 615 | ||||||
6.500%, 05/15/2019 | 455 | 463 | ||||||
6.250%, 11/01/2019 (A) | 4,455 | 4,488 | ||||||
| SEI Institutional Investments Trust / Annual Report / May 31, 2013 | 139 |
Table of Contents
SCHEDULE OF INVESTMENTS
High Yield Bond Fund (Continued)
May 31, 2013
| Description | Face Amount ($ Thousands) | Market Value ($ Thousands) | ||||||
Magnum Hunter Resources | ||||||||
9.750%, 05/15/2020 (A) | $ | 805 | $ | 833 | ||||
9.750%, 05/15/2020 (A) | 95 | 98 | ||||||
MarkWest Energy Partners | ||||||||
5.500%, 02/15/2023 | 805 | 841 | ||||||
MEG Energy | ||||||||
6.500%, 03/15/2021 (A) | 326 | 337 | ||||||
6.375%, 01/30/2023 (A) | 3,035 | 3,111 | ||||||
Memorial Production Partners | ||||||||
7.625%, 05/01/2021 (A) | 1,840 | 1,849 | ||||||
Midstates Petroleum | ||||||||
10.750%, 10/01/2020 (A) | 5,002 | 5,352 | ||||||
9.250%, 06/01/2021 (A) | 3,235 | 3,219 | ||||||
Milagro Oil & Gas | ||||||||
10.500%, 05/15/2016 (B) | 1,950 | 1,599 | ||||||
Millennium Offshore Services Superholdings | ||||||||
9.500%, 02/15/2018 (A) | 1,040 | 1,076 | ||||||
Newfield Exploration | ||||||||
6.875%, 02/01/2020 | 675 | 722 | ||||||
Niska Gas Storage US | ||||||||
8.875%, 03/15/2018 | 3,090 | 3,245 | ||||||
Northern Oil and Gas | ||||||||
8.000%, 06/01/2020 | 1,420 | 1,477 | ||||||
Ocean Rig UDW | ||||||||
9.500%, 04/27/2016 (A) | 6,100 | 6,466 | ||||||
Offshore Group Investment | ||||||||
7.125%, 04/01/2023 (A) | 715 | 738 | ||||||
Pacific Drilling | ||||||||
5.375%, 06/01/2020 (A) | 975 | 965 | ||||||
Parker Drilling | ||||||||
9.125%, 04/01/2018 | 2,200 | 2,387 | ||||||
PDC Energy | ||||||||
7.750%, 10/15/2022 (A) | 2,570 | 2,801 | ||||||
Peabody Energy | ||||||||
6.250%, 11/15/2021 | 390 | 408 | ||||||
6.000%, 11/15/2018 | 860 | 920 | ||||||
Penn Virginia Resource Partners | ||||||||
8.375%, 06/01/2020 | 2,880 | 3,132 | ||||||
8.250%, 04/15/2018 | 1,265 | 1,347 | ||||||
6.500%, 05/15/2021 (A) | 800 | 803 | ||||||
Pioneer Energy Services | ||||||||
9.875%, 03/15/2018 | 1,850 | 2,017 | ||||||
Plains Exploration & Production | ||||||||
6.875%, 02/15/2023 | 905 | 1,024 | ||||||
6.500%, 11/15/2020 | 1,775 | 1,966 | ||||||
QR Energy | ||||||||
9.250%, 08/01/2020 | 725 | 769 | ||||||
Range Resources | ||||||||
5.000%, 08/15/2022 | 2,525 | 2,563 | ||||||
5.000%, 03/15/2023 (A) | 4,550 | 4,596 | ||||||
Regency Energy Partners | ||||||||
5.500%, 04/15/2023 | 550 | 578 | ||||||
4.500%, 11/01/2023 (A) | 690 | 683 | ||||||
| Description | Face Amount ($ Thousands) | Market Value ($ Thousands) | ||||||
Rockies Express Pipeline | ||||||||
6.000%, 01/15/2019 (A) | $ | 2,030 | $ | 2,005 | ||||
Rosetta Resources | ||||||||
5.625%, 05/01/2021 | 965 | 967 | ||||||
Sabine Pass Liquefaction | ||||||||
5.625%, 02/01/2021 (A) | 3,820 | 3,834 | ||||||
5.625%, 04/15/2023 (A) | 4,210 | 4,210 | ||||||
Samson Investment | ||||||||
9.750%, 02/15/2020 (A) | 2,240 | 2,335 | ||||||
SandRidge Energy | ||||||||
8.750%, 01/15/2020 | 70 | 75 | ||||||
8.125%, 10/15/2022 | 4,689 | 5,006 | ||||||
7.500%, 03/15/2021 | 3,375 | 3,476 | ||||||
7.500%, 02/15/2023 | 5,385 | 5,547 | ||||||
Sea Trucks Group | ||||||||
9.000%, 03/26/2018 (A) | 2,150 | 2,182 | ||||||
SESI | ||||||||
7.125%, 12/15/2021 | 4,000 | 4,490 | ||||||
Targa Resources Partners | ||||||||
7.875%, 10/15/2018 | 2,445 | 2,647 | ||||||
6.375%, 08/01/2022 | 1,750 | 1,899 | ||||||
4.250%, 11/15/2023 (A) | 870 | 829 | ||||||
Tesoro Logistics | ||||||||
5.875%, 10/01/2020 (A) | 725 | 756 | ||||||
Trinidad Drilling | ||||||||
7.875%, 01/15/2019 (A) | 880 | 946 | ||||||
Vanguard Natural Resources | ||||||||
7.875%, 04/01/2020 | 835 | 893 | ||||||
Western Refining | ||||||||
6.250%, 04/01/2021 (A) | 265 | 274 | ||||||
WPX Energy | ||||||||
6.000%, 01/15/2022 | 270 | 291 | ||||||
|
| |||||||
| 217,421 | ||||||||
|
| |||||||
Financials — 7.4% |
| |||||||
Ally Financial | ||||||||
8.000%, 11/01/2031 | 1,150 | 1,483 | ||||||
7.500%, 09/15/2020 | 850 | 992 | ||||||
6.250%, 12/01/2017 | 3,675 | 4,045 | ||||||
5.500%, 02/15/2017 | 1,430 | 1,530 | ||||||
4.625%, 06/26/2015 | 360 | 376 | ||||||
Alphabet Holding PIK | ||||||||
7.750%, 11/01/2017 (A) | 4,135 | 4,269 | ||||||
American International Group | ||||||||
8.175%, 05/15/2058 (D) | 1,145 | 1,500 | ||||||
A-S-Issuer Subsidiary | ||||||||
7.875%, 12/15/2020 (A) | 3,035 | 3,179 | ||||||
Aventine (Escrow Security) PIK | ||||||||
0.000%, 10/15/2049 (B)(E)(F)(G) | 2,600 | 1 | ||||||
Bank of America | ||||||||
8.000%, 12/29/2049 (D) | 1,885 | 2,149 | ||||||
5.200%, 12/29/2049 (D) | 3,400 | 3,366 | ||||||
Barclays Bank | ||||||||
7.625%, 11/21/2022 | 1,510 | 1,518 | ||||||
| 140 | SEI Institutional Investments Trust / Annual Report / May 31, 2013 |
Table of Contents
| Description | Face Amount ($ Thousands) | Market Value ($ Thousands) | ||||||
CIT Group | ||||||||
6.625%, 04/01/2018 (A) | $ | 300 | $ | 337 | ||||
5.500%, 02/15/2019 (A) | 1,920 | 2,078 | ||||||
5.250%, 03/15/2018 | 1,520 | 1,634 | ||||||
5.000%, 05/15/2017 | 720 | 767 | ||||||
4.250%, 08/15/2017 | 800 | 824 | ||||||
City National Bank | ||||||||
9.000%, 08/12/2019 | 4,062 | 4,907 | ||||||
CNH Capital | ||||||||
6.250%, 11/01/2016 | 610 | 671 | ||||||
Corrections Corp of America‡ | ||||||||
4.625%, 05/01/2023 (A) | 240 | 244 | ||||||
4.125%, 04/01/2020 (A) | 285 | 286 | ||||||
Credit Acceptance | ||||||||
9.125%, 02/01/2017 | 3,000 | 3,240 | ||||||
E*TRADE Financial | ||||||||
6.375%, 11/15/2019 | 1,575 | 1,654 | ||||||
EPR Properties‡ | ||||||||
5.750%, 08/15/2022 | 1,065 | 1,151 | ||||||
Fidelity & Guaranty Life Holdings | ||||||||
6.375%, 04/01/2021 (A) | 1,000 | 1,030 | ||||||
Fifth Third Bancorp | ||||||||
5.100%, 12/31/2049 (D) | 710 | 708 | ||||||
General Motors Financial | ||||||||
4.250%, 05/15/2023 (A) | 325 | 319 | ||||||
3.250%, 05/15/2018 (A) | 802 | 795 | ||||||
2.750%, 05/15/2016 (A) | 325 | 325 | ||||||
Geo Group‡ | ||||||||
6.625%, 02/15/2021 | 75 | 82 | ||||||
5.125%, 04/01/2023 (A) | 1,320 | 1,346 | ||||||
GETCO Financing Escrow | ||||||||
8.250%, 06/15/2018 (A) | 1,775 | 1,735 | ||||||
Global Investments Group Finance | ||||||||
11.000%, 09/24/2017 | 3,000 | 2,910 | ||||||
HBOS Capital Funding | ||||||||
6.071%, 06/30/2049 (A) (D) | 4,910 | 4,480 | ||||||
Hub International | ||||||||
8.125%, 10/15/2018 (A) | 5,925 | 6,369 | ||||||
Icahn Enterprises | ||||||||
8.000%, 01/15/2018 | 2,800 | 2,968 | ||||||
ILFC E-Capital Trust II | ||||||||
6.250%, 12/21/2065 (A) (D) | 1,900 | 1,786 | ||||||
ING Groep | ||||||||
5.775%, 12/29/2049 (D) | 3,250 | 3,169 | ||||||
ING US | ||||||||
5.650%, 05/15/2053 (A) (D) | 2,050 | 2,060 | ||||||
Ironshore Holdings US | ||||||||
8.500%, 05/15/2020 (A) | 5,000 | 5,831 | ||||||
Jefferies Finance | ||||||||
7.375%, 04/01/2020 (A) | 830 | 834 | ||||||
Jefferies Group | ||||||||
8.500%, 07/15/2019 | 820 | 1,037 | ||||||
Kennedy-Wilson | ||||||||
8.750%, 04/01/2019 | 3,500 | 3,841 | ||||||
8.750%, 04/01/2019 (A) | 430 | 472 | ||||||
| Description | Face Amount ($ Thousands) | Market Value ($ Thousands) | ||||||
Lancashire Holdings | ||||||||
5.700%, 10/01/2022 (A) | $ | 1,200 | $ | 1,126 | ||||
Liberty Mutual Group | ||||||||
7.000%, 03/15/2037 (A) (D) | 1,565 | 1,635 | ||||||
Lloyds Banking Group | ||||||||
6.267%, 11/14/2016 (A) (D) | 1,435 | 1,191 | ||||||
Marlin Water Trust II | ||||||||
6.310%, 07/15/2003 (A) (B) | 4,000 | — | ||||||
Mattamy Group | ||||||||
6.500%, 11/15/2020 (A) | 1,575 | 1,571 | ||||||
Millennium Escrow | ||||||||
7.625%, 11/15/2026 (B) | 200 | — | ||||||
MPT Operating Partnership‡ | ||||||||
6.875%, 05/01/2021 | 4,095 | 4,525 | ||||||
National Life Insurance | ||||||||
10.500%, 09/15/2039 (A) | 1,100 | 1,552 | ||||||
Nationstar Mortgage | ||||||||
9.625%, 05/01/2019 (A) | 915 | 1,043 | ||||||
7.875%, 10/01/2020 (A) | 3,725 | 4,079 | ||||||
6.500%, 07/01/2021 (A) | 3,300 | 3,366 | ||||||
6.500%, 06/01/2022 | 3,015 | 3,015 | ||||||
Norcraft | ||||||||
10.500%, 12/15/2015 | 975 | 1,019 | ||||||
Nuveen Investments | ||||||||
9.500%, 10/15/2020 (A) | 6,890 | 7,390 | ||||||
9.125%, 10/15/2017 (A) | 3,170 | 3,329 | ||||||
Ohio Casualty | ||||||||
7.300%, 06/15/2014 | 1,050 | 1,108 | ||||||
Onex USI Acquisition | ||||||||
7.750%, 01/15/2021 (A) | 4,105 | 4,218 | ||||||
Ono Finance II | ||||||||
10.875%, 07/15/2019 (A) | 780 | 825 | ||||||
Oxford Finance | ||||||||
7.250%, 01/15/2018 (A) | 1,150 | 1,226 | ||||||
PHH | ||||||||
9.250%, 03/01/2016 | 725 | 843 | ||||||
7.375%, 09/01/2019 | 775 | 880 | ||||||
PNC Preferred Funding Trust II | ||||||||
1.503%, 03/29/2049 (A) (D) | 6,540 | 5,755 | ||||||
Provident Funding Associates | ||||||||
6.750%, 06/15/2021 (A) | 780 | 796 | ||||||
RBS Capital Trust I | ||||||||
4.709%, 12/29/2049 (D) | 2,280 | 1,847 | ||||||
RBS Capital Trust III | ||||||||
5.512%, 09/30/2049 (D) | 420 | 352 | ||||||
Realogy | ||||||||
7.875%, 02/15/2019 (A) | 1,125 | 1,235 | ||||||
7.625%, 01/15/2020 (A) | 520 | 589 | ||||||
RHP Hotel Properties‡ | ||||||||
5.000%, 04/15/2021 (A) | 1,416 | 1,437 | ||||||
Rivers Pittsburgh Borrower | ||||||||
9.500%, 06/15/2019 (A) | 725 | 798 | ||||||
Sabra Health Care‡ | ||||||||
8.125%, 11/01/2018 | 4,540 | 4,937 | ||||||
| SEI Institutional Investments Trust / Annual Report / May 31, 2013 | 141 |
Table of Contents
SCHEDULE OF INVESTMENTS
High Yield Bond Fund (Continued)
May 31, 2013
| Description | Face Amount ($ Thousands) | Market Value ($ Thousands) | ||||||
Snoqualmie Entertainment Authority | ||||||||
9.125%, 02/01/2015 (A) | $ | 1,116 | $ | 1,105 | ||||
4.223%, 02/01/2014 (A) (D) | 245 | 241 | ||||||
Springleaf Finance | ||||||||
6.900%, 12/15/2017 | 2,175 | 2,254 | ||||||
6.000%, 06/01/2020 (A) | 915 | 883 | ||||||
USB Realty | ||||||||
1.424%, 12/29/2049 (A) (D) | 6,400 | 5,712 | ||||||
Wilton Re Finance | ||||||||
5.875%, 03/30/2033 (A) (D) | 2,400 | 2,384 | ||||||
XL Capital | ||||||||
6.500%, 12/31/2049 (D) | 2,615 | 2,622 | ||||||
|
| |||||||
| 161,186 | ||||||||
|
| |||||||
Health Care — 2.7% | ||||||||
Acadia Healthcare | ||||||||
12.875%, 11/01/2018 | 1,702 | 2,119 | ||||||
6.125%, 03/15/2021 (A) | 1,100 | 1,147 | ||||||
Alere | ||||||||
7.250%, 07/01/2018 (A) | 790 | 857 | ||||||
6.500%, 06/15/2020 (A) | 3,300 | 3,316 | ||||||
Amsurg | ||||||||
5.625%, 11/30/2020 (A) | 3,075 | 3,198 | ||||||
Biomet | ||||||||
6.500%, 08/01/2020 (A) | 3,231 | 3,401 | ||||||
BioScrip | ||||||||
10.250%, 10/01/2015 | 3,685 | 3,869 | ||||||
DaVita HealthCare Partners | ||||||||
6.625%, 11/01/2020 | 1,435 | 1,532 | ||||||
6.375%, 11/01/2018 | 255 | 271 | ||||||
5.750%, 08/15/2022 | 10 | 11 | ||||||
DJO Finance | ||||||||
9.875%, 04/15/2018 | 4,770 | 5,235 | ||||||
8.750%, 03/15/2018 | 970 | 1,072 | ||||||
7.750%, 04/15/2018 | 3,295 | 3,410 | ||||||
Endo Health Solutions | ||||||||
7.000%, 07/15/2019 | 1,000 | 1,075 | ||||||
HCA Holdings | ||||||||
7.750%, 05/15/2021 | 2,460 | 2,718 | ||||||
6.250%, 02/15/2021 | 665 | 711 | ||||||
Health Management Associates | ||||||||
7.375%, 01/15/2020 | 3,355 | 3,661 | ||||||
HealthSouth | ||||||||
8.125%, 02/15/2020 | 3,745 | 4,148 | ||||||
7.750%, 09/15/2022 | 549 | 607 | ||||||
7.250%, 10/01/2018 | 33 | 36 | ||||||
5.750%, 11/01/2024 | 265 | 274 | ||||||
Hologic | ||||||||
6.250%, 08/01/2020 | 2,810 | 3,003 | ||||||
inVentiv Health | ||||||||
11.000%, 08/15/2018 (A) | 450 | 396 | ||||||
10.750%, 08/15/2018 (A) | 610 | 537 | ||||||
Kindred Healthcare | ||||||||
8.250%, 06/01/2019 | 3,230 | 3,375 | ||||||
| Description | Face Amount ($ Thousands) | Market Value ($ Thousands) | ||||||
Surgical Care Affiliates PIK | ||||||||
8.875%, 07/15/2015 (A) | $ | 1,636 | $ | 1,644 | ||||
Tenet Healthcare | ||||||||
8.000%, 08/01/2020 | 2,685 | 2,947 | ||||||
4.750%, 06/01/2020 (A) | 1,430 | 1,441 | ||||||
4.375%, 10/01/2021 (A) | 1,800 | 1,746 | ||||||
Truven Health Analytics | ||||||||
10.625%, 06/01/2020 (A) | 595 | 672 | ||||||
|
| |||||||
| 58,429 | ||||||||
|
| |||||||
Industrials — 7.9% | ||||||||
Actuant | ||||||||
5.625%, 06/15/2022 | 4,000 | 4,120 | ||||||
ADS Waste Holdings | ||||||||
8.250%, 10/01/2020 (A) | 630 | 676 | ||||||
Air Canada | ||||||||
9.250%, 08/01/2015 (A) | 3,965 | 4,181 | ||||||
Air Medical Group Holdings | ||||||||
9.250%, 11/01/2018 | 4,445 | 4,878 | ||||||
Aircastle | ||||||||
7.625%, 04/15/2020 | 415 | 476 | ||||||
6.750%, 04/15/2017 | 270 | 297 | ||||||
Alion Science & Technology | ||||||||
10.250%, 02/01/2015 | 865 | 500 | ||||||
Alion Science & Technology PIK | ||||||||
12.000%, 11/01/2014 | 2,124 | 2,196 | ||||||
American Airlines Pass-Through Trust, Ser 2011-2, Cl A | ||||||||
8.625%, 10/15/2021 | 1,001 | 1,056 | ||||||
Amsted Industries | ||||||||
8.125%, 03/15/2018 (A) | 870 | 933 | ||||||
Anixter | ||||||||
5.625%, 05/01/2019 | 395 | 420 | ||||||
ARD Finance PIK | ||||||||
11.125%, 06/01/2018 (A) | 1,485 | 1,626 | ||||||
Ardagh Packaging Finance | ||||||||
9.125%, 10/15/2020 (A) | 2,290 | 2,519 | ||||||
7.375%, 10/15/2017 (A) | 300 | 326 | ||||||
7.000%, 11/15/2020 (A) | 3,160 | 3,239 | ||||||
Associated Materials | ||||||||
9.125%, 11/01/2017 | 665 | 703 | ||||||
Atkore International | ||||||||
9.875%, 01/01/2018 | 910 | 981 | ||||||
BC Mountain | ||||||||
7.000%, 02/01/2021 (A) | 1,090 | 1,155 | ||||||
Belden | ||||||||
5.500%, 09/01/2022 (A) | 830 | 853 | ||||||
Berry Plastics | ||||||||
9.750%, 01/15/2021 | 785 | 907 | ||||||
Boart Longyear Management | ||||||||
7.000%, 04/01/2021 (A) | 3,600 | 3,564 | ||||||
BOE Intermediate Holding | ||||||||
9.000%, 11/01/2017 (A) | 835 | 822 | ||||||
| 142 | SEI Institutional Investments Trust / Annual Report / May 31, 2013 |
Table of Contents
| Description | Face Amount ($ Thousands) | Market Value ($ Thousands) | ||||||
BOE Merger | ||||||||
9.500%, 11/01/2017 (A) | $ | 1,743 | $ | 1,817 | ||||
Bombardier | ||||||||
7.750%, 03/15/2020 (A) | 320 | 374 | ||||||
6.125%, 01/15/2023 (A) | 775 | 810 | ||||||
5.750%, 03/15/2022 (A) | 1,065 | 1,108 | ||||||
Builders FirstSource | ||||||||
13.000%, 02/15/2016 (A) (D) | 410 | 412 | ||||||
7.625%, 06/01/2021 (A) | 1,085 | 1,090 | ||||||
Building Materials Corp of America | ||||||||
6.875%, 08/15/2018 (A) | 2,360 | 2,519 | ||||||
6.750%, 05/01/2021 (A) | 700 | 758 | ||||||
BWAY Holding | ||||||||
10.000%, 06/15/2018 | 985 | 1,091 | ||||||
Case New Holland | ||||||||
7.875%, 12/01/2017 | 605 | 711 | ||||||
Cemex Espana Luxembourg | ||||||||
9.250%, 05/12/2020 (A) | 1,793 | 1,923 | ||||||
CEVA Group | ||||||||
11.625%, 10/01/2016 (A) | 2,735 | 2,872 | ||||||
11.500%, 04/01/2018 (A) (B) | 2,500 | 2,275 | ||||||
8.375%, 12/01/2017 (A) | 2,365 | 2,448 | ||||||
CHC Helicopter | ||||||||
9.375%, 06/01/2021 (A) | 2,100 | 2,152 | ||||||
Clean Harbors | ||||||||
5.250%, 08/01/2020 | 3,015 | 3,143 | ||||||
Consolidated Container | ||||||||
10.125%, 07/15/2020 (A) | 1,445 | 1,629 | ||||||
Crown Americas | ||||||||
4.500%, 01/15/2023 (A) | 145 | 142 | ||||||
DigitalGlobe | ||||||||
5.250%, 02/01/2021 (A) | 2,005 | 2,020 | ||||||
Esterline Technologies | ||||||||
7.000%, 08/01/2020 | 1,755 | 1,922 | ||||||
FGI Operating | ||||||||
7.875%, 05/01/2020 (A) | 880 | 948 | ||||||
Florida East Coast Railway | ||||||||
8.125%, 02/01/2017 | 750 | 799 | ||||||
GenCorp | ||||||||
7.125%, 03/15/2021 (A) | 1,590 | 1,701 | ||||||
General Cable | ||||||||
5.750%, 10/01/2022 (A) | 575 | 592 | ||||||
Gibraltar Industries | ||||||||
6.250%, 02/01/2021 (A) | 874 | 922 | ||||||
Graphic Packaging International | ||||||||
4.750%, 04/15/2021 | 1,346 | 1,359 | ||||||
Great Lakes Dredge & Dock | ||||||||
7.375%, 02/01/2019 | 1,215 | 1,280 | ||||||
Griffon | ||||||||
7.125%, 04/01/2018 | 750 | 806 | ||||||
H&E Equipment Services | ||||||||
7.000%, 09/01/2022 | 2,175 | 2,349 | ||||||
Huntington Ingalls Industries | ||||||||
6.875%, 03/15/2018 | 600 | 654 | ||||||
| Description | Face Amount ($ Thousands) | Market Value ($ Thousands) | ||||||
Interline Brands | ||||||||
7.500%, 11/15/2018 | $ | 865 | $ | 926 | ||||
Interline Brands PIK | ||||||||
10.000%, 11/15/2018 (A) | 310 | 343 | ||||||
International Lease Finance | ||||||||
8.750%, 03/15/2017 | 3,280 | 3,883 | ||||||
6.250%, 05/15/2019 | 405 | 442 | ||||||
5.875%, 04/01/2019 | 1,955 | 2,097 | ||||||
5.750%, 05/15/2016 | 170 | 182 | ||||||
4.625%, 04/15/2021 | 715 | 710 | ||||||
Iron Mountain | ||||||||
7.750%, 10/01/2019 | 2,625 | 2,930 | ||||||
Kratos Defense & Security Solutions | ||||||||
10.000%, 06/01/2017 | 1,525 | 1,662 | ||||||
Liberty Tire Recycling | ||||||||
11.000%, 10/01/2016 (A) | 3,900 | 4,007 | ||||||
Manitowoc | ||||||||
8.500%, 11/01/2020 | 1,180 | 1,342 | ||||||
Marquette Transportation | ||||||||
10.875%, 01/15/2017 | 1,650 | 1,786 | ||||||
Masonite International | ||||||||
8.250%, 04/15/2021 (A) | 2,030 | 2,253 | ||||||
Meritor | ||||||||
6.750%, 06/15/2021 | 735 | 726 | ||||||
Midwest Vanadium | ||||||||
11.500%, 02/15/2018 (A) | 1,350 | 891 | ||||||
Milacron | ||||||||
7.750%, 02/15/2021 (A) | 1,490 | 1,564 | ||||||
Mobile Mini | ||||||||
7.875%, 12/01/2020 | 1,190 | 1,318 | ||||||
Mueller Water Products | ||||||||
8.750%, 09/01/2020 | 504 | 570 | ||||||
7.375%, 06/01/2017 | 1,455 | 1,491 | ||||||
Navistar International | ||||||||
8.250%, 11/01/2021 | 1,320 | 1,345 | ||||||
Nortek | ||||||||
8.500%, 04/15/2021 | 1,510 | 1,653 | ||||||
8.500%, 04/15/2021 (A) | 1,950 | 2,116 | ||||||
Old AII | ||||||||
10.000%, 12/15/2016 (B) | 1,675 | — | ||||||
Old AII PIK | ||||||||
9.000%, 12/15/2014 (B) | 950 | — | ||||||
Oshkosh | ||||||||
8.500%, 03/01/2020 | 1,765 | 1,964 | ||||||
8.250%, 03/01/2017 | 705 | 758 | ||||||
Packaging Dynamics | ||||||||
8.750%, 02/01/2016 (A) | 2,724 | 2,850 | ||||||
Polymer Group | ||||||||
7.750%, 02/01/2019 | 965 | 1,040 | ||||||
Polypore International | ||||||||
7.500%, 11/15/2017 | 980 | 1,049 | ||||||
Quality Distribution | ||||||||
9.875%, 11/01/2018 | 4,770 | 5,330 | ||||||
| SEI Institutional Investments Trust / Annual Report / May 31, 2013 | 143 |
Table of Contents
SCHEDULE OF INVESTMENTS
High Yield Bond Fund (Continued)
May 31, 2013
| Description | Face Amount ($ Thousands) | Market Value ($ Thousands) | ||||||
RBS Global | ||||||||
8.500%, 05/01/2018 | $ | 1,205 | $ | 1,304 | ||||
Silver II Borrower | ||||||||
7.750%, 12/15/2020 (A) | 1,830 | 1,899 | ||||||
Swift Services Holdings | ||||||||
10.000%, 11/15/2018 | 1,490 | 1,702 | ||||||
syncreon Global Ireland | ||||||||
9.500%, 05/01/2018 (A) | 2,467 | 2,677 | ||||||
Tekni-Plex | ||||||||
9.750%, 06/01/2019 (A) | 579 | 648 | ||||||
Tempel Steel | ||||||||
12.000%, 08/15/2016 (A) | 1,100 | 1,062 | ||||||
Terex | ||||||||
6.500%, 04/01/2020 | 700 | 751 | ||||||
6.000%, 05/15/2021 | 3,020 | 3,194 | ||||||
Tervita | ||||||||
8.000%, 11/15/2018 (A) | 765 | 792 | ||||||
Titan International | ||||||||
7.875%, 10/01/2017 | 4,335 | 4,638 | ||||||
7.875%, 10/01/2017 (A) | 180 | 193 | ||||||
TRAC Intermodal | ||||||||
11.000%, 08/15/2019 (A) | 1,910 | 2,108 | ||||||
TransDigm | ||||||||
5.500%, 10/15/2020 (A) | 2,100 | 2,174 | ||||||
Trinseo Materials Operating SCA | ||||||||
8.750%, 02/01/2019 (A) | 5,335 | 5,315 | ||||||
Triumph Group | ||||||||
4.875%, 04/01/2021 (A) | 590 | 602 | ||||||
USG | ||||||||
8.375%, 10/15/2018 (A) | 1,535 | 1,689 | ||||||
6.300%, 11/15/2016 | 1,975 | 2,089 | ||||||
Viasystems | ||||||||
7.875%, 05/01/2019 (A) | 3,825 | 4,093 | ||||||
Victor Technologies Group | ||||||||
9.000%, 12/15/2017 | 3,803 | 4,145 | ||||||
Watco | ||||||||
6.375%, 04/01/2023 (A) | 2,440 | 2,568 | ||||||
|
| |||||||
| 169,925 | ||||||||
|
| |||||||
Information Technology — 4.3% | ||||||||
Advanced Micro Devices | ||||||||
7.500%, 08/15/2022 (A) | 3,540 | 3,451 | ||||||
Amkor Technology | ||||||||
7.375%, 05/01/2018 | 735 | 777 | ||||||
6.375%, 10/01/2022 (A) | 2,390 | 2,414 | ||||||
Aspect Software | ||||||||
10.625%, 05/15/2017 | 4,260 | 4,441 | ||||||
Audatex North America | ||||||||
6.750%, 06/15/2018 (A) | 705 | 750 | ||||||
Brocade Communications Systems | ||||||||
4.625%, 01/15/2023 (A) | 1,000 | 985 | ||||||
| Description | Face Amount ($ Thousands) | Market Value ($ Thousands) | ||||||
CDW | ||||||||
12.535%, 10/12/2017 | $ | 641 | $ | 689 | ||||
8.500%, 04/01/2019 | 2,970 | 3,286 | ||||||
8.000%, 12/15/2018 | 2,865 | 3,155 | ||||||
Epicor Software | ||||||||
8.625%, 05/01/2019 | 2,860 | 3,110 | ||||||
Equinix | ||||||||
5.375%, 04/01/2023 | 1,900 | 1,962 | ||||||
4.875%, 04/01/2020 | 2,810 | 2,859 | ||||||
First Data | ||||||||
12.625%, 01/15/2021 | 2,077 | 2,269 | ||||||
11.750%, 08/15/2021 (A) | 690 | 668 | ||||||
11.250%, 03/31/2016 | 390 | 392 | ||||||
11.250%, 01/15/2021 (A) | 1,100 | 1,125 | ||||||
8.875%, 08/15/2020 (A) | 1,200 | 1,326 | ||||||
8.250%, 01/15/2021 (A) | 1,850 | 1,961 | ||||||
7.375%, 06/15/2019 (A) | 635 | 670 | ||||||
6.750%, 11/01/2020 (A) | 1,050 | 1,097 | ||||||
First Data PIK | ||||||||
8.750%, 01/15/2022 (A) | 7,497 | 8,040 | ||||||
Freescale Semiconductor | ||||||||
9.250%, 04/15/2018 (A) | 545 | 593 | ||||||
IAC | ||||||||
4.750%, 12/15/2022 (A) | 1,555 | 1,528 | ||||||
iGATE | ||||||||
9.000%, 05/01/2016 | 3,819 | 4,105 | ||||||
IMS Health | ||||||||
6.000%, 11/01/2020 (A) | 835 | 883 | ||||||
Infor US | ||||||||
11.500%, 07/15/2018 | 610 | 715 | ||||||
9.375%, 04/01/2019 | 4,860 | 5,480 | ||||||
j2 Global | ||||||||
8.000%, 08/01/2020 | 2,115 | 2,274 | ||||||
MagnaChip Semiconductor | ||||||||
10.500%, 04/15/2018 | 1,835 | 2,032 | ||||||
ManTech International | ||||||||
7.250%, 04/15/2018 | 895 | 950 | ||||||
NCR | ||||||||
5.000%, 07/15/2022 | 1,900 | 1,914 | ||||||
NeuStar | ||||||||
4.500%, 01/15/2023 (A) | 950 | 926 | ||||||
Nuance Communications | ||||||||
5.375%, 08/15/2020 (A) | 3,345 | 3,387 | ||||||
NXP | ||||||||
9.750%, 08/01/2018 (A) | 367 | 415 | ||||||
5.750%, 02/15/2021 (A) | 2,800 | 2,940 | ||||||
5.750%, 03/15/2023 (A) | 455 | 473 | ||||||
3.750%, 06/01/2018 (A) | 550 | 542 | ||||||
Seagate HDD Cayman | ||||||||
4.750%, 06/01/2023 (A) | 1,615 | 1,566 | ||||||
Sensata Technologies | ||||||||
6.500%, 05/15/2019 (A) | 5,248 | 5,667 | ||||||
Southern Graphics | ||||||||
8.375%, 10/15/2020 (A) | 450 | 484 | ||||||
| 144 | SEI Institutional Investments Trust / Annual Report / May 31, 2013 |
Table of Contents
| Description | Face Amount ($ Thousands) | Market Value ($ Thousands) | ||||||
SSI Investments II | ||||||||
11.125%, 06/01/2018 | $ | 1,020 | $ | 1,127 | ||||
Stratus Technologies Bermuda | ||||||||
12.000%, 03/29/2015 | 2,637 | 2,703 | ||||||
Stream Global Services | ||||||||
11.250%, 10/01/2014 (A) | 805 | 827 | ||||||
11.250%, 10/01/2014 | 615 | 632 | ||||||
SunEdison | ||||||||
7.750%, 04/01/2019 | 855 | 834 | ||||||
SunGard Data Systems | ||||||||
7.625%, 11/15/2020 | 40 | 44 | ||||||
7.375%, 11/15/2018 | 975 | 1,038 | ||||||
6.625%, 11/01/2019 (A) | 970 | 1,021 | ||||||
VeriSign | ||||||||
4.625%, 05/01/2023 (A) | 1,000 | 1,005 | ||||||
WEX | ||||||||
4.750%, 02/01/2023 (A) | 1,475 | 1,471 | ||||||
|
| |||||||
| 93,003 | ||||||||
|
| |||||||
Materials — 5.8% | ||||||||
AK Steel | ||||||||
8.750%, 12/01/2018 (A) | 1,350 | 1,482 | ||||||
7.625%, 05/15/2020 | 795 | 711 | ||||||
AM Castle | ||||||||
12.750%, 12/15/2016 | 300 | 352 | ||||||
APERAM | ||||||||
7.750%, 04/01/2018 (A) | 4,970 | 4,945 | ||||||
ArcelorMittal | ||||||||
6.125%, 06/01/2018 | 3,095 | 3,281 | ||||||
Ashland | ||||||||
4.750%, 08/15/2022 (A) | 1,725 | 1,762 | ||||||
Ball | ||||||||
5.000%, 03/15/2022 | 1,550 | 1,604 | ||||||
4.000%, 11/15/2023 | 825 | 789 | ||||||
Celanese US Holdings | ||||||||
4.625%, 11/15/2022 | 3,365 | 3,458 | ||||||
Chemtura | ||||||||
7.875%, 09/01/2018 | 2,165 | 2,371 | ||||||
Clearwater Paper | ||||||||
7.125%, 11/01/2018 | 175 | 189 | ||||||
Commercial Metals | ||||||||
4.875%, 05/15/2023 | 1,250 | 1,191 | ||||||
Edgen Murray | ||||||||
8.750%, 11/01/2020 (A) | 2,155 | 2,247 | ||||||
Eldorado | ||||||||
6.125%, 12/15/2020 (A) | 1,350 | 1,370 | ||||||
Essar Steel Algoma | ||||||||
9.375%, 03/15/2015 (A) | 825 | 767 | ||||||
FMG Resources | ||||||||
8.250%, 11/01/2019 (A) | 940 | 992 | ||||||
6.875%, 02/01/2018 (A) | 2,430 | 2,472 | ||||||
FMG Resources August 2006 PTY | ||||||||
6.875%, 04/01/2022 (A) | 1,540 | 1,555 | ||||||
| Description | Face Amount ($ Thousands) | Market Value ($ Thousands) | ||||||
Headwaters | ||||||||
7.625%, 04/01/2019 | $ | 1,435 | $ | 1,539 | ||||
Hecla Mining | ||||||||
6.875%, 05/01/2021 (A) | 3,385 | 3,275 | ||||||
Hexion US Finance | ||||||||
9.000%, 11/15/2020 | 1,260 | 1,282 | ||||||
8.875%, 02/01/2018 | 2,540 | 2,651 | ||||||
6.625%, 04/15/2020 (A) | 765 | 796 | ||||||
6.625%, 04/15/2020 | 540 | 562 | ||||||
Horsehead Holding | ||||||||
10.500%, 06/01/2017 (A) | 870 | 940 | ||||||
Huntsman International | ||||||||
8.625%, 03/15/2020 | 535 | 591 | ||||||
8.625%, 03/15/2021 | 670 | 749 | ||||||
4.875%, 11/15/2020 | 535 | 540 | ||||||
IAMGOLD | ||||||||
6.750%, 10/01/2020 (A) | 5,800 | 5,307 | ||||||
Ineos Finance | ||||||||
8.375%, 02/15/2019 (A) | 1,620 | 1,806 | ||||||
7.500%, 05/01/2020 (A) | 735 | 807 | ||||||
Ineos Group Holdings | ||||||||
6.125%, 08/15/2018 (A) | 1,495 | 1,476 | ||||||
Inmet Mining | ||||||||
8.750%, 06/01/2020 (A) | 1,425 | 1,535 | ||||||
JMC Steel Group | ||||||||
8.250%, 03/15/2018 (A) | 1,730 | 1,752 | ||||||
KGHM International | ||||||||
7.750%, 06/15/2019 (A) | 1,200 | 1,254 | ||||||
MacDermid | ||||||||
9.500%, 04/15/2017 (A) | 1,820 | 1,884 | ||||||
Mirabela Nickel | ||||||||
8.750%, 04/15/2018 (A) | 1,780 | 1,477 | ||||||
Momentive PIK | ||||||||
1.710%, 06/04/2017 (F) (G) | 2,849 | 2,333 | ||||||
New | ||||||||
7.000%, 04/15/2020 (A) | 800 | 848 | ||||||
6.250%, 11/15/2022 (A) | 2,540 | 2,616 | ||||||
Nexeo Solutions | ||||||||
8.375%, 03/01/2018 | 874 | 878 | ||||||
Noranda Aluminum Acquisition | ||||||||
11.000%, 06/01/2019 (A) | 1,510 | 1,484 | ||||||
Novelis | ||||||||
8.750%, 12/15/2020 | 830 | 928 | ||||||
8.375%, 12/15/2017 | 2,700 | 2,916 | ||||||
Orion Engineered Carbons Bondco GmbH | ||||||||
9.625%, 06/15/2018 (A) | 1,928 | 2,145 | ||||||
Perstorp Holding | ||||||||
8.750%, 05/15/2017 (A) | 3,435 | 3,547 | ||||||
PolyOne | ||||||||
7.375%, 09/15/2020 | 775 | 854 | ||||||
Rain CII Carbon | ||||||||
8.250%, 01/15/2021 (A) | 825 | 883 | ||||||
8.000%, 12/01/2018 (A) | 390 | 413 | ||||||
| SEI Institutional Investments Trust / Annual Report / May 31, 2013 | 145 |
Table of Contents
SCHEDULE OF INVESTMENTS
High Yield Bond Fund (Continued)
May 31, 2013
| Description | Face Amount ($ Thousands) | Market Value ($ Thousands) | ||||||
Reichhold Industries PIK | ||||||||
9.000%, 05/08/2017 (A) | $ | 1,826 | $ | 1,424 | ||||
Rentech Nitrogen Partners | ||||||||
6.500%, 04/15/2021 (A) | 435 | 440 | ||||||
Rockwood Specialties Group | ||||||||
4.625%, 10/15/2020 | 1,820 | 1,856 | ||||||
Ryerson | ||||||||
11.250%, 10/15/2018 (A) | 2,465 | 2,619 | ||||||
9.000%, 10/15/2017 (A) | 1,215 | 1,312 | ||||||
Sappi Papier Holding GmbH | ||||||||
8.375%, 06/15/2019 (A) | 1,470 | 1,621 | ||||||
7.750%, 07/15/2017 (A) | 400 | 436 | ||||||
6.625%, 04/15/2021 (A) | 200 | 204 | ||||||
Scotts Miracle-Gro | ||||||||
7.250%, 01/15/2018 | 385 | 406 | ||||||
6.625%, 12/15/2020 | 375 | 408 | ||||||
Sealed Air | ||||||||
8.375%, 09/15/2021 (A) | 2,605 | 3,009 | ||||||
8.125%, 09/15/2019 (A) | 1,385 | 1,568 | ||||||
6.500%, 12/01/2020 (A) | 370 | 412 | ||||||
Smurfit Kappa Acquisitions | ||||||||
4.875%, 09/15/2018 (A) | 1,400 | 1,449 | ||||||
St. Barbara | ||||||||
8.875%, 04/15/2018 (A) | 875 | 849 | ||||||
Steel Dynamics | ||||||||
6.375%, 08/15/2022 (A) | 745 | 812 | ||||||
6.125%, 08/15/2019 (A) | 740 | 805 | ||||||
Taminco Global Chemical | ||||||||
9.750%, 03/31/2020 (A) | 3,220 | 3,647 | ||||||
TPC Group | ||||||||
8.750%, 12/15/2020 (A) | 7,695 | 8,118 | ||||||
US Coatings Acquisition | ||||||||
7.375%, 05/01/2021 (A) | 1,165 | 1,229 | ||||||
Vertellus Specialties | ||||||||
9.375%, 10/01/2015 (A) | 825 | 771 | ||||||
Vulcan Materials | ||||||||
7.500%, 06/15/2021 | 305 | 360 | ||||||
7.000%, 06/15/2018 | 485 | 550 | ||||||
Walter Energy | ||||||||
9.875%, 12/15/2020 (A) | 5,565 | 5,941 | ||||||
8.500%, 04/15/2021 (A) | 2,695 | 2,708 | ||||||
|
| |||||||
| 124,560 | ||||||||
|
| |||||||
Telecommunication Services — 9.9% |
| |||||||
Affinion Group | ||||||||
11.500%, 10/15/2015 | 513 | 439 | ||||||
Alcatel-Lucent USA | ||||||||
6.500%, 01/15/2028 | 1,320 | 1,049 | ||||||
Avaya | ||||||||
10.500%, 03/01/2021 (A) | 1,211 | 1,017 | ||||||
7.000%, 04/01/2019 (A) | 1,610 | 1,501 | ||||||
Baker & Taylor Acquisitions | ||||||||
15.000%, 04/01/2017 (A) | 1,105 | 773 | ||||||
| Description | Face Amount ($ Thousands) | Market Value ($ Thousands) | ||||||
Block Communications | ||||||||
7.250%, 02/01/2020 (A) | $ | 745 | $ | 808 | ||||
CCO Holdings | ||||||||
7.875%, 04/30/2018 | 560 | 593 | ||||||
7.375%, 06/01/2020 | 1,335 | 1,490 | ||||||
7.000%, 01/15/2019 | 1,250 | 1,336 | ||||||
5.250%, 03/15/2021 | 400 | 406 | ||||||
5.250%, 09/30/2022 | 1,440 | 1,440 | ||||||
CenturyLink | ||||||||
5.800%, 03/15/2022 | 1,920 | 1,963 | ||||||
5.625%, 04/01/2020 | 2,820 | 2,915 | ||||||
Cequel Communications Holdings I | ||||||||
6.375%, 09/15/2020 (A) | 3,670 | 3,835 | ||||||
Cincinnati Bell | ||||||||
8.750%, 03/15/2018 | 3,425 | 3,511 | ||||||
Clear Channel Communications | ||||||||
9.000%, 12/15/2019 (A) | 581 | 584 | ||||||
9.000%, 03/01/2021 | 3,335 | 3,310 | ||||||
Clear Channel Worldwide Holdings | ||||||||
7.625%, 03/15/2020 | 255 | 270 | ||||||
7.625%, 03/15/2020 | 2,135 | 2,268 | ||||||
6.500%, 11/15/2022 (A) | 2,740 | 2,891 | ||||||
6.500%, 11/15/2022 (A) | 1,015 | 1,066 | ||||||
Clearwire Communications | ||||||||
12.000%, 12/01/2015 (A) | 2,095 | 2,239 | ||||||
8.250%, 12/01/2040 (A) | 537 | 593 | ||||||
Cogent Communications Group | ||||||||
8.375%, 02/15/2018 (A) | 605 | 675 | ||||||
Columbus International | ||||||||
11.500%, 11/20/2014 (A) | 1,265 | 1,407 | ||||||
CommScope | ||||||||
8.250%, 01/15/2019 (A) | 1,270 | 1,391 | ||||||
CommScope Holding | ||||||||
6.625%, 06/01/2020 (A) | 2,230 | 2,202 | ||||||
CSC Holdings | ||||||||
8.625%, 02/15/2019 | 2,510 | 2,993 | ||||||
6.750%, 11/15/2021 | 2,065 | 2,313 | ||||||
DCP | ||||||||
10.750%, 08/15/2015 (A) | 3,000 | 3,150 | ||||||
Digicel | ||||||||
8.250%, 09/01/2017 (A) | 3,729 | 3,878 | ||||||
Digicel Group | ||||||||
8.250%, 09/30/2020 (A) | 2,011 | 2,142 | ||||||
DISH DBS | ||||||||
7.875%, 09/01/2019 | 3,385 | 3,795 | ||||||
6.750%, 06/01/2021 | 1,225 | 1,295 | ||||||
6.250%, 05/15/2023 (A) | 3,395 | 3,395 | ||||||
5.875%, 07/15/2022 | 1,065 | 1,068 | ||||||
5.125%, 05/01/2020 (A) | 465 | 453 | ||||||
5.000%, 05/15/2017 (A) | 3,135 | 3,135 | ||||||
5.000%, 03/15/2023 | 2,160 | 2,041 | ||||||
4.250%, 04/01/2018 (A) | 3,075 | 2,998 | ||||||
Eileme 2 | ||||||||
11.625%, 01/31/2020 (A) | 655 | 770 | ||||||
| 146 | SEI Institutional Investments Trust / Annual Report / May 31, 2013 |
Table of Contents
| Description | Face Amount ($ Thousands) | Market Value ($ Thousands) | ||||||
GCI | ||||||||
8.625%, 11/15/2019 | $ | 775 | $ | 827 | ||||
6.750%, 06/01/2021 | 505 | 494 | ||||||
Griffey Intermediate | ||||||||
7.000%, 10/15/2020 (A) | 3,890 | 3,939 | ||||||
GXS Worldwide | ||||||||
9.750%, 06/15/2015 | 4,420 | 4,531 | ||||||
Hughes Satellite Systems | ||||||||
7.625%, 06/15/2021 | 2,484 | 2,776 | ||||||
6.500%, 06/15/2019 | 670 | 732 | ||||||
Intelsat Jackson Holdings | ||||||||
7.500%, 04/01/2021 | 160 | 176 | ||||||
7.250%, 10/15/2020 | 3,200 | 3,472 | ||||||
6.625%, 12/15/2022 (A) | 890 | 927 | ||||||
5.500%, 08/01/2023 (A) | 320 | 314 | ||||||
Intelsat Luxembourg | ||||||||
11.250%, 02/04/2017 | 474 | 501 | ||||||
8.125%, 06/01/2023 (A) | 2,400 | 2,568 | ||||||
7.750%, 06/01/2021 (A) | 3,700 | 3,890 | ||||||
inVentiv Health | ||||||||
9.000%, 01/15/2018 (A) | 790 | 841 | ||||||
iPCS PIK | ||||||||
3.524%, 05/01/2014 (D) | 16 | 16 | ||||||
Level 3 Communications | ||||||||
11.875%, 02/01/2019 | 1,585 | 1,819 | ||||||
8.875%, 06/01/2019 | 1,205 | 1,307 | ||||||
Level 3 Financing | ||||||||
9.375%, 04/01/2019 | 435 | 480 | ||||||
8.625%, 07/15/2020 | 835 | 918 | ||||||
8.125%, 07/01/2019 | 835 | 904 | ||||||
7.000%, 06/01/2020 | 970 | 1,027 | ||||||
4.215%, 02/15/2015 (D) | 1,500 | 1,501 | ||||||
Liberty Interactive | ||||||||
8.250%, 02/01/2030 | 3,980 | 4,378 | ||||||
Lucent Technologies | ||||||||
6.450%, 03/15/2029 | 4,785 | 3,840 | ||||||
Lynx I | ||||||||
5.375%, 04/15/2021 (A) | 2,525 | 2,626 | ||||||
Lynx II | ||||||||
6.375%, 04/15/2023 (A) | 1,305 | 1,360 | ||||||
McGraw-Hill Global Education | ||||||||
9.750%, 04/01/2021 (A) | 400 | 415 | ||||||
MetroPCS Wireless | ||||||||
7.875%, 09/01/2018 | 605 | 659 | ||||||
6.625%, 04/01/2023 (A) | 1,965 | 2,078 | ||||||
6.250%, 04/01/2021 (A) | 1,865 | 1,954 | ||||||
Nara Cable Funding | ||||||||
8.875%, 12/01/2018 (A) | 1,326 | 1,379 | ||||||
8.875%, 12/01/2018 (A) | 1,125 | 1,187 | ||||||
Nexstar Broadcasting | ||||||||
6.875%, 11/15/2020 (A) | 1,645 | 1,752 | ||||||
Nexstar/Mission Broadcast | ||||||||
8.875%, 04/15/2017 | 940 | 1,022 | ||||||
| Description | Face Amount ($ Thousands) | Market Value ($ Thousands) | ||||||
Nielsen Finance | ||||||||
4.500%, 10/01/2020 (A) | $ | 1,425 | $ | 1,429 | ||||
NII International Telecom SCA | ||||||||
7.875%, 08/15/2019 (A) | 350 | 340 | ||||||
PAETEC Holding | ||||||||
9.875%, 12/01/2018 | 1,135 | 1,291 | ||||||
Quebecor Media | ||||||||
5.750%, 01/15/2023 | 755 | 774 | ||||||
Sable International Finance | ||||||||
8.750%, 02/01/2020 (A) | 80 | 91 | ||||||
7.750%, 02/15/2017 (A) | 1,834 | 1,953 | ||||||
Satelites Mexicanos | ||||||||
9.500%, 05/15/2017 | 760 | 817 | ||||||
SBA Telecommunications | ||||||||
8.250%, 08/15/2019 | 441 | 483 | ||||||
Sinclair Television Group | ||||||||
9.250%, 11/01/2017 (A) | 895 | 958 | ||||||
8.375%, 10/15/2018 | 320 | 354 | ||||||
6.125%, 10/01/2022 (A) | 375 | 391 | ||||||
5.375%, 04/01/2021 (A) | 3,650 | 3,632 | ||||||
Sitel LLC | ||||||||
11.000%, 08/01/2017 (A) | 1,275 | 1,371 | ||||||
Softbank | ||||||||
4.500%, 04/15/2020 (A) | 3,407 | 3,457 | ||||||
Sprint Capital | ||||||||
8.750%, 03/15/2032 | 6,620 | 7,712 | ||||||
6.900%, 05/01/2019 | 1,400 | 1,515 | ||||||
Sprint Nextel | ||||||||
9.125%, 03/01/2017 | 1,455 | 1,702 | ||||||
9.000%, 11/15/2018 (A) | 2,245 | 2,722 | ||||||
8.375%, 08/15/2017 | 330 | 380 | ||||||
6.000%, 11/15/2022 | 35 | 36 | ||||||
tw telecom holdings | ||||||||
5.375%, 10/01/2022 | 1,110 | 1,149 | ||||||
Unitymedia Hessen GmbH & KG | ||||||||
7.500%, 03/15/2019 (A) | 2,000 | 2,170 | ||||||
5.500%, 01/15/2023 (A) | 4,335 | 4,422 | ||||||
Univision Communications | ||||||||
8.500%, 05/15/2021 (A) | 4,465 | 4,833 | ||||||
7.875%, 11/01/2020 (A) | 2,750 | 3,011 | ||||||
5.125%, 05/15/2023 (A) | 3,460 | 3,391 | ||||||
UPCB Finance III | ||||||||
6.625%, 07/01/2020 (A) | 1,535 | 1,635 | ||||||
UPCB Finance V | ||||||||
7.250%, 11/15/2021 (A) | 2,235 | 2,464 | ||||||
UPCB Finance VI | ||||||||
6.875%, 01/15/2022 (A) | 2,604 | 2,812 | ||||||
Videotron | ||||||||
5.000%, 07/15/2022 | 2,205 | 2,260 | ||||||
Virgin Media Finance | ||||||||
4.875%, 02/15/2022 | 2,235 | 2,255 | ||||||
Visant | ||||||||
10.000%, 10/01/2017 | 830 | 795 | ||||||
| SEI Institutional Investments Trust / Annual Report / May 31, 2013 | 147 |
Table of Contents
SCHEDULE OF INVESTMENTS
High Yield Bond Fund (Continued)
May 31, 2013
| Description | Face Amount ($ Thousands) | Market Value ($ Thousands) | ||||||
West | ||||||||
8.625%, 10/01/2018 | $ | 3,045 | $ | 3,342 | ||||
Wind Acquisition Finance | ||||||||
11.750%, 07/15/2017 (A) | 1,395 | 1,468 | ||||||
7.250%, 02/15/2018 (A) | 2,815 | 2,935 | ||||||
7.250%, 02/15/2018 (A) | 1,285 | 1,333 | ||||||
6.500%, 04/30/2020 (A) | 1,507 | 1,548 | ||||||
Windstream | ||||||||
8.125%, 09/01/2018 | 5 | 5 | ||||||
7.750%, 10/01/2021 | 820 | 882 | ||||||
7.500%, 06/01/2022 | 860 | 912 | ||||||
7.500%, 04/01/2023 | 1,215 | 1,276 | ||||||
6.375%, 08/01/2023 | 2,285 | 2,256 | ||||||
Zayo Group | ||||||||
10.125%, 07/01/2020 | 2,040 | 2,372 | ||||||
8.125%, 01/01/2020 | 1,397 | 1,551 | ||||||
|
| |||||||
| 214,493 | ||||||||
|
| |||||||
Utilities — 2.4% | ||||||||
AES | ||||||||
8.000%, 10/15/2017 | 62 | 73 | ||||||
8.000%, 06/01/2020 | 195 | 234 | ||||||
7.375%, 07/01/2021 | 1,455 | 1,702 | ||||||
4.875%, 05/15/2023 | 3,195 | 3,139 | ||||||
Calpine | ||||||||
7.875%, 07/31/2020 (A) | 1,843 | 2,027 | ||||||
7.500%, 02/15/2021 (A) | 1,822 | 1,977 | ||||||
Elwood Energy | ||||||||
8.159%, 07/05/2026 | 724 | 785 | ||||||
Energy Future Intermediate Holding | ||||||||
11.750%, 03/01/2022 (A) | 2,890 | 3,291 | ||||||
10.000%, 12/01/2020 | 656 | 747 | ||||||
10.000%, 12/01/2020 (A) | 6,450 | 7,313 | ||||||
6.875%, 08/15/2017 (A) | 190 | 202 | ||||||
GenOn Americas Generation | ||||||||
8.500%, 10/01/2021 | 1,149 | 1,327 | ||||||
GenOn Energy | ||||||||
9.875%, 10/15/2020 | 1,580 | 1,786 | ||||||
Homer City Generation | ||||||||
8.137%, 10/01/2019 | 2,665 | 2,805 | ||||||
LBC Tank Terminals Holding Netherlands | ||||||||
6.875%, 05/15/2023 (A) | 1,050 | 1,091 | ||||||
NRG Energy | ||||||||
8.250%, 09/01/2020 | 160 | 179 | ||||||
7.875%, 05/15/2021 | 3,240 | 3,613 | ||||||
7.625%, 01/15/2018 | 1,595 | 1,798 | ||||||
6.625%, 03/15/2023 (A) | 1,622 | 1,715 | ||||||
NSG Holdings | ||||||||
7.750%, 12/15/2025 (A) | 2,100 | 2,279 | ||||||
| Description | Face Amount ($ Thousands) | Market Value ($ Thousands) | ||||||
Sabine Pass LNG | ||||||||
7.500%, 11/30/2016 (A) | $ | 1,880 | $ | 2,002 | ||||
7.500%, 11/30/2016 | 10,385 | 11,579 | ||||||
|
| |||||||
| 51,664 | ||||||||
|
| |||||||
Total Corporate Obligations |
| 1,604,668 | ||||||
|
| |||||||
LOAN PARTICIPATIONS — 9.7% |
| |||||||
Academy Sports, Initial Term Loan | ||||||||
4.750%, 08/03/2018 | 338 | 341 | ||||||
4.500%, 08/03/2018 | 272 | 274 | ||||||
Advantage Sales and Marketing, | ||||||||
8.250%, 06/17/2018 | 704 | 712 | ||||||
Air Medical Group Holdings, | ||||||||
0.000%, 05/21/2018 (H) | 3,010 | 3,010 | ||||||
Albertson’s, Cov-Lite, 1st Lien | ||||||||
5.750%, 02/26/2016 | 1,445 | 1,452 | ||||||
Alcatel Lucent, 1st Lien | ||||||||
6.250%, 07/31/2016 | 1,100 | 1,111 | ||||||
Alcatel-Lucent USA, Term Loan | ||||||||
7.250%, 01/30/2019 | 1,930 | 1,949 | ||||||
American Renal Holdings, Term Loan | ||||||||
8.500%, 02/20/2020 | 2,000 | 2,012 | ||||||
Applied Systems, Delayed Term Loan | ||||||||
9.500%, 06/08/2017 | 375 | 379 | ||||||
Applied Systems, Hybrid Term Loan, 2nd Lien | ||||||||
8.250%, 06/08/2017 | 605 | 611 | ||||||
Apria Healthcare Group, Term Loan | ||||||||
6.750%, 04/06/2020 | 1,750 | 1,762 | ||||||
Arctic Glacier Holdings, Term Loan | ||||||||
6.000%, 05/09/2019 | 496 | 499 | ||||||
Associated Partners, Term Loan | ||||||||
2.000%, 12/24/2015 (I) | 2,000 | — | ||||||
Associated Partners, Term Loan, | ||||||||
6.699%, 12/21/2015 | 2,000 | 2,000 | ||||||
Astoria Generating, Term Loan | ||||||||
8.500%, 10/26/2017 | 4,845 | 5,024 | ||||||
Asurion | ||||||||
4.500%, 05/24/2019 | 999 | 1,003 | ||||||
Avaya, Extended Term Loan B-5 | ||||||||
8.000%, 03/31/2018 | 748 | 714 | ||||||
Berlin Packaging, 2nd Lien | ||||||||
8.750%, 03/28/2020 | 375 | 381 | ||||||
Blue Coat Systems, Term Loan | ||||||||
4.500%, 02/15/2018 | 3,970 | 3,991 | ||||||
Caribbean Restaurants, Term Loan B | ||||||||
9.000%, 02/17/2017 | 117 | 118 | ||||||
| 148 | SEI Institutional Investments Trust / Annual Report / May 31, 2013 |
Table of Contents
| Description | Face Amount ($ Thousands) | Market Value ($ Thousands) | ||||||
Catalent Pharma Solutions, | ||||||||
6.500%, 12/31/2017 | $ | 450 | $ | 455 | ||||
Cengage Learning Acquisitions, Extended Term Loan, Tranche B | ||||||||
5.720%, 07/05/2017 | 350 | 276 | ||||||
Centaur, 1st Lien | ||||||||
5.250%, 02/19/2019 | 765 | 772 | ||||||
Ceridian, Extended Term Loan | ||||||||
5.948%, 05/09/2017 | 2,419 | 2,435 | ||||||
CKX, Term Loan B | ||||||||
9.000%, 06/21/2017 | 506 | 446 | ||||||
Clear Channel | ||||||||
3.848%, 01/29/2016 | 3,170 | 2,942 | ||||||
Cleveland Unlimited, Term Loan | ||||||||
15.000%, 07/25/2016 | 516 | 521 | ||||||
Cleveland Unlimited, Term Loan A, PIK | ||||||||
10.000%, 01/25/2016 (G) | 181 | 182 | ||||||
Cleveland Unlimited, Term Loan C, PIK | ||||||||
15.000%, 07/25/2016 (G) | 84 | 85 | ||||||
Cleveland Unlimted, Term Loan B | ||||||||
15.000%, 07/25/2016 (G) | 172 | 174 | ||||||
Cole Haan LLC, Cov-Lite, Term Loan, 1st Lien | ||||||||
5.750%, 01/31/2020 | 843 | 851 | ||||||
Constellation, Bridge Loan | ||||||||
0.000%, 12/30/2013 (I) | 1,500 | — | ||||||
Cooper Gay Swett & Crawford, | ||||||||
8.250%, 10/16/2020 | 400 | 407 | ||||||
Crestwood Holdings, 1st Lien | ||||||||
0.000%, 05/24/2019 (H) | 1,530 | 1,545 | ||||||
Crestwood Holdings, Term Loan | ||||||||
9.750%, 03/20/2018 | 1,622 | 1,638 | ||||||
Cristal Inorganic Chemicals US | ||||||||
6.034%, 11/15/2014 | 1,663 | 1,664 | ||||||
CSM Bakery Supplies, Cov-Lite, | ||||||||
0.000%, 05/22/2020 (H) | 1,470 | 1,463 | ||||||
DAE Aviation Holdings, Term Loan B1 | ||||||||
6.250%, 11/02/2018 | 1,712 | 1,737 | ||||||
Deltek Systems, Term Loan, 2nd Lien | ||||||||
10.000%, 10/10/2019 | 1,000 | 1,027 | ||||||
Dex Media West | ||||||||
7.250%, 10/24/2014 | 2,299 | 1,954 | ||||||
DJO Finance | ||||||||
4.750%, 09/15/2017 | 1,945 | 1,969 | ||||||
Doncasters PLC, 2nd Lien | ||||||||
9.500%, 10/09/2020 | 350 | 351 | ||||||
DuPont Performance Coatings, | ||||||||
4.750%, 02/01/2020 | 425 | 428 | ||||||
| Description | Face Amount ($ Thousands) | Market Value ($ Thousands) | ||||||
Dynegy Power, Term Loan, 1st Lien | ||||||||
9.250%, 04/23/2020 | $ | 303 | $ | 304 | ||||
Dynegy, Cov-Lite, Term Loan B2 | ||||||||
4.000%, 04/23/2020 | 234 | 234 | ||||||
Endurance International, 2nd Lien | ||||||||
10.250%, 05/09/2020 | 4,225 | 4,267 | ||||||
EP Energy, Term Loan | ||||||||
5.000%, 04/10/2018 | 3,995 | 4,014 | ||||||
Equipower Resources, Term Loan, 2nd Lien | ||||||||
10.000%, 06/21/2019 | 560 | 575 | ||||||
Essential Power, Term Loan | ||||||||
4.500%, 08/08/2019 | 5,339 | 5,375 | ||||||
4.250%, 08/08/2019 | 68 | 68 | ||||||
Expert Global, Term Loan | ||||||||
8.500%, 04/03/2018 | 2,957 | 2,994 | ||||||
Fender Musical Instruments, 1st Lien | ||||||||
5.750%, 04/03/2019 | 250 | 249 | ||||||
First Advantage, 2nd Lien | ||||||||
10.500%, 02/13/2019 | 700 | 693 | ||||||
First Advantage, Cov-Lite, Term Loan | ||||||||
6.250%, 02/13/2019 | 500 | 501 | ||||||
Fortescue Metals Group | ||||||||
5.250%, 10/18/2017 | 2,637 | 2,649 | ||||||
GCA Services Group, Cov-Lite, | ||||||||
9.250%, 11/01/2020 | 800 | 812 | ||||||
Getco, Bridge Loan, 2nd Lien | ||||||||
0.000%, 12/18/2013 (H) | 400 | — | ||||||
Global Aviation Holdings, Term Loan | ||||||||
10.000%, 07/13/2017 | 1,937 | 1,743 | ||||||
3.000%, 02/13/2018 | 614 | 123 | ||||||
Go Daddy Operating, Term Loan | ||||||||
4.250%, 12/16/2018 | 2,134 | 2,141 | ||||||
GoGo | ||||||||
11.250%, 06/21/2017 | 1,146 | 1,126 | ||||||
Graton Economic Development Authority, Term Loan | ||||||||
9.000%, 08/22/2018 | 3,175 | 3,336 | ||||||
Guitar Center, Term Loan | ||||||||
5.540%, 04/09/2017 | 3,086 | 3,077 | ||||||
H.J. Heinz, Term Loan B2 | ||||||||
0.000%, 03/27/2020 (H) | 2,235 | 2,254 | ||||||
Harrah’s Entertainment, Term | ||||||||
5.454%, 01/28/2018 | 936 | 836 | ||||||
Harrah’s Las Vegas Propco | ||||||||
3.700%, 02/13/2013 | 4,770 | 4,353 | ||||||
Harrah’s Operating, Term Loan B-4 | ||||||||
9.500%, 10/31/2016 | 2,903 | 2,911 | ||||||
Heinz, Unfunded Bridge Loan | ||||||||
0.000%, 11/14/2013 (H) | 2,000 | — | ||||||
Hologic, Term Loan B | ||||||||
4.500%, 08/01/2019 | 1,290 | 1,298 | ||||||
| SEI Institutional Investments Trust / Annual Report / May 31, 2013 | 149 |
Table of Contents
SCHEDULE OF INVESTMENTS
High Yield Bond Fund (Continued)
May 31, 2013
| Description | Face Amount ($ Thousands) | Market Value ($ Thousands) | ||||||
Hostess Brands, Term Loan | ||||||||
6.750%, 03/12/2020 | $ | 1,187 | $ | 1,217 | ||||
6.750%, 04/09/2020 | 103 | 106 | ||||||
Inc Research, Term Loan B | ||||||||
6.000%, 07/12/2018 | 2,126 | 2,140 | ||||||
Ineos Holdings Limited, Cov-Lite | ||||||||
4.250%, 05/04/2018 | 2,096 | 2,095 | ||||||
Integra Telecom, 2nd Lien | ||||||||
9.750%, 02/19/2020 | 760 | 780 | ||||||
Integra Telecom, Term Loan | ||||||||
6.000%, 02/22/2019 | 1,510 | 1,526 | ||||||
Intrawest ULC, Term Loan, 1st Lien | ||||||||
7.000%, 12/03/2017 | 3,095 | 3,155 | ||||||
ION Trading Technologies, Cov- Lite, Term Loan, 2nd Lien | ||||||||
0.000%, 05/21/2021 (H) | 2,330 | 2,347 | ||||||
JCPenney, Cov-Lite, Term Loan B, | ||||||||
6.000%, 05/21/2018 | 3,385 | 3,429 | ||||||
Kalispel Tribal Economic Authority | ||||||||
7.500%, 02/25/2017 | 2,931 | 2,924 | ||||||
Knight Capital Group, 1st Lien | ||||||||
0.000%, 11/30/2017 (H) | 350 | 349 | ||||||
Lawson Software, Term Loan B | ||||||||
5.250%, 04/05/2018 | 568 | 573 | ||||||
Learning Care Group, Term Loan | ||||||||
6.000%, 05/08/2019 | 350 | 351 | ||||||
Lone Star | ||||||||
11.000%, 09/02/2019 | 540 | 578 | ||||||
Medical Card, Term Loan | ||||||||
12.250%, 09/17/2015 | 1,868 | 1,868 | ||||||
3.000%, 09/17/2015 | 58 | 58 | ||||||
Medquist, Term Loan B | ||||||||
7.500%, 08/16/2019 | 5,383 | 5,309 | ||||||
Merge Healthcare, Term Loan B | ||||||||
6.000%, 04/23/2019 | 650 | 653 | ||||||
Metroflag, 2nd Lien, 2nd Lien | ||||||||
14.000%, 01/06/2009 (B) | 325 | — | ||||||
Mirion Technologies, 1st Lien | ||||||||
6.250%, 03/30/2018 | 598 | 601 | ||||||
Misys, 2nd Lien | ||||||||
12.000%, 12/06/2019 | 750 | 874 | ||||||
Mohegan Tribal Gaming Authority, Term Loan | ||||||||
5.500%, 03/31/2015 | 2,311 | 2,317 | ||||||
Mohegan Tribal Gaming Authority, Term Loan B | ||||||||
9.000%, 02/28/2016 | 4,340 | 4,481 | ||||||
Nana Development, 1st Lien | ||||||||
8.000%, 03/13/2018 | 500 | 490 | ||||||
National Financial Partners, Unfunded Term Loan | ||||||||
0.000%, 12/31/2013 (H) | 1,075 | — | ||||||
| Description | Face Amount ($ Thousands) | Market Value ($ Thousands) | ||||||
Navistar International | ||||||||
5.750%, 08/17/2017 | $ | 3,304 | $ | 3,365 | ||||
Nelson Education, Term Loan B-1 | ||||||||
2.784%, 07/04/2014 | 1,466 | 1,210 | ||||||
NewPage, Term Loan | ||||||||
7.750%, 12/21/2018 | 2,294 | 2,340 | ||||||
Nielsen, Bridge Loan | ||||||||
0.000%, 10/01/2013 (H) | 5,250 | — | ||||||
Novell, 2nd Lien | ||||||||
11.000%, 11/22/2018 | 1,215 | 1,239 | ||||||
Nuveen Investments, Term Loan, | ||||||||
8.250%, 02/23/2019 | 1,050 | 1,053 | ||||||
NXP Semiconductors, Incremental Term Loan C | ||||||||
4.750%, 01/10/2020 | 547 | 558 | ||||||
Obsidian Natural Gas Trust | ||||||||
7.000%, 11/02/2015 | 1,302 | 1,309 | ||||||
Ocwen Financial | ||||||||
5.000%, 02/15/2018 | 420 | 425 | ||||||
One Call Medical | ||||||||
5.500%, 08/19/2019 | 2,494 | 2,508 | ||||||
Pacific Drilling, 1st Lien | ||||||||
0.000%, 05/18/2018 (H) | 2,250 | 2,259 | ||||||
Panda Temple Power, 1st Lien | ||||||||
7.250%, 04/03/2019 | 1,585 | 1,619 | ||||||
Panolam Industries International | ||||||||
7.250%, 08/23/2017 | 928 | 922 | ||||||
Performance Food Group, Cov-Lite, 2nd Lien | ||||||||
6.250%, 11/07/2019 | 500 | 500 | ||||||
Pierre Food, Term Loan, 2nd Lien | ||||||||
9.500%, 10/02/2017 | 4,475 | 4,570 | ||||||
Pra International, 2nd Lien | ||||||||
10.500%, 06/10/2019 | 500 | 507 | ||||||
Ranpak, 2nd Lien | ||||||||
8.500%, 04/10/2020 | 400 | 408 | ||||||
Rice Drilling B, Term Loan, 2nd Lien | ||||||||
8.500%, 10/25/2018 | 1,994 | 2,019 | ||||||
Rite Aid, Term Loan, 2nd Lien | ||||||||
5.750%, 08/21/2020 | 785 | 811 | ||||||
Sabre Holdings | ||||||||
5.250%, 02/15/2019 | 3,399 | 3,439 | ||||||
Sirva Worldwide, Term Loan | ||||||||
7.500%, 03/22/2019 | 1,700 | 1,687 | ||||||
Smart & Final, Cov-Lite, 2nd Lien | ||||||||
10.500%, 11/15/2020 | 1,181 | 1,205 | ||||||
SpringLeaf Financial | ||||||||
5.500%, 05/10/2017 | 1,859 | 1,864 | ||||||
Standard Aero, Term Loan B2 | ||||||||
6.250%, 11/02/2018 | 776 | 788 | ||||||
Sumtotal Systems, Cov-Lite, | ||||||||
6.250%, 11/16/2018 | 1,000 | 1,007 | ||||||
| 150 | SEI Institutional Investments Trust / Annual Report / May 31, 2013 |
Table of Contents
| Description | Face Amount ($ Thousands) | Market Value ($ Thousands) | ||||||
SUPERVALU, Cov-Lite, 1st Lien | ||||||||
5.000%, 03/21/2019 | $ | 4,260 | $ | 4,244 | ||||
SUPERVALU, Cov-Lite, Term Loan | ||||||||
0.000%, 03/21/2019 (H) | 1,055 | 1,051 | ||||||
SUPERVALU, Term Loan | ||||||||
6.250%, 02/05/2019 | 1,194 | 1,190 | ||||||
Targus Group, Term Loan B | ||||||||
11.000%, 05/24/2016 | 494 | 479 | ||||||
Telx Group, Term Loan B, 1st Lien | ||||||||
6.250%, 09/25/2017 | 1,108 | 1,117 | ||||||
Texas Competitive, Extended | ||||||||
4.700%, 10/10/2017 | 5,830 | 4,216 | ||||||
Texas Competitive, Non-extended Term Loan | ||||||||
3.775%, 10/10/2014 | 2,419 | 1,870 | ||||||
3.699%, 10/10/2014 | 4,727 | 3,655 | ||||||
The Pantry, Term Loan B | ||||||||
5.750%, 08/03/2019 | 1,021 | 1,031 | ||||||
Transtar Industries, Term Loan, | ||||||||
9.750%, 10/09/2019 | 900 | 925 | ||||||
Travelport, 2nd Lien | ||||||||
9.500%, 01/31/2016 | 1,838 | 1,913 | ||||||
Univision Communications, Cov-Lite, 1st Lien | ||||||||
4.500%, 02/28/2020 | 530 | 529 | ||||||
US Shipping, 1st Lien | ||||||||
9.000%, 04/11/2018 | 500 | 498 | ||||||
Vertafore | ||||||||
9.750%, 10/29/2017 | 780 | 797 | ||||||
Wall Street Systems, Cov-Lite, | ||||||||
9.250%, 10/26/2020 | 2,150 | 2,182 | ||||||
Walter Investment Managment, | ||||||||
5.750%, 11/28/2017 | 2,452 | 2,475 | ||||||
WP Prism (Bausch & Lomb), | ||||||||
6.250%, 05/31/2018 | 8,900 | 8,915 | ||||||
|
| |||||||
Total Loan Participations | 209,518 | |||||||
|
| |||||||
COLLATERALIZED DEBT OBLIGATIONS — 9.8% |
| |||||||
Other Asset-Backed Securities — 9.8% |
| |||||||
AMMC CDO, Ser 11A | ||||||||
0.000%, 10/30/2023 (A) | 3,785 | 3,313 | ||||||
AMMC CDO, Ser 2011-9A | ||||||||
0.000%, 01/15/2022 (A) | 2,881 | 2,665 | ||||||
AMMC CDO, Ser 2012-10A, Cl A | ||||||||
0.000%, 04/11/2022 (A) | 3,316 | 3,134 | ||||||
Battalion CLO II Warehouse | ||||||||
0.000%‡‡‡ | 1,300 | 1,300 | ||||||
| Description | Face Amount ($ Thousands) | Market Value ($ Thousands) | ||||||
Citigroup, Ser 2012-3A | ||||||||
0.000%, 01/18/2025 (A) | $ | 2,697 | $ | 2,508 | ||||
Claris III | ||||||||
0.574%, 08/04/2021 | 8,252 | 7,592 | ||||||
Crown Point CLO II Warehouse | ||||||||
0.000%‡‡‡ | 2,740 | 2,740 | ||||||
Figueroa CLO, Ser 2013-1I | ||||||||
0.000%, 03/21/2024 (A) | 7,644 | 7,644 | ||||||
Grayson CLO, Ser 2006-1A, Cl B | ||||||||
0.974%, 11/01/2021 (A) (D) | 6,599 | 5,477 | ||||||
Great Lakes CLO 2012-1, | ||||||||
0.000%, 01/15/2023 (A) | 2,877 | 2,848 | ||||||
Great Lakes CLO, Ser 2012-1A, Cl E | ||||||||
6.074%, 01/15/2023 (A) (D) | 3,292 | 3,062 | ||||||
ICE EM CLO, Ser 2007-1A, Cl A2 | ||||||||
1.065%, 08/15/2022 (A) (D) | 9,372 | 8,575 | ||||||
ICE EM CLO, Ser 2007-1A, Cl A3 | ||||||||
1.315%, 08/15/2022 (A) (D) | 2,736 | 2,424 | ||||||
KKR CLO Trust, Ser 2012-1A, Cl C | ||||||||
4.809%, 12/15/2024 (A) (D) | 3,366 | 3,393 | ||||||
KVK CLO 2013-1, Ser 2013-1A | ||||||||
0.000%, 04/14/2025 (A) | 3,030 | 2,576 | ||||||
KVK CLO, Ser 2012-2A | ||||||||
0.000%, 02/15/2025 (A) | 2,956 | 2,720 | ||||||
Neuberger Berman CLO, | ||||||||
0.000%, 07/25/2023 (A) | 3,984 | 3,367 | ||||||
Neuberger Berman CLO, | ||||||||
7.276%, 07/25/2023 (A) (D) | 1,202 | 1,202 | ||||||
Neuberger Berman CLO, | ||||||||
0.000%, 01/23/2024 (A) | 2,886 | 2,310 | ||||||
Neuberger Berman CLO, | ||||||||
0.000%, 04/28/2025 (A) | 3,194 | 2,970 | ||||||
Newstar Trust, Ser 2007-1A, Cl A1 | ||||||||
0.513%, 09/30/2022 (A) (D) | 9,215 | 8,915 | ||||||
NXT Capital CLO, Ser 2012-1A, Cl E | ||||||||
7.776%, 07/20/2022 (A) (D) | 3,047 | 3,039 | ||||||
OCP CLO, Ser 2012-2A | ||||||||
0.000%, 11/22/2023 (A) | 2,940 | 2,528 | ||||||
Red River CLO, Ser 2006-1A, Cl C | ||||||||
0.994%, 07/27/2018 (A) (D) | 7,544 | 6,450 | ||||||
Red River CLO, Ser 2006-1A, Cl D | ||||||||
1.924%, 07/27/2018 (A) (D) | 2,441 | 1,953 | ||||||
Rockwall CDO, Ser 2006-1A, Cl A1LA | ||||||||
0.574%, 08/01/2021 (A) (D) | 2,736 | 2,586 | ||||||
Rockwall CDO, Ser 2006-1A, Cl A1LB | ||||||||
0.774%, 08/01/2021 (A) (D) | 23,922 | 21,530 | ||||||
Rockwall CDO, Ser 2007-1A, Cl A1LA | ||||||||
0.524%, 08/01/2024 (A) (D) | 87,470 | 80,910 | ||||||
| SEI Institutional Investments Trust / Annual Report / May 31, 2013 | 151 |
Table of Contents
SCHEDULE OF INVESTMENTS
High Yield Bond Fund (Continued)
May 31, 2013
| Description | Face Amount ($ Thousands)/Shares | Market Value ($ Thousands) | ||||||
Venture CDO, Ser 2012-11A | ||||||||
0.000%, 11/14/2022 (A) | $ | 4,583 | $ | 4,084 | ||||
Venture CLO XIV Warehouse | ||||||||
0.000%‡‡‡ | 3,613 | 3,613 | ||||||
Venture X CLO, Ser 2012-10A | ||||||||
0.000%, 07/20/2022 (A) | 2,034 | 1,943 | ||||||
Venture X CLO, Ser 2013-12A | ||||||||
0.000%, 02/28/2024 (A) | 3,067 | 2,883 | ||||||
|
| |||||||
Total Collateralized Debt Obligations | 212,254 | |||||||
|
| |||||||
PREFERRED STOCK — 1.0% | ||||||||
Ally Financial, 8.500% | 5,000 | 134 | ||||||
Ally Financial, 7.000% | 12,215 | 11,975 | ||||||
Aspen Insurance Holdings, | 92,000 | 2,452 | ||||||
Chesapeake Energy, | 780 | 856 | ||||||
Dana Holding, 4.000% (A) | 5,754 | 917 | ||||||
GMAC Capital Trust I, 0.000% (D) | 28,000 | 746 | ||||||
Regions Financial, 6.380% | 149,200 | 3,779 | ||||||
SandRidge Energy, 7.000% | 9,200 | 812 | ||||||
|
| |||||||
Total Preferred Stock | 21,671 | |||||||
|
| |||||||
MUNICIPAL BONDS — 0.6% | ||||||||
California State, Tobacco Securitization, Ser A-1, RB | ||||||||
5.750%, 06/01/2047 | 2,200 | 2,057 | ||||||
New Jersey State, Tobacco Settlement, Ser 1A, RB | ||||||||
4.750%, 06/01/2034 | 4,345 | 3,824 | ||||||
Tobacco Settlement, Ser 1A, RB | ||||||||
5.000%, 06/01/2041 | 8,280 | 7,296 | ||||||
|
| |||||||
Total Municipal Bonds | 13,177 | |||||||
|
| |||||||
ASSET-BACKED SECURITIES — 0.1% |
| |||||||
Other Asset-Backed Securities — 0.1% |
| |||||||
Airplanes Pass-Through Trust, | ||||||||
0.749%, 03/15/2019 (D) | 1,681 | 908 | ||||||
Cajun Global, Ser 2011-1A, Cl A2 | ||||||||
5.955%, 02/20/2041 (A) | 1,475 | 1,644 | ||||||
Domino’s Pizza Master Issuer, | ||||||||
5.216%, 01/25/2042 (A) | 491 | 544 | ||||||
|
| |||||||
Total Asset-Backed Securities | 3,096 | |||||||
|
| |||||||
| Description | Face Amount ($ Thousands)/Shares | Market Value ($ Thousands) | ||||||
CONVERTIBLE BONDS — 0.4% |
| |||||||
Liberty Media CV to 16.7764 | ||||||||
4.500%, 07/15/2014 | $ | 2,395 | $ | 2,434 | ||||
4.000%, 11/15/2029 | 2,255 | 1,606 | ||||||
3.750%, 02/15/2030 | 4,410 | 3,054 | ||||||
Meritor | ||||||||
4.000%, 02/15/2019 (C) | 1,047 | 976 | ||||||
Mirant CV to 14.7167 | ||||||||
0.000%, 06/15/2021 (B) | 1,950 | — | ||||||
Vector Group CV to 48.8281 | ||||||||
3.875%, 06/15/2026 (D) | 369 | 404 | ||||||
|
| |||||||
Total Convertible Bonds | 8,474 | |||||||
|
| |||||||
COMMON STOCK — 0.1% |
| |||||||
Aventine Renewable Energy Holdings* | 1,334 | 28 | ||||||
VSS AHC, Cl A* (E) (F) (G) | 29,628 | 354 | ||||||
Core-Mark Holding | 691 | 41 | ||||||
Dana Holdings | 70,421 | 1,332 | ||||||
Delta Air Lines | 2,369 | 42 | ||||||
Global Aviation Holdings, Cl A* | 101,199 | — | ||||||
HMH Holdings Delaware* (G) | 40,917 | 1,095 | ||||||
Neenah Enterprises | 21,556 | 156 | ||||||
United Continental Holdings | 21 | 1 | ||||||
|
| |||||||
Total Common Stock | 3,049 | |||||||
|
| |||||||
Number of | ||||||||
WARRANTS — 0.1% |
| |||||||
B&G Foods, Expires 03/15/17* | 2,025 | — | ||||||
CUI Acquisition*‡‡ (F) (G) | 46,959 | 1,878 | ||||||
|
| |||||||
Total Warrants | 1,878 | |||||||
|
| |||||||
CASH EQUIVALENT — 2.7% | ||||||||
SEI Daily Income Trust, Prime Obligation Fund, Cl A | 57,457,656 | 57,458 | ||||||
|
| |||||||
Total Cash Equivalent | 57,458 | |||||||
|
| |||||||
Total Investments — 98.7% | $ | 2,135,243 | ||||||
|
| |||||||
| 152 | SEI Institutional Investments Trust / Annual Report / May 31, 2013 |
Table of Contents
A list of the open swap agreements held by the Fund at May 31, 2013, is as follows:
| Credit Default Swaps | ||||||||||||||||||||
| Counterparty | Reference Entity/Obligation | Buy/Sell Protection | (Pays)/ Receives Rate | Termination Date | Notional Amount ($ Thousands) | Net Unrealized Appreciation ($ Thousands) | ||||||||||||||
| JPMorgan Chase Bank | CDX.NA.HY.20 Index | BUY | 5.00 | % | 06/20/18 | $ | 17,920 | $ | 110 | |||||||||||
|
| |||||||||||||||||||
For the year ended May 31, 2013, the total amount of all open swap agreements, as presented in the table above, are representative of the volume of activity for this derivative type during the year.
Percentages are based on a Net Assets of $2,162,551 ($ Thousands).
| * | Non-income producing security. |
| ** | The rate reported is the 7-day effective yield as of May 31, 2013. |
| ‡ | Real Estate Investment Trust. |
| † | Investment in Affiliated Security (see Note 5). |
| ‡‡ | Expiration date is unavailable. |
| ‡‡‡ | Maturity date is unavailable. |
| (A) | Securities sold within terms of a private placement memorandum, exempt from registration under Section 144A of the Securities Act of 1933, as amended, and may be sold only to dealers in that program or other “accredited investors.” These securities have been determined to be liquid under guidelines established by the Board of Trustees. |
| (B) | Security in default on interest payments. |
| (C) | Step Bonds — The rate reflected on the Schedule of Investments is the effective yield on May 31, 2013. The coupon on a step bond changes on a specified date. |
| (D) | Variable Rate Security — The rate reported on the Schedule of Investments is the rate in effect as of May 31, 2013. The date reported on the Schedule of Investments is the final maturity date. |
| (E) | Securities considered restricted. The total value of such securities as of May 31, 2013 was $355 ($ Thousands) and represented 0.02% of Net Assets. |
| (F) | Security considered illiquid. The total value of such security as of May 31, 2013 was $4,566 ($ Thousands) and represented 0.21% of Net Assets. |
| (G) | Security fair valued using methods determined in good faith by the Valuation Committee of the Board of Trustees. The total market value of such securities as of May 31, 2012 was $6,210 ($ Thousands) and represented 0.29% of Net Assets. |
| (H) | Unsettled bank loan. Interest rate not available. |
| (I) | Unfunded bank loan. |
CDO — Collateralized Debt Obligation
Cl — Class
CLO — Collateralized Loan Obligation
CV — Convertible Security
LLC — Limited Liability Company
PIK — Payment-in-Kind
PLC — Public Limited Company
RB — Revenue Bond
Ser — Series
The following is a list of the inputs used as of May 31, 2013, in valuing the Fund’s investments and other financial instruments carried at value ($ Thousands):
| Investments in Securities | Level 1 | Level 2 | Level 3(1) | Total | ||||||||||||
Corporate Obligations | $ | — | $ | 1,599,620 | $ | 5,048 | $ | 1,604,668 | ||||||||
Loan Participations | — | 199,550 | 9,968 | 209,518 | ||||||||||||
Collateralized Debt Obligations | — | — | 212,254 | 212,254 | ||||||||||||
Preferred Stock | 1,797 | 19,874 | — | 21,671 | ||||||||||||
Municipal Bonds | — | 13,177 | — | 13,177 | ||||||||||||
Asset-Backed Securities | — | 3,096 | — | 3,096 | ||||||||||||
Convertible Bonds | — | 8,474 | — | 8,474 | ||||||||||||
Common Stock | 1,444 | 1,095 | 510 | 3,049 | ||||||||||||
Warrants | — | — | 1,878 | 1,878 | ||||||||||||
Cash Equivalent | 57,458 | — | — | 57,458 | ||||||||||||
|
|
|
|
|
|
|
| |||||||||
Total Investments in Securities | $ | 60,699 | $ | 1,844,886 | $ | 229,658 | $ | 2,135,243 | ||||||||
|
|
|
|
|
|
|
| |||||||||
| Other Financial Instruments | Level 1 | Level 2 | Level 3 | Total | ||||||||||||
Credit Default Swaps* | $ | — | $ | 110 | $ | — | $ | 110 | ||||||||
|
|
|
|
|
|
|
| |||||||||
| * | Swaps are valued at the unrealized appreciation on the instrument. |
| (1) | Of the $229,658 in Level 3 securities as of May 31, 2013, $6,210 or 0.29% are not valued via third party pricing vendors and broker quotes. If significant, the disclosure of the unobservable inputs and the interrelationships and sensitivity between these inputs are required for those Level 3 securities that are not valued by third party pricing vendors or broker quotes. |
The following is a reconciliation of investments in which significant unobservable inputs (Level 3) were used in determining value ($ Thousands):
| Investments in Corporate Obligations | Investments in Loan Participations | Investments in Collateralized Debt Obligations | Investments in Convertible Bonds | Investments in Common Stock | Investments in Warrants | Investments in Auction Rate Preferred Securities | ||||||||||||||||||||||
Beginning balance as June 1, 2012 | $ | 4,519 | $ | 7,780 | $ | 194,307 | $ | 4 | $ | 450 | $ | 2,137 | $ | 4,606 | ||||||||||||||
Accrued discounts/premiums | 50 | 24 | 1,377 | — | — | — | — | |||||||||||||||||||||
Realized gain/(loss) | (2,082 | ) | 2,200 | 6,212 | — | — | — | 552 | ||||||||||||||||||||
Change in unrealized appreciation/ (depreciation) | 360 | 480 | 18,782 | (4 | ) | 60 | (259 | ) | (458 | ) | ||||||||||||||||||
Purchases | 17,974 | 947 | 59,646 | — | — | — | — | |||||||||||||||||||||
Sales | (15,751 | ) | (3,447 | ) | (68,070 | ) | — | — | — | (4,700 | ) | |||||||||||||||||
Net transfer into Level 3 | — | 1,984 | — | — | — | — | — | |||||||||||||||||||||
Net transfer out of Level 3 | (22 | ) | — | — | — | — | — | — | ||||||||||||||||||||
|
|
|
|
|
|
|
|
|
|
|
|
|
| |||||||||||||||
Ending balance as of May 31, 2013 | $ | 5,048 | $ | 9,968 | $ | 212,254 | $ | — | $ | 510 | $ | 1,878 | $ | — | ||||||||||||||
|
|
|
|
|
|
|
|
|
|
|
|
|
| |||||||||||||||
Changes in unrealized gains/(losses) included in earnings related to securities still held at reporting date | $ | 321 | $ | 499 | $ | 20,715 | $ | (4 | ) | $ | 59 | $ | (258 | ) | $ | — | ||||||||||||
|
|
|
|
|
|
|
|
|
|
|
|
|
| |||||||||||||||
For the year ended May 31, 2013, there were no transfers between Level 1 and Level 2 assets and liabilities.
For the year ended May 31, 2013, there were transfers between Level 2 and Level 3 assets and liabilities. The transfers were due to changes in the availability of observable inputs used to determine fair value.
For more information on valuation inputs, see Note 2 — Significant Accounting Policies in Notes to Financial Statements.
Amounts designated as “—” are either $0 or have been rounded to $0.
The accompanying notes are an integral part of the financial statements.
| SEI Institutional Investments Trust / Annual Report / May 31, 2013 | 153 |
Table of Contents
SCHEDULE OF INVESTMENTS
Long Duration Fund
May 31, 2013
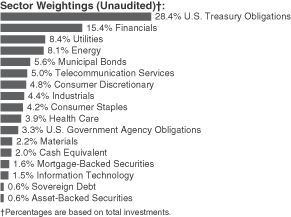
| Description | Face Amount ($ Thousands) | Market Value ($ Thousands) | ||||||
CORPORATE OBLIGATIONS — 57.9% |
| |||||||
Consumer Discretionary — 6.5% |
| |||||||
AutoZone | ||||||||
3.125%, 07/15/2023 | $ | 1,860 | $ | 1,792 | ||||
Comcast | ||||||||
6.950%, 08/15/2037 | 2,550 | 3,392 | ||||||
6.500%, 01/15/2017 | 100 | 118 | ||||||
6.450%, 03/15/2037 | 6,200 | 7,801 | ||||||
6.400%, 05/15/2038 | 6,116 | 7,714 | ||||||
5.900%, 03/15/2016 | 100 | 113 | ||||||
5.700%, 07/01/2019 | 100 | 121 | ||||||
4.650%, 07/15/2042 | 1,770 | 1,809 | ||||||
4.250%, 01/15/2033 | 4,000 | 3,992 | ||||||
Comcast Cable Communications Holdings | ||||||||
9.455%, 11/15/2022 | 950 | 1,410 | ||||||
COX Communications | ||||||||
7.625%, 06/15/2025 | 300 | 380 | ||||||
6.950%, 06/01/2038 (A) | 3,183 | 4,023 | ||||||
4.700%, 12/15/2042 (A) | 4,400 | 4,247 | ||||||
CVS Caremark | ||||||||
6.250%, 06/01/2027 | 1,640 | 2,034 | ||||||
6.125%, 09/15/2039 | 3,825 | 4,713 | ||||||
5.750%, 05/15/2041 | 2,295 | 2,702 | ||||||
CVS Pass-Through Trust | ||||||||
8.353%, 07/10/2031 (A) | 6,171 | 8,192 | ||||||
DIRECTV Holdings | ||||||||
6.350%, 03/15/2040 | 755 | 838 | ||||||
6.000%, 08/15/2040 | 5,705 | 6,093 | ||||||
5.150%, 03/15/2042 | 3,705 | 3,600 | ||||||
Discovery Communications | ||||||||
4.950%, 05/15/2042 | 250 | 251 | ||||||
4.875%, 04/01/2043 | 720 | 718 | ||||||
Ford Motor | ||||||||
7.400%, 11/01/2046 | 4,605 | 5,773 | ||||||
4.750%, 01/15/2043 | 3,500 | 3,256 | ||||||
Home Depot | ||||||||
4.200%, 04/01/2043 | 3,420 | 3,338 | ||||||
| Description | Face Amount ($ Thousands) | Market Value ($ Thousands) | ||||||
Lowe’s | ||||||||
6.875%, 02/15/2028 | $ | 100 | $ | 129 | ||||
5.125%, 11/15/2041 | 3,865 | 4,213 | ||||||
McDonald’s | ||||||||
6.300%, 03/01/2038 | 5,145 | 6,841 | ||||||
4.875%, 07/15/2040 | 910 | 1,015 | ||||||
3.700%, 02/15/2042 | 480 | 442 | ||||||
NBC Universal Media | ||||||||
6.400%, 04/30/2040 | 1,975 | 2,490 | ||||||
5.950%, 04/01/2041 | 3,075 | 3,704 | ||||||
News America | ||||||||
8.450%, 08/01/2034 | 160 | 217 | ||||||
8.150%, 10/17/2036 | 1,685 | 2,245 | ||||||
7.850%, 03/01/2039 | 3,900 | 5,285 | ||||||
7.750%, 01/20/2024 | 125 | 157 | ||||||
7.625%, 11/30/2028 | 4,616 | 5,900 | ||||||
7.430%, 10/01/2026 | 200 | 249 | ||||||
6.900%, 08/15/2039 | 4,250 | 5,295 | ||||||
6.750%, 01/09/2038 | 1,250 | 1,458 | ||||||
6.650%, 11/15/2037 | 700 | 848 | ||||||
6.400%, 12/15/2035 | 875 | 1,034 | ||||||
6.150%, 02/15/2041 | 4,570 | 5,335 | ||||||
Target | ||||||||
7.000%, 01/15/2038 | 737 | 1,008 | ||||||
6.650%, 08/01/2028 | 450 | 570 | ||||||
4.000%, 07/01/2042 | 3,075 | 2,921 | ||||||
TCI Communications | ||||||||
7.875%, 02/15/2026 | 3,000 | 4,083 | ||||||
Time Warner | ||||||||
7.700%, 05/01/2032 | 4,309 | 5,841 | ||||||
7.625%, 04/15/2031 | 11,985 | 16,218 | ||||||
6.250%, 03/29/2041 | 5,400 | 6,323 | ||||||
Time Warner Cable | ||||||||
8.750%, 02/14/2019 | 3,500 | 4,597 | ||||||
6.750%, 06/15/2039 | 3,830 | 4,462 | ||||||
5.875%, 11/15/2040 | 1,645 | 1,748 | ||||||
5.500%, 09/01/2041 | 1,475 | 1,497 | ||||||
4.500%, 09/15/2042 | 4,285 | 3,822 | ||||||
Time Warner Entertainment | ||||||||
8.375%, 07/15/2033 | 3,880 | 5,265 | ||||||
Viacom | ||||||||
4.375%, 03/15/2043 (A) | 6,628 | 5,986 | ||||||
Wal-Mart Stores | ||||||||
7.550%, 02/15/2030 | 840 | 1,186 | ||||||
6.200%, 04/15/2038 | 2,650 | 3,384 | ||||||
5.625%, 04/01/2040 | 5,940 | 7,149 | ||||||
5.625%, 04/15/2041 | 7,095 | 8,555 | ||||||
5.250%, 09/01/2035 | 50 | 57 | ||||||
5.000%, 10/25/2040 | 2,370 | 2,609 | ||||||
4.000%, 04/11/2043 | 960 | 916 | ||||||
Yum! Brands | ||||||||
6.875%, 11/15/2037 | 1,785 | 2,241 | ||||||
|
| |||||||
| 215,715 | ||||||||
|
| |||||||
| 154 | SEI Institutional Investments Trust / Annual Report / May 31, 2013 |
Table of Contents
| Description | Face Amount ($ Thousands) | Market Value ($ Thousands) | ||||||
Consumer Staples — 4.2% |
| |||||||
Ahold Finance USA | ||||||||
6.875%, 05/01/2029 | $ | 885 | $ | 1,113 | ||||
Altria Group | ||||||||
10.200%, 02/06/2039 | 2,640 | 4,204 | ||||||
Anheuser-Busch InBev Finance | ||||||||
4.000%, 01/17/2043 | 4,800 | 4,542 | ||||||
2.625%, 01/17/2023 | 3,975 | 3,835 | ||||||
Anheuser-Busch InBev Worldwide | ||||||||
8.000%, 11/15/2039 | 2,490 | 3,807 | ||||||
6.375%, 01/15/2040 | 2,075 | 2,697 | ||||||
3.750%, 07/15/2042 | 5,727 | 5,203 | ||||||
2.500%, 07/15/2022 | 1,050 | 1,010 | ||||||
Archer-Daniels-Midland | ||||||||
7.000%, 02/01/2031 | 25 | 32 | ||||||
Bestfoods | ||||||||
7.250%, 12/15/2026 | 170 | 239 | ||||||
Bowdoin College | ||||||||
4.693%, 07/01/2112 | 12,240 | 10,961 | ||||||
ConAgra Foods | ||||||||
6.625%, 08/15/2039 (A) | 1,415 | 1,743 | ||||||
3.200%, 01/25/2023 | 2,025 | 1,995 | ||||||
Diageo Capital | ||||||||
2.625%, 04/29/2023 | 5,085 | 4,876 | ||||||
General Mills | ||||||||
5.400%, 06/15/2040 | 815 | 951 | ||||||
Heineken | ||||||||
2.750%, 04/01/2023 (A) | 6,120 | 5,889 | ||||||
Kellogg | ||||||||
3.125%, 05/17/2022 | 1,830 | 1,846 | ||||||
Kraft Foods Group | ||||||||
6.875%, 01/26/2039 | 865 | 1,135 | ||||||
5.000%, 06/04/2042 | 5,645 | 5,917 | ||||||
Kroger | ||||||||
5.000%, 04/15/2042 | 2,210 | 2,273 | ||||||
Lorillard Tobacco | ||||||||
8.125%, 05/01/2040 | 935 | 1,197 | ||||||
7.000%, 08/04/2041 | 1,185 | 1,373 | ||||||
Massachusetts Institute of Technology | ||||||||
5.600%, 07/01/2111 | 2,194 | 2,806 | ||||||
Molson Coors Brewing | ||||||||
5.000%, 05/01/2042 | 2,786 | 2,862 | ||||||
Mondelez International | ||||||||
7.000%, 08/11/2037 | 1,265 | 1,664 | ||||||
6.875%, 02/01/2038 | 6,690 | 8,725 | ||||||
6.500%, 02/09/2040 | 6,990 | 8,836 | ||||||
Pepsi Bottling Group | ||||||||
7.000%, 03/01/2029 | 355 | 478 | ||||||
PepsiCo | ||||||||
5.500%, 01/15/2040 | 1,675 | 1,941 | ||||||
4.000%, 03/05/2042 | 2,505 | 2,380 | ||||||
Pernod-Ricard | ||||||||
5.500%, 01/15/2042 (A) | 750 | 810 | ||||||
4.450%, 01/15/2022 (A) | 350 | 373 | ||||||
| Description | Face Amount ($ Thousands) | Market Value ($ Thousands) | ||||||
Philip Morris International | ||||||||
6.375%, 05/16/2038 | $ | 350 | $ | 439 | ||||
4.500%, 03/20/2042 | 4,935 | 4,830 | ||||||
4.125%, 03/04/2043 | 4,905 | 4,586 | ||||||
3.875%, 08/21/2042 | 2,505 | 2,254 | ||||||
President and Fellows of Harvard College | ||||||||
5.625%, 10/01/2038 | 3,149 | 3,914 | ||||||
3.619%, 10/01/2037 | 2,000 | 1,877 | ||||||
Procter & Gamble | ||||||||
8.000%, 09/01/2024 | 697 | 1,017 | ||||||
SABMiller Holdings | ||||||||
4.950%, 01/15/2042 (A) | 8,874 | 9,492 | ||||||
3.750%, 01/15/2022 (A) | 415 | 436 | ||||||
Tufts University | ||||||||
5.017%, 04/15/2112 | 7,900 | 8,269 | ||||||
Unilever Capital | ||||||||
5.900%, 11/15/2032 | 945 | 1,222 | ||||||
University of Southern California | ||||||||
5.250%, 10/01/2111 | 1,715 | 2,058 | ||||||
|
| |||||||
| 138,107 | ||||||||
|
| |||||||
Energy — 8.1% |
| |||||||
Anadarko Finance | ||||||||
7.500%, 05/01/2031 | 1,590 | 2,096 | ||||||
Anadarko Holding | ||||||||
7.150%, 05/15/2028 | 2,910 | 3,505 | ||||||
Anadarko Petroleum | ||||||||
6.450%, 09/15/2036 | 590 | 718 | ||||||
Apache | ||||||||
5.250%, 02/01/2042 | 310 | 328 | ||||||
4.750%, 04/15/2043 | 5,165 | 5,153 | ||||||
4.250%, 01/15/2044 | 10,990 | 10,235 | ||||||
BG Energy Capital | ||||||||
5.125%, 10/15/2041 (A) | 4,600 | 5,016 | ||||||
Burlington Resources Finance | ||||||||
7.200%, 08/15/2031 | 25 | 34 | ||||||
Canadian Natural Resources | ||||||||
6.500%, 02/15/2037 | 390 | 468 | ||||||
6.250%, 03/15/2038 | 3,850 | 4,545 | ||||||
5.850%, 02/01/2035 | 150 | 167 | ||||||
Cenovus Energy | ||||||||
6.750%, 11/15/2039 | 2,255 | 2,872 | ||||||
4.450%, 09/15/2042 | 1,245 | 1,191 | ||||||
CNOOC Finance | ||||||||
3.875%, 05/02/2022 (A) | 2,550 | 2,601 | ||||||
3.000%, 05/09/2023 | 5,640 | 5,355 | ||||||
Conoco Funding | ||||||||
7.250%, 10/15/2031 | 875 | 1,212 | ||||||
6.950%, 04/15/2029 | 1,710 | 2,266 | ||||||
ConocoPhillips | ||||||||
6.500%, 02/01/2039 | 10,220 | 13,379 | ||||||
5.900%, 05/15/2038 | 4,613 | 5,635 | ||||||
Devon Energy | ||||||||
7.950%, 04/15/2032 | 285 | 389 | ||||||
| SEI Institutional Investments Trust / Annual Report / May 31, 2013 | 155 |
Table of Contents
SCHEDULE OF INVESTMENTS
Long Duration Fund (Continued)
May 31, 2013
| Description | Face Amount ($ Thousands) | Market Value ($ Thousands) | ||||||
5.600%, 07/15/2041 | $ | 4,690 | $ | 5,143 | ||||
4.750%, 05/15/2042 | 1,810 | 1,762 | ||||||
El Paso Natural Gas | ||||||||
7.500%, 11/15/2026 | 3,170 | 4,194 | ||||||
Encana | ||||||||
6.500%, 02/01/2038 | 4,625 | 5,517 | ||||||
Eni | ||||||||
5.700%, 10/01/2040 (A) | 3,430 | 3,456 | ||||||
Enterprise Products Operating | ||||||||
6.650%, 10/15/2034 | 2,310 | 2,851 | ||||||
6.125%, 10/15/2039 | 375 | 438 | ||||||
5.700%, 02/15/2042 | 7,727 | 8,668 | ||||||
4.850%, 03/15/2044 | 2,000 | 1,989 | ||||||
4.450%, 02/15/2043 | 2,910 | 2,735 | ||||||
Gulf South Pipeline | ||||||||
4.000%, 06/15/2022 | 2,580 | 2,665 | ||||||
Halliburton | ||||||||
7.600%, 08/15/2096 (A) | 675 | 980 | ||||||
Hess | ||||||||
7.300%, 08/15/2031 | 3,397 | 4,251 | ||||||
6.000%, 01/15/2040 | 2,409 | 2,698 | ||||||
5.600%, 02/15/2041 | 1,960 | 2,082 | ||||||
Kinder Morgan Energy Partners | ||||||||
6.375%, 03/01/2041 | 7,475 | 8,801 | ||||||
3.950%, 09/01/2022 | 2,560 | 2,646 | ||||||
LASMO | ||||||||
7.300%, 11/15/2027 | 1,510 | 1,992 | ||||||
Marathon Oil | ||||||||
6.600%, 10/01/2037 | 3,820 | 4,725 | ||||||
Marathon Petroleum | ||||||||
6.500%, 03/01/2041 | 6,723 | 8,084 | ||||||
Motiva Enterprises | ||||||||
6.850%, 01/15/2040 (A) | 8,395 | 11,082 | ||||||
Nexen | ||||||||
7.500%, 07/30/2039 | 2,680 | 3,689 | ||||||
7.400%, 05/01/2028 | 2,320 | 3,033 | ||||||
6.400%, 05/15/2037 | 1,875 | 2,307 | ||||||
Noble Energy | ||||||||
4.150%, 12/15/2021 | 770 | 834 | ||||||
Panhandle Eastern Pipeline | ||||||||
8.125%, 06/01/2019 | 725 | 903 | ||||||
Petrobras Global Finance | ||||||||
5.625%, 05/20/2043 | 6,145 | 5,718 | ||||||
4.375%, 05/20/2023 | 2,470 | 2,380 | ||||||
Petrobras International Finance | ||||||||
6.875%, 01/20/2040 | 5,360 | 5,759 | ||||||
6.750%, 01/27/2041 | 1,770 | 1,875 | ||||||
5.875%, 03/01/2018 | 600 | 672 | ||||||
Petro-Canada | ||||||||
7.875%, 06/15/2026 | 35 | 48 | ||||||
6.800%, 05/15/2038 | 1,000 | 1,254 | ||||||
5.950%, 05/15/2035 | 760 | 863 | ||||||
Phillips 66 | ||||||||
5.875%, 05/01/2042 | 5,199 | 6,046 | ||||||
| Description | Face Amount ($ Thousands) | Market Value ($ Thousands) | ||||||
Rosneft Oil via Rosneft International Finance | ||||||||
4.199%, 03/06/2022 (A) | $ | 2,000 | $ | 1,910 | ||||
Shell International Finance | ||||||||
6.375%, 12/15/2038 | 4,118 | 5,513 | ||||||
5.500%, 03/25/2040 | 2,575 | 3,132 | ||||||
Sinopec Capital 2013 | ||||||||
3.125%, 04/24/2023 (A) | 1,875 | 1,763 | ||||||
Sinopec Group Overseas Development 2012 | ||||||||
3.900%, 05/17/2022 (A) | 975 | 996 | ||||||
Southern Natural Gas | ||||||||
7.350%, 02/15/2031 | 600 | 778 | ||||||
Spectra Energy Capital | ||||||||
7.500%, 09/15/2038 | 623 | 834 | ||||||
6.750%, 02/15/2032 | 3,450 | 4,078 | ||||||
3.300%, 03/15/2023 | 6,180 | 6,023 | ||||||
Statoil | ||||||||
6.800%, 01/15/2028 | 400 | 538 | ||||||
6.500%, 12/01/2028 (A) | 1,050 | 1,390 | ||||||
5.100%, 08/17/2040 | 475 | 527 | ||||||
3.950%, 05/15/2043 | 4,185 | 3,923 | ||||||
2.450%, 01/17/2023 | 2,375 | 2,266 | ||||||
Suncor Energy | ||||||||
6.850%, 06/01/2039 | 1,550 | 1,966 | ||||||
6.500%, 06/15/2038 | 3,785 | 4,638 | ||||||
Talisman Energy | ||||||||
5.500%, 05/15/2042 | 1,355 | 1,390 | ||||||
Tennessee Gas Pipeline | ||||||||
8.375%, 06/15/2032 | 4,255 | 5,976 | ||||||
7.000%, 10/15/2028 | 3,960 | 5,147 | ||||||
TransCanada PipeLines | ||||||||
7.625%, 01/15/2039 | 1,800 | 2,554 | ||||||
7.250%, 08/15/2038 | 1,670 | 2,275 | ||||||
Transcontinental Gas PipeLine | ||||||||
7.250%, 12/01/2026 | 1,610 | 2,190 | ||||||
5.400%, 08/15/2041 | 1,505 | 1,670 | ||||||
4.450%, 08/01/2042 | 1,100 | 1,058 | ||||||
Valero Energy | ||||||||
10.500%, 03/15/2039 | 6,267 | 10,068 | ||||||
Weatherford International | ||||||||
5.950%, 04/15/2042 | 4,235 | 4,356 | ||||||
Williams | ||||||||
8.750%, 03/15/2032 | 472 | 630 | ||||||
7.875%, 09/01/2021 | 545 | 685 | ||||||
7.750%, 06/15/2031 | 1,150 | 1,414 | ||||||
|
| |||||||
| 268,993 | ||||||||
|
| |||||||
Financials — 15.5% | ||||||||
ACE INA Holdings | ||||||||
6.700%, 05/15/2036 | 2,677 | 3,601 | ||||||
Aflac | ||||||||
6.900%, 12/17/2039 | 2,900 | 3,718 | ||||||
6.450%, 08/15/2040 | 2,510 | 3,089 | ||||||
| 156 | SEI Institutional Investments Trust / Annual Report / May 31, 2013 |
Table of Contents
| Description | Face Amount ($ Thousands) | Market Value ($ Thousands) | ||||||
AIG SunAmerica Global Financing X | ||||||||
6.900%, 03/15/2032 (A) | $ | 4,917 | $ | 6,260 | ||||
Allstate | ||||||||
6.125%, 12/15/2032 | 445 | 566 | ||||||
5.550%, 05/09/2035 | 75 | 90 | ||||||
5.200%, 01/15/2042 | 2,785 | 3,218 | ||||||
Alta Wind Holdings | ||||||||
7.000%, 06/30/2035 (A) | 2,491 | 2,677 | ||||||
American Express | ||||||||
4.050%, 12/03/2042 | 8,314 | 7,575 | ||||||
American International Group | ||||||||
6.250%, 05/01/2036 | 1,005 | 1,215 | ||||||
4.875%, 06/01/2022 | 1,710 | 1,887 | ||||||
Assurant | ||||||||
6.750%, 02/15/2034 | 2,634 | 2,875 | ||||||
Bank of America MTN | ||||||||
7.800%, 09/15/2016 | 65 | 76 | ||||||
6.000%, 09/01/2017 | 355 | 409 | ||||||
6.000%, 10/15/2036 | 3,935 | 4,610 | ||||||
5.875%, 02/07/2042 | 535 | 626 | ||||||
5.750%, 12/01/2017 | 6,300 | 7,214 | ||||||
5.650%, 05/01/2018 | 2,360 | 2,703 | ||||||
5.625%, 07/01/2020 | 675 | 780 | ||||||
5.000%, 05/13/2021 | 500 | 554 | ||||||
3.300%, 01/11/2023 | 2,545 | 2,465 | ||||||
Bear Stearns | ||||||||
7.250%, 02/01/2018 | 400 | 489 | ||||||
Berkshire Hathaway | ||||||||
4.500%, 02/11/2043 | 11,852 | 11,672 | ||||||
Berkshire Hathaway Finance | ||||||||
4.400%, 05/15/2042 | 2,600 | 2,520 | ||||||
Blackstone Holdings Finance | ||||||||
6.250%, 08/15/2042 (A) | 6,662 | 7,549 | ||||||
Camden Property Trust‡ | ||||||||
4.625%, 06/15/2021 | 1,325 | 1,455 | ||||||
Carlyle Holdings II Finance | ||||||||
5.625%, 03/30/2043 (A) | 5,566 | 5,534 | ||||||
CDP Financial | ||||||||
5.600%, 11/25/2039 (A) | 7,560 | 9,058 | ||||||
Chase Capital III | ||||||||
0.837%, 03/01/2027 (B) | 250 | 213 | ||||||
Chase Capital VI | ||||||||
0.899%, 08/01/2028 (B) | 2,435 | 2,021 | ||||||
Chubb | ||||||||
6.500%, 05/15/2038 | 4,040 | 5,385 | ||||||
Citigroup | ||||||||
8.500%, 05/22/2019 | 75 | 98 | ||||||
8.125%, 07/15/2039 | 5,830 | 8,268 | ||||||
6.875%, 03/05/2038 | 3,370 | 4,316 | ||||||
6.875%, 02/15/2098 | 4,559 | 5,181 | ||||||
6.625%, 06/15/2032 | 600 | 686 | ||||||
6.375%, 08/12/2014 | 50 | 53 | ||||||
6.125%, 11/21/2017 | 100 | 117 | ||||||
6.010%, 01/15/2015 | 50 | 54 | ||||||
| Description | Face Amount ($ Thousands) | Market Value ($ Thousands) | ||||||
6.000%, 12/13/2013 | $ | 125 | $ | 129 | ||||
6.000%, 08/15/2017 | 50 | 58 | ||||||
5.875%, 05/29/2037 | 320 | 376 | ||||||
5.850%, 12/11/2034 | 249 | 286 | ||||||
5.500%, 02/15/2017 | 3,970 | 4,412 | ||||||
5.300%, 01/07/2016 | 2,000 | 2,195 | ||||||
4.587%, 12/15/2015 | 39 | 42 | ||||||
2.650%, 03/02/2015 | 150 | 154 | ||||||
0.823%, 08/25/2036 (B) | 850 | 679 | ||||||
Commonwealth Bank of Australia MTN | ||||||||
5.000%, 10/15/2019 (A) | 1,750 | 2,026 | ||||||
Cooperatieve Centrale Raiffeisen-Boerenleenbank BA | ||||||||
5.800%, 09/30/2110 (A) | 8,380 | 9,236 | ||||||
Deutsche Bank MTN | ||||||||
4.296%, 05/24/2028 (B) | 2,395 | 2,310 | ||||||
Devon OEI Operating | ||||||||
7.500%, 09/15/2027 | 1,000 | 1,363 | ||||||
Discover Bank | ||||||||
8.700%, 11/18/2019 | 1,014 | 1,332 | ||||||
Discover Financial Services | ||||||||
3.850%, 11/21/2022 | 3,261 | 3,284 | ||||||
Duke Realty ‡ | ||||||||
4.375%, 06/15/2022 | 300 | 312 | ||||||
3.875%, 10/15/2022 | 730 | 730 | ||||||
3.625%, 04/15/2023 | 600 | 586 | ||||||
EADS Finance | ||||||||
2.700%, 04/17/2023 (A) | 2,500 | 2,427 | ||||||
Farmers Exchange Capital | ||||||||
7.050%, 07/15/2028 (A) | 12,307 | 15,395 | ||||||
FMR | ||||||||
6.500%, 12/14/2040 (A) | 525 | 640 | ||||||
5.150%, 02/01/2043 (A) | 2,750 | 2,829 | ||||||
Ford Holdings | ||||||||
9.300%, 03/01/2030 | 2,140 | 3,024 | ||||||
Gazprom OAO Via Gaz Capital | ||||||||
4.950%, 02/06/2028 (A) | 2,675 | 2,561 | ||||||
General Electric Capital MTN | ||||||||
7.500%, 08/21/2035 | 385 | 526 | ||||||
6.875%, 01/10/2039 | 14,775 | 18,866 | ||||||
6.750%, 03/15/2032 | 6,912 | 8,612 | ||||||
5.875%, 01/14/2038 | 21,030 | 23,994 | ||||||
Goldman Sachs Group | ||||||||
6.750%, 10/01/2037 | 15,330 | 16,719 | ||||||
6.250%, 02/01/2041 | 3,048 | 3,567 | ||||||
6.125%, 02/15/2033 | 8,060 | 9,216 | ||||||
5.950%, 01/15/2027 | 4,611 | 5,011 | ||||||
5.750%, 01/24/2022 | 2,330 | 2,667 | ||||||
Guardian Life Insurance of America | ||||||||
7.375%, 09/30/2039 (A) | 1,350 | 1,806 | ||||||
Hartford Financial Services Group | ||||||||
6.625%, 03/30/2040 | 2,194 | 2,769 | ||||||
6.100%, 10/01/2041 | 3,285 | 3,888 | ||||||
4.300%, 04/15/2043 | 1,630 | 1,537 | ||||||
| SEI Institutional Investments Trust / Annual Report / May 31, 2013 | 157 |
Table of Contents
SCHEDULE OF INVESTMENTS
Long Duration Fund (Continued)
May 31, 2013
| Description | Face Amount ($ Thousands) | Market Value ($ Thousands) | ||||||
HBOS MTN | ||||||||
6.750%, 05/21/2018 (A) | $ | 4,050 | $ | 4,545 | ||||
HBOS Capital Funding | ||||||||
6.071%, 06/30/2049 (A) (B) | 100 | 91 | ||||||
HCP‡ | ||||||||
6.750%, 02/01/2041 | 2,225 | 2,855 | ||||||
6.300%, 09/15/2016 | 2,195 | 2,532 | ||||||
3.750%, 02/01/2019 | 2,620 | 2,796 | ||||||
Health Care‡ | ||||||||
6.500%, 03/15/2041 | 1,686 | 2,025 | ||||||
5.125%, 03/15/2043 | 8,474 | 8,447 | ||||||
Healthcare Realty Trust‡ | ||||||||
5.750%, 01/15/2021 | 525 | 595 | ||||||
Heathrow Funding | ||||||||
4.875%, 07/15/2021 (A) | 3,070 | 3,331 | ||||||
HSBC Bank USA | ||||||||
7.000%, 01/15/2039 | 2,405 | 3,127 | ||||||
5.875%, 11/01/2034 | 320 | 364 | ||||||
5.625%, 08/15/2035 | 1,290 | 1,417 | ||||||
HSBC Holdings | ||||||||
7.625%, 05/17/2032 | 700 | 918 | ||||||
6.800%, 06/01/2038 | 335 | 418 | ||||||
6.500%, 09/15/2037 | 4,200 | 5,044 | ||||||
6.100%, 01/14/2042 | 825 | 1,023 | ||||||
5.100%, 04/05/2021 | 3,531 | 4,024 | ||||||
HSBC Holdings, Ser 2006 | ||||||||
6.500%, 05/02/2036 | 305 | 365 | ||||||
ING Bank | ||||||||
1.675%, 06/09/2014 (A) (B) | 1,050 | 1,061 | ||||||
International Lease Finance | ||||||||
7.125%, 09/01/2018 (A) | 425 | 501 | ||||||
JPMorgan Chase | ||||||||
6.400%, 05/15/2038 | 400 | 496 | ||||||
6.300%, 04/23/2019 | 1,775 | 2,136 | ||||||
5.600%, 07/15/2041 | 7,260 | 8,381 | ||||||
5.500%, 10/15/2040 | 100 | 114 | ||||||
5.400%, 01/06/2042 | 920 | 1,033 | ||||||
4.500%, 01/24/2022 | 1,230 | 1,333 | ||||||
3.375%, 05/01/2023 | 2,830 | 2,689 | ||||||
0.610%, 06/13/2016 (B) | 2,000 | 1,975 | ||||||
JPMorgan Chase Capital XIII | ||||||||
1.234%, 09/30/2034 (B) | 3,900 | 3,237 | ||||||
KKR Group Finance II | ||||||||
5.500%, 02/01/2043 (A) | 7,566 | 7,252 | ||||||
Liberty Mutual Group | ||||||||
6.500%, 05/01/2042 (A) | 4,840 | 5,659 | ||||||
Macquarie Bank MTN | ||||||||
6.625%, 04/07/2021 (A) | 7,090 | 7,937 | ||||||
Massachusetts Mutual Life Insurance | ||||||||
8.875%, 06/01/2039 (A) | 2,705 | 4,143 | ||||||
5.375%, 12/01/2041 (A) | 3,210 | 3,606 | ||||||
Merrill Lynch | ||||||||
8.950%, 05/18/2017 (B) | 1,340 | 1,524 | ||||||
8.680%, 05/02/2017 (B) | 1,305 | 1,471 | ||||||
| Description | Face Amount ($ Thousands) | Market Value ($ Thousands) | ||||||
7.750%, 05/14/2038 | $ | 410 | $ | 513 | ||||
6.110%, 01/29/2037 | 3,660 | 3,926 | ||||||
MetLife | ||||||||
7.800%, 11/01/2025 (A) | 3,520 | 4,711 | ||||||
6.400%, 12/15/2036 | 2,520 | 2,848 | ||||||
5.875%, 02/06/2041 | 1,240 | 1,487 | ||||||
Metropolitan Life Global Funding I | ||||||||
3.875%, 04/11/2022 (A) | 435 | 460 | ||||||
3.000%, 01/10/2023 (A) | 3,965 | 3,906 | ||||||
Morgan Stanley MTN | ||||||||
6.625%, 04/01/2018 | 4,365 | 5,138 | ||||||
6.375%, 07/24/2042 | 5,524 | 6,488 | ||||||
5.625%, 09/23/2019 | 11,775 | 13,337 | ||||||
4.100%, 05/22/2023 | 855 | 819 | ||||||
3.750%, 02/25/2023 | 1,445 | 1,433 | ||||||
National Capital Trust II | ||||||||
5.486%, 12/29/2049 (A) (B) | 500 | 509 | ||||||
National Rural Utilities Cooperative Finance MTN | ||||||||
8.000%, 03/01/2032 | 417 | 599 | ||||||
Nationwide Mutual Insurance | ||||||||
7.875%, 04/01/2033 (A) | 4,016 | 5,015 | ||||||
New York Life Insurance | ||||||||
6.750%, 11/15/2039 (A) | 8,125 | 10,640 | ||||||
Northwestern Mutual Life Insurance | ||||||||
6.063%, 03/30/2040 (A) | 4,105 | 5,029 | ||||||
Principal Financial Group | ||||||||
4.625%, 09/15/2042 | 1,270 | 1,291 | ||||||
4.350%, 05/15/2043 | 1,285 | 1,255 | ||||||
Prudential Financial MTN | ||||||||
6.625%, 12/01/2037 | 3,815 | 4,758 | ||||||
6.200%, 11/15/2040 | 1,045 | 1,272 | ||||||
5.700%, 12/14/2036 | 3,385 | 3,810 | ||||||
Prudential Holdings | ||||||||
8.695%, 12/18/2023 (A) | 3,087 | 3,952 | ||||||
Prudential Insurance of America | ||||||||
8.300%, 07/01/2025 (A) | 4,500 | 6,024 | ||||||
Royal Bank of Scotland Group | ||||||||
7.648%, 08/31/2049 (B) | 1,900 | 1,995 | ||||||
Security Benefit Life | ||||||||
7.450%, 10/01/2033 (A) | 5,755 | 5,829 | ||||||
Simon Property Group‡ | ||||||||
6.750%, 02/01/2040 | 4,740 | 6,301 | ||||||
4.750%, 03/15/2042 | 3,360 | 3,497 | ||||||
SL Green Realty‡ | ||||||||
5.000%, 08/15/2018 | 1,000 | 1,091 | ||||||
Sydney Airport Finance | ||||||||
3.900%, 03/22/2023 (A) | 4,500 | 4,529 | ||||||
Teachers Insurance & Annuity Association of America | ||||||||
6.850%, 12/16/2039 (A) | 4,660 | 6,132 | ||||||
Toyota Motor Credit MTN | ||||||||
3.400%, 09/15/2021 | 1,350 | 1,409 | ||||||
Ventas Realty‡ | ||||||||
4.750%, 06/01/2021 | 2,500 | 2,732 | ||||||
| 158 | SEI Institutional Investments Trust / Annual Report / May 31, 2013 |
Table of Contents
| Description | Face Amount ($ Thousands) | Market Value ($ Thousands) | ||||||
Wachovia Bank | ||||||||
6.600%, 01/15/2038 | $ | 4,070 | $ | 5,209 | ||||
6.000%, 11/15/2017 | 300 | 353 | ||||||
5.850%, 02/01/2037 | 4,680 | 5,515 | ||||||
WEA Finance | ||||||||
7.125%, 04/15/2018 (A) | 25 | 31 | ||||||
6.750%, 09/02/2019 (A) | 2,090 | 2,564 | ||||||
ZFS Finance USA Trust II | ||||||||
6.450%, 12/15/2065 (A) (B) | 1,939 | 2,114 | ||||||
|
| |||||||
| 513,427 | ||||||||
|
| |||||||
Health Care — 4.0% | ||||||||
AbbVie | ||||||||
4.400%, 11/06/2042 (A) | 5,725 | 5,592 | ||||||
Amgen | ||||||||
6.400%, 02/01/2039 | 3,400 | 4,138 | ||||||
5.750%, 03/15/2040 | 900 | 1,029 | ||||||
5.375%, 05/15/2043 | 5,690 | 6,237 | ||||||
5.150%, 11/15/2041 | 3,700 | 3,925 | ||||||
4.950%, 10/01/2041 | 825 | 846 | ||||||
AstraZeneca | ||||||||
6.450%, 09/15/2037 | 3,522 | 4,469 | ||||||
4.000%, 09/18/2042 | 1,825 | 1,701 | ||||||
Bristol-Myers Squibb | ||||||||
6.875%, 08/01/2097 | 1,800 | 2,482 | ||||||
Cardinal Health | ||||||||
3.200%, 03/15/2023 | 515 | 502 | ||||||
Catholic Health Initiatives | ||||||||
4.350%, 11/01/2042 | 8,136 | 7,817 | ||||||
Celgene | ||||||||
5.700%, 10/15/2040 | 5,085 | 5,741 | ||||||
Coventry Health Care | ||||||||
5.450%, 06/15/2021 | 500 | 579 | ||||||
Covidien International Finance | ||||||||
2.950%, 06/15/2023 | 1,290 | 1,268 | ||||||
GlaxoSmithKline Capital | ||||||||
6.375%, 05/15/2038 | 3,405 | 4,372 | ||||||
Highmark | ||||||||
6.125%, 05/15/2041 (A) | 3,205 | 2,976 | ||||||
Humana | ||||||||
4.625%, 12/01/2042 | 1,068 | 1,017 | ||||||
Johnson & Johnson | ||||||||
5.950%, 08/15/2037 | 795 | 1,030 | ||||||
5.850%, 07/15/2038 | 1,725 | 2,220 | ||||||
Kaiser Foundation Hospitals | ||||||||
4.875%, 04/01/2042 | 5,250 | 5,545 | ||||||
McKesson | ||||||||
2.700%, 12/15/2022 | 2,970 | 2,889 | ||||||
Mead Johnson Nutrition | ||||||||
5.900%, 11/01/2039 | 990 | 1,140 | ||||||
Medtronic | ||||||||
2.750%, 04/01/2023 | 7,240 | 7,069 | ||||||
Memorial Sloan-Kettering Cancer Center | ||||||||
5.000%, 07/01/2042 | 1,845 | 2,012 | ||||||
| Description | Face Amount ($ Thousands) | Market Value ($ Thousands) | ||||||
Merck MTN | ||||||||
6.550%, 09/15/2037 | $ | 815 | $ | 1,097 | ||||
6.500%, 12/01/2033 | 395 | 531 | ||||||
5.850%, 06/30/2039 | 450 | 553 | ||||||
5.760%, 05/03/2037 | 2,236 | 2,890 | ||||||
4.150%, 05/18/2043 | 1,840 | 1,792 | ||||||
3.600%, 09/15/2042 | 1,780 | 1,594 | ||||||
North Shore Long Island Jewish Health Care | ||||||||
4.800%, 11/01/2042 | 4,615 | 4,526 | ||||||
Novartis Capital | ||||||||
2.400%, 09/21/2022 | 3,105 | 2,999 | ||||||
NYU Hospitals Center | ||||||||
4.428%, 07/01/2042 | 4,230 | 3,988 | ||||||
Pfizer | ||||||||
7.200%, 03/15/2039 | 1,290 | 1,820 | ||||||
4.300%, 06/15/2043 | 3,620 | 3,605 | ||||||
Roche Holdings | ||||||||
7.000%, 03/01/2039 (A) | 6,290 | 8,888 | ||||||
St. Barnabas Health Care System | ||||||||
4.000%, 07/01/2028 | 4,375 | 4,167 | ||||||
Stryker | ||||||||
4.100%, 04/01/2043 | 2,220 | 2,162 | ||||||
Thermo Fisher Scientific | ||||||||
3.150%, 01/15/2023 | 3,020 | 2,913 | ||||||
UnitedHealth Group | ||||||||
6.625%, 11/15/2037 | 1,855 | 2,357 | ||||||
WellPoint | ||||||||
5.950%, 12/15/2034 | 776 | 897 | ||||||
5.850%, 01/15/2036 | 485 | 560 | ||||||
4.650%, 01/15/2043 | 2,510 | 2,492 | ||||||
4.625%, 05/15/2042 | 150 | 149 | ||||||
Wyeth | ||||||||
6.000%, 02/15/2036 | 2,985 | 3,689 | ||||||
5.950%, 04/01/2037 | 936 | 1,147 | ||||||
|
| |||||||
| 131,412 | ||||||||
|
| |||||||
Industrials — 4.4% | ||||||||
ABB Treasury Center USA | ||||||||
4.000%, 06/15/2021 (A) | 2,970 | 3,176 | ||||||
American Airlines, Pass-Through Trust, Ser 2011-2, Cl A | ||||||||
8.625%, 10/15/2021 | 13 | 13 | ||||||
BAE Systems | ||||||||
5.800%, 10/11/2041 (A) | 4,995 | 5,659 | ||||||
Boeing | ||||||||
6.875%, 03/15/2039 | 531 | 739 | ||||||
6.625%, 02/15/2038 | 720 | 977 | ||||||
5.875%, 02/15/2040 | 3,385 | 4,262 | ||||||
Burlington Northern Santa Fe | ||||||||
6.200%, 08/15/2036 | 5,600 | 6,829 | ||||||
6.150%, 05/01/2037 | 1,070 | 1,306 | ||||||
5.750%, 05/01/2040 | 1,085 | 1,266 | ||||||
4.400%, 03/15/2042 | 4,430 | 4,342 | ||||||
| SEI Institutional Investments Trust / Annual Report / May 31, 2013 | 159 |
Table of Contents
SCHEDULE OF INVESTMENTS
Long Duration Fund (Continued)
May 31, 2013
| Description | Face Amount ($ Thousands) | Market Value ($ Thousands) | ||||||
4.375%, 09/01/2042 | $ | 1,550 | $ | 1,508 | ||||
3.450%, 09/15/2021 | 10 | 10 | ||||||
Caterpillar | ||||||||
5.200%, 05/27/2041 | 1,035 | 1,170 | ||||||
3.803%, 08/15/2042 | 5,508 | 5,034 | ||||||
Continental Airlines, Pass-Through Trust, Ser 2007-1, Cl A | ||||||||
5.983%, 04/19/2022 | 5,184 | 5,883 | ||||||
Continental Airlines, Pass-Through Trust, Ser 2009-1 | ||||||||
9.000%, 07/08/2016 | 5,417 | 6,256 | ||||||
Continental Airlines, Pass-Through Trust, Ser 2012-2, Cl A | ||||||||
4.000%, 10/29/2024 | 2,410 | 2,494 | ||||||
CSX | ||||||||
4.750%, 05/30/2042 | 4,360 | 4,419 | ||||||
Deere | ||||||||
3.900%, 06/09/2042 | 2,390 | 2,261 | ||||||
FedEx | ||||||||
3.875%, 08/01/2042 | 9,167 | 8,389 | ||||||
General Dynamics | ||||||||
3.600%, 11/15/2042 | 2,570 | 2,277 | ||||||
General Electric | ||||||||
4.125%, 10/09/2042 | 6,505 | 6,207 | ||||||
Lockheed Martin | ||||||||
4.070%, 12/15/2042 | 2,723 | 2,490 | ||||||
4.070%, 12/15/2042 (A) | 4,768 | 4,359 | ||||||
Norfolk Southern | ||||||||
6.000%, 03/15/2105 | 3,703 | 4,338 | ||||||
6.000%, 05/23/2111 | 9,295 | 10,894 | ||||||
5.590%, 05/17/2025 | 68 | 80 | ||||||
Northrop Grumman | ||||||||
4.750%, 06/01/2043 | 13,490 | 13,333 | ||||||
Northwest Airlines, Pass-Through Trust, Ser 2001-1, Cl A1 | ||||||||
7.041%, 04/01/2022 | 265 | 296 | ||||||
Precision Castparts | ||||||||
2.500%, 01/15/2023 | 1,790 | 1,729 | ||||||
Republic Services | ||||||||
5.700%, 05/15/2041 | 2,755 | 3,128 | ||||||
3.550%, 06/01/2022 | 740 | 754 | ||||||
Union Pacific | ||||||||
6.625%, 02/01/2029 | 1,391 | 1,797 | ||||||
6.250%, 05/01/2034 | 50 | 63 | ||||||
5.780%, 07/15/2040 | 3,314 | 3,996 | ||||||
United Parcel Service | ||||||||
3.625%, 10/01/2042 | 1,085 | 1,011 | ||||||
United Parcel Service of America | ||||||||
8.375%, 04/01/2020 (C) | 325 | 477 | ||||||
United Technologies | ||||||||
5.700%, 04/15/2040 | 9,285 | 11,235 | ||||||
4.500%, 06/01/2042 | 5,305 | 5,476 | ||||||
3.100%, 06/01/2022 | 1,985 | 2,029 | ||||||
| Description | Face Amount ($ Thousands) | Market Value ($ Thousands) | ||||||
US Airways, Pass-Through Trust, Ser 2011-1, Cl A | ||||||||
7.125%, 10/22/2023 | $ | 1,821 | $ | 2,131 | ||||
Waste Management | ||||||||
4.600%, 03/01/2021 | 2,662 | 2,952 | ||||||
|
| |||||||
| 147,045 | ||||||||
|
| |||||||
Information Technology — 1.5% |
| |||||||
Apple | ||||||||
3.850%, 05/04/2043 | 9,756 | 8,953 | ||||||
Applied Materials | ||||||||
5.850%, 06/15/2041 | 3,184 | 3,619 | ||||||
Cisco Systems | ||||||||
5.900%, 02/15/2039 | 1,350 | 1,659 | ||||||
Corning | ||||||||
5.750%, 08/15/2040 | 555 | 632 | ||||||
eBay | ||||||||
4.000%, 07/15/2042 | 1,805 | 1,599 | ||||||
Intel | ||||||||
4.000%, 12/15/2032 | 5,390 | 5,203 | ||||||
International Business Machines | ||||||||
4.000%, 06/20/2042 | 3,133 | 3,047 | ||||||
Juniper Networks | ||||||||
5.950%, 03/15/2041 | 4,430 | 4,769 | ||||||
Microsoft | ||||||||
4.500%, 10/01/2040 | 1,040 | 1,095 | ||||||
3.750%, 05/01/2043 | 1,325 | 1,236 | ||||||
3.500%, 11/15/2042 | 8,451 | 7,530 | ||||||
2.125%, 11/15/2022 | 1,175 | 1,113 | ||||||
Motorola Solutions | ||||||||
7.500%, 05/15/2025 | 760 | 956 | ||||||
Oracle | ||||||||
6.500%, 04/15/2038 | 4,990 | 6,551 | ||||||
5.375%, 07/15/2040 | 1,470 | 1,705 | ||||||
|
| |||||||
| 49,667 | ||||||||
|
| |||||||
Materials — 2.2% |
| |||||||
ArcelorMittal | ||||||||
7.500%, 10/15/2039 | 3,905 | 3,925 | ||||||
7.250%, 03/01/2041 | 350 | 341 | ||||||
6.750%, 02/25/2022 | 400 | 428 | ||||||
Barrick North America Finance | ||||||||
5.750%, 05/01/2043 (A) | 5,195 | 4,869 | ||||||
Dow Chemical | ||||||||
4.375%, 11/15/2042 | 5,000 | 4,671 | ||||||
Freeport-McMoRan Copper | ||||||||
5.450%, 03/15/2043 (A) | 10,376 | 9,971 | ||||||
3.875%, 03/15/2023 (A) | 5,315 | 5,173 | ||||||
Newcrest Finance | ||||||||
5.750%, 11/15/2041 (A) | 5,847 | 5,561 | ||||||
Newmont Mining | ||||||||
4.875%, 03/15/2042 | 7,713 | 6,629 | ||||||
Praxair | ||||||||
3.550%, 11/07/2042 | 2,045 | 1,840 | ||||||
| 160 | SEI Institutional Investments Trust / Annual Report / May 31, 2013 |
Table of Contents
| Description | Face Amount ($ Thousands) | Market Value ($ Thousands) | ||||||
Rio Tinto Finance USA | ||||||||
7.125%, 07/15/2028 | $ | 400 | $ | 523 | ||||
4.125%, 08/21/2042 | 1,885 | 1,715 | ||||||
Rohm & Haas | ||||||||
7.850%, 07/15/2029 | 2,545 | 3,425 | ||||||
Southern Copper | ||||||||
7.500%, 07/27/2035 | 2,824 | 3,191 | ||||||
Teck Resources | ||||||||
6.000%, 08/15/2040 | 180 | 183 | ||||||
5.400%, 02/01/2043 | 3,810 | 3,588 | ||||||
5.200%, 03/01/2042 | 1,550 | 1,416 | ||||||
Vale | ||||||||
5.625%, 09/11/2042 | 3,975 | 3,706 | ||||||
Vale Overseas | ||||||||
6.875%, 11/21/2036 | 2,545 | 2,731 | ||||||
Xstrata Finance Canada | ||||||||
6.000%, 11/15/2041 (A) | 5,706 | 5,789 | ||||||
5.300%, 10/25/2042 (A) | 3,100 | 3,044 | ||||||
|
| |||||||
| 72,719 | ||||||||
|
| |||||||
Telecommunication Services — 3.3% |
| |||||||
Alltel | ||||||||
7.875%, 07/01/2032 | 1,145 | 1,619 | ||||||
6.800%, 05/01/2029 | 480 | 602 | ||||||
America Movil | ||||||||
6.375%, 03/01/2035 | 525 | 604 | ||||||
4.375%, 07/16/2042 | 2,950 | 2,617 | ||||||
3.125%, 07/16/2022 | 1,225 | 1,169 | ||||||
AT&T | ||||||||
6.550%, 02/15/2039 | 3,175 | 3,907 | ||||||
6.500%, 09/01/2037 | 3,995 | 4,867 | ||||||
6.300%, 01/15/2038 | 2,255 | 2,687 | ||||||
5.550%, 08/15/2041 | 8,065 | 8,908 | ||||||
5.350%, 09/01/2040 | 9,119 | 9,754 | ||||||
4.350%, 06/15/2045 (A) | 3,168 | 2,939 | ||||||
4.300%, 12/15/2042 (A) | 2,846 | 2,659 | ||||||
British Telecommunications | ||||||||
9.625%, 12/15/2030 | 2,070 | 3,207 | ||||||
CenturyLink | ||||||||
7.650%, 03/15/2042 | 4,035 | 4,015 | ||||||
5.800%, 03/15/2022 | 350 | 358 | ||||||
Deutsche Telekom International Finance | ||||||||
9.250%, 06/01/2032 | 725 | 1,113 | ||||||
8.750%, 06/15/2030 | 2,590 | 3,739 | ||||||
4.875%, 03/06/2042 (A) | 2,980 | 3,022 | ||||||
GTE | ||||||||
6.940%, 04/15/2028 | 1,320 | 1,673 | ||||||
Koninklijke KPN | ||||||||
8.375%, 10/01/2030 | 1,920 | 2,482 | ||||||
Telecom Italia Capital | ||||||||
7.721%, 06/04/2038 | 1,370 | 1,482 | ||||||
7.200%, 07/18/2036 | 550 | 569 | ||||||
6.000%, 09/30/2034 | 925 | 888 | ||||||
| Description | Face Amount ($ Thousands) | Market Value ($ Thousands) | ||||||
Telefonica Emisiones SAU | ||||||||
7.045%, 06/20/2036 | $ | 3,285 | $ | 3,758 | ||||
4.570%, 04/27/2023 | 2,625 | 2,617 | ||||||
Verizon Communications | ||||||||
7.750%, 12/01/2030 | 650 | 876 | ||||||
7.350%, 04/01/2039 | 2,890 | 3,882 | ||||||
6.400%, 02/15/2038 | 7,368 | 8,917 | ||||||
6.250%, 04/01/2037 | 760 | 900 | ||||||
6.000%, 04/01/2041 | 495 | 575 | ||||||
4.750%, 11/01/2041 | 5,075 | 4,994 | ||||||
3.850%, 11/01/2042 | 5,980 | 5,154 | ||||||
Vodafone Group | ||||||||
4.375%, 02/19/2043 | 16,005 | 15,068 | ||||||
|
| |||||||
| 111,621 | ||||||||
|
| |||||||
Utilities — 8.2% |
| |||||||
AGL Capital | ||||||||
5.875%, 03/15/2041 | 2,593 | 3,093 | ||||||
Arizona Public Services | ||||||||
8.000%, 12/30/2015 | 81 | 86 | ||||||
Baltimore Gas & Electric | ||||||||
5.200%, 06/15/2033 | 2,735 | 2,988 | ||||||
Boston Gas | ||||||||
4.487%, 02/15/2042 (A) | 2,147 | 2,197 | ||||||
Bruce Mansfield Unit | ||||||||
6.850%, 06/01/2034 | 1,702 | 1,849 | ||||||
CenterPoint Energy Resources | ||||||||
6.250%, 02/01/2037 | 2,666 | 3,224 | ||||||
Cleco Power | ||||||||
6.000%, 12/01/2040 | 3,625 | 4,137 | ||||||
Consolidated Edison of New York | ||||||||
6.750%, 04/01/2038 | 1,725 | 2,352 | ||||||
6.300%, 08/15/2037 | 1,440 | 1,859 | ||||||
Coso Geothermal Power Holdings | ||||||||
7.000%, 07/15/2026 (A) | 1,954 | 1,211 | ||||||
Dominion Resources | ||||||||
5.250%, 08/01/2033 | 6,405 | 7,179 | ||||||
4.900%, 08/01/2041 | 6,923 | 7,427 | ||||||
DTE Electric | ||||||||
4.000%, 04/01/2043 | 5,024 | 4,901 | ||||||
Duke Energy Carolinas | ||||||||
6.100%, 06/01/2037 | 3,090 | 3,793 | ||||||
5.300%, 02/15/2040 | 7,085 | 8,112 | ||||||
4.000%, 09/30/2042 | 2,050 | 1,943 | ||||||
3.050%, 08/15/2022 | 1,420 | 1,410 | ||||||
Duke Energy Indiana | ||||||||
6.350%, 08/15/2038 | 1,390 | 1,782 | ||||||
Duquesne Light Holdings | ||||||||
6.250%, 08/15/2035 | 3,125 | 3,534 | ||||||
5.900%, 12/01/2021 (A) | 750 | 881 | ||||||
Elm Road Generating Station Supercritical | ||||||||
5.848%, 01/19/2041 (A) | 2,007 | 2,308 | ||||||
| SEI Institutional Investments Trust / Annual Report / May 31, 2013 | 161 |
Table of Contents
SCHEDULE OF INVESTMENTS
Long Duration Fund (Continued)
May 31, 2013
| Description | Face Amount ($ Thousands) | Market Value ($ Thousands) | ||||||
Entergy Louisiana | ||||||||
6.300%, 09/01/2035 | $ | 300 | $ | 300 | ||||
4.440%, 01/15/2026 | 3,120 | 3,430 | ||||||
Entergy Texas | ||||||||
7.125%, 02/01/2019 | 1,435 | 1,746 | ||||||
Exelon Generation | ||||||||
6.250%, 10/01/2039 | 200 | 229 | ||||||
5.750%, 10/01/2041 | 6,231 | 6,722 | ||||||
5.600%, 06/15/2042 | 9,975 | 10,548 | ||||||
FirstEnergy, Ser C | ||||||||
7.375%, 11/15/2031 | 5,705 | 6,439 | ||||||
Florida Power | ||||||||
6.400%, 06/15/2038 | 500 | 642 | ||||||
6.350%, 09/15/2037 | 4,110 | 5,302 | ||||||
Florida Power & Light | ||||||||
5.960%, 04/01/2039 | 2,925 | 3,713 | ||||||
5.690%, 03/01/2040 | 5,000 | 6,214 | ||||||
5.400%, 09/01/2035 | 3,200 | 3,780 | ||||||
Georgia Power | ||||||||
5.950%, 02/01/2039 | 3,850 | 4,678 | ||||||
5.400%, 06/01/2040 | 7,610 | 8,617 | ||||||
4.300%, 03/15/2042 | 1,855 | 1,821 | ||||||
4.300%, 03/15/2043 | 3,350 | 3,260 | ||||||
Iberdrola Finance Ireland | ||||||||
5.000%, 09/11/2019 (A) | 2,200 | 2,384 | ||||||
Indianapolis Power & Light | ||||||||
6.050%, 10/01/2036 (A) | 1,291 | 1,548 | ||||||
4.875%, 11/01/2041 (A) | 2,130 | 2,332 | ||||||
John Sevier Combined Cycle Generation | ||||||||
4.626%, 01/15/2042 | 93 | 101 | ||||||
KCP&L Greater Missouri Operations | ||||||||
8.270%, 11/15/2021 | 2,600 | 3,168 | ||||||
Kentucky Utilities | ||||||||
5.125%, 11/01/2040 | 1,965 | 2,279 | ||||||
KeySpan Gas East | ||||||||
5.819%, 04/01/2041 (A) | 5,985 | 7,291 | ||||||
Metropolitan Edison | ||||||||
7.700%, 01/15/2019 | 350 | 441 | ||||||
MidAmerican Energy MTN | ||||||||
6.750%, 12/30/2031 | 730 | 960 | ||||||
5.800%, 10/15/2036 | 820 | 998 | ||||||
MidAmerican Energy Holdings | ||||||||
6.500%, 09/15/2037 | 3,860 | 4,896 | ||||||
6.125%, 04/01/2036 | 1,893 | 2,279 | ||||||
MidAmerican Funding | ||||||||
6.927%, 03/01/2029 | 170 | 217 | ||||||
Nevada Power | ||||||||
5.450%, 05/15/2041 | 550 | 648 | ||||||
NextEra Energy Capital Holdings | ||||||||
6.000%, 03/01/2019 | 2,470 | 2,917 | ||||||
4.500%, 06/01/2021 | 4,005 | 4,411 | ||||||
Niagara Mohawk Power | ||||||||
4.119%, 11/28/2042 (A) | 2,000 | 1,897 | ||||||
2.721%, 11/28/2022 (A) | 700 | 682 | ||||||
| Description | Face Amount ($ Thousands) | Market Value ($ Thousands) | ||||||
Nisource Finance | ||||||||
5.950%, 06/15/2041 | $ | 545 | $ | 618 | ||||
5.250%, 02/15/2043 | 1,670 | 1,733 | ||||||
4.800%, 02/15/2044 | 1,655 | 1,612 | ||||||
Northeast Utilities | ||||||||
2.800%, 05/01/2023 | 2,120 | 2,048 | ||||||
Northern States Power | ||||||||
5.350%, 11/01/2039 | 2,695 | 3,214 | ||||||
3.400%, 08/15/2042 | 1,015 | 896 | ||||||
Oncor Electric Delivery | ||||||||
7.500%, 09/01/2038 | 600 | 836 | ||||||
5.300%, 06/01/2042 | 13,600 | 15,319 | ||||||
5.250%, 09/30/2040 | 2,165 | 2,439 | ||||||
4.550%, 12/01/2041 | 1,830 | 1,846 | ||||||
4.100%, 06/01/2022 | 2,310 | 2,488 | ||||||
Pacific Gas & Electric | ||||||||
6.350%, 02/15/2038 | 1,000 | 1,283 | ||||||
6.250%, 03/01/2039 | 2,570 | 3,231 | ||||||
6.050%, 03/01/2034 | 3,675 | 4,567 | ||||||
5.800%, 03/01/2037 | 2,226 | 2,658 | ||||||
4.500%, 12/15/2041 | 1,660 | 1,688 | ||||||
PacifiCorp | ||||||||
6.000%, 01/15/2039 | 1,100 | 1,386 | ||||||
Pennsylvania Electric | ||||||||
6.150%, 10/01/2038 | 6,420 | 7,500 | ||||||
Petroleos Mexicanos | ||||||||
5.500%, 06/27/2044 | 4,215 | 4,131 | ||||||
5.500%, 06/27/2044 (A) | 3,000 | 2,940 | ||||||
Public Service Electric & Gas MTN | ||||||||
3.650%, 09/01/2042 | 2,750 | 2,543 | ||||||
Public Service of Colorado | ||||||||
6.500%, 08/01/2038 | 725 | 976 | ||||||
6.250%, 09/01/2037 | 1,580 | 2,071 | ||||||
4.750%, 08/15/2041 | 2,400 | 2,640 | ||||||
Puget Sound Energy | ||||||||
5.795%, 03/15/2040 | 440 | 544 | ||||||
San Diego Gas & Electric | ||||||||
4.300%, 04/01/2042 | 1,375 | 1,437 | ||||||
Sempra Energy | ||||||||
6.000%, 10/15/2039 | 3,565 | 4,308 | ||||||
South Carolina Electric & Gas | ||||||||
6.050%, 01/15/2038 | 400 | 497 | ||||||
Southern California Edison | ||||||||
6.050%, 03/15/2039 | 4,355 | 5,548 | ||||||
Southern California Gas | ||||||||
3.750%, 09/15/2042 | 1,325 | 1,258 | ||||||
Southern Natural Gas | ||||||||
8.000%, 03/01/2032 | 655 | 923 | ||||||
Southern Union | ||||||||
8.250%, 11/15/2029 | 1,825 | 2,323 | ||||||
Southwestern Electric Power | ||||||||
6.200%, 03/15/2040 | 5,095 | 6,213 | ||||||
Texas-New Mexico Power | ||||||||
6.950%, 04/01/2043 (A) | 2,082 | 2,746 | ||||||
| 162 | SEI Institutional Investments Trust / Annual Report / May 31, 2013 |
Table of Contents
| Description | Face Amount ($ Thousands) | Market Value ($ Thousands) | ||||||
Union Electric | ||||||||
8.450%, 03/15/2039 | $ | 2,405 | $ | 3,901 | ||||
Xcel Energy | ||||||||
4.800%, 09/15/2041 | 1 | 1 | ||||||
|
| |||||||
| 273,518 | ||||||||
|
| |||||||
Total Corporate Obligations |
| 1,922,224 | ||||||
|
| |||||||
MUNICIPAL BONDS — 5.6% |
| |||||||
Bay Area, Toll Authority, Build America Project, RB | ||||||||
6.263%, 04/01/2049 | 2,740 | 3,648 | ||||||
City of Gainesville, Build America Project, RB | ||||||||
6.024%, 10/01/2040 | 3,650 | 4,513 | ||||||
City of Houston, Ser A, GO | ||||||||
6.290%, 03/01/2032 | 3,935 | 4,892 | ||||||
City of Houston, Utility System Revenue, Ser A, RB, | ||||||||
5.250%, 11/15/2033 | 320 | 361 | ||||||
City of New York, Build America Project, GO | ||||||||
6.646%, 12/01/2031 | 2,200 | 2,658 | ||||||
5.817%, 10/01/2031 | 2,950 | 3,414 | ||||||
City of Sacramento, RB | ||||||||
6.156%, 05/15/2036 | 100 | 122 | ||||||
City of San Francisco, Public Utilities Commission Water Revenue, Ser DE, RB | ||||||||
6.000%, 11/01/2040 | 3,705 | 4,520 | ||||||
Commonwealth of Massachusetts, Build America Project, RB | ||||||||
5.731%, 06/01/2040 | 1,160 | 1,473 | ||||||
Dallas, Convention Center Hotel Development, RB | ||||||||
7.088%, 01/01/2042 | 600 | 753 | ||||||
Dallas, Independent School District, Build America Project, GO, PSF-GTD | ||||||||
6.450%, 02/15/2035 | 3,415 | 4,137 | ||||||
Florida State, Department of Transportation, RB Callable 07/01/19 @ 100 | ||||||||
6.800%, 07/01/2039 | 580 | 678 | ||||||
Indianapolis, Local Public Improvement Bond Bank, Build America Project, RB | ||||||||
6.116%, 01/15/2040 | 4,860 | 6,231 | ||||||
Las Vegas, Valley Water District, GO | ||||||||
7.013%, 06/01/2039 | 390 | 455 | ||||||
| Description | Face Amount ($ Thousands) | Market Value ($ Thousands) | ||||||
Los Angeles, Community College District, Build America Project, GO | ||||||||
6.750%, 08/01/2049 | $ | 390 | $ | 545 | ||||
Los Angeles, Community College District, Ser D, GO | ||||||||
6.680%, 08/01/2036 | 2,965 | 4,026 | ||||||
Los Angeles, Department of Water & Power, Build America Project, RB | ||||||||
6.008%, 07/01/2039 | 5,000 | 6,253 | ||||||
Los Angeles, Unified School District, Build America Project, GO | ||||||||
6.758%, 07/01/2034 | 3,080 | 4,106 | ||||||
Maryland State, Transportation Authority, RB | ||||||||
5.888%, 07/01/2043 | 320 | 402 | ||||||
Metropolitan New York, Transportation Authority, Build America Project, RB | ||||||||
6.814%, 11/15/2040 | 710 | 926 | ||||||
Michigan State University, RB | ||||||||
6.173%, 02/15/2050 | 1,300 | 1,562 | ||||||
Missouri, Joint Municipal Electric Utility Commission, RB | ||||||||
6.890%, 01/01/2042 | 600 | 745 | ||||||
New Jersey, State Turnpike Authority, Build America Project, RB | ||||||||
7.102%, 01/01/2041 | 1,820 | 2,548 | ||||||
New York City, Municipal Water Finance Authority, Build America Project, RB | ||||||||
5.724%, 06/15/2042 | 1,320 | 1,627 | ||||||
5.440%, 06/15/2043 | 3,260 | 3,868 | ||||||
New York City, Municipal Water Finance Authority, Build | ||||||||
6.491%, 06/15/2042 | 6,630 | 7,927 | ||||||
New York City, Municipal Water Finance Authority, RB Callable 12/15/20 @ 100 | ||||||||
5.375%, 06/15/2043 | 600 | 685 | ||||||
New York City, Municipal Water Finance Authority, Ser GG, RB | ||||||||
5.000%, 06/15/2043 | 710 | 774 | ||||||
New York City, Transitional Finance Authority, Build America Project, RB | ||||||||
5.572%, 11/01/2038 | 2,195 | 2,675 | ||||||
New York City, Transitional Finance Authority, Future Tax Secured Revenue, RB | ||||||||
5.508%, 08/01/2037 | 580 | 707 | ||||||
New York, State Dormitory Authority, Build America Project, RB | ||||||||
5.500%, 03/15/2030 | 3,295 | 4,027 | ||||||
| SEI Institutional Investments Trust / Annual Report / May 31, 2013 | 163 |
Table of Contents
SCHEDULE OF INVESTMENTS
Long Duration Fund (Continued)
May 31, 2013
| Description | Face Amount ($ Thousands) | Market Value ($ Thousands) | ||||||
North Texas, Tollway Authority, Build America Project, RB | ||||||||
6.718%, 01/01/2049 | $ | 7,207 | $ | 9,663 | ||||
Ohio State University, Build America Project, RB | ||||||||
4.910%, 06/01/2040 | 2,785 | 3,081 | ||||||
Ohio State University, Build America Project, Ser A, RB | ||||||||
4.800%, 06/01/2111 | 115 | 119 | ||||||
Port Authority of New York & New Jersey, Build America Project, RB | ||||||||
4.926%, 10/01/2051 | 725 | 790 | ||||||
Port Authority of New York��& New Jersey, RB | ||||||||
4.458%, 10/01/2062 | 4,370 | 4,264 | ||||||
San Diego County, Water Authority, Build America Project, RB | ||||||||
6.138%, 05/01/2049 | 6,060 | 7,799 | ||||||
Santa Clara Valley, Transportation Authority, Build America Project, RB | ||||||||
5.876%, 04/01/2032 | 2,580 | 3,063 | ||||||
State of California, Build America Project, GO | ||||||||
7.625%, 03/01/2040 | 2,600 | 3,731 | ||||||
7.600%, 11/01/2040 | 580 | 842 | ||||||
7.550%, 04/01/2039 | 5,355 | 7,659 | ||||||
7.500%, 04/01/2034 | 2,705 | 3,755 | ||||||
7.300%, 10/01/2039 | 3,700 | 5,087 | ||||||
State of California, GO | ||||||||
7.350%, 11/01/2039 | 4,010 | 5,546 | ||||||
State of Illinois, Build America Project, GO | ||||||||
7.350%, 07/01/2035 | 745 | 905 | ||||||
6.630%, 02/01/2035 | 3,475 | 3,959 | ||||||
State of Illinois, Build America Project, GO | ||||||||
6.725%, 04/01/2035 | 380 | 437 | ||||||
State of Illinois, GO | ||||||||
5.100%, 06/01/2033 | 10,690 | 10,726 | ||||||
State of New York, Build America Project, RB | ||||||||
5.770%, 03/15/2039 | 5,445 | 6,583 | ||||||
State of Texas, Build America Project, GO | ||||||||
5.517%, 04/01/2039 | 450 | 551 | ||||||
State of Texas, Transportation Communication Authority, Build America Project, Ser B, RB | ||||||||
5.178%, 04/01/2030 | 5,105 | 6,078 | ||||||
State of Washington, Build America Project, Ser D, GO | ||||||||
5.481%, 08/01/2039 | 1,640 | 1,975 | ||||||
| Description | Face Amount ($ Thousands) | Market Value ($ Thousands) | ||||||
Triborough Bridge & Tunnel Authority, Build America Project, RB | ||||||||
5.450%, 11/15/2032 | $ | 3,300 | $ | 3,870 | ||||
University of California, Build America Project, Ser AD, RB | ||||||||
4.858%, 05/15/2112 | 12,885 | 12,685 | ||||||
University of Texas, Permanent University Fund, Build America Project, RB | ||||||||
5.262%, 07/01/2039 | 1,505 | 1,787 | ||||||
|
| |||||||
Total Municipal Bonds |
| 186,213 | ||||||
|
| |||||||
U.S. GOVERNMENT AGENCY OBLIGATIONS — 3.4% |
| |||||||
FFCB | ||||||||
5.750%, 05/11/2026 | 6,525 | 8,445 | ||||||
FHLB | ||||||||
5.625%, 06/11/2021 | 960 | 1,210 | ||||||
FHLMC | ||||||||
6.750%, 03/15/2031 | 1,080 | 1,579 | ||||||
3.452%, 12/17/2029 (D) | 8,300 | 4,542 | ||||||
FICO STRIPS, PO | ||||||||
2.024%, 04/05/2019 (D) | 1,500 | 1,348 | ||||||
1.593%, 09/26/2019 (D) | 12,145 | 10,805 | ||||||
0.000%, 12/27/2018 to 09/26/2019 | 4,430 | 4,074 | ||||||
Residual Funding Corp. STRIPS | ||||||||
3.386%, 04/15/2030 (D) | 14,210 | 7,926 | ||||||
1.746%, 07/15/2020 (D) | 1,706 | 1,493 | ||||||
Tennessee Valley Authority | ||||||||
7.125%, 05/01/2030 | 11,165 | 16,170 | ||||||
5.880%, 04/01/2036 | 13,625 | 17,740 | ||||||
5.500%, 06/15/2038 | 465 | 581 | ||||||
5.375%, 04/01/2056 | 12,593 | 15,480 | ||||||
5.250%, 09/15/2039 | 6,530 | 7,917 | ||||||
4.875%, 01/15/2048 | 635 | 714 | ||||||
4.625%, 09/15/2060 | 7,645 | 8,090 | ||||||
3.500%, 12/15/2042 | 5,480 | 5,022 | ||||||
Tennessee Valley Authority STRIPS, PO | ||||||||
0.000%, 01/15/2038 | 3,700 | 1,336 | ||||||
|
| |||||||
Total U.S. Government Agency Obligations |
| 114,472 | ||||||
|
| |||||||
MORTGAGE-BACKED SECURITIES — 1.6% |
| |||||||
Agency Mortgage-Backed Obligations — 1.0% |
| |||||||
FHLMC CMO, Ser 2004-2733, Cl ME | ||||||||
5.000%, 01/15/2034 | 366 | 403 | ||||||
FHLMC CMO, Ser 2004-2748, Cl ZT | ||||||||
5.500%, 02/15/2024 | 626 | 691 | ||||||
FHLMC CMO, Ser 2010-3756, Cl PZ | ||||||||
4.000%, 11/15/2040 | 5,507 | 5,770 | ||||||
FHLMC CMO, Ser 2013-4150, Cl JZ | ||||||||
3.000%, 01/15/2043 | 2,835 | 2,525 | ||||||
| 164 | SEI Institutional Investments Trust / Annual Report / May 31, 2013 |
Table of Contents
| Description | Face Amount ($ Thousands) | Market Value ($ Thousands) | ||||||
FNMA | ||||||||
3.841%, 09/01/2020 | $ | 3,847 | $ | 4,242 | ||||
3.762%, 12/01/2020 | 3,908 | 4,306 | ||||||
3.665%, 10/01/2020 | 3,912 | 4,270 | ||||||
3.583%, 09/01/2020 | 2,008 | 2,182 | ||||||
FNMA CMO, Ser 2004-12, Cl ZX | ||||||||
6.000%, 03/25/2034 | 835 | 1,001 | ||||||
FNMA CMO, Ser 2004-80, Cl XZ | ||||||||
5.000%, 11/25/2034 | 475 | 489 | ||||||
FNMA CMO, Ser 2007-68, Cl SC, IO | ||||||||
6.507%, 07/25/2037 (B) | 169 | 27 | ||||||
GNMA ARM | ||||||||
1.750%, 06/20/2032 (B) | 127 | 133 | ||||||
GNMA CMO, Ser 2004-93, Cl PC | ||||||||
5.000%, 04/16/2034 | 210 | 223 | ||||||
GNMA CMO, Ser 2009-8, Cl PS | ||||||||
6.102%, 08/16/2038 (B) | 302 | 42 | ||||||
GNMA CMO, Ser 2010-4, Cl NS, IO | ||||||||
6.192%, 01/16/2040 (B) | 317 | 51 | ||||||
GNMA CMO, Ser 2011-70, Cl BO, PO | ||||||||
0.000%, 05/20/2041 (D) | 10,425 | 7,347 | ||||||
|
| |||||||
| 33,702 | ||||||||
|
| |||||||
Non-Agency Mortgage-Backed Obligations — 0.6% |
| |||||||
Bayview Commercial Asset Trust, Ser 2004-2, Cl A | ||||||||
0.623%, 08/25/2034 (A) (B) | 2,022 | 1,880 | ||||||
Bayview Commercial Asset Trust, Ser 2007-3, Cl A1 | ||||||||
0.433%, 07/25/2037 (A) (B) | 1,639 | 1,308 | ||||||
Countrywide Alternative Loan Trust, Ser 2005-27, Cl 3A2 | ||||||||
1.276%, 08/25/2035 (B) | 24 | 16 | ||||||
Countrywide Home Loans, Ser 2005-2, Cl 1A1 | ||||||||
0.513%, 03/25/2035 (B) | 164 | 121 | ||||||
DSLA Mortgage Loan Trust, Ser 2005-AR2, Cl 2A1A | ||||||||
0.408%, 03/19/2045 (B) | 233 | 210 | ||||||
GS Mortgage Securities II, Ser 2011-GC5, Cl A4 | ||||||||
3.707%, 08/10/2044 | 4,540 | 4,824 | ||||||
Harborview Mortgage Loan Trust, Ser 2004-8, Cl 2A4A | ||||||||
0.598%, 11/19/2034 (B) | 295 | 249 | ||||||
Harborview Mortgage Loan Trust, Ser 2005-11, Cl 2A1A | ||||||||
0.508%, 08/19/2045 (B) | 428 | 385 | ||||||
Indymac Index Mortgage Loan Trust, Ser 2004-AR12, Cl A1 | ||||||||
0.973%, 12/25/2034 (B) | 146 | 118 | ||||||
Indymac Index Mortgage Loan Trust, Ser 2004-AR5, Cl 2A1B | ||||||||
0.993%, 08/25/2034 (B) | 81 | 69 | ||||||
| Description | Face Amount ($ Thousands) | Market Value ($ Thousands) | ||||||
Indymac Index Mortgage Loan Trust, Ser 2004-AR6, Cl 6A1 | ||||||||
2.852%, 10/25/2034 (B) | $ | 119 | $ | 118 | ||||
Indymac Index Mortgage Loan Trust, Ser 2004-AR7, Cl A2 | ||||||||
1.053%, 09/25/2034 (B) | 34 | 31 | ||||||
Indymac Index Mortgage Loan Trust, Ser 2005-AR18, Cl 2A1A | ||||||||
0.503%, 10/25/2036 (B) | 18 | 14 | ||||||
JPMorgan Mortgage Trust, Ser 2005-A3, Cl 3A3 | ||||||||
2.414%, 06/25/2035 (B) | 12 | 12 | ||||||
Morgan Stanley Capital I, Ser 2011-C3, Cl A4 | ||||||||
4.118%, 07/15/2049 | 4,410 | 4,789 | ||||||
RAMP Trust, Ser 2004-SL1, Cl A7 | ||||||||
7.000%, 11/25/2031 | 44 | 47 | ||||||
Residential Asset Mortgage Products, Ser 2004-SL3, Cl A2 | ||||||||
6.500%, 12/25/2031 | 65 | 66 | ||||||
Residential Asset Securitization Trust, Ser 2004-IP2, Cl 2A1 | ||||||||
2.695%, 12/25/2034 (B) | 89 | 90 | ||||||
WaMu Mortgage Pass-Through Certificates, Ser 2005-AR2, Cl 2A21 | ||||||||
0.523%, 01/25/2045 (B) | 208 | 195 | ||||||
Wells Fargo Mortgage-Backed Securities Trust, | ||||||||
2.678%, 04/25/2036 (B) | 254 | 255 | ||||||
WF-RBS Commercial Mortgage Trust, Ser 2011-C5, Cl A4 | ||||||||
3.667%, 11/15/2044 | 3,590 | 3,793 | ||||||
|
| |||||||
| 18,590 | ||||||||
|
| |||||||
Total Mortgage-Backed Securities |
| 52,292 | ||||||
|
| |||||||
SOVEREIGN DEBT — 0.6% | ||||||||
Banco Nacional de Desenvolvimento Economico e Social | ||||||||
5.500%, 07/12/2020 (A) | 1,300 | 1,443 | ||||||
Federal Republic of Brazil | ||||||||
5.625%, 01/07/2041 | 4,800 | 5,340 | ||||||
International Bank for Reconstruction & Development MTN | ||||||||
3.482%, 10/31/2030 (D) | 5,850 | 2,916 | ||||||
Israel Government AID Bond | ||||||||
5.500%, 09/18/2033 | 1,400 | 1,766 | ||||||
2.856%, 08/15/2026 (D) | 2,585 | 1,639 | ||||||
2.580%, 05/15/2024 (D) | 1,545 | 1,106 | ||||||
Province of Quebec Canada MTN | ||||||||
6.350%, 01/30/2026 | 2,880 | 3,779 | ||||||
| SEI Institutional Investments Trust / Annual Report / May 31, 2013 | 165 |
Table of Contents
SCHEDULE OF INVESTMENTS
Long Duration Fund (Continued)
May 31, 2013
| Description | Face Amount ($ Thousands) | Market Value ($ Thousands) | ||||||
United Mexican States MTN | ||||||||
6.050%, 01/11/2040 | $ | 390 | $ | 462 | ||||
5.950%, 03/19/2019 | 1,300 | 1,540 | ||||||
5.750%, 10/12/2110 | 554 | 575 | ||||||
|
| |||||||
Total Sovereign Debt |
| 20,566 | ||||||
|
| |||||||
ASSET-BACKED SECURITIES — 0.6% |
| |||||||
Mortgage Related Securities — 0.1% | ||||||||
Bear Stearns Asset-Backed Securities Trust, Ser 2006-HE1, Cl 1A2 | ||||||||
0.413%, 12/25/2035 (B) | 17 | 17 | ||||||
Citicorp Residential Mortgage Securities, Ser 2007-1, Cl A5 | ||||||||
6.046%, 03/25/2037 | 180 | 169 | ||||||
Citigroup Mortgage Loan Trust, Ser 2006-AMC1, Cl A2B | ||||||||
0.353%, 09/25/2036 (B) | 3,734 | 2,041 | ||||||
Home Equity Asset Trust, | ||||||||
0.303%, 07/25/2037 (B) | 3 | 3 | ||||||
Oakwood Mortgage Investors, | ||||||||
6.350%, 03/15/2017 | 14 | 14 | ||||||
|
| |||||||
| 2,244 | ||||||||
|
| |||||||
Other Asset-Backed Securities — 0.5% |
| |||||||
Beacon Container Finance, | ||||||||
3.720%, 09/20/2027 (A) | 2,105 | 2,149 | ||||||
CAL Funding II, Ser 2012-1A, Cl A | ||||||||
3.470%, 10/25/2027 (A) | 3,060 | 3,110 | ||||||
Conseco Financial, Ser 1998-2, Cl A5 | ||||||||
6.240%, 12/01/2028 (B) | 95 | 98 | ||||||
Credit Suisse First Boston Mortgage Securities, Ser 2001-MH29, Cl A | ||||||||
5.600%, 09/25/2031 | 21 | 21 | ||||||
Cronos Containers Program, Ser 2012-1A, Cl A | ||||||||
4.210%, 05/18/2027 (A) | 2,138 | 2,167 | ||||||
Cronos Containers Program, | ||||||||
3.810%, 09/18/2027 (A) | 933 | 952 | ||||||
TAL Advantage, Ser 2010-2A, Cl A | ||||||||
4.300%, 10/20/2025 (A) | 1,743 | 1,759 | ||||||
TAL Advantage, Ser 2011-1A, Cl A | ||||||||
4.600%, 01/20/2026 (A) | 422 | 429 | ||||||
Trip Rail Master Funding, | ||||||||
4.370%, 07/15/2041 (A) | 2,107 | 2,260 | ||||||
Triton Container Finance, | ||||||||
0.330%, 02/26/2019 (A) (B) | 766 | 759 | ||||||
| Description | Face Amount ($ Thousands)/ Shares | Market Value ($ Thousands) | ||||||
Triton Container Finance, | ||||||||
4.210%, 05/14/2027 (A) | $ | 2,880 | $ | 2,918 | ||||
|
| |||||||
| 16,622 | ||||||||
|
| |||||||
Total Asset-Backed Securities | 18,866 | |||||||
|
| |||||||
U.S. TREASURY OBLIGATIONS — 28.5% |
| |||||||
U.S. Treasury Bills (D) (E) |
| |||||||
0.080%, 08/22/2013 | 1,840 | 1,840 | ||||||
U.S. Treasury Bonds | ||||||||
6.250%, 05/15/2030 | 17,130 | 25,077 | ||||||
6.125%, 08/15/2029 | 51,627 | 74,230 | ||||||
5.500%, 08/15/2028 | 2,580 | 3,470 | ||||||
5.375%, 02/15/2031 | 83,674 | 112,685 | ||||||
5.250%, 11/15/2028 | 2,650 | 3,483 | ||||||
5.250%, 02/15/2029 | 13,035 | 17,149 | ||||||
4.500%, 05/15/2038 | 7,000 | 8,642 | ||||||
4.375%, 02/15/2038 | 7,350 | 8,905 | ||||||
4.250%, 05/15/2039 | 5,400 | 6,426 | ||||||
4.250%, 11/15/2040 | 8,820 | 10,494 | ||||||
3.875%, 08/15/2040 | 29,835 | 33,387 | ||||||
3.750%, 08/15/2041 | 4,430 | 4,846 | ||||||
3.500%, 02/15/2039 | 8,000 | 8,420 | ||||||
3.125%, 11/15/2041 | 123,105 | 119,681 | ||||||
3.125%, 02/15/2042 | 39,385 | 38,259 | ||||||
3.125%, 02/15/2043 | 64,775 | 62,710 | ||||||
3.000%, 05/15/2042 | 10,770 | 10,190 | ||||||
2.750%, 08/15/2042 | 224,780 | 201,459 | ||||||
2.750%, 11/15/2042 | 129,815 | 116,205 | ||||||
U.S. Treasury Inflation-Protected Securities | ||||||||
2.125%, 02/15/2041 | 8,923 | 11,618 | ||||||
1.250%, 04/15/2014 | 2,293 | 2,328 | ||||||
U.S. Treasury Notes | ||||||||
2.125%, 08/15/2021 | 9,803 | 10,022 | ||||||
1.750%, 05/15/2022 | 14,600 | 14,308 | ||||||
1.750%, 05/15/2023 | 23,975 | 23,098 | ||||||
0.250%, 03/31/2015 | 1,115 | 1,114 | ||||||
U.S. Treasury STRIPS | ||||||||
3.181%, 05/15/2039 | 500 | 205 | ||||||
2.714%, 05/15/2030 | 18,900 | 11,147 | ||||||
2.611%, 11/15/2027 (D) | 8,300 | 5,424 | ||||||
|
| |||||||
Total U.S. Treasury Obligations | 946,822 | |||||||
|
| |||||||
CASH EQUIVALENT — 2.0% |
| |||||||
SEI Daily Income Trust, Prime Obligation Fund, Cl A | ||||||||
0.010%*† | 66,885,364 | 66,885 | ||||||
|
| |||||||
Total Cash Equivalent | 66,885 | |||||||
|
| |||||||
Total Investments — 100.2% | $ | 3,328,340 | ||||||
|
| |||||||
| 166 | SEI Institutional Investments Trust / Annual Report / May 31, 2013 |
Table of Contents
A list of the open futures contracts held by the Fund at May 31, 2013, is as follows:
| Type of Contract | Number of Contracts Long (Short) | Expiration Date | Unrealized Appreciation (Depreciation) ($ Thousands) | |||||||||
U.S. 10-Year Treasury Note | (750 | ) | Jun-2013 | $ | 1,173 | |||||||
U.S. 2-Year Treasury Note | (702 | ) | Jun-2013 | 81 | ||||||||
U.S. 5-Year Treasury Note | (272 | ) | Jun-2013 | 163 | ||||||||
U.S. 5-Year Treasury Note | (1,097 | ) | Oct-2013 | 129 | ||||||||
U.S. Long Treasury Bond | 311 | Sep-2013 | (584 | ) | ||||||||
U.S. Ultra Long Treasury Bond | 612 | Dec-2013 | (1,445 | ) | ||||||||
|
| |||||||||||
| $ | (483 | ) | ||||||||||
|
| |||||||||||
For the year ended May 31, 2013, the total amount of all open futures contracts, as presented in the table above, are representative of the volume of activity for this derivative type during the year.
A list of the open swap agreements held by the Fund at May 31, 2013, is as follows:
| Credit Default Swaps | ||||||||||||||||||||
| Counterparty | Reference Entity/Obligation | Buy/Sell Protection | (Pays)/ Receives Rate | Termination Date | Notional Amount (Thousands) | Net Unrealized Depreciation ($ Thousands) | ||||||||||||||
| JPMorgan Chase Bank | Goldman Sachs Group, Inc. | Buy | 1.00 | % | 09/20/16 | $ | 5,000 | $ | (289 | ) | ||||||||||
|
| |||||||||||||||||||
| Interest Rate Swaps | ||||||||||||||
| Counterparty | Fund Pays | Fund Receives | Termination Date | Notional Amount ($ Thousands) | Net Unrealized Appreciation ($ Thousands) | |||||||||
| Barclays Bank PLC | 2.48% | 3 Month LIBOR | 11/15/27 | $ | 2,605 | $ | 68 | |||||||
| Barclays Bank PLC | 2.42% | 3 Month LIBOR | 11/15/27 | 2,630 | 91 | |||||||||
| Citigroup | 2.71% | 3 Month LIBOR | 08/15/42 | 5,255 | 517 | |||||||||
|
| |||||||||||||
| $ | 676 | |||||||||||||
|
| |||||||||||||
For the year ended May 31, 2013, the total amount of all open swap agreements, as presented in the table above, are representative of the volume of activity for this derivative type during the year.
Percentages are based on a Net Assets of $3,322,291 ($ Thousands).
| * | The rate reported is the 7-day effective yield as of May 31, 2013. |
| ‡ | Real Estate Investment Trust. |
| † | Investment in Affiliated Security (see Note 5). |
| (A) | Securities sold within terms of a private placement memorandum, exempt from registration under Section 144A of the Securities Act of 1933, as amended, and may be sold only to dealers in that program or other “accredited investors.” These securities have been determined to be liquid under guidelines established by the Board of Trustees. |
| (B) | Variable Rate Security — The rate reported on the Schedule of Investments is the rate in effect as of May 31, 2013. The date reported on the Schedule of Investments is the final maturity date. |
| (C) | Step Bonds — The rate reflected on the Schedule of Investments is the effective yield on May 31, 2013. The coupon on a step bond changes on a specified date. |
| (D) | The rate reported is the effective yield at time of purchase. |
| (E) | Security, or portion thereof, has been pledged as collateral on open futures contracts. |
| AID | — Agency for International Development |
| ARM | — Adjustable Rate Mortgage |
| Cl | — Class |
| CMO | — Collateralized Mortgage Obligation |
| FFCB | — Federal Farm Credit Bank |
| FHLB | — Federal Home Loan Bank |
| FHLMC | — Federal Home Loan Mortgage Corporation |
| FICO | — Financing Corporation |
| FNMA | — Federal National Mortgage Association |
| GNMA | — Government National Mortgage Association |
| GO | — General Obligation |
| IO | — Interest Only |
| MTN | — Medium Term Note |
| PLC | — Public Limited Company |
| PO | — Principal Only |
| PSF-GTD | — Public Schools Fund Guarantee |
| RB | — Revenue Bond |
| Ser | — Series |
| STRIPS | — Separately Traded Registered Interest and Principal Securities |
The following is a list of the inputs used as of May 31, 2013, in valuing the Fund’s investments and other financial instruments carried at value ($ Thousands):
| Investments in Securities | Level 1 | Level 2 | Level 3 | Total | ||||||||||||
Corporate Obligations | $ | — | $ | 1,922,224 | $ | — | $ | 1,922,224 | ||||||||
Municipal Bonds | — | 186,213 | — | 186,213 | ||||||||||||
U.S. Government Agency Obligations | — | 114,472 | — | 114,472 | ||||||||||||
Mortgage-Backed Securities | — | 52,292 | — | 52,292 | ||||||||||||
Sovereign Debt | — | 20,566 | — | 20,566 | ||||||||||||
Asset-Backed Securities | — | 18,866 | — | 18,866 | ||||||||||||
U.S. Treasury Obligations | — | 946,822 | — | 946,822 | ||||||||||||
Cash Equivalent | 66,885 | — | — | 66,885 | ||||||||||||
|
|
|
|
|
|
|
| |||||||||
Total Investments in Securities | $ | 66,885 | $ | 3,261,455 | $ | — | $ | 3,328,340 | ||||||||
|
|
|
|
|
|
|
| |||||||||
| Other Financial Instruments | Level 1 | Level 2 | Level 3 | Total | ||||||||||||
Futures Contracts* | $ | (483 | ) | $ | — | $ | — | $ | (483 | ) | ||||||
Credit Default Swaps* | — | (289 | ) | — | (289 | ) | ||||||||||
Interest Rate Swaps* | — | 676 | — | 676 | ||||||||||||
|
|
|
|
|
|
|
| |||||||||
Total Other Financial Instruments | $ | (483 | ) | $ | 387 | $ | — | $ | (96 | ) | ||||||
|
|
|
|
|
|
|
| |||||||||
| * | Futures contracts and swaps are valued at the unrealized appreciation (depreciation) on the instrument. |
For the year ended May 31, 2013, there were no transfers between Level 1 and Level 2 assets and liabilities.
For the year ended May 31, 2013, there were no transfers between Level 2 and Level 3 assets and liabilities.
For more information on valuation inputs, see Note 2 — Significant Accounting Policies in Notes to Financial Statements.
Amounts designated as “—” are $0 or have been rounded to $0.
The accompanying notes are an integral part of the financial statements.
| SEI Institutional Investments Trust / Annual Report / May 31, 2013 | 167 |
Table of Contents
SCHEDULE OF INVESTMENTS
Long Duration Corporate Bond Fund
May 31, 2013
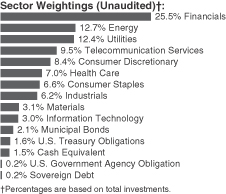
| Description | Face Amount ($ Thousands) | Market Value ($ Thousands) | ||||||
CORPORATE OBLIGATIONS — 94.4%†† |
| |||||||
Consumer Discretionary — 11.1% | ||||||||
AutoZone | ||||||||
3.125%, 07/15/2023 | $ | 1,165 | $ | 1,122 | ||||
Comcast | ||||||||
7.050%, 03/15/2033 | 950 | 1,258 | ||||||
6.950%, 08/15/2037 | 1,915 | 2,547 | ||||||
6.550%, 07/01/2039 | 2,495 | 3,210 | ||||||
6.450%, 03/15/2037 | 5,595 | 7,040 | ||||||
6.400%, 05/15/2038 | 7,125 | 8,986 | ||||||
4.650%, 07/15/2042 | 2,980 | 3,045 | ||||||
4.250%, 01/15/2033 | 3,280 | 3,274 | ||||||
Comcast Cable Communications Holdings | ||||||||
9.455%, 11/15/2022 | 1,380 | 2,049 | ||||||
COX Communications | ||||||||
8.375%, 03/01/2039 (A) | 400 | 581 | ||||||
6.950%, 06/01/2038 (A) | 700 | 885 | ||||||
5.450%, 12/15/2014 | 8 | 9 | ||||||
4.700%, 12/15/2042 (A) | 3,800 | 3,668 | ||||||
4.500%, 06/30/2043 (A) | 500 | 471 | ||||||
3.250%, 12/15/2022 (A) | 2,531 | 2,488 | ||||||
CVS Caremark | ||||||||
6.250%, 06/01/2027 | 2,340 | 2,903 | ||||||
6.125%, 09/15/2039 | 3,690 | 4,547 | ||||||
5.750%, 05/15/2041 | 3,310 | 3,897 | ||||||
CVS Pass-Through Trust | ||||||||
8.353%, 07/10/2031 (A) | 4,452 | 5,910 | ||||||
DIRECTV Holdings | ||||||||
6.375%, 03/01/2041 | 1,865 | 2,080 | ||||||
6.350%, 03/15/2040 | 2,590 | 2,875 | ||||||
5.150%, 03/15/2042 | 8,600 | 8,355 | ||||||
Discovery Communications | ||||||||
6.350%, 06/01/2040 | 1,265 | 1,507 | ||||||
4.950%, 05/15/2042 | 700 | 704 | ||||||
4.875%, 04/01/2043 | 1,290 | 1,286 | ||||||
Ford Motor | ||||||||
7.450%, 07/16/2031 | 2,030 | 2,558 | ||||||
| Description | Face Amount ($ Thousands) | Market Value ($ Thousands) | ||||||
7.400%, 11/01/2046 | $ | 2,470 | $ | 3,096 | ||||
4.750%, 01/15/2043 | 1,770 | 1,647 | ||||||
Home Depot | ||||||||
5.950%, 04/01/2041 | 2,250 | 2,800 | ||||||
Lowe’s MTN | ||||||||
7.110%, 05/15/2037 | 1,892 | 2,489 | ||||||
5.800%, 10/15/2036 | 1,060 | 1,244 | ||||||
5.125%, 11/15/2041 | 2,680 | 2,922 | ||||||
Macy’s Retail Holdings | ||||||||
7.450%, 07/15/2017 | 40 | 49 | ||||||
McDonald’s MTN | ||||||||
6.300%, 03/01/2038 | 2,500 | 3,325 | ||||||
4.875%, 07/15/2040 | 690 | 769 | ||||||
3.700%, 02/15/2042 | 785 | 723 | ||||||
NBC Universal Media | ||||||||
5.950%, 04/01/2041 | 4,350 | 5,240 | ||||||
4.450%, 01/15/2043 | 1,000 | 993 | ||||||
4.375%, 04/01/2021 | 65 | 72 | ||||||
News America | ||||||||
8.150%, 10/17/2036 | 1,251 | 1,667 | ||||||
7.430%, 10/01/2026 | 1,450 | 1,804 | ||||||
7.125%, 04/08/2028 | 400 | 483 | ||||||
6.900%, 08/15/2039 | 1,500 | 1,869 | ||||||
6.750%, 01/09/2038 | 3,825 | 4,463 | ||||||
6.650%, 11/15/2037 | 6,220 | 7,534 | ||||||
6.400%, 12/15/2035 | 2,000 | 2,363 | ||||||
6.150%, 02/15/2041 | 4,865 | 5,679 | ||||||
SES | ||||||||
5.300%, 04/04/2043 (A) | 950 | 971 | ||||||
Target | ||||||||
7.000%, 01/15/2038 | 1,392 | 1,903 | ||||||
6.650%, 08/01/2028 | 345 | 437 | ||||||
TCI Communications | ||||||||
7.875%, 02/15/2026 | 950 | 1,293 | ||||||
Thomson Reuters | ||||||||
4.500%, 05/23/2043 | 1,300 | 1,220 | ||||||
Time Warner | ||||||||
7.700%, 05/01/2032 | 3,600 | 4,880 | ||||||
7.625%, 04/15/2031 | 4,450 | 6,022 | ||||||
6.250%, 03/29/2041 | 3,256 | 3,812 | ||||||
5.375%, 10/15/2041 | 13,475 | 14,312 | ||||||
4.900%, 06/15/2042 | 900 | 904 | ||||||
Time Warner Cable | ||||||||
8.250%, 02/14/2014 | 75 | 79 | ||||||
7.300%, 07/01/2038 | 100 | 124 | ||||||
6.550%, 05/01/2037 | 30 | 34 | ||||||
5.875%, 11/15/2040 | 9,760 | 10,370 | ||||||
5.500%, 09/01/2041 | 7,610 | 7,726 | ||||||
4.500%, 09/15/2042 | 4,475 | 3,992 | ||||||
Time Warner Entertainment | ||||||||
8.375%, 07/15/2033 | 4,245 | 5,760 | ||||||
Viacom | ||||||||
4.875%, 06/15/2043 | 710 | 701 | ||||||
4.375%, 03/15/2043 (A) | 6,041 | 5,456 | ||||||
| 168 | SEI Institutional Investments Trust / Annual Report / May 31, 2013 |
Table of Contents
| Description | Face Amount ($ Thousands) | Market Value ($ Thousands) | ||||||
Wal-Mart Stores | ||||||||
7.550%, 02/15/2030 | $ | 1,070 | $ | 1,511 | ||||
5.625%, 04/01/2040 | 4,500 | 5,416 | ||||||
5.625%, 04/15/2041 | 5,705 | 6,879 | ||||||
5.250%, 09/01/2035 | 800 | 911 | ||||||
5.000%, 10/25/2040 | 13,350 | 14,698 | ||||||
4.000%, 04/11/2043 | 400 | 381 | ||||||
Walt Disney MTN | ||||||||
4.125%, 12/01/2041 | 100 | 99 | ||||||
2.350%, 12/01/2022 | 1,970 | 1,885 | ||||||
Yum! Brands | ||||||||
6.875%, 11/15/2037 | 1,440 | 1,808 | ||||||
|
| |||||||
| 232,070 | ||||||||
|
| |||||||
Consumer Staples — 6.1% | ||||||||
Ahold Finance USA | ||||||||
6.875%, 05/01/2029 | 675 | 849 | ||||||
Altria Group | ||||||||
10.200%, 02/06/2039 | 1,500 | 2,388 | ||||||
9.950%, 11/10/2038 | 910 | 1,427 | ||||||
4.250%, 08/09/2042 | 65 | 57 | ||||||
Anheuser-Busch | ||||||||
6.450%, 09/01/2037 | 2,300 | 2,996 | ||||||
Anheuser-Busch InBev Finance | ||||||||
4.000%, 01/17/2043 | 1,200 | 1,135 | ||||||
Anheuser-Busch InBev | ||||||||
8.200%, 01/15/2039 | 770 | 1,193 | ||||||
8.000%, 11/15/2039 | 610 | 933 | ||||||
6.375%, 01/15/2040 | 210 | 273 | ||||||
3.750%, 07/15/2042 | 9,450 | 8,585 | ||||||
Bestfoods | ||||||||
7.250%, 12/15/2026 | 170 | 239 | ||||||
Bowdoin College | ||||||||
4.693%, 07/01/2112 | 5,275 | 4,724 | ||||||
Campbell Soup | ||||||||
3.800%, 08/02/2042 | 1,735 | 1,515 | ||||||
Cargill | ||||||||
4.100%, 11/01/2042 (A) | 1,750 | 1,657 | ||||||
ConAgra Foods | ||||||||
6.625%, 08/15/2039 (A) | 2,500 | 3,079 | ||||||
4.650%, 01/25/2043 | 3,691 | 3,613 | ||||||
Diageo Capital | ||||||||
5.875%, 09/30/2036 | 485 | 590 | ||||||
3.875%, 04/29/2043 | 5,180 | 4,759 | ||||||
Diageo Investment | ||||||||
4.250%, 05/11/2042 | 1,130 | 1,113 | ||||||
Energizer Holdings | ||||||||
4.700%, 05/19/2021 | 670 | 706 | ||||||
General Mills | ||||||||
5.400%, 06/15/2040 | 505 | 589 | ||||||
4.150%, 02/15/2043 | 1,855 | 1,813 | ||||||
Heineken | ||||||||
4.000%, 10/01/2042 (A) | 3,150 | 2,874 | ||||||
2.750%, 04/01/2023 (A) | 1,000 | 962 | ||||||
| Description | Face Amount ($ Thousands) | Market Value ($ Thousands) | ||||||
Johns Hopkins University | ||||||||
4.083%, 07/01/2053 | $ | 2,000 | $ | 1,963 | ||||
Kellogg | ||||||||
3.125%, 05/17/2022 | 2,335 | 2,356 | ||||||
Kimberly-Clark | ||||||||
5.300%, 03/01/2041 | 555 | 665 | ||||||
Kraft Foods Group | ||||||||
5.000%, 06/04/2042 | 5,835 | 6,116 | ||||||
Kroger | ||||||||
5.000%, 04/15/2042 | 1,365 | 1,404 | ||||||
Lorillard Tobacco | ||||||||
8.125%, 05/01/2040 | 1,130 | 1,446 | ||||||
7.000%, 08/04/2041 | 1,440 | 1,668 | ||||||
Molson Coors Brewing | ||||||||
5.000%, 05/01/2042 | 3,010 | 3,092 | ||||||
Mondelez International | ||||||||
7.000%, 08/11/2037 | 1,105 | 1,454 | ||||||
6.875%, 02/01/2038 | 5,170 | 6,743 | ||||||
6.875%, 01/26/2039 | 1,455 | 1,907 | ||||||
6.500%, 02/09/2040 | 8,115 | 10,258 | ||||||
Pepsi Bottling Group | ||||||||
7.000%, 03/01/2029 | 370 | 498 | ||||||
PepsiCo | ||||||||
5.500%, 01/15/2040 | 2,275 | 2,636 | ||||||
4.875%, 11/01/2040 | 1,300 | 1,388 | ||||||
4.000%, 03/05/2042 | 6,245 | 5,933 | ||||||
3.000%, 08/25/2021 | 16 | 17 | ||||||
2.750%, 03/05/2022 | 415 | 412 | ||||||
Pernod-Ricard | ||||||||
5.500%, 01/15/2042 (A) | 1,750 | 1,890 | ||||||
Philip Morris International | ||||||||
6.375%, 05/16/2038 | 420 | 527 | ||||||
4.500%, 03/20/2042 | 7,165 | 7,013 | ||||||
4.125%, 03/04/2043 | 5,995 | 5,606 | ||||||
3.875%, 08/21/2042 | 1,690 | 1,521 | ||||||
President and Fellows of Harvard | ||||||||
5.625%, 10/01/2038 | 1,390 | 1,728 | ||||||
SABMiller | ||||||||
5.700%, 01/15/2014 (A) | 15 | 16 | ||||||
SABMiller Holdings | ||||||||
4.950%, 01/15/2042 (A) | 5,915 | 6,327 | ||||||
Tufts University | ||||||||
5.017%, 04/15/2112 | 2,314 | 2,422 | ||||||
Unilever Capital | ||||||||
5.900%, 11/15/2032 | 1,295 | 1,674 | ||||||
Wal-Mart Stores | ||||||||
6.500%, 08/15/2037 | 855 | 1,125 | ||||||
|
| |||||||
| 127,874 | ||||||||
|
| |||||||
Energy — 12.7% | ||||||||
Anadarko Finance | ||||||||
7.500%, 05/01/2031 | 4,480 | 5,906 | ||||||
| SEI Institutional Investments Trust / Annual Report / May 31, 2013 | 169 |
Table of Contents
SCHEDULE OF INVESTMENTS
Long Duration Corporate Bond Fund (Continued)
May 31, 2013
| Description | Face Amount ($ Thousands) | Market Value ($ Thousands) | ||||||
Anadarko Petroleum | ||||||||
6.450%, 09/15/2036 | $ | 2,000 | $ | 2,436 | ||||
Apache | ||||||||
6.900%, 09/15/2018 | 10 | 12 | ||||||
5.100%, 09/01/2040 | 3,525 | 3,682 | ||||||
4.750%, 04/15/2043 | 2,290 | 2,285 | ||||||
4.250%, 01/15/2044 | 6,505 | 6,058 | ||||||
BG Energy Capital | ||||||||
5.125%, 10/15/2041(A) | 5,540 | 6,041 | ||||||
BP Capital Markets | ||||||||
2.750%, 05/10/2023 | 1,175 | 1,120 | ||||||
Canadian Natural Resources | ||||||||
6.750%, 02/01/2039 | 2,660 | 3,313 | ||||||
6.250%, 03/15/2038 | 1,500 | 1,771 | ||||||
Cenovus Energy | ||||||||
6.750%, 11/15/2039 | 1,395 | 1,777 | ||||||
4.450%, 09/15/2042 | 770 | 737 | ||||||
CNOOC Finance | ||||||||
3.875%, 05/02/2022 (A) | 2,500 | 2,550 | ||||||
3.000%, 05/09/2023 | 3,695 | 3,508 | ||||||
Conoco Funding | ||||||||
7.250%, 10/15/2031 | 940 | 1,302 | ||||||
6.950%, 04/15/2029 | 1,950 | 2,584 | ||||||
ConocoPhillips | ||||||||
6.500%, 02/01/2039 | 10,250 | 13,418 | ||||||
5.900%, 05/15/2038 | 2,400 | 2,932 | ||||||
ConocoPhillips Canada Funding I | ||||||||
5.950%, 10/15/2036 | 1,040 | 1,270 | ||||||
Devon Energy | ||||||||
7.950%, 04/15/2032 | 755 | 1,031 | ||||||
6.300%, 01/15/2019 | 50 | 59 | ||||||
5.600%, 07/15/2041 | 2,620 | 2,873 | ||||||
4.750%, 05/15/2042 | 1,940 | 1,888 | ||||||
Devon Financing | ||||||||
7.875%, 09/30/2031 | 145 | 195 | ||||||
Diamond Offshore Drilling | ||||||||
5.700%, 10/15/2039 | 4,000 | 4,904 | ||||||
El Paso Natural Gas | ||||||||
8.375%, 06/15/2032 | 1,400 | 1,966 | ||||||
7.500%, 11/15/2026 | 765 | 1,012 | ||||||
Encana | ||||||||
6.625%, 08/15/2037 | 705 | 840 | ||||||
5.150%, 11/15/2041 | 2,450 | 2,445 | ||||||
Energy Transfer Partners | ||||||||
5.150%, 02/01/2043 | 3,905 | 3,770 | ||||||
Eni | ||||||||
5.700%, 10/01/2040 (A) | 2,120 | 2,136 | ||||||
Enterprise Products Operating | ||||||||
6.650%, 10/15/2034 | 2,930 | 3,616 | ||||||
5.950%, 02/01/2041 | 85 | 97 | ||||||
5.700%, 02/15/2042 | 7,200 | 8,077 | ||||||
4.850%, 08/15/2042 | 1,950 | 1,943 | ||||||
4.850%, 03/15/2044 | 700 | 696 | ||||||
4.450%, 02/15/2043 | 1,100 | 1,034 | ||||||
Gulf South Pipeline | ||||||||
4.000%, 06/15/2022 | 4,300 | 4,442 | ||||||
| Description | Face Amount ($ Thousands) | Market Value ($ Thousands) | ||||||
Halliburton | ||||||||
7.600%, 08/15/2096 (A) | $ | 805 | $ | 1,168 | ||||
Hess | ||||||||
7.875%, 10/01/2029 | 3,500 | 4,574 | ||||||
5.600%, 02/15/2041 | 1,490 | 1,583 | ||||||
Husky Energy | ||||||||
6.800%, 09/15/2037 | 1,655 | 2,108 | ||||||
Kinder Morgan Energy Partners MTN | ||||||||
6.950%, 01/15/2038 | 1,700 | 2,098 | ||||||
6.375%, 03/01/2041 | 4,200 | 4,945 | ||||||
5.625%, 09/01/2041 | 1,425 | 1,533 | ||||||
5.000%, 08/15/2042 | 90 | 89 | ||||||
3.950%, 09/01/2022 | 975 | 1,008 | ||||||
LASMO | ||||||||
7.300%, 11/15/2027 | 1,605 | 2,117 | ||||||
Marathon Oil | ||||||||
6.600%, 10/01/2037 | 2,365 | 2,925 | ||||||
2.800%, 11/01/2022 | 1,225 | 1,181 | ||||||
Marathon Petroleum | ||||||||
6.500%, 03/01/2041 | 4,100 | 4,930 | ||||||
Motiva Enterprises | ||||||||
6.850%, 01/15/2040 (A) | 7,990 | 10,547 | ||||||
Nexen | ||||||||
7.500%, 07/30/2039 | 3,840 | 5,286 | ||||||
6.400%, 05/15/2037 | 2,710 | 3,335 | ||||||
Noble Energy | ||||||||
4.150%, 12/15/2021 | 855 | 926 | ||||||
Noble Holding International | ||||||||
3.950%, 03/15/2022 | 11 | 11 | ||||||
Oneok Partners | ||||||||
6.850%, 10/15/2037 | 135 | 164 | ||||||
Panhandle Eastern Pipeline | ||||||||
8.125%, 06/01/2019 | 1,000 | 1,246 | ||||||
Petrobras Global Finance | ||||||||
5.625%, 05/20/2043 | 6,590 | 6,132 | ||||||
4.375%, 05/20/2023 | 1,555 | 1,498 | ||||||
Petrobras International Finance | ||||||||
6.750%, 01/27/2041 | 1,370 | 1,451 | ||||||
Petro-Canada | ||||||||
7.875%, 06/15/2026 | 20 | 27 | ||||||
6.800%, 05/15/2038 | 1,745 | 2,189 | ||||||
Petroleos Mexicanos | ||||||||
5.500%, 06/27/2044 (A) | 2,235 | 2,190 | ||||||
Phillips 66 | ||||||||
5.875%, 05/01/2042 | 5,675 | 6,599 | ||||||
Plains All American Pipeline | ||||||||
5.150%, 06/01/2042 | 1,000 | 1,055 | ||||||
Pride International | ||||||||
7.875%, 08/15/2040 | 2,962 | 4,224 | ||||||
Rosneft Oil via Rosneft International Finance | ||||||||
4.199%, 03/06/2022 (A) | 750 | 716 | ||||||
Ruby Pipeline | ||||||||
6.000%, 04/01/2022 (A) | 2,000 | 2,212 | ||||||
| 170 | SEI Institutional Investments Trust / Annual Report / May 31, 2013 |
Table of Contents
| Description | Face Amount ($ Thousands) | Market Value ($ Thousands) | ||||||
Shell International Finance | ||||||||
6.375%, 12/15/2038 | $ | 3,085 | $ | 4,130 | ||||
5.500%, 03/25/2040 | 2,500 | 3,041 | ||||||
Sinopec Capital 2013 | ||||||||
3.125%, 04/24/2023 (A) | 1,250 | 1,175 | ||||||
Sinopec Group Overseas Development 2012 | ||||||||
3.900%, 05/17/2022 (A) | 1,750 | 1,789 | ||||||
Spectra Energy Capital | ||||||||
6.750%, 02/15/2032 | 1,550 | 1,832 | ||||||
3.300%, 03/15/2023 | 3,200 | 3,119 | ||||||
Statoil | ||||||||
6.500%, 12/01/2028 (A) | 1,105 | 1,463 | ||||||
5.250%, 04/15/2019 | 50 | 59 | ||||||
3.950%, 05/15/2043 | 1,000 | 937 | ||||||
3.150%, 01/23/2022 | 1,005 | 1,036 | ||||||
2.450%, 01/17/2023 | 3,325 | 3,173 | ||||||
Suncor Energy | ||||||||
7.150%, 02/01/2032 | 625 | 801 | ||||||
6.850%, 06/01/2039 | 1,740 | 2,207 | ||||||
6.500%, 06/15/2038 | 3,565 | 4,368 | ||||||
Talisman Energy | ||||||||
6.250%, 02/01/2038 | 2,310 | 2,608 | ||||||
5.500%, 05/15/2042 | 2,500 | 2,564 | ||||||
Tennessee Gas Pipeline | ||||||||
8.375%, 06/15/2032 | 4,000 | 5,618 | ||||||
7.000%, 10/15/2028 | 3,800 | 4,939 | ||||||
Texas Eastern Transmission | ||||||||
7.000%, 07/15/2032 | 1,000 | 1,292 | ||||||
2.800%, 10/15/2022 (A) | 2,560 | 2,482 | ||||||
Total Capital International | ||||||||
2.700%, 01/25/2023 | 1,975 | 1,926 | ||||||
TransCanada PipeLines | ||||||||
7.625%, 01/15/2039 | 1,300 | 1,844 | ||||||
7.250%, 08/15/2038 | 1,490 | 2,030 | ||||||
6.100%, 06/01/2040 | 2,955 | 3,666 | ||||||
Transcontinental Gas PipeLine | ||||||||
7.250%, 12/01/2026 | 880 | 1,197 | ||||||
5.400%, 08/15/2041 | 1,450 | 1,609 | ||||||
4.450%, 08/01/2042 | 1,615 | 1,553 | ||||||
Valero Energy | ||||||||
10.500%, 03/15/2039 | 2,130 | 3,422 | ||||||
6.625%, 06/15/2037 | 2,000 | 2,422 | ||||||
6.125%, 02/01/2020 | 1,574 | 1,888 | ||||||
Weatherford International | ||||||||
5.950%, 04/15/2042 | 5,515 | 5,673 | ||||||
Williams | ||||||||
7.750%, 06/15/2031 | 2,568 | 3,158 | ||||||
Williams Partners | ||||||||
4.000%, 11/15/2021 | 375 | 388 | ||||||
|
| |||||||
| 265,202 | ||||||||
|
| |||||||
| Description | Face Amount ($ Thousands) | Market Value ($ Thousands) | ||||||
Financials — 25.9% | ||||||||
ACE INA Holdings | ||||||||
6.700%, 05/15/2036 | $ | 3,382 | $ | 4,550 | ||||
4.150%, 03/13/2043 | 210 | 205 | ||||||
Aflac | ||||||||
6.900%, 12/17/2039 | 4,000 | 5,128 | ||||||
AIG SunAmerica Global Financing X | ||||||||
6.900%, 03/15/2032 (A) | 6,140 | 7,818 | ||||||
Alexandria Real Estate Equities‡ | ||||||||
4.600%, 04/01/2022 | 2,150 | 2,298 | ||||||
Allstate | ||||||||
5.550%, 05/09/2035 | 185 | 221 | ||||||
5.350%, 06/01/2033 | 655 | 758 | ||||||
5.200%, 01/15/2042 | 4,730 | 5,466 | ||||||
Alta Wind Holdings | ||||||||
7.000%, 06/30/2035 (A) | 1,957 | 2,103 | ||||||
American Express | ||||||||
4.050%, 12/03/2042 | 4,191 | 3,818 | ||||||
American Express Credit MTN | ||||||||
2.800%, 09/19/2016 | 33 | 35 | ||||||
American International Group | ||||||||
6.250%, 05/01/2036 | 675 | 816 | ||||||
Assurant | ||||||||
6.750%, 02/15/2034 | 1,750 | 1,910 | ||||||
Bank of America MTN | ||||||||
6.000%, 10/15/2036 | 7,710 | 9,032 | ||||||
5.000%, 05/13/2021 | 5,450 | 6,036 | ||||||
3.300%, 01/11/2023 | 5,795 | 5,614 | ||||||
Bank of New York Mellon MTN | ||||||||
4.600%, 01/15/2020 | 50 | 57 | ||||||
4.150%, 02/01/2021 | 50 | 55 | ||||||
Barclays Bank | ||||||||
5.200%, 07/10/2014 | 150 | 157 | ||||||
2.750%, 02/23/2015 | 100 | 103 | ||||||
Bear Stearns | ||||||||
6.400%, 10/02/2017 | 3,760 | 4,444 | ||||||
Berkshire Hathaway | ||||||||
4.500%, 02/11/2043 | 7,819 | 7,700 | ||||||
3.750%, 08/15/2021 | 98 | 105 | ||||||
3.400%, 01/31/2022 | 116 | 120 | ||||||
Berkshire Hathaway Finance | ||||||||
5.750%, 01/15/2040 | 2,455 | 2,859 | ||||||
4.400%, 05/15/2042 | 5,000 | 4,845 | ||||||
4.300%, 05/15/2043 | 2,575 | 2,452 | ||||||
2.450%, 12/15/2015 | 13 | 14 | ||||||
Blackstone Holdings Finance | ||||||||
6.250%, 08/15/2042 (A) | 4,882 | 5,532 | ||||||
BRE Properties‡ | ||||||||
5.500%, 03/15/2017 | 750 | 843 | ||||||
Camden Property Trust‡ | ||||||||
4.625%, 06/15/2021 | 2,500 | 2,746 | ||||||
Carlyle Holdings II Finance | ||||||||
5.625%, 03/30/2043 (A) | 3,214 | 3,196 | ||||||
| SEI Institutional Investments Trust / Annual Report / May 31, 2013 | 171 |
Table of Contents
SCHEDULE OF INVESTMENTS
Long Duration Corporate Bond Fund (Continued)
May 31, 2013
| Description | Face Amount ($ Thousands) | Market Value ($ Thousands) | ||||||
CDP Financial | ||||||||
5.600%, 11/25/2039 (A) | $ | 5,695 | $ | 6,824 | ||||
Chase Capital VI | ||||||||
0.899%, 08/01/2028 (B) | 1,695 | 1,407 | ||||||
Chubb | ||||||||
6.500%, 05/15/2038 | 4,455 | 5,938 | ||||||
Citigroup | ||||||||
8.125%, 07/15/2039 | 2,690 | 3,815 | ||||||
6.875%, 03/05/2038 | 11,940 | 15,291 | ||||||
6.875%, 02/15/2098 | 2,545 | 2,892 | ||||||
5.875%, 05/29/2037 | 5,161 | 6,057 | ||||||
5.850%, 12/11/2034 | 142 | 163 | ||||||
5.500%, 02/15/2017 | 2,235 | 2,484 | ||||||
CNA Financial | ||||||||
5.875%, 08/15/2020 | 25 | 29 | ||||||
Commonwealth Bank of Australia MTN | ||||||||
5.000%, 10/15/2019 (A) | 2,500 | 2,895 | ||||||
Cooperatieve Centrale Raiffeisen- Boerenleenbank BA | ||||||||
5.800%, 09/30/2110 (A) | 4,875 | 5,373 | ||||||
5.250%, 05/24/2041 | 255 | 283 | ||||||
4.500%, 01/11/2021 | 75 | 82 | ||||||
3.875%, 02/08/2022 | 125 | 130 | ||||||
Credit Suisse NY MTN | ||||||||
5.400%, 01/14/2020 | 270 | 305 | ||||||
DaimlerChrysler | ||||||||
8.500%, 01/18/2031 | 800 | 1,208 | ||||||
DDR‡ | ||||||||
4.625%, 07/15/2022 | 1,710 | 1,827 | ||||||
Deutsche Bank MTN | ||||||||
4.296%, 05/24/2028 (B) | 1,580 | 1,524 | ||||||
Deutsche Bank Financial MTN | ||||||||
5.375%, 03/02/2015 | 25 | 27 | ||||||
Devon OEI Operating | ||||||||
7.500%, 09/15/2027 | 735 | 1,002 | ||||||
Discover Bank | ||||||||
8.700%, 11/18/2019 | 474 | 623 | ||||||
7.000%, 04/15/2020 | 250 | 303 | ||||||
Discover Financial Services | ||||||||
3.850%, 11/21/2022 | 1,526 | 1,537 | ||||||
Duke Realty‡ | ||||||||
4.375%, 06/15/2022 | 195 | 203 | ||||||
3.875%, 10/15/2022 | 1,405 | 1,405 | ||||||
3.625%, 04/15/2023 | 395 | 386 | ||||||
EADS Finance | ||||||||
2.700%, 04/17/2023 (A) | 5,565 | 5,403 | ||||||
Eaton | ||||||||
4.000%, 11/02/2032 (A) | 4,570 | 4,465 | ||||||
ERP Operating‡ | ||||||||
4.625%, 12/15/2021 | 55 | 61 | ||||||
Essex Portfolio‡ | ||||||||
3.250%, 05/01/2023 | 3,140 | 3,039 | ||||||
| Description | Face Amount ($ Thousands) | Market Value ($ Thousands) | ||||||
Farmers Exchange Capital | ||||||||
7.050%, 07/15/2028 (A) | $ | 5,000 | $ | 6,255 | ||||
Farmers Insurance Exchange | ||||||||
8.625%, 05/01/2024 (A) | 250 | 344 | ||||||
Fifth Third Bancorp | ||||||||
8.250%, 03/01/2038 | 1,390 | 1,919 | ||||||
FMR | ||||||||
6.500%, 12/14/2040 (A) | 1,000 | 1,219 | ||||||
5.150%, 02/01/2043 (A) | 750 | 771 | ||||||
Ford Holdings | ||||||||
9.300%, 03/01/2030 | 2,205 | 3,116 | ||||||
Gazprom OAO Via Gaz Capital | ||||||||
4.950%, 02/06/2028 (A) | 1,250 | 1,197 | ||||||
General Electric Capital MTN | ||||||||
6.875%, 01/10/2039 | 11,975 | 15,291 | ||||||
6.750%, 03/15/2032 | 10,330 | 12,871 | ||||||
6.000%, 08/07/2019 | 150 | 180 | ||||||
5.875%, 01/14/2038 | 19,605 | 22,368 | ||||||
5.625%, 09/15/2017 | 125 | 145 | ||||||
5.625%, 05/01/2018 | 200 | 234 | ||||||
4.625%, 01/07/2021 | 650 | 718 | ||||||
3.150%, 09/07/2022 | 2,255 | 2,202 | ||||||
Goldman Sachs Group | ||||||||
6.750%, 10/01/2037 | 12,550 | 13,687 | ||||||
6.250%, 09/01/2017 | 600 | 698 | ||||||
6.250%, 02/01/2041 | 5,355 | 6,267 | ||||||
6.150%, 04/01/2018 | 1,100 | 1,279 | ||||||
6.125%, 02/15/2033 | 14,015 | 16,025 | ||||||
5.950%, 01/15/2027 | 4,265 | 4,635 | ||||||
5.375%, 03/15/2020 | 175 | 199 | ||||||
5.250%, 07/27/2021 | 123 | 137 | ||||||
3.700%, 08/01/2015 | 55 | 58 | ||||||
Guardian Life Insurance of America | ||||||||
7.375%, 09/30/2039 (A) | 2,810 | 3,758 | ||||||
Hartford Financial Services Group | ||||||||
6.625%, 03/30/2040 | 3,212 | 4,054 | ||||||
6.100%, 10/01/2041 | 1,800 | 2,131 | ||||||
5.950%, 10/15/2036 | 1,300 | 1,500 | ||||||
4.300%, 04/15/2043 | 1,270 | 1,198 | ||||||
HBOS MTN | ||||||||
6.750%, 05/21/2018 (A) | 2,000 | 2,244 | ||||||
HCP‡ | ||||||||
6.750%, 02/01/2041 | 4,500 | 5,774 | ||||||
3.150%, 08/01/2022 | 100 | 97 | ||||||
Health Care‡ | ||||||||
6.500%, 03/15/2041 | 825 | 991 | ||||||
5.125%, 03/15/2043 | 3,925 | 3,913 | ||||||
3.750%, 03/15/2023 | 4,404 | 4,407 | ||||||
Healthcare Realty Trust‡ | ||||||||
5.750%, 01/15/2021 | 1,275 | 1,446 | ||||||
Healthcare Trust of America Holdings‡ | ||||||||
3.700%, 04/15/2023 (A) | 3,410 | 3,343 | ||||||
| 172 | SEI Institutional Investments Trust / Annual Report / May 31, 2013 |
Table of Contents
| Description | Face Amount ($ Thousands) | Market Value ($ Thousands) | ||||||
Heathrow Funding | ||||||||
4.875%, 07/15/2021 (A) | $ | 2,500 | $ | 2,713 | ||||
HSBC Bank | ||||||||
4.750%, 01/19/2021 (A) | 150 | 169 | ||||||
HSBC Bank USA | ||||||||
7.000%, 01/15/2039 | 3,585 | 4,661 | ||||||
5.875%, 11/01/2034 | 1,545 | 1,756 | ||||||
5.625%, 08/15/2035 | 1,895 | 2,081 | ||||||
HSBC Finance | ||||||||
6.676%, 01/15/2021 | 1,760 | 2,087 | ||||||
HSBC Holdings | ||||||||
6.800%, 06/01/2038 | 2,240 | 2,792 | ||||||
6.500%, 09/15/2037 | 5,790 | 6,953 | ||||||
6.100%, 01/14/2042 | 820 | 1,017 | ||||||
5.100%, 04/05/2021 | 2,000 | 2,279 | ||||||
HSBC Holdings, Ser 2006 | ||||||||
6.500%, 05/02/2036 | 1,185 | 1,418 | ||||||
International Lease Finance | ||||||||
7.125%, 09/01/2018 (A) | 1,500 | 1,768 | ||||||
6.750%, 09/01/2016 (A) | 3,700 | 4,186 | ||||||
JPMorgan Chase | ||||||||
6.400%, 05/15/2038 | 3,548 | 4,396 | ||||||
5.600%, 07/15/2041 | 3,000 | 3,463 | ||||||
5.400%, 01/06/2042 | 7,045 | 7,907 | ||||||
4.500%, 01/24/2022 | 490 | 531 | ||||||
3.375%, 05/01/2023 | 3,065 | 2,912 | ||||||
JPMorgan Chase Capital XXI | ||||||||
1.223%, 02/02/2037 (B) | 1,000 | 800 | ||||||
KKR Group Finance II | ||||||||
5.500%, 02/01/2043 (A) | 6,182 | 5,925 | ||||||
Liberty Mutual Group | ||||||||
6.500%, 05/01/2042 (A) | 8,777 | 10,262 | ||||||
Lincoln National | ||||||||
6.300%, 10/09/2037 | 220 | 264 | ||||||
6.150%, 04/07/2036 | 95 | 113 | ||||||
Macquarie Bank MTN | ||||||||
6.625%, 04/07/2021 (A) | 2,500 | 2,798 | ||||||
5.000%, 02/22/2017 (A) | 65 | 71 | ||||||
Macquarie Group | ||||||||
7.300%, 08/01/2014 (A) | 50 | 53 | ||||||
6.250%, 01/14/2021 (A) | 40 | 45 | ||||||
6.000%, 01/14/2020 (A) | 100 | 109 | ||||||
Massachusetts Mutual Life Insurance | ||||||||
8.875%, 06/01/2039 (A) | 3,370 | 5,161 | ||||||
5.375%, 12/01/2041 (A) | 1,100 | 1,236 | ||||||
Merrill Lynch | ||||||||
7.750%, 05/14/2038 | 1,800 | 2,253 | ||||||
6.110%, 01/29/2037 | 2,265 | 2,429 | ||||||
MetLife | ||||||||
10.750%, 08/01/2039 | 405 | 649 | ||||||
7.800%, 11/01/2025 (A) | 2,000 | 2,677 | ||||||
6.500%, 12/15/2032 | 350 | 439 | ||||||
6.400%, 12/15/2036 | 2,000 | 2,260 | ||||||
6.375%, 06/15/2034 | 730 | 914 | ||||||
5.875%, 02/06/2041 | 3,820 | 4,582 | ||||||
| Description | Face Amount ($ Thousands) | Market Value ($ Thousands) | ||||||
MetLife Global Funding I MTN | ||||||||
3.125%, 01/11/2016 (A) | $ | 100 | $ | 105 | ||||
Morgan Stanley | ||||||||
7.250%, 04/01/2032 | 2,035 | 2,566 | ||||||
6.625%, 04/01/2018 | 2,700 | 3,178 | ||||||
6.375%, 07/24/2042 | 8,010 | 9,408 | ||||||
6.250%, 08/28/2017 | 200 | 231 | ||||||
6.250%, 08/09/2026 | 190 | 222 | ||||||
6.000%, 04/28/2015 | 100 | 108 | ||||||
5.950%, 12/28/2017 | 100 | 115 | ||||||
5.375%, 10/15/2015 | 2,650 | 2,885 | ||||||
4.100%, 05/22/2023 | 910 | 872 | ||||||
3.750%, 02/25/2023 | 1,880 | 1,865 | ||||||
National Australia Bank | ||||||||
3.750%, 03/02/2015 (A) | 100 | 105 | ||||||
3.000%, 07/27/2016 (A) | 150 | 158 | ||||||
National City | ||||||||
4.900%, 01/15/2015 | 50 | 53 | ||||||
Nationwide Mutual Insurance | ||||||||
9.375%, 08/15/2039 (A) | 550 | 804 | ||||||
6.600%, 04/15/2034 (A) | 1,767 | 1,820 | ||||||
New York Life Global Funding | ||||||||
5.375%, 09/15/2013 (A) | 50 | 51 | ||||||
2.450%, 07/14/2016 (A) | 50 | 52 | ||||||
New York Life Insurance | ||||||||
6.750%, 11/15/2039 (A) | 10,095 | 13,220 | ||||||
Northwestern Mutual Life Insurance | ||||||||
6.063%, 03/30/2040 (A) | 4,715 | 5,776 | ||||||
PNC Funding | ||||||||
6.700%, 06/10/2019 | 100 | 125 | ||||||
Post Apartment Homes | ||||||||
3.375%, 12/01/2022 | 1,100 | 1,087 | ||||||
Principal Financial Group | ||||||||
4.625%, 09/15/2042 | 3,850 | 3,912 | ||||||
Prudential Financial MTN | ||||||||
6.625%, 12/01/2037 | 2,440 | 3,043 | ||||||
6.625%, 06/21/2040 | 1,000 | 1,283 | ||||||
6.200%, 11/15/2040 | 945 | 1,150 | ||||||
5.700%, 12/14/2036 | 2,325 | 2,617 | ||||||
Prudential Holdings | ||||||||
8.695%, 12/18/2023 (A) | 3,500 | 4,481 | ||||||
Prudential Insurance of America | ||||||||
8.300%, 07/01/2025 (A) | 1,000 | 1,339 | ||||||
Raymond James Financial | ||||||||
5.625%, 04/01/2024 | 1,950 | 2,164 | ||||||
Realty Income‡ | ||||||||
3.250%, 10/15/2022 | 3,006 | 2,972 | ||||||
Siemens Financieringsmaatschappij | ||||||||
6.125%, 08/17/2026 (A) | 100 | 125 | ||||||
Simon Property Group‡ | ||||||||
10.350%, 04/01/2019 | 1,995 | 2,860 | ||||||
6.750%, 02/01/2040 | 4,000 | 5,317 | ||||||
4.750%, 03/15/2042 | 2,535 | 2,638 | ||||||
4.375%, 03/01/2021 | 100 | 111 | ||||||
| SEI Institutional Investments Trust / Annual Report / May 31, 2013 | 173 |
Table of Contents
SCHEDULE OF INVESTMENTS
Long Duration Corporate Bond Fund (Continued)
May 31, 2013
| Description | Face Amount ($ Thousands) | Market Value ($ Thousands) | ||||||
SL Green Realty‡ | ||||||||
5.000%, 08/15/2018 | $ | 3,000 | $ | 3,273 | ||||
Swiss Re Treasury US | ||||||||
4.250%, 12/06/2042 (A) | 2,581 | 2,438 | ||||||
Sydney Airport Finance | ||||||||
3.900%, 03/22/2023 (A) | 2,500 | 2,516 | ||||||
Teachers Insurance & Annuity Association of America | ||||||||
6.850%, 12/16/2039 (A) | 4,330 | 5,698 | ||||||
Toyota Motor Credit MTN | ||||||||
3.400%, 09/15/2021 | 1,710 | 1,785 | ||||||
Travelers | ||||||||
6.250%, 06/15/2037 | 245 | 318 | ||||||
5.350%, 11/01/2040 | 1,285 | 1,507 | ||||||
Travelers Property Casualty | ||||||||
6.375%, 03/15/2033 | 310 | 401 | ||||||
UBS MTN | ||||||||
5.750%, 04/25/2018 | 100 | 118 | ||||||
US Bancorp | ||||||||
4.125%, 05/24/2021 | 22 | 24 | ||||||
Ventas Realty‡ | ||||||||
4.750%, 06/01/2021 | 2,000 | 2,185 | ||||||
Wachovia | ||||||||
7.575%, 08/01/2026 (C) | 2,375 | 3,209 | ||||||
5.750%, 06/15/2017 | 150 | 173 | ||||||
5.750%, 02/01/2018 | 350 | 412 | ||||||
Wachovia Bank | ||||||||
6.600%, 01/15/2038 | 6,910 | 8,844 | ||||||
6.180%, 02/15/2036 | 1,401 | 1,646 | ||||||
5.850%, 02/01/2037 | 2,215 | 2,610 | ||||||
WEA Finance | ||||||||
6.750%, 09/02/2019 (A) | 3,000 | 3,681 | ||||||
Weingarten Realty Investors‡ | ||||||||
3.375%, 10/15/2022 | 1,884 | 1,823 | ||||||
Wells Fargo MTN | ||||||||
4.600%, 04/01/2021 | 100 | 112 | ||||||
3.500%, 03/08/2022 | 525 | 544 | ||||||
Wells Fargo Bank | ||||||||
5.950%, 08/26/2036 | 1,900 | 2,259 | ||||||
Weyerhaeuser‡ | ||||||||
7.375%, 03/15/2032 | 500 | 661 | ||||||
ZFS Finance USA Trust II | ||||||||
6.450%, 12/15/2065 (A) (B) | 2,500 | 2,725 | ||||||
|
| |||||||
| 538,597 | ||||||||
|
| |||||||
Health Care — 7.5% |
| |||||||
AbbVie | ||||||||
4.400%, 11/06/2042 (A) | 9,310 | 9,093 | ||||||
Aetna | ||||||||
2.750%, 11/15/2022 | 1,370 | 1,311 | ||||||
Amgen | ||||||||
6.900%, 06/01/2038 | 1,575 | 2,041 | ||||||
5.750%, 03/15/2040 | 35 | 40 | ||||||
5.650%, 06/15/2042 | 4,360 | 4,900 | ||||||
| Description | Face Amount ($ Thousands) | Market Value ($ Thousands) | ||||||
5.375%, 05/15/2043 | $ | 3,835 | $ | 4,204 | ||||
5.150%, 11/15/2041 | 10,130 | 10,747 | ||||||
AstraZeneca | ||||||||
6.450%, 09/15/2037 | 3,745 | 4,752 | ||||||
4.000%, 09/18/2042 | 1,580 | 1,473 | ||||||
Becton Dickinson | ||||||||
3.125%, 11/08/2021 | 385 | 393 | ||||||
Bristol-Myers Squibb | ||||||||
6.125%, 05/01/2038 | 1,675 | 2,135 | ||||||
Cardinal Health | ||||||||
4.600%, 03/15/2043 | 2,138 | 2,046 | ||||||
Catholic Health Initiatives | ||||||||
4.350%, 11/01/2042 | 2,525 | 2,426 | ||||||
Celgene | ||||||||
5.700%, 10/15/2040 | 3,772 | 4,258 | ||||||
Covidien International Finance | ||||||||
2.950%, 06/15/2023 | 810 | 796 | ||||||
Eli Lilly | ||||||||
7.125%, 06/01/2025 | 410 | 558 | ||||||
Express Scripts Holding | ||||||||
6.125%, 11/15/2041 | 2,070 | 2,570 | ||||||
GlaxoSmithKline Capital | ||||||||
6.375%, 05/15/2038 | 15 | 19 | ||||||
2.850%, 05/08/2022 | 5,090 | 5,078 | ||||||
2.800%, 03/18/2023 | 2,000 | 1,961 | ||||||
Highmark | ||||||||
6.125%, 05/15/2041 (A) | 1,000 | 928 | ||||||
4.750%, 05/15/2021 (A) | 1,330 | 1,297 | ||||||
Humana | ||||||||
4.625%, 12/01/2042 | 802 | 764 | ||||||
Johns Hopkins Health System | ||||||||
2.767%, 05/15/2023 | 1,750 | 1,687 | ||||||
Johnson & Johnson | ||||||||
5.950%, 08/15/2037 | 1,100 | 1,426 | ||||||
5.850%, 07/15/2038 | 1,500 | 1,930 | ||||||
Kaiser Foundation Hospitals | ||||||||
4.875%, 04/01/2042 | 3,175 | 3,353 | ||||||
Mayo Clinic | ||||||||
3.774%, 11/15/2043 | 2,000 | 1,844 | ||||||
McKesson | ||||||||
2.700%, 12/15/2022 | 1,500 | 1,459 | ||||||
Mead Johnson Nutrition | ||||||||
5.900%, 11/01/2039 | 620 | 714 | ||||||
Medtronic | ||||||||
4.000%, 04/01/2043 | 6,370 | 6,036 | ||||||
Memorial Sloan-Kettering Cancer Center | ||||||||
5.000%, 07/01/2042 | 1,000 | 1,090 | ||||||
Merck | ||||||||
6.550%, 09/15/2037 | 1,430 | 1,925 | ||||||
6.500%, 12/01/2033 | 520 | 699 | ||||||
5.850%, 06/30/2039 | 690 | 849 | ||||||
5.760%, 05/03/2037 | 1,100 | 1,422 | ||||||
4.150%, 05/18/2043 | 3,460 | 3,371 | ||||||
3.600%, 09/15/2042 | 2,850 | 2,553 | ||||||
| 174 | SEI Institutional Investments Trust / Annual Report / May 31, 2013 |
Table of Contents
| Description | Face Amount ($ Thousands) | Market Value ($ Thousands) | ||||||
North Shore Long Island Jewish | ||||||||
4.800%, 11/01/2042 | $ | 2,400 | $ | 2,354 | ||||
NYU Hospitals Center | ||||||||
4.428%, 07/01/2042 | 2,650 | 2,499 | ||||||
Perrigo | ||||||||
2.950%, 05/15/2023 | 1,030 | 996 | ||||||
Pfizer | ||||||||
7.200%, 03/15/2039 | 3,530 | 4,979 | ||||||
4.300%, 06/15/2043 | 2,060 | 2,052 | ||||||
Roche Holdings | ||||||||
7.000%, 03/01/2039 (A) | 10,670 | 15,077 | ||||||
Shands Teaching Hospital and Clinics | ||||||||
4.741%, 12/01/2042 | 1,750 | 1,711 | ||||||
St. Barnabas Health Care System | ||||||||
4.000%, 07/01/2028 | 2,240 | 2,134 | ||||||
St. Jude Medical | ||||||||
4.750%, 04/15/2043 | 2,250 | 2,241 | ||||||
Stryker | ||||||||
4.100%, 04/01/2043 | 1,220 | 1,188 | ||||||
Sutter Health | ||||||||
2.286%, 08/15/2053 | 2,000 | 1,943 | ||||||
Thermo Fisher Scientific | ||||||||
3.150%, 01/15/2023 | 2,240 | 2,160 | ||||||
UnitedHealth Group | ||||||||
6.875%, 02/15/2038 | 1,411 | 1,851 | ||||||
6.625%, 11/15/2037 | 2,500 | 3,176 | ||||||
6.500%, 06/15/2037 | 385 | 485 | ||||||
5.950%, 02/15/2041 | 215 | 257 | ||||||
5.800%, 03/15/2036 | 325 | 380 | ||||||
5.700%, 10/15/2040 | 1,065 | 1,235 | ||||||
4.375%, 03/15/2042 | 70 | 69 | ||||||
3.950%, 10/15/2042 | 1,250 | 1,145 | ||||||
WellPoint | ||||||||
5.950%, 12/15/2034 | 737 | 852 | ||||||
5.875%, 06/15/2017 | 50 | 58 | ||||||
5.850%, 01/15/2036 | 710 | 820 | ||||||
4.650%, 01/15/2043 | 5,720 | 5,679 | ||||||
2.375%, 02/15/2017 | 20 | 21 | ||||||
Wyeth | ||||||||
6.000%, 02/15/2036 | 535 | 661 | ||||||
5.950%, 04/01/2037 | 4,425 | 5,420 | ||||||
|
| |||||||
| 155,591 | ||||||||
|
| |||||||
Industrials — 5.9% |
| |||||||
ABB Treasury Center USA | ||||||||
4.000%, 06/15/2021 (A) | 1,840 | 1,967 | ||||||
Air Canada, Pass-Through Trust, | ||||||||
4.125%, 05/15/2025 (A) | 540 | 553 | ||||||
American Airlines, Pass-Through Trust, Ser 2011-1, Cl A | ||||||||
5.250%, 01/31/2021 | 9 | 10 | ||||||
| Description | Face Amount ($ Thousands) | Market Value ($ Thousands) | ||||||
BAE Systems | ||||||||
5.800%, 10/11/2041 (A) | $ | 3,565 | $ | 4,039 | ||||
BAE Systems Holdings | ||||||||
5.200%, 08/15/2015 (A) | 15 | 16 | ||||||
Boeing | ||||||||
6.875%, 03/15/2039 | 640 | 891 | ||||||
6.625%, 02/15/2038 | 850 | 1,153 | ||||||
5.875%, 02/15/2040 | 1,990 | 2,505 | ||||||
Burlington Northern Santa Fe | ||||||||
7.290%, 06/01/2036 | 1,333 | 1,786 | ||||||
6.150%, 05/01/2037 | 1,800 | 2,198 | ||||||
4.450%, 03/15/2043 | 1,250 | 1,235 | ||||||
4.400%, 03/15/2042 | 7,040 | 6,900 | ||||||
Canadian National Railway, | ||||||||
6.200%, 06/01/2036 | 2,665 | 3,472 | ||||||
Caterpillar | ||||||||
5.200%, 05/27/2041 | 640 | 724 | ||||||
3.803%, 08/15/2042 | 850 | 777 | ||||||
Continental Airlines, Pass-Through Trust, Ser 2007-1, Cl A | ||||||||
5.983%, 04/19/2022 | 4,825 | 5,476 | ||||||
Continental Airlines, Pass-Through Trust, Ser 2012-2, Cl A | ||||||||
4.000%, 10/29/2024 | 725 | 750 | ||||||
CSX | ||||||||
4.750%, 05/30/2042 | 5,625 | 5,701 | ||||||
Deere | ||||||||
3.900%, 06/09/2042 | 1,920 | 1,816 | ||||||
Delta Air Lines, Pass-Through Trust, | ||||||||
7.750%, 12/17/2019 | 1,124 | 1,321 | ||||||
FedEx | ||||||||
4.100%, 04/15/2043 | 4,740 | 4,419 | ||||||
3.875%, 08/01/2042 | 4,937 | 4,518 | ||||||
General Dynamics | ||||||||
3.600%, 11/15/2042 | 3,732 | 3,307 | ||||||
General Electric | ||||||||
4.125%, 10/09/2042 | 4,970 | 4,743 | ||||||
Honeywell International | ||||||||
5.700%, 03/15/2037 | 300 | 370 | ||||||
5.375%, 03/01/2041 | 295 | 356 | ||||||
Lockheed Martin | ||||||||
4.850%, 09/15/2041 | 1,885 | 1,928 | ||||||
4.070%, 12/15/2042 | 4,472 | 4,089 | ||||||
Norfolk Southern | ||||||||
6.000%, 03/15/2105 | 2,045 | 2,396 | ||||||
6.000%, 05/23/2111 | 4,205 | 4,928 | ||||||
5.590%, 05/17/2025 | 37 | 43 | ||||||
3.000%, 04/01/2022 | 1,380 | 1,377 | ||||||
Northrop Grumman | ||||||||
4.750%, 06/01/2043 | 2,720 | 2,688 | ||||||
3.250%, 08/01/2023 | 5,920 | 5,839 | ||||||
| SEI Institutional Investments Trust / Annual Report / May 31, 2013 | 175 |
Table of Contents
SCHEDULE OF INVESTMENTS
Long Duration Corporate Bond Fund (Continued)
May 31, 2013
| Description | Face Amount ($ Thousands) | Market Value ($ Thousands) | ||||||
Pitney Bowes | ||||||||
6.250%, 03/15/2019 | $ | 15 | $ | 17 | ||||
Raytheon | ||||||||
4.700%, 12/15/2041 | 300 | 312 | ||||||
Republic Services | ||||||||
5.700%, 05/15/2041 | 3,475 | 3,945 | ||||||
Stanley Black & Decker | ||||||||
2.900%, 11/01/2022 | 1,430 | 1,403 | ||||||
Union Pacific | ||||||||
6.625%, 02/01/2029 | 1,425 | 1,841 | ||||||
5.780%, 07/15/2040 | 3,350 | 4,039 | ||||||
4.163%, 07/15/2022 | 108 | 118 | ||||||
United Parcel Service | ||||||||
3.625%, 10/01/2042 | 690 | 643 | ||||||
United Technologies | ||||||||
5.700%, 04/15/2040 | 4,480 | 5,421 | ||||||
4.500%, 06/01/2042 | 11,640 | 12,016 | ||||||
US Airways Pass-Through Trust, | ||||||||
5.900%, 10/01/2024 | 2,495 | 2,789 | ||||||
Waste Management | ||||||||
7.750%, 05/15/2032 | 200 | 277 | ||||||
7.375%, 03/11/2019 | 25 | 31 | ||||||
7.100%, 08/01/2026 | 130 | 168 | ||||||
6.125%, 11/30/2039 | 2,870 | 3,494 | ||||||
4.600%, 03/01/2021 | 1,645 | 1,824 | ||||||
|
| |||||||
| 122,629 | ||||||||
|
| |||||||
Information Technology — 3.0% |
| |||||||
Apple | ||||||||
3.850%, 05/04/2043 | 6,415 | 5,887 | ||||||
Applied Materials | ||||||||
5.850%, 06/15/2041 | 2,300 | 2,614 | ||||||
Cisco Systems | ||||||||
5.500%, 01/15/2040 | 1,585 | 1,867 | ||||||
Corning | ||||||||
5.750%, 08/15/2040 | 345 | 393 | ||||||
eBay | ||||||||
4.000%, 07/15/2042 | 1,245 | 1,103 | ||||||
HP Enterprise Services | ||||||||
6.000%, 08/01/2013 | 85 | 86 | ||||||
Intel | ||||||||
4.800%, 10/01/2041 | 3,985 | 4,095 | ||||||
4.000%, 12/15/2032 | 7,087 | 6,841 | ||||||
2.700%, 12/15/2022 | 2,540 | 2,444 | ||||||
International Business Machines | ||||||||
6.220%, 08/01/2027 | 3,345 | 4,319 | ||||||
5.875%, 11/29/2032 | 300 | 382 | ||||||
5.600%, 11/30/2039 | 462 | 558 | ||||||
4.000%, 06/20/2042 | 3,593 | 3,494 | ||||||
Intuit | ||||||||
5.750%, 03/15/2017 | 25 | 28 | ||||||
Juniper Networks | ||||||||
5.950%, 03/15/2041 | 3,000 | 3,230 | ||||||
| Description | Face Amount ($ Thousands) | Market Value ($ Thousands) | ||||||
Microsoft | ||||||||
5.300%, 02/08/2041 | $ | 895 | $ | 1,059 | ||||
4.500%, 10/01/2040 | 675 | 711 | ||||||
3.750%, 05/01/2043 | 3,955 | 3,689 | ||||||
3.500%, 11/15/2042 | 5,455 | 4,861 | ||||||
Motorola Solutions | ||||||||
7.500%, 05/15/2025 | 680 | 855 | ||||||
3.500%, 03/01/2023 | 2,000 | 1,956 | ||||||
Oracle | ||||||||
6.500%, 04/15/2038 | 4,145 | 5,442 | ||||||
5.375%, 07/15/2040 | 2,415 | 2,801 | ||||||
Telefonaktiebolaget LM Ericsson | ||||||||
4.125%, 05/15/2022 | 3,953 | 4,050 | ||||||
|
| |||||||
| 62,765 | ||||||||
|
| |||||||
Materials — 3.2% |
| |||||||
ArcelorMittal | ||||||||
7.250%, 03/01/2041 | 2,025 | 1,974 | ||||||
Barrick North America Finance | ||||||||
7.500%, 09/15/2038 | 35 | 40 | ||||||
5.750%, 05/01/2043 (A) | 9,210 | 8,632 | ||||||
Dow Chemical | ||||||||
5.250%, 11/15/2041 | 350 | 375 | ||||||
4.375%, 11/15/2042 | 4,630 | 4,326 | ||||||
E.I. du Pont de Nemours | ||||||||
2.800%, 02/15/2023 | 1,960 | 1,935 | ||||||
Freeport-McMoRan Copper | ||||||||
5.450%, 03/15/2043 (A) | 7,042 | 6,767 | ||||||
3.875%, 03/15/2023 (A) | 4,155 | 4,044 | ||||||
Newcrest Finance | ||||||||
5.750%, 11/15/2041 (A) | 5,891 | 5,603 | ||||||
Newmont Mining | ||||||||
5.875%, 04/01/2035 | 100 | 101 | ||||||
4.875%, 03/15/2042 | 4,182 | 3,595 | ||||||
Praxair | ||||||||
3.550%, 11/07/2042 | 1,275 | 1,147 | ||||||
Rio Tinto Finance USA | ||||||||
9.000%, 05/01/2019 | 150 | 203 | ||||||
5.200%, 11/02/2040 | 20 | 22 | ||||||
4.750%, 03/22/2042 | 205 | 207 | ||||||
4.125%, 08/21/2042 | 1,800 | 1,638 | ||||||
3.500%, 11/02/2020 | 50 | 52 | ||||||
3.500%, 03/22/2022 | 1,375 | 1,379 | ||||||
Rohm & Haas | ||||||||
7.850%, 07/15/2029 | 4,490 | 6,042 | ||||||
Southern Copper | ||||||||
7.500%, 07/27/2035 | 1,750 | 1,977 | ||||||
6.750%, 04/16/2040 | 590 | 617 | ||||||
5.250%, 11/08/2042 | 950 | 823 | ||||||
Teck Resources | ||||||||
5.400%, 02/01/2043 | 2,025 | 1,907 | ||||||
5.200%, 03/01/2042 | 750 | 685 | ||||||
Union Carbide | ||||||||
7.750%, 10/01/2096 | 25 | 29 | ||||||
| 176 | SEI Institutional Investments Trust / Annual Report / May 31, 2013 |
Table of Contents
| Description | Face Amount ($ Thousands) | Market Value ($ Thousands) | ||||||
Vale | ||||||||
5.625%, 09/11/2042 | $ | 2,960 | $ | 2,760 | ||||
Vale Overseas | ||||||||
6.875%, 11/21/2036 | 2,000 | 2,147 | ||||||
Xstrata Finance Canada | ||||||||
6.000%, 11/15/2041 (A) | 4,504 | 4,569 | ||||||
5.300%, 10/25/2042 (A) | 2,005 | 1,969 | ||||||
|
| |||||||
| 65,565 | ||||||||
|
| |||||||
Telecommunication Services — 6.7% |
| |||||||
Alltel | ||||||||
7.875%, 07/01/2032 | 1,105 | 1,562 | ||||||
6.800%, 05/01/2029 | 1,030 | 1,291 | ||||||
America Movil | ||||||||
6.375%, 03/01/2035 | 100 | 115 | ||||||
6.125%, 03/30/2040 | 1,785 | 2,024 | ||||||
4.375%, 07/16/2042 | 4,685 | 4,157 | ||||||
3.125%, 07/16/2022 | 1,250 | 1,193 | ||||||
AT&T | ||||||||
6.550%, 02/15/2039 | 1,625 | 1,999 | ||||||
6.500%, 09/01/2037 | 3,942 | 4,802 | ||||||
6.300%, 01/15/2038 | 13,580 | 16,184 | ||||||
5.600%, 05/15/2018 | 100 | 118 | ||||||
5.550%, 08/15/2041 | 4,485 | 4,954 | ||||||
5.350%, 09/01/2040 | 7,940 | 8,493 | ||||||
4.350%, 06/15/2045 (A) | 7,938 | 7,364 | ||||||
4.300%, 12/15/2042 (A) | 3,718 | 3,474 | ||||||
3.000%, 02/15/2022 | 50 | 50 | ||||||
BellSouth | ||||||||
6.875%, 10/15/2031 | 105 | 124 | ||||||
6.000%, 11/15/2034 | 130 | 141 | ||||||
5.200%, 09/15/2014 | 50 | 53 | ||||||
Bellsouth Capital Funding | ||||||||
7.875%, 02/15/2030 | 305 | 389 | ||||||
British Telecommunications | ||||||||
9.625%, 12/15/2030 | 2,620 | 4,059 | ||||||
Centel Capital | ||||||||
9.000%, 10/15/2019 | 25 | 30 | ||||||
CenturyLink | ||||||||
7.650%, 03/15/2042 | 2,200 | 2,189 | ||||||
Deutsche Telekom International Finance | ||||||||
9.250%, 06/01/2032 | 2,161 | 3,316 | ||||||
8.750%, 06/15/2030 | 2,590 | 3,739 | ||||||
4.875%, 03/06/2042 (A) | 2,845 | 2,885 | ||||||
France Telecom | ||||||||
5.375%, 01/13/2042 | 1,795 | 1,918 | ||||||
GTE | ||||||||
8.750%, 11/01/2021 | 100 | 134 | ||||||
6.940%, 04/15/2028 | 1,280 | 1,622 | ||||||
Koninklijke KPN | ||||||||
8.375%, 10/01/2030 | 2,715 | 3,510 | ||||||
Qwest | ||||||||
7.250%, 09/15/2025 | 1,000 | 1,163 | ||||||
| Description | Face Amount ($ Thousands) | Market Value ($ Thousands) | ||||||
Rogers Communications | ||||||||
4.500%, 03/15/2043 | $ | 2,232 | $ | 2,212 | ||||
Telecom Italia Capital | ||||||||
7.721%, 06/04/2038 | 750 | 811 | ||||||
7.200%, 07/18/2036 | 2,000 | 2,070 | ||||||
6.175%, 06/18/2014 | 33 | 35 | ||||||
Telefonica Emisiones SAU | ||||||||
7.045%, 06/20/2036 | 2,505 | 2,866 | ||||||
6.421%, 06/20/2016 | 75 | 84 | ||||||
6.221%, 07/03/2017 | 65 | 73 | ||||||
5.462%, 02/16/2021 | 152 | 164 | ||||||
4.570%, 04/27/2023 | 2,790 | 2,781 | ||||||
Verizon Communications | ||||||||
8.750%, 11/01/2018 | 107 | 143 | ||||||
7.750%, 12/01/2030 | 630 | 849 | ||||||
7.350%, 04/01/2039 | 3,000 | 4,030 | ||||||
6.900%, 04/15/2038 | 100 | 128 | ||||||
6.400%, 02/15/2038 | 3,925 | 4,750 | ||||||
6.000%, 04/01/2041 | 3,105 | 3,608 | ||||||
5.850%, 09/15/2035 | 2,700 | 3,059 | ||||||
4.750%, 11/01/2041 | 8,090 | 7,961 | ||||||
3.850%, 11/01/2042 | 5,410 | 4,663 | ||||||
Vodafone Group | ||||||||
6.150%, 02/27/2037 | 300 | 357 | ||||||
4.375%, 02/19/2043 | 11,330 | 10,667 | ||||||
2.950%, 02/19/2023 | 4,380 | 4,222 | ||||||
|
| |||||||
| 138,585 | ||||||||
|
| |||||||
Utilities — 12.3% |
| |||||||
AGL Capital | ||||||||
6.375%, 07/15/2016 | 100 | 115 | ||||||
5.875%, 03/15/2041 | 2,000 | 2,385 | ||||||
4.400%, 06/01/2043 | 1,200 | 1,178 | ||||||
3.500%, 09/15/2021 | 68 | 72 | ||||||
Alabama Power | ||||||||
5.200%, 06/01/2041 | 335 | 382 | ||||||
American Transmission Systems | ||||||||
5.250%, 01/15/2022 (A) | 1,135 | 1,268 | ||||||
American Water Capital | ||||||||
6.085%, 10/15/2017 | 25 | 29 | ||||||
Appalachian Power | ||||||||
7.000%, 04/01/2038 | 600 | 786 | ||||||
6.700%, 08/15/2037 | 50 | 63 | ||||||
5.800%, 10/01/2035 | 125 | 143 | ||||||
4.600%, 03/30/2021 | 605 | 674 | ||||||
Arizona Public Service | ||||||||
8.750%, 03/01/2019 | 2,705 | 3,580 | ||||||
Arizona Public Services | ||||||||
4.500%, 04/01/2042 | 12 | 12 | ||||||
Baltimore Gas & Electric | ||||||||
6.350%, 10/01/2036 | 125 | 158 | ||||||
5.200%, 06/15/2033 | 1,580 | 1,726 | ||||||
Boston Gas | ||||||||
4.487%, 02/15/2042 (A) | 1,325 | 1,356 | ||||||
| SEI Institutional Investments Trust / Annual Report / May 31, 2013 | 177 |
Table of Contents
SCHEDULE OF INVESTMENTS
Long Duration Corporate Bond Fund (Continued)
May 31, 2013
| Description | Face Amount ($ Thousands) | Market Value ($ Thousands) | ||||||
Bruce Mansfield Unit | ||||||||
6.850%, 06/01/2034 | $ | 2,072 | $ | 2,251 | ||||
CenterPoint Energy | ||||||||
6.500%, 05/01/2018 | 130 | 157 | ||||||
CenterPoint Energy Resources | ||||||||
6.625%, 11/01/2037 | 1,037 | 1,344 | ||||||
6.250%, 02/01/2037 | 775 | 937 | ||||||
4.500%, 01/15/2021 | 40 | 45 | ||||||
Cleco Power | ||||||||
6.000%, 12/01/2040 | 2,500 | 2,853 | ||||||
Connecticut Light & Power | ||||||||
5.650%, 05/01/2018 | 35 | 41 | ||||||
2.500%, 01/15/2023 | 1,200 | 1,169 | ||||||
Consolidated Edison of New York | ||||||||
6.750%, 04/01/2038 | 1,915 | 2,611 | ||||||
6.200%, 06/15/2036 | 145 | 184 | ||||||
5.700%, 06/15/2040 | 100 | 123 | ||||||
5.500%, 12/01/2039 | 75 | 89 | ||||||
4.200%, 03/15/2042 | 325 | 324 | ||||||
3.950%, 03/01/2043 | 3,030 | 2,885 | ||||||
Dominion Resources | ||||||||
5.250%, 08/01/2033 | 5,050 | 5,660 | ||||||
4.900%, 08/01/2041 | 3,235 | 3,471 | ||||||
4.050%, 09/15/2042 | 1,000 | 936 | ||||||
DTE Electric | ||||||||
3.950%, 06/15/2042 | 180 | 174 | ||||||
3.900%, 06/01/2021 | 30 | 33 | ||||||
DTE Energy | ||||||||
6.375%, 04/15/2033 | 120 | 147 | ||||||
Duke Energy | ||||||||
3.550%, 09/15/2021 | 17 | 18 | ||||||
3.050%, 08/15/2022 | 3,380 | 3,356 | ||||||
2.150%, 11/15/2016 | 25 | 26 | ||||||
Duke Energy Carolinas | ||||||||
6.450%, 10/15/2032 | 230 | 293 | ||||||
6.100%, 06/01/2037 | 2,140 | 2,627 | ||||||
5.300%, 02/15/2040 | 3,840 | 4,397 | ||||||
4.250%, 12/15/2041 | 1,565 | 1,539 | ||||||
4.000%, 09/30/2042 | 4,915 | 4,659 | ||||||
3.900%, 06/15/2021 | 50 | 55 | ||||||
Duke Energy Indiana | ||||||||
6.350%, 08/15/2038 | 1,675 | 2,147 | ||||||
Duke Energy Progress | ||||||||
6.300%, 04/01/2038 | 130 | 166 | ||||||
4.100%, 05/15/2042 | 740 | 714 | ||||||
Duquesne Light Holdings | ||||||||
6.250%, 08/15/2035 | 2,500 | 2,827 | ||||||
El Paso Electric | ||||||||
3.300%, 12/15/2022 | 1,500 | 1,463 | ||||||
Electricite de France | ||||||||
5.250%, 12/29/2049 (A) (B) | 2,250 | 2,259 | ||||||
Elm Road Generating Station Supercritical | ||||||||
5.848%, 01/19/2041 (A) | 1,000 | 1,150 | ||||||
| Description | Face Amount ($ Thousands) | Market Value ($ Thousands) | ||||||
Entergy Louisiana | ||||||||
4.800%, 05/01/2021 | $ | 1,000 | $ | 1,118 | ||||
4.440%, 01/15/2026 | 1,390 | 1,528 | ||||||
Exelon Generation | ||||||||
6.250%, 10/01/2039 | 4,480 | 5,119 | ||||||
5.750%, 10/01/2041 | 5,465 | 5,896 | ||||||
5.600%, 06/15/2042 | 4,140 | 4,378 | ||||||
5.200%, 10/01/2019 | 100 | 112 | ||||||
FirstEnergy, Ser C | ||||||||
7.375%, 11/15/2031 | 2,983 | 3,367 | ||||||
Florida Power | ||||||||
6.400%, 06/15/2038 | 360 | 462 | ||||||
6.350%, 09/15/2037 | 1,880 | 2,425 | ||||||
Florida Power & Light | ||||||||
5.960%, 04/01/2039 | 2,360 | 2,996 | ||||||
5.690%, 03/01/2040 | 4,163 | 5,174 | ||||||
4.050%, 06/01/2042 | 5,000 | 4,921 | ||||||
3.800%, 12/15/2042 | 2,215 | 2,086 | ||||||
Georgia Power | ||||||||
5.650%, 03/01/2037 | 225 | 263 | ||||||
5.400%, 06/01/2040 | 8,270 | 9,365 | ||||||
4.300%, 03/15/2042 | 7,255 | 7,121 | ||||||
Iberdrola Finance Ireland | ||||||||
5.000%, 09/11/2019 (A) | 1,500 | 1,625 | ||||||
Indiana Michigan Power | ||||||||
6.050%, 03/15/2037 | 500 | 592 | ||||||
Indianapolis Power & Light | ||||||||
6.050%, 10/01/2036 (A) | 710 | 851 | ||||||
4.875%, 11/01/2041 (A) | 1,290 | 1,412 | ||||||
KCP&L Greater Missouri Operations | ||||||||
8.270%, 11/15/2021 | 2,500 | 3,046 | ||||||
Kentucky Utilities | ||||||||
5.125%, 11/01/2040 | 2,365 | 2,743 | ||||||
KeySpan Gas East | ||||||||
5.819%, 04/01/2041 (A) | 3,600 | 4,386 | ||||||
Massachusetts Electric | ||||||||
5.900%, 11/15/2039 (A) | 70 | 85 | ||||||
MidAmerican Energy MTN | ||||||||
6.750%, 12/30/2031 | 465 | 611 | ||||||
5.800%, 10/15/2036 | 836 | 1,018 | ||||||
MidAmerican Energy Holdings | ||||||||
6.500%, 09/15/2037 | 4,125 | 5,232 | ||||||
6.125%, 04/01/2036 | 3,400 | 4,093 | ||||||
5.950%, 05/15/2037 | 555 | 660 | ||||||
Nevada Power | ||||||||
6.650%, 04/01/2036 | 210 | 275 | ||||||
NextEra Energy Capital Holdings | ||||||||
6.000%, 03/01/2019 | 1,530 | 1,807 | ||||||
Niagara Mohawk Power | ||||||||
4.119%, 11/28/2042 (A) | 2,000 | 1,897 | ||||||
Nisource Finance | ||||||||
5.950%, 06/15/2041 | 500 | 567 | ||||||
5.800%, 02/01/2042 | 2,000 | 2,213 | ||||||
4.800%, 02/15/2044 | 3,740 | 3,644 | ||||||
| 178 | SEI Institutional Investments Trust / Annual Report / May 31, 2013 |
Table of Contents
| Description | Face Amount ($ Thousands) | Market Value ($ Thousands) | ||||||
Northeast Utilities | ||||||||
2.800%, 05/01/2023 | $ | 1,335 | $ | 1,290 | ||||
Northern States Power | ||||||||
7.125%, 07/01/2025 | 285 | 385 | ||||||
6.200%, 07/01/2037 | 2,500 | 3,255 | ||||||
3.400%, 08/15/2042 | 645 | 569 | ||||||
2.600%, 05/15/2023 | 1,760 | 1,721 | ||||||
Oglethorpe Power | ||||||||
5.375%, 11/01/2040 | 1,705 | 1,883 | ||||||
5.250%, 09/01/2050 | 65 | 68 | ||||||
Oncor Electric Delivery | ||||||||
7.000%, 09/01/2022 | 175 | 226 | ||||||
6.800%, 09/01/2018 | 35 | 43 | ||||||
5.300%, 06/01/2042 | 4,924 | 5,546 | ||||||
5.250%, 09/30/2040 | 4,050 | 4,563 | ||||||
4.550%, 12/01/2041 | 4,500 | 4,540 | ||||||
4.100%, 06/01/2022 | 2,100 | 2,262 | ||||||
Pacific Gas & Electric | ||||||||
6.250%, 03/01/2039 | 3,880 | 4,878 | ||||||
6.050%, 03/01/2034 | 3,800 | 4,722 | ||||||
5.800%, 03/01/2037 | 1,205 | 1,439 | ||||||
3.250%, 09/15/2021 | 18 | 19 | ||||||
PacifiCorp | ||||||||
6.000%, 01/15/2039 | 1,795 | 2,261 | ||||||
5.500%, 01/15/2019 | 310 | 369 | ||||||
Pennsylvania Electric | ||||||||
6.150%, 10/01/2038 | 3,600 | 4,206 | ||||||
6.050%, 09/01/2017 | 50 | 58 | ||||||
Potomac Electric Power | ||||||||
4.150%, 03/15/2043 | 2,000 | 1,999 | ||||||
PPL Electric Utilities | ||||||||
5.200%, 07/15/2041 | 1,100 | 1,272 | ||||||
PPL Energy Supply | ||||||||
4.600%, 12/15/2021 | 100 | 106 | ||||||
Progress Energy | ||||||||
7.050%, 03/15/2019 | 1,720 | 2,145 | ||||||
4.400%, 01/15/2021 | 25 | 28 | ||||||
PSEG Power | ||||||||
5.125%, 04/15/2020 | 50 | 56 | ||||||
4.150%, 09/15/2021 | 127 | 134 | ||||||
Public Service Electric & Gas MTN | ||||||||
3.650%, 09/01/2042 | 4,035 | 3,731 | ||||||
Public Service of Colorado | ||||||||
6.250%, 09/01/2037 | 1,910 | 2,504 | ||||||
3.950%, 03/15/2043 | 5,310 | 5,161 | ||||||
Public Service of Oklahoma | ||||||||
4.400%, 02/01/2021 | 27 | 30 | ||||||
Puget Sound Energy | ||||||||
5.795%, 03/15/2040 | 300 | 371 | ||||||
San Diego Gas & Electric | ||||||||
6.000%, 06/01/2026 | 625 | 801 | ||||||
Sempra Energy | ||||||||
9.800%, 02/15/2019 | 50 | 69 | ||||||
6.000%, 10/15/2039 | 4,000 | 4,833 | ||||||
| Description | Face Amount ($ Thousands) | Market Value ($ Thousands) | ||||||
South Carolina Electric & Gas | ||||||||
5.450%, 02/01/2041 | $ | 85 | $ | 99 | ||||
Southern California Edison | ||||||||
6.000%, 01/15/2034 | 385 | 486 | ||||||
5.950%, 02/01/2038 | 510 | 642 | ||||||
5.500%, 08/15/2018 | 25 | 30 | ||||||
5.500%, 03/15/2040 | 160 | 192 | ||||||
4.050%, 03/15/2042 | 6,405 | 6,272 | ||||||
Southern California Gas | ||||||||
3.750%, 09/15/2042 | 2,360 | 2,241 | ||||||
Southern Natural Gas | ||||||||
8.000%, 03/01/2032 | 400 | 563 | ||||||
7.350%, 02/15/2031 | 2,960 | 3,839 | ||||||
Southern Union | ||||||||
8.250%, 11/15/2029 | 1,500 | 1,910 | ||||||
Southwestern Electric Power | ||||||||
6.200%, 03/15/2040 | 1,734 | 2,114 | ||||||
Southwestern Public Service | ||||||||
8.750%, 12/01/2018 | 40 | 53 | ||||||
Texas-New Mexico Power | ||||||||
6.950%, 04/01/2043 (A) | 2,500 | 3,297 | ||||||
Tucson Electric Power | ||||||||
3.850%, 03/15/2023 | 2,250 | 2,239 | ||||||
Union Electric | ||||||||
8.450%, 03/15/2039 | 2,930 | 4,752 | ||||||
Virginia Electric and Power | ||||||||
8.875%, 11/15/2038 | 235 | 389 | ||||||
Wisconsin Electric Power | ||||||||
2.950%, 09/15/2021 | 3 | 3 | ||||||
|
| |||||||
| 256,809 | ||||||||
|
| |||||||
Total Corporate Obligations | 1,965,687 | |||||||
|
| |||||||
MUNICIPAL BONDS — 2.1% | ||||||||
City of Chicago, GO | ||||||||
6.257%, 01/01/2040 | 1,280 | 1,384 | ||||||
City of Houston, Ser A, GO | ||||||||
6.290%, 03/01/2032 | 3,650 | 4,537 | ||||||
City of New York, GO | ||||||||
5.985%, 12/01/2036 | 1,175 | 1,456 | ||||||
City of San Francisco, Public Utilities Commission Water Revenue, Ser DE, RB | ||||||||
6.000%, 11/01/2040 | 400 | 488 | ||||||
Indianapolis, Local Public Improvement Bond Bank, Build America Project, RB | ||||||||
6.116%, 01/15/2040 | 2,280 | 2,923 | ||||||
Los Angeles, Department of Water & Power, Ser C, RB | ||||||||
5.516%, 07/01/2027 | 1,905 | 2,287 | ||||||
Los Angeles, Community College District, Build America Project, GO | ||||||||
6.750%, 08/01/2049 | 750 | 1,049 | ||||||
| SEI Institutional Investments Trust / Annual Report / May 31, 2013 | 179 |
Table of Contents
SCHEDULE OF INVESTMENTS
Long Duration Corporate Bond Fund (Continued)
May 31, 2013
| Description | Face Amount ($ Thousands) | Market Value ($ Thousands) | ||||||
Los Angeles, Community College District, Ser D, GO | ||||||||
6.680%, 08/01/2036 | $ | 1,000 | $ | 1,358 | ||||
New Jersey State, Turnpike Authority, RB | ||||||||
7.414%, 01/01/2040 | 100 | 145 | ||||||
New Jersey, State Turnpike Authority, Build America Project, RB | ||||||||
7.102%, 01/01/2041 | 100 | 140 | ||||||
New York City, Build America Project, GO | ||||||||
5.206%, 10/01/2031 | 1,500 | 1,725 | ||||||
Ohio State University, Build America Project, RB | ||||||||
4.910%, 06/01/2040 | 1,685 | 1,864 | ||||||
Port Authority of New York & New Jersey, Build America Project, RB | ||||||||
4.926%, 10/01/2051 | 495 | 539 | ||||||
Port Authority of New York & New Jersey, RB | ||||||||
4.458%, 10/01/2062 | 600 | 585 | ||||||
San Diego County, Water Authority, Build America Project, RB | ||||||||
6.138%, 05/01/2049 | 1,910 | 2,458 | ||||||
San Francisco, Public Utilities, RB | ||||||||
6.000%, 11/01/2040 | 1,250 | 1,528 | ||||||
State of California, Build America Project, GO | ||||||||
7.625%, 03/01/2040 | 200 | 287 | ||||||
7.600%, 11/01/2040 | 950 | 1,379 | ||||||
7.550%, 04/01/2039 | 90 | 129 | ||||||
State of Connecticut, Ser A, GO | ||||||||
5.850%, 03/15/2032 | 2,210 | 2,701 | ||||||
State of Illinois, GO | ||||||||
5.100%, 06/01/2033 | 2,900 | 2,910 | ||||||
State of Missouri, Health & Education, Ser A, RB | ||||||||
3.685%, 02/15/2047 | 1,135 | 1,103 | ||||||
State of New York, Build America Project, RB | ||||||||
5.770%, 03/15/2039 | 4,180 | 5,054 | ||||||
State of Texas, Transportation Communication Authority, Build America Project, Ser B, RB | ||||||||
5.178%, 04/01/2030 | 1,730 | 2,060 | ||||||
State of Washington, Build America Project, Ser D, GO | ||||||||
5.481%, 08/01/2039 | 815 | 981 | ||||||
University of California, Build America Project, RB | ||||||||
5.770%, 05/15/2043 | 250 | 300 | ||||||
| Description | Face Amount ($ Thousands)/Shares | Market Value ($ Thousands) | ||||||
University of California, Build America Project, Ser AD, RB | ||||||||
4.858%, 05/15/2112 | $ | 2,800 | $ | 2,756 | ||||
|
| |||||||
Total Municipal Bonds |
| 44,126 | ||||||
|
| |||||||
U.S. GOVERNMENT AGENCY OBLIGATIONS — 0.3% |
| |||||||
Tennessee Valley Authority | ||||||||
5.375%, 04/01/2056 | 3,935 | 4,837 | ||||||
3.500%, 12/15/2042 | 2,525 | 2,314 | ||||||
|
| |||||||
Total U.S. Government Agency Obligations |
| 7,151 | ||||||
|
| |||||||
SOVEREIGN DEBT — 0.2% | ||||||||
International Bank for Reconstruction & Development MTN | ||||||||
3.482%, 10/31/2030 (D) | 2,605 | 1,299 | ||||||
Province of Quebec Canada MTN | ||||||||
6.350%, 01/30/2026 | 2,000 | 2,624 | ||||||
|
| |||||||
Total Sovereign Debt |
| 3,923 | ||||||
|
| |||||||
U.S. TREASURY OBLIGATIONS — 1.5% |
| |||||||
U.S. Treasury Bills (D) (E) | ||||||||
0.079%, 08/22/2013 | 535 | 535 | ||||||
U.S. Treasury Bonds | ||||||||
6.125%, 08/15/2029 | 1,967 | 2,828 | ||||||
3.125%, 02/15/2043 | 12,610 | 12,208 | ||||||
2.750%, 08/15/2042 | 14,540 | 13,032 | ||||||
2.750%, 11/15/2042 | 1,660 | 1,486 | ||||||
U.S. Treasury Notes | ||||||||
1.750%, 05/15/2023 | 2,275 | 2,192 | ||||||
|
| |||||||
Total U.S. Treasury Obligations |
| 32,281 | ||||||
|
| |||||||
CASH EQUIVALENT — 1.5% | ||||||||
SEI Daily Income Trust, |
| |||||||
0.010%*† | 30,301,678 | 30,302 | ||||||
|
| |||||||
Total Cash Equivalent |
| 30,302 | ||||||
|
| |||||||
Total Investments — 100.0% |
| $ | 2,083,470 | |||||
|
| |||||||
| 180 | SEI Institutional Investments Trust / Annual Report / May 31, 2013 |
Table of Contents
A list of the open futures contracts held by the Fund at May 31, 2013, is as follows:
| Type of Contract | Number of Contracts Long (Short) | Expiration Date | Unrealized Appreciation (Depreciation) ($ Thousands) | |||||||||
U.S. 10-Year Treasury Note | (495 | ) | Jun-2013 | $ | 788 | |||||||
U.S. 10-Year Treasury Note | (62 | ) | Sep-2013 | (2 | ) | |||||||
U.S. 2-Year Treasury Note | (323 | ) | Jun-2013 | 47 | ||||||||
U.S. 5-Year Treasury Note | (112 | ) | Jun-2013 | 67 | ||||||||
U.S. 5-Year Treasury Note | (452 | ) | Oct-2013 | 53 | ||||||||
U.S. Long Treasury Bond | 72 | Sep-2013 | (135 | ) | ||||||||
U.S. Ultra Long Treasury Bond | 383 | Dec-2013 | (720 | ) | ||||||||
|
| |||||||||||
| $ | 98 | |||||||||||
|
| |||||||||||
For the year ended May 31, 2013, the total amount of all open futures contracts, as
presented in the table above, are representative of the volume of activity for this
derivative type during the year.
Percentages are based on a Net Assets of $2,082,952 ($ Thousands).
| * | The rate reported is the 7-day effective yield as of May 31, 2013. |
| † | Investment in Affiliated Security (see Note 5). |
| †† | More narrow industries are utilized for compliance purposes, whereas broad sectors are utilized for reporting purposes. |
| ‡ | Real Estate Investment Trust. |
| (A) | Securities sold within terms of a private placement memorandum, exempt from registration under Section 144A of the Securities Act of 1933, as amended, and may be sold only to dealers in that program or other “accredited investors.” These securities have been determined to be liquid under guidelines established by the Board of Trustees. |
| (B) | Variable Rate Security — The rate reported on the Schedule of Investments is the rate in effect as of May 31, 2013. The date reported on the Schedule of Investments is the final maturity date. |
| (C) | Step Bonds — The rate reflected on the Schedule of Investments is the effective yield on May 31, 2013. The coupon on a step bond changes on a specified date. |
| (D) | The rate reported is the effective yield at time of purchase. |
| (E) | Security, or portion thereof, has been pledged as collateral on open futures contracts. |
Cl — Class
GO — General Obligation
MTN — Medium Term Note
RB — Revenue Bond
Ser — Series
The following is a list of the inputs used as of May 31, 2013, in valuing the Fund’s investments and other financial instruments carried at value ($ Thousands):
| Investments in Securities | Level 1 | Level 2 | Level 3 | Total | ||||||||||||
Corporate Obligations | $ | — | $ | 1,965,687 | $ | — | $ | 1,965,687 | ||||||||
Municipal Bonds | — | 44,126 | — | 44,126 | ||||||||||||
U.S. Government Agency Obligations | — | 7,151 | — | 7,151 | ||||||||||||
Sovereign Debt | — | 3,923 | — | 3,923 | ||||||||||||
U.S. Treasury Obligations | — | 32,281 | — | 32,281 | ||||||||||||
Cash Equivalent | 30,302 | — | — | 30,302 | ||||||||||||
|
|
|
|
|
|
|
| |||||||||
Total Investments in Securities | $ | 30,302 | $ | 2,053,168 | $ | — | $ | 2,083,470 | ||||||||
|
|
|
|
|
|
|
| |||||||||
| Other Financial Instruments | Level 1 | Level 2 | Level 3 | Total | ||||||||||||
Futures Contracts* | $ | 98 | $ | — | $ | — | $ | 98 | ||||||||
|
|
|
|
|
|
|
| |||||||||
| * | Futures contracts are valued at the unrealized appreciation on the instrument. |
For the year ended May 31, 2013, there were no transfers between Level 1 and Level 2 assets and liabilities.
For the year ended May 31, 2013, there were no transfers between Level 2 and Level 3 assets and liabilities.
For more information on valuation inputs, see Note 2 — Significant Accounting Policies in Notes to Financial Statements.
Amounts designated as “—” are $0 or have been rounded to $0.
The accompanying notes are an integral part of the financial statements.
| SEI Institutional Investments Trust / Annual Report / May 31, 2013 | 181 |
Table of Contents
SCHEDULE OF INVESTMENTS
Ultra Short Duration Bond Fund
May 31, 2013
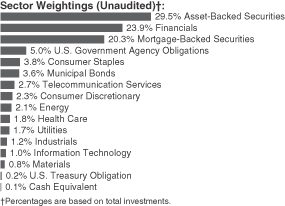
| Description | Face Amount ($ Thousands) | Market Value ($ Thousands) | ||||||
CORPORATE OBLIGATIONS — 40.1% |
| |||||||
Consumer Discretionary — 2.5% |
| |||||||
Amazon.com | ||||||||
0.650%, 11/27/2015 | $ | 825 | $ | 823 | ||||
Best Buy | ||||||||
7.250%, 07/15/2013 | 530 | 532 | ||||||
Comcast | ||||||||
5.850%, 11/15/2015 | 350 | 393 | ||||||
DIRECTV Holdings LLC | ||||||||
3.550%, 03/15/2015 | 650 | 679 | ||||||
Hasbro | ||||||||
6.125%, 05/15/2014 | 300 | 315 | ||||||
Johnson Controls | ||||||||
0.683%, 02/04/2014 (A) | 1,140 | 1,143 | ||||||
Maytag MTN | ||||||||
6.450%, 08/15/2014 | 1,300 | 1,384 | ||||||
NBCUniversal Enterprise | ||||||||
0.965%, 04/15/2018 (A) (B) | 1,400 | 1,412 | ||||||
0.817%, 04/15/2016 (A) (B) | 765 | 768 | ||||||
NBCUniversal Media LLC | ||||||||
2.100%, 04/01/2014 | 1,608 | 1,629 | ||||||
Newell Rubbermaid | ||||||||
2.000%, 06/15/2015 | 700 | 712 | ||||||
Thomson Reuters | ||||||||
0.875%, 05/23/2016 | 1,250 | 1,243 | ||||||
Time Warner Cable | ||||||||
7.500%, 04/01/2014 | 685 | 723 | ||||||
Viacom | ||||||||
1.250%, 02/27/2015 | 590 | 593 | ||||||
Walt Disney MTN | ||||||||
0.450%, 12/01/2015 | 1,000 | 998 | ||||||
|
| |||||||
| 13,347 | ||||||||
|
| |||||||
Consumer Staples — 3.6% | ||||||||
Anheuser-Busch InBev Worldwide | ||||||||
4.125%, 01/15/2015 | 1,200 | 1,265 | ||||||
0.800%, 07/15/2015 | 500 | 501 | ||||||
0.637%, 07/14/2014 (A) | 855 | 858 | ||||||
| Description | Face Amount ($ Thousands) | Market Value ($ Thousands) | ||||||
BAT International Finance | ||||||||
1.400%, 06/05/2015 (B) | $ | 1,365 | $ | 1,377 | ||||
Bottling Group LLC | ||||||||
6.950%, 03/15/2014 | 750 | 787 | ||||||
Campbell Soup | ||||||||
0.574%, 08/01/2014 (A) | 1,150 | 1,152 | ||||||
Coca-Cola Enterprises | ||||||||
0.590%, 02/18/2014 (A) | 725 | 727 | ||||||
ConAgra Foods | ||||||||
1.300%, 01/25/2016 | 1,250 | 1,258 | ||||||
Costco Wholesale | ||||||||
0.650%, 12/07/2015 | 2,155 | 2,161 | ||||||
General Mills | ||||||||
0.576%, 01/29/2016 (A) | 1,250 | 1,251 | ||||||
Heineken | ||||||||
0.800%, 10/01/2015 (B) | 390 | 389 | ||||||
Kellogg | ||||||||
0.505%, 02/13/2015 (A) | 1,000 | 1,002 | ||||||
Kimberly-Clark | ||||||||
0.394%, 05/15/2016 (A) | 1,390 | 1,389 | ||||||
Kraft Foods Group | ||||||||
1.625%, 06/04/2015 | 750 | 760 | ||||||
PepsiCo | ||||||||
0.800%, 08/25/2014 | 745 | 748 | ||||||
Philip Morris International | ||||||||
2.500%, 05/16/2016 | 750 | 785 | ||||||
Reynolds American | ||||||||
1.050%, 10/30/2015 | 310 | 311 | ||||||
SABMiller Holdings | ||||||||
1.850%, 01/15/2015 (B) | 700 | 711 | ||||||
Walgreen | ||||||||
0.780%, 03/13/2014 (A) | 1,600 | 1,603 | ||||||
|
| |||||||
| 19,035 | ||||||||
|
| |||||||
Energy — 1.5% | ||||||||
BP Capital Markets | ||||||||
0.881%, 03/11/2014 (A) | 245 | 246 | ||||||
0.785%, 05/10/2018 (A) | 1,500 | 1,504 | ||||||
0.700%, 11/06/2015 | 1,120 | 1,117 | ||||||
Kinder Morgan Energy Partners | ||||||||
5.000%, 12/15/2013 | 750 | 767 | ||||||
Schlumberger Investment | ||||||||
0.830%, 09/12/2014 (A) (B) | 870 | 876 | ||||||
Schlumberger Norge | ||||||||
1.250%, 08/01/2017 (B) | 205 | 203 | ||||||
Total Capital Canada | ||||||||
0.657%, 01/15/2016 (A) | 1,960 | 1,969 | ||||||
TransCanada PipeLines | ||||||||
0.750%, 01/15/2016 | 1,175 | 1,171 | ||||||
|
| |||||||
| 7,853 | ||||||||
|
| |||||||
Financials — 24.2% | ||||||||
ABN AMRO Bank | ||||||||
1.375%, 01/22/2016 (B) | 1,000 | 1,001 | ||||||
| 182 | SEI Institutional Investments Trust / Annual Report / May 31, 2013 |
Table of Contents
| Description | Face Amount ($ Thousands) | Market Value ($ Thousands) | ||||||
American Express | ||||||||
0.863%, 05/22/2018 (A) | $ | 1,000 | $ | 1,002 | ||||
American Express Centurion Bank | ||||||||
0.725%, 11/13/2015 (A) | 1,210 | 1,212 | ||||||
American Honda Finance MTN | ||||||||
1.000%, 08/11/2015 (B) | 643 | 647 | ||||||
0.648%, 05/26/2016 (A) (B) | 2,600 | 2,603 | ||||||
American International Group | ||||||||
4.250%, 09/15/2014 | 1,350 | 1,408 | ||||||
Australia & New Zealand Banking | ||||||||
0.835%, 05/15/2018 (A) | 625 | 625 | ||||||
Bank of America MTN | ||||||||
1.696%, 01/30/2014 (A) | 570 | 574 | ||||||
1.500%, 10/09/2015 | 2,015 | 2,027 | ||||||
1.250%, 01/11/2016 | 850 | 848 | ||||||
Bank of Montreal | ||||||||
1.300%, 10/31/2014 (B) | 1,325 | 1,341 | ||||||
0.879%, 04/09/2018 (A) | 1,000 | 1,005 | ||||||
Bank of New York Mellon MTN | ||||||||
3.100%, 01/15/2015 | 800 | 834 | ||||||
0.714%, 03/06/2018 (A) | 700 | 701 | ||||||
0.546%, 07/28/2014 (A) | 925 | 927 | ||||||
Bank of Nova Scotia | ||||||||
1.850%, 01/12/2015 | 1,525 | 1,554 | ||||||
0.950%, 03/15/2016 | 500 | 501 | ||||||
0.721%, 09/11/2015 (A) | 625 | 627 | ||||||
Bank of Tokyo-Mitsubishi UFJ | ||||||||
0.723%, 02/26/2016 (A) (B) | 750 | 751 | ||||||
BB&T MTN | ||||||||
3.375%, 09/25/2013 | 871 | 879 | ||||||
0.976%, 04/28/2014 (A) | 1,180 | 1,186 | ||||||
Berkshire Hathaway | ||||||||
0.800%, 02/11/2016 | 700 | �� | 702 | |||||
BNP Paribas MTN | ||||||||
3.030%, 12/20/2014 (A) | 1,030 | 1,066 | ||||||
BPCE | ||||||||
2.375%, 10/04/2013 (B) | 696 | 700 | ||||||
1.526%, 04/25/2016 (A) | 950 | 957 | ||||||
Caisse Centrale Desjardins du Quebec | ||||||||
1.700%, 09/16/2013 (B) | 1,345 | 1,350 | ||||||
Canadian Imperial Bank of Commerce | ||||||||
0.900%, 09/19/2014 (B) | 300 | 302 | ||||||
0.900%, 10/01/2015 | 525 | 526 | ||||||
Capital One | ||||||||
0.734%, 03/22/2016 (A) | 1,250 | 1,248 | ||||||
Capital One Financial | ||||||||
2.150%, 03/23/2015 | 800 | 816 | ||||||
1.427%, 07/15/2014 (A) | 1,626 | 1,641 | ||||||
Caterpillar Financial Services MTN | ||||||||
1.100%, 05/29/2015 | 600 | 606 | ||||||
CDP Financial | ||||||||
3.000%, 11/25/2014 (B) | 1,710 | 1,771 | ||||||
Citigroup | ||||||||
4.875%, 05/07/2015 | 750 | 796 | ||||||
| Description | Face Amount ($ Thousands) | Market Value ($ Thousands) | ||||||
1.250%, 01/15/2016 | $ | 2,350 | $ | 2,347 | ||||
Cooperatieve Centrale | ||||||||
2.125%, 10/13/2015 | 1,940 | 1,998 | ||||||
0.760%, 03/18/2016 (A) | 1,000 | 1,004 | ||||||
Credit Agricole Home Loan SFH | ||||||||
1.026%, 07/21/2014 (A) (B) | 800 | 803 | ||||||
Credit Suisse NY | ||||||||
2.200%, 01/14/2014 | 475 | 480 | ||||||
1.237%, 01/14/2014 (A) | 1,340 | 1,347 | ||||||
Daimler Finance North America LLC | ||||||||
2.300%, 01/09/2015 (B) | 825 | 841 | ||||||
1.250%, 01/11/2016 (B) | 750 | 750 | ||||||
1.059%, 04/10/2014 (A) (B) | 550 | 552 | ||||||
0.879%, 01/09/2015 (A) (B) | 1,380 | 1,385 | ||||||
Danske Bank | ||||||||
1.327%, 04/14/2014 (A) (B) | 775 | 779 | ||||||
ERAC USA Finance LLC | ||||||||
2.750%, 07/01/2013 (B) | 352 | 353 | ||||||
2.250%, 01/10/2014 (B) | 186 | 188 | ||||||
1.400%, 04/15/2016 (B) | 335 | 335 | ||||||
Fifth Third Bank | ||||||||
0.683%, 02/26/2016 (A) | 1,320 | 1,320 | ||||||
Ford Motor Credit LLC | ||||||||
1.525%, 05/09/2016 (A) | 1,170 | 1,175 | ||||||
General Electric Capital MTN | ||||||||
1.314%, 07/02/2015 (A) | 1,635 | 1,657 | ||||||
1.145%, 05/09/2016 (A) | 625 | 633 | ||||||
0.994%, 04/02/2018 (A) | 500 | 503 | ||||||
Glencore Funding LLC | ||||||||
1.431%, 05/27/2016 (A) (B) | 1,350 | 1,349 | ||||||
Goldman Sachs Group MTN | ||||||||
1.600%, 11/23/2015 | 875 | 885 | ||||||
1.476%, 04/30/2018 (A) | 875 | 879 | ||||||
1.274%, 11/21/2014 (A) | 810 | 815 | ||||||
0.777%, 01/12/2015 (A) | 1,170 | 1,169 | ||||||
Hartford Financial Services Group | ||||||||
4.625%, 07/15/2013 | 455 | 457 | ||||||
HSBC Bank | ||||||||
1.078%, 01/17/2014 (A) (B) | 639 | 642 | ||||||
0.915%, 05/15/2018 (A) (B) | 650 | 647 | ||||||
HSBC Bank USA NY | ||||||||
4.625%, 04/01/2014 | 1,200 | 1,240 | ||||||
HSBC USA | ||||||||
2.375%, 02/13/2015 | 1,320 | 1,355 | ||||||
Hyundai Capital America | ||||||||
1.625%, 10/02/2015 (B) | 870 | 876 | ||||||
ING Bank | ||||||||
2.000%, 10/18/2013 (B) | 435 | 437 | ||||||
1.924%, 09/25/2015 (A) (B) | 890 | 906 | ||||||
ING US | ||||||||
3.150%, 02/15/2018 (B) | 650 | 662 | ||||||
International Lease Finance | ||||||||
6.500%, 09/01/2014 (B) | 850 | 901 | ||||||
| SEI Institutional Investments Trust / Annual Report / May 31, 2013 | 183 |
Table of Contents
SCHEDULE OF INVESTMENTS
Ultra Short Duration Bond Fund (Continued)
May 31, 2013
| Description | Face Amount ($ Thousands) | Market Value ($ Thousands) | ||||||
Intesa Sanpaolo | ||||||||
3.125%, 01/15/2016 | $ | 650 | $ | 646 | ||||
JPMorgan Chase | ||||||||
4.650%, 06/01/2014 | 653 | 680 | ||||||
1.176%, 01/25/2018 (A) | 675 | 681 | ||||||
1.102%, 01/24/2014 (A) | 130 | 131 | ||||||
0.937%, 10/15/2015 (A) | 585 | 588 | ||||||
0.893%, 02/26/2016 (A) | 1,830 | 1,836 | ||||||
Manufacturers & Traders Trust | ||||||||
0.575%, 03/07/2016 (A) | 610 | 610 | ||||||
MassMutual Global Funding II | ||||||||
0.657%, 01/14/2014 (A) (B) | 1,312 | 1,315 | ||||||
MetLife Institutional Funding II | ||||||||
0.650%, 01/06/2015 (A) (B) | 1,630 | 1,633 | ||||||
Metropolitan Life Global Funding I | ||||||||
1.700%, 06/29/2015 (B) | 1,000 | 1,018 | ||||||
1.500%, 01/10/2018 (B) | 740 | 733 | ||||||
Monumental Global Funding | ||||||||
0.477%, 01/15/2014 (A) (B) | 697 | 697 | ||||||
Morgan Stanley | ||||||||
1.523%, 02/25/2016 (A) | 2,420 | 2,430 | ||||||
National Rural Utilities Cooperative Finance | ||||||||
1.000%, 02/02/2015 | 750 | 756 | ||||||
0.555%, 04/04/2014 (A) | 200 | 200 | ||||||
0.523%, 05/27/2016 (A) | 1,650 | 1,650 | ||||||
0.356%, 02/18/2014 (A) | 675 | 675 | ||||||
New York Life Global Funding | ||||||||
0.800%, 02/12/2016 (B) | 790 | 787 | ||||||
Nissan Motor Acceptance | ||||||||
4.500%, 01/30/2015 (B) | 835 | 884 | ||||||
Nordea Bank | ||||||||
1.750%, 10/04/2013 (B) | 435 | 437 | ||||||
0.735%, 05/13/2016 (A) (B) | 900 | 900 | ||||||
PACCAR Financial MTN | ||||||||
0.545%, 02/08/2016 (A) | 1,000 | 1,004 | ||||||
Pentair Finance | ||||||||
1.350%, 12/01/2015 | 345 | 346 | ||||||
Petrobras Global Finance BV | ||||||||
1.894%, 05/20/2016 (A) | 2,800 | 2,822 | ||||||
PNC Bank | ||||||||
0.800%, 01/28/2016 | 1,000 | 998 | ||||||
0.596%, 04/29/2016 (A) | 1,230 | 1,230 | ||||||
Pricoa Global Funding I | ||||||||
5.450%, 06/11/2014 (B) | 671 | 705 | ||||||
Principal Life Global Funding II | ||||||||
1.000%, 12/11/2015 (B) | 1,265 | 1,268 | ||||||
0.904%, 07/09/2014 (A) (B) | 400 | 402 | ||||||
0.643%, 05/27/2016 (A) (B) | 1,030 | 1,030 | ||||||
Principal Life Income Funding | ||||||||
5.100%, 04/15/2014 | 540 | 561 | ||||||
0.473%, 11/08/2013 (A) | 250 | 250 | ||||||
Prudential Financial MTN | ||||||||
5.100%, 09/20/2014 | 638 | 673 | ||||||
| Description | Face Amount ($ Thousands) | Market Value ($ Thousands) | ||||||
Royal Bank of Canada MTN | ||||||||
0.850%, 03/08/2016 | $ | 1,780 | $ | 1,778 | ||||
0.645%, 03/08/2016 (A) | 800 | 802 | ||||||
0.510%, 01/06/2015 (A) | 900 | 900 | ||||||
Royal Bank of Scotland Group | ||||||||
2.550%, 09/18/2015 | 295 | 303 | ||||||
Simon Property Group‡ | ||||||||
6.750%, 05/15/2014 | 900 | 938 | ||||||
SLM MTN | ||||||||
3.875%, 09/10/2015 | 400 | 408 | ||||||
Societe Generale | ||||||||
2.200%, 09/14/2013 (B) | 725 | 728 | ||||||
SSIF Nevada | ||||||||
0.977%, 04/14/2014 (A) (B) | 100 | 101 | ||||||
Standard Chartered | ||||||||
1.225%, 05/12/2014 (A) (B) | 775 | 781 | ||||||
State Street | ||||||||
0.631%, 03/07/2014 (A) | 590 | 591 | ||||||
Sumitomo Mitsui Banking | ||||||||
1.350%, 07/18/2015 | 650 | 657 | ||||||
Sun Life Financial Global Funding III | ||||||||
0.530%, 10/06/2013 (A) (B) | 795 | 795 | ||||||
SunTrust Banks | ||||||||
3.600%, 04/15/2016 | 1,250 | 1,332 | ||||||
Svenska Handelsbanken | ||||||||
0.732%, 03/21/2016 (A) | 1,000 | 1,003 | ||||||
Swedbank Hypotek | ||||||||
0.734%, 03/28/2014 (A) (B) | 925 | 928 | ||||||
Toronto-Dominion Bank | ||||||||
0.577%, 07/14/2014 (A) | 1,250 | 1,253 | ||||||
0.453%, 05/01/2015 (A) | 2,205 | 2,205 | ||||||
Toyota Motor Credit | ||||||||
0.564%, 05/17/2016 (A) | 2,760 | 2,761 | ||||||
TSMC Global | ||||||||
0.950%, 04/03/2016 (B) | 550 | 546 | ||||||
UBS MTN | ||||||||
5.875%, 07/15/2016 | 1,000 | 1,121 | ||||||
US Bank | ||||||||
0.557%, 10/14/2014 (A) | 1,140 | 1,141 | ||||||
USAA Capital | ||||||||
3.500%, 07/17/2014 (B) | 450 | 465 | ||||||
Ventas Realty‡ | ||||||||
3.125%, 11/30/2015 | 717 | 755 | ||||||
Volkswagen International Finance | ||||||||
2.875%, 04/01/2016 (B) | 1,225 | 1,282 | ||||||
1.625%, 08/12/2013 (B) | 231 | 231 | ||||||
0.894%, 04/01/2014 (A) (B) | 925 | 926 | ||||||
Wachovia Bank | ||||||||
0.653%, 11/03/2014 (A) | 2,450 | 2,455 | ||||||
Wells Fargo MTN | ||||||||
1.500%, 07/01/2015 | 750 | 761 | ||||||
0.906%, 04/23/2018 (A) | 1,250 | 1,258 | ||||||
Western Union | ||||||||
2.375%, 12/10/2015 | 145 | 147 | ||||||
|
| |||||||
| 126,332 | ||||||||
|
| |||||||
| 184 | SEI Institutional Investments Trust / Annual Report / May 31, 2013 |
Table of Contents
| Description | Face Amount ($ Thousands) | Market Value ($ Thousands) | ||||||
Health Care — 1.8% |
| |||||||
AbbVie | ||||||||
1.200%, 11/06/2015 (B) | $ | 2,511 | $ | 2,521 | ||||
Express Scripts Holding | ||||||||
2.750%, 11/21/2014 | 1,400 | 1,437 | ||||||
McKesson | ||||||||
0.950%, 12/04/2015 | 395 | 396 | ||||||
Merck | ||||||||
0.464%, 05/18/2016 (A) | 900 | 901 | ||||||
Quest Diagnostics | ||||||||
1.134%, 03/24/2014 (A) | 850 | 854 | ||||||
Sanofi | ||||||||
0.594%, 03/28/2014 (A) | 200 | 201 | ||||||
Teva Pharmaceutical Finance III BV | ||||||||
0.782%, 03/21/2014 (A) | 1,590 | 1,595 | ||||||
Thermo Fisher Scientific | ||||||||
2.050%, 02/21/2014 | 189 | 191 | ||||||
UnitedHealth Group | ||||||||
0.398%, 08/28/2014 (A) | 1,000 | 1,001 | ||||||
WellPoint | ||||||||
1.250%, 09/10/2015 | 211 | 212 | ||||||
|
| |||||||
| 9,309 | ||||||||
|
| |||||||
Industrials — 1.1% |
| |||||||
Boeing | ||||||||
0.283%, 11/03/2014 (A) | 1,270 | 1,271 | ||||||
Danaher | ||||||||
1.300%, 06/23/2014 | 1,170 | 1,180 | ||||||
General Electric | ||||||||
0.850%, 10/09/2015 | 2,295 | 2,300 | ||||||
Penske Truck Leasing | ||||||||
2.500%, 07/11/2014 (B) | 85 | 87 | ||||||
Precision Castparts | ||||||||
0.700%, 12/20/2015 | 235 | 235 | ||||||
Tyco Electronics Group | ||||||||
5.950%, 01/15/2014 | 445 | 459 | ||||||
|
| |||||||
| 5,532 | ||||||||
|
| |||||||
Information Technology — 0.9% |
| |||||||
Dell | ||||||||
0.884%, 04/01/2014 (A) | 500 | 499 | ||||||
Hewlett-Packard | ||||||||
0.673%, 05/30/2014 (A) | 1,550 | 1,546 | ||||||
Xerox | ||||||||
1.094%, 05/16/2014 (A) | 2,495 | 2,492 | ||||||
|
| |||||||
| 4,537 | ||||||||
|
| |||||||
Materials — 0.7% |
| |||||||
Anglo American Capital | ||||||||
2.150%, 09/27/2013 (B) | 869 | 872 | ||||||
Rio Tinto Finance USA | ||||||||
8.950%, 05/01/2014 | 1,000 | 1,074 | ||||||
| Description | Face Amount ($ Thousands) | Market Value ($ Thousands) | ||||||
Xstrata Finance Canada | ||||||||
2.050%, 10/23/2015 (B) | $ | 1,350 | $ | 1,361 | ||||
Yara International | ||||||||
5.250%, 12/15/2014 (B) | 450 | 476 | ||||||
|
| |||||||
| 3,783 | ||||||||
|
| |||||||
Telecommunication Services — 2.1% |
| |||||||
AT&T | ||||||||
0.800%, 12/01/2015 | 800 | 799 | ||||||
0.660%, 02/12/2016 (A) | 2,850 | 2,854 | ||||||
BellSouth | ||||||||
5.200%, 09/15/2014 | 361 | 382 | ||||||
British Telecommunications | ||||||||
1.405%, 12/20/2013 (A) | 1,350 | 1,357 | ||||||
Cellco Partnership | ||||||||
5.550%, 02/01/2014 | 1,090 | 1,124 | ||||||
Qwest | ||||||||
3.530%, 06/15/2013 (A) | 410 | 410 | ||||||
Telecom Italia Capital | ||||||||
5.250%, 11/15/2013 | 620 | 631 | ||||||
Verizon Communications | ||||||||
1.250%, 11/03/2014 | 750 | 757 | ||||||
0.474%, 03/06/2015 (A) (B) | 1,550 | 1,547 | ||||||
Vodafone Group | ||||||||
0.659%, 02/19/2016 (A) | 1,200 | 1,201 | ||||||
|
| |||||||
| 11,062 | ||||||||
|
| |||||||
Utilities — 1.7% |
| |||||||
Appalachian Power | ||||||||
0.665%, 08/16/2013 (A) | 850 | 850 | ||||||
Commonwealth Edison | ||||||||
1.625%, 01/15/2014 | 264 | 266 | ||||||
Dominion Resources | ||||||||
1.800%, 03/15/2014 | 1,100 | 1,110 | ||||||
DTE Energy | ||||||||
0.987%, 06/03/2013 (A) | 1,180 | 1,180 | ||||||
Duke Energy | ||||||||
6.300%, 02/01/2014 | 1,030 | 1,068 | ||||||
Duke Energy, Carolinas LLC | ||||||||
5.750%, 11/15/2013 | 175 | 179 | ||||||
Georgia Power | ||||||||
1.300%, 09/15/2013 | 225 | 225 | ||||||
0.600%, 03/15/2016 (A) | 1,180 | 1,181 | ||||||
NextEra Energy Capital Holdings | ||||||||
1.611%, 06/01/2014 | 350 | 353 | ||||||
Northeast Utilities | ||||||||
1.030%, 09/20/2013 (A) | 615 | 616 | ||||||
Pacific Gas & Electric | ||||||||
6.250%, 12/01/2013 | 500 | 514 | ||||||
Sempra Energy | ||||||||
1.040%, 03/15/2014 (A) | 1,200 | 1,205 | ||||||
|
| |||||||
| 8,747 | ||||||||
|
| |||||||
Total Corporate Obligations | 209,537 | |||||||
|
| |||||||
| SEI Institutional Investments Trust / Annual Report / May 31, 2013 | 185 |
Table of Contents
SCHEDULE OF INVESTMENTS
Ultra Short Duration Bond Fund (Continued)
May 31, 2013
| Description | Face Amount ($ Thousands) | Market Value ($ Thousands) | ||||||
ASSET-BACKED SECURITIES — 28.7% |
| |||||||
Automotive — 18.1% |
| |||||||
Ally Auto Receivables Trust, | ||||||||
1.110%, 10/15/2014 | $ | 22 | $ | 22 | ||||
Ally Auto Receivables Trust, | ||||||||
0.910%, 11/17/2014 | 72 | 72 | ||||||
Ally Auto Receivables Trust, | ||||||||
2.450%, 06/15/2016 (B) | 410 | 419 | ||||||
Ally Auto Receivables Trust, | ||||||||
2.230%, 03/15/2016 | 1,000 | 1,015 | ||||||
Ally Auto Receivables Trust, | ||||||||
0.990%, 11/16/2015 | 658 | 660 | ||||||
Ally Auto Receivables Trust, | ||||||||
0.710%, 09/15/2014 | 230 | 230 | ||||||
Ally Auto Receivables Trust, | ||||||||
0.590%, 01/17/2017 | 675 | 675 | ||||||
Ally Auto Receivables Trust, | ||||||||
0.620%, 03/15/2017 | 700 | 700 | ||||||
Ally Auto Receivables Trust, | ||||||||
0.510%, 12/22/2014 | 1,297 | 1,297 | ||||||
Ally Auto Receivables Trust, | ||||||||
0.700%, 12/21/2015 | 325 | 325 | ||||||
Ally Auto Receivables Trust, | ||||||||
0.630%, 05/15/2017 | 1,600 | 1,597 | ||||||
Ally Auto Receivables Trust, | ||||||||
0.720%, 05/20/2016 | 1,145 | 1,145 | ||||||
Ally Master Owner Trust, | ||||||||
1.069%, 01/15/2016 (A) | 1,833 | 1,840 | ||||||
Ally Master Owner Trust, | ||||||||
1.810%, 05/15/2016 | 1,250 | 1,265 | ||||||
Ally Master Owner Trust, Ser 2011-4, Cl A2 | ||||||||
1.540%, 09/15/2016 | 517 | 523 | ||||||
Ally Master Owner Trust, | ||||||||
1.440%, 02/15/2017 | 500 | 506 | ||||||
Ally Master Owner Trust, | ||||||||
1.210%, 06/15/2017 | 515 | 518 | ||||||
| Description | Face Amount ($ Thousands) | Market Value ($ Thousands) | ||||||
Ally Master Owner Trust, | ||||||||
0.649%, 02/15/2018 (A) | $ | 610 | $ | 611 | ||||
Ally Master Owner Trust, Ser 2013-2, Cl A | ||||||||
0.649%, 04/15/2018 (A) | 1,425 | 1,425 | ||||||
AmeriCredit Automobile Receivables Trust, Ser 2010-1, Cl B | ||||||||
3.720%, 11/17/2014 | 35 | 35 | ||||||
AmeriCredit Automobile Receivables Trust, Ser 2010-3, Cl A3 | ||||||||
1.140%, 04/08/2015 | 54 | 54 | ||||||
AmeriCredit Automobile Receivables Trust, Ser 2010-4, Cl B | ||||||||
1.990%, 10/08/2015 | 1,453 | 1,460 | ||||||
AmeriCredit Automobile Receivables Trust, Ser 2010-A, Cl A3 | ||||||||
3.510%, 07/06/2017 | 402 | 411 | ||||||
AmeriCredit Automobile Receivables Trust, Ser 2011-1, Cl A3 | ||||||||
1.390%, 09/08/2015 | 567 | 568 | ||||||
AmeriCredit Automobile Receivables Trust, Ser 2011-3, Cl A3 | ||||||||
1.170%, 01/08/2016 | 1,728 | 1,732 | ||||||
AmeriCredit Automobile Receivables Trust, Ser 2011-3, Cl B | ||||||||
2.280%, 06/08/2016 | 345 | 351 | ||||||
AmeriCredit Automobile Receivables Trust, Ser 2011-4, Cl A2 | ||||||||
0.920%, 03/09/2015 | 113 | 113 | ||||||
AmeriCredit Automobile Receivables Trust, Ser 2012-1, Cl A2 | ||||||||
0.910%, 10/08/2015 | 161 | 161 | ||||||
AmeriCredit Automobile Receivables Trust, Ser 2012-2, Cl A3 | ||||||||
1.050%, 10/11/2016 | 140 | 141 | ||||||
AmeriCredit Automobile Receivables Trust, Ser 2012-3, Cl A2 | ||||||||
0.710%, 12/08/2015 | 579 | 580 | ||||||
AmeriCredit Automobile Receivables Trust, Ser 2012-5, Cl A3 | ||||||||
0.620%, 06/08/2017 | 675 | 675 | ||||||
AmeriCredit Automobile Receivables Trust, Ser 2013-1, Cl A2 | ||||||||
0.490%, 06/08/2016 | 875 | 875 | ||||||
AmeriCredit Automobile Receivables Trust, Ser 2013-2, Cl A3 | ||||||||
0.650%, 12/08/2017 | 930 | 929 | ||||||
ARI Fleet Lease Trust, Ser 2012- A, Cl A | ||||||||
0.749%, 03/15/2020 (A) (B) | 109 | 109 | ||||||
ARI Fleet Lease Trust, Ser 2012- B, Cl A | ||||||||
0.499%, 01/15/2021 (A) (B) | 1,203 | 1,204 | ||||||
| 186 | SEI Institutional Investments Trust / Annual Report / May 31, 2013 |
Table of Contents
| Description | Face Amount ($ Thousands) | Market Value ($ Thousands) | ||||||
ARI Fleet Lease Trust, Ser 2013- A, Cl A2 | ||||||||
0.700%, 12/15/2015 (B) | $ | 585 | $ | 585 | ||||
Avis Budget Rental Car Funding, | ||||||||
3.630%, 08/20/2014 (B) | 119 | 119 | ||||||
Avis Budget Rental Car Funding LLC, | ||||||||
1.850%, 11/20/2014 (B) | 422 | 424 | ||||||
CarMax Auto Owner Trust, | ||||||||
2.820%, 12/15/2014 | 97 | 97 | ||||||
CarMax Auto Owner Trust, | ||||||||
1.410%, 02/16/2015 | 135 | 136 | ||||||
CarMax Auto Owner Trust, | ||||||||
0.990%, 02/17/2015 | 237 | 237 | ||||||
CarMax Auto Owner Trust, | ||||||||
2.170%, 07/17/2017 | 875 | 898 | ||||||
CarMax Auto Owner Trust, | ||||||||
0.890%, 09/15/2016 | 347 | 349 | ||||||
CarMax Auto Owner Trust, | ||||||||
0.520%, 07/17/2017 | 385 | 385 | ||||||
CarMax Auto Owner Trust, | ||||||||
1.500%, 08/15/2018 | 225 | 224 | ||||||
CarMax Auto Owner Trust, | ||||||||
0.420%, 03/15/2016 | 425 | 425 | ||||||
CFC LLC, Ser 2013-1A, Cl A | ||||||||
1.650%, 07/17/2017 (B) | 215 | 215 | ||||||
Chesapeake Funding LLC, | ||||||||
1.448%, 04/07/2024 (A) (B) | 1,188 | 1,202 | ||||||
Chesapeake Funding LLC, | ||||||||
0.948%, 11/07/2023 (A) (B) | 2,160 | 2,170 | ||||||
Chesapeake Funding LLC, | ||||||||
0.648%, 05/07/2024 (A) (B) | 1,200 | 1,202 | ||||||
Credit Acceptance Auto Loan Trust, | ||||||||
1.210%, 10/15/2020 (B) | 560 | 558 | ||||||
Enterprise Fleet Financing LLC, | ||||||||
1.140%, 11/20/2017 (B) | 1,082 | 1,086 | ||||||
Enterprise Fleet Financing LLC, | ||||||||
0.720%, 04/20/2018 (B) | 1,000 | 1,000 | ||||||
| Description | Face Amount ($ Thousands) | Market Value ($ Thousands) | ||||||
Enterprise Fleet Financing LLC, | ||||||||
0.680%, 09/20/2018 (B) | $ | 1,235 | $ | 1,234 | ||||
Fifth Third Auto Trust, Ser 2013- A, Cl A2 | ||||||||
0.450%, 01/15/2016 | 1,005 | 1,005 | ||||||
First Investors Auto Owner Trust, | ||||||||
0.900%, 10/15/2018 (B) | 600 | 599 | ||||||
Ford Credit Auto Lease Trust, | ||||||||
1.420%, 01/15/2015 | 750 | 755 | ||||||
Ford Credit Auto Lease Trust, | ||||||||
0.540%, 11/15/2014 | 410 | 410 | ||||||
Ford Credit Auto Lease Trust, | ||||||||
0.570%, 09/15/2015 | 520 | 520 | ||||||
Ford Credit Auto Owner Trust, | ||||||||
0.980%, 10/15/2014 | 11 | 11 | ||||||
Ford Credit Auto Owner Trust, | ||||||||
0.840%, 06/15/2015 | 243 | 244 | ||||||
Ford Credit Auto Owner Trust, | ||||||||
1.880%, 08/15/2017 | 875 | 893 | ||||||
Ford Credit Auto Owner Trust, | ||||||||
0.580%, 12/15/2016 | 386 | 387 | ||||||
Ford Credit Auto Owner Trust, | ||||||||
0.380%, 11/15/2015 | 605 | 605 | ||||||
Ford Credit Floorplan Master Owner Trust, | ||||||||
0.799%, 02/15/2016 (A) | 847 | 850 | ||||||
Ford Credit Floorplan Master Owner Trust, | ||||||||
0.669%, 01/15/2016 (A) | 1,738 | 1,741 | ||||||
Ford Credit Floorplan Master Owner Trust, | ||||||||
1.920%, 01/15/2019 | 875 | 895 | ||||||
Ford Credit Floorplan Master Owner Trust, | ||||||||
0.579%, 01/15/2018 (A) | 2,145 | 2,145 | ||||||
GE Dealer Floorplan Master Note Trust, | ||||||||
0.799%, 07/20/2016 (A) | 670 | 673 | ||||||
| SEI Institutional Investments Trust / Annual Report / May 31, 2013 | 187 |
Table of Contents
SCHEDULE OF INVESTMENTS
Ultra Short Duration Bond Fund (Continued)
May 31, 2013
| Description | Face Amount ($ Thousands) | Market Value ($ Thousands) | ||||||
GE Dealer Floorplan Master Note Trust, | ||||||||
0.768%, 02/20/2017 (A) | $ | 2,078 | $ | 2,090 | ||||
GE Dealer Floorplan Master Note Trust, | ||||||||
0.688%, 06/20/2017 (A) | 1,625 | 1,632 | ||||||
GE Dealer Floorplan Master Note Trust, | ||||||||
0.639%, 10/20/2017 (A) | 2,465 | 2,472 | ||||||
Harley Davidson Motorcycle Trust, | ||||||||
0.650%, 07/16/2018 | 1,000 | 997 | ||||||
Harley-Davidson Motorcycle Trust, | ||||||||
1.160%, 02/15/2015 | 3 | 3 | ||||||
Harley-Davidson Motorcycle Trust, | ||||||||
0.960%, 05/16/2016 | 888 | 890 | ||||||
Harley-Davidson Motorcycle Trust, | ||||||||
0.710%, 05/15/2015 | 73 | 73 | ||||||
Harley-Davidson Motorcycle Trust, | ||||||||
0.680%, 04/15/2017 | 1,700 | 1,704 | ||||||
Hertz Vehicle Financing LLC, | ||||||||
2.600%, 02/25/2015 (B) | 402 | 406 | ||||||
Hertz Vehicle Financing LLC, | ||||||||
2.200%, 03/25/2016 (B) | 418 | 427 | ||||||
Honda Auto Receivables Owner Trust, | ||||||||
0.940%, 03/18/2015 | 403 | 404 | ||||||
Honda Auto Receivables Owner Trust, | ||||||||
0.770%, 01/15/2016 | 297 | 298 | ||||||
Honda Auto Receivables Owner Trust, | ||||||||
0.560%, 05/15/2016 | 450 | 450 | ||||||
Honda Auto Receivables Owner Trust, | ||||||||
0.520%, 08/18/2016 | 585 | 584 | ||||||
Huntington Auto Trust, | ||||||||
1.010%, 01/15/2016 (B) | 482 | 483 | ||||||
Huntington Auto Trust, | ||||||||
0.510%, 04/17/2017 | 545 | 545 | ||||||
Hyundai Auto Receivables Trust, | ||||||||
1.500%, 10/15/2014 | 19 | 19 | ||||||
Hyundai Auto Receivables Trust, | ||||||||
0.970%, 04/15/2015 | 113 | 113 | ||||||
| Description | Face Amount ($ Thousands) | Market Value ($ Thousands) | ||||||
Hyundai Auto Receivables Trust, | ||||||||
2.450%, 04/15/2016 | $ | 425 | $ | 436 | ||||
Hyundai Auto Receivables Trust, | ||||||||
0.530%, 04/17/2017 | 675 | 675 | ||||||
Hyundai Auto Receivables Trust, | ||||||||
0.400%, 12/15/2015 | 1,250 | 1,250 | ||||||
Mercedes-Benz Auto Lease Trust, | ||||||||
0.880%, 11/17/2014 | 500 | 501 | ||||||
Mercedes-Benz Auto Lease Trust, | ||||||||
0.590%, 02/15/2016 | 965 | 964 | ||||||
Mercedes-Benz Auto Receivables Trust, | ||||||||
0.850%, 03/16/2015 | 301 | 302 | ||||||
Mercedes-Benz Auto Receivables Trust, | ||||||||
0.470%, 10/17/2016 | 985 | 984 | ||||||
Mercedes-Benz Master Owner Trust, | ||||||||
0.790%, 11/15/2017 (B) | 500 | 499 | ||||||
Mercedes-Benz Master Owner Trust, | ||||||||
0.469%, 11/15/2016 (A) (B) | 2,050 | 2,048 | ||||||
MMCA Automobile Trust, | ||||||||
0.810%, 08/15/2014 (B) | 204 | 204 | ||||||
Navistar Financial Dealer Note Master Trust, Ser 2011-1, Cl A | ||||||||
1.343%, 10/25/2016 (A) (B) | 450 | 451 | ||||||
Navistar Financial Owner Trust, | ||||||||
0.850%, 03/18/2015 (B) | 894 | 895 | ||||||
Nissan Auto Lease Trust, | ||||||||
1.040%, 08/15/2014 | 291 | 291 | ||||||
Nissan Auto Lease Trust, | ||||||||
0.980%, 05/15/2015 | 500 | 502 | ||||||
Nissan Auto Lease Trust, | ||||||||
0.450%, 06/15/2015 | 330 | 330 | ||||||
Nissan Auto Lease Trust, | ||||||||
0.450%, 09/15/2015 | 1,000 | 1,000 | ||||||
Nissan Auto Receivables Owner Trust, | ||||||||
1.310%, 09/15/2016 | 1,200 | 1,207 | ||||||
| 188 | SEI Institutional Investments Trust / Annual Report / May 31, 2013 |
Table of Contents
| Description | Face Amount ($ Thousands) | Market Value ($ Thousands) | ||||||
Nissan Auto Receivables Owner Trust, | ||||||||
0.460%, 10/17/2016 | $ | 150 | $ | 150 | ||||
Nissan Auto Receivables Owner Trust, | ||||||||
0.500%, 05/15/2017 | 615 | 614 | ||||||
Nissan Master Owner Trust Receivables, | ||||||||
0.669%, 05/15/2017 (A) | 1,230 | 1,236 | ||||||
Porsche Financial Auto Securitization Trust, Ser 2011- 1, Cl A3 | ||||||||
0.840%, 01/16/2015 (B) | 31 | 31 | ||||||
Porsche Innovative Lease Owner Trust, | ||||||||
1.090%, 09/22/2014 (B) | 283 | 284 | ||||||
Porsche Innovative Lease Owner Trust, | ||||||||
1.260%, 11/20/2017 (B) | 575 | 578 | ||||||
Porsche Innovative Lease Owner Trust, | ||||||||
0.540%, 12/21/2015 (B) | 430 | 430 | ||||||
Prestige Auto Receivables Trust, | ||||||||
1.090%, 02/15/2018 (B) | 1,775 | 1,774 | ||||||
Santander Drive Auto Receivables Trust, | ||||||||
3.890%, 07/17/2017 | 860 | 884 | ||||||
Santander Drive Auto Receivables Trust, | ||||||||
1.250%, 04/15/2015 | 290 | 290 | ||||||
Santander Drive Auto Receivables Trust, | ||||||||
0.830%, 04/15/2015 | 697 | 698 | ||||||
Santander Drive Auto Receivables Trust, | ||||||||
0.790%, 08/17/2015 | 664 | 666 | ||||||
Santander Drive Auto Receivables Trust, | ||||||||
0.480%, 02/16/2016 | 595 | 595 | ||||||
Santander Drive Auto Receivables Trust, | ||||||||
0.700%, 09/15/2017 | 1,200 | 1,199 | ||||||
Santander Drive Auto Receivables Trust, | ||||||||
0.700%, 10/16/2017 | 865 | 865 | ||||||
SNAAC Auto Receivables Trust, | ||||||||
1.140%, 07/16/2018 (B) | 554 | 554 | ||||||
Toyota Auto Receivables Owner Trust, | ||||||||
0.460%, 07/15/2016 | 1,250 | 1,249 | ||||||
Toyota Auto Receivables Owner Trust, | ||||||||
0.550%, 01/17/2017 | 280 | 280 | ||||||
| Description | Face Amount ($ Thousands) | Market Value ($ Thousands) | ||||||
Volkswagen Auto Loan Enhanced Trust, | ||||||||
1.980%, 09/20/2017 | $ | 1,000 | $ | 1,019 | ||||
Volkswagen Auto Loan Enhanced Trust, | ||||||||
0.610%, 10/20/2014 | 181 | 181 | ||||||
Volkswagen Auto Loan Enhanced Trust, | ||||||||
0.370%, 01/20/2016 | 915 | 915 | ||||||
Volvo Financial Equipment LLC, | ||||||||
0.740%, 03/15/2017 (B) | 960 | 959 | ||||||
World Omni Auto Receivables Trust, | ||||||||
0.610%, 06/15/2017 | 700 | 700 | ||||||
World Omni Automobile Lease Securitization Trust, Ser 2011- A, Cl A3 | ||||||||
1.490%, 10/15/2014 | 287 | 287 | ||||||
World Omni Automobile Lease Securitization Trust, Ser 2011- A, Cl A4 | ||||||||
1.780%, 09/15/2016 | 247 | 249 | ||||||
World Omni Automobile Lease Securitization Trust, Ser 2012- A, Cl A3 | ||||||||
0.930%, 11/16/2015 | 2,199 | 2,207 | ||||||
World Omni Master Owner Trust, | ||||||||
0.549%, 02/15/2018 (A) (B) | 955 | 955 | ||||||
|
| |||||||
| 94,500 | ||||||||
|
| |||||||
Credit Cards — 3.2% | ||||||||
American Credit Acceptance Receivables Trust, Ser 2012-3, Cl A | ||||||||
1.640%, 11/15/2016 (B) | 665 | 665 | ||||||
American Express Credit Account Master Trust, Ser 2007-2, Cl B | ||||||||
0.379%, 09/15/2016 (A) | 1,135 | 1,135 | ||||||
American Express Credit Account Master Trust, Ser 2009-2, Cl A | ||||||||
1.449%, 03/15/2017 (A) | 476 | 483 | ||||||
American Express Credit Account Master Trust, Ser 2012-2, Cl B | ||||||||
0.990%, 03/15/2018 | 565 | 567 | ||||||
Bank of America Credit Card Trust, | ||||||||
0.261%, 04/15/2016 (A) | 400 | 400 | ||||||
Capital One Multi-Asset Execution Trust, | ||||||||
0.379%, 02/15/2019 (A) | 1,155 | 1,155 | ||||||
Chase Issuance Trust, | ||||||||
1.780%, 09/15/2015 (A) | 200 | 201 | ||||||
Chase Issuance Trust, | ||||||||
0.790%, 06/15/2017 | 825 | 829 | ||||||
| SEI Institutional Investments Trust / Annual Report / May 31, 2013 | 189 |
Table of Contents
SCHEDULE OF INVESTMENTS
Ultra Short Duration Bond Fund (Continued)
May 31, 2013
| Description | Face Amount ($ Thousands) | Market Value ($ Thousands) | ||||||
Chase Issuance Trust, | ||||||||
0.590%, 08/15/2017 | $ | 1,125 | $ | 1,124 | ||||
Citibank Omni Master Trust, | ||||||||
5.350%, 08/15/2018 (B) | 750 | 792 | ||||||
Citibank Omni Master Trust, | ||||||||
2.949%, 08/15/2018 (A) (B) | 1,100 | 1,133 | ||||||
Discover Card Execution Note Trust, | ||||||||
0.810%, 08/15/2017 | 550 | 552 | ||||||
Discover Card Execution Note Trust, | ||||||||
0.860%, 11/15/2017 | 301 | 303 | ||||||
Discover Card Execution Note Trust, | ||||||||
0.378%, 10/15/2018 (A) | 1,115 | 1,115 | ||||||
Dryrock Issuance Trust, | ||||||||
0.349%, 08/15/2017 (A) | 425 | 425 | ||||||
Dryrock Issuance Trust, | ||||||||
0.640%, 08/15/2018 | 1,215 | 1,210 | ||||||
GE Capital Credit Card Master Note Trust, | ||||||||
0.749%, 01/15/2017 (A) | 659 | 661 | ||||||
Golden Credit Card Trust, | ||||||||
0.649%, 07/17/2017 (A) (B) | 765 | 770 | ||||||
Golden Credit Card Trust, | ||||||||
0.790%, 09/15/2017 (B) | 675 | 675 | ||||||
Gracechurch Card Funding, | ||||||||
0.899%, 02/15/2017 (A) (B) | 1,000 | 1,007 | ||||||
Gracechurch Card Funding, | ||||||||
0.899%, 06/15/2017 (A) (B) | 1,000 | 1,007 | ||||||
Master Credit Card Trust, | ||||||||
0.780%, 04/21/2017 (B) | 420 | 420 | ||||||
|
| |||||||
| 16,629 | ||||||||
|
| |||||||
Mortgage Related Securities — 1.1% | ||||||||
Accredited Mortgage Loan Trust, | ||||||||
0.533%, 01/25/2035 (A) | 615 | 602 | ||||||
Ameriquest Mortgage Securities, | ||||||||
0.400%, 05/25/2035 (A) | 32 | 31 | ||||||
Asset-Backed Securities Home Equity, | ||||||||
0.862%, 04/25/2035 (A) | 109 | 109 | ||||||
Citigroup Mortgage Loan Trust, | ||||||||
0.463%, 01/25/2036 (A) | 186 | 184 | ||||||
| Description | Face Amount ($ Thousands) | Market Value ($ Thousands) | ||||||
HSBC Home Equity Loan Trust, | ||||||||
0.489%, 01/20/2034 (A) | $ | 857 | $ | 844 | ||||
HSBC Home Equity Loan Trust, | ||||||||
0.358%, 01/20/2036 (A) | 2,627 | 2,576 | ||||||
HSBC Home Equity Loan Trust, | ||||||||
0.348%, 03/20/2036 (A) | 732 | 725 | ||||||
HSBC Home Equity Loan Trust, | ||||||||
0.438%, 03/20/2036 (A) | 884 | 857 | ||||||
|
| |||||||
| 5,928 | ||||||||
|
| |||||||
Other Asset-Backed Securities — 6.3% |
| |||||||
Apidos CLO XII, Ser 2013-12A | ||||||||
1.373%, 04/15/2025 (A) (B) | 1,100 | 1,100 | ||||||
Atrium CDO, Ser 2013-10A, Cl A | ||||||||
1.396%, 07/16/2025 (A) (B) | 1,165 | 1,163 | ||||||
Babson CLO, Ser 2013-IA, Cl A | ||||||||
1.312%, 04/20/2025 (A) (B) | 1,200 | 1,200 | ||||||
Carlyle Global Market Strategies CLO, | ||||||||
1.464%, 04/18/2025 (A) (B) | 325 | 325 | ||||||
CIFC Funding, Ser 2013-1A, Cl A1 | ||||||||
1.432%, 04/16/2025 (A) (B) | 1,060 | 1,060 | ||||||
CNH Equipment Trust, | ||||||||
2.490%, 01/15/2016 | 568 | 571 | ||||||
CNH Equipment Trust, | ||||||||
1.170%, 05/15/2015 | 176 | 177 | ||||||
CNH Equipment Trust, | ||||||||
0.900%, 04/15/2015 | 55 | 55 | ||||||
CNH Equipment Trust, | ||||||||
1.190%, 12/15/2016 | 990 | 995 | ||||||
CNH Equipment Trust, | ||||||||
0.570%, 12/15/2017 | 280 | 279 | ||||||
CNH Equipment Trust, | ||||||||
0.440%, 07/15/2016 | 785 | 785 | ||||||
GE Equipment Midticket LLC, | ||||||||
1.470%, 07/14/2015 (B) | 446 | 448 | ||||||
GE Equipment Midticket LLC, | ||||||||
0.470%, 01/22/2015 | 275 | 275 | ||||||
GE Equipment Midticket LLC, | ||||||||
0.600%, 05/23/2016 | 270 | 270 | ||||||
| 190 | SEI Institutional Investments Trust / Annual Report / May 31, 2013 |
Table of Contents
| Description | Face Amount ($ Thousands) | Market Value ($ Thousands) | ||||||
GE Equipment Small Ticket LLC, | ||||||||
1.140%, 06/23/2014 (B) | $ | 38 | $ | 38 | ||||
GE Equipment Small Ticket LLC, | ||||||||
0.850%, 11/21/2014 (B) | 306 | 306 | ||||||
GE Equipment Transportation LLC, | ||||||||
1.330%, 05/20/2019 | 335 | 336 | ||||||
GE Equipment Transportation LLC, | ||||||||
0.770%, 09/22/2014 | 538 | 538 | ||||||
GE Equipment Transportation LLC, | ||||||||
0.990%, 11/23/2015 | 312 | 313 | ||||||
GE Equipment Transportation LLC, | ||||||||
0.620%, 07/25/2016 | 1,761 | 1,759 | ||||||
HLSS Servicer Advance Receivables-Backed Notes, Ser 2012-T2, Cl A2 | ||||||||
1.990%, 10/15/2045 (B) | 765 | 780 | ||||||
HLSS Servicer Advance Receivables-Backed Notes, Ser 2013-T2, Cl A2 | ||||||||
1.147%, 05/16/2044 (B) | 350 | 350 | ||||||
HLSS Servicer Advance Receivables-Backed Notes, Ser 2013-T1, Cl A1 | ||||||||
0.898%, 01/15/2044 (B) | 1,990 | 1,991 | ||||||
HLSS Servicer Advance Receivables-Backed Notes, Ser 2013-T1, Cl A2 | ||||||||
1.495%, 01/16/2046 (B) | 420 | 423 | ||||||
JCP&L Transition Funding LLC, | ||||||||
5.810%, 12/05/2015 | 195 | 198 | ||||||
John Deere Owner Trust, | ||||||||
0.430%, 02/17/2015 | 516 | 517 | ||||||
John Deere Owner Trust, | ||||||||
0.530%, 07/15/2016 | 605 | 605 | ||||||
John Deere Owner Trust, | ||||||||
0.600%, 03/15/2017 | 1,600 | 1,598 | ||||||
Katonah, Ser 2005-7A, Cl B | ||||||||
0.710%, 11/15/2017 (A) (B) | 696 | 682 | ||||||
Macquarie Equipment Funding Trust, | ||||||||
0.610%, 04/20/2015 (B) | 1,135 | 1,136 | ||||||
Madison Park Funding I, | ||||||||
0.584%, 03/22/2021 (A) (B) | 580 | 553 | ||||||
MMAF Equipment Finance LLC, | ||||||||
0.840%, 01/12/2015 (B) | 789 | 790 | ||||||
| Description | Face Amount ($ Thousands) | Market Value ($ Thousands) | ||||||
Nelnet Education Loan Funding, | ||||||||
0.413%, 08/26/2019 (A) | $ | 548 | $ | 547 | ||||
Octagon Investment Partners XVI, | ||||||||
1.425%, 07/17/2025 (A) (B) | 1,000 | 998 | ||||||
OHA Credit Partners VIII, | ||||||||
1.395%, 04/20/2025 (A) (B) | 690 | 687 | ||||||
OHA Intrepid Leveraged Loan Fund, | ||||||||
1.196%, 04/20/2021 (A) (B) | 1,250 | 1,250 | ||||||
PSE&G Transition Funding LLC, | ||||||||
6.610%, 06/15/2015 | 67 | 67 | ||||||
Securitized Asset-Backed Receivables LLC, Ser 2005- FR4, Cl M1 | ||||||||
0.920%, 01/25/2036 (A) | 75 | 75 | ||||||
Sierra Timeshare Receivables Funding LLC, Ser 2007-2A, Cl A2 | ||||||||
1.199%, 09/20/2019 (A) (B) | 56 | 56 | ||||||
SLM Student Loan Trust, | ||||||||
0.356%, 10/25/2021 (A) | 53 | 53 | ||||||
SLM Student Loan Trust, | ||||||||
0.366%, 07/25/2022 (A) | 29 | 29 | ||||||
SLM Student Loan Trust, | ||||||||
0.376%, 01/25/2023 (A) | 637 | 636 | ||||||
SLM Student Loan Trust, | ||||||||
0.356%, 04/25/2023 (A) | 908 | 908 | ||||||
SLM Student Loan Trust, | ||||||||
0.276%, 07/25/2017 (A) | 527 | 527 | ||||||
SLM Student Loan Trust, | ||||||||
0.286%, 10/25/2017 (A) | 134 | 133 | ||||||
SLM Student Loan Trust, | ||||||||
0.501%, 01/25/2016 (A) | 91 | 91 | ||||||
SLM Student Loan Trust, | ||||||||
1.376%, 10/25/2016 (A) | 416 | 417 | ||||||
SLM Student Loan Trust, | ||||||||
0.826%, 10/25/2017 (A) | 102 | 102 | ||||||
SLM Student Loan Trust, Ser 2011-1 | ||||||||
0.713%, 03/25/2026 (A) | 460 | 462 | ||||||
SLM Student Loan Trust, | ||||||||
1.199%, 10/15/2024 (A) (B) | 203 | 204 | ||||||
| SEI Institutional Investments Trust / Annual Report / May 31, 2013 | 191 |
Table of Contents
SCHEDULE OF INVESTMENTS
Ultra Short Duration Bond Fund (Continued)
May 31, 2013
| Description | Face Amount ($ Thousands) | Market Value ($ Thousands) | ||||||
SLM Student Loan Trust, | ||||||||
1.049%, 12/16/2024 (A) (B) | $ | 635 | $ | 638 | ||||
SLM Student Loan Trust, | ||||||||
0.400%, 11/25/2016 (A) | 1,233 | 1,234 | ||||||
SLM Student Loan Trust, | ||||||||
0.353%, 02/27/2017 (A) | 508 | 508 | ||||||
SLM Student Loan Trust, | ||||||||
0.353%, 02/27/2017 (A) | 633 | 633 | ||||||
SLM Student Loan Trust, | ||||||||
0.343%, 02/27/2017 (A) | 532 | 532 | ||||||
SMS Student Loan Trust, | ||||||||
0.526%, 10/28/2029 (A) | 381 | 381 | ||||||
|
| |||||||
| 32,784 | ||||||||
|
| |||||||
Total Asset-Backed Securities | 149,841 | |||||||
|
| |||||||
MORTGAGE-BACKED SECURITIES — 19.7% |
| |||||||
Agency Mortgage-Backed Obligations — 8.1% |
| |||||||
FHLMC | ||||||||
1.000%, 08/20/2014 to 10/13/2015 | 3,400 | 3,419 | ||||||
FHLMC ARM (A) | ||||||||
2.377%, 05/01/2036 | 221 | 233 | ||||||
2.217%, 02/01/2022 | 278 | 297 | ||||||
2.190%, 02/01/2030 | 208 | 221 | ||||||
FHLMC CMO, Ser 1993-1599, Cl C | ||||||||
6.100%, 10/15/2023 | 18 | 18 | ||||||
FHLMC CMO, Ser 2003-2654, Cl OG | ||||||||
5.000%, 02/15/2032 | 116 | 117 | ||||||
FHLMC CMO, Ser 2004-2890, Cl KC | ||||||||
4.500%, 02/15/2019 | 99 | 101 | ||||||
FHLMC CMO, Ser 2005-2931, Cl AM | ||||||||
4.500%, 07/15/2019 | 351 | 359 | ||||||
FHLMC CMO, Ser 2005-3019, Cl DB | ||||||||
4.500%, 05/15/2019 | 58 | 58 | ||||||
FHLMC CMO, Ser 2009-3558, Cl AW | ||||||||
4.750%, 08/15/2019 | 531 | 541 | ||||||
FHLMC CMO, Ser 2010-3634, Cl EA | ||||||||
4.000%, 11/15/2023 | 510 | 522 | ||||||
FHLMC CMO, Ser 2778, Cl JD | ||||||||
5.000%, 12/15/2032 | 89 | 91 | ||||||
FHLMC CMO, Ser 2793, Cl GE | ||||||||
5.500%, 11/15/2032 | 402 | 408 | ||||||
FHLMC TBA | ||||||||
2.500%, 06/15/2027 | 1,400 | 1,427 | ||||||
FNMA | ||||||||
6.000%, 01/01/2027 to 04/01/2040 | 1,186 | 1,293 | ||||||
| Description | Face Amount ($ Thousands) | Market Value ($ Thousands) | ||||||
5.419%, 11/01/2013 | $ | 365 | $ | 365 | ||||
5.000%, 02/01/2023 to 03/01/2025 | 1,413 | 1,522 | ||||||
4.710%, 03/01/2014 | 1,172 | 1,184 | ||||||
1.990%, 01/01/2017 | 425 | 429 | ||||||
1.940%, 01/01/2017 | 497 | 507 | ||||||
FNMA ARM (A) | ||||||||
2.340%, 01/01/2029 | 32 | 34 | ||||||
2.245%, 11/01/2025 | 25 | 27 | ||||||
2.178%, 11/01/2023 | 75 | 78 | ||||||
2.140%, 09/01/2024 | 174 | 182 | ||||||
2.129%, 09/01/2024 | 70 | 72 | ||||||
2.042%, 05/01/2028 | 152 | 162 | ||||||
1.340%, 11/01/2021 | 40 | 41 | ||||||
FNMA Benchmark REMIC CMO, | ||||||||
5.450%, 12/25/2020 | 263 | 266 | ||||||
FNMA CMO, Ser 1993-220, Cl FA | ||||||||
0.819%, 11/25/2013(A) | 2 | 2 | ||||||
FNMA CMO, Ser 1993-58, Cl H | ||||||||
5.500%, 04/25/2023 | 44 | 48 | ||||||
FNMA CMO, Ser 2001-33, Cl FA | ||||||||
0.650%, 07/25/2031(A) | 51 | 52 | ||||||
FNMA CMO, Ser 2002-64, Cl FG | ||||||||
0.450%, 10/18/2032(A) | 39 | 39 | ||||||
FNMA CMO, Ser 2002-77, Cl CB | ||||||||
5.000%, 12/25/2017 | 374 | 398 | ||||||
FNMA CMO, Ser 2010-64, Cl EH | ||||||||
5.000%, 10/25/2035 | 340 | 352 | ||||||
FNMA CMO, Ser 2011-109, Cl PK | ||||||||
4.000%, 08/25/2041 | 412 | 423 | ||||||
FNMA, Ser 2009-M2, Cl A1 | ||||||||
2.387%, 01/25/2019 | 616 | 619 | ||||||
FNMA, Ser M3, Cl A1 | ||||||||
2.587%, 03/25/2020 | 442 | 452 | ||||||
FNMA TBA | ||||||||
3.500%, 06/15/2026 to 06/01/2042 | 3,100 | 3,243 | ||||||
3.000%, 06/25/2027 | 8,028 | 8,353 | ||||||
2.500%, 06/25/2027 | 5,889 | 6,009 | ||||||
GNMA ARM | ||||||||
4.500%, 09/20/2039(A) | 217 | 230 | ||||||
GNMA CMO, Ser 2009-104, Cl NJ | ||||||||
4.250%, 07/20/2036 | 471 | 488 | ||||||
GNMA CMO, Ser 2009-113, Cl MJ | ||||||||
4.000%, 03/16/2023 | 1,417 | 1,475 | ||||||
GNMA CMO, Ser 2009-24, Cl A | ||||||||
4.500%, 03/20/2034 | 219 | 222 | ||||||
GNMA CMO, Ser 2010-122, Cl A | ||||||||
1.897%, 01/16/2032 | 235 | 237 | ||||||
GNMA CMO, Ser 2010-43, Cl JA | ||||||||
3.000%, 09/20/2037 | 560 | 578 | ||||||
GNMA CMO, Ser 2011-110, Cl A | ||||||||
2.237%, 03/16/2033 | 260 | 265 | ||||||
| 192 | SEI Institutional Investments Trust / Annual Report / May 31, 2013 |
Table of Contents
| Description | Face Amount ($ Thousands) | Market Value ($ Thousands) | ||||||
NCUA Guaranteed Notes CMO, | ||||||||
0.650%, 10/07/2020 (A) | $ | 1,611 | $ | 1,622 | ||||
NCUA Guaranteed Notes CMO, | ||||||||
1.840%, 10/07/2020 | 28 | 29 | ||||||
NCUA Guaranteed Notes CMO, | ||||||||
0.568%, 11/06/2017 (A) | 418 | 419 | ||||||
NCUA Guaranteed Notes CMO, | ||||||||
0.648%, 01/08/2020 (A) | 995 | 998 | ||||||
NCUA Guaranteed Notes CMO, | ||||||||
0.600%, 02/06/2020 (A) | 582 | 584 | ||||||
NCUA Guaranteed Notes CMO, | ||||||||
0.580%, 03/06/2020 (A) | 751 | 753 | ||||||
NCUA Guaranteed Notes CMO, | ||||||||
0.583%, 05/07/2020 (A) | 629 | 630 | ||||||
|
| |||||||
| 42,494 | ||||||||
|
| |||||||
Non-Agency Mortgage-Backed Obligations — 11.6% |
| |||||||
Arkle Master Issuer, Ser 2010-2A, Cl 1A1 | ||||||||
1.690%, 05/17/2060 (A) (B) | 956 | 958 | ||||||
Arkle Master Issuer, | ||||||||
1.540%, 05/17/2060 (A) (B) | 550 | 551 | ||||||
Banc of America Merrill Lynch Commercial Mortgage, | ||||||||
5.061%, 03/11/2041 (A) | 356 | 357 | ||||||
Banc of America Mortgage | ||||||||
3.098%, 07/25/2035 (A) | 644 | 621 | ||||||
Banc of America Mortgage | ||||||||
3.100%, 11/25/2035 (A) | 77 | 70 | ||||||
Bear Stearns Adjustable Rate Mortgage Trust, Ser 2005-12, Cl 11A1 | ||||||||
2.903%, 02/25/2036 (A) | 182 | 142 | ||||||
Bear Stearns Adjustable Rate Mortgage Trust, Ser 2005-3, Cl 2A1 | ||||||||
2.866%, 06/25/2035 (A) | 249 | 223 | ||||||
Bear Stearns Adjustable Rate Mortgage Trust, Ser 2005-6, Cl 3A1 | ||||||||
2.887%, 08/25/2035 (A) | 414 | 338 | ||||||
Bear Stearns Commercial Mortgage Securities Trust, Ser PWR5 | ||||||||
4.978%, 07/11/2042 (A) | 215 | 223 | ||||||
Bear Stearns Commercial Mortgage Securities, Ser 2003-PWR2, Cl A4 | ||||||||
5.186%, 05/11/2039 (A) | 508 | 510 | ||||||
| Description | Face Amount ($ Thousands) | Market Value ($ Thousands) | ||||||
Bear Stearns Commercial Mortgage Securities, Ser 2005-T18, Cl A4 | ||||||||
4.933%, 02/13/2042 (A) | $ | 1,048 | $ | 1,112 | ||||
Bear Stearns Commercial Mortgage Securities, Ser 2007-PW10, Cl A4 | ||||||||
5.405%, 12/11/2040 (A) | 925 | 1,010 | ||||||
Bear Stearns Commercial Mortgage Securities, Ser PW18, Cl A2 | ||||||||
5.613%, 06/11/2050 | 140 | 142 | ||||||
Citigroup Commercial Mortgage Trust, | ||||||||
0.685%, 09/10/2045 | 410 | 409 | ||||||
Citigroup Commercial Mortgage Trust, | ||||||||
4.733%, 10/15/2041 | 1,575 | 1,641 | ||||||
Citigroup Mortgage Loan Trust, | ||||||||
2.848%, 09/25/2034 (A) | 120 | 121 | ||||||
Citigroup Mortgage Loan Trust, | ||||||||
2.951%, 03/25/2036 (A) | 354 | 301 | ||||||
Commercial Mortgage Acceptance, | ||||||||
5.440%, 09/15/2030 (B) | 27 | 27 | ||||||
Commercial Mortgage Pass-Through Certificates, Ser 2006-FL12, Cl A2 | ||||||||
0.299%, 12/15/2020 (A) (B) | 12 | 11 | ||||||
Commercial Mortgage Pass-Through Certificates, Ser 2010-C1, Cl A1 | ||||||||
3.156%, 07/10/2046 (B) | 997 | 1,040 | ||||||
Commercial Mortgage Pass-Through Certificates, Ser 2012-CR1, Cl A1 | ||||||||
1.116%, 05/15/2045 | 962 | 969 | ||||||
Commercial Mortgage Pass-Through Certificates, Ser 2012-CR3, Cl A1 | ||||||||
0.666%, 11/15/2045 | 267 | 266 | ||||||
Commercial Mortgage Pass-Through Certificates, Ser 2012-CR4, Cl A1 | ||||||||
0.704%, 10/15/2045 | 614 | 612 | ||||||
Commercial Mortgage Pass-Through Certificates, Ser 2012- CR5, Cl A1 | ||||||||
0.673%, 12/10/2045 | 522 | 520 | ||||||
Commercial Mortgage Pass-Through Certificates, Ser CR2, Cl A1 | ||||||||
0.824%, 08/15/2045 | 302 | 302 | ||||||
Commercial Mortgage Trust, | ||||||||
1.156%, 12/10/2044 | 574 | 577 | ||||||
Countrywide Home Loan Mortgage Pass-Through Trust, | ||||||||
0.740%, 02/25/2035 (A) | 50 | 48 | ||||||
| SEI Institutional Investments Trust / Annual Report / May 31, 2013 | 193 |
Table of Contents
SCHEDULE OF INVESTMENTS
Ultra Short Duration Bond Fund (Continued)
May 31, 2013
| Description | Face Amount ($ Thousands) | Market Value ($ Thousands) | ||||||
Countrywide Home Loan Mortgage Pass-Through Trust, | ||||||||
2.843%, 02/20/2036 (A) | $ | 315 | $ | 265 | ||||
Credit Suisse First Boston Mortgage Securities, Ser 2003-C4, Cl A4 | ||||||||
5.137%, 08/15/2036 (A) | 82 | 82 | ||||||
Credit Suisse First Boston Mortgage Securities, Ser 2003-C5, Cl A4 | ||||||||
4.900%, 12/15/2036 (A) | 892 | 896 | ||||||
DBUBS Mortgage Trust, | ||||||||
3.742%, 11/10/2046 (B) | 760 | 811 | ||||||
FDIC Commercial Mortgage Trust, | ||||||||
0.841%, 05/25/2035 (A) (B) | 1,235 | 1,237 | ||||||
FDIC Structured Sale Guaranteed | ||||||||
0.754%, 02/25/2048 (A) (B) | 393 | 393 | ||||||
Fosse Master Issuer, Ser 2011-1A | ||||||||
1.677%, 10/18/2054 (A) (B) | 844 | 853 | ||||||
GE Capital Commercial Mortgage, | ||||||||
5.189%, 07/10/2039 (A) | 1,352 | 1,404 | ||||||
GMAC Commercial Mortgage | ||||||||
5.406%, 05/10/2040 (A) | 242 | 243 | ||||||
GMAC Commercial Mortgage | ||||||||
4.547%, 12/10/2041 | 67 | 67 | ||||||
GMAC Mortgage Loan Trust, | ||||||||
3.808%, 11/19/2035 (A) | 386 | 346 | ||||||
Greenwich Capital Commercial | ||||||||
4.915%, 01/05/2036 | 221 | 223 | ||||||
Greenwich Capital Commercial | ||||||||
5.317%, 06/10/2036 (A) | 727 | 743 | ||||||
GS Mortgage Securities II, | ||||||||
5.279%, 08/10/2038 (A) | 176 | 177 | ||||||
GS Mortgage Securities II, | ||||||||
1.103%, 03/06/2020 (A) (B) | 310 | 311 | ||||||
GS Mortgage Securities II, | ||||||||
1.456%, 03/06/2020 (A) (B) | 1,016 | 1,019 | ||||||
GS Mortgage Securities II, | ||||||||
3.849%, 12/10/2043 (B) | 727 | 778 | ||||||
GS Mortgage Securities II, | ||||||||
0.662%, 11/10/2045 | 362 | 361 | ||||||
| Description | Face Amount ($ Thousands) | Market Value ($ Thousands) | ||||||
GS Mortgage Securities II, Ser GC3, Cl A1 | ||||||||
2.331%, 03/10/2044 (B) | $ | 338 | $ | 344 | ||||
GSR Mortgage Loan Trust, | ||||||||
3.099%, 07/25/2035 (A) | 452 | 374 | ||||||
GSR Mortgage Loan Trust, | ||||||||
2.776%, 01/25/2036 (A) | 583 | 534 | ||||||
GSR Mortgage Loan Trust, | ||||||||
2.891%, 05/25/2047 (A) | 426 | 349 | ||||||
Impac CMB Trust, Ser 2004-9, Cl 1A1 | ||||||||
0.960%, 01/25/2035 (A) | 119 | 115 | ||||||
Impac CMB Trust, Ser 2005-2, Cl 1A1 | ||||||||
0.720%, 04/25/2035 (A) | 133 | 130 | ||||||
Impac CMB Trust, Ser 2005-3, Cl A1 | ||||||||
0.680%, 08/25/2035 (A) | 124 | 107 | ||||||
Impac CMB Trust, Ser 2005-5, Cl A1 | ||||||||
0.840%, 08/25/2035 (A) | 100 | 90 | ||||||
Impac CMB Trust, Ser 2005-8, Cl 1A | ||||||||
0.460%, 02/25/2036 (A) | 319 | 285 | ||||||
JPMorgan Chase Commercial Mortgage Securities, Ser 2003-LN1, Cl A2 | ||||||||
4.920%, 10/15/2037 (A) | 466 | 467 | ||||||
JPMorgan Chase Commercial Mortgage Securities, Ser 2004-C1, Cl A3 | ||||||||
4.719%, 01/15/2038 | 684 | 695 | ||||||
JPMorgan Chase Commercial Mortgage Securities Pass-Through, | ||||||||
5.212%, 05/15/2041 (A) | 900 | 926 | ||||||
JPMorgan Chase Commercial Mortgage Securities, Ser 2004-CB9, Cl A4 | ||||||||
5.570%, 06/12/2041 (A) | 382 | 398 | ||||||
JPMorgan Chase Commercial Mortgage Securities, Ser 2010-C1, Cl A1 | ||||||||
3.853%, 06/15/2043 (B) | 750 | 788 | ||||||
JPMorgan Chase Commercial Mortgage Securities, Ser 2010-C2, Cl A1 | ||||||||
2.749%, 11/15/2043 (B) | 832 | 863 | ||||||
JPMorgan Chase Commercial Mortgage Securities, Ser 2011-C4, Cl A1 | ||||||||
1.525%, 07/15/2046 (B) | 1,164 | 1,174 | ||||||
JPMorgan Chase Commercial Mortgage Securities, Ser 2011-C5, Cl A1 | ||||||||
1.600%, 08/15/2046 | 2,078 | 2,104 | ||||||
JPMorgan Chase Commercial Mortgage Securities, Ser 2012-LC9, Cl A1 | ||||||||
0.670%, 12/15/2047 | 274 | 272 | ||||||
JPMorgan Chase Commercial Mortgage Securities, Ser C8, Cl A1 | ||||||||
0.705%, 10/15/2045 | 205 | 204 | ||||||
JPMorgan Chase Commercial Mortgage Securities, Ser LDP4, Cl A3A2 | ||||||||
4.903%, 10/15/2042 | 503 | 510 | ||||||
| 194 | SEI Institutional Investments Trust / Annual Report / May 31, 2013 |
Table of Contents
| Description | Face Amount ($ Thousands) | Market Value ($ Thousands) | ||||||
JPMorgan Mortgage Trust, | ||||||||
3.025%, 08/25/2035 (A) | $ | 259 | $ | 246 | ||||
JPMorgan Mortgage Trust, | ||||||||
2.765%, 05/25/2037 (A) | 327 | 260 | ||||||
LB-UBS Commercial Mortgage Trust, | ||||||||
5.124%, 11/15/2032 (A) | 127 | 128 | ||||||
LB-UBS Commercial Mortgage Trust, | ||||||||
4.799%, 12/15/2029 (A) | 1,206 | 1,252 | ||||||
LB-UBS Commercial Mortgage Trust, | ||||||||
5.020%, 08/15/2029 (A) | 1,770 | 1,832 | ||||||
LB-UBS Commercial Mortgage Trust, | ||||||||
4.786%, 10/15/2029 (A) | 490 | 508 | ||||||
Merrill Lynch Mortgage Investors, | ||||||||
0.470%, 04/25/2035 (A) | 129 | 125 | ||||||
Merrill Lynch Mortgage Trust, | ||||||||
4.855%, 10/12/2041 (A) | 866 | 901 | ||||||
Merrill Lynch Mortgage-Backed Securities Trust, Ser 2007-3, Cl 2A1 | ||||||||
3.349%, 06/25/2037 (A) | 485 | 377 | ||||||
Morgan Stanley Bank of America Merrill Lynch Trust, Ser 2012- C6, Cl A1 | ||||||||
0.664%, 11/15/2045 | 172 | 171 | ||||||
Morgan Stanley Capital I, | ||||||||
5.150%, 06/13/2041 | 189 | 189 | ||||||
Morgan Stanley Capital I, | ||||||||
4.800%, 01/13/2041 | 656 | 662 | ||||||
Morgan Stanley Capital I, | ||||||||
5.110%, 06/15/2040 (A) | 1,122 | 1,156 | ||||||
Morgan Stanley Capital I, | ||||||||
4.660%, 09/13/2045 | 1,221 | 1,232 | ||||||
Morgan Stanley Capital I, | ||||||||
5.270%, 06/13/2041 (A) | 600 | 620 | ||||||
Morgan Stanley Capital I, | ||||||||
5.168%, 01/14/2042 | 635 | 665 | ||||||
Morgan Stanley Re-REMIC Trust, | ||||||||
1.000%, 03/27/2051 | 621 | 614 | ||||||
MortgageIT Trust, Ser 2005-5, Cl A1 | ||||||||
0.460%, 12/25/2035 (A) | 452 | 422 | ||||||
| Description | Face Amount ($ Thousands) | Market Value ($ Thousands) | ||||||
Mortgage-Linked Amortizing Notes CMO, Ser 2012-1, Cl A10 | ||||||||
2.060%, 01/15/2022 | $ | 205 | $ | 209 | ||||
Paragon Mortgages, | ||||||||
0.510%, 11/15/2038 (A) (B) | 172 | 153 | ||||||
Paragon Mortgages, | ||||||||
0.390%, 12/15/2039 (A) (B) | 416 | 367 | ||||||
Residential Funding Mortgage Securities, Ser 2007-SA3, Cl 2A1 | ||||||||
4.041%, 07/27/2037 (A) | 360 | 300 | ||||||
Sequoia Mortgage Trust, | ||||||||
0.468%, 01/20/2035 (A) | 56 | 54 | ||||||
Silverstone Master Issuer, | ||||||||
1.826%, 01/21/2055 (A) (B) | 225 | 230 | ||||||
Springleaf Mortgage Loan Trust, | ||||||||
1.270%, 06/25/2058 (A) (B) | 807 | 808 | ||||||
UBS-Barclays Commercial Mortgage Trust, Ser 2012-C3, Cl A1 | ||||||||
0.726%, 08/10/2049 | 464 | 463 | ||||||
UBS-Barclays Commercial | ||||||||
0.673%, 12/10/2045 | 374 | 372 | ||||||
UBS-Barclays Commercial | ||||||||
0.779%, 03/10/2046 | 955 | 952 | ||||||
UBS-Citigroup Commercial Mortgage Trust, Ser 2011-C1, Cl A1 | ||||||||
1.524%, 01/10/2045 | 1,041 | 1,052 | ||||||
Wachovia Bank Commercial Mortgage Trust, Ser 2003-C8, Cl A4 | ||||||||
4.964%, 11/15/2035 (A) | 456 | 463 | ||||||
Wachovia Bank Commercial Mortgage Trust, Ser 2005-C18, Cl A4 | ||||||||
4.935%, 04/15/2042 | 625 | 664 | ||||||
Wachovia Bank Commercial Mortgage Trust, Ser 2005-C21, Cl A4 | ||||||||
5.239%, 10/15/2044 (A) | 545 | 589 | ||||||
Wachovia Bank Commercial Mortgage Trust, Ser C22 | ||||||||
5.290%, 12/15/2044 (A) | 1,050 | 1,144 | ||||||
Wachovia Bank Commercial | ||||||||
5.125%, 08/15/2035 (A) | 194 | 194 | ||||||
WaMu Mortgage Pass-Through Certificates, Ser 2006-AR2, Cl 1A1 | ||||||||
2.480%, 03/25/2036 (A) | 523 | 468 | ||||||
Wells Fargo Commercial Mortgage Trust, Ser 2012-LC5, Cl A1 | ||||||||
0.687%, 10/15/2045 | 470 | 469 | ||||||
| SEI Institutional Investments Trust / Annual Report / May 31, 2013 | 195 |
Table of Contents
SCHEDULE OF INVESTMENTS
Ultra Short Duration Bond Fund (Continued)
May 31, 2013
| Description | Face Amount ($ Thousands) | Market Value ($ Thousands) | ||||||
Wells Fargo Mortgage-Backed Securities Trust, Ser 2004-BB, Cl A2 | ||||||||
2.625%, 01/25/2035 (A) | $ | 263 | $ | 261 | ||||
Wells Fargo Mortgage-Backed Securities Trust, Ser 2006- AR10, Cl 2A1 | ||||||||
2.633%, 07/25/2036 (A) | 419 | 378 | ||||||
Wells Fargo Mortgage-Backed Securities Trust, Ser 2006- AR12, Cl 1A1 | ||||||||
3.037%, 09/25/2036 (A) | 307 | 266 | ||||||
WFRBS Commercial Mortgage Trust, | ||||||||
2.501%, 02/15/2044 (B) | 171 | 174 | ||||||
WFRBS Commercial Mortgage Trust, Ser 2011-C3, Cl A1 | ||||||||
1.988%, 03/15/2044 (B) | 1,056 | 1,074 | ||||||
WFRBS Commercial Mortgage Trust, Ser 2012-C10, Cl A1 | ||||||||
0.734%, 12/15/2045 | 1,271 | 1,269 | ||||||
WFRBS Commercial Mortgage Trust, Ser 2012-C6, Cl A1 | ||||||||
1.081%, 04/15/2045 | 1,189 | 1,196 | ||||||
WFRBS Commercial Mortgage | ||||||||
0.673%, 11/15/2045 | 1,551 | 1,545 | ||||||
|
| |||||||
| 60,513 | ||||||||
|
| |||||||
Total Mortgage-Backed Securities | 103,007 | |||||||
|
| |||||||
U.S. GOVERNMENT AGENCY OBLIGATIONS — 4.8% |
| |||||||
FFCB | ||||||||
0.730%, 08/15/2016 | 2,600 | 2,602 | ||||||
0.300%, 08/21/2014 | 2,505 | 2,507 | ||||||
FHLB | ||||||||
2.750%, 03/13/2015 | 750 | 782 | ||||||
FHLMC | ||||||||
0.375%, 04/28/2014 | 500 | 501 | ||||||
FNMA | ||||||||
1.250%, 06/20/2016 | 375 | 375 | ||||||
0.750%, 02/01/2016 to 09/27/2016 | 8,025 | 8,030 | ||||||
0.710%, 12/04/2015 | 1,130 | 1,130 | ||||||
0.550%, 02/27/2015 | 3,935 | 3,945 | ||||||
0.500%, 03/30/2016 | 5,000 | 4,990 | ||||||
NCUA Guaranteed Notes | ||||||||
0.219%, 06/12/2013 (A) | 382 | 382 | ||||||
|
| |||||||
Total U.S. Government Agency Obligations | 25,244 | |||||||
|
| |||||||
MUNICIPAL BONDS — 3.5% |
| |||||||
City of Austin, Electric Utility Revenue, Ser B, RB | ||||||||
0.672%, 11/15/2015 | 1,840 | 1,836 | ||||||
City of New York, Ser D-2, GO | ||||||||
3.250%, 12/01/2014 | 500 | 520 | ||||||
| Description | Face Amount ($ Thousands) | Market Value ($ Thousands) | ||||||
El Paso, Taxable Pension, GO | ||||||||
3.610%, 08/15/2014 | $ | 2,030 | $ | 2,104 | ||||
Florida, Hurricane Catastrophe Fund Finance, Ser A, RB | ||||||||
1.298%, 07/01/2016 | 1,165 | 1,166 | ||||||
Irvine, Ranch Water District Joint Powers Agency, RB | ||||||||
2.605%, 03/15/2014 | 550 | 559 | ||||||
Kalamazoo, Hospital Finance Authority, Ser B, RB | ||||||||
3.125%, 05/15/2041 (A) | 1,270 | 1,306 | ||||||
Louisiana, Local Government Environmental Facilities & Community Development Authority, RB | ||||||||
1.110%, 02/01/2016 | 130 | 130 | ||||||
Nebraska, Public Power District, | ||||||||
5.140%, 01/01/2014 | 715 | 735 | ||||||
New Jersey, Transportation Trust Fund Authority, Ser B, RB | ||||||||
1.087%, 12/15/2016 | 2,135 | 2,127 | ||||||
New Jersey, Economic Development Authority, Build America Project, RB | ||||||||
1.280%, 06/15/2013 (A) | 580 | 580 | ||||||
New Jersey, Economic Development Authority, Ser 00, RB | ||||||||
1.059%, 03/01/2016 | 1,265 | 1,261 | ||||||
New Jersey State, Turnpike Authority, | ||||||||
4.252%, 01/01/2016 | 1,565 | 1,607 | ||||||
New York, Dormitory Authority, Ser A, RB | ||||||||
5.600%, 12/15/2014 | 175 | 188 | ||||||
New York, Urban Development, RB | ||||||||
2.626%, 12/15/2014 | 605 | 624 | ||||||
North Carolina, Eastern Municipal Power Agency, Ser C, RB | ||||||||
4.430%, 01/01/2014 | 650 | 664 | ||||||
Oregon, School Boards Association, | ||||||||
0.000%, 06/30/2015 | 500 | 489 | ||||||
Philadelphia, Industrial | ||||||||
1.200%, 04/01/2014 | 205 | 206 | ||||||
State of California, GO | ||||||||
5.450%, 04/01/2015 | 305 | 331 | ||||||
State of Illinois, GO | ||||||||
4.071%, 01/01/2014 | 1,000 | 1,018 | ||||||
Wisconsin, General Fund, | ||||||||
0.798%, 05/01/2015 | 820 | 823 | ||||||
|
| |||||||
Total Municipal Bonds | 18,274 | |||||||
|
| |||||||
| 196 | SEI Institutional Investments Trust / Annual Report / May 31, 2013 |
Table of Contents
| Description | Face Amount ($ Thousands)/Shares | Market Value ($ Thousands) | ||||||
U.S. TREASURY OBLIGATION (C) (D) — 0.2% |
| |||||||
U.S. Treasury Notes | ||||||||
0.375%, 01/15/2016 | $ | 875 | $ | 874 | ||||
|
| |||||||
Total U.S. Treasury Obligation | 874 | |||||||
|
| |||||||
CASH EQUIVALENT — 0.1% | ||||||||
SEI Daily Income Trust, Prime | ||||||||
0.010%**† | 648,357 | 648 | ||||||
|
| |||||||
Total Cash Equivalent | 648 | |||||||
|
| |||||||
Total Investments — 97.1% | $ | 507,425 |
| |||||
|
| |||||||
A list of the open futures contracts held by the Fund at May 31, 2013, is as follows:
Type of Contract | Number of Contracts Short | Expiration Date | Unrealized ($ Thousands) | |||||||||
U.S. 10-Year Treasury Note | (45 | ) | Sep-2013 | $ | 4 | |||||||
U.S. 2-Year Treasury Note | (10 | ) | Sep-2013 | — | ||||||||
U.S. 5-Year Treasury Note | (60 | ) | Oct-2013 | 1 | ||||||||
|
| |||||||||||
| $ | 5 | |||||||||||
|
| |||||||||||
For the year ended May 31, 2013, the total amount of all open futures contracts, as presented in the table above, are representative of the volume of activity for this derivative type during the year.
| Percentages | are based on a Net Assets of $522,593 ($ Thousands). |
| ** | The rate reported is the 7-day effective yield as of May 31, 2013. |
| ‡ | Real Estate Investment Trust. |
| † | Investment in Affiliated Security (see Note 5). |
| (A) | Variable Rate Security — The rate reported on the Schedule of Investments is the rate in effect as of May 31, 2013. The date reported on the Schedule of Investments is the final maturity date. |
| (B) | Securities sold within terms of a private placement memorandum, exempt from registration under Section 144A of the Securities Act of 1933, as amended, and may be sold only to dealers in that program or other “accredited investors.” These securities have been determined to be liquid under guidelines established by the Board of Trustees. |
| (C) | Security, or portion thereof, has been pledged as collateral on open futures contracts. |
| (D) | The rate reported is the effective yield at the time of purchase. |
| AMBAC | — American Municipal Bond Assurance Corporation |
| ARM | — Adjustable Rate Mortgage |
| CDO | — Collateralized Debt Obligation |
| Cl | — Class |
| CLO | — Collateralized Loan Obligation |
| CMO | — Collateralized Mortgage Obligation |
| FDIC | — Federal Deposit Insurance Corporation |
| FFCB | — Federal Farm Credit Bank |
| FGIC | — Federal Guaranty Insurance Company |
| FHLB | — Federal Home Loan Bank |
| FHLMC | — Federal Home Loan Mortgage Corporation |
| FNMA | — Federal National Mortgage Association |
| GNMA | — Government National Mortgage Association |
| GO | — General Obligation |
| LLC | — Limited Liability Company |
| MTN | — Medium Term Note |
| NATL-RE | — National Public Finance Guarantee Corporation |
| NCUA | — National Credit Union Association |
| RB | — Revenue Bond |
| REMIC | — Real Estate Mortgage Investment Conduit |
| Re-REMIC | — Resecuritization of Real Estate Mortgage Investment Conduit |
| Ser | — Series |
| TBA | — To Be Announced |
The following is a list of the inputs used as of May 31, 2013, in valuing the Fund’s
investments and other financial instruments carried at value ($ Thousands).
| Investments in Securities | Level 1 | Level 2 | Level 3(1) | Total | ||||||||||||
Corporate Obligations | $ | — | $ | 209,537 | $ | — | $ | 209,537 | ||||||||
Asset-Backed Securities | — | 149,516 | 325 | 149,841 | ||||||||||||
Mortgage-Backed Securities | — | 103,007 | — | 103,007 | ||||||||||||
U.S. Government Agency | — | 25,244 | — | 25,244 | ||||||||||||
Municipal Bonds | — | 18,274 | — | 18,274 | ||||||||||||
U.S. Treasury Obligation | — | 874 | — | 874 | ||||||||||||
Cash Equivalent | 648 | — | — | 648 | ||||||||||||
|
|
|
|
|
|
|
| |||||||||
Total Investments in Securities | $ | 648 | $ | 506,452 | $ | 325 | $ | 507,425 | ||||||||
|
|
|
|
|
|
|
| |||||||||
| Other Financial Instruments | Level 1 | Level 2 | Level 3 | Total | ||||||||||||
Futures Contracts * | $ | 5 | $ | — | $ | — | $ | 5 | ||||||||
|
|
|
|
|
|
|
| |||||||||
| (1) | A reconciliation of Level 3 investments is presented when the Fund has a significant amount of Level 3 investments at the beginning and/or end of the year in relation to net assets. |
| * | Futures contracts are valued at the unrealized appreciation on the instrument. |
For the year ended May 31, 2013, there were no transfers between Level 1 and Level 2 assets and liabilities.
For the year ended May 31, 2013, the transfers out of Level 3 were due to changes in the availability of observable inputs used to determine fair value.
For more information on valuation inputs, see Note 2 — Significant Accounting Policies in Notes to Financial Statements.
Amounts designated as “—” are $0 or have been rounded to $0.
The accompanying notes are an integral part of the financial statements.
| SEI Institutional Investments Trust / Annual Report / May 31, 2013 | 197 |
Table of Contents
SCHEDULE OF INVESTMENTS
Emerging Markets Debt Fund
May 31, 2013
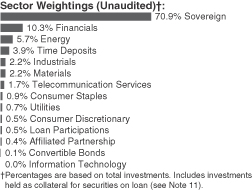
| Description | Face Amount (1) (Thousands) | Market Value ($ Thousands) | ||||||||||
GLOBAL BONDS — 89.0% |
| |||||||||||
Angola — 0.1% |
| |||||||||||
Republic of Angola Via Northern Lights III | ||||||||||||
7.000%, 08/16/2019 | 1,313 | $ | 1,405 | |||||||||
|
| |||||||||||
Argentina — 0.6% | ||||||||||||
City of Buenos Aires Argentina | ||||||||||||
9.950%, 03/01/2017 (A) | 1,267 | 1,115 | ||||||||||
Republic of Argentina | ||||||||||||
8.750%, 06/02/2017 | 492 | 385 | ||||||||||
8.280%, 12/31/2033 | 2,684 | 1,584 | ||||||||||
8.280%, 12/31/2033 | 684 | 391 | ||||||||||
7.000%, 10/03/2015 | 360 | 311 | ||||||||||
7.000%, 10/03/2015 | 1,772 | 1,529 | ||||||||||
6.000%, 03/31/2023 (B) | 172 | 138 | ||||||||||
2.500%, 03/31/2019 (C) | 458 | 157 | ||||||||||
0.000%, 03/31/2023 (B) (D) | 1,680 | 1,260 | ||||||||||
WPE International Cooperatief | ||||||||||||
10.375%, 09/30/2020 | 900 | 711 | ||||||||||
10.375%, 09/30/2020 (A) | 550 | 434 | ||||||||||
|
| |||||||||||
| 8,015 | ||||||||||||
|
| |||||||||||
Azerbaijan — 0.1% | ||||||||||||
State Oil of the Azerbaijan Republic MTN | ||||||||||||
5.450%, 02/09/2017 | 679 | 721 | ||||||||||
4.750%, 03/13/2023 | 200 | 195 | ||||||||||
|
| |||||||||||
| 916 | ||||||||||||
|
| |||||||||||
Belarus — 0.2% | ||||||||||||
Republic of Belarus | ||||||||||||
8.950%, 01/26/2018 | 1,590 | 1,725 | ||||||||||
8.750%, 08/03/2015 | 1,380 | 1,435 | ||||||||||
|
| |||||||||||
| 3,160 | ||||||||||||
|
| |||||||||||
Bermuda — 0.0% | ||||||||||||
Bermuda Government International Bond | ||||||||||||
4.138%, 01/03/2023 (A) | 880 | 909 | ||||||||||
|
| |||||||||||
| Description | Face Amount (1) (Thousands) | Market Value ($ Thousands) | ||||||||||||
Bolivia — 0.0% | ||||||||||||||
Bolivian Government International Bond | ||||||||||||||
4.875%, 10/29/2022 | 300 | $ | 296 | |||||||||||
|
| |||||||||||||
Bosnia and Herzegovina — 0.0% |
| |||||||||||||
Republic of Bosnia & Herzegovina | ||||||||||||||
2.063%, 12/11/2021 (D) | DEM | 1,500 | 815 | |||||||||||
|
| |||||||||||||
Brazil — 7.5% | ||||||||||||||
Andrade Gutierrez International SA | ||||||||||||||
4.000%, 04/30/2018 | 203 | 201 | ||||||||||||
Banco do Brasil | ||||||||||||||
6.250%, 12/31/2049 (A) (D) | 363 | 351 | ||||||||||||
3.875%, 10/10/2022 | 230 | 216 | ||||||||||||
Banco Nacional de Desenvolvimento Economico e Social | ||||||||||||||
6.500%, 06/10/2019 (A) | 720 | 825 | ||||||||||||
5.500%, 07/12/2020 | 100 | 111 | ||||||||||||
5.500%, 07/12/2020 (A) | 400 | 444 | ||||||||||||
Barclays, CLN (Federal Republic of Brazil) | ||||||||||||||
10.000%, 01/01/2017 | BRL | 3,140 | 1,493 | |||||||||||
10.000%, 01/01/2021 | BRL | 900 | 415 | |||||||||||
10.000%, 01/01/2023 | BRL | 17,640 | 8,130 | |||||||||||
6.000%, 08/15/2020 | BRL | 940 | 1,132 | |||||||||||
BM&F Bovespa | ||||||||||||||
5.500%, 07/16/2020 (A) | 406 | 445 | ||||||||||||
BR Properties | ||||||||||||||
9.000%, 12/31/2049 (A) | 180 | 191 | ||||||||||||
Braskem Finance | ||||||||||||||
7.375%, 10/04/2049 | 100 | 104 | ||||||||||||
Brazil Letras do Tesouro Nacional | ||||||||||||||
8.690%, 01/01/2015 | BRL | 12,930 | 5,307 | |||||||||||
Brazil Notas do Tesouro Nacional Serie B | ||||||||||||||
13.199%, 05/15/2015 | BRL | 3,630 | 4,116 | |||||||||||
10.674%, 08/15/2020 | BRL | 8,419 | 10,143 | |||||||||||
6.000%, 08/15/2050 | BRL | 1,710 | 2,196 | |||||||||||
Brazil Notas do Tesouro Nacional Serie F | ||||||||||||||
10.000%, 01/01/2017 | BRL | 1,945 | 925 | |||||||||||
10.000%, 01/01/2021 | BRL | 3,079 | 1,418 | |||||||||||
10.000%, 01/01/2023 | BRL | 5,054 | 2,329 | |||||||||||
Centrais Eletricas Brasileiras | ||||||||||||||
5.750%, 10/27/2021 | 230 | 240 | ||||||||||||
Cia Energetica de Sao Paulo MTN | ||||||||||||||
9.750%, 01/15/2015 | 670 | 492 | ||||||||||||
ESAL GmbH | ||||||||||||||
6.250%, 02/05/2023 (A) | 296 | 294 | ||||||||||||
Federal Republic of Brazil | ||||||||||||||
10.250%, 01/10/2028 | BRL | 980 | 524 | |||||||||||
10.125%, 05/15/2027 | 1,393 | 2,326 | ||||||||||||
| 198 | SEI Institutional Investments Trust / Annual Report / May 31, 2013 |
Table of Contents
| Description | Face Amount (1) (Thousands) | Market Value ($ Thousands) | ||||||||||||
8.875%, 04/15/2024 | 510 | $ | 750 | |||||||||||
8.500%, 01/05/2024 | BRL | 10,320 | 5,184 | |||||||||||
8.250%, 01/20/2034 | 4,226 | 6,128 | ||||||||||||
8.000%, 01/15/2018 | 1,091 | 1,255 | ||||||||||||
7.125%, 01/20/2037 | 2,410 | 3,157 | ||||||||||||
5.875%, 01/15/2019 | 840 | 981 | ||||||||||||
4.875%, 01/22/2021 | 2,179 | 2,446 | ||||||||||||
2.625%, 01/05/2023 | 3,435 | 3,186 | ||||||||||||
Fibria Overseas Finance | ||||||||||||||
6.750%, 03/03/2021 | 600 | 657 | ||||||||||||
General Shopping Finance | ||||||||||||||
10.000%, 12/31/2049 (A) | 43 | 44 | ||||||||||||
Globo Comunicacao e Participacoes | ||||||||||||||
6.250%, 07/20/2015 (C) | 162 | 171 | ||||||||||||
HSBC, CLN (Federal Republic of Brazil) | ||||||||||||||
10.000%, 01/01/2017 | BRL | 8,230 | 3,913 | |||||||||||
10.000%, 01/01/2021 | BRL | 7,500 | 3,455 | |||||||||||
10.000%, 01/01/2021 | BRL | 7,120 | 3,280 | |||||||||||
6.000%, 08/15/2022 | BRL | 900 | 1,092 | |||||||||||
Hypermarcas | ||||||||||||||
6.500%, 04/20/2021 (A) | 200 | 213 | ||||||||||||
Itau Unibanco Holding | ||||||||||||||
5.650%, 03/19/2022 (A) | 232 | 240 | ||||||||||||
5.125%, 05/13/2023 (A) | 388 | 386 | ||||||||||||
JBS Finance II | ||||||||||||||
8.250%, 01/29/2018 | 80 | 85 | ||||||||||||
8.250%, 01/29/2018 (A) | 1,100 | 1,166 | ||||||||||||
JPMorgan Chase, CLN (Nota do Tesouro Nacional) | ||||||||||||||
10.000%, 01/01/2017 | BRL | 23,730 | 11,283 | |||||||||||
10.000%, 01/01/2023 | BRL | 2,800 | 1,290 | |||||||||||
6.000%, 05/15/2015 | BRL | 390 | 442 | |||||||||||
Marfrig Holding Europe | ||||||||||||||
8.375%, 05/09/2018 | 1,052 | 968 | ||||||||||||
Marfrig Overseas | ||||||||||||||
9.500%, 05/04/2020 | 1,700 | 1,589 | ||||||||||||
Minerva Luxembourg | ||||||||||||||
12.250%, 02/10/2022 | 800 | 956 | ||||||||||||
12.250%, 02/10/2022 (A) | 500 | 598 | ||||||||||||
7.750%, 01/31/2023 | 200 | 206 | ||||||||||||
7.750%, 01/31/2023 (A) | 295 | 304 | ||||||||||||
Odebrecht Drilling Norbe VIII | ||||||||||||||
6.350%, 06/30/2021 | 295 | 317 | ||||||||||||
6.350%, 06/30/2021 (A) | 187 | 202 | ||||||||||||
Odebrecht Finance | ||||||||||||||
5.125%, 06/26/2022 (A) | 200 | 209 | ||||||||||||
OGX Austria GmbH | ||||||||||||||
8.500%, 06/01/2018 (A) | 742 | 423 | ||||||||||||
8.375%, 04/01/2022 | 600 | 330 | ||||||||||||
8.375%, 04/01/2022 (A) | 700 | 385 | ||||||||||||
OSX 3 Leasing | ||||||||||||||
9.250%, 03/20/2015 (A) | 600 | 570 | ||||||||||||
QGOG Atlantic | ||||||||||||||
5.250%, 07/30/2018 (A) | 301 | 311 | ||||||||||||
| Description | Face Amount (1) (Thousands) | Market Value ($ Thousands) | ||||||||||||
Samarco Mineracao | ||||||||||||||
4.125%, 11/01/2022 (A) | 457 | $ | 431 | |||||||||||
Schahin II Finance | ||||||||||||||
5.875%, 09/25/2022 (A) | 697 | 723 | ||||||||||||
Vale | ||||||||||||||
5.625%, 09/11/2042 | 340 | 317 | ||||||||||||
Vale Overseas | ||||||||||||||
8.250%, 01/17/2034 | 410 | 501 | ||||||||||||
6.875%, 11/21/2036 | 280 | 301 | ||||||||||||
Voto-Votorantim Overseas Trading Operations | ||||||||||||||
6.625%, 09/25/2019 (A) | 600 | 684 | ||||||||||||
|
| |||||||||||||
| 105,497 | ||||||||||||||
|
| |||||||||||||
Chile — 1.0% | ||||||||||||||
Automotores Gildemeister | ||||||||||||||
6.750%, 01/15/2023 | 600 | 549 | ||||||||||||
Banco del Estado de Chile | ||||||||||||||
4.125%, 10/07/2020 | 160 | 168 | ||||||||||||
4.125%, 10/07/2020 (A) | 300 | 315 | ||||||||||||
3.875%, 02/08/2022 (A) | 250 | 256 | ||||||||||||
Bonos de la Tesoreria de la Republica en pesos | ||||||||||||||
6.000%, 01/01/2020 | CLP | 90,000 | 188 | |||||||||||
BRT Escrow | ||||||||||||||
8.000%, 08/18/2018 (A) | 1,221 | 1,076 | ||||||||||||
Cencosud | ||||||||||||||
4.875%, 01/20/2023 (A) | 300 | 300 | ||||||||||||
Chile Government International Bond | ||||||||||||||
5.500%, 08/05/2020 | CLP | 563,000 | 1,186 | |||||||||||
3.250%, 09/14/2021 | 596 | 612 | ||||||||||||
Empresa Nacional del Petroleo | ||||||||||||||
6.250%, 07/08/2019 | 200 | 224 | ||||||||||||
6.250%, 07/08/2019 (A) | 30 | 34 | ||||||||||||
5.250%, 08/10/2020 | 120 | 128 | ||||||||||||
5.250%, 08/10/2020 (A) | 280 | 298 | ||||||||||||
Nacional del Cobre de Chile | ||||||||||||||
7.500%, 01/15/2019 | 190 | 236 | ||||||||||||
6.150%, 10/24/2036 | 958 | 1,102 | ||||||||||||
6.150%, 10/24/2036 (A) | 569 | 655 | ||||||||||||
5.625%, 09/21/2035 | 1,760 | 1,896 | ||||||||||||
4.250%, 07/17/2042 (A) | 1,136 | 1,002 | ||||||||||||
3.875%, 11/03/2021 | 447 | 458 | ||||||||||||
3.875%, 11/03/2021 (A) | 450 | 462 | ||||||||||||
3.750%, 11/04/2020 | 220 | 226 | ||||||||||||
3.750%, 11/04/2020 (A) | 310 | 318 | ||||||||||||
3.000%, 07/17/2022 (A) | 1,660 | 1,584 | ||||||||||||
SMU | ||||||||||||||
7.750%, 02/08/2020 | 600 | 624 | ||||||||||||
Telefonica Chile | ||||||||||||||
3.875%, 10/12/2022 (A) | 401 | 385 | ||||||||||||
|
| |||||||||||||
| 14,282 | ||||||||||||||
|
| |||||||||||||
| SEI Institutional Investments Trust / Annual Report / May 31, 2013 | 199 |
Table of Contents
SCHEDULE OF INVESTMENTS
Emerging Markets Debt Fund (Continued)
May 31, 2013
| Description | Face Amount (1) (Thousands) | Market Value ($ Thousands) | ||||||||||||
China — 1.7% |
| |||||||||||||
Agile Property Holdings | ||||||||||||||
8.875%, 04/28/2017 | 551 | $ | 584 | |||||||||||
Amber Circle Funding | ||||||||||||||
3.250%, 12/04/2022 | 1,020 | 975 | ||||||||||||
Bestgain Real Estate | ||||||||||||||
2.625%, 03/13/2018 | 200 | 192 | ||||||||||||
China Overseas Finance Cayman II | ||||||||||||||
5.500%, 11/10/2020 | 100 | 111 | ||||||||||||
China Overseas Finance Cayman V | ||||||||||||||
3.950%, 11/15/2022 | 200 | 197 | ||||||||||||
China Railway Resources Huitung | ||||||||||||||
3.850%, 02/05/2023 | 330 | 322 | ||||||||||||
China Shanshui Cement Group | ||||||||||||||
10.500%, 04/27/2017 | 200 | 222 | ||||||||||||
10.500%, 04/27/2017 | 200 | 223 | ||||||||||||
10.500%, 04/27/2017 (A) | 750 | 834 | ||||||||||||
CNPC General Capital | ||||||||||||||
3.400%, 04/16/2023 (A) | 380 | 371 | ||||||||||||
CNPC HK Overseas Capital | ||||||||||||||
5.950%, 04/28/2041 | 400 | 469 | ||||||||||||
COSCO Finance 2011 | ||||||||||||||
4.000%, 12/03/2022 | 200 | 194 | ||||||||||||
Country Garden Holdings | ||||||||||||||
11.250%, 04/22/2017 | 410 | 448 | ||||||||||||
7.500%, 01/10/2023 | 400 | 407 | ||||||||||||
7.500%, 01/10/2023 (A) | 202 | 206 | ||||||||||||
Evergrande Real Estate Group | ||||||||||||||
13.000%, 01/27/2015 | 300 | 321 | ||||||||||||
13.000%, 01/27/2015 | 400 | 428 | ||||||||||||
13.000%, 01/27/2015 (A) | 350 | 374 | ||||||||||||
9.250%, 01/19/2016 | CNY | 5,600 | 930 | |||||||||||
7.500%, 01/19/2014 | CNY | 3,280 | 540 | |||||||||||
Franshion Development | ||||||||||||||
6.750%, 04/15/2021 (A) | 430 | 454 | ||||||||||||
Gemdale International Investment | ||||||||||||||
7.125%, 11/16/2017 | 700 | 738 | ||||||||||||
Hidili Industry International Development | ||||||||||||||
8.625%, 11/04/2015 | 800 | 659 | ||||||||||||
Longfor Properties | ||||||||||||||
9.500%, 04/07/2016 | 600 | 648 | ||||||||||||
Mega Advance Investments | ||||||||||||||
5.000%, 05/12/2021 (A) | 200 | 219 | ||||||||||||
MIE Holdings | ||||||||||||||
9.750%, 05/12/2016 (A) | 200 | 212 | ||||||||||||
Sinochem Offshore Capital | ||||||||||||||
1.800%, 01/18/2014 | CNY | 3,000 | 485 | |||||||||||
Sinochem Overseas Capital | ||||||||||||||
6.300%, 11/12/2040 | 290 | 321 | ||||||||||||
4.500%, 11/12/2020 | 2,429 | 2,585 | ||||||||||||
4.500%, 11/12/2020 (A) | 5,168 | 5,500 | ||||||||||||
Sinopec Capital 2013 | ||||||||||||||
3.125%, 04/24/2023 (A) | 1,369 | 1,287 | ||||||||||||
| Description | Face Amount (1) (Thousands) | Market Value ($ Thousands) | ||||||||||||
Sinopec Group Overseas Development 2012 | ||||||||||||||
4.875%, 05/17/2042 (A) | 320 | $ | 322 | |||||||||||
Sunac China Holdings | ||||||||||||||
12.500%, 10/16/2017 | 400 | 458 | ||||||||||||
9.375%, 04/05/2018 | 1,300 | 1,355 | ||||||||||||
Tencent Holdings | ||||||||||||||
4.625%, 12/12/2016 (A) | 200 | 216 | ||||||||||||
3.375%, 03/05/2018 (A) | 230 | 235 | ||||||||||||
|
| |||||||||||||
| 24,042 | ||||||||||||||
|
| |||||||||||||
Colombia — 3.5% |
| |||||||||||||
Bancolombia | ||||||||||||||
5.125%, 09/11/2022 | 284 | 281 | ||||||||||||
Bogota Distrito Capital | ||||||||||||||
9.750%, 07/26/2028 | COP | 300,000 | 231 | |||||||||||
9.750%, 07/26/2028 (A) | COP | 10,018,000 | 7,712 | |||||||||||
Citigroup Funding, CLN (Republic of Colombia) MTN | ||||||||||||||
11.000%, 07/27/2020 | COP | 8,365,000 | 5,705 | |||||||||||
Colombia Telecomunicaciones ESP | ||||||||||||||
5.375%, 09/27/2022 (A) | 200 | 197 | ||||||||||||
Colombian TES | ||||||||||||||
10.000%, 07/24/2024 | COP | 3,012,000 | 2,122 | |||||||||||
7.500%, 08/26/2026 | COP | 2,650,000 | 1,525 | |||||||||||
Ecopetrol | ||||||||||||||
7.625%, 07/23/2019 | 40 | 49 | ||||||||||||
7.625%, 07/23/2019 (A) | 210 | 256 | ||||||||||||
Emgesa ESP | ||||||||||||||
8.750%, 01/25/2021 | COP | 940,000 | 579 | |||||||||||
Empresa de Energia de Bogota | ||||||||||||||
6.125%, 11/10/2021 | 200 | 217 | ||||||||||||
Empresas Publicas de Medellin ESP | ||||||||||||||
8.375%, 02/01/2021 | COP | 334,000 | 202 | |||||||||||
Grupo Aval | ||||||||||||||
5.250%, 02/01/2017 (A) | 200 | 210 | ||||||||||||
4.750%, 09/26/2022 (A) | 234 | 229 | ||||||||||||
Gruposura Finance | ||||||||||||||
5.700%, 05/18/2021 (A) | 272 | 297 | ||||||||||||
Pacific Rubiales Energy | ||||||||||||||
5.125%, 03/28/2023 (A) | 334 | 337 | ||||||||||||
Republic of Colombia | ||||||||||||||
12.000%, 10/22/2015 | COP | 490,000 | 300 | |||||||||||
11.750%, 02/25/2020 | 3,018 | 4,595 | ||||||||||||
10.375%, 01/28/2033 | 160 | 265 | ||||||||||||
9.850%, 06/28/2027 | COP | 4,375,000 | 3,279 | |||||||||||
8.125%, 05/21/2024 | 1,140 | 1,579 | ||||||||||||
7.750%, 04/14/2021 | COP | 4,434,000 | 2,783 | |||||||||||
7.375%, 01/27/2017 | 310 | 369 | ||||||||||||
7.375%, 03/18/2019 | 1,992 | 2,487 | ||||||||||||
7.375%, 09/18/2037 | 4,770 | 6,511 | ||||||||||||
6.125%, 01/18/2041 | 1,770 | 2,120 | ||||||||||||
| 200 | SEI Institutional Investments Trust / Annual Report / May 31, 2013 |
Table of Contents
| Description | Face Amount (1) (Thousands) | Market Value ($ Thousands) | ||||||||||||
4.375%, 07/12/2021 | 2,154 | $ | 2,337 | |||||||||||
4.375%, 03/21/2023 | COP | 1,484,000 | 744 | |||||||||||
2.625%, 03/15/2023 | 1,113 | 1,035 | ||||||||||||
Titulos de Tesoreria | ||||||||||||||
7.000%, 02/25/2015 | COP | 620,000 | 731 | |||||||||||
Transportadora de Gas Internacional ESP | ||||||||||||||
5.700%, 03/20/2022 (A) | 200 | 217 | ||||||||||||
|
| |||||||||||||
| 49,501 | ||||||||||||||
|
| |||||||||||||
Costa Rica — 0.1% |
| |||||||||||||
Costa Rica Government International Bond | ||||||||||||||
5.625%, 04/30/2043 (A) | 701 | 685 | ||||||||||||
4.375%, 04/30/2025 (A) | 693 | 676 | ||||||||||||
4.250%, 01/26/2023 | 690 | 673 | ||||||||||||
Instituto Costarricense de Electricidad | ||||||||||||||
6.375%, 05/15/2043 (A) | 290 | 272 | ||||||||||||
|
| |||||||||||||
| 2,306 | ||||||||||||||
|
| |||||||||||||
Croatia — 0.7% | ||||||||||||||
Republic of Croatia | ||||||||||||||
6.750%, 11/05/2019 | 2,655 | 2,958 | ||||||||||||
6.625%, 07/14/2020 | 2,413 | 2,665 | ||||||||||||
6.375%, 03/24/2021 | 1,330 | 1,452 | ||||||||||||
6.375%, 03/24/2021 (A) | 200 | 219 | ||||||||||||
6.250%, 04/27/2017 | 200 | 216 | ||||||||||||
6.250%, 04/27/2017 (A) | 1,216 | 1,315 | ||||||||||||
5.875%, 07/09/2018 | EUR | 170 | 239 | |||||||||||
5.500%, 04/04/2023 (A) | 382 | 390 | ||||||||||||
Zagrebacki Holding | ||||||||||||||
5.500%, 07/10/2017 | EUR | 950 | 1,052 | |||||||||||
|
| |||||||||||||
| 10,506 | ||||||||||||||
|
| |||||||||||||
Czech Republic — 0.1% |
| |||||||||||||
Central European Media Enterprises | ||||||||||||||
11.625%, 09/15/2016 | EUR | 900 | 1,231 | |||||||||||
11.625%, 09/15/2016 (A) | EUR | 600 | 821 | |||||||||||
|
| |||||||||||||
| 2,052 | ||||||||||||||
|
| |||||||||||||
Dominican Republic — 0.5% |
| |||||||||||||
Republic of Dominican Republic | ||||||||||||||
9.040%, 01/23/2018 | 1,827 | 2,028 | ||||||||||||
7.500%, 05/06/2021 | 2,889 | 3,272 | ||||||||||||
7.500%, 05/06/2021 (A) | 520 | 589 | ||||||||||||
5.875%, 04/18/2024 (A) | 780 | 796 | ||||||||||||
|
| |||||||||||||
| 6,685 | ||||||||||||||
|
| |||||||||||||
Ecuador — 0.0% |
| |||||||||||||
Republic of Ecuador | ||||||||||||||
9.375%, 12/15/2015 | 580 | 603 | ||||||||||||
|
| |||||||||||||
| Description | Face Amount (1) (Thousands) | Market Value ($ Thousands) | ||||||||||
Egypt — 0.1% |
| |||||||||||
Arab Republic of Egypt | ||||||||||||
6.875%, 04/30/2040 | 300 | $ | 234 | |||||||||
5.750%, 04/29/2020 | 200 | 170 | ||||||||||
5.750%, 04/29/2020 (A) | 270 | 229 | ||||||||||
Nile Finance | ||||||||||||
5.250%, 08/05/2015 | 260 | 234 | ||||||||||
|
| |||||||||||
| 867 | ||||||||||||
|
| |||||||||||
El Salvador — 0.2% |
| |||||||||||
Republic of El Salvador | ||||||||||||
8.250%, 04/10/2032 | 150 | 173 | ||||||||||
7.750%, 01/24/2023 | 367 | 428 | ||||||||||
7.650%, 06/15/2035 | 110 | 118 | ||||||||||
7.650%, 06/15/2035 | 400 | 428 | ||||||||||
7.625%, 02/01/2041 (A) | 150 | 160 | ||||||||||
7.375%, 12/01/2019 | 440 | 507 | ||||||||||
7.375%, 12/01/2019 (A) | 250 | 288 | ||||||||||
5.875%, 01/30/2025 | 500 | 503 | ||||||||||
Telemovil Finance | ||||||||||||
8.000%, 10/01/2017 | 600 | 649 | ||||||||||
|
| |||||||||||
| 3,254 | ||||||||||||
|
| |||||||||||
Gabon — 0.0% | ||||||||||||
Republic of Gabonese Republic | ||||||||||||
8.200%, 12/12/2017 | 100 | 117 | ||||||||||
|
| |||||||||||
Georgia — 0.1% | ||||||||||||
Georgian Railway JSC | ||||||||||||
7.750%, 07/11/2022 (A) | 420 | 487 | ||||||||||
Republic of Georgia | ||||||||||||
6.875%, 04/12/2021 | 200 | 233 | ||||||||||
6.875%, 04/12/2021 (A) | 310 | 360 | ||||||||||
|
| |||||||||||
| 1,080 | ||||||||||||
|
| |||||||||||
Germany — 0.3% | ||||||||||||
Desarrolladora Homex MTN | ||||||||||||
10.000%, 01/06/2021 | 3,500 | 3,579 | ||||||||||
Deutsche Bank, CLN (Cablevision) MTN | ||||||||||||
9.375%, 02/13/2018 (A) | 1,107 | 825 | ||||||||||
|
| |||||||||||
| 4,404 | ||||||||||||
|
| |||||||||||
Ghana — 0.1% | ||||||||||||
Republic of Ghana | ||||||||||||
8.500%, 10/04/2017 | 490 | 551 | ||||||||||
8.500%, 10/04/2017 (A) | 300 | 338 | ||||||||||
|
| |||||||||||
| 889 | ||||||||||||
|
| |||||||||||
Guatemala — 0.2% | ||||||||||||
Guatemala Government Bond | ||||||||||||
5.750%, 06/06/2022 | 1,050 | 1,134 | ||||||||||
4.875%, 02/13/2028 | 600 | 585 | ||||||||||
| SEI Institutional Investments Trust / Annual Report / May 31, 2013 | 201 |
Table of Contents
SCHEDULE OF INVESTMENTS
Emerging Markets Debt Fund (Continued)
May 31, 2013
| Description | Face Amount (1) (Thousands) | Market Value ($ Thousands) | ||||||||||||
4.875%, 02/13/2028 (A) | 364 | $ | 355 | |||||||||||
|
| |||||||||||||
| 2,074 | ||||||||||||||
|
| |||||||||||||
Hong Kong — 0.4% | ||||||||||||||
Central China Real Estate | ||||||||||||||
12.250%, 10/20/2015 | 500 | 549 | ||||||||||||
CFG Investment | ||||||||||||||
9.750%, 07/30/2019 | 550 | 507 | ||||||||||||
CFG Investment SAC | ||||||||||||||
9.750%, 07/30/2019 (A) | 550 | 507 | ||||||||||||
China Oriental Group | ||||||||||||||
8.000%, 08/18/2015 | 200 | 202 | ||||||||||||
8.000%, 08/18/2015 (A) | 650 | 656 | ||||||||||||
Fosun International | ||||||||||||||
7.500%, 05/12/2016 | 600 | 630 | ||||||||||||
Hengdeli Holdings | ||||||||||||||
6.250%, 01/29/2018 | 990 | 1,006 | ||||||||||||
Hutchison Whampoa International 10 |
| |||||||||||||
6.000%, 12/31/2049 (D) | 264 | 280 | ||||||||||||
Industrial & Commercial Bank of China Asia MTN | ||||||||||||||
5.125%, 11/30/2020 | 610 | 661 | ||||||||||||
Shimao Property Holdings | ||||||||||||||
11.000%, 03/08/2018 | 600 | 674 | ||||||||||||
|
| |||||||||||||
| 5,672 | ||||||||||||||
|
| |||||||||||||
Hungary — 3.0% | ||||||||||||||
Magyar Export-Import Bank RT | ||||||||||||||
5.500%, 02/12/2018 (A) | 215 | 222 | ||||||||||||
Republic of Hungary | ||||||||||||||
8.000%, 02/12/2015 | HUF | 1,541,330 | 7,134 | |||||||||||
7.750%, 08/24/2015 | HUF | 1,522,550 | 7,118 | |||||||||||
7.625%, 03/29/2041 | 2,264 | 2,468 | ||||||||||||
7.000%, 06/24/2022 | HUF | 632,000 | 3,031 | |||||||||||
6.750%, 02/24/2017 | HUF | 271,840 | 1,267 | |||||||||||
6.750%, 11/24/2017 | HUF | 1,469,330 | 6,891 | |||||||||||
6.500%, 06/24/2019 | HUF | 167,000 | 782 | |||||||||||
6.375%, 03/29/2021 | 1,716 | 1,864 | ||||||||||||
6.250%, 01/29/2020 | 850 | 921 | ||||||||||||
6.000%, 01/11/2019 | EUR | 1,024 | 1,431 | |||||||||||
6.000%, 11/24/2023 | HUF | 88,440 | 398 | |||||||||||
5.500%, 05/06/2014 | GBP | 598 | 923 | |||||||||||
5.500%, 12/22/2016 | HUF | 458,390 | 2,061 | |||||||||||
5.500%, 12/20/2018 | HUF | 119,000 | 530 | |||||||||||
5.375%, 02/21/2023 | 1,224 | 1,220 | ||||||||||||
5.000%, 03/30/2016 | GBP | 253 | 386 | |||||||||||
4.125%, 02/19/2018 | 1,640 | 1,634 | ||||||||||||
3.500%, 07/18/2016 | EUR | 1,819 | 2,354 | |||||||||||
|
| |||||||||||||
| 42,635 | ||||||||||||||
|
| |||||||||||||
India — 0.3% | ||||||||||||||
Bharti Airtel International Netherlands | ||||||||||||||
5.125%, 03/11/2023 | 300 | 297 | ||||||||||||
| Description | Face Amount (1) (Thousands) | Market Value ($ Thousands) | ||||||||||||
5.125%, 03/11/2023 (A) | 283 | $ | 280 | |||||||||||
Export-Import Bank of India MTN | ||||||||||||||
4.000%, 08/07/2017 | 220 | 229 | ||||||||||||
ICICI Bank | ||||||||||||||
5.750%, 11/16/2020 | 100 | 108 | ||||||||||||
5.750%, 11/16/2020 (A) | 127 | 138 | ||||||||||||
NTPC MTN | ||||||||||||||
4.750%, 10/03/2022 | 200 | 208 | ||||||||||||
Reliance Holdings USA | ||||||||||||||
6.250%, 10/19/2040 | 300 | 335 | ||||||||||||
5.400%, 02/14/2022 (A) | 250 | 273 | ||||||||||||
Vedanta Resources | ||||||||||||||
8.250%, 06/07/2021 | 900 | 972 | ||||||||||||
8.250%, 06/07/2021 (A) | 200 | 216 | ||||||||||||
7.125%, 05/31/2023 (A) | 268 | 266 | ||||||||||||
6.000%, 01/31/2019 (A) | 531 | 529 | ||||||||||||
|
| |||||||||||||
| 3,851 | ||||||||||||||
|
| |||||||||||||
Indonesia — 4.9% | ||||||||||||||
Adaro Indonesia | ||||||||||||||
7.625%, 10/22/2019 (A) | 480 | 511 | ||||||||||||
Deutsche Bank, CLN (Republic of Indonesia) | ||||||||||||||
7.000%, 05/15/2022 | IDR | 6,000,000 | 659 | |||||||||||
7.000%, 05/15/2027 | IDR | 2,500,000 | 266 | |||||||||||
Indo Energy Finance II | ||||||||||||||
6.375%, 01/24/2023 | 300 | 291 | ||||||||||||
6.375%, 01/24/2023 (A) | 408 | 396 | ||||||||||||
Indonesia Treasury Bond | ||||||||||||||
6.125%, 05/15/2028 | IDR | 13,000,000 | 1,263 | |||||||||||
Indosat Palapa | ||||||||||||||
7.375%, 07/29/2020 (A) | 210 | 229 | ||||||||||||
JPMorgan, CLN (Republic of Indonesia) | ||||||||||||||
7.000%, 05/15/2022 | IDR | 126,000,000 | 13,833 | |||||||||||
6.250%, 04/15/2017 | IDR | 1,600,000 | 171 | |||||||||||
6.125%, 05/15/2028 | IDR | 1,700,000 | 165 | |||||||||||
5.625%, 05/15/2023 | IDR | 3,800,000 | 378 | |||||||||||
5.250%, 05/15/2018 | IDR | 22,300,000 | 2,291 | |||||||||||
Majapahit Holding | ||||||||||||||
8.000%, 08/07/2019 | 200 | 245 | ||||||||||||
8.000%, 08/07/2019 (A) | 350 | 428 | ||||||||||||
7.875%, 06/29/2037 (A) | 215 | 270 | ||||||||||||
7.750%, 10/17/2016 | 160 | 184 | ||||||||||||
7.750%, 10/17/2016 | 250 | 287 | ||||||||||||
7.750%, 01/20/2020 (A) | 320 | 388 | ||||||||||||
Pertamina Persero | ||||||||||||||
6.500%, 05/27/2041 (A) | 820 | 834 | ||||||||||||
6.000%, 05/03/2042 (A) | 1,450 | 1,374 | ||||||||||||
5.625%, 05/20/2043 (A) | 970 | 875 | ||||||||||||
4.875%, 05/03/2022 (A) | 550 | 553 | ||||||||||||
Perusahaan Listrik Negara | ||||||||||||||
5.500%, 11/22/2021 (A) | 390 | 417 | ||||||||||||
5.250%, 10/24/2042 | 200 | 178 | ||||||||||||
| 202 | SEI Institutional Investments Trust / Annual Report / May 31, 2013 |
Table of Contents
| Description | Face Amount (1) (Thousands) | Market Value ($ Thousands) | ||||||||||||
Republic of Indonesia | ||||||||||||||
11.625%, 03/04/2019 | 1,006 | $ | 1,444 | |||||||||||
11.625%, 03/04/2019 | 1,981 | 2,843 | ||||||||||||
11.625%, 03/04/2019 (A) | 2,610 | 3,745 | ||||||||||||
11.000%, 10/15/2014 | IDR | 5,300,000 | 586 | |||||||||||
10.375%, 05/04/2014 | 170 | 184 | ||||||||||||
8.500%, 10/12/2035 | 531 | 759 | ||||||||||||
8.500%, 10/12/2035 | 100 | 143 | ||||||||||||
8.500%, 10/12/2035 | 1,840 | 2,631 | ||||||||||||
8.250%, 06/15/2032 | IDR | 50,032,000 | 5,873 | |||||||||||
7.750%, 01/17/2038 | 924 | 1,234 | ||||||||||||
7.750%, 01/17/2038 | 4,137 | 5,523 | ||||||||||||
7.000%, 05/15/2022 | IDR | 28,020,000 | 3,076 | |||||||||||
6.875%, 01/17/2018 | 3,045 | 3,593 | ||||||||||||
6.875%, 01/17/2018 (A) | 100 | 118 | ||||||||||||
6.625%, 05/15/2033 | IDR | 20,880,000 | 2,076 | |||||||||||
6.625%, 02/17/2037 | 70 | 83 | ||||||||||||
6.625%, 02/17/2037 | 100 | 119 | ||||||||||||
6.250%, 04/15/2017 | IDR | 17,400,000 | 1,856 | |||||||||||
5.875%, 03/13/2020 | 310 | 356 | ||||||||||||
5.875%, 03/13/2020 (A) | 790 | 906 | ||||||||||||
5.625%, 05/15/2023 | IDR | 11,280,000 | 1,123 | |||||||||||
4.875%, 05/05/2021 | 1,111 | 1,194 | ||||||||||||
4.875%, 05/05/2021 (A) | 550 | 591 | ||||||||||||
3.750%, 04/25/2022 | 476 | 469 | ||||||||||||
3.375%, 04/15/2023 (A) | 2,114 | 1,998 | ||||||||||||
|
| |||||||||||||
| 69,009 | ||||||||||||||
|
| |||||||||||||
Iraq — 0.3% | ||||||||||||||
Republic of Iraq | ||||||||||||||
5.800%, 01/15/2028 | 5,097 | 4,460 | ||||||||||||
|
| |||||||||||||
Israel — 0.2% | ||||||||||||||
Altice Financing | ||||||||||||||
8.000%, 12/15/2019 | EUR | 540 | 773 | |||||||||||
7.875%, 12/15/2019 | 900 | 996 | ||||||||||||
Altice Finco | ||||||||||||||
9.875%, 12/15/2020 | 800 | 908 | ||||||||||||
|
| |||||||||||||
| 2,677 | ||||||||||||||
|
| |||||||||||||
Ivory Coast — 0.3% | ||||||||||||||
Government of Ivory Coast | ||||||||||||||
7.100%, 12/31/2032 | 3,527 | 3,280 | ||||||||||||
3.750%, 12/31/2032 | 1,485 | 1,381 | ||||||||||||
|
| |||||||||||||
| 4,661 | ||||||||||||||
|
| |||||||||||||
Jamaica — 0.2% | ||||||||||||||
Digicel Group | ||||||||||||||
10.500%, 04/15/2018 | 770 | 836 | ||||||||||||
8.250%, 09/30/2020 | 1,600 | 1,704 | ||||||||||||
8.250%, 09/30/2020 (A) | 500 | 533 | ||||||||||||
|
| |||||||||||||
| 3,073 | ||||||||||||||
|
| |||||||||||||
| Description | Face Amount (1) (Thousands) | Market Value ($ Thousands) | ||||||||||
Kazakhstan — 1.7% | ||||||||||||
ATF Bank JSC | ||||||||||||
9.000%, 05/11/2016 | 400 | $ | 388 | |||||||||
Development Bank of Kazakhstan JSC | ||||||||||||
4.125%, 12/10/2022 | 880 | 839 | ||||||||||
Halyk Savings Bank of Kazakhstan | ||||||||||||
7.250%, 01/28/2021 (A) | 700 | 757 | ||||||||||
KazAgro National Management Holding JSC | ||||||||||||
4.625%, 05/24/2023 (A) | 420 | 400 | ||||||||||
Kazakhstan Temir Zholy Finance | ||||||||||||
6.950%, 07/10/2042 | 500 | 564 | ||||||||||
6.375%, 10/06/2020 | 660 | 743 | ||||||||||
Kazatomprom | ||||||||||||
6.250%, 05/20/2015 | 250 | 264 | ||||||||||
6.250%, 05/20/2015 (A) | 350 | 370 | ||||||||||
Kazkommertsbank MTN | ||||||||||||
8.000%, 11/03/2015 | 400 | 398 | ||||||||||
7.875%, 04/07/2014 | 100 | 101 | ||||||||||
7.500%, 11/29/2016 | 1,000 | 977 | ||||||||||
Kazkommertsbank JSC Via Citigroup Global Markets | ||||||||||||
8.700%, 04/07/2014 (C) (D) | 600 | 591 | ||||||||||
KazMunaiGaz Finance Sub | ||||||||||||
11.750%, 01/23/2015 | 1,859 | 2,122 | ||||||||||
9.125%, 07/02/2018 | 1,068 | 1,327 | ||||||||||
9.125%, 07/02/2018 (A) | 986 | 1,225 | ||||||||||
7.000%, 05/05/2020 | 2,117 | 2,469 | ||||||||||
6.375%, 04/09/2021 | 200 | 225 | ||||||||||
6.375%, 04/09/2021 (A) | 3,065 | 3,448 | ||||||||||
KazMunayGas National JSC | ||||||||||||
7.000%, 05/05/2020 (A) | 1,331 | 1,552 | ||||||||||
5.750%, 04/30/2043 (A) | 1,979 | 1,900 | ||||||||||
4.400%, 04/30/2023 (A) | 1,518 | 1,469 | ||||||||||
Tengizchevroil Finance | ||||||||||||
6.124%, 11/15/2014 | 138 | 141 | ||||||||||
Zhaikmunai Via Zhaikmunai International | ||||||||||||
7.125%, 11/13/2019 | 750 | 804 | ||||||||||
7.125%, 11/13/2019 (A) | 1,020 | 1,094 | ||||||||||
|
| |||||||||||
| 24,168 | ||||||||||||
|
| |||||||||||
Latvia — 0.1% |
| |||||||||||
Republic of Latvia | ||||||||||||
2.750%, 01/12/2020 | 900 | 866 | ||||||||||
|
| |||||||||||
Lithuania — 1.0% | ||||||||||||
Republic of Lithuania | ||||||||||||
7.375%, 02/11/2020 | 480 | 597 | ||||||||||
7.375%, 02/11/2020 (A) | 800 | 994 | ||||||||||
6.625%, 02/01/2022 | 1,300 | 1,570 | ||||||||||
6.625%, 02/01/2022 (A) | 300 | 362 | ||||||||||
6.125%, 03/09/2021 | 5,166 | 6,018 | ||||||||||
6.125%, 03/09/2021 (A) | 1,716 | 1,999 | ||||||||||
| SEI Institutional Investments Trust / Annual Report / May 31, 2013 | 203 |
Table of Contents
SCHEDULE OF INVESTMENTS
Emerging Markets Debt Fund (Continued)
May 31, 2013
| Description | Face Amount (1) (Thousands) | Market Value ($ Thousands) | ||||||||||||
5.125%, 09/14/2017 | 480 | $ | 527 | |||||||||||
4.850%, 02/07/2018 | EUR | 1,050 | 1,507 | |||||||||||
|
| |||||||||||||
| 13,574 | ||||||||||||||
|
| |||||||||||||
Malaysia — 4.4% | ||||||||||||||
Axiata SPV1 Labuan | ||||||||||||||
5.375%, 04/28/2020 | 290 | 323 | ||||||||||||
Malayan Banking MTN | ||||||||||||||
3.250%, 09/20/2022 (D) | 200 | 201 | ||||||||||||
Malaysia Government Bond | ||||||||||||||
5.248%, 09/15/2028 | MYR | 2,100 | 802 | |||||||||||
4.392%, 04/15/2026 | MYR | 10,900 | 3,799 | |||||||||||
4.262%, 09/15/2016 | MYR | 28,330 | 9,412 | |||||||||||
4.160%, 07/15/2021 | MYR | 13,310 | 4,530 | |||||||||||
4.012%, 09/15/2017 | MYR | 24,350 | 8,072 | |||||||||||
3.892%, 03/15/2027 | MYR | 1,348 | 453 | |||||||||||
3.844%, 04/15/2033 | MYR | 1,110 | 365 | |||||||||||
3.580%, 09/28/2018 | MYR | 7,450 | 2,436 | |||||||||||
3.502%, 05/31/2027 | MYR | 2,100 | 672 | |||||||||||
3.492%, 03/31/2020 | MYR | 13,443 | 4,364 | |||||||||||
3.480%, 03/15/2023 | MYR | 4,750 | 1,541 | |||||||||||
3.418%, 08/15/2022 | MYR | 11,873 | 3,828 | |||||||||||
3.314%, 10/31/2017 | MYR | 7,720 | 2,494 | |||||||||||
3.260%, 03/01/2018 | MYR | 14,170 | 4,562 | |||||||||||
3.197%, 10/15/2015 | MYR | 13,750 | 4,460 | |||||||||||
3.172%, 07/15/2016 | MYR | 2,755 | 888 | |||||||||||
Penerbangan Malaysia | ||||||||||||||
5.625%, 03/15/2016 | 741 | 824 | ||||||||||||
Petroliam Nasional | ||||||||||||||
7.625%, 10/15/2026 | 106 | 147 | ||||||||||||
Petronas Capital | ||||||||||||||
7.875%, 05/22/2022 | 1,541 | 2,093 | ||||||||||||
5.250%, 08/12/2019 | 260 | 299 | ||||||||||||
5.250%, 08/12/2019 (A) | 4,144 | 4,759 | ||||||||||||
Petronas Capital Registered | ||||||||||||||
7.875%, 05/22/2022 | 46 | 63 | ||||||||||||
Wakala Global Sukuk | ||||||||||||||
4.646%, 07/06/2021 (A) | 410 | 455 | ||||||||||||
|
| |||||||||||||
| 61,842 | ||||||||||||||
|
| |||||||||||||
Mexico — 7.7% | ||||||||||||||
America Movil | ||||||||||||||
3.125%, 07/16/2022 | 200 | 191 | ||||||||||||
BBVA Bancomer | ||||||||||||||
6.750%, 09/30/2022 (A) | 650 | 730 | ||||||||||||
6.008%, 05/17/2022 (D) | 600 | 615 | ||||||||||||
Cemex | ||||||||||||||
9.500%, 06/15/2018 (A) | 243 | 272 | ||||||||||||
9.000%, 01/11/2018 (A) | 344 | 368 | ||||||||||||
Cemex Espana Luxembourg | ||||||||||||||
9.875%, 04/30/2019 | 200 | 224 | ||||||||||||
9.250%, 05/12/2020 | 900 | 965 | ||||||||||||
9.250%, 05/12/2020 | 400 | 429 | ||||||||||||
9.250%, 05/12/2020 (A) | 789 | 846 | ||||||||||||
| Description | Face Amount (1) (Thousands) | Market Value ($ Thousands) | ||||||||||||
Cemex Finance | ||||||||||||||
9.375%, 10/12/2022 (A) | 843 | $ | 944 | |||||||||||
Comision Federal de Electricidad | ||||||||||||||
5.750%, 02/14/2042 (A) | 570 | 587 | ||||||||||||
4.875%, 05/26/2021 | 200 | 216 | ||||||||||||
4.875%, 05/26/2021 (A) | 300 | 324 | ||||||||||||
Desarrolladora Homex | ||||||||||||||
9.750%, 03/25/2020 | 200 | 68 | ||||||||||||
9.750%, 03/25/2020 (A) | 700 | 259 | ||||||||||||
GEO | ||||||||||||||
9.250%, 06/30/2020 | 498 | 189 | ||||||||||||
8.875%, 03/27/2022 (A) | 200 | 76 | ||||||||||||
Grupo Bimbo | ||||||||||||||
4.875%, 06/30/2020 (A) | 215 | 233 | ||||||||||||
4.500%, 01/25/2022 (A) | 100 | 106 | ||||||||||||
Grupo Senda | ||||||||||||||
10.500%, 10/03/2015 | 4,390 | 4,511 | ||||||||||||
Grupo Televisa | ||||||||||||||
6.000%, 05/15/2018 | 174 | 201 | ||||||||||||
Metalsa | ||||||||||||||
4.900%, 04/24/2023 (A) | 234 | 233 | ||||||||||||
Mexican Bonos, Ser M20 | ||||||||||||||
8.000%, 12/07/2023 | MXP | 10,150 | 947 | |||||||||||
Mexican Bonos | ||||||||||||||
10.000%, 11/20/2036 | MXP | 25,400 | 2,830 | |||||||||||
8.500%, 12/13/2018 | MXP | 12,119 | 1,114 | |||||||||||
8.500%, 05/31/2029 | MXP | 43,730 | 4,285 | |||||||||||
8.500%, 11/18/2038 | MXP | 33,673 | 3,297 | |||||||||||
8.000%, 12/17/2015 | MXP | 8 | 1 | |||||||||||
8.000%, 06/11/2020 | MXP | 6 | 1 | |||||||||||
7.750%, 12/14/2017 | MXP | 14,673 | 1,285 | |||||||||||
7.750%, 05/29/2031 | MXP | 83,152 | 7,553 | |||||||||||
7.750%, 11/13/2042 | MXP | 11,800 | 1,066 | |||||||||||
7.500%, 06/03/2027 | MXP | 143,493 | 13,025 | |||||||||||
6.500%, 06/10/2021 | MXP | 69,480 | 5,846 | |||||||||||
6.500%, 06/09/2022 | MXP | 113,340 | 9,493 | |||||||||||
6.250%, 06/16/2016 | MXP | 3,830 | 314 | |||||||||||
5.000%, 06/15/2017 | MXP | 26,991 | 2,129 | |||||||||||
Mexican Udibonos | ||||||||||||||
4.000%, 11/15/2040 | MXP | 3,300 | 1,536 | |||||||||||
2.500%, 12/10/2020 | MXP | 15,680 | 6,443 | |||||||||||
2.000%, 06/09/2022 | MXP | 3,970 | 1,553 | |||||||||||
Mexichem | ||||||||||||||
6.750%, 09/19/2042 (A) | 419 | 458 | ||||||||||||
4.875%, 09/19/2022 (A) | 200 | 207 | ||||||||||||
Mexico Cetes | ||||||||||||||
4.490%, 06/27/2013 (I) | MXP | 208,459 | 1,620 | |||||||||||
Mexico Generadora de Energia S de rl | ||||||||||||||
5.500%, 12/06/2032 (A) | 200 | 201 | ||||||||||||
NII Capital | ||||||||||||||
10.000%, 08/15/2016 | 1,395 | 1,409 | ||||||||||||
7.625%, 04/01/2021 | 1,076 | 896 | ||||||||||||
Oceanografia | ||||||||||||||
11.250%, 07/15/2015 | 1,386 | 1,199 | ||||||||||||
| 204 | SEI Institutional Investments Trust / Annual Report / May 31, 2013 |
Table of Contents
| Description | Face Amount (1) (Thousands) | Market Value ($ Thousands) | ||||||||||||
Pemex Project Funding Master Trust | ||||||||||||||
6.625%, 06/15/2035 | 1,576 | $ | 1,805 | |||||||||||
5.750%, 03/01/2018 | 974 | 1,105 | ||||||||||||
Petroleos Mexicanos | ||||||||||||||
8.000%, 05/03/2019 | 460 | 573 | ||||||||||||
6.500%, 06/02/2041 | 1,200 | 1,344 | ||||||||||||
6.000%, 03/05/2020 | 200 | 229 | ||||||||||||
6.000%, 03/05/2020 (A) | 80 | 92 | ||||||||||||
5.500%, 06/27/2044 | 50 | 49 | ||||||||||||
5.500%, 06/27/2044 (A) | 190 | 186 | ||||||||||||
3.500%, 01/30/2023 (A) | 210 | 200 | ||||||||||||
Southern Copper | ||||||||||||||
6.750%, 04/16/2040 | 162 | 169 | ||||||||||||
5.250%, 11/08/2042 | 225 | 195 | ||||||||||||
United Mexican States MTN | ||||||||||||||
8.300%, 08/15/2031 | 400 | 590 | ||||||||||||
7.500%, 04/08/2033 | 450 | 623 | ||||||||||||
6.050%, 01/11/2040 | 2,120 | 2,512 | ||||||||||||
5.950%, 03/19/2019 | 1,656 | 1,962 | ||||||||||||
5.750%, 10/12/2110 | 6,636 | 6,885 | ||||||||||||
5.125%, 01/15/2020 | 2,422 | 2,761 | ||||||||||||
4.750%, 03/08/2044 | 2,376 | 2,358 | ||||||||||||
3.625%, 03/15/2022 | 380 | 393 | ||||||||||||
United Mexican States, Ser A MTN | ||||||||||||||
6.750%, 09/27/2034 | 2,189 | 2,796 | ||||||||||||
Urbi Desarrollos Urbanos | ||||||||||||||
9.750%, 02/03/2022 | 1,000 | 220 | ||||||||||||
9.750%, 02/03/2022 (A) | 500 | 110 | ||||||||||||
9.500%, 01/21/2020 | 1,030 | 227 | ||||||||||||
|
| |||||||||||||
| 108,679 | ||||||||||||||
|
| |||||||||||||
Mongolia — 0.1% |
| |||||||||||||
Mongolia Government International Bond | ||||||||||||||
5.125%, 12/05/2022 | 400 | 373 | ||||||||||||
Mongolian Mining MTN | ||||||||||||||
8.875%, 03/29/2017 | 1,280 | 1,216 | ||||||||||||
|
| |||||||||||||
| 1,589 | ||||||||||||||
|
| |||||||||||||
Morocco — 0.2% | ||||||||||||||
Kingdom of Morocco | ||||||||||||||
5.500%, 12/11/2042 | 700 | 664 | ||||||||||||
5.500%, 12/11/2042 (A) | 200 | 190 | ||||||||||||
4.250%, 12/11/2022 | 600 | 584 | ||||||||||||
4.250%, 12/11/2022 (A) | 967 | 942 | ||||||||||||
|
| |||||||||||||
| 2,380 | ||||||||||||||
|
| |||||||||||||
Nigeria — 1.2% | ||||||||||||||
Afren | ||||||||||||||
11.500%, 02/01/2016 | 900 | 1,058 | ||||||||||||
11.500%, 02/01/2016 (A) | 700 | 823 | ||||||||||||
10.250%, 04/08/2019 (A) | 400 | 470 | ||||||||||||
Nigeria Treasury Bill | ||||||||||||||
13.750%, 01/09/2014 | NGN | 127,930 | 755 | |||||||||||
| Description | Face Amount (1) (Thousands) | Market Value ($ Thousands) | ||||||||||||
12.260%, 12/19/2013 | NGN | 84,000 | $ | 498 | ||||||||||
11.780%, 01/23/2014 | NGN | 236,000 | 1,385 | |||||||||||
11.100%, 12/05/2013 | NGN | 10,000 | 60 | |||||||||||
10.970%, 09/05/2013 | NGN | 29,000 | 177 | |||||||||||
10.720%, 03/06/2014 | NGN | 25,000 | 146 | |||||||||||
10.510%, 10/10/2013 | NGN | 20,000 | 122 | |||||||||||
10.150%, 04/10/2014 | NGN | 110,000 | 632 | |||||||||||
6.270%, 03/20/2014 | NGN | 444,390 | 2,570 | |||||||||||
Republic of Nigeria | ||||||||||||||
16.390%, 01/27/2022 | NGN | 170,000 | 1,334 | |||||||||||
16.390%, 01/27/2022 | NGN | 122,750 | 963 | |||||||||||
16.000%, 06/29/2019 | NGN | 127,000 | 919 | |||||||||||
16.000%, 06/29/2019 | NGN | 256,000 | 1,853 | |||||||||||
15.100%, 04/27/2017 | NGN | 90,540 | 623 | |||||||||||
10.700%, 05/30/2018 | NGN | 8,000 | 48 | |||||||||||
6.750%, 01/28/2021 (A) | 550 | 627 | ||||||||||||
Sea Trucks Group | ||||||||||||||
9.000%, 03/26/2018 | 600 | 609 | ||||||||||||
9.000%, 03/26/2018 (A) | 700 | 711 | ||||||||||||
|
| |||||||||||||
| 16,383 | ||||||||||||||
|
| |||||||||||||
Pakistan — 0.1% | ||||||||||||||
Pakistan Mobile Communications | ||||||||||||||
8.625%, 11/13/2013 (A) | 330 | 325 | ||||||||||||
Republic of Pakistan | ||||||||||||||
7.125%, 03/31/2016 | 100 | 97 | ||||||||||||
7.125%, 03/31/2016 | 450 | 436 | ||||||||||||
6.875%, 06/01/2017 | 10 | 10 | ||||||||||||
6.875%, 06/01/2017 | 630 | 605 | ||||||||||||
|
| |||||||||||||
| 1,473 | ||||||||||||||
|
| |||||||||||||
Panama — 1.0% | ||||||||||||||
ENA Norte Trust | ||||||||||||||
4.950%, 04/25/2023 | 294 | 304 | ||||||||||||
Republic of Panama | ||||||||||||||
9.375%, 01/16/2023 | 595 | 851 | ||||||||||||
9.375%, 04/01/2029 | 4,107 | 6,493 | ||||||||||||
8.875%, 09/30/2027 | 1,525 | 2,289 | ||||||||||||
8.125%, 04/28/2034 | 2,249 | 3,171 | ||||||||||||
7.125%, 01/29/2026 | 100 | 131 | ||||||||||||
6.700%, 01/26/2036 | 910 | 1,163 | ||||||||||||
4.300%, 04/29/2053 | 140 | 124 | ||||||||||||
|
| |||||||||||||
| 14,526 | ||||||||||||||
|
| |||||||||||||
Paraguay — 0.1% | ||||||||||||||
Republic of Paraguay | ||||||||||||||
4.625%, 01/25/2023 | 350 | 346 | ||||||||||||
Telefonica Celular del Paraguay | ||||||||||||||
6.750%, 12/13/2022 | 200 | 218 | ||||||||||||
6.750%, 12/13/2022 | 400 | 436 | ||||||||||||
|
| |||||||||||||
| 1,000 | ||||||||||||||
|
| |||||||||||||
| SEI Institutional Investments Trust / Annual Report / May 31, 2013 | 205 |
Table of Contents
SCHEDULE OF INVESTMENTS
Emerging Markets Debt Fund (Continued)
May 31, 2013
| Description | Face Amount (1) (Thousands) | Market Value ($ Thousands) | ||||||||||||
Peru — 1.3% | ||||||||||||||
Ajecorp | ||||||||||||||
6.500%, 05/14/2022 (A) | 200 | $ | 216 | |||||||||||
Azucarera del Peru | ||||||||||||||
6.375%, 08/02/2022 (A) | 124 | 128 | ||||||||||||
Banco de Credito del Peru | ||||||||||||||
5.375%, 09/16/2020 | 10 | 11 | ||||||||||||
5.375%, 09/16/2020 (A) | 306 | 331 | ||||||||||||
BBVA Banco Continental | ||||||||||||||
5.000%, 08/26/2022 (A) | 195 | 199 | ||||||||||||
Cementos Pacasmayo SAA | ||||||||||||||
4.500%, 02/08/2023 (A) | 225 | 218 | ||||||||||||
Inkia Energy | ||||||||||||||
8.375%, 04/04/2021 (A) | 348 | 390 | ||||||||||||
Peru Enhanced Pass-Through Finance | ||||||||||||||
4.360%, 06/02/2025 (A) | 1,000 | 660 | ||||||||||||
2.770%, 05/31/2018 | 269 | 243 | ||||||||||||
2.700%, 05/31/2018 (A) | 304 | 274 | ||||||||||||
Republic of Peru | ||||||||||||||
9.910%, 05/05/2015 | PEI | 785 | 327 | |||||||||||
8.750%, 11/21/2033 | 5,190 | 8,109 | ||||||||||||
8.600%, 08/12/2017 | PEI | 2,260 | 998 | |||||||||||
8.200%, 08/12/2026 | PEI | 1,440 | 682 | |||||||||||
7.840%, 08/12/2020 | PEI | 3,020 | 1,315 | |||||||||||
7.350%, 07/21/2025 | 1,730 | 2,338 | ||||||||||||
7.125%, 03/30/2019 | 180 | 225 | ||||||||||||
6.950%, 08/12/2031 | PEI | 1,500 | 625 | |||||||||||
Volcan Cia Minera SAA | ||||||||||||||
5.375%, 02/02/2022 (A) | 112 | 114 | ||||||||||||
|
| |||||||||||||
| 17,403 | ||||||||||||||
|
| |||||||||||||
Philippines — 1.5% | ||||||||||||||
Development Bank of Philippines | ||||||||||||||
5.500%, 03/25/2021 | 370 | 417 | ||||||||||||
National Power | ||||||||||||||
9.625%, 05/15/2028 | 1,100 | 1,705 | ||||||||||||
Power Sector | ||||||||||||||
7.390%, 12/02/2024 (A) | 650 | 856 | ||||||||||||
Power Sector Assets & Liabilities Management | ||||||||||||||
7.390%, 12/02/2024 | 250 | 329 | ||||||||||||
Republic of Philippines | ||||||||||||||
10.625%, 03/16/2025 | 1,466 | 2,412 | ||||||||||||
9.500%, 02/02/2030 | 2,938 | 4,693 | ||||||||||||
8.375%, 06/17/2019 | 460 | 609 | ||||||||||||
7.750%, 01/14/2031 | 2,767 | 3,881 | ||||||||||||
6.375%, 10/23/2034 | 600 | 766 | ||||||||||||
6.250%, 01/14/2036 | PHP | 52,000 | 1,538 | |||||||||||
5.500%, 03/30/2026 | 620 | 738 | ||||||||||||
4.000%, 01/15/2021 | 1,293 | 1,398 | ||||||||||||
3.900%, 11/26/2022 | PHP | 52,000 | 1,313 | |||||||||||
|
| |||||||||||||
| 20,655 | ||||||||||||||
|
| |||||||||||||
| Description | Face Amount (1) (Thousands) | Market Value ($ Thousands) | ||||||||||||
Poland — 6.4% | ||||||||||||||
CEDC Finance International | ||||||||||||||
8.875%, 12/01/2016 (B) | EUR | 500 | $ | 531 | ||||||||||
Eileme 2 | ||||||||||||||
11.750%, 01/31/2020 | EUR | 700 | 1,068 | |||||||||||
11.625%, 01/31/2020 (A) | 1,350 | 1,586 | ||||||||||||
Polish Television Holding MTN | ||||||||||||||
13.000%, 11/15/2014 (C) | EUR | 100 | 139 | |||||||||||
11.000%, 11/15/2014 (A) (C) | EUR | 400 | 557 | |||||||||||
Republic of Poland | ||||||||||||||
6.375%, 07/15/2019 | 8,742 | 10,534 | ||||||||||||
6.250%, 10/24/2015 | PLN | 3,300 | 1,079 | |||||||||||
5.750%, 10/25/2021 | PLN | 19,935 | 7,038 | |||||||||||
5.750%, 09/23/2022 | PLN | 23,715 | 8,433 | |||||||||||
5.750%, 04/25/2029 | PLN | 3,680 | 1,368 | |||||||||||
5.500%, 04/25/2015 | PLN | 20,890 | 6,652 | |||||||||||
5.500%, 10/25/2019 | PLN | 8,000 | 2,733 | |||||||||||
5.250%, 10/25/2017 | PLN | 4,988 | 1,646 | |||||||||||
5.125%, 04/21/2021 | 200 | 228 | ||||||||||||
5.000%, 03/23/2022 | 4,553 | 5,134 | ||||||||||||
4.750%, 10/25/2016 | PLN | 5,500 | 1,765 | |||||||||||
4.750%, 04/25/2017 | PLN | 20,930 | 6,753 | |||||||||||
4.000%, 10/25/2023 | PLN | 35,130 | 11,018 | |||||||||||
3.750%, 04/25/2018 | PLN | 11,540 | 3,591 | |||||||||||
3.000%, 08/24/2016 | PLN | 36,480 | 11,729 | |||||||||||
3.000%, 03/17/2023 | 900 | 862 | ||||||||||||
2.750%, 08/25/2023 | PLN | 6,558 | 2,209 | |||||||||||
2.470%, 07/25/2014 | PLN | 12,530 | 3,680 | |||||||||||
|
| |||||||||||||
| 90,333 | ||||||||||||||
|
| |||||||||||||
Qatar — 0.6% | ||||||||||||||
Qtel International Finance | ||||||||||||||
7.875%, 06/10/2019 | 613 | 785 | ||||||||||||
4.750%, 02/16/2021 | 300 | 327 | ||||||||||||
4.500%, 01/31/2043 | 250 | 235 | ||||||||||||
3.875%, 01/31/2028 | 200 | 190 | ||||||||||||
3.875%, 01/31/2028 (A) | 200 | 190 | ||||||||||||
3.250%, 02/21/2023 (A) | 255 | 242 | ||||||||||||
State of Qatar | ||||||||||||||
9.750%, 06/15/2030 | 623 | 1,034 | ||||||||||||
6.550%, 04/09/2019 | 348 | 426 | ||||||||||||
6.400%, 01/20/2040 | 1,241 | 1,570 | ||||||||||||
6.400%, 01/20/2040 (A) | 438 | 554 | ||||||||||||
5.750%, 01/20/2042 (A) | 850 | 986 | ||||||||||||
5.250%, 01/20/2020 | 326 | 376 | ||||||||||||
5.250%, 01/20/2020 (A) | 1,486 | 1,713 | ||||||||||||
|
| |||||||||||||
| 8,628 | ||||||||||||||
|
| |||||||||||||
Romania — 0.9% | ||||||||||||||
Romania Government Bond | ||||||||||||||
5.900%, 07/26/2017 | RON | 2,830 | 865 | |||||||||||
5.850%, 07/28/2014 | RON | 5,660 | 1,689 | |||||||||||
5.850%, 04/26/2023 | RON | 930 | 293 | |||||||||||
| 206 | SEI Institutional Investments Trust / Annual Report / May 31, 2013 |
Table of Contents
| Description | Face Amount (1) (Thousands) | Market Value ($ Thousands) | ||||||||||||
5.800%, 10/26/2015 | RON | 5,650 | $ | 1,706 | ||||||||||
5.750%, 04/29/2020 | RON | 1,390 | 425 | |||||||||||
5.600%, 11/28/2018 | RON | 600 | 182 | |||||||||||
Romanian Government International Bond MTN | ||||||||||||||
6.750%, 02/07/2022 | 2,768 | 3,264 | ||||||||||||
6.750%, 02/07/2022 (A) | 390 | 460 | ||||||||||||
6.500%, 06/18/2018 | EUR | 776 | 1,141 | |||||||||||
6.000%, 10/19/2013 | RON | 3,620 | 1,073 | |||||||||||
5.850%, 07/28/2014 | RON | 20 | 6 | |||||||||||
4.375%, 08/22/2023 | 1,390 | 1,375 | ||||||||||||
4.375%, 08/22/2023 (A) | 508 | 503 | ||||||||||||
|
| |||||||||||||
| 12,982 | ||||||||||||||
|
| |||||||||||||
Russia — 9.6% | ||||||||||||||
Alfa Bank Via Alfa Bond Issuance | ||||||||||||||
7.500%, 09/26/2019 | 650 | 696 | ||||||||||||
7.500%, 09/26/2019 (A) | 475 | 509 | ||||||||||||
Brunswick Rail Finance | ||||||||||||||
6.500%, 11/01/2017 | 650 | 677 | ||||||||||||
Credit Bank of Moscow Via CBOM Finance | ||||||||||||||
7.700%, 02/01/2018 | 1,200 | 1,271 | ||||||||||||
EDC Finance | ||||||||||||||
4.875%, 04/17/2020 (A) | 250 | 247 | ||||||||||||
Edel Capital for Sinek Capital SA | ||||||||||||||
7.700%, 08/03/2015 | 600 | 635 | ||||||||||||
EuroChem Mineral & Chemical Via EuroChem GI | ||||||||||||||
5.125%, 12/12/2017 (A) | 250 | 253 | ||||||||||||
Evraz Group | ||||||||||||||
9.500%, 04/24/2018 | 1,000 | 1,112 | ||||||||||||
6.750%, 04/27/2018 | 800 | 798 | ||||||||||||
6.750%, 04/27/2018 (A) | 200 | 200 | ||||||||||||
Far Eastern Shipping | ||||||||||||||
8.750%, 05/02/2020 (A) | 850 | 876 | ||||||||||||
8.000%, 05/02/2018 (A) | 1,500 | 1,519 | ||||||||||||
Gaz Capital | ||||||||||||||
6.510%, 03/07/2022 | 300 | 337 | ||||||||||||
Gazprom Neft OAO Via GPN Capital | ||||||||||||||
4.375%, 09/19/2022 | 1,227 | 1,178 | ||||||||||||
4.375%, 09/19/2022 (A) | 600 | 576 | ||||||||||||
Gazprom OAO Via Gaz Capital | ||||||||||||||
9.250%, 04/23/2019 | 991 | 1,261 | ||||||||||||
4.950%, 07/19/2022 (A) | 932 | 945 | ||||||||||||
4.950%, 02/06/2028 | 300 | 287 | ||||||||||||
4.950%, 02/06/2028 (A) | 893 | 855 | ||||||||||||
Metalloinvest Finance | ||||||||||||||
6.500%, 07/21/2016 | 800 | 843 | ||||||||||||
5.625%, 04/17/2020 | 300 | 298 | ||||||||||||
MTS International Funding | ||||||||||||||
8.625%, 06/22/2020 | 400 | 489 | ||||||||||||
8.625%, 06/22/2020 (A) | 1,050 | 1,283 | ||||||||||||
5.000%, 05/30/2023 (A) | 950 | 940 | ||||||||||||
| Description | Face Amount (1) (Thousands) | Market Value ($ Thousands) | ||||||||||||
Nord | ||||||||||||||
6.375%, 05/07/2018 (A) | 200 | $ | 196 | |||||||||||
Novatek Finance | ||||||||||||||
5.326%, 02/03/2016 | 375 | 397 | ||||||||||||
OAO TMK Capital | ||||||||||||||
7.750%, 01/27/2018 | 1,500 | 1,558 | ||||||||||||
OJSC Novolipetsk Steel | ||||||||||||||
4.450%, 02/19/2018 (A) | 290 | 285 | ||||||||||||
Promsvyazbank Via PSB Finance | ||||||||||||||
10.200%, 11/06/2019 | 850 | 921 | ||||||||||||
8.500%, 04/25/2017 | 400 | 435 | ||||||||||||
Ritekro | ||||||||||||||
11.520%, 11/07/2022 (E) (F) | 538 | 200 | ||||||||||||
Rosneft Oil Via Rosneft International Finance | ||||||||||||||
4.199%, 03/06/2022 | 550 | 525 | ||||||||||||
Russian Agricultural Bank Via RSHB Capital | ||||||||||||||
6.000%, 06/03/2021 (D) | 425 | 436 | ||||||||||||
5.298%, 12/27/2017 (A) | 415 | 433 | ||||||||||||
Russian Federal Bond - OFZ | ||||||||||||||
8.150%, 02/03/2027 | RUB | 138,377 | 4,604 | |||||||||||
7.600%, 04/14/2021 | RUB | 522,525 | 16,852 | |||||||||||
7.600%, 07/20/2022 | RUB | 100,246 | 3,241 | |||||||||||
7.500%, 03/15/2018 | RUB | 53,400 | 1,739 | |||||||||||
7.500%, 02/27/2019 | RUB | 313,400 | 10,185 | |||||||||||
7.400%, 04/19/2017 | RUB | 42,321 | 1,370 | |||||||||||
7.400%, 06/14/2017 | RUB | 108,100 | 3,500 | |||||||||||
7.350%, 01/20/2016 | RUB | 17,740 | 571 | |||||||||||
7.100%, 03/13/2014 | RUB | 138,300 | 4,366 | |||||||||||
7.050%, 01/19/2028 | RUB | 24,537 | 738 | |||||||||||
7.000%, 12/03/2014 (C) | RUB | 35,860 | 1,095 | |||||||||||
7.000%, 06/03/2015 | RUB | 21,780 | 693 | |||||||||||
7.000%, 01/25/2023 | RUB | 80,380 | 2,494 | |||||||||||
6.900%, 08/03/2016 | RUB | 213,100 | 6,783 | |||||||||||
6.200%, 01/31/2018 | RUB | 13,800 | 428 | |||||||||||
Russian Foreign Bond - Eurobond | ||||||||||||||
12.750%, 06/24/2028 | 924 | 1,732 | ||||||||||||
7.850%, 03/10/2018 | RUB | 445,000 | 14,669 | |||||||||||
7.850%, 03/10/2018 (A) | RUB | 10,000 | 330 | |||||||||||
7.500%, 03/31/2030 | 12,519 | 15,210 | ||||||||||||
5.625%, 04/04/2042 | 200 | 219 | ||||||||||||
5.625%, 04/04/2042 (A) | 400 | 438 | ||||||||||||
5.000%, 04/29/2020 | 300 | 334 | ||||||||||||
3.250%, 04/04/2017 (A) | 1,200 | 1,249 | ||||||||||||
Russian Railways Via RZD Capital | ||||||||||||||
5.700%, 04/05/2022 | 399 | 433 | ||||||||||||
Russian Standard Bank Via Russian Standard Finance | ||||||||||||||
9.250%, 07/11/2017 | 1,200 | 1,301 | ||||||||||||
Sberbank of Russia Via SB Capital | ||||||||||||||
6.125%, 02/07/2022 | 310 | 342 | ||||||||||||
6.125%, 02/07/2022 (A) | 290 | 320 | ||||||||||||
6.125%, 02/07/2022 (A) | 200 | 220 | ||||||||||||
| SEI Institutional Investments Trust / Annual Report / May 31, 2013 | 207 |
Table of Contents
SCHEDULE OF INVESTMENTS
Emerging Markets Debt Fund (Continued)
May 31, 2013
| Description | Face Amount (1) (Thousands) | Market Value ($ Thousands) | ||||||||||
5.717%, 06/16/2021 | 400 | $ | 430 | |||||||||
5.250%, 05/23/2023 (A) | 290 | 283 | ||||||||||
5.125%, 10/29/2022 (A) | 275 | 272 | ||||||||||
SCF Capital | ||||||||||||
5.375%, 10/27/2017 (A) | 409 | 411 | ||||||||||
Severstal OAO Via Steel Capital | ||||||||||||
6.700%, 10/25/2017 | 304 | 323 | ||||||||||
5.900%, 10/17/2022 | 400 | 387 | ||||||||||
5.900%, 10/17/2022 (A) | 202 | 195 | ||||||||||
Sibur Securities | ||||||||||||
3.914%, 01/31/2018 (A) | 520 | 499 | ||||||||||
VEB-Leasing Via VEB Leasing Investment | ||||||||||||
5.125%, 05/27/2016 | 340 | 363 | ||||||||||
Vimpel Communications Via VIP Finance Ireland | ||||||||||||
7.748%, 02/02/2021 | 200 | 221 | ||||||||||
VimpelCom Holdings | ||||||||||||
7.504%, 03/01/2022 | 400 | 433 | ||||||||||
7.504%, 03/01/2022 (A) | 600 | 649 | ||||||||||
6.255%, 03/01/2017 | 200 | 211 | ||||||||||
5.200%, 02/13/2019 (A) | 300 | 298 | ||||||||||
VIP Finance Ireland for Vimpel Communications | ||||||||||||
9.125%, 04/30/2018 | 300 | 353 | ||||||||||
9.125%, 04/30/2018 (A) | 400 | 471 | ||||||||||
7.748%, 02/02/2021 (A) | 1,490 | 1,647 | ||||||||||
Vnesheconombank Via VEB Finance | ||||||||||||
6.902%, 07/09/2020 | 1,720 | 1,985 | ||||||||||
6.902%, 07/09/2020 (A) | 835 | 964 | ||||||||||
6.800%, 11/22/2025 | 230 | 259 | ||||||||||
6.800%, 11/22/2025 (A) | 600 | 677 | ||||||||||
6.025%, 07/05/2022 (A) | 860 | 933 | ||||||||||
5.450%, 11/22/2017 (A) | 340 | 368 | ||||||||||
VTB Bank Via VTB Capital | ||||||||||||
6.950%, 10/17/2022 | 451 | 470 | ||||||||||
6.315%, 02/22/2018 | 1,046 | 1,134 | ||||||||||
VTB Capital | ||||||||||||
6.875%, 05/29/2018 | 570 | 626 | ||||||||||
6.551%, 10/13/2020 (A) | 960 | 1,044 | ||||||||||
6.250%, 06/30/2035 | 396 | 426 | ||||||||||
|
| |||||||||||
| 135,259 | ||||||||||||
|
| |||||||||||
Senegal — 0.1% | ||||||||||||
Republic of Senegal | ||||||||||||
8.750%, 05/13/2021 | 400 | 468 | ||||||||||
8.750%, 05/13/2021 (A) | 650 | 761 | ||||||||||
|
| |||||||||||
| 1,229 | ||||||||||||
|
| |||||||||||
Serbia — 0.2% | ||||||||||||
Republic of Serbia | ||||||||||||
7.250%, 09/28/2021 | 1,100 | 1,220 | ||||||||||
7.250%, 09/28/2021 (A) | 600 | 665 | ||||||||||
5.250%, 11/21/2017 (A) | 200 | 204 | ||||||||||
| Description | Face Amount (1) (Thousands) | Market Value ($ Thousands) | ||||||||||||
4.875%, 02/25/2020 | 500 | $ | 492 | |||||||||||
|
| |||||||||||||
| 2,581 | ||||||||||||||
|
| |||||||||||||
Singapore — 0.5% | ||||||||||||||
MMI International | ||||||||||||||
8.000%, 03/01/2017 (A) | 250 | 258 | ||||||||||||
Sea Production | ||||||||||||||
10.292%, 02/14/2014 | 5,226 | 4,808 | ||||||||||||
STATS ChipPAC | ||||||||||||||
4.500%, 03/20/2018 (A) | 201 | 200 | ||||||||||||
Yanlord Land Group | ||||||||||||||
9.500%, 05/04/2017 | 1,170 | 1,240 | ||||||||||||
|
| |||||||||||||
| 6,506 | ||||||||||||||
|
| |||||||||||||
Slovak Republic — 0.1% | ||||||||||||||
Slovakia Government International Bond | ||||||||||||||
4.375%, 05/21/2022 (A) | 1,403 | 1,498 | ||||||||||||
|
| |||||||||||||
Slovenia — 0.0% | ||||||||||||||
Slovenia Government International Bond | ||||||||||||||
5.500%, 10/26/2022 (A) | 841 | 816 | ||||||||||||
|
| |||||||||||||
South Africa — 5.6% | ||||||||||||||
Edcon PTY | ||||||||||||||
9.500%, 03/01/2018 | EUR | 800 | 1,050 | |||||||||||
9.500%, 03/01/2018 | EUR | 230 | 301 | |||||||||||
Gold Field Orogen | ||||||||||||||
4.875%, 10/07/2020 | 200 | 186 | ||||||||||||
Republic of South Africa | ||||||||||||||
13.500%, 09/15/2015 | ZAR | 16,440 | 1,899 | |||||||||||
10.500%, 12/21/2026 | ZAR | 109,489 | 13,504 | |||||||||||
8.750%, 02/28/2048 | ZAR | 16,500 | 1,656 | |||||||||||
8.500%, 06/23/2017 | 3,038 | 3,715 | ||||||||||||
8.250%, 09/15/2017 | ZAR | 37,490 | 3,990 | |||||||||||
8.000%, 12/21/2018 | ZAR | 123,230 | 13,077 | |||||||||||
7.750%, 02/28/2023 | ZAR | 108,416 | 11,179 | |||||||||||
7.250%, 01/15/2020 | ZAR | 30,580 | 3,120 | |||||||||||
7.000%, 02/28/2031 | ZAR | 75,159 | 6,657 | |||||||||||
6.875%, 05/27/2019 | 2,540 | 3,026 | ||||||||||||
6.750%, 03/31/2021 | ZAR | 73,630 | 7,265 | |||||||||||
6.500%, 02/28/2041 | ZAR | 17,600 | 1,371 | |||||||||||
6.250%, 03/31/2036 | ZAR | 24,460 | 1,895 | |||||||||||
6.250%, 03/08/2041 | 580 | 674 | ||||||||||||
5.875%, 05/30/2022 | 800 | 918 | ||||||||||||
5.500%, 03/09/2020 | 1,269 | 1,412 | ||||||||||||
4.665%, 01/17/2024 | 932 | 967 | ||||||||||||
Sappi Papier Holding GmbH | ||||||||||||||
8.375%, 06/15/2019 | 200 | 220 | ||||||||||||
8.375%, 06/15/2019 (A) | 400 | 441 | ||||||||||||
Transnet SOC | ||||||||||||||
4.000%, 07/26/2022 (A) | 305 | 287 | ||||||||||||
|
| |||||||||||||
| 78,810 | ||||||||||||||
|
| |||||||||||||
| 208 | SEI Institutional Investments Trust / Annual Report / May 31, 2013 |
Table of Contents
| Description | Face Amount (1) (Thousands) | Market Value ($ Thousands) | ||||||||||||
Sri Lanka — 0.1% | ||||||||||||||
Bank of Ceylon | ||||||||||||||
6.875%, 05/03/2017 (A) | 360 | $ | 374 | |||||||||||
Democratic Socialist Republic of Sri Lanka | ||||||||||||||
7.400%, 01/22/2015 (A) | 170 | 179 | ||||||||||||
6.250%, 10/04/2020 | 820 | 845 | ||||||||||||
6.250%, 07/27/2021 (A) | 530 | 543 | ||||||||||||
5.875%, 07/25/2022 (A) | 200 | 200 | ||||||||||||
|
| |||||||||||||
| 2,141 | ||||||||||||||
|
| |||||||||||||
Supra-National — 0.1% |
| |||||||||||||
Inter-American Development Bank MTN | ||||||||||||||
5.490%, 08/20/2015 | IDR | 18,690,000 | 1,684 | |||||||||||
|
| |||||||||||||
Thailand — 2.8% |
| |||||||||||||
PTT Global Chemical | ||||||||||||||
4.250%, 09/19/2022 (A) | 200 | 206 | ||||||||||||
PTTEP Canada International Finance MTN | ||||||||||||||
5.692%, 04/05/2021 | 200 | 228 | ||||||||||||
Thailand Government Bond | ||||||||||||||
5.670%, 03/13/2028 | THB | 3,000 | 119 | |||||||||||
3.875%, 06/13/2019 | THB | 48,613 | 1,671 | |||||||||||
3.650%, 12/17/2021 | THB | 262,210 | 8,833 | |||||||||||
3.625%, 05/22/2015 | THB | 177,220 | 5,956 | |||||||||||
3.625%, 06/16/2023 | THB | 130,313 | 4,348 | |||||||||||
3.580%, 12/17/2027 | THB | 70,171 | 2,245 | |||||||||||
3.250%, 06/16/2017 | THB | 164,050 | 5,491 | |||||||||||
2.800%, 10/10/2017 | THB | 112,000 | 3,679 | |||||||||||
1.250%, 03/12/2028 | THB | 31,119 | 1,035 | |||||||||||
Thailand Government Index-Linked Bond | ||||||||||||||
1.200%, 07/14/2021 | THB | 162,352 | 5,432 | |||||||||||
|
| |||||||||||||
| 39,243 | ||||||||||||||
|
| |||||||||||||
Turkey — 7.2% |
| |||||||||||||
Akbank | ||||||||||||||
5.000%, 10/24/2022 | 250 | 259 | ||||||||||||
3.875%, 10/24/2017 (A) | 150 | 154 | ||||||||||||
Export Credit Bank of Turkey | ||||||||||||||
5.875%, 04/24/2019 (A) | 200 | 223 | ||||||||||||
Republic of Turkey | ||||||||||||||
11.875%, 01/15/2030 | 685 | 1,267 | ||||||||||||
10.500%, 01/15/2020 | TRY | 1,690 | 1,084 | |||||||||||
10.000%, 12/04/2013 | TRY | 1,400 | 759 | |||||||||||
10.000%, 06/17/2015 | TRY | 1,900 | 1,082 | |||||||||||
9.500%, 01/12/2022 | TRY | 8,697 | 5,400 | |||||||||||
9.000%, 05/21/2014 | TRY | 5,138 | 2,971 | |||||||||||
9.000%, 01/27/2016 | TRY | 2,400 | 1,356 | |||||||||||
9.000%, 03/08/2017 | TRY | 19,139 | 11,068 | |||||||||||
8.500%, 09/14/2022 | TRY | 11,540 | 6,797 | |||||||||||
| Description | Face Amount (1) (Thousands) | Market Value ($ Thousands) | ||||||||||||
8.000%, 02/14/2034 | 2,434 | $ | 3,408 | |||||||||||
7.500%, 09/24/2014 | TRY | 550 | 298 | |||||||||||
7.500%, 09/24/2014 | TRY | 50 | 27 | |||||||||||
7.500%, 07/14/2017 | 3,004 | 3,635 | ||||||||||||
7.500%, 11/07/2019 | 1,437 | 1,821 | ||||||||||||
7.375%, 02/05/2025 | 2,280 | 2,998 | ||||||||||||
7.250%, 03/05/2038 | 470 | 620 | ||||||||||||
7.100%, 03/08/2023 | TRY | 5,350 | 2,906 | |||||||||||
7.100%, 03/08/2023 | TRY | 2,300 | 1,249 | |||||||||||
7.000%, 09/26/2016 | 880 | 1,023 | ||||||||||||
7.000%, 03/11/2019 | 280 | 344 | ||||||||||||
7.000%, 06/05/2020 | 577 | 720 | ||||||||||||
6.875%, 03/17/2036 | 2,385 | 3,005 | ||||||||||||
6.750%, 04/03/2018 | 6,842 | 8,193 | ||||||||||||
6.750%, 05/30/2040 | 414 | 520 | ||||||||||||
6.500%, 01/07/2015 | TRY | 10,950 | 5,860 | |||||||||||
6.250%, 09/26/2022 | 675 | 823 | ||||||||||||
6.000%, 01/14/2041 | 1,540 | 1,771 | ||||||||||||
5.625%, 03/30/2021 | 410 | 478 | ||||||||||||
5.125%, 03/25/2022 | 3,237 | 3,658 | ||||||||||||
4.875%, 04/16/2043 | 600 | 599 | ||||||||||||
4.500%, 02/11/2015 | TRY | 1,771 | 1,002 | |||||||||||
4.000%, 04/29/2015 | TRY | 5,773 | 3,262 | |||||||||||
4.000%, 04/01/2020 | TRY | 3,623 | 2,320 | |||||||||||
3.250%, 03/23/2023 (G) | 6,056 | 5,889 | ||||||||||||
3.000%, 02/23/2022 | TRY | 16,649 | 8,881 | |||||||||||
2.700%, 07/17/2013 | TRY | 4,005 | 2,120 | |||||||||||
Turkiye Garanti Bankasi | ||||||||||||||
7.375%, 03/07/2018 | TRY | 1,740 | 933 | |||||||||||
5.250%, 09/13/2022 (A) | 400 | 422 | ||||||||||||
4.000%, 09/13/2017 (A) | 300 | 309 | ||||||||||||
Yuksel Insaat | ||||||||||||||
9.500%, 11/10/2015 | 358 | 247 | ||||||||||||
|
| |||||||||||||
| 101,761 | ||||||||||||||
|
| |||||||||||||
Ukraine — 2.2% |
| |||||||||||||
Biz Finance for Ukreximbank | ||||||||||||||
8.375%, 04/27/2015 | 3,723 | 3,714 | ||||||||||||
DTEK Finance | ||||||||||||||
9.500%, 04/28/2015 (A) | 100 | 105 | ||||||||||||
7.875%, 04/04/2018 | 1,200 | 1,191 | ||||||||||||
Ferrexpo Finance | ||||||||||||||
7.875%, 04/07/2016 | 1,500 | 1,489 | ||||||||||||
7.875%, 04/07/2016 (A) | 205 | 203 | ||||||||||||
Financing of Infrastrucural Projects State Enterprise | ||||||||||||||
9.000%, 12/07/2017 (A) | 444 | 461 | ||||||||||||
Government of Ukraine | ||||||||||||||
9.250%, 07/24/2017 | 2,110 | 2,268 | ||||||||||||
9.250%, 07/24/2017 (A) | 1,611 | 1,732 | ||||||||||||
7.950%, 02/23/2021 | 530 | 546 | ||||||||||||
7.950%, 02/23/2021 (A) | 350 | 360 | ||||||||||||
7.800%, 11/28/2022 | 1,820 | 1,838 | ||||||||||||
7.800%, 11/28/2022 (A) | 3,482 | 3,516 | ||||||||||||
| SEI Institutional Investments Trust / Annual Report / May 31, 2013 | 209 |
Table of Contents
SCHEDULE OF INVESTMENTS
Emerging Markets Debt Fund (Continued)
May 31, 2013
| Description | Face Amount (1) (Thousands) | Market Value ($ Thousands) | ||||||||||||
7.750%, 09/23/2020 | 500 | $ | 512 | |||||||||||
7.500%, 04/17/2023 (A) | 1,255 | 1,224 | ||||||||||||
6.875%, 09/23/2015 (A) | 484 | 490 | ||||||||||||
6.250%, 06/17/2016 | 200 | 197 | ||||||||||||
6.250%, 06/17/2016 (A) | 700 | 689 | ||||||||||||
Metinvest | ||||||||||||||
10.250%, 05/20/2015 | 1,680 | 1,789 | ||||||||||||
8.750%, 02/14/2018 | 800 | 800 | ||||||||||||
8.750%, 02/14/2018 (A) | 341 | 341 | ||||||||||||
MHP | ||||||||||||||
8.250%, 04/02/2020 | 400 | 394 | ||||||||||||
8.250%, 04/02/2020 (A) | 1,000 | 970 | ||||||||||||
Mriya Agro Holding | ||||||||||||||
9.450%, 04/19/2018 (A) | 1,581 | 1,565 | ||||||||||||
NAK Naftogaz Ukraine | ||||||||||||||
9.500%, 09/30/2014 | 1,783 | 1,840 | ||||||||||||
Oschadbank Via SSB #1 | ||||||||||||||
8.250%, 03/10/2016 | 630 | 624 | ||||||||||||
State Export-Import Bank of Ukraine JSC Via Biz Finance | ||||||||||||||
8.750%, 01/22/2018 | 970 | 951 | ||||||||||||
Ukraine Railways Via Shortline | ||||||||||||||
9.500%, 05/21/2018 (A) | 250 | 248 | ||||||||||||
Ukrlandfarming | ||||||||||||||
10.875%, 03/26/2018 (A) | 600 | 588 | ||||||||||||
|
| |||||||||||||
| 30,645 | ||||||||||||||
|
| |||||||||||||
United Arab Emirates — 0.9% |
| |||||||||||||
Atlantic Finance | ||||||||||||||
10.750%, 05/27/2014 (C) | 1,050 | 1,123 | ||||||||||||
Dana Gas Sukuk | ||||||||||||||
9.000%, 10/31/2017 (A) | 508 | 511 | ||||||||||||
Dolphin Energy | ||||||||||||||
5.888%, 06/15/2019 | 507 | 555 | ||||||||||||
DP World MTN | ||||||||||||||
6.850%, 07/02/2037 | 1,600 | 1,812 | ||||||||||||
DP World Sukuk | ||||||||||||||
6.250%, 07/02/2017 | 400 | 442 | ||||||||||||
Dubai Electricity & Water Authority | ||||||||||||||
7.375%, 10/21/2020 | 440 | 531 | ||||||||||||
7.375%, 10/21/2020 (A) | 740 | 893 | ||||||||||||
Dubai Holding Commercial Operations MTN | ||||||||||||||
4.750%, 01/30/2014 | EUR | 1,800 | 2,336 | |||||||||||
Dubai Holding MTN | ||||||||||||||
6.000%, 02/01/2017 | GBP | 900 | 1,399 | |||||||||||
Emaar Sukuk MTN | ||||||||||||||
6.400%, 07/18/2019 | 200 | 220 | ||||||||||||
Emirate of Abu Dhabi MTN | ||||||||||||||
7.750%, 10/05/2020 | 1,160 | 1,428 | ||||||||||||
Emirates Airline | ||||||||||||||
5.125%, 06/08/2016 | 320 | 336 | ||||||||||||
4.500%, 02/06/2025 | 400 | 389 | ||||||||||||
Jafz Sukuk | ||||||||||||||
7.000%, 06/19/2019 | 250 | 284 | ||||||||||||
| Description | Face Amount (1) (Thousands) | Market Value ($ Thousands) | ||||||||||
MAF Global Securities MTN | ||||||||||||
5.250%, 07/05/2019 | 550 | $ | 599 | |||||||||
|
| |||||||||||
| 12,858 | ||||||||||||
|
| |||||||||||
United States — 0.3% |
| |||||||||||
Citigroup Funding MTN | ||||||||||||
16.390%, 01/31/2022 (A) | 398 | 423 | ||||||||||
7.000%, 10/25/2019 (A) | 1,100 | 1,187 | ||||||||||
6.000%, 08/16/2018 | 2,301 | 2,161 | ||||||||||
|
| |||||||||||
| 3,771 | ||||||||||||
|
| |||||||||||
Uruguay — 0.5% |
| |||||||||||
Republic of Uruguay PIK | ||||||||||||
7.875%, 01/15/2033 | 1,798 | 2,463 | ||||||||||
Republic of Uruguay | ||||||||||||
8.000%, 11/18/2022 | 942 | 1,272 | ||||||||||
7.625%, 03/21/2036 | 2,277 | 3,097 | ||||||||||
4.125%, 11/20/2045 | 811 | 709 | ||||||||||
|
| |||||||||||
| 7,541 | ||||||||||||
|
| |||||||||||
Venezuela — 3.7% |
| |||||||||||
Government of Venezuela | ||||||||||||
13.625%, 08/15/2018 | 497 | 537 | ||||||||||
13.625%, 08/15/2018 | 1,493 | 1,672 | ||||||||||
12.750%, 08/23/2022 | 12,064 | 13,119 | ||||||||||
11.950%, 08/05/2031 | 4,951 | 5,075 | ||||||||||
11.950%, 08/05/2031 | 294 | 301 | ||||||||||
11.750%, 10/21/2026 | 3,803 | 3,860 | ||||||||||
10.750%, 09/19/2013 | 210 | 213 | ||||||||||
9.250%, 09/15/2027 | 1,047 | 953 | ||||||||||
9.250%, 05/07/2028 | 660 | 584 | ||||||||||
9.000%, 05/07/2023 | 2,200 | 1,972 | ||||||||||
9.000%, 05/07/2023 | 1,174 | 1,052 | ||||||||||
8.500%, 10/08/2014 | 560 | 570 | ||||||||||
8.250%, 10/13/2024 | 580 | 487 | ||||||||||
7.750%, 10/13/2019 | 780 | 698 | ||||||||||
7.650%, 04/21/2025 | 340 | 272 | ||||||||||
7.000%, 12/01/2018 | 1,409 | 1,254 | ||||||||||
7.000%, 03/31/2038 | 90 | 67 | ||||||||||
6.000%, 12/09/2020 | 380 | 302 | ||||||||||
6.000%, 12/09/2020 | 150 | 119 | ||||||||||
Petroleos de Venezuela | ||||||||||||
12.750%, 02/17/2022 | 310 | 329 | ||||||||||
8.500%, 11/02/2017 | 5,492 | 5,176 | ||||||||||
5.500%, 04/12/2037 | 670 | 424 | ||||||||||
5.375%, 04/12/2027 | 1,953 | 1,274 | ||||||||||
5.250%, 04/12/2017 | 582 | 495 | ||||||||||
5.000%, 10/28/2015 | 781 | 717 | ||||||||||
4.900%, 10/28/2014 | 10,745 | 10,316 | ||||||||||
4.900%, 10/28/2014 | 141 | 135 | ||||||||||
|
| |||||||||||
| 51,973 | ||||||||||||
|
| |||||||||||
| 210 | SEI Institutional Investments Trust / Annual Report / May 31, 2013 |
Table of Contents
| Description | Face Amount (1) (Thousands) | Market Value ($ Thousands) | ||||||||||||
Vietnam — 0.1% |
| |||||||||||||
Socialist Republic of Vietnam | ||||||||||||||
6.875%, 01/15/2016 | 440 | $ | 475 | |||||||||||
6.750%, 01/29/2020 | 640 | 720 | ||||||||||||
Vietnam Joint Stock Commercial Bank for Industry and Trade | ||||||||||||||
8.000%, 05/17/2017 (A) | 400 | 420 | ||||||||||||
|
| |||||||||||||
| 1,615 | ||||||||||||||
|
| |||||||||||||
Zambia — 0.0% |
| |||||||||||||
First Quantum Minerals | ||||||||||||||
7.250%, 10/15/2019 (A) | 250 | 249 | ||||||||||||
Zambia Government International Bond | ||||||||||||||
5.375%, 09/20/2022 | 300 | 282 | ||||||||||||
|
| |||||||||||||
| 531 | ||||||||||||||
|
| |||||||||||||
Total Global Bonds |
| 1,256,656 | ||||||||||||
|
| |||||||||||||
LOAN PARTICIPATIONS — 0.4% |
| |||||||||||||
Angola — 0.1% |
| |||||||||||||
Republic of Angola | ||||||||||||||
2.317%, 04/30/2016 (E) (F) | EUR | 758 | 941 | |||||||||||
|
| |||||||||||||
Indonesia — 0.1% |
| |||||||||||||
PT Bumi Resources | ||||||||||||||
11.200%, 08/07/2013 | 1,973 | 1,936 | ||||||||||||
|
| |||||||||||||
Singapore — 0.1% |
| |||||||||||||
Morton Bay Senior | ||||||||||||||
6.220%, 12/31/2013 (E) (F) | 3,020 | 2,282 | ||||||||||||
|
| |||||||||||||
United Arab Emirates — 0.1% |
| |||||||||||||
Dubai World | ||||||||||||||
1.000%, 09/30/2015 | 500 | 350 | ||||||||||||
1.000%, 09/30/2018 | 1,015 | 630 | ||||||||||||
|
| |||||||||||||
| 980 | ||||||||||||||
|
| |||||||||||||
Total Loan Participations |
| 6,139 | ||||||||||||
|
| |||||||||||||
CONVERTIBLE BONDS — 0.1% |
| |||||||||||||
Dana Gas Sukuk CV to 13.3333 Shares | ||||||||||||||
7.000%, 10/31/2017 (A) | 508 | 507 | ||||||||||||
Pyrus CV to 83,858.42969 Shares | ||||||||||||||
7.500%, 12/20/2015 | 700 | 973 | ||||||||||||
Suzlon Energy CV to 533.2762 Shares | ||||||||||||||
8.194%, 07/25/2014 | 500 | 325 | ||||||||||||
|
| |||||||||||||
Total Convertible Bonds |
| 1,805 | ||||||||||||
|
| |||||||||||||
| Description | Face Amount (1) (Thousands)/ Shares/Contracts | Market Value ($ Thousands) | ||||||||||||
TIME DEPOSITS — 3.6% |
| |||||||||||||
United States — 3.6% |
| |||||||||||||
Brown Brothers Harriman | ||||||||||||||
4.150% 06/03/2013 | ZAR | 11 | $ | — | ||||||||||
0.030% 06/03/2013 | 50,484 | 50,484 | ||||||||||||
0.001% 06/03/2013 | EUR | 415 | 538 | |||||||||||
|
| |||||||||||||
Total Time Deposits |
| 51,022 | ||||||||||||
|
| |||||||||||||
AFFILIATED PARTNERSHIP — 0.4% |
| |||||||||||||
United States — 0.4% |
| |||||||||||||
SEI Liquidity Fund, L.P. | ||||||||||||||
0.100%†** (H) | 5,164,383 | 5,164 | ||||||||||||
|
| |||||||||||||
Total Affiliated Partnership |
| 5,164 | ||||||||||||
|
| |||||||||||||
Total Investments — 93.5% |
| $ | 1,320,786 | |||||||||||
|
| |||||||||||||
PURCHASED OPTIONS — 0.0% |
| |||||||||||||
United States — 0.0% |
| |||||||||||||
Euro FX Currency Put Option, | 10,600,000 | $ | 139 | |||||||||||
Euro FX Currency Put Option, | 9,300,000 | 154 | ||||||||||||
Euro FX Currency Put Option, | 9,300,000 | 150 | ||||||||||||
|
| |||||||||||||
Total Purchased Options |
| $ | 443 | |||||||||||
|
| |||||||||||||
A list of the open forward foreign currency contracts held by the Fund at May 31, 2013, is as follows:
| Settlement Date | Currency | Currency | Unrealized Appreciation (Depreciation) ($ Thousands) | |||||||||||||||||
6/3/13-6/14/13 | PEI | 17,228 | USD | 6,457 | $ | 148 | ||||||||||||||
6/3/13-7/26/13 | USD | 6,674 | PEI | 17,866 | (134 | ) | ||||||||||||||
6/3/13-8/29/13 | TRY | 6,706 | USD | 3,567 | 18 | |||||||||||||||
6/4/13 | USD | 3,732 | BRL | 7,661 | (139 | ) | ||||||||||||||
6/4/13-6/14/13 | USD | 8,435 | COP | 15,644,939 | (244 | ) | ||||||||||||||
6/4/13-7/5/13 | COP | 26,332,649 | USD | 13,975 | 201 | |||||||||||||||
6/4/13-9/4/13 | BRL | 32,665 | USD | 15,670 | 469 | |||||||||||||||
6/5/13-7/17/13 | NGN | 214,847 | USD | 1,339 | (2 | ) | ||||||||||||||
6/5/13-7/17/15 | CNH | 224,004 | USD | 34,290 | (1,531 | ) | ||||||||||||||
6/5/13-7/17/15 | USD | 34,223 | CNH | 224,004 | 1,597 | |||||||||||||||
6/6/13-6/14/13 | USD | 3,419 | CLP | 1,673,066 | (71 | ) | ||||||||||||||
6/6/13-6/20/13 | CLP | 3,657,804 | USD | 7,582 | 268 | |||||||||||||||
6/10/13-6/28/13 | USD | 9,884 | PLN | 31,700 | (286 | ) | ||||||||||||||
| SEI Institutional Investments Trust / Annual Report / May 31, 2013 | 211 |
Table of Contents
SCHEDULE OF INVESTMENTS
Emerging Markets Debt Fund (Continued)
May 31, 2013
| Settlement Date | Currency | Currency | Unrealized Appreciation (Depreciation) ($ Thousands) | |||||||||||||||||
6/10/13-8/30/13 | PLN | 86,610 | USD | 26,933 | $ | 788 | ||||||||||||||
6/14/13 | MXP | 295,589 | USD | 23,680 | 664 | |||||||||||||||
6/14/13-7/12/13 | THB | 275,795 | USD | 9,242 | 138 | |||||||||||||||
6/14/13-7/23/13 | USD | 7,533 | THB | 222,917 | (179 | ) | ||||||||||||||
6/14/13-7/26/13 | USD | 23,740 | MXP | 293,380 | (937 | ) | ||||||||||||||
6/17/13 | IDR | 47,666,061 | USD | 4,830 | (30 | ) | ||||||||||||||
6/17/13 | INR | 686,909 | USD | 12,477 | 346 | |||||||||||||||
6/17/13 | USD | 3,479 | INR | 190,018 | (123 | ) | ||||||||||||||
6/17/13-7/22/13 | EUR | 14,497 | USD | 19,029 | 239 | |||||||||||||||
6/17/13-7/22/13 | GBP | 1,815 | USD | 2,807 | 56 | |||||||||||||||
6/17/13-7/22/13 | USD | 760 | EUR | 581 | (7 | ) | ||||||||||||||
6/18/13 | MYR | 17,280 | USD | 5,640 | 68 | |||||||||||||||
6/18/13-8/22/13 | USD | 14,735 | MYR | 44,464 | (442 | ) | ||||||||||||||
6/21/13-6/28/13 | USD | 1,898 | RON | 6,361 | (24 | ) | ||||||||||||||
6/24/13 | PHP | 72,333 | USD | 1,751 | 40 | |||||||||||||||
6/24/13 | TWD | 267,167 | USD | 9,026 | 93 | |||||||||||||||
6/24/13 | USD | 1,740 | TWD | 52,155 | 4 | |||||||||||||||
6/28/13 | USD | 1,050 | ZAR | 10,535 | (6 | ) | ||||||||||||||
6/28/13-8/29/13 | USD | 1,214 | TRY | 2,243 | (24 | ) | ||||||||||||||
6/28/13-8/30/13 | HUF | 1,529,318 | USD | 6,627 | (24 | ) | ||||||||||||||
6/28/13-8/30/13 | RUB | 597,217 | USD | 18,773 | 276 | |||||||||||||||
6/28/13-8/30/13 | ZAR | 139,431 | USD | 14,175 | 380 | |||||||||||||||
7/17/13 | USD | 1,248 | NGN | 199,943 | — | |||||||||||||||
7/31/13-8/30/13 | USD | 67 | CZK | 1,336 | — | |||||||||||||||
8/12/13 | CNY | 9,259 | USD | 1,497 | (5 | ) | ||||||||||||||
8/21/13-8/30/13 | USD | 821 | RUB | 26,284 | (9 | ) | ||||||||||||||
8/21/13-9/3/13 | USD | 1,282 | HUF | 291,717 | (16 | ) | ||||||||||||||
8/30/13 | RON | 4,674 | USD | 1,375 | 7 | |||||||||||||||
9/18/13-10/3/13 | USD | 2,120 | ARS | 13,739 | 212 | |||||||||||||||
9/27/13 | ARS | 2,128 | USD | 360 | (1 | ) | ||||||||||||||
|
| |||||||||||||||||||
| $ | 1,778 | |||||||||||||||||||
|
| |||||||||||||||||||
A list of the counterparties for the open forward foreign currency contracts held by the Fund at May 31, 2013, is as follows:
| Counterparty | Currency to Deliver ($ Thousands) | Currency to Receive ($ Thousands) | Unrealized Appreciation (Depreciation) ($ Thousands) | |||||||||
Bank of America | $ | (23,591 | ) | $ | 23,650 | $ | 59 | |||||
Barclays PLC | (84,282 | ) | 85,184 | 902 | ||||||||
Brown Brothers Harriman | (94 | ) | 94 | — | ||||||||
Citigroup | (44,375 | ) | 44,548 | 173 | ||||||||
Credit Suisse First Boston | (2,725 | ) | 2,890 | 165 | ||||||||
Deutsche Bank | (48,006 | ) | 48,523 | 517 | ||||||||
Goldman Sachs | (9,165 | ) | 8,968 | (197 | ) | |||||||
HSBC | (94,502 | ) | 94,374 | (128 | ) | |||||||
JPMorgan Chase Bank | (31,313 | ) | 31,645 | 332 | ||||||||
Standard Chartered Bank | (2,033 | ) | 2,009 | (24 | ) | |||||||
UBS | (26,463 | ) | 26,442 | (21 | ) | |||||||
|
| |||||||||||
| $ | 1,778 | |||||||||||
|
| |||||||||||
For the year ended May 31, 2013, the total amount of all open forward foreign currency contracts, as presented in the table above, are representative of the volume of activity for this derivative type during the year.
A list of the open swap agreements held by the Fund at May 31, 2013, is as follows:
| Interest Rate Swaps | ||||||||||||||||
| Counterparty | Fund Pays | Fund Receives | Termination Date | Currency | Notional Amount (Thousands) | Unrealized Appreciation (Depreciation) ($ Thousands) | ||||||||||
| Barclays Bank PLC | Singapore Swap Offer Rate Fixing 6-Month | 2.54% | 12/14/2032 | SGD | 622 | $ | (17 | ) | ||||||||
| Barclays Bank PLC | Singapore Swap Offer Rate Fixing 6-Month | 2.77 | 06/14/2032 | SGD | 2,380 | 7 | ||||||||||
| Barclays Bank PLC | 1.71% | Singapore Swap Offer Rate Fixing 6-Month | 12/14/2022 | SGD | 1,083 | 23 | ||||||||||
| Barclays Bank PLC | 1.86 | Singapore Swap Offer Rate Fixing 6-Month | 06/14/2022 | SGD | 4,110 | 19 | ||||||||||
| Barclays Bank PLC | Brazil Interbank Deposit Rate | 8.27 | 01/02/2017 | BRL | 4,427 | (88 | ) | |||||||||
| HSBC | Brazil Interbank Deposit Rate | 8.31 | 01/02/2017 | BRL | 9,841 | (191 | ) | |||||||||
|
| |||||||||||||||
| $ | (247 | ) | ||||||||||||||
|
| |||||||||||||||
| Total Return Swaps | ||||||||||||||||||||
| Counterparty | Reference Entity/Obligation | Fund Pays | Fund Receives | Termination Date | Currency | Notional (Thousands) | Net Unrealized Appreciation (Depreciation) ($ Thousands) | |||||||||||||
| Standard Chartered London | India Government Bond, 8.070%, 07/03/2017 | Cash Deposit Of Notional Amount | Price Return | 07/03/2017 | INR | (643 | ) | $ | 21 | |||||||||||
| Standard Chartered London | India Government Bond, 8.070%, 07/03/2017 | Cash Deposit Of Notional Amount | Price Return | 07/03/2017 | INR | (1,945 | ) | 48 | ||||||||||||
| Standard Chartered London | India Government Bond, 8.070%, 07/03/2017 | Cash Deposit Of Notional Amount | Price Return | 07/03/2017 | INR | (992 | ) | 1 | ||||||||||||
| HSBC | Indonesia Government Bond, 11.500%, 9/15/2019 | Cash Deposit Of Notional Amount | Price Return | 09/15/2019 | IDR | (10,492,700 | ) | (185 | ) | |||||||||||
| HSBC | Indonesia Government Bond, 11.500%, 9/15/2019 | Cash Deposit Of Notional Amount | Price Return | 09/15/2019 | IDR | (1,518,000 | ) | (26 | ) | |||||||||||
| Standard Chartered London | India Government Bond, 8.200%, 09/24/2025 | Cash Deposit Of Notional Amount | Price Return | 09/24/2025 | INR | (1,574 | ) | (1 | ) | |||||||||||
| Standard Chartered London | India Government Bond, 8.200%, 09/24/2025 | Cash Deposit Of Notional Amount | Price Return | 09/24/2025 | INR | (1,873 | ) | (3 | ) | |||||||||||
| Standard Chartered London | India Government Bond, 8.330%, 07/09/2026 | Cash Deposit Of Notional Amount | Price Return | 07/09/2026 | INR | (4,641 | ) | 51 | ||||||||||||
| Standard Chartered London | India Government Bond, 8.330%, 07/09/2026 | Cash Deposit Of Notional Amount | Price Return | 07/09/2026 | INR | (7,030 | ) | 42 | ||||||||||||
| 212 | SEI Institutional Investments Trust / Annual Report / May 31, 2013 |
Table of Contents
| Total Return Swaps | ||||||||||||||||||||||
| Counterparty | Reference Entity/Obligation | Fund Pays | Fund Receives | Termination Date | Currency | Notional (Thousands) | Net Unrealized Appreciation (Depreciation) ($ Thousands) | |||||||||||||||
| Standard Chartered London | India Government Bond, 8.330%, 07/09/2026 | Cash Deposit Of Notional Amount | Price Return | 07/09/2026 | INR | (531 | ) | $ | 3 | |||||||||||||
| HSBC | Indonesia Government Bond, 8.375%, 9/15/2026 | Cash Deposit Of Notional Amount | Price Return | 09/15/2026 | IDR | (3,165,750 | ) | (62 | ) | |||||||||||||
| Standard Chartered London | Indonesia Government Bond, 7%, 5/15/2027 | Cash Deposit Of Notional Amount | Price Return | 05/15/2027 | IDR | (865,000 | ) | (56 | ) | |||||||||||||
| Standard Chartered London | Indonesia Government Bond, 7%, 5/15/2027 | Cash Deposit Of Notional Amount | Price Return | 05/15/2027 | IDR | (257,400 | ) | (12 | ) | |||||||||||||
| HSBC | Indonesia Government Bond, 10.500%, 8/15/2030 | Cash Deposit Of Notional Amount | Price Return | 08/15/2030 | IDR | (11,387,000 | ) | (95 | ) | |||||||||||||
| Standard Chartered London | Indonesia Government Bond, 10.500%, 8/15/2030 | Cash Deposit Of Notional Amount | Price Return | 08/15/2030 | IDR | (5,046,000 | ) | (56 | ) | |||||||||||||
| HSBC | Indonesia Government Bond, 9.500%, 7/15/2031 | Cash Deposit Of Notional Amount | Price Return | 07/15/2031 | IDR | (2,069,100 | ) | (16 | ) | |||||||||||||
| HSBC | Indonesia Government Bond, 8.250%, 6/15/2032 | Cash Deposit Of Notional Amount | Price Return | 06/15/2032 | IDR | (2,350,360 | ) | (43 | ) | |||||||||||||
| Standard Chartered London | Indonesia Government Bond, 6.625%, 05/15/2033 | Cash Deposit Of Notional Amount | Price Return | 05/15/2033 | IDR | (624,335 | ) | (111 | ) | |||||||||||||
| HSBC | Indonesia Government Bond, 6.625%, 05/15/2033 | Cash Deposit Of Notional Amount | Price Return | 05/15/2033 | IDR | (213,000 | ) | (44 | ) | |||||||||||||
|
| |||||||||||||||||||||
| $ | (544 | ) | ||||||||||||||||||||
|
| |||||||||||||||||||||
For the year ended May 31, 2013, the total amount of all open swap agreements, as presented in the tables above, are representative of the volume of activity for this derivative type during the year.
Percentages are based on a Net Assets of $1,411,893 ($ Thousands).
| * | Non-income producing security. |
| ** | The rate reported is the 7-day effective yield as of May 31, 2013. |
| † | Investment in Affiliated Security (see Note 5). |
| (1) | In U.S. dollars unless otherwise indicated. |
| (A) | Securities sold within terms of a private placement memorandum, exempt from registration under Section 144A of the Securities Act of 1933, as amended, and may be sold only to dealers in that program or other “accredited investors.” These securities have been determined to be liquid under guidelines established by the Board of Trustees. |
| (B) | Security in default on interest payments. |
| (C) | Step Bonds — The rate reflected on the Schedule of Investments is the effective yield on May 31, 2013. The coupon on a step bond changes on a specified date. |
| (D) | Variable Rate Security — The rate reported on the Schedule of Investments is the rate in effect as of May 31, 2013. The date reported on the Schedule of Investments is the final maturity date. |
| (E) | Securities considered illiquid. The total value of such securities as of May 31, 2013 was $3,423 ($ Thousands) and represented 0.24% of Net Assets. |
| (F) | Security fair valued using methods determined in good faith by the Valuation Committee of the Board of Trustees. The total market value of such securities as of May 31, 2013 was $3,423 ($ Thousands) and represented 0.24% of Net Assets. |
| (G) | This security or a partial position of this security is on loan at May 31, 2013. The total value of securities on loan at May 31, 2013 was $4,863 ($ Thousands). |
| (H) | This security was purchased with cash collateral held from securities on loan. The total value of such securities as of May 31, 2013 was $5,164 ($ Thousands). |
| (I) | The rate reported is the effective yield at time of purchase. |
ARS — Argentine Peso
BRL — Brazilian Real
CLN — Credit-Linked Note
CLP — Chilean Peso
CNH — Chinese Offshore Yuan
CNY — Chinese Yuan
COP — Colombian Peso
CV — Convertible Security
CZK — Czech Koruna
DEM — German Mark
EUR — Euro
GBP — British Pound Sterling
HUF — Hungarian Forint
IDR — Indonesian Rupiah
INR — Indian Rupee
L.P. — Limited Partnership
MTN — Medium Term Note
MXP — Mexican Peso
MYR — Malaysian Ringgit
NGN — Nigerian Naira
PEI — Peruvian Inca
PHP — Philippine Peso
PIK — Payment-in-Kind
PLC — Public Limited Company
PLN — Polish Zloty
RON — Romanian Leu
RUB — Russian Ruble
Ser — Series
SGD — Singapore Dollar
THB — Thai Baht
TRY — New Turkish Lira
TWD — New Taiwan Dollar
USD — U.S. Dollar
ZAR — South African Rand
The following is a list of the inputs used as of May 31, 2013, in valuing the Fund’s investments and other financial instruments carried at value ($ Thousands):
| Investments in Securities | Level 1 | Level 2 | Level 3(1) | Total | ||||||||||||
Global Bonds | $ | — | $ | 1,256,456 | $ | 200 | $ | 1,256,656 | ||||||||
Loan Participations | — | 980 | 5,159 | 6,139 | ||||||||||||
Convertible Bonds | — | 1,805 | — | 1,805 | ||||||||||||
Time Deposits | 51,022 | — | — | 51,022 | ||||||||||||
Affiliated Partnership | — | 5,164 | — | 5,164 | ||||||||||||
|
|
|
|
|
|
|
| |||||||||
Total Investments in Securities | $ | 51,022 | $ | 1,264,405 | $ | 5,359 | $ | 1,320,786 | ||||||||
|
|
|
|
|
|
|
| |||||||||
| SEI Institutional Investments Trust / Annual Report / May 31, 2013 | 213 |
Table of Contents
SCHEDULE OF INVESTMENTS
Emerging Markets Debt Fund (Concluded)
May 31, 2013
| Other Financial Instruments | Level 1 | Level 2 | Level 3 | Total | ||||||||||||
Purchased Options | $ | — | $ | 443 | $ | — | $ | 443 | ||||||||
Forwards Contracts* | — | 1,778 | — | 1,778 | ||||||||||||
Interest Rate Swaps* | — | (247 | ) | — | (247 | ) | ||||||||||
Total Return Swaps* | — | (544 | ) | — | (544 | ) | ||||||||||
|
|
|
|
|
|
|
| |||||||||
Total Other Financial Instruments | $ | — | $ | 1,430 | $ | — | $ | 1,430 | ||||||||
|
|
|
|
|
|
|
| |||||||||
| (1) | A reconciliation of Level 3 instruments is presented when the Fund has a significant amount of Level 3 investments at the beginning and/or end of the period in relation to net assets. |
| * | Forwards contracts and swaps are valued at the unrealized appreciation (depreciation) on the instrument. |
For the year ended May 31, 2013, there were no transfers between Level 1 and Level 2 assets and liabilities.
For the year ended May 31, 2013, there were transfers between Level 2 and Level 3 assets and liabilities. The transfers were due to changes in the availability of observable inputs used to determine fair value.
For more information on valuation inputs, see Note 2 — Significant Accounting Policies in Notes to Financial Statements.
Amounts designated as “—” are $0 or have been rounded to $0.
The accompanying notes are an integral part of the financial statements.
| 214 | SEI Institutional Investments Trust / Annual Report / May 31, 2013 |
Table of Contents
SCHEDULE OF INVESTMENTS
Real Return Fund
May 31, 2013

| Description | Face Amount ($ Thousands) | Market Value ($ Thousands) | ||||||
U.S. TREASURY OBLIGATIONS — 99.3% |
| |||||||
U.S. Treasury Inflation-Protected Securities | ||||||||
2.625%, 07/15/2017 | $ | 12,242 | $ | 14,169 | ||||
2.500%, 07/15/2016 | 16,451 | 18,402 | ||||||
2.375%, 01/15/2017 | 14,274 | 16,066 | ||||||
2.000%, 07/15/2014 | 19,616 | 20,306 | ||||||
2.000%, 01/15/2016 | 16,827 | 18,218 | ||||||
1.875%, 07/15/2015 | 16,880 | 18,049 | ||||||
1.625%, 01/15/2015 | 19,410 | 20,242 | ||||||
1.625%, 01/15/2018 | 12,972 | 14,537 | ||||||
0.500%, 04/15/2015 | 19,210 | 19,757 | ||||||
0.125%, 04/15/2016 | 33,720 | 34,879 | ||||||
0.125%, 04/15/2017 | 37,904 | 39,500 | ||||||
0.125%, 04/15/2018 | 15,311 | 16,055 | ||||||
|
| |||||||
Total U.S. Treasury Obligations | 250,180 | |||||||
|
| |||||||
Total Investments — 99.3% | $ | 250,180 | ||||||
|
| |||||||
Percentages are based on Net Assets of $251,852 ($ Thousands).
As of May 31, 2013, all of the Fund’s investments were considered level 2, in accordance with ASC-820.
For the year ended May 31, 2013, there were no transfers between Level 1 and
Level 2 assets and liabilities.
For the year ended May 31, 2013, there were no transfers between Level 2 and
Level 3 assets and liabilities.
For more information on valuation inputs, see Note 2 — Significant Accounting Policies in Notes to Financial Statements.
Amounts designated as “—” are $0 or have been rounded to $0.
The accompanying notes are an integral part of the financial statements.
| SEI Institutional Investments Trust / Annual Report / May 31, 2013 | 215 |
Table of Contents
SUMMARY SCHEDULE OF INVESTMENTS
Dynamic Asset Allocation Fund
May 31, 2013
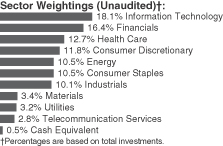
| Description | Percentage of Net Assets (%) | Shares | Market Value ($ Thousands) | |||||||||
COMMON STOCK — 98.4% |
| |||||||||||
Consumer Discretionary — 11.7% |
| |||||||||||
Amazon.com* | 0.7 | % | 28,200 | $ | 7,587 | |||||||
Comcast, Cl A | 0.7 | 204,300 | 8,203 | |||||||||
Home Depot | 0.8 | 115,700 | 9,101 | |||||||||
McDonald’s | 0.7 | 77,700 | 7,504 | |||||||||
News, Cl A | 0.4 | 155,500 | 4,993 | |||||||||
Walt Disney | 0.8 | 139,700 | 8,812 | |||||||||
Other Securities | 7.6 | 86,886 | ||||||||||
|
| |||||||||||
| 133,086 | ||||||||||||
|
| |||||||||||
Consumer Staples — 10.4% |
| |||||||||||
Altria Group | 0.5 | 156,100 | 5,635 | |||||||||
Coca-Cola | 1.0 | 296,100 | 11,841 | |||||||||
Coca-Cola Enterprises | 0.1 | 21,700 | 806 | |||||||||
CVS Caremark | 0.5 | 95,600 | 5,505 | |||||||||
PepsiCo | 0.9 | 119,300 | 9,636 | |||||||||
Philip Morris International | 1.0 | 127,300 | 11,573 | |||||||||
Procter & Gamble | 1.4 | 210,800 | 16,181 | |||||||||
Wal-Mart Stores | 0.9 | 129,400 | 9,684 | |||||||||
Other Securities | 4.1 | 47,579 | ||||||||||
|
| |||||||||||
| 118,440 | ||||||||||||
|
| |||||||||||
Energy — 10.4% |
| |||||||||||
Chevron | 1.6 | 149,800 | 18,388 | |||||||||
ConocoPhillips | 0.5 | 94,800 | 5,815 | |||||||||
Exxon Mobil | 2.8 | 345,100 | 31,221 | |||||||||
Occidental Petroleum | 0.5 | 62,500 | 5,754 | |||||||||
Schlumberger | 0.7 | 102,900 | 7,515 | |||||||||
Other Securities | 4.3 | 49,804 | ||||||||||
|
| |||||||||||
| 118,497 | ||||||||||||
|
| |||||||||||
Financials — 16.2% |
| |||||||||||
American Express | 0.5 | 74,600 | 5,648 | |||||||||
American International Group* | 0.5 | 114,700 | 5,100 | |||||||||
Bank of America | 1.0 | 836,100 | 11,421 | |||||||||
Berkshire Hathaway, Cl B* | 1.4 | 140,700 | 16,050 | |||||||||
Citigroup | 1.1 | 234,700 | 12,202 | |||||||||
Goldman Sachs Group | 0.5 | 34,000 | 5,511 | |||||||||
JPMorgan Chase | 1.4 | 295,300 | 16,121 | |||||||||
| Description | Percentage of Net Assets (%) | Shares | Market Value ($ Thousands) | |||||||||
US Bancorp | 0.5 | % | 144,900 | $ | 5,080 | |||||||
Wells Fargo | 1.4 | 378,300 | 15,340 | |||||||||
Other Securities | 7.9 | 91,191 | ||||||||||
|
| |||||||||||
| 183,664 | ||||||||||||
|
| |||||||||||
Health Care — 12.5% |
| |||||||||||
AbbVie | 0.5 | 122,800 | 5,242 | |||||||||
Amgen | 0.5 | 58,100 | 5,841 | |||||||||
Bristol-Myers Squibb | 0.5 | 127,100 | 5,848 | |||||||||
Gilead Sciences* | 0.6 | 118,100 | 6,434 | |||||||||
Johnson & Johnson | 1.6 | 215,600 | 18,149 | |||||||||
Merck | 1.0 | 233,600 | 10,909 | |||||||||
Pfizer | 1.3 | 554,800 | 15,107 | |||||||||
Other Securities | 6.5 | 74,797 | ||||||||||
|
| |||||||||||
| 142,327 | ||||||||||||
|
| |||||||||||
Industrials — 10.0% |
| |||||||||||
3M | 0.5 | 49,300 | 5,437 | |||||||||
Boeing | 0.5 | 52,900 | 5,238 | |||||||||
General Electric | 1.6 | 801,900 | 18,700 | |||||||||
Union Pacific | 0.5 | 36,400 | 5,628 | |||||||||
United Technologies | 0.5 | 65,400 | 6,206 | |||||||||
Other Securities | 6.4 | 72,130 | ||||||||||
|
| |||||||||||
| 113,339 | ||||||||||||
|
| |||||||||||
Information Technology — 17.9% |
| |||||||||||
Apple | 2.9 | 72,300 | 32,512 | |||||||||
Cisco Systems | 0.9 | 412,300 | 9,928 | |||||||||
Google, Cl A* | 1.6 | 20,600 | 17,930 | |||||||||
Intel | 0.8 | 382,600 | 9,290 | |||||||||
International Business Machines | 1.5 | 80,800 | 16,808 | |||||||||
Microsoft | 1.8 | 581,300 | 20,276 | |||||||||
Oracle | 0.9 | 285,600 | 9,642 | |||||||||
Qualcomm | 0.7 | 133,000 | 8,443 | |||||||||
Visa, Cl A | 0.6 | 40,000 | 7,126 | |||||||||
Other Securities | 6.2 | 71,503 | ||||||||||
|
| |||||||||||
| 203,458 | ||||||||||||
|
| |||||||||||
Materials — 3.4% |
| |||||||||||
Other Securities | 3.4 | 37,721 | ||||||||||
|
| |||||||||||
Telecommunication Services — 2.7% |
| |||||||||||
AT&T | 1.3 | 423,900 | 14,832 | |||||||||
Verizon Communications | 0.9 | 220,900 | 10,709 | |||||||||
Other Securities | 0.5 | 5,537 | ||||||||||
|
| |||||||||||
| 31,078 | ||||||||||||
|
| |||||||||||
Utilities — 3.2% |
| |||||||||||
Other Securities | 3.2 | 35,803 | ||||||||||
|
| |||||||||||
Total Common Stock |
| 1,117,413 | ||||||||||
|
| |||||||||||
| 216 | SEI Institutional Investments Trust / Annual Report / May 31, 2013 |
Table of Contents
| Description | Percentage of Net Assets (%) | Shares/Contracts | Market Value ($ Thousands) | |||||||||
CASH EQUIVALENT — 0.5% |
| |||||||||||
SEI Daily Income Trust, | 0.5% | 5,702,681 | $ | 5,703 | ||||||||
|
| |||||||||||
Total Cash Equivalent |
| 5,703 | ||||||||||
|
| |||||||||||
Total Investments — 98.9% |
| $ | 1,123,116 | |||||||||
|
| |||||||||||
PURCHASED OPTION — 0.2% |
| |||||||||||
June 2013 SPX UO Index Option Put, Expires 6/22/2013, Strike Price $1,575* | 3,000 | $ | 2,490 | |||||||||
|
| |||||||||||
Total Purchased Option |
| $ | 2,490 | |||||||||
|
| |||||||||||
A list of the open forward foreign currency contracts held by the Fund at May 31, 2013, is as follows:
| Settlement Date | Currency (Thousands) | Currency to Receive (Thousands) | Unrealized Appreciation ($ Thousands) | |||||||||||||||||
7/25/13 | EUR | 360,735 | USD | 471,394 | $ | 3,808 | ||||||||||||||
7/25/13 | JPY | 10,968,782 | USD | 111,818 | 3,145 | |||||||||||||||
|
| |||||||||||||||||||
| $ | 6,953 | |||||||||||||||||||
|
| |||||||||||||||||||
A list of the counterparties for the open forward foreign currency contracts held by the Fund at May 31, 2013, is as follows:
| Counterparty | Currency to Deliver ($ Thousands) | Currency to Receive ($ Thousands) | Unrealized Appreciation (Depreciation) ($ Thousands) | |||||||||
BNP Paribas | $ | (161,614 | ) | $ | 165,834 | $ | 4,220 | |||||
Citigroup | (11,545 | ) | 11,534 | (11 | ) | |||||||
Goldman Sachs | (34,881 | ) | 34,871 | (10 | ) | |||||||
UBS | (368,218 | ) | 370,972 | 2,754 | ||||||||
|
| |||||||||||
| $ | 6,953 | |||||||||||
|
| |||||||||||
For the year ended May 31, 2013, the total amount of all open forward foreign currency contracts, as presented in the table above, are representative of the volume of activity for this derivative type during the year.
Percentages are based on a Net Assets of $1,135,631 ($ Thousands).
| * | Non-income producing security. |
| ** | The rate reported is the 7-day effective yield as of May 31, 2013. |
| † | Investment in Affiliated Security (see Note 5). |
Cl — Class
EUR — Euro
JPY — Japanese Yen
SPX — Standard & Poor’s 500 Index
USD — United States Dollar
The Summary Schedule of Investments does not reflect the complete portfolio holdings. It includes the Fund’s 50 largest holdings and each investment of any issuer that exceeds 1% of the Fund’s net assets. “Other Securities” represent all issues not required to be disclosed under the rules adopted by the U.S. Securities and Exchange Commission (“SEC”). In certain instances, securities for which footnotes listed above may otherwise apply are included in the Other Securities caption. The complete schedule of portfolio holdings is available (i) without charge, upon request, by calling (800) 342-5734; and (ii) on the SEC’s website at http://www.sec.gov.
The following is a list of the inputs used as of May 31, 2013, in valuing the Fund’s investments and other financial instruments carried at value ($ Thousands):
| Investments in Securities | Level 1 | Level 2 | Level 3 | Total | ||||||||||||
Common Stock | $ | 1,117,413 | $ | — | $ | — | $ | 1,117,413 | ||||||||
Cash Equivalent | 5,703 | — | — | 5,703 | ||||||||||||
|
|
|
|
|
|
|
| |||||||||
Total Investments in Securities | $ | 1,123,116 | $ | — | $ | — | $ | 1,123,116 | ||||||||
|
|
|
|
|
|
|
| |||||||||
| Other Financial Instruments | Level 1 | Level 2 | Level 3 | Total | ||||||||||||
Purchased Option | $ | 2,490 | $ | — | $ | — | $ | 2,490 | ||||||||
Forwards Contracts* | — | 6,953 | — | 6,953 | ||||||||||||
|
|
|
|
|
|
|
| |||||||||
Total Other Financial Instruments | $ | 2,490 | $ | 6,953 | $ | — | $ | 9,443 | ||||||||
|
|
|
|
|
|
|
| |||||||||
| * | Forwards contracts are valued at the unrealized appreciation on the instrument. |
For the year ended May 31, 2013, there were no transfers between Level 1 and Level 2 assets and liabilities.
For the year ended May 31, 2013, there were no transfers between Level 2 and Level 3 assets and liabilities.
For more information on valuation inputs, see Note 2 — Significant Accounting Policies in Notes to Financial Statements.
Amounts designated as “—” are $0 or have been rounded to $0.
The accompanying notes are an integral part of the financial statements.
| SEI Institutional Investments Trust / Annual Report / May 31, 2013 | 217 |
Table of Contents
SCHEDULE OF INVESTMENTS
Multi-Asset Real Return Fund
May 31, 2013
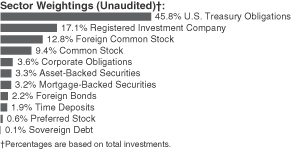
| Description | Face Amount ($ Thousands)/Shares | Market Value ($ Thousands) | ||||||
U.S. TREASURY OBLIGATIONS — 51.2% |
| |||||||
U.S. Treasury Inflation-Protected | ||||||||
2.625%, 07/15/2017 (A) | $ | 13,258 | $ | 15,346 | ||||
2.500%, 07/15/2016 | 21,508 | 24,059 | ||||||
2.375%, 01/15/2017 | 1,408 | 1,585 | ||||||
2.125%, 01/15/2019 | 2,320 | 2,705 | ||||||
2.000%, 07/15/2014 | 21,432 | 22,185 | ||||||
2.000%, 01/15/2016 | 13,552 | 14,672 | ||||||
1.875%, 07/15/2015 | 7,420 | 7,934 | ||||||
1.625%, 01/15/2015 | 18,264 | 19,047 | ||||||
1.625%, 01/15/2018 | 8,922 | 9,998 | ||||||
1.375%, 07/15/2018 | 15,560 | 17,469 | ||||||
0.625%, 07/15/2021 | 1,244 | 1,348 | ||||||
0.500%, 04/15/2015 | 4,356 | 4,479 | ||||||
0.125%, 04/15/2016 | 7,872 | 8,143 | ||||||
0.125%, 04/15/2018 | 6,238 | 6,541 | ||||||
|
| |||||||
Total U.S. Treasury Obligations | 155,511 | |||||||
|
| |||||||
REGISTERED INVESTMENT COMPANY — 19.1% |
| |||||||
Credit Suisse Commodity Return Strategy Fund | 7,694,235 | 57,938 | ||||||
|
| |||||||
Total Registered Investment Company | 57,938 | |||||||
|
| |||||||
FOREIGN COMMON STOCK — 14.3% |
| |||||||
Australia — 0.7% |
| |||||||
Arrium (B) | 156,380 | 118 | ||||||
BHP Billiton (B) | 58,180 | 1,903 | ||||||
Stockland‡ (B) | 15,180 | 53 | ||||||
|
| |||||||
| 2,074 | ||||||||
|
| |||||||
Brazil — 0.7% |
| |||||||
Petroleo Brasileiro ADR, Cl A | 37,670 | 702 | ||||||
Petroleo Brasileiro ADR | 88,930 | 1,580 | ||||||
|
| |||||||
| 2,282 | ||||||||
|
| |||||||
| Description | Shares | Market Value ($ Thousands) | ||||||
Canada — 3.4% |
| |||||||
Agnico Eagle Mines | 15,974 | $ | 521 | |||||
Agrium | 7,163 | 664 | ||||||
Allied Properties, Cl Trust Unit‡ | 4,980 | 162 | ||||||
Artis Real Estate Investment Trust, | 9,740 | 154 | ||||||
Brookfield Residential Properties* | 7,853 | 173 | ||||||
Cameco | 23,460 | 512 | ||||||
Chartwell Retirement Residences‡ | 11,330 | 119 | ||||||
Cominar, Cl Trust Unit‡ | 8,240 | 180 | ||||||
Dominion Diamond* | 17,000 | 255 | ||||||
Dundee, Cl A (Canada)‡ | 5,340 | 176 | ||||||
Goldcorp | 59,080 | 1,759 | ||||||
Granite Real Estate Investment | 4,740 | 175 | ||||||
Kinross Gold | 168,150 | 1,106 | ||||||
Morguard‡ | 4,990 | 90 | ||||||
New Gold* | 46,580 | 318 | ||||||
North American Palladium* | 243,730 | 266 | ||||||
RioCan, Cl Trust Unit‡ | 7,001 | 186 | ||||||
Suncor Energy | 60,840 | 1,851 | ||||||
Teck Cominco, Cl B | 36,460 | 977 | ||||||
West Fraser Timber | 1,530 | 114 | ||||||
Yamana Gold | 58,260 | 689 | ||||||
|
| |||||||
| 10,447 | ||||||||
|
| |||||||
China — 0.4% |
| |||||||
China Petroleum & Chemical (B) | 1,256,000 | 1,281 | ||||||
Evergrande Real Estate Group (B) | 81,000 | 32 | ||||||
|
| |||||||
| 1,313 | ||||||||
|
| |||||||
France — 0.2% |
| |||||||
Total (B) | 16,000 | 797 | ||||||
|
| |||||||
Germany — 0.3% |
| |||||||
BASF (B) | 8,440 | 816 | ||||||
|
| |||||||
Italy — 0.7% |
| |||||||
Eni (B) | 89,270 | 2,024 | ||||||
|
| |||||||
Japan — 0.2% |
| |||||||
JFE Holdings (B) | 25,200 | 515 | ||||||
|
| |||||||
Netherlands — 0.3% |
| |||||||
Koninklijke DSM (B) | 12,449 | 815 | ||||||
LyondellBasell Industries, Cl A | 1 | — | ||||||
|
| |||||||
| 815 | ||||||||
|
| |||||||
Norway — 0.5% |
| |||||||
Aker Solutions (B) | 34,240 | 503 | ||||||
Seadrill | 16,020 | 649 | ||||||
Statoil (B) | 21,700 | 489 | ||||||
|
| |||||||
| 1,641 | ||||||||
|
| |||||||
| 218 | SEI Institutional Investments Trust / Annual Report / May 31, 2013 |
Table of Contents
| Description | Shares | Market Value ($ Thousands) | ||||||
Russia — 0.9% |
| |||||||
Gazprom OAO ADR (B) | 253,080 | $ | 1,887 | |||||
MMC Norilsk Nickel ADR (B) | 55,850 | 800 | ||||||
|
| |||||||
| 2,687 | ||||||||
|
| |||||||
Singapore — 0.0% |
| |||||||
Mapletree Commercial Trust (B) | 44,000 | 46 | ||||||
UOL Group (B) | 9,000 | 48 | ||||||
|
| |||||||
| 94 | ||||||||
|
| |||||||
South Africa — 0.1% |
| |||||||
Exxaro Resources (B) | 21,900 | 344 | ||||||
|
| |||||||
Sweden — 0.2% |
| |||||||
Lundin Petroleum (B) | 22,910 | 473 | ||||||
|
| |||||||
Switzerland — 0.1% |
| |||||||
Glencore Xstrata (B) | 66,029 | 320 | ||||||
|
| |||||||
Thailand — 0.4% |
| |||||||
Banpu (B) | 64,550 | 636 | ||||||
PTT NVDR (B) | 57,900 | 620 | ||||||
|
| |||||||
| 1,256 | ||||||||
|
| |||||||
Turkey — 0.1% |
| |||||||
Koza Altin Isletmeleri (B) | 15,050 | 265 | ||||||
|
| |||||||
United Kingdom — 5.0% |
| |||||||
Anglo American (B) | 56,280 | 1,287 | ||||||
BG Group (B) | 89,380 | 1,628 | ||||||
BP (B) | 476,090 | 3,395 | ||||||
InterContinental Hotels Group (B) | 1,863 | 54 | ||||||
Johnson Matthey (B) | 8,780 | 338 | ||||||
Mondi (B) | 37,870 | 497 | ||||||
Rio Tinto (B) | 73,760 | 3,143 | ||||||
Royal Dutch Shell, Cl A (B) | 107,276 | 3,572 | ||||||
Royal Dutch Shell, Cl B (B) | 34,770 | 1,196 | ||||||
|
| |||||||
| 15,110 | ||||||||
|
| |||||||
Ukraine — 0.1% |
| |||||||
MHP GDR | 18,730 | 346 | ||||||
|
| |||||||
Total Foreign Common Stock | 43,619 | |||||||
|
| |||||||
COMMON STOCK — 10.5% |
| |||||||
Consumer Discretionary — 0.1% |
| |||||||
Regal Entertainment Group, Cl A | 9,560 | 169 | ||||||
SeaWorld Entertainment* | 3,181 | 112 | ||||||
|
| |||||||
| 281 | ||||||||
|
| |||||||
Consumer Staples — 0.2% |
| |||||||
Bunge | 7,290 | 508 | ||||||
|
| |||||||
| Description | Shares | Market Value ($ Thousands) | ||||||
Energy — 6.0% |
| |||||||
Anadarko Petroleum | 12,730 | $ | 1,114 | |||||
Cabot Oil & Gas | 4,800 | 338 | ||||||
Chevron | 22,160 | 2,720 | ||||||
Diamond Offshore Drilling | 7,010 | 482 | ||||||
EOG Resources | 7,440 | 961 | ||||||
Exxon Mobil | 79,010 | 7,148 | ||||||
Halliburton | 15,110 | 632 | ||||||
Helmerich & Payne | 4,060 | 251 | ||||||
Hess | 9,600 | 647 | ||||||
Murphy Oil | 8,110 | 514 | ||||||
Noble Energy | 8,800 | 507 | ||||||
Occidental Petroleum | 17,415 | 1,603 | ||||||
Schlumberger | 13,170 | 962 | ||||||
Valero Energy | 8,130 | 330 | ||||||
|
| |||||||
| 18,209 | ||||||||
|
| |||||||
Financials — 3.1% |
| |||||||
American Realty Capital | 3,904 | 59 | ||||||
Armada Hoffler Properties‡* | 6,057 | 69 | ||||||
Ashford Hospitality Trust | 14,360 | 190 | ||||||
Associated Estates Realty‡ | 11,820 | 194 | ||||||
AvalonBay Communities | 1,425 | 189 | ||||||
BioMed Realty Trust‡ | 3,640 | 76 | ||||||
Boston Properties | 1,920 | 205 | ||||||
Brandywine Realty Trust | 7,740 | 110 | ||||||
CBL & Associates Properties | 1,090 | 25 | ||||||
Chesapeake Lodging Trust‡ | 4,540 | 102 | ||||||
Corporate Office Properties Trust‡ | 1,346 | 36 | ||||||
CubeSmart‡ | 2,170 | 34 | ||||||
CyrusOne‡ | 5,320 | 115 | ||||||
DDR‡ | 8,602 | 150 | ||||||
Digital Realty Trust‡ | 2,800 | 171 | ||||||
Douglas Emmett‡ | 7,340 | 187 | ||||||
Duke Realty‡ | 7,200 | 119 | ||||||
EPR Properties‡ | 930 | 49 | ||||||
Equity Residential‡ | 4,410 | 249 | ||||||
Extra Space Storage‡ | 4,842 | 203 | ||||||
Federal Realty Investment Trust‡ | 840 | 91 | ||||||
Franklin Street Properties‡ | 1,570 | 21 | ||||||
General Growth Properties‡ | 11,350 | 233 | ||||||
HCP‡ | 9,220 | 437 | ||||||
Health Care‡ | 4,790 | 326 | ||||||
Home Properties‡ | 1,130 | 69 | ||||||
Host Hotels & Resorts‡ | 11,720 | 209 | ||||||
Inland Real Estate‡ | 10,520 | 108 | ||||||
Investors Real Estate Trust‡ | 8,219 | 74 | ||||||
Kimco Realty‡ | 6,230 | 138 | ||||||
Lexington Realty Trust‡ | 10,621 | 134 | ||||||
Liberty Property Trust‡ | 2,470 | 100 | ||||||
LTC Properties‡ | 4,810 | 200 | ||||||
Macerich‡ | 1,070 | 69 | ||||||
| SEI Institutional Investments Trust / Annual Report / May 31, 2013 | 219 |
Table of Contents
SCHEDULE OF INVESTMENTS
Multi-Asset Real Return Fund (Continued)
May 31, 2013
| Description | Shares/Face Amount ($ Thousands) | Market Value ($ Thousands) | ||||||
Mack-Cali Realty‡ | 4,080 | $ | 108 | |||||
Medical Properties Trust‡ | 15,015 | 223 | ||||||
Mid-America Apartment Communities‡ | 3,490 | 237 | ||||||
Omega Healthcare Investors‡ | 7,960 | 258 | ||||||
Parkway Properties‡ | 4,228 | 73 | ||||||
Pebblebrook Hotel Trust‡ | 1,010 | 27 | ||||||
Pennsylvania Real Estate Investment Trust‡ | 6,970 | 139 | ||||||
Post Properties‡ | 920 | 44 | ||||||
Prologis‡ | 6,800 | 274 | ||||||
Public Storage‡ | 2,330 | 354 | ||||||
Realty Income‡ | 3,800 | 173 | ||||||
RLJ Lodging Trust‡ | 10,190 | 236 | ||||||
Sabra Health Care‡ | 5,170 | 140 | ||||||
Senior Housing Properties Trust‡ | 8,660 | 224 | ||||||
Simon Property Group‡ | 6,340 | 1,055 | ||||||
SL Green Realty‡ | 550 | 48 | ||||||
Spirit Realty Capital‡ | 2,709 | 54 | ||||||
STAG Industrial‡ | 8,653 | 190 | ||||||
Sun Communities‡ | 4,250 | 212 | ||||||
Ventas‡ | 5,720 | 408 | ||||||
Vornado Realty Trust‡ | 2,340 | 187 | ||||||
|
| |||||||
| 9,405 | ||||||||
|
| |||||||
Industrials — 0.1% |
| |||||||
Masco | 8,300 | 174 | ||||||
Ply Gem Holdings* | 2,290 | 53 | ||||||
|
| |||||||
| 227 | ||||||||
|
| |||||||
Materials — 1.0% |
| |||||||
Commercial Metals | 42,960 | 663 | ||||||
Freeport-McMoRan Copper & Gold, Cl B | 31,800 | 987 | ||||||
Monsanto | 12,490 | 1,257 | ||||||
United States Steel | 18,990 | 336 | ||||||
|
| |||||||
| 3,243 | ||||||||
|
| |||||||
Total Common Stock | 31,873 | |||||||
|
| |||||||
CORPORATE OBLIGATIONS — 4.0% |
| |||||||
Consumer Discretionary — 0.6% |
| |||||||
CBS | ||||||||
5.750%, 04/15/2020 | $ | 145 | 168 | |||||
3.375%, 03/01/2022 | 4 | 4 | ||||||
Comcast | ||||||||
6.450%, 03/15/2037 | 40 | 50 | ||||||
DIRECTV Holdings | ||||||||
4.600%, 02/15/2021 | 60 | 65 | ||||||
3.800%, 03/15/2022 | 165 | 167 | ||||||
Dollar General | ||||||||
4.125%, 07/15/2017 | 29 | 31 | ||||||
Macy’s Retail Holdings | ||||||||
3.875%, 01/15/2022 | 300 | 314 | ||||||
| Description | Face Amount ($ Thousands) | Market Value ($ Thousands) | ||||||
News America | ||||||||
6.150%, 02/15/2041 | $ | 75 | $ | 88 | ||||
4.500%, 02/15/2021 | 90 | 100 | ||||||
3.000%, 09/15/2022 | 95 | 93 | ||||||
Omnicom Group | ||||||||
3.625%, 05/01/2022 | 58 | 58 | ||||||
Time Warner | ||||||||
4.700%, 01/15/2021 | 130 | 145 | ||||||
3.400%, 06/15/2022 | 180 | 182 | ||||||
Time Warner Cable | ||||||||
4.125%, 02/15/2021 | 65 | 69 | ||||||
4.000%, 09/01/2021 | 75 | 78 | ||||||
Wynn Las Vegas | ||||||||
5.375%, 03/15/2022 | 105 | 110 | ||||||
|
| |||||||
| 1,722 | ||||||||
|
| |||||||
Consumer Staples — 0.2% |
| |||||||
Bunge Finance | ||||||||
4.100%, 03/15/2016 | 125 | 133 | ||||||
ConAgra Foods | ||||||||
3.200%, 01/25/2023 | 82 | 81 | ||||||
Kroger | ||||||||
3.400%, 04/15/2022 | 218 | 221 | ||||||
Reynolds American | ||||||||
3.250%, 11/01/2022 | 107 | 104 | ||||||
Tyson Foods | ||||||||
4.500%, 06/15/2022 | 210 | 224 | ||||||
|
| |||||||
| 763 | ||||||||
|
| |||||||
Energy — 0.8% |
| |||||||
Cimarex Energy | ||||||||
5.875%, 05/01/2022 | 54 | 58 | ||||||
DCP Midstream | ||||||||
4.750%, 09/30/2021 (C) | 75 | 79 | ||||||
Energy Transfer Partners | ||||||||
5.200%, 02/01/2022 | 80 | 88 | ||||||
4.650%, 06/01/2021 | 85 | 91 | ||||||
Enterprise Products Operating | ||||||||
5.200%, 09/01/2020 | 110 | 127 | ||||||
Kinder Morgan Energy Partners | ||||||||
4.150%, 03/01/2022 | 48 | 50 | ||||||
3.950%, 09/01/2022 | 261 | 270 | ||||||
Marathon Petroleum | ||||||||
5.125%, 03/01/2021 | 47 | 54 | ||||||
Nabors Industries | ||||||||
9.250%, 01/15/2019 | 84 | 106 | ||||||
Noble Energy | ||||||||
8.250%, 03/01/2019 | 174 | 225 | ||||||
Phillips 66 | ||||||||
4.300%, 04/01/2022 | 225 | 243 | ||||||
Spectra Energy Capital | ||||||||
6.200%, 04/15/2018 | 115 | 137 | ||||||
Transocean | ||||||||
2.500%, 10/15/2017 | 93 | 94 | ||||||
| 220 | SEI Institutional Investments Trust / Annual Report / May 31, 2013 |
Table of Contents
| Description | Face Amount ($ Thousands) | Market Value ($ Thousands) | ||||||
Valero Energy | ||||||||
6.125%, 02/01/2020 | $ | 149 | $ | 179 | ||||
Weatherford International | ||||||||
5.125%, 09/15/2020 | 155 | 167 | ||||||
Williams | ||||||||
3.700%, 01/15/2023 | 232 | 224 | ||||||
Williams Partners | ||||||||
4.000%, 11/15/2021 | 150 | 155 | ||||||
3.350%, 08/15/2022 | 105 | 102 | ||||||
|
| |||||||
| 2,449 | ||||||||
|
| |||||||
Financials — 1.4% |
| |||||||
American International Group | ||||||||
6.400%, 12/15/2020 | 60 | 73 | ||||||
5.600%, 10/18/2016 | 60 | 68 | ||||||
4.875%, 06/01/2022 | 155 | 171 | ||||||
American Tower | ||||||||
5.050%, 09/01/2020‡ | 145 | 159 | ||||||
3.500%, 01/31/2023‡ | 110 | 107 | ||||||
Bank of America MTN | ||||||||
5.200%, 12/29/2049 (D) | 216 | 214 | ||||||
5.000%, 05/13/2021 | 200 | 221 | ||||||
3.300%, 01/11/2023 | 155 | 150 | ||||||
Capital One Financial | ||||||||
4.750%, 07/15/2021 | 145 | 162 | ||||||
Citigroup | ||||||||
6.875%, 03/05/2038 | 40 | 51 | ||||||
5.950%, 12/29/2049 (D) | 250 | 261 | ||||||
Fifth Third Bancorp | ||||||||
3.500%, 03/15/2022 | 67 | 69 | ||||||
Ford Motor Credit | ||||||||
5.000%, 05/15/2018 | 200 | 220 | ||||||
Goldman Sachs Group MTN | ||||||||
5.750%, 01/24/2022 | 5 | 6 | ||||||
5.375%, 03/15/2020 | 40 | 45 | ||||||
5.250%, 07/27/2021 | 110 | 123 | ||||||
3.625%, 02/07/2016 | 40 | 42 | ||||||
Hartford Financial Services Group | ||||||||
5.500%, 03/30/2020 | 80 | 93 | ||||||
5.125%, 04/15/2022 | 85 | 97 | ||||||
HCP | ||||||||
5.375%, 02/01/2021‡ | 205 | 235 | ||||||
Health Care | ||||||||
5.250%, 01/15/2022‡ | 240 | 270 | ||||||
Host Hotels & Resorts | ||||||||
5.250%, 03/15/2022‡ | 70 | 77 | ||||||
HSBC Finance | ||||||||
6.676%, 01/15/2021 | 60 | 71 | ||||||
JPMorgan Chase | ||||||||
6.400%, 05/15/2038 | 40 | 50 | ||||||
5.150%, 04/05/2023 (D) | 90 | 91 | ||||||
4.500%, 01/24/2022 | 140 | 152 | ||||||
Lincoln National | ||||||||
4.200%, 03/15/2022 | 110 | 118 | ||||||
| Description | Face Amount ($ Thousands) | Market Value ($ Thousands) | ||||||
MetLife | ||||||||
7.717%, 02/15/2019 | $ | 50 | $ | 65 | ||||
5.700%, 06/15/2035 | 65 | 75 | ||||||
Morgan Stanley | ||||||||
5.500%, 07/28/2021 | 168 | 189 | ||||||
4.750%, 03/22/2017 | 40 | 44 | ||||||
3.750%, 02/25/2023 | 181 | 180 | ||||||
Murray Street Investment Trust I | ||||||||
4.647%, 03/09/2017 (E) | 18 | 20 | ||||||
Nationwide Financial Services | ||||||||
5.375%, 03/25/2021 (C) | 130 | 145 | ||||||
Prudential Financial | ||||||||
5.625%, 06/15/2043 (D) | 115 | 121 | ||||||
SLM MTN | ||||||||
7.250%, 01/25/2022 | 165 | 173 | ||||||
Vesey Street Investment Trust I | ||||||||
4.404%, 09/01/2016 (E) | 49 | 53 | ||||||
|
| |||||||
| 4,461 | ||||||||
|
| |||||||
Health Care — 0.1% |
| |||||||
Humana | ||||||||
6.450%, 06/01/2016 | 115 | 131 | ||||||
Watson Pharmaceuticals | ||||||||
3.250%, 10/01/2022 | 77 | 76 | ||||||
WellPoint | ||||||||
3.300%, 01/15/2023 | 75 | 75 | ||||||
|
| |||||||
| 282 | ||||||||
|
| |||||||
Industrials — 0.2% |
| |||||||
BE Aerospace | ||||||||
5.250%, 04/01/2022 | 105 | 110 | ||||||
CSX | ||||||||
4.750%, 05/30/2042 | 165 | 167 | ||||||
Republic Services | ||||||||
3.800%, 05/15/2018 | 130 | 140 | ||||||
|
| |||||||
| 417 | ||||||||
|
| |||||||
Information Technology — 0.2% |
| |||||||
Hewlett-Packard | ||||||||
4.650%, 12/09/2021 | 73 | 75 | ||||||
Intel | ||||||||
4.800%, 10/01/2041 | 95 | 98 | ||||||
Motorola Solutions | ||||||||
3.500%, 03/01/2023 | 169 | 165 | ||||||
Total System Services | ||||||||
3.750%, 06/01/2023 | 87 | 85 | ||||||
2.375%, 06/01/2018 | 90 | 90 | ||||||
|
| |||||||
| 513 | ||||||||
|
| |||||||
Materials — 0.2% |
| |||||||
Ball | ||||||||
5.000%, 03/15/2022 | 105 | 109 | ||||||
| SEI Institutional Investments Trust / Annual Report / May 31, 2013 | 221 |
Table of Contents
SCHEDULE OF INVESTMENTS
Multi-Asset Real Return Fund (Continued)
May 31, 2013
| Description | Face Amount ($ Thousands) | Market Value ($ Thousands) | ||||||
Dow Chemical | ||||||||
5.900%, 02/15/2015 | $ | 55 | $ | 60 | ||||
4.375%, 11/15/2042 | 39 | 37 | ||||||
4.250%, 11/15/2020 | 65 | 71 | ||||||
4.125%, 11/15/2021 | 85 | 90 | ||||||
Eagle Spinco | ||||||||
4.625%, 02/15/2021 (C) | 24 | 24 | ||||||
International Paper | ||||||||
7.950%, 06/15/2018 | 110 | 140 | ||||||
4.750%, 02/15/2022 | 135 | 149 | ||||||
|
| |||||||
| 680 | ||||||||
|
| |||||||
Telecommunication Services — 0.1% |
| |||||||
AT&T | ||||||||
5.350%, 09/01/2040 | 113 | 121 | ||||||
3.000%, 02/15/2022 | 90 | 90 | ||||||
U.S. Cellular | ||||||||
6.700%, 12/15/2033 | 70 | 72 | ||||||
Verizon Communications | ||||||||
7.350%, 04/01/2039 | 125 | 168 | ||||||
|
| |||||||
| 451 | ||||||||
|
| |||||||
Utilities — 0.2% |
| |||||||
CMS Energy | ||||||||
5.050%, 03/15/2022 | 52 | 59 | ||||||
Constellation Energy Group | ||||||||
5.150%, 12/01/2020 | 26 | 29 | ||||||
MidAmerican Energy Holdings | ||||||||
6.125%, 04/01/2036 | 140 | 168 | ||||||
ONEOK | ||||||||
4.250%, 02/01/2022 | 170 | 177 | ||||||
Pacific Gas & Electric | ||||||||
4.500%, 12/15/2041 | 65 | 66 | ||||||
|
| |||||||
| 499 | ||||||||
|
| |||||||
Total Corporate Obligations | 12,237 | |||||||
|
| |||||||
ASSET-BACKED SECURITIES — 3.7% |
| |||||||
Automotive — 2.7% |
| |||||||
Ally Auto Receivables Trust, | ||||||||
0.720%, 05/20/2016 | 477 | 477 | ||||||
Ally Master Owner Trust, | ||||||||
1.810%, 05/15/2016 | 385 | 389 | ||||||
Ally Master Owner Trust, | ||||||||
1.000%, 02/15/2018 | 260 | 260 | ||||||
AmeriCredit Automobile Receivables Trust, Ser 2011-4, Cl A2 | ||||||||
0.920%, 03/09/2015 | 10 | 10 | ||||||
| Description | Face Amount ($ Thousands) | Market Value ($ Thousands) | ||||||
AmeriCredit Automobile Receivables Trust, Ser 2012-3, Cl A3 | ||||||||
0.960%, 01/09/2017 | $ | 210 | $ | 211 | ||||
AmeriCredit Automobile Receivables Trust, Ser 2012-4, Cl A2 | ||||||||
0.490%, 04/08/2016 | 258 | 258 | ||||||
AmeriCredit Automobile Receivables Trust, Ser 2013-1, Cl A2 | ||||||||
0.490%, 06/08/2016 | 235 | 235 | ||||||
Avis Budget Rental Car Funding, | ||||||||
2.100%, 03/20/2019 (C) | 150 | 152 | ||||||
Bank of America Auto Trust, | ||||||||
1.030%, 12/15/2016 | 170 | 171 | ||||||
BMW Floorplan Master Owner | ||||||||
0.599%, 09/15/2017 (C) (D) | 425 | 426 | ||||||
Capital Auto Receivables Asset | ||||||||
0.620%, 07/20/2016 | 202 | 202 | ||||||
CFC, Ser 2013-1A, Cl A | ||||||||
1.650%, 07/17/2017 (C) | 245 | 245 | ||||||
Exeter Automobile Receivables | ||||||||
1.300%, 06/15/2017 (C) | 141 | 141 | ||||||
Exeter Automobile Receivables | ||||||||
1.290%, 10/16/2017 (C) | 160 | 160 | ||||||
Fifth Third Auto Trust, Ser 2013-A | ||||||||
0.610%, 09/15/2017 | 221 | 221 | ||||||
Flagship Credit Auto Trust, | ||||||||
1.320%, 04/16/2018 (C) | 131 | 132 | ||||||
Ford Auto Securitization Trust, | ||||||||
1.676%, 09/15/2016 (C) | 207 | 200 | ||||||
Ford Credit Auto Owner Trust, | ||||||||
1.010%, 05/15/2018 | 100 | 100 | ||||||
Ford Credit Floorplan Master | ||||||||
1.899%, 02/15/2017 (C) (D) | 450 | 461 | ||||||
Ford Credit Floorplan Master | ||||||||
0.740%, 09/15/2016 | 480 | 481 | ||||||
Ford Credit Floorplan Master | ||||||||
0.579%, 01/15/2018 (D) | 257 | 257 | ||||||
GE Dealer Floorplan Master Note | ||||||||
0.688%, 06/20/2017 (D) | 255 | 256 | ||||||
Hertz Vehicle Financing, | ||||||||
1.120%, 08/25/2017 (C) | 715 | 713 | ||||||
| 222 | SEI Institutional Investments Trust / Annual Report / May 31, 2013 |
Table of Contents
| Description | Face Amount ($ Thousands) | Market Value ($ Thousands) | ||||||
Huntington Auto Trust, | ||||||||
1.010%, 01/15/2016 (C) | $ | 112 | $ | 112 | ||||
Hyundai Auto Lease Securitization | ||||||||
0.660%, 06/15/2016 (C) | 273 | 273 | ||||||
Mercedes-Benz Auto Lease Trust, | ||||||||
0.590%, 02/15/2016 | 200 | 200 | ||||||
Mercedes-Benz Master Owner | ||||||||
0.790%, 11/15/2017 (C) | 342 | 341 | ||||||
Navistar Financial Owner Trust, | ||||||||
0.850%, 03/18/2015 (C) | 171 | 172 | ||||||
Nissan Auto Lease Trust, | ||||||||
0.680%, 07/15/2014 | 93 | 93 | ||||||
Porsche Innovative Lease Owner Trust, Ser 2011-1 | ||||||||
1.090%, 09/22/2014 (C) | 131 | 131 | ||||||
Santander Drive Auto Receivables Trust, Ser 2012-6, Cl A2 | ||||||||
0.470%, 09/15/2015 | 220 | 220 | ||||||
Santander Drive Auto Receivables Trust, | ||||||||
1.810%, 04/15/2019 | 313 | 313 | ||||||
SMART Trust, Ser 2012-4US, Cl A2A | ||||||||
0.670%, 06/14/2015 | 155 | 155 | ||||||
|
| |||||||
| 8,168 | ||||||||
|
| |||||||
Credit Cards — 0.7% | ||||||||
American Express Credit Account Master Trust, Ser 2012-5, Cl A | ||||||||
0.590%, 05/15/2018 | 270 | 270 | ||||||
Cabela’s Master Credit Card Trust, | ||||||||
2.710%, 02/17/2026 (C) | 265 | 260 | ||||||
Chase Issuance Trust, | ||||||||
1.300%, 02/18/2020 | 305 | 304 | ||||||
Dryrock Issuance Trust, | ||||||||
0.640%, 08/15/2018 | 275 | 274 | ||||||
GE Capital Credit Card Master Note Trust, Ser 2012-6, Cl A | ||||||||
1.360%, 08/17/2020 | 250 | 251 | ||||||
GE Capital Credit Card Master | ||||||||
1.760%, 09/15/2022 | 215 | 212 | ||||||
GE Capital Credit Card Master Note Trust, Ser 2013-1 | ||||||||
1.350%, 03/15/2021 | 370 | 367 | ||||||
| Description | Face Amount ($ Thousands) | Market Value ($ Thousands) | ||||||
Penarth Master Issuer, | ||||||||
0.768%, 03/18/2014 (C) (D) | $ | 174 | $ | 175 | ||||
World Financial Network Credit Card Master Trust, Ser 2013-A, Cl A | ||||||||
1.610%, 12/15/2021 | 161 | 160 | ||||||
|
| |||||||
| 2,273 | ||||||||
|
| |||||||
Other Asset-Backed Securities — 0.3% |
| |||||||
CGRBS, Ser 2013-VN05 | ||||||||
3.187%, 03/13/2035 | 285 | 286 | ||||||
CIT Equipment Collateral, | ||||||||
1.100%, 08/22/2016 (C) | 170 | 171 | ||||||
CNH Equipment Trust, | ||||||||
0.940%, 05/15/2017 | 132 | 133 | ||||||
GSAA Trust, Ser 2006-5, Cl 2A3 | ||||||||
0.463%, 03/25/2036 (D) | 268 | 182 | ||||||
|
| |||||||
| 772 | ||||||||
|
| |||||||
Total Asset-Backed Securities | 11,213 | |||||||
|
| |||||||
MORTGAGE-BACKED SECURITIES — 3.6% |
| |||||||
Agency Mortgage-Backed Obligations — 0.6% |
| |||||||
FNMA TBA | ||||||||
3.500%, 07/01/2041 | 1,785 | 1,844 | ||||||
|
| |||||||
Non-Agency Mortgage-Backed Obligations — 3.0% |
| |||||||
Banc of America Commercial Mortgage Trust, Ser 2006-5, Cl A4 | ||||||||
5.414%, 09/10/2047 | 300 | 334 | ||||||
Banc of America Commercial Mortgage Trust, Ser 2007-5, Cl AM | ||||||||
5.772%, 02/10/2051 (D) | 78 | 86 | ||||||
Bear Stearns Commercial Mortgage Securities Trust, Ser 2006-T24, Cl AJ | ||||||||
5.600%, 10/12/2041 (D) | 110 | 106 | ||||||
Citigroup Commercial Mortgage | ||||||||
5.742%, 03/15/2049 (D) | 195 | 217 | ||||||
COMM Mortgage Trust, | ||||||||
1.873%, 04/12/2035 (C) | 146 | 144 | ||||||
Commercial Mortgage Pass-Through Certificates, Ser 2006-C3, Cl AJ | ||||||||
5.989%, 06/15/2038 (D) | 105 | 106 | ||||||
Commercial Mortgage Trust, | ||||||||
5.475%, 03/10/2039 | 26 | 28 | ||||||
Commercial Mortgage Trust, | ||||||||
5.444%, 03/10/2039 | 263 | 297 | ||||||
| SEI Institutional Investments Trust / Annual Report / May 31, 2013 | 223 |
Table of Contents
SCHEDULE OF INVESTMENTS
Multi-Asset Real Return Fund (Continued)
May 31, 2013
| Description | Face Amount ($ Thousands) | Market Value ($ Thousands) | ||||||
CW Capital Cobalt, | ||||||||
5.985%, 05/15/2046 (D) | $ | 310 | $ | 357 | ||||
Extended Stay America Trust, | ||||||||
0.898%, 12/05/2031 (C) (D) | 140 | 140 | ||||||
Extended Stay America Trust, | ||||||||
2.295%, 12/05/2031 (C) | 180 | 177 | ||||||
First Horizon Alternative Mortgage | ||||||||
6.000%, 07/25/2036 | 193 | 175 | ||||||
GS Mortgage Securites, | ||||||||
2.059%, 04/10/2031 (C) | 261 | 260 | ||||||
GS Mortgage Securities II, | ||||||||
5.553%, 04/10/2038 (D) | 215 | 236 | ||||||
GS Mortgage Securities II, | ||||||||
2.773%, 11/10/2045 | 142 | 138 | ||||||
GS Mortgage Securities II, | ||||||||
1.048%, 11/08/2029 (C) (D) | 280 | 281 | ||||||
GS Mortgage Securities Trust, | ||||||||
3.377%, 05/10/2045 | 345 | 356 | ||||||
GS Mortgage Securities, | ||||||||
2.706%, 12/10/2027 (C) | 287 | 292 | ||||||
IndyMac INDX Mortgage Loan | ||||||||
0.313%, 07/25/2036 (D) | 217 | 167 | ||||||
IndyMac INDX Mortgage Loan | ||||||||
0.393%, 10/25/2036 (D) | 230 | 198 | ||||||
JPMorgan Chase Commercial | ||||||||
5.910%, 02/12/2049 (D) | 100 | 111 | ||||||
JPMorgan Chase Commercial | ||||||||
6.002%, 06/15/2049 (D) | 82 | 93 | ||||||
JPMorgan Chase Commercial | ||||||||
6.200%, 02/15/2051 (D) | 75 | 85 | ||||||
JPMorgan Chase Commercial | ||||||||
2.749%, 11/15/2043 (C) | 143 | 149 | ||||||
LB-UBS Commercial Mortgage | ||||||||
5.424%, 02/15/2040 | 305 | 345 | ||||||
| Description | Face Amount ($ Thousands) | Market Value ($ Thousands) | ||||||
LB-UBS Commercial Mortgage | ||||||||
5.430%, 02/15/2040 | $ | 310 | $ | 345 | ||||
Merrill Lynch Mortgage Trust, | ||||||||
4.960%, 07/12/2038 | 92 | 93 | ||||||
Merrill Lynch Mortgage Trust, | ||||||||
5.739%, 08/12/2043 (D) | 198 | 222 | ||||||
ML-CFC Commercial Mortgage Trust, Ser 2006-4, Cl A1A | ||||||||
5.166%, 12/12/2049 (D) | 746 | 831 | ||||||
ML-CFC Commercial Mortgage Trust, Ser 2007-9, Cl A4 | ||||||||
5.700%, 09/12/2049 | 300 | 342 | ||||||
Morgan Stanley Capital I Trust, | ||||||||
5.647%, 06/11/2042 (D) | 461 | 531 | ||||||
UBS-Barclays Commercial Mortgage Trust, Ser 2012-C3, Cl A4 | ||||||||
3.091%, 08/10/2049 | 98 | 98 | ||||||
UBS-Barclays Commercial Mortgage Trust, Ser 2012-C4, Cl A5 | ||||||||
2.850%, 12/10/2045 | 194 | 189 | ||||||
UBS-Barclays Commercial Mortgage Trust, Ser 2013-C5, Cl A4 | ||||||||
3.185%, 03/10/2046 | 449 | 450 | ||||||
Wachovia Bank Commercial Mortgage Trust, Ser 2006-C25, Cl A1A | ||||||||
5.728%, 05/15/2043 (D) | 522 | 583 | ||||||
Wachovia Bank Commercial Mortgage Trust, Ser 2006-WL7A, Cl A2 | ||||||||
0.318%, 09/15/2021 (C) (D) | 210 | 209 | ||||||
WFRBS Commercial Mortgage Trust, | ||||||||
3.337%, 06/15/2046 | 280 | 289 | ||||||
|
| |||||||
| 9,060 | ||||||||
|
| |||||||
Total Mortgage-Backed Securities |
| 10,904 | ||||||
|
| |||||||
FOREIGN BONDS — 2.4% |
| |||||||
AngloGold Ashanti Holdings | ||||||||
5.375%, 04/15/2020 | 77 | 79 | ||||||
Asciano Finance | ||||||||
5.000%, 04/07/2018 (C) | 130 | 143 | ||||||
Baidu | ||||||||
2.250%, 11/28/2017 | 200 | 199 | ||||||
Barclays Bank | ||||||||
7.625%, 11/21/2022 | 250 | 251 | ||||||
Barclays Bank MTN | ||||||||
6.625%, 03/30/2022 | 130 | 200 | ||||||
Basell Finance | ||||||||
8.100%, 03/15/2027 (C) | 70 | 95 | ||||||
| 224 | SEI Institutional Investments Trust / Annual Report / May 31, 2013 |
Table of Contents
| Description | Face Amount ($ Thousands) | Market Value ($ Thousands) | ||||||
BBVA US Senior SAU | ||||||||
3.250%, 05/16/2014 | $ | 135 | $ | 136 | ||||
Cia Minera Milpo SAA | ||||||||
4.625%, 03/28/2023 (C) | 280 | 269 | ||||||
CNOOC Finance | ||||||||
3.000%, 05/09/2023 | 320 | 304 | ||||||
Cooperatieve Centrale Raiffeisen-Boerenleenbank BA | ||||||||
3.950%, 11/09/2022 | 250 | 249 | ||||||
Danske Bank MTN | ||||||||
5.684%, 12/31/2049 (D) | 92 | 138 | ||||||
Delhaize Group | ||||||||
6.500%, 06/15/2017 | 115 | 132 | ||||||
Deutsche Telekom International Finance | ||||||||
8.750%, 06/15/2030 | 100 | 144 | ||||||
4.875%, 03/06/2042 (C) | 170 | 173 | ||||||
Embraer | ||||||||
5.150%, 06/15/2022 | 48 | 51 | ||||||
Encana | ||||||||
3.900%, 11/15/2021 | 325 | 341 | ||||||
Gazprom OAO Via Gaz Capital MTN | ||||||||
6.212%, 11/22/2016 | 130 | 144 | ||||||
Gerdau Trade | ||||||||
5.750%, 01/30/2021 (C) | 105 | 109 | ||||||
4.750%, 04/15/2023 (C) | 200 | 194 | ||||||
Globo Comunicacao e Participacoes | ||||||||
5.307%, 05/11/2017 (C) (E) | 200 | 212 | ||||||
HSBC Holdings | ||||||||
5.100%, 04/05/2021 | 40 | 46 | ||||||
4.000%, 03/30/2022 | 250 | 265 | ||||||
ING Bank | ||||||||
2.000%, 09/25/2015 (C) | 220 | 223 | ||||||
KazMunayGas National JSC | ||||||||
7.000%, 05/05/2020 (C) | 120 | 140 | ||||||
Korea National Oil | ||||||||
3.125%, 04/03/2017 (C) | 200 | 206 | ||||||
LBG Capital No.2 | ||||||||
15.000%, 12/21/2019 | 140 | 264 | ||||||
MTS International Funding | ||||||||
5.000%, 05/30/2023 (C) | 200 | 198 | ||||||
Nomura Holdings MTN | ||||||||
2.000%, 09/13/2016 | 248 | 248 | ||||||
Perusahaan Listrik Negara | ||||||||
5.500%, 11/22/2021 (C) | 200 | 214 | ||||||
Petronas Capital | ||||||||
5.250%, 08/12/2019 (C) | 125 | 144 | ||||||
Rogers Communications | ||||||||
4.000%, 06/06/2022 | 20 | 20 | ||||||
Royal Bank of Scotland MTN | ||||||||
9.500%, 03/16/2022 (D) | 40 | 47 | ||||||
Sociedad Quimica y Minera de Chile | ||||||||
3.625%, 04/03/2023 (C) | 280 | 274 | ||||||
Standard Chartered MTN | ||||||||
4.000%, 07/12/2022 (D) | 245 | 252 | ||||||
Talent Yield Investments | ||||||||
4.500%, 04/25/2022 (C) | 200 | 210 | ||||||
| Description | Face Amount ($ Thousands) (1)/Shares | Market Value ($ Thousands) | ||||||||||
Telecom Italia Capital | ||||||||||||
7.175%, 06/18/2019 | 60 | $ | 71 | |||||||||
Telefonaktiebolaget LM Ericsson | ||||||||||||
4.125%, 05/15/2022 | 180 | 184 | ||||||||||
Telefonica Emisiones SAU | ||||||||||||
5.462%, 02/16/2021 | 70 | 76 | ||||||||||
Vale | ||||||||||||
5.625%, 09/11/2042 | 210 | 196 | ||||||||||
Vodafone Group | ||||||||||||
6.150%, 02/27/2037 | 140 | 167 | ||||||||||
WPP Finance | ||||||||||||
4.750%, 11/21/2021 | 265 | 284 | ||||||||||
|
| |||||||||||
Total Foreign Bonds |
| 7,292 | ||||||||||
|
| |||||||||||
PREFERRED STOCK — 0.7% |
| |||||||||||
Financials — 0.0% |
| |||||||||||
Allstate | 1,975 | 52 | ||||||||||
|
| |||||||||||
Materials — 0.7% |
| |||||||||||
Vale ADR, Cl B | 152,770 | 2,059 | ||||||||||
|
| |||||||||||
Total Preferred Stock | 2,111 | |||||||||||
|
| |||||||||||
SOVEREIGN DEBT — 0.2% |
| |||||||||||
Indonesia Government | ||||||||||||
3.375%, 04/15/2023 (C) | 300 | 284 | ||||||||||
Qatar Government | ||||||||||||
4.500%, 01/20/2022 (C) | 200 | 221 | ||||||||||
|
| |||||||||||
Total Sovereign Debt | 505 | |||||||||||
|
| |||||||||||
TIME DEPOSITS — 2.1% | ||||||||||||
Brown Brothers Harriman | ||||||||||||
4.150%, 06/01/2013 | ZAR | 46 | 5 | |||||||||
1.903%, 06/01/2013 | AUD | 7 | 7 | |||||||||
0.484%, 06/01/2013 | NOK | 105 | 18 | |||||||||
0.280%, 06/01/2013 | CAD | 12 | 12 | |||||||||
0.100%, 06/01/2013 | SEK | 31 | 5 | |||||||||
0.076%, 06/01/2013 | GBP | 18 | 27 | |||||||||
0.030%, 06/01/2013 | 6,394 | 6,394 | ||||||||||
0.005%, 06/01/2013 | SGD | 5 | 4 | |||||||||
0.005%, 06/01/2013 | HKD | 66 | 8 | |||||||||
0.005%, 06/01/2013 | JPY | 350 | 3 | |||||||||
0.001%, 06/01/2013 | EUR | 45 | 59 | |||||||||
|
| |||||||||||
Total Time Deposits | 6,542 | |||||||||||
|
| |||||||||||
Total Investments — 111.8% | $ | 339,745 | ||||||||||
|
| |||||||||||
| SEI Institutional Investments Trust / Annual Report / May 31, 2013 | 225 |
Table of Contents
SCHEDULE OF INVESTMENTS
Multi-Asset Real Return Fund (Continued)
May 31, 2013
| Description | Contracts | Market Value ($ Thousands) | ||||||||
PURCHASED OPTIONS — 0.0% |
| |||||||||
United States — 0.0% |
| |||||||||
iShares MSCI Emerging Markets Index, Expires 07/20/2013, Strike Price $41* | 700 | $ | 88 | |||||||
S&P 500 Index, Expires 07/20/2013, Strike Price $1,500* | 45 | 34 | ||||||||
|
| |||||||||
Total Purchased Options | $ | 122 | ||||||||
|
| |||||||||
WRITTEN OPTION — 0.0% | ||||||||||
United States — 0.0% | ||||||||||
Dec 2013 SPX U.S. Index, | (45 | ) | $ | (105 | ) | |||||
|
| |||||||||
Total Written Option |
| $ | (105 | ) | ||||||
|
| |||||||||
A list of the open futures contracts held by the Fund at May 31, 2013, is as follows:
| Type of Contracts | Number of Contract Short | Expiration Date | Unrealized Appreciation ($ Thousands) | |||||||||
U.S. 10-Year Treasury Note | (88 | ) | Sep-2013 | $ | 92 | |||||||
U.S. 2-Year Treasury Note | (4 | ) | Sep-2013 | — | ||||||||
U.S. 5-Year Treasury Note | (48 | ) | Oct-2013 | 5 | ||||||||
U.S. Long Treasury Bond | (11 | ) | Sep-2013 | 26 | ||||||||
|
| |||||||||||
| $ | 123 | |||||||||||
|
| |||||||||||
For the year ended May 31, 2013, the total amount of all open futures contracts, as presented in the table above, are representative of the volume of activity for this derivative type during the year.
A list of the open forward foreign currency contracts held by the Fund at May 31, 2013, is as follows:
| Settlement Date | Currency to Deliver (Thousands) | Currency to Receive (Thousands) | Unrealized Appreciation (Depreciation) ($ Thousands) | |||||||||||||||||
6/4/13-7/2/13 | BRL | 14,670 | USD | 7,132 | $ | 277 | ||||||||||||||
6/7/13-9/17/13 | CAD | 10,639 | USD | 10,436 | 145 | |||||||||||||||
6/13/13 | CNY | 4,903 | USD | 789 | (9 | ) | ||||||||||||||
6/13/13 | NOK | 7,333 | USD | 1,259 | 13 | |||||||||||||||
6/13/13 | RUB | 64,547 | USD | 2,070 | 53 | |||||||||||||||
6/13/13 | SEK | 2,085 | USD | 318 | 4 | |||||||||||||||
6/13/13 | SGD | 112 | USD | 91 | 2 | |||||||||||||||
6/13/13 | THB | 24,035 | USD | 818 | 25 | |||||||||||||||
6/13/13 | TRY | 273 | USD | 152 | 6 | |||||||||||||||
6/13/13 | USD | 366 | BRL | 769 | (7 | ) | ||||||||||||||
6/13/13 | USD | 1,561 | GBP | 1,046 | 25 | |||||||||||||||
6/13/13 | ZAR | 4,243 | USD | 470 | 48 | |||||||||||||||
6/13/13-9/17/13 | AUD | 3,599 | USD | 3,667 | 222 | |||||||||||||||
6/13/13-9/17/13 | EUR | 8,898 | USD | 11,630 | 98 | |||||||||||||||
6/13/13-9/17/13 | GBP | 8,535 | USD | 13,127 | 188 | |||||||||||||||
6/13/13-9/17/13 | JPY | 514,223 | USD | 5,187 | 94 | |||||||||||||||
6/13/13-9/17/13 | USD | 5,771 | CNY | 36,212 | 125 | |||||||||||||||
|
| |||||||||||||||||||
| $ | 1,309 | |||||||||||||||||||
|
| |||||||||||||||||||
A list of the counterparties for the open forward foreign currency contracts held by the Fund at May 31, 2013, is as follows:
| Counterparty | Currency to Deliver (Thousands) | Currency to Receive (Thousands) | Unrealized Appreciation (Depreciation) ($ Thousands) | |||||||||
Barclays PLC | $ | (4,242 | ) | $ | 4,260 | $ | 18 | |||||
BNP Paribas | (3,474 | ) | 3,532 | 58 | ||||||||
Brown Brothers Harriman | (2,880 | ) | 2,980 | 100 | ||||||||
Citigroup | (5,832 | ) | 5,894 | 62 | ||||||||
Credit Suisse First Boston | (356 | ) | 361 | 5 | ||||||||
Deutsche Bank | (743 | ) | 751 | 8 | ||||||||
Goldman Sachs | (24,031 | ) | 24,700 | 669 | ||||||||
HSBC | (4,032 | ) | 4,013 | (19 | ) | |||||||
JPMorgan Chase Bank | (2,194 | ) | 2,244 | 50 | ||||||||
Royal Bank of Canada | (9,030 | ) | 9,156 | 126 | ||||||||
Royal Bank of Scotland | (4,977 | ) | 5,203 | 226 | ||||||||
Standard Chartered Bank | (1,077 | ) | 1,068 | (9 | ) | |||||||
UBS | (808 | ) | 823 | 15 | ||||||||
|
| |||||||||||
| $ | 1,309 | |||||||||||
|
| |||||||||||
For the year ended May 31, 2013, the total amount of all open forward foreign currency contracts, as presented in the table above, are representative of the volume of activity for this derivative type during the year.
A list of the open swap agreements held by the Fund at May 31, 2013, is as follows:
| Credit Default Swaps | ||||||||||||||||||||||||
| Counterparty | Reference Entity/Obligation | Buy/Sell Protection | (Pays)/ Receives Rate | Termination Date | Notional Amount ($ Thousands) | Net Unrealized ($ Thousands) | ||||||||||||||||||
| Bank of America | CDX.NA.IG 19-V1 Index | SELL | 1.00 | % | 12/20/17 | $ | (690 | ) | $ | 9 | ||||||||||||||
| Bank of America | Societe Generale | SELL | 3.00 | 12/20/17 | EUR | (200 | ) | 7 | ||||||||||||||||
| Deutsche Bank | Anadarko Petroleum Corporation | SELL | 1.00 | 09/20/17 | (170 | ) | 7 | |||||||||||||||||
|
| |||||||||||||||||||||||
| $ | 23 | |||||||||||||||||||||||
|
| |||||||||||||||||||||||
| Interest Rate Swaps | ||||||||||||||
| Counterparty | Fund Pays | Fund Receives | Termination Date | Notional Amount ($ Thousands) | Net Unrealized Appreciation (Depreciation) ($ Thousands) | |||||||||
| Barclays Bank PLC | 1.10% | 3 Month USD LIBOR | 02/21/2017 | $ | 500 | $ | (6 | ) | ||||||
| Credit Suisse | 3 Month USD LIBOR | 2.09% | 03/12/2022 | 250 | — | |||||||||
| JPMorgan Chase Bank | 0.69 | 3 Month USD LIBOR | 10/13/2013 | 4,910 | (10 | ) | ||||||||
| Morgan Stanley | 2.80 | 3 Month USD LIBOR | 03/06/2042 | 330 | 27 | |||||||||
| 226 | SEI Institutional Investments Trust / Annual Report / May 31, 2013 |
Table of Contents
| Interest Rate Swaps (continued) | ||||||||||||||||
| Counterparty | Fund Pays | Fund Receives | Termination Date | Notional Amount ($ Thousands) | Net Unrealized Appreciation (Depreciation) ($ Thousands) | |||||||||||
| Morgan Stanley | 2.81% | 3 Month USD LIBOR | 02/21/2042 | $ | 450 | $ | 35 | |||||||||
| Morgan Stanley | 1.57 | 6 Month EURIBOR | 05/21/2023 | EUR | 1,550 | 31 | ||||||||||
| Morgan Stanley | 3M US LIBOR | 2.02% | 05/21/2023 | 1,780 | (51 | ) | ||||||||||
| Morgan Stanley | 0.56 | 3 Month USD LIBOR | 03/12/2014 | 3,880 | (10 | ) | ||||||||||
|
| |||||||||||||||
| $ | 16 | |||||||||||||||
|
| |||||||||||||||
| Total Return Swaps | ||||||||||||||||||
| Counterparty | Reference Entity/Obligation | Fund Pays | Fund Receives | Termination Date | Notional ($ Thousands) | Net Unrealized Appreciation ($ Thousands) | ||||||||||||
| UBS Warburg | S&P 500 Total Return Index | Index Return | 1-Month USD LIBOR Plus 45 Bps | 03/17/14 | $ | 32,055 | $ | 529 | ||||||||||
| JPMorgan Chase Bank | S&P 500 Total Return Index | Index Return | 1-Month USD LIBOR Plus 30 Bps | 04/15/14 | 919 | 15 | ||||||||||||
| UBS Warburg | S&P 500 Total Return Index | Index Return | 1-Month USD LIBOR Plus 30 Bps | 04/15/14 | 1,224 | 20 | ||||||||||||
| UBS Warburg | S&P 500 Total Return Index | Index Return | 1-Month USD LIBOR Plus 30 Bps | 04/15/14 | 2,143 | 35 | ||||||||||||
| Deutsche Bank | S&P 500 Total Return Index | Index Return | 1-Month USD LIBOR Plus 32 Bps | 05/15/14 | 1,988 | 33 | ||||||||||||
| Deutsche Bank | S&P 500 Total Return Index | Index Return | 1-Month USD LIBOR Plus 46 Bps | 06/16/14 | 9,997 | — | ||||||||||||
|
| |||||||||||||||||
| $ | 632 | |||||||||||||||||
|
| |||||||||||||||||
For the year ended May 31, 2013, the total amount of all open swap agreements, as presented in the table above, are representative of the volume of activity for this derivative type during the year.
Percentages are based on a Net Assets of $303,899 ($ Thousands).
| * | Non-income producing security. |
| ‡ | Real Estate Investment Trust. |
| (1) | In U.S. dollars unless otherwise indicated. |
| (A) | Security, or portion thereof, has been pledged as collateral on open futures contracts. |
| (B) | Security fair valued using methods determined in good faith by the Valuation Committee of the Board of Trustees. The total market value of such securities as of May 31, 2013 was $29,895 ($ Thousands) and represented 9.84% of Net Assets. |
| (C) | Securities sold within terms of a private placement memorandum, exempt from registration under Section 144A of the Securities Act of 1933, as amended, and may be sold only to dealers in that program or other “accredited investors.” These securities have been determined to be liquid under guidelines established by the Board of Trustees. |
| (D) | Variable Rate Security — The rate reported on the Schedule of Investments is the rate in effect as of May 31, 2013. The date reported on the Schedule of Investments is the final maturity date. |
| (E) | Step Bonds — The rate reflected on the Schedule of Investments is the effective yield on May 31, 2013. The coupon on a step bond changes on a specified date. |
ADR — American Depositary Receipt
AUD — Australian Dollar
BRL — Brazilian Real
CAD — Canadian Dollar
Cl — Class
CNY — Chinese Yuan
EUR — Euro
EURIBOR — Euro Interbank Offered Rate
FNMA — Federal National Mortgage Association
GBP — British Pound Sterling
GDR — Global Depositary Receipt
HKD — Hong Kong Dollar
JPY — Japanese Yen
LIBOR — London Interbank Offered Rate
MSCI — Morgan Stanley Capital International
MTN — Medium Term Note
NOK — Norwegian Krone
NVDR — Non-Voting Depositary Receipt
PLC — Public Limited Company
RUB — Russian Rouble
S&P — Standard & Poor’s
SEK — Swedish Krona
Ser — Series
SGD — Singapore Dollar
SPX — Standard & Poor’s 500 Index
TBA — To Be Announced
THB — Thai Bhat
TRY — Turkish New Lira
USD — United States Dollar
ZAR — South African Rand
The following is a list of the inputs used as of May 31, 2013, in valuing the Fund’s investments and other financial instruments carried at value ($ Thousands):
| Investments in Securities | Level 1 | Level 2 | Level 3 | Total | ||||||||||||
U.S. Treasury Obligations | $ | — | $ | 155,511 | $ | — | $ | 155,511 | ||||||||
Registered Investment Company | 57,938 | — | — | 57,938 | ||||||||||||
Foreign Common Stock | 13,724 | 29,895 | — | 43,619 | ||||||||||||
Common Stock | 31,873 | — | — | 31,873 | ||||||||||||
Corporate Obligations | — | 12,237 | — | 12,237 | ||||||||||||
Asset-Backed Securities | — | 11,213 | — | 11,213 | ||||||||||||
Mortgage-Backed Securities | — | 10,904 | — | 10,904 | ||||||||||||
Foreign Bonds | — | 7,292 | — | 7,292 | ||||||||||||
Preferred Stock | 2,059 | 52 | — | 2,111 | ||||||||||||
Sovereign Debt | — | 505 | — | 505 | ||||||||||||
Time Deposits | 6,542 | — | — | 6,542 | ||||||||||||
|
|
|
|
|
|
|
| |||||||||
Total Investments in Securities | $ | 112,136 | $ | 227,609 | $ | — | $ | 339,745 | ||||||||
|
|
|
|
|
|
|
| |||||||||
| Other Financial Instruments | Level 1 | Level 2 | Level 3 | Total | ||||||||||||
Purchased Options | $ | — | $ | 122 | $ | — | $ | 122 | ||||||||
Written Option | — | (105 | ) | — | (105 | ) | ||||||||||
Futures Contracts* | 123 | — | — | 123 | ||||||||||||
Forwards Contracts* | — | 1,309 | — | 1,309 | ||||||||||||
Credit Default Swaps* | — | 23 | — | 23 | ||||||||||||
Interest Rate Swaps* | — | 16 | — | 16 | ||||||||||||
Total Return Swaps* | — | 632 | — | 632 | ||||||||||||
Reverse Repurchase Agreements | — | (38,354 | ) | — | (38,354 | ) | ||||||||||
|
|
|
|
|
|
|
| |||||||||
Total Other Financial Instruments | $ | 123 | $ | (36,357 | ) | $ | — | $ | (36,234 | ) | ||||||
|
|
|
|
|
|
|
| |||||||||
| * | Futures contracts, forwards contracts and swaps are valued at the unrealized appreciation on the instrument. |
For the year ended May 31, 2013, there were transfers between Level 1 and Level 2 assets and liabilities. The primary reason for changes in the classifications between Levels 1 and 2 occurs when foreign equity securities are fair valued using other observable market-based inputs in place of the closing exchange price due to events occurring after the close of the exchange or market on which the investment is principally traded.
For the year ended May 31, 2013, there were no transfers between Level 2 and Level 3 assets and liabilities.
For more information on valuation inputs, see Note 2 — Significant Accounting Policies in Notes to Financial Statements.
Amounts designated as “—” are either $ 0 or have been rounded to $0.
The accompanying notes are an integral part of the financial statements.
| SEI Institutional Investments Trust / Annual Report / May 31, 2013 | 227 |
Table of Contents
Statements of Assets and Liabilities ($ Thousands)
May 31, 2013
| Large Cap Fund | Large Cap Diversified Alpha Fund | Large Cap Disciplined Equity Fund | Large Cap Index Fund | |||||||||||||
ASSETS: | ||||||||||||||||
Investments at value† | $ | 1,851,992 | * | $ | 296,083 | $ | 5,247,382 | * | $ | 2,159,619 | * | |||||
Affiliated investments, at value†† | 115,688 | 16,839 | 367,288 | 173,851 | ||||||||||||
Cash | 52 | 1 | 62 | 769 | ||||||||||||
Foreign currency, at value††† | — | — | — | — | ||||||||||||
Receivable for fund shares sold | 12,797 | 422 | 15,045 | 167,788 | ||||||||||||
Receivable for investment securities sold | 71,508 | 20,599 | 200,658 | — | ||||||||||||
Dividends and interest receivable | 3,723 | 618 | 11,015 | 4,155 | ||||||||||||
Receivable for variation margin | — | 1 | — | — | ||||||||||||
Foreign tax reclaim receivable | 57 | 12 | 95 | 3 | ||||||||||||
Prepaid expenses | 10 | 2 | 28 | 11 | ||||||||||||
Total Assets | 2,055,827 | 334,577 | 5,841,573 | 2,506,196 | ||||||||||||
LIABILITIES: | ||||||||||||||||
Payable upon return on securities loaned | 86,698 | — | 210,764 | 125,066 | ||||||||||||
Payable for investment securities purchased | 12,501 | 1,004 | 10,417 | 113,154 | ||||||||||||
Payable for fund shares redeemed | 57,618 | 23,451 | 115,027 | 52,999 | ||||||||||||
Payable to custodian | — | — | — | — | ||||||||||||
Payable for variation margin | 824 | 471 | 4,116 | 805 | ||||||||||||
Investment advisory fees payable | 300 | 65 | 770 | 18 | ||||||||||||
Chief Compliance Officer fees payable | 5 | 1 | 16 | 6 | ||||||||||||
Trustees fees payable | 4 | 1 | 13 | 5 | ||||||||||||
Accrued expense payable | 40 | 7 | 135 | 55 | ||||||||||||
Total Liabilities | 157,990 | 25,000 | 341,258 | 292,108 | ||||||||||||
Net Assets | $ | 1,897,837 | $ | 309,577 | $ | 5,500,315 | $ | 2,214,088 | ||||||||
†Cost of investments | 1,363,390 | 250,867 | 4,514,524 | 1,623,720 | ||||||||||||
††Cost of affiliated investments | 115,688 | 16,839 | 370,008 | 173,674 | ||||||||||||
†††Cost of foreign currency | — | — | — | — | ||||||||||||
* Includes market value of securities on loan | 83,441 | — | 202,848 | 120,266 | ||||||||||||
NET ASSETS: | ||||||||||||||||
Paid-in-Capital — (unlimited authorization — no par value) | $ | 1,331,011 | $ | 343,644 | $ | 5,003,002 | $ | 1,687,882 | ||||||||
Undistributed net investment income | 5,494 | 97 | — | 7,007 | ||||||||||||
Accumulated net realized gain (loss) on investments, option contracts, swaptions, futures, securities sold short, swap contracts and foreign currency | 72,846 | (79,263 | ) | (238,865 | ) | (19,926 | ) | |||||||||
Net unrealized appreciation on investments and option contracts | 488,602 | 45,216 | 730,138 | 536,076 | ||||||||||||
Net unrealized appreciation (depreciation) on futures contracts | (116 | ) | (117 | ) | 6,040 | 3,049 | ||||||||||
Net unrealized depreciation on forward foreign currency contracts, foreign currencies and translation of other assets and liabilities denominated in foreign currencies | — | — | — | — | ||||||||||||
Net Assets | $ | 1,897,837 | $ | 309,577 | $ | 5,500,315 | $ | 2,214,088 | ||||||||
Net Asset Value, Offering and Redemption Price Per Share — Class A | $20.94 | $11.59 | $13.24 | $140.87 | ||||||||||||
| | ($1,897,837,154 ÷ 90,647,258 shares | ) | | ($309,576,929 ÷ 26,713,982 shares | ) | | ($5,500,314,801 ÷ 415,458,360 shares | ) | | ($2,214,088,286 ÷ 15,717,295 shares | ) | |||||
Amounts designated as “—” are $0 or have been rounded to $0.
The accompanying notes are an integral part of the financial statements.
| 228 | SEI Institutional Investments Trust / Annual Report / May 31, 2013 |
Table of Contents
| Extended Market Index Fund | Small Cap Fund | Small Cap II Fund | Small/Mid Cap Equity Fund | U.S. Managed Volatility Fund | International Equity Fund | |||||||||||||||||
| $168,057 | * | $ 761,135 | * | $223,326 | * | $2,071,670 | * | $1,068,611 | $ 227,596 | |||||||||||||
| 17,219 | 200,464 | 51,249 | 555,925 | 42,176 | 3,132 | |||||||||||||||||
| 301 | 8 | — | 35 | 116 | — | |||||||||||||||||
| — | — | — | — | 13 | 33 | |||||||||||||||||
| 27,736 | 387 | 4,217 | 18,594 | 37,279 | — | |||||||||||||||||
| — | 7,191 | 1,718 | 18,379 | — | — | |||||||||||||||||
| 131 | 442 | 139 | 1,649 | 2,642 | 1,017 | |||||||||||||||||
| — | — | — | — | — | 4 | |||||||||||||||||
| — | 4 | — | — | — | 277 | |||||||||||||||||
| — | 4 | 1 | 11 | 5 | 1 | |||||||||||||||||
| 213,444 | 969,635 | 280,650 | 2,666,263 | 1,150,842 | 232,060 | |||||||||||||||||
| 13,401 | 173,278 | 41,130 | 467,277 | — | — | |||||||||||||||||
| 21,959 | 6,972 | 2,120 | 26,108 | 170 | — | |||||||||||||||||
| 3,919 | 9,903 | 15,520 | 17,617 | 3,995 | 153 | |||||||||||||||||
| — | — | 4 | — | — | — | |||||||||||||||||
| 37 | 161 | 81 | 615 | 450 | 38 | |||||||||||||||||
| 8 | 319 | 90 | 842 | 212 | 72 | |||||||||||||||||
| — | 3 | 1 | 6 | 3 | 1 | |||||||||||||||||
| — | 2 | — | 5 | 3 | 1 | |||||||||||||||||
| 13 | 21 | 7 | 48 | 29 | 134 | |||||||||||||||||
| 39,337 | 190,659 | 58,953 | 512,518 | 4,862 | 399 | |||||||||||||||||
| $174,107 | $ 778,976 | $221,697 | $2,153,745 | $1,145,980 | $ 231,661 | |||||||||||||||||
| 160,849 | 661,799 | 187,635 | 1,715,141 | 900,832 | 221,141 | |||||||||||||||||
| 17,206 | 200,464 | 51,249 | 555,925 | 42,176 | 3,132 | |||||||||||||||||
| — | — | — | — | 13 | 33 | |||||||||||||||||
| 12,767 | 166,755 | 39,632 | 449,160 | — | — | |||||||||||||||||
| | $166,219 | | $ 817,040 | $178,527 | $1,607,817 | $ 933,522 | $ 622,176 | |||||||||||||||
| 304 | 1,010 | 168 | 6,933 | 4,009 | 4,172 | |||||||||||||||||
| | 185 | | (138,363 | ) | 7,311 | 181,285 | 40,473 | (401,069 | ) | |||||||||||||
| | 7,221 | | 99,336 | 35,691 | 356,529 | 167,779 | 6,455 | |||||||||||||||
| | 178 | | (47 | ) | — | 1,181 | 197 | (43 | ) | |||||||||||||
| | — | | — | — | — | — | (30 | ) | ||||||||||||||
| $174,107 | $ 778,976 | $221,697 | $2,153,745 | $1,145,980 | $ 231,661 | |||||||||||||||||
| $10.77 | $15.42 | $12.23 | $15.69 | $13.54 | $7.73 | |||||||||||||||||
| | ($174,106,808 ÷ 16,159,967 shares | ) | | ($778,975,979 ÷ 50,531,879 shares | ) | | ($221,697,344 ÷ 18,120,416 shares | ) | | ($2,153,744,936 ÷ 137,234,750 shares | ) | | ($1,145,980,097 ÷ 84,639,784 shares | ) | | ($231,660,757 ÷ 29,969,426 shares | ) | |||||
| SEI Institutional Investments Trust / Annual Report / May 31, 2013 | 229 |
Table of Contents
Statements of Assets and Liabilities ($ Thousands)
May 31, 2013
| World Equity Ex-US Fund | Screened World Equity Ex-US Fund | Opportunistic Income Fund | ||||||||||
ASSETS: | ||||||||||||
Investments at value† | $ | 6,072,317 | * | $ | 59,975 | $ | 321,417 | |||||
Affiliated investments, at value†† | 595,845 | 2,590 | 687,875 | |||||||||
Cash | — | 5 | 156 | |||||||||
Foreign currency, at value††† | 5,708 | 100 | — | |||||||||
Receivable for fund shares sold | 146,225 | 35 | 131,031 | |||||||||
Receivable for investment securities sold | 21,965 | 649 | 1,899 | |||||||||
Dividends and interest receivable | 20,881 | 183 | 1,338 | |||||||||
Receivable for variation margin | 61 | — | 9 | |||||||||
Foreign tax reclaim receivable | 1,813 | 55 | 1 | |||||||||
Unrealized gain on foreign spot currency contracts | 27 | 1 | — | |||||||||
Unrealized gain on forward foreign currency contracts | — | — | — | |||||||||
Swap contracts at value†††† | — | — | — | |||||||||
Options purchased, at value††††† | — | — | — | |||||||||
Swaptions purchased, at value††††† | — | — | — | |||||||||
Prepaid expenses | 32 | — | 3 | |||||||||
Total Assets | 6,864,874 | 63,593 | 1,143,729 | |||||||||
LIABILITIES: | ||||||||||||
Payable upon return on securities loaned | 570,537 | — | — | |||||||||
Payable for investment securities purchased | 43,752 | 972 | 146,003 | |||||||||
Payable for fund shares redeemed | 53,699 | 32 | 1,031 | |||||||||
Income distribution payable | — | — | — | |||||||||
Swap contracts at value†††† | — | — | — | |||||||||
Options written, at value††††† | — | — | — | |||||||||
Payable to custodian | 1,254 | — | — | |||||||||
Payable for variation margin | 293 | 16 | — | |||||||||
Unrealized loss on foreign spot currency contracts | 17 | — | — | |||||||||
Unrealized loss on forward foreign currency contracts | — | — | — | |||||||||
Investment advisory fees payable | 1,714 | 16 | 129 | |||||||||
Chief Compliance Officer fees payable | 17 | — | 2 | |||||||||
Trustees fees payable | 14 | — | 2 | |||||||||
Accrued expense payable | 648 | 36 | 40 | |||||||||
Accrued foreign capital gains tax on appreciated securities | 77 | — | — | |||||||||
Total Liabilities | 672,022 | 1,072 | 147,207 | |||||||||
Net Assets | $ | 6,192,852 | $ | 62,521 | $ | 996,522 | ||||||
†Cost of investments | 5,376,217 | 55,319 | 320,007 | |||||||||
††Cost of affiliated investments | 595,845 | 2,590 | 691,905 | |||||||||
†††Cost of foreign currency | 5,858 | 108 | — | |||||||||
††††Cost (Premiums received) | — | — | — | |||||||||
†††††Cost (Premiums received) | — | — | — | |||||||||
* Includes market value of securities on loan | 540,135 | — | — | |||||||||
NET ASSETS: | ||||||||||||
Paid-in-Capital — (unlimited authorization — no par value) | $ | 5,917,904 | $ | 72,695 | $ | 1,028,680 | ||||||
Undistributed (distributions in excess of) net investment income | 71,744 | 579 | 11,315 | |||||||||
Accumulated net realized gain (loss) on investments, option contracts, swaptions, futures, securities sold short, swap contracts and foreign currency | (492,268 | ) | (15,478 | ) | (40,856 | ) | ||||||
Net unrealized appreciation (depreciation) on investments, option contracts and swaptions contracts | 696,100 | 4,656 | (2,620 | ) | ||||||||
Net unrealized appreciation (depreciation) on futures contracts | (2 | ) | 81 | 3 | ||||||||
Net unrealized appreciation (depreciation) on swap contracts | — | — | — | |||||||||
Net unrealized appreciation (depreciation) on forward foreign currency contracts, foreign currencies and translation of other assets and liabilities denominated in foreign currencies | (549 | ) | (12 | ) | — | |||||||
Accumulated foreign capital gains tax on appreciated securities | (77 | ) | — | — | ||||||||
Net Assets | $ | 6,192,852 | $ | 62,521 | $ | 996,522 | ||||||
Net Asset Value, Offering and Redemption Price Per Share — Class A | $11.51 | $8.66 | $8.26 | |||||||||
| | ($6,192,852,336 ÷ 538,234,955 shares | ) | | ($62,521,478 ÷ 7,215,619 shares | ) | | ($996,521,570 ÷ 120,588,965 shares | ) | ||||
Amounts designated as “—” are $0 or have been rounded to $0.
The accompanying notes are an integral part of the financial statements.
| 230 | SEI Institutional Investments Trust / Annual Report / May 31, 2013 |
Table of Contents
| Core Fixed Income Fund | High Yield Bond Fund | Long Duration Fund | Long Duration Corporate Bond Fund | Ultra Short Duration Bond Fund | Emerging Markets Debt Fund | |||||||||||||||||
| $6,657,837 | * | $2,077,785 | $3,261,455 | $2,053,168 | $506,777 | $1,315,622 | * | |||||||||||||||
| 481,629 | 57,458 | 66,885 | 30,302 | 648 | 5,164 | |||||||||||||||||
| 148 | — | — | — | 94 | 815 | |||||||||||||||||
| 3,322 | — | — | — | — | 2,008 | |||||||||||||||||
| 173,455 | 40,765 | 27,969 | — | 39,175 | 48,361 | |||||||||||||||||
| 832,891 | 21,292 | 97,488 | 11,063 | 11,872 | 25,718 | |||||||||||||||||
| 32,749 | 30,781 | 33,689 | 24,553 | 1,161 | 22,223 | |||||||||||||||||
| 1,208 | — | 427 | 237 | 23 | — | |||||||||||||||||
| — | — | — | — | — | — | |||||||||||||||||
| — | — | — | — | — | 12 | |||||||||||||||||
| 1,711 | — | — | — | — | 6,012 | |||||||||||||||||
| 2,606 | — | 676 | — | — | 32,614 | |||||||||||||||||
| 430 | — | — | — | — | 443 | |||||||||||||||||
| 2,890 | — | — | — | — | — | |||||||||||||||||
| 22 | 11 | 19 | 5 | 2 | 7 | |||||||||||||||||
| 8,190,898 | 2,228,092 | 3,488,608 | 2,119,328 | 559,752 | 1,458,999 | |||||||||||||||||
| 185,815 | — | — | — | — | 5,164 | |||||||||||||||||
| 1,379,586 | 46,024 | 58,487 | 29,303 | 37,075 | 33,026 | |||||||||||||||||
| 137,615 | 17,258 | 106,423 | 6,479 | 12 | 3,706 | |||||||||||||||||
| 474 | 249 | 372 | — | 12 | — | |||||||||||||||||
| 1,240 | 1,064 | 46 | — | — | 289 | |||||||||||||||||
| 373 | — | — | — | — | — | |||||||||||||||||
| 4 | 342 | 4 | — | — | — | |||||||||||||||||
| 433 | — | 433 | 213 | — | — | |||||||||||||||||
| — | — | — | — | — | 12 | |||||||||||||||||
| 286 | — | — | — | — | 4,234 | |||||||||||||||||
| 674 | 511 | 421 | 256 | 42 | 507 | |||||||||||||||||
| 20 | 6 | 10 | 6 | 1 | 4 | |||||||||||||||||
| 22 | 5 | 9 | 5 | 1 | 3 | |||||||||||||||||
| 138 | 82 | 112 | 114 | 16 | 161 | |||||||||||||||||
| — | — | — | — | — | — | |||||||||||||||||
| 1,706,680 | 65,541 | 166,317 | 36,376 | 37,159 | 47,106 | |||||||||||||||||
| $6,484,218 | $2,162,551 | $3,322,291 | $2,082,952 | $522,593 | $1,411,893 | |||||||||||||||||
| 6,519,666 | 1,973,300 | 3,134,869 | 2,091,261 | 505,756 | 1,291,393 | |||||||||||||||||
| 481,629 | 57,458 | 66,885 | 30,302 | 648 | 5,164 | |||||||||||||||||
| 3,313 | — | — | — | — | 2,014 | |||||||||||||||||
| 320 | (1,174 | ) | 243 | — | — | 33,116 | ||||||||||||||||
| 3,002 | — | — | — | — | 617 | |||||||||||||||||
| 180,372 | — | — | — | — | 4,863 | |||||||||||||||||
| $6,343,250 | $2,043,696 | $3,203,380 | $2,115,766 | $521,876 | $1,381,260 | |||||||||||||||||
| (344 | ) | 9,647 | (1,544 | ) | 17 | 41 | (6,914 | ) | ||||||||||||||
| | (2,264 | ) | 4,613 | (6,035 | ) | 5,164 | (350 | ) | 12,719 | |||||||||||||
| | 138,116 | | 104,485 | 126,586 | (38,093 | ) | 1,021 | 24,055 | ||||||||||||||
| 2,997 | — | (483 | ) | 98 | 5 | — | ||||||||||||||||
| 1,046 | 110 | 387 | — | — | (791 | ) | ||||||||||||||||
| | 1,417 | | — | — | — | — | 1,564 | |||||||||||||||
| — | — | — | — | — | — | |||||||||||||||||
| $6,484,218 | $2,162,551 | $3,322,291 | $2,082,952 | $522,593 | $1,411,893 | |||||||||||||||||
| $10.54 | $10.01 | $8.75 | $9.93 | $10.04 | $11.11 | |||||||||||||||||
| | ($6,484,218,472 ÷ 615,089,488 shares | ) | | ($2,162,550,629 ÷ 215,996,750 shares | ) | | ($3,322,290,948 ÷ 379,488,771 shares | ) | | ($2,082,951,752 ÷ 209,843,014 shares | ) | | ($522,592,869 ÷ 52,045,507 shares | ) | | ($1,411,892,949 ÷ 127,108,694 shares | ) | |||||
| SEI Institutional Investments Trust / Annual Report / May 31, 2013 | 231 |
Table of Contents
Statements of Assets and Liabilities ($ Thousands)
May 31, 2013
| Real Return Fund | Dynamic Asset Allocation Fund | Multi-Asset Real Return Fund | ||||||||||
ASSETS: | ||||||||||||
Investments at value† | $ | 250,180 | $ | 1,117,413 | $ | 339,745 | ||||||
Affiliated investments, at value†† | — | 5,703 | — | |||||||||
Cash | 728 | 2 | 13 | |||||||||
Foreign currency, at value††† | — | — | 13 | |||||||||
Cash pledged as collateral for forward foreign currency contracts, future contracts and swap contracts | — | — | 50 | |||||||||
Receivable for fund shares sold | 3,036 | 61,613 | 71,080 | |||||||||
Receivable for investment securities sold | — | — | 348 | |||||||||
Dividends and interest receivable | 1,027 | 2,304 | 1,204 | |||||||||
Receivable for variation margin | — | — | 31 | |||||||||
Foreign tax reclaim receivable | — | 6 | 6 | |||||||||
Unrealized gain on forward foreign currency contracts | — | 6,953 | 1,325 | |||||||||
Unrealized gain on foreign spot currency contracts | — | 21 | 3 | |||||||||
Swap contracts, at value†††† | — | — | 755 | |||||||||
Options purchased, at value††††† | — | 2,490 | 122 | |||||||||
Prepaid expenses | 1 | 4 | 1 | |||||||||
Total Assets | 254,972 | 1,196,509 | 414,696 | |||||||||
LIABILITIES: | ||||||||||||
Payable for investment securities purchased | — | 54,593 | 71,972 | |||||||||
Payable for fund shares redeemed | 3,095 | 6,173 | 144 | |||||||||
Swap contracts, at value†††† | — | — | 76 | |||||||||
Options written, at value††††† | — | — | 105 | |||||||||
Reverse repurchase agreements | — | — | 38,354 | |||||||||
Unrealized loss on foreign spot currency contracts | — | 21 | 59 | |||||||||
Unrealized loss on forward foreign currency contracts | — | — | 16 | |||||||||
Investment advisory fees payable | 19 | 55 | 46 | |||||||||
Chief Compliance Officer fees payable | 1 | 3 | 1 | |||||||||
Trustees fees payable | — | 2 | 1 | |||||||||
Accrued expense payable | 5 | 31 | 23 | |||||||||
Total Liabilities | 3,120 | 60,878 | 110,797 | |||||||||
Net Assets | $ | 251,852 | $ | 1,135,631 | $ | 303,899 | ||||||
†Cost of investments and repurchase agreements | 250,130 | 992,130 | 345,902 | |||||||||
††Cost of affiliated investments | — | 5,703 | — | |||||||||
†††Cost of foreign currency | — | — | 14 | |||||||||
††††Cost (Premiums received) | — | — | 8 | |||||||||
†††††Cost (Premiums received) | — | 1,479 | 84 | |||||||||
NET ASSETS: | ||||||||||||
Paid-in-Capital — (unlimited authorization — no par value) | $ | 250,957 | $ | 990,377 | $ | 314,509 | ||||||
Undistributed (distributions in excess of) net investment income | 854 | (4,737 | ) | (2,634 | ) | |||||||
Accumulated net realized gain (loss) on investments, option contracts, swaptions, futures, securities sold short, swap contracts and foreign currency | (9 | ) | 16,744 | (3,798 | ) | |||||||
Net unrealized appreciation (depreciation) on investments and option contracts | 50 | 126,294 | (6,224 | ) | ||||||||
Net unrealized appreciation on futures contracts | — | — | 123 | |||||||||
Net unrealized appreciation on swap contracts | — | — | 671 | |||||||||
Net unrealized appreciation on forward foreign currency contracts, foreign currencies and translation of other assets and liabilities denominated in foreign currencies | — | 6,953 | 1,252 | |||||||||
Net Assets | $ | 251,852 | $ | 1,135,631 | $ | 303,899 | ||||||
Net Asset Value, Offering and Redemption Price Per Share — Class A | $9.86 | $12.81 | $9.19 | |||||||||
| | ($251,851,628 ÷ 25,531,241 shares | ) | | ($1,135,631,333 ÷ 88,649,047 shares | ) | | ($303,898,888 ÷ 33,077,101 shares | ) | ||||
Amounts designated as “—” are $0 or have been rounded to $0.
The accompanying notes are an integral part of the financial statements.
| 232 | SEI Institutional Investments Trust / Annual Report / May 31, 2013 |
Table of Contents
This page intentionally left blank.
Table of Contents
Statements of Operations ($ Thousands)
For the year/period ended May 31, 2013
| Large Cap Fund | Large Cap Diversified Alpha Fund | Large Cap Disciplined Equity Fund | Large Cap Index Fund | |||||||||||||
Investment Income | ||||||||||||||||
Dividends | $ | 37,622 | $ | 5,654 | $ | 112,878 | $ | 39,828 | ||||||||
Dividends from affiliated registered investment company | 32 | 6 | 126 | 22 | ||||||||||||
Interest income | 2 | — | 41 | 18 | ||||||||||||
Security lending income — net | 523 | — | 633 | 329 | ||||||||||||
Less: foreign taxes withheld | (194 | ) | (34 | ) | (145 | ) | (42 | ) | ||||||||
Total Investment Income | 37,985 | 5,626 | 113,533 | 40,155 | ||||||||||||
Expenses: | ||||||||||||||||
Investment advisory fees | 7,650 | 1,251 | 23,100 | 3,084 | ||||||||||||
Administration fees | 956 | 156 | 2,887 | 907 | ||||||||||||
Trustee fees | 22 | 4 | 68 | 21 | ||||||||||||
Chief Compliance Officer fees | 8 | 1 | 22 | 9 | ||||||||||||
Custodian/wire agent fees | 95 | 15 | 292 | 96 | ||||||||||||
Professional fees | 61 | 10 | 174 | 62 | ||||||||||||
Printing fees | 17 | 2 | 48 | 18 | ||||||||||||
Registration fees | 13 | 2 | 32 | 15 | ||||||||||||
Interest expense | 1 | — | 1 | — | ||||||||||||
Overdraft fees | — | — | — | — | ||||||||||||
Other expenses | 39 | 8 | 172 | 38 | ||||||||||||
Total Expenses | 8,862 | 1,449 | 26,796 | 4,250 | ||||||||||||
Less: | ||||||||||||||||
Waiver of investment advisory fees | (4,107 | ) | (513 | ) | (14,254 | ) | (2,863 | ) | ||||||||
Waiver of administration fees | (956 | ) | (156 | ) | (2,887 | ) | (907 | ) | ||||||||
Fees paid indirectly(1) | (112 | ) | (13 | ) | (90 | ) | (8 | ) | ||||||||
Net Expenses | 3,687 | 767 | 9,565 | 472 | ||||||||||||
Net Investment Income | 34,298 | 4,859 | 103,968 | 39,683 | ||||||||||||
Net Realized and Unrealized Gain (Loss) on Investments: | ||||||||||||||||
Investments | 122,141 | 38,601 | 690,778 | (10,432 | ) | |||||||||||
Affiliated investments | (487 | ) | — | (142,653 | ) | (838 | ) | |||||||||
Futures contracts | 5,031 | 1,453 | 93,476 | 5,862 | ||||||||||||
Foreign currency transactions | — | — | (49 | ) | — | |||||||||||
Net Change in Unrealized Appreciation (Depreciation) on: | ||||||||||||||||
Investments | 311,229 | 26,090 | 478,770 | 396,890 | ||||||||||||
Affiliated investments | 895 | — | 169,226 | 1,096 | ||||||||||||
Futures contracts | 1,717 | 340 | 36,701 | 6,480 | ||||||||||||
Foreign currency and translation of other assets and liabilities denominated in foreign currencies | — | — | — | — | ||||||||||||
Net Increase in Net Assets Resulting from Operations | $ | 474,824 | $ | 71,343 | $ | 1,430,217 | $ | 438,741 | ||||||||
| (1) | See Note 5 in the Notes to Financial Statements. |
| (2) | Commenced operations on February 28, 2013. |
Amounts designated as “—” are $0 or have been rounded to $0.
The accompanying notes are an integral part of the financial statements.
| 234 | SEI Institutional Investments Trust / Annual Report / May 31, 2013 |
Table of Contents
| Extended Market Index Fund(2) | Small Cap Fund | Small Cap II Fund | Small/Mid Cap Equity Fund | U.S. Managed Volatility Fund | International Equity Fund | |||||||||||||||||
| $ | 400 | $ | 10,548 | $ | 2,315 | $ | 29,391 | $ | 26,162 | $ | 9,350 | |||||||||||
| 1 | 17 | 5 | 372 | 13 | 4 | |||||||||||||||||
| — | 4 | — | 32 | 2 | 3 | |||||||||||||||||
| 3 | 1,527 | 115 | 3,062 | — | 300 | |||||||||||||||||
| (1 | ) | (14 | ) | — | (42 | ) | (160 | ) | (742 | ) | ||||||||||||
| 403 | 12,082 | 2,435 | 32,815 | 26,017 | 8,915 | |||||||||||||||||
| 34 | 5,284 | 1,166 | 14,411 | 6,047 | 1,697 | |||||||||||||||||
| 14 | 406 | 90 | 1,109 | 465 | 168 | |||||||||||||||||
| — | 10 | 2 | 26 | 11 | 4 | |||||||||||||||||
| — | 3 | 1 | 9 | 5 | 1 | |||||||||||||||||
| 5 | 41 | 9 | 112 | 50 | 225 | |||||||||||||||||
| 2 | 26 | 6 | 68 | 34 | 7 | |||||||||||||||||
| 1 | 7 | 2 | 19 | 9 | 3 | |||||||||||||||||
| 5 | 5 | 4 | 10 | 5 | 2 | |||||||||||||||||
| — | — | — | — | 1 | — | |||||||||||||||||
| — | — | — | — | — | 11 | |||||||||||||||||
| 2 | 22 | 4 | 48 | 18 | 65 | |||||||||||||||||
| 63 | 5,804 | 1,284 | 15,812 | 6,645 | 2,183 | |||||||||||||||||
| (17 | ) | (1,504 | ) | (331 | ) | (4,376 | ) | (3,928 | ) | (524 | ) | |||||||||||
| (14 | ) | (406 | ) | (90 | ) | (1,109 | ) | (465 | ) | (168 | ) | |||||||||||
| — | (36 | ) | — | (166 | ) | — | — | |||||||||||||||
| 32 | 3,858 | 863 | 10,161 | 2,252 | 1,491 | |||||||||||||||||
| 371 | 8,224 | 1,572 | 22,654 | 23,765 | 7,424 | |||||||||||||||||
| 198 | 74,940 | 4,675 | 230,355 | 45,678 | 19,453 | |||||||||||||||||
| — | (4,405 | ) | — | (6,026 | ) | — | (581 | ) | ||||||||||||||
| 4 | 7,092 | 3,382 | 11,933 | 5,699 | 2,500 | |||||||||||||||||
| — | 1 | — | 13 | (75 | ) | (489 | ) | |||||||||||||||
| 7,221 | 118,796 | 37,698 | 309,246 | 135,581 | 54,595 | |||||||||||||||||
| — | 6,111 | — | 8,479 | — | 776 | |||||||||||||||||
| 178 | 1,963 | 23 | 2,725 | 396 | 628 | |||||||||||||||||
| | — | | — | — | — | 2 | 79 | |||||||||||||||
| $ | 7,972 | $ | 212,722 | $ | 47,350 | $ | 579,379 | $ | 211,046 | $ | 84,385 | |||||||||||
| SEI Institutional Investments Trust / Annual Report / May 31, 2013 | 235 |
Table of Contents
Statements of Operations ($ Thousands)
For the year/period ended May 31, 2013
World Equity Ex-US Fund | Screened World Equity Ex-US Fund | Opportunistic Income Fund | ||||||||||
Investment Income | ||||||||||||
Dividends | $ | 162,421 | $ | 1,439 | $ | — | ||||||
Dividends from affiliated registered investment company | 83 | 1 | 20 | |||||||||
Interest income | 88 | 1 | 7,698 | |||||||||
Security lending income — net | 5,936 | — | — | |||||||||
Less: foreign taxes withheld | (13,698 | ) | (101 | ) | — | |||||||
Total Investment Income | 154,830 | 1,340 | 7,718 | |||||||||
Expenses: | ||||||||||||
Investment advisory fees | 32,065 | 377 | 2,141 | |||||||||
Administration fees | 2,915 | 29 | 238 | |||||||||
Trustee fees | 68 | 1 | 6 | |||||||||
Chief Compliance Officer fees | 27 | — | 3 | |||||||||
Custodian/wire agent fees | 715 | 68 | 24 | |||||||||
Professional fees | 198 | 10 | 20 | |||||||||
Printing fees | 54 | 1 | 5 | |||||||||
Registration fees | 36 | — | 18 | |||||||||
Interest expense | — | — | — | |||||||||
Overdraft fees | 39 | — | — | |||||||||
Other expenses | 157 | 29 | 40 | |||||||||
Total Expenses | 36,274 | 515 | 2,495 | |||||||||
Less: | ||||||||||||
Waiver of investment advisory fees | (13,000 | ) | (198 | ) | (1,246 | ) | ||||||
Waiver of administration fees | (2,915 | ) | (29 | ) | (238 | ) | ||||||
Fees paid indirectly(1) | (66 | ) | — | — | ||||||||
Net Expenses | 20,293 | 288 | 1,011 | |||||||||
Net Investment Income | 134,537 | 1,052 | 6,707 | |||||||||
Net Realized and Unrealized Gain (Loss) on Investments: | ||||||||||||
Investments | 159,623 | 1,877 | (253 | ) | ||||||||
Affiliated investments | (2,282 | ) | — | — | ||||||||
Futures contracts | 31,664 | 305 | 13 | |||||||||
Purchased and written options | — | — | — | |||||||||
Swap contracts | — | — | — | |||||||||
Foreign currency transactions | (4,774 | ) | (28 | ) | — | |||||||
Net Change in Unrealized Appreciation (Depreciation) on: | ||||||||||||
Investments | 1,018,112 | 9,629 | 16,531 | |||||||||
Affiliated investments | 3,594 | — | — | |||||||||
Futures contracts | 14,968 | 164 | 10 | |||||||||
Purchased and written options | — | — | — | |||||||||
Purchased swaptions | — | — | — | |||||||||
Swap contracts | — | — | — | |||||||||
Foreign capital gains tax | (77 | ) | — | — | ||||||||
Foreign currency and translation of other assets and liabilities denominated in foreign currencies | (3,829 | ) | (70 | ) | — | |||||||
Net Increase in Net Assets Resulting from Operations | $ | 1,351,536 | $ | 12,929 | $ | 23,008 | ||||||
| (1) | See Note 5 in the Notes to Financial Statements. |
| (2) | Commenced operations on June 29, 2012. |
Amounts designated as “—” are $0 or have been rounded to $0.
The accompanying notes are an integral part of the financial statements.
| 236 | SEI Institutional Investments Trust / Annual Report / May 31, 2013 |
Table of Contents
| Core Fixed Income Fund | High Yield Bond Fund | Long Duration Fund | Long Duration Corporate Bond Fund(2) | Ultra Short Duration Bond Fund | Emerging Markets Debt Fund | |||||||||||||||||
| $ | — | $ | 266 | $ | — | $ | — | $ | — | $ | — | |||||||||||
| 240 | 38 | 32 | 15 | 3 | — | |||||||||||||||||
| 202,021 | 154,359 | 155,691 | 74,591 | 4,041 | 69,596 | |||||||||||||||||
| 132 | — | — | — | — | 3 | |||||||||||||||||
| (1 | ) | (34 | ) | — | — | — | (108 | ) | ||||||||||||||
| 202,392 | 154,629 | 155,723 | 74,606 | 4,044 | 69,491 | |||||||||||||||||
| 22,837 | 9,988 | 11,721 | 5,273 | 531 | 11,194 | |||||||||||||||||
| 3,806 | 1,024 | 1,954 | 879 | 177 | 658 | |||||||||||||||||
| 90 | 24 | 48 | 11 | 4 | 15 | |||||||||||||||||
| 34 | 9 | 15 | 9 | 2 | 6 | |||||||||||||||||
| 407 | 104 | 211 | 63 | 17 | 312 | |||||||||||||||||
| 250 | 63 | 133 | 45 | 12 | 45 | |||||||||||||||||
| 70 | 18 | 31 | 11 | 3 | 12 | |||||||||||||||||
| 32 | 12 | 11 | 58 | 7 | 13 | |||||||||||||||||
| — | 1 | — | — | — | — | |||||||||||||||||
| — | — | — | — | — | 13 | |||||||||||||||||
| 174 | 183 | 241 | 12 | 8 | 191 | |||||||||||||||||
| 27,700 | 11,426 | 14,365 | 6,361 | 761 | 12,459 | |||||||||||||||||
| (14,366 | ) | (4,172 | ) | (6,040 | ) | (2,812 | ) | (164 | ) | (5,499 | ) | |||||||||||
| (3,806 | ) | (1,024 | ) | (1,954 | ) | (879 | ) | (177 | ) | (658 | ) | |||||||||||
| — | — | — | — | — | — | |||||||||||||||||
| 9,528 | 6,230 | 6,371 | 2,670 | 420 | 6,302 | |||||||||||||||||
| 192,864 | 148,399 | 149,352 | 71,936 | 3,624 | 63,189 | |||||||||||||||||
| 158,750 | 60,535 | 307,949 | 21,118 | 724 | 53,768 | |||||||||||||||||
| (8,383 | ) | — | — | — | — | (150 | ) | |||||||||||||||
| 4,693 | — | (4,788 | ) | (3,170 | ) | 105 | (164 | ) | ||||||||||||||
| 451 | — | — | — | — | 78 | |||||||||||||||||
| (5,760 | ) | (3,867 | ) | (180 | ) | — | — | 8,812 | ||||||||||||||
| 3,475 | — | — | — | — | 12,904 | |||||||||||||||||
| (125,397 | ) | 87,189 | (418,911 | ) | (38,093 | ) | 1,700 | (17,148 | ) | |||||||||||||
| 9,047 | — | — | — | — | 209 | |||||||||||||||||
| 7,719 | — | (1,799 | ) | 98 | 18 | 304 | ||||||||||||||||
| 317 | — | — | — | — | (174 | ) | ||||||||||||||||
| 6 | — | — | — | — | — | |||||||||||||||||
| 5,899 | 517 | 267 | — | — | (791 | ) | ||||||||||||||||
| — | — | — | — | — | — | |||||||||||||||||
| (69 | ) | — | — | — | — | (2,230 | ) | |||||||||||||||
| $ | 243,612 | $ | 292,773 | $ | 31,890 | $ | 51,889 | $ | 6,171 | $ | 118,607 | |||||||||||
| SEI Institutional Investments Trust / Annual Report / May 31, 2013 | 237 |
Table of Contents
Statements of Operations ($ Thousands)
For the year ended May 31, 2013
| Real Return Fund | Dynamic Asset Allocation Fund | Multi-Asset Real Return Fund | ||||||||||
Investment Income | ||||||||||||
Dividends | $ | — | $ | 15,389 | $ | 1,608 | ||||||
Dividends from affiliated registered investment company | — | 3 | — | |||||||||
Interest income | 2,543 | 4,514 | 1,195 | |||||||||
Security lending income — net | — | — | — | |||||||||
Less: foreign taxes withheld | — | (6 | ) | (93 | ) | |||||||
Total Investment Income | 2,543 | 19,900 | 2,710 | |||||||||
Expenses: | ||||||||||||
Investment advisory fees | 572 | 4,579 | 1,042 | |||||||||
Administration fees | 130 | 382 | 95 | |||||||||
Trustee fees | 3 | 9 | 2 | |||||||||
Chief Compliance Officer fees | 1 | 4 | 1 | |||||||||
Custodian/wire agent fees | 4 | 39 | 22 | |||||||||
Professional fees | 8 | 28 | 7 | |||||||||
Printing fees | 2 | 7 | 2 | |||||||||
Registration fees | 1 | 12 | 2 | |||||||||
Interest expense | — | — | 66 | |||||||||
Overdraft fees | — | — | 1 | |||||||||
Other expenses | 8 | 15 | 4 | |||||||||
Total Expenses | 729 | 5,075 | 1,244 | |||||||||
Less: | ||||||||||||
Waiver of investment advisory fees | (315 | ) | (3,927 | ) | (545 | ) | ||||||
Waiver of administration fees | (130 | ) | (382 | ) | (95 | ) | ||||||
Fees paid indirectly(1) | — | — | — | |||||||||
Net Expenses | 284 | 766 | 604 | |||||||||
Net Investment Income | 2,259 | 19,134 | 2,106 | |||||||||
Net Realized and Unrealized Gain (Loss) on Investments: | ||||||||||||
Investments | 3,710 | 80 | 716 | |||||||||
Futures contracts | 46 | — | 26 | |||||||||
Written options | — | (3,059 | ) | (475 | ) | |||||||
Swap contracts | — | 20,596 | (7,917 | ) | ||||||||
Foreign currency transactions | — | (844 | ) | 271 | ||||||||
Net Change in Unrealized Appreciation (Depreciation) on: | ||||||||||||
Investments | (6,178 | ) | 156,987 | 1,955 | ||||||||
Futures contracts | — | — | 212 | |||||||||
Purchased and written options | — | 1,011 | (38 | ) | ||||||||
Swap contracts | — | — | 421 | |||||||||
Foreign currency and translation of other assets and liabilities denominated in foreign currencies | — | (16,776 | ) | 12 | ||||||||
Net Increase (Decrease) in Net Assets Resulting from Operations | $ | (163 | ) | $ | 177,129 | $ | (2,711 | ) | ||||
| (1) | See Note 5 in the Notes to Financial Statements. |
Amounts designated as “—” are $0 or have been rounded to $0.
The accompanying notes are an integral part of the financial statements.
| 238 | SEI Institutional Investments Trust / Annual Report / May 31, 2013 |
Table of Contents
This page intentionally left blank.
Table of Contents
Statements of Changes in Net Assets ($ Thousands)
For the years or period ended May 31,
| Large Cap Fund | Large Cap Diversified Alpha Fund | Large Cap Disciplined Equity Fund | ||||||||||||||||||||||
| 2013 | 2012 | 2013 | 2012 | 2013 | 2012 | |||||||||||||||||||
Operations: | ||||||||||||||||||||||||
Net investment income | $ | 34,298 | $ | 23,651 | $ | 4,859 | $ | 4,554 | $ | 103,968 | $ | 102,848 | ||||||||||||
Net realized gain (loss) from investments, affiliated investments, futures contracts and swap contracts | 126,685 | 70,057 | 40,054 | 21,195 | 641,601 | 807,200 | ||||||||||||||||||
Net realized gain (loss) on foreign currency transactions | — | (41 | ) | — | — | (49 | ) | — | ||||||||||||||||
Net change in unrealized appreciation (depreciation) on investments, affiliated investments and future contracts | 313,841 | (103,035 | ) | 26,430 | (27,770 | ) | 684,697 | (982,230 | ) | |||||||||||||||
Net Increase (Decrease) in Net Assets Resulting from Operations | 474,824 | (9,368 | ) | 71,343 | (2,021 | ) | 1,430,217 | (72,182 | ) | |||||||||||||||
Dividends and Distributions From: | ||||||||||||||||||||||||
Net investment income: | ||||||||||||||||||||||||
Class A | (33,960 | ) | (22,774 | ) | (5,999 | ) | (3,329 | ) | (140,201 | ) | (106,581 | ) | ||||||||||||
Net realized gains: | ||||||||||||||||||||||||
Class A | (50,275 | ) | (66,801 | ) | — | — | — | — | ||||||||||||||||
Total Dividends and Distributions | (84,235 | ) | (89,575 | ) | (5,999 | ) | (3,329 | ) | (140,201 | ) | (106,581 | ) | ||||||||||||
Capital Share Transactions:(1) | ||||||||||||||||||||||||
Class A: | ||||||||||||||||||||||||
Proceeds from shares issued | 422,969 | 728,348 | 46,493 | 50,166 | 1,013,176 | 1,161,661 | ||||||||||||||||||
Reinvestment of dividends & distributions | 82,864 | 87,922 | 5,414 | 2,988 | 136,946 | 105,099 | ||||||||||||||||||
Cost of shares redeemed | (772,763 | ) | (559,756 | ) | (128,581 | ) | (91,077 | ) | (2,376,213 | ) | (3,425,587 | ) | ||||||||||||
Increase (Decrease) in Net Assets Derived from Capital Share Transactions | (266,930 | ) | 256,514 | (76,674 | ) | (37,923 | ) | (1,226,091 | ) | (2,158,827 | ) | |||||||||||||
Net Increase (Decrease) in Net Assets | 123,659 | 157,571 | (11,330 | ) | (43,273 | ) | 63,925 | (2,337,590 | ) | |||||||||||||||
Net Assets: | ||||||||||||||||||||||||
Beginning of Period | 1,774,178 | 1,616,607 | 320,907 | 364,180 | 5,436,390 | 7,773,980 | ||||||||||||||||||
End of Period | $ | 1,897,837 | $ | 1,774,178 | $ | 309,577 | $ | 320,907 | $ | 5,500,315 | $ | 5,436,390 | ||||||||||||
Undistributed (Distributions in Excess of) Net Investment Income Included in Net Assets at Period End | $ | 5,494 | $ | 5,122 | $ | 97 | $ | 1,216 | $ | — | $ | 18,169 | ||||||||||||
| (1) | See Note 6 in the Notes to Financial Statements for additional information. |
| (2) | Includes subscriptions as a result of an in-kind transfers of securities (see Note 10). |
| (3) | Commenced operations on February 28, 2013. |
| (4) | Commenced operations on April 10, 2012. |
Amounts designated as “—” are $0 or have been rounded to $0.
The accompanying notes are an integral part of the financial statements.
| 240 | SEI Institutional Investments Trust / Annual Report / May 31, 2013 |
Table of Contents
| Large Cap Index Fund | Extended Market Index Fund(3) | Small Cap Fund | Small Cap II Fund(4) | |||||||||||||||||||||||
| 2013 | 2012 | 2013 | 2013 | 2012 | 2013 | 2012 | ||||||||||||||||||||
| $ | 39,683 | $ | 18,484 | $ | 371 | $ | 8,224 | $ | 6,101 | $ | 1,572 | $ | 79 | |||||||||||||
| (5,408 | ) | 53,371 | 202 | 77,627 | 59,833 | 8,057 | (118 | ) | |||||||||||||||||
| — | — | — | 1 | (4 | ) | — | — | |||||||||||||||||||
| 404,466 |
| (81,490 | ) | 7,399 | 126,870 | (128,827 | ) | 37,721 | (2,030 | ) | |||||||||||||||
| 438,741 |
| (9,635 | ) | 7,972 | 212,722 | (62,897 | ) | 47,350 | (2,069 | ) | |||||||||||||||
| (37,390 | ) | (16,211 | ) | (84 | ) | (10,108 | ) | (4,874 | ) | (1,541 | ) | — | ||||||||||||||
| (17,633 | ) | — | — | — | — | (570 | ) | — | ||||||||||||||||||
| (55,023 | ) | (16,211 | ) | (84 | ) | (10,108 | ) | (4,874 | ) | (2,111 | ) | — | ||||||||||||||
| 1,122,773 | 721,565 | (2) | 172,091 | 119,337 | 332,632 | 246,977 | 64,135 | |||||||||||||||||||
| 54,321 | 15,668 | 84 | 8,729 | 4,151 | 2,031 | — | ||||||||||||||||||||
| (602,393 | ) | (225,853 | ) | (5,956 | ) | (304,936 | ) | (238,605 | ) | (134,616 | ) | — | ||||||||||||||
| | 574,701 | | 511,380 | 166,219 | (176,870 | ) | 98,178 | 114,392 | 64,135 | |||||||||||||||||
| 958,419 | 485,534 | 174,107 | 25,744 | 30,407 | 159,631 | 62,066 | ||||||||||||||||||||
| 1,255,669 | 770,135 | — | 753,232 | 722,825 | 62,066 | — | ||||||||||||||||||||
| $ | 2,214,088 | $ | 1,255,669 | $ | 174,107 | $ | 778,976 | $ | 753,232 | $ | 221,697 | $ | 62,066 | |||||||||||||
$ | 7,007 |
| $ | 4,580 | $ | 304 | $ | 1,010 | $ | 2,209 | $ | 168 | $ | 81 | ||||||||||||
| SEI Institutional Investments Trust / Annual Report / May 31, 2013 | 241 |
Table of Contents
Statements of Changes in Net Assets ($ Thousands)
For the years ended May 31,
| Small/Mid Cap Equity Fund | U.S. Managed Volatility Fund | |||||||||||||||
| 2013 | 2012 | 2013 | 2012 | |||||||||||||
Operations: | ||||||||||||||||
Net investment income | $ | 22,654 | $ | 15,889 | $ | 23,765 | $ | 8,044 | ||||||||
Net realized gain (loss) from investments, affiliated Investments, written options, written swaptions futures contracts and swap contracts | 236,262 | 179,350 | 51,377 | 8,768 | ||||||||||||
Net realized gain (loss) on foreign currency transactions | 13 | (54 | ) | (75 | ) | 20 | ||||||||||
Net change in unrealized appreciation (depreciation) on investments, affiliated investments, written options, future contracts and swap contracts | 320,450 | (384,540 | ) | 135,977 | 4,900 | |||||||||||
Net change in unrealized appreciation (depreciation) on foreign cap gains tax | — | — | — | — | ||||||||||||
Net change in unrealized appreciation (depreciation) on foreign currency transactions | — | — | 2 | (2 | ) | |||||||||||
Net Increase (Decrease) in Net Assets Resulting from Operations | 579,379 | (189,355 | ) | 211,046 | 21,730 | |||||||||||
Dividends and Distributions From: | ||||||||||||||||
Net investment income: | ||||||||||||||||
Class A | (25,590 | ) | (15,466 | ) | (22,592 | ) | (5,773 | ) | ||||||||
Net realized gains: | ||||||||||||||||
Class A | (15,141 | ) | — | (16,946 | ) | (25,157 | ) | |||||||||
Total Dividends and Distributions | (40,731 | ) | (15,466 | ) | (39,538 | ) | (30,930 | ) | ||||||||
Capital Share Transactions:(1) | ||||||||||||||||
Class A: | ||||||||||||||||
Proceeds from shares issued | 437,273 | 425,868 | 510,717 | 671,544 | ||||||||||||
Reinvestment of dividends & distributions | 40,334 | 15,310 | 38,191 | 30,591 | ||||||||||||
Cost of shares redeemed | (843,868 | ) | (570,081 | )(2) | (296,518 | ) | (104,664 | ) | ||||||||
Increase (Decrease) in Net Assets Derived from Capital Share Transactions | (366,261 | ) | (128,903 | ) | 252,390 | 597,471 | ||||||||||
Net Increase (Decrease) in Net Assets | 172,387 | (333,724 | ) | 423,898 | 588,271 | |||||||||||
Net Assets: | ||||||||||||||||
Beginning of Year | 1,981,358 | 2,315,082 | 722,082 | 133,811 | ||||||||||||
End of Year | $ | 2,153,745 | $ | 1,981,358 | $ | 1,145,980 | $ | 722,082 | ||||||||
Undistributed (Distributions in Excess of) Net Investment Income Included in Net Assets at Year End | $ | 6,933 | $ | 8,634 | $ | 4,009 | $ | 2,688 | ||||||||
| (1) | See Note 6 in the Notes to Financial Statements for additional information. |
| (2) | Includes redemptions as a result of an in-kind transfers of securities (see Note 10). |
Amounts designated as “—” are $0 or have been rounded to $0.
The accompanying notes are an integral part of the financial statements.
| 242 | SEI Institutional Investments Trust / Annual Report / May 31, 2013 |
Table of Contents
| International Equity Fund | World Equity Ex-US Fund | Screened World Equity Ex-US Fund | Opportunistic Income Fund | |||||||||||||||||||||||||||
| 2013 | 2012 | 2013 | 2012 | 2013 | 2012 | 2013 | 2012 | |||||||||||||||||||||||
| $ | 7,424 | $ | 10,379 | $ | 134,537 | $ | 106,328 | $ | 1,052 | $ | 811 | $ | 6,707 | $ | 4,754 | |||||||||||||||
| | 21,372 | | (17,819 | ) | 189,005 | (109,876 | ) | 2,182 | (594 | ) | (240 | ) | 697 | |||||||||||||||||
| (489 | ) | (648 | ) | (4,774 | ) | (4,166 | ) | (28 | ) | 6 | — | — | ||||||||||||||||||
| | 55,999 | | (108,105 | ) | 1,036,674 | (989,578 | ) | 9,793 | (11,635 | ) | 16,541 | (1,147 | ) | |||||||||||||||||
| — | (77 | ) | 126 | — | — | — | — | |||||||||||||||||||||||
| 79 | (5 | ) | (3,829 | ) | 2,877 | (70 | ) | 44 | — | — | ||||||||||||||||||||
| 84,385 | (116,198 | ) | 1,351,536 | (994,289 | ) | 12,929 | (11,368 | ) | 23,008 | 4,304 | ||||||||||||||||||||
| (9,490 | ) | (9,424 | ) | (119,081 | ) | (92,739 | ) | (1,070 | ) | (992 | ) | (8,743 | ) | (5,179 | ) | |||||||||||||||
| — | — | — | — | — | — | — | — | |||||||||||||||||||||||
| (9,490 | ) | (9,424 | ) | (119,081 | ) | (92,739 | ) | (1,070 | ) | (992 | ) | (8,743 | ) | (5,179 | ) | |||||||||||||||
| 49,109 | 106,213 | 1,900,967 | 1,951,943 | 11,231 | 16,382 | 795,292 | 15,632 | |||||||||||||||||||||||
| 8,501 | 8,534 | 116,860 | 90,489 | 818 | 806 | 8,488 | 5,015 | |||||||||||||||||||||||
| (225,540 | ) | (210,941 | ) | (1,681,364 | ) | (1,460,559 | ) | (10,143 | ) | (10,916 | ) | (40,482 | ) | (96,090 | ) | |||||||||||||||
| (167,930 | ) | (96,194 | ) | 336,463 | 581,873 | 1,906 | 6,272 | 763,298 | (75,443 | ) | ||||||||||||||||||||
| (93,035 | ) | (221,816 | ) | 1,568,918 | (505,155 | ) | 13,765 | (6,088 | ) | 777,563 | (76,318 | ) | ||||||||||||||||||
| 324,696 | 546,512 | 4,623,934 | 5,129,089 | 48,756 | 54,844 | 218,959 | 295,277 | |||||||||||||||||||||||
| $ | 231,661 | $ | 324,696 | $ | 6,192,852 | $ | 4,623,934 | $ | 62,521 | $ | 48,756 | $ | 996,522 | $ | 218,959 | |||||||||||||||
| $ | 4,172 | $ | 6,204 | $ | 71,744 | $ | 56,700 | $ | 579 | $ | 508 | $ | 11,315 | $ | 6,855 | |||||||||||||||
| SEI Institutional Investments Trust / Annual Report / May 31, 2013 | 243 |
Table of Contents
Statements of Changes in Net Assets ($ Thousands)
For the years or period ended May 31,
| Core Fixed Income Fund | High Yield Bond Fund | Long Duration Fund | Long Duration Corporate Bond Fund(3) | |||||||||||||||||||||||||
| 2013 | 2012 | 2013 | 2012 | 2013 | 2012 | 2013 | ||||||||||||||||||||||
Operations: | ||||||||||||||||||||||||||||
Net investment income | $ | 192,864 | $ | 211,110 | $ | 148,399 | $ | 156,694 | $ | 149,352 | $ | 174,841 | $ | 71,936 | ||||||||||||||
Net realized gain (loss) from investments, affiliated investments, purchased and written options, written swaptions, futures contracts and swap contracts | 149,751 | 163,254 | 56,668 | 35,646 | 302,981 | 294,664 | 17,948 | |||||||||||||||||||||
Net realized gain (loss) on foreign currency transactions | 3,475 | 3,946 | — | — | — | — | — | |||||||||||||||||||||
Net change in unrealized appreciation (depreciation) on investments, affiliated investments, written options futures contracts and swap contracts | (102,409 | ) | 131,762 | 87,706 | (87,084 | ) | (420,443 | ) | 319,516 | (37,995 | ) | |||||||||||||||||
Net change in unrealized appreciation (depreciation) on foreign currency transactions | (69 | ) | 1,067 | — | — | — | — | — | ||||||||||||||||||||
Net Increase (Decrease) in Net Assets Resulting from Operations | 243,612 | 511,139 | 292,773 | 105,256 | 31,890 | 789,021 | 51,889 | |||||||||||||||||||||
Dividends and Distributions From: | ||||||||||||||||||||||||||||
Net investment income: | ||||||||||||||||||||||||||||
Class A | (206,754 | ) | (225,294 | ) | (144,390 | ) | (153,356 | ) | (148,715 | ) | (174,335 | ) | (71,980 | ) | ||||||||||||||
Net realized gains: | ||||||||||||||||||||||||||||
Class A | (99,113 | ) | (122,557 | ) | — | (3,009 | ) | (248,307 | ) | (218,280 | ) | (12,723 | ) | |||||||||||||||
Return of capital: | ||||||||||||||||||||||||||||
Class A | — | — | — | — | — | — | — | |||||||||||||||||||||
Total Dividends and Distributions | (305,867 | ) | (347,851 | ) | (144,390 | ) | (156,365 | ) | (397,022 | ) | (392,615 | ) | (84,703 | ) | ||||||||||||||
Capital Share Transactions:(1) | ||||||||||||||||||||||||||||
Class A: | ||||||||||||||||||||||||||||
Proceeds from shares issued | 2,956,412 | (2) | 1,895,597 | 620,108 | 692,062 | 1,135,778 | (2) | 2,181,318 | (2) | 2,340,569 | (2) | |||||||||||||||||
Reinvestment of dividends & distributions | 296,639 | 334,995 | 139,881 | 152,411 | 384,646 | 388,384 | 84,678 | |||||||||||||||||||||
Cost of shares redeemed | (3,787,895 | ) | (2,073,962 | ) | (660,601 | ) | (817,607 | ) | (3,330,376 | ) | (991,887 | ) | (309,481 | ) | ||||||||||||||
Increase (Decrease) in Net Assets Derived from Capital Share Transactions | (534,844 | ) | 156,630 | 99,388 | 26,866 | (1,809,952 | ) | 1,577,815 | 2,115,766 | |||||||||||||||||||
Net Increase (Decrease) in Net Assets | (597,099 | ) | 319,918 | 247,771 | (24,243 | ) | (2,175,084 | ) | 1,974,221 | 2,082,952 | ||||||||||||||||||
Net Assets: | ||||||||||||||||||||||||||||
Beginning of Period | 7,081,317 | 6,761,399 | 1,914,780 | 1,939,023 | 5,497,375 | 3,523,154 | — | |||||||||||||||||||||
End of Period | $ | 6,484,218 | $ | 7,081,317 | $ | 2,162,551 | $ | 1,914,780 | $ | 3,322,291 | $ | 5,497,375 | $ | 2,082,952 | ||||||||||||||
Undistributed (Distributions in Excess of) Net Investment Income Included in Net Assets at Period End | $ | (344 | ) | $ | (5,117 | ) | $ | 9,647 | $ | 2,053 | $ | (1,544 | ) | $ | 12 | $ | 17 | |||||||||||
| (1) | See Note 6 in the Notes to Financial Statements for additional information. |
| (2) | Includes subscriptions as a result of an in-kind transfer of securities (see Note 10). |
| (3) | Commenced operations on June 29, 2012. |
| (4) | Commenced operations on July 29, 2011. |
Amounts designated as “—” are $0 or have been rounded to $0.
The accompanying notes are an integral part of the financial statements.
| 244 | SEI Institutional Investments Trust / Annual Report / May 31, 2013 |
Table of Contents
| Ultra Short Duration Bond Fund | Emerging Markets | Real Return Fund | Dynamic Asset Allocation Fund | Multi-Asset Real Return Fund(4) | ||||||||||||||||||||||||||||||||||
| 2013 | 2012 | 2013 | 2012 | 2013 | 2012 | 2013 | 2012 | 2013 | 2012 | |||||||||||||||||||||||||||||
| $ | 3,624 | $ | 4,873 | $ | 63,189 | $ | 68,258 | $ | 2,259 | $ | 8,154 | $ | 19,134 | $ | (497 | ) | $ | 2,106 | $ | 1,267 | ||||||||||||||||||
| | 829 | | 54 | 62,344 | 24,704 | 3,756 | 7,917 | 17,617 | 42,339 | (7,650 | ) | (3,848 | ) | |||||||||||||||||||||||||
| | — | | — | 12,904 | (142 | ) | — | — | (844 | ) | — | 271 | 196 | |||||||||||||||||||||||||
| | 1,718 | | (731 | ) | (17,600 | ) | (50,426 | ) | (6,178 | ) | (9,367 | ) | 157,998 | (43,624 | ) | 2,550 | (7,980 | ) | ||||||||||||||||||||
| | — | | — | (2,230 | ) | 3,983 | — | — | (16,776 | ) | 23,729 | 12 | 1,240 | |||||||||||||||||||||||||
| | 6,171 | | 4,196 | 118,607 | 46,377 | (163 | ) | 6,704 | 177,129 | 21,947 | (2,711 | ) | (9,125 | ) | ||||||||||||||||||||||||
| (4,073 | ) | (5,251 | ) | (93,938 | ) | (70,422 | ) | (4,654 | ) | (10,472 | ) | (23,239 | ) | — | (970 | ) | (166 | ) | ||||||||||||||||||||
| — | — | (52,794 | ) | (10,680 | ) | (5,838 | ) | (6,909 | ) | (30,576 | ) | (22,339 | ) | — | — | |||||||||||||||||||||||
| — | — | — | — | — | — | — | — | (194 | ) | — | ||||||||||||||||||||||||||||
| (4,073 | ) | (5,251 | ) | (146,732 | ) | (81,102 | ) | (10,492 | ) | (17,381 | ) | (53,815 | ) | (22,339 | ) | (1,164 | ) | (166 | ) | |||||||||||||||||||
| 565,825 | (2) | 315,607 | 445,867 | 330,816 | 42,921 | 60,444 | 508,259 | 201,504 | 201,232 | 173,818 | ||||||||||||||||||||||||||||
| | 3,958 | | 5,230 | 142,096 | 78,720 | 9,256 | 15,092 | 52,931 | 19,948 | 1,056 | 161 | |||||||||||||||||||||||||||
| (347,511 | ) | (334,917 | ) | (262,863 | ) | (288,584 | ) | (71,531 | ) | (152,230 | ) | (101,522 | ) | (75,756 | ) | (34,577 | ) | (24,625 | ) | |||||||||||||||||||
| | 222,272 | | (14,080 | ) | 325,100 | 120,952 | (19,354 | ) | (76,694 | ) | 459,668 | 145,696 | 167,711 | 149,354 | ||||||||||||||||||||||||
| 224,370 | (15,135 | ) | 296,975 | 86,227 | (30,009 | ) | (87,371 | ) | 582,982 | 145,304 | 163,836 | 140,063 | ||||||||||||||||||||||||||
| 298,223 | 313,358 | 1,114,918 | 1,028,691 | 281,861 | 369,232 | 552,649 | 407,345 | 140,063 | — | |||||||||||||||||||||||||||||
| $ | 522,593 | $ | 298,223 | $ | 1,411,893 | $ | 1,114,918 | $ | 251,852 | $ | 281,861 | $ | 1,135,631 | $ | 552,649 | $ | 303,899 | $ | 140,063 | |||||||||||||||||||
| $ | 41 | | $ | (33 | ) | $ | (6,914) | $ | 7,259 | $ | 854 | $ | 3,155 | $ | (4,737 | ) | $ | (492 | ) | $ | (2,634 | ) | $ | (279 | ) | |||||||||||||
| SEI Institutional Investments Trust / Annual Report / May 31, 2013 | 245 |
Table of Contents
Statement of Cash Flows ($ Thousands)
For the year ended May 31, 2013
| Multi-Asset Real Return Fund | ||||
Cash Flows from Operating Activities: | ||||
Net decrease in net asset resulting from operations | $ | (2,711 | ) | |
Adjustments to reconcile net decrease in net assets resulting from operations to net cash used in operating activities: | ||||
Purchases of investment securities | (277,400 | ) | ||
Proceeds from sale of investment securities | 96,889 | |||
Net realized gain from investments | (609 | ) | ||
Net change in unrealized appreciation on investments | (1,955 | ) | ||
Amortization/accretion of premiums/discounts | 1,509 | |||
Proceeds of written & purchased options | (521 | ) | ||
Proceeds from sales of written & purchased options | 157 | |||
Net realized loss on written & purchased options | 475 | |||
Net change in unrealized depreciation on written & purchased options | 38 | |||
Increase in swap contracts, at value | (444 | ) | ||
Decrease in foreign currency | 87 | |||
Increase in cash pledged as collateral | (38 | ) | ||
Increase in receivable for investment securities sold | (291 | ) | ||
Increase in dividends and interest receivable | (406 | ) | ||
Increase in foreign tax reclaim receivable | (4 | ) | ||
Unrealized gain on forward foreign currency contracts | (65 | ) | ||
Unrealized loss on foreign spot currency contracts | 56 | |||
Increase in prepaid expenses | (1 | ) | ||
Increase in payable for investment securities purchased | 71,436 | |||
Increase in reverse repurchase agreements | 14,877 | |||
Decrease in variation margin payable | (48 | ) | ||
Increase in investment advisory fees payable | 12 | |||
Increase in chief compliance officer fees payable | 1 | |||
Increase in trustees fees payable | 1 | |||
Decrease in accrued expense payable | (1 | ) | ||
Net Cash Used in Operating Activities | (98,956 | ) | ||
Cash Flows from Financing Activities: | ||||
Proceeds from shares issued | 130,608 | |||
Payments on shares redeemed | (34,484 | ) | ||
Distributions from net investment income | (108 | ) | ||
Net Cash Provided by Financing Activities | 96,016 | |||
Net Change in Cash | (2,940 | ) | ||
Cash at Beginning of Year | 2,953 | |||
Cash at End of Year | $ | 13 | ||
Supplemental Information Cash Flows from Net Operating Activities: | ||||
Interest paid | $ | 66 | ||
The accompanying notes are an integral part of the financial statements.
| 246 | SEI Institutional Investments Trust / Annual Report / May 31, 2013 |
Table of Contents
For the years or periods ended May 31,
For a share outstanding throughout each period
| Net Asset Value, Beginning of Period | Net Investment Income(1) | Net Realized and Unrealized Gains (Losses) on Securities(1) | Total from Operations | Dividends from Net Investment Income | Distributions from Realized Capital Gains | Total Dividends and Distributions | Net Asset Value, End of Period | Total Return† | Net Assets End of Period ($ Thousands) | Ratio of Net Expenses to Average Net Assets | Ratio of Expenses to Average Net Assets (Excluding Fees Paid Indirectly and Including Waivers) | Ratio of Expenses to Average Net Assets (Excluding Fees Paid Indirectly and Waivers) | Ratio of Net Investment Income to Average Net Assets | Portfolio Turnover Rate† | ||||||||||||||||||||||||||||||||||||||||||||||
Large Cap Fund |
| |||||||||||||||||||||||||||||||||||||||||||||||||||||||||||
Class A |
| |||||||||||||||||||||||||||||||||||||||||||||||||||||||||||
2013 | $ | 17.07 | $ | 0.34 | $ | 4.38 | $ | 4.72 | $ | (0.33 | ) | $ | (0.52 | ) | $ | (0.85 | ) | $ | 20.94 | 28.44 | % | $ | 1,897,837 | 0.19 | %(6) | 0.19 | %(6) | 0.46 | %(6) | 1.79 | % | 47 | % | |||||||||||||||||||||||||||
2012 | 18.40 | 0.25 | (0.61 | ) | (0.36 | ) | (0.24 | ) | (0.73 | ) | (0.97 | ) | 17.07 | (1.69 | ) | 1,774,178 | 0.26 | (3) | 0.26 | (3) | 0.47 | (3) | 1.47 | 83 | ||||||||||||||||||||||||||||||||||||
2011 | 14.84 | 0.22 | 3.56 | 3.78 | (0.22 | ) | — | (0.22 | ) | 18.40 | 25.70 | 1,616,607 | 0.26 | 0.26 | 0.47 | 1.35 | 85 | |||||||||||||||||||||||||||||||||||||||||||
2010 | 12.55 | 0.23 | 2.28 | 2.51 | (0.22 | ) | — | (0.22 | ) | 14.84 | 20.05 | 1,230,382 | 0.26 | 0.26 | 0.47 | 1.56 | 72 | |||||||||||||||||||||||||||||||||||||||||||
2009 | 18.75 | 0.28 | (6.22 | ) | (5.94 | ) | (0.26 | ) | — | (0.26 | ) | 12.55 | (31.73 | ) | 526,421 | 0.25 | 0.26 | 0.48 | 2.16 | 81 | ||||||||||||||||||||||||||||||||||||||||
Large Cap Diversified Alpha Fund |
| |||||||||||||||||||||||||||||||||||||||||||||||||||||||||||
Class A |
| |||||||||||||||||||||||||||||||||||||||||||||||||||||||||||
2013 | $ | 9.41 | $ | 0.16 | $ | 2.22 | $ | 2.38 | $ | (0.20 | ) | $ | — | $ | (0.20 | ) | $ | 11.59 | 25.66 | % | $ | 309,577 | 0.24 | % | 0.24 | % | 0.46 | % | 1.55 | % | 82 | % | ||||||||||||||||||||||||||||
2012 | 9.53 | 0.13 | (0.16 | ) | (0.03 | ) | (0.09 | ) | — | (0.09 | ) | 9.41 | (0.24 | ) | 320,907 | 0.31 | 0.31 | 0.47 | 1.40 | 101 | ||||||||||||||||||||||||||||||||||||||||
2011 | 7.69 | 0.11 | 1.88 | 1.99 | (0.15 | ) | — | (0.15 | ) | 9.53 | 26.09 | 364,180 | 0.31 | 0.31 | 0.47 | 1.30 | 143 | |||||||||||||||||||||||||||||||||||||||||||
2010 | 6.35 | 0.09 | 1.34 | 1.43 | (0.09 | ) | — | (0.09 | ) | 7.69 | 22.61 | 352,500 | 0.31 | 0.31 | 0.47 | 1.26 | 95 | |||||||||||||||||||||||||||||||||||||||||||
2009 | 10.23 | 0.10 | (3.91 | ) | (3.81 | ) | (0.07 | )** | — | (0.07 | ) | 6.35 | (37.33 | ) | 331,002 | 0.48 | * | 0.48 | * | 0.64 | 1.41 | 132 | ||||||||||||||||||||||||||||||||||||||
Large Cap Disciplined Equity Fund |
| |||||||||||||||||||||||||||||||||||||||||||||||||||||||||||
Class A |
| |||||||||||||||||||||||||||||||||||||||||||||||||||||||||||
2013 | $ | 10.58 | $ | 0.21 | $ | 2.73 | $ | 2.94 | $ | (0.28 | ) | $ | — | $ | (0.28 | ) | $ | 13.24 | 28.24 | % | $ | 5,500,315 | 0.17 | %(5) | 0.17 | %(5) | 0.46 | %(5) | 1.80 | % | 109 | % | ||||||||||||||||||||||||||||
2012 | 10.87 | 0.16 | (0.29 | ) | (0.13 | ) | (0.16 | ) | — | (0.16 | ) | 10.58 | (1.14 | ) | 5,436,390 | 0.18 | (4) | 0.18 | (4) | 0.47 | (4) | 1.54 | 93 | |||||||||||||||||||||||||||||||||||||
2011 | 8.86 | 0.15 | 2.08 | 2.23 | (0.22 | ) | — | (0.22 | ) | 10.87 | 25.39 | 7,773,980 | 0.18 | 0.18 | 0.47 | 1.54 | 118 | |||||||||||||||||||||||||||||||||||||||||||
2010 | 7.36 | 0.15 | 1.49 | 1.64 | (0.14 | ) | — | (0.14 | ) | 8.86 | 22.32 | 6,960,762 | 0.18 | 0.18 | 0.47 | 1.74 | 104 | |||||||||||||||||||||||||||||||||||||||||||
2009 | 12.07 | 0.16 | (4.75 | ) | (4.59 | ) | (0.12 | )*** | — | (0.12 | ) | 7.36 | (38.18 | ) | 6,043,119 | 0.19 | 0.19 | 0.47 | 1.97 | 108 | ||||||||||||||||||||||||||||||||||||||||
Large Cap Index Fund |
| |||||||||||||||||||||||||||||||||||||||||||||||||||||||||||
Class A |
| |||||||||||||||||||||||||||||||||||||||||||||||||||||||||||
2013 | $ | 113.85 | $ | 2.77 | $ | 28.02 | $ | 30.79 | $ | (2.61 | ) | $ | (1.16 | ) | $ | (3.77 | ) | $ | 140.87 | 27.55 | % | $ | 2,214,088 | 0.03 | % | 0.03 | % | 0.23 | % | 2.18 | % | 14 | % | |||||||||||||||||||||||||||
2012 | 117.49 | 2.26 | (3.78 | ) | (1.52 | ) | (2.12 | ) | — | (2.12 | ) | 113.85 | (1.24 | ) | 1,255,669 | 0.06 | 0.06 | 0.24 | 2.01 | 12 | ||||||||||||||||||||||||||||||||||||||||
2011 | 94.53 | 2.01 | 22.98 | 24.99 | (2.03 | ) | — | (2.03 | ) | 117.49 | 26.77 | 770,135 | 0.06 | 0.06 | 0.24 | 1.91 | 17 | |||||||||||||||||||||||||||||||||||||||||||
2010 | 78.92 | 2.01 | 15.53 | 17.54 | (1.93 | ) | — | (1.93 | ) | 94.53 | 22.34 | 509,120 | 0.06 | 0.06 | 0.24 | 2.17 | 11 | |||||||||||||||||||||||||||||||||||||||||||
2009 | 121.02 | 2.13 | (41.96 | ) | (39.83 | ) | (2.13 | ) | (0.14 | ) | (2.27 | ) | 78.92 | (32.99 | ) | 353,892 | 0.06 | 0.06 | 0.25 | 2.56 | 18 | |||||||||||||||||||||||||||||||||||||||
Extended Market Index Fund |
| |||||||||||||||||||||||||||||||||||||||||||||||||||||||||||
2013(7) | $ | 10.00 | $ | 0.03 | $ | 0.75 | $ | 0.78 | $ | (0.01 | ) | $ | — | $ | (0.01 | ) | $ | 10.77 | 7.84 | % | $ | 174,107 | 0.11 | % | 0.11 | % | 0.22 | % | 1.30 | % | 4 | % | ||||||||||||||||||||||||||||
Small Cap Fund |
| |||||||||||||||||||||||||||||||||||||||||||||||||||||||||||
Class A |
| |||||||||||||||||||||||||||||||||||||||||||||||||||||||||||
2013 | $ | 12.04 | $ | 0.13 | $ | 3.42 | $ | 3.55 | $ | (0.17 | ) | $ | — | $ | (0.17 | ) | $ | 15.42 | 29.71 | % | $ | 778,976 | 0.47 | % | 0.47 | % | 0.71 | % | 1.01 | % | 85 | % | ||||||||||||||||||||||||||||
2012 | 13.49 | 0.11 | (1.47 | ) | (1.36 | ) | (0.09 | ) | — | (0.09 | ) | 12.04 | (10.11 | ) | 753,232 | 0.54 | 0.54 | 0.72 | 0.88 | 85 | ||||||||||||||||||||||||||||||||||||||||
2011 | 10.69 | 0.09 | 2.84 | 2.93 | (0.13 | ) | — | (0.13 | ) | 13.49 | 27.56 | 722,825 | 0.54 | 0.54 | 0.72 | 0.76 | 86 | |||||||||||||||||||||||||||||||||||||||||||
2010 | 7.97 | 0.08 | 2.73 | 2.81 | (0.09 | ) | — | (0.09 | ) | 10.69 | 35.32 | 1,339,748 | 0.53 | 0.54 | 0.72 | 0.86 | 106 | |||||||||||||||||||||||||||||||||||||||||||
2009 | 12.42 | 0.11 | (4.37 | ) | (4.26 | ) | (0.19 | ) | — | (0.19 | ) | 7.97 | (34.27 | ) | 985,860 | 0.52 | 0.54 | 0.72 | 1.26 | 122 | ||||||||||||||||||||||||||||||||||||||||
Small Cap II Fund |
| |||||||||||||||||||||||||||||||||||||||||||||||||||||||||||
Class A |
| |||||||||||||||||||||||||||||||||||||||||||||||||||||||||||
2013 | $ | 9.62 | $ | 0.09 | $ | 2.64 | $ | 2.73 | $ | (0.09 | ) | $ | (0.03 | ) | $ | (0.12 | ) | $ | 12.23 | 28.54 | % | $ | 221,697 | 0.48 | % | 0.48 | % | 0.72 | % | 0.88 | % | 113 | % | |||||||||||||||||||||||||||
2012(2) | 10.00 | 0.02 | (0.40 | ) | (0.38 | ) | — | — | — | 9.62 | (3.80 | ) | 62,066 | 0.59 | 0.59 | 0.78 | 1.07 | 9 | ||||||||||||||||||||||||||||||||||||||||||
| * | The expense ratio includes dividend and interest expenses on short sales. Had these expenses been excluded, the ratios would have been 0.31% and 0.32% for the year ended May 31, 2009. |
| ** | Includes a return of capital of $0.05 per share. |
| *** | Includes a return of capital of $0.10 per share. |
| † | Returns and portfolio turnover rates are for the period indicated and have not been annualized. Returns do not reflect the deduction of taxes the shareholder would pay on fund distributions or redemption of fund shares. |
| (1) | Per share net investment income and net realized and unrealized gains (losses) calculated using average shares. |
| (2) | Commenced operations on April 10, 2012. All ratios for the period have been annualized. |
| (3) | The expense ratio includes interest expense. Had this expense been excluded, the ratios would have been 0.26%, 0.26% and 0.47%, respectively. |
| (4) | The expense ratio includes interest expense. Had this expense been excluded, the ratios would have been 0.18%, 0.18% and 0.47%, respectively. |
| (5) | The expense ratio includes interest expense. Had this expense been excluded, the ratios would have been 0.17%, 0.17% and 0.46%, respectively. |
| (6) | The expense ratio includes interest expense. Had this expense been excluded, the ratios would have been 0.19%, 0.19% and 0.46%, respectively. |
| (7) | Commenced operations on February 28, 2013. All ratios for the period have been annualized. |
Amounts designated as “—” are $0 or have been rounded to $0.
The accompanying notes are an integral part of the financial statements.
| SEI Institutional Investments Trust / Annual Report / May 31, 2013 | 247 |
Table of Contents
Financial Highlights
For the years or periods ended May 31,
For a share outstanding throughout each period
| Net Asset Value, Beginning of Period | Net Investment Income(1) | Net | Total from Operations | Dividends from Net Investment Income | Distributions from Realized Capital Gains | Total Dividends and Distributions | Net Asset Value, End of Period | Total Return† | Net Assets End of Period ($ Thousands) | Ratio of Net Expenses to Average Net Assets | Ratio of Expenses to Average Net Assets (Excluding Fees Paid Indirectly and Including Waivers) | Ratio of Expenses to Average Net Assets (Excluding Fees Paid Indirectly and Waivers) | Ratio of | Portfolio Turnover Rate† | ||||||||||||||||||||||||||||||||||||||||||||||
Small/Mid Cap Equity Fund |
| |||||||||||||||||||||||||||||||||||||||||||||||||||||||||||
Class A |
| |||||||||||||||||||||||||||||||||||||||||||||||||||||||||||
2013 | $ | 12.34 | $ | 0.14 | $ | 3.45 | $ | 3.59 | $ | (0.15 | ) | $ | (0.09 | ) | $ | (0.24 | ) | $ | 15.69 | 29.49 | % | $ | 2,153,745 | 0.46 | % | 0.46 | % | 0.71 | % | 1.02 | % | 92 | % | |||||||||||||||||||||||||||
2012 | 13.62 | 0.09 | (1.28 | ) | (1.19 | ) | (0.09 | ) | — | (0.09 | ) | 12.34 | (8.71 | ) | 1,981,358 | 0.49 | 0.49 | 0.72 | 0.77 | 84 | ||||||||||||||||||||||||||||||||||||||||
2011 | 10.53 | 0.08 | 3.07 | 3.15 | (0.06 | ) | — | (0.06 | ) | 13.62 | 29.99 | 2,315,082 | 0.49 | 0.49 | 0.72 | 0.68 | 99 | |||||||||||||||||||||||||||||||||||||||||||
2010 | 7.85 | 0.08 | 2.71 | 2.79 | (0.11 | ) | — | (0.11 | ) | 10.53 | 35.79 | 2,064,443 | 0.49 | 0.50 | 0.72 | 0.79 | 97 | |||||||||||||||||||||||||||||||||||||||||||
2009 | 12.22 | 0.12 | (4.36 | ) | (4.24 | ) | (0.13 | ) | — | (0.13 | ) | 7.85 | (34.70 | ) | 1,724,824 | 0.48 | 0.50 | 0.72 | 1.40 | 125 | ||||||||||||||||||||||||||||||||||||||||
U.S. Managed Volatility Fund |
| |||||||||||||||||||||||||||||||||||||||||||||||||||||||||||
Class A |
| |||||||||||||||||||||||||||||||||||||||||||||||||||||||||||
2013 | $ | 11.39 | $ | 0.32 | $ | 2.37 | $ | 2.69 | $ | (0.31 | ) | $ | (0.23 | ) | $ | (0.54 | ) | $ | 13.54 | 24.19 | % | $ | 1,145,980 | 0.24 | % | 0.24 | % | 0.71 | % | 2.55 | % | 41 | % | |||||||||||||||||||||||||||
2012 | 12.15 | 0.25 | 0.01 | 0.26 | (0.21 | ) | (0.81 | ) | (1.02 | ) | 11.39 | 2.62 | 722,082 | 0.35 | 0.35 | 0.73 | 2.25 | 44 | ||||||||||||||||||||||||||||||||||||||||||
2011 | 11.16 | 0.22 | 2.72 | 2.94 | (0.23 | ) | (1.72 | ) | (1.95 | ) | 12.15 | 28.97 | 133,811 | 0.35 | 0.35 | 0.72 | 1.92 | 114 | ||||||||||||||||||||||||||||||||||||||||||
2010 | 9.55 | 0.22 | 1.78 | 2.00 | (0.22 | ) | (0.17 | ) | (0.39 | ) | 11.16 | 21.12 | 255,094 | 0.35 | 0.35 | 0.72 | 2.04 | 58 | ||||||||||||||||||||||||||||||||||||||||||
2009(2) | 10.00 | 0.09 | (0.51 | ) | (0.42 | ) | (0.03 | ) | — | (0.03 | ) | 9.55 | (4.16 | ) | 237,860 | 0.35 | 0.35 | 0.75 | 2.31 | 31 | ||||||||||||||||||||||||||||||||||||||||
International Equity Fund |
| |||||||||||||||||||||||||||||||||||||||||||||||||||||||||||
Class A |
| |||||||||||||||||||||||||||||||||||||||||||||||||||||||||||
2013 | $ | 6.20 | $ | 0.16 | $ | 1.55 | $ | 1.71 | $ | (0.18 | ) | $ | — | $ | (0.18 | ) | $ | 7.73 | 27.87 | % | $ | 231,661 | 0.44 | % | 0.44 | % | 0.65 | % | 2.21 | % | 52 | % | ||||||||||||||||||||||||||||
2012 | 8.07 | 0.17 | (1.87 | ) | (1.70 | ) | (0.17 | ) | — | (0.17 | ) | 6.20 | (21.10 | ) | 324,696 | 0.45 | 0.45 | 0.65 | 2.48 | 59 | ||||||||||||||||||||||||||||||||||||||||
2011 | 6.37 | 0.18 | 1.82 | 2.00 | (0.30 | ) | — | (0.30 | ) | 8.07 | 31.81 | 546,512 | 0.41 | 0.41 | 0.63 | 2.42 | 107 | |||||||||||||||||||||||||||||||||||||||||||
2010 | 6.08 | 0.15 | 0.27 | 0.42 | (0.13 | ) | — | (0.13 | ) | 6.37 | 6.68 | 605,479 | 0.39 | 0.39 | 0.64 | 2.25 | 153 | |||||||||||||||||||||||||||||||||||||||||||
2009 | 11.12 | 0.21 | (5.15 | ) | (4.94 | ) | (0.09 | ) | (0.01 | ) | (0.10 | ) | 6.08 | (44.32 | ) | 704,876 | 0.39 | (4) | 0.39 | (4) | 0.61 | (4) | 3.03 | 200 | ||||||||||||||||||||||||||||||||||||
World Equity Ex-US Fund |
| |||||||||||||||||||||||||||||||||||||||||||||||||||||||||||
Class A |
| |||||||||||||||||||||||||||||||||||||||||||||||||||||||||||
2013 | $ | 9.24 | $ | 0.25 | $ | 2.24 | $ | 2.49 | $ | (0.22 | ) | $ | — | $ | (0.22 | ) | $ | 11.51 | 27.11 | % | $ | 6,192,852 | 0.35 | % | 0.35 | % | 0.62 | % | 2.30 | % | 52 | % | ||||||||||||||||||||||||||||
2012 | 11.71 | 0.23 | (2.50 | ) | (2.27 | ) | (0.20 | ) | — | (0.20 | ) | 9.24 | (19.36 | ) | 4,623,934 | 0.45 | 0.45 | 0.63 | 2.28 | 56 | ||||||||||||||||||||||||||||||||||||||||
2011 | 9.09 | 0.23 | 2.59 | 2.82 | (0.20 | ) | — | (0.20 | ) | 11.71 | 31.12 | 5,129,089 | 0.45 | 0.45 | 0.64 | 2.12 | 85 | |||||||||||||||||||||||||||||||||||||||||||
2010 | 8.39 | 0.20 | 0.72 | 0.92 | (0.22 | ) | — | (0.22 | ) | 9.09 | 10.74 | 3,712,614 | 0.45 | 0.45 | 0.65 | 2.10 | 149 | |||||||||||||||||||||||||||||||||||||||||||
2009 | 14.56 | 0.26 | (6.43 | ) | (6.17 | ) | — | — | — | 8.39 | (42.38 | ) | 2,721,757 | 0.45 | (5) | 0.45 | (5) | 0.66 | (5) | 3.03 | 171 | |||||||||||||||||||||||||||||||||||||||
Screened World Equity Ex-US Fund |
| |||||||||||||||||||||||||||||||||||||||||||||||||||||||||||
Class A |
| |||||||||||||||||||||||||||||||||||||||||||||||||||||||||||
2013 | $ | 7.02 | $ | 0.15 | $ | 1.64 | $ | 1.79 | $ | (0.15 | ) | $ | — | $ | (0.15 | ) | $ | 8.66 | 25.69 | % | $ | 62,521 | 0.50 | % | 0.50 | % | 0.89 | % | 1.81 | % | 76 | % | ||||||||||||||||||||||||||||
2012 | 9.01 | 0.13 | (1.97 | ) | (1.84 | ) | (0.15 | ) | — | (0.15 | ) | 7.02 | (20.39 | ) | 48,756 | 0.74 | 0.74 | 0.93 | 1.63 | 76 | ||||||||||||||||||||||||||||||||||||||||
2011 | 7.04 | 0.12 | 1.98 | 2.10 | (0.13 | ) | — | (0.13 | ) | 9.01 | 29.93 | 54,844 | 0.77 | 0.77 | 1.06 | 1.42 | 89 | |||||||||||||||||||||||||||||||||||||||||||
2010 | 6.42 | 0.13 | 0.58 | 0.71 | (0.09 | ) | — | (0.09 | ) | 7.04 | 11.00 | 68,743 | 0.80 | 0.80 | 1.06 | 1.69 | 161 | |||||||||||||||||||||||||||||||||||||||||||
2009(3) | 10.00 | 0.14 | (3.66 | ) | (3.52 | ) | (0.06 | ) | — | (0.06 | ) | 6.42 | (35.12 | ) | 52,107 | 0.80 | 0.80 | 1.10 | 2.38 | 101 | ||||||||||||||||||||||||||||||||||||||||
Opportunistic Income Fund |
| |||||||||||||||||||||||||||||||||||||||||||||||||||||||||||
Class A |
| |||||||||||||||||||||||||||||||||||||||||||||||||||||||||||
2013 | $ | 7.97 | $ | 0.12 | $ | 0.34 | $ | 0.46 | $ | (0.17 | ) | $ | — | $ | (0.17 | ) | $ | 8.26 | 5.78 | % | $ | 996,522 | 0.21 | % | 0.26 | % | 0.52 | % | 1.41 | % | 26 | % | ||||||||||||||||||||||||||||
2012 | 7.95 | 0.15 | 0.04 | 0.19 | (0.17 | ) | — | (0.17 | ) | 7.97 | 2.49 | 218,959 | 0.41 | 0.41 | 0.53 | 1.94 | 58 | |||||||||||||||||||||||||||||||||||||||||||
2011 | 7.69 | 0.13 | 0.31 | 0.44 | (0.18 | ) | — | (0.18 | ) | 7.95 | 5.81 | 295,277 | 0.41 | 0.41 | 0.53 | 1.68 | 17 | |||||||||||||||||||||||||||||||||||||||||||
2010 | 6.95 | 0.21 | 0.67 | 0.88 | (0.14 | ) | — | (0.14 | ) | 7.69 | 12.66 | 115,519 | 0.41 | 0.41 | 0.54 | 2.85 | 12 | |||||||||||||||||||||||||||||||||||||||||||
2009 | 9.11 | 0.22 | (2.22 | ) | (2.00 | ) | (0.16 | )* | — | (0.16 | ) | 6.95 | (22.20 | ) | 165,113 | 0.41 | 0.41 | 0.54 | 2.91 | 27 | ||||||||||||||||||||||||||||||||||||||||
| * | Includes a return of capital of $0.04 per share. |
| † | Returns and portfolio turnover rates are for the period indicated and have not been annualized. Returns do not reflect the deduction of taxes the shareholder would pay on fund distributions or redemption of fund shares. |
| (1) | Per share net investment income and net realized and unrealized gains (losses) calculated using average shares. |
| (2) | Commenced operations on December 30, 2008. All ratios for the period have been annualized. |
| (3) | Commenced operations on June 30, 2008. All ratios for the period have been annualized. |
| (4) | The expense ratio includes interest expense on reverse repurchase agreements. Had this expense been excluded, the ratios would have been 0.39%, 0.39% and 0.61%, respectively. |
| (5) | The expense ratio includes interest expense on reverse repurchase agreements. Had this expense been excluded, the ratios would have been 0.45%, 0.45% and 0.66%, respectively. |
Amounts designated as “—” are $0 or have been rounded to $0.
The accompanying notes are an integral part of the financial statements.
| 248 | SEI Institutional Investments Trust / Annual Report / May 31, 2013 |
Table of Contents
Financial Highlights
For the years or periods ended May 31,
For a share outstanding throughout each period
| Net Asset Value, Beginning of Period | Net Investment | Net | Total from Operations | Dividends from Net Investment Income | Distributions from Realized Capital Gains | Total Dividends and Distributions | Net Asset Value, End of Period | Total Return† | Net Assets End of Period ($ Thousands) | Ratio of Net Assets | Ratio of Net Assets | Ratio of Net Assets | Ratio of Net Investment Income (Loss) to Average Net Assets | Portfolio Turnover Rate† | ||||||||||||||||||||||||||||||||||||||||||||||
Core Fixed Income Fund |
| |||||||||||||||||||||||||||||||||||||||||||||||||||||||||||
Class A |
| |||||||||||||||||||||||||||||||||||||||||||||||||||||||||||
2013 | $ | 10.63 | $ | 0.27 | $ | 0.06 | $ | 0.33 | $ | (0.29 | ) | $ | (0.13 | ) | $ | (0.42 | ) | $ | 10.54 | 3.12 | % | $ | 6,484,218 | 0.13 | % | 0.13 | % | 0.36 | % | 2.53 | % | 315 | % | |||||||||||||||||||||||||||
2012 | 10.39 | 0.34 | 0.47 | 0.81 | (0.36 | ) | (0.21 | ) | (0.57 | ) | 10.63 | 7.98 | 7,081,317 | 0.14 | 0.14 | 0.37 | 3.21 | 386 | ||||||||||||||||||||||||||||||||||||||||||
2011 | 10.35 | 0.38 | 0.44 | 0.82 | (0.39 | ) | (0.39 | ) | (0.78 | ) | 10.39 | 8.17 | 6,761,399 | 0.16 | (3) | 0.16 | (3) | 0.38 | (3) | 3.60 | 422 | |||||||||||||||||||||||||||||||||||||||
2010 | 9.42 | 0.47 | 0.95 | 1.42 | (0.49 | ) | — | (0.49 | ) | 10.35 | 15.34 | 5,705,708 | 0.14 | 0.14 | 0.37 | 4.71 | 242 | |||||||||||||||||||||||||||||||||||||||||||
2009 | 9.95 | 0.52 | (0.38 | ) | 0.14 | (0.52 | ) | (0.15 | ) | (0.67 | ) | 9.42 | 1.85 | 4,540,593 | 0.14 | 0.14 | 0.37 | 5.56 | 411 | |||||||||||||||||||||||||||||||||||||||||
High Yield Bond Fund |
| |||||||||||||||||||||||||||||||||||||||||||||||||||||||||||
Class A |
| |||||||||||||||||||||||||||||||||||||||||||||||||||||||||||
2013 | $ | 9.30 | $ | 0.71 | $ | 0.69 | $ | 1.40 | $ | (0.69 | ) | $ | — | $ | (0.69 | ) | $ | 10.01 | 15.46 | % | $ | 2,162,551 | 0.30 | %(11) | 0.30 | %(11) | 0.56 | %(11) | 7.23 | % | 72 | % | ||||||||||||||||||||||||||||
2012 | 9.58 | 0.74 | (0.29 | ) | 0.45 | (0.72 | ) | (0.01 | ) | (0.73 | ) | 9.30 | 5.09 | 1,914,780 | 0.35 | (8) | 0.35 | (8) | 0.56 | (8) | 7.97 | 50 | ||||||||||||||||||||||||||||||||||||||
2011 | 8.74 | 0.79 | 0.81 | 1.60 | (0.76 | ) | (0.00 | )‡ | (0.76 | ) | 9.58 | 19.06 | 1,939,023 | 0.35 | 0.35 | 0.56 | 8.48 | 90 | ||||||||||||||||||||||||||||||||||||||||||
2010 | 7.00 | 0.84 | 1.72 | 2.56 | (0.80 | ) | (0.02 | ) | (0.82 | ) | 8.74 | 37.60 | 1,634,608 | 0.35 | 0.35 | 0.56 | 10.03 | 110 | ||||||||||||||||||||||||||||||||||||||||||
2009 | 9.17 | 0.80 | (2.14 | ) | (1.34 | ) | (0.77 | ) | (0.06 | ) | (0.83 | ) | 7.00 | (13.79 | ) | 1,239,271 | 0.35 | 0.35 | 0.56 | 11.34 | 79 | |||||||||||||||||||||||||||||||||||||||
Long Duration Fund |
| |||||||||||||||||||||||||||||||||||||||||||||||||||||||||||
Class A |
| |||||||||||||||||||||||||||||||||||||||||||||||||||||||||||
2013 | $ | 9.65 | $ | 0.36 | $ | (0.25 | ) | $ | 0.11 | $ | (0.36 | ) | $ | (0.65 | ) | $ | (1.01 | ) | $ | 8.75 | 0.78 | % | $ | 3,322,291 | 0.16 | % | 0.16 | % | 0.37 | % | 3.80 | % | 96 | % | ||||||||||||||||||||||||||
2012 | 8.83 | 0.41 | 1.42 | 1.83 | (0.42 | ) | (0.59 | ) | (1.01 | ) | 9.65 | 21.70 | 5,497,375 | 0.20 | 0.20 | 0.37 | 4.45 | 121 | ||||||||||||||||||||||||||||||||||||||||||
2011 | 8.69 | 0.44 | 0.46 | 0.90 | (0.43 | ) | (0.33 | ) | (0.76 | ) | 8.83 | 10.74 | 3,523,154 | 0.20 | (5) | 0.20 | (5) | 0.37 | (5) | 5.03 | 85 | |||||||||||||||||||||||||||||||||||||||
2010 | 7.77 | 0.45 | 0.93 | 1.38 | (0.46 | ) | — | (0.46 | ) | 8.69 | 18.11 | 2,736,187 | 0.20 | 0.20 | 0.37 | 5.42 | 113 | |||||||||||||||||||||||||||||||||||||||||||
2009 | 8.57 | 0.39 | (0.72 | ) | (0.33 | ) | (0.47 | ) | — | (0.47 | ) | 7.77 | (3.89 | ) | 1,489,047 | 0.20 | 0.20 | 0.39 | 4.88 | 95 | ||||||||||||||||||||||||||||||||||||||||
Long Duration Corporate Bond Fund |
| |||||||||||||||||||||||||||||||||||||||||||||||||||||||||||
Class A |
| |||||||||||||||||||||||||||||||||||||||||||||||||||||||||||
2013(9) | $ | 10.00 | $ | 0.39 | $ | 0.00‡ | $ | 0.39 | $ | (0.39 | ) | $ | (0.07 | ) | $ | (0.46 | ) | $ | 9.93 | 3.75 | % | $ | 2,082,952 | 0.15 | % | 0.15 | % | 0.36 | % | 4.08 | % | 100 | % | |||||||||||||||||||||||||||
Ultra Short Duration Bond Fund |
| |||||||||||||||||||||||||||||||||||||||||||||||||||||||||||
Class A |
| |||||||||||||||||||||||||||||||||||||||||||||||||||||||||||
2013 | $ | 9.95 | $ | 0.10 | $ | 0.11 | $ | 0.21 | $ | (0.12 | ) | $ | — | $ | (0.12 | ) | $ | 10.04 | 2.14 | % | $ | 522,593 | 0.12 | % | 0.12 | % | 0.21 | % | 1.02 | % | 178 | % | ||||||||||||||||||||||||||||
2012 | 9.99 | 0.11 | (0.02 | ) | 0.09 | (0.13 | ) | — | (0.13 | ) | 9.95 | 0.86 | 298,223 | 0.16 | 0.16 | 0.21 | 1.14 | 222 | ||||||||||||||||||||||||||||||||||||||||||
2011(4) | 10.00 | 0.04 | (0.01 | ) | 0.03 | (0.04 | ) | — | (0.04 | ) | 9.99 | 0.33 | 313,358 | 0.18 | 0.18 | 0.23 | 1.65 | 23 | ||||||||||||||||||||||||||||||||||||||||||
Emerging Markets Debt Fund |
| |||||||||||||||||||||||||||||||||||||||||||||||||||||||||||
Class A |
| |||||||||||||||||||||||||||||||||||||||||||||||||||||||||||
2013 | $ | 11.22 | $ | 0.56 | $ | 0.65 | $ | 1.21 | $ | (0.84 | ) | $ | (0.48 | ) | $ | (1.32 | ) | $ | 11.11 | 10.64 | % | $ | 1,411,893 | 0.48 | % | 0.48 | % | 0.94 | % | 4.79 | % | 119 | % | |||||||||||||||||||||||||||
2012 | 11.60 | 0.73 | (0.22 | ) | 0.51 | (0.77 | ) | (0.12 | ) | (0.89 | ) | 11.22 | 4.67 | 1,114,918 | 0.55 | 0.55 | 0.93 | 6.43 | 55 | |||||||||||||||||||||||||||||||||||||||||
2011 | 10.47 | 0.78 | 0.91 | 1.69 | (0.56 | ) | — | (0.56 | ) | 11.60 | 16.51 | 1,028,691 | 0.55 | 0.55 | 0.93 | 6.89 | 75 | |||||||||||||||||||||||||||||||||||||||||||
2010 | 9.27 | 0.84 | 1.40 | 2.24 | (1.04 | ) | — | (1.04 | ) | 10.47 | 24.93 | 989,598 | 0.55 | 0.55 | 0.93 | 8.12 | 66 | |||||||||||||||||||||||||||||||||||||||||||
2009 | 10.42 | 0.75 | (1.19 | ) | (0.44 | ) | (0.71 | ) | — | (0.71 | ) | 9.27 | (3.55 | ) | 901,226 | 0.55 | 0.55 | 0.94 | 8.56 | 78 | ||||||||||||||||||||||||||||||||||||||||
Real Return Fund |
| |||||||||||||||||||||||||||||||||||||||||||||||||||||||||||
Class A |
| |||||||||||||||||||||||||||||||||||||||||||||||||||||||||||
2013 | $ | 10.29 | $ | 0.09 | $ | (0.10 | ) | $ | (0.01 | ) | $ | (0.18 | ) | $ | (0.24 | ) | $ | (0.42 | ) | $ | 9.86 | (0.15 | )% | $ | 251,852 | 0.11 | % | 0.11 | % | 0.28 | % | 0.87 | % | 97 | % | |||||||||||||||||||||||||
2012 | 10.67 | 0.29 | (0.07 | ) | 0.22 | (0.35 | ) | (0.25 | ) | (0.60 | ) | 10.29 | 2.15 | 281,861 | 0.20 | 0.20 | 0.28 | 2.75 | 96 | |||||||||||||||||||||||||||||||||||||||||
2011 | 10.41 | 0.31 | 0.37 | 0.68 | (0.21 | ) | (0.21 | ) | (0.42 | ) | 10.67 | 6.65 | 369,232 | 0.20 | 0.20 | 0.28 | 2.90 | 69 | ||||||||||||||||||||||||||||||||||||||||||
2010 | 10.11 | 0.33 | 0.24 | 0.57 | (0.27 | ) | — | (0.27 | ) | 10.41 | 5.70 | 326,758 | 0.29 | 0.29 | 0.55 | 3.18 | 205 | |||||||||||||||||||||||||||||||||||||||||||
2009 | 10.99 | 0.21 | (0.27 | ) | (0.06 | ) | (0.82 | )* | — | (0.82 | ) | 10.11 | (0.17 | ) | 260,477 | 0.36 | 0.36 | 0.78 | 2.01 | 148 | ||||||||||||||||||||||||||||||||||||||||
Dynamic Asset Allocation Fund |
| |||||||||||||||||||||||||||||||||||||||||||||||||||||||||||
Class A |
| |||||||||||||||||||||||||||||||||||||||||||||||||||||||||||
2013 | $ | 11.14 | $ | 0.30 | $ | 2.20 | $ | 2.50 | $ | (0.35 | ) | $ | (0.48 | ) | $ | (0.83 | ) | $ | 12.81 | 23.75 | % | $ | 1,135,631 | 0.10 | % | 0.10 | % | 0.66 | % | 2.50 | % | 35 | % | |||||||||||||||||||||||||||
2012 | 11.26 | (0.01 | ) | 0.39 | 0.38 | — | (0.50 | ) | (0.50 | ) | 11.14 | 3.73 | 552,649 | 0.50 | 0.50 | 0.67 | (0.10 | ) | 140 | |||||||||||||||||||||||||||||||||||||||||
2011(2) | 10.00 | (0.04 | ) | 1.49 | 1.45 | — | (0.19 | ) | (0.19 | ) | 11.26 | 14.66 | 407,345 | 0.50 | 0.50 | 0.67 | (0.39 | ) | 0 | |||||||||||||||||||||||||||||||||||||||||
Multi-Asset Real Return Fund |
| |||||||||||||||||||||||||||||||||||||||||||||||||||||||||||
Class A |
| |||||||||||||||||||||||||||||||||||||||||||||||||||||||||||
2013 | $ | 9.25 | $ | 0.11 | $ | (0.10 | )(12) | $ | 0.01 | $ | (0.07 | )** | $ | — | $ | (0.07 | ) | $ | 9.19 | 0.07 | % | $ | 303,899 | 0.32 | %(10) | 0.32 | %(10) | 0.66 | %(10) | 1.11 | % | 49 | % | |||||||||||||||||||||||||||
2012(6) | 10.00 | 0.10 | (0.84 | ) | (0.74 | ) | (0.01 | ) | — | (0.01 | ) | 9.25 | (7.37 | ) | 140,063 | 0.41 | (7) | 0.41 | (7) | 0.66 | (7) | 1.23 | 58 | |||||||||||||||||||||||||||||||||||||
| * | Includes a return of capital of $0.06 per share. |
| ** | Includes a return of capital of $0.01 per share. |
| † | Returns and portfolio turnover rates are for the period indicated and have not been annualized. Returns do not reflect the deduction of taxes the shareholder would pay on fund distributions or redemption of fund shares. |
| ‡ | Amount represents less than $0.01. |
| (1) | Per share net investment income (loss) and net realized and unrealized gains (losses) calculated using average shares. |
| (2) | Commenced operations on July 30, 2010. All ratios for the period have been annualized. |
| (3) | The expense ratio includes interest expense. Had this expense been excluded, the ratios would have been 0.14%, 0.14% and 0.36%, respectively. |
| (4) | Commenced operations on February 28, 2011. All ratios for the period have been annualized. |
| (5) | The expense ratio includes interest expense. Had this expense been excluded, the ratios would have been 0.20%, 0.20% and 0.37%, respectively. |
| (6) | Commenced operations on July 29, 2011. All ratios for the period have been annualized. |
| (7) | The expense ratio includes interest expense on reverse repurchase agreements. Had this expense been excluded, the ratios would have been 0.39%, 0.39% and 0.64%, respectively. |
| (8) | The expense ratio includes interest expense. Had this expense been excluded, the ratios would have been 0.35%, 0.35% and 0.56%, respectively. |
| (9) | Commenced operations on June 29, 2012. All ratios for the period have been annualized. |
| (10) | The expense ratio includes interest expense on reverse repurchase agreements. Had this expense been excluded, the ratio would have been 0.29%, 0.29% and 0.63%, respectively. |
| (11) | The expense ratio includes interest expense. Had this expense been excluded, the ratios would have been 0.30%, 0.30% and 0.56%, respectively. |
| (12) | The amount shown for the year ended May 31, 2013, for a share outstanding throughout the period does not accord with the aggregate net gains on investments for that period because of the sales and repurchases of Fund shares in relation to fluctuating market value of the investments of the Fund. |
Amounts designated as “—” are $0 or have been rounded to $0.
The accompanying notes are an integral part of the financial statements.
| SEI Institutional Investments Trust / Annual Report / May 31, 2013 | 249 |
Table of Contents
May 31, 2013
1. ORGANIZATION
SEI Institutional Investments Trust (the “Trust”) was organized as a Massachusetts business trust under a Declaration of Trust dated March 1, 1995. The Trust commenced operations on June 14, 1996.
The Trust is registered under the Investment Company Act of 1940, as amended, as an open-end investment company with 25 registered funds: Large Cap, Large Cap Diversified Alpha, Large Cap Disciplined Equity, Large Cap Index, Extended Market Index, Small Cap, Small Cap II, Small/Mid Cap Equity, U.S. Managed Volatility, International Equity, World Equity Ex-US, Screened World Equity Ex-US, Opportunistic Income, Core Fixed Income, High Yield Bond, Long Duration, Long Duration Corporate Bond, Ultra Short Duration Bond, Emerging Markets Debt, Real Return, Dynamic Asset Allocation, Multi-Asset Real Return, Strategic U.S. Large Cap Equity, Emerging Markets Equity and Global Equity Funds (each a “Fund,” collectively, the “Funds”) each of which are diversified Funds with the exception of the Emerging Markets Debt and Multi-Asset Real Return Funds. The Trust is registered to offer Class A shares of all Funds. The assets of each Fund are segregated, and a shareholder’s interest is limited to the Fund in which shares are held. The Trust’s prospectus provides a description of each Fund’s investment objectives, policies, and strategies.
Effective January 1, 2013, the Enhanced LIBOR Opportunities Fund changed its name to the Opportunistic Income Fund.
As of May 31, 2013, the Strategic U.S. Large Cap Equity, Emerging Markets Equity and Global Equity Funds have not yet commenced operations.
2. SIGNIFICANT ACCOUNTING POLICIES
The following is a summary of the significant accounting policies followed by the Funds.
Use of Estimates — The preparation of financial statements, in conformity with U.S. generally accepted accounting principles (“U.S. GAAP”), requires management to make estimates and assumptions that affect the reported amount of assets and liabilities and disclosure of contingent assets and liabilities as of the date of the financial statements and the reported amounts of increases and decreases in net assets from operations during the reporting period. Actual results could differ from those estimates.
Security Valuation — Securities listed on a securities exchange, market or automated quotation system for which quotations are readily available (except for securities traded on NASDAQ) and are valued at the last quoted sale price on the primary exchange or market (foreign or domestic) on which they are traded, or, if there is no such reported sale, at the most recent quoted bid price. For securities traded on NASDAQ, the NASDAQ Official Closing Price will be used. Debt securities are priced based upon valuations provided by independent, third-party pricing agents, if available. Such values generally reflect the last reported sales price if the security is actively traded. The third-party pricing agents may also value debt securities
at an evaluated bid price by employing methodologies that utilize actual market transactions, broker-supplied valuations, or other methodologies designed to identify the market value for such securities. Debt obligations acquired with remaining maturities of sixty days or less may be valued at their amortized cost, which approximates market value. The prices for foreign securities are reported in local currency and converted to U.S. dollars using currency exchange rates. Prices for most securities held in the Funds are provided daily by recognized independent pricing agents. SEI Investments Management Corporation (“SIMC”) or a Sub-Adviser, as applicable, reasonably believes that prices provided by independent pricing agents are reliable. However, there can be no assurance that such pricing service’s prices will be reliable. SIMC or a Sub-Adviser, as applicable, continuously monitors the reliability of prices obtained from any pricing service and will notify the Funds’ administrator if it believes that a particular pricing service is no longer a reliable source of prices. The Funds’ administrator, in turn, will notify the Trust’s Fair Value Committee (the “Committee”) if it receives such notification from SIMC or a Sub-Adviser, as applicable, or if the Funds’ administrator reasonably believes that a particular pricing service is no longer a reliable source for prices. If a security price cannot be obtained from an independent, third-party pricing agent, the Funds seek to obtain a bid price from at least one independent broker.
Securities for which market prices are not “readily available” are determined to be unreliable or cannot be valued using methodologies described above are valued in accordance with fair value procedures established by the Trust’s Board of Trustees. The Trust’s fair value procedures are implemented through the Committee designated by the Trust’s Board of Trustees. The Committee is currently composed of two members of the Board of Trustees, as well as representatives from SIMC and its affiliates. The Committee provides regular reports to the Board concerning investments for which market prices are not readily available or may be unreliable. Some of the more common reasons that may necessitate that a security be valued using fair value procedures include: the security’s trading has been halted or suspended; the security has been de-listed from a national exchange; the security’s primary trading market is temporarily closed at a time when, under normal conditions, it would be open; or the security’s primary pricing source is not able or willing to provide a price. When a security is valued in accordance with the fair value procedures, the Committee will determine the value after taking into consideration relevant information reasonably available to the Committee. Examples of factors the Committee may consider are: (i) the facts giving rise to the need to fair value; (ii) the last trade price; (iii) the performance of the market or the issuer’s industry; (iv) the liquidity of the security; (v) the size of the holding in a Fund; or (vi) any other appropriate information. The determination of a security’s fair value price often involves the consideration of a number of subjective factors and is therefore subject to the unavoidable risk that the value assigned to a security may be higher or lower than the security’s value would be if a reliable market quotation for the security was readily available.
| 250 | SEI Institutional Investments Trust / Annual Report / May 31, 2013 |
Table of Contents
For securities that principally trade on a foreign market or exchange, a significant gap in time can exist between the time of a particular security’s last trade and the time at which a Fund calculates its net asset value. The closing prices of such securities may no longer reflect their market value at the time a Fund calculates net asset value if an event that could materially affect the value of those securities (a “Significant Event”) has occurred between the time of the security’s last close and the time that a Fund calculates net asset value. A Significant Event may relate to a single issuer or to an entire market sector. If the adviser or sub-adviser of a Fund becomes aware of a Significant Event that has occurred with respect to a security or group of securities after the closing of the exchange or market on which the security or securities principally trade, but before the time at which a Fund calculates net asset value, the adviser or sub-adviser may request that a Fair Value Committee Meeting be called. In addition, the Trust’s administrator monitors price movements among certain selected indices, securities and/or baskets of securities that may be an indicator that the closing prices received earlier from foreign exchanges or markets may not reflect market value at the time a Fund calculates net asset value. If price movements in a monitored index or security exceed levels established by the administrator, the administrator notifies the adviser or sub-adviser for any Fund holding the relevant securities that such limits have been exceeded. In such event, the adviser or sub-adviser makes the determination whether a Fair Value Committee Meeting should be called based on the information provided.
The International Equity, World Equity Ex-US, Screened World Equity Ex-US and Multi-Asset Real Return Funds that hold international securities also use a third-party fair valuation vendor. The vendor provides a fair value for foreign securities held by these funds based on certain factors and methodologies (involving, generally, tracking valuation correlations between the U.S. market and each non-U.S. security). Values from the fair value vendor are applied in the event that there is a movement in the U.S. market that exceeds a specific threshold that has been established by the Committee. The Committee has also established a “confidence interval” which is used to determine the level of historical correlation between the value of a specific foreign security and movements in the U.S. market before a particular security will be fair valued when the threshold is exceeded. In the event that the threshold established by the Committee is exceeded on a specific day, these funds that hold international securities will value the non-U.S. securities within that fund that exceed the applicable “confidence interval” based upon the adjusted prices provided by the fair valuation vendor.
Options and warrants for which the primary market is a national securities exchange are valued at the last sale price on the exchange on which they are traded, or, in the absence of any sale, at the closing bid price. Options and warrants not traded on a national securities exchange are valued at the last quoted bid price.
In accordance with U.S. GAAP, fair value is defined as the price that a Fund would receive upon selling an investment in a orderly transaction
to an independent buyer in the principal or most advantageous market of the investment. A three tier hierarchy has been established to maximize the use of observable and minimize the use of unobservable inputs and to establish classification of fair value measurements for disclosure purposes. Inputs refer broadly to the assumptions that market participants would use in pricing an asset. Inputs may be observable or unobservable. Observable inputs are inputs that reflect the assumptions market participants would use in pricing the asset or liability based on market data obtained from sources independent of the reporting entity. Unobservable inputs are inputs that reflect the reporting entity’s own assumptions about the assumptions market participants would use in pricing the asset or liability based on the best information available in the circumstances.
The three-tier hierarchy of inputs is summarized in the three broad Levels listed below:
| Level 1 — | quoted prices in active markets for identical investments |
| Level 2 — | other significant observable inputs (including quoted prices for similar investments, interest rates, prepayment speeds, credit risks, etc.) |
| Level 3 — | significant unobservable inputs (including the Fund’s own assumptions in determining the fair value of investments) |
Investments are classified within the level of the lowest significant input considered in determining fair value. Investments classified within Level 3 whose fair value measurement considers several inputs may include Level 1 or Level 2 inputs as components of the overall fair value measurement.
Debt securities are valued in accordance with the evaluated bid price supplied by the pricing service and generally categorized as Level 2 in the hierarchy. Other securities that are categorized as Level 2 in the hierarchy include, but are not limited to, preferred stocks, bank loans, warrants, swaps and forward contracts. The Fund may use a
systematic fair valuation model provided by an independent pricing service to value foreign equity securities in order to adjust for stale pricing, which may occur between the close of certain foreign exchanges and the New York Stock Exchange. These are generally categorized as Level 2 in the hierarchy.
When independent prices are unavailable or unreliable, debt securities and swaps may be valued utilizing pricing matrices which consider similar factors that would be used by independent pricing services. These are generally categorized as Level 2 in the hierarchy but may be Level 3 depending on the circumstances. For certain collateralized debt obligations, corporate obligations, mortgage backed securities, auction rate preferred securities and loan participations where observable inputs are limited, assumptions about market activity and risk are used and are categorized as Level 3 in the hierarchy.
The valuation techniques used by the Funds to measure fair value during the year ended May 31, 2013 maximized the use of observable inputs and minimized the use of unobservable inputs.
| SEI Institutional Investments Trust / Annual Report / May 31, 2013 | 251 |
Table of Contents
Notes to Financial Statements (Continued)
May 31, 2013
For the year ended May 31, 2013, there have been no significant changes to the Trust’s fair valuation methodologies. For details of the investment classification, reference the Summary Schedules of Investments/Schedules of Investments.
Security Transactions and Investment Income — Security transactions are recorded on the trade date. Cost used in determining net realized capital gains and losses on the sale of securities is determined on the basis of specific identification. Dividend income and expense is recognized on the ex-dividend date, and interest income or expense is recognized using the accrual basis of accounting.
Distributions received on securities that represent a return of capital or capital gain are recorded as a reduction of cost of investments and/or as a realized gain. The Trust estimates the components of distributions received that may be considered nontaxable distributions or capital gain distributions.
Amortization and accretion is calculated using the scientific interest method, which approximates the effective interest method over the holding period of the security. Amortization of premiums and discounts is included in interest income.
Repurchase Agreements — To the extent consistent with its investment objective and strategies, a Fund may agree to purchase securities from financial institutions subject to the seller’s agreement to repurchase them at a mutually agreed upon date and price. It is the Fund’s policy that repurchase agreements are fully collateralized by U.S. Treasury and Government Agency securities. All collateral is held by the Fund’s custodian bank or a bank with which the custodian bank has entered into a subcustodian agreement, or is segregated in the Federal Reserve Book Entry System. In connection with transactions in repurchase agreements, if the seller defaults and the value of the collateral declines, or if the seller enters an insolvency proceeding, realization of the collateral by the Fund may be delayed or limited.
Reverse Repurchase Agreements — To the extent consistent with its investment objective and strategies, a Fund may issue reverse repurchase agreements. A reverse repurchase agreement involves the sale of portfolio assets together with an agreement to repurchase the same assets later at a fixed price. Additional assets are maintained in an account with the broker. The segregated assets may consist of cash, U.S. Government securities, or other liquid securities at least equal in value to the obligations under the reverse repurchase agreements. In the event the buyer of securities under a reverse repurchase agreement files for bankruptcy or becomes insolvent, a Fund’s use of the proceeds under the reverse repurchase agreement may be restricted pending a determination by the other party, or its trustee or receiver, whether to enforce the obligation to repurchase the securities.
Reverse repurchase agreements outstanding as of May 31, 2013 were as follows:
| Multi-Asset Real Return Fund | ||||||
| Principal Amount ($ Thousands) | Counterparty | Value ($ Thousands) | ||||
| $8,580 | Bank of America, 0.14% | $ | 8,580 | |||
| 8,182 | JPMorgan, 0.16% | 8,182 | ||||
| 6,597 | JPMorgan, 0.16% | 6,597 | ||||
| 6,121 | Bank of America, 0.14% | 6,121 | ||||
| 3,102 | Morgan Stanley, 0.15% | 3,102 | ||||
| 2,162 | Bank of America, 0.14% | 2,162 | ||||
| 1,448 | Bank of America, 0.14% | 1,448 | ||||
| 1,103 | Bank of America, 0.14% | 1,103 | ||||
| 1,059 | Bank of America, 0.14% | 1,059 | ||||
|
| |||||
| $ | 38,354 | |||||
|
| |||||
Expenses — Expenses that are directly related to a Fund are charged directly to that Fund. Other operating expenses of the Funds are prorated to the Funds on the basis of relative net assets.
Foreign Currency Translation — The books and records of the Funds investing in international securities are maintained in U.S. dollars on the following basis:
(I) market value of investment securities, assets and liabilities at the current rate of exchange; and
(II) purchases and sales of investment securities, income and expenses at the relevant rates of exchange prevailing on the respective dates of such transactions.
The Funds do not isolate that portion of gains and losses on investments in equity securities that is due to changes in the foreign exchange rates from that which is due to changes in market prices of equity securities.
The Funds report certain foreign-currency-related transactions as components of realized gains for financial reporting purposes, whereas such components are treated as ordinary income for Federal income tax purposes.
Forward Foreign Currency Contracts — To the extent consistent with its investment objective and strategies, a Fund may enter into forward foreign currency contracts as hedges against either specific transactions, fund positions or anticipated fund positions. All commitments are marked-to-market daily at the applicable foreign exchange rate, and any resulting unrealized gains or losses are recorded currently. The Fund realizes gains and losses at the time forward contracts are extinguished. Unrealized gains or losses on outstanding positions in forward foreign currency contracts held at the close of the period are recognized as ordinary income or loss for Federal income tax purposes. A Fund could be exposed to risk if the counterparties to the contracts are unable to meet the terms of the contract and from unanticipated movements in the value of a foreign currency relative to the U.S. dollar.
| 252 | SEI Institutional Investments Trust / Annual Report / May 31, 2013 |
Table of Contents
Finally, the risk exists that losses could exceed amounts disclosed on the Statements of Assets and Liabilities. Refer to each Fund’s Schedule of Investments or Summary Schedule of Investments for details regarding open forward foreign currency contracts as of May 31, 2013, if applicable.
Futures Contracts — To the extent consistent with its investment objective and strategies, a Fund may use futures contracts for tactical hedging purposes as well as to enhance the Fund’s returns. These Funds’ investments in futures contracts are designed to enable the Funds to more closely approximate the performance of their benchmark indices. Initial margin deposits of cash or securities are made upon entering into futures contracts. The contracts are marked-to-market daily and the resulting changes in value are accounted for as unrealized gains and losses. Variation margin payments are paid or received, depending upon whether unrealized gains or losses are incurred. When contracts are closed, the Funds record a realized gain or loss equal to the difference between the proceeds from (or cost of) the closing transaction and the amount invested in the contract.
Risks of entering into futures contracts include the possibility that there will be an imperfect price correlation between the futures and the underlying securities. Second, it is possible that a lack of liquidity for futures contracts could exist in the secondary market, resulting in an inability to close a position prior to its maturity date. Third, futures contracts involve the risk that a Fund could lose more than the original margin deposit required to initiate a futures transaction.
Finally, the risk exists that losses could exceed amounts disclosed on the Statements of Assets and Liabilities. Refer to each Fund’s Schedule of Investments or Summary Schedule of Investments for details regarding open futures contracts as of May 31, 2013, if applicable.
Options/Swaptions Written/Purchased — To the extent consistent with its investment objective and strategies, a Fund may invest in financial options/swaptions contracts for the purpose of hedging its existing portfolio securities, or securities that a Fund intends to purchase, against fluctuations in fair market value caused by changes in prevailing market interest rates. A Fund may also invest in financial option/swaption contracts to enhance its returns. When the Fund writes or purchases an option/swaption, an amount equal to the premium received or paid by the Fund is recorded as a liability or an asset and is subsequently adjusted to the current market value of the option/swaption written or purchased. Premiums received or paid from writing or purchasing options/ swaptions which expire unexercised are treated by the Fund on the expiration date as realized gains or losses. The difference between the premium and the amount paid or received on effecting a closing purchase or sale transaction, including brokerage commissions, is also treated as a realized gain or loss. If an option/swaption is exercised, the premium paid or received is added to the cost of the purchase or proceeds from the sale in determining whether the Fund has realized a gain or a loss. The Core Fixed Income, Dynamic Asset Allocation and Multi-Asset Real Return Funds had options/swaption contracts as of May 31, 2013, as disclosed in the Funds’ Schedules of Investments or Summary Schedule of Investments.
The risk in writing a call option/swaption is a Fund may give up the opportunity for profit if the market price of the security increases. The risk in writing a put option/swaption is a Fund may incur a loss if the market price of the security decreases and the option/swaption is exercised. The risk in purchasing an option/swaption is a Fund may pay a premium whether or not the option/swaption is exercised. The Funds also have the additional risk of being unable to enter into a closing transaction at an acceptable price if a liquid secondary market does not exist. Option/swaption contracts also involve the risk that they may not work as intended due to unanticipated developments in market conditions or other causes.
Finally, the risk exists that losses on written options could exceed amounts disclosed on the Statements of Assets and Liabilities. Refer to each Fund’s Schedule of Investments or Summary Schedule of Investments for details regarding open option/swaption contracts as of May 31, 2013, if applicable.
Securities Sold Short — To the extent consistent with its investment objective and strategies, a Fund may engage in short sales. Short sales are transactions under which a Fund sells a security it does not own. To complete such a transaction, a Fund must borrow the security to make delivery to the buyer. That Fund then is obligated to replace the security borrowed by purchasing the security at the market price at the time of the replacement. The price at such time may be more or less than the price at which the security was sold by a Fund. Until the security is replaced, a Fund is required to pay the lender amounts equal to any dividends or interest that accrue during the period of the loan. Dividends and interest are shown as an expense for financial reporting purposes. To borrow the security, a Fund also may be required to pay a premium, which would decrease proceeds of the security sold. The proceeds of the short sale are retained by the broker, to the extent necessary to meet margin requirements, until the short position is closed out. A gain, limited to the price at which a Fund sold the security short, or a loss, unlimited in size, will be recognized upon the close of a short sale.
Until a Fund closes its short position or replaces the borrowed security, that Fund will: (a) maintain a segregated account containing cash or liquid securities at such a level that (i) the amount deposited in the account plus the amount deposited with the broker as collateral will equal the current value of the security sold short; and (ii) the amount deposited in the segregated account plus the amount deposited with the broker as collateral will not be less than the market value of the security at the time the security was sold short, or (b) otherwise cover a Fund’s short positions. As of May 31, 2013, none of the Funds held any short positions.
Swap Agreements — To the extent consistent with its investment objective and strategies, a Fund may invest in swap contracts mainly as an efficient means to take and manage risk in the portfolio, including interest rate risk, credit risk and overall yield sensitivity. A swap agreement is a two-party contract under which an agreement is made to exchange
| SEI Institutional Investments Trust / Annual Report / May 31, 2013 | 253 |
Table of Contents
Notes to Financial Statements (Continued)
May 31, 2013
returns from predetermined investments or instruments, including a particular interest rate, foreign currency, or “basket” of securities representing a particular index. Credit default swaps involve the periodic payment by a Fund or counterparty of interest based on a specified rate multiplied by a notional amount assigned to an underlying debt instrument or group of debt instruments in exchange for the assumption of credit risk on the same instruments. In the event of a credit event, usually in the form of a credit rating downgrade, the party receiving periodic payments (i.e. floating rate payer) must pay the other party (i.e. fixed rate payer) an amount equal to the outstanding principal of the downgraded debt instrument. Total return swaps allow an investor to benefit from the cash flow without ever actually owning the underlying security. The receiver must pay any decline in value to the payer at the end of the total return swap. However, the investor does not need to make a payment if there is no decline in price. Payments can be made on various indices, bonds (i.e. mortgage-backed securities, bank debt and corporate bonds), loans or commodities. The value of a total return swap is equal to the change in value of the underlying asset versus the accrued income payment based on LIBOR (London Interbank Offered Rate) or some other form of index on the notional amount. Interest rate swaps involve the exchange by a Fund with another party of their respective commitments to pay or receive interest (e.g., an exchange of floating rate payments for fixed rate payments) with respect to a notional amount of principal to manage a Fund’s exposure to interest rates. Payments received or made are recorded as realized gains or losses. A Fund could be exposed to credit or market risk due to unfavorable changes in the fluctuation of interest rates or if the counterparty defaults on its obligation to perform. Risk of loss may exceed amounts recognized on the Statement of Assets and Liabilities. In connection with swap agreements, securities/cash may be set aside as collateral by a Fund’s custodian. A Fund may enter into swap agreements in order to, among other things, change the maturity or duration of the investment portfolio; protect a Fund’s value from changes in interest rates; or expose a Fund to a different security or market.
Swaps are marked-to-market daily based upon quotations from market makers and the resulting changes in market values, if any, are recorded as unrealized gains or losses in the Statements of Operations. Net payments of interest are recorded as realized gains or losses.
Entering into swap agreements involves, to varying degrees, elements of credit and market risk in excess of the amounts recognized on the Statements of Assets and Liabilities. Such risks involve the possibility that there will be no liquid market for these agreements, that the counterparty to the agreement may default on its obligation to perform and that there may be unfavorable changes in the fluctuation of interest rates. Risks also arise from potential losses from adverse market movements.
This risk is mitigated by having a master netting arrangement between a Fund and the counterparty and by having the counterparty post collateral to cover a Fund’s exposure to the counterparty. See Note 3 for further details. Refer to each Fund’s Schedule of Investments or Summary Schedule of Investments for details regarding open swap agreements as of May 31, 2013, if applicable.
Forward Treasury Commitments — To the extent consistent with its investment objective and strategies, a Fund may invest in commitments to purchase U.S. Treasury securities on an extended settlement basis. Such transactions involve the commitment to purchase a security with payment and delivery taking place in the future, sometimes a month or more after the transaction date. The Funds account for such transactions as purchases and sales and record an unrealized gain or loss each day equal to the difference between the cost of the purchase commitment and the current market value. Realized gains or losses are recorded upon closure or settlement of such commitments. No interest is earned prior to settlement of the transaction. These instruments are subject to market fluctuation due to changes in interest rates and the market value at the time of settlement could be higher or lower than the purchase price. A Fund may incur losses due to changes in the value of the underlying treasury securities from interest rate fluctuations or as a result of counterparty nonperformance.
Delayed Delivery Transactions — To the extent consistent with its investment objective and strategies, a Fund may purchase or sell securities on a when-issued or delayed delivery basis. These transactions involve a commitment by those Funds to purchase or sell securities for a predetermined price or yield, with payment and delivery taking place beyond the customary settlement period. When purchasing a security on a delayed delivery basis, that Fund assumes the rights and risks of ownership of the security, including the risk of price and yield fluctuations, and takes such fluctuations into account when determining its net asset value. Those Funds may dispose of or renegotiate a delayed delivery transaction after it is entered into, and may sell when-issued securities before they are delivered, which may result in a capital gain or loss. When those Funds have sold a security on a delayed delivery basis, that Fund does not participate in future gains and losses with respect to the security.
Loan Participations and Brady Bonds — To the extent consistent with its investment objective and strategies, a Fund may invest in U.S. dollar-denominated fixed- and floating-rate loans (“Loans”) arranged through private negotiations between a foreign sovereign entity and one or more financial institutions (“Lenders”). The Fund invests in such Loans in the form of participations in Loans (“Participations”) or assignments of all or a portion of Loans from third parties. Participations typically result in this Fund having a contractual relationship only with the Lenders, not with the sovereign borrowers. This Fund has the right to receive payments of principal, interest and any fees to which it is entitled from the Lender selling the Participation and only upon receipt by the Lender of the payments from the borrower. In connection with purchasing Participations, the Fund generally has no right to enforce compliance by the borrower with the terms of the loan agreement relating to the Loan, nor any rights of set-off against the borrower, and the Fund will not benefit directly from any collateral supporting the Loan in which it has purchased the Participation. As a result, the Fund assumes the credit risk of both the borrower and the Lender that is selling the Participation.
| 254 | SEI Institutional Investments Trust / Annual Report / May 31, 2013 |
Table of Contents
Certain debt obligations, customarily referred to as “Brady Bonds,” are created through the exchange of existing commercial bank loans to foreign entities for new obligations in connection with debt restructuring under a plan introduced by former U.S. Secretary of the Treasury Nicholas F. Brady. Brady Bonds have only been issued since 1989, and, accordingly, do not have a long payment history. They are issued by governments that may have previously defaulted on the loans being restructured by the Brady Bonds, so they are subject to the risk of default by the issuer. They may be fully or partially collateralized or uncollateralized and issued in various currencies.
Collateralized Debt Obligations — To the extent consistent with its investment objective and strategies, a Fund may invest in collateralized debt obligations (“CDOs”), which include collateralized loan obligations (“CLOs”) and other similarly structured securities. CLOs are a type of asset-backed security. A CLO is a trust, typically collateralized by a pool of loans, which may include, among others, domestic and foreign senior secured loans, senior unsecured loans and subordinate corporate loans, including loans that may be rated below investment grade or equivalent unrated loans. CDOs may charge management fees and administrative expenses.
For CDOs, the cashflows from the trust are split into two or more portions, called tranches, varying in risk and yield. The riskiest portion is the “equity” tranche which bears the bulk of defaults from the bonds or loans in the trust and serves to protect the other, more senior tranches from default in all but the most severe circumstances. Since it is partially protected from defaults, a senior tranche from a CDO trust typically has a higher rating and lower yield than their underlying securities, and can be rated investment grade. Despite the protection from the equity tranche, CDO tranches can experience substantial losses due to actual defaults, increased sensitivity to defaults due to collateral default and disappearance of protecting tranches, market anticipation of defaults, as well as aversion to CDO securities as a class.
The risks of an investment in a CDO depend largely on the type of the collateral securities and the class of the CDO in which a Fund invests. Normally, CLOs and other CDOs are privately offered and sold, and thus, are not registered under the securities laws. As a result, investments in CDOs may be characterized by a Fund as illiquid securities; however, an active dealer market may exist for CDOs allowing a CDO to qualify for
Rule 144A transactions. In addition to the normal risks associated with fixed income securities (e.g., interest rate risk and default risk), CDOs carry additional risks including, but not limited to: (i) the possibility that distributions from collateral securities will not be adequate to make interest or other payments; (ii) the quality of the collateral may decline in value or default; (iii) a Fund may invest in CDOs that are subordinate to other classes; and (iv) the complex structure of the security may not be fully understood at the time of investment and may produce disputes with the issuer or unexpected investment results.
Dividends and Distributions to Shareholders — Dividends from net investment income are declared and paid to shareholders quarterly for the Large Cap, Large Cap Diversified Alpha, Large Cap Disciplined Equity, Large Cap Index, Extended Market Index, Small Cap, Small Cap II, Small/Mid Cap Equity, U.S. Managed Volatility, Opportunistic Income, Emerging Markets Debt, Real Return and Multi-Asset Real Return Funds; declared daily and paid monthly for the Core Fixed Income, High Yield Bond, Long Duration, Long Duration Corporate Bond and Ultra Short Duration Bond Funds; declared and paid at least annually for the International Equity, World Equity Ex-US, Screened World Equity Ex-US and Dynamic Asset Allocation Funds. Dividends and distributions are recorded on the ex-dividend date. Any net realized capital gains will be distributed at least annually by the Funds.
Illiquid Securities — A security is considered illiquid if it cannot be sold or disposed of in the ordinary course of business within seven days or less for its approximate carrying value on the books of a Fund. Valuations of illiquid securities may differ significantly from the values that would have been used had an active market value for these securities existed.
Restricted Securities — As of May 31, 2013, the following Funds owned private placement investments that were purchased through private offerings or acquired through initial public offerings and cannot be sold without prior registration under the Securities Act of 1933 or pursuant to an exemption therefrom. In addition, these Funds have generally agreed to further restrictions on the disposition of certain holdings as set forth in various agreements entered into in connection with the purchase of these private placement investments. The acquisition dates of these investments, the enforceable right to acquire these private placement investments, along with the cost and values at May 31, 2013, were as follows:
| Number of Shares/ Face Amount ($ Thousands) | Acquisition Date | Right to Acquire Date | Cost ($ Thousands) | Market Value ($ Thousands) | % of Net Assets | |||||||||||||||||||
| Small Cap Fund | ||||||||||||||||||||||||
Titanium Asset Management | 132,700 | 8/6/07 | 8/6/07 | $ | 792 | $ | 105 | 0.01 | % | |||||||||||||||
|
|
|
|
|
| |||||||||||||||||||
| Small/Mid Cap Equity Fund | ||||||||||||||||||||||||
Titanium Asset Management | 147,000 | 8/6/07 | 8/6/07 | $ | 867 | $ | 116 | 0.01 | % | |||||||||||||||
|
|
|
|
|
| |||||||||||||||||||
| High Yield Bond Fund | ||||||||||||||||||||||||
Aventine (Escrow Security) | $ | 2,600 | 11/30/10 | 11/30/10 | $ | — | $ | 1 | 0.00 | % | ||||||||||||||
VSS AHC, Cl A | 29,628 | 9/25/09 | 9/25/09 | 551 | 354 | 0.02 | ||||||||||||||||||
|
|
|
|
|
| |||||||||||||||||||
| $ | 551 | $ | 355 | 0.02 | % | |||||||||||||||||||
|
|
|
|
|
| |||||||||||||||||||
| SEI Institutional Investments Trust / Annual Report / May 31, 2013 | 255 |
Table of Contents
Notes to Financial Statements (Continued)
May 31, 2013
Investments in Real Estate Investment Trusts (“REITs”) — Dividend income is recorded based on the income included in distributions received from the REIT investments using published REIT reclassifications including some management estimates when actual amounts are not available. Distributions received in excess of this estimated amount are recorded as a reduction of the cost of investments or reclassified to capital gains. The actual amounts of income, return of capital, and capital gains are only determined by each REIT after its fiscal year-end, and may differ from the estimated amounts.
3. CREDIT DERIVATIVES
To the extent consistent with its investment objective and strategies, a Fund may enter into credit default swaps to simulate long and short bond positions that are either unavailable or considered to be less attractively priced in the bond market. A Fund uses these swaps to reduce risk where a Fund has exposure to the issuer, or to take an active long or short position with respect to the likelihood of an event of default. The reference obligation of the swap can be a single issuer, a “basket” of issuers, or an index. The underlying referenced assets are corporate debt, sovereign debt and asset-backed securities.
The buyer of a credit default swap is generally obligated to pay the seller a periodic stream of payments over the term of the contract in return for a contingent payment upon the occurrence of a credit event with respect to an underlying reference obligation. Generally, a credit event for corporate or sovereign reference obligations means bankruptcy, failure to pay, obligation acceleration, repudiation/moratorium or restructuring. For credit default swaps on asset-backed securities, a credit event may be triggered by events such as failure to pay principal, maturity extension, rating downgrade or write-down.
If a Fund is a seller of protection, and a credit event occurs, as defined under the terms of that particular swap agreement, a Fund will generally either (i) pay to the buyer an amount equal to the notional amount of the swap and take delivery of the referenced obligation, other deliverable obligations, or underlying securities comprising a referenced index or (ii) pay a net settlement amount in the form of cash or securities equal to the notional amount of the swap less the recovery value of the referenced obligation or underlying securities comprising a referenced index.
If a Fund is a buyer of protection and a credit event occurs, as defined under the terms of that particular swap agreement, a Fund will either (i) receive from the seller of protection an amount equal to the notional amount of the swap and deliver the referenced obligation, other deliverable obligations or underlying securities comprising the referenced index or (ii) receive a net settlement amount in the form of cash or securities equal to the notional amount of the swap less the recovery value of the referenced obligation or underlying securities comprising the referenced index. Recovery values are assumed by market makers considering either industry standard recovery rates or entity specific factors and considerations until a credit event occurs. If a credit event has occurred, the recovery value is determined by a facilitated auction whereby a minimum number of allowable broker bids, together with a specified valuation method, are used to calculate the settlement value.
Certain Funds are party to International Swap Dealers Association, Inc. Master Agreements (“ISDA Master Agreements”). These agreements are with select counterparties and they govern transactions, including certain over-the-counter derivative and foreign exchange contracts, entered into by the Funds and the counterparty.
As of May 31, 2013, the High Yield Bond, Core Fixed Income and Long Duration Funds are the buyers (“receiving protection”) on a total notional amount of $17.9 million, $15.3 million and $5.0 million, respectively. Additionally, the Core Fixed Income and Multi-Asset Real Return Funds are the sellers (“providing protection”) on a total notional amount of $3.6 million and $1.1 million, respectively. The notional amounts of the swaps are not recorded in the financial statements; however the notional amounts approximate the maximum potential amount of future payments that the Fund could be required to make if the Fund was the seller of protection and a credit event were to occur. Those credit default swaps (“CDS”) for which the Fund is providing protection at balance sheet date are summarized as follows:
CORE FIXED INCOME FUND WRITTEN CREDIT DERIVATIVE CONTRACTS | SINGLE NAME CDS | CDS ON AN INDEX | ||||||||||||||||||
| REFERENCE ASSET | CORP US$ | SOVEREIGN US$ | ABS US$ | CORP US$ | Total | |||||||||||||||
Fair value of written credit derivatives | $ | (27,351 | ) | — | — | — | $ | (27,351 | ) | |||||||||||
Maximum potential amount of future payments | 3,560,000 | — | — | — | 3,560,000 | |||||||||||||||
Recourse provisions with third parties to recover any amounts paid under the credit derivative (including any purchased credit protection)1 | — | — | — | — | — | |||||||||||||||
Collateral held by the Fund can obtain upon occurrence of triggering event | — | — | — | — | — | |||||||||||||||
| 1 | Potential recoveries would include purchased credit derivatives to the extent they offset written credit derivatives which have an identical underlying, or a netting arrangement or credit support annex with the counterparty. There may be other potential recoveries from recourse provisions where agreements cover multiple derivative arrangements but those amounts have not been included. |
| 256 | SEI Institutional Investments Trust / Annual Report / May 31, 2013 |
Table of Contents
| MAXIMUM POTENTIAL AMOUNT OF FUTURE PAYMENTS BY CONTRACT TERM | ||||||||||||||||||||||||
| CORE FIXED INCOME FUND | 0-6 MONTHS | 6-12 MONTHS | 1-5 YEARS | 5-10 YEARS | > 10 YEARS | Total | ||||||||||||||||||
Current credit spread* on underlying (in basis points) | ||||||||||||||||||||||||
0-200 | — | — | — | $ | 3,560,000 | — | $ | 3,560,000 | ||||||||||||||||
> than 200 | — | — | — | — | — | — | ||||||||||||||||||
Total | $ | 3,560,000 | $ | 3,560,000 | ||||||||||||||||||||
| * | The credit spread on the underlying asset is generally indicative of the current status of the underlying risk of the Fund having to perform. The spread also reflects the cost of buying/selling protection and may include upfront payments required to be made to enter into a contract. Higher credit spreads with a shorter contract term is indicative of a higher likelihood of performance by the Fund. |
MULTI-ASSET REALRETURN FUND WRITTEN CREDIT DERIVATIVE CONTRACTS | SINGLE NAME CDS | CDS ON AN INDEX | ||||||||||||||||||
REFERENCE ASSET | CORP | SOVEREIGN | ABS | CORP | Total | |||||||||||||||
Fair value of written credit derivatives | $ | 19,531 | — | — | $ | 10,827 | $ | 30,358 | ||||||||||||
Maximum potential amount of future payments | 429,202 | — | — | 690,000 | 1,119,202 | |||||||||||||||
Recourse provisions with third parties to recover any amounts paid under the credit derivative (including any purchased credit protection)1 | — | — | — | — | — | |||||||||||||||
Collateral held by the Fund can obtain upon occurrence of triggering event | — | — | — | — | — | |||||||||||||||
| 1 | Potential recoveries would include purchased credit derivatives to the extent they offset written credit derivatives which have an identical underlying, or a netting arrangement or credit support annex with the counterparty. There may be other potential recoveries from recourse provisions where agreements cover multiple derivative arrangements but those amounts have not been included. |
MAXIMUM POTENTIAL AMOUNT OF FUTURE PAYMENTS BY CONTRACT TERM | ||||||||||||||||||||||||
MULTI-ASSET REALRETURN FUND | 0-6 MONTHS | 6-12 MONTHS | 1-5 YEARS | 5-10 YEARS | > 10 YEARS | Total | ||||||||||||||||||
Current credit spread* on underlying (in basis points) | ||||||||||||||||||||||||
0-100 | — | — | $ | 860,000 | — | — | $ | 860,000 | ||||||||||||||||
100-200 | — | — | 259,202 | — | — | 259,202 | ||||||||||||||||||
> than 200 | — | — | — | — | — | — | ||||||||||||||||||
Total | — | — | $ | 1,119,202 | — | — | $ | 1,119,202 | ||||||||||||||||
| * | The credit spread on the underlying asset is generally indicative of the current status of the underlying risk of the Fund having to perform. The spread also reflects the cost of buying/selling protection and may include upfront payments required to be made to enter into a contract. Higher credit spreads with a shorter contract term is indicative of a higher likelihood of performance by the Fund. |
The credit spread disclosed above for each reference obligation where the Fund is the seller of protection is a representation of the current payment/performance risk of the swap.
4. DERIVATIVE TRANSACTIONS
The fair value of derivative instruments as of May 31, 2013 was as follows:
| Asset Derivatives | Liability Derivatives | |||||||||||
| Year ended May 31, 2013 ($ Thousands) | Year ended May 31, 2013 ($ Thousands) | |||||||||||
| Statement of Assets and Liabilities Location | Fair Value | Statement of Assets and Liabilities Location | Fair Value | |||||||||
Derivatives not accounted for as hedging instruments: |
| |||||||||||
| Core Fixed Income Fund | ||||||||||||
Interest rate contracts | Net Assets — Unrealized appreciation on futures contracts | $ | 3,869 | * | Net Assets — Unrealized depreciation on futures contracts | $ | 872 | * | ||||
Net Assets — Unrealized appreciation on swap contracts | 2,332 | † | Net Assets — Unrealized depreciation on swap contracts | 1,213 | † | |||||||
Options purchased, at value | 430 | Options written, at value | 373 | |||||||||
Swaptions purchased, at value | 2,890 | Swaptions written, at value | — | |||||||||
Foreign exchange contracts | Unrealized gain on forward foreign currency contracts | 1,712 | Unrealized loss on forward foreign currency contracts | 287 | ||||||||
Credit contracts | Net Assets — Unrealized appreciation on swap contracts | 97 | † | Net Assets — Unrealized depreciation on swap contracts | 170 | † | ||||||
|
|
|
| |||||||||
Total Derivatives not accounted for as hedging instruments | $ | 11,330 | $ | 2,915 | ||||||||
|
|
|
| |||||||||
| Long Duration Fund | ||||||||||||
Interest rate contracts | Net Assets — Unrealized appreciation on futures contracts | $ | 1,546 | * | Net Assets — Unrealized depreciation on futures contracts | $ | 2,029 | *† | ||||
Net Assets — Unrealized appreciation on swap contracts | 676 | † | Net Assets — Unrealized depreciation on swap contracts | — | ||||||||
Credit contracts | Net Assets — Unrealized depreciation on swap contracts | — | † | Net Assets — Unrealized depreciation on swap contracts | 289 | † | ||||||
|
|
|
| |||||||||
Total Derivatives not accounted for as hedging instruments | $ | 2,222 | $ | 2,318 | ||||||||
|
|
|
| |||||||||
| SEI Institutional Investments Trust / Annual Report / May 31, 2013 | 257 |
Table of Contents
Notes to Financial Statements (Continued)
May 31, 2013
| Asset Derivatives | Liability Derivatives | |||||||||||
| Year ended May 31, 2013 ($ Thousands) | Year ended May 31, 2013 ($ Thousands) | |||||||||||
| Statement of Assets and Liabilities Location | Fair Value | Statement of Assets and Liabilities Location | Fair Value | |||||||||
| Emerging Markets Debt Fund | ||||||||||||
Interest rate contracts | Net Assets — Unrealized appreciation on swap contracts | $ | 49 | † | Net Assets — Unrealized depreciation on swap contracts | $ | 296 | † | ||||
Foreign exchange contracts | Unrealized gain on forward foreign currency contracts | 6,012 | Unrealized loss on forward foreign currency contracts | 4,234 | ||||||||
Options purchased, at value | 443 | Options written, at value | — | |||||||||
Equity contracts | Net Assets — Unrealized appreciation on swap contracts | 166 | † | Net Assets — Unrealized depreciation on swap contracts | 710 | † | ||||||
|
|
|
| |||||||||
Total Derivatives not accounted for as hedging instruments | $ | 6,670 | $ | 5,240 | ||||||||
|
|
|
| |||||||||
| Dynamic Asset Allocation Fund | ||||||||||||
Foreign exchange contracts | Unrealized gain on forward foreign currency contracts | $ | 6,953 | Unrealized loss on forward foreign currency contracts | $ | — | ||||||
Equity contracts | Options purchased, at value | 2,490 | Options written, at value | — | ||||||||
|
|
|
| |||||||||
Total Derivatives not accounted for as hedging instruments | $ | 9,443 | $ | — | ||||||||
|
|
|
| |||||||||
| Multi-Asset Real Return Fund | ||||||||||||
Interest rate contracts | Net Assets — Unrealized appreciation on futures contracts | $ | 123 | * | Net Assets — Unrealized depreciation on futures contracts | $ | — | * | ||||
Net Assets — Unrealized appreciation on swap contracts | 93 | † | Net Assets — Unrealized depreciation on swap contracts | 77 | † | |||||||
Foreign exchange contracts | Unrealized gain on forward foreign currency contracts | 1,325 | Unrealized loss on forward foreign currency contracts | 16 | ||||||||
Credit contracts | Net Assets — Unrealized appreciation on swap contracts | 23 | † | Net Assets — Unrealized depreciation on swap contracts | — | † | ||||||
Equity contracts | Net Assets — Unrealized appreciation on swap contracts | 632 | † | Net Assets — Unrealized depreciation on swap contracts | — | † | ||||||
Options purchased, at value | 122 | Options written, at value | 105 | |||||||||
|
|
|
| |||||||||
Total Derivatives not accounted for as hedging instruments | $ | 2,318 | $ | 198 | ||||||||
|
|
|
| |||||||||
| * | Includes cumulative appreciation/depreciation of futures contracts as reported in the Schedules of Investments. Only current day’s variation margin is reported within the Statements of Assets & Liabilities. |
| † | Includes cumulative appreciation/depreciation of swap contracts as reported in the Schedules of Investments. Market Value is reported within the Statements of Assets & Liabilities for swap contracts that have paid premiums. |
The effect of derivative instruments on the Statements of Operations for the year ended May 31, 2013.
Amount of realized gain or (loss) on derivatives recognized in income ($ Thousands):
| Derivatives Not Accounted for as Hedging Instruments | Options | Futures | Forward Currency Contracts | Swaps | Total | |||||||||||||||
International Equity Fund | ||||||||||||||||||||
Foreign exchange contracts | $ | — | $ | — | $ | (11 | ) | $ | — | $ | (11 | ) | ||||||||
Equity contracts | — | 2,500 | — | — | 2,500 | |||||||||||||||
Total | $ | — | $ | 2,500 | $ | (11 | ) | $ | — | $ | 2,489 | |||||||||
World Equity Ex-US Fund | ||||||||||||||||||||
Foreign exchange contracts | $ | — | $ | — | $ | 614 | $ | — | $ | 614 | ||||||||||
Equity contracts | — | 31,664 | — | — | 31,664 | |||||||||||||||
Total | $ | — | $ | 31,664 | $ | 614 | $ | — | $ | 32,278 | ||||||||||
Screened World Equity Ex-US Fund | ||||||||||||||||||||
Foreign exchange contracts | $ | — | $ | — | $ | 16 | $ | — | $ | 16 | ||||||||||
Equity contracts | — | 305 | — | — | 305 | |||||||||||||||
Total | $ | — | $ | 305 | $ | 16 | $ | — | $ | 321 | ||||||||||
Core Fixed Income Fund | ||||||||||||||||||||
Interest rate contracts | $ | 332 | $ | 4,693 | $ | — | $ | (2,187 | ) | $ | 2,838 | |||||||||
Foreign exchange contracts | — | — | 6,244 | — | 6,244 | |||||||||||||||
Credit contracts | 119 | — | — | (3,573 | ) | (3,454 | ) | |||||||||||||
Total | $ | 451 | $ | 4,693 | $ | 6,244 | $ | (5,760 | ) | $ | 5,628 | |||||||||
Long Duration Fund | ||||||||||||||||||||
Interest rate contracts | $ | — | $ | (4,788 | ) | $ | — | $ | (170 | ) | $ | (4,958 | ) | |||||||
Credit contracts | — | — | — | (10 | ) | (10 | ) | |||||||||||||
Total | $ | — | $ | (4,788 | ) | $ | — | $ | (180 | ) | $ | (4,968 | ) | |||||||
| 258 | SEI Institutional Investments Trust / Annual Report / May 31, 2013 |
Table of Contents
| Derivatives Not Accounted for as Hedging Instruments | Options | Futures | Forward Currency Contracts | Swaps | Total | |||||||||||||||
Emerging Markets Debt Fund | ||||||||||||||||||||
Interest rate contracts | $ | — | $ | (164 | ) | $ | — | $ | 246 | $ | 82 | |||||||||
Foreign exchange contracts | 78 | — | 9,840 | — | 9,918 | |||||||||||||||
Equity contracts | — | — | — | 3,147 | 3,147 | |||||||||||||||
Credit contracts | — | — | — | 5,419 | 5,419 | |||||||||||||||
Total | $ | 78 | $ | (164 | ) | $ | 9,840 | $ | 8,812 | $ | 18,566 | |||||||||
Dynamic Asset Allocation Fund | ||||||||||||||||||||
Foreign exchange contracts | $ | — | $ | — | $ | (1,270 | ) | $ | — | $ | (1,270 | ) | ||||||||
Equity contracts | (3,059 | ) | — | — | 20,596 | * | 17,537 | |||||||||||||
Total | $ | (3,059 | ) | $ | — | $ | (1,270 | ) | $ | 20,596 | $ | 16,267 | ||||||||
Multi-Asset Real Return Fund | ||||||||||||||||||||
Interest rate contracts | $ | — | $ | 26 | $ | — | $ | (61 | ) | $ | (35 | ) | ||||||||
Foreign exchange contracts | — | — | 288 | — | 288 | |||||||||||||||
Credit contracts | — | — | — | 47 | 47 | |||||||||||||||
Equity contracts | (475 | ) | — | — | (7,903 | ) | (8,378 | ) | ||||||||||||
Total | $ | (475 | ) | $ | 26 | $ | 288 | $ | (7,917 | ) | $ | (8,078 | ) | |||||||
| Change in unrealized appreciation or (depreciation) on derivatives recognized in income ($ Thousands): | ||||||||||||||||||||||||
| Derivatives Not Accounted for as Hedging Instruments | Swaptions | Options | Futures | Forward Currency Contracts | Swaps | Total | ||||||||||||||||||
International Equity Fund | ||||||||||||||||||||||||
Foreign exchange contracts | $ | — | $ | — | $ | — | $ | (122 | ) | $ | — | $ | (122 | ) | ||||||||||
Equity contracts | — | — | 628 | — | — | 628 | ||||||||||||||||||
Total | $ | — | $ | — | $ | 628 | $ | (122 | ) | $ | — | $ | 506 | |||||||||||
World Equity Ex-US Fund | ||||||||||||||||||||||||
Foreign exchange contracts | $ | — | $ | — | $ | — | $ | (3,649 | ) | $ | — | $ | (3,649 | ) | ||||||||||
Equity contracts | — | — | 14,968 | — | — | 14,968 | ||||||||||||||||||
Total | $ | — | $ | — | $ | 14,968 | $ | (3,649 | ) | $ | — | $ | 11,319 | |||||||||||
Screened World Equity Ex-US Fund | ||||||||||||||||||||||||
Foreign exchange contracts | $ | — | $ | — | $ | — | $ | (64 | ) | $ | — | $ | (64 | ) | ||||||||||
Equity contracts | — | — | 164 | — | — | 164 | ||||||||||||||||||
Total | $ | — | $ | — | $ | 164 | $ | (64 | ) | $ | — | $ | 100 | |||||||||||
Core Fixed Income Fund | ||||||||||||||||||||||||
Interest rate contracts | $ | 6 | $ | 317 | $ | 7,719 | $ | — | $ | 2,712 | $ | 10,754 | ||||||||||||
Foreign exchange contracts | — | — | — | (137 | ) | — | (137 | ) | ||||||||||||||||
Equity contracts | — | — | — | — | 201 | 201 | ||||||||||||||||||
Credit contracts | — | — | — | — | 2,986 | 2,986 | ||||||||||||||||||
Total | $ | 6 | $ | 317 | $ | 7,719 | $ | (137 | ) | $ | 5,899 | $ | 13,804 | |||||||||||
Long Duration Fund | ||||||||||||||||||||||||
Interest rate contracts | $ | — | $ | — | $ | (1,799 | ) | $ | — | $ | 676 | $ | (1,123 | ) | ||||||||||
Credit contracts | — | — | — | — | (409 | ) | (409 | ) | ||||||||||||||||
Total | $ | — | $ | — | $ | (1,799 | ) | $ | — | $ | 267 | $ | (1,532 | ) | ||||||||||
Emerging Markets Debt Fund | ||||||||||||||||||||||||
Interest rate contracts | $ | — | $ | — | $ | 304 | $ | — | $ | (247 | ) | $ | 57 | |||||||||||
Foreign exchange contracts | — | (174 | ) | — | (2,257 | ) | — | (2,431 | ) | |||||||||||||||
Equity contracts | — | — | — | — | (544 | ) | (544 | ) | ||||||||||||||||
Total | $ | — | $ | (174 | ) | $ | 304 | $ | (2,257 | ) | $ | (791 | ) | $ | (2,918 | ) | ||||||||
Dynamic Asset Allocation Fund | ||||||||||||||||||||||||
Foreign exchange contracts | $ | — | $ | — | $ | — | $ | (16,776 | ) | $ | — | $ | (16,776 | ) | ||||||||||
Equity contracts | — | 1,011 | — | — | — | 1,011 | ||||||||||||||||||
Total | $ | — | $ | 1,011 | $ | — | $ | (16,776 | ) | $ | — | $ | (15,765 | ) | ||||||||||
Multi-Asset Real Return Fund | ||||||||||||||||||||||||
Interest rate contracts | $ | — | $ | (38 | ) | $ | 212 | $ | — | $ | 79 | $ | 253 | |||||||||||
Foreign exchange contracts | — | — | — | 65 | — | 65 | ||||||||||||||||||
Credit contracts | — | — | — | — | 12 | 12 | ||||||||||||||||||
Equity contracts | — | — | — | — | 330 | 330 | ||||||||||||||||||
Total | $ | — | $ | (38 | ) | $ | 212 | $ | 65 | $ | 421 | $ | 660 | |||||||||||
| * | The Dynamic Asset Allocation Fund entered into total return swaps during the period of January 29 through April 30 with an average long notional exposure of $98 million to the MSCI Daily Total Return Japan Local Index and an average short notional exposure of $93 million to the MSCI Total Return Net Europe ex-UK USD Index. |
The ISDA Master Agreements maintain provisions for general obligations, representations, agreements, collateral, and events of default or termination. The occurrence of a specified event of termination may give a counterparty the right to terminate all of its contracts and affect settlement of all outstanding transactions under the applicable ISDA Master Agreement.
| SEI Institutional Investments Trust / Annual Report / May 31, 2013 | 259 |
Table of Contents
Notes to Financial Statements (Continued)
May 31, 2013
Written options transactions entered into during the year ended May 31, 2013, are summarized as follows:
| Core Fixed Income Fund | ||||||||
| Number of Contracts | Premium ($ Thousands) | |||||||
| Balance at beginning of period | 7,022,098 | $ | 1,021 | |||||
| Written | 16,613,341 | 1,475 | ||||||
| Expired | (16,611,922 | ) | (936 | ) | ||||
| Closing buys | (2,741 | ) | (1,256 | ) | ||||
| Balance at end of period | 7,020,776 | $ | 304 | |||||
| Dynamic Asset Allocation Fund | ||||||||
| Number of Contracts | Premium ($ Thousands) | |||||||
| Balance at beginning of period | — | $ | — | |||||
| Written | 1,500 | 2,696 | ||||||
| Closing buys | (1,500 | ) | (2,696 | ) | ||||
| Balance at end of period | — | $ | — | |||||
| Multi-Asset Real Return Fund | ||||||||
| Number of Contracts | Premium ($ Thousands) | |||||||
| Balance at beginning of period | 45 | $ | 102 | |||||
| Written | 170 | 199 | ||||||
| Expired | (15 | ) | (12 | ) | ||||
| Closing buys | (155 | ) | (255 | ) | ||||
| Balance at end of period | 45 | $ | 34 | |||||
As of May 31, 2013, the Funds had cash and/or securities at least equal to the value of written options.
5. AGREEMENTS AND OTHER TRANSACTIONS WITH AFFILIATES
Administration and Transfer Agency Agreement — SEI Investments Global Funds Services (the “Administrator”) serves as administrator to the Funds. The Administrator provides certain administrative and shareholder servicing for an annual fee of 0.05% of the average daily net assets of each Fund. For the year ended May 31, 2013, the Administrator has voluntarily agreed to waive all of its fee.
Investment Advisory Agreement — SIMC serves as investment adviser (the “Adviser”) to each Fund. In connection with serving as Adviser, SIMC is entitled to a fee that is calculated daily and paid monthly, based on the average daily net assets of each Fund. SIMC and the Administrator plan to voluntarily waive a portion of its fees in order to keep investment advisory and administration fees at a specified level. The Funds’ Adviser and Administrator may discontinue all or part of these voluntary waivers at any time. Accordingly, the advisory fee and voluntary expense limitations for each Fund are as follows:
| Advisory Fees | Voluntary Expense Limitations* | |||||||
Large Cap Fund | 0.400 | % | 0.26 | % | ||||
Large Cap Diversified Alpha Fund | 0.400 | 0.31 | ||||||
Large Cap Disciplined Equity Fund | 0.400 | 0.18 | ||||||
Large Cap Index Fund | 0.170 | 0.06 | ||||||
Extended Market Index Fund | 0.120 | 0.06 | ||||||
Small Cap Fund | 0.650 | 0.54 | ||||||
Small Cap II Fund | 0.650 | 0.59 | ||||||
Small/Mid Cap Equity Fund | 0.650 | 0.50 | ||||||
U.S. Managed Volatility Fund | 0.650 | 0.35 | ||||||
International Equity Fund | 0.505 | 0.46 | ||||||
World Equity Ex-US Fund | 0.550 | 0.45 | ||||||
Screened World Equity Ex-US Fund | 0.650 | 0.80 | ||||||
Opportunistic Income Fund | 0.450 | 0.41 | ||||||
Core Fixed Income Fund | 0.300 | 0.14 | ||||||
High Yield Bond Fund | 0.4875 | 0.35 | ||||||
Long Duration Fund | 0.300 | 0.20 | ||||||
Long Duration Corporate Bond Fund | 0.300 | 0.20 | ||||||
Ultra Short Duration Bond Fund | 0.150 | 0.18 | ||||||
Emerging Markets Debt Fund | 0.850 | 0.55 | ||||||
Real Return Fund | 0.220 | 0.20 | ||||||
Dynamic Asset Allocation Fund | 0.600 | 0.50 | ||||||
Multi-Asset Real Return Fund | 0.550 | 0.40 | ||||||
| * | Effective July 1, 2012, voluntary expense waivers were discontinued. |
As of May 31, 2013, SIMC has entered into investment sub-advisory agreements with the following parties and pays the sub-advisers out of the fee that it receives from the Funds:
| Investment Sub-Adviser |
Large Cap Fund |
AJO, L.P. |
AQR Capital Management, LLC |
Brown Advisory LLC |
Delaware Investment Fund Advisers |
LSV Asset Management |
Waddell & Reed Investment Management Company |
WestEnd Advisors LLC |
Large Cap Diversified Alpha Fund |
AJO,L.P. |
Delaware Investment Fund Advisers |
INTECH Investment Management, LLC |
Tocqueville Asset Management, L.P. |
WestEnd Advisors LLC |
Large Cap Disciplined Equity Fund |
Analytic Investors, Inc. |
INTECH Investment Management, LLC |
Lazard Asset Management LLC |
Oppenheimer Funds, Inc. |
Quantitative Management Associates, LLC |
Large Cap Index Fund |
SSgA Funds Management, Inc. |
Extended Market Index Fund |
SSgA Funds Management, Inc. |
| 260 | SEI Institutional Investments Trust / Annual Report / May 31, 2013 |
Table of Contents
| Investment Sub-Adviser |
Small Cap Fund |
AllianceBernstein L.P. |
AQR Capital Management, LLC |
Artisan Partners Limited Partnership |
Janus Capital Management, Inc. |
J.P. Morgan Investment Management |
Lee Munder Capital Group, LLC |
LSV Asset Management |
Robeco Investment Management, Inc. |
Security Capital Research and Management, Inc. |
Timberline Asset Management, LLC |
William Blair & Company, LLC |
Small Cap II Fund |
Alliance Bernstein L.P. |
AQR Capital Management, LLC |
Fiduciary Management Associates, LLC |
Lee Munder Capital Group, LLC |
Timberline Asset Management, LLC |
Small/Mid Cap Equity Fund |
AllianceBernstein L.P. |
Century Capital Management, LLC |
Integrity Asset Management, LLC |
Janus Capital Management, Inc. |
Lee Munder Capital Group, LLC |
LSV Asset Management |
Robeco Investment Management, Inc. |
Security Capital Research and Management Incorporated |
Timberline Asset Management LLC |
Wellington Management Company, LLP |
William Blair & Company, LLC |
U.S. Managed Volatility Fund |
AJO, L.P. |
Analytic Investors, LLC |
LSV Asset Management |
International Equity Fund |
Acadian Asset Management LLC |
Causeway Capital Management LLC |
del Rey Global Investors, LLC |
INTECH Investment Management, LLC |
Neuberger Berman Management LLC |
Schroder Investment Management North America, Inc. |
Tradewinds Global Investors LLC |
World Equity Ex-US Fund |
Acadian Asset Management LLC |
EARNEST Partners, LLC |
JO Hambro Capital Management Limited |
McKinley Capital Management, LLC |
NFJ Investment Group LLC |
Thornburg Investment Management LLC |
Screened World Equity Ex-US Fund |
Acadian Asset Management LLC |
EARNEST Partners, LLC |
McKinley Capital Management, LLC |
Thornburg Investment Management LLC |
Opportunistic Income Fund |
Ares Management, LLC |
| Investment Sub-Adviser |
Wellington Management Company, LLP |
Core Fixed Income Fund |
Jennison Associates LLC |
J.P. Morgan Investment Management, Inc. |
Metropolitan West Asset Management, LLC |
Wells Capital Management, Inc. |
Western Asset Management Company |
Western Asset Management Company Limited |
High Yield Bond Fund |
Ares Management, LLC |
Brigade Capital Management, LLC |
Delaware Investment Fund Advisers |
Guggenheim Partners Investment Management, LLC |
J.P. Morgan Investment Management, Inc. |
Long Duration Fund |
Income Research & Management |
Jennison Associates LLC |
Legal & General Investment Management America, Inc. |
Metropolitan West Asset Management LLC |
Long Duration Corporate Bond Fund |
Income Research & Management |
Jennison Associates LLC |
Legal & General Investment Management America, Inc. |
Metropolitan West Asset Management LLC |
Ultra Short Duration Bond Fund |
Logan Circle Partners, L.P. |
Wellington Management Company, LLP |
Emerging Markets Debt Fund |
Ashmore Investment Management Limited |
Stone Harbor Investment Partners, L.P. |
Real Return Fund |
Wellington Management Company, LLC |
Dynamic Asset Allocation Fund |
SSgA Funds Management, Inc. |
Multi-Asset Real Return Fund |
AllianceBernstein L.P. |
Distribution Agreement — SEI Investments Distribution Co. (the “Distributor”), a wholly owned subsidiary of SEI Investments Company (“SEI”), serves as each Fund’s Distributor pursuant to a Distribution Agreement with the Trust.
Other — The Distribution Agreement between the Distributor and the Trust provides that the Distributor may receive compensation on fund transactions effected for the Trust in accordance with Securities and Exchange Commission (“SEC”) rules. Accordingly, it is expected that fund transactions may result in brokerage commissions being paid to the Distributor. The SEC rules require that such commissions not exceed usual and customary commissions.
Such commissions for the year ended May 31, 2013, were as follows ($ Thousands):
| Large Cap Fund | $ | 41 | ||
| Large Cap Diversified Alpha Fund | 2 |
| SEI Institutional Investments Trust / Annual Report / May 31, 2013 | 261 |
Table of Contents
Notes to Financial Statements (Continued)
May 31, 2013
| Large Cap Disciplined Equity Fund | $ | 175 | ||
| Large Cap Index Fund | 5 | |||
| Small Cap Fund | 167 | |||
| Small Cap II Fund | 4 | |||
| Small/Mid Cap Equity Fund | 28 | |||
| World Equity Ex-US Fund | 38 |
Payments to Affiliates — Certain officers and/or trustees of the Trust are also officers of the Distributor, the Adviser and/or the Administrator. The Trust pays each unaffiliated Trustee an annual fee for attendance at quarterly and interim meetings. Compensation of officers and affiliated Trustees of the Trust is paid by the Adviser or Administrator.
A portion of the services provided by the Chief Compliance Officer (“CCO”) and his staff, whom are employees of the Administrator, are paid for by the Trust as incurred. The services include regulatory oversight of the Trust’s Adviser, sub-advisers and service providers as required by SEC regulations. The CCO’s services have been approved by and are reviewed annually by the Board.
LSV Asset Management (partially-owned subsidiary of SIMC) serves as a sub-adviser to the Large Cap, Small Cap, Small/Mid Cap Equity and U.S. Managed Volatility Funds. For this service LSV Asset Management is entitled to receive a fee from SIMC. Such fees for the year ended May 31, 2013, were as follows ($ Thousands):
| Large Cap Fund | $ | 385 | ||
| Small Cap Fund | 247 | |||
| Small/Mid Cap Equity Fund | 972 | |||
| U.S. Managed Volatility Fund | 1,022 |
Fees Paid Indirectly — The Funds may direct certain fund trades to the Distributor who pays a portion of each Fund’s expenses. Accordingly, the expenses reduced, which were used to pay third party expenses, can be found on the Statements of Operations and the effect on each Fund’s expense ratio, as a percentage of each Fund’s average daily net assets for the year ended May 31, 2013, can be found on the Financial Highlights.
Investment in Affiliated Security — The Funds may invest excess cash in the SEI Daily Income Trust Prime Obligation Fund, an affiliated money market fund. Additionally, the Funds may invest the cash collateral from the securities lending program in the SEI Liquidity Fund, L.P.
To the extent consistent with its investment objectives, a Fund may invest in the SEI LIBOR Plus Portfolio, a portfolio of SEI Alpha Strategy Portfolios, LP. The SEI LIBOR Plus Portfolio seeks to maximize total return consistent with the preservation of capital and prudent investment management.
Interfund Lending — The SEC has granted an exemption that permits the Trust to participate in an interfund lending program (“The Program”) with existing or future investment companies registered under the 1940 Act that are advised by SIMC (the “SEI Funds”). The Program allows the SEI Funds to lend money to and borrow money from each other for temporary or emergency purposes. Participation in The Program is voluntary for both borrowing and lending funds. Interfund loans may be made only when the rate of interest to be charged is more favorable to the lending fund than an investment in overnight repurchase agreements (“Repo Rate”), and more favorable to the borrowing fund than the rate of interest that would be charged by a bank for short-term borrowings (“Bank Loan Rate”). The Bank Loan Rate will be determined using a formula reviewed by the Board of Trustees annually. The interest rate imposed on interfund loans is the average of the Repo Rate and the Bank Loan Rate.
During the year ended May 31, 2013, the Trust borrowed funds from SEI Liquid Asset Trust Prime Obligation Fund. The amount borrowed, interest paid on the borrowing and the corresponding interest rate were as follows ($ Thousands):
| Account Name | Date | Amount Borrowed | Interest Paid | Rate | ||||||||||||
Large Cap Fund | 12/03/2012 | $ | 15,000 | $ | 317 | 0.38 | % | |||||||||
Large Cap Fund | 03/01/2013 | 11,000 | 550 | 0.36 | ||||||||||||
Large Cap Disciplined Equity Fund | 10/02/2012 | 45,000 | 900 | 0.36 | ||||||||||||
Small Cap II Fund | 08/01/2012 | 5,000 | 97 | 0.35 | ||||||||||||
Small/Mid Cap Equity Fund | 03/01/2013 | 6,500 | 195 | 0.36 | ||||||||||||
U.S. Managed Volatility Fund | 05/03/2013 | 16,370 | 637 | 0.35 | ||||||||||||
High Yield Bond Fund | 07/02/2012 | 24,751 | 255 | 0.37 | ||||||||||||
High Yield Bond Fund | 07/03/2012 | 17,974 | 389 | 0.39 | ||||||||||||
High Yield Bond Fund | 03/01/2013 | 12,332 | 370 | 0.36 | ||||||||||||
High Yield Bond Fund | 04/01/2013 | 13,021 | 130 | 0.36 | ||||||||||||
High Yield Bond Fund | 04/02/2013 | 29,323 | 293 | 0.36 | ||||||||||||
The Trust had no outstanding borrowings or loans under the Program at May 31, 2013.
6. CAPITAL SHARE TRANSACTIONS
Capital share transactions for the Funds were as follows (Thousands):
| Large Cap Fund | Large Cap Diversified Alpha Fund | Large Cap Disciplined Equity Fund | Large Cap Index Fund | |||||||||||||||||||||||||||||
| 2013 | 2012 | 2013 | 2012 | 2013 | 2012 | 2013 | 2012 | |||||||||||||||||||||||||
Class A: | ||||||||||||||||||||||||||||||||
Shares Issued | 22,903 | 42,736 | 4,485 | 5,503 | 86,025 | 114,099 | 8,907 | 6,272 | (1) | |||||||||||||||||||||||
Shares Issued In Lieu of Dividends and Distributions | 4,520 | 5,311 | 533 | 335 | 11,879 | 10,479 | 438 | 140 | ||||||||||||||||||||||||
Shares Redeemed | (40,735 | ) | (31,943 | ) | �� | (12,403 | ) | (9,960 | ) | (196,296 | ) | (326,008 | ) | (4,657 | ) | (1,938 | ) | |||||||||||||||
Increase (Decrease) in Net Assets Derived from Class A Transactions | (13,312 | ) | 16,104 | (7,385 | ) | (4,122 | ) | (98,392 | ) | (201,430 | ) | 4,688 | 4,474 | |||||||||||||||||||
| 262 | SEI Institutional Investments Trust / Annual Report / May 31, 2013 |
Table of Contents
| Extended Market Index Fund(2) | Small Cap Fund | Small Cap II Fund(3) | Small/Mid Cap Equity Fund | |||||||||||||||||||||||||
| 2013 | 2013 | 2012 | 2013 | 2012 | 2013 | 2012 | ||||||||||||||||||||||
Class A: | ||||||||||||||||||||||||||||
Shares Issued | 16,710 | 9,157 | 27,655 | 23,779 | 6,454 | 32,351 | 35,194 | |||||||||||||||||||||
Shares Issued In Lieu of Dividends and Distributions | 8 | 670 | 349 | 194 | — | 3,021 | 1,269 | |||||||||||||||||||||
Shares Redeemed | (558 | ) | (21,852 | ) | (19,023 | ) | (12,307 | ) | — | (58,681 | ) | (45,867 | )(1) | |||||||||||||||
Increase (Decrease) in Net Assets | 16,160 | (12,025 | ) | 8,981 | 11,666 | 6,454 | (23,309 | ) | (9,404 | ) | ||||||||||||||||||
| U.S. Managed Volatility Fund | International Equity Fund | World Equtiy Ex-US Fund | ||||||||||||||||||||||
| 2013 | 2012 | 2013 | 2012 | 2013 | 2012 | |||||||||||||||||||
Class A: | ||||||||||||||||||||||||
Shares Issued | 41,088 | 58,784 | 7,066 | 15,813 | 180,161 | 196,762 | ||||||||||||||||||
Shares Issued In Lieu of Dividends | 3,132 | 2,791 | 1,176 | 1,352 | 10,891 | 9,741 | ||||||||||||||||||
Shares Redeemed | (22,975 | ) | (9,190 | )(1) | (30,671 | ) | (32,505 | ) | (153,346 | ) | (143,869 | ) | ||||||||||||
Increase (Decrease) in Net Assets | 21,245 | 52,385 | (22,429 | ) | (15,340 | ) | 37,706 | 62,634 | ||||||||||||||||
| Screened World Equtiy Ex-US Fund | Opportunistic Income Fund | Core Fixed Income Fund | ||||||||||||||||||||||
| 2013 | 2012 | 2013 | 2012 | 2013 | 2012 | |||||||||||||||||||
Class A: | ||||||||||||||||||||||||
Shares Issued | 1,414 | 2,166 | 97,023 | 1,980 | 275,230 | (1) | 180,742 | |||||||||||||||||
Shares Issued In Lieu of Dividends | 100 | 114 | 1,042 | 641 | 27,671 | 32,031 | ||||||||||||||||||
Shares Redeemed | (1,242 | ) | (1,425 | ) | (4,947 | ) | (12,270 | ) | (353,884 | ) | (197,496 | ) | ||||||||||||
Increase (Decrease) in Net Assets | 272 | 855 | 93,118 | (9,649 | ) | (50,983 | ) | 15,277 | ||||||||||||||||
| High Yield Bond Fund | Long Duration Fund | Long Duration Corporate Bond Fund(4) | Ultra Short Duration Bond Fund | |||||||||||||||||||||||||
| 2013 | 2012 | 2013 | 2012 | 2013 | 2013 | 2012 | ||||||||||||||||||||||
Class A: | ||||||||||||||||||||||||||||
Shares Issued | 63,543 | 75,270 | 121,715 | (1) | 234,974 | (1) | 231,742 | (1) | 56,399 | (1) | 31,725 | |||||||||||||||||
Shares Issued In Lieu of Dividends and Distributions | 14,315 | 16,538 | 41,405 | 42,344 | 8,201 | 395 | 526 | |||||||||||||||||||||
Shares Redeemed | (67,810 | ) | (88,223 | ) | (353,166 | )(1) | (106,591 | ) | (30,100 | ) | (34,705 | ) | (33,664 | ) | ||||||||||||||
Increase (Decrease) in Net Assets | 10,048 | 3,585 | (190,046 | ) | 170,727 | 209,843 | 22,089 | (1,413 | ) | |||||||||||||||||||
| Emerging Markets Debt Fund | Real Return Fund | Dynamic Asset Allocation Fund | Multi-Asset Real Return Fund(5) | |||||||||||||||||||||||||||||
| 2013 | 2012 | 2013 | 2012 | 2013 | 2012 | 2013 | 2012 | |||||||||||||||||||||||||
Class A: | ||||||||||||||||||||||||||||||||
Shares Issued | 37,986 | 29,078 | 4,262 | 5,802 | 42,834 | 18,573 | 21,473 | 17,690 | ||||||||||||||||||||||||
Shares Issued In Lieu of Dividends and Distributions | 12,136 | 7,110 | 918 | 1,459 | 4,747 | 1,918 | 112 | 17 | ||||||||||||||||||||||||
Shares Redeemed | (22,375 | ) | (25,495 | ) | (7,038 | ) | (14,483 | ) | (8,540 | ) | (7,054 | ) | (3,645 | ) | (2,570 | ) | ||||||||||||||||
Increase (Decrease) in Net Assets | 27,747 | 10,693 | (1,858 | ) | (7,222 | ) | 39,041 | 13,437 | 17,940 | 15,137 | ||||||||||||||||||||||
| (1) | Includes subscriptions/redemptions as a result of in-kind transfers of securities (see Note 10). |
| (2) | Fund commenced operations on February 28, 2013. |
| (3) | Fund commenced operations on April 10, 2012. |
| (4) | Fund commenced operations on June 29, 2012. |
| (5) | Fund commenced operations on July 29, 2011. |
| SEI Institutional Investments Trust / Annual Report / May 31, 2013 | 263 |
Table of Contents
Notes to Financial Statements (Continued)
May 31, 2013
7. INVESTMENT TRANSACTIONS
The cost of security purchases and proceeds from the sale and maturities of securities other than temporary cash investments, during the year ended May 31, 2013, were as follows:
| U.S. Gov’t ($ Thousands) | Other ($ Thousands) | Total ($ Thousands) | ||||||||||
Large Cap Fund | ||||||||||||
Purchases | $ | — | $ | 854,275 | $ | 854,275 | ||||||
Sales | — | 1,149,381 | 1,149,381 | |||||||||
Large Cap Diversified Alpha Fund | ||||||||||||
Purchases | — | 244,089 | 244,089 | |||||||||
Sales | — | 323,253 | 323,253 | |||||||||
Large Cap Disciplined Equity Fund | ||||||||||||
Purchases | — | 5,916,773 | 5,916,773 | |||||||||
Sales | — | 7,080,832 | 7,080,832 | |||||||||
Large Cap Index Fund | ||||||||||||
Purchases | — | 788,779 | 788,779 | |||||||||
Sales | — | 238,672 | 238,672 | |||||||||
Extended Market Index Fund(1) | ||||||||||||
Purchases | — | 165,307 | 165,307 | |||||||||
Sales | — | 4,587 | 4,587 | |||||||||
Small Cap Fund | ||||||||||||
Purchases | — | 650,613 | 650,613 | |||||||||
Sales | — | 816,327 | 816,327 | |||||||||
Small Cap II Fund | ||||||||||||
Purchases | — | 305,568 | 305,568 | |||||||||
Sales | — | 181,650 | 181,650 | |||||||||
Small/Mid Cap Fund | ||||||||||||
Purchases | — | 1,929,789 | 1,929,789 | |||||||||
Sales | — | 2,309,532 | 2,309,532 | |||||||||
U.S. Managed Volatility Fund | ||||||||||||
Purchases | — | 547,485 | 547,485 | |||||||||
Sales | — | 368,118 | 368,118 | |||||||||
International Equity Fund | ||||||||||||
Purchases | — | 163,624 | 163,624 | |||||||||
Sales | — | 334,401 | 334,401 | |||||||||
World Equity Ex-US Fund | ||||||||||||
Purchases | — | 3,428,764 | 3,428,764 | |||||||||
Sales | — | 2,865,512 | 2,865,512 | |||||||||
Screened World Equity Ex-US Fund | ||||||||||||
Purchases | — | 41,784 | 41,784 | |||||||||
Sales | — | 41,190 | 41,190 | |||||||||
Opportunistic Income Fund | ||||||||||||
Purchases | 70,065 | 592,967 | 663,032 | |||||||||
Sales | 62,941 | 26,133 | 89,074 | |||||||||
Core Fixed Income Fund | ||||||||||||
Purchases | 19,510,993 | 2,843,334 | 22,354,327 | |||||||||
Sales | 19,823,285 | 2,978,877 | 22,802,162 | |||||||||
High Yield Bond Fund | ||||||||||||
Purchases | — | 1,248,831 | 1,248,831 | |||||||||
Sales | — | 1,194,266 | 1,194,266 | |||||||||
Long Duration Fund | ||||||||||||
Purchases | 2,379,388 | 1,346,829 | 3,726,217 | |||||||||
Sales | 3,041,366 | 2,635,945 | 5,677,311 | |||||||||
Long Duration Corporate Bond Fund(2) | ||||||||||||
Purchases | 1,192,308 | 2,770,335 | 3,962,643 | |||||||||
Sales | 1,158,304 | 732,187 | 1,890,491 | |||||||||
Ultra Short Duration Bond Fund | ||||||||||||
Purchases | 292,748 | 296,119 | 588,867 | |||||||||
Sales | 279,054 | 185,929 | 464,983 | |||||||||
Emerging Markets Debt Fund | ||||||||||||
Purchases | — | 1,489,826 | 1,489,826 | |||||||||
Sales | — | 1,308,450 | 1,308,450 | |||||||||
| U.S. Gov’t ($ Thousands) | Other ($ Thousands) | Total ($ Thousands) | ||||||||||
Real Return Fund | ||||||||||||
Purchases | $ | 249,435 | $ | — | $ | 249,435 | ||||||
Sales | 272,807 | — | 272,807 | |||||||||
Dynamic Asset Allocation Fund | ||||||||||||
Purchases | — | 699,516 | 699,516 | |||||||||
Sales | — | 266,699 | 266,699 | |||||||||
Multi-Asset Real Return Fund | ||||||||||||
Purchases | 142,222 | 125,782 | 268,004 | |||||||||
Sales | 51,239 | 43,803 | 95,042 | |||||||||
| (1) | Fund commenced operations on February 28, 2013. |
| (2) | Fund commenced operations on July 29, 2012. |
8. FEDERAL TAX INFORMATION
It is each Fund’s intention to continue to qualify as a regulated investment company under Subchapter M of the Internal Revenue Code and distribute all of its taxable income (including net capital gains). Accordingly, no provision for Federal income taxes is required.
Dividends from net investment income and distributions from net realized capital gains are determined in accordance with U.S. Federal income tax regulations, which may differ from those amounts determined under U.S. GAAP. These book/tax differences are either temporary or permanent in nature. To the extent these differences are permanent, they are charged or credited to paid-in capital, undistributed net investment income or accumulated net realized gain, as appropriate, in the period that the differences arise.
Accordingly, the following permanent differences, primarily attributable to different treatment for gains and losses on paydowns of mortgage and asset-backed securities for tax purposes, defaulted bond basis adjustments, reclassification of long term capital gain distributions on Real Estate Investment Trust securities, reclassification of income and expense from swap transactions, basis adjustments for investments in partnerships, net operating losses, collateralized loan/debt obligations, gains and losses on passive foreign investment companies and certain foreign currency related transactions and non taxable in-kind redemptions, have been reclassified to/ from the following accounts as of May 31, 2013:
| Undistributed Net Investment Income (Loss) ($ Thousands) | Accumulated Realized Gain (Loss) ($ Thousands) | Paid-in Capital ($ Thousands) | ||||||||||
Large Cap Fund | $ | 34 | $ | (34 | ) | $ | — | |||||
Large Cap Diversified Alpha Fund | 21 | (17 | ) | (4 | ) | |||||||
Large Cap Disciplined Equity Fund | 18,064 | (9,764 | ) | (8,300 | ) | |||||||
Large Cap Index Fund | 134 | (134 | ) | — | ||||||||
Extended Market Index Fund | 17 | (17 | ) | — | ||||||||
Small Cap Fund | 685 | (685 | ) | — | ||||||||
Small Cap II Fund | 56 | (56 | ) | — | �� | |||||||
Small/Mid Cap Equity Fund | 1,235 | (1,235 | ) | — | ||||||||
U.S. Managed Volatility Fund | 148 | (148 | ) | — | ||||||||
International Equity Fund | 34 | (34 | ) | — | ||||||||
World Equity Ex-US Fund | (412 | ) | 412 | — | ||||||||
Screened World Equity Ex-US Fund | 89 | (89 | ) | — | ||||||||
Opportunistic Income Fund | 6,496 | (6,496 | ) | — | ||||||||
Core Fixed Income Fund | 18,663 | (18,639 | ) | (24 | ) | |||||||
High Yield Bond Fund | 3,585 | (2,619 | ) | (966 | ) | |||||||
Long Duration Fund | (2,193 | ) | (113,210 | ) | 115,403 | |||||||
Long Duration Corporate Bond Fund | 61 | (61 | ) | — | ||||||||
Ultra Short Duration Fund | 523 | (496 | ) | (27 | ) | |||||||
Emerging Markets Debt Fund | 16,576 | (16,576 | ) | — | ||||||||
Real Return Fund | 94 | (94 | ) | — | ||||||||
Dynamic Asset Allocation Fund | (140 | ) | 140 | — | ||||||||
Multi-Asset Real Return Fund | (3,297 | ) | 5,853 | (2,556 | ) | |||||||
These reclassifications have no impact on net assets or net asset value per share.
| 264 | SEI Institutional Investments Trust / Annual Report / May 31, 2013 |
Table of Contents
The tax character of dividends and distributions paid during the last two years or periods ended May 31, 2013 were as follows:
| Ordinary Income ($ Thousands) | Long-Term Capital Gain ($ Thousands) | Return of Capital ($ Thousands) | Total ($ Thousands) | |||||||||||||||||
Large Cap Fund | 2013 | $ | 41,342 | $ | 42,893 | $ | — | $ | 84,235 | |||||||||||
| 2012 | 22,774 | 66,801 | — | 89,575 | ||||||||||||||||
Large Cap Diversified Alpha Fund | 2013 | 5,999 | — | — | 5,999 | |||||||||||||||
| 2012 | 3,329 | — | — | 3,329 | ||||||||||||||||
Large Cap Disciplined Equity Fund | 2013 | 140,201 | — | — | 140,201 | |||||||||||||||
| 2012 | 106,581 | — | — | 106,581 | ||||||||||||||||
Large Cap Index Fund | 2013 | 38,842 | 16,181 | — | 55,023 | |||||||||||||||
| 2012 | 16,211 | — | — | 16,211 | ||||||||||||||||
Extended Market Index Fund | 2013 | 84 | — | — | 84 | |||||||||||||||
Small Cap Fund | 2013 | 10,108 | — | — | 10,108 | |||||||||||||||
| 2012 | 4,874 | — | — | 4,874 | ||||||||||||||||
Small Cap II Fund | 2013 | 1,541 | 570 | — | 2,111 | |||||||||||||||
| 2012 | — | — | — | — | ||||||||||||||||
Small/Mid Cap Equity Fund | 2013 | 25,590 | 15,141 | — | 40,731 | |||||||||||||||
| 2012 | 15,466 | — | — | 15,466 | ||||||||||||||||
U.S. Managed Volatility Fund | 2013 | 31,318 | 8,220 | — | 39,538 | |||||||||||||||
| 2012 | 10,441 | 20,489 | — | 30,930 | ||||||||||||||||
International Equity Fund | 2013 | 9,490 | — | — | 9,490 | |||||||||||||||
| 2012 | 9,424 | — | — | 9,424 | ||||||||||||||||
World Equity Ex-US Fund | 2013 | 119,081 | — | — | 119,081 | |||||||||||||||
| 2012 | 92,739 | — | — | 92,739 | ||||||||||||||||
Screened World Equity Ex-US Fund | 2013 | 1,070 | — | — | 1,070 | |||||||||||||||
| 2012 | 992 | — | — | 992 | ||||||||||||||||
Opportunistic Income Fund | 2013 | 8,743 | — | — | 8,743 | |||||||||||||||
| 2012 | 5,179 | — | — | 5,179 | ||||||||||||||||
Core Fixed Income Fund | 2013 | 305,867 | — | — | 305,867 | |||||||||||||||
| 2012 | 347,851 | — | — | 347,851 | ||||||||||||||||
High Yield Bond Fund | 2013 | 144,390 | — | — | 144,390 | |||||||||||||||
| 2012 | 156,365 | — | — | 156,365 | ||||||||||||||||
Long Duration Fund | 2013 | 351,417 | 45,605 | — | 397,022 | |||||||||||||||
| 2012 | 312,089 | 80,526 | — | 392,615 | ||||||||||||||||
Long Duration Corporate Bond Fund | 2013 | 84,703 | — | — | 84,703 | |||||||||||||||
Ultra Short Duration Fund | 2013 | 4,073 | — | — | 4,073 | |||||||||||||||
| 2012 | 5,251 | — | — | 5,251 | ||||||||||||||||
Emerging Markets Debt Fund | �� | 2013 | 106,579 | 40,153 | — | 146,732 | ||||||||||||||
| 2012 | 70,422 | 10,680 | — | 81,102 | ||||||||||||||||
Real Return Fund | 2013 | 10,492 | — | — | 10,492 | |||||||||||||||
| 2012 | 13,005 | 4,376 | — | 17,381 | ||||||||||||||||
Dynamic Asset Allocation Fund | 2013 | 36,290 | 17,525 | — | 53,815 | |||||||||||||||
| 2012 | 8,638 | 13,701 | — | 22,339 | ||||||||||||||||
Multi-Asset Real Return Fund | 2013 | 888 | 82 | 194 | 1,164 | |||||||||||||||
| 2012 | 166 | — | — | 166 | ||||||||||||||||
As of May 31, 2013, the components of distributable earnings/(accumulated losses) were as follows:
| Undistributed Ordinary Income ($ Thousands) | Undistributed Long-Term Capital Gain ($ Thousands) | Capital Loss Carryforwards ($ Thousands) | Post October Losses ($ Thousands) | Late Year Ordinary Losses ($ Thousands) | Unrealized Appreciation (Depreciation) ($ Thousands) | Other Temporary Differences ($ Thousands) | Total Distributable Earnings (Accumulated Losses) ($ Thousands) | |||||||||||||||||||||||||
Large Cap Fund | $ | 29,999 | $ | 74,059 | $ | — | $ | — | $ | — | $ | 462,651 | $ | 117 | $ | 566,826 | ||||||||||||||||
Large Cap Diversified Alpha Fund | 97 | — | (78,326 | ) | — | — | 44,045 | 117 | (34,067 | ) | ||||||||||||||||||||||
Large Cap Disciplined Equity Fund | — | — | (602,779 | ) | — | — | 1,106,133 | (6,041 | ) | 497,313 | ||||||||||||||||||||||
Large Cap Index Fund | 9,893 | 5,011 | — | — | — | 514,350 | (3,048 | ) | 526,206 | |||||||||||||||||||||||
Extended Market Index Fund | 628 | 110 | — | — | — | 7,328 | (178 | ) | 7,888 | |||||||||||||||||||||||
| SEI Institutional Investments Trust / Annual Report / May 31, 2013 | 265 |
Table of Contents
Notes to Financial Statements (Continued)
May 31, 2013
| Undistributed Ordinary Income ($ Thousands) | Undistributed Long-Term Capital Gain ($ Thousands) | Capital Loss Carryforwards ($ Thousands) | Post October Losses ($ Thousands) | Late Year Ordinary Losses ($ Thousands) | Unrealized Appreciation (Depreciation) ($ Thousands) | Other Temporary Differences ($ Thousands) | Total Distributable Earnings (Accumulated Losses) ($ Thousands) | |||||||||||||||||||||||||
Small Cap Fund | $ | 1,722 | $ | — | $ | (130,399 | ) | $ | — | $ | — | $ | 90,566 | $ | 47 | $ | (38,064 | ) | ||||||||||||||
Small Cap II Fund | 7,230 | 1,920 | — | — | — | 34,020 | — | 43,170 | ||||||||||||||||||||||||
Small/Mid Cap Equity Fund | 66,959 | 143,709 | — | — | — | 336,441 | (1,181 | ) | 545,928 | |||||||||||||||||||||||
U.S. Managed Volatility Fund | 20,919 | 24,307 | — | — | — | 167,429 | (197 | ) | 212,458 | |||||||||||||||||||||||
International Equity Fund | 4,281 | — | (398,422 | ) | — | — | 3,627 | (1 | ) | (390,515 | ) | |||||||||||||||||||||
World Equity Ex-US Fund | 81,861 | — | (477,885 | ) | — | — | 671,153 | (181 | ) | 274,948 | ||||||||||||||||||||||
Screened World Equity Ex-US Fund | 700 | — | (15,308 | ) | — | — | 4,454 | (20 | ) | (10,174 | ) | |||||||||||||||||||||
Opportunistic Income Fund | 11,313 | — | (50,542 | ) | — | — | 7,074 | (3 | ) | (32,158 | ) | |||||||||||||||||||||
Core Fixed Income Fund | 40,366 | — | — | — | — | 136,061 | (35,459 | ) | 140,968 | |||||||||||||||||||||||
High Yield Bond Fund | 22,002 | 11,387 | — | — | — | 97,158 | (11,692 | ) | 118,855 | |||||||||||||||||||||||
Long Duration Fund | 9,839 | 17,995 | — | (61 | ) | — | 110,824 | (19,686 | ) | 118,911 | ||||||||||||||||||||||
Long Duration Corporate Bond Fund | 20,958 | — | — | (6,393 | ) | — | (39,629 | ) | (7,750 | ) | (32,814 | ) | ||||||||||||||||||||
Ultra Short Duration Fund | 479 | — | (344 | ) | — | — | 1,025 | (443 | ) | 717 | ||||||||||||||||||||||
Emerging Markets Debt Fund | 25,830 | 3,642 | — | — | — | 20,500 | (19,339 | ) | 30,633 | |||||||||||||||||||||||
Real Return Fund | 2,903 | — | — | — | — | (258 | ) | (1,750 | ) | 895 | ||||||||||||||||||||||
Dynamic Asset Allocation Fund | 4,552 | 19,624 | — | — | — | 129,042 | (7,964 | ) | 145,254 | |||||||||||||||||||||||
Multi-Asset Real Return Fund | — | — | — | (1,526 | ) | (1,152 | ) | (6,435 | ) | (1,497 | ) | (10,610 | ) | |||||||||||||||||||
Post-October losses represent losses realized on investment transactions from November 1, 2012 through May 31, 2013 that, in accordance with Federal income tax regulations, the Funds may elect to defer and treat as having arisen in the following fiscal year. For Federal income tax purposes, capital losses incurred in taxable years beginning before December 22, 2010 may be carried forward for a maximum period of eight years and applied against future net capital gains as follows:
| Expires 2015 ($ Thousands) | Expires 2016 ($ Thousands) | Expires 2017 ($ Thousands) | Expires 2018 ($ Thousands) | Expires 2019 ($ Thousands) | Total Capital Loss Carryforwards May 31, 2013 ($ Thousands) | |||||||||||||||||||
Large Cap Diversified Alpha Fund | $ | — | $ | — | $ | — | $ | 78,326 | $ | — | $ | 78,326 | ||||||||||||
Large Cap Disciplined Equity Fund | — | — | — | 602,779 | — | 602,779 | ||||||||||||||||||
Small Cap Fund | — | — | — | 130,399 | — | 130,399 | ||||||||||||||||||
International Equity Fund | — | — | 119,559 | 278,108 | — | 397,667 | ||||||||||||||||||
World Equity Ex-US Fund | — | — | 36,111 | 441,774 | — | 477,885 | ||||||||||||||||||
Screened World Equity Ex-US Fund | — | — | — | 15,308 | — | 15,308 | ||||||||||||||||||
Opportunistic Income Fund | — | — | 7,959 | 23,512 | 19,071 | 50,542 | ||||||||||||||||||
Under the recently enacted Regulated Investment Company Modernization Act of 2010, Funds will be permitted to carry forward capital losses incurred in taxable years beginning after December 22, 2010 for an unlimited period. However, any losses incurred during those future taxable years will be required to be utilized prior to the losses incurred in pre-enactment taxable years. As a result of this ordering rule, pre-enactment capital loss carryforwards may be more likely to expire unused. Additionally, post-enactment capital losses that are carried forward will retain their character as either short-term or long-term capital losses rather than being considered all short-term as under previous law. Losses carried forward under these new provisions are as follows:
| Short-Term Loss ($ Thousands) | Long-Term Loss ($ Thousands) | Total* | ||||||||||
International Equity Fund | $ | 755 | $ | — | $ | 755 | ||||||
Ultra Short Duration Bond Fund | — | 344 | 344 | |||||||||
| * | This table should be used in conjunction with the capital loss carryforwards table. |
During the fiscal year ended May 31, 2013, the following Funds utilized capital loss carryforwards to offset capital gains:
| Amount Utilized ($ Thousands) | ||||
Large Cap Diversified Alpha Fund | $ | 37,689 | ||
Large Cap Disciplined Equity Fund | 631,335 | |||
Small Cap Fund | 76,933 | |||
Small/Mid Cap Equity Fund | 11,157 | |||
International Equity Fund | 7,961 | |||
World Equity Ex-US Fund | 145,772 | |||
Screened World Equity Ex-US Fund | 1,674 | |||
Opportunistic Income Fund | 4,537 | |||
High Yield Bond Fund | 47,362 | |||
Multi-Asset Real Return Fund | 1,417 | |||
| 266 | SEI Institutional Investments Trust / Annual Report / May 31, 2013 |
Table of Contents
For Federal income tax purposes, the cost of securities owned at May 31, 2013, and the net realized gains or losses on securities sold for the period were not materially different from amounts reported for financial reporting purposes. These differences are primarily due to investments in partnerships, passive foreign investment companies, defaulted bond and wash sales which cannot be used for Federal income tax purposes in the current year and have been deferred for use in future years. The aggregate gross unrealized appreciation and depreciation on total investments held by the Funds at May 31, 2013, was as follows:
| Federal Tax Cost ($ Thousands) | Appreciated Securities ($ Thousands) | Depreciated Securities ($ Thousands) | Net Unrealized Appreciation (Depreciation) ($ Thousands) | |||||||||||||
Large Cap Fund | $ | 1,504,912 | $ | 495,696 | $ | (32,928 | ) | $ | 462,768 | |||||||
Large Cap Diversified Alpha Fund | 268,759 | 48,579 | (4,416 | ) | 44,163 | |||||||||||
Large Cap Disciplined Equity Fund | 4,514,579 | 1,191,581 | (91,490 | ) | 1,100,091 | |||||||||||
Large Cap Index Fund | 1,822,168 | 549,163 | (37,861 | ) | 511,302 | |||||||||||
Extended Market Index Fund | 178,126 | 10,089 | (2,939 | ) | 7,150 | |||||||||||
Small Cap Fund | 870,987 | 129,676 | (39,064 | ) | 90,612 | |||||||||||
Small Cap II Fund | 240,555 | 39,366 | (5,346 | ) | 34,020 | |||||||||||
Small/Mid Cap Equity Fund | 2,292,335 | 404,404 | (69,144 | ) | 335,260 | |||||||||||
U.S. Managed Volatility Fund | 943,554 | 174,077 | (6,844 | ) | 167,233 | |||||||||||
International Equity Fund | 227,024 | 26,113 | (22,409 | ) | 3,704 | |||||||||||
World Equity Ex-US Fund | 5,996,382 | 913,974 | (242,194 | ) | 671,780 | |||||||||||
Screened World Equity Ex-US Fund | 58,181 | 7,116 | (2,732 | ) | 4,384 | |||||||||||
Opportunistic Income Fund | 1,002,221 | 12,253 | (5,182 | ) | 7,071 | |||||||||||
Core Fixed Income Fund | 7,008,891 | 241,359 | (110,784 | ) | 130,575 | |||||||||||
High Yield Bond Fund | 2,038,195 | 131,107 | (34,059 | ) | 97,048 | |||||||||||
Long Duration Fund | 3,217,421 | 192,035 | (81,116 | ) | 110,919 | |||||||||||
Long Duration Corporate Bond Fund | 2,123,197 | 27,010 | (66,737 | ) | (39,727 | ) | ||||||||||
Ultra Short Duration Fund | 506,405 | 1,947 | (927 | ) | 1,020 | |||||||||||
Emerging Markets Debt Fund | 1,300,885 | 60,905 | (41,004 | ) | 19,901 | |||||||||||
Real Return Fund | 250,438 | 2,028 | (2,286 | ) | (258 | ) | ||||||||||
Dynamic Asset Allocation Fund | 1,002,038 | 137,226 | (16,148 | ) | 121,078 | |||||||||||
Multi-Asset Real Return Fund | 348,102 | 5,145 | (13,502 | ) | (8,357 | ) | ||||||||||
Management has analyzed the Funds’ tax positions taken on Federal income tax returns for all open tax years and has concluded that as of May 31, 2013, no provision for income tax would be required in the Funds’ financial statements. The Funds’ Federal and state income and Federal excise tax returns for tax years for which the applicable statutes of limitations have not expired are subject to examination by the Internal Revenue Service and state departments of revenue.
9. CONCENTRATION/RISKS
In the normal course of business, the Trust enters into contracts that provide general indemnifications by the Trust to the counterparty to the contract. The Trust’s maximum exposure under these arrangements is dependent on future claims that may be made against the Trust and, therefore, cannot be estimated; however, management believes that, based on experience, the risk of loss from such claims is considered remote.
The market values of the Core Fixed Income, High Yield Bond, Long Duration, Long Duration Corporate Bond, Ultra Short Duration Bond and Multi-Asset Real Return Funds’ investments may change in response to interest rate changes and other factors. During periods of falling interest rates, the values of fixed income securities generally rise. Conversely, during periods of rising interest rates, the values of such securities generally decline. Changes by recognized rating agencies in the ratings of any fixed income security and in the ability of an issuer to make payments of interest and principal may also affect the value of these investments.
The International Equity, World Equity Ex-US, Screened World Equity��Ex-US and Emerging Markets Debt Funds concentrate their investments in securities of foreign issuers in various countries. These investments may involve certain considerations and risks not typically associated with investments in the United States, as a result of, among other factors, the possibility of future political and economic developments and the level of governmental supervision and regulation of securities markets in the respective countries.
10. IN-KIND TRANSFERS OF SECURITIES
During the year ended May 31, 2013, the Core Fixed Income, Long Duration, Long Duration Corporate Bond, and Ultra Short Duration Funds issued shares of beneficial interest in exchange for securities. These securities were transferred at their current value on the date of such transactions.
| Shares Issued (Redeemed) (Thousands) | Value ($ Thousands) | Gain ($ Thousands) | ||||||||||
Core Fixed Income | ||||||||||||
7/31/2012 | 18,108 | $ | 195,406 | $ | — | |||||||
9/28/2012 | 7,720 | 83,603 | — | |||||||||
Long Duration Fund | ||||||||||||
6/29/2012 | (155,797 | ) | 1,495,648 | 115,402 | ||||||||
7/31/2012 | 7,281 | 72,886 | — | |||||||||
2/28/2013 | 4,931 | 44,429 | — | |||||||||
Long Duration Corporate Bond Fund | ||||||||||||
6/29/2012 | 149,565 | 1,495,648 | ||||||||||
9/28/2012 | 5,819 | 60,636 | — | |||||||||
Ultra Short Duration Bond Fund | ||||||||||||
11/30/2012 | 2,511 | 25,206 | — | |||||||||
| SEI Institutional Investments Trust / Annual Report / May 31, 2013 | 267 |
Table of Contents
Notes to Financial Statements (Concluded)
May 31, 2013
During the year ended May 31, 2012, the Large Cap Index, Small/Mid Cap Equity and Long Duration Funds issued shares of beneficial interest in exchange for securities. These securities were transferred at their current value on the date of such transactions.
| Shares Issued (Redeemed) (Thousands) | Value ($ Thousands) | Gain ($ Thousands) | ||||||||||
Large Cap Index Fund | ||||||||||||
1/5/2012 | 272 | $ | 29,489 | $ | — | |||||||
2/3/2012 | 176 | 20,013 | — | |||||||||
Small/Mid Cap Equity Fund | ||||||||||||
8/3/2011 | (2,758 | ) | (35,388 | ) | 4,996 | |||||||
Long Duration Fund | ||||||||||||
8/3/2011 | 4,633 | 41,416 | — | |||||||||
2/3/2012 | 34,942 | 327,759 | — | |||||||||
4/13/2012 | 37,389 | 345,848 | — | |||||||||
11. SECURITIES LENDING
To the extent consistent with its investment objective and strategies, a Fund may lend portfolio securities to brokers, dealers and other financial organizations that meet capital and other credit requirements or other criteria established by the Trust’s Board of Trustees. These loans may not exceed 33 1/3% of the total asset value of the Fund (including the loan collateral). No Fund will lend portfolio securities to its Adviser, sub-adviser or their affiliates unless it has applied for and received specific authority to do so from the SEC. Loans of portfolio securities will be fully collateralized by cash. Collateral will be maintained in an amount equal to at least 100% of the current market value of the loaned securities by marking-to-market daily, although the borrower will be required to deliver collateral between 102% and 105% of the market value of borrowed securities for domestic and foreign securities, respectively. However, due to market fluctuations during the day, the value of securities loaned on a particular day may, during the course of the day, exceed the value of collateral. On each business day, the amount of collateral is adjusted based on the prior day’s market fluctuations and the current day’s lending activity.
Income from lending activity is determined by the amount of interest earned on collateral, less any amounts payable to the borrowers of the securities and the lending agent. Lending securities involves certain risks, including the risk that the Fund may be delayed or prevented from recovering the collateral if the borrower fails to return the securities.
Cash collateral received in connection with securities lending is invested in short-term investments by the lending agent. These investments may include the SEI Liquidity Fund, L.P., and the Fund bears all of the gains and losses on such investment. There is no guarantee that these investments will not lose value.
12. SUBSEQUENT EVENTS
Management has evaluated the need for disclosures and/or adjustments resulting from subsequent events through the date the financial statements were issued. Based on this evaluation, no disclosure and/or adjustments were required to the financial statements as of May 31, 2013 except for the following:
At a meeting of the Board of Trustees held on March 26, 2013, the Board of Trustees approved the closing and liquidation of the International Equity Fund. On June 26, 2013, the Fund ceased operations and commenced an orderly liquidation and distribution of the Fund’s portfolio according to the Plan of Liquidation (the “Plan”). Each shareholder received their prorata portion of the liquidation proceeds according to the Plan.
| 268 | SEI Institutional Investments Trust / Annual Report / May 31, 2013 |
Table of Contents
Report of Independent Registered Public Accounting Firm
To the Board of Trustees and Shareholders
SEI Institutional Investments Trust:
We have audited the accompanying statements of assets and liabilities of the SEI Institutional Investments Trust comprised of the Large Cap Fund, Large Cap Diversified Alpha Fund, Large Cap Disciplined Equity Fund, Large Cap Index Fund, Extended Market Index Fund, Small Cap Fund, Small Cap II Fund, Small/Mid Cap Equity Fund, U.S. Managed Volatility Fund, International Equity Fund, World Equity Ex-US Fund, Screened World Equity Ex-US Fund, Opportunistic Income Fund (formerly the Enhanced LIBOR Opportunities Fund), Core Fixed Income Fund, High Yield Bond Fund, Long Duration Fund, Long Duration Corporate Bond Fund, Ultra Short Duration Bond Fund, Emerging Markets Debt Fund, Real Return Fund, Dynamic Asset Allocation Fund and Multi-Asset Real Return Fund (collectively, the “Funds”), including the schedules of investments or summary schedules of investments, as applicable, as of May 31, 2013, and the related statements of operations for the year or period then ended, the statements of changes in net assets for each of the years or periods in the two-year period then ended, the statement of cash flows for the year then ended for the Multi-Asset Real Return Fund, and the financial highlights for each of the years or periods in the five-year period then ended. These financial statements and financial highlights are the responsibility of the Funds’ management. Our responsibility is to express an opinion on these financial statements and financial highlights based on our audits.
We conducted our audits in accordance with the standards of the Public Company Accounting Oversight Board (United States). Those standards require that we plan and perform the audit to obtain reasonable assurance about whether the financial statements and financial highlights are free of material misstatement. An audit includes examining, on a test basis, evidence supporting the amounts and disclosures in the financial statements. Our procedures included confirmation of securities owned as of May 31, 2013, by correspondence with the custodians and brokers or other appropriate auditing procedures. An audit also includes assessing the accounting principles used and significant estimates made by management, as well as evaluating the overall financial statement presentation. We believe that our audits provide a reasonable basis for our opinion.
In our opinion, the financial statements and financial highlights referred to above present fairly, in all material respects, the financial position of each of the funds comprising SEI Institutional Investments Trust as of May 31, 2013, the results of their operations for the year or period then ended, the changes in their net assets for each of the years or periods in the two-year period then ended, the cash flows for the year then ended for the Multi-Asset Real Return Fund and the financial highlights for each of the years or periods in the five-year period then ended, in conformity with U.S. generally accepted accounting principles.
As disclosed in note 12 to the financial statements, on March 26, 2013, the Board of Trustees approved the closing and liquidation of the International Equity Fund, and the Fund liquidated and ceased operations on June 26, 2013.

Philadelphia, Pennsylvania
July 30, 2013
| SEI Institutional Investments Trust / Annual Report / May 31, 2013 | 269 |
Table of Contents
TRUSTEES AND OFFICERS OF THE TRUST (Unaudited)
The following chart lists Trustees and Officers as of May 31, 2013.
Set forth below are the names, addresses, ages, position with the Trust, Term of Office and Length of Time Served, the principal occupations for the last five years, number of portfolios in fund complex overseen by trustee, and other directorships outside the fund complex of each of the persons currently serving as Trustees and Officers of the Trust. The Trust’s Statement of Additional Information (“SAI”) includes additional information about the Trustees and Officers. The SAI may be obtained without charge by calling 1-800-342-5734.
| Name Address, and Age | Position(s) Held with Trusts | Term of Office and Length of Time Served1 | Principal Occupation(s) During Past Five Years | Number of Portfolios in Fund Complex Overseen by Trustee2 | Other Directorships Held by Trustee | |||||
| INTERESTED TRUSTEES | ||||||||||
Robert A. Nesher One Freedom Valley Drive Oaks, PA 19456 66 yrs. old | Chairman of the Board of Trustees* | since 1982 | Currently performs various services on behalf of SEI for which Mr. Nesher is compensated. | 96 | Trustee of The Advisors’ Inner Circle Fund, The Advisors’ Inner Circle Fund II, Bishop Street Funds, Director of SEI Global Master Fund, plc, SEI Global Assets Fund, plc, SEI Global Investments Fund, plc, SEI Investments Global, Limited, SEI Investments — Global Fund Services, Limited, SEI Investments (Europe), Limited, SEI Global Nominee Ltd., SEI Structured Credit Fund, L.P. | |||||
William M. Doran One Freedom Valley Drive Oaks, PA 19456 72 yrs. old | Trustee* | since 1982 | Self-employed consultant since 2003. Partner, Morgan, Lewis & Bockius LLP (law firm) from 1976 to 2003, counsel to the Trust, SEI, SIMC, the Administrator and the Distributor. Secretary of SEI since 1978. | 96 | Trustee of The Advisors’ Inner Circle Fund, The Advisors’ Inner Circle Fund II, Bishop Street Funds, Director of SEI since 1974. Director of the Distributor since 2003. Director of SEI Investments — Global Fund Services, Limited, SEI Investments Global, Limited, SEI Investments (Europe), Limited, SEI Investments (Asia), SEI Global Nominee Ltd., Limited and SEI Asset Korea Co., Ltd. | |||||
| TRUSTEES | ||||||||||
George J. Sullivan, Jr. One Freedom Valley Drive Oaks, PA 19456 70 yrs. old | Trustee | since 1996 | Retired since January 2012. Self- Employed Consultant, Newfound Consultants Inc. since April 1997- December 2011. | 96 | Trustee of The Advisors’ Inner Circle Fund, The Advisors’ Inner Circle Fund II, Bishop Street Funds, State Street Navigator Securities Lending Trust, and SEI Structured Credit Fund, L.P., member of the independent review committee for SEI’s Canadian-registered mutual funds. | |||||
| * | Messrs. Nesher and Doran are Trustees who may be deemed as “interested” persons of the Trust as that term is defined in the 1940 Act by virtue of their affiliation with SIMC and the Trust’s Distributor. |
| 1 | Each trustee shall hold office during the lifetime of this Trust until the election and qualification of his or her successor, or until he or she sooner dies, resigns or is removed in accordance with the Trust’s Declaration of Trust. |
| 2 | The Fund Complex includes the following Trusts: SEI Asset Allocation Trust, SEI Daily Income Trust, SEI Institutional Investments Trust, Adviser Managed Trust, SEI Institutional International Trust, SEI Institutional Managed Trust, SEI Liquid Asset Trust, SEI Tax Exempt Trust, SEI Alpha Strategy Portfolios, L.P. and New Covenant Funds. |
| 270 | SEI Institutional Investments Trust / Annual Report / May 31, 2013 |
Table of Contents
Name Address, and Age | Position(s) Held with Trusts | Term of Office and Length of Time Served1 | Principal Occupation(s) During Past Five Years | Number of by Trustee2 | Other Directorships Held by Trustee | |||||
| TRUSTEES (continued) | ||||||||||
Nina Lesavoy One Freedom Valley Drive Oaks, PA 19456 55 yrs. old | Trustee | since 2003 | Founder and Managing Director, Avec Capital since 2008. Managing Director, Cue Capital from March 2002-March 2008. | 96 | Director of SEI Structured Credit Fund, L.P. | |||||
James M. Williams Valley Drive Oaks, PA 19456 65 yrs. old | Trustee | since 2004 | Vice President and Chief Investment Officer, J. Paul Getty Trust, Non-Profit Foundation for Visual Arts, since December 2002. | 96 | Trustee/Director of Ariel Mutual Funds, and SEI Strucured Credit Fund, L.P. | |||||
Mitchell A. Johnson One Freedom Valley Drive Oaks, PA 19456 71 yrs. old | Trustee | Since 2007 | Private Investor since 1994. | 96 | Trustee of the Advisors’ Inner Circle Fund, The Advisors’ Inner Circle Fund II, and Bishop Street Funds | |||||
Hubert L. Harris, Jr. One Freedom Valley Drive Oaks, PA 19456 69 yrs. old | Trustee | since 2008 | Retired since December 2005. Chief Executive Officer and Chair of the Board of Directors, AMVESCAP Retirement, Inc., 1997-December 2005. Chief Executive Officer, INVESCO North America, September 2003-December 2005. | 96 | Director of Colonial BancGroup, Inc. and St. Joseph’s Translational Research Institute; Chair of the Board of Trustees, Georgia Tech Foundation, Inc. (nonprofit corporation); Board of Councilors of the Carter Center. | |||||
| OFFICERS | ||||||||||
Robert A. Nesher One Freedom Valley Drive Oaks, PA 19456 66 yrs. old | President and CEO | since 2005 | Currently performs various services on behalf of SEI for which Mr. Nesher is compensated. | N/A | N/A | |||||
Peter A. Rodriguez One Freedom Valley Drive Oaks, PA 19456 51 yrs. old | Controller and Chief Financial Officer | since 2011 | Director, Fund Accounting, SEI Investments Global Funds Services (March 2011, September 2002 to March 2005 and 1997- 2002); Director, Mutual Fund Trading, SEI Private Trust Company (May 2009 to February 2011); Director, Asset Data Services, Global Wealth Services (June 2006 to April 2009); Director, Portfolio Accounting, SEI Investments Global Funds Services (March 2005 to June 2006) | N/A | N/A | |||||
Russell Emery One Freedom Valley Drive Oaks, PA 19456 50 yrs. old | Chief Compliance Officer | since 2006 | Chief Compliance Officer of SEI Institutional Managed Trust, SEI Asset Allocation Trust, SEI Daily Income Trust, SEI Institutional International Trust, SEI Liquid Asset Trust, SEI Tax Exempt Trust, SEI Institutional Investments Trust, The Advisors’ Inner Circle Fund, The Advisors’ Inner Circle Fund II, and Bishop Street Funds, since March 2006. Chief Compliance Officer of SEI Structured Credit Fund, LP and SEI Alpha Strategy Portfolios, LP since June 2007. Chief Compliance Officer of Adviser Managed Trust since December 2010. Chief Compliance Officer of New Covenant Funds since February 2012. | N/A | N/A | |||||
Timothy D. Barto One Freedom Valley Drive Oaks, PA 19456 45 yrs. old | Vice President and Secretary | since 2002 | General Counsel, Vice President and Secretary of SIMC and the Administrator since 2004. Vice President and Assistant Secretary of SEI since 2001. Vice President of SIMC and the Administrator since 1999. | N/A | N/A | |||||
| SEI Institutional Investments Trust / Annual Report / May 31, 2013 | 271 |
Table of Contents
TRUSTEES AND OFFICERS OF THE TRUST (Unaudited)
Name Address, and Age | Position(s) Held with Trusts | Term of Office and Length of Time Served1 | Principal Occupation(s) During Past Five Years | Number of by Trustee2 | Other Directorships Held by Trustee | |||||
| OFFICERS (continued) | ||||||||||
Aaron Buser One Freedom Valley Drive Oaks, PA 19456 42 yrs. old | Vice President and Assistant Secretary | since 2008 | Vice President and Assistant Secretary of SIMC since 2007. Associate at Stark & Stark (2004-2007). | N/A | N/A | |||||
David F. McCann One Freedom Valley Drive Oaks, PA 19456 37 yrs. old | Vice President and Assistant Secretary | since 2009 | Vice President and Assistant Secretary of SIMC since 2008. Attorney, Drinker Biddle & Reath, LLP (law firm), May 2005-October 2008. Attorney, Pepper Hamilton, LLP (law firm), September 2001-May 2005. | N/A | N/A | |||||
Stephen G. MacRae One Freedom Valley Drive Oaks, PA 19456 45 yrs. old | Vice President | since 2012 | Director of Global Investment Product Management, January 2004 to present. | N/A | N/A | |||||
Edward McCusker One Freedom Valley Drive Oaks, PA 19456 29 yrs. old | Anti-Money Laundering Compliance Officer and Privacy Officer | since 2013 | Compliance Manager of SEI Investments Company, May 2011-April 2013. Project Manager and AML Operations Lead of SEI Private Trust Company, September 2010-May 2011. Private Banking Client Service Professional of SEI Private Banking and Trust, September 2008-September 2010. | N/A | N/A | |||||
| 1 | Each trustee shall hold office during the lifetime of this Trust until the election and qualification of his or her successor, or until he or she sooner dies, resigns or is removed in accordance with the Trust’s Declaration of Trust. |
| 2 | The Fund Complex includes the following Trusts: SEI Asset Allocation Trust, SEI Daily Income Trust, SEI Institutional Investments Trust, Adviser Managed Trust, SEI Institutional International Trust, SEI Institutional Managed Trust, SEI Liquid Asset Trust, SEI Tax Exempt Trust, SEI Alpha Strategy Portfolios, L.P. and New Covenant Funds. |
| 272 | SEI Institutional Investments Trust / Annual Report / May 31, 2013 |
Table of Contents
Disclosure of Fund Expenses (Unaudited)
May 31, 2013
All mutual funds have operating expenses. As a shareholder of a fund, your investment is affected by these ongoing costs, which include (among others) costs for portfolio management, administrative services, and shareholder reports like this one. It is important for you to understand the impact of these costs on your investment returns.
Operating expenses such as these are deducted from the fund’s gross income and directly reduce your final investment return. These expenses are expressed as a percentage of the fund’s average net assets; this percentage is known as the fund’s expense ratio.
The following examples use the expense ratio and are intended to help you understand the ongoing costs (in dollars) of investing in your Fund and to compare these costs with those of other mutual funds. The examples are based on an investment of $1,000 made at the beginning of the period shown and held for the entire period.
The table on the next page illustrates your Fund’s costs in two ways:
• Actual Fund return. This section helps you to estimate the actual expenses after fee waivers that your Fund incurred over the period. The “Expenses Paid During Period” column shows the actual dollar expense cost incurred by a $1,000 investment in the Fund, and the “Ending Account Value” number is derived from deducting that expense cost from the Fund’s gross investment return.
You can use this information, together with the actual amount you invested in the Fund, to estimate the expenses you paid over that period. Simply divide your actual starting account value by $1,000 to arrive at a ratio (for example, an $8,600 account value divided by $1,000 = 8.6), then multiply that ratio by the number shown for your Fund under “Expenses Paid During Period.”
• Hypothetical 5% return. This section helps you compare your Fund’s costs with those of other mutual funds. It assumes that the Fund had an annual 5% return before expenses during the year, but that the expense ratio (Column 3) is unchanged. This example is useful in making comparisons because the Securities and Exchange Commission requires all mutual funds to make this 5% calculation. You can assess your Fund’s comparative cost by comparing the hypothetical result for your Fund in the “Expense Paid During Period” column with those that appear in the same charts in the shareholder reports for other funds.
NOTE: Because the return is set at 5% for comparison purposes — NOT your Fund’s actual return — the account values shown do not apply to your specific investment.
| Beginning Account Value 12/1/2012 | Ending Account Value 5/31/2013 | Annualized Expense Ratios | Expense Paid During Period* | |||||||||||||
Large Cap Fund | ||||||||||||||||
Actual Fund Return | ||||||||||||||||
Class A Shares | $ | 1,000.00 | $ | 1,172.70 | 0.18 | % | $ | 0.98 | ||||||||
Hypothetical 5% Return | ||||||||||||||||
Class A Shares | $ | 1,000.00 | $ | 1,024.03 | 0.18 | % | $ | 0.91 | ||||||||
Large Cap Diversified Alpha Fund |
| |||||||||||||||
Actual Fund Return | ||||||||||||||||
Class A Shares | $ | 1,000.00 | $ | 1,153.60 | 0.24 | % | $ | 1.29 | ||||||||
Hypothetical 5% Return | ||||||||||||||||
Class A Shares | $ | 1,000.00 | $ | 1,023.73 | 0.24 | % | $ | 1.21 | ||||||||
Large Cap Disciplined Equity Fund |
| |||||||||||||||
Actual Fund Return | ||||||||||||||||
Class A Shares | $ | 1,000.00 | $ | 1,165.30 | 0.16 | % | $ | 0.86 | ||||||||
Hypothetical 5% Return | ||||||||||||||||
Class A Shares | $ | 1,000.00 | $ | 1,024.13 | 0.16 | % | $ | 0.81 | ||||||||
| Beginning Account Value 12/1/2012 | Ending Account Value 5/31/2013 | Annualized Expense Ratios | Expense Paid During Period* | |||||||||||||
Large Cap Index Fund |
| |||||||||||||||
Actual Fund Return | ||||||||||||||||
Class A Shares | $ | 1,000.00 | $ | 1,166.90 | 0.03 | % | $ | 0.16 | ||||||||
Hypothetical 5% Return | ||||||||||||||||
Class A Shares | $ | 1,000.00 | $ | 1,024.78 | 0.03 | % | $ | 0.15 | ||||||||
Exented Market Index Fund — Commenced 2/28/13 |
| |||||||||||||||
Actual Fund Return | ||||||||||||||||
Class A Shares | $ | 1,000.00 | $ | 1,078.40 | 0.11 | % | $ | 0.29 | ** | |||||||
Hypothetical 5% Return | ||||||||||||||||
Class A Shares | $ | 1,000.00 | $ | 1,024.38 | 0.11 | % | $ | 0.56 | * | |||||||
Small Cap Fund | ||||||||||||||||
Actual Fund Return | ||||||||||||||||
Class A Shares | $ | 1,000.00 | $ | 1,212.10 | 0.47 | % | $ | 2.59 | ||||||||
Hypothetical 5% Return | ||||||||||||||||
Class A Shares | $ | 1,000.00 | $ | 1,022.59 | 0.47 | % | $ | 2.37 | ||||||||
| SEI Institutional Investments Trust / Annual Report / May 31, 2013 | 273 |
Table of Contents
Disclosure of Fund Expenses (Unaudited) (Concluded)
May 31, 2013
| Beginning Account Value 12/1/2012 | Ending Account Value 5/31/2013 | Annualized Expense Ratios | Expense Paid During Period* | |||||||||||||
Small Cap II Fund | ||||||||||||||||
Actual Fund Return | ||||||||||||||||
Class A Shares | $ | 1,000.00 | $ | 1,201.20 | 0.47 | % | $ | 2.58 | ||||||||
Hypothetical 5% Return | ||||||||||||||||
Class A Shares | $ | 1,000.00 | $ | 1,022.59 | 0.47 | % | $ | 2.37 | ||||||||
Small/Mid Cap Equity Fund |
| |||||||||||||||
Actual Fund Return | ||||||||||||||||
Class A Shares | $ | 1,000.00 | $ | 1,203.90 | 0.45 | % | $ | 2.47 | ||||||||
Hypothetical 5% Return | ||||||||||||||||
Class A Shares | $ | 1,000.00 | $ | 1,022.69 | 0.45 | % | $ | 2.27 | ||||||||
U.S. Managed Volatility Fund |
| |||||||||||||||
Actual Fund Return | ||||||||||||||||
Class A Shares | $ | 1,000.00 | $ | 1,146.60 | 0.24 | % | $ | 1.28 | ||||||||
Hypothetical 5% Return | ||||||||||||||||
Class A Shares | $ | 1,000.00 | $ | 1,023.73 | 0.24 | % | $ | 1.21 | ||||||||
International Equity Fund |
| |||||||||||||||
Actual Fund Return | ||||||||||||||||
Class A Shares | $ | 1,000.00 | $ | 1,096.50 | 0.42 | % | $ | 2.20 | ||||||||
Hypothetical 5% Return | ||||||||||||||||
Class A Shares | $ | 1,000.00 | $ | 1,022.84 | 0.42 | % | $ | 2.12 | ||||||||
World Equity Ex-US Fund |
| |||||||||||||||
Actual Fund Return | ||||||||||||||||
Class A Shares | $ | 1,000.00 | $ | 1,098.70 | 0.34 | % | $ | 1.78 | ||||||||
Hypothetical 5% Return | ||||||||||||||||
Class A Shares | $ | 1,000.00 | $ | 1,023.24 | 0.34 | % | $ | 1.72 | ||||||||
Screened World Equity Ex-US Fund |
| |||||||||||||||
Actual Fund Return | ||||||||||||||||
Class A Shares | $ | 1,000.00 | $ | 1,085.30 | 0.45 | % | $ | 2.34 | ||||||||
Hypothetical 5% Return | ||||||||||||||||
Class A Shares | $ | 1,000.00 | $ | 1,022.69 | 0.45 | % | $ | 2.27 | ||||||||
Opportunistic Income Fund |
| |||||||||||||||
Actual Fund Return | ||||||||||||||||
Class A Shares | $ | 1,000.00 | $ | 1,021.70 | 0.20 | % | $ | 1.01 | ||||||||
Hypothetical 5% Return | ||||||||||||||||
Class A Shares | $ | 1,000.00 | $ | 1,023.93 | 0.20 | % | $ | 1.01 | ||||||||
Core Fixed Income Fund |
| |||||||||||||||
Actual Fund Return | ||||||||||||||||
Class A Shares | $ | 1,000.00 | $ | 995.70 | 0.12 | % | $ | 0.60 | ||||||||
Hypothetical 5% Return | ||||||||||||||||
Class A Shares | $ | 1,000.00 | $ | 1,024.33 | 0.12 | % | $ | 0.61 | ||||||||
| Beginning Account Value 12/1/2012 | Ending Account Value 5/31/2013 | Annualized Expense Ratios | Expense Paid During Period* | |||||||||||||
High Yield Bond Fund |
| |||||||||||||||
Actual Fund Return | ||||||||||||||||
Class A Shares | $ | 1,000.00 | $ | 1,065.20 | 0.30 | % | $ | 1.54 | ||||||||
Hypothetical 5% Return | ||||||||||||||||
Class A Shares | $ | 1,000.00 | $ | 1,023.44 | 0.30 | % | $ | 1.51 | ||||||||
Long Duration Fund |
| |||||||||||||||
Actual Fund Return | ||||||||||||||||
Class A Shares | $ | 1,000.00 | $ | 958.40 | 0.16 | % | $ | 0.78 | ||||||||
Hypothetical 5% Return | ||||||||||||||||
Class A Shares | $ | 1,000.00 | $ | 1,024.13 | 0.16 | % | $ | 0.81 | ||||||||
Long Duration Corporate Bond Fund |
| |||||||||||||||
Actual Fund Return | ||||||||||||||||
Class A Shares | $ | 1,000.00 | $ | 969.00 | 0.15 | % | $ | 0.74 | ||||||||
Hypothetical 5% Return | ||||||||||||||||
Class A Shares | $ | 1,000.00 | $ | 1,024.18 | 0.15 | % | $ | 0.76 | ||||||||
Ultra Short Duration Bond Fund |
| |||||||||||||||
Actual Fund Return | ||||||||||||||||
Class A Shares | $ | 1,000.00 | $ | 1,005.10 | 0.11 | % | $ | 0.55 | ||||||||
Hypothetical 5% Return | ||||||||||||||||
Class A Shares | $ | 1,000.00 | $ | 1,024.38 | 0.11 | % | $ | 0.56 | ||||||||
Emerging Markets Debt Fund |
| |||||||||||||||
Actual Fund Return | ||||||||||||||||
Class A Shares | $ | 1,000.00 | $ | 991.30 | 0.48 | % | $ | 2.38 | ||||||||
Hypothetical 5% Return | ||||||||||||||||
Class A Shares | $ | 1,000.00 | $ | 1,022.54 | 0.48 | % | $ | 2.42 | ||||||||
Real Return Fund | ||||||||||||||||
Actual Fund Return | ||||||||||||||||
Class A Shares | $ | 1,000.00 | $ | 985.70 | 0.10 | % | $ | 0.50 | ||||||||
Hypothetical 5% Return | ||||||||||||||||
Class A Shares | $ | 1,000.00 | $ | 1,024.43 | 0.10 | % | $ | 0.50 | ||||||||
Dynamic Asset Allocation Fund |
| |||||||||||||||
Actual Fund Return | ||||||||||||||||
Class A Shares | $ | 1,000.00 | $ | 1,168.30 | 0.08 | % | $ | 0.43 | ||||||||
Hypothetical 5% Return | ||||||||||||||||
Class A Shares | $ | 1,000.00 | $ | 1,024.53 | 0.08 | % | $ | 0.40 | ||||||||
Multi-Asset Real Return Fund |
| |||||||||||||||
Actual Fund Return | ||||||||||||||||
Class A Shares | $ | 1,000.00 | $ | 962.30 | 0.29 | % | $ | 1.42 | ||||||||
Hypothetical 5% Return | ||||||||||||||||
Class A Shares | $ | 1,000.00 | $ | 1,023.49 | 0.29 | % | $ | 1.46 | ||||||||
| * | Expenses are equal to the Fund’s annualized expense ratio multiplied by the average account value over the period, multiplied by 182/365 (to reflect one-half year period shown). |
| ** | Expenses are equal to the Fund’s annualized expense ratio multiplied by the average account value over the period, multiplied by 92/365 (to reflect the period since inception to period end). |
| 274 | SEI Institutional Investments Trust / Annual Report / May 31, 2013 |
Table of Contents
Board of Trustees Considerations in Approving the Advisory and Sub-Advisory Agreements (Unaudited)
SEI Institutional Investments Trust (the “Trust”) and SEI Investments Management Corporation (“SIMC”) have entered into an investment advisory agreement (the “Advisory Agreement”). Pursuant to the Advisory Agreement, SIMC oversees the investment advisory services provided to the series of the Trust (the “Funds”) and may manage the cash portion of the Funds’ assets. Pursuant to separate sub-advisory agreements (the “Sub-Advisory Agreements” and, together with the Advisory Agreement, the “Investment Advisory Agreements”) with SIMC, and under the supervision of SIMC and the Trust’s Board of Trustees (the “Board”), the sub-advisers (each, a “Sub-Adviser” and collectively, the “Sub-Advisers”) are responsible for the day-to-day investment management of all or a discrete portion of the assets of the Funds. The Sub-Advisers are also responsible for managing their employees who provide services to these Funds. The Sub-Advisers are selected based primarily upon the research and recommendations of SIMC, which evaluates quantitatively and qualitatively the Sub-Advisers’ skills and investment results in managing assets for specific asset classes, investment styles and strategies.
The Investment Company Act of 1940, as amended (the “1940 Act”) requires that the initial approval of, as well as the continuation of, the Funds’ Investment Advisory Agreements must be specifically approved: (i) by the vote of the Board or by a vote of the shareholders of the Funds; and (ii) by the vote of a majority of the Trustees who are not parties to the Investment Advisory Agreements or “interested persons” of any party (the “Independent Trustees”), cast in person at a meeting called for the purpose of voting on such approval(s). In connection with their consideration of such approval(s), the Funds’ Trustees must request and evaluate, and SIMC and the Sub-Advisers are required to furnish, such information as may be reasonably necessary to evaluate the terms of the Investment Advisory Agreements. In addition, the Securities and Exchange Commission takes the position that, as part of their fiduciary duties with respect to a mutual fund’s fees, mutual fund boards are required to evaluate the material factors applicable to a decision to approve an Investment Advisory Agreement.
Consistent with these responsibilities, the Trust’s Board calls and holds meetings each year that are dedicated to considering whether to renew the Investment Advisory Agreements between the Trust and SIMC and SIMC and the Sub-Advisers with respect to the Funds of the Trust. In preparation for these meetings, the Board requests and reviews a wide variety of materials provided by SIMC and the Sub-Advisers, including information about SIMC’s and the Sub-Advisers’ affiliates, personnel and operations. The Board also receives extensive data from third party affiliates. This information is provided in addition to the detailed information about the Funds that the Board reviews during the course of each year, including information that relates to Fund operations and Fund performance. The Trustees also receive a memorandum from Fund counsel and independent counsel to the Independent Trustees regarding the responsibilities of Trustees in connection with their consideration of whether to approve the Trust’s Investment Advisory Agreements. Finally, the Independent Trustees receive advice from independent counsel to the Independent Trustees, meet in executive sessions outside the presence of Fund management and participate in question and answer sessions with representatives of SIMC and the Sub-Advisers.
Specifically, during the course of the Trust’s fiscal year, the Board requested and received written materials from SIMC and the Sub-Advisers regarding: (i) the quality of SIMC’s and the Sub-Advisers’ investment management and other services; (ii) SIMC’s and the Sub-Advisers’ investment management personnel; (iii) SIMC’s and the Sub-Advisers’ operations and financial condition; (iv) SIMC’s and the Sub-Advisers’ brokerage practices (including any soft dollar arrangements) and investment strategies; (v) the level of the advisory fees that SIMC charges the Funds and the level of sub-advisory fees that SIMC pays the Sub-Advisers compared with the fees each charge to comparable mutual funds (although for certain Funds, it was determined that no readily available peer group comparable to such Funds was maintained by an independent party); (vi) the Funds’ overall fees and operating expenses compared with similar mutual funds (although for certain Funds, it was determined that no readily available peer group comparable to such Funds was maintained by an independent party); (vii) the level of SIMC’s and the Sub-Advisers’ profitability from their Fund-related operations; (viii) SIMC’s and the Sub-Advisers’ compliance systems; (ix) SIMC’s and the Sub-Advisers’ policies on and compliance procedures for personal securities transactions; (x) SIMC’s and the Sub-Advisers’ reputation, expertise and resources in domestic and/or international financial markets; and (xi) the Funds’ performance compared with similar mutual funds (although for certain Funds, it was determined that no readily available peer group comparable to such Funds was maintained by an independent party).
| SEI Institutional Investments Trust / Annual Report / May 31, 2013 | 275 |
Table of Contents
Board of Trustees Considerations in Approving the Advisory and Sub-Advisory Agreements (Unaudited) (Continued)
At the December 4-5, 2012 and March 26-27, 2013 meetings of the Board of Trustees, the Trustees, including a majority of the Independent Trustees, approved the Investment Advisory Agreements and approved the selection of SIMC and the Sub-Advisers to act in their respective capacities for the Funds. The Board’s approval was based on its consideration and evaluation of a variety of specific factors discussed at the meetings and at prior meetings, including:
| • | the nature, extent and quality of the services provided to the Funds under the Investment Advisory Agreements, including the resources of SIMC and the Sub-Advisers and their affiliates dedicated to the Funds; |
| • | the Funds’ investment performance and how it compared to that of other comparable mutual funds (although for certain Funds, it was determined that no readily available peer group comparable to such Funds was maintained by an independent party); |
| • | the Funds’ expenses under each Investment Advisory Agreement and how those expenses compared to those of other comparable mutual funds (although for certain Funds, it was determined that no readily available peer group comparable to such Funds was maintained by an independent party); |
| • | the profitability of SIMC and the Sub-Advisers and their affiliates with respect to the Funds, including both direct and indirect benefits accruing to SIMC and the Sub-Advisers and their affiliates; and |
| • | the extent to which economies of scale would be realized as the Funds grow and whether fee levels in the Investment Advisory Agreements reflect those economies of scale for the benefit of Fund investors. |
Nature, Extent and Quality of Services. The Board considered the nature, extent and quality of the services provided by SIMC and the Sub-Advisers to the Funds and the resources of SIMC and the Sub-Advisers and their affiliates dedicated to the Funds. In this regard, the Trustees evaluated, among other things, SIMC’s and each Sub-Adviser’s personnel, experience, track record and compliance program. The Trustees found the level of SIMC’s and each Sub-Adviser’s professional staff and culture of compliance satisfactory. Following evaluation, the Board concluded that, within the context of its full deliberations, the nature, extent and quality of services provided by SIMC and the Sub-Advisers to the Funds and the resources of SIMC and the Sub-Advisers and their affiliates dedicated to the Funds supported renewal of the Investment Advisory Agreements.
Fund Performance. The Board of Trustees considered Fund performance in determining whether to renew the Investment Advisory Agreements. Specifically, the Trustees considered the Funds’ performance relative to their peer groups and appropriate indices/benchmarks in light of total return, yield and market trends. As part of this review, the Trustees considered the composition of each peer group and selection criteria including the fact that, for certain Funds, it was determined that no readily available peer group comparable to such Funds was maintained by an independent party. In evaluating performance, the Trustees considered both market risk and shareholder risk expectations for the Funds. The Trustees found Fund performance satisfactory, and, where performance was below the benchmark, the Trustees were satisfied that appropriate steps were being taken. Following evaluation, the Board concluded that, within the context of its full deliberations, the performance of the Funds supported renewal of the Investment Advisory Agreements.
Fund Expenses. With respect to the Funds’ expenses under the Investment Advisory Agreements, the Trustees considered the rate of compensation called for by the Investment Advisory Agreements and the Funds’ net operating expense ratio in comparison to those of other comparable mutual funds. The Trustees also considered information about average expense ratios of comparable mutual funds in the Funds’ respective peer groups including the fact that, for certain Funds, it was determined that no readily available peer group comparable to such Funds was maintained by an independent party. The Trustees further considered the fact that the comparative fee analysis either showed that the various fees for the applicable Funds were below average or that there was a reasonable basis for the fee level. Finally, the Trustees considered the effects of SIMC’s voluntary waiver of management and other fees and the Sub-Advisers’ fees to prevent total Fund expenses from exceeding a specified cap and concluded that SIMC and the Sub-Advisers, through waivers, have maintained the Funds’ net operating expenses at
| 276 | SEI Institutional Investments Trust / Annual Report / May 31, 2013 |
Table of Contents
competitive levels for their respective distribution channels. Following evaluation, the Board concluded that, within the context of its full deliberations, the expenses of the Funds are reasonable and supported renewal of the Investment Advisory Agreements.
Profitability. With regard to profitability, the Trustees considered all compensation flowing to SIMC and the Sub-Advisers and their affiliates, directly or indirectly. The Trustees considered whether the varied levels of compensation and profitability under the Investment Advisory Agreements and other service agreements were reasonable and justified in light of the quality of all services rendered to the Funds by SIMC and the Sub-Advisers and their affiliates. The Trustees found that profitability was reasonable and that the margin was not increasing despite growth in assets. When considering the profitability of the Sub-Advisers, the Board took into account the fact that the Sub-Advisers are compensated by SIMC and not by the Funds directly, and such compensation with respect to any Sub-Adviser reflects an arms-length negotiation between the Sub-Adviser and SIMC. Based on this evaluation, the Board concluded that, within the context of its full deliberations, the profitability of each of SIMC and the Sub-Advisers is reasonable and supported renewal of the Investment Advisory Agreements.
Economies of Scale. The Trustees considered the existence of any economies of scale and whether those were passed along to the Funds’ shareholders through a graduated investment advisory fee schedule or other means, including any fee waivers by SIMC and its affiliates. Based on this evaluation, the Board concluded that, within the context of its full deliberations, the Funds obtain reasonable benefit from economies of scale.
Based on the Trustees’ deliberation and their evaluation of the information described above, the Board, including all of the Independent Trustees, unanimously approved the continuation of the Investment Advisory Agreements and concluded that the compensation under the Investment Advisory Agreements is fair and reasonable in light of such services and expenses and such other matters as the Trustees considered to be relevant in the exercise of their reasonable judgment. In the course of their deliberations, the Trustees did not identify any particular information that was all-important or controlling.
| SEI Institutional Investments Trust / Annual Report / May 31, 2013 | 277 |
Table of Contents
Notice to Shareholders (Unaudited)
For shareholders who do not have a May 31, 2013, taxable year end, this notice is for informational purposes only. For shareholders with a May 31, 2013, taxable year end, please consult your tax adviser as to the pertinence of this notice.
For the fiscal year ended May 31, 2013, the Funds are designating long term and qualifying dividend income with regard to distributions paid during the year as follows:
| (A) Long Term Capital Gains Distributions (Tax Basis) | (B) Return of Capital (Tax Basis) | (C) Ordinary Income Distributions (Tax Basis) | Total Distributions (Tax Basis) | (D) Dividends Qualifying for Corporate Dividends Rec. Deduction (1) | ||||||||||||||||
| Large Cap Fund | 50.92 | % | 0.00 | % | 49.08 | % | 100.00 | % | 57.98 | % | ||||||||||
| Large Cap Diversified Alpha Fund | 0.00 | % | 0.00 | % | 100.00 | % | 100.00 | % | 100.00 | % | ||||||||||
| Large Cap Disciplined Equity Fund | 0.00 | % | 0.00 | % | 100.00 | % | 100.00 | % | 87.36 | % | ||||||||||
| Large Cap Index Fund | 29.41 | % | 0.00 | % | 70.59 | % | 100.00 | % | 76.61 | % | ||||||||||
| Extended Market Index Fund | 0.00 | % | 0.00 | % | 100.00 | % | 100.00 | % | 43.98 | % | ||||||||||
| Small Cap Fund | 0.00 | % | 0.00 | % | 100.00 | % | 100.00 | % | 78.07 | % | ||||||||||
| Small Cap II Fund | 26.99 | % | 0.00 | % | 73.01 | % | 100.00 | % | 25.00 | % | ||||||||||
| Small/Mid Cap Equity Fund | 37.17 | % | 0.00 | % | 62.83 | % | 100.00 | % | 41.44 | % | ||||||||||
| U.S. Managed Volatility Fund | 20.79 | % | 0.00 | % | 79.21 | % | 100.00 | % | 53.44 | % | ||||||||||
| International Equity Fund(6) | 0.00 | % | 0.00 | % | 100.00 | % | 100.00 | % | 0.00 | % | ||||||||||
| World Equity Ex-US Fund(7) | 0.00 | % | 0.00 | % | 100.00 | % | 100.00 | % | 0.00 | % | ||||||||||
| Screened World Equity Ex-US Fund(8) | 0.00 | % | 0.00 | % | 100.00 | % | 100.00 | % | 0.00 | % | ||||||||||
| Opportunistic Income Fund | 0.00 | % | 0.00 | % | 100.00 | % | 100.00 | % | 0.00 | % | ||||||||||
| Core Fixed Income Fund | 0.00 | % | 0.00 | % | 100.00 | % | 100.00 | % | 0.00 | % | ||||||||||
| High Yield Bond Fund | 0.00 | % | 0.00 | % | 100.00 | % | 100.00 | % | 0.00 | % | ||||||||||
| Long Duration Fund | 11.30 | % | 0.00 | % | 88.70 | % | 100.00 | % | 0.00 | % | ||||||||||
| Long Duration Corporate Bond Fund | 0.00 | % | 0.00 | % | 100.00 | % | 100.00 | % | 0.00 | % | ||||||||||
| Ultra Short Duration Fund | 0.00 | % | 0.00 | % | 100.00 | % | 100.00 | % | 0.00 | % | ||||||||||
| Emerging Markets Debt Fund | 27.36 | % | 0.00 | % | 72.64 | % | 100.00 | % | 0.00 | % | ||||||||||
| Real Return Fund | 0.00 | % | 0.00 | % | 100.00 | % | 100.00 | % | 0.00 | % | ||||||||||
| Dynamic Asset Allocation Fund | 32.57 | % | 0.00 | % | 67.43 | % | 100.00 | % | 0.00 | % | ||||||||||
| Multi-Asset Real Return Fund | 7.04 | % | 16.67 | % | 76.29 | % | 100.00 | % | 30.61 | % | ||||||||||
| (E) Qualifying Dividend Income (15% Tax Rate for QDI) (2) | (F) U.S. Government Interest (3) | Interest Related Dividends (4) | Short-Term Capital Gain Dividends (5) | |||||||||||||
| Large Cap Fund | 57.92 | % | 0.01 | % | 0.00 | % | 100.00 | % | ||||||||
| Large Cap Diversified Alpha Fund | 100.00 | % | 0.03 | % | 0.04 | % | 0.00 | % | ||||||||
| Large Cap Disciplined Equity Fund | 86.64 | % | 0.03 | % | 9.22 | % | 0.00 | % | ||||||||
| Large Cap Index Fund | 76.36 | % | 0.01 | % | 0.01 | % | 100.00 | % | ||||||||
| Extended Market Index Fund | 41.73 | % | 0.02 | % | 0.00 | % | 0.00 | % | ||||||||
| Small Cap Fund | 78.95 | % | 0.01 | % | 0.27 | % | 0.00 | % | ||||||||
| Small Cap II Fund | 25.21 | % | 0.05 | % | 0.01 | % | 0.00 | % | ||||||||
| Small/Mid Cap Equity Fund | 40.78 | % | 0.02 | % | 0.38 | % | 0.00 | % | ||||||||
| U.S. Managed Volatility Fund | 53.60 | % | 0.01 | % | 0.00 | % | 100.00 | % | ||||||||
| International Equity Fund(6) | 100.00 | % | 0.00 | % | 0.00 | % | 0.00 | % | ||||||||
| World Equity Ex-US Fund(7) | 91.22 | % | 0.00 | % | 0.00 | % | 0.00 | % | ||||||||
| Screened World Equity Ex-US Fund(8) | 100.00 | % | 0.00 | % | 0.00 | % | 0.00 | % | ||||||||
| Opportunistic Income Fund | 0.00 | % | 0.04 | % | 99.90 | % | 0.00 | % | ||||||||
| Core Fixed Income Fund | 0.00 | % | 8.78 | % | 73.12 | % | 100.00 | % | ||||||||
| High Yield Bond Fund | 0.05 | % | 0.00 | % | 96.87 | % | 0.00 | % | ||||||||
| Long Duration Fund | 0.00 | % | 9.76 | % | 53.31 | % | 100.00 | % | ||||||||
| Long Duration Corporate Bond Fund | 0.00 | % | 2.62 | % | 72.69 | % | 100.00 | % | ||||||||
| Ultra Short Duration Fund | 0.00 | % | 1.44 | % | 95.44 | % | 0.00 | % | ||||||||
| Emerging Markets Debt Fund | 0.00 | % | 0.00 | % | 0.00 | % | 100.00 | % | ||||||||
| Real Return Fund | 0.00 | % | 24.46 | % | 0.70 | % | 100.00 | % | ||||||||
| Dynamic Asset Allocation Fund | 0.00 | % | 0.00 | % | 0.00 | % | 100.00 | % | ||||||||
| Multi-Asset Real Return Fund | 83.38 | % | 31.15 | % | 51.13 | % | 0.00 | % | ||||||||
| (1) | Qualifying dividends represent dividends which qualify for the corporate dividends received deduction. |
| (2) | The percentage in this column represents the amount of “Qualifying Dividend Income” is reflected as a percentage of “Ordinary Income Distributions.” It is the intention of each of the aforementioned funds to designate the maximum amount permitted by the law. The information reported herein may differ from the information and distributions taxable to the shareholders for the calendar year ending December 31, 2013. Complete information will be computed and reported in conjunction with your 2013 Form 1099-DIV. |
| (3) | “U.S. Government Interest” represents the amount of interest that was derived from direct U.S. Government obligations and distributed during the fiscal year. This amount is reflected as a percentage of total ordinary income distributions (the total of short term capital gain and net investment income distributions). Generally, interest from direct U.S. Government obligations is exempt from state income tax. However, for shareholders who are residents of California, Connecticut and New York, the statutory threshold requirements were not satisfied to permit exemption of these amounts from state income. |
| (4) | The percentage in this column represents the amount of “Interest Related Dividend” is reflected as a percentage of net investment income distributions that is exempt from U.S. withholding tax when paid to foreign investors. |
| (5) | The percentage in this column represents the amount of “Short-Term Capital Gain” is reflected as a percentage of short-term capital gain distributions that is exempt from U.S. withholding tax when paid to foreign investors. |
| 278 | SEI Institutional Investments Trust / Annual Report / May 31, 2013 |
Table of Contents
| (6) | The Fund intends to pass through a foreign tax credit to shareholders. For fiscal year ended 2013, the total amount of foreign source income is $9,091,123. The total amount of foreign tax to be paid is $560,672. Your allocable share of the foreign tax credit will be reported on Form 1099 DIV. |
| (7) | The Fund intends to pass through a foreign tax credit to shareholders. For fiscal year ended 2013, the total amount of foreign source income is $161,480,953. The total amount of foreign tax to be paid is $10,108,560. Your allocable share of the foreign tax credit will be reported on Form 1099 DIV. |
| (8) | The Fund intends to pass through a foreign tax credit to shareholders. For fiscal year ended 2013, the total amount of foreign source income is $1,431,078. The total amount of foreign tax paid is $100,244. Your allocable share of the foreign tax credit will be reported on Form 1099 DIV. |
Items (A), (B) and (C) are based on the percentage of each Fund’s total distribution.
Items (D) and (E) are based on the percentage of ordinary income distributions of each Fund. Item (F) is based on the percentage of gross income of each Fund.
Please consult your tax adviser for proper treatment of this information. This notification should be kept with your permanent tax records.
| SEI Institutional Investments Trust / Annual Report / May 31, 2013 | 279 |
Table of Contents
SEI INSTITUTIONAL INVESTMENTS TRUST ANNUAL REPORT MAY 31, 2013
Robert A. Nesher, Chairman
Trustees
William M. Doran
George J. Sullivan, Jr.
Nina Lesavoy
James M. Williams
Mitchell A. Johnson
Hubert L. Harris, Jr.
Officers
Robert A. Nesher
President and Chief Executive Officer
Peter A. Rodriguez
Controller and Chief Financial Officer
Russell Emery
Chief Compliance Officer
Timothy D. Barto
Vice President, Secretary
Aaron Buser
Vice President, Assistant Secretary
David F. McCann
Vice President, Assistant Secretary
Stephen G. MacRae
Vice President
Edward McCusker
Anti-Money Laundering Compliance Officer
Privacy Officer
Investment Adviser
SEI Investments Management Corporation
Administrator
SEI Investments Global Funds Services
Distributor
SEI Investments Distribution Co.
Legal Counsel
Morgan, Lewis & Bockius LLP
Independent Registered Public Accounting Firm
KPMG LLP
This report and the financial statements contained herein are submitted for the general information of the shareholders of the Trust and must be preceded or accompanied by a current prospectus. Shares of the Funds are not deposits or obligations of, or guaranteed or endorsed by, any bank. The shares are not federally insured by the Federal Deposit Insurance Corporation (FDIC), the Federal Reserve Board, or any other government agency. Investment in the shares involves risk, including the possible loss of principal.
For more information call
1.800.DIAL.SEI
(1.800.342.5734)
Table of Contents

SEI-F-140 (5/13)
Table of Contents
| Item 2. | Code of Ethics. |
The Registrant has adopted a code of ethics that applies to the Registrant’s principal executive officer, principal financial officer, comptroller or principal accounting officer, and any person who performs a similar function.
| Item 3. | Audit Committee Financial Expert. |
(a)(1) The Registrant’s Board of Trustees has determined that the Registrant has at least two audit committee financial experts serving on the audit committee.
(a) (2) The audit committee financial experts are George J. Sullivan, Jr. and Hubert L. Harris, Jr. Messrs. Sullivan and Harris are independent as defined in Form N-CSR Item 3 (a) (2).
| Item 4. | Principal Accountant Fees and Services. |
Fees billed by KPMG LLP (“KPMG”) related to the Registrant.
KPMG billed the Registrant aggregate fees for services rendered to the Registrant for the fiscal years 2013 and 2012 as follows:
| Fiscal Year 2013 | Fiscal Year 2012 | |||||||||||||||||||||||||
| All fees and services to the Registrant that were pre- approved | All fees and services to service affiliates that were pre- approved | All other fees and services to service affiliates that did not require pre-approval | All fees and services to the Registrant that were pre- approved | All fees and services to service affiliates that were pre- approved | All other fees and services to service affiliates that did not require pre-approval | |||||||||||||||||||||
(a) | Audit Fees(1) | $ | 629,500 | N/A | $ | 0 | $ | 572,700 | N/A | $ | 0 | |||||||||||||||
(b) | Audit-Related Fees(3) | $ | 20,000 | $ | 0 | $ | 0 | $ | 0 | $ | 0 | $ | 0 | |||||||||||||
(c) | Tax Fees (Tax return review services)(4) | $ | 0 | $ | 8,000 | $ | 0 | $ | 0 | $ | 5,000 | $ | 0 | |||||||||||||
(d) | All Other Fees(2) | $ | 0 | $ | 236,000 | $ | 0 | $ | 0 | $ | 261,000 | $ | 0 | |||||||||||||
Notes:
| (1) | Audit fees include amounts related to the audit of the Registrant’s annual financial statements and services normally provided by the accountant in connection with statutory and regulatory filings. |
| (2) | See Item 4(g) for a description of the services comprising the fees disclosed under this category. |
| (3) | Audit related fees include amounts related to attestation reporting over compliance with an exemptive order under the federal securities laws. |
| (4) | Tax fees include amounts related to tax compliance and consulting services. |
Table of Contents
(e)(1) The Registrant’s Audit Committee has adopted an Audit and Non-Audit Services Pre-Approval Policy (the “Policy”), which sets forth the procedures and the conditions pursuant to which services proposed to be performed by the independent auditor of the Registrant may be pre-approved.
The Policy provides that all requests or applications for proposed services to be provided by the independent auditor must be submitted to the Registrant’s Chief Financial Officer (“CFO”) and must include a detailed description of the services proposed to be rendered. The CFO will determine whether such services: (1) require specific pre-approval; (2) are included within the list of services that have received the general pre-approval of the Audit Committee pursuant to the Policy; or (3) have been previously pre-approved in connection with the independent auditor’s annual engagement letter for the applicable year or otherwise. In any instance where services require pre-approval, the Audit Committee will consider whether such services are consistent with SEC’s rules and whether the provision of such services would impair the auditor’s independence.
Requests or applications to provide services that require specific pre-approval by the Audit Committee will be submitted to the Audit Committee by the CFO. The Audit Committee will be informed by the CFO on a quarterly basis of all services rendered by the independent auditor. The Audit Committee has delegated specific pre-approval authority to either the Audit Committee Chair or financial experts, provided that the estimated fee for any such proposed pre-approved service does not exceed $100,000 and any pre-approval decisions are reported to the Audit Committee at its next regularly scheduled meeting.
Services that have received the general pre-approval of the Audit Committee are identified and described in the Policy. In addition, the Policy sets forth a maximum fee per engagement with respect to each identified service that has received general pre-approval.
All services to be provided by the independent auditor shall be provided pursuant to a signed written engagement letter with the Registrant, the investment advisor or applicable control affiliate (except that matters as to which an engagement letter would be impractical because of timing issues or because the matter is small may not be the subject of an engagement letter) that sets forth both the services to be provided by the independent auditor and the total fees to be paid to the independent auditor for those services.
In addition, the Audit Committee has determined to take additional measures on an annual basis to meet its responsibility to oversee the work of the independent auditor and to assure the auditor’s independence from the Registrant, such as reviewing a formal written statement from the independent auditor delineating all relationships between the independent auditor and the Registrant, and discussing with the independent auditor its methods and procedures for ensuring independence.
(e)(2) Percentage of fees billed applicable to non-audit services pursuant to waiver of pre-approval requirement were as follows:
| Fiscal Year 2013 | Fiscal Year 2012 | |||||||
Audit-Related Fees | 0 | % | 0 | % | ||||
Tax Fees | 0 | % | 0 | % | ||||
All Other Fees | 0 | % | 0 | % | ||||
(f) Not Applicable.
(g) The aggregate non-audit fees and services billed by KPMG for the fiscal years 2013 and 2012 were $244,000 and $266,000, respectively. Non-audit fees consist of SSAE No. 16 review of fund
Table of Contents
accounting and administration operations, attestation report in accordance with Rule 17Ad-13, agreed upon procedures report over certain internal controls related to compliance with federal securities laws and regulations and tax compliance and consulting services for various service affiliates of the registrant.
(h) During the past fiscal year, Registrant’s principal accountant provided certain non-audit services to Registrant’s investment adviser or to entities controlling, controlled by, or under common control with Registrant’s investment adviser that provide ongoing services to Registrant that were not subject to pre-approval pursuant to paragraph (c)(7)(ii) of Rule 2-01 of Regulation S-X. The Audit Committee of Registrant’s Board of Trustees reviewed and considered these non-audit services provided by Registrant’s principal accountant to Registrant’s affiliates, including whether the provision of these non-audit services is compatible with maintaining the principal accountant’s independence.
| Item 5. | Audit Committee of Listed Registrants. |
Not applicable.
| Item 6. | Schedule of Investments |
(a) The Schedules of Investments in securities of unaffiliated issuers as of the close of the reporting period for the Large Cap Fund, Large Cap Diversified Alpha Fund, Large Cap Disciplined Equity Fund, Large Cap Index Fund, Extended Market Index Fund, Small Cap Fund, Small Cap II Fund, Small/Mid Cap Equity Fund, U.S. Managed Volatility Fund, International Equity Fund, World Equity Ex-US Fund and Screened World Equity Ex-US Fund are listed below. The Schedule of Investments in securities of unaffiliated issuers as of the close of the reporting period for the Opportunistic Income Fund, Core Fixed Income Fund, High Yield Bond Fund, Long Duration Bond Fund, Ultra Short Duration Bond Fund, Emerging Markets Debt Fund, Real Return Fund, Dynamic Asset Allocation Fund and Multi-Asset Real Return Fund are included as part of the report to shareholders filed under Item 1 of this form.
Table of Contents
Schedule of Investments
Large Cap Fund
May 31, 2013
| Description | Shares | Market Value ($ Thousands) | ||||||
COMMON STOCK — 97.3% | ||||||||
Consumer Discretionary — 12.7% | ||||||||
Abercrombie & Fitch, Cl A | 22,900 | $ | 1,147 | |||||
Apollo Group, Cl A (A) * | 17,364 | 347 | ||||||
Autoliv (A) | 21,400 | 1,679 | ||||||
Best Buy (A) | 66,600 | 1,835 | ||||||
Big Lots * | 17,400 | 593 | ||||||
Cablevision Systems, Cl A (A) | 3,600 | 55 | ||||||
CBS, Cl B | 159,600 | 7,900 | ||||||
Charter Communications, Cl A * | 32,410 | 3,627 | ||||||
Chipotle Mexican Grill, Cl A (A) * | 13,680 | 4,938 | ||||||
Coach | 185,664 | 10,817 | ||||||
Comcast, Cl A | 115,800 | 4,649 | ||||||
Cooper Tire & Rubber | 32,100 | 830 | ||||||
CST Brands * (A) | 7,666 | 233 | ||||||
Dillard’s, Cl A (A) | 65,400 | 6,034 | ||||||
DIRECTV * | 68,400 | 4,181 | ||||||
Foot Locker | 25,200 | 865 | ||||||
Ford Motor | 167,800 | 2,631 | ||||||
Fossil * | 47,239 | 5,017 | ||||||
GameStop, Cl A (A) | 202,200 | 6,705 | ||||||
Gannett (A) | 159,400 | 3,427 | ||||||
Gap | 90,000 | 3,649 | ||||||
Gildan Activewear, Cl A | 35,700 | 1,476 | ||||||
Harley-Davidson | 154,805 | 8,443 | ||||||
Home Depot | 91,580 | 7,204 | ||||||
Jarden * | 29,900 | 1,393 | ||||||
Kohl’s (A) | 61,600 | 3,167 | ||||||
L Brands | 21,900 | 1,095 | ||||||
Lear | 53,600 | 3,215 | ||||||
Liberty Interactive, Cl A * | 463,575 | 10,407 | ||||||
Lowe’s | 45,400 | 1,912 | ||||||
Macy’s | 111,000 | 5,366 | ||||||
Magna International, Cl A (A) | 21,600 | 1,439 | ||||||
Newell Rubbermaid | 60,200 | 1,628 | ||||||
News, Cl A | 142,400 | 4,573 | ||||||
News, Cl B | 239,000 | 7,705 | ||||||
NIKE, Cl B | 246,599 | 15,205 | ||||||
Nordstrom | 169,933 | 9,995 | ||||||
Panera Bread, Cl A (A) * | 19,800 | 3,798 | ||||||
priceline.com * | 12,300 | 9,889 | ||||||
PulteGroup * | 18,100 | 391 | ||||||
RadioShack (A) * | 27,400 | 101 | ||||||
Ralph Lauren, Cl A | 34,370 | 6,018 | ||||||
Sally Beauty Holdings * | 125,575 | 3,844 | ||||||
Signet Jewelers | 27,600 | 1,891 | ||||||
Starbucks | 123,631 | 7,797 | ||||||
Target | 182,565 | 12,688 | ||||||
Time Warner | 30,700 | 1,792 | ||||||
Time Warner Cable, Cl A | 60,200 | 5,750 | ||||||
TRW Automotive Holdings * | 19,200 | 1,216 | ||||||
Tupperware Brands | 15,900 | 1,287 | ||||||
Under Armour, Cl A (A) * | 65,970 | 4,090 | ||||||
Walt Disney | 171,260 | 10,803 | ||||||
Whirlpool | 76,000 | 9,710 | ||||||
Wyndham Worldwide | 19,900 | 1,157 | ||||||
Yum! Brands | 52,720 | 3,572 | ||||||
|
| |||||||
| 241,176 | ||||||||
|
| |||||||
| Description | Shares | Market Value ($ Thousands) | ||||||
Consumer Staples — 10.4% | ||||||||
Altria Group | 20,300 | $ | 733 | |||||
Anheuser-Busch InBev | 100,144 | 9,205 | ||||||
Archer-Daniels-Midland | 65,500 | 2,111 | ||||||
Avon Products | 35,200 | 830 | ||||||
Bunge | 3,800 | 264 | ||||||
Coca-Cola | 69,800 | 2,791 | ||||||
Coca-Cola Enterprises | 117,100 | 4,351 | ||||||
ConAgra Foods | 42,500 | 1,432 | ||||||
Constellation Brands, Cl A * | 7,800 | 414 | ||||||
Costco Wholesale | 184,020 | 20,181 | ||||||
CVS Caremark | 311,594 | 17,942 | ||||||
Dr. Pepper Snapple Group (A) | 20,000 | 920 | ||||||
Energizer Holdings | 25,400 | 2,431 | ||||||
Estee Lauder, Cl A | 297,419 | 20,159 | ||||||
General Mills | 25,100 | 1,182 | ||||||
Hershey | 16,100 | 1,435 | ||||||
Hillshire Brands | 41,400 | 1,434 | ||||||
Ingredion | 41,400 | 2,820 | ||||||
Kimberly-Clark | 52,400 | 5,074 | ||||||
Kroger | 209,900 | 7,067 | ||||||
Mead Johnson Nutrition, Cl A | 144,310 | 11,699 | ||||||
Mondelez International, Cl A | 373,100 | 10,992 | ||||||
PepsiCo | 79,300 | 6,405 | ||||||
Philip Morris International | 84,680 | 7,698 | ||||||
Procter & Gamble | 108,200 | 8,305 | ||||||
Safeway (A) | 190,200 | 4,377 | ||||||
Smithfield Foods * | 68,900 | 2,270 | ||||||
SUPERVALU (A) | 60,800 | 393 | ||||||
Tyson Foods, Cl A | 295,500 | 7,387 | ||||||
Walgreen | 272,725 | 13,025 | ||||||
Wal-Mart Stores | 65,800 | 4,924 | ||||||
Whole Foods Market | 324,038 | 16,805 | ||||||
|
| |||||||
| 197,056 | ||||||||
|
| |||||||
Energy — 9.8% | ||||||||
Alpha Natural Resources * (A) | 88,600 | 592 | ||||||
Apache | 19,600 | 1,610 | ||||||
Chevron | 222,700 | 27,336 | ||||||
ConocoPhillips | 176,200 | 10,808 | ||||||
Core Laboratories | 41,972 | 5,782 | ||||||
CVR Energy | 42,500 | 2,670 | ||||||
EOG Resources | 100,125 | 12,926 | ||||||
Exxon Mobil | 398,300 | 36,034 | ||||||
FMC Technologies * | 118,183 | 6,578 | ||||||
Halliburton | 31,100 | 1,301 | ||||||
Helmerich & Payne | 21,800 | 1,346 | ||||||
Hess | 37,000 | 2,494 | ||||||
Kinder Morgan | 305,163 | 11,590 | ||||||
Marathon Oil | 143,200 | 4,925 | ||||||
Marathon Petroleum | 156,400 | 12,903 | ||||||
Murphy Oil (A) | 100,000 | 6,332 | ||||||
National Oilwell Varco | 41,750 | 2,935 | ||||||
Noble Energy | 98,400 | 5,673 | ||||||
Occidental Petroleum | 59,390 | 5,468 | ||||||
Patterson-UTI Energy (A) | 161,200 | 3,387 | ||||||
Phillips 66 | 147,750 | 9,836 | ||||||
Schlumberger | 91,349 | 6,671 | ||||||
Valero Energy | 145,100 | 5,895 | ||||||
|
| |||||||
| 185,092 | ||||||||
|
| |||||||
| 1 | SEI Institutional Investments Trust / Annual Report / May 31, 2013 |
Table of Contents
Schedule of Investments
Large Cap Fund
May 31, 2013
| Description | Shares | Market Value ($ Thousands) | ||||||
Financials — 16.6% | ||||||||
ACE | 17,400 | $ | 1,560 | |||||
Aflac | 29,700 | 1,654 | ||||||
Allied World Assurance Holdings | 31,500 | 2,816 | ||||||
Allstate | 125,700 | 6,064 | ||||||
American Capital * | 140,900 | 1,878 | ||||||
American Capital Agency | 9,400 | 243 | ||||||
American Financial Group | 32,294 | 1,568 | ||||||
American International Group * | 240,650 | 10,699 | ||||||
American Tower, Cl A | 10,900 | 848 | ||||||
Ameriprise Financial | 64,900 | 5,291 | ||||||
Annaly Capital Management | 71,700 | 974 | ||||||
Associated Banc | 95,600 | 1,473 | ||||||
Assurant | 108,300 | 5,387 | ||||||
Axis Capital Holdings | 77,600 | 3,380 | ||||||
Bank of America | 563,900 | 7,703 | ||||||
Bank of New York Mellon | 127,200 | 3,824 | ||||||
Berkshire Hathaway, Cl B * | 30,900 | 3,525 | ||||||
BlackRock, Cl A | 1,000 | 279 | ||||||
Boston Properties | 2,900 | 309 | ||||||
Brandywine Realty Trust | 56,000 | 793 | ||||||
Capital One Financial | 148,240 | 9,032 | ||||||
CBL & Associates Properties | 65,600 | 1,508 | ||||||
CBRE Group, Cl A * | 68,700 | 1,593 | ||||||
Charles Schwab | 558,562 | 11,093 | ||||||
Citigroup | 525,050 | 27,297 | ||||||
CME Group, Cl A | 81,625 | 5,545 | ||||||
CNA Financial | 21,600 | 738 | ||||||
Digital Realty Trust ‡ (A) | 3,300 | 201 | ||||||
Discover Financial Services | 187,900 | 8,908 | ||||||
Endurance Specialty Holdings | 19,600 | 987 | ||||||
Everest Re Group | 50,400 | 6,532 | ||||||
Fifth Third Bancorp | 367,900 | 6,696 | ||||||
General Growth Properties ‡ | 14,500 | 298 | ||||||
Goldman Sachs Group | 60,200 | 9,757 | ||||||
Hartford Financial Services Group | 110,300 | 3,379 | ||||||
HCC Insurance Holdings | 6,000 | 257 | ||||||
HCP ‡ | 8,000 | 379 | ||||||
Hospitality Properties Trust ‡ | 35,500 | 1,036 | ||||||
Host Hotels & Resorts ‡ | 14,300 | 254 | ||||||
Huntington Bancshares | 788,700 | 6,112 | ||||||
IntercontinentalExchange (A) * | 47,025 | 8,051 | ||||||
Jones Lang LaSalle | 1,200 | 110 | ||||||
JPMorgan Chase | 629,220 | 34,349 | ||||||
KeyCorp | 800,000 | 8,624 | ||||||
Kimco Realty ‡ | 11,200 | 248 | ||||||
Lincoln National | 158,800 | 5,663 | ||||||
Macerich ‡ | 3,600 | 234 | ||||||
MetLife | 43,500 | 1,923 | ||||||
Montpelier Re Holdings | 49,200 | 1,230 | ||||||
Morgan Stanley | 42,300 | 1,096 | ||||||
PartnerRe | 86,200 | 7,814 | ||||||
PNC Financial Services Group | 53,200 | 3,811 | ||||||
Popular * | 19,400 | 582 | ||||||
Progressive (A) | 335,800 | 8,560 | ||||||
Prologis ‡ | 9,000 | 363 | ||||||
Protective Life (A) | 89,700 | 3,470 | ||||||
Prudential Financial | 42,700 | 2,945 | ||||||
Public Storage ‡ | 2,700 | 410 | ||||||
Realogy Holdings * | 23,200 | 1,198 | ||||||
Regions Financial | 545,200 | 4,978 | ||||||
| Description | Shares | Market Value ($ Thousands) | ||||||
Reinsurance Group of America, Cl A | 39,500 | $ | 2,603 | |||||
RenaissanceRe Holdings | 16,000 | 1,375 | ||||||
Simon Property Group ‡ | 8,300 | 1,381 | ||||||
SL Green Realty ‡ | 2,500 | 217 | ||||||
SLM | 123,900 | 2,942 | ||||||
State Street | 44,100 | 2,918 | ||||||
SunTrust Banks | 43,500 | 1,396 | ||||||
T. Rowe Price Group | 20,000 | 1,517 | ||||||
Travelers | 119,400 | 9,996 | ||||||
Unum Group (A) | 107,700 | 3,067 | ||||||
US Bancorp | 94,200 | 3,303 | ||||||
Validus Holdings | 31,300 | 1,130 | ||||||
Ventas ‡ | 4,915 | 351 | ||||||
Vornado Realty Trust ‡ | 3,600 | 288 | ||||||
Wells Fargo | 595,600 | 24,152 | ||||||
Weyerhaeuser ‡ | 14,700 | 438 | ||||||
|
| |||||||
| 314,603 | ||||||||
|
| |||||||
Health Care — 13.5% | ||||||||
Abbott Laboratories | 127,800 | 4,687 | ||||||
AbbVie | 20,500 | 875 | ||||||
Actavis * | 10,700 | 1,319 | ||||||
Aetna | 104,400 | 6,304 | ||||||
Alexion Pharmaceuticals * | 40,020 | 3,903 | ||||||
Allergan | 90,350 | 8,989 | ||||||
AmerisourceBergen | 71,300 | 3,856 | ||||||
Amgen | 168,577 | 16,947 | ||||||
Baxter International | 20,800 | 1,463 | ||||||
Biogen Idec * | 52,978 | 12,582 | ||||||
Boston Scientific * | 172,700 | 1,596 | ||||||
Bristol-Myers Squibb | 121,110 | 5,572 | ||||||
Cardinal Health | 48,000 | 2,254 | ||||||
Celgene * | 140,283 | 17,346 | ||||||
Cigna | 60,300 | 4,094 | ||||||
Community Health Systems | 30,400 | 1,464 | ||||||
Covance * | 62,402 | 4,654 | ||||||
Covidien | 68,540 | 4,359 | ||||||
DaVita * | 43,180 | 5,357 | ||||||
Eli Lilly | 67,800 | 3,604 | ||||||
Endo Health Solutions * | 14,300 | 519 | ||||||
Express Scripts Holding * | 308,447 | 19,161 | ||||||
Gilead Sciences * | 94,050 | 5,124 | ||||||
HCA Holdings | 88,700 | 3,465 | ||||||
Humana | 73,770 | 5,959 | ||||||
Idexx Laboratories (A) * | 47,481 | 3,914 | ||||||
Intuitive Surgical * | 14,486 | 7,207 | ||||||
Johnson & Johnson | 242,307 | 20,397 | ||||||
McKesson | 32,800 | 3,735 | ||||||
Medtronic | 21,900 | 1,117 | ||||||
Merck | 204,100 | 9,532 | ||||||
Novo Nordisk ADR | 38,480 | 6,199 | ||||||
Omnicare (A) | 26,300 | 1,211 | ||||||
Perrigo | 39,625 | 4,593 | ||||||
Pfizer | 1,137,730 | 30,980 | ||||||
Shire ADR | 49,730 | 4,897 | ||||||
United Therapeutics * | 78,300 | 5,205 | ||||||
UnitedHealth Group | 34,400 | 2,154 | ||||||
Warner Chilcott, Cl A | 5,400 | 104 | ||||||
WellPoint | 71,900 | 5,534 | ||||||
Zimmer Holdings | 45,700 | 3,588 | ||||||
|
| |||||||
| 255,820 | ||||||||
|
| |||||||
| 2 | SEI Institutional Investments Trust / Annual Report / May 31, 2013 |
Table of Contents
Schedule of Investments
Large Cap Fund
May 31, 2013
| Description | Shares | Market Value ($ Thousands) | ||||||
Industrials — 8.6% | ||||||||
AECOM Technology * | 26,200 | $ | 807 | |||||
AGCO | 88,400 | 4,903 | ||||||
Alaska Air Group * | 43,300 | 2,460 | ||||||
Alliant Techsystems | 19,756 | 1,551 | ||||||
Avery Dennison | 1,500 | 65 | ||||||
Canadian Pacific Railway | 67,480 | 8,907 | ||||||
Caterpillar | 54,550 | 4,680 | ||||||
Copa Holdings, Cl A | 12,600 | 1,655 | ||||||
Cummins | 57,550 | 6,885 | ||||||
Danaher | 105,147 | 6,500 | ||||||
Deere | 36,700 | 3,197 | ||||||
Delta Air Lines | 283,200 | 5,101 | ||||||
Engility Holdings * | 6,500 | 166 | ||||||
Exelis | 16,200 | 197 | ||||||
FedEx | 19,100 | 1,840 | ||||||
Fluor (A) | 160,019 | 10,115 | ||||||
General Dynamics | 21,400 | 1,650 | ||||||
General Electric | 305,300 | 7,120 | ||||||
Ingersoll-Rand | 3,000 | 173 | ||||||
ITT | 72,400 | 2,183 | ||||||
Kansas City Southern | 47,660 | 5,276 | ||||||
KBR | 32,400 | 1,169 | ||||||
L-3 Communications Holdings, Cl 3 | 108,800 | 9,258 | ||||||
Lockheed Martin | 35,900 | 3,799 | ||||||
Norfolk Southern | 30,300 | 2,320 | ||||||
Northrop Grumman | 127,200 | 10,480 | ||||||
Oshkosh Truck * | 44,800 | 1,784 | ||||||
Pall | 114,730 | 7,825 | ||||||
Parker Hannifin | 16,800 | 1,676 | ||||||
Pentair | 149,450 | 8,704 | ||||||
Raytheon | 137,200 | 9,143 | ||||||
Roper Industries | 47,662 | 5,921 | ||||||
RR Donnelley & Sons (A) | 91,000 | 1,208 | ||||||
Southwest Airlines | 201,300 | 2,852 | ||||||
Stericycle * | 58,342 | 6,404 | ||||||
Timken | 54,000 | 3,065 | ||||||
Union Pacific | 55,860 | 8,637 | ||||||
United Continental Holdings (A) * | 62,900 | 2,042 | ||||||
URS | 13,300 | 644 | ||||||
Waste Management (A) | 12,700 | 532 | ||||||
|
| |||||||
| 162,894 | ||||||||
|
| |||||||
Information Technology — 18.8% | ||||||||
Accenture, Cl A | 108,547 | 8,913 | ||||||
Adobe Systems * | 476,511 | 20,447 | ||||||
Altera | 88,940 | 2,952 | ||||||
Amdocs | 83,000 | 2,963 | ||||||
Amphenol, Cl A | 68,008 | 5,298 | ||||||
Analog Devices | 78,850 | 3,622 | ||||||
Ansys * | 51,951 | 3,870 | ||||||
Apple | 55,615 | 25,009 | ||||||
Applied Materials | 417,170 | 6,341 | ||||||
BMC Software * | 36,125 | 1,636 | ||||||
Broadridge Financial Solutions | 7,900 | 214 | ||||||
Brocade Communications | ||||||||
Systems * | 51,300 | 279 | ||||||
CA | 89,100 | 2,433 | ||||||
Cisco Systems | 749,480 | 18,047 | ||||||
Citrix Systems * | 63,864 | 4,110 | ||||||
| Description | Shares | Market Value ($ Thousands) | ||||||
Cognizant Technology Solutions, Cl A * | 44,038 | $ | 2,847 | |||||
Computer Sciences | 54,100 | 2,413 | ||||||
CoreLogic * | 83,200 | 2,180 | ||||||
Corning | 177,200 | 2,724 | ||||||
Dell | 146,300 | 1,953 | ||||||
eBay * | 135,300 | 7,320 | ||||||
EMC | 425,682 | 10,540 | ||||||
Facebook, Cl A * | 110,160 | 2,682 | ||||||
Fidelity National Information Services | 40,100 | 1,801 | ||||||
First Solar * (A) | 43,000 | 2,338 | ||||||
Fiserv * | 3,100 | 270 | ||||||
Genpact | 231,871 | 4,487 | ||||||
Google, Cl A * | 21,505 | 18,718 | ||||||
Harris | 23,600 | 1,183 | ||||||
Hewlett-Packard | 129,700 | 3,167 | ||||||
Ingram Micro, Cl A * | 125,800 | 2,404 | ||||||
Intel | 162,900 | 3,955 | ||||||
International Business Machines | 57,264 | 11,912 | ||||||
Intuit | 141,525 | 8,271 | ||||||
Lender Processing Services | 27,700 | 917 | ||||||
Marvell Technology Group | 62,500 | 677 | ||||||
Mastercard, Cl A | 47,977 | 27,359 | ||||||
Microsoft | 244,300 | 8,521 | ||||||
National Instruments | 124,767 | 3,543 | ||||||
NetApp | 147,819 | 5,548 | ||||||
Oracle | 288,768 | 9,749 | ||||||
Qualcomm | 450,283 | 28,584 | ||||||
SAIC (A) | 80,600 | 1,169 | ||||||
Salesforce.com * (A) | 95,300 | 4,034 | ||||||
Seagate Technology | 82,500 | 3,554 | ||||||
Symantec | 200,700 | 4,494 | ||||||
TE Connectivity | 29,200 | 1,296 | ||||||
Tech Data * | 46,200 | 2,316 | ||||||
Teradata * | 222,520 | 12,405 | ||||||
Texas Instruments | 176,220 | 6,325 | ||||||
VeriFone Holdings * | 90,025 | 2,100 | ||||||
VeriSign * | 115,750 | 5,445 | ||||||
Visa, Cl A | 94,600 | 16,852 | ||||||
Vishay Intertechnology (A) * | 59,500 | 866 | ||||||
Western Digital | 144,900 | 9,175 | ||||||
Xerox | 319,300 | 2,807 | ||||||
Yahoo! * | 93,600 | 2,462 | ||||||
|
| |||||||
| 357,497 | ||||||||
|
| |||||||
Materials — 3.2% | ||||||||
Ashland (A) | 9,500 | 845 | ||||||
CF Industries Holdings | 35,600 | 6,798 | ||||||
Domtar | 14,300 | 1,036 | ||||||
Dow Chemical | 237,460 | 8,183 | ||||||
Eastman Chemical | 24,000 | 1,721 | ||||||
Ecolab | 65,507 | 5,533 | ||||||
Freeport-McMoRan Copper & Gold, Cl B | 43,500 | 1,351 | ||||||
Huntsman | 102,600 | 1,996 | ||||||
International Paper | 34,100 | 1,574 | ||||||
Louisiana-Pacific * | 69,700 | 1,225 | ||||||
LyondellBasell Industries, Cl A, (A) | 145,230 | 9,680 | ||||||
Monsanto | 74,310 | 7,479 | ||||||
Newmont Mining | 6,400 | 219 | ||||||
| 3 | SEI Institutional Investments Trust / Annual Report / May 31, 2013 |
Table of Contents
Schedule of Investments
Large Cap Fund
May 31, 2013
| Description | Shares/Face Amount ($ Thousands) | Market Value ($ Thousands) | ||||||
Owens-Illinois * | 45,900 | $ | 1,260 | |||||
Packaging Corp of America | 28,900 | 1,416 | ||||||
PPG Industries | 3,401 | 522 | ||||||
Reliance Steel & Aluminum | 13,500 | 888 | ||||||
Rock Tenn, Cl A | 26,250 | 2,593 | ||||||
Steel Dynamics (A) | 66,500 | 1,020 | ||||||
Syngenta ADR | 69,866 | 5,438 | ||||||
Westlake Chemical | 3,000 | 280 | ||||||
|
| |||||||
| 61,057 | ||||||||
|
| |||||||
Telecommunication Services — 2.0% | ||||||||
AT&T | 238,000 | 8,328 | ||||||
Crown Castle International * | 302,539 | 21,556 | ||||||
SBA Communications, Cl A (A) * | 41,770 | 3,144 | ||||||
Sprint Nextel * | 249,000 | 1,818 | ||||||
Verizon Communications | 81,400 | 3,946 | ||||||
|
| |||||||
| 38,792 | ||||||||
|
| |||||||
Utilities — 1.7% | ||||||||
AES | 323,300 | 3,944 | ||||||
Ameren | 76,700 | 2,611 | ||||||
American Electric Power | 162,300 | 7,437 | ||||||
DTE Energy | 7,500 | 500 | ||||||
Duke Energy | 8,100 | 542 | ||||||
Edison International | 90,500 | 4,157 | ||||||
Entergy | 48,600 | 3,347 | ||||||
Exelon | 40,800 | 1,279 | ||||||
NV Energy | 182,200 | 4,271 | ||||||
Public Service Enterprise Group | 122,700 | 4,054 | ||||||
|
| |||||||
| 32,142 | ||||||||
|
| |||||||
Total Common Stock | 1,846,129 | |||||||
|
| |||||||
Number Of Warrants | ||||||||
WARRANTS — 0.0% | ||||||||
Kinder Morgan, Expires 2017 * | 101,260 | 569 | ||||||
|
| |||||||
Total Warrants | 569 | |||||||
|
| |||||||
AFFILIATED PARTNERSHIP — 4.6% | ||||||||
SEI Liquidity Fund, L.P. | 86,698,189 | 86,698 | ||||||
|
| |||||||
Total Affiliated Partnership | 86,698 | |||||||
|
| |||||||
CASH EQUIVALENTS — 1.6% | ||||||||
Investors Cash Trust - Treasury Portfolio - DWS US Treasury Money Fund | 2,151,956 | 2,152 | ||||||
SEI Daily Income Trust, Prime Obligation Fund, Cl A | 28,990,159 | 28,990 | ||||||
|
| |||||||
Total Cash Equivalents | 31,142 | |||||||
|
| |||||||
U.S. TREASURY OBLIGATION — 0.2% | ||||||||
U.S. Treasury Bills | $ | 3,142 | 3,142 | |||||
| Description |
Market Value ($ Thousands) | |||||
Total U.S. Treasury Obligation | $ | 3,142 | ||||
|
| |||||
Total Investments — 103.7% | $ | 1,967,680 | ||||
|
| |||||
| A list of the open futures contracts held by the Fund at May 31, 2013, is as follows: |
| Type of Contract | Number of Contracts Long | Expiration Date | Unrealized Appreciation ($ Thousands) | |||||||||
S&P 500 Index EMINI | 123 | Jun-2013 | $ | (113 | ) | |||||||
S&P Mid 400 Index E-MINI | 11 | Jun-2013 | (3 | ) | ||||||||
|
| |||||||||||
| $ | (116 | ) | ||||||||||
|
| |||||||||||
For the year ended May 31, 2013, the total amount of all open futures contracts, as presented in the table above, are representative of the volume of activity for this derivative type during the year.
Percentages are based on a Net Assets of $1,897,837 ($ Thousands).
| * | Non-income producing security. |
| ** | The rate reported is the 7-day effective yield as of May 31, 2013. |
| † | Investment in Affiliated Security (see Note 5). |
| ‡ | Real Estate Investment Trust. |
| (A) | This security or a partial position of this security is on loan at May 31, 2013. The total value of securities on loan at May 31, 2013 was $83,442 ($ Thousands). |
| (B) | This security was purchased with cash collateral held from securities on loan (see Note 11). The total value of such securities as of May 31, 2013 was $86,698 ($ Thousands). |
| (C) | Security, or portion thereof, has been pledged as collateral on open futures contracts. |
| (D) | The rate reported is the effective yield at time of purchase. |
ADR — American Depositary Receipt
Cl — Class
L.P. — Limited Partnership
S&P — Standard & Poors
The following is a list of the inputs used as of May 31, 2013, in valuing the Fund’s investments carried at value ($ Thousands):
| Investments in Securities | Level 1 | Level 2 | Level 3 | Total | ||||||||||||
Common Stock | $ | 1,846,129 | $ | — | $ | — | $ | 1,846,129 | ||||||||
Warrant | 569 | — | — | 569 | ||||||||||||
Affiliated Partnership | — | 86,698 | — | 86,698 | ||||||||||||
Cash Equivalents | 31,142 | — | — | 31,142 | ||||||||||||
U.S. Treasury Obligation | — | 3,142 | — | 3,142 | ||||||||||||
|
|
|
|
|
|
|
| |||||||||
Total Investments in Securities | $ | 1,877,840 | $ | 89,840 | $ | — | $ | 1,967,680 | ||||||||
|
|
|
|
|
|
|
| |||||||||
| Other Financial Instruments | Level 1 | Level 2 | Level 3 | Total | ||||||||||||
Futures Contracts* | $ | (116 | ) | $ | — | $ | — | $ | (116 | ) | ||||||
|
|
|
|
|
|
|
| |||||||||
| * | Futures contracts are valued at the unrealized depreciation on the instrument. |
For the year ended May 31, 2013, there were no transfers between Level 1 and Level 2 assets and liabilities.
For the year ended May 31, 2013, there were no transfers between Level 2 and Level 3 assets and liabilities.
For more information on valuation inputs, see Note 2 — Significant Accounting Policies in Notes to Financial Statements.
Amounts designated as “—” are $O or have been rounded to $O.
The accompanying notes are an integral part of the financial statements.
| 4 | SEI Institutional Investments Trust / Annual Report / May 31, 2013 |
Table of Contents
Schedule of Investments
Large Cap Diversified Alpha Fund
May 31, 2013
| Description | Shares | Market Value ($ Thousands) | ||||||
COMMON STOCK — 94.8% | ||||||||
Consumer Discretionary — 16.6% | ||||||||
Aaron’s | 8,600 | $ | 242 | |||||
Aeropostale * | 41,100 | 600 | ||||||
Amazon.com * | 100 | 27 | ||||||
AMC Networks, Cl A * | 700 | 45 | ||||||
Ascena Retail Group * | 40,200 | 817 | ||||||
Cablevision Systems, Cl A | 5,900 | 89 | ||||||
Carmax * | 400 | 19 | ||||||
Carnival, Cl A | 19,300 | 639 | ||||||
Chico’s FAS | 3,200 | 58 | ||||||
Cinemark Holdings | 200 | 6 | ||||||
Coach | 35,633 | 2,076 | ||||||
Comcast, Cl A | 78,500 | 3,152 | ||||||
CST Brands * | 2,522 | 77 | ||||||
Delphi Automotive | 400 | 20 | ||||||
Dillard’s, Cl A | 4,600 | 424 | ||||||
DIRECTV * | 12,600 | 770 | ||||||
Discovery Communications, Cl A * | 10,500 | 828 | ||||||
DISH Network, Cl A | 1,900 | 73 | ||||||
DR Horton | 4,800 | 117 | ||||||
Expedia | 1,200 | 69 | ||||||
Ford Motor | 10,000 | 157 | ||||||
GameStop, Cl A | 17,300 | 574 | ||||||
Gannett | 6,400 | 138 | ||||||
Gap | 25,000 | 1,014 | ||||||
General Motors * | 5,700 | 193 | ||||||
Gildan Activewear, Cl A | 7,000 | 290 | ||||||
Goodyear Tire & Rubber * | 2,800 | 42 | ||||||
H&R Block | 20,600 | 603 | ||||||
Hanesbrands | 12,100 | 603 | ||||||
Hasbro | 300 | 13 | ||||||
Home Depot | 34,900 | 2,745 | ||||||
Jarden * | 6,150 | 286 | ||||||
L Brands | 5,400 | 270 | ||||||
Lamar Advertising, Cl A * | 2,700 | 126 | ||||||
Las Vegas Sands | 500 | 29 | ||||||
Lear | 6,900 | 414 | ||||||
Leggett & Platt | 6,600 | 211 | ||||||
Lennar, Cl A | 7,400 | 291 | ||||||
Liberty Global, Cl A * | 6,300 | 465 | ||||||
Liberty Interactive, Cl A * | 139,225 | 3,125 | ||||||
Liberty Media * | 5,200 | 649 | ||||||
Liberty Ventures, Ser A * | 1,700 | 139 | ||||||
LKQ * | 15,000 | 367 | ||||||
Lowe’s | 35,100 | 1,478 | ||||||
Macy’s | 10,700 | 517 | ||||||
Madison Square Garden, Cl A * | 2,600 | 152 | ||||||
Magna International, Cl A | 4,900 | 326 | ||||||
McDonald’s | 3,700 | 357 | ||||||
McGraw-Hill | 18,280 | 997 | ||||||
Mohawk Industries * | 1,900 | 211 | ||||||
NetFlix * | 200 | 45 | ||||||
Newell Rubbermaid | 34,600 | 936 | ||||||
News, Cl A | 14,800 | 475 | ||||||
NIKE, Cl B | 59,564 | 3,673 | ||||||
Nordstrom | 35,057 | 2,062 | ||||||
NVR * | 300 | 295 | ||||||
priceline.com * | 3,300 | 2,653 | ||||||
| Description | Shares | Market Value ($ Thousands) | ||||||
PulteGroup * | 18,300 | $ | 395 | |||||
Royal Caribbean Cruises | 8,400 | 294 | ||||||
Sally Beauty Holdings * | 31,550 | 966 | ||||||
Scripps Networks Interactive, Cl A | 700 | 47 | ||||||
Service International | 1,900 | 34 | ||||||
Signet Jewelers | 5,800 | 397 | ||||||
Staples | 50,540 | 758 | ||||||
Starz - Liberty Capital * | 5,300 | 123 | ||||||
Target | 31,406 | 2,183 | ||||||
Thomson Reuters | 2,600 | 87 | ||||||
Time Warner | 23,800 | 1,389 | ||||||
Time Warner Cable, Cl A | 15,800 | 1,509 | ||||||
TJX | 8,700 | 440 | ||||||
Toll Brothers * | 600 | 21 | ||||||
TRW Automotive Holdings * | 800 | 51 | ||||||
Urban Outfitters * | 5,300 | 222 | ||||||
Virgin Media | 13,800 | 685 | ||||||
Visteon * | 800 | 51 | ||||||
Walt Disney | 50,762 | 3,202 | ||||||
Whirlpool | 9,900 | 1,265 | ||||||
Williams-Sonoma | 2,500 | 135 | ||||||
|
| |||||||
| 51,323 | ||||||||
|
| |||||||
Consumer Staples — 10.0% | ||||||||
Altria Group | 1,000 | 36 | ||||||
Avon Products | 11,600 | 274 | ||||||
Brown-Forman, Cl B | 2,900 | 200 | ||||||
Bunge | 300 | 21 | ||||||
Campbell Soup | 17,150 | 734 | ||||||
Clorox | 1,500 | 124 | ||||||
Coca-Cola Enterprises | 28,200 | 1,048 | ||||||
Colgate-Palmolive | 16,750 | 969 | ||||||
ConAgra Foods | 6,200 | 209 | ||||||
Constellation Brands, Cl A * | 6,100 | 323 | ||||||
Costco Wholesale | 20,783 | 2,279 | ||||||
CVS Caremark | 35,010 | 2,016 | ||||||
Dr. Pepper Snapple Group | 6,900 | 317 | ||||||
Energizer Holdings | 1,000 | 96 | ||||||
Estee Lauder, Cl A | 29,951 | 2,030 | ||||||
General Mills | 9,800 | 461 | ||||||
Green Mountain Coffee Roasters * | 3,800 | 278 | ||||||
Hershey | 16,100 | 1,435 | ||||||
Hillshire Brands | 8,300 | 287 | ||||||
HJ Heinz | 8,500 | 615 | ||||||
Hormel Foods | 2,400 | 96 | ||||||
Ingredion | 1,800 | 123 | ||||||
JM Smucker | 3,300 | 333 | ||||||
Kellogg | 3,100 | 192 | ||||||
Kimberly-Clark | 17,500 | 1,694 | ||||||
Kraft Foods Group | 19,600 | 1,081 | ||||||
Kroger | 32,800 | 1,105 | ||||||
McCormick | 6,200 | 428 | ||||||
Molson Coors Brewing, Cl B | 3,600 | 178 | ||||||
Mondelez International, Cl A | 68,341 | 2,013 | ||||||
PepsiCo | 27,625 | 2,231 | ||||||
Philip Morris International | 2,100 | 191 | ||||||
Procter & Gamble | 3,200 | 246 | ||||||
Safeway | 21,400 | 493 | ||||||
Sysco | 11,400 | 385 | ||||||
Tyson Foods, Cl A | 25,800 | 645 | ||||||
Walgreen | 57,200 | 2,732 | ||||||
| 1 | SEI Institutional Investments Trust / Annual Report / May 31, 2013 |
Table of Contents
Schedule of Investments
Large Cap Diversified Alpha Fund
May 31, 2013
| Description | Shares | Market Value ($ Thousands) | ||||||
Wal-Mart Stores | 13,710 | $ | 1,026 | |||||
Whole Foods Market | 39,244 | 2,035 | ||||||
|
| |||||||
| 30,979 | ||||||||
|
| |||||||
Energy — 8.3% | ||||||||
Apache | 10,910 | 896 | ||||||
Baker Hughes | 18,280 | 831 | ||||||
Cabot Oil & Gas | 8,300 | 584 | ||||||
Cameron International * | 300 | 18 | ||||||
Cheniere Energy * | 700 | 20 | ||||||
Chevron | 8,500 | 1,043 | ||||||
ConocoPhillips | 15,400 | 945 | ||||||
CVR Energy | 9,900 | 622 | ||||||
Dresser-Rand Group * | 1,500 | 91 | ||||||
EOG Resources | 25,025 | 3,231 | ||||||
EQT | 6,400 | 511 | ||||||
Exxon Mobil | 35,560 | 3,217 | ||||||
Halliburton | 400 | 17 | ||||||
Helmerich & Payne | 1,300 | 80 | ||||||
Hess | 800 | 54 | ||||||
HollyFrontier | 12,000 | 594 | ||||||
Kinder Morgan | 76,693 | 2,913 | ||||||
Marathon Oil | 24,100 | 829 | ||||||
Marathon Petroleum | 27,600 | 2,277 | ||||||
Murphy Oil | 27,020 | 1,711 | ||||||
Noble Energy | 800 | 46 | ||||||
Patterson-UTI Energy | 19,800 | 416 | ||||||
Phillips 66 | 22,900 | 1,524 | ||||||
Schlumberger | 11,430 | 835 | ||||||
Southwestern Energy * | 10,100 | 381 | ||||||
Tesoro | 7,100 | 438 | ||||||
Valero Energy | 36,400 | 1,479 | ||||||
|
| |||||||
| 25,603 | ||||||||
|
| |||||||
Financials — 11.3% | ||||||||
ACE | 200 | 18 | ||||||
Aflac | 15,630 | 870 | ||||||
Allied World Assurance Holdings | 4,600 | 411 | ||||||
Allstate | 11,200 | 540 | ||||||
American Capital * | 16,200 | 216 | ||||||
American Express | 10,175 | 770 | ||||||
American Tower, Cl A | 500 | 39 | ||||||
Ameriprise Financial | 5,100 | 416 | ||||||
Aon | 400 | 25 | ||||||
Arch Capital Group * | 6,400 | 328 | ||||||
Ares Capital | 2,300 | 40 | ||||||
Aspen Insurance Holdings | 500 | 18 | ||||||
Axis Capital Holdings | 4,400 | 192 | ||||||
Bank of America | 85,400 | 1,167 | ||||||
Berkshire Hathaway, Cl B * | 600 | 68 | ||||||
BlackRock, Cl A | 300 | 84 | ||||||
CapitalSource | 4,900 | 46 | ||||||
CBL & Associates Properties | 2,000 | 46 | ||||||
CBOE Holdings | 4,700 | 189 | ||||||
CBRE Group, Cl A * | 23,010 | 533 | ||||||
Cincinnati Financial | 200 | 10 | ||||||
Citigroup | 39,600 | 2,059 | ||||||
CME Group, Cl A | 20,525 | 1,394 | ||||||
Corporate Office Properties Trust ‡ | 300 | 8 | ||||||
Corrections Corp of America ‡ | 5,797 | 204 | ||||||
Discover Financial Services | 27,500 | 1,304 | ||||||
Eaton Vance | 5,100 | 212 | ||||||
| Description | Shares | Market Value ($ Thousands) | ||||||
Everest Re Group | 5,700 | $ | 739 | |||||
Extra Space Storage ‡ | 2,900 | 121 | ||||||
Fidelity National Financial, Cl A | 34,505 | 908 | ||||||
Fifth Third Bancorp | 53,800 | 979 | ||||||
Genworth Financial, Cl A * | 14,900 | 161 | ||||||
Goldman Sachs Group | 10,800 | 1,750 | ||||||
Hartford Financial Services Group | 12,800 | 392 | ||||||
HCC Insurance Holdings | 4,200 | 180 | ||||||
Howard Hughes * | 300 | 30 | ||||||
Hudson City Bancorp | 4,800 | 41 | ||||||
Huntington Bancshares | 116,200 | 900 | ||||||
IntercontinentalExchange * | 11,775 | 2,016 | ||||||
JPMorgan Chase | 36,100 | 1,971 | ||||||
KeyCorp | 88,000 | 949 | ||||||
Lazard, Cl A | 22,144 | 750 | ||||||
Lincoln National | 5,900 | 210 | ||||||
M&T Bank | 3,600 | 378 | ||||||
MetLife | 16,650 | 736 | ||||||
MFA Mortgage Investments ‡ | 9,600 | 84 | ||||||
Moody’s | 2,100 | 139 | ||||||
Morgan Stanley | 17,700 | 458 | ||||||
MSCI, Cl A * | 16,690 | 588 | ||||||
National Retail Properties ‡ | 5,200 | 186 | ||||||
Old Republic International | 4,400 | 60 | ||||||
PartnerRe | 6,300 | 571 | ||||||
Piedmont Office Realty Trust, Cl A ‡ | 5,000 | 95 | ||||||
Popular * | 4,800 | 144 | ||||||
Progressive | 84,350 | 2,150 | ||||||
Rayonier ‡ | 5,100 | 283 | ||||||
Regions Financial | 79,300 | 724 | ||||||
RenaissanceRe Holdings | 3,100 | 267 | ||||||
Senior Housing Properties Trust ‡ | 2,400 | 62 | ||||||
SunTrust Banks | 19,100 | 613 | ||||||
Travelers | 12,600 | 1,055 | ||||||
Unum Group | 800 | 23 | ||||||
US Bancorp | 4,700 | 165 | ||||||
Ventas ‡ | 700 | 50 | ||||||
Waddell & Reed Financial, Cl A | 1,400 | 64 | ||||||
Wells Fargo | 14,500 | 588 | ||||||
Weyerhaeuser ‡ | 52,485 | 1,565 | ||||||
Willis Group Holdings | 13,940 | 545 | ||||||
XL Group, Cl A | 3,900 | 123 | ||||||
|
| |||||||
| 35,020 | ||||||||
|
| |||||||
Health Care — 13.2% | ||||||||
Abbott Laboratories | 9,900 | 363 | ||||||
AbbVie | 6,200 | 265 | ||||||
Actavis * | 7,800 | 962 | ||||||
Aetna | 616 | 37 | ||||||
Agilent Technologies | 13,030 | 592 | ||||||
Allergan | 22,700 | 2,258 | ||||||
AmerisourceBergen | 17,900 | 968 | ||||||
Amgen | 38,028 | 3,823 | ||||||
Ariad Pharmaceuticals * | 9,600 | 176 | ||||||
Baxter International | 5,700 | 401 | ||||||
Biogen Idec * | 9,753 | 2,316 | ||||||
BioMarin Pharmaceutical * | 300 | 19 | ||||||
Boston Scientific * | 3,000 | 28 | ||||||
Brookdale Senior Living, Cl A * | 700 | 20 | ||||||
Cardinal Health | 14,600 | 686 | ||||||
Celgene * | 39,339 | 4,864 | ||||||
| 2 | SEI Institutional Investments Trust / Annual Report / May 31, 2013 |
Table of Contents
Schedule of Investments
Large Cap Diversified Alpha Fund
May 31, 2013
| Description | Shares | Market Value ($ Thousands) | ||||||
Cigna | 8,300 | $ | 564 | |||||
Community Health Systems | 1,400 | 67 | ||||||
Covance * | 1,100 | 82 | ||||||
Covidien | 100 | 7 | ||||||
DaVita * | 3,400 | 422 | ||||||
Edwards Lifesciences * | 500 | 33 | ||||||
Eli Lilly | 31,500 | 1,674 | ||||||
Express Scripts Holding * | 33,132 | 2,058 | ||||||
Forest Laboratories * | 21,680 | 862 | ||||||
Gilead Sciences * | 26,524 | 1,445 | ||||||
Health Management Associates, Cl A * | 4,300 | 59 | ||||||
Hologic * | 28,740 | 596 | ||||||
Humana | 9,700 | 783 | ||||||
Illumina * | 2,100 | 148 | ||||||
Johnson & Johnson | 42,265 | 3,558 | ||||||
Life Technologies * | 400 | 29 | ||||||
McKesson | 8,200 | 934 | ||||||
MEDNAX * | 500 | 46 | ||||||
Merck | 13,200 | 616 | ||||||
Mettler Toledo International * | 600 | 131 | ||||||
Mylan Laboratories * | 18,600 | 567 | ||||||
Novo Nordisk ADR | 9,675 | 1,559 | ||||||
Perrigo | 9,950 | 1,153 | ||||||
Pfizer | 104,150 | 2,836 | ||||||
Regeneron Pharmaceuticals * | 700 | 170 | ||||||
ResMed | 6,400 | 307 | ||||||
Sirona Dental Systems * | 2,400 | 170 | ||||||
St. Jude Medical | 17,795 | 769 | ||||||
Teleflex | 10,030 | 786 | ||||||
Tenet Healthcare * | 3,500 | 166 | ||||||
Thermo Fisher Scientific | 800 | 71 | ||||||
Thoratec * | 2,700 | 84 | ||||||
United Therapeutics * | 6,500 | 432 | ||||||
Zimmer Holdings | 400 | 32 | ||||||
Zoetis * | 500 | 16 | ||||||
|
| |||||||
| 41,010 | ||||||||
|
| |||||||
Industrials — 6.6% | ||||||||
ADT | 1,000 | 41 | ||||||
AECOM Technology * | 14,400 | 443 | ||||||
Alaska Air Group * | 7,700 | 438 | ||||||
Alliant Techsystems | 1,300 | 102 | ||||||
BE Aerospace * | 1,000 | 63 | ||||||
C.H. Robinson Worldwide | 3,900 | 221 | ||||||
Caterpillar | 6,300 | 540 | ||||||
Chicago Bridge & Iron | 900 | 57 | ||||||
Colfax * | 1,500 | 75 | ||||||
Copa Holdings, Cl A | 1,400 | 184 | ||||||
Copart * | 3,300 | 113 | ||||||
Covanta Holding | 2,200 | 45 | ||||||
Crane | 600 | 36 | ||||||
Delta Air Lines | 46,100 | 830 | ||||||
Diana Shipping * | 32,740 | 332 | ||||||
Eaton | 3,600 | 238 | ||||||
Emerson Electric | 13,870 | 797 | ||||||
Expeditors International of Washington | 1,300 | 51 | ||||||
Flowserve | 2,300 | 387 | ||||||
Fluor | 10,100 | 638 | ||||||
Fortune Brands Home & Security | 6,200 | 262 | ||||||
Gardner Denver | 400 | 30 | ||||||
| Description | Shares | Market Value ($ Thousands) | ||||||
General Electric | 44,060 | $ | 1,028 | |||||
GrafTech International * | 82,415 | 691 | ||||||
Illinois Tool Works | 9,550 | 670 | ||||||
Ingersoll-Rand | 19,740 | 1,136 | ||||||
Iron Mountain | 7,200 | 258 | ||||||
ITT | 27,150 | 818 | ||||||
Kirby * | 300 | 23 | ||||||
L-3 Communications Holdings, Cl 3 | 12,800 | 1,089 | ||||||
Lennox International | 1,000 | 64 | ||||||
Lockheed Martin | 6,800 | 720 | ||||||
Manitowoc | 800 | 17 | ||||||
Masco | 13,300 | 280 | ||||||
Northrop Grumman | 32,130 | 2,647 | ||||||
Oshkosh Truck * | 9,700 | 386 | ||||||
Owens Corning * | 400 | 17 | ||||||
Raytheon | 26,000 | 1,733 | ||||||
Republic Services, Cl A | 5,100 | 174 | ||||||
Rockwell Collins | 12,815 | 830 | ||||||
Ryder System | 400 | 25 | ||||||
Snap-on | 800 | 73 | ||||||
Southwest Airlines | 1,500 | 21 | ||||||
TransDigm Group * | 400 | 58 | ||||||
Trinity Industries | 2,900 | 119 | ||||||
Union Pacific | 5,700 | 882 | ||||||
United Continental Holdings * | 9,300 | 302 | ||||||
URS | 6,600 | 320 | ||||||
Valmont Industries | 100 | 15 | ||||||
Waste Connections | 2,100 | 85 | ||||||
|
| |||||||
| 20,404 | ||||||||
|
| |||||||
Information Technology — 19.1% | ||||||||
Activision Blizzard | 20,000 | 289 | ||||||
Adobe Systems * | 113,918 | 4,888 | ||||||
Alliance Data Systems * | 200 | 35 | ||||||
Amdocs | 20,900 | 746 | ||||||
AOL * | 800 | 28 | ||||||
Apple | 7,125 | 3,204 | ||||||
Automatic Data Processing | 11,600 | 797 | ||||||
BMC Software * | 9,050 | 410 | ||||||
Cadence Design Systems * | 6,700 | 101 | ||||||
Check Point Software Technologies * | 13,470 | 675 | ||||||
Cisco Systems | 43,300 | 1,043 | ||||||
Cognizant Technology Solutions, Cl A * | 800 | 52 | ||||||
Computer Sciences | 19,000 | 848 | ||||||
CoreLogic * | 4,100 | 107 | ||||||
Cree * | 900 | 56 | ||||||
eBay * | 41,200 | 2,229 | ||||||
Electronic Arts * | 7,100 | 163 | ||||||
EMC | 87,506 | 2,167 | ||||||
Facebook, Cl A * | 2,400 | 58 | ||||||
First Solar * | 5,500 | 299 | ||||||
FleetCor Technologies * | 2,200 | 192 | ||||||
Genpact * | 5,400 | 105 | ||||||
Google, Cl A * | 5,310 | 4,622 | ||||||
Harris | 4,600 | 230 | ||||||
Ingram Micro, Cl A * | 14,800 | 283 | ||||||
International Business Machines | 10,003 | 2,081 | ||||||
Intuit | 35,525 | 2,076 | ||||||
IPG Photonics * | 900 | 53 | ||||||
Jack Henry & Associates | 2,600 | 122 | ||||||
| 3 | SEI Institutional Investments Trust / Annual Report/ May 31, 2013 |
Table of Contents
Schedule of Investments
Large Cap Diversified Alpha Fund
May 31, 2013
| Description | Shares |
Market Value | ||||||
Linear Technology | 700 | $ | 26 | |||||
LSI * | 73,435 | 543 | ||||||
Marvell Technology Group | 19,700 | 214 | ||||||
Mastercard, Cl A | 6,645 | 3,789 | ||||||
Microsoft | 92,190 | 3,216 | ||||||
Motorola Solutions | 5,400 | 313 | ||||||
NeuStar, Cl A * | 2,300 | 111 | ||||||
Oracle | 87,007 | 2,937 | ||||||
Qualcomm | 81,980 | 5,204 | ||||||
Rackspace Hosting * | 6,700 | 252 | ||||||
Riverbed Technology * | 44,550 | 689 | ||||||
SanDisk * | 6,200 | 366 | ||||||
Seagate Technology | 8,400 | 362 | ||||||
Solera Holdings | 3,300 | 181 | ||||||
Stratasys * | 900 | 75 | ||||||
Symantec | 42,900 | 961 | ||||||
Teradata * | 28,375 | 1,582 | ||||||
VeriFone Holdings * | 54,850 | 1,280 | ||||||
VeriSign * | 29,025 | 1,365 | ||||||
Visa, Cl A | 36,300 | 6,466 | ||||||
Western Digital | 14,000 | 886 | ||||||
Yahoo! * | 6,300 | 166 | ||||||
Zebra Technologies, Cl A * | 500 | 23 | ||||||
|
| |||||||
| 58,966 | ||||||||
|
| |||||||
Materials — 3.6% | ||||||||
Allied Nevada Gold * | 5,800 | 45 | ||||||
Ashland | 600 | 53 | ||||||
Bemis | 2,300 | 90 | ||||||
CF Industries Holdings | 3,700 | 707 | ||||||
E.I. du Pont de Nemours | 15,800 | 882 | ||||||
Eastman Chemical | 1,700 | 122 | ||||||
Ecolab | 1,200 | 101 | ||||||
International Flavors & Fragrances | 1,400 | 112 | ||||||
International Paper | 2,000 | 92 | ||||||
Louisiana-Pacific * | 16,700 | 294 | ||||||
LyondellBasell Industries, Cl A | 25,100 | 1,673 | ||||||
Monsanto | 400 | 40 | ||||||
NewMarket | 300 | 82 | ||||||
Newmont Mining | 17,585 | 603 | ||||||
Owens-Illinois * | 25,395 | 697 | ||||||
Packaging Corp of America | 13,300 | 652 | ||||||
PPG Industries | 400 | 61 | ||||||
Rock Tenn, Cl A | 4,200 | 415 | ||||||
Royal Gold | 3,000 | 164 | ||||||
Sealed Air | 35,568 | 854 | ||||||
Sherwin-Williams | 3,400 | 641 | ||||||
Southern Copper | 9,100 | 283 | ||||||
Syngenta ADR | 17,525 | 1,364 | ||||||
Valspar | 2,800 | 201 | ||||||
Vulcan Materials | 900 | 48 | ||||||
Westlake Chemical | 1,100 | 103 | ||||||
WR Grace * | 9,555 | 808 | ||||||
|
| |||||||
| 11,187 | ||||||||
|
| |||||||
Telecommunication Services — 3.6% | ||||||||
AT&T | 56,500 | 1,977 | ||||||
BCE | 6,100 | 273 | ||||||
Crown Castle International * | 85,138 | 6,066 | ||||||
Frontier Communications | 55,700 | 231 | ||||||
SBA Communications, Cl A * | 5,700 | 429 | ||||||
Sprint Nextel * | 105,900 | 773 | ||||||
| Description | Shares/Face Amount ($ Thousands) | Market Value ($ Thousands) | ||||||
Verizon Communications | 31,300 | $ | 1,517 | |||||
|
| |||||||
| 11,266 | ||||||||
|
| |||||||
Utilities — 2.5% | ||||||||
AES | 23,900 | 291 | ||||||
AGL Resources | 6,100 | 258 | ||||||
American Electric Power | 23,200 | 1,063 | ||||||
Aqua America | 2,600 | 81 | ||||||
Atmos Energy | 3,500 | 148 | ||||||
Centerpoint Energy | 2,700 | 63 | ||||||
DTE Energy | 6,000 | 400 | ||||||
Edison International | 19,200 | 882 | ||||||
Great Plains Energy | 900 | 20 | ||||||
ITC Holdings | 1,900 | 165 | ||||||
National Fuel Gas | 3,300 | 202 | ||||||
NextEra Energy | 14,200 | 1,074 | ||||||
NRG Energy | 15,600 | 398 | ||||||
NV Energy | 42,200 | 989 | ||||||
Pepco Holdings | 2,900 | 60 | ||||||
Pinnacle West Capital | 300 | 17 | ||||||
PPL | 7,100 | 211 | ||||||
Public Service Enterprise Group | 23,700 | 783 | ||||||
Questar | 700 | 17 | ||||||
Sempra Energy | 4,800 | 390 | ||||||
UGI | 5,000 | 191 | ||||||
Vectren | 500 | 17 | ||||||
|
| |||||||
| 7,720 | ||||||||
|
| |||||||
Total Common Stock |
| 293,478 | ||||||
|
| |||||||
EXCHANGE TRADED FUND — 0.3% |
| |||||||
SPDR Gold Trust | 6,470 | 866 | ||||||
|
| |||||||
Total Exchange Traded Fund | 866 | |||||||
|
| |||||||
| Number Of Warrants | ||||||||
WARRANTS — 0.1% | ||||||||
Kinder Morgan, Expires 2017 * | 28,240 | 159 | ||||||
|
| |||||||
Total Warrants | 159 | |||||||
|
| |||||||
CASH EQUIVALENT — 5.4% | ||||||||
SEI Daily Income Trust, Prime Obligation Fund, Cl A | 16,838,688 | 16,839 | ||||||
|
| |||||||
Total Cash Equivalent | 16,839 | |||||||
|
| |||||||
U.S. TREASURY OBLIGATIONS (A)(B) — 0.5% |
| |||||||
U.S. Treasury Bills | ||||||||
0.120%, 06/27/2013 | $ | 514 | 514 | |||||
0.042%, 07/25/2013 | 1,066 | 1,066 | ||||||
|
| |||||||
Total U.S. Treasury Obligations | 1,580 | |||||||
|
| |||||||
Total Investments — 101.1% | $ | 312,922 | ||||||
|
| |||||||
| 4 | SEI Institutional Investments Trust / Annual Report / May 31, 2013 |
Table of Contents
Schedule of Investments
Large Cap Diversified Alpha Fund
May 31, 2013
A list of the open futures contracts held by the Fund at May 31, 2013, is as follows:
| Type of Contract | Number of Contracts Long | Expiration Date | Unrealized Depreciation ($ Thousands) | |||||||||
Russell 2000 Index E-MINI | 13 | Jun-2013 | $ | (7 | ) | |||||||
S&P 500 Index EMINI | 110 | Jun-2013 | (110 | ) | ||||||||
|
| |||||||||||
| $ | (117 | ) | ||||||||||
|
| |||||||||||
For the year ended May 31, 2013, the total amount of all open futures contracts, as presented in the table above, are representative of the volume of activity for this derivative type during the year.
Percentages are based on a Net Assets of $309,577 ($ Thousands).
| * | Non-income producing security. |
| ** | The rate reported is the 7-day effective yield as of May 31, 2013. |
| † | Investment in Affiliated Security (see Note 5). |
| ‡ | Real Estate Investment Trust. |
| (A) | Security, or portion thereof, has been pledged as collateral on open futures contracts. |
| (B) | The rate reported is the effective yield at time of purchase. |
ADR — American Depositary Receipt
Cl — Class
Ser — Series
S&P — Standard & Poor’s
SPDR — Standard & Poor’s Depository Receipt
The following is a list of inputs used as of May 31, 2013, in valuing the Fund’s investments carried at value ($ Thousands):
| Investments in Securities | Level 1 | Level 2 | Level 3 | Total | ||||||||||||
Common Stock | $ | 293,478 | $ | — | $ | — | $ | 293,478 | ||||||||
Exchange Traded Fund | 866 | — | — | 866 | ||||||||||||
Warrant | 159 | — | — | 159 | ||||||||||||
Cash Equivalent | 16,839 | — | — | 16,839 | ||||||||||||
U.S. Treasury Obligations | — | 1,580 | — | 1,580 | ||||||||||||
|
|
|
|
|
|
|
| |||||||||
Total Investments in Securities | $ | 311,342 | $ | 1,580 | $ | — | $ | 312,922 | ||||||||
|
|
|
|
|
|
|
| |||||||||
| Other Financial Instruments | Level 1 | Level 2 | Level 3 | Total | ||||||||||||
Futures Contracts* | $ | (117 | ) | $ | — | $ | — | $ | (117 | ) | ||||||
|
|
|
|
|
|
|
| |||||||||
| * | Futures contracts are valued at the unrealized depreciation on the instrument. |
For the year ended May 31, 2013, there were no transfers between Level 1 and Level 2 assets and liabilities.
For the year ended May 31, 2013, there were no transfers between Level 2 and Level 3 assets and liabilities.
For more information on valuation inputs, see Note 2 — Significant Accounting Policies in Notes to Financial Statements.
Amounts designated as “—” are either $0 or have been rounded to $0.
The accompanying notes are an integral part of the financial statements.
| 5 | SEI Institutional Investments Trust / Annual Report / May 31, 2013 |
Table of Contents
Schedule of Investments
Large Cap Disciplined Equity Fund
May 31, 2013
| Description | Shares | Market Value ($ Thousands) | ||||||
COMMON STOCK — 94.5% |
| |||||||
Consumer Discretionary — 11.7% |
| |||||||
Advance Auto Parts | 40,560 | $ | 3,307 | |||||
AMC Networks, Cl A * | 2,900 | 186 | ||||||
American Eagle Outfitters | 152,265 | 3,013 | ||||||
AutoNation * | 18,700 | 866 | ||||||
AutoZone * | 101,168 | 41,361 | ||||||
Bally Technologies * (A) | 34,250 | 1,951 | ||||||
Brinker International (A) | 292,261 | 11,460 | ||||||
Cablevision Systems, Cl A (A) | 102,600 | 1,551 | ||||||
Carmax * (A) | 12,600 | 589 | ||||||
Carnival, Cl A | 98,500 | 3,260 | ||||||
Carter’s | 3,500 | 252 | ||||||
CBS, Cl B | 102,600 | 5,079 | ||||||
Chico’s FAS (A) | 100,100 | 1,808 | ||||||
Cinemark Holdings | 20,500 | 601 | ||||||
Coach | 75,400 | 4,393 | ||||||
Comcast, Cl A | 1,360,625 | 53,836 | ||||||
Delphi Automotive | 359,749 | 17,559 | ||||||
Dillard’s, Cl A | 54,600 | 5,038 | ||||||
DIRECTV * | 168,498 | 10,300 | ||||||
Discovery Communications, Cl A * (A) | 85,600 | 6,750 | ||||||
DR Horton (A) | 138,300 | 3,369 | ||||||
Expedia (A) | 47,300 | 2,718 | ||||||
Foot Locker | 20,400 | 700 | ||||||
Ford Motor | 1,099,711 | 17,243 | ||||||
GameStop, Cl A (A) | 49,000 | 1,625 | ||||||
Gannett (A) | 279,233 | 6,004 | ||||||
Gap | 273,400 | 11,086 | ||||||
General Motors * (A) | 21,535 | 730 | ||||||
Goodyear Tire & Rubber * | 735,884 | 11,141 | ||||||
H&R Block | 175,400 | 5,134 | ||||||
Hasbro (A) | 64,430 | 2,866 | ||||||
Home Depot | 637,367 | 50,135 | ||||||
Iconix Brand Group * (A) | 67,450 | 2,030 | ||||||
International Game Technology | 184,300 | 3,295 | ||||||
Jack in the Box * | 18,000 | 657 | ||||||
John Wiley & Sons, Cl A | 4,000 | 159 | ||||||
Kohl’s (A) | 149,776 | 7,700 | ||||||
L Brands | 19,300 | 965 | ||||||
Lear | 22,101 | 1,326 | ||||||
Leggett & Platt (A) | 87,700 | 2,806 | ||||||
Lennar, Cl A (A) | 99,000 | 3,893 | ||||||
Lowe’s | 266,000 | 11,201 | ||||||
Macy’s | 891,462 | 43,093 | ||||||
Marriott International, Cl A | 6,900 | 290 | ||||||
Matthews International, Cl A (A) | 80,660 | 3,093 | ||||||
McDonald’s | 189,032 | 18,255 | ||||||
McGraw-Hill | 486,200 | 26,522 | ||||||
Modine Manufacturing * | 173,338 | 1,777 | ||||||
NetFlix * (A) | 2,300 | 520 | ||||||
Newell Rubbermaid | 154,500 | 4,178 | ||||||
News, Cl A | 111,400 | 3,577 | ||||||
NIKE, Cl B | 173,100 | 10,673 | ||||||
O’Reilly Automotive * | 500 | 55 | ||||||
Polaris Industries (A) | 17,600 | 1,681 | ||||||
PulteGroup * (A) | 273,886 | 5,913 | ||||||
PVH | 8,800 | 1,014 | ||||||
Ralph Lauren, Cl A | 25,600 | 4,482 | ||||||
| Description | Shares | Market Value ($ Thousands) | ||||||
Regal Entertainment Group, Cl A (A) | 174,898 | $ | 3,096 | |||||
Ross Stores | 353,450 | 22,727 | ||||||
Scripps Networks Interactive, Cl A | 39,600 | 2,667 | ||||||
Smith & Wesson Holding * (A) | 31,800 | 290 | ||||||
Starbucks | 55,800 | 3,519 | ||||||
Starz - Liberty Capital * | 41,096 | 948 | ||||||
Target | 258,356 | 17,956 | ||||||
Taylor Morrison Home, Cl A * | 440,800 | 11,386 | ||||||
Tenneco * | 46,355 | 2,056 | ||||||
Texas Roadhouse, Cl A | 66,275 | 1,567 | ||||||
Thor Industries (A) | 39,000 | 1,666 | ||||||
Time Warner | 410,270 | 23,947 | ||||||
Time Warner Cable, Cl A | 82,416 | 7,872 | ||||||
TJX | 665,860 | 33,699 | ||||||
Tupperware Brands | 21,600 | 1,749 | ||||||
Urban Outfitters * | 62,000 | 2,600 | ||||||
Vera Bradley * (A) | 95,795 | 2,251 | ||||||
Viacom, Cl B | 398,805 | 26,277 | ||||||
Virgin Media (A) | 37,165 | 1,846 | ||||||
Visteon * | 2,800 | 178 | ||||||
Walt Disney | 161,750 | 10,203 | ||||||
Whirlpool | 138,100 | 17,644 | ||||||
Wyndham Worldwide | 49,700 | 2,889 | ||||||
Wynn Resorts | 2,100 | 285 | ||||||
Yum! Brands | 73,300 | 4,966 | ||||||
|
| |||||||
| 649,350 | ||||||||
|
| |||||||
Consumer Staples — 9.4% | ||||||||
Altria Group | 914,354 | 33,008 | ||||||
Archer-Daniels-Midland | 301,800 | 9,727 | ||||||
Brown-Forman, Cl B | 18,200 | 1,252 | ||||||
Bunge (A) | 212,532 | 14,792 | ||||||
Cal-Maine Foods | 2,100 | 94 | ||||||
Campbell Soup (A) | 49,700 | 2,128 | ||||||
Central Garden and Pet, Cl A * | 191,800 | 1,456 | ||||||
Clorox | 7,600 | 631 | ||||||
Coca-Cola | 347,674 | 13,903 | ||||||
Coca-Cola Enterprises | 423,432 | 15,735 | ||||||
Colgate-Palmolive | 84,000 | 4,859 | ||||||
ConAgra Foods | 27,700 | 933 | ||||||
Constellation Brands, Cl A * | 85,100 | 4,511 | ||||||
Costco Wholesale | 33,200 | 3,641 | ||||||
CVS Caremark | 654,608 | 37,692 | ||||||
Dean Foods * (A) | 82,084 | 861 | ||||||
Dr. Pepper Snapple Group (A) | 369,980 | 17,012 | ||||||
General Mills | 7,000 | 330 | ||||||
Henkel | 40,992 | 3,352 | ||||||
Herbalife (A) | 99,383 | 4,638 | ||||||
Hershey | 25,000 | 2,228 | ||||||
HJ Heinz | 33,800 | 2,446 | ||||||
Hormel Foods | 27,900 | 1,111 | ||||||
Ingredion | 33,500 | 2,282 | ||||||
JM Smucker | 189,625 | 19,145 | ||||||
Kellogg | 25,400 | 1,576 | ||||||
Kimberly-Clark | 90,270 | 8,741 | ||||||
Kraft Foods Group | 446,340 | 24,607 | ||||||
Kroger | 682,067 | 22,965 | ||||||
McCormick (A) | 31,500 | 2,176 | ||||||
Medifast * (A) | 18,500 | 533 | ||||||
Molson Coors Brewing, Cl B | 234,950 | 11,609 | ||||||
Mondelez International, Cl A | 382,013 | 11,254 | ||||||
| 1 | SEI Institutional Investments Trust / Annual Report / May 31, 2013 |
Table of Contents
Schedule of Investments
Large Cap Disciplined Equity Fund
May 31, 2013
| Description | Shares | Market Value ($ Thousands) | ||||||
PepsiCo | 286,392 | $ | 23,132 | |||||
Philip Morris International | 1,001,143 | 91,014 | ||||||
Pilgrim’s Pride * | 32,800 | 392 | ||||||
Procter & Gamble | 335,324 | 25,739 | ||||||
Safeway (A) | 298,923 | 6,878 | ||||||
Sysco (A) | 298,090 | 10,076 | ||||||
TreeHouse Foods * | 22,650 | 1,483 | ||||||
Tyson Foods, Cl A | 655,977 | 16,399 | ||||||
Wal-Mart Stores | 834,879 | 62,483 | ||||||
WhiteWave Foods, Cl A * (A) | 20,968 | 366 | ||||||
WhiteWave Foods, Cl B * (A) | 16,472 | 272 | ||||||
|
| |||||||
| 519,462 | ||||||||
|
| |||||||
Energy — 10.5% | ||||||||
Anadarko Petroleum | 77,300 | 6,761 | ||||||
Apache | 183,655 | 15,084 | ||||||
Cabot Oil & Gas | 117,900 | 8,296 | ||||||
Chevron | 1,125,753 | 138,186 | ||||||
ConocoPhillips | 871,915 | 53,483 | ||||||
Consol Energy | 206,035 | 7,145 | ||||||
Diamond Offshore Drilling (A) | 30,600 | 2,106 | ||||||
Dresser-Rand Group * | 36,100 | 2,188 | ||||||
Ensco, Cl A | 188,700 | 11,354 | ||||||
EOG Resources | 4,500 | 581 | ||||||
EQT | 51,700 | 4,130 | ||||||
Exxon Mobil | 943,024 | 85,315 | ||||||
Halliburton | 45,400 | 1,900 | ||||||
Helmerich & Payne | 24,100 | 1,488 | ||||||
HollyFrontier | 147,743 | 7,313 | ||||||
Key Energy Services * | 329,695 | 2,136 | ||||||
Kinder Morgan | 79,860 | 3,033 | ||||||
Marathon Oil | 114,454 | 3,936 | ||||||
Marathon Petroleum | 251,800 | 20,774 | ||||||
Murphy Oil (A) | 24,600 | 1,558 | ||||||
National Oilwell Varco | 531,770 | 37,383 | ||||||
Noble Energy | 378,238 | 21,805 | ||||||
Occidental Petroleum | 198,741 | 18,298 | ||||||
Oil States International * | 21,810 | 2,148 | ||||||
PDC Energy * | 43,400 | 2,222 | ||||||
Peabody Energy | 549,885 | 10,816 | ||||||
Phillips 66 | 473,522 | 31,522 | ||||||
Pioneer Natural Resources | 27,300 | 3,786 | ||||||
Schlumberger | 423,127 | 30,901 | ||||||
Solazyme * (A) | 138,400 | 1,705 | ||||||
Southwestern Energy * | 50,600 | 1,907 | ||||||
Superior Energy Services * | 8,300 | 222 | ||||||
Tesoro | 213,681 | 13,174 | ||||||
Ultra Petroleum * (A) | 105,369 | 2,400 | ||||||
Valero Energy | 482,496 | 19,604 | ||||||
Williams | 32,600 | 1,147 | ||||||
|
| |||||||
| 575,807 | ||||||||
|
| |||||||
Financials — 14.3% | ||||||||
ACE | 3,300 | 296 | ||||||
Aflac | 97,810 | 5,447 | ||||||
Allstate | 444,646 | 21,450 | ||||||
American Assets Trust | 13,600 | 438 | ||||||
American Capital Agency | 434,297 | 11,205 | ||||||
American Capital Mortgage Investment | 32,400 | 683 | ||||||
American Express | 721,953 | 54,659 | ||||||
American Financial Group | 11,200 | 544 | ||||||
American International Group * | 545,907 | 24,271 | ||||||
| Description | Shares | Market Value ($ Thousands) | ||||||
American Tower, Cl A | 29,000 | $ | 2,257 | |||||
Ameriprise Financial | 14,936 | 1,217 | ||||||
Annaly Capital Management | 201,800 | 2,740 | ||||||
Aon | 7,800 | 497 | ||||||
Arch Capital Group * (A) | 33,435 | 1,712 | ||||||
Axis Capital Holdings | 96,088 | 4,186 | ||||||
Bank of America | 2,942,706 | 40,197 | ||||||
Bank of New York Mellon | 68,500 | 2,059 | ||||||
BB&T | 55,400 | 1,824 | ||||||
Berkshire Hathaway, Cl B * | 79,574 | 9,077 | ||||||
BlackRock, Cl A | 30,600 | 8,543 | ||||||
Brown & Brown | 85,500 | 2,759 | ||||||
Camden Property Trust | 45,520 | 3,152 | ||||||
Capital One Financial | 46,800 | 2,852 | ||||||
CBRE Group, Cl A * | 16,235 | 377 | ||||||
Chubb | 89,100 | 7,761 | ||||||
Cincinnati Financial | 90,500 | 4,284 | ||||||
CIT Group * | 738,858 | 34,047 | ||||||
Citigroup | 1,859,175 | 96,658 | ||||||
CME Group, Cl A | 202,810 | 13,777 | ||||||
Corrections Corp of America ‡ | 137,250 | 4,824 | ||||||
Discover Financial Services | 684,370 | 32,446 | ||||||
East West Bancorp | 82,580 | 2,175 | ||||||
EverBank Financial | 148,300 | 2,328 | ||||||
Extra Space Storage ‡ | 71,095 | 2,978 | ||||||
Fidelity National Financial, Cl A | 320,557 | 8,434 | ||||||
Franklin Resources | 8,500 | 1,316 | ||||||
Franklin Street Properties ‡ | 14,600 | 199 | ||||||
General Growth Properties ‡ | 73,200 | 1,503 | ||||||
Genworth Financial, Cl A * | 268,700 | 2,905 | ||||||
Goldman Sachs Group | 155,201 | 25,155 | ||||||
Hartford Financial Services Group | 117,200 | 3,590 | ||||||
Hudson City Bancorp | 267,400 | 2,273 | ||||||
Huntington Bancshares | 290,400 | 2,250 | ||||||
IntercontinentalExchange * (A) | 53,175 | 9,104 | ||||||
Invesco | 49,100 | 1,657 | ||||||
Jones Lang LaSalle | 44,127 | 4,052 | ||||||
JPMorgan Chase | 1,599,101 | 87,295 | ||||||
Kilroy Realty ‡ (A) | 54,485 | 2,883 | ||||||
Lexington Realty Trust ‡ (A) | 212,165 | 2,671 | ||||||
Lincoln National | 251,700 | 8,976 | ||||||
M&T Bank (A) | 50,840 | 5,333 | ||||||
Macerich ‡ (A) | 48,670 | 3,159 | ||||||
Marsh & McLennan | 545,360 | 21,825 | ||||||
MetLife | 247,400 | 10,937 | ||||||
Moody’s (A) | 136,230 | 9,051 | ||||||
Morgan Stanley | 1,335,490 | 34,589 | ||||||
MSCI, Cl A * | 208,160 | 7,336 | ||||||
NASDAQ OMX Group | 10,800 | 340 | ||||||
Nelnet, Cl A | 20,800 | 812 | ||||||
Northern Trust | 3,400 | 198 | ||||||
PacWest Bancorp (A) | 107,505 | 3,099 | ||||||
PartnerRe | 135,734 | 12,304 | ||||||
Plum Creek Timber ‡ | 254,024 | 12,117 | ||||||
Popular * | 6,637 | 199 | ||||||
Raymond James Financial | 76,720 | 3,373 | ||||||
Realogy Holdings * | 26,780 | 1,383 | ||||||
Regions Financial | 300,543 | 2,744 | ||||||
Reinsurance Group of America, Cl A | 7,300 | 481 | ||||||
Select Income ‡ | 3,800 | 104 | ||||||
Signature Bank NY * | 33,260 | 2,567 | ||||||
| 2 | SEI Institutional Investments Trust / Annual Report / May 31, 2013 |
Table of Contents
Schedule of Investments
Large Cap Disciplined Equity Fund
May 31, 2013
| Description | Shares | Market Value ($ Thousands) | ||||||
Simon Property Group ‡ | 18,889 | $ | 3,144 | |||||
SLM | 6,100 | 145 | ||||||
State Street | 6,100 | 404 | ||||||
SunTrust Banks | 136,200 | 4,371 | ||||||
Symetra Financial | 29,700 | 415 | ||||||
TCF Financial (A) | 157,700 | 2,271 | ||||||
Torchmark (A) | 22,200 | 1,432 | ||||||
Travelers | 96,600 | 8,087 | ||||||
US Bancorp | 897,109 | 31,453 | ||||||
Vornado Realty Trust ‡ | 26,320 | 2,104 | ||||||
Waddell & Reed Financial, Cl A | 45,430 | 2,092 | ||||||
Wells Fargo | 400,355 | 16,234 | ||||||
Weyerhaeuser ‡ | 303,600 | 9,053 | ||||||
Winthrop Realty Trust ‡ | 14,500 | 180 | ||||||
Wintrust Financial (A) | 47,980 | 1,811 | ||||||
XL Group, Cl A | 96,640 | 3,037 | ||||||
|
| |||||||
| 786,167 | ||||||||
|
| |||||||
Health Care — 12.9% | ||||||||
Abbott Laboratories | 489,940 | 17,966 | ||||||
AbbVie | 736,092 | 31,424 | ||||||
Actavis * | 231,040 | 28,485 | ||||||
Aetna | 9,471 | 572 | ||||||
Agilent Technologies | 27,611 | 1,255 | ||||||
Alexion Pharmaceuticals * | 10,500 | 1,024 | ||||||
Allergan | 2,800 | 279 | ||||||
AmerisourceBergen (A) | 102,969 | 5,568 | ||||||
Amgen | 417,016 | 41,923 | ||||||
Ariad Pharmaceuticals * | 121,700 | 2,232 | ||||||
Baxter International | 429,390 | 30,199 | ||||||
Biogen Idec * | 72,900 | 17,313 | ||||||
Bristol-Myers Squibb | 105,717 | 4,864 | ||||||
Brookdale Senior Living, Cl A * | 73,500 | 2,084 | ||||||
Bruker * | 9,000 | 149 | ||||||
C.R. Bard | 10,100 | 1,041 | ||||||
Cardinal Health | 289,201 | 13,581 | ||||||
CareFusion * | 155,565 | 5,717 | ||||||
Celgene * | 127,900 | 15,815 | ||||||
Charles River Laboratories International * | 16,115 | 698 | ||||||
Cigna | 10,500 | 713 | ||||||
Covance * | 25,338 | 1,889 | ||||||
Covidien | 633,270 | 40,276 | ||||||
DaVita * | 39,300 | 4,876 | ||||||
Edwards Lifesciences * | 36,600 | 2,432 | ||||||
Eli Lilly | 703,058 | 37,374 | ||||||
Express Scripts Holding * | 615,880 | 38,258 | ||||||
Gilead Sciences * (A) | 258,795 | 14,099 | ||||||
Haemonetics * | 57,510 | 2,374 | ||||||
HCA Holdings | 161,235 | 6,298 | ||||||
Henry Schein * | 17,560 | 1,691 | ||||||
Humana | 57,500 | 4,645 | ||||||
Intuitive Surgical * | 2,100 | 1,045 | ||||||
Johnson & Johnson | 606,506 | 51,056 | ||||||
Magellan Health Services * | 23,100 | 1,259 | ||||||
McKesson | 185,760 | 21,151 | ||||||
Medtronic | 263,973 | 13,465 | ||||||
Merck | 532,419 | 24,864 | ||||||
Mylan Laboratories * | 435,075 | 13,261 | ||||||
PerkinElmer | 71,200 | 2,230 | ||||||
Pfizer | 4,164,475 | 113,399 | ||||||
Quintiles Transnational Holdings * | 52,200 | 2,299 | ||||||
| Description | Shares | Market Value ($ Thousands) | ||||||
Regeneron Pharmaceuticals * | 2,800 | $ | 677 | |||||
Sanofi-Aventis | 114,980 | 12,295 | ||||||
St. Jude Medical | 68,900 | 2,979 | ||||||
Stryker | 100,200 | 6,652 | ||||||
Team Health Holdings * | 40,300 | 1,574 | ||||||
Tenet Healthcare * | 52,200 | 2,473 | ||||||
UnitedHealth Group | 590,470 | 36,981 | ||||||
Vertex Pharmaceuticals * | 133,330 | 10,708 | ||||||
WellPoint | 15,200 | 1,170 | ||||||
Zimmer Holdings (A) | 6,200 | 487 | ||||||
Zoetis * (A) | 291,965 | 9,343 | ||||||
|
| |||||||
| 706,482 | ||||||||
|
| |||||||
Industrials — 9.6% | ||||||||
3M | 28,666 | 3,161 | ||||||
ACCO Brands * | 111,400 | 796 | ||||||
Actuant, Cl A (A) | 86,370 | 2,937 | ||||||
ADT | 248,040 | 10,068 | ||||||
AECOM Technology * | 9,900 | 305 | ||||||
Alaska Air Group * | 26,175 | 1,487 | ||||||
Alliant Techsystems | 27,100 | 2,128 | ||||||
AO Smith | 6,800 | 267 | ||||||
Avery Dennison | 9,900 | 431 | ||||||
Babcock & Wilcox | 73,800 | 2,190 | ||||||
BE Aerospace * | 38,000 | 2,411 | ||||||
Boeing | 193,882 | 19,198 | ||||||
C.H. Robinson Worldwide | 48,700 | 2,761 | ||||||
Canadian National Railway | 125,250 | 12,684 | ||||||
Carlisle | 17,100 | 1,118 | ||||||
Caterpillar | 13,428 | 1,152 | ||||||
Cintas (A) | 16,800 | 767 | ||||||
CNH Global * (A) | 96,985 | 4,204 | ||||||
CSX | 1,235,270 | 31,141 | ||||||
Deere | 75,400 | 6,568 | ||||||
Delta Air Lines | 372,795 | 6,714 | ||||||
Dun & Bradstreet (A) | 9,800 | 962 | ||||||
Eaton | 3,800 | 251 | ||||||
Echo Global Logistics * | 97,294 | 1,739 | ||||||
Emerson Electric | 451,393 | 25,937 | ||||||
Equifax | 77,400 | 4,714 | ||||||
Expeditors International of Washington | 17,800 | 695 | ||||||
FedEx | 63,500 | 6,118 | ||||||
Flowserve | 30,700 | 5,162 | ||||||
Fluor (A) | 33,100 | 2,092 | ||||||
General Dynamics | 87,000 | 6,708 | ||||||
General Electric | 2,587,775 | 60,347 | ||||||
Honeywell International | 279,633 | 21,940 | ||||||
Hub Group, Cl A * | 57,869 | 2,101 | ||||||
Illinois Tool Works | 52,700 | 3,696 | ||||||
Ingersoll-Rand | 130,400 | 7,502 | ||||||
Iron Mountain | 91,900 | 3,294 | ||||||
Joy Global (A) | 237,655 | 12,852 | ||||||
Kansas City Southern | 6,800 | 753 | ||||||
KAR Auction Services | 94,245 | 2,210 | ||||||
Kennametal | 42,300 | 1,833 | ||||||
L-3 Communications Holdings, Cl 3 | 162,680 | 13,842 | ||||||
Lennox International | 33,600 | 2,150 | ||||||
Lockheed Martin | 198,156 | 20,971 | ||||||
Masco | 293,835 | 6,176 | ||||||
MasTec * (A) | 76,945 | 2,447 | ||||||
Matson | 21,300 | 536 | ||||||
Middleby * | 8,915 | 1,457 | ||||||
| 3 | SEI Institutional Investments Trust / Annual Report / May 31, 2013 |
Table of Contents
Schedule of Investments
Large Cap Disciplined Equity Fund
May 31, 2013
| Description | Shares | Market Value ($ Thousands) | ||||||
Norfolk Southern | 96,500 | $ | 7,391 | |||||
Northrop Grumman | 170,703 | 14,064 | ||||||
Oshkosh Truck * | 106,100 | 4,225 | ||||||
Parker Hannifin (A) | 84,900 | 8,470 | ||||||
Pitney Bowes (A) | 731,265 | 10,735 | ||||||
Quanta Services * | 57,385 | 1,628 | ||||||
Raytheon | 85,400 | 5,691 | ||||||
Republic Services, Cl A | 353,325 | 12,048 | ||||||
Rockwell Collins | 4,300 | 278 | ||||||
Rollins | 5,300 | 134 | ||||||
Roper Industries | 4,000 | 497 | ||||||
Ryder System | 30,800 | 1,942 | ||||||
Snap-on | 36,000 | 3,279 | ||||||
Southwest Airlines | 23,100 | 328 | ||||||
SPX | 21,890 | 1,728 | ||||||
Terex * | 180,620 | 6,479 | ||||||
Toro | 27,300 | 1,301 | ||||||
Towers Watson, Cl A | 218,720 | 16,990 | ||||||
Trimas * | 87,440 | 2,820 | ||||||
Trinity Industries | 70,391 | 2,881 | ||||||
Tyco International | 763,345 | 25,809 | ||||||
UniFirst | 5,600 | 531 | ||||||
Union Pacific | 81,800 | 12,648 | ||||||
United Parcel Service, Cl B | 314,930 | 27,052 | ||||||
United Technologies | 214,403 | 20,347 | ||||||
Valmont Industries | 16,900 | 2,574 | ||||||
WW Grainger | 23,100 | 5,947 | ||||||
|
| |||||||
| 528,790 | ||||||||
|
| |||||||
Information Technology — 18.5% | ||||||||
Accenture, Cl A | 86,800 | 7,127 | ||||||
Amdocs | 217,470 | 7,764 | ||||||
AOL * | 246,517 | 8,544 | ||||||
Apple | 410,514 | 184,600 | ||||||
ARRIS Group * | 16,300 | 247 | ||||||
Arrow Electronics * | 12,500 | 497 | ||||||
Autodesk * | 49,025 | 1,850 | ||||||
Automatic Data Processing | 83,300 | 5,724 | ||||||
Avnet * | 63,600 | 2,173 | ||||||
Blackhawk Network Holdings, Cl A * (A) | 102,310 | 2,437 | ||||||
Booz Allen Hamilton Holding, Cl A | 64,101 | 1,118 | ||||||
Broadridge Financial Solutions | 37,800 | 1,026 | ||||||
CA | 97,400 | 2,660 | ||||||
Cadence Design Systems * (A) | 183,020 | 2,769 | ||||||
Cisco Systems | 3,682,273 | 88,669 | ||||||
Cognizant Technology Solutions, Cl A * | 18,300 | 1,183 | ||||||
CommVault Systems * | 12,400 | 868 | ||||||
Computer Sciences | 362,942 | 16,191 | ||||||
CoreLogic * | 99,400 | 2,604 | ||||||
Corning | 838,500 | 12,888 | ||||||
eBay * | 809,830 | 43,812 | ||||||
Electronic Arts * | 101,700 | 2,338 | ||||||
EMC (A) | 731,360 | 18,109 | ||||||
Facebook, Cl A * | 429,110 | 10,449 | ||||||
First Solar * (A) | 88,364 | 4,805 | ||||||
Fiserv * | 13,200 | 1,151 | ||||||
FleetMatics Group * (A) | 62,300 | 1,853 | ||||||
FLIR Systems | 106,015 | 2,583 | ||||||
Google, Cl A * | 61,304 | 53,360 | ||||||
Harris | 194,203 | 9,735 | ||||||
| Description | Shares | Market Value ($ Thousands) | ||||||
Hewlett-Packard | 477,800 | $ | 11,668 | |||||
Informatica * | 62,500 | 2,272 | ||||||
Ingram Micro, Cl A * | 194,933 | 3,725 | ||||||
Intel | 39,799 | 966 | ||||||
International Business Machines | 569,653 | 118,499 | ||||||
Intuit | 136,600 | 7,983 | ||||||
j2 Global (A) | 43,615 | 1,783 | ||||||
Jabil Circuit | 32,100 | 644 | ||||||
JDS Uniphase * | 45,800 | 624 | ||||||
Juniper Networks * | 53,500 | 949 | ||||||
Lender Processing Services | 54,400 | 1,800 | ||||||
Littelfuse | 26,375 | 1,938 | ||||||
LSI * | 2,422,091 | 17,924 | ||||||
Marvell Technology Group | 88,500 | 959 | ||||||
Mastercard, Cl A | 37,119 | 21,167 | ||||||
Microsemi * | 80,505 | 1,766 | ||||||
Microsoft | 2,803,783 | 97,796 | ||||||
NetApp | 35,300 | 1,325 | ||||||
Netscout Systems * (A) | 109,765 | 2,673 | ||||||
ON Semiconductor * | 252,930 | 2,165 | ||||||
Oracle | 1,726,249 | 58,278 | ||||||
Paychex (A) | 20,000 | 745 | ||||||
Pegasystems | 4,100 | 133 | ||||||
Qualcomm | 925,415 | 58,745 | ||||||
Red Hat * | 53,810 | 2,595 | ||||||
Seagate Technology | 226,216 | 9,745 | ||||||
SolarWinds * | 11,600 | 489 | ||||||
SS&C Technologies Holdings * | 63,986 | 2,024 | ||||||
Symantec | 668,073 | 14,958 | ||||||
Syntel * | 9,700 | 620 | ||||||
Texas Instruments | 256,130 | 9,193 | ||||||
VeriSign * | 500 | 23 | ||||||
Visa, Cl A | 138,762 | 24,719 | ||||||
Web.com Group * | 101,800 | 2,137 | ||||||
Western Digital | 296,500 | 18,774 | ||||||
Western Union | 296,536 | 4,857 | ||||||
Xerox | 325,624 | 2,862 | ||||||
Xilinx | 45,665 | 1,856 | ||||||
Yahoo! * | 247,499 | 6,509 | ||||||
|
| |||||||
| 1,017,022 | ||||||||
|
| |||||||
Materials — 3.5% | ||||||||
Airgas (A) | 7,400 | 761 | ||||||
Ball | 11,200 | 483 | ||||||
Bemis | 39,300 | 1,539 | ||||||
Caesarstone Sdot-Yam * | 75,600 | 2,174 | ||||||
Carpenter Technology | 53,785 | 2,590 | ||||||
Celanese, Cl A | 8,200 | 405 | ||||||
CF Industries Holdings | 52,000 | 9,930 | ||||||
E.I. du Pont de Nemours (A) | 111,891 | 6,242 | ||||||
Eastman Chemical | 135,265 | 9,701 | ||||||
Ecolab | 60,300 | 5,094 | ||||||
Freeport-McMoRan Copper & Gold, Cl B | 372,388 | 11,563 | ||||||
International Flavors & Fragrances | 17,300 | 1,389 | ||||||
International Paper | 12,800 | 591 | ||||||
| 4 | SEI Institutional Investments Trust / Annual Report / May 31, 2013 |
Table of Contents
Schedule of Investments
Large Cap Disciplined Equity Fund
May 31, 2013
| Description | Shares |
Market Value ($ Thousands) | ||||||
LyondellBasell Industries, Cl A (A) | 458,215 | $ | 30,540 | |||||
Monsanto | 280,072 | 28,187 | ||||||
Mosaic | 77,900 | 4,738 | ||||||
Newmont Mining | 368,337 | 12,627 | ||||||
Owens-Illinois * | 146,300 | 4,016 | ||||||
PPG Industries | 35,400 | 5,438 | ||||||
Praxair | 12,500 | 1,429 | ||||||
Rock Tenn, Cl A | 17,995 | 1,777 | ||||||
Rockwood Holdings | 31,385 | 2,092 | ||||||
Schweitzer-Mauduit International (A) | 57,240 | 2,751 | ||||||
Sherwin-Williams | 53,100 | 10,011 | ||||||
Silver Wheaton (A) | 20,365 | 483 | ||||||
Southern Copper (A) | 115,874 | 3,609 | ||||||
US Silica Holdings (A) | 141,335 | 3,122 | ||||||
Vulcan Materials (A) | 512,340 | 27,451 | ||||||
|
| |||||||
| 190,733 | ||||||||
|
| |||||||
Telecommunication Services — 2.4% | ||||||||
America Movil, Ser L | 373,860 | 7,443 | ||||||
AT&T | 1,262,671 | 44,181 | ||||||
CenturyLink | 416,355 | 14,219 | ||||||
Crown Castle International * | 91,100 | 6,491 | ||||||
Frontier Communications (A) | 645,500 | 2,672 | ||||||
Sprint Nextel * (A) | 3,276,246 | 23,917 | ||||||
Verizon Communications | 708,703 | 34,358 | ||||||
|
| |||||||
| 133,281 | ||||||||
|
| |||||||
Utilities — 1.7% | ||||||||
AES | 705,800 | 8,611 | ||||||
AGL Resources | 66,300 | 2,807 | ||||||
Ameren | 116,000 | 3,949 | ||||||
American Electric Power | 150,369 | 6,890 | ||||||
American Water Works | 61,100 | 2,440 | ||||||
California Water Service Group | 138,220 | 2,727 | ||||||
CMS Energy | 89,850 | 2,421 | ||||||
Dominion Resources | 37,700 | 2,132 | ||||||
DTE Energy | 52,400 | 3,490 | ||||||
Duke Energy | 3,401 | 228 | ||||||
Edison International | 497,153 | 22,839 | ||||||
NextEra Energy | 137,422 | 10,392 | ||||||
NRG Energy | 281,315 | 7,179 | ||||||
ONEOK | 33,900 | 1,530 | ||||||
Pepco Holdings | 33,400 | 694 | ||||||
Pinnacle West Capital | 4,100 | 231 | ||||||
PPL (A) | 37,900 | 1,126 | ||||||
Public Service Enterprise Group | 47,300 | 1,563 | ||||||
SCANA | 36,300 | 1,831 | ||||||
Sempra Energy | 57,900 | 4,707 | ||||||
Southern | 5,700 | 250 | ||||||
Xcel Energy | 90,800 | 2,608 | ||||||
|
| |||||||
| 90,645 | ||||||||
|
| |||||||
Total Common Stock | 5,197,739 | |||||||
|
| |||||||
PREFERRED STOCK — 0.3% | ||||||||
Preferred Stock — 0.3% | ||||||||
Henkel | 149,551 | 14,460 | ||||||
|
| |||||||
Total Preferred Stock | 14,460 | |||||||
|
| |||||||
| Description | Shares/Face Amount ($ Thousands) | Market Value ($ Thousands) | ||||||
AFFILIATED PARTNERSHIPS — 4.0% |
| |||||||
SEI LIBOR Plus Portfolio** † | 1,137,968 | $ | 8,660 | |||||
SEI Liquidity Fund, L.P. | 210,764,245 | 210,764 | ||||||
|
| |||||||
Total Affiliated Partnerships | 219,424 | |||||||
|
| |||||||
CASH EQUIVALENT — 2.7% | ||||||||
SEI Daily Income Trust, Prime Obligation Fund, Cl A | 147,864,259 | 147,864 | ||||||
|
| |||||||
Total Cash Equivalent | 147,864 | |||||||
|
| |||||||
U.S. TREASURY OBLIGATIONS (C) (D) — 0.6% |
| |||||||
U.S. Treasury Bills | ||||||||
0.130%, 07/25/2013 | $ | 4,073 | 4,073 | |||||
0.075%, 06/27/2013 | 28,711 | 28,710 | ||||||
0.087%, 06/20/2013 | 2,400 | 2,400 | ||||||
|
| |||||||
Total U.S. Treasury Obligations | 35,183 | |||||||
|
| |||||||
Total Investments — 102.1% | $ | 5,614,670 | ||||||
|
| |||||||
A list of the open futures contracts held by the Fund at May 31, 2013, is as follows:
| Type of Contract | Number of Contracts Long | Expiration Date | Unrealized Appreciation ($ Thousands) | |||||||||
S&P 500 Index EMINI | 1,194 | Jun-2013 | $ | 446 | ||||||||
S&P Composite Index | 206 | Jun-2013 | 5,594 | |||||||||
|
| |||||||||||
| $ | 6,040 | |||||||||||
|
| |||||||||||
For the year ended May 31, 2013, the total amount of all open futures contracts, as presented in the table above, are representative of the volume of activity for this derivativetype during the year.
| 5 | SEI Institutional Investments Trust / Annual Report / May 31, 2013 |
Table of Contents
Schedule of Investments
Large Cap Disciplined Equity Fund
May 31, 2013
Percentages are based on a Net Assets of $5,500,315 ($ Thousands).
| * | Non-income producing security. |
| ** | The rate reported is the 7-day effective yield as of May 31, 2013. |
| † | Investment in Affiliated Security (see Note 5). |
| ‡ | Real Estate Investment Trust. |
| (A) | This security or a partial position of this security is on loan at May 31, 2013. The total value of securities on loan at May 31, 2013 was $202,848 ($ Thousands). |
| (B) | This security was purchased with cash collateral held from securities on loan (see Note 11). The total value of such securities as of May 31, 2013 was $210,764 ($ Thousands). |
| (C) | Security, or portion thereof, has been pledged as collateral on open futures contracts. |
| (D) | The rate reported is the effective yield at time of purchase. |
Cl — Class
LIBOR — London Interbank Offered Rate
L.P. — Limited Partnership
S&P — Standard & Poor’s
Ser — Series
The following is a list of the inputs used as of May 31, 2013, in valuing the Fund’s investments carried at value ($ Thousands):
| Investments in Securities | Level 1 | Level 2 | Level 3 | Total | ||||||||||||
Common Stock | $ | 5,197,739 | $ | — | $ | — | $ | 5,197,739 | ||||||||
Preferred Stock | 14,460 | — | — | 14,460 | ||||||||||||
Affiliated Partnerships | 8,660 | 210,764 | — | 219,424 | ||||||||||||
Cash Equivalent | 147,864 | — | — | 147,864 | ||||||||||||
U.S. Treasury | ||||||||||||||||
Obligations | — | 35,183 | — | 35,183 | ||||||||||||
|
|
|
|
|
|
|
| |||||||||
Total Investments in Securities | $ | 5,368,723 | $ | 245,947 | $ | — | $ | 5,614,670 | ||||||||
|
|
|
|
|
|
|
| |||||||||
| Other Financial Instruments | Level 1 | Level 2 | Level 3 | Total | ||||||||||||
Futures Contracts* | $ | 6,040 | $ | — | $ | — | $ | 6,040 | ||||||||
|
|
|
|
|
|
|
| |||||||||
| * | Futures contracts are valued at the unrealized appreciation on the instrument. |
For the year ended May 31, 2013, there were no transfers between Level 1 and Level 2 assets and liabilities.
For the year ended May 31, 2013, there were no transfers between Level 2 and Level 3 assets and liabilities.
For more information on valuation inputs, see Note 2 — significant accounting Policies in Notes to Financial Statements.
Amounts designated as “—” are $0 or have been rounded to $0.
The accompanying notes are an integral part of the financial statements.
| 6 | SEI Institutional Investments Trust / Annual Report / May 31, 2013 |
Table of Contents
Schedule of Investments
Large Cap Index Fund
May 31, 2013
| Description | Shares | Market Value ($ Thousands) | ||||||
COMMON STOCK — 97.4% | ||||||||
Consumer Discretionary — 12.4% | ||||||||
Aaron’s | 7,400 | $ | 208 | |||||
Abercrombie & Fitch, Cl A | 10,802 | 541 | ||||||
Advance Auto Parts | 9,708 | 791 | ||||||
Allison Transmission Holdings | 2,500 | 59 | ||||||
Amazon.com * | 47,489 | 12,776 | ||||||
AMC Networks, Cl A * | 7,085 | 454 | ||||||
American Eagle Outfitters | 24,371 | 482 | ||||||
Apollo Group, Cl A * | 12,264 | 245 | ||||||
Ascena Retail Group * | 15,200 | 309 | ||||||
AutoNation * | 4,332 | 201 | ||||||
AutoZone * | 4,707 | 1,924 | ||||||
Bally Technologies * (A) | 4,500 | 256 | ||||||
Bed Bath & Beyond * | 28,715 | 1,960 | ||||||
Best Buy (A) | 38,047 | 1,048 | ||||||
Big Lots * | 9,600 | 327 | ||||||
BorgWarner * | 14,582 | 1,182 | ||||||
Brinker International | 9,483 | 372 | ||||||
Cablevision Systems, Cl A (A) | 25,642 | 388 | ||||||
Carmax * (A) | 29,060 | 1,359 | ||||||
Carnival, Cl A | 52,900 | 1,751 | ||||||
Carter’s | 6,000 | 433 | ||||||
CBS, Cl B | 76,169 | 3,770 | ||||||
Charter Communications, Cl A * | 6,000 | 672 | ||||||
Chico’s FAS | 17,700 | 320 | ||||||
Chipotle Mexican Grill, Cl A * | 4,019 | 1,451 | ||||||
Choice Hotels International (A) | 2,584 | 102 | ||||||
Cinemark Holdings | 14,200 | 417 | ||||||
Clear Channel Outdoor Holdings, Cl A * | 700 | 6 | ||||||
Coach | 36,867 | 2,148 | ||||||
Comcast, Cl A | 352,425 | 14,150 | ||||||
CST Brands * (A) | 7,148 | 217 | ||||||
Darden Restaurants | 15,522 | 804 | ||||||
Deckers Outdoor * (A) | 4,900 | 263 | ||||||
Delphi Automotive | 41,200 | 2,011 | ||||||
DeVry (A) | 7,600 | 238 | ||||||
Dick’s Sporting Goods | 12,358 | 647 | ||||||
Dillard’s, Cl A | 3,000 | 277 | ||||||
DIRECTV * | 76,339 | 4,667 | ||||||
Discovery Communications, Cl A * | 32,500 | 2,563 | ||||||
DISH Network, Cl A * | 24,662 | 950 | ||||||
Dollar General * | 23,500 | 1,241 | ||||||
Dollar Tree * | 29,058 | 1,396 | ||||||
DR Horton (A) | 34,068 | 830 | ||||||
DreamWorks Animation SKG, Cl A (A) * | 6,434 | 141 | ||||||
DSW, Cl A | 3,600 | 266 | ||||||
Dunkin’ Brands Group (A) | 7,500 | 297 | ||||||
Expedia (A) | 8,967 | 515 | ||||||
Family Dollar Stores | 11,662 | 713 | ||||||
Foot Locker | 18,569 | 637 | ||||||
Ford Motor | 495,484 | 7,769 | ||||||
Fossil * | 7,500 | 797 | ||||||
GameStop, Cl A (A) | 15,800 | 524 | ||||||
Gannett | 34,859 | 749 | ||||||
Gap | 38,021 | 1,542 | ||||||
Garmin (A) | 13,500 | 472 | ||||||
| Description | Shares | Market Value ($ Thousands) | ||||||
General Motors * (A) | 102,900 | $ | 3,487 | |||||
Gentex (A) | 18,132 | 415 | ||||||
Genuine Parts (A) | 19,571 | 1,522 | ||||||
GNC Holdings, Cl A | 8,600 | 387 | ||||||
Goodyear Tire & Rubber * | 30,352 | 460 | ||||||
Guess? (A) | 7,700 | 245 | ||||||
H&R Block | 33,925 | 993 | ||||||
Hanesbrands | 13,843 | 690 | ||||||
Harley-Davidson | 29,003 | 1,582 | ||||||
Harman International Industries | 8,768 | 466 | ||||||
Hasbro (A) | 15,667 | 697 | ||||||
Home Depot | 200,715 | 15,788 | ||||||
HomeAway * | 4,300 | 131 | ||||||
Hyatt Hotels, Cl A * | 5,700 | 234 | ||||||
International Game Technology | 33,543 | 600 | ||||||
Interpublic Group | 58,775 | 836 | ||||||
ITT Educational Services * | 1,921 | 46 | ||||||
J.C. Penney (A) * | 22,351 | 393 | ||||||
Jarden * | 14,850 | 692 | ||||||
John Wiley & Sons, Cl A (A) | 5,842 | 232 | ||||||
Johnson Controls | 91,445 | 3,416 | ||||||
Kohl’s (A) | 28,319 | 1,456 | ||||||
L Brands | 28,557 | 1,428 | ||||||
Lamar Advertising, Cl A * | 9,840 | 460 | ||||||
Las Vegas Sands | 53,593 | 3,103 | ||||||
Lear | 12,300 | 738 | ||||||
Leggett & Platt (A) | 17,319 | 554 | ||||||
Lennar, Cl A (A) | 19,830 | 780 | ||||||
Liberty Global, Cl A * | 33,371 | 2,459 | ||||||
Liberty Interactive, Cl A * | 70,047 | 1,573 | ||||||
Liberty Media * | 13,420 | 1,676 | ||||||
Liberty Ventures, Ser A * | 4,403 | 359 | ||||||
LKQ * | 36,000 | 881 | ||||||
Lowe’s | 149,010 | 6,275 | ||||||
Macy’s | 52,730 | 2,549 | ||||||
Madison Square Garden, Cl A * | 7,760 | 454 | ||||||
Marriott International, Cl A | 26,687 | 1,121 | ||||||
Mattel | 42,242 | 1,890 | ||||||
McDonald’s | 133,480 | 12,890 | ||||||
McGraw-Hill | 38,439 | 2,097 | ||||||
MGM Resorts International * | 59,039 | 896 | ||||||
Michael Kors Holdings * | 10,400 | 653 | ||||||
Mohawk Industries * | 7,766 | 863 | ||||||
Morningstar | 3,100 | 213 | ||||||
NetFlix * (A) | 7,100 | 1,606 | ||||||
Newell Rubbermaid | 38,365 | 1,037 | ||||||
News, Cl A | 276,185 | 8,868 | ||||||
NIKE, Cl B | 95,934 | 5,915 | ||||||
Nordstrom | 20,012 | 1,177 | ||||||
Norwegian Cruise Line Holdings * (A) | 6,900 | 212 | ||||||
NVR * | 624 | 614 | ||||||
Omnicom Group (A) | 33,744 | 2,096 | ||||||
O’Reilly Automotive * | 15,540 | 1,692 | ||||||
Panera Bread, Cl A * (A) | 3,162 | 607 | ||||||
Penn National Gaming * | 8,189 | 451 | ||||||
PetSmart | 13,773 | 930 | ||||||
Polaris Industries (A) | 8,600 | 821 | ||||||
priceline.com * | 6,600 | 5,306 | ||||||
PulteGroup * | 42,145 | 910 | ||||||
PVH | 8,500 | 979 | ||||||
Ralph Lauren, Cl A | 7,780 | 1,362 | ||||||
| 1 | SEI Institutional Investments Trust / Annual Report / May 31, 2013 |
Table of Contents
Schedule of Investments
Large Cap Index Fund
May 31, 2013
| Description | Shares | Market Value ($ Thousands) | ||||||
Regal Entertainment Group, Cl A (A) | 7,388 | $ | 131 | |||||
Ross Stores | 28,053 | 1,804 | ||||||
Royal Caribbean Cruises | 20,800 | 728 | ||||||
Sally Beauty Holdings * | 21,000 | 643 | ||||||
Scripps Networks Interactive, Cl A | 11,272 | 759 | ||||||
Sears Holdings * (A) | 3,428 | 167 | ||||||
Service International | 31,494 | 566 | ||||||
Signet Jewelers | 11,700 | 802 | ||||||
Sirius XM Radio (A) * | 476,900 | 1,660 | ||||||
Staples (A) | 87,664 | 1,315 | ||||||
Starbucks | 100,506 | 6,339 | ||||||
Starwood Hotels & Resorts Worldwide | 24,784 | 1,693 | ||||||
Starz - Liberty Capital * | 13,420 | 310 | ||||||
Target | 87,685 | 6,094 | ||||||
Tempur-Pedic International (A) * | 9,700 | 410 | ||||||
Tesla Motors * (A) | 9,000 | 880 | ||||||
Thomson Reuters | 46,600 | 1,556 | ||||||
Thor Industries (A) | 5,500 | 235 | ||||||
Tiffany (A) | 16,125 | 1,254 | ||||||
Time Warner | 126,879 | 7,406 | ||||||
Time Warner Cable, Cl A | 39,584 | 3,781 | ||||||
TJX | 98,708 | 4,996 | ||||||
Toll Brothers * | 21,451 | 733 | ||||||
Tractor Supply | 8,700 | 974 | ||||||
TripAdvisor * (A) | 11,067 | 714 | ||||||
TRW Automotive Holdings * | 13,693 | 867 | ||||||
Tupperware Brands | 6,500 | 526 | ||||||
Ulta Salon Cosmetics & Fragrance * | 7,652 | 695 | ||||||
Under Armour, Cl A * (A) | 9,600 | 595 | ||||||
Urban Outfitters * | 13,120 | 550 | ||||||
VF (A) | 10,817 | 1,989 | ||||||
Viacom, Cl B | 66,069 | 4,353 | ||||||
Virgin Media (A) | 35,320 | 1,754 | ||||||
Visteon * | 5,400 | 343 | ||||||
Walt Disney | 234,472 | 14,790 | ||||||
Washington Post, Cl B | 657 | 307 | ||||||
Weight Watchers International | 3,362 | 154 | ||||||
Wendy’s (A) | 26,800 | 159 | ||||||
Whirlpool | 9,387 | 1,199 | ||||||
Williams-Sonoma (A) | 11,062 | 597 | ||||||
Wyndham Worldwide | 18,568 | 1,079 | ||||||
Wynn Resorts | 10,096 | 1,372 | ||||||
Yum! Brands | 61,548 | 4,170 | ||||||
|
| |||||||
| 275,340 | ||||||||
|
| |||||||
Consumer Staples — 9.6% | ||||||||
Altria Group | 268,040 | 9,676 | ||||||
Archer-Daniels-Midland | 89,079 | 2,871 | ||||||
Avon Products | 52,006 | 1,226 | ||||||
Beam | 20,020 | 1,298 | ||||||
Brown-Forman, Cl B | 18,827 | 1,296 | ||||||
Bunge | 18,300 | 1,274 | ||||||
Campbell Soup (A) | 21,178 | 907 | ||||||
Church & Dwight | 17,507 | 1,065 | ||||||
Clorox | 16,303 | 1,354 | ||||||
Coca-Cola | 508,640 | 20,341 | ||||||
Coca-Cola Enterprises | 31,115 | 1,156 | ||||||
Colgate-Palmolive | 126,150 | 7,297 | ||||||
ConAgra Foods | 57,286 | 1,930 | ||||||
| Description | Shares | Market Value ($ Thousands) | ||||||
Constellation Brands, Cl A * | 19,831 | $ | 1,051 | |||||
Costco Wholesale | 57,381 | 6,293 | ||||||
Crimson Wine Group * (A) | 2,442 | 21 | ||||||
CVS Caremark | 168,752 | 9,717 | ||||||
Dean Foods * (A) | 23,187 | 243 | ||||||
Dr. Pepper Snapple Group | 26,600 | 1,223 | ||||||
Energizer Holdings | 6,441 | 616 | ||||||
Estee Lauder, Cl A | 28,508 | 1,932 | ||||||
Flowers Foods | 13,950 | 465 | ||||||
Fresh Market * | 2,500 | 124 | ||||||
General Mills | 86,592 | 4,077 | ||||||
Green Mountain Coffee Roasters * (A) | 19,400 | 1,419 | ||||||
Herbalife (A) | 14,200 | 663 | ||||||
Hershey | 18,798 | 1,675 | ||||||
Hillshire Brands | 18,200 | 630 | ||||||
HJ Heinz | 43,137 | 3,121 | ||||||
Hormel Foods | 18,478 | 736 | ||||||
Ingredion | 7,900 | 538 | ||||||
JM Smucker | 14,011 | 1,415 | ||||||
Kellogg | 30,003 | 1,862 | ||||||
Kimberly-Clark | 52,118 | 5,047 | ||||||
Kraft Foods Group | 78,902 | 4,350 | ||||||
Kroger | 66,073 | 2,225 | ||||||
Lorillard (A) | 50,250 | 2,133 | ||||||
McCormick (A) | 16,893 | 1,167 | ||||||
Mead Johnson Nutrition, Cl A | 25,186 | 2,042 | ||||||
Molson Coors Brewing, Cl B | 15,562 | 769 | ||||||
Mondelez International, Cl A | 234,606 | 6,911 | ||||||
Monster Beverage * | 18,300 | 999 | ||||||
Nu Skin Enterprises, Cl A (A) | 6,700 | 394 | ||||||
PepsiCo | 205,052 | 16,562 | ||||||
Philip Morris International | 223,268 | 20,297 | ||||||
Procter & Gamble | 358,274 | 27,501 | ||||||
Reynolds American | 40,720 | 1,959 | ||||||
Safeway (A) | 29,820 | 686 | ||||||
Smithfield Foods * | 19,175 | 632 | ||||||
Sysco (A) | 79,448 | 2,685 | ||||||
Tyson Foods, Cl A | 30,965 | 774 | ||||||
Walgreen | 114,625 | 5,475 | ||||||
Wal-Mart Stores | 221,579 | 16,583 | ||||||
WhiteWave Foods, Cl A * (A) | 5,923 | 103 | ||||||
WhiteWave Foods, Cl B * (A) | 8,435 | 139 | ||||||
Whole Foods Market | 46,904 | 2,432 | ||||||
|
| |||||||
| 211,377 | ||||||||
|
| |||||||
Energy — 9.7% | ||||||||
Alpha Natural Resources * (A) | 28,065 | 187 | ||||||
Anadarko Petroleum | 66,240 | 5,794 | ||||||
Apache | 52,159 | 4,284 | ||||||
Atwood Oceanics * | 7,200 | 378 | ||||||
Baker Hughes | 55,840 | 2,540 | ||||||
Cabot Oil & Gas | 26,300 | 1,850 | ||||||
Cameron International * | 30,444 | 1,853 | ||||||
CARBO Ceramics (A) | 2,500 | 165 | ||||||
Cheniere Energy * | 26,400 | 775 | ||||||
Chesapeake Energy (A) | 82,166 | 1,795 | ||||||
Chevron | 257,802 | 31,645 | ||||||
Cimarex Energy | 10,500 | 736 | ||||||
Cobalt International Energy * | 24,900 | 646 | ||||||
Concho Resources * | 13,200 | 1,104 | ||||||
ConocoPhillips | 166,476 | 10,212 | ||||||
Consol Energy | 28,944 | 1,004 | ||||||
| 2 | SEI Institutional Investments Trust / Annual Report / May 31, 2013 |
Table of Contents
Schedule of Investments
Large Cap Index Fund
May 31, 2013
| Description | Shares | Market Value ($ Thousands) | ||||||
Continental Resources * | 4,800 | $ | 389 | |||||
Denbury Resources * (A) | 47,324 | 868 | ||||||
Devon Energy | 51,213 | 2,911 | ||||||
Diamond Offshore Drilling | 8,509 | 585 | ||||||
Dresser-Rand Group * | 10,434 | 632 | ||||||
Energen | 8,937 | 484 | ||||||
EOG Resources | 35,945 | 4,641 | ||||||
EQT | 16,766 | 1,339 | ||||||
Era Group * | 2,600 | 67 | ||||||
EXCO Resources (A) | 13,400 | 109 | ||||||
Exxon Mobil | 610,238 | 55,208 | ||||||
FMC Technologies * | 30,020 | 1,671 | ||||||
Golar LNG (A) | 5,500 | 187 | ||||||
Halliburton | 122,797 | 5,139 | ||||||
Helmerich & Payne | 11,850 | 732 | ||||||
Hess | 38,712 | 2,610 | ||||||
HollyFrontier | 26,326 | 1,303 | ||||||
Kinder Morgan | 66,422 | 2,523 | ||||||
Kosmos Energy * | 9,200 | 95 | ||||||
Laredo Petroleum Holdings * (A) | 2,000 | 39 | ||||||
Marathon Oil | 94,976 | 3,266 | ||||||
Marathon Petroleum | 45,688 | 3,769 | ||||||
McDermott International * | 34,300 | 328 | ||||||
Murphy Oil (A) | 24,354 | 1,542 | ||||||
Nabors Industries | 36,000 | 576 | ||||||
National Oilwell Varco | 57,080 | 4,013 | ||||||
Newfield Exploration * | 16,699 | 397 | ||||||
Noble Energy | 48,124 | 2,774 | ||||||
Occidental Petroleum | 106,754 | 9,829 | ||||||
Oceaneering International | 13,200 | 957 | ||||||
Oil States International * | 7,000 | 689 | ||||||
Patterson-UTI Energy (A) | 19,632 | 412 | ||||||
PBF Energy, Cl A (A) | 5,800 | 169 | ||||||
Peabody Energy | 33,074 | 651 | ||||||
Phillips 66 | 83,088 | 5,531 | ||||||
Pioneer Natural Resources | 18,144 | 2,516 | ||||||
QEP Resources | 21,746 | 617 | ||||||
Range Resources | 20,339 | 1,529 | ||||||
Rowan, Cl A * | 16,686 | 555 | ||||||
RPC (A) | 5,550 | 70 | ||||||
SandRidge Energy * (A) | 60,700 | 314 | ||||||
Schlumberger | 175,163 | 12,792 | ||||||
SEACOR Holdings * | 2,600 | 200 | ||||||
SM Energy | 8,200 | 497 | ||||||
Southwestern Energy * | 43,376 | 1,635 | ||||||
Spectra Energy | 83,309 | 2,547 | ||||||
Superior Energy Services * | 22,100 | 590 | ||||||
Teekay | 3,800 | 147 | ||||||
Tesoro | 20,046 | 1,236 | ||||||
Tidewater (A) | 6,370 | 351 | ||||||
Ultra Petroleum * (A) | 21,600 | 492 | ||||||
Unit * | 6,027 | 272 | ||||||
Valero Energy | 74,736 | 3,037 | ||||||
Whiting Petroleum * | 15,600 | 719 | ||||||
Williams | 90,846 | 3,196 | ||||||
World Fuel Services | 8,900 | 363 | ||||||
WPX Energy * (A) | 22,248 | 428 | ||||||
|
| |||||||
| 215,506 | ||||||||
|
| |||||||
Financials — 16.7% | ||||||||
ACE | 45,300 | 4,062 | ||||||
Affiliated Managers Group * | 6,220 | 1,020 | ||||||
| Description | Shares | Market Value ($ Thousands) | ||||||
Aflac | 62,856 | $ | 3,500 | |||||
Alexander & Baldwin * | 3,882 | 137 | ||||||
Alexandria Real Estate Equities (A) | 8,300 | 568 | ||||||
Alleghany * | 2,104 | 821 | ||||||
Allied World Assurance Holdings | 4,600 | 411 | ||||||
Allstate | 66,125 | 3,190 | ||||||
American Campus Communities ‡ (A) | 11,600 | 474 | ||||||
American Capital * | 47,600 | 635 | ||||||
American Capital Agency | 44,959 | 1,160 | ||||||
American Express | 131,834 | 9,981 | ||||||
American Financial Group | 10,614 | 515 | ||||||
American International Group * | 86,323 | 3,838 | ||||||
American National Insurance | 222 | 22 | ||||||
American Tower, Cl A | 52,822 | 4,112 | ||||||
Ameriprise Financial | 28,300 | 2,307 | ||||||
Annaly Capital Management | 124,811 | 1,695 | ||||||
Aon (A) | 37,844 | 2,410 | ||||||
Apartment Investment & Management, Cl A | 17,899 | 542 | ||||||
Arch Capital Group * (A) | 16,500 | 845 | ||||||
Ares Capital | 28,916 | 496 | ||||||
Arthur J Gallagher (A) | 16,004 | 699 | ||||||
Aspen Insurance Holdings | 9,500 | 349 | ||||||
Associated Banc | 21,584 | 333 | ||||||
Assurant | 10,893 | 542 | ||||||
Assured Guaranty | 21,200 | 480 | ||||||
AvalonBay Communities | 15,741 | 2,088 | ||||||
Axis Capital Holdings | 12,700 | 553 | ||||||
Bank of America | 1,411,463 | 19,281 | ||||||
Bank of Hawaii | 5,582 | 281 | ||||||
Bank of New York Mellon | 158,909 | 4,777 | ||||||
BankUnited | 3,500 | 86 | ||||||
BB&T | 88,606 | 2,917 | ||||||
Berkshire Hathaway, Cl B * | 232,900 | 26,567 | ||||||
BioMed Realty Trust ‡ (A) | 19,100 | 400 | ||||||
BlackRock, Cl A | 16,985 | 4,742 | ||||||
BOK Financial | 3,275 | 213 | ||||||
Boston Properties | 19,184 | 2,045 | ||||||
Brandywine Realty Trust | 18,000 | 255 | ||||||
BRE Properties | 9,520 | 476 | ||||||
Brown & Brown | 18,224 | 588 | ||||||
Camden Property Trust | 9,747 | 675 | ||||||
Capital One Financial | 77,325 | 4,712 | ||||||
CapitalSource | 29,082 | 274 | ||||||
Capitol Federal Financial | 17,624 | 209 | ||||||
CBL & Associates Properties | 15,700 | 361 | ||||||
CBOE Holdings | 10,900 | 438 | ||||||
CBRE Group, Cl A * | 42,817 | 992 | ||||||
Charles Schwab | 136,685 | 2,715 | ||||||
Chimera Investment ‡ | 127,100 | 388 | ||||||
Chubb | 36,418 | 3,172 | ||||||
Cincinnati Financial | 17,786 | 842 | ||||||
CIT Group * | 25,600 | 1,180 | ||||||
Citigroup | 383,904 | 19,959 | ||||||
City National (A) | 5,838 | 366 | ||||||
CME Group, Cl A | 44,870 | 3,048 | ||||||
CNA Financial | 1,700 | 58 | ||||||
Comerica | 23,853 | 942 | ||||||
Commerce Bancshares | 9,703 | 422 | ||||||
CommonWealth | 19,825 | 405 | ||||||
| 3 | SEI Institutional Investments Trust / Annual Report / May 31, 2013 |
Table of Contents
Schedule of Investments
Large Cap Index Fund
May 31, 2013
| Description | Shares | Market Value ($ Thousands) | ||||||
Corporate Office Properties Trust ‡ | 10,300 | $ | 274 | |||||
Corrections Corp of America ‡ | 14,641 | 515 | ||||||
Cullen/Frost Bankers (A) | 6,568 | 423 | ||||||
DDR ‡ (A) | 42,100 | 735 | ||||||
Digital Realty Trust ‡ (A) | 15,500 | 944 | ||||||
Discover Financial Services | 67,089 | 3,181 | ||||||
Douglas Emmett ‡ | 19,600 | 500 | ||||||
Duke Realty ‡ | 33,309 | 552 | ||||||
E*TRADE Financial * | 30,600 | 356 | ||||||
East West Bancorp | 17,900 | 471 | ||||||
Eaton Vance (A) | 14,310 | 594 | ||||||
Endurance Specialty Holdings | 5,400 | 272 | ||||||
Equity Lifestyle Properties ‡ | 5,100 | 393 | ||||||
Equity Residential ‡ | 44,187 | 2,499 | ||||||
Erie Indemnity, Cl A | 2,419 | 184 | ||||||
Essex Property Trust ‡ (A) | 4,569 | 718 | ||||||
Everest Re Group | 6,900 | 894 | ||||||
Extra Space Storage ‡ | 15,300 | 641 | ||||||
Federal Realty Investment Trust ‡ | 7,696 | 829 | ||||||
Federated Investors, Cl B (A) | 9,458 | 262 | ||||||
Fidelity National Financial, Cl A | 23,304 | 613 | ||||||
Fifth Third Bancorp | 113,782 | 2,071 | ||||||
First Citizens BancShares, Cl A | 600 | 118 | ||||||
First Horizon National (A) | 31,256 | 359 | ||||||
First Niagara Financial Group | 43,600 | 426 | ||||||
First Republic Bank | 12,800 | 476 | ||||||
Forest City Enterprises, Cl A * | 17,642 | 331 | ||||||
Franklin Resources | 18,803 | 2,911 | ||||||
Fulton Financial | 24,795 | 285 | ||||||
General Growth Properties ‡ | 66,253 | 1,360 | ||||||
Genworth Financial, Cl A * | 60,792 | 657 | ||||||
Goldman Sachs Group | 61,275 | 9,932 | ||||||
Hanover Insurance Group | 6,193 | 311 | ||||||
Hartford Financial Services Group | 56,110 | 1,719 | ||||||
Hatteras Financial ‡ | 12,100 | 312 | ||||||
HCC Insurance Holdings | 12,541 | 537 | ||||||
HCP ‡ | 61,174 | 2,898 | ||||||
Health Care ‡ | 38,583 | 2,625 | ||||||
Home Properties ‡ (A) | 7,300 | 444 | ||||||
Hospitality Properties Trust ‡ | 15,366 | 448 | ||||||
Host Hotels & Resorts ‡ | 90,240 | 1,605 | ||||||
Howard Hughes * | 3,473 | 346 | ||||||
Hudson City Bancorp | 65,328 | 555 | ||||||
Huntington Bancshares | 105,334 | 816 | ||||||
Interactive Brokers Group, Cl A | 2,200 | 35 | ||||||
IntercontinentalExchange * (A) | 9,100 | 1,558 | ||||||
Invesco | 56,200 | 1,896 | ||||||
Janus Capital Group (A) | 23,965 | 210 | ||||||
Jones Lang LaSalle | 5,500 | 505 | ||||||
JPMorgan Chase | 497,734 | 27,171 | ||||||
Kemper | 6,260 | 214 | ||||||
KeyCorp | 121,295 | 1,308 | ||||||
Kilroy Realty ‡ (A) | 8,100 | 428 | ||||||
Kimco Realty ‡ (A) | 51,744 | 1,146 | ||||||
Lazard, Cl A | 16,300 | 552 | ||||||
Legg Mason (A) | 20,181 | 707 | ||||||
Leucadia National | 38,606 | 1,211 | ||||||
Liberty Property Trust ‡ | 12,806 | 520 | ||||||
Lincoln National | 34,688 | 1,237 | ||||||
Loews | 38,736 | 1,775 | ||||||
| Description | Shares | Market Value ($ Thousands) | ||||||
LPL Financial Holdings | 5,700 | $ | 211 | |||||
M&T Bank (A) | 15,734 | 1,651 | ||||||
Macerich ‡ (A) | 16,911 | 1,098 | ||||||
Mack-Cali Realty ‡ | 10,898 | 289 | ||||||
Markel * | 1,950 | 1,020 | ||||||
Marsh & McLennan | 73,865 | 2,956 | ||||||
MBIA (A) * | 13,559 | 193 | ||||||
Mercury General | 2,396 | 107 | ||||||
MetLife | 113,209 | 5,005 | ||||||
MFA Mortgage Investments ‡ | 44,200 | 388 | ||||||
Mid-America Apartment Communities ‡ | 5,100 | 347 | ||||||
Moody’s | 24,927 | 1,656 | ||||||
Morgan Stanley | 204,878 | 5,306 | ||||||
MSCI, Cl A * | 16,500 | 581 | ||||||
NASDAQ OMX Group | 14,500 | 456 | ||||||
National Retail Properties ‡ (A) | 11,400 | 409 | ||||||
New York Community Bancorp (A) | 57,272 | 749 | ||||||
Northern Trust | 27,005 | 1,570 | ||||||
NYSE Euronext | 30,600 | 1,231 | ||||||
Old Republic International | 32,990 | 449 | ||||||
PartnerRe | 6,300 | 571 | ||||||
People’s United Financial (A) | 50,834 | 700 | ||||||
Piedmont Office Realty Trust, Cl A ‡ (A) | 21,400 | 406 | ||||||
Plum Creek Timber ‡ (A) | 19,521 | 931 | ||||||
PNC Financial Services Group | 70,322 | 5,038 | ||||||
Popular * | 10,653 | 320 | ||||||
Post Properties ‡ | 6,700 | 320 | ||||||
Principal Financial Group (A) | 38,208 | 1,446 | ||||||
ProAssurance | 7,600 | 382 | ||||||
Progressive | 75,880 | 1,934 | ||||||
Prologis ‡ | 67,518 | 2,721 | ||||||
Protective Life | 13,309 | 515 | ||||||
Prudential Financial | 62,363 | 4,301 | ||||||
Public Storage ‡ | 19,268 | 2,925 | ||||||
Raymond James Financial | 14,221 | 625 | ||||||
Rayonier ‡ | 14,804 | 820 | ||||||
Realogy Holdings * | 4,800 | 248 | ||||||
Realty Income ‡ (A) | 24,000 | 1,091 | ||||||
Regency Centers ‡ | 11,108 | 573 | ||||||
Regions Financial | 177,187 | 1,618 | ||||||
Reinsurance Group of America, Cl A | 9,999 | 659 | ||||||
RenaissanceRe Holdings | 5,300 | 456 | ||||||
Retail Properties of America, Cl A ‡ | 11,300 | 172 | ||||||
SEI (B) | 17,442 | 534 | ||||||
Senior Housing Properties Trust ‡ | 22,000 | 569 | ||||||
Signature Bank NY * | 7,500 | 579 | ||||||
Simon Property Group ‡ | 40,081 | 6,671 | ||||||
SL Green Realty ‡ | 10,768 | 937 | ||||||
SLM | 64,714 | 1,536 | ||||||
St. Joe * (A) | 8,061 | 165 | ||||||
StanCorp Financial Group | 5,642 | 256 | ||||||
State Street | 61,094 | 4,043 | ||||||
SunTrust Banks | 68,446 | 2,196 | ||||||
SVB Financial Group * | 5,500 | 426 | ||||||
Synovus Financial | 98,672 | 270 | ||||||
T. Rowe Price Group | 32,480 | 2,464 | ||||||
Tanger Factory Outlet Centers ‡ | 9,800 | 338 | ||||||
| 4 | SEI Institutional Investments Trust / Annual Report / May 31, 2013 |
Table of Contents
Schedule of Investments
Large Cap Index Fund
May 31, 2013
| Description | Shares | Market Value ($ Thousands) | ||||||
Taubman Centers ‡ | 7,200 | $ | 580 | |||||
TCF Financial (A) | 20,301 | 292 | ||||||
TD Ameritrade Holding | 31,945 | 749 | ||||||
TFS Financial (A) * | 10,200 | 112 | ||||||
Torchmark (A) | 12,025 | 776 | ||||||
Travelers | 51,975 | 4,351 | ||||||
UDR ‡ | 29,793 | 726 | ||||||
Unum Group | 34,805 | 991 | ||||||
US Bancorp | 249,797 | 8,758 | ||||||
Validus Holdings | 13,126 | 474 | ||||||
Valley National Bancorp (A) | 24,716 | 230 | ||||||
Ventas ‡ | 39,192 | 2,797 | ||||||
Vornado Realty Trust ‡ | 23,636 | 1,890 | ||||||
Waddell & Reed Financial, Cl A | 10,700 | 493 | ||||||
Washington Federal | 13,263 | 232 | ||||||
Weingarten Realty Investors ‡ (A) | 14,967 | 477 | ||||||
Wells Fargo | 640,766 | 25,983 | ||||||
Weyerhaeuser ‡ | 68,392 | 2,039 | ||||||
White Mountains Insurance Group | 747 | 442 | ||||||
WR Berkley | 15,014 | 615 | ||||||
XL Group, Cl A | 40,000 | 1,257 | ||||||
Zions Bancorporation (A) | 25,702 | 721 | ||||||
|
| |||||||
| 369,849 | ||||||||
|
| |||||||
Health Care — 12.1% | ||||||||
Abbott Laboratories | 207,776 | 7,619 | ||||||
AbbVie | 207,376 | 8,853 | ||||||
Actavis * | 16,018 | 1,975 | ||||||
Aetna | 51,235 | 3,093 | ||||||
Agilent Technologies | 44,264 | 2,012 | ||||||
Alere * | 9,300 | 238 | ||||||
Alexion Pharmaceuticals * | 24,400 | 2,380 | ||||||
Allergan | 40,596 | 4,039 | ||||||
Allscripts Healthcare Solutions * | 21,800 | 302 | ||||||
AmerisourceBergen | 32,624 | 1,764 | ||||||
Amgen | 102,358 | 10,290 | ||||||
Ariad Pharmaceuticals * | 24,600 | 451 | ||||||
Baxter International | 73,275 | 5,153 | ||||||
Becton Dickinson | 25,744 | 2,539 | ||||||
Biogen Idec * | 31,700 | 7,528 | ||||||
BioMarin Pharmaceutical * (A) | 13,300 | 834 | ||||||
Bio-Rad Laboratories, Cl A * | 2,500 | 284 | ||||||
Boston Scientific * | 181,839 | 1,680 | ||||||
Bristol-Myers Squibb | 222,259 | 10,226 | ||||||
Brookdale Senior Living, Cl A * | 12,100 | 343 | ||||||
Bruker * | 11,900 | 197 | ||||||
C.R. Bard | 10,685 | 1,102 | ||||||
Cardinal Health | 44,029 | 2,068 | ||||||
CareFusion * | 24,064 | 884 | ||||||
Catamaran * (A) | 25,648 | 1,262 | ||||||
Celgene * | 54,780 | 6,774 | ||||||
Cerner * | 18,148 | 1,784 | ||||||
Charles River Laboratories International * (A) | 6,143 | 266 | ||||||
Cigna | 36,655 | 2,489 | ||||||
Community Health Systems * | 11,362 | 547 | ||||||
Cooper | 6,604 | 746 | ||||||
Covance * | 6,836 | 510 | ||||||
Covidien | 64,500 | 4,102 | ||||||
DaVita * | 12,008 | 1,490 | ||||||
Dentsply International (A) | 17,298 | 722 | ||||||
| Description | Shares | Market Value ($ Thousands) | ||||||
Edwards Lifesciences * | 14,414 | $ | 958 | |||||
Eli Lilly | 135,461 | 7,201 | ||||||
Endo Health Solutions * | 17,097 | 621 | ||||||
Express Scripts Holding * | 106,636 | 6,624 | ||||||
Forest Laboratories * | 37,373 | 1,486 | ||||||
Gilead Sciences * | 199,234 | 10,854 | ||||||
HCA Holdings | 22,200 | 867 | ||||||
Health Management Associates, Cl A * | 32,122 | 443 | ||||||
Health Net * | 10,602 | 338 | ||||||
Henry Schein * | 11,484 | 1,106 | ||||||
Hill-Rom Holdings | 7,724 | 279 | ||||||
Hologic * | 34,800 | 722 | ||||||
Hospira * | 20,081 | 696 | ||||||
Humana | 20,075 | 1,622 | ||||||
Idexx Laboratories * (A) | 7,252 | 598 | ||||||
Illumina * (A) | 15,105 | 1,062 | ||||||
Incyte (A) * | 12,200 | 271 | ||||||
Intuitive Surgical * | 5,400 | 2,687 | ||||||
Johnson & Johnson | 358,909 | 30,213 | ||||||
Laboratory Corp of America Holdings * (A) | 12,311 | 1,225 | ||||||
Life Technologies * | 22,770 | 1,687 | ||||||
LifePoint Hospitals * | 6,576 | 327 | ||||||
McKesson | 31,566 | 3,594 | ||||||
Medivation * | 10,000 | 486 | ||||||
MEDNAX * | 6,100 | 566 | ||||||
Medtronic | 137,185 | 6,998 | ||||||
Merck | 398,443 | 18,607 | ||||||
Mettler Toledo International * (A) | 3,836 | 837 | ||||||
Mylan Laboratories * | 50,819 | 1,549 | ||||||
Myriad Genetics * | 11,300 | 363 | ||||||
Omnicare (A) | 14,331 | 660 | ||||||
Onyx Pharmaceuticals * (A) | 7,700 | 735 | ||||||
Patterson | 11,683 | 457 | ||||||
PerkinElmer | 16,234 | 508 | ||||||
Perrigo (A) | 11,700 | 1,356 | ||||||
Pfizer | 925,080 | 25,190 | ||||||
QIAGEN * | 29,200 | 546 | ||||||
Quest Diagnostics | 20,144 | 1,246 | ||||||
Regeneron Pharmaceuticals * | 9,600 | 2,322 | ||||||
ResMed (A) | 18,835 | 904 | ||||||
Salix Pharmaceuticals * | 9,900 | 601 | ||||||
Sirona Dental Systems * | 8,600 | 610 | ||||||
St. Jude Medical | 39,346 | 1,701 | ||||||
Stryker | 42,004 | 2,789 | ||||||
Techne | 4,541 | 302 | ||||||
Teleflex | 5,240 | 410 | ||||||
Tenet Healthcare * | 12,798 | 606 | ||||||
Thermo Fisher Scientific | 49,025 | 4,329 | ||||||
Thoratec * (A) | 6,400 | 199 | ||||||
United Therapeutics * | 6,400 | 425 | ||||||
UnitedHealth Group | 136,820 | 8,569 | ||||||
Universal Health Services, Cl B | 11,076 | 766 | ||||||
Varian Medical Systems (A) * | 13,530 | 907 | ||||||
VCA Antech * | 10,839 | 277 | ||||||
Vertex Pharmaceuticals * | 26,900 | 2,160 | ||||||
Warner Chilcott, Cl A | 21,000 | 403 | ||||||
Waters * | 11,272 | 1,090 | ||||||
WellPoint | 40,931 | 3,150 | ||||||
Zimmer Holdings (A) | 23,125 | 1,816 | ||||||
| 5 | SEI Institutional Investments Trust / Annual Report / May 31, 2013 |
Table of Contents
Schedule of Investments
Large Cap Index Fund
May 31, 2013
| Description | Shares | Market Value ($ Thousands) | ||||||
Zoetis * (A) | 15,900 | $ | 509 | |||||
|
| |||||||
| 266,976 | ||||||||
|
| |||||||
Industrials — 10.6% | ||||||||
3M | 91,333 | 10,071 | ||||||
ADT | 29,200 | 1,185 | ||||||
AECOM Technology * | 11,700 | 360 | ||||||
AGCO | 12,000 | 666 | ||||||
Air Lease, Cl A (A) | 7,900 | 221 | ||||||
Alliant Techsystems | 4,136 | 325 | ||||||
Ametek | 30,680 | 1,324 | ||||||
Armstrong World Industries * | 1,900 | 99 | ||||||
Avery Dennison | 15,710 | 683 | ||||||
Babcock & Wilcox | 14,650 | 435 | ||||||
BE Aerospace * | 10,166 | 645 | ||||||
Boeing | 98,691 | 9,772 | ||||||
C.H. Robinson Worldwide | 20,686 | 1,173 | ||||||
Carlisle | 9,466 | 619 | ||||||
Caterpillar | 86,288 | 7,403 | ||||||
Chicago Bridge & Iron | 13,095 | 829 | ||||||
Cintas (A) | 13,957 | 637 | ||||||
Clean Harbors * | 7,500 | 429 | ||||||
CNH Global (A) * | 3,500 | 152 | ||||||
Colfax * (A) | 5,500 | 274 | ||||||
Con-way | 7,023 | 267 | ||||||
Copa Holdings, Cl A | 4,100 | 538 | ||||||
Copart * | 12,918 | 444 | ||||||
Covanta Holding (A) | 13,700 | 280 | ||||||
Crane | 6,100 | 364 | ||||||
CSX | 139,596 | 3,519 | ||||||
Cummins | 25,912 | 3,100 | ||||||
Danaher | 77,402 | 4,785 | ||||||
Deere | 53,019 | 4,618 | ||||||
Delta Air Lines | 108,100 | 1,947 | ||||||
Donaldson | 18,244 | 684 | ||||||
Dover | 23,757 | 1,859 | ||||||
Dun & Bradstreet (A) | 5,556 | 545 | ||||||
Eaton | 61,618 | 4,070 | ||||||
Emerson Electric | 97,420 | 5,598 | ||||||
Engility Holdings * | 1,546 | 39 | ||||||
Equifax | 14,656 | 893 | ||||||
Exelis | 23,402 | 284 | ||||||
Expeditors International of Washington | 27,048 | 1,056 | ||||||
Fastenal (A) | 36,724 | 1,916 | ||||||
FedEx | 42,244 | 4,070 | ||||||
Flowserve | 6,600 | 1,110 | ||||||
Fluor (A) | 21,508 | 1,360 | ||||||
Fortune Brands Home & Security | 16,520 | 698 | ||||||
Gardner Denver | 7,200 | 544 | ||||||
GATX | 5,800 | 290 | ||||||
General Cable | 4,700 | 166 | ||||||
General Dynamics | 42,772 | 3,298 | ||||||
General Electric | 1,384,523 | 32,287 | ||||||
Graco | 6,424 | 414 | ||||||
GrafTech International * (A) | 11,500 | 96 | ||||||
Harsco | 10,270 | 240 | ||||||
Hertz Global Holdings * | 25,800 | 667 | ||||||
Honeywell International | 102,890 | 8,073 | ||||||
Hubbell, Cl B | 7,892 | 793 | ||||||
Huntington Ingalls Industries | 6,096 | 337 | ||||||
IDEX | 10,393 | 572 | ||||||
| Description | Shares | Market Value ($ Thousands) | ||||||
IHS, Cl A * | 6,100 | $ | 641 | |||||
Illinois Tool Works | 53,980 | 3,786 | ||||||
Ingersoll-Rand | 37,000 | 2,129 | ||||||
Iron Mountain | 17,490 | 627 | ||||||
ITT * | 11,551 | 348 | ||||||
Jacobs Engineering Group * | 17,002 | 969 | ||||||
JB Hunt Transport Services | 10,972 | 808 | ||||||
Joy Global (A) | 12,833 | 694 | ||||||
Kansas City Southern | 14,000 | 1,550 | ||||||
KAR Auction Services | 2,100 | 49 | ||||||
KBR | 18,480 | 667 | ||||||
Kennametal | 10,000 | 433 | ||||||
Kirby * | 6,900 | 539 | ||||||
L-3 Communications Holdings, Cl 3 | 12,377 | 1,053 | ||||||
Landstar System | 5,765 | 304 | ||||||
Lennox International | 8,200 | 525 | ||||||
Lincoln Electric Holdings | 10,400 | 622 | ||||||
Lockheed Martin | 34,929 | 3,697 | ||||||
Manitowoc (A) | 16,600 | 349 | ||||||
Manpowergroup | 9,884 | 566 | ||||||
Masco | 44,209 | 929 | ||||||
Matson | 3,882 | 97 | ||||||
MRC Global * | 3,500 | 99 | ||||||
MSC Industrial Direct, Cl A | 4,920 | 407 | ||||||
Navistar International * (A) | 9,000 | 323 | ||||||
Nielsen Holdings | 15,100 | 512 | ||||||
Nordson | 8,000 | 570 | ||||||
Norfolk Southern | 43,833 | 3,357 | ||||||
Northrop Grumman | 32,178 | 2,651 | ||||||
Oshkosh Truck * | 11,359 | 452 | ||||||
Owens Corning * | 16,900 | 739 | ||||||
Paccar | 45,370 | 2,432 | ||||||
Pall (A) | 14,045 | 958 | ||||||
Parker Hannifin | 18,704 | 1,866 | ||||||
Pentair | 26,273 | 1,530 | ||||||
Pitney Bowes (A) | 18,085 | 266 | ||||||
Polypore International * (A) | 5,800 | 218 | ||||||
Precision Castparts | 19,446 | 4,160 | ||||||
Quanta Services * | 26,200 | 744 | ||||||
Raytheon | 42,468 | 2,830 | ||||||
Regal-Beloit | 4,900 | 331 | ||||||
Republic Services, Cl A | 38,542 | 1,314 | ||||||
Robert Half International | 17,676 | 615 | ||||||
Rockwell Automation | 17,904 | 1,576 | ||||||
Rockwell Collins (A) | 16,779 | 1,086 | ||||||
Rollins | 5,900 | 149 | ||||||
Roper Industries | 12,200 | 1,515 | ||||||
RR Donnelley & Sons (A) | 22,577 | 300 | ||||||
Ryder System | 6,306 | 398 | ||||||
Snap-on | 6,491 | 591 | ||||||
Southwest Airlines | 97,720 | 1,385 | ||||||
Spirit Aerosystems Holdings, Cl A * | 12,200 | 264 | ||||||
SPX | 5,411 | 427 | ||||||
Stanley Black & Decker | 20,293 | 1,608 | ||||||
Stericycle * (A) | 10,826 | 1,188 | ||||||
Terex * | 13,648 | 490 | ||||||
Textron (A) | 33,622 | 906 | ||||||
Timken | 12,269 | 696 | ||||||
Toro | 7,620 | 363 | ||||||
Towers Watson, Cl A | 6,000 | 466 | ||||||
TransDigm Group * | 6,200 | 906 | ||||||
| 6 | SEI Institutional Investments Trust / Annual Report / May 31, 2013 |
Table of Contents
Schedule of Investments
Large Cap Index Fund
May 31, 2013
| Description | Shares | Market Value ($ Thousands) | ||||||
Trinity Industries | 12,600 | $ | 516 | |||||
Triumph Group | 6,200 | 481 | ||||||
Tyco International | 58,400 | 1,975 | ||||||
Union Pacific | 62,716 | 9,697 | ||||||
United Continental Holdings * | 46,600 | 1,513 | ||||||
United Parcel Service, Cl B | 95,641 | 8,215 | ||||||
United Rentals * (A) | 11,600 | 659 | ||||||
United Technologies | 119,790 | 11,368 | ||||||
URS | 9,500 | 460 | ||||||
UTi Worldwide | 13,200 | 209 | ||||||
Valmont Industries | 2,900 | 442 | ||||||
Verisk Analytics, Cl A * | 18,700 | 1,100 | ||||||
WABCO Holdings * | 9,724 | 733 | ||||||
Wabtec | 6,600 | 726 | ||||||
Waste Connections (A) | 15,450 | 622 | ||||||
Waste Management | 62,894 | 2,637 | ||||||
WESCO International * (A) | 5,400 | 401 | ||||||
WW Grainger | 7,281 | 1,875 | ||||||
Xylem | 24,902 | 701 | ||||||
|
| |||||||
| 235,523 | ||||||||
|
| |||||||
Information Technology — 17.1% | ||||||||
Accenture, Cl A | 85,200 | 6,996 | ||||||
Activision Blizzard | 56,456 | 815 | ||||||
Adobe Systems * | 67,102 | 2,879 | ||||||
Advanced Micro Devices (A) * | 63,134 | 252 | ||||||
Akamai Technologies * | 21,618 | 997 | ||||||
Alliance Data Systems * (A) | 6,112 | 1,082 | ||||||
Altera | 40,473 | 1,343 | ||||||
Amdocs | 20,700 | 739 | ||||||
Amphenol, Cl A | 20,292 | 1,581 | ||||||
Analog Devices | 39,112 | 1,796 | ||||||
Ansys * | 12,000 | 894 | ||||||
AOL * | 12,134 | 421 | ||||||
Apple | 122,045 | 54,881 | ||||||
Applied Materials | 163,155 | 2,480 | ||||||
Arrow Electronics * | 16,189 | 644 | ||||||
Atmel * | 46,100 | 363 | ||||||
Autodesk * | 29,437 | 1,111 | ||||||
Automatic Data Processing | 65,292 | 4,487 | ||||||
Avago Technologies, Cl A | 31,000 | 1,169 | ||||||
Avnet * | 18,210 | 622 | ||||||
AVX | 1,424 | 17 | ||||||
BMC Software * | 19,489 | 883 | ||||||
Broadcom, Cl A | 70,168 | 2,520 | ||||||
Broadridge Financial Solutions | 15,473 | 420 | ||||||
Brocade Communications Systems * | 58,400 | 317 | ||||||
CA | 45,138 | 1,233 | ||||||
Cadence Design Systems * | 38,363 | 580 | ||||||
Cisco Systems | 702,127 | 16,907 | ||||||
Citrix Systems * | 22,987 | 1,479 | ||||||
Cognizant Technology Solutions, Cl A * | 41,388 | 2,676 | ||||||
Computer Sciences | 16,664 | 743 | ||||||
Compuware | 21,851 | 245 | ||||||
Comverse * | 1 | — | ||||||
Concur Technologies * (A) | 6,800 | 549 | ||||||
CoreLogic * | 9,984 | 262 | ||||||
Corning | 204,658 | 3,146 | ||||||
Cree * (A) | 14,622 | 912 | ||||||
Cypress Semiconductor (A) | 19,400 | 218 | ||||||
Dell | 200,243 | 2,673 | ||||||
| Description | Shares | Market Value ($ Thousands) | ||||||
Diebold | 7,029 | $ | 226 | |||||
Dolby Laboratories, Cl A (A) * | 6,443 | 225 | ||||||
DST Systems | 4,595 | 313 | ||||||
eBay * | 152,811 | 8,267 | ||||||
EchoStar, Cl A * | 3,732 | 148 | ||||||
Electronic Arts * | 35,265 | 811 | ||||||
EMC | 277,897 | 6,881 | ||||||
Equinix * | 6,100 | 1,236 | ||||||
F5 Networks * | 10,138 | 844 | ||||||
Facebook, Cl A * | 52,800 | 1,286 | ||||||
FactSet Research Systems (A) | 4,900 | 481 | ||||||
Fairchild Semiconductor International, Cl A * | 16,200 | 235 | ||||||
Fidelity National Information Services | 31,890 | 1,432 | ||||||
Fiserv * | 17,169 | 1,496 | ||||||
FleetCor Technologies * | 7,600 | 662 | ||||||
FLIR Systems | 19,100 | 465 | ||||||
Fortinet * | 19,400 | 374 | ||||||
Freescale Semiconductor * (A) | 3,500 | 56 | ||||||
Fusion-io * (A) | 8,000 | 116 | ||||||
Gartner * | 11,500 | 651 | ||||||
Genpact * | 15,700 | 304 | ||||||
Global Payments | 9,734 | 467 | ||||||
Google, Cl A * | 33,829 | 29,445 | ||||||
Harris | 15,089 | 756 | ||||||
Hewlett-Packard | 261,870 | 6,395 | ||||||
IAC | 10,032 | 486 | ||||||
Informatica * | 15,300 | 556 | ||||||
Ingram Micro, Cl A * | 18,923 | 362 | ||||||
Intel | 659,758 | 16,019 | ||||||
International Business Machines | 142,498 | 29,642 | ||||||
Intuit | 40,086 | 2,343 | ||||||
IPG Photonics (A) * | 4,000 | 237 | ||||||
Itron * | 4,300 | 181 | ||||||
Jabil Circuit | 19,974 | 401 | ||||||
Jack Henry & Associates | 13,500 | 633 | ||||||
JDS Uniphase * | 28,640 | 390 | ||||||
Juniper Networks * | 65,725 | 1,165 | ||||||
Kla-Tencor | 21,309 | 1,199 | ||||||
Lam Research * | 19,552 | 915 | ||||||
Lender Processing Services | 9,214 | 305 | ||||||
Lexmark International, Cl A (A) | 9,086 | 277 | ||||||
Linear Technology | 29,257 | 1,097 | ||||||
LinkedIn, Cl A * | 8,600 | 1,441 | ||||||
LSI * | 77,148 | 571 | ||||||
Marvell Technology Group | 61,600 | 668 | ||||||
Mastercard, Cl A | 14,300 | 8,155 | ||||||
Maxim Integrated Products | 37,200 | 1,097 | ||||||
Microchip Technology (A) | 23,322 | 851 | ||||||
Micron Technology (A) * | 119,816 | 1,399 | ||||||
Micros Systems * (A) | 11,600 | 490 | ||||||
Microsoft | 983,400 | 34,301 | ||||||
Molex (A) | 19,170 | 562 | ||||||
Motorola Solutions | 37,833 | 2,193 | ||||||
National Instruments | 9,904 | 281 | ||||||
NCR * | 19,689 | 658 | ||||||
NetApp | 50,155 | 1,882 | ||||||
NetSuite * (A) | 4,000 | 350 | ||||||
NeuStar, Cl A * | 8,277 | 401 | ||||||
Nuance Communications * (A) | 29,700 | 564 | ||||||
Nvidia | 78,756 | 1,141 | ||||||
| 7 | SEI Institutional Investments Trust / Annual Report / May 31, 2013 |
Table of Contents
Schedule of Investments
Large Cap Index Fund
May 31, 2013
| Description | Shares | Market Value ($ Thousands) | ||||||
ON Semiconductor * | 57,800 | $ | 495 | |||||
Oracle | 474,320 | 16,013 | ||||||
Pandora Media * (A) | 12,800 | 218 | ||||||
Paychex (A) | 40,707 | 1,515 | ||||||
PMC - Sierra * | 21,000 | 126 | ||||||
Polycom * | 22,700 | 257 | ||||||
Qualcomm | 224,959 | 14,280 | ||||||
Rackspace Hosting * | 13,400 | 503 | ||||||
Red Hat * | 24,227 | 1,168 | ||||||
Riverbed Technology * | 19,700 | 305 | ||||||
Rovi * | 11,000 | 284 | ||||||
SAIC (A) | 35,600 | 516 | ||||||
Salesforce.com * (A) | 78,852 | 3,338 | ||||||
SanDisk * | 30,569 | 1,804 | ||||||
ServiceNow * | 1,900 | 70 | ||||||
Silicon Laboratories * | 5,400 | 232 | ||||||
Skyworks Solutions * | 23,200 | 554 | ||||||
SolarWinds * | 7,600 | 320 | ||||||
Solera Holdings | 8,600 | 471 | ||||||
Splunk * | 1,500 | 70 | ||||||
Stratasys * (A) | 3,000 | 252 | ||||||
Symantec | 89,448 | 2,003 | ||||||
Synopsys * | 19,582 | 714 | ||||||
Tech Data * | 5,350 | 268 | ||||||
Teradata * | 20,889 | 1,165 | ||||||
Teradyne * (A) | 23,063 | 414 | ||||||
Texas Instruments | 152,008 | 5,456 | ||||||
TIBCO Software * | 22,000 | 469 | ||||||
Total System Services | 23,691 | 557 | ||||||
Trimble Navigation * | 30,428 | 849 | ||||||
Vantiv, Cl A * | 5,100 | 136 | ||||||
VeriFone Holdings * | 13,400 | 313 | ||||||
Verint Systems * | 1 | — | ||||||
VeriSign * | 18,985 | 893 | ||||||
Visa, Cl A | 68,700 | 12,238 | ||||||
Vishay Intertechnology * (A) | 12,950 | 189 | ||||||
VMware, Cl A * | 11,300 | 804 | ||||||
Western Digital | 27,930 | 1,769 | ||||||
Western Union | 78,028 | 1,278 | ||||||
Workday, Cl A * | 2,200 | 141 | ||||||
Xerox | 160,096 | 1,407 | ||||||
Xilinx | 33,557 | 1,364 | ||||||
Yahoo! * | 147,581 | 3,881 | ||||||
Zebra Technologies, Cl A * | 6,525 | 298 | ||||||
Zynga, Cl A * (A) | 7,000 | 24 | ||||||
|
| |||||||
| 377,538 | ||||||||
|
| |||||||
Materials — 3.6% | ||||||||
Air Products & Chemicals | 28,694 | 2,709 | ||||||
Airgas | 7,315 | 753 | ||||||
Albemarle | 10,944 | 732 | ||||||
Alcoa (A) | 135,702 | 1,153 | ||||||
Allegheny Technologies (A) | 13,297 | 367 | ||||||
Allied Nevada Gold * | 11,400 | 88 | ||||||
Aptargroup | 8,200 | 465 | ||||||
Ashland (A) | 10,276 | 914 | ||||||
Ball | 18,850 | 814 | ||||||
Bemis | 12,774 | 500 | ||||||
Cabot | 8,073 | 331 | ||||||
Carpenter Technology | 5,500 | 265 | ||||||
Celanese, Cl A | 18,983 | 937 | ||||||
CF Industries Holdings | 8,166 | 1,559 | ||||||
Cliffs Natural Resources (A) | 17,300 | 312 | ||||||
| Description | Shares | Market Value ($ Thousands) | ||||||
Commercial Metals | 14,800 | $ | 228 | |||||
Compass Minerals International | 4,100 | 358 | ||||||
Crown Holdings * | 18,151 | 769 | ||||||
Cytec Industries | 5,681 | 406 | ||||||
Domtar | 4,200 | 304 | ||||||
Dow Chemical (A) | 158,870 | 5,475 | ||||||
E.I. du Pont de Nemours (A) | 123,992 | 6,918 | ||||||
Eastman Chemical | 19,428 | 1,393 | ||||||
Ecolab | 35,108 | 2,966 | ||||||
FMC * | 17,420 | 1,092 | ||||||
Freeport-McMoRan Copper & Gold, Cl B | 138,024 | 4,286 | ||||||
Greif, Cl A | 3,500 | 182 | ||||||
Huntsman | 23,129 | 450 | ||||||
International Flavors & Fragrances | 10,891 | 874 | ||||||
International Paper | 55,655 | 2,569 | ||||||
Intrepid Potash (A) * | 6,800 | 128 | ||||||
LyondellBasell Industries, Cl A (A) | 43,500 | 2,899 | ||||||
Martin Marietta Materials (A) | 6,363 | 694 | ||||||
MeadWestvaco | 21,258 | 744 | ||||||
Molycorp * (A) | 7,600 | 50 | ||||||
Monsanto | 70,550 | 7,100 | ||||||
Mosaic | 40,378 | 2,456 | ||||||
NewMarket (A) | 900 | 247 | ||||||
Newmont Mining | 62,033 | 2,127 | ||||||
Nucor | 39,390 | 1,753 | ||||||
Owens-Illinois * | 20,391 | 560 | ||||||
Packaging Corp of America | 12,099 | 593 | ||||||
PPG Industries | 19,123 | 2,938 | ||||||
Praxair | 39,825 | 4,553 | ||||||
Reliance Steel & Aluminum | 10,300 | 677 | ||||||
Rock Tenn, Cl A | 8,700 | 859 | ||||||
Rockwood Holdings | 9,800 | 653 | ||||||
Royal Gold | 8,000 | 438 | ||||||
RPM International | 18,269 | 605 | ||||||
Scotts Miracle-Gro, Cl A (A) | 5,306 | 251 | ||||||
Sealed Air | 24,668 | 593 | ||||||
Sherwin-Williams | 10,737 | 2,024 | ||||||
Sigma-Aldrich (A) | 15,348 | 1,284 | ||||||
Silgan Holdings | 4,455 | 208 | ||||||
Sonoco Products | 12,446 | 436 | ||||||
Southern Copper (A) | 19,868 | 619 | ||||||
Steel Dynamics | 27,900 | 428 | ||||||
Tahoe Resources * | 7,500 | 109 | ||||||
United States Steel (A) | 20,483 | 362 | ||||||
Valspar | 12,464 | 893 | ||||||
Vulcan Materials | 15,857 | 849 | ||||||
Walter Industries (A) | 8,000 | 136 | ||||||
Westlake Chemical | 1,900 | 177 | ||||||
WR Grace * | 9,200 | 778 | ||||||
|
| |||||||
| 79,390 | ||||||||
|
| |||||||
Telecommunication Services — 2.5% |
| |||||||
AT&T | 718,333 | 25,134 | ||||||
CenturyLink | 78,354 | 2,676 | ||||||
Clearwire, Cl A * | 24,800 | 111 | ||||||
Crown Castle International * | 39,696 | 2,828 | ||||||
Frontier Communications (A) | 134,195 | 556 | ||||||
Groupon, Cl A * | 2,500 | 19 | ||||||
Level 3 Communications * (A) | 17,646 | 378 | ||||||
NII Holdings * (A) | 13,620 | 105 | ||||||
| 8 | SEI Institutional Investments Trust / Annual Report / May 31, 2013 |
Table of Contents
Schedule of Investments
Large Cap Index Fund
May 31, 2013
| Description | Shares | Market Value ($ Thousands) | ||||||
SBA Communications, Cl A * (A) | 15,400 | $ | 1,159 | |||||
Sprint Nextel * | 405,444 | 2,960 | ||||||
Telephone & Data Systems | 11,780 | 274 | ||||||
T-Mobile US * | 22,300 | 478 | ||||||
tw telecom, Cl A * | 18,600 | 531 | ||||||
US Cellular * | 831 | 33 | ||||||
Verizon Communications | 372,276 | 18,048 | ||||||
Windstream (A) | 71,447 | 574 | ||||||
|
| |||||||
| 55,864 | ||||||||
|
| |||||||
Utilities — 3.1% | ||||||||
AES | 81,624 | 995 | ||||||
AGL Resources | 14,447 | 612 | ||||||
Alliant Energy | 14,576 | 718 | ||||||
Ameren | 30,890 | 1,052 | ||||||
American Electric Power | 65,450 | 2,999 | ||||||
American Water Works | 21,300 | 851 | ||||||
Aqua America (A) | 16,277 | 506 | ||||||
Atmos Energy | 10,891 | 460 | ||||||
Calpine * | 51,500 | 1,046 | ||||||
Centerpoint Energy | 54,415 | 1,261 | ||||||
CMS Energy | 31,542 | 850 | ||||||
Consolidated Edison | 37,416 | 2,135 | ||||||
Dominion Resources | 76,312 | 4,316 | ||||||
DTE Energy | 21,364 | 1,423 | ||||||
Duke Energy | 93,316 | 6,246 | ||||||
Edison International | 41,479 | 1,905 | ||||||
Entergy | 21,998 | 1,515 | ||||||
Exelon | 114,476 | 3,588 | ||||||
FirstEnergy | 53,427 | 2,084 | ||||||
Great Plains Energy | 17,371 | 392 | ||||||
Hawaiian Electric Industries (A) | 11,946 | 313 | ||||||
Integrys Energy Group | 9,602 | 552 | ||||||
ITC Holdings | 5,200 | 450 | ||||||
MDU Resources Group | 25,521 | 660 | ||||||
National Fuel Gas (A) | 9,189 | 562 | ||||||
NextEra Energy | 55,773 | 4,218 | ||||||
NiSource | 34,221 | 983 | ||||||
Northeast Utilities | 38,908 | 1,621 | ||||||
NRG Energy | 35,300 | 901 | ||||||
NV Energy | 23,900 | 560 | ||||||
OGE Energy | 12,068 | 819 | ||||||
ONEOK | 26,058 | 1,176 | ||||||
Pepco Holdings (A) | 28,144 | 585 | ||||||
PG&E | 53,918 | 2,422 | ||||||
Pinnacle West Capital | 13,292 | 751 | ||||||
PPL (A) | 74,226 | 2,204 | ||||||
Public Service Enterprise Group | 64,952 | 2,146 | ||||||
Questar | 22,046 | 536 | ||||||
SCANA | 14,220 | 717 | ||||||
Sempra Energy | 32,723 | 2,660 | ||||||
Southern | 115,603 | 5,075 | ||||||
TECO Energy | 29,500 | 520 | ||||||
UGI | 13,850 | 529 | ||||||
Vectren | 8,791 | 302 | ||||||
Westar Energy | 15,700 | 498 | ||||||
Wisconsin Energy (A) | 29,298 | 1,196 | ||||||
Xcel Energy | 60,281 | 1,730 | ||||||
|
| |||||||
| 69,640 | ||||||||
|
| |||||||
Total Common Stock | 2,157,003 | |||||||
|
| |||||||
| Description | Shares/Face Amount ($ Thousands) | Market Value ($ Thousands) | ||||||
AFFILIATED PARTNERSHIP — 5.7% |
| |||||||
SEI Liquidity Fund, L.P. | 125,066,291 | $ | 125,066 | |||||
|
| |||||||
Total Affiliated Partnership | 125,066 | |||||||
|
| |||||||
CASH EQUIVALENT — 2.2% | ||||||||
SEI Daily Income Trust, Prime Obligation Fund, Cl A | 48,251,267 | 48,251 | ||||||
|
| |||||||
Total Cash Equivalent | 48,251 | |||||||
|
| |||||||
U.S. TREASURY OBLIGATION (D)(E) — 0.1% |
| |||||||
U.S. Treasury Bill | ||||||||
0.035%, 08/08/2013 | $ | 3,150 | 3,150 | |||||
|
| |||||||
Total U.S. Treasury Obligation | 3,150 | |||||||
|
| |||||||
Total Investments — 105.4% | $ | 2,333,470 | ||||||
|
| |||||||
A list of the open futures contracts held by the Fund at May 31, 2013, is as follows:
| Type of Contract | Number of Contracts Long | Expiration Date | Unrealized Appreciation ($ Thousands) | |||||||||
S&P 500 Index EMINI | 603 | Jun-2013 | $ | 2,707 | ||||||||
S&P Mid 400 Index E-MINI | 46 | Jun-2013 | 342 | |||||||||
|
| |||||||||||
| $ | 3,049 | |||||||||||
|
| |||||||||||
For the year ended May 31, 2013, the total amount of all open futures contracts, as presented in the table above, are representative of the volume of activity for this derivative type during the year.
Percentages are based on a Net Assets of $2,214,088 ($ Thousands).
| * | Non-income producing security. |
| ** | The rate reported is the 7-day effective yield as of May 31, 2013. |
| † | Investment in Affiliated Security (see Note 5). |
| ‡ | Real Estate Investment Trust. |
| (A) | This security or a partial position of this security is on loan at May 31, 2013. The total value of securities on loan at May 31, 2013 was $120,266 ($ Thousands). |
| (B) | The Fund may purchase securities of certain companies with which it is affiliated to the extent these companies are represented in its benchmark index. |
| (C) | This security was purchased with cash collateral held from securities on loan (see Note 11). The total value of such securities as of May 31, 2013 was $125,066 ($ Thousands). |
| (D) | Security, or portion thereof, has been pledged as collateral on open futures contracts. |
| (E) | The rate reported is the effective yield at time of purchase. |
| Cl | — Class |
| L.P. | — Limited Partnership |
| Ser | — Series |
| S&P | — Standard & Poor’s |
| 9 | SEI Institutional Investments Trust / Annual Report / May 31, 2013 |
Table of Contents
Schedule of Investments
Large Cap Index Fund
May 31, 2013
The following is a list of the inputs used as of May 31, 2013, in valuing the Fund’s investments carried at value ($ Thousands).
| Investments in Securities | Level 1 | Level 2 | Level 3 | Total | ||||||||||||
Common Stock | $ | 2,157,003 | $ | — | $ | — | $ | 2,157,003 | ||||||||
Affiliated Partnership | — | 125,066 | — | 125,066 | ||||||||||||
Cash Equivalent | 48,251 | — | — | 48,251 | ||||||||||||
U.S. Treasury Obligation | — | 3,150 | — | 3,150 | ||||||||||||
|
|
|
|
|
|
|
| |||||||||
Total Investments in Securities | $ | 2,205,254 | $ | 128,216 | $ | — | $ | 2,333,470 | ||||||||
|
|
|
|
|
|
|
| |||||||||
| Other Financial Instruments | Level 1 | Level 2 | Level 3 | Total | ||||||||||||
Futures Contracts* | $ | 3,049 | $ | — | $ | — | $ | 3,049 | ||||||||
|
|
|
|
|
|
|
| |||||||||
| * | Futures contracts are valued at the unrealized appreciation on the instrument. |
For the year ended May 31, 2013, there were no transfers between Level 1 and Level 2 assets and liabilities.
For the year ended May 31, 2013, there were no transfers between Level 2 and Level 3 assets and liabilities.
For more information on valuation inputs, see Note 2 — Significant Accounting Policies in Notes to Financial Statements.
Amounts designated as “—” are either $0 or have been rounded to $0.
The accompanying notes are an integral part of the financial statements.
| 10 | SEI Institutional Investments Trust / Annual Report / May 31, 2013 |
Table of Contents
Schedule of Investments
Extended Market Index Fund
May 31, 2013
| Description | Shares | Market Value ($ Thousands) | ||||||
COMMON STOCK — 96.6% | ||||||||
Consumer Discretionary — 16.6% | ||||||||
1-800-Flowers.com, Cl A * | 1,700 | $ | 10 | |||||
Aaron’s | 4,116 | 116 | ||||||
Advance Auto Parts | 3,799 | 310 | ||||||
Aeropostale * | 3,549 | 52 | ||||||
AFC Enterprises * | 1,039 | 38 | ||||||
Allison Transmission Holdings | 1,176 | 28 | ||||||
AMC Networks, Cl A * | 2,960 | 190 | ||||||
American Axle & Manufacturing Holdings * | 2,998 | 53 | ||||||
American Eagle Outfitters | 10,222 | 202 | ||||||
American Greetings, Cl A | 1,481 | 27 | ||||||
American Public Education * | 827 | 31 | ||||||
America’s Car-Mart * | 250 | 11 | ||||||
Ameristar Casinos | 1,492 | 39 | ||||||
ANN * | 2,235 | 69 | ||||||
Arbitron | 1,123 | 53 | ||||||
Arctic Cat | 435 | 20 | ||||||
Asbury Automotive Group * | 1,198 | 49 | ||||||
Ascena Retail Group * | 6,568 | 134 | ||||||
Ascent Capital Group, Cl A * | 554 | 40 | ||||||
Bally Technologies (A) * | 2,125 | 121 | ||||||
Barnes & Noble * | 1,427 | 32 | ||||||
Bassett Furniture Industries | 433 | 6 | ||||||
Beazer Homes USA * (A) | 1,261 | 26 | ||||||
bebe stores inc | 1,520 | 8 | ||||||
Belo, Cl A | 4,184 | 47 | ||||||
Big 5 Sporting Goods | 923 | 18 | ||||||
Big Lots * | 2,646 | 90 | ||||||
Biglari Holdings * | 42 | 17 | ||||||
BJ’s Restaurants * | 1,142 | 43 | ||||||
Black Diamond * | 804 | 7 | ||||||
Bloomin’ Brands * | 1,050 | 24 | ||||||
Blue Nile * | 631 | 22 | ||||||
Blyth | 420 | 6 | ||||||
Bob Evans Farms | 1,287 | 59 | ||||||
Body Central * | 1,000 | 12 | ||||||
Bon-Ton Stores | 800 | 17 | ||||||
Boyd Gaming * (A) | 2,745 | 36 | ||||||
Bravo Brio Restaurant Group * | 1,076 | 19 | ||||||
Bridgepoint Education * | 642 | 8 | ||||||
Bright Horizons Family Solutions * | 335 | 12 | ||||||
Brinker International | 3,782 | 148 | ||||||
Brown Shoe | 1,976 | 41 | ||||||
Brunswick | 4,783 | 161 | ||||||
Buckle | 1,151 | 62 | ||||||
Buffalo Wild Wings * | 827 | 79 | ||||||
Cabela’s * | 2,439 | 164 | ||||||
Caesars Entertainment * | 1,683 | 24 | ||||||
Callaway Golf (A) | 3,306 | 23 | ||||||
Capella Education * | 638 | 28 | ||||||
Career Education * | 2,054 | 6 | ||||||
Carmike Cinemas * | 942 | 17 | ||||||
Carriage Services, Cl A | 906 | 17 | ||||||
Carter’s | 2,570 | 185 | ||||||
Cato, Cl A | 1,296 | 32 | ||||||
Cavco Industries * | 331 | 16 | ||||||
CEC Entertainment | 835 | 33 | ||||||
| Description | Shares | Market Value ($ Thousands) | ||||||
Central European Media Enterprises, Cl A * | 1,306 | $ | 4 | |||||
Charter Communications, Cl A * | 2,565 | 287 | ||||||
Cheesecake Factory (A) | 2,923 | 117 | ||||||
Chico’s FAS | 8,851 | 160 | ||||||
Children’s Place Retail Stores * | 1,033 | 55 | ||||||
Choice Hotels International | 1,177 | 46 | ||||||
Churchill Downs | 534 | 45 | ||||||
Chuy’s Holdings * | 135 | 5 | ||||||
Cinemark Holdings | 6,040 | 177 | ||||||
Citi Trends * | 597 | 8 | ||||||
Clear Channel Outdoor Holdings, Cl A * | 2,296 | 20 | ||||||
Coinstar * | 1,543 | 90 | ||||||
Columbia Sportswear | 522 | 31 | ||||||
Conn’s * | 609 | 30 | ||||||
Cooper Tire & Rubber | 2,632 | 68 | ||||||
Core-Mark Holding | 509 | 30 | ||||||
Corinthian Colleges * (A) | 3,043 | 8 | ||||||
Cracker Barrel Old Country Store | 844 | 76 | ||||||
Crocs * | 3,903 | 69 | ||||||
CSS Industries | 492 | 14 | ||||||
CST Brands * | 3,400 | 103 | ||||||
Culp | 361 | 6 | ||||||
Cumulus Media, Cl A * | 1,239 | 5 | ||||||
Dana Holdings | 7,898 | 149 | ||||||
Deckers Outdoor * (A) | 1,904 | 102 | ||||||
Denny’s * | 4,563 | 28 | ||||||
Destination Maternity | 756 | 19 | ||||||
Destination XL Group * | 842 | 4 | ||||||
DeVry | 3,581 | 112 | ||||||
Dick’s Sporting Goods | 5,135 | 269 | ||||||
Digital Generation * | 548 | 4 | ||||||
Dillard’s, Cl A | 1,562 | 144 | ||||||
DineEquity | 672 | 49 | ||||||
DISH Network, Cl A * | 10,419 | 402 | ||||||
Domino’s Pizza | 3,058 | 181 | ||||||
Dorman Products * | 1,040 | 46 | ||||||
DreamWorks Animation SKG, Cl A * | 2,891 | 63 | ||||||
Drew Industries * | 849 | 32 | ||||||
DSW, Cl A | 1,746 | 129 | ||||||
Dunkin’ Brands Group | 3,830 | 152 | ||||||
Education Management * | 1,700 | 11 | ||||||
Entercom Communications, Cl A * | 882 | 8 | ||||||
Entravision Communications, Cl A * | 3,200 | 15 | ||||||
Ethan Allen Interiors | 1,276 | 40 | ||||||
EW Scripps, Cl A * | 1,770 | 24 | ||||||
Exide Technologies * | 1,560 | 1 | ||||||
Express * | 4,862 | 106 | ||||||
Federal Mogul, Cl A * | 1,725 | 17 | ||||||
Fiesta Restaurant Group * | 805 | 29 | ||||||
Fifth & Pacific * | 6,398 | 138 | ||||||
Finish Line, Cl A | 2,211 | 47 | ||||||
Fisher Communications | 568 | 23 | ||||||
Five Below * | 405 | 16 | ||||||
Foot Locker | 7,914 | 272 | ||||||
Francesca’s Holdings * | 1,524 | 44 | ||||||
Fred’s, Cl A | 1,779 | 28 | ||||||
Fuel Systems Solutions * | 294 | 5 | ||||||
General Motors (A) * | 37,990 | 1,288 | ||||||
| 1 | SEI Institutional Investments Trust / Annual Report / May 31, 2013 |
Table of Contents
Schedule of Investments
Extended Market Index Fund
May 31, 2013
| Description | Shares | Market Value ($ Thousands) | ||||||
Genesco * | 1,369 | $ | 93 | |||||
Gentex | 7,595 | 174 | ||||||
Gentherm * | 1,448 | 27 | ||||||
G-III Apparel Group * | 603 | 25 | ||||||
Global Sources * | 768 | 5 | ||||||
GNC Holdings, Cl A | 3,678 | 166 | ||||||
Grand Canyon Education * | 1,715 | 55 | ||||||
Group 1 Automotive | 1,335 | 85 | ||||||
Guess? (A) | 3,417 | 109 | ||||||
Hanesbrands | 5,038 | 251 | ||||||
Harte-Hanks | 2,346 | 21 | ||||||
Haverty Furniture | 963 | 24 | ||||||
Helen of Troy * | 1,348 | 53 | ||||||
hhgregg * | 1,100 | 17 | ||||||
Hibbett Sports * | 1,112 | 63 | ||||||
Hillenbrand | 2,385 | 57 | ||||||
HomeAway * | 1,377 | 42 | ||||||
Hooker Furniture | 410 | 7 | ||||||
Hot Topic | 1,982 | 28 | ||||||
Hovnanian Enterprises, Cl A * (A) | 4,915 | 30 | ||||||
HSN | 1,911 | 109 | ||||||
Hyatt Hotels, Cl A * | 2,427 | 100 | ||||||
Iconix Brand Group (A) * | 2,751 | 83 | ||||||
International Speedway, Cl A | 1,198 | 42 | ||||||
Interval Leisure Group | 1,698 | 37 | ||||||
iRobot * | 1,002 | 34 | ||||||
Isle of Capri Casinos * | 879 | 7 | ||||||
ITT Educational Services * | 1,256 | 30 | ||||||
Jack in the Box * | 2,021 | 74 | ||||||
JAKKS Pacific | 427 | 4 | ||||||
Jamba * | 1,535 | 5 | ||||||
Jarden * | 5,607 | 261 | ||||||
John Wiley & Sons, Cl A | 2,572 | 102 | ||||||
Jones Group | 3,570 | 52 | ||||||
Jos. A. Bank Clothiers * (A) | 1,196 | 54 | ||||||
Journal Communications, Cl A * | 2,299 | 15 | ||||||
K12 * | 1,188 | 35 | ||||||
KB Home | 4,385 | 97 | ||||||
Kimball International, Cl B | 1,725 | 17 | ||||||
Kirkland’s * | 528 | 8 | ||||||
Krispy Kreme Doughnuts * | 2,671 | 46 | ||||||
Lamar Advertising, Cl A * | 4,097 | 191 | ||||||
Las Vegas Sands | 19,704 | 1,141 | ||||||
La-Z-Boy, Cl Z | 2,326 | 43 | ||||||
LeapFrog Enterprises, Cl A * | 2,538 | 24 | ||||||
Lear | 4,771 | 286 | ||||||
Libbey * | 1,085 | 23 | ||||||
Liberty Global, Cl A * | 13,020 | 960 | ||||||
Liberty Interactive, Cl A * | 26,916 | 604 | ||||||
Liberty Media * | 5,335 | 666 | ||||||
Liberty Ventures, Ser A * | 1,946 | 159 | ||||||
Life Time Fitness * | 2,278 | 114 | ||||||
LifeLock * | 363 | 4 | ||||||
Lin TV, Cl A * | 1,777 | 22 | ||||||
Lincoln Educational Services | 922 | 6 | ||||||
Lions Gate Entertainment (A) * | 4,309 | 124 | ||||||
Lithia Motors, Cl A | 989 | 52 | ||||||
Live Nation * | 7,603 | 103 | ||||||
LKQ * | 15,104 | 370 | ||||||
Loral Space & Communications * | 500 | 30 | ||||||
Luby’s * | 770 | 7 | ||||||
Lumber Liquidators Holdings * | 1,526 | 125 | ||||||
| Description | Shares | Market Value ($ Thousands) | ||||||
M/I Homes * | 1,094 | $ | 27 | |||||
Mac-Gray | 484 | 7 | ||||||
Madison Square Garden, Cl A * | 3,140 | 184 | ||||||
Maidenform Brands * | 736 | 13 | ||||||
Marcus | 361 | 5 | ||||||
MarineMax * | 396 | 5 | ||||||
Marriott Vacations Worldwide * | 1,174 | 52 | ||||||
Matthews International, Cl A | 1,205 | 46 | ||||||
Mattress Firm Holding * | 611 | 22 | ||||||
McClatchy, Cl A * | 2,354 | 6 | ||||||
MDC Holdings | 2,189 | 81 | ||||||
MDC Partners, Cl A | 1,284 | 23 | ||||||
Men’s Wearhouse | 2,168 | 79 | ||||||
Meredith (A) | 1,544 | 63 | ||||||
Meritage Homes * | 1,311 | 62 | ||||||
MGM Resorts International * | 20,474 | 311 | ||||||
Michael Kors Holdings * | 4,354 | 274 | ||||||
Modine Manufacturing * | 2,374 | 24 | ||||||
Mohawk Industries * | 2,937 | 327 | ||||||
Monro Muffler (A) | 1,328 | 62 | ||||||
Morgans Hotel Group * | 2,200 | 15 | ||||||
Morningstar | 1,220 | 84 | ||||||
Movado Group | 820 | 30 | ||||||
Multimedia Games Holding * | 1,304 | 33 | ||||||
National CineMedia | 2,507 | 42 | ||||||
New York Times, Cl A * | 5,882 | 62 | ||||||
Nexstar Broadcasting Group, Cl A | 422 | 12 | ||||||
Norwegian Cruise Line Holdings * | 1,169 | 36 | ||||||
Nutrisystem | 559 | 5 | ||||||
NVR * | 275 | 270 | ||||||
Office Depot (A) * | 12,353 | 54 | ||||||
OfficeMax | 3,846 | 50 | ||||||
Orbitz Worldwide * | 1,500 | 11 | ||||||
Orient-Express Hotels, Cl A * | 4,330 | 51 | ||||||
Overstock.com * | 700 | 18 | ||||||
Oxford Industries | 654 | 43 | ||||||
Panera Bread, Cl A (A) * | 1,420 | 272 | ||||||
Papa John’s International * | 721 | 46 | ||||||
Penn National Gaming * | 3,454 | 190 | ||||||
Penske Auto Group | 1,788 | 57 | ||||||
Pep Boys-Manny Moe & Jack * | 2,465 | 30 | ||||||
Perry Ellis International * | 239 | 5 | ||||||
PetMed Express | 1,196 | 16 | ||||||
Pier 1 Imports | 5,289 | 123 | ||||||
Pinnacle Entertainment * | 2,660 | 52 | ||||||
Polaris Industries (A) | 3,307 | 316 | ||||||
Pool | 2,570 | 132 | ||||||
Quiksilver * | 5,850 | 46 | ||||||
RadioShack (A) * | 5,390 | 20 | ||||||
ReachLocal * | 600 | 8 | ||||||
Red Robin Gourmet Burgers * | 667 | 35 | ||||||
Regal Entertainment Group, Cl A (A) | 3,505 | 62 | ||||||
Regis (A) | 2,527 | 47 | ||||||
Rent-A-Center, Cl A | 3,240 | 119 | ||||||
Rentrak * | 188 | 4 | ||||||
Restoration Hardware Holdings * | 411 | 23 | ||||||
Royal Caribbean Cruises | 7,808 | 273 | ||||||
Ruby Tuesday * | 3,179 | 29 | ||||||
Rue21 * | 788 | 33 | ||||||
Ruth’s Hospitality Group | 1,872 | 21 | ||||||
| 2 | SEI Institutional Investments Trust / Annual Report / May 31, 2013 |
Table of Contents
Schedule of Investments
Extended Market Index Fund
May 31, 2013
| Description | Shares | Market Value ($ Thousands) | ||||||
Ryland Group (A) | 2,416 | $ | 109 | |||||
Saga Communications, Cl A * | 93 | 4 | ||||||
Saks * | 4,451 | 66 | ||||||
Sally Beauty Holdings * | 7,591 | 232 | ||||||
Scholastic | 1,167 | 35 | ||||||
Scientific Games, Cl A * | 2,662 | 29 | ||||||
Sears Holdings (A) * | 2,026 | 99 | ||||||
Sears Hometown and Outlet Stores * | 449 | 25 | ||||||
Select Comfort * | 2,509 | 56 | ||||||
Service International | 11,389 | 205 | ||||||
SHFL Entertainment * | 2,487 | 43 | ||||||
Shoe Carnival | 776 | 19 | ||||||
Shutterfly * | 2,125 | 104 | ||||||
Shutterstock * | 197 | 9 | ||||||
Signet Jewelers | 4,355 | 298 | ||||||
Sinclair Broadcast Group, Cl A | 3,411 | 92 | ||||||
Sirius XM Radio (A) * | 193,179 | 672 | ||||||
Six Flags Entertainment | 1,829 | 136 | ||||||
Skechers U.S.A., Cl A * | 1,682 | 38 | ||||||
Smith & Wesson Holding * (A) | 3,083 | 28 | ||||||
Sonic * | 2,633 | 35 | ||||||
Sonic Automotive, Cl A | 1,864 | 42 | ||||||
Sotheby’s | 3,661 | 136 | ||||||
Spartan Motors | 1,248 | 8 | ||||||
Speedway Motorsports | 235 | 4 | ||||||
Stage Stores | 1,354 | 31 | ||||||
Standard Motor Products | 966 | 33 | ||||||
Standard Pacific (A) * | 5,069 | 45 | ||||||
Starz - Liberty Capital * | 5,839 | 135 | ||||||
Stein Mart * | 1,891 | 24 | ||||||
Steiner Leisure * | 677 | 34 | ||||||
Steinway Musical Instruments * | 276 | 8 | ||||||
Steven Madden * | 1,801 | 87 | ||||||
Stewart Enterprises, Cl A | 3,460 | 45 | ||||||
Stoneridge * | 1,030 | 12 | ||||||
Strayer Education * | 517 | 28 | ||||||
Sturm Ruger | 842 | 42 | ||||||
Superior Industries International | 723 | 13 | ||||||
Tempur-Pedic International (A) * | 2,723 | 115 | ||||||
Tenneco * | 3,263 | 145 | ||||||
Tesla Motors * (A) | 3,479 | 340 | ||||||
Texas Roadhouse, Cl A | 2,666 | 63 | ||||||
Thomson Reuters | 18,885 | 631 | ||||||
Thor Industries | 2,390 | 102 | ||||||
Tilly’s, Cl A * | 843 | 14 | ||||||
Toll Brothers * | 7,439 | 254 | ||||||
Town Sports International Holdings * | 461 | 5 | ||||||
Tractor Supply | 3,660 | 410 | ||||||
TRI Pointe Homes * | 473 | 8 | ||||||
True Religion Apparel * | 1,167 | 37 | ||||||
TRW Automotive Holdings * | 5,193 | 329 | ||||||
Tuesday Morning * | 2,186 | 19 | ||||||
Tumi Holdings * | 698 | 17 | ||||||
Tupperware Brands | 2,724 | 221 | ||||||
Ulta Salon Cosmetics & Fragrance * | 3,273 | 297 | ||||||
Under Armour, Cl A * | 4,008 | 249 | ||||||
Unifi * | 780 | 15 | ||||||
Universal Electronics * | 787 | 21 | ||||||
Universal Technical Institute | 413 | 5 | ||||||
| Description | Shares | Market Value ($ Thousands) | ||||||
Vail Resorts | 1,912 | $ | 122 | |||||
Valassis Communications (A) | 1,709 | 44 | ||||||
Vera Bradley (A) * | 970 | 23 | ||||||
Virgin Media (A) | 14,067 | 699 | ||||||
Visteon * | 2,665 | 169 | ||||||
Vitacost.com * | 844 | 7 | ||||||
Vitamin Shoppe * | 1,284 | 56 | ||||||
VOXX International, Cl A * | 664 | 7 | ||||||
Weight Watchers International | 1,174 | 54 | ||||||
Wendy’s | 11,951 | 71 | ||||||
West Marine * | 537 | 6 | ||||||
Wet Seal, Cl A * | 4,951 | 25 | ||||||
Weyco Group | 263 | 6 | ||||||
Williams-Sonoma (A) | 4,637 | 250 | ||||||
Winmark | 95 | 6 | ||||||
Winnebago Industries * | 1,335 | 28 | ||||||
WMS Industries * | 2,384 | 60 | ||||||
Wolverine World Wide (A) | 2,598 | 136 | ||||||
World Wrestling Entertainment, Cl A | 534 | 5 | ||||||
Zagg * | 515 | 3 | ||||||
Zumiez * | 1,103 | 35 | ||||||
|
| |||||||
| 28,805 | ||||||||
|
| |||||||
Consumer Staples — 3.3% | ||||||||
Alico | 143 | 7 | ||||||
Alliance One International * | 4,660 | 17 | ||||||
Andersons | 833 | 42 | ||||||
Annie’s * | 100 | 4 | ||||||
B&G Foods, Cl A | 2,211 | 64 | ||||||
Boston Beer, Cl A * | 383 | 59 | ||||||
Boulder Brands * | 2,778 | 29 | ||||||
Bunge | 7,443 | 518 | ||||||
Calavo Growers | 626 | 19 | ||||||
Cal-Maine Foods | 664 | 30 | ||||||
Casey’s General Stores | 2,059 | 125 | ||||||
Central Garden and Pet, Cl A * | 2,029 | 15 | ||||||
Chefs’ Warehouse * | 221 | 4 | ||||||
Chiquita Brands International * | 2,782 | 28 | ||||||
Church & Dwight | 7,099 | 432 | ||||||
Coca-Cola Bottling | 289 | 17 | ||||||
Darling International * | 6,357 | 125 | ||||||
Dean Foods * | 10,100 | 106 | ||||||
Diamond Foods * | 1,119 | 17 | ||||||
Dole Food * | 1,870 | 18 | ||||||
Elizabeth Arden * | 1,251 | 59 | ||||||
Energizer Holdings | 3,145 | 301 | ||||||
Female Health | 1,300 | 12 | ||||||
Flowers Foods | 5,872 | 196 | ||||||
Fresh Del Monte Produce | 1,681 | 45 | ||||||
Fresh Market * | 1,188 | 59 | ||||||
Green Mountain Coffee Roasters * | 6,979 | 510 | ||||||
Hain Celestial Group * | 2,130 | 142 | ||||||
Harbinger Group * | 2,478 | 21 | ||||||
Harris Teeter Supermarkets (A) | 1,999 | 94 | ||||||
Herbalife | 5,572 | 260 | ||||||
Hillshire Brands | 6,204 | 215 | ||||||
Ingles Markets, Cl A | 745 | 16 | ||||||
Ingredion | 3,965 | 270 | ||||||
Inter Parfums | 806 | 24 | ||||||
J&J Snack Foods | 864 | 66 | ||||||
| 3 | SEI Institutional Investments Trust / Annual Report / May 31, 2013 |
Table of Contents
Schedule of Investments
Extended Market Index Fund
May 31, 2013
| Description | Shares | Market Value ($ Thousands) | ||||||
John B. Sanfilippo & Son * | 319 | $ | 6 | |||||
Lancaster Colony | 1,029 | 85 | ||||||
Limoneira | 195 | 4 | ||||||
Medifast * | 664 | 19 | ||||||
Nash Finch | 240 | 5 | ||||||
National Beverage * | 452 | 7 | ||||||
Natural Grocers by Vitamin Cottage * | 285 | 8 | ||||||
Nature’s Sunshine Products | 437 | 7 | ||||||
Nu Skin Enterprises, Cl A | 2,505 | 147 | ||||||
Nutraceutical International * | 362 | 7 | ||||||
Oil-Dri Corp of America | 210 | 6 | ||||||
Omega Protein * | 766 | 8 | ||||||
Pantry * | 1,249 | 16 | ||||||
Pilgrim’s Pride * | 2,807 | 34 | ||||||
Post Holdings * | 1,169 | 49 | ||||||
Prestige Brands Holdings * | 2,179 | 64 | ||||||
Pricesmart | 1,023 | 86 | ||||||
Revlon, Cl A * | 220 | 4 | ||||||
Rite Aid * | 28,527 | 84 | ||||||
Roundy’s | 1,300 | 10 | ||||||
Sanderson Farms | 1,041 | 72 | ||||||
Seaboard | 14 | 39 | ||||||
Seneca Foods, Cl A * | 462 | 15 | ||||||
Smithfield Foods * | 7,258 | 239 | ||||||
Snyders-Lance | 1,886 | 49 | ||||||
Spartan Stores | 1,108 | 20 | ||||||
Spectrum Brands Holdings | 1,039 | 63 | ||||||
Star Scientific * (A) | 2,818 | 4 | ||||||
SUPERVALU (A) * | 9,316 | 60 | ||||||
Susser Holdings * | 506 | 24 | ||||||
Tootsie Roll Industries (A) | 855 | 27 | ||||||
TreeHouse Foods * | 1,909 | 125 | ||||||
United Natural Foods (A) * | 2,598 | 137 | ||||||
Universal (A) | 1,045 | 61 | ||||||
USANA Health Sciences * | 316 | 22 | ||||||
Vector Group (A) | 2,496 | 40 | ||||||
Village Super Market, Cl A | 462 | 17 | ||||||
WD-40 | 686 | 37 | ||||||
Weis Markets | 404 | 17 | ||||||
WhiteWave Foods, Cl A (A) * | 4,652 | 81 | ||||||
WhiteWave Foods, Cl B * | 2,874 | 48 | ||||||
|
| |||||||
| 5,819 | ||||||||
|
| |||||||
Energy — 5.4% | ||||||||
Abraxas Petroleum * | 3,194 | 7 | ||||||
Alon USA Energy | 196 | 4 | ||||||
Alpha Natural Resources * (A) | 9,323 | 62 | ||||||
Approach Resources (A) * | 1,498 | 38 | ||||||
Arch Coal (A) | 9,216 | 48 | ||||||
Atwood Oceanics * | 3,040 | 160 | ||||||
Basic Energy Services * | 1,573 | 21 | ||||||
Berry Petroleum, Cl A | 2,775 | 120 | ||||||
Bill Barrett (A) * | 2,164 | 49 | ||||||
Bonanza Creek Energy * | 588 | 22 | ||||||
BPZ Resources * (A) | 2,021 | 4 | ||||||
Bristow Group | 1,903 | 120 | ||||||
C&J Energy Services * | 1,995 | 37 | ||||||
Cal Dive International * | 1,930 | 4 | ||||||
Callon Petroleum * | 785 | 3 | ||||||
CARBO Ceramics | 850 | 56 | ||||||
Carrizo Oil & Gas * | 1,709 | 44 | ||||||
| Description | Shares | Market Value ($ Thousands) | ||||||
Cheniere Energy * | 11,065 | $ | 325 | |||||
Cimarex Energy | 4,461 | 313 | ||||||
Clayton Williams Energy * | 116 | 5 | ||||||
Clean Energy Fuels (A) * | 2,988 | 40 | ||||||
Cloud Peak Energy * | 2,689 | 52 | ||||||
Cobalt International Energy * | 9,515 | 247 | ||||||
Comstock Resources | 2,173 | 35 | ||||||
Concho Resources * | 5,342 | 447 | ||||||
Contango Oil & Gas * | 635 | 22 | ||||||
Continental Resources * | 2,198 | 178 | ||||||
Crosstex Energy | 1,839 | 35 | ||||||
CVR Energy | 697 | 44 | ||||||
Dawson Geophysical * | 552 | 20 | ||||||
Delek US Holdings | 809 | 29 | ||||||
Diamondback Energy * | 475 | 16 | ||||||
Dresser-Rand Group * | 3,955 | 240 | ||||||
Dril-Quip * | 2,087 | 189 | ||||||
Endeavour International * (A) | 4,800 | 16 | ||||||
Energen | 3,789 | 205 | ||||||
Energy XXI Bermuda | 4,281 | 109 | ||||||
EPL Oil & Gas * | 1,301 | 40 | ||||||
Era Group * | 993 | 26 | ||||||
Evolution Petroleum * | 627 | 7 | ||||||
EXCO Resources (A) | 5,531 | 45 | ||||||
Exterran Holdings * | 3,583 | 104 | ||||||
Forest Oil * | 5,432 | 25 | ||||||
Forum Energy Technologies * | 1,105 | 33 | ||||||
FX Energy * | 1,063 | 4 | ||||||
GasLog | 1,250 | 17 | ||||||
Gastar Exploration * | 3,800 | 9 | ||||||
Geospace Technologies * | 498 | 43 | ||||||
Golar LNG (A) | 1,802 | 61 | ||||||
Goodrich Petroleum * | 793 | 10 | ||||||
Green Plains Renewable Energy * | 1,390 | 22 | ||||||
Gulf Island Fabrication | 772 | 16 | ||||||
Gulfmark Offshore, Cl A | 1,180 | 54 | ||||||
Gulfport Energy * | 3,981 | 190 | ||||||
Halcon Resources * (A) | 5,006 | 26 | ||||||
Harvest Natural Resources * | 786 | 2 | ||||||
Helix Energy Solutions Group * | 5,669 | 135 | ||||||
Hercules Offshore * | 6,926 | 48 | ||||||
HollyFrontier | 10,554 | 522 | ||||||
Hornbeck Offshore Services * | 1,512 | 79 | ||||||
ION Geophysical * | 5,869 | 38 | ||||||
Key Energy Services * | 6,559 | 42 | ||||||
KiOR, Cl A * (A) | 1,093 | 5 | ||||||
Knightsbridge Tankers (A) | 943 | 7 | ||||||
Kodiak Oil & Gas * | 14,211 | 125 | ||||||
Kosmos Energy * | 3,175 | 33 | ||||||
Laredo Petroleum Holdings * (A) | 1,189 | 23 | ||||||
Lufkin Industries | 1,757 | 155 | ||||||
Magnum Hunter Resources (A) * | 6,893 | 24 | ||||||
Matador Resources * | 1,000 | 10 | ||||||
Matrix Service * | 1,381 | 23 | ||||||
McDermott International * | 12,770 | 122 | ||||||
McMoRan Exploration * | 4,332 | 72 | ||||||
Midstates Petroleum * | 891 | 6 | ||||||
Mitcham Industries * | 256 | 4 | ||||||
Natural Gas Services Group * | 944 | 21 | ||||||
Newpark Resources * | 4,020 | 45 | ||||||
Nordic American Tankers | 2,477 | 21 | ||||||
Northern Oil And Gas * | 2,839 | 37 | ||||||
| 4 | SEI Institutional Investments Trust / Annual Report / May 31, 2013 |
Table of Contents
Schedule of Investments
Extended Market Index Fund
May 31, 2013
| Description | Shares | Market Value ($ Thousands) | ||||||
Nuverra Environmental Solutions * (A) | 6,589 | $ | 25 | |||||
Oasis Petroleum * | 4,197 | 156 | ||||||
Oceaneering International | 5,546 | 402 | ||||||
Oil States International * | 2,799 | 276 | ||||||
Panhandle Oil and Gas, Cl A | 141 | 4 | ||||||
Parker Drilling * | 5,851 | 26 | ||||||
Patterson-UTI Energy | 7,722 | 162 | ||||||
PBF Energy, Cl A (A) | 1,077 | 31 | ||||||
PDC Energy * | 1,293 | 66 | ||||||
Penn Virginia * | 1,086 | 5 | ||||||
PetroQuest Energy * | 1,123 | 5 | ||||||
PHI * | 643 | 23 | ||||||
Pioneer Energy Services * | 2,036 | 14 | ||||||
Quicksilver Resources * (A) | 6,330 | 14 | ||||||
Rentech * | 10,865 | 24 | ||||||
Resolute Energy * | 2,294 | 19 | ||||||
Rex Energy * | 1,990 | 33 | ||||||
RigNet * | 641 | 16 | ||||||
Rosetta Resources * | 3,185 | 149 | ||||||
RPC (A) | 2,699 | 34 | ||||||
Sanchez Energy * | 230 | 5 | ||||||
SandRidge Energy * (A) | 26,193 | 135 | ||||||
Scorpio Tankers | 8,143 | 77 | ||||||
SEACOR Holdings * | 974 | 75 | ||||||
SemGroup, Cl A | 2,244 | 117 | ||||||
Ship Finance International (A) | 2,176 | 37 | ||||||
SM Energy | 3,313 | 201 | ||||||
Solazyme * (A) | 1,830 | 23 | ||||||
Stone Energy * | 2,184 | 49 | ||||||
Superior Energy Services * | 8,260 | 220 | ||||||
Swift Energy (A) * | 1,983 | 27 | ||||||
Synergy Resources * | 2,162 | 15 | ||||||
Targa Resources | 1,559 | 100 | ||||||
Teekay | 1,554 | 60 | ||||||
Teekay Tankers, Cl A (A) | 2,423 | 7 | ||||||
Tesco * | 1,569 | 20 | ||||||
TETRA Technologies * | 3,505 | 36 | ||||||
TGC Industries | 636 | 5 | ||||||
Tidewater | 2,746 | 151 | ||||||
Triangle Petroleum * | 3,137 | 17 | ||||||
Ultra Petroleum * | 7,992 | 182 | ||||||
Unit * | 2,595 | 117 | ||||||
Uranium Energy (A) * | 1,698 | 4 | ||||||
Vaalco Energy * | 2,970 | 18 | ||||||
Vantage Drilling * | 10,246 | 20 | ||||||
W&T Offshore (A) | 1,738 | 26 | ||||||
Warren Resources * | 1,449 | 4 | ||||||
Western Refining (A) | 2,399 | 80 | ||||||
Whiting Petroleum * | 6,058 | 279 | ||||||
Willbros Group * | 2,254 | 15 | ||||||
World Fuel Services | 3,841 | 156 | ||||||
|
| |||||||
| 9,459 | ||||||||
|
| |||||||
Financials — 22.1% | ||||||||
1st Source | 780 | 19 | ||||||
1st United Bancorp | 1,092 | 7 | ||||||
Acadia Realty Trust | 2,239 | 58 | ||||||
Affiliated Managers Group * | 2,611 | 428 | ||||||
Agree Realty | 647 | 22 | ||||||
Alexander & Baldwin * | 1,777 | 63 | ||||||
Alexander’s ‡ | 88 | 27 | ||||||
| Description | Shares | Market Value ($ Thousands) | ||||||
Alexandria Real Estate Equities | 3,661 | $ | 251 | |||||
Alleghany * | 867 | 338 | ||||||
Allied World Assurance Holdings | 1,904 | 170 | ||||||
American Assets Trust | 1,491 | 48 | ||||||
American Campus Communities ‡ | 5,362 | 219 | ||||||
American Capital * | 16,511 | 220 | ||||||
American Capital Agency | 20,221 | 522 | ||||||
American Capital Mortgage Investment | 2,465 | 52 | ||||||
American Equity Investment Life Holding (A) | 2,778 | 45 | ||||||
American Financial Group | 4,153 | 202 | ||||||
American National Bankshares | 306 | 7 | ||||||
American National Insurance | 331 | 33 | ||||||
American Safety Insurance Holdings * | 181 | 4 | ||||||
Ameris Bancorp * | 1,252 | 21 | ||||||
AMERISAFE | 833 | 28 | ||||||
Ames National | 310 | 6 | ||||||
Amtrust Financial Services (A) | 1,181 | 39 | ||||||
Annaly Capital Management | 49,514 | 672 | ||||||
Anworth Mortgage Asset | 6,168 | 35 | ||||||
Apollo Commercial Real Estate Finance | 1,437 | 24 | ||||||
Apollo Investments | 12,338 | 102 | ||||||
Apollo Residential Mortgage ‡ | 1,087 | 21 | ||||||
Arch Capital Group * | 6,936 | 355 | ||||||
Ares Capital | 13,915 | 239 | ||||||
Argo Group International Holdings | 1,396 | 55 | ||||||
Arlington Asset Investment, Cl A | 712 | 19 | ||||||
ARMOUR Residential REIT ‡ | 20,396 | 105 | ||||||
Arrow Financial | 202 | 5 | ||||||
Arthur J Gallagher (A) | 6,091 | 266 | ||||||
Ashford Hospitality Trust | 2,471 | 33 | ||||||
Aspen Insurance Holdings | 2,995 | 110 | ||||||
Associated Banc | 9,286 | 143 | ||||||
Associated Estates Realty ‡ | 2,189 | 36 | ||||||
Assured Guaranty | 8,987 | 203 | ||||||
Astoria Financial | 3,865 | 38 | ||||||
AV Homes * | 407 | 5 | ||||||
Axis Capital Holdings | 5,368 | 234 | ||||||
Baldwin & Lyons, Cl B | 181 | 4 | ||||||
Bancfirst | 325 | 14 | ||||||
Banco Latinoamericano de Comercio Exterior, Cl E | 1,312 | 30 | ||||||
Bancorp * | 1,604 | 23 | ||||||
Bancorpsouth (A) | 3,982 | 68 | ||||||
Bank Mutual | 899 | 5 | ||||||
Bank of Hawaii | 2,424 | 122 | ||||||
Bank of Kentucky Financial | 233 | 6 | ||||||
Bank of Marin Bancorp | 107 | 4 | ||||||
Bank of the Ozarks | 1,285 | 56 | ||||||
BankFinancial | 797 | 6 | ||||||
BankUnited | 1,596 | 39 | ||||||
Banner | 851 | 27 | ||||||
BBCN Bancorp | 3,395 | 44 | ||||||
Beneficial Mutual Bancorp * | 1,826 | 16 | ||||||
Berkshire Hills Bancorp | 1,150 | 31 | ||||||
BGC Partners, Cl A | 4,736 | 26 | ||||||
BioMed Realty Trust ‡ | 9,729 | 204 | ||||||
| 5 | SEI Institutional Investments Trust / Annual Report / May 31, 2013 |
Table of Contents
Schedule of Investments
Extended Market Index Fund
May 31, 2013
| Description | Shares | Market Value ($ Thousands) | ||||||
BlackRock Kelso Capital | 3,363 | $ | 34 | |||||
BofI Holding * | 609 | 29 | ||||||
BOK Financial | 1,093 | 71 | ||||||
Boston Private Financial Holdings | 3,515 | 35 | ||||||
Brandywine Realty Trust | 6,939 | 98 | ||||||
BRE Properties | 3,990 | 199 | ||||||
Bridge Bancorp | 312 | 7 | ||||||
Brookline Bancorp | 3,274 | 28 | ||||||
Brown & Brown | 6,176 | 199 | ||||||
Bryn Mawr Bank | 622 | 14 | ||||||
C&F Financial | 300 | 14 | ||||||
Calamos Asset Management, Cl A | 382 | 4 | ||||||
Camden National | 539 | 20 | ||||||
Camden Property Trust | 4,338 | 300 | ||||||
Campus Crest Communities | 2,872 | 36 | ||||||
Capital Bank Financial, Cl A * | 360 | 6 | ||||||
Capital City Bank Group * | 800 | 9 | ||||||
Capital Southwest | 156 | 22 | ||||||
CapitalSource | 8,893 | 84 | ||||||
Capitol Federal Financial | 8,187 | 97 | ||||||
CapLease | 3,806 | 33 | ||||||
Capstead Mortgage | 4,218 | 52 | ||||||
Cardinal Financial | 1,341 | 20 | ||||||
Cash America International | 1,279 | 61 | ||||||
Cathay General Bancorp | 3,315 | 67 | ||||||
CBL & Associates Properties | 7,782 | 179 | ||||||
CBOE Holdings | 4,638 | 186 | ||||||
Cedar Realty Trust ‡ | 3,538 | 20 | ||||||
Center Bancorp | 483 | 6 | ||||||
Centerstate Banks | 585 | 5 | ||||||
Central Pacific Financial * | 1,110 | 20 | ||||||
Chatham Lodging Trust ‡ | 935 | 17 | ||||||
Chemical Financial | 1,299 | 34 | ||||||
Chesapeake Lodging Trust ‡ | 2,167 | 49 | ||||||
Chimera Investment ‡ | 54,326 | 166 | ||||||
CIT Group * | 10,237 | 472 | ||||||
Citizens, Cl A * | 2,233 | 14 | ||||||
Citizens & Northern | 240 | 5 | ||||||
City Holding | 685 | 27 | ||||||
City National | 2,440 | 153 | ||||||
CNA Financial | 1,175 | 40 | ||||||
CNB Financial | 248 | 4 | ||||||
CNO Financial Group | 10,825 | 134 | ||||||
CoBiz Financial | 1,971 | 17 | ||||||
Cohen & Steers | 836 | 32 | ||||||
Colonial Properties Trust ‡ | 4,795 | 106 | ||||||
Colony Financial ‡ | 2,800 | 62 | ||||||
Columbia Banking System | 2,109 | 46 | ||||||
Commerce Bancshares | 3,647 | 159 | ||||||
CommonWealth | 6,344 | 130 | ||||||
Community Bank System (A) | 1,702 | 50 | ||||||
Community Trust Bancorp | 658 | 23 | ||||||
Consolidated-Tomoka Land | 174 | 6 | ||||||
Coresite Realty ‡ | 773 | 25 | ||||||
Corporate Office Properties Trust ‡ | 3,830 | 102 | ||||||
Corrections Corp of America ‡ | 5,802 | 204 | ||||||
Cousins Properties ‡ | 4,046 | 42 | ||||||
Cowen Group, Cl A * | 1,721 | 5 | ||||||
Crawford, Cl B | 520 | 4 | ||||||
| Description | Shares | Market Value ($ Thousands) | ||||||
Credit Acceptance * | 332 | $ | 38 | |||||
CubeSmart ‡ | 7,222 | 113 | ||||||
Cullen/Frost Bankers | 2,805 | 181 | ||||||
CVB Financial | 3,879 | 45 | ||||||
CyrusOne ‡ | 929 | 20 | ||||||
CYS Investments ‡ | 9,562 | 98 | ||||||
DCT Industrial Trust ‡ | 14,886 | 110 | ||||||
DDR ‡ | 14,314 | 250 | ||||||
DFC Global * | 1,991 | 30 | ||||||
Diamond Hill Investment Group * | 54 | 4 | ||||||
DiamondRock Hospitality ‡ | 10,107 | 96 | ||||||
Digital Realty Trust ‡ (A) | 6,574 | 400 | ||||||
Dime Community Bancshares | 1,583 | 23 | ||||||
Douglas Emmett ‡ | 7,385 | 188 | ||||||
Duke Realty ‡ | 16,595 | 275 | ||||||
DuPont Fabros Technology ‡ | 2,621 | 64 | ||||||
Dynex Capital ‡ | 2,593 | 26 | ||||||
Eagle Bancorp * | 706 | 16 | ||||||
East West Bancorp | 7,186 | 189 | ||||||
EastGroup Properties ‡ | 1,685 | 99 | ||||||
Eaton Vance | 6,025 | 250 | ||||||
Education Realty Trust ‡ | 4,873 | 51 | ||||||
eHealth * | 1,074 | 26 | ||||||
Employers Holdings | 1,474 | 36 | ||||||
Encore Capital Group * | 975 | 35 | ||||||
Endurance Specialty Holdings | 2,383 | 120 | ||||||
Enstar Group * | 351 | 44 | ||||||
Enterprise Financial Services | 1,249 | 19 | ||||||
EPR Properties ‡ (A) | 2,551 | 134 | ||||||
Equity Lifestyle Properties ‡ | 2,216 | 171 | ||||||
Equity One ‡ | 2,385 | 56 | ||||||
Erie Indemnity, Cl A | 1,387 | 105 | ||||||
ESB Financial | 517 | 6 | ||||||
Essex Property Trust ‡ | 1,927 | 303 | ||||||
EverBank Financial | 1,124 | 18 | ||||||
Evercore Partners, Cl A | 1,276 | 51 | ||||||
Everest Re Group | 2,544 | 330 | ||||||
Excel Trust ‡ | 2,118 | 28 | ||||||
Extra Space Storage ‡ | 5,718 | 240 | ||||||
Ezcorp, Cl A * | 2,157 | 41 | ||||||
FBL Financial Group, Cl A | 582 | 24 | ||||||
FBR * | 169 | 4 | ||||||
Federal Agricultural Mortgage, Cl C | 488 | 15 | ||||||
Federal Realty Investment Trust ‡ | 3,286 | 354 | ||||||
Federated Investors, Cl B (A) | 4,870 | 135 | ||||||
FelCor Lodging Trust ‡* | 5,663 | 35 | ||||||
Fidelity National Financial, Cl A | 11,553 | 304 | ||||||
Fidus Investment | 273 | 5 | ||||||
Fifth Street Finance | 6,831 | 72 | ||||||
Financial Engines | 2,664 | 115 | ||||||
Financial Institutions | 767 | 15 | ||||||
First American Financial | 5,672 | 135 | ||||||
First Bancorp | 697 | 11 | ||||||
First BanCorp * | 3,516 | 21 | ||||||
First Busey | 4,011 | 18 | ||||||
First California Financial Group * | 821 | 7 | ||||||
First Cash Financial Services * | 1,258 | 68 | ||||||
First Citizens BancShares, Cl A | 191 | 38 | ||||||
First Commonwealth Financial | 4,501 | 32 | ||||||
First Community Bancshares | 942 | 14 | ||||||
First Connecticut Bancorp | 1,048 | 15 | ||||||
| 6 | SEI Institutional Investments Trust / Annual Report / May 31, 2013 |
Table of Contents
Schedule of Investments
Extended Market Index Fund
May 31, 2013
| Description | Shares | Market Value ($ Thousands) | ||||||
First Defiance Financial | 192 | $ | 4 | |||||
First Financial | 612 | 19 | ||||||
First Financial Bancorp | �� | 2,549 | 39 | |||||
First Financial Bankshares (A) | 1,728 | 95 | ||||||
First Financial Holdings | 914 | 19 | ||||||
First Financial Northwest | 1,491 | 15 | ||||||
First Industrial Realty Trust ‡ | 5,753 | 97 | ||||||
First Interstate Bancsystem, Cl A | 912 | 18 | ||||||
First Merchants | 1,433 | 24 | ||||||
First Midwest Bancorp | 3,342 | 44 | ||||||
First Niagara Financial Group | 18,547 | 181 | ||||||
First of Long Island | 153 | 5 | ||||||
First Potomac Realty Trust ‡ | 2,322 | 32 | ||||||
First Republic Bank | 5,343 | 199 | ||||||
Firsthand Technology Value Fund * | 600 | 12 | ||||||
FirstMerit | 8,697 | 164 | ||||||
Flushing Financial | 1,070 | 17 | ||||||
FNB (Pennsylvania) | 5,908 | 68 | ||||||
Forest City Enterprises, Cl A * | 7,945 | 149 | ||||||
Forestar Group * | 1,532 | 35 | ||||||
Fox Chase Bancorp | 253 | 4 | ||||||
Franklin Financial * | 262 | 5 | ||||||
Franklin Street Properties ‡ | 4,996 | 68 | ||||||
Fulton Financial | 10,812 | 124 | ||||||
FXCM, Cl A | 1,250 | 17 | ||||||
GAMCO Investors, Cl A | 322 | 17 | ||||||
General Growth Properties ‡ | 26,875 | 552 | ||||||
Geo Group ‡ | 3,790 | 132 | ||||||
German American Bancorp | 744 | 16 | ||||||
Getty Realty ‡ | 1,272 | 27 | ||||||
GFI Group | 3,849 | 16 | ||||||
Glacier Bancorp | 3,080 | 60 | ||||||
Gladstone Capital | 424 | 4 | ||||||
Gladstone Commercial ‡ | 219 | 4 | ||||||
Gladstone Investment | 525 | 4 | ||||||
Glimcher Realty Trust ‡ | 5,911 | 69 | ||||||
Global Indemnity, Cl A * | 202 | 5 | ||||||
Golub Capital BDC | 961 | 17 | ||||||
Government Properties Income Trust ‡ | 1,866 | 45 | ||||||
Gramercy Property Trust ‡* | 1,695 | 8 | ||||||
Great Southern Bancorp | 599 | 16 | ||||||
Green Dot, Cl A * | 1,255 | 23 | ||||||
Greenhill | 1,271 | 63 | ||||||
Greenlight Capital Re, Cl A * | 1,309 | 32 | ||||||
GSV Capital * | 749 | 6 | ||||||
Guaranty Bancorp | 605 | 7 | ||||||
Hancock Holding | 4,114 | 117 | ||||||
Hanmi Financial * | 1,078 | 17 | ||||||
Hanover Insurance Group | 2,017 | 101 | ||||||
Hatteras Financial ‡ | 5,283 | 136 | ||||||
HCC Insurance Holdings | 5,321 | 228 | ||||||
Healthcare Realty Trust ‡ | 4,655 | 124 | ||||||
Heartland Financial USA | 875 | 24 | ||||||
Hercules Technology Growth Capital | 2,903 | 39 | ||||||
Heritage Financial | 307 | 4 | ||||||
Hersha Hospitality Trust, Cl A ‡ | 7,578 | 43 | ||||||
HFF, Cl A * | 1,495 | 28 | ||||||
Highwoods Properties ‡ | 4,168 | 152 | ||||||
Hilltop Holdings * | 1,929 | 31 | ||||||
| Description | Shares | Market Value ($ Thousands) | ||||||
Home BancShares | 998 | $ | 42 | |||||
Home Federal Bancorp | 546 | 7 | ||||||
Home Loan Servicing Solutions | 2,247 | 51 | ||||||
Home Properties ‡ | 2,735 | 166 | ||||||
Homeowners Choice | 315 | 11 | ||||||
HomeStreet | 172 | 4 | ||||||
HomeTrust Bancshares * | 1,102 | 18 | ||||||
Horace Mann Educators | 1,814 | 44 | ||||||
Hospitality Properties Trust ‡ | 7,341 | 214 | ||||||
Howard Hughes * | 1,417 | 141 | ||||||
Hudson Pacific Properties ‡ | 1,870 | 40 | ||||||
Hudson Valley Holding | 305 | 5 | ||||||
Iberiabank | 1,284 | 66 | ||||||
ICG Group * | 1,888 | 21 | ||||||
Independent Bank | 1,002 | 33 | ||||||
Infinity Property & Casualty | 514 | 30 | ||||||
Inland Real Estate ‡ | 3,482 | 36 | ||||||
Interactive Brokers Group, Cl A | 1,827 | 29 | ||||||
International Bancshares | 2,350 | 51 | ||||||
International FCStone * | 268 | 5 | ||||||
Invesco Mortgage Capital ‡ | 7,171 | 134 | ||||||
Investment Technology Group * | 2,017 | 28 | ||||||
Investors Bancorp | 1,997 | 40 | ||||||
Investors Real Estate Trust ‡ | 4,031 | 36 | ||||||
iStar Financial ‡* | 3,718 | 44 | ||||||
Janus Capital Group (A) | 8,012 | 70 | ||||||
JAVELIN Mortgage Investment ‡ | 500 | 8 | ||||||
Jones Lang LaSalle | 2,259 | 207 | ||||||
Kansas City Life Insurance | 165 | 6 | ||||||
KCAP Financial | 1,405 | 15 | ||||||
Kearny Financial * | 607 | 6 | ||||||
Kemper | 2,136 | 73 | ||||||
Kennedy-Wilson Holdings | 2,229 | 38 | ||||||
Kilroy Realty ‡ | 3,943 | 209 | ||||||
Kite Realty Group Trust ‡ | 3,321 | 20 | ||||||
Knight Capital Group, Cl A * | 8,395 | 30 | ||||||
Ladenburg Thalmann Financial Services * | 6,700 | 11 | ||||||
Lakeland Bancorp | 1,670 | 17 | ||||||
Lakeland Financial | 805 | 22 | ||||||
LaSalle Hotel Properties ‡ | 5,142 | 136 | ||||||
Lazard, Cl A | 6,031 | 204 | ||||||
Lexington Realty Trust ‡ | 8,390 | 106 | ||||||
Liberty Property Trust ‡ | 5,375 | 218 | ||||||
LPL Financial Holdings | 2,162 | 80 | ||||||
LTC Properties ‡ | 1,917 | 80 | ||||||
Mack-Cali Realty ‡ | 4,767 | 126 | ||||||
Maiden Holdings | 2,423 | 26 | ||||||
Main Street Capital | 1,349 | 39 | ||||||
MainSource Financial Group | 1,090 | 15 | ||||||
Manning & Napier, Cl A | 272 | 5 | ||||||
Markel * | 663 | 347 | ||||||
MarketAxess Holdings | 1,552 | 67 | ||||||
Marlin Business Services | 322 | 8 | ||||||
MB Financial | 2,381 | 61 | ||||||
MBIA * | 7,682 | 109 | ||||||
MCG Capital | 4,383 | 22 | ||||||
Meadowbrook Insurance Group | 2,953 | 24 | ||||||
Medallion Financial | 952 | 14 | ||||||
Medical Properties Trust ‡ | 8,062 | 120 | ||||||
Medley Capital | 1,432 | 21 | ||||||
Mercantile Bank | 357 | 6 | ||||||
| 7 | SEI Institutional Investments Trust / Annual Report / May 31, 2013 |
Table of Contents
Schedule of Investments
Extended Market Index Fund
May 31, 2013
| Description | Shares | Market Value ($ Thousands) | ||||||
Merchants Bancshares | 207 | $ | 6 | |||||
Mercury General | 1,178 | 53 | ||||||
Meridian Interstate Bancorp * | 338 | 6 | ||||||
Metro Bancorp | 277 | 5 | ||||||
MetroCorp Bancshares * | 605 | 6 | ||||||
MFA Mortgage Investments ‡ | 18,897 | 166 | ||||||
MGIC Investment * | 17,218 | 106 | ||||||
Mid-America Apartment Communities ‡ | 2,219 | 151 | ||||||
MidWestOne Financial Group | 269 | 6 | ||||||
Monmouth Real Estate Investment, Cl A ‡ | 2,046 | 21 | ||||||
Montpelier Re Holdings | 2,089 | 52 | ||||||
Mortgage Investment Trust | 1,188 | 27 | ||||||
MSCI, Cl A * | 6,369 | 224 | ||||||
MVC Capital | 1,258 | 16 | ||||||
National Bankshares | 136 | 5 | ||||||
National Financial Partners * | 1,831 | 46 | ||||||
National Health Investors ‡ | 1,164 | 72 | ||||||
National Interstate | 124 | 4 | ||||||
National Penn Bancshares | 5,289 | 52 | ||||||
National Retail Properties ‡ | 6,043 | 217 | ||||||
National Western Life Insurance, Cl A | 141 | 28 | ||||||
Nationstar Mortgage Holdings * | 846 | 34 | ||||||
Navigators Group * | 483 | 28 | ||||||
NBT Bancorp | 1,908 | 38 | ||||||
Nelnet, Cl A | 1,031 | 40 | ||||||
Netspend Holdings * | 1,425 | 23 | ||||||
New Mountain Finance | 1,279 | 19 | ||||||
New York Community Bancorp (A) | 22,639 | 296 | ||||||
New York Mortgage Trust ‡ | 2,938 | 20 | ||||||
NewStar Financial * | 1,393 | 18 | ||||||
NGP Capital Resources | 883 | 6 | ||||||
Nicholas Financial | 700 | 10 | ||||||
Northfield Bancorp | 405 | 5 | ||||||
Northrim BanCorp | 269 | 6 | ||||||
NorthStar Realty Finance ‡ (A) | 8,216 | 69 | ||||||
Northwest Bancshares | 4,199 | 52 | ||||||
OceanFirst Financial | 288 | 4 | ||||||
Ocwen Financial * | 5,561 | 238 | ||||||
OFG Bancorp | 2,125 | 38 | ||||||
Old National Bancorp | 4,361 | 58 | ||||||
Old Republic International | 13,644 | 186 | ||||||
Omega Healthcare Investors ‡ (A) | 5,877 | 190 | ||||||
OmniAmerican Bancorp * | 615 | 14 | ||||||
One Liberty Properties ‡ | 624 | 17 | ||||||
OneBeacon Insurance Group, Cl A | 1,235 | 18 | ||||||
Oppenheimer Holdings, Cl A | 364 | 7 | ||||||
Oritani Financial | 2,124 | 33 | ||||||
Pacific Continental | 365 | 4 | ||||||
PacWest Bancorp (A) | 1,346 | 39 | ||||||
Park National | 505 | 35 | ||||||
Park Sterling * | 870 | 5 | ||||||
Parkway Properties ‡ | 1,305 | 22 | ||||||
PartnerRe | 2,934 | 266 | ||||||
Pebblebrook Hotel Trust ‡ | 2,603 | 68 | ||||||
PennantPark Investment | 3,011 | 34 | ||||||
Penns Woods Bancorp | 152 | 6 | ||||||
| Description | Shares | Market Value ($ Thousands) | ||||||
Pennsylvania Real Estate Investment Trust ‡ | 3,799 | $ | 76 | |||||
PennyMac Mortgage Investment Trust ‡ | 2,463 | 53 | ||||||
Peoples Bancorp | 210 | 4 | ||||||
PHH * | 2,432 | 49 | ||||||
Phoenix * | 241 | 10 | ||||||
PICO Holdings * | 1,121 | 25 | ||||||
Piedmont Office Realty Trust, Cl A ‡ | 9,166 | 174 | ||||||
Pinnacle Financial Partners * | 1,525 | 38 | ||||||
Piper Jaffray * | 1,077 | 38 | ||||||
Platinum Underwriters Holdings | 1,748 | 100 | ||||||
Popular * | 5,456 | 164 | ||||||
Portfolio Recovery Associates * | 786 | 120 | ||||||
Post Properties ‡ | 2,911 | 139 | ||||||
Potlatch ‡ | 1,720 | 78 | ||||||
Preferred Bank * | 237 | 4 | ||||||
Primerica | 1,929 | 68 | ||||||
PrivateBancorp, Cl A | 2,819 | 55 | ||||||
ProAssurance | 3,225 | 162 | ||||||
Prospect Capital | 11,658 | 121 | ||||||
Prosperity Bancshares (A) | 2,569 | 129 | ||||||
Protective Life | 4,302 | 166 | ||||||
Provident Financial Holdings | 374 | 6 | ||||||
Provident Financial Services | 2,679 | 41 | ||||||
Provident New York Bancorp | 2,345 | 22 | ||||||
PS Business Parks ‡ | 1,028 | 78 | ||||||
Radian Group (A) | 9,348 | 120 | ||||||
RAIT Financial Trust ‡ | 3,021 | 23 | ||||||
Ramco-Gershenson Properties ‡ | 2,637 | 41 | ||||||
Raymond James Financial | 5,881 | 259 | ||||||
Rayonier ‡ | 6,253 | 346 | ||||||
Realogy Holdings * | 2,602 | 134 | ||||||
Realty Income ‡ (A) | 10,036 | 456 | ||||||
Redwood Trust ‡ | 3,305 | 63 | ||||||
Regency Centers ‡ | 4,667 | 241 | ||||||
Reinsurance Group of America, Cl A | 3,816 | 251 | ||||||
RenaissanceRe Holdings | 2,343 | 201 | ||||||
Renasant | 1,160 | 28 | ||||||
Republic Bancorp, Cl A | 198 | 5 | ||||||
Resource Capital ‡ | 4,905 | 30 | ||||||
Retail Opportunity Investments ‡ | 2,559 | 36 | ||||||
Retail Properties of America, Cl A ‡ | 3,703 | 57 | ||||||
RLI | 891 | 67 | ||||||
RLJ Lodging Trust ‡ | 6,537 | 151 | ||||||
Rockville Financial | 1,638 | 21 | ||||||
Rouse Properties ‡ (A) | 1,117 | 22 | ||||||
Ryman Hospitality Properties ‡ (A) | 1,360 | 52 | ||||||
S&T Bancorp | 1,332 | 26 | ||||||
Sabra Health Care REIT ‡ | 1,662 | 45 | ||||||
Safeguard Scientifics * | 1,096 | 17 | ||||||
Safety Insurance Group | 431 | 23 | ||||||
Sandy Spring Bancorp | 847 | 18 | ||||||
Saul Centers ‡ | 444 | 20 | ||||||
SCBT Financial | 699 | 35 | ||||||
Seacoast Banking Corp of Florida * | 2,990 | 6 | ||||||
SEI (B) | 7,119 | 218 | ||||||
| 8 | SEI Institutional Investments Trust / Annual Report / May 31, 2013 |
Table of Contents
Schedule of Investments
Extended Market Index Fund
May 31, 2013
| Description | Shares | Market Value ($ Thousands) | ||||||
Select Income ‡ | 621 | $ | 17 | |||||
Selective Insurance Group | 2,384 | 57 | ||||||
Senior Housing Properties Trust ‡ | 9,807 | 254 | ||||||
Sierra Bancorp | 478 | 7 | ||||||
Signature Bank NY * | 2,570 | 198 | ||||||
Silver Bay Realty Trust ‡ | 1,546 | 28 | ||||||
Simmons First National, Cl A | 518 | 13 | ||||||
SL Green Realty ‡ | 4,440 | 386 | ||||||
Solar Capital | 2,017 | 46 | ||||||
Solar Senior Capital | 230 | 4 | ||||||
Southside Bancshares | 1,078 | 24 | ||||||
Southwest Bancorp * | 379 | 5 | ||||||
Sovran Self Storage ‡ | 1,693 | 110 | ||||||
Spirit Realty Capital ‡ | 1,505 | 30 | ||||||
St. Joe * | 2,820 | 58 | ||||||
STAG Industrial ‡ | 1,656 | 36 | ||||||
StanCorp Financial Group | 2,010 | 91 | ||||||
Starwood Property Trust ‡ | 8,680 | 220 | ||||||
State Auto Financial | 1,090 | 20 | ||||||
State Bank Financial | 1,584 | 25 | ||||||
StellarOne | 1,336 | 21 | ||||||
Sterling Bancorp, Cl N | 1,889 | 23 | ||||||
Sterling Financial | 1,290 | 29 | ||||||
Stewart Information Services | 941 | 26 | ||||||
Stifel Financial * (A) | 3,282 | 118 | ||||||
Strategic Hotels & Resorts ‡ * | 7,688 | 62 | ||||||
Suffolk Bancorp * | 600 | 9 | ||||||
Summit Hotel Properties ‡ | 2,629 | 26 | ||||||
Sun Bancorp * | 1,661 | 5 | ||||||
Sun Communities ‡ | 1,921 | 96 | ||||||
Sunstone Hotel Investors ‡ * | 8,880 | 107 | ||||||
Susquehanna Bancshares | 10,123 | 122 | ||||||
SVB Financial Group * | 2,282 | 177 | ||||||
SWS Group * | 1,049 | 6 | ||||||
SY Bancorp | 635 | 15 | ||||||
Symetra Financial | 3,383 | 47 | ||||||
Synovus Financial | 42,646 | 117 | ||||||
Tanger Factory Outlet Centers ‡ | 4,849 | 167 | ||||||
Taubman Centers ‡ | 3,087 | 249 | ||||||
Taylor Capital Group * | 315 | 5 | ||||||
TCF Financial | 8,739 | 126 | ||||||
TD Ameritrade Holding | 11,973 | 281 | ||||||
Tejon Ranch * | 647 | 20 | ||||||
Terreno Realty ‡ | 1,163 | 22 | ||||||
Territorial Bancorp | 773 | 18 | ||||||
Texas Capital Bancshares * | 1,723 | 76 | ||||||
TFS Financial * | 3,543 | 39 | ||||||
THL Credit | 297 | 5 | ||||||
Thomas Properties Group | 1,219 | 7 | ||||||
TICC Capital (A) | 2,505 | 25 | ||||||
Tompkins Financial | 405 | 17 | ||||||
Tower Group International | 1,816 | 35 | ||||||
TowneBank | 1,394 | 20 | ||||||
Triangle Capital | 1,200 | 34 | ||||||
Trico Bancshares | 909 | 18 | ||||||
Trustco Bank | 4,626 | 26 | ||||||
Trustmark | 3,739 | 95 | ||||||
Two Harbors Investment ‡ | 18,740 | 207 | ||||||
UDR ‡ | 12,779 | 311 | ||||||
UMB Financial | 1,745 | 93 | ||||||
UMH Properties ‡ | 900 | 9 | ||||||
Umpqua Holdings | 4,793 | 65 | ||||||
| Description | Shares | Market Value ($ Thousands) | ||||||
Union First Market Bankshares | 681 | $ | 14 | |||||
United Bankshares (A) | 2,176 | 57 | ||||||
United Community Banks * | 2,074 | 25 | ||||||
United Financial Bancorp | 1,102 | 17 | ||||||
United Fire Group | 971 | 26 | ||||||
Universal Health Realty Income Trust ‡ | 516 | 23 | ||||||
Univest Corp of Pennsylvania | 923 | 17 | ||||||
Urstadt Biddle Properties, Cl A ‡ | 1,156 | 24 | ||||||
Validus Holdings | 5,426 | 196 | ||||||
Valley National Bancorp (A) | 10,772 | 100 | ||||||
ViewPoint Financial Group | 1,510 | 29 | ||||||
Virginia Commerce Bancorp * | 1,405 | 19 | ||||||
Virtus Investment Partners * | 308 | 71 | ||||||
Waddell & Reed Financial, Cl A | 4,502 | 207 | ||||||
Walker & Dunlop * | 223 | 4 | ||||||
Walter Investment Management * | 1,536 | 56 | ||||||
Washington Banking | 307 | 4 | ||||||
Washington Federal | 5,736 | 100 | ||||||
Washington Real Estate Investment Trust ‡ | 3,513 | 98 | ||||||
Washington Trust Bancorp | 470 | 13 | ||||||
Webster Financial | 3,051 | 71 | ||||||
Weingarten Realty Investors ‡ | 6,368 | 203 | ||||||
WesBanco | 1,165 | 29 | ||||||
West Bancorporation | 585 | 7 | ||||||
Westamerica Bancorporation (A) | 1,155 | 52 | ||||||
Western Alliance Bancorp * | 3,203 | 47 | ||||||
Western Asset Mortgage Capital ‡ | 949 | 17 | ||||||
Westfield Financial | 872 | 7 | ||||||
Westwood Holdings Group | 328 | 14 | ||||||
White Mountains Insurance Group | 255 | 151 | ||||||
Whitestone REIT ‡ | 277 | 5 | ||||||
Wilshire Bancorp | 3,163 | 21 | ||||||
Winthrop Realty Trust ‡ | 1,749 | 22 | ||||||
Wintrust Financial | 1,549 | 58 | ||||||
WisdomTree Investments * | 2,775 | 35 | ||||||
World Acceptance * | 376 | 35 | ||||||
WR Berkley | 5,824 | 239 | ||||||
WSFS Financial | 443 | 22 | ||||||
|
| |||||||
| 38,473 | ||||||||
|
| |||||||
Health Care — 10.3% | ||||||||
Abaxis | 1,093 | 48 | ||||||
ABIOMED * | 1,512 | 33 | ||||||
Acadia Healthcare * | 1,187 | 40 | ||||||
Accretive Health * | 2,633 | 30 | ||||||
Accuray * (A) | 3,863 | 21 | ||||||
Achillion Pharmaceuticals * | 3,398 | 28 | ||||||
Acorda Therapeutics * | 1,742 | 58 | ||||||
Aegerion Pharmaceuticals * | 1,506 | 110 | ||||||
Affymetrix (A) * | 1,360 | 5 | ||||||
Air Methods * | 2,177 | 82 | ||||||
Akorn * | 2,527 | 37 | ||||||
Alere * | 4,321 | 111 | ||||||
Align Technology * | 3,813 | 136 | ||||||
Alkermes * | 6,353 | 199 | ||||||
Allscripts Healthcare Solutions * | 9,253 | 128 | ||||||
Almost Family * | 309 | 6 | ||||||
Alnylam Pharmaceuticals * | 2,389 | 73 | ||||||
AMAG Pharmaceuticals * | 703 | 13 | ||||||
| 9 | SEI Institutional Investments Trust / Annual Report / May 31, 2013 |
Table of Contents
Schedule of Investments
Extended Market Index Fund
May 31, 2013
| Description | Shares | Market Value ($ Thousands) | ||||||
Amedisys * | 1,671 | $ | 21 | |||||
AMN Healthcare Services * | 2,009 | 27 | ||||||
Amsurg, Cl A * | 1,366 | 49 | ||||||
Analogic | 520 | 41 | ||||||
AngioDynamics * | 470 | 5 | ||||||
Anika Therapeutics * | 470 | 7 | ||||||
Antares Pharma * | 5,608 | 23 | ||||||
Arena Pharmaceuticals * (A) | 11,853 | 105 | ||||||
Ariad Pharmaceuticals * | 9,624 | 177 | ||||||
Arqule * | 2,366 | 6 | ||||||
Array BioPharma * | 5,460 | 32 | ||||||
ArthroCare * | 1,195 | 41 | ||||||
Assisted Living Concepts, Cl A * | 382 | 5 | ||||||
Astex Pharmaceuticals * | 4,685 | 23 | ||||||
athenahealth * | 1,892 | 160 | ||||||
AtriCure * | 720 | 7 | ||||||
Atrion | 130 | 29 | ||||||
Auxilium Pharmaceuticals * | 2,170 | 32 | ||||||
AVANIR Pharmaceuticals, Cl A * (A) | 7,847 | 26 | ||||||
AVEO Pharmaceuticals * | 2,378 | 6 | ||||||
BioDelivery Sciences International * | 1,800 | 8 | ||||||
BioMarin Pharmaceutical * | 6,246 | 392 | ||||||
Bio-Rad Laboratories, Cl A * | 1,053 | 120 | ||||||
Bio-Reference Labs * | 1,147 | 35 | ||||||
BioScrip * | 2,111 | 30 | ||||||
Brookdale Senior Living, Cl A * | 5,146 | 146 | ||||||
Bruker * | 3,932 | 65 | ||||||
Cadence Pharmaceuticals * | 3,058 | 20 | ||||||
Cambrex * | 1,760 | 24 | ||||||
Cantel Medical | 985 | 34 | ||||||
Capital Senior Living * | 1,312 | 34 | ||||||
Cardiovascular Systems * | 925 | 19 | ||||||
Catamaran * | 10,407 | 512 | ||||||
Celldex Therapeutics * | 3,556 | 45 | ||||||
Centene * | 2,759 | 137 | ||||||
Cepheid * | 3,569 | 124 | ||||||
Cerus * (A) | 1,897 | 10 | ||||||
Charles River Laboratories International * | 2,606 | 113 | ||||||
Chemed | 845 | 59 | ||||||
Chindex International * | 800 | 13 | ||||||
Clovis Oncology * | 666 | 24 | ||||||
Community Health Systems * | 4,795 | 231 | ||||||
Computer Programs & Systems | 502 | 25 | ||||||
Conceptus * | 1,169 | 36 | ||||||
CONMED | 1,208 | 40 | ||||||
Cooper | 2,434 | 275 | ||||||
Coronado Biosciences * | 730 | 7 | ||||||
Corvel * | 317 | 16 | ||||||
Covance * | 2,918 | 218 | ||||||
Cross Country Healthcare * | 1,079 | 6 | ||||||
CryoLife | 1,045 | 6 | ||||||
Cubist Pharmaceuticals * | 3,365 | 185 | ||||||
Curis * | 4,264 | 16 | ||||||
Cyberonics * | 1,146 | 55 | ||||||
Cynosure, Cl A * | 633 | 16 | ||||||
Cytori Therapeutics * | 2,432 | 6 | ||||||
Dendreon (A) * | 6,966 | 28 | ||||||
Depomed * | 3,055 | 18 | ||||||
Derma Sciences * | 483 | 6 | ||||||
| Description | Shares | Market Value ($ Thousands) | ||||||
DexCom * | 3,024 | $ | 63 | |||||
Dyax * | 4,982 | 16 | ||||||
Dynavax Technologies * | 9,390 | 25 | ||||||
Emergent Biosolutions * | 1,484 | 21 | ||||||
Emeritus * | 1,351 | 34 | ||||||
Endo Health Solutions * | 5,811 | 211 | ||||||
Endocyte * | 970 | 13 | ||||||
Endologix * | 2,495 | 34 | ||||||
Ensign Group | 818 | 30 | ||||||
Enzon Pharmaceuticals * | 1,506 | 5 | ||||||
Exact Sciences * | 2,954 | 33 | ||||||
Exactech * | 339 | 6 | ||||||
ExamWorks Group * | 1,445 | 27 | ||||||
Exelixis (A) * | 8,200 | 40 | ||||||
Five Star Quality Care * | 827 | 4 | ||||||
Fluidigm * | 753 | 13 | ||||||
Furiex Pharmaceuticals * | 542 | 20 | ||||||
Genomic Health * | 797 | 29 | ||||||
Gentiva Health Services * | 1,679 | 18 | ||||||
Geron * | 2,670 | 3 | ||||||
Globus Medical, Cl A * | 600 | 9 | ||||||
Greatbatch * | 830 | 27 | ||||||
GTx * | 2,700 | 16 | ||||||
Haemonetics * | 2,747 | 113 | ||||||
Halozyme Therapeutics * | 4,458 | 32 | ||||||
Hanger * | 1,509 | 48 | ||||||
Harvard Bioscience * | 1,037 | 5 | ||||||
HCA Holdings * | 8,480 | 331 | ||||||
Health Management Associates, Cl A * | 13,572 | 187 | ||||||
Health Net * | 4,470 | 142 | ||||||
HealthSouth * | 3,941 | 115 | ||||||
HealthStream * | 964 | 26 | ||||||
Healthways * | 1,721 | 23 | ||||||
HeartWare International * | 679 | 62 | ||||||
Henry Schein * | 4,443 | 428 | ||||||
Hill-Rom Holdings | 3,401 | 123 | ||||||
Hi-Tech Pharmacal * | 601 | 19 | ||||||
HMS Holdings * | 4,631 | 115 | ||||||
Hologic * | 13,655 | 283 | ||||||
ICU Medical * | 527 | 38 | ||||||
Idenix Pharmaceuticals * (A) | 5,394 | 26 | ||||||
Idexx Laboratories (A) * | 2,901 | 239 | ||||||
Illumina * | 6,279 | 442 | ||||||
ImmunoGen * | 3,552 | 65 | ||||||
Immunomedics * | 2,657 | 10 | ||||||
Impax Laboratories * | 2,988 | 57 | ||||||
Incyte (A) * | 5,171 | 115 | ||||||
Infinity Pharmaceuticals * | 1,294 | 35 | ||||||
Insulet * | 2,221 | 66 | ||||||
Integra LifeSciences Holdings * | 852 | 32 | ||||||
Intercept Pharmaceuticals * | 176 | 6 | ||||||
InterMune * | 3,672 | 36 | ||||||
Invacare | 1,589 | 25 | ||||||
IPC The Hospitalist * | 600 | 29 | ||||||
Ironwood Pharmaceuticals, Cl A * (A) | 3,254 | 43 | ||||||
Isis Pharmaceuticals (A) * | 5,994 | 130 | ||||||
Jazz Pharmaceuticals * | 2,234 | 152 | ||||||
Keryx Biopharmaceuticals * (A) | 3,794 | 30 | ||||||
Kindred Healthcare * | 2,465 | 33 | ||||||
Landauer | 473 | 25 | ||||||
| 10 | SEI Institutional Investments Trust / Annual Report / May 31, 2013 |
Table of Contents
Schedule of Investments
Extended Market Index Fund
May 31, 2013
| Description | Shares | Market Value ($ Thousands) | ||||||
Lannett * | 1,000 | $ | 11 | |||||
Lexicon Pharmaceuticals * | 10,540 | 25 | ||||||
LHC Group * | 784 | 17 | ||||||
LifePoint Hospitals * | 2,596 | 129 | ||||||
Ligand Pharmaceuticals, Cl B * | 828 | 25 | ||||||
Luminex * | 1,955 | 38 | ||||||
Magellan Health Services * | 1,140 | 62 | ||||||
MAKO Surgical * (A) | 2,028 | 25 | ||||||
MannKind (A) * | 6,643 | 44 | ||||||
Masimo * | 2,193 | 47 | ||||||
MedAssets * | 2,539 | 42 | ||||||
Medicines * | 3,057 | 98 | ||||||
Medidata Solutions * | 1,047 | 72 | ||||||
Medivation * | 3,804 | 185 | ||||||
MEDNAX * | 2,578 | 239 | ||||||
Merge Healthcare * | 2,399 | 8 | ||||||
Meridian Bioscience | 1,841 | 40 | ||||||
Merit Medical Systems * | 2,075 | 20 | ||||||
Mettler Toledo International * | 1,582 | 345 | ||||||
Molina Healthcare * (A) | 1,336 | 51 | ||||||
Momenta Pharmaceuticals * | 2,154 | 28 | ||||||
MWI Veterinary Supply * | 592 | 72 | ||||||
Myriad Genetics * | 4,326 | 139 | ||||||
National Healthcare | 494 | 23 | ||||||
National Research, Cl A * | 312 | 5 | ||||||
National Research, Cl B * | 52 | 2 | ||||||
Natus Medical * | 958 | 14 | ||||||
Navidea Biopharmaceuticals (A) * | 7,605 | 18 | ||||||
Nektar Therapeutics * | 4,995 | 47 | ||||||
Neogen * | 1,020 | 56 | ||||||
Neurocrine Biosciences * | 3,000 | 39 | ||||||
NewLink Genetics (A) * | 316 | 5 | ||||||
Novavax * | 6,953 | 13 | ||||||
NPS Pharmaceuticals * | 3,864 | 61 | ||||||
NuVasive * | 1,878 | 41 | ||||||
NxStage Medical * | 2,447 | 34 | ||||||
Omnicare (A) | 5,396 | 248 | ||||||
Omnicell * | 1,512 | 27 | ||||||
OncoGenex Pharmaceutical * | 535 | 6 | ||||||
Oncothyreon (A) * | 3,800 | 7 | ||||||
Onyx Pharmaceuticals * (A) | 3,660 | 349 | ||||||
Opko Health * (A) | 4,829 | 32 | ||||||
Optimer Pharmaceuticals (A) * | 1,660 | 25 | ||||||
OraSure Technologies * | 1,039 | 5 | ||||||
Orexigen Therapeutics * | 3,961 | 25 | ||||||
Orthofix International * | 840 | 23 | ||||||
Osiris Therapeutics * | 1,000 | 11 | ||||||
Owens & Minor (A) | 3,439 | 118 | ||||||
Pacira Pharmaceuticals * | 645 | 19 | ||||||
Pain Therapeutics * | 2,988 | 8 | ||||||
Palomar Medical Technologies * | 1,089 | 15 | ||||||
PAREXEL International * | 2,646 | 121 | ||||||
PDL BioPharma (A) | 6,100 | 50 | ||||||
Pharmacyclics * | 2,993 | 274 | ||||||
PharMerica * | 950 | 15 | ||||||
PhotoMedex * | 265 | 4 | ||||||
Pozen * | 1,028 | 5 | ||||||
Progenics Pharmaceuticals * | 1,496 | 6 | ||||||
Providence Service * | 958 | 25 | ||||||
QIAGEN * | 12,248 | 229 | ||||||
Quality Systems | 1,815 | 32 | ||||||
Questcor Pharmaceuticals | 2,931 | 100 | ||||||
| Description | Shares | Market Value ($ Thousands) | ||||||
Quidel * | 1,312 | $ | 31 | |||||
Raptor Pharmaceutical * | 2,707 | 21 | ||||||
Repligen * | 1,722 | 14 | ||||||
Repros Therapeutics * (A) | 942 | 16 | ||||||
ResMed (A) | 7,299 | 350 | ||||||
Rigel Pharmaceuticals * | 3,959 | 18 | ||||||
Rochester Medical * | 419 | 6 | ||||||
RTI Biologics * | 1,118 | 5 | ||||||
Sagent Pharmaceuticals * | 375 | 7 | ||||||
Salix Pharmaceuticals * | 3,257 | 198 | ||||||
Sangamo Biosciences * | 2,570 | 21 | ||||||
Santarus * | 2,389 | 53 | ||||||
Sciclone Pharmaceuticals * | 3,201 | 15 | ||||||
Seattle Genetics * | 5,000 | 172 | ||||||
Select Medical Holdings | 1,965 | 16 | ||||||
Sequenom * (A) | 5,717 | 24 | ||||||
Sirona Dental Systems * | 2,922 | 207 | ||||||
Solta Medical * | 2,684 | 6 | ||||||
Spectranetics * | 1,624 | 30 | ||||||
Spectrum Pharmaceuticals * | 2,979 | 24 | ||||||
Staar Surgical * | 2,378 | 21 | ||||||
STERIS | 3,098 | 140 | ||||||
Sunesis Pharmaceuticals * | 1,135 | 6 | ||||||
SurModics * | 644 | 15 | ||||||
Symmetry Medical * | 1,188 | 11 | ||||||
Synageva BioPharma * | 506 | 21 | ||||||
Synergy Pharmaceuticals * | 2,915 | 15 | ||||||
Synta Pharmaceuticals * (A) | 2,254 | 17 | ||||||
Team Health Holdings * | 1,208 | 47 | ||||||
Techne | 2,025 | 135 | ||||||
Teleflex | 2,202 | 172 | ||||||
TESARO * | 400 | 14 | ||||||
Theravance * | 3,309 | 116 | ||||||
Thoratec * | 3,227 | 101 | ||||||
Threshold Pharmaceuticals * | 895 | 5 | ||||||
Tornier * | 908 | 14 | ||||||
Triple-S Management, Cl B * | 1,166 | 25 | ||||||
Trius Therapeutics * | 1,185 | 9 | ||||||
Unilife (A) * | 6,571 | 22 | ||||||
United Therapeutics * | 2,564 | 170 | ||||||
Universal American * | 2,216 | 20 | ||||||
Universal Health Services, Cl B | 4,647 | 321 | ||||||
US Physical Therapy | 626 | 18 | ||||||
Utah Medical Products | 200 | 9 | ||||||
Vanda Pharmaceuticals * | 2,600 | 24 | ||||||
Vanguard Health Systems * | 1,588 | 21 | ||||||
Vascular Solutions * | 918 | 14 | ||||||
VCA Antech * | 4,683 | 120 | ||||||
Vertex Pharmaceuticals * | 10,442 | 839 | ||||||
Vical * | 4,189 | 15 | ||||||
ViroPharma * | 2,816 | 77 | ||||||
Vivus (A) * | 4,377 | 64 | ||||||
Vocera Communications * | 142 | 2 | ||||||
Volcano (A) * | 2,349 | 45 | ||||||
Warner Chilcott, Cl A | 8,873 | 170 | ||||||
WellCare Health Plans * | 2,366 | 123 | ||||||
West Pharmaceutical Services | 1,865 | 128 | ||||||
Wright Medical Group * | 1,959 | 49 | ||||||
XenoPort * | 2,416 | 13 | ||||||
XOMA * | 4,530 | 19 | ||||||
ZIOPHARM Oncology * (A) | 1,273 | 3 | ||||||
| 11 | SEI Institutional Investments Trust / Annual Report / May 31, 2013 |
Table of Contents
Schedule of Investments
Extended Market Index Fund
May 31, 2013
| Description | Shares | Market Value ($ Thousands) | ||||||
Zoetis (A) | 5,193 | $ | 166 | |||||
|
| |||||||
| 17,986 | ||||||||
|
| |||||||
Industrials — 14.6% | ||||||||
AAON | 645 | 21 | ||||||
AAR | 1,829 | 37 | ||||||
ABM Industries | 2,355 | 57 | ||||||
Acacia Research | 2,149 | 54 | ||||||
ACCO Brands * (A) | 5,129 | 37 | ||||||
Accuride * | 955 | 5 | ||||||
Aceto | 1,517 | 19 | ||||||
Actuant, Cl A * | 3,942 | 134 | ||||||
Acuity Brands | 2,246 | 169 | ||||||
Advisory Board * | 1,584 | 84 | ||||||
AECOM Technology * | 5,512 | 170 | ||||||
Aegion, Cl A * | 1,703 | 39 | ||||||
Aerovironment * | 925 | 19 | ||||||
AGCO | 5,023 | 279 | ||||||
Air Lease, Cl A (A) | 3,731 | 104 | ||||||
Air Transport Services Group * | 2,936 | 18 | ||||||
Aircastle | 2,557 | 40 | ||||||
Alamo Group | 335 | 14 | ||||||
Alaska Air Group * | 3,761 | 214 | ||||||
Albany International, Cl A | 1,198 | 38 | ||||||
Allegiant Travel, Cl A * | 650 | 60 | ||||||
Alliant Techsystems | 1,544 | 121 | ||||||
Altra Holdings | 1,189 | 34 | ||||||
AMERCO * | 400 | 69 | ||||||
Ameresco, Cl A * | 779 | 6 | ||||||
American Railcar Industries | 477 | 16 | ||||||
American Science & Engineering | 455 | 27 | ||||||
American Woodmark * | 484 | 18 | ||||||
Ametek | 12,295 | 530 | ||||||
Ampco-Pittsburgh | 333 | 6 | ||||||
AO Smith | 4,158 | 163 | ||||||
Apogee Enterprises | 1,311 | 35 | ||||||
Applied Industrial Technologies | 2,261 | 109 | ||||||
Argan * | 379 | 6 | ||||||
Arkansas Best | 1,390 | 26 | ||||||
Armstrong World Industries * | 877 | 46 | ||||||
Astec Industries | 963 | 34 | ||||||
Astronics * | 629 | 23 | ||||||
Atlas Air Worldwide Holdings * | 1,169 | 54 | ||||||
Avis Budget Group * | 5,560 | 184 | ||||||
AZZ | 1,096 | 45 | ||||||
Babcock & Wilcox | 5,924 | 176 | ||||||
Barnes Group | 2,352 | 71 | ||||||
Barrett Business Services | 434 | 25 | ||||||
BE Aerospace * | 5,030 | 319 | ||||||
Beacon Roofing Supply * | 2,570 | 106 | ||||||
Belden | 2,423 | 129 | ||||||
Blount International * | 2,285 | 31 | ||||||
Brady, Cl A | 2,227 | 72 | ||||||
Briggs & Stratton (A) | 2,149 | 50 | ||||||
Brink’s | 2,006 | 54 | ||||||
Builders FirstSource * | 2,470 | 17 | ||||||
CAI International * | 472 | 12 | ||||||
Capstone Turbine * | 16,835 | 19 | ||||||
Carlisle | 3,277 | 214 | ||||||
Casella Waste Systems, Cl A * | 1,391 | 6 | ||||||
CBIZ * | 745 | 5 | ||||||
CDI | 269 | 4 | ||||||
| Description | Shares | Market Value ($ Thousands) | ||||||
Celadon Group | 1,075 | $ | 21 | |||||
Chart Industries * | �� | 1,372 | 133 | |||||
Chicago Bridge & Iron | 5,392 | 341 | ||||||
CIRCOR International | 815 | 42 | ||||||
CLARCOR | 2,723 | 148 | ||||||
Clean Harbors * | 2,876 | 164 | ||||||
CNH Global * | 1,194 | 52 | ||||||
Coleman Cable | 800 | 15 | ||||||
Colfax * | 2,589 | 129 | ||||||
Columbus McKinnon * | 1,165 | 25 | ||||||
Comfort Systems USA | 1,291 | 18 | ||||||
Commercial Vehicle Group * | 492 | 4 | ||||||
Consolidated Graphics * | 444 | 21 | ||||||
Con-way | 3,068 | 117 | ||||||
Copa Holdings, Cl A | 1,728 | 227 | ||||||
Copart * | 5,350 | 184 | ||||||
Corporate Executive Board | 1,861 | 114 | ||||||
Covanta Holding | 5,858 | 120 | ||||||
CRA International * | 205 | 4 | ||||||
Crane | 2,629 | 157 | ||||||
Cubic | 689 | 33 | ||||||
Curtiss-Wright | 1,978 | 72 | ||||||
Delta Air Lines | 42,145 | 759 | ||||||
Deluxe | 2,754 | 103 | ||||||
DigitalGlobe * | 2,232 | 67 | ||||||
Donaldson | 7,746 | 291 | ||||||
Douglas Dynamics | 1,222 | 17 | ||||||
DXP Enterprises * | 362 | 21 | ||||||
Dycom Industries * | 1,507 | 34 | ||||||
Dynamic Materials | 265 | 4 | ||||||
Echo Global Logistics * | 786 | 14 | ||||||
EMCOR Group | 3,587 | 143 | ||||||
Encore Wire | 803 | 28 | ||||||
Energy Recovery * | 887 | 4 | ||||||
EnerNOC * | 860 | 11 | ||||||
EnerSys | 2,583 | 129 | ||||||
Engility Holdings * | 910 | 23 | ||||||
Ennis | 1,388 | 24 | ||||||
EnPro Industries * | 868 | 44 | ||||||
ESCO Technologies | 1,177 | 38 | ||||||
Esterline Technologies * | 1,690 | 124 | ||||||
Exelis | 10,028 | 122 | ||||||
ExOne * (A) | 400 | 20 | ||||||
Exponent | 643 | 36 | ||||||
Federal Signal * | 3,047 | 27 | ||||||
Flow International * | 1,744 | 7 | ||||||
Fortune Brands Home & Security | 8,173 | 346 | ||||||
Forward Air | 1,718 | 67 | ||||||
Franklin Covey * | 491 | 7 | ||||||
Franklin Electric | 1,981 | 67 | ||||||
FreightCar America | 233 | 4 | ||||||
FTI Consulting * | 1,768 | 67 | ||||||
FuelCell Energy (A) * | 5,961 | 8 | ||||||
Furmanite * | 737 | 5 | ||||||
G&K Services, Cl A | 839 | 40 | ||||||
Gardner Denver | 2,603 | 196 | ||||||
GATX | 2,552 | 127 | ||||||
GenCorp (A) * | 2,679 | 37 | ||||||
Generac Holdings * | 945 | 38 | ||||||
General Cable | 2,137 | 76 | ||||||
Genesee & Wyoming, Cl A * | 2,274 | 202 | ||||||
| 12 | SEI Institutional Investments Trust / Annual Report / May 31, 2013 |
Table of Contents
Schedule of Investments
Extended Market Index Fund
May 31, 2013
| Description | Shares | Market Value ($ Thousands) | ||||||
Gibraltar Industries * | 1,460 | $ | 24 | |||||
Global Power Equipment Group | 930 | 15 | ||||||
Gorman-Rupp | 782 | 23 | ||||||
GP Strategies * | 782 | 20 | ||||||
Graco | 3,135 | 202 | ||||||
GrafTech International (A) * | 5,217 | 44 | ||||||
Graham | 196 | 5 | ||||||
Granite Construction | 1,711 | 53 | ||||||
Great Lakes Dredge & Dock | 1,880 | 16 | ||||||
Greenbrier * | 1,123 | 26 | ||||||
Griffon | 2,137 | 25 | ||||||
H&E Equipment Services * | 1,325 | 30 | ||||||
Hardinge | 463 | 6 | ||||||
Harsco | 4,428 | 103 | ||||||
Hawaiian Holdings * | 2,880 | 17 | ||||||
Healthcare Services Group | 2,839 | 64 | ||||||
Heartland Express | 2,172 | 31 | ||||||
Heico | 2,785 | 141 | ||||||
Heidrick & Struggles International | 1,352 | 19 | ||||||
Herman Miller | 2,443 | 69 | ||||||
Hertz Global Holdings * | 12,814 | 331 | ||||||
Hexcel * | 4,598 | 160 | ||||||
HNI | 1,949 | 72 | ||||||
Houston Wire & Cable | 355 | 5 | ||||||
Hub Group, Cl A * | 1,562 | 57 | ||||||
Hubbell, Cl B | 3,089 | 310 | ||||||
Huntington Ingalls Industries | 2,259 | 125 | ||||||
Hurco * | 235 | 7 | ||||||
Huron Consulting Group * | 1,011 | 45 | ||||||
Hyster-Yale Materials Handling | 502 | 31 | ||||||
ICF International * | 968 | 29 | ||||||
IDEX | 4,341 | 239 | ||||||
IHS, Cl A * | 2,599 | 273 | ||||||
II-VI * | 2,343 | 39 | ||||||
InnerWorkings * | 1,587 | 17 | ||||||
Insperity | 1,012 | 30 | ||||||
Insteel Industries | 941 | 17 | ||||||
Interface, Cl A | 2,545 | 43 | ||||||
ITT | 4,963 | 150 | ||||||
JB Hunt Transport Services | 4,649 | 342 | ||||||
JetBlue Airways * (A) | 9,981 | 62 | ||||||
John Bean Technologies | 1,331 | 29 | ||||||
Kadant | 625 | 19 | ||||||
Kaman | 1,173 | 40 | ||||||
KAR Auction Services | 1,329 | 31 | ||||||
Kaydon | 1,477 | 40 | ||||||
KBR | 7,645 | 276 | ||||||
Kelly Services, Cl A | 1,295 | 23 | ||||||
Kennametal | 4,214 | 183 | ||||||
KEYW Holding * | 1,268 | 19 | ||||||
Kforce * | 937 | 14 | ||||||
Kirby * | 2,926 | 228 | ||||||
Knight Transportation | 2,537 | 43 | ||||||
Knoll | 2,163 | 34 | ||||||
Korn/Ferry International * | 2,158 | 38 | ||||||
Kratos Defense & Security Solutions * | 1,516 | 9 | ||||||
Landstar System | 2,544 | 134 | ||||||
Layne Christensen * | 969 | 21 | ||||||
LB Foster, Cl A | 471 | 21 | ||||||
Lennox International | 2,729 | 175 | ||||||
| Description | Shares | Market Value ($ Thousands) | ||||||
Lincoln Electric Holdings | 4,333 | $ | 259 | |||||
Lindsay Manufacturing | 527 | 43 | ||||||
LMI Aerospace * | 181 | 3 | ||||||
LSI Industries | 2,000 | 16 | ||||||
Lydall * | 332 | 5 | ||||||
Manitowoc | 7,050 | 148 | ||||||
Manpowergroup | 4,156 | 238 | ||||||
Marten Transport | 797 | 19 | ||||||
MasTec (A) * | 2,362 | 75 | ||||||
Matson | 1,852 | 47 | ||||||
McGrath RentCorp | 1,148 | 38 | ||||||
Meritor * | 4,895 | 35 | ||||||
Met-Pro | 608 | 8 | ||||||
Michael Baker | 173 | 5 | ||||||
Middleby * | 975 | 159 | ||||||
Miller Industries | 411 | 7 | ||||||
Mine Safety Appliances | 1,144 | 57 | ||||||
Mistras Group * | 897 | 19 | ||||||
Mobile Mini * | 1,683 | 57 | ||||||
Moog, Cl A * | 2,424 | 121 | ||||||
MRC Global * | 1,012 | 29 | ||||||
MSC Industrial Direct, Cl A | 2,403 | 199 | ||||||
Mueller Industries | 854 | 46 | ||||||
Mueller Water Products, Cl A | 6,912 | 53 | ||||||
Multi-Color | 757 | 22 | ||||||
MYR Group * | 979 | 20 | ||||||
NACCO Industries, Cl A | 305 | 17 | ||||||
National Presto Industries | 191 | 15 | ||||||
Navigant Consulting * | 2,341 | 31 | ||||||
Navistar International * | 3,791 | 136 | ||||||
NCI Building Systems * | 948 | 14 | ||||||
Nielsen Holdings | 6,367 | 216 | ||||||
NN * | 687 | 6 | ||||||
Nordson | 3,312 | 236 | ||||||
Nortek * | 342 | 24 | ||||||
Northwest Pipe * | 186 | 5 | ||||||
Odyssey Marine Exploration * (A) | 1,425 | 5 | ||||||
Old Dominion Freight Line * | 3,790 | 163 | ||||||
On Assignment * | 1,869 | 49 | ||||||
Orbital Sciences * | 2,558 | 46 | ||||||
Orion Marine Group * | 1,874 | 22 | ||||||
Oshkosh Truck * | 4,817 | 192 | ||||||
Owens Corning * | 6,260 | 274 | ||||||
Pacer International * | 1,424 | 9 | ||||||
Park-Ohio Holdings * | 318 | 12 | ||||||
Patriot Transportation Holding * | 238 | 7 | ||||||
Pendrell * | 8,751 | 21 | ||||||
PGT * | 1,300 | 11 | ||||||
Pike Electric * | 938 | 11 | ||||||
Polypore International * (A) | 2,560 | 96 | ||||||
Powell Industries * | 264 | 12 | ||||||
Preformed Line Products | 90 | 6 | ||||||
Primoris Services | 1,347 | 29 | ||||||
Proto Labs * (A) | 299 | 16 | ||||||
Quad, Cl A (A) | 1,162 | 27 | ||||||
Quality Distribution * | 810 | 7 | ||||||
Quanex Building Products | 1,765 | 33 | ||||||
Raven Industries | 1,555 | 47 | ||||||
RBC Bearings * | 995 | 49 | ||||||
Regal-Beloit | 2,225 | 150 | ||||||
Republic Airways Holdings * | 2,296 | 25 | ||||||
Resources Connection | 1,981 | 22 | ||||||
| 13 | SEI Institutional Investments Trust / Annual Report / May 31, 2013 |
Table of Contents
Schedule of Investments
Extended Market Index Fund
May 31, 2013
| Description | Shares | Market Value ($ Thousands) | ||||||
Rexnord * | 1,326 | $ | 26 | |||||
Roadrunner Transportation Systems * | 772 | 21 | ||||||
Rollins | 2,675 | 68 | ||||||
RPX * | 1,210 | 19 | ||||||
RR Donnelley & Sons (A) | 9,672 | 128 | ||||||
Rush Enterprises, Cl A * | 1,499 | 38 | ||||||
Saia * | 595 | 28 | ||||||
Simpson Manufacturing (A) | 1,743 | 51 | ||||||
SkyWest | 2,322 | 33 | ||||||
SolarCity * | 431 | 19 | ||||||
Spirit Aerosystems Holdings, Cl A * | 6,375 | 138 | ||||||
Spirit Airlines * | 1,847 | 56 | ||||||
SPX | 2,494 | 197 | ||||||
Standard Parking * | 798 | 18 | ||||||
Standex International | 529 | 28 | ||||||
Steelcase, Cl A | 3,357 | 46 | ||||||
Sterling Construction * | 591 | 6 | ||||||
Sun Hydraulics | 977 | 32 | ||||||
Swift Transporation, Cl A * | 3,409 | 57 | ||||||
Swisher Hygiene (A) * | 4,332 | 4 | ||||||
Sykes Enterprises * | 1,811 | 29 | ||||||
TAL International Group | 1,284 | 54 | ||||||
Taser International * | 2,669 | 25 | ||||||
Team * | 857 | 31 | ||||||
Teledyne Technologies * | 1,937 | 150 | ||||||
Tennant | 838 | 41 | ||||||
Terex * | 5,770 | 207 | ||||||
Tetra Tech * | 3,542 | 98 | ||||||
Textainer Group Holdings | 653 | 24 | ||||||
Thermon Group Holdings * | 782 | 15 | ||||||
Timken | 4,509 | 256 | ||||||
Titan International | 2,372 | 55 | ||||||
Titan Machinery * (A) | 812 | 17 | ||||||
TMS International, Cl A | 472 | 7 | ||||||
Toro | 3,200 | 152 | ||||||
Towers Watson, Cl A | 3,133 | 243 | ||||||
TransDigm Group * | 2,605 | 381 | ||||||
Trex * | 670 | 37 | ||||||
Trimas * | 1,376 | 44 | ||||||
Trinity Industries | 4,271 | 175 | ||||||
Triumph Group | 2,596 | 202 | ||||||
TrueBlue * | 1,828 | 43 | ||||||
Tutor Perini * | 1,651 | 31 | ||||||
Twin Disc | 170 | 4 | ||||||
UniFirst | 640 | 61 | ||||||
United Continental Holdings * | 16,952 | 550 | ||||||
United Rentals (A) * | 4,847 | 275 | ||||||
United Stationers | 1,737 | 60 | ||||||
Universal Forest Products | 855 | 34 | ||||||
URS | 3,971 | 192 | ||||||
US Airways Group (A) * | 8,623 | 151 | ||||||
US Ecology | 640 | 17 | ||||||
USG * | 3,982 | 109 | ||||||
UTi Worldwide | 4,395 | 70 | ||||||
Valmont Industries | 1,214 | 185 | ||||||
Verisk Analytics, Cl A * | 7,472 | 439 | ||||||
Viad | 971 | 24 | ||||||
Wabash National * | 3,141 | 33 | ||||||
WABCO Holdings * | 3,310 | 250 | ||||||
Wabtec | 2,453 | 270 | ||||||
| Description | Shares | Market Value ($ Thousands) | ||||||
WageWorks * | 271 | $ | 8 | |||||
Waste Connections | 6,403 | 258 | ||||||
Watsco | 1,559 | 136 | ||||||
Watts Water Technologies, Cl A | 1,256 | 60 | ||||||
Werner Enterprises | 1,890 | 47 | ||||||
Wesco Aircraft Holdings * | 946 | 17 | ||||||
WESCO International (A) * | 2,266 | 168 | ||||||
Woodward Governor | 3,642 | 143 | ||||||
XPO Logistics * | 937 | 16 | ||||||
|
| |||||||
| 25,362 | ||||||||
|
| |||||||
Information Technology — 14.2% | ||||||||
3D Systems * | 4,447 | 216 | ||||||
Accelrys * | 2,620 | 22 | ||||||
ACI Worldwide * | 2,204 | 103 | ||||||
Active Network (A) * | 1,442 | 10 | ||||||
Activision Blizzard | 21,806 | 315 | ||||||
Actuate | 2,744 | 19 | ||||||
Acxiom * | 3,274 | 72 | ||||||
ADTRAN | 2,797 | 65 | ||||||
Advanced Energy Industries * | 1,819 | 33 | ||||||
Advent Software * | 1,368 | 45 | ||||||
Aeroflex Holding * | 729 | 6 | ||||||
Agilysys * | 900 | 10 | ||||||
Alliance Data Systems * (A) | 2,589 | 458 | ||||||
Alpha & Omega Semiconductor * | 1,100 | 9 | ||||||
Amdocs | 8,668 | 309 | ||||||
American Software, Cl A | 472 | 4 | ||||||
Amkor Technology (A) * | 4,013 | 18 | ||||||
ANADIGICS * | 2,864 | 6 | ||||||
Anaren * | 757 | 18 | ||||||
Angie’s List * | 1,648 | 39 | ||||||
Anixter International * | 1,541 | 118 | ||||||
Ansys * | 4,817 | 359 | ||||||
AOL * | 3,465 | 120 | ||||||
Applied Micro Circuits * | 3,298 | 25 | ||||||
ARRIS Group * | 6,270 | 95 | ||||||
Arrow Electronics * | 5,525 | 220 | ||||||
Aruba Networks * | 6,139 | 92 | ||||||
ASML Holding, Cl G | 1,514 | 123 | ||||||
Aspen Technology * | 4,967 | 152 | ||||||
Atmel * | 23,382 | 184 | ||||||
ATMI * | 1,478 | 35 | ||||||
Avago Technologies, Cl A | 12,468 | 470 | ||||||
Aviat Networks * | 1,216 | 3 | ||||||
Avid Technology * | 597 | 4 | ||||||
Avnet * | 7,099 | 243 | ||||||
AVX | 2,278 | 27 | ||||||
Axcelis Technologies * | 7,300 | 12 | ||||||
Badger Meter | 662 | 29 | ||||||
Bankrate * | 2,149 | 31 | ||||||
Bel Fuse, Cl B | 388 | 6 | ||||||
Benchmark Electronics * | 2,530 | 49 | ||||||
Black Box | 1,009 | 27 | ||||||
Blackbaud | 1,955 | 59 | ||||||
Blucora * | 1,829 | 33 | ||||||
Booz Allen Hamilton Holding, Cl A | 1,265 | 22 | ||||||
Bottomline Technologies * | 1,671 | 46 | ||||||
Broadridge Financial Solutions | 6,597 | 179 | ||||||
BroadSoft (A) * | 1,294 | 36 | ||||||
| 14 | SEI Institutional Investments Trust / Annual Report / May 31, 2013 |
Table of Contents
Schedule of Investments
Extended Market Index Fund
May 31, 2013
| Description | Shares | Market Value ($ Thousands) | ||||||
Brocade Communications Systems * | 24,647 | $ | 134 | |||||
Brooks Automation | 3,003 | 32 | ||||||
Cabot Microelectronics * | 1,024 | 37 | ||||||
CACI International, Cl A * | 932 | 60 | ||||||
Cadence Design Systems * | 14,347 | 217 | ||||||
CalAmp * | 1,856 | 24 | ||||||
Calix * | 2,145 | 22 | ||||||
Callidus Software * | 1,356 | 8 | ||||||
Cardtronics * | 1,885 | 54 | ||||||
Cass Information Systems | 490 | 22 | ||||||
Cavium * | 2,131 | 70 | ||||||
Ceva * | 1,338 | 22 | ||||||
Checkpoint Systems * | 1,945 | 27 | ||||||
CIBER * | 3,887 | 16 | ||||||
Ciena * | 4,186 | 70 | ||||||
Cirrus Logic * | 2,795 | 51 | ||||||
Cognex | 2,379 | 107 | ||||||
Coherent * | 1,053 | 60 | ||||||
Cohu | 477 | 5 | ||||||
CommVault Systems * | 2,384 | 167 | ||||||
Computer Task Group | 792 | 18 | ||||||
Compuware | 11,660 | 131 | ||||||
comScore * | 1,647 | 33 | ||||||
Comtech Telecommunications | 832 | 22 | ||||||
Comverse * | 1,000 | 30 | ||||||
Concur Technologies * | 2,411 | 195 | ||||||
Constant Contact * | 1,566 | 23 | ||||||
Convergys | 5,987 | 109 | ||||||
CoreLogic * | 5,183 | 136 | ||||||
Cornerstone OnDemand (A) * | 1,499 | 61 | ||||||
CoStar Group * | 1,463 | 164 | ||||||
Cray * | 1,770 | 32 | ||||||
Cree * | 5,923 | 369 | ||||||
CSG Systems International * | 1,517 | 33 | ||||||
CTS | 2,045 | 25 | ||||||
Cypress Semiconductor | 6,095 | 69 | ||||||
Daktronics | 2,080 | 21 | ||||||
Datalink * | 597 | 7 | ||||||
Dealertrack Technologies * | 1,800 | 58 | ||||||
Demand Media * | 1,687 | 14 | ||||||
Demandware * | 245 | 8 | ||||||
Dice Holdings * | 2,190 | 20 | ||||||
Diebold | 3,433 | 111 | ||||||
Digi International * | 501 | 5 | ||||||
Digimarc | 276 | 6 | ||||||
Digital River * | 1,777 | 31 | ||||||
Diodes * | 1,642 | 39 | ||||||
Dolby Laboratories, Cl A (A) * | 2,604 | 91 | ||||||
DSP Group * | 862 | 7 | ||||||
DST Systems | 1,750 | 119 | ||||||
DTS * | 1,044 | 21 | ||||||
EarthLink | 5,033 | 30 | ||||||
Ebix | 1,425 | 28 | ||||||
EchoStar, Cl A * | 1,803 | 72 | ||||||
Electro Rent | 1,059 | 18 | ||||||
Electro Scientific Industries | 445 | 5 | ||||||
Electronics for Imaging * | 2,028 | 57 | ||||||
Ellie Mae * | 1,163 | 26 | ||||||
Emulex * | 4,088 | 25 | ||||||
Entegris * | 5,908 | 62 | ||||||
Entropic Communications * | 5,249 | 22 | ||||||
| Description | Shares | Market Value ($ Thousands) | ||||||
Envestnet * | 1,195 | $ | 27 | |||||
EPIQ Systems | 1,590 | 19 | ||||||
ePlus * | 144 | 7 | ||||||
Equinix * | 2,398 | 486 | ||||||
Euronet Worldwide * | 2,188 | 67 | ||||||
ExactTarget * | 193 | 4 | ||||||
Exar * | 1,892 | 21 | ||||||
ExlService Holdings * | 1,023 | 30 | ||||||
Extreme Networks * | 5,087 | 18 | ||||||
Fabrinet * | 1,215 | 18 | ||||||
Facebook, Cl A * | 21,469 | 523 | ||||||
FactSet Research Systems (A) | 2,386 | 234 | ||||||
Fair Isaac | 1,491 | 73 | ||||||
Fairchild Semiconductor International, Cl A * | 7,009 | 102 | ||||||
FARO Technologies * | 608 | 23 | ||||||
FEI | 2,052 | 148 | ||||||
Finisar * (A) | 3,954 | 52 | ||||||
FleetCor Technologies * | 2,573 | 224 | ||||||
FleetMatics Group * | 178 | 5 | ||||||
FormFactor * | 3,767 | 22 | ||||||
Forrester Research | 664 | 24 | ||||||
Fortinet * | 6,999 | 135 | ||||||
Freescale Semiconductor * (A) | 2,307 | 37 | ||||||
Fusion-io (A) * | 2,902 | 42 | ||||||
Gartner * | 4,837 | 274 | ||||||
Genpact * | 6,750 | 131 | ||||||
Global Cash Access Holdings * | 3,316 | 22 | ||||||
Global Payments | 4,128 | 198 | ||||||
Globecomm Systems * | 1,244 | 16 | ||||||
Glu Mobile (A) * | 3,700 | 10 | ||||||
GSI Group * | 562 | 5 | ||||||
GT Advanced Technologies * (A) | 6,229 | 28 | ||||||
Guidance Software * | 594 | 5 | ||||||
Guidewire Software * | 769 | 31 | ||||||
Harmonic * | 5,434 | 33 | ||||||
Heartland Payment Systems | 2,011 | 64 | ||||||
Higher One Holdings * (A) | 1,534 | 17 | ||||||
Hittite Microwave * | 1,717 | 93 | ||||||
IAC | 4,121 | 200 | ||||||
iGATE * | 1,486 | 22 | ||||||
Immersion * | 1,567 | 24 | ||||||
Imperva * | 483 | 19 | ||||||
Infinera * (A) | 5,184 | 55 | ||||||
Infoblox * | 303 | 7 | ||||||
Informatica * | 5,685 | 207 | ||||||
Ingram Micro, Cl A * | 8,146 | 156 | ||||||
Inphi * | 462 | 5 | ||||||
Insight Enterprises * | 1,998 | 38 | ||||||
Integrated Device Technology * | 6,245 | 53 | ||||||
Integrated Silicon Solution * | 1,905 | 21 | ||||||
Interactive Intelligence Group * | 668 | 34 | ||||||
InterDigital | 2,230 | 103 | ||||||
Intermec * | 2,795 | 28 | ||||||
Internap Network Services * | 2,584 | 21 | ||||||
International Rectifier * (A) | 3,006 | 66 | ||||||
Intersil, Cl A | 5,572 | 46 | ||||||
IntraLinks Holdings * | 726 | 4 | ||||||
InvenSense, Cl A * (A) | 1,877 | 24 | ||||||
IPG Photonics * | 1,720 | 102 | ||||||
Itron * | 1,711 | 72 | ||||||
Ixia * | 1,858 | 29 | ||||||
| 15 | SEI Institutional Investments Trust / Annual Report / May 31, 2013 |
Table of Contents
Schedule of Investments
Extended Market Index Fund
May 31, 2013
| Description | Shares | Market Value ($ Thousands) | ||||||
IXYS | 480 | $ | 5 | |||||
j2 Global (A) | 1,957 | 80 | ||||||
Jack Henry & Associates | 4,519 | 212 | ||||||
Jive Software * | 1,234 | 21 | ||||||
Kemet * | 2,462 | 11 | ||||||
Keynote Systems | 308 | 4 | ||||||
Kopin * | 1,323 | 5 | ||||||
KVH Industries * | 297 | 4 | ||||||
Lattice Semiconductor * | 5,462 | 28 | ||||||
Lender Processing Services | 4,512 | 149 | ||||||
Lexmark International, Cl A (A) | 3,380 | 103 | ||||||
LinkedIn, Cl A * | 3,306 | 554 | ||||||
Lionbridge Technologies * | 1,118 | 3 | ||||||
Liquidity Services * (A) | 1,222 | 49 | ||||||
Littelfuse | 903 | 66 | ||||||
LivePerson * | 2,491 | 23 | ||||||
LogMeIn * | 1,113 | 28 | ||||||
LTX-Credence * | 2,741 | 16 | ||||||
Manhattan Associates * | 870 | 65 | ||||||
ManTech International, Cl A | 822 | 22 | ||||||
Market Leader * | 833 | 9 | ||||||
Marvell Technology Group | 21,402 | 232 | ||||||
Maxim Integrated Products | 14,904 | 440 | ||||||
MAXIMUS | 1,858 | 139 | ||||||
MaxLinear, Cl A * | 2,300 | 15 | ||||||
Maxwell Technologies * | 564 | 4 | ||||||
Measurement Specialties * | 677 | 30 | ||||||
MEMC Electronic Materials * | 10,109 | 82 | ||||||
Mentor Graphics | 5,140 | 98 | ||||||
Mercury Systems * | 2,123 | 19 | ||||||
Methode Electronics | 1,284 | 20 | ||||||
Micrel | 2,393 | 24 | ||||||
Micros Systems * | 4,271 | 180 | ||||||
Microsemi * | 4,814 | 106 | ||||||
MicroStrategy, Cl A * | 353 | 32 | ||||||
Mindspeed Technologies * (A) | 1,400 | 5 | ||||||
MKS Instruments | 2,223 | 63 | ||||||
MoneyGram International * | 1,105 | 22 | ||||||
Monolithic Power Systems * | 1,451 | 36 | ||||||
Monotype Imaging Holdings | 1,660 | 38 | ||||||
Monster Worldwide * | 5,608 | 31 | ||||||
MoSys * | 2,200 | 10 | ||||||
Move * | 1,935 | 22 | ||||||
MTS Systems | 689 | 42 | ||||||
Nanometrics * | 1,244 | 18 | ||||||
National Instruments | 4,967 | 141 | ||||||
NCR * | 8,183 | 273 | ||||||
NETGEAR * | 1,592 | 53 | ||||||
Netscout Systems * | 1,658 | 40 | ||||||
NetSuite * | 1,803 | 158 | ||||||
NeuStar, Cl A * | 3,532 | 171 | ||||||
Newport * | 1,795 | 24 | ||||||
NIC * | 2,822 | 47 | ||||||
Nuance Communications (A) * | 12,581 | 239 | ||||||
Numerex, Cl A * | 477 | 5 | ||||||
NVE * | 94 | 5 | ||||||
OmniVision Technologies * | 2,342 | 43 | ||||||
ON Semiconductor * | 23,800 | 204 | ||||||
OpenTable * | 1,226 | 82 | ||||||
Oplink Communications * | 1,066 | 18 | ||||||
OSI Systems * | 868 | 50 | ||||||
Palo Alto Networks * | 333 | 16 | ||||||
| Description | Shares | Market Value ($ Thousands) | ||||||
Pandora Media (A) * | 4,371 | $ | 74 | |||||
Park Electrochemical | 982 | 24 | ||||||
Parkervision * (A) | 4,352 | 19 | ||||||
PC Connection * | 831 | 14 | ||||||
PDF Solutions * | 1,453 | 27 | ||||||
Pegasystems | 818 | 26 | ||||||
Perficient * | 1,900 | 24 | ||||||
Pericom Semiconductor * | 911 | 6 | ||||||
Photronics * | 3,129 | 24 | ||||||
Plantronics | 2,269 | 105 | ||||||
Plexus * | 1,528 | 45 | ||||||
PLX Technology * | 889 | 4 | ||||||
PMC - Sierra * | 8,954 | 54 | ||||||
Polycom * | 9,747 | 110 | ||||||
Power Integrations | 1,389 | 59 | ||||||
Power-One * | 3,384 | 21 | ||||||
PRGX Global * | 936 | 5 | ||||||
Procera Networks * | 1,381 | 20 | ||||||
Progress Software * | 2,458 | 58 | ||||||
PROS Holdings * | 999 | 29 | ||||||
PTC * | 6,390 | 160 | ||||||
QLIK Technologies * | 4,525 | 139 | ||||||
QLogic * | 4,022 | 39 | ||||||
Quantum * (A) | 12,478 | 19 | ||||||
QuinStreet * | 1,186 | 9 | ||||||
Rackspace Hosting * | 5,677 | 213 | ||||||
Rambus * | 5,110 | 40 | ||||||
RealD (A) * | 1,964 | 30 | ||||||
RealNetworks * | 844 | 6 | ||||||
RealPage * (A) | 1,646 | 31 | ||||||
Responsys * | 1,990 | 19 | ||||||
RF Micro Devices * | 11,847 | 65 | ||||||
Richardson Electronics | 515 | 6 | ||||||
Riverbed Technology * | 8,750 | 135 | ||||||
Rofin-Sinar Technologies * | 1,315 | 35 | ||||||
Rogers * | 693 | 32 | ||||||
Rosetta Stone * | 700 | 12 | ||||||
Rovi * | 5,534 | 143 | ||||||
Ruckus Wireless (A) * | 317 | 4 | ||||||
Rudolph Technologies * | 1,707 | 21 | ||||||
Sanmina * | 3,566 | 48 | ||||||
Sapient * | 5,254 | 68 | ||||||
ScanSource * | 1,196 | 38 | ||||||
SciQuest * | 538 | 12 | ||||||
Seachange International * | 1,543 | 17 | ||||||
Semtech * | 3,475 | 127 | ||||||
ServiceNow * | 569 | 21 | ||||||
ServiceSource International * | 2,646 | 22 | ||||||
ShoreTel * | 970 | 4 | ||||||
Sigma Designs * | 1,313 | 6 | ||||||
Silicon Graphics International * | 1,590 | 24 | ||||||
Silicon Image * | 4,561 | 28 | ||||||
Silicon Laboratories * | 2,382 | 102 | ||||||
Skyworks Solutions * | 9,865 | 235 | ||||||
SolarWinds * | 3,260 | 137 | ||||||
Solera Holdings | 3,627 | 199 | ||||||
Sonus Networks * | 10,101 | 32 | ||||||
Sourcefire * | 1,678 | 94 | ||||||
Spansion, Cl A * | 2,282 | 31 | ||||||
Splunk * | 684 | 32 | ||||||
SPS Commerce * | 429 | 23 | ||||||
SS&C Technologies Holdings * | 1,509 | 48 | ||||||
| 16 | SEI Institutional Investments Trust / Annual Report / May 31, 2013 |
Table of Contents
Schedule of Investments
Extended Market Index Fund
May 31, 2013
| Description | Shares | Market Value ($ Thousands) | ||||||
Stamps.com * | 655 | $ | 25 | |||||
STEC * | 1,327 | 5 | ||||||
Stratasys (A) * | 1,669 | 140 | ||||||
SunPower, Cl A (A) * | 2,036 | 39 | ||||||
Super Micro Computer * | 1,651 | 17 | ||||||
Supertex * | 203 | 4 | ||||||
support.com * | 981 | 5 | ||||||
Symmetricom * | 833 | 4 | ||||||
Synaptics * | 1,487 | 61 | ||||||
Synchronoss Technologies * | 1,197 | 38 | ||||||
SYNNEX * | 1,170 | 47 | ||||||
Synopsys * | 7,952 | 290 | ||||||
Syntel * | 677 | 43 | ||||||
Take-Two Interactive Software * | 3,339 | 56 | ||||||
Tangoe * | 1,555 | 23 | ||||||
Tech Data * | 2,065 | 103 | ||||||
TeleTech Holdings * | 727 | 16 | ||||||
Tellabs | 16,613 | 34 | ||||||
Telular * | 635 | 8 | ||||||
Tessera Technologies | 2,330 | 48 | ||||||
TIBCO Software * | 8,648 | 184 | ||||||
TiVo * | 5,286 | 68 | ||||||
Travelzoo * | 287 | 8 | ||||||
Trimble Navigation * | 12,820 | 358 | ||||||
TriQuint Semiconductor * | 7,539 | 53 | ||||||
Trulia * | 249 | 8 | ||||||
TTM Technologies * | 2,787 | 23 | ||||||
Tyler Technologies * | 1,587 | 110 | ||||||
Ubiquiti Networks * | 600 | 11 | ||||||
Ultimate Software Group * | 1,535 | 171 | ||||||
Ultra Clean Holdings * | 1,052 | 6 | ||||||
Ultratech * | 1,168 | 43 | ||||||
Unisys * | 1,883 | 39 | ||||||
United Online | 4,262 | 29 | ||||||
Universal Display * | 1,708 | 51 | ||||||
Unwired Planet * | 3,218 | 7 | ||||||
Valueclick * | 4,094 | 108 | ||||||
Vantiv, Cl A * | 1,708 | 45 | ||||||
Vasco Data Security International * | 554 | 5 | ||||||
Veeco Instruments * | 2,201 | 93 | ||||||
VeriFone Holdings * | 5,729 | 134 | ||||||
Verint Systems * | 2,250 | 76 | ||||||
ViaSat * | 1,956 | 137 | ||||||
VirnetX Holding (A) * | 1,842 | 44 | ||||||
Virtusa * | 949 | 22 | ||||||
Vishay Intertechnology (A) * | 7,217 | 105 | ||||||
Vishay Precision Group * | 464 | 7 | ||||||
VistaPrint (A) * | 1,499 | 69 | ||||||
VMware, Cl A * | 4,517 | 321 | ||||||
Vocus * | 398 | 3 | ||||||
Volterra Semiconductor * | 1,475 | 21 | ||||||
Web.com Group * | 1,639 | 34 | ||||||
WebMD Health, Cl A * | 2,193 | 65 | ||||||
Websense * | 1,781 | 44 | ||||||
WEX * | 2,076 | 153 | ||||||
Workday, Cl A * | 1,089 | 70 | ||||||
XO Group * | 1,415 | 15 | ||||||
Xoom * | 670 | 12 | ||||||
Yelp, Cl A * | 298 | 9 | ||||||
Zebra Technologies, Cl A * | 2,764 | 126 | ||||||
Zillow, Cl A (A) * | 137 | 8 | ||||||
| Description | Shares | Market Value ($ Thousands) | ||||||
Zix * | 1,213 | $ | 5 | |||||
Zygo * | 320 | 5 | ||||||
Zynga, Cl A * | 4,674 | 16 | ||||||
|
| |||||||
| 24,653 | ||||||||
|
| |||||||
Materials — 5.5% | ||||||||
A. Schulman | 1,329 | 38 | ||||||
ADA-ES * | 677 | 25 | ||||||
AEP Industries * | 180 | 15 | ||||||
AK Steel Holding (A) * | 6,900 | 24 | ||||||
Albemarle | 4,643 | 311 | ||||||
Allied Nevada Gold * | 3,878 | 30 | ||||||
AM Castle * | 923 | 16 | ||||||
AMCOL International | 1,156 | 37 | ||||||
American Vanguard | 1,199 | 37 | ||||||
Aptargroup | 3,466 | 197 | ||||||
Arabian American Development * | 817 | 6 | ||||||
Ashland | 4,008 | 356 | ||||||
Axiall | 3,725 | 161 | ||||||
Balchem | 1,288 | 62 | ||||||
Berry Plastics Group * | 1,338 | 28 | ||||||
Boise * | 4,506 | 36 | ||||||
Boise Cascade * | 670 | 20 | ||||||
Buckeye Technologies | 1,703 | 64 | ||||||
Cabot | 3,432 | 141 | ||||||
Calgon Carbon * | 2,418 | 44 | ||||||
Carpenter Technology | 2,001 | 96 | ||||||
Celanese, Cl A | 7,992 | 394 | ||||||
Century Aluminum * | 2,659 | 26 | ||||||
Chemtura * | 5,329 | 122 | ||||||
Clearwater Paper * | 1,051 | 50 | ||||||
Coeur Mining * | 4,561 | 65 | ||||||
Commercial Metals | 4,941 | 76 | ||||||
Compass Minerals International | 1,740 | 152 | ||||||
Crown Holdings * | 7,635 | 323 | ||||||
Cytec Industries | 2,017 | 144 | ||||||
Deltic Timber | 496 | 31 | ||||||
Domtar | 1,825 | 132 | ||||||
Eagle Materials | 2,583 | 191 | ||||||
Ferro * | 4,105 | 28 | ||||||
Flotek Industries * | 2,196 | 38 | ||||||
FutureFuel | 376 | 5 | ||||||
General Moly * | 1,340 | 3 | ||||||
Glatfelter | 1,871 | 46 | ||||||
Globe Specialty Metals | 2,702 | 33 | ||||||
Gold Resource | 1,558 | 15 | ||||||
Golden Star Resources * (A) | 13,515 | 10 | ||||||
Graphic Packaging Holding * | 6,417 | 49 | ||||||
Greif, Cl A | 1,319 | 69 | ||||||
H.B. Fuller | 2,733 | 114 | ||||||
Hawkins | 473 | 19 | ||||||
Haynes International | 523 | 26 | ||||||
Headwaters * | 3,320 | 35 | ||||||
Hecla Mining (A) | 19,356 | 74 | ||||||
Horsehead Holding * | 2,209 | 25 | ||||||
Huntsman | 10,024 | 195 | ||||||
Innophos Holdings | 989 | 50 | ||||||
Innospec * | 1,013 | 42 | ||||||
Intrepid Potash (A) * | 2,360 | 44 | ||||||
Kaiser Aluminum | 854 | 54 | ||||||
KapStone Paper and Packaging * | 1,721 | 50 | ||||||
KMG Chemicals | 309 | 7 | ||||||
| 17 | SEI Institutional Investments Trust / Annual Report / May 31, 2013 |
Table of Contents
Schedule of Investments
Extended Market Index Fund
May 31, 2013
| Description | Shares | Market Value ($ Thousands) | ||||||
Koppers Holdings | 873 | $ | 36 | |||||
Kraton Performance Polymers * | 1,480 | 31 | ||||||
Kronos Worldwide (A) | 1,084 | 18 | ||||||
Landec * | 1,493 | 21 | ||||||
Louisiana-Pacific * | 7,342 | 129 | ||||||
LSB Industries * | 839 | 28 | ||||||
Martin Marietta Materials | 2,401 | 262 | ||||||
Materion | 974 | 29 | ||||||
McEwen Mining (A) * | 10,068 | 26 | ||||||
Midway Gold * | 5,336 | 6 | ||||||
Minerals Technologies | 1,524 | 65 | ||||||
Molycorp * (A) | 4,747 | 31 | ||||||
Myers Industries | 1,718 | 25 | ||||||
Neenah Paper | 793 | 25 | ||||||
NewMarket | 397 | 109 | ||||||
Olin | 4,316 | 108 | ||||||
Olympic Steel | 327 | 8 | ||||||
OM Group * | 1,483 | 44 | ||||||
OMNOVA Solutions * | 2,467 | 18 | ||||||
Packaging Corp of America | 5,049 | 247 | ||||||
Paramount Gold and Silver * (A) | 2,528 | 4 | ||||||
PolyOne | 5,332 | 137 | ||||||
Quaker Chemical | 634 | 41 | ||||||
Reliance Steel & Aluminum | 3,938 | 259 | ||||||
Resolute Forest Products * | 3,492 | 53 | ||||||
Rock Tenn, Cl A | 3,635 | 359 | ||||||
Rockwood Holdings | 3,605 | 240 | ||||||
Royal Gold | 3,402 | 186 | ||||||
RPM International | 6,888 | 228 | ||||||
RTI International Metals * | 1,343 | 39 | ||||||
Schnitzer Steel Industries, Cl A | 1,156 | 29 | ||||||
Schweitzer-Mauduit International | 1,338 | 64 | ||||||
Scotts Miracle-Gro, Cl A | 2,259 | 107 | ||||||
Sensient Technologies | 2,735 | 113 | ||||||
Silgan Holdings | 2,012 | 94 | ||||||
Sonoco Products | 5,321 | 186 | ||||||
Southern Copper | 8,429 | 263 | ||||||
Steel Dynamics | 11,537 | 177 | ||||||
Stepan | 825 | 45 | ||||||
Stillwater Mining * | 4,980 | 60 | ||||||
SunCoke Energy * | 3,046 | 47 | ||||||
Tahoe Resources * | 3,488 | 51 | ||||||
Texas Industries * | 1,223 | 87 | ||||||
Tredegar | 1,141 | 29 | ||||||
Universal Stainless & Alloy Products * | 134 | 4 | ||||||
US Silica Holdings | 226 | 5 | ||||||
Valspar | 4,826 | 346 | ||||||
Walter Industries | 2,626 | 45 | ||||||
Wausau Paper | 2,219 | 26 | ||||||
Westlake Chemical | 855 | 80 | ||||||
Worthington Industries | 2,902 | 100 | ||||||
WR Grace * | 3,824 | 323 | ||||||
Zep | 1,221 | 20 | ||||||
Zoltek * | 1,636 | 21 | ||||||
|
| |||||||
| 9,615 | ||||||||
|
| |||||||
Telecommunication Services — 1.0% | ||||||||
8x8 * | 3,514 | 29 | ||||||
Atlantic Telegraph-Network | 267 | 13 | ||||||
Cbeyond * | 541 | 5 | ||||||
Cincinnati Bell * | 9,086 | 31 | ||||||
| Description | Shares | Market Value ($ Thousands) | ||||||
Clearwire, Cl A * | 15,242 | $ | 68 | |||||
Cogent Communications Group | 2,004 | 55 | ||||||
Consolidated Communications Holdings | 1,826 | 31 | ||||||
Fairpoint Communications * | 770 | 7 | ||||||
General Communication, Cl A * | 1,903 | 17 | ||||||
Groupon, Cl A * | 2,441 | 19 | ||||||
Hawaiian Telcom Holdco * | 205 | 5 | ||||||
IDT, Cl B * | 603 | 10 | ||||||
inContact * | 2,028 | 15 | ||||||
Iridium Communications * | 2,646 | 19 | ||||||
Leap Wireless International * | 2,932 | 17 | ||||||
Level 3 Communications * | 8,592 | 184 | ||||||
Lumos Networks | 571 | 8 | ||||||
magicJack VocalTec (A) * | 536 | 8 | ||||||
Neutral Tandem | 2,553 | 15 | ||||||
NII Holdings * (A) | 7,776 | 60 | ||||||
NTELOS Holdings | 298 | 5 | ||||||
ORBCOMM * | 1,386 | 5 | ||||||
Premiere Global Services * | 2,318 | 28 | ||||||
Primus Telecommunications Group * | 800 | 9 | ||||||
SBA Communications, Cl A (A) * | 6,219 | 468 | ||||||
Shenandoah Telecommunications | 1,352 | 22 | ||||||
Telephone & Data Systems | 5,155 | 120 | ||||||
T-Mobile US * | 9,605 | 206 | ||||||
tw telecom, Cl A * | 7,831 | 223 | ||||||
US Cellular * | 652 | 26 | ||||||
USA Mobility | 1,232 | 17 | ||||||
Vonage Holdings * | 7,720 | 21 | ||||||
|
| |||||||
| 1,766 | ||||||||
|
| |||||||
Utilities — 3.6% | ||||||||
ALLETE | 2,070 | 98 | ||||||
Alliant Energy | 5,718 | 282 | ||||||
American States Water | 837 | 44 | ||||||
American Water Works | 9,018 | 360 | ||||||
Aqua America | 7,250 | 225 | ||||||
Artesian Resources, Cl A | 284 | 6 | ||||||
Atlantic Power | 5,621 | 27 | ||||||
Atmos Energy | 4,682 | 198 | ||||||
Avista | 2,452 | 66 | ||||||
Black Hills | 2,002 | 95 | ||||||
California Water Service Group | 2,041 | 40 | ||||||
Calpine * | 19,572 | 398 | ||||||
CH Energy Group | 667 | 43 | ||||||
Chesapeake Utilities | 477 | 25 | ||||||
Cleco | 3,222 | 147 | ||||||
Connecticut Water Service | 606 | 17 | ||||||
Consolidated Water | 1,000 | 11 | ||||||
Delta Natural Gas | 500 | 11 | ||||||
El Paso Electric | 1,736 | 62 | ||||||
Empire District Electric | 1,856 | 40 | ||||||
Genie Energy, Cl B * | 1,000 | 9 | ||||||
Great Plains Energy | 7,223 | 163 | ||||||
Hawaiian Electric Industries | 5,158 | 135 | ||||||
IDACORP | 2,724 | 129 | ||||||
ITC Holdings | 2,725 | 236 | ||||||
Laclede Group | 1,803 | 85 | ||||||
MDU Resources Group | 9,832 | 254 | ||||||
MGE Energy | 1,043 | 56 | ||||||
| 18 | SEI Institutional Investments Trust / Annual Report / May 31, 2013 |
Table of Contents
Schedule of Investments
Extended Market Index Fund
May 31, 2013
| Description | Shares/Face Amount ($ Thousands) | Market Value ($ Thousands) | ||||||
Middlesex Water | 901 | $ | 17 | |||||
National Fuel Gas | 3,788 | 232 | ||||||
New Jersey Resources | 2,247 | 102 | ||||||
Northwest Natural Gas | 1,176 | 50 | ||||||
NorthWestern | 1,546 | 64 | ||||||
NV Energy | 12,162 | 285 | ||||||
OGE Energy | 5,038 | 342 | ||||||
Ormat Technologies * | 1,034 | 24 | ||||||
Otter Tail | 1,546 | 42 | ||||||
Piedmont Natural Gas | 3,992 | 135 | ||||||
PNM Resources | 4,417 | 99 | ||||||
Portland General Electric | 4,100 | 125 | ||||||
Questar | 9,308 | 226 | ||||||
SJW | 864 | 23 | ||||||
South Jersey Industries | 1,798 | 105 | ||||||
Southwest Gas | 2,541 | 120 | ||||||
UGI | 5,864 | 224 | ||||||
UIL Holdings | 2,750 | 107 | ||||||
Unitil | 458 | 13 | ||||||
UNS Energy | 2,216 | 104 | ||||||
Vectren | 4,343 | 149 | ||||||
Westar Energy | 6,570 | 208 | ||||||
WGL Holdings | 2,761 | 119 | ||||||
York Water | 252 | 5 | ||||||
|
| |||||||
| 6,182 | ||||||||
|
| |||||||
Total Common Stock | 168,120 | |||||||
|
| |||||||
AFFILIATED PARTNERSHIP — 7.7% |
| |||||||
SEI Liquidity Fund, L.P. | 13,400,661 | 13,401 | ||||||
|
| |||||||
Total Affiliated Partnership | 13,401 | |||||||
|
| |||||||
CASH EQUIVALENT — 2.0% | ||||||||
SEI Daily Income Trust, Prime Obligation Fund, Cl A | 3,600,163 | 3,600 | ||||||
|
| |||||||
Total Cash Equivalent | 3,600 | |||||||
|
| |||||||
U.S. TREASURY OBLIGATION (D)(E) —0.1% |
| |||||||
U.S. Treasury Bills | ||||||||
0.037%, 08/08/2013 | $ | 155 | 155 | |||||
|
| |||||||
Total U.S. Treasury Obligation | 155 | |||||||
|
| |||||||
Total Investments — 106.4% | $ | 185,276 | ||||||
|
| |||||||
A list of the open futures contracts held by the Fund at May 31, 2013, is as follows:
| Type of Contract | Number of Contracts Long | Expiration Date | Unrealized Appreciation ($ Thousands) | |||||||||
Russell 2000 Index E-MINI | 13 | Jun-2013 | $ | 70 | ||||||||
S&P Mid 400 Index E-MINI | 21 | Jun-2013 | 108 | |||||||||
|
| |||||||||||
| $ | 178 | |||||||||||
|
| |||||||||||
For the year ended May 31, 2013, the total amount of all open futures contracts, as presented in the table above, are representative of the volume of activity for this derivative type during the year.
Percentages are based on a Net Assets of $174,107 ($ Thousands).
| * | Non-income producing security. |
| ** | The rate reported is the 7-day effective yield as of May 31, 2013. |
| † | Investment in Affiliated Security (see Note 5). |
| ‡ | Real Estate Investment Trust. |
| (A) | This security or a partial position of this security is on loan at May 31, 2013. The total value of securities on loan at May 31, 2013 was $12,767 ($ Thousands). |
| (B) | The Fund may purchase securities of certain companies with which it is affiliated to the extent these companies are represented in its benchmark index. |
| (C) | This security was purchased with cash collateral held from securities on loan (see Note 11). The total value of such securities as of May 31, 2013 was $13,401 ($ Thousands). |
| (D) | Security, or portion thereof, has been pledged as collateral on open futures contracts. |
| (E) | The rate reported is the effective yield at time of purchase. |
Cl — Class
L.P. — Limited Partnership
REIT — Real Estate Investment Trust
S&P — Standard & Poor’s
Ser — Series
The following is a list of the inputs used as of May 31, 2013, in valuing the Fund’s investments carried at value ($ Thousands):
| Investments in Securities | Level 1 | Level 2 | Level 3 | Total | ||||||||||||
Common Stock | $ | 168,120 | $ | — | $ | — | $ | 168,120 | ||||||||
Affiliated Partnership | — | 13,401 | — | 13,401 | ||||||||||||
Cash Equivalent | 3,600 | — | — | 3,600 | ||||||||||||
U.S. Treasury Obligation | — | 155 | — | 155 | ||||||||||||
|
|
|
|
|
|
|
| |||||||||
Total Investments in Securities | $ | 171,720 | $ | 13,556 | $ | — | $ | 185,276 | ||||||||
|
|
|
|
|
|
|
| |||||||||
| Other Financial Instruments | Level 1 | Level 2 | Level 3 | Total | ||||||||||||
Futures Contracts* | $ | 178 | $ | — | $ | — | $ | 178 | ||||||||
|
|
|
|
|
|
|
| |||||||||
| * | Futures contracts are valued at the unrealized appreciation on the instrument. |
For the year ended May 31, 2013, there were no transfers between Level 1 and Level 2 assets and liabilities.
For the year ended May 31, 2013, there were no transfers between Level 2 and Level 3 assets and liabilities.
For more information on valuation inputs, see Note 2 — Significant Accounting Policies in Notes to Financial Statements.
Amounts designated as “—” are $0 or have been rounded to $0.
The accompanying notes are an integral part of the financial statements.
| 19 | SEI Institutional Investments Trust / Annual Report / May 31, 2013 |
Table of Contents
Schedule of Investments
Small Cap Fund
May 31, 2013
| Description | Shares | Market Value ($ Thousands) | ||||||
COMMON STOCK — 96.1% | ||||||||
Consumer Discretionary — 14.3% | ||||||||
Aeropostale * | 30,179 | $ | 441 | |||||
America’s Car-Mart * | 6,400 | 289 | ||||||
Ameristar Casinos | 3,000 | 79 | ||||||
ANN * | 29,893 | 917 | ||||||
Arctic Cat | 54,176 | 2,540 | ||||||
Beazer Homes USA * (A) | 36,537 | 756 | ||||||
Belo, Cl A | 93,767 | 1,052 | ||||||
Big Lots * | 40,985 | 1,396 | ||||||
Biglari Holdings * | 1,410 | 568 | ||||||
BJ’s Restaurants * (A) | 40,811 | 1,532 | ||||||
Blue Nile * | 1,800 | 64 | ||||||
Bob Evans Farms | 12,600 | 582 | ||||||
Boyd Gaming * (A) | 20,640 | 269 | ||||||
Bravo Brio Restaurant Group * | 35,400 | 637 | ||||||
Bright Horizons Family Solutions * | 26,902 | 970 | ||||||
Brown Shoe | 35,500 | 738 | ||||||
Brunswick | 40,532 | 1,361 | ||||||
Cabela’s * | 24,330 | 1,632 | ||||||
Callaway Golf (A) | 63,406 | 435 | ||||||
Capella Education * | 9,900 | 431 | ||||||
Career Education * | 160,500 | 478 | ||||||
Carmike Cinemas * | 6,300 | 112 | ||||||
Carter’s | 28,739 | 2,071 | ||||||
Cato, Cl A | 34,800 | 866 | ||||||
CEC Entertainment | 10,500 | 421 | ||||||
Children’s Place Retail Stores * | 14,460 | 771 | ||||||
Coinstar * (A) | 19,300 | 1,124 | ||||||
Columbia Sportswear (A) | 7,031 | 423 | ||||||
Conn’s * (A) | 43,910 | 2,162 | ||||||
Cooper Tire & Rubber | 41,116 | 1,062 | ||||||
Core-Mark Holding | 16,733 | 990 | ||||||
Corinthian Colleges * (A) | 129,700 | 337 | ||||||
Crocs * | 4,100 | 72 | ||||||
CSS Industries | 10,800 | 299 | ||||||
Dana Holdings | 38,585 | 730 | ||||||
Deckers Outdoor * (A) | 12,329 | 662 | ||||||
Destination Maternity | 15,400 | 384 | ||||||
Destination XL Group * | 80,400 | 399 | ||||||
Dick’s Sporting Goods | 12,010 | 629 | ||||||
Dorman Products (A) | 22,547 | 1,004 | ||||||
DreamWorks Animation SKG, Cl A * (A) | 45,600 | 1,001 | ||||||
Drew Industries | 2,600 | 98 | ||||||
Ethan Allen Interiors (A) | 18,885 | 592 | ||||||
Express * | 46,499 | 1,014 | ||||||
Federal Mogul, Cl A * | 13,400 | 131 | ||||||
Five Below * (A) | 32,890 | 1,258 | ||||||
Francesca’s Holdings (A) * | 84,180 | 2,403 | ||||||
Fred’s, Cl A (A) | 35,200 | 558 | ||||||
GameStop, Cl A (A) | 36,833 | 1,221 | ||||||
Genesco * | 5,425 | 367 | ||||||
G-III Apparel Group * | 2,400 | 101 | ||||||
Gordmans Stores * | 52,095 | 667 | ||||||
Grand Canyon Education * | 43,816 | 1,407 | ||||||
Helen of Troy * | 11,900 | 472 | ||||||
hhgregg * (A) | 44,400 | 692 | ||||||
Hibbett Sports * (A) | 42,277 | 2,411 | ||||||
Hillenbrand | 6,300 | 150 | ||||||
| Description | Shares | Market Value ($ Thousands) | ||||||
HomeAway * (A) | 69,726 | $ | 2,132 | |||||
Hot Topic | 9,700 | 136 | ||||||
Hovnanian Enterprises, Cl A * (A) | 45,400 | 279 | ||||||
Ignite Restaurant Group * | 24,500 | 448 | ||||||
Imax * | 21,243 | 550 | ||||||
Jack in the Box * | 40,308 | 1,471 | ||||||
JAKKS Pacific (A) | 12,900 | 130 | ||||||
Jones Group (A) | 34,700 | 506 | ||||||
Jos. A. Bank Clothiers * (A) | 14,700 | 660 | ||||||
Journal Communications, Cl A * | 63,900 | 423 | ||||||
K12 * (A) | 28,583 | 850 | ||||||
Krispy Kreme Doughnuts * | 124,095 | 2,149 | ||||||
Libbey (A) * | 101,800 | 2,154 | ||||||
Life Time Fitness * (A) | 12,195 | 608 | ||||||
Lincoln Educational Services | 4,800 | 33 | ||||||
LKQ * | 34,199 | 837 | ||||||
Loral Space & Communications * | 6,600 | 397 | ||||||
Lumber Liquidators Holdings * (A) | 24,535 | 2,014 | ||||||
M/I Homes * | 2,200 | 55 | ||||||
Maidenform Brands * | 46,153 | 840 | ||||||
Marriott Vacations Worldwide * | 8,500 | 376 | ||||||
Matthews International, Cl A (A) | 63,113 | 2,421 | ||||||
Mattress Firm Holding * | 2,160 | 78 | ||||||
MDC Holdings | 5,400 | 200 | ||||||
MDC Partners, Cl A | 106,300 | 1,874 | ||||||
Men’s Wearhouse | 32,238 | 1,167 | ||||||
Meredith (A) | 19,065 | 781 | ||||||
Modine Manufacturing * | 37,900 | 388 | ||||||
Monro Muffler Brake (A) | 54,701 | 2,572 | ||||||
Morgans Hotel Group * | 11,700 | 78 | ||||||
Movado Group | 13,900 | 502 | ||||||
Multimedia Games Holding * | 20,500 | 525 | ||||||
NACCO Industries, Cl A | 6,600 | 370 | ||||||
National CineMedia | 114,327 | 1,899 | ||||||
Nutrisystem (A) | 64,200 | 580 | ||||||
Office Depot * (A) | 27,900 | 123 | ||||||
OfficeMax (A) | 8,400 | 109 | ||||||
Orient-Express Hotels, Cl A * | 61,028 | 723 | ||||||
Oxford Industries (A) | 14,279 | 938 | ||||||
Panera Bread, Cl A * (A) | 5,035 | 966 | ||||||
Papa John’s International * | 4,100 | 264 | ||||||
Pep Boys-Manny Moe & Jack * (A) | 31,490 | 389 | ||||||
Perry Ellis International | 19,700 | 416 | ||||||
PetMed Express (A) | 39,700 | 532 | ||||||
Pier 1 Imports (A) | 93,973 | 2,179 | ||||||
Pool | 7,200 | 371 | ||||||
Quiksilver * (A) | 60,156 | 473 | ||||||
RadioShack (A) | 23,000 | 85 | ||||||
ReachLocal * | 73,100 | 1,016 | ||||||
Red Robin Gourmet Burgers * | 33,383 | 1,753 | ||||||
Regis (A) | 72,622 | 1,337 | ||||||
Rent-A-Center, Cl A | 45,200 | 1,653 | ||||||
Restoration Hardware Holdings * (A) | 10,600 | 592 | ||||||
Scholastic (A) | 28,000 | 847 | ||||||
Scientific Games, Cl A * | 32,054 | 349 | ||||||
Shutterfly * (A) | 48,200 | 2,349 | ||||||
Six Flags Entertainment | 13,592 | 1,014 | ||||||
Skechers U.S.A., Cl A * (A) | 29,200 | 657 | ||||||
Smith & Wesson Holding * (A) | 50,300 | 458 | ||||||
| 1 | SEI Institutional Investments Trust / Annual Report / May 31, 2013 |
Table of Contents
Schedule of Investments
Small Cap Fund
May 31, 2013
| Description | Shares | Market Value ($ Thousands) | ||||||
SodaStream International * (A) | 19,207 | $ | 1,225 | |||||
Sonic * | 42,000 | 551 | ||||||
Sotheby’s | 11,660 | 434 | ||||||
Stage Stores | 15,900 | 366 | ||||||
Standard Motor Products | 21,200 | 717 | ||||||
Standard Pacific * (A) | 116,679 | 1,033 | ||||||
Steiner Leisure * | 1,900 | 97 | ||||||
Stewart Enterprises, Cl A (A) | 55,500 | 722 | ||||||
Tesla Motors * | 2,033 | 199 | ||||||
TRI Pointe Homes * (A) | 15,750 | 265 | ||||||
Tumi Holdings * | 14,200 | 344 | ||||||
Universal Electronics * | 22,900 | 612 | ||||||
Vail Resorts | 7,830 | 501 | ||||||
Valassis Communications (A) | 800 | 21 | ||||||
Vitamin Shoppe * | 27,748 | 1,214 | ||||||
Wet Seal, Cl A * | 176,200 | 874 | ||||||
Winnebago Industries * | 3,200 | 66 | ||||||
WMS Industries * | 39,700 | 1,006 | ||||||
Wolverine World Wide (A) | 60,590 | 3,172 | ||||||
Zumiez * (A) | 47,277 | 1,504 | ||||||
|
| |||||||
| 111,227 | ||||||||
|
| |||||||
Consumer Staples — 2.8% | ||||||||
Andersons | 9,500 | 484 | ||||||
Annie’s * (A) | 12,860 | 500 | ||||||
Casey’s General Stores (A) | 34,003 | 2,066 | ||||||
Central Garden and Pet, Cl A * | 21,557 | 164 | ||||||
Chefs’ Warehouse * | 27,408 | 518 | ||||||
Chiquita Brands International * | 202,400 | 2,044 | ||||||
Coca-Cola Bottling | 2,800 | 167 | ||||||
Darling International * | 65,077 | 1,276 | ||||||
Dole Food * (A) | 110,799 | 1,049 | ||||||
Fairway Group Holdings, Cl A * | 15,000 | 327 | ||||||
Fresh Del Monte Produce | 63,000 | 1,686 | ||||||
Fresh Market * | 23,071 | 1,143 | ||||||
Harris Teeter Supermarkets (A) | 700 | 33 | ||||||
Ingles Markets, Cl A | 11,100 | 244 | ||||||
Ingredion | 7,402 | 504 | ||||||
J&J Snack Foods | 6,770 | 514 | ||||||
Lancaster Colony (A) | 8,000 | 660 | ||||||
Medifast * (A) | 13,100 | 378 | ||||||
Nash Finch | 7,100 | 154 | ||||||
Pantry * | 34,064 | 426 | ||||||
Pilgrim’s Pride * | 51,900 | 621 | ||||||
Post Holdings * | 2,000 | 84 | ||||||
Prestige Brands Holdings * | 32,542 | 956 | ||||||
Rite Aid * | 364,600 | 1,072 | ||||||
Sanderson Farms (A) | 6,409 | 442 | ||||||
Seneca Foods, Cl A * | 3,900 | 125 | ||||||
Spartan Stores (A) | 40,892 | 727 | ||||||
Spectrum Brands Holdings | 2,700 | 163 | ||||||
TreeHouse Foods * | 8,414 | 551 | ||||||
Universal (A) | 8,700 | 510 | ||||||
USANA Health Sciences * (A) | 20,100 | 1,409 | ||||||
WD-40 | 3,900 | 211 | ||||||
Weis Markets | 6,700 | 274 | ||||||
WhiteWave Foods, Cl A * (A) | 26,810 | 468 | ||||||
|
| |||||||
| 21,950 | ||||||||
|
| |||||||
Energy — 5.9% | ||||||||
Alberta Oilsands * | 536,100 | 16 | ||||||
Alon USA Energy | 1,800 | 33 | ||||||
Resources (A) * | 45,200 | 1,139 | ||||||
| Description | Shares | Market Value ($ Thousands) | ||||||
Bill Barrett * (A) | 30,000 | $ | 677 | |||||
Bonanza Creek Energy * | 9,730 | 361 | ||||||
Bristow Group | 4,000 | 251 | ||||||
C&J Energy Services * | 3,800 | 71 | ||||||
Cloud Peak Energy * | 73,700 | 1,415 | ||||||
Comstock Resources | 69,900 | 1,127 | ||||||
Contango Oil & Gas * | 2,500 | 87 | ||||||
CVR Energy | 1,600 | 100 | ||||||
Delek US Holdings | 38,780 | 1,397 | ||||||
Dresser-Rand Group * | 29,836 | 1,808 | ||||||
Dril-Quip * | 33,432 | 3,024 | ||||||
Emerald Oil * | 41,491 | 254 | ||||||
Energy XXI Bermuda (A) | 29,600 | 756 | ||||||
EPL Oil & Gas * | 28,500 | 868 | ||||||
Era Group * | 4,100 | 105 | ||||||
Forest Oil * (A) | 59,600 | 271 | ||||||
Forum Energy Technologies * (A) | 33,245 | 987 | ||||||
Frontline * (A) | 45,300 | 84 | ||||||
Goodrich Petroleum * (A) | 22,515 | 283 | ||||||
Green Plains Renewable Energy * | 19,200 | 305 | ||||||
Gulfmark Offshore, Cl A (A) | 33,874 | 1,553 | ||||||
Gulfport Energy * | 11,142 | 531 | ||||||
Helix Energy Solutions Group * | 42,825 | 1,022 | ||||||
Hornbeck Offshore Services * (A) | 14,631 | 761 | ||||||
Key Energy Services * | 155,984 | 1,011 | ||||||
Kinder Morgan Escrow * | 69,898 | — | ||||||
Knightsbridge Tankers (A) | 1,900 | 13 | ||||||
Laredo Petroleum Holdings * (A) | 71,379 | 1,382 | ||||||
Lufkin Industries | 9,135 | 806 | ||||||
Matador Resources * (A) | 47,655 | 476 | ||||||
McDermott International * | 68,036 | 650 | ||||||
Mitcham Industries * | 3,700 | 58 | ||||||
Newpark Resources * (A) | 59,900 | 668 | ||||||
Oasis Petroleum * | 97,847 | 3,636 | ||||||
Oceaneering International | 11,675 | 846 | ||||||
Oil States International * | 5,570 | 549 | ||||||
Parker Drilling * | 256,800 | 1,145 | ||||||
Penn Virginia | 74,900 | 349 | ||||||
PetroQuest Energy * | 22,600 | 103 | ||||||
Pioneer Energy Services * | 120,847 | 843 | ||||||
Rentech | 54,400 | 120 | ||||||
REX American Resources * | 1,500 | 42 | ||||||
Rosetta Resources * | 16,544 | 775 | ||||||
Scorpio Tankers (A) | 177,700 | 1,686 | ||||||
SEACOR Holdings * | 4,100 | 315 | ||||||
Ship Finance International (A) | 55,900 | 949 | ||||||
StealthGas * | 73,100 | 773 | ||||||
Stone Energy * | 14,000 | 315 | ||||||
Superior Energy Services * | 14,700 | 392 | ||||||
Swift Energy * (A) | 36,248 | 492 | ||||||
Targa Resources | 7,560 | 487 | ||||||
Tesco * | 40,100 | 512 | ||||||
Tesoro | 1,600 | 99 | ||||||
TETRA Technologies * | 58,405 | 608 | ||||||
TGC Industries | 32,755 | 276 | ||||||
Tidewater (A) | 18,000 | 992 | ||||||
Triangle Petroleum * | 10,100 | 55 | ||||||
Unit * | 19,500 | 881 | ||||||
USEC * (A) | 36,800 | 14 | ||||||
Vaalco Energy * (A) | 122,900 | 752 | ||||||
| 2 | SEI Institutional Investments Trust / Annual Report / May 31, 2013 |
Table of Contents
Schedule of Investments
Small Cap Fund
May 31, 2013
| Description | Shares | Market Value ($ Thousands) | ||||||
W&T Offshore | 3,800 | $ | 56 | |||||
Western Refining (A) | 29,300 | 978 | ||||||
Willbros Group * | 55,700 | 375 | ||||||
World Fuel Services (A) | 46,362 | 1,888 | ||||||
|
| |||||||
| 45,653 | ||||||||
|
| |||||||
Financials — 20.3% | ||||||||
1st Source | 6,200 | 150 | ||||||
Acadia Realty Trust | 17,855 | 463 | ||||||
Affiliated Managers Group * | 7,735 | 1,268 | ||||||
Agree Realty | 7,600 | 253 | ||||||
Alexandria Real Estate Equities | 4,650 | 319 | ||||||
Allied World Assurance Holdings | 4,900 | 438 | ||||||
American Assets Trust | 14,405 | 464 | ||||||
American Capital Mortgage Investment | 18,200 | 384 | ||||||
American Equity Investment Life Holding (A) | 78,900 | 1,278 | ||||||
AMERISAFE | 2,000 | 68 | ||||||
Amtrust Financial Services (A) | 21,650 | 715 | ||||||
Anworth Mortgage Asset | 123,600 | 696 | ||||||
Apartment Investment & Management, Cl A | 24,681 | 747 | ||||||
Apollo Investments * | 14,400 | 119 | ||||||
Ares Capital | 1,950 | 33 | ||||||
Argo Group International Holdings | 21,890 | 867 | ||||||
Artisan Partners Asset Management, Cl A * | 3,425 | 160 | ||||||
Ashford Hospitality Trust | 32,500 | 429 | ||||||
Aspen Insurance Holdings | 6,100 | 224 | ||||||
Associated Banc | 14,000 | 216 | ||||||
Associated Estates Realty ‡ | 14,400 | 237 | ||||||
AvalonBay Communities | 7,012 | 930 | ||||||
Banco Latinoamericano de Comercio Exterior, Cl E | 46,900 | 1,075 | ||||||
Bancorpsouth (A) | 85,000 | 1,459 | ||||||
Bank of the Ozarks (A) | 37,283 | 1,627 | ||||||
BankUnited | 34,498 | 848 | ||||||
Banner | 45,102 | 1,447 | ||||||
Berkshire Hills Bancorp | 33,215 | 891 | ||||||
BGC Partners, Cl A | 8,400 | 46 | ||||||
BioMed Realty Trust ‡ | 30,700 | 643 | ||||||
BlackRock Kelso Capital (A) | 80,300 | 800 | ||||||
Boston Private Financial Holdings (A) | 88,608 | 873 | ||||||
Boston Properties | 7,028 | 749 | ||||||
Brandywine Realty Trust | 23,900 | 338 | ||||||
Camden National | 4,600 | 173 | ||||||
Campus Crest Communities | 104,300 | 1,319 | ||||||
CapLease | 45,800 | 395 | ||||||
Capstead Mortgage | 21,600 | 265 | ||||||
Cardinal Financial | 18,717 | 283 | ||||||
CBL & Associates Properties | 40,388 | 929 | ||||||
Central Pacific Financial * | 60,210 | 1,104 | ||||||
Chesapeake Lodging Trust ‡ | 25,300 | 571 | ||||||
City Holding (A) | 12,400 | 491 | ||||||
CNO Financial Group | 309,005 | 3,813 | ||||||
CoBiz Financial | 48,325 | 418 | ||||||
Cohen & Steers (A) | 14,600 | 551 | ||||||
Colonial Properties Trust ‡ | 17,200 | 380 | ||||||
Columbia Banking System (A) | 11,400 | 249 | ||||||
| Description | Shares | Market Value ($ Thousands) | ||||||
CommonWealth | 11,800 | $ | 241 | |||||
Community Bank System (A) | 6,000 | 176 | ||||||
Community Trust Bancorp | 8,400 | 296 | ||||||
Coresite Realty ‡ | 20,155 | 647 | ||||||
Cousins Properties ‡ | 13,600 | 140 | ||||||
Credit Acceptance * | 2,200 | 251 | ||||||
CubeSmart ‡ | 24,000 | 376 | ||||||
Customers Bancorp * | 17,200 | 295 | ||||||
CYS Investments ‡ | 26,800 | 276 | ||||||
Dime Community Bancshares | 27,100 | 390 | ||||||
Douglas Emmett ‡ | 27,080 | 690 | ||||||
Dynex Capital ‡ | 28,900 | 294 | ||||||
Eagle Bancorp * | 53,651 | 1,208 | ||||||
East West Bancorp | 20,395 | 537 | ||||||
EastGroup Properties ‡ | 35,559 | 2,090 | ||||||
Education Realty Trust ‡ | 105,867 | 1,107 | ||||||
Employers Holdings | 74,253 | 1,837 | ||||||
Encore Capital Group * (A) | 18,000 | 642 | ||||||
Endurance Specialty Holdings | 26,809 | 1,349 | ||||||
Equity One ‡ (A) | 32,492 | 758 | ||||||
Equity Residential ‡ | 25,437 | 1,438 | ||||||
Essex Property Trust ‡ (A) | 2,050 | 322 | ||||||
FBR * | 54,675 | 1,323 | ||||||
Federal Realty Investment Trust ‡ | 2,000 | 216 | ||||||
Federated Investors, Cl B (A) | 21,431 | 593 | ||||||
Financial Engines (A) | 54,469 | 2,349 | ||||||
First American Financial | 15,000 | 358 | ||||||
First Commonwealth Financial | 88,800 | 640 | ||||||
First Financial Holdings | 2,200 | 46 | ||||||
First Horizon National (A) | 114,945 | 1,320 | ||||||
First Industrial Realty Trust ‡ | 13,200 | 223 | ||||||
First Merchants | 16,500 | 273 | ||||||
First Midwest Bancorp | 113,326 | 1,491 | ||||||
First NBC Bank Holding * | 14,592 | 367 | ||||||
First Potomac Realty Trust ‡ | 2,100 | 29 | ||||||
FirstMerit | 39,024 | 736 | ||||||
Flagstar Bancorp * | 14,400 | 202 | ||||||
Flushing Financial | 28,000 | 438 | ||||||
FNB (Pennsylvania) | 13,400 | 154 | ||||||
Forest City Enterprises, Cl A * | 23,770 | 446 | ||||||
Fulton Financial | 32,600 | 375 | ||||||
FXCM, Cl A (A) | 54,158 | 751 | ||||||
General Growth Properties ‡ | 31,676 | 650 | ||||||
Geo Group ‡ | 8,300 | 289 | ||||||
Getty Realty ‡ (A) | 10,500 | 220 | ||||||
Glimcher Realty Trust ‡ | 35,400 | 414 | ||||||
Government Properties Income Trust ‡ | 29,400 | 715 | ||||||
Great American Group * | 92,182 | 14 | ||||||
Hancock Holding | 34,051 | 972 | ||||||
Hanover Insurance Group | 41,639 | 2,092 | ||||||
Hatteras Financial ‡ | 27,400 | 707 | ||||||
HCP ‡ | 23,748 | 1,125 | ||||||
Health Care ‡ | 15,250 | 1,037 | ||||||
Healthcare Realty Trust ‡ | 7,800 | 208 | ||||||
Hercules Technology Growth Capital | 12,000 | 161 | ||||||
Highwoods Properties ‡ (A) | 32,555 | 1,186 | ||||||
Home BancShares | 3,800 | 160 | ||||||
Home Loan Servicing Solutions | 28,400 | 649 | ||||||
Horace Mann Educators | 103,375 | 2,512 | ||||||
| 3 | SEI Institutional Investments Trust / Annual Report / May 31, 2013 |
Table of Contents
Schedule of Investments
Small Cap Fund
May 31, 2013
| Description | Shares | Market Value ($ Thousands) | ||||||
Hospitality Properties Trust ‡ | 8,200 | $ | 239 | |||||
Host Hotels & Resorts ‡ | 45,959 | 818 | ||||||
Iberiabank | 27,603 | 1,423 | ||||||
Infinity Property & Casualty | 30,943 | 1,787 | ||||||
Inland Real Estate ‡ | 71,800 | 737 | ||||||
International Bancshares (A) | 30,100 | 656 | ||||||
Investment Technology Group * | 60,200 | 831 | ||||||
Investors Bancorp | 23,370 | 462 | ||||||
Investors Real Estate Trust ‡ | 6,900 | 62 | ||||||
Janus Capital Group | 12,200 | 107 | ||||||
Jones Lang LaSalle | 6,078 | 558 | ||||||
Kennedy-Wilson Holdings (A) | 133,100 | 2,284 | ||||||
Kimco Realty ‡ | 20,000 | 443 | ||||||
LaSalle Hotel Properties ‡ | 13,270 | 350 | ||||||
Lexington Realty Trust ‡ (A) | 135,155 | 1,702 | ||||||
LPL Financial Holdings | 16,287 | 604 | ||||||
LTC Properties ‡ | 17,600 | 732 | ||||||
Macerich ‡ | 13,336 | 866 | ||||||
Mack-Cali Realty ‡ | 37,238 | 987 | ||||||
Maiden Holdings | 140,600 | 1,502 | ||||||
MainSource Financial Group | 29,400 | 409 | ||||||
MarketAxess Holdings | 19,655 | 852 | ||||||
MCG Capital | 14,200 | 70 | ||||||
Meadowbrook Insurance Group (A) | 265,300 | 2,128 | ||||||
Medallion Financial | 23,200 | 345 | ||||||
MFA Mortgage Investments ‡ | 108,128 | 949 | ||||||
MGIC Investment * (A) | 18,500 | 114 | ||||||
Mid-America Apartment Communities ‡ | 12,171 | 827 | ||||||
Montpelier Re Holdings | 46,200 | 1,155 | ||||||
MSCI, Cl A * | 23,964 | 845 | ||||||
National Health Investors ‡ (A) | 2,500 | 156 | ||||||
National Penn Bancshares (A) | 54,715 | 541 | ||||||
National Retail Properties ‡ (A) | 9,240 | 331 | ||||||
NBT Bancorp | 26,100 | 519 | ||||||
Nelnet, Cl A | 75,200 | 2,937 | ||||||
Northfield Bancorp | 73,246 | 839 | ||||||
Northwest Bancshares | 9,800 | 122 | ||||||
OceanFirst Financial | 10,300 | 143 | ||||||
Ocwen Financial * | 40,900 | 1,750 | ||||||
OFG Bancorp (A) | 49,050 | 872 | ||||||
Old National Bancorp | 71,313 | 953 | ||||||
OmniAmerican Bancorp * | 14,900 | 332 | ||||||
One Liberty Properties ‡ | 3,700 | 98 | ||||||
Oritani Financial | 20,300 | 311 | ||||||
PacWest Bancorp (A) | 59,767 | 1,723 | ||||||
Pebblebrook Hotel Trust ‡ | 59,571 | 1,563 | ||||||
PennantPark Investment (A) | 87,393 | 974 | ||||||
PennyMac Mortgage Investment Trust ‡ | 24,200 | 524 | ||||||
PHH * | 9,100 | 184 | ||||||
PICO Holdings * | 25,958 | 586 | ||||||
Pinnacle Financial Partners * | 3,600 | 90 | ||||||
Piper Jaffray * | 15,700 | 561 | ||||||
Platinum Underwriters Holdings | 56,346 | 3,217 | ||||||
Popular * | 15,600 | 468 | ||||||
Potlatch ‡ (A) | 13,000 | 591 | ||||||
Primerica * | 22,200 | 782 | ||||||
ProAssurance | 26,753 | 1,343 | ||||||
Prologis ‡ | 39,117 | 1,576 | ||||||
Prospect Capital (A) | 69,100 | 718 | ||||||
| Description | Shares | Market Value ($ Thousands) | ||||||
Prosperity Bancshares (A) | 10,540 | $ | 528 | |||||
Protective Life | 10,500 | 406 | ||||||
Provident Financial Services | 38,200 | 581 | ||||||
PS Business Parks ‡ | 5,600 | 427 | ||||||
Public Storage ‡ | 8,671 | 1,316 | ||||||
Radian Group (A) | 27,395 | 353 | ||||||
RAIT Financial Trust ‡ | 6,566 | 50 | ||||||
Ramco-Gershenson Properties ‡ | 56,700 | 885 | ||||||
Regency Centers ‡ | 9,115 | 470 | ||||||
Reinsurance Group of America, Cl A | 11,305 | 745 | ||||||
Republic Bancorp, Cl A (A) | 11,400 | 271 | ||||||
Retail Opportunity Investments ‡ | 12,200 | 171 | ||||||
RLJ Lodging Trust ‡ | 13,050 | 302 | ||||||
Sabra Health Care ‡ (A) | 28,566 | 773 | ||||||
Safeguard Scientifics * | 35,544 | 561 | ||||||
Selective Insurance Group | 20,365 | 483 | ||||||
Signature Bank NY * | 18,210 | 1,405 | ||||||
Simon Property Group ‡ | 14,591 | 2,429 | ||||||
SL Green Realty ‡ | 6,695 | 582 | ||||||
Solar Capital | 18,700 | 430 | ||||||
Southside Bancshares (A) | 9,765 | 221 | ||||||
Sovran Self Storage ‡ | 4,000 | 260 | ||||||
STAG Industrial ‡ | 11,600 | 255 | ||||||
Starwood Property Trust ‡ | 31,700 | 804 | ||||||
Stifel Financial * (A) | 35,585 | 1,281 | ||||||
Sun Communities ‡ | 1,000 | 50 | ||||||
Sunstone Hotel Investors ‡* | 69,050 | 833 | ||||||
Susquehanna Bancshares | 104,789 | 1,259 | ||||||
SVB Financial Group * | 9,580 | 741 | ||||||
Symetra Financial | 62,900 | 878 | ||||||
Synovus Financial | 99,955 | 274 | ||||||
Tanger Factory Outlet Centers ‡ | 25,689 | 886 | ||||||
TCF Financial (A) | 46,006 | 663 | ||||||
THL Credit | 29,000 | 440 | ||||||
TICC Capital (A) | 44,500 | 437 | ||||||
Titanium Asset Management (B)(C)(D) * | 132,700 | 105 | ||||||
Tompkins Financial | 4,200 | 174 | ||||||
Tower Group International | 32,845 | 635 | ||||||
Two Harbors Investment ‡ | 72,800 | 803 | ||||||
UDR ‡ (A) | 28,300 | 690 | ||||||
UMB Financial (A) | 700 | 37 | ||||||
Umpqua Holdings (A) | 19,300 | 261 | ||||||
Union First Market Bankshares | 15,200 | 304 | ||||||
United Community Banks * | 47,000 | 557 | ||||||
Universal Health Realty Income Trust ‡ | 1,300 | 59 | ||||||
Validus Holdings | 31,300 | 1,130 | ||||||
Ventas ‡ | 11,840 | 845 | ||||||
ViewPoint Financial Group | 46,700 | 884 | ||||||
Virginia Commerce Bancorp * | 17,600 | 239 | ||||||
Vornado Realty Trust ‡ | 10,700 | 855 | ||||||
Washington Real Estate Investment Trust ‡ (A) | 7,900 | 220 | ||||||
Webster Financial | 8,000 | 187 | ||||||
Weingarten Realty Investors ‡ (A) | 10,200 | 325 | ||||||
WesBanco | 7,700 | 193 | ||||||
Western Alliance Bancorp * | 80,525 | 1,184 | ||||||
Wilshire Bancorp | 52,800 | 348 | ||||||
Winthrop Realty Trust ‡ | 51,700 | 642 | ||||||
WisdomTree Investments * | 79,860 | 993 | ||||||
| 4 | SEI Institutional Investments Trust / Annual Report / May 31, 2013 |
Table of Contents
Schedule of Investments
Small Cap Fund
May 31, 2013
| Description | Shares | Market Value ($ Thousands) | ||||||
WSFS Financial | 16,900 | $ | 849 | |||||
Zions Bancorporation (A) | 24,368 | 684 | ||||||
|
| |||||||
| 158,297 | ||||||||
|
| |||||||
Health Care — 12.1% | ||||||||
Acadia Healthcare * | 103,338 | 3,451 | ||||||
ACADIA Pharmaceuticals * (A) | 16,000 | 225 | ||||||
Accuray * (A) | 277,500 | 1,490 | ||||||
Achillion Pharmaceuticals * | 56,935 | 475 | ||||||
Acorda Therapeutics * | 11,180 | 374 | ||||||
Aegerion Pharmaceuticals * (A) | 11,860 | 864 | ||||||
Affymax * (A) | 240,100 | 497 | ||||||
Akorn * (A) | 51,264 | 745 | ||||||
Alere * | 46,700 | 1,195 | ||||||
Align Technology * (A) | 19,670 | 703 | ||||||
Almost Family * | 100 | 2 | ||||||
AMAG Pharmaceuticals * | 14,000 | 259 | ||||||
Amedisys * | 27,100 | 334 | ||||||
Amsurg, Cl A * | 22,046 | 783 | ||||||
Analogic | 3,300 | 262 | ||||||
Ariad Pharmaceuticals * | 40,745 | 747 | ||||||
Arqule * | 55,000 | 149 | ||||||
Array BioPharma * | 70,500 | 412 | ||||||
ArthroCare * | 12,300 | 417 | ||||||
Assisted Living Concepts, Cl A * | 7,400 | 88 | ||||||
athenahealth * | 19,043 | 1,610 | ||||||
Auxilium Pharmaceuticals * (A) | 14,700 | 219 | ||||||
BioScrip * | 69,849 | 977 | ||||||
Bruker * | 38,140 | 631 | ||||||
Cambrex * | 24,200 | 333 | ||||||
Cantel Medical | 3,800 | 129 | ||||||
Celldex Therapeutics * | 27,852 | 356 | ||||||
Centene * | 18,958 | 938 | ||||||
Cepheid * (A) | 7,700 | 268 | ||||||
Charles River Laboratories International * | 15,201 | 658 | ||||||
Chemed (A) | 3,800 | 266 | ||||||
Chimerix * | 16,720 | 359 | ||||||
Computer Programs & Systems | 5,200 | 261 | ||||||
Conceptus * | 40,211 | 1,246 | ||||||
CONMED | 47,313 | 1,558 | ||||||
Coronado Biosciences * | 44,787 | 443 | ||||||
Cubist Pharmaceuticals * (A) | 30,764 | 1,690 | ||||||
Cyberonics * (A) | — | — | ||||||
DexCom * | 59,180 | 1,233 | ||||||
Dynavax Technologies * (A) | 112,200 | 293 | ||||||
Emergent Biosolutions * | 46,400 | 659 | ||||||
Emeritus * | 39,230 | 997 | ||||||
Endocyte * | 16,700 | 229 | ||||||
Endologix * (A) | 79,320 | 1,066 | ||||||
Ensign Group (A) | 16,000 | 577 | ||||||
Exact Sciences * | 100,807 | 1,133 | ||||||
ExamWorks Group * (A) | 100,913 | 1,883 | ||||||
Five Star Quality Care * | 28,700 | 147 | ||||||
Fluidigm * (A) | 39,764 | 678 | ||||||
Furiex Pharmaceuticals * | 17,932 | 663 | ||||||
Gentiva Health Services * | 58,800 | 627 | ||||||
Greatbatch * | 39,995 | 1,288 | ||||||
Halozyme Therapeutics * (A) | 53,510 | 378 | ||||||
Hanger * | 2,000 | 64 | ||||||
Health Net * | 18,610 | 593 | ||||||
HealthSouth (A) * | 77,341 | 2,265 | ||||||
| Description | Shares | Market Value ($ Thousands) | ||||||
HeartWare International * (A) | 9,590 | $ | 875 | |||||
Hill-Rom Holdings | 7,100 | 257 | ||||||
Hi-Tech Pharmacal | 17,200 | 550 | ||||||
HMS Holdings * (A) | 61,977 | 1,543 | ||||||
Hyperion Therapeutics * | 14,269 | 286 | ||||||
ICON * | 51,498 | 1,768 | ||||||
ICU Medical * | 17,657 | 1,261 | ||||||
Impax Laboratories * | 9,800 | 186 | ||||||
Imris * | 124,420 | 322 | ||||||
Incyte * (A) | 33,963 | 753 | ||||||
Infinity Pharmaceuticals * | 23,077 | 622 | ||||||
Insulet * (A) | 36,750 | 1,097 | ||||||
Intercept Pharmaceuticals * | 6,021 | 201 | ||||||
Invacare | 39,700 | 615 | ||||||
IPC The Hospitalist * (A) | 16,783 | 818 | ||||||
Ironwood Pharmaceuticals, Cl A * (A) | 36,417 | 486 | ||||||
Isis Pharmaceuticals * (A) | 51,613 | 1,117 | ||||||
Jazz Pharmaceuticals * | 16,360 | 1,112 | ||||||
Keryx Biopharmaceuticals * (A) | 214,979 | 1,722 | ||||||
Kindred Healthcare * | 17,500 | 236 | ||||||
LHC Group * | 14,000 | 308 | ||||||
LifePoint Hospitals * | 4,900 | 244 | ||||||
Magellan Health Services * | 17,170 | 936 | ||||||
Masimo | 46,399 | 1,005 | ||||||
Medical Action Industries * | 74,800 | 628 | ||||||
Medivation * | 11,985 | 582 | ||||||
MEDNAX * (A) | 20,557 | 1,908 | ||||||
Merit Medical Systems * | 29,600 | 292 | ||||||
Momenta Pharmaceuticals * (A) | 20,900 | 275 | ||||||
Nektar Therapeutics * | 48,470 | 459 | ||||||
Neurocrine Biosciences * | 30,600 | 396 | ||||||
NewLink Genetics * (A) | 28,244 | 461 | ||||||
Novadaq Technologies * (A) | 148,136 | 2,009 | ||||||
NuVasive * | 8,500 | 185 | ||||||
Onyx Pharmaceuticals * (A) | 14,370 | 1,372 | ||||||
Optimer Pharmaceuticals * (A) | 36,179 | 538 | ||||||
OraSure Technologies * | 42,200 | 185 | ||||||
Orexigen Therapeutics * | 145,345 | 920 | ||||||
Orthofix International * | 21,800 | 603 | ||||||
Owens & Minor (A) | 9,600 | 328 | ||||||
Pacira Pharmaceuticals * (A) | 24,221 | 710 | ||||||
PAREXEL International * (A) | 40,130 | 1,834 | ||||||
PDL BioPharma (A) | 206,800 | 1,706 | ||||||
PerkinElmer | 21,304 | 667 | ||||||
Pharmacyclics * | 6,350 | 582 | ||||||
PharMerica * | 55,000 | 859 | ||||||
Pozen * (A) | 40,400 | 214 | ||||||
Puma Biotechnology * | 21,284 | 829 | ||||||
Quality Systems (A) | 1,500 | 27 | ||||||
Questcor Pharmaceuticals (A) | 7,900 | 270 | ||||||
Quidel * (A) | 58,282 | 1,393 | ||||||
Repros Therapeutics * (A) | 13,810 | 239 | ||||||
Rigel Pharmaceuticals * | 20,900 | 97 | ||||||
Sagent Pharmaceuticals * | 29,450 | 530 | ||||||
Santarus * | 42,500 | 946 | ||||||
Sarepta Therapeutics * (A) | 6,680 | 236 | ||||||
Sciclone Pharmaceuticals * | 83,600 | 402 | ||||||
Seattle Genetics * (A) | 10,370 | 356 | ||||||
Select Medical Holdings | 63,400 | 501 | ||||||
Sirona Dental Systems * | 13,665 | 969 | ||||||
Skilled Healthcare Group, Cl A * | 21,800 | 155 | ||||||
| 5 | SEI Institutional Investments Trust / Annual Report / May 31, 2013 |
Table of Contents
Schedule of Investments
Small Cap Fund
May 31, 2013
| Description | Shares | Market Value ($ Thousands) | ||||||
Spectranetics * | 55,376 | $ | 1,036 | |||||
STERIS (A) | 8,900 | 404 | ||||||
Symmetry Medical * | 38,400 | 358 | ||||||
Synageva BioPharma * | 17,816 | 734 | ||||||
Syneron Medical * | 69,654 | 620 | ||||||
Synta Pharmaceuticals * (A) | 31,920 | 236 | ||||||
Team Health Holdings * | 25,094 | 980 | ||||||
Techne | 20,374 | 1,355 | ||||||
Teleflex | 6,439 | 504 | ||||||
TESARO * | 10,476 | 358 | ||||||
Threshold Pharmaceuticals * (A) | 103,910 | 594 | ||||||
Tornier * | 27,868 | 441 | ||||||
Trinity Biotech ADR | 8,000 | 140 | ||||||
Trius Therapeutics * | 47,260 | 363 | ||||||
Unilife * (A) | 179,450 | 592 | ||||||
ViroPharma * | 12,990 | 357 | ||||||
Vocera Communications * | 22,580 | 333 | ||||||
Volcano * (A) | 18,991 | 363 | ||||||
WellCare Health Plans * | 21,996 | 1,147 | ||||||
XenoPort * | 48,500 | 267 | ||||||
|
| |||||||
| 94,352 | ||||||||
|
| |||||||
Industrials — 17.9% | ||||||||
AAR | 9,300 | 187 | ||||||
ABM Industries | 23,300 | 563 | ||||||
ACCO Brands * (A) | 48,500 | 347 | ||||||
Actuant, Cl A (A) | 94,194 | 3,203 | ||||||
Acuity Brands (A) | 12,470 | 936 | ||||||
Advisory Board * | 9,557 | 505 | ||||||
Aegean Marine Petroleum Network | 53,600 | 521 | ||||||
Air Transport Services Group * | 149,329 | 903 | ||||||
Aircastle | 85,500 | 1,353 | ||||||
Alamo Group | 4,800 | 204 | ||||||
Alaska Air Group * | 3,800 | 216 | ||||||
Albany International, Cl A | 21,200 | 673 | ||||||
Alliant Techsystems | 8,600 | 675 | ||||||
Altra Holdings | 11,400 | 328 | ||||||
AMERCO * | 1,200 | 207 | ||||||
American Science & Engineering | 2,100 | 126 | ||||||
Ampco-Pittsburgh | 9,900 | 182 | ||||||
Apogee Enterprises | 23,300 | 622 | ||||||
Applied Industrial Technologies | 600 | 29 | ||||||
Armstrong World Industries * | 12,510 | 650 | ||||||
Astec Industries | 14,700 | 519 | ||||||
Atlas Air Worldwide Holdings * | 20,800 | 966 | ||||||
Avis Budget Group * | 15,825 | 525 | ||||||
Beacon Roofing Supply * (A) | 20,164 | 831 | ||||||
Belden | 26,024 | 1,391 | ||||||
Blount International * | 15,900 | 213 | ||||||
Brady, Cl A | 8,871 | 289 | ||||||
Briggs & Stratton (A) | 900 | 21 | ||||||
Brink’s | 41,500 | 1,114 | ||||||
Carlisle | 26,540 | 1,736 | ||||||
Celadon Group | 12,700 | 248 | ||||||
Chart Industries * | 12,895 | 1,254 | ||||||
CIRCOR International | 18,420 | 941 | ||||||
CLARCOR | 15,277 | 829 | ||||||
Clean Harbors * | 7,522 | 430 | ||||||
Comfort Systems USA | 27,586 | 381 | ||||||
Consolidated Graphics * | 3,600 | 168 | ||||||
| Description | Shares | Market Value ($ Thousands) | ||||||
Corporate Executive Board | 21,829 | $ | 1,336 | |||||
CRA International * | 13,945 | 250 | ||||||
Cubic | 22,336 | 1,063 | ||||||
Curtiss-Wright | 38,016 | 1,382 | ||||||
Deluxe | 12,000 | 449 | ||||||
DigitalGlobe * | 53,628 | 1,621 | ||||||
Ducommun * | 8,800 | 171 | ||||||
DXP Enterprises * | 7,870 | 465 | ||||||
Dycom Industries * | 67,845 | 1,544 | ||||||
EMCOR Group | 74,220 | 2,950 | ||||||
Encore Wire | 11,400 | 394 | ||||||
EnerSys | 1,900 | 95 | ||||||
Ennis | 7,900 | 135 | ||||||
EnPro Industries * (A) | 9,363 | 472 | ||||||
Exponent | 3,500 | 196 | ||||||
Flow International * | 115,000 | 456 | ||||||
Fortune Brands Home & Security | 26,670 | 1,127 | ||||||
FreightCar America | 8,500 | 154 | ||||||
FTI Consulting * (A) | 87,203 | 3,313 | ||||||
G&K Services, Cl A | 48,416 | 2,339 | ||||||
Genco Shipping & Trading * (A) | 4,800 | 8 | ||||||
Generac Holdings * | 19,350 | 784 | ||||||
General Cable | 17,312 | 612 | ||||||
Genesee & Wyoming, Cl A * | 36,814 | 3,278 | ||||||
Gibraltar Industries * | 16,200 | 263 | ||||||
Global Brass & Copper Holdings * | 16,500 | 218 | ||||||
Global Power Equipment Group (A) | 45,800 | 728 | ||||||
Graco | 14,710 | 948 | ||||||
GrafTech International * (A) | 231,601 | 1,943 | ||||||
Granite Construction | 31,400 | 969 | ||||||
Great Lakes Dredge & Dock | 113,100 | 939 | ||||||
Greenbrier * | 5,000 | 117 | ||||||
H&E Equipment Services * (A) | 3,600 | 81 | ||||||
Hawaiian Holdings * (A) | 115,300 | 687 | ||||||
Heico, Cl A | 47,405 | 1,754 | ||||||
HEICO | 12,662 | 641 | ||||||
Heritage-Crystal Clean * (A) | 58,360 | 878 | ||||||
Hexcel * | 102,817 | 3,575 | ||||||
Hub Group, Cl A * | 39,632 | 1,439 | ||||||
Hyster-Yale Materials Handling | 5,400 | 334 | ||||||
ICF International * | 33,600 | 1,013 | ||||||
IDEX | 15,725 | 866 | ||||||
Insperity | 15,500 | 467 | ||||||
Interface, Cl A | 92,636 | 1,556 | ||||||
ITT | 11,400 | 344 | ||||||
JetBlue Airways * (A) | 49,100 | 305 | ||||||
John Bean Technologies | 12,400 | 268 | ||||||
Kadant | 40,413 | 1,209 | ||||||
Kaman | 8,500 | 288 | ||||||
KAR Auction Services | 30,431 | 714 | ||||||
Kaydon | 42,271 | 1,143 | ||||||
Kelly Services, Cl A | 18,800 | 333 | ||||||
Kennametal | 9,682 | 420 | ||||||
KEYW Holding * (A) | 47,599 | 702 | ||||||
Kforce * | 33,600 | 500 | ||||||
Kirby * | 22,584 | 1,763 | ||||||
Korn/Ferry International * | 3,800 | 67 | ||||||
Landstar System | 22,148 | 1,169 | ||||||
Layne Christensen * | 4,300 | 92 | ||||||
LB Foster, Cl A | 6,900 | 306 | ||||||
| 6 | SEI Institutional Investments Trust / Annual Report / May 31, 2013 |
Table of Contents
Schedule of Investments
Small Cap Fund
May 31, 2013
| Description | Shares | Market Value ($ Thousands) | ||||||
Lennox International | 8,393 | $ | 537 | |||||
Lincoln Electric Holdings | 17,370 | 1,039 | ||||||
Lindsay Manufacturing (A) | 8,968 | 729 | ||||||
LS Starrett, Cl A | 700 | 7 | ||||||
Marten Transport | 34,710 | 833 | ||||||
Meritor * | 89,800 | 650 | ||||||
Metalico * | 26,000 | 37 | ||||||
Middleby * | 13,080 | 2,138 | ||||||
Miller Industries | 6,700 | 110 | ||||||
Mine Safety Appliances | 5,700 | 285 | ||||||
Mobile Mini * | 19,949 | 671 | ||||||
Moog, Cl A * | 15,436 | 773 | ||||||
MSC Industrial Direct, Cl A | 9,366 | 774 | ||||||
Mueller Industries | 8,600 | 468 | ||||||
Mueller Water Products, Cl A | 68,200 | 519 | ||||||
MYR Group * | 26,700 | 540 | ||||||
National Presto Industries | 1,500 | 115 | ||||||
Navigant Consulting * | 42,800 | 564 | ||||||
Nordson | 19,982 | 1,423 | ||||||
Northwest Pipe * | 14,860 | 409 | ||||||
Old Dominion Freight Line * | 64,181 | 2,764 | ||||||
Orbital Sciences * | 23,300 | 424 | ||||||
Orion Marine Group * | 117,405 | 1,410 | ||||||
Pacer International * | 25,400 | 155 | ||||||
Pitney Bowes (A) | 27,000 | 396 | ||||||
Ply Gem Holdings * | 14,729 | 340 | ||||||
Polypore International * (A) | 34,902 | 1,313 | ||||||
Quad, Cl A (A) | 29,700 | 692 | ||||||
Rand Logistics * | 24,000 | 134 | ||||||
RBC Bearings * | 13,052 | 639 | ||||||
Regal-Beloit | 8,578 | 579 | ||||||
Resources Connection | 34,500 | 378 | ||||||
Ritchie Bros Auctioneers (A) | 64,905 | 1,344 | ||||||
Rush Enterprises, Cl A * (A) | 41,417 | 1,064 | ||||||
Ryder System | 29,700 | 1,872 | ||||||
Saia * | 44,242 | 2,114 | ||||||
Simpson Manufacturing (A) | 17,525 | 513 | ||||||
SkyWest | 34,864 | 489 | ||||||
Spirit Aerosystems Holdings, Cl A * | 1,700 | 37 | ||||||
Spirit Airlines * | 35,730 | 1,087 | ||||||
Standard Parking * | 53,733 | 1,199 | ||||||
Standex International | 3,500 | 183 | ||||||
Steelcase, Cl A | 140,112 | 1,939 | ||||||
Swift Transportation, Cl A * | 125,830 | 2,119 | ||||||
TAL International Group (A) | 4,500 | 190 | ||||||
Taser International * | 55,600 | 528 | ||||||
Teledyne Technologies * | 7,358 | 568 | ||||||
Tennant | 11,456 | 565 | ||||||
Terex * | 14,300 | 513 | ||||||
Tetra Tech * | 68,217 | 1,881 | ||||||
Titan Machinery * (A) | 4,000 | 82 | ||||||
TMS International, Cl A | 60,400 | 916 | ||||||
Towers Watson, Cl A | 20,182 | 1,568 | ||||||
Trex * (A) | 19,680 | 1,094 | ||||||
Trimas * | 21,363 | 689 | ||||||
Triumph Group | 11,708 | 909 | ||||||
TrueBlue * | 86,790 | 2,043 | ||||||
Tutor Perini * | 105,300 | 1,950 | ||||||
UniFirst | 1,000 | 95 | ||||||
United Rentals * (A) | 19,645 | 1,117 | ||||||
United Stationers | 6,900 | 238 | ||||||
| Description | Shares | Market Value ($ Thousands) | ||||||
US Ecology | 37,220 | $ | 1,019 | |||||
USG * (A) | 30,478 | 833 | ||||||
Valmont Industries | 7,010 | 1,068 | ||||||
Wabash National * | 63,700 | 669 | ||||||
Wabtec | 19,902 | 2,189 | ||||||
WageWorks * | 11,862 | 344 | ||||||
Watsco (A) | 10,980 | 958 | ||||||
Watts Water Technologies, Cl A | 15,034 | 716 | ||||||
Werner Enterprises | 22,420 | 561 | ||||||
WESCO International * (A) | 28,969 | 2,151 | ||||||
Woodward | 16,000 | 626 | ||||||
|
| |||||||
| 139,804 | ||||||||
|
| |||||||
Information Technology — 17.3% | ||||||||
Active Network * (A) | 2,200 | 15 | ||||||
Actuate * | 50,600 | 342 | ||||||
Acxiom * | 29,890 | 657 | ||||||
ADTRAN | 89,833 | 2,077 | ||||||
Advanced Energy Industries * | 40,300 | 741 | ||||||
Advent Software * | 2,535 | 84 | ||||||
Amkor Technology * (A) | 79,900 | 363 | ||||||
Amtech Systems * | 1,300 | 7 | ||||||
Arrow Electronics * | 22,300 | 887 | ||||||
Aruba Networks * | 60,260 | 900 | ||||||
Aspen Technology * | 63,286 | 1,938 | ||||||
Atmel * | 67,375 | 530 | ||||||
Benchmark Electronics * | 47,497 | 926 | ||||||
Black Box | 14,900 | 401 | ||||||
Blackbaud | 60,528 | 1,836 | ||||||
Blackhawk Network Holdings, Cl A * | 2,449 | 58 | ||||||
Blucora * | 27,200 | 496 | ||||||
Broadridge Financial Solutions | 78,375 | 2,127 | ||||||
BroadSoft * (A) | 21,840 | 605 | ||||||
Brooks Automation | 7,200 | 77 | ||||||
CACI International, Cl A * (A) | 24,410 | 1,566 | ||||||
Cadence Design Systems (A) * | 190,166 | 2,877 | ||||||
Calix * | 63,700 | 667 | ||||||
Cavium (A) * | 94,936 | 3,110 | ||||||
Ceva * | 6,200 | 104 | ||||||
ChannelAdvisor * | 8,410 | 143 | ||||||
CIBER * | 229,400 | 936 | ||||||
Ciena * (A) | 59,633 | 998 | ||||||
Coherent * | 9,024 | 518 | ||||||
CommVault Systems * | 13,032 | 912 | ||||||
Comtech Telecommunications | 28,438 | 751 | ||||||
Convergys | 57,186 | 1,039 | ||||||
Cornerstone OnDemand * (A) | 37,986 | 1,544 | ||||||
CoStar Group * (A) | 22,444 | 2,509 | ||||||
Cray * | 24,300 | 442 | ||||||
CSG Systems International * | 37,300 | 807 | ||||||
Cyan * | 52,269 | 698 | ||||||
Dealertrack Technologies * | 89,300 | 2,879 | ||||||
Demandware * (A) | 37,150 | 1,137 | ||||||
Dice Holdings * (A) | 2,200 | 20 | ||||||
Diebold | 71,502 | 2,303 | ||||||
Digi International * | 90,600 | 869 | ||||||
Digital River * | 19,700 | 344 | ||||||
Diodes * | 22,700 | 536 | ||||||
DTS * | 40,318 | 797 | ||||||
EarthLink | 213,615 | 1,267 | ||||||
Electronics for Imaging * | 3,800 | 106 | ||||||
| 7 | SEI Institutional Investments Trust / Annual Report / May 31, 2013 |
Table of Contents
Schedule of Investments
Small Cap Fund
May 31, 2013
| Description | Shares | Market Value ($ Thousands) | ||||||
Ellie Mae * | 19,400 | $ | 434 | |||||
Emulex * | 133,229 | 830 | ||||||
Entegris * | 27,300 | 284 | ||||||
Envestnet * | 148,275 | 3,407 | ||||||
Euronet Worldwide * | 39,697 | 1,211 | ||||||
ExactTarget * | 25,296 | 582 | ||||||
Exar * | 121,400 | 1,369 | ||||||
ExlService Holdings * | 22,502 | 660 | ||||||
Fairchild Semiconductor International, Cl A * | 107,971 | 1,567 | ||||||
FARO Technologies * | 1,800 | 67 | ||||||
FleetMatics Group * | 30,116 | 896 | ||||||
FormFactor * | 37,000 | 218 | ||||||
Forrester Research | 6,100 | 221 | ||||||
Fortinet * | 35,120 | 676 | ||||||
Fusion-io * (A) | 21,130 | 306 | ||||||
Genpact * | 26,290 | 509 | ||||||
Global Cash Access Holdings * | 46,400 | 306 | ||||||
GT Advanced Technologies * (A) | 23,400 | 104 | ||||||
Guidewire Software * | 69,206 | 2,835 | ||||||
Harmonic * | 62,300 | 380 | ||||||
Hittite Microwave * | 23,419 | 1,271 | ||||||
Imation * | 12,000 | 49 | ||||||
Imperva * | 16,320 | 650 | ||||||
Infinera * (A) | 139,549 | 1,469 | ||||||
Infoblox * | 137,614 | 3,348 | ||||||
Inphi * | 79,726 | 814 | ||||||
Insight Enterprises * | 32,300 | 622 | ||||||
Integrated Device Technology * | 85,053 | 725 | ||||||
Interactive Intelligence Group * (A) | 23,196 | 1,165 | ||||||
Intermec * | 20,800 | 205 | ||||||
Internap Network Services * | 80,269 | 640 | ||||||
International Rectifier * (A) | 31,650 | 696 | ||||||
Intersil, Cl A | 71,000 | 582 | ||||||
IntraLinks Holdings * | 39,345 | 242 | ||||||
InvenSense, Cl A * (A) | 84,937 | 1,094 | ||||||
Itron * | 4,000 | 168 | ||||||
j2 Global (A) | 13,856 | 567 | ||||||
Kemet * | 20,300 | 93 | ||||||
Lender Processing Services | 9,300 | 308 | ||||||
Lexmark International, Cl A (A) | 25,300 | 772 | ||||||
Limelight Networks * | 105,000 | 249 | ||||||
Liquidity Services * (A) | 19,108 | 764 | ||||||
LivePerson * | 134,846 | 1,246 | ||||||
LTX-Credence * | 26,800 | 152 | ||||||
Manhattan Associates * | 9,300 | 698 | ||||||
Marin Software * (A) | 9,823 | 118 | ||||||
Maxwell Technologies * (A) | 14,700 | 106 | ||||||
Measurement Specialties * | 40,962 | 1,821 | ||||||
Mentor Graphics | 24,200 | 460 | ||||||
Micrel | 2,200 | 22 | ||||||
MicroStrategy, Cl A * | 6,824 | 624 | ||||||
MKS Instruments | 31,797 | 895 | ||||||
Model N * (A) | 29,625 | 599 | ||||||
Monolithic Power Systems | 8,977 | 221 | ||||||
Monotype Imaging Holdings | 2,100 | 48 | ||||||
Move * | 28,750 | 327 | ||||||
MTS Systems | 5,200 | 314 | ||||||
Multi-Fineline Electronix * | 8,850 | 141 | ||||||
Nanometrics * | 33,300 | 481 | ||||||
National Instruments | 7,208 | 205 | ||||||
| Description | Shares | Market Value ($ Thousands) | ||||||
Netscout Systems * | 5,700 | $ | 139 | |||||
NetSuite * (A) | 5,200 | 456 | ||||||
Newport * | 25,900 | 341 | ||||||
NIC | 7,500 | 125 | ||||||
NICE Systems ADR | 7,450 | 275 | ||||||
ON Semiconductor * | 59,960 | 513 | ||||||
OpenTable * (A) | 7,250 | 484 | ||||||
Oplink Communications * | 800 | 14 | ||||||
OSI Systems * | 11,900 | 688 | ||||||
Palo Alto Networks * (A) | 7,830 | 380 | ||||||
Pandora Media * (A) | 32,290 | 550 | ||||||
Park Electrochemical | 16,100 | 389 | ||||||
Photronics * | 54,700 | 417 | ||||||
Plantronics | 20,772 | 960 | ||||||
PLX Technology * | 34,700 | 157 | ||||||
Power Integrations (A) | 9,060 | 387 | ||||||
Power-One * | 62,400 | 395 | ||||||
PRGX Global * | 94,600 | 518 | ||||||
Progress Software * | 40,800 | 959 | ||||||
PROS Holdings * | 6,300 | 182 | ||||||
PTC * | 95,989 | 2,410 | ||||||
Pulse Electronics * (A) | 2,300 | 7 | ||||||
QLogic * | 86,400 | 842 | ||||||
Quantum * (A) | 84,100 | 130 | ||||||
Rally Software Development * | 28,729 | 630 | ||||||
RealD * (A) | 53,339 | 805 | ||||||
RealNetworks * | 1,050 | 8 | ||||||
RealPage * (A) | 95,109 | 1,811 | ||||||
RF Micro Devices * | 163,425 | 902 | ||||||
Ruckus Wireless * (A) | 30,250 | 379 | ||||||
Rudolph Technologies * | 35,280 | 432 | ||||||
Saba Software * | 105,800 | 913 | ||||||
Sanmina * | 22,100 | 300 | ||||||
Semtech * | 32,540 | 1,189 | ||||||
ServiceSource International * | 58,060 | 473 | ||||||
Silicon Image * | 12,600 | 77 | ||||||
SolarWinds * | 8,381 | 353 | ||||||
Solera Holdings | 7,313 | 401 | ||||||
Sonus Networks * | 286,671 | 920 | ||||||
Sourcefire * | 27,752 | 1,553 | ||||||
Spansion, Cl A * | 14,500 | 199 | ||||||
Splunk * | 12,120 | 567 | ||||||
SPS Commerce * | 23,067 | 1,245 | ||||||
SS&C Technologies Holdings * | 81,870 | 2,590 | ||||||
STEC * | 16,800 | 59 | ||||||
Stratasys * (A) | 7,577 | 637 | ||||||
Sykes Enterprises * (A) | 61,400 | 971 | ||||||
Synaptics * | 19,090 | 788 | ||||||
SYNNEX * (A) | 7,200 | 292 | ||||||
Tableau Software, Cl A * | 9,606 | 491 | ||||||
Tangoe * (A) | 69,710 | 1,039 | ||||||
Tech Data * | 31,400 | 1,574 | ||||||
TeleCommunication Systems, Cl A * | 77,200 | 181 | ||||||
TeleTech Holdings * | 25,800 | 580 | ||||||
Tellabs | 256,100 | 530 | ||||||
Teradyne * (A) | 50,150 | 900 | ||||||
Tessco Technologies | 9,400 | 215 | ||||||
Travelzoo * | 8,800 | 253 | ||||||
Trulia * (A) | 39,492 | 1,214 | ||||||
Tyler Technologies * | 8,728 | 602 | ||||||
Ultimate Software Group * (A) | 5,825 | 648 | ||||||
| 8 | SEI Institutional Investments Trust / Annual Report / May 31, 2013 |
Table of Contents
Schedule of Investments
Small Cap Fund
May 31, 2013
| Description | Shares | Market Value ($ Thousands) | ||||||
Ultra Clean Holdings * | 39,320 | $ | 228 | |||||
Ultratech * | 51,200 | 1,867 | ||||||
Unisys * | 18,600 | 384 | ||||||
United Online (A) | 126,900 | 864 | ||||||
Veeco Instruments * (A) | 21,905 | 928 | ||||||
Vishay Intertechnology * (A) | 15,733 | 229 | ||||||
VistaPrint * (A) | 25,706 | 1,181 | ||||||
Vocus * | 5,100 | 45 | ||||||
Volterra Semiconductor * | 14,500 | 204 | ||||||
WebMD Health, Cl A * | 4,600 | 136 | ||||||
Websense * | 37,300 | 927 | ||||||
WEX * | 13,897 | 1,027 | ||||||
Yelp, Cl A * (A) | 12,327 | 367 | ||||||
Zebra Technologies, Cl A * | 14,909 | 681 | ||||||
Zillow, Cl A * (A) | 3,488 | 196 | ||||||
|
| |||||||
| 134,482 | ||||||||
|
| |||||||
Materials — 3.4% | ||||||||
A. Schulman | 19,800 | 572 | ||||||
Allegheny Technologies | 15,960 | 440 | ||||||
Boise * (A) | 98,200 | 791 | ||||||
Cabot | 14,300 | 585 | ||||||
Century Aluminum * | 27,100 | 269 | ||||||
Chemtura * | 12,700 | 291 | ||||||
Coeur Mining * | 7,600 | 108 | ||||||
Compass Minerals International (A) | 11,685 | 1,020 | ||||||
Cytec Industries | 7,257 | 519 | ||||||
Ferro * | 47,000 | 322 | ||||||
Glatfelter | 27,800 | 688 | ||||||
Globe Specialty Metals | 11,600 | 142 | ||||||
Greif, Cl A | 12,583 | 656 | ||||||
GSE Holding * | 134,118 | 857 | ||||||
H.B. Fuller | 39,700 | 1,650 | ||||||
Haynes International | 5,300 | 259 | ||||||
Headwaters * | 80,900 | 858 | ||||||
Horsehead Holding * (A) | 43,200 | 497 | ||||||
Innophos Holdings | 13,068 | 661 | ||||||
Innospec * | 25,100 | 1,030 | ||||||
Intrepid Potash * (A) | 70,612 | 1,326 | ||||||
Koppers Holdings | 2,000 | 82 | ||||||
Kraton Performance Polymers * | 13,500 | 280 | ||||||
LSB Industries * | 14,200 | 480 | ||||||
Materion | 4,300 | 128 | ||||||
McEwen Mining * (A) | 30,500 | 78 | ||||||
Minerals Technologies | 30,270 | 1,290 | ||||||
Myers Industries | 8,500 | 125 | ||||||
Neenah Paper | 17,200 | 540 | ||||||
Noranda Aluminum Holding | 88,000 | 356 | ||||||
Olin | 18,700 | 466 | ||||||
OM Group * | 4,000 | 117 | ||||||
Owens-Illinois * | 24,546 | 674 | ||||||
PolyOne | 81,500 | 2,094 | ||||||
Rock Tenn, Cl A | 400 | 40 | ||||||
RTI International Metals * (A) | 35,271 | 1,023 | ||||||
Schnitzer Steel Industries, Cl A (A) | 37,900 | 936 | ||||||
Schweitzer-Mauduit International | 8,600 | 413 | ||||||
Scotts Miracle-Gro, Cl A (A) | 11,688 | 553 | ||||||
Sensient Technologies | 43,393 | 1,791 | ||||||
Silgan Holdings | 21,044 | 984 | ||||||
| Description | Shares | Market Value ($ Thousands) | ||||||
Wausau Paper | 2,400 | $ | 28 | |||||
Worthington Industries (A) | 4,900 | 168 | ||||||
|
| |||||||
| 26,187 | ||||||||
|
| |||||||
Telecommunication Services — 0.3% | ||||||||
Atlantic Telegraph-Network | 11,600 | 578 | ||||||
Boingo Wireless * (A) | 78,700 | 570 | ||||||
Iridium Communications * (A) | 24,000 | 171 | ||||||
Neutral Tandem | 19,800 | 115 | ||||||
USA Mobility | 16,000 | 216 | ||||||
Vonage Holdings * | 114,600 | 314 | ||||||
|
| |||||||
| 1,964 | ||||||||
|
| |||||||
Utilities — 1.8% | ||||||||
ALLETE | 10,210 | 483 | ||||||
American States Water | 1,700 | 90 | ||||||
Cadiz * (A) | 64,700 | 380 | ||||||
California Water Service Group | 9,400 | 186 | ||||||
CH Energy Group | 900 | 58 | ||||||
Chesapeake Utilities | 7,129 | 377 | ||||||
Cleco | 31,778 | 1,446 | ||||||
Dynegy * (A) | 8,200 | 200 | ||||||
El Paso Electric | 8,900 | 319 | ||||||
Empire District Electric (A) | 22,000 | 478 | ||||||
Great Plains Energy | 62,465 | 1,410 | ||||||
IDACORP | 14,775 | 698 | ||||||
Laclede Group (A) | 18,700 | 885 | ||||||
MGE Energy | 2,400 | 128 | ||||||
NorthWestern | 17,500 | 721 | ||||||
Otter Tail | 2,200 | 60 | ||||||
Piedmont Natural Gas | 21,900 | 740 | ||||||
PNM Resources | 32,165 | 721 | ||||||
Portland General Electric | 79,053 | 2,406 | ||||||
Southwest Gas | 10,931 | 518 | ||||||
UIL Holdings (A) | 13,771 | 537 | ||||||
UNS Energy | 8,900 | 417 | ||||||
Westar Energy | 8,259 | 262 | ||||||
WGL Holdings | 17,834 | 765 | ||||||
|
| |||||||
| 14,285 | ||||||||
|
| |||||||
Total Common Stock | 748,201 | |||||||
|
| |||||||
EXCHANGE TRADED FUNDS — 1.1% | ||||||||
iShares Russell 2000 Growth Index Fund (A) | 31,929 | 3,592 | ||||||
iShares Russell 2000 Index Fund (A) | 17,458 | 1,708 | ||||||
iShares Russell 2000 Value Index Fund (A) | 45,600 | 3,936 | ||||||
|
| |||||||
Total Exchange Traded Funds | 9,236 | |||||||
|
| |||||||
Number Of Warrants | ||||||||
WARRANTS — 0.0% | ||||||||
Dynegy, Expires 2017 * | 2,629 | 5 | ||||||
Magnum Hunter Resource, Expires | 5,126 | — | ||||||
|
| |||||||
Total Warrants | 5 | |||||||
|
| |||||||
| 9 | SEI Institutional Investments Trust / Annual Report / May 31, 2013 |
Table of Contents
Schedule of Investments
Small Cap Fund
May 31, 2013
| Description | Shares/Face Amount ($ Thousands) | Market Value ($ Thousands) | ||||||
CONVERTIBLE BOND — 0.0% | ||||||||
Eddie Bauer Holdings | ||||||||
5.250%, 04/01/2014 (E) | $ | 2,856 | $ | 3 | ||||
|
| |||||||
Total Convertible Bond | 3 | |||||||
|
| |||||||
AFFILIATED PARTNERSHIP — 22.2% |
| |||||||
SEI Liquidity Fund, L.P. | 173,278,252 | 173,278 | ||||||
|
| |||||||
Total Affiliated Partnership | 173,278 | |||||||
|
| |||||||
CASH EQUIVALENT — 3.5% | ||||||||
SEI Daily Income Trust, Prime Obligation Fund, Cl A | 27,185,676 | 27,186 | ||||||
|
| |||||||
Total Cash Equivalent | 27,186 | |||||||
|
| |||||||
U.S. TREASURY OBLIGATIONS (G)(H) — 0.5% |
| |||||||
U.S. Treasury Bills | ||||||||
0.075%, 06/27/2013 | 240 | 240 | ||||||
0.053%, 07/25/2013 | 3,450 | 3,450 | ||||||
|
| |||||||
Total U.S. Treasury Obligations | 3,690 | |||||||
|
| |||||||
Total Investments — 123.4% | $ | 961,599 | ||||||
|
| |||||||
The open futures contracts held by the Fund at May 31, 2013, are as follows:
| Type of Contract | Number of Contracts Long (Short) | Expiration Date | Unrealized Depreciation ($ Thousands) | |||||||||
Russell 2000 Index E-MINI | 50 | Jun-2013 | $ | (47 | ) | |||||||
|
| |||||||||||
For the year ended May 31, 2013, the total amount of all open futures contracts, as presented in the table above, are representative of the volume of activity for this derivative type during the period.
Percentages are based on a Net Assets of $778,976 ($ Thousands).
| * | Non-income producing security. |
| ** | The rate reported is the 7-day effective yield as of May 31, 2013. |
| † | Investment in Affiliated Security (see Note 5). |
| ‡ | Real Estate Investment Trust. |
| (A) | This security or a partial position of this security is on loan at May 31, 2013. The total value of securities on loan at May 31, 2013 was $166,755 ($ Thousands). |
| (B) | Securities considered illiquid. The total value of such securities as of May 31, 2013 was $105 ($ Thousands) and represented 0.01% of Net Assets. |
| (C) | Security fair valued using methods determined in good faith by the Valuation Committee of the Board of Trustees. The total market value of such securities as of May 31, 2013 was $105 ($ Thousands) and represented 0.01% of Net Assets. |
| (D) | Securities considered restricted. The total value of such securities as of May 31, 2013 was $105 ($ Thousands) and represented 0.01% of Net Assets. |
| (E) | Security in default on interest payments. |
| (F) | This security was purchased with cash collateral held from securities on loan (see Note 11). The total value of such securities as of May 31, 2013 was $173,278 ($ Thousands). |
| (G) | Security, or portion thereof, has been pledged as collateral on open futures contracts. |
| (H) | The rate reported is the effective yield at time of purchase. |
ADR — American Depositary Receipt
Cl — Class
L.P. — Limited Partnership
NY — New York
The following is a list of the inputs used as of May 31, 2013, in valuing the Fund’s investments carried at value ($ Thousands).
| Investments in Securities | Level 1 | Level 2 | Level 3(1) | Total | ||||||||||||
Common Stock | $ | 748,096 | $ | 105 | $ | — | $ | 748,201 | ||||||||
Exchange Traded Funds | 9,236 | — | — | 9,236 | ||||||||||||
Warrants | 5 | — | — | 5 | ||||||||||||
Convertible Bond | — | — | 3 | 3 | ||||||||||||
Affiliated Partnership | — | 173,278 | — | 173,278 | ||||||||||||
Cash Equivalent | 27,186 | — | — | 27,186 | ||||||||||||
U.S. Treasury Obligations | — | 3,690 | — | 3,690 | ||||||||||||
|
|
|
|
|
|
|
| |||||||||
Total Investments in Securities | $ | 784,523 | $ | 177,073 | $ | 3 | $ | 961,599 | ||||||||
|
|
|
|
|
|
|
| |||||||||
| Other Financial Instruments | Level 1 | Level 2 | Level 3 | Total | ||||||||||||
Futures Contracts* | $ | (47 | ) | $ | — | $ | — | $ | (47 | ) | ||||||
|
|
|
|
|
|
|
| |||||||||
| (1) | A reconciliation of Level 3 investments is presented when the Fund has a significant amount of Level 3 investments at the beginning and/or end of the period in relation to the net assets. |
| * | Futures contracts are valued at the unrealized depreciation on the instrument. |
For the year ended May 31, 2013, there were no transfers between Level 1 and Level 2 assets and liabilities.
For the year ended May 31, 2013, there were no transfers between Level 2 and Level 3 assets and liabilities.
For more information on valuation inputs, see Note 2 — Significant Accounting Policies in Notes to Financial Statements.
Amounts designated as “—” are $O or have been rounded to $O.
The accompanying notes are an integral part of the financial statements.
| 10 | SEI Institutional Investments Trust / Annual Report / May 31, 2013 |
Table of Contents
Schedule of Investments
Small Cap II Fund
May 31, 2013
| Description | Shares | Market Value ($ Thousands) | ||||||
COMMON STOCK — 99.1% | ||||||||
Consumer Discretionary — 16.4% | ||||||||
Aaron’s | 14,910 | $ | 419 | |||||
Aeropostale * | 15,613 | 228 | ||||||
America’s Car-Mart * | 2,600 | 117 | ||||||
Ameristar Casinos | 3,800 | 100 | ||||||
ANN * | 19,581 | 601 | ||||||
Arctic Cat | 9,773 | 458 | ||||||
Beazer Homes USA * (A) | 22,051 | 456 | ||||||
Belo, Cl A | 45,180 | 507 | ||||||
Biglari Holdings * | 650 | 262 | ||||||
BJ’s Restaurants * (A) | 18,478 | 694 | ||||||
Bravo Brio Restaurant Group * | 12,000 | 216 | ||||||
Bright Horizons Family Solutions * | 14,249 | 514 | ||||||
Brown Shoe | 23,300 | 485 | ||||||
Brunswick | 18,371 | 617 | ||||||
Cabela’s * | 12,850 | 862 | ||||||
Callaway Golf (A) | 32,954 | 226 | ||||||
Capella Education * | 4,100 | 179 | ||||||
Career Education * | 62,700 | 187 | ||||||
Carmike Cinemas * | 8,400 | 149 | ||||||
Cato, Cl A | 10,300 | 256 | ||||||
Cheesecake Factory (A) | 12,570 | 502 | ||||||
Children’s Place Retail Stores * | 400 | 21 | ||||||
Columbia Sportswear | 3,656 | 220 | ||||||
Conn’s * | 13,293 | 654 | ||||||
Cooper Tire & Rubber | 11,665 | 301 | ||||||
Core-Mark Holding | 8,000 | 474 | ||||||
Corinthian Colleges * (A) | 92,800 | 241 | ||||||
Cracker Barrel Old Country Store | 1,100 | 98 | ||||||
Destination Maternity | 13,200 | 329 | ||||||
Dick’s Sporting Goods | 6,365 | 333 | ||||||
Dorman Products (A) | 10,216 | 455 | ||||||
Drew Industries | 11,780 | 445 | ||||||
Ethan Allen Interiors (A) | 9,822 | 308 | ||||||
Express * | 23,154 | 505 | ||||||
Five Below * (A) | 8,012 | 306 | ||||||
Francesca’s Holdings * (A) | 28,297 | 808 | ||||||
Fred’s, Cl A | 13,800 | 219 | ||||||
GameStop, Cl A (A) | 16,688 | 553 | ||||||
G-III Apparel Group * | 1,000 | 42 | ||||||
Grand Canyon Education * | 22,561 | 725 | ||||||
Helen of Troy * | 8,700 | 345 | ||||||
hhgregg * | 12,800 | 200 | ||||||
Hibbett Sports * | 9,425 | 537 | ||||||
HomeAway * | 24,171 | 739 | ||||||
Hot Topic | 1,800 | 25 | ||||||
Hovnanian Enterprises, Cl A * (A) | 42,100 | 258 | ||||||
Imax * (A) | 9,625 | 249 | ||||||
Jack in the Box * | 18,019 | 658 | ||||||
JAKKS Pacific | 3,915 | 40 | ||||||
Krispy Kreme Doughnuts * | 21,100 | 365 | ||||||
Lions Gate Entertainment * (A) | 12,600 | 363 | ||||||
LKQ * | 18,120 | 444 | ||||||
Loral Space & Communications | 5,100 | 307 | ||||||
Lumber Liquidators Holdings * (A) | 8,110 | 666 | ||||||
M/I Homes * | 7,400 | 184 | ||||||
| Description | Shares | Market Value ($ Thousands) | ||||||
Maidenform Brands * | 3,100 | $ | 56 | |||||
Matthews International, Cl A | 10,186 | 391 | ||||||
Mattress Firm Holding * | 1,150 | 41 | ||||||
Men’s Wearhouse | 5,862 | 212 | ||||||
Modine Manufacturing * | 19,500 | 200 | ||||||
Monro Muffler (A) | 14,129 | 664 | ||||||
Movado Group | 21,630 | 781 | ||||||
Multimedia Games Holding * | 9,600 | 246 | ||||||
NACCO Industries, Cl A | 2,400 | 134 | ||||||
National CineMedia | 23,010 | 382 | ||||||
New York Times, Cl A * | 6,800 | 72 | ||||||
Nutrisystem (A) | 14,500 | 131 | ||||||
Office Depot * (A) | 30,800 | 136 | ||||||
OfficeMax | 3,400 | 44 | ||||||
Orient-Express Hotels, Cl A * | 39,624 | 469 | ||||||
Oxford Industries (A) | 12,764 | 838 | ||||||
Panera Bread, Cl A * (A) | 2,665 | 511 | ||||||
Papa John’s International * | 2,400 | 155 | ||||||
Perry Ellis International | 8,800 | 186 | ||||||
PetMed Express (A) | 28,100 | 376 | ||||||
Pier 1 Imports (A) | 50,177 | 1,164 | ||||||
Red Robin Gourmet Burgers * | 11,847 | 622 | ||||||
Regis (A) | 8,747 | 161 | ||||||
Restoration Hardware Holdings * | 5,617 | 314 | ||||||
Ryland Group (A) | 12,320 | 558 | ||||||
Scholastic | 6,200 | 187 | ||||||
Scientific Games, Cl A * | 16,670 | 182 | ||||||
Shutterfly * | 23,327 | 1,137 | ||||||
Six Flags Entertainment | 6,890 | 514 | ||||||
Smith & Wesson Holding * (A) | 21,400 | 195 | ||||||
Sonic * | 23,400 | 307 | ||||||
Standard Motor Products | 11,000 | 372 | ||||||
Standard Pacific * (A) | 52,886 | 468 | ||||||
Steiner Leisure * | 4,800 | 244 | ||||||
Steven Madden * | 11,390 | 552 | ||||||
Stewart Enterprises, Cl A | 22,700 | 295 | ||||||
Tenneco * | 10,230 | 454 | ||||||
Vail Resorts (A) | 6,100 | 391 | ||||||
Vitamin Shoppe * (A) | 12,599 | 551 | ||||||
Wet Seal, Cl A * | 91,900 | 456 | ||||||
Winnebago Industries * | 2,400 | 50 | ||||||
Zumiez * (A) | 21,429 | 682 | ||||||
|
| |||||||
| 36,333 | ||||||||
|
| |||||||
Consumer Staples — 3.6% | ||||||||
Andersons | 7,600 | 387 | ||||||
Casey’s General Stores (A) | 11,298 | 686 | ||||||
Central Garden and Pet, Cl A * | 11,211 | 85 | ||||||
Chefs’ Warehouse * | 14,540 | 275 | ||||||
Chiquita Brands International * | 44,000 | 444 | ||||||
Darling International * | 33,172 | 650 | ||||||
Dole Food * (A) | 13,813 | 131 | ||||||
Elizabeth Arden * | 10,760 | 507 | ||||||
Fresh Del Monte Produce | 23,700 | 634 | ||||||
Fresh Market * | 10,453 | 518 | ||||||
Ingredion | 3,830 | 261 | ||||||
Lancaster Colony | 500 | 41 | ||||||
Medifast * (A) | 7,600 | 219 | ||||||
Pantry * | 17,716 | 222 | ||||||
Pilgrim’s Pride * | 30,500 | 365 | ||||||
Post Holdings * | 1,200 | 51 | ||||||
| 1 | SEI Institutional Investments Trust / Annual Report / May 31, 2013 |
Table of Contents
Schedule of Investments
Small Cap II Fund
May 31, 2013
| Description | Shares | Market Value ($ Thousands) | ||||||
Prestige Brands Holdings * | 11,497 | $ | 338 | |||||
Rite Aid * | 122,300 | 360 | ||||||
Sanderson Farms (A) | 4,416 | 304 | ||||||
Snyders-Lance | 15,490 | 401 | ||||||
Spectrum Brands Holdings | 1,300 | 78 | ||||||
TreeHouse Foods * | 4,353 | 285 | ||||||
USANA Health Sciences * (A) | 6,700 | 470 | ||||||
WD-40 | 3,300 | 179 | ||||||
Weis Markets | 1,800 | 74 | ||||||
|
| |||||||
| 7,965 | ||||||||
|
| |||||||
Energy — 5.7% | ||||||||
Bristow Group (A) | 5,000 | 314 | ||||||
Clayton Williams Energy * | 700 | 31 | ||||||
Cloud Peak Energy * | 12,700 | 244 | ||||||
Comstock Resources | 3,500 | 57 | ||||||
CVR Energy | 4,100 | 258 | ||||||
Delek US Holdings | 5,100 | 184 | ||||||
Dril-Quip * | 4,900 | 443 | ||||||
Emerald Oil * | 22,442 | 137 | ||||||
Energy XXI Bermuda (A) | 23,600 | 603 | ||||||
EPL Oil & Gas * | 11,300 | 344 | ||||||
Forest Oil * (A) | 4,700 | 21 | ||||||
Forum Energy Technologies * (A) | 19,919 | 591 | ||||||
Goodrich Petroleum * (A) | 11,701 | 147 | ||||||
Green Plains Renewable Energy * | 6,500 | 103 | ||||||
Gulfmark Offshore, Cl A (A) | 10,230 | 469 | ||||||
Halcon Resources * (A) | 66,568 | 352 | ||||||
Helix Energy Solutions Group * | 19,171 | 457 | ||||||
Hornbeck Offshore Services * | 6,629 | 345 | ||||||
Key Energy Services * | 32,705 | 212 | ||||||
Knightsbridge Tankers (A) | 7,300 | 51 | ||||||
Kodiak Oil & Gas * (A) | 8,600 | 76 | ||||||
Laredo Petroleum Holdings * (A) | 19,423 | 376 | ||||||
Matador Resources * (A) | 25,280 | 252 | ||||||
McDermott International * | 35,197 | 336 | ||||||
Mitcham Industries * | 7,100 | 111 | ||||||
Oasis Petroleum * | 32,685 | 1,215 | ||||||
Oceaneering International | 6,200 | 449 | ||||||
Oil States International * | 2,960 | 292 | ||||||
Parker Drilling * | 44,700 | 199 | ||||||
Penn Virginia | 40,000 | 186 | ||||||
PetroQuest Energy * | 27,100 | 124 | ||||||
Pioneer Energy Services * | 59,212 | 413 | ||||||
Quicksilver Resources * (A) | 19,000 | 42 | ||||||
Rentech | 61,700 | 136 | ||||||
Rosetta Resources * | 15,886 | 744 | ||||||
Ship Finance International (A) | 20,400 | 346 | ||||||
Stone Energy * | 11,800 | 266 | ||||||
Swift Energy * (A) | 26,839 | 364 | ||||||
Targa Resources | 900 | 58 | ||||||
Tesco * | 26,200 | 334 | ||||||
TETRA Technologies * | 2,900 | 30 | ||||||
Triangle Petroleum * | 12,400 | 67 | ||||||
Vaalco Energy * | 43,300 | 265 | ||||||
W&T Offshore (A) | 800 | 12 | ||||||
Western Refining (A) | 7,000 | 234 | ||||||
Willbros Group * | 36,600 | 246 | ||||||
|
| |||||||
| 12,536 | ||||||||
|
| |||||||
| Description | Shares | Market Value ($ Thousands) | ||||||
Financials — 19.5% | ||||||||
Affiliated Managers Group * | 2,770 | $ | 454 | |||||
American Assets Trust | 1,900 | 61 | ||||||
AMERISAFE | 1,000 | 34 | ||||||
Amtrust Financial Services (A) | 12,846 | 424 | ||||||
Argo Group International Holdings | 12,210 | 484 | ||||||
Associated Estates Realty ‡ | 27,680 | 455 | ||||||
Banco Latinoamericano de | 15,800 | 362 | ||||||
Bank of the Ozarks (A) | 16,100 | 703 | ||||||
BankUnited | 17,847 | 439 | ||||||
Banner | 11,975 | 384 | ||||||
BBCN Bancorp | 16,790 | 216 | ||||||
BGC Partners, Cl A | 4,200 | 23 | ||||||
BlackRock Kelso Capital | 33,500 | 334 | ||||||
Boston Private Financial | 15,615 | 154 | ||||||
Brandywine Realty Trust | 39,090 | 554 | ||||||
Brookline Bancorp | 6,000 | 51 | ||||||
Campus Crest Communities | 15,800 | 200 | ||||||
Capital Bank Financial, Cl A * | 11,790 | 211 | ||||||
Cardinal Financial | 9,728 | 147 | ||||||
CBL & Associates Properties | 12,519 | 288 | ||||||
Chesapeake Lodging Trust ‡ | 18,600 | 419 | ||||||
City Holding | 7,300 | 289 | ||||||
CNO Financial Group | 11,600 | 143 | ||||||
Colonial Properties Trust ‡ | 25,520 | 564 | ||||||
Columbia Banking System (A) | 30,120 | 658 | ||||||
Community Bank System (A) | 1,900 | 56 | ||||||
Coresite Realty ‡ | 8,100 | 260 | ||||||
Cousins Properties ‡ | 24,400 | 252 | ||||||
Credit Acceptance * | 1,759 | 200 | ||||||
DiamondRock Hospitality ‡ | 65,480 | 623 | ||||||
DuPont Fabros Technology ‡ (A) | 22,820 | 553 | ||||||
Eagle Bancorp * | 14,421 | 325 | ||||||
EastGroup Properties ‡ | 12,718 | 747 | ||||||
Education Realty Trust ‡ | 28,057 | 293 | ||||||
Employers Holdings | 26,407 | 653 | ||||||
Encore Capital Group * (A) | 2,500 | 89 | ||||||
Endurance Specialty Holdings | 22,079 | 1,111 | ||||||
Equity One ‡ (A) | 16,899 | 394 | ||||||
Evercore Partners, Cl A | 13,940 | 554 | ||||||
Federated Investors, Cl B (A) | 11,146 | 308 | ||||||
First American Financial | 8,000 | 191 | ||||||
First Commonwealth Financial | 36,300 | 262 | ||||||
First Horizon National (A) | 37,779 | 434 | ||||||
First Industrial Realty Trust ‡ | 2,600 | 44 | ||||||
First Midwest Bancorp | 36,559 | 481 | ||||||
First NBC Bank Holding * | 7,553 | 190 | ||||||
FirstMerit | 21,658 | 409 | ||||||
Forestar Group * | 3,700 | 85 | ||||||
Fulton Financial | 43,760 | 503 | ||||||
Geo Group ‡ | 7,900 | 275 | ||||||
Getty Realty ‡ (A) | 4,400 | 92 | ||||||
Glimcher Realty Trust ‡ | 42,700 | 499 | ||||||
Government Properties Income | 1,800 | 44 | ||||||
Hancock Holding | 17,644 | 504 | ||||||
Hanover Insurance Group | 22,385 | 1,124 | ||||||
| 2 | SEI Institutional Investments Trust / Annual Report / May 31, 2013 |
Table of Contents
Schedule of Investments
Small Cap II Fund
May 31, 2013
| Description | Shares | Market Value ($ Thousands) | ||||||
Healthcare Realty Trust ‡ | 5,100 | $ | 136 | |||||
Hercules Technology Growth Capital | 9,500 | 127 | ||||||
Home BancShares (A) | 4,300 | 181 | ||||||
Horace Mann Educators | 40,786 | 991 | ||||||
Hudson Pacific Properties ‡ | 1,400 | 30 | ||||||
Iberiabank | 22,550 | 1,162 | ||||||
Infinity Property & Casualty | 11,856 | 685 | ||||||
Inland Real Estate ‡ (A) | 52,100 | 535 | ||||||
International Bancshares (A) | 4,400 | 96 | ||||||
Investment Technology Group * | 19,300 | 267 | ||||||
Investors Bancorp | 10,856 | 215 | ||||||
Jones Lang LaSalle | 2,760 | 253 | ||||||
Lexington Realty Trust ‡ (A) | 41,271 | 520 | ||||||
LTC Properties ‡ | 5,400 | 225 | ||||||
Markel * | 51 | 27 | ||||||
Medical Properties Trust ‡ | 28,660 | 425 | ||||||
MFA Mortgage Investments ‡ | 56,030 | 492 | ||||||
MGIC Investment * | 9,400 | 58 | ||||||
Mid-America Apartment | 6,329 | 430 | ||||||
Montpelier Re Holdings | 19,500 | 487 | ||||||
National Health Investors ‡ | 900 | 56 | ||||||
National Penn Bancshares (A) | 18,335 | 181 | ||||||
NBT Bancorp (A) | 14,700 | 292 | ||||||
Nelnet, Cl A | 14,200 | 555 | ||||||
Ocwen Financial * | 6,100 | 261 | ||||||
OFG Bancorp | 11,780 | 209 | ||||||
Oritani Financial | 14,800 | 227 | ||||||
PacWest Bancorp (A) | 19,358 | 558 | ||||||
Pebblebrook Hotel Trust ‡ | 14,157 | 371 | ||||||
PennantPark Investment | 13,600 | 152 | ||||||
Pennsylvania Real Estate Investment Trust ‡ | 5,100 | 101 | ||||||
Pinnacle Financial Partners * | 6,500 | 163 | ||||||
Piper Jaffray * | 10,300 | 368 | ||||||
Platinum Underwriters Holdings | 23,234 | 1,327 | ||||||
Potlatch ‡ | 3,400 | 154 | ||||||
Primerica * | 6,600 | 232 | ||||||
ProAssurance | 8,879 | 446 | ||||||
Prospect Capital | 51,800 | 538 | ||||||
Prosperity Bancshares (A) | 8,090 | 405 | ||||||
Provident Financial Services | 14,300 | 218 | ||||||
PS Business Parks ‡ | 2,400 | 183 | ||||||
Ramco-Gershenson Properties ‡ | 33,500 | 523 | ||||||
Reinsurance Group of America, Cl A | 5,858 | 386 | ||||||
Retail Opportunity Investments ‡ | 7,400 | 104 | ||||||
RLJ Lodging Trust ‡ | 8,000 | 185 | ||||||
Sabra Health Care ‡ (A) | 15,000 | 406 | ||||||
Signature Bank NY * | 5,710 | 441 | ||||||
Silver Bay Realty Trust ‡ | 595 | 11 | ||||||
Solar Capital | 17,500 | 402 | ||||||
Sovran Self Storage ‡ | 2,000 | 130 | ||||||
STAG Industrial ‡ | 14,600 | 321 | ||||||
Starwood Property Trust ‡ | 6,300 | 160 | ||||||
Stifel Financial * (A) | 12,192 | 439 | ||||||
Sun Communities ‡ | 7,390 | 369 | ||||||
Susquehanna Bancshares | 74,698 | 897 | ||||||
SVB Financial Group * | 4,732 | 366 | ||||||
| Description | Shares | Market Value ($ Thousands) | ||||||
Symetra Financial | 16,700 | $ | 233 | |||||
Synovus Financial | 51,985 | 142 | ||||||
Tanger Factory Outlet Centers ‡ | 9,767 | 337 | ||||||
TCF Financial (A) | 23,926 | 345 | ||||||
Texas Capital Bancshares * | 13,728 | 606 | ||||||
TICC Capital (A) | 39,300 | 386 | ||||||
Tower Group International | 6,000 | 116 | ||||||
Two Harbors Investment ‡ | 12,200 | 135 | ||||||
Umpqua Holdings | 2,200 | 30 | ||||||
ViewPoint Financial Group | 12,600 | 239 | ||||||
Washington Federal | 24,750 | 433 | ||||||
Webster Financial | 25,320 | 591 | ||||||
Wilshire Bancorp | 44,700 | 295 | ||||||
Zions Bancorporation (A) | 12,607 | 354 | ||||||
|
| |||||||
| 43,327 | ||||||||
|
| |||||||
Health Care — 13.6% | ||||||||
Acadia Healthcare * | 33,767 | 1,127 | ||||||
Accuray * (A) | 5,600 | 30 | ||||||
Acorda Therapeutics * | 2,600 | 87 | ||||||
Affymax * (A) | 55,000 | 114 | ||||||
Akorn * (A) | 55,172 | 802 | ||||||
Align Technology * | 10,430 | 373 | ||||||
Alkermes * | 11,900 | 372 | ||||||
AMAG Pharmaceuticals * | 2,000 | 37 | ||||||
Amedisys * | 17,100 | 211 | ||||||
Amsurg, Cl A * | 24,911 | 885 | ||||||
Analogic | 9,580 | 761 | ||||||
Arena Pharmaceuticals * (A) | 6,000 | 53 | ||||||
Arqule * | 31,600 | 86 | ||||||
Array BioPharma * | 31,400 | 183 | ||||||
ArthroCare * | 2,000 | 68 | ||||||
athenahealth * | 3,504 | 296 | ||||||
AVEO Pharmaceuticals * | 8,600 | 22 | ||||||
BioScrip * | 31,661 | 443 | ||||||
Cantel Medical | 6,500 | 221 | ||||||
Celldex Therapeutics * | 10,659 | 136 | ||||||
Centene * | 8,590 | 425 | ||||||
Cepheid * (A) | 4,140 | 144 | ||||||
Charles River Laboratories International * | 17,736 | 768 | ||||||
Chemed | 900 | 63 | ||||||
Computer Programs & Systems | 2,800 | 140 | ||||||
CONMED | 8,900 | 293 | ||||||
Coronado Biosciences * (A) | 20,292 | 200 | ||||||
Cubist Pharmaceuticals * (A) | 8,414 | 462 | ||||||
DexCom * | 26,813 | 558 | ||||||
Dynavax Technologies * | 35,500 | 93 | ||||||
Emergent Biosolutions * | 27,400 | 389 | ||||||
Endocyte * (A) | 19,400 | 266 | ||||||
Ensign Group | 7,300 | 263 | ||||||
Exact Sciences * | 3,000 | 34 | ||||||
ExamWorks Group * | 20,987 | 392 | ||||||
Furiex Pharmaceuticals * | 8,125 | 300 | ||||||
Gentiva Health Services * | 31,800 | 339 | ||||||
Greatbatch * | 2,900 | 93 | ||||||
HealthSouth * | 38,552 | 1,129 | ||||||
HeartWare International * (A) | 5,080 | 464 | ||||||
Hi-Tech Pharmacal | 500 | 16 | ||||||
HMS Holdings * | 28,092 | 699 | ||||||
Hyperion Therapeutics * | 7,564 | 152 | ||||||
| 3 | SEI Institutional Investments Trust / Annual Report / May 31, 2013 |
Table of Contents
Schedule of Investments
Small Cap II Fund
May 31, 2013
| Description | Shares | Market Value ($ Thousands) | ||||||
ICON * | 15,755 | $ | 541 | |||||
ICU Medical * | 9,700 | 692 | ||||||
Impax Laboratories * | 10,000 | 189 | ||||||
Infinity Pharmaceuticals * | 10,818 | 292 | ||||||
Integra LifeSciences Holdings * | 1,700 | 64 | ||||||
Intercept Pharmaceuticals * | 3,190 | 107 | ||||||
Invacare | 10,800 | 167 | ||||||
IPC The Hospitalist * | 8,322 | 406 | ||||||
Isis Pharmaceuticals * (A) | 24,030 | 520 | ||||||
Jazz Pharmaceuticals * | 8,680 | 590 | ||||||
Keryx Biopharmaceuticals * (A) | 74,903 | 600 | ||||||
Kindred Healthcare * | 3,700 | 50 | ||||||
LHC Group * | 13,800 | 303 | ||||||
Masimo * | 19,760 | 428 | ||||||
MEDNAX * | 7,474 | 694 | ||||||
Momenta Pharmaceuticals * | 4,600 | 60 | ||||||
MWI Veterinary Supply * | 1,100 | 134 | ||||||
NewLink Genetics * (A) | 12,791 | 209 | ||||||
NPS Pharmaceuticals * | 13,800 | 217 | ||||||
NuVasive * | 2,800 | 61 | ||||||
Onyx Pharmaceuticals * (A) | 5,265 | 503 | ||||||
Optimer Pharmaceuticals * (A) | 17,181 | 256 | ||||||
OraSure Technologies * | 16,700 | 73 | ||||||
Orexigen Therapeutics * | 81,952 | 519 | ||||||
Orthofix International * | 8,600 | 238 | ||||||
Pacira Pharmaceuticals * (A) | 12,937 | 379 | ||||||
PAREXEL International * | 19,212 | 878 | ||||||
PDL BioPharma (A) | 88,200 | 728 | ||||||
PerkinElmer | 11,039 | 346 | ||||||
Pharmacyclics * | 3,290 | 301 | ||||||
PharMerica * | 18,100 | 283 | ||||||
Pozen * | 25,100 | 133 | ||||||
Puma Biotechnology * | 4,209 | 164 | ||||||
Repros Therapeutics * (A) | 7,330 | 127 | ||||||
Rigel Pharmaceuticals * | 33,100 | 153 | ||||||
Santarus * | 24,600 | 548 | ||||||
Sarepta Therapeutics * (A) | 3,540 | 125 | ||||||
Sciclone Pharmaceuticals * | 63,900 | 307 | ||||||
Select Medical Holdings | 22,000 | 174 | ||||||
Sirona Dental Systems * | 7,270 | 516 | ||||||
Spectranetics * | 25,111 | 470 | ||||||
STERIS | 1,300 | 59 | ||||||
Synageva BioPharma * | 3,140 | 129 | ||||||
Team Health Holdings * | 28,047 | 1,096 | ||||||
Teleflex | 3,331 | 261 | ||||||
TESARO * | 5,560 | 190 | ||||||
Threshold Pharmaceuticals * (A) | 29,300 | 168 | ||||||
Trius Therapeutics * | 21,430 | 164 | ||||||
WellCare Health Plans * | 5,205 | 271 | ||||||
West Pharmaceutical Services | 700 | 48 | ||||||
Wright Medical Group * | 2,100 | 53 | ||||||
XenoPort * | 38,700 | 213 | ||||||
|
| |||||||
| 30,186 | ||||||||
|
| |||||||
Industrials — 17.2% | ||||||||
Actuant, Cl A (A) | 50,650 | 1,722 | ||||||
Advisory Board * | 4,332 | 229 | ||||||
Aegion, Cl A * | 1,900 | 43 | ||||||
Aircastle | 22,100 | 350 | ||||||
Albany International, Cl A | 5,300 | 168 | ||||||
Altra Holdings | 4,900 | 141 | ||||||
| Description | Shares | Market Value ($ Thousands) | ||||||
AMERCO | 100 | $ | 17 | |||||
American Science & Engineering | 2,100 | 126 | ||||||
Apogee Enterprises | 15,100 | 403 | ||||||
Atlas Air Worldwide Holdings * | 2,300 | 107 | ||||||
Avis Budget Group * | 7,173 | 238 | ||||||
Beacon Roofing Supply * (A) | 21,586 | 890 | ||||||
Belden | 15,763 | 842 | ||||||
Brady, Cl A | 5,589 | 182 | ||||||
Carlisle | 7,590 | 496 | ||||||
Chart Industries * | 11,030 | 1,073 | ||||||
CIRCOR International | 11,370 | 581 | ||||||
CLARCOR | 6,935 | 376 | ||||||
Consolidated Graphics * | 1,800 | 84 | ||||||
Con-way | 10,650 | 405 | ||||||
Corporate Executive Board | 9,891 | 605 | ||||||
Curtiss-Wright | 21,247 | 773 | ||||||
Deluxe | 500 | 19 | ||||||
DigitalGlobe * | 24,358 | 736 | ||||||
Dycom Industries * | 35,320 | 803 | ||||||
EMCOR Group | 4,700 | 187 | ||||||
EnerSys | 1,600 | 80 | ||||||
EnPro Industries * (A) | 4,844 | 244 | ||||||
Esterline Technologies * | 8,800 | 646 | ||||||
Exponent | 1,800 | 101 | ||||||
FreightCar America | 2,300 | 42 | ||||||
G&K Services, Cl A | 18,895 | 913 | ||||||
General Cable | 8,971 | 317 | ||||||
Genesee & Wyoming, Cl A * | 17,628 | 1,570 | ||||||
Granite Construction | 3,300 | 102 | ||||||
H&E Equipment Services | 17,200 | 385 | ||||||
Hexcel * | 38,512 | 1,339 | ||||||
IDEX | 8,340 | 459 | ||||||
Insperity | 9,400 | 283 | ||||||
Interface, Cl A | 38,184 | 641 | ||||||
John Bean Technologies | 9,200 | 199 | ||||||
Kadant | 6,168 | 185 | ||||||
KAR Auction Services | 15,744 | 369 | ||||||
Kaydon | 8,306 | 225 | ||||||
Kelly Services, Cl A | 2,400 | 42 | ||||||
KEYW Holding * (A) | 25,244 | 372 | ||||||
Kforce * | 18,400 | 274 | ||||||
Kirby * | 7,593 | 593 | ||||||
Lennox International | 3,806 | 244 | ||||||
Lincoln Electric Holdings | 9,210 | 551 | ||||||
Lindsay Manufacturing (A) | 4,080 | 331 | ||||||
Manitowoc (A) | 20,890 | 439 | ||||||
MasTec * (A) | 20,220 | 643 | ||||||
Meritor * | 7,200 | 52 | ||||||
Middleby * | 3,595 | 588 | ||||||
Mine Safety Appliances | 3,900 | 195 | ||||||
Mistras Group * | 1,200 | 26 | ||||||
Mobile Mini * | 9,039 | 304 | ||||||
Mueller Industries | 3,900 | 212 | ||||||
Mueller Water Products, Cl A | 45,600 | 347 | ||||||
MYR Group * | 16,600 | 336 | ||||||
Navigant Consulting * | 10,600 | 140 | ||||||
Old Dominion Freight Line * | 7,281 | 313 | ||||||
On Assignment * | 15,050 | 392 | ||||||
Orbital Sciences * | 27,460 | 499 | ||||||
Orion Marine Group * | 18,977 | 228 | ||||||
| 4 | SEI Institutional Investments Trust / Annual Report / May 31, 2013 |
Table of Contents
Schedule of Investments
Small Cap II Fund
May 31, 2013
| Description | Shares | Market Value ($ Thousands) | ||||||
Ply Gem Holdings * | 3,458 | $ | 80 | |||||
Primoris Services | 11,500 | 245 | ||||||
Proto Labs * (A) | 3,910 | 216 | ||||||
RBC Bearings * | 6,860 | 336 | ||||||
Regal-Beloit | 4,438 | 300 | ||||||
Resources Connection | 21,300 | 233 | ||||||
Saia * | 12,200 | 583 | ||||||
SkyWest | 7,600 | 107 | ||||||
Standex International | 3,500 | 183 | ||||||
Steelcase, Cl A | 44,295 | 613 | ||||||
Swift Transporation, Cl A * | 41,377 | 697 | ||||||
Taser International * | 29,000 | 275 | ||||||
Team * | 1,000 | 36 | ||||||
Teledyne Technologies * | 8,979 | 693 | ||||||
Terex * | 7,410 | 266 | ||||||
Tetra Tech * | 19,719 | 544 | ||||||
Towers Watson, Cl A | 4,854 | 377 | ||||||
Trex * | 10,130 | 563 | ||||||
Trimas * | 11,103 | 358 | ||||||
Triumph Group | 6,067 | 471 | ||||||
TrueBlue * | 32,610 | 768 | ||||||
Tutor Perini * | 1,300 | 24 | ||||||
UniFirst | 500 | 47 | ||||||
United Rentals * (A) | 10,420 | 592 | ||||||
US Ecology | 16,864 | 462 | ||||||
USG * | 13,809 | 377 | ||||||
Valmont Industries | 3,720 | 567 | ||||||
WageWorks * | 5,376 | 156 | ||||||
Watts Water Technologies, Cl A | 7,813 | 372 | ||||||
WESCO International * (A) | 4,261 | 316 | ||||||
Woodward Governor | 10,703 | 419 | ||||||
|
| |||||||
| 38,093 | ||||||||
|
| |||||||
Information Technology — 16.5% | ||||||||
ACI Worldwide * | 11,150 | 519 | ||||||
Active Network * (A) | 9,800 | 66 | ||||||
Actuate * | 34,100 | 230 | ||||||
Advanced Energy Industries * | 18,900 | 348 | ||||||
Aruba Networks * | 13,790 | 206 | ||||||
Aspen Technology * | 31,321 | 959 | ||||||
ATMI * | 2,400 | 57 | ||||||
Benchmark Electronics * | 8,300 | 162 | ||||||
Black Box | 6,400 | 172 | ||||||
Blucora * | 16,300 | 297 | ||||||
CACI International, Cl A * (A) | 3,333 | 214 | ||||||
Cadence Design Systems * | 40,474 | 612 | ||||||
Calix * | 21,800 | 228 | ||||||
Cardtronics * | 14,530 | 415 | ||||||
Cavium (A) * | 34,538 | 1,131 | ||||||
Ceva * | 5,900 | 99 | ||||||
Ciena * (A) | 31,631 | 529 | ||||||
Cognex | 7,640 | 343 | ||||||
Coherent | 4,677 | 268 | ||||||
CommVault Systems * | 3,378 | 236 | ||||||
comScore * | 5,700 | 113 | ||||||
Comtech Telecommunications | 4,713 | 124 | ||||||
Convergys | 18,151 | 330 | ||||||
CoStar Group (A) * | 9,141 | 1,022 | ||||||
Cray * | 11,000 | 200 | ||||||
CSG Systems International * | 13,800 | 298 | ||||||
Cyan * | 12,112 | 162 | ||||||
| Description | Shares | Market Value ($ Thousands) | ||||||
Dealertrack Technologies * | 31,079 | $ | 1,002 | |||||
Demandware * (A) | 8,930 | 273 | ||||||
Dice Holdings * | 2,700 | 24 | ||||||
Diebold | 14,444 | 465 | ||||||
Digital River * | 8,000 | 140 | ||||||
EarthLink | 23,500 | 139 | ||||||
Electronics for Imaging * | 14,840 | 414 | ||||||
Ellie Mae * | 9,200 | 206 | ||||||
Emulex * | 52,753 | 329 | ||||||
Entegris * | 42,130 | 439 | ||||||
Envestnet * | 17,355 | 399 | ||||||
ExactTarget * | 13,420 | 309 | ||||||
ExlService Holdings * | 9,337 | 274 | ||||||
Extreme Networks * | 26,600 | 95 | ||||||
Fairchild Semiconductor International, Cl A * | 56,661 | 822 | ||||||
FEI | 5,660 | 408 | ||||||
FleetMatics Group * | 15,970 | 475 | ||||||
FormFactor * | 35,900 | 211 | ||||||
Fortinet * | 8,340 | 161 | ||||||
Global Cash Access Holdings * | 36,800 | 243 | ||||||
Glu Mobile * (A) | 5,200 | 14 | ||||||
Guidewire Software * | 22,148 | 907 | ||||||
Harmonic * (A) | 39,500 | 241 | ||||||
Hittite Microwave * | 5,664 | 307 | ||||||
Infinera * (A) | 31,238 | 329 | ||||||
Infoblox * | 43,534 | 1,059 | ||||||
Insight Enterprises * | 16,000 | 308 | ||||||
Interactive Intelligence Group * | 10,535 | 529 | ||||||
Intermec * | 3,300 | 33 | ||||||
Internap Network Services * | 36,382 | 290 | ||||||
InvenSense, Cl A * (A) | 71,204 | 917 | ||||||
Ixia * | 25,908 | 407 | ||||||
Kemet * | 13,100 | 60 | ||||||
Limelight Networks * | 62,700 | 149 | ||||||
Liquidity Services * (A) | 9,886 | 396 | ||||||
LTX-Credence * | 21,800 | 124 | ||||||
Manhattan Associates * | 6,660 | 500 | ||||||
MEMC Electronic Materials * | 10,600 | 86 | ||||||
Mentor Graphics | 8,400 | 160 | ||||||
MKS Instruments | 9,792 | 276 | ||||||
Monotype Imaging Holdings | 2,200 | 50 | ||||||
Move * | 27,300 | 311 | ||||||
Nanometrics * | 3,100 | 45 | ||||||
Netscout Systems * | 3,700 | 90 | ||||||
Newport * | 4,500 | 59 | ||||||
OSI Systems * | 13,792 | 798 | ||||||
Pandora Media * (A) | 17,130 | 292 | ||||||
Photronics * | 12,800 | 98 | ||||||
Plantronics | 5,472 | 253 | ||||||
PLX Technology * | 27,000 | 122 | ||||||
Power Integrations | 4,810 | 205 | ||||||
Power-One * | 35,900 | 227 | ||||||
Procera Networks * | 900 | 13 | ||||||
Progress Software * | 400 | 9 | ||||||
PROS Holdings * | 1,900 | 55 | ||||||
PTC * | 40,496 | 1,017 | ||||||
Quantum * (A) | 30,300 | 47 | ||||||
RF Micro Devices * | 84,602 | 467 | ||||||
Sanmina * | 3,200 | 43 | ||||||
| 5 | SEI Institutional Investments Trust / Annual Report / May 31, 2013 |
Table of Contents
Schedule of Investments
Small Cap II Fund
May 31, 2013
| Description | Shares | Market Value ($ Thousands) | ||||||
Sapient * | 5,200 | $ | 67 | |||||
Semtech * | 31,110 | 1,137 | ||||||
Silicon Image * | 13,600 | 83 | ||||||
Silicon Laboratories * | 10,840 | 466 | ||||||
SolarWinds * | 108 | 5 | ||||||
Sonus Networks * | 150,098 | 482 | ||||||
Sourcefire * (A) | 8,691 | 486 | ||||||
Spansion, Cl A * | 10,200 | 140 | ||||||
SPS Commerce * | 10,451 | 564 | ||||||
STEC * | 15,800 | 56 | ||||||
Sykes Enterprises * | 10,200 | 161 | ||||||
Synaptics * | 10,120 | 418 | ||||||
Tableau Software, Cl A * | 3,084 | 158 | ||||||
Take-Two Interactive Software * | 20,170 | 336 | ||||||
Tangoe * (A) | 63,324 | 944 | ||||||
TeleTech Holdings * | 2,600 | 58 | ||||||
Tellabs | 126,800 | 262 | ||||||
Teradyne * (A) | 26,600 | 477 | ||||||
Travelzoo * | 7,000 | 201 | ||||||
Trulia * | 7,986 | 245 | ||||||
Ultimate Software Group * | 2,640 | 294 | ||||||
Unisys * | 8,400 | 173 | ||||||
United Online | 47,900 | 326 | ||||||
Veeco Instruments * (A) | 11,621 | 493 | ||||||
Vishay Intertechnology * (A) | 8,139 | 119 | ||||||
Volterra Semiconductor * | 4,200 | 59 | ||||||
WEX * | 6,297 | 465 | ||||||
Zebra Technologies, Cl A * | 7,729 | 353 | ||||||
|
| |||||||
| 36,489 | ||||||||
|
| |||||||
Materials — 3.8% | ||||||||
A. Schulman | 12,800 | 370 | ||||||
Allegheny Technologies | 8,257 | 228 | ||||||
Axiall | 700 | 30 | ||||||
Boise | 22,300 | 180 | ||||||
Century Aluminum * | 8,800 | 87 | ||||||
Chemtura * | 11,300 | 259 | ||||||
Clearwater Paper * | 2,000 | 96 | ||||||
Coeur Mining * | 400 | 6 | ||||||
Compass Minerals International (A) | 6,041 | 527 | ||||||
Cytec Industries | 3,760 | 269 | ||||||
Ferro * | 14,600 | 100 | ||||||
Flotek Industries * | 11,620 | 202 | ||||||
Greif, Cl A | 6,544 | 341 | ||||||
H.B. Fuller | 11,740 | 488 | ||||||
Haynes International | 700 | 34 | ||||||
Headwaters * | 15,300 | 162 | ||||||
Horsehead Holding * | 8,000 | 92 | ||||||
Innophos Holdings | 6,761 | 342 | ||||||
Innospec | 9,100 | 373 | ||||||
Intrepid Potash (A) | 10,746 | 202 | ||||||
Koppers Holdings | 3,700 | 152 | ||||||
Kraton Performance Polymers * | 6,300 | 131 | ||||||
LSB Industries * | 900 | 30 | ||||||
Minerals Technologies | 14,010 | 597 | ||||||
Myers Industries | 5,200 | 77 | ||||||
Noranda Aluminum Holding | 47,500 | 192 | ||||||
OM Group * | 800 | 24 | ||||||
Owens-Illinois * | 12,699 | 349 | ||||||
PolyOne | 42,730 | 1,098 | ||||||
| Description | Shares | Market Value ($ Thousands) | ||||||
Quaker Chemical | 1,500 | $ | 97 | |||||
RTI International Metals * (A) | 10,042 | 291 | ||||||
Scotts Miracle-Gro, Cl A (A) | 6,079 | 287 | ||||||
Sensient Technologies | 6,476 | 267 | ||||||
Silgan Holdings | 5,659 | 265 | ||||||
SunCoke Energy * | 12,600 | 195 | ||||||
Worthington Industries | 3,700 | 127 | ||||||
|
| |||||||
| 8,567 | ||||||||
|
| |||||||
Telecommunication Services — 0.1% | ||||||||
Consolidated Communications Holdings | 3,000 | 51 | ||||||
magicJack VocalTec * (A) | 5,200 | 78 | ||||||
Neutral Tandem | 800 | 5 | ||||||
Vonage Holdings * | 39,600 | 108 | ||||||
|
| |||||||
| 242 | ||||||||
|
| |||||||
Utilities — 2.7% | ||||||||
ALLETE | 10,250 | 485 | ||||||
American States Water | 5,400 | 287 | ||||||
Avista | 100 | 3 | ||||||
California Water Service Group | 15,500 | 306 | ||||||
Cleco | 12,144 | 553 | ||||||
El Paso Electric | 1,400 | 50 | ||||||
Great Plains Energy | 32,486 | 733 | ||||||
IDACORP | 8,784 | 415 | ||||||
Laclede Group | 1,500 | 71 | ||||||
MGE Energy | 700 | 37 | ||||||
Otter Tail | 5,600 | 153 | ||||||
PNM Resources | 7,100 | 159 | ||||||
Portland General Electric | 44,710 | 1,361 | ||||||
UIL Holdings (A) | 12,620 | 492 | ||||||
UNS Energy | 13,280 | 622 | ||||||
Westar Energy | 4,273 | 135 | ||||||
WGL Holdings | 1,300 | 56 | ||||||
|
| |||||||
| 5,918 | ||||||||
|
| |||||||
Total Common Stock | 219,656 | |||||||
|
| |||||||
EXCHANGE TRADED FUNDS — 1.1% | ||||||||
iShares Russell 2000 Growth Index Fund (A) | 14,213 | 1,599 | ||||||
iShares Russell 2000 Index Fund (A) | 9,080 | 888 | ||||||
|
| |||||||
Total Exchange Traded Funds | 2,487 | |||||||
|
| |||||||
AFFILIATED PARTNERSHIP — 18.6% | ||||||||
SEI Liquidity Fund, L.P. | 41,129,582 | 41,130 | ||||||
|
| |||||||
Total Affiliated Partnership | 41,130 | |||||||
|
| |||||||
CASH EQUIVALENT — 4.6% | ||||||||
SEI Daily Income Trust, Prime Obligation Fund, Cl A 0.010% **† | 10,118,854 | 10,119 | ||||||
|
| |||||||
Total Cash Equivalent | 10,119 | |||||||
|
| |||||||
| 6 | SEI Institutional Investments Trust / Annual Report / May 31, 2013 |
Table of Contents
Schedule of Investments
Small Cap II Fund
May 31, 2013
| Description | Face Amount ($ Thousands) | Market Value ($ Thousands) | ||||||
U.S. TREASURY OBLIGATIONS (C) — 0.5% |
| |||||||
U.S. Treasury Bills | ||||||||
0.087%, 07/25/2013 | $ | 529 | $ | 529 | ||||
0.080%, 06/27/2013 | 654 | 654 | ||||||
|
| |||||||
Total U.S. Treasury Obligations | 1,183 | |||||||
|
| |||||||
Total Investments — 123.9% | $ | 274,575 | ||||||
|
| |||||||
Percentages are based on a Net Assets of $221,697 ($ Thousands).
| * | Non-income producing security. |
| ** | The rate reported is the 7-day effective yield as of May 31, 2013. |
| † | Investment in Affiliated Security (see Note 5). |
| ‡ | Real Estate Investment Trust. |
| (A) | This security or a partial position of this security is on loan at May 31, 2013. The total value of securities on loan at May 31, 2013 was $39,632 ($ Thousands). |
| (B) | This security was purchased with cash collateral held from securities on loan (see Note 11). The total value of such securities as of May 31, 2013 was $41,130 ($ Thousands). |
| (C) | The rate reported is the effective yield at time of purchase. |
Cl — Class
L.P. — Limited Partnership
NY — New York
The following is a summary of the inputs used as of May 31, 2013, in valuing the Fund’s investments carried at value ($ Thousands):
| Investments in Securities | Level 1 | Level 2 | Level 3 | Total | ||||||||||||
Common Stock | $ | 219,656 | $ | — | $ | — | $ | 219,656 | ||||||||
Exchange Traded Funds | 2,487 | — | — | 2,487 | ||||||||||||
Affiliated Partnership | — | 41,130 | — | 41,130 | ||||||||||||
Cash Equivalent | 10,119 | — | — | 10,119 | ||||||||||||
U.S. Treasury Obligations | — | 1,183 | — | 1,183 | ||||||||||||
|
|
|
|
|
|
|
| |||||||||
Total Investments in Securities | $ | 232,262 | $ | 42,313 | $ | — | $ | 274,575 | ||||||||
|
|
|
|
|
|
|
| |||||||||
During the year ended May 31, 2013, there were no transfers between Level 1 and Level 2 assets and liabilities.
During the year ended May 31, 2013, there were no transfers between Level 2 and Level 3 assets and liabilities.
For more information on valuation inputs, see Note 2 — Significant Accounting Policies in Notes to Financial Statements.
Amounts designated as “—” are $O or have been rounded to $O.
The accompanying notes are an integral part of the financial statements.
| 7 | SEI Institutional Investments Trust / Annual Report / May 31, 2013 |
Table of Contents
Schedule of Investments
Small/Mid Cap Equity Fund
May 31, 2013
| Description | Shares | Market Value ($ Thousands) | ||||||
COMMON STOCK — 95.0% | ||||||||
Consumer Discretionary — 13.6% | ||||||||
Abercrombie & Fitch, Cl A | 38,738 | $ | 1,940 | |||||
Aeropostale * | 57,271 | 837 | ||||||
AFC Enterprises * | 40,830 | 1,489 | ||||||
Allison Transmission Holdings | 76,604 | 1,823 | ||||||
America’s Car-Mart * | 3,300 | 149 | ||||||
ANN * | 46,795 | 1,436 | ||||||
Arctic Cat | 17,142 | 804 | ||||||
Asbury Automotive Group * | 59,999 | 2,472 | ||||||
Autoliv (A) | 36,100 | 2,832 | ||||||
Beazer Homes USA * (A) | 67,188 | 1,391 | ||||||
Belo, Cl A | 218,297 | 2,449 | ||||||
Big Lots * | 96,765 | 3,295 | ||||||
BJ’s Restaurants * (A) | 83,727 | 3,143 | ||||||
Bloomin’ Brands * (A) | 165,414 | 3,848 | ||||||
Bob Evans Farms | 20,100 | 928 | ||||||
Bravo Brio Restaurant Group * | 20,200 | 364 | ||||||
Bright Horizons Family Solutions * | 73,570 | 2,652 | ||||||
Brinker International (A) | 20,900 | 819 | ||||||
Brunswick | 171,700 | 5,764 | ||||||
Buffalo Wild Wings * (A) | 34,640 | 3,324 | ||||||
Cabela’s * | 64,046 | 4,295 | ||||||
Callaway Golf (A) | 120,645 | 826 | ||||||
Carter’s | 89,303 | 6,436 | ||||||
Cato, Cl A | 46,500 | 1,158 | ||||||
CEC Entertainment | 27,580 | 1,105 | ||||||
Cheesecake Factory (A) | 50,580 | 2,019 | ||||||
Children’s Place Retail Stores * | 21,690 | 1,157 | ||||||
Columbia Sportswear (A) | 13,377 | 805 | ||||||
Conn’s * (A) | 68,627 | 3,378 | ||||||
Cooper Tire & Rubber | 72,778 | 1,881 | ||||||
Core-Mark Holding | 16,549 | 979 | ||||||
Dana Holdings | 170,630 | 3,228 | ||||||
Darden Restaurants (A) | 34,112 | 1,767 | ||||||
Deckers Outdoor * (A) | 47,449 | 2,547 | ||||||
Destination XL Group * | 74,600 | 370 | ||||||
Dick’s Sporting Goods | 32,870 | 1,720 | ||||||
Dillard’s, Cl A | 25,000 | 2,307 | ||||||
Dollar General * | 33,872 | 1,788 | ||||||
Dorman Products * (A) | 46,217 | 2,058 | ||||||
DR Horton (A) | 191,345 | 4,661 | ||||||
DSW, Cl A | 42,530 | 3,147 | ||||||
Dunkin’ Brands Group (A) | 33,601 | 1,331 | ||||||
Ethan Allen Interiors (A) | 35,934 | 1,127 | ||||||
Express * | 184,542 | 4,023 | ||||||
Five Below * (A) | 85,883 | 3,284 | ||||||
Francesca’s Holdings * (A) | 240,526 | 6,867 | ||||||
GameStop, Cl A (A) | 126,102 | 4,182 | ||||||
Gannett (A) | 251,161 | 5,400 | ||||||
Genesco * | 13,145 | 888 | ||||||
Gildan Activewear, Cl A | 72,814 | 3,011 | ||||||
Grand Canyon Education * | 116,443 | 3,740 | ||||||
Harley-Davidson | 27,849 | 1,519 | ||||||
Harman International Industries | 27,700 | 1,471 | ||||||
Hasbro (A) | 32,006 | 1,424 | ||||||
Hibbett Sports * (A) | 165,200 | 9,421 | ||||||
HomeAway * (A) | 164,496 | 5,030 | ||||||
HSN | 61,399 | 3,493 | ||||||
Ignite Restaurant Group * | 22,700 | 415 | ||||||
Imax * | 126,945 | 3,289 | ||||||
| Description | Shares | Market Value ($ Thousands) | ||||||
International Game Technology | 75,000 | $ | 1,341 | |||||
Interpublic Group | 90,841 | 1,292 | ||||||
iRobot * (A) | 73,950 | 2,499 | ||||||
Jack in the Box * | 70,881 | 2,586 | ||||||
Jones Group | 104,300 | 1,520 | ||||||
K12 * (A) | 14,700 | 437 | ||||||
Krispy Kreme Doughnuts * | 139,040 | 2,408 | ||||||
La-Z-Boy, Cl Z | 110,108 | 2,034 | ||||||
Lear | 31,200 | 1,871 | ||||||
Libbey * | 94,500 | 2,000 | ||||||
Life Time Fitness * (A) | 71,730 | 3,575 | ||||||
Lincoln Educational Services | 41,174 | 284 | ||||||
LKQ * | 93,541 | 2,290 | ||||||
Lumber Liquidators Holdings * (A) | 41,870 | 3,438 | ||||||
Matthews International, Cl A (A) | 51,664 | 1,981 | ||||||
Mattress Firm Holding * | 5,920 | 213 | ||||||
MDC Partners, Cl A | 98,700 | 1,740 | ||||||
Men’s Wearhouse | 52,789 | 1,911 | ||||||
Meredith (A) | 27,535 | 1,128 | ||||||
Monro Muffler (A) | 125,462 | 5,899 | ||||||
National CineMedia | 351,023 | 5,831 | ||||||
Newell Rubbermaid | 67,396 | 1,822 | ||||||
Nutrisystem | 34,900 | 315 | ||||||
Orient-Express Hotels, Cl A * | 117,806 | 1,395 | ||||||
Oxford Industries (A) | 15,391 | 1,011 | ||||||
Panera Bread, Cl A * (A) | 13,780 | 2,643 | ||||||
Pep Boys-Manny Moe & Jack * (A) | 76,285 | 941 | ||||||
PetSmart | 23,826 | 1,608 | ||||||
Pier 1 Imports (A) | 362,273 | 8,401 | ||||||
Polaris Industries (A) | 38,800 | 3,706 | ||||||
Quiksilver * | 603,724 | 4,751 | ||||||
RadioShack * (A) | 65,700 | 243 | ||||||
Red Robin Gourmet Burgers * | 48,917 | 2,569 | ||||||
Regis (A) | 95,720 | 1,762 | ||||||
Rent-A-Center, Cl A | 24,700 | 904 | ||||||
Restoration Hardware Holdings * (A) | 29,008 | 1,621 | ||||||
Royal Caribbean Cruises | 39,886 | 1,396 | ||||||
Ryland Group (A) | 98,865 | 4,476 | ||||||
Sally Beauty Holdings * | 123,077 | 3,767 | ||||||
Samsonite International | 1,099,500 | 2,868 | ||||||
Scholastic | 45,700 | 1,382 | ||||||
Scientific Games, Cl A * | 60,990 | 664 | ||||||
Shutterfly * (A) | 111,829 | 5,451 | ||||||
Sinclair Broadcast Group, Cl A | 39,700 | 1,073 | ||||||
Six Flags Entertainment | 24,389 | 1,819 | ||||||
Skechers U.S.A., Cl A * | 18,710 | 421 | ||||||
SodaStream International * | 8,596 | 548 | ||||||
Stage Stores | 58,700 | 1,351 | ||||||
Standard Pacific * (A) | 342,894 | 3,035 | ||||||
Steven Madden * | 54,282 | 2,633 | ||||||
Taylor Morrison Home, Cl A * | 94,000 | 2,428 | ||||||
Tenneco * | 112,570 | 4,994 | ||||||
TRW Automotive Holdings * | 49,200 | 3,117 | ||||||
Ulta Salon Cosmetics & Fragrance * | 22,796 | 2,069 | ||||||
Vail Resorts (A) | 18,960 | 1,214 | ||||||
Vitamin Shoppe * | 58,578 | 2,562 | ||||||
Whirlpool | 16,900 | 2,159 | ||||||
Wolverine World Wide (A) | 117,671 | 6,160 | ||||||
Wyndham Worldwide | 77,149 | 4,484 | ||||||
Zumiez (A) * | 96,950 | 3,085 | ||||||
|
| |||||||
| 292,432 | ||||||||
|
| |||||||
| 1 | SEI Institutional Investments Trust / Annual Report / May 31, 2013 |
Table of Contents
Schedule of Investments
Small/Mid Cap Equity Fund
May 31, 2013
| Description | Shares | Market Value ($ Thousands) | ||||||
Consumer Staples — 2.7% | ||||||||
Casey’s General Stores (A) | 114,083 | $ | 6,932 | |||||
Central Garden and Pet, Cl A * | 41,018 | 311 | ||||||
Chefs’ Warehouse * (A) | 75,032 | 1,417 | ||||||
Chiquita Brands International * | 117,300 | 1,185 | ||||||
Coca-Cola Enterprises | 36,318 | 1,349 | ||||||
Darling International * | 169,949 | 3,333 | ||||||
Dole Food * (A) | 149,167 | 1,413 | ||||||
Elizabeth Arden * | 50,314 | 2,370 | ||||||
Energizer Holdings | 18,200 | 1,742 | ||||||
Fresh Del Monte Produce | 57,800 | 1,547 | ||||||
Fresh Market * (A) | 47,294 | 2,343 | ||||||
Hain Celestial Group * (A) | 39,815 | 2,653 | ||||||
Ingredion | 34,152 | 2,326 | ||||||
Inter Parfums | 12,900 | 386 | ||||||
J&J Snack Foods | 14,705 | 1,116 | ||||||
JM Smucker | 14,097 | 1,423 | ||||||
Kroger | 57,150 | 1,924 | ||||||
Molson Coors Brewing, Cl B | 36,948 | 1,826 | ||||||
Omega Protein * | 90,700 | 990 | ||||||
Pantry * | 64,814 | 811 | ||||||
Prestige Brands Holdings * | 24,197 | 711 | ||||||
Safeway (A) | 108,400 | 2,494 | ||||||
Sanderson Farms (A) | 25,883 | 1,784 | ||||||
Smithfield Foods * | 65,800 | 2,167 | ||||||
Spartan Stores | 64,658 | 1,149 | ||||||
Spectrum Brands Holdings | 50,734 | 3,059 | ||||||
SUPERVALU * (A) | 94,000 | 607 | ||||||
Sysco (A) | 47,130 | 1,593 | ||||||
TreeHouse Foods * (A) | 15,968 | 1,046 | ||||||
Tyson Foods, Cl A | 48,202 | 1,205 | ||||||
USANA Health Sciences * (A) | 42,000 | 2,944 | ||||||
Weis Markets | 17,700 | 724 | ||||||
|
| |||||||
| 56,880 | ||||||||
|
| |||||||
Energy — 5.7% | ||||||||
Alberta Oilsands * | 1,600,500 | 46 | ||||||
Approach Resources (A) * | 42,000 | 1,058 | ||||||
Bill Barrett * (A) | 27,800 | 627 | ||||||
Bonanza Creek Energy * | 23,575 | 876 | ||||||
Comstock Resources | 21,400 | 345 | ||||||
Core Laboratories | 19,621 | 2,703 | ||||||
CVR Energy | 28,700 | 1,803 | ||||||
Diamondback Energy * | 35,310 | 1,192 | ||||||
Dresser-Rand Group * | 105,341 | 6,384 | ||||||
Dril-Quip * | 56,041 | 5,069 | ||||||
Emerald Oil * | 113,329 | 692 | ||||||
EPL Oil & Gas * | 7,500 | 228 | ||||||
EQT | 22,806 | 1,822 | ||||||
Forum Energy Technologies * (A) | 155,118 | 4,605 | ||||||
Geospace Technologies * | 15,943 | 1,385 | ||||||
Goodrich Petroleum * | 42,841 | 538 | ||||||
Gulfmark Offshore, Cl A (A) | 26,346 | 1,208 | ||||||
Gulfport Energy * | 135,751 | 6,474 | ||||||
Helix Energy Solutions Group * (A) | 190,173 | 4,538 | ||||||
Helmerich & Payne (A) | 40,200 | 2,482 | ||||||
Hornbeck Offshore Services * (A) | 29,990 | 1,560 | ||||||
Key Energy Services * | 119,652 | 775 | ||||||
Kinder Morgan Escrow * | 646 | — | ||||||
Kodiak Oil & Gas * (A) | 444,683 | 3,904 | ||||||
Laredo Petroleum Holdings * (A) | 100,247 | 1,941 | ||||||
| Description | Shares | Market Value ($ Thousands) | ||||||
Lufkin Industries | 11,232 | $ | 991 | |||||
Matador Resources * (A) | 130,470 | 1,302 | ||||||
McDermott International * | 265,726 | 2,538 | ||||||
Nabors Industries | 131,025 | 2,097 | ||||||
Newfield Exploration * | 66,622 | 1,585 | ||||||
Newpark Resources * (A) | 108,900 | 1,214 | ||||||
Oasis Petroleum * | 174,719 | 6,493 | ||||||
Oceaneering International | 31,980 | 2,318 | ||||||
Oil States International * | 15,263 | 1,503 | ||||||
Painted Pony Petroleum * | 204,380 | 1,849 | ||||||
Parker Drilling * | 301,100 | 1,343 | ||||||
PDC Energy * (A) | 95,054 | 4,866 | ||||||
Pioneer Energy Services * | 220,276 | 1,538 | ||||||
Pioneer Natural Resources | 15,130 | 2,098 | ||||||
Range Resources | 16,967 | 1,276 | ||||||
Rex Energy * (A) | 114,580 | 1,903 | ||||||
Rosetta Resources * | 84,069 | 3,939 | ||||||
Scorpio Tankers (A) | 165,000 | 1,566 | ||||||
SemGroup, Cl A | 60,830 | 3,183 | ||||||
Spectra Energy | 73,067 | 2,234 | ||||||
StealthGas * | 67,900 | 718 | ||||||
Superior Energy Services * | 128,931 | 3,440 | ||||||
Swift Energy * (A) | 68,971 | 935 | ||||||
Targa Resources | 20,714 | 1,334 | ||||||
Tesoro | 64,000 | 3,946 | ||||||
TETRA Technologies * | 136,135 | 1,417 | ||||||
Trican Well Service | 255,430 | 3,591 | ||||||
Ultra Petroleum * (A) | 126,317 | 2,878 | ||||||
USEC * (A) | 61,099 | 23 | ||||||
W&T Offshore (A) | 47,000 | 693 | ||||||
Western Refining (A) | 91,500 | 3,053 | ||||||
World Fuel Services | 59,096 | 2,407 | ||||||
|
| |||||||
| 122,526 | ||||||||
|
| |||||||
Financials — 20.5% | ||||||||
1st Source | 800 | 19 | ||||||
Acadia Realty Trust * | 43,245 | 1,121 | ||||||
Affiliated Managers Group * | 14,250 | 2,337 | ||||||
Alexandria Real Estate Equities | 33,650 | 2,305 | ||||||
Allied World Assurance Holdings | 15,000 | 1,341 | ||||||
Allstate | 45,773 | 2,208 | ||||||
Altisource Residential, Cl B * | 74,150 | 1,353 | ||||||
American Assets Trust | 34,900 | 1,124 | ||||||
American Capital Mortgage Investment | 16,900 | 356 | ||||||
American Equity Investment Life Holding (A) | 58,200 | 943 | ||||||
American Financial Group | 150,694 | 7,318 | ||||||
Ameriprise Financial | 61,093 | 4,980 | ||||||
Apartment Investment & Management, Cl A | 76,558 | 2,317 | ||||||
Arch Capital Group * (A) | 105,435 | 5,399 | ||||||
Ares Capital | 43,000 | 738 | ||||||
Artisan Partners Asset Management, Cl A * | 2,436 | 114 | ||||||
Aspen Insurance Holdings | 34,400 | 1,264 | ||||||
Associated Banc | 73,700 | 1,136 | ||||||
Assured Guaranty | 130,960 | 2,963 | ||||||
AvalonBay Communities | 21,713 | 2,880 | ||||||
Banco Latinoamericano de Comercio Exterior, Cl E | 84,745 | 1,943 | ||||||
Bancorpsouth (A) | 329,471 | 5,654 | ||||||
Bank of the Ozarks | 62,188 | 2,714 | ||||||
BankUnited | 65,466 | 1,609 | ||||||
| 2 | SEI Institutional Investments Trust / Annual Report / May 31, 2013 |
Table of Contents
Schedule of Investments
Small/Mid Cap Equity Fund
May 31, 2013
| Description | Shares | Market Value ($ Thousands) | ||||||
Banner | 93,328 | $ | 2,994 | |||||
Berkshire Hills Bancorp | 48,005 | 1,288 | ||||||
BioMed Realty Trust ‡ (A) | 95,400 | 1,997 | ||||||
Boston Private Financial Holdings (A) | 199,003 | 1,960 | ||||||
Boston Properties | 21,450 | 2,286 | ||||||
Brandywine Realty Trust | 142,700 | 2,021 | ||||||
Calamos Asset Management, Cl A | 41,900 | 441 | ||||||
Campus Crest Communities | 77,900 | 985 | ||||||
CapLease | 210,800 | 1,817 | ||||||
Cardinal Financial | 35,614 | 539 | ||||||
CBL & Associates Properties (A) | 116,533 | 2,679 | ||||||
Central Pacific Financial * | 55,900 | 1,025 | ||||||
Chimera Investment ‡ | 245,200 | 748 | ||||||
CNA Financial | 54,600 | 1,866 | ||||||
CNO Financial Group | 665,245 | 8,209 | ||||||
CoBiz Financial | 117,060 | 1,013 | ||||||
Colonial Properties Trust ‡ | 45,100 | 997 | ||||||
Comerica | 27,700 | 1,094 | ||||||
Commerce Bancshares | 1 | — | ||||||
CommonWealth | 67,750 | 1,385 | ||||||
Community Trust Bancorp | 15,687 | 552 | ||||||
Coresite Realty ‡ | 14,910 | 479 | ||||||
Countrywide * | 35,500 | 253 | ||||||
CubeSmart ‡ | 169,407 | 2,651 | ||||||
Customers Bancorp * | 16,000 | 275 | ||||||
CYS Investments ‡ | 125,100 | 1,286 | ||||||
DDR ‡ (A) | 203,321 | 3,550 | ||||||
DiamondRock Hospitality ‡ | 309,873 | 2,947 | ||||||
Digital Realty Trust ‡ (A) | 19,257 | 1,173 | ||||||
Dime Community Bancshares | 50,900 | 733 | ||||||
Douglas Emmett ‡ | 36,850 | 939 | ||||||
Eagle Bancorp * (A) | 115,541 | 2,601 | ||||||
East West Bancorp | 131,200 | 3,456 | ||||||
EastGroup Properties ‡ | 58,671 | 3,448 | ||||||
Eaton Vance (A) | 66,707 | 2,769 | ||||||
Education Realty Trust ‡ | 214,591 | 2,245 | ||||||
Employers Holdings | 100,828 | 2,494 | ||||||
Endurance Specialty Holdings | 72,722 | 3,660 | ||||||
Equity One ‡ (A) | 61,825 | 1,442 | ||||||
Equity Residential ‡ | 78,350 | 4,431 | ||||||
Essex Property Trust ‡ (A) | 6,200 | 974 | ||||||
Everest Re Group | 19,700 | 2,553 | ||||||
FBR * | 50,733 | 1,228 | ||||||
Federal Realty Investment Trust ‡ | 6,250 | 673 | ||||||
Federated Investors, Cl B (A) | 40,776 | 1,128 | ||||||
Fidelity National Financial, Cl A | 94,299 | 2,481 | ||||||
Fifth Third Bancorp | 142,198 | 2,588 | ||||||
Financial Engines (A) | 131,520 | 5,671 | ||||||
First Horizon National (A) | 646,702 | 7,424 | ||||||
First Midwest Bancorp | 164,532 | 2,165 | ||||||
First NBC Bank Holding * | 27,713 | 696 | ||||||
First Niagara Financial Group | 593,266 | 5,796 | ||||||
FirstMerit | 70,213 | 1,325 | ||||||
Flushing Financial | 66,600 | 1,041 | ||||||
Forest City Enterprises, Cl A * (A) | 57,585 | 1,080 | ||||||
Fulton Financial | 93,546 | 1,075 | ||||||
FXCM, Cl A (A) | 88,679 | 1,230 | ||||||
General Growth Properties ‡ | 97,220 | 1,996 | ||||||
Genworth Financial, Cl A * | 335,734 | 3,629 | ||||||
Geo Group ‡ | 7,700 | 268 | ||||||
| Description | Shares | Market Value ($ Thousands) | ||||||
Government Properties Income Trust ‡ | 13,800 | $ | 336 | |||||
Great American Group * | 91,400 | 14 | ||||||
Hancock Holding | 115,772 | 3,305 | ||||||
Hanover Insurance Group | 75,904 | 3,813 | ||||||
Hartford Financial Services Group | 64,820 | 1,985 | ||||||
HCP ‡ | 73,300 | 3,473 | ||||||
Health Care ‡ | 47,150 | 3,208 | ||||||
Highwoods Properties ‡ (A) | 31,080 | 1,132 | ||||||
Home Loan Servicing Solutions | 26,400 | 603 | ||||||
Horace Mann Educators | 136,167 | 3,309 | ||||||
Hospitality Properties Trust ‡ | 89,900 | 2,623 | ||||||
Host Hotels & Resorts ‡ | 247,241 | 4,398 | ||||||
Huntington Bancshares | 801,230 | 6,209 | ||||||
Iberiabank | 65,507 | 3,376 | ||||||
Infinity Property & Casualty | 26,911 | 1,554 | ||||||
International Bancshares (A) | 47,046 | 1,025 | ||||||
Investment Technology Group * | 184,775 | 2,552 | ||||||
Investors Bancorp | 41,428 | 819 | ||||||
Janus Capital Group (A) | 269,327 | 2,362 | ||||||
Jones Lang LaSalle | 38,865 | 3,569 | ||||||
Kennedy-Wilson Holdings | 123,600 | 2,121 | ||||||
KeyCorp | 485,427 | 5,233 | ||||||
Kimco Realty ‡ (A) | 61,550 | 1,363 | ||||||
LaSalle Hotel Properties ‡ | 21,495 | 568 | ||||||
Lexington Realty Trust ‡ (A) | 655,780 | 8,256 | ||||||
Liberty Property Trust ‡ | 50,611 | 2,054 | ||||||
Lincoln National | 51,900 | 1,851 | ||||||
LPL Financial Holdings | 99,218 | 3,679 | ||||||
Macerich ‡ | 41,148 | 2,671 | ||||||
Mack-Cali Realty ‡ | 73,150 | 1,939 | ||||||
Maiden Holdings | 109,200 | 1,166 | ||||||
MarketAxess Holdings | 48,448 | 2,101 | ||||||
Meadowbrook Insurance Group | 337,500 | 2,707 | ||||||
Medical Properties Trust ‡ | 214,576 | 3,184 | ||||||
MFA Mortgage Investments ‡ | 374,636 | 3,289 | ||||||
Mid-America Apartment Communities ‡ | 23,157 | 1,574 | ||||||
Montpelier Re Holdings | 75,900 | 1,897 | ||||||
MSCI, Cl A * | 74,273 | 2,617 | ||||||
National Penn Bancshares (A) | 294,427 | 2,909 | ||||||
National Retail Properties ‡ (A) | 22,385 | 803 | ||||||
Nelnet, Cl A | 91,100 | 3,558 | ||||||
Northfield Bancorp | 67,963 | 779 | ||||||
NorthStar Realty Finance ‡ (A) | 394,339 | 3,324 | ||||||
Ocwen Financial * | 73,750 | 3,155 | ||||||
OFG Bancorp (A) | 93,095 | 1,655 | ||||||
Old National Bancorp | 70,775 | 946 | ||||||
OmniAmerican Bancorp * | 13,800 | 307 | ||||||
PacWest Bancorp (A) | 100,090 | 2,886 | ||||||
PartnerRe | 43,534 | 3,946 | ||||||
Pebblebrook Hotel Trust ‡ | 229,190 | 6,014 | ||||||
Pennsylvania Real Estate Investment Trust ‡ | 167,400 | 3,330 | ||||||
Platinum Underwriters Holdings | 27,270 | 1,557 | ||||||
Popular * | 215,812 | 6,475 | ||||||
Potlatch ‡ (A) | 81,484 | 3,702 | ||||||
ProAssurance | 104,128 | 5,227 | ||||||
Prologis ‡ | 120,909 | 4,873 | ||||||
Prosperity Bancshares (A) | 25,530 | 1,279 | ||||||
Public Storage ‡ | 26,578 | 4,035 | ||||||
Radian Group (A) | 66,340 | 854 | ||||||
RAIT Financial Trust ‡ | 22,999 | 176 | ||||||
| 3 | SEI Institutional Investments Trust / Annual Report / May 31, 2013 |
Table of Contents
Schedule of Investments
Small/Mid Cap Equity Fund
May 31, 2013
| Description | Shares | Market Value ($ Thousands) | ||||||
Regency Centers ‡ | 28,200 | $ | 1,455 | |||||
Regions Financial | 213,300 | 1,947 | ||||||
Reinsurance Group of America, Cl A | 70,293 | 4,632 | ||||||
Republic Bancorp, Cl A (A) | 37,026 | 882 | ||||||
RLJ Lodging Trust ‡ | 40,200 | 931 | ||||||
Ryman Hospitality Properties ‡ (A) | 93,739 | 3,586 | ||||||
Safeguard Scientifics * | 86,105 | 1,359 | ||||||
Selective Insurance Group | 49,320 | 1,170 | ||||||
Signature Bank NY * | 29,470 | 2,274 | ||||||
Simon Property Group ‡ | 45,029 | 7,495 | ||||||
SL Green Realty ‡ (A) | 19,500 | 1,696 | ||||||
Southside Bancshares (A) | 39,823 | 902 | ||||||
StanCorp Financial Group (A) | 36,700 | 1,667 | ||||||
Starwood Property Trust ‡ (A) | 25,500 | 647 | ||||||
Sterling Financial | 111,534 | 2,523 | ||||||
Stifel Financial * (A) | 61,180 | 2,202 | ||||||
Sunstone Hotel Investors * ‡ | 369,001 | 4,450 | ||||||
SunTrust Banks | 70,298 | 2,256 | ||||||
Susquehanna Bancshares | 455,981 | 5,476 | ||||||
SVB Financial Group * (A) | 77,621 | 6,007 | ||||||
Synovus Financial | 1,060,857 | 2,907 | ||||||
Tanger Factory Outlet Centers ‡ | 57,105 | 1,969 | ||||||
TCF Financial (A) | 188,327 | 2,712 | ||||||
THL Credit | 26,900 | 408 | ||||||
Titanium Asset Management * (B)(C)(D) | 147,000 | 116 | ||||||
Tower Group International (A) | 79,238 | 1,532 | ||||||
Two Harbors Investment ‡ | 39,500 | 436 | ||||||
UDR ‡ (A) | 87,150 | 2,124 | ||||||
United Community Banks * | 43,600 | 517 | ||||||
Unum Group (A) | 147,780 | 4,209 | ||||||
Validus Holdings | 53,600 | 1,936 | ||||||
Ventas ‡ | 36,450 | 2,601 | ||||||
ViewPoint Financial Group | 31,700 | 600 | ||||||
Virtus Investment Partners * | 10,280 | 2,383 | ||||||
Vornado Realty Trust ‡ | 33,100 | 2,646 | ||||||
Waddell & Reed Financial, Cl A | 69,017 | 3,178 | ||||||
Weingarten Realty Investors ‡ (A) | 31,550 | 1,006 | ||||||
WesBanco | 53,800 | 1,348 | ||||||
Western Alliance Bancorp * | 341,171 | 5,015 | ||||||
Willis Group Holdings | 47,139 | 1,841 | ||||||
Winthrop Realty Trust ‡ | 117,300 | 1,456 | ||||||
WisdomTree Investments * | 119,130 | 1,482 | ||||||
WSFS Financial | 15,700 | 789 | ||||||
Zions Bancorporation (A) | 341,670 | 9,584 | ||||||
|
| |||||||
| 441,962 | ||||||||
|
| |||||||
Health Care — 9.9% | ||||||||
Acadia Healthcare * (A) | 164,526 | 5,494 | ||||||
Accuray * (A) | 254,100 | 1,364 | ||||||
Akorn * | 140,727 | 2,045 | ||||||
Alere * | 43,400 | 1,110 | ||||||
Algeta * | 39,603 | 1,544 | ||||||
Align Technology * (A) | 53,840 | 1,925 | ||||||
Alkermes * | 40,920 | 1,279 | ||||||
AmerisourceBergen | 24,894 | 1,346 | ||||||
Amsurg, Cl A * | 41,948 | 1,490 | ||||||
Arena Pharmaceuticals * (A) | 151,990 | 1,344 | ||||||
Ariad Pharmaceuticals * | 78,173 | 1,434 | ||||||
athenahealth * (A) | 42,707 | 3,611 | ||||||
BioMarin Pharmaceutical * (A) | 31,297 | 1,962 | ||||||
BioScrip * | 143,238 | 2,002 | ||||||
| Description | Shares | Market Value ($ Thousands) | ||||||
CareFusion * | 59,751 | $ | 2,196 | |||||
Celldex Therapeutics * | 54,863 | 702 | ||||||
Centene * | 38,861 | 1,924 | ||||||
Cepheid * (A) | 21,320 | 741 | ||||||
Charles River Laboratories International * | 120,359 | 5,213 | ||||||
Community Health Systems * | 91,431 | 4,404 | ||||||
CONMED | 34,435 | 1,134 | ||||||
Coronado Biosciences * | 91,810 | 907 | ||||||
Covance * | 41,870 | 3,123 | ||||||
Cubist Pharmaceuticals * (A) | 87,769 | 4,823 | ||||||
DexCom * | 121,305 | 2,527 | ||||||
Endo Health Solutions * (A) | 98,836 | 3,588 | ||||||
Endologix * (A) | 190,368 | 2,558 | ||||||
Ensign Group | 28,800 | 1,039 | ||||||
ExamWorks Group * (A) | 94,949 | 1,772 | ||||||
Exelixis * (A) | 219,580 | 1,063 | ||||||
Furiex Pharmaceuticals * | 36,757 | 1,359 | ||||||
Greatbatch * | 39,715 | 1,279 | ||||||
Health Net * | 91,344 | 2,911 | ||||||
HealthSouth * | 245,346 | 7,186 | ||||||
HeartWare International * | 46,450 | 4,239 | ||||||
Hill-Rom Holdings | 20,700 | 748 | ||||||
HMS Holdings * (A) | 127,104 | 3,165 | ||||||
Hologic * | 100,646 | 2,088 | ||||||
Humana | 24,900 | 2,011 | ||||||
Hyperion Therapeutics * | 39,047 | 784 | ||||||
ICON * | 81,297 | 2,792 | ||||||
ICU Medical * | 18,960 | 1,354 | ||||||
Idexx Laboratories * (A) | 24,413 | 2,013 | ||||||
ImmunoGen * (A) | 92,680 | 1,703 | ||||||
Incyte * (A) | 116,488 | 2,583 | ||||||
Infinity Pharmaceuticals * | 50,482 | 1,360 | ||||||
Insulet * (A) | 64,620 | 1,930 | ||||||
Intercept Pharmaceuticals * | 16,472 | 551 | ||||||
Invacare | 15,300 | 237 | ||||||
IPC The Hospitalist * (A) | 42,939 | 2,094 | ||||||
Ironwood Pharmaceuticals, Cl A * (A) | 212,647 | 2,839 | ||||||
Isis Pharmaceuticals * (A) | 112,495 | 2,435 | ||||||
Jazz Pharmaceuticals * | 44,780 | 3,043 | ||||||
Keryx Biopharmaceuticals * (A) | 338,866 | 2,714 | ||||||
Kindred Healthcare * | 41,100 | 555 | ||||||
LifePoint Hospitals * | 29,900 | 1,487 | ||||||
Magellan Health Services * | 67,355 | 3,671 | ||||||
Masimo * | 120,806 | 2,615 | ||||||
Medical Action Industries * | 69,600 | 585 | ||||||
Medicines * (A) | 63,340 | 2,040 | ||||||
Medivation * | 25,353 | 1,231 | ||||||
MEDNAX * (A) | 69,842 | 6,483 | ||||||
Mettler Toledo International * (A) | 7,389 | 1,613 | ||||||
NewLink Genetics * (A) | 57,759 | 942 | ||||||
NPS Pharmaceuticals * | 134,320 | 2,116 | ||||||
Onyx Pharmaceuticals * (A) | 42,100 | 4,018 | ||||||
Optimer Pharmaceuticals * (A) | 81,129 | 1,207 | ||||||
Orexigen Therapeutics * | 223,728 | 1,416 | ||||||
Pacira Pharmaceuticals * (A) | 66,312 | 1,943 | ||||||
PAREXEL International * (A) | 91,433 | 4,177 | ||||||
Patterson | 31,583 | 1,234 | ||||||
PDL BioPharma (A) | 117,800 | 972 | ||||||
PerkinElmer | 40,494 | 1,268 | ||||||
Pharmacyclics * | 25,779 | 2,362 | ||||||
PharMerica * | 51,500 | 804 | ||||||
Puma Biotechnology * | 21,703 | 845 | ||||||
Quest Diagnostics (A) | 31,032 | 1,919 | ||||||
| 4 | SEI Institutional Investments Trust / Annual Report / May 31, 2013 |
Table of Contents
Schedule of Investments
Small/Mid Cap Equity Fund
May 31, 2013
| Description | Shares | Market Value ($ Thousands) | ||||||
Questcor Pharmaceuticals (A) | 22,600 | $ | 772 | |||||
Quidel * (A) | 57,762 | 1,381 | ||||||
Repros Therapeutics * (A) | 37,810 | 655 | ||||||
Salix Pharmaceuticals * | 45,080 | 2,735 | ||||||
Sarepta Therapeutics * (A) | 18,280 | 646 | ||||||
Sciclone Pharmaceuticals * | 183,521 | 883 | ||||||
Seattle Genetics * (A) | 80,296 | 2,756 | ||||||
Select Medical Holdings | 143,000 | 1,130 | ||||||
Sirona Dental Systems * | 37,520 | 2,662 | ||||||
Skilled Healthcare Group, Cl A * (A) | 98,400 | 698 | ||||||
Spectranetics * | 113,614 | 2,125 | ||||||
Symmetry Medical * | 35,600 | 332 | ||||||
Synageva BioPharma * | 42,323 | 1,745 | ||||||
Team Health Holdings * | 119,092 | 4,653 | ||||||
Techne (A) | 44,636 | 2,969 | ||||||
Teleflex | 12,220 | 957 | ||||||
TESARO * | 28,682 | 981 | ||||||
Trinity Biotech ADR | 7,000 | 123 | ||||||
Trius Therapeutics * | 96,790 | 742 | ||||||
United Therapeutics * | 39,800 | 2,645 | ||||||
Universal Health Services, Cl B | 79,532 | 5,499 | ||||||
Varian Medical Systems * (A) | 53,661 | 3,596 | ||||||
Volcano * (A) | 70,101 | 1,339 | ||||||
WellCare Health Plans * | 123,611 | 6,445 | ||||||
|
| |||||||
| 213,054 | ||||||||
|
| |||||||
Industrials — 17.3% | ||||||||
AAR | 47,800 | 959 | ||||||
ABM Industries | 21,600 | 522 | ||||||
ACCO Brands * (A) | 45,000 | 322 | ||||||
Actuant, Cl A (A) | 216,480 | 7,360 | ||||||
Acuity Brands (A) | 31,690 | 2,379 | ||||||
Advisory Board * | 19,601 | 1,035 | ||||||
Aegean Marine Petroleum Network | 49,800 | 484 | ||||||
AGCO | 67,600 | 3,750 | ||||||
Air Transport Services Group * | 105,800 | 640 | ||||||
Aircastle | 119,900 | 1,897 | ||||||
Alliant Techsystems | 29,500 | 2,316 | ||||||
Altra Holdings | 88,381 | 2,546 | ||||||
AMERCO * | 13,118 | 2,262 | ||||||
Apogee Enterprises | 76,092 | 2,030 | ||||||
Applied Industrial Technologies | 56,667 | 2,724 | ||||||
Armstrong World Industries * | 58,966 | 3,064 | ||||||
Avis Budget Group * (A) | 153,724 | 5,097 | ||||||
BE Aerospace * | 66,101 | 4,193 | ||||||
Beacon Roofing Supply * | 41,335 | 1,704 | ||||||
Belden | 55,323 | 2,957 | ||||||
Blount International * | 14,100 | 189 | ||||||
Brady, Cl A | 16,832 | 548 | ||||||
Briggs & Stratton (A) | 136,391 | 3,192 | ||||||
Brink’s | 34,700 | 931 | ||||||
Carlisle | 39,200 | 2,564 | ||||||
Chart Industries * | 35,300 | 3,434 | ||||||
Cintas (A) | 38,140 | 1,741 | ||||||
CIRCOR International | 26,690 | 1,364 | ||||||
CLARCOR | 31,342 | 1,700 | ||||||
Clean Harbors * (A) | 73,578 | 4,209 | ||||||
Colfax * | 43,961 | 2,194 | ||||||
Consolidated Graphics * | 26,200 | 1,222 | ||||||
Corporate Executive Board | 44,746 | 2,738 | ||||||
Cubic | 17,282 | 823 | ||||||
Curtiss-Wright | 25,079 | 912 | ||||||
Deluxe (A) | 175,740 | 6,573 | ||||||
| Description | Shares | Market Value ($ Thousands) | ||||||
DigitalGlobe * | 216,091 | $ | 6,532 | |||||
Dover (A) | 24,753 | 1,937 | ||||||
DXP Enterprises * | 25,270 | 1,493 | ||||||
Dycom Industries * | 272,395 | 6,197 | ||||||
EMCOR Group | 144,992 | 5,763 | ||||||
Engility Holdings * | 6,300 | 161 | ||||||
EnPro Industries * (A) | 17,767 | 895 | ||||||
Esterline Technologies * | 60,955 | 4,474 | ||||||
Expeditors International of Washington | 77,015 | 3,006 | ||||||
Flow International * | 107,000 | 425 | ||||||
Flowserve | 8,941 | 1,503 | ||||||
Fluor | 31,951 | 2,020 | ||||||
FTI Consulting * (A) | 68,040 | 2,585 | ||||||
G&K Services, Cl A | 73,774 | 3,564 | ||||||
General Cable (A) | 32,907 | 1,163 | ||||||
Genesee & Wyoming, Cl A * | 123,606 | 11,007 | ||||||
Global Power Equipment Group (A) | 42,000 | 668 | ||||||
GrafTech International (A) * | 558,666 | 4,687 | ||||||
Great Lakes Dredge & Dock | 105,000 | 871 | ||||||
Heico, Cl A | 126,890 | 4,695 | ||||||
Hertz Global Holdings * | 147,629 | 3,813 | ||||||
Hexcel * | 270,332 | 9,399 | ||||||
ICF International * | 31,200 | 941 | ||||||
IDEX (A) | 43,040 | 2,369 | ||||||
Interface, Cl A | 229,478 | 3,855 | ||||||
ITT | 54,400 | 1,640 | ||||||
JetBlue Airways * (A) | 45,600 | 283 | ||||||
Joy Global (A) | 30,926 | 1,672 | ||||||
Kadant | 88,787 | 2,656 | ||||||
KAR Auction Services | 57,750 | 1,354 | ||||||
Kaydon | 30,389 | 822 | ||||||
Kennametal | 117,152 | 5,077 | ||||||
KEYW Holding * (A) | 130,302 | 1,922 | ||||||
Kirby * | 39,040 | 3,048 | ||||||
L-3 Communications Holdings, Cl 3 | 34,600 | 2,944 | ||||||
Landstar System | 118,620 | 6,262 | ||||||
Lennox International | 17,219 | 1,102 | ||||||
Lincoln Electric Holdings | 47,540 | 2,843 | ||||||
Lindsay Manufacturing (A) | 18,370 | 1,493 | ||||||
Lydall * | 49,700 | 719 | ||||||
Middleby * | 18,570 | 3,036 | ||||||
Mobile Mini * | 40,891 | 1,376 | ||||||
Moog, Cl A * | 100,394 | 5,027 | ||||||
MSC Industrial Direct, Cl A | 40,972 | 3,387 | ||||||
Navigant Consulting * | 31,000 | 409 | ||||||
Navistar International * (A) | 71,295 | 2,557 | ||||||
NN * | 85,100 | 788 | ||||||
Nordson | 42,147 | 3,002 | ||||||
Northwest Pipe * | 35,995 | 990 | ||||||
Old Dominion Freight Line * | 258,158 | 11,116 | ||||||
On Assignment * | 101,721 | 2,649 | ||||||
Orion Marine Group * (A) | 115,412 | 1,386 | ||||||
Oshkosh Truck * | 51,500 | 2,051 | ||||||
Owens Corning * | 159,510 | 6,971 | ||||||
Parker Hannifin | 19,918 | 1,987 | ||||||
Performant Financial * | 154,097 | 1,700 | ||||||
Pitney Bowes (A) | 25,100 | 368 | ||||||
Ply Gem Holdings * | 17,869 | 413 | ||||||
Polypore International * (A) | 178,593 | 6,719 | ||||||
Primoris Services | 140,958 | 3,004 | ||||||
Rand Logistics * | 23,000 | 129 | ||||||
RBC Bearings * | 35,704 | 1,748 | ||||||
| 5 | SEI Institutional Investments Trust / Annual Report / May 31, 2013 |
Table of Contents
Schedule of Investments
Small/Mid Cap Equity Fund
May 31, 2013
| Description | Shares | Market Value ($ Thousands) | ||||||
Regal-Beloit | 92,664 | $ | 6,256 | |||||
Ritchie Bros Auctioneers (A) | 170,049 | 3,520 | ||||||
Rollins | 3,649 | 92 | ||||||
Ryder System | 24,400 | 1,538 | ||||||
Sensata Technologies Holding * | 181,300 | 6,364 | ||||||
Simpson Manufacturing (A) | 42,448 | 1,242 | ||||||
SkyWest | 49,700 | 697 | ||||||
Spirit Aerosystems Holdings, Cl A * | 191,343 | 4,135 | ||||||
Spirit Airlines * | 106,880 | 3,253 | ||||||
Standard Parking * | 61,937 | 1,382 | ||||||
Stanley Black & Decker | 26,223 | 2,077 | ||||||
Steelcase, Cl A | 160,603 | 2,223 | ||||||
Swift Transporation, Cl A * | 166,665 | 2,807 | ||||||
TAL International Group (A) | 32,200 | 1,361 | ||||||
Teledyne Technologies * | 47,398 | 3,660 | ||||||
Tennant | 55,378 | 2,732 | ||||||
Terex * | 113,349 | 4,066 | ||||||
Tetra Tech * | 72,144 | 1,989 | ||||||
Textron (A) | 132,956 | 3,585 | ||||||
Timken | 82,140 | 4,662 | ||||||
Titan Machinery * (A) | 3,300 | 68 | ||||||
TMS International, Cl A | 56,100 | 851 | ||||||
Towers Watson, Cl A | 42,160 | 3,275 | ||||||
TransDigm Group * | 24,694 | 3,608 | ||||||
Trimas * | 40,649 | 1,311 | ||||||
Triumph Group | 22,255 | 1,728 | ||||||
TrueBlue * | 253,823 | 5,975 | ||||||
Tutor Perini * | 98,200 | 1,819 | ||||||
United Rentals * (A) | 53,790 | 3,057 | ||||||
URS | 58,900 | 2,853 | ||||||
US Ecology | 76,295 | 2,089 | ||||||
USG * (A) | 62,477 | 1,708 | ||||||
Valmont Industries | 19,182 | 2,922 | ||||||
Wabash National * | 59,100 | 621 | ||||||
Wabtec | 37,955 | 4,175 | ||||||
WageWorks * | 170,606 | 4,942 | ||||||
Watts Water Technologies, Cl A (A) | 28,605 | 1,362 | ||||||
Werner Enterprises | 54,290 | 1,359 | ||||||
WESCO International * (A) | 110,647 | 8,216 | ||||||
Xylem | 69,165 | 1,946 | ||||||
|
| |||||||
| 372,774 | ||||||||
|
| |||||||
Information Technology — 17.5% | ||||||||
Acxiom * | 61,265 | 1,347 | ||||||
ADTRAN (A) | 56,768 | 1,312 | ||||||
Amdocs | 44,400 | 1,585 | ||||||
ARRIS Group * | 210,676 | 3,188 | ||||||
Arrow Electronics * | 86,675 | 3,446 | ||||||
Aruba Networks * | 123,060 | 1,839 | ||||||
Aspen Technology * | 130,895 | 4,008 | ||||||
Atmel * | 985,922 | 7,759 | ||||||
Avnet * | 34,300 | 1,172 | ||||||
Benchmark Electronics * | 81,800 | 1,595 | ||||||
Black Box | 42,000 | 1,130 | ||||||
Blackbaud | 178,852 | 5,426 | ||||||
Broadridge Financial Solutions | 192,902 | 5,235 | ||||||
Brocade Communications Systems * | 228,700 | 1,242 | ||||||
CACI International, Cl A * (A) | 26,946 | 1,728 | ||||||
Cadence Design Systems * (A) | 893,370 | 13,517 | ||||||
Cavium * (A) | 166,597 | 5,458 | ||||||
CIBER * | 213,000 | 869 | ||||||
| Description | Shares | Market Value ($ Thousands) | ||||||
Ciena * (A) | 341,356 | $ | 5,714 | |||||
Coherent * | 17,158 | 985 | ||||||
CommVault Systems * | 15,284 | 1,070 | ||||||
Computer Sciences | 33,500 | 1,495 | ||||||
Comtech Telecommunications | 36,982 | 976 | ||||||
Concur Technologies * (A) | 54,010 | 4,360 | ||||||
Convergys | 184,682 | 3,356 | ||||||
Cornerstone OnDemand * (A) | 54,610 | 2,219 | ||||||
CoStar Group * (A) | 76,200 | 8,520 | ||||||
Cyan * | 63,273 | 845 | ||||||
Dealertrack Technologies * | 248,867 | 8,023 | ||||||
Demandware * (A) | 46,090 | 1,411 | ||||||
Diebold | 124,915 | 4,024 | ||||||
Digi International * | 84,100 | 807 | ||||||
Diodes * | 21,100 | 498 | ||||||
DTS * (A) | 87,500 | 1,729 | ||||||
EarthLink | 191,655 | 1,137 | ||||||
Emulex * | 134,546 | 838 | ||||||
Entegris * | 266,210 | 2,774 | ||||||
Envestnet * | 78,516 | 1,804 | ||||||
Euronet Worldwide * | 137,241 | 4,186 | ||||||
ExactTarget * | 69,247 | 1,593 | ||||||
Exar * | 112,700 | 1,271 | ||||||
ExlService Holdings * | 42,243 | 1,239 | ||||||
Fair Isaac | 74,490 | 3,656 | ||||||
Fairchild Semiconductor International, Cl A * | 467,680 | 6,786 | ||||||
Fidelity National Information Services | 52,857 | 2,373 | ||||||
FleetMatics Group * | 216,192 | 6,432 | ||||||
Fortinet * | 43,032 | 829 | ||||||
Gartner * (A) | 53,550 | 3,032 | ||||||
Genpact * | 63,680 | 1,232 | ||||||
GT Advanced Technologies * (A) | 154,200 | 686 | ||||||
Guidewire Software * | 134,673 | 5,516 | ||||||
Harris | 54,900 | 2,752 | ||||||
Heartland Payment Systems (A) | 92,313 | 2,960 | ||||||
Hittite Microwave * | 25,519 | 1,385 | ||||||
IAC | 71,875 | 3,485 | ||||||
Imation * | 41,300 | 169 | ||||||
Imperva * | 103,320 | 4,115 | ||||||
Infinera * | 161,209 | 1,698 | ||||||
Infoblox * | 196,961 | 4,792 | ||||||
Informatica * | 118,540 | 4,310 | ||||||
Inphi * | 63,829 | 652 | ||||||
Insight Enterprises * | 72,500 | 1,396 | ||||||
Integrated Device Technology * | 628,318 | 5,353 | ||||||
Interactive Intelligence Group * (A) | 47,507 | 2,385 | ||||||
Internap Network Services * | 164,613 | 1,314 | ||||||
Intersil, Cl A | 268,462 | 2,201 | ||||||
IntraLinks Holdings * | 95,310 | 585 | ||||||
InvenSense, Cl A * (A) | 174,114 | 2,243 | ||||||
IPG Photonics * (A) | 25,440 | 1,509 | ||||||
Itron * | 12,366 | 519 | ||||||
Ixia * (A) | 154,990 | 2,436 | ||||||
j2 Global (A) | 28,980 | 1,185 | ||||||
Jabil Circuit | 123,006 | 2,467 | ||||||
Jack Henry & Associates | 84,687 | 3,974 | ||||||
JDS Uniphase * | 292,040 | 3,978 | ||||||
Juniper Networks * | 107,681 | 1,909 | ||||||
Kla-Tencor | 16,200 | 912 | ||||||
Lattice Semiconductor * | 483,244 | 2,489 | ||||||
Lexmark International, Cl A (A) | 49,300 | 1,504 | ||||||
| 6 | SEI Institutional Investments Trust / Annual Report / May 31, 2013 |
Table of Contents
Schedule of Investments
Small/Mid Cap Equity Fund
May 31, 2013
| Description | Shares | Market Value ($ Thousands) | ||||||
Liquidity Services * (A) | 36,262 | $ | 1,451 | |||||
Littelfuse | 37,323 | 2,743 | ||||||
LivePerson * (A) | 143,374 | 1,325 | ||||||
LSI * | 115,300 | 853 | ||||||
Measurement Specialties * | 66,858 | 2,972 | ||||||
MEMC Electronic Materials * | 208,490 | 1,683 | ||||||
Microchip Technology (A) | 54,365 | 1,983 | ||||||
MKS Instruments | 35,919 | 1,011 | ||||||
Molex (A) | 64,435 | 1,890 | ||||||
Monolithic Power Systems * | 21,741 | 534 | ||||||
MTS Systems | 12,200 | 736 | ||||||
ON Semiconductor * | 518,085 | 4,435 | ||||||
OSI Systems * | 24,392 | 1,411 | ||||||
Palo Alto Networks * (A) | 57,430 | 2,786 | ||||||
Pandora Media * (A) | 277,035 | 4,715 | ||||||
Plantronics | 32,825 | 1,516 | ||||||
Plexus * | 94,632 | 2,761 | ||||||
Power Integrations (A) | 24,810 | 1,059 | ||||||
PRGX Global * | 88,000 | 482 | ||||||
Progress Software * | 72,952 | 1,715 | ||||||
PTC * | 421,032 | 10,572 | ||||||
Pulse Electronics * (A) | 4,300 | 14 | ||||||
RealD * (A) | 174,441 | 2,632 | ||||||
RealPage * (A) | 184,642 | 3,516 | ||||||
RF Micro Devices * | 310,330 | 1,713 | ||||||
Rogers * | 51,648 | 2,390 | ||||||
Saba Software * | 98,200 | 847 | ||||||
SAIC (A) | 116,700 | 1,692 | ||||||
Seagate Technology | 65,900 | 2,839 | ||||||
Semtech * (A) | 89,070 | 3,255 | ||||||
ServiceNow * | 70,515 | 2,592 | ||||||
Shutterstock * (A) | 52,750 | 2,497 | ||||||
SolarWinds * | 551 | 23 | ||||||
Solera Holdings | 65,620 | 3,594 | ||||||
Sonus Networks * | 571,871 | 1,836 | ||||||
Sourcefire * (A) | 39,321 | 2,200 | ||||||
Splunk * | 43,220 | 2,021 | ||||||
SPS Commerce * | 47,285 | 2,552 | ||||||
SS&C Technologies Holdings * | 205,029 | 6,485 | ||||||
Stamps.com * | 7,300 | 278 | ||||||
Stratasys * (A) | 24,010 | 2,018 | ||||||
Symantec | 78,916 | 1,767 | ||||||
Synaptics * | 52,260 | 2,156 | ||||||
Synopsys * | 81,864 | 2,984 | ||||||
Tableau Software, Cl A * | 15,910 | 813 | ||||||
Tangoe * | 142,893 | 2,131 | ||||||
Tech Data * | 31,800 | 1,594 | ||||||
Teradata * | 47,145 | 2,628 | ||||||
Teradyne * (A) | 137,290 | 2,463 | ||||||
Trimble Navigation * | 115,561 | 3,224 | ||||||
TriQuint Semiconductor * | 599,073 | 4,218 | ||||||
Trulia * (A) | 147,418 | 4,532 | ||||||
Tyler Technologies * | 7,874 | 543 | ||||||
Ultimate Software Group * (A) | 11,929 | 1,328 | ||||||
Ultra Clean Holdings * | 95,251 | 553 | ||||||
Ultratech * | 94,712 | 3,453 | ||||||
United Online (A) | 147,700 | 1,006 | ||||||
Veeco Instruments * (A) | 59,964 | 2,542 | ||||||
Verint Systems * | 101,550 | 3,409 | ||||||
Virtusa * | 70,620 | 1,657 | ||||||
Vishay Intertechnology * (A) | 277,032 | 4,034 | ||||||
VistaPrint * (A) | 80,134 | 3,682 | ||||||
Web.com Group * (A) | 206,230 | 4,329 | ||||||
Western Digital | 44,700 | 2,831 | ||||||
WEX * | 60,188 | 4,446 | ||||||
WNS Holdings ADR * | 165,110 | 2,658 | ||||||
| Description | Shares | Market Value ($ Thousands) | ||||||
Zebra Technologies, Cl A * | 28,352 | $ | 1,295 | |||||
|
| |||||||
| 377,852 | ||||||||
|
| |||||||
Materials — 4.9% | ||||||||
Air Products & Chemicals | 19,293 | 1,821 | ||||||
Albemarle | 23,610 | 1,580 | ||||||
Allegheny Technologies (A) | 99,229 | 2,736 | ||||||
Ashland (A) | 37,307 | 3,317 | ||||||
Axiall | 38,558 | 1,664 | ||||||
Boise * (A) | 199,100 | 1,605 | ||||||
Buckeye Technologies (A) | 49,100 | 1,830 | ||||||
Cabot | 53,600 | 2,194 | ||||||
Chemtura * | 87,751 | 2,012 | ||||||
Cliffs Natural Resources (A) | 17,700 | 319 | ||||||
Compass Minerals International (A) | 46,689 | 4,074 | ||||||
Crown Holdings * | 52,770 | 2,235 | ||||||
Cytec Industries | 13,793 | 986 | ||||||
Domtar | 18,100 | 1,312 | ||||||
Eastman Chemical | 14,400 | 1,033 | ||||||
Glatfelter (A) | 51,000 | 1,261 | ||||||
Globe Specialty Metals | 10,700 | 131 | ||||||
Greif, Cl A | 55,636 | 2,898 | ||||||
GSE Holding * | 123,400 | 788 | ||||||
H.B. Fuller | 61,905 | 2,573 | ||||||
Headwaters * | 311,950 | 3,310 | ||||||
Horsehead Holding * (A) | 28,300 | 326 | ||||||
Huntsman | 111,600 | 2,171 | ||||||
Innophos Holdings | 24,799 | 1,254 | ||||||
Intrepid Potash * (A) | 39,341 | 739 | ||||||
Kaiser Aluminum (A) | 50,291 | 3,190 | ||||||
KapStone Paper and Packaging* | 128,580 | 3,730 | ||||||
Louisiana-Pacific * (A) | 168,750 | 2,965 | ||||||
LSB Industries * | 9,200 | 311 | ||||||
Methanex | 50,990 | 2,254 | ||||||
Minerals Technologies | 34,805 | 1,483 | ||||||
Neenah Paper | 35,800 | 1,125 | ||||||
Nucor | 30,159 | 1,342 | ||||||
Olin | 74,800 | 1,865 | ||||||
OM Group * | 4,700 | 138 | ||||||
Owens-Illinois * | 98,247 | 2,697 | ||||||
Packaging Corp of America | 46,350 | 2,271 | ||||||
PolyOne | 365,377 | 9,386 | ||||||
Reliance Steel & Aluminum | 38,809 | 2,553 | ||||||
Rock Tenn, Cl A | 44,289 | 4,375 | ||||||
Rockwood Holdings | 72,110 | 4,807 | ||||||
RTI International Metals * (A) | 167,121 | 4,848 | ||||||
Schweitzer-Mauduit International | 35,900 | 1,725 | ||||||
Scotts Miracle-Gro, Cl A (A) | 56,435 | 2,668 | ||||||
Sensient Technologies | 51,822 | 2,139 | ||||||
Silgan Holdings (A) | 77,468 | 3,623 | ||||||
Steel Dynamics (A) | 61,000 | 936 | ||||||
UFP Technologies * | 60,200 | 1,155 | ||||||
|
| |||||||
| 105,755 | ||||||||
|
| |||||||
Telecommunication Services — 0.3% | ||||||||
Iridium Communications * | 139,300 | 993 | ||||||
Neutral Tandem | 48,200 | 281 | ||||||
SBA Communications, Cl A * (A) | 34,267 | 2,579 | ||||||
USA Mobility | 76,117 | 1,026 | ||||||
Vonage Holdings * | 481,600 | 1,320 | ||||||
|
| |||||||
| 6,199 | ||||||||
|
| |||||||
Utilities — 2.6% | ||||||||
AGL Resources | 53,132 | 2,249 | ||||||
| 7 | SEI Institutional Investments Trust / Annual Report / May 31, 2013 |
Table of Contents
Schedule of Investments
Small/Mid Cap Equity Fund
May 31, 2013
| Description | Shares | Market Value ($ Thousands) | ||||||
ALLETE | 24,730 | $ | 1,170 | |||||
Ameren | 42,000 | 1,430 | ||||||
Avista | 54,700 | 1,461 | ||||||
Cadiz * (A) | 60,000 | 353 | ||||||
Chesapeake Utilities | 17,278 | 915 | ||||||
Cleco | 66,386 | 3,021 | ||||||
Dynegy * (A) | 8,000 | 195 | ||||||
Edison International | 26,252 | 1,206 | ||||||
El Paso Electric | 85,802 | 3,071 | ||||||
Empire District Electric | 20,400 | 443 | ||||||
Great Plains Energy | 224,484 | 5,067 | ||||||
IDACORP (A) | 28,114 | 1,328 | ||||||
NorthWestern | 12,100 | 498 | ||||||
NRG Energy | 134,121 | 3,423 | ||||||
NV Energy | 155,671 | 3,649 | ||||||
Piedmont Natural Gas (A) | 20,300 | 686 | ||||||
PNM Resources | 161,524 | 3,622 | ||||||
Portland General Electric | 177,306 | 5,397 | ||||||
SCANA | 27,187 | 1,371 | ||||||
Southwest Gas | 26,475 | 1,253 | ||||||
TECO Energy (A) | 88,085 | 1,551 | ||||||
UGI | 137,142 | 5,237 | ||||||
UIL Holdings (A) | 15,389 | 600 | ||||||
Vectren | 79,584 | 2,733 | ||||||
Westar Energy | 15,673 | 497 | ||||||
WGL Holdings | 30,120 | 1,293 | ||||||
Xcel Energy | 57,350 | 1,647 | ||||||
|
| |||||||
| 55,366 | ||||||||
|
| |||||||
Total Common Stock | 2,044,800 | |||||||
|
| |||||||
EXCHANGE TRADED FUNDS — 0.9% |
| |||||||
iShares Russell 2000 Growth Index Fund (A) | 111,361 | 12,527 | ||||||
iShares Russell 2000 Index Fund (A) | 33,218 | 3,250 | ||||||
iShares Russell 2000 Value Index Fund (A) | 43,200 | 3,729 | ||||||
iShares Russell Midcap Value Index Fund | 1,651 | 97 | ||||||
|
| |||||||
Total Exchange Traded Funds | 19,603 | |||||||
|
| |||||||
| Number Of Warrants | ||||||||
WARRANTS — 0.0% | ||||||||
Magnum Hunter Resource, | 18,718 | — | ||||||
|
| |||||||
Total Warrants | — | |||||||
|
| |||||||
AFFILIATED PARTNERSHIP — 21.7% |
| |||||||
SEI Liquidity Fund, L.P. | ||||||||
0.100% ** † (E) | 467,277,078 | 467,277 | ||||||
|
| |||||||
Total Affiliated Partnership | 467,277 | |||||||
|
| |||||||
CASH EQUIVALENT — 4.1% | ||||||||
SEI Daily Income Trust, Prime Obligation Fund, Cl A | ||||||||
0.010% ** † | 88,647,658 | 88,648 | ||||||
|
| |||||||
Total Cash Equivalent | 88,648 | |||||||
|
| |||||||
| Description | Face Amount ($ Thousands) | Market Value ($ Thousands) | ||||||
U.S. TREASURY OBLIGATION — 0.3% |
| |||||||
U.S. Treasury Bills | ||||||||
0.094%, 06/27/2013 (F)(G) | $ | 7,267 | $ | 7,267 | ||||
|
| |||||||
Total U.S. Treasury Obligation | 7,267 | |||||||
|
| |||||||
Total Investments — 122.0% | $ | 2,627,595 | ||||||
|
| |||||||
A list of the open futures contracts held by the Fund at May 31, 2013, is as follows:
| Type of Contract | Number of Contracts | Expiration Date | Unrealized Appreciation ($ Thousands) | |||||||||
Russell 2000 Index E-MINI | 334 | Jun-2013 | $ | 727 | ||||||||
S&P Mid 400 Index E-MINI | 258 | Jun-2013 | 454 | |||||||||
|
| |||||||||||
| $ | 1,181 | |||||||||||
|
| |||||||||||
For the year ended May 31, 2013, the total amount of all open futures contracts, as presented in the table above, are representative of the volume of activity for this derivative type during the year.
Percentages are based on a Net Assets of $2,153,745 ($ Thousands).
| * | Non-income producing security. |
| ** | The rate reported is the 7-day effective yield as of May 31, 2013. |
| † | Investment in Affiliated Security (see Note 5). |
| ‡ | Real Estate Investment Trust. |
| (A) | This security or a partial position of this security is on loan at May 31, 2013. The total value of securities on loan at May 31, 2013 was $449,160 ($ Thousands). |
| (B) | Securities considered illiquid. The total value of such securities as of May 31, 2013 was $116 ($ Thousands) and represented 0.01% of Net Assets. |
| (C) | Security fair valued using methods determined in good faith by the Valuation Committee of the Board of Trustees. The total market value of such securities as of May 31, 2013 was $116 ($ Thousands) and represented 0.01% of Net Assets. |
| (D) | Securities considered restricted. The total value of such securities as of May 31, 2013 was $116 ($ Thousands) and represented 0.01% of Net Assets. |
| (E) | This security was purchased with cash collateral held from securities on loan (see Note 11). The total value of such securities as of May 31, 2013 was $467,277 ($ Thousands). |
| (F) | Security, or portion thereof, has been pledged as collateral on open futures contracts. |
| (G) | The rate reported is the effective yield at time of purchase. |
ADR — American Depositary Receipt
Cl — Class
L.P. — Limited Partnership
S&P — Standard & Poor’s
| 8 | SEI Institutional Investments Trust / Annual Report / May 31, 2013 |
Table of Contents
Schedule of Investments
Small/Mid Cap Equity Fund
May 31, 2013
The following is a list of the inputs used as of May 31, 2013, in valuing the Fund’s investments carried at value ($ Thousands):
| Investments in Securities | Level 1 | Level 2 | Level 3 (1) | Total | ||||||||||||
Common Stock | $ | 2,044,684 | $ | — | $ | 116 | $ | 2,044,800 | ||||||||
Exchange Traded Funds | 19,603 | — | — | 19,603 | ||||||||||||
Affiliated Partnership | — | 467,277 | — | 467,277 | ||||||||||||
Cash Equivalent | 88,648 | — | — | 88,648 | ||||||||||||
U.S. Treasury Obligation | — | 7,267 | — | 7,267 | ||||||||||||
|
|
|
|
|
|
|
| |||||||||
Total Investments in Securities | $ | 2,152,935 | $ | 474,544 | $ | 116 | $ | 2,627,595 | ||||||||
|
|
|
|
|
|
|
| |||||||||
| Other Financial Instruments | Level 1 | Level 2 | Level 3 | Total | ||||||||||||
Futures Contracts * | $ | 1,181 | $ | — | $ | — | $ | 1,181 | ||||||||
|
|
|
|
|
|
|
| |||||||||
| * | Futures contracts are valued at the unrealized appreciation on the instrument. |
| (1) | A reconciliation of Level 3 investments is presented when the Fund has a significant amount of Level 3 investments at the beginning and/or end of the year in relation to the net assets. |
For the year ended May 31, 2013, there were no transfers between Level 1 and Level 2 assets and liabilities.
For the year ended May 31, 2013, there were no transfers between Level 2 and Level 3 assets and liabilities.
Amounts designated as “—” are either $0 or have been rounded to $0.
The accompanying notes are an integral part of the financial statements.
| 9 | SEI Institutional Investments Trust / Annual Report / May 31, 2013 |
Table of Contents
Schedule of Investments
U.S. Managed Volatility Fund
May 31, 2013
| Description | Shares | Market Value ($ Thousands) | ||||||
COMMON STOCK — 93.1% | ||||||||
Consumer Discretionary — 6.3% | ||||||||
Aaron’s | 72,900 | $ | 2,048 | |||||
Brinker International | 24,909 | 977 | ||||||
Canadian Tire, Cl A | 51,300 | 4,135 | ||||||
Choice Hotels International | 52,900 | 2,089 | ||||||
Cinemark Holdings | 94,700 | 2,779 | ||||||
Cogeco Cable | 13,400 | 584 | ||||||
Cracker Barrel Old Country Store | 32,600 | 2,916 | ||||||
DIRECTV * | 147,000 | 8,986 | ||||||
GameStop, Cl A | 58,000 | 1,923 | ||||||
Genuine Parts | 16,100 | 1,252 | ||||||
H&R Block | 116,400 | 3,407 | ||||||
Hasbro | 40,200 | 1,788 | ||||||
Jarden * | 29,100 | 1,355 | ||||||
Kohl’s | 78,100 | 4,015 | ||||||
Madison Square Garden, Cl A * | 57,800 | 3,383 | ||||||
PetSmart | 84,932 | 5,733 | ||||||
Regal Entertainment Group, Cl A | 113,000 | 2,000 | ||||||
Scripps Networks Interactive, Cl A | 35,300 | 2,378 | ||||||
Shaw Communications, Cl B | 141,300 | 3,151 | ||||||
Target | 208,389 | 14,483 | ||||||
Time Warner Cable, Cl A | 34,700 | 3,314 | ||||||
|
| |||||||
| 72,696 | ||||||||
|
| |||||||
Consumer Staples — 18.8% | ||||||||
Altria Group | 215,520 | 7,780 | ||||||
Archer-Daniels-Midland | 47,000 | 1,515 | ||||||
Bunge | 97,555 | 6,790 | ||||||
Cal-Maine Foods | 34,600 | 1,548 | ||||||
Campbell Soup | 169,630 | 7,262 | ||||||
Church & Dwight | 61,198 | 3,722 | ||||||
Clorox | 128,686 | 10,691 | ||||||
Coca-Cola Enterprises | 136,122 | 5,058 | ||||||
Colgate-Palmolive | 110,054 | 6,366 | ||||||
ConAgra Foods | 200,300 | 6,748 | ||||||
CVS Caremark | 137,600 | 7,923 | ||||||
Dr. Pepper Snapple Group | 190,150 | 8,743 | ||||||
Energizer Holdings | 35,900 | 3,436 | ||||||
Flowers Foods | 99,900 | 3,334 | ||||||
Fresh Del Monte Produce | 79,800 | 2,136 | ||||||
General Mills | 68,400 | 3,220 | ||||||
Harris Teeter Supermarkets | 26,800 | 1,260 | ||||||
Hershey | 93,857 | 8,364 | ||||||
HJ Heinz | 45,568 | 3,297 | ||||||
Hormel Foods | 256,770 | 10,225 | ||||||
Ingredion | 41,100 | 2,800 | ||||||
JM Smucker | 32,500 | 3,281 | ||||||
Kellogg | 74,064 | 4,596 | ||||||
Kimberly-Clark | 133,030 | 12,881 | ||||||
Kraft Foods Group | 9,233 | 509 | ||||||
Kroger | 308,441 | 10,385 | ||||||
Lorillard | 38,100 | 1,617 | ||||||
McCormick | 27,256 | 1,883 | ||||||
Metro, Cl A | 86,800 | 5,829 | ||||||
Molson Coors Brewing, Cl B | 92,000 | 4,546 | ||||||
Philip Morris International | 83,423 | 7,584 | ||||||
Reynolds American | 127,938 | 6,155 | ||||||
Safeway | 238,500 | 5,488 | ||||||
Sysco | 110,039 | 3,719 | ||||||
| Description | Shares | Market Value ($ Thousands) | ||||||
TreeHouse Foods * | 35,300 | $ | 2,311 | |||||
Tyson Foods, Cl A | 148,300 | 3,707 | ||||||
Universal | 43,100 | 2,527 | ||||||
Walgreen | 144,800 | 6,916 | ||||||
Wal-Mart Stores | 233,800 | 17,497 | ||||||
Weis Markets | 37,000 | 1,514 | ||||||
|
| |||||||
| 215,163 | ||||||||
|
| |||||||
Energy — 3.6% | ||||||||
Cenovus Energy | 28,200 | 844 | ||||||
Chevron | 90,000 | 11,048 | ||||||
ConocoPhillips | 132,300 | 8,115 | ||||||
Diamond Offshore Drilling | 10,100 | 695 | ||||||
Exxon Mobil | 166,200 | 15,036 | ||||||
Imperial Oil | 64,400 | 2,508 | ||||||
TransCanada | 66,900 | 3,067 | ||||||
|
| |||||||
| 41,313 | ||||||||
|
| |||||||
Financials — 16.7% | ||||||||
Alleghany * | 16,405 | 6,398 | ||||||
Allied World Assurance Holdings | 111,163 | 9,939 | ||||||
Allstate | 83,500 | 4,028 | ||||||
American Campus Communities ‡ | 72,300 | 2,952 | ||||||
American Capital Agency | 79,200 | 2,043 | ||||||
Arch Capital Group * | 95,868 | 4,909 | ||||||
Axis Capital Holdings | 75,200 | 3,276 | ||||||
BOK Financial | 17,600 | 1,146 | ||||||
Canadian Imperial Bank of Commerce | 40,100 | 3,040 | ||||||
CBOE Holdings | 81,300 | 3,263 | ||||||
Chubb | 75,000 | �� | 6,533 | |||||
Endurance Specialty Holdings | 40,800 | 2,053 | ||||||
Equity Lifestyle Properties ‡ | 38,300 | 2,956 | ||||||
Erie Indemnity, Cl A | 40,000 | 3,036 | ||||||
Essex Property Trust ‡ | 6,400 | 1,006 | ||||||
Everest Re Group | 98,993 | 12,831 | ||||||
Federal Realty Investment Trust ‡ | 10,195 | 1,098 | ||||||
Fidelity National Financial, Cl A | 108,509 | 2,855 | ||||||
First Citizens BancShares, Cl A | 3,741 | 738 | ||||||
First Niagara Financial Group | 337,200 | 3,294 | ||||||
Genworth MI Canada | 22,800 | 538 | ||||||
Government Properties Income Trust ‡ | 56,000 | 1,361 | ||||||
Hancock Holding | 102,400 | 2,924 | ||||||
Hanover Insurance Group | 30,500 | 1,532 | ||||||
HCC Insurance Holdings | 145,700 | 6,243 | ||||||
Home Properties ‡ | 50,839 | 3,089 | ||||||
Liberty Property Trust ‡ | 11,801 | 479 | ||||||
MFA Mortgage Investments ‡ | 260,700 | 2,289 | ||||||
Mid-America Apartment Communities ‡ | 48,891 | 3,323 | ||||||
National Bank of Canada | 45,600 | 3,366 | ||||||
National Retail Properties ‡ | 33,500 | 1,202 | ||||||
PartnerRe | 201,369 | 18,254 | ||||||
PennyMac Mortgage Investment Trust ‡ | 137,200 | 2,970 | ||||||
Piedmont Office Realty Trust, Cl A ‡ | 152,700 | 2,900 | ||||||
Platinum Underwriters Holdings | 46,600 | 2,661 | ||||||
Plum Creek Timber ‡ | 58,739 | 2,802 | ||||||
Primerica * | 71,100 | 2,504 | ||||||
| 1 | SEI Institutional Investments Trust / Annual Report / May 31, 2013 |
Table of Contents
Schedule of Investments
U.S. Managed Volatility Fund
May 31, 2013
| Description | Shares | Market Value ($ Thousands) | ||||||
Prosperity Bancshares | 63,500 | $ | 3,181 | |||||
Public Storage ‡ | 13,767 | 2,090 | ||||||
Realty Income ‡ | 16,000 | 727 | ||||||
RenaissanceRe Holdings | 158,845 | 13,654 | ||||||
Senior Housing Properties Trust ‡ | 35,200 | 910 | ||||||
Signature Bank NY * | 42,400 | 3,272 | ||||||
Silver Bay Realty Trust ‡ | 9,496 | 169 | ||||||
Tanger Factory Outlet Centers ‡ | 94,916 | 3,273 | ||||||
TFS Financial * | 298,000 | 3,272 | ||||||
Tompkins Financial | 22,059 | 916 | ||||||
Tower Group International | 21,187 | 410 | ||||||
Travelers | 96,600 | 8,087 | ||||||
Two Harbors Investment ‡ | 270,600 | 2,985 | ||||||
Validus Holdings | 274,205 | 9,902 | ||||||
Washington Federal | 7,153 | 125 | ||||||
White Mountains Insurance Group | 5,200 | 3,074 | ||||||
|
| |||||||
| 191,878 | ||||||||
|
| |||||||
Health Care — 14.6% | ||||||||
Abbott Laboratories | 99,795 | 3,659 | ||||||
AbbVie | 87,600 | 3,740 | ||||||
Actavis * | 59,283 | 7,309 | ||||||
Aetna | 84,900 | 5,126 | ||||||
AmerisourceBergen | 256,471 | 13,870 | ||||||
Amgen | 157,640 | �� | 15,847 | |||||
AstraZeneca ADR | 107,100 | 5,489 | ||||||
Baxter International | 38,600 | 2,715 | ||||||
Becton Dickinson | 105,488 | 10,403 | ||||||
Cardinal Health | 210,951 | 9,906 | ||||||
Celgene * | 29,200 | 3,611 | ||||||
Cooper | 15,400 | 1,740 | ||||||
Cubist Pharmaceuticals * | 59,800 | 3,286 | ||||||
Eli Lilly | 112,915 | 6,003 | ||||||
Endo Health Solutions * | 26,900 | 976 | ||||||
Greatbatch * | 40,900 | 1,317 | ||||||
Humana | 12,600 | 1,018 | ||||||
Johnson & Johnson | 168,942 | 14,222 | ||||||
Magellan Health Services * | 33,800 | 1,842 | ||||||
McKesson | 122,929 | 13,997 | ||||||
Medtronic | 47,400 | 2,418 | ||||||
Merck | 130,200 | 6,080 | ||||||
Orthofix International * | 29,900 | 827 | ||||||
Patterson | 79,400 | 3,103 | ||||||
PDL BioPharma | 156,300 | 1,289 | ||||||
Pfizer | 349,100 | 9,506 | ||||||
Quest Diagnostics | 20,800 | 1,286 | ||||||
Techne | 49,585 | 3,298 | ||||||
United Therapeutics * | 48,800 | 3,244 | ||||||
UnitedHealth Group | 47,100 | 2,950 | ||||||
WellPoint | 37,800 | 2,910 | ||||||
Zimmer Holdings | 58,300 | 4,577 | ||||||
|
| |||||||
| 167,564 | ||||||||
|
| |||||||
Industrials — 5.9% | ||||||||
Alliant Techsystems | 45,600 | 3,580 | ||||||
C.H. Robinson Worldwide | 50,900 | 2,886 | ||||||
Covanta Holding | 32,600 | 666 | ||||||
Dun & Bradstreet | 27,400 | 2,689 | ||||||
FTI Consulting * | 42,400 | 1,611 | ||||||
General Dynamics | 54,500 | 4,202 | ||||||
| Description | Shares | Market Value ($ Thousands) | ||||||
L-3 Communications Holdings, Cl 3 | 111,700 | $ | 9,504 | |||||
Landstar System | 49,400 | 2,608 | ||||||
Lockheed Martin | 82,074 | 8,686 | ||||||
Northrop Grumman | 102,800 | 8,470 | ||||||
Old Dominion Freight Line * | 77,400 | 3,333 | ||||||
Raytheon | 144,100 | 9,603 | ||||||
Rollins | 137,200 | 3,466 | ||||||
TransDigm Group * | 21,100 | 3,083 | ||||||
Verisk Analytics, Cl A * | 54,900 | 3,229 | ||||||
|
| |||||||
| 67,616 | ||||||||
|
| |||||||
Information Technology — 8.2% | ||||||||
Activision Blizzard | 214,200 | 3,091 | ||||||
Amdocs | 363,453 | 12,975 | ||||||
AOL * | 98,666 | 3,420 | ||||||
BMC Software * | 64,400 | 2,917 | ||||||
Broadridge Financial Solutions | 123,800 | 3,360 | ||||||
CACI International, Cl A * | 23,100 | 1,482 | �� | |||||
Cisco Systems | 325,100 | 7,828 | ||||||
CSG Systems International * | 69,600 | 1,505 | ||||||
Dell | 109,300 | 1,459 | ||||||
FLIR Systems | 125,000 | 3,045 | ||||||
Global Payments | 57,700 | 2,767 | ||||||
Harris | 81,816 | 4,102 | ||||||
IAC | 25,453 | 1,234 | ||||||
Ingram Micro, Cl A * | 181,800 | 3,474 | ||||||
Intel | 232,700 | 5,650 | ||||||
International Business Machines | 59,152 | 12,305 | ||||||
Jack Henry & Associates | 24,400 | 1,145 | ||||||
Microsoft | 227,200 | 7,925 | ||||||
National Instruments | 24,600 | 699 | ||||||
NeuStar, Cl A * | 43,100 | 2,089 | ||||||
SAIC | 443,100 | 6,425 | ||||||
Tech Data * | 36,400 | 1,824 | ||||||
Total System Services | 124,000 | 2,915 | ||||||
|
| |||||||
| 93,636 | ||||||||
|
| |||||||
Materials — 1.7% | ||||||||
Aptargroup | 53,700 | 3,046 | ||||||
Ball | 87,200 | 3,764 | ||||||
Barrick Gold | 35,900 | 756 | ||||||
Bemis | 69,000 | 2,701 | ||||||
Compass Minerals International | 37,000 | 3,229 | ||||||
Greif, Cl A | 11,500 | 599 | ||||||
Newmont Mining | 50,483 | 1,731 | ||||||
Silgan Holdings | 66,100 | 3,091 | ||||||
|
| |||||||
| 18,917 | ||||||||
|
| |||||||
Telecommunication Services — 2.6% | ||||||||
AT&T | 130,700 | 4,573 | ||||||
BCE | 17,900 | 800 | ||||||
NTT DOCOMO ADR | 91,700 | 1,346 | ||||||
Rogers Communications, Cl B | 67,800 | 3,083 | ||||||
SBA Communications, Cl A * | 21,400 | 1,611 | ||||||
SK Telecom ADR | 207,600 | 4,214 | ||||||
Verizon Communications | 200,058 | 9,699 | ||||||
Vodafone Group ADR | 141,800 | 4,105 | ||||||
|
| |||||||
| 29,431 | ||||||||
|
| |||||||
Utilities — 14.7% | ||||||||
AGL Resources | 74,600 | 3,158 | ||||||
Alliant Energy | 114,514 | 5,641 | ||||||
| 2 | SEI Institutional Investments Trust / Annual Report / May 31, 2013 |
Table of Contents
Schedule of Investments
U.S. Managed Volatility Fund
May 31, 2013
| Description | Shares/Face Amount ($ Thousands) | Market Value ($ Thousands) | ||||||
Ameren | 112,600 | $ | 3,833 | |||||
American Electric Power | 144,905 | 6,640 | ||||||
American States Water | 40,800 | 2,168 | ||||||
American Water Works | 226,980 | 9,065 | ||||||
Atmos Energy | 146,400 | 6,181 | ||||||
Cleco | 62,400 | 2,840 | ||||||
CMS Energy | 266,538 | 7,183 | ||||||
Consolidated Edison | 138,467 | 7,902 | ||||||
DTE Energy | 184,975 | 12,321 | ||||||
Edison International | 294,275 | 13,519 | ||||||
El Paso Electric | 37,100 | 1,328 | ||||||
Entergy | 67,900 | 4,677 | ||||||
Great Plains Energy | 72,400 | 1,634 | ||||||
Hawaiian Electric Industries | 199,993 | 5,234 | ||||||
IDACORP | 49,500 | 2,338 | ||||||
Integrys Energy Group | 15,491 | 891 | ||||||
ITC Holdings | 23,905 | 2,069 | ||||||
Laclede Group | 73,500 | 3,479 | ||||||
NextEra Energy | 75,794 | 5,731 | ||||||
NV Energy | 180,700 | 4,236 | ||||||
Pepco Holdings | 8,024 | 167 | ||||||
PG&E | 131,500 | 5,906 | ||||||
Pinnacle West Capital | 117,874 | 6,657 | ||||||
Portland General Electric | 145,500 | 4,429 | ||||||
PPL | 107,000 | 3,178 | ||||||
Public Service Enterprise Group | 189,729 | 6,269 | ||||||
SCANA | 36,492 | 1,841 | ||||||
Southern | 59,572 | 2,615 | ||||||
UGI | 107,524 | 4,106 | ||||||
Vectren | 183,040 | 6,286 | ||||||
Westar Energy | 65,646 | 2,082 | ||||||
WGL Holdings | 26,000 | 1,116 | ||||||
Wisconsin Energy | 185,188 | 7,557 | ||||||
Xcel Energy | 160,428 | 4,607 | ||||||
|
| |||||||
| 168,884 | ||||||||
|
| |||||||
Total Common Stock | 1,067,098 | |||||||
|
| |||||||
CASH EQUIVALENT — 3.7% | ||||||||
SEI Daily Income Trust, Prime Obligation Fund, Cl A | ||||||||
0.010% ** † | 42,175,790 | 42,176 | ||||||
|
| |||||||
Total Cash Equivalent | 42,176 | |||||||
|
| |||||||
U.S. TREASURY OBLIGATION (A)(B) — 0.1% |
| |||||||
U.S. Treasury Bills | ||||||||
0.075%, 06/27/2013 | $ | 1,513 | 1,513 | |||||
|
| |||||||
Total U.S. Treasury Obligation | 1,513 | |||||||
|
| |||||||
Total Investments — 96.9% | $ | 1,110,787 | ||||||
|
| |||||||
A list of the open futures contracts held by the Fund at May 31, 2013, is as follows:
| Type of Contract | Number of Contracts Long | Expiration Date | Unrealized Appreciation ($ Thousands) | |||||||||
S&P 500 Index EMINI | 674 | Jun-2013 | $ | 197 | ||||||||
|
| |||||||||||
For the year ended May 31, 2013, the total amount of all open futures contracts, as presented in the table above, are representative of the volume of activity for this derivative type during the year.
Percentages are based on a Net Assets of $1,145,980 ($ Thousands).
| * | Non-income producing security. |
| ** | The rate reported is the 7-day effective yield as of May 31, 2013. |
| † | Investment in Affiliated Security (see Note 5). |
| ‡ | Real Estate Investment Trust. |
| (A) | Security, or portion thereof, has been pledged as collateral on open futures contracts. |
| (B) | The rate reported is the effective yield at time of purchase. |
ADR — American Depositary Receipt
Cl — Class
S&P — Standard & Poors
The following is a list of the inputs used as of May 31, 2013, in valuing the Fund’s investments and other financial instruments carried at value ($ Thousands):
| Investments in Securities | Level 1 | Level 2 | Level 3 | Total | ||||||||||||
Common Stock | $ | 1,067,098 | $ | — | $ | — | $ | 1,067,098 | ||||||||
Cash Equivalent | 42,176 | — | — | 42,176 | ||||||||||||
U.S. Treasury Obligation | — | 1,513 | — | 1,513 | ||||||||||||
|
|
|
|
|
|
|
| |||||||||
Total Investments in Securities | $ | 1,109,274 | $ | 1,513 | $ | — | $ | 1,110,787 | ||||||||
|
|
|
|
|
|
|
| |||||||||
| Other Financial Instruments | Level 1 | Level 2 | Level 3 | Total | ||||||||||||
Futures Contracts * | $ | 197 | $ | — | $ | — | $ | 197 | ||||||||
|
|
|
|
|
|
|
| |||||||||
| * | Futures contracts are valued at the unrealized appreciation on the instrument. |
For the year ended May 31, 2013, there were no transfers between Level 1 and Level 2 assets and liabilities.
For the year ended May 31, 2013, there were no transfers between Level 2 and Level 3 assets and liabilities.
For more information on valuation inputs, see Note 2 — Significant Accounting Policies in Notes to Financial Statements.
Amounts designated as “—” are $O or have been rounded to $O.
The accompanying notes are an integral part of the financial statements.
| 3 | SEI Institutional Investments Trust / Annual Report / May 31, 2013 |
Table of Contents
Schedule of Investments
International Equity Fund
May 31, 2013
| Description | Shares | Market Value ($ Thousands) | ||||||
COMMON STOCK — 95.2% | ||||||||
Australia — 2.9% | ||||||||
Alumina * (A) | 24,308 | $ | 24 | |||||
Amcor (A) | 42,598 | 403 | ||||||
AMP (A) | 15,099 | 74 | ||||||
APA Group (A) | 5,483 | 34 | ||||||
Australia & New Zealand Banking Group (A) | 4,340 | 113 | ||||||
Beach Energy (A) | 20,242 | 23 | ||||||
Bendigo Bank (A) | 1,747 | 17 | ||||||
BGP Holdings * | 39,545 | — | ||||||
BHP Billiton ADR | 4,700 | 307 | ||||||
BlueScope Steel * (A) | 2,013 | 10 | ||||||
Boral (A) | 21,629 | 94 | ||||||
Brambles (A) | 139,484 | 1,217 | ||||||
Caltex Australia (A) | 13,542 | 290 | ||||||
CFS Retail Property Trust Group (A) | 5,135 | 10 | ||||||
Coca-Cola Amatil (A) | 1,442 | 18 | ||||||
Cochlear (A) | 1,415 | 87 | ||||||
Commonwealth Bank of Australia (A) | 3,618 | 230 | ||||||
Crown (A) | 4,650 | 57 | ||||||
CSL (A) | 10,696 | 610 | ||||||
Dexus Property Group (A) | 67,093 | 70 | ||||||
DuluxGroup (A) | 6,048 | 26 | ||||||
Flight Centre (A) | 1,228 | 46 | ||||||
Goodman Group ‡ (A) | 37,964 | 186 | ||||||
GPT Group (A) | 4,938 | 18 | ||||||
Iluka Resources (A) | 31,285 | 330 | ||||||
Insurance Australia Group (A) | 53,278 | 288 | ||||||
K&S (A) | 2,648 | 4 | ||||||
Lend Lease Group (A) | 7,432 | 71 | ||||||
Macquarie Group (A) | 2,969 | 121 | ||||||
Newcrest Mining (A) | 33,750 | 462 | ||||||
Qantas Airways * (A) | 62,890 | 95 | ||||||
Ramsay Health Care (A) | 3,067 | 101 | ||||||
Resolute Mining (A) | 7,169 | 5 | ||||||
Stockland ‡(A) | 1,088 | 4 | ||||||
Suncorp Group (A) | 15,562 | 185 | ||||||
Tatts Group (A) | 30,386 | 93 | ||||||
Telstra (A) | 79,672 | 361 | ||||||
Toll Holdings (A) | 1,676 | 8 | ||||||
Transurban Group (A) | 6,537 | 43 | ||||||
Treasury Wine Estates (A) | 3,330 | 19 | ||||||
Wesfarmers (A) | 2,681 | 100 | ||||||
Westfield Group ‡(A) | 9,699 | 107 | ||||||
Westfield Retail Trust (A) | 36,464 | 107 | ||||||
Westpac Banking (A) | 4,441 | 120 | ||||||
Woolworths (A) | 952 | 30 | ||||||
|
| |||||||
| 6,618 | ||||||||
|
| |||||||
Austria — 0.3% | ||||||||
Andritz (A) | 8,148 | 443 | ||||||
Erste Group Bank (A) | 3,895 | 125 | ||||||
IMMOFINANZ (A) | 20,683 | 84 | ||||||
OMV (A) | 522 | 24 | ||||||
Raiffeisen International Bank Holding (A) | 221 | 7 | ||||||
| Description | Shares | Market Value ($ Thousands) | ||||||
Vienna Insurance Group (A) | 697 | $ | 34 | |||||
|
| |||||||
| 717 | ||||||||
|
| |||||||
Belgium — 1.1% | ||||||||
Ageas (A) | 13,450 | 492 | ||||||
Anheuser-Busch InBev (A) | 3,667 | 337 | ||||||
Belgacom (A) | 35,884 | 802 | ||||||
Colruyt (A) | 12,070 | 614 | ||||||
Delhaize Group (A) | 636 | 41 | ||||||
KBC Groep * (A) | 5,785 | 229 | ||||||
Solvay (A) | 190 | 27 | ||||||
UCB (A) | 1,892 | 102 | ||||||
|
| |||||||
| 2,644 | ||||||||
|
| |||||||
Brazil — 0.4% | ||||||||
Banco Santander Brasil ADR | 31,823 | 227 | ||||||
Centrais Eletricas Brasileiras * | 69,683 | 180 | ||||||
Cia Brasileira de Distribuicao Grupo Pao de Acucar ADR | 5,724 | 281 | ||||||
Fibria Celulose ADR * | 21,928 | 241 | ||||||
Petroleo Brasileiro ADR * | 387 | 7 | ||||||
Tim Participacoes ADR | 530 | 10 | ||||||
|
| |||||||
| 946 | ||||||||
|
| |||||||
Canada — 3.8% | ||||||||
Agrium | 6,700 | 620 | ||||||
Bank of Nova Scotia | 6,000 | 343 | ||||||
Barrick Gold | 45,340 | 958 | ||||||
Cameco | 26,210 | 568 | ||||||
Canadian Natural Resources | 2,800 | 84 | ||||||
Canadian Pacific Railway | 3,908 | 521 | ||||||
Canam Group * | 700 | 6 | ||||||
Cenovus Energy | 9,255 | 278 | ||||||
Dollarama | 8,200 | 577 | ||||||
Equal Energy | 1,590 | 6 | ||||||
Imperial Oil | 14,700 | 576 | ||||||
Intertape Polymer Group | 500 | 6 | ||||||
Kinross Gold | 110,924 | 711 | ||||||
Magna International, Cl A | 9,500 | 635 | ||||||
New Gold * | 53,200 | 363 | ||||||
Silver Wheaton | 17,200 | 409 | ||||||
Suncor Energy | 32,250 | 980 | ||||||
Talisman Energy | 29,238 | 341 | ||||||
Toronto-Dominion Bank | 9,077 | 737 | ||||||
|
| |||||||
| 8,719 | ||||||||
|
| |||||||
China — 0.3% | ||||||||
Bank of China (A) | 456,000 | 215 | ||||||
China First Chemical Holdings (A) | 22,000 | 5 | ||||||
Huaneng Power International (A) | 152,100 | 155 | ||||||
Industrial & Commercial Bank of China (A) | 484,000 | 339 | ||||||
Shanghai Electric Group (A) | 262,000 | 97 | ||||||
|
| |||||||
| 811 | ||||||||
|
| |||||||
Denmark — 0.9% | ||||||||
AP Moeller - Maersk, Cl B (A) | 19 | 135 | ||||||
Carlsberg, Cl B (A) | 544 | 52 | ||||||
Coloplast, Cl B (A) | 3,012 | 171 | ||||||
Jyske Bank * (A) | 14,200 | 559 | ||||||
Novo-Nordisk, Cl B (A) | 3,227 | 522 | ||||||
PER Aarsleff, Cl B | 73 | 7 | ||||||
| 1 | SEI Institutional Investments Trust / Annual Report / May 31, 2013 |
Table of Contents
Schedule of Investments
International Equity Fund
May 31, 2013
| Description | Shares | Market Value ($ Thousands) | ||||||
TrygVesta (A) | 6,500 | $ | 544 | |||||
|
| |||||||
| 1,990 | ||||||||
|
| |||||||
Finland — 0.3% | ||||||||
Cramo (A) | 429 | 5 | ||||||
Huhtamaki (A) | 2,060 | 39 | ||||||
Kone, Cl B (A) | 1,329 | 116 | ||||||
Neste Oil (A) | 1,193 | 17 | ||||||
Orion, Cl B (A) | 2,576 | 63 | ||||||
Pohjola Bank, Cl A (A) | 3,772 | 61 | ||||||
Sampo, Cl A (A) | 3,260 | 132 | ||||||
Stora Enso, Cl R (A) | 23,449 | 169 | ||||||
Tieto (A) | 272 | 6 | ||||||
UPM-Kymmene (A) | 4,618 | 49 | ||||||
Wartsila Abp, Cl B (A) | 403 | 19 | ||||||
|
| |||||||
| 676 | ||||||||
|
| |||||||
France — 11.3% | ||||||||
Air France-KLM * (A) | 3,331 | 32 | ||||||
Alstom (A) | 7,796 | 292 | ||||||
Areva * (A) | 12,755 | 212 | ||||||
Arkema (A) | 13,470 | 1,382 | ||||||
Assystem | 993 | 22 | ||||||
AtoS (A) | 1,160 | 84 | ||||||
AXA (A) | 34,421 | 693 | ||||||
BNP Paribas (A) | 41,970 | 2,449 | ||||||
Boursorama * (A) | 883 | 7 | ||||||
Bureau Veritas (A) | 1,046 | 120 | ||||||
Capital Gemini (A) | 897 | 44 | ||||||
Carrefour (A) | 20,886 | 610 | ||||||
Cegid Group | 983 | 19 | ||||||
CGG * (A) | 586 | 14 | ||||||
Cie Lebon | 48 | 7 | ||||||
Ciments Francais | 109 | 6 | ||||||
CNP Assurances (A) | 2,714 | 41 | ||||||
Compagnie Generale des Etablissements Michelin, Cl B (A) | 4,291 | 374 | ||||||
Credit Agricole * (A) | 26,385 | 246 | ||||||
Credit Agricole Ile de France | 100 | 7 | ||||||
Credit Agricole Toulouse | 66 | 5 | ||||||
Credit Industriel et Commercial | 33 | 5 | ||||||
Danone (A) | 4,000 | 294 | ||||||
Dassault Systemes (A) | 236 | 30 | ||||||
Devoteam | 486 | 6 | ||||||
Electricite de France (A) | 13,502 | 305 | ||||||
Essilor International (A) | 8,584 | 942 | ||||||
Eurazeo * | 66 | 3 | ||||||
Eutelsat Communications (A) | 13,428 | 416 | ||||||
Exel Industries, Cl A | 113 | 5 | ||||||
Fonciere Des Regions ‡(A) | 72 | 6 | ||||||
Gecina ‡(A) | 475 | 58 | ||||||
Iliad (A) | 326 | 68 | ||||||
Kering (A) | 3,344 | 725 | ||||||
Klepierre ‡(A) | 1,191 | 51 | ||||||
Lafarge (A) | 4,436 | 316 | ||||||
Legrand (A) | 19,422 | 949 | ||||||
Les Nouveaux Constructeurs Investissement | 681 | 7 | ||||||
L’Oreal (A) | 4,172 | 701 | ||||||
LVMH Moet Hennessy Louis Vuitton (A) | 3,609 | 636 | ||||||
Montupet (A) | 250 | 5 | ||||||
| Description | Shares | Market Value ($ Thousands) | ||||||
Nexity (A) | 936 | $ | 33 | |||||
Oeneo | 1,550 | 6 | ||||||
Osiatis | 432 | 5 | ||||||
Pernod-Ricard (A) | 3,078 | 369 | ||||||
Plastic Omnium (A) | 433 | 23 | ||||||
Publicis Groupe (A) | 8,500 | 606 | ||||||
Renault (A) | 1,528 | 118 | ||||||
Rexel (A) | 38,327 | 864 | ||||||
Safran (A) | 19,116 | 1,013 | ||||||
Sanofi-Aventis (A) | 44,881 | 4,772 | ||||||
Schneider Electric (A) | 27,868 | 2,199 | ||||||
SES Global (A) | 2,439 | 72 | ||||||
Societe BIC (A) | 20 | 2 | ||||||
Societe Generale (A) | 6,612 | 263 | ||||||
Societe Internationale de Plantations d’Heveas | 73 | 6 | ||||||
Sodexo (A) | 9,573 | 813 | ||||||
Sword Group | 327 | 5 | ||||||
Technip (A) | 4,994 | 554 | ||||||
Teleperformance (A) | 276 | 13 | ||||||
Thales (A) | 7,679 | 372 | ||||||
Total (A) | 20,450 | 1,019 | ||||||
Unibail-Rodamco (A) | 349 | 85 | ||||||
Valeo (A) | 125 | 8 | ||||||
Vallourec (A) | 6,173 | 334 | ||||||
Vivendi (A) | 13,850 | 270 | ||||||
Wendel (A) | 845 | 93 | ||||||
|
| |||||||
| 26,111 | ||||||||
|
| |||||||
Germany — 9.0% | ||||||||
Adidas (A) | 6,912 | 749 | ||||||
Allianz (A) | 2,984 | 460 | ||||||
BASF (A) | 1,176 | 114 | ||||||
Bayer (A) | 14,999 | 1,598 | ||||||
Bayerische Motoren Werke (A) | 570 | 54 | ||||||
Borussia Dortmund GmbH & KGaA (A) | 3,568 | 15 | ||||||
Brenntag (A) | 4,954 | 752 | ||||||
Commerzbank * (A) | 17,030 | 175 | ||||||
Constantin Medien * | 2,771 | 5 | ||||||
Continental (A) | 7,208 | 940 | ||||||
DaimlerChrysler (A) | 28,422 | 1,800 | ||||||
Deutsche Bank (A) | 21,615 | 1,001 | ||||||
Deutsche Boerse (A) | 18,918 | 1,216 | ||||||
Deutsche Lufthansa * (A) | 25,178 | 539 | ||||||
Deutsche Post (A) | 24,468 | 615 | ||||||
Deutsche Telekom (A) | 114 | 1 | ||||||
E.ON (A) | 10,552 | 177 | ||||||
Fresenius (A) | 323 | 38 | ||||||
Fresenius Medical Care (A) | 3,360 | 227 | ||||||
GEA Group (A) | 19,526 | 706 | ||||||
Gildemeister (A) | 1,037 | 24 | ||||||
Grammer (A) | 513 | 18 | ||||||
Hannover Rueckversicherung (A) | 1,432 | 107 | ||||||
HeidelbergCement (A) | 14,666 | 1,102 | ||||||
Henkel (A) | 1,557 | 126 | ||||||
Infineon Technologies (A) | 87,142 | 739 | ||||||
Kabel Deutschland Holding (A) | 1,552 | 146 | ||||||
Lanxess (A) | 1,276 | 94 | ||||||
Linde (A) | 8,631 | 1,648 | ||||||
Merck KGaA (A) | 2,570 | 406 | ||||||
Muenchener Rueckversicherungs (A) | 5,317 | 989 | ||||||
| 2 | SEI Institutional Investments Trust / Annual Report / May 31, 2013 |
Table of Contents
Schedule of Investments
International Equity Fund
May 31, 2013
| Description | Shares | Market Value ($ Thousands) | ||||||
SAP (A) | 8,450 | $ | 630 | |||||
SAP ADR | 7,500 | 551 | ||||||
Siemens (A) | 19,052 | 2,003 | ||||||
Sixt (A) | 887 | 20 | ||||||
Suedzucker (A) | 5,949 | 201 | ||||||
Symrise (A) | 17,734 | 721 | ||||||
ThyssenKrupp * (A) | 657 | 13 | ||||||
Ultrasonic * (A) | 495 | 7 | ||||||
Volkswagen (A) | 173 | 37 | ||||||
|
| |||||||
| 20,764 | ||||||||
|
| |||||||
Greece — 0.0% | ||||||||
Hellenic Telecommunications | 1,777 | 16 | ||||||
OPAP (A) | 2,814 | 23 | ||||||
|
| |||||||
| 39 | ||||||||
|
| |||||||
Hong Kong — 3.2% | ||||||||
AIA Group (A) | 199,000 | 880 | ||||||
Asia Orient Holdings * (A) | 40,000 | 7 | ||||||
BOC Hong Kong Holdings (A) | 15,500 | 52 | ||||||
Chaoda Modern Agriculture * | 1,048,000 | — | ||||||
Cheung Kong Holdings (A) | 4,000 | 56 | ||||||
China Merchants Holdings International (A) | 90,000 | 297 | ||||||
China Mobile (A) | 47,100 | 498 | ||||||
China Mobile ADR | 15,600 | 808 | ||||||
CNOOC (A) | 398,000 | 697 | ||||||
First Pacific (A) | 36,000 | 48 | ||||||
Galaxy Entertainment Group * (A) | 52,000 | 270 | ||||||
Hang Seng Bank (A) | 3,300 | 53 | ||||||
Henderson Land Development (A) | 22,000 | 154 | ||||||
HKT Trust (A) | 51,000 | 58 | ||||||
Hong Kong & China Gas (A) | 24,500 | 69 | ||||||
Hong Kong Exchanges and Clearing (A) | 1,200 | 20 | ||||||
Hongkong Land Holdings (A) | 91,000 | 629 | ||||||
Hopewell Holdings (A) | 15,000 | 54 | ||||||
Hopewell Hong Kong Properties * (B) | 600 | — | ||||||
Hutchison Whampoa (A) | 2,600 | 27 | ||||||
Hysan Development (A) | 11,000 | 49 | ||||||
Jardine Matheson Holdings (A) | 9,300 | 610 | ||||||
Jardine Strategic Holdings (A) | 23,021 | 921 | ||||||
Kerry Properties (A) | 11,000 | 45 | ||||||
MGM China Holdings * (A) | 2,400 | 6 | ||||||
MTR (A) | 4,000 | 16 | ||||||
New World Development (A) | 104,000 | 165 | ||||||
Power Assets Holdings (A) | 6,500 | 57 | ||||||
SJM Holdings (A) | 24,000 | 65 | ||||||
Sun Hung Kai Properties (A) | 6,000 | 79 | ||||||
Swire Pacific, Cl A (A) | 1,000 | 13 | ||||||
Swire Properties (A) | 17,400 | 54 | ||||||
Wharf Holdings (A) | 18,000 | 159 | ||||||
Wheelock (A) | 22,000 | 123 | ||||||
Yue Yuen Industrial Holdings (A) | 123,000 | 358 | ||||||
|
| |||||||
| 7,397 | ||||||||
|
| |||||||
India — 0.4% | ||||||||
Idea Cellular * (A) | 363,003 | 842 | ||||||
|
| |||||||
Indonesia — 0.1% | ||||||||
| Description | Shares | Market Value ($ Thousands) | ||||||
Bank Mandiri Persero (A) | 341,400 | $ | 337 | |||||
|
| |||||||
Ireland — 0.5% | ||||||||
Dragon Oil (A) | 16,800 | 158 | ||||||
James Hardie Industries (A) | 10,374 | 98 | ||||||
Kerry Group, Cl A | 412 | 23 | ||||||
Ryanair Holdings ADR * | 10,300 | 503 | ||||||
Seagate Technology | 232 | 10 | ||||||
Smurfit Kappa Group (A) | 22,266 | 370 | ||||||
|
| |||||||
| 1,162 | ||||||||
|
| |||||||
Israel — 1.3% | ||||||||
Bank Hapoalim * (A) | 7,873 | 36 | ||||||
Bank Leumi Le-Israel * (A) | 8,439 | 30 | ||||||
Bezeq Israeli Telecommunication (A) | 429,205 | 555 | ||||||
Check Point Software Technologies * | 31,351 | 1,570 | ||||||
Teva Pharmaceutical Industries ADR | 20,061 | 766 | ||||||
|
| |||||||
| 2,957 | ||||||||
|
| |||||||
Italy — 1.1% | ||||||||
Assicurazioni Generali (A) | 1,318 | 24 | ||||||
Atlantia (A) | 3,625 | 62 | ||||||
Banca Intesa (A) | 79,900 | 149 | ||||||
Banche Popolari Unite (A) | 4,153 | 18 | ||||||
Banco Popolare Scarl * (A) | 17,221 | 25 | ||||||
Enel (A) | 87,752 | 329 | ||||||
ERG (A) | 22,620 | 228 | ||||||
Exor (A) | 7,727 | 244 | ||||||
Fiat * (A) | 7,320 | 57 | ||||||
Fiat Industrial (A) | 954 | 11 | ||||||
Finmeccanica * (A) | 43,578 | 240 | ||||||
FNM * (A) | 19,072 | 6 | ||||||
Iren * (A) | 4,385 | 5 | ||||||
Luxottica Group (A) | 105 | 5 | ||||||
Mediobanca (A) | 12,630 | 83 | ||||||
Prysmian (A) | 262 | 6 | ||||||
Safilo Group * (A) | 719 | 14 | ||||||
Snam (A) | 116,564 | 551 | ||||||
Telecom Italia (A) | 666,618 | 411 | ||||||
UniCredit (A) | 8,408 | 47 | ||||||
|
| |||||||
| 2,515 | ||||||||
|
| |||||||
Japan — 15.7% | ||||||||
AEON Financial Service (A) | 900 | 24 | ||||||
Aeon Mall (A) | 1,500 | 39 | ||||||
Aichi Electric (A) | 2,000 | 6 | ||||||
Alfresa Holdings (A) | 1,100 | 57 | ||||||
Alpen (A) | 1,800 | 35 | ||||||
Alps Logistics (A) | 600 | 6 | ||||||
Amada (A) | 2,000 | 14 | ||||||
Anabuki Kosan (A) | 2,000 | 7 | ||||||
Aoyama Trading (A) | 700 | 19 | ||||||
Arakawa Chemical Industries (A) | 1,700 | 14 | ||||||
Arcland Sakamoto (A) | 1,600 | 30 | ||||||
Asics (A) | 2,700 | 41 | ||||||
Astellas Pharma (A) | 20,900 | 1,062 | ||||||
AT-Group (A) | 3,000 | 51 | ||||||
Bank of Yokohama (A) | 28,000 | 136 | ||||||
Benesse (A) | 14,100 | 518 | ||||||
Bridgestone (A) | 28,700 | 927 | ||||||
| 3 | SEI Institutional Investments Trust / Annual Report / May 31, 2013 |
Table of Contents
Schedule of Investments
International Equity Fund
May 31, 2013
| Description | Shares | Market Value ($ Thousands) | ||||||
CAC (A) | 1,900 | $ | 17 | |||||
Calsonic Kansei (A) | 23,000 | 99 | ||||||
Casio Computer (A) | 5,300 | 47 | ||||||
C-Cube (A) | 2,600 | 13 | ||||||
Central Japan Railway (A) | 3,500 | 383 | ||||||
Chiyoda (A) | 2,000 | 21 | ||||||
Chugai Pharmaceutical (A) | 3,000 | 60 | ||||||
Credit Saison (A) | 300 | 7 | ||||||
Dai Nippon Printing (A) | 57,500 | 487 | ||||||
Daicel (A) | 4,000 | 32 | ||||||
Daihatsu Diesel Manufacturing (A) | 1,000 | 5 | ||||||
Daihatsu Motor * (A) | 8,000 | 169 | ||||||
Daiichi Jitsugyo (A) | 2,000 | 9 | ||||||
Daiichi Kensetsu | 1,200 | 12 | ||||||
Daiichi Sankyo (A) | 9,900 | 162 | ||||||
Daikin Industries (A) | 800 | 35 | ||||||
Dainippon Sumitomo Pharma (A) | 8,400 | 115 | ||||||
Daito Trust Construction (A) | 3,700 | 343 | ||||||
Daiwa House Industry (A) | 24,000 | 451 | ||||||
Daiwa Securities Group * (A) | 33,000 | 268 | ||||||
East Japan Railway (A) | 8,000 | 589 | ||||||
FANUC * (A) | 10,500 | 1,538 | ||||||
Fast Retailing (A) | 100 | 33 | ||||||
Fuji Heavy Industries (A) | 13,000 | 291 | ||||||
Fuji Soft (A) | 500 | 11 | ||||||
FUJIFILM Holdings (A) | 22,400 | 460 | ||||||
Fujitsu * (A) | 21,000 | 86 | ||||||
Fukuda (A) | 2,000 | 7 | ||||||
Grandy House (A) | 2,700 | 10 | ||||||
Hachijuni Bank (A) | 25,400 | 129 | ||||||
Hankyu Hanshin Holdings (A) | 15,000 | 79 | ||||||
Haruyama Trading (A) | 1,000 | 7 | ||||||
Hino Motors (A) | 27,000 | 381 | ||||||
Hirose Electric (A) | 100 | 13 | ||||||
Hiroshima Bank (A) | 5,000 | 20 | ||||||
Hisamitsu Pharmaceutical (A) | 1,000 | 49 | ||||||
Hitachi (A) | 107,000 | 716 | ||||||
Hitachi Construction Machinery (A) | 300 | 7 | ||||||
Hokuriku Gas (A) | 5,000 | 13 | ||||||
Hulic (A) | 4,200 | 35 | ||||||
IHI (A) | 2,000 | 7 | ||||||
Iida Home Max (A) | 3,700 | 55 | ||||||
IT Holdings (A) | 7,000 | 97 | ||||||
Iwatani (A) | 4,000 | 15 | ||||||
Japan Airlines (A) | 1,900 | 97 | ||||||
Japan Carlit (A) | 1,100 | 6 | ||||||
Japan Exchange Group (A) | 100 | 9 | ||||||
Japan Prime Realty Investment, Cl A ‡ (A) | 1 | 3 | ||||||
Japan Real Estate Investment, Cl A ‡ (A) | 1 | 10 | ||||||
Japan Retail Fund Investment, Cl A ‡ (A) | 40 | 76 | ||||||
JFE Holdings * (A) | 300 | 6 | ||||||
JGC (A) | 36,000 | 1,188 | ||||||
Kamei (A) | 600 | 5 | ||||||
Kanematsu * (A) | 20,000 | 24 | ||||||
Kansai Paint (A) | 69,000 | 887 | ||||||
Kao (A) | 10,000 | 312 | ||||||
KDDI (A) | 23,700 | 1,064 | ||||||
| Description | Shares | Market Value ($ Thousands) | ||||||
Keio (A) | 1,000 | $ | 7 | |||||
Keyence (A) | 2,800 | 850 | ||||||
Kikkoman (A) | 1,000 | 16 | ||||||
Kobe Steel * (A) | 6,000 | 8 | ||||||
Kohsoku (A) | 700 | 6 | ||||||
KU Holdings (A) | 800 | 7 | ||||||
Kubota (A) | 4,000 | 58 | ||||||
KVK (A) | 1,000 | 6 | ||||||
Lawson (A) | 5,200 | 376 | ||||||
LIXIL Group (A) | 100 | 2 | ||||||
Mabuchi Motor (A) | 17,700 | 841 | ||||||
Maezawa Kyuso Industries (A) | 400 | 5 | ||||||
Makita (A) | 3,800 | 202 | ||||||
Marubeni (A) | 1,000 | 7 | ||||||
Maruka Machinery (A) | 400 | 5 | ||||||
Maruzen - General Commercial Kitchen Appliances & Equipment (A) | 1,000 | 8 | ||||||
Matsui Construction (A) | 2,000 | 7 | ||||||
Mazda Motor * (A) | 25,000 | 96 | ||||||
Miraca Holdings (A) | 7,800 | 335 | ||||||
Misawa Homes (A) | 4,300 | 91 | ||||||
Mitsubishi Estate (A) | 3,000 | 73 | ||||||
Mitsubishi Heavy Industries (A) | 3,000 | 18 | ||||||
Mitsubishi Logistics (A) | 3,000 | 41 | ||||||
Mitsubishi Tanabe Pharma (A) | 17,900 | 227 | ||||||
Mitsui Engineering & Shipbuilding (A) | 3,000 | 5 | ||||||
Mitsui Fudosan (A) | 4,000 | 110 | ||||||
Mitsui Sumitomo Insurance Group Holdings (A) | 25,500 | 622 | ||||||
Mitsui Trust Holdings (A) | 107,610 | 439 | ||||||
Mizuho Financial Group (A) | 7,100 | 13 | ||||||
Namco Bandai Holdings (A) | 3,600 | 58 | ||||||
NEC Fielding (A) | 1,900 | 23 | ||||||
Nihon Unisys (A) | 2,600 | 23 | ||||||
Nintendo (A) | 4,600 | 452 | ||||||
Nippo (A) | 6,000 | 77 | ||||||
Nippon Building Fund, Cl A ‡ (A) | 2 | 20 | ||||||
Nippon Road (A) | 4,000 | 20 | ||||||
Nippon Telegraph & Telephone (A) | 22,900 | 1,124 | ||||||
Nippon Telegraph & Telephone ADR | 21,343 | 528 | ||||||
Nitto Denko (A) | 1,200 | 71 | ||||||
Nomura Holdings * (A) | 37,900 | 286 | ||||||
Nomura Real Estate Holdings (A) | 7,100 | 157 | ||||||
North Pacific Bank (A) | 42,400 | 139 | ||||||
NTT Data (A) | 17 | 57 | ||||||
NTT Urban Development (A) | 4 | 5 | ||||||
Nuflare Technology (A) | 1 | 8 | ||||||
Obayashi (A) | 2,000 | 10 | ||||||
Onoken (A) | 700 | 7 | ||||||
Oriental Land (A) | 300 | 41 | ||||||
ORIX (A) | 1,300 | 17 | ||||||
Otsuka (A) | 300 | 28 | ||||||
Otsuka Holdings (A) | 5,500 | 175 | ||||||
Panasonic * (A) | 26,000 | 197 | ||||||
Park24 (A) | 1,500 | 28 | ||||||
Relo Holdings (A) | 400 | 18 | ||||||
Ricoh (A) | 4,000 | 46 | ||||||
Rohm (A) | 8,100 | 294 | ||||||
| 4 | SEI Institutional Investments Trust / Annual Report / May 31, 2013 |
Table of Contents
Schedule of Investments
International Equity Fund
May 31, 2013
| Description | Shares | Market Value ($ Thousands) | ||||||
Sankyo (A) | 5,700 | $ | 249 | |||||
Santen Pharmaceutical (A) | 6,200 | 247 | ||||||
Sato Shoji (A) | 1,100 | 6 | ||||||
Secom (A) | 8,000 | 401 | ||||||
Seibu Electric Industry (A) | 3,000 | 12 | ||||||
Seino Holdings (A) | 13,000 | 99 | ||||||
Sekisui Chemical (A) | 64,000 | 633 | ||||||
Sekisui House (A) | 21,000 | 271 | ||||||
Seven & I Holdings (A) | 32,100 | 1,085 | ||||||
Shimano (A) | 100 | 8 | ||||||
Shin-Etsu Chemical * (A) | 11,200 | 698 | ||||||
Shinko Shoji (A) | 700 | 6 | ||||||
Shinsho (A) | 3,000 | 5 | ||||||
Shionogi (A) | 4,300 | 80 | ||||||
Shiseido (A) | 46,300 | 655 | ||||||
Showa (A) | 5,200 | 63 | ||||||
SMC (A) | 10,100 | 1,906 | ||||||
Softbank * (A) | 9,100 | 452 | ||||||
Sojitz (A) | 69,100 | 119 | ||||||
Sony (A) | 6,300 | 124 | ||||||
Sony Financial Holdings (A) | 500 | 7 | ||||||
Sugi Holdings (A) | 9,800 | 326 | ||||||
Sumitomo Forestry (A) | 1,800 | 21 | ||||||
Sumitomo Metal Mining (A) | 1,000 | 13 | ||||||
Sumitomo Mitsui Financial Group (A) | 33,800 | 1,327 | ||||||
Sumitomo Realty & Development (A) | 4,000 | 152 | ||||||
Suruga Bank (A) | 4,000 | 60 | ||||||
Suzuken (A) | 2,100 | 66 | ||||||
Suzuki Motor (A) | 29,100 | 704 | ||||||
Sysmex (A) | 1,000 | 65 | ||||||
T&D Holdings (A) | 400 | 5 | ||||||
Tachibana Eletech (A) | 900 | 8 | ||||||
Tachikawa (A) | 1,200 | 6 | ||||||
Taiyo Nippon Sanso (A) | 1,000 | 7 | ||||||
Tobu Railway (A) | 4,000 | 21 | ||||||
Toho Holdings (A) | 4,700 | 84 | ||||||
Tokyo Electron (A) | 9,700 | 475 | ||||||
Tokyu (A) | 5,000 | 31 | ||||||
Tokyu Land (A) | 9,000 | 81 | ||||||
Toshiba (A) | 1,000 | 5 | ||||||
Toshiba TEC (A) | 7,000 | 36 | ||||||
Toyoda Gosei (A) | 200 | 5 | ||||||
Toyota Motor (A) | 38,800 | 2,253 | ||||||
Toyota Motor ADR | 3,160 | 371 | ||||||
Toyota Tsusho (A) | 5,600 | 147 | ||||||
Tsumura (A) | 1,600 | 45 | ||||||
Wacoal Holdings (A) | 26,723 | 269 | ||||||
Warabeya Nichiyo (A) | 1,700 | 28 | ||||||
Yachiyo Industry (A) | 900 | 7 | ||||||
Yakult Honsha (A) | 1,400 | 59 | ||||||
Yamaha Motor (A) | 1,600 | 25 | ||||||
Yaskawa Electric (A) | 1,000 | 12 | ||||||
Yokogawa Electric (A) | 1,900 | 23 | ||||||
Yuasa Trading (A) | 5,000 | 9 | ||||||
|
| |||||||
| 36,318 | ||||||||
|
| |||||||
Jersey — 0.0% | ||||||||
Randgold Resources (A) | 157 | 13 | ||||||
|
| |||||||
Mexico — 0.0% | ||||||||
| Description | Shares | Market Value ($ Thousands) | ||||||
Bio Pappel * | 2,246 | $ | 5 | |||||
Grupo Financiero Banorte, Ser O | 11,900 | 76 | ||||||
Industrias Bachoco | 5,443 | 15 | ||||||
|
| |||||||
| 96 | ||||||||
|
| |||||||
Netherlands — 5.1% | ||||||||
Aegon (A) | 58,923 | 401 | ||||||
Akzo Nobel (A) | 34,413 | 2,195 | ||||||
ASML Holding (A) | 7,004 | 578 | ||||||
Boskalis Westminster (A) | 366 | 15 | ||||||
European Aeronautic Defense and Space (A) | 8,576 | 492 | ||||||
Gemalto | 2,212 | 185 | ||||||
Heineken (A) | 11,529 | 800 | ||||||
Heineken Holding (A) | 282 | 16 | ||||||
ING Groep * (A) | 54,362 | 505 | ||||||
KAS Bank ADR | 1,202 | 14 | ||||||
Koninklijke Ahold (A) | 71,717 | 1,160 | ||||||
Koninklijke DSM (A) | 2,936 | 192 | ||||||
Koninklijke Philips (A) | 4,438 | 125 | ||||||
Koninklijke Vopak (A) | 1,260 | 76 | ||||||
LyondellBasell Industries, Cl A | 287 | 19 | ||||||
NXP Semiconductor * | 351 | 11 | ||||||
Randstad Holding (A) | 1,482 | 63 | ||||||
Reed Elsevier (A) | 87,413 | 1,429 | ||||||
Tetragon Financial Group | 568 | 6 | ||||||
TNT * (A) | 152,955 | 414 | ||||||
TNT Express (A) | 106,172 | 814 | ||||||
Unilever (A) | 38,739 | 1,578 | ||||||
Wolters Kluwer (A) | 38,585 | 841 | ||||||
|
| |||||||
| 11,929 | ||||||||
|
| |||||||
New Zealand — 0.1% | ||||||||
Contact Energy (A) | 7,115 | 29 | ||||||
Fletcher Building (A) | 17,477 | 116 | ||||||
|
| |||||||
| 145 | ||||||||
|
| |||||||
Norway — 1.8% | ||||||||
Aker Solutions (A) | 547 | 8 | ||||||
DnB (A) | 124,523 | 2,008 | ||||||
Gjensidige Forsikring (A) | 5,100 | 77 | ||||||
Orkla (A) | 65,560 | 550 | ||||||
Seadrill (A) | 5,909 | 238 | ||||||
Statoil (A) | 55,740 | 1,255 | ||||||
Telenor (A) | 1,118 | 24 | ||||||
|
| |||||||
| 4,160 | ||||||||
|
| |||||||
Portugal — 0.1% | ||||||||
Energias de Portugal (A) | 31,206 | 100 | ||||||
Galp Energia SGPS, Cl B (A) | 3,605 | 59 | ||||||
|
| |||||||
| 159 | ||||||||
|
| |||||||
Russia — 0.7% | ||||||||
Gazprom OAO ADR * | 44,534 | 337 | ||||||
NovaTek OAO GDR (A) | 2,335 | 259 | ||||||
Sberbank of Russia ADR * | 87,748 | 1,071 | ||||||
|
| |||||||
| 1,667 | ||||||||
|
| |||||||
Singapore — 1.2% | ||||||||
CapitaCommercial Trust ‡ (A) | 47,000 | 56 | ||||||
CapitaLand (A) | 52,000 | 141 | ||||||
ComfortDelGro (A) | 35,000 | 53 | ||||||
DBS Group Holdings (A) | 30,000 | 406 | ||||||
Keppel (A) | 15,180 | 126 | ||||||
| 5 | SEI Institutional Investments Trust / Annual Report / May 31, 2013 |
Table of Contents
Schedule of Investments
International Equity Fund
May 31, 2013
| Description | Shares | Market Value ($ Thousands) | ||||||
Keppel Land (A) | 19,000 | $ | 56 | |||||
Keppel REIT | 3,036 | 4 | ||||||
New Toyo International Holdings (A) | 48,000 | 12 | ||||||
SembCorp Industries (A) | 109,000 | 417 | ||||||
SembCorp Marine (A) | 150,000 | 512 | ||||||
Singapore Airlines (A) | 52,000 | 440 | ||||||
Singapore Technologies Engineering (A) | 32,000 | 103 | ||||||
Singapore Telecommunications (A) | 2,000 | 6 | ||||||
STATS ChipPAC * (A) | 32,000 | 10 | ||||||
UE E&C (A) | 10,000 | 6 | ||||||
United Overseas Bank (A) | 22,300 | 376 | ||||||
UOL Group (A) | 11,000 | 58 | ||||||
|
| |||||||
| 2,782 | ||||||||
|
| |||||||
South Africa — 0.1% | ||||||||
Gold Fields (A) | 37,700 | 229 | ||||||
Impala Platinum Holdings (A) | 7,600 | 80 | ||||||
|
| |||||||
| 309 | ||||||||
|
| |||||||
South Korea — 1.8% | ||||||||
Hana Financial Group (A) | 190 | 6 | ||||||
Hyundai Motor * (A) | 4,109 | 764 | ||||||
KB Financial Group ADR | 7,284 | 238 | ||||||
KT ADR | 31,600 | 533 | ||||||
KT&G | 9,652 | 680 | ||||||
LG.Philips LCD * (A) | 7,480 | 206 | ||||||
Samsung Electronics * (A) | 1,119 | 1,508 | ||||||
SK Telecom ADR | 18,064 | 367 | ||||||
|
| |||||||
| 4,302 | ||||||||
|
| |||||||
Spain — 0.9% | ||||||||
Acciona (A) | 278 | 17 | ||||||
ACS Actividades Construcciones y | 463 | 13 | ||||||
Amadeus IT Holding, Cl A (A) | 5,239 | 159 | ||||||
Banco Bilbao Vizcaya Argentaria (A) | 2,229 | 21 | ||||||
Banco Popular Espanol * (A) | 219,292 | 181 | ||||||
Banco Santander Central Hispano (A) | 1,482 | 10 | ||||||
Distribuidora Internacional de Alimentacion (A) | 14,960 | 117 | ||||||
Enagas (A) | 3,393 | 84 | ||||||
Ferrovial (A) | 7,036 | 113 | ||||||
Gas Natural (A) | 2,310 | 48 | ||||||
Grifols (A) | 3,151 | 115 | ||||||
Iberdrola (A) | 4,222 | 23 | ||||||
Inditex (A) | 785 | 97 | ||||||
Indra Sistemas (A) | 45,800 | 598 | ||||||
Red Electrica (A) | 398 | 21 | ||||||
Tecnicas Reunidas (A) | 10,281 | 495 | ||||||
Zardoya Otis (A) | 2,184 | 30 | ||||||
|
| |||||||
| 2,142 | ||||||||
|
| |||||||
Sweden — 2.4% | ||||||||
Assa Abloy, Cl B (A) | 3,461 | 138 | ||||||
Atlas Copco, Cl B (A) | 81 | 2 | ||||||
Boliden (A) | 2,217 | 32 | ||||||
Electrolux, Cl B (A) | 12,791 | 343 | ||||||
Elekta, Cl B (A) | 44,434 | 674 | ||||||
Getinge, Cl B (A) | 1,085 | 32 | ||||||
| Description | Shares | Market Value ($ Thousands) | ||||||
Hexagon, Cl B (A) | 3,366 | $ | 97 | |||||
Investor, Cl B (A) | 1,325 | 38 | ||||||
Lundin Petroleum * (A) | 1,037 | 21 | ||||||
Nordea Bank (A) | 71,622 | 877 | ||||||
Sandvik (A) | 42,851 | 598 | ||||||
Skandinaviska Enskilda Banken, Cl A (A) | 68,737 | 713 | ||||||
Svenska Cellulosa, Cl B (A) | 2,705 | 67 | ||||||
Svenska Handelsbanken, Cl A (A) | 2,610 | 112 | ||||||
Swedbank, Cl A (A) | 25,984 | 616 | ||||||
Telefonaktiebolaget LM Ericsson, Cl B (A) | 89,580 | 1,049 | ||||||
Telefonaktiebolaget LM Ericsson ADR | 23,216 | 271 | ||||||
|
| |||||||
| 5,680 | ||||||||
|
| |||||||
Switzerland — 8.7% | ||||||||
Actelion (A) | 176 | 11 | ||||||
Baloise Holding (A) | 873 | 85 | ||||||
Coca-Cola HBC * | 927 | 26 | ||||||
Compagnie Financiere Richemont (A) | 1,533 | 135 | ||||||
Credit Suisse Group (A) | 13,181 | 388 | ||||||
EMS-Chemie Holding (A) | 190 | 56 | ||||||
Givaudan (A) | 1,455 | 1,868 | ||||||
Holcim (A) | 213 | 16 | ||||||
Julius Baer Group * (A) | 17,719 | 697 | ||||||
Lonza Group (A) | 148 | 11 | ||||||
Nestle (A) | 30,099 | 1,987 | ||||||
Novartis (A) | 35,181 | 2,511 | ||||||
OC Oerlikon (A) | 18,752 | 226 | ||||||
Partners Group Holding (A) | 2,358 | 598 | ||||||
Roche Holding (A) | 17,457 | 4,313 | ||||||
Schindler Holding | 334 | 48 | ||||||
SGS (A) | 541 | 1,208 | ||||||
Sika (A) | 298 | 731 | ||||||
Sulzer (A) | 6,519 | 1,085 | ||||||
Swatch Group (A) | 75 | 7 | ||||||
Swiss Life Holding (A) | 2,095 | 346 | ||||||
Swiss Re (A) | 2,420 | 177 | ||||||
Syngenta (A) | 2,006 | 780 | ||||||
UBS | 85,143 | 1,490 | ||||||
Weatherford International * | 18,863 | 254 | ||||||
Zurich Insurance Group (A) | 4,169 | 1,099 | ||||||
|
| |||||||
| 20,153 | ||||||||
|
| |||||||
Taiwan — 0.1% | ||||||||
United Microelectronics ADR | 72,529 | 157 | ||||||
|
| |||||||
Thailand — 0.0% | ||||||||
Krung Thai Bank (A) | 15,800 | 12 | ||||||
|
| |||||||
Turkey — 0.1% | ||||||||
Turkiye Is Bankasi, Cl C (A) | 40,696 | 150 | ||||||
|
| |||||||
United Kingdom — 18.5% | ||||||||
3i Group (A) | 19,426 | 100 | ||||||
Aberdeen Asset Management (A) | 23,778 | 167 | ||||||
Afren * (A) | 193,790 | 381 | ||||||
Aggreko (A) | 183 | 5 | ||||||
Amlin (A) | 114,563 | 721 | ||||||
| 6 | SEI Institutional Investments Trust / Annual Report / May 31, 2013 |
Table of Contents
Schedule of Investments
International Equity Fund
May 31, 2013
| Description | Shares | Market Value ($ Thousands) | ||||||
Antofagasta (A) | 1,616 | $ | 23 | |||||
ARM Holdings (A) | 5,771 | 84 | ||||||
Associated British Foods (A) | 19,808 | 542 | ||||||
AstraZeneca (A) | 10,630 | 543 | ||||||
Aviva (A) | 147,280 | 739 | ||||||
Babcock International Group (A) | 7,978 | 140 | ||||||
BAE Systems (A) | 100,500 | 613 | ||||||
Balfour Beatty (A) | 225,037 | 787 | ||||||
Barclays (A) | 371,097 | 1,774 | ||||||
Barratt Developments * (A) | 34,091 | 164 | ||||||
Beazley (A) | 1,968 | 7 | ||||||
BG Group (A) | 120,298 | 2,190 | ||||||
BHP Billiton (A) | 50,472 | 1,448 | ||||||
BP (A) | 79,076 | 564 | ||||||
BP PLC ADR | 5,636 | 242 | ||||||
British American Tobacco (A) | 24,629 | 1,350 | ||||||
British Land ‡ (A) | 2,547 | 24 | ||||||
British Polythene Industries (A) | 806 | 7 | ||||||
British Sky Broadcasting Group (A) | 583 | 7 | ||||||
BT Group, Cl A (A) | 51,114 | 232 | ||||||
Bunzl (A) | 39,759 | 772 | ||||||
Capita (A) | 48,921 | 711 | ||||||
Carnival (A) | 4,805 | 160 | ||||||
Centamin * (A) | 22,576 | 13 | ||||||
Centrica (A) | 118,328 | 679 | ||||||
Compass Group (A) | 9,376 | 123 | ||||||
Diageo (A) | 35,576 | 1,049 | ||||||
Experian (A) | 37,081 | 680 | ||||||
Fresnillo (A) | 2,064 | 36 | ||||||
GlaxoSmithKline (A) | 17,319 | 447 | ||||||
Hammerson ‡ (A) | 6,484 | 50 | ||||||
Hargreaves Lansdown (A) | 5,247 | 76 | ||||||
Hill & Smith Holdings | 928 | 6 | ||||||
Home Retail Group (A) | 333,386 | 787 | ||||||
HSBC Holdings | 212,689 | 2,329 | ||||||
ICAP (A) | 82,885 | 457 | ||||||
IMI (A) | 1,711 | 33 | ||||||
Imperial Tobacco Group (A) | 6,076 | 218 | ||||||
Inmarsat (A) | 10,612 | 98 | ||||||
InterContinental Hotels Group (A) | 2,994 | 86 | ||||||
International Consolidated Airlines | 3,881 | 16 | ||||||
Intertek Group (A) | 3,579 | 174 | ||||||
ITV (A) | 65,645 | 130 | ||||||
J Sainsbury (A) | 17,507 | 99 | ||||||
Johnson Matthey (A) | 2,115 | 81 | ||||||
Kingfisher (A) | 1,348 | 7 | ||||||
Land Securities Group ‡ (A) | 4,335 | 61 | ||||||
Legal & General Group (A) | 70,198 | 189 | ||||||
Lloyds Banking Group * (A) | 1,096,961 | 1,017 | ||||||
Marks & Spencer Group (A) | 454 | 3 | ||||||
Michael Page International (A) | 90,844 | 526 | ||||||
Micro Focus International (A) | 2,429 | 25 | ||||||
Mondi (A) | 6,088 | 80 | ||||||
National Grid (A) | 2,181 | 26 | ||||||
Next (A) | 3,680 | 257 | ||||||
Novae Group | 1,125 | 8 | ||||||
Old Mutual (A) | 45,643 | 141 | ||||||
Pearson (A) | 441 | 8 | ||||||
Persimmon * (A) | 3,156 | 58 | ||||||
Petrofac (A) | 63,155 | 1,281 | ||||||
| Description | Shares | Market Value ($ Thousands) | ||||||
Premier Oil (A) | 114,112 | $ | 619 | |||||
Prudential (A) | 61,729 | 1,036 | ||||||
QinetiQ (A) | 35,860 | 100 | ||||||
Rank Group | 2,046 | 5 | ||||||
Reed Elsevier (A) | 73,160 | 816 | ||||||
Rexam (A) | 72,623 | 580 | ||||||
Rio Tinto (A) | 24,436 | 1,042 | ||||||
Rolls-Royce Holdings (A) | 40,650 | 736 | ||||||
Royal Bank of Scotland Group * (A) | 21,073 | 106 | ||||||
Royal Dutch Shell, Cl A (A) | 26,128 | 870 | ||||||
Royal Dutch Shell, Cl A (GBP) (A) | 26,315 | 874 | ||||||
Royal Dutch Shell, Cl B (A) | 15,178 | 522 | ||||||
Royal Dutch Shell ADR, Cl B | 5,625 | 387 | ||||||
SABMiller (A) | 15,029 | 754 | ||||||
Schroders (A) | 7,041 | 251 | ||||||
Shire (A) | 24,451 | 803 | ||||||
SIG (A) | 2,784 | 7 | ||||||
SSE (A) | 318 | 7 | ||||||
Standard Life (A) | 57,646 | 340 | ||||||
Subsea 7 * (A) | 26,430 | 580 | ||||||
Synthomer (A) | 8,047 | 25 | ||||||
Tate & Lyle (A) | 2,664 | 33 | ||||||
Taylor Wimpey PLC (A) | 32,793 | 49 | ||||||
Tesco (A) | 314,694 | 1,739 | ||||||
Tullow Oil (A) | 26,981 | 424 | ||||||
Unilever (A) | 19,874 | 833 | ||||||
United Utilities Group (A) | 3,266 | 37 | ||||||
Vodafone Group (A) | 494,036 | 1,429 | ||||||
Weir Group (A) | 709 | 25 | ||||||
Whitbread (A) | 4,215 | 183 | ||||||
William Hill (A) | 37,213 | 248 | ||||||
Willis Group Holdings | 12,300 | 480 | ||||||
Wolseley (A) | 5,923 | 301 | ||||||
WPP (A) | 46,044 | 782 | ||||||
Xchanging (A) | 9,733 | 20 | ||||||
|
| |||||||
| 42,894 | ||||||||
|
| |||||||
United States — 1.0% | ||||||||
Addus HomeCare * | 357 | 6 | ||||||
Alon USA Energy | 4,211 | 77 | ||||||
Autoliv | 5,000 | 392 | ||||||
Axis Capital Holdings | 7,836 | 341 | ||||||
Computer Sciences | 7,603 | 339 | ||||||
Delek US Holdings | 259 | 9 | ||||||
Manning & Napier, Cl A | 264 | 5 | ||||||
Manpowergroup | 4,033 | 231 | ||||||
Marathon Petroleum | 2,711 | 224 | ||||||
Newmont Mining | 13,300 | 456 | ||||||
Northrop Grumman | 702 | 58 | ||||||
Phillips 66 | 240 | 16 | ||||||
Renewable Energy Group * | 860 | 12 | ||||||
Republic Airways Holdings * | 2,063 | 22 | ||||||
TravelCenters of America * | 1,128 | 13 | ||||||
US Concrete * | 320 | 5 | ||||||
Valero Energy | 246 | 10 | ||||||
Valueclick * | 777 | 21 | ||||||
|
| |||||||
| 2,237 | ||||||||
|
| |||||||
Total Common Stock | 220,550 | |||||||
|
| |||||||
| 7 | SEI Institutional Investments Trust / Annual Report / May 31, 2013 |
Table of Contents
Schedule of Investments
International Equity Fund
May 31, 2013
| Description | Shares/Face Amount (1) (Thousands) | Market Value ($ Thousands) | ||||||
PREFERRED STOCK — 0.6% | ||||||||
Germany — 0.6% | ||||||||
Bayerische Motoren Werke (A) | 125 | $ | 9 | |||||
Henkel (A) | 5,064 | 486 | ||||||
Jungheinrich (A) | 143 | 6 | ||||||
KSB (A) | 9 | 5 | ||||||
Porsche Automobil Holding (A) | 960 | 79 | ||||||
ProSiebenSat.1 Media (A) | 2,192 | 87 | ||||||
Volkswagen (A) | 3,257 | 705 | ||||||
|
| |||||||
Total Preferred Stock | 1,377 | |||||||
|
| |||||||
| Number Of Rights | ||||||||
RIGHTS — 0.0% | ||||||||
Italy — 0.0% | ||||||||
Exor, Expires 06/06/13 | 7,727 | — | ||||||
Exor (Preferred), | 7,727 | — | ||||||
|
| |||||||
Total Rights | — | |||||||
|
| |||||||
CASH EQUIVALENT — 1.4% | ||||||||
SEI Daily Income Trust, Prime Obligation Fund, Cl A 0.010% ** † | 3,132,179 | 3,132 | ||||||
|
| |||||||
Total Cash Equivalent | 3,132 | |||||||
|
| |||||||
TIME DEPOSITS — 2.1% | ||||||||
Brown Brothers Harriman | ||||||||
4.150%, 06/01/2013 ZAR | 6 | 1 | ||||||
1.903%, 06/01/2013 AUD | 43 | 41 | ||||||
1.667%, 06/01/2013 NZD | 27 | 22 | ||||||
0.484%, 06/01/2013 NOK | 9 | 1 | ||||||
0.280%, 06/01/2013 CAD | — | — | ||||||
0.100%, 06/01/2013 SEK | 1 | — | ||||||
0.076%, 06/01/2013 GBP | 27 | 40 | ||||||
0.030%, 06/01/2013 | 4,667 | 4,667 | ||||||
0.005%, 06/01/2013 HKD | 87 | 11 | ||||||
0.005%, 06/01/2013 JPY | 3,205 | 32 | ||||||
0.005%, 06/01/2013 SGD | 1 | 1 | ||||||
0.001%, 06/01/2013 CHF | 41 | 43 | ||||||
0.001%, 06/01/2013 EUR | 78 | 101 | ||||||
(0.10)%, 06/01/2013 DKK | 23 | 4 | ||||||
|
| |||||||
Total Time Deposits | 4,964 | |||||||
|
| |||||||
U.S. TREASURY OBLIGATION (C)(D) — 0.3% |
| |||||||
U.S. Treasury Bills | ||||||||
2.766%, 06/27/2013 | 705 | 705 | ||||||
|
| |||||||
Total U.S. Treasury Obligation | 705 | |||||||
|
| |||||||
Total Investments — 99.6% | $ | 230,728 | ||||||
|
| |||||||
A list of the open futures contracts held by the Fund at May 31, 2013, is as follows:
| Type of Contract | Number of Contracts Long | Expiration Date | Unrealized Depreciation ($ Thousands) | |||||||||
Hang Seng Index | 1 | Jun-2013 | $ | (2 | ) | |||||||
SPI 200 Index | 4 | Jun-2013 | (5 | ) | ||||||||
Topix Index | 8 | Jun-2013 | (36 | ) | ||||||||
|
| |||||||||||
| $ | (43 | ) | ||||||||||
|
| |||||||||||
For the year ended May 31, 2013, the total amount of all open futures contracts, as presented in the table above, are representative of the volume of activity for this derivative type during the year.
Percentages are based on a Net Assets of $231,661 ($ Thousands).
| * | Non-income producing security. |
| ** | The rate reported is the 7-day effective yield as of May 31, 2013. |
| ‡ | Real Estate Investment Trust. |
| † | Investment in Affiliated Security (see Note 5). |
| (1) | In U.S. dollars unless otherwise indicated. |
| (A) | Security fair valued using methods determined in good faith by the Valuation Committee of the Board of Trustees. The total market value of such securities as of May 31, 2013 was $199,028 ($ Thousands) and represented 85.9% of Net Assets. |
| (B) | Securities sold within terms of a private placement memorandum, exempt from registration under Section 144A of the Securities Act of 1933, as amended, and may be sold only to dealers in that program or other “accredited investors.” These securities have been determined to be liquid under guidelines established by the Board of Trustees. |
| (C) | Security, or portion thereof, has been pledged as collateral on open futures contracts. |
| (D) | The rate reported is the effective yield at time of purchase. |
ADR — American Depositary Receipt
ARM — Adjustable Rate Mortgage
AUD — Australian Dollar
CAD — Canadian Dollar
CHF — Swiss Franc
Cl — Class
DKK — Danish Krone
EUR — Euro
GBP — British Pound Sterling
GDR — Global Depositary Receipt
HKD — Hong Kong Dollar
JPY — Japanese Yen
NOK — Norwegian Krone
NZD — New Zealand Dollar
PLC — Public Limited Company
REIT — Real Estate Investment Trust
SGD — Singapore Dollar
SEK — Swedish Krona
Ser — Series
SGD — Singapore Dollar
SPI — Share Price Index
ZAR — South African Rand
The following is a summary of the inputs used as of May 31, 2013, in valuing the Fund’s investments and other financial instruments carried at value ($ Thousands):
| Investments in Securities | Level 1 | Level 2 | Level 3 | Total | ||||||||||||
Common Stock | $ | 22,899 | $ | 197,651 | $ | — | $ | 220,550 | ||||||||
Preferred Stock | — | 1,377 | — | 1,377 | ||||||||||||
Cash Equivalent | 3,132 | — | — | 3,132 | ||||||||||||
Time Deposits | 4,964 | — | — | 4,964 | ||||||||||||
U.S. Treasury Obligation | — | 705 | — | 705 | ||||||||||||
|
|
|
|
|
|
|
| |||||||||
Total Investments in Securities | $ | 30,995 | $ | 199,733 | $ | — | $ | 230,728 | ||||||||
|
|
|
|
|
|
|
| |||||||||
| Other Financial Instruments | Level 1 | Level 2 | Level 3 | Total | ||||||||||||
Futures Contracts * | $ | (43 | ) | $ | — | $ | — | $ | (43 | ) | ||||||
| * | Futures contracts are valued at the unrealized depreciation on the instrument. |
| 8 | SEI Institutional Investments Trust / Annual Report / May 31, 2013 |
Table of Contents
Schedule of Investments
International Equity Fund
May 31, 2013
For the year ended May 31, 2013, there were transfers between Level 1 and Level 2 assets and liabilities. The primary reason for changes in the classifications between Levels 1 and 2 occurs when foreign equity securities are fair valued using other observable market-based inputs in place of the closing exchange price due to events occurring after the close of the exchange or market on which the investment is principally traded.
For the year ended May 31, 2013, there were transfers between Level 2 and Level 3 assets and liabilities. The transfers were due to changes in the availability of observable inputs used to determine fair value.
For more information on valuation inputs, see Note 2 — Significant Accounting Policies in Notes to Financial Statements.
Amounts designated as “—” are $0 or have been rounded to $0.
The accompanying notes are an integral part of the financial statements.
| 9 | SEI Institutional Investments Trust / Annual Report / May 31, 2013 |
Table of Contents
Schedule of Investments
World Equity Ex-US Fund
May 31, 2013
| Description | Shares | Market Value ($ Thousands) | ||||||
COMMON STOCK — 95.5% | ||||||||
Argentina — 0.1% | ||||||||
MercadoLibre (A) | 67,500 | $ | 7,737 | |||||
Australia — 1.8% | ||||||||
Amcor (B) | 967,139 | 9,141 | ||||||
Australia & New Zealand Banking Group ADR | 830,800 | 21,759 | ||||||
Bendigo Bank (B) | 46,797 | 440 | ||||||
BGP Holdings * | 239,898 | — | ||||||
BHP Billiton ADR (A) | 334,936 | 21,878 | ||||||
BlueScope Steel * (B) | 197,656 | 985 | ||||||
Boral (B) | 475,114 | 2,056 | ||||||
Caltex Australia (B) | 698,894 | 14,933 | ||||||
CSL (B) | 58,810 | 3,352 | ||||||
Downer EDI (B) | 308,011 | 1,087 | ||||||
DuluxGroup (B) | 625,671 | 2,739 | ||||||
Federation Centres ‡ (B) | 1,083,678 | 2,573 | ||||||
NRW Holdings (B) | 347,290 | 379 | ||||||
Nufarm (B) | 93,961 | 408 | ||||||
Primary Health Care (B) | 141,845 | 691 | ||||||
Qantas Airways * (B) | 1,943,663 | 2,945 | ||||||
Resolute Mining (B) | 1,184,013 | 881 | ||||||
Rio Tinto (B) | 29,790 | 1,546 | ||||||
Sigma Pharmaceuticals (B) | 489,088 | 374 | ||||||
Sims Group (A)(B) | 302,197 | 2,784 | ||||||
Tabcorp Holdings (B) | 454,670 | 1,428 | ||||||
Telstra (B) | 829,590 | 3,758 | ||||||
Telstra ADR | 559,600 | 12,585 | ||||||
|
| |||||||
| 108,722 | ||||||||
|
| |||||||
Austria — 1.1% | ||||||||
AMS (B) | 3,657 | 350 | ||||||
Conwert Immobilien Invest (B) | 949,560 | 11,046 | ||||||
Erste Group Bank (B) | 607,386 | 19,452 | ||||||
OMV (B) | 148,939 | 6,851 | ||||||
Schoeller-Bleckmann Oilfield Equipment (B) | 276,236 | 28,255 | ||||||
|
| |||||||
| 65,954 | ||||||||
|
| |||||||
Belgium — 0.3% | ||||||||
Anheuser-Busch InBev (B) | 117,815 | 10,818 | ||||||
Delhaize Group (A)(B) | 74,919 | 4,763 | ||||||
|
| |||||||
| 15,581 | ||||||||
|
| |||||||
Brazil — 3.3% | ||||||||
Banco Bradesco ADR (A) | 2,623,461 | 42,316 | ||||||
Banco do Brasil | 2,421,000 | 28,541 | ||||||
Cia de Saneamento Basico do Estadode Sao Paulo ADR * (A) | 3,140,670 | 39,949 | ||||||
Cia Paranaense de Energia ADR (A) | 1,312,400 | 20,434 | ||||||
Cia Vale do Rio Doce ADR, Cl B (A) | 1,303,500 | 18,770 | ||||||
Embraer ADR (A) | 382,672 | 13,880 | ||||||
Kroton Educacional | 304,100 | 4,382 | ||||||
Natura Cosmeticos | 439,700 | 10,406 | ||||||
Petroleo Brasileiro ADR * | 506,000 | 8,992 | ||||||
Tim Participacoes ADR | 79,399 | 1,521 | ||||||
Totvs | 951,523 | 16,487 | ||||||
|
| |||||||
| 205,678 | ||||||||
|
| |||||||
Canada — 4.7% | ||||||||
Agrium (A) | 299,900 | 27,774 | ||||||
| Description | Shares | Market Value ($ Thousands) | ||||||
Canadian National Railway | 190,453 | $ | 19,387 | |||||
Canadian Tire, Cl A | 6,500 | 524 | ||||||
Canfor * | 185,800 | 3,125 | ||||||
CCL Industries, Cl B | 5,700 | 364 | ||||||
Celestica * | 139,300 | 1,289 | ||||||
Cenovus Energy | 284,317 | 8,539 | ||||||
Dorel Industries, Cl B | 21,800 | 870 | ||||||
Empire, Cl A | 32,200 | 2,094 | ||||||
Genworth MI Canada | 32,500 | 766 | ||||||
George Weston | 4,900 | 395 | ||||||
Granite Real Estate Investment Trust ‡ (A) | 24,932 | 923 | ||||||
Laurentian Bank of Canada | 11,200 | 478 | ||||||
Lululemon Athletica * (A) | 253,334 | 19,712 | ||||||
Magna International, Cl A (A) | 543,000 | 36,260 | ||||||
Manulife Financial (A) | 1,821,000 | 28,772 | ||||||
Methanex | 89,000 | 3,950 | ||||||
Metro, Cl A | 15,900 | 1,068 | ||||||
Norbord | 35,235 | 1,156 | ||||||
Potash Corp of Saskatchewan | 397,650 | 16,709 | ||||||
Quebecor, Cl B | 72,600 | 3,250 | ||||||
Rogers Communications, Cl B | 296,953 | 13,455 | ||||||
Royal Bank of Canada | 105,400 | 6,275 | ||||||
Saputo | 107,700 | 5,281 | ||||||
Suncor Energy | 147,900 | 4,500 | ||||||
Superior Plus | 37,800 | 436 | ||||||
Teck Cominco, Cl B | 563,950 | 15,109 | ||||||
Toronto-Dominion Bank | 271,600 | 21,959 | ||||||
Transcontinental, Cl A | 20,300 | 242 | ||||||
Valeant Pharmaceuticals International * | 315,020 | 29,074 | ||||||
West Fraser Timber | 37,700 | 2,809 | ||||||
Yamana Gold | 1,500,800 | 17,319 | ||||||
|
| |||||||
| 293,864 | ||||||||
|
| |||||||
Chile — 0.1% | ||||||||
Enersis ADR | 230,029 | 3,855 | ||||||
|
| |||||||
China — 4.1% | ||||||||
Agricultural Bank of China (B) | 909,000 | 423 | ||||||
Anhui Conch Cement (B) | 5,179,500 | 16,756 | ||||||
Anton Oilfield Services Group (A)(B) | 7,221,000 | 6,178 | ||||||
Baidu ADR * | 170,152 | 16,444 | ||||||
Bank of China (B) | 39,142,000 | 18,435 | ||||||
Bank of Communications (B) | 1,141,000 | 869 | ||||||
China Construction Bank (B) | 2,072,000 | 1,670 | ||||||
China Merchants Bank (B) | 1,755,099 | 3,512 | ||||||
China Oilfield Services (B) | 11,257,400 | 23,639 | ||||||
China Petroleum & Chemical (B) | 22,116,900 | 22,555 | ||||||
China Shipping Container Lines * (A)(B) | 42,678,900 | 10,823 | ||||||
Industrial & Commercial Bank of China (B) | 55,654,402 | 38,938 | ||||||
Mindray Medical International ADR (A) | 528,301 | 21,671 | ||||||
Shanghai Friendship Group, Cl B (B) | 16,620 | 20 | ||||||
SINA * | 89,500 | 5,164 | ||||||
Sinopharm Group (B) | 3,233,386 | 8,712 | ||||||
Tencent Holdings (B) | 757,400 | 29,811 | ||||||
Weichai Power (B) | 5,469,600 | 20,069 | ||||||
| 1 | SEI Institutional Investments Trust / Annual Report / May 31, 2013 |
Table of Contents
Schedule of Investments
World Equity Ex-US Fund
May 31, 2013
| Description | Shares | Market Value ($ Thousands) | ||||||
Yanzhou Coal Mining ADR (A) | 727,900 | $ | 7,323 | |||||
|
| |||||||
| 253,012 | ||||||||
|
| |||||||
Colombia — 0.3% | ||||||||
Bancolombia ADR, Cl R (A) | 300,406 | 17,394 | ||||||
|
| |||||||
Czech Republic — 0.2% | ||||||||
Komercni Banka (B) | 62,153 | 11,712 | ||||||
|
| |||||||
Denmark — 1.1% | ||||||||
AP Moeller - Maersk, Cl B (B) | 207 | 1,475 | ||||||
Carlsberg, Cl B (B) | 255,900 | 24,229 | ||||||
Coloplast, Cl B (B) | 45,545 | 2,589 | ||||||
GN Store Nord (B) | 203,565 | 3,885 | ||||||
Jyske Bank *(B) | 5,865 | 231 | ||||||
Novo-Nordisk, Cl B (B) | 166,672 | 26,933 | ||||||
Pandora (B) | 237,780 | 8,189 | ||||||
Rockwool International, Cl B (B) | 2,009 | 273 | ||||||
|
| |||||||
| 67,804 | ||||||||
|
| |||||||
Finland — 0.2% | ||||||||
Huhtamaki (B) | 15,460 | 292 | ||||||
Konecranes (B) | 72,020 | 2,469 | ||||||
Neste Oil (B) | 17,217 | 249 | ||||||
Orion, Cl B (B) | 40,639 | 997 | ||||||
Stora Enso, Cl R (A)(B) | 929,110 | 6,703 | ||||||
Tieto (B) | 10,912 | 223 | ||||||
UPM-Kymmene (A)(B) | 198,080 | 2,103 | ||||||
|
| |||||||
| 13,036 | ||||||||
|
| |||||||
France — 3.6% | ||||||||
Air France-KLM * (B) | 676,826 | 6,494 | ||||||
Air Liquide (B) | 163,847 | 21,009 | ||||||
AtoS (B) | 19,133 | 1,392 | ||||||
BNP Paribas (B) | 178,866 | 10,437 | ||||||
Capital Gemini (B) | 318,212 | 15,454 | ||||||
Compagnie Generale des Etablissements Michelin, Cl B (B) | 201,900 | 17,569 | ||||||
Etablissements Maurel et Prom (B) | 40,065 | 688 | ||||||
France Telecom ADR (A) | 1,182,400 | 11,942 | ||||||
Iliad (B) | 21,150 | 4,412 | ||||||
LVMH Moet Hennessy Louis Vuitton (B) | 156,366 | 27,542 | ||||||
Publicis Groupe (B) | 295,201 | 21,061 | ||||||
Rallye (B) | 5,843 | 229 | ||||||
Renault (B) | 108,973 | 8,386 | ||||||
Safran (B) | 165,030 | 8,747 | ||||||
Sanofi-Aventis (B) | 240,800 | 25,602 | ||||||
Societe Generale (B) | 379,686 | 15,099 | ||||||
Technicolor * (B) | 55,226 | 234 | ||||||
Teleperformance (B) | 193,007 | 9,058 | ||||||
Thales (B) | 57,065 | 2,762 | ||||||
Total (B) | 185,610 | 9,250 | ||||||
Valeo (B) | 57,596 | 3,827 | ||||||
|
| |||||||
| 221,194 | ||||||||
|
| |||||||
Germany — 7.9% | ||||||||
Aareal Bank * (B) | 25,770 | 634 | ||||||
Adidas (B) | 462,997 | 50,194 | ||||||
Allianz (B) | 101,821 | 15,683 | ||||||
BASF (B) | 287,873 | 27,819 | ||||||
Beiersdorf (B) | 59,805 | 5,378 | ||||||
| Description | Shares | Market Value ($ Thousands) | ||||||
Celesio (B) | 102,453 | $ | 2,099 | |||||
Deutsche Bank (B) | 525,528 | 24,347 | ||||||
Deutsche Boerse (B) | 414,300 | 26,632 | ||||||
Deutsche Lufthansa * (B) | 963,214 | 20,606 | ||||||
Duerr (B) | 47,320 | 3,059 | ||||||
E.ON (B) | 70,196 | 1,179 | ||||||
Freenet * (B) | 198,591 | 4,231 | ||||||
Fresenius Medical Care (B) | 317,484 | 21,493 | ||||||
GEA Group (B) | 751,622 | 27,203 | ||||||
Gerresheimer (B) | 9,019 | 537 | ||||||
Gildemeister (B) | 37,137 | 849 | ||||||
Hannover Rueckversicherung (B) | 9,392 | 705 | ||||||
Henkel (B) | 332,600 | 26,975 | ||||||
Hugo Boss (A)(B) | 226,354 | 25,131 | ||||||
Kabel Deutschland Holding (B) | 277,699 | 26,073 | ||||||
KUKA * (B) | 28,658 | 1,351 | ||||||
Leoni (B) | 5,676 | 282 | ||||||
Merck KGaA (B) | 71,544 | 11,291 | ||||||
Muenchener Rueckversicherungs (B) | 117,048 | 21,769 | ||||||
Norddeutsche Affinerie (B) | 127,186 | 7,612 | ||||||
Rheinmetall (B) | 85,761 | 4,261 | ||||||
SAF-Holland * (B) | 28,897 | 287 | ||||||
SAP (A)(B) | 637,530 | 47,574 | ||||||
Siemens (B) | 388,581 | 40,843 | ||||||
Suedzucker (B) | 250,310 | 8,445 | ||||||
Symrise (B) | 762,589 | 30,989 | ||||||
TUI * (B) | 295,329 | 3,584 | ||||||
United Internet (B) | 58,779 | 1,664 | ||||||
|
| |||||||
| 490,779 | ||||||||
|
| |||||||
Hong Kong — 3.2% | ||||||||
AIA Group (B) | 6,771,340 | 29,935 | ||||||
Chaoda Modern Agriculture * | 52,790 | — | ||||||
CLP Holdings (B) | 567,500 | 4,782 | ||||||
CNOOC (B) | 9,720,274 | 17,027 | ||||||
Daphne International Holdings (B) | 15,184,000 | 13,684 | ||||||
First Pacific (B) | 20,967,289 | 27,749 | ||||||
Hang Seng Bank (B) | 751,600 | 12,064 | ||||||
Hong Kong Exchanges and Clearing (B) | 1,221,177 | 20,442 | ||||||
Jardine Matheson Holdings (B) | 405,429 | 26,606 | ||||||
Melco Crown Entertainment ADR * | 218,420 | 5,194 | ||||||
Orient Overseas International (B) | 3,815,500 | 23,913 | ||||||
Power Assets Holdings (B) | 581,500 | 5,108 | ||||||
SJM Holdings (B) | 1,437,000 | 3,899 | ||||||
Skyworth Digital Holdings (B) | 3,922,000 | 2,630 | ||||||
Sun Hung Kai Properties (B) | 392,000 | 5,187 | ||||||
|
| |||||||
| 198,220 | ||||||||
|
| |||||||
India — 1.4% | ||||||||
Axis Bank (B) | 998,967 | 25,205 | ||||||
HCL Technologies (B) | 55,782 | 734 | ||||||
ICICI Bank ADR | 921,352 | 41,433 | ||||||
Indian Bank (B) | 90,444 | 227 | ||||||
ITC (B) | 783,210 | 4,709 | ||||||
Lupin (B) | 26,129 | 340 | ||||||
Tata Motors ADR | 451,700 | 12,390 | ||||||
|
| |||||||
| 85,038 | ||||||||
|
| |||||||
Indonesia — 1.1% | ||||||||
Bank Rakyat Indonesia Persero (B) | 32,579,742 | 29,460 | ||||||
Kalbe Farma (B) | 185,268,345 | 27,348 | ||||||
Telekomunikasi Indonesia Persero (B) | 2,990,000 | 3,357 | ||||||
| 2 | SEI Institutional Investments Trust / Annual Report / May 31, 2013 |
Table of Contents
Schedule of Investments
World Equity Ex-US Fund
May 31, 2013
| Description | Shares | Market Value ($ Thousands) | ||||||
Telekomunikasi Indonesia Persero ADR | 101,663 | $ | 4,595 | |||||
|
| |||||||
| 64,760 | ||||||||
|
| |||||||
Ireland — 0.7% | ||||||||
Accenture, Cl A (A) | 224,033 | 18,395 | ||||||
ICON * | 794,178 | 27,272 | ||||||
|
| |||||||
| 45,667 | ||||||||
|
| |||||||
Israel — 0.6% | ||||||||
Bank Hapoalim * (B) | 766,649 | 3,542 | ||||||
Israel Chemicals (B) | 934,480 | 10,377 | ||||||
Teva Pharmaceutical Industries ADR | 569,900 | 21,770 | ||||||
|
| |||||||
| 35,689 | ||||||||
|
| |||||||
Italy — 0.9% | ||||||||
Azimut Holding (B) | 326,230 | 6,162 | ||||||
Brembo (B) | 17,559 | 289 | ||||||
Exor (B) | 206,377 | 6,522 | ||||||
Fiat * (A)(B) | 502,522 | 3,927 | ||||||
Gtech Spa * (B) | 110,189 | 2,955 | ||||||
Mediaset * (B) | 171,175 | 530 | ||||||
Safilo Group * (B) | 20,195 | 385 | ||||||
Saipem (B) | 399,430 | 10,621 | ||||||
Tod’s (B) | 178,892 | 25,464 | ||||||
|
| |||||||
| 56,855 | ||||||||
|
| |||||||
Japan — 12.8% | ||||||||
Aeon (B) | 49,600 | 576 | ||||||
Alfresa Holdings (B) | 106,500 | 5,506 | ||||||
Alpen (B) | 13,300 | 255 | ||||||
Alpine Electronics (B) | 80,100 | 746 | ||||||
Aoyama Trading (B) | 29,400 | 809 | ||||||
Arnest One (B) | 68,600 | 1,235 | ||||||
Asahi Kasei (B) | 273,000 | 1,827 | ||||||
Bridgestone (B) | 455,215 | 14,700 | ||||||
Calsonic Kansei (B) | 850,000 | 3,655 | ||||||
Canon Marketing Japan (B) | 20,400 | 276 | ||||||
Central Glass (B) | 73,000 | 224 | ||||||
Central Japan Railway (B) | 52,200 | 5,718 | ||||||
Coca-Cola West (B) | 45,600 | 807 | ||||||
COMSYS Holdings (B) | 81,900 | 990 | ||||||
Daicel (B) | 395,000 | 3,138 | ||||||
Daihatsu Motor * (B) | 423,000 | 8,927 | ||||||
Daiichikosho | 23,200 | 590 | ||||||
Daikyo (B) | 1,523,000 | 4,518 | ||||||
Dainippon Sumitomo Pharma (B) | 441,300 | 6,065 | ||||||
Daito Trust Construction (B) | 179,400 | 16,611 | ||||||
Daiwa House Industry (B) | 908,000 | 17,071 | ||||||
Daiwa Securities Group * (B) | 919,000 | 7,478 | ||||||
DCM Holdings (B) | 66,300 | 500 | ||||||
Denso (B) | 849,400 | 34,913 | ||||||
Dowa Holdings (B) | 389,000 | 3,209 | ||||||
FANUC * (B) | 80,711 | 11,825 | ||||||
Fuji Electric * (B) | 324,000 | 1,049 | ||||||
Fuji Soft (B) | 11,300 | 242 | ||||||
Fujitsu * (B) | 1,051,000 | 4,328 | ||||||
Hino Motors (B) | 373,000 | 5,265 | ||||||
HIS (B) | 97,900 | 3,891 | ||||||
Hitachi (B) | 7,578,300 | 50,746 | ||||||
Honda Motor ADR (A) | 441,429 | 16,584 | ||||||
Hoosiers Holdings | 32,800 | 323 | ||||||
Idemitsu Kosan (B) | 3,500 | 282 | ||||||
IHI (B) | 159,000 | 579 | ||||||
| Description | Shares | Market Value ($ Thousands) | ||||||
Ines (B) | 34,900 | $ | 247 | |||||
IT Holdings (B) | 195,100 | 2,706 | ||||||
Iwatani (B) | 101,000 | 376 | ||||||
Izumi (B) | 19,200 | 458 | ||||||
Japan Airlines (B) | 316,600 | 16,145 | ||||||
Japan Exchange Group (B) | 285,500 | 26,175 | ||||||
Jin (A)(B) | 45,500 | 2,355 | ||||||
KDDI (B) | 859,416 | 38,572 | ||||||
Komatsu (B) | 1,372,471 | 34,192 | ||||||
Kubota (B) | 793,779 | 11,438 | ||||||
Kyokuto Securities * (B) | 12,200 | 224 | ||||||
Kyowa Exeo (B) | 71,400 | 786 | ||||||
Kyowa Hakko Kirin (B) | 22,000 | 245 | ||||||
Maeda Road Construction (B) | 87,000 | 1,142 | ||||||
Matsumotokiyoshi Holdings (B) | 16,700 | 416 | ||||||
Mazda Motor * (B) | 537,000 | 2,055 | ||||||
Medipal Holdings (B) | 541,900 | 7,188 | ||||||
MEIJI Holdings (B) | 6,000 | 262 | ||||||
Misawa Homes (B) | 98,000 | 2,073 | ||||||
Mitsubishi UFJ Financial Group (B) | 5,588,056 | 32,264 | ||||||
Mitsui ADR | 82,300 | 21,028 | ||||||
Mitsui Engineering & Shipbuilding (B) | 225,000 | 363 | ||||||
Mitsui Matsushima (B) | 258,000 | 406 | ||||||
Mitsui Trust Holdings (B) | 9,067,046 | 36,956 | ||||||
Mizuho Financial Group (B) | 12,193,700 | 23,096 | ||||||
Morinaga Milk Industry (B) | 80,000 | 226 | ||||||
Nagoya Railroad (B) | 90,000 | 235 | ||||||
Namco Bandai Holdings (B) | 522,600 | 8,427 | ||||||
NEC Capital Solutions (B) | 9,300 | 214 | ||||||
NEC Networks & System Integration (B) | 39,800 | 846 | ||||||
Nichii Gakkan (B) | 250,400 | 2,281 | ||||||
Nichirei (B) | 45,000 | 222 | ||||||
Nihon Unisys (B) | 28,300 | 256 | ||||||
Nippo (B) | 166,000 | 2,137 | ||||||
Nippon Flour Mills (B) | 78,000 | 368 | ||||||
Nippon Steel & Sumitomo Metal * (B) | 5,387,000 | 13,435 | ||||||
Nippon Telegraph & Telephone (B) | 439,900 | 21,584 | ||||||
Nissan Tokyo Sales Holdings (B) | 327,000 | 1,039 | ||||||
Nitto Denko ADR | 834,060 | 24,830 | ||||||
NOF (B) | 45,000 | 236 | ||||||
Nomura Holdings * (B) | 760,200 | 5,735 | ||||||
Nomura Real Estate Holdings (B) | 165,600 | 3,653 | ||||||
North Pacific Bank (B) | 224,800 | 735 | ||||||
Otsuka (B) | 20,100 | 1,853 | ||||||
Otsuka Holdings (B) | 22,100 | 705 | ||||||
Pigeon (B) | 22,400 | 1,786 | ||||||
Resona Holdings (B) | 208,000 | 928 | ||||||
Round One (B) | 72,600 | 446 | ||||||
SCSK (B) | 13,100 | 264 | ||||||
Secom (B) | 473,100 | 23,735 | ||||||
Sega Sammy Holdings (B) | 537,300 | 12,700 | ||||||
Seino Holdings (B) | 201,000 | 1,529 | ||||||
Shimachu (B) | 17,100 | 423 | ||||||
Showa (B) | 20,600 | 253 | ||||||
Showa Shell Sekiyu (B) | 51,500 | 405 | ||||||
SKY Perfect JSAT Holdings (B) | 4,256 | 1,824 | ||||||
Softbank * (B) | 711,130 | 35,363 | ||||||
Sojitz (B) | 1,858,000 | 3,186 | ||||||
Sumitomo Forestry (B) | 25,500 | 298 | ||||||
Sumitomo Mitsui Financial Group (B) | 192,400 | 7,557 | ||||||
Suzuken (B) | 146,000 | 4,603 | ||||||
| 3 | SEI Institutional Investments Trust / Annual Report / May 31, 2013 |
Table of Contents
Schedule of Investments
World Equity Ex-US Fund
May 31, 2013
| Description | Shares | Market Value ($ Thousands) | ||||||
Sysmex (B) | 410,574 | $ | 26,797 | |||||
Takashimaya (B) | 69,000 | 637 | ||||||
Toagosei (B) | 341,000 | 1,394 | ||||||
Toho Holdings (B) | 193,600 | 3,455 | ||||||
Tokai Tokyo Securities * (B) | 2,997,200 | 20,200 | ||||||
Token (B) | 4,540 | 227 | ||||||
Tokyo Seimitsu (B) | 60,500 | 1,261 | ||||||
Toppan Printing (B) | 36,000 | 233 | ||||||
Toshiba TEC (B) | 168,000 | 852 | ||||||
Toyoda Gosei (B) | 57,800 | 1,379 | ||||||
Toyota Motor (B) | 730,109 | 42,389 | ||||||
Tsuruha Holdings (B) | 37,900 | 3,036 | ||||||
UNY Group Holdings (B) | 67,200 | 440 | ||||||
Wacom (B) | 470,000 | 5,777 | ||||||
Watabe Wedding (B) | 7,955 | 59 | ||||||
Zenkoku Hosho (B) | 18,000 | 577 | ||||||
|
| |||||||
| 789,656 | ||||||||
|
| |||||||
Malaysia — 0.1% | ||||||||
Hong Leong Financial Group (B) | 94,700 | 455 | ||||||
Malayan Banking (B) | 1,853,900 | 6,095 | ||||||
RHB Capital (B) | 180,000 | 509 | ||||||
Tenaga Nasional (B) | 456,800 | 1,230 | ||||||
|
| |||||||
| 8,289 | ||||||||
|
| |||||||
Mexico — 0.6% | ||||||||
Alfa, Cl A | 330,212 | 779 | ||||||
Grupo Financiero Banorte, Ser O | 1,831,135 | 11,658 | ||||||
Grupo Financiero Santander Mexico ADR * | 757,193 | 11,979 | ||||||
Wal-Mart de Mexico | 5,135,600 | 15,090 | ||||||
|
| |||||||
| 39,506 | ||||||||
|
| |||||||
Netherlands — 3.6% | ||||||||
AerCap Holdings * | 63,374 | 1,098 | ||||||
ASML Holding (B) | 262,891 | 21,695 | ||||||
Chicago Bridge & Iron | 490,468 | 31,047 | ||||||
Core Laboratories (A) | 324,577 | 44,714 | ||||||
European Aeronautic Defense and Space (A)(B) | 375,514 | 21,560 | ||||||
Heineken Holding (B) | 51,727 | 3,044 | ||||||
LyondellBasell Industries, Cl A (A) | 429,325 | 28,614 | ||||||
Nutreco (B) | 37,964 | 1,607 | ||||||
NXP Semiconductor * | 940,980 | 29,029 | ||||||
Randstad Holding (B) | 32,621 | 1,394 | ||||||
Reed Elsevier (B) | 1,587,200 | 25,935 | ||||||
Ternium ADR | 33,376 | 778 | ||||||
TomTom * (B) | 49,095 | 256 | ||||||
Yandex, Cl A * | 429,144 | 11,655 | ||||||
|
| |||||||
| 222,426 | ||||||||
|
| |||||||
New Zealand — 0.0% | ||||||||
Trade Me (B) | 596,605 | 2,367 | ||||||
|
| |||||||
Norway — 2.0% | ||||||||
DnB (B) | 2,181,356 | 35,174 | ||||||
DNO International * (B) | 163,666 | 292 | ||||||
Norsk Hydro (A)(B) | 3,021,328 | 13,656 | ||||||
Seadrill (B) | 35,400 | 1,428 | ||||||
SpareBank 1 SMN (B) | 33,373 | 289 | ||||||
Statoil (A)(B) | 870,230 | 19,593 | ||||||
Statoil ADR (A) | 1,872,022 | 42,158 | ||||||
| Description | Shares | Market Value ($ Thousands) | ||||||
Telenor (B) | 563,800 | $ | 11,825 | |||||
|
| |||||||
| 124,415 | ||||||||
|
| |||||||
Peru — 0.1% | ||||||||
Credicorp | 37,380 | 5,144 | ||||||
|
| |||||||
Philippines — 0.0% | ||||||||
Metropolitan Bank & Trust (B) | 107,000 | 319 | ||||||
|
| |||||||
Poland — 0.0% | ||||||||
Polski Koncern Naftowy Orlen * (B) | 37,153 | 591 | ||||||
Tauron Polska Energia (B) | 321,681 | 419 | ||||||
|
| |||||||
| 1,010 | ||||||||
|
| |||||||
Qatar — 0.4% | ||||||||
Industries Qatar QSC (B) | 566,995 | 25,886 | ||||||
|
| |||||||
Russia — 0.7% | ||||||||
Lukoil ADR | 411,081 | 24,069 | ||||||
Mail.ru Group GDR * | 645,732 | 18,029 | ||||||
|
| |||||||
| 42,098 | ||||||||
|
| |||||||
Singapore — 1.6% | ||||||||
ComfortDelGro (B) | 376,000 | 565 | ||||||
DBS Group Holdings (B) | 1,842,000 | 24,926 | ||||||
Ezion Holdings (B) | 3,077,000 | 5,513 | ||||||
Golden Agri-Resources (B) | 48,399,700 | 21,963 | ||||||
Keppel (B) | 2,786,647 | 23,053 | ||||||
United Overseas Bank ADR | 719,200 | 24,323 | ||||||
|
| |||||||
| 100,343 | ||||||||
|
| |||||||
South Africa — 0.6% | ||||||||
Aspen Pharmacare Holdings (B) | 184,255 | 3,792 | ||||||
Sasol ADR (A) | 775,100 | 34,399 | ||||||
Telkom * | 253,773 | 376 | ||||||
|
| |||||||
| 38,567 | ||||||||
|
| |||||||
South Korea — 3.8% | ||||||||
Hana Financial Group (B) | 357,820 | 11,933 | ||||||
Hanjin Shipping * (B) | 134,180 | 904 | ||||||
Hyundai Mobis (B) | 87,123 | 21,790 | ||||||
Hyundai Motor * (B) | 56,417 | 10,492 | ||||||
Kia Motors (B) | 220,267 | 11,430 | ||||||
Kolao Holdings (B) | 46,960 | 1,323 | ||||||
KT (B) | 121,340 | 4,148 | ||||||
LG.Philips LCD * (B) | 466,210 | 12,836 | ||||||
POSCO (B) | 41,435 | 11,729 | ||||||
POSCO ADR (A) | 284,200 | 20,079 | ||||||
Samsung Electronics (B) | 55,820 | 75,210 | ||||||
SK Holdings * (B) | 60,747 | 9,449 | ||||||
SK Telecom (B) | 6,110 | 1,128 | ||||||
SK Telecom ADR (A) | 1,270,400 | 25,789 | ||||||
Woori Finance Holdings (B) | 372,880 | 3,884 | ||||||
Woori Finance Holdings ADR (A) | 392,000 | 12,297 | ||||||
|
| |||||||
| 234,421 | ||||||||
|
| |||||||
Spain — 0.6% | ||||||||
Amadeus IT Holding, Cl A (A)(B) | 1,105,901 | 33,656 | ||||||
Banco Popular Espanol * (B) | 180 | — | ||||||
Grifols (B) | 86,855 | 3,171 | ||||||
|
| |||||||
| 36,827 | ||||||||
|
| |||||||
Sweden — 2.3% | ||||||||
| 4 | SEI Institutional Investments Trust / Annual Report / May 31, 2013 |
Table of Contents
Schedule of Investments
World Equity Ex-US Fund
May 31, 2013
| Description | Shares | Market Value ($ Thousands) | ||||||
Electrolux, Cl B (B) | 60,554 | $ | 1,625 | |||||
Getinge, Cl B (A)(B) | 1,073,866 | 31,979 | ||||||
Hennes & Mauritz, Cl B (A)(B) | 510,085 | 17,389 | ||||||
Hexagon, Cl B (A)(B) | 910,351 | 26,314 | ||||||
Holmen, Cl B (A)(B) | 30,513 | 825 | ||||||
Nordea Bank (B) | 1,142,743 | 13,990 | ||||||
Skandinaviska Enskilda Banken, Cl A (B) | 194,601 | 2,018 | ||||||
Svenska Cellulosa ADR | 548,000 | 13,645 | ||||||
Swedbank, Cl A (B) | 803,723 | 19,072 | ||||||
Telefonaktiebolaget LM Ericsson ADR (A) | 1,575,600 | 18,387 | ||||||
|
| |||||||
| 145,244 | ||||||||
|
| |||||||
Switzerland — 6.2% | ||||||||
Actelion (B) | 444,885 | 26,481 | ||||||
Bucher Industries (B) | 1,014 | 237 | ||||||
Credit Suisse Group (B) | 955,914 | 28,155 | ||||||
Credit Suisse Group ADR (A) | 619,975 | 18,252 | ||||||
EMS-Chemie Holding (B) | 11,430 | 3,377 | ||||||
Forbo Holding (B) | 3,531 | 2,160 | ||||||
Georg Fischer (B) | 5,364 | 2,456 | ||||||
Givaudan (B) | 20,743 | 26,629 | ||||||
Julius Baer Group * (B) | 312,572 | 12,301 | ||||||
Nestle (B) | 204,401 | 13,493 | ||||||
Novartis (B) | 347,512 | 24,806 | ||||||
Novartis ADR | 360,626 | 25,879 | ||||||
OC Oerlikon (B) | 604,741 | 7,285 | ||||||
Roche Holding (B) | 284,021 | 70,173 | ||||||
Swatch Group, Cl B (B) | 10,787 | 6,127 | ||||||
Swiss Life Holding (B) | 38,451 | 6,352 | ||||||
Swiss Re (B) | 94,182 | 6,892 | ||||||
Syngenta (B) | 40,870 | 15,888 | ||||||
Transocean (A) | 448,883 | 22,547 | ||||||
UBS (B) | 1,762,492 | 30,817 | ||||||
Zurich Insurance Group ADR (A) | 1,348,600 | 35,832 | ||||||
|
| |||||||
| 386,139 | ||||||||
|
| |||||||
Taiwan — 1.6% | ||||||||
Advanced Semiconductor Engineering | 5,639,750 | 23,687 | ||||||
Fubon Financial Holding (B) | 9,047,949 | 11,901 | ||||||
Hermes Microvision (B) | 88,000 | 2,849 | ||||||
HON HAI Precision Industry (B) | 1,853,000 | 4,688 | ||||||
Innolux * (B) | 5,358,000 | 3,575 | ||||||
MediaTek (B) | 2,176,000 | 26,862 | ||||||
Taishin Financial Holding (B) | 2,389,610 | 1,022 | ||||||
Taiwan PCB Techvest * (B) | 182,000 | 246 | ||||||
Taiwan Semiconductor Manufacturing ADR (A) | 724,000 | 13,510 | ||||||
TPK Holding (B) | 168,000 | 3,307 | ||||||
United Microelectronics (B) | 3,643,000 | 1,600 | ||||||
United Microelectronics ADR | 1,211,600 | 2,629 | ||||||
|
| |||||||
| 95,876 | ||||||||
|
| |||||||
Thailand — 1.1% | ||||||||
Advanced Info Service (B) | 893,300 | 7,726 | ||||||
Airports of Thailand (B) | 238,300 | 1,452 | ||||||
Bangkok Bank (B) | 1,174,300 | 7,931 | ||||||
CP ALL (B) | 16,986,531 | 24,140 | ||||||
Krung Thai Bank | 16,807,850 | 12,291 | ||||||
Pruksa Real Estate (B) | 2,331,500 | 1,969 | ||||||
PTT Global Chemical (B) | 349,100 | 832 | ||||||
Thai Airways International (B) | 482,300 | 533 | ||||||
| Description | Shares | Market Value ($ Thousands) | ||||||
Thaicom (B) | 4,055,700 | $ | 4,831 | |||||
Thanachart Capital (B) | 1,205,600 | 1,809 | ||||||
Total Access Communication (B) | 1,651,300 | 6,249 | ||||||
|
| |||||||
| 69,763 | ||||||||
|
| |||||||
Turkey — 1.4% | ||||||||
Akbank (B) | 3,810,901 | 18,075 | ||||||
Kardemir Karabuk Demir Celik Sanayi ve Ticaret, Cl D * (B) | 3,027,350 | 2,597 | ||||||
KOC Holding ADR | 442,350 | 12,607 | ||||||
Turk Hava Yollari (B) | 2,165,095 | 10,014 | ||||||
Turkiye Garanti Bankasi (B) | 1,792,079 | 9,219 | ||||||
Turkiye Is Bankasi, Cl C (B) | 4,737,672 | 17,491 | ||||||
Turkiye Vakiflar Bankasi Tao, Cl D (B) | 4,525,161 | 14,292 | ||||||
|
| |||||||
| 84,295 | ||||||||
|
| |||||||
United Kingdom — 15.9% | ||||||||
3i Group (B) | 6,029,833 | 30,911 | ||||||
Aberdeen Asset Management (B) | 812,120 | 5,695 | ||||||
ARM Holdings (B) | 641,221 | 9,371 | ||||||
ARM Holdings ADR (A) | 1,168,359 | 51,268 | ||||||
Ashtead Group (B) | 432,770 | 4,091 | ||||||
Associated British Foods (B) | 624,872 | 17,086 | ||||||
AstraZeneca (B) | 462,729 | 23,623 | ||||||
AstraZeneca ADR (A) | 716,000 | 36,695 | ||||||
BAE Systems ADR (A) | 1,095,000 | 26,992 | ||||||
Barclays (B) | 8,481,991 | 40,542 | ||||||
Berkeley Group Holdings (B) | 151,450 | 4,835 | ||||||
BP (B) | 313,767 | 2,238 | ||||||
BP PLC ADR (A) | 333,202 | 14,298 | ||||||
British American Tobacco (B) | 470,443 | 25,794 | ||||||
Burberry Group (B) | 563,371 | 12,294 | ||||||
Cairn Energy * (B) | 404,542 | 1,663 | ||||||
Carnival (B) | 416,780 | 13,930 | ||||||
CSR (B) | 64,970 | 539 | ||||||
Diageo (B) | 1,257,639 | 37,070 | ||||||
Diageo ADR (A) | 105,800 | 12,512 | ||||||
Drax Group (B) | 26,733 | 231 | ||||||
EnQuest * (B) | 459,062 | 893 | ||||||
Ensco, Cl A | 189,300 | 11,390 | ||||||
Experian (B) | 1,376,861 | 25,268 | ||||||
GlaxoSmithKline (B) | 249,910 | 6,452 | ||||||
Halma (B) | 336,730 | 2,624 | ||||||
Home Retail Group (A)(B) | 1,009,815 | 2,383 | ||||||
HSBC Holdings | 5,931,891 | 64,950 | ||||||
Imperial Tobacco Group (B) | 623,500 | 22,325 | ||||||
Interserve (B) | 32,790 | 241 | ||||||
Kingfisher (B) | 4,179,226 | 21,726 | ||||||
Marks & Spencer Group ADR (A) | 990,400 | 14,064 | ||||||
Micro Focus International (B) | 120,600 | 1,248 | ||||||
Mondi (B) | 476,401 | 6,257 | ||||||
Pace | 116,725 | 446 | ||||||
Pearson (B) | 645,434 | 11,970 | ||||||
Persimmon * (B) | 298,020 | 5,468 | ||||||
QinetiQ (B) | 540,438 | 1,516 | ||||||
Reckitt Benckiser Group (B) | 371,639 | 26,518 | ||||||
Rio Tinto (B) | 86,661 | 3,693 | ||||||
Rio Tinto ADR (A) | 906,713 | 38,735 | ||||||
Rolls-Royce Holdings (B) | 1,025,940 | 18,569 | ||||||
Royal Bank of Scotland Group * (B) | 2,708,511 | 13,647 | ||||||
Royal Dutch Shell, Cl A (B) | 1,358,917 | 45,247 | ||||||
Royal Dutch Shell, Cl A (GBP) (B) | 329,219 | 10,933 | ||||||
Royal Dutch Shell ADR, Cl A | 493,300 | 32,740 | ||||||
| 5 | SEI Institutional Investments Trust / Annual Report / May 31, 2013 |
Table of Contents
Schedule of Investments
World Equity Ex-US Fund
May 31, 2013
| Description | Shares | Market Value ($ Thousands) | ||||||
RPC Group (B) | 75,736 | $ | 461 | |||||
SABMiller (B) | 296,188 | 14,868 | ||||||
Sage Group (B) | 5,074,100 | 27,945 | ||||||
Sage Group ADR | 577,600 | 12,898 | ||||||
Shire (B) | 1,032,431 | 33,908 | ||||||
Standard Chartered (B) | 915,541 | 21,153 | ||||||
Subsea 7 * (B) | 446,951 | 9,817 | ||||||
Taylor Wimpey PLC (B) | 2,068,099 | 3,087 | ||||||
Tesco (B) | 4,332,700 | 23,940 | ||||||
Tullow Oil (B) | 484,648 | 7,610 | ||||||
Unilever ADR (A) | 573,433 | 24,090 | ||||||
WH Smith (B) | 20,284 | 231 | ||||||
William Hill (B) | 559,001 | 3,728 | ||||||
WPP (B) | 2,405,072 | 40,855 | ||||||
|
| |||||||
| 985,572 | ||||||||
|
| |||||||
United States — 3.4% | ||||||||
Alon USA Energy | 55,651 | 1,019 | ||||||
Axis Capital Holdings | 589,600 | 25,683 | ||||||
Boise * | 298,237 | 2,404 | ||||||
Cambrex * | 91,410 | 1,258 | ||||||
Carnival, Cl A (A) | 590,419 | 19,543 | ||||||
Central Garden and Pet * | 35,753 | 278 | ||||||
Computer Sciences | 386,494 | 17,241 | ||||||
Delek US Holdings | 97,114 | 3,499 | ||||||
Everest Re Group (A) | 214,083 | 27,747 | ||||||
Exelis | 21,454 | 260 | ||||||
Green Plains Renewable Energy * | 22,786 | 362 | ||||||
Greenbrier * | 17,320 | 406 | ||||||
Liberty Global, Cl A * | 155,100 | 11,431 | ||||||
Marathon Petroleum | 125,948 | 10,391 | ||||||
Northrop Grumman | 35,257 | 2,905 | ||||||
Pantry * | 21,144 | 265 | ||||||
PharMerica * | 16,824 | 263 | ||||||
RenaissanceRe Holdings | 145,700 | 12,525 | ||||||
Renewable Energy Group * | 21,662 | 293 | ||||||
Schlumberger | 309,985 | 22,638 | ||||||
Tesoro | 90,169 | 5,559 | ||||||
TravelCenters of America * | 25,977 | 289 | ||||||
Tyson Foods, Cl A | 20,725 | 518 | ||||||
Virgin Media (A) | 534,913 | 26,564 | ||||||
Western Refining (A) | 38,884 | 1,297 | ||||||
Yum! Brands (A) | 257,470 | 17,443 | ||||||
|
| |||||||
| 212,081 | ||||||||
|
| |||||||
Total Common Stock | 5,912,795 | |||||||
|
| |||||||
PREFERRED STOCK — 0.9% | ||||||||
Brazil — 0.3% | ||||||||
Cia Brasileira de Distribuicao Grupo Pao de Acucar, Cl Preference | 84,600 | 4,110 | ||||||
Itau Unibanco Holding ADR | 1,110,413 | 16,700 | ||||||
|
| |||||||
| 20,810 | ||||||||
|
| |||||||
Germany — 0.6% | ||||||||
Henkel (B) | 83,631 | 8,025 | ||||||
Volkswagen (B) | 120,700 | 26,138 | ||||||
|
| |||||||
| 34,163 | ||||||||
|
| |||||||
Total Preferred Stock | 54,973 | |||||||
|
| |||||||
| Description | Shares/Face Amount (1) (Thousands) | Market Value ($ Thousands) | ||||||
| Number Of Rights | ||||||||
RIGHTS — 0.0% | ||||||||
Italy — 0.0% | ||||||||
Exor, Expires 06/06/13 | 206,377 | $ | — | |||||
Exor (Preferred), Expires 06/06/13 | 206,377 | — | ||||||
|
| |||||||
Total Rights | — | |||||||
|
| |||||||
AFFILIATED PARTNERSHIP — 9.2% | ||||||||
SEI Liquidity Fund, L.P. | ||||||||
0.100% **† (C) | 570,536,741 | 570,537 | ||||||
|
| |||||||
Total Affiliated Partnership | 570,537 | |||||||
|
| |||||||
CASH EQUIVALENT — 0.4% | ||||||||
SEI Daily Income Trust, Prime Obligation Fund, Cl A 0.010% ** † | 25,307,648 | 25,308 | ||||||
|
| |||||||
Total Cash Equivalent | 25,308 | |||||||
|
| |||||||
TIME DEPOSITS — 1.5% | ||||||||
Brown Brothers Harriman | ||||||||
4.150%, 06/01/2013 ZAR | 56 | 6 | ||||||
1.903%, 06/01/2013 AUD | 183 | 175 | ||||||
1.667%, 06/01/2013 NZD | 461 | 368 | ||||||
0.484%, 06/01/2013 NOK | 2,738 | 465 | ||||||
0.280%, 06/01/2013 CAD | 104 | 101 | ||||||
0.100%, 06/01/2013 SEK | 4,540 | 683 | ||||||
0.076%, 06/01/2013 GBP | 2,746 | 4,163 | ||||||
0.030%, 06/01/2013 | 81,091 | 81,091 | ||||||
0.005%, 06/01/2013 HKD | 6,188 | 797 | ||||||
0.005%, 06/01/2013 JPY | 17,860 | 177 | ||||||
0.005%, 06/01/2013 SGD | 385 | 304 | ||||||
0.001%, 06/01/2013 CHF | 2,001 | 2,086 | ||||||
0.001%, 06/01/2013 EUR | 1,248 | 1,618 | ||||||
(0.10)%, 06/01/2013 DKK | 1,309 | 227 | ||||||
|
| |||||||
Total Time Deposits | 92,261 | |||||||
|
| |||||||
U.S. TREASURY OBLIGATIONS (D) (E) — 0.2% |
| |||||||
U.S. Treasury Bills | ||||||||
0.080%, 06/27/2013 | 7,521 | 7,521 | ||||||
0.070%, 07/25/2013 | 4,767 | 4,767 | ||||||
|
| |||||||
Total U.S. Treasury Obligations | 12,288 | |||||||
|
| |||||||
Total Investments — 107.7% | $ | 6,668,162 | ||||||
|
| |||||||
| 6 | SEI Institutional Investments Trust / Annual Report / May 31, 2013 |
Table of Contents
Schedule of Investments
World Equity Ex-US Fund
May 31, 2013
A list of the open futures contracts held by the Fund at May 31, 2013, is as follows:
| Type of Contract | Number of Contracts Long | Expiration Date | Unrealized Appreciation (Depreciation) ($ Thousands) | |||||||||
DJ Euro Stoxx 50 Index | 1,174 | Jun-2013 | $ | 329 | ||||||||
FTSE 100 Index | 379 | Jun-2013 | 180 | |||||||||
Hang Seng Index | 41 | Jun-2013 | (15 | ) | ||||||||
S&P TSX 60 Index | 113 | Jun-2013 | 119 | |||||||||
SPI 200 Index | 103 | Jun-2013 | (203 | ) | ||||||||
Topix Index | 238 | Jun-2013 | (412 | ) | ||||||||
|
| |||||||||||
| $ | (2 | ) | ||||||||||
|
| |||||||||||
For the year ended May 31, 2013, the total amount of all open futures contracts, as presented in the table above, are representative of the volume of activity for this derivative type during the year.
Percentages are based on a Net Assets of $6,192,852 ($ Thousands).
| * | Non-income producing security. |
| ** | The rate reported is the 7-day effective yield as of May 31, 2013. |
| ‡ | Real Estate Investment Trust. |
| † | Investment in Affiliated Security (see Note 5). |
| (A) | This security or a partial position of this security is on loan at May 31, 2013. The total value of securities on loan at May 31, 2013 was $540,135 ($ Thousands). |
| (B) | Security fair valued using methods determined in good faith by the Valuation Committee of the Board of Trustees. The total market value of such securities as of May 31, 2013 was $4,036,972 ($ Thousands) and represented 65.2% of Net Assets. |
| (C) | This security was purchased with cash collateral held from securities on loan (see Note 11). The total value of such securities as of May 31, 2013 was $570,537 ($ Thousands). |
| (D) | Security, or portion thereof, has been pledged as collateral on open futures contracts. |
| (E) | The rate reported is the effective yield at time of purchase. |
ADR — American Depositary Receipt
AUD — Australian Dollar
CAD — Canadian Dollar
CHF — Swiss Franc
Cl — Class
DJ — Dow Jones
DKK — Danish Krone
EUR — Euro
FTSE — Financial Times and Stock Exchange
GBP — British Pound Sterling
GDR — Global Depositary Receipt
HKD — Hong Kong Dollar
JPY — Japanese Yen
L.P. — Limited Partnership
NOK — Norwegian Krone
NZD — New Zealand Dollar
PLC — Public Limited Company
SEK — Swedish Krona
Ser — Series
SGD — Singapore Dollar
SPI — Share Price Index
TSX — Toronto Stock Exchange
ZAR — South African Rand
The following is a summary of the inputs used as of May 31, 2013, in valuing the Fund’s investments and other financial instruments carried at value ($ Thousands):
| Investments in Securities | Level 1 | Level 2 | Level 3 | Total | ||||||||||||
Common Stock | $ | 1,909,986 | $ | 4,002,809 | $ | — | $ | 5,912,795 | ||||||||
Preferred Stock | 20,810 | 34,163 | — | 54,973 | ||||||||||||
Affiliated Partnership | — | 570,537 | — | 570,537 | ||||||||||||
Cash Equivalent | 25,308 | — | — | 25,308 | ||||||||||||
Time Deposits | 92,261 | — | — | 92,261 | ||||||||||||
U.S. Treasury Obligations | — | 12,288 | — | 12,288 | ||||||||||||
|
|
|
|
|
|
|
| |||||||||
Total Investments in Securities | $ | 2,048,365 | $ | 4,619,797 | $ | — | $ | 6,668,162 | ||||||||
|
|
|
|
|
|
|
| |||||||||
| Other Financial Instruments | Level 1 | Level 2 | Level 3 | Total | ||||||||||||
Futures Contracts * | $ | (2 | ) | $ | — | $ | — | $ | (2 | ) | ||||||
|
|
|
|
|
|
|
| |||||||||
| * | Futures contracts are valued at the unrealized depreciation on the instrument. |
For the year ended May 31, 2013, there were transfers between Level 1 and Level 2 assets and liabilities. The primary reason for changes in the classifications between Levels 1 and 2 occurs when foreign equity securities are fair valued using other observable market-based inputs in place of the closing exchange price due to events occurring after the close of the exchange or market on which the investment is principally traded.
For the year ended May 31, 2013, there were no transfers between Level 2 and Level 3 assets and liabilities.
For more information on valuation inputs, see Note 2 — Significant Accounting Policies in Notes to Financial Statements.
Amounts designated as “—” are $0 or have been rounded to $0.
The accompanying notes are an integral part of the financial statements.
| 7 | SEI Institutional Investments Trust / Annual Report / May 31, 2013 |
Table of Contents
Schedule of Investments
Screened World Equity Ex-US Fund
May 31, 2013
| Description | Shares | Market Value ($ Thousands) | ||||||
COMMON STOCK — 91.4% | ||||||||
Argentina — 0.2% | ||||||||
MercadoLibre | 1,100 | $ | 126 | |||||
|
| |||||||
Australia — 1.7% | ||||||||
BGP Holdings * | 4,500 | — | ||||||
BHP Billiton ADR | 4,614 | 301 | ||||||
Caltex Australia (A) | 3,705 | 79 | ||||||
Commonwealth Bank of Australia (A) | 5,747 | 366 | ||||||
CSL (A) | 1,110 | 63 | ||||||
Federation Centres ‡ (A) | 20,627 | 49 | ||||||
K&S (A) | 2,260 | 4 | ||||||
Rio Tinto (A) | 560 | 29 | ||||||
Tassal Group (A) | 8,132 | 16 | ||||||
Telstra (A) | 15,800 | 72 | ||||||
Westpac Banking (A) | 2,739 | 74 | ||||||
|
| |||||||
| 1,053 | ||||||||
|
| |||||||
Austria — 2.1% | ||||||||
Conwert Immobilien Invest (A) | 13,048 | 152 | ||||||
Erste Group Bank (A) | 8,680 | 278 | ||||||
OMV (A) | 9,483 | 436 | ||||||
Schoeller-Bleckmann Oilfield Equipment (A) | 3,719 | 380 | ||||||
Strabag (A) | 1,589 | 34 | ||||||
Voestalpine (A) | 106 | 4 | ||||||
|
| |||||||
| 1,284 | ||||||||
|
| |||||||
Belgium — 0.1% | ||||||||
Recticel (A) | 4,647 | 32 | ||||||
Sioen Industries (A) | 1,719 | 16 | ||||||
|
| |||||||
| 48 | ||||||||
|
| |||||||
Brazil — 1.5% | ||||||||
Banco Bradesco ADR | 14,249 | 230 | ||||||
Banco do Brasil | 21,300 | 251 | ||||||
Embraer ADR | 6,087 | 221 | ||||||
Kroton Educacional | 5,800 | 83 | ||||||
Natura Cosmeticos | 7,465 | 177 | ||||||
|
| |||||||
| 962 | ||||||||
|
| |||||||
Canada — 4.2% | ||||||||
Agrium | 2,900 | 269 | ||||||
Canadian National Railway | 3,558 | 362 | ||||||
Canadian Natural Resources | 8,800 | 263 | ||||||
Canfor * | 3,200 | 54 | ||||||
Cenovus Energy | 4,004 | 120 | ||||||
Chorus Aviation, Cl A | 840 | 2 | ||||||
Exco Technologies | 600 | 3 | ||||||
Intertape Polymer Group | 12,872 | 160 | ||||||
Lululemon Athletica * | 3,627 | 282 | ||||||
Magellan Aerospace * | 1,300 | 6 | ||||||
Parkland Fuel | 211 | 4 | ||||||
Potash Corp of Saskatchewan | 5,603 | 235 | ||||||
Rogers Communications, Cl B | 4,082 | 185 | ||||||
Royal Bank of Canada | 2,000 | 119 | ||||||
Suncor Energy | 2,800 | 85 | ||||||
Talisman Energy | 22,800 | 268 | ||||||
Teck Cominco, Cl B | 8,100 | 217 | ||||||
|
| |||||||
| 2,634 | ||||||||
|
| |||||||
Chile — 0.1% | ||||||||
| Description | Shares | Market Value ($ Thousands) | ||||||
Enersis ADR | 2,614 | $ | 44 | |||||
|
| |||||||
China — 5.7% | ||||||||
Agricultural Bank of China (A) | 456,000 | 212 | ||||||
Anhui Conch Cement (A) | 73,000 | 236 | ||||||
Anton Oilfield Services Group (A) | 138,000 | 118 | ||||||
Baidu ADR * | 2,635 | 255 | ||||||
Bank of China (A) | 642,000 | 302 | ||||||
China Construction Bank (A) | 402,000 | 324 | ||||||
China Merchants Bank (A) | 25,811 | 52 | ||||||
China Oilfield Services (A) | 153,800 | 323 | ||||||
China Shipping Container Lines * (A) | 589,000 | 149 | ||||||
Industrial & Commercial Bank of China (A) | 1,150,836 | 805 | ||||||
Mindray Medical International ADR | 7,276 | 299 | ||||||
SINA * | 1,250 | 72 | ||||||
Sinopharm Group (A) | 45,636 | 123 | ||||||
Weichai Power (A) | 74,200 | 272 | ||||||
|
| |||||||
| 3,542 | ||||||||
|
| |||||||
Colombia — 0.4% | ||||||||
Bancolombia ADR, Cl R | 4,170 | 241 | ||||||
|
| |||||||
Czech Republic — 0.3% | ||||||||
Komercni Banka (A) | 887 | 167 | ||||||
|
| |||||||
Denmark — 0.9% | ||||||||
Novo-Nordisk, Cl B (A) | 2,447 | 395 | ||||||
Pandora (A) | 4,560 | 157 | ||||||
|
| |||||||
| 552 | ||||||||
|
| |||||||
Finland — 1.3% | ||||||||
Atria, Cl A | 3,056 | 25 | ||||||
HKScan, Cl A | 2,192 | 11 | ||||||
Konecranes (A) | 1,400 | 48 | ||||||
Neste Oil (A) | 13,023 | 188 | ||||||
Norvestia, Cl B (A) | 38 | — | ||||||
Orion, Cl B (A) | 6,944 | 170 | ||||||
Pohjola Bank, Cl A (A) | 8,822 | 143 | ||||||
Stora Enso, Cl R (A) | 518 | 4 | ||||||
Tieto (A) | 1,555 | 32 | ||||||
UPM-Kymmene (A) | 16,148 | 172 | ||||||
|
| |||||||
| 793 | ||||||||
|
| |||||||
France — 5.0% | ||||||||
Air Liquide (A) | 2,539 | 326 | ||||||
BNP Paribas (A) | 6,604 | 385 | ||||||
Bongrain (A) | 180 | 12 | ||||||
Burelle (A) | 141 | 63 | ||||||
Cie Lebon | 46 | 6 | ||||||
Compagnie Generale des Etablissements Michelin, Cl B (A) | 4,385 | 382 | ||||||
Constructions Industrielles de la | 38 | 4 | ||||||
Esso Francaise (A) | 190 | 12 | ||||||
Fleury Michon | 114 | 6 | ||||||
Iliad (A) | 400 | 83 | ||||||
Les Nouveaux Constructeurs Investissement | 3,175 | 31 | ||||||
LVMH Moet Hennessy Louis Vuitton (A) | 2,333 | 411 | ||||||
Publicis Groupe (A) | 4,355 | 311 | ||||||
| 1 | SEI Institutional Investments Trust / Annual Report / May 31, 2013 |
Table of Contents
Schedule of Investments
Screened World Equity Ex-US Fund
May 31, 2013
| Description | Shares | Market Value ($ Thousands) | ||||||
Renault (A) | 2,080 | $ | 160 | |||||
Safran (A) | 2,500 | 133 | ||||||
Societe Generale (A) | 6,050 | 241 | ||||||
Teleperformance (A) | 1,140 | 54 | ||||||
Tessi (A) | 971 | 103 | ||||||
Thales (A) | 4,941 | 239 | ||||||
UBISOFT Entertainment * (A) | 11,900 | 155 | ||||||
|
| |||||||
| 3,117 | ||||||||
|
| |||||||
Germany — 5.3% | ||||||||
Adidas (A) | 3,090 | 335 | ||||||
ADVA Optical Networking * (A) | 249 | 1 | ||||||
Allianz (A) | 1,444 | 222 | ||||||
BASF (A) | 4,536 | 438 | ||||||
Bayer (A) | 3,674 | 391 | ||||||
Beiersdorf (A) | 1,130 | 102 | ||||||
Borussia Dortmund GmbH & KGaA (A) | 6,049 | 24 | ||||||
Constantin Medien * | 19,238 | 37 | ||||||
CropEnergies (A) | 3,563 | 27 | ||||||
Deutsche Bank (A) | 7,753 | 359 | ||||||
Deutsche Lufthansa * (A) | 10,310 | 221 | ||||||
Fresenius Medical Care (A) | 4,992 | 338 | ||||||
Hannover Rueckversicherung (A) | 50 | 4 | ||||||
Koenig & Bauer (A) | 756 | 16 | ||||||
Patrizia Immobilien * (A) | 5,233 | 62 | ||||||
SAP (A) | 3,982 | 297 | ||||||
Siemens (A) | 2,433 | 256 | ||||||
Sixt (A) | 2,630 | 59 | ||||||
Symrise (A) | 2,530 | 103 | ||||||
Ultrasonic * (A) | 882 | 12 | ||||||
|
| |||||||
| 3,304 | ||||||||
|
| |||||||
Hong Kong — 3.8% | ||||||||
AIA Group (A) | 105,382 | 466 | ||||||
Allan International Holdings | 11,683 | 4 | ||||||
Champion Technology Holdings (A) | 98,000 | 1 | ||||||
Chuang’s Consortium International * (A) | 452,000 | 62 | ||||||
CNOOC (A) | 129,030 | 226 | ||||||
CSI Properties (A) | 1,960,000 | 87 | ||||||
Daphne International Holdings (A) | 214,000 | 193 | ||||||
EcoGreen Fine Chemicals Group | 326,000 | 78 | ||||||
Harbour Centre Development | 7,000 | 14 | ||||||
Hong Kong Exchanges and Clearing (A) | 17,221 | 288 | ||||||
Keck Seng Investments | 8,000 | 4 | ||||||
Luen Thai Holdings (A) | 201,000 | 84 | ||||||
Melco Crown Entertainment ADR * | 4,200 | 100 | ||||||
Orient Overseas International (A) | 53,000 | 332 | ||||||
Pacific Century Premium Developments * (A) | 8,000 | 3 | ||||||
Pacific Textile Holdings (A) | 25,000 | 31 | ||||||
Power Assets Holdings (A) | 11,000 | 97 | ||||||
SJM Holdings (A) | 27,000 | 73 | ||||||
Skyworth Digital Holdings (A) | 74,000 | 50 | ||||||
TAI Cheung Holdings (A) | 5,000 | 4 | ||||||
Wharf Holdings (A) | 15,000 | 133 | ||||||
Wing On International (A) | 12,111 | 38 | ||||||
|
| |||||||
| 2,368 | ||||||||
|
| |||||||
India — 1.0% | ||||||||
ICICI Bank ADR | 13,577 | 611 | ||||||
Wipro ADR | 464 | 3 | ||||||
|
| |||||||
| 614 | ||||||||
|
| |||||||
Indonesia — 0.5% | ||||||||
| Description | Shares | Market Value ($ Thousands) | ||||||
Asahimas Flat Glass (A) | 3,000 | $ | 2 | |||||
Bank Rakyat Indonesia Persero (A) | 81,000 | 73 | ||||||
Telekomunikasi Indonesia Persero (A) | 42,500 | 48 | ||||||
Telekomunikasi Indonesia Persero ADR | 3,626 | 164 | ||||||
|
| |||||||
| 287 | ||||||||
|
| |||||||
Ireland — 1.2% | ||||||||
Accenture, Cl A | 4,432 | 364 | ||||||
ICON * | 11,034 | 379 | ||||||
|
| |||||||
| 743 | ||||||||
|
| |||||||
Italy — 0.8% | ||||||||
Azimut Holding (A) | 6,250 | 118 | ||||||
Danieli & C Officine Meccaniche (A) | 145 | 4 | ||||||
Enel (A) | 26,161 | 98 | ||||||
Fiat * (A) | 30,585 | 239 | ||||||
Gtech Spa * (A) | 1,800 | 48 | ||||||
|
| |||||||
| 507 | ||||||||
|
| |||||||
Japan — 12.9% | ||||||||
AOI Electronics (A) | 200 | 3 | ||||||
Argo Graphics (A) | 1,200 | 18 | ||||||
Asahi Broadcasting (A) | 8,800 | 66 | ||||||
Asahi Kasei (A) | 5,000 | 33 | ||||||
AT-Group (A) | 4,000 | 68 | ||||||
Belluna (A) | 5,000 | 49 | ||||||
Bridgestone (A) | 5,855 | 189 | ||||||
C-Cube (A) | 6,600 | 32 | ||||||
Chuo Spring (A) | 3,000 | 9 | ||||||
Cleanup (A) | 500 | 4 | ||||||
Coca-Cola Central Japan (A) | 2,100 | 31 | ||||||
Computer Engineering & Consulting (A) | 8,000 | 50 | ||||||
Daiwa House Industry (A) | 15,000 | 282 | ||||||
Daiwa Securities Group * (A) | 19,000 | 155 | ||||||
Denso (A) | 13,500 | 555 | ||||||
Dowa Holdings (A) | 7,000 | 58 | ||||||
Faith (A) | 153 | 17 | ||||||
FANUC * (A) | 1,120 | 164 | ||||||
FJ Next (A) | 3,700 | 37 | ||||||
Fuji Kiko (A) | 2,000 | 6 | ||||||
Fukuda Denshi (A) | 300 | 12 | ||||||
Gamecard-Joyco Holdings | 1,000 | 15 | ||||||
Happinet (A) | 9,400 | 72 | ||||||
Hitachi (A) | 74,000 | 495 | ||||||
Hokkaido Coca-Cola Bottling (A) | 2,000 | 10 | ||||||
Hokkan Holdings (A) | 14,000 | 41 | ||||||
Hokuriku Gas (A) | 17,000 | 44 | ||||||
Honda Motor ADR | 8,785 | 330 | ||||||
Ichikoh Industries * (A) | 3,000 | 4 | ||||||
IT Holdings (A) | 200 | 3 | ||||||
Japan Airlines (A) | 2,200 | 112 | ||||||
Japan Exchange Group (A) | 520 | 48 | ||||||
Jidosha Buhin Kogyo (A) | 1,000 | 5 | ||||||
Jin (A) | 900 | 47 | ||||||
JK Holdings (A) | 3,100 | 18 | ||||||
Kamei (A) | 4,000 | 33 | ||||||
KDDI (A) | 5,175 | 232 | ||||||
Keiyo Gas (A) | 1,000 | 5 | ||||||
Kohsoku (A) | 400 | 4 | ||||||
Komatsu (A) | 12,350 | 308 | ||||||
Komatsu Wall Industry (A) | 1,600 | 32 | ||||||
KRS (A) | 4,800 | 45 | ||||||
KU Holdings (A) | 700 | 6 | ||||||
| 2 | SEI Institutional Investments Trust / Annual Report / May 31, 2013 |
Table of Contents
Schedule of Investments
Screened World Equity Ex-US Fund
May 31, 2013
| Description | Shares | Market Value ($ Thousands) | ||||||
Kubota (A) | 14,868 | $ | 214 | |||||
Maeda Road Construction (A) | 13,000 | 171 | ||||||
Marubun (A) | 2,400 | 11 | ||||||
Maruka Machinery (A) | 300 | 4 | ||||||
Maruzen - General Commercial Kitchen Appliances & Equipment (A) | 4,000 | 33 | ||||||
Mazda Motor * (A) | 10,000 | 38 | ||||||
Medipal Holdings (A) | 1,200 | 16 | ||||||
Mitani (A) | 4,800 | 84 | ||||||
Mitsui Trust Holdings (A) | 60,600 | 247 | ||||||
Murakami (A) | 1,000 | 14 | ||||||
Nagawa | 300 | 5 | ||||||
Namura Shipbuilding (A) | 7,200 | 67 | ||||||
Nichireki (A) | 3,363 | 23 | ||||||
NIFTY (A) | 20 | 27 | ||||||
Nihon Tokushu Toryo (A) | 1,600 | 6 | ||||||
Nippon Steel & Sumitomo Metal * (A) | 74,000 | 185 | ||||||
Nippon Telegraph & Telephone (A) | 7,100 | 348 | ||||||
Nishikawa Rubber (A) | 400 | 7 | ||||||
Nisshin Fudosan (A) | 5,200 | 36 | ||||||
Nissin Sugar (A) | 2,800 | 62 | ||||||
Nomura Holdings * (A) | 30,700 | 232 | ||||||
Pigeon (A) | 400 | 32 | ||||||
Rokko Butter (A) | 1,600 | 11 | ||||||
San-Ai Oil (A) | 2,691 | 10 | ||||||
Sankyo Frontier (A) | 2,000 | 14 | ||||||
Secom (A) | 6,600 | 331 | ||||||
Seibu Electric Industry (A) | 2,000 | 8 | ||||||
Seino Holdings (A) | 20,000 | 152 | ||||||
Senshu Electric (A) | 5,000 | 62 | ||||||
Shidax (A) | 2,600 | 13 | ||||||
Shin Nippon Air Technologies (A) | 2,000 | 11 | ||||||
Shiroki (A) | 9,000 | 19 | ||||||
Sinko Industries (A) | 1,100 | 9 | ||||||
SKY Perfect JSAT Holdings (A) | 55 | 24 | ||||||
Softbank * (A) | 4,499 | 224 | ||||||
Soken Chemical & Engineering (A) | 700 | 10 | ||||||
Sumitomo Densetsu (A) | 300 | 4 | ||||||
Sumitomo Mitsui Financial Group (A) | 3,700 | 145 | ||||||
Tachikawa (A) | 2,600 | 12 | ||||||
TKC (A) | 2,900 | 48 | ||||||
Tokai (A) | 300 | 8 | ||||||
Tokyo Energy & Systems (A) | 1,000 | 4 | ||||||
Toyota Motor (A) | 18,717 | 1,087 | ||||||
Tsuruha Holdings (A) | 700 | 56 | ||||||
Vital KSK Holdings (A) | 1,400 | 10 | ||||||
Wacom (A) | 10,800 | 133 | ||||||
Warabeya Nichiyo (A) | 3,700 | 61 | ||||||
Yachiyo Industry (A) | 600 | 5 | ||||||
Zojirushi (A) | 2,000 | 6 | ||||||
|
| |||||||
| 8,086 | ||||||||
|
| |||||||
Malaysia — 0.4% | ||||||||
DRB-Hicom (A) | 18,300 | 17 | ||||||
Faber Group (A) | 44,700 | 23 | ||||||
Malayan Banking (A) | 55,000 | 181 | ||||||
Tenaga Nasional (A) | 16,700 | 45 | ||||||
|
| |||||||
| 266 | ||||||||
|
| |||||||
Mexico — 1.0% | ||||||||
Grupo Financiero Banorte, Ser O | 28,503 | 181 | ||||||
Grupo KUO De | 900 | 2 | ||||||
Industrias Bachoco | 42,402 | 122 | ||||||
| Description | Shares | Market Value ($ Thousands) | ||||||
Industrias Bachoco ADR | 2,630 | $ | 91 | |||||
Infraestructura Energetica Nova * | 1,555 | 6 | ||||||
Wal-Mart de Mexico | 72,405 | 213 | ||||||
|
| |||||||
| 615 | ||||||||
|
| |||||||
Netherlands — 3.2% | ||||||||
ASML Holding (A) | 4,038 | 333 | ||||||
Core Laboratories | 4,672 | 643 | ||||||
European Aeronautic Defense and | 6,258 | 359 | ||||||
ING Groep *(A) | 288 | 3 | ||||||
KAS Bank ADR | 1,472 | 17 | ||||||
SNS Reaal * | 1,762 | 1 | ||||||
Unilever (A) | 10,703 | 436 | ||||||
Yandex, Cl A * | 7,203 | 196 | ||||||
|
| |||||||
| 1,988 | ||||||||
|
| |||||||
New Zealand — 0.3% | ||||||||
Air New Zealand (A) | 8,185 | 10 | ||||||
Fletcher Building (A) | 23,121 | 153 | ||||||
Trade Me (A) | 11,385 | 45 | ||||||
|
| |||||||
| 208 | ||||||||
|
| |||||||
Norway — 1.3% | ||||||||
DnB (A) | 40,386 | 651 | ||||||
Norsk Hydro (A) | 41,673 | 189 | ||||||
|
| |||||||
| 840 | ||||||||
|
| |||||||
Peru — 0.2% | ||||||||
Credicorp | 710 | 98 | ||||||
|
| |||||||
Philippines — 0.2% | ||||||||
Lopez Holdings (A) | 1,077,100 | 154 | ||||||
|
| |||||||
Poland — 0.1% | ||||||||
Getin Holding (A) | 3,605 | 3 | ||||||
KGHM Polska Miedz (A) | 279 | 12 | ||||||
Polski Koncern Naftowy Orlen * (A) | 4,075 | 65 | ||||||
|
| |||||||
| 80 | ||||||||
|
| |||||||
Portugal — 0.0% | ||||||||
Portucel (A) | 4,792 | 17 | ||||||
|
| |||||||
Russia — 0.2% | ||||||||
Surgutneftegas ADR * | 14,617 | 109 | ||||||
|
| |||||||
Singapore — 1.3% | ||||||||
DBS Group Holdings (A) | 32,000 | 433 | ||||||
Ezion Holdings (A) | 59,000 | 106 | ||||||
Golden Agri-Resources (A) | 8,000 | 4 | ||||||
GP Batteries International | 11,708 | 9 | ||||||
New Toyo International Holdings (A) | 35,000 | 9 | ||||||
Oversea-Chinese Banking (A) | 2,000 | 16 | ||||||
Popular Holdings (A) | 41,000 | 9 | ||||||
QAF (A) | 35,000 | 29 | ||||||
United Industrial (A) | 79,000 | 191 | ||||||
|
| |||||||
| 806 | ||||||||
|
| |||||||
South Africa — 0.1% | ||||||||
| 3 | SEI Institutional Investments Trust / Annual Report / May 31, 2013 |
Table of Contents
Schedule of Investments
Screened World Equity Ex-US Fund
May 31, 2013
| Description | Shares | Market Value ($ Thousands) | ||||||
Aspen Pharmacare Holdings (A) | 3,520 | $ | 72 | |||||
South Korea — 3.5% | ||||||||
Hyundai Mobis (A) | 1,255 | 314 | ||||||
Hyundai Motor * (A) | 1,031 | 192 | ||||||
Kia Motors (A) | 603 | 31 | ||||||
Kolao Holdings (A) | 900 | 25 | ||||||
LG.Philips LCD * (A) | 510 | 14 | ||||||
POSCO (A) | 596 | 169 | ||||||
Samsung Electronics (A) | 879 | 1,184 | ||||||
SK Holdings * (A) | 926 | 144 | ||||||
Taekwang Industrial (A) | 109 | 101 | ||||||
YESCO | 1,180 | 40 | ||||||
|
| |||||||
| 2,214 | ||||||||
|
| |||||||
Spain — 0.8% | ||||||||
Amadeus IT Holding, Cl A (A) | 15,531 | 473 | ||||||
Grifols (A) | 1,650 | 60 | ||||||
|
| |||||||
| 533 | ||||||||
|
| |||||||
Sweden — 1.2% | ||||||||
AarhusKarlshamn | 612 | 32 | ||||||
Getinge, Cl B (A) | 14,812 | 441 | ||||||
Hennes & Mauritz, Cl B (A) | 7,268 | 248 | ||||||
Svenska Cellulosa, Cl B (A) | 243 | 6 | ||||||
|
| |||||||
| 727 | ||||||||
|
| |||||||
Switzerland — 6.3% | ||||||||
Credit Suisse Group ADR | 8,928 | 263 | ||||||
Emmi | 47 | 14 | ||||||
EMS-Chemie Holding (A) | 220 | 65 | ||||||
Highlight Communications (A) | 8,083 | 44 | ||||||
Julius Baer Group * (A) | 4,260 | 168 | ||||||
Nestle (A) | 2,877 | 190 | ||||||
Novartis (A) | 5,263 | 376 | ||||||
Novartis ADR | 5,145 | 369 | ||||||
OC Oerlikon (A) | 3,988 | 48 | ||||||
Roche Holding (A) | 5,498 | 1,358 | ||||||
Swatch Group, Cl B (A) | 222 | 126 | ||||||
Swiss Life Holding (A) | 1,016 | 168 | ||||||
Swiss Re (A) | 1,100 | 81 | ||||||
Syngenta (A) | 706 | 274 | ||||||
Transocean | 6,300 | 316 | ||||||
UBS (A) | 5,200 | 91 | ||||||
|
| |||||||
| 3,951 | ||||||||
|
| |||||||
Taiwan — 1.7% | ||||||||
Advanced Semiconductor Engineering | 79,236 | 333 | ||||||
Asia Polymer (A) | 45,000 | 35 | ||||||
Asustek Computer (A) | 1,647 | 18 | ||||||
AU Optronics ADR * | 19,226 | 86 | ||||||
CMC Magnetics * (A) | 78,000 | 15 | ||||||
Elitegroup Computer Systems (A) | 52,000 | 22 | ||||||
Formosa Chemicals & Fibre (A) | 5,000 | 12 | ||||||
Formosa Petrochemical (A) | 7,000 | 18 | ||||||
Hermes Microvision (A) | 2,000 | 65 | ||||||
HON HAI Precision Industry (A) | 8,131 | 21 | ||||||
HON HAI Precision Industry GDR (A) | 18,319 | 92 | ||||||
Nan Ya Plastics (A) | 6,000 | 12 | ||||||
Pegatron * (A) | 3,633 | 6 | ||||||
Quanta Computer (A) | 8,000 | 17 | ||||||
Taiwan Semiconductor Manufacturing ADR | 12,481 | 233 | ||||||
| Description | Shares | Market Value ($ Thousands) | ||||||
TPK Holding (A) | 3,000 | $ | 59 | |||||
Yageo * (A) | 43,000 | 15 | ||||||
Zenitron (A) | 23,000 | 15 | ||||||
|
| |||||||
| 1,074 | ||||||||
|
| |||||||
Thailand — 1.0% | ||||||||
Advanced Info Service (A) | 25,400 | 220 | ||||||
Krung Thai Bank (A) | 113,900 | 83 | ||||||
Pruksa Real Estate (A) | 45,100 | 38 | ||||||
PTT (Foreign) (A) | 13,000 | 139 | ||||||
PTT Global Chemical (A) | 26,700 | 64 | ||||||
Thaicom (A) | 77,100 | 92 | ||||||
Total Access Communication (A) | 2,100 | 8 | ||||||
|
| |||||||
| 644 | ||||||||
|
| |||||||
Turkey — 1.3% | ||||||||
Akbank (A) | 52,657 | 250 | ||||||
KOC Holding ADR | 2,190 | 62 | ||||||
Turkiye Garanti Bankasi (A) | 24,692 | 127 | ||||||
Turkiye Is Bankasi, Cl C (A) | 65,354 | 241 | ||||||
Turkiye Vakiflar Bankasi Tao, Cl D (A) | 38,552 | 122 | ||||||
|
| |||||||
| 802 | ||||||||
|
| |||||||
United Kingdom — 14.8% | ||||||||
3i Group (A) | 15,900 | 81 | ||||||
Aberdeen Asset Management (A) | 15,470 | 108 | ||||||
ARM Holdings (A) | 9,442 | 138 | ||||||
ARM Holdings ADR | 16,794 | 737 | ||||||
Ashtead Group (A) | 8,250 | 78 | ||||||
Associated British Foods (A) | 10,163 | 278 | ||||||
AstraZeneca (A) | 6,527 | 333 | ||||||
Barclays (A) | 43,067 | 206 | ||||||
Berkeley Group Holdings (A) | 2,900 | 93 | ||||||
BHP Billiton (A) | 2,228 | 64 | ||||||
BP (A) | 39,795 | 284 | ||||||
BP PLC ADR | 5,984 | 257 | ||||||
British American Tobacco (A) | 7,716 | 423 | ||||||
British Polythene Industries (A) | 597 | 5 | ||||||
Burberry Group (A) | 8,869 | 194 | ||||||
Carnival (A) | 6,121 | 205 | ||||||
Dart Group | 7,297 | 22 | ||||||
Diageo (A) | 18,393 | 542 | ||||||
Gem Diamonds * | 15,406 | 33 | ||||||
GlaxoSmithKline (A) | 4,770 | 123 | ||||||
Halma (A) | 6,410 | 50 | ||||||
HSBC Holdings | 74,209 | 812 | ||||||
Impellam Group | 800 | 5 | ||||||
Imperial Tobacco Group (A) | 2,279 | 82 | ||||||
Johnson Service Group | 14,781 | 10 | ||||||
Kingfisher (A) | 60,387 | 314 | ||||||
Lavendon Group (A) | 8,308 | 20 | ||||||
Mondi (A) | 3,008 | 40 | ||||||
Pearson (A) | 10,139 | 188 | ||||||
Persimmon * (A) | 5,700 | 105 | ||||||
QinetiQ (A) | 2,709 | 8 | ||||||
Reckitt Benckiser Group (A) | 5,588 | 399 | ||||||
Rio Tinto (A) | 1,640 | 70 | ||||||
Rio Tinto ADR | 6,743 | 288 | ||||||
Rolls-Royce Holdings (A) | 16,382 | 296 | ||||||
Royal Bank of Scotland Group * (A) | 43,350 | 218 | ||||||
SABMiller (A) | 4,480 | 225 | ||||||
Shire (A) | 14,213 | 467 | ||||||
Standard Chartered (A) | 13,408 | 310 | ||||||
| 4 | SEI Institutional Investments Trust / Annual Report / May 31, 2013 |
Table of Contents
Schedule of Investments
Screened World Equity Ex-US Fund
May 31, 2013
| Description | Shares/Face Amount (1) (Thousands) | Market Value ($ Thousands) | ||||||
Standard Life (A) | 12,330 | $ | 73 | |||||
Subsea 7 * (A) | 13,680 | 300 | ||||||
Trinity Mirror * | 27,435 | 51 | ||||||
Tullow Oil (A) | 6,895 | 108 | ||||||
Unilever ADR | 8,342 | 350 | ||||||
WPP (A) | 12,765 | 217 | ||||||
Xchanging (A) | 23,731 | 49 | ||||||
|
| |||||||
| 9,259 | ||||||||
|
| |||||||
United States — 3.5% | ||||||||
Adams Resources & Energy | 276 | 17 | ||||||
Alon USA Energy | 1,077 | 20 | ||||||
Carnival, Cl A | 8,424 | 279 | ||||||
Computer Sciences | 3,994 | 178 | ||||||
Everest Re Group | 3,085 | 400 | ||||||
Liberty Global, Cl A * | 2,300 | 169 | ||||||
Manning & Napier, Cl A | 4,412 | 88 | ||||||
Marathon Petroleum | 2,990 | 247 | ||||||
Northrop Grumman | 1,418 | 117 | ||||||
Phillips 66 | 1,453 | 97 | ||||||
Schlumberger | 4,626 | 338 | ||||||
Star Gas Partners | 2,528 | 12 | ||||||
Tesoro | 64 | 4 | ||||||
Yum! Brands | 3,740 | 253 | ||||||
|
| |||||||
| 2,219 | ||||||||
|
| |||||||
Total Common Stock | 57,148 | |||||||
|
| |||||||
PREFERRED STOCK — 0.9% | ||||||||
Brazil — 0.8% | ||||||||
Itau Unibanco Holding ADR | 17,710 | 266 | ||||||
Petroleo Brasileiro, Cl Preference * | 26,700 | 250 | ||||||
|
| |||||||
| 516 | ||||||||
|
| |||||||
Germany — 0.1% | ||||||||
Draegerwerk (A) | 200 | 25 | ||||||
Sto (A) | 95 | 15 | ||||||
|
| |||||||
| 40 | ||||||||
|
| |||||||
Total Preferred Stock | 556 | |||||||
|
| |||||||
CASH EQUIVALENT — 4.1% | ||||||||
SEI Daily Income Trust, Prime Obligation Fund, Cl A 0.010% **† | 2,589,743 | 2,590 | ||||||
|
| |||||||
Total Cash Equivalent | 2,590 | |||||||
|
| |||||||
TIME DEPOSITS — 3.4% | ||||||||
Brown Brothers Harriman | ||||||||
4.150%, 06/01/2013 ZAR | 1 | — | ||||||
1.903%, 06/01/2013 AUD | 53 | 51 | ||||||
1.667%, 06/01/2013 NZD | 2 | 2 | ||||||
0.484%, 06/01/2013 NOK | 54 | 9 | ||||||
0.280%, 06/01/2013 CAD | 15 | 14 | ||||||
0.100%, 06/01/2013 SEK | 80 | 12 | ||||||
0.076%, 06/01/2013 GBP | 49 | 74 | ||||||
0.030%, 06/01/2013 | 1,587 | 1,587 | ||||||
0.005%, 06/01/2013 HKD | 149 | 19 | ||||||
0.005%, 06/01/2013 JPY | 4,626 | 46 | ||||||
0.005%, 06/01/2013 SGD | 17 | 13 | ||||||
0.001%, 06/01/2013 CHF | 53 | 55 | ||||||
| Description | Shares/Face Amount (1) (Thousands) | Market Value ($ Thousands) | ||||||
0.001%, 06/01/2013 EUR | 156 | $ | 202 | |||||
(0.10)%, 06/01/2013 DKK | 80 | 14 | ||||||
|
| |||||||
Total Time Deposits | 2,098 | |||||||
|
| |||||||
U.S. TREASURY OBLIGATIONS (B) (C) — 0.3% |
| |||||||
U.S. Treasury Bills | ||||||||
0.080%, 06/27/2013 | $ | 130 | 130 | |||||
0.042%, 07/25/2013 | 43 | 43 | ||||||
|
| |||||||
Total U.S. Treasury Obligations | 173 | |||||||
|
| |||||||
Total Investments — 100.1% | $ | 62,565 | ||||||
|
| |||||||
A list of the open futures contracts held by the Fund at May 31, 2013, is as follows:
| Type of Contract | Number of Contracts Long | Expiration Date | Unrealized Appreciation (Depreciation) ($ Thousands) | |||||||||
DJ Euro Stoxx 50 Index | 22 | Jun-2013 | $ | 35 | ||||||||
FTSE 100 Index | 7 | Jun-2013 | 19 | |||||||||
Hang Seng Index | 1 | Jun-2013 | (2 | ) | ||||||||
S&P TSX 60 Index | 2 | Jun-2013 | (5 | ) | ||||||||
SPI 200 Index | 2 | Jun-2013 | (6 | ) | ||||||||
Topix Index | 4 | Jun-2013 | 40 | |||||||||
|
| |||||||||||
| $ | 81 | |||||||||||
|
| |||||||||||
For the year ended May 31, 2013, the total amount of all open futures contracts, as presented in the table above, are representative of the volume of activity for this derivative type during the year.
Percentages are based on a Net Assets of $62,521 ($ Thousands).
| * | Non-income producing security. |
| ** | The rate reported is the 7-day effective yield as of May 31, 2013. |
| † | Investment in Affiliated Security (see Note 5). |
| ‡ | Real Estate Investment Trust. |
| (1) | In U.S. dollars unless otherwise indicated. |
| (A) | Security fair valued using methods determined in good faith by the Valuation Committee of the Board of Trustees. The total market value of such securities as of May 31, 2013 was $42,654 ($ Thousands) and represented 68.2% of Net Assets. |
| (B) | Security, or portion thereof, has been pledged as collateral on open futures contracts. (C) The rate reported is the effective yield at time of purchase. |
| 5 | SEI Institutional Investments Trust / Annual Report / May 31, 2013 |
Table of Contents
Schedule of Investments
Screened World Equity Ex-US Fund
May 31, 2013
ADR — American Depositary Receipt
AUD — Australian Dollar
CAD — Canadian Dollar
CHF — Swiss Franc
Cl — Class
DJ — Dow Jones
DKK — Danish Krone
EUR — Euro
FTSE — Financial Times and Stock Exchange
GBP — British Pound Sterling
GDR — Global Depositary Receipt
HKD — Hong Kong Dollar
JPY — Japanese Yen
NOK — Norwegian Krone
NZD — New Zealand Dollar
PLC — Public Limited Company
S&P — Standard & Poor’s
SEK — Swedish Krona
Ser — Series
SGD — Singapore Dollar
SPI — Share Price Index
TSX — Toronto Stock Exchange
ZAR — South African Rand
The following is a summary of the inputs used as of May 31, 2013, in valuing the Fund’s investments and other financial instruments carried at value ($ Thousands):
| Investments in Securities | Level 1 | Level 2 | Level 3 | Total | ||||||||||||
Common Stock | $ | 14,534 | $ | 42,614 | $ | — | $ | 57,148 | ||||||||
Preferred Stock | 516 | 40 | — | 556 | ||||||||||||
Cash Equivalent | 2,590 | — | — | 2,590 | ||||||||||||
Time Deposits | 2,098 | — | — | 2,098 | ||||||||||||
U.S. Treasury Obligations | — | 173 | — | 173 | ||||||||||||
|
|
|
|
|
|
|
| |||||||||
Total Investments in Securities | $ | 19,738 | $ | 42,827 | $ | — | $ | 62,565 | ||||||||
|
|
|
|
|
|
|
| |||||||||
| Other Financial Instruments | Level 1 | Level 2 | Level 3 | Total | ||||||||||||
Futures Contracts * | $ | 81 | $ | — | $ | — | $ | 81 | ||||||||
|
|
|
|
|
|
|
| |||||||||
| * | Futures contracts are valued at the unrealized appreciation on the instrument. |
For the year ended May 31, 2013, there were no transfers between Level 1 and Level 2 assets and liabilities.
For the year ended May 31, 2013, there were no transfers between Level 2 and Level 3 assets and liabilities.
For more information on valuation inputs, see Note 2 — Significant Accounting Policies in Notes to Financial Statements.
Amounts designated as “—” are $0 or have been rounded to $0.
The accompanying notes are an integral part of the financial statements.
| 6 | SEI Institutional Investments Trust / Annual Report / May 31, 2013 |
Table of Contents
Schedule of Investments
Dynamic Asset Allocation Fund
May 31, 2013
| Description | Shares | Market Value ($ Thousands) | ||||||
COMMON STOCK — 98.4% | ||||||||
Consumer Discretionary — 11.7% | ||||||||
Abercrombie & Fitch, Cl A | 6,200 | $ | 310 | |||||
Amazon.com * | 28,200 | 7,587 | ||||||
Apollo Group, Cl A * | 5,500 | 110 | ||||||
AutoNation * | 1,400 | 65 | ||||||
AutoZone * | 2,700 | 1,104 | ||||||
Bed Bath & Beyond * | 16,600 | 1,133 | ||||||
Best Buy | 19,700 | 543 | ||||||
BorgWarner * | 8,000 | 649 | ||||||
Cablevision Systems, Cl A | 17,100 | 259 | ||||||
Carmax * | 17,600 | 823 | ||||||
Carnival, Cl A | 32,700 | 1,082 | ||||||
CBS, Cl B | 43,500 | 2,153 | ||||||
Chipotle Mexican Grill, Cl A * | 2,400 | 866 | ||||||
Coach | 20,700 | 1,206 | ||||||
Comcast, Cl A | 204,300 | 8,203 | ||||||
Darden Restaurants | 8,500 | 440 | ||||||
Delphi Automotive | 22,000 | 1,074 | ||||||
DIRECTV * | 45,000 | 2,751 | ||||||
Discovery Communications, Cl A * | 18,400 | 1,451 | ||||||
Dollar General * | 22,400 | 1,183 | ||||||
Dollar Tree * | 17,200 | 826 | ||||||
DR Horton | 18,300 | 446 | ||||||
Expedia | 6,100 | 351 | ||||||
Family Dollar Stores | 6,300 | 385 | ||||||
Ford Motor | 305,100 | 4,784 | ||||||
Fossil * | 3,600 | 382 | ||||||
GameStop, Cl A | 10,400 | 345 | ||||||
Gannett | 16,800 | 361 | ||||||
Gap | 22,600 | 916 | ||||||
Garmin | 8,500 | 297 | ||||||
Genuine Parts | 11,800 | 917 | ||||||
Goodyear Tire & Rubber * | 19,600 | 297 | ||||||
H&R Block | 22,800 | 667 | ||||||
Harley-Davidson | 17,100 | 933 | ||||||
Harman International Industries | 5,500 | 292 | ||||||
Hasbro | 8,500 | 378 | ||||||
Home Depot | 115,700 | 9,101 | ||||||
International Game Technology | 19,800 | 354 | ||||||
Interpublic Group | 28,600 | 407 | ||||||
J.C. Penney * | 14,100 | 248 | ||||||
Johnson Controls | 51,000 | 1,905 | ||||||
Kohl’s | 16,400 | 843 | ||||||
L Brands | 18,100 | 905 | ||||||
Leggett & Platt | 10,400 | 333 | ||||||
Lennar, Cl A | 10,700 | 421 | ||||||
Lowe’s | 86,700 | 3,651 | ||||||
Macy’s | 29,000 | 1,402 | ||||||
Marriott International, Cl A | 20,100 | 845 | ||||||
Mattel | 25,300 | 1,132 | ||||||
McDonald’s | 77,700 | 7,504 | ||||||
NetFlix * | 4,200 | 950 | ||||||
Newell Rubbermaid | 24,100 | 652 | ||||||
News, Cl A | 155,500 | 4,993 | ||||||
NIKE, Cl B | 56,700 | 3,496 | ||||||
Nordstrom | 10,400 | 612 | ||||||
Omnicom Group | 19,200 | 1,193 | ||||||
O’Reilly Automotive * | 8,700 | 948 | ||||||
PetSmart | 9,100 | 614 | ||||||
priceline.com * | 4,100 | 3,296 | ||||||
PulteGroup * | 28,700 | 620 | ||||||
PVH | 6,100 | 703 | ||||||
| Description | Shares | Market Value ($ Thousands) | ||||||
Ralph Lauren, Cl A | 4,800 | $ | 841 | |||||
Ross Stores | 16,400 | 1,055 | ||||||
Scripps Networks Interactive, Cl A | 5,800 | 391 | ||||||
Staples | 53,400 | 801 | ||||||
Starbucks | 58,500 | 3,690 | ||||||
Starwood Hotels & Resorts Worldwide | 14,600 | 997 | ||||||
Target | 50,900 | 3,537 | ||||||
Tiffany | 9,400 | 731 | ||||||
Time Warner | 72,800 | 4,249 | ||||||
Time Warner Cable, Cl A | 21,900 | 2,092 | ||||||
TJX | 57,200 | 2,895 | ||||||
TripAdvisor * | 8,100 | 522 | ||||||
Urban Outfitters * | 7,300 | 306 | ||||||
VF | 6,500 | 1,195 | ||||||
Viacom, Cl B | 35,800 | 2,359 | ||||||
Walt Disney | 139,700 | 8,812 | ||||||
Washington Post, Cl B | 200 | 93 | ||||||
Whirlpool | 6,200 | 792 | ||||||
Wyndham Worldwide | 11,500 | 668 | ||||||
Wynn Resorts | 6,100 | 829 | ||||||
Yum! Brands | 35,500 | 2,405 | ||||||
|
| |||||||
| 131,957 | ||||||||
|
| |||||||
Consumer Staples — 10.4% | ||||||||
Altria Group | 156,100 | 5,635 | ||||||
Archer-Daniels-Midland | 49,200 | 1,586 | ||||||
Avon Products | 34,000 | 801 | ||||||
Beam | 12,200 | 791 | ||||||
Brown-Forman, Cl B | 11,700 | 805 | ||||||
Campbell Soup | 15,100 | 647 | ||||||
Clorox | 10,700 | 889 | ||||||
Coca-Cola | 296,100 | 11,841 | ||||||
Coca-Cola Enterprises | 21,700 | 806 | ||||||
Colgate-Palmolive | 68,600 | 3,968 | ||||||
ConAgra Foods | 30,500 | 1,028 | ||||||
Constellation Brands, Cl A * | 12,800 | 679 | ||||||
Costco Wholesale | 34,000 | 3,729 | ||||||
CVS Caremark | 95,600 | 5,505 | ||||||
Dr. Pepper Snapple Group | 16,000 | 736 | ||||||
Estee Lauder, Cl A | 17,600 | 1,193 | ||||||
General Mills | 50,900 | 2,396 | ||||||
Hershey | 11,100 | 989 | ||||||
HJ Heinz | 23,900 | 1,729 | ||||||
Hormel Foods | 8,900 | 354 | ||||||
JM Smucker | 8,300 | 838 | ||||||
Kellogg | 18,300 | 1,136 | ||||||
Kimberly-Clark | 30,400 | 2,943 | ||||||
Kraft Foods Group | 46,566 | 2,567 | ||||||
Kroger | 37,900 | 1,276 | ||||||
Lorillard | 27,900 | 1,184 | ||||||
McCormick | 10,500 | 725 | ||||||
Mead Johnson Nutrition, Cl A | 14,900 | 1,208 | ||||||
Molson Coors Brewing, Cl B | 13,100 | 647 | ||||||
Mondelez International, Cl A | 138,600 | 4,083 | ||||||
Monster Beverage * | 9,700 | 530 | ||||||
PepsiCo | 119,300 | 9,636 | ||||||
Philip Morris International | 127,300 | 11,573 | ||||||
Procter & Gamble | 210,800 | 16,181 | ||||||
Reynolds American | 23,700 | 1,140 | ||||||
Safeway | 17,500 | 403 | ||||||
Sysco | 46,700 | 1,578 | ||||||
Tyson Foods, Cl A | 18,800 | 470 | ||||||
Walgreen | 67,300 | 3,214 | ||||||
| 1 | SEI Institutional Investments Trust / Annual Report / May 31, 2013 |
Table of Contents
Schedule of Investments
Dynamic Asset Allocation Fund
May 31, 2013
| Description | Shares | Market Value ($ Thousands) | ||||||
Wal-Mart Stores | 129,400 | $ | 9,684 | |||||
Whole Foods Market | 25,400 | 1,317 | ||||||
|
| |||||||
| 118,440 | ||||||||
|
| |||||||
Energy — 10.4% | ||||||||
Anadarko Petroleum | 39,100 | 3,420 | ||||||
Apache | 30,800 | 2,530 | ||||||
Baker Hughes | 33,600 | 1,528 | ||||||
Cabot Oil & Gas | 15,500 | 1,090 | ||||||
Cameron International * | 18,200 | 1,108 | ||||||
Chesapeake Energy | 40,300 | 880 | ||||||
Chevron | 149,800 | 18,388 | ||||||
ConocoPhillips | 94,800 | 5,815 | ||||||
Consol Energy | 19,100 | 662 | ||||||
Denbury Resources * | 25,300 | 464 | ||||||
Devon Energy | 28,600 | 1,626 | ||||||
Diamond Offshore Drilling | 5,000 | 344 | ||||||
Ensco, Cl A | 17,200 | 1,035 | ||||||
EOG Resources | 21,300 | 2,750 | ||||||
EQT | 11,400 | 910 | ||||||
Exxon Mobil | 345,100 | 31,221 | ||||||
FMC Technologies * | 17,600 | 980 | ||||||
Halliburton | 73,000 | 3,055 | ||||||
Helmerich & Payne | 6,900 | 426 | ||||||
Hess | 22,500 | 1,517 | ||||||
Kinder Morgan | 47,077 | 1,788 | ||||||
Marathon Oil | 52,800 | 1,816 | ||||||
Marathon Petroleum | 24,700 | 2,038 | ||||||
Murphy Oil | 13,900 | 880 | ||||||
Nabors Industries | 19,300 | 309 | ||||||
National Oilwell Varco | 33,600 | 2,362 | ||||||
Newfield Exploration * | 10,000 | 238 | ||||||
Noble | 19,700 | 763 | ||||||
Noble Energy | 27,400 | 1,580 | ||||||
Occidental Petroleum | 62,500 | 5,754 | ||||||
Peabody Energy | 20,200 | 397 | ||||||
Phillips 66 | 48,600 | 3,235 | ||||||
Pioneer Natural Resources | 10,100 | 1,401 | ||||||
QEP Resources | 11,800 | 335 | ||||||
Range Resources | 12,100 | 910 | ||||||
Rowan, Cl A * | 9,100 | 302 | ||||||
Schlumberger | 102,900 | 7,515 | ||||||
Southwestern Energy * | 26,000 | 980 | ||||||
Spectra Energy | 50,700 | 1,550 | ||||||
Tesoro | 11,500 | 709 | ||||||
Valero Energy | 41,300 | 1,678 | ||||||
Williams | 54,000 | 1,900 | ||||||
WPX Energy * | 16,000 | 308 | ||||||
|
| |||||||
| 118,497 | ||||||||
|
| |||||||
Financials — 16.2% | ||||||||
ACE | 26,700 | 2,394 | ||||||
Aflac | 34,800 | 1,938 | ||||||
Allstate | 37,900 | 1,828 | ||||||
American Express | 74,600 | 5,648 | ||||||
American International Group * | 114,700 | 5,100 | ||||||
American Tower, Cl A | 31,100 | 2,421 | ||||||
Ameriprise Financial | 15,000 | 1,223 | ||||||
Aon | 24,800 | 1,579 | ||||||
Apartment Investment & Management, Cl A | 10,800 | 327 | ||||||
Assurant | 6,300 | 313 | ||||||
AvalonBay Communities | 9,800 | 1,300 | ||||||
Bank of America | 836,100 | 11,421 | ||||||
Bank of New York Mellon | 91,300 | 2,744 | ||||||
| Description | Shares | Market Value ($ Thousands) | ||||||
BB&T | 53,100 | $ | 1,748 | |||||
Berkshire Hathaway, Cl B * | 140,700 | 16,050 | ||||||
BlackRock, Cl A | 9,841 | 2,748 | ||||||
Boston Properties | 11,100 | 1,183 | ||||||
Capital One Financial | 45,700 | 2,784 | ||||||
CBRE Group, Cl A * | 25,800 | 598 | ||||||
Charles Schwab | 87,300 | 1,734 | ||||||
Chubb | 19,500 | 1,698 | ||||||
Cincinnati Financial | 12,500 | 592 | ||||||
Citigroup | 234,700 | 12,202 | ||||||
CME Group, Cl A | 24,400 | 1,658 | ||||||
Comerica | 12,500 | 494 | ||||||
Discover Financial Services | 39,300 | 1,863 | ||||||
E*TRADE Financial * | 21,100 | 245 | ||||||
Equity Residential ‡ | 23,400 | 1,323 | ||||||
Fifth Third Bancorp | 65,500 | 1,192 | ||||||
First Horizon National | 13,200 | 151 | ||||||
Franklin Resources | 10,500 | 1,626 | ||||||
Genworth Financial, Cl A * | 36,000 | 389 | ||||||
Goldman Sachs Group | 34,000 | 5,511 | ||||||
Hartford Financial Services Group | 33,100 | 1,014 | ||||||
HCP ‡ | 33,800 | 1,601 | ||||||
Health Care ‡ | 22,400 | 1,524 | ||||||
Host Hotels & Resorts ‡ | 53,800 | 957 | ||||||
Hudson City Bancorp | 35,200 | 299 | ||||||
Huntington Bancshares | 56,300 | 436 | ||||||
IntercontinentalExchange * | 5,500 | 942 | ||||||
Invesco | 33,100 | 1,117 | ||||||
JPMorgan Chase | 295,300 | 16,121 | ||||||
KeyCorp | 63,900 | 689 | ||||||
Kimco Realty ‡ | 28,900 | 640 | ||||||
Legg Mason | 9,300 | 326 | ||||||
Leucadia National | 21,000 | 659 | ||||||
Lincoln National | 22,400 | 799 | ||||||
Loews | 22,800 | 1,045 | ||||||
M&T Bank | 9,100 | 955 | ||||||
Macerich ‡ | 9,800 | 636 | ||||||
Marsh & McLennan | 41,600 | 1,665 | ||||||
McGraw-Hill | 20,700 | 1,129 | ||||||
MetLife | 85,400 | 3,775 | ||||||
Moody’s | 15,700 | 1,043 | ||||||
Morgan Stanley | 107,800 | 2,792 | ||||||
NASDAQ OMX Group | 9,100 | 286 | ||||||
Northern Trust | 16,500 | 959 | ||||||
NYSE Euronext | 19,100 | 768 | ||||||
People’s United Financial | 25,600 | 352 | ||||||
Plum Creek Timber ‡ | 11,600 | 553 | ||||||
PNC Financial Services Group | 39,600 | 2,837 | ||||||
Principal Financial Group | 19,600 | 742 | ||||||
Progressive | 40,900 | 1,043 | ||||||
Prologis ‡ | 36,300 | 1,463 | ||||||
Prudential Financial | 36,600 | 2,524 | ||||||
Public Storage ‡ | 10,900 | 1,655 | ||||||
Regions Financial | 107,500 | 981 | ||||||
Simon Property Group ‡ | 24,500 | 4,078 | ||||||
SLM | 32,800 | 779 | ||||||
SunTrust Banks | 39,600 | 1,271 | ||||||
T. Rowe Price Group | 19,700 | 1,494 | ||||||
Torchmark | 6,300 | 406 | ||||||
Travelers | 29,700 | 2,486 | ||||||
Unum Group | 18,000 | 513 | ||||||
US Bancorp | 144,900 | 5,080 | ||||||
Ventas ‡ | 23,200 | 1,656 | ||||||
Vornado Realty Trust ‡ | 12,500 | 999 | ||||||
| 2 | SEI Institutional Investments Trust / Annual Report / May 31, 2013 |
Table of Contents
Schedule of Investments
Dynamic Asset Allocation Fund
May 31, 2013
| Description | Shares | Market Value ($ Thousands) | ||||||
Wells Fargo | 378,300 | $ | 15,340 | |||||
Weyerhaeuser ‡ | 39,900 | 1,190 | ||||||
XL Group, Cl A | 24,500 | 770 | ||||||
Zions Bancorporation | 13,500 | 379 | ||||||
|
| |||||||
| 184,793 | ||||||||
|
| |||||||
Health Care — 12.5% | ||||||||
Abbott Laboratories | 122,300 | 4,485 | ||||||
AbbVie | 122,800 | 5,242 | ||||||
Actavis * | 9,500 | 1,171 | ||||||
Aetna | 30,118 | 1,819 | ||||||
Agilent Technologies | 25,600 | 1,164 | ||||||
Alexion Pharmaceuticals * | 14,900 | 1,453 | ||||||
Allergan | 24,200 | 2,408 | ||||||
AmerisourceBergen | 17,600 | 952 | ||||||
Amgen | 58,100 | 5,841 | ||||||
Baxter International | 42,800 | 3,010 | ||||||
Becton Dickinson | 15,500 | 1,529 | ||||||
Biogen Idec * | 18,400 | 4,370 | ||||||
Boston Scientific * | 106,500 | 984 | ||||||
Bristol-Myers Squibb | 127,100 | 5,848 | ||||||
C.R. Bard | 6,400 | 660 | ||||||
Cardinal Health | 25,200 | 1,184 | ||||||
CareFusion * | 18,700 | 687 | ||||||
Celgene * | 32,700 | 4,043 | ||||||
Cerner * | 10,800 | 1,061 | ||||||
Cigna | 20,900 | 1,419 | ||||||
Covidien | 37,200 | 2,366 | ||||||
DaVita * | 6,900 | 856 | ||||||
Dentsply International | 9,300 | 388 | ||||||
Edwards Lifesciences * | 9,600 | 638 | ||||||
Eli Lilly | 77,800 | 4,136 | ||||||
Express Scripts Holding * | 63,800 | 3,963 | ||||||
Forest Laboratories * | 18,600 | 739 | ||||||
Gilead Sciences * | 118,100 | 6,434 | ||||||
Hospira * | 10,900 | 378 | ||||||
Humana | 11,700 | 945 | ||||||
Intuitive Surgical * | 3,000 | 1,493 | ||||||
Johnson & Johnson | 215,600 | 18,149 | ||||||
Laboratory Corp of America Holdings * | 7,700 | 766 | ||||||
Life Technologies * | 12,900 | 956 | ||||||
McKesson | 17,400 | 1,981 | ||||||
Medtronic | 78,900 | 4,025 | ||||||
Merck | 233,600 | 10,909 | ||||||
Mylan Laboratories * | 30,800 | 939 | ||||||
Patterson | 6,800 | 266 | ||||||
PerkinElmer | 8,500 | 266 | ||||||
Perrigo | 6,700 | 777 | ||||||
Pfizer | 554,800 | 15,107 | ||||||
Quest Diagnostics | 13,100 | 810 | ||||||
Regeneron Pharmaceuticals * | 6,100 | 1,476 | ||||||
St. Jude Medical | 23,000 | 994 | ||||||
Stryker | 21,100 | 1,401 | ||||||
Tenet Healthcare * | 7,900 | 374 | ||||||
Thermo Fisher Scientific | 28,100 | 2,481 | ||||||
UnitedHealth Group | 79,700 | 4,992 | ||||||
Varian Medical Systems * | 7,900 | 529 | ||||||
Waters * | 7,200 | 696 | ||||||
WellPoint | 23,000 | 1,770 | ||||||
Zimmer Holdings | 12,700 | 997 | ||||||
|
| |||||||
| 142,327 | ||||||||
|
| |||||||
Industrials — 10.0% | ||||||||
3M | 49,300 | 5,437 | ||||||
| Description | Shares | Market Value ($ Thousands) | ||||||
ADT | 18,300 | $ | 743 | |||||
Avery Dennison | 7,400 | 322 | ||||||
Boeing | 52,900 | 5,238 | ||||||
C.H. Robinson Worldwide | 12,500 | 709 | ||||||
Caterpillar | 51,000 | 4,376 | ||||||
Cintas | 7,800 | 356 | ||||||
CSX | 76,000 | 1,916 | ||||||
Cummins | 14,100 | 1,687 | ||||||
Danaher | 43,400 | 2,683 | ||||||
Deere | 30,600 | 2,666 | ||||||
Dover | 13,400 | 1,048 | ||||||
Dun & Bradstreet | 3,500 | 344 | ||||||
Eaton | 37,101 | 2,451 | ||||||
Emerson Electric | 56,500 | 3,246 | ||||||
Equifax | 10,200 | 621 | ||||||
Expeditors International of Washington | 14,300 | 558 | ||||||
Fastenal | 19,900 | 1,038 | ||||||
FedEx | 23,100 | 2,225 | ||||||
Flowserve | 3,300 | 555 | ||||||
Fluor | 12,800 | 809 | ||||||
General Dynamics | 24,800 | 1,912 | ||||||
General Electric | 801,900 | 18,700 | ||||||
Honeywell International | 61,000 | 4,786 | ||||||
Illinois Tool Works | 30,900 | 2,167 | ||||||
Ingersoll-Rand | 20,200 | 1,162 | ||||||
Iron Mountain | 11,027 | 395 | ||||||
Jacobs Engineering Group * | 11,000 | 627 | ||||||
Joy Global | 6,900 | 373 | ||||||
Kansas City Southern | 8,100 | 897 | ||||||
L-3 Communications Holdings, Cl 3 | 6,100 | 519 | ||||||
Lockheed Martin | 21,100 | 2,233 | ||||||
Masco | 30,100 | 633 | ||||||
Norfolk Southern | 23,400 | 1,792 | ||||||
Northrop Grumman | 17,500 | 1,442 | ||||||
Paccar | 25,800 | 1,383 | ||||||
Pall | 9,300 | 634 | ||||||
Parker Hannifin | 11,000 | 1,097 | ||||||
Pentair | 15,846 | 923 | ||||||
Pitney Bowes | 16,500 | 242 | ||||||
Precision Castparts | 11,500 | 2,460 | ||||||
Quanta Services * | 14,000 | 397 | ||||||
Raytheon | 25,900 | 1,726 | ||||||
Republic Services, Cl A | 23,400 | 798 | ||||||
Robert Half International | 10,100 | 351 | ||||||
Rockwell Automation | 10,400 | 915 | ||||||
Rockwell Collins | 10,000 | 648 | ||||||
Roper Industries | 7,300 | 907 | ||||||
Ryder System | 2,700 | 170 | ||||||
Snap-on | 4,200 | 382 | ||||||
Southwest Airlines | 52,400 | 743 | ||||||
Stanley Black & Decker | 12,500 | 990 | ||||||
Stericycle * | 6,800 | 746 | ||||||
Textron | 20,100 | 542 | ||||||
Tyco International | 34,300 | 1,160 | ||||||
Union Pacific | 36,400 | 5,628 | ||||||
United Parcel Service, Cl B | 55,600 | 4,776 | ||||||
United Technologies | 65,400 | 6,206 | ||||||
Waste Management | 32,000 | 1,342 | ||||||
WW Grainger | 4,400 | 1,133 | ||||||
Xylem | 13,300 | 374 | ||||||
|
| |||||||
| 113,339 | ||||||||
|
| |||||||
| 3 | SEI Institutional Investments Trust / Annual Report / May 31, 2013 |
Table of Contents
Schedule of Investments
Dynamic Asset Allocation Fund
May 31, 2013
| Description | Shares | Market Value ($ Thousands) | ||||||
Information Technology — 17.9% | ||||||||
Accenture, Cl A | 50,200 | $ | 4,122 | |||||
Adobe Systems * | 37,800 | 1,622 | ||||||
Advanced Micro Devices * | 42,400 | 170 | ||||||
Akamai Technologies * | 12,900 | 595 | ||||||
Altera | 24,800 | 823 | ||||||
Amphenol, Cl A | 12,100 | 943 | ||||||
Analog Devices | 22,600 | 1,038 | ||||||
Apple | 72,300 | 32,512 | ||||||
Applied Materials | 88,000 | 1,338 | ||||||
Autodesk * | 17,800 | 672 | ||||||
Automatic Data Processing | 38,100 | 2,618 | ||||||
BMC Software * | 9,400 | 426 | ||||||
Broadcom, Cl A | 39,900 | 1,433 | ||||||
CA | 23,900 | 653 | ||||||
Cisco Systems | 412,300 | 9,928 | ||||||
Citrix Systems * | 13,800 | 888 | ||||||
Cognizant Technology Solutions, Cl A * | 22,600 | 1,461 | ||||||
Computer Sciences | 10,200 | 455 | ||||||
Corning | 116,800 | 1,795 | ||||||
Dell | 111,100 | 1,483 | ||||||
eBay * | 90,700 | 4,907 | ||||||
Electronic Arts * | 22,600 | 519 | ||||||
EMC | 164,100 | 4,063 | ||||||
F5 Networks * | 5,400 | 449 | ||||||
Fidelity National Information Services | 23,800 | 1,069 | ||||||
First Solar * | 3,800 | 207 | ||||||
Fiserv * | 10,100 | 880 | ||||||
FLIR Systems | 11,600 | 282 | ||||||
Google, Cl A * | 20,600 | 17,930 | ||||||
Harris | 7,500 | 376 | ||||||
Hewlett-Packard | 152,400 | 3,722 | ||||||
Intel | 382,600 | 9,290 | ||||||
International Business Machines | 80,800 | 16,808 | ||||||
Intuit | 20,300 | 1,186 | ||||||
Jabil Circuit | 14,700 | 295 | ||||||
JDS Uniphase * | 18,500 | 252 | ||||||
Juniper Networks * | 41,000 | 727 | ||||||
Kla-Tencor | 11,800 | 664 | ||||||
Lam Research * | 11,187 | 523 | ||||||
Linear Technology | 15,900 | 596 | ||||||
LSI * | 41,100 | 304 | ||||||
Mastercard, Cl A | 8,200 | 4,676 | ||||||
Microchip Technology | 16,500 | 602 | ||||||
Micron Technology * | 80,600 | 941 | ||||||
Microsoft | 581,300 | 20,276 | ||||||
Molex | 10,400 | 305 | ||||||
Motorola Solutions | 20,200 | 1,171 | ||||||
NetApp | 26,700 | 1,002 | ||||||
Nvidia | 44,800 | 649 | ||||||
Oracle | 285,600 | 9,642 | ||||||
Paychex | 24,600 | 916 | ||||||
Qualcomm | 133,000 | 8,443 | ||||||
Red Hat * | 15,300 | 738 | ||||||
SAIC | 22,600 | 328 | ||||||
Salesforce.com * | 42,800 | 1,812 | ||||||
SanDisk * | 17,900 | 1,056 | ||||||
Seagate Technology | 24,800 | 1,068 | ||||||
Symantec | 50,400 | 1,128 | ||||||
TE Connectivity | 30,700 | 1,363 | ||||||
Teradata * | 13,700 | 764 | ||||||
Teradyne * | 15,000 | 269 | ||||||
Description | Shares | Market Value ($ Thousands) | ||||||
Texas Instruments | 86,500 | $ | 3,105 | |||||
Total System Services | 12,500 | 294 | ||||||
VeriSign * | 10,200 | 480 | ||||||
Visa, Cl A | 40,000 | 7,126 | ||||||
Western Digital | 16,600 | 1,051 | ||||||
Western Union | 42,500 | 696 | ||||||
Xerox | 100,400 | 883 | ||||||
Xilinx | 18,400 | 748 | ||||||
Yahoo! * | 72,300 | 1,902 | ||||||
|
| |||||||
| 203,458 | ||||||||
|
| |||||||
Materials — 3.4% | ||||||||
Air Products & Chemicals | 15,200 | 1,435 | ||||||
Airgas | 4,600 | 473 | ||||||
Alcoa | 88,900 | 756 | ||||||
Allegheny Technologies | 8,500 | 234 | ||||||
Ball | 11,200 | 483 | ||||||
Bemis | 8,000 | 313 | ||||||
CF Industries Holdings | 4,700 | 897 | ||||||
Cliffs Natural Resources | 9,400 | 170 | ||||||
Dow Chemical | 94,200 | 3,246 | ||||||
E.I. du Pont de Nemours | 72,800 | 4,061 | ||||||
Eastman Chemical | 11,700 | 839 | ||||||
Ecolab | 20,100 | 1,698 | ||||||
FMC | 9,800 | 615 | ||||||
Freeport-McMoRan Copper & Gold, Cl B | 81,600 | 2,534 | ||||||
International Flavors & Fragrances | 5,800 | 466 | ||||||
International Paper | 33,600 | 1,551 | ||||||
LyondellBasell Industries, Cl A | 28,300 | 1,886 | ||||||
MeadWestvaco | 11,500 | 402 | ||||||
Monsanto | 41,700 | 4,197 | ||||||
Mosaic | 20,300 | 1,235 | ||||||
Newmont Mining | 39,800 | 1,364 | ||||||
Nucor | 23,400 | 1,041 | ||||||
Owens-Illinois * | 12,300 | 338 | ||||||
PPG Industries | 11,300 | 1,736 | ||||||
Praxair | 23,300 | 2,664 | ||||||
Sealed Air | 14,900 | 358 | ||||||
Sherwin-Williams | 6,300 | 1,188 | ||||||
Sigma-Aldrich | 9,900 | 828 | ||||||
United States Steel | 11,800 | 209 | ||||||
Vulcan Materials | 9,400 | 504 | ||||||
|
| |||||||
| 37,721 | ||||||||
|
| |||||||
Telecommunication Services — 2.7% | ||||||||
AT&T | 423,900 | 14,832 | ||||||
CenturyLink | 46,700 | 1,595 | ||||||
Crown Castle International * | 22,200 | 1,582 | ||||||
Frontier Communications | 73,000 | 302 | ||||||
Sprint Nextel * | 239,200 | 1,746 | ||||||
Verizon Communications | 220,900 | 10,709 | ||||||
Windstream | 38,800 | 312 | ||||||
|
| |||||||
| 31,078 | ||||||||
|
| |||||||
Utilities — 3.2% | ||||||||
AES | 52,200 | 637 | ||||||
AGL Resources | 8,500 | 360 | ||||||
Ameren | 19,300 | 657 | ||||||
American Electric Power | 36,200 | 1,659 | ||||||
Centerpoint Energy | 35,300 | 818 | ||||||
CMS Energy | 22,400 | 604 | ||||||
Consolidated Edison | 21,400 | 1,221 | ||||||
Dominion Resources | 45,300 | 2,562 | ||||||
| 4 | SEI Institutional Investments Trust / Annual Report / May 31, 2013 |
Table of Contents
Schedule of Investments
Dynamic Asset Allocation Fund
May 31, 2013
| Description | Shares/Contracts | Market Value ($ Thousands) | ||||||
DTE Energy | 13,000 | $ | 866 | |||||
Duke Energy | 55,030 | 3,683 | ||||||
Edison International | 23,900 | 1,098 | ||||||
Entergy | 13,200 | 909 | ||||||
Exelon | 67,500 | 2,115 | ||||||
FirstEnergy | 30,500 | 1,190 | ||||||
Integrys Energy Group | 5,700 | 328 | ||||||
NextEra Energy | 33,300 | 2,518 | ||||||
NiSource | 24,200 | 695 | ||||||
Northeast Utilities | 23,200 | 967 | ||||||
NRG Energy | 25,600 | 653 | ||||||
ONEOK | 15,500 | 700 | ||||||
Pepco Holdings | 16,800 | 349 | ||||||
PG&E | 32,200 | 1,446 | ||||||
Pinnacle West Capital | 7,800 | 441 | ||||||
PPL | 42,500 | 1,262 | ||||||
Public Service Enterprise Group | 37,000 | 1,222 | ||||||
SCANA | 11,000 | 555 | ||||||
Sempra Energy | 16,500 | 1,341 | ||||||
Southern | 68,100 | 2,990 | ||||||
TECO Energy | 16,000 | 282 | ||||||
Wisconsin Energy | 15,700 | 641 | ||||||
Xcel Energy | 36,000 | 1,034 | ||||||
|
| |||||||
| 35,803 | ||||||||
|
| |||||||
Total Common Stock | 1,117,413 | |||||||
|
| |||||||
CASH EQUIVALENT — 0.5% | ||||||||
SEI Daily Income Trust, Prime Obligation Fund, Cl A | ||||||||
0.010% ** † | 5,702,681 | 5,703 | ||||||
|
| |||||||
Total Cash Equivalent | 5,703 | |||||||
|
| |||||||
Total Investments — 98.9% | $ | 1,123,116 | ||||||
|
| |||||||
PURCHASED OPTION — 0.2% | ||||||||
June 2013 SPX UO Index Option Put, Expires 06/22/2013, Strike Price $1,575 * | 3,000 | 2,490 | ||||||
|
| |||||||
Total Purchased Option | 2,490 | |||||||
|
| |||||||
A list of the outstanding forward foreign currency contracts held by the Fund at May 31, 2013, is as follows:
| Settlement Date | Currency to Deliver (Thousands) | Currency to Receive (Thousands) | Unrealized ($ Thousands) | |||||||||
7/25/13 | EUR | 360,735 | USD | 471,394 | $ | 3,808 | ||||||
7/25/13 | JPY | 10,968,782 | USD | 111,818 | 3,145 | |||||||
|
| |||||||||||
| $ | 6,953 | |||||||||||
|
| |||||||||||
A list of the counterparties for the outstanding forward foreign currency contracts held by the Fund at May 31, 2013, is as follows:
| Counterparty | Currency to Deliver ($ Thousands) | Currency to Receive ($ Thousands) | Unrealized Appreciation (Depreciation) ($ Thousands) | |||||||||
BNP Paribas | $ | (161,614 | ) | $ | 165,834 | $ | 4,220 | |||||
Citigroup | (11,545 | ) | 11,534 | (11 | ) | |||||||
Goldman Sachs | (34,881 | ) | 34,871 | (10 | ) | |||||||
UBS | (368,218 | ) | 370,972 | 2,754 | ||||||||
|
| |||||||||||
| $ | 6,953 | |||||||||||
|
| |||||||||||
For the year ended May 31, 2013, the total amount of all open forward foreign currency contracts, as presented in the table above, are representative of the volume of activity for this derivative type during the year.
Percentages are based on a Net Assets of $1,135,631 ($ Thousands).
| * | Non-income producing security. |
| ** | The rate reported is the 7-day effective yield as of May 31, 2013. |
| ‡ | Real Estate Investment Trust. |
| † | Investment in Affiliated Security (see Note 5). |
Cl — Class
EUR — Euro
JPY — Japanese Yen
SPX — Standard & Poor’s 500 Index
USD — United States Dollar
The following is a list of the inputs used as of May 31, 2013, in valuing the Fund’s investments carried at value ($ Thousands):
| Investments in Securities | Level 1 | Level 2 | Level 3 | Total | ||||||||||||
Common Stock | $ | 1,117,413 | $ | — | $ | — | $ | 1,117,413 | ||||||||
Cash Equivalent | 5,703 | — | — | 5,703 | ||||||||||||
|
|
|
|
|
|
|
| |||||||||
Total Investments in Securities | $ | 1,123,116 | $ | — | $ | — | $ | 1,123,116 | ||||||||
|
|
|
|
|
|
|
| |||||||||
| Other Financial Instruments | Level 1 | Level 2 | Level 3 | Total | ||||||||||||
Purchased Option * | $ | 2,490 | $ | — | $ | — | $ | 2,490 | ||||||||
Forwards Contracts * | — | 6,953 | — | 6,953 | ||||||||||||
|
|
|
|
|
|
|
| |||||||||
Total Other Financial Instruments | $ | 2,490 | $ | 6,953 | $ | — | $ | 9,443 | ||||||||
|
|
|
|
|
|
|
| |||||||||
| * | Options and forwards contracts are valued at the unrealized appreciation on the instrument. |
For the year ended May 31, 2013, there were no transfers between Level 1 and Level 2 assets and liabilities.
For the year ended May 31, 2013, there were no transfers between Level 2 and Level 3 assets and liabilities.
For more information on valuation inputs, see Note 2 — Significant Accounting Policies in Notes to Financial Statements.
Amounts designated as “—” are either $0 or have been rounded to $0. The accompanying notes are an integral part of the financial statements.
| 5 | SEI Institutional Investments Trust / Annual Report / May 31, 2013 |
Table of Contents
Report of Independent Registered Public Accounting Firm
To the Board of Trustees and Shareholders
SEI Institutional Investments Trust:
We have audited, in accordance with the standards of the Public Company Accounting Oversight Board (United States), the financial statements of SEI Institutional Investments Trust, comprised of the Large Cap Fund, Large Cap Diversified Alpha Fund, Large Cap Disciplined Equity Fund, Large Cap Index Fund, Extended Market Index Fund, Small Cap Fund, Small Cap II Fund, Small/Mid Cap Equity Fund, U.S. Managed Volatility Fund, International Equity Fund, World Equity Ex-US Fund, Screened World Equity Ex-US Fund, Opportunistic Income Fund (formerly the Enhanced LIBOR Opportunities Fund), Core Fixed Income Fund, High Yield Bond Fund, Long Duration Fund, Long Duration Corporate Bond Fund, Ultra Short Duration Bond Fund, Emerging Markets Debt Fund, Real Return Fund, Dynamic Asset Allocation Fund and Multi-Asset Real Return Fund (collectively, the “Funds”), as of and for the year ended May 31, 2013, and have issued our unqualified report thereon dated July 30, 2013 (which report and financial statements are included in Item 1 of this Certified Shareholder Report on Form N-CSR). Our audits included an audit of the Funds’ schedules of investments in securities (the “Schedules”) as of May 31, 2013 appearing in Item 6 of this Form N-CSR. These Schedules are the responsibility of the Funds’ management. Our responsibility is to express an opinion on these Schedules based on our audits.
In our opinion, the Schedules referred to above, when read in conjunction with the financial statements of the Funds referred to above, present fairly, in all material respects, the information set forth therein.
/s/ KPMG LLP
Philadelphia, Pennsylvania
July 30, 2013
Table of Contents
(b) In accordance with Section 13(c) of the Investment Company Act of 1940 the Screened World Equity Ex-US Fund did not hold any divested securities during the fiscal year ended May 31, 2013:
Item 7. Disclosure of Proxy Voting Policies and Procedures for Closed-End Management Investment Companies.
Not applicable.
Item 8. Portfolio Managers of Closed-End Management Investment Companies
Not applicable.
Item 9. Purchases of Equity Securities by Closed-End Management Company and Affiliated Purchasers.
Not applicable.
Item 10. Submission of Matters to a Vote of Security Holders.
The Registrant has a standing Governance Committee (the “Committee”) currently consisting of the Independent Trustees. The Committee is responsible for evaluating and recommending nominees for election to the Registrant’s Board of Trustees (the “Board”). Pursuant to the Committee’s Charter, adopted on June 18, 2004, as amended, the Committee will review all shareholder recommendations for nominations to fill vacancies on the Board if such recommendations are submitted in writing and addressed to the Committee at the Registrant’s office.
Table of Contents
| Item 11. | Controls and Procedures. |
(a) The registrant’s principal executive and principal financial officers, or persons performing similar functions, have concluded that the Registrant’s disclosure controls and procedures (as defined in Rule 30a-3(c) under the Investment Company Act of 1940 (the “1940 Act”)) are effective, based on the evaluation of these controls and procedures required by Rule 30a-3(b) under the 1940 Act and Rules 13a-15(b) or 15d-15(b) under the Securities Exchange Act of 1934 as of a date within 90 days of the filing date of this report.
(b) There were no changes in the Registrant’s internal control over financial reporting (as defined in Rule 30a-3(d) under the 1940 Act) that occurred during the second fiscal quarter of the period covered by this report that have materially affected, or are reasonably likely to materially affect, the Registrant’s internal control over financial reporting.
| Items 12. | Exhibits. |
(a)(1) Code of Ethics attached hereto.
(a)(2) A separate certification for the principal executive officer and the principal financial officer of the Registrant as required by Rule 30a-2(a) under the Investment Company Act of 1940, as amended (17 CFR 270.30a-2(a)), are filed herewith.
(b) Officer certifications as required by Rule 30a-2(b) under the Investment Company Act of 1940, as amended (17 CFR 270.30a-2(b)) also accompany this filing as an exhibit.
Table of Contents
SIGNATURES
Pursuant to the requirements of the Securities Exchange Act of 1934 and the Investment Company Act of 1940, the Registrant has duly caused this report to be signed on its behalf by the undersigned, thereunto duly authorized.
| SEI Institutional Investments Trust | ||
| By | /S/ ROBERT A. NESHER | |
Robert A. Nesher President & CEO | ||
Date: August 8, 2013
Pursuant to the requirements of the Securities Exchange Act of 1934 and the Investment Company Act of 1940, this report has been signed below by the following persons on behalf of the Registrant and in the capacities and on the dates indicated.
| By | /S/ ROBERT A. NESHER | |
Robert A. Nesher President & CEO | ||
Date: August 8, 2013
| By | /S/ PETER A. RODRIGUEZ | |
Peter A. Rodriguez Controller & CFO | ||
Date: August 8, 2013