UNITED STATES
SECURITIES AND EXCHANGE COMMISSION
Washington, D.C. 20549
FORM N-CSR
CERTIFIED SHAREHOLDER REPORT OF REGISTERED MANAGEMENT
INVESTMENT COMPANIES
Investment Company Act file number 811-07257
SEI Institutional Investments Trust
SEI Investments
One Freedom Valley Drive
Oaks, PA 19456
CT Corporation
155 Federal Street
Boston, MA 02110
Registrant’s telephone number, including area code: 1-800-342-5734
Date of fiscal year end: May 31, 2015
Date of reporting period: May 31, 2015
| Item 1. | Reports to Stockholders. |

May 31, 2015
ANNUAL REPORT
SEI Institutional Investments Trust
† Large Cap Fund
† Large Cap Diversified Alpha Fund
† Large Cap Disciplined Equity Fund
† Large Cap Index Fund
† S&P 500 Index Fund
† Extended Market Index Fund
† Small Cap Fund
† Small Cap II Fund
† Small/Mid Cap Equity Fund
† U.S. Managed Volatility Fund
† World Equity Ex-US Fund
† Screened World Equity Ex-US Fund
† Emerging Markets Equity Fund
† Opportunistic Income Fund
† Core Fixed Income Fund
† High Yield Bond Fund
† Long Duration Fund
† Long Duration Credit Fund
† Ultra Short Duration Bond Fund
† Emerging Markets Debt Fund
† Real Return Fund
† Limited Duration Bond Fund
† Intermediate Duration Credit Fund
† Dynamic Asset Allocation Fund
† Multi-Asset Real Return Fund

The Trust files its complete schedule of portfolio holdings with the Securities and Exchange Commission for the first and third quarters of each fiscal year on Form N-Q within sixty days after the end of the period. The Trust’s Forms N-Q are available on the Commission’s website at http://www.sec.gov, and may be reviewed and copied at the Commission’s Public Reference Room in Washington, DC. Information on the operation of the Public Reference Room may be obtained by calling 1-800-SEC-0330.
A description of the policies and procedures that the Trust uses to determine how to vote proxies relating to portfolio securities, as well as information relating to how a Fund voted proxies relating to portfolio securities during the most recent 12-month period ended June 30, is available (i) without charge, upon request, by calling 1-800-DIAL-SEI; and (ii) on the Commission’s website at http://www.sec.gov.
SEI INSTITUTIONAL INVESTMENTS TRUST — MAY 31, 2015 (Unaudited)
The Funds’ fiscal year — June 1, 2014 through May 31, 2015 — began rather quietly. For example, the geopolitical standoff between Russia, Ukraine and Europe continued to come off the boil; U.S. economic growth recovered from its surprisingly weak start in 2014; certain high-risk areas of the market (such as high-yield and emerging-market debt and equities) continued the recoveries they had begun in late 2013 and early 2014; and key measures of volatility and investor risk aversion reached extreme lows by the end of June 2014. This all began to change in July 2014, as shocks in commodities and currency markets, accompanied by divergent central bank policies, fostered rising uncertainty and volatility as well as divergent behavior within and across asset classes. Despite the intrigue, most equity and fixed-income asset classes in the U.S. produced positive returns for the one-year period ending May 31, 2015. Results were more of a mixed bag in other asset classes and outside the U.S., as a significantly stronger dollar weighed on commodity and international-asset returns.
Geopolitical events
In contrast to the Funds’ previous fiscal year, the conflict between Russia and Ukraine (and, by extension, between Russia and western powers such as Europe and the U.S.) simmered but did not boil over. There was continued (and in some cases intensifying) strife in several Middle Eastern and African nations, including Syria, Iraq, Libya and Nigeria. However, disruptions within the latter three countries, which are net oil producers, were not sufficient to stop the price of crude oil from falling sharply during the period. In fact, some of the most interesting geopolitical wrangling occurred within the oil markets. Faced with a dramatic increase in North American oil production in recent years, the Organization of Petroleum Exporting Countries (“OPEC”) decided to maintain, rather than cut, existing production targets, despite “an extremely well-supplied market.”1 This decision reflected an intense battle for market share that began during 2014 between Saudi Arabia, the oil market’s key producer, and North America, where significant investments have been made in unconventional (but costlier) forms of oil-and-gas production. Although not necessarily related, the Obama administration invested a great deal of diplomatic time and effort during the year in reaching a deal with Iran — which happens to be Saudi Arabia’s key rival in the region — in an attempt to check its nuclear ambitions while easing the west’s economic sanctions. Although Iran has vast amounts of oil reserves, most energy analysts do not believe the agreement will have an immediate impact on either the country’s oil production or the global price of oil. Still, Saudi Arabia has been willing to allow the price of oil to fall in order to recover market share, even running down its foreign-currency reserves and increasing its borrowing to cover government expenditures. We believe these oil-market dynamics could continue to have diverse and meaningful impacts on the world’s economies and financial markets.
Economic performance
The Funds’ fiscal year began during the second quarter of 2014 when the U.S. economy was regaining traction following a weather-induced decline at the start of the year. The growth recovery continued in the third quarter of 2014 and slowed a bit in the fourth before contracting once again in the first quarter of 2015. This year’s first-quarter disappointment was driven by extreme winter weather in certain parts of the U.S., as well as sluggish demand from abroad. The latter factor was made worse by a stronger dollar (which makes imports from the U.S. more expensive to foreign buyers) and increasingly contentious labor negotiations in several west-coast ports that, at times, prevented the smooth flow of goods into and out of the country. While overall U.S. growth was not terribly impressive for the full period, it remained positive and, encouragingly, the labor market continued to strengthen. Initial claims for unemployment benefits maintained their sharp, downward trajectory from the highs of 2009, and the U.S. unemployment rate fell from 6.3% at the end of May 2014 to 5.5% at the end of May 2015, according to the Bureau of Labor Statistics. The proportion of working-age individuals participating in the labor force, which declined sharply from 2008 to 2013, continued to show signs of stabilizing. Employee compensation also exhibited steady growth, although the pace remained below its long-term average. While the U.S. economy appears to have rebounded in the second quarter of 2015, there have nonetheless been additional signs of sluggishness. For example, after a solid run during the first half of the Funds’ fiscal year, industrial production, capacity utilization and consumer-sentiment measures have been trending down since the start of 2015. And lower oil prices, historically a boon for U.S. consumers, have had a more mixed impact this time around. As global oil prices fell, many higher-cost North American producers began to struggle, as did states and regions where heavy energy investments were made in recent years. Still, the overall story during the reporting period was one of slow but continued growth. As a result, the Federal Reserve (“Fed”) ended its asset-purchase programs (also known as quantitative easing) in 2014, and most market observers still expect it to begin hiking interest rates sometime in late 2015. But these signs of sluggishness have pushed the expected start date of Fed interest rate hikes further into the future.
| 1 | “OPEC 166th Meeting concludes,” Organization of the Petroleum Exporting Countries, November 27, 2014, <http://www.opec.org/opec_web/en/press_room/2938.htm>. |
| SEI Institutional Investments Trust / Annual Report / May 31, 2015 | 1 |
SEI INSTITUTIONAL INVESTMENTS TRUST — MAY 31, 2015 (Unaudited) (Continued)
Among developed markets, Japan’s economy was a standout, as the government’s reform efforts continued to foster recovery. The world’s third largest national economy struggled in the third quarter of 2014, following a national sales-tax hike designed to chip away at its high level of sovereign debt. However, it finished the period with two consecutive quarters of solid growth. Japan’s economy is still smaller than it was before the 2008-2009 financial crisis though, and as a result, policymakers in the government and at the Bank of Japan (“BOJ”) have signalled they are in no hurry to engage in further tightening measures at this point.
The U.K. economy, a stalwart among developed markets from 2013 into 2014, continued to grow during the Funds’ fiscal year but at a declining pace. The Bank of England, which began stabilizing policy in mid-2012, stood pat during the period. In the last five monthly meetings of 2014, however, two members of the bank’s Monetary Policy Committee (“MPC”) voted to lower the bank’s official interest rate target from 0.50% to 0.25%, reflecting uncertainty over the country’s slowing pace of growth. Thus far in 2015, MPC members have voted unanimously to keep the rate at 0.50%, indicating a more optimistic outlook. This development, along with May 2015 elections that gave a surprisingly resounding victory to conservatives, supported the country’s currency (the pound sterling) against the euro through the first five months of 2015 and against the U.S. dollar in May 2015.
Europe continued to play the sick man among developed economies, although consistent with recent years, country performance varied widely, and the eurozone’s growth trajectory was better than the period from 2011 through 2012 (although it was still slower than prior to the global financial crisis in 2008-2009). There were some important signs of improvement, driven in part by a weaker euro, which boosted demand for European exports. The catalyst for a weaker euro was the European Central Bank’s (“ECB”) initiation — finally — of a quantitative easing program aimed at stabilizing the continent’s financial system and fostering credit expansion and faster economic growth. These efforts were of limited help to Greece; the country remained the weakest link in the euro area, as it became clear that its government would not be able to make all of the scheduled payments to its creditors (most of them official institutions such as the ECB and the International Monetary Fund) in 2015. Elections in Greece led to the formation of a socialist government in early 2015 that was stridently opposed to the austerity measures imposed by 2011 and 2012 creditor agreements. As a result, investors and policymakers began to worry once more about whether Greece would have to leave the eurozone and, if so, whether its departure would cause financial contagion within and beyond Europe. From February through the end of May, Greece was in testy negotiations with its official creditors, eurozone finance ministers and heads of state, and especially Germany. The uncertainty was reflected in its bond yields (which, after falling steadily from mid-2012, reversed course and rose steadily from September 2014 through the end of May) and its stock market (which, as reflected by the Athens Stock Exchange General Index, fell more than 30% over the Funds’ fiscal year in euro terms). Among the core countries of the eurozone, Germany remained the strongest of the group, while France showed some meaningful improvement in economic activity. Activity in Italy’s economy, the eurozone’s third largest, continued to stagnate in 2014, while Spain’s economy, the fourth largest in the eurozone, continued to recover from its lows of 2013. At the end of 2014, unemployment in both countries remained high at 12.7% and 24.5%, respectively, according to the Organization for Economic Cooperation and Development; even worse, youth unemployment (ages 15 to 24) reemained above 40% in Italy and above 50% in Spain at the end of 2014. In our view, the eurozone economy still has a ways to go to return to full health, but policymakers finally appear to be taking steps in the right direction.
In emerging markets, the darlings of the prior decade — Brazil, China, India and Russia — continued to struggle with slowing growth or outright recession. Brazil and Russia were hit hard by the bear market in oil and other commodities, and slowdowns in their economies appeared to accelerate in 2015. Regionally, Brazil was not alone, as most economies in Latin America struggled during the period. Russia’s economy is widely expected to contract for full-year 2015, although its currency and its debt have stabilized since falling precipitously in the wake of the oil-price shock. China and India are still seeing very healthy rates of economic growth, but those rates continued to slow during the Funds’ fiscal year. In China, President Xi Jinping’s administration continued to vigorously pursue an anti-corruption agenda, but these efforts were overshadowed in the second half of the period by a series of surprise interest rate cuts and other easing measures by the People’s Bank of China (“PBOC”). In India, the election of Prime Minister Narendra Modi in 2014 was widely viewed as a business-friendly development, and the Indian stock market (as reflected by the India Bombay Stock Exchange 30 Sensex Index) responded favorably from early 2014 through early 2015. Since then, Indian stocks have moved sideways and slightly lower, as economic growth slowed and the new prime minister focused on longer-term reforms. Similar to the PBOC, the Reserve Bank of India made surprise cuts to its key lending rate in early 2015 for the first time since 2013. Growth in smaller emerging economies and frontier economies varied widely; this is normally the case, but the variation was accentuated by commodity-price shocks that favored commodity importers and hurt commodity exporters.
Market developments — commodities
Commodity markets were routed badly during the Funds’ fiscal year. As already noted, the oil market was hit especially hard due to substantial increases in global supply, driven by a massive expansion of North American production and OPEC’s refusal to cut output. Oil prices fell by more
| 2 | SEI Institutional Investments Trust / Annual Report / May 31, 2015 |
than half from mid-2014 through the start of 2015 and ended the period more than 40% lower. Most other commodities were also hit hard, as they: fell in sympathy with oil; reacted to concerns about slowing growth in China and other large emerging markets; and responded to a sharply stronger U.S. dollar. (Most commodity trading takes place in U.S. dollars; thus, as the dollar’s value increases, the prices of most commodities tend to fall.) The Bloomberg Commodity Index fell by roughly 25% over the Funds’ fiscal year.
Market developments — fixed income and foreign exchange
One of the biggest stories in currency markets was the sharp appreciation of the U.S. dollar against most currencies from July 2014 through March 2015, as expectations of tighter Fed policy and dovish actions by the ECB and BOJ led investors to favor the dollar. This had an especially negative impact on local-currency emerging-market debt (“EMD”), as the market value of expected interest and principal payments declined in dollar terms. For example, local-currency bonds denominated in the Brazilian real and the Turkish lira were down 10% and 13%, respectively, due almost entirely to depreciation of those currencies against the dollar. On the other hand, dollar-denominated EMD outperformed, driven by the same U.S. dollar dynamic. Russia was among the worst EMD performers from June through December 2014, due to lower oil prices, western sanctions in response to its conflict with Ukraine, and a domestic recession. However, Russian debt returns were positive from the start of 2015 through the end of the Funds’ fiscal year, as the country’s outlook, while still subpar, stabilized. Venezuela, a major oil producer, also saw its debt punished by the market. Ukraine’s debt was hurt by continued conflict with Russia and worries about its economy. As noted above, the pound sterling was supported by business-friendly election results in 2015; this helped turn around its decline against the dollar from July 2014 through March 2015.
In U.S. fixed-income markets, inflation-protected securities lagged as inflation expectations fell in the face of lower commodity prices, a stronger dollar and sluggish growth. The U.S. Treasury yield curve flattened; shorter-term rates rose on expectations of a Fed rate hike in the near future, while longer-term rates fell on disappointing economic results, falling inflation expectations and bouts of risk aversion. Long rates reversed course in a choppy fashion from February 2015 through May 2015 but still ended the period slightly lower. This meant positive returns in longer-dated Treasurys, as Treasury bond yields and prices move inversely. Interest rate volatility was notably higher once the Fed ended its quantitative-easing efforts.
Most non-Treasury sectors performed well. Non-agency mortgage-backed securities (“MBS”), commercial MBS (“CMBS”) and asset-backed securities (“ABS”) outperformed comparably dated Treasurys. Non-agency MBS outperformance was driven by the ongoing U.S. housing recovery, limited supply and attractive risk-adjusted returns. CMBS outperformance, driven by ongoing improvement in commercial real estate fundamentals, was reflected in tightening yield spreads over Treasurys. (Spread is the additional yield offered by a security over a benchmark security, such as a Treasury, of similar maturity; when the spread narrows, it indicates that the higher-risk security has outperformed, and when it widens, it implies that the benchmark or risk-free security has outperformed.) Within ABS, securitized credit card and automobile loans were outperformers.
Investment-grade and high-yield corporate debt underperformed Treasurys, as spreads widened in both sectors. The struggles of the energy sector (especially issues related to oil, gas and coal production) played a significant role in the underperformance. Industrial issues also performed poorly overall. Within investment-grade, financials outperformed (especially banks, where bondholders have benefited from stricter capital regulations and sturdier balance sheets). Healthcare was also positive, thanks to solid corporate fundamentals and strong merger-and-acquisition (“M&A”) activity. Within high yield, collateralized loan obligations outperformed, primarily due to a supply-and-demand imbalance, as strong investor demand was met by sluggish loan production. Taxable municipal debt also performed well compared to corporates.
Market developments — equities
In the U.S., stocks, as reflected by the S&P 500 Index, sold off sharply at two points during the Funds’ fiscal year — summer 2014 and October 2014. However, they recovered enough to post low double-digit returns over the full period. The more technology-heavy Nasdaq Composite Index was a notable outperformer among U.S. benchmarks, thanks to the strong performance of biotechnology and information technology names. Volatility, as measured by the Chicago Board Options Exchange Volatility Index or VIX (a measure of risk aversion derived from the behavior of buyers and sellers of options on the S&P 500), fell to extreme lows through the end of June 2014 before turning up and then spiking in October during the stock market selloff. Volatility spiked again from December 2014 through January 2015 on further bouts of risk aversion. From that point on, the VIX was in a downtrend, reminiscent of its behavior a year ago but at slightly higher levels overall. Small-cap stocks, as measured by the Russell 2000 Index, underperformed large caps (Russell 1000) during the first half of the Funds’ fiscal year, outperformed in March-to-April of 2015, then hit a bit of a rough patch through the end of May. For the full period, large- and small-cap stocks provided similar
| SEI Institutional Investments Trust / Annual Report / May 31, 2015 | 3 |
SEI INSTITUTIONAL INVESTMENTS TRUST — MAY 31, 2015 (Unaudited) (Concluded)
returns. Growth stocks (Russell 1000 Growth Index) and value stocks (Russell 1000 Value Index) performed largely in line from the start of the period through the October selloff. After that, growth stocks outperformed notably. This was driven primarily by the strong rallies in growth-oriented healthcare and biotechnology names and the carnage in value-heavy energy stocks that resulted from the aforementioned oil-market upheaval. After underperforming in the first few months, lower-volatility stocks outperformed higher-volatility ones in the second half of the fiscal year. Most U.S. equity sectors provided positive returns. Healthcare led the way (thanks to biotechnology and vigorous M&A activity) followed by information technology. Large-cap consumer discretionary names also did well. Energy was a significant underperformer, especially in the small-cap arena, which was heavy with exploration & production and oil-field services & equipment providers.
Outside of the U.S., stock returns were uninspiring in U.S. dollar terms; the MSCI ACWI ex-US Index was down slightly. (Returns measured in a global currency basket were over 10%.) There were notable divergences across (and within) sectors, countries and regions. Five out of ten sectors in the Index produced positive dollar returns. As in the U.S., healthcare and information technology were strongest, and energy (along with utilities) was weakest. Regionally, Japan was a notable outperformer, as the government’s economic and financial reform efforts continued to have positive effects; as a result, the country outperformed both European and U.K. equities within MSCI ACWI ex-US. In emerging markets, China’s domestic A shares performed quite well; so well, in fact, that many observers were concerned about a bubble in that country’s stock market by the end of the reporting period. As a group, emerging markets (as reflected by the MSCI Emerging Markets Index) were outpaced by developed markets, but within the asset class, Asia did well. For the full period, China was up over 30%, India more than 20% and Taiwan more than 10%. Malaysia and Indonesia lagged, with both markets down in the high single digits. In Asian frontier markets, Pakistan was a standout performer, but the rest of the group lagged Asian developed; Vietnam, Sri Lanka and Bangladesh were the worst performers among Asian frontier markets. In Europe, Middle East and Africa (“EMEA”), both emerging and frontier markets fared poorly in U.S. dollar terms, with both down more than 6%. There was some dispersion within these results. Within emerging, Egypt performed well, while Greece, Poland and Turkey produced negative returns. Romania saw positive returns in frontier EMEA, but several countries were down in high-single to low-double digits, and Kazakhstan was the worst performer, down almost 30%. Results in Latin America were similar; emerging markets were down almost 20%, led lower by Brazil and Colombia, while in frontier markets, Argentina led with a 6% return, and Panama was the laggard with a 25% loss.
Our view
Toward the end of the Funds’ fiscal year, there were indications that the U.S. economy had returned to growth, but the immediate rebound was not as strong as the one seen in the second quarter of 2014. Whether its momentum improves remains to be seen, and the outcome could influence the Fed’s policy decisions later in 2015. Global growth also remains sluggish overall, but policy measures being taken in many developed and emerging economies should brighten the outlook in the quarters and years ahead. Although the U.S. and U.K. have led developed markets in recent years, we believe there may be more attractive opportunities in Europe and Japan, based on comparative equity-market valuations. Emerging-market equities are cheap in relative terms, but we would view them as a longer-term theme. In fixed-income markets, low-risk and risk-free sovereign government debt still looks expensive to us, but credit markets should continue to offer relative-value opportunities. Finally, while commodities and other inflation-sensitive asset classes may continue to struggle, we believe they still have a role to play in some investors’ portfolios; historically, they have helped preserve purchasing power, and they are certainly cheaper after the developments of the 12 months ending May 31, 2015.
On behalf of SEI Investments, I want to thank you for your continued confidence. We are working every day to maintain that confidence, and we look forward to serving your investment needs in the future.
Sincerely,

William Lawrence
Managing Director, Portfolio Management Group
| 4 | SEI Institutional Investments Trust / Annual Report / May 31, 2015 |
MANAGEMENT’S DISCUSSION AND ANALYSIS OF FUND PERFORMANCE
SEI INSTITUTIONAL INVESTMENTS TRUST — MAY 31, 2015 (Unaudited)
Large Cap Fund
I. Objective
The Large Cap Fund (the “Fund”) seeks to provide long-term growth of capital and income.
II. Multi-Manager Approach Statement
The Fund uses a multi-manager approach, relying on a number of sub-advisers with differing investment approaches to manage portions of the Fund’s portfolio, under the general supervision of SEI Investments Management Corporation (“SIMC”). The Fund utilized the following sub-advisers as of May 31, 2015: AJO, L.P.; AQR Capital Management, LLC; Brown Advisory LLC; Jackson Square Partners, LLC; LSV Asset Management; and Waddell & Reed Investment Management Co. There were no sub-adviser changes during the year.
III. Return vs. Benchmark
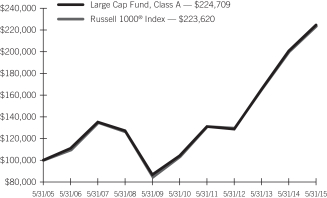
For the fiscal year ending May 31, 2015, the Fund outperformed the Russell 1000® Index (“Index”), returning 11.95% versus an Index return of 11.91%.
IV. Fund Attribution
Absolute Performance
As noted in the enclosed shareholder letter, the modest, ongoing U.S. economic expansion, supported by stimulative monetary policy, provided a positive backdrop for the U.S. equity market. Nine out of ten sectors in the Russell 1000® Index posted positive returns. Healthcare was the strongest sector, returning 28.95% over the fiscal year ending May 31, 2015, followed by technology with an 18.73% return and consumer discretionary with a 17.39% return. Energy was the only negative sector; it declined 16.22%, as oil prices declined more than 42% during the period.
Benchmark-Relative Performance
Sector overweights in healthcare and technology had positive effects, but they did not fully offset the negative impact from an overweight in energy.
Selection was positive overall, driven by healthcare, energy and staples names, while selection in consumer discretionary, technology and materials lagged.
Among the Fund’s managers, Jackson Square Partners, LLC was the best performer due to selection in healthcare. Brown Advisory LLC posted strong returns from selection in technology. Waddell & Reed Investment Management Co lagged due to selection in industrials and consumer discretionary.
Large Cap Fund:
AVERAGE ANNUAL TOTAL RETURN1
| One Year Return | Annualized 3 Year Return | Annualized 5 Year Return | Annualized 10 Year Return | Annualized Inception to Date | ||||||||||||||||
| Large Cap Fund, Class A | 11.95% | 20.38% | 16.60% | 8.43% | 8.20% | |||||||||||||||
| Russell 1000® Index | 11.91% | 19.97% | 16.68% | 8.38% | 8.46% | |||||||||||||||
Comparison of Change in the Value of a $100,000 Investment in the Large Cap Fund, Class A, versus the Russell 1000® Index
| 1 | For the year ended May 31, 2015. Past performance is not an indication of future performance. Class A shares were offered beginning 6/14/96. Returns shown do not reflect the deduction of taxes that a shareholder would pay on fund distributions or the redemption of fund shares. The returns for certain periods reflect fee waivers and/or reimbursements in effect for that year; absent fee waivers and reimbursements, performance would have been lower. |
| SEI Institutional Investments Trust / Annual Report / May 31, 2015 | 5 |
MANAGEMENT’S DISCUSSION AND ANALYSIS OF FUND PERFORMANCE
SEI INSTITUTIONAL INVESTMENTS TRUST — MAY 31, 2015 (Unaudited)
Large Cap Diversified Alpha Fund
I. Objective
The Large Cap Diversified Alpha Fund (the “Fund”) seeks to provide long-term growth of capital and income.
II. Multi-Manager Approach Statement
The Fund uses a multi-manager approach, relying on a number of sub-advisers with differing investment approaches to manage portions of the Fund’s portfolio, under the general supervision of SEI Investments Management Corporation (“SIMC”). The Fund utilized the following sub-advisers as of May 31, 2015: AJO, L.P.; Brandywine Global Investment Management, LLC; Jackson Square Partners, LLC; and Parametric Portfolio Associates LLC. There were no sub-adviser changes during the year.
III. Return vs. Benchmark
For the fiscal year ending May 31, 2015, the Fund outperformed the Russell 1000® Index (“Index”), returning 12.43% versus an Index return of 11.91%.
IV. Fund Attribution
Absolute Performance
As noted in the enclosed shareholder letter, the modest, ongoing U.S. economic expansion, supported by stimulative monetary policy, provided a positive backdrop for the U.S. equity market. Nine out of ten sectors in the Russell 1000® Index posted positive returns. Healthcare was the strongest sector, returning 28.95% over the fiscal year ending May 31, 2015, followed by technology with an 18.73% return and consumer discretionary with a 17.39% return. Energy was the only negative sector; it declined 16.22%, as oil prices declined more than 42% during the period.
Benchmark-Relative Performance
Sector allocation was slightly positive, as the positive contribution from a technology overweight offset the negative impact from an overweight in energy.
Selection was positive, driven by healthcare names, while selection in consumer discretionary, technology and materials lagged.
Among the Fund’s managers, Jackson Square Partners, LLC was the best performer due to selection in healthcare. Brandywine Global Investment Management, LLC was the main laggard due to selection in consumer discretionary, as well as the underperformance of its value-versus-growth tilt.
Large Cap Diversified Alpha Fund:
AVERAGE ANNUAL TOTAL RETURN1
One Year Return | Annualized 3 Year Return | Annualized 5 Year Return | Annualized Inception to Date | |||||||||||||
| Large Cap Diversified Alpha Fund, Class A | 12.43% | 20.02% | 16.81% | 6.94% | ||||||||||||
| Russell 1000® Index | 11.91% | 19.97% | 16.68% | 7.98% | ||||||||||||
Comparison of Change in the Value of a $100,000 Investment in the Large Cap Diversified Alpha Fund, Class A, versus the Russell 1000® Index

| 1 | For the year ended May 31, 2015. Past performance is no indication of future performance. Class A shares were offered beginning 2/28/06. Returns shown do not reflect the deduction of taxes that a shareholder would pay on fund distributions or the redemption of fund shares. The returns for certain periods reflect fee waivers and/or reimbursements in effect for that year; absent fee waivers and reimbursements, performance would have been lower. |
| 6 | SEI Institutional Investments Trust / Annual Report / May 31, 2015 |
MANAGEMENT’S DISCUSSION AND ANALYSIS OF FUND PERFORMANCE
SEI INSTITUTIONAL INVESTMENTS TRUST — MAY 31, 2015 (Unaudited)
Large Cap Disciplined Equity Fund
I. Objective:
The Large Cap Disciplined Equity Fund (the “Fund”) seeks to provide capital appreciation.
II. Multi-Manager Approach Statement
The Fund uses a multi-manager approach, relying on a number of sub-advisers with differing investment approaches to manage portions of the Fund’s portfolio, under the general supervision of SEI Investments Management Corporation (SIMC). The Fund utilized the following sub-advisers as of May 31, 2015: Analytic Investors, LLC; INTECH Investment Management LLC; Lazard Asset Management LLC; Oppenheimer Funds, Inc.; and Quantitative Management Associates LLC. There were no sub-adviser changes during the year.
III. Return vs. Benchmark
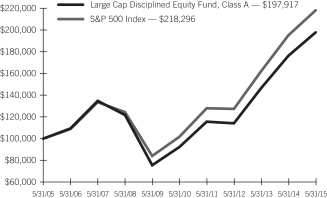
For the fiscal year ending May 31, 2015, the Fund outperformed the S&P 500 Index (“Index”), returning 12.23% versus an Index return of 11.81%.
IV. Fund Attribution
Absolute Performance
As noted in the enclosed shareholder letter, the modest, ongoing U.S. economic expansion, supported by stimulative monetary policy, provided a positive backdrop for the U.S. equity market. Nine out of ten sectors in the S&P 500 Index posted positive returns. Healthcare was the strongest sector, returning 27.35% over the fiscal year ending May 31, 2015, followed by technology with an 18.81% return and consumer discretionary with a 17.99% return. Energy was the only negative sector; it declined 15.50%, as oil prices declined more than 42% during the year.
Benchmark-Relative Performance
Allocation and selection were both very strong, as an underweight to energy and overweight in healthcare both contributed to performance.
Stock selection in healthcare and industrials were both strong, while selection in consumer discretionary lagged.
Among the Fund’s managers, Lazard Asset Management LLC was the best performer due to its selection in healthcare. Analytic Investors, LLC posted strong returns from selection in industrials and energy. Oppenheimer Funds, Inc. lagged due to selection in consumer staples and energy.
Large Cap Disciplined Equity Fund:
AVERAGE ANNUAL TOTAL RETURN1
One Year Return | Annualized 3 Year Return | Annualized 5 Year Return | Annualized 10 Year Return | Annualized Inception to Date | ||||||||||||||||
| Large Cap Disciplined Equity Fund, Class A | 12.23% | 20.14% | 16.54% | 7.07% | 8.00% | |||||||||||||||
| S&P 500 Index | 11.81% | 19.67% | 16.54% | 8.12% | 8.72% | |||||||||||||||
Comparison of Change in the Value of a $100,000 Investment in the Large Cap Disciplined Equity Fund, Class A, versus the S&P 500 Index
| 1 | For the year ended May 31, 2015. Past performance is not an indication of future performance. Class A shares were offered beginning 8/28/03. Returns shown do not reflect the deduction of taxes that a shareholder would pay on fund distributions or the redemption of fund shares. The returns for certain periods reflect fee waivers and/or reimbursements in effect for that year; absent fee waivers and reimbursements, performance would have been lower. |
| SEI Institutional Investments Trust / Annual Report / May 31, 2015 | 7 |
MANAGEMENT’S DISCUSSION AND ANALYSIS OF FUND PERFORMANCE
SEI INSTITUTIONAL INVESTMENTS TRUST — MAY 31, 2015 (Unaudited)
Large Cap Index Fund
I. Objective:
The Large Cap Index Fund (the “Fund”) seeks to provide investment results that correspond to the aggregate price and dividend performance of the securities in the Russell 1000 Index.
II. Multi-Manager Approach Statement
The Fund uses a sub-adviser to manage the Fund under the supervision of SEI Investments Management Corporation (“SIMC”). The sole sub-adviser as of May 31, 2015 was SSgA Funds Management, Inc. There were no sub-adviser changes during the year.
III. Return vs. Benchmark
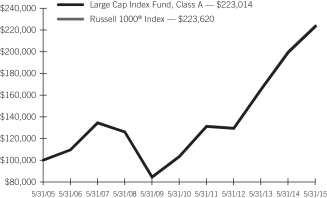
For the fiscal year ending May 31, 2015, the Fund underperformed the Russell 1000® Index (“Index”), returning 11.89% versus an Index return of 11.91%.
IV. Fund Attribution
As noted in the enclosed shareholder letter, the modest, ongoing U.S. economic expansion, supported by stimulative monetary policy, provided a positive backdrop for the U.S. equity market. Nine out of ten sectors in the Russell 1000® Index posted positive returns. Healthcare was the strongest sector, returning 28.95% over the fiscal year ending May 31, 2015, followed by technology with an 18.73% return and consumer discretionary with a 17.39% return. Energy was the only negative sector; it declined 16.22%, as oil prices declined more than 42% during the year.
Large Cap Index Fund:
AVERAGE ANNUAL TOTAL RETURN1
One Year Return | Annualized 3 Year Return | Annualized 5 Year Return | Annualized 10 Year Return | Annualized Inception to Date | ||||||||||||||||
| Large Cap Index Fund, Class A | 11.89% | 19.93% | 16.65% | 8.35% | 7.18% | |||||||||||||||
| Russell 1000® Index | 11.91% | 19.97% | 16.68% | 8.38% | 8.46% | |||||||||||||||
Comparison of Change in the Value of a $100,000 Investment in the Large Cap Index Fund, Class A, versus the Russell 1000® Index
| 1 | For the year ended May 31, 2015. Past performance is not an indication of future performance. Class A shares were offered beginning 4/1/02. Returns shown do not reflect the deduction of taxes that a shareholder would pay on fund distributions or the redemption of fund shares. The returns for certain periods reflect fee waivers and/or reimbursements in effect for that year; absent fee waivers and reimbursements, performance would have been lower. |
| 8 | SEI Institutional Investments Trust / Annual Report / May 31, 2015 |
MANAGEMENT’S DISCUSSION AND ANALYSIS OF FUND PERFORMANCE
SEI INSTITUTIONAL INVESTMENTS TRUST — MAY 31, 2015 (Unaudited)
S&P 500 Index Fund
I. Objective:
The S&P 500 Index Fund (the “Fund”) seeks investment results that correspond to the aggregate price and dividend performance of the securities in the S&P 500 Index.
II. Multi-Manager Approach Statement
The Fund uses a sub-adviser to manage the Fund under the supervision of SEI Investments Management Corporation (“SIMC”). The sole sub-adviser as of May 31, 2015 was SSgA Funds Management, Inc. There were no sub-adviser changes during the year.
III. Return vs. Benchmark
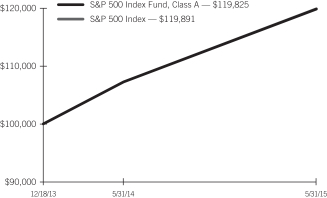
For the fiscal year ending May 31, 2015, the Fund underperformed the S&P 500 Index (“Index”), returning 11.71% versus an Index return of 11.81%.
IV. Fund Attribution
Absolute Performance
As noted in the enclosed shareholder letter, the modest, ongoing U.S. economic expansion, supported by stimulative monetary policy, provided a positive backdrop for the U.S. equity market. Nine out of ten sectors in the S&P 500 Index posted positive returns. Healthcare was the strongest sector, returning 27.35% over the fiscal year ending May 31, 2015, followed by technology with an 18.81% return and consumer discretionary with a 17.99% return. Energy was the only negative sector; it declined 15.50%, as oil prices declined more than 42% during the year.
S&P 500 Index Fund:
AVERAGE ANNUAL TOTAL RETURN1
One Year Return | Annualized Inception to Date | |||||||
| S&P 500 Index Fund, Class A | 11.71% | 13.27% | ||||||
| S&P 500 Index | 11.81% | 13.33% | ||||||
Comparison of Change in the Value of a $100,000 Investment in the S&P 500 Index Fund, Class A, versus the S&P 500 Index
| 1 | For the year ended May 31, 2015. Past performance is not an indication of future performance. Class A shares were offered beginning 12/18/13. Returns shown do not reflect the deduction of taxes that a shareholder would pay on fund distributions or the redemption of fund shares. The returns for certain periods reflect fee waivers and/or reimbursements in effect for that period; absent fee waivers and reimbursements, performance would have been lower. |
| SEI Institutional Investments Trust / Annual Report / May 31, 2015 | 9 |
MANAGEMENT’S DISCUSSION AND ANALYSIS OF FUND PERFORMANCE
SEI INSTITUTIONAL INVESTMENTS TRUST — MAY 31, 2015 (Unaudited)
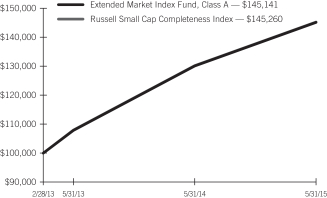
Extended Market Index Fund
I. Objective:
The Extended Market Index Fund (the “Fund”) seeks to provide investment results that approximate, as closely as practicable and before expenses, the performance of the Russell Small Cap Completeness Index.
II. Multi-Manager Approach Statement
The Fund uses a sub-adviser to manage the Fund under the supervision of SEI Investments Management Corporation (“SIMC”). The sole sub-adviser as of May 31, 2015 was SSgA Funds Management, Inc. There were no sub-adviser changes during the year.
III. Return vs. Benchmark
For the fiscal year ending May 31, 2015, the Fund outperformed the Russell Small Cap Completeness Index (“Index”), returning 11.61% versus an Index return of 11.56%.
IV. Fund Attribution
Absolute Performance
As noted in the enclosed shareholder letter, the modest, ongoing U.S. economic expansion, supported by stimulative monetary policy, provided a positive backdrop for the U.S. equity market. Nine out of ten sectors in the Russell Small Cap Completeness Index posted positive returns. Healthcare was the strongest sector, returning 43.11% over the fiscal year ending May 31, 2015, followed by technology with an 18.21% return and consumer discretionary with a 14.31% return. Energy was the only negative sector; it declined 33.54%, as oil prices declined more than 42% during the year.
Extended Market Index Fund:
AVERAGE ANNUAL TOTAL RETURN1
One Year Return | Annualized Inception to Date | |||||
| Extended Market Index Fund, Class A | 11.61% | 18.01% | ||||
| Russell Small Cap Completeness Index | 11.56% | 18.03% | ||||
Comparison of Change in the Value of a $100,000 Investment in the Extended Market Index Fund, Class A, versus the Russell Small Cap Completeness Index
| 1 | For the year ended May 31, 2015. Past performance is not an indication of future performance. Class A shares were offered beginning 2/28/13. Returns shown do not reflect the deduction of taxes that a shareholder would pay on fund distributions or the redemption of fund shares. The returns for certain periods reflect fee waivers and/or reimbursements in effect for that period; absent fee waivers and reimbursements, performance would have been lower. |
| 10 | SEI Institutional Investments Trust / Annual Report / May 31, 2015 |
MANAGEMENT’S DISCUSSION AND ANALYSIS OF FUND PERFORMANCE
SEI INSTITUTIONAL INVESTMENTS TRUST — MAY 31, 2015 (Unaudited)
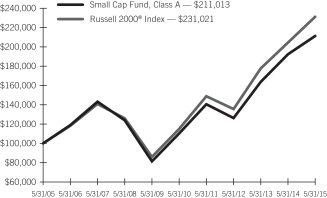
Small Cap Fund
I. Objective:
The Small Cap Fund (the “Fund”) seeks to provide capital appreciation.
II. Multi-Manager Approach Statement
The Fund uses a multi-manager approach, relying on a number of sub-advisers with differing investment approaches to manage portions of the Fund’s portfolio, under the general supervision of SEI Investments Management Corporation (“SIMC”). The Fund utilized the following sub-advisers as of May 31, 2015: AQR Capital Management, LLC; EAM Investors, LLC; J.P. Morgan Investment Management Inc.; LSV Asset Management; Montibus Capital Management LLC; Robeco Investment Management, Inc.; Security Capital Research & Management Incorporated; and William Blair & Company L.L.C. During the year, EAM Investors, LLC was added, while AllianceBernstein L.P., Artisan Partners Limited Partnership, Janus Capital Management, Inc. and Lee Munder Capital Group, LLC were removed.
III. Return vs. Benchmark
For the fiscal year ending May 31, 2015, the Fund underperformed the Russell 2000® Index (“Index”), returning 9.86% versus an Index return of 11.32%.
IV. Fund Attribution
Absolute Performance
As noted in the enclosed shareholder letter, the modest, ongoing U.S. economic expansion, supported by stimulative monetary policy, provided a positive backdrop for the U.S. equity market. Eight out of ten sectors in the Russell 2000® Index posted positive returns, and five of them posted double-digit returns. Healthcare was the strongest sector, returning 41.3% over the fiscal year ending May 31, 2015, primarily driven by biotechnology. Technology followed with a 21.81% return. Energy and materials were the only negative sectors; energy declined 33.54%, as oil prices declined more than 42% during the year, while materials were down 1.2%.
Benchmark-Relative Performance
Sector allocation was the main detractor, as overweights in energy and industrials dragged on performance. An underweight in materials partially offset this effect.
Roughly half of the managers outperformed, and half underperformed the Russell 2000® Index. J.P. Morgan Investment Management Inc. was the strongest outperformer due to stock selection, particularly in industrials. Robeco Investment Management, Inc. was the weakest performer due to poor selection in energy and industrials.
Small Cap Fund:
AVERAGE ANNUAL TOTAL RETURN1
One Year Return | Annualized 3 Year Return | Annualized 5 Year Return | Annualized 10 Year Return | Annualized Inception to Date | ||||||||||||||||
| Small Cap Fund, Class A | 9.86% | 18.71% | 13.91% | 7.75% | 8.53% | |||||||||||||||
| Russell 2000® Index | 11.32% | 19.45% | 15.04% | 8.73% | 8.26% | |||||||||||||||
Comparison of Change in the Value of a $100,000 Investment in the Small Cap Fund, Class A, versus the Russell 2000® Index
| 1 | For the year ended May 31, 2015. Past performance is not an indication of future performance. Class A shares were offered beginning 6/14/96. Returns shown do not reflect the deduction of taxes that a shareholder would pay on fund distributions or the redemption of fund shares. The returns for certain periods reflect fee waivers and/or reimbursements in effect for that year; absent fee waivers and reimbursements, performance would have been lower. |
| SEI Institutional Investments Trust / Annual Report / May 31, 2015 | 11 |
MANAGEMENT’S DISCUSSION AND ANALYSIS OF FUND PERFORMANCE
SEI INSTITUTIONAL INVESTMENTS TRUST — MAY 31, 2015 (Unaudited)
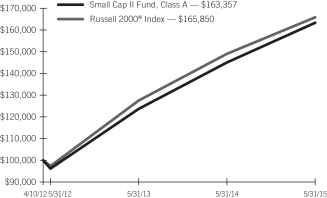
Small Cap II Fund
I. Objective:
The Small Cap II Fund (the “Fund”) seeks to provide capital appreciation.
II. Multi-Manager Approach Statement
The Fund uses a multi-manager approach, relying on a number of sub-advisers with differing investment approaches to manage portions of the Fund’s portfolio under the general supervision of SEI Investments Management Corporation (“SIMC”). The Fund utilized the following sub-advisers as of May 31, 2015: Alliance Bernstein L.P.; AQR Capital Management, LLC; EAM Investors, LLC; Fiduciary Management Associates, LLC; LMCG Investments, LLC; Montibus Capital Management LLC.; and Snow Capital Management L.P. EAM Investors, LLC and Snow Capital Management LLC were added during the year.
III. Return vs. Benchmark
For the fiscal year ending May 31, 2015, the Fund outperformed the Russell 2000® Index (“Index”), returning 12.58% versus an Index return of 11.32%.
IV. Fund Attribution
Absolute Performance
As noted in the enclosed shareholder letter, the modest, ongoing U.S. economic expansion, supported by stimulative monetary policy, provided a positive backdrop for the U.S. equity market. Eight out of ten sectors in the Russell 2000® Index posted positive returns, and five of them posted double-digit returns. Healthcare was the strongest sector, returning 41.3% over the fiscal year ending May 31, 2015, primarily driven by biotechnology. Technology followed with a 21.81% return. Energy and materials were the only negative sectors; energy declined 33.54%, as oil prices declined more than 42% during the year, while materials were down 1.2%.
Benchmark-Relative Performance
Sector allocation was slightly positive, driven by an overweight in technology; this was offset by a slight overweight in energy.
Selection was very strong; positive results in eight out of ten sectors contributed 1.75% to relative returns. Contributions were strongest in healthcare, materials and consumer staples, while selection within industrials and technology lagged.
Among the Fund’s managers, five of the seven outperformed the Russell 2000® Index. Montibus Capital Management LLC was the strongest outperformer due to its stock selection in healthcare, information technology and financials. LMCG Investments, LLC was the weakest performer due to poor selection and sector allocations in healthcare and industrials.
Small Cap II Fund:
AVERAGE ANNUAL TOTAL RETURN1
One Year Return | Annualized 3 Year Return | Annualized Inception to Date | ||||||||||||
| Small Cap II Fund, Class A | 12.58% | 19.30% | 16.92% | |||||||||||
| Russell 2000® Index | 11.32% | 19.45% | 17.48% | |||||||||||
Comparison of Change in the Value of a $100,000 Investment in the Small Cap II Fund, Class A, versus the Russell 2000® Index
| 1 | For the year ended May 31, 2015. Past performance is not an indication of future performance. Class A shares were offered beginning 4/10/12. Returns shown do not reflect the deduction of taxes that a shareholder would pay on fund distributions or the redemption of fund shares. The returns for certain periods reflect fee waivers and/or reimbursements in effect for that period; absent fee waivers and reimbursements, performance would have been lower. |
| 12 | SEI Institutional Investments Trust / Annual Report / May 31, 2015 |
MANAGEMENT’S DISCUSSION AND ANALYSIS OF FUND PERFORMANCE
SEI INSTITUTIONAL INVESTMENTS TRUST — MAY 31, 2015 (Unaudited)
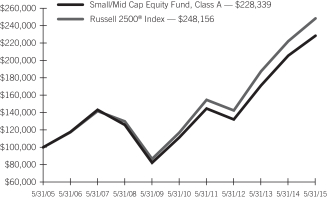
Small/Mid Cap Equity Fund
I. Objective:
The Small/Mid Cap Fund (the “Fund”) seeks to provide long-term capital appreciation.
II. Multi-Manager Approach Statement
The Fund uses a multi-manager approach, relying on a number of sub-advisers with differing investment approaches to manage portions of the Fund’s portfolio, under the general supervision of SEI Investments Management Corporation (“SIMC”). The Fund utilized the following sub-advisers as of May 31, 2015: AllianceBernstein L.P.; Arrowpoint Asset Management, LLC; CastleArk Management LLC.; Integrity Asset Management; LMCG Investments, LLC; LSV Asset Management; Montibus Capital Management LLC; Robeco Investment Management, Inc.; and Security Capital Research & Management Incorporated. During the year, Arrowpoint Asset Management, LLC and CastleArk Management LLC were added; Janus Capital Management, Inc., Wellington Management Company, LLP, and William Blair & Company, LLC were removed.
III. Return vs. Benchmark
For the fiscal year ending May 31, 2015, the Fund underperformed the Russell 2500® Index (“Index”), returning 11.16% versus an Index return of 11.76%.
IV. Fund Attribution
Absolute Performance
As noted in the enclosed shareholder letter, the modest, ongoing U.S. economic expansion, supported by stimulative monetary policy, provided a positive backdrop for the U.S. equity market. Eight out of ten sectors in the Russell 2500® Index posted positive returns, and five of them posted double-digit returns. Healthcare was the strongest sector, returning 42.85% over the fiscal year ending May 31, 2015, primarily driven by biotechnology. Technology followed with a 19.57% return. Energy and telecommunications were the only negative sectors; energy declined 36.91%, as oil prices declined more than 42% during the year, while telecoms were down 0.73%.
Benchmark-Relative Performance
Sector allocation was slightly negative overall. Overweights in healthcare and technology, combined with an underweight in materials, were positive, but an overweight to the underperforming industrials sector detracted.
Stock selection lagged slightly, due to picks in the industrials and materials sectors.
Among the Fund’s managers, Arrowpoint Asset Management, LLC contributed the most to the performance against the Russell 2500® Index due to solid stock selection, particularly in consumer discretionary. Montibus Capital Management LLC was also a strong contributor due to selection across most sectors. Integrity Asset Management was the weakest performer due to poor selection, primarily in industrials.
Small/Mid Cap Equity Fund:
AVERAGE ANNUAL TOTAL RETURN1
One Year Return | Annualized 3 Year Return | Annualized 5 Year Return | Annualized 10 Year Return | Annualized Inception to Date | ||||||||||||||||
| Small/Mid Cap Equity Fund, Class A | 11.16% | 20.01% | 15.45% | 8.61% | 9.31% | |||||||||||||||
| Russell 2500® Index | 11.76% | 20.36% | 16.28% | 9.51% | 10.03% | |||||||||||||||
Comparison of Change in the Value of a $100,000 Investment in the Small/Mid Cap Equity Fund, Class A, versus the Russell 2500® Index
| 1 | For the year ended May 31, 2015. Past performance is not an indication of future performance. Class A shares were offered beginning 12/15/03. Returns shown do not reflect the deduction of taxes that a shareholder would pay on fund distributions or the redemption of fund shares. The returns for certain periods reflect fee waivers and/or reimbursements in effect for that year; absent fee waivers and reimbursements, performance would have been lower. |
| SEI Institutional Investments Trust / Annual Report / May 31, 2015 | 13 |
MANAGEMENT’S DISCUSSION AND ANALYSIS OF FUND PERFORMANCE
SEI INSTITUTIONAL INVESTMENTS TRUST — MAY 31, 2015 (Unaudited)
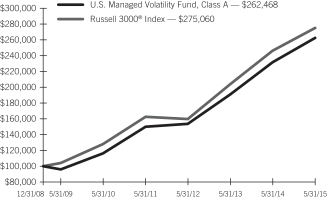
U.S. Managed Volatility Fund
I. Objective:
The U.S. Managed Volatility Fund (the “Fund”) seeks capital appreciation with less volatility than the broad U.S. equity markets.
II. Multi-Manager Approach Statement
The Fund uses a multi-manager approach, relying on a number of sub-advisers with differing investment approaches to manage portions of the Fund’s portfolio, under the general supervision of SEI Investments Management Corporation (“SIMC”). The Fund utilized the following sub-advisers as of May 31, 2015: AJO, L.P.; Analytic Investors, LLC; and LSV Asset Management. There were no sub-adviser changes during the year.
III. Return vs. Benchmark
For the fiscal year ending May 31, 2015, the Fund outperformed the Russell 3000® Index (“Index”), returning 13.33% versus an Index return of 11.86%.
IV. Fund Attribution
Absolute Performance
As noted in the enclosed shareholder letter, lower-volatility stocks performed well, especially in the second half of the year ending May 31, 2015, and the Fund benefited from exposure to this area of the market. A tilt toward smaller-capitalization stocks also contributed to the Fund’s positive performance.
From a sector perspective, healthcare and consumer staples helped drive performance. Energy holdings were detrimental, given the steep decline in oil prices during the second half of the year. Telecommunications also had a negative effect.
Benchmark-Relative Performance
The underweight to higher-volatility stocks contributed significantly to the fund’s relative performance throughout the year. Positive stock selection also boosted performance.
However, the tilt to lower volatility accounted to a less extent for the fund’s excess return as there were other tilts and active positions (described below) which explained a greater part of the outperformance.
The Fund’s underweights to energy and industrials were important contributors to outperformance, as oil and other commodity prices plunged during the year.
An overweight to the healthcare sector (particularly the equipment & services industry) was particularly beneficial, as increased merger-and-acquisition activity drew investors into the sector. An underweight to technology and an overweight to utilities detracted.
The Fund’s allocation to stocks exhibiting strong momentum was positive. While value stocks were relatively poor performers, selection among value stocks more than offset their drag on performance.
At the manager level, Analytic Investors, LLC and LSV Asset Management managed to beat the Russell 3000® Index, while AJO, L.P. lagged marginally, due to poor selection and a significant underweight in technology, which rallied strongly. Analytic Investors, LLC and LSV Asset Management benefited primarily from underweights to energy and overweights to healthcare.
U.S. Managed Volatility Fund:
AVERAGE ANNUAL TOTAL RETURN1
One Year Return | Annualized 3 Year Return | Annualized 5 Year Return | Annualized Inception to Date | |||||||||||||
| U.S. Managed Volatility Fund, Class A | 13.33% | 19.55% | 17.72% | 16.23% | ||||||||||||
| Russell 3000® Index | 11.86% | 19.92% | 16.54% | 17.08% | ||||||||||||
Comparison of Change in the Value of a $100,000 Investment in the U.S. Managed Volatility Fund, Class A, versus the Russell 3000® Index
| 1 | For the year ended May 31, 2015. Past performance is not an indication of future performance. Class A shares were offered beginning 12/31/08. Returns shown do not reflect the deduction of taxes that a shareholder would pay on fund distributions or the redemption of fund shares. The returns for certain periods reflect fee waivers and/or reimbursements in effect for that year; absent fee waivers and reimbursements, performance would have been lower. |
| 14 | SEI Institutional Investments Trust / Annual Report / May 31, 2015 |
MANAGEMENT’S DISCUSSION AND ANALYSIS OF FUND PERFORMANCE
SEI INSTITUTIONAL INVESTMENTS TRUST — MAY 31, 2015 (Unaudited)
World Equity Ex-US Fund
I. Objective:
The World Equity Ex-US Fund (the “Fund”) seeks to provide capital appreciation.
II. Multi-Manager Approach Statement
The Fund uses a multi-manager approach, relying on a number of sub-advisers with differing investment approaches to manage portions of the Fund’s portfolio, under the general supervision of SEI Investments Management Corporation (“SIMC”). The Fund utilized the following sub-advisers as of May 31, 2015: Acadian Asset Management LLC, Bailie Gifford Overseas Ltd.; EARNEST Partners LLC; JO Hambro Capital Management Limited; McKinley Capital Management, LLC; and NFJ Investment Group LLC. During the year, Thornburg Investment Management Inc. was removed from the Fund.
III. Return vs. Benchmark
For the fiscal year ending May 31, 2015, the Fund outperformed the MSCI All Country World Ex-US Net Index (“Index”), returning 1.93% versus an Index return of -0.90%.
IV. Fund Attribution
Absolute Performance
As noted in the shareholder letter, a sharply stronger U.S. dollar kept a lid on the returns of many assets outside the United States, and global equities were no exception. The Fund provided low single-digit returns, while its benchmark index was slightly negative.
There were notable performance divergences between regions. Thanks to government stimulus and reform efforts, Japan easily outpaced its developed-market peers in Europe and the U.K. Emerging markets lagged developed markets overall, although Asian emerging markets — most notably China, India and Taiwan — did well. Other emerging markets fared poorly, including Brazil and Russia, as well as the smaller countries of Colombia, UAE, Turkey and Poland.
Only five out of ten sectors posted positive returns. Healthcare was the strongest by far, followed by information technology and consumer discretionary. Financials and industrials were slightly positive. All other sectors were negative, with the worst performances from energy and utilities.
Benchmark-Relative Performance
Regional allocation detracted slightly, while stock selection generated strong results. The strongest relative contribution came from Europe and the Middle East, thanks to stock selection in Ireland, Switzerland, Germany, Netherlands, Spain and Italy. Stock selection in Norway was the only meaningful detractor in the region; an overweight to the country also hurt results. Stock selection in the U.K. also contributed positively. Selection was strong in Canada. An underweight to and selection in Japan detracted from relative returns. Emerging markets had a negative impact overall, due to stock selection. The Fund benefited from an ex-benchmark position in U.S. companies. The Fund’s U.K. holdings also performed well, delivering a return of over 3%, far outpacing the overall U.K. market. A similar outcome was seen in the Fund’s Pacific ex-Japan holdings, where the Fund’s Hong Kong holdings enjoyed a tailwind, offset to a small extent by selection in Australia. The Fund’s European holdings posted slightly positive returns overall. Holdings in some of the smaller economies performed well, most notably Ireland, Italy and Belgium. The biggest detractors were holdings in Portugal, Norway and Austria.
From a sector standpoint, both stock selection and sector allocation were positive. Selection was strongest in healthcare, followed by information technology (“IT”), financials, materials and consumer discretionary. Selection in energy, utilities and consumer staples detracted. Significant overweights to IT and healthcare were positive, as both of those sectors performed well, as noted in the shareholder letter. The Fund’s relative performance was also helped by an underweight to energy.
World Equity Ex-US Fund:
AVERAGE ANNUAL TOTAL RETURN1
One Year Return | Annualized 3 Year Return | Annualized 5 Year Return | Annualized 10 Year Return | Annualized Inception to Date | ||||||||||||||||
| World Equity Ex-US Fund, Class A | 1.93% | 13.98% | 9.38% | 5.56% | 5.27% | |||||||||||||||
| MSCI All Country World Ex-US Net Index | -0.90% | 12.61% | 8.09% | 6.04% | 6.23% | |||||||||||||||
| SEI Institutional Investments Trust / Annual Report / May 31, 2015 | 15 |
MANAGEMENT’S DISCUSSION AND ANALYSIS OF FUND PERFORMANCE
SEI INSTITUTIONAL INVESTMENTS TRUST — MAY 31, 2015 (Unaudited)
World Equity Ex-US Fund (Concluded)
Comparison of Change in the Value of a $100,000 Investment in the World Ex-US Equity Fund, Class A, versus the MSCI All Country World Ex-US Net Index

| 1 | For the year ended May 31, 2015. Past performance is not an indication of future performance. Class A shares were offered beginning 3/28/05. Returns shown do not reflect the deduction of taxes that a shareholder would pay on fund distributions or the redemption of fund shares. The returns for certain periods reflect fee waivers and/or reimbursements in effect for that year; absent fee waivers and reimbursements, performance would have been lower. |
| 16 | SEI Institutional Investments Trust / Annual Report / May 31, 2015 |
MANAGEMENT’S DISCUSSION AND ANALYSIS OF FUND PERFORMANCE
SEI INSTITUTIONAL INVESTMENTS TRUST — MAY 31, 2015 (Unaudited)
Screened World Equity Ex-US Fund
I. Objective:
The Screened World Equity Ex-US Fund (the “Fund”) seeks to provide capital appreciation.
II. Multi-Manager Approach Statement
The Fund uses a multi-manager approach, relying on a number of sub-advisers with differing investment approaches to manage portions of the Fund’s portfolio, under the general supervision of SEI Investments Management Corporation (“SIMC”). The Fund utilized the following sub-advisers as of May 31, 2015: Acadian Asset Management LLC; Baillie Gifford Overseas Ltd; EARNEST Partners LLC; and McKinley Capital Management, LLC. During the year, Thornburg Investment Management Inc. was removed from the Fund.
III. Return vs. Benchmark
For the fiscal year ending May 31, 2015, the Fund outperformed the MSCI All Country World Ex-US Net Index (“Index”), returning -0.04% versus an Index return of -0.90%.
IV. Fund Attribution
Absolute Performance
As noted in the shareholder letter, a sharply stronger U.S. dollar kept a lid on the returns of many assets outside the United States, and global equities were no exception. Both the Fund and its benchmark realized slightly negative returns.
There were notable performance divergences between regions. Thanks to government stimulus and reform efforts, Japan easily outpaced its developed-market peers in Europe and the U.K. Emerging markets lagged developed markets overall, although Asian emerging markets — most notably China, India and Taiwan — did well. Other emerging markets fared poorly, including Brazil and Russia, as well as the smaller countries of Colombia, UAE, Turkey and Poland. The Fund’s European holdings posted a negative return overall. Holdings in some of the smaller economies performed well, including Ireland, Denmark, Italy and Belgium. The biggest detractors were Portugal, Norway and Austria.
Six out of ten sectors posted positive returns. Healthcare was the strongest, followed by information technology, consumer discretionary,
telecommunications and industrials. Poorly performing sectors were led by energy, followed by utilities and materials.
Benchmark-Relative Performance
Regionally, stock selection generated strong results against the benchmark, while allocation detracted. The strongest contributions came from selection in the U.K. and Europe and the Middle East (especially in Ireland, Spain, Italy, Finland and Denmark). Selection in the Netherlands detracted, as did overweights to Norway and Austria. Selection was strong in Canada, and the Fund benefited from off-benchmark holdings in the United States. An underweight to and selection in Japan detracted. Within emerging markets, selection was positive in Latin America and also in the Europe, Middle East and Africa region but negative in emerging Asia (especially China and Korea). A slight overweight to emerging markets negatively impacted results. The Fund’s Pacific ex-Japan holdings performed well, thanks to a tailwind from Hong Kong; this was offset to a small extent by selection in Australia.
From a sector standpoint, allocation was positive, but stock selection detracted slightly. Selection was strongest in industrials, healthcare and materials. Selection in energy, information technology (IT) and financials detracted. A significant overweight to IT, along with underweights to energy and utilities, was positive.
| SEI Institutional Investments Trust / Annual Report / May 31, 2015 | 17 |
MANAGEMENT’S DISCUSSION AND ANALYSIS OF FUND PERFORMANCE
SEI INSTITUTIONAL INVESTMENTS TRUST — MAY 31, 2015 (Unaudited)
Screened World Equity Ex-US Fund (Concluded)
Screened World Equity Ex-US Fund:
AVERAGE ANNUAL TOTAL RETURN1
One Year Return | Annualized 3 Year Return | Annualized 5 Year Return | Annualized Inception to Date | |||||||||||||
| Screened World Equity Ex-US Fund, Class A | -0.04% | 12.68% | 8.15% | 0.92% | ||||||||||||
| MSCI All Country World Ex-US Net Index | -0.90% | 12.61% | 8.09% | 2.58% | ||||||||||||
Comparison of Change in the Value of a $100,000 Investment in the Screened World Ex-US Equity Fund, Class A, versus the MSCI All Country World Ex-US Net Index

| 1 | For the year ended May 31, 2015. Past performance is not an indication of future performance. Class A shares were offered beginning 6/30/08. Returns shown do not reflect the deduction of taxes that a shareholder would pay on fund distributions or the redemption of fund shares. The returns for certain periods reflect fee waivers and/or reimbursements in effect for that year; absent fee waivers and reimbursements, performance would have been lower. |
| 18 | SEI Institutional Investments Trust / Annual Report / May 31, 2015 |
MANAGEMENT’S DISCUSSION AND ANALYSIS OF FUND PERFORMANCE
SEI INSTITUTIONAL INVESTMENTS TRUST — MAY 31, 2015 (Unaudited)
Emerging Markets Equity Fund
I. Objective:
The Emerging Markets Equity Fund (the “Fund”) seeks to provide capital appreciation.
II. Multi-Manager Approach Statement
The Fund uses a multi-manager approach, relying on a number of sub-advisers with differing investment approaches to manage portions of the Fund’s portfolio, under the general supervision of SEI Investments Management Corporation (“SIMC”). The Fund utilized the following sub-advisers as of May 31, 2015: AllianceBernstein L.P.; Causeway Capital Management LLC; JO Hambro Capital Management Limited; Kleinwort Benson Investors International Ltd; RWC Asset Advisers (US) LLC; and WCM Investment Management. During the period, Lazard Asset Management LLC and Everest Capital LLC were removed from the Fund, and RWC Asset Advisers (US) LLC and WCM Investment Management were added.
III. Return vs. Benchmark
For the period October 31, 2014 to May 31, 2015, the Fund outperformed the MSCI Emerging Markets Index (“Index”), returning 0.33% versus an Index return of -0.10%.
IV. Fund Attribution
Absolute Performance
As noted in the shareholder letter, a sharply stronger U.S. dollar kept a lid on the returns of many assets outside the United States, and emerging-market equities were no exception. The Fund’s return was slightly positive, while its benchmark realized slightly negative returns.
The strongest-performing regions were in Asia. Chinese and Hong Kong-listed stocks boosted returns, as did the more advanced markets of Taiwan and Korea. The Philippines also performed well. Some of the smaller emerging economies in Asia fared poorly, such as Malaysia and Indonesia. Frontier markets in Asia performed poorly overall; Pakistan was an exception, but Sri Lanka, Vietnam and Bangladesh were down over the year. There was significant dispersion of results within the Europe, Middle East and Africa (“EMEA”) region. Emerging markets were led by Egypt, and Hungary and Qatar were up slightly. Frontier markets were led by single-digit returns in Romania, Morocco and Ukraine. Emerging-market laggards in the region included Greece, Poland, Turkey and Russia, and the frontier markets of Kazakhstan, Kuwait, Mauritius,
Nigeria and Ivory Coast also fell. Latin America significantly underperformed other regions, dragged down by results in Brazil, Colombia and the frontier market of Panama. Argentina, the other frontier market in the region, held up well. Emerging- and frontier-market holdings listed on European exchanges performed reasonably well.
From a sector perspective, five out of ten sectors posted positive returns. Industrials was the top-performing sector, followed by healthcare, information technology, financials and materials. Utilities was the worst performer, followed by energy, telecommunications and consumer staples.
Benchmark-Relative Performance
From a regional perspective, stock selection generated strong results, while allocation detracted. The strongest contribution came from selection in emerging Asia, particularly in China, Taiwan, Korea and Thailand. An overweight to the Philippines and an underweight to Malaysia helped results. An overweight to and selection in Indonesia detracted. Selection within the frontier market of Pakistan was positive. An underweight to Latin America — Brazil and Mexico in particular — helped relative performance, as did selection in both countries. Selection in the emerging and frontier EMEA markets — especially in Egypt, Qatar, UAE and Nigeria — added to results. Holdings in Poland fared poorly, and an overweight to the country also detracted. Underweights to Russia and South Africa helped performance, but overweights to Kazakhstan and Nigeria were negative. Emerging- and frontier-market holdings listed on Canadian and U.S. exchanges detracted.
From a sector standpoint, selection was strongest in industrials, materials, financials and healthcare. It detracted in consumer staples, consumer discretionary and utilities. An underweight to information technology was negative, while underweights to materials and energy boosted results.
Emerging Markets Equity Fund:
AVERAGE ANNUAL TOTAL RETURN1
| Cumulative Inception to Date | ||||
| Emerging Markets Equity Fund, Class A | 0.33% | |||
| MSCI Emerging Markets Index | -0.10% | |||
| SEI Institutional Investments Trust / Annual Report / May 31, 2015 | 19 |
MANAGEMENT’S DISCUSSION AND ANALYSIS OF FUND PERFORMANCE
SEI INSTITUTIONAL INVESTMENTS TRUST — MAY 31, 2015 (Unaudited)
Emerging Markets Equity Fund (Concluded)
Comparison of Change in the Value of a $100,000 Investment in the Emerging Markets Equity Fund, Class A, versus the MSCI Emerging Markets Index
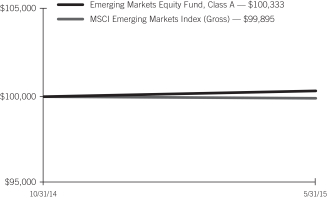
| 1 | For the period ended May 31, 2015. Past performance is no indication of future performance. Class A shares were offered beginning 10/31/14. Returns shown do not reflect the deduction of taxes that a shareholder would pay on fund distributions or the redemption of fund shares. The returns for certain periods reflect fee waivers and/or reimbursements in effect for that year; absent fee waivers and reimbursements, performance would have been lower. |
| 20 | SEI Institutional Investments Trust / Annual Report / May 31, 2015 |
MANAGEMENT’S DISCUSSION AND ANALYSIS OF FUND PERFORMANCE
SEI INSTITUTIONAL INVESTMENTS TRUST — MAY 31, 2015 (Unaudited)
Opportunistic Income Fund
I. Objective
The Opportunistic Income Fund (the “Fund”) seeks capital appreciation and income.
II. Multi-Manager Approach Statement
The Fund uses a multi-manager approach, relying on a number of sub-advisers with differing investment approaches to manage portions of the Fund’s portfolio, under the general supervision of SEI Investments Management Corporation (“SIMC”). The Fund utilized the following sub-advisers as of May 31, 2015: Ares Management LLC; Brookfield Investment Management Inc.; Declaration Management & Research LLC; and Wellington Management Company, LLP. There were no sub-adviser changes were made during the year.
III. Return vs. Benchmark
For the fiscal year ending May 31, 2015, the Fund outperformed the BofA Merrill Lynch U.S. Dollar 3-Month LIBOR Constant Maturity Index (“Index”), returning 1.91% versus an Index return of 0.24%.
IV. Fund Attribution
Absolute Performance
Returns in the fixed-income market remained depressed, due to central banks continuing to keep short-term rates at record-low levels, as noted in the enclosed shareholder letter.
Benchmark-Relative Performance
The Fund’s bank-loan holdings were one of the biggest contributors to relative performance. In general, bank loans performed well during the period, due to the favorable supply-and-demand balance noted in the shareholder letter.
The Fund’s overweight to non-agency mortgage-backed securities (“MBS”) continued to do well, as security prices were modestly higher across the legacy non-agency sectors. The housing recovery, along with attractive risk-adjusted yields, continued to support this sector.
The Fund’s overweight to senior commercial MBS was beneficial, as spreads tightened across the board in the commercial real estate sector.
A meaningful allocation to certain asset-backed securities — securitized auto loans and credit cards in particular — contributed to relative performance, reflecting continued steady growth in the U.S. economy.
All four sub-advisers contributed to relative performance. Ares Management LLC focused on bank loans, while Brookfield and Declaration focused on non-agency mortgages and commercial mortgage-backed securities (“CMBS”). Wellington’s focus on consumer-related asset-backed securities (“ABS”) sectors also contributed.
Use of Derivatives
The Fund used to-be-announced (“TBA”) forward contracts to effectively manage duration, yield-curve and market exposures. TBA contracts confer the obligation to buy or sell future debt obligations of the three U.S. government-sponsored agencies that issue or guarantee MBS — Fannie Mae, Freddie Mac and Ginnie Mae. The use of forward contracts did not have a meaningful impact on the Fund’s performance.
Opportunistic Income Fund:
AVERAGE ANNUAL TOTAL RETURN1
One Year Return | Annualized 3 Year Return | Annualized 5 Year Return | Annualized Inception to Date | |||||||||||||
| Opportunistic Income Fund, Class A | 1.91% | 3.41% | 3.70% | 0.23% | ||||||||||||
| BofA Merrill Lynch U.S. Dollar 3-Month LIBOR Constant Maturity Index | 0.24% | 0.28% | 0.33% | 1.45% | ||||||||||||
Comparison of Change in the Value of a $100,000 Investment in the Opportunistic Income Fund, Class A, versus the BofA Merrill Lynch U.S. Dollar 3-Month LIBOR Constant Maturity Index
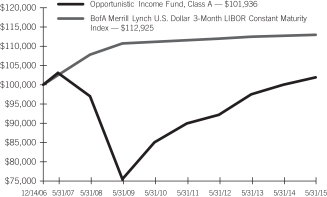
| 1 | For the year ended May 31, 2015. Past performance is not an indication of future performance. Class A shares were offered beginning 12/14/06. Returns shown do not reflect the deduction of taxes that a shareholder would pay on fund distributions or the redemption of fund shares. The returns for certain periods reflect fee waivers and/or reimbursements in effect for that year; absent fee waivers and reimbursements, performance would have been lower. |
| SEI Institutional Investments Trust / Annual Report / May 31, 2015 | 21 |
MANAGEMENT’S DISCUSSION AND ANALYSIS OF FUND PERFORMANCE
SEI INSTITUTIONAL INVESTMENTS TRUST — MAY 31, 2015 (Unaudited)
Core Fixed Income Fund
I. Objective:
The Core Fixed Income Fund (the “Fund”) seeks to provide current income consistent with the preservation of capital.
II. Multi-Manager Approach Statement
The Fund uses a multi-manager approach, relying on a number of sub-advisers with differing investment approaches to manage portions of the Fund’s portfolio, under the general supervision of SEI Investments Management Corporation (“SIMC”). The Fund utilized the following sub-advisers as of May 31, 2015: Jennison Associates LLC; J.P. Morgan Investment Management Inc.; Metropolitan West Asset Management LLC; Wells Capital Management Incorporated; Western Asset Management Company; and Western Asset Management Company Limited. There were no sub-adviser changes during the year.
III. Return vs. Benchmark
For the fiscal year ending May 31, 2015, the Fund outperformed the Barclays U.S. Aggregate Bond Index (“Index”), returning 3.79% versus an Index return of 3.03%.
IV. Fund Attribution
Absolute Performance
The Fund provided a moderate return during the year ended May 31, 2015. As mentioned in the shareholder letter, U.S. Treasury yields moved in a divergent pattern; short-term yields increased, long-term yields decreased, and as a result, the yield curve flattened. Returns were choppy due to rising interest rate volatility that arose from various actions by major central banks (the U.S. Federal Reserve, European Central Bank and Bank of Japan). Returns across the credit-quality spectrum and credit sectors were positive, but they lagged the returns of similarly dated Treasurys. Treasury performed well due to concerns about global growth (particularly in the eurozone), low global developed market bond yields, and an absence of inflation pressures, given the drop in commodity prices (especially oil).
Benchmark-Relative Performance
The Fund’s yield curve flattening posture (Western Asset Management Company Limited and Jennison Associates LLC) contributed to relative
performance, as longer-dated Treasurys outperformed shorter-dated Treasurys. Two-year Treasury yields rose by 0.23% to 0.61%, while 30-year yields declined 0.45% to 2.88%. (Bond yields and bond prices tend to move inversely.) This was offset somewhat by a shorter-duration posture (J.P. Morgan Investment Management Inc. and Metropolitan West Asset Management LLC); with longer-term yields declining, this detracted from relative returns.
An allocation to non-agency mortgages (Western Asset Management Company Limited, Metropolitan West Asset Management LLC and J.P. Morgan Investment Management Inc.) was positive, as this sector was supported by continued recovery in the U.S. housing market plus a lack of new issuance and strong demand.
An overweight to commercial mortgage-backed securities (Western Asset Management Company Limited and Metropolitan West Asset Management LLC) was positive, as commercial real estate securities benefited from strong demand and solid operating performance in the underlying real estate assets.
An overweight to asset-backed securities (Wells Capital Management Incorporated) helped returns, as securities backed by credit card and automobile loans were boosted by an improving consumer credit profile in the U.S., thanks to steady economic growth and improving incomes.
A slight overweight to corporate bonds subtracted from relative returns, as Treasurys outperformed this sector. This underperformance was mitigated somewhat by an underweight to industrial bonds, which had the largest underperformance, and an overweight to financial issuers which performed more in line with comparably dated Treasurys.
All managers outperformed the benchmark. Western Asset Management Company was the best performer, followed by Jennison Associates LLC, as their curve-flattening positions boosted relative returns. Wells Capital Management Incorporated was the next best performer, followed by J.P. Morgan Investment Management Inc. and Metropolitan West Asset Management LLC, respectively.
Use of Derivatives
The Fund used derivatives throughout the fiscal year ending May 31, 2015 as a way to manage duration, yield-curve positioning, spread
| 22 | SEI Institutional Investments Trust / Annual Report / May 31, 2015 |
MANAGEMENT’S DISCUSSION AND ANALYSIS OF FUND PERFORMANCE
SEI INSTITUTIONAL INVESTMENTS TRUST — MAY 31, 2015 (Unaudited)
Core Fixed Income Fund (Concluded)
duration and foreign-currency exposures in an efficient manner. Options, swaptions, futures and forward contracts were used for these purposes, and the overall impact on Fund performance was largely neutral.
Core Fixed Income Fund:
AVERAGE ANNUAL TOTAL RETURN1
One Year Return | Annualized 3 Year Return | Annualized 5 Year Return | Annualized 10 Year Return | Annualized Inception to Date | ||||||||||||||||
| Core Fixed Income Fund, Class A | 3.79% | 3.42% | 5.26% | 5.48% | 6.30% | |||||||||||||||
| Barclays U.S. Aggregate Bond Index | 3.03% | 2.21% | 3.90% | 4.61% | 5.81% | |||||||||||||||
Comparison of Change in the Value of a $100,000 Investment in the Core Fixed Income Fund, Class A, versus the Barclays U.S. Aggregate Bond Index
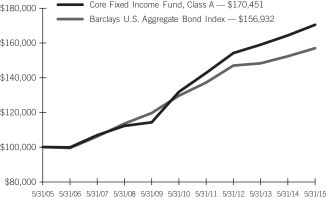
| 1 | For the year ended May 31, 2015. Past performance is not an indication of future performance. Class A shares were offered beginning 6/14/96. Returns shown do not reflect the deduction of taxes that a shareholder would pay on fund distributions or the redemption of fund shares. The returns for certain periods reflect fee waivers and/or reimbursements in effect for that year; absent fee waivers and reimbursements, performance would have been lower. |
| SEI Institutional Investments Trust / Annual Report / May 31, 2015 | 23 |
MANAGEMENT’S DISCUSSION AND ANALYSIS OF FUND PERFORMANCE
SEI INSTITUTIONAL INVESTMENTS TRUST — MAY 31, 2015 (Unaudited)
High Yield Bond Fund
I. Objective:
The High Yield Bond Fund (the “Fund”) seeks total return.
II. Multi-Manager Approach Statement
The Fund uses a multi-manager approach, relying on a number of sub-advisers with differing investment approaches to manage portions of the Fund’s portfolio, under the general supervision of SEI Investments Management Corporation (“SIMC”). The Fund utilized the following sub-advisers as of May 31, 2015: Ares Management LLC; Benefit Street Partners L.L.C; Brigade Capital Management, LP; Delaware Investments Fund Advisers, a Series of Delaware Management Business Trust; J.P. Morgan Investment Management Inc. SIMC also directly manages a portion of the Fund. There were no sub-adviser changes during the year.
III. Return vs. Benchmark
For the fiscal year ending May 31, 2015, the Fund outperformed the BofA Merrill Lynch U.S. High Yield Constrained Index (“Index”), returning 2.63% versus an Index return of 1.86%.
IV. Fund Attribution
Absolute Performance
The high-yield debt market produced meager returns during the year. While healthcare (particularly health facilities) contributed positively to absolute performance, exposure to the energy sector (especially exploration & production and oil field equipment & services) detracted. As noted in the shareholder letter, fast-growing supplies caused oil prices to crash.
Benchmark-Relative Performance
The Fund’s allocation to collateralized loan obligations (“CLO”) boosted relative performance. Yields, which move inversely with prices, began the period at 8.72% and ended at 6.63%. Older-vintage CLO holdings performed strongly during most of 2014, and the Fund was well-positioned, thanks to a large exposure to a AAA rated tranche of a 2007 deal. Following a relatively weak 2014, the debt and equity tranches of newer-vintage CLOs rebounded strongly during the first five months of 2015. Throughout the second half of 2014, the Fund’s allocation was shifted to emphasize these newer-vintage securities, and this was beneficial given their recovery in 2015.
Selection in healthcare contributed significantly to performance, as solid corporate financials and acquisition-related news led select credits higher. Selection in the leisure sector (particularly gaming) helped returns, as the Fund avoided a large gaming company that saw its bonds fall sharply due to bankruptcy. Selection in media (specifically media content and cable & satellite TV) also contributed. Selection within utility (electric generation) detracted, as a large index constituent filed for bankruptcy. Selection in energy (particularly exploration & production) subtracted from relative returns, as the steep decline in oil prices during the second half of 2014 weighed heavily on the sector. Selection in the transportation sector was also negative.
An underweight to basic industry (especially metals/mining excluding steel) contributed; as noted in the shareholder letter, coal prices hovered near decade lows, and this caused coal companies to struggle financially. An allocation to cash detracted, given that money market rates were just slightly above zero during the year.
SIMC was the top relative performer by a wide margin, thanks to the strong performance of CLOs, but the impact was tempered by the Fund’s relatively small allocation to this manager. Benefit Street Partners L.L.C and Ares Management LLC were the next strongest performers, followed by J.P. Morgan Investment Management Inc. then Brigade Capital Management, LP. Benefit Street Partners L.L.C outperformed thanks to an overweight and selection in media, as well as selection in the basic industry and leisure sectors. Ares Management LLC benefited from an underweight and selection in basic industry, along with selection in leisure and telecommunications. J.P. Morgan Investment Management Inc.’s outperformance was driven by allocation weights and selection in energy, services and leisure; and Brigade Capital Management, LP’s was driven by the same effects in retail, energy and leisure. Delaware Investments Fund Advisers, a Series of Delaware Management Business Trust was a notable underperformer over the year, due to selection in energy and retail, as well as an underweight and selection in healthcare.
Use of Derivatives
The Fund used derivatives throughout the fiscal year ending May 31, 2015 as a way to manage duration, yield-curve positioning, and spread duration in an efficient manner. Futures and credit default swaps were used for this purpose, and they had a modestly negative impact on overall Fund performance.
| 24 | SEI Institutional Investments Trust / Annual Report / May 31, 2015 |
MANAGEMENT’S DISCUSSION AND ANALYSIS OF FUND PERFORMANCE
SEI INSTITUTIONAL INVESTMENTS TRUST — MAY 31, 2015 (Unaudited)
High Yield Bond Fund (Concluded)
High Yield Bond Fund:
AVERAGE ANNUAL TOTAL RETURN1
One Year Return | Annualized 3 Year Return | Annualized 5 Year Return | Annualized Inception to Date | |||||||||||||
| High Yield Bond Fund, Class A | 2.63% | 8.49% | 9.82% | 8.51% | ||||||||||||
| BofA Merrill Lynch U.S. High Yield Constrained Index | 1.86% | 8.07% | 9.00% | 8.29% | ||||||||||||
Comparison of Change in the Value of a $100,000 Investment in the High Yield Bond Fund, Class A, versus the BofA Merrill Lynch U.S. High Yield Constrained Index

| 1 | For the year ended May 31, 2015. Past performance is not an indication of future performance. Class A shares were offered beginning 12/5/05. Returns shown do not reflect the deduction of taxes that a shareholder would pay on fund distributions or the redemption of fund shares. The returns for certain periods reflect fee waivers and/or reimbursements in effect for that year; absent fee waivers and reimbursements, performance would have been lower. |
| SEI Institutional Investments Trust / Annual Report / May 31, 2015 | 25 |
MANAGEMENT’S DISCUSSION AND ANALYSIS OF FUND PERFORMANCE
SEI INSTITUTIONAL INVESTMENTS TRUST — MAY 31, 2015 (Unaudited)
Long Duration Fund
I. Objective:
The Long Duration Fund (the “Fund”) seeks to provide return characteristics similar to those of high quality bonds. For the period of May 31, 2014 to April 13, 2015, the Fund sought return characteristics similar to those of high quality corporate bonds, with a duration range of between nine and fourteen years.
II. Multi-Manager Approach Statement
The Fund uses a multi-manager approach, relying on a number of sub-advisers with differing investment approaches to manage portions of the Fund’s portfolio, under the general supervision of SEI Investments Management Corporation (“SIMC”). The Fund utilized the following sub-advisers as of May 31, 2015: Income Research & Management; Jennison Associates LLC; Legal & General Investment Management America Inc.; and Metropolitan West Asset Management LLC. There were no sub-adviser changes during the year.
III. Return vs. Benchmark
For the fiscal year ending May 31, 2015, the Fund underperformed the Barclays Long U.S. Government/Credit Index (“Index”), returning 5.68% versus an Index return of 5.92%.
IV. Fund Attribution
Absolute Performance
Longer-dated Treasurys performed well during the one-year period ending May 31, 2015, as long-term yields fell. (Bond yields and prices tend to move inversely.) Ten-year Treasury yields fell 35 basis points (0.35%) to end at 2.12%, and 30-year Treasury yields fell 45 basis points to end at 2.88%. The Fund’s long-duration strategy (higher sensitivity to interest rate movements) benefited from these trends.
Benchmark-Relative Performance
The Fund was positioned for a flattening yield curve (Jennison Associates LLC) with an overweight to 30-year Treasurys and an underweight to 2-year Treasurys, which helped relative performance. An overweight to and security selection in taxable municipal debt (Metropolitan West Asset Management LLC and Income Research & Management) helped performance, as these securities outperformed
long corporates. An overweight to financials, particularly banks (Legal & General Investment Management America Inc. and Metropolitan West Asset Management LLC) also boosted relative performance. The Fund’s short-duration posture (Metropolitan West Asset Management LLC) detracted, as longer-dated bonds outperformed. An overweight to corporates (Income Research & Management and Jennison Associates LLC) detracted, as yield spreads over Treasurys widened, generating negative relative returns. An underweight to Treasurys (Met West and Income Research & Management) hurt relative performance, given the strong performance of longer-dated U.S. government debt.
Metropolitan West Asset Management LLC was the best performing manager, thanks to an overweight and selection in taxable municipals and an overweight in financials (particularly banks). Jennison Associates LLC and Legal & General Investment Management America Inc. also performed well. Jennison Associates LLC benefited from a curve-flattening position, while Legal & General Investment Management America Inc. was helped by an overweight to financials (banks) and selections within energy and metals & mining. Income Research & Management lagged the benchmark due to and overweight to corporates and an underweight to Treasurys.
Use of Derivatives
Derivatives were used on a limited basis. Treasury futures and interest rate swaps were utilized to help manage the risk associated with interest rate and yield-curve positioning. They did not have a material impact on performance.
Long Duration Fund:
AVERAGE ANNUAL TOTAL RETURN1,2
One Year Return | Annualized 3 Year Return | Annualized 5 Year Return | Annualized 10 Year Return | Annualized Inception to Date | ||||||||||||||||
| Long Duration Fund, Class A | 5.68% | 4.26% | 8.84% | 5.29% | 5.92% | |||||||||||||||
| Barclays Long U.S. Government/Credit Index | 5.92% | 3.63% | 8.35% | 6.70% | 7.31% | |||||||||||||||
| 26 | SEI Institutional Investments Trust / Annual Report / May 31, 2015 |
MANAGEMENT’S DISCUSSION AND ANALYSIS OF FUND PERFORMANCE
SEI INSTITUTIONAL INVESTMENTS TRUST — MAY 31, 2015 (Unaudited)
Long Duration Fund (Concluded)
Comparison of Change in the Value of a $100,000 Investment in the Long Duration Fund, Class A, versus the Barclays Long U.S. Government/Credit Index, the 60/40 Hybrid of the Barclays Long U.S. Credit & Barclays Long U.S. Government Index

| 1 | For the year ended May 31, 2015. Past performance is not an indication of future performance. Class A shares were offered beginning 4/21/04. Returns shown do not reflect the deduction of taxes that a shareholder would pay on fund distributions or the redemption of fund shares. The returns for certain periods reflect fee waivers and/or reimbursements in effect for that year; absent fee waivers and reimbursements, performance would have been lower. |
| 2 | This table compares the Fund’s average annual total returns to those of a broad-based index and the Fund’s 60/40 Blended Benchmark, which consists of the Barclays U.S. Long Credit Index and the Barclays U.S. Long Government Index. The Fund’s Blended Benchmark is designed to provide a useful comparison to the Fund’s overall performance and more accurately reflects the Fund’s investment strategy than the broad-based index. |
| SEI Institutional Investments Trust / Annual Report / May 31, 2015 | 27 |
MANAGEMENT’S DISCUSSION AND ANALYSIS OF FUND PERFORMANCE
SEI INSTITUTIONAL INVESTMENTS TRUST — MAY 31, 2015 (Unaudited)
Long Duration Credit Fund
I. Objective:
The Long Duration Credit Fund (the “Fund”) seeks to provide return characteristics similar to those of high quality bonds. Effective April 1, 2015, the Fund’s name was changed from the Long Duration Corporate Bond Fund to the Long Duration Credit Fund. For the period of May 31, 2014 to March 31, 2015, the Fund sought return characteristics similar to those of high quality corporate bonds. Effective April 1, 2015, the Fund sought return characteristics similar to those of high quality bonds.
II. Multi-Manager Approach Statement
The Fund uses a multi-manager approach, relying on a number of sub-advisers with differing investment approaches to manage portions of the Fund’s portfolio, under the general supervision of SEI Investments Management Corporation (“SIMC”). The Fund utilized the following sub-advisers as of May 31, 2015: Income Research & Management; Jennison Associates LLC; Legal & General Investment Management America Inc.; Logan Circle Partners, L.P.; and Metropolitan West Asset Management LLC. There were no sub-adviser changes during the year.
III. Return vs. Benchmark
On April 1, 2015, the Fund’s benchmark changed from the Barclays Long US Corporate Index to the Barclays Long A+ U.S. Credit Index. For the 10-month period ending March 31, 2015, the Fund returned 8.51%, and the Barclays Long U.S. Corporate Index returned 7.72%. For the two-month period ending May 31, 2015, the Fund returned -4.14%, and the Barclays Long U.S. Corporate Index returned -4.01%. For the fiscal year ending May 31, 2015, the Fund underperformed the Barclays Long A+ U.S. Credit Index (“Index”), returning 4.02% versus an Index return of 4.75%.
IV. Fund Attribution
Absolute Performance
Longer-dated Treasurys performed well during the fiscal year ending May 31, 2015, as long-term yields fell. (Bond yields and prices tend to move inversely.) Ten-year Treasury yields fell 35 basis points (0.35%) to end at 2.12%, and 30-year Treasury yields fell 45 basis points to end at 2.88%. The Fund’s long-duration strategy (higher sensitivity to interest rate movements) benefited from these trends.
Benchmark-Relative Performance
The Fund was positioned for a flattening yield curve (Jennison Associates LLC) with an overweight to 30-year Treasurys and an underweight to 2-year Treasurys, which helped relative performance. Allocations to non-corporate sectors, including Treasuries (Logan Circle Partners, L.P.) and taxable municipal debt (Metropolitan West Asset Management LLC and Income Research & Management) helped performance, as these securities outperformed corporates. An underweight to corporates on a contribution-to-risk basis (Metropolitan West Asset Management LLC and Income Research & Management) helped relative performance, as spreads widened, particularly in industrials. The Fund’s short-duration posture (Metropolitan West Asset Management LLC) detracted, as longer-term yields fell. Security selection within financials, particularly among brokerage, asset managers and exchanges, as well as banking, detracted (Income Research & Management). Underweights to pharmaceuticals and communications also detracted (Logan Circle Partners, L.P., Metropolitan West Asset Management LLC and Income Research & Management).
Metropolitan West Asset Management LLC was the best performing manager, thanks to its allocation to taxable municipals and an underweight in corporates (particularly industrials). Jennison Associates LLC and Legal & General Investment Management America Inc. also performed well. Jennison Associates LLC benefited from a curve-flattening position, while Legal & General Investment Management America Inc. Investment Management America Inc. was helped by selections within energy and metals & mining. Logan Circle Partners, L.P. outperformed slightly, thanks to allocations to non-corporates and Treasurys. Income Research & Management lagged the benchmark due to poor selection within financials (brokerage/asset managers and banks) and underweights to pharmaceutical and communications issuers.
Use of Derivatives
Derivatives were used on a limited basis. Treasury futures were utilized to help manage the risk associated with interest rate and yield-curve positioning. These had a negligible impact on performance.
| 28 | SEI Institutional Investments Trust / Annual Report / May 31, 2015 |
MANAGEMENT’S DISCUSSION AND ANALYSIS OF FUND PERFORMANCE
SEI INSTITUTIONAL INVESTMENTS TRUST — MAY 31, 2015 (Unaudited)
Long Duration Credit Fund (Concluded)
Long Duration Credit Fund:
AVERAGE ANNUAL TOTAL RETURN1
One Year Return | Annualized Inception to Date | |||||||
| Long Duration Credit Fund, Class A | 4.02% | 5.42% | ||||||
| Barclays Long A+ U.S. Credit Index | 4.75% | 4.37% | ||||||
| Barclays U.S. Corporate Index | 3.20% | 4.96% | ||||||
Comparison of Change in the Value of a $100,000 Investment in the Long Duration Credit Fund, versus the Barclays Long A+ U.S. Credit Index2 and the Barclays U.S. Corporate Index2
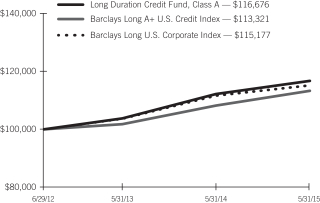
| 1 | For the year ended May 31, 2015. Past performance is not an indication of future performance. Class A shares were offered beginning 6/29/12. Returns shown do not reflect the deduction of taxes that a shareholder would pay on fund distributions or the redemption of fund shares. The returns for certain periods reflect fee waivers and/or reimbursements in effect for that year; absent fee waivers and reimbursements, performance would have been lower. |
| 2 | As of April 1, 2015, the Fund changed its benchmark from the Barclays U.S. Corporate Index to the Barclays Long A+ U.S. Credit Index. |
| SEI Institutional Investments Trust / Annual Report / May 31, 2015 | 29 |
MANAGEMENT’S DISCUSSION AND ANALYSIS OF FUND PERFORMANCE
SEI INSTITUTIONAL INVESTMENTS TRUST — MAY 31, 2015 (Unaudited)
Ultra Short Duration Bond Fund
I. Objective
The Ultra Short Duration Bond Fund (the “Fund”) seeks to provide higher current income than that typically offered by a money market fund while maintaining a high degree of liquidity and a correspondingly higher risk of principal volatility.
II. Multi-Manager Approach Statement
The Fund uses a multi-manager approach, relying on a number of sub-advisers with differing investment approaches to manage portions of the Fund’s portfolio, under the general supervision of SEI Investments Management Corporation (SIMC). The Fund utilizes the following sub-advisers as of May 31, 2015: Logan Circle Partners, L.P.; and Wellington Management Company, LLP. There were no sub-adviser changes during the year.
III. Return vs. Benchmark
For the fiscal year ending May 31, 2015, the Fund outperformed the Barclays Short U.S. Treasury 9-12 Month Index (“Index”), returning 0.72% versus an Index return of 0.23%.
IV. Fund Attribution
Absolute Performance
As noted in the shareholder letter, the Federal Reserve has continued to keep short-term interest rates near zero. As a result, short-duration strategies, including the Fund, provided meager returns.
Benchmark-Relative Performance
The Fund’s overweight to the financials sector contributed to outperformance, as fundamentals for those issuers continued to improve, thanks to improved operations and stricter regulatory capital requirements.
An overweight to the non-agency mortgage-backed securities (“MBS”) did well over the period, as prices were modestly higher across the legacy non-agency sectors. These securities continued to be supported by the U.S. housing recovery and attractive risk-adjusted yields compared to other sectors.
The Fund’s overweight to senior commercial MBS was beneficial, as spreads tightened across the board in that sector.
A meaningful allocation to asset-backed securities, specifically consumer-related sub-sectors such as auto loan and credit card securitizations, performed well, as the U.S. economy continued to experience steady growth.
Both managers contributed to relative outperformance.
Use of Derivatives
The Fund used Treasury futures and to-be-announced (“TBA”) forward contracts to effectively manage duration, yield-curve and market exposures. (TBA contracts confer the obligation to buy or sell future debt obligations of the three U.S. government-sponsored agencies that issue or guarantee MBS — Fannie Mae, Freddie Mac and Ginnie Mae.) None of these had a meaningful impact on the Fund’s performance.
Ultra Short Duration Bond Fund:
AVERAGE ANNUAL TOTAL RETURN1
One Year Return | Annualized 3 Year Return | Annualized Inception to Date | ||||||||||
| Ultra Short Duration Bond Fund, Class A | 0.72% | 1.32% | 1.22% | |||||||||
| Barclays Short U.S. Treasury 9-12 Month Index | 0.23% | 0.26% | 0.29% | |||||||||
Comparison of Change in the Value of a $100,000 Investment in the Ultra Short Duration Bond Fund, Class A, versus the Barclays Short U.S. Treasury 9-12 Month Index
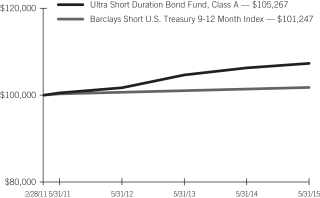
| 1 | For the year ended May 31, 2015. Past performance is not an indication of future performance. Class A shares were offered beginning 2/28/11. Returns shown do not reflect the deduction of taxes that a shareholder would pay on fund distributions or the redemption of fund shares. The returns for certain periods reflect fee waivers and/or reimbursements in effect for that year; absent fee waivers and reimbursements, performance would have been lower. |
| 30 | SEI Institutional Investments Trust / Annual Report / May 31, 2015 |
MANAGEMENT’S DISCUSSION AND ANALYSIS OF FUND PERFORMANCE
SEI INSTITUTIONAL INVESTMENTS TRUST — MAY 31, 2015 (Unaudited)
Emerging Markets Debt Fund
I. Objective:
The Emerging Markets Debt Fund (the “Fund”) seeks to maximize total return.
II. Multi-Manager Approach Statement
The Fund uses a multi-manager approach, relying on a number of sub-advisers with differing investment approaches to manage portions of the Fund’s portfolio, under the general supervision of SEI Investments Management Corporation (SIMC). The Fund utilized the following sub-advisers as of May 31, 2015: Investec Asset Management, Ltd.; Neuberger Berman Fixed Income LLC; and Stone Harbor Investment Partners LP. There were no sub-adviser changes during the year.
III. Return vs. Benchmark
For the fiscal year ended May 31, 2015, the Fund underperformed the blended 50% J.P. Morgan EMBI Global Diversified Index (U.S. dollar), 50% J.P. Morgan GBI-EM Global Diversified Index (local currencies), returning -6.07% versus the blended index return of -5.79%.
IV. Fund Attribution
Absolute Performance
Emerging-market debt (“EMD”) denominated in external currencies, as measured by the J.P. Morgan EMBI Global Diversified Index generated a modest 2.46% return over the fiscal year ended May 31, 2015. This was much stronger than the -13.49% return (in U.S. dollar terms) of local-currency EMD. Local-currency bonds’ negative returns were driven almost exclusively by weakness against the U.S. dollar in aggregate, emerging-market (“EM”) currencies depreciated more than 10% against the dollar during the Fund’s fiscal year.
As discussed in the shareholder letter, Russia was among the worst performers in the second half of 2014 but among the best performers over the first five months of 2015. Venezuela also struggled due to sharply lower oil prices, and Ukraine’s debt fell in response to its ongoing economic struggles and conflict with Russia. Although these credits have stabilized and partially recovered, they dragged on EMD performance over the fiscal year ended May 31, 2015.
The currencies of Brazil and Turkey have weakened against the U.S. dollar since the second half of 2014, and this negatively impacted the performance of their debt and dragged on the asset class performance.
Benchmark-Relative Performance
Due to holdings of cash and local-currency debt, the Fund was underweight better-performing external debt over the period. This positioning detracted from relative performance. A position in Mexican local-currency debt and an underweight to Mexican external debt detracted, as local-currency bonds and the peso performed poorly, while external debt had modestly positive returns. An overweight to Venezuelan external debt also detracted. Venezuela was consistently one of the top-three overweights in the Fund, and it had the worst-performing hard-currency debt in the second half of 2014. Indonesian external debt contributed to relative returns. The country was also consistently one of the top three overweights during the period, and its bonds generated solid positive returns in each quarter.
The Fund’s exposure to off-benchmark emerging corporate debt exposure averaged 5% during the period. The J.P. Morgan Corporate Debt Index outperformed the EMBI Global Diversified Index, so this exposure contributed positively to relative performance.
Neuberger Berman was the Fund’s best-performing manager, thanks to a lower exposure to local-currency debt. Its underweights to Ukraine, Turkey and Israel were also helpful, while an underweight to Poland hurt. Investec’s contribution was modestly positive as a result of positive country selection. Positions in Chile helped, while positions in Philippines and Venezuela hurt. Stone Harbor detracted the most during the period, as it was hurt by poor positioning in countries like Russia, Venezuela, Philippines, Brazil and Ukraine.
Use of Derivatives
Currency forwards and interest rate swaps were the primary derivatives used within the Fund to efficiently optimize active currency and duration exposures. These instruments are used on a regular basis and, during the second half of 2014, currency forwards were used to broadly reduce the Fund’s exposure to EM currencies. The Fund’s exposure to EM currencies was over 50% early in the fiscal
| SEI Institutional Investments Trust / Annual Report / May 31, 2015 | 31 |
MANAGEMENT’S DISCUSSION AND ANALYSIS OF FUND PERFORMANCE
SEI INSTITUTIONAL INVESTMENTS TRUST — MAY 31, 2015 (Unaudited)
Emerging Markets Debt Fund (Concluded)
year, but this was systematically reduced during the year, ending 2014 at roughly 46%. This had a positive impact on performance.
Emerging Markets Debt Fund:
AVERAGE ANNUAL TOTAL RETURN1,2
| One Year Return | Annualized 3 Year Return | Annualized 5 Year Return | Annualized Inception to Date | |||||||||||||
| Emerging Markets Debt Fund, Class A | -6.17% | 1.40% | 4.92% | 6.85% | ||||||||||||
| J.P. Morgan EMBI Global Diversified Index (broad based) | 2.46% | 6.05% | 7.51% | 7.65% | ||||||||||||
| J.P. Morgan GBI-EM Global Diversified Index | -13.49% | -1.62% | 1.37% | 5.98% | ||||||||||||
| 50/50 Hybrid consisting of the J.P. Morgan EMBI Global Diversified Index and the J.P. Morgan GBI-EM Global Diversified Index | -5.79% | 2.19% | 4.47% | 11.53% | ||||||||||||
Comparison of Change in the Value of a $100,000 Investment in the Emerging Market Debt Fund, Class A, versus a 50/50 Hybrid of the Following Indexes: the J.P. Morgan EMBI Global Diversified Index, and the J.P. Morgan GBI-EM Global Diversified Index
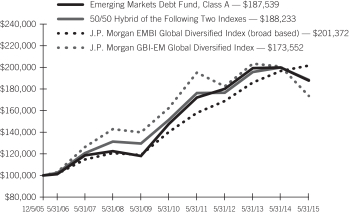
| 1 | For the year ended May 31, 2015. Past performance is not an indication of future performance. Class A shares were offered beginning 12/5/05. Returns shown do not reflect the deduction of taxes that a shareholder would pay on fund distributions or the redemption of fund shares. The returns for certain periods reflect fee waivers and/or reimbursements in effect for that year; absent fee waivers and reimbursements, performance would have been lower. |
| 2 | This table compares the Fund’s average annual total returns to those of a broad-based index and the Fund’s 50/50 Blended Benchmark, which consists of the J.P. Morgan EMBI Global Diversified Index (broad based) and the J.P. Morgan GBI-EM Diversified Index. The Fund’s Blended Benchmark is designed to provide a useful comparison to the Fund’s overall performance and more accurately reflects the Fund’s investment strategy than the broad-based index. |
| 32 | SEI Institutional Investments Trust / Annual Report / May 31, 2015 |
MANAGEMENT’S DISCUSSION AND ANALYSIS OF FUND PERFORMANCE
SEI INSTITUTIONAL INVESTMENTS TRUST — MAY 31, 2015 (Unaudited)
Real Return Fund
I. Objective
The Real Return Fund (the “Fund”) seeks to provide a total return exceeding the rate of inflation.
II. Investment Approach
The Fund is directly managed by SEI Investments Management Corporation (“SIMC”). There were no manager changes made during the fiscal year ended May 31, 2015.
III. Return vs. Benchmark
For the fiscal year ending May 31, 2015, the Fund outperformed the Barclays 1-5 Year U.S. TIPS Index (“Index”), returning -1.60% versus an Index return of -1.62%.
IV. Fund Attribution
Absolute Performance
As discussed in the shareholder letter, Inflation-sensitive assets performed poorly, due to falling oil and commodity prices, a stronger U.S. dollar, and sluggish growth.
Benchmark-Relative Performance
The Fund performed in line with the benchmark, as the Fund manager aims to replicate the performance of the Barclays 1-5 Year U.S. TIPS Index.
Real Return Fund:
AVERAGE ANNUAL TOTAL RETURN1
One Year Return | Annualized 3 Year Return | Annualized 5 Year Return | Annualized Inception to Date | |||||||||||||
| Real Return Fund, Class A | -1.60% | -0.27% | 1.56% | 3.35% | ||||||||||||
| Barclays 1-5 Year U.S. TIPS Index | -1.62% | -0.22% | 1.61% | 3.20% | ||||||||||||
Comparison of Change in the Value of a $100,000 Investment in the Real Return Fund, Class A, versus the Barclays 1-5 Year U.S. TIPS Index
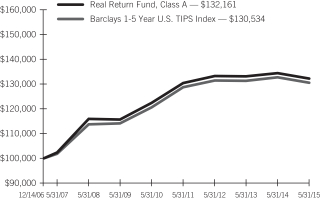
| 1 | For the year ended May 31, 2015. Past performance is not an indication of future performance. Class A shares were offered beginning 12/14/06. Returns shown do not reflect the deduction of taxes that a shareholder would pay on fund distributions or the redemption of fund shares. The returns for certain periods reflect fee waivers and/or reimbursements in effect for that year; absent fee waivers and reimbursements, performance would have been lower. |
| SEI Institutional Investments Trust / Annual Report / May 31, 2015 | 33 |
MANAGEMENT’S DISCUSSION AND ANALYSIS OF FUND PERFORMANCE
SEI INSTITUTIONAL INVESTMENTS TRUST — MAY 31, 2015 (Unaudited)
Limited Duration Bond Fund
I. Objective:
The Limited Duration Bond Fund (the “Fund”) seeks preservation of capital and current income.
II. Multi-Manager Approach Statement
The Fund is managed by a sub-adviser under the general supervision of SEI Investments Management Corporation (“SIMC”). The Fund utilized the following sub-adviser as of May 31, 2015: Logan Circle Partners, L.P. There were no sub-adviser changes during the period.
III. Return vs. Benchmark
For the period July 31, 2014 to May 31, 2015, the Fund outperformed the BofA Merrill Lynch 1-3 Year U.S. Treasury Index (“Index”), returning 0.98% versus an Index return of 0.92%.
IV. Fund Attribution
Absolute Performance
As noted in the shareholder letter, the Federal Reserve has continued to keep short-term interest rates near zero. As a result, short-duration strategies, including the Fund, provided meager returns.
Benchmark-Relative Performance
Allocation to consumer-related asset-backed securities — specifically credit card and auto-loan securitizations — performed well, as the U.S. economy continued to experience steady growth.
An overweight to senior commercial mortgage-backed securities was beneficial, as spreads tightened across the board in that sector.
Shorter-than-benchmark duration was beneficial, as the 2-year Treasury yield increased 23 basis points (0.23%) to yield 0.61% at the end of the Fund’s fiscal year. (Bond yields and prices tend to move inversely.)
An allocation to corporate debt (specifically industrials) and agency mortgage-backed securities detracted, as both of those sectors underperformed Treasurys.
Limited Duration Bond Fund:
AVERAGE ANNUAL TOTAL RETURN1
Cumulative to Date | ||||
| Limited Duration Bond Fund, Class A | 0.98% | |||
| BofA Merrill Lynch 1-3 Year U.S. Treasury Index | 0.92% | |||
Comparison of Change in the Value of a $100,000 Investment in the Limited Duration Bond Fund, Class A, versus the BofA Merrill Lynch 1-3 Year U.S. Treasury Index
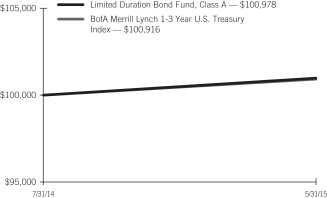
| 1 | For the year ended May 31, 2015. Past performance is not an indication of future performance. Class A shares were offered beginning 7/31/14. Returns shown do not reflect the deduction of taxes that a shareholder would pay on fund distributions or the redemption of fund shares. The returns for certain periods reflect fee waivers and/or reimbursements in effect for that year; absent fee waivers and reimbursements, performance would have been lower. |
| 34 | SEI Institutional Investments Trust / Annual Report / May 31, 2015 |
MANAGEMENT’S DISCUSSION AND ANALYSIS OF FUND PERFORMANCE
SEI INSTITUTIONAL INVESTMENTS TRUST — MAY 31, 2015 (Unaudited)
Intermediate Duration Credit Fund
I. Objective:
The Intermediate Duration Credit Fund (the “Fund”) seeks to provide current income consistent with the preservation of capital.
II. Multi-Manager Approach Statement
The Fund uses a multi-manager approach, relying on a number of sub-advisers with differing investment approaches to manage portions of the Fund’s portfolio, under the general supervision of SEI Investments Management Corporation (“SIMC”). The Fund utilized the following sub-advisers as of May 31, 2015: Income Research & Management; Legal & General Investment Management America Inc.; and Logan Circle Partners, L.P. There were no manager changes during the period.
III. Return vs. Benchmark
For the period March 31, 2015 to May 31, 2015, the Fund underperformed the Barclays A+ U.S. Credit Index (“Index”), returning -1.46% versus and Index return of -1.14%.
IV. Fund Attribution
Security selection within pharmaceuticals (Logan Circle Partners, L.P., Income Research & Management), electric (Logan Circle Partners, L.P.) and consumer cyclical (Income Research & Management, Legal & General Investment Management America Inc.) added to performance. The Fund also benefited from security selection within insurance and banking (Income Research & Management) as well as electric bonds (Legal & General Investment Management America Inc.).
Absolute Performance
Intermediate-duration credit struggled during April 2015 and May 2015, as interest rates rose steadily. (Fixed-income prices and yields tend to move inversely.) This dynamic was driven by a worldwide selloff of government bonds, as well as improving economic expectations in the U.S., which raised expectations that the Federal Reserve will begin hiking rates in 2015.
Benchmark-Relative Performance
The Fund’s duration positioning was largely neutral and thus had a negligible effect on relative performance. Yield-curve positioning detracted, due to overweights to the underperforming 10- and 30-year maturities and an underweight to better-performing 1-to-7-year maturities (Logan Circle Partners, L.P.). A significant allocation to BBB rated corporate bonds (Logan Circle Partners, L.P. and Income Research & Management) detracted, as these securities underperformed higher-rated ones. Underweights to municipal, sovereign and foreign-agency debt, and an overweight to corporates, detracted (Logan Circle Partners, L.P. and Income Research & Management). The Fund benefited from security selection within pharmaceuticals (Logan Circle Partners, L.P. and Income Research & Management), electric (Logan Circle Partners, L.P. and Legal & General Investment Management America Inc.) and consumer cyclical (Income Research & Management and Legal & General Investment Management America Inc.). Selection within insurance and banking (Income Research & Management) also contributed.
All three managers lagged the benchmark index. Income Research & Management performed best, helped by security selection within pharmaceuticals, consumer cyclicals, insurance and banking; its allocations to corporates and lower-quality credits, along with underweights to municipal, sovereign and foreign-agency debt, detracted. Legal & General Investment Management America Inc.’s results were hurt by an overweight to industrial issuers (especially communications and energy) and security selection in technology. This was partially offset by beneficial selection within consumer cyclical and electric issues. Logan Circle Partners, L.P. was helped by selection among pharmaceutical and electric issues but hurt by overweights to 10- and 30-year maturities, underweights to 1-to-7-year maturities, an allocation to lower-quality credits, an overweight to corporates, and underweights to municipal, sovereign and foreign-agency debt.
Use of Derivatives
Derivatives were used on a limited basis. Treasury futures and interest rate swaps were utilized to help manage the risk associated with interest rate and yield-curve positioning. They did not have a material impact on performance.
| SEI Institutional Investments Trust / Annual Report / May 31, 2015 | 35 |
MANAGEMENT’S DISCUSSION AND ANALYSIS OF FUND PERFORMANCE
SEI INSTITUTIONAL INVESTMENTS TRUST — MAY 31, 2015 (Unaudited)
Intermediate Duration Credit Fund (Concluded)
Intermediate Duration Credit Fund:
AVERAGE ANNUAL TOTAL RETURN1
Cumulative to Date | ||||
| Intermediate Duration Credit Fund, Class A | -1.46% | |||
| Barclays A+ U.S. Credit Index | -1.14% | |||
| 36 | SEI Institutional Investments Trust / Annual Report / May 31, 2015 |
MANAGEMENT’S DISCUSSION AND ANALYSIS OF FUND PERFORMANCE
SEI INSTITUTIONAL INVESTMENTS TRUST — MAY 31, 2015 (Unaudited)
Dynamic Asset Allocation Fund
I. Objective:
The Dynamic Asset Allocation Fund, (the “Fund”) seeks long-term total return.
II. Multi-Manager Approach Statement
The Fund is managed by a sub-adviser under the general supervision of SEI Investments Management Corporation (“SIMC”). The Fund utilized the following sub-adviser as of May 31, 2015: SSgA Funds Management, Inc. There were no sub-adviser changes during the year.
III. Return vs. Benchmark
For the fiscal year ending May 31, 2015, the Fund outperformed the S&P 500 Index (“Index”), returning 22.32% (consolidated return) versus an Index return of 11.81%.
IV. Fund Attribution
Absolute Performance
The Fund benefited from its strategic allocation to U.S. equities. Slightly more than half the Fund’s overall performance was attributable to the rally in the S&P 500 Index over fiscal year ending May 31, 2015.
Benchmark-Relative Performance
The sharp appreciation of the U.S. dollar against the euro added to absolute performance. The European Central Bank’s willingness to finally undertake quantitative easing (“QE”), coupled with the winding down of QE by the U.S. Federal Reserve, contributed to the sharp decline of the euro against the dollar. Exposure to the Indian rupee against the euro also contributed to returns, as the rupee has strengthened since the election of a pro-growth government in India.
A position in Japanese stocks against U.S. large-cap stocks, based on more attractive equity valuations in Japan, was beneficial. A weaker Japanese yen helped boost the country’s export-heavy economy.
A short position in the British pound, paired with a long position in the Indian rupee, detracting from returns in May. Following greater-than-anticipated victories for the Conservative party in the U.K. general election (and resulting expectations for a pro-growth shift in government policy), the pound rallied sharply. The position was eliminated shortly after the election results.
Use of Derivatives
The short euro, long dollar trade was implemented using foreign-currency forward contracts and put options. The purpose of these derivatives was to efficiently gain exposure to movements between the two currencies. These derivatives impacted performance positively.
Foreign-currency forward contracts were used to gain access to both a short euro position and a long Indian rupee position, as well as short British pound, long Indian rupee positions. The use of these contracts provided efficient exposure to movements in these currency pairs. The euro/rupee contracts had a positive effect on performance, while the pound/rupee contracts detracted.
Futures contracts were used to efficiently implement the long Japanese equities, short U.S. large-cap equities position. These contracts had a positive impact on performance.
Dynamic Asset Allocation Fund:
AVERAGE ANNUAL TOTAL RETURN1
One Year Return | Annualized 3 Year Return | Annualized Inception to Date | ||||||||||
| Dynamic Asset Allocation Fund, Class A | 22.32% | 20.46% | 16.34% | |||||||||
| S&P 500 Index | 11.81% | 19.67% | 16.80% | |||||||||
| SEI Institutional Investments Trust / Annual Report / May 31, 2015 | 37 |
MANAGEMENT’S DISCUSSION AND ANALYSIS OF FUND PERFORMANCE
SEI INSTITUTIONAL INVESTMENTS TRUST — MAY 31, 2015 (Unaudited)
Dynamic Asset Allocation Fund (Concluded)
Comparison of Change in the Value of a $100,000 Investment in the Dynamic Asset Allocation Fund, Class A, versus the S&P 500 Index
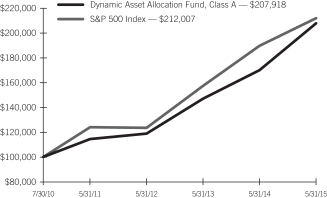
| 1 | For the year ended May 31, 2015. Past performance is not an indication of future performance. Class A shares were offered beginning 7/30/10. Returns shown do not reflect the deduction of taxes that a shareholder would pay on fund distributions or the redemption of fund shares. The returns for certain periods reflect fee waivers and/or reimbursements in effect for that year; absent fee waivers and reimbursements, performance would have been lower. |
| 38 | SEI Institutional Investments Trust / Annual Report / May 31, 2015 |
MANAGEMENT’S DISCUSSION AND ANALYSIS OF FUND PERFORMANCE
SEI INSTITUTIONAL INVESTMENTS TRUST — MAY 31, 2015 (Unaudited)
Multi-Asset Real Return Fund
I. Objective
The Multi-Asset Real Return Fund (the “Fund”) seeks a total return exceeding the rate of inflation.
II. Multi-Manager Approach Statement
The Fund uses a multi-manager approach, relying on a number of sub-advisers with differing investment approaches to manage portions of the Fund’s portfolio, under the general supervision of SEI Investments Management Corporation (“SIMC”). The Fund utilized the following sub-advisers as of May 31, 2015: AllianceBernstein L.P. and QS Investors, LLC. There were no sub-adviser changes during the year.
III. Return vs. Benchmark
For the fiscal year ending May 31, 2015, the Fund underperformed the Barclays 1-5 Year U.S. TIPS Index (“Index”), returning -5.16% (consolidated return) versus an Index return of
-1.62%.
IV. Fund Attribution
Absolute Return
Inflation-sensitive assets generally underperformed, as inflation risks remained low. The Fund’s negative absolute return was driven by declining commodity prices, especially oil. As noted in the shareholder letter, the Bloomberg Commodity Index returned negative 24.55% over the fiscal year ending May 31, 2015. The Fund’s equity long/short and fixed-income holdings provided positive returns.
Benchmark-Relative Return
Relative underperformance was attributable to the Fund’s strategic exposure to commodities within wholly owned underlying controlled foreign corporation. While commodities experienced poor performance across many sectors, the plunge in crude oil from late 2014 into early 2015 was the major detractor.
Both equity (QS Investors, LLC) and fixed-income (AllianceBernstein L.P.) positions boosted relative returns. QS Investors, LLC’s equity long/short strategy benefited from a net long exposure to U.S. equities in a period of strong equity market performance. AllianceBernstein L.P.’s sector rotation and issue selection in the investment-grade credit and securitized sectors were the main contributors to relative performance.
Use of Derivatives
The Fund utilized equity index futures to hedge broad equity market exposure. The Fund also utilized bond futures and interest rate swaps to hedge duration. While the equity index futures, bond futures and interest rate swap positions detracted from absolute return, they provided the intended hedges. The Fund utilized commodity futures to obtain a diversified, strategic exposure to the commodities market. This exposure was a meaningful detractor from total return.
Multi-Asset Real Return Fund:
AVERAGE ANNUAL TOTAL RETURN1
One Year Return | Annualized | Annualized to Date | ||||||||||
| Multi-Asset Real Return Fund, Class A | -5.16% | -1.34% | -3.00% | |||||||||
| Barclays 1-5 Year U.S. TIPS Index | -1.62% | -0.22% | -0.04% | |||||||||
Comparison of Change in the Value of a $100,000 Investment in the Multi-Asset Real Return Fund, Class A, versus the Barclays 1-5 Year U.S. TIPS Index

| 1 | For the year ended May 31, 2015. Past performance is not an indication of future performance. Class A shares were offered beginning 7/29/11. Returns shown do not reflect the deduction of taxes that a shareholder would pay on fund distributions or the redemption of fund shares. The returns for certain periods reflect fee waivers and/or reimbursements in effect for that period; absent fee waivers and reimbursements, performance would have been lower. |
| SEI Institutional Investments Trust / Annual Report / May 31, 2015 | 39 |
SUMMARY SCHEDULE OF INVESTMENTS
Large Cap Fund
May 31, 2015
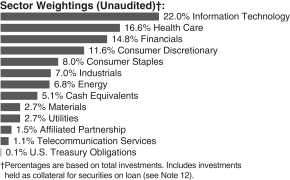
| Description | Percentage of Net Assets (%) | Shares | Market Value ($ Thousands) | |||||||||
COMMON STOCK — 96.2% |
| |||||||||||
Consumer Discretionary — 12.0% |
| |||||||||||
Amazon.com* | 0.9 | % | 50,902 | $ | 21,849 | |||||||
Home Depot | 0.7 | 142,352 | 15,861 | |||||||||
Liberty Interactive, Cl A* | 0.7 | 548,375 | 15,338 | |||||||||
Starbucks | 0.9 | 418,425 | 21,741 | |||||||||
TripAdvisor* | 0.8 | 242,687 | 18,507 | |||||||||
Other Securities (A) | 8.0 | 190,648 | ||||||||||
|
| |||||||||||
| 283,944 | ||||||||||||
|
| |||||||||||
Consumer Staples — 8.2% |
| |||||||||||
Costco Wholesale | 0.7 | 118,102 | 16,840 | |||||||||
Estee Lauder, Cl A | 0.6 | 154,842 | 13,538 | |||||||||
Philip Morris International | 0.9 | 254,240 | 21,120 | |||||||||
Walgreens Boots Alliance | 0.7 | 197,662 | 16,967 | |||||||||
Other Securities (A) | 5.3 | 125,876 | ||||||||||
|
| |||||||||||
| 194,341 | ||||||||||||
|
| |||||||||||
Energy — 7.1% |
| |||||||||||
Exxon Mobil | 0.9 | 252,052 | 21,475 | |||||||||
Valero Energy | 0.7 | 279,279 | 16,544 | |||||||||
Other Securities (A) | 5.5 | 129,193 | ||||||||||
|
| |||||||||||
| 167,212 | ||||||||||||
|
| |||||||||||
Financials — 15.2% |
| |||||||||||
American International Group | 0.7 | 287,260 | 16,836 | |||||||||
Capital One Financial | 0.8 | 235,470 | 19,676 | |||||||||
Charles Schwab | 0.7 | 506,219 | 16,022 | |||||||||
Citigroup | 1.4 | 633,330 | 34,250 | |||||||||
Crown Castle International‡ | 0.6 | 163,800 | 13,358 | |||||||||
JPMorgan Chase | 1.3 | 464,970 | 30,586 | |||||||||
Travelers | 0.7 | 154,776 | 15,651 | |||||||||
Wells Fargo | 0.6 | 260,556 | 14,581 | |||||||||
Other Securities (A) | 8.4 | 199,235 | ||||||||||
|
| |||||||||||
| 360,195 | ||||||||||||
|
| |||||||||||
| Description | Percentage of Net Assets (%) | Shares | Market Value ($ Thousands) | |||||||||
Health Care — 17.1% | ||||||||||||
Actavis* | 1.1 | % | 85,832 | $ | 26,334 | |||||||
Alexion Pharmaceuticals* | 0.6 | 86,980 | 14,251 | |||||||||
Anthem | 0.7 | 103,660 | 17,399 | |||||||||
Biogen* | 0.8 | 49,795 | 19,768 | |||||||||
Bristol-Myers Squibb | 0.8 | 302,624 | 19,549 | |||||||||
Celgene* | 1.1 | 230,490 | 26,377 | |||||||||
Express Scripts Holding* | 0.7 | 191,352 | 16,674 | |||||||||
Gilead Sciences | 0.8 | 177,630 | 19,943 | |||||||||
Humana | 0.8 | 88,317 | 18,957 | |||||||||
Johnson & Johnson | 0.8 | 193,142 | 19,341 | |||||||||
Pfizer | 1.1 | 735,170 | 25,547 | |||||||||
Teva Pharmaceutical Industries ADR | 0.6 | 232,642 | 13,982 | |||||||||
United Therapeutics* | 0.6 | 72,395 | 13,301 | |||||||||
Valeant Pharmaceuticals International* | 0.7 | 64,816 | 15,476 | |||||||||
Other Securities (A) | 5.9 | 137,502 | ||||||||||
|
| |||||||||||
| 404,401 | ||||||||||||
|
| |||||||||||
Industrials — 7.3% |
| |||||||||||
Danaher | 0.6 | 157,823 | 13,623 | |||||||||
Northrop Grumman | 0.7 | 104,584 | 16,648 | |||||||||
Stericycle* | 0.6 | 102,175 | 14,028 | |||||||||
Other Securities (A) | 5.4 | 127,271 | ||||||||||
|
| |||||||||||
| 171,570 | ||||||||||||
|
| |||||||||||
Information Technology — 22.7% |
| |||||||||||
Adobe Systems* | 0.8 | 224,245 | 17,735 | |||||||||
Apple | 1.3 | 240,123 | 31,283 | |||||||||
Cisco Systems | 0.6 | 489,587 | 14,350 | |||||||||
Cognizant Technology Solutions, Cl A* | 0.8 | 313,603 | 20,296 | |||||||||
eBay* | 0.8 | 301,625 | 18,508 | |||||||||
Equinix‡ | 0.7 | 64,177 | 17,204 | |||||||||
Google, Cl A* | 0.8 | 35,597 | 19,412 | |||||||||
Google, Cl C* | 0.7 | 29,945 | 15,934 | |||||||||
Intel | 0.8 | 514,420 | 17,727 | |||||||||
MasterCard, Cl A | 1.2 | 298,120 | 27,504 | |||||||||
Microsoft | 1.6 | 786,045 | 36,834 | |||||||||
NXP Semiconductor* | 0.6 | 140,061 | 15,722 | |||||||||
Qualcomm | 1.0 | 323,360 | 22,532 | |||||||||
Visa, Cl A | 1.5 | 527,434 | 36,224 | |||||||||
Other Securities (A) | 9.5 | 225,049 | ||||||||||
|
| |||||||||||
| 536,314 | ||||||||||||
|
| |||||||||||
Materials — 2.8% |
| |||||||||||
Other Securities (A) | 2.8 | 66,095 | ||||||||||
|
| |||||||||||
| 40 | SEI Institutional Investments Trust / Annual Report / May 31, 2015 |
| Description | Percentage of Net Assets (%) | Shares | Market Value ($ Thousands) | |||||||||
Telecommunication Services — 1.1% |
| |||||||||||
Other Securities | 1.1 | % | $ | 26,510 | ||||||||
|
| |||||||||||
Utilities — 2.7% |
| |||||||||||
Other Securities | 2.7 | 64,839 | ||||||||||
|
| |||||||||||
Total Common Stock |
| 2,275,421 | ||||||||||
|
| |||||||||||
AFFILIATED PARTNERSHIP — 1.5% |
| |||||||||||
SEI Liquidity Fund, L.P. | ||||||||||||
0.060% (B)**† | 1.5 | 36,554,719 | 36,555 | |||||||||
|
| |||||||||||
Total Affiliated Partnership |
| 36,555 | ||||||||||
|
| |||||||||||
CASH EQUIVALENTS — 5.2% |
| |||||||||||
SEI Daily Income | 5.0 | 118,861,228 | 118,861 | |||||||||
Other Securities | 0.2 | 5,089 | ||||||||||
|
| |||||||||||
Total Cash Equivalents |
| 123,950 | ||||||||||
|
| |||||||||||
U.S. TREASURY OBLIGATIONS (C) — 0.1% |
| |||||||||||
Other Securities | 0.1 | 1,587 | ||||||||||
|
| |||||||||||
Total U.S. Treasury Obligations |
| 1,587 | ||||||||||
|
| |||||||||||
Total Investments — 103.0% |
| $ | 2,437,513 | |||||||||
|
| |||||||||||
Percentages are based on a Net Assets of $2,366,204 ($ Thousands).
| * | Non-income producing security. |
| ** | The rate reported is the 7-day effective yield as of May 31, 2015. |
| ‡ | Real Estate Investment Trust. |
| † | Investment in Affiliated Security (see Note 6). |
| (A) | Certain securities or partial positions of certain securities are on loan at May 31, 2015 (see Note 12). The total market value of securities on loan at May 31, 2015 was $35,431 ($ Thousands). |
| (B) | This security was purchased with cash collateral held from securities on loan (see Note 12). The total value of such securities as of May 31, 2015 was $36,555 ($ Thousands). |
| (C) | Security, or portion thereof, has been pledged as collateral on open futures contracts. |
ADR — American Depositary Receipt
Cl — Class
L.P. — Limited Partnership
The Summary Schedule of Investments does not reflect the complete portfolio holdings. It includes the Fund’s 50 largest holdings and each investment of any issuer that exceeds 1% of the Fund’s net assets. “Other Securities” represent all issuers not required to be disclosed under the rules adopted by the U.S. Securities and Exchange Commission (“SEC”). In certain instances, securities for which footnotes listed above may otherwise apply are included in the Other Securities caption. The complete schedule of portfolio holdings is available (i) without charge, upon request, by calling (800) 342-5734; and (ii) on the SEC’s website at http://www.sec.gov.
The following is a list of the level of inputs used as of May 31, 2015, in valuing the Fund’s investments carried at value ($ Thousands):
| Investments in Securities | Level 1 | Level 2 | Level 3 | Total | ||||||||||||
Common Stock | $ | 2,275,421 | $ | — | $ | — | $ | 2,275,421 | ||||||||
Affiliated Partnership | — | 36,555 | — | 36,555 | ||||||||||||
Cash Equivalents | 123,950 | — | — | 123,950 | ||||||||||||
U.S. Treasury Obligations | — | 1,587 | — | 1,587 | ||||||||||||
|
|
|
|
|
|
|
| |||||||||
Total Investments in Securities | $ | 2,399,371 | $ | 38,142 | $ | — | $ | 2,437,513 | ||||||||
|
|
|
|
|
|
|
| |||||||||
For the year ended May 31, 2015, there were no transfers between Level 1 and Level 2 assets and liabilities.
For the year ended May 31, 2015, there were no transfers between Level 2 and Level 3 assets and liabilities.
For more information on valuation inputs, see Note 2 — Significant Accounting Policies in Notes to Financial Statements.
Amounts designated as “—” are either $0 or have been rounded to $0.
The accompanying notes are an integral part of the financial statements.
| SEI Institutional Investments Trust / Annual Report / May 31, 2015 | 41 |
SUMMARY SCHEDULE OF INVESTMENTS
Large Cap Diversified Alpha Fund
May 31, 2015

| Description | Percentage of Net Assets (%) | Shares | Market Value ($ Thousands) | |||||||||
COMMON STOCK — 94.9% |
| |||||||||||
Consumer Discretionary — 14.2% |
| |||||||||||
DIRECTV* | 1.0 | % | 6,777 | $ | 617 | |||||||
Discovery Communications, Cl C* | 0.8 | 16,680 | 525 | |||||||||
General Motors | 1.3 | 22,425 | 807 | |||||||||
Liberty Interactive, Cl A* | 0.7 | 15,569 | 436 | |||||||||
Michael Kors Holdings* | 0.8 | 10,271 | 477 | |||||||||
NIKE, Cl B | 1.1 | 6,941 | 706 | |||||||||
Priceline Group* | 0.8 | 407 | 477 | |||||||||
Toyota Motor ADR | 1.7 | 7,902 | 1,089 | |||||||||
Other Securities | 6.0 | 3,876 | ||||||||||
|
| |||||||||||
| 9,010 | ||||||||||||
|
| |||||||||||
Consumer Staples — 4.2% |
| |||||||||||
Walgreens Boots Alliance | 0.8 | 5,963 | 512 | |||||||||
Other Securities | 3.4 | 2,182 | ||||||||||
|
| |||||||||||
| 2,694 | ||||||||||||
|
| |||||||||||
Energy — 8.6% |
| |||||||||||
EOG Resources | 0.7 | 4,972 | 441 | |||||||||
Kinder Morgan | 0.7 | 11,051 | 458 | |||||||||
Other Securities | 7.2 | 4,580 | ||||||||||
|
| |||||||||||
| 5,479 | ||||||||||||
|
| |||||||||||
Financials — 15.5% |
| |||||||||||
Allstate | 0.8 | 7,915 | 533 | |||||||||
Citigroup | 1.9 | 22,116 | 1,196 | |||||||||
Crown Castle International‡ | 1.0 | 7,396 | 603 | |||||||||
Hartford Financial Services Group | 0.9 | 13,279 | 546 | |||||||||
JPMorgan Chase | 1.5 | 14,961 | 984 | |||||||||
KKR | 0.7 | 19,784 | 454 | |||||||||
MetLife | 1.0 | 12,349 | 645 | |||||||||
PNC Financial Services Group | 0.8 | 5,000 | 478 | |||||||||
Travelers | 0.7 | 4,172 | 422 | |||||||||
Other Securities | 6.2 | 3,974 | ||||||||||
|
| |||||||||||
| 9,835 | ||||||||||||
|
| |||||||||||
| Description | Percentage of Net Assets (%) | Shares | Market Value ($ Thousands) | |||||||||
Health Care — 13.1% |
| |||||||||||
Actavis* | 1.0 | % | 2,043 | $ | 627 | |||||||
Biogen* | 1.2 | 1,849 | 734 | |||||||||
Cardinal Health | 0.9 | 6,812 | 601 | |||||||||
Celgene* | 1.6 | 9,013 | 1,031 | |||||||||
Gilead Sciences | 1.0 | 5,925 | 665 | |||||||||
Merck | 0.8 | 7,943 | 484 | |||||||||
Novo Nordisk ADR | 1.1 | 11,999 | 678 | |||||||||
Pfizer | 0.7 | 13,383 | 465 | |||||||||
Valeant Pharmaceuticals International* | 1.0 | 2,714 | 648 | |||||||||
Other Securities | 3.8 | 2,394 | ||||||||||
|
| |||||||||||
| 8,327 | ||||||||||||
|
| |||||||||||
Industrials — 8.8% |
| |||||||||||
American Airlines Group | 0.7 | 10,485 | 444 | |||||||||
Delta Air Lines | 1.0 | 14,088 | 605 | |||||||||
FedEx | 0.7 | 2,519 | 436 | |||||||||
Other Securities | 6.4 | 4,146 | ||||||||||
|
| |||||||||||
| 5,631 | ||||||||||||
|
| |||||||||||
Information Technology — 23.8% |
| |||||||||||
Apple | 1.6 | 7,993 | 1,041 | |||||||||
Baidu ADR* | 0.7 | 2,248 | 444 | |||||||||
Cisco Systems | 1.0 | 22,554 | 661 | |||||||||
eBay* | 1.5 | 14,999 | 920 | |||||||||
Electronic Arts* | 0.9 | 8,699 | 546 | |||||||||
Equinix‡ | 1.5 | 3,465 | 929 | |||||||||
Google, Cl A* | 0.7 | 865 | 472 | |||||||||
Google, Cl C* | 1.0 | 1,223 | 651 | |||||||||
Intel | 0.8 | 13,953 | 481 | |||||||||
International Business Machines | 0.7 | 2,542 | 431 | |||||||||
Intuit | 0.7 | 4,540 | 473 | |||||||||
MasterCard, Cl A | 1.2 | 8,025 | 740 | |||||||||
Micron Technology* | 0.8 | 18,842 | 526 | |||||||||
Microsoft | 1.5 | 20,362 | 954 | |||||||||
Qualcomm | 1.7 | 15,526 | 1,082 | |||||||||
Visa, Cl A | 0.9 | 8,728 | 600 | |||||||||
Other Securities | 6.6 | 4,167 | ||||||||||
|
| |||||||||||
| 15,118 | ||||||||||||
|
| |||||||||||
Materials — 3.1% |
| |||||||||||
Other Securities | 3.1 | 1,957 | ||||||||||
|
| |||||||||||
Telecommunication Services — 2.2% |
| |||||||||||
Verizon Communications | 1.6 | 20,340 | 1,006 | |||||||||
Other Securities | 0.6 | 402 | ||||||||||
|
| |||||||||||
| 1,408 | ||||||||||||
|
| |||||||||||
| 42 | SEI Institutional Investments Trust / Annual Report / May 31, 2015 |
| Description | Percentage of Net Assets (%) | Shares | Market Value ($ Thousands) | |||||||||
Utilities — 1.4% |
| |||||||||||
Edison International | 0.8 | % | 8,057 | $ | 490 | |||||||
Other Securities | 0.6 | 388 | ||||||||||
|
| |||||||||||
| 878 | ||||||||||||
|
| |||||||||||
Total Common Stock |
| 60,337 | ||||||||||
|
| |||||||||||
CASH EQUIVALENT — 5.8% |
| |||||||||||
SEI Daily Income Trust, Prime Obligation Fund, Cl A | 5.8 | 3,684,519 | 3,685 | |||||||||
|
| |||||||||||
Total Cash Equivalent |
| 3,685 | ||||||||||
|
| |||||||||||
U.S. TREASURY OBLIGATION (A) — 0.3% |
| |||||||||||
Other Securities | 0.3 | 206 | ||||||||||
|
| |||||||||||
Total U.S. Treasury Obligation |
| 206 | ||||||||||
|
| |||||||||||
Total Investments — 101.0% |
| $ | 64,228 | |||||||||
|
| |||||||||||
A list of the open futures contracts held by the Fund at May 31, 2015, is as follows:
| Type of Contract | Number of Contracts Long | Expiration Date | Unrealized Appreciation ($ Thousands) | |||||||||
S&P 500 Index E-MINI | 10 | Jun-2015 | $ | 37 | ||||||||
|
| |||||||||||
For the year ended May 31, 2015, the total amount of all open futures contracts, as presented in the table above, are representative of the volume of activity for this derivative type during the year.
Percentages are based on a Net Assets of $63,607 ($ Thousands).
| * | Non-income producing security. |
| ** | The rate reported is the 7-day effective yield as of May 31, 2015. |
| † | Investment in Affiliated Security (see Note 6). |
| ‡ | Real Estate Investment Trust. |
| (A) | Security, or portion thereof, has been pledged as collateral on open futures contracts. |
ADR — American Depositary Receipt
Cl — Class
S&P — Standard & Poor’s
The Summary Schedule of Investments does not reflect the complete portfolio holdings. It includes the Fund’s 50 largest holdings and each investment of any issuer that exceeds 1% of the Fund’s net assets. “Other Securities” represent all issuers not required to be disclosed under the rules adopted by the U.S. Securities and Exchange Commission (“SEC”). In certain instances, securities for which footnotes listed above may otherwise apply are included in the Other Securities caption. The complete schedule of portfolio holdings is available (i) without charge, upon request, by calling (800) 342-5734; and (ii) on the SEC’s website at http://www.sec.gov.
The following is a list of the level of inputs used as of May 31, 2015, in valuing the Fund’s investments and other financial instruments carried at value ($ Thousands):
| Investments in Securities | Level 1 | Level 2 | Level 3 | Total | ||||||||||||
Common Stock | $ | 60,337 | $ | — | $ | — | $ | 60,337 | ||||||||
Cash Equivalent | 3,685 | — | — | 3,685 | ||||||||||||
U.S. Treasury Obligation | — | 206 | — | 206 | ||||||||||||
|
|
|
|
|
|
|
| |||||||||
Total Investments in Securities | $ | 64,022 | $ | 206 | $ | — | $ | 64,228 | ||||||||
|
|
|
|
|
|
|
| |||||||||
| Other Financial Instruments | Level 1 | Level 2 | Level 3 | Total | ||||||||||||
Futures Contracts* | ||||||||||||||||
Unrealized Appreciation | $ | 37 | $ | — | $ | — | $ | 37 | ||||||||
|
|
|
|
|
|
|
| |||||||||
| * | Futures contracts are valued at the unrealized appreciation on the instrument. |
For the year ended May 31, 2015, there were no transfers between Level 1 and Level 2 assets and liabilities.
For the year ended May 31, 2015, there were no transfers between Level 2 and Level 3 assets and liabilities.
For more information on valuation inputs, see Note 2 — Significant Accounting Policies in Notes to Financial Statements.
Amounts designated as “—” are either $0 or have been rounded to $0.
The accompanying notes are an integral part of the financial statements.
| SEI Institutional Investments Trust / Annual Report / May 31, 2015 | 43 |
SUMMARY SCHEDULE OF INVESTMENTS
Large Cap Disciplined Equity Fund
May 31, 2015
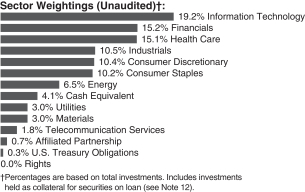
| Description | Percentage of Net Assets (%) | Shares | Market Value ($ Thousands) | |||||||||
COMMON STOCK — 96.1% |
| |||||||||||
Consumer Discretionary — 10.6% |
| |||||||||||
AutoZone* | 0.7 | % | 40,438 | $ | 27,240 | |||||||
Comcast, Cl A (A) | 1.5 | 1,056,567 | 61,767 | |||||||||
Home Depot | 0.7 | 271,652 | 30,267 | |||||||||
Other Securities (A) | 7.7 | 324,558 | ||||||||||
|
| |||||||||||
| 443,832 | ||||||||||||
|
| |||||||||||
Consumer Staples — 10.3% |
| |||||||||||
Altria Group | 0.8 | 684,375 | 35,040 | |||||||||
Coca-Cola | 0.6 | 610,652 | 25,012 | |||||||||
CVS Health | 0.7 | 289,446 | 29,633 | |||||||||
Henkel | 0.6 | 234,293 | 23,978 | |||||||||
Kroger | 0.6 | 330,073 | 24,029 | |||||||||
Mondelez International, Cl A | 0.8 | 793,530 | 33,003 | |||||||||
PepsiCo | 1.3 | 575,989 | 55,543 | |||||||||
Philip Morris International | 0.8 | 388,821 | 32,299 | |||||||||
Procter & Gamble | 0.8 | 452,941 | 35,506 | |||||||||
Wal-Mart Stores | 0.8 | 441,645 | 32,801 | |||||||||
Other Securities (A) | 2.5 | 105,427 | ||||||||||
|
| |||||||||||
| 432,271 | ||||||||||||
|
| |||||||||||
Energy — 6.5% |
| |||||||||||
Chevron | 1.0 | 420,044 | 43,265 | |||||||||
Exxon Mobil | 1.0 | 499,039 | 42,518 | |||||||||
Other Securities (A) | 4.5 | 188,266 | ||||||||||
|
| |||||||||||
| 274,049 | ||||||||||||
|
| |||||||||||
Financials — 15.4% |
| |||||||||||
American International Group | 0.6 | 419,988 | 24,615 | |||||||||
Berkshire Hathaway, Cl B* | 1.4 | 424,804 | 60,747 | |||||||||
Citigroup | 1.2 | 897,315 | 48,527 | |||||||||
CME Group, Cl A | 0.5 | 233,850 | 22,029 | |||||||||
Discover Financial Services | 0.6 | 403,927 | 23,537 | |||||||||
JPMorgan Chase | 1.1 | 724,401 | 47,651 | |||||||||
Voya Financial | 0.6 | 553,303 | 25,070 | |||||||||
| Description | Percentage of Net Assets (%) | Shares | Market Value ($ Thousands) | |||||||||
Wells Fargo | 0.9 | % | 666,132 | $ | 37,277 | |||||||
Other Securities (A) | 8.5 | 358,147 | ||||||||||
|
| |||||||||||
| 647,600 | ||||||||||||
|
| |||||||||||
Health Care — 15.3% |
| |||||||||||
Actavis* | 0.8 | 112,566 | 34,536 | |||||||||
Amgen | 0.6 | 153,329 | 23,959 | |||||||||
Bristol-Myers Squibb | 0.9 | 566,665 | 36,607 | |||||||||
Express Scripts Holding* | 0.6 | 297,670 | 25,939 | |||||||||
Gilead Sciences (A) | 1.1 | 426,771 | 47,914 | |||||||||
Johnson & Johnson | 1.2 | 521,334 | 52,206 | |||||||||
Merck | 0.9 | 620,155 | 37,761 | |||||||||
Pfizer | 1.0 | 1,214,196 | 42,193 | |||||||||
Thermo Fisher Scientific | 0.6 | 184,220 | 23,880 | |||||||||
UnitedHealth Group | 1.0 | 352,150 | 42,332 | |||||||||
Zoetis, Cl A | 0.7 | 547,941 | 27,271 | |||||||||
Other Securities (A) | 5.9 | 246,638 | ||||||||||
|
| |||||||||||
| 641,236 | ||||||||||||
|
| |||||||||||
Industrials — 10.6% |
| |||||||||||
3M | 0.7 | 201,559 | 32,064 | |||||||||
General Electric | 0.9 | 1,324,993 | 36,133 | |||||||||
Honeywell International | 0.6 | 226,998 | 23,653 | |||||||||
Lockheed Martin | 0.7 | 154,400 | 29,058 | |||||||||
Southwest Airlines | 0.6 | 705,214 | 26,128 | |||||||||
Union Pacific | 0.6 | 245,545 | 24,778 | |||||||||
Other Securities (A) | 6.5 | 275,067 | ||||||||||
|
| |||||||||||
| 446,881 | ||||||||||||
|
| |||||||||||
Information Technology — 19.5% |
| |||||||||||
Apple | 3.7 | 1,196,834 | 155,924 | |||||||||
Cisco Systems | 1.1 | 1,501,752 | 44,016 | |||||||||
Google, Cl A* | 0.8 | 61,675 | 33,632 | |||||||||
Google, Cl C* | 1.2 | 95,479 | 50,805 | |||||||||
Intel (A) | 1.0 | 1,238,298 | 42,672 | |||||||||
MasterCard, Cl A | 0.5 | 241,115 | 22,245 | |||||||||
Microsoft | 1.5 | 1,365,561 | 63,990 | |||||||||
Xerox | 0.7 | 2,736,062 | 31,246 | |||||||||
Other Securities (A) | 9.0 | 372,572 | ||||||||||
|
| |||||||||||
| 817,102 | ||||||||||||
|
| |||||||||||
Materials — 3.0% |
| |||||||||||
LyondellBasell Industries, Cl A | 0.7 | 270,549 | 27,352 | |||||||||
Other Securities | 2.3 | 99,351 | ||||||||||
|
| |||||||||||
| 126,703 | ||||||||||||
|
| |||||||||||
Telecommunication Services — 1.8% |
| |||||||||||
Verizon Communications | 1.4 | 1,155,747 | 57,140 | |||||||||
Other Securities | 0.4 | 18,472 | ||||||||||
|
| |||||||||||
| 75,612 | ||||||||||||
|
| |||||||||||
| 44 | SEI Institutional Investments Trust / Annual Report / May 31, 2015 |
| Description | Percentage of Net Assets (%) | Shares | Market Value ($ Thousands) | |||||||||
Utilities — 3.1% |
| |||||||||||
Other Securities | 3.1 | % | $ | 128,874 | ||||||||
|
| |||||||||||
Total Common Stock |
| 4,034,160 | ||||||||||
|
| |||||||||||
RIGHTS — 0.0% | ||||||||||||
United States — 0.0% | ||||||||||||
Other Securities | 0.0 | 91 | ||||||||||
|
| |||||||||||
Total Rights |
| 91 | ||||||||||
|
| |||||||||||
AFFILIATED PARTNERSHIP — 0.7% |
| |||||||||||
SEI Liquidity Fund, L.P. 0.060%**† (B) | 0.7 | 29,683,177 | 29,683 | |||||||||
|
| |||||||||||
Total Affiliated Partnership |
| 29,683 | ||||||||||
|
| |||||||||||
CASH EQUIVALENT — 4.1% |
| |||||||||||
SEI Daily Income Trust, Prime | 4.1 | 172,334,872 | 172,335 | |||||||||
|
| |||||||||||
Total Cash Equivalent |
| 172,335 | ||||||||||
|
| |||||||||||
U.S. TREASURY OBLIGATIONS (C) — 0.3% |
| |||||||||||
Other Securities | 0.3 | 14,576 | ||||||||||
|
| |||||||||||
Total U.S. Treasury Obligations |
| 14,576 | ||||||||||
|
| |||||||||||
Total Investments — 101.2% |
| $ | 4,250,845 | |||||||||
|
| |||||||||||
A list of the open futures contracts held by the Fund at May 31, 2015, is as follows:
| Type of Contract | Number of Contracts Long | Expiration Date | Unrealized Appreciation ($ Thousands) | |||||||||
S&P 500 Index E-MINI | 770 | Jun-2015 | $ | 1,652 | ||||||||
S&P 500 Index E-MINI | 181 | Sep-2015 | 318 | |||||||||
|
| |||||||||||
| $ | 1,970 | |||||||||||
|
| |||||||||||
For the year ended May 31, 2015, the total amount of all open futures contracts, as presented in the table above, are representative of the volume of activity for this derivative type during the year.
Percentages are based on a Net Assets of $4,198,645 ($ Thousands).
| * | Non-income producing security. |
| ** | The rate reported is the 7-day effective yield as of May 31, 2015. |
| † | Investment in Affiliated Security (see Note 6). |
| (A) | Certain securities or partial positions of certain securities are on loan at May 31, 2015 (see Note 12). The total market value of securities on loan at May 31, 2015 was $28,661 ($ Thousands). |
| (B) | This security was purchased with cash collateral held from securities on loan (See Note 12). The total value of such securities as of May 31, 2015 was $29,683 ($ Thousands). |
| (C) | Security, or portion thereof, has been pledged as collateral on open futures contracts. |
Cl — Class
L.P. — Limited Partnership
S&P — Standard & Poor’s
The Summary Schedule of Investments does not reflect the complete portfolio holdings. It includes the Fund’s 50 largest holdings and each investment of any issuer that exceeds 1% of the Fund’s net assets. “Other Securities” represent all issuers not required to be disclosed under the rules adopted by the U.S. Securities and Exchange Commission (“SEC”). In certain instances, securities for which footnotes listed above may otherwise apply are included in the Other Securities caption. The complete schedule of portfolio holdings is available (i) without charge, upon request, by calling (800) 342-5734; and (ii) on the SEC’s website at http://www.sec.gov.
The following is a list of the level of inputs used as of May 31, 2015, in valuing the Fund’s investments and other financial instruments carried at value ($ Thousands):
| Investments in Securities | Level 1 | Level 2 | Level 3 | Total | ||||||||||||
Common Stock | $ | 4,034,160 | $ | — | $ | — | $ | 4,034,160 | ||||||||
Rights | — | 91 | — | 91 | ||||||||||||
Affiliated Partnership | — | 29,683 | — | 29,683 | ||||||||||||
Cash Equivalent | 172,335 | — | — | 172,335 | ||||||||||||
U.S. Treasury Obligations | — | 14,576 | — | 14,576 | ||||||||||||
|
|
|
|
|
|
|
| |||||||||
Total Investments in Securities | $ | 4,206,495 | $ | 44,350 | $ | — | $ | 4,250,845 | ||||||||
|
|
|
|
|
|
|
| |||||||||
| Other Financial Instruments | Level 1 | Level 2 | Level 3 | Total | ||||||||||||
Futures Contracts* | ||||||||||||||||
Unrealized Appreciation | $ | 1,970 | $ | — | $ | — | $ | 1,970 | ||||||||
|
|
|
|
|
|
|
| |||||||||
| * | Futures contracts are valued at the unrealized appreciation on the instrument. |
For the year ended May 31, 2015, there were no transfers between Level 1 and Level 2 assets and liabilities.
For the year ended May 31, 2015, there were no transfers between Level 2 and Level 3 assets and liabilities.
For more information on valuation inputs, see Note 2 — Significant Accounting Policies in Notes to Financial Statements.
Amounts designated as “—” are $0 or have been rounded to $0.
The accompanying notes are an integral part of the financial statements.
| SEI Institutional Investments Trust / Annual Report / May 31, 2015 | 45 |
SUMMARY SCHEDULE OF INVESTMENTS
Large Cap Index Fund
May 31, 2015
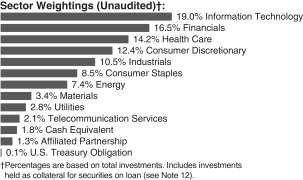
| Description | Percentage of Net Assets (%) | Shares | Market Value ($ Thousands) | |||||||||
COMMON STOCK — 98.1% |
| |||||||||||
Consumer Discretionary — 12.6% |
| |||||||||||
Amazon.com* | 0.7 | % | 33,989 | $ | 14,589 | |||||||
Comcast, Cl A (A) | 0.7 | 234,625 | 13,716 | |||||||||
Home Depot | 0.7 | 116,315 | 12,960 | |||||||||
McDonald’s | 0.4 | 89,880 | 8,622 | |||||||||
Walt Disney | 0.9 | 156,572 | 17,281 | |||||||||
Other Securities (A) | 9.2 | 180,707 | ||||||||||
|
| |||||||||||
| 247,875 | ||||||||||||
|
| |||||||||||
Consumer Staples — 8.6% |
| |||||||||||
Altria Group | 0.4 | 180,540 | 9,244 | |||||||||
Coca-Cola | 0.8 | 359,340 | 14,719 | |||||||||
CVS Health | 0.5 | 106,052 | 10,858 | |||||||||
PepsiCo | 0.7 | 137,352 | 13,245 | |||||||||
Philip Morris International | 0.6 | 142,668 | 11,851 | |||||||||
Procter & Gamble | 1.0 | 242,974 | 19,047 | |||||||||
Wal-Mart Stores | 0.5 | 144,379 | 10,723 | |||||||||
Other Securities (A) | 4.1 | 80,968 | ||||||||||
|
| |||||||||||
| 170,655 | ||||||||||||
|
| |||||||||||
Energy — 7.5% |
| |||||||||||
Chevron | 0.9 | 172,102 | 17,727 | |||||||||
Exxon Mobil | 1.7 | 386,338 | 32,916 | |||||||||
Schlumberger | 0.5 | 118,063 | 10,717 | |||||||||
Other Securities (A) | 4.4 | 85,857 | ||||||||||
|
| |||||||||||
| 147,217 | ||||||||||||
|
| |||||||||||
Financials — 16.7% |
| |||||||||||
Bank of America | 0.8 | 951,663 | 15,703 | |||||||||
Berkshire Hathaway, Cl B* | 1.2 | 164,500 | 23,524 | |||||||||
Citigroup | 0.8 | 275,004 | 14,872 | |||||||||
Goldman Sachs Group | 0.4 | 40,675 | 8,387 | |||||||||
JPMorgan Chase | 1.1 | 340,034 | 22,368 | |||||||||
SEI (B)† | 0.0 | 11,742 | 562 | |||||||||
Wells Fargo | 1.2 | 429,266 | 24,022 | |||||||||
Other Securities (A) | 11.2 | 220,372 | ||||||||||
|
| |||||||||||
| 329,810 | ||||||||||||
|
| |||||||||||
| Description | Percentage of Net Assets (%) | Shares | Market Value ($ Thousands) | |||||||||
Health Care — 14.4% |
| |||||||||||
AbbVie | 0.5 | % | 153,062 | $ | 10,192 | |||||||
Actavis* | 0.5 | 32,954 | 10,111 | |||||||||
Amgen | 0.6 | 68,658 | 10,729 | |||||||||
Biogen* | 0.4 | 21,500 | 8,535 | |||||||||
Bristol-Myers Squibb | 0.5 | 150,459 | 9,720 | |||||||||
Gilead Sciences | 0.8 | 139,034 | 15,609 | |||||||||
Johnson & Johnson | 1.3 | 254,309 | 25,466 | |||||||||
Medtronic | 0.5 | 129,826 | 9,908 | |||||||||
Merck | 0.8 | 264,443 | 16,102 | |||||||||
Pfizer | 1.0 | 572,822 | 19,906 | |||||||||
UnitedHealth Group | 0.5 | 88,920 | 10,689 | |||||||||
Other Securities (A) | 7.0 | 136,695 | ||||||||||
|
| |||||||||||
| 283,662 | ||||||||||||
|
| |||||||||||
Industrials — 10.6% |
| |||||||||||
3M | 0.5 | 59,433 | 9,454 | |||||||||
Boeing | 0.4 | 61,691 | 8,669 | |||||||||
General Electric | 1.3 | 901,423 | 24,582 | |||||||||
United Technologies | 0.5 | 83,190 | 9,747 | |||||||||
Other Securities (A) | 7.9 | 156,350 | ||||||||||
|
| |||||||||||
| 208,802 | ||||||||||||
|
| |||||||||||
Information Technology — 19.2% |
| |||||||||||
Apple | 3.6 | 543,415 | 70,796 | |||||||||
Cisco Systems | 0.7 | 464,027 | 13,601 | |||||||||
Facebook, Cl A* | 0.7 | 178,700 | 14,151 | |||||||||
Google, Cl A* | 0.7 | 25,429 | 13,867 | |||||||||
Google, Cl C* | 0.7 | 25,799 | 13,728 | |||||||||
Intel (A) | 0.8 | 450,658 | 15,530 | |||||||||
International Business Machines | 0.7 | 85,598 | 14,522 | |||||||||
MasterCard, Cl A | 0.4 | 91,500 | 8,442 | |||||||||
Microsoft | 1.8 | 743,400 | 34,836 | |||||||||
Oracle | 0.7 | 297,520 | 12,939 | |||||||||
Qualcomm | 0.5 | 153,159 | 10,672 | |||||||||
Visa, Cl A | 0.6 | 181,800 | 12,486 | |||||||||
Other Securities (A) | 7.3 | 143,736 | ||||||||||
|
| |||||||||||
| 379,306 | ||||||||||||
|
| |||||||||||
Materials — 3.5% |
| |||||||||||
Other Securities (A) | 3.5 | 68,758 | ||||||||||
|
| |||||||||||
Telecommunication Services — 2.1% |
| |||||||||||
AT&T | 0.8 | 469,633 | 16,221 | |||||||||
Verizon Communications | 1.0 | 371,776 | 18,381 | |||||||||
Other Securities (A) | 0.3 | 6,540 | ||||||||||
|
| |||||||||||
| 41,142 | ||||||||||||
|
| |||||||||||
| 46 | SEI Institutional Investments Trust / Annual Report / May 31, 2015 |
| Description | Percentage of Net Assets (%) | Shares | Market Value ($ Thousands) | |||||||||
Utilities — 2.9% |
| |||||||||||
Other Securities | 2.9 | % | $ | 56,871 | ||||||||
|
| |||||||||||
Total Common Stock |
| 1,934,098 | ||||||||||
|
| |||||||||||
AFFILIATED PARTNERSHIP — 1.3% |
| |||||||||||
SEI Liquidity Fund, L.P. | 1.3 | 25,575,279 | 25,575 | |||||||||
|
| |||||||||||
Total Affiliated Partnership |
| 25,575 | ||||||||||
|
| |||||||||||
CASH EQUIVALENT — 1.8% |
| |||||||||||
SEI Daily Income Trust, Prime Obligation Fund, Cl A | 1.8 | 36,001,609 | 36,002 | |||||||||
|
| |||||||||||
Total Cash Equivalent |
| 36,002 | ||||||||||
|
| |||||||||||
U.S. TREASURY OBLIGATION (D) — 0.1% |
| |||||||||||
Other Securities | 0.1 | 2,150 | ||||||||||
|
| |||||||||||
Total U.S. Treasury Obligation |
| 2,150 | ||||||||||
|
| |||||||||||
Total Investments — 101.3% |
| $ | 1,997,825 | |||||||||
|
| |||||||||||
A list of the open futures contracts held by the Fund at May 31, 2015, is as follows:
| Type of Contract | Number of Contracts Long | Expiration Date | Unrealized Appreciation ($ Thousands) | |||||||||
S&P 500 Index E-MINI | 322 | Jun-2015 | $ | 893 | ||||||||
S&P Mid 400 Index E-MINI | 35 | Jun-2015 | 105 | |||||||||
|
| |||||||||||
| $ | 998 | |||||||||||
|
| |||||||||||
For the year ended May 31, 2015, the total amount of all open futures contracts, as presented in the table above, are representative of the volume of activity for this derivative type during the year.
Percentages are based on a Net Assets of $1,972,254 ($ Thousands).
| * | Non-income producing security. |
| ** | The rate reported is the 7-day effective yield as of May 31, 2015. |
| † | Investment in Affiliated Security (see Note 6). |
| (A) | Certain securities or partial positions of certain securities are on loan at May 31, 2015 (see Note 12). The total market value of securities on loan at May 31, 2015 was $24,808 ($ Thousands). |
| (B) | The Fund may purchase securities of certain companies with which it is affiliated to the extent these companies are represented in its benchmark index. |
| (C) | This security was purchased with cash collateral held from securities on loan (See Note 12). The total value of such securities as of May 31, 2015 was $25,575 ($ Thousands). |
| (D) | Security, or portion thereof, has been pledged as collateral on open futures contracts. |
Cl — Class
L.P. — Limited Partnership
S&P — Standard & Poor’s
The Summary Schedule of Investments does not reflect the complete portfolio holdings. It includes the Fund’s 50 largest holdings and each investment of any issuer that exceeds 1% of the Fund’s net assets. “Other Securities” represent all issuers not required to be disclosed under the rules adopted by the U.S. Securities and Exchange Commission (“SEC”). In certain instances, securities for which footnotes listed above may otherwise apply are included in the Other Securities caption. The complete schedule of portfolio holdings is available (i) without charge, upon request, by calling (800) 342-5734; and (ii) on the SEC’s website at http://www.sec.gov.
The following is a list of the level of inputs used as of May 31, 2015, in valuing the Fund’s investments and other financial instruments carried at value ($ Thousands):
| Investments in Securities | Level 1 | Level 2 | Level 3 | Total | ||||||||||||
Common Stock | $ | 1,934,098 | $ | — | $ | — | $ | 1,934,098 | ||||||||
Affiliated Partnership | — | 25,575 | — | 25,575 | ||||||||||||
Cash Equivalent | 36,002 | — | — | 36,002 | ||||||||||||
U.S. Treasury Obligation | — | 2,150 | — | 2,150 | ||||||||||||
|
|
|
|
|
|
|
| |||||||||
Total Investments in Securities | $ | 1,970,100 | $ | 27,725 | $ | — | $ | 1,997,825 | ||||||||
|
|
|
|
|
|
|
| |||||||||
| Other Financial Instruments | Level 1 | Level 2 | Level 3 | Total | ||||||||||||
Futures Contracts* | ||||||||||||||||
Unrealized Appreciation | $ | 998 | $ | — | $ | — | $ | 998 | ||||||||
|
|
|
|
|
|
|
| |||||||||
| * | Futures contracts are valued at the unrealized appreciation on the instrument. |
For the year ended May 31, 2015, there were no transfers between Level 1 and Level 2 assets and liabilities.
For the year ended May 31, 2015, there were no transfers between Level 2 and Level 3 assets and liabilities.
For more information on valuation inputs, see Note 2 — Significant Accounting Policies in Notes to Financial Statements.
Amounts designated as “—” are $0 or have been rounded to $0.
The accompanying notes are an integral part of the financial statements.
| SEI Institutional Investments Trust / Annual Report / May 31, 2015 | 47 |
SUMMARY SCHEDULE OF INVESTMENTS
S&P 500 Index Fund
May 31, 2015
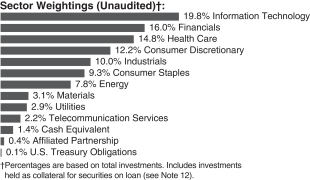
| Description | Percentage of Net Assets (%) | Shares | Market Value ($ Thousands) | |||||||||
COMMON STOCK — 98.2% |
| |||||||||||
Consumer Discretionary — 12.2% |
| |||||||||||
Amazon.com* | 0.8 | % | 63,960 | $ | 27,454 | |||||||
Comcast, Cl A | 0.8 | 426,974 | 24,961 | |||||||||
Home Depot | 0.8 | 221,487 | 24,678 | |||||||||
McDonald’s | 0.5 | 161,587 | 15,501 | |||||||||
Walt Disney | 0.9 | 262,683 | 28,992 | |||||||||
Other Securities (A) | 8.4 | 268,751 | ||||||||||
|
| |||||||||||
| 390,337 | ||||||||||||
|
| |||||||||||
Consumer Staples — 9.3% |
| |||||||||||
Altria Group | 0.5 | 330,983 | 16,946 | |||||||||
Coca-Cola | 0.8 | 660,257 | 27,044 | |||||||||
CVS Health | 0.6 | 189,083 | 19,358 | |||||||||
PepsiCo | 0.8 | 249,078 | 24,019 | |||||||||
Philip Morris International | 0.7 | 259,978 | 21,597 | |||||||||
Procter & Gamble | 1.1 | 453,670 | 35,563 | |||||||||
Wal-Mart Stores | 0.6 | 265,483 | 19,718 | |||||||||
Other Securities | 4.2 | 133,037 | ||||||||||
|
| |||||||||||
| 297,282 | ||||||||||||
|
| |||||||||||
Energy — 7.8% |
| |||||||||||
Chevron | 1.0 | 315,878 | 32,536 | |||||||||
Exxon Mobil | 1.9 | 704,600 | 60,032 | |||||||||
Schlumberger | 0.6 | 214,383 | 19,460 | |||||||||
Other Securities (A) | 4.3 | 137,405 | ||||||||||
|
| |||||||||||
| 249,433 | ||||||||||||
|
| |||||||||||
Financials — 15.9% |
| |||||||||||
Bank of America | 0.9 | 1,767,483 | 29,163 | |||||||||
Berkshire Hathaway, Cl B* | 1.3 | 306,328 | 43,805 | |||||||||
Citigroup | 0.9 | 509,757 | 27,568 | |||||||||
JPMorgan Chase | 1.3 | 626,357 | 41,202 | |||||||||
Wells Fargo | 1.4 | 787,648 | 44,077 | |||||||||
Other Securities (A) | 10.1 | 323,324 | ||||||||||
|
| |||||||||||
| 509,139 | ||||||||||||
|
| |||||||||||
| Description | Percentage of Net Assets (%) | Shares | Market Value ($ Thousands) | |||||||||
Health Care — 14.9% | ||||||||||||
AbbVie | 0.6 | % | 289,178 | $ | 19,256 | |||||||
Actavis* | 0.6 | 65,599 | 20,126 | |||||||||
Amgen | 0.6 | 127,491 | 19,922 | |||||||||
Biogen* | 0.5 | 39,400 | 15,641 | |||||||||
Bristol-Myers Squibb | 0.6 | 279,383 | 18,048 | |||||||||
Celgene* | 0.5 | 134,587 | 15,402 | |||||||||
Gilead Sciences | 0.9 | 250,278 | 28,099 | |||||||||
Johnson & Johnson | 1.5 | 467,070 | 46,772 | |||||||||
Medtronic | 0.6 | 239,561 | 18,283 | |||||||||
Merck | 0.9 | 476,870 | 29,037 | |||||||||
Pfizer | 1.1 | 1,029,735 | 35,783 | |||||||||
UnitedHealth Group | 0.6 | 160,287 | 19,268 | |||||||||
Other Securities | 5.9 | 188,397 | ||||||||||
|
| |||||||||||
| 474,034 | ||||||||||||
|
| |||||||||||
Industrials — 10.0% |
| |||||||||||
3M | 0.5 | 106,691 | 16,973 | |||||||||
Boeing | 0.5 | 110,091 | 15,470 | |||||||||
General Electric | 1.5 | 1,690,770 | 46,107 | |||||||||
United Technologies | 0.5 | 138,891 | 16,274 | |||||||||
Other Securities (A) | 7.0 | 224,109 | ||||||||||
|
| |||||||||||
| 318,933 | ||||||||||||
|
| |||||||||||
Information Technology — 19.8% |
| |||||||||||
Apple | 4.0 | 978,246 | 127,446 | |||||||||
Cisco Systems | 0.8 | 857,743 | 25,140 | |||||||||
Facebook, Cl A* | 0.9 | 352,778 | 27,936 | |||||||||
Google, Cl A* | 0.8 | 47,941 | 26,143 | |||||||||
Google, Cl C* | 0.8 | 48,263 | 25,681 | |||||||||
Intel (A) | 0.9 | 795,752 | 27,422 | |||||||||
International Business Machines | 0.8 | 154,451 | 26,203 | |||||||||
MasterCard, Cl A | 0.5 | 164,147 | 15,144 | |||||||||
Microsoft | 2.0 | 1,378,004 | 64,573 | |||||||||
Oracle | 0.7 | 538,665 | 23,427 | |||||||||
Qualcomm | 0.6 | 277,278 | 19,321 | |||||||||
Visa, Cl A | 0.7 | 325,970 | 22,388 | |||||||||
Other Securities (A) | 6.3 | 201,135 | ||||||||||
|
| |||||||||||
| 631,959 | ||||||||||||
|
| |||||||||||
Materials — 3.2% |
| |||||||||||
Other Securities | 3.2 | 100,286 | ||||||||||
|
| |||||||||||
Telecommunication Services — 2.2% |
| |||||||||||
AT&T | 0.9 | 872,043 | 30,120 | |||||||||
Verizon Communications | 1.1 | 698,152 | 34,517 | |||||||||
Other Securities | 0.2 | 6,692 | ||||||||||
|
| |||||||||||
| 71,329 | ||||||||||||
|
| |||||||||||
| 48 | SEI Institutional Investments Trust / Annual Report / May 31, 2015 |
| Description | Percentage of Net Assets (%) | Shares | Market Value ($ Thousands) | |||||||||
Utilities — 2.9% |
| |||||||||||
Other Securities | 2.9 | % | $ | 92,937 | ||||||||
|
| |||||||||||
Total Common Stock |
| 3,135,669 | ||||||||||
|
| |||||||||||
AFFILIATED PARTNERSHIP — 0.4% |
| |||||||||||
SEI Liquidity Fund, L.P. | 0.4 | 12,329,426 | 12,329 | |||||||||
|
| |||||||||||
Total Affiliated Partnership |
| 12,329 | ||||||||||
|
| |||||||||||
CASH EQUIVALENT — 1.4% |
| |||||||||||
SEI Daily Income Trust, Prime Obligation Fund, Cl A | 1.4 | 45,190 | 45,190 | |||||||||
|
| |||||||||||
Total Cash Equivalent |
| 45,190 | ||||||||||
|
| |||||||||||
U.S. TREASURY OBLIGATIONS (C) — 0.1% |
| |||||||||||
Other Securities | 0.1 | 3,900 | ||||||||||
|
| |||||||||||
Total U.S. Treasury Obligations |
| 3,900 | ||||||||||
|
| |||||||||||
Total Investments — 100.1% |
| $ | 3,197,088 | |||||||||
|
| |||||||||||
A list of the open futures contracts held by the Fund at May 31, 2015, is as follows:
| Type of Contract | Number of Contracts Long | Expiration Date | Unrealized Appreciation ($ Thousands) | |||||||||
S&P 500 Index E-MINI | 547 | Jun-2015 | $ | 1,553 | ||||||||
|
| |||||||||||
For the year ended May 31, 2015, the total amount of all open futures contracts, as presented in the table above, are representative of the volume of activity for this derivative type during the year.
Percentages are based on a Net Assets of $3,194,844 ($ Thousands).
| * | Non-income producing security. |
| ** | The rate reported is the 7-day effective yield as of May 31, 2015. |
| † | Investment in Affiliated Security (see Note 6). |
| (A) | Certain securities or partial positions of certain securities are on loan at May 31, 2015 (see Note 12). The total market value of securities on loan at May 31, 2015 was $11,973 ($ Thousands). |
| (B) | This security was purchased with cash collateral held from securities on loan (See Note 12). The total value of such securities as of May 31, 2015 was $12,329 ($ Thousands). |
| (C) | Security, or portion thereof, has been pledged as collateral on open futures contracts. |
Cl — Class
L.P. — Limited Partnership
S&P — Standard & Poor’s
The Summary Schedule of Investments does not reflect the complete portfolio holdings. It includes the Fund’s 50 largest holdings and each investment of any issuer that exceeds 1% of the Fund’s net assets. “Other Securities” represent all issuers not required to be disclosed under the rules adopted by the U.S. Securities and Exchange Commission (“SEC”). In certain instances, securities for which footnotes listed above may otherwise apply are included in the Other Securities caption. The complete schedule of portfolio holdings is available (i) without charge, upon request, by calling (800) 342-5734; and (ii) on the SEC’s website at http://www.sec.gov.
The following is a list of the level of inputs used as of May 31, 2015, in valuing the Fund’s investments and other financial instruments carried at value ($ Thousands):
| Investments in Securities | Level 1 | Level 2 | Level 3 | Total | ||||||||||||
Common Stock | $ | 3,135,669 | $ | — | $ | — | $ | 3,135,669 | ||||||||
Affiliated Partnership | — | 12,329 | — | 12,329 | ||||||||||||
Cash Equivalent | 45,190 | — | — | 45,190 | ||||||||||||
U.S. Treasury Obligations | — | 3,900 | — | 3,900 | ||||||||||||
|
|
|
|
|
|
|
| |||||||||
Total Investments in Securities | $ | 3,180,859 | $ | 16,229 | $ | — | $ | 3,197,088 | ||||||||
|
|
|
|
|
|
|
| |||||||||
| Other Financial Instruments | Level 1 | Level 2 | Level 3 | Total | ||||||||||||
Futures Contracts* | ||||||||||||||||
Unrealized Appreciation | $ | 1,553 | $ | — | $ | — | $ | 1,553 | ||||||||
|
|
|
|
|
|
|
| |||||||||
| * | Futures contracts are valued at the unrealized appreciation on the instrument. |
For the year ended May 31, 2015, there were no transfers between Level 1 and Level 2 assets and liabilities.
For the year ended May 31, 2015, there were no transfers between Level 2 and Level 3 assets and liabilities.
For more information on valuation inputs, see Note 2 — Significant Accounting Policies in Notes to Financial Statements.
Amounts designated as “—” are $0 or have been rounded to $0.
The accompanying notes are an integral part of the financial statements.
| SEI Institutional Investments Trust / Annual Report / May 31, 2015 | 49 |
SUMMARY SCHEDULE OF INVESTMENTS
Extended Market Index Fund
May 31, 2015
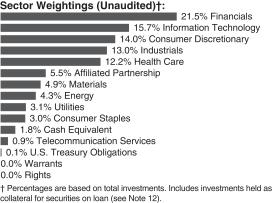
| Description | Percentage of Net Assets (%) | Shares | Market Value ($ Thousands) | |||||||||
COMMON STOCK — 98.0% |
| |||||||||||
Consumer Discretionary — 14.9% |
| |||||||||||
Advance Auto Parts | 0.3 | % | 12,199 | $ | 1,869 | |||||||
Charter Communications, Cl A* (A) | 0.3 | 13,165 | 2,357 | |||||||||
DISH Network, Cl A* | 0.3 | 35,419 | 2,507 | |||||||||
Foot Locker | 0.2 | 24,414 | 1,543 | |||||||||
Jarden* | 0.2 | 32,310 | 1,714 | |||||||||
Las Vegas Sands | 0.4 | 62,204 | 3,162 | |||||||||
Lear | 0.2 | 12,971 | 1,505 | |||||||||
Liberty Interactive, Cl A* | 0.3 | 81,516 | 2,280 | |||||||||
Polaris Industries | 0.2 | 11,007 | 1,575 | |||||||||
Signet Jewelers | 0.2 | 13,455 | 1,740 | |||||||||
Sirius XM Holdings* | 0.2 | 433,479 | 1,673 | |||||||||
Tesla Motors* (A) | 0.5 | 15,679 | 3,932 | |||||||||
Thomson Reuters | 0.3 | 58,985 | 2,357 | |||||||||
Ulta Salon Cosmetics & Fragrance* | 0.2 | 10,773 | 1,644 | |||||||||
Other Securities (A) | 11.1 | 79,774 | ||||||||||
|
| |||||||||||
| 109,632 | ||||||||||||
|
| |||||||||||
Consumer Staples — 3.2% |
| |||||||||||
Bunge | 0.3 | 24,443 | 2,262 | |||||||||
Church & Dwight | 0.3 | 22,699 | 1,906 | |||||||||
Other Securities (A) | 2.6 | 19,396 | ||||||||||
|
| |||||||||||
| 23,564 | ||||||||||||
|
| |||||||||||
Energy — 4.5% |
| |||||||||||
Cheniere Energy* | 0.4 | 39,365 | 2,985 | |||||||||
Concho Resources* | 0.3 | 19,942 | 2,399 | |||||||||
Other Securities (A) | 3.8 | 27,983 | ||||||||||
|
| |||||||||||
| 33,367 | ||||||||||||
|
| |||||||||||
Financials — 22.7% |
| |||||||||||
Annaly Capital Management‡ | 0.2 | 158,514 | 1,655 | |||||||||
Federal Realty Investment Trust‡ | 0.2 | 11,286 | 1,518 | |||||||||
| Description | Percentage of Net Assets (%) | Shares | Market Value ($ Thousands) | |||||||||
FNF Group | 0.2 | % | 46,258 | $ | 1,756 | |||||||
Markel* | 0.2 | 2,313 | 1,787 | |||||||||
SEI (C) | 0.2 | 22,519 | 1,077 | |||||||||
TD Ameritrade Holding | 0.2 | 44,973 | 1,671 | |||||||||
Other Securities (A) | 21.5 | 158,151 | ||||||||||
|
| |||||||||||
| 167,615 | ||||||||||||
|
| |||||||||||
Health Care — 12.9% |
| |||||||||||
Alnylam Pharmaceuticals* | 0.2 | 12,089 | 1,585 | |||||||||
BioMarin Pharmaceutical* | 0.4 | 25,946 | 3,258 | |||||||||
Catamaran* | 0.3 | 34,407 | 2,059 | |||||||||
Illumina* | 0.6 | 22,979 | 4,736 | |||||||||
Incyte* | 0.4 | 23,971 | 2,640 | |||||||||
Jazz Pharmaceuticals* | 0.2 | 9,934 | 1,782 | |||||||||
Medivation* | 0.2 | 12,804 | 1,691 | |||||||||
Mettler Toledo International* | 0.2 | 4,882 | 1,585 | |||||||||
Omnicare | 0.2 | 16,596 | 1,581 | |||||||||
Other Securities (A) | 10.2 | 74,418 | ||||||||||
|
| |||||||||||
| 95,335 | ||||||||||||
|
| |||||||||||
Industrials — 13.7% |
| |||||||||||
Towers Watson, Cl A | 0.2 | 10,933 | 1,508 | |||||||||
TransDigm Group | 0.3 | 8,805 | 1,990 | |||||||||
United Continental Holdings* | 0.5 | 61,752 | 3,371 | |||||||||
Verisk Analytics, Cl A* | 0.3 | 27,672 | 2,008 | |||||||||
Wabtec | 0.2 | 16,106 | 1,615 | |||||||||
Other Securities (A) | 12.2 | 90,650 | ||||||||||
|
| |||||||||||
| 101,142 | ||||||||||||
|
| |||||||||||
Information Technology — 16.6% |
| |||||||||||
Activision Blizzard | 0.3 | 82,406 | 2,082 | |||||||||
FleetCor Technologies* | 0.3 | 13,773 | 2,095 | |||||||||
LinkedIn, Cl A* | 0.5 | 17,206 | 3,354 | |||||||||
Maxim Integrated Products | 0.2 | 47,304 | 1,659 | |||||||||
Palo Alto Networks* | 0.2 | 9,133 | 1,548 | |||||||||
Qorvo* | 0.3 | 23,880 | 1,962 | |||||||||
ServiceNow* | 0.3 | 25,569 | 1,959 | |||||||||
Twitter* | 0.4 | 85,300 | 3,128 | |||||||||
Other Securities (A) | 14.1 | 104,522 | ||||||||||
|
| |||||||||||
| 122,309 | ||||||||||||
|
| |||||||||||
Materials — 5.2% |
| |||||||||||
Celanese, Cl A | 0.2 | 25,992 | 1,790 | |||||||||
Rock-Tenn, Cl A | 0.2 | 24,070 | 1,568 | |||||||||
Other Securities (A) | 4.8 | 34,692 | ||||||||||
|
| |||||||||||
| 38,050 | ||||||||||||
|
| |||||||||||
Telecommunication Services — 1.0% |
| |||||||||||
SBA Communications, Cl A* | 0.3 | 21,419 | 2,395 | |||||||||
T-Mobile US* | 0.2 | 44,405 | 1,726 | |||||||||
Other Securities (A) | 0.5 | 3,290 | ||||||||||
|
| |||||||||||
| 7,411 | ||||||||||||
|
| |||||||||||
| 50 | SEI Institutional Investments Trust / Annual Report / May 31, 2015 |
| Description | Percentage of Net Assets (%) | Shares | Market Value ($ Thousands) | |||||||||
Utilities — 3.3% |
| |||||||||||
American Water Works | 0.2 | % | 29,918 | $ | 1,582 | |||||||
Other Securities (A) | 3.1 | 22,353 | ||||||||||
|
| |||||||||||
| 23,935 | ||||||||||||
|
| |||||||||||
Total Common Stock |
| 722,360 | ||||||||||
|
| |||||||||||
WARRANTS — 0.0% | ||||||||||||
Other Securities | 0.0 | — | ||||||||||
|
| |||||||||||
Total Warrants |
| — | ||||||||||
|
| |||||||||||
RIGHTS — 0.0% |
| |||||||||||
Bermuda — 0.0% |
| |||||||||||
Other Securities | 0.0 | — | ||||||||||
|
| |||||||||||
United States — 0.0% |
| |||||||||||
Other Securities | 0.0 | — | ||||||||||
|
| |||||||||||
Total Rights |
| — | ||||||||||
|
| |||||||||||
AFFILIATED PARTNERSHIP — 5.8% |
| |||||||||||
SEI Liquidity Fund, L.P. 0.060%† (B) | 5.8 | 42,794,061 | 42,794 | |||||||||
|
| |||||||||||
Total Affiliated Partnership |
| 42,794 | ||||||||||
|
| |||||||||||
CASH EQUIVALENT — 1.9% |
| |||||||||||
SEI Daily Income Trust, Prime Obligation | 1.9 | 14,157,347 | 14,157 | |||||||||
|
| |||||||||||
Total Cash Equivalent |
| 14,157 | ||||||||||
|
| |||||||||||
U.S. TREASURY OBLIGATIONS (D) — 0.1% |
| |||||||||||
Other Securities | 0.1 | 810 | ||||||||||
|
| |||||||||||
Total U.S. Treasury Obligations |
| 810 | ||||||||||
|
| |||||||||||
Total Investments — 105.8% |
| $ | 780,121 | |||||||||
|
| |||||||||||
A list of the open futures contracts held by the Fund at May 31, 2015, is as follows:
| Type of Contract | Number of Contracts Long (Short) | Expiration Date | Unrealized Appreciation (Depreciation) ($ Thousands) | |||||||||
Russell 2000 Index E-MINI | 47 | Jun-2015 | $ | 71 | ||||||||
S&P Mid 400 Index E-MINI | 60 | Jun-2015 | 176 | |||||||||
|
| |||||||||||
| $ | 247 | |||||||||||
|
| |||||||||||
For the year ended May 31, 2015, the total amount of all open futures contracts, as presented in the table above, are representative of the volume of activity for this derivative type during the year.
Percentages are based on a Net Assets of $737,363 ($ Thousands).
| * | Non-income producing security. |
| ** | The rate reported is the 7-day effective yield as of May 31, 2015. |
| † | Investment in Affiliated Security (see Note 6). |
| ‡ | Real Estate Investment Trust. |
| (A) | Certain securities or partial positions of certain securities are on loan at May 31, 2015. The total value of securities on loan at May 31, 2015 was $ 41,297 ($ Thousands). |
| (B) | This security was purchased with cash collateral held from securities on loan (see Note 12). The total value of such securities as of May 31, 2015 was $42,794 ($ Thousands). |
| (C) | The Fund may purchase securities of certain companies with which it is affiliated to the extent these companies are represented in its benchmark index. |
| (D) | Security, or portion thereof, has been pledged as collateral on open futures contracts. |
Cl — Class
L.P. — Limited Partnership
S&P — Standard & Poor’s
The Summary Schedule of Investments does not reflect the complete portfolio holdings. It includes the Fund’s 50 largest holdings and each investment of any issuer that exceeds 1% of the Fund’s net assets. “Other Securities” represent all issuers not required to be disclosed under the rules adopted by the U.S. Securities and Exchange Commission (“SEC”). In certain instances, securities for which footnotes listed above may otherwise apply are included in the Other Securities caption. The complete schedule of portfolio holdings is available (i) without charge, upon request, by calling (800) 342-5734; and (ii) on the SEC’s website at http://www.sec.gov.
The following is a list of the level of inputs used as of May 31, 2015, in valuing the Fund’s investments and other financial instruments carried at value ($ Thousands):
| Investments in Securities | Level 1 | Level 2 | Level 3 | Total | ||||||||||||
Common Stock | $ | 722,360 | $ | — | $ | — | $ | 722,360 | ||||||||
Warrants | — | — | — | — | ||||||||||||
Rights | — | — | — | — | ||||||||||||
Affiliated Partnership | — | 42,794 | — | 42,794 | ||||||||||||
Cash Equivalent | 14,157 | — | — | 14,157 | ||||||||||||
U.S. Treasury Obligations | — | 810 | — | 810 | ||||||||||||
|
|
|
|
|
|
|
| |||||||||
Total Investments in Securities | $ | 736,517 | $ | 43,604 | $ | — | $ | 780,121 | ||||||||
|
|
|
|
|
|
|
| |||||||||
| Other Financial Instruments | Level 1 | Level 2 | Level 3 | Total | ||||||||||||
Futures Contracts * | ||||||||||||||||
Unrealized Appreciation | $ | 247 | $ | — | $ | — | $ | 247 | ||||||||
|
|
|
|
|
|
|
| |||||||||
| * | Futures contracts are valued at the unrealized appreciation on the instrument. |
For the year ended May 31, 2015 there were no transfers between Level 1 and Level 2 assets and liabilities.
For the year ended May 31, 2015, there were no transfers between Level 2 and Level 3 assets and liabilities.
For more information on valuation inputs, see Note 2 — Significant Accounting Policies in Notes to Financial Statements.
Amounts designated as “—” are $0 or have been rounded to $0.
The accompanying notes are an integral part of the financial statements.
| SEI Institutional Investments Trust / Annual Report / May 31, 2015 | 51 |
SUMMARY SCHEDULE OF INVESTMENTS
Small Cap Fund
May 31, 2015
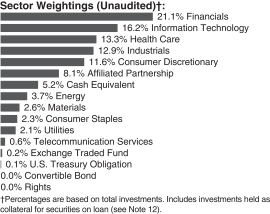
| Description | Percentage of Net Assets (%) | Shares | Market Value ($ Thousands) | |||||||||
COMMON STOCK — 93.8% |
| |||||||||||
Consumer Discretionary — 12.6% |
| |||||||||||
Brunswick | 0.3 | % | 44,524 | $ | 2,273 | |||||||
Burlington Stores* | 0.3 | 42,089 | 2,221 | |||||||||
Jack in the Box | 0.4 | 29,767 | 2,584 | |||||||||
Libbey | 0.3 | 50,322 | 1,988 | |||||||||
Vail Resorts | 0.5 | 32,309 | 3,352 | |||||||||
Wolverine World Wide | 0.3 | 80,526 | 2,366 | |||||||||
Other Securities (A) | 10.5 | 71,564 | ||||||||||
|
| |||||||||||
| 86,348 | ||||||||||||
|
| |||||||||||
Consumer Staples — 2.5% |
| |||||||||||
SpartanNash | 0.4 | 79,391 | 2,482 | |||||||||
Other Securities (A) | 2.1 | 14,652 | ||||||||||
|
| |||||||||||
| 17,134 | ||||||||||||
|
| |||||||||||
Energy — 4.0% |
| |||||||||||
Scorpio Tankers | 0.3 | 239,100 | 2,181 | |||||||||
Other Securities (A) | 3.7 | 24,889 | ||||||||||
|
| |||||||||||
| 27,070 | ||||||||||||
|
| |||||||||||
Financials — 22.9% |
| |||||||||||
Bank of the Ozarks (A) | 0.5 | 78,359 | 3,445 | |||||||||
Central Pacific Financial | 0.3 | 90,691 | 2,124 | |||||||||
CNO Financial Group | 0.6 | 211,570 | 3,808 | |||||||||
Geo Group‡ | 0.4 | 72,000 | 2,731 | |||||||||
Hanover Insurance Group | 0.4 | 39,135 | 2,786 | |||||||||
Highwoods Properties‡ | 0.5 | 81,805 | 3,432 | |||||||||
Maiden Holdings | 0.3 | 142,800 | 1,996 | |||||||||
Pebblebrook Hotel Trust‡ | 0.4 | 71,615 | 3,071 | |||||||||
Popular* | 0.4 | 81,800 | 2,658 | |||||||||
Western Alliance Bancorp* | 0.4 | 78,945 | 2,475 | |||||||||
Yadkin Financial* | 0.3 | 112,726 | 2,226 | |||||||||
Other Securities (A) | 18.4 | 125,806 | ||||||||||
|
| |||||||||||
| 156,558 | ||||||||||||
|
| |||||||||||
Health Care — 14.4% |
| |||||||||||
Acadia Healthcare* (A) | 0.5 | 49,328 | 3,657 | |||||||||
CONMED | 0.3 | 35,601 | 1,977 | |||||||||
| Description | Percentage of Net Assets (%) | Shares | Market Value ($ Thousands) | |||||||||
Greatbatch* | 0.3 | % | 43,700 | $ | 2,272 | |||||||
HealthSouth | 0.5 | 82,591 | 3,565 | |||||||||
Sage Therapeutics* | 0.3 | 28,400 | 2,126 | |||||||||
Other Securities (A) | 12.5 | 85,083 | ||||||||||
|
| |||||||||||
| 98,680 | ||||||||||||
|
| |||||||||||
Industrials — 14.0% |
| |||||||||||
Acuity Brands | 0.3 | 11,411 | 2,014 | |||||||||
Curtiss-Wright | 0.4 | 32,860 | 2,369 | |||||||||
EMCOR Group | 0.4 | 64,759 | 2,938 | |||||||||
G&K Services, Cl A | 0.4 | 37,167 | 2,590 | |||||||||
Generac Holdings* (A) | 0.3 | 54,755 | 2,288 | |||||||||
Great Lakes Dredge & Dock* | 0.3 | 381,300 | 2,120 | |||||||||
Interface, Cl A | 0.3 | 95,552 | 2,057 | |||||||||
Kadant | 0.3 | 46,769 | 2,203 | |||||||||
Primoris Services | 0.4 | 129,961 | 2,439 | |||||||||
Tutor Perini* | 0.3 | 111,500 | 2,337 | |||||||||
Other Securities (A) | 10.6 | 72,593 | ||||||||||
|
| |||||||||||
| 95,948 | ||||||||||||
|
| |||||||||||
Information Technology — 17.6% |
| |||||||||||
Aspen Technology* | 0.3 | 48,992 | 2,097 | |||||||||
Belden | 0.4 | 32,602 | 2,752 | |||||||||
Cavium* | 0.5 | 43,907 | 3,090 | |||||||||
Demandware* | 0.3 | 36,890 | 2,298 | |||||||||
Envestnet* | 0.3 | 49,075 | 2,150 | |||||||||
Exar* | 0.3 | 189,500 | 2,058 | |||||||||
Guidewire Software* (A) | 0.3 | 40,079 | 1,942 | |||||||||
Infoblox* | 0.4 | 91,371 | 2,375 | |||||||||
Inphi* | 0.5 | 149,400 | 3,577 | |||||||||
MAXIMUS | 0.3 | 34,876 | 2,280 | |||||||||
Qlik Technologies* | 0.3 | 57,144 | 2,067 | |||||||||
Qorvo* | 0.4 | 36,915 | 3,033 | |||||||||
Silicon Laboratories* | 0.3 | 36,017 | 1,997 | |||||||||
SPS Commerce* | 0.3 | 33,345 | 2,168 | |||||||||
Other Securities (A) | 12.7 | 86,526 | ||||||||||
|
| |||||||||||
| 120,410 | ||||||||||||
|
| |||||||||||
Materials — 2.9% |
| |||||||||||
Sensient Technologies | 0.4 | 37,490 | 2,538 | |||||||||
Other Securities (A) | 2.5 | 16,878 | ||||||||||
|
| |||||||||||
| 19,416 | ||||||||||||
|
| |||||||||||
Telecommunication Services — 0.6% |
| |||||||||||
Other Securities (A) | 0.6 | 4,015 | ||||||||||
|
| |||||||||||
Utilities — 2.3% |
| |||||||||||
Portland General | ||||||||||||
Electric (A) | 0.4 | 76,630 | 2,679 | |||||||||
Other Securities (A) | 1.9 | 13,221 | ||||||||||
|
| |||||||||||
| 15,900 | ||||||||||||
|
| |||||||||||
Total Common Stock |
| 641,479 | ||||||||||
|
| |||||||||||
| 52 | SEI Institutional Investments Trust / Annual Report / May 31, 2015 |
| Description | Percentage of Net Assets (%) | Shares | Market Value ($ Thousands) | |||||||||
EXCHANGE TRADED FUND — 0.3% |
| |||||||||||
Other Securities | 0.3 | % | $ | 1,849 | ||||||||
|
| |||||||||||
Total Exchange Traded Fund |
| 1,849 | ||||||||||
|
| |||||||||||
RIGHTS — 0.0% |
| |||||||||||
Other Securities | 0.0 | — | ||||||||||
|
| |||||||||||
Total Rights | — | |||||||||||
|
| |||||||||||
CONVERTIBLE BOND — 0.0% |
| |||||||||||
Consumer Discretionary — 0.0% |
| |||||||||||
Other Securities | 0.0 | 4 | ||||||||||
|
| |||||||||||
Total Convertible Bond |
| 4 | ||||||||||
|
| |||||||||||
AFFILIATED PARTNERSHIP — 8.9% |
| |||||||||||
SEI Liquidity Fund, L.P. 0.060%**† (B) | 8.9 | 60,494,618 | 60,495 | |||||||||
|
| |||||||||||
Total Affiliated Partnership |
| 60,495 | ||||||||||
|
| |||||||||||
CASH EQUIVALENT — 5.6% |
| |||||||||||
SEI Daily Income Trust, Prime Obligation Fund, Cl A 0.010%**† | 5.6 | 38,294,397 | 38,294 | |||||||||
|
| |||||||||||
Total Cash Equivalent |
| 38,294 | ||||||||||
|
| |||||||||||
U.S. TREASURY OBLIGATION — 0.1% |
| |||||||||||
Other Securities | 0.1 | 689 | ||||||||||
|
| |||||||||||
Total U.S. Treasury Obligation |
| 689 | ||||||||||
|
| |||||||||||
Total Investments — 108.7% |
| $ | 742,810 | |||||||||
|
| |||||||||||
A list of the open futures contracts held by the Fund at May 31, 2015, is as follows:
| Type of Contract | Number of Contracts Long | Expiration Date | Unrealized Appreciation ($ Thousands) | |||||||||
Russell 2000 Index E-MINI | 129 | Jun-2015 | $ | 367 | ||||||||
|
| |||||||||||
For the year ended May 31, 2015, the total amount of all open futures contracts, as presented in the table above, are representative of the volume of activity for this derivative type during the year.
Percentages are based on a Net Assets of $683,624 ($ Thousands).
| * | Non-income producing security. |
| ** | The rate reported is the 7-day effective yield as of May 31, 2015. |
| ‡ | Real Estate Investment Trust. |
| † | Investment in Affiliated Security (see Note 6). |
| (A) | Certain securities or partial positions of certain securities are on loan at May 31, 2015. The total value of securities on loan at May 31, 2015 was $58,596 ($ Thousands). |
| (B) | This security was purchased with cash collateral held from securities on loan (see Note 12). The total value of such securities as of May 31, 2015 was $60,495 ($ Thousands). |
Cl — Class
L.P. — Limited Partnership
The Summary Schedule of Investments does not reflect the complete portfolio holdings. It includes the Fund’s 50 largest holdings and each investment of any issuer that exceeds 1% of the Fund’s net assets. “Other Securities” represent all issuers not required to be disclosed under the rules adopted by the U.S. Securities and Exchange Commission (“SEC”). In certain instances, securities for which footnotes listed above may otherwise apply are included in the Other Securities caption. The complete schedule of portfolio holdings is available (i) without charge, upon request, by calling (800) 342-5734; and (ii) on the SEC’s website at http://www.sec.gov.
The following is a list of the level of inputs used as of May 31, 2015, in valuing the Fund’s investments and other financial instruments carried at value ($ Thousands):
| Investments in Securities | Level 1 | Level 2 | Level 3(1) | Total | ||||||||||||
Common Stock | $ | 641,479 | $ | — | $ | — | $ | 641,479 | ||||||||
Exchange Traded Fund | 1,849 | — | — | 1,849 | ||||||||||||
Rights | — | — | — | — | ||||||||||||
Convertible Bond | — | — | 4 | 4 | ||||||||||||
Affiliated Partnership | — | 60,495 | — | 60,495 | ||||||||||||
Cash Equivalent | 38,294 | — | — | 38,294 | ||||||||||||
U.S. Treasury Obligation | — | 689 | — | 689 | ||||||||||||
|
|
|
|
|
|
|
| |||||||||
Total Investments in Securities | $ | 681,622 | $ | 61,184 | $ | 4 | $ | 742,810 | ||||||||
|
|
|
|
|
|
|
| |||||||||
| Other Financial Instruments | Level 1 | Level 2 | Level 3 | Total | ||||||||||||
Futures Contracts* | ||||||||||||||||
Unrealized Appreciation | $ | 367 | $ | — | $ | — | $ | 367 | ||||||||
|
|
|
|
|
|
|
| |||||||||
| (1) | A reconciliation of Level 3 investments is presented when the Fund has a significant amount of Level 3 investments at the beginning and/or end of the period in relation to the net assets. |
| * | Futures contracts are valued at the unrealized appreciation on the instrument. |
For the year ended May 31, 2015, there were no transfers between Level 1 and Level 2 assets and liabilities.
For the year ended May 31, 2015, there were no transfers between Level 2 and Level 3 assets and liabilities.
For more information on valuation inputs, see Note 2 — Significant Accounting Policies in Notes to Financial Statements.
Amounts designated as “—” are $O or have been rounded to $O.
The accompanying notes are an integral part of the financial statements.
| SEI Institutional Investments Trust / Annual Report / May 31, 2015 | 53 |
SUMMARY SCHEDULE OF INVESTMENTS
Small Cap II Fund
May 31, 2015
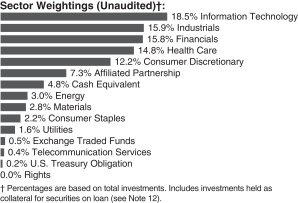
| Description | Percentage of Net Assets (%) | Shares | Market Value ($ Thousands) | |||||||||
COMMON STOCK — 94.6% |
| |||||||||||
Consumer Discretionary — 13.3% |
| |||||||||||
Abercrombie & Fitch, Cl A (A) | 0.6 | % | 105,200 | $ | 2,153 | |||||||
Big Lots | 0.5 | 39,330 | 1,727 | |||||||||
Burlington Stores* | 0.3 | 23,781 | 1,255 | |||||||||
Five Below* | 0.4 | 41,864 | 1,392 | |||||||||
Jack in the Box | 0.4 | 15,441 | 1,340 | |||||||||
Pool | 0.4 | 24,337 | 1,613 | |||||||||
Other Securities (A) | 10.7 | 40,190 | ||||||||||
|
| |||||||||||
| 49,670 | ||||||||||||
|
| |||||||||||
Consumer Staples — 2.4% |
| |||||||||||
Other Securities (A) | 2.4 | 8,750 | ||||||||||
|
| |||||||||||
Energy — 3.3% |
| |||||||||||
Carrizo Oil & Gas* | 0.3 | 25,009 | 1,255 | |||||||||
PBF Energy, Cl A | 0.5 | 66,300 | 1,778 | |||||||||
Tidewater (A) | 0.5 | 72,165 | 1,771 | |||||||||
Other Securities (A) | 2.0 | 7,324 | ||||||||||
|
| |||||||||||
| 12,128 | ||||||||||||
|
| |||||||||||
Financials — 17.2% |
| |||||||||||
Blackstone Mortgage Trust, Cl A‡ | 0.3 | 42,250 | 1,277 | |||||||||
First Niagara Financial Group | 0.6 | 247,160 | 2,202 | |||||||||
Green Dot, Cl A* | 0.4 | 105,000 | 1,538 | |||||||||
Hanover Insurance Group | 0.5 | 24,379 | 1,735 | |||||||||
Highwoods Properties‡ | 0.4 | 30,750 | 1,290 | |||||||||
Horace Mann Educators | 0.3 | 35,759 | 1,231 | |||||||||
Iberiabank | 0.5 | 30,705 | 1,973 | |||||||||
OFG Bancorp (A) | 0.6 | 160,000 | 2,102 | |||||||||
TCF Financial | 0.6 | 148,644 | 2,340 | |||||||||
Other Securities (A) | 13.0 | 48,579 | ||||||||||
|
| |||||||||||
| 64,267 | ||||||||||||
|
| |||||||||||
| Description | Percentage of Net Assets (%) | Shares | Market Value ($ Thousands) | |||||||||
Health Care — 15.9% |
| |||||||||||
Acadia Healthcare* (A) | 0.6 | % | 29,158 | $ | 2,162 | |||||||
Akorn* | 0.3 | 27,509 | 1,263 | |||||||||
Amsurg, Cl A* | 0.6 | 33,946 | 2,286 | |||||||||
Analogic | 0.3 | 16,300 | 1,379 | |||||||||
Community Health Systems* | 0.4 | 25,200 | 1,394 | |||||||||
DexCom* | 0.5 | 24,407 | 1,750 | |||||||||
HealthSouth | 0.5 | 46,718 | 2,016 | |||||||||
Integra LifeSciences Holdings* | 0.6 | 32,525 | 2,185 | |||||||||
LDR Holding* | 0.4 | 33,418 | 1,354 | |||||||||
Other Securities (A) | 11.7 | 43,784 | ||||||||||
|
| |||||||||||
| 59,573 | ||||||||||||
|
| |||||||||||
Industrials — 17.3% |
| |||||||||||
ACCO Brands* | 0.4 | 189,000 | 1,389 | |||||||||
Actuant, Cl A | 0.3 | 50,579 | 1,189 | |||||||||
Atlas Air Worldwide Holdings* | 0.4 | 27,400 | 1,493 | |||||||||
Crane | 0.4 | 22,100 | 1,338 | |||||||||
EMCOR Group | 0.4 | 33,244 | 1,508 | |||||||||
Hexcel | 0.4 | 32,942 | 1,622 | |||||||||
Huron Consulting Group* | 0.4 | 23,465 | 1,509 | |||||||||
Regal-Beloit | 0.4 | 19,646 | 1,536 | |||||||||
Spirit AeroSystems Holdings, Cl A* | 0.3 | 23,610 | 1,289 | |||||||||
Triumph Group | 0.8 | 44,230 | 2,950 | |||||||||
Wesco Aircraft Holdings* | 0.5 | 130,340 | 1,924 | |||||||||
Other Securities (A) | 12.6 | 46,944 | ||||||||||
|
| |||||||||||
| 64,691 | ||||||||||||
|
| |||||||||||
Information Technology — 20.1% |
| |||||||||||
Aspen Technology* | 0.4 | 36,727 | 1,572 | |||||||||
Blackbaud | 0.4 | 29,090 | 1,491 | |||||||||
Cavium* | 0.5 | 26,393 | 1,857 | |||||||||
Dealertrack Technologies* | 0.5 | 41,967 | 1,750 | |||||||||
Euronet Worldwide* | 0.4 | 26,005 | 1,555 | |||||||||
Infoblox* | 0.5 | 79,687 | 2,071 | |||||||||
MAXIMUS | 0.4 | 20,003 | 1,308 | |||||||||
OmniVision Technologies* | 0.6 | 84,700 | 2,284 | |||||||||
OSI Systems* | 0.5 | 23,900 | 1,727 | |||||||||
PTC* | 0.3 | 29,311 | 1,210 | |||||||||
Silicon Laboratories* | 0.5 | 32,059 | 1,777 | |||||||||
Zebra Technologies, Cl A* | 0.3 | 10,698 | 1,173 | |||||||||
Other Securities (A) | 14.8 | 55,428 | ||||||||||
|
| |||||||||||
| 75,203 | ||||||||||||
|
| |||||||||||
Materials — 3.0% |
| |||||||||||
Other Securities (A) | 3.0 | 11,347 | ||||||||||
|
| |||||||||||
Telecommunication Services — 0.4% |
| |||||||||||
Other Securities (A) | 0.4 | 1,624 | ||||||||||
| �� |
|
| ||||||||||
| 54 | SEI Institutional Investments Trust / Annual Report / May 31, 2015 |
| Description | Percentage of Net Assets (%) | Shares | Market Value ($ Thousands) | |||||||||
Utilities — 1.7% |
| |||||||||||
Other Securities (A) | 1.7 | % | $ | 6,367 | ||||||||
|
| |||||||||||
Total Common Stock |
| 353,620 | ||||||||||
|
| |||||||||||
EXCHANGE TRADED FUNDS — 0.6% |
| |||||||||||
Other Securities | 0.6 | 2,139 | ||||||||||
|
| |||||||||||
Total Exchange Traded Funds |
| 2,139 | ||||||||||
|
| |||||||||||
RIGHTS — 0.0% |
| |||||||||||
Other Securities | 0.0 | — | ||||||||||
|
| |||||||||||
Total Rights |
| — | ||||||||||
|
| |||||||||||
AFFILIATED PARTNERSHIP — 8.0% |
| |||||||||||
SEI Liquidity Fund, L.P. 0.060% (B) | 8.0 | 29,913,883 | 29,914 | |||||||||
|
| |||||||||||
Total Affiliated Partnership |
| 29,914 | ||||||||||
|
| |||||||||||
CASH EQUIVALENT — 5.2% |
| |||||||||||
SEI Daily Income Trust, Prime Obligation Fund, Cl A | 6.5 | 19,425,519 | 19,426 | |||||||||
|
| |||||||||||
Total Cash Equivalent |
| 19,426 | ||||||||||
|
| |||||||||||
U.S. TREASURY OBLIGATION (C) — 0.2% |
| |||||||||||
Other Securities | 0.2 | 925 | ||||||||||
|
| |||||||||||
Total U.S. Treasury Obligation |
| 925 | ||||||||||
|
| |||||||||||
Total Investments — 108.6% |
| $ | 406,024 | |||||||||
|
| |||||||||||
A list of the open futures contracts held by the Fund at May 31, 2015, is as follows:
| Type of Contract | Number of Contracts Long | Expiration Date | Unrealized Appreciation ($ Thousands) | |||||||||
Russell 2000 Index E-MINI | 66 | Jun-2015 | $ | 217 | ||||||||
|
| |||||||||||
For the year ended May 31, 2015, the total amount of all open futures contracts, as presented in the table above, are representative of the volume of activity for this derivative type during the year.
Percentages are based on a Net Assets of $373,858 ($ Thousands).
| * | Non-income producing security. |
| ** | The rate reported is the 7-day effective yield as of May 31, 2015. |
| ‡ | Real Estate Investment Trust. |
| † | Investment in Affiliated Security (see Note 6). |
| (A) | Certain securities or partial positions of certain securities are on loan at May 31, 2015. The total value of securities on loan at May 31, 2015 was $28,796 ($ Thousands). |
| (B) | This security was purchased with cash collateral held from securities on loan (see Note 12). The total value of such securities as of May 31, 2015 was $29,914 ($ Thousands). |
| (C) | All or a portion of this security has been pledged as collateral for open futures contracts. |
Cl — Class
L.P. — Limited Partnership
The Summary Schedule of Investments does not reflect the complete portfolio holdings. It includes the Fund’s 50 largest holdings and each investment of any issuer that exceeds 1% of the Fund’s net assets. “Other Securities” represent all issuers not required to be disclosed under the rules adopted by the U.S. Securities and Exchange Commission (“SEC”). In certain instances, securities for which footnotes listed above may otherwise apply are included in the Other Securities caption. The complete schedule of portfolio holdings is available (i) without charge, upon request, by calling (800) 342-5734; and (ii) on the SEC’s website at http://www.sec.gov.
The following is a list of the level of inputs used as of May 31, 2015, in valuing the Fund’s investments and other financial instruments carried at value ($ Thousands):
| Investments in Securities | Level 1 | Level 2 | Level 3 | Total | ||||||||||||
Common Stock | $ | 353,620 | $ | — | $ | — | $ | 353,620 | ||||||||
Exchange Traded Funds | 2,139 | — | — | 2,139 | ||||||||||||
Rights | — | — | — | — | ||||||||||||
Affiliated Partnership | — | 29,914 | — | 29,914 | ||||||||||||
Cash Equivalent | 19,426 | — | — | 19,426 | ||||||||||||
U.S. Treasury Obligation | — | 925 | — | 925 | ||||||||||||
|
|
|
|
|
|
|
| |||||||||
Total Investments in Securities | $ | 375,185 | $ | 30,839 | $ | — | $ | 406,024 | ||||||||
|
|
|
|
|
|
|
| |||||||||
| Other Financial Instruments | Level 1 | Level 2 | Level 3 | Total | ||||||||||||
Futures Contracts* | ||||||||||||||||
Unrealized Appreciation | $ | 217 | $ | — | $ | — | $ | 217 | ||||||||
|
|
|
|
|
|
|
| |||||||||
| * | Futures contracts are valued at the unrealized appreciation on the instrument. |
For the year ended May 31, 2015, there were no transfers between Level 1 and Level 2 assets and liabilities.
For the year ended May 31, 2015, there were no transfers between Level 2 and Level 3 assets and liabilities.
For more information on valuation inputs, see Note 2 — Significant Accounting Policies in Notes to Financial Statements.
Amounts designated as “—” are $O or have been rounded to $O.
The accompanying notes are an integral part of the financial statements.
| SEI Institutional Investments Trust / Annual Report / May 31, 2015 | 55 |
SUMMARY SCHEDULE OF INVESTMENTS
Small/Mid Cap Equity Fund
May 31, 2015
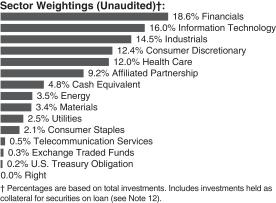
| Description | Percentage of Net Assets (%) | Shares | Market Value ($ Thousands) | |||||||||
COMMON STOCK — 95.2% |
| |||||||||||
Consumer Discretionary — 13.8% |
| |||||||||||
Carter’s | 0.3 | % | 54,939 | $ | 5,671 | |||||||
Five Below* (A) | 0.5 | 261,691 | 8,701 | |||||||||
Gannett | 0.4 | 201,785 | 7,222 | |||||||||
Imax* (A) | 0.4 | 163,740 | 6,605 | |||||||||
Jack in the Box | 0.4 | 74,223 | 6,443 | |||||||||
LKQ* | 0.3 | 216,749 | 6,192 | |||||||||
National CineMedia | 0.4 | 468,058 | 7,456 | |||||||||
Sally Beauty Holdings* | 0.3 | 193,182 | 6,029 | |||||||||
Wolverine World Wide | 0.3 | 188,915 | 5,550 | |||||||||
Other Securities (A) | 10.5 | 197,565 | ||||||||||
|
| |||||||||||
| 257,434 | ||||||||||||
|
| |||||||||||
Consumer Staples — 2.4% |
| |||||||||||
Other Securities (A) | 2.4 | 43,754 | ||||||||||
|
| |||||||||||
Energy — 3.9% |
| |||||||||||
RigNet* (A) | 0.3 | 155,504 | 5,519 | |||||||||
Other Securities (A) | 3.6 | 67,103 | ||||||||||
|
| |||||||||||
| 72,622 | ||||||||||||
|
| |||||||||||
Financials — 20.7% |
| |||||||||||
American Financial Group | 0.4 | 104,132 | 6,612 | |||||||||
Bank of the Ozarks | 0.4 | 169,378 | 7,448 | |||||||||
CNO Financial Group | 0.4 | 395,593 | 7,121 | |||||||||
Huntington Bancshares | 0.4 | 589,368 | 6,560 | |||||||||
Investors Bancorp | 0.3 | 502,762 | 6,038 | |||||||||
KeyCorp | 0.3 | 430,211 | 6,272 | |||||||||
LPL Financial Holdings (A) | 0.4 | 165,528 | 7,058 | |||||||||
Popular* | 0.4 | 207,015 | 6,726 | |||||||||
WisdomTree Investments | 0.3 | 266,233 | 5,687 | |||||||||
Zions Bancorporation | 0.4 | 268,765 | 7,762 | |||||||||
Other Securities (A) | 17.0 | 317,545 | ||||||||||
|
| |||||||||||
| 384,829 | ||||||||||||
|
| |||||||||||
| Description | Percentage of Net Assets (%) | Shares | Market Value ($ Thousands) | |||||||||
Health Care — 13.4% |
| |||||||||||
Acadia Healthcare* (A) | 0.6 | % | 145,341 | $ | 10,776 | |||||||
Akorn* | 0.3 | 124,999 | 5,737 | |||||||||
Alere* | 0.3 | 109,281 | 5,637 | |||||||||
Amsurg, Cl A* | 0.3 | 85,139 | 5,733 | |||||||||
Cooper | 0.4 | 35,783 | 6,504 | |||||||||
DexCom* | 0.4 | 102,831 | 7,375 | |||||||||
Health Net* | 0.3 | 95,176 | 5,924 | |||||||||
HealthSouth | 0.4 | 155,752 | 6,722 | |||||||||
LDR Holding* | 0.4 | 176,160 | 7,138 | |||||||||
Other Securities (A) | 10.0 | 187,497 | ||||||||||
|
| |||||||||||
| 249,043 | ||||||||||||
|
| |||||||||||
Industrials — 16.1% |
| |||||||||||
CEB | 0.5 | 98,074 | 8,296 | |||||||||
Clean Harbors* | 0.5 | 178,332 | 10,047 | |||||||||
Deluxe | 0.4 | 111,070 | 7,089 | |||||||||
EMCOR Group | 0.3 | 136,268 | 6,182 | |||||||||
JetBlue Airways* (A) | 0.4 | 336,407 | 6,782 | |||||||||
Oshkosh Truck | 0.3 | 124,368 | 6,238 | |||||||||
Other Securities (A) | 13.7 | 255,020 | ||||||||||
|
| |||||||||||
| 299,654 | ||||||||||||
|
| |||||||||||
Information Technology — 17.8% |
| |||||||||||
Cadence Design Systems* | 0.6 | 562,814 | 11,138 | |||||||||
Cavium* | 0.4 | 93,789 | 6,600 | |||||||||
Dealertrack Technologies* | 0.4 | 158,313 | 6,602 | |||||||||
Euronet Worldwide* | 0.4 | 107,626 | 6,436 | |||||||||
Infoblox* | 0.5 | 349,588 | 9,086 | |||||||||
Qorvo* | 0.3 | 67,066 | 5,509 | |||||||||
Silicon Laboratories* | 0.3 | 110,351 | 6,118 | |||||||||
SolarWinds* | 0.4 | 170,036 | 8,068 | |||||||||
Solera Holdings | 0.6 | 212,502 | 10,483 | |||||||||
SPS Commerce* | 0.3 | 86,912 | 5,651 | |||||||||
SS&C Technologies Holdings | 0.5 | 158,176 | 9,321 | |||||||||
Zebra Technologies, Cl A* | 0.3 | 53,228 | 5,836 | |||||||||
Other Securities (A) | 12.8 | 240,513 | ||||||||||
|
| |||||||||||
| 331,361 | ||||||||||||
|
| |||||||||||
Materials — 3.8% |
| |||||||||||
PolyOne | 0.4 | 174,481 | 6,786 | |||||||||
Other Securities (A) | 3.4 | 63,298 | ||||||||||
|
| |||||||||||
| 70,084 | ||||||||||||
|
| |||||||||||
Telecommunication Services — 0.5% |
| |||||||||||
Other Securities (A) | 0.5 | 9,803 | ||||||||||
|
| |||||||||||
Utilities — 2.8% |
| |||||||||||
Pinnacle West Capital | 0.3 | 91,658 | 5,584 | |||||||||
Portland General Electric (A) | 0.4 | 235,176 | 8,222 | |||||||||
| 56 | SEI Institutional Investments Trust / Annual Report / May 31, 2015 |
| Description | Percentage of Net Assets (%) | Shares | Market Value ($ Thousands) | |||||||||
Other Securities (A) | 2.1 | % | $ | 38,395 | ||||||||
|
| |||||||||||
| 52,201 | ||||||||||||
|
| |||||||||||
Total Common Stock |
| 1,770,785 | ||||||||||
|
| |||||||||||
EXCHANGE TRADED FUNDS — 0.3% |
| |||||||||||
Other Securities | 0.3 | 6,224 | ||||||||||
|
| |||||||||||
Total Exchange Traded Funds |
| 6,224 | ||||||||||
|
| |||||||||||
RIGHT — 0.0% |
| |||||||||||
United States — 0.0% |
| |||||||||||
Other Securities | 0.0 | — | ||||||||||
|
| |||||||||||
Total Right |
| — | ||||||||||
|
| |||||||||||
AFFILIATED PARTNERSHIP — 10.3% |
| |||||||||||
SEI Liquidity Fund, L.P. | 10.3 | 191,808,785 | 191,809 | |||||||||
|
| |||||||||||
Total Affiliated Partnership |
| 191,809 | ||||||||||
|
| |||||||||||
CASH EQUIVALENT — 5.3% |
| |||||||||||
SEI Daily Income Trust, Prime Obligation Fund, Cl A | 5.3 | 98,885,069 | 98,885 | |||||||||
|
| |||||||||||
Total Cash Equivalent |
| 98,885 | ||||||||||
|
| |||||||||||
U.S. TREASURY OBLIGATION — 0.3% |
| |||||||||||
Other Securities | 0.3 | 4,389 | ||||||||||
|
| |||||||||||
Total U.S. Treasury Obligation |
| 4,389 | ||||||||||
|
| |||||||||||
Total Investments — 111.4% |
| $ | 2,072,092 | |||||||||
|
| |||||||||||
A list of the open futures contracts held by the Fund at May 31, 2015, is as follows:
| Type of Contract | Number of Contracts Long | Expiration Date | Unrealized Appreciation ($ Thousands) | |||||||||
Russell 2000 Index E-MINI | 222 | Jun-2015 | $ | 629 | ||||||||
|
| |||||||||||
For the year ended May 31, 2015, the total amount of all open futures contracts, as presented in the table above, are representative of the volume of activity for this derivative type during the year.
Percentages are based on a Net Assets of $1,859,609 ($ Thousands).
| * | Non-income producing security. |
| ** | The rate reported is the 7-day effective yield as of May 31, 2015. |
| † | Investment in Affiliated Security (see Note 6). |
| (A) | Certain securities or partial positions of certain securities are on loan at May 31, 2015. The total value of securities on loan at May 31, 2015 was $186,581 ($ Thousands). |
| (B) | This security was purchased with cash collateral held from securities on loan (see Note 12). The total value of such securities as of May 31, 2015 was $191,809 ($ Thousands). |
Cl — Class
L.P. — Limited Partnership
The Summary Schedule of Investments does not reflect the complete portfolio holdings. It includes the Fund’s 50 largest holdings and each investment of any issuer that exceeds 1% of the Fund’s net assets. “Other Securities” represent all issuers not required to be disclosed under the rules adopted by the U.S. Securities and Exchange Commission (“SEC”). In certain instances, securities for which footnotes listed above may otherwise apply are included in the Other Securities caption. The complete schedule of portfolio holdings is available (i) without charge, upon request, by calling (800) 342-5734; and (ii) on the SEC’s website at http://www.sec.gov.
The following is a list of the level of inputs used as of May 31, 2015, in valuing the Fund’s investments and other financial instruments carried at value ($ Thousands):
| Investments in Securities | Level 1 | Level 2 | Level 3 | Total | ||||||||||||
Common Stock | $ | 1,770,785 | $ | — | $ | — | $ | 1,770,785 | ||||||||
Exchange Traded Funds | 6,224 | — | — | 6,224 | ||||||||||||
Right | — | — | — | — | ||||||||||||
Affiliated Partnership | — | 191,809 | — | 191,809 | ||||||||||||
Cash Equivalent | 98,885 | — | — | 98,885 | ||||||||||||
U.S. Treasury Obligation | — | 4,389 | — | 4,389 | ||||||||||||
|
|
|
|
|
|
|
| |||||||||
Total Investments in Securities | $ | 1,875,894 | $ | 196,198 | $ | — | $ | 2,072,092 | ||||||||
|
|
|
|
|
|
|
| |||||||||
| Other Financial Instruments | Level 1 | Level 2 | Level 3 | Total | ||||||||||||
Futures Contracts* | ||||||||||||||||
Unrealized Appreciation | $ | 629 | $ | — | $ | — | $ | 629 | ||||||||
|
|
|
|
|
|
|
| |||||||||
| * | Futures contracts are valued at the unrealized appreciation on the instrument. |
For the year ended May 31, 2015, there were no transfers between Level 1, Level 2 and Level 3 assets and liabilities.
For the year ended May 31, 2015, there were no Level 3 securities.
For more information on valuation inputs, see Note 2 — Significant Accounting Policies in Notes to Financial Statements.
Amounts designated as “—” are either $0 or have been rounded to $0.
The accompanying notes are an integral part of the financial statements.
| SEI Institutional Investments Trust / Annual Report / May 31, 2015 | 57 |
SUMMARY SCHEDULE OF INVESTMENTS
U.S. Managed Volatility Fund
May 31, 2015
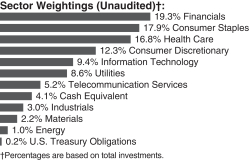
| Description | Percentage of Net Assets (%) | Shares | Market Value ($ Thousands) | |||||||||
COMMON STOCK — 96.4% |
| |||||||||||
Consumer Discretionary — 12.4% |
| |||||||||||
Aramark | 0.6 | % | 263,647 | $ | 8,265 | |||||||
Bed Bath & Beyond* | 0.6 | 117,300 | 8,366 | |||||||||
DIRECTV* | 0.6 | 98,000 | 8,922 | |||||||||
Kohl’s | 0.9 | 201,549 | 13,200 | |||||||||
Target | 0.8 | 133,887 | 10,620 | |||||||||
Other Securities | 8.9 | 126,344 | ||||||||||
|
| |||||||||||
| 175,717 | ||||||||||||
|
| |||||||||||
Consumer Staples — 18.0% |
| |||||||||||
Altria Group | 1.3 | 367,612 | 18,821 | |||||||||
Bunge | 1.4 | 209,509 | 19,392 | |||||||||
Clorox | 1.0 | 135,737 | 14,613 | |||||||||
Costco Wholesale | 1.0 | 100,048 | 14,266 | |||||||||
CVS Health | 0.6 | 87,904 | 9,000 | |||||||||
Dr. Pepper Snapple Group | 0.9 | 167,972 | 12,873 | |||||||||
Kroger | 1.5 | 293,850 | 21,392 | |||||||||
PepsiCo | 0.9 | 138,543 | 13,360 | |||||||||
Tyson Foods, Cl A | 1.0 | 327,069 | 13,884 | |||||||||
Wal-Mart Stores | 1.6 | 302,574 | 22,472 | |||||||||
Other Securities | 6.8 | 94,509 | ||||||||||
|
| |||||||||||
| 254,582 | ||||||||||||
|
| |||||||||||
Energy — 1.0% |
| |||||||||||
Other Securities | 1.0 | 14,523 | ||||||||||
|
| |||||||||||
Financials — 19.4% | ||||||||||||
Allied World Assurance Holdings | 0.7 | 229,620 | 9,757 | |||||||||
Allstate | 0.6 | 129,700 | 8,731 | |||||||||
Axis Capital Holdings | 0.9 | 223,775 | 12,317 | |||||||||
CBOE Holdings | 0.8 | 188,375 | 11,024 | |||||||||
Everest Re Group | 1.7 | 128,513 | 23,326 | |||||||||
PartnerRe | 1.2 | 128,556 | 16,896 | |||||||||
RenaissanceRe Holdings | 1.1 | 152,001 | 15,521 | |||||||||
Travelers | 1.1 | 159,499 | 16,128 | |||||||||
Validus Holdings | 0.8 | 274,958 | 11,798 | |||||||||
| Description | Percentage of Net Assets (%) | Shares | Market Value ($ Thousands) | |||||||||
Other Securities | 10.5 | % | $ | 149,233 | ||||||||
|
| |||||||||||
| 274,731 | ||||||||||||
|
| |||||||||||
Health Care — 16.9% |
| |||||||||||
Aetna | 0.6 | 71,200 | 8,399 | |||||||||
AmerisourceBergen | 1.0 | 118,949 | 13,389 | |||||||||
Anthem | 0.7 | 62,000 | 10,407 | |||||||||
Baxter International | 0.7 | 145,600 | 9,698 | |||||||||
Eli Lilly | 0.7 | 131,602 | 10,383 | |||||||||
Express Scripts Holding* | 0.9 | 142,819 | 12,445 | |||||||||
Johnson & Johnson | 1.9 | 260,604 | 26,097 | |||||||||
McKesson | 0.6 | 36,342 | 8,621 | |||||||||
Merck | 1.1 | 265,111 | 16,143 | |||||||||
Omnicare | 0.6 | 89,816 | 8,558 | |||||||||
Pfizer | 1.1 | 445,700 | 15,488 | |||||||||
Quest Diagnostics | 0.7 | 139,300 | 10,479 | |||||||||
Other Securities | 6.3 | 88,916 | ||||||||||
|
| |||||||||||
| 239,023 | ||||||||||||
|
| |||||||||||
Industrials — 3.1% | ||||||||||||
Deere | 0.6 | 87,800 | 8,225 | |||||||||
Other Securities | 2.5 | 35,164 | ||||||||||
|
| |||||||||||
| 43,389 | ||||||||||||
|
| |||||||||||
Information Technology — 9.5% |
| |||||||||||
Amdocs | 1.6 | 407,689 | 22,362 | |||||||||
FactSet Research Systems | 0.6 | 49,690 | 8,207 | |||||||||
Intel | 0.6 | 253,300 | 8,729 | |||||||||
International Business Machines | 1.6 | 133,670 | 22,677 | |||||||||
Other Securities | 5.1 | 72,346 | ||||||||||
|
| |||||||||||
| 134,321 | ||||||||||||
|
| |||||||||||
Materials — 2.3% | ||||||||||||
Avery Dennison | 0.6 | 136,330 | 8,440 | |||||||||
Other Securities | 1.7 | 23,582 | ||||||||||
|
| |||||||||||
| 32,022 | ||||||||||||
|
| |||||||||||
Telecommunication Services — 5.2% |
| |||||||||||
AT&T | 1.4 | 582,217 | 20,110 | |||||||||
Verizon Communications | 1.6 | 462,226 | 22,852 | |||||||||
Other Securities | 2.2 | 30,397 | ||||||||||
|
| |||||||||||
| 73,359 | ||||||||||||
|
| |||||||||||
Utilities — 8.6% |
| |||||||||||
Consolidated Edison | 0.8 | 188,463 | 11,654 | |||||||||
DTE Energy | 0.6 | 111,268 | 8,816 | |||||||||
Edison International | 1.4 | 324,765 | 19,749 | |||||||||
Entergy | 1.5 | 275,063 | 21,034 | |||||||||
Exelon | 0.6 | 235,800 | 7,977 | |||||||||
Public Service Enterprise Group | 0.6 | 188,500 | 8,036 | |||||||||
| 58 | SEI Institutional Investments Trust / Annual Report / May 31, 2015 |
| Description | Percentage of Net Assets (%) | Shares | Market Value ($ Thousands) | |||||||||
Other Securities | 3.2 | % | $ | 45,114 | ||||||||
|
| |||||||||||
| 122,380 | ||||||||||||
|
| |||||||||||
Total Common Stock |
| 1,364,047 | ||||||||||
|
| |||||||||||
CASH EQUIVALENT — 4.2% |
| |||||||||||
SEI Daily Income Trust, Prime Obligation Fund, Cl A 0.010%**† | 4.2 | 58,843,509 | 58,844 | |||||||||
|
| |||||||||||
Total Cash Equivalent |
| 58,844 | ||||||||||
|
| |||||||||||
U.S. TREASURY OBLIGATIONS (A) — 0.1% |
| |||||||||||
Other Securities | 0.1 | 2,108 | ||||||||||
|
| |||||||||||
Total U.S. Treasury Obligations |
| 2,108 | ||||||||||
|
| |||||||||||
Total Investments — 100.7% |
| $ | 1,424,999 | |||||||||
|
| |||||||||||
A list of the open futures contracts held by the Fund at May 31, 2015, is as follows:
| Type of Contract | Number of Contracts Long | Expiration Date | Unrealized Appreciation ($ Thousands) | |||||||||
S&P 500 Index E-MINI | 307 | Jun-2015 | $ | 1,137 | ||||||||
|
| |||||||||||
For the year ended May 31, 2015, the total amount of all open futures contracts, as presented in the table above, are representative of the volume of activity for this derivative type during the year.
Percentages are based on a Net Assets of $1,414,638 ($ Thousands).
| * | Non-income producing security. |
| ** | The rate reported is the 7-day effective yield as of May 31, 2015. |
| † | Investment in Affiliated Security (see Note 6). |
| (A) | Security, or portion thereof, has been pledged as collateral on open futures contracts. |
Cl — Class
S&P — Standard & Poor’s
The Summary Schedule of Investments does not reflect the complete portfolio holdings. It includes the Fund’s 50 largest holdings and each investment of any issuer that exceeds 1% of the Fund’s net assets. “Other Securities” represent all issuers not required to be disclosed under the rules adopted by the U.S. Securities and Exchange Commission (“SEC”). In certain instances, securities for which footnotes listed above may otherwise apply are included in the Other Securities caption. The complete schedule of portfolio holdings is available (i) without charge, upon request, by calling (800) 342-5734; and (ii) on the SEC’s website at http://www.sec.gov.
The following is a list of the level of inputs used as of May 31, 2015, in valuing the Fund’s investments and other financial instruments carried at value ($ Thousands):
| Investments in Securities | Level 1 | Level 2 | Level 3 | Total | ||||||||||||
Common Stock | $ | 1,364,047 | $ | — | $ | — | $ | 1,364,047 | ||||||||
Cash Equivalent | 58,844 | — | — | 58,844 | ||||||||||||
U.S. Treasury Obligations | — | 2,108 | — | 2,108 | ||||||||||||
|
|
|
|
|
|
|
| |||||||||
Total Investments in Securities | $ | 1,422,891 | $ | 2,108 | $ | — | $ | 1,424,999 | ||||||||
|
|
|
|
|
|
|
| |||||||||
| Other Financial Instruments | Level 1 | Level 2 | Level 3 | Total | ||||||||||||
Futures Contracts* | $ | 1,137 | $ | — | $ | — | $ | 1,137 | ||||||||
|
|
|
|
|
|
|
| |||||||||
| * | Future contracts are valued at the unrealized appreciation on the instrument. |
For the year ended May 31, 2015, there were no significant transfers between Level 1 and Level 2 assets and liabilities.
For the year ended May 31, 2015, there were no significant transfers between Level 2 and Level 3 assets and liabilities.
For more information on valuation inputs, see Note 2 — Significant Accounting Policies in Notes to Financial Statements.
Amounts designated as “—” are $0 or have been rounded to $0.
The accompanying notes are an integral part of the financial statements.
| SEI Institutional Investments Trust / Annual Report / May 31, 2015 | 59 |
SUMMARY SCHEDULE OF INVESTMENTS
World Equity Ex-US Fund
May 31, 2015
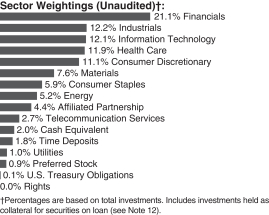
| Description | Percentage of Net Assets (%) | Shares | Market Value ($ Thousands) | |||||||||
COMMON STOCK — 94.4% |
| |||||||||||
Argentina — 0.3% |
| |||||||||||
Other Securities (A) | 0.3 | % | $ | 23,611 | ||||||||
|
| |||||||||||
Australia — 3.5% |
| |||||||||||
Newcrest Mining* | 0.5 | 3,596,526 | 38,899 | |||||||||
Other Securities (A) | 3.0 | 228,761 | ||||||||||
|
| |||||||||||
| 267,660 | ||||||||||||
|
| |||||||||||
Austria — 1.0% |
| |||||||||||
Other Securities | 1.0 | 79,195 | ||||||||||
|
| |||||||||||
Belgium — 0.5% |
| |||||||||||
Other Securities | 0.5 | 41,149 | ||||||||||
|
| |||||||||||
Brazil — 1.3% |
| |||||||||||
Other Securities (A) | 1.3 | 95,289 | ||||||||||
|
| |||||||||||
Canada — 4.7% |
| |||||||||||
Valeant Pharmaceuticals International* | 0.7 | 212,232 | 50,402 | |||||||||
Other Securities (A) | 4.0 | 305,401 | ||||||||||
|
| |||||||||||
| 355,803 | ||||||||||||
|
| |||||||||||
Chile — 0.1% |
| |||||||||||
Other Securities | 0.1 | 3,913 | ||||||||||
|
| |||||||||||
China — 4.4% |
| |||||||||||
Anhui Conch Cement | 0.8 | 14,920,500 | 62,557 | |||||||||
China Construction Bank | 0.5 | 40,279,800 | 40,480 | |||||||||
Tencent Holdings | 0.5 | 2,042,828 | 41,033 | |||||||||
Other Securities (A) | 2.6 | 190,619 | ||||||||||
|
| |||||||||||
| 334,689 | ||||||||||||
|
| |||||||||||
| Description | Percentage of Net Assets (%) | Shares | Market Value ($ Thousands) | |||||||||
Colombia — 0.2% |
| |||||||||||
Other Securities (A) | 0.2 | % | $ | 13,842 | ||||||||
|
| |||||||||||
Czech Republic — 0.2% |
| |||||||||||
Other Securities | 0.2 | 15,076 | ||||||||||
|
| |||||||||||
Denmark — 1.1% |
| |||||||||||
Other Securities | 1.1 | 86,645 | ||||||||||
|
| |||||||||||
Finland — 0.8% |
| |||||||||||
Other Securities (A) | 0.8 | 57,558 | ||||||||||
|
| |||||||||||
France — 3.3% |
| |||||||||||
L’Oreal | 0.5 | 206,352 | 38,901 | |||||||||
Other Securities (A) | 2.8 | 211,474 | ||||||||||
|
| |||||||||||
| 250,375 | ||||||||||||
|
| |||||||||||
Germany — 5.1% |
| |||||||||||
Other Securities (A) | 5.1 | 387,924 | ||||||||||
|
| |||||||||||
Hong Kong — 3.6% |
| |||||||||||
BOC Hong Kong Holdings | 0.5 | 9,613,500 | 39,562 | |||||||||
China Mobile | 1.2 | 7,145,844 | 94,122 | |||||||||
Other Securities | 1.9 | 138,333 | ||||||||||
|
| |||||||||||
| 272,017 | ||||||||||||
|
| |||||||||||
India — 2.2% |
| |||||||||||
Tata Motors ADR | 0.7 | 1,446,683 | 55,408 | |||||||||
Other Securities | 1.5 | 110,409 | ||||||||||
|
| |||||||||||
| 165,817 | ||||||||||||
|
| |||||||||||
Indonesia — 0.7% |
| |||||||||||
Other Securities | 0.7 | 56,343 | ||||||||||
|
| |||||||||||
Ireland — 4.0% |
| |||||||||||
Actavis* | 0.5 | 121,618 | 37,314 | |||||||||
ICON* | 1.0 | 1,135,714 | 73,674 | |||||||||
Mallinckrodt* | 0.5 | 288,126 | 37,295 | |||||||||
Shire ADR | 0.1 | 33,154 | 8,625 | |||||||||
Other Securities | 1.9 | 148,274 | ||||||||||
|
| |||||||||||
| 305,182 | ||||||||||||
|
| |||||||||||
Israel — 1.0% |
| |||||||||||
Teva Pharmaceutical Industries ADR | 0.8 | 961,742 | 57,801 | |||||||||
Other Securities | 0.2 | 16,671 | ||||||||||
|
| |||||||||||
| 74,472 | ||||||||||||
|
| |||||||||||
Italy — 0.8% |
| |||||||||||
Fiat Chrysler Automobiles* | 0.5 | 2,471,136 | 39,419 | |||||||||
Other Securities | 0.3 | 21,710 | ||||||||||
|
| |||||||||||
| 61,129 | ||||||||||||
|
| |||||||||||
| 60 | SEI Institutional Investments Trust / Annual Report / May 31, 2015 |
| Description | Percentage of Net Assets (%) | Shares | Market Value ($ Thousands) | |||||||||
Japan — 12.9% |
| |||||||||||
Daiwa Securities Group | 0.5 | % | 5,078,520 | $ | 40,405 | |||||||
Denso | 0.8 | 1,222,200 | 64,126 | |||||||||
FANUC | 0.7 | 244,622 | 54,288 | |||||||||
Hitachi | 0.5 | 5,730,300 | 39,250 | |||||||||
Japan Exchange Group | 0.8 | 2,073,157 | 63,233 | |||||||||
Mizuho Financial Group | 0.6 | 22,035,700 | 48,761 | |||||||||
Omron | 0.5 | 867,544 | 40,478 | |||||||||
Other Securities (A) | 8.5 | 637,094 | ||||||||||
|
| |||||||||||
| 987,635 | ||||||||||||
|
| |||||||||||
Malaysia — 0.1% |
| |||||||||||
Other Securities | 0.1 | 9,542 | ||||||||||
|
| |||||||||||
Mexico — 0.6% |
| |||||||||||
America Movil ADR, Ser L | 0.5 | 1,868,455 | 39,238 | |||||||||
Other Securities | 0.1 | 7,105 | ||||||||||
|
| |||||||||||
| 46,343 | ||||||||||||
|
| |||||||||||
Netherlands — 2.6% |
| |||||||||||
Core Laboratories (A) | 0.5 | 338,868 | 39,810 | |||||||||
NXP Semiconductor* | 0.5 | 348,250 | 39,091 | |||||||||
Other Securities (A) | 1.6 | 118,784 | ||||||||||
|
| |||||||||||
| 197,685 | ||||||||||||
|
| |||||||||||
Norway — 1.8% |
| |||||||||||
DnB | 0.9 | 3,789,725 | 66,340 | |||||||||
Norsk Hydro (A) | 0.6 | 9,868,021 | 46,178 | |||||||||
Other Securities (A) | 0.3 | 27,449 | ||||||||||
|
| |||||||||||
| 139,967 | ||||||||||||
|
| |||||||||||
Panama — 0.1% |
| |||||||||||
Other Securities (A) | 0.1 | 7,560 | ||||||||||
|
| |||||||||||
Peru — 0.2% |
| |||||||||||
Other Securities | 0.2 | 15,288 | ||||||||||
|
| |||||||||||
Philippines — 0.0% |
| |||||||||||
Other Securities | 0.0 | 277 | ||||||||||
|
| |||||||||||
Poland — 0.1% |
| |||||||||||
Other Securities | 0.1 | 8,863 | ||||||||||
|
| |||||||||||
Portugal — 0.1% |
| |||||||||||
Other Securities | 0.1 | 6,598 | ||||||||||
|
| |||||||||||
Qatar — 0.1% |
| |||||||||||
Other Securities | 0.1 | 5,208 | ||||||||||
|
| |||||||||||
Russia — 0.6% |
| |||||||||||
Other Securities | 0.6 | 45,626 | ||||||||||
|
| |||||||||||
| Description | Percentage of Net Assets (%) | Shares | Market Value ($ Thousands) | |||||||||
Singapore — 2.2% |
| |||||||||||
Avago Technologies, Cl A | 0.6 | % | 282,590 | $ | 41,843 | |||||||
DBS Group Holdings | 0.6 | 2,973,000 | 44,742 | |||||||||
Other Securities | 1.0 | 84,631 | ||||||||||
|
| |||||||||||
| 171,216 | ||||||||||||
|
| |||||||||||
South Africa — 1.4% |
| |||||||||||
Naspers, Cl N | 0.5 | 256,094 | 37,570 | |||||||||
Other Securities | 0.9 | 70,811 | ||||||||||
|
| |||||||||||
| 108,381 | ||||||||||||
|
| |||||||||||
South Korea — 3.5% |
| |||||||||||
Samsung Electronics | 1.0 | 65,793 | 77,592 | |||||||||
SK Hynix | 0.7 | 1,222,750 | 56,379 | |||||||||
Other Securities (A) | 1.8 | 130,895 | ||||||||||
|
| |||||||||||
| 264,866 | ||||||||||||
|
| |||||||||||
Spain — 0.9% |
| |||||||||||
Amadeus IT Holding, Cl A | 0.6 | 1,039,249 | 47,210 | |||||||||
Other Securities | 0.3 | 24,758 | ||||||||||
|
| |||||||||||
| 71,968 | ||||||||||||
|
| |||||||||||
Sweden — 2.4% |
| |||||||||||
Other Securities (A) | 2.4 | 186,209 | ||||||||||
|
| |||||||||||
Switzerland — 5.6% |
| |||||||||||
Actelion | 0.7 | 367,862 | 51,240 | |||||||||
Novartis | 0.6 | 467,346 | 47,807 | |||||||||
Novartis ADR | 0.6 | 407,970 | 41,911 | |||||||||
Roche Holding | 1.1 | 280,044 | 81,993 | |||||||||
Zurich Insurance Group ADR | 0.6 | 1,469,800 | 46,990 | |||||||||
Other Securities (A) | 2.0 | 156,731 | ||||||||||
|
| |||||||||||
| 426,672 | ||||||||||||
|
| |||||||||||
Taiwan — 3.7% |
| |||||||||||
Taiwan Semiconductor Manufacturing | 0.2 | 3,008,000 | 14,308 | |||||||||
Taiwan Semiconductor Manufacturing ADR | 1.0 | 3,126,275 | 75,906 | |||||||||
Other Securities (A) | 2.5 | 195,919 | ||||||||||
|
| |||||||||||
| 286,133 | ||||||||||||
|
| |||||||||||
Thailand — 0.0% |
| |||||||||||
Other Securities | 0.0 | 2,024 | ||||||||||
|
| |||||||||||
Turkey — 1.1% |
| |||||||||||
Other Securities | 1.1 | 87,341 | ||||||||||
|
| |||||||||||
| SEI Institutional Investments Trust / Annual Report / May 31, 2015 | 61 |
SUMMARY SCHEDULE OF INVESTMENTS
World Equity Ex-US Fund (Continued)
May 31, 2015
| Description | Percentage of Net Assets (%) | Shares | Market Value ($ Thousands) | |||||||||
United Kingdom — 14.0% |
| |||||||||||
ARM Holdings | 0.3 | % | 1,488,355 | $ | 26,232 | |||||||
ARM Holdings ADR | 0.9 | 1,284,691 | 68,436 | |||||||||
Imperial Tobacco Group | 0.5 | 754,442 | 38,797 | |||||||||
ITV | 0.6 | 10,807,748 | 44,908 | |||||||||
Marks & Spencer Group ADR | 0.5 | 2,181,000 | 38,844 | |||||||||
Persimmon | 0.7 | 1,686,282 | 50,486 | |||||||||
Reckitt Benckiser Group | 0.5 | 436,427 | 39,325 | |||||||||
Rio Tinto ADR (A) | 0.6 | 1,058,977 | 46,351 | |||||||||
Royal Dutch Shell, Cl A | 0.5 | 1,285,909 | 38,304 | |||||||||
Royal Dutch Shell, Cl A (GBP) | 0.1 | 120,089 | 3,561 | |||||||||
Royal Dutch Shell ADR, Cl A | 0.5 | 627,200 | 37,456 | |||||||||
Shire | 1.5 | 1,296,792 | 111,507 | |||||||||
Other Securities | 6.8 | 524,689 | ||||||||||
|
| |||||||||||
| 1,068,896 | ||||||||||||
|
| |||||||||||
United States — 1.6% |
| |||||||||||
Everest Re Group | 0.6 | 242,188 | 43,960 | |||||||||
Other Securities | 1.0 | 77,132 | ||||||||||
|
| |||||||||||
| 121,092 | ||||||||||||
|
| |||||||||||
Total Common Stock |
| 7,213,079 | ||||||||||
|
| |||||||||||
PREFERRED STOCK — 0.9% |
| |||||||||||
Brazil — 0.5% |
| |||||||||||
Other Securities | 0.5 | 36,452 | ||||||||||
|
| |||||||||||
Germany — 0.4% |
| |||||||||||
Other Securities | 0.4 | 34,877 | ||||||||||
|
| |||||||||||
Total Preferred Stock |
| 71,329 | ||||||||||
|
| |||||||||||
RIGHTS — 0.0% |
| |||||||||||
Brazil — 0.0% |
| |||||||||||
Other Securities | 0.0 | — | ||||||||||
|
| |||||||||||
United Kingdom — 0.0% |
| |||||||||||
Other Securities | 0.0 | 32 | ||||||||||
|
| |||||||||||
Total Rights |
|
| 32 |
| ||||||||
|
| |||||||||||
AFFILIATED PARTNERSHIP — 4.5% |
| |||||||||||
SEI Liquidity Fund, L.P. | 4.5 | 347,864,814 | 347,865 | |||||||||
|
| |||||||||||
Total Affiliated Partnership |
| 347,865 | ||||||||||
|
| |||||||||||
| Description | Percentage of Net Assets (%) | Shares/Face Amount (Thousands) (1) | Market Value ($ Thousands) | |||||||||
CASH EQUIVALENT — 2.1% |
| |||||||||||
SEI Daily Income Trust, Prime Obligation Fund, Cl A 0.010%**† | 2.1 | % | 159,793,968 | $ | 159,794 | |||||||
|
| |||||||||||
Total Cash Equivalent |
| 159,794 | ||||||||||
|
| |||||||||||
U.S. TREASURY OBLIGATIONS — 0.2% |
| |||||||||||
Other Securities (C) | 0.2 | 12,700 | ||||||||||
|
| |||||||||||
Total U.S. Treasury Obligations |
| 12,700 | ||||||||||
|
| |||||||||||
TIME DEPOSITS — 1.9% |
| |||||||||||
Brown Brothers Harriman | ||||||||||||
5.800%, 06/01/2015 | ZAR | 22,339 | 1,836 | |||||||||
2.650%, 06/01/2015 | NZD | — | — | |||||||||
1.250%, 06/01/2015 | AUD | 190 | 145 | |||||||||
0.427%, 06/01/2015 | NOK | 9,408 | 1,207 | |||||||||
0.100%, 06/01/2015 | CAD | 628 | 503 | |||||||||
0.100%, 06/01/2015 | SGD | 38 | 28 | |||||||||
0.079%, 06/01/2015 | GBP | 3,406 | 5,198 | |||||||||
0.030%, 06/01/2015 | 124,718 | 124,718 | ||||||||||
0.005%, 06/01/2015 | JPY | 18,388 | 148 | |||||||||
0.005%, 06/01/2015 | HKD | 11,299 | 1,458 | |||||||||
(0.211)%, 06/01/2015 | EUR | 5,066 | 5,554 | |||||||||
(0.400)%, 06/01/2015 | SEK | — | — | |||||||||
(1.000)%, 06/01/2015 | CHF | 1,133 | 1,201 | |||||||||
(1.050)%, 06/01/2015 | DKK | 1 | — | |||||||||
|
| |||||||||||
Total Time Deposits |
| 141,996 | ||||||||||
|
| |||||||||||
Total Investments — 104.0% |
| $ | 7,946,795 | |||||||||
|
| |||||||||||
A list of the open futures contracts held by the Fund at May 31, 2015, is as follows:
| Type of Contract | Number of Contracts Long | Expiration Date | Unrealized Appreciation (Depreciation) ($ Thousands) | |||||||||
Euro-Stoxx | 1,614 | Jun-2015 | $ | 26 | ||||||||
FTSE 100 Index | 434 | Jun-2015 | 191 | |||||||||
Hang Seng Index | 46 | Jun-2015 | (142 | ) | ||||||||
S&P TSX 60 Index | 125 | Jun-2015 | (210 | ) | ||||||||
SPI 200 Index | 147 | Jun-2015 | 62 | |||||||||
Topix Index | 310 | Jun-2015 | 2,000 | |||||||||
|
| |||||||||||
| $ | 1,927 | |||||||||||
|
| |||||||||||
For the year ended May 31, 2015, the total amount of all open futures contracts, as presented in the table above, are representative of the volume of activity for this derivative type during the year.
| 62 | SEI Institutional Investments Trust / Annual Report / May 31, 2015 |
Percentages are based on a Net Assets of $7,644,844 ($ Thousands).
| * | Non-income producing security. |
| ** | The rate reported is the 7-day effective yield as of May 31, 2015. |
| † | Investment in Affiliated Security (see Note 6). |
| (1) | In U.S. dollars unless otherwise indicated. |
| (A) | Certain securities or partial positions of certain securities are on loan at May 31, 2015. The total value of securities on loan at May 31, 2015 was $326,306 ($ Thousands). |
| (B) | This security was purchased with cash collateral held from securities on loan (see Note 12). The total value of such securities as of May 31, 2015 was $347,865 ($ Thousands). |
| (C) | Security, or portion thereof, has been pledged as collateral on open futures contracts. |
ADR — American Depositary Receipt
AUD — Australian Dollar
CAD — Canadian Dollar
CHF — Swiss Franc
Cl — Class
DKK — Danish Krone
EUR — Euro
FTSE — Financial Times and Stock Exchange
GBP — British Pound Sterling
HKD — Hong Kong Dollar
JPY — Japanese Yen
L.P. — Limited Partnership
NOK — Norwegian Krone
NZD — New Zealand Dollar
S&P — Standard & Poor’s
SEK — Swedish Krone
SGD — Singapore Dollar
SPI — Share Price Index
TSX — Toronto Stock Exchange
ZAR — South African Rand
The Summary Schedule of Investments does not reflect the complete portfolio holdings. It includes the Fund’s 50 largest holdings and each investment of any issuer that exceeds 1% of the Fund’s net assets. “Other Securities” represent all issuers not required to be disclosed under the rules adopted by the U.S. Securities and Exchange Commission (“SEC”). In certain instances, securities for which footnotes listed above may otherwise apply are included in the Other Securities caption. The complete schedule of portfolio holdings is available (i) without charge, upon request, by calling (800) 342-5734; and (ii) on the SEC’s website at http://www.sec.gov.
The following is a list of the level of inputs used as of May 31, 2015, in valuing the Fund’s investments and other financial instruments carried at value ($ Thousands):
| Investments in Securities | Level 1 | Level 2 | Level 3(1) | Total | ||||||||||||
Common Stock | $ | 7,199,966 | $ | — | $ | 13,113 | $ | 7,213,079 | ||||||||
Preferred Stock | 71,329 | — | — | 71,329 | ||||||||||||
Rights | 32 | — | — | 32 | ||||||||||||
Affiliated Partnership | — | 347,865 | — | 347,865 | ||||||||||||
Cash Equivalent | 159,794 | — | — | 159,794 | ||||||||||||
U.S. Treasury Obligations | — | 12,700 | — | 12,700 | ||||||||||||
Time Deposits | — | 141,996 | — | 141,996 | ||||||||||||
|
|
|
|
|
|
|
| |||||||||
Total Investments in Securities | $ | 7,431,121 | $ | 502,561 | $ | 13,113 | $ | 7,946,795 | ||||||||
|
|
|
|
|
|
|
| |||||||||
| Other Financial Instruments | Level 1 | Level 2 | Level 3 | Total | ||||||||||||
Futures Contracts* | ||||||||||||||||
Unrealized Appreciation | $ | 2,279 | $ | — | $ | — | $ | 2,279 | ||||||||
Unrealized Depreciation | (352 | ) | — | — | (352 | ) | ||||||||||
|
|
|
|
|
|
|
| |||||||||
Total Other Financial Instruments | $ | 1,927 | $ | — | $ | — | $ | 1,927 | ||||||||
|
|
|
|
|
|
|
| |||||||||
| (1) | A reconciliation of Level 3 investments is presented when the Fund has a significant amount of Level 3 investments at the beginning and/or end of the period in relation to net assets. |
| * | Futures contracts are valued at the unrealized appreciation (depreciation) on the instrument. |
For the year ended May 31, 2015, there were transfers between Level 1 and Level 2 assets and liabilities. The primary reason for changes in the classifications between Levels 1 and 2 occurs when foreign equity securities are fair valued using other observable market-based inputs in place of the closing exchange price due to events occurring after the close of the exchange or market on which the investment is principally traded.
For the year ended May 31, 2015, there were no transfers between Level 2 and Level 3 assets and liabilities.
For more information on valuation inputs, see Note 2 — Significant Accounting Policies in Notes to Financial Statements.
Amounts designated as “—” are $0 or have been rounded to $0.
The accompanying notes are an integral part of the financial statements.
| SEI Institutional Investments Trust / Annual Report / May 31, 2015 | 63 |
SUMMARY SCHEDULE OF INVESTMENTS
Screened World Equity Ex-US Fund
May 31, 2015
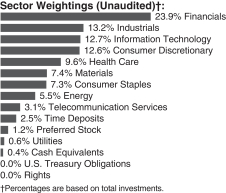
| Description | Percentage of Net Assets (%) | Shares | Market Value ($ Thousands) | |||||||||
COMMON STOCK — 94.3% |
| |||||||||||
Argentina — 0.5% |
| |||||||||||
Other Securities | 0.5 | % | $ | 406 | ||||||||
|
| |||||||||||
Australia — 2.9% |
| |||||||||||
Australia & New Zealand Banking Group | 0.5 | 16,376 | 416 | |||||||||
Commonwealth Bank of Australia | 0.5 | 6,914 | 450 | |||||||||
Other Securities | 1.9 | 1,555 | ||||||||||
|
| |||||||||||
| 2,421 | ||||||||||||
|
| |||||||||||
Austria — 2.1% |
| |||||||||||
Voestalpine | 0.5 | 10,115 | 420 | |||||||||
Other Securities | 1.6 | 1,339 | ||||||||||
|
| |||||||||||
| 1,759 | ||||||||||||
|
| |||||||||||
Belgium — 0.4% |
| |||||||||||
Other Securities | 0.4 | 355 | ||||||||||
|
| |||||||||||
Brazil — 1.5% |
| |||||||||||
Other Securities | 1.5 | 1,216 | ||||||||||
|
| |||||||||||
Canada — 5.2% |
| |||||||||||
Magna International, Cl A | 0.6 | 8,600 | 492 | |||||||||
Toronto-Dominion Bank | 0.5 | 10,400 | 451 | |||||||||
Other Securities | 4.1 | 3,375 | ||||||||||
|
| |||||||||||
| 4,318 | ||||||||||||
|
| |||||||||||
Chile — 0.1% |
| |||||||||||
Other Securities | 0.1 | 44 | ||||||||||
|
| |||||||||||
China — 4.1% |
| |||||||||||
Anhui Conch Cement | 0.5 | 100,500 | 421 | |||||||||
Other Securities | 3.6 | 2,999 | ||||||||||
|
| |||||||||||
| 3,420 | ||||||||||||
|
| |||||||||||
| Description | Percentage of Net Assets (%) | Shares | Market Value ($ Thousands) | |||||||||
Colombia — 0.3% |
| |||||||||||
Other Securities | 0.3 | % | $ | 224 | ||||||||
|
| |||||||||||
Czech Republic — 0.3% |
| |||||||||||
Other Securities | 0.3 | 244 | ||||||||||
|
| |||||||||||
Denmark — 2.1% |
| |||||||||||
Novo Nordisk, Cl B | 0.6 | 8,716 | 486 | |||||||||
Other Securities | 1.5 | 1,313 | ||||||||||
|
| |||||||||||
| 1,799 | ||||||||||||
|
| |||||||||||
Finland — 2.0% |
| |||||||||||
Other Securities | 2.0 | 1,639 | ||||||||||
|
| |||||||||||
France — 3.7% |
| |||||||||||
Essilor International | 0.5 | 3,590 | 438 | |||||||||
Other Securities | 3.2 | 2,635 | ||||||||||
|
| |||||||||||
| 3,073 | ||||||||||||
|
| |||||||||||
Germany — 3.0% |
| |||||||||||
Other Securities | 3.0 | 2,531 | ||||||||||
|
| |||||||||||
Hong Kong — 3.1% |
| |||||||||||
China Mobile | 0.6 | 38,500 | 507 | |||||||||
Hong Kong Exchanges and Clearing | 0.6 | 13,800 | 531 | |||||||||
Orient Overseas International | 0.5 | 79,000 | 438 | |||||||||
Other Securities | 1.4 | 1,123 | ||||||||||
|
| |||||||||||
| 2,599 | ||||||||||||
|
| |||||||||||
India — 1.6% |
| |||||||||||
HDFC Bank ADR | 0.7 | 9,375 | 559 | |||||||||
ICICI Bank ADR | 0.6 | 50,443 | 532 | |||||||||
Other Securities | 0.3 | 283 | ||||||||||
|
| |||||||||||
| 1,374 | ||||||||||||
|
| |||||||||||
Indonesia — 0.8% |
| |||||||||||
Other Securities | 0.8 | 648 | ||||||||||
|
| |||||||||||
Ireland — 2.3% |
| |||||||||||
ICON* | 1.1 | 14,516 | 942 | |||||||||
Ryanair Holdings ADR | 0.5 | 6,233 | 415 | |||||||||
Other Securities | 0.7 | 563 | ||||||||||
|
| |||||||||||
| 1,920 | ||||||||||||
|
| |||||||||||
Israel — 0.3% |
| |||||||||||
Other Securities | 0.3 | 209 | ||||||||||
|
| |||||||||||
Italy — 1.2% |
| |||||||||||
Other Securities | 1.2 | 1,030 | ||||||||||
|
| |||||||||||
| 64 | SEI Institutional Investments Trust / Annual Report / May 31, 2015 |
| Description | Percentage of Net Assets (%) | Shares | Market Value ($ Thousands) | |||||||||
Japan — 11.6% |
| |||||||||||
Denso | 1.3 | % | 20,100 | $ | 1,055 | |||||||
Japan Airlines | 0.6 | 14,700 | 506 | |||||||||
Nippon Telegraph & Telephone | 0.6 | 6,700 | 468 | |||||||||
Secom | 0.7 | 8,600 | 576 | |||||||||
Toyota Motor | 1.1 | 13,600 | 943 | |||||||||
Other Securities | 7.3 | 6,184 | ||||||||||
|
| |||||||||||
| 9,732 | ||||||||||||
|
| |||||||||||
Malaysia — 0.2% |
| |||||||||||
Other Securities | 0.2 | 145 | ||||||||||
|
| |||||||||||
Mexico — 1.0% |
| |||||||||||
Other Securities | 1.0 | 858 | ||||||||||
|
| |||||||||||
Netherlands — 3.1% |
| |||||||||||
Core Laboratories | 0.8 | 5,475 | 643 | |||||||||
Unilever | 1.3 | 25,424 | 1,082 | |||||||||
Other Securities | 1.0 | 856 | ||||||||||
|
| |||||||||||
| 2,581 | ||||||||||||
|
| |||||||||||
New Zealand — 0.6% |
| |||||||||||
Other Securities | 0.6 | 500 | ||||||||||
|
| |||||||||||
Norway — 1.7% |
| |||||||||||
DnB | 1.2 | 56,268 | 985 | |||||||||
Other Securities | 0.5 | 473 | ||||||||||
|
| |||||||||||
| 1,458 | ||||||||||||
|
| |||||||||||
Panama — 0.2% |
| |||||||||||
Other Securities | 0.2 | 140 | ||||||||||
|
| |||||||||||
Peru — 0.2% |
| |||||||||||
Other Securities | 0.2 | 164 | ||||||||||
|
| |||||||||||
Philippines — 0.1% |
| |||||||||||
Other Securities | 0.1 | 95 | ||||||||||
|
| |||||||||||
Poland — 0.3% |
| |||||||||||
Other Securities | 0.3 | 278 | ||||||||||
|
| |||||||||||
Portugal — 0.2% |
| |||||||||||
Other Securities | 0.2 | 183 | ||||||||||
|
| |||||||||||
Qatar — 0.2% |
| |||||||||||
Other Securities | 0.2 | 150 | ||||||||||
|
| |||||||||||
Russia — 0.5% |
| |||||||||||
Other Securities | 0.5 | 392 | ||||||||||
|
| |||||||||||
Singapore — 1.6% |
| |||||||||||
DBS Group Holdings | 0.5 | 28,900 | 435 | |||||||||
| Description | Percentage of Net Assets (%) | Shares | Market Value ($ Thousands) | |||||||||
Other Securities | 1.1 | % | $ | 870 | ||||||||
|
| |||||||||||
| 1,305 | ||||||||||||
|
| |||||||||||
South Africa — 2.1% |
| |||||||||||
FirstRand | 0.6 | 124,118 | 531 | |||||||||
Naspers, Cl N | 0.8 | 4,539 | 666 | |||||||||
Other Securities | 0.7 | 571 | ||||||||||
|
| |||||||||||
| 1,768 | ||||||||||||
|
| |||||||||||
South Korea — 3.6% |
| |||||||||||
Samsung Electronics | 1.6 | 1,162 | 1,370 | |||||||||
SK Hynix | 0.5 | 9,239 | 426 | |||||||||
Other Securities | 1.5 | 1,257 | ||||||||||
|
| |||||||||||
| 3,053 | ||||||||||||
|
| |||||||||||
Spain — 1.3% | ||||||||||||
Amadeus IT Holding, Cl A | 0.9 | 15,987 | 726 | |||||||||
Other Securities | 0.4 | 388 | ||||||||||
|
| |||||||||||
| 1,114 | ||||||||||||
|
| |||||||||||
Sweden — 2.8% | ||||||||||||
Atlas Copco, Cl B | 0.5 | 16,572 | 445 | |||||||||
Getinge, Cl B | 0.6 | 19,628 | 473 | |||||||||
Svenska Handelsbanken, Cl A | 0.6 | 34,152 | 513 | |||||||||
Other Securities | 1.1 | 915 | ||||||||||
|
| |||||||||||
| 2,346 | ||||||||||||
|
| |||||||||||
Switzerland — 4.5% | ||||||||||||
Nestle | 0.7 | 8,081 | 624 | |||||||||
Novartis | 0.4 | 2,850 | 292 | |||||||||
Novartis ADR | 0.8 | 6,591 | 677 | |||||||||
Roche Holding | 1.0 | 2,724 | 798 | |||||||||
Other Securities | 1.6 | 1,392 | ||||||||||
|
| |||||||||||
| 3,783 | ||||||||||||
|
| |||||||||||
Taiwan — 3.4% | ||||||||||||
Taiwan Semiconductor Manufacturing | 0.3 | 59,000 | 281 | |||||||||
Taiwan Semiconductor Manufacturing ADR | 1.4 | 47,091 | 1,143 | |||||||||
Other Securities | 1.7 | 1,462 | ||||||||||
|
| |||||||||||
| 2,886 | ||||||||||||
|
| |||||||||||
Thailand — 0.0% | ||||||||||||
Other Securities | 0.0 | 30 | ||||||||||
|
| |||||||||||
Turkey — 1.1% |
| |||||||||||
Other Securities | 1.1 | 958 | ||||||||||
|
| |||||||||||
United Kingdom — 14.7% |
| |||||||||||
ARM Holdings | 0.6 | 26,394 | 465 | |||||||||
ARM Holdings ADR | 1.3 | 20,756 | 1,106 | |||||||||
| SEI Institutional Investments Trust / Annual Report / May 31, 2015 | 65 |
SUMMARY SCHEDULE OF INVESTMENTS
Screened World Equity Ex-US Fund (Continued)
May 31, 2015
| Description | Percentage of Net Assets (%) | Shares | Market Value ($ Thousands) | |||||||||
Associated British Foods | 0.5 | % | 9,394 | $ | 434 | |||||||
AstraZeneca | 0.5 | 6,447 | 430 | |||||||||
Diageo | 0.6 | 19,249 | 533 | |||||||||
HSBC Holdings | 0.7 | 61,573 | 585 | |||||||||
Prudential | 0.9 | 30,062 | 746 | |||||||||
Rio Tinto | 0.5 | 10,091 | 440 | |||||||||
Shire | 1.5 | 14,843 | 1,276 | |||||||||
Wolseley | 0.6 | 8,629 | 532 | |||||||||
Other Securities | 7.0 | 5,817 | ||||||||||
|
| |||||||||||
| 12,364 | ||||||||||||
|
| |||||||||||
United States — 1.8% |
| |||||||||||
Carnival, Cl A | 0.7 | 12,633 | 585 | |||||||||
Everest Re Group | 0.9 | 3,913 | 710 | |||||||||
Other Securities | 0.2 | 253 | ||||||||||
|
| |||||||||||
| 1,548 | ||||||||||||
|
| |||||||||||
Total Common Stock |
| 79,060 | ||||||||||
|
| |||||||||||
PREFERRED STOCK — 1.1% |
| |||||||||||
Brazil — 1.1% | ||||||||||||
Itau Unibanco Holding | 0.5 | 42,510 | 459 | |||||||||
Other Securities | 0.6 | 526 | ||||||||||
|
| |||||||||||
| 985 | ||||||||||||
|
| |||||||||||
Germany — 0.0% | ||||||||||||
Other Securities | 0.0 | 40 | ||||||||||
|
| |||||||||||
Total Preferred Stock |
| 1,025 | ||||||||||
|
| |||||||||||
RIGHTS — 0.0% | ||||||||||||
Brazil — 0.0% | ||||||||||||
Other Securities | 0.0 | — | ||||||||||
|
| |||||||||||
Italy — 0.0% | ||||||||||||
Other Securities | 0.0 | — | ||||||||||
|
| |||||||||||
United Kingdom — 0.0% |
| |||||||||||
Other Securities | 0.0 | 1 | ||||||||||
|
| |||||||||||
Total Rights |
| 1 | ||||||||||
|
| |||||||||||
CASH EQUIVALENT — 0.4% |
| |||||||||||
SEI Daily Income Trust, Prime Obligation Fund, Cl A | 296,201 | 296 | ||||||||||
|
| |||||||||||
Total Cash Equivalent |
| 296 | ||||||||||
|
| |||||||||||
| Description | Percentage of Net Assets (%) | Face Amount (Thousands) (1) | Market Value ($ Thousands) | |||||||||
U.S. TREASURY OBLIGATION (A) — 0.0% |
| |||||||||||
Other Securities | 0.0 | % | $ | 16 | ||||||||
|
| |||||||||||
Total U.S. Treasury Obligation |
| 16 | ||||||||||
|
| |||||||||||
TIME DEPOSITS — 2.5% |
| |||||||||||
Brown Brothers Harriman | ||||||||||||
5.800%, 06/01/2015 | ZAR | 455 | 38 | |||||||||
2.650%, 06/01/2015 | NZD | 2 | 1 | |||||||||
1.250%, 06/01/2015 | AUD | 60 | 46 | |||||||||
0.427%, 06/01/2015 | NOK | 100 | 13 | |||||||||
0.100%, 06/01/2015 | CAD | 16 | 13 | |||||||||
0.100%, 06/01/2015 | SGD | 13 | 9 | |||||||||
0.079%, 06/01/2015 | GBP | 65 | 100 | |||||||||
0.030%, 06/01/2015 | 1,611 | 1,611 | ||||||||||
0.005%, 06/01/2015 | HKD | 125 | 16 | |||||||||
0.005%, 06/01/2015 | JPY | 4,565 | 37 | |||||||||
(0.211)%, 06/01/2015 | EUR | 104 | 114 | |||||||||
(0.400)%, 06/01/2015 | SEK | 95 | 11 | |||||||||
(1.000)%, 06/01/2015 | CHF | 48 | 51 | |||||||||
(1.050)%, 06/01/2015 | DKK | 87 | 13 | |||||||||
|
| |||||||||||
Total Time Deposits |
| 2,073 | ||||||||||
|
| |||||||||||
Total Investments — 98.3% |
| $ | 82,471 | |||||||||
|
| |||||||||||
A list of the open futures contracts held by the Fund at May 31, 2015, is as follows:
| Type of Contract | Number of Contracts Long | Expiration Date | Unrealized Appreciation (Depreciation) ($ Thousands) | |||||||||
Euro-Stoxx | 9 | Jun-2015 | $ | (1 | ) | |||||||
FTSE 100 Index | 3 | Jun-2015 | (1 | ) | ||||||||
SPI 200 Index | 1 | Jun-2015 | — | |||||||||
Topix Index | 2 | Jun-2015 | 7 | |||||||||
|
| |||||||||||
| $ | 5 | |||||||||||
|
| |||||||||||
For the year ended May 31, 2015, the total amount of all open futures contracts, as presented in the table above, are representative of the volume of activity for this derivative type during the year.
Percentages are based on a Net Assets of $83,879 ($ Thousands).
| * | Non-income producing security. |
| ** | The rate reported is the 7-day effective yield as of May 31, 2015. |
| † | Investment in Affiliated Security (see Note 6). |
| (1) | In U.S. dollars unless otherwise indicated. |
| (A) | Security, or portion thereof, has been pledged as collateral on open futures contracts. |
ADR — American Depositary Receipt
AUD — Australian Dollar
CAD — Canadian Dollar
CHF — Swiss Franc
Cl — Class
DKK — Danish Krone
EUR — Euro
| 66 | SEI Institutional Investments Trust / Annual Report / May 31, 2015 |
FTSE — Financial Times and Stock Exchange
GBP — British Pound Sterling
HKD — Hong Kong Dollar
JPY — Japanese Yen
NOK — Norwegian Krone
NZD — New Zealand Dollar
S&P — Standard & Poor’s
SEK — Swedish Krone
SGD — Singapore Dollar
SPI — Share Price Index
ZAR — South African Rand
The Summary Schedule of Investments does not reflect the complete portfolio holdings. It includes the Fund’s 50 largest holdings and each investment of any issuer that exceeds 1% of the Fund’s net assets. “Other Securities” represent all issuers not required to be disclosed under the rules adopted by the U.S. Securities and Exchange Commission (“SEC”). In certain instances, securities for which footnotes listed above may otherwise apply are included in the Other Securities caption. The complete schedule of portfolio holdings is available (i) without charge, upon request, by calling (800) 342-5734; and (ii) on the SEC’s website at http://www.sec.gov.
The following is a list of the level of inputs used as of May 31, 2015, in valuing the Fund’s investments and other financial instruments carried at value ($ Thousands):
| Investments in Securities | Level 1 | Level 2 | Level 3(1) | Total | ||||||||||||
Common Stock | $ | 78,968 | $ | 1 | $ | 91 | $ | 79,060 | ||||||||
Preferred Stock | 1,025 | — | — | 1,025 | ||||||||||||
Rights | 1 | — | — | 1 | ||||||||||||
Cash Equivalent | 296 | — | — | 296 | ||||||||||||
U.S. Treasury Obligation | — | 16 | — | 16 | ||||||||||||
Time Deposits | — | 2,073 | — | 2,073 | ||||||||||||
|
|
|
|
|
|
|
| |||||||||
Total Investments in Securities | $ | 80,290 | $ | 2,090 | $ | 91 | $ | 82,471 | ||||||||
|
|
|
|
|
|
|
| |||||||||
| Other Financial Instruments | Level 1 | Level 2 | Level 3 | Total | ||||||||||||
Futures Contracts* | ||||||||||||||||
Unrealized Appreciation | $ | 7 | $ | — | $ | — | $ | 7 | ||||||||
Unrealized Depreciation | (2 | ) | — | — | (2 | ) | ||||||||||
|
|
|
|
|
|
|
| |||||||||
Total Other Financial Instruments | $ | 5 | $ | — | $ | — | $ | 5 | ||||||||
|
|
|
|
|
|
|
| |||||||||
| (1) | A reconciliation of Level 3 investments is presented when the Fund has a significant amount of Level 3 investments at the beginning and/or end of the period in relation to net assets. |
| * | Futures contracts are valued at the unrealized appreciation (depreciation) on the instrument. |
For the year ended May 31, 2015, there were transfers between Level 1 and Level 2 assets and liabilities. The primary reason for changes in the classifications between Levels 1 and 2 occurs when foreign equity securities are fair valued using other observable market-based inputs in place of the closing exchange price due to events occurring after the close of the exchange or market on which the investment is principally traded.
For the year ended May 31, 2015, there were no transfers between Level 2 and Level 3 assets and liabilities.
For more information on valuation inputs, see Note 2 – Significant Accounting Policies in Notes to Financial Statements.
Amounts designated as “—” are $0 or have been rounded to $0.
The accompanying notes are an integral part of the financial statements.
| SEI Institutional Investments Trust / Annual Report / May 31, 2015 | 67 |
SUMMARY SCHEDULE OF INVESTMENTS
Emerging Markets Equity Fund
May 31, 2015
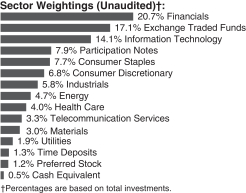
| Description | Percentage of Net Assets (%) | Shares | Market Value ($ Thousands) | |||||||||
COMMON STOCK — 71.6% |
| |||||||||||
Argentina — 1.5% | ||||||||||||
MercadoLibre | 0.7 | % | 26,465 | $ | 3,841 | |||||||
YPF ADR | 0.4 | 80,344 | 2,231 | |||||||||
Other Securities | 0.4 | 2,986 | ||||||||||
|
| |||||||||||
| 9,058 | ||||||||||||
|
| |||||||||||
Botswana — 0.0% | ||||||||||||
Other Securities | 0.0 | 217 | ||||||||||
|
| |||||||||||
Brazil — 3.9% | ||||||||||||
Ambev ADR | 0.4 | 435,090 | 2,502 | |||||||||
JBS | 0.7 | 843,900 | 4,116 | |||||||||
TOTVS | 0.4 | 186,400 | 2,239 | |||||||||
Other Securities | 2.4 | 14,033 | ||||||||||
|
| |||||||||||
| 22,890 | ||||||||||||
|
| |||||||||||
Canada — 0.3% | ||||||||||||
Other Securities | 0.3 | 1,942 | ||||||||||
|
| |||||||||||
Chile — 0.7% | ||||||||||||
Other Securities | 0.7 | 3,929 | ||||||||||
|
| |||||||||||
China — 10.2% | ||||||||||||
Bank of China | 1.3 | 11,232,000 | 7,462 | |||||||||
China Communications Construction | 0.4 | 1,413,000 | 2,443 | |||||||||
China Construction Bank | 0.8 | 4,543,000 | 4,566 | |||||||||
Ctrip.com International ADR* | 0.5 | 39,300 | 3,139 | |||||||||
Industrial & Commercial Bank of China | 0.6 | 4,014,000 | 3,495 | |||||||||
Qunar Cayman Islands ADR* | 0.4 | 58,435 | 2,576 | |||||||||
Tencent Holdings | 1.0 | 303,200 | 6,090 | |||||||||
Other Securities | 5.2 | 30,503 | ||||||||||
|
| |||||||||||
| 60,274 | ||||||||||||
|
| |||||||||||
| Description | Percentage of Net Assets (%) | Shares | Market Value ($ Thousands) | |||||||||
Colombia — 1.1% | ||||||||||||
Other Securities | 1.1 | % | $ | 6,722 | ||||||||
|
| |||||||||||
Czech Republic — 0.4% | ||||||||||||
Other Securities | 0.4 | 2,137 | ||||||||||
|
| |||||||||||
Egypt — 0.7% | ||||||||||||
Commercial International Bank Egypt GDR | 0.5 | 395,662 | 2,706 | |||||||||
Other Securities | 0.2 | 1,540 | ||||||||||
|
| |||||||||||
| 4,246 | ||||||||||||
|
| |||||||||||
Georgia — 0.1% | ||||||||||||
Other Securities | 0.1 | 406 | ||||||||||
|
| |||||||||||
Greece — 0.1% | ||||||||||||
Other Securities | 0.1 | 670 | ||||||||||
|
| |||||||||||
Hong Kong — 4.3% | ||||||||||||
China Mobile ADR | 0.6 | 57,900 | 3,807 | |||||||||
Other Securities | 3.7 | 21,529 | ||||||||||
|
| |||||||||||
| 25,336 | ||||||||||||
|
| |||||||||||
Hungary — 0.1% | ||||||||||||
Other Securities | 0.1 | 368 | ||||||||||
|
| |||||||||||
India — 2.1% | ||||||||||||
Dr Reddy’s Laboratories ADR | 1.0 | 108,860 | 6,034 | |||||||||
ICICI Bank ADR | 0.4 | 236,900 | 2,502 | |||||||||
Tata Motors ADR | 0.5 | 80,200 | 3,072 | |||||||||
Other Securities | 0.2 | 959 | ||||||||||
|
| |||||||||||
| 12,567 | ||||||||||||
|
| |||||||||||
Indonesia — 3.2% | ||||||||||||
Bank Negara Indonesia Persero | 0.4 | 4,402,800 | 2,289 | |||||||||
Other Securities | 2.8 | 16,969 | ||||||||||
|
| |||||||||||
| 19,258 | ||||||||||||
|
| |||||||||||
Ivory Coast — 0.0% | ||||||||||||
Other Securities | 0.0 | 159 | ||||||||||
|
| |||||||||||
Jersey — 0.1% | ||||||||||||
Other Securities | 0.1 | 302 | ||||||||||
|
| |||||||||||
Kazakhstan — 0.2% | ||||||||||||
Other Securities | 0.2 | 1,469 | ||||||||||
|
| |||||||||||
Kenya — 0.2% | ||||||||||||
Other Securities | 0.2 | 1,252 | ||||||||||
|
| |||||||||||
| 68 | SEI Institutional Investments Trust / Annual Report / May 31, 2015 |
| Description | Percentage of Net Assets (%) | Shares | Market Value ($ Thousands) | |||||||||
Lithuania — 0.1% | ||||||||||||
Other Securities | 0.1 | % | $ | 334 | ||||||||
|
| |||||||||||
Malaysia — 1.0% | ||||||||||||
Other Securities | 1.0 | 5,791 | ||||||||||
|
| |||||||||||
Mauritius — 0.0% | ||||||||||||
Other Securities | 0.0 | 271 | ||||||||||
|
| |||||||||||
Mexico — 2.7% | ||||||||||||
Grupo Televisa ADR | 0.6 | 98,565 | 3,731 | |||||||||
Other Securities | 2.1 | 12,080 | ||||||||||
|
| |||||||||||
| 15,811 | ||||||||||||
|
| |||||||||||
Morocco — 0.2% | ||||||||||||
Other Securities | 0.2 | 987 | ||||||||||
|
| |||||||||||
Nigeria — 0.6% | ||||||||||||
Other Securities | 0.6 | 3,772 | ||||||||||
|
| |||||||||||
Oman — 0.1% | ||||||||||||
Other Securities | 0.1 | 852 | ||||||||||
|
| |||||||||||
Pakistan — 0.6% | ||||||||||||
Habib Bank | 0.6 | 1,800,000 | 3,589 | |||||||||
|
| |||||||||||
Panama — 0.5% |
| |||||||||||
Other Securities | 0.5 | 3,042 | ||||||||||
|
| |||||||||||
Peru — 0.7% | ||||||||||||
Other Securities | 0.7 | 4,158 | ||||||||||
|
| |||||||||||
Philippines — 4.0% | ||||||||||||
BDO Unibank | 0.6 | 1,443,385 | 3,496 | |||||||||
Megaworld | 0.4 | 21,972,084 | 2,341 | |||||||||
Robinsons Land | 0.3 | 2,621,700 | 1,735 | |||||||||
Universal Robina | 0.8 | 1,136,240 | 4,863 | |||||||||
Other Securities | 1.9 | 11,186 | ||||||||||
|
| |||||||||||
| 23,621 | ||||||||||||
|
| |||||||||||
Poland — 1.6% | ||||||||||||
Eurocash | 0.5 | 310,925 | 3,084 | |||||||||
Powszechny Zaklad Ubezpieczen | 0.5 | 22,425 | 2,675 | |||||||||
Other Securities | 0.6 | 4,031 | ||||||||||
|
| |||||||||||
| 9,790 | ||||||||||||
|
| |||||||||||
Qatar — 0.5% | ||||||||||||
Other Securities | 0.5 | 2,865 | ||||||||||
|
| |||||||||||
Romania — 1.1% | ||||||||||||
Banca Transilvania* | 0.6 | 5,645,850 | 3,372 | |||||||||
Other Securities | 0.5 | 3,035 | ||||||||||
|
| |||||||||||
| 6,407 | ||||||||||||
|
| |||||||||||
| Description | Percentage of Net Assets (%) | Shares | Market Value ($ Thousands) | |||||||||
Russia — 2.0% | ||||||||||||
Other Securities | 2.0 | % | $ | 11,698 | ||||||||
|
| |||||||||||
South Africa — 2.7% | ||||||||||||
Other Securities | 2.7 | 15,909 | ||||||||||
|
| |||||||||||
South Korea — 7.9% | ||||||||||||
Korea Electric Power ADR | 0.4 | 125,100 | 2,586 | |||||||||
KT&G | 0.6 | 37,256 | 3,241 | |||||||||
Medy-Tox | 0.7 | 9,120 | 3,833 | |||||||||
Samsung Electronics | 1.1 | 5,525 | 6,516 | |||||||||
SK Hynix | 0.5 | 65,784 | 3,033 | |||||||||
SK Telecom ADR | 0.4 | 96,000 | 2,346 | |||||||||
Other Securities | 4.2 | 25,413 | ||||||||||
|
| |||||||||||
| 46,968 | ||||||||||||
|
| |||||||||||
Spain — 0.0% | ||||||||||||
Other Securities | 0.0 | 178 | ||||||||||
|
| |||||||||||
Taiwan — 9.0% | ||||||||||||
Fubon Financial Holding | 0.4 | 1,085,000 | 2,234 | |||||||||
Hon Hai Precision Industry | 0.6 | 1,039,000 | 3,355 | |||||||||
Pegatron | 0.7 | 1,392,000 | 4,154 | |||||||||
Taiwan Semiconductor Manufacturing ADR | 1.3 | 308,265 | 7,485 | |||||||||
Taiwan Semiconductor Manufacturing | 0.3 | 360,000 | 1,712 | |||||||||
Other Securities | 5.7 | 34,203 | ||||||||||
|
| |||||||||||
| 53,143 | ||||||||||||
|
| |||||||||||
Thailand — 2.5% | ||||||||||||
PTT | 0.4 | 229,700 | 2,369 | |||||||||
Other Securities | 2.1 | 12,186 | ||||||||||
|
| |||||||||||
| 14,555 | ||||||||||||
|
| |||||||||||
Turkey — 1.3% | ||||||||||||
Coca-Cola Icecek | 0.4 | 134,565 | 2,280 | |||||||||
Other Securities | 0.9 | 5,398 | ||||||||||
|
| |||||||||||
| 7,678 | ||||||||||||
|
| |||||||||||
Ukraine — 0.0% | ||||||||||||
Other Securities | 0.0 | 230 | ||||||||||
|
| |||||||||||
United Arab Emirates — 2.2% |
| |||||||||||
Al Noor Hospitals Group | 0.5 | 217,016 | 3,159 | |||||||||
DAMAC Properties Dubai* | 0.5 | 3,339,537 | 2,700 | |||||||||
Emaar Properties | 0.4 | 1,111,417 | 2,339 | |||||||||
Other Securities | 0.8 | 4,763 | ||||||||||
|
| |||||||||||
| 12,961 | ||||||||||||
|
| |||||||||||
United Kingdom — 0.2% |
| |||||||||||
Other Securities | 0.2 | 558 | ||||||||||
|
| |||||||||||
| SEI Institutional Investments Trust / Annual Report / May 31, 2015 | 69 |
SUMMARY SCHEDULE OF INVESTMENTS
Emerging Markets Equity Fund (Continued)
May 31, 2015
| Description | Percentage of Net Assets (%) | Shares/Number of P-Notes | Market Value ($ Thousands) | |||||||||
United States — 0.9% | ||||||||||||
PriceSmart | 0.6 | % | 42,608 | $ | 3,474 | |||||||
Other Securities | 0.3 | 2,054 | ||||||||||
|
| |||||||||||
| 5,528 | ||||||||||||
|
| |||||||||||
Total Common Stock |
| 423,898 | ||||||||||
|
| |||||||||||
EXCHANGE TRADED FUNDS — 17.0% |
| |||||||||||
United States — 17.0% |
| |||||||||||
iPath MSCI India Index ETN | 0.4 | 36 | 2,522 | |||||||||
iShares MSCI Emerging Markets Index Fund | 15.1 | 2,176 | 89,493 | |||||||||
iShares MSCI India ETF | 0.4 | 83 | 2,537 | |||||||||
WisdomTree India Earnings Fund | 1.1 | 279 | 6,178 | |||||||||
|
| |||||||||||
Total Exchange Traded Funds |
| 100,730 | ||||||||||
|
| |||||||||||
PARTICIPATION NOTES* — 7.9% |
| |||||||||||
Bupa Arabia for Cooperative Insurance, Expires 04/05/17 | 0.5 | 47 | 2,966 | |||||||||
Glenmark Pharmaceuticals, Expires 06/28/18 | 0.1 | 47 | 641 | |||||||||
LIC Housing Finance, Expires 03/08/19 | 0.1 | 84 | 549 | |||||||||
Mouwasat Medical Services, Expires 09/20/17 | 0.2 | 29 | 1,136 | |||||||||
National Bank of Kuwait, Expires 03/24/16 | 0.7 | 1,413 | 3,823 | |||||||||
Samba Financial Group, Expires 03/02/17 | 0.3 | 211 | 1,623 | |||||||||
Saudi Pharmaceuticals, Expires 12/05/17 | 0.3 | 149 | 1,909 | |||||||||
SKS Microfinance, Expires 11/05/18 | 0.1 | 89 | 647 | |||||||||
Other Securities | 5.6 | 33,033 | ||||||||||
|
| |||||||||||
Total Participation Notes |
| 46,327 | ||||||||||
|
| |||||||||||
PREFERRED STOCK — 1.2% |
| |||||||||||
Brazil — 1.0% |
| |||||||||||
Other Securities | 1.0 | 5,649 | ||||||||||
|
| |||||||||||
Colombia — 0.1% | ||||||||||||
Other Securities | 0.1 | 698 | ||||||||||
|
| |||||||||||
| Description | Percentage of Net Assets (%) | Shares/Face Amount (Thousands) (1) | Market Value ($ Thousands) | |||||||||
South Korea — 0.1% | ||||||||||||
Other Securities | 0.1 | % | $ | 631 | ||||||||
|
| |||||||||||
Total Preferred Stock |
| 6,978 | ||||||||||
|
| |||||||||||
CASH EQUIVALENT — 0.5% |
| |||||||||||
SEI Daily Income Trust, Prime | 0.5 | 2,799,884 | 2,800 | |||||||||
|
| |||||||||||
Total Cash Equivalent |
| 2,800 | ||||||||||
|
| |||||||||||
TIME DEPOSITS — 1.2% |
| |||||||||||
Brown Brothers Harriman | ||||||||||||
5.800% 06/01/2015 | ZAR | 7 | 1 | |||||||||
0.100% 06/01/2015 | CAD | 3 | 2 | |||||||||
0.079% 06/01/2015 | GBP | 43 | 65 | |||||||||
0.030% 06/01/2015 | 7,228 | 7,228 | ||||||||||
0.005% 06/01/2015 | HKD | 269 | 35 | |||||||||
(0.211)% 06/01/2015 | EUR | 20 | 22 | |||||||||
|
| |||||||||||
Total Time Deposits |
| 7,353 | ||||||||||
|
| |||||||||||
Total Investments — 99.4% |
| $ | 588,086 | |||||||||
|
| |||||||||||
Percentages are based on a Net Assets of $591,963 ($ Thousands).
| * | Non-income producing security. |
| ** | The rate reported is the 7-day effective yield as of May 31, 2015. |
| † | Investment in Affiliated Security (see Note 6). |
| (1) | In U.S. dollars unless otherwise indicated. |
ADR — American Depositary Receipt
CAD — Canadian Dollar
Cl — Class
ETN — Exchange Traded Note
GBP — British Pound Sterling
GDR — Global Depositary Receipt
EUR — Euro
HKD — Hong Kong Dollar
ZAR — South African Rand
The Summary Schedule of Investments does not reflect the complete portfolio holdings. It includes the Fund’s 50 largest holdings and each investment of any issuer that exceeds 1% of the Fund’s net assets. “Other Securities” represent all issuers not required to be disclosed under the rules adopted by the U.S. Securities and Exchange Commission (“SEC”). In certain instances, securities for which footnotes listed above may otherwise apply are included in the Other Securities caption. The complete schedule of portfolio holdings is available (i) without charge, upon request, by calling (800) 342-5734; and (ii) on the SEC’s website at http://www.sec.gov.
| 70 | SEI Institutional Investments Trust / Annual Report / May 31, 2015 |
The following is a list of the level of inputs used as of May 31, 2015, in valuing the Fund’s investments carried at value ($ Thousands):
| Investments in Securities | Level 1 | Level 2 | Level 3 | Total | ||||||||||||
Common Stock | $ | 422,627 | $ | 1,271 | $ | — | $ | 423,898 | ||||||||
Exchange Traded Funds | 100,730 | — | — | 100,730 | ||||||||||||
Participation Notes | — | 46,327 | — | 46,327 | ||||||||||||
Preferred Stock | 6,978 | — | — | 6,978 | ||||||||||||
Cash Equivalent | 2,800 | — | — | 2,800 | ||||||||||||
Time Deposits | — | 7,353 | — | 7,353 | ||||||||||||
|
|
|
|
|
|
|
| |||||||||
Total Investments in Securities | $ | 533,135 | $ | 54,951 | $ | — | $ | 588,086 | ||||||||
|
|
|
|
|
|
|
| |||||||||
For the period ended May 31, 2015, there were no transfers between Level 1 and Level 2 assets and liabilities.
For the period ended May 31, 2015, there were no transfers between Level 2 and Level 3 assets and liabilities.
For more information on valuation inputs, see Note 2 — Significant Accounting Policies in Notes to Financial Statements.
Amounts designated as “—” are $0 or have been rounded to $0.
The accompanying notes are an integral part of the financial statements.
| SEI Institutional Investments Trust / Annual Report / May 31, 2015 | 71 |
SCHEDULE OF INVESTMENTS
Opportunistic Income Fund
May 31, 2015
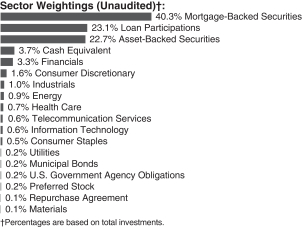
| Description | Face Amount ($ Thousands) | Market Value ($ Thousands) | ||||||
MORTGAGE-BACKED SECURITIES — 39.1% |
| |||||||
Agency Mortgage-Backed Obligations — 9.3% |
| |||||||
FFCB | ||||||||
0.450%, 09/16/2016 | $ | 1,500 | $ | 1,499 | ||||
FHLMC | ||||||||
0.500%, 05/13/2016 | 200 | 200 | ||||||
FHLMC ARM (A) | ||||||||
3.026%, 03/01/2036 | 3,199 | 3,489 | ||||||
2.387%, 06/01/2035 | 2,808 | 2,997 | ||||||
1.937%, 10/01/2035 | 1,498 | 1,577 | ||||||
FHLMC CMO, Ser 2007-3311, Cl FN | ||||||||
0.486%, 05/15/2037 (A) | 1,107 | 1,107 | ||||||
FHLMC CMO, Ser 2010-3721, Cl FB | ||||||||
0.686%, 09/15/2040 (A) | 3,721 | 3,760 | ||||||
FHLMC CMO, Ser 2011-3891, Cl BF | ||||||||
0.724%, 07/15/2041 (A) | 2,590 | 2,608 | ||||||
FHLMC Multifamily Structured Pass-Through Certificates, Ser K035, Cl A2 | ||||||||
3.458%, 08/25/2023 (A) | 7,000 | 7,511 | ||||||
FHLMC Multifamily Structured Pass-Through Certificates, Ser K703, Cl X1, IO | ||||||||
2.036%, 05/25/2018 (A) | 29,667 | 1,566 | ||||||
FHLMC Multifamily Structured Pass-Through Certificates, Ser K708, Cl X1, IO | ||||||||
1.488%, 01/25/2019 (A) | 86,805 | 4,150 | ||||||
FHLMC Multifamily Structured Pass-Through Certificates, Ser K710, Cl X1, IO | ||||||||
1.776%, 05/25/2019 (A) | 31,480 | 1,883 | ||||||
FHLMC Multifamily Structured Pass-Through Certificates, Ser KF03, Cl A | ||||||||
0.524%, 01/25/2021 (A) | 4,076 | 4,077 | ||||||
| Description | Face Amount ($ Thousands) | Market Value ($ Thousands) | ||||||
FHLMC Multifamily Structured Pass-Through Certificates, Ser KF06, Cl A | ||||||||
0.506%, 11/25/2021 (A) | $ | 7,996 | $ | 8,001 | ||||
FHLMC Multifamily Structured Pass-Through Certificates, Ser KLSF, Cl A | ||||||||
0.506%, 11/25/2021 (A) | 10,000 | 10,013 | ||||||
FHLMC REMIC, Ser 2007-3335, Cl BF | ||||||||
0.336%, 07/15/2019 (A) | 491 | 491 | ||||||
FHLMC REMIC, Ser 2010-83, Cl BA | ||||||||
5.000%, 08/25/2040 | 948 | 1,019 | ||||||
FNMA | ||||||||
6.000%, 09/01/2039 to 04/01/2040 | 1,605 | 1,837 | ||||||
4.500%, 10/01/2024 | 2,627 | 2,822 | ||||||
3.000%, 05/01/2022 | 4,973 | 5,244 | ||||||
FNMA ARM (A) | ||||||||
2.502%, 04/01/2034 | 1,722 | 1,843 | ||||||
2.425%, 10/01/2033 to 05/01/2034 | 928 | 980 | ||||||
2.371%, 10/01/2033 | 643 | 686 | ||||||
2.364%, 08/01/2034 | 1,733 | 1,848 | ||||||
2.354%, 07/01/2036 | 2,623 | 2,802 | ||||||
2.351%, 05/01/2035 | 1,043 | 1,113 | ||||||
2.339%, 10/01/2024 | 349 | 373 | ||||||
2.310%, 05/01/2035 | 1,578 | 1,677 | ||||||
2.287%, 10/01/2033 | 977 | 1,049 | ||||||
2.281%, 04/01/2033 | 497 | 529 | ||||||
2.277%, 09/01/2034 | 898 | 956 | ||||||
2.270%, 10/01/2033 | 564 | 601 | ||||||
2.198%, 06/01/2035 | 1,017 | 1,080 | ||||||
2.158%, 01/01/2034 | 1,087 | 1,164 | ||||||
2.111%, 05/01/2037 | 3,245 | 3,446 | ||||||
2.060%, 09/01/2033 | 1,467 | 1,534 | ||||||
2.022%, 06/01/2035 | 697 | 735 | ||||||
1.995%, 10/01/2035 | 1,907 | 2,033 | ||||||
1.965%, 07/01/2034 | 839 | 892 | ||||||
1.959%, 07/01/2034 | 1,831 | 1,927 | ||||||
1.833%, 02/01/2035 | 2,433 | 2,556 | ||||||
1.824%, 03/01/2035 | 2,604 | 2,737 | ||||||
FNMA CMO, Ser 2005-92, Cl UF | ||||||||
0.535%, 10/25/2025 (A) | 2,081 | 2,089 | ||||||
FNMA CMO, Ser 2010-87, Cl PF | ||||||||
0.566%, 06/25/2040 (A) | 3,068 | 3,084 | ||||||
FNMA CMO, Ser 2011-63, Cl FG | ||||||||
0.635%, 07/25/2041 (A) | 2,369 | 2,385 | ||||||
FNMA CMO, Ser 2011-88, Cl AB | ||||||||
2.500%, 09/25/2026 | 2,657 | 2,711 | ||||||
FNMA CMO, Ser 2012-112, Cl BI, IO | ||||||||
3.000%, 09/25/2031 | 14,234 | 1,825 | ||||||
| 72 | SEI Institutional Investments Trust / Annual Report / May 31, 2015 |
| Description | Face Amount ($ Thousands) | Market Value ($ Thousands) | ||||||
FNMA CMO, Ser 2013-96, Cl FW | ||||||||
0.579%, 09/25/2043 (A) | $ | 2,583 | $ | 2,597 | ||||
FNMA REMIC, Ser 2011-406, Cl 6, IO | ||||||||
4.000%, 01/25/2041 (A) | 1,295 | 251 | ||||||
FNMA, Ser 2013-M3, Cl FA | ||||||||
0.398%, 06/25/2018 (A) | 8,858 | 8,858 | ||||||
FNMA, Ser 2014-M8, Cl FA | ||||||||
0.442%, 05/25/2018 (A) | 5,790 | 5,798 | ||||||
FNMA TBA | ||||||||
3.500%, 06/15/2026 | 1,150 | 1,220 | ||||||
3.000%, 06/25/2027 | 2,875 | 3,004 | ||||||
GNMA ARM (A) | ||||||||
1.841%, 12/20/2060 | 3,272 | 3,422 | ||||||
1.630%, 09/20/2060 to 11/20/2060 | 3,714 | 3,796 | ||||||
1.366%, 11/20/2060 | 3,438 | 3,499 | ||||||
1.267%, 12/20/2060 | 3,655 | 3,734 | ||||||
GNMA CMO, Ser 2002-66, Cl FC | ||||||||
0.583%, 07/16/2031 (A) | 1,379 | 1,385 | ||||||
GNMA CMO, Ser 2011-69, Cl CI, IO | ||||||||
5.000%, 03/20/2036 | 259 | 4 | ||||||
GNMA CMO, Ser 2012-70, Cl IO, IO | ||||||||
0.788%, 08/16/2052 (A) | 14,350 | 735 | ||||||
GNMA CMO, Ser 2012-95, Cl IO, IO | ||||||||
1.047%, 02/16/2053 (A) | 3,405 | 228 | ||||||
GNMA, Ser 2011-152, Cl IO, IO | ||||||||
1.158%, 08/16/2051 (A) | 14,252 | 636 | ||||||
GNMA, Ser 2012-89, Cl IO, IO | ||||||||
1.180%, 12/16/2053 (A) | 10,149 | 563 | ||||||
Mortgage-Linked Amortizing Notes CMO, Ser 2012-1, Cl A10 | ||||||||
2.060%, 01/15/2022 | 1,857 | 1,895 | ||||||
NCUA Guaranteed Notes CMO, | ||||||||
0.531%, 12/07/2020 (A) | 5,948 | 5,954 | ||||||
NCUA Guaranteed Notes CMO, | ||||||||
0.631%, 10/07/2020 (A) | 7,630 | 7,676 | ||||||
NCUA Guaranteed Notes CMO, | ||||||||
0.648%, 11/05/2020 (A) | 7,533 | 7,579 | ||||||
NCUA Guaranteed Notes CMO, | ||||||||
0.741%, 12/08/2020 (A) | 8,505 | 8,582 | ||||||
NCUA Guaranteed Notes CMO, | ||||||||
0.741%, 12/08/2020 (A) | 494 | 498 | ||||||
NCUA Guaranteed Notes CMO, | ||||||||
0.631%, 01/08/2020 (A) | 4,985 | 5,012 | ||||||
| Description | Face Amount ($ Thousands) | Market Value ($ Thousands) | ||||||
NCUA Guaranteed Notes CMO, | ||||||||
0.578%, 02/06/2020 (A) | $ | 5,851 | $ | 5,876 | ||||
NCUA Guaranteed Notes CMO, | ||||||||
0.580%, 03/11/2020 (A) | 6,142 | 6,161 | ||||||
NCUA Guaranteed Notes CMO, | ||||||||
0.561%, 03/06/2020 (A) | 883 | 885 | ||||||
NCUA Guaranteed Notes CMO, | ||||||||
0.558%, 05/07/2020 (A) | 502 | 502 | ||||||
|
| |||||||
| 200,856 | ||||||||
|
| |||||||
Non-Agency Mortgage-Backed Obligations — 29.8% |
| |||||||
A10 Securitization LLC, Ser 2013-2, Cl A | ||||||||
2.620%, 11/15/2027 (B) | 3,236 | 3,256 | ||||||
Adjustable Rate Mortgage Trust, Ser 2005-2, Cl 1A2 | ||||||||
2.514%, 06/25/2035 (A) (B) | 687 | 635 | ||||||
Adjustable Rate Mortgage Trust, Ser 2005-4, Cl 7A2 | ||||||||
0.645%, 08/25/2035 (A) (B) | 474 | 471 | ||||||
BAMLL Commercial Mortgage Securities Trust, Ser 2014-ICTS, Cl D | ||||||||
2.086%, 06/15/2028 (A) (B) | 2,500 | 2,497 | ||||||
Banc of America Commercial Mortgage, Ser 2006-4, Cl AM | ||||||||
5.675%, 07/10/2046 | 3,165 | 3,318 | ||||||
Banc of America Commercial Mortgage, Ser 2006-6, Cl A4 | ||||||||
5.356%, 10/10/2045 | 3,470 | 3,560 | ||||||
Banc of America Commercial Mortgage, Ser 2007-3, Cl AJ | ||||||||
5.576%, 06/10/2049 (A) | 4,030 | 4,207 | ||||||
Banc of America Funding Trust, Ser 2006-I, Cl 1A1 | ||||||||
2.314%, 12/20/2036 (A) (B) | 8,592 | 8,640 | ||||||
Banc of America Funding, Ser 2004-C, Cl 2A2 | ||||||||
2.860%, 12/20/2034 (A) (B) | 655 | 641 | ||||||
Banc of America Funding, Ser 2005-F, Cl 4A1 | ||||||||
2.662%, 09/20/2035 (A) (B) | 223 | 192 | ||||||
Banc of America Funding, Ser 2006-D, Cl 3A1 | ||||||||
2.820%, 05/20/2036 (A) (B) | 151 | 134 | ||||||
Banc of America Funding, Ser 2010-R11A, Cl 4A6 | ||||||||
2.073%, 11/26/2036 (A) (B) | 534 | 533 | ||||||
| SEI Institutional Investments Trust / Annual Report / May 31, 2015 | 73 |
SCHEDULE OF INVESTMENTS
Opportunistic Income Fund (Continued)
May 31, 2015
| Description | Face Amount ($ Thousands) | Market Value ($ Thousands) | ||||||
Banc of America Funding, Ser 2010-R4, Cl 6A1 | ||||||||
0.318%, 01/26/2037 (A) (B) | $ | 589 | $ | 584 | ||||
Banc of America Merrill Lynch Commercial Mortgage, Ser 2, Cl H | ||||||||
5.165%, 07/10/2043 (A) (B) | 1,238 | 1,237 | ||||||
Banc of America Merrill Lynch Commercial Mortgage, Ser 2006-5, Cl A2 | ||||||||
5.317%, 09/10/2047 | 364 | 364 | ||||||
Banc of America Mortgage Securities, Ser 2003-E, Cl 2A2 | ||||||||
2.814%, 06/25/2033 (A) (B) | 5,456 | 5,489 | ||||||
Banc of America Mortgage Securities, Ser 2005-A, Cl 2A1 | ||||||||
2.669%, 02/25/2035 (A) (B) | 81 | 79 | ||||||
Banc of America Mortgage Trust, Ser 2003-F, Cl 2A3 | ||||||||
2.625%, 07/25/2033 (A) (B) | 3,187 | 3,197 | ||||||
Banc of America Mortgage Trust, Ser 2003-I, Cl 2A6 | ||||||||
2.775%, 10/25/2033 (A) (B) | 6,353 | 6,380 | ||||||
Banc of America Mortgage Trust, Ser 2003-K, Cl 2A1 | ||||||||
2.713%, 12/25/2033 (A) (B) | 3,447 | 3,403 | ||||||
Banc of America Mortgage Trust, Ser 2004-A, Cl 2A2 | ||||||||
2.666%, 02/25/2034 (A) (B) | 2,396 | 2,382 | ||||||
Banc of America Mortgage Trust, Ser 2004-C, Cl 2A1 | ||||||||
2.695%, 04/25/2034 (A) (B) | 1,688 | 1,682 | ||||||
Banc of America Mortgage Trust, | ||||||||
2.692%, 01/25/2035 (A) (B) | 1,333 | 1,319 | ||||||
Banc of America Re-Remic Trust, | ||||||||
2.786%, 09/15/2026 (A) (B) | 1,500 | 1,496 | ||||||
Bayview Commercial Asset Trust, | ||||||||
1.055%, 12/25/2033 (A) (B) | 2,505 | 2,413 | ||||||
Bayview Commercial Asset Trust, | ||||||||
0.545%, 04/25/2034 (A) (B) | 5,183 | 4,941 | ||||||
Bayview Commercial Asset Trust, | ||||||||
0.615%, 08/25/2034 (A) (B) | 3,000 | 2,844 | ||||||
Bayview Commercial Asset Trust, | ||||||||
0.535%, 04/25/2035 (A) (B) | 3,546 | 3,252 | ||||||
BCAP LLC Trust, | ||||||||
2.848%, 01/21/2038 (A) (B) | 738 | 741 | ||||||
| Description | Face Amount ($ Thousands) | Market Value ($ Thousands) | ||||||
Bear Stearns Alt-A Trust, | ||||||||
2.369%, 12/25/2033 (A) (B) | $ | 3,401 | $ | 3,449 | ||||
Bear Stearns Alt-A Trust, | ||||||||
2.508%, 08/25/2034 (A) (B) | 4,789 | 4,844 | ||||||
Bear Stearns ARM Trust, | ||||||||
2.639%, 01/25/2034 (A) (B) | 6,029 | 6,019 | ||||||
Bear Stearns ARM Trust, | ||||||||
2.855%, 04/25/2034 (A) (B) | 3,470 | 3,441 | ||||||
Bear Stearns ARM Trust, | ||||||||
2.273%, 04/25/2034 (A) (B) | 1,208 | 1,193 | ||||||
Bear Stearns ARM Trust, | ||||||||
2.991%, 07/25/2034 (A) (B) | 4,263 | 4,265 | ||||||
Bear Stearns ARM Trust, | ||||||||
2.781%, 11/25/2034 (A) (B) | 1,851 | 1,844 | ||||||
Bear Stearns ARM Trust, | ||||||||
3.032%, 11/25/2034 (A) (B) | 1,422 | 1,432 | ||||||
Bear Stearns ARM Trust, | ||||||||
2.680%, 03/25/2035 (A) (B) | 4,011 | 4,046 | ||||||
Bear Stearns ARM Trust, | ||||||||
2.515%, 03/25/2035 (A) (B) | 3,329 | 3,334 | ||||||
Bear Stearns ARM Trust, | ||||||||
2.260%, 08/25/2035 (A) (B) | 7,988 | 8,022 | ||||||
Bear Stearns Commercial Mortgage Securities, Ser 2005-PWR9, Cl A4A | ||||||||
4.871%, 09/11/2042 | 266 | 266 | ||||||
Bear Stearns Commercial Mortgage Securities, Ser 2006-PW11, Cl A4 | ||||||||
5.430%, 03/11/2039 (A) | 600 | 611 | ||||||
Bear Stearns Commercial Mortgage Securities, Ser 2006-PW13, Cl A4 | ||||||||
5.540%, 09/11/2041 | 451 | 468 | ||||||
Bear Stearns Commercial Mortgage Securities, Ser 2007-PW10, Cl A4 | ||||||||
5.405%, 12/11/2040 (A) | 476 | 480 | ||||||
Bear Stearns Mortgage Funding Trust, Ser 2006-SL5, Cl 1A | ||||||||
0.481%, 12/25/2036 (A) (B) | 43 | 71 | ||||||
| 74 | SEI Institutional Investments Trust / Annual Report / May 31, 2015 |
| Description | Face Amount ($ Thousands) | Market Value ($ Thousands) | ||||||
BHMS Mortgage Trust, | ||||||||
2.130%, 07/05/2033 (A) (B) | $ | 2,000 | $ | 1,983 | ||||
BOCA Hotel Portfolio Trust, | ||||||||
2.336%, 08/15/2026 (A) (B) | 3,600 | 3,596 | ||||||
Carefree Portfolio Trust, | ||||||||
1.506%, 11/15/2019 (A) (B) | 3,880 | 3,888 | ||||||
Carefree Portfolio Trust, | ||||||||
2.036%, 11/15/2019 (A) (B) | 3,000 | 3,006 | ||||||
CD Mortgage Trust, | ||||||||
5.299%, 01/15/2046 (A) | 606 | 612 | ||||||
CD Mortgage Trust, | ||||||||
5.886%, 11/15/2044 (A) | 829 | 896 | ||||||
CGBAM Commercial Mortgage Trust, Ser 2014-HD, Cl D | ||||||||
2.186%, 02/15/2031 (A) (B) | 2,000 | 1,991 | ||||||
Chase Mortgage Finance, | ||||||||
2.423%, 12/25/2035 (A) (B) | 1,735 | 1,595 | ||||||
Chase Mortgage Finance, | ||||||||
2.532%, 02/25/2037 (A) (B) | 1,657 | 1,633 | ||||||
Chase Mortgage Finance, | ||||||||
2.448%, 02/25/2037 (A) (B) | 1,737 | 1,738 | ||||||
Chase Mortgage Finance, | ||||||||
2.507%, 07/25/2037 (A) (B) | 2,289 | 2,315 | ||||||
CHL Mortgage Pass-Through Trust, Ser 2003-46, Cl 2A1 | ||||||||
2.730%, 01/19/2034 (A) (B) | 3,959 | 3,930 | ||||||
CHL Mortgage Pass-Through Trust, Ser 2004-9, Cl A4 | ||||||||
5.250%, 06/25/2034 (B) | 946 | 950 | ||||||
Citicorp Mortgage Securities, | ||||||||
5.000%, 07/25/2020 (B) | 141 | 147 | ||||||
Citicorp Mortgage Securities, | ||||||||
6.000%, 02/25/2037 (B) | 1,072 | 1,096 | ||||||
Citigroup Commercial Mortgage Trust, Ser 2008-C7, Cl A4 | ||||||||
6.144%, 12/10/2049 (A) | 689 | 748 | ||||||
Citigroup Commercial Mortgage Trust, Ser 2012-GC8, Cl A1 | ||||||||
0.685%, 09/10/2045 | 53 | 53 | ||||||
Citigroup Commercial Mortgage Trust, Ser 2014-388G, Cl D | ||||||||
1.936%, 06/15/2033 (A) (B) | 7,000 | 6,979 | ||||||
| Description | Face Amount ($ Thousands) | Market Value ($ Thousands) | ||||||
Citigroup Commercial Mortgage Trust, Ser 2014-388G, Cl F | ||||||||
3.336%, 06/15/2033 (A) (B) | $ | 500 | $ | 500 | ||||
Citigroup Commercial Mortgage Trust, Ser 2014-GC23, Cl A4 | ||||||||
3.622%, 07/10/2047 | 3,390 | 3,597 | ||||||
Citigroup Deutsche Bank Commercial Mortgage, Ser 2007-CD4, Cl A4 | ||||||||
5.322%, 12/11/2049 | 1,025 | 1,072 | ||||||
Citigroup Mortgage Loan Trust, | ||||||||
2.732%, 04/25/2037 (A) (B) | 1,180 | 1,062 | ||||||
Citigroup Mortgage Loan Trust, | ||||||||
3.233%, 11/25/2038 (A) (B) | 2,781 | 2,803 | ||||||
Citigroup Mortgage Loan Trust, | ||||||||
4.750%, 03/25/2037 (B) | 919 | 918 | ||||||
COMM Mortgage Trust, | ||||||||
3.612%, 06/10/2046 (A) | 3,420 | 3,643 | ||||||
COMM Mortgage Trust, | ||||||||
1.344%, 07/10/2045 | 139 | 139 | ||||||
COMM Mortgage Trust, | ||||||||
0.986%, 03/15/2029 (A) (B) | 4,480 | 4,474 | ||||||
COMM Mortgage Trust, | ||||||||
2.182%, 06/11/2027 (A) (B) | 1,840 | 1,837 | ||||||
COMM Mortgage Trust, | ||||||||
1.836%, 08/13/2027 (A) (B) | 2,000 | 2,014 | ||||||
Commercial Mortgage Pass-Through Certificates, Ser 2006-C8, Cl A4 | ||||||||
5.306%, 12/10/2046 | 2,637 | 2,763 | ||||||
Commercial Mortgage Pass-Through Certificates, Ser 2007-C9, Cl AJFL | ||||||||
0.872%, 12/10/2049 (A) (B) | 6,710 | 6,549 | ||||||
Commercial Mortgage Pass-Through Certificates, Ser 2010-C1, Cl A1 | ||||||||
3.156%, 07/10/2046 (B) | 104 | 105 | ||||||
Commercial Mortgage Pass-Through Certificates, Ser 2012-CR2, Cl A1 | ||||||||
0.824%, 08/15/2045 | 39 | 39 | ||||||
Commercial Mortgage Pass-Through Certificates, Ser 2012-CR4, Cl A1 | ||||||||
0.704%, 10/15/2045 | 45 | 45 | ||||||
Commercial Mortgage Pass-Through Certificates, Ser 2012-CR5, Cl A1 | ||||||||
0.673%, 12/10/2045 | 67 | 67 | ||||||
| SEI Institutional Investments Trust / Annual Report / May 31, 2015 | 75 |
SCHEDULE OF INVESTMENTS
Opportunistic Income Fund (Continued)
May 31, 2015
| Description | Face Amount ($ Thousands) | Market Value ($ Thousands) | ||||||
Commercial Mortgage Pass-Through Certificates, Ser 2013-FL3, Cl MMHP | ||||||||
3.786%, 10/13/2028 (A) (B) | $ | 4,000 | $ | 4,028 | ||||
Commercial Mortgage Pass-Through Certificates, Ser 2014-KYO, Cl C | ||||||||
1.832%, 06/11/2027 (A) (B) | 2,270 | 2,266 | ||||||
Commercial Mortgage Pass-Through Certificates, Ser 2014-TWC, Cl D | ||||||||
2.430%, 02/13/2032 (A) (B) | 3,000 | 2,998 | ||||||
Commercial Mortgage Trust, | ||||||||
5.867%, 12/10/2049 (A) | 3,300 | 3,556 | ||||||
Commercial Mortgage Trust, | ||||||||
1.278%, 08/10/2046 | 171 | 172 | ||||||
Commercial Mortgage Trust, | ||||||||
1.001%, 08/10/2046 (A) | 48,467 | 2,433 | ||||||
Commercial Mortgage Trust, | ||||||||
0.885%, 02/10/2047 (A) | 36,704 | 1,703 | ||||||
Commercial Mortgage Trust, | ||||||||
2.532%, 06/11/2027 (A) (B) | 1,260 | 1,257 | ||||||
Countrywide Alternative Loan Trust, Ser 2003-J1, Cl 3A1 | ||||||||
5.000%, 10/25/2018 (B) | 746 | 747 | ||||||
Countrywide Home Loan Mortgage Pass-Through Trust, | ||||||||
2.144%, 07/25/2034 (A) (B) | 993 | 984 | ||||||
Countrywide Home Loan Mortgage Pass-Through Trust, | ||||||||
4.500%, 06/25/2019 (B) | 584 | 600 | ||||||
Credit Suisse Commercial Mortgage Trust, Ser 2007-C2, Cl AM | ||||||||
5.607%, 01/15/2049 (A) | 1,282 | 1,353 | ||||||
Credit Suisse Commercial Mortgage Trust, Ser 2007-C2, Cl AMFL | ||||||||
0.416%, 01/15/2049 (A) | 7,110 | 6,854 | ||||||
Credit Suisse Commercial Mortgage Trust, Ser 2017-ICE, Cl D | ||||||||
2.336%, 04/15/2027 (A) (B) | 2,180 | 2,172 | ||||||
Credit Suisse First Boston Mortgage Securities, Ser 2004-AR5, Cl 6A1 | ||||||||
2.477%, 06/25/2034 (A) (B) | 9,096 | 9,130 | ||||||
| Description | Face Amount ($ Thousands) | Market Value ($ Thousands) | ||||||
Credit Suisse First Boston Mortgage Securities, Ser 2005-C2, Cl AMFX | ||||||||
4.877%, 04/15/2037 | $ | 3,440 | $ | 3,444 | ||||
Credit Suisse Mortgage Capital Certificates, Ser 2006-C3, Cl AM | ||||||||
5.793%, 06/15/2038 (A) | 4,050 | 4,221 | ||||||
Credit Suisse Mortgage Capital Certificates, Ser 2006-C4, Cl A3 | ||||||||
5.467%, 09/15/2039 | 571 | 594 | ||||||
Credit Suisse Mortgage Capital Certificates, Ser 2006-C4, Cl AM | ||||||||
5.509%, 09/15/2039 | 3,000 | 3,146 | ||||||
Credit Suisse Mortgage Trust, Ser 2014-ICE, Cl XICP, IO | ||||||||
1.686%, 04/15/2027 | 30,718 | 906 | ||||||
Credit Suisse Mortgage Trust, | ||||||||
2.436%, 02/15/2029 (A) (B) | 1,500 | 1,496 | ||||||
CS First Boston Mortgage Securities, Ser 2004-AR8, Cl 6A1 | ||||||||
2.336%, 09/25/2034 (A) (B) | 2,690 | 2,676 | ||||||
DBUBS Mortgage Trust, | ||||||||
3.742%, 11/10/2046 (B) | 266 | 269 | ||||||
DBUBS Mortgage Trust, | ||||||||
1.382%, 07/10/2044 (A) (B) | 39,511 | 1,676 | ||||||
Del Coronado Trust, Ser 2013-HDC, Cl E | ||||||||
2.836%, 03/15/2026 (A) (B) | 3,000 | 3,000 | ||||||
Deutsche Mortgage Securities Mortgage Loan Trust, Ser 2004-4, Cl 2AR1 | ||||||||
0.455%, 06/25/2034 (A) (B) | 4,992 | 4,724 | ||||||
DSLA Mortgage Loan Trust, | ||||||||
1.026%, 09/19/2044 (A) (B) | 1,013 | 953 | ||||||
DSLA Mortgage Loan Trust, | ||||||||
1.006%, 09/19/2044 (A) (B) | 2,753 | 2,652 | ||||||
DSLA Mortgage Loan Trust, Ser 2004-AR4, Cl 2A1A | ||||||||
0.546%, 01/19/2045 (A) (B) | 1,742 | 1,529 | ||||||
Extended Stay America Trust, | ||||||||
1.681%, 12/05/2031 (A) (B) | 2,400 | 2,397 | ||||||
Extended Stay America Trust, | ||||||||
3.321%, 12/05/2031 (A) (B) | 3,560 | 3,557 | ||||||
FDIC Structured Sale Guaranteed Notes, Ser 2010-S1, Cl 1A | ||||||||
0.730%, 02/25/2048 (A) (B) | 3,409 | 3,410 | ||||||
| 76 | SEI Institutional Investments Trust / Annual Report / May 31, 2015 |
| Description | Face Amount ($ Thousands) | Market Value ($ Thousands) | ||||||
FDIC Structured Sale Guaranteed Notes, Ser 2010-S2, Cl 1A | ||||||||
0.680%, 11/29/2037 (A) (B) | $ | 971 | $ | 968 | ||||
FHLMC Structured Agency Credit Risk Debt Notes, Ser 2014-DN2, Cl M1 | ||||||||
1.035%, 04/25/2024 (A) (B) | 624 | 623 | ||||||
First Horizon Alternative Mortgage Trust, Ser 2005-AA3, Cl 3A1 | ||||||||
2.261%, 05/25/2035 (A) (B) | 448 | 420 | ||||||
FNMA Connecticut Avenue Securities, Ser 2014-C02, Cl 1M1 | ||||||||
1.135%, 05/25/2024 (A) (B) | 419 | 417 | ||||||
FNMA Connecticut Avenue Securities, Ser 2014-C02, Cl 2M1 | ||||||||
1.135%, 05/25/2024 (A) (B) | 317 | 315 | ||||||
FNMA Connecticut Avenue Securities, Ser 2014-C03, Cl 1M1 | ||||||||
1.385%, 07/25/2024 (A) (B) | 2,741 | 2,736 | ||||||
FNMA Connecticut Avenue Securities, Ser 2015-C02, Cl 1M1 | ||||||||
1.337%, 05/25/2025 (A) (B) | 210 | 210 | ||||||
GAHR Commericial Mortgage Trust, Ser 2015-NRF, Cl AFL1 | ||||||||
1.486%, 12/15/2016 (A) (B) | 3,000 | 3,008 | ||||||
GE Capital Commercial Mortgage, | ||||||||
5.315%, 11/10/2045 (A) | 995 | 1,003 | ||||||
GMAC Mortgage Loan Trust, | ||||||||
3.034%, 12/19/2033 (A) (B) | 1,036 | 1,026 | ||||||
Granite Master Issuer, Ser 2005-1, Cl A4 | ||||||||
0.384%, 12/20/2054 (A) (B) | 572 | 569 | ||||||
Granite Master Issuer, Ser 2006-3, Cl A3 | ||||||||
0.264%, 12/20/2054 (A) (B) | 874 | 868 | ||||||
Granite Master Issuer, Ser 2006-3, Cl A4 | ||||||||
0.264%, 12/20/2054 (A) (B) | 837 | 832 | ||||||
Granite Master Issuer, Ser 2006-3, Cl A7 | ||||||||
0.384%, 12/20/2054 (A) (B) | 586 | 583 | ||||||
Granite Master Issuer, Ser 2006-4, Cl A6 | ||||||||
0.364%, 12/20/2054 (A) (B) | 49 | 49 | ||||||
Granite Master Issuer, Ser 2007-1, Cl 2A1 | ||||||||
0.324%, 12/20/2054 (A) (B) | 479 | 476 | ||||||
Granite Master Issuer, Ser 2007-1, Cl 3A1 | ||||||||
0.384%, 12/20/2054 (A) (B) | 461 | 458 | ||||||
| Description | Face Amount ($ Thousands) | Market Value ($ Thousands) | ||||||
Greenwich Capital Commercial Funding, Ser 2005-GG5, Cl AM | ||||||||
5.277%, 04/10/2037 (A) | $ | 3,581 | $ | 3,617 | ||||
GS Mortgage Securities II, | ||||||||
5.553%, 04/10/2038 (A) | 3,040 | 3,108 | ||||||
GS Mortgage Securities II, | ||||||||
3.849%, 12/10/2043 (B) | 110 | 112 | ||||||
GS Mortgage Securities II, | ||||||||
0.649%, 12/10/2043 (A) (B) | 58,956 | 386 | ||||||
GS Mortgage Securities II, | ||||||||
0.941%, 03/10/2044 (A) (B) | 40,501 | 1,023 | ||||||
GS Mortgage Securities II, | ||||||||
0.662%, 11/10/2045 | 37 | 37 | ||||||
GS Mortgage Securities II, | ||||||||
1.206%, 07/10/2046 | 99 | 99 | ||||||
GS Mortgage Securities II, | ||||||||
1.217%, 08/10/2046 | 207 | 207 | ||||||
GSR Mortgage Loan Trust, | ||||||||
0.585%, 10/25/2032 (A) (B) | 70 | 69 | ||||||
GSR Mortgage Loan Trust, | ||||||||
2.756%, 01/25/2035 (A) (B) | 509 | 483 | ||||||
GSR Mortgage Loan Trust, | ||||||||
2.648%, 04/25/2035 (A) (B) | 964 | 929 | ||||||
GSR Mortgage Loan Trust, | ||||||||
2.656%, 09/25/2035 (A) (B) | 1,171 | 1,176 | ||||||
GSR Mortgage Loan Trust, | ||||||||
2.632%, 01/25/2036 (A) (B) | 2,545 | 2,354 | ||||||
HarborView Mortgage Loan Trust, | ||||||||
2.669%, 08/19/2034 (A) (B) | 4,403 | 4,484 | ||||||
HarborView Mortgage Loan Trust, | ||||||||
2.298%, 11/19/2034 (A) (B) | 143 | 133 | ||||||
HarborView Mortgage Loan Trust, | ||||||||
0.524%, 06/20/2035 (A) (B) | 3,987 | 3,755 | ||||||
Hilton USA Trust, Ser 2013-HLF, Cl AFL | ||||||||
1.181%, 11/05/2030 (A) (B) | 370 | 369 | ||||||
Hilton USA Trust, Ser 2013-HLF, Cl BFL | ||||||||
1.681%, 11/05/2030 (A) (B) | 2,956 | 2,961 | ||||||
| SEI Institutional Investments Trust / Annual Report / May 31, 2015 | 77 |
SCHEDULE OF INVESTMENTS
Opportunistic Income Fund (Continued)
May 31, 2015
| Description | Face Amount ($ Thousands) | Market Value ($ Thousands) | ||||||
Hilton USA Trust, Ser 2013-HLF, Cl CFL | ||||||||
2.081%, 11/05/2030 (A) (B) | $ | 2,464 | $ | 2,468 | ||||
Hilton USA Trust, Ser 2013-HLF, Cl DFL | ||||||||
2.931%, 11/05/2030 (A) (B) | 5,051 | 5,056 | ||||||
HSI Asset Securitization Trust, | ||||||||
0.821%, 07/25/2035 (A) (B) | 1,723 | 1,689 | ||||||
Hyatt Hotel Portfolio Trust, | ||||||||
3.986%, 11/15/2029 (A) (B) | 4,780 | 4,769 | ||||||
Impac CMB Trust, Ser 2004-10, Cl 4M1 | ||||||||
1.085%, 03/25/2035 (A) (B) | 231 | 207 | ||||||
Impac Secured Assets Trust, | ||||||||
0.435%, 04/25/2037 (A) (B) | 1,676 | 1,540 | ||||||
IndyMac INDA Mortgage Loan Trust, Ser 2007-AR3, Cl 1A1 | ||||||||
2.820%, 07/25/2037 (A) (B) | 3,421 | 3,005 | ||||||
IndyMac INDX Mortgage Loan Trust, Ser 2006-AR4, Cl A1A | ||||||||
0.395%, 05/25/2046 | 268 | 224 | ||||||
JPMorgan Alternative Loan Trust, | ||||||||
2.450%, 03/25/2037 (A) (B) | 604 | 485 | ||||||
JPMorgan Chase Commercial Mortgage Securities, Ser 2005-CB13, Cl A4 | ||||||||
5.246%, 01/12/2043 (A) | 2,000 | 2,008 | ||||||
JPMorgan Chase Commercial Mortgage Securities, Ser 2005-LDP4, Cl A4 | ||||||||
4.918%, 10/15/2042 (A) | 660 | 663 | ||||||
JPMorgan Chase Commercial Mortgage Securities, Ser 2006-LDP7, Cl A4 | ||||||||
5.905%, 04/15/2045 (A) | 295 | 303 | ||||||
JPMorgan Chase Commercial Mortgage Securities, Ser 2006-LDP8, Cl AM | ||||||||
5.440%, 05/15/2045 | 5,146 | 5,384 | ||||||
JPMorgan Chase Commercial Mortgage Securities, Ser 2007-CB18, Cl A4 | ||||||||
5.440%, 06/12/2047 | 2,874 | 3,035 | ||||||
JPMorgan Chase Commercial Mortgage Securities, Ser 2010-C1, Cl A1 | ||||||||
3.853%, 06/15/2043 (B) | 4 | 4 | ||||||
JPMorgan Chase Commercial Mortgage Securities, Ser 2010-C2, Cl A1 | ||||||||
2.749%, 11/15/2043 (B) | 105 | 106 | ||||||
| Description | Face Amount ($ Thousands) | Market Value ($ Thousands) | ||||||
JPMorgan Chase Commercial Mortgage Securities, Ser 2010-CNTR, Cl XA, IO | ||||||||
2.011%, 08/05/2032 (A) (B) | $ | 14,247 | $ | 1,028 | ||||
JPMorgan Chase Commercial Mortgage Securities, Ser 2011-C3, Cl XA, IO | ||||||||
1.171%, 02/15/2046 (A) (B) | 35,057 | 1,310 | ||||||
JPMorgan Chase Commercial Mortgage Securities, Ser 2012-C8, Cl A1 | ||||||||
0.705%, 10/15/2045 | 15 | 15 | ||||||
JPMorgan Chase Commercial Mortgage Securities, Ser 2012-C8, Cl XA, IO | ||||||||
2.109%, 10/15/2045 (A) | 14,196 | 1,357 | ||||||
JPMorgan Chase Commercial Mortgage Securities, Ser 2012-LC9, Cl A1 | ||||||||
0.670%, 12/15/2047 | 17 | 17 | ||||||
JPMorgan Chase Commercial Mortgage Securities, Ser 2013-C13, Cl A1 | ||||||||
1.303%, 01/15/2046 | 180 | 181 | ||||||
JPMorgan Chase Commercial Mortgage Securities, Ser 2014-BXH, Cl A | ||||||||
1.086%, 04/15/2027 (A) (B) | 3,340 | 3,334 | ||||||
JPMorgan Chase Commercial Mortgage Securities, Ser 2014-FBLU, Cl C | ||||||||
2.182%, 12/15/2028 (A) (B) | 4,000 | 4,003 | ||||||
JPMorgan Chase Commercial Mortgage Securities, Ser 2014-INN, Cl D | ||||||||
2.536%, 06/15/2029 (A) (B) | 3,000 | 2,993 | ||||||
JPMorgan Mortgage Trust, | ||||||||
4.500%, 09/25/2034 (B) | 634 | 651 | ||||||
JPMorgan Mortgage Trust, | ||||||||
2.636%, 06/25/2035 (A) (B) | 1,794 | 1,793 | ||||||
JPMorgan Mortgage Trust, | ||||||||
2.588%, 07/25/2035 (A) (B) | 344 | 342 | ||||||
JPMorgan Mortgage Trust, | ||||||||
2.432%, 11/25/2033 (A) (B) | 897 | 899 | ||||||
JPMorgan Mortgage Trust, | ||||||||
2.533%, 07/25/2035 (A) (B) | 4,646 | 4,651 | ||||||
JPMorgan Mortgage Trust, | ||||||||
2.489%, 07/25/2035 (A) (B) | 1,295 | 1,300 | ||||||
| 78 | SEI Institutional Investments Trust / Annual Report / May 31, 2015 |
| Description | Face Amount ($ Thousands) | Market Value ($ Thousands) | ||||||
JPMorgan Mortgage Trust, | ||||||||
2.557%, 07/25/2035 (A) (B) | $ | 1,277 | $ | 1,295 | ||||
JPMorgan Mortgage Trust, | ||||||||
2.804%, 06/25/2037 (A) (B) | 129 | 116 | ||||||
LB-UBS Commercial Mortgage Trust, Ser 2005-C7, Cl AM | ||||||||
5.263%, 11/15/2040 (A) | 3,039 | 3,056 | ||||||
LB-UBS Commercial Mortgage Trust, Ser 2006-C4, Cl AM | ||||||||
5.878%, 06/15/2038 (A) | �� | 1,420 | 1,485 | |||||
LB-UBS Commercial Mortgage Trust, Ser 2007-C1, Cl AJ | ||||||||
5.484%, 02/15/2040 | 2,660 | 2,773 | ||||||
LB-UBS Commercial Mortgage Trust, Ser 2007-C2, Cl AM | ||||||||
5.493%, 02/15/2040 (A) | 1,727 | 1,829 | ||||||
LB-UBS Commercial Mortgage Trust, Ser 2007-C6, Cl A4 | ||||||||
5.858%, 07/15/2040 (A) | 828 | 866 | ||||||
Master Adjustable Rate Mortgages Trust, Ser 2004-13, Cl 3A7 | ||||||||
2.665%, 11/21/2034 (A) (B) | 5,501 | 5,627 | ||||||
Master Adjustable Rate Mortgages Trust, Ser 2005-6, Cl 5A1 | ||||||||
2.491%, 07/25/2035 (A) (B) | 136 | 117 | ||||||
MASTR Alternative Loan Trust, Ser 2003-5, Cl 4A1 | ||||||||
5.500%, 07/25/2033 (B) | 4,218 | 4,484 | ||||||
Mellon Residential Funding, | ||||||||
2.609%, 10/20/2029 (A) (B) | 501 | 504 | ||||||
Mellon Residential Funding, | ||||||||
0.886%, 11/15/2031 (A) (B) | 2,320 | 2,273 | ||||||
Merrill Lynch Mortgage Investors Trust, Ser 2003-D, Cl A | ||||||||
0.805%, 08/25/2028 (A) (B) | 2,882 | 2,762 | ||||||
Merrill Lynch Mortgage Investors Trust, Ser 2003-G, Cl A1 | ||||||||
0.825%, 01/25/2029 (A) (B) | 1,124 | 1,076 | ||||||
Merrill Lynch Mortgage Investors Trust, Ser 2005-A4, Cl 1A | ||||||||
2.537%, 07/25/2035 (A) (B) | 1,134 | 920 | ||||||
Merrill Lynch Mortgage Investors, Ser 2004-1, Cl 2A1 | ||||||||
2.164%, 12/25/2034 (A) (B) | 2,070 | 2,075 | ||||||
Merrill Lynch Mortgage Investors, Ser 2005-A2, Cl A2 | ||||||||
2.463%, 02/25/2035 (A) (B) | 3,348 | 3,366 | ||||||
Merrill Lynch Mortgage Trust, Ser 2005-MCP1, Cl AM | ||||||||
4.805%, 06/12/2043 (A) | 383 | 383 | ||||||
| Description | Face Amount ($ Thousands) | Market Value ($ Thousands) | ||||||
Merrill Lynch/Countrywide Commercial Mortgage Trust, Ser 2007-5, Cl A4 | ||||||||
5.378%, 08/12/2048 | $ | 595 | $ | 622 | ||||
Merrill Lynch/Countrywide Commercial Mortgage Trust, Ser 2007-5, Cl AMFL | ||||||||
0.365%, 08/12/2048 (A) (B) | 2,690 | 2,560 | ||||||
Morgan Stanley ABS Capital I, Ser 2005-WMC5, Cl M3 | ||||||||
0.920%, 06/25/2035 (A) | 45 | 45 | ||||||
Morgan Stanley Bank of America Merrill Lynch Trust, Ser 2013-C7, Cl A4 | ||||||||
2.918%, 02/15/2046 | 4,000 | 4,082 | ||||||
Morgan Stanley Capital I Trust, Ser 2015-XLF1, Cl B | ||||||||
1.936%, 08/13/2016 (A) (B) | 2,750 | 2,755 | ||||||
Morgan Stanley Capital I, | ||||||||
5.574%, 11/12/2049 (A) | 5,000 | 5,114 | ||||||
Morgan Stanley Mortgage Loan Trust, Ser 2004-10AR, Cl 1A | ||||||||
2.932%, 11/25/2034 (A) (B) | 1,688 | 1,662 | ||||||
Morgan Stanley Mortgage Loan Trust, Ser 2005-5AR, Cl 1A1 | ||||||||
0.455%, 09/25/2035 (A) (B) | 496 | 492 | ||||||
Morgan Stanley Re-REMIC Trust, Ser 2012-IO, Cl AXA | ||||||||
1.000%, 03/27/2051 (B) | 74 | 74 | ||||||
MRFC Mortgage Pass-Through Trust, Ser 2002-TBC2, Cl A | ||||||||
1.046%, 08/15/2032 (A) (B) | 1,511 | 1,429 | ||||||
Nomura Asset Acceptance Alternative Loan Trust, Ser 2004-AP3, Cl A6 | ||||||||
4.793%, 10/25/2034 (B) | 1,437 | 1,486 | ||||||
Nomura Resecuritization Trust, Ser 2014-6R, Cl 5A1 | ||||||||
2.501%, 04/26/2037 (A) (B) | 3,407 | 3,471 | ||||||
Nomura Resecuritization Trust, Ser 2015-2R, Cl 5A1 | ||||||||
0.898%, 04/26/2047 (A) (B) | 2,096 | 2,022 | ||||||
Nomura Resecuritization Trust, Ser 2015-4R, Cl 3A2 | ||||||||
2.475%, 01/26/2036 (B) | 6,384 | 6,192 | ||||||
Opteum Mortgage Acceptance Asset-Backed Pass-Through Certificates, Ser 2005-2, Cl AII1 | ||||||||
0.445%, 04/25/2035 (A) (B) | 528 | 531 | ||||||
PHH Mortgage Capital LLC, | ||||||||
2.429%, 07/25/2038 (A) (B) | 2,092 | 2,042 | ||||||
| SEI Institutional Investments Trust / Annual Report / May 31, 2015 | 79 |
SCHEDULE OF INVESTMENTS
Opportunistic Income Fund (Continued)
May 31, 2015
| Description | Face Amount ($ Thousands) | Market Value ($ Thousands) | ||||||
Provident Funding Mortgage Loan Trust, Ser 2003-1, Cl A | ||||||||
2.540%, 08/25/2033 (A) (B) | $ | 2,712 | $ | 2,797 | ||||
RBSSP Resecuritization Trust, Ser 2009-7, Cl 2A5 | ||||||||
3.543%, 09/26/2035 (A) (B) | 3,161 | 3,201 | ||||||
Residential Accredit Loans, | ||||||||
0.345%, 01/25/2037 (A) (B) | 5,793 | 4,522 | ||||||
Residential Accredit Loans, | ||||||||
0.345%, 03/25/2047 (A) (B) | 1,711 | 1,411 | ||||||
Residential Asset Securitization Trust, Ser 2007-A8, Cl 3A1 | ||||||||
6.229%, 08/25/2022 (A) (B) | 1,090 | 984 | ||||||
Residential Funding Mortgage Securities I, Ser 2004-S5, Cl 2A1 | ||||||||
4.500%, 05/25/2019 (B) | 1,208 | 1,222 | ||||||
Residential Funding Securities LLC, Ser 2003-RM2, Cl AI5 | ||||||||
8.500%, 05/25/2033 (B) | 197 | 205 | ||||||
Sequoia Mortgage Trust, | ||||||||
0.984%, 10/20/2027 (A) (B) | 1,389 | 1,358 | ||||||
Sequoia Mortgage Trust, | ||||||||
1.992%, 02/25/2040 (A) (B) | 178 | 176 | ||||||
Sequoia Mortgage Trust, | ||||||||
2.865%, 01/25/2042 (A) (B) | 1,486 | 1,491 | ||||||
Sequoia Mortgage Trust, | ||||||||
1.450%, 02/25/2043 (A) (B) | 2,631 | 2,540 | ||||||
Springleaf Mortgage Loan Trust, | ||||||||
2.220%, 10/25/2057 (A) (B) | 1,462 | 1,466 | ||||||
Springleaf Mortgage Loan Trust, | ||||||||
1.570%, 12/25/2059 (A) (B) | 1,747 | 1,751 | ||||||
Springleaf Mortgage Loan Trust, | ||||||||
1.270%, 06/25/2058 (A) (B) | 114 | 114 | ||||||
Springleaf Mortgage Loan Trust, | ||||||||
1.780%, 12/25/2065 (A) (B) | 4,452 | 4,462 | ||||||
Springleaf Mortgage Loan Trust, | ||||||||
1.870%, 09/25/2057 (A) (B) | 7,494 | 7,475 | ||||||
Structured Adjustable Rate Mortgage Loan Trust, Ser 2004-2, Cl 4A2 | ||||||||
2.531%, 03/25/2034 (A) (B) | 3,096 | 3,036 | ||||||
| Description | Face Amount ($ Thousands) | Market Value ($ Thousands) | ||||||
Structured Adjustable Rate Mortgage Loan Trust, Ser 2004-3AC, Cl A1 | ||||||||
2.399%, 03/25/2034 (A) (B) | $ | 2,762 | $ | 2,771 | ||||
Structured Adjustable Rate Mortgage Loan Trust, Ser 2004-9XS, Cl A | ||||||||
0.555%, 07/25/2034 (A) (B) | 4,480 | 4,311 | ||||||
Structured Adjustable Rate Mortgage Loan Trust, Ser 2005-7, Cl 1A3 | ||||||||
2.482%, 04/25/2035 (A) (B) | 2,566 | 2,434 | ||||||
Structured Asset Mortgage Investments, Ser 2004-AR5, Cl 1A1 | ||||||||
0.846%, 10/19/2034 (A) (B) | 2,599 | 2,484 | ||||||
Structured Asset Securities Mortgage Pass-Through Certificates, Ser 2003-17A, Cl 2A1 | ||||||||
2.381%, 05/25/2033 (A) (B) | 4,169 | 4,184 | ||||||
Thornburg Mortgage Securities Trust, Ser 2003-4, Cl A1 | ||||||||
0.825%, 09/25/2043 (A) (B) | 2,563 | 2,474 | ||||||
Thornburg Mortgage Securities Trust, Ser 2004-3, Cl A | ||||||||
0.921%, 09/25/2044 (A) (B) | 1,524 | 1,461 | ||||||
Thornburg Mortgage Securities Trust, Ser 2005-1, Cl A3 | ||||||||
2.230%, 04/25/2045 (A) (B) | 1,999 | 2,008 | ||||||
Thornburg Mortgage Securities Trust, Ser 2005-2, Cl A1 | ||||||||
2.232%, 07/25/2045 (A) (B) | 2,828 | 2,743 | ||||||
Thornburg Mortgage Securities Trust, Ser 2007-1, Cl A2B | ||||||||
2.006%, 03/25/2037 (A) (B) | 2,648 | 2,319 | ||||||
Towd Point Mortgage Trust, | ||||||||
3.750%, 11/25/2057 (B) | 3,786 | 3,898 | ||||||
UBS Commercial Mortgage Trust, | ||||||||
2.270%, 05/10/2045 (A) (B) | 12,434 | 1,371 | ||||||
UBS-Barclays Commercial Mortgage Trust, Ser 2012-C3, Cl A1 | ||||||||
0.726%, 08/10/2049 | 61 | 61 | ||||||
UBS-Barclays Commercial Mortgage Trust, Ser 2012-C4, Cl A1 | ||||||||
0.673%, 12/10/2045 | 48 | 48 | ||||||
UBS-Barclays Commercial Mortgage Trust, Ser 2013-C5, Cl A1 | ||||||||
0.779%, 03/10/2046 | 162 | 161 | ||||||
| 80 | SEI Institutional Investments Trust / Annual Report / May 31, 2015 |
| Description | Face Amount ($ Thousands) | Market Value ($ Thousands) | ||||||
Wachovia Bank Commercial Mortgage Trust, Ser 2005-C21, Cl A4 | ||||||||
5.252%, 10/15/2044 (A) | $ | 96 | $ | 96 | ||||
Wachovia Bank Commercial Mortgage Trust, Ser 2005-C22, Cl A4 | ||||||||
5.267%, 12/15/2044 (A) | 172 | 173 | ||||||
Wachovia Bank Commercial Mortgage Trust, Ser 2006-C26, Cl A2 | ||||||||
5.935%, 06/15/2045 | 230 | 231 | ||||||
Wachovia Bank Commercial Mortgage Trust, Ser 2006-C28, Cl AM | ||||||||
5.603%, 10/15/2048 (A) | 5,390 | 5,676 | ||||||
Wachovia Bank Commercial Mortgage Trust, Ser 2007-C31, Cl AM | ||||||||
5.591%, 04/15/2047 (A) | 3,000 | 3,195 | ||||||
Wachovia Bank Commercial Mortgage Trust, Ser 2007-C33, Cl AJ | ||||||||
5.951%, 02/15/2051 (A) | 3,040 | 3,191 | ||||||
WaMu Mortgage Pass-Through Certificates, Ser 2003-AR10, Cl A7 | ||||||||
2.418%, 10/25/2033 (A) (B) | 3,951 | 4,027 | ||||||
WaMu Mortgage Pass-Through Certificates, Ser 2003-AR11, Cl A6 | ||||||||
2.423%, 10/25/2033 (A) (B) | 876 | 886 | ||||||
WaMu Mortgage Pass-Through Certificates, Ser 2003-AR7, Cl A7 | ||||||||
2.299%, 08/25/2033 (A) (B) | 2,786 | 2,792 | ||||||
WaMu Mortgage Pass-Through Certificates, Ser 2004-AR1, Cl A | ||||||||
2.441%, 03/25/2034 (A) (B) | 5,389 | 5,404 | ||||||
WaMu Mortgage Pass-Through Certificates, Ser 2004-AR10, Cl A1B | ||||||||
0.605%, 07/25/2044 (A) (B) | 4,870 | 4,674 | ||||||
WaMu Mortgage Pass-Through Certificates, Ser 2004-AR11, Cl A | ||||||||
2.431%, 10/25/2034 (A) (B) | 2,759 | 2,786 | ||||||
WaMu Mortgage Pass-Through Certificates, Ser 2004-AR13, Cl A1A | ||||||||
0.905%, 11/25/2034 (A) (B) | 2,365 | 2,245 | ||||||
WaMu Mortgage Pass-Through Certificates, Ser 2004-AR13, Cl A2A | ||||||||
0.921%, 11/25/2034 | 3,277 | 3,099 | ||||||
| Description | Face Amount ($ Thousands) | Market Value ($ Thousands) | ||||||
WaMu Mortgage Pass-Through Certificates, Ser 2004-AR14, Cl A1 | ||||||||
2.396%, 01/25/2035 (A) (B) | $ | 5,600 | $ | 5,644 | ||||
WaMu Mortgage Pass-Through Certificates, Ser 2004-AR2, Cl A | ||||||||
1.536%, 04/25/2044 (A) (B) | 3,090 | 3,040 | ||||||
WaMu Mortgage Pass-Through Certificates, Ser 2004-AR8, Cl A2 | ||||||||
0.585%, 06/25/2044 (A) (B) | 3,197 | 2,952 | ||||||
WaMu Mortgage Pass-Through Certificates, Ser 2004-CB2, Cl 1A | ||||||||
5.000%, 07/25/2034 (B) | 1,760 | 1,857 | ||||||
WaMu Mortgage Pass-Through Certificates, Ser 2004-CB4, Cl 22A | ||||||||
6.000%, 12/25/2019 (B) | 245 | 255 | ||||||
WaMu Mortgage Pass-Through Certificates, Ser 2005-AR1, Cl A1A | ||||||||
0.505%, 01/25/2045 (A) (B) | 2,496 | 2,342 | ||||||
WaMu Mortgage Pass-Through Certificates, Ser 2005-AR1, Cl A2A3 | ||||||||
0.585%, 01/25/2045 (A) (B) | 1,310 | 1,242 | ||||||
WaMu Mortgage Pass-Through Certificates, Ser 2005-AR11, Cl A1A | ||||||||
0.505%, 08/25/2045 (A) (B) | 3,295 | 3,088 | ||||||
WaMu Mortgage Pass-Through Certificates, Ser 2005-AR13, Cl A1A1 | ||||||||
0.475%, 10/25/2045 (A) (B) | 3,401 | 3,163 | ||||||
WaMu Mortgage Pass-Through Certificates, Ser 2005-AR13, Cl A1A2 | ||||||||
1.586%, 10/25/2045 (A) (B) | 626 | 624 | ||||||
WaMu Mortgage Pass-Through Certificates, Ser 2005-AR14, Cl 1A4 | ||||||||
2.342%, 12/25/2035 (A) (B) | 174 | 168 | ||||||
WaMu Mortgage Pass-Through Certificates, Ser 2005-AR17, Cl A1A1 | ||||||||
0.455%, 12/25/2045 (A) (B) | 3,264 | 3,037 | ||||||
WaMu Mortgage Pass-Through Certificates, Ser 2005-AR19, Cl A1A1 | ||||||||
0.455%, 12/25/2045 (A) (B) | 292 | 281 | ||||||
WaMu Mortgage Pass-Through Certificates, Ser 2005-AR2, Cl 2A21 | ||||||||
0.515%, 01/25/2045 (A) (B) | 1,787 | 1,647 | ||||||
| SEI Institutional Investments Trust / Annual Report / May 31, 2015 | 81 |
SCHEDULE OF INVESTMENTS
Opportunistic Income Fund (Continued)
May 31, 2015
| Description | Face Amount ($ Thousands) | Market Value ($ Thousands) | ||||||
WaMu Mortgage Pass-Through Certificates, Ser 2005-AR6, Cl 2A1A | ||||||||
0.415%, 04/25/2045 (A) (B) | $ | 3,166 | $ | 2,984 | ||||
WaMu Mortgage Pass-Through Certificates, Ser 2005-AR8, Cl 2A1A | ||||||||
0.475%, 07/25/2045 (A) (B) | 3,851 | 3,599 | ||||||
WaMu Mortgage Pass-Through Certificates, Ser 2005-AR9, Cl A1A | ||||||||
0.505%, 07/25/2045 (A) (B) | 1,773 | 1,696 | ||||||
WaMu Mortgage Pass-Through Certificates, Ser 2006-AR1, Cl 2A1A | ||||||||
1.217%, 01/25/2046 (A) (B) | 2,793 | 2,692 | ||||||
WaMu Mortgage Pass-Through Certificates, Ser 2006-AR17, Cl 1A | ||||||||
0.956%, 12/25/2046 (A) (B) | 1,398 | 1,115 | ||||||
WaMu Mortgage Pass-Through Certificates, Ser 2007-OA3, Cl 5A | ||||||||
1.948%, 04/25/2047 (A) (B) | 4,392 | 3,330 | ||||||
Wells Fargo Commercial Mortgage Trust, Ser 2012-LC5, Cl A1 | ||||||||
0.687%, 10/15/2045 | 60 | 60 | ||||||
Wells Fargo Commercial Mortgage Trust, Ser 2013-C15, Cl A1 | ||||||||
1.264%, 08/15/2046 | 138 | 139 | ||||||
Wells Fargo Mortgage-Backed Securities Trust, Ser 2003-H, Cl A1 | ||||||||
2.615%, 09/25/2033 (A) (B) | 1,607 | 1,625 | ||||||
Wells Fargo Mortgage-Backed Securities Trust, Ser 2004-E, Cl A1 | ||||||||
2.748%, 05/25/2034 (A) (B) | 378 | 378 | ||||||
Wells Fargo Mortgage-Backed Securities Trust, Ser 2004-K, Cl 1A2 | ||||||||
2.615%, 07/25/2034 (A) (B) | 1,689 | 1,693 | ||||||
Wells Fargo Mortgage-Backed Securities Trust, Ser 2004-N, Cl A7 | ||||||||
2.594%, 08/25/2034 (A) (B) | 4,182 | 4,178 | ||||||
Wells Fargo Mortgage-Backed Securities Trust, Ser 2004-O, Cl A1 | ||||||||
2.615%, 08/25/2034 (A) (B) | 1,998 | 1,986 | ||||||
Wells Fargo Mortgage-Backed Securities Trust, Ser 2004-Q, Cl 1A2 | ||||||||
2.616%, 09/25/2034 (A) (B) | 3,417 | 3,448 | ||||||
| Description | Face Amount ($ Thousands) | Market Value ($ Thousands) | ||||||
Wells Fargo Mortgage-Backed Securities Trust, Ser 2004-R, Cl 1A1 | ||||||||
2.615%, 09/25/2034 (A) (B) | $ | 4,305 | $ | 4,361 | ||||
Wells Fargo Mortgage-Backed Securities Trust, Ser 2004-S, Cl A1 | ||||||||
2.634%, 09/25/2034 (A) (B) | 997 | 1,019 | ||||||
Wells Fargo Mortgage-Backed Securities Trust, Ser 2004-U, Cl A1 | ||||||||
2.589%, 10/25/2034 (A) (B) | 5,707 | 5,688 | ||||||
Wells Fargo Mortgage-Backed Securities Trust, Ser 2004-Y, Cl 3A1 | ||||||||
2.595%, 11/25/2034 (A) (B) | 5,125 | 5,169 | ||||||
Wells Fargo Mortgage-Backed Securities Trust, Ser 2004-Z, Cl 2A1 | ||||||||
2.615%, 12/25/2034 (A) (B) | 1,875 | 1,884 | ||||||
Wells Fargo Mortgage-Backed Securities Trust, Ser 2005-AR1, Cl 1A1 | ||||||||
2.617%, 02/25/2035 (A) (B) | 5,891 | 5,922 | ||||||
Wells Fargo Mortgage-Backed Securities Trust, Ser 2005-AR10, Cl 1A1 | ||||||||
2.646%, 06/25/2035 (A) (B) | 5,781 | 5,901 | ||||||
Wells Fargo Mortgage-Backed Securities Trust, Ser 2005-AR10, Cl 2A2 | ||||||||
2.641%, 06/25/2035 (A) (B) | 4,100 | 4,167 | ||||||
Wells Fargo Mortgage-Backed Securities Trust, Ser 2005-AR10, Cl 2A17 | ||||||||
2.641%, 06/25/2035 (A) (B) | 1,353 | 1,377 | ||||||
Wells Fargo Mortgage-Backed Securities Trust, Ser 2005-AR11, Cl 1A1 | ||||||||
2.618%, 06/25/2035 (A) (B) | 1,077 | 1,067 | ||||||
Wells Fargo Mortgage-Backed Securities Trust, Ser 2005-AR12, Cl 2A5 | ||||||||
2.643%, 06/25/2035 (A) (B) | 1,345 | 1,375 | ||||||
Wells Fargo Mortgage-Backed Securities Trust, Ser 2005-AR16, Cl 2A1 | ||||||||
2.601%, 02/25/2034 (A) (B) | 1,101 | 1,115 | ||||||
Wells Fargo Mortgage-Backed Securities Trust, Ser 2005-AR3, Cl 2A1 | ||||||||
2.617%, 03/25/2035 (A) (B) | 2,029 | 2,042 | ||||||
| 82 | SEI Institutional Investments Trust / Annual Report / May 31, 2015 |
| Description | Face Amount ($ Thousands) | Market Value ($ Thousands) | ||||||
Wells Fargo Mortgage-Backed Securities Trust, Ser 2005-AR7, Cl 2A1 | ||||||||
2.740%, 05/25/2035 (A) (B) | $ | 473 | $ | 469 | ||||
Wells Fargo Mortgage-Backed Securities Trust, Ser 2005-AR8, Cl 1A1 | ||||||||
2.680%, 06/25/2035 (A) (B) | 2,036 | 2,073 | ||||||
Wells Fargo Mortgage-Backed Securities Trust, Ser 2005-AR8, Cl 3A2 | ||||||||
2.677%, 06/25/2035 (A) (B) | 1,268 | 1,294 | ||||||
Wells Fargo Mortgage-Backed Securities Trust, Ser 2005-AR9, Cl 3A1 | ||||||||
2.653%, 06/25/2034 (A) (B) | 1,964 | 1,987 | ||||||
Wells Fargo Mortgage-Backed Securities Trust, Ser 2006-4, Cl 2A2 | ||||||||
5.500%, 04/25/2036 (B) | 531 | 516 | ||||||
Wells Fargo Mortgage-Backed Securities Trust, Ser 2006-AR12, Cl 1A1 | ||||||||
2.495%, 09/25/2036 (A) (B) | 926 | 861 | ||||||
Wells Fargo Mortgage-Backed Securities Trust, Ser 2006-AR2, Cl 2A1 | ||||||||
2.641%, 03/25/2036 (A) (B) | 751 | 748 | ||||||
WFCG Commercial Mortgage Trust, Ser 2015-BXRP, Cl C | ||||||||
1.972%, 11/15/2029 (A) (B) | 2,000 | 1,977 | ||||||
WFRBS Commercial Mortgage Trust, Ser 2011-C2, Cl XA, IO | ||||||||
1.069%, 02/15/2044 (A) (B) | 29,958 | 758 | ||||||
WFRBS Commercial Mortgage Trust, Ser 2012-C6, Cl A1 | ||||||||
1.081%, 04/15/2045 | 146 | 146 | ||||||
WFRBS Commercial Mortgage Trust, Ser 2012-C9, Cl A1 | ||||||||
0.673%, 11/15/2045 | 64 | 64 | ||||||
|
| |||||||
| 647,284 | ||||||||
|
| |||||||
Total Mortgage-Backed Securities |
| 848,140 | ||||||
|
| |||||||
LOAN PARTICIPATIONS — 22.5% |
| |||||||
Acadia Healthcare Company, Term Loan, 1st Lien | ||||||||
4.250%, 02/11/2022 | 1,397 | 1,408 | ||||||
Acosta, Term Loan B, 1st Lien | ||||||||
4.250%, 09/24/2021 | 5,525 | 5,537 | ||||||
Activision Blizzard, Term Loan B | ||||||||
3.250%, 10/12/2020 | 1,876 | 1,884 | ||||||
Advantage Sales and Marketing, Term Loan, 1st Lien | ||||||||
4.250%, 07/23/2021 | 4,730 | 4,726 | ||||||
| Description | Face Amount ($ Thousands) | Market Value ($ Thousands) | ||||||
Advantage Sales, Term Loan, 1st Lien | ||||||||
4.250%, 07/23/2021 | $ | 145 | $ | 145 | ||||
Advantage Sales, Term Loan, 2nd Lien | ||||||||
7.500%, 07/25/2022 | 1,500 | 1,512 | ||||||
Affinia Group, Term Loan, 2nd Lien | ||||||||
4.750%, 04/25/2020 | 1,385 | 1,385 | ||||||
Affinion Group Holdings, Term Loan | ||||||||
6.750%, 10/09/2016 | 4,035 | 3,888 | ||||||
Air Medical, Cov-Lite, Term Loan, 1st Lien | ||||||||
4.500%, 04/15/2022 | 2,705 | 2,692 | ||||||
Alere, Term Loan B | ||||||||
4.250%, 06/30/2017 | 384 | 385 | ||||||
Alinta Energy Finance, Delayed Term Loan | ||||||||
6.375%, 08/13/2018 | 50 | 50 | ||||||
Alinta Ltd., Cov-Lite, 1st Lien | ||||||||
6.375%, 08/13/2019 | 2,934 | 2,955 | ||||||
Alinta Ltd., Unfunded Term Loan | ||||||||
1.000%, 08/13/2018 | 145 | (1 | ) | |||||
Alliance Laundry Systems LLC, Term Loan B | ||||||||
4.250%, 12/10/2018 | 2,682 | 2,684 | ||||||
Alliant Holdings, Term Loan, 1st Lien | ||||||||
5.000%, 12/20/2019 | 420 | 423 | ||||||
Alliant Holdings, Term Loan, Tranche 1 | ||||||||
5.000%, 12/20/2019 | 5,148 | 5,187 | ||||||
Allison Transmission | ||||||||
3.500%, 08/23/2019 | 4,195 | 4,209 | ||||||
AMC Entertainment, Term Loan | ||||||||
3.500%, 04/30/2020 | 1,975 | 1,976 | ||||||
American Builders & Contract Supply, Term Loan B | ||||||||
3.500%, 04/16/2020 | 3,214 | 3,209 | ||||||
American Renal Holdings, Term Loan | ||||||||
8.500%, 03/20/2020 | 1,310 | 1,306 | ||||||
4.500%, 08/20/2019 | 5,197 | 5,204 | ||||||
American Tire Distributors, Cov-Lite, 2nd Lien | ||||||||
5.250%, 09/24/2021 | 1,910 | 1,928 | ||||||
Amsurg, Cov-Lite, Term Loan | ||||||||
3.750%, 07/16/2021 | 1,710 | 1,714 | ||||||
Applied Systems, Term Loan, 1st Lien | ||||||||
4.250%, 01/25/2021 | 3,169 | 3,172 | ||||||
| SEI Institutional Investments Trust / Annual Report / May 31, 2015 | 83 |
SCHEDULE OF INVESTMENTS
Opportunistic Income Fund (Continued)
May 31, 2015
| Description | Face Amount ($ Thousands) | Market Value ($ Thousands) | ||||||
Applied Systems, Term Loan, 2nd Lien | ||||||||
7.500%, 01/24/2022 | $ | 1,740 | $ | 1,749 | ||||
Aramark US, Extended 1st Lien | ||||||||
0.031%, 07/26/2016 | 27 | 27 | ||||||
Aramark, 1st Lien, Term Loan F | ||||||||
3.250%, 02/24/2021 | 5,074 | 5,069 | ||||||
Ardagh Holdings USA, 1st Lien | ||||||||
4.000%, 12/17/2019 | 990 | 991 | ||||||
Aricent Technologies, 1st Lien | ||||||||
5.500%, 04/14/2021 | 3,189 | 3,205 | ||||||
Aricent Technologies, Term Loan, 1st Lien | ||||||||
5.500%, 04/14/2021 | 553 | 556 | ||||||
Aricent, Term Loan, 2nd Lien | ||||||||
9.500%, 04/14/2022 | 1,918 | 1,926 | ||||||
Asurion, LLC, Term Loan B | ||||||||
3.250%, 07/08/2020 | 1,008 | 1,009 | ||||||
Asurion, LLC, Term Loan B-1 | ||||||||
5.000%, 05/24/2019 | 3,237 | 3,247 | ||||||
Asurion, LLC, Term Loan, 2nd Lien | ||||||||
8.500%, 03/03/2021 | 5,400 | 5,525 | ||||||
Bass Pro Group LLC, Term Loan B | ||||||||
3.750%, 11/20/2019 | 2,807 | 2,806 | ||||||
BE Aerospace, Term Loan | ||||||||
4.000%, 11/19/2021 | 1,224 | 1,235 | ||||||
BE Aerospace, Term Loan, 1st Lien | ||||||||
4.000%, 11/19/2021 | 404 | 408 | ||||||
Berry Plastics, Term Loan D | ||||||||
3.500%, 02/08/2020 | 1,960 | 1,956 | ||||||
Biomet, Term Loan B2 | ||||||||
3.685%, 07/25/2017 | 4,108 | 4,103 | ||||||
Black Knight, Cov-Lite, Term Loan, 1st Lien | ||||||||
0.000%, 05/09/2022 (C) | 443 | 445 | ||||||
Booz Allen Hamiliton, Term Loan B1, 1st Lien | ||||||||
3.750%, 07/31/2019 | 1,643 | 1,651 | ||||||
Boyd Acquisition, Term Loan B | ||||||||
4.250%, 11/20/2017 | 836 | 838 | ||||||
Boyd Gaming, Term Loan B | ||||||||
4.000%, 08/14/2020 | 3,694 | 3,706 | ||||||
Brickman Group Holdings, Term Loan, 1st Lien | ||||||||
4.000%, 12/18/2020 | 3,456 | 3,451 | ||||||
Bright Horizons Family Solutions LLC, Term Loan | ||||||||
5.250%, 01/30/2020 | — | — | ||||||
4.000%, 01/30/2020 | 342 | 343 | ||||||
Burger King, Cov-Lite, 1st Lien | ||||||||
4.500%, 12/12/2021 | 1,516 | 1,516 | ||||||
| Description | Face Amount ($ Thousands) | Market Value ($ Thousands) | ||||||
Calpine, Term Loan, 1st Lien | ||||||||
0.000%, 05/20/2022 (C) | $ | 5,099 | $ | 5,085 | ||||
Catalina Marketing, Cov-Lite, Term Loan | ||||||||
0.000%, 04/09/2021 (C) | 1,000 | 902 | ||||||
CCM Merger | ||||||||
4.500%, 08/06/2021 | 1,958 | 1,968 | ||||||
CDW, Term Loan | ||||||||
3.250%, 04/29/2020 | 1,960 | 1,954 | ||||||
Cequel Communications | ||||||||
3.500%, 02/10/2019 | 2,323 | 2,326 | ||||||
Cequel Communications, Term Loan | ||||||||
3.500%, 02/14/2019 | 6 | 6 | ||||||
Ceramtec Acquisition, Term Loan B1 | ||||||||
4.250%, 08/30/2020 | 726 | 729 | ||||||
Ceramtec Acquisition, Term Loan B2 | ||||||||
4.250%, 08/30/2020 | 73 | 73 | ||||||
Ceramtec Acquisition, Term Loan B3 | ||||||||
4.250%, 08/30/2020 | 215 | 216 | ||||||
Charter Communication Operating LLC, Term Loan E | ||||||||
3.000%, 07/01/2020 | 3,021 | 3,000 | ||||||
Chief Exploration, Term Loan | ||||||||
7.500%, 05/16/2021 | 2,200 | 2,090 | ||||||
Commscope, Term Loan, 1st Lien | ||||||||
0.000%, 05/27/2022 (C) | 2,120 | 2,123 | ||||||
Communication Sales and Leasing, Term Loan, 1st Lien | ||||||||
5.000%, 10/14/2022 | 1,256 | 1,251 | ||||||
Communication Sales and Leasing, Term Loan, 2nd Lien | ||||||||
5.000%, 10/14/2022 | 1,184 | 1,180 | ||||||
Communication Sales and Leasing, Term Loan, 3rd Lien | ||||||||
5.000%, 10/14/2022 | 120 | 119 | ||||||
Community Health Systems, Term Loan G | ||||||||
3.750%, 12/31/2019 | 913 | 913 | ||||||
Community Health Systems, Term Loan H | ||||||||
4.000%, 01/27/2021 | 3,723 | 3,730 | ||||||
Constantia Flexibles, Cov-Lite, 1st Lien | ||||||||
4.750%, 04/30/2022 | 293 | 295 | ||||||
Constantia Flexibles, Cov-Lite, Term Loan | ||||||||
4.750%, 04/29/2022 | 1,507 | 1,513 | ||||||
Cumulus Media, 1st Lien | ||||||||
4.250%, 12/23/2020 | 3,078 | 2,903 | ||||||
DAE Aviation Holdings, 1st Lien | ||||||||
5.000%, 11/02/2018 | 2,843 | 2,849 | ||||||
| 84 | SEI Institutional Investments Trust / Annual Report / May 31, 2015 |
| Description | Face Amount ($ Thousands) | Market Value ($ Thousands) | ||||||
DAE Aviation Holdings, Term Loan, 1st Lien | ||||||||
7.750%, 08/05/2019 | $ | 1,000 | $ | 1,006 | ||||
Dealertrack, Cov-Lite, Term Loan B, 1st Lien | ||||||||
3.250%, 02/28/2021 | 1,479 | 1,476 | ||||||
Dex Media West, Term Loan | ||||||||
8.000%, 12/30/2016 | 1,943 | 1,375 | ||||||
Digital Globe, Term Loan B, 1st Lien | ||||||||
3.750%, 01/25/2020 | 735 | 736 | ||||||
Dollar Tree, Cov-Lite, 1st Lien | ||||||||
4.250%, 02/06/2022 | 2,600 | 2,624 | ||||||
DuPont De Nemours, Cov-Lite, Term Loan B, 1st Lien | ||||||||
3.750%, 05/12/2022 | 2,273 | 2,275 | ||||||
EFS Cogen, Term Loan B, 1st Lien | ||||||||
3.750%, 12/17/2020 | 1,515 | 1,519 | ||||||
Emerald Performance Materials, LLC, Term Loan, 1st Lien | ||||||||
4.500%, 07/30/2021 | 820 | 821 | ||||||
Energy & Exploration Partners, Term Loan B, 1st Lien | ||||||||
7.750%, 01/22/2019 | 4,036 | 3,486 | ||||||
Energy Transfer Equity, Term Loan B, 1st Lien | ||||||||
4.000%, 12/02/2019 | 688 | 688 | ||||||
3.250%, 12/02/2019 | 4,185 | 4,164 | ||||||
Entegris, Term Loan B, 1st Lien | ||||||||
3.500%, 04/30/2021 | 3,338 | 3,331 | ||||||
Envision Healthcare, Cov-Lite, Term Loan | ||||||||
4.000%, 05/25/2018 | 174 | 174 | ||||||
Envision Healthcare, Initial Term Loan | ||||||||
4.000%, 04/27/2018 | 995 | 996 | ||||||
4.000%, 05/25/2018 | 2,031 | 2,033 | ||||||
Envision Healthcare, 1st Lien | ||||||||
5.000%, 11/09/2019 | 2,840 | 2,830 | ||||||
Epicor, Cov-Lite, 1st Lien | ||||||||
4.000%, 06/01/2022 | 2,268 | 2,270 | ||||||
Epicor, Cov-Lite, Term Loan, 1st Lien | ||||||||
0.000%, 05/12/2022 (C) | 1,831 | 1,833 | ||||||
Equinox Fitness Clubs, Term Loan B | ||||||||
5.000%, 01/31/2020 | 5,450 | 5,477 | ||||||
Evergreen Skillsoft, Term Loan, 1st Lien | ||||||||
5.750%, 04/28/2021 | 4,584 | 4,512 | ||||||
Fibertech Networks, LLC, Term Loan B | ||||||||
4.000%, 12/18/2019 | 2,368 | 2,364 | ||||||
First Data, Term Loan, 1st Lien | ||||||||
3.685%, 03/23/2018 | 5,936 | 5,932 | ||||||
| Description | Face Amount ($ Thousands) | Market Value ($ Thousands) | ||||||
Four Seasons Holdings, Term Loan | ||||||||
3.500%, 06/27/2020 | $ | 1,323 | $ | 1,324 | ||||
Freescale Semiconductor, Term Loan | ||||||||
3.750%, 02/13/2020 | 3,933 | 3,943 | ||||||
Generac Power Systems, Term Loan B | ||||||||
3.250%, 05/31/2020 | 1,250 | 1,246 | ||||||
Genesys Telecommuniocations, Delayed Draw, Term Loan, 1st Lien | ||||||||
4.500%, 11/13/2020 | 1,728 | 1,728 | ||||||
Genesys Telecommunications, Term Loan | ||||||||
4.000%, 02/08/2020 | 5,712 | 5,694 | ||||||
Genpact International, Term Loan B | ||||||||
3.500%, 08/17/2019 | 1,956 | 1,959 | ||||||
GNC, Term Loan, 1st Lien | ||||||||
3.250%, 03/02/2018 | 5,933 | 5,864 | ||||||
GO Daddy, Cov-Lite, Term Loan B, 1st Lien | ||||||||
4.750%, 05/13/2021 | 1,191 | 1,195 | ||||||
Gray Television, Cov-Lite, Term B, 1st Lien | ||||||||
3.750%, 06/13/2021 | 37 | 38 | ||||||
Gray Television, Term Loan, 1st Lien | ||||||||
3.750%, 06/13/2021 | 595 | 595 | ||||||
Grifols Worldwide Operations, Term Loan B, 2nd Lien | ||||||||
3.184%, 02/27/2021 | 3,709 | 3,717 | ||||||
H.J. Heinz, Term Loan B2 | ||||||||
3.250%, 06/05/2020 | 1,206 | 1,206 | ||||||
Harbor Freight Tools, Cov-Lite, Term Loan | ||||||||
4.750%, 07/26/2019 | 66 | 66 | ||||||
Harbor Freight Tools, Term Loan | ||||||||
4.750%, 07/26/2019 | 3,501 | 3,522 | ||||||
Harron Communications, Term Loan B | ||||||||
3.500%, 06/20/2020 | 244 | 243 | ||||||
Headwaters, Term Loan B | ||||||||
4.500%, 03/11/2022 | 580 | 582 | ||||||
Hilton Hotels, Cov-Lite, Term Loan B, 1st Lien | ||||||||
3.500%, 10/26/2020 | 1,063 | 1,065 | ||||||
Hilton Worldwide Finance, Term Loan | ||||||||
3.500%, 10/26/2020 | 709 | 710 | ||||||
Hilton Worldwide, Term Loan B, 1st Lien | ||||||||
3.500%, 10/26/2020 | 310 | 311 | ||||||
| SEI Institutional Investments Trust / Annual Report / May 31, 2015 | 85 |
SCHEDULE OF INVESTMENTS
Opportunistic Income Fund (Continued)
May 31, 2015
| Description | Face Amount ($ Thousands) | Market Value ($ Thousands) | ||||||
Houghton Mifflin Harcourt Publishers, Term Loan, 1st Lien | ||||||||
0.000%, 05/11/2021 (C) | $ | 2,900 | $ | 2,895 | ||||
Hub International, Ltd., Term Loan | ||||||||
4.000%, 10/02/2020 | 22 | 21 | ||||||
Hub International, Ltd., Term Loan B, 1st Lien | ||||||||
4.000%, 10/02/2020 | 8,502 | 8,468 | ||||||
Hudson’s Bay, Term Loan, 1st Lien | ||||||||
4.750%, 11/04/2020 | 1,625 | 1,631 | ||||||
Hyperion Insurance, Term Loan, 1st Lien | ||||||||
5.500%, 04/29/2022 | 2,500 | 2,516 | ||||||
IMS Health, Term Loan B | ||||||||
3.500%, 03/17/2021 | 2,043 | 2,040 | ||||||
Ina Beteiligungs, Term Loan, 1st Lien | ||||||||
4.250%, 05/15/2020 | 1,225 | 1,231 | ||||||
Ineos Holdings, Ltd., Cov-Lite | ||||||||
3.750%, 05/04/2018 | 1,495 | 1,494 | ||||||
Ineos, Term Loan | ||||||||
4.250%, 03/11/2022 | 900 | 901 | ||||||
Infor, Term Loan B, 1st Lien | ||||||||
3.750%, 06/03/2020 | 1,891 | 1,881 | ||||||
Intelsat Jackson Holdings, Term Loan B-2 | ||||||||
3.750%, 06/30/2019 | 1,678 | 1,672 | ||||||
Interactive Data, Cov-Lite, Term Loan, 1st Lien | ||||||||
4.750%, 05/02/2021 | 5,170 | 5,184 | ||||||
Inventiv Health, Incremental Term Loan B-3 | ||||||||
7.750%, 05/15/2018 | 265 | 264 | ||||||
ION Trading Technologies, Term Loan, 1st Lien | ||||||||
4.250%, 06/10/2021 | 531 | 528 | ||||||
ION Trading Technologies, Term Loan, 2nd Lien | ||||||||
7.250%, 06/10/2022 | 2,420 | 2,400 | ||||||
Ipreo Holdings, LLC, Term Loan B, 1st Lien | ||||||||
4.250%, 08/06/2021 | 1,678 | 1,675 | ||||||
Jeld-Wen, Cov-Lite, Term Loan B, 1st Lien | ||||||||
5.250%, 09/24/2021 | 5,786 | 5,815 | ||||||
Klockner Pentaplast, Term Loan, 1st Lien | ||||||||
5.000%, 04/22/2020 | 631 | 633 | ||||||
5.000%, 04/28/2020 | 270 | 271 | ||||||
Kronos, Incremental Term Loan, 1st Lien | ||||||||
4.500%, 10/30/2019 | 4,143 | 4,155 | ||||||
| Description | Face Amount ($ Thousands) | Market Value ($ Thousands) | ||||||
Language Line, Term Loan B | ||||||||
6.250%, 06/20/2016 | $ | 5,694 | $ | 5,677 | ||||
Lee Enterprises, Term Loan B | ||||||||
7.250%, 03/31/2019 | 1,953 | 1,962 | ||||||
Lee Enterprises, Term Loan, 1st Lien | ||||||||
7.250%, 03/31/2019 | 215 | 216 | ||||||
Leslie’s Poolmart, Cov-Lite, 1st Lien | ||||||||
4.250%, 10/16/2019 | 4,313 | 4,317 | ||||||
Level 3 Communications, Term Loan B | ||||||||
4.000%, 01/15/2020 | 2,500 | 2,498 | ||||||
Level 3 Communications, Term Loan B III | ||||||||
4.000%, 08/01/2019 | 2,000 | 1,999 | ||||||
Level 3 Financing, Term Loan, Tranche B-II | ||||||||
4.500%, 05/31/2022 | 1,071 | 1,068 | ||||||
Light Tower Fiber, LLC, Term Loan | ||||||||
8.000%, 04/12/2021 | 633 | 631 | ||||||
Light Tower Fiber, LLC, Term Loan B | ||||||||
4.000%, 04/13/2020 | 4,950 | 4,942 | ||||||
LPL Holdings, Term Loan B | ||||||||
3.250%, 03/29/2019 | 1,715 | 1,714 | ||||||
Media General, Delayed Term Loan | ||||||||
4.250%, 07/31/2020 | 888 | 892 | ||||||
Mediacom Communications, Term Loan H | ||||||||
3.250%, 01/29/2021 | 3,095 | 3,077 | ||||||
MEG Energy, Term Loan | ||||||||
3.750%, 03/21/2020 | 1,625 | 1,598 | ||||||
MGM Resorts International, Term Loan B | ||||||||
3.500%, 12/20/2019 | 412 | 411 | ||||||
MGM Resorts International, Term Loan B1 | ||||||||
3.500%, 12/20/2019 | 1,154 | 1,152 | ||||||
Michaels Stores, Term Loan B | ||||||||
3.750%, 01/24/2020 | 1,773 | 1,774 | ||||||
3.750%, 01/28/2020 | 1,173 | 1,174 | ||||||
Millennium Laboratories, LLC, Term Loan B, 1st Lien | ||||||||
5.250%, 04/16/2021 | 5,315 | 3,648 | ||||||
Minimax GmbH, Term Loan B | ||||||||
4.250%, 08/14/2020 | 3,842 | 3,842 | ||||||
Mohegan Tribal Gaming Authority, Term Loan A, 1st Lien | ||||||||
4.525%, 06/15/2018 | 2,132 | 2,121 | ||||||
Mohegan Tribal Gaming Authority, Term Loan B, 1st Lien | ||||||||
5.500%, 11/19/2019 | 1,529 | 1,523 | ||||||
| 86 | SEI Institutional Investments Trust / Annual Report / May 31, 2015 |
| Description | Face Amount ($ Thousands) | Market Value ($ Thousands) | ||||||
MTL Publishing, Term Loan B | ||||||||
3.750%, 06/29/2018 | $ | 2,572 | $ | 2,570 | ||||
Mueller Water Products, Inc., Initial Loan | ||||||||
4.000%, 11/19/2021 | 40 | 40 | ||||||
Mueller Water Products, Term Loan B, 1st Lien | ||||||||
4.000%, 11/19/2021 | 546 | 549 | ||||||
Murray Energy, Cov-Lite, Term Loan B, 2nd Lien | ||||||||
7.500%, 04/09/2020 | 2,478 | 2,399 | ||||||
Navistar International, Term Loan B | ||||||||
5.750%, 08/17/2017 | 1,383 | 1,387 | ||||||
NCI Building Systems, Term Loan | ||||||||
4.250%, 06/24/2019 | 1,470 | 1,467 | ||||||
Nelson Education, Term Loan B-1 | ||||||||
6.750%, 07/03/2014 (D) | 730 | 527 | ||||||
Numericable, Term Loan B, 1st Lien | ||||||||
4.500%, 05/21/2020 | 850 | 852 | ||||||
NXP, Cov-Lite, Term Loan D, 1st Lien | ||||||||
3.250%, 01/11/2020 | 1,955 | 1,948 | ||||||
Ocwen Financial, Term Loan | ||||||||
5.000%, 02/15/2018 | 635 | 630 | ||||||
Opal Acquisition, Term Loan, 1st Lien | ||||||||
5.000%, 11/27/2020 | 6,570 | 6,555 | ||||||
Par Pharmaceutical Incremental, Term Loan B, 1st Lien | ||||||||
4.250%, 09/30/2019 | 1,995 | 1,998 | ||||||
Peabody Energy, Cov-Lite, Term Loan B, 1st Lien | ||||||||
4.250%, 09/24/2020 | 4,515 | 4,026 | ||||||
Penn Products Terminals, Term Loan, Tranche B | ||||||||
4.750%, 04/01/2022 | 1,080 | 1,088 | ||||||
PETCO Animal Supplies, Term Loan B | ||||||||
4.000%, 11/24/2017 | 1,469 | 1,472 | ||||||
Pinnacle Foods Group, LLC, Term Loan G | ||||||||
3.000%, 04/29/2020 | 498 | 497 | ||||||
Pinnacle Foods Group, LLC, Term Loan H | ||||||||
3.000%, 04/29/2020 | 1,300 | 1,296 | ||||||
Post Holdings | ||||||||
3.750%, 06/02/2021 | 1,008 | 1,004 | ||||||
Post Holdings, Term Loan B, 1st Lien | ||||||||
3.750%, 06/02/2021 | 1,265 | 1,260 | ||||||
Quintiles Transnational, Term Loan, 1st Lien | ||||||||
3.250%, 05/06/2022 | 2,483 | 2,488 | ||||||
| Description | Face Amount ($ Thousands) | Market Value ($ Thousands) | ||||||
Radnet, Term Loan, 1st Lien | ||||||||
0.000%, 10/10/2018 (C) | $ | 2,415 | $ | 2,415 | ||||
RE/MAX International, Term Loan | ||||||||
4.250%, 07/31/2020 | 2,541 | 2,534 | ||||||
Realogy, Extended Synthetic Term Loan | ||||||||
0.150%, 10/10/2016 | 41 | 40 | ||||||
Redtop Acquisitions, Ltd., 1st Lien | ||||||||
4.500%, 12/03/2020 | 617 | 616 | ||||||
Redtop Acquisitions, Ltd., 2nd Lien | ||||||||
8.250%, 06/03/2021 | 518 | 520 | ||||||
Regal Cinemas, Term Loan | ||||||||
3.750%, 04/01/2022 | 653 | 655 | ||||||
3.750%, 03/25/2022 | 1,448 | 1,453 | ||||||
Rexnord, LLC, Cov-Lite, Term Loan B, 1st Lien | ||||||||
4.000%, 08/21/2020 | 1,522 | 1,520 | ||||||
Rexnord, LLC, Term Loan B | ||||||||
4.000%, 08/21/2020 | 4,687 | 4,681 | ||||||
Ryman Hospitality Properties, Cov-Lite, Term Loan | ||||||||
3.750%, 01/15/2021 | 526 | 528 | ||||||
Salem Communications, Term Loan B | ||||||||
4.500%, 03/12/2020 | 690 | 689 | ||||||
Seadrill Partners, LLC, Term Loan B, 1st Lien | ||||||||
4.000%, 02/21/2021 | 3,934 | 3,219 | ||||||
Seaworld, Term Loan B-2 | ||||||||
3.000%, 05/14/2020 | 2,113 | 2,043 | ||||||
Seminole Hard Rock Entertainment, Term Loan B | ||||||||
3.500%, 05/14/2020 | 3,224 | 3,213 | ||||||
Serta Simmons Holdings, Term Loan B | ||||||||
4.250%, 10/01/2019 | 2,965 | 2,974 | ||||||
Shield Finance, Term Loan B | ||||||||
5.000%, 01/29/2021 | 1,782 | 1,791 | ||||||
Sinclair Television Group, Term Loan B1, 1st Lien | ||||||||
3.500%, 07/30/2021 | 2,321 | 2,321 | ||||||
Skillsoft, Cov-Lite, Term Loan, 2nd Lien | ||||||||
9.250%, 04/28/2022 | 973 | 922 | ||||||
Smart & Final, Cov-Lite, Term Loan | ||||||||
4.750%, 11/08/2019 | 825 | 826 | ||||||
Smart Technologies, Term Loan | ||||||||
10.500%, 01/31/2018 | 124 | 124 | ||||||
Starwood Property Trust, Term Loan B | ||||||||
3.500%, 04/17/2020 | 835 | 836 | ||||||
| SEI Institutional Investments Trust / Annual Report / May 31, 2015 | 87 |
SCHEDULE OF INVESTMENTS
Opportunistic Income Fund (Continued)
May 31, 2015
| Description | Face Amount ($ Thousands) | Market Value ($ Thousands) | ||||||
Sterigenics-Nordion, Cov-Lite, Term Loan, 1st Lien | ||||||||
4.250%, 05/15/2022 | $ | 2,231 | $ | 2,231 | ||||
SunGard Data Systems, Term Loan E | ||||||||
4.000%, 03/07/2020 | 1,670 | 1,672 | ||||||
Syncreon Holdings, Ltd., Term Loan B, 1st Lien | ||||||||
5.250%, 10/28/2020 | 4,732 | 4,238 | ||||||
Syniverse Holdings, Term Loan | ||||||||
4.000%, 04/23/2019 | 1,212 | 1,157 | ||||||
TASC, Term Loan, 1st Lien | ||||||||
7.000%, 05/23/2020 | 4,988 | 5,030 | ||||||
TASC, Term Loan, 2nd Lien | ||||||||
12.000%, 05/23/2021 | 2,300 | 2,412 | ||||||
Telesat Canada, Term Loan B | ||||||||
3.500%, 03/28/2019 | 391 | 390 | ||||||
Templar Energy, Cov-Lite, 2nd Lien | ||||||||
8.500%, 11/25/2020 | 3,939 | 3,029 | ||||||
Texas Competitive, Extended Term Loan | ||||||||
4.668%, 10/10/2017 (D) | 3,873 | 2,353 | ||||||
The Neiman Marcus Group, Term Loan, 1st Lien | ||||||||
4.250%, 10/25/2020 | 3,940 | 3,940 | ||||||
TI Group Automotive Systems, LLC, Term Loan B, 1st Lien | ||||||||
4.250%, 07/02/2021 | 5,619 | 5,624 | ||||||
Townsquare Media, Term Loan | ||||||||
4.250%, 03/25/2022 | 1,480 | 1,488 | ||||||
Trans Union, LLC, Term Loan, 1st Lien | ||||||||
4.000%, 04/09/2021 | 5,940 | 5,921 | ||||||
TransDigm, Term Loan C, 1st Lien | ||||||||
3.750%, 02/25/2020 | 3,496 | 3,486 | ||||||
TransDigm, Term Loan D, 1st Lien | ||||||||
3.750%, 06/04/2021 | 1,016 | 1,014 | ||||||
Tribune, Term Loan B, 1st Lien | ||||||||
4.000%, 12/27/2020 | 3,965 | 3,966 | ||||||
Tribune, Term Loan, 1st Lien | ||||||||
5.750%, 08/04/2021 | 1,862 | 1,860 | ||||||
Tronox, Term Loan B | ||||||||
4.250%, 03/19/2020 | 448 | 449 | ||||||
4.000%, 03/19/2020 | 533 | 534 | ||||||
True Religion Apparel, Term Loan, | ||||||||
5.875%, 07/30/2019 | 1,351 | 1,205 | ||||||
Univision Communications, Extended Term Loan C-3 | ||||||||
4.000%, 03/01/2020 | 1,570 | 1,567 | ||||||
Univision Communications, Term Loan, 1st Lien | ||||||||
4.000%, 03/01/2020 | 2,405 | 2,401 | ||||||
| Description | Face Amount ($ Thousands) | Market Value ($ Thousands) | ||||||
UPC Finance Partnership | ||||||||
3.250%, 06/30/2021 | $ | 1,000 | $ | 996 | ||||
Valeant Pharmaceuticals International, Term Loan E | ||||||||
3.500%, 06/26/2020 | 1,592 | 1,592 | ||||||
Valeant Pharmaceuticals, Term Loan | ||||||||
3.750%, 02/13/2019 | 127 | 254 | ||||||
3.500%, 12/11/2019 | 1,274 | 1,274 | ||||||
Vantiv, LLC, Term Loan B, 1st Lien | ||||||||
3.750%, 06/13/2021 | 1,215 | 1,218 | ||||||
Verint Systems, Term Loan B, 1st Lien | ||||||||
3.500%, 09/06/2019 | 2,524 | 2,526 | ||||||
Virgin Media Investment, Term Loan B | ||||||||
3.500%, 06/07/2020 | 2,559 | 2,551 | ||||||
Virgin Media, Term Loan, 1st Lien | ||||||||
0.000%, 06/07/2023 (C) | 2,088 | 2,081 | ||||||
Warner Music Group, Term Loan | ||||||||
3.750%, 07/01/2020 | 5,489 | 5,438 | ||||||
Waste Industries USA, Cov-Lite, | ||||||||
4.250%, 02/20/2020 | 2,850 | 2,864 | ||||||
WCA Waste Systems, Term Loan | ||||||||
4.000%, 03/23/2018 | 2,725 | 2,710 | ||||||
Weight Watchers International | ||||||||
4.000%, 04/02/2020 | 7 | 3 | ||||||
4.000%, 04/02/2020 | 2,650 | 1,311 | ||||||
West, Term Loan | ||||||||
3.250%, 06/30/2018 | 861 | 860 | ||||||
Wide Open West, Term Loan, 1st Lien | ||||||||
4.500%, 04/01/2019 | 4,974 | 4,969 | ||||||
Wilsonart International Holdings LLC, 1st Lien | ||||||||
4.000%, 10/24/2019 | 5,947 | 5,930 | ||||||
York Risk Services Holding, | ||||||||
4.750%, 09/18/2021 | 5,850 | 5,799 | ||||||
York Risk Services, Cov-Lite, 1st Lien | ||||||||
4.750%, 10/01/2021 | 632 | 627 | ||||||
Ziggo, Term Loan B1, 1st Lien | ||||||||
3.500%, 01/15/2022 | 959 | 955 | ||||||
Ziggo, Term Loan B2, 1st Lien | ||||||||
3.500%, 01/15/2022 | 541 | 538 | ||||||
Ziggo, Term Loan B3, 1st Lien | ||||||||
3.500%, 01/15/2022 | 967 | 962 | ||||||
|
| |||||||
Total Loan Participations |
| 486,804 | ||||||
|
| |||||||
| 88 | SEI Institutional Investments Trust / Annual Report / May 31, 2015 |
| Description | Face Amount ($ Thousands) | Market Value ($ Thousands) | ||||||
ASSET-BACKED SECURITIES — 22.1% |
| |||||||
Automotive — 4.0% | ||||||||
Ally Auto Receivables Trust, | ||||||||
0.630%, 05/15/2017 | $ | 202 | $ | 202 | ||||
Ally Auto Receivables Trust, | ||||||||
0.790%, 01/15/2018 | 3,998 | 4,000 | ||||||
Ally Auto Receivables Trust, | ||||||||
0.720%, 05/20/2016 | 17 | 17 | ||||||
Ally Auto Receivables Trust, | ||||||||
0.750%, 02/21/2017 | 375 | 375 | ||||||
Ally Master Owner Trust, | ||||||||
0.886%, 06/15/2017 (A) | 289 | 289 | ||||||
Ally Master Owner Trust, | ||||||||
1.210%, 06/15/2017 | 620 | 620 | ||||||
Ally Master Owner Trust, | ||||||||
0.636%, 02/15/2018 (A) | 225 | 225 | ||||||
Ally Master Owner Trust, | ||||||||
0.636%, 04/15/2018 (A) | 400 | 401 | ||||||
American Credit Acceptance Receivables Trust, Ser 2013-1, Cl A | ||||||||
1.450%, 04/16/2018 (B) | 98 | 98 | ||||||
American Credit Acceptance Receivables Trust, Ser 2013-2, Cl A | ||||||||
1.320%, 02/15/2017 (B) | 9 | 9 | ||||||
American Credit Acceptance Receivables Trust, Ser 2014-1, Cl A | ||||||||
1.140%, 03/12/2018 (B) | 66 | 66 | ||||||
American Credit Acceptance Receivables Trust, Ser 2014-4, Cl A | ||||||||
1.330%, 07/10/2018 (B) | 356 | 357 | ||||||
AmeriCredit Automobile Receivables Trust, Ser 2012-4, Cl B | ||||||||
1.310%, 11/08/2017 | 415 | 416 | ||||||
AmeriCredit Automobile Receivables Trust, Ser 2012-5, Cl A3 | ||||||||
0.620%, 06/08/2017 | 19 | 19 | ||||||
AmeriCredit Automobile Receivables Trust, Ser 2013-2, Cl A3 | ||||||||
0.650%, 12/08/2017 | 210 | 210 | ||||||
| Description | Face Amount ($ Thousands) | Market Value ($ Thousands) | ||||||
AmeriCredit Automobile Receivables Trust, Ser 2013-4, Cl C | ||||||||
2.720%, 09/09/2019 | $ | 1,150 | $ | 1,176 | ||||
AmeriCredit Automobile Receivables Trust, Ser 2013-5, Cl A2B | ||||||||
0.560%, 03/08/2017 (A) | 42 | 42 | ||||||
AmeriCredit Automobile Receivables Trust, Ser 2014-1, Cl A2 | ||||||||
0.570%, 07/10/2017 | 1,627 | 1,627 | ||||||
AmeriCredit Automobile Receivables Trust, Ser 2015-1, Cl A2A | ||||||||
0.770%, 04/09/2018 | 760 | 760 | ||||||
ARI Fleet Lease Trust, | ||||||||
0.736%, 03/15/2020 (A) (B) | 93 | 93 | ||||||
ARI Fleet Lease Trust, | ||||||||
0.486%, 01/15/2021 (A) (B) | 1,034 | 1,033 | ||||||
ARI Fleet Lease Trust, | ||||||||
0.810%, 11/15/2022 (B) | 213 | 213 | ||||||
BMW Vehicle Lease Trust, | ||||||||
0.860%, 02/21/2017 | 1,000 | 1,000 | ||||||
BMW Vehicle Owner Trust, | ||||||||
0.670%, 11/27/2017 | 1,642 | 1,644 | ||||||
Capital Auto Receivables Asset Trust, Ser 2013-1, Cl A3 | ||||||||
0.790%, 06/20/2017 | 2,549 | 2,550 | ||||||
Capital Auto Receivables Asset Trust, Ser 2013-1, Cl A4 | ||||||||
0.970%, 01/22/2018 | 2,500 | 2,503 | ||||||
Capital Auto Receivables Asset Trust, Ser 2013-4, Cl A1 | ||||||||
0.564%, 03/21/2016 (A) | 22 | 22 | ||||||
Capital Auto Receivables Asset Trust, Ser 2014-1, Cl A1A | ||||||||
0.680%, 05/20/2016 | 215 | 215 | ||||||
Capital Auto Receivables Asset Trust, Ser 2014-1, Cl A3 | ||||||||
1.320%, 06/20/2018 | 3,500 | 3,513 | ||||||
Capital Auto Receivables Asset Trust, Ser 2015-1, Cl A1A | ||||||||
0.950%, 07/20/2017 | 1,000 | 998 | ||||||
CarMax Auto Owner Trust, | ||||||||
2.170%, 07/17/2017 | 150 | 151 | ||||||
CarMax Auto Owner Trust, | ||||||||
0.520%, 07/17/2017 | 28 | 28 | ||||||
| SEI Institutional Investments Trust / Annual Report / May 31, 2015 | 89 |
SCHEDULE OF INVESTMENTS
Opportunistic Income Fund (Continued)
May 31, 2015
| Description | Face Amount ($ Thousands) | Market Value ($ Thousands) | ||||||
CarMax Auto Owner Trust, | ||||||||
1.500%, 08/15/2018 | $ | 55 | $ | 55 | ||||
CFC, Ser 2013-1A, Cl A | ||||||||
1.650%, 07/17/2017 (B) | 2 | 2 | ||||||
Chesapeake Funding LLC, | ||||||||
0.931%, 11/07/2023 (A) (B) | 63 | 63 | ||||||
Chesapeake Funding LLC, | ||||||||
0.631%, 05/07/2024 (A) (B) | 924 | 924 | ||||||
Chesapeake Funding LLC, | ||||||||
0.601%, 03/07/2026 (A) (B) | 1,555 | 1,555 | ||||||
Chesapeake Funding LLC, | ||||||||
0.681%, 02/07/2027 (A) (B) | 945 | 945 | ||||||
Chrysler Capital Auto Receivables Trust, Ser 2013-AA, Cl A3 | ||||||||
0.910%, 04/16/2018 (B) | 1,182 | 1,184 | ||||||
CPS Auto Receivables Trust, Ser 2013-D, Cl A | ||||||||
1.540%, 07/16/2018 (B) | 364 | 364 | ||||||
CPS Auto Receivables Trust, Ser 2014-A, Cl A | ||||||||
1.210%, 08/15/2018 (B) | 200 | 200 | ||||||
Credit Acceptance Auto Loan Trust, Ser 2013-2A, Cl A | ||||||||
1.500%, 04/15/2021 (B) | 465 | 467 | ||||||
Credit Acceptance Auto Loan Trust, Ser 2014-1A, Cl A | ||||||||
1.550%, 10/15/2021 (B) | 690 | 692 | ||||||
DT Auto Owner Trust, | ||||||||
0.660%, 07/17/2017 (B) | 26 | 26 | ||||||
Enterprise Fleet Financing LLC, Ser 2012-2, Cl A2 | ||||||||
0.720%, 04/20/2018 (B) | 18 | 18 | ||||||
Enterprise Fleet Financing LLC, Ser 2013-1, Cl A2 | ||||||||
0.680%, 09/20/2018 (B) | 368 | 368 | ||||||
Enterprise Fleet Financing LLC, Ser 2013-2, Cl A2 | ||||||||
1.060%, 03/20/2019 (B) | 377 | 378 | ||||||
Enterprise Fleet Financing LLC, Ser 2014-1, Cl A2 | ||||||||
0.870%, 09/20/2019 (B) | 1,267 | 1,267 | ||||||
Fifth Third Auto Trust, | ||||||||
0.880%, 10/16/2017 | 419 | 420 | ||||||
First Investors Auto Owner Trust, Ser 2012-2A, Cl A2 | ||||||||
1.470%, 05/15/2018 (B) | 71 | 71 | ||||||
| Description | Face Amount ($ Thousands) | Market Value ($ Thousands) | ||||||
First Investors Auto Owner Trust, Ser 2013-1A, Cl A2 | ||||||||
0.900%, 10/15/2018 (B) | $ | 29 | $ | 29 | ||||
First Investors Auto Owner Trust, Ser 2013-2A, Cl A2 | ||||||||
1.230%, 03/15/2019 (B) | 141 | 142 | ||||||
First Investors Auto Owner Trust, Ser 2013-3A, Cl A2 | ||||||||
0.890%, 09/15/2017 (B) | 44 | 44 | ||||||
First Investors Auto Owner Trust, Ser 2014-1A, Cl A2 | ||||||||
0.800%, 02/15/2018 (B) | 232 | 232 | ||||||
First Investors Auto Owner Trust, Ser 2014-3A, Cl A2 | ||||||||
1.060%, 11/15/2018 (B) | 994 | 993 | ||||||
Flagship Credit Auto Trust, | ||||||||
1.430%, 12/16/2019 (B) | 2,031 | 2,028 | ||||||
Ford Credit Auto Lease Trust, Ser 2011-B, Cl A4 | ||||||||
1.350%, 12/15/2016 | 565 | 566 | ||||||
Ford Credit Auto Owner Trust, Ser 2012-A, Cl B | ||||||||
1.880%, 08/15/2017 | 175 | 177 | ||||||
Ford Credit Auto Owner Trust, Ser 2012-B, Cl D | ||||||||
2.930%, 10/15/2018 | 1,000 | 1,022 | ||||||
Ford Credit Auto Owner Trust, Ser 2012-C, Cl A3 | ||||||||
0.580%, 12/15/2016 | 526 | 526 | ||||||
Ford Credit Auto Owner Trust, Ser 2012-C, Cl A4 | ||||||||
0.790%, 11/15/2017 | 1,390 | 1,391 | ||||||
Ford Credit Floorplan Master Owner Trust, Ser 2012-2, Cl A | ||||||||
1.920%, 01/15/2019 | 1,280 | 1,299 | ||||||
Ford Credit Floorplan Master Owner Trust, Ser 2013-1, Cl A2 | ||||||||
0.566%, 01/15/2018 (A) | 195 | 195 | ||||||
Ford Credit Floorplan Master Owner Trust, Ser 2013-5, Cl A2 | ||||||||
0.656%, 09/15/2018 (A) | 425 | 426 | ||||||
Ford Credit Floorplan Master Owner Trust, Ser 2014-1, Cl B | ||||||||
1.400%, 02/15/2019 | 135 | 135 | ||||||
GE Dealer Floorplan Master Note Trust, Ser 2015-1, Cl A | ||||||||
0.684%, 01/20/2020 (A) | 1,000 | 1,001 | ||||||
Harley-Davidson Motorcycle Trust, Ser 2012-1, Cl A3 | ||||||||
0.680%, 04/15/2017 | 15 | 15 | ||||||
Harley-Davidson Motorcycle Trust, Ser 2013-1, Cl A3 | ||||||||
0.650%, 07/16/2018 | 181 | 181 | ||||||
| 90 | SEI Institutional Investments Trust / Annual Report / May 31, 2015 |
| Description | Face Amount ($ Thousands) | Market Value ($ Thousands) | ||||||
Hertz Fleet Lease Funding, | ||||||||
0.732%, 12/10/2027 (A) (B) | $ | 2,282 | $ | 2,282 | ||||
Hertz Fleet Lease Funding, | ||||||||
0.582%, 04/10/2028 (A) (B) | 1,910 | 1,910 | ||||||
Honda Auto Receivables Owner Trust, Ser 2012-4, Cl A3 | ||||||||
0.520%, 08/18/2016 | 27 | 27 | ||||||
Honda Auto Receivables Owner Trust, Ser 2013-4, Cl A3 | ||||||||
0.690%, 09/18/2017 | 5,000 | 5,000 | ||||||
Huntington Auto Trust, Ser 2011-1A, Cl A4 | ||||||||
1.310%, 11/15/2016 (B) | 114 | 114 | ||||||
Huntington Auto Trust, Ser 2012-2, Cl A3 | ||||||||
0.510%, 04/17/2017 | 36 | 36 | ||||||
Hyundai Auto Receivables Trust, Ser 2011-B, Cl B | ||||||||
2.270%, 02/15/2017 | 19 | 19 | ||||||
Hyundai Auto Receivables Trust, Ser 2013-B, Cl A4 | ||||||||
1.010%, 02/15/2019 | 8,550 | 8,571 | ||||||
Hyundai Auto Receivables Trust, Ser 2013-C, Cl A3 | ||||||||
1.010%, 02/15/2018 | 4,590 | 4,599 | ||||||
M&T Bank Auto Receivables Trust, Ser 2013-1A, Cl A3 | ||||||||
1.060%, 11/15/2017 (B) | 4,373 | 4,383 | ||||||
Mercedes Benz Auto Lease Trust, Ser 2015-A, Cl A3 | ||||||||
1.100%, 08/15/2017 | 835 | 836 | ||||||
Mercedes-Benz Auto Lease Trust, Ser 2013-B, Cl A3 | ||||||||
0.620%, 07/15/2016 | 423 | 423 | ||||||
Mercedes-Benz Auto Receivables Trust, Ser 2012-1, Cl A3 | ||||||||
0.470%, 10/17/2016 | 506 | 506 | ||||||
Motor PLC, Ser 2013-1, Cl A1 | ||||||||
0.685%, 02/25/2021 (A) (B) | 8 | 8 | ||||||
Nissan Auto Receivables Owner Trust, Ser 2012-A, Cl A4 | ||||||||
1.000%, 07/16/2018 | 1,095 | 1,097 | ||||||
Porsche Innovative Lease Owner Trust, Ser 2013-1, Cl A4 | ||||||||
0.880%, 10/22/2019 (B) | 390 | 390 | ||||||
Prestige Auto Receivables Trust, Ser 2013-1A, Cl A2 | ||||||||
1.090%, 02/15/2018 (B) | 72 | 72 | ||||||
Prestige Auto Receivables Trust, Ser 2013-1A, Cl A3 | ||||||||
1.330%, 05/15/2019 (B) | 960 | 963 | ||||||
| Description | Face Amount ($ Thousands) | Market Value ($ Thousands) | ||||||
Prestige Auto Receivables Trust, Ser 2014-1A, Cl A2 | ||||||||
0.970%, 03/15/2018 (B) | $ | 233 | $ | 233 | ||||
Prestige Auto Receivables Trust, Ser 2015-1, Cl A2 | ||||||||
1.090%, 02/15/2019 (B) | 355 | 355 | ||||||
Santander Drive Auto Receivables Trust, Ser 2012-3, Cl D | ||||||||
3.640%, 05/15/2018 | 785 | 806 | ||||||
Santander Drive Auto Receivables Trust, Ser 2012-4, Cl B | ||||||||
1.830%, 03/15/2017 | 75 | 75 | ||||||
Santander Drive Auto Receivables Trust, Ser 2013-2, Cl A3 | ||||||||
0.700%, 09/15/2017 | 68 | 68 | ||||||
Santander Drive Auto Receivables Trust, Ser 2014-1, Cl A2A | ||||||||
0.660%, 06/15/2017 | 65 | 65 | ||||||
SNAAC Auto Receivables Trust, Ser 2014-1A, Cl A | ||||||||
1.030%, 09/17/2018 (B) | 285 | 285 | ||||||
Toyota Auto Receivables Owner Trust, Ser 2013-A, Cl A3 | ||||||||
0.550%, 01/17/2017 | 38 | 38 | ||||||
Volkswagen Auto Loan Enhanced Trust, Ser 2012-1, Cl A3 | ||||||||
0.850%, 08/22/2016 | 315 | 315 | ||||||
Volkswagen Auto Loan Enhanced Trust, Ser 2013-2, Cl A2 | ||||||||
0.420%, 07/20/2016 | 117 | 117 | ||||||
Volvo Financial Equipment LLC, Ser 2014-1A, Cl A3 | ||||||||
0.820%, 04/16/2018 (B) | 405 | 405 | ||||||
Westlake Automobile Receivables Trust, Ser 2013-1A, Cl A2 | ||||||||
1.120%, 01/15/2018 (B) | 672 | 672 | ||||||
Westlake Automobile Receivables Trust, Ser 2014-1A, Cl A2 | ||||||||
0.700%, 05/15/2017 (B) | 330 | 330 | ||||||
Westlake Automobile Receivables Trust, Ser 2014-2A, Cl A2 | ||||||||
0.970%, 10/16/2017 (B) | 468 | 468 | ||||||
Westlake Automobile Receivables Trust, Ser 2015-1A, Cl A2 | ||||||||
1.170%, 03/15/2018 (B) | 1,230 | 1,227 | ||||||
Wheels SPV LLC, Ser 2014-1A, Cl A2 | ||||||||
0.840%, 03/20/2023 (B) | 4,714 | 4,710 | ||||||
World Omni Auto Receivables Trust, Ser 2012-A, Cl A3 | ||||||||
0.640%, 02/15/2017 | 6 | 6 | ||||||
World Omni Automobile Lease Securitization Trust, | ||||||||
0.506%, 05/16/2016 (A) | 53 | 53 | ||||||
| SEI Institutional Investments Trust / Annual Report / May 31, 2015 | 91 |
SCHEDULE OF INVESTMENTS
Opportunistic Income Fund (Continued)
May 31, 2015
| Description | Face Amount ($ Thousands) | Market Value ($ Thousands) | ||||||
World Omni Master Owner Trust, Ser 2013-1, Cl A | ||||||||
0.536%, 02/15/2018 (A) (B) | $ | 105 | $ | 105 | ||||
|
| |||||||
| 85,842 | ||||||||
|
| |||||||
Credit Cards — 4.0% | ||||||||
American Express Credit Account Master Trust, Ser 2012-2, Cl B | ||||||||
0.990%, 03/15/2018 | 100 | 100 | ||||||
American Express Credit Account Master Trust, Ser 2013-1, Cl A | ||||||||
0.606%, 02/16/2021 (A) | 310 | 311 | ||||||
American Express Credit Account Master Trust, Ser 2013-3, Cl A | ||||||||
0.980%, 05/15/2019 | 305 | 306 | ||||||
American Express Credit Account Master Trust, Ser 2014-1, Cl A | ||||||||
0.556%, 12/15/2021 (A) | 5,000 | 4,991 | ||||||
American Express Credit Account Master Trust, Ser 2014-2, Cl A | ||||||||
1.260%, 01/15/2020 | 4,500 | 4,516 | ||||||
BA Credit Card Trust, Ser 2014-A1, Cl A | ||||||||
0.566%, 06/15/2021 (A) | 4,000 | 4,003 | ||||||
BA Credit Card Trust, Ser 2014-A2, Cl A | ||||||||
0.456%, 09/16/2019 (A) | 5,000 | 5,001 | ||||||
BA Credit Card Trust, Ser 2015-A1, Cl A | ||||||||
0.516%, 06/15/2020 (A) | 5,000 | 5,006 | ||||||
Cabela’s Credit Card Master Note Trust, Ser 2011-4A, Cl A2 | ||||||||
0.736%, 10/15/2019 (A) (B) | 860 | 863 | ||||||
Cabela’s Credit Card Master Note Trust, Ser 2012-2A, Cl A2 | ||||||||
0.666%, 06/15/2020 (A) (B) | 3,500 | 3,506 | ||||||
Cabela’s Credit Card Master Note Trust, Ser 2013-2A, Cl A2 | ||||||||
0.836%, 08/16/2021 (A) (B) | 210 | 211 | ||||||
Cabela’s Credit Card Master Note Trust, Ser 2014-1, Cl A | ||||||||
0.532%, 03/16/2020 (A) | 2,670 | 2,671 | ||||||
Cabela’s Credit Card Master Note Trust, Ser 2014-2, Cl A | ||||||||
0.631%, 07/15/2022 (A) | 5,000 | 4,986 | ||||||
Capital One Multi-Asset Execution Trust, Ser 2007-A5, Cl A5 | ||||||||
0.226%, 07/15/2020 (A) | 6,000 | 5,967 | ||||||
Capital One Multi-Asset Execution Trust, Ser 2013-A2, Cl A2 | ||||||||
0.366%, 02/15/2019 (A) | 325 | 325 | ||||||
Capital One Multi-Asset Execution Trust, Ser 2013-A3, Cl A3 | ||||||||
0.960%, 09/16/2019 | 615 | 616 | ||||||
| Description | Face Amount ($ Thousands) | Market Value ($ Thousands) | ||||||
Capital One Multi-Asset Execution Trust, Ser 2014-A4, Cl A | ||||||||
0.546%, 06/15/2022 | $ | 4,000 | $ | 4,000 | ||||
Chase Issuance Trust, Ser 2007-A2, Cl A2 | ||||||||
0.236%, 04/15/2019 (A) | 6,000 | 5,983 | ||||||
Chase Issuance Trust, Ser 2012-A9, Cl A9 | ||||||||
0.336%, 10/16/2017 (A) | 5,000 | 5,000 | ||||||
Chase Issuance Trust, Ser 2013-A6, Cl A6 | ||||||||
0.606%, 07/15/2020 (A) | 500 | 502 | ||||||
Chase Issuance Trust, Ser 2013-A9, Cl A | ||||||||
0.606%, 11/16/2020 (A) | 4,850 | 4,869 | ||||||
Chase Issuance Trust, Ser 2014, Cl A1 | ||||||||
1.150%, 01/15/2019 | 735 | 738 | ||||||
Citibank Credit Card Issuance Trust, Ser 2013-A2, Cl A2 | ||||||||
0.465%, 05/26/2020 (A) | 6,915 | 6,915 | ||||||
Citibank Credit Card Issuance Trust, Ser 2013-A3, Cl A3 | ||||||||
1.110%, 07/23/2018 | 500 | 502 | ||||||
Citibank Credit Card Issuance Trust, Ser 2013-A6, Cl A6 | ||||||||
1.320%, 09/07/2018 | 990 | 997 | ||||||
Citibank Credit Card Issuance Trust, Ser 2014-A4, Cl A4 | ||||||||
1.230%, 04/24/2019 | 1,250 | 1,254 | ||||||
Discover Card Execution Note Trust, Ser 2010-A2, Cl A2 | ||||||||
0.766%, 03/15/2018 (A) | 2,000 | 2,002 | ||||||
Discover Card Execution Note Trust, Ser 2014-A1, Cl A1 | ||||||||
0.616%, 07/15/2021 (A) | 5,000 | 5,017 | ||||||
Discover Card Execution Note Trust, Ser 2014-A3, Cl A3 | ||||||||
1.220%, 10/15/2019 | 705 | 707 | ||||||
Discover Card Master Trust, | ||||||||
0.556%, 11/15/2019 (A) | 4,000 | 4,008 | ||||||
Dryrock Issuance Trust, Ser 2012-2, Cl A | ||||||||
0.640%, 08/15/2018 | 350 | 350 | ||||||
Golden Credit Card Trust, | ||||||||
0.790%, 09/15/2017 (B) | 125 | 125 | ||||||
Gracechurch Card Funding, | ||||||||
0.886%, 06/15/2017 (A) (B) | 250 | 250 | ||||||
Synchrony Credit Card Master Note Trust, Ser 2012-5, Cl A | ||||||||
0.950%, 06/15/2018 | 260 | 260 | ||||||
| 92 | SEI Institutional Investments Trust / Annual Report / May 31, 2015 |
| Description | Face Amount ($ Thousands) | Market Value ($ Thousands) | ||||||
Synchrony Credit Card Master Note Trust, Ser 2014-1, Cl A | ||||||||
1.610%, 11/15/2020 | $ | 1,000 | $ | 1,005 | ||||
|
| |||||||
| 87,863 | ||||||||
|
| |||||||
Other Asset-Backed Securities — 14.1% |
| |||||||
1776 CLO Ltd., Ser 2006-1A, Cl B | ||||||||
0.726%, 05/08/2020 (A) (B) | 5,000 | 4,867 | ||||||
Aames Mortgage Investment Trust, Ser 2005-4, Cl M1 | ||||||||
0.886%, 10/25/2035 (A) | 815 | 814 | ||||||
ABCLO, Ser 2007-1A, Cl B | ||||||||
1.025%, 04/15/2021 | 1,000 | 991 | ||||||
ABCLO, Ser 2007-1A, Cl D | ||||||||
4.175%, 04/15/2021 (A) (B) | 1,930 | 1,911 | ||||||
Accredited Mortgage Loan Trust, Ser 2004-4, Cl A1A | ||||||||
0.861%, 01/25/2035 (A) | 136 | 133 | ||||||
Accredited Mortgage Loan Trust, Ser 2006-2, Cl A4 | ||||||||
0.445%, 09/25/2036 (A) | 8,100 | 6,779 | ||||||
Aegis Asset-Backed Securities Trust Mortgage Pass-Through Certificates, Ser 2005-4, Cl M1 | ||||||||
0.635%, 10/25/2035 (A) | 2,914 | 2,641 | ||||||
Aegis Asset-Backed Securities Trust Mortgage Pass-Through Certificates, Ser 2004-3, Cl A2B | ||||||||
1.285%, 09/25/2034 (A) | 437 | 432 | ||||||
Aegis Asset-Backed Securities Trust Mortgage Pass-Through Certificates, Ser 2004-4, Cl A1 | ||||||||
0.905%, 10/25/2034 (A) | 606 | 596 | ||||||
Aircraft Lease Securitisation Ltd., | ||||||||
0.438%, 05/10/2032 (A) (B) | 1,486 | 1,473 | ||||||
Ally Master Owner Trust, Ser 2014-4, Cl A2 | ||||||||
1.430%, 06/17/2019 | 1,220 | 1,224 | ||||||
Ally Master Owner Trust, Ser 2014-5, Cl A2 | ||||||||
1.600%, 10/15/2019 | 1,000 | 1,006 | ||||||
Alterna Funding I LLC, Ser 2014-1A | ||||||||
1.639%, 02/15/2021 (B) | 1,427 | 1,431 | ||||||
Ameriquest Mortgage Securities, Ser 2005-R10, Cl A2B | ||||||||
0.405%, 01/25/2036 (A) | 531 | 530 | ||||||
Ameriquest Mortgage Securities, Ser 2005-R9, Cl AF6 | ||||||||
5.325%, 11/25/2035 | 596 | 611 | ||||||
Apidos CLO XII, Ser 2013-12A, Cl A | ||||||||
1.375%, 04/15/2025 (A) (B) | 500 | 494 | ||||||
| Description | Face Amount ($ Thousands) | Market Value ($ Thousands) | ||||||
Apidos CLO XVII, Ser 2014-17A, Cl A1A | ||||||||
1.774%, 04/17/2026 (A) (B) | $ | 995 | $ | 995 | ||||
Argent Securities, Ser 2006-W2, Cl A2B | ||||||||
0.371%, 03/25/2036 (A) | 1,405 | 749 | ||||||
ARL First LLC, Ser 2012-1A, Cl A1 | ||||||||
1.936%, 12/15/2042 (A) (B) | 2,218 | 2,243 | ||||||
Asset-Backed Funding Certificates, Ser 2004-OPT5, Cl M1 | ||||||||
1.310%, 03/25/2034 (A) | 244 | 216 | ||||||
Avalon IV Capital, Ser 2014-1AR, Cl AR | ||||||||
1.444%, 04/17/2023 (A) (B) | 770 | 770 | ||||||
Avenue CLO III, Ser 2006-3A, Cl A3L | ||||||||
1.025%, 07/20/2018 (A) (B) | 758 | 757 | ||||||
Bacchus, Ser 2006-1A, Cl D | ||||||||
1.825%, 01/20/2019 (A) (B) | 2,000 | 1,980 | ||||||
Baker Street CLO II, Ser 2006-1A, Cl C | ||||||||
1.005%, 10/15/2019 (A) (B) | 3,000 | 2,880 | ||||||
Bear Stearns Asset-Backed Securities I Trust, Ser 2006-EC1, Cl M1 | ||||||||
0.595%, 12/25/2035 (A) | 3,239 | 3,180 | ||||||
Bear Stearns Asset-Backed Securities Trust, Ser 2005-SD2, Cl 2A1 | ||||||||
0.845%, 12/25/2044 (A) | 133 | 133 | ||||||
BlackRock Senior Income Series V, Ser 2007-5A, Cl B | ||||||||
0.697%, 08/13/2019 (A) (B) | 4,500 | 4,364 | ||||||
BlueMountain CLO, Ser 2015-4A, Cl A1 | ||||||||
1.760%, 11/30/2026 (A) (B) | 3,500 | 3,502 | ||||||
Callidus Debt Partners CLO Fund V, Ser 2006-5A, Cl C | ||||||||
1.726%, 11/20/2020 (A) (B) | 3,410 | 3,346 | ||||||
Canaras Summit CLO, Ser 2007-1A, Cl E | ||||||||
4.619%, 06/19/2021 (A) (B) | 1,500 | 1,496 | ||||||
Carlyle High Yield Partners IX, Ser 2006-9A, Cl A1 | ||||||||
0.508%, 08/01/2021 (A) (B) | 3,764 | 3,716 | ||||||
Carrington Mortgage Loan Trust, Ser 2005-NC5, Cl A2 | ||||||||
0.501%, 10/25/2035 (A) | 211 | 211 | ||||||
Cent CLO, Ser 2014-20A, Cl A | ||||||||
1.757%, 01/25/2026 (A) (B) | 1,250 | 1,247 | ||||||
Cent CLO, Ser 2014-22A, Cl A1 | ||||||||
1.756%, 11/07/2026 (A) (B) | 3,100 | 3,102 | ||||||
| SEI Institutional Investments Trust / Annual Report / May 31, 2015 | 93 |
SCHEDULE OF INVESTMENTS
Opportunistic Income Fund (Continued)
May 31, 2015
| Description | Face Amount ($ Thousands) | Market Value ($ Thousands) | ||||||
Chase Funding Mortgage Loan Asset-Backed Certificates, Ser 2004-2, Cl 1A4 | ||||||||
5.323%, 02/26/2035 | $ | 594 | $ | 605 | ||||
CIFC Funding, Ser 2013-1A, Cl A1 | ||||||||
1.426%, 04/16/2025 (A) (B) | 265 | 263 | ||||||
CIT Equipment Collateral, Ser 2014-VT1, Cl A2 | ||||||||
0.860%, 05/22/2017 (B) | 1,000 | 1,000 | ||||||
CNH Equipment Trust, Ser 2012-B, Cl A3 | ||||||||
0.860%, 09/15/2017 | 4 | 4 | ||||||
CNH Equipment Trust, Ser 2013-C, Cl A2 | ||||||||
0.630%, 01/17/2017 | 16 | 16 | ||||||
CNH Equipment Trust, Ser 2013-D, Cl A2 | ||||||||
0.490%, 03/15/2017 | 46 | 46 | ||||||
CNH Wholesale Master Note Trust, Ser 2013-2A, Cl A | ||||||||
0.786%, 08/15/2019 (A) (B) | 425 | 426 | ||||||
ColumbusNova CLO II, Ser 2006-2A, Cl C | ||||||||
1.029%, 04/04/2018 (A) (B) | 1,000 | 993 | ||||||
Comstock Funding, Ser 1A, Cl C | ||||||||
2.034%, 05/30/2020 (A) (B) | 2,500 | 2,499 | ||||||
Conseco Financial, Ser 1997-2, Cl A6 | ||||||||
7.240%, 06/15/2028 (A) | 1,184 | 1,219 | ||||||
Conseco Financial, Ser 1997-3, Cl A5 | ||||||||
7.140%, 03/15/2028 | 230 | 242 | ||||||
Conseco Financial, Ser 1997-3, Cl A6 | ||||||||
7.320%, 03/15/2028 | 76 | 80 | ||||||
Conseco Financial, Ser 1997-6, Cl A8 | ||||||||
7.070%, 01/15/2029 | 12 | 12 | ||||||
Conseco Financial, Ser 1997-7, Cl A7 | ||||||||
6.960%, 07/15/2028 (A) | 264 | 272 | ||||||
Countrywide Asset-Backed Certificates, Ser 2004-5, Cl 3A | ||||||||
0.645%, 09/25/2034 (A) | 17 | 17 | ||||||
Dell Equipment Finance Trust, Ser 2014-1, Cl A2 | ||||||||
0.640%, 07/22/2016 (B) | 2,794 | 2,795 | ||||||
Dryden Senior Loan Fund, Ser 2014-31A, Cl A | ||||||||
1.625%, 04/18/2026 (A) (B) | 1,215 | 1,211 | ||||||
Duane Street CLO II, Ser 2006-2A, Cl C | ||||||||
1.026%, 08/20/2018 (A) (B) | 1,000 | 992 | ||||||
| Description | Face Amount ($ Thousands) | Market Value ($ Thousands) | ||||||
Duane Street CLO III, Ser 2006-3A, Cl D | ||||||||
1.776%, 01/11/2021 (A) (B) | $ | 2,000 | $ | 1,971 | ||||
Encore Credit Receivables Trust, Ser 2005-3, Cl M3 | ||||||||
0.695%, 10/25/2035 (A) | 2,600 | 2,312 | ||||||
Fieldstone Mortgage Investment Trust, Ser 2004-3, Cl M4 | ||||||||
2.026%, 08/25/2034 (A) | 572 | 572 | ||||||
First Frankin Mortgage Loan Trust, Ser 2005-FF8, Cl M1 | ||||||||
0.675%, 09/25/2035 (A) | 5,356 | 5,212 | ||||||
First Franklin Mortgage Loan Asset-Backed Certificates, Ser 2006-FF1, Cl 2A3 | ||||||||
0.425%, 01/25/2036 (A) | 718 | 709 | ||||||
First Franklin Mortgage Loan Asset-Backed Certificates, Ser 2006-FF9, Cl M1 | ||||||||
0.435%, 06/25/2036 (A) | 14,235 | 890 | ||||||
First Franklin Mortgage Loan Asset-Backed Certificates, Ser 2006-FFA, Cl A3 | ||||||||
0.421%, 09/25/2026 (A) | 268 | 183 | ||||||
First Franklin Mortgage Loan Asset-Backed Certificates, Ser 2006-FFB, Cl A2 | ||||||||
0.445%, 12/25/2026 (A) | 85 | 61 | ||||||
Foothill CLO, Ser 2007-1A, Cl E | ||||||||
3.784%, 02/22/2021 (A) (B) | 1,400 | 1,393 | ||||||
Franklin CLO V, Ser 2006-5A, Cl A2 | ||||||||
0.531%, 06/15/2018 (A) (B) | 512 | 510 | ||||||
Gale Force CLO, Ser 2007-3A, Cl A1 | ||||||||
0.515%, 04/19/2021 (A) (B) | 1,786 | 1,769 | ||||||
GE Equipment Midticket LLC, Ser 2012-1, Cl A3 | ||||||||
0.600%, 05/23/2016 | 4 | 4 | ||||||
GE Equipment Small Ticket LLC, Ser 2014-1A, Cl A3 | ||||||||
0.950%, 09/25/2017 (B) | 615 | 615 | ||||||
GE Equipment Transportation LLC, Ser 2013-2, Cl A2 | ||||||||
0.610%, 06/24/2016 | 642 | 642 | ||||||
GE Equipment Transportation LLC, Ser 2015-1, Cl A3 | ||||||||
1.280%, 02/25/2019 | 850 | 850 | ||||||
Gleneagles CLO, Ser 2005-1A, Cl D | ||||||||
2.178%, 11/01/2017 (A) (B) | 582 | 562 | ||||||
GMACM Home Equity Loan Trust, Ser 2007-HE2, Cl A2 | ||||||||
6.054%, 12/25/2037 (A) | 2,437 | 2,413 | ||||||
| 94 | SEI Institutional Investments Trust / Annual Report / May 31, 2015 |
| Description | Face Amount ($ Thousands) | Market Value ($ Thousands) | ||||||
GMF Floorplan Owner Revolving Trust, Ser 2015-1, Cl A2 | ||||||||
0.682%, 05/15/2020 (A) (B) | $ | 575 | $ | 575 | ||||
Golub Capital Management CLO, Ser 2007-A1, Cl B | ||||||||
0.798%, 07/31/2021 | 708 | 696 | ||||||
Gramercy Park CLO, Ser 2014-1AR, Cl A1R | ||||||||
1.574%, 07/17/2023 (A) (B) | 750 | 750 | ||||||
GreatAmerica Leasing Receivables, Ser 2015-1, Cl A2 | ||||||||
1.120%, 06/20/2017 (B) | 965 | 966 | ||||||
Greens Creek Funding, Ser 2007-1A, Cl C | ||||||||
2.525%, 04/18/2021 (A) (B) | 2,000 | 1,928 | ||||||
GSAMP Trust, Ser 2006-HE8, Cl A2C | ||||||||
0.355%, 01/25/2037 (A) | 4,409 | 3,696 | ||||||
Hilton Grand Vacations Trust, Ser 2014-AA, Cl A | ||||||||
1.770%, 11/25/2026 (B) | 3,964 | 3,930 | ||||||
HLSS Servicer Advance Receivables Backed Notes, Ser 2012-T2, Cl C2 | ||||||||
3.960%, 10/15/2045 (B) | 1,200 | 1,200 | ||||||
HLSS Servicer Advance Receivables Backed Notes, Ser 2012-T2, Cl D2 | ||||||||
4.940%, 10/15/2045 (B) | 2,100 | 2,100 | ||||||
HLSS Servicer Advance Receivables Backed Notes, Ser 2013-T1, Cl C2 | ||||||||
2.487%, 01/16/2046 (B) | 1,000 | 981 | ||||||
HLSS Servicer Advance Receivables Trust, Ser 2014-T2, Cl AT2 | ||||||||
2.217%, 01/15/2047 (B) | 2,748 | 2,754 | ||||||
Home Equity Mortgage Trust, Ser 2006-5, Cl A1 | ||||||||
6.000%, 01/25/2037 | 10,586 | 6,228 | ||||||
HSBC Home Equity Loan Trust, Ser 2007-2, Cl AS | ||||||||
0.374%, 07/20/2036 (A) | 4,043 | 3,998 | ||||||
HSI Asset Securitization Trust, Ser 2005-I1, Cl 2A3 | ||||||||
0.475%, 11/25/2035 (A) | 1,431 | 1,337 | ||||||
Indymac Residential Asset-Backed Trust, Ser 2005-C, Cl AII3 | ||||||||
0.551%, 10/25/2035 (A) | 2,520 | 2,429 | ||||||
ING IM CLO, Ser 2013-1A, Cl A1 | ||||||||
1.415%, 04/15/2024 (A) (B) | 3,555 | 3,519 | ||||||
ING IM CLO, Ser 2014-1A, Cl A1 | ||||||||
1.775%, 04/18/2026 (A) (B) | 970 | 970 | ||||||
| Description | Face Amount ($ Thousands) | Market Value ($ Thousands) | ||||||
ING IM CLO, Ser 2014-1RA, Cl A1R | ||||||||
1.471%, 03/14/2022 (A) (B) | $ | 1,000 | $ | 1,000 | ||||
ING IM CLO, Ser 2014-1RA, Cl A2R | ||||||||
2.091%, 03/14/2022 (A) (B) | 600 | 599 | ||||||
ING Investment Management CLO II, Ser 2006-2A, Cl A2 | ||||||||
0.618%, 08/01/2020 (A) (B) | 1,500 | 1,480 | ||||||
ING Investment Management CLO II, Ser 2006-2A, Cl C | ||||||||
0.978%, 08/01/2020 (A) (B) | 3,000 | 2,919 | ||||||
John Deere Owner Trust, Ser 2012-B, Cl A3 | ||||||||
0.530%, 07/15/2016 | 18 | 18 | ||||||
JPMorgan Chase Commercial Mortgage Securities, | ||||||||
0.920%, 07/25/2035 (A) | 187 | 187 | ||||||
JPMorgan Mortgage Acquisition, Ser 2007-CH1, Cl AV4 | ||||||||
0.311%, 11/25/2036 (A) | 233 | 233 | ||||||
Kubota Credit Owner Trust, | ||||||||
0.580%, 02/15/2017 (B) | 201 | 201 | ||||||
Kubota Credit Owner Trust, | ||||||||
0.940%, 12/15/2017 (B) | 645 | 645 | ||||||
Latitude CLO I, Ser 2005-1A, Cl B1 | ||||||||
1.171%, 12/15/2017 (A) (B) | 966 | 966 | ||||||
LCM V, Ser 2007-5A, Cl B | ||||||||
0.645%, 03/21/2019 (A) (B) | 2,250 | 2,219 | ||||||
LCM V, Ser 2007-5A, Cl E | ||||||||
3.665%, 03/21/2019 (A) (B) | 2,000 | 1,963 | ||||||
LCM VI, Ser 2007-6A, Cl D | ||||||||
2.536%, 05/28/2019 (A) (B) | 500 | 496 | ||||||
Lehman ABS Manufactured Housing Contract Trust, Ser 2001-B, Cl A3 | ||||||||
4.350%, 04/15/2040 | 1,296 | 1,357 | ||||||
Lehman ABS Manufactured Housing Contract Trust, Ser 2001-B, Cl A4 | ||||||||
5.270%, 04/15/2040 | 217 | 230 | ||||||
Lehman ABS Manufactured Housing Contract Trust, Ser 2001-B, Cl A6 | ||||||||
6.467%, 04/15/2040 (A) | 361 | 391 | ||||||
Lehman XS Trust, Ser 2005-9N, Cl 1A1 | ||||||||
0.455%, 02/25/2036 (A) (B) | 1,831 | 1,534 | ||||||
LightPoint CLO V, Ser 2006-5A, Cl D | ||||||||
3.929%, 08/05/2019 (A) (B) | 1,700 | 1,682 | ||||||
| SEI Institutional Investments Trust / Annual Report / May 31, 2015 | 95 |
SCHEDULE OF INVESTMENTS
Opportunistic Income Fund (Continued)
May 31, 2015
| Description | Face Amount ($ Thousands) | Market Value ($ Thousands) | ||||||
Limerock CLO I, Ser 2007-1A, Cl B | ||||||||
0.908%, 04/24/2023 (A) (B) | $ | 3,000 | $ | 2,846 | ||||
Limerock CLO II, Ser 2014-2A, Cl A | ||||||||
1.775%, 04/18/2026 (A) (B) | 850 | 850 | ||||||
Magnetite IX, Ser 2014-9A, Cl A1 | ||||||||
1.697%, 07/25/2026 (A) (B) | 940 | 940 | ||||||
Master Asset-Backed Securities Trust, | ||||||||
5.233%, 11/25/2035 | 3,264 | 3,299 | ||||||
Master Asset-Backed Securities Trust, Ser 2005-HE1, Cl M2 | ||||||||
0.860%, 05/25/2035 (A) | 571 | 571 | ||||||
Master Asset-Backed Securities Trust, Ser 2006-HE5, Cl A3 | ||||||||
0.345%, 11/25/2036 (A) | 838 | 573 | ||||||
Master Asset-Backed Securities Trust, Ser 2006-HE5, Cl A4 | ||||||||
0.405%, 11/25/2036 (A) | 67 | 46 | ||||||
Master Asset-Backed Securities Trust, Ser 2006-NC3, Cl A3 | ||||||||
0.285%, 10/25/2036 (A) | 3,439 | 2,140 | ||||||
Master Asset-Backed Securities Trust, Ser 2006-NC3, Cl A5 | ||||||||
0.395%, 10/25/2036 (A) | 2,050 | 1,298 | ||||||
Mayport CLO, Ser 2006-1A, Cl B1L | ||||||||
1.634%, 02/22/2020 (A) (B) | 3,100 | 3,034 | ||||||
Merrill Lynch CLO, Ser 2007-1A, Cl E | ||||||||
4.527%, 04/14/2021 (A) (B) | 2,000 | 2,000 | ||||||
Merrill Lynch Mortgage Investors Trust, Ser 2006-FF1, Cl A2C | ||||||||
0.385%, 08/25/2036 (A) | 182 | 181 | ||||||
Michigan Finance Authority, | ||||||||
0.936%, 04/29/2030 (A) | 6,000 | 5,993 | ||||||
Mid-State Trust, Ser 2004-1, Cl M1 | ||||||||
6.497%, 08/15/2037 | 1,321 | 1,414 | ||||||
MMAF Equipment Finance LLC, Ser 2013-AA, Cl A2 | ||||||||
0.690%, 05/09/2016 (B) | 62 | 62 | ||||||
MMAF Equipment Finance LLC, Ser 2014-AA, Cl A3 | ||||||||
0.870%, 01/08/2019 (B) | 1,010 | 1,006 | ||||||
MMAF Equipment Finance LLC, Ser 2015-AA, Cl A2 | ||||||||
0.960%, 09/18/2017 (B) | 395 | 395 | ||||||
Morgan Stanley ABS Capital I, Ser 2005-HE6, Cl A2C | ||||||||
0.505%, 11/25/2035 (A) | 3,844 | 3,771 | ||||||
| Description | Face Amount ($ Thousands) | Market Value ($ Thousands) | ||||||
Morgan Stanley ABS Capital I, Ser 2005-NC2, Cl M2 | ||||||||
0.815%, 03/25/2035 (A) | $ | 4,791 | $ | 4,751 | ||||
Morgan Stanley ABS Capital I, Ser 2006-HE8, Cl A2B | ||||||||
0.285%, 10/25/2036 (A) | 3,039 | 1,893 | ||||||
Morgan Stanley Dean Witter Capital I, Ser 2002-AM3, Cl M1 | ||||||||
1.606%, 02/25/2033 (A) | 45 | 41 | ||||||
Morgan Stanley Dean Witter Capital I, Ser 2003-NC4, Cl M2 | ||||||||
3.181%, 04/25/2033 (A) | 40 | 37 | ||||||
MVW Owner Trust, Ser 2014-1A, Cl A | ||||||||
2.250%, 09/20/2031 (B) | 5,179 | 5,168 | ||||||
Nantucket CLO, Ser 2006-1A, Cl E | ||||||||
4.032%, 11/24/2020 (A) (B) | 1,500 | 1,478 | ||||||
Nationstar Home Equity Loan Trust, Ser 2006-B, Cl AV4 | ||||||||
0.461%, 09/25/2036 (A) | 5,952 | 5,459 | ||||||
Navient Student Loan Trust, | ||||||||
0.495%, 03/27/2023 (A) | 3,000 | 2,997 | ||||||
Navigator CDO, Ser 2006-2A, Cl D | ||||||||
3.770%, 09/20/2020 (A) (B) | 2,088 | 2,021 | ||||||
Neuberger Berman CLO, | ||||||||
1.745%, 04/15/2026 (A) (B) | 625 | 625 | ||||||
New Century Home Equity Loan Trust, Ser 2005-C, Cl A2C | ||||||||
0.435%, 12/25/2035 (A) | 2,825 | 2,741 | ||||||
NewMark Capital Funding CLO, Ser 2013-1A, Cl A2 | ||||||||
1.354%, 06/02/2025 (A) (B) | 3,553 | 3,502 | ||||||
NOB Hill CLO, Ser 2006-1A, Cl C | ||||||||
1.074%, 08/15/2018 (A) (B) | 3,600 | 3,560 | ||||||
NYCTL Trust, Ser 2014-A, Cl A | ||||||||
1.030%, 11/10/2027 (B) | 871 | 870 | ||||||
OCP CLO, Ser 2012-1A, Cl B | ||||||||
3.765%, 03/22/2023 | 2,000 | 2,000 | ||||||
OCP CLO, Ser 2012-1A, Cl D | ||||||||
5.765%, 03/22/2023 (A) (B) | 1,500 | 1,500 | ||||||
Octagon Investment Partners XVI, | ||||||||
1.394%, 07/17/2025 (A) (B) | 300 | 297 | ||||||
Octagon Investment Partners XX, Ser 2014-1A, Cl A | ||||||||
1.720%, 08/12/2026 (A) (B) | 3,230 | 3,233 | ||||||
OHA Credit Partners VIII, | ||||||||
1.395%, 04/20/2025 (A) (B) | 200 | 198 | ||||||
OHA Intrepid Leveraged Loan Fund, Ser 2013-1AR, Cl AR | ||||||||
1.195%, 04/20/2021 (A) (B) | 150 | 150 | ||||||
| 96 | SEI Institutional Investments Trust / Annual Report / May 31, 2015 |
| Description | Face Amount ($ Thousands) | Market Value ($ Thousands) | ||||||
Option One Mortgage Loan Trust, Ser 2005-1, Cl A1A | ||||||||
0.685%, 02/25/2035 (A) | $ | 350 | $ | 345 | ||||
Option One Mortgage Loan Trust, Ser 2005-5, Cl A3 | ||||||||
0.395%, 12/25/2035 (A) | 1,025 | 1,017 | ||||||
Option One Mortgage Loan Trust, Ser 2006-3, Cl 2A2 | ||||||||
0.281%, 02/25/2037 (A) | 584 | 342 | ||||||
Origen Manufactured Housing Contract Trust, Ser 2005-B, Cl A4 | ||||||||
5.910%, 01/15/2037 | 700 | 734 | ||||||
Origen Manufactured Housing Contract Trust, Ser 2005-B, Cl M1 | ||||||||
5.990%, 01/15/2037 | 80 | 83 | ||||||
Ownit Mortgage Loan Trust, | ||||||||
0.351%, 03/25/2037 (A) | 4,564 | 4,357 | ||||||
Park Place Securities Asset-Backed Pass-Through Certificates, Ser 2005-WHQ1, Cl M5 | ||||||||
0.935%, 03/25/2035 (A) | 4,242 | 3,610 | ||||||
Popular ABS Mortgage Pass-Through Trust, Ser 2004-5, Cl AF4 | ||||||||
4.655%, 12/25/2034 (A) | 681 | 680 | ||||||
Popular ABS Mortgage Pass-Through Trust, Ser 2005-3, Cl AF4 | ||||||||
4.620%, 07/25/2035 (A) | 314 | 315 | ||||||
Popular ABS Mortgage Pass-Through Trust, Ser 2005-B, Cl M1 | ||||||||
0.661%, 08/25/2035 (A) | 509 | 509 | ||||||
Race Point III CLO, Ser 2006-3, Cl B | ||||||||
0.655%, 04/15/2020 (A) (B) | 2,985 | 2,959 | ||||||
Race Point III CLO, Ser 2006-3, Cl C | ||||||||
0.955%, 04/15/2020 (A) (B) | 1,830 | 1,811 | ||||||
Race Point IV CLO, Ser 2007-4A, Cl A1A | ||||||||
0.478%, 08/01/2021 (A) (B) | 1,615 | 1,609 | ||||||
Race Point VI CLO, Ser 2014-6RA, Cl BR | ||||||||
2.413%, 05/24/2023 (A) (B) | 725 | 725 | ||||||
Residential Asset Securities, | ||||||||
0.501%, 01/25/2036 (A) | 2,187 | 2,159 | ||||||
SACO I, Ser 2005-9, Cl A1 | ||||||||
0.681%, 12/25/2035 (A) | 1,211 | 1,145 | ||||||
| Description | Face Amount ($ Thousands) | Market Value ($ Thousands) | ||||||
SACO I, Ser 2005-WM3, Cl A1 | ||||||||
0.705%, 09/25/2035 (A) | $ | 756 | $ | 719 | ||||
Saxon Asset Securities Trust, Ser 2003-3, Cl AF6 | ||||||||
5.536%, 12/25/2033 | 264 | 267 | ||||||
Securitized Asset-Backed Receivables LLC, Ser 2006-NC3, Cl A2B | ||||||||
0.331%, 09/25/2036 (A) | 4,435 | 2,295 | ||||||
Securitized Asset-Backed Receivables LLC, Ser 2007-BR5, Cl A2A | ||||||||
0.315%, 05/25/2037 (A) | 1,125 | 789 | ||||||
Securitized Asset-Backed Receivables LLC, Ser 2007-NC1, Cl A2B | ||||||||
0.335%, 12/25/2036 (A) | 2,620 | 1,525 | ||||||
Sierra Timeshare Receivables Funding LLC, Ser 2013-3A, Cl A | ||||||||
2.200%, 10/20/2030 (B) | 1,545 | 1,549 | ||||||
Sierra Timeshare Receivables Funding LLC, Ser 2014-1A, Cl A | ||||||||
2.070%, 03/20/2030 (B) | 2,601 | 2,596 | ||||||
Sierra Timeshare Receivables Funding LLC, Ser 2014-2A, Cl A | ||||||||
2.050%, 06/20/2031 (B) | 1,878 | 1,873 | ||||||
Sierra Timeshare Receivables Funding LLC, Ser 2014-3A, Cl A | ||||||||
2.300%, 10/20/2031 (B) | 1,490 | 1,503 | ||||||
Sierra Timeshare Receivables Funding LLC, Ser 2015-1A, Cl A | ||||||||
2.400%, 03/22/2032 (B) | 4,595 | 4,611 | ||||||
SLM Student Loan Trust, Ser 2011-B, Cl A1 | ||||||||
1.036%, 12/16/2024 (A) (B) | 32 | 32 | ||||||
SLM Student Loan Trust, Ser 2013-3, Cl A2 | ||||||||
0.485%, 05/26/2020 (A) | 5,000 | 4,996 | ||||||
SLM Student Loan Trust, Ser 2013-6, Cl A2 | ||||||||
0.685%, 02/25/2021 (A) | 4,000 | 4,003 | ||||||
SLM Student Loan Trust, Ser 2014-1, Cl A1 | ||||||||
0.461%, 05/28/2019 (A) | 1,212 | 1,212 | ||||||
SLM Student Loan Trust, Ser 2014-1, Cl A2 | ||||||||
0.565%, 07/26/2021 (A) | 2,000 | 2,000 | ||||||
SLM Student Loan Trust, Ser 2014-2, Cl A1 | ||||||||
0.435%, 07/25/2019 (A) | 1,920 | 1,920 | ||||||
Soundview Home Equity Loan Trust, Ser 2005-4, Cl M2 | ||||||||
0.655%, 03/25/2036 (A) | 3,458 | 2,913 | ||||||
| SEI Institutional Investments Trust / Annual Report / May 31, 2015 | 97 |
SCHEDULE OF INVESTMENTS
Opportunistic Income Fund (Continued)
May 31, 2015
| Description | Face Amount ($ Thousands) | Market Value ($ Thousands) | ||||||
Soundview Home Equity Loan Trust, Ser 2005-OPT3, Cl A4 | ||||||||
0.481%, 11/25/2035 (A) | $ | 226 | $ | 224 | ||||
Specialty Underwriting & Residential Finance Trust, Ser 2005-AB1, Cl M1 | ||||||||
0.615%, 03/25/2036 (A) | 3,315 | 3,251 | ||||||
Springleaf Funding Trust, Ser 2014-AA, Cl A | ||||||||
2.410%, 12/15/2022 (B) | 725 | 726 | ||||||
Stoney Lane Funding I, Ser 2007-1A, Cl A1 | ||||||||
0.514%, 04/18/2022 (A) (B) | 1,335 | 1,322 | ||||||
Structured Asset Investment Loan Trust, Ser 2006-2, Cl A3 | ||||||||
0.365%, 04/25/2036 (A) | 943 | 857 | ||||||
Structured Asset Securities, Ser 2006-GEL3, Cl A2 | ||||||||
0.415%, 07/25/2036 (A) (B) | 1,097 | 1,091 | ||||||
Structured Asset Securities, Ser 2006-WF1, Cl A1 | ||||||||
0.335%, 02/25/2036 (A) | 229 | 227 | ||||||
Structured Asset Securities, Ser 2006-WF3, Cl A4 | ||||||||
0.495%, 09/25/2036 (A) | 1,820 | 1,691 | ||||||
Structured Asset Securities, Ser 2007-BC1, Cl A4 | ||||||||
0.315%, 02/25/2037 (A) | 5,370 | 4,681 | ||||||
Symphony CLO V, Ser 2007-5A, Cl A1 | ||||||||
1.025%, 01/15/2024 (A) (B) | 1,716 | 1,701 | ||||||
Trimaran CLO VII, Ser 2007-1A, Cl A2L | ||||||||
0.641%, 06/15/2021 (A) (B) | 2,000 | 1,940 | ||||||
Venture VIII CDO, Ser 2007-8A, Cl B | ||||||||
0.696%, 07/22/2021 (A) (B) | 3,000 | 2,991 | ||||||
Volvo Financial Equipment LLC, Ser 2013-1A, Cl A3 | ||||||||
0.740%, 03/15/2017 (B) | 193 | 193 | ||||||
Volvo Financial Equipment LLC, Ser 2015-1A, Cl A2 | ||||||||
0.950%, 11/15/2017 (B) | 1,205 | 1,206 | ||||||
Westgate Resorts LLC, | ||||||||
2.750%, 05/20/2027 (B) | 2,748 | 2,749 | ||||||
|
| |||||||
| 305,350 | ||||||||
|
| |||||||
Total Asset-Backed Securities (Cost $472,598) ($ Thousands) |
| 479,055 | ||||||
|
| |||||||
CORPORATE OBLIGATIONS — 9.3% |
| |||||||
Consumer Discretionary — 1.6% |
| |||||||
AutoZone | ||||||||
1.300%, 01/13/2017 | 950 | 952 | ||||||
| Description | Face Amount ($ Thousands) | Market Value ($ Thousands) | ||||||
CCO Holdings LLC | ||||||||
5.250%, 09/30/2022 | $ | 2,750 | $ | 2,791 | ||||
Cedar Fair | ||||||||
5.250%, 03/15/2021 | 1,000 | 1,045 | ||||||
CSC Holdings LLC | ||||||||
8.625%, 02/15/2019 | 1,090 | 1,243 | ||||||
CVS Health | ||||||||
1.200%, 12/05/2016 | 490 | 493 | ||||||
Daimler Finance North America LLC | ||||||||
1.375%, 08/01/2017 (B) | 625 | 625 | ||||||
0.704%, 03/02/2018 (A) (B) | 1,000 | 1,001 | ||||||
Family Tree Escrow LLC | ||||||||
5.750%, 03/01/2023 (B) | 1,015 | 1,071 | ||||||
Ford Motor Credit LLC | ||||||||
1.724%, 12/06/2017 | 500 | 499 | ||||||
1.214%, 01/09/2018 (A) | 750 | 753 | ||||||
1.098%, 03/12/2019 (A) | 500 | 499 | ||||||
General Motors Financial | ||||||||
2.400%, 04/10/2018 | 1,000 | 1,000 | ||||||
Graton Economic Development Authority | ||||||||
9.625%, 09/01/2019 (B) | 1,290 | 1,403 | ||||||
Hyundai Capital America | ||||||||
2.000%, 03/19/2018 (B) | 375 | 377 | ||||||
1.875%, 08/09/2016 (B) | 200 | 202 | ||||||
1.625%, 10/02/2015 (B) | 35 | 35 | ||||||
NBCUniversal Enterprise | ||||||||
0.960%, 04/15/2018 (A) (B) | 400 | 403 | ||||||
Nissan Motor Acceptance MTN | ||||||||
1.500%, 03/02/2018 | 550 | 551 | ||||||
Seminole Hard Rock Entertainment | ||||||||
5.875%, 05/15/2021 (B) | 1,315 | 1,328 | ||||||
Sinclair Television Group | ||||||||
5.625%, 08/01/2024 (B) | 2,000 | 2,020 | ||||||
5.375%, 04/01/2021 | 1,000 | 1,017 | ||||||
Sirius XM Radio | ||||||||
5.875%, 10/01/2020 (B) | 4,000 | 4,165 | ||||||
5.375%, 04/15/2025 (B) | 385 | 385 | ||||||
4.250%, 05/15/2020 (B) | 1,000 | 999 | ||||||
Six Flags Entertainment | ||||||||
5.250%, 01/15/2021 (B) | 2,000 | 2,065 | ||||||
Time Warner Cable | ||||||||
5.850%, 05/01/2017 | 350 | 376 | ||||||
Toyota Motor Credit MTN | ||||||||
0.596%, 01/12/2018 (A) | 1,000 | 1,002 | ||||||
TRW Automotive | ||||||||
7.250%, 03/15/2017 (B) | 560 | 619 | ||||||
Volkswagen Group of America Finance LLC | ||||||||
1.250%, 05/23/2017 (B) | 500 | 501 | ||||||
0.716%, 11/20/2017 (A) (B) | 1,000 | 1,002 | ||||||
| 98 | SEI Institutional Investments Trust / Annual Report / May 31, 2015 |
| Description | Face Amount ($ Thousands) | Market Value ($ Thousands) | ||||||
Whirlpool | ||||||||
1.350%, 03/01/2017 | $ | 575 | $ | 576 | ||||
William Carter | ||||||||
5.250%, 08/15/2021 | 2,615 | 2,707 | ||||||
|
| |||||||
| 33,705 | ||||||||
|
| |||||||
Consumer Staples — 0.4% | ||||||||
Bayer US Finance LLC | ||||||||
0.551%, 10/06/2017 (A) (B) | 700 | 700 | ||||||
Elizabeth Arden | ||||||||
7.375%, 03/15/2021 | 1,062 | 896 | ||||||
ERAC USA Finance LLC | ||||||||
1.400%, 04/15/2016 (B) | 300 | 301 | ||||||
Heineken | ||||||||
0.800%, 10/01/2015 (B) | 75 | 75 | ||||||
JM Smucker | ||||||||
1.750%, 03/15/2018 (B) | 265 | 265 | ||||||
Kroger | ||||||||
0.804%, 10/17/2016 (A) | 1,000 | 1,003 | ||||||
Mondelez International | ||||||||
0.798%, 02/01/2019 (A) | 1,000 | 990 | ||||||
President and Fellows of Harvard College | ||||||||
6.300%, 10/01/2037 | 595 | 623 | ||||||
Reynolds American | ||||||||
1.050%, 10/30/2015 | 50 | 50 | ||||||
SABMiller Holdings | ||||||||
0.968%, 08/01/2018 (A) (B) | 600 | 602 | ||||||
Spectrum Brands | ||||||||
5.750%, 07/15/2025 (B) | 765 | 788 | ||||||
Sutter Health | ||||||||
1.090%, 08/15/2053 | 525 | 524 | ||||||
Valeant Pharmaceuticals International | ||||||||
5.625%, 12/01/2021 (B) | 2,900 | 3,009 | ||||||
|
| |||||||
| 9,826 | ||||||||
|
| |||||||
Energy — 0.9% | ||||||||
Atwood Oceanics | ||||||||
6.500%, 02/01/2020 | 1,700 | 1,658 | ||||||
BP Capital Markets | ||||||||
0.899%, 09/26/2018 (A) | 850 | 852 | ||||||
0.789%, 05/10/2018 (A) | 400 | 400 | ||||||
0.702%, 02/13/2018 (A) | 600 | 599 | ||||||
Canadian Natural Resources | ||||||||
5.700%, 05/15/2017 | 150 | 162 | ||||||
ConocoPhillips | ||||||||
1.500%, 05/15/2018 | 525 | 526 | ||||||
Enbridge | ||||||||
0.734%, 06/02/2017 (A) | 900 | 889 | ||||||
Genesis Energy | ||||||||
6.000%, 05/15/2023 | 795 | 805 | ||||||
Gibson Energy | ||||||||
6.750%, 07/15/2021 (B) | 948 | 986 | ||||||
| Description | Face Amount ($ Thousands) | Market Value ($ Thousands) | ||||||
Halcon Resources | ||||||||
8.625%, 02/01/2020 (B) | $ | 1,360 | $ | 1,380 | ||||
Hess | ||||||||
1.300%, 06/15/2017 | 510 | 507 | ||||||
Kinder Morgan | ||||||||
2.000%, 12/01/2017 | 345 | 346 | ||||||
Penn Virginia Resource Partners | ||||||||
6.500%, 05/15/2021 | 1,000 | 1,068 | ||||||
Regency Energy Partners | ||||||||
5.000%, 10/01/2022 | 2,500 | 2,614 | ||||||
Sabine Pass Liquefaction LLC | ||||||||
6.250%, 03/15/2022 | 3,000 | 3,157 | ||||||
5.625%, 02/01/2021 | 1,300 | 1,342 | ||||||
Statoil | ||||||||
0.736%, 11/08/2018 (A) | 800 | 800 | ||||||
Total Capital International | ||||||||
0.849%, 08/10/2018 (A) | 400 | 402 | ||||||
TransCanada PipeLines | ||||||||
1.066%, 01/12/2018 (A) | 1,100 | 1,103 | ||||||
0.750%, 01/15/2016 | 250 | 250 | ||||||
|
| |||||||
| 19,846 | ||||||||
|
| |||||||
Financials — 3.2% | ||||||||
Abbey National Treasury Services | ||||||||
0.780%, 03/13/2017 (A) | 850 | 851 | ||||||
ABN AMRO Bank | ||||||||
4.250%, 02/02/2017 (B) | 565 | 591 | ||||||
1.079%, 10/28/2016 (A) (B) | 550 | 553 | ||||||
American Express Credit MTN | ||||||||
1.125%, 06/05/2017 | 1,300 | 1,297 | ||||||
American Honda Finance MTN | ||||||||
1.500%, 03/13/2018 | 600 | 603 | ||||||
Australia & New Zealand Banking Group | ||||||||
0.834%, 05/15/2018 (A) | 250 | 251 | ||||||
0.651%, 01/10/2017 (A) (B) | 500 | 501 | ||||||
Bank of America | ||||||||
1.700%, 08/25/2017 | 800 | 803 | ||||||
1.350%, 11/21/2016 | 800 | 802 | ||||||
1.315%, 01/15/2019 (A) | 700 | 708 | ||||||
0.740%, 06/05/2017 (A) | 500 | 500 | ||||||
Bank of Montreal MTN | ||||||||
1.300%, 07/14/2017 | 700 | 703 | ||||||
0.874%, 04/09/2018 (A) | 350 | 352 | ||||||
0.795%, 07/15/2016 (A) | 175 | 176 | ||||||
Bank of New York Mellon MTN | ||||||||
0.704%, 03/06/2018 (A) | 325 | 326 | ||||||
Bank of Nova Scotia | ||||||||
1.300%, 07/21/2017 | 600 | 602 | ||||||
Bank of Tokyo-Mitsubishi UFJ | ||||||||
0.815%, 03/05/2018 (A) (B) | 900 | 901 | ||||||
0.574%, 09/08/2017 (A) (B) | 500 | 498 | ||||||
Barclays Bank MTN | ||||||||
6.050%, 12/04/2017 (B) | 575 | 628 | ||||||
0.856%, 02/17/2017 (A) | 850 | 852 | ||||||
| SEI Institutional Investments Trust / Annual Report / May 31, 2015 | 99 |
SCHEDULE OF INVESTMENTS
Opportunistic Income Fund (Continued)
May 31, 2015
| Description | Face Amount ($ Thousands) | Market Value ($ Thousands) | ||||||
BB&T MTN | ||||||||
0.938%, 02/01/2019 (A) | $ | 500 | $ | 501 | ||||
BNP Paribas MTN | ||||||||
0.858%, 12/12/2016 (A) | 1,350 | 1,356 | ||||||
Boart Longyear Management | ||||||||
10.000%, 10/01/2018 (B) | 2,417 | 2,329 | ||||||
BPCE MTN | ||||||||
1.129%, 02/10/2017 (A) | 1,000 | 1,006 | ||||||
Branch Banking & Trust | ||||||||
1.350%, 10/01/2017 | 450 | 451 | ||||||
Capital One | ||||||||
0.959%, 02/05/2018 (A) | 750 | 753 | ||||||
Capital One Bank USA | ||||||||
1.300%, 06/05/2017 | 850 | 847 | ||||||
1.150%, 11/21/2016 | 500 | 501 | ||||||
Citigroup | ||||||||
1.550%, 08/14/2017 | 500 | 500 | ||||||
1.044%, 04/08/2019 (A) | 650 | 655 | ||||||
0.967%, 04/27/2018 (A) | 450 | 450 | ||||||
Citizens Bank MTN | ||||||||
1.600%, 12/04/2017 | 1,000 | 1,003 | ||||||
Commonwealth Bank of Australia MTN | ||||||||
0.668%, 03/12/2018 (A) (B) | 850 | 850 | ||||||
Cooperatieve Centrale Raiffeisen-Boerenleenbank | ||||||||
0.750%, 03/18/2016 (A) | 400 | 401 | ||||||
Credit Agricole | ||||||||
1.121%, 10/03/2016 (A) (B) | 700 | 704 | ||||||
Credit Suisse NY MTN | ||||||||
1.700%, 04/27/2018 | 850 | 846 | ||||||
0.969%, 01/29/2018 (A) | 750 | 752 | ||||||
Daimler Finance North America LLC | ||||||||
1.650%, 05/18/2018 (B) | 300 | 300 | ||||||
Deutsche Bank | ||||||||
1.350%, 05/30/2017 | 1,000 | 997 | ||||||
0.957%, 02/13/2018 (A) | 650 | 652 | ||||||
General Electric Capital | ||||||||
0.981%, 04/02/2018 (A) | 275 | 279 | ||||||
Goldman Sachs Group MTN | ||||||||
1.478%, 04/30/2018 (A) | 180 | 182 | ||||||
1.437%, 04/23/2020 (A) | 725 | 733 | ||||||
1.374%, 11/15/2018 (A) | 750 | 755 | ||||||
Harley-Davidson Financial Services MTN | ||||||||
3.875%, 03/15/2016 (B) | 500 | 512 | ||||||
Hartford Financial Services Group | ||||||||
5.375%, 03/15/2017 | 1,000 | 1,071 | ||||||
HSBC Bank | ||||||||
0.914%, 05/15/2018 (A) (B) | 200 | 201 | ||||||
HSBC USA | ||||||||
1.300%, 06/23/2017 | 1,250 | 1,253 | ||||||
1.147%, 09/24/2018 (A) | 300 | 303 | ||||||
| Description | Face Amount ($ Thousands) | Market Value ($ Thousands) | ||||||
Huntington National Bank | ||||||||
1.700%, 02/26/2018 | $ | 800 | $ | 800 | ||||
Hutchison Whampoa International | ||||||||
1.625%, 10/31/2017 (B) | 600 | 599 | ||||||
ING Bank | ||||||||
1.800%, 03/16/2018 (B) | 390 | 393 | ||||||
0.964%, 10/01/2019 (A) (B) | 500 | 501 | ||||||
Intesa Sanpaolo | ||||||||
3.125%, 01/15/2016 | 200 | 202 | ||||||
JPMorgan Chase | ||||||||
1.232%, 01/23/2020 (A) | 500 | 507 | ||||||
1.177%, 01/25/2018 (A) | 200 | 202 | ||||||
0.909%, 01/28/2019 (A) | 700 | 701 | ||||||
JPMorgan Chase Capital XXI | ||||||||
1.229%, 02/02/2037 (A) | 250 | 208 | ||||||
KeyBank | ||||||||
0.803%, 06/01/2018 (A) | 850 | 849 | ||||||
Lloyds Bank | ||||||||
0.791%, 03/16/2018 (A) | 1,250 | 1,251 | ||||||
Macquarie Group | ||||||||
1.278%, 01/31/2017 (A) (B) | 650 | 653 | ||||||
Manufacturers & Traders Trust | ||||||||
1.400%, 07/25/2017 | �� | 700 | 702 | |||||
0.653%, 01/30/2017 (A) | 600 | 599 | ||||||
Metropolitan Life Global Funding I | ||||||||
1.500%, 01/10/2018 (B) | 260 | 260 | ||||||
0.651%, 04/10/2017 (A) (B) | 1,000 | 1,003 | ||||||
0.477%, 07/14/2016 (A) (B) | 1,200 | 1,201 | ||||||
Mizuho Bank | ||||||||
0.909%, 03/26/2018 (A) (B) | 800 | 802 | ||||||
Morgan Stanley | ||||||||
5.950%, 12/28/2017 | 245 | 271 | ||||||
1.532%, 02/25/2016 (A) | 350 | 352 | ||||||
1.128%, 01/24/2019 (A) | 650 | 652 | ||||||
MSCI | ||||||||
5.250%, 11/15/2024 (B) | 955 | 997 | ||||||
New York Life Global Funding | ||||||||
1.125%, 03/01/2017 (B) | 600 | 602 | ||||||
0.627%, 05/23/2016 (A) (B) | 300 | 301 | ||||||
Nissan Motor Acceptance | ||||||||
0.969%, 09/26/2016 (A) (B) | 350 | 352 | ||||||
Nordea Bank | ||||||||
1.250%, 04/04/2017 (B) | 750 | 751 | ||||||
PACCAR Financial MTN | ||||||||
1.100%, 06/06/2017 | 780 | 782 | ||||||
PNC Bank | ||||||||
1.150%, 11/01/2016 | 600 | 601 | ||||||
0.703%, 06/01/2018 (A) | 850 | 849 | ||||||
Pricoa Global Funding I MTN | ||||||||
1.150%, 11/25/2016 (B) | 500 | 501 | ||||||
Principal Life Global Funding II MTN | ||||||||
1.200%, 05/19/2017 (B) | 400 | 401 | ||||||
1.125%, 02/24/2017 (B) | 650 | 652 | ||||||
| 100 | SEI Institutional Investments Trust / Annual Report / May 31, 2015 |
| Description | Face Amount ($ Thousands) | Market Value ($ Thousands) | ||||||
Prudential Financial MTN | ||||||||
1.054%, 08/15/2018 (A) | $ | 700 | $ | 705 | ||||
Reinsurance Group of America | ||||||||
5.625%, 03/15/2017 | 200 | 214 | ||||||
RHP Hotel Properties | ||||||||
5.000%, 04/15/2021‡ | 435 | 442 | ||||||
5.000%, 04/15/2023‡ (B) | 1,035 | 1,035 | ||||||
Santander Bank | ||||||||
1.206%, 01/12/2018 (A) | 1,250 | 1,250 | ||||||
Societe Generale | ||||||||
1.354%, 10/01/2018 (A) | 500 | 508 | ||||||
Standard Chartered MTN | ||||||||
0.914%, 04/17/2018 (A) (B) | 1,000 | 999 | ||||||
Sumitomo Mitsui Banking | ||||||||
0.856%, 01/16/2018 (A) | 500 | 501 | ||||||
0.701%, 01/10/2017 (A) | 1,000 | 1,000 | ||||||
Svenska Handelsbanken | ||||||||
0.735%, 09/23/2016 (A) | 700 | 703 | ||||||
Synchrony Financial | ||||||||
1.875%, 08/15/2017 | 455 | 457 | ||||||
1.509%, 02/03/2020 (A) | 1,000 | 1,004 | ||||||
Toronto-Dominion Bank MTN | ||||||||
0.570%, 03/13/2018 (A) | 700 | 700 | ||||||
0.531%, 01/06/2017 (A) | 1,100 | 1,101 | ||||||
UBS MTN | ||||||||
5.875%, 12/20/2017 | 250 | 276 | ||||||
1.133%, 06/01/2020 (A) | 1,000 | 998 | ||||||
Unitrin | ||||||||
6.000%, 05/15/2017 | 110 | 118 | ||||||
US Bancorp MTN | ||||||||
0.764%, 11/15/2018 (A) | 800 | 804 | ||||||
Ventas Realty | ||||||||
1.550%, 09/26/2016‡ | 400 | 402 | ||||||
1.250%, 04/17/2017‡ | 170 | 170 | ||||||
Volkswagen Group of America Finance LLC | ||||||||
0.754%, 05/22/2018 (A) (B) | 500 | 500 | ||||||
WEA Finance LLC | ||||||||
1.750%, 09/15/2017 (B) | 350 | 351 | ||||||
Wells Fargo MTN | ||||||||
0.958%, 01/30/2020 (A) | 1,000 | 1,007 | ||||||
Westpac Banking | ||||||||
1.200%, 05/19/2017 | 500 | 501 | ||||||
0.884%, 01/17/2019 (A) | 550 | 552 | ||||||
|
| |||||||
| 69,436 | ||||||||
|
| |||||||
Health Care — 0.7% | ||||||||
AbbVie | ||||||||
1.800%, 05/14/2018 | 650 | 651 | ||||||
Actavis Funding SCS | ||||||||
1.348%, 03/12/2018 (A) | 4,100 | 4,144 | ||||||
1.300%, 06/15/2017 | 800 | 796 | ||||||
Amgen | ||||||||
2.125%, 05/15/2017 | 800 | 813 | ||||||
| Description | Face Amount ($ Thousands) | Market Value ($ Thousands) | ||||||
Becton Dickinson | ||||||||
1.800%, 12/15/2017 | $ | 1,000 | $ | 1,007 | ||||
ExamWorks Group | ||||||||
5.625%, 04/15/2023 | 785 | 803 | ||||||
Express Scripts Holding | ||||||||
1.250%, 06/02/2017 | 1,100 | 1,097 | ||||||
LifePoint Health | ||||||||
5.500%, 12/01/2021 | 1,225 | 1,288 | ||||||
Mallinckrodt International Finance | ||||||||
4.875%, 04/15/2020 (B) | 557 | 570 | ||||||
McKesson | ||||||||
1.292%, 03/10/2017 | 535 | 536 | ||||||
Medtronic | ||||||||
1.500%, 03/15/2018 (B) | 425 | 426 | ||||||
Mylan | ||||||||
1.350%, 11/29/2016 | 650 | 649 | ||||||
Providence Health & Services Obligated Group | ||||||||
1.074%, 10/01/2016 (A) | 650 | 653 | ||||||
Thermo Fisher Scientific | ||||||||
1.300%, 02/01/2017 | 225 | 225 | ||||||
Zimmer Holdings | ||||||||
1.450%, 04/01/2017 | 950 | 953 | ||||||
|
| |||||||
| 14,611 | ||||||||
|
| |||||||
Industrials — 1.0% | ||||||||
Air Lease | ||||||||
4.500%, 01/15/2016 | 600 | 612 | ||||||
2.125%, 01/15/2018 | 310 | 308 | ||||||
Bombardier | ||||||||
6.000%, 10/15/2022 (B) | 1,818 | 1,648 | ||||||
Clean Harbors | ||||||||
5.250%, 08/01/2020 | 900 | 925 | ||||||
Continential | ||||||||
4.500%, 09/15/2019 | 625 | 643 | ||||||
GATX | ||||||||
1.250%, 03/04/2017 | 345 | 344 | ||||||
General Electric Capital MTN | ||||||||
1.250%, 05/15/2017 | 550 | 553 | ||||||
0.894%, 01/09/2020 (A) | 1,000 | 1,014 | ||||||
0.787%, 01/14/2019 (A) | 400 | 402 | ||||||
International Lease Finance | ||||||||
6.750%, 09/01/2016 (B) | 650 | 687 | ||||||
Manitowoc | ||||||||
5.875%, 10/15/2022 | 293 | 317 | ||||||
Nielsen Finance LLC | ||||||||
5.000%, 04/15/2022 (B) | 5,000 | 5,019 | ||||||
Norbord | ||||||||
5.375%, 12/01/2020 (B) | 3,409 | 3,400 | ||||||
Pentair Finance | ||||||||
1.350%, 12/01/2015 | 80 | 80 | ||||||
Precision Castparts | ||||||||
0.700%, 12/20/2015 | 80 | 80 | ||||||
| SEI Institutional Investments Trust / Annual Report / May 31, 2015 | 101 |
SCHEDULE OF INVESTMENTS
Opportunistic Income Fund (Continued)
May 31, 2015
| Description | Face Amount ($ Thousands) | Market Value ($ Thousands) | ||||||
Rockwell Collins | ||||||||
0.621%, 12/15/2016 (A) | $ | 400 | $ | 400 | ||||
Sensata Technologies BV | ||||||||
5.000%, 10/01/2025 (B) | 1,586 | 1,601 | ||||||
United Rentals North America | ||||||||
4.625%, 07/15/2023 | 2,650 | 2,650 | ||||||
|
| |||||||
| 20,683 | ||||||||
|
| |||||||
Information Technology — 0.6% | ||||||||
Audatex North America | ||||||||
6.125%, 11/01/2023 (B) | 3,300 | 3,432 | ||||||
6.000%, 06/15/2021 (B) | 1,600 | 1,670 | ||||||
Bankrate | ||||||||
6.125%, 08/15/2018 (B) | 3,145 | 3,082 | ||||||
Equinix | ||||||||
5.750%, 01/01/2025 | 3,535 | 3,641 | ||||||
Fidelity National Information Services | ||||||||
1.450%, 06/05/2017 | 295 | 295 | ||||||
Hewlett-Packard | ||||||||
1.217%, 01/14/2019 (A) | 750 | 750 | ||||||
Hughes Satellite Systems | ||||||||
6.500%, 06/15/2019 | 250 | 275 | ||||||
Western Union | ||||||||
2.375%, 12/10/2015 | 30 | 30 | ||||||
|
| |||||||
| 13,175 | ||||||||
|
| |||||||
Materials — 0.1% | ||||||||
Glencore Funding LLC | ||||||||
1.445%, 05/27/2016 (A) (B) | 400 | 401 | ||||||
Monsanto | ||||||||
1.150%, 06/30/2017 | 900 | 897 | ||||||
Rio Tinto Finance USA | ||||||||
1.111%, 06/17/2016 (A) | 400 | 401 | ||||||
|
| |||||||
| 1,699 | ||||||||
|
| |||||||
Telecommunication Services — 0.5% |
| |||||||
AT&T | ||||||||
1.209%, 06/30/2020 (A) | 750 | 755 | ||||||
British Telecommunications | ||||||||
1.625%, 06/28/2016 | 235 | 237 | ||||||
1.250%, 02/14/2017 | 415 | 415 | ||||||
CommScope | ||||||||
5.500%, 06/15/2024 (B) | 1,500 | 1,494 | ||||||
5.000%, 06/15/2021 (B) | 1,000 | 998 | ||||||
Level 3 Financing | ||||||||
5.125%, 05/01/2023 (B) | 1,900 | 1,905 | ||||||
SoftBank | ||||||||
4.500%, 04/15/2020 (B) | 1,751 | 1,799 | ||||||
Thomson Reuters | ||||||||
1.650%, 09/29/2017 | 395 | 396 | ||||||
1.300%, 02/23/2017 | 400 | 400 | ||||||
| Description | Face Amount ($ Thousands) | Market Value ($ Thousands) | ||||||
Verizon Communications | ||||||||
2.021%, 09/14/2018 (A) | $ | 435 | $ | 451 | ||||
1.801%, 09/15/2016 (A) | 3,400 | 3,450 | ||||||
|
| |||||||
| 12,300 | ||||||||
|
| |||||||
Utilities — 0.2% | ||||||||
Dominion Gas Holdings LLC | ||||||||
1.050%, 11/01/2016 | 750 | 751 | ||||||
Eversource Energy | ||||||||
1.600%, 01/15/2018 | 290 | 292 | ||||||
Exelon | ||||||||
4.900%, 06/15/2015 | 600 | 601 | ||||||
RJS Power Holdings LLC | ||||||||
5.125%, 07/15/2019 (B) | 3,005 | 2,982 | ||||||
Southern | ||||||||
1.300%, 08/15/2017 | 545 | 545 | ||||||
|
| |||||||
| 5,171 | ||||||||
|
| |||||||
Total Corporate Obligations | 200,452 | |||||||
|
| |||||||
MUNICIPAL BONDS — 0.2% | ||||||||
Florida State, Hurricane Catastrophe Fund Finance, Ser A, RB | ||||||||
1.298%, 07/01/2016 | 345 | 347 | ||||||
Illinois State, GO | ||||||||
4.050%, 06/01/2015 | 250 | 250 | ||||||
Illinois State, Ser B, GO | ||||||||
1.780%, 04/01/2016 | 1,000 | 1,002 | ||||||
New Jersey State, Economic Development Authority, Ser 00, RB | ||||||||
1.059%, 03/01/2016 | 285 | 286 | ||||||
New Jersey State, Economic Development Authority, Ser Q, RB | ||||||||
1.096%, 06/15/2016 | 1,100 | 1,098 | ||||||
New Jersey State, Turnpike Authority, Ser B, RB, AMBAC | ||||||||
4.252%, 01/01/2016 | 75 | 76 | ||||||
University of California, Ser Y-1, GO | ||||||||
0.684%, 07/01/2041 (A) | 755 | 755 | ||||||
|
| |||||||
Total Municipal Bonds | 3,814 | |||||||
|
| |||||||
U.S. GOVERNMENT AGENCY OBLIGATIONS — 0.2% |
| |||||||
FHLB | ||||||||
0.375%, 06/24/2016 | 2,500 | 2,500 | ||||||
FNMA | ||||||||
0.500%, 03/30/2016 | 1,100 | 1,101 | ||||||
|
| |||||||
Total U.S. Government Agency Obligations |
| 3,601 | ||||||
|
| |||||||
| 102 | SEI Institutional Investments Trust / Annual Report / May 31, 2015 |
| Description | Shares/Face Amount ($ Thousands) | Market Value ($ Thousands) | ||||||
PREFERRED STOCK — 0.2% |
| |||||||
Ally Financial, 7.000% (B) | 1,500 | $ | 1,515 | |||||
Public Storage, 5.900%‡ | 75,000 | 1,917 | ||||||
|
| |||||||
Total Preferred Stock | 3,432 | |||||||
|
| |||||||
CASH EQUIVALENT — 3.6% | ||||||||
SEI Daily Income Trust, Prime Obligation Fund, Cl A | ||||||||
0.010%*† | 78,062,182 | 78,062 | ||||||
|
| |||||||
Total Cash Equivalent | 78,062 | |||||||
|
| |||||||
REPURCHASE AGREEMENT — 0.1% |
| |||||||
BNP Paribas | $ | 3,000 | 3,000 | |||||
|
| |||||||
Total Repurchase Agreement | 3,000 | |||||||
|
| |||||||
Total Investments — 97.2% | $ | 2,106,360 | ||||||
|
| |||||||
A list of the open futures contracts held by the Fund at May 31, 2015, is as follows:
| Type of Contract | Number of Contracts Long (Short) | Expiration Date | Unrealized Appreciation (Depreciation) ($ Thousands) | |||||||||
U.S. 10-Year Treasury Note | (129 | ) | Sep-2015 | $ | (64 | ) | ||||||
U.S. 2-Year Treasury Note | (135 | ) | Sep-2015 | (39 | ) | |||||||
U.S. 5-Year Treasury Note | 1 | Sep-2015 | — | |||||||||
U.S. 5-Year Treasury Note | (100 | ) | Sep-2015 | (27 | ) | |||||||
U.S. Long Treasury Bond | (1 | ) | Sep-2015 | (1 | ) | |||||||
|
| |||||||||||
| $ | (131 | ) | ||||||||||
|
| |||||||||||
For the year ended May 31, 2015, the total amount of all open futures contracts, as presented in the table above, are representative of the volume of activity for this derivative type during the year.
Percentages are based on a Net Assets of $2,167,478 ($ Thousands).
| * | The rate reported is the 7-day effective yield as of May 31, 2015. |
| ‡ | Real Estate Investment Trust. |
| † | Investment in Affiliated Security (see Note 6). |
| (A) | Variable Rate Security — The rate reported on the Schedule of Investments is the rate in effect as of May 31, 2015. |
| (B) | Securities sold within terms of a private placement memorandum, exempt from registration under Section 144A of the Securities Act of 1933, as amended, and may be sold only to dealers in that program or other “accredited investors.” These securities have been determined to be liquid under guidelines established by the Board of Trustees. |
| (C) | Unsettled bank loan. Interest rate not available. |
| (D) | Security in default on interest payments. |
ABS — Asset-Based Security
AMBAC — American Municipal Bond Assurance Corporation
ARM — Adjustable Rate Mortgage
Cl — Class
CLO — Collateralized Loan Obligation
CMO — Collateralized Mortgage Obligation
FDIC — Federal Deposit Insurance Company
FFCB — Federal Farm Credit Bank
FHLB — Federal Home Loan Bank
FHLMC — Federal Home Loan Mortgage Corporation
FNMA — Federal National Mortgage Association
GNMA — Government National Mortgage Association
GO — General Obligation
IO — Interest Only — face amount represents notional amount
LLC — Limited Liability Company
L.P. — Limited Partnership
Ltd. — Limited
MTN — Medium Term Note
NCUA — National Credit Union Association
PLC — Public Limited Company
RB — Revenue Bond
REMIC — Real Estate Mortgage Investment Conduit
Re-REMIC — Resecuritization of Real Estate Mortgage Investment Conduit
Ser — Series
TBA — To Be Announced
The following is a list of the level of inputs used as of May 31, 2015, in valuing the Fund’s investments and other financial instruments carried at value ($ Thousands):
| Investments in Securities | Level 1 | Level 2 | Level 3(1) | Total | ||||||||||||
Mortgage-Backed Securities | $ | — | $ | 844,584 | $ | 3,556 | $ | 848,140 | ||||||||
Loan Participations | — | 486,804 | — | 486,804 | ||||||||||||
Asset-Backed Securities | — | 479,055 | — | 479,055 | ||||||||||||
Corporate Obligations | — | 200,452 | — | 200,452 | ||||||||||||
Municipal Bonds | — | 3,814 | — | 3,814 | ||||||||||||
U.S. Government Agency Obligations | — | 3,601 | — | 3,601 | ||||||||||||
Preferred Stock | 3,432 | — | — | 3,432 | ||||||||||||
Cash Equivalent | 78,062 | — | — | 78,062 | ||||||||||||
Repurchase Agreement | — | 3,000 | — | 3,000 | ||||||||||||
|
|
|
|
|
|
|
| |||||||||
Total Investments in Securities | $ | 81,494 | $ | 2,021,310 | $ | 3,556 | $ | 2,106,360 | ||||||||
|
|
|
|
|
|
|
| |||||||||
| Other Financial Instruments | Level 1 | Level 2 | Level 3 | Total | ||||||||||||
Futures Contracts* | ||||||||||||||||
Unrealized Depreciation | $ | (131 | ) | $ | — | $ | — | $ | (131 | ) | ||||||
|
|
|
|
|
|
|
| |||||||||
| (1) | A reconciliation of Level 3 investments and disclosures of significant unobservable inputs are presented when the Fund has significant amount of Level 3 investments at the beginning and/or end of the period in relation to net assets. Management has concluded that Level 3 investments are not material in relation to net assets. |
| * | Futures contracts are valued at the unrealized depreciation on the instrument. |
For the year ended May 31, 2015, there were no transfers between Level 1 and Level 2 assets and liabilities.
For the year ended May 31, 2015, there were no transfers between Level 2 and Level 3 assets and liabilities.
Amounts designated as “—” are $0 or have been rounded to $0.
For more information on valuation inputs, see Note 2 — Significant Accounting Policies in Notes to Financial Statements.
The accompanying notes are an integral part of the financial statements.
| SEI Institutional Investments Trust / Annual Report / May 31, 2015 | 103 |
SCHEDULE OF INVESTMENTS
Core Fixed Income Fund
May 31, 2015
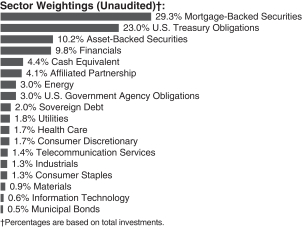
| Description | Face Amount ($ Thousands) | Market Value ($ Thousands) | ||||||
MORTGAGE-BACKED SECURITIES — 32.9% |
| |||||||
Agency Mortgage-Backed Obligations — 25.7% |
| |||||||
FHLMC | ||||||||
11.000%, 02/17/2021 | $ | 123 | $ | 137 | ||||
10.000%, 03/17/2026 to 10/01/2030 | 987 | 1,100 | ||||||
8.000%, 06/01/2030 | 3 | 3 | ||||||
7.500%, 08/01/2030 to 09/01/2038 | 1,016 | 1,208 | ||||||
7.000%, 11/01/2015 to 03/01/2039 | 425 | 494 | ||||||
6.500%, 06/01/2017 to 09/01/2039 | 3,610 | 4,154 | ||||||
6.000%, 04/01/2017 to 08/01/2038 | 4,731 | 5,308 | ||||||
5.500%, 09/01/2023 to 12/01/2038 | 7,388 | 8,422 | ||||||
5.000%, 04/01/2020 to 07/01/2044 | 7,800 | 8,516 | ||||||
4.500%, 05/01/2030 to 06/01/2045 | 25,096 | 27,696 | ||||||
4.000%, 10/01/2025 to 06/01/2045 | 77,530 | 83,779 | ||||||
3.500%, 12/01/2028 to 03/01/2045 | 46,395 | 48,918 | ||||||
2.600%, 07/01/2045 | 1,582 | 1,626 | ||||||
2.100%, 10/01/2036 (A) | 771 | 813 | ||||||
FHLMC ARM (A) | ||||||||
3.385%, 07/01/2036 | 199 | 207 | ||||||
2.936%, 05/01/2036 | 252 | 270 | ||||||
2.898%, 08/01/2044 | 962 | 1,000 | ||||||
2.894%, 03/01/2037 | 180 | 196 | ||||||
2.828%, 02/01/2037 | 121 | 130 | ||||||
2.794%, 12/01/2036 | 221 | 240 | ||||||
2.790%, 05/01/2037 | 1,168 | 1,250 | ||||||
2.754%, 04/01/2037 | 86 | 92 | ||||||
| Description | Face Amount ($ Thousands) | Market Value ($ Thousands) | ||||||
2.750%, 05/01/2045 | $ | 1,102 | $ | 1,136 | ||||
2.727%, 03/01/2037 | 414 | 447 | ||||||
2.695%, 04/01/2037 | 457 | 495 | ||||||
2.640%, 05/01/2037 | 460 | 492 | ||||||
2.611%, 11/01/2036 | 130 | 141 | ||||||
2.565%, 12/01/2036 | 275 | 298 | ||||||
2.497%, 05/01/2036 | 304 | 322 | ||||||
2.495%, 05/01/2037 to 05/01/2038 | 542 | 581 | ||||||
2.490%, 10/01/2036 to 04/01/2037 | 630 | 676 | ||||||
2.485%, 02/01/2037 | 645 | 687 | ||||||
2.480%, 10/01/2037 | 450 | 484 | ||||||
2.477%, 05/01/2037 | 290 | 311 | ||||||
2.443%, 09/01/2036 | 549 | 590 | ||||||
2.420%, 05/01/2036 | 221 | 237 | ||||||
2.385%, 05/01/2037 | 338 | 359 | ||||||
2.375%, 01/01/2035 to 11/01/2036 | 264 | 282 | ||||||
2.368%, 11/01/2036 | 255 | 273 | ||||||
2.365%, 01/01/2037 | 942 | 1,010 | ||||||
2.285%, 09/01/2036 | 90 | 92 | ||||||
2.280%, 12/01/2036 | 95 | 101 | ||||||
2.278%, 06/01/2037 | 162 | 174 | ||||||
2.276%, 02/01/2037 | 79 | 84 | ||||||
2.260%, 10/01/2036 | 903 | 961 | ||||||
2.250%, 11/01/2037 | 142 | 151 | ||||||
2.213%, 12/01/2036 | 495 | 529 | ||||||
2.139%, 09/01/2036 | 3,222 | 3,429 | ||||||
2.137%, 12/01/2036 | 654 | 695 | ||||||
2.113%, 08/01/2036 | 861 | 914 | ||||||
2.099%, 08/01/2037 | 945 | 1,011 | ||||||
2.095%, 10/01/2036 | 104 | 110 | ||||||
2.093%, 07/01/2036 | 415 | 439 | ||||||
2.000%, 08/01/2036 | 385 | 405 | ||||||
1.936%, 05/01/2037 | 172 | 181 | ||||||
1.925%, 04/01/2037 | 225 | 237 | ||||||
1.855%, 05/01/2037 | 2,068 | 2,185 | ||||||
1.607%, 08/01/2037 | 651 | 686 | ||||||
FHLMC CMO, Ser 1988-1, Cl Z | ||||||||
9.300%, 04/15/2019 | 3 | 3 | ||||||
FHLMC CMO, | ||||||||
7.000%, 10/15/2021 | 139 | 154 | ||||||
FHLMC CMO, | ||||||||
6.000%, 07/15/2029 | 34 | 39 | ||||||
FHLMC CMO, | ||||||||
6.500%, 05/15/2031 | 349 | 403 | ||||||
FHLMC CMO, | ||||||||
6.500%, 09/15/2031 | 61 | 70 | ||||||
FHLMC CMO, | ||||||||
6.500%, 01/15/2032 | 115 | 129 | ||||||
| 104 | SEI Institutional Investments Trust / Annual Report / May 31, 2015 |
| Description | Face Amount ($ Thousands) | Market Value ($ Thousands) | ||||||
FHLMC CMO, | ||||||||
6.500%, 06/15/2032 | $ | 193 | $ | 224 | ||||
FHLMC CMO, | ||||||||
6.500%, 06/15/2032 | 480 | 552 | ||||||
FHLMC CMO, Ser 2002-41, Cl 2A | ||||||||
5.909%, 07/25/2032 (A) | 546 | 644 | ||||||
FHLMC CMO, Ser 2002-42, Cl A5 | ||||||||
7.500%, 02/25/2042 | 758 | 887 | ||||||
FHLMC CMO, Ser 2002-48, Cl 1A | ||||||||
5.581%, 07/25/2033 (A) | 42 | 48 | ||||||
FHLMC CMO, | ||||||||
14.143%, 01/15/2033 (A) | 191 | 252 | ||||||
FHLMC CMO, | ||||||||
14.510%, 06/15/2033 (A) | 149 | 195 | ||||||
FHLMC CMO, | ||||||||
14.418%, 09/15/2033 (A) | 143 | 188 | ||||||
FHLMC CMO, | ||||||||
4.000%, 10/15/2033 | 309 | 332 | ||||||
FHLMC CMO, | ||||||||
8.806%, 11/15/2033 (A) | 131 | 149 | ||||||
FHLMC CMO, Ser 2003-54, Cl 2A | ||||||||
6.500%, 02/25/2043 | 393 | 466 | ||||||
FHLMC CMO, Ser 2003-54, Cl 3A | ||||||||
7.000%, 02/25/2043 | 490 | 601 | ||||||
FHLMC CMO, Ser 2003-57, Cl 1A1 | ||||||||
6.500%, 07/25/2043 | 421 | 494 | ||||||
FHLMC CMO, Ser 2003-57, Cl 1A2 | ||||||||
7.000%, 07/25/2043 | 544 | 634 | ||||||
FHLMC CMO, Ser 2003-57, Cl 1A3 | ||||||||
7.500%, 07/25/2043 | 441 | 531 | ||||||
FHLMC CMO, Ser 2003-58, Cl 4A | ||||||||
7.500%, 09/25/2043 | 600 | 717 | ||||||
FHLMC CMO, | ||||||||
5.000%, 01/15/2034 | 751 | 839 | ||||||
FHLMC CMO, Ser 2004-59, Cl 1A3 | ||||||||
7.500%, 10/25/2043 | 624 | 757 | ||||||
FHLMC CMO, Ser 2004-60, Cl 1A2 | ||||||||
7.000%, 03/25/2044 | 482 | 603 | ||||||
FHLMC CMO, Ser 2004-60, Cl 1A3 | ||||||||
7.500%, 03/25/2044 | 633 | 778 | ||||||
FHLMC CMO, | ||||||||
11.960%, 03/15/2020 (A) | 487 | 549 | ||||||
FHLMC CMO, | ||||||||
0.000%, 03/15/2020 (B) | 62 | 62 | ||||||
| Description | Face Amount ($ Thousands) | Market Value ($ Thousands) | ||||||
FHLMC CMO, | ||||||||
6.000%, 05/15/2035 | $ | 248 | $ | 274 | ||||
FHLMC CMO, | ||||||||
0.586%, 05/15/2035 (A) | 254 | 256 | ||||||
FHLMC CMO, | ||||||||
21.258%, 05/15/2035 (A) | 76 | 105 | ||||||
FHLMC CMO, | ||||||||
19.663%, 07/15/2035 (A) | 314 | 396 | ||||||
FHLMC CMO, | ||||||||
23.915%, 06/15/2035 (A) | 102 | 157 | ||||||
FHLMC CMO, | ||||||||
0.000%, 04/15/2035 (B) | 196 | 179 | ||||||
FHLMC CMO, | ||||||||
0.000%, 01/15/2036 (B) | 375 | 343 | ||||||
FHLMC CMO, | ||||||||
0.000%, 05/15/2036 (B) | 193 | 185 | ||||||
FHLMC CMO, | ||||||||
0.000%, 05/15/2036 (B) | 262 | 254 | ||||||
FHLMC CMO, | ||||||||
6.000%, 06/15/2036 | 279 | 318 | ||||||
FHLMC CMO, | ||||||||
6.464%, 08/15/2036 (A) | 455 | 78 | ||||||
FHLMC CMO, | ||||||||
6.404%, 09/15/2036 (A) | 218 | 33 | ||||||
FHLMC CMO, | ||||||||
6.214%, 01/15/2037 (A) | 188 | 24 | ||||||
FHLMC CMO, | ||||||||
0.000%, 05/15/2037 (B) | 44 | 40 | ||||||
FHLMC CMO, | ||||||||
0.386%, 11/15/2036 (A) | 14 | 14 | ||||||
FHLMC CMO, | ||||||||
0.366%, 05/15/2036 (A) | 16 | 16 | ||||||
FHLMC CMO, | ||||||||
0.416%, 02/15/2019 (A) | 1,849 | 1,850 | ||||||
FHLMC CMO, | ||||||||
0.000%, 04/15/2037 (B) | 78 | 76 | ||||||
| SEI Institutional Investments Trust / Annual Report / May 31, 2015 | 105 |
SCHEDULE OF INVESTMENTS
Core Fixed Income Fund (Continued)
May 31, 2015
| Description | Face Amount ($ Thousands) | Market Value ($ Thousands) | ||||||
FHLMC CMO, | ||||||||
6.264%, 11/15/2037 (A) | $ | 260 | $ | 39 | ||||
FHLMC CMO, | ||||||||
5.814%, 11/15/2037 (A) | 259 | 35 | ||||||
FHLMC CMO, | ||||||||
6.234%, 11/15/2037 (A) | 244 | 35 | ||||||
FHLMC CMO, | ||||||||
16.986%, 02/15/2038 (A) | 53 | 71 | ||||||
FHLMC CMO, | ||||||||
5.864%, 05/15/2038 (A) | 210 | 29 | ||||||
FHLMC CMO, | ||||||||
5.844%, 05/15/2038 (A) | 1,107 | 131 | ||||||
FHLMC CMO, | ||||||||
6.014%, 06/15/2038 (A) | 1,253 | 187 | ||||||
FHLMC CMO, | ||||||||
6.000%, 06/15/2038 | 157 | 174 | ||||||
FHLMC CMO, | ||||||||
0.000%, 02/15/2037 (B) | 320 | 303 | ||||||
FHLMC CMO, | ||||||||
19.152%, 06/15/2036 (A) | 143 | 196 | ||||||
FHLMC CMO, | ||||||||
1.937%, 02/15/2039 (A) | 189 | 190 | ||||||
FHLMC CMO, | ||||||||
0.000%, 05/15/2036 (B) | 262 | 255 | ||||||
FHLMC CMO, | ||||||||
0.000%, 04/15/2036 (B) | 235 | 220 | ||||||
FHLMC CMO, | ||||||||
0.000%, 04/15/2036 (B) | 168 | 157 | ||||||
FHLMC CMO, | ||||||||
0.000%, 10/15/2039 (B) | 336 | 304 | ||||||
FHLMC CMO, | ||||||||
6.064%, 12/15/2039 (A) | 646 | 67 | ||||||
FHLMC CMO, | ||||||||
0.000%, 07/15/2034 (B) | 154 | 135 | ||||||
FHLMC CMO, | ||||||||
0.000%, 01/15/2040 (B) | 212 | 201 | ||||||
| Description | Face Amount ($ Thousands) | Market Value ($ Thousands) | ||||||
FHLMC CMO, | ||||||||
6.044%, 01/15/2040 (A) | $ | 276 | $ | 47 | ||||
FHLMC CMO, | ||||||||
16.881%, 02/15/2040 (A) | 400 | 602 | ||||||
FHLMC CMO, | ||||||||
4.000%, 11/15/2037 | 893 | 944 | ||||||
FHLMC CMO, | ||||||||
5.000%, 04/15/2032 | 977 | 72 | ||||||
FHLMC CMO, | ||||||||
5.000%, 08/15/2040 | 987 | 116 | ||||||
FHLMC CMO, | ||||||||
4.000%, 03/15/2034 | 870 | 31 | ||||||
FHLMC CMO, | ||||||||
5.814%, 10/15/2040 (A) | 993 | 178 | ||||||
FHLMC CMO, | ||||||||
4.000%, 08/15/2035 | 174 | 1 | ||||||
FHLMC CMO, | ||||||||
4.000%, 08/15/2037 | 955 | 74 | ||||||
FHLMC CMO, | ||||||||
4.000%, 10/15/2037 | 591 | 34 | ||||||
FHLMC CMO, | ||||||||
4.000%, 11/15/2029 | 1,054 | 82 | ||||||
FHLMC CMO, | ||||||||
1.769%, 01/15/2040 (A) | 1,744 | 163 | ||||||
FHLMC CMO, | ||||||||
5.500%, 05/15/2041 (A) | 455 | 498 | ||||||
FHLMC CMO, | ||||||||
5.764%, 05/15/2041 (A) | 1,785 | 296 | ||||||
FHLMC CMO, | ||||||||
5.000%, 08/15/2038 | 1,357 | 1,461 | ||||||
FHLMC CMO, | ||||||||
5.708%, 10/15/2038 (A) | 222 | 251 | ||||||
FHLMC CMO, | ||||||||
6.414%, 11/15/2041 (A) | 2,018 | 396 | ||||||
FHLMC CMO, | ||||||||
6.424%, 04/15/2042 (A) | 171 | 33 | ||||||
| 106 | SEI Institutional Investments Trust / Annual Report / May 31, 2015 |
| Description | Face Amount ($ Thousands) | Market Value ($ Thousands) | ||||||
FHLMC CMO, | ||||||||
0.579%, 07/15/2037 (A) | $ | 1,174 | $ | 1,172 | ||||
FHLMC CMO, | ||||||||
5.864%, 07/15/2042 (A) | 316 | 64 | ||||||
FHLMC CMO, | ||||||||
3.000%, 09/15/2031 | 3,034 | 373 | ||||||
FHLMC CMO, | ||||||||
5.864%, 08/15/2042 (A) | 383 | 78 | ||||||
FHLMC CMO, | ||||||||
2.500%, 09/15/2041 | 5,755 | 5,903 | ||||||
FHLMC CMO, | ||||||||
3.500%, 10/15/2032 | 1,272 | 177 | ||||||
FHLMC CMO, | ||||||||
5.964%, 11/15/2042 (A) | 315 | 71 | ||||||
FHLMC CMO, | ||||||||
5.964%, 11/15/2042 (A) | 332 | 86 | ||||||
FHLMC CMO, | ||||||||
5.964%, 11/15/2042 (A) | 482 | 108 | ||||||
FHLMC CMO, | ||||||||
5.964%, 12/15/2042 (A) | 939 | 227 | ||||||
FHLMC CMO, | ||||||||
2.500%, 12/15/2041 | 12,434 | 12,510 | ||||||
FHLMC CMO, | ||||||||
3.500%, 04/15/2043 | 810 | 131 | ||||||
FHLMC CMO, | ||||||||
3.000%, 05/15/2043 | 743 | 674 | ||||||
FHLMC CMO, | ||||||||
3.000%, 05/15/2043 | 1,456 | 1,354 | ||||||
FHLMC CMO, | ||||||||
3.000%, 07/15/2043 | 951 | 898 | ||||||
FHLMC CMO, | ||||||||
3.500%, 10/15/2037 | 2,757 | 2,934 | ||||||
FHLMC CMO, | ||||||||
3.500%, 10/15/2037 | 1,300 | 1,357 | ||||||
FHLMC CMO, | ||||||||
3.000%, 02/15/2045 | 9,277 | 9,401 | ||||||
FHLMC CMO, | ||||||||
4.000%, 09/15/2040 | 2,772 | 2,927 | ||||||
| Description | Face Amount ($ Thousands) | Market Value ($ Thousands) | ||||||
FHLMC CMO, | ||||||||
4.000%, 04/15/2041 | $ | 4,166 | $ | 4,434 | ||||
FHLMC CMO, | ||||||||
4.000%, 04/15/2040 | 612 | 661 | ||||||
FHLMC GNMA CMO, | ||||||||
6.250%, 10/25/2023 | 348 | 385 | ||||||
FHLMC Multifamily Structured Pass-Through Certificates CMO, Ser 2011-K010, Cl A1 | ||||||||
3.320%, 07/25/2020 | 49 | 51 | ||||||
FHLMC Multifamily Structured Pass-Through Certificates CMO, Ser K007, Cl X1, IO | ||||||||
1.174%, 04/25/2020 (A) | 10,487 | 448 | ||||||
FHLMC Multifamily Structured Pass-Through Certificates CMO, Ser K015, Cl X1, IO | ||||||||
1.648%, 07/25/2021 (A) | 3,076 | 256 | ||||||
FHLMC Multifamily Structured Pass-Through Certificates CMO, Ser K016, Cl X1, IO | ||||||||
1.560%, 10/25/2021 (A) | 532 | 43 | ||||||
FHLMC Multifamily Structured Pass-Through Certificates, Ser K044, Cl A2 | ||||||||
2.811%, 01/25/2025 | 1,780 | 1,807 | ||||||
FHLMC Multifamily Structured Pass-Through Certificates, Ser KF05, Cl A | ||||||||
0.523%, 09/25/2021 (A) | 9,401 | 9,407 | ||||||
FHLMC Multifamily Structured Pass-Through Certificates, Ser KSCT, Cl A2 | ||||||||
4.285%, 01/25/2020 | 2,080 | 2,304 | ||||||
FHLMC Reference REMIC CMO, Ser 2006-R007, Cl ZA | ||||||||
6.000%, 05/15/2036 | 1,046 | 1,190 | ||||||
FHLMC STRIP CMO, | ||||||||
3.000%, 08/15/2042 | 1,498 | 1,518 | ||||||
FHLMC STRIP CMO, | ||||||||
3.000%, 01/15/2043 | 6,153 | 6,235 | ||||||
FHLMC STRIPS CMO, | ||||||||
7.514%, 08/15/2036 (A) | 615 | 119 | ||||||
FHLMC STRIPS CMO, | ||||||||
4.500%, 07/15/2037 | 1,618 | 119 | ||||||
FHLMC STRIPS CMO, | ||||||||
0.000%, 09/15/2043 (B) | 926 | 733 | ||||||
| SEI Institutional Investments Trust / Annual Report / May 31, 2015 | 107 |
SCHEDULE OF INVESTMENTS
Core Fixed Income Fund (Continued)
May 31, 2015
| Description | Face Amount ($ Thousands) | Market Value ($ Thousands) | ||||||
FHLMC TBA | ||||||||
3.500%, 07/15/2041 to 08/25/2041 | $ | 20,500 | $ | 21,296 | ||||
2.500%, 06/15/2027 | 8,100 | 8,274 | ||||||
FNMA | ||||||||
8.000%, 06/01/2015 to 11/01/2037 | 155 | 177 | ||||||
7.500%, 06/01/2030 to 04/01/2039 | 1,253 | 1,518 | ||||||
7.000%, 12/01/2015 to 02/01/2039 | 3,170 | 3,697 | ||||||
6.500%, 05/01/2017 to 07/01/2039 | 8,364 | 9,683 | ||||||
6.000%, 06/01/2016 to 11/01/2048 | 9,752 | 11,134 | ||||||
5.500%, 06/01/2020 to 08/01/2041 | 46,427 | 52,300 | ||||||
5.000%, 02/01/2020 to 07/01/2045 | 28,227 | 31,917 | ||||||
4.685%, 02/01/2020 | 546 | 608 | ||||||
4.666%, 07/01/2020 | 673 | 748 | ||||||
4.540%, 01/01/2020 to 05/01/2021 | 2,867 | 3,199 | ||||||
4.500%, 07/01/2020 to 03/01/2045 | 58,928 | 64,613 | ||||||
4.338%, 11/01/2021 | 5,896 | 6,548 | ||||||
4.317%, 07/01/2021 | 1,232 | 1,371 | ||||||
4.300%, 07/01/2021 | 5,317 | 5,917 | ||||||
4.250%, 04/01/2021 | 2,000 | 2,224 | ||||||
4.120%, 04/01/2020 | 1,121 | 1,227 | ||||||
4.060%, 07/01/2021 | 2,240 | 2,467 | ||||||
4.050%, 01/01/2021 | 1,430 | 1,564 | ||||||
4.040%, 10/01/2020 | 2,120 | 2,324 | ||||||
4.000%, 04/01/2019 to 06/01/2045 | 115,937 | 125,265 | ||||||
3.980%, 08/01/2021 | 4,603 | 5,050 | ||||||
3.975%, 11/01/2020 | 764 | 834 | ||||||
3.940%, 07/01/2021 | 1,500 | 1,651 | ||||||
3.930%, 01/01/2021 | 982 | 1,076 | ||||||
3.740%, 07/01/2020 | 1,323 | 1,432 | ||||||
3.630%, 01/01/2018 | 2,000 | 2,115 | ||||||
3.615%, 12/01/2020 | 3,697 | 4,000 | ||||||
3.583%, 09/01/2020 | 6,511 | 7,006 | ||||||
3.500%, 12/01/2029 to 05/01/2043 | 45,526 | 48,041 | ||||||
3.290%, 10/01/2020 to 08/01/2026 | 3,474 | 3,662 | ||||||
3.230%, 11/01/2020 | 1,438 | 1,526 | ||||||
3.000%, 03/01/2033 to 09/01/2042 | 29,959 | 30,630 | ||||||
2.830%, 06/01/2022 | 2,572 | 2,668 | ||||||
2.820%, 06/01/2022 | 2,925 | 3,033 | ||||||
2.646%, 10/01/2022 | 7,592 | 7,813 | ||||||
| Description | Face Amount ($ Thousands) | Market Value ($ Thousands) | ||||||
2.500%, 10/01/2042 | $ | 5,141 | $ | 5,034 | ||||
2.380%, 12/01/2022 | 1,985 | 1,999 | ||||||
FNMA ARM (A) | ||||||||
6.230%, 08/01/2036 | 88 | 95 | ||||||
5.931%, 05/01/2037 | 21 | 23 | ||||||
5.346%, 12/01/2035 | 65 | 69 | ||||||
4.365%, 04/01/2040 | 1,174 | 1,265 | ||||||
2.754%, 02/01/2045 | 1,629 | 1,684 | ||||||
2.741%, 01/01/2045 | 1,449 | 1,497 | ||||||
2.726%, 01/01/2045 | 2,681 | 2,771 | ||||||
2.668%, 11/01/2036 | 317 | 338 | ||||||
2.581%, 03/01/2045 | 480 | 493 | ||||||
2.575%, 10/01/2036 | 1,410 | 1,517 | ||||||
2.498%, 09/01/2037 | 14 | 15 | ||||||
2.479%, 05/01/2036 | 128 | 136 | ||||||
2.461%, 11/01/2036 | 460 | 490 | ||||||
2.447%, 03/01/2037 | 1,687 | 1,792 | ||||||
2.446%, 06/01/2036 | 508 | 549 | ||||||
2.411%, 12/01/2036 | 546 | 583 | ||||||
2.405%, 02/01/2037 | 578 | 615 | ||||||
2.364%, 04/01/2037 | 447 | 480 | ||||||
2.346%, 06/01/2036 | 550 | 595 | ||||||
2.308%, 09/01/2037 | 312 | 337 | ||||||
2.278%, 09/01/2036 | 354 | 377 | ||||||
2.277%, 06/01/2036 | 292 | 311 | ||||||
2.270%, 07/01/2036 | 386 | 411 | ||||||
2.257%, 11/01/2037 | 248 | 265 | ||||||
2.247%, 07/01/2037 | 484 | 515 | ||||||
2.244%, 08/01/2036 | 266 | 284 | ||||||
2.163%, 10/01/2036 | 299 | 320 | ||||||
2.141%, 09/01/2036 | 182 | 194 | ||||||
1.818%, 01/01/2037 | 423 | 445 | ||||||
1.809%, 02/01/2037 | 252 | 265 | ||||||
1.780%, 09/01/2036 | 245 | 257 | ||||||
1.748%, 05/01/2037 | 1,194 | 1,263 | ||||||
1.712%, 07/01/2037 | 229 | 240 | ||||||
FNMA CMO, Ser 1991-113, Cl ZE | ||||||||
7.500%, 09/25/2021 | 97 | 108 | ||||||
FNMA CMO, Ser 1992-143, Cl M | ||||||||
8.000%, 09/25/2022 | 250 | 281 | ||||||
FNMA CMO, Ser 1992-41, Cl MA | ||||||||
8.000%, 08/25/2022 | 327 | 365 | ||||||
FNMA CMO, Ser 1992-69, Cl Z | ||||||||
8.000%, 05/25/2022 | 223 | 253 | ||||||
FNMA CMO, Ser 1992-96, Cl B, PO | ||||||||
0.000%, 05/25/2022 (B) | — | — | ||||||
FNMA CMO, Ser 1993-149, Cl SH | ||||||||
11.500%, 08/25/2023 (A) | 99 | 129 | ||||||
FNMA CMO, Ser 1993-75, Cl ZQ | ||||||||
6.500%, 05/25/2023 | 469 | 523 | ||||||
FNMA CMO, Ser 1993-99, Cl Z | ||||||||
7.000%, 07/25/2023 | 491 | 542 | ||||||
FNMA CMO, Ser 1994-31, Cl ZC | ||||||||
6.500%, 02/25/2024 | 412 | 474 | ||||||
| 108 | SEI Institutional Investments Trust / Annual Report / May 31, 2015 |
| Description | Face Amount ($ Thousands) | Market Value ($ Thousands) | ||||||
FNMA CMO, Ser 1994-63, Cl PK | ||||||||
7.000%, 04/25/2024 | $ | 362 | $ | 412 | ||||
FNMA CMO, Ser 1997-32, Cl PG | ||||||||
6.500%, 04/25/2027 | 284 | 327 | ||||||
FNMA CMO, Ser 1999-11, Cl Z | ||||||||
5.500%, 03/25/2029 | 286 | 321 | ||||||
FNMA CMO, | ||||||||
0.000%, 10/25/2023 (B) | 111 | 110 | ||||||
FNMA CMO, Ser 2001-50, Cl BA | ||||||||
7.000%, 10/25/2041 | 388 | 451 | ||||||
FNMA CMO, Ser 2001-52, Cl YZ | ||||||||
6.500%, 10/25/2031 | 36 | 41 | ||||||
FNMA CMO, Ser 2001-79, Cl BA | ||||||||
7.000%, 03/25/2045 | 321 | 377 | ||||||
FNMA CMO, Ser 2002-10, Cl SB | ||||||||
18.757%, 03/25/2017 (A) | 16 | 18 | ||||||
FNMA CMO, Ser 2002-33, Cl A2 | ||||||||
7.500%, 06/25/2032 | 459 | 552 | ||||||
FNMA CMO, Ser 2002-90, Cl A1 | ||||||||
6.500%, 06/25/2042 | 559 | 641 | ||||||
FNMA CMO, Ser 2002-95, Cl DB | ||||||||
6.000%, 01/25/2033 | 1,658 | 1,923 | ||||||
FNMA CMO, Ser 2003-124, Cl TS | ||||||||
9.800%, 01/25/2034 (A) | 22 | 26 | ||||||
FNMA CMO, Ser 2003-131, Cl SK | ||||||||
15.831%, 01/25/2034 (A) | 204 | 269 | ||||||
FNMA CMO, | ||||||||
0.000%, 05/25/2033 (B) | 106 | 99 | ||||||
FNMA CMO, | ||||||||
0.000%, 03/25/2034 (B) | 243 | 239 | ||||||
FNMA CMO, | ||||||||
0.000%, 09/25/2032 (B) | 5 | 5 | ||||||
FNMA CMO, | ||||||||
0.000%, 10/25/2032 (B) | 43 | 43 | ||||||
FNMA CMO, Ser 2004-61, Cl FH | ||||||||
0.985%, 11/25/2032 (A) | 544 | 558 | ||||||
FNMA CMO, Ser 2005-106, Cl US | ||||||||
23.889%, 11/25/2035 (A) | 461 | 709 | ||||||
FNMA CMO, Ser 2005-29, Cl ZA | ||||||||
5.500%, 04/25/2035 | 768 | 808 | ||||||
FNMA CMO, Ser 2005-5, Cl PA | ||||||||
5.000%, 01/25/2035 | 498 | 548 | ||||||
FNMA CMO, Ser 2005-72, Cl SB | ||||||||
16.413%, 08/25/2035 (A) | 134 | 181 | ||||||
FNMA CMO, Ser 2005-74, Cl CS | ||||||||
19.512%, 05/25/2035 (A) | 252 | 350 | ||||||
FNMA CMO, | ||||||||
19.622%, 05/25/2035 (A) | 193 | 268 | ||||||
| Description | Face Amount ($ Thousands) | Market Value ($ Thousands) | ||||||
FNMA CMO, | ||||||||
16.413%, 10/25/2035 (A) | $ | 174 | $ | 229 | ||||
FNMA CMO, | ||||||||
0.000%, 09/25/2035 (B) | 115 | 113 | ||||||
FNMA CMO, | ||||||||
6.415%, 11/25/2036 (A) | 1,190 | 271 | ||||||
FNMA CMO, | ||||||||
6.565%, 11/25/2036 (A) | 2,654 | 425 | ||||||
FNMA CMO, | ||||||||
6.465%, 12/25/2036 (A) | 182 | 33 | ||||||
FNMA CMO, | ||||||||
0.242%, 12/25/2036 (A) | 483 | 482 | ||||||
FNMA CMO, | ||||||||
7.015%, 01/25/2037 (A) | 1,136 | 193 | ||||||
FNMA CMO, | ||||||||
0.000%, 03/25/2036 (B) | 207 | 194 | ||||||
FNMA CMO, | ||||||||
0.000%, 04/25/2036 (B) | 193 | 181 | ||||||
FNMA CMO, | ||||||||
0.000%, 03/25/2036 (B) | 227 | 221 | ||||||
FNMA CMO, | ||||||||
29.319%, 05/25/2036 (A) | 166 | 309 | ||||||
FNMA CMO, | ||||||||
0.000%, 12/25/2033 (B) | 102 | 89 | ||||||
FNMA CMO, | ||||||||
23.522%, 06/25/2036 (A) | 148 | 201 | ||||||
FNMA CMO, | ||||||||
6.465%, 03/25/2036 (A) | 212 | 34 | ||||||
FNMA CMO, | ||||||||
6.000%, 07/25/2036 | 370 | 427 | ||||||
FNMA CMO, | ||||||||
0.000%, 04/25/2035 (B) | 190 | 184 | ||||||
FNMA CMO, | ||||||||
0.000%, 07/25/2036 (B) | 505 | 451 | ||||||
FNMA CMO, | ||||||||
6.500%, 08/25/2036 | 257 | 295 | ||||||
| SEI Institutional Investments Trust / Annual Report / May 31, 2015 | 109 |
SCHEDULE OF INVESTMENTS
Core Fixed Income Fund (Continued)
May 31, 2015
| Description | Face Amount ($ Thousands) | Market Value ($ Thousands) | ||||||
FNMA CMO, | ||||||||
6.465%, 10/25/2026 (A) | $ | 591 | $ | 77 | ||||
FNMA CMO, | ||||||||
6.265%, 10/25/2037 (A) | 662 | 101 | ||||||
FNMA CMO, Ser 2007-101, Cl A2 | ||||||||
0.463%, 06/27/2036 (A) | 800 | 787 | ||||||
FNMA CMO, | ||||||||
6.265%, 12/25/2037 (A) | 599 | 99 | ||||||
FNMA CMO, | ||||||||
1.505%, 01/25/2038 (A) | 1,051 | 72 | ||||||
FNMA CMO, Ser 2007-29, Cl SG | ||||||||
22.051%, 04/25/2037 (A) | 119 | 166 | ||||||
FNMA CMO, Ser 2007-43, Cl FL | ||||||||
0.485%, 05/25/2037 (A) | 88 | 88 | ||||||
FNMA CMO, | ||||||||
5.915%, 06/25/2037 (A) | 422 | 57 | ||||||
FNMA CMO, Ser 2007-54, Cl FA | ||||||||
0.585%, 06/25/2037 (A) | 354 | 357 | ||||||
FNMA CMO, | ||||||||
6.965%, 07/25/2037 (A) | 913 | 155 | ||||||
FNMA CMO, Ser 2007-64, Cl FA | ||||||||
0.655%, 07/25/2037 (A) | 36 | 36 | ||||||
FNMA CMO, | ||||||||
6.435%, 07/25/2037 (A) | 434 | 62 | ||||||
FNMA CMO, | ||||||||
6.515%, 07/25/2037 (A) | 579 | 112 | ||||||
FNMA CMO, | ||||||||
6.215%, 07/25/2037 (A) | 580 | 88 | ||||||
FNMA CMO, Ser 2007-79, Cl SB | ||||||||
23.339%, 08/25/2037 (A) | 63 | 93 | ||||||
FNMA CMO, Ser 2007-85, Cl SG | ||||||||
15.788%, 09/25/2037 (A) | 136 | 178 | ||||||
FNMA CMO, | ||||||||
5.595%, 06/25/2037 (A) | 528 | 54 | ||||||
FNMA CMO, Ser 2008-1, Cl BI, IO | ||||||||
5.725%, 02/25/2038 (A) | 538 | 67 | ||||||
FNMA CMO, | ||||||||
6.805%, 03/25/2038 (A) | 337 | 49 | ||||||
FNMA CMO, | ||||||||
6.245%, 03/25/2037 (A) | 5,751 | 434 | ||||||
| Description | Face Amount ($ Thousands) | Market Value ($ Thousands) | ||||||
FNMA CMO, Ser 2008-24, Cl NA | ||||||||
6.750%, 06/25/2037 | $ | 113 | $ | 125 | ||||
FNMA CMO, Ser 2008-24, Cl PF | ||||||||
0.835%, 02/25/2038 (A) | 353 | 358 | ||||||
FNMA CMO, | ||||||||
6.665%, 04/25/2038 (A) | 167 | 25 | ||||||
FNMA CMO, | ||||||||
0.642%, 10/25/2016 (A) | 402 | 3 | ||||||
FNMA CMO, Ser 2008-4, Cl SD, IO | ||||||||
5.815%, 02/25/2038 (A) | 1,416 | 188 | ||||||
FNMA CMO, Ser 2009-103, Cl MB | ||||||||
2.358%, 12/25/2039 (A) | 480 | 501 | ||||||
FNMA CMO, | ||||||||
6.465%, 03/25/2039 (A) | 248 | 39 | ||||||
FNMA CMO, | ||||||||
5.000%, 07/25/2039 | 378 | 56 | ||||||
FNMA CMO, | ||||||||
0.000%, 01/25/2037 (B) | 655 | 594 | ||||||
FNMA CMO, | ||||||||
5.715%, 10/25/2039 (A) | 253 | 33 | ||||||
FNMA CMO, | ||||||||
0.000%, 03/25/2037 (B) | 4,086 | 4,010 | ||||||
FNMA CMO, | ||||||||
5.500%, 10/25/2039 | 218 | 40 | ||||||
FNMA CMO, | ||||||||
0.000%, 10/25/2037 (B) | 485 | 442 | ||||||
FNMA CMO, | ||||||||
5.995%, 12/25/2039 (A) | 342 | 43 | ||||||
FNMA CMO, Ser 2010-1, Cl WA | ||||||||
6.188%, 02/25/2040 (A) | 362 | 411 | ||||||
FNMA CMO, | ||||||||
6.395%, 09/25/2040 (A) | 2,220 | 434 | ||||||
FNMA CMO, Ser 2010-123, Cl PM | ||||||||
4.000%, 07/25/2040 | 3,600 | 3,909 | ||||||
FNMA CMO, | ||||||||
6.345%, 12/25/2040 (A) | 830 | 132 | ||||||
FNMA CMO, | ||||||||
6.345%, 01/25/2041 (A) | 1,584 | 292 | ||||||
FNMA CMO, Ser 2010-16, Cl WA | ||||||||
6.445%, 03/25/2040 (A) | 455 | 514 | ||||||
| 110 | SEI Institutional Investments Trust / Annual Report / May 31, 2015 |
| Description | Face Amount ($ Thousands) | Market Value ($ Thousands) | ||||||
FNMA CMO, | ||||||||
6.915%, 02/25/2040 (A) | $ | 438 | $ | 57 | ||||
FNMA CMO, | ||||||||
6.295%, 04/25/2040 (A) | 2,033 | 310 | ||||||
FNMA CMO, | ||||||||
6.235%, 04/25/2040 (A) | 470 | 84 | ||||||
FNMA CMO, | ||||||||
0.000%, 10/25/2035 (B) | 223 | 210 | ||||||
FNMA CMO, | ||||||||
4.815%, 07/25/2040 (A) | 2,021 | 302 | ||||||
FNMA CMO, Ser 2011-2, Cl WA | ||||||||
5.817%, 02/25/2051 (A) | 311 | 343 | ||||||
FNMA CMO, | ||||||||
1.833%, 04/25/2041 (A) | 1,292 | 91 | ||||||
FNMA CMO, Ser 2011-43, Cl WA | ||||||||
5.852%, 05/25/2051 (A) | 620 | 683 | ||||||
FNMA CMO, Ser 2011-53, Cl TN | ||||||||
4.000%, 06/25/2041 | 2,566 | 2,768 | ||||||
FNMA CMO, Ser 2011-75, Cl FA | ||||||||
0.735%, 08/25/2041 (A) | 353 | 358 | ||||||
FNMA CMO, | ||||||||
6.215%, 09/25/2041 (A) | 1,929 | 368 | ||||||
FNMA CMO, | ||||||||
5.000%, 05/25/2034 | 2,831 | 320 | ||||||
FNMA CMO, | ||||||||
6.365%, 10/25/2041 (A) | 3,469 | 612 | ||||||
FNMA CMO, Ser 2012-112, Cl DA | ||||||||
3.000%, 10/25/2042 | 8,471 | 8,582 | ||||||
FNMA CMO, | ||||||||
5.965%, 11/25/2042 (A) | 754 | 186 | ||||||
FNMA CMO, | ||||||||
5.965%, 11/25/2042 (A) | 1,014 | 252 | ||||||
FNMA CMO, | ||||||||
5.965%, 12/25/2042 (A) | 1,918 | 391 | ||||||
FNMA CMO, | ||||||||
5.965%, 12/25/2042 (A) | 333 | 86 | ||||||
FNMA CMO, Ser 2012-134, Cl LC | ||||||||
3.000%, 12/25/2042 | 1,830 | 1,867 | ||||||
FNMA CMO, | ||||||||
5.965%, 12/25/2042 (A) | 932 | 185 | ||||||
| Description | Face Amount ($ Thousands) | Market Value ($ Thousands) | ||||||
FNMA CMO, | ||||||||
3.000%, 12/25/2027 | $ | 1,988 | $ | 208 | ||||
FNMA CMO, Ser 2012-28, Cl B | ||||||||
6.500%, 06/25/2039 | 130 | 145 | ||||||
FNMA CMO, Ser 2012-46, Cl BA | ||||||||
6.000%, 05/25/2042 | 1,624 | 1,857 | ||||||
FNMA CMO, | ||||||||
5.815%, 07/25/2042 (A) | 7,035 | 1,542 | ||||||
FNMA CMO, | ||||||||
6.465%, 02/25/2041 (A) | 628 | 127 | ||||||
FNMA CMO, | ||||||||
0.000%, 03/25/2042 (B) | 117 | 113 | ||||||
FNMA CMO, | ||||||||
6.465%, 03/25/2042 (A) | 1,695 | 310 | ||||||
FNMA CMO, | ||||||||
0.000%, 03/25/2042 (B) | 234 | 226 | ||||||
FNMA CMO, | ||||||||
6.415%, 07/25/2042 (A) | 665 | 136 | ||||||
FNMA CMO, | ||||||||
3.000%, 09/25/2027 | 7,766 | 879 | ||||||
FNMA CMO, | ||||||||
5.915%, 09/25/2042 (A) | 1,004 | 204 | ||||||
FNMA CMO, Ser 2012-M12, Cl 1A | ||||||||
2.841%, 08/25/2022 (A) | 7,970 | 8,269 | ||||||
FNMA CMO, | ||||||||
4.202%, 02/25/2017 (A) | 7,626 | 397 | ||||||
FNMA CMO, | ||||||||
0.000%, 10/25/2043 (B) | 2,025 | 1,598 | ||||||
FNMA CMO, | ||||||||
0.000%, 10/25/2043 (B) | 4,591 | 3,635 | ||||||
FNMA CMO, | ||||||||
0.000%, 10/25/2043 (B) | 1,094 | 866 | ||||||
FNMA CMO, | ||||||||
0.000%, 12/25/2043 (B) | 1,351 | 1,090 | ||||||
FNMA CMO, Ser 2013-133, Cl AB | ||||||||
4.000%, 06/25/2039 | 1,635 | 1,760 | ||||||
FNMA CMO, | ||||||||
5.965%, 03/25/2043 (A) | 3,171 | 837 | ||||||
| SEI Institutional Investments Trust / Annual Report / May 31, 2015 | 111 |
SCHEDULE OF INVESTMENTS
Core Fixed Income Fund (Continued)
May 31, 2015
| Description | Face Amount ($ Thousands) | Market Value ($ Thousands) | ||||||
FNMA CMO, | ||||||||
3.000%, 04/25/2032 | $ | 1,943 | $ | 221 | ||||
FNMA CMO, | ||||||||
5.915%, 07/25/2043 (A) | 949 | 235 | ||||||
FNMA CMO, Ser 2013-9, Cl BC | ||||||||
6.500%, 07/25/2042 | 3,544 | 4,068 | ||||||
FNMA CMO, Ser 2013-9, Cl CB | ||||||||
5.500%, 04/25/2042 | 3,656 | 4,131 | ||||||
FNMA CMO, | ||||||||
0.000%, 09/25/2043 (B) | 909 | 725 | ||||||
FNMA CMO, Ser 2013-94, Cl HA | ||||||||
4.000%, 01/25/2040 | 751 | 811 | ||||||
FNMA CMO, Ser 2014-9, Cl A | ||||||||
4.000%, 05/25/2037 | 1,761 | 1,893 | ||||||
FNMA CMO, Ser 2014-M12, Cl FA | ||||||||
0.478%, 10/25/2021 (A) | 5,762 | 5,774 | ||||||
FNMA CMO, | ||||||||
0.129%, 01/25/2024 (A) | 68,348 | 560 | ||||||
FNMA CMO, Ser 2014-M8, Cl FA | ||||||||
0.442%, 05/25/2018 (A) | 5,578 | 5,585 | ||||||
FNMA Grantor Trust CMO, Ser 2000-T6, Cl A1 | ||||||||
7.500%, 06/25/2030 | 682 | 787 | ||||||
FNMA Grantor Trust CMO, Ser 2002-T19, Cl A2 | ||||||||
7.000%, 07/25/2042 | 479 | 552 | ||||||
FNMA Grantor Trust CMO, Ser 2004-T3, Cl 1A3 | ||||||||
7.000%, 02/25/2044 | 527 | 608 | ||||||
FNMA Interest STRIPS CMO, Ser 1997-293, Cl 1, PO | ||||||||
0.000%, 12/01/2024 (B) | 233 | 231 | ||||||
FNMA Interest STRIPS CMO, Ser 1998-300, Cl 1, PO | ||||||||
0.000%, 09/01/2024 (B) | 145 | 143 | ||||||
FNMA Interest STRIPS CMO, Ser 2002-323, Cl 16, IO | ||||||||
7.000%, 01/25/2032 | 376 | 77 | ||||||
FNMA Interest STRIPS CMO, Ser 2003-334, Cl 16, IO | ||||||||
6.500%, 02/01/2033 | 547 | 117 | ||||||
FNMA Interest STRIPS CMO, Ser 2012-409, Cl C1, IO | ||||||||
3.000%, 11/25/2026 | 4,323 | 384 | ||||||
FNMA Interest STRIPS CMO, Ser 2012-409, Cl C2, IO | ||||||||
3.000%, 04/25/2027 | 3,008 | 341 | ||||||
FNMA Interest STRIPS CMO, Ser 2012-409, Cl C13, IO | ||||||||
3.500%, 11/25/2041 | 1,762 | 337 | ||||||
| Description | Face Amount ($ Thousands) | Market Value ($ Thousands) | ||||||
FNMA Interest STRIPS CMO, Ser 2012-409, Cl C17, IO | ||||||||
4.000%, 11/25/2041 | $ | 2,143 | $ | 431 | ||||
FNMA Interest STRIPS CMO, Ser 2012-409, Cl C22, IO | ||||||||
4.500%, 11/25/2039 | 2,410 | 426 | ||||||
FNMA Interest STRIPS CMO, Ser 2012-411, Cl A3 | ||||||||
3.000%, 08/25/2042 | 1,069 | 1,084 | ||||||
FNMA Multifamily Megas, | ||||||||
2.800%, 06/25/2025 (A) | 3,740 | 3,757 | ||||||
FNMA Multifamily Megas, | ||||||||
2.967%, 05/01/2027 (A) | 5,000 | 5,079 | ||||||
FNMA REMIC Trust CMO, Ser 2007-W7, Cl 1A4 | ||||||||
38.072%, 07/25/2037 (A) | 18 | 29 | ||||||
FNMA TBA | ||||||||
5.000%, 07/15/2038 | 1,900 | 2,110 | ||||||
4.500%, 07/01/2037 to 06/25/2045 | 13,715 | 14,906 | ||||||
4.000%, 06/01/2039 to 07/25/2045 | 71,670 | 76,379 | ||||||
3.500%, 06/15/2026 to 07/25/2045 | 84,210 | 87,902 | ||||||
3.000%, 06/25/2030 to 07/25/2045 | 57,360 | 58,715 | ||||||
2.500%, 07/01/2027 to 06/25/2030 | 15,935 | 16,276 | ||||||
FNMA Whole Loan CMO, Ser 2003-W17, Cl 1A7 | ||||||||
5.750%, 08/25/2033 | 927 | 1,011 | ||||||
FNMA Whole Loan CMO, Ser 2003-W2, Cl 2A9 | ||||||||
5.900%, 07/25/2042 | 908 | 1,024 | ||||||
FNMA Whole Loan CMO, Ser 2003-W6, Cl 3A | ||||||||
6.500%, 09/25/2042 | 345 | 398 | ||||||
FNMA Whole Loan CMO, Ser 2003-W8, Cl 2A | ||||||||
7.000%, 10/25/2042 | 291 | 339 | ||||||
FNMA Whole Loan CMO, Ser 2004-W1, Cl 2A2 | ||||||||
7.000%, 12/25/2033 | 556 | 654 | ||||||
FNMA Whole Loan CMO, Ser 2004-W10, Cl A6 | ||||||||
5.750%, 08/25/2034 | 2,000 | 2,269 | ||||||
FNMA Whole Loan CMO, Ser 2004-W2, Cl 2A2 | ||||||||
7.000%, 02/25/2044 | 482 | 565 | ||||||
FNMA Whole Loan CMO, Ser 2004-W9, Cl 2A1 | ||||||||
6.500%, 02/25/2044 | 455 | 515 | ||||||
| 112 | SEI Institutional Investments Trust / Annual Report / May 31, 2015 |
| Description | Face Amount ($ Thousands) | Market Value ($ Thousands) | ||||||
FNMA Whole Loan CMO, Ser 2006-W1, Cl 1A3 | ||||||||
7.500%, 12/25/2045 | $ | 201 | $ | 236 | ||||
FNMA Whole Loan CMO, Ser 2006-W2, Cl 1AF1 | ||||||||
0.405%, 02/25/2036 (A) | 308 | 308 | ||||||
FNMA Whole Loan CMO, Ser 2007-W1, Cl 1AF1 | ||||||||
0.445%, 11/25/2046 (A) | 624 | 625 | ||||||
FNMA Whole Loan CMO, Ser 2009-W1, Cl A | ||||||||
6.000%, 12/25/2049 | 918 | 1,064 | ||||||
FNMA, Ser M8, Cl A2 | ||||||||
2.900%, 01/25/2025 | 950 | 969 | ||||||
FNMA, Ser M8, Cl AB2 | ||||||||
2.829%, 01/25/2025 | 1,030 | 1,040 | ||||||
FNMA, Ser M8, Cl X2 | ||||||||
0.285%, 01/25/2025 (A) | 90,199 | 1,314 | ||||||
GNMA | ||||||||
9.500%, 12/15/2020 | 2 | 3 | ||||||
7.000%, 12/20/2017 to 05/15/2033 | 1,219 | 1,383 | ||||||
6.500%, 01/15/2024 to 07/15/2035 | 2,617 | 3,020 | ||||||
6.000%, 12/15/2023 to 10/20/2040 | 9,734 | 11,283 | ||||||
5.000%, 07/20/2040 to 12/20/2044 | 2,575 | 2,894 | ||||||
4.500%, 01/20/2040 to 05/20/2045 | 16,080 | 17,670 | ||||||
4.000%, 04/15/2045 to 05/20/2045 | 1,162 | 1,266 | ||||||
3.500%, 04/20/2045 to 05/20/2045 | 14,249 | 14,985 | ||||||
3.000%, 04/15/2045 | 5,161 | 5,310 | ||||||
2.510%, 08/01/2045 | 544 | 556 | ||||||
GNMA ARM | ||||||||
1.750%, 03/20/2032 to 03/20/2034 (A) | 201 | 209 | ||||||
1.660%, 01/20/2060 (A) | 1,186 | 1,224 | ||||||
1.625%, 04/20/2028 to 07/20/2034 (A) | 319 | 332 | ||||||
GNMA CMO, Ser 2001-22, Cl PS | ||||||||
20.531%, 03/17/2031 (A) | 409 | 653 | ||||||
GNMA CMO, Ser 2002-57, Cl SB | ||||||||
109.750%, 08/16/2032 | 47 | 211 | ||||||
GNMA CMO, Ser 2003-60, Cl GS | ||||||||
12.111%, 05/16/2033 (A) | 51 | 63 | ||||||
GNMA CMO, | ||||||||
6.367%, 11/16/2033 (A) | 312 | 67 | ||||||
GNMA CMO, Ser 2004-28, Cl SV | ||||||||
8.819%, 04/20/2034 (A) | 343 | 368 | ||||||
| Description | Face Amount ($ Thousands) | Market Value ($ Thousands) | ||||||
GNMA CMO, Ser 2004-34, Cl CS | ||||||||
19.449%, 02/20/2034 (A) | $ | 31 | $ | 45 | ||||
GNMA CMO, Ser 2004-71, Cl ST | ||||||||
7.000%, 09/20/2034 (A) | 138 | 161 | ||||||
GNMA CMO, | ||||||||
0.000%, 01/17/2033 (B) | 12 | 12 | ||||||
GNMA CMO, Ser 2004-87, Cl SB | ||||||||
7.462%, 03/17/2033 (A) | 84 | 92 | ||||||
GNMA CMO, Ser 2004-93, Cl PC | ||||||||
5.000%, 04/16/2034 | 54 | 57 | ||||||
GNMA CMO, | ||||||||
5.920%, 01/20/2035 (A) | 603 | 96 | ||||||
GNMA CMO, Ser 2005-7, Cl JM | ||||||||
16.317%, 05/18/2034 (A) | 47 | 54 | ||||||
GNMA CMO, Ser 2005-92, Cl PB | ||||||||
6.000%, 12/20/2035 | 1,000 | 1,162 | ||||||
GNMA CMO, | ||||||||
6.810%, 04/20/2036 (A) | 1,128 | 208 | ||||||
GNMA CMO, | ||||||||
0.000%, 07/20/2036 (B) | 54 | 52 | ||||||
GNMA CMO, | ||||||||
6.469%, 09/20/2033 (A) | 76 | 1 | ||||||
GNMA CMO, | ||||||||
6.320%, 06/20/2036 (A) | 420 | 46 | ||||||
GNMA CMO, Ser 2007-17, Cl AF | ||||||||
0.383%, 04/16/2037 (A) | 434 | 435 | ||||||
GNMA CMO, | ||||||||
6.019%, 05/20/2037 (A) | 866 | 129 | ||||||
GNMA CMO, | ||||||||
6.019%, 05/20/2037 (A) | 352 | 49 | ||||||
GNMA CMO, | ||||||||
6.569%, 07/20/2037 (A) | 507 | 92 | ||||||
GNMA CMO, | ||||||||
6.366%, 11/20/2037 (A) | 329 | 51 | ||||||
GNMA CMO, | ||||||||
6.347%, 12/16/2037 (A) | 5,946 | 1,027 | ||||||
GNMA CMO, | ||||||||
6.469%, 12/20/2037 (A) | 420 | 73 | ||||||
GNMA CMO, Ser 2007-9, Cl CI, IO | ||||||||
6.016%, 03/20/2037 (A) | 408 | 63 | ||||||
GNMA CMO, Ser 2008-10, Cl S, IO | ||||||||
5.650%, 02/20/2038 (A) | 517 | 78 | ||||||
| SEI Institutional Investments Trust / Annual Report / May 31, 2015 | 113 |
SCHEDULE OF INVESTMENTS
Core Fixed Income Fund (Continued)
May 31, 2015
| Description | Face Amount ($ Thousands) | Market Value ($ Thousands) | ||||||
GNMA CMO, | ||||||||
6.977%, 01/16/2038 (A) | $ | 321 | $ | 63 | ||||
GNMA CMO, | ||||||||
0.000%, 02/17/2033 (B) | 106 | 106 | ||||||
GNMA CMO, | ||||||||
7.517%, 04/16/2038 (A) | 212 | 49 | ||||||
GNMA CMO, | ||||||||
6.019%, 06/20/2038 (A) | 448 | 66 | ||||||
GNMA CMO, | ||||||||
7.120%, 12/20/2038 (A) | 708 | 134 | ||||||
GNMA CMO, | ||||||||
6.217%, 06/16/2039 (A) | 724 | 68 | ||||||
GNMA CMO, | ||||||||
6.217%, 11/16/2039 (A) | 858 | 141 | ||||||
GNMA CMO, | ||||||||
6.220%, 11/20/2039 (A) | 8,597 | 1,381 | ||||||
GNMA CMO, | ||||||||
6.500%, 03/20/2039 | 270 | 58 | ||||||
GNMA CMO, | ||||||||
6.500%, 03/20/2039 | 14 | 3 | ||||||
GNMA CMO, | ||||||||
5.500%, 11/16/2037 | 511 | 58 | ||||||
GNMA CMO, | ||||||||
6.090%, 04/20/2039 (A) | 703 | 106 | ||||||
GNMA CMO, | ||||||||
6.119%, 03/20/2039 (A) | 262 | 24 | ||||||
GNMA CMO, | ||||||||
7.419%, 09/20/2038 (A) | 270 | 55 | ||||||
GNMA CMO, | ||||||||
6.000%, 05/20/2039 | 114 | 23 | ||||||
GNMA CMO, | ||||||||
1.000%, 06/16/2037 (A) | 1,021 | 32 | ||||||
GNMA CMO, | ||||||||
5.899%, 06/20/2039 (A) | 222 | 33 | ||||||
GNMA CMO, | ||||||||
5.770%, 06/20/2039 (A) | 561 | 75 | ||||||
| Description | Face Amount ($ Thousands) | Market Value ($ Thousands) | ||||||
GNMA CMO, | ||||||||
5.860%, 02/20/2039 (A) | $ | 483 | $ | 70 | ||||
GNMA CMO, | ||||||||
6.000%, 12/20/2038 | 273 | 29 | ||||||
GNMA CMO, | ||||||||
6.220%, 12/20/2038 (A) | 818 | 72 | ||||||
GNMA CMO, Ser 2009-66, Cl LC | ||||||||
6.000%, 08/16/2039 | 2,245 | 2,652 | ||||||
GNMA CMO, | ||||||||
6.617%, 07/16/2039 (A) | 89 | 11 | ||||||
GNMA CMO, | ||||||||
5.867%, 08/16/2039 (A) | 532 | 82 | ||||||
GNMA CMO, | ||||||||
0.000%, 11/16/2037 (B) | 549 | 495 | ||||||
GNMA CMO, | ||||||||
6.117%, 08/16/2038 (A) | 79 | 9 | ||||||
GNMA CMO, | ||||||||
5.920%, 08/20/2039 (A) | 560 | 73 | ||||||
GNMA CMO, | ||||||||
5.816%, 08/20/2040 (A) | 1,201 | 259 | ||||||
GNMA CMO, | ||||||||
0.000%, 12/20/2032 (B) | 231 | 230 | ||||||
GNMA CMO, | ||||||||
0.000%, 11/20/2035 (B) | 294 | 285 | ||||||
GNMA CMO, | ||||||||
0.000%, 08/20/2035 (B) | 355 | 331 | ||||||
GNMA CMO, | ||||||||
4.000%, 09/16/2037 | 2,507 | 143 | ||||||
GNMA CMO, | ||||||||
6.320%, 03/20/2039 (A) | 478 | 63 | ||||||
GNMA CMO, | ||||||||
6.207%, 01/16/2040 (A) | 11,444 | 1,657 | ||||||
GNMA CMO, Ser 2010-4, Cl SL, IO | ||||||||
6.217%, 01/16/2040 (A) | 240 | 41 | ||||||
GNMA CMO, | ||||||||
6.516%, 06/20/2037 (A) | 1,356 | 234 | ||||||
GNMA CMO, | ||||||||
6.367%, 04/16/2034 (A) | 50 | 1 | ||||||
| 114 | SEI Institutional Investments Trust / Annual Report / May 31, 2015 |
| Description | Face Amount ($ Thousands) | Market Value ($ Thousands) | ||||||
GNMA CMO, Ser 2010-59, Cl LB | ||||||||
4.500%, 10/20/2039 | $ | 2,900 | $ | 3,132 | ||||
GNMA CMO, Ser 2010-74, Cl C | ||||||||
4.244%, 05/16/2041 (A) | 5,000 | 5,213 | ||||||
GNMA CMO, | ||||||||
6.469%, 01/20/2040 (A) | 1,084 | 190 | ||||||
GNMA CMO, Ser 2010-H10, Cl FC | ||||||||
1.182%, 05/20/2060 (A) | 4,282 | 4,381 | ||||||
GNMA CMO, Ser 2010-H26, Cl LF | ||||||||
0.523%, 08/20/2058 (A) | 5,807 | 5,802 | ||||||
GNMA CMO, | ||||||||
5.917%, 10/16/2041 (A) | 1,173 | 235 | ||||||
GNMA CMO, | ||||||||
0.924%, 09/16/2046 (A) | 41,711 | 1,921 | ||||||
GNMA CMO, | ||||||||
5.000%, 11/16/2041 | 110 | 24 | ||||||
GNMA CMO, | ||||||||
0.673%, 03/20/2061 (A) | 1,487 | 1,490 | ||||||
GNMA CMO, | ||||||||
0.825%, 02/16/2053 (A) | 10,343 | 608 | ||||||
GNMA CMO, | ||||||||
6.017%, 10/16/2042 (A) | 1,595 | 322 | ||||||
GNMA CMO, | ||||||||
0.834%, 02/16/2053 (A) | 8,061 | 486 | ||||||
GNMA CMO, Ser 2012-141, Cl WC | ||||||||
3.747%, 01/20/2042 (A) | 758 | 799 | ||||||
GNMA CMO, | ||||||||
1.107%, 04/16/2054 (A) | 21,609 | 1,303 | ||||||
GNMA CMO, | ||||||||
1.226%, 04/16/2053 (A) | 13,461 | 791 | ||||||
GNMA CMO, Ser 2012-61, Cl FM | ||||||||
0.583%, 05/16/2042 (A) | 1,044 | 1,052 | ||||||
GNMA CMO, | ||||||||
3.500%, 02/20/2038 | 2,052 | 235 | ||||||
GNMA CMO, | ||||||||
5.917%, 08/16/2042 (A) | 1,430 | 243 | ||||||
GNMA CMO, Ser 2012-H15, Cl FA | ||||||||
0.623%, 05/20/2062 (A) | 973 | 976 | ||||||
GNMA CMO, Ser 2012-H21, Cl CF | ||||||||
0.873%, 05/20/2061 (A) | 2,098 | 2,112 | ||||||
GNMA CMO, Ser 2012-H21, Cl DF | ||||||||
0.823%, 05/20/2061 (A) | 1,404 | 1,407 | ||||||
| Description | Face Amount ($ Thousands) | Market Value ($ Thousands) | ||||||
GNMA CMO, Ser 2012-H22, Cl FD | ||||||||
0.648%, 01/20/2061 (A) | $ | 2,249 | $ | 2,256 | ||||
GNMA CMO, Ser 2012-H24, Cl FA | ||||||||
0.623%, 03/20/2060 (A) | 927 | 931 | ||||||
GNMA CMO, Ser 2012-H24, Cl FE | ||||||||
0.773%, 10/20/2062 (A) | 1,395 | 1,402 | ||||||
GNMA CMO, Ser 2012-H24, Cl FG | ||||||||
0.603%, 04/20/2060 (A) | 1,777 | 1,780 | ||||||
GNMA CMO, | ||||||||
0.723%, 07/20/2062 (A) | 1,408 | 1,414 | ||||||
GNMA CMO, Ser 2012-H27, Cl FB | ||||||||
0.673%, 10/20/2062 (A) | 2,859 | 2,868 | ||||||
GNMA CMO, Ser 2012-H28, Cl FA | ||||||||
0.753%, 09/20/2062 (A) | 2,110 | 2,112 | ||||||
GNMA CMO, Ser 2012-H30, Cl JA | ||||||||
0.653%, 01/20/2060 (A) | 1,093 | 1,096 | ||||||
GNMA CMO, Ser 2012-H30, Cl PA | ||||||||
0.623%, 11/20/2059 (A) | 900 | 903 | ||||||
GNMA CMO, | ||||||||
1.074%, 09/16/2044 (A) | 11,168 | 766 | ||||||
GNMA CMO, | ||||||||
1.216%, 02/16/2046 (A) | 14,340 | 1,083 | ||||||
GNMA CMO, | ||||||||
0.931%, 06/16/2055 (A) | 7,456 | 450 | ||||||
GNMA CMO, | ||||||||
5.970%, 12/20/2043 (A) | 319 | 65 | ||||||
GNMA CMO, | ||||||||
0.758%, 09/16/2051 (A) | 36,026 | 2,293 | ||||||
GNMA CMO, Ser 2013-H01, Cl JA | ||||||||
0.493%, 01/20/2063 (A) | 1,335 | 1,325 | ||||||
GNMA CMO, Ser 2013-H01, Cl TA | ||||||||
0.673%, 01/20/2063 (A) | 1,731 | 1,737 | ||||||
GNMA CMO, | ||||||||
0.885%, 05/16/2054 (A) | 12,195 | 765 | ||||||
GNMA CMO, | ||||||||
1.328%, 02/16/2048 (A) | 11,426 | 826 | ||||||
GNMA CMO, | ||||||||
1.035%, 09/16/2055 (A) | 10,662 | 750 | ||||||
GNMA CMO, Ser 2014-H04, Cl FB | ||||||||
0.828%, 02/20/2064 (A) | 2,876 | 2,897 | ||||||
GNMA TBA | ||||||||
4.500%, 06/01/2039 | 6,400 | 6,931 | ||||||
4.000%, 07/01/2039 to 06/01/2045 | 33,130 | 35,244 | ||||||
| SEI Institutional Investments Trust / Annual Report / May 31, 2015 | 115 |
SCHEDULE OF INVESTMENTS
Core Fixed Income Fund (Continued)
May 31, 2015
| Description | Face Amount ($ Thousands) | Market Value ($ Thousands) | ||||||
3.500%, 06/15/2041 to 06/20/2045 | $ | 22,720 | $ | 23,865 | ||||
3.000%, 06/01/2043 to 06/20/2045 | 21,130 | 21,653 | ||||||
GNMA, Ser 186, Cl IO, IO | ||||||||
0.895%, 08/16/2054 (A) | 18,315 | 1,285 | ||||||
GNMA, Ser 44, Cl A | ||||||||
2.170%, 04/16/2041 | 1,248 | 1,265 | ||||||
GNMA, Ser 47, Cl AC | ||||||||
2.500%, 05/16/2055 | 1,329 | 1,342 | ||||||
GNMA, Ser 73, Cl IO, IO | ||||||||
0.894%, 11/16/2055 (A) | 17,330 | 1,332 | ||||||
NCUA Guaranteed Notes CMO, Ser 2010-C1, Cl APT | ||||||||
2.650%, 10/29/2020 | 2,015 | 2,061 | ||||||
NCUA Guaranteed Notes CMO, Ser 2010-R1, Cl 1A | ||||||||
0.631%, 10/07/2020 (A) | 7,055 | 7,098 | ||||||
NCUA Guaranteed Notes CMO, Ser 2010-R2, Cl 1A | ||||||||
0.551%, 11/06/2017 (A) | 2,801 | 2,808 | ||||||
NCUA Guaranteed Notes CMO, Ser 2010-R3, Cl 1A | ||||||||
0.741%, 12/08/2020 (A) | 468 | 472 | ||||||
NCUA Guaranteed Notes CMO, Ser 2010-R3, Cl 2A | ||||||||
0.741%, 12/08/2020 (A) | 402 | 405 | ||||||
NCUA Guaranteed Notes CMO, Ser 2011-R1, Cl 1A | ||||||||
0.631%, 01/08/2020 (A) | 55 | 55 | ||||||
NCUA Guaranteed Notes CMO, Ser 2011-R2, Cl 1A | ||||||||
0.578%, 02/06/2020 (A) | 653 | 656 | ||||||
|
| |||||||
| 1,439,385 | ||||||||
|
| |||||||
Non-Agency Mortgage-Backed Obligations — 7.2% |
| |||||||
A10 Securitization LLC, | ||||||||
3.492%, 04/15/2024 (C) | 95 | 95 | ||||||
A10 Term Asset Financing LLC, Ser 2013-2, Cl B | ||||||||
4.380%, 11/15/2027 (C) | 250 | 252 | ||||||
A10 Term Asset Financing LLC, | ||||||||
1.720%, 04/15/2033 (C) | 593 | 592 | ||||||
A10 Term Asset Financing LLC, | ||||||||
3.020%, 04/15/2033 (C) | 603 | 604 | ||||||
Alternative Loan Trust, | ||||||||
0.000%, 11/25/2031 (B) (C) | 115 | 100 | ||||||
American General Mortgage Loan Trust, Ser 2010-1A, Cl A3 | ||||||||
5.650%, 03/25/2058 (A) (C) | 570 | 581 | ||||||
| Description | Face Amount ($ Thousands) | Market Value ($ Thousands) | ||||||
ASG Resecuritization Trust, Ser 2009-2, Cl G60 | ||||||||
4.369%, 05/24/2036 (A) (C) | $ | 202 | $ | 203 | ||||
ASG Resecuritization Trust, Ser 2009-3, Cl A65 | ||||||||
2.057%, 03/26/2037 (A) (C) | 609 | 606 | ||||||
ASG Resecuritization Trust, Ser 2009-4, Cl A60 | ||||||||
6.000%, 06/28/2037 (C) | 166 | 167 | ||||||
ASG Resecuritization Trust, Ser 2011-1, Cl 3A50 | ||||||||
2.564%, 11/28/2035 (A) (C) | 348 | 342 | ||||||
BAMLL Commercial Mortgage Securities Trust, | ||||||||
3.218%, 04/14/2033 (A) (C) | 420 | 426 | ||||||
Banc of America Alternative Loan Trust, Ser 2003-11, Cl 1A1 | ||||||||
6.000%, 01/25/2034 (C) | 178 | 187 | ||||||
Banc of America Alternative Loan Trust, Ser 2003-11, Cl 2A1 | ||||||||
6.000%, 01/25/2034 (C) | 356 | 370 | ||||||
Banc of America Alternative Loan Trust, Ser 2003-7, Cl 1CB1 | ||||||||
5.500%, 09/25/2033 (C) | 268 | 279 | ||||||
Banc of America Alternative Loan Trust, Ser 2003-7, Cl 2A4 | ||||||||
5.000%, 09/25/2018 (C) | 192 | 194 | ||||||
Banc of America Alternative Loan Trust, Ser 2004-1, Cl 5A1 | ||||||||
5.500%, 02/25/2019 (C) | 132 | 134 | ||||||
Banc of America Alternative Loan Trust, Ser 2004-8, Cl 3A1 | ||||||||
5.500%, 09/25/2019 (C) | 151 | 148 | ||||||
Banc of America Alternative Loan Trust, Ser 2006-8, Cl 3A1 | ||||||||
6.114%, 11/25/2021 (A) (C) | 94 | 91 | ||||||
Banc of America Alternative Loan Trust, Ser 2007-1, Cl 2A1 | ||||||||
6.283%, 04/25/2037 (A) (C) | 277 | 221 | ||||||
Banc of America Commercial Mortgage, Ser 2005-4, Cl A5A | ||||||||
4.933%, 07/10/2045 | 146 | 146 | ||||||
Banc of America Commercial Mortgage, Ser 2006-5, Cl AM | ||||||||
5.448%, 09/10/2047 | 2,370 | 2,476 | ||||||
Banc of America Funding, Ser 2003-2, Cl 1A1 | ||||||||
6.500%, 06/25/2032 (C) | 16 | 17 | ||||||
Banc of America Funding, Ser 2004-2, Cl 1CB1 | ||||||||
5.750%, 09/20/2034 (C) | 231 | 249 | ||||||
Banc of America Funding, Ser 2004-C, Cl 1A1 | ||||||||
2.802%, 12/20/2034 (A) (C) | 78 | 76 | ||||||
| 116 | SEI Institutional Investments Trust / Annual Report / May 31, 2015 |
| Description | Face Amount ($ Thousands) | Market Value ($ Thousands) | ||||||
Banc of America Funding, Ser 2005-B, Cl 2A1 | ||||||||
2.694%, 04/20/2035 (A) (C) | $ | 2,922 | $ | 2,654 | ||||
Banc of America Funding, Ser 2010-R11A, Cl 1A6 | ||||||||
5.192%, 08/26/2035 (A) (C) | 234 | 237 | ||||||
Banc of America Funding, Ser 2010-R5, Cl 1A1 | ||||||||
5.500%, 10/26/2037 (C) | 36 | 36 | ||||||
Banc of America Funding, Ser 2012-R6, Cl 1A1 | ||||||||
3.000%, 10/26/2039 (C) | 1,219 | 1,209 | ||||||
Banc of America Funding, Ser 2015-R2, Cl 9A1 | ||||||||
0.389%, 03/27/2036 (A) (C) | 7,447 | 7,155 | ||||||
Banc of America Mortgage Securities, Ser 2003-3, Cl 1A7 | ||||||||
5.500%, 05/25/2033 (C) | 284 | 292 | ||||||
Banc of America Mortgage Securities, Ser 2003-3, Cl 2A1 | ||||||||
0.735%, 05/25/2018 (A) (C) | 65 | 63 | ||||||
Banc of America Mortgage Securities, Ser 2003-6, Cl 2A1 | ||||||||
0.635%, 08/25/2018 (A) (C) | 40 | 40 | ||||||
Banc of America Mortgage Securities, Ser 2003-A, Cl 2A2 | ||||||||
3.016%, 02/25/2033 (A) (C) | 3 | 2 | ||||||
Banc of America Mortgage Securities, Ser 2003-E, Cl 2A2 | ||||||||
2.814%, 06/25/2033 (A) (C) | 155 | 156 | ||||||
Banc of America Mortgage Securities, Ser 2004-3, Cl 1A26 | ||||||||
5.500%, 04/25/2034 (C) | 180 | 183 | ||||||
Banc of America Mortgage Securities, Ser 2004-3, Cl 3A1 | ||||||||
5.000%, 04/25/2019 (C) | 51 | 52 | ||||||
Banc of America Mortgage Securities, Ser 2004-5, Cl 4A1 | ||||||||
4.750%, 06/25/2019 (C) | 35 | 35 | ||||||
Banc of America Mortgage Securities, Ser 2004-9, Cl 3A1 | ||||||||
6.500%, 09/25/2032 (C) | 47 | 49 | ||||||
Banc of America Mortgage Trust, Ser 2003-I, Cl 2A6 | ||||||||
2.775%, 10/25/2033 (A) (C) | 6,363 | 6,391 | ||||||
Bayview Commercial Asset Trust, Ser 2006-4A, Cl A1 | ||||||||
0.415%, 12/25/2036 (A) (C) | 1,636 | 1,481 | ||||||
BB-UBS Trust, Ser 2012-TFT, Cl A | ||||||||
2.892%, 06/05/2030 (C) | 1,500 | 1,495 | ||||||
BCAP LLC Trust, | ||||||||
5.750%, 06/26/2037 (C) | 45 | 46 | ||||||
| Description | Face Amount ($ Thousands) | Market Value ($ Thousands) | ||||||
BCAP LLC Trust, | ||||||||
5.500%, 04/26/2037 (A) (C) | $ | 280 | $ | 287 | ||||
BCAP LLC Trust, | ||||||||
5.500%, 11/26/2034 (C) | 346 | 361 | ||||||
BCAP LLC Trust, | ||||||||
4.500%, 01/26/2036 (A) (C) | 372 | 373 | ||||||
BCAP LLC Trust, | ||||||||
5.402%, 04/26/2037 (A) (C) | 391 | 398 | ||||||
BCAP LLC Trust, | ||||||||
2.671%, 04/26/2035 (A) (C) | 59 | 58 | ||||||
BCAP LLC Trust, | ||||||||
2.068%, 07/26/2045 (A) (C) | 668 | 670 | ||||||
BCAP LLC Trust, | ||||||||
0.828%, 02/26/2047 (A) (C) | 78 | 78 | ||||||
BCAP LLC Trust, | ||||||||
5.061%, 05/26/2035 (A) (C) | 700 | 664 | ||||||
BCAP LLC Trust, | ||||||||
1.093%, 09/26/2037 (A) (C) | 638 | 613 | ||||||
BCAP LLC Trust, | ||||||||
5.000%, 08/26/2037 (A) (C) | 644 | 654 | ||||||
BCAP LLC Trust, | ||||||||
0.324%, 05/28/2036 (A) (C) | 385 | 379 | ||||||
BCAP LLC Trust, | ||||||||
0.364%, 05/26/2036 (A) (C) | 978 | 932 | ||||||
BCAP LLC Trust, | ||||||||
0.344%, 08/26/2036 (A) (C) | 262 | 258 | ||||||
BCAP LLC Trust, | ||||||||
1.993%, 05/26/2037 (A) (C) | 334 | 335 | ||||||
Bear Stearns Adjustable Rate Mortgage Trust, | ||||||||
2.930%, 05/25/2034 (A) (C) | 65 | 65 | ||||||
Bear Stearns Adjustable Rate Mortgage Trust, | ||||||||
1.829%, 05/25/2034 (A) (C) | 197 | 187 | ||||||
Bear Stearns Adjustable Rate Mortgage Trust, | ||||||||
2.160%, 08/25/2035 (A) (C) | 234 | 236 | ||||||
| SEI Institutional Investments Trust / Annual Report / May 31, 2015 | 117 |
SCHEDULE OF INVESTMENTS
Core Fixed Income Fund (Continued)
May 31, 2015
| Description | Face Amount ($ Thousands) | Market Value ($ Thousands) | ||||||
Bear Stearns Alt-A Trust, | ||||||||
0.925%, 11/25/2034 (A) (C) | $ | 30 | $ | 30 | ||||
Bear Stearns Alternative Trust, Ser 2005-2, Cl 2A4 | ||||||||
2.516%, 04/25/2035 (A) (C) | 153 | 146 | ||||||
Bear Stearns Commercial Mortgage Securities, | ||||||||
0.763%, 06/11/2041 (A) (C) | 3,399 | — | ||||||
Bear Stearns Commercial Mortgage Securities, | ||||||||
5.573%, 04/12/2038 (A) | 4,195 | 4,280 | ||||||
Bear Stearns Commercial Mortgage Securities, | ||||||||
5.405%, 12/11/2040 (A) | 295 | 298 | ||||||
Bear Stearns Commercial Mortgage Securities, | ||||||||
6.084%, 06/11/2050 (A) | 1,050 | 1,152 | ||||||
CD Commercial Mortgage Trust, Ser 2005-CD1, Cl AJ | ||||||||
5.225%, 07/15/2044 (A) | 600 | 606 | ||||||
CD Commercial Mortgage Trust, Ser 2006-CD2, Cl AM | ||||||||
5.346%, 01/15/2046 (A) | 200 | 204 | ||||||
CD Commercial Mortgage Trust, Ser 2006-CD2, Cl X, IO | ||||||||
0.086%, 01/15/2046 (A) (C) | 58,660 | 13 | ||||||
CD Commercial Mortgage Trust, Ser 2007-CD4, Cl A3 | ||||||||
5.293%, 12/11/2049 | 13 | 13 | ||||||
CD Commercial Mortgage Trust, Ser 2007-CD4, Cl XC, IO | ||||||||
0.367%, 12/11/2049 (A) (C) | 33,666 | 177 | ||||||
CFCRE Commercial Mortgage Trust, Ser 2011-C1, Cl A4 | ||||||||
4.961%, 04/15/2044 (A) (C) | 2,670 | 2,992 | ||||||
CG-CCRE Commercial Mortgage Trust, Ser 2014-FL1, Cl A | ||||||||
1.136%, 06/15/2031 (A) (C) | 1,360 | 1,358 | ||||||
Chase Mortgage Finance, Ser 2007-A1, Cl 2A1 | ||||||||
2.499%, 02/25/2037 (A) (C) | 154 | 154 | ||||||
Chase Mortgage Finance, Ser 2007-A1, Cl 9A1 | ||||||||
2.498%, 02/25/2037 (A) (C) | 119 | 118 | ||||||
Chase Mortgage Finance, Ser 2007-A2, Cl 1A1 | ||||||||
2.647%, 07/25/2037 (A) (C) | 258 | 257 | ||||||
Chevy Chase Funding LLC Mortgage-Backed Certificates, Ser 2003-4X, Cl A2 | ||||||||
0.575%, 10/25/2034 (A) (C) | 5,102 | 4,717 | ||||||
| Description | Face Amount ($ Thousands) | Market Value ($ Thousands) | ||||||
Chevy Chase Funding LLC Mortgage-Backed Certificates, Ser 2004-1A, Cl A1 | ||||||||
0.465%, 01/25/2035 (A) (C) | $ | 28 | $ | 25 | ||||
Chevy Chase Funding LLC Mortgage-Backed Certificates, Ser 2004-1A, Cl A2 | ||||||||
0.515%, 01/25/2035 (A) (C) | 3,729 | 3,377 | ||||||
CHL Mortgage Pass-Through Trust, Ser 2003-39, Cl A6 | ||||||||
5.000%, 10/25/2033 (C) | 364 | 380 | ||||||
CHL Mortgage Pass-Through Trust, Ser 2003-J13, Cl 1A7 | ||||||||
5.250%, 01/25/2034 (C) | 562 | 588 | ||||||
CHL Mortgage Pass-Through Trust, Ser 2003-J7, Cl 4A3 | ||||||||
9.534%, 08/25/2018 (A) (C) | 16 | 17 | ||||||
CHL Mortgage Pass-Through Trust, Ser 2004-14, Cl 4A1 | ||||||||
2.385%, 08/25/2034 (A) (C) | 332 | 326 | ||||||
CHL Mortgage Pass-Through Trust, Ser 2004-20, Cl 2A1 | ||||||||
2.500%, 09/25/2034 (A) (C) | 46 | 34 | ||||||
CHL Mortgage Pass-Through Trust, Ser 2004-5, Cl 1A4 | ||||||||
5.500%, 06/25/2034 (C) | 340 | 354 | ||||||
CHL Mortgage Pass-Through Trust, Ser 2004-8, Cl 2A1 | ||||||||
4.500%, 06/25/2019 (C) | 198 | 204 | ||||||
CHL Mortgage Pass-Through Trust, Ser 2005-20, Cl A7 | ||||||||
5.250%, 12/25/2027 (C) | 430 | 414 | ||||||
Citigroup Commercial Mortgage Trust, Ser 2013-GC17, Cl A4 | ||||||||
4.131%, 11/10/2046 | 972 | 1,069 | ||||||
Citigroup Commercial Mortgage Trust, Ser 2014-388G, Cl A | ||||||||
0.936%, 06/15/2033 (A) (C) | 1,070 | 1,068 | ||||||
Citigroup Commercial Mortgage Trust, Ser 2014-GC25, Cl AS | ||||||||
4.017%, 10/10/2047 | 1,290 | 1,376 | ||||||
Citigroup Mortgage Loan Trust, Ser 2004-HYB1, Cl A41 | ||||||||
2.840%, 02/25/2034 (A) (C) | 47 | 46 | ||||||
Citigroup Mortgage Loan Trust, Ser 2004-RR2, Cl A2 | ||||||||
2.603%, 05/25/2034 (A) (C) | 363 | 374 | ||||||
Citigroup Mortgage Loan Trust, Ser 2004-UST1, Cl A6 | ||||||||
2.221%, 08/25/2034 (A) (C) | 108 | 104 | ||||||
Citigroup Mortgage Loan Trust, Ser 2005-2, Cl 2A11 | ||||||||
5.500%, 05/25/2035 (C) | 228 | 238 | ||||||
| 118 | SEI Institutional Investments Trust / Annual Report / May 31, 2015 |
| Description | Face Amount ($ Thousands) | Market Value ($ Thousands) | ||||||
Citigroup Mortgage Loan Trust, Ser 2008-AR4, Cl 1A1A | ||||||||
2.523%, 11/25/2038 (A) (C) | $ | 521 | $ | 521 | ||||
Citigroup Mortgage Loan Trust, Ser 2009-10, Cl 1A1 | ||||||||
2.405%, 09/25/2033 (A) (C) | 325 | 329 | ||||||
Citigroup Mortgage Loan Trust, | ||||||||
5.750%, 05/25/2037 (A) (C) | 375 | 387 | ||||||
Citigroup Mortgage Loan Trust, Ser 2009-5, Cl 8A1 | ||||||||
6.000%, 06/25/2036 (C) | 745 | 770 | ||||||
Citigroup Mortgage Loan Trust, Ser 2010-7, Cl 10A1 | ||||||||
2.611%, 02/25/2035 (A) (C) | 85 | 85 | ||||||
Citigroup Mortgage Loan Trust, Ser 2010-8, Cl 5A6 | ||||||||
4.000%, 11/25/2036 (C) | 687 | 697 | ||||||
Citigroup Mortgage Loan Trust, Ser 2010-8, Cl 6A6 | ||||||||
4.500%, 12/25/2036 (C) | 781 | 798 | ||||||
COBALT CMBS Commercial Mortgage Trust, | ||||||||
5.526%, 04/15/2047 (A) | 520 | 554 | ||||||
COMM Mortgage Trust, | ||||||||
5.116%, 06/10/2044 (A) | 342 | 342 | ||||||
COMM Mortgage Trust, | ||||||||
5.819%, 07/10/2038 (A) | 1,010 | 1,051 | ||||||
COMM Mortgage Trust, | ||||||||
4.205%, 07/10/2046 (C) | 1,736 | 1,903 | ||||||
COMM Mortgage Trust, | ||||||||
1.801%, 10/15/2045 | 465 | 469 | ||||||
COMM Mortgage Trust, | ||||||||
4.046%, 10/10/2046 | 155 | 170 | ||||||
COMM Mortgage Trust, | ||||||||
4.300%, 10/10/2046 | 440 | 482 | ||||||
COMM Mortgage Trust, | ||||||||
4.762%, 10/10/2046 (A) | 190 | 209 | ||||||
COMM Mortgage Trust, | ||||||||
5.085%, 10/10/2046 (A) | 90 | 99 | ||||||
COMM Mortgage Trust, | ||||||||
3.282%, 01/10/2046 | 777 | 799 | ||||||
COMM Mortgage Trust, | ||||||||
3.452%, 07/15/2047 | 808 | 852 | ||||||
| Description | Face Amount ($ Thousands) | Market Value ($ Thousands) | ||||||
COMM Mortgage Trust, | ||||||||
3.305%, 11/10/2047 | $ | 763 | $ | 796 | ||||
COMM Mortgage Trust, | ||||||||
0.986%, 08/13/2027 (A) (C) | 396 | 395 | ||||||
COMM Mortgage Trust, | ||||||||
1.336%, 06/15/2034 (A) (C) | 1,960 | 1,956 | ||||||
COMM Mortgage Trust, | ||||||||
3.286%, 06/15/2034 (A) (C) | 2,080 | 2,082 | ||||||
COMM Mortgage Trust, | ||||||||
1.030%, 02/13/2032 (A) (C) | 550 | 549 | ||||||
COMM Mortgage Trust, | ||||||||
1.424%, 03/10/2047 (A) | 15,528 | 1,307 | ||||||
COMM Mortgage Trust, | ||||||||
3.819%, 06/10/2047 | 1,037 | 1,107 | ||||||
COMM Mortgage Trust, | ||||||||
3.694%, 08/10/2047 | 2,492 | 2,632 | ||||||
COMM Mortgage Trust, | ||||||||
3.838%, 09/10/2047 | 752 | 805 | ||||||
COMM Mortgage Trust, | ||||||||
3.548%, 09/10/2047 | 504 | 534 | ||||||
COMM Mortgage Trust, | ||||||||
4.048%, 12/10/2047 (A) | 1,740 | 1,856 | ||||||
COMM Mortgage Trust, | ||||||||
3.387%, 12/10/2047 | 292 | 306 | ||||||
Commercial Mortgage | ||||||||
1.892%, 08/15/2045 (A) | 1,179 | 111 | ||||||
Commercial Mortgage | ||||||||
2.822%, 11/15/2045 | 90 | 92 | ||||||
Commercial Mortgage | ||||||||
2.122%, 11/17/2026 (A) (C) | 116 | 116 | ||||||
Commercial Mortgage | ||||||||
3.424%, 03/10/2031 (C) | 471 | 490 | ||||||
Commercial Mortgage | ||||||||
3.796%, 08/10/2047 | 662 | 710 | ||||||
| SEI Institutional Investments Trust / Annual Report / May 31, 2015 | 119 |
SCHEDULE OF INVESTMENTS
Core Fixed Income Fund (Continued)
May 31, 2015
| Description | Face Amount ($ Thousands) | Market Value ($ Thousands) | ||||||
COOF Securitization Trust, Ser 2014-1, Cl A, IO | ||||||||
3.015%, 06/25/2040 (A) (C) | $ | 1,123 | $ | 153 | ||||
Countrywide Alternative Loan Trust, Ser 2003-20CB, Cl 1A1 | ||||||||
5.500%, 10/25/2033 (C) | 1,143 | 1,165 | ||||||
Countrywide Alternative Loan Trust, Ser 2004-27CB, Cl A1 | ||||||||
6.000%, 12/25/2034 (C) | 1,249 | 1,277 | ||||||
Countrywide Alternative Loan Trust, Ser 2004-J1, Cl 1A1 | ||||||||
6.000%, 02/25/2034 (C) | 94 | 96 | ||||||
Countrywide Alternative Loan Trust, Ser 2004-J6, Cl 2A1 | ||||||||
6.500%, 11/25/2031 (C) | 452 | 477 | ||||||
Countrywide Alternative Loan Trust, Ser 2005-27, Cl 3A2 | ||||||||
1.247%, 08/25/2035 (A) (C) | 514 | 363 | ||||||
Countrywide Home Loan Mortgage Pass-Through Trust, | ||||||||
0.585%, 09/25/2035 (A) (C) | 2,556 | 2,296 | ||||||
Credit Suisse Commercial Mortgage Trust, | ||||||||
5.607%, 01/15/2049 (A) | 1,465 | 1,546 | ||||||
Credit Suisse First Boston Mortgage Securities, | ||||||||
5.250%, 11/25/2033 (C) | 445 | 455 | ||||||
Credit Suisse First Boston Mortgage Securities, | ||||||||
5.250%, 11/25/2033 (C) | 208 | 213 | ||||||
Credit Suisse First Boston Mortgage Securities, | ||||||||
7.000%, 12/25/2033 (C) | 169 | 178 | ||||||
Credit Suisse First Boston Mortgage Securities, | ||||||||
6.000%, 11/25/2018 (C) | 219 | 229 | ||||||
Credit Suisse First Boston Mortgage Securities, | ||||||||
5.500%, 09/25/2034 (C) | 337 | 368 | ||||||
Credit Suisse First Boston Mortgage Securities, | ||||||||
5.500%, 12/25/2034 (C) | 391 | 423 | ||||||
Credit Suisse First Boston Mortgage Securities, | ||||||||
5.100%, 08/15/2038 (A) | 107 | 106 | ||||||
| Description | Face Amount ($ Thousands) | Market Value ($ Thousands) | ||||||
Credit Suisse Mortgage Capital Certificates, | ||||||||
3.376%, 12/27/2036 (A) (C) | $ | 102 | $ | 103 | ||||
Credit Suisse Mortgage Capital Certificates, | ||||||||
2.744%, 07/28/2036 (A) (C) | 345 | 346 | ||||||
Credit Suisse Mortgage Capital Certificates, Ser 2011-9R, Cl A1 | ||||||||
2.181%, 03/27/2046 (A) (C) | 300 | 300 | ||||||
Credit Suisse Mortgage Capital Certificates, | ||||||||
2.254%, 07/27/2037 (A) (C) | 408 | 407 | ||||||
Credit Suisse Mortgage Trust, Ser 2014-ICE, Cl A | ||||||||
1.050%, 04/15/2027 (A) (C) | 673 | 671 | ||||||
CSAIL Commercial Mortgage Trust, Ser 2015-C2, Cl AS | ||||||||
3.849%, 06/15/2057 | 1,431 | 1,490 | ||||||
CSAIL Commercial Mortgage Trust, Ser 2015-C2, Cl ASB | ||||||||
3.224%, 06/15/2057 | 2,724 | 2,827 | ||||||
CSMC Trust, Ser 2010-16, Cl A3 | ||||||||
3.812%, 06/25/2050 (A) (C) | 361 | 363 | ||||||
CSMC Trust, Ser 2012-11R, Cl A6 | ||||||||
1.179%, 06/28/2047 (A) (C) | 2,964 | 2,852 | ||||||
CSMC Trust, Ser 2015-1R, Cl 7A3 | ||||||||
2.508%, 07/27/2036 (A) (C) | 4,715 | 4,806 | ||||||
CSMC Trust, Ser 2015-5R, Cl 1A1 | ||||||||
1.057%, 09/26/2046 | 7,400 | 7,187 | ||||||
DBRR Trust, Ser 2011-LC2, Cl A4A | ||||||||
4.537%, 07/12/2044 (A) (C) | 2,845 | 3,159 | ||||||
DBUBS Mortgage Trust, | ||||||||
3.742%, 11/10/2046 (C) | 1,941 | 1,967 | ||||||
DBUBS Mortgage Trust, | ||||||||
4.537%, 07/10/2044 (C) | 2,596 | 2,894 | ||||||
DBUBS Mortgage Trust, | ||||||||
5.002%, 11/10/2046 (C) | 455 | 515 | ||||||
Deutsche Alt-A Securities Mortgage Loan Trust, | ||||||||
5.780%, 02/25/2020 (A) (C) | 131 | 135 | ||||||
DSLA Mortgage Loan Trust, Ser 2004-AR2, Cl A2B | ||||||||
0.986%, 11/19/2044 (A) (C) | 1,268 | 1,100 | ||||||
FDIC Guaranteed Notes Trust, Ser 2010-S1, Cl 1A | ||||||||
0.730%, 02/25/2048 (A) (C) | 1,108 | 1,108 | ||||||
FDIC Trust, Ser 2013-N1, Cl A | ||||||||
4.500%, 10/25/2018 (C) | 32 | 32 | ||||||
| 120 | SEI Institutional Investments Trust / Annual Report / May 31, 2015 |
| Description | Face Amount ($ Thousands) | Market Value ($ Thousands) | ||||||
FHLMC Structured Agency Credit Risk Debt Notes, | ||||||||
1.831%, 04/25/2024 (A) (C) | $ | 13,900 | $ | 13,783 | ||||
FHLMC Structured Agency Credit Risk Debt Notes, | ||||||||
2.585%, 08/25/2024 (A) (C) | 3,400 | 3,440 | ||||||
FHLMC Structured Agency Credit Risk Debt Notes, | ||||||||
1.835%, 08/25/2024 (A) (C) | 1,309 | 1,314 | ||||||
FHLMC Structured Agency Credit Risk Debt Notes, | ||||||||
1.435%, 01/25/2025 (A) (C) | 1,273 | 1,274 | ||||||
First Horizon Alternative Mortgage Securities, Ser 2004-AA3, Cl A1 | ||||||||
2.196%, 09/25/2034 (A) (C) | 326 | 319 | ||||||
FNMA Connecticut Avenue Securities, | ||||||||
1.385%, 07/25/2024 (A) (C) | 1,105 | 1,103 | ||||||
FREMF Mortgage Trust, | ||||||||
0.200%, 05/25/2045 | 27,821 | 310 | ||||||
FREMF Mortgage Trust, | ||||||||
3.687%, 08/25/2045 (A) (C) | 1,110 | 1,116 | ||||||
FREMF Mortgage Trust, | ||||||||
3.988%, 01/25/2047 (A) (C) | 390 | 399 | ||||||
FREMF Mortgage Trust, | ||||||||
3.685%, 01/25/2048 (A) (C) | 1,090 | 1,084 | ||||||
GE Business Loan Trust, | ||||||||
0.556%, 11/15/2031 (A) (C) | 2,109 | 2,109 | ||||||
GE Business Loan Trust, | ||||||||
0.352%, 04/16/2035 (A) (C) | 1,296 | 1,228 | ||||||
GE Capital Commercial Mortgage, Ser 2005-C4, Cl A4 | ||||||||
5.315%, 11/10/2045 (A) | 6,995 | 7,047 | ||||||
GMAC Commercial Mortgage Securities, Ser 2006-C1, Cl AM | ||||||||
5.290%, 11/10/2045 (A) | 2,690 | 2,741 | ||||||
GMAC Mortgage Loan Trust, Ser 2003-AR1, Cl A4 | ||||||||
2.881%, 10/19/2033 (A) (C) | 693 | 684 | ||||||
GMAC Mortgage Loan Trust, Ser 2003-GH2, Cl A4 | ||||||||
5.000%, 10/25/2033 (C) | 245 | 242 | ||||||
| Description | Face Amount ($ Thousands) | Market Value ($ Thousands) | ||||||
GMAC Mortgage Loan Trust, Ser 2003-J7, Cl A7 | ||||||||
5.000%, 11/25/2033 (C) | $ | 341 | $ | 343 | ||||
GMAC Mortgage Loan Trust, Ser 2004-J5, Cl A7 | ||||||||
6.500%, 01/25/2035 (C) | 286 | 298 | ||||||
GMAC Mortgage Loan Trust, Ser 2004-J6, Cl 1A1 | ||||||||
5.000%, 01/25/2020 (C) | 87 | 90 | ||||||
GNMA TBA | ||||||||
3.500%, 07/15/2041 | 19,200 | 20,112 | ||||||
Greenwich Capital Commercial Funding, Ser 2005-GG5, Cl A5 | ||||||||
5.224%, 04/10/2037 (A) | 1,338 | 1,341 | ||||||
GS Mortgage Securities II, Ser 2006-GG6, Cl A4 | ||||||||
5.553%, 04/10/2038 (A) | 1,000 | 1,008 | ||||||
GS Mortgage Securities II, Ser GC30, Cl A3 | ||||||||
3.119%, 05/10/2050 | 1,259 | 1,272 | ||||||
GS Mortgage Securities II, Ser GC30, Cl AAB | ||||||||
3.120%, 05/10/2050 | 988 | 1,018 | ||||||
GS Mortgage Securities II, Ser GC30, Cl AS | ||||||||
3.777%, 05/10/2050 | 1,219 | 1,255 | ||||||
GS Mortgage Securities Trust, Ser 2006-GG8, Cl X, IO | ||||||||
0.574%, 11/10/2039 (A) (C) | 8,267 | 49 | ||||||
GS Mortgage Securities Trust, Ser 2011-GC3, Cl A2 | ||||||||
3.645%, 03/10/2044 (C) | 1,097 | 1,109 | ||||||
GS Mortgage Securities Trust, Ser 2011-GC5, Cl XA, IO | ||||||||
1.658%, 08/10/2044 (A) (C) | 2,059 | 108 | ||||||
GS Mortgage Securities Trust, Ser 2012-GCJ7, Cl A1 | ||||||||
1.144%, 05/10/2045 | 344 | 344 | ||||||
GS Mortgage Securities Trust, Ser 2013-GC16, Cl B | ||||||||
5.161%, 11/10/2046 (A) | 390 | 437 | ||||||
GS Mortgage Securities Trust, Ser 2014-GC18, Cl A4 | ||||||||
4.074%, 01/10/2047 | 338 | 368 | ||||||
GS Mortgage Securities Trust, Ser 2014-GC18, Cl AAB | ||||||||
3.648%, 01/10/2047 | 865 | 922 | ||||||
GS Mortgage Securities Trust, Ser 2014-GC20, Cl AAB | ||||||||
3.655%, 04/10/2047 | 1,021 | 1,091 | ||||||
GS Mortgage Securities Trust, Ser 2014-GC24, Cl AAB | ||||||||
3.650%, 09/10/2047 | 2,877 | 3,063 | ||||||
| SEI Institutional Investments Trust / Annual Report / May 31, 2015 | 121 |
SCHEDULE OF INVESTMENTS
Core Fixed Income Fund (Continued)
May 31, 2015
| Description | Face Amount ($ Thousands) | Market Value ($ Thousands) | ||||||
GS Mortgage Securities Trust, Ser 2014-GC26, Cl AAB | ||||||||
3.365%, 11/10/2047 | $ | 1,036 | $ | 1,086 | ||||
GS Mortgage Securities Trust, Ser 2015-GC28, Cl A5 | ||||||||
3.396%, 02/10/2048 | 1,454 | 1,504 | ||||||
GS Mortgage Securities Trust, Ser 2015-GC28, Cl AS | ||||||||
3.759%, 02/10/2048 | 1,519 | 1,584 | ||||||
GS Mortgage Securities Trust, Ser GC6, Cl A1 | ||||||||
1.282%, 01/10/2045 | 38 | 39 | ||||||
GS Mortgage Securities Trust, Ser GCJ7, Cl A2 | ||||||||
2.318%, 05/10/2045 | 1,722 | 1,754 | ||||||
GS Mortgage Securities, | ||||||||
2.706%, 12/10/2027 (C) | 283 | 288 | ||||||
GSMPS Mortgage Loan Trust, Ser 1998-1, Cl A | ||||||||
8.000%, 09/19/2027 (A) (C) | 2 | 3 | ||||||
GSMPS Mortgage Loan Trust, Ser 2005-RP3, Cl 1AF | ||||||||
0.535%, 09/25/2035 (A) (C) | 420 | 356 | ||||||
GSMPS Mortgage Loan Trust, Ser 2005-RP3, Cl 1AS, IO | ||||||||
4.694%, 09/25/2035 (A) (C) | 336 | 43 | ||||||
GSR Mortgage Loan Trust, Ser 2004-8F, Cl 2A3 | ||||||||
6.000%, 09/25/2034 (C) | 265 | 275 | ||||||
GSR Mortgage Loan Trust, Ser 2005-5F, Cl 8A3 | ||||||||
0.685%, 06/25/2035 (A) (C) | 41 | 40 | ||||||
GSR Mortgage Loan Trust, Ser 2007-1F, Cl 2A4 | ||||||||
5.500%, 01/25/2037 (C) | 58 | 58 | ||||||
HILT Mortgage Trust, | ||||||||
1.086%, 07/15/2029 (A) (C) | 1,450 | 1,450 | ||||||
Homestar Mortgage Acceptance, Ser 2004-5, Cl A1 | ||||||||
0.635%, 10/25/2034 (A) (C) | 492 | 492 | ||||||
Impac CMB Trust, | ||||||||
0.485%, 05/25/2035 (A) (C) | 230 | 226 | ||||||
Impac CMB Trust, | ||||||||
0.585%, 05/25/2037 (A) (C) | 2,573 | 2,423 | ||||||
Impac Secured Assets CMN Owner Trust, Ser 2003-2, Cl A1 | ||||||||
5.500%, 08/25/2033 (C) | 407 | 416 | ||||||
Impac Secured Assets Trust, Ser 2006-1, Cl 2A1 | ||||||||
0.531%, 05/25/2036 (A) (C) | 321 | 311 | ||||||
| Description | Face Amount ($ Thousands) | Market Value ($ Thousands) | ||||||
Impac Secured Assets Trust, Ser 2006-2, Cl 2A1 | ||||||||
0.535%, 08/25/2036 (A) (C) | $ | 516 | $ | 508 | ||||
Impact Funding Affordable Multifamily Housing Mortgage Loan Trust, Ser 2010-1, Cl A1 | ||||||||
5.314%, 01/25/2051 (C) | 4,629 | 5,352 | ||||||
Indymac Index Mortgage Loan Trust, Ser 2004-AR6, Cl 6A1 | ||||||||
2.698%, 10/25/2034 (A) (C) | 18 | 17 | ||||||
Indymac Index Mortgage Loan Trust, Ser 2004-AR7, Cl A2 | ||||||||
1.045%, 09/25/2034 (A) (C) | 30 | 27 | ||||||
Indymac Index Mortgage Loan Trust, Ser 2004-AR8, Cl 2A2A | ||||||||
0.985%, 11/25/2034 (A) (C) | 49 | 44 | ||||||
JPMBB Commercial Mortgage Securities Trust, | ||||||||
5.081%, 11/15/2045 (A) | 410 | 450 | ||||||
JPMBB Commercial Mortgage Securities Trust, | ||||||||
4.887%, 01/15/2047 (A) | 230 | 257 | ||||||
JPMBB Commercial Mortgage Securities Trust, | ||||||||
4.561%, 09/15/2047 (A) | 750 | 780 | ||||||
JPMBB Commercial Mortgage Securities Trust, | ||||||||
3.407%, 11/15/2047 | 149 | 157 | ||||||
JPMBB Commercial Mortgage Securities Trust, | ||||||||
2.912%, 10/15/2048 | 690 | 681 | ||||||
JPMBB Commercial Mortgage Securities Trust, | ||||||||
3.042%, 10/15/2048 | 945 | 969 | ||||||
JPMorgan Chase Commercial Mortgage Securities Trust, Ser 2004-LN2, Cl A2 | ||||||||
5.115%, 07/15/2041 | 53 | 54 | ||||||
JPMorgan Chase Commercial Mortgage Securities Trust, Ser 2006-CB15, Cl X1, IO | ||||||||
0.213%, 06/12/2043 (A) | 39,978 | 105 | ||||||
JPMorgan Chase Commercial Mortgage Securities Trust, Ser 2006-LDP7, Cl A4 | ||||||||
5.905%, 04/15/2045 (A) | 2,864 | 2,943 | ||||||
JPMorgan Chase Commercial Mortgage Securities Trust, Ser 2006-LDP9, Cl A3SF | ||||||||
0.341%, 05/15/2047 (A) | 295 | 292 | ||||||
| 122 | SEI Institutional Investments Trust / Annual Report / May 31, 2015 |
| Description | Face Amount ($ Thousands) | Market Value ($ Thousands) | ||||||
JPMorgan Chase Commercial Mortgage Securities Trust, Ser 2006-LDP9, Cl AM | ||||||||
5.372%, 05/15/2047 | $ | 5,610 | $ | 5,811 | ||||
JPMorgan Chase Commercial Mortgage Securities Trust, Ser 2007-CB20, Cl AM | ||||||||
5.877%, 02/12/2051 (A) | 238 | 259 | ||||||
JPMorgan Chase Commercial Mortgage Securities Trust, Ser 2010-C2, Cl A3 | ||||||||
4.070%, 11/15/2043 (C) | 3,667 | 3,981 | ||||||
JPMorgan Chase Commercial Mortgage Securities Trust, Ser 2010-CNTR, Cl A1 | ||||||||
3.300%, 08/05/2032 (C) | 711 | 734 | ||||||
JPMorgan Chase Commercial Mortgage Securities Trust, Ser 2011-C5, Cl A2 | ||||||||
3.149%, 08/15/2046 | 637 | 652 | ||||||
JPMorgan Chase Commercial Mortgage Securities, | ||||||||
5.236%, 12/15/2044 (A) | 4,607 | 4,636 | ||||||
JPMorgan Chase Commercial Mortgage Securities, | ||||||||
5.481%, 12/12/2044 (A) | 501 | 507 | ||||||
JPMorgan Chase Commercial Mortgage Securities, | ||||||||
3.673%, 02/15/2046 (C) | 2,040 | 2,084 | ||||||
JPMorgan Chase Commercial Mortgage Securities, | ||||||||
1.677%, 12/15/2047 | 584 | 587 | ||||||
JPMorgan Mortgage Trust, Ser 2004-A3, Cl 4A1 | ||||||||
2.524%, 07/25/2034 (A) (C) | 86 | 88 | ||||||
JPMorgan Mortgage Trust, Ser 2004-A3, Cl SF3 | ||||||||
2.108%, 06/25/2034 (A) (C) | 1,039 | 1,028 | ||||||
JPMorgan Mortgage Trust, Ser 2004-A4, Cl 1A1 | ||||||||
2.550%, 09/25/2034 (A) (C) | 71 | 73 | ||||||
JPMorgan Mortgage Trust, Ser 2005-A1, Cl 3A4 | ||||||||
2.571%, 02/25/2035 (A) (C) | 370 | 377 | ||||||
JPMorgan Mortgage Trust, Ser 2005-A2, Cl 5A2 | ||||||||
2.481%, 04/25/2035 (A) (C) | 156 | 155 | ||||||
JPMorgan Mortgage Trust, Ser 2005-A3, Cl 5A3 | ||||||||
2.754%, 06/25/2035 (A) (C) | 496 | 498 | ||||||
| Description | Face Amount ($ Thousands) | Market Value ($ Thousands) | ||||||
JPMorgan Mortgage Trust, | ||||||||
2.503%, 08/25/2034 (A) (C) | $ | 612 | $ | 612 | ||||
JPMorgan Mortgage Trust, | ||||||||
2.433%, 11/25/2033 (A) (C) | 616 | 617 | ||||||
JPMorgan Mortgage Trust, | ||||||||
2.541%, 08/25/2034 (A) (C) | 277 | 279 | ||||||
JPMorgan Mortgage Trust, | ||||||||
2.774%, 01/25/2045 (A) (C) | 1,365 | 1,375 | ||||||
JPMorgan Resecuritization Trust, Ser 2009-6, Cl 4A1 | ||||||||
2.499%, 09/26/2036 (A) (C) | 157 | 159 | ||||||
JPMorgan Resecuritization Trust, Ser 2010-4, Cl 7A1 | ||||||||
1.865%, 08/26/2035 (A) (C) | 88 | 87 | ||||||
KGS-Alpha Capital, | ||||||||
0.859%, 08/27/2037 (A) | 6,643 | 236 | ||||||
KGS-Alpha SBA COOF Trust, Ser 2014-2, Cl A, IO | ||||||||
3.203%, 04/25/2040 (A) (C) | 872 | 127 | ||||||
LB Commercial Mortgage Trust, Ser 2007-C3, Cl AM | ||||||||
5.903%, 07/15/2044 (A) | 380 | 412 | ||||||
LB-UBS Commercial Mortgage Trust, Ser 2006-C1, Cl XCL, IO | ||||||||
0.353%, 02/15/2041 (A) (C) | 19,159 | 42 | ||||||
LB-UBS Commercial Mortgage Trust, Ser 2006-C7, Cl A2 | ||||||||
5.300%, 11/15/2038 | 5,737 | 5,781 | ||||||
LB-UBS Commercial Mortgage Trust, Ser 2007-C1, Cl A4 | ||||||||
5.424%, 02/15/2040 | 128 | 135 | ||||||
LB-UBS Commercial Mortgage Trust, Ser 2007-C1, Cl AM | ||||||||
5.455%, 02/15/2040 | 150 | 159 | ||||||
Lehman XS Trust, | ||||||||
0.485%, 12/25/2035 (A) (C) | 1,402 | 829 | ||||||
LVII Resecuritization Trust, | ||||||||
5.212%, 11/27/2037 (A) (C) | 188 | 189 | ||||||
Master Adjustable Rate Mortgages Trust, Ser 2004-13, Cl 3A7 | ||||||||
2.665%, 11/21/2034 (A) (C) | 906 | 927 | ||||||
Master Adjustable Rate Mortgages Trust, Ser 2004-13, Cl 3A7A | ||||||||
2.665%, 11/21/2034 (A) (C) | 6,664 | 6,837 | ||||||
Master Alternative Loans Trust, Ser 2004-4, Cl 1A1 | ||||||||
5.500%, 05/25/2034 (C) | 1,131 | 1,205 | ||||||
| SEI Institutional Investments Trust / Annual Report / May 31, 2015 | 123 |
SCHEDULE OF INVESTMENTS
Core Fixed Income Fund (Continued)
May 31, 2015
| Description | Face Amount ($ Thousands) | Market Value ($ Thousands) | ||||||
Master Resecuritization Trust, Ser 2005-PO, Cl 3PO, PO | ||||||||
0.000%, 05/28/2035 (B) (C) | $ | 91 | $ | 73 | ||||
MASTR Adjustable Rate Mortgages Trust, | ||||||||
2.600%, 06/25/2034 (A) (C) | 20 | 19 | ||||||
MASTR Alternative Loan Trust, Ser 2003-9, Cl 2A1 | ||||||||
6.000%, 12/25/2033 (C) | 166 | 169 | ||||||
MASTR Alternative Loan Trust, Ser 2006-3, Cl 1A3 | ||||||||
6.250%, 07/25/2036 (C) | 469 | 408 | ||||||
MASTR Asset Securitization Trust, Ser 2003-11, Cl 9A6 | ||||||||
5.250%, 12/25/2033 (C) | 429 | 452 | ||||||
MASTR Asset Securitization Trust, Ser 2003-2, Cl 1A1 | ||||||||
5.000%, 03/25/2018 (C) | 18 | 18 | ||||||
MASTR Asset Securitization Trust, Ser 2003-3, Cl 3A18 | ||||||||
5.500%, 04/25/2033 (C) | 131 | 132 | ||||||
MASTR Reperforming Loan Trust, Ser 2005-1, Cl 1A1 | ||||||||
6.000%, 08/25/2034 (C) | 2,088 | 2,065 | ||||||
MASTR Reperforming Loan Trust, Ser 2005-2, Cl 1A1F | ||||||||
0.535%, 05/25/2035 (A) (C) | 406 | 333 | ||||||
MASTR Seasoned Securitization Trust, Ser 2004-1, Cl 4A1 | ||||||||
2.496%, 10/25/2032 (A) (C) | 9 | 9 | ||||||
MASTR Seasoned Securitization Trust, Ser 2005-1, Cl 4A1 | ||||||||
2.436%, 10/25/2032 (A) (C) | 79 | 79 | ||||||
Merrill Lynch Mortgage Investors Trust, Ser 2003-A4, Cl 2A | ||||||||
2.651%, 07/25/2033 (A) (C) | 106 | 97 | ||||||
Merrill Lynch Mortgage Investors Trust, Ser 2004-1, Cl 2A1 | ||||||||
2.164%, 12/25/2034 (A) (C) | 345 | 346 | ||||||
Merrill Lynch Mortgage Investors Trust, Ser 2004-A, Cl A2 | ||||||||
0.895%, 04/25/2029 (A) (C) | 217 | 206 | ||||||
Merrill Lynch Mortgage Investors Trust, Ser 2004-A1, Cl 2A1 | ||||||||
2.393%, 02/25/2034 (A) (C) | 112 | 112 | ||||||
Merrill Lynch Mortgage Investors Trust, Ser 2004-A1, Cl 4A | ||||||||
2.602%, 02/25/2034 (A) (C) | 861 | 865 | ||||||
Merrill Lynch Mortgage Investors Trust, Ser 2004-A4, Cl A2 | ||||||||
2.496%, 08/25/2034 (A) (C) | 185 | 189 | ||||||
Merrill Lynch Mortgage Investors Trust, Ser 2004-B, Cl A3 | ||||||||
2.015%, 05/25/2029 (A) (C) | 306 | 307 | ||||||
| Description | Face Amount ($ Thousands) | Market Value ($ Thousands) | ||||||
Merrill Lynch Mortgage Investors Trust, Ser 2004-D, Cl A2 | ||||||||
1.105%, 09/25/2029 (A) (C) | $ | 236 | $ | 227 | ||||
Merrill Lynch Mortgage Investors Trust, Ser 2005-1, Cl 2A1 | ||||||||
2.129%, 04/25/2035 (A) (C) | 36 | 34 | ||||||
Merrill Lynch Mortgage Investors Trust, Ser 2006-1, Cl 1A | ||||||||
2.476%, 02/25/2036 (A) (C) | 249 | 242 | ||||||
Merrill Lynch Mortgage Trust, Ser 2005-CIP1, Cl A4 | ||||||||
5.047%, 07/12/2038 (A) | 47 | 47 | ||||||
ML-CFC Commercial Mortgage Trust, Ser 2006-4, Cl XC, IO | ||||||||
0.607%, 12/12/2049 (A) (C) | 11,121 | 90 | ||||||
Morgan Stanley Bank of America Merrill Lynch Trust, | ||||||||
1.827%, 08/15/2045 (A) (C) | 4,905 | 383 | ||||||
Morgan Stanley Bank of America Merrill Lynch Trust, | ||||||||
1.394%, 07/15/2046 | 1,833 | 1,843 | ||||||
Morgan Stanley Bank of America Merrill Lynch Trust, Ser 2013-C10, Cl A4 | ||||||||
4.082%, 07/15/2046 (A) | 1,600 | 1,763 | ||||||
Morgan Stanley Bank of America Merrill Lynch Trust, Ser 2013-C7, Cl AS | ||||||||
3.214%, 02/15/2046 | 207 | 212 | ||||||
Morgan Stanley Bank of America Merrill Lynch Trust, Ser 2013-C9, Cl A2 | ||||||||
1.970%, 05/15/2046 | 602 | 609 | ||||||
Morgan Stanley Bank of America Merrill Lynch Trust, Ser 2015-C22, Cl A3 | ||||||||
3.046%, 05/15/2046 | 3,478 | 3,496 | ||||||
Morgan Stanley Capital I Trust, Ser 2011-C2, Cl A2 | ||||||||
3.476%, 06/15/2044 (C) | 1,975 | 2,011 | ||||||
Morgan Stanley Capital I Trust, Ser 2014-CPT, Cl AM | ||||||||
3.402%, 07/13/2029 (A) (C) | 4,570 | 4,775 | ||||||
Morgan Stanley Capital I Trust, Ser 2014-CPT, Cl B | ||||||||
3.446%, 07/13/2029 (A) (C) | 3,870 | 4,022 | ||||||
Morgan Stanley Capital I, | ||||||||
0.214%, 02/12/2044 (A) (C) | 32,229 | 100 | ||||||
Morgan Stanley Capital I, | ||||||||
3.224%, 07/15/2049 | 9,585 | 9,817 | ||||||
| 124 | SEI Institutional Investments Trust / Annual Report / May 31, 2015 |
| Description | Face Amount ($ Thousands) | Market Value ($ Thousands) | ||||||
Morgan Stanley Mortgage Loan Trust, Ser 2004-3, Cl 4A | ||||||||
5.686%, 04/25/2034 (A) (C) | $ | 348 | $ | 366 | ||||
Morgan Stanley Mortgage Loan Trust, Ser 2007-3XS, Cl 2A3S | ||||||||
5.858%, 01/25/2047 | 23 | 17 | ||||||
Morgan Stanley Re-REMIC Trust, Ser 2012-IO, Cl AXA | ||||||||
1.000%, 03/27/2051 (C) | 679 | 678 | ||||||
Morgan Stanley Re-REMIC Trust, Ser 2012-XA, Cl A | ||||||||
2.000%, 07/27/2049 (C) | 1,243 | 1,242 | ||||||
Morgan Stanley Re-REMIC Trust, Ser 2012-XA, Cl B | ||||||||
0.250%, 07/27/2049 (C) | 400 | 356 | ||||||
MSCG Trust, Ser 2015-ALDR, Cl A2 | ||||||||
3.577%, 06/07/2035 (C) | 2,030 | 2,082 | ||||||
New York Mortgage Trust, | ||||||||
2.603%, 05/25/2036 (A) (C) | 360 | 325 | ||||||
Nomura Resecuritization Trust, Ser 2010-6RA, Cl 1A5 | ||||||||
2.650%, 03/26/2036 (A) (C) | 278 | 277 | ||||||
Nomura Resecuritization Trust, Ser 2014-1R, Cl 3A1 | ||||||||
0.324%, 07/26/2036 (A) (C) | 2,077 | 2,051 | ||||||
Northstar, Ser 2013-1A, Cl A | ||||||||
2.031%, 08/25/2029 (A) (C) | 509 | 509 | ||||||
Northstar, Ser 2013-1A, Cl B | ||||||||
5.181%, 08/25/2029 (A) (C) | 500 | 505 | ||||||
ORES NPL LLC, | ||||||||
3.081%, 09/25/2025 (C) | 261 | 261 | ||||||
Prime Mortgage Trust, | ||||||||
6.000%, 02/25/2034 (C) | 133 | 140 | ||||||
Prime Mortgage Trust, | ||||||||
0.000%, 02/25/2034 (B) (C) | 35 | 28 | ||||||
Prime Mortgage Trust, Ser 2006-DR1, Cl 2A1 | ||||||||
5.500%, 05/25/2035 (C) | 1,823 | 1,778 | ||||||
RAIT Trust, Ser 2014-FL3, Cl A | ||||||||
1.428%, 12/15/2031 (A) (C) | 523 | 527 | ||||||
RALI Trust, Ser 2003-QS15, Cl A7 | ||||||||
5.500%, 08/25/2033 (C) | 762 | 777 | ||||||
RALI Trust, Ser 2003-QS18, Cl A1 | ||||||||
5.000%, 09/25/2018 (C) | 116 | 118 | ||||||
RALI Trust, Ser 2003-QS19, Cl A1 | ||||||||
5.750%, 10/25/2033 (C) | 243 | 256 | ||||||
RALI Trust, Ser 2004-QS7, Cl A4 | ||||||||
5.500%, 05/25/2034 (C) | 1,395 | 1,428 | ||||||
RALI Trust, Ser 2005-QO2, Cl A1 | ||||||||
1.507%, 09/25/2045 (A) (C) | 722 | 619 | ||||||
| Description | Face Amount ($ Thousands) | Market Value ($ Thousands) | ||||||
RALI Trust, Ser 2005-QO5, Cl A1 | ||||||||
1.147%, 01/25/2046 (A) (C) | $ | 1,052 | $ | 738 | ||||
RAMP Trust, Ser 2004-SL1, Cl A8 | ||||||||
6.500%, 11/25/2031 (C) | 344 | 354 | ||||||
RAMP Trust, Ser 2005-SL1, Cl A5 | ||||||||
6.500%, 05/25/2032 (C) | 36 | 33 | ||||||
RBSSP Resecuritization Trust, Ser 2010-12, Cl 8A1 | ||||||||
4.000%, 06/27/2021 (C) | 2 | 2 | ||||||
RBSSP Resecuritization Trust, Ser 2010-9, Cl 7A5 | ||||||||
4.000%, 05/26/2037 (A) (C) | 303 | 307 | ||||||
RBSSP Resecuritization Trust, Ser 2012-3, Cl 3A1 | ||||||||
0.324%, 09/26/2036 (A) (C) | 468 | 448 | ||||||
RCMC LLC, Ser 2012-CRE1, Cl A | ||||||||
5.624%, 11/15/2044 (C) | 458 | 469 | ||||||
Residential Asset Mortgage Products, Ser 2004-SL1, Cl A7 | ||||||||
7.000%, 11/25/2031 (C) | 87 | 92 | ||||||
Residential Asset Mortgage Products, Ser 2004-SL3, Cl A2 | ||||||||
6.500%, 12/25/2031 (C) | 553 | 578 | ||||||
Residential Asset Securitization Trust, Ser 2003-A5, Cl A1 | ||||||||
5.500%, 06/25/2033 (C) | 218 | 222 | ||||||
Residential Asset Securitization Trust, Ser 2004-IP2, Cl 2A1 | ||||||||
2.480%, 12/25/2034 (A) (C) | 863 | 865 | ||||||
RFMSI Trust, Ser 2003-S4, Cl A4 | ||||||||
5.750%, 03/25/2033 (C) | 169 | 173 | ||||||
Salomon Brothers Mortgage Securities VII, | ||||||||
2.494%, 09/25/2033 (A) (C) | 320 | 324 | ||||||
Sequoia Mortgage Trust, Ser 2004-12, Cl A3 | ||||||||
0.664%, 01/20/2035 (A) (C) | 427 | 392 | ||||||
Springleaf Mortgage Loan Trust, Ser 2012-2A, Cl M4 | ||||||||
6.000%, 10/25/2057 (A) (C) | 800 | 829 | ||||||
Springleaf Mortgage Loan Trust, Ser 2012-3A, Cl M1 | ||||||||
2.660%, 12/25/2059 (A) (C) | 432 | 434 | ||||||
Springleaf Mortgage Loan Trust, Ser 2012-3A, Cl M2 | ||||||||
3.560%, 12/25/2059 (A) (C) | 330 | 333 | ||||||
Springleaf Mortgage Loan Trust, Ser 2012-3A, Cl M3 | ||||||||
4.440%, 12/25/2059 (A) (C) | 253 | 258 | ||||||
Springleaf Mortgage Loan Trust, Ser 2012-3A, Cl M4 | ||||||||
5.300%, 12/25/2059 (A) (C) | 121 | 125 | ||||||
| SEI Institutional Investments Trust / Annual Report / May 31, 2015 | 125 |
SCHEDULE OF INVESTMENTS
Core Fixed Income Fund (Continued)
May 31, 2015
| Description | Face Amount ($ Thousands) | Market Value ($ Thousands) | ||||||
Springleaf Mortgage Loan Trust, | ||||||||
1.780%, 12/25/2065 (A) (C) | $ | 839 | $ | 841 | ||||
Structured Adjustable Rate Mortgage Loan Trust, | ||||||||
2.341%, 06/25/2034 (A) (C) | 147 | 147 | ||||||
Structured Adjustable Rate Mortgage Loan Trust, | ||||||||
0.505%, 10/25/2035 (A) (C) | 3,074 | 2,672 | ||||||
Structured Agency Credit Risk Debt Notes, | ||||||||
2.381%, 02/25/2024 (A) (C) | 1,580 | 1,598 | ||||||
Structured Asset Mortgage Investments II Trust, | ||||||||
0.661%, 04/19/2035 (A) (C) | 3,379 | 3,121 | ||||||
Structured Asset Mortgage Investments, Ser 2004-AR5, Cl 1A1 | ||||||||
0.846%, 10/19/2034 (A) (C) | 231 | 221 | ||||||
Structured Asset Securities Mortgage Pass-Through Certificates, | ||||||||
2.185%, 10/25/2031 (A) (C) | 48 | 48 | ||||||
Structured Asset Securities Mortgage Pass-Through Certificates, | ||||||||
5.489%, 11/25/2033 (A) (C) | 88 | 91 | ||||||
Structured Asset Securities Mortgage Pass-Through Certificates, | ||||||||
5.500%, 10/25/2033 (C) | 417 | 426 | ||||||
Structured Asset Securities Mortgage Pass-Through Certificates, Ser 2004-5H, Cl A4 | ||||||||
5.540%, 12/25/2033 (C) | 461 | 474 | ||||||
Structured Asset Securities, Ser 2003-31A, Cl 2A7 | ||||||||
2.436%, 10/25/2033 (A) (C) | 5,420 | 5,328 | ||||||
Structured Asset Securities, Ser 2003-37A, Cl 2A | ||||||||
3.732%, 12/25/2033 (A) (C) | 126 | 126 | ||||||
Thornburg Mortgage Securities Trust, Ser 2003-4, Cl A1 | ||||||||
0.825%, 09/25/2043 (A) (C) | 505 | 488 | ||||||
UBS Commercial Mortgage Trust, Ser 2012-C1, Cl XA, IO | ||||||||
2.270%, 05/10/2045 (A) (C) | 5,525 | 609 | ||||||
| Description | Face Amount ($ Thousands) | Market Value ($ Thousands) | ||||||
UBS-BAMLL Trust, | ||||||||
3.663%, 06/10/2030 (C) | $ | 400 | $ | 419 | ||||
UBS-Barclays Commercial Mortgage Trust, | ||||||||
2.113%, 05/10/2063 | 964 | 981 | ||||||
UBS-Barclays Commercial Mortgage Trust, | ||||||||
1.739%, 05/10/2063 (A) (C) | 3,577 | 260 | ||||||
UBS-Barclays Commercial Mortgage Trust, | ||||||||
3.185%, 03/10/2046 | 492 | 509 | ||||||
UBS-Barclays Commercial Mortgage Trust, | ||||||||
3.244%, 04/10/2046 | 54 | 56 | ||||||
VML, Ser 2014-NPL1, Cl A1 | ||||||||
3.875%, 04/27/2054 (A) (C) | 302 | 303 | ||||||
VNO Mortgage Trust, Ser 2012-6AVE, Cl A | ||||||||
2.996%, 11/15/2030 (C) | 100 | 102 | ||||||
Wachovia Bank Commercial Mortgage Trust, | ||||||||
0.050%, 06/15/2045 (A) (C) | 78,016 | 59 | ||||||
Wachovia Bank Commercial Mortgage Trust, | ||||||||
5.383%, 12/15/2043 | 560 | 592 | ||||||
WaMu Mortgage Pass-Through Certificates Trust, | ||||||||
2.511%, 01/25/2033 (A) (C) | 214 | 216 | ||||||
WaMu Mortgage Pass-Through Certificates Trust, | ||||||||
1.547%, 06/25/2042 (A) (C) | 67 | 65 | ||||||
WaMu Mortgage Pass-Through Certificates Trust, | ||||||||
2.419%, 10/25/2033 (A) (C) | 263 | 268 | ||||||
WaMu Mortgage Pass-Through Certificates Trust, | ||||||||
2.452%, 06/25/2033 (A) (C) | 253 | 253 | ||||||
WaMu Mortgage Pass-Through Certificates Trust, | ||||||||
2.299%, 08/25/2033 (A) (C) | 217 | 218 | ||||||
| 126 | SEI Institutional Investments Trust / Annual Report / May 31, 2015 |
| Description | Face Amount ($ Thousands) | Market Value ($ Thousands) | ||||||
WaMu Mortgage Pass-Through Certificates Trust, | ||||||||
2.381%, 08/25/2033 (A) (C) | $ | 146 | $ | 150 | ||||
WaMu Mortgage Pass-Through Certificates Trust, | ||||||||
2.405%, 09/25/2033 (A) (C) | 477 | 481 | ||||||
WaMu Mortgage Pass-Through Certificates Trust, | ||||||||
2.441%, 09/25/2033 (A) (C) | 169 | 168 | ||||||
WaMu Mortgage Pass-Through Certificates Trust, | ||||||||
5.000%, 02/25/2018 (C) | 50 | 50 | ||||||
WaMu Mortgage Pass-Through Certificates Trust, | ||||||||
4.500%, 12/25/2018 (C) | 83 | 85 | ||||||
WaMu Mortgage Pass-Through Certificates Trust, | ||||||||
16.954%, 06/25/2033 (A) (C) | 40 | 45 | ||||||
WaMu Mortgage Pass-Through Certificates Trust, | ||||||||
5.250%, 10/25/2033 (C) | 756 | 776 | ||||||
WaMu Mortgage Pass-Through Certificates Trust, | ||||||||
2.459%, 06/25/2034 (A) (C) | 136 | 137 | ||||||
WaMu Mortgage Pass-Through Certificates Trust, | ||||||||
2.459%, 06/25/2034 (A) (C) | 178 | 179 | ||||||
WaMu Mortgage Pass-Through Certificates Trust, | ||||||||
5.500%, 08/25/2019 (C) | 209 | 214 | ||||||
WaMu Mortgage Pass-Through Certificates Trust, | ||||||||
5.500%, 06/25/2034 (C) | 483 | 505 | ||||||
WaMu Mortgage Pass-Through Certificates Trust, | ||||||||
0.475%, 10/25/2045 (A) (C) | 3,290 | 3,060 | ||||||
WaMu Mortgage Pass-Through Certificates Trust, Ser 2005-AR15, Cl A1A2 | ||||||||
0.465%, 11/25/2045 (A) (C) | 3,951 | 3,434 | ||||||
| Description | Face Amount ($ Thousands) | Market Value ($ Thousands) | ||||||
WaMu Mortgage Pass-Through Certificates Trust, | ||||||||
0.475%, 12/25/2045 (A) (C) | $ | 3,605 | $ | 3,289 | ||||
WaMu Mortgage Pass-Through Certificates Trust, | ||||||||
1.217%, 01/25/2046 (A) (C) | 2,422 | 917 | ||||||
WaMu Mortgage Pass-Through Certificates Trust, | ||||||||
2.198%, 10/25/2046 (A) (C) | 842 | 763 | ||||||
WaMu Mortgage Pass-Through Certificates Trust, | ||||||||
1.960%, 11/25/2036 (A) (C) | 269 | 238 | ||||||
WaMu Mortgage Pass-Through Certificates Trust, | ||||||||
0.946%, 12/25/2046 (A) (C) | 403 | 166 | ||||||
WaMu Mortgage Pass-Through Certificates Trust, | ||||||||
2.198%, 12/25/2046 (A) (C) | 395 | 363 | ||||||
WaMu Mortgage Pass-Through Certificates Trust, | ||||||||
2.165%, 02/25/2037 (A) (C) | 3,035 | 2,527 | ||||||
Washington Mutual Mortgage Pass-Through Certificates, Ser 2005-3, Cl CX, IO | ||||||||
5.500%, 05/25/2035 (C) | 447 | 92 | ||||||
Washington Mutual MSC Mortgage Pass-Through Certificates Trust, Ser 2003-MS8, Cl 1P, PO | ||||||||
0.000%, 05/25/2033 (B) (C) | 59 | 51 | ||||||
Washington Mutual MSC Mortgage Pass-Through Certificates Trust, Ser 2003-MS9, Cl 2P, PO | ||||||||
0.000%, 04/25/2033 (B) (C) | 135 | 124 | ||||||
Washington Mutual MSC Mortgage Pass-Through Certificates, Ser 2003-MS2, Cl 1A1 | ||||||||
5.750%, 02/25/2033 (C) | 58 | 62 | ||||||
Wells Fargo Mortgage Loan Trust, Ser 2012-RR1, Cl A1 | ||||||||
2.847%, 08/27/2037 (A) (C) | 151 | 151 | ||||||
Wells Fargo Mortgage-Backed Securities Trust, | ||||||||
2.490%, 11/25/2033 (A) (C) | 250 | 251 | ||||||
Wells Fargo Mortgage-Backed Securities Trust, | ||||||||
2.490%, 02/25/2034 (A) (C) | 168 | 167 | ||||||
| SEI Institutional Investments Trust / Annual Report / May 31, 2015 | 127 |
SCHEDULE OF INVESTMENTS
Core Fixed Income Fund (Continued)
May 31, 2015
| Description | Face Amount ($ Thousands) | Market Value ($ Thousands) | ||||||
Wells Fargo Mortgage-Backed Securities Trust, | ||||||||
2.748%, 05/25/2034 (A) (C) | $ | 40 | $ | 40 | ||||
Wells Fargo Mortgage-Backed Securities Trust, | ||||||||
2.652%, 12/25/2034 (A) (C) | 337 | 339 | ||||||
Wells Fargo Mortgage-Backed Securities Trust, | ||||||||
2.652%, 12/25/2034 (A) (C) | 225 | 228 | ||||||
Wells Fargo Mortgage-Backed Securities Trust, | ||||||||
2.525%, 12/25/2034 (A) (C) | 113 | 114 | ||||||
Wells Fargo Mortgage-Backed Securities Trust, | ||||||||
2.497%, 12/25/2034 (A) (C) | 169 | 170 | ||||||
Wells Fargo Mortgage-Backed Securities Trust, | ||||||||
2.606%, 07/25/2034 (A) (C) | 412 | 416 | ||||||
Wells Fargo Mortgage-Backed Securities Trust, | ||||||||
2.615%, 08/25/2034 (A) (C) | 93 | 93 | ||||||
Wells Fargo Mortgage-Backed Securities Trust, | ||||||||
2.614%, 09/25/2034 (A) (C) | 677 | 679 | ||||||
Wells Fargo Mortgage-Backed Securities Trust, | ||||||||
2.625%, 10/25/2034 (A) (C) | 311 | 313 | ||||||
Wells Fargo Mortgage-Backed Securities Trust, | ||||||||
2.625%, 10/25/2034 (A) (C) | 248 | 252 | ||||||
Wells Fargo Mortgage-Backed Securities Trust, | ||||||||
5.284%, 08/25/2035 (A) (C) | 223 | 221 | ||||||
Wells Fargo Mortgage-Backed Securities Trust, | ||||||||
2.666%, 03/25/2035 (A) (C) | 1,438 | 1,448 | ||||||
Wells Fargo Mortgage-Backed Securities Trust, | ||||||||
2.603%, 06/25/2035 (A) (C) | 433 | 435 | ||||||
Wells Fargo Mortgage-Backed Securities Trust, | ||||||||
2.592%, 10/25/2033 (A) (C) | 145 | 146 | ||||||
| Description | Face Amount ($ Thousands) | Market Value ($ Thousands) | ||||||
Wells Fargo Mortgage-Backed Securities Trust, | ||||||||
5.733%, 11/25/2036 (A) (C) | $ | 366 | $ | 360 | ||||
Wells Fargo Mortgage-Backed Securities Trust, | ||||||||
2.625%, 04/25/2036 (A) (C) | 404 | 402 | ||||||
Wells Fargo Mortgage-Backed Securities Trust, | ||||||||
2.410%, 04/25/2036 (A) (C) | 6,826 | 6,937 | ||||||
Wells Fargo Re-REMIC Trust, Ser 2012-IO, Cl A | ||||||||
1.750%, 08/20/2021 (C) | 304 | 304 | ||||||
WFRBS Commercial Mortgage Trust, Ser 2012-C10, Cl XA, IO | ||||||||
1.780%, 12/15/2045 (A) (C) | 7,290 | 678 | ||||||
WFRBS Commercial Mortgage Trust, Ser 2012-C7, Cl A2 | ||||||||
3.431%, 06/15/2045 | 2,420 | 2,558 | ||||||
WFRBS Commercial Mortgage Trust, Ser 2012-C7, Cl XA, IO | ||||||||
1.564%, 06/15/2045 (A) (C) | 3,091 | 254 | ||||||
WFRBS Commercial Mortgage Trust, Ser 2012-C8, Cl A1 | ||||||||
0.864%, 08/15/2045 | 5,837 | 5,839 | ||||||
WFRBS Commercial Mortgage Trust, Ser 2012-C8, Cl A3 | ||||||||
3.001%, 08/15/2045 | 3,740 | 3,855 | ||||||
WFRBS Commercial Mortgage Trust, Ser 2013-C12, Cl XA, IO | ||||||||
1.484%, 03/15/2048 (A) (C) | 14,731 | 1,132 | ||||||
WFRBS Commercial Mortgage Trust, Ser 2014-C19, Cl B | ||||||||
4.723%, 03/15/2047 (A) | 210 | 230 | ||||||
WFRBS Commercial Mortgage Trust, Ser 2014-C19, Cl XA, IO | ||||||||
1.303%, 03/15/2047 (A) | 5,296 | 395 | ||||||
WFRBS Commercial Mortgage Trust, Ser 2014-C21, Cl AS | ||||||||
3.891%, 08/15/2047 | 1,320 | 1,409 | ||||||
WFRBS Commercial Mortgage Trust, Ser 2014-C21, Cl B | ||||||||
4.213%, 08/15/2047 (A) | 2,180 | 2,312 | ||||||
WFRBS Commercial Mortgage Trust, Ser 2014-C21, Cl XA, IO | ||||||||
1.194%, 08/15/2047 (A) | 16,049 | 1,232 | ||||||
WFRBS Commercial Mortgage Trust, Ser 2014-C23, Cl XA, IO | ||||||||
0.719%, 10/15/2057 (A) | 27,740 | 1,282 | ||||||
WFRBS Commercial Mortgage Trust, Ser 2014-C24, Cl AS | ||||||||
3.931%, 11/15/2047 | 1,330 | 1,414 | ||||||
|
| |||||||
| 401,329 | ||||||||
|
| |||||||
Total Mortgage-Backed Securities |
| 1,840,714 | ||||||
|
| |||||||
| 128 | SEI Institutional Investments Trust / Annual Report / May 31, 2015 |
| Description | Face Amount ($ Thousands) | Market Value ($ Thousands) | ||||||
CORPORATE OBLIGATIONS — 26.6% |
| |||||||
Consumer Discretionary — 1.9% | ||||||||
21st Century Fox America | ||||||||
8.875%, 04/26/2023 | $ | 150 | $ | 204 | ||||
7.300%, 04/30/2028 | 150 | 190 | ||||||
6.650%, 11/15/2037 | 310 | 393 | ||||||
6.200%, 12/15/2034 | 265 | 321 | ||||||
Amazon.com | ||||||||
4.950%, 12/05/2044 | 4,130 | 4,235 | ||||||
4.800%, 12/05/2034 | 100 | 104 | ||||||
3.800%, 12/05/2024 | 2,255 | 2,323 | ||||||
3.300%, 12/05/2021 | 120 | 123 | ||||||
Bed Bath & Beyond | ||||||||
5.165%, 08/01/2044 | 840 | 865 | ||||||
4.915%, 08/01/2034 | 190 | 194 | ||||||
Best Buy | ||||||||
5.000%, 08/01/2018 | 237 | 250 | ||||||
CBS | ||||||||
4.900%, 08/15/2044 | 135 | 131 | ||||||
Coach | ||||||||
4.250%, 04/01/2025 | 1,110 | 1,091 | ||||||
Comcast | ||||||||
6.950%, 08/15/2037 | 1,040 | 1,388 | ||||||
6.550%, 07/01/2039 | 340 | 440 | ||||||
6.450%, 03/15/2037 | 290 | 367 | ||||||
6.400%, 03/01/2040 | 280 | 361 | ||||||
5.850%, 11/15/2015 | 648 | 664 | ||||||
4.600%, 08/15/2045 | 490 | 509 | ||||||
4.400%, 08/15/2035 | 4,630 | 4,762 | ||||||
4.250%, 01/15/2033 | 420 | 425 | ||||||
4.200%, 08/15/2034 | 570 | 571 | ||||||
3.375%, 02/15/2025 | 800 | 812 | ||||||
3.375%, 08/15/2025 | 1,940 | 1,967 | ||||||
Comcast Cable Communications Holdings | ||||||||
9.455%, 11/15/2022 | 660 | 942 | ||||||
CVS Health | ||||||||
5.750%, 05/15/2041 | 280 | 335 | ||||||
2.750%, 12/01/2022 | 230 | �� | 226 | |||||
CVS Pass-Through Trust | ||||||||
6.036%, 12/10/2028 | 2,128 | 2,492 | ||||||
5.926%, 01/10/2034 (C) | 184 | 217 | ||||||
5.880%, 01/10/2028 | 143 | 163 | ||||||
5.789%, 01/10/2026 (C) | 1,309 | 1,470 | ||||||
Daimler Finance North America LLC | ||||||||
3.300%, 05/19/2025 (C) | 475 | 481 | ||||||
2.625%, 09/15/2016 (C) | 389 | 397 | ||||||
2.375%, 08/01/2018 (C) | 4,410 | 4,510 | ||||||
1.875%, 01/11/2018 (C) | 1,241 | 1,250 | ||||||
1.125%, 03/10/2017 (C) | 2,585 | 2,586 | ||||||
DIRECTV Holdings | ||||||||
4.450%, 04/01/2024 | 1,450 | 1,522 | ||||||
3.800%, 03/15/2022 | 945 | 971 | ||||||
| Description | Face Amount ($ Thousands) | Market Value ($ Thousands) | ||||||
DIRECTV Holdings LLC | ||||||||
3.950%, 01/15/2025 | $ | 1,970 | $ | 1,990 | ||||
Discovery Communications | ||||||||
4.950%, 05/15/2042 | 115 | 111 | ||||||
Ford Motor | ||||||||
4.750%, 01/15/2043 | 2,480 | 2,523 | ||||||
Ford Motor Credit LLC | ||||||||
3.664%, 09/08/2024 | 920 | 924 | ||||||
3.219%, 01/09/2022 | 1,565 | 1,578 | ||||||
2.597%, 11/04/2019 | 2,520 | 2,533 | ||||||
2.459%, 03/27/2020 | 540 | 536 | ||||||
Gap | ||||||||
5.950%, 04/12/2021 | 236 | 272 | ||||||
General Motors | ||||||||
5.000%, 04/01/2035 | 770 | 778 | ||||||
3.500%, 10/02/2018 | 1,745 | 1,794 | ||||||
General Motors Financial | ||||||||
4.750%, 08/15/2017 | 2,250 | 2,379 | ||||||
3.450%, 04/10/2022 | 1,395 | 1,374 | ||||||
Historic TW | ||||||||
9.150%, 02/01/2023 | 300 | 407 | ||||||
Home Depot | ||||||||
4.250%, 04/01/2046 | 940 | 945 | ||||||
2.625%, 06/01/2022 | 1,835 | 1,835 | ||||||
Hyundai Capital America | ||||||||
2.600%, 03/19/2020 (C) | 1,540 | 1,554 | ||||||
2.125%, 10/02/2017 (C) | 650 | 657 | ||||||
2.000%, 03/19/2018 (C) | 615 | 619 | ||||||
Johnson Controls | ||||||||
5.250%, 12/01/2041 | 100 | 109 | ||||||
4.950%, 07/02/2064 | 365 | 366 | ||||||
3.750%, 12/01/2021 | 289 | 304 | ||||||
Kohl’s | ||||||||
6.250%, 12/15/2017 | 255 | 284 | ||||||
Lowe’s MTN | ||||||||
7.110%, 05/15/2037 | 250 | 336 | ||||||
5.125%, 11/15/2041 | 48 | 55 | ||||||
LVMH Moet Hennessy Louis Vuitton | ||||||||
1.625%, 06/29/2017 (C) | 802 | 810 | ||||||
Macy’s Retail Holdings | ||||||||
7.450%, 07/15/2017 | 120 | 135 | ||||||
6.900%, 04/01/2029 | 100 | 127 | ||||||
5.125%, 01/15/2042 | 54 | 58 | ||||||
4.300%, 02/15/2043 | 153 | 146 | ||||||
2.875%, 02/15/2023 | 232 | 228 | ||||||
McDonald’s MTN | ||||||||
5.350%, 03/01/2018 | 670 | 741 | ||||||
4.600%, 05/26/2045 | 620 | 628 | ||||||
2.200%, 05/26/2020 | 910 | 909 | ||||||
NBCUniversal Media LLC | ||||||||
4.375%, 04/01/2021 | 820 | 901 | ||||||
Nissan Motor Acceptance | ||||||||
1.800%, 03/15/2018 (C) | 255 | 257 | ||||||
| SEI Institutional Investments Trust / Annual Report / May 31, 2015 | 129 |
SCHEDULE OF INVESTMENTS
Core Fixed Income Fund (Continued)
May 31, 2015
| Description | Face Amount ($ Thousands) | Market Value ($ Thousands) | ||||||
QVC | ||||||||
5.950%, 03/15/2043 | $ | 50 | $ | 49 | ||||
Scripps Networks Interactive | ||||||||
3.950%, 06/15/2025 | 1,090 | 1,095 | ||||||
3.900%, 11/15/2024 | 1,130 | 1,148 | ||||||
3.500%, 06/15/2022 | 640 | 640 | ||||||
2.800%, 06/15/2020 | 915 | 912 | ||||||
Time Warner | ||||||||
7.700%, 05/01/2032 | 2,530 | 3,441 | ||||||
7.625%, 04/15/2031 | 2,985 | 3,999 | ||||||
6.500%, 11/15/2036 | 50 | 60 | ||||||
6.250%, 03/29/2041 | 355 | 411 | ||||||
5.375%, 10/15/2041 | 37 | 39 | ||||||
4.750%, 03/29/2021 | 780 | 859 | ||||||
4.700%, 01/15/2021 | 670 | 736 | ||||||
Time Warner Cable | ||||||||
8.250%, 04/01/2019 | 2,890 | 3,424 | ||||||
7.300%, 07/01/2038 | 100 | 117 | ||||||
6.550%, 05/01/2037 | 2,056 | 2,220 | ||||||
4.125%, 02/15/2021 | 110 | 114 | ||||||
Time Warner Entertainment | ||||||||
8.375%, 07/15/2033 | 1,380 | 1,747 | ||||||
Viacom | ||||||||
5.250%, 04/01/2044 | 550 | 536 | ||||||
4.850%, 12/15/2034 | 1,856 | 1,795 | ||||||
4.250%, 09/01/2023 | 430 | 445 | ||||||
3.875%, 12/15/2021 | 200 | 206 | ||||||
3.250%, 03/15/2023 | 44 | 43 | ||||||
Volkswagen Group of America Finance LLC | ||||||||
2.450%, 11/20/2019 (C) | 1,600 | 1,622 | ||||||
2.400%, 05/22/2020 (C) | 1,570 | 1,581 | ||||||
Volkswagen International Finance | ||||||||
2.375%, 03/22/2017 (C) | 146 | 149 | ||||||
1.125%, 11/18/2016 (C) | 2,835 | 2,842 | ||||||
Walgreens Boots Alliance | ||||||||
4.800%, 11/18/2044 | 580 | 574 | ||||||
4.500%, 11/18/2034 | 64 | 64 | ||||||
Wal-Mart Stores | ||||||||
5.800%, 02/15/2018 | 1,760 | 1,978 | ||||||
4.300%, 04/22/2044 | 3,240 | 3,361 | ||||||
3.300%, 04/22/2024 | 175 | 181 | ||||||
Walt Disney MTN | ||||||||
0.450%, 12/01/2015 | 125 | 125 | ||||||
Yum! Brands | ||||||||
5.350%, 11/01/2043 | 725 | 734 | ||||||
|
| |||||||
| 106,702 | ||||||||
|
| |||||||
Consumer Staples — 1.5% | ||||||||
Altria Group | ||||||||
9.950%, 11/10/2038 | 290 | 485 | ||||||
9.250%, 08/06/2019 | 2,120 | 2,696 | ||||||
5.375%, 01/31/2044 | 880 | 943 | ||||||
4.750%, 05/05/2021 | 1,260 | 1,396 | ||||||
| Description | Face Amount ($ Thousands) | Market Value ($ Thousands) | ||||||
4.500%, 05/02/2043 | $ | 940 | $ | 917 | ||||
2.850%, 08/09/2022 | 1,690 | 1,658 | ||||||
2.625%, 01/14/2020 | 1,670 | 1,682 | ||||||
Anheuser-Busch InBev Finance | ||||||||
2.625%, 01/17/2023 | 1,080 | 1,053 | ||||||
Anheuser-Busch InBev Worldwide | ||||||||
7.750%, 01/15/2019 | 3,515 | 4,213 | ||||||
5.375%, 01/15/2020 | 2,360 | 2,692 | ||||||
2.500%, 07/15/2022 | 2,086 | 2,042 | ||||||
Bunge Finance | ||||||||
5.900%, 04/01/2017 | 107 | 115 | ||||||
Cargill | ||||||||
6.000%, 11/27/2017 (C) | 100 | 111 | ||||||
Coca-Cola Femsa | ||||||||
2.375%, 11/26/2018 | 2,020 | 2,056 | ||||||
ConAgra Foods | ||||||||
2.100%, 03/15/2018 | 69 | 69 | ||||||
1.900%, 01/25/2018 | 405 | 405 | ||||||
Diageo Investment | ||||||||
2.875%, 05/11/2022 | 3,730 | 3,752 | ||||||
EMD Finance LLC | ||||||||
2.400%, 03/19/2020 (C) | 2,240 | 2,256 | ||||||
1.700%, 03/19/2018 (C) | 1,930 | 1,937 | ||||||
ERAC USA Finance LLC | ||||||||
6.700%, 06/01/2034 (C) | 221 | 276 | ||||||
5.625%, 03/15/2042 (C) | 1,273 | 1,433 | ||||||
4.500%, 02/15/2045 (C) | 405 | 390 | ||||||
Heineken | ||||||||
1.400%, 10/01/2017 (C) | 770 | 772 | ||||||
Imperial Tobacco Finance | ||||||||
2.050%, 02/11/2018 (C) | 790 | 792 | ||||||
Kimberly-Clark | ||||||||
2.400%, 03/01/2022 | 36 | 36 | ||||||
Kraft Foods Group | ||||||||
6.500%, 02/09/2040 | 700 | 866 | ||||||
6.125%, 08/23/2018 | 100 | 113 | ||||||
5.375%, 02/10/2020 | 847 | 953 | ||||||
5.000%, 06/04/2042 | 660 | 683 | ||||||
3.500%, 06/06/2022 | 3,495 | 3,569 | ||||||
Kroger | ||||||||
7.500%, 04/01/2031 | 280 | 373 | ||||||
6.900%, 04/15/2038 | 570 | 745 | ||||||
5.400%, 07/15/2040 | 45 | 52 | ||||||
2.950%, 11/01/2021 | 1,215 | 1,224 | ||||||
Lorillard Tobacco | ||||||||
8.125%, 06/23/2019 | 570 | 691 | ||||||
3.750%, 05/20/2023 | 770 | 770 | ||||||
Molson Coors Brewing | ||||||||
3.500%, 05/01/2022 (D) | 220 | 226 | ||||||
Mondelez International | ||||||||
4.000%, 02/01/2024 | 4,390 | 4,673 | ||||||
Novartis Capital | ||||||||
2.400%, 09/21/2022 | 200 | 199 | ||||||
| 130 | SEI Institutional Investments Trust / Annual Report / May 31, 2015 |
| Description | Face Amount ($ Thousands) | Market Value ($ Thousands) | ||||||
PepsiCo | ||||||||
7.900%, 11/01/2018 | $ | 339 | $ | 410 | ||||
4.250%, 10/22/2044 | 640 | 644 | ||||||
2.750%, 04/30/2025 | 815 | 796 | ||||||
1.850%, 04/30/2020 | 1,285 | 1,277 | ||||||
1.250%, 04/30/2018 | 830 | 829 | ||||||
Pernod Ricard | ||||||||
5.750%, 04/07/2021 (C) | 1,857 | 2,127 | ||||||
5.500%, 01/15/2042 (C) (D) | 1,400 | 1,595 | ||||||
4.450%, 01/15/2022 (C) | 1,890 | 2,044 | ||||||
Philip Morris International | ||||||||
2.900%, 11/15/2021 | 1,750 | 1,794 | ||||||
2.500%, 08/22/2022 | 1,530 | 1,499 | ||||||
Reynolds American | ||||||||
6.150%, 09/15/2043 | 640 | 723 | ||||||
3.250%, 11/01/2022 | 810 | 798 | ||||||
Sysco | ||||||||
3.000%, 10/02/2021 | 2,002 | 2,042 | ||||||
2.350%, 10/02/2019 | 2,750 | 2,795 | ||||||
Tyson Foods | ||||||||
5.150%, 08/15/2044 | 1,750 | 1,903 | ||||||
3.950%, 08/15/2024 | 680 | 706 | ||||||
UBM | ||||||||
5.750%, 11/03/2020 (C) | 850 | 935 | ||||||
Walgreen | ||||||||
3.100%, 09/15/2022 | 234 | 232 | ||||||
Walgreens Boots Alliance | ||||||||
3.300%, 11/18/2021 | 2,463 | 2,490 | ||||||
Wm Wrigley Jr | ||||||||
3.375%, 10/21/2020 (C) | 1,960 | 2,036 | ||||||
2.900%, 10/21/2019 (C) | 2,843 | 2,909 | ||||||
2.400%, 10/21/2018 (C) | 1,085 | 1,108 | ||||||
2.000%, 10/20/2017 (C) | 550 | 557 | ||||||
|
| |||||||
| 81,563 | ||||||||
|
| |||||||
Energy — 3.4% | ||||||||
Anadarko Holding | ||||||||
7.150%, 05/15/2028 | 150 | 193 | ||||||
Anadarko Petroleum | ||||||||
6.375%, 09/15/2017 | 2,430 | 2,684 | ||||||
4.500%, 07/15/2044 | 1,000 | 966 | ||||||
ANR Pipeline | ||||||||
9.625%, 11/01/2021 | 100 | 136 | ||||||
Apache | ||||||||
6.900%, 09/15/2018 | 180 | 208 | ||||||
5.625%, 01/15/2017 | 370 | 396 | ||||||
3.250%, 04/15/2022 | 56 | 56 | ||||||
Baker Hughes | ||||||||
7.500%, 11/15/2018 | 2,020 | 2,408 | ||||||
BG Energy Capital | ||||||||
5.125%, 10/15/2041 (C) | 200 | 221 | ||||||
4.000%, 10/15/2021 (C) | 2,775 | 2,973 | ||||||
BP Capital Markets | ||||||||
3.561%, 11/01/2021 | 110 | 116 | ||||||
3.535%, 11/04/2024 | 300 | 302 | ||||||
| Description | Face Amount ($ Thousands) | Market Value ($ Thousands) | ||||||
3.506%, 03/17/2025 | $ | 2,325 | $ | 2,345 | ||||
3.245%, 05/06/2022 | 950 | 965 | ||||||
2.248%, 11/01/2016 | 159 | 162 | ||||||
Buckeye Partners | ||||||||
5.850%, 11/15/2043 | 40 | 40 | ||||||
Burlington Resources | ||||||||
8.200%, 03/15/2025 | 400 | 530 | ||||||
Canadian Natural Resources | ||||||||
7.200%, 01/15/2032 | 150 | 186 | ||||||
6.450%, 06/30/2033 | 200 | 238 | ||||||
Canadian Oil Sands | ||||||||
6.000%, 04/01/2042 (C) | 883 | 814 | ||||||
Cenovus Energy | ||||||||
6.750%, 11/15/2039 | 21 | 25 | ||||||
4.450%, 09/15/2042 | 56 | 51 | ||||||
3.000%, 08/15/2022 | 45 | 43 | ||||||
Chevron | ||||||||
3.191%, 06/24/2023 | 95 | 98 | ||||||
2.411%, 03/03/2022 | 1,960 | 1,951 | ||||||
2.355%, 12/05/2022 | 160 | 156 | ||||||
1.365%, 03/02/2018 | 2,285 | 2,291 | ||||||
CNOOC Finance 2013 | ||||||||
3.000%, 05/09/2023 | 253 | 244 | ||||||
CNOOC Finance 2015 USA LLC | ||||||||
3.500%, 05/05/2025 | 2,900 | 2,877 | ||||||
Conoco Funding | ||||||||
6.950%, 04/15/2029 | 995 | 1,314 | ||||||
ConocoPhillips | ||||||||
5.750%, 02/01/2019 | 50 | 57 | ||||||
4.150%, 11/15/2034 | 2,065 | 2,085 | ||||||
2.875%, 11/15/2021 | 935 | 953 | ||||||
2.200%, 05/15/2020 | 485 | 487 | ||||||
Continental Resources | ||||||||
5.000%, 09/15/2022 | 60 | 60 | ||||||
4.900%, 06/01/2044 | 1,000 | 871 | ||||||
4.500%, 04/15/2023 | 415 | 409 | ||||||
Devon Energy | ||||||||
6.300%, 01/15/2019 | 100 | 114 | ||||||
5.600%, 07/15/2041 | 1,480 | 1,626 | ||||||
4.750%, 05/15/2042 | 127 | 127 | ||||||
3.250%, 05/15/2022 | 2,415 | 2,423 | ||||||
Devon Financing | ||||||||
7.875%, 09/30/2031 | 520 | 693 | ||||||
Diamond Offshore Drilling | ||||||||
4.875%, 11/01/2043 | 283 | 236 | ||||||
Ecopetrol | ||||||||
7.375%, 09/18/2043 | 650 | 699 | ||||||
5.875%, 05/28/2045 | 2,030 | 1,877 | ||||||
4.125%, 01/16/2025 | 167 | 158 | ||||||
Encana | ||||||||
5.150%, 11/15/2041 | 2,525 | 2,494 | ||||||
Energy Transfer Equity | ||||||||
5.500%, 06/01/2027 | 625 | 629 | ||||||
Energy Transfer Partners | ||||||||
8.250%, 11/15/2029 | 4,295 | 5,673 | ||||||
5.150%, 03/15/2045 | 472 | 443 | ||||||
| SEI Institutional Investments Trust / Annual Report / May 31, 2015 | 131 |
SCHEDULE OF INVESTMENTS
Core Fixed Income Fund (Continued)
May 31, 2015
| Description | Face Amount ($ Thousands) | Market Value ($ Thousands) | ||||||
4.050%, 03/15/2025 | $ | 1,130 | $ | 1,102 | ||||
3.296%, 11/01/2066 (A) | 485 | 420 | ||||||
Eni | ||||||||
5.700%, 10/01/2040 (C) | 200 | 214 | ||||||
EnLink Midstream Partners | ||||||||
5.050%, 04/01/2045 | 1,470 | 1,403 | ||||||
4.150%, 06/01/2025 | 1,085 | 1,087 | ||||||
Ensco | ||||||||
5.750%, 10/01/2044 | 56 | 54 | ||||||
5.200%, 03/15/2025 | 355 | 366 | ||||||
Enterprise Products Operating LLC | ||||||||
5.100%, 02/15/2045 | 32 | 33 | ||||||
4.950%, 10/15/2054 | 55 | 54 | ||||||
4.900%, 05/15/2046 | 640 | 642 | ||||||
4.850%, 03/15/2044 | 465 | 467 | ||||||
3.900%, 02/15/2024 | 99 | 102 | ||||||
3.750%, 02/15/2025 | 1,004 | 1,021 | ||||||
3.700%, 02/15/2026 | 1,225 | 1,231 | ||||||
2.550%, 10/15/2019 | 104 | 105 | ||||||
EOG Resources | ||||||||
4.100%, 02/01/2021 | 150 | 163 | ||||||
2.625%, 03/15/2023 | 88 | 87 | ||||||
Exxon Mobil | ||||||||
3.567%, 03/06/2045 | 1,500 | 1,431 | ||||||
2.709%, 03/06/2025 | 1,955 | 1,943 | ||||||
1.912%, 03/06/2020 | 1,960 | 1,970 | ||||||
1.305%, 03/06/2018 | 1,670 | 1,674 | ||||||
Florida Gas Transmission LLC | ||||||||
7.900%, 05/15/2019 (C) | 1,850 | 2,198 | ||||||
3.875%, 07/15/2022 (C) | 2,170 | 2,224 | ||||||
Halliburton | ||||||||
6.150%, 09/15/2019 | 300 | 349 | ||||||
Hess | ||||||||
8.125%, 02/15/2019 | 1,020 | 1,224 | ||||||
Kerr-McGee | ||||||||
6.950%, 07/01/2024 | 3,535 | 4,407 | ||||||
Kinder Morgan | ||||||||
6.950%, 06/01/2028 | 2,250 | 2,624 | ||||||
5.550%, 06/01/2045 | 755 | 738 | ||||||
5.300%, 12/01/2034 | 425 | 415 | ||||||
4.300%, 06/01/2025 | 5,330 | 5,340 | ||||||
Kinder Morgan Energy Partners | ||||||||
6.500%, 04/01/2020 | 3,327 | 3,834 | ||||||
4.300%, 05/01/2024 | 1,110 | 1,113 | ||||||
4.100%, 11/15/2015 | 1,520 | 1,541 | ||||||
Magellan Midstream Partners | ||||||||
3.200%, 03/15/2025 | 57 | 56 | ||||||
Marathon Petroleum | ||||||||
5.000%, 09/15/2054 | 320 | 307 | ||||||
MPLX | ||||||||
4.000%, 02/15/2025 | 405 | 405 | ||||||
Nabors Industries | ||||||||
5.000%, 09/15/2020 | 310 | 321 | ||||||
National Oilwell Varco | ||||||||
1.350%, 12/01/2017 | 81 | 81 | ||||||
| Description | Face Amount ($ Thousands) | Market Value ($ Thousands) | ||||||
Newfield Exploration | ||||||||
5.625%, 07/01/2024 | $ | 1,065 | $ | 1,121 | ||||
Noble Energy | ||||||||
5.250%, 11/15/2043 | 150 | 153 | ||||||
5.050%, 11/15/2044 | 86 | 86 | ||||||
4.150%, 12/15/2021 | 2,180 | 2,301 | ||||||
3.900%, 11/15/2024 | 1,200 | 1,215 | ||||||
Noble Holding International | ||||||||
5.250%, 03/15/2042 | 119 | 95 | ||||||
4.000%, 03/16/2018 | 48 | 49 | ||||||
3.950%, 03/15/2022 | 40 | 37 | ||||||
Occidental Petroleum | ||||||||
3.125%, 02/15/2022 | 810 | 828 | ||||||
2.700%, 02/15/2023 | 150 | 148 | ||||||
1.750%, 02/15/2017 | 153 | 155 | ||||||
ONEOK Partners | ||||||||
6.650%, 10/01/2036 | 75 | 79 | ||||||
2.000%, 10/01/2017 | 1,175 | 1,175 | ||||||
Panhandle Eastern Pipeline | ||||||||
8.125%, 06/01/2019 | 1,161 | 1,381 | ||||||
Petrobras Global Finance | ||||||||
6.250%, 03/17/2024 (D) | 2,284 | 2,269 | ||||||
4.875%, 03/17/2020 | 1,460 | 1,417 | ||||||
4.375%, 05/20/2023 | 196 | 175 | ||||||
Petrobras International Finance | ||||||||
7.875%, 03/15/2019 | 200 | 215 | ||||||
6.750%, 01/27/2041 | 300 | 281 | ||||||
6.125%, 10/06/2016 | 700 | 723 | ||||||
5.750%, 01/20/2020 | 1,127 | 1,126 | ||||||
5.375%, 01/27/2021 | 6,160 | 6,009 | ||||||
Petro-Canada | ||||||||
7.875%, 06/15/2026 | 100 | 137 | ||||||
6.800%, 05/15/2038 | 200 | 259 | ||||||
6.050%, 05/15/2018 | 100 | 112 | ||||||
Petroleos Mexicanos | ||||||||
6.625%, 06/15/2035 | 5,602 | 6,291 | ||||||
6.375%, 01/23/2045 | 4,470 | 4,850 | ||||||
5.625%, 01/23/2046 (C) | 1,175 | 1,161 | ||||||
5.500%, 06/27/2044 (C) | 300 | 292 | ||||||
4.875%, 01/18/2024 | 81 | 84 | ||||||
4.500%, 01/23/2026 (C) | 795 | 797 | ||||||
4.250%, 01/15/2025 (C) | 74 | 74 | ||||||
3.500%, 01/30/2023 | 785 | 759 | ||||||
2.378%, 04/15/2025 | 1,740 | 1,761 | ||||||
Phillips 66 | ||||||||
4.875%, 11/15/2044 | 595 | 601 | ||||||
4.300%, 04/01/2022 | 57 | 61 | ||||||
2.950%, 05/01/2017 | 76 | 78 | ||||||
Plains All American Pipeline | ||||||||
4.900%, 02/15/2045 | 644 | 634 | ||||||
3.600%, 11/01/2024 | 200 | 197 | ||||||
2.600%, 12/15/2019 | 88 | 88 | ||||||
QEP Resources | ||||||||
5.375%, 10/01/2022 | 550 | 553 | ||||||
| 132 | SEI Institutional Investments Trust / Annual Report / May 31, 2015 |
| Description | Face Amount ($ Thousands) | Market Value ($ Thousands) | ||||||
Rowan | ||||||||
5.850%, 01/15/2044 | $ | 480 | $ | 420 | ||||
5.400%, 12/01/2042 | 766 | 637 | ||||||
Sabine Pass LNG | ||||||||
7.500%, 11/30/2016 (C) | 940 | 1,004 | ||||||
Schlumberger Investment | ||||||||
3.650%, 12/01/2023 | 100 | 105 | ||||||
3.300%, 09/14/2021 (C) | 317 | 330 | ||||||
Shell International Finance | ||||||||
6.375%, 12/15/2038 | 840 | 1,095 | ||||||
4.375%, 03/25/2020 | 70 | 78 | ||||||
4.300%, 09/22/2019 | 500 | 550 | ||||||
3.400%, 08/12/2023 | 2,145 | 2,232 | ||||||
3.100%, 06/28/2015 | 165 | 165 | ||||||
Shell International Finance BV | ||||||||
4.375%, 05/11/2045 | 2,955 | 3,024 | ||||||
4.125%, 05/11/2035 | 8,480 | 8,559 | ||||||
2.125%, 05/11/2020 | 1,080 | 1,085 | ||||||
Sinopec Group Overseas Development 2012 | ||||||||
2.750%, 05/17/2017 (C) | 900 | 919 | ||||||
Sinopec Group Overseas Development 2014 | ||||||||
4.375%, 04/10/2024 (C) | 2,700 | 2,893 | ||||||
Spectra Energy Capital LLC | ||||||||
5.650%, 03/01/2020 | 375 | 412 | ||||||
Spectra Energy Partners | ||||||||
4.500%, 03/15/2045 | 1,700 | 1,602 | ||||||
Statoil | ||||||||
5.250%, 04/15/2019 | 200 | 226 | ||||||
3.700%, 03/01/2024 | 1,085 | 1,144 | ||||||
3.150%, 01/23/2022 | 100 | 103 | ||||||
3.125%, 08/17/2017 | 100 | 104 | ||||||
2.900%, 11/08/2020 | 1,435 | 1,487 | ||||||
2.450%, 01/17/2023 | 111 | 108 | ||||||
2.250%, 11/08/2019 | 1,225 | 1,244 | ||||||
Suncor Energy | ||||||||
3.600%, 12/01/2024 | 3,615 | 3,686 | ||||||
Sunoco Logistics Partners Operations | ||||||||
5.350%, 05/15/2045 | 1,068 | 1,047 | ||||||
5.300%, 04/01/2044 | 50 | 48 | ||||||
4.250%, 04/01/2024 | 78 | 79 | ||||||
Talisman Energy | ||||||||
3.750%, 02/01/2021 | 985 | 976 | ||||||
TC PipeLines | ||||||||
4.650%, 06/15/2021 | 412 | 433 | ||||||
Tennessee Gas Pipeline | ||||||||
8.375%, 06/15/2032 | 2,000 | 2,490 | ||||||
8.000%, 02/01/2016 | 3,205 | 3,341 | ||||||
Texas Eastern Transmission | ||||||||
2.800%, 10/15/2022 (C) | 375 | 357 | ||||||
Tosco | ||||||||
8.125%, 02/15/2030 | 100 | 144 | ||||||
| Description | Face Amount ($ Thousands) | Market Value ($ Thousands) | ||||||
Total Capital | ||||||||
4.125%, 01/28/2021 | $ | 74 | $ | 81 | ||||
2.300%, 03/15/2016 | 300 | 304 | ||||||
Total Capital International | ||||||||
2.875%, 02/17/2022 | 2,515 | 2,552 | ||||||
2.750%, 06/19/2021 | 100 | 102 | ||||||
2.700%, 01/25/2023 | 138 | 136 | ||||||
1.550%, 06/28/2017 | 150 | 152 | ||||||
0.750%, 01/25/2016 | 45 | 45 | ||||||
TransCanada Pipelines | ||||||||
7.125%, 01/15/2019 | 200 | 234 | ||||||
6.500%, 08/15/2018 | 100 | 114 | ||||||
TransCanada PipeLines | ||||||||
4.625%, 03/01/2034 | 2,405 | 2,524 | ||||||
TransCanada Trust | ||||||||
5.625%, 05/20/2075 (A) | 725 | 738 | ||||||
Transocean | ||||||||
7.350%, 12/15/2041 | 33 | 28 | ||||||
6.500%, 11/15/2020 (D) | 275 | 262 | ||||||
6.375%, 12/15/2021 | 252 | 237 | ||||||
5.050%, 12/15/2016 | 360 | 374 | ||||||
3.000%, 10/15/2017 (D) | 1,720 | 1,678 | ||||||
Valero Energy | ||||||||
7.500%, 04/15/2032 | 710 | 895 | ||||||
4.900%, 03/15/2045 | 1,010 | 996 | ||||||
Weatherford International | ||||||||
9.875%, 03/01/2039 | 250 | 299 | ||||||
6.500%, 08/01/2036 | 83 | 78 | ||||||
5.950%, 04/15/2042 | 945 | 855 | ||||||
4.500%, 04/15/2022 | 762 | 738 | ||||||
Western Gas Partners | ||||||||
5.375%, 06/01/2021 | 429 | 476 | ||||||
3.950%, 06/01/2025 | 1,155 | 1,147 | ||||||
Williams | ||||||||
8.750%, 03/15/2032 | 1,284 | 1,650 | ||||||
7.875%, 09/01/2021 | 1,334 | 1,632 | ||||||
7.750%, 06/15/2031 | 339 | 404 | ||||||
7.500%, 01/15/2031 | 9 | 10 | ||||||
Williams Partners | ||||||||
4.000%, 09/15/2025 | 1,120 | 1,104 | ||||||
|
| |||||||
| 191,648 | ||||||||
|
| |||||||
Financials — 11.1% | ||||||||
Aegon | ||||||||
2.138%, 07/29/2049 (A) | 2,180 | 1,886 | ||||||
AIA Group MTN | ||||||||
3.200%, 03/11/2025 (C) | 895 | 890 | ||||||
AIG Global Funding MTN | ||||||||
1.650%, 12/15/2017 (C) | 97 | 97 | ||||||
AIG SunAmerica Global Financing X | ||||||||
6.900%, 03/15/2032 (C) | 250 | 336 | ||||||
Allstate | ||||||||
3.150%, 06/15/2023 | 1,375 | 1,406 | ||||||
| SEI Institutional Investments Trust / Annual Report / May 31, 2015 | 133 |
SCHEDULE OF INVESTMENTS
Core Fixed Income Fund (Continued)
May 31, 2015
| Description | Face Amount ($ Thousands) | Market Value ($ Thousands) | ||||||
American Express Credit MTN | ||||||||
2.375%, 03/24/2017 | $ | 120 | $ | 123 | ||||
2.375%, 05/26/2020 | 1,880 | 1,884 | ||||||
2.250%, 08/15/2019 | 3,165 | 3,188 | ||||||
1.750%, 06/12/2015 | 3,235 | 3,236 | ||||||
American Honda Finance MTN | ||||||||
7.625%, 10/01/2018 (C) | 150 | 179 | ||||||
American International Group | ||||||||
6.400%, 12/15/2020 | 955 | 1,141 | ||||||
6.250%, 03/15/2037 | 2,578 | 2,839 | ||||||
4.500%, 07/16/2044 | 665 | 669 | ||||||
4.375%, 01/15/2055 | 580 | 548 | ||||||
3.875%, 01/15/2035 | 111 | 105 | ||||||
American Tower | ||||||||
4.000%, 06/01/2025‡ | 840 | 831 | ||||||
3.500%, 01/31/2023‡ | 1,481 | 1,461 | ||||||
3.450%, 09/15/2021‡ | 1,515 | 1,528 | ||||||
2.800%, 06/01/2020‡ | 1,040 | 1,034 | ||||||
American Tower Trust I | ||||||||
1.551%, 03/15/2018‡ (C) | 135 | 135 | ||||||
Anadarko Finance | ||||||||
7.500%, 05/01/2031 | 240 | 314 | ||||||
ANZ New Zealand International | ||||||||
3.125%, 08/10/2015 (C) | 190 | 191 | ||||||
Aon | ||||||||
6.250%, 09/30/2040 | 79 | 99 | ||||||
4.750%, 05/15/2045 | 655 | 667 | ||||||
3.500%, 09/30/2015 | 46 | 46 | ||||||
3.125%, 05/27/2016 | 235 | 240 | ||||||
Assurant | ||||||||
2.500%, 03/15/2018 | 1,545 | 1,570 | ||||||
Australia & New Zealand Banking Group | ||||||||
4.875%, 01/12/2021 (C) | 137 | 155 | ||||||
3.250%, 03/01/2016 (C) | 200 | 204 | ||||||
2.400%, 11/23/2016 (C) | 453 | 462 | ||||||
0.556%, 10/29/2049 (A) | 1,400 | 865 | ||||||
AvalonBay Communities MTN | ||||||||
3.950%, 01/15/2021‡ | 1,500 | 1,605 | ||||||
Bank of America MTN | ||||||||
6.500%, 08/01/2016 | 4,875 | 5,166 | ||||||
6.400%, 08/28/2017 | 350 | 386 | ||||||
6.100%, 06/15/2017 | 6,825 | 7,419 | ||||||
6.000%, 09/01/2017 | 1,760 | 1,923 | ||||||
5.750%, 12/01/2017 | 235 | 258 | ||||||
5.700%, 05/02/2017 | 1,870 | 2,006 | ||||||
5.650%, 05/01/2018 | 1,040 | 1,147 | ||||||
5.625%, 10/14/2016 | 7,715 | 8,155 | ||||||
5.625%, 07/01/2020 | 180 | 206 | ||||||
5.420%, 03/15/2017 | 4,230 | 4,505 | ||||||
5.000%, 05/13/2021 | 75 | 84 | ||||||
5.000%, 01/21/2044 | 4,650 | 5,044 | ||||||
4.875%, 04/01/2044 | 1,830 | 1,957 | ||||||
4.750%, 04/21/2045 | 415 | 399 | ||||||
| Description | Face Amount ($ Thousands) | Market Value ($ Thousands) | ||||||
4.250%, 10/22/2026 | $ | 1,200 | $ | 1,208 | ||||
4.200%, 08/26/2024 | 3,720 | 3,779 | ||||||
4.100%, 07/24/2023 | 305 | 320 | ||||||
4.000%, 04/01/2024 | 2,110 | 2,199 | ||||||
4.000%, 01/22/2025 | 1,825 | 1,819 | ||||||
3.950%, 04/21/2025 | 555 | 550 | ||||||
3.300%, 01/11/2023 | 1,313 | 1,315 | ||||||
1.500%, 10/09/2015 | 3,510 | 3,519 | ||||||
0.571%, 06/15/2017 (A) | 2,710 | 2,689 | ||||||
0.551%, 06/15/2016 (A) | 2,700 | 2,692 | ||||||
Bank of Montreal MTN | ||||||||
2.550%, 11/06/2022 | 200 | 198 | ||||||
1.400%, 09/11/2017 | 100 | 101 | ||||||
Bank of New York Mellon MTN | ||||||||
3.550%, 09/23/2021 | 144 | 153 | ||||||
3.400%, 05/15/2024 | 5,665 | 5,842 | ||||||
3.250%, 09/11/2024 | 270 | 274 | ||||||
Bank of Nova Scotia | ||||||||
1.450%, 04/25/2018 | 300 | 300 | ||||||
Bank of Tokyo-Mitsubishi UFJ | ||||||||
2.350%, 02/23/2017 (C) | 295 | 300 | ||||||
Barclays | ||||||||
4.375%, 09/11/2024 | 755 | 751 | ||||||
3.650%, 03/16/2025 | 1,210 | 1,184 | ||||||
Barclays Bank | ||||||||
6.050%, 12/04/2017 (C) | 850 | 928 | ||||||
5.000%, 09/22/2016 | 4,760 | 5,005 | ||||||
2.500%, 09/21/2015 (C) | 365 | 367 | ||||||
2.250%, 05/10/2017 (C) (D) | 221 | 226 | ||||||
0.625%, 08/07/2049 (A) | 380 | 239 | ||||||
Bear Stearns | ||||||||
7.250%, 02/01/2018 | 3,430 | 3,918 | ||||||
6.400%, 10/02/2017 | 3,370 | 3,741 | ||||||
4.650%, 07/02/2018 | 3,000 | 3,244 | ||||||
Berkshire Hathaway | ||||||||
4.500%, 02/11/2043 | 2,200 | 2,298 | ||||||
3.750%, 08/15/2021 (D) | 488 | 531 | ||||||
2.200%, 08/15/2016 | 75 | 76 | ||||||
BlackRock | ||||||||
6.250%, 09/15/2017 | 100 | 111 | ||||||
3.500%, 03/18/2024 | 80 | 83 | ||||||
3.375%, 06/01/2022 | 100 | 105 | ||||||
Blackstone Holdings Finance LLC | ||||||||
5.875%, 03/15/2021 (C) | 450 | 522 | ||||||
BNP Paribas MTN | ||||||||
2.375%, 09/14/2017 | 1,490 | 1,519 | ||||||
BPCE MTN | ||||||||
5.150%, 07/21/2024 (C) | 1,550 | 1,624 | ||||||
1.625%, 01/26/2018 | 300 | 301 | ||||||
Branch Banking & Trust | ||||||||
5.625%, 09/15/2016 | 325 | 344 | ||||||
Capital One Bank USA | ||||||||
3.375%, 02/15/2023 | 300 | 299 | ||||||
1.150%, 11/21/2016 | 2,150 | 2,154 | ||||||
| 134 | SEI Institutional Investments Trust / Annual Report / May 31, 2015 |
| Description | Face Amount ($ Thousands) | Market Value ($ Thousands) | ||||||
Capital One Financial | ||||||||
3.500%, 06/15/2023 | $ | 250 | $ | 253 | ||||
Caterpillar Financial Services MTN | ||||||||
7.150%, 02/15/2019 | 250 | 297 | ||||||
2.850%, 06/01/2022 | 155 | 157 | ||||||
CC Holdings GS V LLC | ||||||||
3.849%, 04/15/2023 | 245 | 245 | ||||||
Charles Schwab | ||||||||
3.225%, 09/01/2022 | 100 | 102 | ||||||
Chase Capital VI | ||||||||
0.903%, 08/01/2028 (A) | 1,050 | 895 | ||||||
Citigroup | ||||||||
8.125%, 07/15/2039 | 100 | 151 | ||||||
6.125%, 05/15/2018 | 440 | 493 | ||||||
6.000%, 08/15/2017 | 3,845 | 4,208 | ||||||
5.875%, 01/30/2042 | 550 | 666 | ||||||
5.850%, 08/02/2016 | 300 | 316 | ||||||
5.500%, 02/15/2017 | 11,465 | 12,226 | ||||||
5.500%, 09/13/2025 | 1,370 | 1,527 | ||||||
5.375%, 08/09/2020 | 2,072 | 2,345 | ||||||
5.300%, 05/06/2044 | 300 | 324 | ||||||
4.300%, 11/20/2026 | 590 | 598 | ||||||
3.875%, 10/25/2023 | 151 | 157 | ||||||
3.500%, 05/15/2023 | 930 | 924 | ||||||
3.300%, 04/27/2025 | 2,490 | 2,449 | ||||||
2.500%, 09/26/2018 | 395 | 402 | ||||||
2.400%, 02/18/2020 | 1,975 | 1,972 | ||||||
1.700%, 07/25/2016 | 1,765 | 1,776 | ||||||
1.700%, 04/27/2018 | 2,505 | 2,492 | ||||||
1.550%, 08/14/2017 | 2,505 | 2,504 | ||||||
0.832%, 08/25/2036 (A) | 3,239 | 2,555 | ||||||
Citigroup Capital III | ||||||||
7.625%, 12/01/2036 | 2,000 | 2,511 | ||||||
CME Group | ||||||||
3.000%, 09/15/2022 | 400 | 409 | ||||||
3.000%, 03/15/2025 | 1,240 | 1,233 | ||||||
CNA Financial | ||||||||
5.875%, 08/15/2020 | 134 | 154 | ||||||
3.950%, 05/15/2024 | 140 | 143 | ||||||
Comerica | ||||||||
3.000%, 09/16/2015 | 145 | 146 | ||||||
Commonwealth Bank of Australia | ||||||||
5.000%, 10/15/2019 (C) | 900 | 1,007 | ||||||
2.250%, 03/16/2017 (C) | 378 | 386 | ||||||
Compass Bank | ||||||||
3.875%, 04/10/2025 | 910 | 887 | ||||||
Cooperatieve Centrale Raiffeisen-Boerenleenbank BA | ||||||||
11.000%, 12/31/2049 (A) (C) | 2,043 | 2,615 | ||||||
5.750%, 12/01/2043 | 710 | 831 | ||||||
4.625%, 12/01/2023 | 2,060 | 2,189 | ||||||
3.875%, 02/08/2022 | 300 | 319 | ||||||
3.375%, 05/21/2025 | 1,435 | 1,447 | ||||||
| Description | Face Amount ($ Thousands) | Market Value ($ Thousands) | ||||||
Countrywide Financial | ||||||||
6.250%, 05/15/2016 | $ | 300 | $ | 313 | ||||
Credit Agricole | ||||||||
8.375%, 12/31/2049 (A) (C) | 3,250 | 3,835 | ||||||
4.375%, 03/17/2025 (C) | 1,715 | 1,703 | ||||||
Credit Suisse Group Funding Guernsey | ||||||||
4.875%, 05/15/2045 (C) | 2,765 | 2,802 | ||||||
3.750%, 03/26/2025 (C) | 1,230 | 1,214 | ||||||
Credit Suisse NY | ||||||||
6.000%, 02/15/2018 | 990 | 1,093 | ||||||
3.625%, 09/09/2024 | 3,225 | 3,282 | ||||||
0.602%, 08/24/2015 (A) | 6,000 | 6,000 | ||||||
DDR | ||||||||
4.625%, 07/15/2022‡ | 1,855 | 1,989 | ||||||
3.375%, 05/15/2023‡ | 1,785 | 1,755 | ||||||
Deutsche Bank | ||||||||
3.700%, 05/30/2024 | 453 | 460 | ||||||
1.350%, 05/30/2017 | 2,440 | 2,433 | ||||||
Discover Financial Services | ||||||||
3.750%, 03/04/2025 | 1,075 | 1,052 | ||||||
DNB Boligkreditt | ||||||||
2.000%, 05/28/2020 (C) | 2,930 | 2,932 | ||||||
Equity Commonwealth | ||||||||
6.650%, 01/15/2018‡ | 255 | 275 | ||||||
5.875%, 09/15/2020‡ | 95 | 105 | ||||||
ERAC USA Finance LLC | ||||||||
4.500%, 08/16/2021 (C) | 175 | 191 | ||||||
ERP Operating | ||||||||
5.750%, 06/15/2017‡ | 100 | 109 | ||||||
5.125%, 03/15/2016‡ | 1,000 | 1,033 | ||||||
4.625%, 12/15/2021‡ | 200 | 221 | ||||||
Farmers Exchange Capital | ||||||||
7.200%, 07/15/2048 (C) | 1,788 | 2,285 | ||||||
Farmers Exchange Capital II | ||||||||
6.151%, 11/01/2053 (A) (C) | 5,120 | 5,611 | ||||||
Federal Realty Investment Trust | ||||||||
3.950%, 01/15/2024‡ | 835 | 878 | ||||||
3.000%, 08/01/2022‡ | 605 | 605 | ||||||
Fifth Third Bank | ||||||||
2.875%, 10/01/2021 | 200 | 200 | ||||||
First Chicago NBD Institutional Capital I | ||||||||
0.830%, 02/01/2027 (A) | 3,750 | 3,195 | ||||||
First Industrial MTN | ||||||||
7.500%, 12/01/2017 | 1,765 | 1,962 | ||||||
FMR LLC | ||||||||
6.450%, 11/15/2039 (C) | 250 | 317 | ||||||
Ford Motor Credit LLC | ||||||||
8.125%, 01/15/2020 | 520 | 644 | ||||||
5.875%, 08/02/2021 | 3,110 | 3,604 | ||||||
5.000%, 05/15/2018 | 206 | 223 | ||||||
4.207%, 04/15/2016 | 200 | 205 | ||||||
3.984%, 06/15/2016 | 555 | 570 | ||||||
3.000%, 06/12/2017 | 500 | 513 | ||||||
| SEI Institutional Investments Trust / Annual Report / May 31, 2015 | 135 |
SCHEDULE OF INVESTMENTS
Core Fixed Income Fund (Continued)
May 31, 2015
| Description | Face Amount ($ Thousands) | Market Value ($ Thousands) | ||||||
General Electric Capital MTN | ||||||||
6.875%, 01/10/2039 | $ | 2,360 | $ | 3,305 | ||||
6.750%, 03/15/2032 | 150 | 202 | ||||||
6.375%, 11/15/2067 (A) | 4,505 | 4,910 | ||||||
6.150%, 08/07/2037 | 1,875 | 2,442 | ||||||
5.875%, 01/14/2038 | 1,725 | 2,166 | ||||||
5.625%, 05/01/2018 | 4,233 | 4,735 | ||||||
5.550%, 05/04/2020 | 590 | 684 | ||||||
5.500%, 01/08/2020 | 480 | 553 | ||||||
5.375%, 10/20/2016 | 1,500 | 1,591 | ||||||
5.300%, 02/11/2021 | 2,553 | 2,937 | ||||||
4.650%, 10/17/2021 | 140 | 157 | ||||||
4.625%, 01/07/2021 | 3,640 | 4,074 | ||||||
4.375%, 09/16/2020 | 60 | 66 | ||||||
2.250%, 11/09/2015 | 180 | 181 | ||||||
2.100%, 12/11/2019 | 356 | 361 | ||||||
0.754%, 08/15/2036 (A) | 3,035 | 2,753 | ||||||
0.659%, 05/05/2026 (A) | 1,600 | 1,524 | ||||||
Glitnir HF | ||||||||
7.451%, 09/14/2016 (C) (E) (F) | 500 | — | ||||||
6.693%, 06/15/2016 (C) (F) | 4,480 | — | ||||||
Goldman Sachs Capital II | ||||||||
4.000%, 06/01/2043 (A) | 13,260 | 10,243 | ||||||
Goldman Sachs Group | ||||||||
7.500%, 02/15/2019 | 1,520 | 1,801 | ||||||
6.750%, 10/01/2037 | 4,702 | 5,774 | ||||||
6.250%, 02/01/2041 | 2,290 | 2,841 | ||||||
6.150%, 04/01/2018 | 7,500 | 8,371 | ||||||
6.000%, 06/15/2020 | 2,795 | 3,226 | ||||||
5.750%, 10/01/2016 | 1,505 | 1,597 | ||||||
5.250%, 07/27/2021 | 9,460 | 10,676 | ||||||
5.150%, 05/22/2045 | 1,695 | 1,730 | ||||||
3.750%, 05/22/2025 | 3,765 | 3,798 | ||||||
3.625%, 02/07/2016 | 470 | 479 | ||||||
3.625%, 01/22/2023 | 178 | 182 | ||||||
0.676%, 07/22/2015 (A) | 45 | 45 | ||||||
HBOS MTN | ||||||||
6.750%, 05/21/2018 (C) | 5,100 | 5,697 | ||||||
HCP | ||||||||
6.300%, 09/15/2016‡ | 940 | 1,000 | ||||||
6.000%, 01/30/2017‡ | 2,313 | 2,488 | ||||||
5.375%, 02/01/2021‡ | 105 | 118 | ||||||
4.000%, 06/01/2025‡ | 615 | 616 | ||||||
3.875%, 08/15/2024‡ | 4,506 | 4,524 | ||||||
2.625%, 02/01/2020‡ | 100 | 100 | ||||||
Health Care | ||||||||
5.250%, 01/15/2022‡ | 1,825 | 2,031 | ||||||
4.950%, 01/15/2021‡ | 6,340 | 7,023 | ||||||
4.700%, 09/15/2017‡ | 225 | 240 | ||||||
4.500%, 01/15/2024‡ (D) | 183 | 194 | ||||||
Healthcare Realty Trust | ||||||||
5.750%, 01/15/2021‡ | 60 | 67 | ||||||
| Description | Face Amount ($ Thousands) | Market Value ($ Thousands) | ||||||
Healthcare Trust of America Holdings | ||||||||
3.375%, 07/15/2021‡ | $ | 975 | $ | 990 | ||||
Highwoods Properties | ||||||||
7.500%, 04/15/2018‡ | 1,339 | 1,543 | ||||||
Hongkong & Shanghai Banking | ||||||||
0.438%, 07/22/2049 (A) | 195 | 123 | ||||||
HSBC Bank | ||||||||
4.750%, 01/19/2021 (C) | 250 | 279 | ||||||
4.125%, 08/12/2020 (C) | 261 | 284 | ||||||
1.500%, 05/15/2018 (C) | 100 | 100 | ||||||
0.600%, 06/29/2049 (A) | 1,160 | 732 | ||||||
HSBC Finance | ||||||||
6.676%, 01/15/2021 | 1,010 | 1,189 | ||||||
HSBC Holdings | ||||||||
5.250%, 03/14/2044 | 4,200 | 4,607 | ||||||
4.250%, 03/14/2024 | 2,750 | 2,868 | ||||||
4.000%, 03/30/2022 | 390 | 418 | ||||||
HSBC USA | ||||||||
2.350%, 03/05/2020 | 359 | 359 | ||||||
ILFC E-Capital Trust II | ||||||||
6.250%, 12/21/2065 (A) (C) | 1,200 | 1,182 | ||||||
ING Bank | ||||||||
5.800%, 09/25/2023 (C) | 3,145 | 3,551 | ||||||
3.750%, 03/07/2017 (C) | 457 | 477 | ||||||
International Lease Finance | ||||||||
6.750%, 09/01/2016 (C) | 5,590 | 5,911 | ||||||
Intesa Sanpaolo | ||||||||
5.017%, 06/26/2024 (C) | 4,115 | 4,128 | ||||||
3.625%, 08/12/2015 (C) | 940 | 945 | ||||||
3.125%, 01/15/2016 | 860 | 870 | ||||||
2.375%, 01/13/2017 | 1,839 | 1,855 | ||||||
Invesco Finance | ||||||||
4.000%, 01/30/2024 | 171 | 180 | ||||||
Jefferies Group | ||||||||
6.250%, 01/15/2036 | 400 | 402 | ||||||
3.875%, 11/09/2015 | 171 | 173 | ||||||
John Deere Capital | ||||||||
2.250%, 04/17/2019 | 930 | 947 | ||||||
1.700%, 01/15/2020 | 405 | 401 | ||||||
JPMorgan Chase | ||||||||
6.400%, 05/15/2038 | 385 | 492 | ||||||
6.000%, 07/05/2017 | 3,365 | 3,678 | ||||||
6.000%, 10/01/2017 | 9,155 | 10,081 | ||||||
4.950%, 06/01/2045 | 3,040 | 3,078 | ||||||
4.850%, 02/01/2044 | 940 | 1,017 | ||||||
4.500%, 01/24/2022 | 750 | 820 | ||||||
4.350%, 08/15/2021 | 510 | 554 | ||||||
4.125%, 12/15/2026 | 3,220 | 3,250 | ||||||
3.875%, 09/10/2024 | 1,800 | 1,810 | ||||||
3.625%, 05/13/2024 | 1,490 | 1,521 | ||||||
3.375%, 05/01/2023 | 1,240 | 1,231 | ||||||
2.250%, 01/23/2020 | 4,995 | 4,969 | ||||||
0.600%, 06/13/2016 (A) | 4,250 | 4,243 | ||||||
| 136 | SEI Institutional Investments Trust / Annual Report / May 31, 2015 |
| Description | Face Amount ($ Thousands) | Market Value ($ Thousands) | ||||||
JPMorgan Chase Capital XXIII | ||||||||
1.274%, 05/15/2047 (A) | $ | 4,697 | $ | 3,723 | ||||
Kaupthing Bank | ||||||||
7.125%, 05/19/2016 (C) (E) (F) (G) | 12,000 | 1 | ||||||
KeyBank | ||||||||
3.300%, 06/01/2025 | 1,185 | 1,180 | ||||||
Lazard Group LLC | ||||||||
4.250%, 11/14/2020 | 1,210 | 1,285 | ||||||
3.750%, 02/13/2025 | 2,215 | 2,160 | ||||||
Liberty Mutual Group | ||||||||
5.000%, 06/01/2021 (C) | 95 | 105 | ||||||
Lincoln National | ||||||||
4.850%, 06/24/2021 | 58 | 64 | ||||||
Lloyds Bank | ||||||||
5.800%, 01/13/2020 (C) | 200 | 231 | ||||||
3.500%, 05/14/2025 | 1,630 | 1,642 | ||||||
Lloyds Banking Group | ||||||||
4.500%, 11/04/2024 | 1,490 | 1,527 | ||||||
M&T Bank | ||||||||
6.875%, 12/29/2049 | 3,540 | 3,620 | ||||||
Macquarie Bank MTN | ||||||||
5.000%, 02/22/2017 (C) | 150 | 159 | ||||||
0.907%, 10/27/2017 (A) (C) | 3,000 | 3,005 | ||||||
Macquarie Group | ||||||||
6.250%, 01/14/2021 (C) | 200 | 230 | ||||||
6.000%, 01/14/2020 (C) | 225 | 256 | ||||||
Manufacturers & Traders Trust | ||||||||
6.625%, 12/04/2017 | 250 | 281 | ||||||
Marsh & McLennan | ||||||||
3.500%, 03/10/2025 | 110 | 112 | ||||||
2.350%, 03/06/2020 | 176 | 177 | ||||||
Massachusetts Mutual Life Insurance | ||||||||
8.875%, 06/01/2039 (C) | 1,650 | 2,545 | ||||||
5.375%, 12/01/2041 (C) | 66 | 76 | ||||||
MassMutual Global Funding II | ||||||||
2.500%, 10/17/2022 (C) | 261 | 256 | ||||||
2.100%, 08/02/2018 (C) | 105 | 107 | ||||||
MetLife | ||||||||
7.717%, 02/15/2019 | 1,750 | 2,106 | ||||||
6.400%, 12/15/2036 | 4,360 | 4,983 | ||||||
3.000%, 03/01/2025 | 595 | 586 | ||||||
1.903%, 12/15/2017 | 810 | 815 | ||||||
Metropolitan Life Global Funding I | ||||||||
3.875%, 04/11/2022 (C) | 1,125 | 1,202 | ||||||
Mid-America Apartments | ||||||||
4.300%, 10/15/2023‡ | 1,200 | 1,262 | ||||||
3.750%, 06/15/2024‡ | 1,380 | 1,398 | ||||||
Mizuho Bank | ||||||||
3.600%, 09/25/2024 (C) | 400 | 412 | ||||||
Morgan Stanley MTN | ||||||||
7.300%, 05/13/2019 | 1,875 | 2,223 | ||||||
6.625%, 04/01/2018 | 5,810 | 6,574 | ||||||
| Description | Face Amount ($ Thousands) | Market Value ($ Thousands) | ||||||
5.950%, 12/28/2017 | $ | 550 | $ | 608 | ||||
5.750%, 10/18/2016 | 190 | 202 | ||||||
5.750%, 01/25/2021 | 235 | 271 | ||||||
5.625%, 09/23/2019 | 1,145 | 1,295 | ||||||
5.550%, 04/27/2017 | 514 | 554 | ||||||
5.500%, 07/28/2021 | 200 | 229 | ||||||
5.450%, 01/09/2017 | 1,850 | 1,967 | ||||||
5.375%, 10/15/2015 | 1,585 | 1,612 | ||||||
4.750%, 03/22/2017 | 300 | 318 | ||||||
4.350%, 09/08/2026 | 1,000 | 1,017 | ||||||
4.300%, 01/27/2045 | 2,145 | 2,080 | ||||||
3.950%, 04/23/2027 | 1,885 | 1,841 | ||||||
3.750%, 02/25/2023 | 179 | 185 | ||||||
2.650%, 01/27/2020 | 2,380 | 2,405 | ||||||
1.875%, 01/05/2018 | 172 | 173 | ||||||
0.725%, 10/18/2016 (A) | 2,500 | 2,502 | ||||||
Murray Street Investment Trust I | ||||||||
4.647%, 03/09/2017 (H) | 2,785 | 2,939 | ||||||
National Bank of Canada | ||||||||
2.200%, 10/19/2016 (C) | 4,350 | 4,435 | ||||||
National City Bank MTN | ||||||||
5.800%, 06/07/2017 | 525 | 569 | ||||||
0.634%, 06/07/2017 (A) | 3,000 | 2,986 | ||||||
Nationwide Mutual Insurance | ||||||||
9.375%, 08/15/2039 (C) | 460 | 711 | ||||||
2.561%, 12/15/2024 (A) (C) | 4,407 | 4,407 | ||||||
Navient MTN | ||||||||
8.450%, 06/15/2018 | 530 | 594 | ||||||
3.875%, 09/10/2015 | 2,360 | 2,372 | ||||||
New York Life Global Funding | ||||||||
2.150%, 06/18/2019 (C) | 293 | 296 | ||||||
2.100%, 01/02/2019 (C) | 1,625 | 1,646 | ||||||
New York Life Insurance | ||||||||
6.750%, 11/15/2039 (C) | 1,355 | 1,842 | ||||||
Nomura Holdings | ||||||||
6.700%, 03/04/2020 | 150 | 178 | ||||||
4.125%, 01/19/2016 | 150 | 153 | ||||||
Nordea Bank | ||||||||
4.875%, 05/13/2021 (C) | 2,085 | 2,282 | ||||||
Northwestern Mutual Life Insurance | ||||||||
6.063%, 03/30/2040 (C) | 2,470 | 3,097 | ||||||
Pacific Life Global Funding MTN | ||||||||
5.000%, 05/15/2017 (C) | 170 | 180 | ||||||
Pacific Life Insurance | ||||||||
9.250%, 06/15/2039 (C) | 150 | 228 | ||||||
PNC Bank MTN | ||||||||
6.875%, 04/01/2018 | 250 | 284 | ||||||
2.400%, 10/18/2019 | 2,140 | 2,169 | ||||||
2.300%, 06/01/2020 | 2,230 | 2,230 | ||||||
2.250%, 07/02/2019 | 1,600 | 1,617 | ||||||
0.800%, 01/28/2016 (D) | 297 | 298 | ||||||
Post Apartment Homes | ||||||||
4.750%, 10/15/2017 | 70 | 75 | ||||||
| SEI Institutional Investments Trust / Annual Report / May 31, 2015 | 137 |
SCHEDULE OF INVESTMENTS
Core Fixed Income Fund (Continued)
May 31, 2015
| Description | Face Amount ($ Thousands) | Market Value ($ Thousands) | ||||||
Pricoa Global Funding I MTN | ||||||||
1.600%, 05/29/2018 (C) | $ | 150 | $ | 150 | ||||
Principal Financial Group | ||||||||
3.400%, 05/15/2025 | 810 | 809 | ||||||
Private Export Funding | ||||||||
4.375%, 03/15/2019 | 4,660 | 5,142 | ||||||
2.125%, 07/15/2016 | 4,760 | 4,842 | ||||||
Prudential Financial | ||||||||
5.375%, 05/15/2045 (A) | 580 | 584 | ||||||
4.600%, 05/15/2044 | 335 | 336 | ||||||
Prudential Insurance of America | ||||||||
8.300%, 07/01/2025 (C) | 250 | 339 | ||||||
Realty Income | ||||||||
3.250%, 10/15/2022‡ | 150 | 149 | ||||||
Reckson Operating Partnership | ||||||||
6.000%, 03/31/2016‡ | 95 | 99 | ||||||
Royal Bank of Canada | ||||||||
1.875%, 02/05/2020 | 3,200 | 3,191 | ||||||
1.200%, 09/19/2017 | 300 | 300 | ||||||
0.625%, 12/04/2015 | 2,970 | 2,972 | ||||||
0.500%, 06/29/2085 (A) | 860 | 603 | ||||||
Royal Bank of Scotland | ||||||||
4.650%, 06/04/2018 | 2,280 | 2,400 | ||||||
Royal Bank of Scotland Group MTN | ||||||||
6.400%, 10/21/2019 | 1,950 | 2,227 | ||||||
6.100%, 06/10/2023 | 1,650 | 1,799 | ||||||
5.125%, 05/28/2024 | 910 | 936 | ||||||
2.550%, 09/18/2015 | 850 | 854 | ||||||
Scentre Group Trust 1 | ||||||||
2.375%, 04/28/2021‡ (C) | 2,000 | 1,976 | ||||||
Security Benefit Life Insurance | ||||||||
8.750%, 05/15/2016 (C) | 5,200 | 5,528 | ||||||
Simon Property Group | ||||||||
4.125%, 12/01/2021‡ | 108 | 118 | ||||||
Skandinaviska Enskilda Banken MTN | ||||||||
2.450%, 05/27/2020 (C) | 2,340 | 2,339 | ||||||
1.750%, 03/19/2018 (C) | 322 | 323 | ||||||
SL Green Realty | ||||||||
7.750%, 03/15/2020‡ | 2,000 | 2,403 | ||||||
Societe Generale | ||||||||
0.498%, 11/29/2049 (A) | 860 | 538 | ||||||
SpareBank 1 Boligkreditt | ||||||||
1.750%, 11/15/2019 (C) | 200 | 199 | ||||||
Stadshypotek | ||||||||
1.875%, 10/02/2019 (C) | 1,910 | 1,920 | ||||||
1.750%, 04/09/2020 (C) | 4,505 | 4,469 | ||||||
Standard Chartered | ||||||||
5.700%, 03/26/2044 (C) | 4,237 | 4,626 | ||||||
5.200%, 01/26/2024 (C) (D) | 410 | 443 | ||||||
3.200%, 04/17/2025 (C) | 1,215 | 1,174 | ||||||
| Description | Face Amount ($ Thousands) | Market Value ($ Thousands) | ||||||
State Street | ||||||||
4.956%, 03/15/2018 | $ | 2,390 | $ | 2,578 | ||||
3.300%, 12/16/2024 | 310 | 317 | ||||||
3.100%, 05/15/2023 | 24 | 24 | ||||||
Sumitomo Mitsui Banking MTN | ||||||||
1.350%, 07/11/2017 | 2,255 | 2,252 | ||||||
SunTrust Banks | ||||||||
2.350%, 11/01/2018 | 39 | 40 | ||||||
Svenska Handelsbanken | ||||||||
3.125%, 07/12/2016 | 282 | 289 | ||||||
Synchrony Financial | ||||||||
4.250%, 08/15/2024 | 1,120 | 1,149 | ||||||
2.700%, 02/03/2020 | 1,745 | 1,747 | ||||||
Tanger Properties | ||||||||
3.875%, 12/01/2023‡ | 805 | 827 | ||||||
3.750%, 12/01/2024‡ | 705 | 712 | ||||||
Teachers Insurance & Annuity Association of America | ||||||||
6.850%, 12/16/2039 (C) | 1,740 | 2,309 | ||||||
4.900%, 09/15/2044 (C) | 600 | 643 | ||||||
Toyota Motor Credit MTN | ||||||||
2.750%, 05/17/2021 | 1,895 | 1,944 | ||||||
1.250%, 10/05/2017 | 2,740 | 2,755 | ||||||
1.125%, 05/16/2017 | 3,075 | 3,088 | ||||||
Travelers Property Casualty | ||||||||
7.750%, 04/15/2026 | 300 | 399 | ||||||
US Bancorp MTN | ||||||||
3.000%, 03/15/2022 | 67 | 69 | ||||||
US Bank | ||||||||
2.800%, 01/27/2025 | 336 | 331 | ||||||
2.125%, 10/28/2019 | 2,555 | 2,582 | ||||||
Ventas Realty | ||||||||
2.700%, 04/01/2020‡ | 2,950 | 2,978 | ||||||
Voya Financial | ||||||||
2.900%, 02/15/2018 | 350 | 360 | ||||||
Wachovia Capital Trust III | ||||||||
5.570%, 12/31/2049 (A) | 4,792 | 4,748 | ||||||
WEA Finance LLC | ||||||||
4.750%, 09/17/2044 (C) | 750 | 772 | ||||||
3.750%, 09/17/2024 (C) | 1,370 | 1,393 | ||||||
Wells Fargo | ||||||||
5.625%, 12/11/2017 | 830 | 917 | ||||||
5.606%, 01/15/2044 | 1,700 | 1,930 | ||||||
5.375%, 11/02/2043 | 220 | 244 | ||||||
4.650%, 11/04/2044 | 410 | 412 | ||||||
4.600%, 04/01/2021 | 500 | 557 | ||||||
4.480%, 01/16/2024 | 1,392 | 1,497 | ||||||
3.500%, 03/08/2022 | 250 | 262 | ||||||
3.450%, 02/13/2023 | 1,100 | 1,116 | ||||||
3.000%, 01/22/2021 | 3,020 | 3,105 | ||||||
1.500%, 01/16/2018 | 800 | 804 | ||||||
Wells Fargo Bank | ||||||||
6.000%, 11/15/2017 | 3,370 | 3,736 | ||||||
| 138 | SEI Institutional Investments Trust / Annual Report / May 31, 2015 |
| Description | Face Amount ($ Thousands) | Market Value ($ Thousands) | ||||||
Wells Fargo Capital X | ||||||||
5.950%, 12/15/2036 | $ | 520 | $ | 529 | ||||
Westpac Banking | ||||||||
2.450%, 11/28/2016 (C) | 350 | 358 | ||||||
ZFS Finance USA Trust II | ||||||||
6.450%, 12/15/2065 (A) (C) | 6,290 | 6,510 | ||||||
|
| |||||||
| 619,318 | ||||||||
|
| |||||||
Health Care — 1.9% | ||||||||
AbbVie | ||||||||
4.500%, 05/14/2035 | 1,800 | 1,812 | ||||||
4.400%, 11/06/2042 | 2,485 | 2,413 | ||||||
3.600%, 05/14/2025 | 2,930 | 2,949 | ||||||
2.900%, 11/06/2022 | 490 | 483 | ||||||
2.500%, 05/14/2020 | 2,585 | 2,584 | ||||||
1.800%, 05/14/2018 | 1,905 | 1,907 | ||||||
1.750%, 11/06/2017 | 680 | 682 | ||||||
Actavis | ||||||||
3.250%, 10/01/2022 | 112 | 111 | ||||||
Actavis Funding SCS | ||||||||
4.750%, 03/15/2045 | 4,405 | 4,362 | ||||||
4.550%, 03/15/2035 | 753 | 747 | ||||||
3.800%, 03/15/2025 | 2,475 | 2,492 | ||||||
3.450%, 03/15/2022 | 6,013 | 6,065 | ||||||
3.000%, 03/12/2020 | 1,479 | 1,499 | ||||||
Aetna | ||||||||
6.750%, 12/15/2037 | 60 | 80 | ||||||
4.500%, 05/15/2042 | 71 | 74 | ||||||
2.200%, 03/15/2019 | 945 | 959 | ||||||
Amgen | ||||||||
5.750%, 03/15/2040 | 237 | 274 | ||||||
5.650%, 06/15/2042 | 3,225 | 3,699 | ||||||
5.375%, 05/15/2043 | 270 | 298 | ||||||
5.150%, 11/15/2041 | 1,580 | 1,692 | ||||||
4.500%, 03/15/2020 | 84 | 92 | ||||||
4.400%, 05/01/2045 | 1,005 | 973 | ||||||
3.875%, 11/15/2021 | 200 | 213 | ||||||
3.625%, 05/22/2024 | 470 | 481 | ||||||
2.700%, 05/01/2022 | 920 | 906 | ||||||
2.200%, 05/22/2019 | 1,150 | 1,156 | ||||||
2.125%, 05/01/2020 | 2,145 | 2,118 | ||||||
Anthem | ||||||||
5.875%, 06/15/2017 | 350 | 381 | ||||||
5.100%, 01/15/2044 | 550 | 597 | ||||||
4.625%, 05/15/2042 | 219 | 219 | ||||||
3.700%, 08/15/2021 | 290 | 306 | ||||||
3.500%, 08/15/2024 | 730 | 734 | ||||||
3.300%, 01/15/2023 | 133 | 133 | ||||||
3.125%, 05/15/2022 | 740 | 740 | ||||||
Bayer US Finance LLC | ||||||||
3.375%, 10/08/2024 (C) | 200 | 203 | ||||||
1.500%, 10/06/2017 (C) | 3,850 | 3,877 | ||||||
Becton Dickinson and Company | ||||||||
4.685%, 12/15/2044 | 1,050 | 1,070 | ||||||
| Description | Face Amount ($ Thousands) | Market Value ($ Thousands) | ||||||
3.734%, 12/15/2024 | $ | 1,299 | $ | 1,326 | ||||
2.675%, 12/15/2019 | 1,521 | 1,545 | ||||||
Boston Scientific | ||||||||
3.850%, 05/15/2025 | 930 | 928 | ||||||
3.375%, 05/15/2022 | 625 | 623 | ||||||
Catholic Health Initiatives | ||||||||
4.350%, 11/01/2042 | 190 | 179 | ||||||
Celgene | ||||||||
5.250%, 08/15/2043 | 930 | 1,030 | ||||||
3.625%, 05/15/2024 | 88 | 90 | ||||||
1.900%, 08/15/2017 | 150 | 152 | ||||||
CHS | ||||||||
8.000%, 11/15/2019 | 200 | 212 | ||||||
Forest Laboratories | ||||||||
5.000%, 12/15/2021 (C) | 173 | 190 | ||||||
Gilead Sciences | ||||||||
3.700%, 04/01/2024 | 4,025 | 4,202 | ||||||
GlaxoSmithKline Capital | ||||||||
5.650%, 05/15/2018 | 1,590 | 1,786 | ||||||
2.850%, 05/08/2022 | 410 | 413 | ||||||
Humana | ||||||||
7.200%, 06/15/2018 | 1,950 | 2,248 | ||||||
3.850%, 10/01/2024 | 2,530 | 2,599 | ||||||
Johnson & Johnson | ||||||||
4.500%, 12/05/2043 | 1,500 | 1,662 | ||||||
Laboratory Corp of America Holdings | ||||||||
3.200%, 02/01/2022 | 128 | 128 | ||||||
Medco Health Solutions | ||||||||
7.125%, 03/15/2018 | 200 | 229 | ||||||
2.750%, 09/15/2015 | 135 | 136 | ||||||
Medtronic | ||||||||
4.625%, 03/15/2045 (C) | 1,040 | 1,085 | ||||||
4.450%, 03/15/2020 | 1,210 | 1,341 | ||||||
4.375%, 03/15/2035 (C) | 908 | 931 | ||||||
3.625%, 03/15/2024 | 2,765 | 2,904 | ||||||
3.500%, 03/15/2025 (C) | 2,350 | 2,406 | ||||||
3.150%, 03/15/2022 (C) | 1,305 | 1,335 | ||||||
2.500%, 03/15/2020 (C) | 2,840 | 2,880 | ||||||
Merck | ||||||||
3.700%, 02/10/2045 | 3,000 | 2,787 | ||||||
2.750%, 02/10/2025 | 850 | 828 | ||||||
2.350%, 02/10/2022 | 2,795 | 2,761 | ||||||
Mylan | ||||||||
5.400%, 11/29/2043 | 615 | 661 | ||||||
2.550%, 03/28/2019 | 1,980 | 1,984 | ||||||
1.800%, 06/24/2016 | 77 | 77 | ||||||
Novartis Securities Investment | ||||||||
5.125%, 02/10/2019 | 94 | 105 | ||||||
Perrigo | ||||||||
4.000%, 11/15/2023 | 460 | 474 | ||||||
Perrigo Finance | ||||||||
4.900%, 12/15/2044 | 700 | 708 | ||||||
3.900%, 12/15/2024 | 2,035 | 2,076 | ||||||
3.500%, 12/15/2021 | 820 | 838 | ||||||
| SEI Institutional Investments Trust / Annual Report / May 31, 2015 | 139 |
SCHEDULE OF INVESTMENTS
Core Fixed Income Fund (Continued)
May 31, 2015
| Description | Face Amount ($ Thousands) | Market Value ($ Thousands) | ||||||
Pharmacia | ||||||||
8.700%, 10/15/2021 | $ | 350 | $ | 448 | ||||
Roche Holdings | ||||||||
6.000%, 03/01/2019 (C) | 514 | 591 | ||||||
Teva Pharmaceutical Finance | ||||||||
3.650%, 11/10/2021 | 225 | 234 | ||||||
Thermo Fisher Scientific | ||||||||
5.300%, 02/01/2044 | 140 | 157 | ||||||
4.150%, 02/01/2024 | 172 | 181 | ||||||
3.600%, 08/15/2021 | 710 | 734 | ||||||
3.300%, 02/15/2022 | 905 | 916 | ||||||
3.200%, 03/01/2016 | 1,425 | 1,449 | ||||||
1.300%, 02/01/2017 | 88 | 88 | ||||||
UnitedHealth Group | ||||||||
6.875%, 02/15/2038 | 800 | 1,096 | ||||||
6.625%, 11/15/2037 | 200 | 269 | ||||||
5.800%, 03/15/2036 | 560 | 689 | ||||||
3.875%, 10/15/2020 | 870 | 947 | ||||||
3.375%, 11/15/2021 | 400 | 420 | ||||||
2.875%, 12/15/2021 | 2,395 | 2,433 | ||||||
2.875%, 03/15/2023 | 150 | 151 | ||||||
Wyeth | ||||||||
5.950%, 04/01/2037 | 1,980 | 2,434 | ||||||
Zoetis | ||||||||
4.700%, 02/01/2043 | 34 | 33 | ||||||
3.250%, 02/01/2023 | 479 | 470 | ||||||
|
| |||||||
| 108,980 | ||||||||
|
| |||||||
Industrials — 1.5% | ||||||||
3M | ||||||||
1.375%, 09/29/2016 | 86 | 87 | ||||||
ABB Finance USA | ||||||||
4.375%, 05/08/2042 | 227 | 241 | ||||||
2.875%, 05/08/2022 | 117 | 118 | ||||||
1.625%, 05/08/2017 | 81 | 82 | ||||||
ADT | ||||||||
4.875%, 07/15/2042 | 111 | 88 | ||||||
4.125%, 06/15/2023 | 48 | 45 | ||||||
Air 2 US | ||||||||
8.027%, 10/01/2019 (C) | 714 | 764 | ||||||
Air Canada, Pass-Through Trust, Ser 2013-1, Cl A | ||||||||
4.125%, 05/15/2025 (C) | 131 | 137 | ||||||
American Airlines, Pass-Through Trust, Ser 2011-1, Cl A | ||||||||
5.250%, 01/31/2021 | 82 | 88 | ||||||
American Airlines, Pass-Through Trust, Ser 2013-2, Cl A | ||||||||
4.950%, 01/15/2023 | 5,267 | 5,659 | ||||||
BAE Systems | ||||||||
4.750%, 10/11/2021 (C) | 3,955 | 4,384 | ||||||
BAE Systems Holdings | ||||||||
5.200%, 08/15/2015 (C) | 360 | 363 | ||||||
| Description | Face Amount ($ Thousands) | Market Value ($ Thousands) | ||||||
Boeing | ||||||||
4.875%, 02/15/2020 | $ | 2,440 | $ | 2,777 | ||||
Burlington Northern Santa Fe LLC | ||||||||
7.290%, 06/01/2036 | 200 | 270 | ||||||
4.550%, 09/01/2044 | 2,355 | 2,398 | ||||||
4.150%, 04/01/2045 | 2,940 | 2,808 | ||||||
3.850%, 09/01/2023 | 3,450 | 3,672 | ||||||
3.050%, 09/01/2022 | 300 | 305 | ||||||
Cargill | ||||||||
7.350%, 03/06/2019 (C) | 100 | 120 | ||||||
3.300%, 03/01/2022 (C) | 50 | 52 | ||||||
Caterpillar Financial Services MTN | ||||||||
2.750%, 08/20/2021 | 1,915 | 1,959 | ||||||
Continental Airlines, Pass-Through Trust, Ser 1997-4, Cl A | ||||||||
6.900%, 01/02/2018 | 70 | 74 | ||||||
Continental Airlines, Pass-Through Trust, Ser 1999-1, Cl A | ||||||||
6.545%, 02/02/2019 | 361 | 392 | ||||||
Continental Airlines, Pass-Through Trust, Ser 1999-2, Cl A | ||||||||
7.256%, 03/15/2020 | 813 | 906 | ||||||
Continental Airlines, Pass-Through Trust, Ser 2000-1, Cl A | ||||||||
8.048%, 11/01/2020 | 1,464 | 1,650 | ||||||
Continental Airlines, Pass-Through Trust, Ser 2007-1, Cl A | ||||||||
5.983%, 04/19/2022 | 2,365 | 2,661 | ||||||
CRH America | ||||||||
3.875%, 05/18/2025 (C) | 200 | 203 | ||||||
CSX | ||||||||
7.375%, 02/01/2019 | 150 | 178 | ||||||
4.250%, 06/01/2021 | 65 | 71 | ||||||
Danaher | ||||||||
3.900%, 06/23/2021 | 266 | 288 | ||||||
Deere | ||||||||
3.900%, 06/09/2042 | 64 | 62 | ||||||
Delta Air Lines, Pass-Through Trust, Ser 2007-1, Cl A | ||||||||
6.821%, 08/10/2022 | 1,337 | 1,570 | ||||||
Delta Air Lines, Pass-Through Trust, Ser 2010-2, Cl A | ||||||||
4.950%, 05/23/2019 | 177 | 188 | ||||||
Eaton | ||||||||
7.625%, 04/01/2024 | 325 | 422 | ||||||
4.150%, 11/02/2042 | 530 | 520 | ||||||
4.000%, 11/02/2032 | 99 | 99 | ||||||
2.750%, 11/02/2022 | 2,460 | 2,433 | ||||||
1.500%, 11/02/2017 | 692 | 695 | ||||||
FedEx | ||||||||
4.100%, 02/01/2045 | 900 | 840 | ||||||
3.900%, 02/01/2035 | 96 | 91 | ||||||
| 140 | SEI Institutional Investments Trust / Annual Report / May 31, 2015 |
| Description | Face Amount ($ Thousands) | Market Value ($ Thousands) | ||||||
Fluor | ||||||||
3.375%, 09/15/2021 | $ | 308 | $ | 322 | ||||
General Electric | ||||||||
5.250%, 12/06/2017 | 91 | 100 | ||||||
4.500%, 03/11/2044 | 1,310 | 1,394 | ||||||
4.125%, 10/09/2042 | 91 | 91 | ||||||
Hutchison Whampoa International 12 II | ||||||||
3.250%, 11/08/2022 (C) | 294 | 299 | ||||||
Illinois Tool Works | ||||||||
3.900%, 09/01/2042 | 100 | 97 | ||||||
Ingersoll-Rand | ||||||||
6.391%, 11/15/2027 | 150 | 181 | ||||||
JetBlue Airways Private Trust, Ser 2004-2, Cl G1 | ||||||||
0.649%, 08/15/2016 (A) | 1,490 | 1,482 | ||||||
Koninklijke Philips | ||||||||
7.200%, 06/01/2026 | 300 | 376 | ||||||
L-3 Communications | ||||||||
3.950%, 05/28/2024 | 1,205 | 1,195 | ||||||
Lockheed Martin | ||||||||
3.350%, 09/15/2021 | 1,885 | 1,988 | ||||||
Norfolk Southern | ||||||||
3.950%, 10/01/2042 | 129 | 122 | ||||||
Northrop Grumman | ||||||||
3.850%, 04/15/2045 | 896 | 820 | ||||||
3.250%, 08/01/2023 | 6,810 | 6,882 | ||||||
Parker-Hannifin MTN | ||||||||
3.300%, 11/21/2024 | 1,385 | 1,426 | ||||||
Penske Truck Leasing Lp | ||||||||
3.375%, 02/01/2022 (C) | 1,832 | 1,812 | ||||||
3.050%, 01/09/2020 (C) | 745 | 755 | ||||||
Penske Truck Leasing LP | ||||||||
2.500%, 06/15/2019 (C) | 1,930 | 1,921 | ||||||
Pitney Bowes MTN | ||||||||
5.600%, 03/15/2018 | 100 | 109 | ||||||
Raytheon | ||||||||
3.125%, 10/15/2020 | 720 | 753 | ||||||
Republic Services | ||||||||
3.550%, 06/01/2022 | 125 | 129 | ||||||
Ryder System MTN | ||||||||
3.600%, 03/01/2016 | 132 | 135 | ||||||
2.500%, 03/01/2017 | 177 | 180 | ||||||
Siemens Financieringsmaatschappij | ||||||||
3.250%, 05/27/2025 (C) | 1,125 | 1,133 | ||||||
2.900%, 05/27/2022 (C) | 5,050 | 5,081 | ||||||
2.150%, 05/27/2020 (C) | 1,080 | 1,079 | ||||||
1.450%, 05/25/2018 (C) | 2,160 | 2,161 | ||||||
Union Pacific | ||||||||
4.698%, 01/02/2024 | 117 | 126 | ||||||
4.300%, 06/15/2042 | 100 | 104 | ||||||
3.250%, 01/15/2025 | 1,340 | 1,379 | ||||||
| Description | Face Amount ($ Thousands) | Market Value ($ Thousands) | ||||||
United Parcel Service | ||||||||
8.375%, 04/01/2020 | $ | 140 | $ | 180 | ||||
3.125%, 01/15/2021 | 90 | 95 | ||||||
2.450%, 10/01/2022 | 100 | 100 | ||||||
United Technologies | ||||||||
8.875%, 11/15/2019 | 400 | 511 | ||||||
5.400%, 05/01/2035 | 640 | 746 | ||||||
4.500%, 06/01/2042 | 1,110 | 1,154 | ||||||
US Airways, Pass-Through Trust, Ser 2012-1, Cl A | ||||||||
5.900%, 10/01/2024 | 43 | 49 | ||||||
US Airways, Pass-Through Trust, Ser 2012-2, Cl A | ||||||||
4.625%, 06/03/2025 | 4,773 | 5,065 | ||||||
Valmont Industries | ||||||||
5.250%, 10/01/2054 | 800 | 744 | ||||||
Verisk Analytics | ||||||||
5.500%, 06/15/2045 | 215 | 221 | ||||||
4.000%, 06/15/2025 | 610 | 610 | ||||||
Waste Management | ||||||||
4.750%, 06/30/2020 | 150 | 167 | ||||||
3.900%, 03/01/2035 | 40 | 39 | ||||||
3.500%, 05/15/2024 | 720 | 736 | ||||||
|
| |||||||
| 83,809 | ||||||||
|
| |||||||
Information Technology — 0.7% | ||||||||
Alibaba Group Holding | ||||||||
3.600%, 11/28/2024 (C) | 890 | 878 | ||||||
Apple | ||||||||
4.375%, 05/13/2045 | 2,320 | 2,351 | ||||||
3.850%, 05/04/2043 | 1,750 | 1,644 | ||||||
3.450%, 02/09/2045 | 156 | 136 | ||||||
3.200%, 05/13/2025 | 675 | 682 | ||||||
2.700%, 05/13/2022 | 3,175 | 3,201 | ||||||
2.400%, 05/03/2023 | 400 | 388 | ||||||
0.529%, 05/03/2018 (A) | 100 | 100 | ||||||
Arrow Electronics | ||||||||
7.500%, 01/15/2027 | 200 | 236 | ||||||
6.875%, 06/01/2018 | 270 | 303 | ||||||
Cisco Systems | ||||||||
5.900%, 02/15/2039 | 200 | 245 | ||||||
5.500%, 01/15/2040 | 150 | 175 | ||||||
eBay | ||||||||
4.000%, 07/15/2042 | 84 | 72 | ||||||
3.450%, 08/01/2024 | 200 | 198 | ||||||
2.875%, 08/01/2021 | 88 | 88 | ||||||
2.600%, 07/15/2022 | 150 | 143 | ||||||
EMC | ||||||||
3.375%, 06/01/2023 | 190 | 193 | ||||||
Harris | ||||||||
5.054%, 04/27/2045 | 320 | 318 | ||||||
Hewlett-Packard | ||||||||
4.650%, 12/09/2021 | 45 | 49 | ||||||
4.300%, 06/01/2021 | 94 | 100 | ||||||
| SEI Institutional Investments Trust / Annual Report / May 31, 2015 | 141 |
SCHEDULE OF INVESTMENTS
Core Fixed Income Fund (Continued)
May 31, 2015
| Description | Face Amount ($ Thousands) | Market Value ($ Thousands) | ||||||
Intel | ||||||||
4.800%, 10/01/2041 | $ | 487 | $ | 516 | ||||
3.300%, 10/01/2021 | 150 | 159 | ||||||
International Business Machines | ||||||||
7.625%, 10/15/2018 | 200 | 239 | ||||||
4.000%, 06/20/2042 | 150 | 139 | ||||||
1.250%, 02/06/2017 | 50 | 50 | ||||||
Intuit | ||||||||
5.750%, 03/15/2017 | 230 | 248 | ||||||
Keysight Technologies | ||||||||
4.550%, 10/30/2024 (C) | 570 | 565 | ||||||
KLA-Tencor | ||||||||
4.125%, 11/01/2021 | 2,450 | 2,544 | ||||||
MasterCard | ||||||||
3.375%, 04/01/2024 | 1,720 | 1,795 | ||||||
Microsoft | ||||||||
4.500%, 10/01/2040 | 61 | 64 | ||||||
3.750%, 02/12/2045 | 2,195 | 2,021 | ||||||
3.500%, 02/12/2035 | 2,983 | 2,786 | ||||||
2.375%, 02/12/2022 | 100 | 99 | ||||||
0.875%, 11/15/2017 | 54 | 54 | ||||||
National Semiconductor | ||||||||
6.600%, 06/15/2017 | 380 | 422 | ||||||
Oracle | ||||||||
6.500%, 04/15/2038 | 50 | 65 | ||||||
6.125%, 07/08/2039 | 163 | 203 | ||||||
4.375%, 05/15/2055 | 250 | 241 | ||||||
4.300%, 07/08/2034 | 250 | 256 | ||||||
4.125%, 05/15/2045 | 610 | 590 | ||||||
3.900%, 05/15/2035 | 4,345 | 4,206 | ||||||
2.950%, 05/15/2025 | 1,540 | 1,512 | ||||||
2.500%, 05/15/2022 | 1,535 | 1,514 | ||||||
2.250%, 10/08/2019 | 1,065 | 1,080 | ||||||
1.200%, 10/15/2017 | 104 | 104 | ||||||
QUALCOMM | ||||||||
3.450%, 05/20/2025 | 620 | 617 | ||||||
Texas Instruments | ||||||||
2.750%, 03/12/2021 | 1,435 | 1,472 | ||||||
TSMC Global | ||||||||
1.625%, 04/03/2018 (C) | 3,415 | 3,379 | ||||||
Xerox | ||||||||
4.500%, 05/15/2021 | 80 | 86 | ||||||
2.950%, 03/15/2017 | 165 | 170 | ||||||
|
| |||||||
| 38,696 | ||||||||
|
| |||||||
Materials — 1.0% | ||||||||
Agrium | ||||||||
4.125%, 03/15/2035 | 390 | 368 | ||||||
3.375%, 03/15/2025 | 149 | 146 | ||||||
Albemarle | ||||||||
5.450%, 12/01/2044 | 990 | 1,020 | ||||||
Barrick | ||||||||
4.100%, 05/01/2023 | 4,205 | 4,168 | ||||||
3.850%, 04/01/2022 | 640 | 635 | ||||||
| Description | Face Amount ($ Thousands) | Market Value ($ Thousands) | ||||||
Barrick Gold | ||||||||
6.950%, 04/01/2019 | $ | 1,530 | $ | 1,781 | ||||
Barrick North America Finance LLC | ||||||||
4.400%, 05/30/2021 | 700 | 726 | ||||||
BHP Billiton Finance USA | ||||||||
6.500%, 04/01/2019 | 445 | 520 | ||||||
5.000%, 09/30/2043 | 1,040 | 1,125 | ||||||
3.850%, 09/30/2023 | 1,585 | 1,669 | ||||||
3.250%, 11/21/2021 | 3,010 | 3,137 | ||||||
Celulosa Arauco y Constitucion | ||||||||
4.750%, 01/11/2022 | 1,050 | 1,106 | ||||||
Dow Chemical | ||||||||
8.550%, 05/15/2019 | 177 | 218 | ||||||
3.000%, 11/15/2022 | 3,630 | 3,625 | ||||||
E.I. du Pont de Nemours | ||||||||
5.600%, 12/15/2036 | 275 | 324 | ||||||
Eastman Chemical | ||||||||
4.650%, 10/15/2044 | 640 | 632 | ||||||
3.800%, 03/15/2025 | 1,110 | 1,135 | ||||||
2.700%, 01/15/2020 | 2,295 | 2,316 | ||||||
Ecolab | ||||||||
4.350%, 12/08/2021 | 420 | 457 | ||||||
1.450%, 12/08/2017 | 200 | 199 | ||||||
Freeport-McMoRan | ||||||||
4.000%, 11/14/2021 | 1,090 | 1,082 | ||||||
2.150%, 03/01/2017 | 404 | 406 | ||||||
Freeport-McMoran Oil & Gas LLC | ||||||||
6.875%, 02/15/2023 | 319 | 343 | ||||||
6.500%, 11/15/2020 | 227 | 241 | ||||||
Glencore Finance Canada | ||||||||
5.800%, 11/15/2016 (C) | 390 | 413 | ||||||
2.700%, 10/25/2017 (C) | 1,900 | 1,930 | ||||||
2.050%, 10/23/2015 (C) | 2,913 | 2,922 | ||||||
Glencore Funding LLC | ||||||||
2.875%, 04/16/2020 (C) | 3,030 | 3,015 | ||||||
International Paper | ||||||||
5.150%, 05/15/2046 | 565 | 577 | ||||||
5.000%, 09/15/2035 | 2,245 | 2,257 | ||||||
LYB International Finance | ||||||||
4.875%, 03/15/2044 | 610 | 616 | ||||||
LyondellBasell Industries | ||||||||
4.625%, 02/26/2055 | 595 | 543 | ||||||
Monsanto | ||||||||
4.700%, 07/15/2064 | 18 | 16 | ||||||
Mosaic | ||||||||
5.625%, 11/15/2043 | 565 | 638 | ||||||
5.450%, 11/15/2033 | 695 | 772 | ||||||
4.875%, 11/15/2041 | 117 | 118 | ||||||
4.250%, 11/15/2023 | 150 | 158 | ||||||
3.750%, 11/15/2021 | 50 | 53 | ||||||
Nucor | ||||||||
4.000%, 08/01/2023 | 54 | 56 | ||||||
OCP | ||||||||
4.500%, 10/22/2025 (C) | 1,860 | 1,814 | ||||||
| 142 | SEI Institutional Investments Trust / Annual Report / May 31, 2015 |
| Description | Face Amount ($ Thousands) | Market Value ($ Thousands) | ||||||
Placer Dome | ||||||||
6.450%, 10/15/2035 | $ | 281 | $ | 290 | ||||
Potash Corp of Saskatchewan | ||||||||
6.500%, 05/15/2019 | 250 | 291 | ||||||
4.875%, 03/30/2020 | 10 | 11 | ||||||
PPG Industries | ||||||||
6.650%, 03/15/2018 | 111 | 126 | ||||||
Praxair | ||||||||
2.650%, 02/05/2025 | 114 | 111 | ||||||
Rio Tinto Finance USA | ||||||||
9.000%, 05/01/2019 | 875 | 1,102 | ||||||
6.500%, 07/15/2018 | 435 | 496 | ||||||
4.125%, 05/20/2021 (D) | 170 | 182 | ||||||
3.750%, 09/20/2021 | 120 | 126 | ||||||
Rock-Tenn | ||||||||
4.000%, 03/01/2023 | 330 | 341 | ||||||
3.500%, 03/01/2020 | 570 | 591 | ||||||
Southern Copper | ||||||||
5.875%, 04/23/2045 | 170 | 166 | ||||||
5.250%, 11/08/2042 | 3,610 | 3,241 | ||||||
Stauffer Chemical | ||||||||
8.153%, 04/15/2017 (B) (C) (G) | 350 | 240 | ||||||
7.810%, 04/15/2018 (B) (C) (G) | 860 | 484 | ||||||
Teck Resources | ||||||||
3.750%, 02/01/2023 (D) | 698 | 630 | ||||||
Union Carbide | ||||||||
7.750%, 10/01/2096 | 100 | 129 | ||||||
7.500%, 06/01/2025 | 200 | 254 | ||||||
Vale Overseas | ||||||||
8.250%, 01/17/2034 | 740 | 830 | ||||||
6.875%, 11/21/2036 (D) | 2,958 | 2,909 | ||||||
4.375%, 01/11/2022 (D) | 1,605 | 1,577 | ||||||
|
| |||||||
| 57,404 | ||||||||
|
| |||||||
Telecommunication Services — 1.6% |
| |||||||
America Movil | ||||||||
5.625%, 11/15/2017 | 1,450 | 1,591 | ||||||
5.000%, 03/30/2020 | 540 | 607 | ||||||
3.125%, 07/16/2022 | 2,037 | 2,046 | ||||||
2.375%, 09/08/2016 | 238 | 242 | ||||||
AT&T | ||||||||
6.300%, 01/15/2038 | 1,400 | 1,596 | ||||||
5.800%, 02/15/2019 | 500 | 564 | ||||||
5.550%, 08/15/2041 | 360 | 381 | ||||||
5.500%, 02/01/2018 | 130 | 143 | ||||||
5.350%, 09/01/2040 | 700 | 718 | ||||||
4.750%, 05/15/2046 | 3,800 | 3,619 | ||||||
4.500%, 05/15/2035 | 840 | 796 | ||||||
4.450%, 05/15/2021 | 440 | 473 | ||||||
4.350%, 06/15/2045 | 867 | 773 | ||||||
4.300%, 12/15/2042 | 595 | 537 | ||||||
| Description | Face Amount ($ Thousands) | Market Value ($ Thousands) | ||||||
3.875%, 08/15/2021 | $ | 350 | $ | 367 | ||||
3.400%, 05/15/2025 | 12,385 | 12,046 | ||||||
3.000%, 02/15/2022 | 700 | 696 | ||||||
3.000%, 06/30/2022 | 2,505 | 2,466 | ||||||
2.450%, 06/30/2020 | 1,300 | 1,288 | ||||||
0.900%, 02/12/2016 | 184 | 184 | ||||||
BellSouth Telecommunications LLC | ||||||||
6.300%, 12/15/2015 | 51 | 51 | ||||||
Bharti Airtel International Netherlands | ||||||||
5.350%, 05/20/2024 (C) | 805 | 881 | ||||||
British Telecommunications | ||||||||
5.950%, 01/15/2018 | 1,011 | 1,125 | ||||||
Centel Capital | ||||||||
9.000%, 10/15/2019 | 200 | 240 | ||||||
Comcast Cable Holdings LLC | ||||||||
10.125%, 04/15/2022 | 190 | 262 | ||||||
Cox Communications | ||||||||
4.800%, 02/01/2035 (C) | 865 | 836 | ||||||
4.700%, 12/15/2042 (C) | 10 | 9 | ||||||
Cox Enterprises | ||||||||
7.375%, 07/15/2027 (C) | 170 | 210 | ||||||
Deutsche Telekom International Finance | ||||||||
2.250%, 03/06/2017 (C) | 3,130 | 3,179 | ||||||
DIRECTV Holdings | ||||||||
6.000%, 08/15/2040 | 2,220 | 2,418 | ||||||
Grupo Televisa | ||||||||
5.000%, 05/13/2045 | 500 | 501 | ||||||
GTE | ||||||||
8.750%, 11/01/2021 | 600 | 778 | ||||||
Nippon Telegraph & Telephone | ||||||||
1.400%, 07/18/2017 | 200 | 201 | ||||||
Orange | ||||||||
9.000%, 03/01/2031 | 120 | 177 | ||||||
2.750%, 09/14/2016 | 140 | 143 | ||||||
Rogers Communications | ||||||||
4.100%, 10/01/2023 | 133 | 140 | ||||||
Sky | ||||||||
3.750%, 09/16/2024 (C) | 1,505 | 1,520 | ||||||
Sprint Capital | ||||||||
8.750%, 03/15/2032 | 390 | 398 | ||||||
TCI Communications | ||||||||
7.125%, 02/15/2028 | 400 | 535 | ||||||
Telecom Italia Capital | ||||||||
7.175%, 06/18/2019 | 70 | 79 | ||||||
Telefonica Emisiones SAU | ||||||||
6.421%, 06/20/2016 | 100 | 105 | ||||||
6.221%, 07/03/2017 | 100 | 110 | ||||||
5.877%, 07/15/2019 | 180 | 205 | ||||||
5.462%, 02/16/2021 | 69 | 78 | ||||||
5.134%, 04/27/2020 | 1,160 | 1,290 | ||||||
| SEI Institutional Investments Trust / Annual Report / May 31, 2015 | 143 |
SCHEDULE OF INVESTMENTS
Core Fixed Income Fund (Continued)
May 31, 2015
| Description | Face Amount ($ Thousands) | Market Value ($ Thousands) | ||||||
Tencent Holdings MTN | ||||||||
3.800%, 02/11/2025 (C) | $ | 1,030 | $ | 1,035 | ||||
Thomson Reuters | ||||||||
4.700%, 10/15/2019 | 250 | 275 | ||||||
3.850%, 09/29/2024 | 1,085 | 1,109 | ||||||
Verizon Communications | ||||||||
6.550%, 09/15/2043 | 6,672 | 8,104 | ||||||
6.400%, 09/15/2033 | 2,104 | 2,475 | ||||||
5.850%, 09/15/2035 | 150 | 169 | ||||||
5.150%, 09/15/2023 | 510 | 570 | ||||||
5.050%, 03/15/2034 | 308 | 320 | ||||||
4.862%, 08/21/2046 | 4,490 | 4,333 | ||||||
4.522%, 09/15/2048 (C) | 3,074 | 2,808 | ||||||
4.500%, 09/15/2020 | 300 | 327 | ||||||
4.400%, 11/01/2034 | 7,705 | 7,416 | ||||||
4.272%, 01/15/2036 (C) | 3,243 | 3,022 | ||||||
4.150%, 03/15/2024 | 880 | 930 | ||||||
3.450%, 03/15/2021 | 1,120 | 1,160 | ||||||
3.000%, 11/01/2021 | 3,300 | 3,319 | ||||||
2.625%, 02/21/2020 | 82 | 83 | ||||||
2.500%, 09/15/2016 | 2,565 | 2,609 | ||||||
2.450%, 11/01/2022 | 10 | 10 | ||||||
Verizon New England | ||||||||
7.875%, 11/15/2029 | 500 | 632 | ||||||
Vodafone Group | ||||||||
2.950%, 02/19/2023 | 3,725 | 3,505 | ||||||
1.625%, 03/20/2017 | 240 | 241 | ||||||
|
| |||||||
| 91,056 | ||||||||
|
| |||||||
Utilities — 2.0% | ||||||||
AGL Capital | ||||||||
6.375%, 07/15/2016 | 200 | 212 | ||||||
5.875%, 03/15/2041 | 73 | 90 | ||||||
5.250%, 08/15/2019 | 170 | 190 | ||||||
Alabama Power | ||||||||
6.125%, 05/15/2038 | 69 | 90 | ||||||
5.875%, 12/01/2022 | 150 | 180 | ||||||
5.500%, 10/15/2017 | 100 | 110 | ||||||
3.750%, 03/01/2045 | 900 | 853 | ||||||
Alabama Power Capital Trust V | ||||||||
3.374%, 10/01/2042 (A) | 100 | 97 | ||||||
Ameren Illinois | ||||||||
4.300%, 07/01/2044 | 680 | 705 | ||||||
American Electric Power | ||||||||
1.650%, 12/15/2017 | 1,920 | 1,924 | ||||||
American Water Capital | ||||||||
3.850%, 03/01/2024 | 300 | 318 | ||||||
Appalachian Power | ||||||||
5.950%, 05/15/2033 | 200 | 238 | ||||||
4.450%, 06/01/2045 | 2,705 | 2,722 | ||||||
Berkshire Hathaway Energy | ||||||||
6.500%, 09/15/2037 | 3,200 | 4,059 | ||||||
4.500%, 02/01/2045 | 2,395 | 2,447 | ||||||
3.750%, 11/15/2023 | 488 | 509 | ||||||
| Description | Face Amount ($ Thousands) | Market Value ($ Thousands) | ||||||
Boston Gas | ||||||||
4.487%, 02/15/2042 (C) | $ | 140 | $ | 148 | ||||
CenterPoint Energy | ||||||||
6.500%, 05/01/2018 | 271 | 306 | ||||||
CenterPoint Energy Houston Electric LLC | ||||||||
4.500%, 04/01/2044 | 1,925 | 2,054 | ||||||
CenterPoint Energy Resources | ||||||||
6.125%, 11/01/2017 | 320 | 355 | ||||||
4.500%, 01/15/2021 | 246 | 268 | ||||||
Cleveland Electric Illuminating | ||||||||
7.880%, 11/01/2017 | 200 | 230 | ||||||
Comision Federal de Electricidad | ||||||||
4.875%, 05/26/2021 (C) | 249 | 265 | ||||||
Commonwealth Edison | ||||||||
3.700%, 03/01/2045 | 305 | 290 | ||||||
Consolidated Edison of New York | ||||||||
6.650%, 04/01/2019 | 650 | 764 | ||||||
4.625%, 12/01/2054 | 580 | 596 | ||||||
4.450%, 03/15/2044 | 2,475 | 2,574 | ||||||
Consumers Energy | ||||||||
2.850%, 05/15/2022 | 56 | 57 | ||||||
Dominion Resources | ||||||||
5.250%, 08/01/2033 | 735 | 808 | ||||||
4.700%, 12/01/2044 | 930 | 963 | ||||||
2.500%, 12/01/2019 | 1,985 | 2,007 | ||||||
1.950%, 08/15/2016 | 56 | 57 | ||||||
DTE Electric | ||||||||
2.650%, 06/15/2022 | 66 | 66 | ||||||
Duke Energy | ||||||||
3.550%, 09/15/2021 | 722 | 760 | ||||||
Duke Energy Carolinas LLC | ||||||||
6.000%, 01/15/2038 | 48 | 62 | ||||||
4.000%, 09/30/2042 | 1,512 | 1,498 | ||||||
Duke Energy Florida | ||||||||
3.850%, 11/15/2042 | 1,360 | 1,312 | ||||||
Duquesne Light Holdings | ||||||||
6.400%, 09/15/2020 (C) | 2,525 | 2,967 | ||||||
Enel Finance International | ||||||||
5.125%, 10/07/2019 (C) | 200 | 222 | ||||||
Entergy Louisiana LLC | ||||||||
6.500%, 09/01/2018 | 500 | 577 | ||||||
Exelon | ||||||||
5.625%, 06/15/2035 | 2,065 | 2,374 | ||||||
Exelon Generation LLC | ||||||||
6.200%, 10/01/2017 (D) | 159 | 176 | ||||||
4.000%, 10/01/2020 | 288 | 303 | ||||||
FirstEnergy | ||||||||
4.250%, 03/15/2023 | 2,040 | 2,101 | ||||||
2.750%, 03/15/2018 | 650 | 663 | ||||||
FirstEnergy, Ser C | ||||||||
7.375%, 11/15/2031 | 4,905 | 6,171 | ||||||
FirstEnergy Transmission LLC | ||||||||
5.450%, 07/15/2044 (C) | 325 | 351 | ||||||
| 144 | SEI Institutional Investments Trust / Annual Report / May 31, 2015 |
| Description | Face Amount ($ Thousands) | Market Value ($ Thousands) | ||||||
Florida Power & Light | ||||||||
5.950%, 10/01/2033 | $ | 150 | $ | 192 | ||||
Great Plains Energy | ||||||||
4.850%, 06/01/2021 | 27 | 30 | ||||||
IPALCO Enterprises | ||||||||
7.250%, 04/01/2016 (C) | 2,545 | 2,653 | ||||||
5.000%, 05/01/2018 | 2,380 | 2,523 | ||||||
Jersey Central Power & Light | ||||||||
7.350%, 02/01/2019 | 100 | 117 | ||||||
John Sevier Combined Cycle Generation | ||||||||
4.626%, 01/15/2042 | 246 | 273 | ||||||
Kansas City Power & Light | ||||||||
5.300%, 10/01/2041 | 250 | 282 | ||||||
KCP&L Greater Missouri Operations | ||||||||
8.270%, 11/15/2021 | 2,894 | 3,691 | ||||||
KeySpan Gas East | ||||||||
5.819%, 04/01/2041 (C) | 2,500 | 3,104 | ||||||
Majapahit Holding BV | ||||||||
7.750%, 01/20/2020 | 660 | 771 | ||||||
Metropolitan Edison | ||||||||
3.500%, 03/15/2023 (C) | 5,050 | 5,068 | ||||||
Nevada Power | ||||||||
6.500%, 08/01/2018 | 290 | 334 | ||||||
5.450%, 05/15/2041 | 150 | 180 | ||||||
5.375%, 09/15/2040 | 45 | 54 | ||||||
Niagara Mohawk Power | ||||||||
4.881%, 08/15/2019 (C) | 180 | 199 | ||||||
4.278%, 10/01/2034 (C) | 945 | 975 | ||||||
NiSource Finance | ||||||||
6.800%, 01/15/2019 | 3,547 | 4,126 | ||||||
5.800%, 02/01/2042 | 471 | 570 | ||||||
Northern States Power | ||||||||
6.250%, 06/01/2036 | 130 | 174 | ||||||
5.350%, 11/01/2039 | 56 | 69 | ||||||
Oncor Electric Delivery | ||||||||
6.800%, 09/01/2018 | 4,135 | 4,799 | ||||||
Pacific Gas & Electric | ||||||||
8.250%, 10/15/2018 | 1,570 | 1,892 | ||||||
6.050%, 03/01/2034 | 390 | 485 | ||||||
5.800%, 03/01/2037 | 560 | 675 | ||||||
5.400%, 01/15/2040 | 156 | 182 | ||||||
4.450%, 04/15/2042 | 2,360 | 2,409 | ||||||
3.250%, 09/15/2021 | 35 | 36 | ||||||
3.250%, 06/15/2023 | 725 | 740 | ||||||
PacifiCorp | ||||||||
6.250%, 10/15/2037 | 310 | 404 | ||||||
5.650%, 07/15/2018 | 500 | 563 | ||||||
3.600%, 04/01/2024 | 1,700 | 1,803 | ||||||
PECO Energy | ||||||||
4.150%, 10/01/2044 | 1,985 | 2,045 | ||||||
| Description | Face Amount ($ Thousands) | Market Value ($ Thousands) | ||||||
Potomac Electric Power | ||||||||
4.150%, 03/15/2043 | $ | 795 | $ | 824 | ||||
3.600%, 03/15/2024 | 815 | 856 | ||||||
Progress Energy | ||||||||
6.000%, 12/01/2039 | 200 | 255 | ||||||
PSEG Power LLC | ||||||||
5.125%, 04/15/2020 | 50 | 56 | ||||||
4.150%, 09/15/2021 | 72 | 76 | ||||||
2.750%, 09/15/2016 | 1,055 | 1,078 | ||||||
Public Service Electric & Gas MTN | ||||||||
5.375%, 11/01/2039 | 97 | 119 | ||||||
3.050%, 11/15/2024 | 735 | 745 | ||||||
Public Service of Colorado | ||||||||
4.300%, 03/15/2044 | 475 | 499 | ||||||
Public Service of New Hampshire | ||||||||
3.500%, 11/01/2023 | 960 | 1,006 | ||||||
Public Service of New Mexico | ||||||||
7.950%, 05/15/2018 | 3,000 | 3,510 | ||||||
Public Service of Oklahoma | ||||||||
5.150%, 12/01/2019 | 220 | 247 | ||||||
Puget Energy | ||||||||
6.000%, 09/01/2021 | 2,095 | 2,447 | ||||||
Puget Sound Energy | ||||||||
4.300%, 05/20/2045 | 1,005 | 1,022 | ||||||
San Diego Gas & Electric | ||||||||
6.000%, 06/01/2026 | 400 | 508 | ||||||
Sempra Energy | ||||||||
6.500%, 06/01/2016 | 135 | 143 | ||||||
6.000%, 10/15/2039 | 170 | 211 | ||||||
2.875%, 10/01/2022 | 140 | 139 | ||||||
South Carolina Electric & Gas | ||||||||
4.500%, 06/01/2064 | 52 | 51 | ||||||
Southern | ||||||||
2.150%, 09/01/2019 | 1,920 | 1,931 | ||||||
Southern California Edison | ||||||||
6.650%, 04/01/2029 | 200 | 268 | ||||||
3.500%, 10/01/2023 | 1,015 | 1,064 | ||||||
Southern California Gas | ||||||||
4.450%, 03/15/2044 | 1,287 | 1,385 | ||||||
Southern Star Central Gas Pipeline | ||||||||
6.000%, 06/01/2016 (C) | 655 | 680 | ||||||
Southwestern Electric Power | ||||||||
6.450%, 01/15/2019 | 672 | 772 | ||||||
3.900%, 04/01/2045 | 795 | 735 | ||||||
3.550%, 02/15/2022 | 610 | 636 | ||||||
Southwestern Public Service | ||||||||
8.750%, 12/01/2018 | 50 | 62 | ||||||
Virginia Electric and Power | ||||||||
5.400%, 04/30/2018 | 100 | 111 | ||||||
4.650%, 08/15/2043 | 1,475 | 1,609 | ||||||
4.450%, 02/15/2044 | 520 | 548 | ||||||
2.950%, 01/15/2022 | 1,470 | 1,509 | ||||||
| SEI Institutional Investments Trust / Annual Report / May 31, 2015 | 145 |
SCHEDULE OF INVESTMENTS
Core Fixed Income Fund (Continued)
May 31, 2015
| Description | Face Amount ($ Thousands) | Market Value ($ Thousands) | ||||||
Wisconsin Electric Power | ||||||||
3.650%, 12/15/2042 | $ | 183 | $ | 177 | ||||
3.100%, 06/01/2025 | 110 | 111 | ||||||
2.950%, 09/15/2021 | 14 | 14 | ||||||
|
| |||||||
| 112,911 | ||||||||
|
| |||||||
Total Corporate Obligations |
| 1,492,087 | ||||||
|
| |||||||
ASSET-BACKED SECURITIES — 11.4% |
| |||||||
Automotive — 1.6% | ||||||||
Ally Auto Receivables Trust, | ||||||||
0.630%, 05/15/2017 | 227 | 227 | ||||||
Ally Auto Receivables Trust, | ||||||||
0.480%, 02/15/2017 | 1,290 | 1,290 | ||||||
Ally Auto Receivables Trust, | ||||||||
1.530%, 04/15/2019 | 5,303 | 5,321 | ||||||
Ally Auto Receivables Trust, | ||||||||
1.840%, 01/15/2020 | 911 | 922 | ||||||
AmeriCredit Automobile Receivables Trust, Ser 2012-5, Cl A3 | ||||||||
0.620%, 06/08/2017 | 35 | 35 | ||||||
AmeriCredit Automobile Receivables Trust, Ser 2014-1, Cl A3 | ||||||||
0.900%, 02/08/2019 | 140 | 140 | ||||||
Avis Budget Rental Car Funding LLC, | ||||||||
2.100%, 03/20/2019 (C) | 1,421 | 1,439 | ||||||
Avis Budget Rental Car Funding LLC, Ser 2013-1A, Cl A | ||||||||
1.920%, 09/20/2019 (C) | 2,666 | 2,662 | ||||||
Avis Budget Rental Car Funding LLC, Ser 2013-2A, Cl A | ||||||||
2.970%, 02/20/2020 (C) | 590 | 609 | ||||||
Bank of The West Auto Trust, | ||||||||
1.090%, 03/15/2019 (C) | 1,141 | 1,143 | ||||||
California Republic Auto Receivables Trust, | ||||||||
1.570%, 12/16/2019 | 729 | 732 | ||||||
California Republic Auto Receivables Trust, | ||||||||
1.790%, 03/16/2020 | 729 | 734 | ||||||
| Description | Face Amount ($ Thousands) | Market Value ($ Thousands) | ||||||
California Republic Auto Receivables Trust, | ||||||||
1.330%, 04/15/2019 | $ | 1,167 | $ | 1,170 | ||||
California Republic Auto Receivables Trust, | ||||||||
1.820%, 09/15/2020 | 1,345 | 1,352 | ||||||
California Republic Auto Receivables Trust, | ||||||||
1.310%, 08/15/2019 | 1,748 | 1,748 | ||||||
Capital Auto Receivables Asset Trust, Ser 2013-1, Cl A3 | ||||||||
0.790%, 06/20/2017 | 2,311 | 2,312 | ||||||
Capital Auto Receivables Asset Trust, Ser 2013-2, Cl A4 | ||||||||
1.560%, 07/20/2018 | 1,301 | 1,310 | ||||||
Capital Auto Receivables Asset Trust, Ser 2013-3, Cl A4 | ||||||||
1.680%, 04/20/2018 | 714 | 720 | ||||||
Capital Auto Receivables Asset Trust, Ser 2013-4, Cl A3 | ||||||||
1.090%, 03/20/2018 | 2,101 | 2,105 | ||||||
Capital Auto Receivables Asset Trust, Ser 2013-4, Cl A4 | ||||||||
1.470%, 07/20/2018 | 2,428 | 2,443 | ||||||
Capital Auto Receivables Asset Trust, Ser 2014-1, Cl A3 | ||||||||
1.320%, 06/20/2018 | 1,680 | 1,686 | ||||||
Capital Auto Receivables Asset Trust, Ser 2014-1, Cl A4 | ||||||||
1.690%, 10/22/2018 | 1,629 | 1,640 | ||||||
Capital Auto Receivables Asset Trust, Ser 2014-2, Cl A1 | ||||||||
0.481%, 06/20/2016 (A) | 2,222 | 2,222 | ||||||
Capital Auto Receivables Asset Trust, Ser 2014-2, Cl A3 | ||||||||
1.260%, 05/21/2018 | 2,575 | 2,576 | ||||||
Capital Auto Receivables Asset Trust, Ser 2014-2, Cl A4 | ||||||||
1.620%, 10/22/2018 | 736 | 741 | ||||||
Capital Auto Receivables Asset Trust, Ser 2014-3, Cl A3 | ||||||||
1.480%, 11/20/2018 | 2,361 | 2,368 | ||||||
Capital Auto Receivables Asset Trust, Ser 2014-3, Cl A4 | ||||||||
1.830%, 04/22/2019 | 295 | 297 | ||||||
Capital Auto Receivables Asset Trust, Ser 2015-1, Cl A2 | ||||||||
1.420%, 06/20/2018 | 3,325 | 3,338 | ||||||
Capital Auto Receivables Asset Trust, Ser 2015-1, Cl A3 | ||||||||
1.610%, 06/20/2019 | 2,527 | 2,528 | ||||||
| 146 | SEI Institutional Investments Trust / Annual Report / May 31, 2015 |
| Description | Face Amount ($ Thousands) | Market Value ($ Thousands) | ||||||
Capital Auto Receivables Asset Trust, Ser 2015-1, Cl A4 | ||||||||
1.860%, 10/21/2019 | $ | 1,329 | $ | 1,330 | ||||
Capital Auto Receivables Asset Trust, Ser 2015-2, Cl A2 | ||||||||
1.390%, 09/20/2018 | 1,118 | 1,118 | ||||||
Capital Auto Receivables Asset Trust, Ser 2015-2, Cl A3 | ||||||||
1.730%, 09/20/2019 | 1,622 | 1,622 | ||||||
Capital Auto Receivables Asset Trust, Ser 2015-2, Cl A4 | ||||||||
1.970%, 01/21/2020 | 2,404 | 2,404 | ||||||
CarFinance Capital Auto Trust, Ser 2014-2A, Cl A | ||||||||
1.440%, 11/16/2020 (C) | 705 | 702 | ||||||
Carnow Auto Receivables Trust, Ser 2014-1A, Cl A | ||||||||
0.960%, 01/17/2017 (C) | 235 | 235 | ||||||
Chrysler Capital Auto Receivables Trust, Ser 2014-AA, Cl A3 | ||||||||
0.830%, 09/17/2018 (C) | 150 | 150 | ||||||
CPS Auto Receivables Trust, Ser 2013-D, Cl A | ||||||||
1.540%, 07/16/2018 (C) | 581 | 581 | ||||||
CPS Auto Receivables Trust, Ser 2014-A, Cl A | ||||||||
1.210%, 08/15/2018 (C) | 224 | 223 | ||||||
CPS Auto Receivables Trust, Ser 2014-C, Cl A | ||||||||
1.310%, 02/15/2019 (C) | 721 | 719 | ||||||
CPS Auto Receivables Trust, Ser 2014-C, Cl C | ||||||||
3.770%, 08/17/2020 (C) | 167 | 168 | ||||||
CPS Auto Receivables Trust, Ser 2014-D, Cl A | ||||||||
1.490%, 04/15/2019 (C) | 841 | 840 | ||||||
CPS Auto Receivables Trust, Ser 2014-D, Cl C | ||||||||
4.350%, 11/16/2020 (C) | 150 | 151 | ||||||
CPS Auto Trust, Ser 2011-B, Cl A | ||||||||
3.680%, 09/17/2018 (C) | 99 | 100 | ||||||
CPS Auto Trust, Ser 2011-C, Cl A | ||||||||
4.210%, 03/15/2019 (C) | 108 | 110 | ||||||
CPS Auto Trust, Ser 2012-A, Cl A | ||||||||
2.780%, 06/17/2019 (C) | 50 | 51 | ||||||
CPS Auto Trust, Ser 2012-B, Cl A | ||||||||
2.520%, 09/16/2019 (C) | 332 | 334 | ||||||
CPS Auto Trust, Ser 2012-C, Cl A | ||||||||
1.820%, 12/16/2019 (C) | 227 | 228 | ||||||
CPS Auto Trust, Ser 2012-D, Cl A | ||||||||
1.480%, 03/16/2020 (C) | 151 | 151 | ||||||
Credit Acceptance Auto Loan Trust, Ser 2012-2A, Cl A | ||||||||
1.520%, 03/16/2020 (C) | 104 | 104 | ||||||
| Description | Face Amount ($ Thousands) | Market Value ($ Thousands) | ||||||
Credit Acceptance Auto Loan Trust, Ser 2014-1A, Cl A | ||||||||
1.550%, 10/15/2021 (C) | $ | 500 | $ | 501 | ||||
Exeter Automobile Receivables Trust, Ser 2014-1A, Cl A | ||||||||
1.290%, 05/15/2018 (C) | 502 | 503 | ||||||
Exeter Automobile Receivables Trust, Ser 2014-2A, Cl C | ||||||||
3.260%, 12/16/2019 (C) | 135 | 135 | ||||||
Exeter Automobile Receivables Trust, Ser 2014-3A, Cl A | ||||||||
1.320%, 01/15/2019 (C) | 830 | 829 | ||||||
First Investors Auto Owner Trust, Ser 2012-2A, Cl A2 | ||||||||
1.470%, 05/15/2018 (C) | 72 | 72 | ||||||
First Investors Auto Owner Trust, Ser 2013-1A, Cl A2 | ||||||||
0.900%, 10/15/2018 (C) | 40 | 40 | ||||||
Flagship Credit Auto Trust, Ser 2014-2, Cl A | ||||||||
1.430%, 12/16/2019 (C) | 387 | 386 | ||||||
Flagship Credit Auto Trust, Ser 2014-2, Cl B | ||||||||
2.840%, 11/16/2020 (C) | 178 | 179 | ||||||
Flagship Credit Auto Trust, Ser 2014-2, Cl C | ||||||||
3.950%, 12/15/2020 (C) | 88 | 88 | ||||||
Ford Credit Auto Owner Trust, Ser 2013-B, Cl A3 | ||||||||
0.570%, 10/15/2017 | 1,222 | 1,222 | ||||||
Ford Credit Auto Owner Trust, Ser 2014-1, Cl A | ||||||||
2.260%, 11/15/2025 (C) | 7,172 | 7,291 | ||||||
Ford Credit Auto Owner Trust, Ser 2014-2, Cl A | ||||||||
2.310%, 04/15/2026 (C) | 2,395 | 2,434 | ||||||
Ford Credit Auto Owner Trust, Ser 2015-1, Cl A | ||||||||
2.120%, 07/15/2026 (C) | 3,465 | 3,485 | ||||||
Ford Credit Auto Owner Trust, Ser 2015-A, Cl A4 | ||||||||
1.640%, 06/15/2020 | 702 | 706 | ||||||
Ford Credit Floorplan Master Owner Trust, Ser 2015-2, Cl A2 | ||||||||
0.752%, 01/15/2022 (A) | 4,182 | 4,186 | ||||||
Hertz Vehicle Financing, Ser 2015-1A, Cl A | ||||||||
2.730%, 03/25/2021 | 5,150 | 5,153 | ||||||
Honda Auto Receivables Owner Trust, Ser 2013-3, Cl A3 | ||||||||
0.770%, 05/15/2017 | 1,448 | 1,449 | ||||||
Honda Auto Receivables Owner Trust, Ser 2014-1, Cl A3 | ||||||||
0.670%, 11/21/2017 | 663 | 663 | ||||||
| SEI Institutional Investments Trust / Annual Report / May 31, 2015 | 147 |
SCHEDULE OF INVESTMENTS
Core Fixed Income Fund (Continued)
May 31, 2015
| Description | Face Amount ($ Thousands) | Market Value ($ Thousands) | ||||||
Honda Auto Receivables Owner Trust, Ser 2014-4, Cl A4 | ||||||||
1.460%, 10/15/2020 | $ | 610 | $ | 613 | ||||
Huntington Auto Trust, Ser 2012-1, Cl A3 | ||||||||
0.810%, 09/15/2016 | — | — | ||||||
Hyundai Auto Receivables Trust, Ser 2011-C, Cl A4 | ||||||||
1.300%, 02/15/2018 | 520 | 521 | ||||||
|
| |||||||
| 87,587 | ||||||||
|
| |||||||
Credit Cards — 0.7% | ||||||||
American Express Credit Account Master Trust, Ser 2012-4, Cl A | ||||||||
0.426%, 05/15/2020 (A) | 1,531 | 1,531 | ||||||
Capital One Multi-Asset Execution Trust, Ser 2005-A9, Cl A | ||||||||
0.276%, 08/15/2018 (A) | 8,622 | 8,616 | ||||||
Capital One Multi-Asset Execution Trust, Ser 2007-A1, Cl A1 | ||||||||
0.236%, 11/15/2019 (A) | 1,176 | 1,172 | ||||||
Citibank Credit Card Issuance Trust, Ser 2014-A6, Cl A6 | ||||||||
2.150%, 07/15/2021 | 11,620 | 11,784 | ||||||
Discover Card Execution Note Trust, Ser 2014-A1, Cl A1 | ||||||||
0.616%, 07/15/2021 (A) | 2,172 | 2,179 | ||||||
Discover Card Execution Note Trust, Ser 2015-A2, Cl A | ||||||||
1.900%, 10/17/2022 | 5,455 | 5,457 | ||||||
MBNA Credit Card Master Note Trust, Ser 2004-A3, Cl A3 | ||||||||
0.446%, 08/16/2021 (A) | 3,354 | 3,339 | ||||||
Synchrony Credit Card Master Note Trust, Ser 2012-5, Cl A | ||||||||
0.950%, 06/15/2018 | 4,437 | 4,438 | ||||||
World Financial Network Credit Card Master Trust, | ||||||||
0.610%, 07/15/2019 | 1,482 | 1,482 | ||||||
|
| |||||||
| 39,998 | ||||||||
|
| |||||||
Mortgage Related Securities — 1.0% |
| |||||||
Aames Mortgage Trust, Ser 2002-1, Cl A3 | ||||||||
6.461%, 06/25/2032 | 46 | 44 | ||||||
Accredited Mortgage Loan Trust, Ser 2005-3, Cl A1 | ||||||||
0.420%, 09/25/2035 (A) | 2,006 | 2,000 | ||||||
Argent Securities Asset-Backed Pass-Through Certificates, Ser 2004-W5, Cl AV2 | ||||||||
1.221%, 04/25/2034 (A) | 1,113 | 1,053 | ||||||
| Description | Face Amount ($ Thousands) | Market Value ($ Thousands) | ||||||
Argent Securities Asset-Backed Pass-Through Certificates, Ser 2005-W2, Cl A1 | ||||||||
0.445%, 10/25/2035 (A) | $ | 7,512 | $ | 7,129 | ||||
Asset-Backed Funding Certificates, | ||||||||
5.010%, 06/25/2035 | 457 | 472 | ||||||
Asset-Backed Funding Certificates, | ||||||||
0.845%, 06/25/2035 (A) | 19 | 19 | ||||||
Asset-Backed Securities Home Equity Loan Trust, Ser 2003-HE7, Cl M1 | ||||||||
1.157%, 12/15/2033 (A) | 2,049 | 1,964 | ||||||
Asset-Backed Securities Home Equity Loan Trust, Ser 2005-HE6, Cl M2 | ||||||||
0.695%, 07/25/2035 (A) | 617 | 612 | ||||||
Bear Stearns Asset-Backed Securities Trust, Ser 2005-HE12, Cl 1A3 | ||||||||
0.571%, 12/25/2035 (A) | 2,166 | 2,164 | ||||||
Bear Stearns Asset-Backed Securities Trust, | ||||||||
0.551%, 08/25/2035 (A) | 736 | 734 | ||||||
Centex Home Equity, | ||||||||
3.735%, 02/25/2032 | 96 | 97 | ||||||
Centex Home Equity, Ser 2003-B, Cl AF6 | ||||||||
3.173%, 06/25/2033 (A) | 35 | 35 | ||||||
Centex Home Equity, Ser 2005-A, Cl M1 | ||||||||
0.665%, 01/25/2035 (A) | 6,968 | 6,416 | ||||||
Centex Home Equity, Ser 2006-A, Cl AV4 | ||||||||
0.435%, 06/25/2036 (A) | 75 | 69 | ||||||
Citicorp Residential Mortgage Securities, Ser 2006-2, Cl A4 | ||||||||
5.775%, 09/25/2036 | 2,624 | 2,757 | ||||||
Contimortgage Home Equity Trust, Ser 1997-2, Cl A9 | ||||||||
7.090%, 04/15/2028 | — | — | ||||||
Credit Suisse First Boston Mortgage Securities, Ser 2004-CF2, Cl 1M1 | ||||||||
5.250%, 01/25/2043 (C) | 6,310 | 6,506 | ||||||
Delta Funding Home Equity Loan Trust, Ser 1999-3, Cl A1A | ||||||||
1.006%, 09/15/2029 (A) | 310 | 284 | ||||||
| 148 | SEI Institutional Investments Trust / Annual Report / May 31, 2015 |
| Description | Face Amount ($ Thousands) | Market Value ($ Thousands) | ||||||
EMC Mortgage Loan Trust, Ser 2002-AA, Cl A1 | ||||||||
1.125%, 05/25/2039 (A) (C) | $ | 359 | $ | 342 | ||||
GSAA Trust, Ser 2005-6, Cl A3 | ||||||||
0.555%, 06/25/2035 (A) | 2,566 | 2,456 | ||||||
JPMorgan Mortgage Acquisition, Ser 05-OPT1, Cl M1 | ||||||||
0.635%, 06/25/2035 (A) | 3,676 | 3,649 | ||||||
Lake Country Mortgage Loan Trust, Ser 2006-HE1, Cl A3 | ||||||||
0.535%, 07/25/2034 (A) (C) | 16 | 16 | ||||||
Master Asset-Backed Securities Trust, Ser 2006-WMC3, Cl A4 | ||||||||
0.345%, 08/25/2036 (A) | 1,002 | 501 | ||||||
Morgan Stanley ABS Capital I Trust, Ser 2005-WMC3, Cl M4 | ||||||||
1.115%, 03/25/2035 (A) | 5,500 | 5,398 | ||||||
New Century Home Equity Loan Trust, Ser 2005-4, Cl A2C | ||||||||
0.555%, 09/25/2035 (A) | 1,416 | 1,414 | ||||||
Renaissance Home Equity Loan Trust, Ser 2005-2, Cl AF3 | ||||||||
4.499%, 08/25/2035 | 353 | 354 | ||||||
Residential Funding Mortgage Securities II, | ||||||||
8.290%, 02/25/2025 | 40 | 39 | ||||||
Salomon Brothers Mortgage Securities VII, | ||||||||
3.950%, 04/25/2032 (C) | 68 | 67 | ||||||
Saxon Asset Securities Trust, Ser 2003-1, Cl AF6 | ||||||||
4.795%, 06/25/2033 | 131 | 133 | ||||||
Security National Mortgage Loan Trust, Ser 2007-1A, Cl 2A | ||||||||
0.535%, 04/25/2037 (A) (C) | 485 | 406 | ||||||
Soundview Home Equity Loan Trust, Ser 2007-OPT1, Cl 2A2 | ||||||||
0.335%, 06/25/2037 (A) | 117 | 71 | ||||||
Structured Asset Securities Mortgage Loan Trust, Ser 2006-WF2, Cl A3 | ||||||||
0.335%, 07/25/2036 (A) | 118 | 117 | ||||||
Structured Asset Security Pass-Through Certificates, Ser 2002-AL1, Cl A2 | ||||||||
3.450%, 02/25/2032 | 197 | 196 | ||||||
UCFC Home Equity Loan, Ser 1998-D, Cl MF1 | ||||||||
6.905%, 04/15/2030 | 421 | 430 | ||||||
Wells Fargo Home Equity Asset-Backed Securities Trust, Ser 2004-2, Cl A33 | ||||||||
0.685%, 10/25/2034 (A) | 6,668 | 6,463 | ||||||
|
| |||||||
| 54,407 | ||||||||
|
| |||||||
| Description | Face Amount ($ Thousands) | Market Value ($ Thousands) | ||||||
Other Asset-Backed Securities — 8.1% |
| |||||||
321 Henderson Receivables I LLC, Ser 2014-1A, Cl A | ||||||||
3.960%, 03/15/2063 (C) | $ | 1,106 | $ | 1,168 | ||||
Academic Loan Funding Trust, Ser 2012-1A, Cl A1 | ||||||||
0.985%, 12/27/2022 (A) (C) | 342 | 342 | ||||||
Academic Loan Funding Trust, Ser 2013-1A, Cl A | ||||||||
0.981%, 12/26/2044 (A) (C) | 645 | 641 | ||||||
Access Group, Ser 2006-1, Cl A2 | ||||||||
0.392%, 08/25/2023 (A) | 1,414 | 1,408 | ||||||
Ally Master Owner Trust, Ser 2012-5, Cl A | ||||||||
1.540%, 09/15/2019 | 6,840 | 6,871 | ||||||
Ally Master Owner Trust, Ser 2014-4, Cl A2 | ||||||||
1.430%, 06/17/2019 | 6,890 | 6,914 | ||||||
Ally Master Owner Trust, Ser 2014-5, Cl A1 | ||||||||
0.676%, 10/15/2019 (A) | 4,035 | 4,044 | ||||||
Ally Master Owner Trust, Ser 2015-2, Cl A1 | ||||||||
0.745%, 01/15/2021 (A) | 2,389 | 2,395 | ||||||
ALM VII, Ser 2012-7A, Cl A1 | ||||||||
1.695%, 10/19/2024 (A) (C) | 4,350 | 4,350 | ||||||
ALM XII, Ser 2015-12A, Cl A1 | ||||||||
1.826%, 04/16/2027 (A) (C) | 2,500 | 2,501 | ||||||
Ameriquest Mortgage Securities Asset-Backed Pass-Through Certificates, Ser 2005-R5, Cl M1 | ||||||||
0.615%, 07/25/2035 (A) | 229 | 229 | ||||||
AMMC CLO XIV, | ||||||||
1.727%, 07/27/2026 (A) (C) | 2,300 | 2,298 | ||||||
Apidos CLO XVI, | ||||||||
3.075%, 01/19/2025 (A) (C) | 500 | 497 | ||||||
Apidos CLO XVIII, | ||||||||
1.688%, 07/22/2026 (A) (C) | 1,500 | 1,501 | ||||||
Arrowpoint CLO, | ||||||||
1.768%, 03/12/2026 (A) (C) | 1,900 | 1,897 | ||||||
AXIS Equipment Finance Receivables II LLC, Ser 2013-1A, Cl A | ||||||||
1.750%, 03/20/2017 (C) | 215 | 215 | ||||||
B2R Mortgage Trust, Ser 2015-1, Cl A1 | ||||||||
2.563%, 05/15/2048 (C) | 168 | 167 | ||||||
Babson CLO, Ser 2014-IIA, Cl A | ||||||||
1.664%, 10/17/2026 (A) (C) | 1,000 | 998 | ||||||
| SEI Institutional Investments Trust / Annual Report / May 31, 2015 | 149 |
SCHEDULE OF INVESTMENTS
Core Fixed Income Fund (Continued)
May 31, 2015
| Description | Face Amount ($ Thousands) | Market Value ($ Thousands) | ||||||
Ballyrock CLO, Ser 2014-1A, Cl A1 | ||||||||
1.755%, 10/20/2026 (A) (C) | $ | 1,620 | $ | 1,622 | ||||
Bear Stearns Asset-Backed Securities Trust, Ser 2005-SD1, Cl 1A3 | ||||||||
0.585%, 08/25/2043 (A) | 2,400 | 2,366 | ||||||
Brazos Education Loan Authority, Ser 2012-1, Cl A1 | ||||||||
0.881%, 12/26/2035 (A) | 3,765 | 3,791 | ||||||
Brazos Higher Education Authority, Ser 2010-1, Cl A2 | ||||||||
1.482%, 02/25/2035 (A) | 4,835 | 5,015 | ||||||
Brazos Higher Education Authority, Ser 2011-1, Cl A2 | ||||||||
1.062%, 02/25/2030 (A) | 2,160 | 2,166 | ||||||
Brazos Higher Education Authority, Ser 2011-2, Cl A3 | ||||||||
1.277%, 10/27/2036 (A) | 3,520 | 3,567 | ||||||
Business Loan Express Business Loan Trust, Ser 2004-A, Cl A | ||||||||
0.615%, 02/25/2031 (A) (C) | 1,477 | 1,403 | ||||||
BXG Receivables Note Trust, Ser 2012-A, Cl A | ||||||||
2.660%, 12/02/2027 (C) | 260 | 259 | ||||||
Carlyle Global Market Strategies CLO, Ser 2013-4A, Cl C | ||||||||
3.070%, 10/15/2025 (A) (C) | 550 | 548 | ||||||
Carlyle Global Market Strategies Commodities Funding, Ser 2014-1A, Cl A | ||||||||
2.175%, 10/15/2021 (A) (C) | 867 | 867 | ||||||
Carrington Mortgage Loan Trust, Ser 2005-NC4, Cl A3 | ||||||||
0.585%, 09/25/2035 (A) | 1,461 | 1,450 | ||||||
Cedar Funding III CLO, Ser 2014-3A, Cl A1 | ||||||||
1.791%, 05/20/2026 (A) (C) | 1,200 | 1,200 | ||||||
Cent CLO, Ser 2013-19A, Cl A1A | ||||||||
1.607%, 10/29/2025 (A) (C) | 2,250 | 2,226 | ||||||
CenterPoint Energy Transition Bond LLC, Ser 2008-A, Cl A1 | ||||||||
4.192%, 02/01/2020 | 1,663 | 1,703 | ||||||
Chase Funding Mortgage Loan Asset-Backed Certificates, Ser 2003-6, Cl 1A5 | ||||||||
5.260%, 11/25/2034 | 453 | 473 | ||||||
Chase Funding Mortgage Loan Asset-Backed Certificates, Ser 2003-6, Cl 1A7 | ||||||||
4.277%, 11/25/2034 | 449 | 456 | ||||||
CIT Education Loan Trust, Ser 2007-1, Cl A | ||||||||
0.357%, 03/25/2042 (A) (C) | 3,048 | 2,939 | ||||||
| Description | Face Amount ($ Thousands) | Market Value ($ Thousands) | ||||||
Citicorp Residential Mortgage Securities, Ser 2006-2, Cl A5 | ||||||||
6.036%, 09/25/2036 | $ | 6,465 | $ | 6,515 | ||||
Citicorp Residential Mortgage Securities, Ser 2007-1, Cl A5 | ||||||||
5.892%, 03/25/2037 | 990 | 964 | ||||||
CNH Equipment Trust, Ser 2013-C, Cl A2 | ||||||||
0.630%, 01/17/2017 | 18 | 18 | ||||||
CNH Equipment Trust, Ser 2014-A, Cl A2 | ||||||||
0.490%, 06/15/2017 | 203 | 203 | ||||||
Concord Funding LLC, Ser 2012-2, Cl A | ||||||||
3.145%, 01/15/2017 (C) | 1,350 | 1,350 | ||||||
Conseco Finance Home Loan Trust, Ser 2000-E, Cl M1 | ||||||||
8.130%, 08/15/2031 (A) | 24 | 24 | ||||||
Conseco Financial, Ser 1997-2, Cl A6 | ||||||||
7.240%, 06/15/2028 (A) | 7 | 7 | ||||||
Conseco Financial, Ser 1998-2, Cl A5 | ||||||||
6.240%, 12/01/2028 (A) | 75 | 78 | ||||||
Consumer Credit Origination Loan Trust, Ser 2015-1, Cl A | ||||||||
2.820%, 03/15/2021 (C) | 339 | 341 | ||||||
Countrywide Asset-Backed Certificates, Ser 2002-BC1, Cl A | ||||||||
0.845%, 04/25/2032 (A) | 44 | 30 | ||||||
Countrywide Asset-Backed Certificates, Ser 2003-BC2, Cl 2A1 | ||||||||
0.785%, 06/25/2033 (A) | 115 | 98 | ||||||
Countrywide Asset-Backed Certificates, Ser 2004-6, Cl 1A1 | ||||||||
0.725%, 12/25/2034 (A) | 4,763 | 4,499 | ||||||
Countrywide Asset-Backed Certificates, Ser 2005-11, Cl MV1 | ||||||||
0.651%, 02/25/2036 (A) | 5,306 | 5,276 | ||||||
Countrywide Asset-Backed Certificates, Ser 2006-15, Cl A3 | ||||||||
5.178%, 10/25/2046 (A) | 170 | 148 | ||||||
Countrywide Asset-Backed Certificates, Ser 2006-SD3, Cl A1 | ||||||||
0.511%, 07/25/2036 (A) (C) | 282 | 231 | ||||||
Countrywide Asset-Backed Certificates, Ser 2007-13, Cl 2A1 | ||||||||
1.085%, 10/25/2047 (A) | 659 | 587 | ||||||
Countrywide Asset-Backed Certificates, Ser 2007-QH1, Cl A1 | ||||||||
0.385%, 02/25/2037 (A) (C) | 746 | 483 | ||||||
| 150 | SEI Institutional Investments Trust / Annual Report / May 31, 2015 |
| Description | Face Amount ($ Thousands) | Market Value ($ Thousands) | ||||||
Covenant Credit Partners CLO, Ser 2014-1A, Cl A | ||||||||
1.755%, 07/20/2026 (A) (C) | $ | 500 | $ | 499 | ||||
Credit-Based Asset Servicing and Securitization LLC, Ser 2003-CB3, Cl AF1 | ||||||||
3.379%, 12/25/2032 | 69 | 67 | ||||||
Credit-Based Asset Servicing and Securitization LLC, Ser 2006-CB2, Cl AF2 | ||||||||
3.603%, 12/25/2036 | 552 | 378 | ||||||
Credit-Based Asset Servicing and Securitization LLC, Ser 2006-CB2, Cl AF4 | ||||||||
3.603%, 12/25/2036 | 1,016 | 785 | ||||||
Credit-Based Asset Servicing and Securitization LLC, Ser 2007-RP1, Cl A | ||||||||
0.495%, 05/25/2046 (A) (C) | 8,245 | 6,971 | ||||||
CWABS Revolving Home Equity Loan Trust, Ser 2004-K, Cl 2A | ||||||||
0.486%, 02/15/2034 (A) | 320 | 286 | ||||||
CWHEQ Revolving Home Equity Loan Trust, Ser 2007-A, Cl A | ||||||||
0.306%, 04/15/2037 (A) | 7,220 | 6,576 | ||||||
Dryden 37 Senior Loan Fund, Ser 2015-37A, Cl A | ||||||||
1.816%, 04/15/2027 (A) (C) | 3,860 | 3,863 | ||||||
Educational Funding of the South, Ser 2011-1, Cl A2 | ||||||||
0.927%, 04/25/2035 (A) | 3,253 | 3,248 | ||||||
EFS Volunteer No. 3 LLC, Ser 2012-1, Cl A3 | ||||||||
1.181%, 04/25/2033 (A) (C) | 4,600 | 4,657 | ||||||
Equity One Mortgage Pass-Through Trust, Ser 2003-2, Cl M1 | ||||||||
5.050%, 09/25/2033 (A) | 103 | 104 | ||||||
First Franklin Mortgage Loan Trust, Ser 2004-FF7, Cl A5 | ||||||||
1.185%, 09/25/2034 (A) | 20 | 20 | ||||||
First Franklin Mortgage Loan Trust, Ser 2005-FFH3, Cl M1 | ||||||||
0.695%, 09/25/2035 (A) | 6,978 | 6,941 | ||||||
FirstKey Lending Trust, Ser 2015-SFR1, Cl A | ||||||||
2.553%, 03/09/2047 (C) | 333 | 334 | ||||||
Flatiron CLO, Ser 2013-1A, Cl B | ||||||||
3.020%, 01/17/2026 (A) (C) | 950 | 936 | ||||||
Flatiron CLO, Ser 2014-1A, Cl A1 | ||||||||
1.654%, 07/17/2026 (A) (C) | 3,510 | 3,507 | ||||||
Ford Credit Floorplan Master Owner Trust, Ser 2012-2, Cl A | ||||||||
1.920%, 01/15/2019 | 2,653 | 2,693 | ||||||
| Description | Face Amount ($ Thousands) | Market Value ($ Thousands) | ||||||
Ford Credit Floorplan Master Owner Trust, Ser 2013-5, Cl A1 | ||||||||
1.500%, 09/15/2018 | $ | 830 | $ | 837 | ||||
Ford Credit Floorplan Master Owner Trust, Ser 2014-1, Cl A1 | ||||||||
1.200%, 02/15/2019 | 2,066 | 2,072 | ||||||
Ford Credit Floorplan Master Owner Trust, Ser 2014-1, Cl A2 | ||||||||
0.586%, 02/15/2019 (A) | 693 | 694 | ||||||
Ford Credit Floorplan Master Owner Trust, Ser 2014-4, Cl A1 | ||||||||
1.400%, 08/15/2019 | 3,800 | 3,811 | ||||||
Ford Credit Floorplan Master Owner Trust, Ser 2015-1, Cl A2 | ||||||||
0.582%, 01/15/2020 (A) | 904 | 904 | ||||||
Galaxy XIX CLO, | ||||||||
1.806%, 01/24/2027 (A) (C) | 2,000 | 2,002 | ||||||
GCAT, Ser 2014-1A, Cl A1 | ||||||||
3.228%, 07/25/2019 (A) (C) | 830 | 835 | ||||||
GLC II Trust, Ser 2014-A, Cl A | ||||||||
4.000%, 12/18/2020 (C) | 1,204 | 1,207 | ||||||
GLC Trust, Ser 2014-A, Cl A | ||||||||
3.000%, 07/15/2021 (C) | 968 | 964 | ||||||
Global SC Finance II SRL, Ser 2014-1A, Cl A2 | ||||||||
3.090%, 07/17/2029 (C) | 3,859 | 3,872 | ||||||
GMAT Trust, Ser 2014-1A, Cl A | ||||||||
3.721%, 02/25/2044 (C) | 154 | 154 | ||||||
Green Tree Financial, Ser 2008-MH1, Cl A2 | ||||||||
8.970%, 04/25/2038 (A) (C) | 1,681 | 1,755 | ||||||
Green Tree Financial, Ser 2008-MH1, Cl A3 | ||||||||
8.970%, 04/25/2038 (A) (C) | 1,401 | 1,463 | ||||||
Greenpoint Manufactured Housing, Ser 2001-2, Cl IA2 | ||||||||
3.685%, 02/20/2032 (A) | 725 | 665 | ||||||
Greenpoint Manufactured Housing, Ser 2001-2, Cl IIA2 | ||||||||
3.675%, 03/13/2032 (A) | 1,200 | 1,087 | ||||||
GSAMP Trust, Ser 2006-HE2, Cl A3 | ||||||||
0.445%, 03/25/2046 (A) | 8,000 | 7,362 | ||||||
Higher Education Funding I, Ser 2014-1, Cl A | ||||||||
1.332%, 05/25/2034 (A) (C) | 3,510 | 3,551 | ||||||
HLSS Servicer Advance Receivables Backed Notes, Ser 2013-T7, Cl AT7 | ||||||||
1.981%, 11/15/2046 (C) | 2,614 | 2,601 | ||||||
HLSS Servicer Advance Receivables Trust, Ser 2012-T2, Cl A2 | ||||||||
1.990%, 10/15/2045 (C) | 730 | 730 | ||||||
| SEI Institutional Investments Trust / Annual Report / May 31, 2015 | 151 |
SCHEDULE OF INVESTMENTS
Core Fixed Income Fund (Continued)
May 31, 2015
| Description | Face Amount ($ Thousands) | Market Value ($ Thousands) | ||||||
HLSS Servicer Advance Receivables Trust, Ser 2013-T1, Cl A2 | ||||||||
1.495%, 01/16/2046 (C) | $ | 539 | $ | 538 | ||||
HLSS Servicer Advance Receivables Trust, Ser 2013-T1, Cl B2 | ||||||||
1.744%, 01/16/2046 (C) | 182 | 182 | ||||||
HLSS Servicer Advance Receivables Trust, Ser 2014-T2, Cl AT2 | ||||||||
2.217%, 01/15/2047 (C) | 444 | 445 | ||||||
HSI Asset Securitization Trust, Ser 2006-OPT3, Cl 3A3 | ||||||||
0.365%, 02/25/2036 (A) | 1,094 | 1,021 | ||||||
ING IM CLO, Ser 2014-1A, Cl A1 | ||||||||
1.775%, 04/18/2026 (A) (C) | 3,900 | 3,901 | ||||||
JGWPT XXX LLC, Ser 2013-3A, Cl A | ||||||||
4.080%, 01/17/2073 (C) | 2,176 | 2,291 | ||||||
JGWPT XXXII LLC, Ser 2014-2A, Cl A | ||||||||
3.610%, 01/17/2073 (C) | 2,838 | 2,887 | ||||||
JGWPT XXXIII LLC, Ser 2014-3A, Cl A | ||||||||
3.500%, 06/15/2077 (C) | 1,335 | 1,350 | ||||||
JPMorgan Mortgage Acquisition, Ser 2007-CH1, Cl AV4 | ||||||||
0.311%, 11/25/2036 (A) | 2,094 | 2,087 | ||||||
Key Resorts LLC, Ser 2014-A, Cl A | ||||||||
3.220%, 03/17/2031 (C) | 461 | 463 | ||||||
Latitude CLO II, Ser 2006-2A, Cl A2 | ||||||||
0.601%, 12/15/2018 (A) (C) | 1,088 | 1,083 | ||||||
Lehman ABS Manufactured Housing Contract Trust, Ser 2001-B, Cl A4 | ||||||||
5.270%, 04/15/2040 | 181 | 192 | ||||||
Long Beach Mortgage Loan Trust, Ser 2005-1, Cl M2 | ||||||||
0.980%, 02/25/2035 (A) | 6,835 | 6,634 | ||||||
Madison Avenue Manufactured Housing Contract Trust, Ser 2002-A, Cl M2 | ||||||||
2.435%, 03/25/2032 (A) | 61 | 61 | ||||||
Magnetite VI, Ser 2015-6A, Cl CR | ||||||||
2.884%, 09/15/2023 (A) (C) | 1,500 | 1,500 | ||||||
Mid-State Trust, Ser 2003-11, Cl A1 | ||||||||
4.864%, 07/15/2038 | 2,771 | 2,941 | ||||||
Mid-State Trust, Ser 2004-1, Cl A | ||||||||
6.005%, 08/15/2037 | 422 | 441 | ||||||
Mid-State Trust, Ser 2006-1, Cl A | ||||||||
5.787%, 10/15/2040 (C) | 4,896 | 5,253 | ||||||
| Description | Face Amount ($ Thousands) | Market Value ($ Thousands) | ||||||
Nationstar Agency Advance Funding Trust, Ser 2013-T2A, Cl AT2 | ||||||||
1.892%, 02/18/2048 (C) | $ | 232 | $ | 228 | ||||
Navient Private Education Loan Trust, Ser 2014-AA, Cl A2A | ||||||||
2.740%, 02/15/2029 (C) | 4,024 | 4,045 | ||||||
Navient Private Education Loan Trust, Ser 2015-AA, Cl A2A | ||||||||
2.650%, 12/15/2028 (C) | 1,614 | 1,618 | ||||||
Navient Private Education Loan Trust, Ser 2015-AA, Cl A2B | ||||||||
1.382%, 12/15/2028 (A) (C) | 2,187 | 2,197 | ||||||
Navient Student Loan Trust, Ser 2014-1, Cl A2 | ||||||||
0.495%, 03/27/2023 (A) | 1,388 | 1,387 | ||||||
Navient Student Loan Trust, Ser 2014-1, Cl A3 | ||||||||
0.691%, 06/25/2031 (A) | 5,330 | 5,301 | ||||||
Navient Student Loan Trust, Ser 2014-2, Cl A | ||||||||
0.825%, 03/25/2043 (A) | 6,870 | 6,839 | ||||||
Navient Student Loan Trust, Ser 2014-3, Cl A | ||||||||
0.805%, 03/25/2043 (A) | 6,865 | 6,825 | ||||||
Navient Student Loan Trust, Ser 2014-4, Cl A | ||||||||
0.801%, 03/25/2043 (A) | 4,916 | 4,887 | ||||||
Navient Student Loan Trust, Ser 2014-8, Cl A2 | ||||||||
0.621%, 04/25/2023 (A) | 1,300 | 1,301 | ||||||
Navient Student Loan Trust, Ser 2014-8, Cl B | ||||||||
1.685%, 07/26/2049 (A) | 134 | 130 | ||||||
Nelnet Student Loan Trust, Ser 2004-3, Cl A5 | ||||||||
0.457%, 10/27/2036 (A) | 2,057 | 2,033 | ||||||
Nelnet Student Loan Trust, Ser 2004-4, Cl A5 | ||||||||
0.437%, 01/25/2037 (A) | 1,943 | 1,922 | ||||||
Nelnet Student Loan Trust, Ser 2005-1, Cl A5 | ||||||||
0.387%, 10/25/2033 (A) | 2,231 | 2,182 | ||||||
Nelnet Student Loan Trust, Ser 2005-2, Cl A5 | ||||||||
0.365%, 03/23/2037 (A) | 1,848 | 1,804 | ||||||
Nelnet Student Loan Trust, Ser 2005-3, Cl A5 | ||||||||
0.385%, 12/24/2035 (A) | 6,032 | 5,923 | ||||||
Nelnet Student Loan Trust, Ser 2005-4, Cl A4 | ||||||||
0.445%, 03/22/2032 (A) | 742 | 715 | ||||||
Nelnet Student Loan Trust, Ser 2006-1, Cl A4 | ||||||||
0.372%, 11/23/2022 (A) | 426 | 426 | ||||||
| 152 | SEI Institutional Investments Trust / Annual Report / May 31, 2015 |
| Description | Face Amount ($ Thousands) | Market Value ($ Thousands) | ||||||
Nelnet Student Loan Trust, Ser 2006-2, Cl A4 | ||||||||
0.357%, 10/26/2026 (A) | $ | 1,625 | $ | 1,624 | ||||
Nelnet Student Loan Trust, Ser 2010-4A, Cl A | ||||||||
0.985%, 04/25/2046 (A) (C) | 931 | 942 | ||||||
Nelnet Student Loan Trust, Ser 2014-4A, Cl A2 | ||||||||
1.135%, 11/25/2043 (A) (C) | 3,735 | 3,749 | ||||||
Nelnet Student Loan Trust, Ser 2015-2A, Cl A2 | ||||||||
0.785%, 09/25/2042 (A) (C) | 6,575 | 6,575 | ||||||
Neuberger Berman CLO, Ser 2014-16A, Cl A1 | ||||||||
1.745%, 04/15/2026 (A) (C) | 1,060 | 1,060 | ||||||
Normandy Mortgage Loan LLC, Ser 2013-NPL3, Cl A | ||||||||
4.949%, 09/16/2043 (C) | 957 | 956 | ||||||
NYMT Residential, Ser 2012-RP1A | ||||||||
4.250%, 12/25/2017 (A) (C) | 1,099 | 1,099 | ||||||
NYMT Residential, Ser 2013-RP3A | ||||||||
4.850%, 09/25/2018 (C) | 595 | 595 | ||||||
Oak Hill Advisors Residential Loan Trust, Ser 2014-NPL2, Cl A1 | ||||||||
3.475%, 04/25/2054 (C) | 1,071 | 1,075 | ||||||
Oak Hill Advisors Residential Loan Trust, Ser 2014-NPL2, Cl A2 | ||||||||
4.000%, 04/25/2054 (C) | 343 | 339 | ||||||
Octagon Investment Partners XI, Ser 2007-1X, Cl A1B | ||||||||
0.542%, 08/25/2021 (A) | 2,776 | 2,728 | ||||||
OHA Loan Funding, Ser 2014-1A, Cl A1 | ||||||||
1.762%, 10/20/2026 (A) (C) | 3,000 | 2,997 | ||||||
OneMain Financial Issuance Trust, Ser 2015-1A, Cl A | ||||||||
3.190%, 03/18/2026 (C) | 1,151 | 1,160 | ||||||
OZLM VIII, Ser 2014-8A, Cl A1A | ||||||||
1.714%, 10/17/2026 (A) (C) | 2,000 | 1,999 | ||||||
Park Place Securities Asset-Backed Pass-Through Certificates, Ser 2004-WCW1, Cl M2 | ||||||||
1.205%, 09/25/2034 (A) | 349 | 346 | ||||||
Park Place Securities Asset-Backed Pass-Through Certificates, Ser 2004-WWF1, Cl M2 | ||||||||
1.205%, 12/25/2034 (A) | 1,180 | 1,181 | ||||||
Park Place Securities Asset-Backed Pass-Through Certificates, Ser 2005-WCH1, Cl M2 | ||||||||
0.965%, 01/25/2036 (A) | 2,255 | 2,243 | ||||||
| Description | Face Amount ($ Thousands) | Market Value ($ Thousands) | ||||||
Park Place Securities Asset-Backed Pass-Through Certificates, Ser 2005-WCW2, Cl A2D | ||||||||
0.555%, 07/25/2035 (A) | $ | 5,685 | $ | 5,664 | ||||
Park Place Securities Asset-Backed Pass-Through Certificates, Ser 2005-WCW2, Cl M1 | ||||||||
0.685%, 07/25/2035 (A) | 7,350 | 7,264 | ||||||
Popular ABS Mortgage Pass-Through Trust, Ser 2004-5, Cl AF4 | ||||||||
4.655%, 12/25/2034 (A) | 14 | 14 | ||||||
Progreso Receivables Funding I LLC, Ser 2013-A, Cl A | ||||||||
4.000%, 07/09/2018 (C) | 500 | 501 | ||||||
Progreso Receivables Funding II LLC, Ser 2014-A, Cl A | ||||||||
3.500%, 07/08/2019 (C) | 1,000 | 1,001 | ||||||
Progreso Receivables Funding LLC, Ser 2015-A, Cl A | ||||||||
3.625%, 02/10/2020 (C) | 1,030 | 1,030 | ||||||
Race Point CLO, Ser 2012-7A, Cl A | ||||||||
1.696%, 11/08/2024 (A) (C) | 4,500 | 4,500 | ||||||
RAMP Trust, Ser 2002-RS4, Cl AI5 | ||||||||
6.163%, 08/25/2032 | 3 | 3 | ||||||
RAMP Trust, Ser 2003-RS10, Cl AI6 | ||||||||
5.860%, 11/25/2033 | 529 | 565 | ||||||
RAMP Trust, Ser 2003-RS11, Cl AI6A | ||||||||
5.980%, 12/25/2033 | 440 | 475 | ||||||
RAMP Trust, Ser 2006-RZ1, Cl A3 | ||||||||
0.485%, 03/25/2036 (A) | 586 | 572 | ||||||
RAMP Trust, Ser 2006-RZ3, Cl A2 | ||||||||
0.345%, 08/25/2036 (A) | 3,147 | 3,108 | ||||||
RSB Bondco LLC, Ser 2007-A, Cl A3 | ||||||||
5.820%, 06/28/2019 | 2,470 | 2,631 | ||||||
Saranac CLO II, Ser 2014-2A, Cl B | ||||||||
2.326%, 02/20/2025 (A) (C) | 1,750 | 1,736 | ||||||
Selene Non-Performing Loans LLC, Ser 2014-1A, Cl A | ||||||||
2.981%, 05/25/2054 (C) | 265 | 263 | ||||||
Shackleton CLO, Ser 2013-4A, Cl B1 | ||||||||
2.270%, 01/13/2025 (A) (C) | 1,450 | 1,450 | ||||||
SLC Student Loan Trust, Ser 2007-2, Cl A2 | ||||||||
0.674%, 05/15/2028 (A) | 869 | 869 | ||||||
SLM Private Education Loan Trust, | ||||||||
3.480%, 10/15/2030 (C) | 641 | 665 | ||||||
| SEI Institutional Investments Trust / Annual Report / May 31, 2015 | 153 |
SCHEDULE OF INVESTMENTS
Core Fixed Income Fund (Continued)
May 31, 2015
| Description | Face Amount ($ Thousands) | Market Value ($ Thousands) | ||||||
SLM Private Education Loan Trust, | ||||||||
2.950%, 02/15/2046 (C) | $ | 2,757 | $ | 2,836 | ||||
SLM Private Education Loan Trust, | ||||||||
0.836%, 07/15/2022 (A) (C) | 1,155 | 1,156 | ||||||
SLM Private Education Loan Trust, | ||||||||
1.850%, 06/17/2030 (C) | 397 | 395 | ||||||
SLM Private Education Loan Trust, | ||||||||
2.940%, 10/15/2031 (C) | 669 | 691 | ||||||
SLM Private Education Loan Trust, | ||||||||
0.786%, 07/15/2022 (A) (C) | 657 | 658 | ||||||
SLM Private Education Loan Trust, | ||||||||
2.590%, 01/15/2026 (C) | 1,128 | 1,147 | ||||||
SLM Student Loan Trust, | ||||||||
0.861%, 03/15/2038 (A) | 1,773 | 1,606 | ||||||
SLM Student Loan Trust, | ||||||||
0.991%, 03/15/2033 (A) (C) | 1,856 | 1,856 | ||||||
SLM Student Loan Trust, | ||||||||
0.827%, 04/27/2026 (A) (C) | 3,200 | 3,200 | ||||||
SLM Student Loan Trust, | ||||||||
0.447%, 07/25/2023 (A) | 2,836 | 2,826 | ||||||
SLM Student Loan Trust, | ||||||||
0.737%, 01/25/2040 (A) | 470 | 431 | ||||||
SLM Student Loan Trust, | ||||||||
0.777%, 04/25/2024 (A) (C) | 6,046 | 6,052 | ||||||
SLM Student Loan Trust, | ||||||||
0.367%, 04/27/2020 (A) | 3,684 | 3,659 | ||||||
SLM Student Loan Trust, | ||||||||
0.377%, 04/25/2025 (A) | 296 | 295 | ||||||
SLM Student Loan Trust, | ||||||||
0.417%, 10/25/2028 (A) | 2,900 | 2,841 | ||||||
SLM Student Loan Trust, | ||||||||
1.477%, 07/27/2026 (A) | 1,191 | 1,212 | ||||||
SLM Student Loan Trust, | ||||||||
0.417%, 10/27/2031 (A) | 1,789 | 1,743 | ||||||
SLM Student Loan Trust, | ||||||||
0.427%, 10/25/2029 (A) | 1,657 | 1,618 | ||||||
| Description | Face Amount ($ Thousands) | Market Value ($ Thousands) | ||||||
SLM Student Loan Trust, | ||||||||
0.397%, 01/27/2025 (A) | $ | 1,547 | $ | 1,544 | ||||
SLM Student Loan Trust, | ||||||||
0.447%, 01/25/2041 (A) | 4,250 | 3,998 | ||||||
SLM Student Loan Trust, | ||||||||
0.377%, 01/25/2021 (A) | 2,551 | 2,517 | ||||||
SLM Student Loan Trust, | ||||||||
0.347%, 04/25/2022 (A) | 16 | 16 | ||||||
SLM Student Loan Trust, | ||||||||
0.437%, 01/25/2041 (A) | 4,250 | 3,981 | ||||||
SLM Student Loan Trust, | ||||||||
0.447%, 07/25/2025 (A) | 934 | 834 | ||||||
SLM Student Loan Trust, | ||||||||
1.127%, 04/27/2043 (A) | 1,036 | 937 | ||||||
SLM Student Loan Trust, | ||||||||
1.477%, 01/25/2029 (A) | 1,155 | 1,074 | ||||||
SLM Student Loan Trust, | ||||||||
1.477%, 04/25/2029 (A) | 1,155 | 1,075 | ||||||
SLM Student Loan Trust, | ||||||||
2.127%, 04/25/2029 (A) | 1,155 | 1,124 | ||||||
SLM Student Loan Trust, | ||||||||
1.577%, 01/25/2018 (A) | 372 | 374 | ||||||
SLM Student Loan Trust, | ||||||||
2.127%, 07/25/2029 (A) | 1,155 | 1,171 | ||||||
SLM Student Loan Trust, | ||||||||
2.127%, 07/25/2029 (A) | 1,155 | 1,162 | ||||||
SLM Student Loan Trust, | ||||||||
2.127%, 07/25/2029 (A) | 1,155 | 1,159 | ||||||
SLM Student Loan Trust, | ||||||||
2.527%, 10/25/2029 (A) | 1,155 | 1,200 | ||||||
SLM Student Loan Trust, | ||||||||
1.777%, 04/25/2023 (A) | 6,252 | 6,414 | ||||||
SLM Student Loan Trust, | ||||||||
2.527%, 10/25/2029 (A) | 1,155 | 1,203 | ||||||
SLM Student Loan Trust, | ||||||||
0.585%, 03/25/2025 (A) | 330 | 329 | ||||||
| 154 | SEI Institutional Investments Trust / Annual Report / May 31, 2015 |
| Description | Face Amount ($ Thousands) | Market Value ($ Thousands) | ||||||
SLM Student Loan Trust, | ||||||||
1.385%, 10/25/2034 (A) | $ | 495 | $ | 508 | ||||
SLM Student Loan Trust, | ||||||||
0.935%, 05/26/2026 (A) | 1,094 | 1,108 | ||||||
SLM Student Loan Trust, | ||||||||
1.185%, 04/27/2043 (A) | 1,862 | 1,758 | ||||||
SLM Student Loan Trust, | ||||||||
0.936%, 10/16/2023 (A) (C) | 999 | 1,001 | ||||||
SLM Student Loan Trust, | ||||||||
1.936%, 06/15/2045 (A) (C) | 3,176 | 3,263 | ||||||
SLM Student Loan Trust, | ||||||||
1.985%, 11/25/2043 (A) | 487 | �� | 489 | |||||
SLM Student Loan Trust, | ||||||||
1.685%, 06/25/2043 (A) | 373 | 368 | ||||||
SLM Student Loan Trust, | ||||||||
0.485%, 05/26/2020 (A) | 3,000 | 2,998 | ||||||
SLM Student Loan Trust, | ||||||||
1.685%, 09/25/2043 (A) | 768 | 752 | ||||||
SLM Student Loan Trust, | ||||||||
0.731%, 06/25/2027 (A) | 2,649 | 2,658 | ||||||
SLM Student Loan Trust, | ||||||||
0.581%, 10/26/2020 (A) | 1,216 | 1,218 | ||||||
SLM Student Loan Trust, | ||||||||
0.685%, 02/25/2021 (A) | 633 | 633 | ||||||
SLM Student Loan Trust, | ||||||||
3.500%, 10/28/2029 (C) | 3,733 | 3,689 | ||||||
SLM Student Loan Trust, | ||||||||
0.565%, 07/26/2021 (A) | 1,946 | 1,946 | ||||||
SLM Student Loan Trust, | ||||||||
0.775%, 03/26/2029 (A) | 1,774 | 1,782 | ||||||
Small Business Administration, | ||||||||
3.380%, 12/01/2033 | 1,212 | 1,279 | ||||||
Small Business Administration, | ||||||||
2.520%, 01/01/2035 | 1,110 | 1,111 | ||||||
SMB Private Education Loan Trust, | ||||||||
0.780%, 07/17/2023 (A) (C) | 2,768 | 2,768 | ||||||
| Description | Face Amount ($ Thousands) | Market Value ($ Thousands) | ||||||
SMB Private Education Loan Trust, | ||||||||
2.490%, 06/15/2027 (C) | $ | 2,370 | $ | 2,350 | ||||
SMB Private Education Loan Trust, | ||||||||
1.180%, 06/15/2027 (A) (C) | 1,602 | 1,602 | ||||||
SpringCastle America Funding LLC, Ser 2014-AA, Cl A | ||||||||
2.700%, 05/25/2023 (C) | 2,319 | 2,329 | ||||||
SpringCastle America Funding LLC, Ser 2014-AA, Cl B | ||||||||
4.610%, 10/25/2027 (C) | 600 | 609 | ||||||
Springleaf Funding Trust, | ||||||||
2.580%, 09/15/2021 (C) | 1,876 | 1,881 | ||||||
Springleaf Funding Trust, | ||||||||
2.410%, 12/15/2022 (C) | 933 | 934 | ||||||
Stanwich Mortgage Loan Trust, | ||||||||
2.981%, 02/16/2043 (C) | 122 | 122 | ||||||
Structured Asset Investment Loan Trust, Ser 2004-8, Cl A2 | ||||||||
0.735%, 09/25/2034 (A) | 3,364 | 3,211 | ||||||
Structured Asset Securities Mortgage Loan Trust, Ser 2005-WF2, Cl A3 | ||||||||
0.785%, 05/25/2035 (A) | 7,135 | 7,139 | ||||||
Structured Asset Securities Mortgage Loan Trust, Ser 2005-WF4, Cl A4 | ||||||||
0.545%, 11/25/2035 (A) | 192 | 192 | ||||||
Sunset Mortgage Loan, | ||||||||
3.721%, 11/16/2044 (C) | 1,674 | 1,666 | ||||||
Trade MAPS 1, Ser 2013-1A, Cl A | ||||||||
0.882%, 12/10/2018 (A) (C) | 3,109 | 3,108 | ||||||
Trafigura Securitisation Finance, | ||||||||
1.136%, 10/15/2021 (A) (C) | 957 | 957 | ||||||
Truman Capital Mortgage Loan Trust, Ser 2014-NPL1, Cl A1 | ||||||||
3.228%, 07/25/2053 (C) | 616 | 615 | ||||||
Truman Capital Mortgage Loan Trust, Ser 2014-NPL2, Cl A1 | ||||||||
3.125%, 06/25/2054 (C) | 734 | 733 | ||||||
Truman Capital Mortgage Loan Trust, Ser 2014-NPL2, Cl A2 | ||||||||
4.250%, 06/25/2054 (C) | 301 | 295 | ||||||
Truman Capital Mortgage Loan Trust, Ser 2014-NPL3, Cl A1 | ||||||||
3.125%, 04/25/2053 (C) | 682 | 681 | ||||||
| SEI Institutional Investments Trust / Annual Report / May 31, 2015 | 155 |
SCHEDULE OF INVESTMENTS
Core Fixed Income Fund (Continued)
May 31, 2015
| Description | Face Amount ($ Thousands) | Market Value ($ Thousands) | ||||||
U.S. Small Business Administration, | ||||||||
2.517%, 03/10/2025 | $ | 1,330 | $ | 1,342 | ||||
US Residential Opportunity Fund Trust, Ser 2015-1III, Cl A | ||||||||
3.721%, 01/27/2035 (C) | 1,079 | 1,088 | ||||||
Venture XV CLO, | ||||||||
2.325%, 07/15/2025 (A) (C) | 800 | 800 | ||||||
Venture XVI CLO, | ||||||||
1.753%, 04/15/2026 (A) (C) | 4,020 | 4,021 | ||||||
VOLT XIX LLC, | ||||||||
3.875%, 04/25/2055 (C) | 883 | 886 | ||||||
VOLT XXVI LLC, | ||||||||
3.125%, 09/25/2043 (C) | 1,287 | 1,285 | ||||||
VOLT XXX LLC, | ||||||||
3.625%, 10/25/2057 (C) | 765 | 767 | ||||||
VOLT XXXI LLC, | ||||||||
3.375%, 02/25/2055 (C) | 718 | 719 | ||||||
VOLT, Ser 2014-3A, Cl A1 | ||||||||
3.250%, 05/25/2054 | 157 | 157 | ||||||
VOLT, Ser 2014-NPL4, Cl A1 | ||||||||
3.125%, 04/27/2054 (C) | 1,276 | 1,276 | ||||||
VOLT, Ser 2014-NPL5, Cl A1 | ||||||||
3.228%, 09/25/2058 | 755 | 755 | ||||||
VOLT, Ser 2014-NPL6, Cl A2 | ||||||||
4.250%, 09/25/2043 | 422 | 415 | ||||||
VOLT, Ser 2014-NPL7, Cl A1 | ||||||||
3.375%, 08/27/2057 (C) | 1,418 | 1,420 | ||||||
VOLT, Ser 2014-NPL8, Cl A1 | ||||||||
3.375%, 10/26/2054 (C) | 427 | 427 | ||||||
Voya CLO, Ser 2014-4A, Cl A1 | ||||||||
1.777%, 10/14/2026 (A) (C) | 3,500 | 3,498 | ||||||
Westgate Resorts LLC, | ||||||||
3.000%, 01/20/2025 (C) | 223 | 223 | ||||||
Westgate Resorts LLC, | ||||||||
2.500%, 03/20/2025 (C) | 199 | 199 | ||||||
|
| |||||||
| 457,147 | ||||||||
|
| |||||||
Total Asset-Backed Securities |
| 639,139 | ||||||
|
| |||||||
U.S. GOVERNMENT AGENCY OBLIGATIONS — 3.3% |
| |||||||
FAMC | ||||||||
2.375%, 07/22/2015 | 170 | 171 | ||||||
2.125%, 09/15/2015 | 175 | 176 | ||||||
| Description | Face Amount ($ Thousands) | Market Value ($ Thousands) | ||||||
FFCB | ||||||||
1.500%, 11/16/2015 | $ | 7,830 | $ | 7,867 | ||||
0.240%, 02/27/2017 (A) | 7,130 | 7,138 | ||||||
0.206%, 09/14/2016 (A) | 7,370 | 7,375 | ||||||
FHLB | ||||||||
5.500%, 07/15/2036 | 200 | 269 | ||||||
0.875%, 05/24/2017 | 100 | 100 | ||||||
0.065%, 07/20/2015 (B) | 40,635 | 40,631 | ||||||
0.060%, 06/10/2015 (B) | 12,195 | 12,195 | ||||||
0.057%, 06/24/2015 (B) | 15,765 | 15,764 | ||||||
FHLMC | ||||||||
5.625%, 11/23/2035 | 1,581 | 1,619 | ||||||
1.620%, 11/21/2019 | 810 | 807 | ||||||
FICO STRIPS, PO | ||||||||
9.800%, 04/06/2018 | 7,590 | 9,465 | ||||||
8.600%, 09/26/2019 | 5,655 | 7,300 | ||||||
1.386%, 11/02/2018 (B) | 9,315 | 8,880 | ||||||
1.350%, 08/03/2018 (B) | 9,280 | 8,891 | ||||||
1.315%, 05/11/2018 (B) | 3,620 | 3,505 | ||||||
1.302%, 04/06/2018 (B) | 2,920 | 2,830 | ||||||
1.281%, 02/08/2018 (B) | 960 | 933 | ||||||
0.000%, 12/06/2018 to 09/26/2019 (B) | 7,550 | 7,157 | ||||||
FNMA | ||||||||
2.625%, 09/06/2024 | 1,458 | 1,491 | ||||||
2.331%, 10/09/2019 (B) | 27,035 | 24,828 | ||||||
FNMA, PO | ||||||||
0.000%, 05/15/2030 (B) | 1,800 | 1,087 | ||||||
Residual Funding Principal STRIPS | ||||||||
1.757%, 07/15/2020 (B) | 3,880 | 3,535 | ||||||
Resolution Funding STRIPS | ||||||||
1.804%, 10/15/2019 (B) | 440 | 409 | ||||||
Tennessee Valley Authority | ||||||||
5.880%, 04/01/2036 | 1,550 | 2,070 | ||||||
5.250%, 09/15/2039 | 498 | 627 | ||||||
4.625%, 09/15/2060 | 231 | 257 | ||||||
3.875%, 02/15/2021 | 3,090 | 3,428 | ||||||
2.875%, 09/15/2024 | 4,030 | 4,142 | ||||||
Tennessee Valley Authority Generic STRIPS | ||||||||
5.740%, 07/15/2028 (B) | 1,500 | 971 | ||||||
Tennessee Valley Authority Principal STRIPS, PO | ||||||||
0.000%, 11/01/2025 (B) | 1,000 | 729 | ||||||
|
| |||||||
Total U.S. Government Agency Obligations (Cost $179,562) ($ Thousands) |
| 186,647 | ||||||
|
| |||||||
SOVEREIGN DEBT — 2.2% |
| |||||||
African Development Bank | ||||||||
8.800%, 09/01/2019 (K) | 700 | 876 | ||||||
Brazilian Government International Bond | ||||||||
5.000%, 01/27/2045 | 200 | 186 | ||||||
| 156 | SEI Institutional Investments Trust / Annual Report / May 31, 2015 |
| Description | Face Amount (Thousands) (1) | Market Value ($ Thousands) | ||||||
Federal Republic of Brazil | ||||||||
4.250%, 01/07/2025 (D) | 755 | $ | 743 | |||||
FMS Wertmanagement AoeR | ||||||||
1.000%, 11/21/2017 | 1,660 | 1,662 | ||||||
Israel Government AID Bond | ||||||||
5.500%, 09/18/2033 | 1,000 | 1,325 | ||||||
3.516%, 11/01/2024 (B) | 1,000 | 775 | ||||||
3.008%, 02/15/2025 (B) | 1,000 | 766 | ||||||
2.986%, 08/15/2025 (B) | 1,000 | 754 | ||||||
Italy Buoni Poliennali Del Tesoro | ||||||||
3.750%, 09/01/2024 | EUR | 18,220 | 23,200 | |||||
Japan Bank for International Cooperation | ||||||||
1.750%, 05/28/2020 | 2,160 | 2,145 | ||||||
Japan Finance Organization for Municipalities | ||||||||
4.000%, 01/13/2021 | 3,600 | 3,976 | ||||||
Mexico Government International Bond MTN | ||||||||
6.050%, 01/11/2040 | 394 | 469 | ||||||
5.750%, 10/12/2110 | 2,947 | 3,072 | ||||||
5.550%, 01/21/2045 | 20,210 | 22,711 | ||||||
4.750%, 03/08/2044 | 968 | 976 | ||||||
4.600%, 01/23/2046 | 760 | 748 | ||||||
4.000%, 10/02/2023 | 84 | 88 | ||||||
3.500%, 01/21/2021 | 300 | 309 | ||||||
Province of Ontario Canada | ||||||||
1.875%, 05/21/2020 | 1,915 | 1,923 | ||||||
Province of Quebec Canada | ||||||||
7.500%, 07/15/2023 | 260 | 351 | ||||||
2.625%, 02/13/2023 | 5,600 | 5,721 | ||||||
Republic of Colombia | ||||||||
5.625%, 02/26/2044 | 6,830 | 7,359 | ||||||
5.000%, 06/15/2045 | 470 | 464 | ||||||
Republic of Indonesia MTN | ||||||||
5.875%, 03/13/2020 | 190 | 214 | ||||||
5.875%, 01/15/2024 (C) | 1,264 | 1,422 | ||||||
5.125%, 01/15/2045 (C) | 845 | 839 | ||||||
4.875%, 05/05/2021 | 500 | 541 | ||||||
3.750%, 04/25/2022 | 500 | 501 | ||||||
3.750%, 04/25/2022 (C) | 360 | 360 | ||||||
Republic of Paraguay | ||||||||
6.100%, 08/11/2044 (C) | 960 | 1,032 | ||||||
4.625%, 01/25/2023 (C) | 1,285 | 1,317 | ||||||
Republic of Peru | ||||||||
5.625%, 11/18/2050 | 1,080 | 1,269 | ||||||
Republic of Poland | ||||||||
4.000%, 01/22/2024 | 7,630 | 8,155 | ||||||
Republic of Slovakia | ||||||||
4.375%, 05/21/2022 (C) | 2,990 | 3,330 | ||||||
Republic of Slovenia | ||||||||
5.850%, 05/10/2023 (C) | 655 | 763 | ||||||
5.500%, 10/26/2022 (C) | 1,426 | 1,622 | ||||||
| Description | Face Amount (Thousands) (1) | Market Value ($ Thousands) | ||||||
5.250%, 02/18/2024 (C) | 2,605 | $ | 2,934 | |||||
Republic of South Africa | ||||||||
5.875%, 09/16/2025 (D) | 4,750 | 5,390 | ||||||
Republic of Turkey | ||||||||
6.250%, 09/26/2022 | 859 | 969 | ||||||
5.750%, 03/22/2024 (D) | 4,240 | 4,673 | ||||||
5.625%, 03/30/2021 | 562 | 613 | ||||||
Russian Foreign Bond - Eurobond | ||||||||
7.500%, 03/31/2030 | 3,266 | 3,825 | ||||||
4.500%, 04/04/2022 | 2,400 | 2,361 | ||||||
Ukraine Government AID Bonds | ||||||||
1.847%, 05/29/2020 | 852 | 852 | ||||||
|
| |||||||
Total Sovereign Debt |
| 123,581 | ||||||
|
| |||||||
MUNICIPAL BONDS — 0.5% |
| |||||||
Brazos, Higher Education Authority, | ||||||||
0.269%, 12/26/2024 (A) | 1,183 | 1,162 | ||||||
California State, Build America Project, GO | ||||||||
7.600%, 11/01/2040 | 1,170 | 1,795 | ||||||
6.650%, 03/01/2022 | 70 | 86 | ||||||
City of Chicago, Ser B, GO | ||||||||
6.314%, 01/01/2044 | 2,690 | 2,462 | ||||||
City of Houston, Ser A, GO | ||||||||
6.290%, 03/01/2032 | 605 | 751 | ||||||
City of Los Angeles, Department of Airports, RB | ||||||||
6.582%, 05/15/2039 | 180 | 231 | ||||||
City of New York, Build America Project, GO | ||||||||
5.047%, 10/01/2024 | 4,000 | 4,580 | ||||||
City of New York, | ||||||||
6.646%, 12/01/2031 | 2,000 | 2,358 | ||||||
County of Clark, Airport System Revenue, Ser C-BUILD, RB | ||||||||
6.820%, 07/01/2045 | 1,990 | 2,806 | ||||||
Illinois State, Build America Project, GO | ||||||||
6.200%, 07/01/2021 | 1,500 | 1,610 | ||||||
Illinois State, GO | ||||||||
5.100%, 06/01/2033 | 270 | 256 | ||||||
Los Angeles, Community College District, Build America Project, GO | ||||||||
6.750%, 08/01/2049 | 1,345 | 1,942 | ||||||
New Jersey State, Turnpike Authority, Build America Project, RB | ||||||||
7.102%, 01/01/2041 | 1,774 | 2,486 | ||||||
| SEI Institutional Investments Trust / Annual Report / May 31, 2015 | 157 |
SCHEDULE OF INVESTMENTS
Core Fixed Income Fund (Continued)
May 31, 2015
| Description | Face Amount ($ Thousands) | Market Value ($ Thousands) | ||||||
New York State, Dormitory Authority, RB | ||||||||
5.600%, 03/15/2040 | $ | 280 | $ | 345 | ||||
North Texas, Tollway Authority, Build America Project, RB | ||||||||
6.718%, 01/01/2049 | 1,554 | 2,175 | ||||||
Northstars Education Finance Authority, RB | ||||||||
1.029%, 01/29/2046 (A) | 50 | 49 | ||||||
Ohio State University, Build America Project, Ser A, RB | ||||||||
4.800%, 06/01/2111 | 1,159 | 1,150 | ||||||
Ohio State, American Municipal Power, RB | ||||||||
7.499%, 02/15/2050 | 200 | 282 | ||||||
Port Authority of New York & New Jersey, Build America Project, RB | ||||||||
5.647%, 11/01/2040 | 200 | 244 | ||||||
Port Authority of New York & New Jersey, RB | ||||||||
4.458%, 10/01/2062 | 1,820 | 1,880 | ||||||
South Carolina State, Student Loan, Ser A-2, Cl A2, RB | ||||||||
0.403%, 12/01/2020 (A) | 1,135 | 1,134 | ||||||
Virginia State, Housing Development Authority, Ser C, RB | ||||||||
6.000%, 06/25/2034 | 245 | 262 | ||||||
|
| |||||||
Total Municipal Bonds |
| 30,046 | ||||||
|
| |||||||
U.S. TREASURY OBLIGATIONS — 25.9% |
| |||||||
U.S. Treasury Bills | ||||||||
0.025%, 06/25/2015 (B) (J) | 226 | 226 | ||||||
0.020%, 06/18/2015 (B) (J) | 105 | 105 | ||||||
0.005%, 06/04/2015 (B) (J) | 74 | 74 | ||||||
0.000%, 06/11/2015 (B) (J) | 342 | 342 | ||||||
U.S. Treasury Bonds | ||||||||
4.500%, 05/15/2038 | 500 | 649 | ||||||
3.750%, 11/15/2043 | 23,412 | 27,557 | ||||||
3.625%, 08/15/2043 | 4,164 | 4,793 | ||||||
3.625%, 02/15/2044 | 34,259 | 39,446 | ||||||
3.375%, 05/15/2044 | 3,538 | 3,897 | ||||||
3.125%, 02/15/2042 | 1,790 | 1,884 | ||||||
3.125%, 02/15/2043 | 7,219 | 7,577 | ||||||
3.000%, 11/15/2044 | 14,645 | 15,051 | ||||||
3.000%, 05/15/2045 | 22,439 | 23,126 | ||||||
2.900%, 11/15/2042 (B) | 6,245 | 2,738 | ||||||
2.875%, 05/15/2043 | 39,610 | 39,619 | ||||||
2.750%, 08/15/2042 (J) | 46,065 | 44,982 | ||||||
2.750%, 11/15/2042 | 31,940 | 31,171 | ||||||
2.500%, 02/15/2045 (D) | 67,560 | 62,630 | ||||||
| Description | Face Amount ($ Thousands) | Market Value ($ Thousands) | ||||||
U.S. Treasury Inflation-Protected Securities | ||||||||
2.375%, 01/15/2025 | $ | 601 | $ | 720 | ||||
2.125%, 02/15/2040 | 524 | 669 | ||||||
2.000%, 01/15/2016 | 8,875 | 9,030 | ||||||
1.875%, 07/15/2015 | 7,320 | 7,366 | ||||||
1.750%, 01/15/2028 | 225 | 260 | ||||||
1.375%, 02/15/2044 | 34,310 | 38,210 | ||||||
0.750%, 02/15/2042 | 5,737 | 5,497 | ||||||
0.750%, 02/15/2045 | 10,614 | 10,154 | ||||||
0.625%, 01/15/2024 | 982 | 1,012 | ||||||
0.625%, 02/15/2043 | 19,482 | 18,053 | ||||||
0.250%, 01/15/2025 | 13,563 | 13,525 | ||||||
0.125%, 04/15/2016 | 21,314 | 21,441 | ||||||
0.125%, 04/15/2017 | 6,596 | 6,699 | ||||||
0.125%, 07/15/2024 | 13,370 | 13,243 | ||||||
U.S. Treasury Notes | ||||||||
3.625%, 08/15/2019 | 7,500 | 8,209 | ||||||
3.125%, 04/30/2017 | 12,011 | 12,593 | ||||||
3.125%, 05/15/2019 | 18,185 | 19,496 | ||||||
3.125%, 05/15/2021 | 2,150 | 2,325 | ||||||
2.875%, 03/31/2018 | 11,810 | 12,463 | ||||||
2.500%, 05/15/2024 | 19,881 | 20,623 | ||||||
2.375%, 06/30/2018 | 5,985 | 6,239 | ||||||
2.375%, 08/15/2024 | 11,470 | 11,768 | ||||||
2.125%, 05/15/2025 | 34,544 | 34,647 | ||||||
2.000%, 02/15/2025 (D) | 79,170 | 78,502 | ||||||
1.875%, 05/31/2022 | 22,380 | 22,427 | ||||||
1.750%, 09/30/2019 | 48,028 | 48,838 | ||||||
1.750%, 04/30/2022 | 4,447 | 4,420 | ||||||
1.750%, 05/15/2023 | 3,220 | 3,172 | ||||||
1.625%, 06/30/2019 | 19,734 | 19,999 | ||||||
1.625%, 07/31/2019 | 20,858 | 21,124 | ||||||
1.625%, 08/31/2019 | 7,840 | 7,937 | ||||||
1.625%, 12/31/2019 | 13,370 | 13,498 | ||||||
1.500%, 01/31/2019 | 6,993 | 7,077 | ||||||
1.500%, 05/31/2019 | 15,804 | 15,951 | ||||||
1.500%, 10/31/2019 | 9,233 | 9,284 | ||||||
1.500%, 05/31/2020 | 35,047 | 35,095 | ||||||
1.500%, 01/31/2022 | 11,320 | 11,088 | ||||||
1.375%, 02/28/2019 | 14,356 | 14,451 | ||||||
1.375%, 02/29/2020 | 3,320 | 3,311 | ||||||
1.375%, 03/31/2020 | 1,285 | 1,281 | ||||||
1.375%, 04/30/2020 (D) | 55,859 | 55,622 | ||||||
1.000%, 09/15/2017 | 21,516 | 21,654 | ||||||
1.000%, 12/15/2017 | 12,905 | 12,971 | ||||||
1.000%, 02/15/2018 | 18,360 | 18,429 | ||||||
1.000%, 05/15/2018 | 7,798 | 7,816 | ||||||
1.000%, 11/30/2019 | 46,510 | 45,707 | ||||||
0.875%, 01/31/2017 | 4,195 | 4,219 | ||||||
0.875%, 05/15/2017 | 23,885 | 24,017 | ||||||
0.875%, 08/15/2017 | 79,000 | 79,315 | ||||||
0.875%, 11/15/2017 | 40,825 | 40,927 | ||||||
0.875%, 01/15/2018 | 10,425 | 10,436 | ||||||
| 158 | SEI Institutional Investments Trust / Annual Report / May 31, 2015 |
| Description | Face Amount ($ Thousands) | Market Value ($ Thousands) | ||||||
0.750%, 10/31/2017 | $ | 12,319 | $ | 12,317 | ||||
0.750%, 04/15/2018 | 17,047 | 16,971 | ||||||
0.625%, 02/15/2017 | 921 | 922 | ||||||
0.625%, 05/31/2017 | 19,958 | 19,966 | ||||||
0.625%, 09/30/2017 | 14,429 | 14,393 | ||||||
0.625%, 11/30/2017 | 950 | 946 | ||||||
0.500%, 03/31/2017 | 12,340 | 12,327 | ||||||
0.500%, 04/30/2017 (D) | 74,540 | 74,431 | ||||||
U.S. Treasury STRIPS (B) | ||||||||
6.322%, 05/15/2024 | 800 | 656 | ||||||
6.102%, 05/15/2026 | 500 | 385 | ||||||
5.812%, 02/15/2024 | 75 | 62 | ||||||
5.738%, 08/15/2024 | 200 | 163 | ||||||
5.680%, 05/15/2029 | 100 | 70 | ||||||
5.299%, 05/15/2034 | 500 | 289 | ||||||
4.994%, 11/15/2029 | 1,450 | 989 | ||||||
4.570%, 08/15/2033 | 1,150 | 681 | ||||||
4.457%, 05/15/2020 | 4,700 | 4,342 | ||||||
4.254%, 02/15/2030 | 3,650 | 2,468 | ||||||
4.224%, 11/15/2030 | 4,250 | 2,799 | ||||||
4.195%, 05/15/2030 | 2,400 | 1,609 | ||||||
4.008%, 02/15/2033 | 600 | 365 | ||||||
4.007%, 08/15/2030 | 3,350 | 2,228 | ||||||
3.993%, 11/15/2033 | 3,750 | 2,201 | ||||||
3.892%, 02/15/2032 | 1,950 | 1,224 | ||||||
3.877%, 05/15/2027 | 2,070 | 1,544 | ||||||
3.841%, 02/15/2034 | 1,850 | 1,077 | ||||||
3.839%, 02/15/2028 | 2,473 | 1,802 | ||||||
3.816%, 11/15/2031 | 3,215 | 2,045 | ||||||
3.622%, 11/15/2032 | 3,700 | 2,266 | ||||||
3.602%, 05/15/2032 | 9,250 | 5,780 | ||||||
3.590%, 08/15/2031 | 3,400 | 2,181 | ||||||
3.583%, 08/15/2028 | 2,800 | 1,999 | ||||||
3.514%, 08/15/2034 | 300 | 171 | ||||||
3.366%, 05/15/2031 | 2,230 | 1,446 | ||||||
3.251%, 05/15/2028 | 670 | 484 | ||||||
3.249%, 02/15/2029 | 3,980 | 2,788 | ||||||
3.059%, 08/15/2032 | 1,000 | 619 | ||||||
3.046%, 08/15/2029 | 3,500 | 2,407 | ||||||
3.011%, 11/15/2034 | 1,850 | 1,048 | ||||||
2.939%, 08/15/2023 | 800 | 673 | ||||||
2.919%, 11/15/2021 | 3,650 | 3,231 | ||||||
2.878%, 11/15/2027 | 16,555 | 12,154 | ||||||
2.814%, 05/15/2023 | 5,200 | 4,407 | ||||||
2.784%, 11/15/2028 | 800 | 567 | ||||||
2.749%, 05/15/2033 | 3,950 | 2,378 | ||||||
2.596%, 08/15/2039 | 100 | 49 | ||||||
2.543%, 05/15/2022 | 2,500 | 2,182 | ||||||
2.441%, 11/15/2023 | 600 | 501 | ||||||
1.797%, 05/15/2021 | 500 | 449 | ||||||
1.526%, 11/15/2027 | 3,595 | 2,679 | ||||||
|
| |||||||
Total U.S. Treasury Obligations |
| 1,448,408 | ||||||
|
| |||||||
| Description | Shares/Contracts | Market Value ($ Thousands) | ||||||
AFFILIATED PARTNERSHIP — 4.6% |
| |||||||
SEI Liquidity Fund, L.P. | 256,061,634 | $ | 256,062 | |||||
|
| |||||||
Total Affiliated Partnership | 256,062 | |||||||
|
| |||||||
CASH EQUIVALENT — 4.9% |
| |||||||
SEI Daily Income Trust, Prime Obligation Fund, Cl A | 275,148,803 | 275,149 | ||||||
|
| |||||||
Total Cash Equivalent | 275,149 | |||||||
|
| |||||||
Total Investments — 112.3% | $ | 6,291,833 | ||||||
|
| |||||||
PURCHASED OPTIONS — 0.0% |
| |||||||
December 2015, Euro Dollar Future Call, | 169 | 13 | ||||||
December 2015, Euro Dollar Future Put, | 169 | 4 | ||||||
September 2015, U.S. 10 Year Future Option Put, | 66 | 16 | ||||||
|
| |||||||
Total Purchased Options | 33 | |||||||
|
| |||||||
PURCHASED SWAPTION — 0.0% |
| |||||||
February 2019, 3-Month LIBOR Put, Expires: 01/14/2019, | 8,145,000 | 109 | ||||||
|
| |||||||
Total Purchased Swaption | 109 | |||||||
|
| |||||||
WRITTEN OPTIONS — 0.0% |
| |||||||
December 2015, Euro Dollar Future Put, Expires 12/14/15, Strike Price $99.25* | (169 | ) | (19 | ) | ||||
December 2015, IMM Euro Dollar Future Call, Expires 12/16/15, | (169 | ) | (97 | ) | ||||
July 2015, Euro-Bund Future Option Put, Expires 06/15/15, | (34 | ) | (1 | ) | ||||
July 2015, U.S. 10 Year Future Option Call, Expires 06/15/15, | (176 | ) | (6 | ) | ||||
| SEI Institutional Investments Trust / Annual Report / May 31, 2015 | 159 |
SCHEDULE OF INVESTMENTS
Core Fixed Income Fund (Continued)
May 31, 2015
| Description | Contracts | Market Value ($ Thousands) | ||||||
July 2015, U.S. 10 Year Future Option Call, Expires 06/15/15, | (97 | ) | $ | (4 | ) | |||
July 2015, U.S. 10 Year Future Option Call, Expires 06/15/15, | (154 | ) | (22 | ) | ||||
July 2015, U.S. 10 Year Future Option Call, Expires 06/15/15, Strike Price $133.00* | (176 | ) | (3 | ) | ||||
July 2015, U.S. 10 Year Future Option Put, Expires 06/15/15, Strike Price $126.50* | (97 | ) | (35 | ) | ||||
July 2015, U.S. Bond Future Option Call, Expires 06/15/15, | (85 | ) | (1 | ) | ||||
July 2015, U.S. Bond Future Option Put, Expires 06/15/15, | (85 | ) | (96 | ) | ||||
June 2015, Euro Dollar Future Put, Expires 06/15/15, | (130 | ) | (1 | ) | ||||
September 2015, IMM Euro Dollar Future Call, Expires 09/17/15, | (108 | ) | (34 | ) | ||||
September 2015, IMM Euro Dollar Future Put, Expires 09/17/15, | (108 | ) | (7 | ) | ||||
September 2015, U.S. 10 Year Future Option Call, Expires 08/24/15, | (99 | ) | (82 | ) | ||||
September 2015, U.S. 10 Year Future Option Call, Expires 08/24/15, | (48 | ) | (32 | ) | ||||
September 2015, U.S. 10 Year Future Option Call, Expires 08/24/15, | (66 | ) | (36 | ) | ||||
|
| |||||||
Total Written Options |
| (476 | ) | |||||
|
| |||||||
WRITTEN SWAPTION — 0.0% |
| |||||||
February 2019, 3-Month LIBOR Put, Expires: 01/14/2019, | (30,730,000 | ) | (156 | ) | ||||
|
| |||||||
Total Written Swaption |
| (156 | ) | |||||
|
| |||||||
A list of the open futures contracts held by the Fund at May 31, 2015, is as follows:
| Type of Contract | Number of Contracts Long (Short) | Expiration Date | Unrealized Appreciation (Depreciation) ($ Thousands) | |||||||||
90-Day Euro$ | (332 | ) | Dec-2015 | $ | 14 | |||||||
90-Day Euro$ | (258 | ) | Dec-2016 | (51 | ) | |||||||
90-Day Euro$ | (441 | ) | Sep-2015 | 4 | ||||||||
Euro Fx Currency | (40 | ) | Jun-2015 | (55 | ) | |||||||
Euro-BTP Italian Government Bond | 61 | Jun-2015 | 74 | |||||||||
Euro-Bund | (280 | ) | Jun-2015 | 1,219 | ||||||||
Euro-Bund | (32 | ) | Sep-2015 | (49 | ) | |||||||
U.S. 2-Year Treasury Note | (1,500 | ) | Sep-2015 | (391 | ) | |||||||
U.S. 5-Year Treasury Note | (73 | ) | Sep-2015 | (26 | ) | |||||||
U.S. 5-Year Treasury Note | 1,355 | Sep-2015 | 875 | |||||||||
U.S. 10-Year Treasury Note | 1,038 | Sep-2015 | 696 | |||||||||
U.S. Long Treasury Bond | (430 | ) | Sep-2015 | (1,471 | ) | |||||||
U.S. Ultra Long Treasury Bond | 379 | Sep-2015 | 1,228 | |||||||||
U.S. Ultra Long Treasury Bond | (724 | ) | Sep-2015 | (879 | ) | |||||||
|
| |||||||||||
| $ | 1,188 | |||||||||||
|
| |||||||||||
For the year ended May 31, 2015, the total amount of all open futures contracts, as presented in the table above, are representative of the volume of activity for this derivative type during the year.
A list of the open forward foreign currency contracts held by the Fund at May 31, 2015, is as follows:
| Settlement Date | Currency to Deliver (Thousands) | Currency to Receive (Thousands) | Unrealized Appreciation (Depreciation) ($ Thousands) | |||||||||||||||||
7/16/15 | GBP | 8,600 | USD | 13,397 | $ | 280 | ||||||||||||||
7/16/15 | USD | 13,343 | GBP | 8,600 | (226 | ) | ||||||||||||||
7/16/15-8/13/15 | EUR | 51,588 | USD | 58,329 | 1,724 | |||||||||||||||
8/13/15 | JPY | 1,108,175 | USD | 9,272 | 332 | |||||||||||||||
8/13/15 | USD | 12,649 | EUR | 11,201 | (358 | ) | ||||||||||||||
|
| |||||||||||||||||||
| $ | 1,752 | |||||||||||||||||||
|
| |||||||||||||||||||
A list of the counterparties for the open forward foreign currency contracts held by the Fund at May 31, 2015, is as follows:
| Counterparty | Currency to Deliver ($ Thousands) | Currency to Receive ($ Thousands) | Unrealized Appreciation ($ Thousands) | |||||||||
Bank of America | $ | (34,350 | ) | $ | 34,621 | $ | 271 | |||||
Barclays PLC | (10,735 | ) | 11,071 | 336 | ||||||||
Citigroup | (49,309 | ) | 50,160 | 851 | ||||||||
Morgan Stanley | (7,333 | ) | 7,516 | 183 | ||||||||
UBS | (2,925 | ) | 3,036 | 111 | ||||||||
|
| |||||||||||
| $ | 1,752 | |||||||||||
|
| |||||||||||
For the year ended May 31, 2015, the total amount of all open forward foreign currency contracts, as presented in the table above, are representative of the volume of activity for this derivative type during the year.
| 160 | SEI Institutional Investments Trust / Annual Report / May 31, 2015 |
A list of the open OTC swap agreements held by the Fund at May 31, 2015 is as follows:
| Interest Rate Swaps | ||||||||||||||
| Counterparty | Fund Pays | Fund Receives | Termination Date | Notional Amount ($ Thousands) | Net Unrealized Depreciation ($ Thousands) | |||||||||
| Citigroup | 2.71% | 3 Month USD - LIBOR | 08/15/42 | $ | 8,210 | $ | (258 | ) | ||||||
| Barclays Bank PLC | 2.48% | 3 Month USD - LIBOR | 11/15/27 | 4,105 | (348 | ) | ||||||||
| Barclays Bank PLC | 2.42% | 3 Month USD - LIBOR | 11/15/27 | 4,110 | (311 | ) | ||||||||
|
| |||||||||||||
| $ | (917 | ) | ||||||||||||
|
| |||||||||||||
| Credit Default Swaps | ||||||||||||||||
| Counterparty | Reference Entity/Obligation | Buy/Sell Protection | (Pays)/Receives Rate | Termination Date | Notional Amount ($ Thousands) | Net Unrealized Appreciation (Depreciation) ($ Thousands) | ||||||||||
| Deutsche Bank | Berkshire Hathaway | SELL | 1.00 | 03/20/24 | $ | (3,280 | ) | $ | 83 | |||||||
| Goldman Sachs | Metlife | SELL | 1.00 | 06/20/21 | (1,660 | ) | (5 | ) | ||||||||
| Goldman Sachs | Metlife | SELL | 1.00 | 06/20/21 | (1,900 | ) | (5 | ) | ||||||||
|
| |||||||||||||||
| $ | 73 | |||||||||||||||
|
| |||||||||||||||
A list of the open centrally cleared swap agreements held by the Fund at May 31, 2015 is as follows:
| Interest Rate Swaps | ||||||||||||||
| Counterparty | Fund Pays | Fund Receives | Termination Date | Notional Amount ($ Thousands) | Net Unrealized Appreciation (Depreciation) ($ Thousands) | |||||||||
| UBS | 2.39% | 3 Month USD - LIBOR | 02/15/41 | $ | 16,166 | $ | 660 | |||||||
| Citigroup | 3.68% | 3 Month USD - LIBOR | 11/15/43 | 5,080 | (1,144 | ) | ||||||||
|
| |||||||||||||
| $ | (484 | ) | ||||||||||||
|
| |||||||||||||
For the year ended May 31, 2015, the total amount of open swap agreements, as presented in the tables above, are representative of the volume of activity for this derivative type during the year.
Percentages are based on a Net Assets of $5,600,807 ($ Thousands).
| * | Non-income producing security. |
| ** | The rate reported is the 7-day effective yield as of May 31, 2015. |
| ‡ | Real Estate Investment Trust. |
| † | Investment in Affiliated Security (see Note 6). |
| (1) | In U.S. Dollars unless otherwise indicated. |
| (A) | Variable Rate Security — The rate reported on the Schedule of Investments is the rate in effect as of May 31, 2015. |
| (B) | The rate reported is the effective yield at time of purchase. |
| (C) | Securities sold within terms of a private placement memorandum, exempt from registration under Section 144A of the Securities Act of 1933, as amended, and may be sold only to dealers in that program or other “accredited investors.” These securities have been determined to be liquid under guidelines established by the Board of Trustees. |
| (D) | This security or a partial position of this security is on loan at May 31, 2015. The total market value of securities on loan at May 31, 2015 was $250,380 ($ Thousands). |
| (E) | Securities considered illiquid. The total market value of such securities as of May 31, 2015 was $1 ($ Thousands) and represented 0.0% of Net Assets. |
| (F) | Security in default on interest payments. |
| (G) | Security fair valued using methods determined in good faith by the Valuation Committee of the Board of Trustees. The total market value of such securities as of May 31, 2015 was $725 ($ Thousands) and represented 0.01% of Net Assets. |
| (H) | Step Bonds — The rate reflected on the Schedule of Investments is the effective yield on May 31, 2015. The coupon on a step bond changes on a specified date. |
| (I) | This security was purchased with cash collateral held from securities on loan. The total value of such securities as of May 31, 2015 was $256,062 ($ Thousands). |
| (J) | Security, or portion thereof, has been pledged as collateral on open futures contracts. |
| (K) | This security is a Supra-National organization. |
ABS — Asset-Based Security
AID — Agency for International Development
ARM — Adjustable Rate Mortgage
BTP — Buono del Tesoro Poliennale
Cl — Class
CLO — Collateralized Loan Obligation
CMBS — Commercial Mortgage-Backed Securities
CMO — Collateralized Mortgage Obligation
EUR — Euro
FAMC — Federal Agricultural Mortgage Corporation
FDIC — Federal Deposit Insurance Company
FFCB — Federal Farm Credit Bank
FHLB — Federal Home Loan Bank
FHLMC — Federal Home Loan Mortgage Corporation
FICO — Financing Corporation
FNMA — Federal National Mortgage Association
GBP — British Pound Sterling
GNMA — Government National Mortgage Association
GO — General Obligation
IO — Interest Only — face amount represents notional amount
JPY — Japanese Yen
LLC — Limited Liability Company
LIBOR — London Interbank Offered Rate
L.P. — Limited Partnership
MTN — Medium Term Note
NCUA — National Credit Union Association
OTC — Over the Counter
PLC — Public Limited Company
PO — Principal Only
RB — Revenue Bond
Re-REMIC — Real Estate Mortgage Investment Conduit
REMIC — Real Estate Mortgage Investment Conduit
Ser — Series
STRIPS — Separately Traded Registered Interest and Principal Securities
TBA — To Be Announced
USD — U.S. Dollar
| SEI Institutional Investments Trust / Annual Report / May 31, 2015 | 161 |
SCHEDULE OF INVESTMENTS
Core Fixed Income Fund (Concluded)
May 31, 2015
| Investments in Securities | Level 1 | Level 2 | Level 3(1) | Total | ||||||||||||
Mortgage-Backed Securities | $ | — | $ | 1,840,714 | $ | — | $ | 1,840,714 | ||||||||
Corporate Obligations | — | 1,491,362 | 725 | 1,492,087 | ||||||||||||
Asset-Backed Securities | — | 639,139 | — | 639,139 | ||||||||||||
U.S. Government Agency | ||||||||||||||||
Obligations | — | 186,647 | — | 186,647 | ||||||||||||
Sovereign Debt | — | 123,581 | — | 123,581 | ||||||||||||
Municipal Bonds | — | 30,046 | — | 30,046 | ||||||||||||
U.S. Treasury Obligations | — | 1,448,408 | — | 1,448,408 | ||||||||||||
Affiliated Partnership | — | 256,062 | — | 256,062 | ||||||||||||
Cash Equivalent | 275,149 | — | — | 275,149 | ||||||||||||
|
|
|
|
|
|
|
| |||||||||
Total Investments in Securities | $ | 275,149 | $ | 6,015,959 | $ | 725 | $ | 6,291,833 | ||||||||
|
|
|
|
|
|
|
| |||||||||
| Other Financial Instruments | Level 1 | Level 2 | Level 3 | Total | ||||||||||||
Purchased Options | $ | — | $ | 33 | $ | — | $ | 33 | ||||||||
Purchased Swaptions | — | 109 | — | 109 | ||||||||||||
Written Options | — | (476 | ) | — | (476 | ) | ||||||||||
Written Swaption | — | (156 | ) | — | (156 | ) | ||||||||||
Futures Contracts* | ||||||||||||||||
Unrealized Appreciation | 4,110 | — | — | 4,110 | ||||||||||||
Unrealized Depreciation | (2,922 | ) | — | — | (2,922 | ) | ||||||||||
Forwards Contracts* | ||||||||||||||||
Unrealized Appreciation | — | 2,336 | — | 2,336 | ||||||||||||
Unrealized Depreciation | — | (584 | ) | — | (584 | ) | ||||||||||
OTC Swaps | ||||||||||||||||
Interest Rate Swaps* | ||||||||||||||||
Unrealized Depreciation | — | (917 | ) | — | (917 | ) | ||||||||||
Credit Default Swaps* | ||||||||||||||||
Unrealized Appreciation | — | 83 | — | 83 | ||||||||||||
Unrealized Depreciation | — | (10 | ) | — | (10 | ) | ||||||||||
Centrally Cleared Swaps* | ||||||||||||||||
Interest Rate Swaps* | ||||||||||||||||
Unrealized Appreciation | — | 660 | — | 660 | ||||||||||||
Unrealized Depreciation | — | (1,144 | ) | — | (1,144 | ) | ||||||||||
|
|
|
|
|
|
|
| |||||||||
Total Other Financial Instruments | $ | 1,188 | $ | (66 | ) | $ | — | $ | 1,122 | |||||||
|
|
|
|
|
|
|
| |||||||||
| (1) | A reconciliation of Level 3 investments is presented when the Fund has a significant amount of Level 3 investments at the beginning and/or end of the period in relation to net assets. Management has concluded that Level 3 investments are not material in relation to net assets. |
| * | Futures contracts, forward contracts and swaps are valued at the unrealized appreciation (depreciation) on the instrument. |
For the year ended May 31, 2015, there were no transfers between Level 1 and Level 2 assets and liabilities.
For the year ended May 31, 2015, there were no transfers between Level 2 and Level 3 assets and liabilities.
For more information on valuation inputs, see Note 2 — Significant Accounting Policies in Notes to Financial Statements.
Amounts designated as “—” are $0 or have been rounded to $0.
The accompanying notes are an integral part of the financial statements.
| 162 | SEI Institutional Investments Trust / Annual Report / May 31, 2015 |
SCHEDULE OF INVESTMENTS
High Yield Bond Fund
May 31, 2015
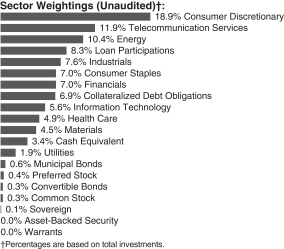
| Description | Face Amount ($ Thousands) | Market Value ($ Thousands) | ||||||
CORPORATE OBLIGATIONS — 80.0% |
| |||||||
Consumer Discretionary — 19.0% |
| |||||||
Academy | ||||||||
9.250%, 08/01/2019 (A) | $ | 715 | $ | 756 | ||||
Adelphia Communications (escrow security) | ||||||||
10.250%, 06/15/2011 (B) | 125 | 1 | ||||||
7.875%, 01/15/2009 (B) | 250 | 2 | ||||||
7.750%, 05/01/2009 (B) | 75 | 1 | ||||||
Adelphia Communications (escrow security), Ser B PIK | ||||||||
9.500%, 02/15/2004 (B) | 25 | — | ||||||
Affinia Group | ||||||||
7.750%, 05/01/2021 | 1,020 | 1,063 | ||||||
Affinity Gaming LLC | ||||||||
9.000%, 05/15/2018 | 7,185 | 7,185 | ||||||
Algeco Scotsman Global Finance | ||||||||
10.750%, 10/15/2019 (A) | 1,493 | 1,198 | ||||||
8.500%, 10/15/2018 (A) | 5,165 | 5,133 | ||||||
AMC Entertainment | ||||||||
9.750%, 12/01/2020 | 1,415 | 1,547 | ||||||
5.875%, 02/15/2022 | 1,000 | 1,042 | ||||||
American Axle & Manufacturing | ||||||||
7.750%, 11/15/2019 | 360 | 410 | ||||||
6.250%, 03/15/2021 | 790 | 835 | ||||||
American Builders & Contractors Supply | ||||||||
5.625%, 04/15/2021 (A) | 1,210 | 1,237 | ||||||
American Tire Distributors | ||||||||
10.250%, 03/01/2022 (A) | 780 | 825 | ||||||
Aramark Services | ||||||||
5.750%, 03/15/2020 | 3,450 | 3,601 | ||||||
Argos Merger Sub | ||||||||
7.125%, 03/15/2023 (A) | 2,872 | 3,044 | ||||||
| Description | Face Amount ($ Thousands) | Market Value ($ Thousands) | ||||||
Beazer Homes USA | ||||||||
5.750%, 06/15/2019 | $ | 1,560 | $ | 1,529 | ||||
Belo | ||||||||
7.750%, 06/01/2027 | 2,025 | 2,253 | ||||||
Bon-Ton Department Stores | ||||||||
8.000%, 06/15/2021 | 5,418 | 4,389 | ||||||
Boyd Gaming | ||||||||
9.000%, 07/01/2020 | 1,980 | 2,163 | ||||||
6.875%, 05/15/2023 | 5,015 | 5,103 | ||||||
Brookfield Residential Properties | ||||||||
6.375%, 05/15/2025 (A) | 632 | 630 | ||||||
Burger King Worldwide | ||||||||
6.000%, 04/01/2022 (A) | 3,840 | 3,982 | ||||||
Cablevision Systems | ||||||||
7.750%, 04/15/2018 | 4,736 | 5,192 | ||||||
5.875%, 09/15/2022 | 1,947 | 1,942 | ||||||
Caesars Entertainment Operating | ||||||||
11.250%, 06/01/2017 (B) | 1,645 | 1,324 | ||||||
9.000%, 02/15/2020 (B) | 19,310 | 15,880 | ||||||
8.500%, 02/15/2020 (B) | 1,595 | 1,308 | ||||||
Caesars Entertainment Resort Properties LLC | ||||||||
8.000%, 10/01/2020 | 3,310 | 3,351 | ||||||
Caesars Growth Properties Holdings LLC | ||||||||
9.375%, 05/01/2022 (A) | 1,080 | 883 | ||||||
CCO Holdings LLC | ||||||||
7.375%, 06/01/2020 | 940 | 1,001 | ||||||
6.625%, 01/31/2022 | 1,575 | 1,675 | ||||||
6.500%, 04/30/2021 | 2,220 | 2,335 | ||||||
5.875%, 05/01/2027 (A) | 526 | 530 | ||||||
5.375%, 05/01/2025 (A) | 2,378 | 2,396 | ||||||
5.250%, 03/15/2021 | 1,710 | 1,740 | ||||||
5.250%, 09/30/2022 | 2,740 | 2,781 | ||||||
5.125%, 02/15/2023 | 2,000 | 2,000 | ||||||
5.125%, 05/01/2023 (A) | 1,309 | 1,316 | ||||||
Cedar Fair | ||||||||
5.375%, 06/01/2024 (A) | 1,870 | 1,935 | ||||||
5.250%, 03/15/2021 | 2,000 | 2,090 | ||||||
Century Communities | ||||||||
6.875%, 05/15/2022 (A) | 5,625 | 5,597 | ||||||
Chester Downs & Marina LLC | ||||||||
9.250%, 02/01/2020 (A) | 5,910 | 4,610 | ||||||
Chinos Intermediate Holdings A | ||||||||
7.750%, 05/01/2019 (A) | 1,755 | 1,505 | ||||||
Cinemark USA | ||||||||
7.375%, 06/15/2021 | 870 | 933 | ||||||
5.125%, 12/15/2022 | 1,100 | 1,122 | ||||||
4.875%, 06/01/2023 | 435 | 437 | ||||||
Claire’s Stores | ||||||||
9.000%, 03/15/2019 (A) | 2,235 | 1,984 | ||||||
8.875%, 03/15/2019 | 3,700 | 1,822 | ||||||
| SEI Institutional Investments Trust / Annual Report / May 31, 2015 | 163 |
SCHEDULE OF INVESTMENTS
High Yield Bond Fund (Continued)
May 31, 2015
| Description | Face Amount ($ Thousands) | Market Value ($ Thousands) | ||||||
Clear Channel Worldwide Holdings | ||||||||
7.625%, 03/15/2020 | $ | 2,710 | $ | 2,857 | ||||
6.500%, 11/15/2022 | 5,030 | 5,314 | ||||||
Conn’s | ||||||||
7.250%, 07/15/2022 (A) | 3,373 | 3,238 | ||||||
CSC Holdings LLC | ||||||||
8.625%, 02/15/2019 | 2,375 | 2,707 | ||||||
6.750%, 11/15/2021 | 1,000 | 1,089 | ||||||
5.250%, 06/01/2024 (A) | 1,913 | 1,872 | ||||||
CST Brands | ||||||||
5.000%, 05/01/2023 | 350 | 356 | ||||||
Cumulus Media Holdings | ||||||||
7.750%, 05/01/2019 | 845 | 794 | ||||||
Dana Holding | ||||||||
6.750%, 02/15/2021 | 1,749 | 1,852 | ||||||
6.000%, 09/15/2023 | 340 | 360 | ||||||
5.500%, 12/15/2024 | 915 | 933 | ||||||
5.375%, 09/15/2021 | 535 | 557 | ||||||
DBP Holding | ||||||||
7.750%, 10/15/2020 (A) | 930 | 807 | ||||||
DISH DBS | ||||||||
7.875%, 09/01/2019 | 135 | 153 | ||||||
6.750%, 06/01/2021 | 2,990 | 3,194 | ||||||
5.875%, 07/15/2022 | 7,019 | 7,159 | ||||||
5.875%, 11/15/2024 | 4,675 | 4,687 | ||||||
5.125%, 05/01/2020 | 285 | 291 | ||||||
5.000%, 03/15/2023 | 2,040 | 1,966 | ||||||
DreamWorks Animation SKG | ||||||||
6.875%, 08/15/2020 (A) | 1,090 | 1,090 | ||||||
Empire Today LLC | ||||||||
11.375%, 02/01/2017 (A) | 1,841 | 1,528 | ||||||
ESH Hospitality | ||||||||
5.250%, 05/01/2025‡ (A) | 940 | 947 | ||||||
Family Tree Escrow LLC | ||||||||
5.750%, 03/01/2023 (A) | 2,356 | 2,486 | ||||||
5.250%, 03/01/2020 (A) | 149 | 156 | ||||||
FCA US LLC | ||||||||
8.250%, 06/15/2021 | 4,665 | 5,152 | ||||||
Ferrellgas | ||||||||
6.500%, 05/01/2021 | 2,650 | 2,683 | ||||||
Fiat Chrysler Automobiles | ||||||||
5.250%, 04/15/2023 (A) | 460 | 462 | ||||||
4.500%, 04/15/2020 (A) | 295 | 300 | ||||||
Fontainebleau Las Vegas | ||||||||
10.250%, 06/15/2015 (A) (B) | 3,500 | 17 | ||||||
Gannett | ||||||||
5.500%, 09/15/2024 (A) | 510 | 519 | ||||||
4.875%, 09/15/2021 (A) | 565 | 569 | ||||||
General Motors | ||||||||
4.875%, 10/02/2023 | 2,425 | 2,584 | ||||||
General Motors Financial | ||||||||
4.250%, 05/15/2023 | 325 | 333 | ||||||
3.450%, 04/10/2022 | 410 | 404 | ||||||
| Description | Face Amount ($ Thousands) | Market Value ($ Thousands) | ||||||
Gestamp Funding Luxembourg | ||||||||
5.625%, 05/31/2020 (A) | $ | 2,260 | $ | 2,342 | ||||
Gibson Brands | ||||||||
8.875%, 08/01/2018 (A) | 1,436 | 1,472 | ||||||
Goodyear Tire & Rubber | ||||||||
8.750%, 08/15/2020 | 1,080 | 1,299 | ||||||
6.500%, 03/01/2021 | 2,695 | 2,870 | ||||||
Graton Economic Development Authority | ||||||||
9.625%, 09/01/2019 (A) | 4,790 | 5,209 | ||||||
Guitar Center | ||||||||
9.625%, 04/15/2020 (A) | 4,945 | 4,024 | ||||||
6.500%, 04/15/2019 (A) | 2,285 | 2,062 | ||||||
Gymboree | ||||||||
9.125%, 12/01/2018 | 860 | 379 | ||||||
HD Supply | ||||||||
11.500%, 07/15/2020 | 2,130 | 2,492 | ||||||
11.000%, 04/15/2020 | 535 | 606 | ||||||
7.500%, 07/15/2020 | 1,567 | 1,694 | ||||||
5.250%, 12/15/2021 (A) | 1,066 | 1,109 | ||||||
Hillman Group | ||||||||
6.375%, 07/15/2022 (A) | 740 | 727 | ||||||
Hilton Worldwide Finance LLC | ||||||||
5.625%, 10/15/2021 | 420 | 443 | ||||||
iHeartCommunications | ||||||||
14.000%, 02/01/2021 | 1,703 | 1,312 | ||||||
10.625%, 03/15/2023 (A) | 959 | 957 | ||||||
10.000%, 01/15/2018 | 1,285 | 1,108 | ||||||
9.000%, 12/15/2019 | 901 | 885 | ||||||
9.000%, 03/01/2021 | 970 | 917 | ||||||
9.000%, 09/15/2022 | 7,835 | 7,373 | ||||||
Interline Brands PIK | ||||||||
10.000%, 11/15/2018 | 242 | 254 | ||||||
International Automotive Components Group | ||||||||
9.125%, 06/01/2018 (A) | 1,705 | 1,756 | ||||||
International Game Technology | ||||||||
6.500%, 02/15/2025 (A) | 605 | 567 | ||||||
6.250%, 02/15/2022 (A) | 1,570 | 1,527 | ||||||
5.625%, 02/15/2020 | 415 | 408 | ||||||
Interval Acquisition | ||||||||
5.625%, 04/15/2023 (A) | 3,295 | 3,361 | ||||||
Isle of Capri Casinos | ||||||||
5.875%, 03/15/2021 | 740 | 766 | ||||||
Jarden | ||||||||
6.125%, 11/15/2022 | 500 | 522 | ||||||
JC Penney | ||||||||
8.125%, 10/01/2019 | 2,345 | 2,363 | ||||||
6.375%, 10/15/2036 | 1,160 | 876 | ||||||
5.650%, 06/01/2020 | 3,500 | 3,159 | ||||||
L Brands | ||||||||
6.950%, 03/01/2033 | �� | 1,174 | 1,283 | |||||
6.625%, 04/01/2021 | 1,225 | 1,384 | ||||||
| 164 | SEI Institutional Investments Trust / Annual Report / May 31, 2015 |
| Description | Face Amount ($ Thousands) | Market Value ($ Thousands) | ||||||
5.625%, 02/15/2022 | $ | 1,995 | $ | 2,170 | ||||
5.625%, 10/15/2023 | 585 | 642 | ||||||
Landry’s | ||||||||
9.375%, 05/01/2020 (A) | 4,229 | 4,551 | ||||||
Lear | ||||||||
5.250%, 01/15/2025 | 250 | 252 | ||||||
Lennar | ||||||||
4.750%, 05/30/2025 | 1,280 | 1,251 | ||||||
Liberty Interactive LLC | ||||||||
8.250%, 02/01/2030 | 4,555 | 4,988 | ||||||
LIN Television | ||||||||
5.875%, 11/15/2022 (A) | 3,064 | 3,141 | ||||||
Marina District Finance | ||||||||
9.875%, 08/15/2018 | 1,385 | 1,437 | ||||||
MGM Resorts International | ||||||||
7.750%, 03/15/2022 | 1,050 | 1,189 | ||||||
6.750%, 10/01/2020 | 1,965 | 2,130 | ||||||
6.625%, 12/15/2021 | 3,625 | 3,897 | ||||||
6.000%, 03/15/2023 | 8,052 | 8,344 | ||||||
5.250%, 03/31/2020 | 2,185 | 2,251 | ||||||
Michaels Stores | ||||||||
5.875%, 12/15/2020 (A) | 505 | 533 | ||||||
Mohegan Tribal Gaming Authority | ||||||||
9.750%, 09/01/2021 | 8,344 | 8,886 | ||||||
Monitronics International | ||||||||
9.125%, 04/01/2020 | 9,855 | 9,683 | ||||||
Murphy Oil USA | ||||||||
6.000%, 08/15/2023 | 1,415 | 1,503 | ||||||
Neiman Marcus Group LLC | ||||||||
8.000%, 10/15/2021 (A) | 445 | 477 | ||||||
Neiman Marcus Group LLC PIK | ||||||||
8.750%, 10/15/2021 (A) | 2,300 | 2,484 | ||||||
Netflix | ||||||||
5.875%, 02/15/2025 (A) | 2,315 | 2,419 | ||||||
5.500%, 02/15/2022 (A) | 3,204 | 3,340 | ||||||
5.375%, 02/01/2021 | 1,947 | 2,030 | ||||||
New Academy Finance LLC PIK | ||||||||
8.000%, 06/15/2018 (A) | 963 | 973 | ||||||
New Albertsons | ||||||||
8.700%, 05/01/2030 | 1,870 | 1,917 | ||||||
8.000%, 05/01/2031 | 9,580 | 9,472 | ||||||
7.750%, 06/15/2026 | 135 | 131 | ||||||
7.450%, 08/01/2029 | 3,800 | 3,686 | ||||||
Nexstar Broadcasting | ||||||||
6.875%, 11/15/2020 | 3,475 | 3,692 | ||||||
6.125%, 02/15/2022 (A) | 6,004 | 6,274 | ||||||
Nine West Holdings | ||||||||
8.250%, 03/15/2019 (A) | 6,460 | 5,168 | ||||||
Party City Holdings | ||||||||
8.875%, 08/01/2020 | 1,490 | 1,604 | ||||||
Peninsula Gaming LLC | ||||||||
8.375%, 02/15/2018 (A) | 2,750 | 2,891 | ||||||
| Description | Face Amount ($ Thousands) | Market Value ($ Thousands) | ||||||
Petco Animal Supplies | ||||||||
9.250%, 12/01/2018 (A) | $ | 1,195 | $ | 1,253 | ||||
PF Chang’s China Bistro | ||||||||
10.250%, 06/30/2020 (A) | 1,750 | 1,802 | ||||||
Pinnacle Entertainment | ||||||||
7.750%, 04/01/2022 | 970 | 1,072 | ||||||
7.500%, 04/15/2021 | 3,125 | 3,316 | ||||||
6.375%, 08/01/2021 | 560 | 598 | ||||||
Polymer Group | ||||||||
7.750%, 02/01/2019 | 685 | 712 | ||||||
6.875%, 06/01/2019 (A) | 1,925 | 1,795 | ||||||
Quebecor Media | ||||||||
0.000%, 11/15/2013 (B) | 1,800 | 2 | ||||||
0.000%, 03/15/2016 (B) | 2,175 | 3 | ||||||
QVC | ||||||||
4.375%, 03/15/2023 | 2,000 | 2,013 | ||||||
Radio One | ||||||||
9.250%, 02/15/2020 (A) | 3,580 | 3,347 | ||||||
7.375%, 04/15/2022 (A) | 1,766 | 1,775 | ||||||
Radio Systems | ||||||||
8.375%, 11/01/2019 (A) | 1,025 | 1,104 | ||||||
Regal Entertainment Group | ||||||||
5.750%, 03/15/2022 | 1,455 | 1,499 | ||||||
RSI Home Products | ||||||||
6.500%, 03/15/2023 (A) | 2,425 | 2,498 | ||||||
Sally Holdings LLC | ||||||||
5.750%, 06/01/2022 | 780 | 831 | ||||||
5.500%, 11/01/2023 | 565 | 597 | ||||||
Schaeffler Finance BV | ||||||||
4.750%, 05/15/2023 (A) | 400 | 404 | ||||||
Schaeffler Holding Finance PIK | ||||||||
6.750%, 11/15/2022 (A) | 2,190 | 2,387 | ||||||
Scientific Games International | ||||||||
10.000%, 12/01/2022 | 2,720 | 2,632 | ||||||
7.000%, 01/01/2022 (A) | 2,500 | 2,606 | ||||||
Serta Simmons Holdings LLC | ||||||||
8.125%, 10/01/2020 (A) | 3,030 | 3,228 | ||||||
Service International | ||||||||
7.625%, 10/01/2018 | 410 | 474 | ||||||
7.500%, 04/01/2027 | 1,265 | 1,480 | ||||||
5.375%, 05/15/2024 | 380 | 403 | ||||||
ServiceMaster | ||||||||
7.250%, 03/01/2038 | 4,710 | 4,469 | ||||||
7.000%, 08/15/2020 | 451 | 478 | ||||||
ServiceMaster LLC | ||||||||
7.450%, 08/15/2027 | 1,400 | 1,424 | ||||||
Shingle Springs Tribal Gaming Authority | ||||||||
9.750%, 09/01/2021 (A) | 4,400 | 4,928 | ||||||
Sinclair Television Group | ||||||||
6.125%, 10/01/2022 | 385 | 406 | ||||||
5.625%, 08/01/2024 (A) | 6,982 | 7,052 | ||||||
5.375%, 04/01/2021 | 5,335 | 5,428 | ||||||
| SEI Institutional Investments Trust / Annual Report / May 31, 2015 | 165 |
SCHEDULE OF INVESTMENTS
High Yield Bond Fund (Continued)
May 31, 2015
| Description | Face Amount ($ Thousands) | Market Value ($ Thousands) | ||||||
Sirius XM Radio | ||||||||
6.000%, 07/15/2024 (A) | $ | 1,375 | $ | 1,427 | ||||
5.875%, 10/01/2020 (A) | 2,000 | 2,082 | ||||||
5.750%, 08/01/2021 (A) | 1,375 | 1,432 | ||||||
5.375%, 04/15/2025 (A) | 8,280 | 8,292 | ||||||
4.625%, 05/15/2023 (A) | 3,350 | 3,233 | ||||||
4.250%, 05/15/2020 (A) | 1,400 | 1,398 | ||||||
Six Flags Entertainment | ||||||||
5.250%, 01/15/2021 (A) | 4,850 | 5,008 | ||||||
Spanish Broadcasting System | ||||||||
12.500%, 04/15/2017 (A) | 1,641 | 1,711 | ||||||
Spencer Spirit Holdings PIK | ||||||||
9.000%, 05/01/2018 (A) | 4,882 | 4,955 | ||||||
Station Casinos LLC | ||||||||
7.500%, 03/01/2021 | 2,073 | 2,208 | ||||||
Taylor Morrison Communities | ||||||||
5.625%, 03/01/2024 (A) | 4,695 | 4,613 | ||||||
Tempur Sealy International | ||||||||
6.875%, 12/15/2020 | 1,175 | 1,254 | ||||||
Time | ||||||||
5.750%, 04/15/2022 (A) | 920 | 895 | ||||||
Time Warner Cable | ||||||||
6.750%, 06/15/2039 | 720 | 789 | ||||||
5.500%, 09/01/2041 | 975 | 943 | ||||||
Townsquare Media | ||||||||
6.500%, 04/01/2023 (A) | 4,115 | 4,105 | ||||||
Toys R Us | ||||||||
10.375%, 08/15/2017 | 5,680 | 4,998 | ||||||
Tupy Overseas | ||||||||
6.625%, 07/17/2024 (A) | 600 | 601 | ||||||
UCI International | ||||||||
8.625%, 02/15/2019 | 1,440 | 1,296 | ||||||
Viking Cruises | ||||||||
8.500%, 10/15/2022 (A) | 2,120 | 2,374 | ||||||
6.250%, 05/15/2025 (A) | 5,790 | 5,804 | ||||||
VTR Finance | ||||||||
6.875%, 01/15/2024 (A) | 3,625 | 3,775 | ||||||
William Lyon Homes | ||||||||
7.000%, 08/15/2022 | 2,580 | 2,683 | ||||||
WMG Acquisition | ||||||||
6.750%, 04/15/2022 (A) | 4,850 | 4,711 | ||||||
6.000%, 01/15/2021 (A) | 698 | 722 | ||||||
5.625%, 04/15/2022 (A) | 1,045 | 1,066 | ||||||
Wynn Las Vegas LLC | ||||||||
5.500%, 03/01/2025 (A) | 4,340 | 4,340 | ||||||
4.250%, 05/30/2023 (A) | 487 | 458 | ||||||
ZF North America Capital | ||||||||
4.750%, 04/29/2025 (A) | 1,445 | 1,445 | ||||||
4.500%, 04/29/2022 (A) | 795 | 809 | ||||||
|
| |||||||
| 477,389 | ||||||||
|
| |||||||
Consumer Staples — 7.0% | ||||||||
21st Century Oncology | ||||||||
11.000%, 05/01/2023 (A) | 1,490 | 1,479 | ||||||
| Description | Face Amount ($ Thousands) | Market Value ($ Thousands) | ||||||
Albea Beauty Holdings | ||||||||
8.375%, 11/01/2019 (A) | $ | 745 | $ | 805 | ||||
American Achievement | ||||||||
10.875%, 04/15/2016 (A) | 3,275 | 3,189 | ||||||
APX Group | ||||||||
8.750%, 12/01/2020 | 8,075 | 7,308 | ||||||
6.375%, 12/01/2019 | 3,118 | 3,114 | ||||||
Armored Autogroup | ||||||||
9.250%, 11/01/2018 | 1,045 | 1,096 | ||||||
Ashtead Capital | ||||||||
6.500%, 07/15/2022 (A) | 2,340 | 2,513 | ||||||
B&G Foods | ||||||||
4.625%, 06/01/2021 | 700 | 699 | ||||||
Biomet | ||||||||
6.500%, 08/01/2020 | 2,450 | 2,591 | ||||||
6.500%, 10/01/2020 | 300 | 315 | ||||||
Bumble Bee Holdco PIK | ||||||||
9.625%, 03/15/2018 (A) | 3,022 | 3,120 | ||||||
Bumble Bee Holdings | ||||||||
9.000%, 12/15/2017 (A) | 964 | 1,012 | ||||||
Central Garden and Pet | ||||||||
8.250%, 03/01/2018 | 1,511 | 1,548 | ||||||
Ceridian HCM Holding | ||||||||
11.000%, 03/15/2021 (A) | 1,574 | 1,666 | ||||||
Chiquita Brands International | ||||||||
7.875%, 02/01/2021 | 289 | 314 | ||||||
Concordia Healthcare | ||||||||
7.000%, 04/15/2023 (A) | 2,984 | 3,003 | ||||||
Constellation Brands | ||||||||
4.750%, 11/15/2024 | 500 | 518 | ||||||
3.875%, 11/15/2019 | 1,000 | 1,024 | ||||||
Cott Beverages | ||||||||
6.750%, 01/01/2020 (A) | 1,640 | 1,726 | ||||||
5.375%, 07/01/2022 (A) | 2,867 | 2,810 | ||||||
Darling Ingredients | ||||||||
5.375%, 01/15/2022 | 1,395 | 1,404 | ||||||
Dean Foods | ||||||||
6.500%, 03/15/2023 (A) | 219 | 228 | ||||||
Diamond Foods | ||||||||
7.000%, 03/15/2019 (A) | 900 | 932 | ||||||
DJO Finco | ||||||||
8.125%, 06/15/2021 (A) | 1,955 | 2,014 | ||||||
Edgewell Personal Care | ||||||||
5.500%, 06/15/2025 (A) | 990 | 990 | ||||||
Elizabeth Arden | ||||||||
7.375%, 03/15/2021 | 2,768 | 2,336 | ||||||
Fresenius Medical Care US Finance II | ||||||||
5.625%, 07/31/2019 (A) | 1,650 | 1,794 | ||||||
4.750%, 10/15/2024 (A) | 800 | 812 | ||||||
4.125%, 10/15/2020 (A) | 2,250 | 2,292 | ||||||
Global A&T Electronics | ||||||||
10.000%, 02/01/2019 (A) | 415 | 392 | ||||||
| 166 | SEI Institutional Investments Trust / Annual Report / May 31, 2015 |
| Description | Face Amount ($ Thousands) | Market Value ($ Thousands) | ||||||
Grifols Worldwide Operations | ||||||||
5.250%, 04/01/2022 | $ | 4,061 | $ | 4,142 | ||||
Harland Clarke Holdings | ||||||||
9.250%, 03/01/2021 (A) | 9,691 | 9,255 | ||||||
HJ Heinz | ||||||||
4.875%, 02/15/2025 (A) | 980 | 1,056 | ||||||
HRG Group | ||||||||
7.875%, 07/15/2019 (A) | 4,120 | 4,363 | ||||||
7.750%, 01/15/2022 (A) | 2,041 | 1,990 | ||||||
Immucor | ||||||||
11.125%, 08/15/2019 | 5,415 | 5,753 | ||||||
inVentiv Health PIK | ||||||||
10.000%, 08/15/2018 (A) | 652 | 676 | ||||||
JBS Investments GmbH | ||||||||
7.750%, 10/28/2020 (A) | 2,088 | 2,311 | ||||||
7.250%, 04/03/2024 (A) | 470 | 499 | ||||||
JBS USA LLC | ||||||||
5.875%, 07/15/2024 (A) | 718 | 740 | ||||||
5.750%, 06/15/2025 (A) | 1,605 | 1,621 | ||||||
KeHE Distributors LLC | ||||||||
7.625%, 08/15/2021 (A) | 1,900 | 2,028 | ||||||
Lantheus Medical Imaging | ||||||||
9.750%, 05/15/2017 | 2,485 | 2,498 | ||||||
Midas Intermediate Holdco II LLC | ||||||||
7.875%, 10/01/2022 (A) | 1,080 | 1,085 | ||||||
Pilgrim’s Pride | ||||||||
5.750%, 03/15/2025 (A) | 261 | 265 | ||||||
Post Holdings | ||||||||
7.375%, 02/15/2022 | 1,915 | 1,960 | ||||||
6.750%, 12/01/2021 (A) | 780 | 772 | ||||||
6.000%, 12/15/2022 (A) | 1,420 | 1,328 | ||||||
Prestige Brands | ||||||||
5.375%, 12/15/2021 (A) | 1,025 | 1,042 | ||||||
Quintiles Transnational | ||||||||
4.875%, 05/15/2023 (A) | 2,499 | 2,536 | ||||||
Rite Aid | ||||||||
7.700%, 02/15/2027 | 3,225 | 3,789 | ||||||
6.875%, 12/15/2028 (A) | 210 | 238 | ||||||
6.125%, 04/01/2023 (A) | 8,300 | 8,632 | ||||||
Spectrum Brands | ||||||||
6.750%, 03/15/2020 | 480 | 505 | ||||||
6.625%, 11/15/2022 | 2,240 | 2,402 | ||||||
6.375%, 11/15/2020 | 480 | 512 | ||||||
6.125%, 12/15/2024 (A) | 2,363 | 2,511 | ||||||
5.750%, 07/15/2025 (A) | 1,370 | 1,411 | ||||||
Sterigenics-Nordion Holdings LLC | ||||||||
6.500%, 05/15/2023 (A) | 7,099 | 7,152 | ||||||
SUPERVALU | ||||||||
7.750%, 11/15/2022 | 4,395 | 4,714 | ||||||
6.750%, 06/01/2021 | 5,150 | 5,276 | ||||||
TransUnion Holding | ||||||||
8.125%, 06/15/2018 | 2,349 | 2,408 | ||||||
| Description | Face Amount ($ Thousands) | Market Value ($ Thousands) | ||||||
TransUnion Holding PIK | ||||||||
9.625%, 06/15/2018 | $ | 425 | $ | 428 | ||||
Truven Health Analytics | ||||||||
10.625%, 06/01/2020 | 1,598 | 1,682 | ||||||
United Surgical Partners International | ||||||||
9.000%, 04/01/2020 | 1,730 | 1,855 | ||||||
Valeant Pharmaceuticals International | ||||||||
7.250%, 07/15/2022 (A) | 1,720 | 1,840 | ||||||
7.000%, 10/01/2020 (A) | 4,640 | 4,855 | ||||||
6.750%, 08/15/2021 (A) | 1,165 | 1,223 | ||||||
6.125%, 04/15/2025 (A) | 3,707 | 3,855 | ||||||
5.875%, 05/15/2023 (A) | 7,852 | 8,137 | ||||||
5.500%, 03/01/2023 (A) | 3,967 | 4,046 | ||||||
5.375%, 03/15/2020 (A) | 2,417 | 2,520 | ||||||
Valeant Pharmaceuticals International Escrow | ||||||||
7.500%, 07/15/2021 (A) | 3,755 | 4,108 | ||||||
6.750%, 08/15/2018 (A) | 1,750 | 1,850 | ||||||
Vector Group | ||||||||
7.750%, 02/15/2021 | 2,030 | 2,182 | ||||||
|
| |||||||
| 177,095 | ||||||||
|
| |||||||
Energy — 10.4% | ||||||||
Alpha Natural Resources | ||||||||
6.250%, 06/01/2021 | 805 | 110 | ||||||
6.000%, 06/01/2019 | 2,300 | 322 | ||||||
American Energy-Permian | ||||||||
8.000%, 06/15/2020 (A) | 3,178 | 3,194 | ||||||
7.375%, 11/01/2021 (A) | 1,219 | 817 | ||||||
7.125%, 11/01/2020 (A) | 1,403 | 940 | ||||||
6.780%, 08/01/2019 (A) (C) | 6,000 | 4,073 | ||||||
American Greetings | ||||||||
7.375%, 12/01/2021 | 390 | 415 | ||||||
Antero Resources | ||||||||
5.125%, 12/01/2022 | 220 | 219 | ||||||
Antero Resources Finance | ||||||||
6.000%, 12/01/2020 | 170 | 174 | ||||||
5.375%, 11/01/2021 | 435 | 440 | ||||||
Arch Coal | ||||||||
8.000%, 01/15/2019 (A) | 200 | 60 | ||||||
7.250%, 06/15/2021 | 955 | 167 | ||||||
7.000%, 06/15/2019 | 510 | 92 | ||||||
Atlas Energy Holdings | ||||||||
9.250%, 08/15/2021 | 1,950 | 1,550 | ||||||
7.750%, 01/15/2021 | 1,350 | 1,013 | ||||||
Atwood Oceanics | ||||||||
6.500%, 02/01/2020 | 1,448 | 1,412 | ||||||
Basic Energy Services | ||||||||
7.750%, 02/15/2019 | 1,035 | 869 | ||||||
| SEI Institutional Investments Trust / Annual Report / May 31, 2015 | 167 |
SCHEDULE OF INVESTMENTS
High Yield Bond Fund (Continued)
May 31, 2015
| Description | Face Amount ($ Thousands) | Market Value ($ Thousands) | ||||||
Baytex Energy | ||||||||
5.625%, 06/01/2024 (A) | $ | 1,605 | $ | 1,549 | ||||
Bellatrix Exploration | ||||||||
8.500%, 05/15/2020 (A) | 2,206 | 2,167 | ||||||
Berry Petroleum LLC | ||||||||
6.750%, 11/01/2020 | 1,408 | 1,204 | ||||||
6.375%, 09/15/2022 | 3,429 | 2,812 | ||||||
Bill Barrett | ||||||||
7.625%, 10/01/2019 | 1,889 | 1,804 | ||||||
Blue Racer Midstream LLC | ||||||||
6.125%, 11/15/2022 (A) | 2,560 | 2,652 | ||||||
BreitBurn Energy Partners | ||||||||
8.625%, 10/15/2020 | 640 | 570 | ||||||
7.875%, 04/15/2022 | 3,050 | 2,684 | ||||||
California Resources | ||||||||
6.000%, 11/15/2024 | 2,090 | 1,923 | ||||||
5.500%, 09/15/2021 | 1,790 | 1,696 | ||||||
Calumet Specialty Products Partners | ||||||||
7.625%, 01/15/2022 | 2,165 | 2,235 | ||||||
Carrizo Oil & Gas | ||||||||
7.500%, 09/15/2020 | 400 | 424 | ||||||
6.250%, 04/15/2023 | 396 | 404 | ||||||
Chaparral Energy | ||||||||
8.250%, 09/01/2021 | 915 | 741 | ||||||
7.625%, 11/15/2022 | 1,035 | 828 | ||||||
CHC Helicopter | ||||||||
9.250%, 10/15/2020 | 1,292 | 1,095 | ||||||
Chesapeake Energy | ||||||||
6.875%, 11/15/2020 | 340 | 359 | ||||||
6.625%, 08/15/2020 | 1,495 | 1,562 | ||||||
6.125%, 02/15/2021 | 145 | 148 | ||||||
5.750%, 03/15/2023 | 1,560 | 1,541 | ||||||
4.875%, 04/15/2022 | 2,620 | 2,496 | ||||||
Citgo Holding | ||||||||
10.750%, 02/15/2020 (A) | 2,600 | 2,720 | ||||||
Comstock Resources | ||||||||
10.000%, 03/15/2020 (A) | 3,005 | 2,900 | ||||||
Concho Resources | ||||||||
5.500%, 04/01/2023 | 170 | 173 | ||||||
CONSOL Energy | ||||||||
5.875%, 04/15/2022 | 420 | 392 | ||||||
Crestwood Midstream Partners | ||||||||
6.250%, 04/01/2023 (A) | 490 | 516 | ||||||
6.125%, 03/01/2022 | 1,060 | 1,106 | ||||||
CSI Compressco | ||||||||
7.250%, 08/15/2022 (A) | 1,415 | 1,344 | ||||||
Denbury Resources | ||||||||
5.500%, 05/01/2022 | 1,070 | 1,021 | ||||||
4.625%, 07/15/2023 | 755 | 689 | ||||||
Dresser-Rand Group | ||||||||
6.500%, 05/01/2021 | 600 | 641 | ||||||
Endeavor Energy Resources | ||||||||
7.000%, 08/15/2021 (A) | 3,800 | 3,791 | ||||||
| Description | Face Amount ($ Thousands) | Market Value ($ Thousands) | ||||||
Energy Transfer Equity | ||||||||
5.875%, 01/15/2024 | $ | 5,839 | $ | 6,204 | ||||
5.500%, 06/01/2027 | 380 | 382 | ||||||
EP Energy LLC | ||||||||
9.375%, 05/01/2020 | 2,228 | 2,420 | ||||||
7.750%, 09/01/2022 | 980 | 1,029 | ||||||
6.375%, 06/15/2023 (A) | 855 | 856 | ||||||
EV Energy Partners | ||||||||
8.000%, 04/15/2019 | 1,160 | 1,119 | ||||||
EXCO Resources | ||||||||
8.500%, 04/15/2022 | 555 | 326 | ||||||
Exterran Partners | ||||||||
6.000%, 04/01/2021 | 1,335 | 1,305 | ||||||
Genesis Energy | ||||||||
6.000%, 05/15/2023 | 2,434 | 2,464 | ||||||
5.750%, 02/15/2021 | 755 | 755 | ||||||
Gibson Energy | ||||||||
6.750%, 07/15/2021 (A) | 5,200 | 5,408 | ||||||
Global Partners | ||||||||
6.250%, 07/15/2022 | 3,335 | 3,285 | ||||||
Halcon Resources | ||||||||
9.750%, 07/15/2020 | 2,410 | 1,741 | ||||||
9.250%, 02/15/2022 | 400 | 278 | ||||||
8.875%, 05/15/2021 | 4,070 | 2,859 | ||||||
8.625%, 02/01/2020 (A) | 1,345 | 1,365 | ||||||
Hiland Partners | ||||||||
7.250%, 10/01/2020 (A) | 2,035 | 2,213 | ||||||
5.500%, 05/15/2022 (A) | 1,760 | 1,826 | ||||||
IronGate Energy Services LLC | ||||||||
11.000%, 07/01/2018 (A) | 500 | 391 | ||||||
Jupiter Resources | ||||||||
8.500%, 10/01/2022 (A) | 2,245 | 1,886 | ||||||
Kinder Morgan | ||||||||
5.000%, 02/15/2021 (A) | 1,180 | 1,267 | ||||||
Kosmos Energy | ||||||||
7.875%, 08/01/2021 | 2,035 | 1,999 | ||||||
Laredo Petroleum | ||||||||
7.375%, 05/01/2022 | 2,000 | 2,125 | ||||||
5.625%, 01/15/2022 | 1,390 | 1,393 | ||||||
Legacy Reserves | ||||||||
8.000%, 12/01/2020 | 2,250 | 1,946 | ||||||
6.625%, 12/01/2021 | 2,085 | 1,741 | ||||||
Linn Energy LLC | ||||||||
8.625%, 04/15/2020 | 110 | 99 | ||||||
7.750%, 02/01/2021 | 1,785 | 1,540 | ||||||
6.500%, 05/15/2019 | 500 | 431 | ||||||
6.500%, 09/15/2021 | 1,805 | 1,449 | ||||||
6.250%, 11/01/2019 | 4,960 | 4,241 | ||||||
MarkWest Energy Partners | ||||||||
6.500%, 08/15/2021 | 265 | 284 | ||||||
5.500%, 02/15/2023 | 970 | 1,009 | ||||||
4.875%, 12/01/2024 | 3,960 | 4,000 | ||||||
4.875%, 06/01/2025 | 1,385 | 1,376 | ||||||
| 168 | SEI Institutional Investments Trust / Annual Report / May 31, 2015 |
| Description | Face Amount ($ Thousands) | Market Value ($ Thousands) | ||||||
MEG Energy | ||||||||
7.000%, 03/31/2024 (A) | $ | 1,660 | $ | 1,602 | ||||
6.500%, 03/15/2021 (A) | 326 | 316 | ||||||
6.375%, 01/30/2023 (A) | 3,025 | 2,859 | ||||||
Memorial Production Partners | ||||||||
7.625%, 05/01/2021 | 5,670 | 5,557 | ||||||
6.875%, 08/01/2022 (A) | 6,185 | 5,887 | ||||||
Midstates Petroleum | ||||||||
10.750%, 10/01/2020 | 2,906 | 1,380 | ||||||
9.250%, 06/01/2021 | 485 | 223 | ||||||
Milagro Oil & Gas | ||||||||
10.500%, 05/15/2016 (B) | 1,950 | 390 | ||||||
Murray Energy | ||||||||
11.250%, 04/15/2021 (A) | 4,075 | 3,932 | ||||||
Newfield Exploration | ||||||||
5.375%, 01/01/2026 | 1,795 | 1,858 | ||||||
NGL Energy Partners | ||||||||
6.875%, 10/15/2021 | 1,700 | 1,781 | ||||||
Northern Oil and Gas | ||||||||
8.000%, 06/01/2020 | 1,665 | 1,573 | ||||||
NuStar Logistics | ||||||||
6.750%, 02/01/2021 | 1,070 | 1,142 | ||||||
Oasis Petroleum | ||||||||
6.875%, 03/15/2022 | 2,880 | 2,945 | ||||||
Ocean Rig UDW | ||||||||
7.250%, 04/01/2019 (A) | 800 | 604 | ||||||
Pacific Drilling | ||||||||
5.375%, 06/01/2020 (A) | 3,087 | 2,547 | ||||||
Parker Drilling | ||||||||
6.750%, 07/15/2022 | 1,340 | 1,162 | ||||||
PBF Logistics | ||||||||
6.875%, 05/15/2023 (A) | 4,875 | 4,966 | ||||||
PDC Energy | ||||||||
7.750%, 10/15/2022 | 1,470 | 1,573 | ||||||
Peabody Energy | ||||||||
6.500%, 09/15/2020 | 160 | 82 | ||||||
6.250%, 11/15/2021 | 2,205 | 1,086 | ||||||
Penn Virginia Resource Partners | ||||||||
8.375%, 06/01/2020 | 1,820 | 1,998 | ||||||
6.500%, 05/15/2021 | 2,600 | 2,777 | ||||||
Petrobras International Finance | ||||||||
6.750%, 01/27/2041 | 1,940 | 1,815 | ||||||
Pioneer Energy Services | ||||||||
6.125%, 03/15/2022 | 1,710 | 1,385 | ||||||
Range Resources | ||||||||
4.875%, 05/15/2025 (A) | 610 | 610 | ||||||
Regency Energy Partners | ||||||||
8.375%, 06/01/2019 (A) | 3,810 | 3,970 | ||||||
5.875%, 03/01/2022 | 1,365 | 1,495 | ||||||
5.750%, 09/01/2020 | 35 | 39 | ||||||
5.500%, 04/15/2023 | 550 | 569 | ||||||
5.000%, 10/01/2022 | 1,845 | 1,929 | ||||||
| Description | Face Amount ($ Thousands) | Market Value ($ Thousands) | ||||||
RKI Exploration & Production LLC | ||||||||
8.500%, 08/01/2021 (A) | $ | 610 | $ | 607 | ||||
Rockies Express Pipeline LLC | ||||||||
6.000%, 01/15/2019 (A) | 1,655 | 1,742 | ||||||
5.625%, 04/15/2020 (A) | 3,595 | 3,748 | ||||||
Rose Rock Midstream | ||||||||
5.625%, 07/15/2022 | 5,356 | 5,343 | ||||||
5.625%, 11/15/2023 (A) | 890 | 877 | ||||||
Rosetta Resources | ||||||||
5.875%, 06/01/2022 | 1,100 | 1,174 | ||||||
RSP Permian | ||||||||
6.625%, 10/01/2022 (A) | 170 | 177 | ||||||
Sabine Pass Liquefaction LLC | ||||||||
6.250%, 03/15/2022 | 4,035 | 4,247 | ||||||
5.750%, 05/15/2024 | 4,390 | 4,461 | ||||||
5.625%, 02/01/2021 | 4,920 | 5,080 | ||||||
5.625%, 04/15/2023 | 7,355 | 7,484 | ||||||
5.625%, 03/01/2025 (A) | 6,690 | 6,690 | ||||||
Sanchez Energy | ||||||||
7.750%, 06/15/2021 | 110 | 112 | ||||||
6.125%, 01/15/2023 | 580 | 551 | ||||||
SandRidge Energy | ||||||||
8.750%, 01/15/2020 | 280 | 181 | ||||||
8.125%, 10/15/2022 | 3,295 | 1,878 | ||||||
7.500%, 03/15/2021 | 95 | 54 | ||||||
7.500%, 02/15/2023 | 4,790 | 2,658 | ||||||
SemGroup | ||||||||
7.500%, 06/15/2021 | 1,970 | 2,078 | ||||||
SESI LLC | ||||||||
7.125%, 12/15/2021 | 2,000 | 2,140 | ||||||
Seventy Seven Energy | ||||||||
6.500%, 07/15/2022 | 660 | 414 | ||||||
SM Energy | ||||||||
6.500%, 11/15/2021 | 130 | 136 | ||||||
6.125%, 11/15/2022 (A) | 663 | 691 | ||||||
5.625%, 06/01/2025 | 405 | 409 | ||||||
Summit Midstream Holdings LLC | ||||||||
7.500%, 07/01/2021 | 1,200 | 1,254 | ||||||
5.500%, 08/15/2022 | 1,100 | 1,056 | ||||||
Targa Resources Partners | ||||||||
6.625%, 10/01/2020 (A) | 1,970 | 2,081 | ||||||
5.250%, 05/01/2023 | 50 | 50 | ||||||
4.125%, 11/15/2019 (A) | 225 | 225 | ||||||
Tesoro Logistics | ||||||||
6.250%, 10/15/2022 (A) | 355 | 375 | ||||||
6.125%, 10/15/2021 | 460 | 483 | ||||||
5.875%, 10/01/2020 | 974 | 1,020 | ||||||
5.500%, 10/15/2019 (A) | 355 | 375 | ||||||
Transocean | ||||||||
6.375%, 12/15/2021 | 820 | 772 | ||||||
4.300%, 10/15/2022 | 480 | 383 | ||||||
| SEI Institutional Investments Trust / Annual Report / May 31, 2015 | 169 |
SCHEDULE OF INVESTMENTS
High Yield Bond Fund (Continued)
May 31, 2015
| Description | Face Amount ($ Thousands) | Market Value ($ Thousands) | ||||||
Trinidad Drilling | ||||||||
7.875%, 01/15/2019 (A) | $ | 880 | $ | 867 | ||||
Tullow Oil PLC | ||||||||
6.250%, 04/15/2022 (A) | 928 | 847 | ||||||
Ultra Petroleum | ||||||||
6.125%, 10/01/2024 (A) | 610 | 560 | ||||||
Unit | ||||||||
6.625%, 05/15/2021 | 1,950 | 1,901 | ||||||
Vanguard Natural Resources LLC | ||||||||
7.875%, 04/01/2020 | 545 | 534 | ||||||
Weatherford International | ||||||||
4.500%, 04/15/2022 | 970 | 939 | ||||||
Western Refining Logistics | ||||||||
7.500%, 02/15/2023 (A) | 1,565 | 1,632 | ||||||
Whiting Canadian Holding ULC | ||||||||
8.125%, 12/01/2019 | 1,135 | 1,203 | ||||||
Whiting Petroleum | ||||||||
6.250%, 04/01/2023 (A) | 1,570 | 1,609 | ||||||
5.750%, 03/15/2021 | 1,730 | 1,760 | ||||||
Williams Partners | ||||||||
6.125%, 07/15/2022 | 625 | 673 | ||||||
4.875%, 03/15/2024 | 1,200 | 1,218 | ||||||
WPX Energy | ||||||||
5.250%, 09/15/2024 | 510 | 485 | ||||||
YPF | ||||||||
8.750%, 04/04/2024 (A) | 1,345 | 1,389 | ||||||
|
| |||||||
| 261,741 | ||||||||
|
| |||||||
Financials — 7.0% | ||||||||
AAF Holdings LLC PIK | ||||||||
12.000%, 07/01/2019 (A) | 1,007 | 906 | ||||||
Ally Financial | ||||||||
8.000%, 03/15/2020 | 1,699 | 2,009 | ||||||
8.000%, 11/01/2031 | 1,890 | 2,325 | ||||||
6.250%, 12/01/2017 | 440 | 472 | ||||||
5.125%, 09/30/2024 | 4,374 | 4,472 | ||||||
4.750%, 09/10/2018 | 185 | 192 | ||||||
4.625%, 05/19/2022 | 490 | 490 | ||||||
4.625%, 03/30/2025 | 2,825 | 2,769 | ||||||
4.125%, 03/30/2020 | 2,435 | 2,435 | ||||||
3.500%, 01/27/2019 | 3,150 | 3,126 | ||||||
Alphabet Holding PIK | ||||||||
7.750%, 11/01/2017 | 3,220 | 3,256 | ||||||
American Equity Investment Life Holding | ||||||||
6.625%, 07/15/2021 | 1,900 | 2,024 | ||||||
ARC Properties Operating Partnership | ||||||||
3.000%, 02/06/2019‡ | 4,970 | 4,784 | ||||||
A-S Issuer Subsidiary | ||||||||
7.875%, 12/15/2020 (A) | 3,915 | 4,023 | ||||||
Aventine (escrow security) | ||||||||
0.000%, 10/15/2049 (B) (D) (E) (H) | 2,600 | 1 | ||||||
| Description | Face Amount ($ Thousands) | Market Value ($ Thousands) | ||||||
Bank of America | ||||||||
8.000%, 12/29/2049 (C) | $ | 2,240 | $ | 2,386 | ||||
6.500%, 12/31/2049 (C) | 1,715 | 1,814 | ||||||
5.125%, 12/31/2049 (C) | 1,947 | 1,923 | ||||||
Barclays Bank | ||||||||
7.625%, 11/21/2022 | 1,710 | 1,988 | ||||||
Boart Longyear Management | ||||||||
10.000%, 10/01/2018 (A) | 2,500 | 2,409 | ||||||
7.000%, 04/01/2021 (A) | 4,040 | 2,828 | ||||||
CIT Group | ||||||||
6.625%, 04/01/2018 (A) | 300 | 323 | ||||||
5.500%, 02/15/2019 (A) | 3,115 | 3,290 | ||||||
5.250%, 03/15/2018 | 720 | 752 | ||||||
3.875%, 02/19/2019 | 1,795 | 1,800 | ||||||
Citigroup | ||||||||
5.950%, 12/29/2049 (C) | 1,950 | 1,952 | ||||||
City National Bank | ||||||||
9.000%, 08/12/2019 | 4,062 | 4,974 | ||||||
Communications Sales & Leasing | ||||||||
8.250%, 10/15/2023‡ (A) | 3,981 | 4,061 | ||||||
6.000%, 04/15/2023‡ (A) | 2,894 | 2,908 | ||||||
Corrections Corp of America | ||||||||
4.625%, 05/01/2023‡ | 1,435 | 1,431 | ||||||
4.125%, 04/01/2020‡ | 995 | 1,010 | ||||||
Credit Accaptance | ||||||||
7.375%, 03/15/2023 | 5,395 | 5,597 | ||||||
Credit Suisse Group | ||||||||
7.500%, 12/11/2048 | 2,985 | 3,175 | ||||||
Crown Castle International | ||||||||
5.250%, 01/15/2023‡ | 940 | 991 | ||||||
CTR Partnership | ||||||||
5.875%, 06/01/2021‡ | 2,680 | 2,754 | ||||||
CyrusOne | ||||||||
6.375%, 11/15/2022 | 380 | 399 | ||||||
Denali Borrower LLC | ||||||||
5.625%, 10/15/2020 (A) | 1,210 | 1,284 | ||||||
Felcor Lodging | ||||||||
6.000%, 06/01/2025 (A) | 2,863 | 2,935 | ||||||
Genworth Holdings | ||||||||
7.625%, 09/24/2021 | 7,340 | 7,762 | ||||||
6.500%, 06/15/2034 | 315 | 287 | ||||||
Geo Group | ||||||||
6.625%, 02/15/2021‡ | 475 | 500 | ||||||
5.875%, 01/15/2022‡ | 825 | 871 | ||||||
5.875%, 10/15/2024‡ | 1,050 | 1,116 | ||||||
5.125%, 04/01/2023‡ | 660 | 678 | ||||||
GLP Capital | ||||||||
4.875%, 11/01/2020 | 429 | 444 | ||||||
Goldman Sachs Group | ||||||||
5.375%, 12/31/2049 (C) | 640 | 638 | ||||||
HSBC Holdings | ||||||||
6.375%, 12/29/2049 (C) | 1,735 | 1,783 | ||||||
| 170 | SEI Institutional Investments Trust / Annual Report / May 31, 2015 |
| Description | Face Amount ($ Thousands) | Market Value ($ Thousands) | ||||||
Hub Holdings LLC PIK | ||||||||
8.125%, 07/15/2019 (A) | $ | 325 | $ | 323 | ||||
HUB International | ||||||||
7.875%, 10/01/2021 (A) | 5,795 | 5,983 | ||||||
Infinity Acquisition LLC | ||||||||
7.250%, 08/01/2022 (A) | 1,575 | 1,488 | ||||||
ING Groep | ||||||||
6.500%, 12/31/2049 | 1,180 | 1,167 | ||||||
Iron Mountain | ||||||||
6.000%, 08/15/2023‡ | 790 | 837 | ||||||
James Hardie International Finance | ||||||||
5.875%, 02/15/2023 (A) | 2,055 | 2,137 | ||||||
Jefferies Finance LLC | ||||||||
6.875%, 04/15/2022 (A) | 2,660 | 2,570 | ||||||
JPMorgan Chase | ||||||||
7.900%, 04/29/2049 (C) | 1,967 | 2,098 | ||||||
6.750%, 08/29/2049 (C) | 1,590 | 1,733 | ||||||
Kennedy-Wilson | ||||||||
5.875%, 04/01/2024 | 3,340 | 3,398 | ||||||
Lloyds Banking Group | ||||||||
7.500%, 12/01/2099 (C) | 8,175 | 8,696 | ||||||
Mattamy Group | ||||||||
6.500%, 11/15/2020 (A) | 1,795 | 1,741 | ||||||
Millennium (escrow security) | ||||||||
7.625%, 11/15/2026 (B) | 200 | — | ||||||
MSCI | ||||||||
5.250%, 11/15/2024 (A) | 1,170 | 1,221 | ||||||
National Life Insurance | ||||||||
10.500%, 09/15/2039 (A) | 1,100 | 1,719 | ||||||
Nationstar Mortgage LLC | ||||||||
6.500%, 08/01/2018 | 1,350 | 1,360 | ||||||
6.500%, 07/01/2021 | 1,000 | 961 | ||||||
6.500%, 06/01/2022 | 2,000 | 1,885 | ||||||
Navient MTN | ||||||||
8.000%, 03/25/2020 | 4,000 | 4,510 | ||||||
Opal Acquisition | ||||||||
8.875%, 12/15/2021 (A) | 4,600 | 4,531 | ||||||
Popular | ||||||||
7.000%, 07/01/2019 | 3,070 | 3,147 | ||||||
Quicken Loans | ||||||||
5.750%, 05/01/2025 (A) | 5,278 | 5,285 | ||||||
Realogy Group LLC | ||||||||
7.625%, 01/15/2020 (A) | 630 | 673 | ||||||
5.250%, 12/01/2021 (A) | 250 | 255 | ||||||
RHP Hotel Properties | ||||||||
5.000%, 04/15/2021‡ | 2,671 | 2,711 | ||||||
5.000%, 04/15/2023‡ (A) | 1,180 | 1,180 | ||||||
Royal Bank of Scotland Group | ||||||||
5.125%, 05/28/2024 | 780 | 802 | ||||||
USI | ||||||||
7.750%, 01/15/2021 (A) | 4,240 | 4,325 | ||||||
Voya Financial | ||||||||
5.650%, 05/15/2053 (C) | 2,050 | 2,127 | ||||||
| Description | Face Amount ($ Thousands) | Market Value ($ Thousands) | ||||||
Walter Investment Management | ||||||||
7.875%, 12/15/2021 | $ | 1,363 | $ | 1,251 | ||||
Wells Fargo | ||||||||
7.980%, 03/29/2049 (C) | 1,950 | 2,145 | ||||||
Wilton Re Finance LLC | ||||||||
5.875%, 03/30/2033 (A) (C) | 2,400 | 2,576 | ||||||
XL Capital | ||||||||
6.500%, 12/31/2049 (C) | 1,530 | 1,318 | ||||||
|
| |||||||
| 176,500 | ||||||||
|
| |||||||
Health Care — 4.9% | ||||||||
Acadia Healthcare | ||||||||
12.875%, 11/01/2018 | 1,702 | 1,881 | ||||||
6.125%, 03/15/2021 | 1,100 | 1,139 | ||||||
5.625%, 02/15/2030 (A) | 1,876 | 1,918 | ||||||
5.125%, 07/01/2022 | 2,080 | 2,080 | ||||||
Alere | ||||||||
6.500%, 06/15/2020 | 230 | 242 | ||||||
Amsurg | ||||||||
5.625%, 11/30/2020 | 4,375 | 4,465 | ||||||
5.625%, 07/15/2022 | 950 | 973 | ||||||
Aurora Diagnostics Holdings | ||||||||
10.750%, 01/15/2018 | 4,425 | 3,983 | ||||||
CHS | ||||||||
7.125%, 07/15/2020 | 2,300 | 2,452 | ||||||
6.875%, 02/01/2022 | 5,030 | 5,370 | ||||||
5.125%, 08/01/2021 | 2,000 | 2,075 | ||||||
DaVita HealthCare Partners | ||||||||
5.125%, 07/15/2024 | 5,573 | 5,632 | ||||||
5.000%, 05/01/2025 | 3,993 | 3,968 | ||||||
Endo Finance LLC | ||||||||
6.000%, 02/01/2025 (A) | 5,332 | 5,399 | ||||||
ExamWorks Group | ||||||||
5.625%, 04/15/2023 | 2,350 | 2,403 | ||||||
HCA | ||||||||
7.500%, 02/15/2022 | 8,010 | 9,372 | ||||||
6.500%, 02/15/2020 | 1,250 | 1,395 | ||||||
5.875%, 03/15/2022 | 2,050 | 2,291 | ||||||
5.375%, 02/01/2025 | 7,396 | 7,618 | ||||||
5.250%, 04/15/2025 | 335 | 356 | ||||||
5.000%, 03/15/2024 | 2,900 | 3,023 | ||||||
4.750%, 05/01/2023 | 1,000 | 1,035 | ||||||
3.750%, 03/15/2019 | 1,000 | 1,015 | ||||||
HCA Holdings | ||||||||
7.750%, 05/15/2021 | 2,445 | 2,616 | ||||||
6.250%, 02/15/2021 | 15 | 16 | ||||||
HealthSouth | ||||||||
5.750%, 11/01/2024 | 1,269 | 1,310 | ||||||
5.125%, 03/15/2023 | 620 | 636 | ||||||
Hologic | ||||||||
6.250%, 08/01/2020 | 3,515 | 3,642 | ||||||
Horizon Pharma Financing | ||||||||
6.625%, 05/01/2023 (A) | 581 | 598 | ||||||
| SEI Institutional Investments Trust / Annual Report / May 31, 2015 | 171 |
SCHEDULE OF INVESTMENTS
High Yield Bond Fund (Continued)
May 31, 2015
| Description | Face Amount ($ Thousands) | Market Value ($ Thousands) | ||||||
IASIS Healthcare LLC | ||||||||
8.375%, 05/15/2019 | $ | 3,856 | $ | 4,032 | ||||
inVentiv Health | ||||||||
11.000%, 08/15/2018 (A) | 445 | 433 | ||||||
9.000%, 01/15/2018 (A) | 1,360 | 1,421 | ||||||
Kindred Healthcare | ||||||||
8.750%, 01/15/2023 (A) | 175 | 194 | ||||||
8.000%, 01/15/2020 (A) | 3,795 | 4,103 | ||||||
6.375%, 04/15/2022 | 4,165 | 4,248 | ||||||
Kinetic Concepts | ||||||||
12.500%, 11/01/2019 | 1,745 | 1,906 | ||||||
10.500%, 11/01/2018 | 2,205 | 2,371 | ||||||
LifePoint Health | ||||||||
5.500%, 12/01/2021 | 3,000 | 3,154 | ||||||
Mallinckrodt International Finance | ||||||||
5.500%, 04/15/2025 (A) | 2,853 | 2,869 | ||||||
4.875%, 04/15/2020 (A) | 568 | 582 | ||||||
4.750%, 04/15/2023 | 800 | 768 | ||||||
MModal Escrow | ||||||||
0.000%, 12/31/2049 (B) | 1,830 | — | ||||||
Omnicare | ||||||||
5.000%, 12/01/2024 | 1,323 | 1,464 | ||||||
4.750%, 12/01/2022 | 1,585 | 1,720 | ||||||
Par Pharmaceutical | ||||||||
7.375%, 10/15/2020 | 970 | 1,038 | ||||||
Surgical Care Affiliates | ||||||||
6.000%, 04/01/2023 (A) | 894 | 916 | ||||||
Tenet Healthcare | ||||||||
8.125%, 04/01/2022 | 3,490 | 3,804 | ||||||
8.000%, 08/01/2020 | 2,365 | 2,471 | ||||||
6.750%, 02/01/2020 | 2,717 | 2,853 | ||||||
6.000%, 10/01/2020 | 885 | 947 | ||||||
5.500%, 03/01/2019 (A) | 1,704 | 1,725 | ||||||
5.000%, 03/01/2019 (A) | 715 | 713 | ||||||
4.750%, 06/01/2020 | 1,020 | 1,038 | ||||||
4.500%, 04/01/2021 | 550 | 545 | ||||||
|
| |||||||
| 124,218 | ||||||||
|
| |||||||
Industrials — 7.6% | ||||||||
Abengoa | ||||||||
5.125%, 03/05/2017 (A) | 200 | 213 | ||||||
Abengoa Finance SAU | ||||||||
8.875%, 11/01/2017 (A) | 695 | 726 | ||||||
Abengoa Greenfield | ||||||||
6.500%, 10/01/2019 (A) | 1,030 | 968 | ||||||
ACCO Brands | ||||||||
6.750%, 04/30/2020 | 1,555 | 1,656 | ||||||
Accudyne Industries Borrower | ||||||||
7.750%, 12/15/2020 (A) | 1,375 | 1,272 | ||||||
Actuant | ||||||||
5.625%, 06/15/2022 | 4,000 | 4,100 | ||||||
| Description | Face Amount ($ Thousands) | Market Value ($ Thousands) | ||||||
ADT | ||||||||
6.250%, 10/15/2021 | $ | 1,635 | $ | 1,754 | ||||
4.125%, 04/15/2019 | 500 | 509 | ||||||
3.500%, 07/15/2022 | 1,240 | 1,141 | ||||||
AECOM Technology | ||||||||
5.875%, 10/15/2024 (A) | 1,040 | 1,082 | ||||||
5.750%, 10/15/2022 (A) | 840 | 869 | ||||||
AerCap Ireland Capital | ||||||||
4.500%, 05/15/2021 (A) | 3,780 | 3,931 | ||||||
3.750%, 05/15/2019 (A) | 375 | 381 | ||||||
Aerojet Rocketdyne Holdings | ||||||||
7.125%, 03/15/2021 | 1,595 | 1,707 | ||||||
Air Medical Merger Sub | ||||||||
6.375%, 05/15/2023 (A) | 3,900 | 3,754 | ||||||
Aircastle | ||||||||
7.625%, 04/15/2020 | 1,340 | 1,551 | ||||||
Allegiant Travel | ||||||||
5.500%, 07/15/2019 | 196 | 201 | ||||||
Allegion US Holding | ||||||||
5.750%, 10/01/2021 | 1,120 | 1,173 | ||||||
Amsted Industries | ||||||||
5.000%, 03/15/2022 (A) | 1,950 | 1,979 | ||||||
Apex Tool Group LLC | ||||||||
7.000%, 02/01/2021 (A) | 1,905 | 1,734 | ||||||
Ardagh Finance Holdings | ||||||||
8.625%, 06/15/2019 (A) | 807 | 860 | ||||||
Ardagh Packaging Finance | ||||||||
9.125%, 10/15/2020 (A) | 2,790 | 2,985 | ||||||
7.000%, 11/15/2020 (A) | 47 | 48 | ||||||
6.000%, 06/30/2021 (A) | 1,621 | 1,629 | ||||||
3.271%, 12/15/2019 (A) (C) | 715 | 703 | ||||||
Associated Materials LLC | ||||||||
9.125%, 11/01/2017 | 525 | 449 | ||||||
Avis Budget Car Rental LLC | ||||||||
5.500%, 04/01/2023 | 1,277 | 1,309 | ||||||
5.250%, 03/15/2025 (A) | 1,975 | 1,935 | ||||||
5.125%, 06/01/2022 (A) | 65 | 65 | ||||||
BlueLine Rental Finance | ||||||||
7.000%, 02/01/2019 (A) | 970 | 1,002 | ||||||
Bombardier | ||||||||
7.750%, 03/15/2020 (A) | 250 | 258 | ||||||
7.500%, 03/15/2025 (A) | 1,365 | 1,305 | ||||||
6.000%, 10/15/2022 (A) | 3,473 | 3,147 | ||||||
5.750%, 03/15/2022 (A) | 875 | 798 | ||||||
Builders FirstSource | ||||||||
7.625%, 06/01/2021 (A) | 1,668 | 1,743 | ||||||
Building Materials Corp of America | ||||||||
6.750%, 05/01/2021 (A) | 1,200 | 1,270 | ||||||
BWAY Holding | ||||||||
9.125%, 08/15/2021 (A) | 2,500 | 2,594 | ||||||
Case New Holland | ||||||||
7.875%, 12/01/2017 | 145 | 160 | ||||||
| 172 | SEI Institutional Investments Trust / Annual Report / May 31, 2015 |
| Description | Face Amount ($ Thousands) | Market Value ($ Thousands) | ||||||
Cemex | ||||||||
7.250%, 01/15/2021 (A) | $ | 1,860 | $ | 2,002 | ||||
Cenveo | ||||||||
11.500%, 05/15/2017 | 2,045 | 2,101 | ||||||
6.000%, 08/01/2019 (A) | 5,392 | 5,122 | ||||||
CEVA Group | ||||||||
7.000%, 03/01/2021 (A) | 950 | 940 | ||||||
Clean Harbors | ||||||||
5.250%, 08/01/2020 | 3,675 | 3,776 | ||||||
CNH Capital LLC | ||||||||
3.625%, 04/15/2018 | 215 | 215 | ||||||
Consolidated Container LLC | ||||||||
10.125%, 07/15/2020 (A) | 775 | 690 | ||||||
Covanta Holding | ||||||||
5.875%, 03/01/2024 | 1,565 | 1,612 | ||||||
CPG Merger Sub LLC | ||||||||
8.000%, 10/01/2021 (A) | 1,275 | 1,339 | ||||||
DigitalGlobe | ||||||||
5.250%, 02/01/2021 (A) | 4,000 | 4,001 | ||||||
EnPro Industries | ||||||||
5.875%, 09/15/2022 (A) | 278 | 288 | ||||||
Esterline Technologies | ||||||||
7.000%, 08/01/2020 | 1,755 | 1,830 | ||||||
FGI Operating LLC | ||||||||
7.875%, 05/01/2020 | 1,590 | 1,272 | ||||||
Florida East Coast Holdings | ||||||||
6.750%, 05/01/2019 (A) | 2,955 | 2,948 | ||||||
Gardner Denver | ||||||||
6.875%, 08/15/2021 (A) | 3,116 | 2,886 | ||||||
Gates Global LLC | ||||||||
6.000%, 07/15/2022 (A) | 1,905 | 1,757 | ||||||
General Cable | ||||||||
5.750%, 10/01/2022 | 1,215 | 1,112 | ||||||
Gibraltar Industries | ||||||||
6.250%, 02/01/2021 | 661 | 682 | ||||||
Great Lakes Dredge & Dock | ||||||||
7.375%, 02/01/2019 (A) | 1,625 | 1,674 | ||||||
H&E Equipment Services | ||||||||
7.000%, 09/01/2022 | 1,145 | 1,208 | ||||||
Hertz | ||||||||
7.375%, 01/15/2021 | 400 | 418 | ||||||
6.250%, 10/15/2022 | 1,055 | 1,084 | ||||||
5.875%, 10/15/2020 | 1,555 | 1,588 | ||||||
Icahn Enterprises | ||||||||
6.000%, 08/01/2020 | 3,400 | 3,655 | ||||||
5.875%, 02/01/2022 | 3,650 | 3,828 | ||||||
4.875%, 03/15/2019 | 2,961 | 3,054 | ||||||
International Lease Finance | ||||||||
6.250%, 05/15/2019 | 675 | 749 | ||||||
5.875%, 04/01/2019 | 2,730 | 2,986 | ||||||
4.625%, 04/15/2021 | 180 | 188 | ||||||
Jack Cooper Holdings | ||||||||
10.250%, 06/01/2020 (A) | 1,510 | 1,323 | ||||||
| Description | Face Amount ($ Thousands) | Market Value ($ Thousands) | ||||||
JCH Parent PIK | ||||||||
10.500%, 03/15/2019 (A) | $ | 511 | $ | 378 | ||||
KLX | ||||||||
5.875%, 12/01/2022 (A) | 2,535 | 2,567 | ||||||
Kratos Defense & Security Solutions | ||||||||
7.000%, 05/15/2019 | 1,195 | 1,064 | ||||||
Manitowoc | ||||||||
8.500%, 11/01/2020 | 1,180 | 1,254 | ||||||
Masonite International | ||||||||
5.625%, 03/15/2023 (A) | 635 | 657 | ||||||
Meritor | ||||||||
6.750%, 06/15/2021 | 1,105 | 1,146 | ||||||
6.250%, 02/15/2024 | 160 | 163 | ||||||
Milacron LLC | ||||||||
7.750%, 02/15/2021 (A) | 905 | 937 | ||||||
Navios South American Logistics | ||||||||
7.250%, 05/01/2022 (A) | 1,425 | 1,379 | ||||||
Navistar International | ||||||||
8.250%, 11/01/2021 | 770 | 770 | ||||||
NCI Building Systems | ||||||||
8.250%, 01/15/2023 (A) | 1,276 | 1,362 | ||||||
Nielsen Finance LLC | ||||||||
5.000%, 04/15/2022 (A) | 7,893 | 7,923 | ||||||
4.500%, 10/01/2020 | 1,425 | 1,448 | ||||||
Nielsen Luxembourg | ||||||||
5.500%, 10/01/2021 (A) | 725 | 743 | ||||||
Nortek | ||||||||
8.500%, 04/15/2021 | 1,950 | 2,113 | ||||||
Novelis | ||||||||
8.375%, 12/15/2017 | 2,000 | 2,093 | ||||||
Orbital ATK | ||||||||
5.250%, 10/01/2021 (A) | 620 | 643 | ||||||
Oshkosh | ||||||||
5.375%, 03/01/2022 | 70 | 73 | ||||||
5.375%, 03/01/2025 (A) | 230 | 238 | ||||||
Plastipak Holdings | ||||||||
6.500%, 10/01/2021 (A) | 1,800 | 1,854 | ||||||
Quality Distribution LLC | ||||||||
9.875%, 11/01/2018 | 488 | 514 | ||||||
Reynolds Group Issuer | ||||||||
9.875%, 08/15/2019 | 1,172 | 1,242 | ||||||
9.000%, 04/15/2019 | 2,865 | 2,980 | ||||||
8.250%, 02/15/2021 | 4,264 | 4,493 | ||||||
6.875%, 02/15/2021 | 1,225 | 1,292 | ||||||
5.750%, 10/15/2020 | 7,045 | 7,336 | ||||||
Sensata Technologies | ||||||||
4.875%, 10/15/2023 (A) | 1,000 | 1,020 | ||||||
Sensata Technologies BV | ||||||||
5.000%, 10/01/2025 (A) | 2,412 | 2,435 | ||||||
Syncreon Group | ||||||||
8.625%, 11/01/2021 (A) | 2,155 | 1,724 | ||||||
| SEI Institutional Investments Trust / Annual Report / May 31, 2015 | 173 |
SCHEDULE OF INVESTMENTS
High Yield Bond Fund (Continued)
May 31, 2015
| Description | Face Amount ($ Thousands) | Market Value ($ Thousands) | ||||||
Tempel Steel | ||||||||
12.000%, 08/15/2016 (A) | $ | 1,100 | $ | 976 | ||||
Terex | ||||||||
6.500%, 04/01/2020 | 700 | 733 | ||||||
6.000%, 05/15/2021 | 3,750 | 3,816 | ||||||
TransDigm | ||||||||
6.500%, 07/15/2024 | 3,495 | 3,565 | ||||||
6.500%, 05/15/2025 (A) | 1,385 | 1,416 | ||||||
6.000%, 07/15/2022 | 1,900 | 1,926 | ||||||
Trinseo Materials Operating SCA | ||||||||
6.750%, 05/01/2022 (A) | 200 | 204 | ||||||
Triumph Group | ||||||||
4.875%, 04/01/2021 | 865 | 852 | ||||||
United Airlines, Pass-Through Trust, Ser 2013-1, Cl B | ||||||||
5.375%, 08/15/2021 | 526 | 553 | ||||||
United Airlines, Pass-Through Trust, Ser 95A1 | ||||||||
9.020%, 04/19/2012 (B) | 349 | 1 | ||||||
United Rentals North America | ||||||||
8.250%, 02/01/2021 | 1,298 | 1,397 | ||||||
7.625%, 04/15/2022 | 535 | 584 | ||||||
7.375%, 05/15/2020 | 170 | 183 | ||||||
6.125%, 06/15/2023 | 1,100 | 1,150 | ||||||
5.750%, 11/15/2024 | 2,950 | 2,998 | ||||||
5.500%, 07/15/2025 | 460 | 459 | ||||||
USG | ||||||||
5.500%, 03/01/2025 (A) | 2,702 | 2,797 | ||||||
Vander Intermediate Holding II PIK | ||||||||
9.750%, 02/01/2019 (A) | 685 | 692 | ||||||
Watco LLC | ||||||||
6.375%, 04/01/2023 (A) | 1,435 | 1,464 | ||||||
WESCO Distribution | ||||||||
5.375%, 12/15/2021 | 1,300 | 1,326 | ||||||
West | ||||||||
5.375%, 07/15/2022 (A) | 2,260 | 2,192 | ||||||
Wise Metals Group LLC | ||||||||
8.750%, 12/15/2018 (A) | 660 | 705 | ||||||
Wise Metals Intermediate Holdings LLC | ||||||||
9.750%, 06/15/2019 (A) | 425 | 461 | ||||||
|
| |||||||
| 191,580 | ||||||||
|
| |||||||
Information Technology — 5.6% |
| |||||||
ACI Worldwide | ||||||||
6.375%, 08/15/2020 (A) | 580 | 611 | ||||||
Activision Blizzard | ||||||||
5.625%, 09/15/2021 (A) | 5,500 | 5,878 | ||||||
Advanced Micro Devices | ||||||||
7.750%, 08/01/2020 | 855 | 727 | ||||||
7.500%, 08/15/2022 | 3,325 | 2,926 | ||||||
7.000%, 07/01/2024 | 2,305 | 1,936 | ||||||
| Description | Face Amount ($ Thousands) | Market Value ($ Thousands) | ||||||
Amkor Technology | ||||||||
6.625%, 06/01/2021 | $ | 1,070 | $ | 1,094 | ||||
6.375%, 10/01/2022 | 2,395 | 2,455 | ||||||
Anixter | ||||||||
5.125%, 10/01/2021 | 3,432 | 3,543 | ||||||
Aspect Software | ||||||||
10.625%, 05/15/2017 | 915 | 823 | ||||||
Audatex North America | ||||||||
6.125%, 11/01/2023 (A) | 4,270 | 4,441 | ||||||
6.000%, 06/15/2021 (A) | 2,280 | 2,379 | ||||||
Bankrate | ||||||||
6.125%, 08/15/2018 (A) | 3,170 | 3,107 | ||||||
Belden | ||||||||
5.500%, 09/01/2022 (A) | 910 | 933 | ||||||
Blackboard | ||||||||
7.750%, 11/15/2019 (A) | 1,075 | 1,032 | ||||||
BMC Software Finance | ||||||||
8.125%, 07/15/2021 (A) | 7,345 | 6,638 | ||||||
Boxer Parent PIK | ||||||||
9.000%, 10/15/2019 (A) | 1,885 | 1,546 | ||||||
CDW LLC | ||||||||
5.500%, 12/01/2024 | 824 | 863 | ||||||
5.000%, 09/01/2023 | 3,208 | 3,291 | ||||||
Cimpress | ||||||||
7.000%, 04/01/2022 (A) | 1,078 | 1,124 | ||||||
CommScope | ||||||||
4.375%, 06/15/2020 (A) | 150 | 151 | ||||||
CommScope Technologies Finance LLC | ||||||||
6.000%, 06/15/2025 (A) | 8,765 | 8,875 | ||||||
Eagle Midco | ||||||||
9.000%, 06/15/2018 (A) | 3,205 | 3,269 | ||||||
EarthLink Holdings | ||||||||
7.375%, 06/01/2020 | 1,950 | 2,038 | ||||||
Entegris | ||||||||
6.000%, 04/01/2022 (A) | 3,520 | 3,678 | ||||||
Epicor Software | ||||||||
8.625%, 05/01/2019 | 3,070 | 3,208 | ||||||
Equinix | ||||||||
5.750%, 01/01/2025 | 2,721 | 2,803 | ||||||
5.375%, 01/01/2022 | 513 | 534 | ||||||
4.875%, 04/01/2020 | 2,785 | 2,875 | ||||||
First Data | ||||||||
12.625%, 01/15/2021 | 1,647 | 1,929 | ||||||
11.750%, 08/15/2021 | 3,643 | 4,166 | ||||||
11.250%, 01/15/2021 | 1,087 | 1,220 | ||||||
8.875%, 08/15/2020 (A) | 1,200 | 1,269 | ||||||
8.250%, 01/15/2021 (A) | 1,845 | 1,967 | ||||||
7.375%, 06/15/2019 (A) | 770 | 801 | ||||||
6.750%, 11/01/2020 (A) | 4,672 | 4,987 | ||||||
First Data PIK | ||||||||
8.750%, 01/15/2022 (A) | 8,067 | 8,632 | ||||||
IMS Health | ||||||||
6.000%, 11/01/2020 (A) | 890 | 926 | ||||||
| 174 | SEI Institutional Investments Trust / Annual Report / May 31, 2015 |
| Description | Face Amount ($ Thousands) | Market Value ($ Thousands) | ||||||
Infor Software Parent LLC | ||||||||
7.125%, 05/01/2021 (A) | $ | 4,150 | $ | 4,223 | ||||
Infor US | ||||||||
6.500%, 05/15/2022 (A) | 4,552 | 4,729 | ||||||
Magnachip Semiconductor | ||||||||
6.625%, 07/15/2021 | 1,170 | 901 | ||||||
Micron Technology | ||||||||
5.875%, 02/15/2022 | 2,469 | 2,592 | ||||||
5.625%, 01/15/2026 (A) | 340 | 334 | ||||||
5.500%, 02/01/2025 (A) | 3,855 | 3,826 | ||||||
5.250%, 08/01/2023 (A) | 170 | 170 | ||||||
5.250%, 01/15/2024 (A) | 1,025 | 1,015 | ||||||
NCR | ||||||||
5.000%, 07/15/2022 | 1,900 | 1,848 | ||||||
NeuStar | ||||||||
4.500%, 01/15/2023 | 2,365 | 2,081 | ||||||
NXP | ||||||||
5.750%, 02/15/2021 (A) | 3,250 | 3,429 | ||||||
5.750%, 03/15/2023 (A) | 455 | 485 | ||||||
Open Text | ||||||||
5.625%, 01/15/2023 (A) | 800 | 808 | ||||||
Plantronics | ||||||||
5.500%, 05/31/2023 (A) | 3,395 | 3,446 | ||||||
Project Homestake Merger | ||||||||
8.875%, 03/01/2023 (A) | 1,155 | 1,154 | ||||||
Sabre GLBL | ||||||||
5.375%, 04/15/2023 (A) | 1,660 | 1,689 | ||||||
Sungard Availability Services Capital | ||||||||
8.750%, 04/01/2022 (A) | 940 | 700 | ||||||
SunGard Data Systems | ||||||||
7.625%, 11/15/2020 | 295 | 312 | ||||||
7.375%, 11/15/2018 | 375 | 390 | ||||||
6.625%, 11/01/2019 | 615 | 642 | ||||||
VeriSign | ||||||||
4.625%, 05/01/2023 | 1,000 | 987 | ||||||
WEX | ||||||||
4.750%, 02/01/2023 (A) | 1,475 | 1,431 | ||||||
Zebra Technologies | ||||||||
7.250%, 10/15/2022 (A) | 4,299 | 4,664 | ||||||
|
| |||||||
| 140,531 | ||||||||
|
| |||||||
Materials — 4.5% | ||||||||
AK Steel | ||||||||
7.625%, 05/15/2020 | 1,175 | 1,040 | ||||||
7.625%, 10/01/2021 | 775 | 651 | ||||||
ArcelorMittal | ||||||||
6.250%, 03/01/2021 | 420 | 443 | ||||||
6.125%, 06/01/2025 | 540 | 549 | ||||||
5.125%, 06/01/2020 | 450 | 457 | ||||||
Aruba Investments | ||||||||
8.750%, 02/15/2023 (A) | 905 | 919 | ||||||
| Description | Face Amount ($ Thousands) | Market Value ($ Thousands) | ||||||
Ashland | ||||||||
4.750%, 08/15/2022 | $ | 1,895 | $ | 1,933 | ||||
Axalta Coating Systems US Holdings | ||||||||
7.375%, 05/01/2021 (A) | 385 | 418 | ||||||
Ball | ||||||||
5.000%, 03/15/2022 | 3,050 | 3,134 | ||||||
Chemours | ||||||||
7.000%, 05/15/2025 (A) | 2,011 | 2,046 | ||||||
6.625%, 05/15/2023 (A) | 1,901 | 1,930 | ||||||
Cliffs Natural Resources | ||||||||
5.950%, 01/15/2018 | 610 | 509 | ||||||
Consolidated Energy Finance | ||||||||
6.750%, 10/15/2019 (A) | 1,772 | 1,825 | ||||||
Constellium | ||||||||
5.750%, 05/15/2024 (A) | 250 | 235 | ||||||
Cornerstone Chemical | ||||||||
9.375%, 03/15/2018 (A) | 8,257 | 8,691 | ||||||
Eldorado | ||||||||
6.125%, 12/15/2020 (A) | 1,350 | 1,330 | ||||||
Evolution Escrow Issuer LLC | ||||||||
7.500%, 03/15/2022 (A) | 1,155 | 1,149 | ||||||
First Quantum Minerals | ||||||||
7.250%, 05/15/2022 (A) | 400 | 386 | ||||||
7.000%, 02/15/2021 (A) | 819 | 793 | ||||||
6.750%, 02/15/2020 (A) | 444 | 434 | ||||||
FMG Resources | ||||||||
9.750%, 03/01/2022 (A) | 1,554 | 1,632 | ||||||
8.250%, 11/01/2019 (A) | 2,540 | 2,324 | ||||||
Graphic Packaging International | ||||||||
4.750%, 04/15/2021 | 1,346 | 1,396 | ||||||
Hecla Mining | ||||||||
6.875%, 05/01/2021 | 2,305 | 2,184 | ||||||
Hexion | ||||||||
10.000%, 04/15/2020 (A) | 4,238 | 4,492 | ||||||
Hexion US Finance | ||||||||
8.875%, 02/01/2018 | 905 | 830 | ||||||
6.625%, 04/15/2020 | 8,103 | 7,637 | ||||||
Huntsman International LLC | ||||||||
8.625%, 03/15/2021 | 142 | 150 | ||||||
4.875%, 11/15/2020 | 1,420 | 1,441 | ||||||
IAMGOLD | ||||||||
6.750%, 10/01/2020 (A) | 6,385 | 5,363 | ||||||
Ineos Group Holdings | ||||||||
6.125%, 08/15/2018 (A) | 695 | 714 | ||||||
5.875%, 02/15/2019 (A) | 2,243 | 2,282 | ||||||
Kaiser Aluminum | ||||||||
8.250%, 06/01/2020 | 1,665 | 1,811 | ||||||
KGHM International | ||||||||
7.750%, 06/15/2019 (A) | 1,900 | 1,978 | ||||||
Kissner Milling | ||||||||
7.250%, 06/01/2019 (A) | 790 | 809 | ||||||
| SEI Institutional Investments Trust / Annual Report / May 31, 2015 | 175 |
SCHEDULE OF INVESTMENTS
High Yield Bond Fund (Continued)
May 31, 2015
| Description | Face Amount ($ Thousands) | Market Value ($ Thousands) | ||||||
LSB Industries | ||||||||
7.750%, 08/01/2019 | $ | 2,240 | $ | 2,380 | ||||
Lundin Mining | ||||||||
7.875%, 11/01/2022 (A) | 1,615 | 1,747 | ||||||
Mirabela Nickel | ||||||||
1.000%, 07/31/2044 | 23 | — | ||||||
New Gold | ||||||||
7.000%, 04/15/2020 (A) | 800 | 835 | ||||||
6.250%, 11/15/2022 (A) | 2,303 | 2,306 | ||||||
Nexeo Solutions LLC | ||||||||
8.375%, 03/01/2018 | 874 | 791 | ||||||
Noranda Aluminum Acquisition | ||||||||
11.000%, 06/01/2019 | 385 | 364 | ||||||
Norbord | ||||||||
6.250%, 04/15/2023 | 670 | 674 | ||||||
NOVA Chemicals | ||||||||
5.000%, 05/01/2025 (A) | 7,190 | 7,370 | ||||||
Rain CII Carbon LLC | ||||||||
8.250%, 01/15/2021 (A) | 6,970 | 6,761 | ||||||
8.000%, 12/01/2018 (A) | 330 | 323 | ||||||
Rayonier AM Products | ||||||||
5.500%, 06/01/2024 (A) | 1,640 | 1,472 | ||||||
Reichhold Holdings | ||||||||
15.000%, 03/13/2017 (H) | 560 | 560 | ||||||
12.000%, 03/31/2017 (H) | 932 | 932 | ||||||
Reichhold Industries | ||||||||
12.000%, 03/31/2017 (H) | 385 | 385 | ||||||
Reichhold Industries PIK | ||||||||
9.000%, 05/08/2017 (A) (B) | 1,056 | — | ||||||
Rentech Nitrogen Partners | ||||||||
6.500%, 04/15/2021 (A) | 380 | 376 | ||||||
Ryerson | ||||||||
11.250%, 10/15/2018 | 441 | 426 | ||||||
9.000%, 10/15/2017 | 1,255 | 1,277 | ||||||
Sappi Papier Holding GmbH | ||||||||
7.750%, 07/15/2017 (A) | 400 | 433 | ||||||
Scotts Miracle-Gro | ||||||||
6.625%, 12/15/2020 | 400 | 419 | ||||||
Sealed Air | ||||||||
8.375%, 09/15/2021 (A) | 2,680 | 3,015 | ||||||
4.875%, 12/01/2022 (A) | 431 | 434 | ||||||
Signode Industrial Group Lux | ||||||||
6.375%, 05/01/2022 (A) | 6,615 | 6,615 | ||||||
Smurfit Kappa Acquisitions | ||||||||
4.875%, 09/15/2018 (A) | 1,400 | 1,477 | ||||||
Steel Dynamics | ||||||||
5.500%, 10/01/2024 | 955 | 985 | ||||||
TPC Group | ||||||||
8.750%, 12/15/2020 (A) | 4,980 | 4,818 | ||||||
Walter Energy | ||||||||
9.875%, 12/15/2020 | 4,200 | 168 | ||||||
8.500%, 04/15/2021 | 2,060 | 103 | ||||||
| Description | Face Amount ($ Thousands) | Market Value ($ Thousands) | ||||||
WR Grace | ||||||||
5.625%, 10/01/2024 (A) | $ | 725 | $ | 763 | ||||
5.125%, 10/01/2021 (A) | 2,253 | 2,326 | ||||||
|
| |||||||
| 114,450 | ||||||||
|
| |||||||
Sovereign — 0.1% | ||||||||
Seminole Tribe | ||||||||
6.535%, 10/01/2020 (A) | 1,280 | 1,382 | ||||||
|
| |||||||
Telecommunication Services — 12.0% |
| |||||||
Acosta | ||||||||
7.750%, 10/01/2022 (A) | 1,400 | 1,430 | ||||||
Aegis Merger Sub | ||||||||
10.250%, 02/15/2023 (A) | 2,642 | 2,701 | ||||||
Affinion Group | ||||||||
7.875%, 12/15/2018 | 1,800 | 1,260 | ||||||
Alcatel-Lucent USA | ||||||||
8.875%, 01/01/2020 (A) | 2,765 | 3,035 | ||||||
6.750%, 11/15/2020 (A) | 185 | 196 | ||||||
Altice | ||||||||
7.750%, 05/15/2022 (A) | 7,423 | 7,497 | ||||||
7.625%, 02/15/2025 (A) | 1,385 | 1,368 | ||||||
Altice Financing | ||||||||
6.625%, 02/15/2023 (A) | 4,628 | 4,796 | ||||||
6.500%, 01/15/2022 (A) | 3,690 | 3,782 | ||||||
Altice US Finance | ||||||||
7.750%, 07/15/2025 | 1,355 | 1,332 | ||||||
Altice US Finance I | ||||||||
5.375%, 07/15/2023 (A) | 9,075 | 9,075 | ||||||
Avaya | ||||||||
10.500%, 03/01/2021 (A) | 1,631 | 1,395 | ||||||
9.000%, 04/01/2019 (A) | 1,560 | 1,611 | ||||||
7.000%, 04/01/2019 (A) | 1,565 | 1,565 | ||||||
Blue Coat Holdings | ||||||||
8.375%, 06/01/2023 (A) | 515 | 520 | ||||||
CenturyLink | ||||||||
6.750%, 12/01/2023 | 5,130 | 5,476 | ||||||
5.800%, 03/15/2022 | 2,190 | 2,245 | ||||||
5.625%, 04/01/2020 | 3,155 | 3,293 | ||||||
Cequel Communications Holdings I LLC | ||||||||
6.375%, 09/15/2020 (A) | 4,500 | 4,590 | ||||||
Cogeco Cable | ||||||||
4.875%, 05/01/2020 (A) | 1,050 | 1,081 | ||||||
Cogent Communications Finance | ||||||||
5.625%, 04/15/2021 (A) | 2,580 | 2,503 | ||||||
Cogent Communications Group | ||||||||
5.375%, 03/01/2022 (A) | 2,767 | 2,767 | ||||||
Columbus International | ||||||||
7.375%, 03/30/2021 (A) | 3,555 | 3,835 | ||||||
CommScope | ||||||||
5.500%, 06/15/2024 (A) | 3,265 | 3,253 | ||||||
5.000%, 06/15/2021 (A) | 1,085 | 1,082 | ||||||
| 176 | SEI Institutional Investments Trust / Annual Report / May 31, 2015 |
| Description | Face Amount ($ Thousands) | Market Value ($ Thousands) | ||||||
CommScope Holding PIK | ||||||||
6.625%, 06/01/2020 (A) | $ | 1,940 | $ | 1,998 | ||||
Digicel Group | ||||||||
8.250%, 09/30/2020 (A) | 5,511 | 5,715 | ||||||
7.125%, 04/01/2022 (A) | 1,390 | 1,352 | ||||||
6.750%, 03/01/2023 (A) | 1,410 | 1,399 | ||||||
Expo Event Transco | ||||||||
9.000%, 06/15/2021 (A) | 2,654 | 2,734 | ||||||
Frontier Communications | ||||||||
7.625%, 04/15/2024 | 1,330 | 1,280 | ||||||
7.125%, 01/15/2023 | 1,255 | 1,202 | ||||||
6.875%, 01/15/2025 | 440 | 401 | ||||||
6.250%, 09/15/2021 | 200 | 193 | ||||||
GCI | ||||||||
6.750%, 06/01/2021 | 924 | 945 | ||||||
Gray Television | ||||||||
7.500%, 10/01/2020 | 4,215 | 4,489 | ||||||
Hughes Satellite Systems | ||||||||
7.625%, 06/15/2021 | 3,484 | 3,915 | ||||||
Intelsat Jackson Holdings | ||||||||
7.500%, 04/01/2021 | 1,290 | 1,309 | ||||||
7.250%, 10/15/2020 | 4,150 | 4,207 | ||||||
6.625%, 12/15/2022 | 2,436 | 2,253 | ||||||
5.500%, 08/01/2023 | 4,067 | 3,735 | ||||||
Intelsat Luxembourg | ||||||||
8.125%, 06/01/2023 | 4,785 | 4,259 | ||||||
7.750%, 06/01/2021 | 8,145 | 7,351 | ||||||
Level 3 Communications | ||||||||
5.750%, 12/01/2022 | 2,210 | 2,257 | ||||||
Level 3 Financing | ||||||||
8.625%, 07/15/2020 | 2,711 | 2,924 | ||||||
7.000%, 06/01/2020 | 970 | 1,039 | ||||||
6.125%, 01/15/2021 | 1,180 | 1,251 | ||||||
5.625%, 02/01/2023 (A) | 465 | 480 | ||||||
5.375%, 08/15/2022 | 360 | 368 | ||||||
5.375%, 05/01/2025 (A) | 6,390 | 6,358 | ||||||
5.125%, 05/01/2023 (A) | 3,285 | 3,293 | ||||||
McGraw-Hill Global Education Holdings LLC | ||||||||
9.750%, 04/01/2021 | 565 | 626 | ||||||
MDC Partners | ||||||||
6.750%, 04/01/2020 (A) | 3,653 | 3,626 | ||||||
Midcontinent Communications & Midcontinent Finance | ||||||||
6.250%, 08/01/2021 (A) | 440 | 455 | ||||||
NII Capital | ||||||||
7.625%, 04/01/2021 (B) | 174 | 49 | ||||||
NII International Telecom SCA | ||||||||
7.875%, 08/15/2019 (A) (B) | 2,875 | 2,659 | ||||||
Nortel Networks | ||||||||
9.002%, 07/15/2011 (B) | 2,209 | 1,958 | ||||||
Numericable Group | ||||||||
6.250%, 05/15/2024 (A) | 1,124 | 1,139 | ||||||
6.000%, 05/15/2022 (A) | 8,940 | 9,018 | ||||||
| Description | Face Amount ($ Thousands) | Market Value ($ Thousands) | ||||||
Outfront Media Capital LLC | ||||||||
5.875%, 03/15/2025 | $ | 4,255 | $ | 4,489 | ||||
5.625%, 02/15/2024 | 200 | 209 | ||||||
5.250%, 02/15/2022 | 605 | 626 | ||||||
Quebecor Media | ||||||||
5.750%, 01/15/2023 | 1,645 | 1,707 | ||||||
Qwest Capital Funding | ||||||||
7.750%, 02/15/2031 | 730 | 774 | ||||||
RCN Telecom Services LLC | ||||||||
8.500%, 08/15/2020 (A) | 1,175 | 1,251 | ||||||
Sable International Finance | ||||||||
8.750%, 02/01/2020 (A) | 80 | 86 | ||||||
SBA Communications | ||||||||
4.875%, 07/15/2022 (A) | 3,000 | 3,017 | ||||||
SBA Telecommunications | ||||||||
5.750%, 07/15/2020 | 634 | 666 | ||||||
Sitel LLC | ||||||||
11.000%, 08/01/2017 (A) | 2,055 | 2,117 | ||||||
SoftBank | ||||||||
4.500%, 04/15/2020 (A) | 2,596 | 2,667 | ||||||
Sprint | ||||||||
7.875%, 09/15/2023 | 16,590 | 16,870 | ||||||
7.625%, 02/15/2025 | 4,583 | 4,496 | ||||||
7.250%, 09/15/2021 | 2,820 | 2,838 | ||||||
7.125%, 06/15/2024 | 5,090 | 4,925 | ||||||
Sprint Capital | ||||||||
8.750%, 03/15/2032 | 4,570 | 4,661 | ||||||
6.900%, 05/01/2019 | 3,000 | 3,111 | ||||||
6.875%, 11/15/2028 | 8,346 | 7,532 | ||||||
Sprint Communications | ||||||||
9.000%, 11/15/2018 (A) | 695 | 797 | ||||||
Telecom Italia | ||||||||
5.303%, 05/30/2024 (A) | 1,125 | 1,170 | ||||||
T-Mobile USA | ||||||||
6.731%, 04/28/2022 | 2,695 | 2,870 | ||||||
6.633%, 04/28/2021 | 895 | 954 | ||||||
6.625%, 04/01/2023 | 300 | 316 | ||||||
6.542%, 04/28/2020 | 665 | 703 | ||||||
6.375%, 03/01/2025 | 10,085 | 10,526 | ||||||
6.250%, 04/01/2021 | 710 | 749 | ||||||
6.000%, 03/01/2023 | 565 | 587 | ||||||
U.S. Cellular | ||||||||
6.700%, 12/15/2033 | 625 | 605 | ||||||
Unitymedia GmbH | ||||||||
6.125%, 01/15/2025 (A) | 1,800 | 1,863 | ||||||
Unitymedia Hessen GmbH & KG | ||||||||
5.500%, 01/15/2023 (A) | 4,885 | 5,038 | ||||||
Univision Communications | ||||||||
8.500%, 05/15/2021 (A) | 2,450 | 2,612 | ||||||
5.125%, 05/15/2023 (A) | 930 | 932 | ||||||
5.125%, 02/15/2025 (A) | 2,559 | 2,545 | ||||||
UPCB Finance IV | ||||||||
5.375%, 01/15/2025 (A) | 2,700 | 2,704 | ||||||
| SEI Institutional Investments Trust / Annual Report / May 31, 2015 | 177 |
SCHEDULE OF INVESTMENTS
High Yield Bond Fund (Continued)
May 31, 2015
| Description | Face Amount ($ Thousands) | Market Value ($ Thousands) | ||||||
UPCB Finance V | ||||||||
7.250%, 11/15/2021 (A) | $ | 2,012 | $ | 2,193 | ||||
UPCB Finance VI | ||||||||
6.875%, 01/15/2022 (A) | 591 | 638 | ||||||
Videotron | ||||||||
5.375%, 06/15/2024 (A) | 420 | 436 | ||||||
5.000%, 07/15/2022 | 2,705 | 2,793 | ||||||
Virgin Media Finance | ||||||||
6.375%, 04/15/2023 (A) | 1,010 | 1,073 | ||||||
5.750%, 01/15/2025 (A) | 869 | 889 | ||||||
Virgin Media Secured Finance | ||||||||
5.375%, 04/15/2021 (A) | 2,876 | 3,012 | ||||||
5.250%, 01/15/2021 | 2,100 | 2,242 | ||||||
5.250%, 01/15/2026 (A) | 1,460 | 1,462 | ||||||
Wave Holdco LLC PIK | ||||||||
8.250%, 07/15/2019 (A) | 759 | 770 | ||||||
WideOpenWest Finance LLC | ||||||||
13.375%, 10/15/2019 | 800 | 876 | ||||||
10.250%, 07/15/2019 | 2,625 | 2,802 | ||||||
Wind Acquisition Finance | ||||||||
7.375%, 04/23/2021 (A) | 6,635 | 6,917 | ||||||
6.500%, 04/30/2020 (A) | 1,302 | 1,383 | ||||||
4.750%, 07/15/2020 (A) | 3,290 | 3,315 | ||||||
Windstream | ||||||||
7.750%, 10/01/2021 | 3,265 | 3,085 | ||||||
7.500%, 06/01/2022 | 860 | 785 | ||||||
7.500%, 04/01/2023 | 1,775 | 1,593 | ||||||
Zayo Group LLC | ||||||||
6.375%, 05/15/2025 (A) | 450 | 451 | ||||||
6.000%, 04/01/2023 (A) | 8,727 | 8,788 | ||||||
Ziggo Bond Finance BV | ||||||||
5.875%, 01/15/2025 (A) | 435 | 444 | ||||||
|
| |||||||
| 300,885 | ||||||||
|
| |||||||
Utilities — 1.9% | ||||||||
Abengoa Yield | ||||||||
7.000%, 11/15/2019 (A) | 1,250 | 1,297 | ||||||
AES | ||||||||
7.375%, 07/01/2021 | 800 | 895 | ||||||
5.500%, 03/15/2024 | 500 | 503 | ||||||
5.500%, 04/15/2025 | 2,075 | 2,039 | ||||||
4.875%, 05/15/2023 | 1,570 | 1,507 | ||||||
3.262%, 06/01/2019 (C) | 395 | 396 | ||||||
AES Gener | ||||||||
8.375%, 12/18/2073 (A) (C) | 705 | 770 | ||||||
AmeriGas Finance LLC | ||||||||
7.000%, 05/20/2022 | 5,393 | 5,797 | ||||||
Calpine | ||||||||
5.500%, 02/01/2024 | 810 | 808 | ||||||
5.375%, 01/15/2023 | 1,330 | 1,337 | ||||||
DPL | ||||||||
6.750%, 10/01/2019 (A) | 1,340 | 1,440 | ||||||
| Description | Face Amount ($ Thousands) | Market Value ($ Thousands) | ||||||
Dynegy | ||||||||
7.625%, 11/01/2024 (A) | $ | 3,300 | $ | 3,547 | ||||
7.375%, 11/01/2022 (A) | 3,390 | 3,606 | ||||||
5.875%, 06/01/2023 | 3,365 | 3,348 | ||||||
Enel | ||||||||
8.750%, 09/24/2073 (A) (C) | 1,469 | 1,749 | ||||||
Ferrellgas | ||||||||
6.750%, 01/15/2022 | 97 | 99 | ||||||
GenOn Americas Generation LLC | ||||||||
9.125%, 05/01/2031 | 800 | 752 | ||||||
8.500%, 10/01/2021 | 4,725 | 4,548 | ||||||
GenOn Energy | ||||||||
9.875%, 10/15/2020 | 1,320 | 1,360 | ||||||
LBC Tank Terminals Holding Netherlands | ||||||||
6.875%, 05/15/2023 (A) | 2,800 | 2,898 | ||||||
NRG Energy | ||||||||
8.250%, 09/01/2020 | 340 | 358 | ||||||
7.875%, 05/15/2021 | 1,430 | 1,532 | ||||||
6.250%, 07/15/2022 | 530 | 555 | ||||||
6.250%, 05/01/2024 | 1,864 | 1,906 | ||||||
NSG Holdings LLC | ||||||||
7.750%, 12/15/2025 (A) | 2,015 | 2,207 | ||||||
PPL Energy Supply LLC | ||||||||
6.500%, 06/01/2025 (A) | 221 | 226 | ||||||
RJS Power Holdings LLC | ||||||||
5.125%, 07/15/2019 (A) | 2,000 | 1,985 | ||||||
|
| |||||||
| 47,465 | ||||||||
|
| |||||||
Total Corporate Obligations | 2,013,236 | |||||||
|
| |||||||
LOAN PARTICIPATIONS — 8.3% |
| |||||||
21st Century Oncology | ||||||||
6.500%, 04/28/2022 | 2,045 | 2,040 | ||||||
Academy Sports, Initial Term Loan | ||||||||
4.500%, 08/03/2018 | 598 | 599 | ||||||
Acadia Healthcare Company, Term Loan, 1st Lien | ||||||||
4.250%, 02/11/2022 | 998 | 1,006 | ||||||
Accellent, Cov-Lite, 2nd Lien | ||||||||
7.500%, 03/11/2022 | 825 | 789 | ||||||
Accellent, Term Loan, 1st Lien | ||||||||
4.500%, 03/12/2021 | 1,416 | 1,406 | ||||||
Affinion Group Holdings, Term Loan | ||||||||
6.750%, 10/09/2016 | 1,775 | 1,711 | ||||||
Albertson’s, Term Loan | ||||||||
5.375%, 03/21/2019 | 1,431 | 1,437 | ||||||
Albertson’s, Term Loan B4, 1st Lien | ||||||||
5.500%, 08/25/2021 | 3,310 | 3,329 | ||||||
| 178 | SEI Institutional Investments Trust / Annual Report / May 31, 2015 |
| Description | Face Amount ($ Thousands) | Market Value ($ Thousands) | ||||||
Alinta Energy Finance, Delayed Term Loan | ||||||||
6.375%, 08/13/2018 | $ | 43 | $ | 43 | ||||
Alinta Ltd., Cov-Lite, 1st Lien | ||||||||
6.375%, 08/13/2019 | 2,515 | 2,532 | ||||||
Alinta Ltd., Unfunded Term Loan | ||||||||
1.000%, 08/13/2018 | 124 | — | ||||||
Alliance Laundry Systems LLC, Term Loan B | ||||||||
4.250%, 12/10/2018 | 1,142 | 1,142 | ||||||
American Energy, Term Loan | ||||||||
5.250%, 08/04/2020 | 700 | 531 | ||||||
American Rock Salt, Term Loan | ||||||||
8.500%, 03/20/2020 | 2,000 | 1,993 | ||||||
American Tire Distributors, Cov-Lite, 2nd Lien | ||||||||
5.250%, 09/24/2021 | 1,330 | 1,342 | ||||||
Angren Inc., 2nd Lien | ||||||||
9.250%, 08/18/2021 | 1,300 | 1,300 | ||||||
5.500%, 02/18/2021 | 593 | 591 | ||||||
AP NMT Acquisition, Term Loan | ||||||||
6.750%, 08/11/2021 | 2,046 | 2,027 | ||||||
Applied Systems, Term Loan, 2nd Lien | ||||||||
7.500%, 01/24/2022 | 1,593 | 1,601 | ||||||
Arctic Glacier, Cov-Lite, 1st Lien | ||||||||
6.000%, 05/10/2019 | 465 | 463 | ||||||
Aricent, Term Loan, 2nd Lien | ||||||||
9.500%, 04/14/2022 | 2,100 | 2,109 | ||||||
Arizona Chemical, Cov-Lite, 2nd Lien | ||||||||
7.500%, 06/10/2022 | 389 | 385 | ||||||
Asurion, LLC, Term Loan | ||||||||
5.000%, 05/24/2019 | 955 | 958 | ||||||
Asurion, LLC, Term Loan, 2nd Lien | ||||||||
8.500%, 03/03/2021 | 4,040 | 4,133 | ||||||
Atkore, Cov-Lite, 2nd Lien | ||||||||
7.750%, 10/09/2021 | 975 | 914 | ||||||
Avaya, Term Loan B-3 | ||||||||
4.685%, 10/26/2017 | 1,053 | 1,049 | ||||||
BJ’s Wholesale Club, 2nd Lien | ||||||||
8.500%, 03/26/2020 | 1,810 | 1,828 | ||||||
Bway Intermediate, 1st Lien | ||||||||
5.500%, 08/14/2020 | 695 | 697 | ||||||
Carestream Health, Cov-Lite, 2nd Lien | ||||||||
9.500%, 12/05/2019 | 2,500 | 2,500 | ||||||
CD&R Millennium, Term Loan | ||||||||
8.250%, 07/31/2022 | 2,340 | 2,334 | ||||||
Cengage Learning Acquisitions, Term Loan, 1st Lien | ||||||||
8.250%, 03/31/2020 | 2,930 | 2,936 | ||||||
| Description | Face Amount ($ Thousands) | Market Value ($ Thousands) | ||||||
Ceridian, Cov-Lite | ||||||||
4.500%, 09/15/2020 | $ | 8 | $ | 8 | ||||
Ceridian, Cov-Lite, 1st Lien | ||||||||
4.500%, 09/15/2020 | 1,053 | 1,049 | ||||||
Ceva Group, PLC, Term Loan, 1st Lien | ||||||||
6.500%, 03/19/2021 | 496 | 471 | ||||||
Ceva Intercompany, Cov-Lite, Term Loan | ||||||||
6.500%, 03/19/2021 | 1 | 1 | ||||||
Ceva Intercompany, Term Loan, 1st Lien | ||||||||
6.500%, 03/19/2021 | 212 | 201 | ||||||
Ceva Logistics Canada, Term Loan, 1st Lien | ||||||||
6.500%, 03/19/2021 | 36 | 35 | ||||||
Chief Exploration, Term Loan | ||||||||
7.500%, 05/16/2021 | 710 | 675 | ||||||
CKX, Term Loan B | ||||||||
9.000%, 06/21/2017 | 476 | 167 | ||||||
Clear Channel Communications, Extended Term Loan, 1st Lien | ||||||||
6.905%, 01/22/2019 | 8,183 | 7,640 | ||||||
Crestwood Holdings, 1st Lien | ||||||||
7.000%, 06/19/2019 | 1,381 | 1,372 | ||||||
CTI Foods, 2nd Lien | ||||||||
8.250%, 06/28/2021 | 950 | 921 | ||||||
DAE Aviation Holdings, 1st Lien | ||||||||
5.000%, 11/02/2018 | 2,281 | 2,285 | ||||||
DAE Aviation Holdings, Term Loan, 1st Lien | ||||||||
7.750%, 08/05/2019 | 1,000 | 1,006 | ||||||
Dex Media West, Term Loan | ||||||||
8.000%, 12/30/2016 | 1,660 | 1,175 | ||||||
Diamond Foods, 1st Lien | ||||||||
4.250%, 08/20/2018 | 926 | 926 | ||||||
Dollar Tree, Cov-Lite, 1st Lien | ||||||||
4.250%, 02/06/2022 | 2,000 | 2,018 | ||||||
Empire Generating, Term Loan | ||||||||
5.250%, 03/12/2021 | 1,780 | 1,769 | ||||||
Endurance International, 1st Lien | ||||||||
5.000%, 11/09/2019 | 1,674 | 1,668 | ||||||
Energy & Exploration Partners, Term Loan B, 1st Lien | ||||||||
7.750%, 01/22/2019 | 2,620 | 2,263 | ||||||
Evergreen Skillsoft, Term Loan | ||||||||
5.750%, 04/23/2021 | 5 | 5 | ||||||
5.750%, 04/28/2021 | 471 | 464 | ||||||
Evergreen Skillsoft, Term Loan, 1st Lien | ||||||||
5.750%, 04/28/2021 | 1,025 | 1,009 | ||||||
Evergreen Skillsoft, Cov-Lite, Term Loan, 2nd Lien | ||||||||
9.250%, 04/28/2022 | 1,668 | 1,581 | ||||||
| SEI Institutional Investments Trust / Annual Report / May 31, 2015 | 179 |
SCHEDULE OF INVESTMENTS
High Yield Bond Fund (Continued)
May 31, 2015
| Description | Face Amount ($ Thousands) | Market Value ($ Thousands) | ||||||
Expert Global, Term Loan | ||||||||
8.500%, 04/02/2018 | $ | 914 | $ | 915 | ||||
8.500%, 04/02/2018 | 20 | 21 | ||||||
Fender Musical Instruments, 1st Lien | ||||||||
5.750%, 04/03/2019 | 170 | 170 | ||||||
First Advantage, 2nd Lien | ||||||||
10.500%, 08/28/2019 (H) | 700 | 695 | ||||||
First Advantage, Cov-Lite, Term Loan | ||||||||
6.250%, 02/28/2019 | 489 | 486 | ||||||
First Advantage, Term Loan B | ||||||||
6.250%, 08/28/2019 | 1 | 1 | ||||||
Flint Group, Term Loan B, 2nd Lien | ||||||||
8.250%, 09/05/2022 | 1,620 | 1,589 | ||||||
GCA Services Group, Cov-Lite, 2nd Lien | ||||||||
9.250%, 11/01/2020 | 640 | 643 | ||||||
Global Aviation Holdings, Term Loan | ||||||||
10.000%, 07/13/2017 (B) | 1,937 | — | ||||||
3.000%, 02/13/2018 (B) | 633 | — | ||||||
Green Energy Partners, 1st Lien | ||||||||
6.500%, 11/12/2021 | 990 | 1,001 | ||||||
Greenway Medical Technologies, Term Loan, 1st Lien | ||||||||
6.000%, 11/04/2020 | 988 | 987 | ||||||
Gymboree, Cov-Lite, 1st Lien | ||||||||
5.000%, 02/23/2018 | 375 | 283 | ||||||
Harrah’s Entertainment, Term Loan B6 | ||||||||
9.500%, 03/01/2017 | 2,965 | 2,772 | ||||||
Hostess Brands, Term Loan | ||||||||
6.750%, 04/09/2020 | 1,411 | 1,428 | ||||||
6.750%, 04/09/2020 | 124 | 125 | ||||||
HUB International, Ltd., Term Loan B, 1st Lien | ||||||||
4.000%, 10/02/2020 | 2,270 | 2,261 | ||||||
Hyland Software, Term Loan B, 1st Lien | ||||||||
4.750%, 02/19/2021 | 832 | 834 | ||||||
IMG Worldwide 5/14 Cov-Lite Term Loan | ||||||||
5.250%, 05/06/2021 | 2 | 1 | ||||||
IMG Worldwide, Cov-Lite, 1st Lien | ||||||||
5.250%, 05/06/2021 | 50 | 50 | ||||||
IMG Worldwide, Term Loan, 1st Lien | ||||||||
5.250%, 05/06/2021 | 544 | 545 | ||||||
Indivior, Term Loan | ||||||||
7.000%, 12/19/2019 | 2,574 | 2,478 | ||||||
| Description | Face Amount ($ Thousands) | Market Value ($ Thousands) | ||||||
Infor, Term Loan B, 1st Lien | ||||||||
3.750%, 06/03/2020 | $ | 1,307 | $ | 1,300 | ||||
Informatica Bridge Loan | ||||||||
0.000%, 05/01/2016 (F) | 1,710 | 1,710 | ||||||
Integra Telecom, 1st Lien | ||||||||
5.250%, 08/08/2020 | 1,480 | 1,472 | ||||||
Interactive Data, Cov-Lite, Term Loan, 1st Lien | ||||||||
4.750%, 05/02/2021 | 1,047 | 1,050 | ||||||
Interline Brands, Term Loan | ||||||||
4.000%, 03/17/2021 | 639 | 638 | ||||||
ION Trading Technologies, Term Loan, 2nd Lien | ||||||||
7.250%, 06/10/2022 | 4,332 | 4,296 | ||||||
J. Crew Group, 1st Lien | ||||||||
4.000%, 03/05/2021 | 920 | 837 | ||||||
J. Crew Group, Term Loan B | ||||||||
4.000%, 03/05/2021 | 548 | 498 | ||||||
KCA Deutag Drilling, Ltd., Term Loan B, 1st Lien | ||||||||
6.250%, 05/15/2020 | 1,012 | 888 | ||||||
Lions Gate, Term Loan, 2nd Lien | ||||||||
5.000%, 03/11/2022 | 2,109 | 2,109 | ||||||
Magic Newco, 1st Lien | ||||||||
5.000%, 12/12/2018 | 985 | 987 | ||||||
Marina District Finance, 1st Lien | ||||||||
6.500%, 08/15/2018 | 1,251 | 1,264 | ||||||
Mashantucket Pequot Tribe, Term Loan, 1st Lien | ||||||||
9.375%, 06/30/2020 | 5,425 | 4,435 | ||||||
5.000%, 07/01/2018 | 174 | 136 | ||||||
Mauser-Werke GMBG, | ||||||||
4.500%, 07/31/2021 | 657 | 657 | ||||||
Medical Card, Term Loan | ||||||||
12.000%, 03/17/2017 | 1,588 | 1,509 | ||||||
0.095%, 03/17/2017 PIK | 109 | 104 | ||||||
Metroflag, 2nd Lien | ||||||||
14.000%, 01/06/2009 (B) | 325 | — | ||||||
MGF Sourcing US, LLC, 1st Lien | ||||||||
8.750%, 09/12/2019 | 833 | 827 | ||||||
MH Sub I LLC, Cov-Lite, 2nd Lien | ||||||||
8.500%, 07/08/2022 | 2,347 | 2,315 | ||||||
Millennium Laboratories, LLC, Term Loan B, 1st Lien | ||||||||
5.250%, 04/16/2021 | 929 | 638 | ||||||
Misys, 2nd Lien | ||||||||
12.000%, 06/12/2019 | 1,550 | 1,688 | ||||||
MMI, Term Loan | ||||||||
9.000%, 01/31/2020 | 3,162 | 2,884 | ||||||
| 180 | SEI Institutional Investments Trust / Annual Report / May 31, 2015 |
| Description | Face Amount ($ Thousands) | Market Value ($ Thousands) | ||||||
Mohegan Tribal Gaming Authority, Term Loan B, | ||||||||
5.500%, 11/19/2019 | $ | 1,422 | $ | 1,418 | ||||
Moxie Liberty, 1st Lien | ||||||||
7.500%, 08/21/2020 | 785 | 783 | ||||||
Moxie Patriot, LLC, Term Loan B-1, 1st Lien | ||||||||
6.750%, 12/19/2020 | 775 | 771 | ||||||
Murray Energy, Cov-Lite, Term Loan B, 2nd Lien | ||||||||
7.500%, 04/09/2020 | 2,694 | 2,608 | ||||||
Nana Development, 1st Lien | ||||||||
8.000%, 03/13/2018 | 300 | 293 | ||||||
Navistar International, Term Loan | ||||||||
5.750%, 08/17/2017 | 625 | 627 | ||||||
Nelson Education, Term Loan B-1 | ||||||||
6.750%, 07/03/2014 | 1,369 | 989 | ||||||
New Albertsons, Term Loan | ||||||||
4.750%, 06/27/2021 | 806 | 808 | ||||||
Nine West, Cov-Lite, Unsecured Guaranteed Term Loan | ||||||||
6.250%, 01/08/2020 | 1,710 | 1,419 | ||||||
Obsidian Natural Gas Trust, Term Loan | ||||||||
7.000%, 11/02/2015 | 257 | 255 | ||||||
Ocean, Cov-Lite, Term | ||||||||
6.000%, 03/31/2021 | 2,518 | 2,157 | ||||||
Ocean Rig, Term Loan B | ||||||||
5.500%, 07/16/2021 | 3,078 | 2,772 | ||||||
Opal Acquisition, Term | ||||||||
5.000%, 11/27/2020 | 3,145 | 3,138 | ||||||
Ortho-Clinical Diagnostics, Term Loan B | ||||||||
4.750%, 06/30/2021 | 325 | 321 | ||||||
Ortho-Clinical Diagnostics, Term Loan B, 1st Lien | ||||||||
4.750%, 06/30/2021 | 608 | 600 | ||||||
Oxea, Cov-Lite, 2nd Lien | ||||||||
8.250%, 07/15/2020 | 1,250 | 1,146 | ||||||
Panda Temple Power, 1st Lien | ||||||||
7.250%, 04/03/2019 | 350 | 334 | ||||||
Panolam Industries International, Term Loan | ||||||||
7.750%, 08/23/2017 | 752 | 745 | ||||||
Peak, Cov-Lite, 2nd Lien | ||||||||
8.250%, 06/17/2022 | 2,335 | 2,265 | ||||||
Performance Food Group 5/13 2nd Lien Cov-Lite TL | ||||||||
6.250%, 11/14/2019 | 167 | 167 | ||||||
| Description | Face Amount ($ Thousands) | Market Value ($ Thousands) | ||||||
Performance Food Group, | ||||||||
6.250%, 11/14/2019 | $ | 325 | $ | 326 | ||||
Petsmart, 1st Lien | ||||||||
0.000%, 03/10/2022 (F) | 100 | 100 | ||||||
Pierre Food, Term Loan, | ||||||||
9.500%, 10/10/2017 | 3,378 | 3,408 | ||||||
Polymer Group, Term Loan B | ||||||||
5.250%, 12/19/2019 | 154 | 154 | ||||||
Polymer Group, Term Loan B, 1st Lien | ||||||||
5.250%, 12/19/2019 | 1,065 | 1,069 | ||||||
Rite Aid, 2nd Lien | ||||||||
5.750%, 08/21/2020 | 785 | 793 | ||||||
4.875%, 06/11/2021 | 1,250 | 1,251 | ||||||
Riverbed Technology, Cov-Lite, Term Loan, 1st Lien | ||||||||
6.000%, 04/24/2022 | 935 | 944 | ||||||
Road Infrastructure Investment, LLC, Term Loan, 2nd Lien | ||||||||
7.750%, 09/30/2021 | 300 | 282 | ||||||
Rue 21, Term Loan B, 1st Lien | ||||||||
0.000%, 10/09/2020 (F) | 2,115 | 1,954 | ||||||
SIG Combibloc, Cov-Lite, 1st Lien | ||||||||
4.250%, 03/11/2022 | 340 | 342 | ||||||
Solenis, Cov-Lite, 2nd Lien | ||||||||
7.750%, 07/31/2022 | 560 | 541 | ||||||
SS&C Technologies Bridge Loan | ||||||||
0.000%, 02/02/2016 (F) | 1,655 | 1,655 | ||||||
Staples, Term Loan B, 1st Lien | ||||||||
0.000%, 04/23/2021 (F) | 5,000 | 5,003 | ||||||
Starwood Property Trust, Term Loan B | ||||||||
3.500%, 04/17/2020 | 1,995 | 1,998 | ||||||
Steinway Musical Instruments, Term Loan, 1st Lien | ||||||||
4.750%, 09/19/2019 | 1,174 | 1,171 | ||||||
Sterigenics Unfunded Bridge Loan | ||||||||
0.000%, 04/16/2023 (G) | 992 | — | ||||||
TASC, Term Loan, 2nd Lien | ||||||||
12.000%, 05/23/2021 | 1,700 | 1,783 | ||||||
Templar Energy, Cov-Lite, | ||||||||
8.500%, 11/25/2020 | 2,800 | �� | 2,153 | |||||
Tenet Healthcare Unfunded Bridge Loan | ||||||||
0.000%, 04/01/2016 (G) | 6,675 | — | ||||||
| SEI Institutional Investments Trust / Annual Report / May 31, 2015 | 181 |
SCHEDULE OF INVESTMENTS
High Yield Bond Fund (Continued)
May 31, 2015
| Description | Face Amount ($ Thousands) | Market Value ($ Thousands) | ||||||
Texas Competitive, Extended Term Loan | ||||||||
4.668%, 10/10/2017 (B) | $ | 40 | $ | 24 | ||||
4.668%, 10/10/2017 (B) | 4,175 | 2,536 | ||||||
Texas Competitive, | ||||||||
4.668%, 04/25/2015 (B) | 10,741 | 6,445 | ||||||
4.668%, 08/21/2015 (B) | 87 | 52 | ||||||
The Hillman Companies, Term Loan B, 1st Lien | ||||||||
4.500%, 06/30/2021 | 313 | 313 | ||||||
The Neiman Marcus Group, Term Loan, 1st Lien | ||||||||
4.250%, 10/25/2020 | 2,952 | 2,952 | ||||||
Toys R Us, Term Loan | ||||||||
9.750%, 04/09/2020 | 2,494 | 2,347 | ||||||
Trans Union, LLC, Term Loan, 1st Lien | ||||||||
4.000%, 04/09/2021 | 3,487 | 3,476 | ||||||
Travelport, Term Loan | ||||||||
5.750%, 09/02/2021 | 4,245 | 4,279 | ||||||
Trinseo, Cov-Lite, 1st Lien | ||||||||
0.000%, 10/28/2021 (F) | 515 | 516 | ||||||
True Religion Apparel, Term Loan, 1st Lien | ||||||||
5.875%, 07/30/2019 | 783 | 698 | ||||||
Valeant, Term Loan B | ||||||||
4.000%, 03/13/2022 | 1,218 | 1,220 | ||||||
Varsity Brands, Cov-Lite, | ||||||||
5.000%, 12/10/2021 | 1,217 | 1,222 | ||||||
Vat Holdings, Term Loan, | ||||||||
4.750%, 02/11/2021 | 1,011 | 1,009 | ||||||
Vertafore, Term Loan | ||||||||
9.750%, 10/27/2017 | 780 | 788 | ||||||
Walter Investment Management, Term Loan, 1st Lien | ||||||||
4.750%, 12/18/2020 | 1,592 | 1,504 | ||||||
Weather Channel, 1st Lien | ||||||||
0.000%, 02/13/2020 (F) | 2,281 | 2,280 | ||||||
Weight Watchers International | ||||||||
4.000%, 04/02/2020 | 846 | 418 | ||||||
Weight Watchers International, Term Loan B2, 1st Lien | ||||||||
4.000%, 04/02/2020 | 2 | 1 | ||||||
Wilton Brands, 1st Lien | ||||||||
7.500%, 08/30/2018 | 4,210 | 4,079 | ||||||
York Risk Services Holding, Term Loan B | ||||||||
4.750%, 09/18/2021 | 902 | 894 | ||||||
| Description | Face Amount ($ Thousands) | Market Value ($ Thousands) | ||||||
York Risk Services, Cov-Lite, 1st Lien | ||||||||
4.750%, 10/01/2021 | $ | 98 | $ | 97 | ||||
Ziggo, Unfunded Term Loan B1, 1st Lien | ||||||||
0.000%, 01/15/2022 (G) | 323 | 2 | ||||||
|
| |||||||
Total Loan Participations |
| 209,656 | ||||||
|
| |||||||
COLLATERALIZED DEBT OBLIGATIONS — 6.9% |
| |||||||
Other Asset-Backed Securities — 6.9% |
| |||||||
B&M CLO Ltd., | ||||||||
4.026%, 04/16/2026 (A) (C) | 2,142 | 2,057 | ||||||
B&M CLO Ltd., | ||||||||
5.026%, 04/16/2026 (A) (C) | 3,529 | 3,061 | ||||||
B&M CLO Ltd., | ||||||||
6.026%, 04/16/2026 (A) (C) | 2,520 | 2,112 | ||||||
Battalion CLO III Ltd., | ||||||||
0.000%, 01/18/2025 (A) | 2,697 | 2,355 | ||||||
Battalion CLO Ltd., | ||||||||
0.000%, 10/22/2025 | 1,560 | 1,092 | ||||||
Battalion CLO V Ltd., | ||||||||
0.000%, 04/17/2026 (A) | 3,445 | 2,549 | ||||||
Battalion CLO VII Ltd., | ||||||||
5.574%, 10/17/2026 (A) (C) | 2,323 | 2,213 | ||||||
Battalion CLO VII Ltd., | ||||||||
0.000%, 10/17/2026 (A) | 4,118 | 3,377 | ||||||
Battalion CLO VIII, | ||||||||
5.711%, 04/18/2027 (A) (C) | 1,268 | 1,167 | ||||||
Battalion CLO VIII, | ||||||||
0.000%, 04/18/2027 (A) | 4,720 | 4,720 | ||||||
Benefit Street Partners CLO III, | ||||||||
0.000%, 01/20/2026 (A) | 2,636 | 2,030 | ||||||
Benefit Street Partners CLO IV | ||||||||
0.000%, 07/20/2026 | 3,422 | 2,943 | ||||||
Benefit Street Partners CLO V | ||||||||
0.000%, 10/20/2026 | 5,411 | 4,599 | ||||||
Benefit Street Partners CLO VII Warehouse Note | ||||||||
0.000%*‡‡ | 8,605 | 8,605 | ||||||
| 182 | SEI Institutional Investments Trust / Annual Report / May 31, 2015 |
| Description | Face Amount ($ Thousands) | Market Value ($ Thousands) | ||||||
Benefit Street Partners CLO, | ||||||||
0.000%, 4/18/2027 | $ | 9,535 | $ | 8,582 | ||||
CVP Cascade CLO Ltd., | ||||||||
6.075%, 07/18/2026 (A) (C) | 2,531 | 2,126 | ||||||
CVP Cascade CLO Ltd., | ||||||||
5.075%, 07/18/2026 (A) (C) | 1,752 | 1,516 | ||||||
Fifth Street Senior Loan Fund I LLC, | ||||||||
7.456%, 01/20/2027 (A) (C) | 5,110 | 4,395 | ||||||
Fifth Street Senior Loan Fund II Warehouse Note | ||||||||
0.000%‡‡ | 6,315 | 6,315 | ||||||
Figueroa CLO, | ||||||||
0.000%, 3/21/2024 | 7,644 | 5,328 | ||||||
Figueroa CLO, Ser 2013-2 | ||||||||
0.000%, 12/15/2025 | 3,070 | 2,710 | ||||||
Fortress Credit Opportunities III CLO LP, Ser 2014-3A, Cl E | ||||||||
6.521%, 04/28/2026 (A) (C) | 3,518 | 3,361 | ||||||
Fortress Credit Opportunities VI CLO, Ser 2015-6A, Cl F | ||||||||
7.019%, 10/10/2026 (A) (C) | 2,270 | 2,220 | ||||||
Great Lakes CLO Ltd., | ||||||||
5.775%, 01/15/2023 (A) (C) | 3,292 | 3,070 | ||||||
Great Lakes CLO Ltd., | ||||||||
0.000%, 01/15/2023 (A) | 2,877 | 2,129 | ||||||
Great Lakes CLO Ltd., | ||||||||
0.000%, 04/15/25 | 7,057 | 5,646 | ||||||
Great Lakes CLO Ltd., | ||||||||
6.275%, 04/15/2025 (A) (C) | 2,520 | 2,167 | ||||||
Hildene CLO Ltd., | ||||||||
5.375%, 07/19/2026 (A) (C) | 2,013 | 1,878 | ||||||
Hildene CLO Ltd., | ||||||||
3.975%, 07/19/2026 (A) (C) | 2,013 | 1,966 | ||||||
JFIN Revolver CLO Ltd., | ||||||||
2.275%, 01/20/2021 (A) (C) | 2,010 | 2,005 | ||||||
JFIN Revolver CLO Ltd., | ||||||||
3.026%, 02/20/2022 (A) (C) | 2,049 | 2,018 | ||||||
| Description | Face Amount ($ Thousands) | Market Value ($ Thousands) | ||||||
KVK CLO, Ser 2012-2A, Cl SUB | ||||||||
0.000%, 02/10/2025 (A) | $ | 2,956 | $ | 2,069 | ||||
Lockwood Grove CLO Ltd., | ||||||||
6.812%, 01/25/2024 (A) (C) | 2,809 | 2,795 | ||||||
Lockwood Grove CLO Ltd., | ||||||||
0.000%, 01/25/2024 (A) | 3,461 | 3,565 | ||||||
MidOcean Credit CLO III, | ||||||||
6.276%, 07/21/2026 (A) (C) | 2,032 | 1,728 | ||||||
Nelder Grove CLO Ltd., | ||||||||
4.806%, 08/28/2026 (A) (C) | 2,049 | 2,059 | ||||||
Nelder Grove CLO Ltd., | ||||||||
7.036%, 08/28/2026 (A) (C) | 3,074 | 3,074 | ||||||
Neuberger Berman CLO XIII, | ||||||||
0.000%, 01/23/2024 (A) | 542 | 282 | ||||||
Neuberger Berman CLO XVI, | ||||||||
0.000%, 04/15/2026 (A) | 2,625 | 1,706 | ||||||
Neuberger Berman CLO XVI, | ||||||||
0.000%, 04/15/2026 (A) | 175 | 131 | ||||||
NewStar Arlington Senior Loan Program LLC, | ||||||||
6.377%, 07/25/2025 (A) (C) | 2,026 | 1,898 | ||||||
NewStar Clarendon Fund CLO LLC, Ser 2015-1A, Cl E | ||||||||
6.315%, 01/25/2027 (A) (C) | 4,470 | 4,112 | ||||||
NXT Capital CLO LLC, | ||||||||
7.775%, 07/20/2022 (A) (C) | 3,047 | 3,047 | ||||||
OCP CLO, Ser 2012-2A, Cl SUB | ||||||||
0.000%, 11/22/2023 (A) | 2,940 | 1,999 | ||||||
Peaks CLO Ltd., | ||||||||
4.775%, 06/15/2026 (A) (C) | 1,015 | 944 | ||||||
Rockwall CDO, | ||||||||
0.528%, 08/01/2024 (A) (C) | 20,656 | 20,036 | ||||||
Shackleton CLO Ltd., | ||||||||
0.000%, 07/17/2026 (A) | 7,965 | 5,337 | ||||||
Trinitas CLO Ltd., | ||||||||
0.000%, 04/15/2026 (A) | 3,530 | 3,001 | ||||||
Trinitas CLO Ltd., | ||||||||
4.075%, 07/15/2026 (A) (C) | 1,245 | 1,190 | ||||||
| SEI Institutional Investments Trust / Annual Report / May 31, 2015 | 183 |
SCHEDULE OF INVESTMENTS
High Yield Bond Fund (Continued)
May 31, 2015
| Description | Face Amount ($ Thousands)/Shares | Market Value ($ Thousands) | ||||||
Venture X CLO, | ||||||||
0.000%, 07/20/2022 (A) | $ | 7,029 | $ | 5,604 | ||||
Venture XI CLO, | ||||||||
0.000%, 11/14/2022 (A) | 7,097 | 5,287 | ||||||
Venture XII CLO, | ||||||||
0.000%, 02/28/2024 (A) | 3,067 | 2,178 | ||||||
Venture XIV CLO | ||||||||
0.000%, 08/25/2025 (A) | 113 | 81 | ||||||
Venture XIV CLO, | ||||||||
0.000%, 08/28/2025 (A) | 1,842 | 1,529 | ||||||
|
| |||||||
Total Collateralized Debt Obligations |
| 173,964 | ||||||
|
| |||||||
MUNICIPAL BONDS — 0.6% |
| |||||||
Commonwealth of Puerto Rico, | ||||||||
8.000%, 07/01/2035 | 5,343 | 4,494 | ||||||
5.000%, 07/01/2041 | 470 | 328 | ||||||
Mohegan Tribal Finance Authority, RB | ||||||||
7.000%, 02/01/2045 | 4,750 | 4,600 | ||||||
Texas State, Public Finance Authority, RB | ||||||||
8.250%, 07/01/2024 | 5,455 | 5,486 | ||||||
|
| |||||||
Total Municipal Bonds | 14,908 | |||||||
|
| |||||||
PREFERRED STOCK — 0.4% |
| |||||||
Ally Financial, 7.000% (A) | 2,725 | 2,752 | ||||||
Aspen Insurance Holdings, 5.950% (C) | 92,000 | 2,365 | ||||||
Ceva Holdings, 0.000%* | 1,214 | 880 | ||||||
GMAC Capital Trust I, 8.125% (C) | 28,000 | 730 | ||||||
RBS Capital Funding Trust V, 5.900% | 38,602 | 953 | ||||||
Royal Bank of Scotland Group, 6.400% | 23,083 | 578 | ||||||
SLM, 1.971% (C) | 15,524 | 924 | ||||||
|
| |||||||
Total Preferred Stock | 9,182 | |||||||
|
| |||||||
CONVERTIBLE BONDS — 0.3% |
| |||||||
Liberty Media CV to 16.7764 | ||||||||
3.750%, 02/15/2030 | 7,900 | 4,858 | ||||||
| Description | Face Amount ($ Thousands)/Shares | Market Value ($ Thousands) | ||||||
Liberty Media CV to 22.9469 | ||||||||
4.000%, 11/15/2029 | $ | 2,561 | $ | 1,612 | ||||
Mirabela Nickel | ||||||||
9.500%, 06/24/2019 (A) (D) | 986 | 986 | ||||||
Mirant CV to 14.7167 | ||||||||
0.000%, 06/15/2021 (B) | 1,950 | — | ||||||
|
| |||||||
Total Convertible Bonds |
| 7,456 | ||||||
|
| |||||||
COMMON STOCK — 0.3% | ||||||||
Cengage Learning Holdings II* | 2,860 | 79 | ||||||
Ceva Holdings* | 561 | 406 | ||||||
CUI Acquisition* (D) (H)‡‡‡ | 3 | 223 | ||||||
Dana Holdings | 118,652 | 2,583 | ||||||
Global Aviation Holdings, Cl A* | 101,199 | — | ||||||
HMH Holdings Delaware* | 73,792 | 1,946 | ||||||
Mirabela Nickel* | 3,878,512 | 371 | ||||||
MModal* | 43,639 | 633 | ||||||
Quad, Cl A | 1,006 | 21 | ||||||
Reichhold Industries* (H) | 1,755 | 749 | ||||||
VSS AHC, Cl A* (D) (E) (H) | 29,628 | 28 | ||||||
|
| |||||||
Total Common Stock | 7,039 | |||||||
|
| |||||||
ASSET-BACKED SECURITY — 0.0% |
| |||||||
Other Asset-Backed Securities — 0.0% |
| |||||||
Airplanes, Pass-Through Trust, Ser 2001-1A, Cl A9 | ||||||||
0.736%, 03/15/2019 (C) | 1,552 | 629 | ||||||
|
| |||||||
Total Asset-Backed Security (Cost $1,212) ($ Thousands) | 629 | |||||||
|
| |||||||
Number Of | ||||||||
WARRANTS — 0.0% | ||||||||
B&G Foods, Expires 03/15/2017* | 2,025 | — | ||||||
Medical Card Systems*‡‡‡ | 20,372 | — | ||||||
MModal, Expires 07/31/2017* | 20,773 | 5 | ||||||
MModal, Expires 07/31/2017* | 15,753 | 8 | ||||||
|
| |||||||
Total Warrants | 13 | |||||||
|
| |||||||
CASH EQUIVALENT — 3.4% |
| |||||||
SEI Daily Income Trust, Prime Obligation Fund, Cl A | 86,501,454 | 86,501 | ||||||
|
| |||||||
Total Cash Equivalent |
| 86,501 | ||||||
|
| |||||||
Total Investments — 100.2% |
| $ | 2,522,584 | |||||
|
| |||||||
| 184 | SEI Institutional Investments Trust / Annual Report / May 31, 2015 |
A list of centrally cleared swap agreements held by the Fund at May 31, 2015, is as follows:
| Credit Default Swaps | ||||||||||||||||
| Counterparty | Reference Entity/Obligation | Buy/Sell Protection | (Pays)/Receives Rate | Termination Date | Notional Amount (Thousands) | Net Unrealized ($ Thousands) | ||||||||||
| JPMorgan Chase Bank | CDX.NA.HY 23 Index | SELL | 5.00 | 12/20/19 | $ | (4,660 | ) | $ | (22 | ) | ||||||
| JPMorgan Chase Bank | CDX.NA.HY 23 Index | BUY | 5.00 | 12/20/19 | 3,000 | 30 | ||||||||||
| JPMorgan Chase Bank | CDX.NA.HY 24V1Index | SELL | 5.00 | 6/20/20 | (10,000 | ) | (23 | ) | ||||||||
| JPMorgan Chase Bank | CDX.NA.HY 24V1Index | BUY | 5.00 | 6/20/20 | 16,400 | (75 | ) | |||||||||
|
| |||||||||||||||
| $ | (90 | ) | ||||||||||||||
|
| |||||||||||||||
For the year ended May 31, 2015, the total amount of all open swap agreements, as presented in the table above, are representative of the volume of activity for this derivative type during the period.
Percentages are based on a Net Assets of $2,516,770 ($ Thousands).
| * | Non-income producing security. |
| ** | The rate reported is the 7-day effective yield as of May 31, 2015. |
| † | Investment in Affiliated Security (see Note 6). |
| ‡ | Real Estate Investment Trust. |
| ‡‡ | Maturity date is unavailable. |
| ‡‡‡ | Expiration date is unavailable. |
| (A) | Securities sold within terms of a private placement memorandum, exempt from registration under Section 144A of the Securities Act of 1933, as amended, and may be sold only to dealers in that program or other “accredited investors.” These securities have been determined to be liquid under guidelines established by the Board of Trustees. |
| (B) | Security in default on interest payments. |
| (C) | Variable Rate Security — The rate reported on the Schedule of Investments is the rate in effect as of May 31, 2015. |
| (D) | Securities considered illiquid. The total market value of such securities as of May 31, 2015 was $1,236 ($ Thousands) and represented 0.0% of Net Assets. |
| (E) | Securities considered restricted. The total value of such securities as of May 31, 2015 was $29 ($ Thousands) and represented 0.0% of Net Assets. |
| (F) | Unsettled bank loan. Interest rate not available. |
| (G) | Unfunded bank loan. |
| (H) | Security is fair valued using methods determined in good faith by the Valuation Committee of the Board of Trustees. The total market value of such securities as of May 31, 2015 was $3,573 ($ Thousands) and represented 0.14% of Net Assets. |
CDO — Collateralized Debt Obligation
Cl — Class
CLO — Collateralized Loan Obligation
CV — Convertible Security
GO — General Obligation
LLC — Limited Liability Company
Ltd. — Limited
MTN — Medium Term Note
OTC — Over the Counter
PIK — Payment-in-Kind
PLC — Public Limited Company
RB — Revenue Bond
Ser — Series
The following is a list of the level of inputs used as of May 31, 2015, in valuing the Fund’s investments and other financial instruments carried at value ($ Thousands):
| Investments in Securities | Level 1 | Level 2 | Level 3(1) | Total | ||||||||||||
Corporate Obligations | $ | — | $ | 2,011,300 | $ | 1,936 | $ | 2,013,236 | ||||||||
Loan Participations | — | 203,970 | 5,686 | 209,656 | ||||||||||||
Collateralized Debt Obligations | — | — | 173,964 | 173,964 | ||||||||||||
Preferred Stock | 6,425 | 2,757 | — | 9,182 | ||||||||||||
Convertible Bonds | — | 6,470 | 986 | 7,456 | ||||||||||||
Common Stock | 2,583 | 3,050 | 1,406 | 7,039 | ||||||||||||
Asset-Backed Security | — | 629 | — | 629 | ||||||||||||
Warrants | — | — | 13 | 13 | ||||||||||||
Municipal Bonds | — | 14,908 | — | 14,908 | ||||||||||||
Cash Equivalent | 86,501 | — | — | 86,501 | ||||||||||||
|
|
|
|
|
|
|
| |||||||||
Total Investments in Securities | $ | 95,509 | $ | 2,243,084 | $ | 183,991 | $ | 2,522,584 | ||||||||
|
|
|
|
|
|
|
| |||||||||
Other Financial Instruments | Level 1 | Level 2 | Level 3 | Total | ||||||||||||
Centrally Cleared Swaps | ||||||||||||||||
Credit Default Swaps* | ||||||||||||||||
Unrealized Appreciation | $ | — | $ | 30 | $ | — | $ | 30 | ||||||||
Unrealized Depreciation | — | (120 | ) | — | (120 | ) | ||||||||||
|
|
|
|
|
|
|
| |||||||||
Total Securities Sold Short | $ | — | $ | (90 | ) | $ | — | $ | (90 | ) | ||||||
|
|
|
|
|
|
|
| |||||||||
| (1) | Of the $183,991 in Level 3 securities as of May 31, 2015, $3,573 or 0.14% are not valued via third party pricing vendors and broker quotes. If significant, the disclosure of the unobservable inputs and the interrelationships and sensitivity between these inputs are required for those Level 3 securities that are not valued by third party pricing vendors or broker quotes. |
| * | Swaps are valued at the unrealized appreciation (depreciation) on the instrument. |
The following is a reconciliation of investments in which significant unobservable inputs (Level 3) were used in determining value ($ Thousands):
Investments in Corporate Obligations | Investments in Loan Participations | Investments in CollateralizedDebt Obligations | Investments in Preferred Stock | Investments in ConvertibleBonds | Investments in CommonStock | Investments in Warrants | ||||||||||||||||||||||
Beginning balance as June 1, 2014 | $ | 589 | $ | 20,992 | $ | 190,964 | $ | 1,426 | $ | — | $ | 1,011 | $ | 563 | ||||||||||||||
Accrued discounts/premiums | 7 | 10 | 1,142 | — | (2 | ) | — | — | ||||||||||||||||||||
Realized gain/(loss) | (5,684 | ) | 132 | 13,092 | — | — | 138 | (3,338 | ) | |||||||||||||||||||
Change in unrealized appreciation/ (depreciation) | 5,818 | (149 | ) | (4,743 | ) | — | (11 | ) | (69 | ) | 3,338 | |||||||||||||||||
Purchases | 498 | — | 90,291 | — | 999 | 267 | — | |||||||||||||||||||||
Sales | (1,065 | ) | (17,663 | ) | (118,680 | ) | — | — | (690 | ) | (563 | ) | ||||||||||||||||
Net transfer into Level 3 | 1,877 | 3,381 | 1,898 | — | — | 749 | 13 | |||||||||||||||||||||
Net transfer out of Level 3 | (104 | ) | (1,017 | ) | — | (1,426 | ) | — | — | — | ||||||||||||||||||
|
|
|
|
|
|
|
|
|
|
|
|
|
| |||||||||||||||
Ending balance as of May 31, 2015 | $ | 1,936 | $ | 5,686 | $ | 173,964 | $ | — | $ | 986 | $ | 1,406 | $ | 13 | ||||||||||||||
|
|
|
|
|
|
|
|
|
|
|
|
|
| |||||||||||||||
Changes in unrealized gains/(losses) included in earnings related to securities still held at reporting date | $ | 64 | $ | (40 | ) | $ | (4,285 | ) | $ | — | $ | (11 | ) | $ | (402 | ) | $ | (2 | ) | |||||||||
|
|
|
|
|
|
|
|
|
|
|
|
|
| |||||||||||||||
For the period ended May 31, 2015, there were no transfers between Level 1 and Level 2 assets and liabilities.
For the period ended May 31, 2015, there were transfers between Level 2 and Level 3 assets and liabilities. The transfers were due to changes in the availability of observable inputs used to determine fair value.
For more information on valuation inputs, see Note 2 — Significant Accounting Policies in Notes to Financial Statements.
Amounts designated as “—” are either $0 or have been rounded to $0.
The accompanying notes are an integral part of the financial statements.
| SEI Institutional Investments Trust / Annual Report / May 31, 2015 | 185 |
SCHEDULE OF INVESTMENTS
Long Duration Fund
May 31, 2015

| Description | Face Amount ($ Thousands) | Market Value ($ Thousands) | ||||||
CORPORATE OBLIGATIONS — 68.9% |
| |||||||
Consumer Discretionary — 7.0% |
| |||||||
21st Century Fox America | ||||||||
8.150%, 10/17/2036 | $ | 2,015 | $ | 2,836 | ||||
7.850%, 03/01/2039 | 3,900 | 5,554 | ||||||
7.750%, 01/20/2024 | 125 | 160 | ||||||
7.625%, 11/30/2028 | 2,411 | 3,234 | ||||||
7.430%, 10/01/2026 | 775 | 977 | ||||||
6.900%, 08/15/2039 | 2,450 | 3,207 | ||||||
6.750%, 01/09/2038 | 360 | 457 | ||||||
6.550%, 03/15/2033 | 2,170 | 2,737 | ||||||
6.400%, 12/15/2035 | 875 | 1,094 | ||||||
6.150%, 02/15/2041 | 3,650 | 4,400 | ||||||
Amazon.com | ||||||||
4.950%, 12/05/2044 | 4,210 | 4,317 | ||||||
AutoZone | ||||||||
3.125%, 07/15/2023 | 785 | 779 | ||||||
Bed Bath & Beyond | ||||||||
4.915%, 08/01/2034 | 1,040 | 1,063 | ||||||
Comcast | ||||||||
6.950%, 08/15/2037 | 2,830 | 3,777 | ||||||
6.450%, 03/15/2037 | 4,470 | 5,660 | ||||||
6.400%, 05/15/2038 | 7,948 | 10,113 | ||||||
5.900%, 03/15/2016 | 100 | 104 | ||||||
5.700%, 07/01/2019 | 100 | 115 | ||||||
5.650%, 06/15/2035 | 1,285 | 1,517 | ||||||
4.650%, 07/15/2042 | 2,835 | 2,962 | ||||||
4.600%, 08/15/2045 | 2,645 | 2,747 | ||||||
4.400%, 08/15/2035 | 500 | 514 | ||||||
4.250%, 01/15/2033 | 4,965 | 5,019 | ||||||
4.200%, 08/15/2034 | 5,986 | 5,996 | ||||||
Cox Communications | ||||||||
7.625%, 06/15/2025 | 300 | 376 | ||||||
6.950%, 06/01/2038 (A) | 3,183 | 3,732 | ||||||
4.800%, 02/01/2035 (A) | 500 | 483 | ||||||
4.700%, 12/15/2042 (A) | 4,400 | 4,076 | ||||||
Cox Enterprises | ||||||||
7.375%, 07/15/2027 (A) | 1,300 | 1,610 | ||||||
| Description | Face Amount ($ Thousands) | Market Value ($ Thousands) | ||||||
CVS Health | ||||||||
5.300%, 12/05/2043 | $ | 1,330 | $ | 1,522 | ||||
CVS Pass-Through Trust | ||||||||
8.353%, 07/10/2031 (A) | 7,001 | 9,463 | ||||||
DIRECTV Holdings | ||||||||
6.000%, 08/15/2040 | 5,335 | 5,812 | ||||||
5.150%, 03/15/2042 | 1,805 | 1,767 | ||||||
Discovery Communications | ||||||||
4.875%, 04/01/2043 | 1,070 | 1,012 | ||||||
Ford Holdings | ||||||||
9.300%, 03/01/2030 | 2,675 | 4,049 | ||||||
Ford Motor | ||||||||
7.450%, 07/16/2031 | 2,908 | 3,789 | ||||||
7.400%, 11/01/2046 | 2,185 | 3,066 | ||||||
4.750%, 01/15/2043 | 745 | 758 | ||||||
Home Depot | ||||||||
4.875%, 02/15/2044 | 1,415 | 1,539 | ||||||
4.250%, 04/01/2046 | 1,945 | 1,956 | ||||||
4.200%, 04/01/2043 | 1,035 | 1,041 | ||||||
Johnson Controls | ||||||||
4.950%, 07/02/2064 | 1,730 | 1,733 | ||||||
4.625%, 07/02/2044 | 1,005 | 1,014 | ||||||
3.625%, 07/02/2024 | 1,095 | 1,119 | ||||||
Lowe’s | ||||||||
6.875%, 02/15/2028 | 100 | 133 | ||||||
5.125%, 11/15/2041 | 4,710 | 5,444 | ||||||
Macy’s Retail Holdings | ||||||||
4.500%, 12/15/2034 | 1,755 | 1,774 | ||||||
McDonald’s MTN | ||||||||
4.600%, 05/26/2045 | 2,060 | 2,088 | ||||||
NBCUniversal Media LLC | ||||||||
6.400%, 04/30/2040 | 1,006 | 1,297 | ||||||
5.950%, 04/01/2041 | 2,075 | 2,526 | ||||||
Newell Rubbermaid | ||||||||
4.000%, 12/01/2024 | 1,785 | 1,845 | ||||||
Target | ||||||||
6.650%, 08/01/2028 | 460 | 577 | ||||||
3.500%, 07/01/2024 | 535 | 557 | ||||||
TCI Communications | ||||||||
7.875%, 02/15/2026 | 3,150 | 4,367 | ||||||
Thomson Reuters | ||||||||
4.500%, 05/23/2043 | 295 | 285 | ||||||
4.300%, 11/23/2023 | 1,075 | 1,152 | ||||||
Tiffany | ||||||||
4.900%, 10/01/2044 | 805 | 796 | ||||||
Time Warner | ||||||||
7.700%, 05/01/2032 | 4,392 | 5,973 | ||||||
7.625%, 04/15/2031 | 9,810 | 13,143 | ||||||
6.500%, 11/15/2036 | 195 | 236 | ||||||
6.250%, 03/29/2041 | 3,400 | 3,935 | ||||||
6.100%, 07/15/2040 | 1,220 | 1,431 | ||||||
Time Warner Cable | ||||||||
7.300%, 07/01/2038 | 940 | 1,096 | ||||||
6.750%, 06/15/2039 | 1,945 | 2,132 | ||||||
| 186 | SEI Institutional Investments Trust / Annual Report / May 31, 2015 |
| Description | Face Amount ($ Thousands) | Market Value ($ Thousands) | ||||||
6.550%, 05/01/2037 | $ | 1,000 | $ | 1,080 | ||||
5.875%, 11/15/2040 | 995 | 1,008 | ||||||
5.500%, 09/01/2041 | 2,935 | 2,837 | ||||||
4.500%, 09/15/2042 | 740 | 642 | ||||||
Viacom | ||||||||
5.850%, 09/01/2043 | 4,375 | 4,536 | ||||||
5.250%, 04/01/2044 | 810 | 789 | ||||||
4.850%, 12/15/2034 | 2,375 | 2,297 | ||||||
4.375%, 03/15/2043 | 6,628 | 5,676 | ||||||
Walgreens Boots Alliance | ||||||||
4.800%, 11/18/2044 | 3,730 | 3,691 | ||||||
3.800%, 11/18/2024 | 5,420 | 5,453 | ||||||
Wal-Mart Stores | ||||||||
7.550%, 02/15/2030 | 800 | 1,173 | ||||||
6.200%, 04/15/2038 | 2,650 | 3,416 | ||||||
5.625%, 04/01/2040 | 5,940 | 7,314 | ||||||
5.625%, 04/15/2041 | 3,200 | 3,874 | ||||||
5.250%, 09/01/2035 | 50 | 59 | ||||||
5.000%, 10/25/2040 | 2,640 | 2,978 | ||||||
4.750%, 10/02/2043 | 5,000 | 5,460 | ||||||
4.300%, 04/22/2044 | 7,950 | 8,247 | ||||||
Walt Disney MTN | ||||||||
4.125%, 12/01/2041 | 475 | 490 | ||||||
4.125%, 06/01/2044 | 3,985 | 4,055 | ||||||
|
| |||||||
| 235,118 | ||||||||
|
| |||||||
Consumer Staples — 2.5% | ||||||||
Ahold Finance USA | ||||||||
6.875%, 05/01/2029 | 635 | 806 | ||||||
Altria Group | ||||||||
5.375%, 01/31/2044 | 4,710 | 5,047 | ||||||
Anheuser-Busch InBev Finance | ||||||||
4.625%, 02/01/2044 | 1,625 | 1,689 | ||||||
Anheuser-Busch InBev Worldwide | ||||||||
6.375%, 01/15/2040 | 2,075 | 2,690 | ||||||
3.750%, 07/15/2042 | 3,710 | 3,426 | ||||||
Autopistas Metropolitanas de Puerto Rico | ||||||||
6.750%, 06/30/2035 (A) | 900 | 761 | ||||||
Bestfoods | ||||||||
7.250%, 12/15/2026 | 170 | 234 | ||||||
Bowdoin College | ||||||||
4.693%, 07/01/2112 | 8,731 | 7,652 | ||||||
Coca-Cola Femsa | ||||||||
3.875%, 11/26/2023 | 3,310 | 3,494 | ||||||
ConAgra Foods | ||||||||
6.625%, 08/15/2039 | 815 | 911 | ||||||
4.650%, 01/25/2043 | 260 | 243 | ||||||
Diageo Capital | ||||||||
3.875%, 04/29/2043 | 2,090 | 2,013 | ||||||
2.625%, 04/29/2023 | 2,205 | 2,168 | ||||||
| Description | Face Amount ($ Thousands) | Market Value ($ Thousands) | ||||||
Diageo Investment | ||||||||
4.250%, 05/11/2042 | $ | 430 | $ | 436 | ||||
2.875%, 05/11/2022 | 1,400 | 1,408 | ||||||
General Mills | ||||||||
5.400%, 06/15/2040 | 815 | 931 | ||||||
Kraft Foods Group | ||||||||
6.875%, 01/26/2039 | 865 | 1,076 | ||||||
5.000%, 06/04/2042 | 8,519 | 8,813 | ||||||
Massachusetts Institute of Technology | ||||||||
5.600%, 07/01/2111 | 800 | 1,011 | ||||||
4.678%, 07/01/2114 | 4,365 | 4,620 | ||||||
Mondelez International | ||||||||
4.000%, 02/01/2024 | 3,775 | 4,019 | ||||||
Northwestern University | ||||||||
4.643%, 12/01/2044 | 2,125 | 2,357 | ||||||
Pepsi Bottling Group | ||||||||
7.000%, 03/01/2029 | 425 | 589 | ||||||
PepsiCo | ||||||||
4.000%, 03/05/2042 | 1,745 | 1,698 | ||||||
3.600%, 08/13/2042 | 1,210 | 1,106 | ||||||
Pernod Ricard | ||||||||
5.500%, 01/15/2042 (A) | 880 | 1,003 | ||||||
4.450%, 01/15/2022 (A) | 350 | 378 | ||||||
Philip Morris International | ||||||||
6.375%, 05/16/2038 | 400 | 512 | ||||||
4.500%, 03/20/2042 | 4,010 | 4,037 | ||||||
4.250%, 11/10/2044 | 2,730 | 2,667 | ||||||
4.125%, 03/04/2043 | 1,395 | 1,354 | ||||||
3.875%, 08/21/2042 | 2,775 | 2,576 | ||||||
SABMiller Holdings | ||||||||
4.950%, 01/15/2042 (A) | 1,860 | 1,984 | ||||||
Sysco | ||||||||
4.500%, 10/02/2044 | 3,105 | 3,152 | ||||||
4.350%, 10/02/2034 | 1,695 | 1,738 | ||||||
Tufts University | ||||||||
5.017%, 04/15/2112 | 3,386 | 3,582 | ||||||
University of Southern California | ||||||||
5.250%, 10/01/2111 | 1,915 | 2,385 | ||||||
|
| |||||||
| 84,566 | ||||||||
|
| |||||||
Energy — 10.8% | ||||||||
Alta Wind Holdings | ||||||||
7.000%, 06/30/2035 (A) | 2,265 | 2,673 | ||||||
Anadarko Finance | ||||||||
7.500%, 05/01/2031 | 1,760 | 2,306 | ||||||
Anadarko Holding | ||||||||
7.150%, 05/15/2028 | 3,480 | 4,488 | ||||||
Anadarko Petroleum | ||||||||
6.450%, 09/15/2036 | 590 | 709 | ||||||
4.832%, 10/10/2036 (B) | 18,000 | 7,267 | ||||||
4.500%, 07/15/2044 | 3,575 | 3,453 | ||||||
| SEI Institutional Investments Trust / Annual Report / May 31, 2015 | 187 |
SCHEDULE OF INVESTMENTS
Long Duration Fund (Continued)
May 31, 2015
| Description | Face Amount ($ Thousands) | Market Value ($ Thousands) | ||||||
Apache | ||||||||
5.250%, 02/01/2042 | $ | 310 | $ | 324 | ||||
5.100%, 09/01/2040 | 400 | 404 | ||||||
4.750%, 04/15/2043 | 3,945 | 3,820 | ||||||
4.250%, 01/15/2044 | 2,225 | 2,046 | ||||||
BG Energy Capital | ||||||||
5.125%, 10/15/2041 (A) | 4,600 | 5,089 | ||||||
BP Capital Markets | ||||||||
3.814%, 02/10/2024 | 3,300 | 3,435 | ||||||
3.535%, 11/04/2024 | 100 | 101 | ||||||
Burlington Resources Finance | ||||||||
7.200%, 08/15/2031 | 25 | 33 | ||||||
Canadian Natural Resources | ||||||||
6.250%, 03/15/2038 | 2,805 | 3,314 | ||||||
5.850%, 02/01/2035 | 150 | 169 | ||||||
3.900%, 02/01/2025 | 1,500 | 1,516 | ||||||
Cenovus Energy | ||||||||
6.750%, 11/15/2039 | 2,255 | 2,677 | ||||||
5.200%, 09/15/2043 | 1,030 | 1,035 | ||||||
3.800%, 09/15/2023 | 250 | 250 | ||||||
CNOOC Finance 2013 | ||||||||
3.000%, 05/09/2023 | 910 | 879 | ||||||
Columbia Pipeline Group | ||||||||
5.800%, 06/01/2045 (A) | 640 | 662 | ||||||
4.500%, 06/01/2025 (A) | 1,170 | 1,187 | ||||||
Conoco Funding | ||||||||
7.250%, 10/15/2031 | 695 | 933 | ||||||
6.950%, 04/15/2029 | 1,910 | 2,522 | ||||||
ConocoPhillips | ||||||||
6.500%, 02/01/2039 | 4,535 | 5,862 | ||||||
5.900%, 05/15/2038 | 4,388 | 5,285 | ||||||
4.300%, 11/15/2044 | 7,380 | 7,348 | ||||||
Continental Resources | ||||||||
4.900%, 06/01/2044 | 2,250 | 1,960 | ||||||
3.800%, 06/01/2024 | 2,170 | 2,026 | ||||||
Devon Energy | ||||||||
7.950%, 04/15/2032 | 285 | 382 | ||||||
5.600%, 07/15/2041 | 2,160 | 2,374 | ||||||
4.750%, 05/15/2042 | 2,790 | 2,783 | ||||||
Ecopetrol | ||||||||
5.875%, 05/28/2045 | 5,635 | 5,210 | ||||||
El Paso Natural Gas | ||||||||
8.375%, 06/15/2032 | 505 | 623 | ||||||
7.500%, 11/15/2026 | 2,895 | 3,593 | ||||||
Encana | ||||||||
6.500%, 02/01/2038 | 3,350 | 3,782 | ||||||
Energy Transfer Partners | ||||||||
8.250%, 11/15/2029 | 1,825 | 2,410 | ||||||
6.500%, 02/01/2042 | 3,000 | 3,312 | ||||||
5.950%, 10/01/2043 | 6,500 | 6,803 | ||||||
5.150%, 02/01/2043 | 1,000 | 962 | ||||||
Eni | ||||||||
5.700%, 10/01/2040 (A) | 3,430 | 3,664 | ||||||
| Description | Face Amount ($ Thousands) | Market Value ($ Thousands) | ||||||
EnLink Midstream Partners | ||||||||
5.600%, 04/01/2044 | $ | 2,750 | $ | 2,851 | ||||
5.050%, 04/01/2045 | 500 | 477 | ||||||
Ensco | ||||||||
5.750%, 10/01/2044 | 4,410 | 4,249 | ||||||
5.200%, 03/15/2025 | 1,870 | 1,928 | ||||||
Enterprise Products Operating LLC | ||||||||
6.650%, 10/15/2034 | 2,570 | 3,253 | ||||||
6.125%, 10/15/2039 | 405 | 471 | ||||||
5.700%, 02/15/2042 | 6,222 | 7,022 | ||||||
5.100%, 02/15/2045 | 2,775 | 2,880 | ||||||
4.950%, 10/15/2054 | 1,130 | 1,111 | ||||||
4.900%, 05/15/2046 | 2,225 | 2,233 | ||||||
4.850%, 03/15/2044 | 3,455 | 3,473 | ||||||
4.450%, 02/15/2043 | 3,115 | 2,955 | ||||||
3.750%, 02/15/2025 | 2,880 | 2,930 | ||||||
Exxon Mobil | ||||||||
3.567%, 03/06/2045 | 2,555 | 2,438 | ||||||
Hess | ||||||||
5.600%, 02/15/2041 | 1,960 | 2,094 | ||||||
Kinder Morgan | ||||||||
5.550%, 06/01/2045 | 6,045 | 5,910 | ||||||
5.300%, 12/01/2034 | 5,111 | 4,992 | ||||||
5.050%, 02/15/2046 | 2,532 | 2,323 | ||||||
Kinder Morgan Energy Partners | ||||||||
6.375%, 03/01/2041 | 7,475 | 7,919 | ||||||
5.500%, 03/01/2044 | 2,290 | 2,230 | ||||||
5.000%, 08/15/2042 | 1,400 | 1,286 | ||||||
3.950%, 09/01/2022 | 2,560 | 2,585 | ||||||
LASMO | ||||||||
7.300%, 11/15/2027 | 4,305 | 5,667 | ||||||
Marathon Oil | ||||||||
6.600%, 10/01/2037 | 3,820 | 4,506 | ||||||
Marathon Petroleum | ||||||||
6.500%, 03/01/2041 | 4,198 | 5,024 | ||||||
Motiva Enterprises | ||||||||
6.850%, 01/15/2040 (A) | 3,515 | 4,138 | ||||||
Nexen Energy ULC | ||||||||
7.400%, 05/01/2028 | 2,230 | 3,026 | ||||||
Noble Energy | ||||||||
5.250%, 11/15/2043 | 4,690 | 4,797 | ||||||
5.050%, 11/15/2044 | 4,670 | 4,694 | ||||||
Panhandle Eastern Pipeline | ||||||||
8.125%, 06/01/2019 | 725 | 862 | ||||||
Petro-Canada | ||||||||
7.875%, 06/15/2026 | 45 | 61 | ||||||
6.800%, 05/15/2038 | 1,510 | 1,953 | ||||||
5.950%, 05/15/2035 | 760 | 888 | ||||||
Petroleos Mexicanos | ||||||||
6.500%, 06/02/2041 | 4,980 | 5,453 | ||||||
6.375%, 01/23/2045 | 13,235 | 14,361 | ||||||
5.625%, 01/23/2046 (A) | 2,210 | 2,184 | ||||||
| 188 | SEI Institutional Investments Trust / Annual Report / May 31, 2015 |
| Description | Face Amount ($ Thousands) | Market Value ($ Thousands) | ||||||
5.500%, 06/27/2044 (A) | $ | 5,105 | $ | 4,973 | ||||
4.250%, 01/15/2025 (A) | 2,260 | 2,248 | ||||||
Phillips 66 | ||||||||
5.875%, 05/01/2042 | 1,860 | 2,112 | ||||||
4.875%, 11/15/2044 | 10,790 | 10,905 | ||||||
4.650%, 11/15/2034 | 3,952 | 4,019 | ||||||
Plains All American Pipeline | ||||||||
3.850%, 10/15/2023 | 4,397 | 4,445 | ||||||
Pride International | ||||||||
7.875%, 08/15/2040 | 6,059 | 6,922 | ||||||
Ruby Pipeline | ||||||||
6.000%, 04/01/2022 (A) | 1,500 | 1,654 | ||||||
Shell International Finance BV | ||||||||
6.375%, 12/15/2038 | 4,118 | 5,370 | ||||||
4.550%, 08/12/2043 | 7,590 | 7,966 | ||||||
4.375%, 05/11/2045 | 7,350 | 7,522 | ||||||
4.125%, 05/11/2035 | 2,350 | 2,372 | ||||||
Southern Natural Gas | ||||||||
7.350%, 02/15/2031 | 1,223 | 1,409 | ||||||
Spectra Energy Capital | ||||||||
6.750%, 02/15/2032 | 1,510 | 1,638 | ||||||
3.300%, 03/15/2023 | 3,610 | 3,396 | ||||||
Spectra Energy Partners | ||||||||
4.500%, 03/15/2045 | 1,000 | 943 | ||||||
Statoil | ||||||||
6.800%, 01/15/2028 | 380 | 501 | ||||||
6.500%, 12/01/2028 (A) | 1,140 | 1,485 | ||||||
4.800%, 11/08/2043 | 510 | 562 | ||||||
3.950%, 05/15/2043 | 2,875 | 2,773 | ||||||
2.450%, 01/17/2023 | 2,375 | 2,318 | ||||||
Suncor Energy | ||||||||
6.500%, 06/15/2038 | 1,465 | 1,839 | ||||||
3.600%, 12/01/2024 | 1,005 | 1,025 | ||||||
Sunoco Logistics Partners Operations | ||||||||
5.350%, 05/15/2045 | 1,375 | 1,348 | ||||||
TC PipeLines | ||||||||
4.375%, 03/13/2025 | 1,000 | 1,004 | ||||||
Tennessee Gas Pipeline | ||||||||
8.375%, 06/15/2032 | 2,705 | 3,368 | ||||||
7.000%, 10/15/2028 | 7,537 | 9,074 | ||||||
Texas Eastern Transmission | ||||||||
7.000%, 07/15/2032 | 2,010 | 2,566 | ||||||
TransCanada PipeLines | ||||||||
7.625%, 01/15/2039 | 1,053 | 1,496 | ||||||
7.250%, 08/15/2038 | 1,670 | 2,270 | ||||||
4.625%, 03/01/2034 | 9,133 | 9,585 | ||||||
Transcontinental Gas Pipe Line | ||||||||
7.250%, 12/01/2026 | 1,540 | 1,921 | ||||||
5.400%, 08/15/2041 | 1,795 | 1,798 | ||||||
4.450%, 08/01/2042 | 1,210 | 1,068 | ||||||
Valero Energy | ||||||||
10.500%, 03/15/2039 | 3,740 | 6,020 | ||||||
| Description | Face Amount ($ Thousands) | Market Value ($ Thousands) | ||||||
Williams | ||||||||
5.750%, 06/24/2044 | $ | 2,610 | $ | 2,659 | ||||
Williams Partners | ||||||||
4.500%, 11/15/2023 | 650 | 678 | ||||||
4.300%, 03/04/2024 | 3,000 | 3,073 | ||||||
|
| |||||||
| 361,220 | ||||||||
|
| |||||||
Financials — 16.4% | ||||||||
ACE INA Holdings | ||||||||
6.700%, 05/15/2036 | 2,677 | 3,665 | ||||||
Aflac | ||||||||
6.900%, 12/17/2039 | 2,900 | 3,800 | ||||||
AIG SunAmerica Global Financing X | ||||||||
6.900%, 03/15/2032 (A) | 4,097 | 5,499 | ||||||
Alexandria Real Estate Equities | ||||||||
3.900%, 06/15/2023‡ | 3,050 | 3,097 | ||||||
American International Group | ||||||||
4.500%, 07/16/2044 | 645 | 648 | ||||||
3.875%, 01/15/2035 | 4,186 | 3,959 | ||||||
ARC Properties Operating Partnership | ||||||||
4.600%, 02/06/2024‡ | 4,150 | 4,108 | ||||||
Assurant | ||||||||
6.750%, 02/15/2034 | 2,794 | 3,426 | ||||||
Bank of America MTN | ||||||||
8.950%, 05/18/2017 (C) | 1,340 | 1,406 | ||||||
8.680%, 05/02/2017 (C) | 1,305 | 1,361 | ||||||
7.800%, 09/15/2016 | 65 | 70 | ||||||
6.110%, 01/29/2037 | 2,405 | 2,801 | ||||||
6.000%, 10/15/2036 | 3,810 | 4,711 | ||||||
5.875%, 02/07/2042 | 2,000 | 2,458 | ||||||
5.750%, 12/01/2017 | 5,750 | 6,307 | ||||||
5.625%, 07/01/2020 | 675 | 772 | ||||||
5.000%, 01/21/2044 | 2,003 | 2,173 | ||||||
4.875%, 04/01/2044 | 1,770 | 1,892 | ||||||
4.750%, 04/21/2045 | 2,460 | 2,363 | ||||||
4.100%, 07/24/2023 | 5,630 | 5,907 | ||||||
4.000%, 01/22/2025 | 5,750 | 5,731 | ||||||
3.950%, 04/21/2025 | 2,430 | 2,408 | ||||||
3.300%, 01/11/2023 | 2,090 | 2,094 | ||||||
Berkshire Hathaway | ||||||||
4.500%, 02/11/2043 | 7,518 | 7,851 | ||||||
Berkshire Hathaway Finance | ||||||||
4.400%, 05/15/2042 | 1,300 | 1,361 | ||||||
Blackstone Holdings Finance LLC | ||||||||
6.250%, 08/15/2042 (A) | 4,482 | 5,427 | ||||||
Brixmor Operating Partnership | ||||||||
3.850%, 02/01/2025 | 1,620 | 1,609 | ||||||
Carlyle Holdings II Finance | ||||||||
5.625%, 03/30/2043 (A) | 5,886 | 6,493 | ||||||
CBL & Associates | ||||||||
5.250%, 12/01/2023‡ | 2,650 | 2,776 | ||||||
4.600%, 10/15/2024‡ | 750 | 752 | ||||||
| SEI Institutional Investments Trust / Annual Report / May 31, 2015 | 189 |
SCHEDULE OF INVESTMENTS
Long Duration Fund (Continued)
May 31, 2015
| Description | Face Amount ($ Thousands) | Market Value ($ Thousands) | ||||||
CDP Financial | ||||||||
5.600%, 11/25/2039 (A) | $ | 6,055 | $ | 7,729 | ||||
Chase Capital VI | ||||||||
0.903%, 08/01/2028 (C) | 2,435 | 2,075 | ||||||
Chubb | ||||||||
6.500%, 05/15/2038 | 1,970 | 2,675 | ||||||
Cincinnati Financial | ||||||||
6.920%, 05/15/2028 | 5,284 | 6,735 | ||||||
Citigroup | ||||||||
8.125%, 07/15/2039 | 1,989 | 2,998 | ||||||
6.875%, 02/15/2098 | 2,752 | 3,647 | ||||||
6.625%, 06/15/2032 | 885 | 1,072 | ||||||
6.125%, 11/21/2017 | 100 | 111 | ||||||
6.125%, 08/25/2036 | 5,290 | 6,227 | ||||||
6.000%, 08/15/2017 | 50 | 55 | ||||||
5.875%, 01/30/2042 | 200 | 242 | ||||||
5.500%, 09/13/2025 | 1,000 | 1,115 | ||||||
4.587%, 12/15/2015 | 39 | 40 | ||||||
0.832%, 08/25/2036 (C) | 850 | 670 | ||||||
Cooperatieve Centrale Raiffeisen-Boerenleenbank BA | ||||||||
5.800%, 09/30/2110 (A) | 5,033 | 5,642 | ||||||
Credit Agricole | ||||||||
4.375%, 03/17/2025 (A) | 1,170 | 1,162 | ||||||
Credit Suisse Group Funding Guernsey | ||||||||
4.875%, 05/15/2045 (A) | 1,785 | 1,809 | ||||||
3.750%, 03/26/2025 (A) | 7,330 | 7,234 | ||||||
Devon OEI Operating | ||||||||
7.500%, 09/15/2027 | 1,160 | 1,545 | ||||||
Discover Bank | ||||||||
8.700%, 11/18/2019 | 1,014 | 1,241 | ||||||
Discover Financial Services | ||||||||
3.850%, 11/21/2022 | 3,261 | 3,330 | ||||||
Farmers Exchange Capital | ||||||||
7.200%, 07/15/2048 (A) | 1,000 | 1,278 | ||||||
Farmers Exchange Capital II | ||||||||
6.151%, 11/01/2053 (A) (C) | 10,040 | 11,003 | ||||||
FMR | ||||||||
5.150%, 02/01/2043 (A) | 2,750 | 3,031 | ||||||
General Electric Capital MTN | ||||||||
6.875%, 01/10/2039 | 7,679 | 10,755 | ||||||
6.750%, 03/15/2032 | 6,700 | 9,029 | ||||||
5.875%, 01/14/2038 | 18,580 | 23,326 | ||||||
0.754%, 08/15/2036 (C) | 1,250 | 1,134 | ||||||
Goldman Sachs Group | ||||||||
6.750%, 10/01/2037 | 9,500 | 11,667 | ||||||
6.250%, 02/01/2041 | 5,301 | 6,576 | ||||||
6.125%, 02/15/2033 | 8,180 | 10,066 | ||||||
5.950%, 01/15/2027 | 1,506 | 1,740 | ||||||
5.150%, 05/22/2045 | 2,425 | 2,475 | ||||||
4.800%, 07/08/2044 | 4,960 | 5,188 | ||||||
| Description | Face Amount ($ Thousands) | Market Value ($ Thousands) | ||||||
Guardian Life Insurance of America | ||||||||
4.875%, 06/19/2064 (A) | $ | 5,845 | $ | 5,984 | ||||
Hartford Financial Services Group | ||||||||
6.625%, 03/30/2040 | 795 | 1,034 | ||||||
6.100%, 10/01/2041 | 165 | 201 | ||||||
HBOS MTN | ||||||||
6.750%, 05/21/2018 (A) | 4,050 | 4,524 | ||||||
HCP | ||||||||
4.250%, 11/15/2023‡ | 8,829 | 9,093 | ||||||
3.875%, 08/15/2024‡ | 1,460 | 1,466 | ||||||
Health Care | ||||||||
5.125%, 03/15/2043‡ | 7,119 | 7,596 | ||||||
Healthcare Realty Trust | ||||||||
5.750%, 01/15/2021‡ | 525 | 590 | ||||||
Highmark | ||||||||
6.125%, 05/15/2041 (A) | 3,705 | 3,766 | ||||||
HSBC Bank USA MTN | ||||||||
7.000%, 01/15/2039 | 2,230 | 3,045 | ||||||
5.625%, 08/15/2035 | 1,790 | 2,109 | ||||||
HSBC Holdings | ||||||||
6.500%, 09/15/2037 | 4,550 | 5,683 | ||||||
5.250%, 03/14/2044 | 2,175 | 2,386 | ||||||
International Lease Finance | ||||||||
7.125%, 09/01/2018 (A) | 95 | 107 | ||||||
JPMorgan Chase | ||||||||
6.300%, 04/23/2019 | 1,775 | 2,047 | ||||||
5.600%, 07/15/2041 | 7,660 | 9,056 | ||||||
5.500%, 10/15/2040 | 205 | 239 | ||||||
5.400%, 01/06/2042 | 120 | 138 | ||||||
4.950%, 06/01/2045 | 4,630 | 4,688 | ||||||
4.850%, 02/01/2044 | 1,010 | 1,093 | ||||||
3.875%, 09/10/2024 | 3,300 | 3,319 | ||||||
JPMorgan Chase Capital XIII | ||||||||
1.223%, 09/30/2034 (C) | 3,900 | 3,291 | ||||||
JPMorgan Chase Capital XXIII | ||||||||
1.274%, 05/15/2047 (C) | 1,907 | 1,511 | ||||||
KKR Group Finance II | ||||||||
5.500%, 02/01/2043 (A) | 11,999 | 12,830 | ||||||
KKR Group Finance III LLC | ||||||||
5.125%, 06/01/2044 (A) | 1,300 | 1,317 | ||||||
Liberty Mutual Group | ||||||||
6.500%, 03/15/2035 (A) | 265 | 318 | ||||||
6.500%, 05/01/2042 (A) | 7,318 | 8,813 | ||||||
Macquarie Bank MTN | ||||||||
6.625%, 04/07/2021 (A) | 4,090 | 4,791 | ||||||
Marsh & McLennan | ||||||||
3.500%, 06/03/2024 | 1,635 | 1,661 | ||||||
Massachusetts Mutual Life Insurance | ||||||||
8.875%, 06/01/2039 (A) | 1,820 | 2,807 | ||||||
| 190 | SEI Institutional Investments Trust / Annual Report / May 31, 2015 |
| Description | Face Amount ($ Thousands) | Market Value ($ Thousands) | ||||||
MetLife | ||||||||
6.400%, 12/15/2036 | $ | 3,836 | $ | 4,385 | ||||
5.875%, 02/06/2041 | 1,240 | 1,534 | ||||||
4.875%, 11/13/2043 | 7,730 | 8,377 | ||||||
4.125%, 08/13/2042 | 335 | 325 | ||||||
4.050%, 03/01/2045 | 3,931 | 3,761 | ||||||
Metropolitan Life Global Funding I | ||||||||
3.875%, 04/11/2022 (A) | 435 | 465 | ||||||
3.000%, 01/10/2023 (A) | 1,845 | 1,848 | ||||||
Metropolitan Life Insurance | ||||||||
7.800%, 11/01/2025 (A) | 3,520 | 4,669 | ||||||
Moody’s | ||||||||
5.250%, 07/15/2044 | 4,645 | 5,058 | ||||||
Morgan Stanley MTN | ||||||||
6.375%, 07/24/2042 | 3,124 | 3,980 | ||||||
6.250%, 08/09/2026 | 4,610 | 5,666 | ||||||
5.625%, 09/23/2019 | 5,775 | 6,532 | ||||||
4.350%, 09/08/2026 | 2,550 | 2,594 | ||||||
4.300%, 01/27/2045 | 6,875 | 6,666 | ||||||
3.950%, 04/23/2027 | 1,730 | 1,689 | ||||||
3.875%, 04/29/2024 | 2,195 | 2,261 | ||||||
3.700%, 10/23/2024 | 2,410 | 2,456 | ||||||
Nationwide Health Properties MTN | ||||||||
6.590%, 07/07/2038‡ | 1,310 | 1,663 | ||||||
Nationwide Mutual Insurance | ||||||||
8.250%, 12/01/2031 (A) | 1,000 | 1,376 | ||||||
7.875%, 04/01/2033 (A) | 4,016 | 5,366 | ||||||
4.950%, 04/22/2044 (A) | 6,240 | 6,357 | ||||||
New York Life Insurance | ||||||||
6.750%, 11/15/2039 (A) | 5,515 | 7,499 | ||||||
5.875%, 05/15/2033 (A) | 3,852 | 4,632 | ||||||
Northwestern Mutual Life Insurance | ||||||||
6.063%, 03/30/2040 (A) | 3,840 | 4,814 | ||||||
Piedmont Operating Partnership | ||||||||
4.450%, 03/15/2024‡ | 1,740 | 1,797 | ||||||
Principal Financial Group | ||||||||
4.625%, 09/15/2042 | 2,320 | 2,348 | ||||||
4.350%, 05/15/2043 | 525 | 520 | ||||||
Prudential Financial MTN | ||||||||
6.625%, 12/01/2037 | 648 | 825 | ||||||
5.800%, 11/16/2041 | 1,190 | 1,387 | ||||||
5.700%, 12/14/2036 | 7,039 | 8,083 | ||||||
Prudential Insurance of America | ||||||||
8.300%, 07/01/2025 (A) | 4,500 | 6,109 | ||||||
Realty Income | ||||||||
4.650%, 08/01/2023‡ | 7,350 | 7,945 | ||||||
Security Benefit Life | ||||||||
7.450%, 10/01/2033 (A) | 2,080 | 2,618 | ||||||
| Description | Face Amount ($ Thousands) | Market Value ($ Thousands) | ||||||
Simon Property Group | ||||||||
6.750%, 02/01/2040‡ | $ | 1,634 | $ | 2,206 | ||||
4.750%, 03/15/2042‡ | 1,925 | 2,077 | ||||||
SL Green Realty | ||||||||
7.750%, 03/15/2020‡ | 1,775 | 2,132 | ||||||
5.000%, 08/15/2018‡ | 1,000 | 1,074 | ||||||
Teachers Insurance & Annuity | ||||||||
6.850%, 12/16/2039 (A) | 5,740 | 7,618 | ||||||
4.900%, 09/15/2044 (A) | 6,300 | 6,749 | ||||||
TIAA Asset Management Finance LLC | ||||||||
4.125%, 11/01/2024 (A) | 2,085 | 2,160 | ||||||
Travelers | ||||||||
5.350%, 11/01/2040 | 1,935 | 2,309 | ||||||
Ventas Realty | ||||||||
5.700%, 09/30/2043‡ | 5,465 | 6,235 | ||||||
4.750%, 06/01/2021‡ | 2,500 | 2,745 | ||||||
4.375%, 02/01/2045‡ | 3,500 | 3,337 | ||||||
WEA Finance LLC | ||||||||
4.750%, 09/17/2044 (A) | 3,400 | 3,499 | ||||||
Wells Fargo | ||||||||
5.606%, 01/15/2044 | 1,375 | 1,561 | ||||||
4.650%, 11/04/2044 | 3,915 | 3,936 | ||||||
3.900%, 05/01/2045 | 1,695 | 1,591 | ||||||
Wells Fargo Bank | ||||||||
6.600%, 01/15/2038 | 2,400 | 3,246 | ||||||
6.000%, 11/15/2017 | 300 | 333 | ||||||
5.950%, 08/26/2036 | 1,000 | 1,248 | ||||||
5.850%, 02/01/2037 | 5,620 | 6,915 | ||||||
XL Capital | ||||||||
6.375%, 11/15/2024 | 3,390 | 4,071 | ||||||
ZFS Finance USA Trust II | ||||||||
6.450%, 12/15/2065 (A) (C) | 1,939 | 2,007 | ||||||
|
| |||||||
| 549,704 | ||||||||
|
| |||||||
Health Care — 6.9% | ||||||||
AbbVie | ||||||||
4.700%, 05/14/2045 | 7,085 | 7,203 | ||||||
4.500%, 05/14/2035 | 1,910 | 1,923 | ||||||
4.400%, 11/06/2042 | 9,385 | 9,113 | ||||||
3.600%, 05/14/2025 | 4,535 | 4,564 | ||||||
Actavis Funding SCS | ||||||||
4.750%, 03/15/2045 | 6,705 | 6,640 | ||||||
3.850%, 06/15/2024 | 3,160 | 3,195 | ||||||
3.800%, 03/15/2025 | 855 | 861 | ||||||
Aetna | ||||||||
4.750%, 03/15/2044 | 5,550 | 5,912 | ||||||
Amgen | ||||||||
6.400%, 02/01/2039 | 3,400 | 4,155 | ||||||
5.750%, 03/15/2040 | 500 | 577 | ||||||
5.375%, 05/15/2043 | 1,640 | 1,808 | ||||||
5.150%, 11/15/2041 | 2,935 | 3,143 | ||||||
| SEI Institutional Investments Trust / Annual Report / May 31, 2015 | 191 |
SCHEDULE OF INVESTMENTS
Long Duration Fund (Continued)
May 31, 2015
| Description | Face Amount ($ Thousands) | Market Value ($ Thousands) | ||||||
4.950%, 10/01/2041 | $ | 825 | $ | 858 | ||||
4.400%, 05/01/2045 | 1,630 | 1,578 | ||||||
Anthem | ||||||||
4.850%, 08/15/2054 | 2,335 | 2,361 | ||||||
4.650%, 01/15/2043 | 2,080 | 2,124 | ||||||
4.650%, 08/15/2044 | 250 | 253 | ||||||
3.500%, 08/15/2024 | 4,360 | 4,386 | ||||||
AstraZeneca | ||||||||
6.450%, 09/15/2037 | 3,522 | 4,639 | ||||||
4.000%, 09/18/2042 | 1,825 | 1,784 | ||||||
Bayer US Finance LLC | ||||||||
3.375%, 10/08/2024 (A) | 575 | 584 | ||||||
Baylor Scott & White Holdings | ||||||||
4.185%, 11/15/2045 | 2,545 | 2,430 | ||||||
Becton Dickinson | ||||||||
4.875%, 05/15/2044 | 400 | 426 | ||||||
4.685%, 12/15/2044 | 1,630 | 1,661 | ||||||
3.875%, 05/15/2024 | 1,750 | 1,815 | ||||||
Cardinal Health | ||||||||
4.500%, 11/15/2044 | 1,830 | 1,842 | ||||||
Catholic Health Initiatives | ||||||||
4.350%, 11/01/2042 | 7,535 | 7,107 | ||||||
Celgene | ||||||||
5.700%, 10/15/2040 | 4,184 | 4,876 | ||||||
4.625%, 05/15/2044 | 3,600 | 3,628 | ||||||
Cleveland Clinic Foundation | ||||||||
4.858%, 01/01/2114 | 3,588 | 3,501 | ||||||
EMD Finance LLC | ||||||||
3.250%, 03/19/2025 (A) | 4,690 | 4,641 | ||||||
Gilead Sciences | ||||||||
4.800%, 04/01/2044 | 3,430 | 3,664 | ||||||
4.500%, 02/01/2045 | 2,055 | 2,100 | ||||||
GlaxoSmithKline Capital | ||||||||
6.375%, 05/15/2038 | 3,405 | 4,425 | ||||||
Hartford HealthCare | ||||||||
5.746%, 04/01/2044 | 6,630 | 7,472 | ||||||
Humana | ||||||||
4.950%, 10/01/2044 | 3,260 | 3,427 | ||||||
Johnson & Johnson | ||||||||
4.500%, 12/05/2043 | 1,700 | 1,883 | ||||||
McKesson | ||||||||
4.883%, 03/15/2044 | 1,675 | 1,772 | ||||||
3.796%, 03/15/2024 | 4,105 | 4,239 | ||||||
Mead Johnson Nutrition | ||||||||
5.900%, 11/01/2039 | 990 | 1,155 | ||||||
4.600%, 06/01/2044 | 825 | 839 | ||||||
Medtronic | ||||||||
4.625%, 03/15/2045 (A) | 6,560 | 6,841 | ||||||
4.375%, 03/15/2035 (A) | 5,745 | 5,889 | ||||||
2.750%, 04/01/2023 | 2,510 | 2,483 | ||||||
Memorial Sloan-Kettering Cancer Center | ||||||||
5.000%, 07/01/2042 | 1,845 | 2,039 | ||||||
| Description | Face Amount ($ Thousands) | Market Value ($ Thousands) | ||||||
Merck | ||||||||
4.150%, 05/18/2043 | $ | 5,260 | $ | 5,246 | ||||
3.700%, 02/10/2045 | 1,575 | 1,463 | ||||||
3.600%, 09/15/2042 | 1,970 | 1,860 | ||||||
Merck Sharp & Dohme MTN | ||||||||
5.760%, 05/03/2037 | 2,236 | 2,792 | ||||||
Mylan | ||||||||
4.200%, 11/29/2023 | 1,875 | 1,942 | ||||||
North Shore-Long Island Jewish Health Care | ||||||||
6.150%, 11/01/2043 | 2,920 | 3,535 | ||||||
4.800%, 11/01/2042 | 4,615 | 4,487 | ||||||
Novartis Capital | ||||||||
4.400%, 05/06/2044 | 8,560 | 9,164 | ||||||
NYU Hospitals Center | ||||||||
5.750%, 07/01/2043 | 950 | 1,127 | ||||||
4.428%, 07/01/2042 | 4,230 | 4,178 | ||||||
Perrigo | ||||||||
4.000%, 11/15/2023 | 1,535 | 1,582 | ||||||
Perrigo Finance | ||||||||
4.900%, 12/15/2044 | 800 | 809 | ||||||
3.900%, 12/15/2024 | 6,535 | 6,667 | ||||||
Pfizer | ||||||||
7.200%, 03/15/2039 | 590 | 837 | ||||||
4.400%, 05/15/2044 | 2,270 | 2,324 | ||||||
Providence Health & Services Obligated Group | ||||||||
4.379%, 10/01/2023 | 705 | 767 | ||||||
Quest Diagnostics | ||||||||
3.500%, 03/30/2025 | 5,279 | 5,187 | ||||||
Southern Baptist Hospital of Florida | ||||||||
4.857%, 07/15/2045 | 915 | 935 | ||||||
St. Barnabas | ||||||||
4.000%, 07/01/2028 | 4,375 | 4,244 | ||||||
Stryker | ||||||||
4.375%, 05/15/2044 | 2,000 | 2,008 | ||||||
4.100%, 04/01/2043 | 1,425 | 1,361 | ||||||
3.375%, 05/15/2024 | 2,145 | 2,185 | ||||||
Thermo Fisher Scientific | ||||||||
3.150%, 01/15/2023 | 3,020 | 3,021 | ||||||
Trinity Health | ||||||||
4.125%, 12/01/2045 | 4,609 | 4,453 | ||||||
UnitedHealth Group | ||||||||
6.875%, 02/15/2038 | 2,010 | 2,753 | ||||||
6.625%, 11/15/2037 | 555 | 746 | ||||||
Wyeth | ||||||||
6.000%, 02/15/2036 | 2,985 | 3,704 | ||||||
5.950%, 04/01/2037 | 936 | 1,151 | ||||||
Zimmer Holdings | ||||||||
4.450%, 08/15/2045 | 1,670 | 1,612 | ||||||
|
| |||||||
| 229,956 | ||||||||
|
| |||||||
| 192 | SEI Institutional Investments Trust / Annual Report / May 31, 2015 |
| Description | Face Amount ($ Thousands) | Market Value ($ Thousands) | ||||||
Industrials — 4.7% | ||||||||
ABB Treasury Center USA | ||||||||
4.000%, 06/15/2021 (A) | $ | 1,685 | $ | 1,829 | ||||
Airbus Group Finance | ||||||||
2.700%, 04/17/2023 (A) | 2,500 | 2,475 | ||||||
American Airlines, Pass-Through Trust, | ||||||||
5.250%, 01/31/2021 | 4 | 4 | ||||||
American Airlines, Pass-Through Trust, | ||||||||
4.950%, 01/15/2023 | 1,694 | 1,820 | ||||||
American Airlines, Pass-Through Trust, | ||||||||
3.700%, 10/01/2026 | 2,681 | 2,731 | ||||||
BAE Systems | ||||||||
5.800%, 10/11/2041 (A) | 1,145 | 1,372 | ||||||
BAE Systems Holdings | ||||||||
4.750%, 10/07/2044 (A) | 5,106 | 5,256 | ||||||
Burlington Northern Santa Fe LLC | ||||||||
6.200%, 08/15/2036 | 5,600 | 7,098 | ||||||
6.150%, 05/01/2037 | 1,180 | 1,514 | ||||||
5.750%, 05/01/2040 | 660 | 792 | ||||||
5.150%, 09/01/2043 | 2,235 | 2,511 | ||||||
4.900%, 04/01/2044 | 5,485 | 5,958 | ||||||
4.550%, 09/01/2044 | 1,150 | 1,171 | ||||||
4.400%, 03/15/2042 | 3,270 | 3,318 | ||||||
4.375%, 09/01/2042 | 1,710 | 1,718 | ||||||
Caterpillar | ||||||||
4.750%, 05/15/2064 | 3,515 | 3,647 | ||||||
3.803%, 08/15/2042 | 6,318 | 5,986 | ||||||
Continental Airlines, Pass-Through Trust, Ser 2007-1, Cl A | ||||||||
5.983%, 04/19/2022 | 4,777 | 5,375 | ||||||
Continental Airlines, Pass-Through Trust, Ser 2009-1 | ||||||||
9.000%, 07/08/2016 | 4,664 | 5,002 | ||||||
CSX | ||||||||
4.750%, 05/30/2042 | 4,425 | 4,697 | ||||||
Deere | ||||||||
3.900%, 06/09/2042 | 2,660 | 2,579 | ||||||
Delta Air Lines, Pass-Through Trust, Ser 2011-1, Cl A | ||||||||
5.300%, 04/15/2019 | 6 | 6 | ||||||
Federal Express | ||||||||
7.600%, 07/01/2097 | 2,095 | 2,857 | ||||||
FedEx | ||||||||
5.100%, 01/15/2044 | 275 | 295 | ||||||
4.100%, 02/01/2045 | 275 | 257 | ||||||
4.000%, 01/15/2024 | 1,495 | 1,585 | ||||||
| Description | Face Amount ($ Thousands) | Market Value ($ Thousands) | ||||||
3.900%, 02/01/2035 | $ | 700 | $ | 664 | ||||
3.875%, 08/01/2042 | 4,367 | 3,925 | ||||||
General Electric | ||||||||
4.125%, 10/09/2042 | 6,925 | 6,934 | ||||||
John Deere Capital MTN | ||||||||
3.350%, 06/12/2024 | 1,600 | 1,659 | ||||||
L-3 Communications | ||||||||
3.950%, 05/28/2024 | 3,385 | 3,357 | ||||||
Lockheed Martin | ||||||||
4.070%, 12/15/2042 | 3,743 | 3,672 | ||||||
3.600%, 03/01/2035 | 5,390 | 5,135 | ||||||
Norfolk Southern | ||||||||
6.000%, 03/15/2105 | 3,703 | 4,462 | ||||||
6.000%, 05/23/2111 | 4,332 | 5,243 | ||||||
4.800%, 08/15/2043 | 1,410 | 1,524 | ||||||
4.450%, 06/15/2045 | 480 | 482 | ||||||
3.850%, 01/15/2024 | 3,115 | 3,290 | ||||||
2.903%, 02/15/2023 | 710 | 704 | ||||||
Northrop Grumman | ||||||||
4.750%, 06/01/2043 | 9,800 | 10,274 | ||||||
Northwest Airlines, Pass-Through Trust, Ser 2001-1, Cl A1 | ||||||||
7.041%, 04/01/2022 | 224 | 263 | ||||||
Parker-Hannifin MTN | ||||||||
4.450%, 11/21/2044 | 1,645 | 1,737 | ||||||
Republic Services | ||||||||
3.550%, 06/01/2022 | 2,025 | 2,081 | ||||||
Siemens Financieringsmaatschappij | ||||||||
4.400%, 05/27/2045 (A) | 5,425 | 5,575 | ||||||
Union Pacific | ||||||||
4.850%, 06/15/2044 | 5,355 | 6,028 | ||||||
United Airlines, Pass-Through Trust, Ser 2014-2, Cl A | ||||||||
3.750%, 09/03/2026 | 3,340 | 3,415 | ||||||
United Technologies | ||||||||
5.700%, 04/15/2040 | 6,159 | 7,482 | ||||||
4.500%, 06/01/2042 | 4,985 | 5,183 | ||||||
US Airways, Pass-Through Trust, Ser 2011-1A, Cl A | ||||||||
7.125%, 10/22/2023 | 1,569 | 1,843 | ||||||
|
| |||||||
| 156,785 | ||||||||
|
| |||||||
Information Technology — 2.9% |
| |||||||
Apple | ||||||||
4.450%, 05/06/2044 | 1,150 | 1,193 | ||||||
4.375%, 05/13/2045 | 9,475 | 9,600 | ||||||
3.450%, 02/09/2045 | 2,400 | 2,094 | ||||||
CDK Global | ||||||||
4.500%, 10/15/2024 (A) | 5,215 | 5,362 | ||||||
Cisco Systems | ||||||||
5.900%, 02/15/2039 | 3,920 | 4,795 | ||||||
Corning | ||||||||
5.750%, 08/15/2040 | 555 | 662 | ||||||
| SEI Institutional Investments Trust / Annual Report / May 31, 2015 | 193 |
SCHEDULE OF INVESTMENTS
Long Duration Fund (Continued)
May 31, 2015
| Description | Face Amount ($ Thousands) | Market Value ($ Thousands) | ||||||
Intel | ||||||||
4.800%, 10/01/2041 | $ | 3,445 | $ | 3,649 | ||||
4.000%, 12/15/2032 | 790 | 798 | ||||||
Juniper Networks | ||||||||
5.950%, 03/15/2041 | 4,430 | 4,705 | ||||||
Microsoft | ||||||||
4.875%, 12/15/2043 | 3,822 | 4,247 | ||||||
4.000%, 02/12/2055 | 8,826 | 8,063 | ||||||
3.750%, 02/12/2045 | 1,895 | 1,744 | ||||||
3.500%, 02/12/2035 | 3,115 | 2,909 | ||||||
3.500%, 11/15/2042 | 1,765 | 1,584 | ||||||
Oracle | ||||||||
6.500%, 04/15/2038 | 6,460 | 8,349 | ||||||
4.500%, 07/08/2044 | 2,675 | 2,733 | ||||||
4.375%, 05/15/2055 | 5,215 | 5,032 | ||||||
4.300%, 07/08/2034 | 7,290 | 7,453 | ||||||
3.900%, 05/15/2035 | 5,830 | 5,644 | ||||||
QUALCOMM | ||||||||
4.800%, 05/20/2045 | 2,475 | 2,469 | ||||||
4.650%, 05/20/2035 | 3,420 | 3,408 | ||||||
Seagate HDD Cayman | ||||||||
5.750%, 12/01/2034 (A) | 2,255 | 2,317 | ||||||
4.875%, 06/01/2027 (A) | 3,930 | 3,970 | ||||||
4.750%, 01/01/2025 (A) | 3,340 | 3,421 | ||||||
|
| |||||||
| 96,201 | ||||||||
|
| |||||||
Materials — 2.3% | ||||||||
Air Products & Chemicals | ||||||||
3.350%, 07/31/2024 | 2,170 | 2,225 | ||||||
Barrick North America Finance LLC | ||||||||
5.750%, 05/01/2043 | 8,180 | 8,252 | ||||||
BHP Billiton Finance USA | ||||||||
5.000%, 09/30/2043 | 2,420 | 2,618 | ||||||
CF Industries | ||||||||
5.150%, 03/15/2034 | 1,205 | 1,265 | ||||||
Dow Chemical | ||||||||
4.625%, 10/01/2044 | 1,000 | 969 | ||||||
4.375%, 11/15/2042 | 5,845 | 5,505 | ||||||
4.250%, 10/01/2034 | 2,540 | 2,485 | ||||||
Eastman Chemical | ||||||||
4.650%, 10/15/2044 | 1,305 | 1,289 | ||||||
Freeport-McMoRan | ||||||||
5.450%, 03/15/2043 | 7,877 | 6,868 | ||||||
5.400%, 11/14/2034 | 1,385 | 1,244 | ||||||
Glencore Finance Canada | ||||||||
6.000%, 11/15/2041 (A) | 5,594 | 5,984 | ||||||
International Paper | ||||||||
5.150%, 05/15/2046 | 2,265 | 2,312 | ||||||
5.000%, 09/15/2035 | 2,020 | 2,031 | ||||||
Kinross | ||||||||
5.950%, 03/15/2024 | 1,705 | 1,656 | ||||||
LYB International Finance | ||||||||
4.875%, 03/15/2044 | 2,575 | 2,602 | ||||||
| Description | Face Amount ($ Thousands) | Market Value ($ Thousands) | ||||||
LyondellBasell Industries | ||||||||
4.625%, 02/26/2055 | $ | 1,000 | $ | 913 | ||||
Monsanto | ||||||||
4.200%, 07/15/2034 | 910 | 876 | ||||||
3.950%, 04/15/2045 | 500 | 438 | ||||||
Mosaic | ||||||||
5.450%, 11/15/2033 | 1,225 | 1,361 | ||||||
Nacional del Cobre de Chile | ||||||||
5.625%, 10/18/2043 (A) | 3,985 | 4,477 | ||||||
4.250%, 07/17/2042 (A) | 775 | 715 | ||||||
Newcrest Finance | ||||||||
5.750%, 11/15/2041 (A) | 4,504 | 4,048 | ||||||
Newmont Mining | ||||||||
6.250%, 10/01/2039 | 1,500 | 1,538 | ||||||
Praxair | ||||||||
3.550%, 11/07/2042 | 1,820 | 1,651 | ||||||
Rio Tinto Finance USA | ||||||||
4.125%, 08/21/2042 | 120 | 113 | ||||||
Rohm & Haas | ||||||||
7.850%, 07/15/2029 | 4,445 | 6,078 | ||||||
Southern Copper | ||||||||
7.500%, 07/27/2035 | 2,974 | 3,385 | ||||||
5.875%, 04/23/2045 | 1,910 | 1,868 | ||||||
Teck Resources | ||||||||
6.000%, 08/15/2040 | 180 | 156 | ||||||
5.400%, 02/01/2043 | 1,450 | 1,204 | ||||||
5.200%, 03/01/2042 | 1,050 | 848 | ||||||
Vale Overseas | ||||||||
6.875%, 11/21/2036 | 845 | 831 | ||||||
|
| |||||||
| 77,805 | ||||||||
|
| |||||||
Telecommunication Services — 5.7% |
| |||||||
Alltel | ||||||||
7.875%, 07/01/2032 | 1,095 | 1,526 | ||||||
6.800%, 05/01/2029 | 570 | 703 | ||||||
America Movil | ||||||||
6.375%, 03/01/2035 | 585 | 710 | ||||||
4.375%, 07/16/2042 | 3,230 | 3,130 | ||||||
AT&T | ||||||||
6.500%, 09/01/2037 | 2,758 | 3,216 | ||||||
6.300%, 01/15/2038 | 1,500 | 1,710 | ||||||
5.550%, 08/15/2041 | 6,690 | 7,085 | ||||||
5.350%, 09/01/2040 | 6,824 | 6,999 | ||||||
4.800%, 06/15/2044 | 6,303 | 6,003 | ||||||
4.750%, 05/15/2046 | 5,722 | 5,449 | ||||||
4.500%, 05/15/2035 | 9,115 | 8,641 | ||||||
4.350%, 06/15/2045 | 10,413 | 9,283 | ||||||
4.300%, 12/15/2042 | 3,406 | 3,072 | ||||||
3.400%, 05/15/2025 | 1,560 | 1,517 | ||||||
British Telecommunications | ||||||||
9.625%, 12/15/2030 | 2,070 | 3,262 | ||||||
CenturyLink | ||||||||
7.650%, 03/15/2042 | 2,425 | 2,352 | ||||||
5.800%, 03/15/2022 | 350 | 359 | ||||||
| 194 | SEI Institutional Investments Trust / Annual Report / May 31, 2015 |
| Description | Face Amount ($ Thousands) | Market Value ($ Thousands) | ||||||
Deutsche Telekom International Finance | ||||||||
9.250%, 06/01/2032 | $ | 805 | $ | 1,272 | ||||
8.750%, 06/15/2030 | 725 | 1,070 | ||||||
4.875%, 03/06/2042 (A) | 2,755 | 2,921 | ||||||
GTE | ||||||||
6.940%, 04/15/2028 | 1,260 | 1,589 | ||||||
Koninklijke | ||||||||
8.375%, 10/01/2030 | 1,895 | 2,687 | ||||||
Orange | ||||||||
5.500%, 02/06/2044 | 1,130 | 1,260 | ||||||
Rogers Communications | ||||||||
5.450%, 10/01/2043 | 2,350 | 2,612 | ||||||
5.000%, 03/15/2044 | 3,415 | 3,582 | ||||||
SES GLOBAL Americas Holdings GP | ||||||||
5.300%, 03/25/2044 (A) | 6,578 | 6,964 | ||||||
Telefonaktiebolaget LM Ericsson | ||||||||
4.125%, 05/15/2022 | 5,175 | 5,524 | ||||||
Telefonica Emisiones SAU | ||||||||
7.045%, 06/20/2036 | 1,640 | 2,121 | ||||||
Verizon Communications | ||||||||
6.550%, 09/15/2043 | 5,574 | 6,771 | ||||||
6.400%, 09/15/2033 | 718 | 844 | ||||||
6.250%, 04/01/2037 | 760 | 891 | ||||||
6.000%, 04/01/2041 | 1,500 | 1,712 | ||||||
5.050%, 03/15/2034 | 4,175 | 4,335 | ||||||
5.012%, 08/21/2054 | 14,087 | 13,393 | ||||||
4.862%, 08/21/2046 | 20,841 | 20,112 | ||||||
4.750%, 11/01/2041 | 1,015 | 993 | ||||||
4.672%, 03/15/2055 (A) | 17,361 | 15,621 | ||||||
4.522%, 09/15/2048 (A) | 18,029 | 16,470 | ||||||
4.400%, 11/01/2034 | 7,115 | 6,848 | ||||||
Vodafone Group | ||||||||
4.375%, 02/19/2043 | 7,415 | 6,505 | ||||||
|
| |||||||
| 191,114 | ||||||||
|
| |||||||
Utilities — 9.7% |
| |||||||
AGL Capital | ||||||||
5.875%, 03/15/2041 | 2,593 | 3,201 | ||||||
4.400%, 06/01/2043 | 1,000 | 1,036 | ||||||
Appalachian Power | ||||||||
4.450%, 06/01/2045 | 560 | 563 | ||||||
Arizona Public Services | ||||||||
8.000%, 12/30/2015 | 16 | 16 | ||||||
Baltimore Gas & Electric | ||||||||
5.200%, 06/15/2033 | 3,275 | 3,834 | ||||||
Berkshire Hathaway Energy | ||||||||
6.500%, 09/15/2037 | 2,515 | 3,190 | ||||||
6.125%, 04/01/2036 | 6,910 | 8,379 | ||||||
5.150%, 11/15/2043 | 2,250 | 2,527 | ||||||
| Description | Face Amount ($ Thousands) | Market Value ($ Thousands) | ||||||
Boston Gas | ||||||||
4.487%, 02/15/2042 (A) | $ | 2,147 | $ | 2,267 | ||||
Bruce Mansfield Unit 1 2007 Pass-Through Trust | ||||||||
6.850%, 06/01/2034 | 1,496 | 1,565 | ||||||
CenterPoint Energy Houston Electric LLC | ||||||||
4.500%, 04/01/2044 | 1,900 | 2,028 | ||||||
CenterPoint Energy Resources | ||||||||
6.250%, 02/01/2037 | 3,791 | 4,579 | ||||||
Cleco Power | ||||||||
6.000%, 12/01/2040 | 1,100 | 1,279 | ||||||
Commonwealth Edison | ||||||||
3.700%, 03/01/2045 | 3,149 | 2,993 | ||||||
Consolidated Edison of New York | ||||||||
6.750%, 04/01/2038 | 1,725 | 2,365 | ||||||
6.300%, 08/15/2037 | 1,440 | 1,880 | ||||||
4.450%, 03/15/2044 | 3,145 | 3,271 | ||||||
Dominion Resources | ||||||||
5.250%, 08/01/2033 | 3,830 | 4,210 | ||||||
4.900%, 08/01/2041 | 2,715 | 2,879 | ||||||
DTE Energy | ||||||||
3.850%, 12/01/2023 | 2,215 | 2,337 | ||||||
3.500%, 06/01/2024 | 1,375 | 1,399 | ||||||
Duke Energy | ||||||||
3.750%, 04/15/2024 | 535 | 559 | ||||||
3.050%, 08/15/2022 | 1,420 | 1,437 | ||||||
Duke Energy Carolinas | ||||||||
6.100%, 06/01/2037 | 3,090 | 3,903 | ||||||
5.300%, 02/15/2040 | 8,100 | 9,591 | ||||||
4.000%, 09/30/2042 | 2,270 | 2,249 | ||||||
Duke Energy Florida | ||||||||
6.400%, 06/15/2038 | 550 | 729 | ||||||
6.350%, 09/15/2037 | 1,080 | 1,445 | ||||||
Duke Energy Indiana | ||||||||
6.350%, 08/15/2038 | 855 | 1,134 | ||||||
4.900%, 07/15/2043 | 2,120 | 2,381 | ||||||
Duke Energy Progress | ||||||||
4.375%, 03/30/2044 | 3,320 | 3,509 | ||||||
Duquesne Light Holdings | ||||||||
6.250%, 08/15/2035 | 3,125 | 3,568 | ||||||
5.900%, 12/01/2021 (A) | 750 | 871 | ||||||
El Paso Electric | ||||||||
5.000%, 12/01/2044 | 1,000 | 1,027 | ||||||
Electricite de France | ||||||||
6.000%, 01/22/2114 (A) | 8,445 | 9,471 | ||||||
Elm Road Generating Station Supercritical | ||||||||
5.848%, 01/19/2041 (A) | 2,007 | 2,336 | ||||||
Entergy Louisiana | ||||||||
4.440%, 01/15/2026 | 2,990 | 3,289 | ||||||
Eversource Energy | ||||||||
2.800%, 05/01/2023 | 2,120 | �� | 2,078 | |||||
| SEI Institutional Investments Trust / Annual Report / May 31, 2015 | 195 |
SCHEDULE OF INVESTMENTS
Long Duration Fund (Continued)
May 31, 2015
| Description | Face Amount ($ Thousands) | Market Value ($ Thousands) | ||||||
Exelon | ||||||||
5.625%, 06/15/2035 | $ | 1,250 | $ | 1,437 | ||||
Exelon Generation LLC | ||||||||
6.250%, 10/01/2039 | 200 | 233 | ||||||
5.750%, 10/01/2041 | 4,931 | 5,383 | ||||||
5.600%, 06/15/2042 | 5,000 | 5,449 | ||||||
FirstEnergy Transmission LLC | ||||||||
5.450%, 07/15/2044 (A) | 7,080 | 7,657 | ||||||
Florida Power & Light | ||||||||
5.960%, 04/01/2039 | 3,035 | 3,977 | ||||||
5.690%, 03/01/2040 | 5,000 | 6,348 | ||||||
5.650%, 02/01/2037 | 2,500 | 3,145 | ||||||
5.400%, 09/01/2035 | 3,200 | 3,917 | ||||||
Georgia Power | ||||||||
5.950%, 02/01/2039 | 3,850 | 4,757 | ||||||
5.400%, 06/01/2040 | 6,230 | 7,298 | ||||||
4.300%, 03/15/2042 | 2,055 | 2,050 | ||||||
Indianapolis Power & Light | ||||||||
6.050%, 10/01/2036 (A) | 1,291 | 1,653 | ||||||
4.875%, 11/01/2041 (A) | 1,970 | 2,196 | ||||||
4.500%, 06/01/2044 (A) | 2,375 | 2,506 | ||||||
ITC Holdings | ||||||||
5.300%, 07/01/2043 | 2,085 | 2,315 | ||||||
Jersey Central Power & Light | ||||||||
6.400%, 05/15/2036 | 1,425 | 1,628 | ||||||
John Sevier Combined Cycle Generation | ||||||||
4.626%, 01/15/2042 | 3,872 | 4,294 | ||||||
Kansas Gas & Electric | ||||||||
4.300%, 07/15/2044 (A) | 2,715 | 2,842 | ||||||
KCP&L Greater Missouri Operations | ||||||||
8.270%, 11/15/2021 | 2,600 | 3,316 | ||||||
Kentucky Utilities | ||||||||
5.125%, 11/01/2040 | 2,195 | 2,606 | ||||||
KeySpan Gas East | ||||||||
5.819%, 04/01/2041 (A) | 7,485 | 9,293 | ||||||
Metropolitan Edison | ||||||||
7.700%, 01/15/2019 | 350 | 414 | ||||||
MidAmerican Energy | ||||||||
6.750%, 12/30/2031 | 810 | 1,089 | ||||||
5.800%, 10/15/2036 | 920 | 1,164 | ||||||
4.800%, 09/15/2043 | 1,725 | 1,943 | ||||||
4.400%, 10/15/2044 | 1,450 | 1,523 | ||||||
Midamerican Funding | ||||||||
6.927%, 03/01/2029 | 170 | 226 | ||||||
Monongahela Power | ||||||||
5.400%, 12/15/2043 (A) | 885 | 1,016 | ||||||
4.100%, 04/15/2024 (A) | 6,930 | 7,406 | ||||||
Narragansett Electric | ||||||||
4.170%, 12/10/2042 (A) | 1,990 | 1,994 | ||||||
NextEra Energy Capital Holdings | ||||||||
6.000%, 03/01/2019 | 2,470 | 2,807 | ||||||
| Description | Face Amount ($ Thousands) | Market Value ($ Thousands) | ||||||
Niagara Mohawk Power | ||||||||
4.119%, 11/28/2042 (A) | $ | 2,000 | $ | 1,990 | ||||
2.721%, 11/28/2022 (A) | 700 | 692 | ||||||
NiSource Finance | ||||||||
5.950%, 06/15/2041 | 545 | 665 | ||||||
Northern States Power | ||||||||
6.250%, 06/01/2036 | 1,813 | 2,420 | ||||||
5.350%, 11/01/2039 | 2,695 | 3,331 | ||||||
3.400%, 08/15/2042 | 1,105 | 1,015 | ||||||
NSTAR Electric | ||||||||
4.400%, 03/01/2044 | 655 | 694 | ||||||
Oncor Electric Delivery | ||||||||
7.500%, 09/01/2038 | 600 | 876 | ||||||
5.300%, 06/01/2042 | 5,125 | 6,052 | ||||||
5.250%, 09/30/2040 | 2,165 | 2,515 | ||||||
Pacific Gas & Electric | ||||||||
6.350%, 02/15/2038 | 1,000 | 1,307 | ||||||
6.250%, 03/01/2039 | 1,910 | 2,435 | ||||||
6.050%, 03/01/2034 | 4,940 | 6,149 | ||||||
4.600%, 06/15/2043 | 2,185 | 2,353 | ||||||
4.500%, 12/15/2041 | 1,660 | 1,713 | ||||||
PacifiCorp | ||||||||
6.000%, 01/15/2039 | 1,210 | 1,531 | ||||||
5.750%, 04/01/2037 | 2,972 | 3,691 | ||||||
Pennsylvania Electric | ||||||||
6.150%, 10/01/2038 | 6,082 | 7,275 | ||||||
PSEG Power LLC | ||||||||
8.625%, 04/15/2031 | 4,340 | 6,230 | ||||||
Public Service Electric & Gas MTN | ||||||||
4.000%, 06/01/2044 | 1,000 | 1,016 | ||||||
3.650%, 09/01/2042 | 3,050 | 2,866 | ||||||
Public Service of Colorado | ||||||||
6.500%, 08/01/2038 | 725 | 1,005 | ||||||
6.250%, 09/01/2037 | 1,740 | 2,373 | ||||||
4.750%, 08/15/2041 | 2,400 | 2,672 | ||||||
4.300%, 03/15/2044 | 2,825 | 2,969 | ||||||
San Diego Gas & Electric | ||||||||
4.500%, 08/15/2040 | 675 | 735 | ||||||
4.300%, 04/01/2042 | 1,375 | 1,438 | ||||||
Sempra Energy | ||||||||
6.000%, 10/15/2039 | 3,565 | 4,421 | ||||||
Southaven Combined Cycle Generation | ||||||||
3.846%, 08/15/2033 | 2,368 | 2,515 | ||||||
Southern California Edison | ||||||||
6.050%, 03/15/2039 | 4,355 | 5,636 | ||||||
4.650%, 10/01/2043 | 2,250 | 2,448 | ||||||
4.500%, 09/01/2040 | 4,960 | 5,293 | ||||||
Southern California Gas | ||||||||
4.450%, 03/15/2044 | 2,450 | 2,637 | ||||||
3.750%, 09/15/2042 | 1,465 | 1,425 | ||||||
Southwestern Electric Power | ||||||||
6.200%, 03/15/2040 | 3,335 | 4,254 | ||||||
| 196 | SEI Institutional Investments Trust / Annual Report / May 31, 2015 |
| Description | Face Amount ($ Thousands) | Market Value ($ Thousands) | ||||||
3.900%, 04/01/2045 | $ | 2,000 | $ | 1,848 | ||||
Texas-New Mexico Power | ||||||||
6.950%, 04/01/2043 (A) | 1,082 | 1,578 | ||||||
Tucson Electric Power | ||||||||
5.000%, 03/15/2044 | 5,025 | 5,354 | ||||||
Union Electric | ||||||||
8.450%, 03/15/2039 | 2,125 | 3,570 | ||||||
Virginia Electric & Power | ||||||||
4.650%, 08/15/2043 | 1,095 | 1,194 | ||||||
4.450%, 02/15/2044 | 2,500 | 2,634 | ||||||
3.450%, 02/15/2024 | 530 | 554 | ||||||
|
| |||||||
| 322,626 | ||||||||
|
| |||||||
Total Corporate Obligations (Cost $2,180,647) ($ Thousands) | 2,305,095 | |||||||
|
| |||||||
MUNICIPAL BONDS — 6.8% |
| |||||||
American Municipal Power, Build America Project, RB | ||||||||
6.053%, 02/15/2043 | 4,385 | 5,320 | ||||||
Bay Area, Toll Authority, Build America Project, RB | ||||||||
6.263%, 04/01/2049 | 1,690 | 2,305 | ||||||
California State, Build America Project, GO | ||||||||
7.600%, 11/01/2040 | 580 | 890 | ||||||
City of Gainesville, Build America Project, RB | ||||||||
6.024%, 10/01/2040 | 3,650 | 4,490 | ||||||
City of Houston, System Revenue, Ser A, RB | ||||||||
5.250%, 11/15/2033 | 320 | 362 | ||||||
City of Houston, Revenue, Ser B, RB | ||||||||
3.828%, 05/15/2028 | 2,775 | 2,919 | ||||||
City of New York, Build America Project, GO | ||||||||
6.646%, 12/01/2031 | 2,200 | 2,593 | ||||||
5.817%, 10/01/2031 | 2,950 | 3,312 | ||||||
City of New York, Build America Project, GO | ||||||||
5.517%, 10/01/2037 | 4,455 | 5,338 | ||||||
City of Sacramento, Municipal Utility District, Build America Project, RB | ||||||||
6.156%, 05/15/2036 | 100 | 124 | ||||||
City of San Francisco, Public Utilities Commission Water Revenue, Build America Project, Ser DE, RB | ||||||||
6.000%, 11/01/2040 | 3,705 | 4,560 | ||||||
| Description | Face Amount ($ Thousands) | Market Value ($ Thousands) | ||||||
Commonwealth of Massachusetts, Build America Project, GO | ||||||||
4.910%, 05/01/2029 | $ | 1,210 | $ | 1,412 | ||||
Commonwealth of Massachusetts, Build America Project, RB | ||||||||
5.731%, 06/01/2040 | 1,080 | 1,349 | ||||||
Commonwealth of Pennsylvania, Build America Project, Ser B, GO | ||||||||
5.450%, 02/15/2030 | 4,215 | 4,954 | ||||||
Dallas, Convention Center Hotel Development, Build America Project, RB | ||||||||
7.088%, 01/01/2042 | 600 | 768 | ||||||
District of Columbia, Water & Sewer Authority, RB | ||||||||
4.814%, 10/01/2114 | 2,735 | 2,860 | ||||||
Grand Parkway Transportation, | ||||||||
5.184%, 10/01/2042 | 2,930 | 3,517 | ||||||
Illinois State, GO | ||||||||
5.100%, 06/01/2033 | 8,735 | 8,292 | ||||||
Illinois, Finance Authority, RB | ||||||||
4.000%, 06/01/2047 | 1,260 | 1,216 | ||||||
Indianapolis, Local Public Improvement Bond Bank, Build America Project, RB | ||||||||
6.116%, 01/15/2040 | 4,860 | 6,228 | ||||||
Los Angeles, Community College District, Build America Project, GO | ||||||||
6.750%, 08/01/2049 | 1,790 | 2,585 | ||||||
Los Angeles, Community College District, Ser D, GO | ||||||||
6.680%, 08/01/2036 | 2,965 | 3,895 | ||||||
Los Angeles, Department of Water & Power, Build America Project, RB | ||||||||
6.574%, 07/01/2045 | 1,225 | 1,706 | ||||||
6.008%, 07/01/2039 | 5,000 | 6,192 | ||||||
Los Angeles, Unified School District, Build America Project, GO | ||||||||
6.758%, 07/01/2034 | 2,860 | 3,841 | ||||||
Los Angeles, Unified School District, Build America Project, GO | ||||||||
5.750%, 07/01/2034 | 1,875 | 2,296 | ||||||
| SEI Institutional Investments Trust / Annual Report / May 31, 2015 | 197 |
SCHEDULE OF INVESTMENTS
Long Duration Fund (Continued)
May 31, 2015
| Description | Face Amount ($ Thousands) | Market Value ($ Thousands) | ||||||
Metropolitan Water Reclamation District of Greater Chicago, GO | ||||||||
5.720%, 12/01/2038 | $ | 2,630 | $ | 3,161 | ||||
Michigan State University, Build America Project, Ser B, RB | ||||||||
6.173%, 02/15/2050 | 3,200 | 3,874 | ||||||
Missouri, Joint Municipal Electric Utility Commission, Build America Project, Ser A, RB | ||||||||
6.890%, 01/01/2042 | 600 | 732 | ||||||
Municipal Electric Authority of Georgia, Build America Project, RB | ||||||||
6.637%, 04/01/2057 | 3,511 | 4,420 | ||||||
New Jersey State, Turnpike Authority, Build America Project, RB | ||||||||
7.414%, 01/01/2040 | 60 | 87 | ||||||
7.102%, 01/01/2041 | 2,450 | 3,433 | ||||||
New York City, Municipal Water Finance Authority, Build America Project, RB | ||||||||
6.491%, 06/15/2042 | 6,630 | 7,626 | ||||||
New York City, Municipal Water Finance Authority, Build America Project, RB | ||||||||
5.440%, 06/15/2043 | 2,960 | 3,645 | ||||||
New York City, Municipal Water Finance Authority, RB | ||||||||
5.375%, 06/15/2043 | 600 | 702 | ||||||
New York City, Municipal Water Finance Authority, Ser GG, RB | ||||||||
5.000%, 06/15/2043 | 710 | 784 | ||||||
New York City, Transitional Finance Authority, Build America Project, RB | ||||||||
5.572%, 11/01/2038 | 2,195 | 2,686 | ||||||
New York City, Transitional Finance Authority, Future Tax Secured Revenue, Build America Project, RB | ||||||||
5.767%, 08/01/2036 | 4,150 | 5,079 | ||||||
5.508%, 08/01/2037 | 580 | 710 | ||||||
New York State, Dormitory Authority, Build America Project, RB | ||||||||
5.500%, 03/15/2030 | 3,295 | 3,879 | ||||||
| Description | Face Amount ($ Thousands) | Market Value ($ Thousands) | ||||||
5.289%, 03/15/2033 | $ | 1,550 | $ | 1,810 | ||||
North Texas, Tollway Authority, Build America Project, RB | ||||||||
6.718%, 01/01/2049 | 4,796 | 6,712 | ||||||
Ohio State University, Build America Project, Ser A, RB | ||||||||
4.800%, 06/01/2111 | 115 | 114 | ||||||
Ohio State, Water Development Authority, RB | ||||||||
4.879%, 12/01/2034 | 3,925 | 4,467 | ||||||
Port Authority of New York & New Jersey, RB | ||||||||
4.926%, 10/01/2051 | 725 | 823 | ||||||
4.458%, 10/01/2062 | 5,885 | 6,078 | ||||||
Regents of the University of California, Medical Center Revenue, Build America Project, Ser H, RB | ||||||||
6.548%, 05/15/2048 | 1,480 | �� | 1,928 | |||||
San Diego County, Regional Transportation Commission, RB | ||||||||
5.911%, 04/01/2048 | 2,300 | 3,045 | ||||||
San Diego County, Water Authority, Build America Project, RB | ||||||||
6.138%, 05/01/2049 | 2,585 | 3,387 | ||||||
Santa Clara Valley, Transportation Authority, Build America Project, RB | ||||||||
5.876%, 04/01/2032 | 2,580 | 3,152 | ||||||
State of California, Build America Project, GO | ||||||||
7.625%, 03/01/2040 | 2,355 | 3,550 | ||||||
7.550%, 04/01/2039 | 970 | 1,462 | ||||||
7.500%, 04/01/2034 | 7,700 | 11,087 | ||||||
7.350%, 11/01/2039 | 5,330 | 7,730 | ||||||
7.300%, 10/01/2039 | 4,100 | 5,918 | ||||||
State of Illinois, Build America Project, GO | ||||||||
7.100%, 07/01/2035 | 1,890 | 1,957 | ||||||
State of New York, Build America Project, RB | ||||||||
5.770%, 03/15/2039 | 12,820 | 15,608 | ||||||
State of Texas, Build America Project, GO | ||||||||
5.517%, 04/01/2039 | 450 | 574 | ||||||
Texas State, Transportation Commission State Highway Fund, Build America Project, | ||||||||
5.178%, 04/01/2030 | 2,725 | 3,211 | ||||||
| 198 | SEI Institutional Investments Trust / Annual Report / May 31, 2015 |
| Description | Face Amount ($ Thousands) | Market Value ($ Thousands) | ||||||
Triborough Bridge & Tunnel Authority, Build America Project, RB | ||||||||
5.450%, 11/15/2032 | $ | 3,300 | $ | 3,776 | ||||
University of California, Ser AD, RB | ||||||||
4.858%, 05/15/2112 | 13,775 | 13,100 | ||||||
University of Texas Permanent University Fund, Build America Project, RB | ||||||||
5.262%, 07/01/2039 | 1,505 | 1,848 | ||||||
|
| |||||||
Total Municipal Bonds |
| 225,479 | ||||||
|
| |||||||
U.S. GOVERNMENT AGENCY OBLIGATIONS — 3.9% |
| |||||||
FFCB | ||||||||
5.750%, 05/11/2026 | 6,525 | 8,380 | ||||||
3.125%, 11/06/2029 | 3,000 | 2,891 | ||||||
FHLB | ||||||||
5.625%, 06/11/2021 | 960 | 1,162 | ||||||
FHLMC | ||||||||
6.750%, 03/15/2031 | 7,890 | 11,668 | ||||||
6.250%, 07/15/2032 | 6,735 | 9,685 | ||||||
FICO STRIPS, PO | ||||||||
0.000%, 12/27/2018 to 09/26/2019 (B) | 16,575 | 15,522 | ||||||
FNMA | ||||||||
3.500%, 03/07/2033 | 2,529 | 2,516 | ||||||
3.000%, 11/26/2032 to 05/23/2033 | 4,596 | 4,311 | ||||||
2.625%, 09/06/2024 | 12,635 | 12,921 | ||||||
FNMA, PO | ||||||||
0.000%, 05/15/2030 (B) | 8,380 | 5,059 | ||||||
Residual Funding STRIPS | ||||||||
3.490%, 04/15/2030 (B) | 17,770 | 11,335 | ||||||
1.809%, 07/15/2020 (B) | 1,706 | 1,554 | ||||||
Tennessee Valley Authority | ||||||||
5.500%, 06/15/2038 | 305 | 394 | ||||||
5.375%, 04/01/2056 | 12,593 | 15,919 | ||||||
5.250%, 09/15/2039 | 7,900 | 9,950 | ||||||
4.875%, 01/15/2048 | 635 | 750 | ||||||
4.625%, 09/15/2060 | 7,645 | 8,505 | ||||||
3.500%, 12/15/2042 | 5,480 | 5,350 | ||||||
Tennessee Valley Authority STRIPS, PO | ||||||||
0.000%, 01/15/2038 (B) | 3,700 | 1,660 | ||||||
|
| |||||||
Total U.S. Government Agency Obligations | 129,532 | |||||||
|
| |||||||
| Description | Face Amount ($ Thousands) | Market Value ($ Thousands) | ||||||
MORTGAGE-BACKED SECURITIES — 1.9% |
| |||||||
Agency Mortgage-Backed Obligations — 1.5% |
| |||||||
FHLMC CMO, Ser 2004-2733, Cl ME | ||||||||
5.000%, 01/15/2034 | $ | 303 | $ | 338 | ||||
FHLMC CMO, Ser 2004-2748, Cl ZT | ||||||||
5.500%, 02/15/2024 | 699 | 801 | ||||||
FHLMC CMO, Ser 2010-3756, Cl PZ | ||||||||
4.000%, 11/15/2040 | 5,984 | 6,438 | ||||||
FHLMC CMO, Ser 2013-4150, Cl JZ | ||||||||
3.000%, 01/15/2043 | 3,003 | 2,783 | ||||||
FHLMC CMO, Ser 3770, Cl ZB | ||||||||
5.000%, 12/15/2040 | 3,626 | 3,813 | ||||||
FHLMC Multifamily Structured Pass-Through Certificates, | ||||||||
2.637%, 01/25/2023 | 4,380 | 4,473 | ||||||
FHLMC Multifamily Structured Pass-Through Certificates, | ||||||||
3.531%, 07/25/2023 (C) | 5,385 | 5,810 | ||||||
FNMA | ||||||||
3.841%, 09/01/2020 | 3,716 | 4,034 | ||||||
3.762%, 12/01/2020 | 3,701 | 4,016 | ||||||
3.666%, 10/01/2020 | 3,434 | 3,725 | ||||||
3.583%, 09/01/2020 | 1,914 | 2,059 | ||||||
FNMA CMO, Ser 2004-12, Cl ZX | ||||||||
6.000%, 03/25/2034 | 941 | 1,166 | ||||||
FNMA CMO, Ser 2004-80, Cl XZ | ||||||||
5.000%, 11/25/2034 | 525 | 600 | ||||||
FNMA CMO, Ser 2007-68, Cl SC, IO | ||||||||
6.515%, 07/25/2037 (C) | 79 | 15 | ||||||
GNMA ARM | ||||||||
1.625%, 06/20/2032 (C) | 92 | 96 | ||||||
GNMA CMO, Ser 2004-93, Cl PC | ||||||||
5.000%, 04/16/2034 | 119 | 125 | ||||||
GNMA CMO, Ser 2009-8, Cl PS, IO | ||||||||
6.117%, 08/16/2038 (C) | 175 | 19 | ||||||
GNMA CMO, Ser 2010-4, Cl NS, IO | ||||||||
6.207%, 01/16/2040 (C) | 191 | 28 | ||||||
GNMA CMO, Ser 2011-70, Cl BO, PO | ||||||||
0.000%, 05/20/2041 (B) | 10,425 | 8,386 | ||||||
|
| |||||||
| 48,725 | ||||||||
|
| |||||||
| SEI Institutional Investments Trust / Annual Report / May 31, 2015 | 199 |
SCHEDULE OF INVESTMENTS
Long Duration Fund (Continued)
May 31, 2015
| Description | Face Amount ($ Thousands) | Market Value ($ Thousands) | ||||||
Non-Agency Mortgage-Backed Obligations — 0.4% |
| |||||||
Countrywide Alternative Loan Trust, Ser 2005-27, Cl 3A2 | ||||||||
1.247%, 08/25/2035 (A) (C) | $ | 17 | $ | 12 | ||||
Countrywide Home Loans, | ||||||||
0.505%, 03/25/2035 (A) (C) | 132 | 100 | ||||||
DSLA Mortgage Loan Trust, | ||||||||
0.396%, 03/19/2045 (A) (C) | 178 | 159 | ||||||
GS Mortgage Securities II, | ||||||||
3.707%, 08/10/2044 | 4,540 | 4,873 | ||||||
Harborview Mortgage Loan Trust, Ser 2004-8, Cl 2A4A | ||||||||
0.986%, 11/19/2034 (A) (C) | 254 | 214 | ||||||
Harborview Mortgage Loan Trust, Ser 2005-11, Cl 2A1A | ||||||||
0.496%, 08/19/2045 (A) (C) | 344 | 317 | ||||||
Indymac Index Mortgage Loan Trust, Ser 2004-AR12, Cl A1 | ||||||||
0.965%, 12/25/2034 (A) (C) | 127 | 106 | ||||||
Indymac Index Mortgage Loan Trust, Ser 2004-AR5, Cl 2A1B | ||||||||
0.985%, 08/25/2034 (A) (C) | 69 | 61 | ||||||
Indymac Index Mortgage Loan Trust, Ser 2004-AR6, Cl 6A1 | ||||||||
2.698%, 10/25/2034 (A) (C) | 89 | 85 | ||||||
Indymac Index Mortgage Loan Trust, Ser 2004-AR7, Cl A2 | ||||||||
1.045%, 09/25/2034 (A) (C) | 27 | 25 | ||||||
Indymac Index Mortgage Loan Trust, Ser 2005-AR18, Cl 2A1A | ||||||||
0.495%, 10/25/2036 (A) (C) | 16 | 12 | ||||||
Morgan Stanley Capital I, | ||||||||
4.118%, 07/15/2049 | 4,410 | 4,814 | ||||||
Residential Asset Mortgage Products, Ser 2004-SL1, Cl A7 | ||||||||
7.000%, 11/25/2031 (A) | 25 | 27 | ||||||
Residential Asset Mortgage Products, Ser 2004-SL3, Cl A2 | ||||||||
6.500%, 12/25/2031 (A) | 37 | 38 | ||||||
Residential Asset Securitization Trust, Ser 2004-IP2, Cl 2A1 | ||||||||
2.480%, 12/25/2034 (A) (C) | 59 | 60 | ||||||
WaMu Mortgage Pass-Through Certificates, Ser 2005-AR2, Cl 2A21 | ||||||||
0.515%, 01/25/2045 (A) (C) | 163 | 150 | ||||||
| Description | Face Amount ($ Thousands) | Market Value ($ Thousands) | ||||||
Wells Fargo Mortgage-Backed Securities Trust, | ||||||||
2.625%, 04/25/2036 (A) (C) | $ | 158 | $ | 157 | ||||
WFRBS Commercial Mortgage Trust, Ser 2011-C5, Cl A4 | ||||||||
3.667%, 11/15/2044 | 3,590 | 3,844 | ||||||
|
| |||||||
| 15,054 | ||||||||
|
| |||||||
Total Mortgage-Backed Securities | 63,779 | |||||||
|
| |||||||
SOVEREIGN DEBT — 1.0% |
| |||||||
Banco Nacional de Desenvolvimento Economico e Social | ||||||||
5.500%, 07/12/2020 (A) | 1,300 | 1,376 | ||||||
Federal Republic of Brazil | ||||||||
5.625%, 01/07/2041 | 1,645 | 1,670 | ||||||
International Bank for Reconstruction & Development MTN | ||||||||
3.725%, 10/31/2030 (B) (E) | 5,850 | 3,503 | ||||||
Israel Government AID Bond | ||||||||
5.500%, 09/18/2033 | 1,400 | 1,856 | ||||||
3.289%, 05/01/2024 (B) | 1,020 | 805 | ||||||
3.010%, 08/15/2026 (B) | 2,585 | 1,867 | ||||||
2.703%, 05/15/2024 (B) | 1,545 | 1,218 | ||||||
Republic of Colombia | ||||||||
5.625%, 02/26/2044 | 1,570 | 1,692 | ||||||
4.000%, 02/26/2024 | 1,680 | 1,709 | ||||||
Republic of Uruguay | ||||||||
5.100%, 06/18/2050 | 2,590 | 2,609 | ||||||
United Mexican States MTN | ||||||||
6.050%, 01/11/2040 | 286 | 340 | ||||||
5.950%, 03/19/2019 | 1,300 | 1,474 | ||||||
5.750%, 10/12/2110 | 624 | 650 | ||||||
5.550%, 01/21/2045 | 1,670 | 1,877 | ||||||
4.750%, 03/08/2044 | 7,803 | 7,863 | ||||||
4.600%, 01/23/2046 | 165 | 162 | ||||||
4.000%, 10/02/2023 | 2,652 | 2,765 | ||||||
|
| |||||||
Total Sovereign Debt | 33,436 | |||||||
|
| |||||||
ASSET-BACKED SECURITIES — 0.3% |
| |||||||
Mortgage Related Securities — 0.0% |
| |||||||
Conseco Financial, | ||||||||
6.240%, 12/01/2028 (C) | 63 | 65 | ||||||
|
| |||||||
Other Asset-Backed Securities — 0.3% |
| |||||||
Citicorp Residential Mortgage Securities, Ser 2007-1, Cl A5 | ||||||||
5.892%, 03/25/2037 | 180 | 175 | ||||||
| 200 | SEI Institutional Investments Trust / Annual Report / May 31, 2015 |
| Description | Face Amount ($ Thousands) | Market Value ($ Thousands) | ||||||
Education Loan Asset-Backed Trust I, Ser 2013-1, Cl A2 | ||||||||
0.985%, 04/26/2032 (A) (C) | $ | 2,765 | $ | 2,782 | ||||
JGWPT XXX LLC, Ser 2013-3A, Cl A | ||||||||
4.080%, 01/17/2073 (A) | 1,470 | 1,548 | ||||||
Nelnet Student Loan Trust, | ||||||||
1.035%, 07/27/2037 (A) (C) | 2,745 | 2,745 | ||||||
SLM Student Loan Trust, | ||||||||
1.335%, 10/25/2034 (C) | 2,620 | 2,718 | ||||||
|
| |||||||
| 9,968 | ||||||||
|
| |||||||
Total Asset-Backed Securities | 10,033 | |||||||
|
| |||||||
U.S. TREASURY OBLIGATIONS — 16.1% |
| |||||||
U.S. Treasury Bills | ||||||||
0.011%, 06/04/2015 (B) (D) | 374 | 374 | ||||||
0.000%, 06/11/2015 (B) (D) | 2,046 | 2,046 | ||||||
U.S. Treasury Bonds | ||||||||
6.250%, 05/15/2030 | 2,440 | 3,609 | ||||||
5.250%, 02/15/2029 | 5,615 | 7,504 | ||||||
5.000%, 05/15/2037 | 9,605 | 13,322 | ||||||
4.500%, 02/15/2036 | 26,757 | 34,782 | ||||||
4.250%, 05/15/2039 | 9,480 | 11,896 | ||||||
3.875%, 08/15/2040 | 27,715 | 33,037 | ||||||
3.750%, 11/15/2043 | 16,310 | 19,197 | ||||||
3.625%, 08/15/2043 | 16,417 | 18,896 | ||||||
3.625%, 02/15/2044 | 11,706 | 13,478 | ||||||
3.375%, 05/15/2044 | 5,115 | 5,633 | ||||||
3.125%, 11/15/2041 | 13,395 | 14,121 | ||||||
3.125%, 02/15/2043 | 40,951 | 42,983 | ||||||
3.000%, 11/15/2044 (D) | 39,217 | 40,305 | ||||||
3.000%, 05/15/2045 | 10,900 | 11,234 | ||||||
2.750%, 08/15/2042 | 5,780 | 5,644 | ||||||
2.500%, 02/15/2045 | 126,731 | 117,484 | ||||||
| Description | Face Amount ($ Thousands)/Shares | Market Value ($ Thousands) | ||||||
U.S. Treasury Inflation-Protected Securities | ||||||||
1.375%, 02/15/2044 | $ | 11,435 | $ | 12,902 | ||||
0.750%, 02/15/2045 | 11,035 | 10,586 | ||||||
U.S. Treasury Notes | ||||||||
2.125%, 05/15/2025 | 4,820 | 4,834 | ||||||
U.S. Treasury STRIPS | ||||||||
2.875%, 05/15/2043 | 87,765 | 87,785 | ||||||
2.863%, 11/15/2027 (B) | 6,340 | 4,655 | ||||||
2.682%, 05/15/2039 (B) | 43,500 | 21,478 | ||||||
1.351%, 11/15/2027 (B) | 2,020 | 1,505 | ||||||
|
| |||||||
Total U.S. Treasury Obligations | 539,290 | |||||||
|
| |||||||
CASH EQUIVALENT — 1.4% |
| |||||||
SEI Daily Income Trust, | 47,930,942 | 47,931 | ||||||
|
| |||||||
Total Cash Equivalent | 47,931 | |||||||
|
| |||||||
Total Investments — 100.3% | $ | 3,354,575 | ||||||
|
| |||||||
A list of the open futures contracts held by the Fund at May 31, 2015, is as follows:
| Type of Contract | Number of Contracts Long/ (Short) | Expiration Date | Unrealized Appreciation (Depreciation) ($ Thousands) | |||||||||
U.S. 10-Year Treasury Note | (426 | ) | Sep-2015 | $ | (447 | ) | ||||||
U.S. 2-Year Treasury Note | (1,701 | ) | Sep-2015 | (446 | ) | |||||||
U.S. 5-Year Treasury Note | 1,293 | Sep-2015 | 835 | |||||||||
U.S. Long Treasury Bond | (77 | ) | Sep-2015 | (260 | ) | |||||||
U.S. Ultra Long Treasury Bond | 999 | Sep-2015 | 1,913 | |||||||||
|
| |||||||||||
| $ | 1,595 | |||||||||||
|
| |||||||||||
For year ended May 31, 2015, the total amount of all open futures contracts, as presented in the table above, are representative of the volume of activity for this derivative type during the period.
A list of the open centrally cleared swap agreements held by the Fund at May 31, 2015, is as follows:
| Interest Rate Swaps | ||||||||||||||||
| Counterparty | Fund Pays | Fund Receives | Termination Date | Notional Amount ($ Thousands) | Net Unrealized Depreciation ($ Thousands) | |||||||||||
| Citigroup | 3.68% | 3 Month USD - LIBOR | 11/15/43 | $ | 3,570 | $ | (803 | ) | ||||||||
|
| |||||||||||||||
A list of the open OTC swap agreements held by the Fund at May 31, 2015, is as follows:
| Interest Rate Swaps | ||||||||||||||||
| Counterparty | Fund Pays | Fund Receives | Termination Date | Notional Amount ($ Thousands) | Net Unrealized Depreciation ($ Thousands) | |||||||||||
| Barclays Bank PLC | 2.48% | 3 Month USD - LIBOR | 11/15/27 | $ | 2,605 | $ | (222 | ) | ||||||||
| Barclays Bank PLC | 2.42% | 3 Month USD - LIBOR | 11/15/27 | 2,630 | (199 | ) | ||||||||||
| Citigroup | 2.71% | 3 Month USD - LIBOR | 8/15/42 | 5,255 | (165 | ) | ||||||||||
|
| |||||||||||||||
| $ | (586 | ) | ||||||||||||||
|
| |||||||||||||||
| SEI Institutional Investments Trust / Annual Report / May 31, 2015 | 201 |
SCHEDULE OF INVESTMENTS
Long Duration Fund (Concluded)
May 31, 2015
For the year ended May 31, 2015, the total amount of all open swap agreements, as presented in the table above, are representative of the volume of activity for this derivative type during the year.
Percentages are based on a Net Assets of $3,343,845 ($ Thousands).
| * | The rate reported is the 7-day effective yield as of May 31, 2015. |
| ‡ | Real Estate Investment Trust. |
| † | Investment in Affiliated Security (see Note 6). |
| (A) | Securities sold within terms of a private placement memorandum, exempt from registration under Section 144A of the Securities Act of 1933, as amended, and may be sold only to dealers in that program or other “accredited investors.” These securities have been determined to be liquid under guidelines established by the Board of Trustees. |
| (B) | The rate reported is the effective yield at time of purchase. |
| (C) | Variable Rate Security — The rate reported on the Schedule of Investments is the rate in effect as of May 31, 2015. |
| (D) | Security, or portion thereof, has been pledged as collateral on open future contracts. |
| (E) | This security is a Supra-National organization. |
AID — Agency for International Development
ARM — Adjustable Rate Mortgage
Cl — Class
CMO — Collateralized Mortgage Obligation
FFCB — Federal Farm Credit Bank
FHLB — Federal Home Loan Bank
FHLMC — Federal Home Loan Mortgage Corporation
FICO — Financing Corporation
FNMA — Federal National Mortgage Association
GNMA — Government National Mortgage Association
GO — General Obligation
IO — Interest Only — face amount represents notional amount
LIBOR — London Interbank Offered Rate
LLC — Limited Liability Company
MTN — Medium Term Note
PLC — Public Limited Company
PO — Principal Only
RB — Revenue Bond
Ser — Series
STRIPS — Separately Traded Registered Interest and Principal Securities
The following is a list of the level of inputs used as of May 31, 2015, in valuing the Fund’s investments and other financial instruments carried at value ($ Thousands):
| Investments in Securities | Level 1 | Level 2 | Level 3 | Total | ||||||||||||
Corporate Obligations | $ | — | $ | 2,305,095 | $ | — | $ | 2,305,095 | ||||||||
Municipal Bonds | — | 225,479 | — | 225,479 | ||||||||||||
U.S. Government Agency Obligations | — | 129,532 | — | 129,532 | ||||||||||||
Mortgage-Backed Securities | — | 63,779 | — | 63,779 | ||||||||||||
Sovereign Debt | — | 33,436 | — | 33,436 | ||||||||||||
Asset-Backed Securities | — | 10,033 | — | 10,033 | ||||||||||||
U.S. Treasury Obligations | — | 539,290 | — | 539,290 | ||||||||||||
Cash Equivalent | 47,931 | — | — | 47,931 | ||||||||||||
|
|
|
|
|
|
|
| |||||||||
Total Investments in Securities | $ | 47,931 | $ | 3,306,644 | $ | — | $ | 3,354,575 | ||||||||
|
|
|
|
|
|
|
| |||||||||
| Other Financial Instruments | Level 1 | Level 2 | Level 3 | Total | ||||||||||||
Futurs Contracts* | ||||||||||||||||
Unrealized Appreciation | $ | 2,748 | $ | — | $ | — | $ | 2,748 | ||||||||
Unrealized Depreciation | (1,153 | ) | — | — | (1,153 | ) | ||||||||||
Centrally Cleared Swaps | ||||||||||||||||
Interest Rate Swaps* | ||||||||||||||||
Unrealized Depreciation | — | (803 | ) | — | (803 | ) | ||||||||||
OTC Swaps | ||||||||||||||||
Interest Rate Swaps* | ||||||||||||||||
Unrealized Depreciation | — | (586 | ) | — | (586 | ) | ||||||||||
|
|
|
|
|
|
|
| |||||||||
Total Other Financial Instruments | $ | 1,595 | $ | (1,389 | ) | $ | — | $ | 206 | |||||||
|
|
|
|
|
|
|
| |||||||||
| * | Futures contracts and swaps are valued at the unrealized appreciation (depreciation) on the instrument. |
For the year ended May 31, 2015, there were no transfers between Level 1 and Level 2 assets and liabilities.
For the year ended May 31, 2015, there were no transfers between Level 2 and Level 3 assets and liabilities.
For more information on valuation inputs, See Note 2 — Signifigant Accounting Policies in Notes to Financial States.
Amounts designated as “—” are $O or have been rounded to $O.
The accompanying notes are an integral part of the financial statements.
| 202 | SEI Institutional Investments Trust / Annual Report / May 31, 2015 |
SCHEDULE OF INVESTMENTS
Long Duration Credit Fund(1)
May 31, 2015
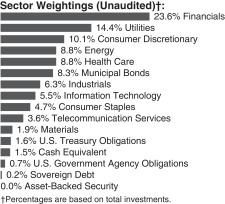
| Description | Face Amount ($ Thousands) | Market Value ($ Thousands) | ||||||
CORPORATE OBLIGATIONS — 86.8% |
| |||||||
Consumer Discretionary — 9.6% |
| |||||||
21st Century Fox America | ||||||||
7.125%, 04/08/2028 | $ | 400 | $ | 505 | ||||
6.900%, 08/15/2039 | 1,500 | 1,964 | ||||||
6.750%, 01/09/2038 | 3,385 | 4,295 | ||||||
6.650%, 11/15/2037 | 2,280 | 2,894 | ||||||
6.200%, 12/15/2034 | 2,614 | 3,166 | ||||||
Amazon.com | ||||||||
4.950%, 12/05/2044 | 5,680 | 5,825 | ||||||
CBS | ||||||||
5.900%, 10/15/2040 | 40 | 44 | ||||||
4.600%, 01/15/2045 | 650 | 599 | ||||||
Comcast | ||||||||
6.950%, 08/15/2037 | 8,839 | 11,796 | ||||||
6.550%, 07/01/2039 | 315 | 407 | ||||||
6.450%, 03/15/2037 | 4,030 | 5,103 | ||||||
6.400%, 05/15/2038 | 13,760 | 17,509 | ||||||
5.650%, 06/15/2035 | 6,675 | 7,878 | ||||||
4.750%, 03/01/2044 | 4,360 | 4,639 | ||||||
4.650%, 07/15/2042 | 3,790 | 3,960 | ||||||
4.600%, 08/15/2045 | 7,335 | 7,619 | ||||||
4.500%, 01/15/2043 | 3,910 | 3,987 | ||||||
4.400%, 08/15/2035 | 1,845 | 1,898 | ||||||
4.250%, 01/15/2033 | 4,975 | 5,029 | ||||||
4.200%, 08/15/2034 | 19,556 | 19,589 | ||||||
Comcast Cable Communications Holdings | ||||||||
9.455%, 11/15/2022 | 620 | 885 | ||||||
Cox Communications | ||||||||
8.375%, 03/01/2039 (A) | 2,528 | 3,383 | ||||||
6.950%, 06/01/2038 (A) | 500 | 586 | ||||||
4.800%, 02/01/2035 (A) | 550 | 532 | ||||||
4.700%, 12/15/2042 (A) | 850 | 787 | ||||||
4.500%, 06/30/2043 (A) | 220 | 201 | ||||||
Cox Enterprises | ||||||||
7.375%, 07/15/2027 (A) | 500 | 619 | ||||||
| Description | Face Amount ($ Thousands) | Market Value ($ Thousands) | ||||||
CVS Pass-Through Trust | ||||||||
8.353%, 07/10/2031 (A) | $ | 5,672 | $ | 7,667 | ||||
Darden Restaurants | ||||||||
6.800%, 10/15/2037 | 650 | 785 | ||||||
DIRECTV Holdings LLC | ||||||||
6.375%, 03/01/2041 | 1,495 | 1,697 | ||||||
6.350%, 03/15/2040 | 1,830 | 2,082 | ||||||
Discovery Communications | ||||||||
4.950%, 05/15/2042 | 460 | 446 | ||||||
4.875%, 04/01/2043 | 500 | 473 | ||||||
Ford Holdings | ||||||||
9.300%, 03/01/2030 | 2,279 | 3,450 | ||||||
General Motors | ||||||||
5.000%, 04/01/2035 | 2,680 | 2,708 | ||||||
Grupo Televisa | ||||||||
6.625%, 01/15/2040 | 20 | 24 | ||||||
Home Depot | ||||||||
4.875%, 02/15/2044 | 3,315 | 3,607 | ||||||
4.400%, 03/15/2045 | 12,795 | 13,209 | ||||||
4.250%, 04/01/2046 | 2,095 | 2,107 | ||||||
4.200%, 04/01/2043 | 160 | 161 | ||||||
3.750%, 02/15/2024 | 4,910 | 5,228 | ||||||
Johnson Controls | ||||||||
5.700%, 03/01/2041 | 55 | 64 | ||||||
4.950%, 07/02/2064 | 695 | 696 | ||||||
Lowe’s MTN | ||||||||
7.110%, 05/15/2037 | 3,092 | 4,153 | ||||||
6.650%, 09/15/2037 | 2,560 | 3,418 | ||||||
5.800%, 10/15/2036 | 1,260 | 1,542 | ||||||
5.125%, 11/15/2041 | 3,105 | 3,589 | ||||||
5.000%, 09/15/2043 | 1,050 | 1,190 | ||||||
4.250%, 09/15/2044 | 3,750 | 3,821 | ||||||
McDonald’s MTN | ||||||||
4.600%, 05/26/2045 | 2,575 | 2,610 | ||||||
NBCUniversal Media LLC | ||||||||
6.400%, 04/30/2040 | 265 | 342 | ||||||
5.950%, 04/01/2041 | 3,250 | 3,956 | ||||||
4.450%, 01/15/2043 | 1,750 | 1,755 | ||||||
4.375%, 04/01/2021 | 65 | 71 | ||||||
2.875%, 01/15/2023 | 225 | 224 | ||||||
NIKE | ||||||||
3.625%, 05/01/2043 | 7,445 | 7,091 | ||||||
QVC | ||||||||
5.950%, 03/15/2043 | 2,290 | 2,229 | ||||||
5.450%, 08/15/2034 | 2,160 | 2,067 | ||||||
Target | ||||||||
6.650%, 08/01/2028 | 355 | 445 | ||||||
6.500%, 10/15/2037 | 2,071 | 2,777 | ||||||
4.000%, 07/01/2042 | 10,360 | 10,090 | ||||||
Thomson Reuters | ||||||||
4.500%, 05/23/2043 | 290 | 280 | ||||||
Time Warner | ||||||||
7.700%, 05/01/2032 | 2,332 | 3,171 | ||||||
7.625%, 04/15/2031 | 2,100 | 2,814 | ||||||
| SEI Institutional Investments Trust / Annual Report / May 31, 2015 | 203 |
SCHEDULE OF INVESTMENTS
Long Duration Credit Fund(1) (Continued)
May 31, 2015
| Description | Face Amount ($ Thousands) | Market Value ($ Thousands) | ||||||
6.500%, 11/15/2036 | $ | 960 | $ | 1,161 | ||||
6.250%, 03/29/2041 | 966 | 1,118 | ||||||
6.200%, 03/15/2040 | 260 | 308 | ||||||
6.100%, 07/15/2040 | 1,480 | 1,736 | ||||||
5.375%, 10/15/2041 | 3,285 | 3,496 | ||||||
Time Warner Cable | ||||||||
6.550%, 05/01/2037 | 10 | 11 | ||||||
5.875%, 11/15/2040 | 150 | 152 | ||||||
Time Warner Entertainment | ||||||||
8.375%, 07/15/2033 | 2,585 | 3,272 | ||||||
Viacom | ||||||||
5.850%, 09/01/2043 | 615 | 638 | ||||||
5.250%, 04/01/2044 | 500 | 487 | ||||||
4.875%, 06/15/2043 | 190 | 176 | ||||||
4.850%, 12/15/2034 | 880 | 851 | ||||||
4.375%, 03/15/2043 | 4,401 | 3,769 | ||||||
Walgreen | ||||||||
4.400%, 09/15/2042 | 30 | 28 | ||||||
Walgreens Boots Alliance | ||||||||
4.800%, 11/18/2044 | 3,030 | 2,999 | ||||||
Wal-Mart Stores | ||||||||
7.550%, 02/15/2030 | 1,275 | 1,870 | ||||||
6.500%, 08/15/2037 | 13,500 | 17,974 | ||||||
5.625%, 04/01/2040 | 5,750 | 7,080 | ||||||
5.625%, 04/15/2041 | 3,150 | 3,813 | ||||||
5.250%, 09/01/2035 | 8,250 | 9,726 | ||||||
5.000%, 10/25/2040 | 19,215 | 21,677 | ||||||
4.750%, 10/02/2043 | 8,405 | 9,179 | ||||||
4.300%, 04/22/2044 | 5,445 | 5,648 | ||||||
4.000%, 04/11/2043 | 7,960 | 7,898 | ||||||
Walt Disney MTN | ||||||||
4.125%, 12/01/2041 | 370 | 381 | ||||||
4.125%, 06/01/2044 | 3,540 | 3,602 | ||||||
3.700%, 12/01/2042 | 4,709 | 4,531 | ||||||
|
| |||||||
| 331,319 | ||||||||
|
| |||||||
Consumer Staples — 4.4% |
| |||||||
Altria Group | ||||||||
10.200%, 02/06/2039 | 1,395 | 2,373 | ||||||
9.950%, 11/10/2038 | 132 | 220 | ||||||
4.250%, 08/09/2042 | 420 | 388 | ||||||
Anheuser-Busch | ||||||||
6.450%, 09/01/2037 | 2,300 | 3,001 | ||||||
Anheuser-Busch InBev Finance | ||||||||
4.625%, 02/01/2044 | 6,930 | 7,204 | ||||||
Anheuser-Busch InBev Worldwide | ||||||||
8.200%, 01/15/2039 | 4,010 | 6,133 | ||||||
8.000%, 11/15/2039 | 1,255 | 1,895 | ||||||
6.375%, 01/15/2040 | 210 | 272 | ||||||
3.750%, 07/15/2042 | 5,565 | 5,140 | ||||||
| Description | Face Amount ($ Thousands) | Market Value ($ Thousands) | ||||||
Archer-Daniels-Midland | ||||||||
4.016%, 04/16/2043 | $ | 4,820 | $ | 4,701 | ||||
Autopistas Metropolitanas de Puerto Rico | ||||||||
6.750%, 06/30/2035 (A) | 1,000 | 845 | ||||||
Board of Trustees of The Leland Stanford Junior University | ||||||||
3.460%, 05/01/2047 | 1,375 | 1,297 | ||||||
Bowdoin College | ||||||||
4.693%, 07/01/2112 | 4,864 | 4,263 | ||||||
California Institute of Technology | ||||||||
4.700%, 11/01/2111 | 1,000 | 1,019 | ||||||
Cargill | ||||||||
4.100%, 11/01/2042 (A) | 690 | 686 | ||||||
Coca-Cola Femsa | ||||||||
5.250%, 11/26/2043 | 3,290 | 3,672 | ||||||
ConAgra Foods | ||||||||
8.250%, 09/15/2030 | 750 | 1,019 | ||||||
6.625%, 08/15/2039 | 1,380 | 1,543 | ||||||
Diageo Capital | ||||||||
5.875%, 09/30/2036 | 485 | 596 | ||||||
3.875%, 04/29/2043 | 7,900 | 7,611 | ||||||
Diageo Investment | ||||||||
4.250%, 05/11/2042 | 1,425 | 1,447 | ||||||
Grupo Bimbo | ||||||||
4.875%, 06/27/2044 (A) | 660 | 639 | ||||||
Kimberly-Clark | ||||||||
5.300%, 03/01/2041 | 555 | 656 | ||||||
Kraft Foods Group | ||||||||
6.875%, 01/26/2039 | 1,245 | 1,548 | ||||||
5.000%, 06/04/2042 | 4,750 | 4,914 | ||||||
Land O’ Lakes | ||||||||
6.000%, 11/15/2022 (A) | 880 | 948 | ||||||
Massachusetts Institute of Technology | ||||||||
5.600%, 07/01/2111 | 3,600 | 4,550 | ||||||
4.678%, 07/01/2114 | 3,280 | 3,472 | ||||||
3.959%, 07/01/2038 | 1,927 | 1,993 | ||||||
Northwestern University | ||||||||
4.643%, 12/01/2044 | 1,200 | 1,331 | ||||||
3.688%, 12/01/2038 | 1,570 | 1,551 | ||||||
Pepsi Bottling Group | ||||||||
7.000%, 03/01/2029 | 1,400 | 1,942 | ||||||
PepsiCo | ||||||||
4.875%, 11/01/2040 | 1,130 | 1,245 | ||||||
4.250%, 10/22/2044 | 2,540 | 2,554 | ||||||
4.000%, 03/05/2042 | 3,420 | 3,328 | ||||||
3.600%, 03/01/2024 | 3,645 | 3,824 | ||||||
3.600%, 08/13/2042 | 3,135 | 2,867 | ||||||
3.000%, 08/25/2021 | 16 | 17 | ||||||
| 204 | SEI Institutional Investments Trust / Annual Report / May 31, 2015 |
| Description | Face Amount ($ Thousands) | Market Value ($ Thousands) | ||||||
Pernod Ricard | ||||||||
5.500%, 01/15/2042 (A) | $ | 150 | $ | 171 | ||||
Philip Morris International | ||||||||
6.375%, 05/16/2038 | 420 | 537 | ||||||
4.875%, 11/15/2043 | 765 | 820 | ||||||
4.500%, 03/20/2042 | 8,950 | 9,010 | ||||||
4.250%, 11/10/2044 | 2,520 | 2,461 | ||||||
4.125%, 03/04/2043 | 6,600 | 6,407 | ||||||
3.875%, 08/21/2042 | 2,300 | 2,135 | ||||||
President and Fellows of Harvard College | ||||||||
6.500%, 01/15/2039 (A) | 1,800 | 2,547 | ||||||
3.619%, 10/01/2037 | 400 | 400 | ||||||
Princeton University | ||||||||
5.700%, 03/01/2039 | 1,399 | 1,816 | ||||||
Procter & Gamble | ||||||||
5.550%, 03/05/2037 | 3,750 | 4,717 | ||||||
Reynolds American | ||||||||
6.150%, 09/15/2043 | 20 | 23 | ||||||
SABMiller Holdings | ||||||||
4.950%, 01/15/2042 (A) | 2,115 | 2,256 | ||||||
3.750%, 01/15/2022 (A) | 2,150 | 2,247 | ||||||
Sysco | ||||||||
4.350%, 10/02/2034 | 7,295 | 7,478 | ||||||
3.500%, 10/02/2024 | 3,535 | 3,601 | ||||||
Tufts University | ||||||||
5.017%, 04/15/2112 | 3,212 | 3,398 | ||||||
University of Chicago | ||||||||
4.411%, 10/01/2044 | 715 | 746 | ||||||
William Marsh Rice University | ||||||||
3.574%, 05/15/2045 | 9,040 | 8,451 | ||||||
|
| |||||||
| 151,925 | ||||||||
|
| |||||||
Energy — 8.7% | ||||||||
Anadarko Petroleum | ||||||||
6.450%, 09/15/2036 | 5,030 | 6,044 | ||||||
4.657%, 10/10/2036 (B) | 15,000 | 6,056 | ||||||
Apache | ||||||||
6.900%, 09/15/2018 | 10 | 12 | ||||||
5.100%, 09/01/2040 | 4,225 | 4,269 | ||||||
4.750%, 04/15/2043 | 1,395 | 1,351 | ||||||
Baker Hughes | ||||||||
5.125%, 09/15/2040 | 65 | 72 | ||||||
BG Energy Capital | ||||||||
5.125%, 10/15/2041 (A) | 5,840 | 6,461 | ||||||
BP Capital Markets | ||||||||
3.994%, 09/26/2023 | 2,155 | 2,269 | ||||||
3.535%, 11/04/2024 | 5,150 | 5,182 | ||||||
2.750%, 05/10/2023 | 1,650 | 1,609 | ||||||
Buckeye Partners | ||||||||
5.850%, 11/15/2043 | 70 | 70 | ||||||
Cameron International | ||||||||
7.000%, 07/15/2038 | 40 | 47 | ||||||
| Description | Face Amount ($ Thousands) | Market Value ($ Thousands) | ||||||
Canadian Oil Sands | ||||||||
6.000%, 04/01/2042 (A) | $ | 985 | $ | 908 | ||||
Cenovus Energy | ||||||||
5.200%, 09/15/2043 | 1,145 | 1,151 | ||||||
4.450%, 09/15/2042 | 375 | 342 | ||||||
CNOOC Finance | ||||||||
3.000%, 05/09/2023 | 2,665 | 2,575 | ||||||
Conoco Funding | ||||||||
6.950%, 04/15/2029 | 3,188 | 4,209 | ||||||
ConocoPhillips | ||||||||
6.500%, 02/01/2039 | 11,158 | 14,422 | ||||||
5.900%, 05/15/2038 | 2,400 | 2,891 | ||||||
4.300%, 11/15/2044 | 10,730 | 10,683 | ||||||
4.150%, 11/15/2034 | 1,500 | 1,514 | ||||||
ConocoPhillips Canada Funding I | ||||||||
5.950%, 10/15/2036 | 1,040 | 1,260 | ||||||
Continental Resources | ||||||||
4.900%, 06/01/2044 | 1,000 | 871 | ||||||
DCP Midstream Operating | ||||||||
5.600%, 04/01/2044 | 1,665 | 1,566 | ||||||
Devon Energy | ||||||||
6.300%, 01/15/2019 | 50 | 57 | ||||||
5.600%, 07/15/2041 | 900 | 989 | ||||||
4.750%, 05/15/2042 | 200 | 199 | ||||||
Devon Financing | ||||||||
7.875%, 09/30/2031 | 1,750 | 2,331 | ||||||
El Paso Natural Gas | ||||||||
8.375%, 06/15/2032 | 1,530 | 1,888 | ||||||
El Paso Pipeline Partners | ||||||||
4.700%, 11/01/2042 | 1,355 | 1,189 | ||||||
Energy Transfer Partners | ||||||||
8.250%, 11/15/2029 | 750 | 991 | ||||||
6.500%, 02/01/2042 | 310 | 342 | ||||||
6.050%, 06/01/2041 | 1,010 | 1,061 | ||||||
5.150%, 02/01/2043 | 3,230 | 3,107 | ||||||
5.150%, 03/15/2045 | 1,160 | 1,088 | ||||||
Eni | ||||||||
5.700%, 10/01/2040 (A) | 2,120 | 2,264 | ||||||
EnLink Midstream Partners | ||||||||
5.600%, 04/01/2044 | 1,000 | 1,037 | ||||||
5.050%, 04/01/2045 | 400 | 382 | ||||||
Enterprise Products Operating LLC | ||||||||
6.450%, 09/01/2040 | 705 | 851 | ||||||
5.950%, 02/01/2041 | 1,085 | 1,239 | ||||||
5.750%, 03/01/2035 | 185 | 206 | ||||||
5.700%, 02/15/2042 | 4,082 | 4,607 | ||||||
5.100%, 02/15/2045 | 1,990 | 2,065 | ||||||
4.900%, 05/15/2046 | 915 | 918 | ||||||
4.850%, 03/15/2044 | 640 | 643 | ||||||
EOG Resources | ||||||||
3.900%, 04/01/2035 | 5,669 | 5,564 | ||||||
| SEI Institutional Investments Trust / Annual Report / May 31, 2015 | 205 |
SCHEDULE OF INVESTMENTS
Long Duration Credit Fund(1) (Continued)
May 31, 2015
| Description | Face Amount ($ Thousands) | Market Value ($ Thousands) | ||||||
Exxon Mobil | ||||||||
3.567%, 03/06/2045 | $ | 16,045 | $ | 15,309 | ||||
Halliburton | ||||||||
7.450%, 09/15/2039 | 145 | 201 | ||||||
6.700%, 09/15/2038 | 1,735 | 2,255 | ||||||
4.750%, 08/01/2043 | 1,255 | 1,326 | ||||||
Kinder Morgan | ||||||||
5.550%, 06/01/2045 | 1,845 | 1,804 | ||||||
5.300%, 12/01/2034 | 4,178 | 4,081 | ||||||
5.050%, 02/15/2046 | 5,018 | 4,604 | ||||||
Kinder Morgan Energy Partners | ||||||||
6.950%, 01/15/2038 | 490 | 549 | ||||||
6.550%, 09/15/2040 | 200 | 211 | ||||||
5.500%, 03/01/2044 | 1,780 | 1,733 | ||||||
Marathon Oil | ||||||||
6.600%, 10/01/2037 | 195 | 230 | ||||||
Marathon Petroleum | ||||||||
6.500%, 03/01/2041 | 3,368 | 4,030 | ||||||
5.000%, 09/15/2054 | 1,030 | 989 | ||||||
Motiva Enterprises | ||||||||
6.850%, 01/15/2040 (A) | 5,710 | 6,722 | ||||||
Nexen Energy ULC | ||||||||
7.500%, 07/30/2039 | 900 | 1,245 | ||||||
Noble Energy | ||||||||
6.000%, 03/01/2041 | 360 | 397 | ||||||
5.250%, 11/15/2043 | 3,484 | 3,563 | ||||||
5.050%, 11/15/2044 | 5,860 | 5,890 | ||||||
ONEOK Partners | ||||||||
6.850%, 10/15/2037 | 135 | 146 | ||||||
6.125%, 02/01/2041 | 80 | 79 | ||||||
Petro-Canada | ||||||||
6.800%, 05/15/2038 | 2,140 | 2,768 | ||||||
Petroleos Mexicanos | ||||||||
6.375%, 01/23/2045 | 295 | 320 | ||||||
5.625%, 01/23/2046 (A) | 1,370 | 1,354 | ||||||
Phillips 66 | ||||||||
5.875%, 05/01/2042 | 990 | 1,124 | ||||||
4.875%, 11/15/2044 | 4,065 | 4,108 | ||||||
4.650%, 11/15/2034 | 2,642 | 2,687 | ||||||
Phillips 66 Partners | ||||||||
4.680%, 02/15/2045 | 140 | 134 | ||||||
Plains All American Pipeline | ||||||||
5.150%, 06/01/2042 | 450 | 455 | ||||||
3.850%, 10/15/2023 | 1,490 | 1,506 | ||||||
Pride International | ||||||||
7.875%, 08/15/2040 | 2,850 | 3,256 | ||||||
Shell International Finance BV | ||||||||
6.375%, 12/15/2038 | 10,966 | 14,301 | ||||||
5.500%, 03/25/2040 | 2,500 | 2,969 | ||||||
4.550%, 08/12/2043 | 6,885 | 7,226 | ||||||
4.375%, 05/11/2045 | 17,395 | 17,801 | ||||||
4.125%, 05/11/2035 | 5,694 | 5,747 | ||||||
| Description | Face Amount ($ Thousands) | Market Value ($ Thousands) | ||||||
Southern Natural Gas | ||||||||
7.350%, 02/15/2031 | $ | 2,215 | $ | 2,551 | ||||
Spectra Energy Capital | ||||||||
6.750%, 02/15/2032 | 800 | 868 | ||||||
Spectra Energy Partners | ||||||||
5.950%, 09/25/2043 | 160 | 186 | ||||||
4.500%, 03/15/2045 | 1,000 | 943 | ||||||
Statoil | ||||||||
6.500%, 12/01/2028 (A) | 2,325 | 3,028 | ||||||
5.250%, 04/15/2019 | 50 | 56 | ||||||
5.100%, 08/17/2040 | 1,415 | 1,613 | ||||||
4.800%, 11/08/2043 | 1,534 | 1,690 | ||||||
3.950%, 05/15/2043 | 2,400 | 2,315 | ||||||
2.450%, 01/17/2023 | 1,825 | 1,781 | ||||||
Suncor Energy | ||||||||
6.500%, 06/15/2038 | 7,555 | 9,485 | ||||||
5.950%, 12/01/2034 | 1,385 | 1,625 | ||||||
3.600%, 12/01/2024 | 2,300 | 2,345 | ||||||
Sunoco Logistics Partners Operations | ||||||||
5.350%, 05/15/2045 | 2,447 | 2,398 | ||||||
TC PipeLines | ||||||||
4.375%, 03/13/2025 | 1,300 | 1,306 | ||||||
Tennessee Gas Pipeline | ||||||||
8.375%, 06/15/2032 | 2,775 | 3,455 | ||||||
Total Capital International | ||||||||
3.700%, 01/15/2024 | 2,205 | 2,313 | ||||||
2.700%, 01/25/2023 | 885 | 873 | ||||||
TransCanada PipeLines | ||||||||
7.250%, 08/15/2038 | 1,490 | 2,025 | ||||||
6.100%, 06/01/2040 | 3,207 | 3,865 | ||||||
5.000%, 10/16/2043 | 1,275 | 1,347 | ||||||
4.625%, 03/01/2034 | 13,718 | 14,396 | ||||||
Transocean | ||||||||
7.350%, 12/15/2041 | 1,360 | 1,173 | ||||||
Valero Energy | ||||||||
10.500%, 03/15/2039 | 2,476 | 3,986 | ||||||
6.625%, 06/15/2037 | 475 | 562 | ||||||
Weatherford International | ||||||||
9.875%, 03/01/2039 | 1,265 | 1,512 | ||||||
Williams Partners | ||||||||
6.300%, 04/15/2040 | 50 | 55 | ||||||
5.800%, 11/15/2043 | 1,435 | 1,473 | ||||||
5.400%, 03/04/2044 | 1,600 | 1,551 | ||||||
5.100%, 09/15/2045 | 945 | 894 | ||||||
|
| |||||||
| 301,642 | ||||||||
|
| |||||||
Financials — 23.7% |
| |||||||
ACE INA Holdings | ||||||||
6.700%, 05/15/2036 | 6,035 | 8,262 | ||||||
Aflac | ||||||||
6.900%, 12/17/2039 | 6,185 | 8,103 | ||||||
6.450%, 08/15/2040 | 130 | 166 | ||||||
| 206 | SEI Institutional Investments Trust / Annual Report / May 31, 2015 |
| Description | Face Amount ($ Thousands) | Market Value ($ Thousands) | ||||||
AIA Group MTN | ||||||||
4.875%, 03/11/2044 (A) | $ | 5,072 | $ | 5,562 | ||||
AIG SunAmerica Global Financing X | ||||||||
6.900%, 03/15/2032 (A) | 5,110 | 6,858 | ||||||
Alexandria Real Estate Equities | ||||||||
3.900%, 06/15/2023‡ | 400 | 406 | ||||||
American Express | ||||||||
4.050%, 12/03/2042 | 7,683 | 7,278 | ||||||
American International Group | ||||||||
3.875%, 01/15/2035 | 1,996 | 1,888 | ||||||
American Tower Trust I | ||||||||
3.070%, 03/15/2023‡ (A) | 3,764 | 3,753 | ||||||
Apollo Management Holdings | ||||||||
4.000%, 05/30/2024 (A) | 2,250 | 2,295 | ||||||
Assurant | ||||||||
6.750%, 02/15/2034 | 2,645 | 3,244 | ||||||
Bank of America MTN | ||||||||
7.750%, 05/14/2038 | 1,425 | 1,952 | ||||||
6.500%, 07/15/2018 | 265 | 300 | ||||||
6.110%, 01/29/2037 | 5,255 | 6,119 | ||||||
6.000%, 10/15/2036 | 1,665 | 2,059 | ||||||
5.875%, 02/07/2042 | 4,200 | 5,162 | ||||||
5.000%, 01/21/2044 | 5,395 | 5,853 | ||||||
4.875%, 04/01/2044 | 1,500 | 1,604 | ||||||
4.750%, 04/21/2045 | 5,025 | 4,826 | ||||||
4.100%, 07/24/2023 | 5,840 | 6,128 | ||||||
4.000%, 01/22/2025 | 6,525 | 6,503 | ||||||
3.300%, 01/11/2023 | 1,370 | 1,372 | ||||||
Bank of New York Mellon MTN | ||||||||
4.600%, 01/15/2020 | 50 | 56 | ||||||
Bank One Capital III | ||||||||
8.750%, 09/01/2030 | 620 | 896 | ||||||
Barclays | ||||||||
3.650%, 03/16/2025 | 4,000 | 3,915 | ||||||
Berkshire Hathaway | ||||||||
4.500%, 02/11/2043 | 9,128 | 9,533 | ||||||
3.400%, 01/31/2022 | 56 | 59 | ||||||
Berkshire Hathaway Finance | ||||||||
5.750%, 01/15/2040 | 2,080 | 2,597 | ||||||
4.400%, 05/15/2042 | 2,250 | 2,356 | ||||||
4.300%, 05/15/2043 | 2,510 | 2,586 | ||||||
2.450%, 12/15/2015 | 13 | 13 | ||||||
Blackstone Holdings Finance LLC | ||||||||
6.250%, 08/15/2042 (A) | 4,839 | 5,859 | ||||||
5.000%, 06/15/2044 (A) | 5,285 | 5,461 | ||||||
4.450%, 07/15/2045 (A) | 700 | 669 | ||||||
Carlyle Holdings II Finance | ||||||||
5.625%, 03/30/2043 (A) | 10,349 | 11,416 | ||||||
CBL & Associates | ||||||||
5.250%, 12/01/2023‡ | 850 | 890 | ||||||
4.600%, 10/15/2024‡ | 350 | 351 | ||||||
| Description | Face Amount ($ Thousands) | Market Value ($ Thousands) | ||||||
CDP Financial | ||||||||
5.600%, 11/25/2039 (A) | $ | 6,215 | $ | 7,933 | ||||
Chubb | ||||||||
6.500%, 05/15/2038 | 5,813 | 7,895 | ||||||
Cincinnati Financial | ||||||||
6.920%, 05/15/2028 | 833 | 1,062 | ||||||
6.125%, 11/01/2034 | 3,553 | 4,203 | ||||||
Citigroup | ||||||||
8.125%, 07/15/2039 | 1,810 | 2,728 | ||||||
6.875%, 03/05/2038 | 1,810 | 2,396 | ||||||
6.875%, 02/15/2098 | 2,435 | 3,227 | ||||||
6.675%, 09/13/2043 | 2,601 | 3,305 | ||||||
6.125%, 08/25/2036 | 8,485 | 9,988 | ||||||
4.500%, 01/14/2022 | 390 | 427 | ||||||
3.875%, 10/25/2023 | 5,935 | 6,187 | ||||||
3.300%, 04/27/2025 | 5,915 | 5,818 | ||||||
Citigroup Capital III | ||||||||
7.625%, 12/01/2036 | 895 | 1,124 | ||||||
CME Group | ||||||||
5.300%, 09/15/2043 | 5,140 | 6,056 | ||||||
Cooperatieve Centrale Raiffeisen-Boerenleenbank BA | ||||||||
11.000%, 12/31/2049 (A) (C) | 1,000 | 1,280 | ||||||
5.800%, 09/30/2110 (A) | 5,720 | 6,412 | ||||||
5.750%, 12/01/2043 | 3,940 | 4,609 | ||||||
5.250%, 05/24/2041 | 395 | 457 | ||||||
4.625%, 12/01/2023 | 1,670 | 1,775 | ||||||
3.875%, 02/08/2022 | 55 | 59 | ||||||
Credit Suisse Group Funding Guernsey | ||||||||
4.875%, 05/15/2045 (A) | 5,235 | 5,304 | ||||||
3.750%, 03/26/2025 (A) | 8,060 | 7,954 | ||||||
Credit Suisse NY MTN | ||||||||
3.625%, 09/09/2024 | 250 | 254 | ||||||
Crown Castle Towers LLC | ||||||||
3.663%, 05/15/2025 (A) | 2,200 | 2,205 | ||||||
DaimlerChrysler | ||||||||
8.500%, 01/18/2031 | 150 | 229 | ||||||
Daimler Finance North America LLC | ||||||||
1.375%, 08/01/2017 (A) | 10,000 | 10,004 | ||||||
Deutsche Bank | ||||||||
4.500%, 04/01/2025 | 1,135 | 1,109 | ||||||
Devon OEI Operating | ||||||||
7.500%, 09/15/2027 | 10 | 13 | ||||||
ERP Operating | ||||||||
4.625%, 12/15/2021‡ | 55 | 61 | ||||||
4.500%, 06/01/2045‡ | 4,500 | 4,637 | ||||||
Farmers Exchange Capital | ||||||||
7.200%, 07/15/2048 (A) | 800 | 1,022 | ||||||
Farmers Exchange Capital II | ||||||||
6.151%, 11/01/2053 (A) (C) | 5,580 | 6,115 | ||||||
| SEI Institutional Investments Trust / Annual Report / May 31, 2015 | 207 |
SCHEDULE OF INVESTMENTS
Long Duration Credit Fund(1) (Continued)
May 31, 2015
| Description | Face Amount ($ Thousands) | Market Value ($ Thousands) | ||||||
Farmers Exchange Capital III | ||||||||
5.454%, 10/15/2054 (A) (C) | $ | 1,500 | $ | 1,515 | ||||
First Union Capital II | ||||||||
7.950%, 11/15/2029 | 355 | 479 | ||||||
FMR | ||||||||
5.150%, 02/01/2043 (A) | 260 | 287 | ||||||
4.950%, 02/01/2033 | 250 | 268 | ||||||
General Electric Capital MTN | ||||||||
6.875%, 01/10/2039 | 11,265 | 15,778 | ||||||
6.750%, 03/15/2032 | 15,195 | 20,476 | ||||||
6.150%, 08/07/2037 | 280 | 365 | ||||||
5.875%, 01/14/2038 (D) | 43,114 | 54,127 | ||||||
Goldman Sachs Group MTN | ||||||||
6.750%, 10/01/2037 | 6,695 | 8,222 | ||||||
6.345%, 02/15/2034 | 930 | 1,123 | ||||||
6.250%, 02/01/2041 | 7,564 | 9,384 | ||||||
6.125%, 02/15/2033 | 17,910 | 22,040 | ||||||
5.750%, 10/01/2016 | 345 | 366 | ||||||
5.375%, 03/15/2020 | 175 | 197 | ||||||
5.250%, 07/27/2021 | 398 | 449 | ||||||
5.150%, 05/22/2045 | 3,345 | 3,414 | ||||||
4.800%, 07/08/2044 | 5,870 | 6,140 | ||||||
4.000%, 03/03/2024 | 3,920 | 4,056 | ||||||
3.750%, 05/22/2025 | 2,250 | 2,270 | ||||||
3.700%, 08/01/2015 | 55 | 55 | ||||||
3.625%, 01/22/2023 | 215 | 219 | ||||||
Guardian Life Insurance of America | ||||||||
4.875%, 06/19/2064 (A) | 7,070 | 7,239 | ||||||
Hartford Financial Services Group | ||||||||
6.625%, 03/30/2040 | 1,794 | 2,333 | ||||||
HBOS | ||||||||
6.000%, 11/01/2033 (A) | 1,304 | 1,466 | ||||||
HCP | ||||||||
6.750%, 02/01/2041‡ | 525 | 669 | ||||||
4.250%, 11/15/2023‡ | 4,520 | 4,655 | ||||||
3.875%, 08/15/2024‡ | 835 | 838 | ||||||
Health Care | ||||||||
6.500%, 03/15/2041‡ | 775 | 972 | ||||||
5.125%, 03/15/2043‡ | 1,020 | 1,088 | ||||||
3.750%, 03/15/2023‡ | 4,134 | 4,188 | ||||||
Highmark | ||||||||
6.125%, 05/15/2041 (A) | 1,560 | 1,586 | ||||||
4.750%, 05/15/2021 (A) | 1,330 | 1,373 | ||||||
HSBC Bank | ||||||||
7.650%, 05/01/2025 | 1,155 | 1,499 | ||||||
4.750%, 01/19/2021 (A) | 150 | 167 | ||||||
HSBC Bank USA MTN | ||||||||
7.000%, 01/15/2039 | 4,650 | 6,350 | ||||||
5.875%, 11/01/2034 | 12,250 | 14,888 | ||||||
5.625%, 08/15/2035 | 4,485 | 5,284 | ||||||
| Description | Face Amount ($ Thousands) | Market Value ($ Thousands) | ||||||
HSBC Holdings | ||||||||
6.800%, 06/01/2038 | $ | 2,240 | $ | 2,902 | ||||
6.500%, 09/15/2037 | 7,640 | 9,543 | ||||||
6.100%, 01/14/2042 | 965 | 1,236 | ||||||
5.250%, 03/14/2044 | 11,305 | 12,400 | ||||||
4.000%, 03/30/2022 | 275 | 295 | ||||||
Hutchison Whampoa International 11 | ||||||||
4.625%, 01/13/2022 (A) | 1,520 | 1,669 | ||||||
JPMorgan Chase | ||||||||
6.400%, 05/15/2038 | 11,413 | 14,580 | ||||||
5.625%, 08/16/2043 | 435 | 492 | ||||||
5.600%, 07/15/2041 | 6,880 | 8,134 | ||||||
5.500%, 10/15/2040 | 5,980 | 6,962 | ||||||
5.400%, 01/06/2042 | 14,235 | 16,339 | ||||||
4.950%, 06/01/2045 | 7,350 | 7,442 | ||||||
4.850%, 02/01/2044 | 9,270 | 10,030 | ||||||
4.250%, 10/15/2020 | 300 | 325 | ||||||
3.875%, 02/01/2024 | 235 | 245 | ||||||
3.875%, 09/10/2024 | 2,505 | 2,519 | ||||||
3.375%, 05/01/2023 | 250 | 248 | ||||||
3.200%, 01/25/2023 | 200 | 201 | ||||||
JPMorgan Chase Capital XXIII | ||||||||
1.274%, 05/15/2047 (C) | 2,000 | 1,585 | ||||||
KKR Group Finance II LLC | ||||||||
5.500%, 02/01/2043 (A) | 8,622 | 9,219 | ||||||
KKR Group Finance III LLC | ||||||||
5.125%, 06/01/2044 (A) | 7,297 | 7,394 | ||||||
Liberty Mutual Group | ||||||||
6.500%, 05/01/2042 (A) | 3,132 | 3,772 | ||||||
Lincoln National | ||||||||
6.300%, 10/09/2037 | 100 | 123 | ||||||
6.150%, 04/07/2036 | 45 | 54 | ||||||
Macquarie Bank | ||||||||
5.000%, 02/22/2017 (A) | 65 | 69 | ||||||
Macquarie Group | ||||||||
6.250%, 01/14/2021 (A) | 40 | 46 | ||||||
6.000%, 01/14/2020 (A) | 100 | 114 | ||||||
Massachusetts Mutual Life Insurance | ||||||||
8.875%, 06/01/2039 (A) | 2,010 | 3,100 | ||||||
MetLife | ||||||||
10.750%, 08/01/2039 | 1,270 | 2,102 | ||||||
6.500%, 12/15/2032 | 350 | 448 | ||||||
5.875%, 02/06/2041 | 3,820 | 4,725 | ||||||
5.700%, 06/15/2035 | 8,595 | 10,490 | ||||||
4.875%, 11/13/2043 | 8,300 | 8,994 | ||||||
4.721%, 12/15/2044 | 5,555 | 5,881 | ||||||
MetLife Capital Trust IV | ||||||||
7.875%, 12/15/2037 (A) | 220 | 285 | ||||||
Metropolitan Life Insurance | ||||||||
7.800%, 11/01/2025 (A) | 2,000 | 2,653 | ||||||
| 208 | SEI Institutional Investments Trust / Annual Report / May 31, 2015 |
| Description | Face Amount ($ Thousands) | Market Value ($ Thousands) | ||||||
Morgan Stanley MTN | ||||||||
7.250%, 04/01/2032 | $ | 155 | $ | 209 | ||||
6.375%, 07/24/2042 | 3,115 | 3,969 | ||||||
6.250%, 08/09/2026 | 8,221 | 10,104 | ||||||
5.375%, 10/15/2015 | 480 | 488 | ||||||
4.350%, 09/08/2026 | 700 | 712 | ||||||
4.300%, 01/27/2045 | 13,370 | 12,963 | ||||||
3.950%, 04/23/2027 | 355 | 347 | ||||||
3.875%, 04/29/2024 | 5,440 | 5,605 | ||||||
3.700%, 10/23/2024 | 3,405 | 3,469 | ||||||
Mutual of Omaha Insurance | ||||||||
4.297%, 07/15/2054 (A) (C) | 1,300 | 1,331 | ||||||
National Rural Utilities Cooperative Finance | ||||||||
4.023%, 11/01/2032 | 4,777 | 4,909 | ||||||
Nationwide Financial Services | ||||||||
5.300%, 11/18/2044 (A) | 1,450 | 1,501 | ||||||
Nationwide Health Properties MTN | ||||||||
6.900%, 10/01/2037‡ | 1,600 | 2,034 | ||||||
Nationwide Mutual Insurance | ||||||||
9.375%, 08/15/2039 (A) | 1,520 | 2,348 | ||||||
8.250%, 12/01/2031 (A) | 500 | 688 | ||||||
7.875%, 04/01/2033 (A) | 527 | 704 | ||||||
4.950%, 04/22/2044 (A) | 1,300 | 1,324 | ||||||
New York Life Global Funding | ||||||||
2.450%, 07/14/2016 (A) | 50 | 51 | ||||||
New York Life Insurance | ||||||||
6.750%, 11/15/2039 (A) | 6,880 | 9,355 | ||||||
5.875%, 05/15/2033 (A) | 4,447 | 5,347 | ||||||
Nordea Bank | ||||||||
4.250%, 09/21/2022 (A) | 55 | 58 | ||||||
Northwestern Mutual Life Insurance | ||||||||
6.063%, 03/30/2040 (A) | 4,415 | 5,535 | ||||||
Pacific Life Insurance | ||||||||
9.250%, 06/15/2039 (A) | 1,000 | 1,517 | ||||||
PNC Bank MTN | ||||||||
3.800%, 07/25/2023 | 450 | 470 | ||||||
3.250%, 06/01/2025 | 4,885 | 4,883 | ||||||
PNC Funding | ||||||||
6.700%, 06/10/2019 | 100 | 118 | ||||||
Prudential Financial MTN | ||||||||
6.625%, 06/21/2040 | 625 | 789 | ||||||
5.700%, 12/14/2036 | 6,294 | 7,228 | ||||||
Prudential Insurance of America | ||||||||
8.300%, 07/01/2025 (A) | 1,000 | 1,357 | ||||||
Scentre Group Trust 1 | ||||||||
3.250%, 10/28/2025‡ (A) | 3,000 | 2,945 | ||||||
Simon Property Group | ||||||||
6.750%, 02/01/2040‡ | 3,465 | 4,679 | ||||||
4.750%, 03/15/2042‡ | 4,290 | 4,630 | ||||||
4.375%, 03/01/2021‡ | 40 | 44 | ||||||
| Description | Face Amount ($ Thousands) | Market Value ($ Thousands) | ||||||
SL Green Realty | ||||||||
7.750%, 03/15/2020‡ | $ | 60 | $ | 72 | ||||
Swiss Re Treasury US | ||||||||
4.250%, 12/06/2042 (A) | 6,581 | 6,657 | ||||||
Teachers Insurance & Annuity Association of America | ||||||||
6.850%, 12/16/2039 (A) | 4,540 | 6,026 | ||||||
4.900%, 09/15/2044 (A) | 4,085 | 4,376 | ||||||
Travelers | ||||||||
6.750%, 06/20/2036 | 5,420 | 7,471 | ||||||
6.250%, 06/15/2037 | 125 | 164 | ||||||
5.350%, 11/01/2040 | 1,565 | 1,867 | ||||||
4.600%, 08/01/2043 | 6,320 | 6,927 | ||||||
Trinity Acquisition | ||||||||
6.125%, 08/15/2043 | 50 | 55 | ||||||
US Bancorp MTN | ||||||||
4.125%, 05/24/2021 | 22 | 24 | ||||||
Validus Holdings | ||||||||
8.875%, 01/26/2040 | 1,230 | 1,651 | ||||||
Ventas Realty | ||||||||
5.700%, 09/30/2043‡ | 3,910 | 4,461 | ||||||
Wachovia | ||||||||
5.750%, 06/15/2017 | 150 | 164 | ||||||
WEA Finance LLC | ||||||||
4.750%, 09/17/2044 (A) | 2,400 | 2,470 | ||||||
Wells Fargo | ||||||||
5.606%, 01/15/2044 | 7,578 | 8,604 | ||||||
5.375%, 11/02/2043 | 3,185 | 3,533 | ||||||
4.650%, 11/04/2044 | 6,730 | 6,766 | ||||||
4.600%, 04/01/2021 | 40 | 44 | ||||||
4.100%, 06/03/2026 | 1,395 | 1,440 | ||||||
3.900%, 05/01/2045 | 11,460 | 10,754 | ||||||
3.500%, 03/08/2022 | 235 | 247 | ||||||
3.300%, 09/09/2024 | 750 | 756 | ||||||
3.000%, 02/19/2025 | 3,500 | 3,427 | ||||||
Wells Fargo Bank | ||||||||
6.600%, 01/15/2038 | 5,445 | 7,364 | ||||||
5.950%, 08/26/2036 | 1,100 | 1,372 | ||||||
5.850%, 02/01/2037 | 7,831 | 9,636 | ||||||
XLIT | ||||||||
5.250%, 12/15/2043 | 2,770 | 3,014 | ||||||
ZFS Finance USA Trust I | ||||||||
6.500%, 05/09/2037 (A) (C) | 1,710 | 1,819 | ||||||
ZFS Finance USA Trust II | ||||||||
6.450%, 12/15/2065 (A) (C) | 2,475 | 2,562 | ||||||
|
| |||||||
| 820,073 | ||||||||
|
| |||||||
Health Care — 8.9% | ||||||||
Abbott Laboratories | ||||||||
2.950%, 03/15/2025 | 4,985 | 4,963 | ||||||
AbbVie | ||||||||
4.700%, 05/14/2045 | 6,715 | 6,826 | ||||||
4.500%, 05/14/2035 | 16,990 | 17,107 | ||||||
4.400%, 11/06/2042 | 5,085 | 4,938 | ||||||
| SEI Institutional Investments Trust / Annual Report / May 31, 2015 | 209 |
SCHEDULE OF INVESTMENTS
Long Duration Credit Fund(1) (Continued)
May 31, 2015
| Description | Face Amount ($ Thousands) | Market Value ($ Thousands) | ||||||
Actavis | ||||||||
4.625%, 10/01/2042 | $ | 25 | $ | 24 | ||||
Actavis Funding SCS | ||||||||
4.850%, 06/15/2044 | 625 | 627 | ||||||
4.750%, 03/15/2045 | 2,445 | 2,421 | ||||||
4.550%, 03/15/2035 | 9,150 | 9,071 | ||||||
Aetna | ||||||||
4.750%, 03/15/2044 | 3,385 | 3,606 | ||||||
4.500%, 05/15/2042 | 1,995 | 2,088 | ||||||
Amgen | ||||||||
6.900%, 06/01/2038 | 2,190 | 2,824 | ||||||
6.400%, 02/01/2039 | 1,220 | 1,491 | ||||||
5.750%, 03/15/2040 | 1,455 | 1,680 | ||||||
5.650%, 06/15/2042 | 2,325 | 2,667 | ||||||
5.150%, 11/15/2041 | 2,595 | 2,779 | ||||||
Anthem | ||||||||
4.650%, 01/15/2043 | 2,780 | 2,838 | ||||||
4.650%, 08/15/2044 | 1,600 | 1,621 | ||||||
4.625%, 05/15/2042 | 300 | 300 | ||||||
2.375%, 02/15/2017 | 20 | 20 | ||||||
Ascension Health | ||||||||
4.847%, 11/15/2053 | 895 | 968 | ||||||
AstraZeneca | ||||||||
6.450%, 09/15/2037 | 8,960 | 11,801 | ||||||
4.000%, 09/18/2042 | 1,810 | 1,770 | ||||||
Baxter International | ||||||||
4.500%, 06/15/2043 | 65 | 66 | ||||||
3.200%, 06/15/2023 | 1,580 | 1,572 | ||||||
Bayer US Finance LLC | ||||||||
3.375%, 10/08/2024 (A) | 4,605 | 4,680 | ||||||
Baylor Scott & White Holdings | ||||||||
4.185%, 11/15/2045 | 4,735 | 4,522 | ||||||
Becton Dickinson | ||||||||
4.875%, 05/15/2044 | 1,000 | 1,065 | ||||||
4.685%, 12/15/2044 | 1,065 | 1,085 | ||||||
Bristol-Myers Squibb | ||||||||
4.500%, 03/01/2044 | 135 | 146 | ||||||
Catholic Health Initiatives | ||||||||
4.350%, 11/01/2042 | 3,250 | 3,065 | ||||||
Celgene | ||||||||
5.700%, 10/15/2040 | 3,242 | 3,778 | ||||||
5.250%, 08/15/2043 | 670 | 742 | ||||||
4.625%, 05/15/2044 | 780 | 786 | ||||||
Cigna | ||||||||
5.875%, 03/15/2041 | 65 | 81 | ||||||
City of Hope | ||||||||
5.623%, 11/15/2043 | 850 | 986 | ||||||
Cleveland Clinic Foundation | ||||||||
4.858%, 01/01/2114 | 3,656 | 3,568 | ||||||
Gilead Sciences | ||||||||
4.800%, 04/01/2044 | 4,470 | 4,775 | ||||||
4.500%, 02/01/2045 | 10,950 | 11,189 | ||||||
| Description | Face Amount ($ Thousands) | Market Value ($ Thousands) | ||||||
GlaxoSmithKline Capital | ||||||||
6.375%, 05/15/2038 | $ | 9,584 | $ | 12,456 | ||||
Hartford HealthCare | ||||||||
5.746%, 04/01/2044 | 2,480 | 2,795 | ||||||
Humana | ||||||||
8.150%, 06/15/2038 | 1,510 | 2,134 | ||||||
4.625%, 12/01/2042 | 55 | 55 | ||||||
Johnson & Johnson | ||||||||
5.950%, 08/15/2037 | 4,285 | 5,666 | ||||||
4.500%, 12/05/2043 | 2,000 | 2,216 | ||||||
4.375%, 12/05/2033 | 8,300 | 9,239 | ||||||
McKesson | ||||||||
4.883%, 03/15/2044 | 1,550 | 1,640 | ||||||
Mead Johnson Nutrition | ||||||||
5.900%, 11/01/2039 | 620 | 723 | ||||||
Medtronic | ||||||||
4.625%, 03/15/2044 | 7,416 | 7,775 | ||||||
4.625%, 03/15/2045 (A) | 19,210 | 20,032 | ||||||
4.375%, 03/15/2035 (A) | 13,665 | 14,009 | ||||||
3.625%, 03/15/2024 | 1,200 | 1,261 | ||||||
Memorial Sloan-Kettering Cancer Center | ||||||||
5.000%, 07/01/2042 | 1,000 | 1,105 | ||||||
4.200%, 07/01/2055 | 600 | 572 | ||||||
Merck | ||||||||
4.150%, 05/18/2043 | 3,050 | 3,042 | ||||||
3.700%, 02/10/2045 | 13,750 | 12,773 | ||||||
3.600%, 09/15/2042 | 850 | 803 | ||||||
2.750%, 02/10/2025 | 7,515 | 7,323 | ||||||
Merck Sharp & Dohme MTN | ||||||||
5.760%, 05/03/2037 | 1,276 | 1,593 | ||||||
North Shore-Long Island Jewish Health Care | ||||||||
6.150%, 11/01/2043 | 630 | 763 | ||||||
4.800%, 11/01/2042 | 2,400 | 2,333 | ||||||
Novartis Capital | ||||||||
4.400%, 05/06/2044 | 6,745 | 7,221 | ||||||
NYU Hospitals Center | ||||||||
4.428%, 07/01/2042 | 2,650 | 2,618 | ||||||
Pfizer | ||||||||
7.200%, 03/15/2039 | 2,965 | 4,206 | ||||||
4.400%, 05/15/2044 | 2,125 | 2,175 | ||||||
4.300%, 06/15/2043 | 5,420 | 5,441 | ||||||
Pharmacia | ||||||||
6.600%, 12/01/2028 | 615 | 824 | ||||||
Providence Health & Services Obligated Group | ||||||||
4.379%, 10/01/2023 | 2,400 | 2,611 | ||||||
Roche Holdings | ||||||||
4.000%, 11/28/2044 (A) | 4,840 | 4,865 | ||||||
Shands Teaching Hospital and Clinics | ||||||||
4.741%, 12/01/2042 | 1,750 | 1,809 | ||||||
| 210 | SEI Institutional Investments Trust / Annual Report / May 31, 2015 |
| Description | Face Amount ($ Thousands) | Market Value ($ Thousands) | ||||||
Southern Baptist Hospital of Florida | ||||||||
4.857%, 07/15/2045 | $ | 1,370 | $ | 1,400 | ||||
St. Barnabas | ||||||||
4.000%, 07/01/2028 | 2,240 | 2,173 | ||||||
St. Jude Medical | ||||||||
4.750%, 04/15/2043 | 1,000 | 1,048 | ||||||
Stryker | ||||||||
4.375%, 05/15/2044 | 1,220 | 1,225 | ||||||
4.100%, 04/01/2043 | 785 | 750 | ||||||
Sutter Health | ||||||||
2.286%, 08/15/2053 | 2,000 | 1,959 | ||||||
Trinity Health | ||||||||
4.125%, 12/01/2045 | 2,524 | 2,438 | ||||||
UnitedHealth Group | ||||||||
6.875%, 02/15/2038 | 1,411 | 1,933 | ||||||
6.625%, 11/15/2037 | 4,480 | 6,020 | ||||||
6.500%, 06/15/2037 | 4,820 | 6,438 | ||||||
5.950%, 02/15/2041 | 95 | 121 | ||||||
5.800%, 03/15/2036 | 325 | 400 | ||||||
5.700%, 10/15/2040 | 1,065 | 1,316 | ||||||
4.375%, 03/15/2042 | 30 | 30 | ||||||
3.950%, 10/15/2042 | 2,100 | 2,040 | ||||||
Wyeth | ||||||||
5.950%, 04/01/2037 | 4,425 | 5,440 | ||||||
Wyeth LLC | ||||||||
6.500%, 02/01/2034 | 3,590 | 4,687 | ||||||
Zimmer Holdings | ||||||||
4.450%, 08/15/2045 | 2,285 | 2,205 | ||||||
4.250%, 08/15/2035 | 1,145 | 1,114 | ||||||
Zoetis | ||||||||
4.700%, 02/01/2043 | 25 | 25 | ||||||
|
| |||||||
| 309,376 | ||||||||
|
| |||||||
Industrials — 6.4% | ||||||||
3M MTN | ||||||||
3.875%, 06/15/2044 | 4,610 | 4,599 | ||||||
Air Canada, Pass-Through Trust, Ser 2013-1, Cl A | ||||||||
4.125%, 05/15/2025 (A) | 501 | 523 | ||||||
Air Canada, Ser 2015-1, Class A Pass-Through Trust | ||||||||
3.600%, 03/15/2027 (A) | 5,500 | 5,535 | ||||||
American Airlines, | ||||||||
4.950%, 01/15/2023 | 1,763 | 1,894 | ||||||
American Airlines, | ||||||||
3.700%, 10/01/2026 | 2,133 | 2,173 | ||||||
BAE Systems Holdings | ||||||||
5.200%, 08/15/2015 (A) | 15 | 15 | ||||||
4.750%, 10/07/2044 (A) | 3,098 | 3,189 | ||||||
| Description | Face Amount ($ Thousands) | Market Value ($ Thousands) | ||||||
Boeing | ||||||||
6.875%, 03/15/2039 | $ | 660 | $ | 949 | ||||
6.625%, 02/15/2038 | 870 | 1,205 | ||||||
3.300%, 03/01/2035 | 6,000 | 5,701 | ||||||
Burlington Northern Santa Fe LLC | ||||||||
7.290%, 06/01/2036 | 1,333 | 1,800 | ||||||
5.050%, 03/01/2041 | 340 | 373 | ||||||
4.950%, 09/15/2041 | 140 | 153 | ||||||
4.900%, 04/01/2044 | 9,320 | 10,125 | ||||||
4.550%, 09/01/2044 | 600 | 611 | ||||||
4.450%, 03/15/2043 | 1,250 | 1,275 | ||||||
4.400%, 03/15/2042 | 3,825 | 3,881 | ||||||
Canadian National Railway | ||||||||
6.200%, 06/01/2036 | 5,665 | 7,454 | ||||||
4.500%, 11/07/2043 | 3,800 | 4,113 | ||||||
Caterpillar | ||||||||
5.200%, 05/27/2041 | 640 | 741 | ||||||
4.750%, 05/15/2064 | 4,220 | 4,379 | ||||||
3.803%, 08/15/2042 | 7,145 | 6,769 | ||||||
CSX | ||||||||
4.750%, 05/30/2042 | 4,080 | 4,331 | ||||||
4.500%, 08/01/2054 | 900 | 902 | ||||||
Cummins | ||||||||
4.875%, 10/01/2043 | 1,365 | 1,537 | ||||||
Deere | ||||||||
3.900%, 06/09/2042 | 11,415 | 11,069 | ||||||
Eaton | ||||||||
4.000%, 11/02/2032 | 2,780 | 2,788 | ||||||
Federal Express | ||||||||
7.600%, 07/01/2097 | 1,403 | 1,913 | ||||||
FedEx | ||||||||
4.100%, 04/15/2043 | 790 | 752 | ||||||
3.875%, 08/01/2042 | 1,641 | 1,475 | ||||||
General Electric | ||||||||
4.500%, 03/11/2044 | 7,135 | 7,594 | ||||||
4.125%, 10/09/2042 | 3,770 | 3,775 | ||||||
2.700%, 10/09/2022 | 1,010 | 1,011 | ||||||
Honeywell International | ||||||||
5.700%, 03/15/2037 | 300 | 371 | ||||||
5.375%, 03/01/2041 | 4,645 | 5,660 | ||||||
Koninklijke Philips | ||||||||
6.875%, 03/11/2038 | 80 | 101 | ||||||
Lockheed Martin | ||||||||
4.850%, 09/15/2041 | 1,885 | 2,044 | ||||||
4.070%, 12/15/2042 | 3,000 | 2,943 | ||||||
3.800%, 03/01/2045 | 2,200 | 2,045 | ||||||
3.600%, 03/01/2035 | 6,795 | 6,474 | ||||||
Norfolk Southern | ||||||||
6.000%, 03/15/2105 | 440 | 530 | ||||||
6.000%, 05/23/2111 | 345 | 418 | ||||||
Parker-Hannifin MTN | ||||||||
4.450%, 11/21/2044 | 1,255 | 1,325 | ||||||
4.200%, 11/21/2034 | 4,795 | 4,989 | ||||||
| SEI Institutional Investments Trust / Annual Report / May 31, 2015 | 211 |
SCHEDULE OF INVESTMENTS
Long Duration Credit Fund(1) (Continued)
May 31, 2015
| Description | Face Amount ($ Thousands) | Market Value ($ Thousands) | ||||||
Raytheon | ||||||||
7.200%, 08/15/2027 | $ | 400 | $ | 542 | ||||
4.700%, 12/15/2041 | 560 | 605 | ||||||
4.200%, 12/15/2044 | 3,610 | 3,667 | ||||||
Republic Services | ||||||||
5.700%, 05/15/2041 | 2,100 | 2,488 | ||||||
Rockwell Collins | ||||||||
3.700%, 12/15/2023 | 820 | 865 | ||||||
Siemens Financieringsmaatschappij | ||||||||
6.125%, 08/17/2026 (A) | 100 | 125 | ||||||
4.400%, 05/27/2045 (A) | 7,200 | 7,399 | ||||||
Stanley Black & Decker | ||||||||
5.200%, 09/01/2040 | 280 | 317 | ||||||
Union Pacific | ||||||||
4.850%, 06/15/2044 | 5,528 | 6,222 | ||||||
4.821%, 02/01/2044 | 4,909 | 5,473 | ||||||
4.750%, 09/15/2041 | 135 | 149 | ||||||
4.750%, 12/15/2043 | 4,415 | 4,870 | ||||||
3.875%, 02/01/2055 | 730 | 669 | ||||||
3.250%, 01/15/2025 | 5,050 | 5,197 | ||||||
United Airlines, Pass-Through Trust, Ser 2014-2, Cl A | ||||||||
3.750%, 09/03/2026 | 2,724 | 2,785 | ||||||
United Parcel Service | ||||||||
6.200%, 01/15/2038 | 3,842 | 4,959 | ||||||
3.625%, 10/01/2042 | 4,985 | 4,735 | ||||||
United Technologies | ||||||||
5.700%, 04/15/2040 | 7,615 | 9,251 | ||||||
4.500%, 06/01/2042 | 23,775 | 24,719 | ||||||
4.150%, 05/15/2045 | 4,085 | 4,025 | ||||||
US Airways, Pass-Through Trust, Ser 2012-1, Cl A | ||||||||
5.900%, 10/01/2024 | 2,155 | 2,436 | ||||||
|
| |||||||
| 223,002 | ||||||||
|
| |||||||
Information Technology — 5.4% |
| |||||||
Alibaba Group Holding | ||||||||
3.600%, 11/28/2024 (A) | 1,700 | 1,678 | ||||||
Apple | ||||||||
4.450%, 05/06/2044 | 4,380 | 4,542 | ||||||
4.375%, 05/13/2045 | 22,900 | 23,201 | ||||||
3.850%, 05/04/2043 | 4,275 | 4,016 | ||||||
3.450%, 02/09/2045 | 9,220 | 8,043 | ||||||
Applied Materials | ||||||||
5.850%, 06/15/2041 | 90 | 105 | ||||||
Broadcom MTN | ||||||||
4.500%, 08/01/2034 | 5,950 | 5,982 | ||||||
Cisco Systems | ||||||||
5.900%, 02/15/2039 | 6,439 | 7,877 | ||||||
5.500%, 01/15/2040 | 7,315 | 8,558 | ||||||
Corning | ||||||||
5.750%, 08/15/2040 | 345 | 411 | ||||||
4.700%, 03/15/2037 | 2,000 | 2,064 | ||||||
| Description | Face Amount ($ Thousands) | Market Value ($ Thousands) | ||||||
Intel | ||||||||
4.800%, 10/01/2041 | $ | 13,135 | $ | 13,914 | ||||
4.000%, 12/15/2032 | 550 | 556 | ||||||
International Business Machines | ||||||||
4.000%, 06/20/2042 | 1,000 | 928 | ||||||
3.625%, 02/12/2024 | 4,400 | 4,557 | ||||||
Intuit | ||||||||
5.750%, 03/15/2017 | 25 | 27 | ||||||
Microsoft | ||||||||
5.300%, 02/08/2041 | 515 | 604 | ||||||
4.875%, 12/15/2043 | 1,470 | 1,633 | ||||||
4.000%, 02/12/2055 | 6,959 | 6,358 | ||||||
3.750%, 02/12/2045 | 12,495 | 11,503 | ||||||
3.500%, 02/12/2035 | 6,790 | 6,342 | ||||||
3.500%, 11/15/2042 | 670 | 601 | ||||||
Motorola Solutions | ||||||||
7.500%, 05/15/2025 | 1,420 | 1,744 | ||||||
Oracle | ||||||||
6.500%, 04/15/2038 | 7,067 | 9,133 | ||||||
6.125%, 07/08/2039 | 3,655 | 4,547 | ||||||
5.375%, 07/15/2040 | 6,362 | 7,250 | ||||||
4.500%, 07/08/2044 | 1,450 | 1,481 | ||||||
4.375%, 05/15/2055 | 7,160 | 6,909 | ||||||
4.300%, 07/08/2034 | 16,725 | 17,099 | ||||||
4.125%, 05/15/2045 | 9,060 | 8,770 | ||||||
2.950%, 05/15/2025 | 5,775 | 5,669 | ||||||
QUALCOMM | ||||||||
4.800%, 05/20/2045 | 5,285 | 5,271 | ||||||
4.650%, 05/20/2035 | 4,200 | 4,186 | ||||||
Seagate HDD Cayman | ||||||||
5.750%, 12/01/2034 (A) | 2,185 | 2,245 | ||||||
|
| |||||||
| 187,804 | ||||||||
|
| |||||||
Materials — 1.9% | ||||||||
Air Products & Chemicals | ||||||||
3.350%, 07/31/2024 | 1,505 | 1,543 | ||||||
Albemarle | ||||||||
5.450%, 12/01/2044 | 1,449 | 1,493 | ||||||
Barrick North America Finance LLC | ||||||||
7.500%, 09/15/2038 | 15 | 17 | ||||||
5.750%, 05/01/2043 | 2,195 | 2,214 | ||||||
5.700%, 05/30/2041 | 1,000 | 975 | ||||||
BHP Billiton Finance USA | ||||||||
5.000%, 09/30/2043 | 10,615 | 11,484 | ||||||
Dow Chemical | ||||||||
5.250%, 11/15/2041 | 755 | 792 | ||||||
4.625%, 10/01/2044 | 825 | 799 | ||||||
4.250%, 10/01/2034 | 2,870 | 2,808 | ||||||
E.I. du Pont de Nemours | ||||||||
4.150%, 02/15/2043 | 1,930 | 1,920 | ||||||
Ecolab | ||||||||
5.500%, 12/08/2041 | 460 | 531 | ||||||
| 212 | SEI Institutional Investments Trust / Annual Report / May 31, 2015 |
| Description | Face Amount ($ Thousands) | Market Value ($ Thousands) | ||||||
Freeport-McMoRan | ||||||||
5.450%, 03/15/2043 | $ | 1,385 | $ | 1,207 | ||||
Georgia-Pacific LLC | ||||||||
8.875%, 05/15/2031 | 3,255 | 4,817 | ||||||
7.250%, 06/01/2028 | 330 | 431 | ||||||
Glencore Finance Canada | ||||||||
6.000%, 11/15/2041 (A) | 2,878 | 3,079 | ||||||
International Paper | ||||||||
8.700%, 06/15/2038 | 1,000 | 1,381 | ||||||
5.150%, 05/15/2046 | 2,315 | 2,363 | ||||||
5.000%, 09/15/2035 | 440 | 442 | ||||||
LYB International Finance | ||||||||
5.250%, 07/15/2043 | 1,525 | 1,626 | ||||||
LyondellBasell Industries | ||||||||
4.625%, 02/26/2055 | 1,645 | 1,502 | ||||||
Monsanto | ||||||||
4.700%, 07/15/2064 | 1,935 | 1,746 | ||||||
4.400%, 07/15/2044 | 1,245 | 1,188 | ||||||
4.200%, 07/15/2034 | 3,735 | 3,594 | ||||||
Newcrest Finance | ||||||||
5.750%, 11/15/2041 (A) | 1,150 | 1,033 | ||||||
Newmont Mining | ||||||||
6.250%, 10/01/2039 | 6,150 | 6,308 | ||||||
5.875%, 04/01/2035 | 100 | 101 | ||||||
Nucor | ||||||||
6.400%, 12/01/2037 | 40 | 49 | ||||||
Praxair | ||||||||
3.550%, 11/07/2042 | 1,135 | 1,030 | ||||||
Rio Tinto Alcan | ||||||||
7.250%, 03/15/2031 | 1,790 | 2,290 | ||||||
Rio Tinto Finance USA | ||||||||
9.000%, 05/01/2019 | 150 | 189 | ||||||
5.200%, 11/02/2040 | 20 | 22 | ||||||
4.750%, 03/22/2042 | 120 | 123 | ||||||
4.125%, 08/21/2042 | 3,300 | 3,113 | ||||||
3.500%, 11/02/2020 | 20 | 21 | ||||||
Southern Copper | ||||||||
7.500%, 07/27/2035 | 790 | 899 | ||||||
Teck Resources | ||||||||
6.000%, 08/15/2040 | 50 | 43 | ||||||
3.750%, 02/01/2023 | 195 | 176 | ||||||
Union Carbide | ||||||||
7.750%, 10/01/2096 | 25 | 32 | ||||||
Vale Overseas | ||||||||
8.250%, 01/17/2034 | 1,570 | 1,760 | ||||||
6.875%, 11/21/2036 | 225 | 221 | ||||||
6.875%, 11/10/2039 | 55 | 55 | ||||||
|
| |||||||
| 65,417 | ||||||||
|
| |||||||
Telecommunication Services — 3.5% |
| |||||||
America Movil | ||||||||
6.375%, 03/01/2035 | 50 | 61 | ||||||
6.125%, 11/15/2037 | 50 | 60 | ||||||
6.125%, 03/30/2040 | 2,495 | 2,999 | ||||||
4.375%, 07/16/2042 | 3,480 | 3,372 | ||||||
| Description | Face Amount ($ Thousands) | Market Value ($ Thousands) | ||||||
AT&T | ||||||||
8.000%, 11/15/2031 | $ | 2,625 | $ | 3,663 | ||||
6.300%, 01/15/2038 | 2,080 | 2,371 | ||||||
5.600%, 05/15/2018 | 40 | 44 | ||||||
5.550%, 08/15/2041 | 4,485 | 4,750 | ||||||
5.350%, 09/01/2040 | 4,145 | 4,251 | ||||||
4.800%, 06/15/2044 | 5,640 | 5,371 | ||||||
4.750%, 05/15/2046 | 4,285 | 4,080 | ||||||
4.500%, 05/15/2035 | 8,025 | 7,608 | ||||||
4.350%, 06/15/2045 | 3,639 | 3,244 | ||||||
3.000%, 02/15/2022 | 20 | 20 | ||||||
3.000%, 06/30/2022 | 4,285 | 4,219 | ||||||
Bellsouth Capital Funding | ||||||||
7.875%, 02/15/2030 | 2,855 | 3,639 | ||||||
Centel Capital | ||||||||
9.000%, 10/15/2019 | 25 | 30 | ||||||
Deutsche Telekom International Finance | ||||||||
9.250%, 06/01/2032 | 2,536 | 4,006 | ||||||
8.750%, 06/15/2030 | 990 | 1,461 | ||||||
GTE | ||||||||
8.750%, 11/01/2021 | 100 | 130 | ||||||
Koninklijke | ||||||||
8.375%, 10/01/2030 | 130 | 184 | ||||||
Rogers Communications | ||||||||
5.450%, 10/01/2043 | 5,200 | 5,779 | ||||||
SES Global Americas Holdings | ||||||||
5.300%, 03/25/2044 (A) | 6,621 | 7,010 | ||||||
Telefonaktiebolaget LM Ericsson | ||||||||
4.125%, 05/15/2022 | 4,523 | 4,828 | ||||||
Verizon Communications | ||||||||
7.350%, 04/01/2039 | 2,120 | 2,775 | ||||||
6.550%, 09/15/2043 | 515 | 626 | ||||||
6.400%, 09/15/2033 | 899 | 1,057 | ||||||
6.000%, 04/01/2041 | 1,420 | 1,621 | ||||||
5.050%, 03/15/2034 | 855 | 888 | ||||||
5.012%, 08/21/2054 | 8,271 | 7,864 | ||||||
4.862%, 08/21/2046 | 3,755 | 3,624 | ||||||
4.750%, 11/01/2041 | 1,685 | 1,649 | ||||||
4.672%, 03/15/2055 (A) | 13,991 | 12,589 | ||||||
4.522%, 09/15/2048 (A) | 6,172 | 5,638 | ||||||
4.400%, 11/01/2034 | 4,030 | 3,879 | ||||||
Vodafone Group | ||||||||
7.875%, 02/15/2030 | 1,035 | 1,324 | ||||||
6.150%, 02/27/2037 | 130 | 147 | ||||||
4.375%, 02/19/2043 | 5,255 | 4,611 | ||||||
|
| |||||||
| 121,472 | ||||||||
|
| |||||||
Utilities — 14.3% | ||||||||
AGL Capital | ||||||||
6.375%, 07/15/2016 | 100 | 106 | ||||||
4.400%, 06/01/2043 | 665 | 689 | ||||||
3.500%, 09/15/2021 | 68 | 72 | ||||||
| SEI Institutional Investments Trust / Annual Report / May 31, 2015 | 213 |
SCHEDULE OF INVESTMENTS
Long Duration Credit Fund(1) (Continued)
May 31, 2015
| Description | Face Amount ($ Thousands) | Market Value ($ Thousands) | ||||||
Alabama Power | ||||||||
5.200%, 06/01/2041 | $ | 155 | $ | 184 | ||||
5.125%, 02/15/2019 | 195 | 217 | ||||||
4.150%, 08/15/2044 | 135 | 137 | ||||||
Appalachian Power | ||||||||
6.700%, 08/15/2037 | 50 | 66 | ||||||
5.800%, 10/01/2035 | 125 | 151 | ||||||
4.600%, 03/30/2021 | 70 | 77 | ||||||
Arizona Public Service | ||||||||
8.750%, 03/01/2019 | 455 | 565 | ||||||
5.050%, 09/01/2041 | 50 | 58 | ||||||
4.500%, 04/01/2042 | 12 | 13 | ||||||
Baltimore Gas & Electric | ||||||||
6.350%, 10/01/2036 | 125 | 161 | ||||||
5.200%, 06/15/2033 | 1,620 | 1,897 | ||||||
Berkshire Hathaway Energy | ||||||||
6.125%, 04/01/2036 | 4,401 | 5,336 | ||||||
5.950%, 05/15/2037 | 245 | 297 | ||||||
5.150%, 11/15/2043 | 470 | 528 | ||||||
Boston Gas | ||||||||
4.487%, 02/15/2042 (A) | 1,325 | 1,399 | ||||||
CenterPoint Energy Houston Electric LLC | ||||||||
4.500%, 04/01/2044 | 7,917 | 8,449 | ||||||
3.550%, 08/01/2042 | 500 | 465 | ||||||
CenterPoint Energy Resources | ||||||||
6.250%, 02/01/2037 | 1,095 | 1,322 | ||||||
4.500%, 01/15/2021 | 40 | 44 | ||||||
Cleco Power | ||||||||
6.000%, 12/01/2040 | 1,150 | 1,337 | ||||||
Commonwealth Edison | ||||||||
4.700%, 01/15/2044 | 2,200 | 2,420 | ||||||
3.700%, 03/01/2045 | 11,840 | 11,252 | ||||||
Connecticut Light & Power | ||||||||
4.150%, 06/01/2045 | 4,500 | 4,580 | ||||||
Consolidated Edison of New York | ||||||||
6.750%, 04/01/2038 | 1,915 | 2,625 | ||||||
6.200%, 06/15/2036 | 65 | 82 | ||||||
5.850%, 04/01/2018 | 180 | 202 | ||||||
5.700%, 06/15/2040 | 40 | 49 | ||||||
5.500%, 12/01/2039 | 75 | 89 | ||||||
4.625%, 12/01/2054 | 1,075 | 1,104 | ||||||
4.450%, 03/15/2044 | 650 | 676 | ||||||
3.950%, 03/01/2043 | 5,840 | 5,596 | ||||||
Consumers Energy | ||||||||
4.350%, 08/31/2064 | 4,500 | 4,476 | ||||||
Dominion Resources | ||||||||
5.250%, 08/01/2033 | 20 | 22 | ||||||
4.900%, 08/01/2041 | 2,885 | 3,059 | ||||||
4.050%, 09/15/2042 | 450 | 425 | ||||||
DTE Electric | ||||||||
3.950%, 06/15/2042 | 80 | 80 | ||||||
| Description | Face Amount ($ Thousands) | Market Value ($ Thousands) | ||||||
3.900%, 06/01/2021 | $ | 30 | $ | 32 | ||||
3.700%, 03/15/2045 | 7,835 | 7,432 | ||||||
Duke Energy | ||||||||
3.950%, 10/15/2023 | 1,685 | 1,791 | ||||||
3.550%, 09/15/2021 | 17 | 18 | ||||||
3.050%, 08/15/2022 | 3,380 | 3,420 | ||||||
2.150%, 11/15/2016 | 25 | 25 | ||||||
Duke Energy Carolinas LLC | ||||||||
6.450%, 10/15/2032 | 110 | 141 | ||||||
6.100%, 06/01/2037 | 2,010 | 2,539 | ||||||
6.050%, 04/15/2038 | 1,475 | 1,923 | ||||||
5.300%, 02/15/2040 | 5,760 | 6,820 | ||||||
4.250%, 12/15/2041 | 2,000 | 2,065 | ||||||
4.000%, 09/30/2042 | 15,185 | 15,044 | ||||||
3.900%, 06/15/2021 | 50 | 54 | ||||||
3.750%, 06/01/2045 | 500 | 478 | ||||||
Duke Energy Florida | ||||||||
6.400%, 06/15/2038 | 3,215 | 4,260 | ||||||
Duke Energy Indiana | ||||||||
6.450%, 04/01/2039 | 4,275 | 5,670 | ||||||
6.350%, 08/15/2038 | 3,365 | 4,463 | ||||||
4.900%, 07/15/2043 | 435 | 489 | ||||||
Duke Energy Progress | ||||||||
4.375%, 03/30/2044 | 2,270 | 2,399 | ||||||
4.150%, 12/01/2044 | 1,250 | 1,274 | ||||||
4.100%, 05/15/2042 | 530 | 536 | ||||||
Duquesne Light Holdings | ||||||||
6.250%, 08/15/2035 | 2,500 | 2,854 | ||||||
El Paso Electric | ||||||||
5.000%, 12/01/2044 | 350 | 359 | ||||||
Electricite de France | ||||||||
6.000%, 01/22/2114 (A) | 9,993 | 11,207 | ||||||
5.250%, 12/29/2049 (A) (C) | 720 | 748 | ||||||
Elm Road Generating Station Supercritical | ||||||||
5.848%, 01/19/2041 (A) | 1,000 | 1,164 | ||||||
Entergy Louisiana | ||||||||
4.440%, 01/15/2026 | 1,510 | 1,661 | ||||||
Exelon Generation LLC | ||||||||
6.250%, 10/01/2039 | 4,340 | 5,065 | ||||||
5.600%, 06/15/2042 | 1,220 | 1,329 | ||||||
5.200%, 10/01/2019 | 100 | 111 | ||||||
FirstEnergy Transmission LLC | ||||||||
5.450%, 07/15/2044 (A) | 1,000 | 1,081 | ||||||
Florida Power & Light | ||||||||
5.960%, 04/01/2039 | 2,570 | 3,368 | ||||||
5.690%, 03/01/2040 | 6,568 | 8,339 | ||||||
5.650%, 02/01/2037 | 1,000 | 1,258 | ||||||
4.050%, 06/01/2042 | 10,960 | 11,055 | ||||||
4.050%, 10/01/2044 | 3,215 | 3,233 | ||||||
3.800%, 12/15/2042 | 5,320 | 5,086 | ||||||
Georgia Power | ||||||||
5.650%, 03/01/2037 | 105 | 125 | ||||||
5.400%, 06/01/2040 | 11,470 | 13,437 | ||||||
| 214 | SEI Institutional Investments Trust / Annual Report / May 31, 2015 |
| Description | Face Amount ($ Thousands) | Market Value ($ Thousands) | ||||||
4.300%, 03/15/2042 | $ | 10,530 | $ | 10,502 | ||||
4.300%, 03/15/2043 | 2,945 | 2,918 | ||||||
Gulf Power | ||||||||
4.550%, 10/01/2044 | 1,500 | 1,585 | ||||||
Indianapolis Power & Light | ||||||||
4.650%, 06/01/2043 (A) | 4,250 | 4,590 | ||||||
International Transmission | ||||||||
4.625%, 08/15/2043 (A) | 1,975 | 2,147 | ||||||
Jersey Central Power & Light | ||||||||
6.150%, 06/01/2037 | 275 | 327 | ||||||
John Sevier Combined Cycle Generation | ||||||||
4.626%, 01/15/2042 | 3,104 | 3,442 | ||||||
Kansas Gas & Electric | ||||||||
4.300%, 07/15/2044 (A) | 3,275 | 3,428 | ||||||
Kentucky Utilities | ||||||||
5.125%, 11/01/2040 | 2,715 | 3,223 | ||||||
KeySpan Gas East | ||||||||
5.819%, 04/01/2041 (A) | 4,951 | 6,147 | ||||||
Louisville Gas & Electric | ||||||||
4.650%, 11/15/2043 | 3,590 | 4,001 | ||||||
MidAmerican Energy | ||||||||
4.800%, 09/15/2043 | 6,390 | 7,197 | ||||||
4.400%, 10/15/2044 | 7,655 | 8,039 | ||||||
Monongahela Power | ||||||||
5.400%, 12/15/2043 (A) | 2,930 | 3,365 | ||||||
Narragansett Electric | ||||||||
4.170%, 12/10/2042 (A) | 1,000 | 1,002 | ||||||
Nevada Power | ||||||||
6.650%, 04/01/2036 | 100 | 133 | ||||||
Niagara Mohawk Power | ||||||||
4.278%, 10/01/2034 (A) | 5,244 | 5,410 | ||||||
4.119%, 11/28/2042 (A) | 2,000 | 1,990 | ||||||
NiSource Finance | ||||||||
5.950%, 06/15/2041 | 220 | 269 | ||||||
5.800%, 02/01/2042 | 900 | 1,088 | ||||||
Northern States Power | ||||||||
6.250%, 06/01/2036 | 1,176 | 1,570 | ||||||
6.200%, 07/01/2037 | 3,130 | 4,135 | ||||||
4.850%, 08/15/2040 | 3,400 | 3,899 | ||||||
2.600%, 05/15/2023 | 1,760 | 1,748 | ||||||
Oglethorpe Power | ||||||||
5.375%, 11/01/2040 | 2,895 | 3,351 | ||||||
5.250%, 09/01/2050 | 1,205 | 1,364 | ||||||
4.200%, 12/01/2042 | 3,960 | 3,878 | ||||||
Ohio Edison | ||||||||
8.250%, 10/15/2038 | 395 | 599 | ||||||
Oklahoma Gas & Electric | ||||||||
4.550%, 03/15/2044 | 1,395 | 1,502 | ||||||
Oncor Electric Delivery | ||||||||
7.500%, 09/01/2038 | 200 | 292 | ||||||
7.000%, 09/01/2022 | 85 | 107 | ||||||
6.800%, 09/01/2018 | 35 | 41 | ||||||
5.300%, 06/01/2042 | 4,519 | 5,336 | ||||||
| Description | Face Amount ($ Thousands) | Market Value ($ Thousands) | ||||||
5.250%, 09/30/2040 | $ | 1,650 | $ | 1,917 | ||||
4.550%, 12/01/2041 | 4,700 | 5,000 | ||||||
Oncor Electric Delivery LLC | ||||||||
3.750%, 04/01/2045 (A) | 1,825 | 1,714 | ||||||
One Gas | ||||||||
4.658%, 02/01/2044 | 1,420 | 1,564 | ||||||
Pacific Gas & Electric | ||||||||
6.250%, 03/01/2039 | 4,640 | 5,915 | ||||||
6.050%, 03/01/2034 | 8,974 | 11,171 | ||||||
5.800%, 03/01/2037 | 1,205 | 1,453 | ||||||
5.125%, 11/15/2043 | 370 | 421 | ||||||
4.600%, 06/15/2043 | 9,020 | 9,715 | ||||||
4.450%, 04/15/2042 | 5,495 | 5,610 | ||||||
4.300%, 03/15/2045 | 2,235 | 2,259 | ||||||
3.250%, 09/15/2021 | 18 | 19 | ||||||
PacifiCorp | ||||||||
6.250%, 10/15/2037 | 2,875 | 3,746 | ||||||
6.000%, 01/15/2039 | 5,175 | 6,547 | ||||||
4.100%, 02/01/2042 | 2,725 | 2,757 | ||||||
PECO Energy | ||||||||
4.800%, 10/15/2043 | 1,505 | 1,724 | ||||||
Pennsylvania Electric | ||||||||
6.150%, 10/01/2038 | 3,600 | 4,306 | ||||||
6.050%, 09/01/2017 | 50 | 55 | ||||||
Piedmont Natural Gas | ||||||||
4.650%, 08/01/2043 | 830 | 943 | ||||||
Potomac Electric Power | ||||||||
4.950%, 11/15/2043 | 950 | 1,075 | ||||||
PPL Electric Utilities | ||||||||
5.200%, 07/15/2041 | 1,100 | 1,278 | ||||||
4.750%, 07/15/2043 | 3,600 | 4,032 | ||||||
Progress Energy | ||||||||
4.400%, 01/15/2021 | 25 | 27 | ||||||
PSEG Power LLC | ||||||||
8.625%, 04/15/2031 | 4,493 | 6,450 | ||||||
5.125%, 04/15/2020 | 50 | 56 | ||||||
4.300%, 11/15/2023 | 2,155 | 2,278 | ||||||
4.150%, 09/15/2021 | 127 | 135 | ||||||
Public Service Electric & Gas MTN | ||||||||
4.050%, 05/01/2045 | 1,800 | 1,814 | ||||||
4.000%, 06/01/2044 | 695 | 706 | ||||||
3.750%, 03/15/2024 | 2,150 | 2,299 | ||||||
3.650%, 09/01/2042 | 2,015 | 1,893 | ||||||
Public Service of Colorado | ||||||||
6.250%, 09/01/2037 | 2,070 | 2,823 | ||||||
4.300%, 03/15/2044 | 1,250 | 1,314 | ||||||
3.950%, 03/15/2043 | 6,185 | 6,279 | ||||||
2.900%, 05/15/2025 | 5,010 | 5,013 | ||||||
Public Service of Oklahoma | ||||||||
4.400%, 02/01/2021 | 27 | 30 | ||||||
Puget Sound Energy | ||||||||
5.795%, 03/15/2040 | 130 | 165 | ||||||
4.300%, 05/20/2045 | 1,400 | 1,423 | ||||||
| SEI Institutional Investments Trust / Annual Report / May 31, 2015 | 215 |
SCHEDULE OF INVESTMENTS
Long Duration Credit Fund(1) (Continued)
May 31, 2015
| Description | Face Amount ($ Thousands) | Market Value ($ Thousands) | ||||||
San Diego Gas & Electric | ||||||||
6.000%, 06/01/2026 | $ | 625 | $ | 793 | ||||
Saudi Electricity Global Sukuk 2 | ||||||||
5.060%, 04/08/2043(A) | 2,720 | 2,768 | ||||||
Saudi Electricity Global Sukuk 3 | ||||||||
5.500%, 04/08/2044 (A) | 495 | 535 | ||||||
Sempra Energy | ||||||||
9.800%, 02/15/2019 | 50 | 64 | ||||||
6.000%, 10/15/2039 | 3,390 | 4,204 | ||||||
South Carolina Electric & Gas | ||||||||
5.450%, 02/01/2041 | 605 | 719 | ||||||
5.100%, 06/01/2065 | 6,175 | 6,456 | ||||||
Southern California Edison | ||||||||
6.000%, 01/15/2034 | 175 | 222 | ||||||
5.950%, 02/01/2038 | 510 | 643 | ||||||
5.500%, 03/15/2040 | 70 | 86 | ||||||
4.650%, 10/01/2043 | 17,240 | 18,755 | ||||||
4.050%, 03/15/2042 | 7,405 | 7,421 | ||||||
Southern California Gas | ||||||||
4.450%, 03/15/2044 | 2,000 | 2,153 | ||||||
3.750%, 09/15/2042 | 3,690 | 3,590 | ||||||
Southwestern Electric Power | ||||||||
6.200%, 03/15/2040 | 1,204 | 1,536 | ||||||
Southwestern Public Service | ||||||||
8.750%, 12/01/2018 | 40 | 49 | ||||||
4.500%, 08/15/2041 | 11,705 | 12,548 | ||||||
Tampa Electric | ||||||||
4.350%, 05/15/2044 | 1,225 | 1,273 | ||||||
Texas-New Mexico Power | ||||||||
6.950%, 04/01/2043 (A) | 2,000 | 2,916 | ||||||
Union Electric | ||||||||
8.450%, 03/15/2039 | 2,780 | 4,671 | ||||||
Virginia Electric & Power | ||||||||
6.350%, 11/30/2037 | 630 | 851 | ||||||
4.650%, 08/15/2043 | 2,530 | 2,759 | ||||||
4.450%, 02/15/2044 | 5,470 | 5,763 | ||||||
4.200%, 05/15/2045 | 1,750 | 1,766 | ||||||
3.450%, 02/15/2024 | 4,715 | 4,927 | ||||||
Wisconsin Electric Power | ||||||||
4.250%, 06/01/2044 | 850 | 888 | ||||||
3.650%, 12/15/2042 | 3,930 | 3,804 | ||||||
2.950%, 09/15/2021 | 3 | 3 | ||||||
Wisconsin Power & Light | ||||||||
4.100%, 10/15/2044 | 1,500 | 1,521 | ||||||
Wisconsin Public Service | ||||||||
4.752%, 11/01/2044 | 3,615 | 4,106 | ||||||
Xcel Energy | ||||||||
4.800%, 09/15/2041 | 215 | 233 | ||||||
|
| |||||||
| 495,234 | ||||||||
|
| |||||||
Total Corporate Obligations | 3,007,264 | |||||||
|
| |||||||
| Description | Face Amount ($ Thousands) | Market Value ($ Thousands) | ||||||
MUNICIPAL BONDS — 8.2% |
| |||||||
American Municipal Power, RB | ||||||||
6.053%, 02/15/2043 | $ | 2,200 | $ | 2,669 | ||||
Arizona, Health Facilities | ||||||||
0.994%, 01/01/2037 (C) | 800 | 712 | ||||||
Bay Area, Toll Authority, Build America Project, RB | ||||||||
6.263%, 04/01/2049 | 5,845 | 7,971 | ||||||
City of Houston, Ser A, GO | ||||||||
6.290%, 03/01/2032 | 2,550 | 3,167 | ||||||
City of Houston, Utility System Revenue, Ser B, RB | ||||||||
3.828%, 05/15/2028 | 1,600 | 1,683 | ||||||
City of New York, Build America Project, GO | ||||||||
5.985%, 12/01/2036 | 1,175 | 1,461 | ||||||
5.206%, 10/01/2031 | 750 | 858 | ||||||
Commonwealth of Massachusetts, Ser D, GO | ||||||||
4.500%, 08/01/2031 | 330 | 358 | ||||||
Commonwealth of Massachusetts, Ser E, GO | ||||||||
5.456%, 12/01/2039 | 5,085 | 6,281 | ||||||
Grand Parkway Transportation, Sub-Ser E, RB | ||||||||
5.184%, 10/01/2042 | 1,350 | 1,621 | ||||||
Illinois State, GO | ||||||||
5.100%, 06/01/2033 | 9,585 | 9,099 | ||||||
Indianapolis, Local Public Improvement Bond Bank, Build America Project, Ser B, RB | ||||||||
6.116%, 01/15/2040 | 2,755 | 3,530 | ||||||
Los Angeles, Department of Water & Power | ||||||||
5.716%, 07/01/2039 | 1,510 | 1,851 | ||||||
Los Angeles, Community College District, Ser D, GO | ||||||||
6.680%, 08/01/2036 | 500 | 657 | ||||||
Los Angeles, Department of Water & Power, Build America Project, RB | ||||||||
6.574%, 07/01/2045 | 4,530 | 6,307 | ||||||
Los Angeles, Department of Water & Power, Ser C, RB | ||||||||
5.516%, 07/01/2027 | 955 | 1,119 | ||||||
Los Angeles, Unified School District, Build America Project, GO | ||||||||
6.758%, 07/01/2034 | 11,000 | 14,774 | ||||||
| 216 | SEI Institutional Investments Trust / Annual Report / May 31, 2015 |
| Description | Face Amount ($ Thousands) | Market Value ($ Thousands) | ||||||
Metropolitan Water Reclamation District of Greater Chicago, Build America Project, GO | ||||||||
5.720%, 12/01/2038 | $ | 2,040 | $ | 2,452 | ||||
Michigan State University, Build America Project, RB | ||||||||
6.173%, 02/15/2050 | 850 | 1,029 | ||||||
Municipal Electric Authority of Georgia, Build America Project, RB | ||||||||
7.055%, 04/01/2057 | 2,235 | 2,558 | ||||||
6.637%, 04/01/2057 | 3,909 | 4,927 | ||||||
New Jersey State, Turnpike Authority, Build America Project, RB | ||||||||
7.414%, 01/01/2040 | 2,895 | 4,214 | ||||||
7.102%, 01/01/2041 | 9,770 | 13,690 | ||||||
New York City, Transitional Finance Authority Future Tax Secured Revenue, RB | ||||||||
5.508%, 08/01/2037 | 1,890 | 2,315 | ||||||
New York City, Municipal Water Finance Authority, Build America Project, RB | ||||||||
6.011%, 06/15/2042 | 750 | 989 | ||||||
5.882%, 06/15/2044 | 500 | 654 | ||||||
5.724%, 06/15/2042 | 3,720 | 4,744 | ||||||
5.440%, 06/15/2043 | 5,000 | 6,156 | ||||||
New York City, Transitional Finance Authority, Build America Project, RB | ||||||||
5.572%, 11/01/2038 | 900 | 1,101 | ||||||
New York State, Urban Development, Build America Project, RB | ||||||||
5.770%, 03/15/2039 | 6,305 | 7,676 | ||||||
Ohio State, Water Development Authority, RB | ||||||||
4.879%, 12/01/2034 | 1,795 | 2,043 | ||||||
Port Authority of New York & New Jersey, RB | ||||||||
4.926%, 10/01/2051 | 245 | 278 | ||||||
4.458%, 10/01/2062 | 11,725 | 12,109 | ||||||
San Antonio, Electric and Gas Revenue, RB | ||||||||
5.808%, 02/01/2041 | 5,500 | 6,923 | ||||||
San Diego County, Water Authority, Build America Project, RB | ||||||||
6.138%, 05/01/2049 | 1,000 | 1,310 | ||||||
| Description | Face Amount ($ Thousands) | Market Value ($ Thousands) | ||||||
Santa Clara Valley, Transportation Authority, Build America Project, RB | ||||||||
5.876%, 04/01/2032 | $ | 3,605 | $ | 4,405 | ||||
State of California, Build America Project, GO | ||||||||
7.625%, 03/01/2040 | 7,200 | 10,853 | ||||||
7.550%, 04/01/2039 | 18,155 | 27,374 | ||||||
7.500%, 04/01/2034 | 13,085 | 18,840 | ||||||
7.300%, 10/01/2039 | 15,850 | 22,878 | ||||||
State of Connecticut, Ser A, GO | ||||||||
5.850%, 03/15/2032 | 2,210 | 2,715 | ||||||
State of Illinois, Build America Project, GO | ||||||||
7.100%, 07/01/2035 | 1,000 | 1,035 | ||||||
State of Texas, Build America Project, GO | ||||||||
5.517%, 04/01/2039 | 5,000 | 6,383 | ||||||
State of Texas, Build America Project, Ser A, GO | ||||||||
4.631%, 04/01/2033 | 1,500 | 1,676 | ||||||
State of Texas, Transportation Communication Authority, Build America Project, Ser B, RB | ||||||||
5.178%, 04/01/2030 | 4,025 | 4,743 | ||||||
Texas, Transportation Commission State Highway Fund, Ser B, RB | ||||||||
5.028%, 04/01/2026 | 6,600 | 7,675 | ||||||
University of California, Build America Project, RB | ||||||||
5.770%, 05/15/2043 | 5,950 | 7,424 | ||||||
University of California, Ser AD, RB | ||||||||
4.858%, 05/15/2112 | 6,337 | 6,027 | ||||||
University of California, | ||||||||
3.931%, 05/15/2045 | 950 | 927 | ||||||
University of California, | ||||||||
4.767%, 05/15/2115 | 4,529 | 4,277 | ||||||
University of California, | ||||||||
4.131%, 05/15/2045 | 6,000 | 5,817 | ||||||
University of Texas Permanent University Fund, Build America Project, RB | ||||||||
5.262%, 07/01/2039 | 4,540 | 5,575 | ||||||
University of Texas, Build America Project, Ser B, RB | ||||||||
6.276%, 08/15/2041 | 60 | 68 | ||||||
| SEI Institutional Investments Trust / Annual Report / May 31, 2015 | 217 |
SCHEDULE OF INVESTMENTS
Long Duration Credit Fund(1) (Continued)
May 31, 2015
| Description | Face Amount ($ Thousands) | Market Value ($ Thousands) | ||||||
Virginia Commonwealth University, Health System Authority, Ser A, RB | ||||||||
4.956%, 01/01/2044 | $ | 475 | $ | 538 | ||||
Washington State, Build America Project, Ser F, RB | ||||||||
5.140%, 08/01/2040 | 4,495 | 5,343 | ||||||
|
| |||||||
Total Municipal Bonds |
| 283,859 | ||||||
|
| |||||||
U.S. GOVERNMENT AGENCY OBLIGATIONS — 0.7% |
| |||||||
FHLB | ||||||||
0.065%, 06/19/2015 (B) | 4,365 | 4,365 | ||||||
0.060%, 06/03/2015 to 06/05/2015 (B) | 13,520 | 13,520 | ||||||
FNMA | ||||||||
3.000%, 10/18/2032 | 1,040 | 980 | ||||||
Tennessee Valley Authority | ||||||||
5.880%, 04/01/2036 | 1,200 | 1,603 | ||||||
5.375%, 04/01/2056 | 2,160 | 2,730 | ||||||
|
| |||||||
Total U.S. Government Agency Obligations | 23,198 | |||||||
|
| |||||||
SOVEREIGN DEBT — 0.2% |
| |||||||
Andina de Fomento | ||||||||
4.375%, 06/15/2022 | 970 | 1,063 | ||||||
Asian Development Bank | ||||||||
5.820%, 06/16/2028 | 3,500 | 4,607 | ||||||
International Bank for Reconstruction & Development MTN | ||||||||
3.726%, 10/31/2030 (B) (E) | 2,605 | 1,560 | ||||||
|
| |||||||
Total Sovereign Debt (Cost $7,319) ($ Thousands) | 7,230 | |||||||
|
| |||||||
ASSET-BACKED SECURITY — 0.0% |
| |||||||
Other Asset-Backed Securities — 0.0% |
| |||||||
321 Henderson Receivables LLC, Ser 2013-3A, Cl A | ||||||||
4.080%, 01/17/2073 (A) | 525 | 553 | ||||||
|
| |||||||
Total Asset-Backed Security (Cost $525) ($ Thousands) | 553 | |||||||
|
| |||||||
U.S. TREASURY OBLIGATIONS — 1.6% |
| |||||||
U.S. Treasury Bonds | ||||||||
3.000%, 11/15/2044 (D) | 2,351 | 2,416 | ||||||
2.500%, 02/15/2045 | 34,210 | 31,714 | ||||||
U.S. Treasury Inflation-Protected Securities | ||||||||
1.375%, 02/15/2044 | 608 | 677 | ||||||
0.750%, 02/15/2045 | 1,504 | 1,439 | ||||||
| Description | Face Amount ($ Thousands)/Shares | Market Value ($ Thousands) | ||||||
U.S. Treasury Notes | ||||||||
2.125%, 05/15/2025 | $ | 17,785 | $ | 17,838 | ||||
0.750%, 04/15/2018 | 1,630 | 1,623 | ||||||
|
| |||||||
Total U.S. Treasury Obligations | 55,707 | |||||||
|
| |||||||
CASH EQUIVALENT — 1.5% |
| |||||||
SEI Daily Income Trust, Prime Obligation Fund, Cl A | ||||||||
0.010%*† | 50,311,891 | 50,312 | ||||||
|
| |||||||
Total Cash Equivalent (Cost $50,312) ($ Thousands) | 50,312 | |||||||
|
| |||||||
Total Investments — 99.0% | $ | 3,428,123 | ||||||
|
| |||||||
A list of the open futures contracts held by the Fund at May 31, 2015, is as follows:
| Type of Contract | Number of Contracts Long (Short) | Expiration Date | Unrealized Appreciation (Depreciation) ($ Thousands) | |||||||||
U.S. 10-Year Treasury Note | (70 | ) | Sep-2015 | $ | (74 | ) | ||||||
U.S. 10-Year Treasury Note | 48 | Sep-2015 | 28 | |||||||||
U.S. 2-Year Treasury Note | (1,709 | ) | Sep-2015 | (448 | ) | |||||||
U.S. 5-Year Treasury Note | 1,649 | Sep-2015 | 1,065 | |||||||||
U.S. 5-Year Treasury Note | (246 | ) | Sep-2015 | (110 | ) | |||||||
U.S. Long Treasury Bond | (84 | ) | Sep-2015 | (283 | ) | |||||||
U.S. Ultra Long Treasury Bond | (96 | ) | Sep-2015 | (81 | ) | |||||||
U.S. Ultra Long Treasury Bond | 86 | Sep-2015 | 128 | |||||||||
|
| |||||||||||
| $ | 225 | |||||||||||
|
| |||||||||||
For the year ended May 31, 2015, the total amount of all open futures contracts, as presented in the table above, are representative of the volume of activity for this derivative type during the year.
Percentages are based on a Net Assets of $3,465,228 ($ Thousands).
| * | The rate reported is the 7-day effective yield as of May 31, 2015. |
| † | Investment in Affiliated Security (see Note 6). |
| ‡ | Real Estate Investment Trust. |
| (1) | Effective April 13, 2015, the Long Duration Corporate Bond Fund was renamed the Long Duration Credit Fund. |
| (A) | Securities sold within terms of a private placement memorandum, exempt from registration under Section 144A of the Securities Act of 1933, as amended, and may be sold only to dealers in that program or other “accredited investors.” These securities have been determined to be liquid under guidelines established by the Board of Trustees. |
| (B) | The rate reported is the effective yield at time of purchase. |
| (C) | Variable Rate Security — The rate reported on the Schedule of Investments is the rate in effect as of May 31, 2015. |
| (D) | Security, or portion thereof, has been pledged as collateral on open future contracts. |
| (E) | This security is a Supra-National Organization. |
Cl — Class
FHLB — Federal Home Loan Bank
FNMA — Federal National Mortgage Association
GO — General Obligation
LLC — Limited Liability Company
MTN — Medium Term Note
RB — Revenue Bond
Ser — Series
| 218 | SEI Institutional Investments Trust / Annual Report / May 31, 2015 |
The following is a list of the level of inputs used as of May 31, 2015, in valuing the Fund’s investments and other financial instruments carried at value ($ Thousands):
| Investments in Securities | Level 1 | Level 2 | Level 3 | Total | ||||||||||||
Corporate Obligations | $ | — | $ | 3,007,264 | $ | — | $ | 3,007,264 | ||||||||
Municipal Bonds | — | 283,859 | — | 283,859 | ||||||||||||
U.S. Government Agency Obligations | — | 23,198 | — | 23,198 | ||||||||||||
Sovereign Debt | — | 7,230 | — | 7,230 | ||||||||||||
Asset-Backed Security | — | 553 | — | 553 | ||||||||||||
U.S. Treasury Obligations | — | 55,707 | — | 55,707 | ||||||||||||
Cash Equivalent | 50,312 | — | — | 50,312 | ||||||||||||
|
|
|
|
|
|
|
| |||||||||
Total Investments in Securities | $ | 50,312 | $ | 3,377,811 | $ | — | $ | 3,428,123 | ||||||||
|
|
|
|
|
|
|
| |||||||||
| Other Financial Instruments | Level 1 | Level 2 | Level 3 | Total | ||||||||||||
Futures Contracts* | ||||||||||||||||
Unrealized Appreciation | $ | 1,221 | $ | — | $ | — | $ | 1,221 | ||||||||
Unrealized Depreciation | (996 | ) | — | — | (996 | ) | ||||||||||
|
|
|
|
|
|
|
| |||||||||
Total Other Financial Instruments | $ | 225 | $ | — | $ | — | $ | 225 | ||||||||
|
|
|
|
|
|
|
| |||||||||
| * | Futures are valued at the unrealized appreciation (depreciation) on the instrument. |
For the year ended May 31, 2015, there were no transfers between Level 1 and Level 2 assets and liabilities.
For the year ended May 31, 2015, there were no transfers between Level 2 and Level 3 assets and liabilities.
For more information on valuation inputs, see Note 2 — Significant Accounting Policies in Notes to Financial Statements.
Amounts designated as “—” are $0 or have been rounded to $0.
The accompanying notes are an integral part of the financial statements.
| SEI Institutional Investments Trust / Annual Report / May 31, 2015 | 219 |
SCHEDULE OF INVESTMENTS
Ultra Short Duration Bond Fund
May 31, 2015

| Description | Face Amount ($ Thousands) | Market Value ($ Thousands) | ||||||
CORPORATE OBLIGATIONS — 48.1% |
| |||||||
Consumer Discretionary — 1.9% |
| |||||||
AutoZone | ||||||||
1.300%, 01/13/2017 | $ | 1,250 | $ | 1,252 | ||||
CVS Health | ||||||||
1.200%, 12/05/2016 | 825 | 830 | ||||||
General Motors Financial | ||||||||
2.400%, 04/10/2018 | 1,600 | 1,600 | ||||||
Hyundai Capital America | ||||||||
2.000%, 03/19/2018 (A) | 560 | 564 | ||||||
1.625%, 10/02/2015 (A) | 870 | 872 | ||||||
NBCUniversal Enterprise | ||||||||
0.960%, 04/15/2018 (A) (B) | 1,400 | 1,409 | ||||||
0.812%, 04/15/2016 (A) (B) | 2,765 | 2,774 | ||||||
Time Warner Cable | ||||||||
5.850%, 05/01/2017 | 950 | 1,020 | ||||||
TRW Automotive | ||||||||
7.250%, 03/15/2017 (A) | 940 | 1,038 | ||||||
Whirlpool | ||||||||
1.350%, 03/01/2017 | 1,055 | 1,057 | ||||||
|
| |||||||
| 12,416 | ||||||||
|
| |||||||
Consumer Staples — 1.0% |
| |||||||
BAT International Finance | ||||||||
1.400%, 06/05/2015 (A) | 615 | 615 | ||||||
Heineken | ||||||||
0.800%, 10/01/2015 (A) | 390 | 390 | ||||||
JM Smucker | ||||||||
1.750%, 03/15/2018 (A) | 380 | 381 | ||||||
Mondelez International | ||||||||
0.798%, 02/01/2019 (B) | 1,500 | 1,485 | ||||||
President and Fellows of Harvard College | ||||||||
6.300%, 10/01/2037 | 600 | 629 | ||||||
Reynolds American | ||||||||
1.050%, 10/30/2015 | 310 | 310 | ||||||
| Description | Face Amount ($ Thousands) | Market Value ($ Thousands) | ||||||
SABMiller Holdings | ||||||||
0.968%, 08/01/2018 (A) (B) | $ | 750 | $ | 752 | ||||
Sysco | ||||||||
1.450%, 10/02/2017 | 285 | 286 | ||||||
Walgreens Boots Alliance | ||||||||
1.750%, 11/17/2017 | 1,650 | 1,662 | ||||||
|
| |||||||
| 6,510 | ||||||||
|
| |||||||
Energy — 3.4% |
| |||||||
BP Capital Markets | ||||||||
1.674%, 02/13/2018 | 3,865 | 3,898 | ||||||
0.789%, 05/10/2018 (B) | 1,500 | 1,500 | ||||||
0.702%, 02/13/2018 (B) | 1,000 | 998 | ||||||
Chevron | ||||||||
1.365%, 03/02/2018 | 3,920 | 3,931 | ||||||
CNOOC Nexen Finance | ||||||||
1.625%, 04/30/2017 | 1,100 | 1,097 | ||||||
ConocoPhillips | ||||||||
1.500%, 05/15/2018 | 790 | 791 | ||||||
Devon Energy | ||||||||
0.811%, 12/15/2016 (B) | 1,450 | 1,434 | ||||||
Enbridge | ||||||||
0.712%, 06/02/2017 (B) | 1,575 | 1,556 | ||||||
Hess | ||||||||
1.300%, 06/15/2017 | 810 | 805 | ||||||
Kinder Morgan | ||||||||
2.000%, 12/01/2017 | 785 | 787 | ||||||
Petrobras Global Finance BV | ||||||||
2.631%, 03/17/2017 (B) | 2,200 | 2,151 | ||||||
Schlumberger Norge | ||||||||
1.250%, 08/01/2017 (A) | 205 | 205 | ||||||
TransCanada PipeLines | ||||||||
1.066%, 01/12/2018 (B) | 2,600 | 2,606 | ||||||
|
| |||||||
| 21,759 | ||||||||
|
| |||||||
Financials — 30.5% |
| |||||||
Abbey National Treasury Services | ||||||||
0.780%, 03/13/2017 (B) | 4,485 | 4,488 | ||||||
0.683%, 09/29/2017 (B) | 1,500 | 1,495 | ||||||
ABN AMRO Bank | ||||||||
4.250%, 02/02/2017 (A) | 705 | 738 | ||||||
1.079%, 10/28/2016 (A) (B) | 850 | 855 | ||||||
0.674%, 06/06/2016 (A) (B) | 1,950 | 1,948 | ||||||
American Express Credit | ||||||||
1.125%, 06/05/2017 | 2,250 | 2,245 | ||||||
0.789%, 07/29/2016 (B) | 2,480 | 2,486 | ||||||
American Honda Finance | ||||||||
1.500%, 03/13/2018 | 1,600 | 1,607 | ||||||
0.657%, 05/26/2016 (A) (B) | 750 | 752 | ||||||
Australia & New Zealand Banking Group | ||||||||
0.834%, 05/15/2018 (B) | 625 | 628 | ||||||
Banco Santander Chile | ||||||||
1.176%, 04/11/2017 (A) (B) | 1,200 | 1,197 | ||||||
| 220 | SEI Institutional Investments Trust / Annual Report / May 31, 2015 |
| Description | Face Amount ($ Thousands) | Market Value ($ Thousands) | ||||||
Bank of America | ||||||||
5.650%, 05/01/2018 | $ | 305 | $ | 336 | ||||
5.300%, 03/15/2017 | 900 | 958 | ||||||
2.000%, 01/11/2018 | 545 | 549 | ||||||
1.700%, 08/25/2017 | 1,100 | 1,104 | ||||||
1.500%, 10/09/2015 | 554 | 555 | ||||||
1.315%, 01/15/2019 (B) | 1,000 | 1,012 | ||||||
0.892%, 08/25/2017 (B) | 2,790 | 2,790 | ||||||
Bank of Montreal MTN | ||||||||
1.400%, 04/10/2018 | 925 | 926 | ||||||
0.874%, 04/09/2018 (B) | 1,000 | 1,006 | ||||||
0.527%, 07/14/2017 (B) | 750 | 750 | ||||||
Bank of New York Mellon MTN | ||||||||
0.747%, 09/11/2019 (B) | 2,000 | 1,990 | ||||||
0.704%, 03/06/2018 (B) | 700 | 701 | ||||||
Bank of Nova Scotia | ||||||||
1.300%, 07/21/2017 | 1,150 | 1,154 | ||||||
Bank of Tokyo-Mitsubishi UFJ | ||||||||
1.450%, 09/08/2017 (A) | 1,000 | 998 | ||||||
0.874%, 09/09/2016 (A) (B) | 500 | 501 | ||||||
0.732%, 02/26/2016 (A) (B) | 1,450 | 1,451 | ||||||
0.574%, 09/08/2017 (A) (B) | 1,025 | 1,022 | ||||||
Barclays Bank | ||||||||
6.050%, 12/04/2017 (A) | 1,500 | 1,637 | ||||||
0.856%, 02/17/2017 (B) | 2,675 | 2,682 | ||||||
BB&T MTN | ||||||||
1.131%, 06/15/2018 (B) | 890 | 898 | ||||||
0.938%, 02/01/2019 (B) | 800 | 802 | ||||||
Berkshire Hathaway Finance | ||||||||
0.576%, 01/12/2018 (B) | 1,710 | 1,715 | ||||||
BNP Paribas MTN | ||||||||
0.858%, 12/12/2016 (B) | 2,000 | 2,009 | ||||||
BPCE MTN | ||||||||
1.129%, 02/10/2017 (B) | 1,000 | 1,006 | ||||||
Branch Banking & Trust | ||||||||
0.692%, 12/01/2016 (B) | 2,130 | 2,132 | ||||||
Capital One | ||||||||
0.959%, 02/05/2018 (B) | 1,100 | 1,104 | ||||||
Capital One Bank USA | ||||||||
1.300%, 06/05/2017 | 2,500 | 2,492 | ||||||
Capital One Financial | ||||||||
1.000%, 11/06/2015 | 2,450 | 2,453 | ||||||
Citigroup | ||||||||
1.800%, 02/05/2018 | 1,350 | 1,351 | ||||||
1.700%, 04/27/2018 | 850 | 846 | ||||||
1.550%, 08/14/2017 | 750 | 750 | ||||||
1.250%, 01/15/2016 | 3,700 | 3,712 | ||||||
1.044%, 04/08/2019 (B) | 1,000 | 1,008 | ||||||
0.982%, 11/24/2017 (B) | 2,580 | 2,582 | ||||||
Citizens Bank MTN | ||||||||
1.600%, 12/04/2017 | 2,000 | 2,006 | ||||||
Commonwealth Bank of Australia MTN | ||||||||
0.534%, 09/08/2017 (A) (B) | 1,250 | 1,249 | ||||||
| Description | Face Amount ($ Thousands) | Market Value ($ Thousands) | ||||||
Cooperatieve Centrale Raiffeisen-Boerenleenbank BA | ||||||||
0.750%, 03/18/2016 (B) | $ | 850 | $ | 853 | ||||
Credit Agricole | ||||||||
1.121%, 10/03/2016 (A) (B) | 2,025 | 2,036 | ||||||
Credit Suisse NY | ||||||||
1.700%, 04/27/2018 | 2,725 | 2,713 | ||||||
0.969%, 01/29/2018 (B) | 1,100 | 1,103 | ||||||
0.567%, 03/11/2016 (B) | 3,200 | 3,200 | ||||||
Daimler Finance North America LLC | ||||||||
1.650%, 05/18/2018 (A) | 800 | 801 | ||||||
1.375%, 08/01/2017 (A) | 670 | 670 | ||||||
1.250%, 01/11/2016 (A) | 1,885 | 1,891 | ||||||
Deutsche Bank | ||||||||
1.350%, 05/30/2017 | 1,250 | 1,246 | ||||||
0.957%, 02/13/2018 (B) | 1,100 | 1,103 | ||||||
ERAC USA Finance LLC | ||||||||
1.400%, 04/15/2016 (A) | 335 | 336 | ||||||
Export-Import Bank of Korea | ||||||||
1.027%, 01/14/2017 (B) | 2,200 | 2,209 | ||||||
Fifth Third Bank | ||||||||
1.450%, 02/28/2018 | 2,520 | 2,511 | ||||||
1.350%, 06/01/2017 | 2,000 | 2,002 | ||||||
Ford Motor Credit LLC | ||||||||
1.724%, 12/06/2017 | 750 | 748 | ||||||
1.529%, 05/09/2016 (B) | 820 | 825 | ||||||
1.500%, 01/17/2017 | 1,480 | 1,482 | ||||||
1.098%, 03/12/2019 (B) | 1,000 | 998 | ||||||
0.784%, 09/08/2017 (B) | 1,300 | 1,292 | ||||||
General Electric Capital MTN | ||||||||
5.625%, 09/15/2017 | 1,900 | 2,088 | ||||||
0.981%, 04/02/2018 (B) | 500 | 506 | ||||||
Goldman Sachs Group MTN | ||||||||
2.375%, 01/22/2018 | 2,900 | 2,944 | ||||||
1.478%, 04/30/2018 (B) | 215 | 218 | ||||||
1.437%, 04/23/2020 (B) | 875 | 885 | ||||||
1.374%, 11/15/2018 (B) | 1,375 | 1,384 | ||||||
1.071%, 12/15/2017 (B) | 1,730 | 1,734 | ||||||
Harley-Davidson Financial Services MTN | ||||||||
3.875%, 03/15/2016 (A) | 750 | 769 | ||||||
HSBC Bank | ||||||||
0.914%, 05/15/2018 (A) (B) | 650 | 653 | ||||||
HSBC USA | ||||||||
1.300%, 06/23/2017 | 3,460 | 3,468 | ||||||
Huntington National Bank | ||||||||
1.375%, 04/24/2017 | 850 | 850 | ||||||
1.350%, 08/02/2016 | 1,000 | 996 | ||||||
ING Bank | ||||||||
1.907%, 09/25/2015 (A) (B) | 1,390 | 1,396 | ||||||
0.964%, 10/01/2019 (A) (B) | 1,300 | 1,302 | ||||||
| SEI Institutional Investments Trust / Annual Report / May 31, 2015 | 221 |
SCHEDULE OF INVESTMENTS
Ultra Short Duration Bond Fund (Continued)
May 31, 2015
| Description | Face Amount ($ Thousands) | Market Value ($ Thousands) | ||||||
JPMorgan Chase | ||||||||
1.700%, 03/01/2018 | $ | 2,350 | $ | 2,353 | ||||
1.232%, 01/23/2020 (B) | 700 | 710 | ||||||
0.909%, 01/28/2019 (B) | 1,000 | 1,002 | ||||||
0.772%, 03/01/2018 (B) | 1,100 | 1,099 | ||||||
KeyBank | ||||||||
0.803%, 06/01/2018 (B) | 1,300 | 1,298 | ||||||
0.772%, 11/25/2016 (B) | 1,490 | 1,492 | ||||||
Korea Development Bank | ||||||||
0.901%, 01/22/2017 (B) | 2,450 | 2,449 | ||||||
Lloyds Bank | ||||||||
0.791%, 03/16/2018 (B) | 1,250 | 1,251 | ||||||
Macquarie Group | ||||||||
1.278%, 01/31/2017 (A) (B) | 1,000 | 1,005 | ||||||
Manufacturers & Traders Trust | ||||||||
1.400%, 07/25/2017 | 1,150 | 1,153 | ||||||
0.653%, 01/30/2017 (B) | 900 | 899 | ||||||
Metropolitan Life Global Funding I | ||||||||
1.500%, 01/10/2018 (A) | 740 | 740 | ||||||
0.651%, 04/10/2017 (A) (B) | 2,175 | 2,182 | ||||||
Mizuho Bank | ||||||||
0.717%, 09/25/2017 (A) (B) | 4,090 | 4,082 | ||||||
Morgan Stanley | ||||||||
5.950%, 12/28/2017 | 550 | 608 | ||||||
2.125%, 04/25/2018 | 2,200 | 2,218 | ||||||
1.128%, 01/24/2019 (B) | 750 | 752 | ||||||
Nissan Motor Acceptance | ||||||||
0.969%, 09/26/2016 (A) (B) | 985 | 990 | ||||||
0.812%, 03/03/2017 (A) (B) | 615 | 617 | ||||||
Nordea Bank | ||||||||
1.250%, 04/04/2017 (A) | 1,250 | 1,252 | ||||||
PACCAR Financial MTN | ||||||||
1.400%, 05/18/2018 | 1,970 | 1,971 | ||||||
1.100%, 06/06/2017 | 1,170 | 1,173 | ||||||
Pentair Finance | ||||||||
1.350%, 12/01/2015 | 345 | 346 | ||||||
Pricoa Global Funding I MTN | ||||||||
1.350%, 08/18/2017 (A) | 3,000 | 3,001 | ||||||
1.150%, 11/25/2016 (A) | 800 | 802 | ||||||
Principal Life Global Funding II | ||||||||
1.200%, 05/19/2017 (A) | 1,000 | 1,002 | ||||||
1.125%, 09/18/2015 (A) | 490 | 491 | ||||||
1.125%, 02/24/2017 (A) | 550 | 551 | ||||||
1.000%, 12/11/2015 (A) | 850 | 852 | ||||||
Prudential Financial MTN | ||||||||
1.054%, 08/15/2018 (B) | 1,649 | 1,660 | ||||||
Royal Bank of Canada MTN | ||||||||
1.200%, 01/23/2017 | 500 | 502 | ||||||
0.850%, 03/08/2016 | 3,130 | 3,139 | ||||||
Santander Bank | ||||||||
1.206%, 01/12/2018 (B) | 1,250 | 1,250 | ||||||
Societe Generale | ||||||||
1.354%, 10/01/2018 (B) | 2,500 | 2,539 | ||||||
| Description | Face Amount ($ Thousands) | Market Value ($ Thousands) | ||||||
Standard Chartered MTN | ||||||||
0.914%, 04/17/2018 (A) (B) | $ | 2,000 | $ | 1,999 | ||||
Sumitomo Mitsui Banking | ||||||||
0.701%, 01/10/2017 (B) | 1,500 | 1,500 | ||||||
SunTrust Bank | ||||||||
0.714%, 02/15/2017 (B) | 1,000 | 999 | ||||||
Synchrony Financial | ||||||||
1.875%, 08/15/2017 | 760 | 763 | ||||||
1.509%, 02/03/2020 (B) | 1,750 | 1,758 | ||||||
Toronto-Dominion Bank MTN | ||||||||
1.625%, 03/13/2018 | 2,445 | 2,465 | ||||||
Travelers | ||||||||
6.250%, 06/20/2016 | 2,000 | 2,117 | ||||||
UBS MTN | ||||||||
5.875%, 12/20/2017 | 1,000 | 1,105 | ||||||
0.969%, 03/26/2018 (B) | 1,500 | 1,503 | ||||||
0.915%, 08/14/2019 (B) | 1,750 | 1,749 | ||||||
Union Bank | ||||||||
1.019%, 09/26/2016 (B) | 400 | 402 | ||||||
US Bancorp MTN | ||||||||
0.677%, 04/25/2019 (B) | 1,400 | 1,403 | ||||||
Ventas Realty | ||||||||
1.550%, 09/26/2016‡ | 750 | 754 | ||||||
1.250%, 04/17/2017‡ | 285 | 285 | ||||||
Volkswagen Group of America Finance LLC | ||||||||
1.250%, 05/23/2017 (A) | 750 | 752 | ||||||
0.754%, 05/22/2018 (A) (B) | 750 | 750 | ||||||
0.716%, 11/20/2017 (A) (B) | 1,500 | 1,502 | ||||||
Volkswagen International Finance | ||||||||
1.125%, 11/18/2016 (A) | 2,040 | 2,045 | ||||||
0.716%, 11/18/2016 (A) (B) | 1,260 | 1,263 | ||||||
Voya Financial | ||||||||
2.900%, 02/15/2018 | 650 | 669 | ||||||
Wachovia MTN | ||||||||
5.750%, 02/01/2018 | 2,710 | 3,012 | ||||||
WEA Finance LLC | ||||||||
1.750%, 09/15/2017 (A) | 700 | 703 | ||||||
Wells Fargo MTN | ||||||||
1.400%, 09/08/2017 | 1,000 | 1,003 | ||||||
0.958%, 01/30/2020 (B) | 1,250 | 1,259 | ||||||
Western Union | ||||||||
2.375%, 12/10/2015 | 145 | 146 | ||||||
Westpac Banking | ||||||||
1.200%, 05/19/2017 | 700 | 702 | ||||||
0.884%, 01/17/2019 (B) | 800 | 803 | ||||||
|
| |||||||
| 196,730 | ||||||||
|
| |||||||
Health Care — 4.5% | ||||||||
AbbVie | ||||||||
1.800%, 05/14/2018 | 1,200 | 1,202 | ||||||
1.200%, 11/06/2015 | 2,300 | 2,304 | ||||||
1.040%, 11/06/2015 (B) | 380 | 381 | ||||||
| 222 | SEI Institutional Investments Trust / Annual Report / May 31, 2015 |
| Description | Face Amount ($ Thousands) | Market Value ($ Thousands) | ||||||
Actavis Funding SCS | ||||||||
2.350%, 03/12/2018 | $ | 1,730 | $ | 1,747 | ||||
1.348%, 03/12/2018 (B) | 2,025 | 2,047 | ||||||
1.300%, 06/15/2017 | 1,250 | 1,244 | ||||||
Amgen | ||||||||
2.125%, 05/15/2017 | 1,350 | 1,372 | ||||||
0.664%, 05/22/2017 (B) | 3,080 | 3,084 | ||||||
Bayer US Finance LLC | ||||||||
0.521%, 10/07/2016 (A) (B) | 1,600 | 1,601 | ||||||
Becton Dickinson | ||||||||
0.721%, 06/15/2016 (B) | 850 | 851 | ||||||
Express Scripts Holding | ||||||||
2.650%, 02/15/2017 | 2,860 | 2,926 | ||||||
1.250%, 06/02/2017 | 1,750 | 1,746 | ||||||
GlaxoSmithKline Capital | ||||||||
0.700%, 03/18/2016 | 2,050 | 2,054 | ||||||
McKesson | ||||||||
1.292%, 03/10/2017 | 1,030 | 1,032 | ||||||
0.950%, 12/04/2015 | 395 | 395 | ||||||
Medtronic | ||||||||
1.500%, 03/15/2018 (A) | 935 | 937 | ||||||
Mylan | ||||||||
1.350%, 11/29/2016 | 950 | 949 | ||||||
Perrigo | ||||||||
1.300%, 11/08/2016 | 265 | 265 | ||||||
Providence Health & Services Obligated Group | ||||||||
1.074%, 10/01/2016 (B) | 1,450 | 1,456 | ||||||
Thermo Fisher Scientific | ||||||||
1.300%, 02/01/2017 | 415 | 415 | ||||||
Zimmer Holdings | ||||||||
1.450%, 04/01/2017 | 1,400 | 1,405 | ||||||
|
| |||||||
| 29,413 | ||||||||
|
| |||||||
Industrials — 1.3% | ||||||||
Air Lease | ||||||||
4.500%, 01/15/2016 | 1,000 | 1,020 | ||||||
2.125%, 01/15/2018 | 385 | 383 | ||||||
GATX | ||||||||
1.250%, 03/04/2017 | 525 | 523 | ||||||
Hutchison Whampoa International | ||||||||
1.625%, 10/31/2017 (A) | 1,400 | 1,398 | ||||||
Norfolk Southern | ||||||||
5.750%, 01/15/2016 | 2,740 | 2,818 | ||||||
Precision Castparts | ||||||||
0.700%, 12/20/2015 | 235 | 235 | ||||||
Rockwell Collins | ||||||||
0.621%, 12/15/2016 (B) | 1,730 | 1,732 | ||||||
|
| |||||||
| 8,109 | ||||||||
|
| |||||||
Information Technology — 0.8% | ||||||||
Alibaba Group Holding | ||||||||
0.806%, 11/28/2017 (A) (B) | 1,190 | 1,183 | ||||||
| Description | Face Amount ($ Thousands) | Market Value ($ Thousands) | ||||||
Fidelity National Information Services | ||||||||
1.450%, 06/05/2017 | $ | 470 | $ | 470 | ||||
Hewlett-Packard | ||||||||
3.000%, 09/15/2016 | 2,200 | 2,251 | ||||||
1.217%, 01/14/2019 (B) | 1,000 | 1,000 | ||||||
TSMC Global | ||||||||
0.950%, 04/03/2016 (A) | 550 | 549 | ||||||
|
| |||||||
| 5,453 | ||||||||
|
| |||||||
Materials — 1.1% | ||||||||
Glencore Finance Canada | ||||||||
2.050%, 10/23/2015 (A) | 2,250 | 2,257 | ||||||
Glencore Funding LLC | ||||||||
1.445%, 05/27/2016 (A) (B) | 1,350 | 1,354 | ||||||
Monsanto | ||||||||
1.150%, 06/30/2017 | 1,425 | 1,421 | ||||||
Rio Tinto Finance USA | ||||||||
1.111%, 06/17/2016 (B) | 2,260 | 2,266 | ||||||
|
| |||||||
| 7,298 | ||||||||
|
| |||||||
Telecommunication Services — 1.8% |
| |||||||
AT&T | �� | |||||||
5.500%, 02/01/2018 | 1,500 | 1,650 | ||||||
1.209%, 06/30/2020 (B) | 1,250 | 1,258 | ||||||
British Telecommunications | ||||||||
1.250%, 02/14/2017 | 655 | 655 | ||||||
Thomson Reuters | ||||||||
1.650%, 09/29/2017 | 1,190 | 1,192 | ||||||
Verizon Communications | ||||||||
2.021%, 09/14/2018 (B) | 935 | 971 | ||||||
1.801%, 09/15/2016 (B) | 1,310 | 1,329 | ||||||
1.350%, 06/09/2017 | 2,000 | 1,999 | ||||||
0.664%, 06/09/2017 (B) | 2,520 | 2,516 | ||||||
|
| |||||||
| 11,570 | ||||||||
|
| |||||||
Utilities — 1.8% | ||||||||
Dominion Gas Holdings LLC | ||||||||
1.050%, 11/01/2016 | 1,000 | 1,001 | ||||||
Duke Energy | ||||||||
0.651%, 04/03/2017 (B) | 3,700 | 3,706 | ||||||
Duke Energy Progress | ||||||||
0.464%, 03/06/2017 (B) | 1,710 | 1,707 | ||||||
Georgia Power | ||||||||
0.625%, 11/15/2015 | 2,700 | 2,702 | ||||||
NextEra Energy Capital Holdings | ||||||||
1.339%, 09/01/2015 | 900 | 902 | ||||||
Southern | ||||||||
1.300%, 08/15/2017 | 780 | 781 | ||||||
Xcel Energy | ||||||||
1.200%, 06/01/2017 | 670 | 671 | ||||||
|
| |||||||
| 11,470 | ||||||||
|
| |||||||
Total Corporate Obligations | 310,728 | |||||||
|
| |||||||
| SEI Institutional Investments Trust / Annual Report / May 31, 2015 | 223 |
SCHEDULE OF INVESTMENTS
Ultra Short Duration Bond Fund (Continued)
May 31, 2015
| Description | Face Amount ($ Thousands) | Market Value ($ Thousands) | ||||||
ASSET-BACKED SECURITIES — 28.4% |
| |||||||
Automotive — 16.5% | ||||||||
Ally Auto Receivables Trust, Ser 2013-SN1, Cl A3 | ||||||||
0.720%, 05/20/2016 | $ | 145 | $ | 145 | ||||
Ally Auto Receivables Trust, Ser 2014-SN1, Cl A3 | ||||||||
0.750%, 02/21/2017 | 565 | 565 | ||||||
Ally Master Owner Trust, Ser 2014-1, Cl A1 | ||||||||
0.656%, 01/15/2019 (B) | 1,150 | 1,152 | ||||||
Ally Master Owner Trust, Ser 2014-4, Cl A1 | ||||||||
0.586%, 06/17/2019 (B) | 945 | 945 | ||||||
Ally Master Owner Trust, Ser 2014-4, Cl A2 | ||||||||
1.430%, 06/17/2019 | 1,950 | 1,957 | ||||||
Ally Master Owner Trust, Ser 2014-5, Cl A2 | ||||||||
1.600%, 10/15/2019 | 2,245 | 2,258 | ||||||
American Credit Acceptance Receivables Trust, | ||||||||
1.450%, 04/16/2018 (A) | 152 | 152 | ||||||
American Credit Acceptance Receivables Trust, | ||||||||
1.320%, 02/15/2017 (A) | 23 | 23 | ||||||
American Credit Acceptance Receivables Trust, | ||||||||
1.140%, 03/12/2018 (A) | 99 | 99 | ||||||
American Credit Acceptance Receivables Trust, | ||||||||
1.330%, 07/10/2018 (A) | 806 | 807 | ||||||
AmeriCredit Automobile Receivables Trust, | ||||||||
1.310%, 11/08/2017 | 1,110 | 1,112 | ||||||
AmeriCredit Automobile Receivables Trust, | ||||||||
0.620%, 06/08/2017 | 101 | 101 | ||||||
AmeriCredit Automobile Receivables Trust, | ||||||||
0.650%, 12/08/2017 | 631 | 630 | ||||||
AmeriCredit Automobile Receivables Trust, | ||||||||
0.920%, 04/09/2018 | 1,376 | 1,377 | ||||||
| Description | Face Amount ($ Thousands) | Market Value ($ Thousands) | ||||||
AmeriCredit Automobile Receivables Trust, | ||||||||
2.720%, 09/09/2019 | $ | 1,850 | $ | 1,892 | ||||
AmeriCredit Automobile Receivables Trust, | ||||||||
0.560%, 03/08/2017 (B) | 42 | 42 | ||||||
AmeriCredit Automobile Receivables Trust, | ||||||||
1.270%, 07/08/2019 | 875 | 876 | ||||||
ARI Fleet Lease Trust, Ser 2012-A, Cl A | ||||||||
0.736%, 03/15/2020 (A) (B) | 313 | 313 | ||||||
ARI Fleet Lease Trust, Ser 2012-B, Cl A | ||||||||
0.486%, 01/15/2021 (A) (B) | 1,623 | 1,620 | ||||||
ARI Fleet Lease Trust, Ser 2013-A, Cl A3 | ||||||||
0.920%, 07/15/2021 (A) | 370 | 370 | ||||||
ARI Fleet Lease Trust, Ser 2014-A, Cl A2 | ||||||||
0.810%, 11/15/2022 (A) | 350 | 349 | ||||||
Bank of The West Auto Trust, Ser 2015-1, Cl A2B | ||||||||
0.537%, 04/16/2018 (A) (B) | 1,665 | 1,665 | ||||||
California Republic Auto Receivables Trust, | ||||||||
1.410%, 09/17/2018 (A) | 1,216 | 1,222 | ||||||
California Republic Auto Receivables Trust, | ||||||||
0.540%, 03/15/2017 | 1,289 | 1,289 | ||||||
Capital Auto Receivables Asset Trust, Ser 2013-1, Cl A4 | ||||||||
0.970%, 01/22/2018 | 915 | 916 | ||||||
Capital Auto Receivables Asset Trust, Ser 2014-1, Cl A1A | ||||||||
0.680%, 05/20/2016 | 321 | 321 | ||||||
Capital Auto Receivables Asset Trust, Ser 2014-1, Cl A3 | ||||||||
1.320%, 06/20/2018 | 520 | 522 | ||||||
Capital Auto Receivables Asset Trust, Ser 2014-3, Cl A2 | ||||||||
1.180%, 12/20/2017 | 1,615 | 1,619 | ||||||
Carfinance Capital Auto Trust, Ser 2013-1A, Cl A | ||||||||
1.650%, 07/17/2017 (A) | 8 | 8 | ||||||
CarMax Auto Owner Trust, Ser 2011-2, Cl A4 | ||||||||
1.350%, 02/15/2017 | 705 | 706 | ||||||
| 224 | SEI Institutional Investments Trust / Annual Report / May 31, 2015 |
| Description | Face Amount ($ Thousands) | Market Value ($ Thousands) | ||||||
CarMax Auto Owner Trust, Ser 2011-3, Cl B | ||||||||
2.170%, 07/17/2017 | $ | 875 | $ | 881 | ||||
CarMax Auto Owner Trust, Ser 2012-1, Cl C | ||||||||
2.200%, 10/16/2017 | 990 | 1,000 | ||||||
CarMax Auto Owner Trust, Ser 2012-1, Cl D | ||||||||
3.090%, 08/15/2018 | 2,360 | 2,395 | ||||||
CarMax Auto Owner Trust, Ser 2012-2, Cl A3 | ||||||||
0.840%, 03/15/2017 | 305 | 306 | ||||||
CarMax Auto Owner Trust, Ser 2012-3, Cl A3 | ||||||||
0.520%, 07/17/2017 | 143 | 143 | ||||||
CarMax Auto Owner Trust, Ser 2012-3, Cl C | ||||||||
1.500%, 08/15/2018 | 225 | 227 | ||||||
Carnow Auto Receivables Trust, Ser 2014-1A, Cl A | ||||||||
0.960%, 01/17/2017 (A) | 869 | 869 | ||||||
Chesapeake Funding LLC, Ser 2011-2A, Cl A | ||||||||
1.428%, 04/07/2024 (A) (B) | 675 | 677 | ||||||
Chesapeake Funding LLC, Ser 2012-1A, Cl A | ||||||||
0.931%, 11/07/2023 (A) (B) | 730 | 730 | ||||||
Chesapeake Funding LLC, Ser 2012-2A, Cl A | ||||||||
0.631%, 05/07/2024 (A) (B) | 461 | 461 | ||||||
Chesapeake Funding LLC, Ser 2014-1A, Cl A | ||||||||
0.601%, 03/07/2026 (A) (B) | 1,503 | 1,503 | ||||||
Chesapeake Funding LLC, Ser 2015-1A, Cl B | ||||||||
1.131%, 02/07/2027 (A) (B) | 1,330 | 1,330 | ||||||
CPS Auto Receivables Trust, Ser 2013-D, Cl A | ||||||||
1.540%, 07/16/2018 (A) | 1,801 | 1,802 | ||||||
CPS Auto Receivables Trust, Ser 2014-A, Cl A | ||||||||
1.210%, 08/15/2018 (A) | 544 | 542 | ||||||
CPS Auto Receivables Trust, Ser 2015-A, Cl A | ||||||||
1.530%, 07/15/2019 (A) | 2,545 | 2,541 | ||||||
Credit Acceptance Auto Loan Trust, Ser 2013-1A, Cl A | ||||||||
1.210%, 10/15/2020 (A) | 494 | 494 | ||||||
Credit Acceptance Auto Loan Trust, Ser 2013-2A, Cl A | ||||||||
1.500%, 04/15/2021 (A) | 910 | 913 | ||||||
Credit Acceptance Auto Loan Trust, Ser 2014-1A, Cl A | ||||||||
1.550%, 10/15/2021 (A) | 1,210 | 1,213 | ||||||
| Description | Face Amount ($ Thousands) | Market Value ($ Thousands) | ||||||
Credit Acceptance Auto Loan Trust, Ser 2014-2A, Cl A | ||||||||
1.880%, 03/15/2022 (A) | $ | 2,250 | $ | 2,254 | ||||
DT Auto Owner Trust, Ser 2014-1A, Cl A | ||||||||
0.660%, 07/17/2017 (A) | 39 | 39 | ||||||
Enterprise Fleet Financing LLC, Ser 2012-2, Cl A2 | ||||||||
0.720%, 04/20/2018 (A) | 72 | 72 | ||||||
Enterprise Fleet Financing LLC, Ser 2013-1, Cl A2 | ||||||||
0.680%, 09/20/2018 (A) | 314 | 314 | ||||||
Enterprise Fleet Financing LLC, Ser 2014-1, Cl A2 | ||||||||
0.870%, 09/20/2019 (A) | 377 | 377 | ||||||
Enterprise Fleet Financing LLC, Ser 2014-2, Cl A2 | ||||||||
1.050%, 03/20/2020 (A) | 2,225 | 2,224 | ||||||
First Investors Auto Owner Trust, Ser 2012-2A, Cl A2 | ||||||||
1.470%, 05/15/2018 (A) | 177 | 177 | ||||||
First Investors Auto Owner Trust, Ser 2013-1A, Cl A2 | ||||||||
0.900%, 10/15/2018 (A) | 121 | 121 | ||||||
First Investors Auto Owner Trust, Ser 2013-2A, Cl A2 | ||||||||
1.230%, 03/15/2019 (A) | 477 | 478 | ||||||
First Investors Auto Owner Trust, Ser 2013-3A, Cl A2 | ||||||||
0.890%, 09/15/2017 (A) | 44 | 44 | ||||||
First Investors Auto Owner Trust, Ser 2014-1A, Cl A2 | ||||||||
0.800%, 02/15/2018 (A) | 407 | 407 | ||||||
First Investors Auto Owner Trust, Ser 2014-2A, Cl A2 | ||||||||
0.860%, 08/15/2018 (A) | 2,783 | 2,780 | ||||||
First Investors Auto Owner Trust, Ser 2014-3A, Cl A2 | ||||||||
1.060%, 11/15/2018 (A) | 1,773 | 1,772 | ||||||
Ford Credit Auto Lease Trust, | ||||||||
1.100%, 11/15/2017 | 260 | 261 | ||||||
Ford Credit Auto Owner Trust, | ||||||||
1.880%, 08/15/2017 | 875 | 883 | ||||||
Ford Credit Auto Owner Trust, Ser 2012-B, Cl D | ||||||||
2.930%, 10/15/2018 | 1,500 | 1,533 | ||||||
Ford Credit Floorplan Master Owner Trust, Ser 2012-2, Cl A | ||||||||
1.920%, 01/15/2019 | 2,000 | 2,030 | ||||||
Ford Credit Floorplan Master Owner Trust, Ser 2013-1, Cl A2 | ||||||||
0.566%, 01/15/2018 (B) | 665 | 665 | ||||||
| SEI Institutional Investments Trust / Annual Report / May 31, 2015 | 225 |
SCHEDULE OF INVESTMENTS
Ultra Short Duration Bond Fund (Continued)
May 31, 2015
| Description | Face Amount ($ Thousands) | Market Value ($ Thousands) | ||||||
Ford Credit Floorplan Master Owner Trust, Ser 2013-5, Cl A2 | ||||||||
0.656%, 09/15/2018 (B) | $ | 655 | $ | 656 | ||||
Ford Credit Floorplan Master Owner Trust, Ser 2014-1, Cl B | ||||||||
1.400%, 02/15/2019 | 205 | 205 | ||||||
GE Dealer Floorplan Master Note Trust, Ser 2012-3, Cl A | ||||||||
0.674%, 06/20/2017 (B) | 2,550 | 2,550 | ||||||
GM Financial Automobile Leasing Trust, Ser 2014-1A, Cl A3 | ||||||||
1.010%, 05/22/2017 (A) | 860 | 861 | ||||||
GM Financial Automobile Leasing Trust, Ser 2015-1, Cl B | ||||||||
2.140%, 06/20/2019 | 1,040 | 1,045 | ||||||
GMF Floorplan Owner Revolving Trust, Ser 2015-1, Cl A2 | ||||||||
0.682%, 05/15/2020 (A) (B) | 1,600 | 1,600 | ||||||
Harley-Davidson Motorcycle Trust, Ser 2012-1, Cl A3 | ||||||||
0.680%, 04/15/2017 | 95 | 95 | ||||||
Harley-Davidson Motorcycle Trust, Ser 2013-1, Cl A3 | ||||||||
0.650%, 07/16/2018 | 604 | 603 | ||||||
Hertz Fleet Lease Funding, Ser 2013-3, Cl B | ||||||||
1.225%, 12/10/2027 (A) (B) | 1,825 | 1,827 | ||||||
Honda Auto Receivables Owner Trust, Ser 2012-3, Cl A3 | ||||||||
0.560%, 05/15/2016 | 105 | 105 | ||||||
Honda Auto Receivables Owner Trust, Ser 2014-3, Cl A3 | ||||||||
0.880%, 07/15/2017 | 1,020 | 1,021 | ||||||
Huntington Auto Trust, Ser 2012-2, Cl A3 | ||||||||
0.510%, 04/17/2017 | 181 | 181 | ||||||
Mercedes-Benz Auto Lease Trust, Ser 2013-B, Cl A3 | ||||||||
0.620%, 07/15/2016 | 632 | 632 | ||||||
Mercedes-Benz Auto Receivables Trust, Ser 2013-1, Cl A3 | ||||||||
0.780%, 08/15/2017 | 381 | 382 | ||||||
Mercedes-Benz Auto Receivables Trust, Ser 2014-1, Cl A3 | ||||||||
0.870%, 10/15/2018 | 1,075 | 1,076 | ||||||
Mercedes-Benz Master Owner Trust, Ser 2012-AA, Cl A | ||||||||
0.790%, 11/15/2017 (A) | 500 | 501 | ||||||
Motor, Ser 2013-1, Cl A1 | ||||||||
0.685%, 02/25/2021 (A) (B) | 29 | 29 | ||||||
Nissan Auto Receivables Owner Trust, Ser 2013-A, Cl A3 | ||||||||
0.500%, 05/15/2017 | 249 | 249 | ||||||
| Description | Face Amount ($ Thousands) | Market Value ($ Thousands) | ||||||
Oscar US Funding Trust, Ser 2014-1A, Cl A2 | ||||||||
1.000%, 08/15/2017 (A) | $ | 2,040 | $ | 2,038 | ||||
Porsche Innovative Lease Owner Trust, Ser 2013-1, Cl A4 | ||||||||
0.880%, 10/22/2019 (A) | 665 | 666 | ||||||
Porsche Innovative Lease Owner Trust, Ser 2014-1, Cl A3 | ||||||||
1.030%, 11/20/2017 (A) | 2,000 | 2,003 | ||||||
Prestige Auto Receivables Trust, Ser 2012-1A, Cl A3 | ||||||||
1.760%, 10/16/2017 (A) | 306 | 307 | ||||||
Prestige Auto Receivables Trust, Ser 2013-1A, Cl A2 | ||||||||
1.090%, 02/15/2018 (A) | 361 | 361 | ||||||
Prestige Auto Receivables Trust, Ser 2013-1A, Cl A3 | ||||||||
1.330%, 05/15/2019 (A) | 600 | 602 | ||||||
Prestige Auto Receivables Trust, Ser 2014-1A, Cl A2 | ||||||||
0.970%, 03/15/2018 (A) | 1,995 | 1,995 | ||||||
Prestige Auto Receivables Trust, Ser 2015-1, Cl A2 | ||||||||
1.090%, 02/15/2019 (A) | 585 | 584 | ||||||
Santander Drive Auto Receivables Trust, Ser 2012-1, Cl C | ||||||||
3.780%, 11/15/2017 | 1,134 | 1,142 | ||||||
Santander Drive Auto Receivables Trust, Ser 2012-3, Cl C | ||||||||
3.010%, 04/16/2018 | 963 | 970 | ||||||
Santander Drive Auto Receivables Trust, Ser 2012-3, Cl D | ||||||||
3.640%, 05/15/2018 | 1,175 | 1,207 | ||||||
Santander Drive Auto Receivables Trust, Ser 2012-4, Cl B | ||||||||
1.830%, 03/15/2017 | 209 | 209 | ||||||
Santander Drive Auto Receivables Trust, Ser 2012-5, Cl B | ||||||||
1.560%, 08/15/2018 | 302 | 302 | ||||||
Santander Drive Auto Receivables Trust, Ser 2012-6, Cl B | ||||||||
1.330%, 05/15/2017 | 87 | 87 | ||||||
Santander Drive Auto Receivables Trust, Ser 2013-2, Cl A3 | ||||||||
0.700%, 09/15/2017 | 232 | 232 | ||||||
Santander Drive Auto Receivables Trust, Ser 2013-3, Cl A3 | ||||||||
0.700%, 10/16/2017 | 354 | 354 | ||||||
Santander Drive Auto Receivables Trust, Ser 2013-4, Cl B | ||||||||
2.160%, 01/15/2020 | 1,370 | 1,382 | ||||||
Santander Drive Auto Receivables Trust, Ser 2014-1, Cl A2A | ||||||||
0.660%, 06/15/2017 | 115 | 115 | ||||||
| 226 | SEI Institutional Investments Trust / Annual Report / May 31, 2015 |
| Description | Face Amount ($ Thousands) | Market Value ($ Thousands) | ||||||
Santander Drive Auto Receivables Trust, Ser 2014-4, Cl A2A | ||||||||
0.670%, 01/16/2018 | $ | 587 | $ | 587 | ||||
SMART Trust, | ||||||||
2.280%, 08/14/2017 (A) | 639 | 640 | ||||||
SMART Trust, | ||||||||
1.540%, 08/14/2017 | 767 | 768 | ||||||
SMART Trust, | ||||||||
0.486%, 07/14/2016 (B) | 1,073 | 1,073 | ||||||
SNAAC Auto Receivables Trust, Ser 2014-1A, Cl A | ||||||||
1.030%, 09/17/2018 (A) | 471 | 471 | ||||||
Susquehanna Auto Receivables Trust, Ser 2014-1A, Cl A3 | ||||||||
1.000%, 02/15/2018 (A) | 1,200 | 1,201 | ||||||
Toyota Auto Receivables Owner Trust, Ser 2013-A, Cl A3 | ||||||||
0.550%, 01/17/2017 | 153 | 153 | ||||||
Volkswagen Auto Lease Trust, Ser 2013-A, Cl A3 | ||||||||
0.840%, 07/20/2016 | 263 | 263 | ||||||
Volkswagen Credit Auto Master Trust, Ser 2014-1A, Cl A1 | ||||||||
0.531%, 07/22/2019 (A) (B) | 1,250 | 1,249 | ||||||
Volvo Financial Equipment LLC, Ser 2013-1A, Cl A3 | ||||||||
0.740%, 03/15/2017 (A) | 638 | 638 | ||||||
Volvo Financial Equipment LLC, Ser 2014-1A, Cl A3 | ||||||||
0.820%, 04/16/2018 (A) | 605 | 604 | ||||||
Westlake Automobile Receivables Trust, Ser 2013-1A, Cl A2 | ||||||||
1.120%, 01/15/2018 (A) | 357 | 357 | ||||||
Westlake Automobile Receivables Trust, Ser 2014-1A, Cl A2 | ||||||||
0.700%, 05/15/2017 (A) | 851 | 851 | ||||||
Westlake Automobile Receivables Trust, Ser 2014-2A, Cl A2 | ||||||||
0.970%, 10/16/2017 (A) | 2,040 | 2,040 | ||||||
Westlake Automobile Receivables Trust, Ser 2014-2A, Cl C | ||||||||
2.240%, 04/15/2020 (A) | 555 | 558 | ||||||
Westlake Automobile Receivables Trust, Ser 2015-1A, Cl B | ||||||||
1.680%, 11/16/2020 (A) | 1,365 | 1,359 | ||||||
Wheels SPV LLC, | ||||||||
0.840%, 03/20/2023 (A) | 1,893 | 1,891 | ||||||
World Omni Automobile Lease Securitization Trust, Ser 2014-A, Cl A3 | ||||||||
1.160%, 09/15/2017 | 2,000 | 2,008 | ||||||
| Description | Face Amount ($ Thousands) | Market Value ($ Thousands) | ||||||
World Omni Master Owner Trust, Ser 2013-1, Cl A | ||||||||
0.536%, 02/15/2018 (A) (B) | $ | 2,435 | $ | 2,435 | ||||
|
| |||||||
| 106,831 | ||||||||
|
| |||||||
Credit Cards — 1.8% | ||||||||
American Express Credit Account Master Trust, Ser 2012-2, Cl B | ||||||||
0.990%, 03/15/2018 | 565 | 565 | ||||||
American Express Credit Account Master Trust, Ser 2013-3, Cl A | ||||||||
0.980%, 05/15/2019 | 455 | 456 | ||||||
Barclays Dryrock Issuance Trust, Ser 2014-1, Cl A | ||||||||
0.546%, 12/16/2019 (B) | 805 | 804 | ||||||
Cabela’s Credit Card Master Note Trust, Ser 2013-2A, Cl A2 | ||||||||
0.836%, 08/16/2021 (A) (B) | 395 | 398 | ||||||
Capital One Multi-Asset Execution Trust, Ser 2014-A2, Cl A2 | ||||||||
1.260%, 01/15/2020 | 1,000 | 1,005 | ||||||
Chase Issuance Trust, Ser 2014-A1, Cl A1 | ||||||||
1.150%, 01/15/2019 | 1,760 | 1,766 | ||||||
Chase Issuance Trust, Ser 2014-A6, Cl A6 | ||||||||
1.260%, 07/15/2019 | 1,150 | 1,154 | ||||||
Citibank Credit Card Issuance Trust, Ser 2014-A4, Cl A4 | ||||||||
1.230%, 04/24/2019 | 2,000 | 2,007 | ||||||
Discover Card Execution Note Trust, Ser 2014-A3, Cl A3 | ||||||||
1.220%, 10/15/2019 | 1,045 | 1,049 | ||||||
Master Credit Card Trust II, Ser 2012-2A, Cl A | ||||||||
0.780%, 04/21/2017 (A) | 420 | 420 | ||||||
Synchrony Credit Card Master Note Trust, Ser 2014-1, Cl A | ||||||||
1.610%, 11/15/2020 | 2,250 | 2,260 | ||||||
|
| |||||||
| 11,884 | ||||||||
|
| |||||||
Mortgage Related Securities — 1.0% |
| |||||||
Accredited Mortgage Loan Trust, Ser 2004-4, Cl A1A | ||||||||
0.865%, 01/25/2035 (B) | 486 | 478 | ||||||
Aegis Asset-Backed Securities Trust Mortgage Pass-Through Certificates, Ser 2004-4, Cl A1 | ||||||||
0.905%, 10/25/2034 (B) | 1,895 | 1,863 | ||||||
Bear Stearns Asset-Backed Securities I Trust, | ||||||||
1.201%, 03/25/2035 (B) | 1,278 | 1,264 | ||||||
| SEI Institutional Investments Trust / Annual Report / May 31, 2015 | 227 |
SCHEDULE OF INVESTMENTS
Ultra Short Duration Bond Fund (Continued)
May 31, 2015
| Description | Face Amount ($ Thousands) | Market Value ($ Thousands) | ||||||
Lake Country Mortgage Loan Trust, Ser 2006-HE1, Cl A4 | ||||||||
0.555%, 07/25/2034 (A) (B) | $ | 20 | $ | 20 | ||||
Master Asset-Backed Securities Trust, Ser 2005-HE1, Cl M2 | ||||||||
0.860%, 05/25/2035 (B) | 1,051 | 1,051 | ||||||
Merrill Lynch Mortgage Investors Trust, Ser 2006-FF1, Cl A2C | ||||||||
0.385%, 08/25/2036 (B) | 273 | 271 | ||||||
Option One Mortgage Loan Trust Asset-Backed Certificates, Ser 2005-4, Cl A3 | ||||||||
0.445%, 11/25/2035 (B) | 147 | 145 | ||||||
Option One Mortgage Loan Trust, Ser 2005-1, Cl A1A | ||||||||
0.685%, 02/25/2035 (B) | 504 | 497 | ||||||
RASC Trust, Ser 2005-KS8, Cl M1 | ||||||||
0.595%, 08/25/2035 (B) | 785 | 782 | ||||||
|
| |||||||
| 6,371 | ||||||||
|
| |||||||
Other Asset-Backed Securities — 9.1% |
| |||||||
Apidos CLO XII, | ||||||||
1.375%, 04/15/2025 (A) (B) | 1,100 | 1,086 | ||||||
Avalon IV Capital, | ||||||||
1.444%, 04/17/2023 (A) (B) | 840 | 840 | ||||||
Bear Stearns Asset-Backed Securities Trust, | ||||||||
0.845%, 12/25/2044 (B) | 200 | 200 | ||||||
Carlyle Global Market Strategies CLO, Ser 2013-2A, Cl A | ||||||||
1.425%, 04/18/2025 (A) (B) | 325 | 322 | ||||||
Carlyle Global Market Strategies CLO, Ser 2014-2AR, Cl A1R | ||||||||
1.575%, 07/20/2023 (A) (B) | 745 | 745 | ||||||
Cent CLO, | ||||||||
1.505%, 08/01/2024 (A) (B) | 2,220 | 2,220 | ||||||
Cent CLO, Ser 2014-20A, Cl A | ||||||||
1.724%, 01/25/2026 (A) (B) | 1,850 | 1,846 | ||||||
CIFC Funding, Ser 2013-1A, Cl A1 | ||||||||
1.426%, 04/16/2025 (A) (B) | 1,060 | 1,050 | ||||||
CIT Equipment Collateral, | ||||||||
0.860%, 05/22/2017 (A) | 3,000 | 3,000 | ||||||
CNH Equipment Trust, | ||||||||
0.490%, 03/15/2017 | 70 | 70 | ||||||
CNH Equipment Trust, | ||||||||
0.630%, 12/15/2017 | 3,595 | 3,594 | ||||||
Dell Equipment Finance Trust, | ||||||||
0.940%, 06/22/2020 (A) | 1,400 | 1,401 | ||||||
| Description | Face Amount ($ Thousands) | Market Value ($ Thousands) | ||||||
Dryden XXXI Senior Loan Fund, Ser 2014-31A, Cl A | ||||||||
1.625%, 04/18/2026 (A) (B) | $ | 1,315 | $ | 1,311 | ||||
GE Equipment Midticket LLC, | ||||||||
0.600%, 05/23/2016 | 15 | 15 | ||||||
GE Equipment Midticket LLC, | ||||||||
1.140%, 05/22/2018 | 2,000 | 2,002 | ||||||
GE Equipment Small Ticket LLC, Ser 2014-1A, Cl A3 | ||||||||
0.950%, 09/25/2017 (A) | 1,020 | 1,020 | ||||||
GE Equipment Transportation LLC, | ||||||||
0.620%, 07/25/2016 | 143 | 143 | ||||||
GE Equipment Transportation LLC, Ser 2013-1, Cl A3 | ||||||||
0.690%, 11/25/2016 | 158 | 158 | ||||||
GE Equipment Transportation LLC, | ||||||||
0.610%, 06/24/2016 | 119 | 119 | ||||||
Gramercy Park CLO, | ||||||||
1.574%, 07/17/2023 (A) (B) | 1,000 | 1,000 | ||||||
GreatAmerica Leasing Receivables, Ser 2015-1, Cl A3 | ||||||||
1.540%, 07/20/2018 (A) | 2,440 | 2,449 | ||||||
HLSS Servicer Advance Receivables Trust, | ||||||||
1.990%, 10/15/2045 (A) | 2,300 | 2,300 | ||||||
HLSS Servicer Advance Receivables Trust, | ||||||||
1.744%, 01/16/2046 (A) | 1,095 | 1,095 | ||||||
ING IM CLO, Ser 2014-1A, Cl A1 | ||||||||
1.775%, 04/18/2026 (A) (B) | 1,310 | 1,311 | ||||||
ING IM CLO, | ||||||||
1.471%, 03/14/2022 (A) (B) | 800 | 800 | ||||||
ING IM CLO, | ||||||||
2.091%, 03/14/2022 (A) (B) | 1,400 | 1,398 | ||||||
John Deere Owner Trust, | ||||||||
0.530%, 07/15/2016 | 68 | 68 | ||||||
John Deere Owner Trust, | ||||||||
0.690%, 01/15/2019 | 1,995 | 1,995 | ||||||
John Deere Owner Trust, | ||||||||
0.600%, 03/15/2017 | 853 | 853 | ||||||
John Deere Owner Trust, | ||||||||
0.920%, 04/16/2018 | 1,515 | 1,516 | ||||||
| 228 | SEI Institutional Investments Trust / Annual Report / May 31, 2015 |
| Description | Face Amount ($ Thousands) | Market Value ($ Thousands) | ||||||
JPMorgan Mortgage Acquisition, | ||||||||
0.920%, 07/25/2035 (B) | $ | 209 | $ | 208 | ||||
Kubota Credit Owner Trust, | ||||||||
0.580%, 02/15/2017 (A) | 351 | 351 | ||||||
Limerock CLO II, | ||||||||
1.775%, 04/18/2026 (A) (B) | 1,250 | 1,251 | ||||||
Madison Park Funding, | ||||||||
0.565%, 03/22/2021 (A) (B) | 580 | 566 | ||||||
Magnetite IX, Ser 2014-9A, Cl A1 | ||||||||
1.697%, 07/25/2026 (A) (B) | 1,265 | 1,265 | ||||||
MMAF Equipment Finance LLC, | ||||||||
2.100%, 07/15/2017 (A) | 1,966 | 1,979 | ||||||
MMAF Equipment Finance LLC, | ||||||||
0.870%, 01/08/2019 (A) | 1,645 | 1,639 | ||||||
Morgan Stanley Capital I Trust, | ||||||||
0.920%, 06/25/2035 (B) | 63 | 62 | ||||||
Navient Student Loan Trust, | ||||||||
0.435%, 03/25/2021 (B) | 3,172 | 3,170 | ||||||
Neuberger Berman CLO XVI, | ||||||||
1.745%, 04/15/2026 (A) (B) | 955 | 955 | ||||||
Octagon Investment Partners XVI, | ||||||||
1.394%, 07/17/2025 (A) (B) | 1,000 | 989 | ||||||
OHA Credit Partners VIII, | ||||||||
1.395%, 04/20/2025 (A) (B) | 690 | 683 | ||||||
OHA Intrepid Leveraged Loan Fund, Ser 2013-1AR, Cl AR | ||||||||
1.195%, 04/20/2021 (A) (B) | 536 | 536 | ||||||
Race Point VI CLO, | ||||||||
2.413%, 05/24/2023 (A) (B) | 1,650 | 1,651 | ||||||
SLM Private Education Loan Trust, Ser 2011-B, Cl A1 | ||||||||
1.036%, 12/16/2024 (A) (B) | 251 | 252 | ||||||
SLM Student Loan Trust, | ||||||||
0.347%, 07/25/2023 (B) | 1,188 | 1,188 | ||||||
SLM Student Loan Trust, | ||||||||
0.277%, 07/25/2017 (B) | 23 | 23 | ||||||
SLM Student Loan Trust, | ||||||||
0.287%, 10/25/2017 (B) | 24 | 24 | ||||||
| Description | Face Amount ($ Thousands) | Market Value ($ Thousands) | ||||||
SLM Student Loan Trust, | ||||||||
0.827%, 10/25/2017 (B) | $ | 24 | $ | 24 | ||||
SLM Student Loan Trust, | ||||||||
1.186%, 10/15/2024 (A) (B) | 39 | 39 | ||||||
Springleaf Funding Trust, | ||||||||
2.410%, 12/15/2022 (A) | 1,065 | 1,066 | ||||||
Structured Asset Securities Mortgage Loan Trust, | ||||||||
0.415%, 07/25/2036 (A) (B) | 1,764 | 1,754 | ||||||
Structured Asset Securities Mortgage Loan Trust, | ||||||||
0.335%, 02/25/2036 (B) | 515 | 511 | ||||||
Symphony CLO VIII, | ||||||||
2.002%, 01/09/2023 (A) (B) | 1,660 | 1,660 | ||||||
Voya CLO, Ser 2014-3A, Cl A1 | ||||||||
1.697%, 07/25/2026 (A) (B) | 910 | 909 | ||||||
|
| |||||||
| 58,682 | ||||||||
|
| |||||||
Total Asset-Backed Securities | 183,768 | |||||||
|
| |||||||
MORTGAGE-BACKED SECURITIES — 17.7% |
| |||||||
Agency Mortgage-Backed Obligations — 4.1% |
| |||||||
FHLMC | ||||||||
5.000%, 03/01/2019 to 06/01/2026 | 1,206 | 1,272 | ||||||
FHLMC ARM (B) | ||||||||
2.375%, 05/01/2036 | 170 | 182 | ||||||
2.231%, 02/01/2022 | 145 | 151 | ||||||
2.181%, 02/01/2030 | 143 | 152 | ||||||
FHLMC CMO, Ser 2003-2676, Cl CY | ||||||||
4.000%, 09/15/2018 | 129 | 134 | ||||||
FHLMC CMO, Ser 2004-2764, Cl OE | ||||||||
4.500%, 03/15/2019 | 187 | 195 | ||||||
FHLMC CMO, Ser 2009-3570, Cl A | ||||||||
4.500%, 06/15/2024 | 420 | 443 | ||||||
FHLMC CMO, Ser 2010-3634, Cl EA | ||||||||
4.000%, 11/15/2023 | 96 | 96 | ||||||
FHLMC Multifamily Structured Pass-Through Certificates, | ||||||||
1.873%, 01/25/2018 | 294 | 296 | ||||||
| SEI Institutional Investments Trust / Annual Report / May 31, 2015 | 229 |
SCHEDULE OF INVESTMENTS
Ultra Short Duration Bond Fund (Continued)
May 31, 2015
| Description | Face Amount ($ Thousands) | Market Value ($ Thousands) | ||||||
FNMA | ||||||||
6.000%, 01/01/2027 to 04/01/2040 | $ | 506 | $ | 579 | ||||
5.000%, 04/01/2020 to 03/01/2025 | 2,222 | 2,358 | ||||||
4.500%, 05/01/2023 | 568 | 607 | ||||||
FNMA ARM (B) | ||||||||
2.465%, 01/01/2029 | 16 | 17 | ||||||
2.245%, 11/01/2025 | 13 | 14 | ||||||
2.243%, 11/01/2023 | 37 | 38 | ||||||
2.194%, 09/01/2024 | 134 | 140 | ||||||
2.140%, 09/01/2024 | 54 | 56 | ||||||
2.074%, 05/01/2028 | 60 | 63 | ||||||
1.375%, 11/01/2021 | 22 | 23 | ||||||
FNMA CMO, Ser 1993-58, Cl H | ||||||||
5.500%, 04/25/2023 | 51 | 56 | ||||||
FNMA CMO, Ser 2001-33, Cl FA | ||||||||
0.635%, 07/25/2031 (B) | 32 | 33 | ||||||
FNMA CMO, Ser 2002-56, Cl MC | ||||||||
5.500%, 09/25/2017 | 423 | 436 | ||||||
FNMA CMO, Ser 2002-64, Cl FG | ||||||||
0.433%, 10/18/2032 (B) | 37 | 37 | ||||||
FNMA CMO, Ser 2002-77, Cl CB | ||||||||
5.000%, 12/25/2017 | 133 | 138 | ||||||
FNMA CMO, Ser 2008-15, Cl EL | ||||||||
4.250%, 06/25/2022 | 124 | 124 | ||||||
FNMA CMO, Ser 2008-18, Cl HD | ||||||||
4.000%, 12/25/2018 | 182 | 187 | ||||||
FNMA CMO, Ser 2008-47, Cl FA | ||||||||
0.685%, 06/25/2023 (B) | 171 | 173 | ||||||
FNMA CMO, Ser 2010-64, Cl EH | ||||||||
5.000%, 10/25/2035 | 78 | 79 | ||||||
FNMA CMO, Ser 2011-109, Cl PK | ||||||||
4.000%, 08/25/2041 | 169 | 180 | ||||||
FNMA TBA | ||||||||
3.500%, 06/15/2026 | 3,850 | 4,083 | ||||||
3.000%, 06/25/2027 | 8,028 | 8,388 | ||||||
GNMA ARM (B) | ||||||||
2.500%, 09/20/2039 | 268 | 285 | ||||||
GNMA CMO, Ser 2006-47, Cl AC | ||||||||
5.000%, 02/16/2033 | 326 | 337 | ||||||
GNMA CMO, Ser 2009-10, Cl JA | ||||||||
4.500%, 03/16/2034 | 256 | 267 | ||||||
GNMA CMO, Ser 2009-113, Cl MJ | ||||||||
4.000%, 03/16/2023 | 527 | 543 | ||||||
GNMA CMO, Ser 2009-93, Cl ND | ||||||||
3.500%, 04/20/2037 | 192 | 195 | ||||||
GNMA CMO, Ser 2010-30, Cl QE | ||||||||
4.000%, 06/20/2038 | 377 | 389 | ||||||
GNMA CMO, Ser 2010-86, Cl PG | ||||||||
3.000%, 01/20/2036 | 246 | 249 | ||||||
GNMA CMO, Ser 2011-106, Cl ME | ||||||||
3.000%, 06/20/2038 | 732 | 741 | ||||||
| Description | Face Amount ($ Thousands) | Market Value ($ Thousands) | ||||||
GNMA CMO, Ser 2011-110, Cl A | ||||||||
2.237%, 03/16/2033 | $ | 145 | $ | 146 | ||||
Mortgage-Linked Amortizing Notes CMO, Ser 2012-1, Cl A10 | ||||||||
2.060%, 01/15/2022 | 327 | 333 | ||||||
NCUA Guaranteed Notes CMO, | ||||||||
0.631%, 10/07/2020 (B) | 616 | 620 | ||||||
NCUA Guaranteed Notes CMO, | ||||||||
1.840%, 10/07/2020 | 6 | 6 | ||||||
NCUA Guaranteed Notes CMO, Ser 2010-R2, Cl 1A | ||||||||
0.551%, 11/06/2017 (B) | 303 | 303 | ||||||
NCUA Guaranteed Notes CMO, | ||||||||
0.631%, 01/08/2020 (B) | 742 | 746 | ||||||
NCUA Guaranteed Notes CMO, | ||||||||
0.578%, 02/06/2020 (B) | 449 | 451 | ||||||
NCUA Guaranteed Notes CMO, | ||||||||
0.561%, 03/06/2020 (B) | 111 | 111 | ||||||
NCUA Guaranteed Notes CMO, | ||||||||
0.558%, 05/07/2020 (B) | 279 | 279 | ||||||
|
| |||||||
| 26,731 | ||||||||
|
| |||||||
Non-Agency Mortgage-Backed Obligations — 13.6% |
| |||||||
BAMLL Commercial Mortgage Securities Trust, Ser 2014-ICTS, Cl A | ||||||||
0.986%, 06/15/2028 (A) (B) | 750 | 750 | ||||||
Banc of America Merrill Lynch Commercial Mortgage, Ser 2005-4, Cl A5A | ||||||||
4.933%, 07/10/2045 | 515 | 516 | ||||||
Banc of America Mortgage Securities, Ser 2005-F, Cl 2A2 | ||||||||
2.655%, 07/25/2035 (A) (B) | 417 | 385 | ||||||
Banc of America Mortgage Securities, Ser 2005-J, Cl 2A1 | ||||||||
2.714%, 11/25/2035 (A) (B) | 53 | 49 | ||||||
Bear Stearns Adjustable Rate Mortgage Trust, Ser 2005-12, Cl 11A1 | ||||||||
2.550%, 02/25/2036 (A) (B) | 126 | 98 | ||||||
Bear Stearns Adjustable Rate Mortgage Trust, Ser 2005-3, Cl 2A1 | ||||||||
2.625%, 06/25/2035 (A) (B) | 178 | 164 | ||||||
Bear Stearns Adjustable Rate Mortgage Trust, Ser 2005-6, Cl 3A1 | ||||||||
2.645%, 08/25/2035 (A) (B) | 313 | 281 | ||||||
| 230 | SEI Institutional Investments Trust / Annual Report / May 31, 2015 |
| Description | Face Amount ($ Thousands) | Market Value ($ Thousands) | ||||||
Bear Stearns Commercial Mortgage Securities Trust, | ||||||||
5.468%, 06/11/2041 (B) | $ | — | $ | — | ||||
Bear Stearns Commercial Mortgage Securities Trust, | ||||||||
5.201%, 12/11/2038 | 740 | 775 | ||||||
Bear Stearns Commercial Mortgage Securities Trust, | ||||||||
5.405%, 12/11/2040 (B) | 683 | 688 | ||||||
Bear Stearns Commercial Mortgage Securities Trust, | ||||||||
5.600%, 03/11/2039 (B) | 1,650 | 1,679 | ||||||
Bear Stearns Commercial Mortgage Securities, | ||||||||
4.871%, 09/11/2042 | 109 | 109 | ||||||
Bear Stearns Commercial Mortgage Securities, | ||||||||
5.139%, 10/12/2042 (B) | 648 | 650 | ||||||
Bear Stearns Commercial Mortgage Securities, | ||||||||
5.430%, 03/11/2039 (B) | 924 | 940 | ||||||
Bear Stearns Commercial Mortgage Securities, | ||||||||
5.540%, 09/11/2041 | 722 | 749 | ||||||
BLCP Hotel Trust, | ||||||||
1.136%, 08/15/2029 (A) (B) | 1,000 | 997 | ||||||
CD Commercial Mortgage Trust, | ||||||||
5.396%, 07/15/2044 (B) | 1,095 | 1,098 | ||||||
CD Mortgage Trust, | ||||||||
5.299%, 01/15/2046 (B) | 2,638 | 2,663 | ||||||
CD Mortgage Trust, | ||||||||
5.886%, 11/15/2044 (B) | 1,345 | 1,454 | ||||||
CHL Mortgage Pass-Through Trust, | ||||||||
0.725%, 02/25/2035 (A) (B) | 40 | 38 | ||||||
CHL Mortgage Pass-Through Trust, | ||||||||
2.503%, 02/20/2036 (A) (B) | 248 | 207 | ||||||
Citigroup Commercial Mortgage Trust, | ||||||||
5.711%, 06/10/2017 (B) | 1,650 | 1,772 | ||||||
| Description | Face Amount ($ Thousands) | Market Value ($ Thousands) | ||||||
Citigroup Commercial Mortgage Trust, | ||||||||
6.144%, 12/10/2049 (B) | $ | 1,149 | $ | 1,246 | ||||
Citigroup Commercial Mortgage Trust, | ||||||||
0.685%, 09/10/2045 | 223 | 223 | ||||||
Citigroup Commercial Mortgage Trust, | ||||||||
0.936%, 06/15/2033 (A) (B) | 1,695 | 1,692 | ||||||
Citigroup Deutsche Bank Commercial Mortgage, Ser 2007-CD4, Cl A4 | ||||||||
5.322%, 12/11/2049 | 1,650 | 1,726 | ||||||
Citigroup Mortgage Loan Trust, Ser 2004-HYB3, Cl 1A | ||||||||
2.578%, 09/25/2034 (A) (B) | 74 | 74 | ||||||
Citigroup Mortgage Loan Trust, Ser 2006-AR2, Cl 1A1 | ||||||||
2.685%, 03/25/2036 (A) (B) | 297 | 272 | ||||||
COBALT CMBS Commercial Mortgage Trust, Ser 2006-C1, Cl A4 | ||||||||
5.223%, 08/15/2048 | 1,647 | 1,719 | ||||||
COMM Mortgage Trust, | ||||||||
5.750%, 06/10/2046 (B) | 2,099 | 2,160 | ||||||
COMM Mortgage Trust, | ||||||||
3.156%, 07/10/2046 (A) | 509 | 511 | ||||||
COMM Mortgage Trust, | ||||||||
0.824%, 08/15/2045 | 160 | 160 | ||||||
COMM Mortgage Trust, | ||||||||
0.704%, 10/15/2045 | 285 | 285 | ||||||
COMM Mortgage Trust, | ||||||||
0.673%, 12/10/2045 | 313 | 312 | ||||||
COMM Mortgage Trust, | ||||||||
1.278%, 08/10/2046 | 470 | 472 | ||||||
COMM Mortgage Trust, | ||||||||
1.344%, 07/10/2045 | 1,770 | 1,774 | ||||||
COMM Mortgage Trust, | ||||||||
0.986%, 03/15/2029 (A) (B) | 2,720 | 2,716 | ||||||
Commercial Mortgage Pass-Through Certificates, Ser 2012-CR3, Cl A1 | ||||||||
0.666%, 11/15/2045 | 152 | 151 | ||||||
Credit Suisse Commercial Mortgage Trust, Ser 2006-C4, Cl A3 | ||||||||
5.467%, 09/15/2039 | 367 | 382 | ||||||
| SEI Institutional Investments Trust / Annual Report / May 31, 2015 | 231 |
SCHEDULE OF INVESTMENTS
Ultra Short Duration Bond Fund (Continued)
May 31, 2015
| Description | Face Amount ($ Thousands) | Market Value ($ Thousands) | ||||||
CSMC, Ser 2014-ICE, Cl A | ||||||||
1.050%, 04/15/2027 (A) (B) | $ | 550 | $ | 548 | ||||
DBUBS Mortgage Trust, | ||||||||
3.742%, 11/10/2046 (A) | 664 | 673 | ||||||
FDIC Guaranteed Notes Trust, Ser 2010-S1, Cl 1A | ||||||||
0.730%, 02/25/2048 (A) (B) | 715 | 715 | ||||||
FHLMC Structured Agency Credit Risk Debt Notes, | ||||||||
1.181%, 02/25/2024 (A) (B) | 353 | 353 | ||||||
FHLMC Structured Agency Credit Risk Debt Notes, | ||||||||
1.035%, 04/25/2024 (A) (B) | 927 | 926 | ||||||
FNMA Connecticut Avenue Securities, | ||||||||
1.135%, 05/25/2024 (A) (B) | 678 | 674 | ||||||
FNMA Connecticut Avenue Securities, | ||||||||
1.135%, 05/25/2024 (A) (B) | 519 | 515 | ||||||
FNMA Connecticut Avenue Securities, | ||||||||
1.385%, 07/25/2024 (A) (B) | 1,814 | 1,811 | ||||||
FNMA Connecticut Avenue Securities, | ||||||||
1.337%, 05/25/2025 (A) (B) | 320 | 320 | ||||||
GE Capital Commercial Mortgage, Ser 2005-C3, Cl A7A | ||||||||
4.974%, 07/10/2045 (B) | 357 | 357 | ||||||
GE Capital Commercial Mortgage, Ser 2005-C4, Cl A4 | ||||||||
5.315%, 11/10/2045 (B) | 1,495 | 1,506 | ||||||
GMAC Mortgage Loan Trust, | ||||||||
2.941%, 11/19/2035 (A) (B) | 304 | 280 | ||||||
GS Mortgage Securities II, | ||||||||
0.662%, 11/10/2045 | 196 | 196 | ||||||
GS Mortgage Securities Trust, Ser 2006-GG8, Cl A4 | ||||||||
5.560%, 11/10/2039 | 904 | 942 | ||||||
GS Mortgage Securities Trust, Ser 2010-C2, Cl A1 | ||||||||
3.849%, 12/10/2043 (A) | 2,374 | 2,417 | ||||||
GS Mortgage Securities Trust, Ser 2013-GC13, Cl A1 | ||||||||
1.206%, 07/10/2046 | 335 | 336 | ||||||
| Description | Face Amount ($ Thousands) | Market Value ($ Thousands) | ||||||
GSR Mortgage Loan Trust, | ||||||||
2.630%, 07/25/2035 (A) (B) | $ | 372 | $ | 338 | ||||
GSR Mortgage Loan Trust, | ||||||||
2.632%, 01/25/2036 (A) (B) | 412 | 381 | ||||||
GSR Mortgage Loan Trust, | ||||||||
2.715%, 05/25/2047 (A) (B) | 349 | 287 | ||||||
HILT Mortgage Trust, | ||||||||
1.086%, 07/15/2029 (A) (B) | 4,200 | 4,200 | ||||||
Hilton USA Trust, | ||||||||
1.181%, 11/05/2030 (A) (B) | 557 | 557 | ||||||
Homestar Mortgage Acceptance, Ser 2004-3, Cl AV2C | ||||||||
0.765%, 07/25/2034 (A) (B) | 1,063 | 1,058 | ||||||
Impac CMB Trust, Ser 2004-9, Cl 1A1 | ||||||||
0.945%, 01/25/2035 (A) (B) | 98 | 89 | ||||||
Impac CMB Trust, Ser 2005-2, Cl 1A1 | ||||||||
0.705%, 04/25/2035 (A) (B) | 107 | 99 | ||||||
Impac CMB Trust, Ser 2005-3, Cl A1 | ||||||||
0.665%, 08/25/2035 (A) (B) | 99 | 89 | ||||||
Impac CMB Trust, Ser 2005-5, Cl A1 | ||||||||
0.825%, 08/25/2035 (A) (B) | 81 | 72 | ||||||
Impac CMB Trust, Ser 2005-8, Cl 1A | ||||||||
0.445%, 02/25/2036 (A) (B) | 262 | 226 | ||||||
JPMBB Commercial Mortgage Securities Trust, | ||||||||
2.977%, 11/15/2045 | 1,665 | 1,733 | ||||||
JPMBB Commercial Mortgage Securities Trust, | ||||||||
1.266%, 04/15/2047 | 2,157 | 2,158 | ||||||
JPMorgan Chase Commercial Mortgage Securities Trust, Ser 2005-LDP3, Cl A4A | ||||||||
4.936%, 08/15/2042 (B) | 998 | 998 | ||||||
JPMorgan Chase Commercial Mortgage Securities Trust, Ser 2005-LDP4, Cl A4 | ||||||||
4.918%, 10/15/2042 (B) | 829 | 832 | ||||||
JPMorgan Chase Commercial Mortgage Securities Trust, Ser 2006-LDP7, Cl A4 | ||||||||
5.905%, 04/15/2045 (B) | 480 | 493 | ||||||
| 232 | SEI Institutional Investments Trust / Annual Report / May 31, 2015 |
| Description | Face Amount ($ Thousands) | Market Value ($ Thousands) | ||||||
JPMorgan Chase Commercial Mortgage Securities Trust, Ser 2010-C1, Cl A1 | ||||||||
3.853%, 06/15/2043 (A) | $ | 27 | $ | 27 | ||||
JPMorgan Chase Commercial Mortgage Securities Trust, Ser 2010-C2, Cl A1 | ||||||||
2.749%, 11/15/2043 (A) | 469 | 472 | ||||||
JPMorgan Chase Commercial Mortgage Securities Trust, Ser 2012-C8, Cl A1 | ||||||||
0.705%, 10/15/2045 | 63 | 63 | ||||||
JPMorgan Chase Commercial Mortgage Securities Trust, | ||||||||
1.303%, 01/15/2046 | 602 | 605 | ||||||
JPMorgan Chase Commercial Mortgage Securities Trust, | ||||||||
1.086%, 10/15/2029 (A) (B) | 3,005 | 3,001 | ||||||
JPMorgan Chase Commercial Mortgage Securities Trust, | ||||||||
1.382%, 08/15/2027 (A) (B) | 1,225 | 1,227 | ||||||
JPMorgan Chase Commercial Mortgage Securities Trust, | ||||||||
1.432%, 01/15/2032 (A) (B) | 2,550 | 2,551 | ||||||
JPMorgan Chase Commercial Mortgage Securities, | ||||||||
0.670%, 12/15/2047 | 75 | 75 | ||||||
JPMorgan Mortgage Trust, | ||||||||
2.529%, 08/25/2035 (A) (B) | 185 | 175 | ||||||
JPMorgan Mortgage Trust, | ||||||||
2.754%, 05/25/2037 (A) (B) | 224 | 192 | ||||||
LB-UBS Commercial Mortgage Trust, | ||||||||
6.028%, 06/15/2038 (B) | 2,141 | 2,215 | ||||||
LB-UBS Commercial Mortgage Trust, | ||||||||
5.858%, 07/15/2040 (B) | 1,150 | 1,203 | ||||||
Merrill Lynch Mortgage Investors, | ||||||||
0.455%, 04/25/2035 (A) (B) | 98 | 94 | ||||||
Merrill Lynch Mortgage Trust, | ||||||||
5.291%, 01/12/2044 (B) | 1,448 | 1,462 | ||||||
Merrill Lynch Mortgage-Backed Securities Trust, | ||||||||
3.343%, 06/25/2037 (A) (B) | 381 | 319 | ||||||
| Description | Face Amount ($ Thousands) | Market Value ($ Thousands) | ||||||
ML-CFC Commercial Mortgage Trust, | ||||||||
5.378%, 08/12/2048 | $ | 309 | $ | 323 | ||||
Morgan Stanley Bank of America Merrill Lynch Trust, | ||||||||
0.664%, 11/15/2045 | 94 | 94 | ||||||
Morgan Stanley Bank of America Merrill Lynch Trust, | ||||||||
3.085%, 08/15/2046 | 1,380 | 1,441 | ||||||
Morgan Stanley Capital I Trust, | ||||||||
4.890%, 06/12/2047 | 84 | 83 | ||||||
Morgan Stanley Capital I Trust, | ||||||||
1.085%, 03/15/2045 | 377 | 378 | ||||||
Morgan Stanley Re-REMIC Trust, | ||||||||
1.000%, 03/27/2051 (A) | 362 | 362 | ||||||
MortgageIT Trust, Ser 2005-5, Cl A1 | ||||||||
0.445%, 12/25/2035 (A) (B) | 371 | 336 | ||||||
Opteum Mortgage Acceptance Asset-Backed Pass-Through Certificates, Ser 2005-2, Cl AII1 | ||||||||
0.445%, 04/25/2035 (A) (B) | 810 | 814 | ||||||
Paragon Mortgages, | ||||||||
0.494%, 11/15/2038 (A) (B) | 157 | 146 | ||||||
Paragon Mortgages, Ser 2007-15A, Cl A2C | ||||||||
0.381%, 12/15/2039 (A) (B) | 381 | 350 | ||||||
Residential Funding Mortgage Securities, Ser 2007-SA3, Cl 2A1 | ||||||||
3.805%, 07/27/2037 (A) (B) | 288 | 243 | ||||||
Sequoia Mortgage Trust, Ser 2004-12, Cl A1 | ||||||||
0.451%, 01/20/2035 (A) (B) | 45 | 42 | ||||||
Silverstone Master Issuer, Ser 2012-1A, Cl 1A | ||||||||
1.826%, 01/21/2055 (A) (B) | 225 | 226 | ||||||
Springleaf Mortgage Loan Trust, Ser 2013-1A, Cl A | ||||||||
1.270%, 06/25/2058 (A) (B) | 410 | 409 | ||||||
UBS-Barclays Commercial Mortgage Trust, Ser 2012-C3, Cl A1 | ||||||||
0.726%, 08/10/2049 | 258 | 257 | ||||||
UBS-Barclays Commercial Mortgage Trust, Ser 2012-C4, Cl A1 | ||||||||
0.673%, 12/10/2045 | 224 | 224 | ||||||
| SEI Institutional Investments Trust / Annual Report / May 31, 2015 | 233 |
SCHEDULE OF INVESTMENTS
Ultra Short Duration Bond Fund (Continued)
May 31, 2015
| Description | Face Amount ($ Thousands) | Market Value ($ Thousands) | ||||||
UBS-Barclays Commercial Mortgage Trust, Ser 2013-C5, Cl A1 | ||||||||
0.779%, 03/10/2046 | $ | 590 | $ | 587 | ||||
Wachovia Bank Commercial Mortgage Trust, Ser 2005-C21, Cl A4 | ||||||||
5.252%, 10/15/2044 (B) | 400 | 401 | ||||||
Wachovia Bank Commercial Mortgage Trust, Ser 2005-C22, Cl A4 | ||||||||
5.267%, 12/15/2044 (B) | 803 | 809 | ||||||
Wachovia Bank Commercial Mortgage Trust, Ser 2006-C27, Cl A1A | ||||||||
5.749%, 07/15/2045 (B) | 1,145 | 1,190 | ||||||
WaMu Mortgage Pass-Through | ||||||||
2.325%, 03/25/2036 (A) (B) | 403 | 372 | ||||||
Wells Fargo Commercial Mortgage | ||||||||
0.687%, 10/15/2045 | 253 | 253 | ||||||
Wells Fargo Commercial Mortgage | ||||||||
1.264%, 08/15/2046 | 293 | 294 | ||||||
Wells Fargo Mortgage-Backed | ||||||||
2.619%, 01/25/2035 (A) (B) | 172 | 171 | ||||||
Wells Fargo Mortgage-Backed | ||||||||
2.634%, 07/25/2036 (A) (B) | 351 | 343 | ||||||
Wells Fargo Mortgage-Backed Securities Trust, Ser 2006-AR12, Cl 1A1 | ||||||||
2.495%, 09/25/2036 (A) (B) | 198 | 184 | ||||||
WFRBS Commercial Mortgage Trust, | ||||||||
2.501%, 02/15/2044 (A) | 176 | 176 | ||||||
WFRBS Commercial Mortgage Trust, | ||||||||
3.791%, 02/15/2044 (A) | 3,160 | 3,184 | ||||||
WFRBS Commercial Mortgage Trust, | ||||||||
3.240%, 05/15/2017 (A) | 816 | �� | 828 | |||||
WFRBS Commercial Mortgage Trust, | ||||||||
0.734%, 12/15/2045 | 363 | 363 | ||||||
WFRBS Commercial Mortgage Trust, | ||||||||
1.081%, 04/15/2045 | 370 | 371 | ||||||
| Description | Face Amount ($ Thousands) | Market Value ($ Thousands) | ||||||
WFRBS Commercial Mortgage Trust, | ||||||||
0.673%, 11/15/2045 | $ | 421 | $ | 420 | ||||
|
| |||||||
| 87,471 | ||||||||
|
| |||||||
Total Mortgage-Backed Securities (Cost $114,387) ($ Thousands) |
| 114,202 | ||||||
|
| |||||||
MUNICIPAL BONDS — 4.4% |
| |||||||
Chicago, Midway International Airport, Ser C, RB | ||||||||
1.320%, 01/01/2016 | 590 | 593 | ||||||
El Paso, GO | ||||||||
1.049%, 08/15/2016 | 1,090 | 1,095 | ||||||
Florida State, Hurricane Catastrophe Fund Finance, Ser A, RB | ||||||||
1.298%, 07/01/2016 | 1,165 | 1,171 | ||||||
Harris County, Toll Road Project, Ser Senior LIEN-SE, RB | ||||||||
2.440%, 08/15/2015 | 1,420 | 1,427 | ||||||
Hawaii State, Ser ES, GO | ||||||||
0.731%, 08/01/2016 | 2,245 | 2,249 | ||||||
Illinois State, Ser B, GO | ||||||||
1.780%, 04/01/2016 | 1,600 | 1,603 | ||||||
Intermountain Power Agency, Sub-Ser B, RB | ||||||||
0.785%, 07/01/2016 | 1,655 | 1,656 | ||||||
Louisville, Regional Airport Authority, Ser C, RB | ||||||||
0.769%, 07/01/2016 | 2,245 | 2,249 | ||||||
Maine State, Municipal Bond Bank, Liquor Revenue, RB | ||||||||
1.068%, 06/01/2015 | 1,030 | 1,030 | ||||||
New Jersey State, Economic Development Authority, Ser 00, RB | ||||||||
1.059%, 03/01/2016 | 1,265 | 1,267 | ||||||
New Jersey State, Economic Development Authority, Ser Q, RB | ||||||||
1.096%, 06/15/2016 | 7,290 | 7,278 | ||||||
New Jersey State, Transportation Trust Fund Authority, Ser B, RB | ||||||||
1.087%, 12/15/2016 | 2,800 | 2,789 | ||||||
New Jersey State, Turnpike Authority, Ser B, RB, AMBAC | ||||||||
4.252%, 01/01/2016 | 265 | 270 | ||||||
Orange County, Ser A, RB | ||||||||
0.580%, 11/02/2015 | 1,215 | 1,215 | ||||||
Saint Paul, Housing and Redevelopment Authority, RB | ||||||||
1.041%, 07/01/2016 | 980 | 980 | ||||||
| 234 | SEI Institutional Investments Trust / Annual Report / May 31, 2015 |
| Description | Face Amount ($ Thousands) | Market Value ($ Thousands) | ||||||
University of California, Ser Y-1, RB Callable 01/01/2017 @ 100 | ||||||||
0.684%, 07/01/2041 (B) | $ | 1,310 | $ | 1,310 | ||||
|
| |||||||
Total Municipal Bonds (Cost $28,177) ($ Thousands) | 28,182 | |||||||
|
| |||||||
U.S. GOVERNMENT AGENCY OBLIGATIONS — 2.1% |
| |||||||
FFCB | ||||||||
0.450%, 09/16/2016 | 2,000 | 1,999 | ||||||
FHLB | ||||||||
1.625%, 04/13/2017 | 2,900 | 2,916 | ||||||
1.375%, 03/26/2018 | 2,520 | 2,522 | ||||||
FHLMC | ||||||||
1.400%, 05/25/2018 | 4,800 | 4,809 | ||||||
1.250%, 12/05/2017 | 500 | 500 | ||||||
1.000%, 06/19/2017 | 1,200 | 1,201 | ||||||
|
| |||||||
Total U.S. Government Agency Obligations (Cost $13,947) ($ Thousands) |
| 13,947 | ||||||
|
| |||||||
SOVEREIGN DEBT — 0.6% |
| |||||||
Province of Ontario | ||||||||
1.600%, 09/21/2016 | 3,700 | 3,745 | ||||||
|
| |||||||
Total Sovereign Debt |
| 3,745 | ||||||
|
| |||||||
U.S. TREASURY OBLIGATIONS — 1.0% |
| |||||||
U.S. Treasury Notes | ||||||||
0.625%, 04/30/2018 | 5,000 | 4,958 | ||||||
0.500%, 07/31/2017 | 1,500 | 1,494 | ||||||
|
| |||||||
Total U.S. Treasury Obligations | 6,452 | |||||||
|
| |||||||
REPURCHASE AGREEMENT — 0.8% |
| |||||||
BNP Paribas | 5,100 | 5,100 | ||||||
|
| |||||||
Total Repurchase Agreement | 5,100 | |||||||
|
| |||||||
COMMERCIAL PAPER — 0.8% |
| |||||||
UnitedHealth Group | ||||||||
0.250%, 06/09/2015 (A) (C) | 5,000 | 5,000 | ||||||
|
| |||||||
Total Commercial Paper | 5,000 | |||||||
|
| |||||||
| Description | Shares | Market Value ($ Thousands) | ||||||
CASH EQUIVALENT — 0.6% |
| |||||||
SEI Daily Income Trust, Prime Obligation Fund, Cl A | 3,761,423 | $ | 3,761 | |||||
|
| |||||||
Total Cash Equivalent |
| 3,761 | ||||||
|
| |||||||
Total Investments — 104.5% |
| $ | 674,885 | |||||
|
| |||||||
A list of the open futures contracts held by the Fund at May 31, 2015, is as follows:
| Type of Contract | Number of Contracts Long (Short) | Expiration Date | Unrealized Appreciation (Depreciation) ($ Thousands) | |||||||||
U.S. 10-Year Treasury Note | (50 | ) | Sep-2015 | $ | (21 | ) | ||||||
U.S. 2-Year Treasury Note | (42 | ) | Sep-2015 | (10 | ) | |||||||
U.S. 5-Year Treasury Note | 7 | Sep-2015 | 3 | |||||||||
U.S. Long Treasury Bond | (1 | ) | Sep-2015 | (1 | ) | |||||||
|
| |||||||||||
| $ | (29 | ) | ||||||||||
|
| |||||||||||
For the year ended May 31, 2015, the total amount of all open futures contracts, as presented in the table above, are representative of the volume of activity for this derivative type during the year.
Percentages are based on a Net Assets of $645,872 ($ Thousands).
| * | The rate reported is the 7-day effective yield as of May 31, 2015. |
| ‡ | Real Estate Investment Trust. |
| † | Investment in Affiliated Security (see Note 6). |
| (A) | Securities sold within terms of a private placement memorandum, exempt from registration under Section 144A of the Securities Act of 1933, as amended, and may be sold only to dealers in that program or other “accredited investors.” These securities have been determined to be liquid under guidelines established by the Board of Trustees. |
| (B) | Variable Rate Security — The rate reported on the Schedule of Investments is the rate in effect as of May 31, 2015. |
| (C) | The rate reported is the effective yield at time of purchase. |
AMBAC — American Municipal Bond Assurance Corporation
ARM — Adjustable Rate Mortgage
Cl — Class
CLO — Collateralized Loan Obligation
CMBS — Commercial Mortgage-Backed Securities
CMO — Collateralized Mortgage Obligation
FDIC — Federal Deposit Insurance Company
FFCB — Federal Farm Credit Bank
FHLB — Federal Home Loan Bank
FHLMC — Federal Home Loan Mortgage Corporation
FMAC — Financial Management Advisory Committee
FNMA — Federal National Mortgage Association
GNMA — Government National Mortgage Association
GO — General Obligation
LLC — Limited Liability Company
MTN — Medium Term Note
NCUA — National Credit Union Association
RB — Revenue Bond
Re-REMIC — Real Estate Mortgage Investment Conduit
REMIC — Real Estate Mortgage Investment Conduit
Ser — Series
SPV — Special Purpose Vehicle
TBA — To Be Announced
| SEI Institutional Investments Trust / Annual Report / May 31, 2015 | 235 |
SCHEDULE OF INVESTMENTS
Ultra Short Duration Bond Fund (Concluded)
May 31, 2015
The following is a list of the level of inputs used as of May 31, 2015, in valuing the Fund’s investments and other financial instruments carried at value ($ Thousands).
| Investments in Securities | Level 1 | Level 2 | Level 3 | Total | ||||||||||||
Corporate Obligations | $ | — | $ | 310,728 | $ | — | $ | 310,728 | ||||||||
Asset-Backed Securities | — | 183,768 | — | 183,768 | ||||||||||||
Mortgage-Backed Securities | — | 114,202 | — | 114,202 | ||||||||||||
Municipal Bonds | — | 28,182 | — | 28,182 | ||||||||||||
U.S. Government Agency Obligations | — | 13,947 | — | 13,947 | ||||||||||||
Sovereign Debt | — | 3,745 | — | 3,745 | ||||||||||||
U.S. Treasury Obligations | — | 6,452 | — | 6,452 | ||||||||||||
Repurchase Agreement | — | 5,100 | — | 5,100 | ||||||||||||
Commercial Paper | — | 5,000 | — | 5,000 | ||||||||||||
Cash Equivalent | 3,761 | — | — | 3,761 | ||||||||||||
|
|
|
|
|
|
|
| |||||||||
Total Investments in Securities | $ | 3,761 | $ | 671,124 | $ | — | $ | 674,885 | ||||||||
|
|
|
|
|
|
|
| |||||||||
| Other Financial Instruments | Level 1 | Level 2 | Level 3 | Total | ||||||||||||
Futures Contracts* | ||||||||||||||||
Unrealized Appreciation | $ | 3 | $ | — | $ | — | $ | 3 | ||||||||
Unrealized Depreciation | (32 | ) | — | — | (32 | ) | ||||||||||
|
|
|
|
|
|
|
| |||||||||
Total Other Financial Instruments | $ | (29 | ) | $ | — | $ | — | $ | (29 | ) | ||||||
|
|
|
|
|
|
|
| |||||||||
| * | Futures contracts are valued at the unrealized appreciation/(depreciation) on the instrument. |
For the year ended May 31, 2015, there were no transfers between Level 1 and Level 2 assets and liabilities.
For the year ended May 31, 2015 , there were no transfers between Level 2 and Level 3 assets and liabilities.
For the year ended May 31, 2015, there were no Level 3 securities.
For more information on valuation inputs, see Note 2 — Significant Accounting Policies in Notes to Financial Statements.
Amounts designated as “—” are $0 or have been rounded to $0.
The accompanying notes are an integral part of the financial statements.
| 236 | SEI Institutional Investments Trust / Annual Report / May 31, 2015 |
SCHEDULE OF INVESTMENTS
Emerging Markets Debt Fund
May 31, 2015
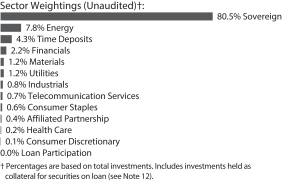
| Description | Face Amount (1) (Thousands) | Market Value ($ Thousands) | ||||||||
GLOBAL BONDS — 92.6% |
| |||||||||
Angola — 0.0% |
| |||||||||
Republic of Angola via Northern Lights III | ||||||||||
7.000%, 08/16/2019 | 722 | $ | 737 | |||||||
|
| |||||||||
Argentina — 1.3% | ||||||||||
City of Buenos Aires Argentina MTN | ||||||||||
8.950%, 02/19/2021 | 1,175 | 1,228 | ||||||||
Provincia de Buenos Aires | ||||||||||
9.375%, 09/14/2018 | 1,425 | 1,411 | ||||||||
Republic of Argentina | ||||||||||
7.000%, 10/03/2015 | 2,527 | 2,484 | ||||||||
7.000%, 04/17/2017 | 6,613 | 6,438 | ||||||||
6.000%, 03/31/2023 (A) | 1,154 | 1,258 | ||||||||
0.084%, 12/15/2035 (B) | 1,548 | 137 | ||||||||
0.044%, 12/15/2035 (B) | 29,601 | 2,655 | ||||||||
0.000%, 03/31/2023 (A) (B) | 1,680 | 1,831 | ||||||||
YPF | ||||||||||
8.750%, 04/04/2024 (C) | 1,014 | 1,047 | ||||||||
8.500%, 07/28/2025 (C) | 4,953 | 5,034 | ||||||||
|
| |||||||||
| 23,523 | ||||||||||
|
| |||||||||
Armenia — 0.3% | ||||||||||
Republic of Armenia | ||||||||||
7.150%, 03/26/2025 (C) | 5,722 | 5,887 | ||||||||
|
| |||||||||
Azerbaijan — 0.8% | ||||||||||
International Bank of Azerbaijan | ||||||||||
5.625%, 06/11/2019 | 2,100 | 2,048 | ||||||||
Republic of Azerbaijan | ||||||||||
4.750%, 03/18/2024 | 2,100 | 2,165 | ||||||||
4.750%, 03/18/2024 (C) | 1,911 | 1,970 | ||||||||
State Oil of the Azerbaijan Republic | ||||||||||
6.950%, 03/18/2030 | 1,090 | 1,165 | ||||||||
5.450%, 02/09/2017 | 1,159 | 1,200 | ||||||||
| Description | Face Amount (1) (Thousands) | Market Value ($ Thousands) | ||||||||||
4.750%, 03/13/2023 | 6,281 | $ | 6,031 | |||||||||
|
| |||||||||||
| 14,579 | ||||||||||||
|
| |||||||||||
Barbados — 0.0% |
| |||||||||||
Columbus International | ||||||||||||
7.375%, 03/30/2021 (C) | 805 | 868 | ||||||||||
|
| |||||||||||
Belize — 0.2% | ||||||||||||
Republic of Belize | ||||||||||||
6.767%, 08/20/2017 (D) | 4,825 | 3,628 | ||||||||||
|
| |||||||||||
Bermuda — 0.1% | ||||||||||||
Government of Bermuda | ||||||||||||
4.854%, 02/06/2024 | 2,150 | 2,317 | ||||||||||
|
| |||||||||||
Bolivia — 0.4% | ||||||||||||
Government of Bolivia | ||||||||||||
5.950%, 08/22/2023 | 6,326 | 6,721 | ||||||||||
|
| |||||||||||
Brazil — 8.2% | ||||||||||||
Banco Nacional de Desenvolvimento Economico e Social | ||||||||||||
6.500%, 06/10/2019 | 100 | 109 | ||||||||||
6.500%, 06/10/2019 (C) | 720 | 787 | ||||||||||
5.500%, 07/12/2020 | 200 | 212 | ||||||||||
5.500%, 07/12/2020 (C) | 400 | 423 | ||||||||||
Brazil Letras do Tesouro Nacional | ||||||||||||
12.983%, 01/01/2016 (E) | BRL | 24,150 | 7,002 | |||||||||
12.154%, 01/01/2017 (E) | BRL | 36,062 | 9,257 | |||||||||
11.769%, 07/01/2018 (E) | BRL | 26,243 | 5,688 | |||||||||
8.185%, 01/01/2018 (E) | BRL | 50,044 | 11,475 | |||||||||
Brazil Loan Trust 1 | ||||||||||||
5.477%, 07/24/2023 (C) | 3,076 | 3,061 | ||||||||||
Brazil Minas SPE via State of Minas Gerais | ||||||||||||
5.333%, 02/15/2028 | 215 | 209 | ||||||||||
Brazil Notas do Tesouro Nacional Serie B | ||||||||||||
14.253%, 08/15/2020 | BRL | 5,660 | 4,616 | |||||||||
Brazil Notas do Tesouro Nacional Serie F | ||||||||||||
10.000%, 01/01/2017 | BRL | 41,884 | 12,526 | |||||||||
10.000%, 01/01/2018 | BRL | 25,766 | 7,606 | |||||||||
10.000%, 01/01/2021 | BRL | 39,888 | 11,363 | |||||||||
10.000%, 01/01/2023 | BRL | 27,272 | 7,630 | |||||||||
10.000%, 01/01/2025 | BRL | 81,400 | 22,424 | |||||||||
Caixa Economica Federal | ||||||||||||
4.250%, 05/13/2019 | 300 | 298 | ||||||||||
| SEI Institutional Investments Trust / Annual Report / May 31, 2015 | 237 |
SCHEDULE OF INVESTMENTS
Emerging Markets Debt Fund (Continued)
May 31, 2015
| Description | Face Amount (1) (Thousands) | Market Value ($ Thousands) | ||||||||||
CIMPOR Financial Operations | ||||||||||||
5.750%, 07/17/2024 (C) | 775 | $ | 690 | |||||||||
Cosan Luxembourg | ||||||||||||
5.000%, 03/14/2023 (C) | 946 | 891 | ||||||||||
ESAL GmbH | ||||||||||||
6.250%, 02/05/2023 (C) | 1,122 | 1,142 | ||||||||||
Federal Republic of Brazil | ||||||||||||
10.125%, 05/15/2027 | 1,309 | 1,996 | ||||||||||
8.875%, 04/15/2024 | 445 | 598 | ||||||||||
8.250%, 01/20/2034 | 8,971 | 11,752 | ||||||||||
7.125%, 01/20/2037 | 9,820 | 11,759 | ||||||||||
5.000%, 01/27/2045 | 2,668 | 2,475 | ||||||||||
4.875%, 01/22/2021 | 440 | 467 | ||||||||||
2.625%, 01/05/2023 | 734 | 664 | ||||||||||
Gerdau Trade | ||||||||||||
5.750%, 01/30/2021 (C) | 68 | 70 | ||||||||||
GTL Trade Finance | ||||||||||||
5.893%, 04/29/2024 (C) | 1,003 | 986 | ||||||||||
JBS Finance II | ||||||||||||
8.250%, 01/29/2018 | 380 | 396 | ||||||||||
8.250%, 01/29/2018 (C) | 550 | 574 | ||||||||||
Marfrig Holding Europe | ||||||||||||
8.375%, 05/09/2018 | 3,200 | 3,224 | ||||||||||
6.875%, 06/24/2019 (C) | 425 | 399 | ||||||||||
Marfrig Overseas | ||||||||||||
9.500%, 05/04/2020 (C) | 1,850 | 1,878 | ||||||||||
Minerva Luxembourg | ||||||||||||
7.750%, 01/31/2023 | 1,200 | 1,236 | ||||||||||
Petrobras Global Finance | ||||||||||||
4.875%, 03/17/2020 | 2,082 | 2,021 | ||||||||||
Petrobras International Finance | ||||||||||||
6.875%, 01/20/2040 | 302 | 284 | ||||||||||
5.750%, 01/20/2020 | 1,913 | 1,911 | ||||||||||
Rio Oil Finance Trust | ||||||||||||
6.250%, 07/06/2024 (C) | 1,513 | 1,509 | ||||||||||
|
| |||||||||||
| 151,608 | ||||||||||||
|
| |||||||||||
Chile — 1.4% | ||||||||||||
Banco del Estado de Chile | ||||||||||||
4.125%, 10/07/2020 | 160 | 170 | ||||||||||
4.125%, 10/07/2020 (C) | 300 | 319 | ||||||||||
3.875%, 02/08/2022 (C) | 250 | 261 | ||||||||||
Bonos de la Tesoreria de la Republica en pesos | ||||||||||||
6.000%, 01/01/2020 | CLP | 90,000 | 160 | |||||||||
6.000%, 01/01/2022 | CLP | 100,000 | 181 | |||||||||
Empresa Electrica Angamos | ||||||||||||
4.875%, 05/25/2029 (C) | 662 | 668 | ||||||||||
Empresa Nacional del Petroleo | ||||||||||||
6.250%, 07/08/2019 | 200 | 223 | ||||||||||
6.250%, 07/08/2019 (C) | 30 | 34 | ||||||||||
5.250%, 08/10/2020 | 120 | 129 | ||||||||||
| Description | Face Amount (1) (Thousands) | Market Value ($ Thousands) | ||||||||||
5.250%, 08/10/2020 (C) | 280 | $ | 301 | |||||||||
4.375%, 10/30/2024 (C) | 716 | 731 | ||||||||||
Nacional del Cobre de Chile | ||||||||||||
6.150%, 10/24/2036 | 958 | 1,132 | ||||||||||
6.150%, 10/24/2036 (C) | 569 | 672 | ||||||||||
5.625%, 09/21/2035 | 1,760 | 1,997 | ||||||||||
5.625%, 10/18/2043 | 380 | 427 | ||||||||||
4.875%, 11/04/2044 (C) | 6,949 | 7,012 | ||||||||||
4.500%, 08/13/2023 (C) | 508 | 547 | ||||||||||
4.250%, 07/17/2042 | 685 | 633 | ||||||||||
3.875%, 11/03/2021 | 447 | 470 | ||||||||||
3.000%, 07/17/2022 (C) | 1,310 | 1,288 | ||||||||||
Republic of Chile | ||||||||||||
5.500%, 08/05/2020 | CLP | 413,000 | 709 | |||||||||
3.875%, 08/05/2020 | 334 | 364 | ||||||||||
3.250%, 09/14/2021 | 140 | 148 | ||||||||||
3.125%, 03/27/2025 | 950 | 971 | ||||||||||
2.250%, 10/30/2022 | 5,817 | 5,744 | ||||||||||
VTR Finance | ||||||||||||
6.875%, 01/15/2024 (C) | 1,021 | 1,063 | ||||||||||
|
| |||||||||||
| 26,354 | ||||||||||||
|
| |||||||||||
China — 1.2% | ||||||||||||
Amber Circle Funding | ||||||||||||
3.250%, 12/04/2022 | 1,020 | 1,024 | ||||||||||
China Cinda Finance MTN | ||||||||||||
4.250%, 04/23/2025 (C) | 764 | 745 | ||||||||||
CITIC | ||||||||||||
7.875%, 04/15/2049 (B) | 224 | 234 | ||||||||||
6.800%, 01/17/2023 | 2,500 | 2,936 | ||||||||||
CNOOC Curtis Funding No. 1 | ||||||||||||
4.500%, 10/03/2023 | 1,100 | 1,183 | ||||||||||
CNOOC Finance 2015 | ||||||||||||
3.500%, 05/05/2025 | 297 | 295 | ||||||||||
Country Garden Holdings | ||||||||||||
7.875%, 05/27/2019 | 522 | 549 | ||||||||||
7.250%, 04/04/2021 | 73 | 74 | ||||||||||
7.250%, 04/04/2021 | 835 | 845 | ||||||||||
Longfor Properties MTN | ||||||||||||
6.875%, 10/18/2019 | 200 | 208 | ||||||||||
Sinochem Offshore Capital MTN | ||||||||||||
3.250%, 04/29/2019 (C) | 1,012 | 1,032 | ||||||||||
Sinochem Overseas Capital | ||||||||||||
4.500%, 11/12/2020 | 5,354 | 5,755 | ||||||||||
Sinopec Capital 2013 | ||||||||||||
3.125%, 04/24/2023 (C) | 1,169 | 1,144 | ||||||||||
Sinopec Group Overseas Development 2013 | ||||||||||||
4.375%, 10/17/2023 | 1,492 | 1,599 | ||||||||||
Sinopec Group Overseas Development 2014 | ||||||||||||
4.375%, 04/10/2024 (C) | 1,000 | 1,072 | ||||||||||
| 238 | SEI Institutional Investments Trust / Annual Report / May 31, 2015 |
| Description | Face Amount (1) (Thousands) | Market Value ($ Thousands) | ||||||||||
Sinopec Group Overseas Development 2015 | ||||||||||||
3.250%, 04/28/2025 (C) | 1,395 | $ | 1,377 | |||||||||
State Grid Overseas Investment 2014 | ||||||||||||
4.125%, 05/07/2024 (C) | 1,457 | 1,562 | ||||||||||
|
| |||||||||||
| 21,634 | ||||||||||||
|
| |||||||||||
Colombia — 5.8% | ||||||||||||
Bogota Distrito Capital | ||||||||||||
9.750%, 07/26/2028 | COP | 794,000 | 376 | |||||||||
9.750%, 07/26/2028 (C) | COP | 10,018,000 | 4,746 | |||||||||
Citigroup Funding, CLN (Republic of Colombia) | ||||||||||||
11.000%, 07/24/2020 | COP | 8,365,000 | 4,025 | |||||||||
Colombian TES | ||||||||||||
11.250%, 10/24/2018 | COP | 88,000 | 41 | |||||||||
11.000%, 07/24/2020 | COP | 392,500 | 189 | |||||||||
10.000%, 07/24/2024 | COP | 4,160,600 | 1,978 | |||||||||
7.750%, 09/18/2030 | COP | 34,553,200 | 13,790 | |||||||||
7.500%, 08/26/2026 | COP | 8,434,800 | 3,395 | |||||||||
7.000%, 09/11/2019 | COP | 1,905,500 | 790 | |||||||||
7.000%, 05/04/2022 | COP | 26,410,100 | 10,672 | |||||||||
7.000%, 05/04/2022 | COP | 3,598,000 | 1,454 | |||||||||
7.000%, 05/04/2022 | COP | 628,000 | 254 | |||||||||
7.000%, 05/04/2022 | COP | 470,000 | 190 | |||||||||
Emgesa ESP | ||||||||||||
8.750%, 01/25/2021 | COP | 1,640,000 | 679 | |||||||||
Empresas Publicas de Medellin ESP | ||||||||||||
8.375%, 02/01/2021 | COP | 5,072,000 | 2,110 | |||||||||
7.625%, 09/10/2024 (C) | COP | 2,224,000 | 861 | |||||||||
7.625%, 09/10/2024 (C) | COP | 2,876,000 | 1,114 | |||||||||
Financiera de Desarrollo Territorial Findeter | ||||||||||||
7.875%, 08/12/2024 | COP | 1,095,000 | 431 | |||||||||
7.875%, 08/12/2024 (C) | COP | 2,046,000 | 804 | |||||||||
Pacific Rubiales Energy | ||||||||||||
5.625%, 01/19/2025 (C) | 2,820 | 2,263 | ||||||||||
5.125%, 03/28/2023 (C) | 544 | 435 | ||||||||||
Republic of Colombia | ||||||||||||
12.000%, 10/22/2015 | COP | 907,000 | 366 | |||||||||
12.000%, 10/22/2015 | COP | 915,000 | 369 | |||||||||
11.750%, 02/25/2020 | 2,543 | 3,484 | ||||||||||
9.850%, 06/28/2027 | COP | 7,914,000 | 3,891 | |||||||||
9.850%, 06/28/2027 | COP | 369,000 | 181 | |||||||||
8.125%, 05/21/2024 | 1,105 | 1,446 | ||||||||||
7.750%, 04/14/2021 | COP | 6,528,000 | 2,836 | |||||||||
7.375%, 01/27/2017 | 4,610 | 5,037 | ||||||||||
7.375%, 03/18/2019 | 1,222 | 1,433 | ||||||||||
7.375%, 09/18/2037 | 9,889 | 12,794 | ||||||||||
6.125%, 01/18/2041 | 2,710 | 3,096 | ||||||||||
6.000%, 04/28/2028 | COP | 18,996,700 | 6,588 | |||||||||
5.625%, 02/26/2044 | 2,056 | 2,215 | ||||||||||
| Description | Face Amount (1) (Thousands) | Market Value ($ Thousands) | ||||||||||
5.000%, 06/15/2045 | 3,467 | $ | 3,419 | |||||||||
4.375%, 07/12/2021 | 3,932 | 4,156 | ||||||||||
4.375%, 03/21/2023 | COP | 8,136,000 | 2,905 | |||||||||
4.000%, 02/26/2024 | 466 | 474 | ||||||||||
2.625%, 03/15/2023 | 599 | 557 | ||||||||||
|
| |||||||||||
| 105,844 | ||||||||||||
|
| |||||||||||
Costa Rica — 0.5% | ||||||||||||
Banco Nacional de Costa Rica | ||||||||||||
6.250%, 11/01/2023 (C) | 290 | 294 | ||||||||||
Instituto Costarricense de Electricidad | ||||||||||||
6.950%, 11/10/2021 | 400 | 428 | ||||||||||
6.375%, 05/15/2043 | 290 | 247 | ||||||||||
Republic of Costa Rica | ||||||||||||
7.158%, 03/12/2045 | 600 | 593 | ||||||||||
7.158%, 03/12/2045 (C) | 1,585 | 1,585 | ||||||||||
7.000%, 04/04/2044 | 1,800 | 1,755 | ||||||||||
7.000%, 04/04/2044 (C) | 2,791 | 2,721 | ||||||||||
4.375%, 04/30/2025 | 376 | 337 | ||||||||||
4.375%, 04/30/2025 (C) | 971 | 871 | ||||||||||
4.250%, 01/26/2023 | 1,546 | 1,442 | ||||||||||
|
| |||||||||||
| 10,273 | ||||||||||||
|
| |||||||||||
Croatia — 0.5% | ||||||||||||
Republic of Croatia | ||||||||||||
6.750%, 11/05/2019 | 855 | 946 | ||||||||||
6.625%, 07/14/2020 | 1,307 | 1,447 | ||||||||||
6.375%, 03/24/2021 (C) | 2,903 | 3,190 | ||||||||||
6.250%, 04/27/2017 | 200 | 212 | ||||||||||
6.250%, 04/27/2017 (C) | 590 | 625 | ||||||||||
5.875%, 07/09/2018 | EUR | 170 | 205 | |||||||||
5.500%, 04/04/2023 | 2,000 | 2,107 | ||||||||||
|
| |||||||||||
| 8,732 | ||||||||||||
|
| |||||||||||
Dominican Republic — 1.4% | ||||||||||||
Republic of Dominican Republic | ||||||||||||
15.950%, 06/04/2021 | DOP | 4,500 | 129 | |||||||||
11.500%, 05/10/2024 | DOP | 67,000 | 1,644 | |||||||||
11.000%, 01/05/2018 | DOP | 7,560 | 175 | |||||||||
11.000%, 07/30/2021 (C) | DOP | 67,030 | 1,570 | |||||||||
9.040%, 01/23/2018 | 1,506 | 1,622 | ||||||||||
8.625%, 04/20/2027 | 1,748 | 2,098 | ||||||||||
7.500%, 05/06/2021 | 5,018 | 5,620 | ||||||||||
7.500%, 05/06/2021 (C) | 520 | 583 | ||||||||||
7.450%, 04/30/2044 | 1,324 | 1,466 | ||||||||||
7.450%, 04/30/2044 (C) | 2,143 | 2,373 | ||||||||||
6.850%, 01/27/2045 | 525 | 543 | ||||||||||
6.850%, 01/27/2045 (C) | 3,872 | 4,008 | ||||||||||
5.875%, 04/18/2024 | 380 | 398 | ||||||||||
5.875%, 04/18/2024 (C) | 3,276 | 3,432 | ||||||||||
|
| |||||||||||
| 25,661 | ||||||||||||
|
| |||||||||||
| SEI Institutional Investments Trust / Annual Report / May 31, 2015 | 239 |
SCHEDULE OF INVESTMENTS
Emerging Markets Debt Fund (Continued)
May 31, 2015
| Description | Face Amount (1) (Thousands) | Market Value ($ Thousands) | ||||||||
Ecuador — 1.0% | ||||||||||
EP PetroEcuador via Noble Sovereign Funding I | ||||||||||
5.897%, 09/24/2019 (B) | 4,598 | $ | 4,161 | |||||||
Republic of Ecuador | ||||||||||
10.500%, 03/24/2020 (C) | 4,979 | 5,228 | ||||||||
9.375%, 12/15/2015 | 1,905 | 1,914 | ||||||||
7.950%, 06/20/2024 | 6,750 | 6,396 | ||||||||
|
| |||||||||
| 17,699 | ||||||||||
|
| |||||||||
Egypt — 0.0% | ||||||||||
Arab Republic of Egypt | ||||||||||
6.875%, 04/30/2040 | 921 | 942 | ||||||||
|
| |||||||||
El Salvador — 0.7% | ||||||||||
Republic of El Salvador | ||||||||||
8.250%, 04/10/2032 | 888 | 997 | ||||||||
7.750%, 01/24/2023 | 1,176 | 1,288 | ||||||||
7.750%, 01/24/2023 | 821 | 899 | ||||||||
7.650%, 06/15/2035 | 2,260 | 2,347 | ||||||||
7.375%, 12/01/2019 | 440 | 481 | ||||||||
6.375%, 01/18/2027 | 2,871 | 2,846 | ||||||||
6.375%, 01/18/2027 (C) | 1,835 | 1,819 | ||||||||
5.875%, 01/30/2025 | 1,555 | 1,504 | ||||||||
5.875%, 01/30/2025 (C) | 828 | 801 | ||||||||
|
| |||||||||
| 12,982 | ||||||||||
|
| |||||||||
Ethiopia — 0.1% | ||||||||||
Federal Democratic Republic of Ethiopia | ||||||||||
6.625%, 12/11/2024 | 800 | 807 | ||||||||
6.625%, 12/11/2024 (C) | 1,649 | 1,663 | ||||||||
|
| |||||||||
| 2,470 | ||||||||||
|
| |||||||||
Gabon — 0.1% | ||||||||||
Republic of Gabon | ||||||||||
8.200%, 12/12/2017 | 620 | 659 | ||||||||
6.375%, 12/12/2024 | 321 | 316 | ||||||||
6.375%, 12/12/2024 (C) | 331 | 326 | ||||||||
|
| |||||||||
| 1,301 | ||||||||||
|
| |||||||||
Georgia — 0.3% | ||||||||||
Georgian Railway | ||||||||||
7.750%, 07/11/2022 | 4,351 | 4,782 | ||||||||
|
| |||||||||
Ghana — 0.4% | ||||||||||
Republic of Ghana | ||||||||||
8.500%, 10/04/2017 | 327 | 338 | ||||||||
8.500%, 10/04/2017 (C) | 300 | 310 | ||||||||
8.125%, 01/18/2026 | 3,660 | 3,459 | ||||||||
8.125%, 01/18/2026 (C) | 2,189 | 2,068 | ||||||||
7.875%, 08/07/2023 | 1,200 | 1,130 | ||||||||
7.875%, 08/07/2023 (C) | 650 | 612 | ||||||||
|
| |||||||||
| 7,917 | ||||||||||
|
| |||||||||
| Description | Face Amount (1) (Thousands) | Market Value ($ Thousands) | ||||||||||
Guatemala — 0.1% | ||||||||||||
Comcel Trust | ||||||||||||
6.875%, 02/06/2024 (C) | 1,370 | $ | 1,469 | |||||||||
Republic of Guatemala | ||||||||||||
4.875%, 02/13/2028 | 672 | 679 | ||||||||||
|
| |||||||||||
| 2,148 | ||||||||||||
|
| |||||||||||
Honduras — 0.1% |
| |||||||||||
Republic of Honduras | ||||||||||||
8.750%, 12/16/2020 | 1,241 | 1,409 | ||||||||||
|
| |||||||||||
Hong Kong — 0.1% |
| |||||||||||
MCE Finance | ||||||||||||
5.000%, 02/15/2021 | 244 | 235 | ||||||||||
5.000%, 02/15/2021 (C) | 88 | 85 | ||||||||||
Shimao Property Holdings | ||||||||||||
8.125%, 01/22/2021 | 800 | 840 | ||||||||||
|
| |||||||||||
| 1,160 | ||||||||||||
|
| |||||||||||
Hungary — 4.0% |
| |||||||||||
Magyar Export-Import Bank Zrt | ||||||||||||
4.000%, 01/30/2020 (C) | 1,144 | 1,164 | ||||||||||
Republic of Hungary | ||||||||||||
7.750%, 08/24/2015 | HUF | 43,220 | 155 | |||||||||
7.625%, 03/29/2041 | 9,230 | 12,968 | ||||||||||
7.500%, 11/12/2020 | HUF | 164,830 | 717 | |||||||||
7.000%, 06/24/2022 | HUF | 3,022,790 | 13,160 | |||||||||
6.750%, 11/24/2017 | HUF | 27,380 | 108 | |||||||||
6.500%, 06/24/2019 | HUF | 1,162,840 | 4,744 | |||||||||
6.375%, 03/29/2021 | 1,454 | 1,679 | ||||||||||
6.250%, 01/29/2020 | 910 | 1,033 | ||||||||||
6.000%, 11/24/2023 | HUF | 470,110 | 1,979 | |||||||||
5.750%, 11/22/2023 | 6,886 | 7,825 | ||||||||||
5.500%, 12/22/2016 | HUF | 783,950 | 2,947 | |||||||||
5.500%, 12/20/2018 | HUF | 234,150 | 916 | |||||||||
5.500%, 06/24/2025 | HUF | 2,473,530 | 10,226 | |||||||||
5.375%, 02/21/2023 | 1,584 | 1,751 | ||||||||||
5.375%, 03/25/2024 | 618 | 685 | ||||||||||
5.000%, 03/30/2016 | GBP | 253 | 395 | |||||||||
4.125%, 02/19/2018 | 4,298 | 4,497 | ||||||||||
4.000%, 04/25/2018 | HUF | 341,120 | 1,271 | |||||||||
4.000%, 03/25/2019 | 2,302 | 2,400 | ||||||||||
3.500%, 06/24/2020 | HUF | 149,110 | 546 | |||||||||
3.500%, 06/24/2020 | HUF | 162,070 | 594 | |||||||||
2.500%, 06/22/2018 | HUF | 308,790 | 1,102 | |||||||||
|
| |||||||||||
| 72,862 | ||||||||||||
|
| |||||||||||
India — 0.1% |
| |||||||||||
ABJA Investment | ||||||||||||
5.950%, 07/31/2024 | 740 | 750 | ||||||||||
Export-Import Bank of India MTN | ||||||||||||
4.000%, 08/07/2017 | 265 | 276 | ||||||||||
| 240 | SEI Institutional Investments Trust / Annual Report / May 31, 2015 |
| Description | Face Amount (1) (Thousands) | Market Value ($ Thousands) | ||||||||||
Vedanta Resources | ||||||||||||
8.250%, 06/07/2021 (C) | 200 | $ | 197 | |||||||||
7.125%, 05/31/2023 (C) | 200 | 184 | ||||||||||
6.000%, 01/31/2019 (C) | 341 | 319 | ||||||||||
|
| |||||||||||
| 1,726 | ||||||||||||
|
| |||||||||||
Indonesia — 7.9% |
| |||||||||||
Deutsche Bank, CLN (Republic of Indonesia) | ||||||||||||
7.000%, 05/15/2022 | IDR | 6,000,000 | 426 | |||||||||
7.000%, 05/15/2027 | IDR | 2,500,000 | 171 | |||||||||
6.625%, 05/15/2033 | IDR | 6,800,000 | 428 | |||||||||
JPMorgan, CLN (Republic of Indonesia) | ||||||||||||
7.000%, 05/15/2022 | IDR | 116,900,000 | 8,301 | |||||||||
6.625%, 05/15/2033 | IDR | 3,500,000 | 220 | |||||||||
Majapahit Holding | ||||||||||||
8.000%, 08/07/2019 | 200 | 233 | ||||||||||
8.000%, 08/07/2019 (C) | 350 | 408 | ||||||||||
7.875%, 06/29/2037 (C) | 215 | 258 | ||||||||||
Pelabuhan Indonesia III | ||||||||||||
4.875%, 10/01/2024 | 1,858 | 1,890 | ||||||||||
4.875%, 10/01/2024 (C) | 200 | 203 | ||||||||||
Pertamina Persero MTN | ||||||||||||
6.500%, 05/27/2041 (C) | 820 | 847 | ||||||||||
6.450%, 05/30/2044 (C) | 2,412 | 2,490 | ||||||||||
6.000%, 05/03/2042 | 394 | 381 | ||||||||||
6.000%, 05/03/2042 (C) | 1,450 | 1,401 | ||||||||||
5.625%, 05/20/2043 | 5,457 | 5,076 | ||||||||||
4.875%, 05/03/2022 (C) | 550 | 567 | ||||||||||
Republic of Indonesia | ||||||||||||
12.800%, 06/15/2021 | IDR | 230,000 | 21 | |||||||||
11.625%, 03/04/2019 | 258 | 342 | ||||||||||
11.625%, 03/04/2019 | 1,006 | 1,332 | ||||||||||
11.625%, 03/04/2019 (C) | 2,500 | 3,309 | ||||||||||
11.000%, 09/15/2025 | IDR | 2,000,000 | 180 | |||||||||
9.000%, 03/15/2029 | IDR | 185,892,000 | 14,830 | |||||||||
8.500%, 10/12/2035 | 4,038 | 5,608 | ||||||||||
8.375%, 03/15/2024 | IDR | 306,862,000 | 23,467 | |||||||||
8.375%, 09/15/2026 | IDR | 700,000 | 54 | |||||||||
8.375%, 03/15/2034 | IDR | 187,736,000 | 14,197 | |||||||||
8.250%, 06/15/2032 | IDR | 5,900,000 | 439 | |||||||||
7.875%, 04/15/2019 | IDR | 68,624,000 | 5,158 | |||||||||
7.750%, 01/17/2038 | 2,633 | 3,449 | ||||||||||
7.750%, 01/17/2038 | 6,451 | 8,451 | ||||||||||
7.000%, 05/15/2022 | IDR | 68,500,000 | 4,864 | |||||||||
6.875%, 01/17/2018 | 2,379 | 2,682 | ||||||||||
6.750%, 01/15/2044 (C) | 1,750 | 2,122 | ||||||||||
6.625%, 05/15/2033 | IDR | 34,970,000 | 2,201 | |||||||||
6.625%, 02/17/2037 | 2,082 | 2,410 | ||||||||||
6.125%, 05/15/2028 | IDR | 18,170,000 | 1,135 | |||||||||
5.875%, 01/15/2024 | 4,183 | 4,706 | ||||||||||
5.625%, 05/15/2023 | IDR | 71,594,000 | 4,618 | |||||||||
5.250%, 01/17/2042 | 867 | 873 | ||||||||||
| Description | Face Amount (1) (Thousands) | Market Value ($ Thousands) | ||||||||||
5.125%, 01/15/2045 (C) | 1,516 | $ | 1,505 | |||||||||
4.875%, 05/05/2021 | 3,173 | 3,431 | ||||||||||
4.875%, 05/05/2021 (C) | 200 | 216 | ||||||||||
4.125%, 01/15/2025 | 6,305 | 6,280 | ||||||||||
3.375%, 04/15/2023 (C) | 3,263 | 3,145 | ||||||||||
2.875%, 07/08/2021 (C) | EUR | 740 | 836 | |||||||||
|
| |||||||||||
| 145,161 | ||||||||||||
|
| |||||||||||
Iraq — 0.2% |
| |||||||||||
Republic of Iraq | ||||||||||||
5.800%, 01/15/2028 | 4,251 | 3,512 | ||||||||||
|
| |||||||||||
Israel — 0.0% |
| |||||||||||
Altice Financing | ||||||||||||
8.000%, 12/15/2019 | EUR | 140 | 163 | |||||||||
|
| |||||||||||
Italy — 0.0% |
| |||||||||||
Wind Acquisition Finance | ||||||||||||
4.750%, 07/15/2020 (C) | 68 | 69 | ||||||||||
4.000%, 07/15/2020 (C) | EUR | 171 | 190 | |||||||||
|
| |||||||||||
| 259 | ||||||||||||
|
| |||||||||||
Ivory Coast — 1.2% |
| |||||||||||
Government of Ivory Coast | ||||||||||||
11.660%, 12/31/2032 | 3,527 | 3,368 | ||||||||||
11.660%, 12/31/2032 | 11,908 | 11,372 | ||||||||||
6.375%, 03/03/2028 (C) | 3,659 | 3,659 | ||||||||||
5.375%, 07/23/2024 (C) | 3,903 | 3,723 | ||||||||||
|
| |||||||||||
| 22,122 | ||||||||||||
|
| |||||||||||
Jamaica — 0.4% |
| |||||||||||
Digicel Group | ||||||||||||
8.250%, 09/30/2020 | 1,750 | 1,815 | ||||||||||
7.125%, 04/01/2022 (C) | 1,248 | 1,213 | ||||||||||
Government of Jamaica | ||||||||||||
7.625%, 07/09/2025 | 4,817 | 5,365 | ||||||||||
|
| |||||||||||
| 8,393 | ||||||||||||
|
| |||||||||||
Kazakhstan — 2.5% |
| |||||||||||
Development Bank of Kazakhstan | ||||||||||||
4.125%, 12/10/2022 | 880 | 790 | ||||||||||
Halyk Savings Bank of Kazakhstan | ||||||||||||
7.250%, 01/28/2021 | 100 | 104 | ||||||||||
7.250%, 01/28/2021 (C) | 700 | 727 | ||||||||||
KazAgro National Management Holding | ||||||||||||
4.625%, 05/24/2023 | 4,650 | 4,173 | ||||||||||
Kazakhstan Temir Zholy Finance | ||||||||||||
6.950%, 07/10/2042 | 500 | 485 | ||||||||||
6.375%, 10/06/2020 (C) | 660 | 693 | ||||||||||
| SEI Institutional Investments Trust / Annual Report / May 31, 2015 | 241 |
SCHEDULE OF INVESTMENTS
Emerging Markets Debt Fund (Continued)
May 31, 2015
| Description | Face Amount (1) (Thousands) | Market Value ($ Thousands) | ||||||||||
KazMunaiGaz Finance Sub MTN | ||||||||||||
9.125%, 07/02/2018 | 2,029 | $ | 2,296 | |||||||||
9.125%, 07/02/2018 (C) | 986 | 1,116 | ||||||||||
7.000%, 05/05/2020 | 3,902 | 4,171 | ||||||||||
6.375%, 04/09/2021 | 3,351 | 3,482 | ||||||||||
6.375%, 04/09/2021 (C) | 4,114 | 4,275 | ||||||||||
KazMunayGas National | ||||||||||||
6.000%, 11/07/2044 (C) | 2,318 | 1,977 | ||||||||||
5.750%, 04/30/2043 | 14,389 | 11,964 | ||||||||||
5.750%, 04/30/2043 (C) | 4,674 | 3,895 | ||||||||||
4.875%, 05/07/2025 (C) | 1,297 | 1,188 | ||||||||||
4.400%, 04/30/2023 (C) | 2,895 | 2,653 | ||||||||||
Nostrum Oil & Gas Finance | ||||||||||||
6.375%, 02/14/2019 (C) | 457 | 430 | ||||||||||
Republic of Kazakhstan | ||||||||||||
4.875%, 10/14/2044 (C) | 423 | 379 | ||||||||||
3.875%, 10/14/2024 (C) | 394 | 379 | ||||||||||
Samruk-Energy MTN | ||||||||||||
3.750%, 12/20/2017 | 700 | 679 | ||||||||||
Zhaikmunai Via Zhaikmunai International | ||||||||||||
7.125%, 11/13/2019 (C) | 364 | 343 | ||||||||||
|
| |||||||||||
| 46,199 | ||||||||||||
|
| |||||||||||
Kenya — 0.5% |
| |||||||||||
Kenya Infrastructure Bond | ||||||||||||
11.000%, 09/15/2025 | KES | 295,000 | 2,938 | |||||||||
Republic of Kenya | ||||||||||||
6.875%, 06/24/2024 | 507 | 531 | ||||||||||
6.875%, 06/24/2024 (C) | 4,827 | 5,053 | ||||||||||
5.875%, 06/24/2019 (C) | 1,643 | 1,692 | ||||||||||
|
| |||||||||||
| 10,214 | ||||||||||||
|
| |||||||||||
Kuwait — 0.0% |
| |||||||||||
NBK Tier 1 Financing | ||||||||||||
5.750%, 12/29/2049 (B) | 413 | 425 | ||||||||||
|
| |||||||||||
Lithuania — 0.2% |
| |||||||||||
Republic of Lithuania | ||||||||||||
7.375%, 02/11/2020 | 343 | 416 | ||||||||||
6.625%, 02/01/2022 | 200 | 244 | ||||||||||
6.625%, 02/01/2022 (C) | 300 | 367 | ||||||||||
6.125%, 03/09/2021 (C) | 1,716 | 2,018 | ||||||||||
|
| |||||||||||
| 3,045 | ||||||||||||
|
| |||||||||||
Malaysia — 5.2% |
| |||||||||||
1MDB Global Investments | ||||||||||||
4.400%, 03/09/2023 | 2,600 | 2,262 | ||||||||||
Government of Malaysia | ||||||||||||
5.248%, 09/15/2028 (C) | MYR | 1,050 | 319 | |||||||||
4.935%, 09/30/2043 | MYR | 7,500 | 2,139 | |||||||||
4.498%, 04/15/2030 | MYR | 1,540 | 437 | |||||||||
| Description | Face Amount (1) (Thousands) | Market Value ($ Thousands) | ||||||||||
4.444%, 05/22/2024 | MYR | 14,600 | $ | 4,083 | ||||||||
4.392%, 04/15/2026 | MYR | 12,223 | 3,425 | |||||||||
4.378%, 11/29/2019 | MYR | 4,860 | 1,366 | |||||||||
4.262%, 09/15/2016 | MYR | 18,260 | 5,053 | |||||||||
4.181%, 07/15/2024 | MYR | 34,754 | 9,624 | |||||||||
4.160%, 07/15/2021 | MYR | 7,164 | 1,991 | |||||||||
4.048%, 09/30/2021 | MYR | 5,020 | 1,381 | |||||||||
4.012%, 09/15/2017 | MYR | 12,660 | 3,503 | |||||||||
3.955%, 09/15/2025 | MYR | 8,390 | 2,295 | |||||||||
3.892%, 03/15/2027 | MYR | 2,325 | 621 | |||||||||
3.889%, 07/31/2020 | MYR | 17,215 | 4,748 | |||||||||
3.844%, 04/15/2033 | MYR | 1,960 | 504 | |||||||||
3.835%, 08/12/2015 | MYR | 14,949 | 4,085 | |||||||||
3.654%, 10/31/2019 | MYR | 22,840 | 6,229 | |||||||||
3.580%, 09/28/2018 | MYR | 8,125 | 2,217 | |||||||||
3.502%, 05/31/2027 | MYR | 1,050 | 269 | |||||||||
3.492%, 03/31/2020 | MYR | 26,500 | 7,166 | |||||||||
3.480%, 03/15/2023 | MYR | 19,004 | 5,022 | |||||||||
3.418%, 08/15/2022 | MYR | 10,253 | 2,707 | |||||||||
3.394%, 03/15/2017 | MYR | 3,233 | 883 | |||||||||
3.314%, 10/31/2017 | MYR | 24,970 | 6,809 | |||||||||
3.260%, 03/01/2018 | MYR | 20,690 | 5,610 | |||||||||
3.197%, 10/15/2015 | MYR | 10,915 | 2,980 | |||||||||
3.172%, 07/15/2016 | MYR | 9,460 | 2,588 | |||||||||
Petronas Capital MTN | ||||||||||||
4.500%, 03/18/2045 (C) | 1,300 | 1,326 | ||||||||||
3.500%, 03/18/2025 (C) | 3,303 | 3,341 | ||||||||||
|
| |||||||||||
| 94,983 | ||||||||||||
|
| |||||||||||
Mexico — 8.9% |
| |||||||||||
America Movil | ||||||||||||
7.125%, 12/09/2024 | MXN | 23,310 | 1,493 | |||||||||
6.000%, 06/09/2019 | MXN | 14,350 | 932 | |||||||||
BBVA Bancomer | ||||||||||||
6.750%, 09/30/2022 (C) | 500 | 568 | ||||||||||
Cemex | ||||||||||||
6.125%, 05/05/2025 (C) | 1,594 | 1,608 | ||||||||||
5.700%, 01/11/2025 (C) | 245 | 241 | ||||||||||
Cemex Finance | ||||||||||||
9.375%, 10/12/2022 | 2,000 | 2,270 | ||||||||||
9.375%, 10/12/2022 (C) | 779 | 884 | ||||||||||
6.000%, 04/01/2024 (C) | 98 | 99 | ||||||||||
Comision Federal de Electricidad | ||||||||||||
5.750%, 02/14/2042 (C) | 570 | 593 | ||||||||||
4.875%, 01/15/2024 (C) | 288 | 302 | ||||||||||
Fermaca Enterprises S de RL | ||||||||||||
6.375%, 03/30/2038 (C) | 430 | 453 | ||||||||||
JB y Compania | ||||||||||||
3.750%, 05/13/2025 (C) | 399 | 399 | ||||||||||
Mexican Bonos | ||||||||||||
10.000%, 12/05/2024 | MXN | 250,600 | 20,917 | |||||||||
10.000%, 11/20/2036 | MXN | 8,930 | 801 | |||||||||
8.500%, 12/13/2018 | MXN | 14,390 | 1,039 | |||||||||
| 242 | SEI Institutional Investments Trust / Annual Report / May 31, 2015 |
| Description | Face Amount (1) (Thousands) | Market Value ($ Thousands) | ||||||||||
8.500%, 05/31/2029 | MXN | 23,897 | $ | 1,860 | ||||||||
8.500%, 11/18/2038 | MXN | 81,205 | 6,385 | |||||||||
8.000%, 12/17/2015 | MXN | 42,880 | 2,853 | |||||||||
8.000%, 06/11/2020 | MXN | 17,410 | 1,258 | |||||||||
7.750%, 12/14/2017 | MXN | 76,202 | 5,333 | |||||||||
7.750%, 05/29/2031 | MXN | 118,609 | 8,662 | |||||||||
7.750%, 11/23/2034 | MXN | 230 | 17 | |||||||||
7.750%, 11/13/2042 | MXN | 4,090 | 300 | |||||||||
7.500%, 06/03/2027 | MXN | 36,567 | 2,621 | |||||||||
6.500%, 06/10/2021 | MXN | 55,859 | 3,775 | |||||||||
6.500%, 06/09/2022 | MXN | 92,538 | 6,246 | |||||||||
6.250%, 06/16/2016 | MXN | 37,533 | 2,503 | |||||||||
5.000%, 06/15/2017 | MXN | 47,433 | 3,135 | |||||||||
5.000%, 12/11/2019 | MXN | 135,460 | 8,692 | |||||||||
Mexican Bonos, Ser M10 | ||||||||||||
7.250%, 12/15/2016 | MXN | 50,991 | 3,483 | |||||||||
Mexican Bonos, Ser M20 | ||||||||||||
8.000%, 12/07/2023 | MXN | 60,732 | 4,465 | |||||||||
Mexican Udibonos | ||||||||||||
4.500%, 11/22/2035 | MXN | 8,180 | 3,286 | |||||||||
2.500%, 12/10/2020 | MXN | 7,527 | 2,610 | |||||||||
2.000%, 06/09/2022 | MXN | 1,752 | 581 | |||||||||
Mexico Cetes | ||||||||||||
3.410%, 03/03/2016 (E) | MXN | 475,960 | 3,008 | |||||||||
Petroleos Mexicanos | ||||||||||||
7.190%, 09/12/2024 | MXN | 69,790 | 4,396 | |||||||||
6.625%, 06/15/2035 | 5,616 | 6,307 | ||||||||||
6.500%, 06/02/2041 | 600 | 657 | ||||||||||
6.375%, 01/23/2045 | 500 | 543 | ||||||||||
6.375%, 01/23/2045 (C) | 1,016 | 1,102 | ||||||||||
5.750%, 03/01/2018 | 670 | 737 | ||||||||||
5.625%, 01/23/2046 (C) | 498 | 492 | ||||||||||
4.250%, 01/15/2025 (C) | 2,841 | 2,825 | ||||||||||
3.500%, 01/30/2023 (C) | 210 | 201 | ||||||||||
Sixsigma Networks Mexico | ||||||||||||
8.250%, 11/07/2021 (C) | 591 | 629 | ||||||||||
Southern Copper | ||||||||||||
3.875%, 04/23/2025 | 873 | 854 | ||||||||||
Trust F | ||||||||||||
5.250%, 12/15/2024‡ (C) | 1,380 | 1,459 | ||||||||||
United Mexican States MTN | ||||||||||||
7.500%, 04/08/2033 | 468 | 658 | ||||||||||
6.050%, 01/11/2040 | 1,212 | 1,442 | ||||||||||
5.750%, 10/12/2110 | 478 | 498 | ||||||||||
5.550%, 01/21/2045 | 6,150 | 6,911 | ||||||||||
4.750%, 03/08/2044 | 3,744 | 3,773 | ||||||||||
4.600%, 01/23/2046 | 7,046 | 6,931 | ||||||||||
4.000%, 10/02/2023 | 2,336 | 2,435 | ||||||||||
3.600%, 01/30/2025 | 11,052 | 11,113 | ||||||||||
United Mexican States, | ||||||||||||
6.750%, 09/27/2034 | 4,572 | 6,001 | ||||||||||
|
| |||||||||||
| 163,636 | ||||||||||||
|
| |||||||||||
| Description | Face Amount (1) (Thousands) | Market Value ($ Thousands) | ||||||||||
Mongolia — 0.8% | ||||||||||||
Development Bank of Mongolia MTN | ||||||||||||
5.750%, 03/21/2017 | 1,138 | $ | 1,118 | |||||||||
Government of Mongolia MTN | ||||||||||||
5.125%, 12/05/2022 | 11,062 | 9,983 | ||||||||||
4.125%, 01/05/2018 | 3,048 | 2,919 | ||||||||||
Trade & Development Bank of Mongolia MTN | ||||||||||||
9.375%, 05/19/2020 (C) | 453 | 482 | ||||||||||
|
| |||||||||||
| 14,502 | ||||||||||||
|
| |||||||||||
Montenegro — 0.0% | ||||||||||||
Republic of Montenegro | ||||||||||||
7.875%, 09/14/2015 | EUR | 140 | 156 | |||||||||
5.375%, 05/20/2019 | EUR | 481 | 547 | |||||||||
|
| |||||||||||
| 703 | ||||||||||||
|
| |||||||||||
Morocco — 0.2% | ||||||||||||
Kingdom of Morocco | ||||||||||||
5.500%, 12/11/2042 | 1,900 | 2,022 | ||||||||||
4.250%, 12/11/2022 (C) | 632 | 656 | ||||||||||
OCP | ||||||||||||
5.625%, 04/25/2024 (C) | 411 | 438 | ||||||||||
|
| |||||||||||
| 3,116 | ||||||||||||
|
| |||||||||||
Mozambique — 0.1% | ||||||||||||
Republic of Mozambique | ||||||||||||
6.305%, 09/11/2020 | 1,066 | 1,024 | ||||||||||
|
| |||||||||||
Nigeria — 0.6% | ||||||||||||
Republic of Nigeria | ||||||||||||
16.390%, 01/27/2022 | NGN | 141,837 | 789 | |||||||||
16.000%, 06/29/2019 | NGN | 214,300 | 1,143 | |||||||||
15.100%, 04/27/2017 | NGN | 29,439 | 151 | |||||||||
14.200%, 03/14/2024 | NGN | 158,445 | 801 | |||||||||
6.750%, 01/28/2021 (F) | 4,026 | 4,217 | ||||||||||
6.750%, 01/28/2021 (C) | 550 | 576 | ||||||||||
6.375%, 07/12/2023 | 3,266 | 3,344 | ||||||||||
|
| |||||||||||
| 11,021 | ||||||||||||
|
| |||||||||||
Pakistan — 0.4% | ||||||||||||
Republic of Pakistan | ||||||||||||
8.250%, 04/15/2024 | 5,175 | 5,589 | ||||||||||
7.250%, 04/15/2019 (C) | 610 | 637 | ||||||||||
7.125%, 03/31/2016 | 100 | 103 | ||||||||||
7.125%, 03/31/2016 | 450 | 464 | ||||||||||
6.875%, 06/01/2017 | 10 | 10 | ||||||||||
6.875%, 06/01/2017 | 630 | 656 | ||||||||||
|
| |||||||||||
| 7,459 | ||||||||||||
|
| |||||||||||
| SEI Institutional Investments Trust / Annual Report / May 31, 2015 | 243 |
SCHEDULE OF INVESTMENTS
Emerging Markets Debt Fund (Continued)
May 31, 2015
| Description | Face Amount (1) (Thousands) | Market Value ($ Thousands) | ||||||||||
Panama — 1.0% | ||||||||||||
Panama Notas del Tesoro | ||||||||||||
4.875%, 02/05/2021 | 840 | $ | 902 | |||||||||
Republic of Panama | ||||||||||||
9.375%, 01/16/2023 | 595 | 821 | ||||||||||
9.375%, 04/01/2029 | 5,438 | 8,225 | ||||||||||
8.875%, 09/30/2027 | 1,613 | 2,331 | ||||||||||
8.125%, 04/28/2034 | 2,249 | 3,115 | ||||||||||
7.125%, 01/29/2026 | 100 | 128 | ||||||||||
6.700%, 01/26/2036 | 1,095 | 1,393 | ||||||||||
4.300%, 04/29/2053 | 140 | 128 | ||||||||||
4.000%, 09/22/2024 | 472 | 484 | ||||||||||
3.750%, 03/16/2025 | 1,296 | 1,301 | ||||||||||
|
| |||||||||||
| 18,828 | ||||||||||||
|
| |||||||||||
Paraguay — 0.5% | ||||||||||||
Republic of Paraguay | ||||||||||||
6.100%, 08/11/2044 | 1,187 | 1,276 | ||||||||||
6.100%, 08/11/2044 (C) | 1,822 | 1,959 | ||||||||||
4.625%, 01/25/2023 (F) | 4,006 | 4,106 | ||||||||||
4.625%, 01/25/2023 (C) | 1,149 | 1,178 | ||||||||||
Telefonica Celular del Paraguay | ||||||||||||
6.750%, 12/13/2022 | 200 | 212 | ||||||||||
6.750%, 12/13/2022 | 900 | 953 | ||||||||||
|
| |||||||||||
| 9,684 | ||||||||||||
|
| |||||||||||
Peru — 1.6% | ||||||||||||
Abengoa Transmission Sur | ||||||||||||
6.875%, 04/30/2043 (C) | 327 | 367 | ||||||||||
BBVA Banco Continental | ||||||||||||
5.250%, 09/22/2029 (B) (C) | 794 | 813 | ||||||||||
Peru Enhanced Pass-Through Finance | ||||||||||||
4.680%, 06/02/2025 (C), (E) | 1,000 | 753 | ||||||||||
2.091%, 05/31/2018 (E) | 188 | 180 | ||||||||||
2.020%, 05/31/2018 (C), (E) | 213 | 204 | ||||||||||
Republic of Peru | ||||||||||||
8.750%, 11/21/2033 | 3,185 | 4,985 | ||||||||||
8.200%, 08/12/2026 | PEI | 5,055 | 1,832 | |||||||||
7.350%, 07/21/2025 | 2,372 | 3,178 | ||||||||||
6.950%, 08/12/2031 | PEI | 16,242 | 5,207 | |||||||||
6.950%, 08/12/2031 | PEI | 7,279 | 2,334 | |||||||||
6.850%, 02/12/2042 | PEI | 882 | 271 | |||||||||
6.550%, 03/14/2037 | 2,248 | 2,917 | ||||||||||
5.700%, 08/12/2024 | PEI | 4,658 | 1,432 | |||||||||
5.700%, 08/12/2024 (C) | PEI | 14,227 | 4,376 | |||||||||
5.625%, 11/18/2050 | 881 | 1,035 | ||||||||||
|
| |||||||||||
| 29,884 | ||||||||||||
|
| |||||||||||
Philippines — 0.3% | ||||||||||||
Development Bank of Philippines | ||||||||||||
5.500%, 03/25/2021 | 370 | 412 | ||||||||||
| Description | Face Amount (1) (Thousands) | Market Value ($ Thousands) | ||||||||||
National Power | ||||||||||||
9.625%, 05/15/2028 | 1,100 | $ | 1,707 | |||||||||
Republic of Philippines | ||||||||||||
9.500%, 02/02/2030 | 376 | 629 | ||||||||||
6.375%, 01/15/2032 | 1,477 | 1,987 | ||||||||||
4.200%, 01/21/2024 | 599 | 666 | ||||||||||
3.900%, 11/26/2022 | PHP | 52,000 | 1,169 | |||||||||
|
| |||||||||||
| 6,570 | ||||||||||||
|
| |||||||||||
Poland — 1.8% | ||||||||||||
Eileme 2 | ||||||||||||
11.625%, 01/31/2020 | 350 | 392 | ||||||||||
Republic of Poland | ||||||||||||
5.750%, 09/23/2022 | PLN | 15,678 | 4,997 | |||||||||
5.250%, 10/25/2017 | PLN | 9,130 | 2,624 | |||||||||
4.000%, 10/25/2023 | PLN | 11,370 | 3,290 | |||||||||
4.000%, 01/22/2024 | 1,742 | 1,862 | ||||||||||
3.250%, 07/25/2025 | PLN | 13,563 | 3,713 | |||||||||
3.000%, 08/24/2016 | PLN | 11,967 | 3,286 | |||||||||
2.750%, 08/25/2023 | PLN | 21,546 | 6,443 | |||||||||
2.691%, 07/25/2016 (E) | PLN | 1,980 | 517 | |||||||||
2.500%, 07/25/2018 | PLN | 6,227 | 1,678 | |||||||||
1.634%, 01/25/2016 (E) | PLN | 11,526 | 3,038 | |||||||||
0.000%, 07/25/2017 (E) | PLN | 4,720 | 1,209 | |||||||||
|
| |||||||||||
| 33,049 | ||||||||||||
|
| |||||||||||
Qatar — 0.3% | ||||||||||||
Ooredoo International Finance | ||||||||||||
7.875%, 06/10/2019 | 873 | 1,063 | ||||||||||
State of Qatar | ||||||||||||
6.400%, 01/20/2040 | 2,800 | 3,738 | ||||||||||
|
| |||||||||||
| 4,801 | ||||||||||||
|
| |||||||||||
Romania — 1.8% | ||||||||||||
Government of Romania MTN | ||||||||||||
6.750%, 02/07/2022 | 1,656 | 1,983 | ||||||||||
6.750%, 02/07/2022 (C) | 390 | 467 | ||||||||||
6.125%, 01/22/2044 (C) | 1,568 | 1,901 | ||||||||||
5.950%, 06/11/2021 | RON | 26,380 | 7,528 | |||||||||
5.850%, 04/26/2023 | RON | 5,580 | 1,610 | |||||||||
5.750%, 04/29/2020 | RON | 17,530 | 4,919 | |||||||||
4.875%, 01/22/2024 | 158 | 173 | ||||||||||
4.875%, 01/22/2024 (C) | 2,950 | 3,223 | ||||||||||
4.750%, 08/29/2016 | RON | 10,860 | 2,787 | |||||||||
4.750%, 06/24/2019 | RON | 21,070 | 5,651 | |||||||||
4.750%, 02/24/2025 | RON | 4,380 | 1,192 | |||||||||
4.375%, 08/22/2023 | 1,670 | 1,765 | ||||||||||
|
| |||||||||||
| 33,199 | ||||||||||||
|
| |||||||||||
Russia — 6.5% | ||||||||||||
Alfa Bank via Alfa Bond Issuance | ||||||||||||
7.750%, 04/28/2021 | 2,600 | 2,636 | ||||||||||
| 244 | SEI Institutional Investments Trust / Annual Report / May 31, 2015 |
| Description | Face Amount (1) (Thousands) | Market Value ($ Thousands) | ||||||||||
EDC Finance | ||||||||||||
4.875%, 04/17/2020 | 1,700 | $ | 1,564 | |||||||||
Gazprom OAO Via Gaz Capital | ||||||||||||
9.250%, 04/23/2019 | 3,923 | 4,432 | ||||||||||
9.250%, 04/23/2019 (C) | 489 | 552 | ||||||||||
6.510%, 03/07/2022 (C) | 283 | 287 | ||||||||||
4.950%, 07/19/2022 (C) | 204 | 192 | ||||||||||
Lukoil International Finance | ||||||||||||
3.416%, 04/24/2018 (C) | 240 | 230 | ||||||||||
Ritekro | ||||||||||||
13.934%, 11/07/2022 (E) (G) (H) | 538 | 269 | ||||||||||
Russian Federal Bond - OFZ | ||||||||||||
8.150%, 02/03/2027 | RUB | 41,888 | 682 | |||||||||
7.600%, 04/14/2021 | RUB | 592,255 | 9,808 | |||||||||
7.600%, 07/20/2022 | RUB | 526,434 | 8,552 | |||||||||
7.500%, 03/15/2018 | RUB | 405,446 | 7,115 | |||||||||
7.500%, 02/27/2019 | RUB | 935,706 | 16,055 | |||||||||
7.400%, 04/19/2017 | RUB | 162,620 | 2,923 | |||||||||
7.400%, 06/14/2017 | RUB | 44,700 | 800 | |||||||||
7.350%, 01/20/2016 | RUB | 100,000 | 1,867 | |||||||||
7.050%, 01/19/2028 | RUB | 274,209 | 4,025 | |||||||||
7.000%, 11/24/2021 (D) | RUB | 24,270 | 377 | |||||||||
7.000%, 01/25/2023 | RUB | 328,216 | 5,126 | |||||||||
7.000%, 08/16/2023 | RUB | 220,930 | 3,413 | |||||||||
6.900%, 08/03/2016 | RUB | 59,436 | 1,087 | |||||||||
6.800%, 12/11/2019 | RUB | 32,930 | 540 | |||||||||
6.700%, 05/15/2019 | RUB | 204,041 | 3,392 | |||||||||
6.400%, 05/27/2020 | RUB | 48,590 | 774 | |||||||||
6.200%, 01/31/2018 | RUB | 459,473 | 7,818 | |||||||||
Russian Foreign Bond - Eurobond | ||||||||||||
7.850%, 03/10/2018 | RUB | 145,000 | 2,561 | |||||||||
7.850%, 03/10/2018 (C) | RUB | 10,000 | 177 | |||||||||
5.625%, 04/04/2042 | 2,400 | 2,314 | ||||||||||
5.000%, 04/29/2020 | 11,400 | 11,714 | ||||||||||
4.875%, 09/16/2023 | 2,800 | 2,772 | ||||||||||
4.875%, 09/16/2023 (C) | 2,000 | 1,980 | ||||||||||
4.500%, 04/04/2022 | 1,200 | 1,177 | ||||||||||
3.500%, 01/16/2019 | 1,200 | 1,191 | ||||||||||
3.250%, 04/04/2017 | 1,400 | 1,425 | ||||||||||
Sistema via Sistema International Funding | ||||||||||||
6.950%, 05/17/2019 | 1,790 | 1,737 | ||||||||||
VEB-Leasing via VEB Leasing Investment | ||||||||||||
5.125%, 05/27/2016 | 340 | 340 | ||||||||||
VimpelCom Holdings | ||||||||||||
7.748%, 02/02/2021 (C) | 198 | 203 | ||||||||||
7.504%, 03/01/2022 (C) | 447 | 452 | ||||||||||
5.950%, 02/13/2023 (C) | 95 | 88 | ||||||||||
5.200%, 02/13/2019 (C) | 308 | 299 | ||||||||||
Vnesheconombank via VEB Finance | ||||||||||||
6.902%, 07/09/2020 | 1,635 | 1,627 | ||||||||||
| Description | Face Amount (1) (Thousands) | Market Value ($ Thousands) | ||||||||||
6.800%, 11/22/2025 | 3,190 | $ | 3,041 | |||||||||
6.800%, 11/22/2025 (C) | 600 | 572 | ||||||||||
5.450%, 11/22/2017 | 110 | 110 | ||||||||||
5.450%, 11/22/2017 (C) | 340 | 339 | ||||||||||
|
| |||||||||||
| 118,635 | ||||||||||||
|
| |||||||||||
Senegal — 0.5% | ||||||||||||
Republic of Senegal | ||||||||||||
8.750%, 05/13/2021 | 1,390 | 1,562 | ||||||||||
8.750%, 05/13/2021 (C) | 200 | 225 | ||||||||||
6.250%, 07/30/2024 | 7,579 | 7,428 | ||||||||||
6.250%, 07/30/2024 (C) | 530 | 519 | ||||||||||
|
| |||||||||||
| 9,734 | ||||||||||||
|
| |||||||||||
Serbia — 0.4% | ||||||||||||
Republic of Serbia | ||||||||||||
7.250%, 09/28/2021 | 3,068 | 3,527 | ||||||||||
7.250%, 09/28/2021 (C) | 300 | 345 | ||||||||||
5.875%, 12/03/2018 | 655 | 694 | ||||||||||
5.875%, 12/03/2018 (C) | 1,623 | 1,720 | ||||||||||
4.875%, 02/25/2020 | 200 | 206 | ||||||||||
|
| |||||||||||
| 6,492 | ||||||||||||
|
| |||||||||||
Singapore — 0.1% | ||||||||||||
Government of Singapore | ||||||||||||
3.375%, 09/01/2033 | SGD | 1,850 | 1,482 | |||||||||
3.000%, 09/01/2024 | SGD | 1,522 | 1,188 | |||||||||
|
| |||||||||||
| 2,670 | ||||||||||||
|
| |||||||||||
Slovenia — 0.7% | ||||||||||||
Republic of Slovenia | ||||||||||||
5.850%, 05/10/2023 | 2,300 | 2,681 | ||||||||||
5.250%, 02/18/2024 | 7,310 | 8,234 | ||||||||||
4.125%, 02/18/2019 | 1,100 | 1,160 | ||||||||||
|
| |||||||||||
| 12,075 | ||||||||||||
|
| |||||||||||
South Africa — 5.3% | ||||||||||||
Eskom Holdings | ||||||||||||
6.750%, 08/06/2023 | 1,400 | 1,433 | ||||||||||
Eskom Holdings SOC | ||||||||||||
7.125%, 02/11/2025 (C) | 7,794 | 8,030 | ||||||||||
Republic of South Africa | ||||||||||||
10.500%, 12/21/2026 | ZAR | 103,770 | 10,004 | |||||||||
8.750%, 01/31/2044 | ZAR | 28,360 | 2,299 | |||||||||
8.750%, 02/28/2048 | ZAR | 55,016 | 4,462 | |||||||||
8.500%, 06/23/2017 | 2,100 | 2,373 | ||||||||||
8.500%, 01/31/2037 | ZAR | 60,179 | 4,817 | |||||||||
8.250%, 09/15/2017 | ZAR | 27,059 | 2,274 | |||||||||
8.250%, 03/31/2032 | ZAR | 107,296 | 8,462 | |||||||||
8.000%, 12/21/2018 | ZAR | 103,522 | 8,655 | |||||||||
8.000%, 01/31/2030 | ZAR | 127,819 | 10,007 | |||||||||
7.750%, 02/28/2023 | ZAR | 60,147 | 4,874 | |||||||||
7.250%, 01/15/2020 | ZAR | 46,149 | 3,731 | |||||||||
| SEI Institutional Investments Trust / Annual Report / May 31, 2015 | 245 |
SCHEDULE OF INVESTMENTS
Emerging Markets Debt Fund (Continued)
May 31, 2015
| Description | Face Amount (1) (Thousands) | Market Value ($ Thousands) | ||||||||||
7.000%, 02/28/2031 | ZAR | 44,220 | $ | 3,122 | ||||||||
6.875%, 05/27/2019 | 940 | 1,078 | ||||||||||
6.750%, 03/31/2021 | ZAR | 54,420 | 4,258 | |||||||||
6.500%, 02/28/2041 | ZAR | 28,542 | 1,802 | |||||||||
6.250%, 03/31/2036 | ZAR | 42,210 | 2,648 | |||||||||
5.875%, 05/30/2022 | 3,036 | 3,417 | ||||||||||
5.875%, 09/16/2025 | 5,356 | 6,078 | ||||||||||
5.500%, 03/09/2020 | 433 | 475 | ||||||||||
Transnet SOC | ||||||||||||
9.500%, 05/13/2021 (C) | ZAR | 16,660 | 1,352 | |||||||||
4.000%, 07/26/2022 (C) | 305 | 293 | ||||||||||
ZAR Sovereign Capital Fund Propriety | ||||||||||||
3.903%, 06/24/2020 (C) | 1,305 | 1,338 | ||||||||||
|
| |||||||||||
| 97,282 | ||||||||||||
|
| |||||||||||
Sri Lanka — 0.4% | ||||||||||||
Democratic Socialist Republic of Sri Lanka | ||||||||||||
6.250%, 10/04/2020 (C) | 888 | 907 | ||||||||||
6.125%, 06/03/2025 (C) | 1,480 | 1,480 | ||||||||||
6.000%, 01/14/2019 | 2,025 | 2,073 | ||||||||||
5.875%, 07/25/2022 | 1,300 | 1,290 | ||||||||||
5.875%, 07/25/2022 (C) | 925 | 918 | ||||||||||
|
| |||||||||||
| 6,668 | ||||||||||||
|
| |||||||||||
Supranational — 0.2% | ||||||||||||
European Investment Bank MTN | ||||||||||||
8.500%, 09/17/2024 | ZAR | 11,350 | 920 | |||||||||
Inter-American Development Bank MTN | ||||||||||||
7.350%, 09/12/2018 | IDR | 24,590,000 | 1,797 | |||||||||
5.598%, 08/20/2015 (E) | IDR | 10,910,000 | 806 | |||||||||
|
| |||||||||||
| 3,523 | ||||||||||||
|
| |||||||||||
Thailand — 2.5% | ||||||||||||
Government of Thailand | ||||||||||||
5.670%, 03/13/2028 | THB | 3,000 | 114 | |||||||||
3.875%, 06/13/2019 | THB | 280,570 | 8,933 | |||||||||
3.850%, 12/12/2025 | THB | 160,000 | 5,223 | |||||||||
3.650%, 12/17/2021 | THB | 271,930 | 8,649 | |||||||||
3.625%, 06/16/2023 | THB | 435,290 | 13,816 | |||||||||
3.580%, 12/17/2027 | THB | 72,150 | 2,269 | |||||||||
3.250%, 06/16/2017 | THB | 59,000 | 1,816 | |||||||||
1.250%, 03/12/2028 | THB | 28,944 | 771 | |||||||||
1.200%, 07/14/2021 | THB | 78,989 | 2,256 | |||||||||
PTT Exploration & Production | ||||||||||||
4.875%, 06/18/2019 (B) (C) | 1,879 | 1,902 | ||||||||||
|
| |||||||||||
| 45,749 | ||||||||||||
|
| |||||||||||
Trinidad & Tobago — 0.1% | ||||||||||||
Republic of Trinidad & Tobago | ||||||||||||
4.375%, 01/16/2024 (C) | 1,289 | 1,386 | ||||||||||
|
| |||||||||||
| Description | Face Amount (1) (Thousands) | Market Value ($ Thousands) | ||||||||||
Tunisia — 0.1% | ||||||||||||
Banque Centrale de Tunisie | ||||||||||||
5.750%, 01/30/2025 (C) | 1,649 | $ | 1,701 | |||||||||
|
| |||||||||||
Turkey — 6.6% | ||||||||||||
Export Credit Bank of Turkey | ||||||||||||
5.875%, 04/24/2019 (C) | 200 | 212 | ||||||||||
5.000%, 09/23/2021 (C) | 674 | 683 | ||||||||||
Finansbank | ||||||||||||
6.250%, 04/30/2019 (C) | 1,612 | 1,647 | ||||||||||
Republic of Turkey | ||||||||||||
11.875%, 01/15/2030 | 1,050 | 1,816 | ||||||||||
10.700%, 02/24/2016 | TRY | 1,710 | 645 | |||||||||
10.500%, 01/15/2020 | TRY | 7,030 | 2,789 | |||||||||
10.400%, 03/27/2019 | TRY | 8,790 | 3,427 | |||||||||
10.400%, 03/20/2024 | TRY | 2,700 | 1,097 | |||||||||
9.500%, 01/12/2022 | TRY | 9,830 | 3,772 | |||||||||
9.000%, 01/27/2016 | TRY | 11,400 | 4,251 | |||||||||
9.000%, 03/08/2017 | TRY | 20,043 | 7,471 | |||||||||
9.000%, 07/24/2024 | TRY | 26,309 | 9,888 | |||||||||
8.800%, 11/14/2018 | TRY | 4,584 | 1,703 | |||||||||
8.500%, 07/10/2019 | TRY | 22,562 | 8,285 | |||||||||
8.500%, 09/14/2022 | TRY | 16,527 | 6,053 | |||||||||
8.300%, 10/07/2015 | TRY | 3,069 | 1,148 | |||||||||
8.300%, 06/20/2018 | TRY | 17,461 | 6,409 | |||||||||
8.200%, 07/13/2016 | TRY | 10,113 | 3,733 | |||||||||
8.000%, 03/12/2025 | TRY | 11,191 | 3,936 | |||||||||
8.000%, 02/14/2034 | 900 | 1,204 | ||||||||||
7.400%, 02/05/2020 | TRY | 24,775 | 8,681 | |||||||||
7.375%, 02/05/2025 | 4,040 | 4,939 | ||||||||||
7.250%, 03/05/2038 | 270 | 341 | ||||||||||
7.100%, 03/08/2023 | TRY | 8,160 | 2,734 | |||||||||
7.000%, 06/05/2020 | 4,477 | 5,158 | ||||||||||
6.875%, 03/17/2036 | 5,409 | 6,522 | ||||||||||
6.750%, 04/03/2018 | 1,886 | 2,088 | ||||||||||
6.750%, 05/30/2040 | 3,104 | 3,733 | ||||||||||
6.625%, 02/17/2045 (F) | 1,395 | 1,677 | ||||||||||
6.300%, 02/14/2018 | TRY | 4,490 | 1,570 | |||||||||
6.250%, 09/26/2022 | 2,180 | 2,460 | ||||||||||
6.000%, 01/14/2041 | 3,115 | 3,434 | ||||||||||
5.625%, 03/30/2021 | 2,449 | 2,672 | ||||||||||
5.125%, 03/25/2022 (F) | 1,520 | 1,612 | ||||||||||
4.250%, 04/14/2026 | 1,639 | 1,590 | ||||||||||
3.250%, 03/23/2023 | 40 | 38 | ||||||||||
TC Ziraat Bankasi | ||||||||||||
4.250%, 07/03/2019 (C) | 1,710 | 1,713 | ||||||||||
|
| |||||||||||
| 121,131 | ||||||||||||
|
| |||||||||||
Ukraine — 0.0% |
| |||||||||||
Government of Ukraine | ||||||||||||
9.250%, 07/24/2017 | 1,000 | 477 | ||||||||||
|
| |||||||||||
Uruguay — 0.7% |
| |||||||||||
Republic of Uruguay PIK | ||||||||||||
7.875%, 01/15/2033 | 3,132 | 4,369 | ||||||||||
| 246 | SEI Institutional Investments Trust / Annual Report / May 31, 2015 |
| Description | Face Amount (1) (Thousands) | Market Value ($ Thousands) | ||||||||||
Republic of Uruguay | ||||||||||||
7.625%, 03/21/2036 | 1,536 | $ | 2,135 | |||||||||
5.100%, 06/18/2050 | 4,232 | 4,263 | ||||||||||
4.500%, 08/14/2024 | 1,482 | 1,586 | ||||||||||
Republic of Uruguay Treasury Bills | ||||||||||||
12.554%, 07/17/2015 (E) | 9,152 | 337 | ||||||||||
|
| |||||||||||
| 12,690 | ||||||||||||
|
| |||||||||||
Venezuela — 2.5% |
| |||||||||||
Petroleos de Venezuela | ||||||||||||
9.000%, 11/17/2021 | 4,501 | 1,985 | ||||||||||
8.500%, 11/02/2017 | 19,791 | 14,670 | ||||||||||
8.500%, 11/02/2017 | 330 | 245 | ||||||||||
6.000%, 05/16/2024 | 9,870 | 3,758 | ||||||||||
5.250%, 04/12/2017 | 20 | 11 | ||||||||||
5.250%, 04/12/2017 | 9,534 | 5,144 | ||||||||||
Republic of Venezuela | ||||||||||||
13.625%, 08/15/2018 | 1,493 | 1,101 | ||||||||||
13.625%, 08/15/2018 | 497 | 337 | ||||||||||
12.750%, 08/23/2022 | 2,827 | 1,385 | ||||||||||
12.750%, 08/23/2022 | 3,442 | 1,687 | ||||||||||
11.950%, 08/05/2031 | 1,294 | 591 | ||||||||||
11.950%, 08/05/2031 | 5 | 2 | ||||||||||
11.750%, 10/21/2026 | 1,000 | 460 | ||||||||||
11.750%, 10/21/2026 | 1,875 | 862 | ||||||||||
9.250%, 09/15/2027 | 1,546 | 687 | ||||||||||
9.250%, 05/07/2028 | 2,693 | 1,078 | ||||||||||
9.000%, 05/07/2023 | 616 | 251 | ||||||||||
8.250%, 10/13/2024 | 9,490 | 3,749 | ||||||||||
8.250%, 10/13/2024 | 577 | 228 | ||||||||||
7.750%, 10/13/2019 | 1,319 | 560 | ||||||||||
7.650%, 04/21/2025 | 20 | 8 | ||||||||||
7.650%, 04/21/2025 | 2,187 | 842 | ||||||||||
5.750%, 02/26/2016 | 3,062 | 2,570 | ||||||||||
5.750%, 02/26/2016 | 4,005 | 3,362 | ||||||||||
|
| |||||||||||
| 45,573 | ||||||||||||
|
| |||||||||||
Vietnam — 0.1% |
| |||||||||||
Socialist Republic of Vietnam | ||||||||||||
6.750%, 01/29/2020 | 534 | 596 | ||||||||||
4.800%, 11/19/2024 (C) | 1,246 | 1,269 | ||||||||||
|
| |||||||||||
| 1,865 | ||||||||||||
|
| |||||||||||
Zambia — 0.4% |
| |||||||||||
Republic of Zambia | ||||||||||||
10.000%, 09/03/2015 | ZMW | 2,420 | 323 | |||||||||
8.500%, 04/14/2024 | 1,075 | 1,161 | ||||||||||
8.500%, 04/14/2024 (C) | 230 | 248 | ||||||||||
5.375%, 09/20/2022 | 2,980 | 2,734 | ||||||||||
Republic of Zambia Treasury Bills | ||||||||||||
22.791%, 08/24/2015 (E) | ZMW | 2,240 | 293 | |||||||||
| Description | Face Amount (1) (Thousands)/Shares | Market Value ($ Thousands) | ||||||||||
19.347%, 09/21/2015 (E) | ZMW | 15,000 | $ | 1,926 | ||||||||
|
| |||||||||||
| 6,685 | ||||||||||||
|
| |||||||||||
Total Global Bonds |
| 1,702,052 | ||||||||||
|
| |||||||||||
LOAN PARTICIPATION — 0.0% |
| |||||||||||
Singapore — 0.0% |
| |||||||||||
Morton Bay Senior | ||||||||||||
6.220%, 01/02/2049 (G) (H) | 3,020 | — | ||||||||||
|
| |||||||||||
Total Loan Participation |
| — | ||||||||||
|
| |||||||||||
AFFILIATED PARTNERSHIP — 0.4% |
| |||||||||||
SEI Liquidity Fund, L.P. | ||||||||||||
0.060%*† (I) | 7,894,702 | 7,895 | ||||||||||
|
| |||||||||||
Total Affiliated Partnership |
| 7,895 | ||||||||||
|
| |||||||||||
TIME DEPOSITS — 4.2% |
| |||||||||||
Brown Brothers Harriman | ||||||||||||
5.800%, 06/01/2015 | ZAR | 15 | 1 | |||||||||
0.100%, 06/01/2015 | SGD | 9 | 7 | |||||||||
0.079%, 06/01/2015 | GBP | — | — | |||||||||
0.030%, 06/01/2015 | 76,236 | 76,236 | ||||||||||
(0.211)%, 06/01/2015 | EUR | 51 | 56 | |||||||||
(1.000)%, 06/01/2015 | CHF | — | — | |||||||||
|
| |||||||||||
Total Time Deposits |
| 76,300 | ||||||||||
|
| |||||||||||
Total Investments — 97.2% |
| $ | 1,786,247 | |||||||||
|
| |||||||||||
A list of the open futures contracts held by the Fund at May 31, 2015, is as follows:
| Type of Contract | Number of (Short) | Expiration Date | Unrealized Appreciation (Depreciation) ($ Thousands) | |||||||||
JSE Bond Future R2037 | 208 | Aug-2015 | $ | (21 | ) | |||||||
JSE Bond Future R208 | 962 | Aug-2015 | (64 | ) | ||||||||
Korea 3-Year Bond | 163 | Jun-2015 | 81 | |||||||||
U.S. 10-Year Treasury Note | 37 | Sep-2015 | 15 | |||||||||
U.S. 10-Year Treasury Note | (149 | ) | Sep-2015 | (112 | ) | |||||||
U.S. 2-Year Treasury Note | 17 | Sep-2015 | 4 | |||||||||
U.S. 2-Year Treasury Note | (165 | ) | Sep-2015 | (41 | ) | |||||||
U.S. 5-Year Treasury Note | (243 | ) | Sep-2015 | (97 | ) | |||||||
U.S. Long Treasury Bond | (13 | ) | Sep-2015 | (12 | ) | |||||||
|
| |||||||||||
| $ | (247 | ) | ||||||||||
|
| |||||||||||
For the year ended May 31, 2015, the total amount of all open futures contracts, as presented in the tables above, are representative of the volume of activity for this derivative type during the year.
| SEI Institutional Investments Trust / Annual Report / May 31, 2015 | 247 |
SCHEDULE OF INVESTMENTS
Emerging Markets Debt Fund (Continued)
May 31, 2015
A list of the open forward foreign currency contracts held by the Fund at May 31, 2015, is as follows:
| Settlement Date | Currency to Deliver (Thousands) | Currency to Receive (Thousands) | Unrealized Appreciation (Depreciation) ($ Thousands) | |||||||||||||||||
6/2/15-6/17/15 | USD | 17,945 | KRW | 20,060,751 | $ | 154 | ||||||||||||||
6/2/15-7/27/15 | EUR | 70,749 | USD | 78,195 | 621 | |||||||||||||||
6/2/15-9/1/15 | BRL | 328,455 | USD | 105,795 | 3,890 | |||||||||||||||
6/2/15-9/2/15 | USD | 62,489 | BRL | 198,117 | (860 | ) | ||||||||||||||
6/2/15-9/16/15 | KRW | 39,745,957 | USD | 36,044 | 191 | |||||||||||||||
6/3/15-8/10/15 | USD | 103,270 | EUR | 93,533 | (711 | ) | ||||||||||||||
6/3/15-11/20/15 | IDR | 458,604,205 | USD | 34,476 | 27 | |||||||||||||||
6/3/15-11/20/15 | USD | 44,270 | IDR | 590,664,328 | (192 | ) | ||||||||||||||
6/5/15-6/17/15 | MYR | 101,148 | USD | 27,648 | 79 | |||||||||||||||
6/5/15-7/27/15 | USD | 60,227 | PLN | 220,741 | (1,470 | ) | ||||||||||||||
6/5/15-9/17/15 | USD | 39,217 | MYR | 142,682 | (407 | ) | ||||||||||||||
6/8/15 | USD | 2,237 | RUB | 117,941 | 1 | |||||||||||||||
6/8/15-6/17/15 | PLN | 43,238 | USD | 11,828 | 317 | |||||||||||||||
6/8/15-7/8/15 | INR | 1,483,575 | USD | 23,079 | (81 | ) | ||||||||||||||
6/8/15-7/15/15 | RUB | 1,961,068 | USD | 37,346 | 456 | |||||||||||||||
6/8/15-8/13/15 | USD | 29,295 | ZAR | 353,570 | (340 | ) | ||||||||||||||
6/8/15-8/13/15 | ZAR | 355,704 | USD | 29,173 | 65 | |||||||||||||||
6/8/15-9/16/15 | USD | 43,060 | INR | 2,752,306 | (320 | ) | ||||||||||||||
6/9/15-6/17/15 | CLP | 12,619,887 | USD | 20,393 | 21 | |||||||||||||||
6/9/15-9/16/15 | USD | 43,387 | CLP | 26,784,892 | (248 | ) | ||||||||||||||
6/10/15 | GBP | 262 | USD | 398 | (1 | ) | ||||||||||||||
6/10/15-8/24/15 | ILS | 134,003 | USD | 34,162 | (485 | ) | ||||||||||||||
6/11/15 | CAD | 12,673 | USD | 10,331 | 180 | |||||||||||||||
6/11/15-8/4/15 | USD | 18,348 | COP | 44,331,108 | (941 | ) | ||||||||||||||
6/11/15-9/16/15 | COP | 63,146,949 | USD | 25,321 | 529 | |||||||||||||||
6/15/15-10/28/15 | TRY | 86,844 | USD | 32,448 | 115 | |||||||||||||||
6/17/15 | CNY | 80,302 | USD | 13,119 | 176 | |||||||||||||||
6/17/15 | CZK | 19,939 | USD | 780 | (18 | ) | ||||||||||||||
6/17/15 | PHP | 458,047 | USD | 10,275 | 9 | |||||||||||||||
6/17/15 | RON | 36,553 | USD | 9,101 | 79 | |||||||||||||||
6/17/15 | USD | 10,903 | ILS | 42,582 | 104 | |||||||||||||||
6/17/15 | USD | 14,286 | PEI | 45,147 | (15 | ) | ||||||||||||||
6/17/15 | USD | 5,717 | SGD | 7,750 | 28 | |||||||||||||||
6/17/15-6/18/15 | EUR | 11,167 | HUF | 3,378,325 | (275 | ) | ||||||||||||||
6/17/15-6/25/15 | USD | 15,260 | RON | 62,493 | 166 | |||||||||||||||
6/17/15-7/7/15 | EUR | 34,857 | PLN | 141,207 | (644 | ) | ||||||||||||||
6/17/15-7/7/15 | USD | 18,315 | TWD | 569,880 | 255 | |||||||||||||||
6/17/15-7/27/15 | THB | 463,589 | USD | 14,036 | 274 | |||||||||||||||
6/17/15-7/31/15 | HUF | 3,921,934 | USD | 14,396 | 502 | |||||||||||||||
6/17/15-7/31/15 | USD | 5,270 | HUF | 1,445,258 | (152 | ) | ||||||||||||||
6/17/15-8/10/15 | RON | 88,449 | EUR | 19,835 | (58 | ) | ||||||||||||||
6/17/15-8/17/15 | MXN | 247,600 | USD | 16,189 | 175 | |||||||||||||||
6/17/15-8/17/15 | USD | 36,442 | MXN | 557,768 | (388 | ) | ||||||||||||||
6/17/15-8/18/15 | SGD | 40,152 | USD | 29,645 | (106 | ) | ||||||||||||||
6/17/15-9/16/15 | PEI | 105,071 | USD | 33,169 | 89 | |||||||||||||||
6/17/15-9/16/15 | USD | 25,987 | CNY | 160,604 | (171 | ) | ||||||||||||||
6/17/15-9/16/15 | USD | 22,397 | PHP | 999,152 | (61 | ) | ||||||||||||||
6/17/15-9/30/15 | TWD | 976,401 | USD | 31,405 | (422 | ) | ||||||||||||||
6/17/15-10/28/15 | USD | 39,441 | TRY | 105,105 | (404 | ) | ||||||||||||||
6/18/15 | HUF | 2,462,885 | EUR | 8,054 | 105 | |||||||||||||||
6/29/15-7/7/15 | PLN | 68,290 | EUR | 16,604 | 34 | |||||||||||||||
7/10/15 | AUD | 8,764 | USD | 6,816 | 123 | |||||||||||||||
7/10/15 | USD | 6,806 | AUD | 8,764 | (113 | ) | ||||||||||||||
7/10/15-9/15/15 | CNH | 70,571 | USD | 11,100 | (229 | ) | ||||||||||||||
7/10/15-9/15/15 | USD | 24,863 | CNH | 156,381 | 241 | |||||||||||||||
7/27/15 | USD | 700 | THB | 23,250 | (10 | ) | ||||||||||||||
8/10/15 | EUR | 12,777 | RON | 57,021 | 47 | |||||||||||||||
10/21/15-6/2/16 | USD | 9,714 | NGN | 2,405,733 | 474 | |||||||||||||||
12/4/15-3/23/16 | NGN | 1,492,152 | USD | 6,399 | (84 | ) | ||||||||||||||
|
| |||||||||||||||||||
| $ | 321 | |||||||||||||||||||
|
| |||||||||||||||||||
A list of the counterparties for the open forward foreign currency contracts held by the Fund at May 31, 2015, is as follows:
| Counterparty | Currency to Deliver ($ Thousands) | Currency to Receive ($ Thousands) | Unrealized Appreciation (Depreciation) ($ Thousands) | |||||||||
Barclays PLC | $ | (259 | ) | $ | 250 | $ | (9 | ) | ||||
Citigroup | (421,216 | ) | 420,281 | (935 | ) | |||||||
Goldman Sachs | (515,281 | ) | 516,809 | 1,528 | ||||||||
HSBC | (10,311 | ) | 10,262 | (49 | ) | |||||||
JPMorgan Chase Bank | (343,736 | ) | 343,548 | (188 | ) | |||||||
Standard Chartered | (216,491 | ) | 216,490 | (1 | ) | |||||||
UBS | (2,315 | ) | 2,290 | (25 | ) | |||||||
|
| |||||||||||
| $ | 321 | |||||||||||
|
| |||||||||||
For the year ended May 31, 2015, the total amount of all open forward foreign currency contracts, as presented in the tables above, are representative of the volume of activity for this derivative type during the year.
| 248 | SEI Institutional Investments Trust / Annual Report / May 31, 2015 |
A list of open OTC swap agreements held by the Fund at May 31, 2015, is as follows:
| Interest Rate Swaps | ||||||||||||||||
| Counterparty | Fund Pays | Fund Receives | Termination Date | Currency | Notional Amount (Thousands) | Net Unrealized ($ Thousands) | ||||||||||
| Goldman Sachs | 3-Month ZAR - JIBAR | 8.76% | 01/16/2029 | ZAR | 65,000 | $ | 170 | |||||||||
| Goldman Sachs | 1.04% | 6-Month CZK - PRIBOR | 05/20/2025 | CZK | 85,675 | (21 | ) | |||||||||
| Goldman Sachs | 4.53% | 1-DAY CLP - CLICP | 03/11/2025 | CLP | 1,015,968 | 139 | ||||||||||
| Goldman Sachs | 3-Month ZAR - JIBAR | 8.30% | 01/16/2024 | ZAR | 25,000 | 35 | ||||||||||
| Goldman Sachs | 3-Month ZAR - JIBAR | 8.19% | 12/20/2023 | ZAR | 16,000 | 15 | ||||||||||
| Goldman Sachs | 1-Year BRL-CDI | 10.84% | 01/03/2023 | BRL | 6,139 | (193 | ) | |||||||||
| Goldman Sachs | 1-Day BRL - CDI | 11.99% | 01/02/2023 | BRL | 3,000 | (18 | ) | |||||||||
| Goldman Sachs | 1-Day BRL - CDI | 12.73% | 01/04/2021 | BRL | 13,491 | 79 | ||||||||||
JPMorgan Chase Bank | 5.33% | Columbia IBR Overnight Interbank | 03/11/2020 | COP | 8,358,503 | 67 | ||||||||||
| Goldman Sachs | 5.12% | 28-DAY MXN - TIIE | 11/28/2019 | MXN | 17,000 | 4 | ||||||||||
| Goldman Sachs | 28-Day MXN - TIIE | 6.82% | 06/27/2019 | MXN | 273,456 | 77 | ||||||||||
| Goldman Sachs | 1-Year BRL-CDI | 11.81% | 01/02/2018 | BRL | 12,298 | (91 | ) | |||||||||
| Goldman Sachs | 1-Year BRL-CDI | 11.98% | 01/02/2018 | BRL | 11,341 | (71 | ) | |||||||||
| Goldman Sachs | 1-Day BRL - CDI | 13.27% | 01/02/2017 | BRL | 35,880 | (8 | ) | |||||||||
| Goldman Sachs | 2.45% | 6-Month HUF - BUBOR | 07/11/2016 | HUF | 3,518,440 | (117 | ) | |||||||||
| Goldman Sachs | 0.76% | 3-Month ILS - TELBOR | 05/22/2016 | ILS | 11,000 | (20 | ) | |||||||||
| Goldman Sachs | 0.95% | 3-Month ILS - TELBOR | 04/02/2016 | ILS | 7,800 | (18 | ) | |||||||||
| Goldman Sachs | 1.21% | 3-Month ILS - TELBOR | 02/14/2016 | ILS | 10,000 | (31 | ) | |||||||||
| Goldman Sachs | 3.31% | 6-Month PLN - WIBOR | 02/03/2016 | PLN | 37,500 | (142 | ) | |||||||||
| Goldman Sachs | 1.20% | 3-Month ILS - TELBOR | 01/16/2016 | ILS | 42,828 | (129 | ) | |||||||||
| Goldman Sachs | 1-Year BRL-CDI | 11.59% | 01/04/2016 | BRL | 6,632 | (18 | ) | |||||||||
| Goldman Sachs | 1-Year BRL-CDI | 11.00% | 01/04/2016 | BRL | 56,744 | (383 | ) | |||||||||
| Goldman Sachs | 1-Year BRL-CDI | 11.92% | 01/04/2016 | BRL | 18,744 | (63 | ) | |||||||||
| JPMorgan Chase Bank | 1.00% | 6-Month CZK - PRIBOR | 05/29/2025 | CZK | 26,000 | (2 | ) | |||||||||
Goldman Sachs | 3.45% | 6-Month HUF - BUBOR | 05/11/2025 | HUF | 900,000 | (129 | ) | |||||||||
| JPMorgan Chase Bank | 3-Month ILS - TELBOR | 2.67% | 03/02/2025 | ILS | 13,092 | (19 | ) | |||||||||
Goldman Sachs | 3-Month ILS - TELBOR | 2.89% | 02/26/2025 | ILS | 21,298 | 24 | ||||||||||
| JPMorgan Chase Bank | 4.29% | 6-Month HUF - BUBOR | 08/04/2024 | HUF | 1,000,000 | (493 | ) | |||||||||
| JPMorgan Chase Bank | 6-Month THB - BIBOR | 2.13% | 05/18/2020 | THB | 238,000 | 3 | ||||||||||
| JPMorgan Chase Bank | 0.50% | 6-Month CZK - PRIBOR | 05/05/2020 | CZK | 180,000 | 40 | ||||||||||
Goldman Sachs | 0.59% | 6-Month CZK - PRIBOR | 03/13/2020 | CZK | 30,000 | 1 | ||||||||||
| JPMorgan Chase Bank | 0.54% | 6-Month CZK - PRIBOR | 02/16/2020 | CZK | 320,000 | 34 | ||||||||||
| JPMorgan Chase Bank | 3-Month ILS - TELBOR | 1.14% | 03/24/2019 | ILS | 125,000 | (24 | ) | |||||||||
| JPMorgan Chase Bank | 0.64% | 3-Month ILS - TELBOR | 07/31/2016 | ILS | 20,000 | (61 | ) | |||||||||
|
| |||||||||||||||
| $ | (1,363 | ) | ||||||||||||||
|
| |||||||||||||||
| Cross Currency Swaps | ||||||||||||||||||||
| Counterparty | Fund Pays | Fund Receives | Termination Date | Currency | Notional Amount of | Notional Amount of | Net Unrealized Depreciation ($ Thousands) | |||||||||||||
| JPMorgan Chase Bank | 3 Month USD - LIBOR | 8.57% | 10/28/2016 | TRY | 100,000 | (44,783 | ) | $ | (519 | ) | ||||||||||
|
| |||||||||||||||||||
A list of centrally cleared swap agreements held by the Fund at May 31, 2015, is as follows:
| Interest Rate Swaps | ||||||||||||||||
| Counterparty | Fund Pays | Fund Receives | Termination Date | Currency | Notional Amount (Thousands) | Net Unrealized (Depreciation) ($ Thousands) | ||||||||||
CitiBank | 2.34% | 3 Month USD - LIBOR | 02/06/2045 | USD | 320 | $ | 16 | |||||||||
CitiBank | 2.14% | 3-Month USD - LIBOR | 01/12/2025 | USD | 9,306 | (57 | ) | |||||||||
CitiBank | 2.08% | 3-Month USD - LIBOR | 01/13/2025 | USD | 7,056 | (2 | ) | |||||||||
|
| |||||||||||||||
| $ | (43 | ) | ||||||||||||||
|
| |||||||||||||||
For the year ended May 31, 2015, the total amount of all open swap agreements, as presented in the tables above, are representative of the volume of activity for this derivative type during the year
Percentages are based on a Net Assets of $1,836,776 ($ Thousands).
| * | The rate reported is the 7-day effective yield as of May 31, 2015. |
| ‡ | Real Estate Investment Trust. |
| † | Investment in Affiliated Security (see Note 6). |
| (1) | In U.S. dollars unless otherwise indicated. |
| (A) | Security in default on interest payments. |
| (B) | Variable Rate Security — The rate reported on the Schedule of Investments is the rate in effect as of May 31, 2015. |
| (C) | Securities sold within terms of a private placement memorandum, exempt from registration under Section 144A of the Securities Act of 1933, as amended, and may be sold only to dealers in that program or other “accredited investors.” These securities have been determined to be liquid under guidelines established by the Board of Trustees. |
| (D) | Step Bonds — The rate reflected on the Schedule of Investments is the effective yield on May 31, 2015. The coupon on a step bond changes on a specified date. |
| (E) | The rate reported is the effective yield at time of purchase. |
| (F) | This security or a partial position of this security is on loan at May 31, 2015. The total market value of securities on loan at May 31, 2015 was $7,567 ($ Thousands). |
| (G) | Security fair valued using methods determined in good faith by the Valuation Committee of the Board of Trustees. The total market value of such securities as of May 31, 2015 was $269 ($ Thousands) and represented 0.0% of Net Assets. |
| (H) | Securities considered illiquid. The total market value of such securities as of May 31, 2015 was $269 ($ Thousands) and represented 0.0% of Net Assets. |
| (I) | This security was purchased with cash collateral held from securities on loan (See Note 12). The total value of such securities as of May 31, 2015 was $7,895 ($ Thousands). |
| SEI Institutional Investments Trust / Annual Report / May 31, 2015 | 249 |
SCHEDULE OF INVESTMENTS
Emerging Markets Debt Fund (Concluded)
May 31, 2015
AUD — Australian Dollar
BIBOR — Bangkok Interbank Offered Rate
BRL — Brazilian Real
BUBOR — Budapest Interbank Offered Rate
CAD — Canadian Dollar
CDI — Average One-Day Interbank Deposit Rate
CHF — Swiss Franc
CLN — Credit Linked Note
CLP — Chilean Peso
CNH — Chinese Yuen (Offshore)
CNY — Chinese Yuen
CZK — Czech Koruna
COP — Colombian Peso
DOP — Dominican Peso
EUR — Euro
GBP — British Pound Sterling
HUF — Hungarian Forint
IDR — Indonesian Rupiah
ILS — Israeli Shekel
JIBAR — Johannesburg Interbank Agreed Rate
KES — Kenyan Shilling
KRW — Korean Won
LIBOR — London Interbank Offered Rate
L.P. — Limited Partnership
MTN — Medium Term Note
MXN — Mexican Peso
MYR — Malaysian Ringgit
NGN — Nigerian Naira
OTC — Over the Counter
PEI — Peruvian Inca
PHP — Philippine Peso
PIK — Payment-in-Kind
PLN — Polish Zloty
PRIBOR — Prague Interbank Offered Rate
RON — Romanian Leu
RUB — Russian Ruble
SGD — Singapore Dollar
Ser — Series
TELBOR — Tel Aviv Interbank Offered Rate
THB — Thai Bhat
TIIE — Equilibrium Interbank Interest Rate
TRY — New Turkish Lira
TWD — Taiwanese Dollar
USD — U.S. Dollar
WIBOR — Warsaw Interbank Offered Rate
ZAR — South African Rand
ZMW — Zambia Kwacha
The following is a list of the level of inputs used as of May 31, 2015, in valuing the Fund’s investments and other financial instruments carried at value ($ Thousands):
| Investments in Securities | Level 1 | Level 2 | Level 3(1) | Total | ||||||||||||
Global Bonds | $ | — | $ | 1,701,783 | $ | 269 | $ | 1,702,052 | ||||||||
Loan Participation | — | — | — | — | ||||||||||||
Affiliated Partnership | — | 7,895 | — | 7,895 | ||||||||||||
Time Deposits | — | 76,300 | — | 76,300 | ||||||||||||
|
|
|
|
|
|
|
| |||||||||
Total Investments in Securities | $ | — | $ | 1,785,978 | $ | 269 | $ | 1,786,247 | ||||||||
|
|
|
|
|
|
|
| |||||||||
| Other Financial Instruments | Level 1 | Level 2 | Level 3 | Total | ||||||||||||
Futures Contracts* | ||||||||||||||||
Unrealized Appreciation | $ | 100 | $ | — | $ | — | $ | 100 | ||||||||
Unrealized Depreciation | (347 | ) | — | — | (347 | ) | ||||||||||
Forwards Contracts* | ||||||||||||||||
Unrealized Appreciation | — | 9,527 | — | 9,527 | ||||||||||||
Unrealized Depreciation | — | (9,206 | ) | — | (9,206 | ) | ||||||||||
| Other Financial Instruments | Level 1 | Level 2 | Level 3 | Total | ||||||||||||
OTC Swaps | ||||||||||||||||
Interest Rate Swaps* | ||||||||||||||||
Unrealized Appreciation | $ | — | $ | 688 | $ | — | $ | 688 | ||||||||
Unrealized Depreciation | — | (2,051 | ) | — | (2,051 | ) | ||||||||||
Cross Currency Swaps* | ||||||||||||||||
Unrealized Depreciation | — | (519 | ) | — | (519 | ) | ||||||||||
Centrally Cleared Swaps | ||||||||||||||||
Interest Rate Swaps* | ||||||||||||||||
Unrealized Appreciation | — | 16 | — | 16 | ||||||||||||
Unrealized Depreciation | — | (59 | ) | — | (59 | ) | ||||||||||
|
|
|
|
|
|
|
| |||||||||
Total Other Financial Instruments | $ | (247 | ) | $ | (1,604 | ) | $ | — | $ | (1,851 | ) | |||||
|
|
|
|
|
|
|
| |||||||||
| (1) | A reconciliation of Level 3 instruments is presented when the Fund has a significant amount of Level 3 investments at the beginning and/or end of the period in relation to net assets. Management has concluded that Level 3 investments are not material in relation to net assets. |
| * | Futures contracts, forwards contracts and swaps are valued at the unrealized appreciation (depreciation) on the instrument. |
For the year ended May 31, 2015, there were no transfers between Level 1 and Level 2 assets and liabilities.
For the year ended May 31, 2015, there were transfers between Level 2 and Level 3 assets and liabilities. The transfers were due to changes in the availability of observable inputs used to determine fair value.
For more information on valuation inputs, see Note 2 — Significant Accounting Policies in Notes to Financial Statements.
Amounts designated as “—” are $0 or have been rounded to $0.
The accompanying notes are an integral part of the financial statements.
| 250 | SEI Institutional Investments Trust / Annual Report / May 31, 2015 |
SCHEDULE OF INVESTMENTS
Real Return Fund
May 31, 2015
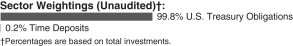
| Description | Face Amount ($ Thousands) | Market Value ($ Thousands) | ||||||
U.S. TREASURY OBLIGATIONS — 100.1% |
| |||||||
U.S. Treasury Inflation-Protected Securities | ||||||||
2.625%, 07/15/2017 | $ | 10,740 | $ | 11,577 | ||||
2.500%, 07/15/2016 | 14,479 | 15,071 | ||||||
2.375%, 01/15/2017 | 12,543 | 13,200 | ||||||
2.125%, 01/15/2019 | 10,507 | 11,494 | ||||||
1.875%, 07/15/2019 | 12,043 | 13,192 | ||||||
1.625%, 01/15/2018 | 11,345 | 12,031 | ||||||
1.375%, 07/15/2018 | 11,189 | 11,916 | ||||||
1.375%, 01/15/2020 | 14,597 | 15,689 | ||||||
0.125%, 04/15/2017 | 33,601 | 34,123 | ||||||
0.125%, 04/15/2018 | 37,371 | 38,048 | ||||||
0.125%, 04/15/2019 | 37,016 | 37,624 | ||||||
0.125%, 04/15/2020 | 13,489 | 13,656 | ||||||
|
| |||||||
Total U.S. Treasury Obligations (Cost $227,537) ($ Thousands) |
| 227,621 | ||||||
|
| |||||||
TIME DEPOSIT — 0.2% | ||||||||
Brown Brothers Harriman | ||||||||
0.030%, 06/01/2015 | 373 | 373 | ||||||
|
| |||||||
Total Time Deposit (Cost $373) ($ Thousands) | 373 | |||||||
|
| |||||||
Total Investments — 100.3% (Cost $227,910) ($ Thousands) | $ | 227,994 | ||||||
|
| |||||||
Percentages are based on Net Assets of $227,335 ($ Thousands).
As of May 31, 2015, all of the Fund’s investments were considered level 2, in accordance with the authoritative guidance on fair value measurements and disclosure under U.S. GAAP.
For the year ended May 31, 2015, there were no transfers between Level 1 and Level 2 assets and liabilities.
For the year ended May 31, 2015, there were no transfers between Level 2 and Level 3 assets and liabilities.
For more information on valuation inputs, see Note 2 — Significant Accounting Policies in Notes to Financial Statements.
Amounts designated as “—” are $0 or have been rounded to $0.
The accompanying notes are an integral part of the financial statements.
| SEI Institutional Investments Trust / Annual Report / May 31, 2015 | 251 |
SCHEDULE OF INVESTMENTS
Limited Duration Bond Fund
May 31, 2015
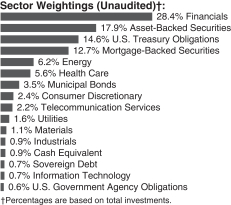
| Description | Face Amount ($ Thousands) | Market Value ($ Thousands) | ||||||
CORPORATE OBLIGATIONS — 41.3% |
| |||||||
Consumer Discretionary — 2.0% |
| |||||||
Comcast | ||||||||
6.500%, 01/15/2017 | $ | 3,830 | $ | 4,167 | ||||
Hyundai Capital America | ||||||||
2.000%, 03/19/2018 (A) | 2,250 | 2,264 | ||||||
Scripps Networks Interactive | ||||||||
2.800%, 06/15/2020 | 2,540 | 2,532 | ||||||
Walgreens Boots Alliance | ||||||||
1.750%, 11/17/2017 | 4,389 | 4,420 | ||||||
|
| |||||||
| 13,383 | ||||||||
|
| |||||||
Energy — 5.3% | ||||||||
BP Capital Markets | ||||||||
1.674%, 02/13/2018 | 2,370 | 2,390 | ||||||
Chevron | ||||||||
1.365%, 03/02/2018 | 3,280 | 3,289 | ||||||
1.345%, 11/15/2017 | 1,840 | 1,850 | ||||||
Chevron Phillips Chemical LLC | ||||||||
1.700%, 05/01/2018 (A) | 2,535 | 2,545 | ||||||
CNOOC Nexen Finance | ||||||||
1.625%, 04/30/2017 | 800 | 798 | ||||||
Columbia Pipeline Group | ||||||||
2.450%, 06/01/2018 (A) | 875 | 883 | ||||||
DCP Midstream Operating | ||||||||
2.500%, 12/01/2017 | 1,650 | 1,605 | ||||||
Energy Transfer Partners | ||||||||
6.125%, 02/15/2017 | 180 | 193 | ||||||
Enterprise Products Operating LLC | ||||||||
6.650%, 04/15/2018 | 2,092 | 2,375 | ||||||
1.650%, 05/07/2018 | 1,000 | 1,001 | ||||||
Kinder Morgan | ||||||||
7.000%, 06/15/2017 | 2,000 | 2,191 | ||||||
Kinder Morgan Energy Partners | ||||||||
5.950%, 02/15/2018 | 1,370 | 1,508 | ||||||
ONEOK Partners | ||||||||
2.000%, 10/01/2017 | 3,590 | 3,591 | ||||||
Petrobras Global Finance | ||||||||
3.250%, 03/17/2017 | 750 | 741 | ||||||
| Description | Face Amount ($ Thousands) | Market Value ($ Thousands) | ||||||
Plains All American Pipeline | ||||||||
6.500%, 05/01/2018 | $ | 2,000 | $ | 2,262 | ||||
Shell International Finance BV | ||||||||
2.125%, 05/11/2020 | 3,380 | 3,396 | ||||||
Statoil | ||||||||
0.479%, 11/09/2017 (B) | 1,405 | 1,401 | ||||||
TransCanada PipeLines | ||||||||
1.875%, 01/12/2018 | 1,605 | 1,622 | ||||||
1.066%, 01/12/2018 (B) | 1,205 | 1,208 | ||||||
Weatherford International | ||||||||
6.350%, 06/15/2017 | 370 | 397 | ||||||
|
| |||||||
| 35,246 | ||||||||
|
| |||||||
Financials — 23.9% | ||||||||
Abbey National Treasury Services | ||||||||
1.375%, 03/13/2017 | 2,000 | 2,009 | ||||||
AIG Global Funding MTN | ||||||||
1.650%, 12/15/2017 (A) | 890 | 894 | ||||||
American Express Bank | ||||||||
6.000%, 09/13/2017 | 2,450 | 2,698 | ||||||
American Express Credit | ||||||||
1.300%, 07/29/2016 | 750 | 754 | ||||||
American Honda Finance MTN | ||||||||
1.550%, 12/11/2017 | 3,380 | 3,413 | ||||||
1.500%, 03/13/2018 | 1,500 | 1,507 | ||||||
American International Group MTN | ||||||||
5.600%, 10/18/2016 | 2,000 | 2,121 | ||||||
Bank of America | ||||||||
5.300%, 03/15/2017 | 850 | 905 | ||||||
1.700%, 08/25/2017 | 1,570 | 1,576 | ||||||
1.650%, 03/26/2018 | 850 | 850 | ||||||
1.250%, 02/14/2017 | 650 | 651 | ||||||
Bank of Montreal MTN | ||||||||
1.300%, 07/15/2016 | 4,660 | 4,688 | ||||||
Bank of New York Mellon MTN | ||||||||
1.350%, 03/06/2018 | 1,890 | 1,890 | ||||||
Bank of Nova Scotia | ||||||||
1.375%, 07/15/2016 | 1,700 | 1,713 | ||||||
Bank of Tokyo-Mitsubishi | ||||||||
1.550%, 09/09/2016 (A) | 2,695 | 2,710 | ||||||
Barclays | ||||||||
2.000%, 03/16/2018 | 1,780 | 1,789 | ||||||
BB&T MTN | ||||||||
1.131%, 06/15/2018 (B) | 1,425 | 1,438 | ||||||
Branch Banking & Trust | ||||||||
1.050%, 12/01/2016 | 1,680 | 1,683 | ||||||
Capital One Bank USA | ||||||||
1.150%, 11/21/2016 | 4,150 | 4,157 | ||||||
Citigroup | ||||||||
1.850%, 11/24/2017 | 960 | 966 | ||||||
1.800%, 02/05/2018 | 5,060 | 5,063 | ||||||
0.534%, 06/09/2016 (B) | 600 | 598 | ||||||
| 252 | SEI Institutional Investments Trust / Annual Report / May 31, 2015 |
| Description | Face Amount ($ Thousands) | Market Value ($ Thousands) | ||||||
Cooperatieve Centrale Raiffeisen-Boerenleenbank | ||||||||
0.750%, 03/18/2016 (B) | $ | 700 | $ | 702 | ||||
Credit Suisse NY | ||||||||
1.700%, 04/27/2018 | 2,600 | 2,589 | ||||||
Daimler Finance North America LLC | ||||||||
1.375%, 08/01/2017 (A) | 2,693 | 2,694 | ||||||
DNB Boligkreditt | ||||||||
1.450%, 03/21/2018 (A) | 4,750 | 4,749 | ||||||
Export-Import Bank of Korea | ||||||||
1.027%, 01/14/2017 (B) | 3,915 | 3,932 | ||||||
Fifth Third Bank | ||||||||
1.450%, 02/28/2018 | 5,100 | 5,082 | ||||||
Ford Motor Credit LLC | ||||||||
5.000%, 05/15/2018 | 1,750 | 1,897 | ||||||
1.500%, 01/17/2017 | 2,650 | 2,653 | ||||||
General Electric Capital MTN | ||||||||
5.625%, 09/15/2017 | 4,325 | 4,753 | ||||||
0.479%, 05/11/2016 (B) | 1,045 | 1,047 | ||||||
Genworth Financial | ||||||||
8.625%, 12/15/2016 | 700 | 753 | ||||||
Goldman Sachs Group | ||||||||
2.375%, 01/22/2018 | 4,700 | 4,771 | ||||||
1.071%, 12/15/2017 (B) | 1,500 | 1,504 | ||||||
Harley-Davidson Financial Services MTN | ||||||||
2.700%, 03/15/2017 (A) | 670 | 687 | ||||||
1.550%, 11/17/2017 (A) | 2,000 | 2,008 | ||||||
HSBC USA | ||||||||
1.300%, 06/23/2017 | 3,050 | 3,057 | ||||||
Huntington National Bank | ||||||||
1.300%, 11/20/2016 | 4,020 | 3,995 | ||||||
JPMorgan Chase | ||||||||
6.000%, 10/01/2017 | 2,450 | 2,698 | ||||||
1.700%, 03/01/2018 | 1,500 | 1,502 | ||||||
KeyBank | ||||||||
1.100%, 11/25/2016 | 1,850 | 1,852 | ||||||
0.772%, 11/25/2016 (B) | 400 | 401 | ||||||
Korea Development Bank | ||||||||
0.901%, 01/22/2017 (B) | 3,600 | 3,598 | ||||||
Lloyds Bank | ||||||||
1.750%, 05/14/2018 | 2,970 | 2,978 | ||||||
MassMutual Global Funding | ||||||||
2.000%, 04/05/2017 (A) | 1,350 | 1,373 | ||||||
Metropolitan Life Global Funding I | ||||||||
1.500%, 01/10/2018 (A) | 1,650 | 1,650 | ||||||
Morgan Stanley MTN | ||||||||
4.750%, 03/22/2017 | 3,480 | 3,689 | ||||||
2.125%, 04/25/2018 | 2,410 | 2,430 | ||||||
MUFG Union Bank | ||||||||
1.500%, 09/26/2016 | 700 | 705 | ||||||
Nissan Motor Acceptance MTN | ||||||||
1.950%, 09/12/2017 (A) | 850 | 860 | ||||||
| Description | Face Amount ($ Thousands) | Market Value ($ Thousands) | ||||||
1.500%, 03/02/2018 | $ | 4,190 | $ | 4,198 | ||||
PNC Bank | ||||||||
1.150%, 11/01/2016 | 3,171 | 3,178 | ||||||
Pricoa Global Funding I | ||||||||
1.350%, 08/18/2017 (A) | 4,250 | 4,252 | ||||||
1.150%, 11/25/2016 (A) | 1,380 | 1,383 | ||||||
Royal Bank of Canada | ||||||||
2.000%, 10/01/2018 | 3,500 | 3,551 | ||||||
0.634%, 03/08/2016 (B) | 1,650 | 1,654 | ||||||
Santander Bank | ||||||||
2.000%, 01/12/2018 | 2,030 | 2,038 | ||||||
Sumitomo Mitsui Banking MTN | ||||||||
1.350%, 07/11/2017 | 1,300 | 1,298 | ||||||
Synchrony Financial | ||||||||
1.875%, 08/15/2017 | 1,190 | 1,194 | ||||||
Toronto-Dominion Bank | ||||||||
2.200%, 07/29/2015 (A) | 6,000 | 6,016 | ||||||
Toyota Motor Credit MTN | ||||||||
1.250%, 10/05/2017 | 1,841 | 1,851 | ||||||
Travelers MTN | ||||||||
5.750%, 12/15/2017 | 875 | 976 | ||||||
UBS MTN | ||||||||
1.800%, 03/26/2018 | 2,250 | 2,252 | ||||||
US Bancorp MTN | ||||||||
1.650%, 05/15/2017 | 1,270 | 1,286 | ||||||
Volkswagen Group of America Finance LLC | ||||||||
1.600%, 11/20/2017 (A) | 2,600 | 2,614 | ||||||
Volkswagen International Finance | ||||||||
2.375%, 03/22/2017 (A) | 2,400 | 2,450 | ||||||
Voya Financial | ||||||||
2.900%, 02/15/2018 | 300 | 309 | ||||||
Wells Fargo MTN | ||||||||
2.625%, 12/15/2016 | 1,300 | 1,332 | ||||||
1.400%, 09/08/2017 | 3,200 | 3,211 | ||||||
0.907%, 04/23/2018 (B) | 600 | 604 | ||||||
|
| |||||||
| 160,329 | ||||||||
|
| |||||||
Health Care — 4.7% | ||||||||
AbbVie | ||||||||
1.800%, 05/14/2018 | 2,125 | 2,128 | ||||||
Actavis Funding SCS | ||||||||
2.350%, 03/12/2018 | 2,880 | 2,908 | ||||||
Anthem | ||||||||
2.300%, 07/15/2018 | 1,214 | 1,232 | ||||||
1.875%, 01/15/2018 | 2,570 | 2,584 | ||||||
Bayer US Finance LLC | ||||||||
1.500%, 10/06/2017 (A) | 4,395 | 4,426 | ||||||
Becton Dickinson | ||||||||
1.800%, 12/15/2017 | 2,580 | 2,598 | ||||||
Express Scripts Holding | ||||||||
2.650%, 02/15/2017 | 3,018 | 3,087 | ||||||
2.250%, 06/15/2019 | 1,790 | 1,788 | ||||||
| SEI Institutional Investments Trust / Annual Report / May 31, 2015 | 253 |
SCHEDULE OF INVESTMENTS
Limited Duration Bond Fund (Continued)
May 31, 2015
| Description | Face Amount ($ Thousands) | Market Value ($ Thousands) | ||||||
McLaren Health Care | ||||||||
1.964%, 05/15/2018 | $ | 1,270 | $ | 1,278 | ||||
Mylan | ||||||||
1.350%, 11/29/2016 | 1,200 | 1,199 | ||||||
Perrigo | ||||||||
1.300%, 11/08/2016 | 1,480 | 1,479 | ||||||
UnitedHealth Group | ||||||||
1.400%, 12/15/2017 | 1,760 | 1,771 | ||||||
Zimmer Holdings | ||||||||
2.000%, 04/01/2018 | 2,345 | 2,363 | ||||||
Zoetis | ||||||||
1.150%, 02/01/2016 | 2,606 | 2,609 | ||||||
|
| |||||||
| 31,450 | ||||||||
|
| |||||||
Industrials — 0.8% | ||||||||
Hutchison Whampoa International | ||||||||
1.625%, 10/31/2017 (A) | 730 | 729 | ||||||
John Deere Capital MTN | ||||||||
1.400%, 03/15/2017 | 150 | 152 | ||||||
MUFG Americas Holdings | ||||||||
1.625%, 02/09/2018 | 2,100 | 2,100 | ||||||
Penske Truck Leasing LP | ||||||||
3.750%, 05/11/2017 (A) | 2,090 | 2,173 | ||||||
|
| |||||||
| 5,154 | ||||||||
|
| |||||||
Information Technology — 0.6% | ||||||||
Alibaba Group Holding | ||||||||
1.625%, 11/28/2017 (A) | 750 | 752 | ||||||
Hewlett-Packard | ||||||||
3.000%, 09/15/2016 | 3,100 | 3,172 | ||||||
|
| |||||||
| 3,924 | ||||||||
|
| |||||||
Materials — 0.9% | ||||||||
Ecolab | ||||||||
1.450%, 12/08/2017 | 2,590 | 2,582 | ||||||
Freeport-McMoRan | ||||||||
2.300%, 11/14/2017 | 2,835 | 2,839 | ||||||
Glencore Finance Canada | ||||||||
2.050%, 10/23/2015 (A) | 700 | 702 | ||||||
|
| |||||||
| 6,123 | ||||||||
|
| |||||||
Telecommunication Services — 1.8% |
| |||||||
AT&T | ||||||||
5.500%, 02/01/2018 | 2,800 | 3,079 | ||||||
British Telecommunications | ||||||||
1.625%, 06/28/2016 | 2,605 | 2,623 | ||||||
Harris | ||||||||
1.999%, 04/27/2018 | 1,620 | 1,624 | ||||||
Verizon Communications | ||||||||
1.350%, 06/09/2017 | 3,390 | 3,388 | ||||||
0.664%, 06/09/2017 (B) | 1,700 | 1,698 | ||||||
|
| |||||||
| 12,412 | ||||||||
|
| |||||||
| Description | Face Amount ($ Thousands) | Market Value ($ Thousands) | ||||||
Utilities — 1.3% | ||||||||
Dayton Power & Light | ||||||||
1.875%, 09/15/2016 | $ | 1,985 | $ | 2,004 | ||||
Georgia Power | ||||||||
0.591%, 03/15/2016 (B) | 225 | 225 | ||||||
Oncor Electric Delivery LLC | ||||||||
5.000%, 09/30/2017 | 660 | 716 | ||||||
Southern Power | ||||||||
1.500%, 06/01/2018 | 4,200 | 4,194 | ||||||
West Penn Power | ||||||||
5.950%, 12/15/2017 (A) | 470 | 519 | ||||||
Xcel Energy | ||||||||
1.200%, 06/01/2017 | 1,145 | 1,146 | ||||||
|
| |||||||
| 8,804 | ||||||||
|
| |||||||
Total Corporate Obligations | 276,825 | |||||||
|
| |||||||
ASSET-BACKED SECURITIES — 15.0% |
| |||||||
Automotive — 10.8% | ||||||||
Ally Master Owner Trust, Ser 2012-5, Cl A | ||||||||
1.540%, 09/15/2019 | 3,000 | 3,014 | ||||||
Ally Master Owner Trust, Ser 2013-1, Cl A2 | ||||||||
1.000%, 02/15/2018 | 400 | 401 | ||||||
Ally Master Owner Trust, Ser 2014-1, Cl A1 | ||||||||
0.656%, 01/15/2019 (B) | 3,260 | 3,267 | ||||||
Ally Master Owner Trust, Ser 2014-3, Cl A | ||||||||
1.330%, 03/15/2019 | 435 | 436 | ||||||
Ally Master Owner Trust, Ser 2014-4, Cl A1 | ||||||||
0.586%, 06/17/2019 (B) | 1,850 | 1,850 | ||||||
Capital Auto Receivables Asset Trust, Ser 2013-3, Cl B | ||||||||
2.320%, 07/20/2018 | 3,565 | 3,617 | ||||||
Capital Auto Receivables Asset Trust, Ser 2014-3, Cl A1 | ||||||||
0.504%, 02/21/2017 (B) | 765 | 765 | ||||||
CarMax Auto Owner Trust, Ser 2012-1, Cl C | ||||||||
2.200%, 10/16/2017 | 1,335 | 1,349 | ||||||
CarMax Auto Owner Trust, Ser 2012-1, Cl D | ||||||||
3.090%, 08/15/2018 | 3,195 | 3,242 | ||||||
CarMax Auto Owner Trust, Ser 2013-1, Cl A4 | ||||||||
0.890%, 08/17/2018 | 600 | 599 | ||||||
CarMax Auto Owner Trust, Ser 2013-2, Cl B | ||||||||
1.210%, 01/15/2019 | 1,025 | 1,022 | ||||||
| 254 | SEI Institutional Investments Trust / Annual Report / May 31, 2015 |
| Description | Face Amount ($ Thousands) | Market Value ($ Thousands) | ||||||
CarMax Auto Owner Trust, Ser 2013-4, Cl A4 | ||||||||
1.280%, 05/15/2019 | $ | 1,240 | $ | 1,245 | ||||
Chesapeake Funding LLC, Ser 2012-1A, Cl B | ||||||||
1.781%, 11/07/2023 (A) (B) | 200 | 200 | ||||||
Chesapeake Funding LLC, Ser 2012-1A, Cl C | ||||||||
2.181%, 11/07/2023 (A) (B) | 200 | 200 | ||||||
Chesapeake Funding LLC, Ser 2014-1A, Cl A | ||||||||
0.601%, 03/07/2026 (A) (B) | 2,950 | 2,950 | ||||||
Chesapeake Funding LLC, Ser 2015-1A, Cl B | ||||||||
1.131%, 02/07/2027 (A) (B) | 1,430 | 1,430 | ||||||
CPS Auto Receivables Trust, Ser 2013-C, Cl A | ||||||||
1.640%, 04/16/2018 (A) | 463 | 464 | ||||||
CPS Auto Receivables Trust, Ser 2013-D, Cl A | ||||||||
1.540%, 07/16/2018 (A) | 670 | 670 | ||||||
CPS Auto Receivables Trust, Ser 2014-A, Cl A | ||||||||
1.210%, 08/15/2018 (A) | 333 | 332 | ||||||
CPS Auto Receivables Trust, Ser 2014-B, Cl A | ||||||||
1.110%, 11/15/2018 (A) | 265 | 264 | ||||||
CPS Auto Receivables Trust, Ser 2014-C, Cl A | ||||||||
1.310%, 02/15/2019 (A) | 444 | 443 | ||||||
Credit Acceptance Auto Loan Trust, Ser 2015-1A, Cl A | ||||||||
2.000%, 07/15/2022 (A) | 1,395 | 1,396 | ||||||
Enterprise Fleet Financing LLC, Ser 2014-2, Cl A2 | ||||||||
1.050%, 03/20/2020 (A) | 1,500 | 1,500 | ||||||
First Investors Auto Owner Trust, Ser 2014-2A, Cl A3 | ||||||||
1.490%, 12/15/2017 (A) | 750 | 749 | ||||||
Ford Credit Floorplan Master Owner Trust, Ser 2012-2, Cl A | ||||||||
1.920%, 01/15/2019 | 3,245 | 3,293 | ||||||
Ford Credit Floorplan Master Owner Trust, Ser 2013-1, Cl B | ||||||||
1.120%, 01/15/2018 | 740 | 741 | ||||||
Ford Credit Floorplan Master Owner Trust, Ser 2013-1, Cl C | ||||||||
1.370%, 01/15/2018 | 950 | 952 | ||||||
Ford Credit Floorplan Master Owner Trust, Ser 2014-4, Cl A2 | ||||||||
0.536%, 08/15/2019 (B) | 2,190 | 2,183 | ||||||
GE Dealer Floorplan Master Note Trust, Ser 2012-3, Cl A | ||||||||
0.674%, 06/20/2017 (B) | 1,035 | 1,035 | ||||||
| Description | Face Amount ($ Thousands) | Market Value ($ Thousands) | ||||||
GE Dealer Floorplan Master Note Trust, Ser 2013-1, Cl A | ||||||||
0.584%, 04/20/2016 (B) | $ | 1,060 | $ | 1,060 | ||||
GM Financial Automobile Leasing Trust, Ser 2014-1A, Cl A4 | ||||||||
1.300%, 05/21/2018 (A) | 1,140 | 1,144 | ||||||
GM Financial Automobile Leasing Trust, Ser 2015-1, Cl B | ||||||||
2.140%, 06/20/2019 | 1,425 | 1,432 | ||||||
GMF Floorplan Owner Revolving Trust, Ser 2015-1, Cl A1 | ||||||||
1.650%, 05/15/2020 (A) | 2,405 | 2,405 | ||||||
GMF Floorplan Owner Revolving Trust, Ser 2015-1, Cl B | ||||||||
1.970%, 05/15/2020 (A) | 1,320 | 1,320 | ||||||
Harley-Davidson Motorcycle Trust, Ser 2013-1, Cl A4 | ||||||||
0.870%, 07/15/2019 | 250 | 250 | ||||||
Mercedes-Benz Auto Receivables Trust, Ser 2013-1, Cl A4 | ||||||||
1.130%, 11/15/2019 | 325 | 326 | ||||||
NextGear Floorplan Master Owner Trust, Ser 2014-1A, Cl A | ||||||||
1.920%, 10/15/2019 (A) | 370 | 372 | ||||||
Nissan Auto Receivables Owner Trust, Ser 2013-C, Cl A3 | ||||||||
0.670%, 08/15/2018 | 580 | 580 | ||||||
Porsche Innovative Lease Owner Trust, Ser 2014-1, Cl A4 | ||||||||
1.260%, 09/21/2020 (A) | 375 | 376 | ||||||
Prestige Auto Receivables Trust, Ser 2012-1A, Cl C | ||||||||
3.250%, 07/15/2019 (A) | 1,429 | 1,449 | ||||||
Prestige Auto Receivables Trust, Ser 2013-1A, Cl A2 | ||||||||
1.090%, 02/15/2018 (A) | 161 | 161 | ||||||
Prestige Auto Receivables Trust, Ser 2014-1A, Cl A2 | ||||||||
0.970%, 03/15/2018 (A) | 540 | 540 | ||||||
Prestige Auto Receivables Trust, Ser 2014-1A, Cl B | ||||||||
1.910%, 04/15/2020 (A) | 1,470 | 1,473 | ||||||
Prestige Auto Receivables Trust, Ser 2015-1, Cl A3 | ||||||||
1.530%, 02/15/2021 (A) | 1,050 | 1,047 | ||||||
Santander Drive Auto Receivables Trust, Ser 2012-1, Cl C | ||||||||
3.780%, 11/15/2017 | 647 | 652 | ||||||
Santander Drive Auto Receivables Trust, Ser 2012-2, Cl C | ||||||||
3.200%, 02/15/2018 | 1,214 | 1,223 | ||||||
Santander Drive Auto Receivables Trust, Ser 2012-3, Cl C | ||||||||
3.010%, 04/16/2018 | 2,208 | 2,225 | ||||||
| SEI Institutional Investments Trust / Annual Report / May 31, 2015 | 255 |
SCHEDULE OF INVESTMENTS
Limited Duration Bond Fund (Continued)
May 31, 2015
| Description | Face Amount ($ Thousands) | Market Value ($ Thousands) | ||||||
Santander Drive Auto Receivables Trust, | ||||||||
1.830%, 03/15/2017 | $ | 24 | $ | 24 | ||||
Santander Drive Auto Receivables Trust, | ||||||||
2.940%, 12/15/2017 | 2,345 | 2,372 | ||||||
Santander Drive Auto Receivables Trust, | ||||||||
1.560%, 08/15/2018 | 149 | 149 | ||||||
Santander Drive Auto Receivables Trust, | ||||||||
1.940%, 06/15/2016 | 1,050 | 1,055 | ||||||
Santander Drive Auto Receivables Trust, | ||||||||
1.780%, 11/15/2018 (A) | 355 | 356 | ||||||
Santander Drive Auto Receivables Trust, | ||||||||
1.760%, 01/15/2019 | 1,430 | 1,434 | ||||||
Santander Drive Auto Receivables Trust, | ||||||||
1.330%, 03/15/2018 | 1,105 | 1,106 | ||||||
Santander Drive Auto Receivables Trust, | ||||||||
1.110%, 12/15/2017 | 390 | 390 | ||||||
Santander Drive Auto Receivables Trust, | ||||||||
1.020%, 02/15/2016 (A) | 534 | 535 | ||||||
SMART Trust, Ser 2011-4USA, Cl A4A | ||||||||
2.280%, 08/14/2017 (A) | 224 | 224 | ||||||
SMART Trust, Ser 2012-4US, Cl A4A | ||||||||
1.250%, 08/14/2018 | 235 | 235 | ||||||
Susquehanna Auto Receivables Trust, | ||||||||
1.000%, 02/15/2018 (A) | 550 | 550 | ||||||
Volkswagen Auto Lease Trust, Ser 2014-A, Cl A4 | ||||||||
0.990%, 07/20/2018 | 740 | 741 | ||||||
Westlake Automobile Receivables Trust, | ||||||||
0.970%, 10/16/2017 (A) | 965 | 965 | ||||||
Westlake Automobile Receivables Trust, | ||||||||
1.580%, 04/15/2020 (A) | 500 | 501 | ||||||
Westlake Automobile Receivables Trust, | ||||||||
2.240%, 04/15/2020 (A) | 575 | 578 | ||||||
Westlake Automobile Receivables Trust, | ||||||||
1.680%, 11/16/2020 (A) | 1,845 | 1,837 | ||||||
Westlake Automobile Receivables Trust, | ||||||||
2.290%, 11/16/2020 (A) | 1,600 | 1,605 | ||||||
|
| |||||||
| 72,301 | ||||||||
|
| |||||||
| Description | Face Amount ($ Thousands) | Market Value ($ Thousands) | ||||||
Credit Cards — 1.6% | ||||||||
American Express Credit Account Master Trust, Ser 2008-2, Cl A | ||||||||
1.446%, 09/15/2020 (B) | $ | 1,120 | $ | 1,150 | ||||
American Express Credit Account Master Trust, Ser 2014-4, Cl A | ||||||||
1.430%, 06/15/2020 | 1,250 | 1,256 | ||||||
Chase Issuance Trust, Ser 2012-A2, Cl A2 | ||||||||
0.456%, 05/15/2019 (B) | 1,625 | 1,626 | ||||||
Chase Issuance Trust, Ser 2012-A3, Cl A3 | ||||||||
0.790%, 06/15/2017 | 775 | 775 | ||||||
Chase Issuance Trust, Ser 2013-A1, Cl A1 | ||||||||
1.300%, 02/18/2020 | 550 | 550 | ||||||
Chase Issuance Trust, Ser 2014-A3, Cl A3 | ||||||||
0.386%, 05/15/2018 (B) | 840 | 840 | ||||||
Citibank Credit Card Issuance Trust, Ser 2013-A10, Cl A10 | ||||||||
0.730%, 02/07/2018 | 1,425 | 1,427 | ||||||
Discover Card Execution Note Trust, Ser 2014-A5, Cl A | ||||||||
1.390%, 04/15/2020 | 1,150 | 1,155 | ||||||
Golden Credit Card Trust, Ser 2012-2A, Cl A1 | ||||||||
1.770%, 01/15/2019 (A) | 1,000 | 1,012 | ||||||
Golden Credit Card Trust, Ser 2012-3A, Cl A | ||||||||
0.636%, 07/17/2017 (A) (B) | 300 | 300 | ||||||
Synchrony Credit Card Master Note Trust, Ser 2012-6, Cl A | ||||||||
1.360%, 08/17/2020 | 916 | 917 | ||||||
|
| |||||||
| 11,008 | ||||||||
|
| |||||||
Mortgage Related Securities — 0.8% |
| |||||||
Aegis Asset Backed Securities Trust Mortgage Pass-Through Certificates, Ser 2004-2, Cl A1 | ||||||||
0.785%, 06/25/2034 (B) | 586 | 580 | ||||||
Aegis Asset-Backed Securities Trust Mortgage Pass-Through Certificates, Ser 2004-4, Cl A1 | ||||||||
0.905%, 10/25/2034 (B) | 850 | 836 | ||||||
Bear Stearns Asset-Backed Securities Trust, Ser 2004-2, Cl A1 | ||||||||
1.181%, 08/25/2034 (B) | 336 | 336 | ||||||
Merrill Lynch Mortgage Investors Trust, Ser 2006-FF1, Cl M1 | ||||||||
0.405%, 08/25/2036 (B) | 3,400 | 3,308 | ||||||
|
| |||||||
| 5,060 | ||||||||
|
| |||||||
| 256 | SEI Institutional Investments Trust / Annual Report / May 31, 2015 |
| Description | Face Amount ($ Thousands) | Market Value ($ Thousands) | ||||||
Other Asset-Backed Securities — 1.8% |
| |||||||
Ascentium Equipment Receivables, Ser 2014-1A, Cl A2 | ||||||||
1.040%, 01/10/2017 (A) | $ | 296 | $ | 296 | ||||
Bear Stearns Asset-Backed Securities Trust, Ser 2004-SD3, Cl A3 | ||||||||
0.755%, 09/25/2034 (B) | 320 | 314 | ||||||
CenterPoint Energy Restoration Bond LLC, Ser 2009-1, Cl A2 | ||||||||
3.460%, 08/15/2019 | 1,460 | 1,513 | ||||||
CIT Equipment Collateral, Ser 2014-VTI, Cl A3 | ||||||||
1.690%, 10/21/2019 | 470 | 471 | ||||||
GE Equipment Midticket LLC, Ser 2014-1, Cl A3 | ||||||||
1.140%, 05/22/2018 | 200 | 200 | ||||||
GE Equipment Small Ticket LLC, Ser 2014-1A, Cl A4 | ||||||||
1.440%, 10/25/2021 (A) | 1,665 | 1,675 | ||||||
HLSS Servicer Advance Receivables Backed Notes, Ser 2013-T3, Cl B3 | ||||||||
2.140%, 05/15/2046 (A) | 1,000 | 995 | ||||||
John Deere Owner Trust, Ser 2012-B, Cl A3 | ||||||||
0.530%, 07/15/2016 | 56 | 56 | ||||||
John Deere Owner Trust, Ser 2014-B, Cl A3 | ||||||||
1.070%, 11/15/2018 | 1,000 | 1,001 | ||||||
Kubota Credit Owner Trust, Ser 2014-1A, Cl A3 | ||||||||
1.160%, 05/15/2018 (A) | 2,000 | 2,004 | ||||||
Navient Student Loan Trust, Ser 2014-1, Cl A1 | ||||||||
0.435%, 03/25/2021 (B) | 871 | 870 | ||||||
Saxon Asset Securities Trust, Ser 2006-1, Cl A2C | ||||||||
0.505%, 03/25/2036 (B) | 437 | 427 | ||||||
SLM Student Loan Trust, Ser 2006-10, Cl A4 | ||||||||
0.347%, 07/25/2023 (B) | 171 | 171 | ||||||
SLM Student Loan Trust, Ser 2007-2, Cl A2 | ||||||||
0.277%, 07/25/2017 (B) | 352 | 351 | ||||||
Structured Asset Securities, Ser 2005-WF1, Cl A3 | ||||||||
0.845%, 02/25/2035(B) | 2,015 | 2,001 | ||||||
|
| |||||||
| 12,345 | ||||||||
|
| |||||||
Total Asset-Backed Securities | 100,714 | |||||||
|
| |||||||
| Description | Face Amount ($ Thousands) | Market Value ($ Thousands) | ||||||
MORTGAGE-BACKED SECURITIES — 10.7% |
| |||||||
Agency Mortgage-Backed Obligations — 2.9% |
| |||||||
FHLMC | ||||||||
4.000%, 06/01/2025 | $ | 1,013 | $ | 1,085 | ||||
2.259%, 03/01/2037 | 339 | 360 | ||||||
FHLMC CMO, Ser 2010-3747, Cl PA | ||||||||
4.000%, 04/15/2038 | 523 | 558 | ||||||
FHLMC CMO, Ser 2010-3753, Cl PD | ||||||||
3.000%, 09/15/2039 | 1,415 | 1,448 | ||||||
FHLMC Multifamily Structured Pass-Through Certificates, Ser 2010-K008, Cl A1 | ||||||||
2.746%, 12/25/2019 | 295 | 305 | ||||||
FHLMC Multifamily Structured Pass-Through Certificates, Ser K001, Cl A2 | ||||||||
5.651%, 04/25/2016 (B) | 275 | 284 | ||||||
FHLMC Multifamily Structured Pass-Through Certificates, Ser K501, Cl A2 | ||||||||
1.655%, 11/25/2016 | 835 | 844 | ||||||
FNMA | ||||||||
5.000%, 06/01/2019 | 127 | 135 | ||||||
2.500%, 04/01/2027 | 1,367 | 1,403 | ||||||
1.220%, 08/01/2017 | 675 | 679 | ||||||
FNMA CMO, Ser 2008-18, Cl HD | ||||||||
4.000%, 12/25/2018 | 218 | 225 | ||||||
FNMA CMO, Ser 2009-70, Cl NL | ||||||||
3.000%, 08/25/2019 | 210 | 215 | ||||||
FNMA CMO, Ser 2011-23, Cl AB | ||||||||
2.750%, 06/25/2020 | 227 | 232 | ||||||
FNMA CMO, Ser 2012-29, Cl NA | ||||||||
3.500%, 03/25/2042 | 828 | 852 | ||||||
GNMA ARM (B) | ||||||||
3.000%, 02/20/2041 | 752 | 782 | ||||||
2.500%, 04/20/2042 | 314 | 325 | ||||||
2.000%, 10/20/2042 | 625 | 642 | ||||||
1.625%, 08/20/2040 | 610 | 633 | ||||||
GNMA CMO, Ser 2004-17, Cl MA | ||||||||
5.000%, 02/16/2032 | 133 | 136 | ||||||
GNMA CMO, Ser 2010-162, Cl PQ | ||||||||
4.500%, 06/16/2039 | 256 | 270 | ||||||
GNMA CMO, Ser 2011-106, Cl ME | ||||||||
3.000%, 06/20/2038 | 341 | 346 | ||||||
GNMA CMO, Ser 2012-31, Cl QJ | ||||||||
3.000%, 12/20/2039 | 792 | 818 | ||||||
GNMA, Ser 2012-109, Cl AB | ||||||||
1.388%, 09/16/2044 | 1,146 | 1,124 | ||||||
GNMA, Ser 2013-105, Cl A | ||||||||
1.705%, 02/16/2037 | 1,419 | 1,410 | ||||||
| SEI Institutional Investments Trust / Annual Report / May 31, 2015 | 257 |
SCHEDULE OF INVESTMENTS
Limited Duration Bond Fund (Continued)
May 31, 2015
| Description | Face Amount ($ Thousands) | Market Value ($ Thousands) | ||||||
GNMA, Ser 2013-12, Cl AB | ||||||||
1.826%, 11/16/2052 | $ | 1,552 | $ | 1,513 | ||||
GNMA, Ser 2013193, Cl AB | ||||||||
2.000%, 12/16/2049 | 844 | 849 | ||||||
GNMA, Ser 2014-103, Cl AB | ||||||||
1.742%, 06/16/2053 | 796 | 818 | ||||||
NCUA Guaranteed Notes CMO, Ser 2011-R2, Cl 1A | ||||||||
0.578%, 02/06/2020 (B) | 954 | 958 | ||||||
|
| |||||||
| 19,249 | ||||||||
|
| |||||||
Non-Agency Mortgage-Backed Obligations — 7.8% |
| |||||||
Agate Bay Mortgage Trust, Ser 2015-2, Cl A7 | ||||||||
3.500%, 03/25/2045 (A) (B) | 2,011 | 2,073 | ||||||
BAMLL Commercial Mortgage Securities Trust, Ser 2013-DSNY, Cl A | ||||||||
1.236%, 09/15/2026 (A) (B) | 700 | 699 | ||||||
BAMLL Commercial Mortgage Securities Trust, Ser 2014-ICTS, Cl A | ||||||||
0.986%, 06/15/2028 (A) (B) | 1,250 | 1,251 | ||||||
Bear Stearns Commercial Mortgage Securities, Ser 2005-PWR8, Cl A4 | ||||||||
4.674%, 06/11/2041 | 51 | 50 | ||||||
BLCP Hotel Trust, Ser 2014-CLRN, Cl A | ||||||||
1.136%, 08/15/2029 (A) (B) | 350 | 349 | ||||||
CD Commercial Mortgage Trust, Ser 2005-CD1, Cl A4 | ||||||||
5.226%, 07/15/2044 (B) | 392 | 393 | ||||||
Citigroup Commercial Mortgage Trust, Ser 2012-GC8, Cl A2 | ||||||||
1.813%, 09/10/2045 | 635 | 642 | ||||||
Citigroup Commercial Mortgage Trust, Ser 2013-GC11, Cl A2 | ||||||||
1.987%, 04/10/2046 | 985 | 997 | ||||||
Citigroup Commercial Mortgage Trust, Ser 2013-SMP, Cl A | ||||||||
2.110%, 01/12/2030 (A) | 667 | 677 | ||||||
Citigroup Commercial Mortgage Trust, Ser 2014-388G, Cl A | ||||||||
0.936%, 06/15/2033 (A) (B) | 1,925 | 1,921 | ||||||
COMM Mortgage Trust, Ser 2012-9W57, Cl A | ||||||||
2.365%, 02/10/2029 (A) | 1,710 | 1,745 | ||||||
COMM Mortgage Trust, Ser 2013-CR9, Cl A1 | ||||||||
1.344%, 07/10/2045 | 533 | 534 | ||||||
COMM Mortgage Trust, Ser 2014-BBG, Cl A | ||||||||
0.986%, 03/15/2029 (A) (B) | 1,590 | 1,588 | ||||||
| Description | Face Amount ($ Thousands) | Market Value ($ Thousands) | ||||||
COMM Mortgage Trust, Ser 2014-PAT, Cl A | ||||||||
0.986%, 08/13/2027 (A) (B) | $ | 320 | $ | 319 | ||||
COMM Mortgage Trust, Ser 2014-UBS4, Cl A2 | ||||||||
2.963%, 08/10/2019 | 600 | 624 | ||||||
CSMC Trust, Ser 2014-TIKI, Cl A | ||||||||
1.140%, 09/15/2038 (A) (B) | 1,000 | 997 | ||||||
CSMC Trust, Ser 2014-WIN1, Cl 1A1 | ||||||||
3.000%, 08/25/2029 (A) (B) | 1,719 | 1,759 | ||||||
CSMC Trust, Ser 2014-WIN1, Cl 2A5 | ||||||||
3.000%, 09/25/2044 (A) (B) | 951 | 967 | ||||||
CSMC, Ser 2014-ICE, Cl A | ||||||||
1.050%, 04/15/2027 (A) (B) | 1,050 | 1,047 | ||||||
CSMLT Trust, Ser 2015-1, Cl A3 | ||||||||
3.500%, 05/25/2045 (A) | 3,705 | 3,802 | ||||||
FHLMC Structured Agency Credit Risk Debt Notes, Ser 2015-DNA1, Cl M1 | ||||||||
1.080%, 10/25/2027 (A) (B) | 2,481 | 2,478 | ||||||
GS Mortgage Securities Trust, Ser 2010-C1, Cl A1 | ||||||||
3.679%, 05/10/2020 (A) | 370 | 383 | ||||||
GS Mortgage Securities Trust, Ser 2010-C2, Cl A1 | ||||||||
3.849%, 12/10/2043 (A) | 219 | 223 | ||||||
Homestar Mortgage Acceptance, Ser 2004-3, Cl AV1 | ||||||||
0.635%, 07/25/2034 (A) (B) | 1,157 | 1,147 | ||||||
Impac CMB Trust Series, Ser 2003-8, Cl 1A1 | ||||||||
0.861%, 10/25/2033 (A) (B) | 283 | 277 | ||||||
JPMBB Commercial Mortgage Securities Trust, Ser 2014-C22, Cl A1 | ||||||||
1.451%, 06/15/2019 | 1,072 | 1,073 | ||||||
JPMorgan Chase Commercial Mortgage Securities Trust, Ser 2005-LDP4, Cl A4 | ||||||||
4.918%, 10/15/2042 (B) | 130 | 131 | ||||||
JPMorgan Chase Commercial Mortgage Securities Trust, Ser 2011-PLSD, Cl A2 | ||||||||
3.364%, 11/13/2044 (A) | 2,750 | 2,834 | ||||||
JPMorgan Chase Commercial Mortgage Securities Trust, Ser 2014-CBM, Cl A | ||||||||
1.086%, 10/15/2029 (A) (B) | 1,500 | 1,498 | ||||||
JPMorgan Chase Commercial Mortgage Securities Trust, Ser 2014-FL5, Cl A | ||||||||
1.166%, 07/15/2031 (A) (B) | 600 | 599 | ||||||
| 258 | SEI Institutional Investments Trust / Annual Report / May 31, 2015 |
| Description | Face Amount ($ Thousands) | Market Value ($ Thousands) | ||||||
JPMorgan Chase Commercial Mortgage Securities Trust, Ser 2014-PHH, Cl A | ||||||||
1.382%, 08/15/2027 (A) (B) | $ | 2,910 | $ | 2,914 | ||||
JPMorgan Chase Commercial Mortgage Securities Trust, Ser 2015-CSMO, Cl A | ||||||||
1.432%, 01/15/2032 (A) (B) | 3,980 | 3,982 | ||||||
JPMorgan Chase Commercial Mortgage Securities Trust, Ser C19, Cl A1 | ||||||||
1.266%, 04/15/2047 | 401 | 401 | ||||||
JPMorgan Trust, Ser 2015-3, Cl A5 | ||||||||
3.500%, 05/25/2045 (A) (B) | 2,695 | 2,761 | ||||||
Merrill Lynch Mortgage Trust, Ser 2005-LC1, Cl A4 | ||||||||
5.291%, 01/12/2044 (B) | 596 | 602 | ||||||
Morgan Stanley Bank of America Merrill Lynch Trust, Ser 2012-C5, Cl A2 | ||||||||
1.972%, 08/15/2045 | 1,290 | 1,308 | ||||||
Morgan Stanley Capital I Trust, Ser 2012-C4, Cl A2 | ||||||||
2.111%, 03/15/2045 | 1,275 | 1,294 | ||||||
WFRBS Commercial Mortgage Trust, Ser 2011-C2A2, Cl A2 | ||||||||
3.791%, 02/15/2044 (A) | 95 | 96 | ||||||
WFRBS Commercial Mortgage Trust, Ser 2011-C5, Cl A2 | ||||||||
2.684%, 11/15/2044 | 100 | 102 | ||||||
WFRBS Commercial Mortgage Trust, Ser 2013-C12, Cl A2 | ||||||||
2.072%, 03/15/2048 | 1,125 | 1,143 | ||||||
WFRBS Commercial Mortgage Trust, Ser 2014-C21, Cl A2 | ||||||||
2.917%, 08/15/2047 | 500 | 520 | ||||||
WFRBS Commercial Mortgage Trust, Ser 2014-C25, Cl A1 | ||||||||
1.518%, 11/15/2047 | 930 | 931 | ||||||
WinWater Mortgage Loan Trust, Ser 2015-A, Cl A5 | ||||||||
3.500%, 05/27/2045 (A) (B) | 3,185 | 3,274 | ||||||
|
| |||||||
| 52,405 | ||||||||
|
| |||||||
Total Mortgage-Backed Securities | 71,654 | |||||||
|
| |||||||
MUNICIPAL BONDS — 2.9% | ||||||||
Babylon, BAN | ||||||||
1.000%, 08/01/2015 | 890 | 891 | ||||||
California State, Build America Project, GO | ||||||||
6.200%, 10/01/2019 | 1,290 | 1,519 | ||||||
| Description | Face Amount ($ Thousands) | Market Value ($ Thousands) | ||||||
Georgia State, Electric Authority, RB | ||||||||
3.552%, 01/01/2017 | $ | 810 | $ | 839 | ||||
Hawaii State, Highway Revenue Authority, Ser C, RB | ||||||||
0.700%, 01/01/2016 | 850 | 850 | ||||||
Indiana Bond Bank, RB | ||||||||
3.908%, 08/01/2016 | 1,750 | 1,814 | ||||||
Intermountain Power Agency, Sub-Ser B, RB | ||||||||
1.333%, 07/01/2017 | 525 | 525 | ||||||
Kentucky State, Commission Revenue Board, RB | ||||||||
1.028%, 04/01/2016 | 190 | 190 | ||||||
Kentucky State, Property & Building Commission, Build America Project, RB | ||||||||
4.077%, 11/01/2015 | 600 | 608 | ||||||
Louisville, Regional Airport Authority, Ser C, RB | ||||||||
0.769%, 07/01/2016 | 1,000 | 1,001 | ||||||
Michigan State, Ser A, GO | ||||||||
1.625%, 05/15/2017 | 1,000 | 1,012 | ||||||
New Jersey State, Economic Development Authority, Ser Q, RB | ||||||||
1.802%, 06/15/2017 | 4,715 | 4,683 | ||||||
New Jersey State, Transportation Trust Fund Authority, Ser B, RB | ||||||||
1.758%, 12/15/2018 | 1,000 | 985 | ||||||
New York City, Sub-Ser G, | ||||||||
1.700%, 04/01/2017 | 1,020 | 1,030 | ||||||
Orange County, Ser A, RB | ||||||||
0.580%, 11/02/2015 | 1,185 | 1,185 | ||||||
Saint Paul, Housing & Redevelopment Authority, RB | ||||||||
1.838%, 07/01/2018 | 1,155 | 1,155 | ||||||
Salt Lake City, Redevelopment Agency, Performing Arts Center Project, TA | ||||||||
3.000%, 04/01/2016 | 1,400 | 1,426 | ||||||
|
| |||||||
Total Municipal Bonds | 19,713 | |||||||
|
| |||||||
SOVEREIGN DEBT — 0.6% | ||||||||
Province of Ontario | ||||||||
1.600%, 09/21/2016 | 4,000 | 4,048 | ||||||
|
| |||||||
Total Sovereign Debt | 4,048 | |||||||
|
| |||||||
U.S. GOVERNMENT AGENCY OBLIGATIONS — 0.6% |
| |||||||
FHLMC | ||||||||
1.400%, 05/25/2018 | 2,000 | 2,004 | ||||||
| SEI Institutional Investments Trust / Annual Report / May 31, 2015 | 259 |
SCHEDULE OF INVESTMENTS
Limited Duration Bond Fund (Concluded)
May 31, 2015
| Description | Face Amount ($ Thousands)/Shares | Market Value ($ Thousands) | ||||||
1.250%, 12/05/2017 | $ | 1,600 | $ | 1,600 | ||||
|
| |||||||
Total U.S. Government Agency Obligations | 3,604 | |||||||
|
| |||||||
U.S. TREASURY OBLIGATIONS — 12.3% |
| |||||||
U.S. Treasury Notes | ||||||||
3.125%, 05/15/2019 | 18,410 | 19,737 | ||||||
1.000%, 11/30/2019 | 21,300 | 20,932 | ||||||
0.750%, 02/28/2018 | 9,150 | 9,118 | ||||||
0.625%, 11/30/2017 | 10,825 | 10,781 | ||||||
0.625%, 04/30/2018 | 2,400 | 2,380 | ||||||
0.500%, 07/31/2017 | 19,600 | 19,530 | ||||||
|
| |||||||
Total U.S. Treasury Obligations | 82,478 | |||||||
|
| |||||||
CASH EQUIVALENT — 0.7% |
| |||||||
SEI Daily Income Trust, Prime Obligation Fund, Cl A | ||||||||
0.010%*† | 4,935,526 | 4,936 | ||||||
|
| |||||||
Total Cash Equivalent | 4,936 | |||||||
|
| |||||||
Total Investments — 84.1% | $ | 563,972 | ||||||
|
| |||||||
Percentages are based on a Net Assets of $670,579 ($ Thousands).
| * | The rate reported is the 7-day effective yield as of May 31, 2015. |
| † | Investment in Affiliated Security (see Note 6). |
| (A) | Securities sold within terms of a private placement memorandum, exempt from registration under Section 144A of the Securities Act of 1933, as amended, and may be sold only to dealers in that program or other “accredited investors.” These securities have been determined to be liquid under guidelines established by the Board of Trustees. |
| (B) | Variable Rate Security — The rate reported on the Schedule of Investments is the rate in effect as of May 31, 2015. |
ARM — Adjustable Rate Mortgage
BAN — Bond Anticipation Note
Cl — Class
CMO — Collateralized Mortgage Obligation
FHLMC — Federal Home Loan Mortgage Corporation
FNMA — Federal National Mortgage Association
GNMA — Government National Mortgage Association
GO — General Obligation
LLC — Limited Liability Company
LP — Limited Partnership
MTN — Medium Term Note
NCUA — National Credit Union Association
RB — Revenue Bond
Ser — Series
TA — Tax Allocation
The following is a list of the level of inputs used as of May 31, 2015, in valuing the Fund’s investments carried at value ($ Thousands):
| Investments in Securities | Level 1 | Level 2 | Level 3 | Total | ||||||||||||
Corporate Obligations | $ | — | $ | 276,825 | $ | — | $ | 276,825 | ||||||||
Asset-Backed Securities | — | 100,714 | — | 100,714 | ||||||||||||
Mortgage-Backed Securities | — | 71,654 | — | 71,654 | ||||||||||||
Municipal Bonds | — | 19,713 | — | 19,713 | ||||||||||||
Sovereign Debt | — | 4,048 | — | 4,048 | ||||||||||||
U.S. Government Agency Obligations | — | 3,604 | — | 3,604 | ||||||||||||
U.S. Treasury Obligations | — | 82,478 | — | 82,478 | ||||||||||||
Cash Equivalent | 4,936 | — | — | 4,936 | ||||||||||||
|
|
|
|
|
|
|
| |||||||||
Total Investments in Securities | $ | 4,936 | $ | 559,036 | $ | — | $ | 563,972 | ||||||||
|
|
|
|
|
|
|
| |||||||||
For the year ended May 31, 2015, there were no transfers between Level 1 and Level 2 assets and liabilities.
For the year ended May 31, 2015, there were no transfers between Level 2 and Level 3 assets and liabilities.
For more information on valuation inputs, see Note 2 — Significant Accounting Policies in Notes to Financial Statements.
Amounts designated as “—” are either $0 or have been rounded to $0.
The accompanying notes are an integral part of the financial statements.
| 260 | SEI Institutional Investments Trust / Annual Report / May 31, 2015 |
SCHEDULE OF INVESTMENTS
Intermediate Duration Credit Fund
May 31, 2015
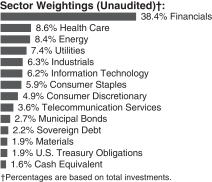
| Description | Face Amount ($ Thousands) | Market Value ($ Thousands) | ||||||
CORPORATE OBLIGATIONS — 90.6% |
| |||||||
Consumer Discretionary — 4.8% |
| |||||||
21st Century Fox America | ||||||||
8.150%, 10/17/2036 | $ | 40 | $ | 56 | ||||
7.850%, 03/01/2039 | 1,100 | 1,566 | ||||||
7.700%, 10/30/2025 | 200 | 263 | ||||||
6.900%, 08/15/2039 | 2,170 | 2,841 | ||||||
6.200%, 12/15/2034 | 60 | 73 | ||||||
6.150%, 02/15/2041 | 320 | 386 | ||||||
Amazon.com | ||||||||
4.950%, 12/05/2044 | 2,510 | 2,574 | ||||||
1.200%, 11/29/2017 | 970 | 970 | ||||||
American Honda Finance | ||||||||
2.125%, 10/10/2018 | 5,610 | 5,722 | ||||||
Comcast | ||||||||
7.050%, 03/15/2033 | 40 | 53 | ||||||
6.950%, 08/15/2037 | 5,555 | 7,414 | ||||||
6.300%, 11/15/2017 | 2,316 | 2,597 | ||||||
5.650%, 06/15/2035 | 170 | 201 | ||||||
4.600%, 08/15/2045 | 1,225 | 1,272 | ||||||
4.200%, 08/15/2034 | 4,130 | 4,137 | ||||||
3.375%, 02/15/2025 | 2,745 | 2,786 | ||||||
3.375%, 08/15/2025 | 5,980 | 6,063 | ||||||
Comcast Cable Communications Holdings | ||||||||
9.455%, 11/15/2022 | 950 | 1,356 | ||||||
DIRECTV Holdings LLC | ||||||||
4.450%, 04/01/2024 | 2,630 | 2,761 | ||||||
Ford Holdings | ||||||||
9.300%, 03/01/2030 | 287 | 434 | ||||||
Ford Motor | ||||||||
7.450%, 07/16/2031 | 755 | 984 | ||||||
7.400%, 11/01/2046 | �� | 340 | 477 | |||||
Home Depot | ||||||||
5.400%, 03/01/2016 | 8,000 | 8,295 | ||||||
4.400%, 04/01/2021 | 2,130 | 2,382 | ||||||
4.400%, 03/15/2045 | 840 | 867 | ||||||
2.250%, 09/10/2018 | 2,000 | 2,053 | ||||||
NBCUniversal Media LLC | ||||||||
5.950%, 04/01/2041 | 530 | 645 | ||||||
| Description | Face Amount ($ Thousands) | Market Value ($ Thousands) | ||||||
NVR | ||||||||
3.950%, 09/15/2022 | $ | 765 | $ | 791 | ||||
QVC | ||||||||
5.450%, 08/15/2034 | 1,990 | 1,904 | ||||||
4.375%, 03/15/2023 | 1,395 | 1,404 | ||||||
Target | ||||||||
6.500%, 10/15/2037 | 1,780 | 2,387 | ||||||
3.500%, 07/01/2024 | 4,390 | 4,569 | ||||||
2.300%, 06/26/2019 | 3,700 | 3,771 | ||||||
Time Warner | ||||||||
6.250%, 03/29/2041 | 537 | 622 | ||||||
Viacom | ||||||||
5.625%, 09/15/2019 | 1,750 | 1,959 | ||||||
|
| |||||||
| 76,635 | ||||||||
|
| |||||||
Consumer Staples — 5.9% | ||||||||
Altria Group | ||||||||
9.950%, 11/10/2038 | 1,118 | 1,868 | ||||||
Anheuser-Busch InBev Worldwide | ||||||||
2.500%, 07/15/2022 | 7,122 | 6,971 | ||||||
1.375%, 07/15/2017 | 5,085 | 5,123 | ||||||
Anheuser-Busch LLC | ||||||||
5.000%, 03/01/2019 | 1,000 | 1,114 | ||||||
Bowdoin College | ||||||||
4.693%, 07/01/2112 | 2,565 | 2,248 | ||||||
ConAgra Foods | ||||||||
1.300%, 01/25/2016 | 4,100 | 4,108 | ||||||
CVS Health | ||||||||
1.200%, 12/05/2016 | 4,700 | 4,726 | ||||||
CVS, Pass-Through Trust | ||||||||
8.353%, 07/10/2031 (A) | 2,497 | 3,375 | ||||||
7.507%, 01/10/2032 (A) | 1,764 | 2,259 | ||||||
Diageo Capital | ||||||||
0.625%, 04/29/2016 | 4,765 | 4,768 | ||||||
Grupo Bimbo | ||||||||
4.875%, 06/27/2044 (A) | 925 | 895 | ||||||
Japan Tobacco | ||||||||
2.100%, 07/23/2018 (A) | 1,628 | 1,651 | ||||||
Lorillard Tobacco | ||||||||
6.875%, 05/01/2020 | 500 | 588 | ||||||
Massachusetts Institute of Technology | ||||||||
5.600%, 07/01/2111 | 3,430 | 4,335 | ||||||
PepsiCo | ||||||||
3.125%, 11/01/2020 | 4,365 | 4,588 | ||||||
1.250%, 04/30/2018 | 5,830 | 5,822 | ||||||
Philip Morris International | ||||||||
4.875%, 11/15/2043 | 1,900 | 2,037 | ||||||
4.500%, 03/20/2042 | 1,535 | 1,545 | ||||||
3.875%, 08/21/2042 | 380 | 353 | ||||||
SABMiller Holdings | ||||||||
3.750%, 01/15/2022 (A) | 3,200 | 3,345 | ||||||
2.450%, 01/15/2017 (A) | 200 | 204 | ||||||
| SEI Institutional Investments Trust / Annual Report / May 31, 2015 | 261 |
SCHEDULE OF INVESTMENTS
Intermediate Duration Credit Fund (Continued)
May 31, 2015
| Description | Face Amount ($ Thousands) | Market Value ($ Thousands) | ||||||
Sysco | ||||||||
2.600%, 06/12/2022 | $ | 2,920 | $ | 2,908 | ||||
1.450%, 10/02/2017 | 2,905 | 2,918 | ||||||
University of Southern California | ||||||||
5.250%, 10/01/2111 | 3,300 | 4,111 | ||||||
Walgreens Boots Alliance | ||||||||
4.800%, 11/18/2044 | 50 | 49 | ||||||
1.750%, 11/17/2017 | 3,130 | 3,152 | ||||||
Wal-Mart Stores | ||||||||
5.800%, 02/15/2018 | 4,650 | 5,227 | ||||||
4.750%, 10/02/2043 | 530 | 579 | ||||||
4.300%, 04/22/2044 | 3,170 | 3,288 | ||||||
3.250%, 10/25/2020 | 3,034 | 3,229 | ||||||
2.550%, 04/11/2023 | 6,335 | 6,315 | ||||||
|
| |||||||
| 93,699 | ||||||||
|
| |||||||
Energy — 8.3% | ||||||||
Anadarko Petroleum | ||||||||
4.244%, 10/10/2036 (B) | 12,000 | 4,845 | ||||||
Apache | ||||||||
4.750%, 04/15/2043 | 1,810 | 1,752 | ||||||
4.250%, 01/15/2044 | 320 | 294 | ||||||
1.750%, 04/15/2017 | 3,758 | 3,784 | ||||||
BP Capital Markets | ||||||||
3.506%, 03/17/2025 | 3,750 | 3,782 | ||||||
3.200%, 03/11/2016 | 2,000 | 2,039 | ||||||
1.846%, 05/05/2017 | 494 | 501 | ||||||
1.375%, 11/06/2017 | 2,802 | 2,808 | ||||||
British Transco Finance | ||||||||
6.625%, 06/01/2018 | 1,765 | 2,028 | ||||||
Chevron | ||||||||
1.365%, 03/02/2018 | 3,500 | 3,510 | ||||||
CNOOC Finance 2013 | ||||||||
1.750%, 05/09/2018 | 210 | 210 | ||||||
1.125%, 05/09/2016 | 210 | 210 | ||||||
Columbia Pipeline Group | ||||||||
4.500%, 06/01/2025 (A) | 1,535 | 1,558 | ||||||
2.450%, 06/01/2018 (A) | 3,210 | 3,240 | ||||||
Conoco Funding | ||||||||
6.950%, 04/15/2029 | 1,187 | 1,567 | ||||||
ConocoPhillips | ||||||||
6.500%, 02/01/2039 | 1,715 | 2,217 | ||||||
2.400%, 12/15/2022 | 2,000 | 1,947 | ||||||
1.176%, 05/15/2022 (C) | 3,955 | 3,997 | ||||||
Energy Transfer Partners | ||||||||
4.050%, 03/15/2025 | 2,100 | 2,048 | ||||||
Ensco | ||||||||
5.200%, 03/15/2025 | 4,435 | 4,572 | ||||||
Enterprise Products Operating LLC | ||||||||
5.250%, 01/31/2020 | 1,720 | 1,934 | ||||||
3.900%, 02/15/2024 | 2,750 | 2,846 | ||||||
| Description | Face Amount ($ Thousands) | Market Value ($ Thousands) | ||||||
3.700%, 02/15/2026 | $ | 5,130 | $ | 5,156 | ||||
1.650%, 05/07/2018 | 2,620 | 2,623 | ||||||
Exxon Mobil | ||||||||
1.305%, 03/06/2018 | 6,990 | 7,007 | ||||||
Kinder Morgan | ||||||||
5.550%, 06/01/2045 | 1,330 | 1,300 | ||||||
5.300%, 12/01/2034 | 2,210 | 2,158 | ||||||
Kinder Morgan Energy Partners | ||||||||
6.375%, 03/01/2041 | 5,248 | 5,561 | ||||||
3.950%, 09/01/2022 | 1,760 | 1,777 | ||||||
Marathon Oil | ||||||||
2.800%, 11/01/2022 | 1,225 | 1,178 | ||||||
Nexen | ||||||||
7.400%, 05/01/2028 | 1,012 | 1,373 | ||||||
Noble Energy | ||||||||
5.250%, 11/15/2043 | 20 | 20 | ||||||
3.900%, 11/15/2024 | 2,420 | 2,450 | ||||||
Phillips 66 | ||||||||
4.650%, 11/15/2034 | 160 | 163 | ||||||
Plains All American Pipeline | ||||||||
3.850%, 10/15/2023 | 3,028 | 3,061 | ||||||
Shell International Finance | ||||||||
6.375%, 12/15/2038 | 1,305 | 1,702 | ||||||
4.375%, 05/11/2045 | 3,165 | 3,239 | ||||||
4.125%, 05/11/2035 | 2,275 | 2,296 | ||||||
3.625%, 08/21/2042 | 711 | 652 | ||||||
3.400%, 08/12/2023 | 3,525 | 3,668 | ||||||
3.250%, 05/11/2025 | 9,340 | 9,474 | ||||||
2.125%, 05/11/2020 | 3,180 | 3,195 | ||||||
2.000%, 11/15/2018 | 1,200 | 1,218 | ||||||
Statoil | ||||||||
4.250%, 11/23/2041 | 1,750 | 1,779 | ||||||
1.200%, 01/17/2018 | 3,750 | 3,750 | ||||||
Suncor Energy | ||||||||
5.950%, 12/01/2034 | 775 | 909 | ||||||
3.600%, 12/01/2024 | 4,045 | 4,124 | ||||||
Sunoco Logistics Partners Operations | ||||||||
4.950%, 01/15/2043 | 2,124 | 1,954 | ||||||
Total Capital Canada | ||||||||
2.750%, 07/15/2023 | 2,875 | 2,837 | ||||||
TransCanada PipeLines | ||||||||
6.100%, 06/01/2040 | 1,595 | 1,922 | ||||||
4.625%, 03/01/2034 | 1,255 | 1,317 | ||||||
Valero Energy | ||||||||
10.500%, 03/15/2039 | 1,668 | 2,685 | ||||||
Williams Partners | ||||||||
4.000%, 09/15/2025 | 950 | 936 | ||||||
|
| |||||||
| 133,173 | ||||||||
|
| |||||||
Financials — 38.0% | ||||||||
ABN AMRO Bank | ||||||||
1.375%, 01/22/2016 (A) | 4,195 | 4,209 | ||||||
1.079%, 10/28/2016 (A) (C) | 1,930 | 1,942 | ||||||
| 262 | SEI Institutional Investments Trust / Annual Report / May 31, 2015 |
| Description | Face Amount ($ Thousands) | Market Value ($ Thousands) | ||||||
ACE INA Holdings | ||||||||
5.800%, 03/15/2018 | $ | 1,880 | $ | 2,101 | ||||
Aflac | ||||||||
2.650%, 02/15/2017 | 3,714 | 3,818 | ||||||
AgriBank | ||||||||
9.125%, 07/15/2019 (A) | 807 | 1,019 | ||||||
AIA Group MTN | ||||||||
3.200%, 03/11/2025 (A) | 5,300 | 5,269 | ||||||
Allstate | ||||||||
3.150%, 06/15/2023 | 6,910 | 7,066 | ||||||
American Express | ||||||||
7.000%, 03/19/2018 | 1,950 | 2,230 | ||||||
5.500%, 09/12/2016 | 2,748 | 2,908 | ||||||
American Express Centurion Bank MTN | ||||||||
6.000%, 09/13/2017 | 3,000 | 3,303 | ||||||
American Express Credit MTN | ||||||||
2.800%, 09/19/2016 | 444 | 455 | ||||||
2.375%, 03/24/2017 | 3,510 | 3,585 | ||||||
1.125%, 06/05/2017 | 4,443 | 4,433 | ||||||
American International Group | ||||||||
6.400%, 12/15/2020 | 3,881 | 4,639 | ||||||
4.375%, 01/15/2055 | 2,200 | 2,079 | ||||||
3.875%, 01/15/2035 | 20 | 19 | ||||||
American Tower Trust I | ||||||||
3.070%, 03/15/2023‡ (A) | 4,800 | 4,785 | ||||||
Ameriprise Financial | ||||||||
4.000%, 10/15/2023 | 1,770 | 1,893 | ||||||
ANZ New Zealand International | ||||||||
1.750%, 03/29/2018 (A) | 4,000 | 4,014 | ||||||
Apollo Management Holdings | ||||||||
4.000%, 05/30/2024 (A) | 5,120 | 5,222 | ||||||
Associates Corp of North America | ||||||||
6.950%, 11/01/2018 | 478 | 555 | ||||||
Bank of America MTN | ||||||||
7.625%, 06/01/2019 | 175 | 210 | ||||||
6.000%, 09/01/2017 | 5,000 | 5,462 | ||||||
6.000%, 10/15/2036 | 1,395 | 1,725 | ||||||
5.875%, 02/07/2042 | 1,500 | 1,844 | ||||||
5.650%, 05/01/2018 | 2,910 | 3,210 | ||||||
5.625%, 07/01/2020 | 2,980 | 3,408 | ||||||
5.000%, 01/21/2044 | 1,555 | 1,687 | ||||||
4.750%, 08/01/2015 | 1,915 | 1,927 | ||||||
4.750%, 04/21/2045 | 4,760 | 4,572 | ||||||
4.250%, 10/22/2026 | 2,639 | 2,656 | ||||||
4.000%, 04/01/2024 | 3,620 | 3,773 | ||||||
4.000%, 01/22/2025 | 5,590 | 5,571 | ||||||
2.600%, 01/15/2019 | 2,410 | 2,448 | ||||||
Bank of New York Mellon MTN | ||||||||
4.600%, 01/15/2020 | 160 | 178 | ||||||
2.300%, 09/11/2019 | 1,650 | 1,672 | ||||||
BB&T | ||||||||
6.850%, 04/30/2019 | 115 | 136 | ||||||
4.900%, 06/30/2017 | 880 | 938 | ||||||
| Description | Face Amount ($ Thousands) | Market Value ($ Thousands) | ||||||
Bear Stearns LLC | ||||||||
5.550%, 01/22/2017 | $ | 460 | $ | 490 | ||||
Berkshire Hathaway | ||||||||
3.750%, 08/15/2021 | 2,110 | 2,296 | ||||||
Berkshire Hathaway Finance | ||||||||
4.300%, 05/15/2043 | 85 | 88 | ||||||
1.600%, 05/15/2017 | 3,500 | 3,551 | ||||||
Blackstone Holdings Finance LLC | ||||||||
5.000%, 06/15/2044 (A) | 3,115 | 3,219 | ||||||
4.450%, 07/15/2045 (A) | 1,545 | 1,476 | ||||||
BNP Paribas MTN | ||||||||
2.400%, 12/12/2018 | 4,665 | 4,742 | ||||||
Branch Banking & Trust | ||||||||
3.800%, 10/30/2026 | 1,780 | 1,851 | ||||||
2.850%, 04/01/2021 | 4,535 | 4,642 | ||||||
Brixmor Operating Partnership | ||||||||
3.850%, 02/01/2025 | 1,345 | 1,336 | ||||||
Capital One | ||||||||
1.650%, 02/05/2018 | 4,200 | 4,182 | ||||||
Capital One Bank USA | ||||||||
2.300%, 06/05/2019 | 2,905 | 2,905 | ||||||
Carlyle Holdings II Finance | ||||||||
5.625%, 03/30/2043 (A) | 3,134 | 3,457 | ||||||
CDP Financial | ||||||||
5.600%, 11/25/2039 (A) | 700 | 894 | ||||||
4.400%, 11/25/2019 (A) | 850 | 939 | ||||||
Charles Schwab | ||||||||
4.450%, 07/22/2020 | 1,720 | 1,917 | ||||||
Chubb | ||||||||
5.750%, 05/15/2018 | 3,803 | 4,283 | ||||||
Citigroup | ||||||||
8.500%, 05/22/2019 | 3,675 | 4,534 | ||||||
6.125%, 11/21/2017 | 1,090 | 1,205 | ||||||
6.125%, 08/25/2036 | 430 | 506 | ||||||
6.000%, 08/15/2017 | 570 | 624 | ||||||
5.500%, 09/13/2025 | 2,430 | 2,709 | ||||||
4.950%, 11/07/2043 | 2,100 | 2,306 | ||||||
3.750%, 06/16/2024 | 5,160 | 5,319 | ||||||
1.700%, 07/25/2016 | 569 | 573 | ||||||
1.350%, 03/10/2017 | 4,000 | 4,004 | ||||||
CME Group | ||||||||
3.000%, 03/15/2025 | 2,765 | 2,749 | ||||||
Cooperatieve Centrale Raiffeisen-Boerenleenbank MTN | ||||||||
5.800%, 09/30/2110 (A) | 400 | 448 | ||||||
3.375%, 05/21/2025 | 3,510 | 3,539 | ||||||
Credit Suisse Group Funding Guernsey | ||||||||
4.875%, 05/15/2045 (A) | 3,160 | 3,202 | ||||||
Credit Suisse NY | ||||||||
3.625%, 09/09/2024 | 4,730 | 4,813 | ||||||
3.000%, 10/29/2021 | 3,130 | 3,151 | ||||||
| SEI Institutional Investments Trust / Annual Report / May 31, 2015 | 263 |
SCHEDULE OF INVESTMENTS
Intermediate Duration Credit Fund (Continued)
May 31, 2015
| Description | Face Amount ($ Thousands) | Market Value ($ Thousands) | ||||||
1.750%, 01/29/2018 | $ | 4,745 | $ | 4,749 | ||||
1.375%, 05/26/2017 | 3,130 | 3,132 | ||||||
Crown Castle Towers LLC | ||||||||
3.222%, 05/15/2022 (A) | 2,230 | 2,237 | ||||||
Daimler Finance North America LLC | ||||||||
2.875%, 03/10/2021 (A) | 3,085 | 3,141 | ||||||
1.375%, 08/01/2017 (A) | 3,000 | 3,001 | ||||||
Discover Financial Services | ||||||||
3.950%, 11/06/2024 | 2,860 | 2,876 | ||||||
ERP Operating | ||||||||
4.500%, 06/01/2045‡ | 1,975 | 2,035 | ||||||
Fifth Third Bank | ||||||||
2.875%, 10/01/2021 | 3,570 | 3,573 | ||||||
Ford Motor Credit LLC | ||||||||
3.664%, 09/08/2024 | 2,360 | 2,370 | ||||||
General Electric Capital MTN | ||||||||
7.500%, 08/21/2035 | 385 | 567 | ||||||
6.375%, 11/15/2067 (C) | 1,800 | 1,962 | ||||||
6.000%, 08/07/2019 | 9,920 | 11,559 | ||||||
5.875%, 01/14/2038 | 2,780 | 3,490 | ||||||
5.625%, 09/15/2017 | 915 | 1,005 | ||||||
5.625%, 05/01/2018 | 305 | 341 | ||||||
5.400%, 02/15/2017 | 2,055 | 2,210 | ||||||
2.300%, 04/27/2017 | 2,600 | 2,664 | ||||||
0.659%, 05/05/2026 (C) | 2,210 | 2,106 | ||||||
Goldman Sachs Group MTN | ||||||||
7.500%, 02/15/2019 | 1,700 | 2,014 | ||||||
6.750%, 10/01/2037 | 1,130 | 1,388 | ||||||
6.345%, 02/15/2034 | 760 | 918 | ||||||
6.250%, 02/01/2041 | 1,900 | 2,357 | ||||||
6.150%, 04/01/2018 | 1,155 | 1,289 | ||||||
6.125%, 02/15/2033 | 720 | 886 | ||||||
5.950%, 01/18/2018 | 1,630 | 1,802 | ||||||
5.950%, 01/15/2027 | 2,285 | 2,640 | ||||||
5.375%, 03/15/2020 | 2,890 | 3,248 | ||||||
5.150%, 05/22/2045 | 1,695 | 1,730 | ||||||
4.800%, 07/08/2044 | 6,615 | 6,918 | ||||||
2.900%, 07/19/2018 | 3,735 | 3,842 | ||||||
1.884%, 11/29/2023 (C) | 4,000 | 4,086 | ||||||
Hartford Financial Services Group | ||||||||
6.625%, 03/30/2040 | 20 | 26 | ||||||
6.100%, 10/01/2041 | 1,820 | 2,216 | ||||||
5.125%, 04/15/2022 | 2,180 | 2,447 | ||||||
HCP | ||||||||
4.250%, 11/15/2023‡ | 120 | 124 | ||||||
4.200%, 03/01/2024‡ | 4,071 | 4,176 | ||||||
HSBC Bank | ||||||||
7.650%, 05/01/2025 | 1,550 | 2,012 | ||||||
4.875%, 08/24/2020 | 4,285 | 4,798 | ||||||
HSBC Finance | ||||||||
6.676%, 01/15/2021 | 2,650 | 3,119 | ||||||
5.500%, 01/19/2016 | 3,800 | 3,913 | ||||||
| Description | Face Amount ($ Thousands) | Market Value ($ Thousands) | ||||||
HSBC Holdings | ||||||||
6.375%, 03/29/2049 (C) | $ | 2,400 | $ | 2,448 | ||||
5.100%, 04/05/2021 | 111 | 126 | ||||||
HSBC USA | ||||||||
5.000%, 09/27/2020 | 1,710 | 1,919 | ||||||
Huntington National Bank | ||||||||
1.700%, 02/26/2018 | 2,750 | 2,751 | ||||||
Infinity Property & Casualty | ||||||||
5.000%, 09/19/2022 | 2,075 | 2,213 | ||||||
ING US | ||||||||
5.500%, 07/15/2022 | 2,755 | 3,153 | ||||||
Intesa Sanpaolo | ||||||||
2.375%, 01/13/2017 | 2,840 | 2,865 | ||||||
JPMorgan Chase | ||||||||
6.400%, 05/15/2038 | 2,940 | 3,756 | ||||||
6.000%, 10/01/2017 | 6,900 | 7,597 | ||||||
6.000%, 01/15/2018 | 7,000 | 7,780 | ||||||
4.950%, 06/01/2045 | 4,230 | 4,283 | ||||||
4.625%, 05/10/2021 | 700 | 771 | ||||||
3.875%, 09/10/2024 | 9,170 | 9,221 | ||||||
3.250%, 09/23/2022 | 3,180 | 3,217 | ||||||
0.600%, 06/13/2016 (C) | 2,540 | 2,536 | ||||||
KeyBank | ||||||||
1.700%, 06/01/2018 | 2,365 | 2,371 | ||||||
KFW | ||||||||
2.125%, 01/17/2023 | 3,130 | 3,148 | ||||||
1.250%, 02/15/2017 | 5,405 | 5,458 | ||||||
KKR Group Finance III LLC | ||||||||
5.125%, 06/01/2044 (A) | 2,861 | 2,899 | ||||||
Liberty Mutual Group | ||||||||
6.500%, 05/01/2042 (A) | 2,131 | 2,566 | ||||||
Lloyds Bank | ||||||||
2.350%, 09/05/2019 | 1,880 | 1,896 | ||||||
Lloyds TSB Bank MTN | ||||||||
6.500%, 09/14/2020 (A) | 2,720 | 3,192 | ||||||
Macquarie Bank MTN | ||||||||
1.600%, 10/27/2017 (A) | 3,500 | 3,500 | ||||||
Merrill Lynch MTN | ||||||||
6.875%, 04/25/2018 | 1,120 | 1,277 | ||||||
6.400%, 08/28/2017 | 2,120 | 2,335 | ||||||
MetLife | ||||||||
10.750%, 08/01/2039 | 1,835 | 3,037 | ||||||
Metropolitan Life Global Funding I MTN | ||||||||
3.875%, 04/11/2022 (A) | 4,500 | 4,807 | ||||||
3.650%, 06/14/2018 (A) | 530 | 563 | ||||||
2.300%, 04/10/2019 (A) | 5,000 | 5,059 | ||||||
1.875%, 06/22/2018 (A) | 3,570 | 3,598 | ||||||
1.500%, 01/10/2018 (A) | 562 | 562 | ||||||
Mitsubishi UFJ Trust & Banking | ||||||||
1.600%, 10/16/2017 (A) | 3,500 | 3,502 | ||||||
Moody’s | ||||||||
5.250%, 07/15/2044 | 1,120 | 1,220 | ||||||
| 264 | SEI Institutional Investments Trust / Annual Report / May 31, 2015 |
| Description | Face Amount ($ Thousands) | Market Value ($ Thousands) | ||||||
Morgan Stanley | ||||||||
7.300%, 05/13/2019 | $ | 1,880 | $ | 2,229 | ||||
7.250%, 04/01/2032 | 20 | 27 | ||||||
6.625%, 04/01/2018 | 6,600 | 7,467 | ||||||
6.375%, 07/24/2042 | 2,940 | 3,746 | ||||||
5.625%, 09/23/2019 | 1,085 | 1,227 | ||||||
5.500%, 01/26/2020 | 1,270 | 1,434 | ||||||
4.350%, 09/08/2026 | 4,500 | 4,577 | ||||||
4.300%, 01/27/2045 | 6,467 | 6,270 | ||||||
3.950%, 04/23/2027 | 2,915 | 2,847 | ||||||
3.700%, 10/23/2024 | 2,832 | 2,886 | ||||||
2.650%, 01/27/2020 | 2,900 | 2,930 | ||||||
0.755%, 10/15/2015 (C) | 1,940 | 1,942 | ||||||
MUFG Americas Holdings | ||||||||
3.000%, 02/10/2025 | 3,735 | 3,625 | ||||||
MUFG Union Bank | ||||||||
3.000%, 06/06/2016 | 7,235 | 7,387 | ||||||
National Rural Utilities Cooperative Finance MTN | ||||||||
4.023%, 11/01/2032 | 3,360 | 3,453 | ||||||
0.950%, 04/24/2017 | 3,180 | 3,178 | ||||||
New York Life Global Funding | ||||||||
1.950%, 02/11/2020 (A) | 3,500 | 3,483 | ||||||
Nissan Motor Acceptance MTN | ||||||||
1.500%, 03/02/2018 | 3,000 | 3,005 | ||||||
Nomura Holdings MTN | ||||||||
2.000%, 09/13/2016 | 3,340 | 3,370 | ||||||
Nordea Bank | ||||||||
1.625%, 05/15/2018 (A) | 2,700 | 2,702 | ||||||
PACCAR Financial MTN | ||||||||
1.600%, 03/15/2017 | 164 | 166 | ||||||
1.100%, 06/06/2017 | 3,680 | 3,690 | ||||||
Pacific Life Insurance | ||||||||
9.250%, 06/15/2039 (A) | 1,170 | 1,775 | ||||||
PNC Bank | ||||||||
3.300%, 10/30/2024 | 1,840 | 1,878 | ||||||
1.600%, 06/01/2018 | 4,250 | 4,260 | ||||||
Principal Financial Group | ||||||||
3.400%, 05/15/2025 | 2,690 | 2,687 | ||||||
Principal Life Global Funding II | ||||||||
1.500%, 09/11/2017 (A) | 2,157 | 2,167 | ||||||
Prudential Financial MTN | ||||||||
7.375%, 06/15/2019 | 2,300 | 2,757 | ||||||
5.700%, 12/14/2036 | 1,660 | 1,906 | ||||||
Realty Income | ||||||||
4.650%, 08/01/2023‡ | 3,930 | 4,248 | ||||||
Royal Bank of Scotland Group MTN | ||||||||
6.400%, 10/21/2019 | 1,610 | 1,839 | ||||||
Simon Property Group | ||||||||
10.350%, 04/01/2019‡ | 595 | 764 | ||||||
6.125%, 05/30/2018‡ | 3,502 | 3,968 | ||||||
2.200%, 02/01/2019‡ | 8,355 | 8,484 | ||||||
Standard Chartered | ||||||||
2.250%, 04/17/2020 (A) | 1,655 | 1,638 | ||||||
| Description | Face Amount ($ Thousands) | Market Value ($ Thousands) | ||||||
Synchrony Financial | ||||||||
2.700%, 02/03/2020 | $ | 1,000 | $ | 1,001 | ||||
Teachers Insurance & Annuity Association of America | ||||||||
6.850%, 12/16/2039 (A) | 125 | 166 | ||||||
4.900%, 09/15/2044 (A) | 1,900 | 2,035 | ||||||
TIAA Asset Management Finance LLC | ||||||||
4.125%, 11/01/2024 (A) | 3,240 | 3,357 | ||||||
2.950%, 11/01/2019 (A) | 3,130 | 3,190 | ||||||
Toronto-Dominion Bank MTN | ||||||||
2.625%, 09/10/2018 | 3,500 | 3,628 | ||||||
Toyota Motor Credit MTN | ||||||||
2.050%, 01/12/2017 | 230 | 235 | ||||||
1.450%, 01/12/2018 | 4,605 | 4,632 | ||||||
Travelers MTN | ||||||||
5.900%, 06/02/2019 | 155 | 179 | ||||||
5.750%, 12/15/2017 | 175 | 195 | ||||||
UBS MTN | ||||||||
5.875%, 12/20/2017 | 348 | 385 | ||||||
5.750%, 04/25/2018 | 150 | 167 | ||||||
1.800%, 03/26/2018 | 3,500 | 3,503 | ||||||
1.375%, 08/14/2017 | 2,545 | 2,542 | ||||||
US Bancorp MTN | ||||||||
2.200%, 11/15/2016 | 2,840 | 2,896 | ||||||
1.650%, 05/15/2017 | 3,500 | 3,543 | ||||||
US Bank | ||||||||
2.125%, 10/28/2019 | 2,710 | 2,739 | ||||||
Validus Holdings | ||||||||
8.875%, 01/26/2040 | 1,370 | 1,839 | ||||||
Vesey Street Investment Trust I | ||||||||
4.404%, 09/01/2016 (D) | 2,720 | 2,825 | ||||||
Volkswagen Group of America Finance LLC | ||||||||
2.400%, 05/22/2020 (A) | 2,140 | 2,156 | ||||||
1.650%, 05/22/2018 (A) | 3,250 | 3,259 | ||||||
1.250%, 05/23/2017 (A) | 2,175 | 2,180 | ||||||
Wachovia | ||||||||
0.618%, 10/28/2015 (C) | 2,330 | 2,331 | ||||||
Wachovia Capital Trust III | ||||||||
5.570%, 12/31/2049 (C) | 1,940 | 1,922 | ||||||
WEA Finance LLC | ||||||||
4.750%, 09/17/2044 (A) | 120 | 123 | ||||||
3.750%, 09/17/2024 (A) | 3,382 | 3,440 | ||||||
Wells Fargo MTN | ||||||||
5.375%, 11/02/2043 | 5 | 6 | ||||||
4.650%, 11/04/2044 | 2,510 | 2,523 | ||||||
4.100%, 06/03/2026 | 2,760 | 2,848 | ||||||
3.900%, 05/01/2045 | 610 | 572 | ||||||
2.150%, 01/15/2019 | 12,160 | 12,320 | ||||||
2.150%, 01/30/2020 | 6,310 | 6,308 | ||||||
Westpac Banking | ||||||||
1.200%, 05/19/2017 | 3,500 | 3,510 | ||||||
| SEI Institutional Investments Trust / Annual Report / May 31, 2015 | 265 |
SCHEDULE OF INVESTMENTS
Intermediate Duration Credit Fund (Continued)
May 31, 2015
| Description | Face Amount ($ Thousands) | Market Value ($ Thousands) | ||||||
WP Carey | ||||||||
4.600%, 04/01/2024‡ | $ | 4,135 | $ | 4,247 | ||||
ZFS Finance USA Trust I | ||||||||
6.500%, 05/09/2037 (A) (C) | 6,400 | 6,808 | ||||||
|
| |||||||
| 607,126 | ||||||||
|
| |||||||
Health Care — 8.5% |
| |||||||
AbbVie | ||||||||
4.700%, 05/14/2045 | 3,005 | 3,055 | ||||||
4.500%, 05/14/2035 | 5,585 | 5,623 | ||||||
4.400%, 11/06/2042 | 1,700 | 1,651 | ||||||
3.600%, 05/14/2025 | 970 | 976 | ||||||
3.200%, 11/06/2022 | 1,350 | 1,356 | ||||||
2.500%, 05/14/2020 | 4,930 | 4,928 | ||||||
2.000%, 11/06/2018 | 4,120 | 4,126 | ||||||
1.750%, 11/06/2017 | 452 | 454 | ||||||
Aetna | ||||||||
2.750%, 11/15/2022 | 3,155 | 3,129 | ||||||
AmerisourceBergen | ||||||||
3.250%, 03/01/2025 | 3,500 | 3,476 | ||||||
1.150%, 05/15/2017 | 495 | 494 | ||||||
Amgen | ||||||||
4.400%, 05/01/2045 | 1,130 | 1,094 | ||||||
Bayer US Finance LLC | ||||||||
2.375%, 10/08/2019 (A) | 4,520 | 4,581 | ||||||
1.500%, 10/06/2017 (A) | 3,000 | 3,021 | ||||||
Blue Cross & Blue Shield of Minnesota | ||||||||
3.790%, 05/01/2025 (A) | 3,121 | 3,115 | ||||||
Boston Scientific | ||||||||
2.850%, 05/15/2020 | 1,120 | 1,124 | ||||||
Coventry Health Care | ||||||||
5.950%, 03/15/2017 | 4,250 | 4,599 | ||||||
Dignity Health | ||||||||
2.637%, 11/01/2019 | 4,119 | 4,187 | ||||||
Forest Laboratories | ||||||||
4.875%, 02/15/2021 (A) | 3,290 | 3,596 | ||||||
Gilead Sciences | ||||||||
4.500%, 02/01/2045 | 1,090 | 1,114 | ||||||
3.500%, 02/01/2025 | 3,367 | 3,445 | ||||||
2.050%, 04/01/2019 | 4,100 | 4,153 | ||||||
Humana | ||||||||
7.200%, 06/15/2018 | 1,925 | 2,219 | ||||||
Johnson & Johnson | ||||||||
5.950%, 08/15/2037 | 40 | 53 | ||||||
5.550%, 08/15/2017 | 1,959 | 2,157 | ||||||
Medtronic | ||||||||
4.375%, 03/15/2035 (A) | 7,295 | 7,478 | ||||||
3.150%, 03/15/2022 (A) | 2,800 | 2,865 | ||||||
2.500%, 03/15/2020 (A) | 7,305 | 7,409 | ||||||
1.500%, 03/15/2018 (A) | 3,840 | 3,848 | ||||||
Merck | ||||||||
2.750%, 02/10/2025 | 3,470 | 3,381 | ||||||
2.350%, 02/10/2022 | 3,025 | 2,989 | ||||||
| Description | Face Amount ($ Thousands) | Market Value ($ Thousands) | ||||||
1.850%, 02/10/2020 | $ | 3,200 | $ | 3,196 | ||||
1.300%, 05/18/2018 | 4,200 | 4,211 | ||||||
Perrigo Finance | ||||||||
3.500%, 12/15/2021 | 3,110 | 3,178 | ||||||
Pfizer | ||||||||
6.200%, 03/15/2019 | 2,880 | 3,333 | ||||||
Pharmacia | ||||||||
6.600%, 12/01/2028 | 1,700 | 2,277 | ||||||
Roche Holdings | ||||||||
2.875%, 09/29/2021 (A) | 3,950 | 4,030 | ||||||
Sanofi | ||||||||
1.250%, 04/10/2018 | 8,005 | 8,000 | ||||||
Takeda Pharmaceutical | ||||||||
1.625%, 03/17/2017 (A) | 1,000 | 1,009 | ||||||
UnitedHealth Group | ||||||||
4.700%, 02/15/2021 | 3,935 | 4,421 | ||||||
2.875%, 12/15/2021 | 2,580 | 2,621 | ||||||
1.400%, 12/15/2017 | 4,685 | 4,714 | ||||||
|
| |||||||
| 136,686 | ||||||||
|
| |||||||
Industrials — 6.2% | ||||||||
Air Canada, 2015-1 Class A Pass-Through Trust | ||||||||
3.600%, 03/15/2027 (A) | 4,250 | 4,278 | ||||||
Air Lease | ||||||||
2.125%, 01/15/2018 | 1,950 | 1,938 | ||||||
American Airlines, Pass-Through Trust, Ser 2013-2, Cl A | ||||||||
4.950%, 01/15/2023 | 2,473 | 2,657 | ||||||
American Airlines, Pass-Through Trust, Ser 2014-1, Cl B | ||||||||
4.375%, 10/01/2022 | 1,765 | 1,811 | ||||||
BAE Systems | ||||||||
5.800%, 10/11/2041 (A) | 3,940 | 4,720 | ||||||
Boeing | ||||||||
2.500%, 03/01/2025 | 2,100 | 2,044 | ||||||
Burlington Northern Santa Fe LLC | ||||||||
5.650%, 05/01/2017 | 1,700 | 1,848 | ||||||
5.150%, 09/01/2043 | 775 | 871 | ||||||
4.150%, 04/01/2045 | 815 | 778 | ||||||
Canadian National Railway | ||||||||
2.850%, 12/15/2021 | 2,850 | 2,921 | ||||||
1.450%, 12/15/2016 | 2,910 | 2,939 | ||||||
Caterpillar | ||||||||
4.750%, 05/15/2064 | 670 | 695 | ||||||
3.803%, 08/15/2042 | 1,180 | 1,118 | ||||||
3.400%, 05/15/2024 | 2,400 | 2,490 | ||||||
Continental Airlines, Pass-Through Trust, Ser 2012-2, Cl A | ||||||||
4.000%, 10/29/2024 | 4,496 | 4,720 | ||||||
| 266 | SEI Institutional Investments Trust / Annual Report / May 31, 2015 |
| Description | Face Amount ($ Thousands) | Market Value ($ Thousands) | ||||||
Delta Air Lines, Pass-Through Trust, Ser 2011-1, Cl A | ||||||||
5.300%, 04/15/2019 | $ | 56 | $ | 60 | ||||
Delta Air Lines, Pass-Through Trust, Ser 2012-1, Cl A | ||||||||
4.750%, 05/07/2020 | 4,282 | 4,604 | ||||||
General Dynamics | ||||||||
2.250%, 11/15/2022 | 2,460 | 2,384 | ||||||
General Electric | ||||||||
5.250%, 12/06/2017 | 2,920 | 3,206 | ||||||
4.500%, 03/11/2044 | 2,345 | 2,496 | ||||||
4.125%, 10/09/2042 | 2,195 | 2,198 | ||||||
John Deere Capital MTN | ||||||||
2.800%, 03/04/2021 | 6,380 | 6,544 | ||||||
1.350%, 01/16/2018 | 2,000 | 2,010 | ||||||
Koninklijke Philips | ||||||||
3.750%, 03/15/2022 | 1,790 | 1,847 | ||||||
Lockheed Martin | ||||||||
4.070%, 12/15/2042 | 1,688 | 1,656 | ||||||
2.900%, 03/01/2025 | 2,200 | 2,168 | ||||||
2.125%, 09/15/2016 | 722 | 734 | ||||||
Norfolk Southern | ||||||||
6.000%, 05/23/2111 | 4,499 | 5,446 | ||||||
PACCAR Financial MTN | ||||||||
2.200%, 09/15/2019 | 4,000 | 4,052 | ||||||
Parker-Hannifin MTN | ||||||||
4.200%, 11/21/2034 | 3,260 | 3,392 | ||||||
Raytheon | ||||||||
2.500%, 12/15/2022 | 4,800 | 4,768 | ||||||
Siemens Financieringsmaatschappij | ||||||||
4.400%, 05/27/2045 (A) | 3,330 | 3,422 | ||||||
2.900%, 05/27/2022 (A) | 2,340 | 2,354 | ||||||
Union Pacific | ||||||||
4.821%, 02/01/2044 | 100 | 111 | ||||||
United Parcel Service | ||||||||
3.125%, 01/15/2021 | 3,000 | 3,170 | ||||||
United Technologies | ||||||||
5.700%, 04/15/2040 | 280 | 340 | ||||||
4.500%, 06/01/2042 | 6,720 | 6,987 | ||||||
|
| |||||||
| 99,777 | ||||||||
|
| |||||||
Information Technology — 6.1% |
| |||||||
Alibaba Group Holding | ||||||||
3.125%, 11/28/2021 (A) | 6,820 | 6,827 | ||||||
1.625%, 11/28/2017 (A) | 3,498 | 3,507 | ||||||
Apple | ||||||||
4.375%, 05/13/2045 | 2,970 | 3,009 | ||||||
3.200%, 05/13/2025 | 4,330 | 4,374 | ||||||
2.850%, 05/06/2021 | 4,517 | 4,644 | ||||||
2.700%, 05/13/2022 | 4,340 | 4,376 | ||||||
1.550%, 02/07/2020 | 5,000 | 4,935 | ||||||
Baidu | ||||||||
3.250%, 08/06/2018 | 2,600 | 2,690 | ||||||
| Description | Face Amount ($ Thousands) | Market Value ($ Thousands) | ||||||
Broadcom MTN | ||||||||
4.500%, 08/01/2034 | $ | 3,195 | $ | 3,212 | ||||
CDK Global | ||||||||
4.500%, 10/15/2024 (A) | 2,351 | 2,417 | ||||||
Cisco Systems | ||||||||
1.100%, 03/03/2017 | 3,500 | 3,518 | ||||||
Corning | ||||||||
7.250%, 08/15/2036 | 1,604 | 2,068 | ||||||
2.900%, 05/15/2022 | 3,115 | 3,143 | ||||||
3.625%, 05/19/2021 | 1,000 | 1,084 | ||||||
International Business Machines | ||||||||
3.375%, 08/01/2023 | 2,750 | 2,812 | ||||||
1.950%, 07/22/2016 | 1,736 | 1,763 | ||||||
1.950%, 02/12/2019 | 2,000 | 2,025 | ||||||
Microsoft | ||||||||
4.000%, 02/12/2055 | 581 | 531 | ||||||
3.500%, 02/12/2035 | 3,260 | 3,045 | ||||||
2.700%, 02/12/2025 | 8,050 | 7,887 | ||||||
Oracle | ||||||||
6.125%, 07/08/2039 | 1,825 | 2,270 | ||||||
4.300%, 07/08/2034 | 3,085 | 3,154 | ||||||
2.500%, 05/15/2022 | 5,230 | 5,159 | ||||||
2.250%, 10/08/2019 | 7,180 | 7,282 | ||||||
Qualcomm | ||||||||
4.800%, 05/20/2045 | 2,270 | 2,264 | ||||||
4.650%, 05/20/2035 | 905 | 902 | ||||||
3.000%, 05/20/2022 | 1,645 | 1,653 | ||||||
Seagate HDD Cayman | ||||||||
5.750%, 12/01/2034 (A) | 3,935 | 4,042 | ||||||
4.875%, 06/01/2027 (A) | 425 | 429 | ||||||
4.750%, 06/01/2023 | 2,115 | 2,199 | ||||||
4.750%, 01/01/2025 (A) | 355 | 364 | ||||||
|
| |||||||
| 97,585 | ||||||||
|
| |||||||
Materials — 1.9% | ||||||||
Albemarle | ||||||||
4.150%, 12/01/2024 | 2,310 | 2,362 | ||||||
3.000%, 12/01/2019 | 20 | 20 | ||||||
BHP Billiton Finance USA | ||||||||
5.000%, 09/30/2043 | 2,859 | 3,093 | ||||||
Ecolab | ||||||||
4.350%, 12/08/2021 | 1,720 | 1,873 | ||||||
Freeport-McMoRan | ||||||||
3.550%, 03/01/2022 | 3,600 | 3,405 | ||||||
Georgia-Pacific LLC | ||||||||
8.875%, 05/15/2031 | 660 | 977 | ||||||
3.600%, 03/01/2025 (A) | 2,860 | 2,885 | ||||||
International Paper | ||||||||
7.500%, 08/15/2021 | 1,000 | 1,259 | ||||||
5.150%, 05/15/2046 | 1,175 | 1,199 | ||||||
3.800%, 01/15/2026 | 2,025 | 2,037 | ||||||
| SEI Institutional Investments Trust / Annual Report / May 31, 2015 | 267 |
SCHEDULE OF INVESTMENTS
Intermediate Duration Credit Fund (Continued)
May 31, 2015
| Description | Face Amount ($ Thousands) | Market Value ($ Thousands) | ||||||
Rio Tinto Finance USA | ||||||||
6.500%, 07/15/2018 | $ | 3,330 | $ | 3,800 | ||||
3.500%, 03/22/2022 | 1,640 | 1,685 | ||||||
2.250%, 12/14/2018 | 950 | 960 | ||||||
1.375%, 06/17/2016 | 1,920 | 1,926 | ||||||
Rockwood Specialties Group | ||||||||
4.625%, 10/15/2020 | 1,850 | 1,931 | ||||||
Xstrata Finance Canada | ||||||||
5.800%, 11/15/2016 (A) | 1,200 | 1,271 | ||||||
|
| |||||||
| 30,683 | ||||||||
|
| |||||||
Telecommunication Services — 3.5% |
| |||||||
America Movil | ||||||||
3.125%, 07/16/2022 | 6,455 | 6,483 | ||||||
AT&T | ||||||||
6.500%, 09/01/2037 | 2,750 | 3,207 | ||||||
4.750%, 05/15/2046 | 20 | 19 | ||||||
4.500%, 05/15/2035 | 3,040 | 2,882 | ||||||
3.400%, 05/15/2025 | 2,305 | 2,242 | ||||||
2.450%, 06/30/2020 | 3,895 | 3,858 | ||||||
Crown Castle Towers LLC | ||||||||
6.113%, 01/15/2020 (A) | 3,640 | 4,178 | ||||||
Deutsche Telekom International Finance | ||||||||
9.250%, 06/01/2032 | 80 | 126 | ||||||
6.000%, 07/08/2019 | 600 | 694 | ||||||
Rogers Communications | ||||||||
5.450%, 10/01/2043 | 71 | 79 | ||||||
5.000%, 03/15/2044 | 380 | 399 | ||||||
SES Global Americas Holdings | ||||||||
5.300%, 03/25/2044 (A) | 1,750 | 1,853 | ||||||
Telefonos de Mexico | ||||||||
5.500%, 11/15/2019 | 2,575 | 2,925 | ||||||
Tencent Holdings MTN | ||||||||
3.375%, 05/02/2019 (A) | 1,900 | 1,959 | ||||||
2.000%, 05/02/2017 (A) | 2,955 | 2,969 | ||||||
Verizon Communications | ||||||||
6.550%, 09/15/2043 | 3,090 | 3,753 | ||||||
6.400%, 09/15/2033 | 95 | 112 | ||||||
5.150%, 09/15/2023 | 2,770 | 3,094 | ||||||
5.012%, 08/21/2054 | 1,342 | 1,276 | ||||||
4.862%, 08/21/2046 | 2,423 | 2,338 | ||||||
4.522%, 09/15/2048 (A) | 2,629 | 2,402 | ||||||
4.150%, 03/15/2024 | 3,190 | 3,373 | ||||||
Wireless Telecom Services | ||||||||
3.324%, 11/27/2022 (B) | 8,000 | 6,215 | ||||||
|
| |||||||
| 56,436 | ||||||||
|
| |||||||
Utilities — 7.4% |
| |||||||
Ameren Illinois | ||||||||
6.125%, 11/15/2017 | 1,450 | 1,616 | ||||||
2.700%, 09/01/2022 | 2,000 | 2,003 | ||||||
| Description | Face Amount ($ Thousands) | Market Value ($ Thousands) | ||||||
CenterPoint Energy Houston Electric LLC | ||||||||
4.500%, 04/01/2044 | $ | 2,215 | $ | 2,364 | ||||
Commonwealth Edison | ||||||||
4.000%, 08/01/2020 | 40 | 43 | ||||||
Connecticut Light & Power | ||||||||
5.650%, 05/01/2018 | 2,720 | 3,052 | ||||||
Consumers Energy | ||||||||
6.700%, 09/15/2019 | 425 | 505 | ||||||
Dominion Resources | ||||||||
5.250%, 08/01/2033 | 3,531 | 3,882 | ||||||
4.900%, 08/01/2041 | 48 | 51 | ||||||
Duke Energy | ||||||||
6.250%, 06/15/2018 | 3,200 | 3,639 | ||||||
Duke Energy Carolinas | ||||||||
5.300%, 02/15/2040 | 20 | 24 | ||||||
Duke Energy Carolinas LLC | ||||||||
5.100%, 04/15/2018 | 410 | 455 | ||||||
4.300%, 06/15/2020 | 195 | 216 | ||||||
4.250%, 12/15/2041 | 125 | 129 | ||||||
4.000%, 09/30/2042 | 385 | 381 | ||||||
3.900%, 06/15/2021 | 220 | 238 | ||||||
Duke Energy Florida | ||||||||
3.100%, 08/15/2021 | 5,500 | 5,716 | ||||||
Duke Energy Indiana | ||||||||
6.350%, 08/15/2038 | 275 | 365 | ||||||
4.900%, 07/15/2043 | 235 | 264 | ||||||
Duke Energy Progress | ||||||||
5.300%, 01/15/2019 | 455 | 511 | ||||||
4.100%, 05/15/2042 | 870 | 880 | ||||||
3.000%, 09/15/2021 | 2,685 | 2,791 | ||||||
2.800%, 05/15/2022 | 126 | 127 | ||||||
Electricite de France | ||||||||
6.000%, 01/22/2114 (A) | 140 | 157 | ||||||
2.150%, 01/22/2019 (A) | 4,000 | 4,043 | ||||||
Exelon Generation LLC | ||||||||
5.750%, 10/01/2041 | 86 | 94 | ||||||
Florida Power | ||||||||
6.400%, 06/15/2038 | 40 | 53 | ||||||
6.350%, 09/15/2037 | 85 | 114 | ||||||
Florida Power & Light | ||||||||
5.960%, 04/01/2039 | 125 | 164 | ||||||
5.125%, 06/01/2041 | 207 | 241 | ||||||
4.125%, 02/01/2042 | 2,835 | 2,931 | ||||||
Georgia Power | ||||||||
4.300%, 03/15/2042 | 320 | 319 | ||||||
4.300%, 03/15/2043 | 3,645 | 3,612 | ||||||
Great Plains Energy | ||||||||
5.292%, 06/15/2022 (D) | 1,660 | 1,880 | ||||||
Kansas City Power & Light | ||||||||
7.150%, 04/01/2019 | 4,880 | 5,801 | ||||||
Kentucky Utilities | ||||||||
5.125%, 11/01/2040 | 295 | 350 | ||||||
| 268 | SEI Institutional Investments Trust / Annual Report / May 31, 2015 |
| Description | Face Amount ($ Thousands) | Market Value ($ Thousands) | ||||||
Louisville Gas & Electric | ||||||||
4.650%, 11/15/2043 | $ | 125 | $ | 139 | ||||
Massachusetts Electric | ||||||||
5.900%, 11/15/2039 (A) | 210 | 261 | ||||||
MidAmerican Energy | ||||||||
5.800%, 10/15/2036 | 105 | 133 | ||||||
5.300%, 03/15/2018 | 270 | 298 | ||||||
2.400%, 03/15/2019 | 2,845 | 2,910 | ||||||
Monongahela Power | ||||||||
5.400%, 12/15/2043 (A) | 2,215 | 2,544 | ||||||
4.100%, 04/15/2024 (A) | 860 | 919 | ||||||
Nevada Power | ||||||||
7.125%, 03/15/2019 | 400 | 474 | ||||||
NextEra Energy Capital Holdings | ||||||||
1.586%, 06/01/2017 | 2,620 | 2,631 | ||||||
Northern States Power | ||||||||
3.400%, 08/15/2042 | 100 | 92 | ||||||
Oglethorpe Power | ||||||||
5.375%, 11/01/2040 | 1,420 | 1,644 | ||||||
4.200%, 12/01/2042 | 150 | 147 | ||||||
Oncor Electric Delivery | ||||||||
6.800%, 09/01/2018 | 525 | 609 | ||||||
5.300%, 06/01/2042 | 3,413 | 4,030 | ||||||
Pacific Gas & Electric | ||||||||
5.800%, 03/01/2037 | 2,226 | 2,685 | ||||||
PacifiCorp | ||||||||
6.000%, 01/15/2039 | 2,970 | 3,757 | ||||||
5.650%, 07/15/2018 | 100 | 113 | ||||||
5.500%, 01/15/2019 | 400 | 452 | ||||||
4.100%, 02/01/2042 | 105 | 106 | ||||||
2.950%, 06/01/2023 | 4,000 | 4,049 | ||||||
PECO Energy | ||||||||
4.800%, 10/15/2043 | 3,260 | 3,735 | ||||||
Public Service Electric & Gas MTN | ||||||||
1.800%, 06/01/2019 | 4,198 | 4,209 | ||||||
Public Service of Colorado | ||||||||
6.250%, 09/01/2037 | 220 | 300 | ||||||
4.300%, 03/15/2044 | 265 | 279 | ||||||
3.950%, 03/15/2043 | 200 | 203 | ||||||
2.900%, 05/15/2025 | 3,225 | 3,227 | ||||||
Public Service of Oklahoma | ||||||||
6.625%, 11/15/2037 | 900 | 1,179 | ||||||
San Diego Gas & Electric | ||||||||
3.950%, 11/15/2041 | 41 | 41 | ||||||
3.600%, 09/01/2023 | 1,224 | 1,293 | ||||||
3.000%, 08/15/2021 | 2,470 | 2,568 | ||||||
Sempra Energy | ||||||||
9.800%, 02/15/2019 | 100 | 128 | ||||||
South Carolina Electric & Gas | ||||||||
5.450%, 02/01/2041 | 2,190 | 2,602 | ||||||
Southaven Combined Cycle Generation LLC | ||||||||
3.846%, 08/15/2033 | 186 | 197 | ||||||
| Description | Face Amount ($ Thousands) | Market Value ($ Thousands) | ||||||
Southern | ||||||||
2.450%, 09/01/2018 | $ | 4,000 | $ | 4,105 | ||||
Southern California Edison | ||||||||
4.650%, 10/01/2043 | 1,835 | 1,996 | ||||||
3.875%, 06/01/2021 | 2,410 | 2,620 | ||||||
1.845%, 02/01/2022 | 5,465 | 5,476 | ||||||
1.125%, 05/01/2017 | 595 | 597 | ||||||
Southern California Gas | ||||||||
3.750%, 09/15/2042 | 170 | 165 | ||||||
Union Electric | ||||||||
6.700%, 02/01/2019 | 4,770 | 5,594 | ||||||
|
| |||||||
| 117,518 | ||||||||
|
| |||||||
Total Corporate Obligations | 1,449,318 | |||||||
|
| |||||||
MUNICIPAL BONDS — 2.7% |
| |||||||
Bay Area, Toll Authority, Build America Project, RB | ||||||||
6.793%, 04/01/2030 | 1,222 | 1,563 | ||||||
City of Houston, Ser A, GO | ||||||||
6.290%, 03/01/2032 | 1,130 | 1,403 | ||||||
City of New York, Build America Project, GO | ||||||||
6.271%, 12/01/2037 | 900 | 1,188 | ||||||
Commonwealth of Massachusetts, Build America Project, GO | ||||||||
4.910%, 05/01/2029 | 100 | 117 | ||||||
Commonwealth of Massachusetts, Build America Project, RB | ||||||||
5.731%, 06/01/2040 | 80 | 101 | ||||||
Commonwealth of Pennsylvania, Build America Project, GO | ||||||||
5.450%, 02/15/2030 | 320 | 375 | ||||||
East Baton Rouge, Sewerage Commission, Build America Project, RB Callable 02/01/2020 @ 100 | ||||||||
6.087%, 02/01/2045 | 965 | 1,086 | ||||||
Grand Parkway Transportation, RB | ||||||||
5.184%, 10/01/2042 | 530 | 636 | ||||||
Illinois State, GO | ||||||||
5.100%, 06/01/2033 | 1,700 | 1,602 | ||||||
Kentucky, Asset Liability Commission, RB | ||||||||
3.165%, 04/01/2018 | 1,852 | 1,909 | ||||||
Los Angeles, Unified School District, Build America Project, GO | ||||||||
6.758%, 07/01/2034 | 2,320 | 3,131 | ||||||
| SEI Institutional Investments Trust / Annual Report / May 31, 2015 | 269 |
SCHEDULE OF INVESTMENTS
Intermediate Duration Credit Fund (Concluded)
May 31, 2015
| Description | Face Amount ($ Thousands) | Market Value ($ Thousands) | ||||||
Michigan State University, Build America Project, RB Callable 02/15/2030 @ 100 | ||||||||
6.173%, 02/15/2050 | $ | 100 | $ | 121 | ||||
Municipal Electric Authority of Georgia, Build America Project, RB | ||||||||
7.055%, 04/01/2057 | 2,232 | 2,555 | ||||||
6.637%, 04/01/2057 | 849 | 1,071 | ||||||
New Jersey Economic Development Authority, Ser B, RB | ||||||||
2.911%, 02/15/2020 (B) | 4,500 | 3,836 | ||||||
New York State Urban Development, Build America Project, RB | ||||||||
4.810%, 03/15/2021 | 2,130 | 2,377 | ||||||
North Texas, Tollway Authority, Build America Project, RB | ||||||||
6.718%, 01/01/2049 | 60 | 85 | ||||||
Ohio State Water Development Authority, Build America Project, RB | ||||||||
4.879%, 12/01/2034 | 1,435 | 1,635 | ||||||
Port Authority of New York & New Jersey, RB | ||||||||
4.458%, 10/01/2062 | 620 | 640 | ||||||
Regents of the University of California Medical Center Pooled Revenue, Build America Project, Ser H, RB | ||||||||
6.548%, 05/15/2048 | 120 | 157 | ||||||
State of California, Build America Project, GO | ||||||||
7.550%, 04/01/2039 | 3,085 | 4,657 | ||||||
7.500%, 04/01/2034 | 2,300 | 3,323 | ||||||
State of Connecticut, Ser A, GO | ||||||||
5.850%, 03/15/2032 | 2,050 | 2,516 | ||||||
State of New Jersey, State Turnpike Authority, Build America Project, RB | ||||||||
7.102%, 01/01/2041 | 2,500 | 3,529 | ||||||
State of Texas, Build America Project, GO | ||||||||
5.517%, 04/01/2039 | 1,040 | 1,351 | ||||||
State of Texas, Transportation Communication Authority, Build America Project, | ||||||||
5.178%, 04/01/2030 | 675 | 794 | ||||||
University of California, Build America Project, RB | ||||||||
5.770%, 05/15/2043 | 1,300 | 1,625 | ||||||
|
| |||||||
Total Municipal Bonds | 43,383 | |||||||
|
| |||||||
| Description | Face Amount ($ Thousands)/Shares | Market Value ($ Thousands) | ||||||
SOVEREIGN DEBT — 2.2% |
| |||||||
Andina de Fomento | ||||||||
4.375%, 06/15/2022 (F) | $ | 1,360 | $ | 1,491 | ||||
Asian Development Bank MTN | ||||||||
1.500%, 01/22/2020 (F) | 2,740 | 2,740 | ||||||
European Investment Bank | ||||||||
1.875%, 03/15/2019 (F) | 6,230 | 6,359 | ||||||
1.125%, 12/15/2016 (F) | 5,480 | 5,524 | ||||||
Inter-American Development Bank MTN | ||||||||
1.750%, 10/15/2019 (F) | 4,080 | 4,135 | ||||||
International Bank for Reconstruction & Development | ||||||||
1.375%, 04/10/2018 (F) | 5,810 | 5,878 | ||||||
0.750%, 12/15/2016 (F) | 4,170 | 4,175 | ||||||
International Finance | ||||||||
1.750%, 09/04/2018 (F) | 4,305 | 4,356 | ||||||
Province of Quebec Canada MTN | ||||||||
6.350%, 01/30/2026 | 270 | 346 | ||||||
|
| |||||||
Total Sovereign Debt | 35,004 | |||||||
|
| |||||||
U.S. TREASURY OBLIGATIONS — 1.8% |
| |||||||
U.S. Treasury Bonds | ||||||||
4.500%, 02/15/2036 | 2,105 | 2,736 | ||||||
2.500%, 02/15/2045 | 4,805 | 4,454 | ||||||
U.S. Treasury Notes | ||||||||
2.125%, 05/15/2025 | 1,080 | 1,083 | ||||||
2.000%, 02/15/2025 | 5,757 | 5,708 | ||||||
1.750%, 04/30/2022 | 745 | 741 | ||||||
1.375%, 03/31/2020 | 3,305 | 3,294 | ||||||
1.375%, 04/30/2020 | 10,662 | 10,617 | ||||||
0.500%, 03/31/2017 (E) | 1,115 | 1,114 | ||||||
0.500%, 04/30/2017 | 100 | 100 | ||||||
|
| |||||||
Total U.S. Treasury Obligations |
| 29,847 | ||||||
|
| |||||||
CASH EQUIVALENT — 1.6% |
| |||||||
SEI Daily Income Trust, Prime Obligation Fund, Cl A | 25,542,606 | 25,543 | ||||||
|
| |||||||
Total Cash Equivalent | 25,543 | |||||||
|
| |||||||
Total Investments — 98.9% |
| $ | 1,583,095 | |||||
|
| |||||||
| 270 | SEI Institutional Investments Trust / Annual Report / May 31, 2015 |
A list of the open futures contracts held by the Fund at May 31, 2015, is as follows:
| Type of Contract | Number of Contracts Short | Expiration Date | Unrealized Depreciation ($ Thousands) | |||||||||
Ten Year Note | (170 | ) | Sep-2015 | $ | (100 | ) | ||||||
U.S. Ultra Long Treasury Bond | (101 | ) | Sep-2015 | (155 | ) | |||||||
|
| |||||||||||
| $ | (255 | ) | ||||||||||
|
| |||||||||||
For year ended May 31, 2015, the total amount of all open futures contracts, as presented in the table above, are representative of the volume of activity for this derivative type during the year.
Percentages are based on a Net Assets of $1,600,117 ($ Thousands).
| * | The rate reported is the 7-day effective yield as of May 31, 2015. |
| ‡ | Real Estate Investment Trust. |
| † | Investment in Affiliated Security (see Note 6). |
| (A) | Securities sold within terms of a private placement memorandum, exempt from registration under Section 144A of the Securities Act of 1933, as amended, and may be sold only to dealers in that program or other “accredited investors.” These securities have been determined to be liquid under guidelines established by the Board of Trustees. |
| (B) | The rate reported is the effective yield at time of purchase. |
| (C) | Variable Rate Security — The rate reported on the Schedule of Investments is the rate in effect as of May 31, 2015. |
| (D) | Step Bonds — The rate reflected on the Schedule of Investments is the effective yield on May 31, 2015. The coupon on a step bond changes on a specified date. |
| (E) | Security, or portion thereof, has been pledged as collateral on open futures contracts. |
| (F) | This security is a Supra-National organization. |
Cl — Class
GO — General Obligation
LLC — Limited Liability Company
MTN — Medium Term Note
RB — Revenue Bond
Ser — Series
The following is a list of the level of inputs used as of May 31, 2015, in valuing the Fund’s investments and other financial instruments carried at value ($ Thousands):
| Investments in Securities | Level 1 | Level 2 | Level 3 | Total | ||||||||||||
Corporate Obligations | $ | — | $ | 1,449,318 | $ | — | $ | 1,449,318 | ||||||||
Municipal Bonds | — | 43,383 | — | 43,383 | ||||||||||||
Sovereign Debt | — | 35,004 | — | 35,004 | ||||||||||||
U.S. Treasury Obligations | — | 29,847 | — | 29,847 | ||||||||||||
Cash Equivalent | 25,543 | — | — | 25,543 | ||||||||||||
|
|
|
|
|
|
|
| |||||||||
Total Investments in Securities | $ | 25,543 | $ | 1,557,552 | $ | — | $ | 1,583,095 | ||||||||
|
|
|
|
|
|
|
| |||||||||
| Other Financial Instruments | Level 1 | Level 2 | Level 3 | Total | ||||||||||||
Futures Contracts* | ||||||||||||||||
Unrealized Depreciation | $ | (255 | ) | $ | — | $ | — | $ | (255 | ) | ||||||
|
|
|
|
|
|
|
| |||||||||
| * | Futures contracts are valued at the unrealized depreciation on the instrument. |
For the year ended May 31, 2015, there were no transfers between Level 1 and Level 2 assets and liabilities.
For the year ended May 31, 2015, there were no transfers between Level 2 and Level 3 assets and liabilities.
For more information on valuation inputs, see Note 2 — Significant Accounting Policies in Notes to Financial Statements.
Amounts designated as “—” are $0 or have been rounded to $0.
The accompanying notes are an integral part of the financial statements.
| SEI Institutional Investments Trust / Annual Report / May 31, 2015 | 271 |
CONSOLIDATED SUMMARY SCHEDULE OF INVESTMENTS
Dynamic Asset Allocation Fund
May 31, 2015
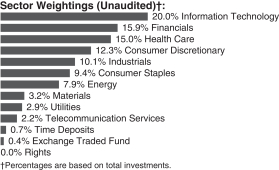
| Description | Percentage of Net Assets (%) | Shares | Market Value ($ Thousands) | |||||||||
COMMON STOCK — 98.6% |
| |||||||||||
Consumer Discretionary — 12.3% |
| |||||||||||
Amazon.com* | 0.8 | % | 40,300 | $ | 17,298 | |||||||
Comcast, Cl A | 0.8 | 269,200 | 15,737 | |||||||||
Home Depot | 0.8 | 139,632 | 15,558 | |||||||||
McDonald’s | 0.5 | 102,100 | 9,794 | |||||||||
Walt Disney | 0.9 | 165,562 | 18,273 | |||||||||
Other Securities | 8.5 | 169,022 | ||||||||||
|
| |||||||||||
| 245,682 | ||||||||||||
|
| |||||||||||
Consumer Staples — 9.4% |
| |||||||||||
Altria Group | 0.5 | 209,100 | 10,706 | |||||||||
Coca-Cola | 0.9 | 416,200 | 17,048 | |||||||||
CVS Health | 0.6 | 119,400 | 12,224 | |||||||||
PepsiCo | 0.8 | 157,062 | 15,146 | |||||||||
Philip Morris International | 0.7 | 164,000 | 13,624 | |||||||||
Procter & Gamble | 1.1 | 285,800 | 22,404 | |||||||||
Wal-Mart Stores | 0.6 | 167,555 | 12,444 | |||||||||
Other Securities | 4.2 | 83,102 | ||||||||||
|
| |||||||||||
| 186,698 | ||||||||||||
|
| |||||||||||
Energy — 7.9% |
| |||||||||||
Chevron | 1.0 | 199,000 | 20,497 | |||||||||
Exxon Mobil | 1.9 | 443,300 | 37,769 | |||||||||
Schlumberger | 0.6 | 135,300 | 12,281 | |||||||||
Other Securities | 4.4 | 86,159 | ||||||||||
|
| |||||||||||
| 156,706 | ||||||||||||
|
| |||||||||||
Financials — 15.8% |
| |||||||||||
Bank of America | 0.9 | 1,113,900 | 18,379 | |||||||||
Berkshire Hathaway, Cl B* | 1.4 | 192,900 | 27,585 | |||||||||
Citigroup | 0.8 | 321,300 | 17,376 | |||||||||
JPMorgan Chase | 1.3 | 394,400 | 25,944 | |||||||||
Wells Fargo | 1.4 | 495,800 | 27,745 | |||||||||
Other Securities | 10.0 | 199,008 | ||||||||||
|
| |||||||||||
| 316,037 | ||||||||||||
|
| |||||||||||
| Description | Percentage of Net Assets (%) | Shares | Market Value ($ Thousands) | |||||||||
Health Care — 14.9% |
| |||||||||||
AbbVie | 0.6 | % | 182,500 | $ | 12,153 | |||||||
Actavis* | 0.6 | 41,400 | 12,702 | |||||||||
Amgen | 0.6 | 80,500 | 12,579 | |||||||||
Biogen* | 0.5 | 24,900 | 9,885 | |||||||||
Bristol-Myers Squibb | 0.6 | 176,300 | 11,389 | |||||||||
Celgene* | 0.5 | 85,100 | 9,739 | |||||||||
Gilead Sciences | 0.9 | 157,756 | 17,711 | |||||||||
Johnson & Johnson | 1.5 | 294,000 | 29,441 | |||||||||
Medtronic | 0.6 | 151,255 | 11,544 | |||||||||
Merck | 0.9 | 300,600 | 18,303 | |||||||||
Pfizer | 1.1 | 648,596 | 22,539 | |||||||||
UnitedHealth Group | 0.6 | 101,200 | 12,165 | |||||||||
Other Securities | 5.9 | 117,353 | ||||||||||
|
| |||||||||||
| 297,503 | ||||||||||||
|
| |||||||||||
Industrials — 10.0% |
| |||||||||||
3M | 0.5 | 67,400 | 10,722 | |||||||||
Boeing | 0.5 | 69,600 | 9,780 | |||||||||
General Electric | 1.5 | 1,064,300 | 29,023 | |||||||||
United Technologies | 0.5 | 87,800 | 10,288 | |||||||||
Other Securities | 7.0 | 140,312 | ||||||||||
|
| |||||||||||
| 200,125 | ||||||||||||
|
| |||||||||||
Information Technology — 19.9% |
| |||||||||||
Apple | 4.0 | 615,000 | 80,122 | |||||||||
Cisco Systems | 0.8 | 540,900 | 15,854 | |||||||||
Facebook, Cl A* | 0.9 | 222,300 | 17,604 | |||||||||
Google, Cl A* | 0.8 | 30,245 | 16,493 | |||||||||
Google, Cl C* | 0.8 | 30,422 | 16,188 | |||||||||
Intel | 0.9 | 501,700 | 17,289 | |||||||||
International Business Machines | 0.8 | 97,358 | 16,517 | |||||||||
Microsoft | 2.0 | 866,900 | 40,623 | |||||||||
Oracle | 0.8 | 339,800 | 14,778 | |||||||||
Qualcomm | 0.6 | 175,000 | 12,194 | |||||||||
Visa, Cl A | 0.7 | 205,600 | 14,121 | |||||||||
Other Securities | 6.8 | 135,829 | ||||||||||
|
| |||||||||||
| 397,612 | ||||||||||||
|
| |||||||||||
Materials — 3.2% |
| |||||||||||
Other Securities | 3.2 | 63,296 | ||||||||||
|
| |||||||||||
Telecommunication Services — 2.3% |
| |||||||||||
AT&T | 1.0 | 549,500 | 18,980 | |||||||||
Verizon Communications | 1.1 | 439,800 | 21,744 | |||||||||
Other Securities | 0.2 | 4,215 | ||||||||||
|
| |||||||||||
| 44,939 | ||||||||||||
|
| |||||||||||
Utilities — 2.9% |
| |||||||||||
Other Securities | 2.9 | 58,076 | ||||||||||
|
| |||||||||||
Total Common Stock |
| 1,966,674 | ||||||||||
|
| |||||||||||
| 272 | SEI Institutional Investments Trust / Annual Report / May 31, 2015 |
| Description | Percentage of Net Assets (%) | Face Amount ($ Thousands)/ Contracts | Market Value ($ Thousands) | |||||||||
RIGHTS — 0.0% |
| |||||||||||
Other Securities | 0.0 | % | $ | 23 | ||||||||
|
| |||||||||||
Total Rights |
| 23 | ||||||||||
|
| |||||||||||
EXCHANGE TRADED FUND — 0.4% |
| |||||||||||
Other Securities | 0.4 | 7,026 | ||||||||||
|
| |||||||||||
Total Exchange Traded Fund |
| 7,026 | ||||||||||
|
| |||||||||||
TIME DEPOSITS — 0.7% |
| |||||||||||
Brown Brothers Harriman 0.030%, 06/01/2015 | 0.7 | $ | 13,980 | 13,980 | ||||||||
(0.211)%, 06/01/2015 | EUR | 0.0 | 562 | 617 | ||||||||
|
| |||||||||||
Total Time Deposits |
| 14,597 | ||||||||||
|
| |||||||||||
Total Investments — 99.7% |
| $ | 1,988,320 | |||||||||
|
| |||||||||||
PURCHASED OPTION — 0.0% |
| |||||||||||
July 2015, Euro-Bund Call, Expires 06/20/2015, | 0.0 | % | 2,400 | $ | 210 | |||||||
|
| |||||||||||
Total Purchased Option |
| $ | 210 | |||||||||
|
| |||||||||||
A list of the open futures contracts held by the Fund at May 31, 2015, is as follows:
| Type of Contract | Number of Contracts Long (Short) | Expiration Date | Unrealized Appreciation (Depreciation) ($ Thousands) | |||||||||
S&P 500 Index E-MINI | (1,879 | ) | Jun-2015 | $ | (5,194 | ) | ||||||
Topix Index | 1,486 | Jun-2015 | 16,973 | |||||||||
|
| |||||||||||
| $ | 11,779 | |||||||||||
|
| |||||||||||
For the year ended May 31, 2015, the total amount of all open futures contracts, as presented in the table above, are representative of the volume of activity for this derivative type during the year.
A list of the open forward foreign currency contracts held by the Fund at May 31, 2015, is as follows:
| Settlement Date | Currency to Deliver (Thousands) | Currency to Receive (Thousands) | Unrealized Appreciation (Depreciation) ($ Thousands) | |||||||||||||||||
7/22/15 | EUR | 177,563 | USD | 189,862 | $ | (4,918 | ) | |||||||||||||
7/22/15 | GBP | 65,655 | USD | 97,971 | (2,160 | ) | ||||||||||||||
7/22/15 | INR | 6,173,090 | USD | 95,146 | (504 | ) | ||||||||||||||
7/22/15 | USD | 93,765 | EUR | 87,019 | 1,692 | |||||||||||||||
7/22/15 | USD | 103,263 | GBP | 65,655 | (3,132 | ) | ||||||||||||||
7/22/15 | USD | 196,858 | INR | 12,482,812 | (3,442 | ) | ||||||||||||||
|
| |||||||||||||||||||
| $ | (12,464 | ) | ||||||||||||||||||
|
| |||||||||||||||||||
A list of the counterparties for the open forward foreign currency contracts held by the Fund at May 31, 2015, is as follows:
| Counterparty | Currency to Deliver ($ Thousands) | Currency to Receive ($ Thousands) | Unrealized Appreciation (Depreciation) ($ Thousands) | |||||||||
Bank of America | $ | (485,440 | ) | $ | 481,082 | $ | (4,358 | ) | ||||
Deutsche Bank | (96,050 | ) | 93,584 | (2,466 | ) | |||||||
Societe Generale | (106,790 | ) | 103,602 | (3,188 | ) | |||||||
Standard Bank | (118 | ) | 121 | 3 | ||||||||
UBS | (96,050 | ) | 93,595 | (2,455 | ) | |||||||
|
| |||||||||||
| $ | (12,464 | ) | ||||||||||
|
| |||||||||||
For the year ended May 31, 2015, the total amount of all open forward foreign currency contracts, as presented in the table above, are representative of the volume of activity for this derivative type during the year.
Percentages are based on a Net Assets of $1,993,576 ($ Thousands).
| * | Non-income producing security. |
Cl — Class
EUR — Euro
GBP — British Pound Sterling
INR — Indian Rupee
S&P — Standard & Poor’s
USD — U.S. Dollar
The Summary Schedule of Investments does not reflect the complete portfolio holdings. It includes the Fund’s 50 largest holdings and each investment of any issuer that exceeds 1% of the Fund’s net assets. “Other Securities” represent all issues not required to be disclosed under the rules adopted by the U.S. Securities and Exchange Commission (“SEC”). In certain instances, securities for which footnotes listed above may otherwise apply are included in the Other Securities caption. The complete schedule of portfolio holdings is available (i) without charge, upon request, by calling (800) 342-5734; and (ii) on the SEC’s website at http://www.sec.gov.
The following is a list of the level of inputs used as of May 31, 2015, in valuing the Fund’s investments and other financial instruments carried at value ($ Thousands):
| Investments in Securities | Level 1 | Level 2 | Level 3 | Total | ||||||||||||
Common Stock | $ | 1,966,674 | $ | — | $ | — | $ | 1,966,674 | ||||||||
Rights | 23 | — | — | 23 | ||||||||||||
Exchange Traded Fund | 7,026 | — | — | 7,026 | ||||||||||||
Time Deposits | — | 14,597 | — | 14,597 | ||||||||||||
|
|
|
|
|
|
|
| |||||||||
Total Investments in Securities | $ | 1,973,723 | $ | 14,597 | $ | — | $ | 1,988,320 | ||||||||
|
|
|
|
|
|
|
| |||||||||
| Other Financial Instruments | Level 1 | Level 2 | Level 3 | Total | ||||||||||||
Purchased Option | $ | — | $ | 210 | $ | — | $ | 210 | ||||||||
Futures Contracts* | ||||||||||||||||
Unrealized Appreciation | 16,973 | — | — | 16,973 | ||||||||||||
Unrealized Depreciation | (5,194 | ) | — | — | (5,194 | ) | ||||||||||
Forwards Contracts* | ||||||||||||||||
Unrealized Appreciation | — | 1,692 | — | 1,692 | ||||||||||||
Unrealized Depreciation | — | (14,156 | ) | — | (14,156 | ) | ||||||||||
|
|
|
|
|
|
|
| |||||||||
Total Other Financial Instruments | $ | 11,779 | $ | (12,254 | ) | $ | — | $ | (475 | ) | ||||||
|
|
|
|
|
|
|
| |||||||||
| * | Futures contracts and forwards contracts are valued at the unrealized appreciation (depreciation) on the instrument. |
For the year ended May 31, 2015, there were no transfers between Level 1 and Level 2 assets and liabilities.
For the year ended May 31, 2015, there were no transfers between Level 2 and Level 3 assets and liabilities.
For more information on valuation inputs, see Note 2 — Significant Accounting Policies in Notes to Financial Statements.
Amounts designated as “—” are $0 or have been rounded to $0.
The accompanying notes are an integral part of the financial statements.
| SEI Institutional Investments Trust / Annual Report / May 31, 2015 | 273 |
CONSOLIDATED SCHEDULE OF INVESTMENTS
Multi-Asset Real Return Fund
May 31, 2015
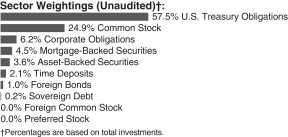
| Description | Shares | Market Value ($ Thousands) | ||||||||
COMMON STOCK — 29.5% |
| |||||||||
Consumer Discretionary — 0.4% |
| |||||||||
Cinemark Holdings | 29,200 | $ | 1,183 | |||||||
Gray Television* | 4,800 | 77 | ||||||||
Madison Square Garden, Cl A* | 18,900 | 1,615 | ||||||||
|
| |||||||||
| 2,875 | ||||||||||
|
| |||||||||
Consumer Staples — 5.8% | ||||||||||
Altria Group | 52,900 | 2,708 | ||||||||
Archer-Daniels-Midland | 19,100 | 1,009 | ||||||||
Cal-Maine Foods | 63,300 | 3,588 | ||||||||
Central Garden and Pet, Cl A* | 10,200 | 100 | ||||||||
Clorox | 9,600 | 1,034 | ||||||||
Coca-Cola | 4,900 | 201 | ||||||||
Costco Wholesale | 17,700 | 2,524 | ||||||||
Coty, Cl A | 35,800 | 893 | ||||||||
CVS Health (E) | 38,500 | 3,942 | ||||||||
Dean Foods | 42,800 | 788 | ||||||||
Dr. Pepper Snapple Group (E) | 48,500 | 3,717 | ||||||||
Fresh Del Monte Produce | 15,200 | 572 | ||||||||
Ingles Markets, Cl A | 12,000 | 587 | ||||||||
John B Sanfilippo & Son | 13,000 | 658 | ||||||||
Kimberly-Clark | 1,400 | 152 | ||||||||
Kroger | 21,500 | 1,565 | ||||||||
Monster Beverage* (E) | 29,100 | 3,704 | ||||||||
Omega Protein* | 8,300 | 114 | ||||||||
PepsiCo | 18,200 | 1,755 | ||||||||
Philip Morris International | 54,000 | 4,486 | ||||||||
Pilgrim’s Pride | 90,200 | 2,307 | ||||||||
Procter & Gamble | 24,700 | 1,936 | ||||||||
Sanderson Farms | 19,300 | 1,574 | ||||||||
Seaboard* | 33 | 113 | ||||||||
SpartanNash | 7,600 | 238 | ||||||||
SUPERVALU* | 240,300 | 2,122 | ||||||||
USANA Health Sciences* | 2,100 | 269 | ||||||||
|
| |||||||||
| 42,656 | ||||||||||
|
| |||||||||
Energy — 6.3% | ||||||||||
Alon USA Energy | 53,600 | 945 | ||||||||
California Resources | 216,200 | 1,697 | ||||||||
Chevron (E) | 25,370 | 2,613 | ||||||||
Dawson Geophysical* | 4,308 | 23 | ||||||||
Delek US Holdings | 4,800 | 182 | ||||||||
Ensco, Cl A (E) | 129,700 | 3,048 | ||||||||
Exxon Mobil (E) | 90,400 | 7,702 | ||||||||
Frank’s International | 22,700 | 450 | ||||||||
| Description | Shares | Market Value ($ Thousands) | ||||||||
Frontline* | 130,600 | $ | 337 | |||||||
Gulf Island Fabrication | 6,900 | 78 | ||||||||
HollyFrontier | 1,000 | 42 | ||||||||
Marathon Petroleum | 24,700 | 2,555 | ||||||||
Noble | 153,100 | 2,565 | ||||||||
Nordic American Tankers | 175,200 | 2,262 | ||||||||
Nuverra Environmental Solutions* | 38,300 | 197 | ||||||||
Pacific Ethanol* | 64,900 | 747 | ||||||||
Pioneer Energy Services* | 67,200 | 472 | ||||||||
REX American Resources* | 22,400 | 1,431 | ||||||||
Rowan, Cl A | 2,200 | 47 | ||||||||
Seventy Seven Energy* | 90,700 | 535 | ||||||||
Swift Energy* | 177,000 | 375 | ||||||||
Teekay Tankers, Cl A | 158,200 | 1,068 | ||||||||
Tesoro (E) | 48,000 | 4,248 | ||||||||
Transocean | 199,500 | 3,761 | ||||||||
VAALCO Energy* | 129,500 | 289 | ||||||||
Valero Energy | 75,700 | 4,484 | ||||||||
Western Refining | 39,400 | 1,733 | ||||||||
Willbros Group* | 40,400 | 75 | ||||||||
WPX Energy* | 186,800 | 2,408 | ||||||||
|
| |||||||||
| 46,369 | ||||||||||
|
| |||||||||
Financials — 3.1% | ||||||||||
Altisource Portfolio Solutions* | 32,100 | 883 | ||||||||
Ashford Hospitality Prime‡ | 5,600 | 88 | ||||||||
Ashford Hospitality Trust‡ | 46,200 | 397 | ||||||||
Associated Estates Realty‡ | 20,700 | 592 | ||||||||
Banc of California | 4,000 | 52 | ||||||||
BGC Partners, Cl A | 21,900 | 207 | ||||||||
Chimera Investment‡ | 86,300 | 1,245 | ||||||||
Citigroup | 16,200 | 876 | ||||||||
Communications Sales & Leasing‡ | 22,900 | 597 | ||||||||
CoreSite Realty‡ | 28,300 | 1,336 | ||||||||
CyrusOne‡ | 11,200 | 361 | ||||||||
FelCor Lodging Trust‡ | 31,100 | 334 | ||||||||
First BanCorp* | 55,700 | 341 | ||||||||
Heartland Financial USA | 1,800 | 61 | ||||||||
Hospitality Properties Trust‡ | 3,800 | 115 | ||||||||
International FCStone* | 29,200 | 1,024 | ||||||||
Investment Technology Group | 26,700 | 717 | ||||||||
Janus Capital Group | 70,200 | 1,274 | ||||||||
Jones Lang LaSalle | 2,800 | 485 | ||||||||
LaSalle Hotel Properties‡ | 2,100 | 77 | ||||||||
LendingTree* | 4,500 | 267 | ||||||||
Marcus & Millichap* | 3,200 | 150 | ||||||||
Mortgage Investment Trust‡ | 52,500 | 989 | ||||||||
New Residential Investments‡ | 97,800 | 1,668 | ||||||||
Public Storage‡ | 3,300 | 639 | ||||||||
RE, Cl A | 4,900 | 164 | ||||||||
Regency Centers‡ | 4,500 | 284 | ||||||||
Ryman Hospitality Properties‡ | 33,700 | 1,857 | ||||||||
Simon Property Group‡ | 6,400 | 1,161 | ||||||||
St. Joe* | 77,700 | 1,238 | ||||||||
Summit Hotel Properties‡ | 23,600 | 315 | ||||||||
Universal Insurance Holdings | 47,200 | 1,205 | ||||||||
WisdomTree Investments | 70,400 | 1,504 | ||||||||
|
| |||||||||
| 22,503 | ||||||||||
|
| |||||||||
| 274 | SEI Institutional Investments Trust / Annual Report / May 31, 2015 |
| Description | Shares | Market Value ($ Thousands) | ||||||||
Health Care — 6.9% | ||||||||||
Aetna | 12,800 | $ | 1,510 | |||||||
Affymetrix* | 84,800 | 995 | ||||||||
Almost Family* | 7,200 | 276 | ||||||||
Alnylam Pharmaceuticals* | 12,500 | 1,639 | ||||||||
Amedisys* | 6,100 | 189 | ||||||||
Amgen (E) | 24,800 | 3,875 | ||||||||
AMN Healthcare Services* | 18,900 | 503 | ||||||||
Anthem (E) | 30,500 | 5,119 | ||||||||
BioMarin Pharmaceutical* | 1,100 | 138 | ||||||||
Bristol-Myers Squibb | 29,800 | 1,925 | ||||||||
Cambrex* | 47,100 | 1,885 | ||||||||
Centene* (E) | 64,700 | 4,875 | ||||||||
Depomed* | 138,300 | 2,885 | ||||||||
Ensign Group | 18,800 | 872 | ||||||||
Geron* | 329,100 | 1,270 | ||||||||
Gilead Sciences (E) | 30,400 | 3,413 | ||||||||
Halozyme Therapeutics* | 30,600 | 531 | ||||||||
Health Net* (E) | 56,700 | 3,529 | ||||||||
Hospira* (E) | 50,600 | 4,474 | ||||||||
ICU Medical * | 5,100 | 495 | ||||||||
Illumina* (E) | 700 | 144 | ||||||||
Impax Laboratories* | 5,700 | 268 | ||||||||
Incyte* | 3,300 | 364 | ||||||||
Isis Pharmaceuticals* | 4,400 | 296 | ||||||||
Johnson & Johnson (E) | 12,100 | 1,212 | ||||||||
Magellan Health Services* | 2,879 | 195 | ||||||||
Merge Healthcare* | 56,500 | 258 | ||||||||
Molina Healthcare* | 39,200 | 2,851 | ||||||||
PAREXEL International* | 6,700 | 445 | ||||||||
Quintiles Transnational Holdings* | 2,300 | 160 | ||||||||
Repligen* | 5,100 | 208 | ||||||||
Sciclone Pharmaceuticals* | 60,200 | 557 | ||||||||
Sequenom* | 17,800 | 60 | ||||||||
Sucampo Pharmaceuticals, Cl A* | 16,700 | 271 | ||||||||
United Therapeutics* | 3,200 | 588 | ||||||||
UnitedHealth Group | 14,800 | 1,779 | ||||||||
Universal Health Services, Cl B | 4,700 | 609 | ||||||||
|
| |||||||||
| 50,663 | ||||||||||
|
| |||||||||
Industrials — 1.5% | ||||||||||
American Woodmark* | 1,200 | 62 | ||||||||
Apogee Enterprises | 11,600 | 623 | ||||||||
Argan | 4,800 | 172 | ||||||||
Atlas Air Worldwide Holdings* | 10,600 | 578 | ||||||||
Cintas | 1,500 | 129 | ||||||||
Civeo | 350,100 | 1,400 | ||||||||
Dycom Industries* | 3,200 | 184 | ||||||||
Echo Global Logistics* | 6,800 | 219 | ||||||||
Ennis | 5,400 | 91 | ||||||||
Insperity | 30,500 | 1,605 | ||||||||
JetBlue Airways* | 7,000 | 141 | ||||||||
| Description | Shares | Market Value ($ Thousands) | ||||||||
Matson | 25,900 | $ | 1,043 | |||||||
PAM Transportation Services* | 400 | 24 | ||||||||
RPX* | 51,400 | 818 | ||||||||
SkyWest | 2,800 | 41 | ||||||||
Southwest Airlines | 9,700 | 359 | ||||||||
Spirit AeroSystems Holdings, Cl A* | 51,000 | 2,784 | ||||||||
USA Truck* | 11,700 | 270 | ||||||||
|
| |||||||||
| 10,543 | ||||||||||
|
| |||||||||
Information Technology — 4.0% |
| |||||||||
Broadridge Financial Solutions | 16,300 | 883 | ||||||||
BroadSoft* | 9,400 | 343 | ||||||||
DST Systems | 9,100 | 1,077 | ||||||||
EarthLink Holdings | 190,100 | 1,319 | ||||||||
Ebix | 18,100 | 644 | ||||||||
Electronic Arts* (E) | 40,000 | 2,510 | ||||||||
Ellie Mae* | 30,000 | 1,897 | ||||||||
EPAM Systems* (E) | 54,800 | 3,941 | ||||||||
ePlus* | 11,900 | 924 | ||||||||
Facebook, Cl A* | 2,300 | 182 | ||||||||
FactSet Research Systems | 16,800 | 2,775 | ||||||||
Fortinet* | 28,200 | 1,130 | ||||||||
GTT Communications* | 3,300 | 73 | ||||||||
Hackett Group | 9,600 | 114 | ||||||||
Higher One Holdings* | 8,900 | 25 | ||||||||
Limelight Networks* | 17,600 | 77 | ||||||||
LogMeIn* | 4,400 | 279 | ||||||||
Luxoft Holding, Cl A* | 12,600 | 674 | ||||||||
Manhattan Associates* | 43,900 | 2,408 | ||||||||
MAXIMUS | 4,400 | 288 | ||||||||
MicroStrategy, Cl A* | 3,400 | 598 | ||||||||
Monster Worldwide* | 53,600 | 325 | ||||||||
Progress Software* | 1,500 | 40 | ||||||||
Proofpoint* | 16,400 | 970 | ||||||||
Stamps.com* | 8,400 | 565 | ||||||||
Sykes Enterprises* | 1,600 | 39 | ||||||||
Tableau Software, Cl A* | 37,800 | 4,279 | ||||||||
Vasco Data Security International* | 16,100 | 429 | ||||||||
|
| |||||||||
| 28,808 | ||||||||||
|
| |||||||||
Telecommunication Services — 0.7% |
| |||||||||
Atlantic Telegraph-Network | 10,600 | 711 | ||||||||
FairPoint Communications* | 6,700 | 135 | ||||||||
General Communication, Cl A* | 21,700 | 349 | ||||||||
Inteliquent | 63,200 | 1,114 | ||||||||
magicJack VocalTec* | 57,500 | 474 | ||||||||
NTELOS Holdings | 30,400 | 263 | ||||||||
Telephone & Data Systems | 22,300 | 662 | ||||||||
Verizon Communications (E) | 30,900 | 1,528 | ||||||||
|
| |||||||||
| 5,236 | ||||||||||
|
| |||||||||
| SEI Institutional Investments Trust / Annual Report / May 31, 2015 | 275 |
CONSOLIDATED SCHEDULE OF INVESTMENTS
Multi-Asset Real Return Fund (Continued)
May 31, 2015
| Description | Shares/Face Amount ($ Thousands) | Market Value ($ Thousands) | ||||||||
Utilities — 0.8% | ||||||||||
Entergy | 31,400 | $ | 2,401 | |||||||
PG&E | 36,600 | 1,957 | ||||||||
UGI | 38,300 | 1,432 | ||||||||
|
| |||||||||
| 5,790 | ||||||||||
|
| |||||||||
Total Common Stock |
| 215,443 | ||||||||
|
| |||||||||
CORPORATE OBLIGATIONS — 7.4% |
| |||||||||
Consumer Discretionary — 1.0% |
| |||||||||
21st Century Fox America | ||||||||||
6.150%, 02/15/2041 | $ | 75 | 90 | |||||||
4.500%, 02/15/2021 | 90 | 99 | ||||||||
4.000%, 10/01/2023 | 117 | 124 | ||||||||
3.000%, 09/15/2022 | 420 | 422 | ||||||||
CBS | ||||||||||
5.750%, 04/15/2020 | 145 | 166 | ||||||||
3.500%, 01/15/2025 | 625 | 609 | ||||||||
Comcast | ||||||||||
6.450%, 03/15/2037 | 40 | 51 | ||||||||
CSC Holdings LLC | ||||||||||
8.625%, 02/15/2019 | 126 | 144 | ||||||||
Dana Holdings | ||||||||||
6.000%, 09/15/2023 | 91 | 96 | ||||||||
DIRECTV Holdings | ||||||||||
4.600%, 02/15/2021 | 60 | 65 | ||||||||
3.800%, 03/15/2022 | 110 | 113 | ||||||||
DIRECTV Holdings LLC | ||||||||||
5.000%, 03/01/2021 | 835 | 919 | ||||||||
4.450%, 04/01/2024 | 174 | 183 | ||||||||
Discovery Communications LLC | ||||||||||
3.450%, 03/15/2025 | 338 | 326 | ||||||||
Ford Motor Credit LLC | ||||||||||
2.597%, 11/04/2019 | 896 | 901 | ||||||||
General Motors | ||||||||||
3.500%, 10/02/2018 | 365 | 375 | ||||||||
Goodyear Tire & Rubber | ||||||||||
8.250%, 08/15/2020 | 161 | 169 | ||||||||
KB Home | ||||||||||
4.750%, 05/15/2019 | 294 | 293 | ||||||||
Time Warner | ||||||||||
4.700%, 01/15/2021 | 130 | 143 | ||||||||
3.550%, 06/01/2024 | 559 | 560 | ||||||||
Time Warner Cable | ||||||||||
4.500%, 09/15/2042 | 245 | 213 | ||||||||
4.125%, 02/15/2021 | 65 | 67 | ||||||||
Viacom | ||||||||||
3.875%, 04/01/2024 | 267 | 266 | ||||||||
Walgreens Boots Alliance | ||||||||||
3.800%, 11/18/2024 | 885 | 890 | ||||||||
|
| |||||||||
| 7,284 | ||||||||||
|
| |||||||||
| Description | Face Amount ($ Thousands) | Market Value ($ Thousands) | ||||||||
Consumer Staples — 0.4% |
| |||||||||
Altria Group | ||||||||||
4.750%, 05/05/2021 | $ | 215 | $ | 238 | ||||||
2.625%, 01/14/2020 | 895 | 902 | ||||||||
Bunge Finance | ||||||||||
8.500%, 06/15/2019 | 7 | 9 | ||||||||
4.100%, 03/15/2016 | 125 | 128 | ||||||||
Grupo Bimbo | ||||||||||
3.875%, 06/27/2024 (A) | 553 | 563 | ||||||||
Kroger | ||||||||||
3.400%, 04/15/2022 | 452 | 464 | ||||||||
Reynolds American | ||||||||||
3.250%, 11/01/2022 | 107 | 105 | ||||||||
Tyson Foods | ||||||||||
3.950%, 08/15/2024 | 550 | 571 | ||||||||
2.650%, 08/15/2019 | 169 | 172 | ||||||||
|
| |||||||||
| 3,152 | ||||||||||
|
| |||||||||
Energy — 1.0% | ||||||||||
DCP Midstream | ||||||||||
4.750%, 09/30/2021 (A) | 75 | 73 | ||||||||
Diamond Offshore Drilling | ||||||||||
4.875%, 11/01/2043 | 301 | 251 | ||||||||
Ecopetrol | ||||||||||
5.875%, 05/28/2045 | 252 | 233 | ||||||||
Energy Transfer Partners | ||||||||||
5.200%, 02/01/2022 | 465 | 497 | ||||||||
4.650%, 06/01/2021 | 85 | 90 | ||||||||
EnLink Midstream Partners | ||||||||||
5.050%, 04/01/2045 | 371 | 354 | ||||||||
Enterprise Products Operating | ||||||||||
5.200%, 09/01/2020 | 110 | 124 | ||||||||
Enterprise Products Operating LLC | ||||||||||
3.700%, 02/15/2026 | 810 | 814 | ||||||||
Freeport-McMoran Oil & Gas LLC | ||||||||||
6.500%, 11/15/2020 | 129 | 137 | ||||||||
Kinder Morgan Energy Partners | ||||||||||
4.150%, 03/01/2022 | 48 | 49 | ||||||||
3.950%, 09/01/2022 | 536 | 541 | ||||||||
Marathon Petroleum | ||||||||||
5.125%, 03/01/2021 | 47 | 52 | ||||||||
Noble Energy | ||||||||||
8.250%, 03/01/2019 | 174 | 209 | ||||||||
4.150%, 12/15/2021 | 340 | 359 | ||||||||
3.900%, 11/15/2024 | 463 | 469 | ||||||||
ONEOK | ||||||||||
4.250%, 02/01/2022 | 111 | 108 | ||||||||
Paragon Offshore | ||||||||||
7.250%, 08/15/2024 (A) | 323 | 134 | ||||||||
6.750%, 07/15/2022 (A) | 56 | 23 | ||||||||
Petroleos Mexicanos | ||||||||||
3.500%, 07/18/2018 | 144 | 149 | ||||||||
| 276 | SEI Institutional Investments Trust / Annual Report / May 31, 2015 |
| Description | Face Amount ($ Thousands) | Market Value ($ Thousands) | ||||||||
Plains All American Pipeline | ||||||||||
3.600%, 11/01/2024 | $ | 511 | $ | 503 | ||||||
Regency Energy Partners | ||||||||||
4.500%, 11/01/2023 | 72 | 72 | ||||||||
Reliance Holdings USA | ||||||||||
5.400%, 02/14/2022 (A) | 966 | 1,069 | ||||||||
SM Energy | ||||||||||
6.500%, 01/01/2023 | 35 | 36 | ||||||||
Transocean | ||||||||||
6.500%, 11/15/2020 | 390 | 372 | ||||||||
Valero Energy | ||||||||||
6.125%, 02/01/2020 | 149 | 173 | ||||||||
Williams Partners | ||||||||||
3.900%, 01/15/2025 | 176 | 173 | ||||||||
|
| |||||||||
| 7,064 | ||||||||||
|
| |||||||||
Financials — 2.2% | ||||||||||
American International Group | ||||||||||
6.400%, 12/15/2020 | 60 | 72 | ||||||||
5.600%, 10/18/2016 | 60 | 64 | ||||||||
4.875%, 06/01/2022 | 410 | 458 | ||||||||
American Tower | ||||||||||
5.050%, 09/01/2020‡ | 145 | 159 | ||||||||
4.700%, 03/15/2022‡ | 230 | 244 | ||||||||
3.500%, 01/31/2023‡ | 110 | 108 | ||||||||
2.800%, 06/01/2020‡ | 450 | 447 | ||||||||
Bank of America | ||||||||||
6.500%, 12/31/2049 (B) | 233 | 246 | ||||||||
0.861%, 03/28/2018 (B) | 850 | 927 | ||||||||
Barclays | ||||||||||
4.375%, 09/11/2024 | 240 | 239 | ||||||||
Barclays Bank | ||||||||||
7.750%, 04/10/2023 (B) | 321 | 355 | ||||||||
6.860%, 09/29/2049 (A) (B) | 106 | 120 | ||||||||
Citigroup | ||||||||||
3.875%, 03/26/2025 | 680 | 674 | ||||||||
Credit Suisse Group Funding Guernsey | ||||||||||
3.750%, 03/26/2025 (A) | 1,314 | 1,297 | ||||||||
Dai-ichi Life Insurance | ||||||||||
5.100%, 12/31/2049 (A) (B) | 413 | 442 | ||||||||
Ford Motor Credit | ||||||||||
4.375%, 08/06/2023 | 260 | 278 | ||||||||
Ford Motor Credit LLC | ||||||||||
5.875%, 08/02/2021 | 200 | 232 | ||||||||
Goldman Sachs Group MTN | ||||||||||
1.884%, 11/29/2023 (B) | 1,315 | 1,343 | ||||||||
Hartford Financial Services Group | ||||||||||
5.500%, 03/30/2020 | 80 | 91 | ||||||||
5.125%, 04/15/2022 | 335 | 376 | ||||||||
HCP | ||||||||||
5.375%, 02/01/2021‡ | 205 | 230 | ||||||||
Health Care | ||||||||||
5.250%, 01/15/2022‡ | 540 | 601 | ||||||||
| Description | Face Amount ($ Thousands) | Market Value ($ Thousands) | ||||||||
Healthcare Realty Trust | ||||||||||
5.750%, 01/15/2021‡ | $ | 320 | $ | 360 | ||||||
Host Hotels & Resorts | ||||||||||
5.250%, 03/15/2022‡ | 70 | 77 | ||||||||
3.750%, 10/15/2023‡ | 13 | 13 | ||||||||
HSBC Finance | ||||||||||
6.676%, 01/15/2021 | 60 | 71 | ||||||||
Hutchison Whampoa International | ||||||||||
1.625%, 10/31/2017 (A) | 355 | 354 | ||||||||
Intesa Sanpaolo MTN | ||||||||||
5.017%, 06/26/2024 (A) | 583 | 585 | ||||||||
JPMorgan Chase | ||||||||||
6.400%, 05/15/2038 | 40 | 51 | ||||||||
Lincoln National | ||||||||||
4.200%, 03/15/2022 | 110 | 118 | ||||||||
Lloyds Banking Group | ||||||||||
7.500%, 12/01/2099 (B) | 371 | 395 | ||||||||
MetLife | ||||||||||
7.717%, 02/15/2019 | 50 | 60 | ||||||||
5.700%, 06/15/2035 | 65 | 79 | ||||||||
5.250%, 12/29/2049 (B) | 711 | 712 | ||||||||
Mizuho Financial Group Cayman 3 | ||||||||||
4.600%, 03/27/2024 (A) | 631 | 669 | ||||||||
Morgan Stanley MTN | ||||||||||
5.500%, 07/28/2021 | 168 | 192 | ||||||||
4.750%, 03/22/2017 | 40 | 42 | ||||||||
Murray Street Investment Trust I | ||||||||||
4.647%, 03/09/2017 (C) | 18 | 19 | ||||||||
Nationwide Financial Services | ||||||||||
5.375%, 03/25/2021 (A) | 320 | 358 | ||||||||
Nordea Bank MTN | ||||||||||
6.125%, 12/31/2049 (A) (B) | 370 | 379 | ||||||||
PNC Bank | ||||||||||
3.800%, 07/25/2023 | 460 | 480 | ||||||||
Prudential Financial | ||||||||||
5.625%, 06/15/2043 (B) | 290 | 308 | ||||||||
Rabobank Capital Funding Trust | ||||||||||
5.254%, 10/21/2016 (A) (B) | 240 | 249 | ||||||||
Santander Bank | ||||||||||
1.206%, 01/12/2018 (B) | 990 | 990 | ||||||||
Santander UK | ||||||||||
5.000%, 11/07/2023 (A) | 555 | 584 | ||||||||
SLM MTN | ||||||||||
7.250%, 01/25/2022 | 15 | 16 | ||||||||
|
| |||||||||
| 16,164 | ||||||||||
|
| |||||||||
Health Care — 0.7% | ||||||||||
AbbVie | ||||||||||
3.600%, 05/14/2025 | 734 | 739 | ||||||||
Actavis Funding SCS | ||||||||||
3.850%, 06/15/2024 | 241 | 244 | ||||||||
3.800%, 03/15/2025 | 846 | 852 | ||||||||
| SEI Institutional Investments Trust / Annual Report / May 31, 2015 | 277 |
CONSOLIDATED SCHEDULE OF INVESTMENTS
Multi-Asset Real Return Fund (Continued)
May 31, 2015
| Description | Face Amount ($ Thousands) | Market Value ($ Thousands) | ||||||||
Bayer US Finance LLC | ||||||||||
3.375%, 10/08/2024 (A) | $ | 337 | $ | 343 | ||||||
Becton Dickinson | ||||||||||
3.734%, 12/15/2024 | 403 | 411 | ||||||||
CHS | ||||||||||
5.125%, 08/15/2018 | 144 | 148 | ||||||||
Laboratory Corp of America Holdings | ||||||||||
3.600%, 02/01/2025 | 285 | 280 | ||||||||
Medtronic | �� | |||||||||
3.500%, 03/15/2025 (A) | 920 | 942 | ||||||||
Perrigo Finance | ||||||||||
3.900%, 12/15/2024 | 320 | 326 | ||||||||
3.500%, 12/15/2021 | 217 | 222 | ||||||||
Thermo Fisher Scientific | ||||||||||
4.150%, 02/01/2024 | 276 | 290 | ||||||||
|
| |||||||||
| 4,797 | ||||||||||
|
| |||||||||
Industrials — 0.1% | ||||||||||
AerCap Aviation Solutions | ||||||||||
6.375%, 05/30/2017 | 355 | 378 | ||||||||
International Lease Finance | ||||||||||
5.875%, 04/01/2019 | 249 | 272 | ||||||||
Novelis | ||||||||||
8.375%, 12/15/2017 | 76 | 79 | ||||||||
Republic Services | ||||||||||
3.800%, 05/15/2018 | 130 | 138 | ||||||||
|
| |||||||||
| 867 | ||||||||||
|
| |||||||||
Information Technology — 0.2% | ||||||||||
Intel | ||||||||||
4.800%, 10/01/2041 | 95 | 101 | ||||||||
KLA-Tencor | ||||||||||
4.650%, 11/01/2024 | 691 | 708 | ||||||||
Seagate HDD Cayman | ||||||||||
4.750%, 01/01/2025 (A) | 343 | 351 | ||||||||
Total System Services | ||||||||||
2.375%, 06/01/2018 | 90 | 90 | ||||||||
|
| |||||||||
| 1,250 | ||||||||||
|
| |||||||||
Materials — 0.8% | ||||||||||
Barrick | ||||||||||
4.100%, 05/01/2023 | 154 | 153 | ||||||||
Dow Chemical | ||||||||||
4.250%, 11/15/2020 | 65 | 70 | ||||||||
Eastman Chemical | ||||||||||
3.800%, 03/15/2025 | 315 | 322 | ||||||||
Glencore Funding LLC | ||||||||||
3.125%, 04/29/2019 (A) | 1,455 | 1,481 | ||||||||
International Paper | ||||||||||
7.500%, 08/15/2021 | 360 | 453 | ||||||||
4.750%, 02/15/2022 | 415 | 457 | ||||||||
3.650%, 06/15/2024 | 94 | 95 | ||||||||
| Description | Face Amount ($ Thousands) | Market Value ($ Thousands) | ||||||||
LyondellBasell Industries | ||||||||||
5.750%, 04/15/2024 | $ | 1,125 | $ | 1,308 | ||||||
NOVA Chemicals | ||||||||||
5.250%, 08/01/2023 (A) | 339 | 349 | ||||||||
OCP | ||||||||||
5.625%, 04/25/2024 (A) | 297 | 317 | ||||||||
Sealed Air | ||||||||||
5.250%, 04/01/2023 (A) | 204 | 210 | ||||||||
Teck Resources | ||||||||||
4.500%, 01/15/2021 | 242 | 248 | ||||||||
Yamana | ||||||||||
4.950%, 07/15/2024 | 759 | 749 | ||||||||
|
| |||||||||
| 6,212 | ||||||||||
|
| |||||||||
Telecommunication Services — 0.7% |
| |||||||||
AT&T | ||||||||||
5.350%, 09/01/2040 | 113 | 116 | ||||||||
3.000%, 02/15/2022 | 485 | 482 | ||||||||
Reed Elsevier Capital | ||||||||||
8.625%, 01/15/2019 | 455 | 553 | ||||||||
SBA Tower Trust | ||||||||||
2.898%, 10/15/2044 (A) | 753 | 760 | ||||||||
Sprint | ||||||||||
7.875%, 09/15/2023 | 245 | 249 | ||||||||
Tencent Holdings MTN | ||||||||||
3.375%, 05/02/2019 (A) | 520 | 536 | ||||||||
Verizon Communications | ||||||||||
7.350%, 04/01/2039 | 125 | 164 | ||||||||
6.550%, 09/15/2043 | 270 | 328 | ||||||||
4.600%, 04/01/2021 | 850 | 931 | ||||||||
3.850%, 11/01/2042 | 323 | 276 | ||||||||
3.500%, 11/01/2024 | 611 | 612 | ||||||||
|
| |||||||||
| 5,007 | ||||||||||
|
| |||||||||
Utilities — 0.3% | ||||||||||
AES | ||||||||||
7.375%, 07/01/2021 | 318 | 356 | ||||||||
Berkshire Hathaway Energy | ||||||||||
6.125%, 04/01/2036 | 275 | 333 | ||||||||
CMS Energy | ||||||||||
5.050%, 03/15/2022 | 52 | 58 | ||||||||
Constellation Energy Group | ||||||||||
5.150%, 12/01/2020 | 26 | 29 | ||||||||
Exelon Generation LLC | ||||||||||
4.250%, 06/15/2022 | 360 | 370 | ||||||||
Israel Electric | ||||||||||
5.000%, 11/12/2024 | 581 | 605 | ||||||||
NRG Energy | ||||||||||
6.250%, 05/01/2024 | 243 | 249 | ||||||||
Pacific Gas & Electric | ||||||||||
4.500%, 12/15/2041 | 65 | 67 | ||||||||
|
| |||||||||
| 2,067 | ||||||||||
|
| |||||||||
Total Corporate Obligations | 53,864 | |||||||||
|
| |||||||||
| 278 | SEI Institutional Investments Trust / Annual Report / May 31, 2015 |
| Description | Face Amount ($ Thousands) | Market Value ($ Thousands) | ||||||||
MORTGAGE-BACKED SECURITIES — 5.3% |
| |||||||||
Agency Mortgage-Backed Obligations — 0.2% |
| |||||||||
FHLMC Multifamily Structured Pass-Through Certificates, | ||||||||||
1.875%, 04/25/2022 | $ | 922 | $ | 928 | ||||||
FNMA CMO, | ||||||||||
4.500%, 05/25/2025 | 2,477 | 269 | ||||||||
FNMA TBA | ||||||||||
4.000%, 06/01/2039 | (4,911 | ) | (5,244 | ) | ||||||
GNMA TBA | ||||||||||
3.500%, 07/15/2041 | 5,000 | 5,238 | ||||||||
|
| |||||||||
| 1,191 | ||||||||||
|
| |||||||||
Non-Agency Mortgage-Backed Obligations — 5.1% |
| |||||||||
Alternative Loan Trust, | ||||||||||
5.500%, 07/25/2035 (A) | 137 | 131 | ||||||||
Alternative Loan Trust, | ||||||||||
5.500%, 12/25/2035 (A) | 390 | 358 | ||||||||
Alternative Loan Trust, | ||||||||||
6.000%, 08/25/2036 (A) | 229 | 225 | ||||||||
Alternative Loan Trust, | ||||||||||
5.750%, 06/25/2036 (A) | 569 | 512 | ||||||||
Alternative Loan Trust, | ||||||||||
5.750%, 05/25/2036 (A) | 239 | 212 | ||||||||
Alternative Loan Trust, | ||||||||||
5.500%, 02/25/2036 (A) | 344 | 310 | ||||||||
Alternative Loan Trust, | ||||||||||
5.750%, 03/25/2037 (A) | 331 | 295 | ||||||||
Banc of America Commercial Mortgage Trust, | ||||||||||
5.774%, 02/10/2051 (B) | 1,372 | 1,481 | ||||||||
Banc of America Commercial Mortgage Trust, | ||||||||||
5.772%, 02/10/2051 (B) | 78 | 82 | ||||||||
Bear Stearns Commercial Mortgage Securities Trust, | ||||||||||
5.611%, 09/11/2041 (B) | 568 | 583 | ||||||||
BHMS, Ser 2014-ATLS, Cl AFX | ||||||||||
3.601%, 07/01/2033 (A) | 905 | 936 | ||||||||
Carefree Portfolio Trust, | ||||||||||
1.506%, 11/15/2019 (A) (B) | 516 | 517 | ||||||||
| Description | Face Amount ($ Thousands) | Market Value ($ Thousands) | ||||||||
CGRBS, Ser 2013-VN05, Cl A | ||||||||||
3.187%, 03/13/2035 | $ | 285 | $ | 295 | ||||||
Chase Mortgage Finance Trust, | ||||||||||
6.000%, 07/25/2037 (A) | 189 | 164 | ||||||||
CHL Mortgage Pass-Through Trust, Ser 2006-10, Cl 1A8 | ||||||||||
6.000%, 05/25/2036 (A) | 329 | 306 | ||||||||
CHL Mortgage Pass-Through Trust, Ser 2006-13, Cl 1A18 | ||||||||||
6.250%, 09/25/2036 (A) | 455 | 416 | ||||||||
CHL Mortgage Pass-Through Trust, Ser 2006-13, Cl 1A19 | ||||||||||
6.250%, 09/25/2036 (A) | 164 | 150 | ||||||||
Citigroup Commercial Mortgage Trust, Ser 2006-C4, Cl A1A | ||||||||||
5.963%, 03/15/2049 (B) | 144 | 148 | ||||||||
Citigroup Commercial Mortgage Trust, Ser 2015-GC27, Cl A5 | ||||||||||
3.137%, 02/10/2048 | 779 | 789 | ||||||||
COMM Mortgage Trust, | ||||||||||
1.873%, 04/12/2035 (A) | 1,353 | 1,337 | ||||||||
COMM Mortgage Trust, | ||||||||||
1.082%, 06/11/2027 (A) (B) | 663 | 662 | ||||||||
COMM Mortgage Trust, | ||||||||||
1.336%, 06/15/2034 (A) (B) | 589 | 588 | ||||||||
COMM Mortgage Trust, | ||||||||||
5.292%, 12/10/2046 | 1,233 | 1,302 | ||||||||
Commercial Mortgage Loan Trust, | ||||||||||
6.240%, 12/10/2049 (B) | 1,247 | 1,350 | ||||||||
Commercial Mortgage Trust, | ||||||||||
5.444%, 03/10/2039 | 1,155 | 1,219 | ||||||||
Commercial Mortgage Trust, | ||||||||||
5.475%, 03/10/2039 | 246 | 259 | ||||||||
Countrywide Alternative Loan Trust, Ser 2006-28CB, Cl A14 | ||||||||||
6.250%, 10/25/2036 (A) | 393 | 335 | ||||||||
Countrywide Home Loan Mortgage Pass-Through Trust, | ||||||||||
2.582%, 02/25/2047 (A) (B) | 177 | 147 | ||||||||
Credit Suisse Commercial Mortgage Trust, | ||||||||||
5.700%, 06/15/2039 (B) | 461 | 483 | ||||||||
CW Capital Cobalt, | ||||||||||
5.959%, 05/15/2046 (B) | 156 | 167 | ||||||||
| SEI Institutional Investments Trust / Annual Report / May 31, 2015 | 279 |
CONSOLIDATED SCHEDULE OF INVESTMENTS
Multi-Asset Real Return Fund (Continued)
May 31, 2015
| Description | Face Amount ($ Thousands) | Market Value ($ Thousands) | ||||||||
Deutsche Alt-A Securities Mortgage Loan Trust, | ||||||||||
0.371%, 12/25/2036 (A) (B) | $ | 321 | $ | 202 | ||||||
Extended Stay America Trust, | ||||||||||
0.881%, 12/05/2031 (A) (B) | 140 | 139 | ||||||||
Extended Stay America Trust, | ||||||||||
2.295%, 12/05/2031 (A) | 180 | 179 | ||||||||
FHLMC Structured Agency Credit Risk Debt Notes, | ||||||||||
4.435%, 11/25/2023 (A) (B) | 785 | 809 | ||||||||
FHLMC Structured Agency Credit Risk Debt Notes, | ||||||||||
1.035%, 04/25/2024 (A) (B) | 342 | 341 | ||||||||
FHLMC Structured Agency Credit Risk Debt Notes, | ||||||||||
3.785%, 04/25/2024 (A) (B) | 269 | 265 | ||||||||
FHLMC Structured Agency Credit Risk Debt Notes, | ||||||||||
4.185%, 08/25/2024 (A) (B) | 890 | 900 | ||||||||
FHLMC Structured Agency Credit Risk Debt Notes, | ||||||||||
4.735%, 10/25/2024 (A) (B) | 250 | 261 | ||||||||
FHLMC Structured Agency Credit Risk Debt Notes, | ||||||||||
4.935%, 10/25/2024 (A) (B) | 300 | 320 | ||||||||
FHLMC Structured Agency Credit Risk Debt Notes, | ||||||||||
3.480%, 10/25/2027 (A) (B) | 265 | 264 | ||||||||
FHLMC Structured Agency Credit Risk Debt Notes, | ||||||||||
2.385%, 03/25/2025 (A) (B) | 425 | 428 | ||||||||
First Horizon Alternative Mortgage Securities Trust, | ||||||||||
6.000%, 07/25/2036 (A) | 145 | 122 | ||||||||
FNMA Connecticut Avenue Securities, | ||||||||||
1.385%, 07/25/2024 (A) (B) | 306 | 306 | ||||||||
FNMA Connecticut Avenue Securities, | ||||||||||
5.085%, 11/25/2024 (A) (B) | 533 | 560 | ||||||||
| Description | Face Amount ($ Thousands) | Market Value ($ Thousands) | ||||||||||
FNMA Connecticut Avenue Securities, | ||||||||||||
5.185%, 11/25/2024 (A) (B) | $ | 205 | $ | 217 | ||||||||
FNMA Connecticut Avenue Securities, | ||||||||||||
4.485%, 02/25/2025 (A) (B) | 415 | 421 | ||||||||||
FNMA Connecticut Avenue Securities, | ||||||||||||
4.187%, 05/25/2025 (A) (B) | 420 | 419 | ||||||||||
GS Mortgage Securites, Ser 2006-AR4, Cl A2 | ||||||||||||
2.059%, 04/10/2031 (A) (B) | 213 | 211 | ||||||||||
GS Mortgage Securities II, Ser 2006-GG6, Cl A4 | ||||||||||||
5.553%, 04/10/2038 (B) | 215 | 217 | ||||||||||
GS Mortgage Securities II, | ||||||||||||
5.795%, 08/10/2045 (B) | 578 | 620 | ||||||||||
GS Mortgage Securities Trust, Ser 2013-G1, Cl A2 | ||||||||||||
3.557%, 04/10/2031 (A) (B) | 1,485 | 1,506 | ||||||||||
GS Mortgage Securities, | ||||||||||||
2.706%, 12/10/2027 (A) | 267 | 272 | ||||||||||
HomeBanc Mortgage Trust, | ||||||||||||
0.435%, 03/25/2035 (A) (B) | 156 | 139 | ||||||||||
IndyMac INDX Mortgage Loan Trust, Ser 2006-AR15, Cl A1 | ||||||||||||
0.305%, 07/25/2036 (A) (B) | 181 | 145 | ||||||||||
JP Morgan Mortgage Trust, | ||||||||||||
6.000%, 08/25/2037 (A) | 258 | 231 | ||||||||||
JPMorgan Chase Commercial Mortgage Securities Trust, | ||||||||||||
4.838%, 07/15/2041 (A) (B) | 165 | 165 | ||||||||||
JPMorgan Chase Commercial Mortgage Securities Trust, | ||||||||||||
5.885%, 02/12/2049 (B) | 100 | 106 | ||||||||||
JPMorgan Chase Commercial Mortgage Securities Trust, | ||||||||||||
5.882%, 02/15/2051 (B) | 1,275 | 1,365 | ||||||||||
JPMorgan Chase Commercial Mortgage Securities Trust, | ||||||||||||
6.208%, 02/15/2051 (B) | 75 | 82 | ||||||||||
| 280 | SEI Institutional Investments Trust / Annual Report / May 31, 2015 |
| Description | Face Amount ($ Thousands) | Market Value ($ Thousands) | ||||||||||
JPMorgan Chase Commercial Mortgage Securities Trust, | ||||||||||||
5.439%, 01/15/2049 | $ | 1,186 | $ | 1,260 | ||||||||
JPMorgan Chase Commercial Mortgage Securities Trust, | ||||||||||||
5.998%, 02/12/2051 | 726 | 792 | ||||||||||
JPMorgan Chase Commercial Mortgage Securities Trust, | ||||||||||||
2.749%, 11/15/2043 (A) | 974 | 980 | ||||||||||
JPMorgan Chase Commercial Mortgage Securities Trust, | ||||||||||||
1.106%, 06/15/2029 (A) (B) | 923 | 920 | ||||||||||
LB-UBS Commercial Mortgage Trust, Ser 2007-C1, Cl A4 | ||||||||||||
5.424%, 02/15/2040 | 292 | 308 | ||||||||||
LB-UBS Commercial Mortgage Trust, Ser 2007-C1, Cl AM | ||||||||||||
5.455%, 02/15/2040 | 305 | 323 | ||||||||||
LSTAR Commercial Mortgage Trust, Ser 2014-2, Cl A2 | ||||||||||||
2.767%, 01/20/2041 (A) | 533 | 543 | ||||||||||
Merrill Lynch Mortgage Trust, | ||||||||||||
5.739%, 08/12/2043 (B) | 181 | 189 | ||||||||||
ML-CFC Commercial Mortgage Trust, Ser 2006-4, Cl A1A | ||||||||||||
5.166%, 12/12/2049 | 320 | 336 | ||||||||||
ML-CFC Commercial Mortgage Trust, Ser 2007-9, Cl A4 | ||||||||||||
5.700%, 09/12/2049 | 300 | 321 | ||||||||||
PFP III, Ser 2014-1, Cl A | ||||||||||||
1.356%, 06/14/2031 (A) (B) | 428 | 428 | ||||||||||
RSO, Ser 2014-CRE2, Cl A | ||||||||||||
1.236%, 04/15/2032 (A) (B) | 409 | 406 | ||||||||||
Starwood Retail Property Trust, Ser 2014, Cl A | ||||||||||||
1.406%, 11/15/2027 (A) (B) | 585 | 586 | ||||||||||
UBS-Barclays Commercial Mortgage Trust, | ||||||||||||
3.091%, 08/10/2049 | 98 | 101 | ||||||||||
UBS-Barclays Commercial Mortgage Trust, | ||||||||||||
2.850%, 12/10/2045 | 194 | 197 | ||||||||||
Wachovia Bank Commercial Mortgage Trust, | ||||||||||||
6.009%, 06/15/2045 (B) | 439 | 456 | ||||||||||
Wachovia Bank Commercial Mortgage Trust, | ||||||||||||
5.416%, 01/15/2045 (B) | 1,477 | 1,505 | ||||||||||
| Description | Face Amount ($ Thousands) | Market Value ($ Thousands) | ||||||||||
Wells Fargo Mortgage-Backed Securities Trust, | ||||||||||||
5.750%, 07/25/2037 (A) | $ | 226 | $ | 221 | ||||||||
WFRBS Commercial Mortgage Trust, | ||||||||||||
3.337%, 06/15/2046 | 280 | 294 | ||||||||||
WFRBS Commercial Mortgage Trust, | ||||||||||||
3.036%, 05/15/2047 | 549 | 572 | ||||||||||
|
| |||||||||||
| 37,709 | ||||||||||||
|
| |||||||||||
Total Mortgage-Backed Securities |
| 38,900 | ||||||||||
|
| |||||||||||
ASSET-BACKED SECURITIES — 4.3% |
| |||||||||||
Automotive — 3.0% |
| |||||||||||
Ally Master Owner Trust, | ||||||||||||
1.290%, 01/15/2019 | 1,051 | 1,055 | ||||||||||
Ally Master Owner Trust, | ||||||||||||
1.630%, 05/15/2020 | 788 | 788 | ||||||||||
AmeriCredit Automobile Receivables Trust, | ||||||||||||
0.920%, 04/09/2018 | 437 | 437 | ||||||||||
AmeriCredit Automobile Receivables Trust, | ||||||||||||
0.960%, 04/09/2018 | 315 | 315 | ||||||||||
ARI Fleet Lease Trust, | ||||||||||||
0.810%, 11/15/2022 (A) | 292 | 292 | ||||||||||
Avis Budget Rental Car Funding AESOP LLC, | ||||||||||||
2.970%, 02/20/2020 (A) | 710 | 733 | ||||||||||
Avis Budget Rental Car Funding AESOP LLC, | ||||||||||||
2.460%, 07/20/2020 (A) | 1,119 | 1,133 | ||||||||||
Bank of The West Auto Trust, | ||||||||||||
1.310%, 10/15/2019 (A) | 748 | 748 | ||||||||||
BMW Floorplan Master Owner Trust, Ser 2012-1A, Cl A | ||||||||||||
0.586%, 09/15/2017 (A) (B) | 425 | 425 | ||||||||||
California Republic Auto Receivables Trust, Ser 2014-2, Cl A4 | ||||||||||||
1.570%, 12/16/2019 | 734 | 737 | ||||||||||
| SEI Institutional Investments Trust / Annual Report / May 31, 2015 | 281 |
CONSOLIDATED SCHEDULE OF INVESTMENTS
Multi-Asset Real Return Fund (Continued)
May 31, 2015
| Description | Face Amount ($ Thousands) | Market Value ($ Thousands) | ||||||||||
California Republic Auto Receivables Trust, Ser 2015-2, Cl A3 | ||||||||||||
1.310%, 08/15/2019 | $ | 561 | $ | 561 | ||||||||
Capital Auto Receivables Asset Trust, Ser 2013-3, Cl A2 | ||||||||||||
1.040%, 11/21/2016 | 374 | 374 | ||||||||||
Capital Auto Receivables Asset Trust, Ser 2014-1, Cl B | ||||||||||||
2.220%, 01/22/2019 | 160 | 162 | ||||||||||
Carfinance Capital Auto Trust, | ||||||||||||
1.650%, 07/17/2017 (A) | 9 | 9 | ||||||||||
Chrysler Capital Auto Receivables Trust, Ser 2014-BA, Cl A2 | ||||||||||||
0.690%, 09/15/2017 (A) | 1,009 | 1,009 | ||||||||||
CPS Auto Receivables Trust, | ||||||||||||
1.820%, 09/15/2020 (A) | 404 | 405 | ||||||||||
CPS Auto Receivables Trust, | ||||||||||||
1.110%, 11/15/2018 (A) | 386 | 385 | ||||||||||
Drive Auto Receivables Trust, | ||||||||||||
0.930%, 12/15/2017 (A) | 358 | 358 | ||||||||||
Enterprise Fleet Financing LLC, | ||||||||||||
0.870%, 09/20/2019 (A) | 284 | 284 | ||||||||||
Enterprise Fleet Financing LLC, | ||||||||||||
1.300%, 09/20/2020 (A) | 760 | 761 | ||||||||||
Exeter Automobile Receivables Trust, Ser 2013-1A, Cl A | ||||||||||||
1.290%, 10/16/2017 (A) | 19 | 19 | ||||||||||
Exeter Automobile Receivables Trust, Ser 2014-1A, Cl A | ||||||||||||
1.290%, 05/15/2018 (A) | 142 | 142 | ||||||||||
Exeter Automobile Receivables Trust, Ser 2014-2A, Cl A | ||||||||||||
1.060%, 08/15/2018 (A) | 174 | 174 | ||||||||||
Flagship Credit Auto Trust, | ||||||||||||
1.320%, 04/16/2018 (A) | 30 | 30 | ||||||||||
Ford Auto Securitization Trust, | ||||||||||||
1.676%, 09/15/2016 (A) | 41 | 33 | ||||||||||
Ford Credit Auto Owner Trust, | ||||||||||||
1.010%, 05/15/2018 | 100 | 100 | ||||||||||
Ford Credit Auto Owner Trust, | ||||||||||||
2.310%, 04/15/2026 (A) | 640 | 650 | ||||||||||
Ford Credit Floorplan Master Owner Trust, Ser 2014-1, Cl A1 | ||||||||||||
1.200%, 02/15/2019 | 770 | 772 | ||||||||||
| Description | Face Amount ($ Thousands) | Market Value ($ Thousands) | ||||||||||
Ford Credit Floorplan Master Owner Trust, Ser 2015-2, Cl A2 | ||||||||||||
0.752%, 01/15/2022 (B) | $ | 741 | $ | 742 | ||||||||
GE Dealer Floorplan Master Note Trust, Ser 2014-1, Cl A | ||||||||||||
0.564%, 07/20/2019 (B) | 481 | 477 | ||||||||||
GE Dealer Floorplan Master Note Trust, Ser 2015-1, Cl A | ||||||||||||
0.684%, 01/20/2020 (B) | 683 | 684 | ||||||||||
GM Financial Automobile Leasing Trust, Ser 2015-1, Cl A2 | ||||||||||||
1.100%, 12/20/2017 | 739 | 739 | ||||||||||
Harley-Davidson Motorcycle Trust, Ser 2014-1, Cl A3 | ||||||||||||
1.100%, 09/15/2019 | 340 | 341 | ||||||||||
Harley-Davidson Motorcycle Trust, Ser 2015-2, Cl A3 | ||||||||||||
1.300%, 03/16/2020 | 748 | 748 | ||||||||||
Hertz Fleet Lease Funding, Ser 2013-3, Cl A | ||||||||||||
0.732%, 12/10/2027 (A) (B) | 866 | 866 | ||||||||||
Hertz Vehicle Financing, | ||||||||||||
1.120%, 08/25/2017 (A) | 715 | 715 | ||||||||||
Hyundai Auto Lease Securitization Trust, Ser 2015-A, Cl A2 | ||||||||||||
1.000%, 10/16/2017 (A) | 516 | 516 | ||||||||||
Mercedes Benz Auto Lease Trust, Ser 2014-A, Cl A2A | ||||||||||||
0.480%, 06/15/2016 | 236 | 236 | ||||||||||
Mercedes-Benz Master Owner Trust, Ser 2012-A, Cl A | ||||||||||||
0.790%, 11/15/2017 (A) | 342 | 342 | ||||||||||
Navistar Financial Dealer Note Master Owner Trust II, Ser 2014-1, Cl A | ||||||||||||
0.935%, 10/25/2019 (A) (B) | 596 | 596 | ||||||||||
Porsche Innovative Lease Owner Trust, Ser 2015-1, Cl A4 | ||||||||||||
1.430%, 05/21/2021 (A) | 746 | 746 | ||||||||||
Santander Drive Auto Receivables Trust, Ser 2013-4, Cl A3 | ||||||||||||
1.110%, 12/15/2017 | 249 | 249 | ||||||||||
Volvo Financial Equipment LLC, Ser 2015-1A, Cl A3 | ||||||||||||
1.510%, 06/17/2019 (A) | 742 | 744 | ||||||||||
|
| |||||||||||
| 21,632 | ||||||||||||
|
| |||||||||||
Credit Cards — 0.9% | ||||||||||||
Barclays Dryrock Issuance Trust, Ser 2014-3, Cl A | ||||||||||||
2.410%, 07/15/2022 | 416 | 424 | ||||||||||
| 282 | SEI Institutional Investments Trust / Annual Report / May 31, 2015 |
| Description | Face Amount ($ Thousands) | Market Value ($ Thousands) | ||||||||||
Barclays Dryrock Issuance Trust, Ser 2015-1, Cl A | ||||||||||||
2.200%, 12/15/2022 | $ | 748 | $ | 753 | ||||||||
Cabela’s Credit Card Master Note Trust, Ser 2014-1, Cl A | ||||||||||||
0.532%, 03/16/2020 (B) | 500 | 500 | ||||||||||
Chase Issuance Trust, Ser 2014, Cl A1 | ||||||||||||
1.150%, 01/15/2019 | 630 | 632 | ||||||||||
Discover Card Execution Note Trust, Ser 2015, Cl A1 | ||||||||||||
0.536%, 08/17/2020 (B) | 540 | 541 | �� | |||||||||
Discover Card Execution Note Trust, Ser 2015-A2, Cl A | ||||||||||||
1.900%, 10/17/2022 | 754 | 754 | ||||||||||
First National Master Note Trust, | ||||||||||||
0.716%, 10/15/2019 (B) | 561 | 562 | ||||||||||
Synchrony Credit Card Master Note Trust, Ser 2012-2, Cl A | ||||||||||||
2.220%, 01/15/2022 | 1,098 | 1,110 | ||||||||||
World Financial Network Credit Card Master Trust, | ||||||||||||
1.610%, 12/15/2021 | 161 | 161 | ||||||||||
World Financial Network Credit Card Master Trust, | ||||||||||||
0.566%, 12/15/2019 (B) | 705 | 706 | ||||||||||
World Financial Network Credit Card Master Trust, | ||||||||||||
0.703%, 02/15/2022 (B) | 424 | 424 | ||||||||||
|
| |||||||||||
| 6,567 | ||||||||||||
|
| |||||||||||
Other Asset-Backed Securities — 0.4% |
| |||||||||||
CIT Equipment Collateral, | ||||||||||||
0.860%, 05/22/2017 (A) | 924 | 924 | ||||||||||
CNH Equipment Trust, | ||||||||||||
1.850%, 04/15/2021 | 520 | 522 | ||||||||||
Dell Equipment Finance Trust, | ||||||||||||
1.300%, 03/23/2020 (A) | 258 | 258 | ||||||||||
GE Equipment Small Ticket LLC, Ser 2014-1A, Cl A2 | ||||||||||||
0.590%, 08/24/2016 (A) | 536 | 535 | ||||||||||
GSAA Trust, Ser 2006-5, Cl 2A3 | ||||||||||||
0.451%, 03/25/2036 (B) | 226 | 154 | ||||||||||
| Description | Face Amount (1) (Thousands) | Market Value ($ Thousands) | ||||||||||
Macquarie Equipment Funding Trust, Ser 2014-A, Cl A2 | ||||||||||||
0.800%, 11/21/2016 (A) | 755 | $ | 757 | |||||||||
|
| |||||||||||
| 3,150 | ||||||||||||
|
| |||||||||||
Total Asset-Backed Securities |
| 31,349 | ||||||||||
|
| |||||||||||
FOREIGN BONDS — 1.2% |
| |||||||||||
Bank of Ireland | ||||||||||||
1.781%, 09/22/2015 (A) (B) | CAD | 425 | 330 | |||||||||
Barclays Bank | ||||||||||||
6.625%, 03/30/2022 | EUR | 75 | 107 | |||||||||
Basell Finance | ||||||||||||
8.100%, 03/15/2027 (A) | 70 | 95 | ||||||||||
BNP Paribas | ||||||||||||
5.186%, 06/29/2049 (A) (B) | 165 | 166 | ||||||||||
Cia Minera Milpo SAA | ||||||||||||
4.625%, 03/28/2023 (A) | 280 | 289 | ||||||||||
Comcel Trust | ||||||||||||
6.875%, 02/06/2024 (A) | 315 | 338 | ||||||||||
Credit Agricole | ||||||||||||
7.875%, 01/23/2024 (A) (B) | 216 | 230 | ||||||||||
Deutsche Telekom International Finance | ||||||||||||
4.875%, 03/06/2042 (A) | 560 | 594 | ||||||||||
Empresa de Transporte de Pasajeros Metro | ||||||||||||
4.750%, 02/04/2024 (A) | 296 | 320 | ||||||||||
HBOS Capital Funding | ||||||||||||
4.939%, 05/29/2049 (B) | EUR | 317 | 346 | |||||||||
ING Bank | ||||||||||||
2.000%, 09/25/2015 (A) | 220 | 221 | ||||||||||
Korea National Oil | ||||||||||||
3.125%, 04/03/2017 (A) | 200 | 205 | ||||||||||
Marfrig Overseas | ||||||||||||
9.500%, 05/04/2020 (A) | 160 | 162 | ||||||||||
MCE Finance | ||||||||||||
5.000%, 02/15/2021 (A) | 250 | 241 | ||||||||||
Minsur | ||||||||||||
6.250%, 02/07/2024 (A) | 609 | 674 | ||||||||||
Nomura Holdings | ||||||||||||
2.000%, 09/13/2016 | 248 | 250 | ||||||||||
Numericable Group | ||||||||||||
5.375%, 05/15/2022 (A) | 223 | 256 | ||||||||||
Odebrecht Finance | ||||||||||||
5.250%, 06/27/2029 (A) | 369 | 325 | ||||||||||
Petrobras International Finance | ||||||||||||
5.750%, 01/20/2020 | 702 | 701 | ||||||||||
Petronas Capital | ||||||||||||
5.250%, 08/12/2019 | 125 | 140 | ||||||||||
Rogers Communications | ||||||||||||
4.000%, 06/06/2022 | CAD | 20 | 17 | |||||||||
Royal Bank of Scotland | ||||||||||||
9.500%, 03/16/2022 (B) | 35 | 39 | ||||||||||
| SEI Institutional Investments Trust / Annual Report / May 31, 2015 | 283 |
CONSOLIDATED SCHEDULE OF INVESTMENTS
Multi-Asset Real Return Fund (Continued)
May 31, 2015
| Description | Face Amount (1) (Thousands)/Shares | Market Value ($ Thousands) | ||||||||||
Sociedad Quimica y Minera de Chile | ||||||||||||
3.625%, 04/03/2023 (A) | 280 | $ | 270 | |||||||||
Societe Generale | ||||||||||||
5.922%, 04/05/2017 (A) (B) | 100 | 104 | ||||||||||
Standard Chartered | ||||||||||||
4.000%, 07/12/2022 (B) | 465 | 478 | ||||||||||
Talent Yield Investments | ||||||||||||
4.500%, 04/25/2022 (A) | 1,012 | 1,069 | ||||||||||
Telecom Italia Capital | ||||||||||||
7.175%, 06/18/2019 | 60 | 68 | ||||||||||
Telefonica Emisiones SAU | ||||||||||||
5.462%, 02/16/2021 | 70 | 79 | ||||||||||
Trust F | ||||||||||||
5.250%, 12/15/2024‡ (A) | 630 | 666 | ||||||||||
Virgolino de Oliveira Finance | ||||||||||||
10.500%, 01/28/2018 (A) | 500 | 5 | ||||||||||
|
| |||||||||||
Total Foreign Bonds |
| 8,785 | ||||||||||
|
| |||||||||||
SOVEREIGN DEBT — 0.2% |
| |||||||||||
Brazil Notas do Tesouro Nacional Serie F, BRL | ||||||||||||
10.000%, 01/01/2017 | BRL | 4,890 | 1,462 | |||||||||
Qatar Government International Bond | ||||||||||||
4.500%, 01/20/2022 (A) | 200 | 222 | ||||||||||
United Mexican States MTN | ||||||||||||
5.950%, 03/19/2019 | 94 | 107 | ||||||||||
|
| |||||||||||
Total Sovereign Debt |
| 1,791 | ||||||||||
|
| |||||||||||
FOREIGN COMMON STOCK — 0.0% |
| |||||||||||
Puerto Rico — 0.0% |
| |||||||||||
Popular* | 9,800 | 318 | ||||||||||
|
| |||||||||||
Total Foreign Common Stock |
| 318 | ||||||||||
|
| |||||||||||
PREFERRED STOCK — 0.0% |
| |||||||||||
Financials — 0.0% | ||||||||||||
Allstate (B) | 750 | 20 | ||||||||||
|
| |||||||||||
Total Preferred Stock |
| 20 | ||||||||||
|
| |||||||||||
U.S. TREASURY OBLIGATIONS — 68.1% |
| |||||||||||
U.S. Treasury Bills | ||||||||||||
0.025%, 06/25/2015 (D) (E) | 27,000 | 27,000 | ||||||||||
0.020%, 07/23/2015 (D) | 25,000 | 24,999 | ||||||||||
0.010%, 08/13/2015 (D) | 35,000 | 35,000 | ||||||||||
0.005%, 06/04/2015 (D) (E) | 34,000 | 34,000 | ||||||||||
U.S. Treasury Inflation-Protected Securities | ||||||||||||
2.625%, 07/15/2017 | 3,452 | 3,721 | ||||||||||
| Description | Face Amount (1) (Thousands)/Shares | Market Value ($ Thousands) | ||||||||||
2.500%, 07/15/2016 (E) | 33,438 | $ | 34,804 | |||||||||
2.125%, 01/15/2019 (E) | 13,336 | 14,588 | ||||||||||
1.625%, 01/15/2018 (E) | 21,334 | 22,625 | ||||||||||
1.375%, 01/15/2020 (E) | 28,387 | 30,512 | ||||||||||
0.125%, 04/15/2016 | 11,946 | 12,016 | ||||||||||
0.125%, 04/15/2017 | 64,580 | 65,584 | ||||||||||
0.125%, 04/15/2018 (E) | 74,141 | 75,485 | ||||||||||
0.125%, 04/15/2019 (E) | 77,830 | 79,107 | ||||||||||
0.125%, 04/15/2020 | 37,377 | 37,841 | ||||||||||
|
| |||||||||||
Total U.S. Treasury Obligations |
| 497,282 | ||||||||||
|
| |||||||||||
TIME DEPOSITS — 2.4% |
| |||||||||||
Brown Brothers Harriman | ||||||||||||
5.800%, 06/01/2015 | ZAR | — | — | |||||||||
0.427%, 06/01/2015 | NOK | — | — | |||||||||
0.100%, 06/01/2015 | CAD | 125 | 101 | |||||||||
0.100%, 06/01/2015 | SGD | — | — | |||||||||
0.079%, 06/01/2015 | GBP | — | — | |||||||||
0.030%, 06/01/2015 | USD | 13,539 | 13,539 | |||||||||
0.030%, 06/01/2015 | USD | 4,216 | 4,216 | |||||||||
0.005%, 06/01/2015 | HKD | — | — | |||||||||
0.005%, 06/01/2015 | JPY | — | — | |||||||||
(0.211)%, 06/01/2015 | EUR | 16 | 17 | |||||||||
(0.400)%, 06/01/2015 | SEK | — | — | |||||||||
|
| |||||||||||
Total Time Deposits |
| 17,873 | ||||||||||
|
| |||||||||||
Total Investments — 118.4% |
| $ | 865,625 | |||||||||
|
| |||||||||||
COMMON STOCK SOLD SHORT — (14.5)% |
| |||||||||||
Consumer Discretionary — (6.1)% |
| |||||||||||
American Public Education* | (6,200 | ) | (150 | ) | ||||||||
Apollo Education Group, Cl A* | (16,400 | ) | (272 | ) | ||||||||
Arctic Cat | (17,800 | ) | (589 | ) | ||||||||
bebe stores | (146,800 | ) | (382 | ) | ||||||||
Black Diamond* | (15,500 | ) | (144 | ) | ||||||||
Bob Evans Farms | (33,600 | ) | (1,543 | ) | ||||||||
Cabela’s* | (73,700 | ) | (3,759 | ) | ||||||||
Callaway Golf | (36,700 | ) | (346 | ) | ||||||||
Carmike Cinemas* | (5,400 | ) | (150 | ) | ||||||||
CBS, Cl B | (2,600 | ) | (160 | ) | ||||||||
Christopher & Banks* | (30,900 | ) | (177 | ) | ||||||||
Chuy’s Holdings* | (58,900 | ) | (1,531 | ) | ||||||||
Crocs* | (32,500 | ) | (489 | ) | ||||||||
Cumulus Media, Cl A* | (85,300 | ) | (201 | ) | ||||||||
Del Frisco’s Restaurant Group* | (2,200 | ) | (41 | ) | ||||||||
Delphi Automotive | (4,700 | ) | (409 | ) | ||||||||
Destination XL Group* | (38,400 | ) | (186 | ) | ||||||||
Discovery Communications, Cl A* | (12,700 | ) | (431 | ) | ||||||||
Dixie Group* | (71,854 | ) | (697 | ) | ||||||||
Dorman Products* | (16,300 | ) | (761 | ) | ||||||||
| 284 | SEI Institutional Investments Trust / Annual Report / May 31, 2015 |
| Description | Shares | Market Value ($ Thousands) | ||||||||
Federal-Mogul Holdings, Cl A* | (13,600 | ) | $ | (169 | ) | |||||
Ford Motor | (257,200 | ) | (3,902 | ) | ||||||
Fox Factory Holding* | (31,700 | ) | (517 | ) | ||||||
Fuel Systems Solutions* | (72,100 | ) | (589 | ) | ||||||
Groupon, Cl A* | (5,000 | ) | (32 | ) | ||||||
Guess? | (99,400 | ) | (1,743 | ) | ||||||
Harley-Davidson | (33,600 | ) | (1,797 | ) | ||||||
Iconix Brand Group* | (43,200 | ) | (1,115 | ) | ||||||
Johnson Controls | (8,100 | ) | (421 | ) | ||||||
Kate Spade* | (46,300 | ) | (1,147 | ) | ||||||
Las Vegas Sands | (5,600 | ) | (285 | ) | ||||||
Liberty Tax | (3,100 | ) | (74 | ) | ||||||
Lifetime Brands | (2,100 | ) | (31 | ) | ||||||
Lions Gate Entertainment | (21,400 | ) | (708 | ) | ||||||
LKQ* | (51,000 | ) | (1,457 | ) | ||||||
Mattel | (46,700 | ) | (1,205 | ) | ||||||
Media General* | (24,200 | ) | (401 | ) | ||||||
Men’s Wearhouse | (12,000 | ) | (696 | ) | ||||||
Meritage Homes* | (5,700 | ) | (250 | ) | ||||||
MGM Resorts International* | (23,500 | ) | (471 | ) | ||||||
Michael Kors Holdings* | (24,100 | ) | (1,121 | ) | ||||||
Movado Group | (11,200 | ) | (293 | ) | ||||||
New Home* | (2,000 | ) | (31 | ) | ||||||
Pep Boys-Manny Moe & Jack* | (11,700 | ) | (119 | ) | ||||||
Pier 1 Imports | (21,100 | ) | (268 | ) | ||||||
PVH | (3,900 | ) | (408 | ) | ||||||
Ralph Lauren, Cl A | (16,100 | ) | (2,099 | ) | ||||||
Rentrak* | (4,800 | ) | (326 | ) | ||||||
SeaWorld Entertainment | (42,200 | ) | (912 | ) | ||||||
Standard Motor Products | (2,600 | ) | (91 | ) | ||||||
Stoneridge* | (47,700 | ) | (569 | ) | ||||||
Town Sports International Holdings | (41,000 | ) | (138 | ) | ||||||
TRI Pointe Homes* | (151,900 | ) | (2,190 | ) | ||||||
TripAdvisor* | (16,100 | ) | (1,228 | ) | ||||||
Tuesday Morning* | (21,600 | ) | (277 | ) | ||||||
UCP, Cl A* | (801 | ) | (7 | ) | ||||||
VOXX International, Cl A* | (18,700 | ) | (160 | ) | ||||||
William Lyon Homes, Cl A* | (7,100 | ) | (161 | ) | ||||||
Winnebago Industries | (11,500 | ) | (250 | ) | ||||||
Wynn Resorts | (41,100 | ) | (4,138 | ) | ||||||
|
| |||||||||
| (44,214 | ) | |||||||||
|
| |||||||||
Financials — (0.8)% | ||||||||||
Bancorp* | (44,000 | ) | (425 | ) | ||||||
CBOE Holdings | (14,900 | ) | (872 | ) | ||||||
Commerce Bancshares | (2,400 | ) | (107 | ) | ||||||
eHealth* | (50,600 | ) | (660 | ) | ||||||
Ezcorp, Cl A* | (15,700 | ) | (125 | ) | ||||||
Genworth Financial, Cl A* | (33,600 | ) | (267 | ) | ||||||
Hudson City Bancorp | (28,200 | ) | (268 | ) | ||||||
Ocwen Financial* | (172,000 | ) | (1,748 | ) | ||||||
Regional Management* | (16,200 | ) | (282 | ) | ||||||
TFS Financial | (51,000 | ) | (757 | ) | ||||||
|
| |||||||||
| (5,511 | ) | |||||||||
|
| |||||||||
| Description | Shares | Market Value ($ Thousands) | ||||||||
Industrials — (1.4)% | ||||||||||
Ameresco, Cl A* | (32,500 | ) | $ | (236 | ) | |||||
American Science & Engineering | (6,800 | ) | (266 | ) | ||||||
Barrett Business Services | (3,500 | ) | (126 | ) | ||||||
Chart Industries* | (24,900 | ) | (808 | ) | ||||||
Copa Holdings, Cl A | (18,500 | ) | (1,578 | ) | ||||||
Flowserve | (1,200 | ) | (66 | ) | ||||||
Generac Holdings* | (4,700 | ) | (196 | ) | ||||||
Kirby* | (20,200 | ) | (1,550 | ) | ||||||
LMI Aerospace* | (9,800 | ) | (98 | ) | ||||||
Manitowoc | (3,400 | ) | (64 | ) | ||||||
MSC Industrial Direct, Cl A | (5,500 | ) | (382 | ) | ||||||
Powell Industries | (9,300 | ) | (337 | ) | ||||||
Power Solutions International* | (6,700 | ) | (368 | ) | ||||||
PowerSecure International* | (82,400 | ) | (1,227 | ) | ||||||
Raven Industries | (17,600 | ) | (339 | ) | ||||||
Shiloh* | (3,300 | ) | (32 | ) | ||||||
UTi Worldwide* | (147,000 | ) | (1,414 | ) | ||||||
Virgin America* | (7,200 | ) | (205 | ) | ||||||
Wesco Aircraft Holdings* | (72,500 | ) | (1,070 | ) | ||||||
|
| |||||||||
| (10,362 | ) | |||||||||
|
| |||||||||
Information Technology — (4.0)% |
| |||||||||
ADTRAN | (14,300 | ) | (246 | ) | ||||||
Anixter International* | (5,900 | ) | (401 | ) | ||||||
Apple | (8,600 | ) | (1,120 | ) | ||||||
Applied Micro Circuits* | (585,800 | ) | (3,743 | ) | ||||||
Applied Optoelectronics* | (20,700 | ) | (370 | ) | ||||||
Audience* | (8,500 | ) | (41 | ) | ||||||
CalAmp* | (29,500 | ) | (582 | ) | ||||||
Calix* | (12,600 | ) | (101 | ) | ||||||
Cray* | (16,700 | ) | (511 | ) | ||||||
CUI Global* | (10,600 | ) | (57 | ) | ||||||
Daktronics | (4,700 | ) | (51 | ) | ||||||
Electro Scientific Industries | (31,400 | ) | (172 | ) | ||||||
Exar* | (34,100 | ) | (370 | ) | ||||||
Extreme Networks* | (424,700 | ) | (1,151 | ) | ||||||
FARO Technologies* | (17,500 | ) | (764 | ) | ||||||
Finisar* | (69,000 | ) | (1,511 | ) | ||||||
Immersion* | (83,900 | ) | (1,014 | ) | ||||||
Intevac* | (31,600 | ) | (172 | ) | ||||||
JDS Uniphase* | (96,300 | ) | (1,235 | ) | ||||||
Kopin* | (48,500 | ) | (169 | ) | ||||||
MaxLinear, Cl A* | (91,176 | ) | (914 | ) | ||||||
Maxwell Technologies* | (40,400 | ) | (206 | ) | ||||||
Nanometrics* | (8,900 | ) | (138 | ) | ||||||
NeoPhotonics* | (4,200 | ) | (35 | ) | ||||||
Numerex, Cl A* | (3,600 | ) | (31 | ) | ||||||
PDF Solutions* | (6,900 | ) | (110 | ) | ||||||
Power Integrations | (25,400 | ) | (1,289 | ) | ||||||
Radisys* | (19,300 | ) | (56 | ) | ||||||
Ruckus Wireless* | (54,400 | ) | (572 | ) | ||||||
SanDisk | (52,300 | ) | (3,576 | ) | ||||||
| SEI Institutional Investments Trust / Annual Report / May 31, 2015 | 285 |
CONSOLIDATED SCHEDULE OF INVESTMENTS
Multi-Asset Real Return Fund (Continued)
May 31, 2015
| Description | Shares/Contracts | Market Value ($ Thousands) | ||||||||
Semtech* | (11,500 | ) | $ | (246 | ) | |||||
Silicon Graphics International* | (87,800 | ) | (564 | ) | ||||||
Sonus Networks* | (166,000 | ) | (1,300 | ) | ||||||
Trimble Navigation* | (32,300 | ) | (757 | ) | ||||||
Ultra Clean Holdings* | (19,500 | ) | (126 | ) | ||||||
Ultratech* | (117,000 | ) | (2,333 | ) | ||||||
Veeco Instruments* | (18,900 | ) | (572 | ) | ||||||
Xilinx | (61,200 | ) | (2,902 | ) | ||||||
|
| |||||||||
| (29,508 | ) | |||||||||
|
| |||||||||
Materials — (2.2)% | ||||||||||
Advanced Emissions Solutions* | (47,900 | ) | (656 | ) | ||||||
Allegheny Technologies | (6,200 | ) | (201 | ) | ||||||
AM Castle* | (9,800 | ) | (59 | ) | ||||||
American Vanguard | (213,300 | ) | (2,939 | ) | ||||||
Axiall | (7,600 | ) | (287 | ) | ||||||
Carpenter Technology | (39,100 | ) | (1,597 | ) | ||||||
Deltic Timber | (5,400 | ) | (349 | ) | ||||||
Flotek Industries* | (180,000 | ) | (2,068 | ) | ||||||
FMC | (5,900 | ) | (337 | ) | ||||||
Freeport-McMoRan, Cl B | (17,500 | ) | (344 | ) | ||||||
H.B. Fuller | (37,100 | ) | (1,562 | ) | ||||||
Horsehead Holding* | (34,100 | ) | (424 | ) | ||||||
Koppers Holdings | (20,700 | ) | (534 | ) | ||||||
Louisiana-Pacific* | (226,500 | ) | (4,097 | ) | ||||||
Worthington Industries | (1,600 | ) | (44 | ) | ||||||
WR Grace* | (5,400 | ) | (529 | ) | ||||||
|
| |||||||||
| (16,027 | ) | |||||||||
|
| |||||||||
Total Common Stock Sold Short |
| (105,622 | ) | |||||||
|
| |||||||||
PURCHASED OPTIONS — 0.0% |
| |||||||||
December 2015, Corn Future Option Call, Expires 11/23/15, | 120 | 125 | ||||||||
November 2015, Soybean Future Option Call, Expires 10/26/15, | 46 | 71 | ||||||||
|
| |||||||||
Total Purchased Options |
| $ | 196 | |||||||
|
| |||||||||
A list of the open futures contracts held by the Fund at May 31, 2015, is as follows:
| Type of Contract | Number of Contracts Long (Short) | Expiration Date | Unrealized (Depreciation) | |||||||||
Brent Crude | 162 | Sep-2015 | $ | 119 | ||||||||
Canadian 10-Year Bond | 18 | Sep-2015 | 25 | |||||||||
Coffee | 46 | Jul-2015 | (181 | ) | ||||||||
Copper | (40 | ) | Dec-2015 | 137 | ||||||||
Copper | 189 | Jul-2015 | (176 | ) | ||||||||
Corn | 500 | Jul-2015 | (825 | ) | ||||||||
Cotton No. 2 | (168 | ) | Jul-2015 | 79 | ||||||||
Cotton No. 2 | 64 | Dec-2015 | (1 | ) | ||||||||
Crude Oil | 153 | Jul-2015 | 823 | |||||||||
Crude Oil | 175 | Nov-2015 | 47 | |||||||||
Euro-Bobl | (109 | ) | Jun-2015 | 60 | ||||||||
Gasoline | 40 | Jul-2015 | 463 | |||||||||
| Type of Contract | Number of Contracts Long (Short) | Expiration Date | Unrealized (Depreciation) | |||||||||
Gold | 148 | Aug-2015 | $ | (220 | ) | |||||||
Heating Oil | 73 | Jul-2015 | 541 | |||||||||
Heating Oil | (33 | ) | Nov-2015 | 86 | ||||||||
Lean Hogs | 41 | Jul-2015 | (28 | ) | ||||||||
Live Cattle | 69 | Aug-2015 | 51 | |||||||||
LME Nickel | 31 | Jul-2015 | 12 | |||||||||
LME Nickel | 51 | Sep-2015 | (273 | ) | ||||||||
LME Nickel | (33 | ) | Sep-2016 | 243 | ||||||||
MINI MSCI EAFE | (116 | ) | Jun-2015 | (584 | ) | |||||||
Natural Gas | 52 | Jul-2015 | 49 | |||||||||
Natural Gas | 482 | Sep-2015 | (480 | ) | ||||||||
Palladium | 115 | Sep-2015 | (128 | ) | ||||||||
PRI LME Aluminum | 73 | Jul-2015 | (151 | ) | ||||||||
S&P 500 Index E-MINI | (112 | ) | Jun-2015 | (354 | ) | |||||||
Silver | 72 | Jul-2015 | 131 | |||||||||
Soybean | 133 | Jul-2015 | (247 | ) | ||||||||
Soybean | (218 | ) | Nov-2015 | 734 | ||||||||
Soybean Meal | 108 | Jul-2015 | (90 | ) | ||||||||
Soybean Oil | 194 | Jul-2015 | 249 | |||||||||
Sugar | 435 | Jul-2015 | (364 | ) | ||||||||
U.S. 2-Year Treasury Note | (4 | ) | Sep-2015 | (1 | ) | |||||||
U.S. 5-Year Treasury Note | (84 | ) | Sep-2015 | (54 | ) | |||||||
U.S. 10-Year Treasury Note | (130 | ) | Sep-2015 | (146 | ) | |||||||
U.S. Long Treasury Bond | (20 | ) | Sep-2015 | (89 | ) | |||||||
U.S. Ultra Long Treasury Bond | 8 | Sep-2015 | 28 | |||||||||
Wheat | (182 | ) | Dec-2015 | 101 | ||||||||
Wheat | 485 | Jul-2015 | (793 | ) | ||||||||
Zinc LME | 87 | Jul-2015 | (38 | ) | ||||||||
|
| |||||||||||
| $ | (1,245 | ) | ||||||||||
|
| |||||||||||
For the year ended May 31, 2015, the total amount of all open futures contracts, as presented in the table above, are representative of the volume of activity for this derivative type during the year.
A list of the open forward foreign currency contracts held by the Fund at May 31, 2015, is as follows:
| Settlement Date | Currency to Deliver (Thousands) | Currency to Receive (Thousands) | Unrealized Appreciation (Depreciation) ($ Thousands) | |||||||||||||||||
6/2/15-7/2/15 | BRL | 9,695 | USD | 3,164 | $ | 144 | ||||||||||||||
6/2/15 | USD | 1,537 | BRL | 4,847 | (19 | ) | ||||||||||||||
6/4/15 | GBP | 2,505 | USD | 3,741 | (81 | ) | ||||||||||||||
6/5/15 | SGD | 1,288 | USD | 956 | 1 | |||||||||||||||
6/12/15 | TWD | 29,914 | USD | 963 | (11 | ) | ||||||||||||||
6/12/15 | USD | 990 | TWD | 30,097 | (9 | ) | ||||||||||||||
6/17/15 | CAD | 2,839 | USD | 2,374 | 100 | |||||||||||||||
6/18/15 | EUR | 4,038 | USD | 4,435 | 7 | |||||||||||||||
6/19/15 | AUD | 3,507 | USD | 2,809 | 127 | |||||||||||||||
7/10/15 | USD | 1,118 | IDR | 14,925,620 | 3 | |||||||||||||||
|
| |||||||||||||||||||
| $ | 262 | |||||||||||||||||||
|
| |||||||||||||||||||
A list of the counterparties for the open forward foreign currency contracts held by the Fund at May 31, 2015, is as follows:
| Counterparty | Currency to Deliver ($ Thousands) | Currency to Receive ($ Thousands) | Unrealized Appreciation (Depreciation) ($ Thousands) | |||||||||
Barclays PLC | $ | (2,108 | ) | $ | 2,102 | $ | (6 | ) | ||||
BNP Paribas | (2,274 | ) | 2,374 | 100 | ||||||||
Credit Suisse First Boston | (4,428 | ) | 4,435 | 7 | ||||||||
Goldman Sachs | (4,684 | ) | 4,623 | (61 | ) | |||||||
HSBC | (4,858 | ) | 4,967 | 109 | ||||||||
JPMorgan Chase Bank | (955 | ) | 956 | 1 | ||||||||
Royal Bank of Scotland | (975 | ) | 963 | (12 | ) | |||||||
Standard Chartered | (1,518 | ) | 1,642 | 124 | ||||||||
|
| |||||||||||
| $ | 262 | |||||||||||
|
| |||||||||||
For the year ended May 31, 2015, the total amount of all open forward foreign currency contracts, as presented in the table above, are representative of the volume of activity for this derivative type during the year.
| 286 | SEI Institutional Investments Trust / Annual Report / May 31, 2015 |
A list of the open centrally cleared swap agreements held by the Fund at May 31, 2015, is as follows:
| Interest Rate Swaps | ||||||||||||||||
| Counterparty | Fund Pays | Fund Receives | Termination Date | Currency | Notional Amount (Thousands) | Net Unrealized Appreciation (Depreciation) ($ Thousands) | ||||||||||
Morgan Stanley | 3-Month USD - LIBOR | 1.75% | 10/31/19 | USD | 3,860 | $ | 46 | |||||||||
| Morgan Stanley | 3-Month USD - LIBOR | 3.31% | 5/6/34 | USD | 1,650 | 209 | ||||||||||
| Morgan Stanley | 2.31% | 3-Month USD - LIBOR | 5/18/25 | USD | 2,880 | (36 | ) | |||||||||
| Morgan Stanley | 1.99% | 3-Month USD - LIBOR | 4/21/25 | USD | 2,040 | 31 | ||||||||||
| Morgan Stanley | 6-Month AUD - BBR | 2.97% | 3/11/25 | AUD | 3,610 | (9 | ) | |||||||||
| Morgan Stanley | 3-Month USD - LIBOR | 2.69% | 9/24/24 | USD | 2,470 | 129 | ||||||||||
| Morgan Stanley | 3-Month USD - LIBOR | 2.67% | 7/18/24 | USD | 1,710 | 96 | ||||||||||
| Morgan Stanley | 2.67% | 3-Month USD - LIBOR | 7/10/24 | USD | 2,130 | (121 | ) | |||||||||
| Morgan Stanley | 2.63% | 3-Month USD - LIBOR | 7/2/24 | USD | 3,360 | (181 | ) | |||||||||
| Morgan Stanley | 3-Month USD - LIBOR | 2.63% | 5/29/24 | USD | 1,630 | 71 | ||||||||||
| Morgan Stanley | 2.63% | 3-Month USD - LIBOR | 5/23/24 | USD | 4,050 | (177 | ) | |||||||||
| Morgan Stanley | 2.82% | 3-Month USD - LIBOR | 4/28/24 | USD | 2,770 | (171 | ) | |||||||||
| Morgan Stanley | 2.89% | 3-Month USD - LIBOR | 2/14/24 | USD | 1,780 | (131 | ) | |||||||||
| Morgan Stanley | 2.98% | 3-Month USD - LIBOR | 1/14/24 | USD | 1,990 | (166 | ) | |||||||||
| Morgan Stanley | 2.24% | 3-Month USD - LIBOR | 6/25/21 | USD | 1,680 | (60 | ) | |||||||||
| Morgan Stanley | 1.57% | 3-Month USD - LIBOR | 4/1/20 | USD | 5,370 | (8 | ) | |||||||||
| Morgan Stanley | 0.81% | 3-Month USD - LIBOR | 5/18/17 | USD | 15,030 | 2 | ||||||||||
| Morgan Stanley | 2.14% | 3-Month AUD - BBR | 3/11/17 | AUD | 23,690 | (21 | ) | |||||||||
| Morgan Stanley | 0.97% | 3-Month CAD - CDOR | 3/10/17 | CAD | 17,880 | (3 | ) | |||||||||
| Morgan Stanley | 0.54% | 3-Month USD - LIBOR | 5/6/16 | USD | 44,600 | (39 | ) | |||||||||
|
| |||||||||||||||
| $ | (539 | ) | ||||||||||||||
|
| |||||||||||||||
A list of the open OTC swap agreements held by the Fund at May 31, 2015, is as follows:
| Interest Rate Swaps | ||||||||||||||||||
| Counterparty | Fund Pays | Fund Receives | Termination Date | Currency | Notional Amount (Thousands) | Net Unrealized Appreciation (Depreciation) ($ Thousands) | ||||||||||||
| Barclays Bank PLC | 1.10% | 3 Month USD - LIBOR | 2/21/17 | USD | 500 | $ | (5 | ) | ||||||||||
| Citibank | 12.31% | 1-Year BRL - CDI | 1/4/21 | BRL | 8,038 | 6 | ||||||||||||
| Citibank | 1-Year BRL - CDI | 13.19% | 1/2/17 | BRL | 26,966 | (15 | ) | |||||||||||
| Credit Suisse | 3-Month USD - LIBOR | 2.09% | 3/12/22 | USD | 250 | 4 | ||||||||||||
| Morgan Stanley | 2.80% | 3 Month USD -LIBOR | 3/6/42 | USD | 330 | (15 | ) | |||||||||||
| Morgan Stanley | 2.81% | 3 Month USD -LIBOR | 2/21/42 | USD | 450 | (23 | ) | |||||||||||
|
| |||||||||||||||||
| $ | (48 | ) | ||||||||||||||||
|
| |||||||||||||||||
| Credit Default Swaps | ||||||||||||||||||||
| Counterparty | Reference Entity/Obligation | Buy/Sell Protection | (Pays)/Receives Rate | Termination Date | Currency | Notional Amount (Thousands) | Net Unrealized Appreciation ($ Thousands) | |||||||||||||
| Bank of America | Societe Generale | Sell | 3.00% | 12/20/17 | EUR | (200 | ) | $ | 9 | |||||||||||
| Credit Suisse | Kohl’s Corporation | Sell | 1.00% | 6/20/19 | USD | (379 | ) | 11 | ||||||||||||
| Credit Suisse | Kohl’s Corporation | Sell | 1.00% | 6/20/19 | USD | (153 | ) | 4 | ||||||||||||
| Credit Suisse | Kohl’s Corporation | Sell | 1.00% | 6/20/19 | USD | (155 | ) | 5 | ||||||||||||
| Credit Suisse | Kohl’s Corporation | Sell | 1.00% | 6/20/19 | USD | (223 | ) | 6 | ||||||||||||
| Deutsche Bank | Anadarko Petroleum Corporation | Sell | 1.00% | 9/20/17 | USD | (170 | ) | 5 | ||||||||||||
|
| |||||||||||||||||||
| $ | 40 | |||||||||||||||||||
|
| |||||||||||||||||||
For the year ended May 31, 2015, the total amount of all open swap agreements, as presented in the table above, are representative of the volume of activity for this derivative type during the year.
Percentages are based on a Net Assets of $730,812 ($ Thousands).
| * | Non-income producing security. |
| ‡ | Real Estate Investment Trust. |
| (1) | In U.S. Dollars unless otherwise indicated. |
| (A) | Securities sold within terms of a private placement memorandum, exempt from registration under Section 144A of the Securities Act of 1933, as amended, and may be sold only to dealers in that program or other “accredited investors.” These securities have been determined to be liquid under guidelines established by the Board of Trustees. |
| (B) | Variable Rate Security — The rate reported on the Schedule of Investments is the rate in effect as of May 31, 2015. |
| (C) | Step Bonds — The rate reflected on the Schedule of Investments is the effective yield on May 31, 2015. The coupon on a step bond changes on a specified date. |
| (D) | The rate reported is the effective yield at time of purchase. |
| (E) | Security, or portion thereof, has been pledged as collateral on open futures contracts, reverse repurchase agreements and securities sold short. |
AUD — Australian Dollar
BRL — Brazilian Real
CAD — Canadian Dollar
CDI — Average One-Day Interbank Deposit Rate
CDOR — Canadian Dollar Offered Rate
Cl — Class
CMO — Collateralized Mortgage Obligation
EAFE — Europe, Australasia and Far East
EUR — Euro
| SEI Institutional Investments Trust / Annual Report / May 31, 2015 | 287 |
CONSOLIDATED SCHEDULE OF INVESTMENTS
Multi-Asset Real Return Fund (Concluded)
May 31, 2015
FHLMC — Federal Home Loan Mortgage Corporation
FNMA — Federal National Mortgage Association
GBP — British Pound Sterling
HKD — Hong Kong Dollar
IDR — Indonesian Rupiah
JPY — Japanese Yen
LIBOR — London Interbank Offered Rate
LLC — Limited Liability Company
LME — London Metal Exchange
MSCI — Morgan Stanley Capital International
MTN — Medium Term Note
NOK — Norwegian Krone
OTC — Over the Counter
PLC — Public Limited Company
S&P — Standard & Poor’s
SEK — Swedish Krone
Ser — Series
TWD — Taiwanese Dollar
USD — U.S. Dollar
ZAR — South African Rand
The following is a list of the level of inputs used as of May 31, 2015, in valuing the Fund’s investments and other financial instruments carried at value ($ Thousands):
| Investments in Securities | Level 1 | Level 2 | Level 3 | Total | ||||||||||||
Common Stock | $ | 215,443 | $ | — | $ | — | $ | 215,443 | ||||||||
Corporate Obligations | — | 53,864 | — | 53,864 | ||||||||||||
Mortgage-Backed Securities | — | 38,900 | — | 38,900 | ||||||||||||
Asset-Backed Securities | — | 31,349 | — | 31,349 | ||||||||||||
Foreign Bonds | — | 8,785 | — | 8,785 | ||||||||||||
Sovereign Debt | — | 1,791 | — | 1,791 | ||||||||||||
Foreign Common Stock | 318 | — | — | 318 | ||||||||||||
Preferred Stock | — | 20 | — | 20 | ||||||||||||
U.S. Treasury Obligations | — | 497,282 | — | 497,282 | ||||||||||||
Time Deposits | — | 17,873 | — | 17,873 | ||||||||||||
|
|
|
|
|
|
|
| |||||||||
Total Investments in Securities | $ | 215,761 | $ | 649,864 | $ | — | $ | 865,625 | ||||||||
|
|
|
|
|
|
|
| |||||||||
| Securities Sold Short | Level 1 | Level 2 | Level 3 | Total | ||||||||||||
Common Stock | $ | (105,622 | ) | $ | — | $ | — | $ | (105,622 | ) | ||||||
|
|
|
|
|
|
|
| |||||||||
| Other Financial Instruments | Level 1 | Level 2 | Level 3 | Total | ||||||||||||
Purchased Options | $ | — | $ | 196 | $ | — | $ | 196 | ||||||||
Futures Contracts* | ||||||||||||||||
Unrealized Appreciation | 3,978 | — | — | 3,978 | ||||||||||||
Unrealized Depreciation | (5,223 | ) | — | — | (5,223 | ) | ||||||||||
Forwards Contracts* | ||||||||||||||||
Unrealized Appreciation | — | 382 | — | 382 | ||||||||||||
Unrealized Depreciation | — | (120 | ) | — | (120 | ) | ||||||||||
Centrally Cleared Swaps | ||||||||||||||||
Interest Rate Swaps* | ||||||||||||||||
Unrealized Appreciation | — | 584 | — | 584 | ||||||||||||
Unrealized Depreciation | — | (1,123 | ) | — | (1,123 | ) | ||||||||||
OTC Swaps | ||||||||||||||||
Interest Rate Swaps* | ||||||||||||||||
Unrealized Appreciation | — | 10 | — | 10 | ||||||||||||
Unrealized Depreciation | — | (58 | ) | — | (58 | ) | ||||||||||
Credit Default Swaps* | ||||||||||||||||
Unrealized Appreciation | — | 40 | — | 40 | ||||||||||||
Reverse Repurchase | ||||||||||||||||
Agreements | — | (135,632 | ) | — | (135,632 | ) | ||||||||||
|
|
|
|
|
|
|
| |||||||||
Total Other Financial Instruments | $ | (1,245 | ) | $ | (135,721 | ) | $ | — | $ | (136,966 | ) | |||||
|
|
|
|
|
|
|
| |||||||||
| * | Futures contracts, forwards contracts and swaps are valued at the unrealized appreciation (depreciation) on the instrument. |
For the year ended May 31, 2015, there were no transfers between Level 1 and Level 2 assets and liabilities.
For the year ended May 31, 2015, there were no transfers between Level 2 and Level 3 assets and liabilities.
For more information on valuation inputs, see Note 2 — Significant Accounting Policies in Notes to Financial Statements.
Amounts designated as “—” are $O or have been rounded to $O.
The accompanying notes are an integral part of the financial statements.
| 288 | SEI Institutional Investments Trust / Annual Report / May 31, 2015 |
This page intentionally left blank.
Statements of Assets and Liabilities ($ Thousands)
May 31, 2015
Large Cap Fund | Large Cap Alpha Fund | Large Cap Equity Fund | Large Cap Index Fund | |||||||||||||
Assets: | ||||||||||||||||
Investments at value† | $ | 2,282,097 | * | $ | 60,543 | $ | 4,048,827 | * | $ | 1,935,686 | * | |||||
Affiliated investment, at value†† | 155,416 | 3,685 | 202,018 | 62,139 | ||||||||||||
Cash | — | — | — | — | ||||||||||||
Cash pledged as collateral for futures contracts | 6,100 | 688 | 11,185 | — | ||||||||||||
Foreign currency, at value††† | — | — | — | — | ||||||||||||
Receivable for fund shares sold | 1,768 | 90 | 34,618 | 58 | ||||||||||||
Receivable for investment securities sold | 12,859 | 2,437 | 211,237 | 14,866 | ||||||||||||
Dividends and interest receivable | 3,229 | — | 7,606 | 3,732 | ||||||||||||
Foreign tax reclaim receivable | — | 1 | 93 | — | ||||||||||||
Prepaid expenses | 10 | 1 | 47 | — | ||||||||||||
Total Assets | 2,461,479 | 67,445 | 4,515,631 | 2,016,481 | ||||||||||||
Liabilities: | ||||||||||||||||
Payable upon return on securities loaned | 36,555 | — | 29,683 | 25,575 | ||||||||||||
Payable for investment securities purchased | 14,346 | 467 | 30,938 | 149 | ||||||||||||
Payable for fund shares redeemed | 43,679 | 3,355 | 255,420 | 18,096 | ||||||||||||
Payable for variation margin | 248 | — | 163 | 342 | ||||||||||||
Investment advisory fees payable | 369 | 13 | 640 | 17 | ||||||||||||
CCO fees payable | 2 | — | 3 | 1 | ||||||||||||
Trustees fees payable | 7 | — | 13 | 6 | ||||||||||||
Accrued expense payable | 69 | 3 | 126 | 41 | ||||||||||||
Total Liabilites | 95,275 | 3,838 | 316,986 | 44,227 | ||||||||||||
Net Assets | $ | 2,366,204 | $ | 63,607 | $ | 4,198,645 | $ | 1,972,254 | ||||||||
†Cost of investments and repurchase agreements | 1,696,596 | 50,180 | 3,377,130 | 1,065,704 | ||||||||||||
††Cost of affiliated investments | 155,416 | 3,685 | 202,018 | 61,800 | ||||||||||||
†††Cost of foreign currency | — | — | — | — | ||||||||||||
*Includes market value of securities on loan | 35,431 | — | 28,661 | 24,808 | ||||||||||||
Net Assets: | ||||||||||||||||
Paid-in-Capital — (unlimited authorization — no par value) | $ | 1,595,819 | $ | 36,219 | $ | 3,235,478 | $ | 1,066,706 | ||||||||
Undistributed net investment income | 4,124 | — | 10,481 | 5,034 | ||||||||||||
Accumulated net realized gain (loss) on investments, option contracts, swaptions, futures contracts, securities sold short, swap contracts and foreign currency | 180,760 | 16,988 | 279,030 | | | | ||||||||||
Net unrealized appreciation on investments and option contracts | 585,501 | 10,363 | 671,697 | 870,321 | ||||||||||||
Net unrealized appreciation on futures contracts | — | 37 | 1,970 | 998 | ||||||||||||
Net unrealized appreciation (depreciation) on forward foreign currency contracts, foreign currencies and translation of other assets and liabilities denominated in foreign currencies | — | — | (11 | ) | | | | |||||||||
Net Assets | $ | 2,366,204 | $ | 63,607 | $ | 4,198,645 | $ | 1,972,254 | ||||||||
Net Asset Value, Offering and Redemption Price Per Share — Class A | $22.89 | $15.28 | $14.38 | $169.36 | ||||||||||||
| | ($2,366,204,354 ÷ 103,381,177 shares | ) | | ($63,607,124 ÷ 4,163,615 shares | ) | | ($4,198,645,127 ÷ 292,021,494 shares | ) | | ($1,972,254,282 ÷ 11,645,444 shares | ) | |||||
Amounts designated as “—” are $0 or have been rounded to $0.
The accompanying notes are an integral part of the financial statements.
| 290 | SEI Institutional Investments Trust / Annual Report / May 31, 2015 |
| S&P 500 Index Fund | Extended Market Index Fund | Small Cap Fund | Small Cap II Fund | Small/Mid Cap Equity Fund | U.S. Managed Volatility Fund | |||||||||||||||||
| $3,139,569 | * | $723,170 | * | $644,021 | * | $356,684 | * | $1,781,398 | * | $1,366,155 | ||||||||||||
| 57,519 | 56,951 | 98,789 | 49,340 | 290,694 | 58,844 | |||||||||||||||||
| — | — | — | — | 4 | — | |||||||||||||||||
| — | — | 1,500 | 1,950 | 7,484 | 2,923 | |||||||||||||||||
| — | — | — | — | — | 582 | |||||||||||||||||
| 149,191 | 63,629 | 4,926 | 11 | 17,581 | 3,179 | |||||||||||||||||
| — | 681 | 8,366 | 8,789 | 53,204 | 12,896 | |||||||||||||||||
| 6,174 | 512 | 424 | 229 | 1,576 | 2,810 | |||||||||||||||||
| 2 | — | — | — | — | — | |||||||||||||||||
| 10 | 4 | 4 | 2 | 12 | 9 | |||||||||||||||||
| 3,352,465 | 844,947 | 758,030 | 417,005 | 2,151,953 | 1,447,398 | |||||||||||||||||
| 12,329 | 42,794 | 60,495 | 29,914 | 191,809 | — | |||||||||||||||||
| 136,969 | 63,669 | 10,419 | 8,694 | 12,819 | 14,748 | |||||||||||||||||
| 7,783 | 959 | 3,100 | 4,297 | 86,923 | 17,683 | |||||||||||||||||
| 429 | 108 | 110 | 85 | — | — | |||||||||||||||||
| 26 | 23 | 261 | 140 | 720 | 268 | |||||||||||||||||
| 2 | 1 | — | — | 1 | 1 | |||||||||||||||||
| 9 | 2 | 2 | 1 | 6 | 4 | |||||||||||||||||
| 74 | 28 | 19 | 16 | 66 | 56 | |||||||||||||||||
| 157,621 | 107,584 | 74,406 | 43,147 | 292,344 | 32,760 | |||||||||||||||||
| $3,194,844 | $737,363 | $683,624 | $373,858 | $1,859,609 | $1,414,638 | |||||||||||||||||
| 2,968,787 | 640,216 | 541,373 | 309,259 | 1,421,648 | 1,121,449 | |||||||||||||||||
| 57,519 | 56,951 | 98,789 | 49,340 | 290,694 | 58,844 | |||||||||||||||||
| — | — | — | — | — | 598 | |||||||||||||||||
| 11,973 | 41,297 | 58,596 | 28,796 | 186,581 | — | |||||||||||||||||
| $3,016,043 | $639,806 | $561,351 | $312,342 | $1,336,457 | $1,097,205 | |||||||||||||||||
| 9,496 | 284 | 434 | 196 | 4,932 | 3,742 | |||||||||||||||||
| (3,030 | ) | 14,072 | 18,824 | 13,678 | 157,842 | 67,862 | |||||||||||||||
| 170,782 | 82,954 | 102,648 | 47,425 | 359,750 | 244,706 | |||||||||||||||||
| 1,553 | 247 | 367 | 217 | 629 | 1,137 | |||||||||||||||||
| — |
| — | — | — | (1 | ) | (14 | ) | |||||||||||||
| $3,194,844 | $737,363 | $683,624 | $373,858 | $1,859,609 | $1,414,638 | |||||||||||||||||
| $11.69 | $13.69 | $19.06 | $12.95 | $14.89 | $14.64 | |||||||||||||||||
| | ($3,194,844,084 ÷ 273,248,988 shares | ) | | ($737,363,063 ÷ 53,852,043 shares | ) | | ($683,624,009 ÷ 35,861,923 shares | ) | | ($373,858,386 ÷ 28,871,393 shares | ) | | ($1,859,608,800 ÷ 124,893,997 shares | ) | | ($1,414,637,761 ÷ 96,639,884 shares | ) | |||||
| SEI Institutional Investments Trust / Annual Report / May 31, 2015 | 291 |
Statements of Assets and Liabilities ($ Thousands)
May 31, 2015
World Equity Ex-US Fund | Screened World Equity Ex-US Fund | Emerging Fund | Opportunistic Income Fund | |||||||||||||
Assets: | ||||||||||||||||
Investments at value† | $ | 7,439,136 | * | $ | 82,175 | $ | 585,286 | $ | 2,028,298 | |||||||
Affiliated investment, at value†† | 507,659 | 296 | 2,800 | 78,062 | ||||||||||||
Cash | — | 265 | 1,981 | 4,375 | ||||||||||||
Foreign currency, at value††† | 10,711 | 36 | 1,243 | — | ||||||||||||
Cash pledged as collateral for forward foreign currency contracts, futures contracts and swap contracts | 16,344 | 57 | — | 349 | ||||||||||||
Receivable for fund shares sold | 37,597 | 793 | 83,860 | 113,880 | ||||||||||||
Receivable for investment securities sold | 32,339 | 318 | 1,161 | 10,854 | ||||||||||||
Dividends and interest receivable | 18,634 | 191 | 959 | 6,743 | ||||||||||||
Receivable for variation margin | 148 | — | — | 1 | ||||||||||||
Foreign tax reclaim receivable | 6,140 | 89 | — | — | ||||||||||||
Unrealized gain on foreign spot currency contracts | 29 | — | 1 | — | ||||||||||||
Unrealized gain on forward foreign currency contracts | — | — | — | — | ||||||||||||
Swap contracts, at value †††† | — | — | — | — | ||||||||||||
Options purchased, at value††††† | — | — | — | — | ||||||||||||
Swaptions purchased, at value ††††† | — | — | — | — | ||||||||||||
Prepaid expenses | 45 | 1 | 1 | 13 | ||||||||||||
Total Assets | 8,068,782 | 84,221 | 677,292 | 2,242,575 | ||||||||||||
Liabilities: | ||||||||||||||||
Payable upon return on securities loaned | 347,865 | — | — | — | ||||||||||||
Payable for investment securities purchased | 39,011 | 250 | 79,784 | 50,567 | ||||||||||||
Payable for fund shares redeemed | 31,490 | 17 | 5,180 | 23,952 | ||||||||||||
Income distribution payable | — | — | — | — | ||||||||||||
Swap contracts, at value†††† | — | — | — | — | ||||||||||||
Options written, at value††††† | — | — | — | — | ||||||||||||
Payable to custodian | 112 | — | — | — | ||||||||||||
Payable for variation margin | 2,047 | 3 | — | 66 | ||||||||||||
Unrealized loss on foreign spot currency contracts | 10 | — | 3 | — | ||||||||||||
Unrealized loss on forward foreign currency contracts | — | — | — | — | ||||||||||||
Swaptions written, at value††††† | — | — | — | — | ||||||||||||
Investment advisory fees payable | 2,035 | 19 | 254 | 425 | ||||||||||||
CCO fees payable | 6 | — | — | 2 | ||||||||||||
Trustees fees payable | 21 | — | 1 | 6 | ||||||||||||
Accrued expense payable | 761 | 53 | 107 | 79 | ||||||||||||
Accrued foreign capital gains tax on appreciated securities | 580 | — | — | — | ||||||||||||
Total Liabilites | 423,938 | 342 | 85,329 | 75,097 | ||||||||||||
Net Assets | $ | 7,644,844 | $ | 83,879 | $ | 591,963 | $ | 2,167,478 | ||||||||
†Cost of investments and repurchase agreements | 6,573,747 | 77,760 | 578,310 | 2,023,382 | ||||||||||||
††Cost of affiliated investments | 507,659 | 296 | 2,800 | 78,062 | ||||||||||||
†††Cost of foreign currency | 10,726 | 45 | 941 | — | ||||||||||||
††††Cost (premiums received) | — | — | — | — | ||||||||||||
†††††Cost (premiums received) | — | — | — | — | ||||||||||||
*Includes market value of securities on loan | 326,306 | — | — | — | ||||||||||||
Net Assets: | ||||||||||||||||
Paid-in-Capital — (unlimited authorization — no par value) | $ | 6,689,945 | $ | 87,883 | $ | 581,239 | $ | 2,199,901 | ||||||||
Undistributed (distributions in excess of) net investment income | 69,403 | 838 | 3,230 | 18,074 | ||||||||||||
Accumulated net realized gain (loss) on investments, option contracts, swaptions, futures contracts, securities sold short, swap contracts and foreign currency | 19,525 | (9,241 | ) | 538 | (55,282 | ) | ||||||||||
Net unrealized appreciation (depreciation) on investments | 865,389 | 4,415 | 6,976 | 4,916 | ||||||||||||
Net unrealized appreciation on options | — | — | — | — | ||||||||||||
Net unrealized appreciation on swaptions | — | — | — | — | ||||||||||||
Net unrealized appreciation (depreciation) on futures contracts | 1,927 | 5 | — | (131 | ) | |||||||||||
Net unrealized depreciation on swap contracts | — | — | — | — | ||||||||||||
Net unrealized appreciation (depreciation) on forward foreign currency contracts, foreign currencies and translation of other assets and liabilities denominated in foreign currencies | (765 | ) | (21 | ) | (20 | ) | — | |||||||||
Accumulated foreign capital gains tax on appreciated securities | (580 | ) | — | — | — | |||||||||||
Net Assets | $ | 7,644,844 | $ | 83,879 | $ | 591,963 | $ | 2,167,478 | ||||||||
Net Asset Value, Offering and Redemption Price Per Share — Class A | $12.68 | $9.52 | $10.01 | $8.25 | ||||||||||||
| | ($7,644,843,729 ÷ 602,860,658 shares | ) | | ($83,879,472 ÷ 8,814,620 shares | ) | | ($591,962,550 ÷ 59,146,548 shares | ) | | ($2,167,477,194 ÷ 262,610,719 shares | ) | |||||
Amounts designated as “—” are $0 or have been rounded to $0.
The accompanying notes are an integral part of the financial statements.
| 292 | SEI Institutional Investments Trust / Annual Report / May 31, 2015 |
| Core Fixed Income Fund | High Yield Bond Fund | Long Duration Fund | Long Duration Credit Fund | Ultra Short Duration Bond Fund | Emerging Markets Debt Fund | |||||||||||||||||
| $5,760,622 | * | $2,436,083 | $3,306,644 | $3,377,811 | $671,124 | $1,778,352 | * | |||||||||||||||
| 531,211 | 86,501 | 47,931 | 50,312 | 3,761 | 7,895 | |||||||||||||||||
| 472 | 729 | 144 | 190 | 41 | 2,523 | |||||||||||||||||
| 1,670 | — | — | — | — | 454 | |||||||||||||||||
| 5,243 |
| 1,165 | 888 | — | 94 | 1,467 | |||||||||||||||
| 91,672 | 12,238 | 31,602 | 44,928 | 1,724 | 26,277 | |||||||||||||||||
| 485,927 | 14,258 | 17,383 | 133,325 | 9,842 | 9,876 | |||||||||||||||||
| 26,005 | 35,905 | 33,355 | 38,922 | 1,594 | 40,366 | |||||||||||||||||
| 609 | 5 | 1,385 | 452 | 1 | 47 | |||||||||||||||||
| — | — | 8 | — | 4 | — | |||||||||||||||||
| — | — | — | — | — | — | |||||||||||||||||
| 2,336 | — | — | — | — | 9,527 | |||||||||||||||||
| 49 | — | — | — | — | 687 | |||||||||||||||||
| 33 | — | — | — | — | — | |||||||||||||||||
| 109 | — | — | — | — | — | |||||||||||||||||
| 40 | 10 | 26 | 20 | 5 | 4 | |||||||||||||||||
| 6,905,998 | 2,586,894 | 3,439,366 | 3,645,960 | 688,190 | 1,877,475 | |||||||||||||||||
| 256,062 | — | — | — | — | 7,895 | |||||||||||||||||
| 983,033 | 55,815 | 18,245 | 44,879 | 22,669 | 9,396 | |||||||||||||||||
| 61,856 | 12,773 | 75,411 | 134,479 | 19,543 | 10,543 | |||||||||||||||||
| 205 | 500 | 413 | 448 | 8 | — | |||||||||||||||||
| 917 | 319 | 586 | — | — | 2,570 | |||||||||||||||||
| 476 | — | — | — | — | — | |||||||||||||||||
| — | — | — | — | — | — | |||||||||||||||||
| 1,191 | 7 | 376 | 375 | 20 | 162 | |||||||||||||||||
| — | — | — | — | — | — | |||||||||||||||||
| 584 | — | — | — | — | 9,206 | |||||||||||||||||
| 156 | — | — | — | — | — | |||||||||||||||||
| 519 | 598 | 372 | 390 | 56 | 597 | |||||||||||||||||
| 4 | 2 | 2 | 2 | — | 1 | |||||||||||||||||
| 19 | 7 | 12 | 11 | 2 | 5 | |||||||||||||||||
| 169 | 103 | 104 | 148 | 20 | 324 | |||||||||||||||||
| — | — | — | — | — | — | |||||||||||||||||
| 1,305,191 | 70,124 | 95,521 | 180,732 | 42,318 | 40,699 | |||||||||||||||||
| $5,600,807 | $2,516,770 | $3,343,845 | $3,465,228 | $645,872 | $1,836,776 | |||||||||||||||||
| 5,630,054 | 2,436,690 | 3,114,488 | 3,384,688 | 670,809 | 1,916,980 | |||||||||||||||||
| 531,211 | 86,501 | 47,931 | 50,312 | 3,761 | 7,895 | |||||||||||||||||
| 1,651 | — | — | — | — | 471 | |||||||||||||||||
| (24 | ) | (229 | ) | — | — | — | — | |||||||||||||||
| (764 | ) | — | — | — | — | — | ||||||||||||||||
| 250,380 | — | — | — | — | 7,567 | |||||||||||||||||
| $5,412,208 | $2,530,268 | $3,085,151 | $3,411,483 | $647,743 | $2,016,660 | |||||||||||||||||
| 4,872 |
| 11,788 | (1,296 | ) | 30 | — | (12,145 | ) | |||||||||||||
| 51,263 |
| (24,589 | ) | 67,628 | 60,367 | (2,157 | ) | (33,741 | ) | ||||||||||||
| 130,568 | (607 | ) | 192,156 | (6,877 | ) | 315 | (138,628 | ) | ||||||||||||||
| 73 | — | — | — | — | — | |||||||||||||||||
| 201 | — | — | — | — | — | |||||||||||||||||
| 1,188 |
| — | 1,595 | 225 | (29 | ) | (247 | ) | |||||||||||||
| (1,328 | ) | (90 | ) | (1,389 | ) | — | — | (1,925 | ) | |||||||||||||
| 1,762 |
| — | — | — | — | 6,802 | |||||||||||||||
| — |
| — | — | — | — | — | |||||||||||||||
| $5,600,807 | $2,516,770 | $3,343,845 | $3,465,228 | $645,872 | $1,836,776 | |||||||||||||||||
| $10.62 |
| $9.41 | $8.92 | $10.18 | $10.01 | $9.65 | |||||||||||||||
| | ($5,600,807,151 ÷ 527,458,629 shares | ) | | ($2,516,769,838 ÷ 267,508,286 shares | ) | | ($3,343,845,123 ÷ 374,893,097 shares | ) | | ($3,465,228,020 ÷ 340,362,296 shares | ) | | ($645,872,196 ÷ 64,516,098 shares | ) | | ($1,836,776,213 ÷ 190,292,993 shares | ) | |||||
| SEI Institutional Investments Trust / Annual Report / May 31, 2015 | 293 |
Statements of Assets and Liabilities/Consolidated Statements of Assets and Liabilities ($ Thousands)
May 31, 2015
Real Return Fund | Limited Duration Bond Fund | |||||||
Assets: | ||||||||
Investments at value† | $ | 227,994 | $ | 559,036 | ||||
Affiliated investment, at value†† | — | 4,936 | ||||||
Cash | — | — | ||||||
Foreign currency, at value††† | — | — | ||||||
Cash pledged as collateral for forward foreign currency contracts, futures contracts and swap contracts | — | — | ||||||
Receivable for fund shares sold | 72 | 107,271 | ||||||
Receivable for investment securities sold | — | 6,847 | ||||||
Dividends and interest receivable | 750 | 1,975 | ||||||
Receivable for variation margin | — | — | ||||||
Foreign tax reclaim receivable | — | 4 | ||||||
Unrealized gain on forward foreign currency contracts | — | — | ||||||
Unrealized gain on foreign spot currency contracts | — | — | ||||||
Swap contracts, at value †††† | — | — | ||||||
Options purchased, at value††††† | — | — | ||||||
Prepaid expenses | 1 | 1 | ||||||
Total Assets | 228,817 | 680,070 | ||||||
Liabilities: | ||||||||
Payable for securities sold short@ | — | — | ||||||
Payable for investment securities purchased | — | 9,235 | ||||||
Payable for fund shares redeemed | 1,118 | 127 | ||||||
Swap contracts, at value†††† | — | — | ||||||
Reverse repurchase agreements | — | — | ||||||
Income distribution payable | — | 14 | ||||||
Payable to custodian | 343 | — | ||||||
Payable for variation margin | — | — | ||||||
Foreign currency payable to custodian | — | — | ||||||
Unrealized loss on forward foreign currency contracts | — | — | ||||||
Unrealized loss on foreign spot currency contracts | — | — | ||||||
Investment advisory fees payable | 12 | 48 | ||||||
CCO fees payable | — | — | ||||||
Trustees fees payable | 1 | 1 | ||||||
Accrued expense payable | 8 | 66 | ||||||
Total Liabilites | 1,482 | 9,491 | ||||||
Net Assets | $ | 227,335 | $ | 670,579 | ||||
†Cost of investments and repurchase agreements | 227,910 | 558,206 | ||||||
††Cost of affiliated investments | — | 4,936 | ||||||
†††Cost of foreign currency | — | — | ||||||
††††Cost (premiums received) | — | — | ||||||
†††††Cost (proceeds) | — | — | ||||||
@Proceeds from securities sold short | — | — | ||||||
Net Assets: | ||||||||
Paid-in-Capital — (unlimited authorization — no par value) | $ | 231,880 | $ | 669,715 | ||||
Undistributed (distributions in excess of) net investment income | (2,012 | ) | 3 | |||||
Accumulated net realized gain (loss) on investments, option contracts, swaptions, futures contracts, securities sold short, swap contracts and foreign currency | (2,617 | ) | 31 | |||||
Net unrealized appreciation (depreciation) on investments and securities sold short | 84 | 830 | ||||||
Net unrealized depreciation on option contracts | — | — | ||||||
Net unrealized appreciation (depreciation) on futures contracts | — | — | ||||||
Net unrealized depreciation on swap contracts | — | — | ||||||
Net unrealized appreciation (depreciation) on forward foreign currency contracts, foreign currencies and translation of other assets and liabilities denominated in foreign currencies | — | — | ||||||
Net Assets | $ | 227,335 | $ | 670,579 | ||||
Net Asset Value, Offering and Redemption Price Per Share — Class A | $9.59 | $10.01 | ||||||
|
| ($227,335,435 ÷ 23,703,744 shares | ) |
| ($670,578,977 ÷ 66,993,671 shares | ) | |||
Amounts designated as “—” are $0 or have been rounded to $0.
The accompanying notes are an integral part of the financial statements.
| 294 | SEI Institutional Investments Trust / Annual Report / May 31, 2015 |
| Intermediate Duration Credit Fund | Dynamic Asset Allocation Fund | Multi-Asset Real Return Fund | ||||||||
| $1,557,552 | $1,988,320 | $ | 865,625 | |||||||
| 25,543 | — | — | ||||||||
| 210 | 88 | 108,688 | ||||||||
| — | — | — | ||||||||
| — | 13,867 | 1,543 | ||||||||
| 11,440 | 68,687 | 1,815 | ||||||||
| 25,282 | — | 5,287 | ||||||||
| 12,586 | 3,998 | 1,787 | ||||||||
| — | 1,475 | 3,221 | ||||||||
| — | 2 | 27 | ||||||||
| — | 1,692 | 382 | ||||||||
| — | — | 7 | ||||||||
| — | — | 44 | ||||||||
| — | 210 | 196 | ||||||||
| — | 12 | 4 | ||||||||
| 1,632,613 | 2,078,351 | 988,626 | ||||||||
| — | — | 105,622 | ||||||||
| 32,013 | 27,444 | 9,336 | ||||||||
| — | 42,262 | 5,240 | ||||||||
| — | — | 58 | ||||||||
| — | — | 135,632 | ||||||||
| — | 90 | — | ||||||||
| — | — | — | ||||||||
| 158 | 648 | 1,576 | ||||||||
| — | 4 | 1 | ||||||||
| — | 14,156 | 101 | ||||||||
| — | — | 25 | ||||||||
| 194 | 101 | 150 | ||||||||
| 1 | 1 | 1 | ||||||||
| — | 6 | 2 | ||||||||
| 130 | 63 | 70 | ||||||||
| 32,496 | 84,775 | 257,814 | ||||||||
| $1,600,117 | $1,993,576 | $ | 730,812 | |||||||
| 1,580,552 | 1,495,472 | 848,862 | ||||||||
| 25,543 | — | — | ||||||||
| — | — | 532 | ||||||||
| — | — | (6 | ) | |||||||
| — | 631 | 257 | ||||||||
| — | — | 115,454 | ||||||||
| $1,625,466 | $1,396,703 | $ | 777,247 | |||||||
| — | 91,417 | (14,431 | ) | |||||||
| (2,094 | ) | 13,714 | (56,996 | ) | ||||||
| (23,000 | ) | 488,190 | 26,595 | |||||||
| — | (421 | ) | (61 | ) | ||||||
| (255 | ) | 11,779 | (1,245 | ) | ||||||
| — | — | (547 | ) | |||||||
| — | (7,806 | ) | 250 | |||||||
| $1,600,117 | $1,993,576 | $ | 730,812 | |||||||
| $9.82 | $16.97 | $8.64 | ||||||||
| | ($1,600,116,937 ÷ 162,867,877 shares | ) | | ($1,993,575,894 ÷ 117,463,968 shares | ) | | ($730,812,292 ÷ 84,580,191 shares | ) | ||
| SEI Institutional Investments Trust / Annual Report / May 31, 2015 | 295 |
Statements of Operations ($ Thousands)
For the year ended May 31, 2015
| Large Cap Fund | Large Cap Diversified Alpha Fund | Large Cap Disciplined Equity Fund | Large Cap Index Fund | |||||||||||||
Investment Income: | ||||||||||||||||
Dividends | $ | 35,839 | $ | 2,007 | $ | 82,355 | $ | 35,888 | ||||||||
Dividends from Affiliated Registered Investment Company | 10 | 1 | 15 | 9 | ||||||||||||
Interest Income | 2 | — | 2 | — | ||||||||||||
Security Lending Income—Net | 190 | — | 243 | 244 | ||||||||||||
Less: Foreign Taxes Withheld | (243 | ) | (7 | ) | (131 | ) | (11 | ) | ||||||||
| 35,798 | 2,001 | 82,484 | 36,130 | |||||||||||||
Expenses: | ||||||||||||||||
Investment Advisory Fees | 9,579 | 463 | 18,374 | 3,234 | ||||||||||||
Administration Fees | 1,198 | 58 | 2,297 | 951 | ||||||||||||
Trustee Fees | 28 | 1 | 55 | 22 | ||||||||||||
Chief Compliance Officer Fees | 11 | 1 | 21 | 9 | ||||||||||||
Custodian/Wire Agent Fees | 136 | 6 | 250 | 102 | ||||||||||||
Professional Fees | 87 | 4 | 164 | 70 | ||||||||||||
Printing Fees | 21 | 1 | 40 | 17 | ||||||||||||
Registration Fees | 26 | 2 | 46 | 18 | ||||||||||||
Interest Expense | — | — | 2 | — | ||||||||||||
Other Expenses | 111 | 7 | 210 | 86 | ||||||||||||
Total Expenses | 11,197 | 543 | 21,459 | 4,509 | ||||||||||||
Less: | ||||||||||||||||
Waiver of Investment Advisory Fees | (5,268 | ) | (208 | ) | (10,565 | ) | (3,044 | ) | ||||||||
Waiver of Administration Fees | (1,197 | ) | (58 | ) | (2,297 | ) | (951 | ) | ||||||||
Fees Paid Indirectly(1) | (105 | ) | — | (40 | ) | (20 | ) | |||||||||
Net Expenses | 4,627 | 277 | 8,557 | 494 | ||||||||||||
Net Investment Income | 31,171 | 1,724 | 73,927 | 35,636 | ||||||||||||
Net Realized Gain (Loss) on: | ||||||||||||||||
Investments | 266,247 | 21,226 | 491,968 | 74,801 | ||||||||||||
Futures Contracts | 1,522 | 512 | 9,751 | 5,249 | ||||||||||||
Foreign Currency Transactions | — | — | (28 | ) | — | |||||||||||
Net Change in Unrealized Appreciation (Depreciation) on: | ||||||||||||||||
Investments | (30,084 | ) | (9,693 | ) | (46,453 | ) | 97,936 | |||||||||
Futures Contracts | (89 | ) | (195 | ) | (717 | ) | (537 | ) | ||||||||
Foreign Currency and Translation of Other Assets and Liabilities Denominated in Foreign Currencies | — | — | (11 | ) | — | |||||||||||
Net Increase in Net Assets Resulting From Operations | $ | 268,767 | $ | 13,574 | $ | 528,437 | $ | 213,085 | ||||||||
| (1) | See Note 6 in the Notes to Financial Statements. |
Amounts designated as “—” are $0 or have been rounded to $0.
The accompanying notes are an integral part of the financial statements.
| 296 | SEI Institutional Investments Trust / Annual Report / May 31, 2015 |
| S&P 500 Index Fund | Extended Market Index Fund | Small Cap Fund | Small Cap II Fund | Small/Mid Cap Equity Fund | U.S. Managed Volatility Fund | |||||||||||||||||
| $ | 38,141 | $ | 7,357 | $ | 6,415 | $ | 2,635 | $ | 19,815 | $ | 33,506 | |||||||||||
| 3 | 2 | 3 | 1 | 9 | 4 | |||||||||||||||||
| — | — | 1 | 1 | 2 | — | |||||||||||||||||
| 98 | 646 | 989 | 222 | 1,356 | — | |||||||||||||||||
| (9 | ) | (14 | ) | (12 | ) | (3 | ) | (39 | ) | (242 | ) | |||||||||||
| 38,233 | 7,991 | 7,396 | 2,856 | 21,143 | 33,268 | |||||||||||||||||
| 555 | 703 | 4,412 | 1,953 | 12,251 | 8,622 | |||||||||||||||||
| 925 | 293 | 339 | 150 | 942 | 663 | |||||||||||||||||
| 22 | 7 | 7 | 4 | 22 | 15 | |||||||||||||||||
| 9 | 3 | 3 | 1 | 9 | 6 | |||||||||||||||||
| 88 | 31 | 37 | 16 | 101 | 72 | |||||||||||||||||
| 81 | 22 | 25 | 12 | 69 | 49 | |||||||||||||||||
| 18 | 5 | 6 | 3 | 16 | 12 | |||||||||||||||||
| 155 | 13 | 6 | 9 | 31 | 29 | |||||||||||||||||
| — | — | — | — | — | — | |||||||||||||||||
| 135 | 31 | 33 | 16 | 88 | 61 | |||||||||||||||||
| 1,988 | 1,108 | 4,868 | 2,164 | 13,529 | 9,529 | |||||||||||||||||
| (370 | ) | (469 | ) | (1,295 | ) | (638 | ) | (3,786 | ) | (5,704 | ) | |||||||||||
| (925 | ) | (293 | ) | (339 | ) | (150 | ) | (943 | ) | (663 | ) | |||||||||||
| (5 | ) | — | (10 | ) | (6 | ) | (35 | ) | — | |||||||||||||
| 688 | 346 | 3,224 | 1,370 | 8,765 | 3,162 | |||||||||||||||||
| 37,545 | 7,645 | 4,172 | 1,486 | 12,378 | 30,106 | |||||||||||||||||
| (2,555 | ) | 19,377 | 44,262 | 22,304 | 264,019 | 112,435 | ||||||||||||||||
| 2,086 | 961 | 354 | (138 | ) | 9,550 | 4,504 | ||||||||||||||||
| — | 1 | — | — | (2 | ) | 11 | ||||||||||||||||
| 133,913 | 35,983 | 14,434 | 11,296 | (86,967 | ) | 17,486 | ||||||||||||||||
| 906 | 290 | 615 | 169 | 374 | 105 | |||||||||||||||||
| — |
| — | — | — | — | (20 | ) | ||||||||||||||
| $ | 171,895 | $ | 64,257 | $ | 63,837 | $ | 35,117 | $ | 199,352 | $ | 164,627 | |||||||||||
| SEI Institutional Investments Trust / Annual Report / May 31, 2015 | 297 |
Statements of Operations ($ Thousands)
For the year/period ended May 31, 2015
| World Equity Ex-US Fund | Screened World Equity Ex-US Fund | Emerging Markets Equity Fund(2) | Opportunistic Income Fund | |||||||||||||
Investment Income: | ||||||||||||||||
Dividends | $ | 172,462 | $ | 2,054 | $ | 5,167 | $ | 311 | ||||||||
Dividends from Affiliated Registered Investment Company | 23 | — | — | 8 | ||||||||||||
Interest Income | 52 | 1 | 39 | 57,461 | ||||||||||||
Security Lending Income — Net | 6,047 | — | — | — | ||||||||||||
Less: Foreign Taxes Withheld | (14,853 | ) | (165 | ) | (441 | ) | — | |||||||||
| 163,731 | 1,890 | 4,765 | 57,780 | |||||||||||||
Expenses: | ||||||||||||||||
Investment Advisory Fees | 38,552 | 529 | 2,256 | 8,974 | ||||||||||||
Administration Fees | 3,505 | 41 | 107 | 997 | ||||||||||||
Trustee Fees | 80 | 1 | 2 | 23 | ||||||||||||
Chief Compliance Officer Fees | 33 | — | 1 | 9 | ||||||||||||
Custodian/Wire Agent Fees | 509 | 60 | 53 | 113 | ||||||||||||
Professional Fees | 262 | 3 | 11 | 74 | ||||||||||||
Printing Fees | 62 | 1 | 2 | 18 | ||||||||||||
Registration Fees | 116 | 1 | 46 | 26 | ||||||||||||
Overdraft Fees | 16 | — | — | — | ||||||||||||
Other Expenses | 315 | 2 | 8 | 158 | ||||||||||||
Total Expenses | 43,450 | 638 | 2,486 | 10,392 | ||||||||||||
Less: | ||||||||||||||||
Waiver of Investment Advisory Fees | (16,420 | ) | (302 | ) | (980 | ) | (4,188 | ) | ||||||||
Waiver of Administration Fees | (3,505 | ) | (41 | ) | (107 | ) | (997 | ) | ||||||||
Fees Paid Indirectly (1) | (35 | ) | — | — | — | |||||||||||
Net Expenses | 23,490 | 295 | 1,399 | 5,207 | ||||||||||||
Net Investment Income | 140,241 | 1,595 | 3,366 | 52,573 | ||||||||||||
Net Realized Gain (Loss) on: | ||||||||||||||||
Investments | 156,419 | 3,019 | 1,300 | (1,842 | ) | |||||||||||
Capital Gains Distributions Received from Underlying Funds | — | — | | 33 | | | — | | ||||||||
Futures Contracts | 14,169 | 704 | — | 5 | ||||||||||||
Purchased and Written Options | — | — | — | — | ||||||||||||
Swap Contracts | — | — | — | — | ||||||||||||
Foreign Currency Transactions | (4,709 | ) | (95 | ) | (263 | ) | (1 | ) | ||||||||
Net Change in Unrealized Appreciation (Depreciation) on: | ||||||||||||||||
Investments | (156,517 | ) | (5,063 | ) | 6,976 | (10,155 | ) | |||||||||
Futures Contracts | 964 | (71 | ) | — | (211 | ) | ||||||||||
Purchased and Written Options | — | — | — | — | ||||||||||||
Purchased and Written Swaptions | — | — | — | — | ||||||||||||
Swap Contracts | — | — | — | — | ||||||||||||
Foreign Currency and Translation of Other Assets and Liabilities Denominated in Foreign Currencies | (415 | ) | (16 | ) | (20 | ) | — | |||||||||
Net Increase (Decrease) in Net Assets Resulting From Operations | $ | 150,152 | $ | 73 | $ | 11,392 | $ | 40,369 | ||||||||
| (1) | See Note 6 in the Notes to Financial Statements. |
| (2) | Commenced operations on October 31, 2014. |
Amounts designated as “—” are $0 or have been rounded to $0.
The accompanying notes are an integral part of the financial statements.
| 298 | SEI Institutional Investments Trust / Annual Report / May 31, 2015 |
| Core Fixed Income Fund | High Yield Bond Fund | Long Duration Fund | Long Duration Credit Fund | Ultra Short Duration Bond Fund | Emerging Markets Debt Fund | |||||||||||||||||
| $ | — | $ | 1,621 | $ | — | $ | — | $ | — | $ | — | |||||||||||
| 34 |
| 10 | 5 | 6 | 1 | — | |||||||||||||||
| 165,189 | 144,995 | 161,732 | 135,962 | 8,245 | 105,724 | |||||||||||||||||
| 370 | — | — | — | — | 32 | |||||||||||||||||
| (3 | ) | (31 | ) | — | — | — | (1,042 | ) | ||||||||||||||
| 165,590 | 146,595 | 161,737 | 135,968 | 8,246 | 104,714 | |||||||||||||||||
| 18,277 | 11,188 | 11,692 | 9,473 | 1,155 | 14,604 | |||||||||||||||||
| 3,046 | 1,148 | 1,949 | 1,579 | 385 | 859 | |||||||||||||||||
| 72 | 26 | 47 | 37 | 9 | 20 | |||||||||||||||||
| 27 | 11 | 18 | 15 | 4 | 8 | |||||||||||||||||
| 345 | 124 | 225 | 155 | 45 | 222 | |||||||||||||||||
| 219 | 85 | 138 | 118 | 26 | 63 | |||||||||||||||||
| 53 | 20 | 34 | 29 | 7 | 15 | |||||||||||||||||
| 55 | 60 | 27 | 77 | — | 45 | |||||||||||||||||
| — | — | — | — | — | 20 | |||||||||||||||||
| 478 | 138 | 183 | 193 | 86 | 81 | |||||||||||||||||
| 22,572 | 12,800 | 14,313 | 11,676 | 1,717 | 15,937 | |||||||||||||||||
| (11,575 | ) | (4,762 | ) | (6,626 | ) | (5,368 | ) | (385 | ) | (8,147 | ) | |||||||||||
| (3,046 | ) | (1,148 | ) | (1,949 | ) | (1,579 | ) | (385 | ) | (859 | ) | |||||||||||
| — | — | — | — | — | — | |||||||||||||||||
| 7,951 | 6,890 | 5,738 | 4,729 | 947 | 6,931 | |||||||||||||||||
| 157,639 | 139,705 | 155,999 | 131,239 | 7,299 | 97,783 | |||||||||||||||||
| 127,664 | 5,929 | 157,695 | 89,128 | 454 | (1,930 | ) | ||||||||||||||||
| — |
| — | — | — | — | — | |||||||||||||||
| (6,460 | ) | (150 | ) | 13,947 | 7,601 | (379 | ) | (1,354 | ) | |||||||||||||
| 289 | — | — | — | — | — | |||||||||||||||||
| (1,081 | ) | (642 | ) | (527 | ) | — | — | 2,163 | ||||||||||||||
| 5,999 | — | — | — | — | (40,767 | ) | ||||||||||||||||
| (53,502 | ) | (79,508 | ) | (82,870 | ) | (115,557 | ) | (1,828 | ) | (164,956 | ) | |||||||||||
| 1,939 | — | 1,568 | 183 | (36 | ) | (21 | ) | |||||||||||||||
| 515 | — | — | — | — | — | |||||||||||||||||
| 594 | — | — | — | — | — | |||||||||||||||||
| (1,894 | ) | 319 | (1,456 | ) | — | — | (2,091 | ) | ||||||||||||||
| 613 |
| — | — | — | — | 4,102 | |||||||||||||||
$ | 232,315 |
| $ | 65,653 | $ | 244,356 | $ | 112,594 | $ | 5,510 | $ | (107,071 | ) | |||||||||
| SEI Institutional Investments Trust / Annual Report / May 31, 2015 | 299 |
Statements of Operations/Consolidated Statements of Operations ($ Thousands)
For the year/period ended May 31, 2015
| Real Return Fund | Limited Duration Bond Fund(1) | |||||||
Investment Income: | ||||||||
Dividends | $ | — | $ | — | ||||
Dividends from Affiliated Registered Investment Company | — | 1 | ||||||
Interest Income | (1,469 | )†† | 3,113 | |||||
Less: Foreign Taxes Withheld | — | — | ||||||
| (1,469 | ) | 3,114 | ||||||
Expenses: | ||||||||
Investment Advisory Fees | 467 | 664 | ||||||
Administration Fees | 106 | 133 | ||||||
Trustee Fees | 3 | 3 | ||||||
Chief Compliance Officer Fees | 1 | 1 | ||||||
Custodian/Wire Agent Fees | 3 | 13 | ||||||
Professional Fees | 8 | 12 | ||||||
Printing Fees | 2 | 3 | ||||||
Registration Fees | 3 | 52 | ||||||
Interest Expense on Reverse Repurchase Agreements | — | — | ||||||
Dividend Expense on Securities Sold Short | — | — | ||||||
Overdraft Fees | 3 | — | ||||||
Other Expenses | 10 | 12 | ||||||
Total Expenses | 606 | 893 | ||||||
Less: | ||||||||
Waiver of Investment Advisory Fees | (340 | ) | (371 | ) | ||||
Waiver of Administration Fees | (106 | ) | (133 | ) | ||||
Net Expenses | 160 | 389 | ||||||
Net Investment Income (Loss) | (1,629 | ) | 2,725 | |||||
Net Realized Gain (Loss) on: | ||||||||
Investments | (77 | ) | 246 | |||||
Securities Sold Short | — | — | ||||||
Futures Contracts | — | — | ||||||
Purchased and Written Options | — | — | ||||||
Swap Contracts | — | — | ||||||
Foreign Currency Transactions | — | — | ||||||
Net Change in Unrealized Appreciation (Depreciation) on: | ||||||||
Investments | (1,368 | ) | 830 | |||||
Securities Sold Short | — | — | ||||||
Futures Contracts | — | — | ||||||
Purchased and Written Options | — | — | ||||||
Swap Contracts | — | — | ||||||
Foreign Currency and Translation of Other Assets and Liabilities Denominated in Foreign Currencies | — | — | ||||||
Net Increase (Decrease) in Net Assets Resulting From Operations | $ | (3,074 | ) | $ | 3,801 | |||
| †† | Negative interest income is due to negative yields on U.S. Treasury Inflation Protected Securities. |
| (1) | Commenced operations on July 31, 2014. |
| (2) | Commenced operations on March 31, 2015. |
Amounts designated as “—” are $0 or have been rounded to $0.
The accompanying notes are an integral part of the financial statements.
| 300 | SEI Institutional Investments Trust / Annual Report / May 31, 2015 |
| Intermediate Duration Credit Fund(2) | Dynamic Asset Allocation Fund | Multi-Asset Real Return Fund | ||||||||
| $ | — | $ | 35,888 | $ | 4,525 | |||||
| 2 | — | — | ||||||||
| 5,427 | 5 | 708 | ||||||||
| — | (49 | ) | (5 | ) | ||||||
| 5,429 | 35,844 | 5,228 | ||||||||
| 598 | 10,788 | 4,008 | ||||||||
| 120 | 899 | 364 | ||||||||
| — | 21 | 9 | ||||||||
| 1 | 9 | 3 | ||||||||
| 13 | 13 | 21 | ||||||||
| 14 | 67 | 27 | ||||||||
| 3 | 16 | 6 | ||||||||
| 90 | 24 | 6 | ||||||||
| — | — | 184 | ||||||||
| — | — | 776 | ||||||||
| — | — | 4 | ||||||||
| 10 | 83 | 388 | ||||||||
| 849 | 11,920 | 5,796 | ||||||||
| (239 | ) | (9,709 | ) | (2,303 | ) | |||||
| (120 | ) | (899 | ) | (364 | ) | |||||
| 490 | 1,312 | 3,129 | ||||||||
| 4,939 | 34,532 | 2,099 | ||||||||
| (2,482 | ) | 13,668 | 5,299 | |||||||
| — | — | (15,037 | ) | |||||||
| 418 | 15,613 | (43,368 | ) | |||||||
| — | 7,350 | (283 | ) | |||||||
| — | — | 279 | ||||||||
| — | 148,542 | 2,037 | ||||||||
| (23,000 | ) | 143,113 | 887 | |||||||
| — | — | 9,282 | ||||||||
| (255 | ) | 11,779 | 1,372 | |||||||
| — | 1,137 | (61 | ) | |||||||
| — | — | (453 | ) | |||||||
| — | (16,157 | ) | 245 | |||||||
| $ | (20,380 | ) | $ | 359,577 | $ | (37,702 | ) | |||
| SEI Institutional Investments Trust / Annual Report / May 31, 2015 | 301 |
Statements of Changes in Net Assets ($ Thousands)
For the years or period ended May 31,
Large Cap Fund | Large Cap Diversified Alpha Fund | Large Cap Disciplined Equity Fund | ||||||||||||||||||||||
| 2015 | 2014 | 2015 | 2014 | 2015 | 2014 | |||||||||||||||||||
Operations: | ||||||||||||||||||||||||
Net Investment Income | $ | 31,171 | $ | 29,230 | $ | 1,724 | $ | 3,006 | $ | 73,927 | $ | 81,200 | ||||||||||||
Net Realized Gain (Loss) from Investments, Affiliated Investments, Futures Contracts and Swap Contracts | 267,769 | 249,266 | 21,738 | 76,888 | 501,691 | 859,646 | ||||||||||||||||||
Net Realized Gain on Foreign Currency Transactions | — | — | — | — | — | 16 | ||||||||||||||||||
Net Change in Unrealized Appreciation (Depreciation) on Investments, Affiliated Investments and Futures Contracts | (30,173 | ) | 127,188 | (9,888 | ) | (24,811 | ) | (47,181 | ) | (15,341 | ) | |||||||||||||
Net Increase in Net Assets Resulting from Operations | 268,767 | 405,684 | 13,574 | 55,083 | 528,437 | 925,521 | ||||||||||||||||||
Dividends and Distributions From: | ||||||||||||||||||||||||
Net Investment Income: | ||||||||||||||||||||||||
Class A | (32,637 | ) | (28,887 | ) | (1,987 | ) | (2,968 | ) | (73,454 | ) | (70,879 | ) | ||||||||||||
Net Realized Gains: | ||||||||||||||||||||||||
Class A | (213,341 | ) | (196,027 | ) | (2,247 | ) | — | (558,785 | ) | (284,707 | ) | |||||||||||||
Total Dividends and Distributions | (245,978 | ) | (224,914 | ) | (4,234 | ) | (2,968 | ) | (632,239 | ) | (355,586 | ) | ||||||||||||
Capital Share Transactions:(1) | ||||||||||||||||||||||||
Class A: | ||||||||||||||||||||||||
Proceeds from Shares Issued | 526,105 | 712,342 | 7,304 | 24,012 | 393,813 | 483,241 | ||||||||||||||||||
Reinvestment of Dividends & Distributions | 238,120 | 217,467 | 3,514 | 2,772 | 620,914 | 348,910 | ||||||||||||||||||
Cost of Shares Redeemed | (726,024 | ) | (703,202 | ) | (95,276 | ) | (249,751 | ) | (1,334,496 | ) | (2,280,185 | ) | ||||||||||||
Increase (Decrease) in Net Assets Derived from Capital Share Transactions | 38,201 | 226,607 | (84,458 | ) | (222,967 | ) | (319,769 | ) | (1,448,034 | ) | ||||||||||||||
Net Increase (Decrease) in Net Assets | 60,990 | 407,377 | (75,118 | ) | (170,852 | ) | (423,571 | ) | (878,099 | ) | ||||||||||||||
Net Assets: | ||||||||||||||||||||||||
Beginning of Period | 2,305,214 | 1,897,837 | 138,725 | 309,577 | 4,622,216 | 5,500,315 | ||||||||||||||||||
End of Period | $ | 2,366,204 | $ | 2,305,214 | $ | 63,607 | $ | 138,725 | $ | 4,198,645 | $ | 4,622,216 | ||||||||||||
Undistributed Net Investment Income Included in Net Assets at Period End | $ | 4,124 | $ | 5,901 | $ | — | $ | 106 | $ | 10,481 | $ | 10,270 | ||||||||||||
| (1) | See Note 7 in the Notes to Financial Statements for additional information. |
| (2) | Commenced operations on December 18, 2013. |
| (3) | Includes subscriptions as a result of an in-kind transfer of securities (see Note 11). |
Amounts designated as “—” are $0 or have been rounded to $0.
The accompanying notes are an integral part of the financial statements.
| 302 | SEI Institutional Investments Trust / Annual Report / May 31, 2015 |
| Large Cap Index Fund | S&P 500 Index Fund(2) | Extended Market Index Fund | Small Cap Fund | |||||||||||||||||||||||||||
| 2015 | 2014 | 2015 | 2014 | 2015 | 2014 | 2015 | 2014 | |||||||||||||||||||||||
| $ | 35,636 | $ | 38,572 | $ | 37,545 | $ | 5,568 | $ | 7,645 | $ | 4,852 | $ | 4,172 | $ | 5,105 | |||||||||||||||
| | 80,050 | | 112,407 | (469 | ) | (453 | ) | 20,338 | 9,078 | 44,616 | 131,199 | |||||||||||||||||||
| — | — | — | 438 | 1 | — | — | — | |||||||||||||||||||||||
| | 97,399 | | 234,795 | 134,819 | 37,516 | 36,273 | 39,529 | 15,049 | (11,323 | ) | ||||||||||||||||||||
| 213,085 | 385,774 | 171,895 | 43,069 | 64,257 | 53,459 | 63,837 | 124,981 | |||||||||||||||||||||||
| (36,785 | ) | (39,793 | ) | (31,162 | ) | (2,597 | ) | (8,576 | ) | (4,224 | ) | (4,749 | ) | (6,428 | ) | |||||||||||||||
| (112,771 | ) | (30,168 | ) | (2,404 | ) | — | (12,821 | ) | (2,426 | ) | (17,304 | ) | — | |||||||||||||||||
| (149,556 | ) | (69,961 | ) | (33,566 | ) | (2,597 | ) | (21,397 | ) | (6,650 | ) | (22,053 | ) | (6,428 | ) | |||||||||||||||
| 308,586 | 400,402 | 2,662,395 | (3) | 847,703 | 264,461 | 362,728 | 69,000 | 58,141 | ||||||||||||||||||||||
| 148,236 | 68,805 | 33,048 | 2,493 | 21,340 | 6,632 | 18,158 | 5,346 | |||||||||||||||||||||||
| (453,706 | ) | (1,093,499 | ) | (475,519 | ) | (54,077 | ) | (104,581 | ) | (76,993 | ) | (137,872 | ) | (268,462 | ) | |||||||||||||||
| | 3,116 | | (624,292 | ) | 2,219,924 | 796,119 | 181,220 | 292,367 | (50,714 | ) | (204,975 | ) | ||||||||||||||||||
| 66,645 | (308,479 | ) | 2,358,253 | 836,591 | 224,080 | 339,176 | (8,930 | ) | (86,422 | ) | ||||||||||||||||||||
| 1,905,609 | 2,214,088 | 836,591 | — | 513,283 | 174,107 | 692,554 | 778,976 | |||||||||||||||||||||||
| $ | 1,972,254 | $ | 1,905,609 | $ | 3,194,844 | $ | 836,591 | $ | 737,363 | $ | 513,283 | $ | 683,624 | $ | 692,554 | |||||||||||||||
$ | 5,034 |
| $ | 6,019 | $ | 9,496 | $ | 2,996 | $ | 284 | $ | 1,078 | $ | 434 | $ | 435 | ||||||||||||||
| SEI Institutional Investments Trust / Annual Report / May 31, 2015 | 303 |
Statements of Changes in Net Assets ($ Thousands)
For the years or period ended May 31,
Small Cap II Fund | Small/Mid Cap Equity Fund | U.S. Managed Volatility Fund | ||||||||||||||||||||||
| 2015 | 2014 | 2015 | 2014 | 2015 | 2014 | |||||||||||||||||||
Operations: | ||||||||||||||||||||||||
Net Investment Income | $ | 1,486 | $ | 1,129 | $ | 12,378 | $ | 10,805 | $ | 30,106 | $ | 25,301 | ||||||||||||
Net Realized Gain (Loss) from Investments, Affiliated Investments, Written Options, Written Swaptions Futures Contracts and Swap Contracts | 22,166 | 32,321 | 273,569 | 274,919 | 116,939 | 141,153 | ||||||||||||||||||
Net Realized Gain (Loss) on Foreign Currency Transactions | — | — | (2 | ) | 7 | 11 | (62 | ) | ||||||||||||||||
Net Change in Unrealized Appreciation (Depreciation) on Investments, Affiliated Investments, Written Options, Futures Contracts and Swap Contracts | 11,465 | 486 | (86,593 | ) | 89,262 | 17,591 | 60,276 | |||||||||||||||||
Net Change in Unrealized Depreciation on Foreign Cap Gains Tax | — | — | — | — | — | — | ||||||||||||||||||
Net Change in Unrealized Appreciation (Depreciation) on Foreign Currency Transactions | — | — | — | (1 | ) | (20 | ) | 6 | ||||||||||||||||
Net Increase in Net Assets Resulting from Operations | 35,117 | 33,936 | 199,352 | 374,992 | 164,627 | 226,674 | ||||||||||||||||||
Dividends and Distributions From: | ||||||||||||||||||||||||
Net Investment Income: | ||||||||||||||||||||||||
Class A | (1,730 | ) | (1,119 | ) | (13,133 | ) | (13,895 | ) | (30,488 | ) | (25,557 | ) | ||||||||||||
Net Realized Gains: | ||||||||||||||||||||||||
Class A | (22,274 | ) | (25,584 | ) | (249,463 | ) | (320,629 | ) | (135,734 | ) | (94,547 | ) | ||||||||||||
Total Dividends and Distributions | (24,004 | ) | (26,703 | ) | (262,596 | ) | (334,524 | ) | (166,222 | ) | (120,104 | ) | ||||||||||||
Capital Share Transactions:(1) | ||||||||||||||||||||||||
Class A: | ||||||||||||||||||||||||
Proceeds from Shares Issued | 148,293 | 145,303 | 209,230 | 229,408 | 299,776 | 224,022 | ||||||||||||||||||
Reinvestment of Dividends & Distributions | 22,855 | 24,904 | 258,096 | 331,178 | 161,311 | 118,271 | ||||||||||||||||||
Cost of Shares Redeemed | (60,838 | ) | (146,702 | ) | (373,749 | ) | (925,523 | ) | (281,378 | ) | (358,319 | ) | ||||||||||||
Increase (Decrease) in Net Assets Derived from Capital Share Transactions | 110,310 | 23,505 | 93,577 | (364,937 | ) | 179,709 | (16,026 | ) | ||||||||||||||||
Net Increase (Decrease) in Net Assets | 121,423 | 30,738 | 30,333 | (324,469 | ) | 178,114 | 90,544 | |||||||||||||||||
Net Assets: | ||||||||||||||||||||||||
Beginning of Period | 252,435 | 221,697 | 1,829,276 | 2,153,745 | 1,236,524 | 1,145,980 | ||||||||||||||||||
End of Period | $ | 373,858 | $ | 252,435 | $ | 1,859,609 | $ | 1,829,276 | $ | 1,414,638 | $ | 1,236,524 | ||||||||||||
Undistributed Net Investment Income Included in Net Assets at Period End | $ | 196 | $ | 318 | $ | 4,932 | $ | 5,107 | $ | 3,742 | $ | 3,767 | ||||||||||||
| (1) | See Note 7 in the Notes to Financial Statements for additional information. |
| (2) | Commenced operations on October 31, 2014. |
Amounts designated as “—” are $0 or have been rounded to $0.
The accompanying notes are an integral part of the financial statements.
| 304 | SEI Institutional Investments Trust / Annual Report / May 31, 2015 |
World Equity Ex-US Fund | Screened World Equity Ex-US Fund | Emerging Markets Equity Fund(2) | Opportunistic Income Fund | |||||||||||||||||||||||||
| 2015 | 2014 | 2015 | 2014 | 2015 | 2015 | 2014 | ||||||||||||||||||||||
| $ | 140,241 | $ | 130,495 | $ | 1,595 | $ | 1,206 | $ | 3,366 | $ | 52,573 | $ | 35,946 | |||||||||||||||
| 170,588 |
| 441,914 | 3,723 | 2,651 | 1,333 | (1,837 | ) | (9,332 | ) | ||||||||||||||||||
| (4,709 | ) | (1,722 | ) | (95 | ) | 15 | (263 | ) | (1 | ) | — | ||||||||||||||||
| (155,553 | ) | 326,771 | (5,134 | ) | 4,817 | 6,976 | (10,366 | ) | 17,768 | ||||||||||||||||||
| — |
| (503 | ) | — | — | — | — | — | |||||||||||||||||||
| (415 | ) | 199 | (16 | ) | 7 | (20 | ) | — | — | ||||||||||||||||||
| 150,152 | 897,154 | 73 | 8,696 | 11,392 | 40,369 | 44,382 | ||||||||||||||||||||||
| (135,664 | ) | (149,128 | ) | (1,372 | ) | (1,227 | ) | (668 | ) | (51,651 | ) | (31,408 | ) | |||||||||||||||
| (82,563 | ) | — | — | — | — | — | — | |||||||||||||||||||||
| (218,227 | ) | (149,128 | ) | (1,372 | ) | (1,227 | ) | (668 | ) | (51,651 | ) | (31,408 | ) | |||||||||||||||
| 1,723,101 | 1,481,341 | 17,626 | 16,386 | 607,465 | 755,105 | 1,093,631 | ||||||||||||||||||||||
| 213,272 | 145,529 | 924 | 846 | 658 | 50,192 | 30,893 | ||||||||||||||||||||||
| (946,582 | ) | (1,844,620 | ) | (10,489 | ) | (10,105 | ) | (26,884 | ) | (502,388 | ) | (258,169 | ) | |||||||||||||||
| 989,791 |
| (217,750 | ) | 8,061 | 7,127 | 581,239 | 302,909 | 866,355 | |||||||||||||||||||
| 921,716 | 530,276 | 6,762 | 14,596 | 591,963 | 291,627 | 879,329 | ||||||||||||||||||||||
| 6,723,128 | 6,192,852 | 77,117 | 62,521 | — | 1,875,851 | 996,522 | ||||||||||||||||||||||
| $ | 7,644,844 | $ | 6,723,128 | $ | 83,879 | $ | 77,117 | $ | 591,963 | $ | 2,167,478 | $ | 1,875,851 | |||||||||||||||
$ | 69,403 |
| $ | 57,952 | $ | 838 | $ | 671 | $ | 3,230 | $ | 18,074 | $ | 18,033 | ||||||||||||||
| SEI Institutional Investments Trust / Annual Report / May 31, 2015 | 305 |
Statements of Changes in Net Assets ($ Thousands)
For the years or period ended May 31,
| Core Fixed Income Fund | High Yield Bond Fund | Long Duration Fund | ||||||||||||||||||||||
| 2015 | 2014 | 2015 | 2014 | 2015 | 2014 | |||||||||||||||||||
Operations: | ||||||||||||||||||||||||
Net Investment Income (Loss) | $ | 157,639 | $ | 169,392 | $ | 139,705 | $ | 136,895 | $ | 155,999 | $ | 150,928 | ||||||||||||
Net Realized Gain (Loss) from Investments, Affiliated Investments, Written Options, Written Swaptions, Futures Contracts and Swap Contracts | 120,412 | (11,546 | ) | 5,137 | 47,959 | 171,115 | (36,933 | ) | ||||||||||||||||
Net Realized Gain (Loss) on Foreign Currency Transactions | 5,999 | (1,106 | ) | — | — | — | — | |||||||||||||||||
Net Change in Unrealized Appreciation (Depreciation) on Investments, Affiliated Investments, Written Options, Futures Contracts and Swap Contracts | (52,348 | ) | 40,891 | (79,189 | ) | (26,103 | ) | (82,758 | ) | 148,630 | ||||||||||||||
Net Change in Unrealized Appreciation (Depreciation) on Foreign Currency Transactions | 613 | (268 | ) | — | — | — | — | |||||||||||||||||
Net Increase (Decrease) in Net Assets Resulting from Operations | 232,315 | 197,363 | 65,653 | 158,751 | 244,356 | 262,625 | ||||||||||||||||||
Dividends and Distributions From: | ||||||||||||||||||||||||
Net Investment Income: | ||||||||||||||||||||||||
Class A | (161,700 | ) | (177,685 | ) | (138,330 | ) | (135,226 | ) | (155,525 | ) | (150,249 | ) | ||||||||||||
Net Realized Gains: | ||||||||||||||||||||||||
Class A | (19,513 | ) | (23,149 | ) | (49,592 | ) | (34,630 | ) | (43,415 | ) | (18,009 | ) | ||||||||||||
Total Dividends and Distributions | (181,213 | ) | (200,834 | ) | (187,922 | ) | (169,856 | ) | (198,940 | ) | (168,258 | ) | ||||||||||||
Capital Share Transactions:(1) | ||||||||||||||||||||||||
Class A: | ||||||||||||||||||||||||
Proceeds from Shares Issued | 1,588,584 | 1,896,737 | (2) | 678,945 | 418,542 | 506,434 | 1,288,121 | |||||||||||||||||
Reinvestment of Dividends & Distributions | 177,099 | 194,429 | 181,899 | 164,731 | 191,899 | 162,667 | ||||||||||||||||||
Cost of Shares Redeemed | (2,126,284 | ) | (2,661,607 | ) | (396,907 | ) | (559,617 | ) | (1,421,341 | ) | (846,009 | ) | ||||||||||||
Increase (Decrease) in Net Assets Derived from Capital Share Transactions | (360,601 | ) | (570,441 | ) | 463,937 | 23,656 | (723,008 | ) | 604,779 | |||||||||||||||
Net Increase (Decrease) in Net Assets | (309,499 | ) | (573,912 | ) | 341,668 | 12,551 | (677,592 | ) | 699,146 | |||||||||||||||
Net Assets: | ||||||||||||||||||||||||
Beginning of Period | 5,910,306 | 6,484,218 | 2,175,102 | 2,162,551 | 4,021,437 | 3,322,291 | ||||||||||||||||||
End of Period | $ | 5,600,807 | $ | 5,910,306 | $ | 2,516,770 | $ | 2,175,102 | $ | 3,343,845 | $ | 4,021,437 | ||||||||||||
Undistributed (Distributions in Excess of) Net Investment Income Included in Net Assets at Period End | $ | 4,872 | $ | (1,442 | ) | $ | 11,788 | $ | 19,644 | $ | (1,296 | ) | $ | (1,425 | ) | |||||||||
| (1) | See Note 7 in the Notes to Financial Statements for additional information. |
| (2) | Includes subscriptions as a result of an in-kind transfer of securities (see Note 11). |
| (3) | Commenced operations on July 31, 2014. |
Amounts designated as “—” are $0 or have been rounded to $0.
The accompanying notes are an integral part of the financial statements.
| 306 | SEI Institutional Investments Trust / Annual Report / May 31, 2015 |
Long Duration Credit Fund | Ultra Short Duration Bond Fund | Emerging Markets Debt Fund | Real Return Fund | Limited Duration Bond Fund(3) | ||||||||||||||||||||||||||||||||
| 2015 | 2014 | 2015 | 2014 | 2015 | 2014 | 2015 | 2014 | 2015 | ||||||||||||||||||||||||||||
| $ | 131,239 | $ | 109,350 | $ | 7,299 | $ | 5,014 | $ | 97,783 | $ | 84,887 | $ | (1,629 | ) | $ | 1,213 | $ | 2,725 | ||||||||||||||||||
| 96,729 |
| (25,055 | ) | 75 | 99 | (1,121 | ) | (26,199 | ) | (77 | ) | (492 | ) | 246 | |||||||||||||||||||||
| — |
| — | — | — | (40,767 | ) | (42,846 | ) | — | — | — | ||||||||||||||||||||||||
| (115,374 | ) | 146,717 | (1,864 | ) | 1,124 | (167,068 | ) | 3,004 | (1,368 | ) | 1,402 | 830 | |||||||||||||||||||||||
| — |
| — | — | — | 4,102 | 1,136 | — | — | — | ||||||||||||||||||||||||||
| 112,594 |
| 231,012 | 5,510 | 6,237 | (107,071 | ) | 19,982 | (3,074 | ) | 2,123 | 3,801 | ||||||||||||||||||||||||
| (131,283 | ) | (109,485 | ) | (8,484 | ) | (5,851 | ) | (62,267 | ) | (44,045 | ) | (1,584 | ) | (900 | ) | (2,884 | ) | |||||||||||||||||||
| — | (13,203 | ) | — | — | — | (17,116 | ) | — | (2,005 | ) | (53 | ) | ||||||||||||||||||||||||
| (131,283 | ) | (122,688 | ) | (8,484 | ) | (5,851 | ) | (62,267 | ) | (61,161 | ) | (1,584 | ) | (2,905 | ) | (2,937 | ) | |||||||||||||||||||
| 1,426,153 | (2) | 814,026 | (2) | 396,249 | 434,616 | 593,399 | 525,857 | 58,556 | 68,124 | 692,080 | ||||||||||||||||||||||||||
| 130,812 | 122,652 | 8,329 | 5,767 | 60,474 | 59,203 | 1,563 | 2,756 | 2,847 | ||||||||||||||||||||||||||||
| (893,305 | ) | (307,697 | ) | (473,931 | ) | (245,163 | ) | (243,859 | ) | (359,674 | ) | (35,704 | ) | (114,372 | ) | (25,212 | ) | |||||||||||||||||||
| 663,660 |
| 628,981 |
| (69,353 | ) | 195,220 | 410,014 | 225,386 | 24,415 | (43,492 | ) | 669,715 | ||||||||||||||||||||||||
| 644,971 | 737,305 | (72,327 | ) | 195,606 | 240,676 | 184,207 | 19,757 | (44,274 | ) | 670,579 | ||||||||||||||||||||||||||
| 2,820,257 | 2,082,952 | 718,199 | 522,593 | 1,596,100 | 1,411,893 | 207,578 | 251,852 | — | ||||||||||||||||||||||||||||
| $ | 3,465,228 | $ | 2,820,257 | $ | 645,872 | $ | 718,199 | $ | 1,836,776 | $ | 1,596,100 | $ | 227,335 | $ | 207,578 | $ | 670,579 | |||||||||||||||||||
$ | 30 |
| $ | (22 | ) | $ | — | $ | (6 | ) | $ | (12,145 | ) | $ | (7,096 | ) | $ | (2,012 | ) | $ | 1,166 | $ | 3 | |||||||||||||
| SEI Institutional Investments Trust / Annual Report / May 31, 2015 | 307 |
Statements of Changes in Net Assets/Consolidated Statements of Changes in Net Assets ($ Thousands)
For the years or period ended May 31,
Intermediate Duration Credit Fund(2) | Dynamic Asset Allocation Fund | Multi-Asset Real Return Fund | ||||||||||||||||||||
| 2015 | 2015 | 2014 | 2015 | 2014 | ||||||||||||||||||
Operations: | ||||||||||||||||||||||
Net Investment Income | $ | 4,939 | $ | 34,532 | $ | 26,866 | $ | 2,099 | $ | 7,172 | ||||||||||||
Net Realized Gain (Loss) from Investments, Affiliated Investments, Written Options, Written Swaptions, Futures Contracts and Swap Contracts | (2,064) | 36,631 | (17,549) | (53,110) | (10,297) | |||||||||||||||||
Net Realized Gain (Loss) on Foreign Currency Transactions | — | 148,542 | (26,868) | 2,037 | (434) | |||||||||||||||||
Net Change in Unrealized Appreciation (Depreciation) on Investments, Affiliated Investments, Written Options, Futures Contracts and Swap Contracts | (23,255) | 156,029 | 217,225 | 11,027 | 19,145 | |||||||||||||||||
Net Change in Unrealized Appreciation (Depreciation) on Foreign Currency Transactions | — | (16,157) | 1,398 | 245 | (1,247) | |||||||||||||||||
Net Increase (Decrease) in Net Assets Resulting from Operations | (20,380) | 359,577 | 201,072 | (37,702) | 14,339 | |||||||||||||||||
Dividends and Distributions From: | ||||||||||||||||||||||
Net Investment Income: | ||||||||||||||||||||||
Class A | (4,969) | (84,817) | (2,250) | (12,380) | — | |||||||||||||||||
Net Realized Gains: | ||||||||||||||||||||||
Class A | — | — | (21,963) | — | — | |||||||||||||||||
Return of Capital: | ||||||||||||||||||||||
Class A | (129) | — | — | (2,378) | — | |||||||||||||||||
Total Dividends and Distributions | (5,098) | (84,817) | (24,213) | (14,758) | — | |||||||||||||||||
Capital Share Transactions:(1) | ||||||||||||||||||||||
Class A: | ||||||||||||||||||||||
Proceeds from Shares Issued | 1,646,813 | (3) | 412,308 | 477,460 | 226,397 | 474,358 | ||||||||||||||||
Reinvestment of Dividends & Distributions | 5,009 | 83,152 | 23,820 | 13,785 | — | |||||||||||||||||
Cost of Shares Redeemed | (26,227) | (333,966) | (256,448) | (172,932) | (76,574) | |||||||||||||||||
Increase in Net Assets Derived from Capital Share Transactions | 1,625,595 | 161,494 | 244,832 | 67,250 | 397,784 | |||||||||||||||||
Net Increase in Net Assets | 1,600,117 | 436,254 | 421,691 | 14,790 | 412,123 | |||||||||||||||||
Net Assets: | ||||||||||||||||||||||
Beginning of Period | — | 1,557,322 | 1,135,631 | 716,022 | 303,899 | |||||||||||||||||
End of Period | $ | 1,600,117 | $ | 1,993,576 | $ | 1,557,322 | $ | 730,812 | $ | 716,022 | ||||||||||||
Undistributed (Distributions in Excess of) Net Investment Income Included in Net Assets at Period End | $ | — | $ | 91,417 | $ | (6,927) | $ | (14,431) | $ | (6,591) | ||||||||||||
| (1) | See Note 7 in the Notes to Financial Statements for additional information. |
| (2) | Commenced operations on March 31, 2015. |
| (3) | Includes subscriptions as a result of an in-kind transfer of securities (see Note 11). |
Amounts designated as “—” are $0 or have been rounded to $0.
The accompanying notes are an integral part of the financial statements.
| 308 | SEI Institutional Investments Trust / Annual Report / May 31, 2015 |
Consolidated Statement of Cash Flows ($ Thousands)
For the year ended May 31, 2015
| Multi-Asset Real Return Fund | ||||
Cash Flows from Operating Activities: | ||||
Net Decrease in Net Assets from Operations | $ | (37,702 | ) | |
Adjustments to Reconcile Net Decrease in Net Assets Resulting from Operations to Net Cash Used in Operating Activities: | ||||
Purchase of Investment Securities | (1,020,968 | ) | ||
Proceeds from Disposition of Investment Securities | 957,587 | |||
Purchased Options/Purchases to Cover Written Options & Securities Sold Short | (195,063 | ) | ||
Proceeds from Sale of Options/Expired Options and Securities Sold Short | 192,121 | |||
Amortization (Accretion of Market Discount) | 6,335 | |||
Net Realized (Gain) Loss on: | ||||
Investments | (5,300 | ) | ||
Options | 283 | |||
Securities Sold Short | 15,037 | |||
Net Change in Unrealized (Appreciation) Depreciation on: | ||||
Investments | (887 | ) | ||
Options | 61 | |||
Securities Sold Short | (9,282 | ) | ||
Changes in assets: | ||||
Foreign currency, at value | (390 | ) | ||
Cash pledged as collateral for forward foreign currency contracts, futures contracts and swap contracts | 11,618 | |||
Receivable for investment securities sold | 39,070 | |||
Dividends and interest receivable | 758 | |||
Receivable for variation margin | (3,168 | ) | ||
Foreign tax reclaim receivable | (1 | ) | ||
Unrealized gain on forward foreign currency contracts | (287 | ) | ||
Unrealized gain on foreign spot currency contracts | (7 | ) | ||
Swap contracts, at value | 50 | |||
Prepaid expenses | (1 | ) | ||
Changes in liabilities: | ||||
Payable for investment securities purchased | (34,369 | ) | ||
Swap contracts, at value | 43 | |||
Payable for variation margin | 519 | |||
Unrealized loss on forward foreign currency contracts | 2 | |||
Unrealized loss on foreign spot currency contracts | 25 | |||
Investment advisory fees payable | (25 | ) | ||
Accrued expense payable | 30 | |||
Net Cash Used in Operating Activities | (83,911 | ) | ||
Cash Flows from Financing Activities: | ||||
Reverse repurchase agreements | 38,430 | |||
Proceeds from Shares Issued | 228,677 | |||
Distributions from Net Investment Income | (973 | ) | ||
Cost of Shares Redeemed | (167,721 | ) | ||
Net Cash Provided by Financing Activities | 98,413 | |||
Net Change in Cash | 14,502 | |||
Cash at beginning of year | $ | 93,655 | ||
Cash at end of year | $ | 108,157 | ||
Supplemental Disclosure of Cash Flow Information | ||||
Interest Paid | $ | 184 | ||
The accompanying notes are an integral part of the financial statements.
| SEI Institutional Investments Trust / Annual Report / May 31, 2015 | 309 |
For the years or periods ended May 31,
For a share outstanding throughout each period
| Net Asset Value, Beginning of Period | Net Investment Income(1) | Net Realized and Unrealized Gains (Losses) on Securities(1) | Total from Operations | Dividends from Net Investment Income | Distributions from Realized Capital Gains | Total Dividends and Distributions | Net Asset Value, End of Period | Total Return† | Net Assets End of Period ($ Thousands) | Ratio of Net Expenses to Average Net Assets | Ratio of Expenses to Average Net Assets (Excluding Fees Paid Indirectly and Including Waivers) | Ratio of Expenses to Average Net Assets (Excluding Fees Paid Indirectly and Waivers) | Ratio of Net Investment Income to Average Net Assets | Portfolio Turnover Rate† | ||||||||||||||||||||||||||||||||||||||||||||||
Large Cap Fund |
| |||||||||||||||||||||||||||||||||||||||||||||||||||||||||||
Class A |
| |||||||||||||||||||||||||||||||||||||||||||||||||||||||||||
2015 | $ | 22.72 | $ | 0.30 | $ | 2.27 | $ | 2.57 | $ | (0.31 | ) | $ | (2.09 | ) | $ | (2.40 | ) | $ | 22.89 | 11.95 | % | $ | 2,366,204 | 0.19 | % | 0.19 | % | 0.47 | % | 1.30 | % | 60 | % | |||||||||||||||||||||||||||
2014 | 20.94 | 0.30 | 3.96 | 4.26 | (0.30 | ) | (2.18 | ) | (2.48 | ) | 22.72 | 21.32 | 2,305,214 | 0.18 | 0.18 | 0.46 | 1.38 | 59 | ||||||||||||||||||||||||||||||||||||||||||
2013 | 17.07 | 0.34 | 4.38 | 4.72 | (0.33 | ) | (0.52 | ) | (0.85 | ) | 20.94 | 28.44 | 1,897,837 | 0.19 | (6) | 0.19 | (6) | 0.46 | (6) | 1.79 | 47 | |||||||||||||||||||||||||||||||||||||||
2012 | 18.40 | 0.25 | (0.61 | ) | (0.36 | ) | (0.24 | ) | (0.73 | ) | (0.97 | ) | 17.07 | (1.69 | ) | 1,774,178 | 0.26 | (3) | 0.26 | (3) | 0.47 | (3) | 1.47 | 83 | ||||||||||||||||||||||||||||||||||||
2011 | 14.84 | 0.22 | 3.56 | 3.78 | (0.22 | ) | — | (0.22 | ) | 18.40 | 25.70 | 1,616,607 | 0.26 | 0.26 | 0.47 | 1.35 | 85 | |||||||||||||||||||||||||||||||||||||||||||
Large Cap Diversified Alpha Fund |
| |||||||||||||||||||||||||||||||||||||||||||||||||||||||||||
Class A |
| |||||||||||||||||||||||||||||||||||||||||||||||||||||||||||
2015 | $ | 14.05 | $ | 0.22 | $ | 1.50 | $ | 1.72 | $ | (0.23 | ) | $ | (0.26 | ) | $ | (0.49 | ) | $ | 15.28 | 12.43 | % | $ | 63,607 | 0.24 | % | 0.24 | % | 0.47 | % | 1.49 | % | 110 | % | |||||||||||||||||||||||||||
2014 | 11.59 | 0.16 | 2.42 | 2.58 | (0.12 | ) | — | (0.12 | ) | 14.05 | 22.36 | 138,725 | 0.24 | 0.24 | 0.46 | 1.24 | 121 | |||||||||||||||||||||||||||||||||||||||||||
2013 | 9.41 | 0.16 | 2.22 | 2.38 | (0.20 | ) | — | (0.20 | ) | 11.59 | 25.66 | 309,577 | 0.24 | 0.24 | 0.46 | 1.55 | 82 | |||||||||||||||||||||||||||||||||||||||||||
2012 | 9.53 | 0.13 | (0.16 | ) | (0.03 | ) | (0.09 | ) | — | (0.09 | ) | 9.41 | (0.24 | ) | 320,907 | 0.31 | 0.31 | 0.47 | 1.40 | 101 | ||||||||||||||||||||||||||||||||||||||||
2011 | 7.69 | 0.11 | 1.88 | 1.99 | (0.15 | ) | — | (0.15 | ) | 9.53 | 26.09 | 364,180 | 0.31 | 0.31 | 0.47 | 1.30 | 143 | |||||||||||||||||||||||||||||||||||||||||||
Large Cap Disciplined Equity Fund |
| |||||||||||||||||||||||||||||||||||||||||||||||||||||||||||
Class A |
| |||||||||||||||||||||||||||||||||||||||||||||||||||||||||||
2015 | $ | 14.79 | $ | 0.24 | $ | 1.45 | $ | 1.69 | $ | (0.23 | ) | $ | (1.87 | ) | $ | (2.10 | ) | $ | 14.38 | 12.23 | % | $ | 4,198,645 | 0.18 | %(12) | 0.18 | %(12) | 0.47 | %(12) | 1.61 | % | 113 | % | |||||||||||||||||||||||||||
2014 | 13.24 | 0.23 | 2.39 | 2.62 | (0.20 | ) | (0.87 | ) | (1.07 | ) | 14.79 | 20.49 | 4,622,216 | 0.18 | (9) | 0.18 | (9) | 0.46 | (9) | 1.65 | 110 | |||||||||||||||||||||||||||||||||||||||
2013 | 10.58 | 0.21 | 2.73 | 2.94 | (0.28 | ) | — | (0.28 | ) | 13.24 | 28.24 | 5,500,315 | 0.17 | (5) | 0.17 | (5) | 0.46 | (5) | 1.80 | 109 | ||||||||||||||||||||||||||||||||||||||||
2012 | 10.87 | 0.16 | (0.29 | ) | (0.13 | ) | (0.16 | ) | — | (0.16 | ) | 10.58 | (1.14 | ) | 5,436,390 | 0.18 | (4) | 0.18 | (4) | 0.47 | (4) | 1.54 | 93 | |||||||||||||||||||||||||||||||||||||
2011 | 8.86 | 0.15 | 2.08 | 2.23 | (0.22 | ) | — | (0.22 | ) | 10.87 | 25.39 | 7,773,980 | 0.18 | 0.18 | 0.47 | 1.54 | 118 | |||||||||||||||||||||||||||||||||||||||||||
Large Cap Index Fund |
| |||||||||||||||||||||||||||||||||||||||||||||||||||||||||||
Class A |
| |||||||||||||||||||||||||||||||||||||||||||||||||||||||||||
2015 | $ | 164.21 | $ | 3.14 | $ | 15.63 | $ | 18.77 | $ | (3.23 | ) | $ | (10.39 | ) | $ | (13.62 | ) | $ | 169.36 | 11.89 | % | $ | 1,972,254 | 0.03 | % | 0.03 | % | 0.24 | % | 1.87 | % | 12 | % | |||||||||||||||||||||||||||
2014 | 140.87 | 2.91 | 25.93 | 28.84 | (3.02 | ) | (2.48 | ) | (5.50 | ) | 164.21 | 20.88 | 1,905,609 | 0.02 | 0.02 | 0.23 | 1.92 | 10 | ||||||||||||||||||||||||||||||||||||||||||
2013 | 113.85 | 2.77 | 28.02 | 30.79 | (2.61 | ) | (1.16 | ) | (3.77 | ) | 140.87 | 27.55 | 2,214,088 | 0.03 | 0.03 | 0.23 | 2.18 | 14 | ||||||||||||||||||||||||||||||||||||||||||
2012 | 117.49 | 2.26 | (3.78 | ) | (1.52 | ) | (2.12 | ) | — | (2.12 | ) | 113.85 | (1.24 | ) | 1,255,669 | 0.06 | 0.06 | 0.24 | 2.01 | 12 | ||||||||||||||||||||||||||||||||||||||||
2011 | 94.53 | 2.01 | 22.98 | 24.99 | (2.03 | ) | — | (2.03 | ) | 117.49 | 26.77 | 770,135 | 0.06 | 0.06 | 0.24 | 1.91 | 17 | |||||||||||||||||||||||||||||||||||||||||||
S&P 500 Index Fund |
| |||||||||||||||||||||||||||||||||||||||||||||||||||||||||||
Class A |
| |||||||||||||||||||||||||||||||||||||||||||||||||||||||||||
2015 | $ | 10.68 | $ | 0.23 | $ | 1.01 | $ | 1.24 | $ | (0.21 | ) | $ | (0.02 | ) | $ | (0.23 | ) | $ | 11.69 | 11.71 | % | $ | 3,194,844 | 0.04 | % | 0.04 | % | 0.11 | % | 2.03 | % | 15 | % | |||||||||||||||||||||||||||
2014(10) | 10.00 | 0.09 | 0.63 | 0.72 | (0.04 | ) | — | (0.04 | ) | 10.68 | 7.27 | 836,591 | 0.04 | 0.04 | 0.11 | 2.02 | 3 | |||||||||||||||||||||||||||||||||||||||||||
Extended Market Index Fund |
| |||||||||||||||||||||||||||||||||||||||||||||||||||||||||||
2015 | $ | 12.74 | $ | 0.17 | $ | 1.27 | $ | 1.44 | $ | (0.19 | ) | $ | (0.30 | ) | $ | (0.49 | ) | $ | 13.69 | 11.61 | % | $ | 737,363 | 0.06 | % | 0.06 | % | 0.19 | % | 1.30 | % | 19 | % | |||||||||||||||||||||||||||
2014 | 10.77 | 0.17 | 2.03 | 2.20 | (0.14 | ) | (0.09 | ) | (0.23 | ) | 12.74 | 20.59 | 513,283 | 0.06 | 0.06 | 0.18 | 1.36 | 17 | ||||||||||||||||||||||||||||||||||||||||||
2013(7) | 10.00 | 0.03 | 0.75 | 0.78 | (0.01 | ) | — | (0.01 | ) | 10.77 | 7.84 | 174,107 | 0.11 | 0.11 | 0.22 | 1.30 | 4 | |||||||||||||||||||||||||||||||||||||||||||
Small Cap Fund |
| |||||||||||||||||||||||||||||||||||||||||||||||||||||||||||
Class A |
| |||||||||||||||||||||||||||||||||||||||||||||||||||||||||||
2015 | $ | 17.95 | $ | 0.11 | $ | 1.62 | $ | 1.73 | $ | (0.13 | ) | $ | (0.49 | ) | $ | (0.62 | ) | $ | 19.06 | 9.86 | % | $ | 683,624 | 0.48 | %(13) | 0.48 | %(13) | 0.72 | %(13) | 0.61 | % | 113 | % | |||||||||||||||||||||||||||
2014 | 15.42 | 0.12 | 2.56 | 2.68 | (0.15 | ) | — | (0.15 | ) | 17.95 | 17.39 | 692,554 | 0.47 | 0.47 | 0.72 | 0.67 | 63 | |||||||||||||||||||||||||||||||||||||||||||
2013 | 12.04 | 0.13 | 3.42 | 3.55 | (0.17 | ) | — | (0.17 | ) | 15.42 | 29.71 | 778,976 | 0.47 | 0.47 | 0.71 | 1.01 | 85 | |||||||||||||||||||||||||||||||||||||||||||
2012 | 13.49 | 0.11 | (1.47 | ) | (1.36 | ) | (0.09 | ) | — | (0.09 | ) | 12.04 | (10.11 | ) | 753,232 | 0.54 | 0.54 | 0.72 | 0.88 | 85 | ||||||||||||||||||||||||||||||||||||||||
2011 | 10.69 | 0.09 | 2.84 | 2.93 | (0.13 | ) | — | (0.13 | ) | 13.49 | 27.56 | 722,825 | 0.54 | 0.54 | 0.72 | 0.76 | 86 | |||||||||||||||||||||||||||||||||||||||||||
Small Cap II Fund |
| |||||||||||||||||||||||||||||||||||||||||||||||||||||||||||
Class A |
| |||||||||||||||||||||||||||||||||||||||||||||||||||||||||||
2015 | $ | 12.50 | $ | 0.06 | $ | 1.42 | $ | 1.48 | $ | (0.07 | ) | $ | (0.96 | ) | $ | (1.03 | ) | $ | 12.95 | 12.58 | % | $ | 373,858 | 0.46 | % | 0.46 | % | 0.72 | % | 0.49 | % | 107 | % | |||||||||||||||||||||||||||
2014 | 12.23 | 0.06 | 2.01 | 2.07 | (0.07 | ) | (1.73 | ) | (1.80 | ) | 12.50 | 17.35 | 252,435 | 0.46 | (8) | 0.46 | (8) | 0.71 | (8) | 0.50 | 108 | |||||||||||||||||||||||||||||||||||||||
2013 | 9.62 | 0.09 | 2.64 | 2.73 | (0.09 | ) | (0.03 | ) | (0.12 | ) | 12.23 | 28.54 | 221,697 | 0.48 | 0.48 | 0.72 | 0.88 | 113 | ||||||||||||||||||||||||||||||||||||||||||
2012(2) | 10.00 | 0.02 | (0.40 | ) | (0.38 | ) | — | — | — | 9.62 | (3.80 | ) | 62,066 | 0.59 | 0.59 | 0.78 | 1.07 | 9 | ||||||||||||||||||||||||||||||||||||||||||
| † | Returns and portfolio turnover rates are for the period indicated and have not been annualized. Returns do not reflect the deduction of taxes the shareholder would pay on fund distributions or redemption of fund shares. |
| (1) | Per share net investment income and net realized and unrealized gains (losses) calculated using average shares. |
| (2) | Commenced operations on April 10, 2012. All ratios for the period have been annualized. |
| (3) | The expense ratio includes interest expense. Had this expense been excluded, the ratios would have been 0.26%, 0.26% and 0.47%, respectively. |
| (4) | The expense ratio includes interest expense. Had this expense been excluded, the ratios would have been 0.18%, 0.18% and 0.47%, respectively. |
| (5) | The expense ratio includes interest expense. Had this expense been excluded, the ratios would have been 0.17%, 0.17% and 0.46%, respectively. |
| (6) | The expense ratio includes interest expense. Had this expense been excluded, the ratios would have been 0.19%, 0.19% and 0.46%, respectively. |
| (7) | Commenced operations on February 28, 2013. All ratios for the period have been annualized. |
| (8) | The expense ratio includes interest expense. Had this expense been excluded, the ratios would have been 0.46%, 0.46% and 0.71%, respectively. |
| (9) | The expense ratio includes interest expense. Had this expense been excluded, the ratios would have been 0.18%, 0.18% and 0.46%, respectively. |
| (10) | Commenced operations on December 18, 2013. All ratios for the period have been annualized. |
| (11) | The expense ratio includes interest expense. Had this expense been excluded, the ratios would have been 0.18%, 0.18% and 0.41%, respectively. |
| (12) | The expense ratio includes interest expense. Had this expense been excluded, the ratios would have been 0.18%, 0.18% and 0.47%, respectively. |
| (13) | The expense ratio includes interest expense. Had this expense been excluded, the ratios would have been 0.48%, 0.48% and 0.72%, respectively. |
Amounts designated as “—” are $0 or have been rounded to $0.
The accompanying notes are an integral part of the financial statements.
| 310 | SEI Institutional Investments Trust / Annual Report / May 31, 2015 |
Financial Highlights
For the years or periods ended May 31,
For a share outstanding throughout each period
| Net Asset Value, Beginning of Period | Net Investment Income(1) | Net | Total from Operations | Dividends from Net Investment Income | Distributions from Realized Capital Gains | Total Dividends and Distributions | Net Asset Value, End of Period | Total Return† | Net Assets End of Period ($ Thousands) | Ratio of Net Expenses to Average Net Assets | Ratio of Expenses to Average Net Assets (Excluding Fees Paid Indirectly and Including Waivers) | Ratio of Expenses to Average Net Assets (Excluding Fees Paid Indirectly and Waivers) | Ratio of | Portfolio Turnover Rate† | ||||||||||||||||||||||||||||||||||||||||||||||
Small/Mid Cap Equity Fund |
| |||||||||||||||||||||||||||||||||||||||||||||||||||||||||||
Class A |
| |||||||||||||||||||||||||||||||||||||||||||||||||||||||||||
2015 | $ | 15.58 | $ | 0.10 | $ | 1.47 | $ | 1.57 | $ | (0.10 | ) | $ | (2.16 | ) | $ | (2.26 | ) | $ | 14.89 | 11.16 | % | $ | 1,859,609 | 0.47 | % | 0.47 | % | 0.72 | % | 0.66 | % | 95 | % | |||||||||||||||||||||||||||
2014 | 15.69 | 0.09 | 2.87 | 2.96 | (0.11 | ) | (2.96 | ) | (3.07 | ) | 15.58 | 20.09 | 1,829,276 | 0.46 | 0.46 | 0.71 | 0.55 | 54 | ||||||||||||||||||||||||||||||||||||||||||
2013 | 12.34 | 0.14 | 3.45 | 3.59 | (0.15 | ) | (0.09 | ) | (0.24 | ) | 15.69 | 29.49 | 2,153,745 | 0.46 | 0.46 | 0.71 | 1.02 | 92 | ||||||||||||||||||||||||||||||||||||||||||
2012 | 13.62 | 0.09 | (1.28 | ) | (1.19 | ) | (0.09 | ) | — | (0.09 | ) | 12.34 | (8.71 | ) | 1,981,358 | 0.49 | 0.49 | 0.72 | �� | 0.77 | 84 | |||||||||||||||||||||||||||||||||||||||
2011 | 10.53 | 0.08 | 3.07 | 3.15 | (0.06 | ) | — | (0.06 | ) | 13.62 | 29.99 | 2,315,082 | 0.49 | 0.49 | 0.72 | 0.68 | 99 | |||||||||||||||||||||||||||||||||||||||||||
U.S. Managed Volatility Fund |
| |||||||||||||||||||||||||||||||||||||||||||||||||||||||||||
Class A |
| |||||||||||||||||||||||||||||||||||||||||||||||||||||||||||
2015 | $ | 14.74 | $ | 0.34 | $ | 1.52 | $ | 1.86 | $ | (0.34 | ) | $ | (1.62 | ) | $ | (1.96 | ) | $ | 14.64 | 13.33 | % | $ | 1,414,638 | 0.24 | % | 0.24 | % | 0.72 | % | 2.27 | % | 58 | % | |||||||||||||||||||||||||||
2014 | 13.54 | 0.31 | 2.42 | 2.73 | (0.31 | ) | (1.22 | ) | (1.53 | ) | 14.74 | 21.39 | 1,236,524 | 0.23 | 0.23 | 0.71 | 2.19 | 72 | ||||||||||||||||||||||||||||||||||||||||||
2013 | 11.39 | 0.32 | 2.37 | 2.69 | (0.31 | ) | (0.23 | ) | (0.54 | ) | 13.54 | 24.19 | 1,145,980 | 0.24 | 0.24 | 0.71 | 2.55 | 41 | ||||||||||||||||||||||||||||||||||||||||||
2012 | 12.15 | 0.25 | 0.01 | 0.26 | (0.21 | ) | (0.81 | ) | (1.02 | ) | 11.39 | 2.62 | 722,082 | 0.35 | 0.35 | 0.73 | 2.25 | 44 | ||||||||||||||||||||||||||||||||||||||||||
2011 | 11.16 | 0.22 | 2.72 | 2.94 | (0.23 | ) | (1.72 | ) | (1.95 | ) | 12.15 | 28.97 | 133,811 | 0.35 | 0.35 | 0.72 | 1.92 | 114 | ||||||||||||||||||||||||||||||||||||||||||
World Equity Ex-US Fund |
| |||||||||||||||||||||||||||||||||||||||||||||||||||||||||||
Class A |
| |||||||||||||||||||||||||||||||||||||||||||||||||||||||||||
2015 | $ | 12.86 | $ | 0.25 | $ | (0.03 | )(5) | $ | 0.22 | $ | (0.25 | ) | $ | (0.15 | ) | $ | (0.40 | ) | $ | 12.68 | 1.93 | % | $ | 7,644,844 | 0.34 | % | 0.34 | % | 0.62 | % | 2.00 | % | 45 | % | ||||||||||||||||||||||||||
2014 | 11.51 | 0.24 | 1.40 | 1.64 | (0.29 | ) | — | (0.29 | ) | 12.86 | 14.31 | 6,723,128 | 0.34 | 0.34 | 0.62 | 2.01 | 46 | |||||||||||||||||||||||||||||||||||||||||||
2013 | 9.24 | 0.25 | 2.24 | 2.49 | (0.22 | ) | — | (0.22 | ) | 11.51 | 27.11 | 6,192,852 | 0.35 | 0.35 | 0.62 | 2.30 | 52 | |||||||||||||||||||||||||||||||||||||||||||
2012 | 11.71 | 0.23 | (2.50 | ) | (2.27 | ) | (0.20 | ) | — | (0.20 | ) | 9.24 | (19.36 | ) | 4,623,934 | 0.45 | 0.45 | 0.63 | 2.28 | 56 | ||||||||||||||||||||||||||||||||||||||||
2011 | 9.09 | 0.23 | 2.59 | 2.82 | (0.20 | ) | — | (0.20 | ) | 11.71 | 31.12 | 5,129,089 | 0.45 | 0.45 | 0.64 | 2.12 | 85 | |||||||||||||||||||||||||||||||||||||||||||
Screened World Equity Ex-US Fund |
| |||||||||||||||||||||||||||||||||||||||||||||||||||||||||||
Class A |
| |||||||||||||||||||||||||||||||||||||||||||||||||||||||||||
2015 | $ | 9.69 | $ | 0.18 | $ | (0.19 | ) | $ | (0.01 | ) | $ | (0.16 | ) | $ | — | $ | (0.16 | ) | $ | 9.52 | (0.04 | )% | $ | 83,879 | 0.36 | % | 0.36 | % | 0.78 | % | 1.96 | % | 63 | % | ||||||||||||||||||||||||||
2014 | 8.66 | 0.16 | 1.04 | 1.20 | (0.17 | ) | — | (0.17 | ) | 9.69 | 13.87 | 77,117 | 0.44 | 0.44 | 0.85 | 1.75 | 45 | |||||||||||||||||||||||||||||||||||||||||||
2013 | 7.02 | 0.15 | 1.64 | 1.79 | (0.15 | ) | — | (0.15 | ) | 8.66 | 25.69 | 62,521 | 0.50 | 0.50 | 0.89 | 1.81 | 76 | |||||||||||||||||||||||||||||||||||||||||||
2012 | 9.01 | 0.13 | (1.97 | ) | (1.84 | ) | (0.15 | ) | — | (0.15 | ) | 7.02 | (20.39 | ) | 48,756 | 0.74 | 0.74 | 0.93 | 1.63 | 76 | ||||||||||||||||||||||||||||||||||||||||
2011 | 7.04 | 0.12 | 1.98 | 2.10 | (0.13 | ) | — | (0.13 | ) | 9.01 | 29.93 | 54,844 | 0.77 | 0.77 | 1.06 | 1.42 | 89 | |||||||||||||||||||||||||||||||||||||||||||
Emerging Markets Equity Fund |
| |||||||||||||||||||||||||||||||||||||||||||||||||||||||||||
Class A |
| |||||||||||||||||||||||||||||||||||||||||||||||||||||||||||
2015(4) | $ | 10.00 | $ | 0.10 | $ | (0.07 | )(5) | $ | 0.03 | $ | (0.02 | ) | $ | — | $ | (0.02 | ) | $ | 10.01 | 0.33 | % | $ | 591,963 | 0.65 | % | 0.65 | % | 1.16 | % | 1.57 | % | 103 | % | |||||||||||||||||||||||||||
Opportunistic Income Fund |
| |||||||||||||||||||||||||||||||||||||||||||||||||||||||||||
Class A |
| |||||||||||||||||||||||||||||||||||||||||||||||||||||||||||
2015 | $ | 8.31 | $ | 0.22 | $ | (0.06 | ) | $ | 0.16 | $ | (0.22 | ) | $ | — | $ | (0.22 | ) | $ | 8.25 | 1.91 | % | $ | 2,167,478 | 0.26 | % | 0.26 | % | 0.52 | % | 2.64 | % | 42 | % | |||||||||||||||||||||||||||
2014 | 8.26 | 0.19 | 0.02 | 0.21 | (0.16 | ) | — | (0.16 | ) | 8.31 | 2.59 | 1,875,851 | 0.24 | (2) | 0.24 | (2) | 0.52 | (2) | 2.34 | 121 | ||||||||||||||||||||||||||||||||||||||||
2013 | 7.97 | 0.12 | 0.34 | 0.46 | (0.17 | ) | — | (0.17 | ) | 8.26 | 5.78 | 996,522 | 0.21 | 0.26 | 0.52 | 1.41 | 26 | |||||||||||||||||||||||||||||||||||||||||||
2012 | 7.95 | 0.15 | 0.04 | 0.19 | (0.17 | ) | — | (0.17 | ) | 7.97 | 2.49 | 218,959 | 0.41 | 0.41 | 0.53 | 1.94 | 58 | |||||||||||||||||||||||||||||||||||||||||||
2011 | 7.69 | 0.13 | 0.31 | 0.44 | (0.18 | ) | — | (0.18 | ) | 7.95 | 5.81 | 295,277 | 0.41 | 0.41 | 0.53 | 1.68 | 17 | |||||||||||||||||||||||||||||||||||||||||||
Core Fixed Income Fund |
| |||||||||||||||||||||||||||||||||||||||||||||||||||||||||||
Class A |
| |||||||||||||||||||||||||||||||||||||||||||||||||||||||||||
2015 | $ | 10.54 | $ | 0.27 | $ | 0.12 | $ | 0.39 | $ | (0.28 | ) | $ | (0.03 | ) | $ | (0.31 | ) | $ | 10.62 | 3.79 | % | $ | 5,600,807 | 0.13 | % | 0.13 | % | 0.37 | % | 2.59 | % | 316 | % | |||||||||||||||||||||||||||
2014 | 10.54 | 0.29 | 0.05 | 0.34 | (0.30 | ) | (0.04 | ) | (0.34 | ) | 10.54 | 3.36 | 5,910,306 | 0.12 | 0.12 | 0.36 | 2.78 | 329 | ||||||||||||||||||||||||||||||||||||||||||
2013 | 10.63 | 0.27 | 0.06 | 0.33 | (0.29 | ) | (0.13 | ) | (0.42 | ) | 10.54 | 3.12 | 6,484,218 | 0.13 | 0.13 | 0.36 | 2.53 | 315 | ||||||||||||||||||||||||||||||||||||||||||
2012 | 10.39 | 0.34 | 0.47 | 0.81 | (0.36 | ) | (0.21 | ) | (0.57 | ) | 10.63 | 7.98 | 7,081,317 | 0.14 | 0.14 | 0.37 | 3.21 | 386 | ||||||||||||||||||||||||||||||||||||||||||
2011 | 10.35 | 0.38 | 0.44 | 0.82 | (0.39 | ) | (0.39 | ) | (0.78 | ) | 10.39 | 8.17 | 6,761,399 | 0.16 | (3) | 0.16 | (3) | 0.38 | (3) | 3.60 | 422 | |||||||||||||||||||||||||||||||||||||||
| † | Returns and portfolio turnover rates are for the period indicated and have not been annualized. Returns do not reflect the deduction of taxes the shareholder would pay on fund distributions or redemption of fund shares. |
| (1) | Per share net investment income and net realized and unrealized gains (losses) calculated using average shares. |
| (2) | The expense ratio includes interest expense. Had this expense been excluded, the ratios would have been 0.24%, 0.24% and 0.52%, respectively. |
| (3) | The expense ratio includes interest expense. Had this expense been excluded, the ratios would have been 0.14%, 0.14% and 0.36%, respectively. |
| (4) | Commenced operations on October 31, 2014. All ratios for the period have been annualized. |
| (5) | The amount shown for the year ended May 31, 2015, for a share outstanding throughout the period does not accord with the aggregate net gains on investments for that period because of the sales and repurchase of Fund shares in relation to fluctuating market value of the investments of the Fund. |
Amounts designated as “—” are $0 or have been rounded to $0.
The accompanying notes are an integral part of the financial statements.
| SEI Institutional Investments Trust / Annual Report / May 31, 2015 | 311 |
Financial Highlights/Consolidated Financial Highlights
For the years or periods ended May 31,
For a share outstanding throughout each period
| Net Asset Value, Beginning of Period | Net Investment | Net | Total from Operations | Dividends from Net Investment Income | Distributions from Realized Capital Gains | Total Dividends and Distributions | Net Asset Value, End of Period | Total Return† | Net Assets End of Period ($ Thousands) | Ratio of Net Assets | Ratio of Net Assets | Ratio of Net Assets | Ratio of Net Investment Income (Loss) to Average Net Assets | �� | Portfolio Turnover Rate† | |||||||||||||||||||||||||||||||||||||||||||||
High Yield Bond Fund |
| |||||||||||||||||||||||||||||||||||||||||||||||||||||||||||
Class A |
| |||||||||||||||||||||||||||||||||||||||||||||||||||||||||||
2015 | $ | 9.96 | $ | 0.58 | $ | (0.34 | ) | $ | 0.24 | $ | (0.58 | ) | $ | (0.21 | ) | $ | (0.79 | ) | $ | 9.41 | 2.63 | % | $ | 2,516,770 | 0.30 | % | 0.30 | % | 0.56 | % | 6.09 | % | 55 | % | ||||||||||||||||||||||||||
2014 | 10.01 | 0.63 | 0.10 | 0.73 | (0.62 | ) | (0.16 | ) | (0.78 | ) | 9.96 | 7.75 | 2,175,102 | 0.30 | 0.30 | 0.56 | 6.41 | 65 | ||||||||||||||||||||||||||||||||||||||||||
2013 | 9.30 | 0.71 | 0.69 | 1.40 | (0.69 | ) | — | (0.69 | ) | 10.01 | 15.46 | 2,162,551 | 0.30 | (7) | 0.30 | (7) | 0.56 | (7) | 7.23 | 72 | ||||||||||||||||||||||||||||||||||||||||
2012 | 9.58 | 0.74 | (0.29 | ) | 0.45 | (0.72 | ) | (0.01 | ) | (0.73 | ) | 9.30 | 5.09 | 1,914,780 | 0.35 | (5) | 0.35 | (5) | 0.56 | (5) | 7.97 | 50 | ||||||||||||||||||||||||||||||||||||||
2011 | 8.74 | 0.79 | 0.81 | 1.60 | (0.76 | ) | (0.00 | )‡ | (0.76 | ) | 9.58 | 19.06 | 1,939,023 | 0.35 | 0.35 | 0.56 | 8.48 | 90 | ||||||||||||||||||||||||||||||||||||||||||
Long Duration Fund |
| |||||||||||||||||||||||||||||||||||||||||||||||||||||||||||
Class A |
| |||||||||||||||||||||||||||||||||||||||||||||||||||||||||||
2015 | $ | 8.88 | $ | 0.36 | $ | 0.14 | $ | 0.50 | $ | (0.36 | ) | $ | (0.10 | ) | $ | (0.46 | ) | $ | 8.92 | 5.68 | % | $ | 3,343,845 | 0.15 | % | 0.15 | % | 0.37 | % | 4.00 | % | 73 | % | |||||||||||||||||||||||||||
2014 | 8.75 | 0.36 | 0.17 | 0.53 | (0.36 | ) | (0.04 | ) | (0.40 | ) | 8.88 | 6.41 | 4,021,437 | 0.15 | 0.15 | 0.37 | 4.28 | 105 | ||||||||||||||||||||||||||||||||||||||||||
2013 | 9.65 | 0.36 | (0.25 | ) | 0.11 | (0.36 | ) | (0.65 | ) | (1.01 | ) | 8.75 | 0.78 | 3,322,291 | 0.16 | 0.16 | 0.37 | 3.80 | 96 | |||||||||||||||||||||||||||||||||||||||||
2012 | 8.83 | 0.41 | 1.42 | 1.83 | (0.42 | ) | (0.59 | ) | (1.01 | ) | 9.65 | 21.70 | 5,497,375 | 0.20 | 0.20 | 0.37 | 4.45 | 121 | ||||||||||||||||||||||||||||||||||||||||||
2011 | 8.69 | 0.44 | 0.46 | 0.90 | (0.43 | ) | (0.33 | ) | (0.76 | ) | 8.83 | 10.74 | 3,523,154 | 0.20 | (4) | 0.20 | (4) | 0.37 | (4) | 5.03 | 85 | |||||||||||||||||||||||||||||||||||||||
Long Duration Credit Fund(10) |
| |||||||||||||||||||||||||||||||||||||||||||||||||||||||||||
Class A |
| |||||||||||||||||||||||||||||||||||||||||||||||||||||||||||
2015 | $ | 10.20 | $ | 0.43 | $ | (0.02 | ) | $ | 0.41 | $ | (0.43 | ) | $ | — | $ | (0.43 | ) | $ | 10.18 | 4.02 | % | $ | 3,465,228 | 0.15 | % | 0.15 | % | 0.37 | % | 4.16 | % | 151 | % | |||||||||||||||||||||||||||
2014 | 9.93 | 0.44 | 0.32 | 0.76 | (0.44 | ) | (0.05 | ) | (0.49 | ) | 10.20 | 8.10 | 2,820,257 | 0.15 | 0.15 | 0.36 | 4.56 | 115 | ||||||||||||||||||||||||||||||||||||||||||
2013(6) | 10.00 | 0.39 | 0.00 | ‡ | 0.39 | (0.39 | ) | (0.07 | ) | (0.46 | ) | 9.93 | 3.75 | 2,082,952 | 0.15 | 0.15 | 0.36 | 4.08 | 100 | |||||||||||||||||||||||||||||||||||||||||
Ultra Short Duration Bond Fund |
| |||||||||||||||||||||||||||||||||||||||||||||||||||||||||||
Class A |
| |||||||||||||||||||||||||||||||||||||||||||||||||||||||||||
2015 | $ | 10.05 | $ | 0.09 | $ | (0.02 | ) | $ | 0.07 | $ | (0.11 | ) | $ | — | $ | (0.11 | ) | $ | 10.01 | 0.72 | % | $ | 645,872 | 0.12 | % | 0.12 | % | 0.22 | % | 0.95 | % | 112 | % | |||||||||||||||||||||||||||
2014 | 10.04 | 0.09 | 0.02 | 0.11 | (0.10 | ) | — | (0.10 | ) | 10.05 | 1.13 | 718,199 | 0.11 | 0.11 | 0.21 | 0.87 | 118 | |||||||||||||||||||||||||||||||||||||||||||
2013 | 9.95 | 0.10 | 0.11 | 0.21 | (0.12 | ) | — | (0.12 | ) | 10.04 | 2.14 | 522,593 | 0.12 | 0.12 | 0.21 | 1.02 | 178 | |||||||||||||||||||||||||||||||||||||||||||
2012 | 9.99 | 0.11 | (0.02 | ) | 0.09 | (0.13 | ) | — | (0.13 | ) | 9.95 | 0.86 | 298,223 | 0.16 | 0.16 | 0.21 | 1.14 | 222 | ||||||||||||||||||||||||||||||||||||||||||
2011(3) | 10.00 | 0.04 | (0.01 | ) | 0.03 | (0.04 | ) | — | (0.04 | ) | 9.99 | 0.33 | 313,358 | 0.18 | 0.18 | 0.23 | 1.65 | 23 | ||||||||||||||||||||||||||||||||||||||||||
Emerging Markets Debt Fund |
| |||||||||||||||||||||||||||||||||||||||||||||||||||||||||||
Class A |
| |||||||||||||||||||||||||||||||||||||||||||||||||||||||||||
2015 | $ | 10.68 | $ | 0.57 | $ | (1.22 | ) | $ | (0.65 | ) | $ | (0.38 | ) | $ | — | $ | (0.38 | ) | $ | 9.65 | (6.17 | )% | $ | 1,836,776 | 0.40 | % | 0.40 | % | 0.93 | % | 5.69 | % | 78 | % | ||||||||||||||||||||||||||
2014 | 11.11 | 0.60 | (0.58 | ) | 0.02 | (0.33 | ) | (0.12 | ) | (0.45 | ) | 10.68 | 0.44 | 1,596,100 | 0.45 | 0.45 | 0.95 | 5.86 | 100 | |||||||||||||||||||||||||||||||||||||||||
2013 | 11.22 | 0.56 | 0.65 | 1.21 | (0.84 | ) | (0.48 | ) | (1.32 | ) | 11.11 | 10.64 | 1,411,893 | 0.48 | 0.48 | 0.94 | 4.79 | 119 | ||||||||||||||||||||||||||||||||||||||||||
2012 | 11.60 | 0.73 | (0.22 | ) | 0.51 | (0.77 | ) | (0.12 | ) | (0.89 | ) | 11.22 | 4.67 | 1,114,918 | 0.55 | 0.55 | 0.93 | 6.43 | 55 | |||||||||||||||||||||||||||||||||||||||||
2011 | 10.47 | 0.78 | 0.91 | 1.69 | (0.56 | ) | — | (0.56 | ) | 11.60 | 16.51 | 1,028,691 | 0.55 | 0.55 | 0.93 | 6.89 | 75 | |||||||||||||||||||||||||||||||||||||||||||
Real Return Fund |
| |||||||||||||||||||||||||||||||||||||||||||||||||||||||||||
Class A |
| |||||||||||||||||||||||||||||||||||||||||||||||||||||||||||
2015 | $ | 9.82 | $ | (0.07 | ) | $ | (0.09 | ) | $ | (0.16 | ) | $ | (0.07 | ) | $ | — | $ | (0.07 | ) | $ | 9.59 | (1.60 | )% | $ | 227,335 | 0.08 | % | 0.08 | % | 0.29 | % | (0.77 | )% | 41 | % | |||||||||||||||||||||||||
2014 | 9.86 | 0.05 | 0.04 | 0.09 | (0.04 | ) | (0.09 | ) | (0.13 | ) | 9.82 | 0.96 | 207,578 | 0.08 | 0.08 | 0.29 | 0.52 | 49 | ||||||||||||||||||||||||||||||||||||||||||
2013 | 10.29 | 0.09 | (0.10 | ) | (0.01 | ) | (0.18 | ) | (0.24 | ) | (0.42 | ) | 9.86 | (0.15 | ) | 251,852 | 0.11 | 0.11 | 0.28 | 0.87 | 97 | |||||||||||||||||||||||||||||||||||||||
2012 | 10.67 | 0.29 | (0.07 | ) | 0.22 | (0.35 | ) | (0.25 | ) | (0.60 | ) | 10.29 | 2.15 | 281,861 | 0.20 | 0.20 | 0.28 | 2.75 | 96 | |||||||||||||||||||||||||||||||||||||||||
2011 | 10.41 | 0.31 | 0.37 | 0.68 | (0.21 | ) | (0.21 | ) | (0.42 | ) | 10.67 | 6.65 | 369,232 | 0.20 | 0.20 | 0.28 | 2.90 | 69 | ||||||||||||||||||||||||||||||||||||||||||
Limited Duration Bond Fund |
| |||||||||||||||||||||||||||||||||||||||||||||||||||||||||||
Class A |
| |||||||||||||||||||||||||||||||||||||||||||||||||||||||||||
2015(8) | $ | 10.00 | $ | 0.09 | $ | 0.01 | $ | 0.10 | $ | (0.09 | ) | $ | — | $ | (0.09 | ) | $ | 10.01 | 0.98 | % | $ | 670,579 | 0.15 | % | 0.15 | % | 0.34 | % | 1.03 | % | 62 | % | ||||||||||||||||||||||||||||
Intermediate Duration Credit Fund |
| |||||||||||||||||||||||||||||||||||||||||||||||||||||||||||
2015(9) | $ | 10.00 | $ | 0.03 | $ | (0.18 | ) | $ | (0.15 | ) | $ | (0.03 | )** | $ | — | $ | (0.03 | ) | $ | 9.82 | (1.46 | )% | $ | 1,600,117 | 0.20 | % | 0.20 | % | 0.35 | % | 2.03 | % | 122 | % | ||||||||||||||||||||||||||
Dynamic Asset Allocation Fund |
| |||||||||||||||||||||||||||||||||||||||||||||||||||||||||||
Class A |
| |||||||||||||||||||||||||||||||||||||||||||||||||||||||||||
2015 | $ | 14.53 | $ | 0.31 | $ | 2.88 | $ | 3.19 | $ | (0.75 | ) | $ | — | $ | (0.75 | ) | $ | 16.97 | 22.32 | % | $ | 1,993,576 | 0.07 | % | 0.07 | % | 0.66 | % | 1.92 | % | 9 | % | ||||||||||||||||||||||||||||
2014 | 12.81 | 0.27 | 1.69 | 1.96 | (0.02 | ) | (0.22 | ) | (0.24 | ) | 14.53 | 15.49 | 1,557,322 | 0.07 | 0.07 | 0.66 | 1.99 | 11 | ||||||||||||||||||||||||||||||||||||||||||
2013 | 11.14 | 0.30 | 2.20 | 2.50 | (0.35 | ) | (0.48 | ) | (0.83 | ) | 12.81 | 23.75 | 1,135,631 | 0.10 | 0.10 | 0.66 | 2.50 | 35 | ||||||||||||||||||||||||||||||||||||||||||
2012 | 11.26 | (0.01 | ) | 0.39 | 0.38 | — | (0.50 | ) | (0.50 | ) | 11.14 | 3.73 | 552,649 | 0.50 | 0.50 | 0.67 | (0.10 | ) | 140 | |||||||||||||||||||||||||||||||||||||||||
2011(2) | 10.00 | (0.04 | ) | 1.49 | 1.45 | — | (0.19 | ) | (0.19 | ) | 11.26 | 14.66 | 407,345 | 0.50 | 0.50 | 0.67 | (0.39 | ) | — | |||||||||||||||||||||||||||||||||||||||||
| ** | Includes a return of capital of less than $0.01 per share. |
| † | Returns and portfolio turnover rates are for the period indicated and have not been annualized. Returns do not reflect the deduction of taxes the shareholder would pay on fund distributions or redemption of fund shares. |
| ‡ | Amount represents less than $0.01. |
| (1) | Per share net investment income (loss) and net realized and unrealized gains (losses) calculated using average shares. |
| (2) | Commenced operations on July 30, 2010. All ratios for the period have been annualized. |
| (3) | Commenced operations on February 28, 2011. All ratios for the period have been annualized. |
| (4) | The expense ratio includes interest expense. Had this expense been excluded, the ratios would have been 0.20%, 0.20% and 0.37%, respectively. |
| (5) | The expense ratio includes interest expense. Had this expense been excluded, the ratios would have been 0.35%, 0.35% and 0.56%, respectively. |
| (6) | Commenced operations on June 29, 2012. All ratios for the period have been annualized. |
| (7) | The expense ratio includes interest expense. Had this expense been excluded, the ratios would have been 0.30%, 0.30% and 0.56%, respectively. |
| (8) | Commenced operations on July 31, 2014. All ratios have been annualized. |
| (9) | Commenced operations on March 31, 2015. All ratios have been annualized. |
| (10) | Effective April 13, 2015, the Long Duration Corporate Bond Fund was renamed the Long Duration Credit Fund. |
Amounts designated as “—” are $0 or have been rounded to $0.
The accompanying notes are an integral part of the financial statements.
| 312 | SEI Institutional Investments Trust / Annual Report / May 31, 2015 |
Consolidated Financial Highlights
For the years or periods ended May 31,
For a share outstanding throughout each period
| Net Asset Value, Beginning of Period | Net Investment | Net | Total from Operations | Dividends from Net Investment Income | Distributions from Realized Capital Gains | Total Dividends and Distributions | Net Asset Value, End of Period | Total Return† | Net Assets End of Period ($ Thousands) | Ratio of Net Assets | Ratio of Net Assets | Ratio of Net Assets | Ratio of Net Investment Income to Average Net Assets | Portfolio Turnover Rate† | ||||||||||||||||||||||||||||||||||||||||||||||
Multi-Asset Real Return Fund |
| |||||||||||||||||||||||||||||||||||||||||||||||||||||||||||
Class A |
| |||||||||||||||||||||||||||||||||||||||||||||||||||||||||||
2015 | $ | 9.30 | $ | 0.03 | $ | (0.51 | ) | $ | (0.48 | ) | $ | (0.18 | )*** | $ | — | $ | (0.18 | ) | $ | 8.64 | (5.16 | )% | $ | 730,812 | 0.43 | %(6) | 0.43 | %(6) | 0.80 | %(6) | 0.29 | % | 99 | % | ||||||||||||||||||||||||||
2014 | 9.19 | 0.12 | (0.01 | ) | 0.11 | — | — | — | 9.30 | 1.20 | 716,022 | 0.32 | (5) | 0.32 | (5) | 0.64 | (5) | 1.30 | 122 | |||||||||||||||||||||||||||||||||||||||||
2013 | 9.25 | 0.11 | (0.10 | )(4) | 0.01 | (0.07 | )** | — | (0.07 | ) | 9.19 | 0.07 | 303,899 | 0.32 | (3) | 0.32 | (3) | 0.66 | (3) | 1.11 | 49 | |||||||||||||||||||||||||||||||||||||||
2012* | 10.00 | 0.10 | (0.84 | ) | (0.74 | ) | (0.01 | ) | — | (0.01 | ) | 9.25 | (7.37 | ) | 140,063 | 0.41 | (2) | 0.41 | (2) | 0.66 | (2) | 1.23 | 58 | |||||||||||||||||||||||||||||||||||||
| *** | Includes a return of capital of $0.02 per share. |
| ** | Includes a return of capital of $0.01 per share. |
| † | Returns and portfolio turnover rates are for the period indicated and have not been annualized. Returns do not reflect the deduction of taxes the shareholder would pay on fund distributions or redemption of fund shares. |
| * | Commenced operations on July 29, 2011. All ratios for the period have been annualized. |
| (1) | Per share net investment income and net realized and unrealized losses calculated using average shares. |
| (2) | The expense ratio includes interest expense on reverse repurchase agreements. Had this expense been excluded, the ratios would have been 0.39%, 0.39% and 0.64%, respectively. |
| (3) | The expense ratio includes interest expense on reverse repurchase agreements. Had this expense been excluded, the ratios would have been 0.29%, 0.29% and 0.63%, respectively. |
| (4) | The amount shown for the year ended May 31, 2013, for a share outstanding throughout the period does not accord with the aggregate net gains on investments for that period because of the sales and repurchases of Fund shares in relation to fluctuating market value of the investments of the Fund. |
| (5) | The expense ratio includes interest expense on reverse repurchase agreements and dividend expense on securities sold short. Had this expense been excluded, the ratios would have been 0.30%, 0.30% and 0.62%, respectively. |
| (6) | The expense ratio includes interest expense on reverse repurchase agreements and dividend expense on securities sold short. Had this expense been excluded, the ratios would have been 0.30%, 0.30% and 0.67%, respectively. |
Amounts designated as “—” are $0 or have been rounded to $0.
The accompanying notes are an integral part of the financial statements.
| SEI Institutional Investments Trust / Annual Report / May 31, 2015 | 313 |
Notes to Financial Statements/Consolidated Notes to Financial Statements
May 31, 2015
1. ORGANIZATION
SEI Institutional Investments Trust (the “Trust”) was organized as a Massachusetts business trust under a Declaration of Trust dated March 1, 1995. The Trust commenced operations on June 14, 1996.
The Trust is registered under the Investment Company Act of 1940, as amended, as an open-end investment company with 27 registered funds: Large Cap, Large Cap Diversified Alpha, Large Cap Disciplined Equity, Large Cap Index, S&P 500 Index, Extended Market Index, Small Cap, Small Cap II, Small/Mid Cap Equity, U.S. Managed Volatility, World Equity Ex-US, Screened World Equity Ex-US, Emerging Markets Equity, Opportunistic Income, Core Fixed Income, High Yield Bond, Long Duration, Long Duration Credit, Ultra Short Duration Bond, Emerging Markets Debt, Real Return, Limited Duration Bond, Intermediate Duration Credit Fund, Dynamic Asset Allocation, Multi-Asset Real Return, Strategic U.S. Large Cap Equity and Global Equity Funds (each a “Fund,” collectively, the “Funds”) each of which are diversified Funds with the exception of the Emerging Markets Debt and Multi-Asset Real Return Funds. The Trust is registered to offer Class A shares of all Funds. The assets of each Fund are segregated, and a shareholder’s interest is limited to the Fund in which shares are held. The Trust’s prospectus provides a description of each Fund’s investment goals, principal strategies and risks.
The DAA Commodity Strategy Subsidiary, Ltd. and the MARR Commodity Strategy Subsidiary, Ltd. are wholly-owned subsidiaries of the Dynamic Asset Allocation and Multi-Asset Real Return Funds (the “Subsidiaries”) respectively. The Subsidiaries are organized under the laws of the Cayman Islands as an exempt limited company. Information regarding the Dynamic Asset Allocation and Multi-Asset Real Return Funds and their respective subsidiary has been consolidated on the Consolidated Summary Schedule of Investments, Consolidated Schedule of Investments, Consolidated Statements of Assets and Liabilities, Consolidated Statements of Operations, Consolidated Statements of Changes in Net Assets, Consolidated Statement of Cash Flows and Consolidated Financial Highlights.
Effective April 1, 2015, the Long Duration Corporate Bond Fund changed its name to the Long Duration Credit Fund and its principal investment strategy.
As of May 31, 2015, the Strategic U.S. Large Cap Equity and Global Equity Funds have not yet commenced operations.
2. SIGNIFICANT ACCOUNTING POLICIES
The following is a summary of the significant accounting policies followed by the Funds.
Use of Estimates — The preparation of financial statements, in conformity with U.S. generally accepted accounting principles (“U.S. GAAP”), requires management to make estimates and assumptions that affect the reported amount of assets and liabilities and disclosure of contingent assets and liabilities as of the date of the financial statements and the reported amounts of increases and decreases in net assets from operations during the reporting period. Actual results could differ from those estimates.
Security Valuation — Securities listed on a securities exchange, market or automated quotation system for which quotations are readily available (except for securities traded on NASDAQ) and are valued at the last quoted sale price on the primary exchange or market (foreign or domestic) on which they are traded, or, if there is no such
reported sale, at the most recent quoted bid price. For securities traded on NASDAQ, the NASDAQ Official Closing Price will be used. Debt securities are priced based upon valuations provided by independent, third-party pricing agents, if available. Such values generally reflect the last reported sales price if the security is actively traded. The third-party pricing agents may also value debt securities at an evaluated bid price by employing methodologies that utilize actual market transactions, broker-supplied valuations, or other methodologies designed to identify the market value for such securities. Debt obligations acquired with remaining maturities of sixty days or less may be valued at their amortized cost, which approximates market value. The prices for foreign securities are reported in local currency and converted to U.S. dollars using currency exchange rates. Prices for most securities held in the Funds are provided daily by recognized independent pricing agents. SEI Investments Management Corporation (“SIMC”) or a Sub-Adviser, as applicable, reasonably believes that prices provided by independent pricing agents are reliable. However, there can be no assurance that such pricing service’s prices will be reliable. SIMC or a Sub-Adviser, as applicable, continuously monitors the reliability of prices obtained from any pricing service and will notify the Funds’ administrator if it believes that a particular pricing service is no longer a reliable source of prices. The Funds’ administrator, in turn, will notify the Trust’s Fair Value Committee (the “Committee”) if it receives such notification from SIMC or a Sub-Adviser, as applicable, or if the Funds’ administrator reasonably believes that a particular pricing service is no longer a reliable source for prices. If a security price cannot be obtained from an independent, third-party pricing agent, the Funds seek to obtain a bid price from at least one independent broker.
Securities for which market prices are not “readily available”, are determined to be unreliable, or cannot be valued using methodologies described above are valued in accordance with fair value procedures established by the Trust’s Board of Trustees. The Trust’s fair value procedures are implemented through the Committee designated by the Trust’s Board of Trustees. The Committee is currently composed of two members of the Board of Trustees, as well as representatives from SIMC and its affiliates. The Committee provides regular reports to the Board concerning investments for which market prices are not readily available or may be unreliable. Some of the more common reasons that may necessitate that a security be valued using fair value procedures include: the security’s trading has been halted or suspended; the security has been de-listed from a national exchange; the security’s primary trading market is temporarily closed at a time when, under normal conditions, it would be open; or the security’s primary pricing source is not able or willing to provide a price. When a security is valued in accordance with the fair value procedures, the Committee will determine the value after taking into consideration relevant information reasonably available to the Committee. Examples of factors the Committee may consider are: (i) the facts giving rise to the need to fair value; (ii) the last trade price; (iii) the performance of the market or the issuer’s industry; (iv) the liquidity of the security; (v) the size of the holding in a Fund; or (vi) any other appropriate information. The determination of a security’s fair value price often involves the consideration of a number of subjective factors and is therefore subject to the unavoidable risk that the value assigned to a security may be higher or lower than the security’s value would be if a reliable market quotation for the security was readily available.
| 314 | SEI Institutional Investments Trust / Annual Report / May 31, 2015 |
For securities that principally trade on a foreign market or exchange, a significant gap in time can exist between the time of a particular security’s last trade and the time at which a Fund calculates its net asset value. The closing prices of such securities may no longer reflect their market value at the time a Fund calculates net asset value if an event that could materially affect the value of those securities (a “Significant Event”) has occurred between the time of the security’s last close and the time that a Fund calculates net asset value. A Significant Event may relate to a single issuer or to an entire market sector. If the adviser or sub-adviser of a Fund becomes aware of a Significant Event that has occurred with respect to a security or group of securities after the closing of the exchange or market on which the security or securities principally trade, but before the time at which a Fund calculates net asset value, the adviser or sub-adviser may request that a Fair Value Committee Meeting be called. In addition, the Trust’s administrator monitors price movements among certain selected indices, securities and/or baskets of securities that may be an indicator that the closing prices received earlier from foreign exchanges or markets may not reflect market value at the time a Fund calculates net asset value. If price movements in a monitored index or security exceed levels established by the administrator, the administrator notifies the adviser or sub-adviser for any Fund holding the relevant securities that such limits have been exceeded. In such event, the adviser or sub-adviser makes the determination whether a Fair Value Committee Meeting should be called based on the information provided.
The World Equity Ex-US, Screened World Equity Ex-US, Emerging Markets Equity and Multi-Asset Real Return Funds that hold international securities also use a third-party fair valuation vendor. The vendor provides a fair value for foreign securities held by these funds based on certain factors and methodologies (involving, generally, tracking valuation correlations between the U.S. market and each non-U.S. security). Values from the fair value vendor are applied in the event that there is a movement in the U.S. market that exceeds a specific threshold that has been established by the Committee. The Committee has also established a “confidence interval” which is used to determine the level of historical correlation between the value of a specific foreign security and movements in the U.S. market before a particular security will be fair valued when the threshold is exceeded. In the event that the threshold established by the Committee is exceeded on a specific day, these funds that hold international securities will value the non-U.S. securities within that fund that exceed the applicable “confidence interval” based upon the adjusted prices provided by the fair valuation vendor.
Options and warrants for which the primary market is a national securities exchange are valued at the last sale price on the exchange on which they are traded, or, in the absence of any sale, at the closing bid price. Options and warrants not traded on a national securities exchange are valued at the last quoted bid price.
In accordance with U.S. GAAP, fair value is defined as the price that a Fund would receive upon selling an investment in an orderly transaction to an independent buyer in the principal or most advantageous market of the investment. A three tier hierarchy has been established to maximize the use of observable and minimize the use of unobservable inputs and to establish classification of fair value measurements for disclosure purposes. Inputs refer broadly to the
assumptions that market participants would use in pricing an asset. Inputs may be observable or unobservable. Observable inputs are inputs that reflect the assumptions market participants would use in pricing the asset or liability based on market data obtained from sources independent of the reporting entity. Unobservable inputs are inputs that reflect the reporting entity’s own assumptions about the assumptions market participants would use in pricing the asset or liability based on the best information available in the circumstances.
The three-tier hierarchy of inputs is summarized in the three broad Levels listed below:
| Level 1 — | quoted prices in active markets for identical investments |
| Level 2 — | other significant observable inputs (including quoted prices for similar investments, interest rates, prepayment speeds, credit risks, etc.) |
| Level 3 — | significant unobservable inputs (including the Fund’s own assumptions in determining the fair value of investments) |
Investments are classified within the level of the lowest significant input considered in determining fair value. Investments classified within Level 3 whose fair value measurement considers several inputs may include Level 1 or Level 2 inputs as components of the overall fair value measurement.
Debt securities are valued in accordance with the evaluated bid price supplied by the pricing service and generally categorized as Level 2 in the hierarchy. Other securities that are categorized as Level 2 in the hierarchy include, but are not limited to, preferred stocks, bank loans, warrants, swaps and forward contracts. The Fund may use a
systematic fair valuation model provided by an independent pricing service to value foreign equity securities in order to adjust for stale pricing, which may occur between the close of certain foreign exchanges and the New York Stock Exchange. These are generally categorized as Level 2 in the hierarchy.
When independent prices are unavailable or unreliable, debt securities and swaps may be valued utilizing pricing matrices which consider similar factors that would be used by independent pricing services. These are generally categorized as Level 2 in the hierarchy but may be Level 3 depending on the circumstances. For certain collateralized debt obligations, corporate obligations, mortgage backed securities, auction rate preferred securities and loan participations where observable inputs are limited, assumptions about market activity and risk are used and are categorized as Level 3 in the hierarchy.
The valuation techniques used by the Funds to measure fair value during the year ended May 31, 2015 maximized the use of observable inputs and minimized the use of unobservable inputs.
For the year ended May 31, 2015, there have been no significant changes to the Trust’s fair valuation methodologies. For details of the investment classification, reference the Summary Schedules of Investments/Schedules of Investments.
Security Transactions and Investment Income — Security transactions are recorded on the trade date. Cost used in determining net realized capital gains and losses on the sale of securities is determined on the basis of specific identification. Dividend income
| SEI Institutional Investments Trust / Annual Report / May 31, 2015 | 315 |
Notes to Financial Statements/Consolidated Notes to Financial Statements (Continued)
May 31, 2015
and expense is recognized on the ex-dividend date, and interest income or expense is recognized using the accrual basis of accounting.
Distributions received on securities that represent a return of capital or capital gain are recorded as a reduction of cost of investments and/or as a realized gain. The Trust estimates the components of distributions received that may be considered nontaxable distributions or capital gain distributions.
Amortization and accretion is calculated using the scientific interest method, which approximates the effective interest method over the holding period of the security. Amortization of premiums and discounts is included in interest income.
Repurchase Agreements — Securities pledged as collateral for repurchase agreements are held by each Fund’s custodian bank until the repurchase date of the repurchase agreement. The Funds may also invest in tri-party repurchase agreements. Securities held as collateral for tri-party repurchase agreements are maintained by the broker’s custodian bank in a segregated account until the repurchase date of the repurchase agreement. Provisions of the repurchase agreements and the Trust’s policies require that the market value of the collateral, including accrued interest thereon, is sufficient in the event of default by the counterparty. If the counterparty defaults and the value of the collateral declines, or if the counterparty enters into an insolvency proceeding, realization of the collateral by the Funds may be delayed or limited.
Reverse Repurchase Agreements — To the extent consistent with its Investment Objective and Strategies, a Fund may enter into reverse repurchase agreements. A reverse repurchase agreement involves the sale of portfolio assets together with an agreement to repurchase the same assets later at a fixed price. Assets are then segregated to cover the requirements to repurchase the assets. The segregated assets may consist of cash, U.S. Government securities, or other liquid securities at least equal in value to the obligations under the reverse repurchase agreements. In the event the buyer of securities under a reverse repurchase agreement files for bankruptcy or becomes insolvent, a Fund’s use of the proceeds under the reverse repurchase agreement may be restricted pending a determination by the other party, or its trustee or receiver, whether to enforce the obligation to repurchase the securities.
Reverse repurchase agreements outstanding as of May 31, 2015 were as follows:
Multi-Asset Real Return Fund | ||||||||||
Principal Amount ($ Thousands) | Counterparty | Rate % | Value ($ Thousands) | |||||||
| $6,547 | Barclays | 0.27% | $ | 6,547 | ||||||
| 3,604 | Barclays | 0.27% | 3,604 | |||||||
| 29,645 | Chase Securities | 0.23% | 29,645 | |||||||
| 40,200 | Chase Securities | 0.25% | 40,200 | |||||||
| 17,119 | Chase Securities | 0.25% | 17,119 | |||||||
| 6,157 | HSBC | 0.24% | 6,157 | |||||||
| 3,884 | HSBC | 0.24% | 3,884 | |||||||
| 9,221 | HSBC | 0.25% | 9,221 | |||||||
| 19,255 | Merrill Lynch | 0.25% | 19,255 | |||||||
|
| |||||||||
| $ | 135,632 | |||||||||
|
| |||||||||
Expenses — Expenses that are directly related to a Fund are charged directly to that Fund. Other operating expenses of the Funds are prorated to the Funds on the basis of relative net assets.
Commodity-Linked Investments — To the extent consistent with its Investment Objective and Strategies, the Dynamic Asset Allocation and Multi-Asset Real Return Funds may invest in commodity investments to provide exposure to the investment returns of the commodities markets. Commodity investments include notes with interest payments that are tied to an underlying commodity or commodity index, ETFs or other exchange-traded products that are tied to the performance of a commodity or commodity index or other types of investment vehicles or instruments that provide returns that are tied to commodities or commodity indices. The Dynamic Asset Allocation and Multi-Asset Real Return Funds may also invest in equity securities of issuers in commodity-related industries.
The Dynamic Asset Allocation and Multi-Asset Real Return Funds may also seek to gain exposure to the commodity markets, in whole or in part, through investments in a wholly owned Subsidiary. The Subsidiary, unlike the Fund, may invest to a significant extent directly in commodities and in equity-linked securities and commodity-linked derivative instruments, including options, futures contracts, swaps, options on futures contracts and commodity-linked structured notes. The Subsidiary may also invest in other instruments in which the Fund is permitted to invest, either as investments or to serve as margin or collateral for its derivative positions. A Fund may invest up to 25% of its total assets in its Subsidiary.
In order for a Fund to qualify as a regulated investment company under Subchapter M of the Code, the Fund must derive at least 90% of its gross income each taxable year from qualifying income. The status of certain commodity-linked derivative instruments as qualifying income has been addressed in Revenue Ruling 2006-1 and Revenue Ruling 2006-31 which provide that income from certain commodity-linked derivative instruments in which the Fund invests will not be considered qualifying income. To the extent the Dynamic Asset Allocation and Multi-Asset Real Return Funds invest in such instruments directly, each Fund will seek to restrict its income from commodity-linked derivative instruments that do not generate qualifying income, such as commodity-linked swaps, to a maximum of 10% of its gross income (when combined with its other investments that produce non-qualifying income).
Foreign Currency Translation — The books and records of the Funds investing in international securities are maintained in U.S. dollars on the following basis:
(I) market value of investment securities, assets and liabilities at the current rate of exchange; and
(II) purchases and sales of investment securities, income and expenses at the relevant rates of exchange prevailing on the respective dates of such transactions.
The Funds do not isolate that portion of gains and losses on investments in equity securities that is due to changes in the foreign exchange rates from that which is due to changes in market prices of equity securities.
| 316 | SEI Institutional Investments Trust / Annual Report / May 31, 2015 |
The Funds report certain foreign-currency-related transactions as components of realized gains for financial reporting purposes, whereas such components are treated as ordinary income for Federal income tax purposes.
Forward Foreign Currency Contracts — To the extent consistent with its Investment Objective and Strategies, a Fund may enter into forward foreign currency contracts as hedges against either specific transactions, fund positions or anticipated fund positions. A Fund may also engage in currency transactions to enhance that Fund’s returns. All commitments are marked-to-market daily at the applicable foreign exchange rate, and any resulting unrealized gains or losses are recorded currently. A Fund realizes gains and losses at the time forward contracts are extinguished. Unrealized gains or losses on outstanding positions in forward foreign currency contracts held at the close of the period are recognized as ordinary income or loss for Federal income tax purposes. A Fund could be exposed to risk if the counterparties to the contracts are unable to meet the terms of the contract and from unanticipated movements in the value of a foreign currency relative to the U.S. dollar.
Finally, the risk exists that losses could exceed amounts disclosed on the Statements of Assets and Liabilities or Consolidated Statements of Assets and Liabilities. Refer to each Fund’s Schedule of Investments, Summary Schedule of Investments, Consolidated Schedule of Investments or Consolidated Summary Schedule of Investments for details regarding open forward foreign currency contracts as of May 31, 2015, if applicable.
Futures Contracts — To the extent consistent with its Investment Objective and Strategies, a Fund may use futures contracts for tactical hedging purposes as well as to enhance the Fund’s returns. In addition, fixed income funds will utilize futures contracts to help manage duration and yield curve exposure. These Funds’ investments in futures contracts are designed to enable the Funds to more closely approximate the performance of their benchmark indices. Initial margin deposits of cash or securities are made upon entering into futures contracts. The contracts are marked-to-market daily and the resulting changes in value are accounted for as unrealized gains and losses. Variation margin payments are paid or received, depending upon whether unrealized gains or losses are incurred. When contracts are closed, the Funds record a realized gain or loss equal to the difference between the proceeds from (or cost of) the closing transaction and the amount invested in the contract.
Risks of entering into futures contracts include the possibility that there will be an imperfect price correlation between the futures and the underlying securities. Second, it is possible that a lack of liquidity for futures contracts could exist in the secondary market, resulting in an inability to close a position prior to its maturity date. Third, futures contracts involve the risk that a Fund could lose more than the original margin deposit required to initiate a futures transaction.
Finally, the risk exists that losses could exceed amounts disclosed on the Statements of Assets and Liabilities or Consolidated Statements of Assets and Liabilities. Refer to each Fund’s Schedule of Investments, Summary Schedule of Investments or Consolidated Schedule of Investments for details regarding open futures contracts as of May 31, 2015, if applicable.
Options/Swaptions Written/Purchased — To the extent consistent with its Investment Objective and Strategies, a Fund may invest in financial options/swaptions contracts for the purpose of hedging its existing portfolio securities, or securities that a Fund intends to purchase, against fluctuations in fair market value caused by changes in prevailing market interest rates. A Fund may also invest in financial option/swaption contracts to enhance its returns. When the Fund writes or purchases an option/swaption, an amount equal to the premium received or paid by the Fund is recorded as a liability or an asset and is subsequently adjusted to the current market value of the option/swaption written or purchased. Premiums received or paid from writing or purchasing options/ swaptions which expire unexercised are treated by the Fund on the expiration date as realized gains or losses. The difference between the premium and the amount paid or received on effecting a closing purchase or sale transaction, including brokerage commissions, is also treated as a realized gain or loss. If an option/swaption is exercised, the premium paid or received is added to the cost of the purchase or proceeds from the sale in determining whether the Fund has realized a gain or a loss. The Core Fixed Income and Dynamic Asset Allocation Funds had options/swaption contracts as of May 31, 2015, as disclosed in the Funds’ Schedule of Investments or Consolidated Summary Schedule of Investments.
The risk in writing a call option/swaption is a Fund may give up the opportunity for profit if the market price of the security increases. The risk in writing a put option/swaption is a Fund may incur a loss if the market price of the security decreases and the option/swaption is exercised. The risk in purchasing an option/swaption is a Fund may pay a premium whether or not the option/swaption is exercised. The Funds also have the additional risk of being unable to enter into a closing transaction at an acceptable price if a liquid secondary market does not exist. Option/swaption contracts also involve the risk that they may not work as intended due to unanticipated developments in market conditions or other causes.
Finally, the risk exists that losses on written options could exceed amounts disclosed on the Statements of Assets and Liabilities. Refer to each Fund’s Schedule of Investments or Consolidated Summary Schedule of Investments for details regarding open option/swaption contracts as of May 31, 2015, if applicable.
Securities Sold Short — To the extent consistent with its Investment Objective and Strategies, a Fund may engage in short sales. Short sales are transactions under which a Fund sells a security it does not own. To complete such a transaction, a Fund must borrow the security to make delivery to the buyer. A Fund then is obligated to replace the security borrowed by purchasing the security at the market price at the time of the replacement. The price at such time may be more or less than the price at which the security was sold by a Fund. Until the security is replaced, a Fund is required to pay the lender amounts equal to any dividends or interest that accrue during the period of the loan. Dividends and interest are shown as an expense for financial reporting purposes. To borrow the security, a Fund also may be required to pay a premium, which would decrease proceeds of the security sold. The proceeds of the
| SEI Institutional Investments Trust / Annual Report / May 31, 2015 | 317 |
Notes to Financial Statements/Consolidated Notes to Financial Statements (Continued)
May 31, 2015
short sale are retained by the broker, to the extent necessary to meet margin requirements, until the short position is closed out. A gain, limited to the price at which a Fund sold the security short, or a loss, unlimited in size, will be recognized upon the close of a short sale.
Until a Fund closes its short position or replaces the borrowed security, the Fund will: (i) earmark on the books of the Fund or place in a segregated account cash or liquid securities at such a level that the amount earmarked or deposited in the segregated account plus the amount deposited with the broker as collateral will equal the current value of the security sold short; or (ii) otherwise “cover” the Fund’s short position as required by the 1940 Act. Refer to each Fund’s Schedule of Investments, Summary Schedule of Investments, Consolidated Summary Schedule of Investments or Consolidated Schedule of Investments for details regarding securities sold short as of May 31, 2015, if applicable. As of May 31, 2015, the Multi-Asset Real Return Fund held short positions.
Swap Agreements — To the extent consistent with its Investment Objective and Strategies, a Fund may invest in swap contracts as an efficient means to synthetically obtain exposure to securities or baskets of securities and to manage a Fund’s interest rate duration and yield curve exposure. Swap contracts may also be used to mitigate a Fund’s overall level of risk and/or a Fund’s risk to particular types of securities, currencies or market segments. Interest rate swaps may further be used to manage a Fund’s yield spread sensitivity. A Fund may buy credit default swaps in an attempt to manage credit risk where a Fund has credit exposure to an issuer, and a Fund may sell credit default swaps to more efficiently gain credit exposure to a security or basket of securities. A swap agreement is a two-party contract under which an agreement is made to exchange returns from predetermined investments or instruments, including a particular interest rate, foreign currency, or “basket” of securities representing a particular index. Swap agreements are privately negotiated in the over-the-counter market (“OTC swaps”) or may be executed in a multilateral or other trade facility platform, such as a registered commodities exchange (“Centrally Cleared swaps”). Interest rate swaps involve the exchange by a Fund with another party of their respective commitments to pay or receive interest (e.g., an exchange of floating rate payments for fixed rate payments) with respect to a notional amount of principal. Credit-default swaps involve periodic payments by a Fund or counterparty based on a specified rate multiplied by a notional amount assigned to an underlying debt instrument or group of debt instruments in exchange for the assumption of credit risk on the same instruments. In the event of a credit event, usually in the form of a credit rating downgrade, the party receiving periodic payments (i.e. floating rate payer) must pay the other party (i.e. fixed rate payer) an amount equal to the recovery rate used to settle the contracts. The recovery rate is a function of how many credit default swap investors wish to deliver the security or receive the security. The recovery rate is determined through an auction process. Total return swaps allow an investor to benefit from the cash flow without ever actually owning the underlying security. The receiver must pay any decline in value to the payer at the end of the total return swap. However, the investor does not need to make a payment if there is no decline in price. Payments
can be made on various indices, bonds (i.e. mortgage backed securities, bank debt and corporate), loans or commodities. The value of a total return swap is equal to the change in value of the underlying asset versus the accrued income payment based on LIBOR or some other form of indices on the notional amount. Interest rate swaps involve the exchange by a Fund with another party of their respective commitments to pay or receive interest (e.g., an exchange of floating rate payments for fixed rate payments) with respect to a notional amount of principal to manage a Fund’s exposure to interest rates. Payments received or made are recorded as realized gains or loss. A Fund could be exposed to credit or market risk due to unfavorable changes in the fluctuation of interest rates or if the counterparty defaults on its obligation to perform. Risk of loss may exceed amounts recognized on the Statements of Assets and Liabilities or Consolidated Statements of Assets and Liabilities. Interest rate swap contracts outstanding at period end, if any, are listed after a Fund’s portfolio. In connection with swap agreements securities may be set aside as collateral by a Fund’s custodian.
Swaps are marked-to-market daily based upon quotations from market makers and the resulting changes in market values, if any, are recorded as an unrealized gain or loss on the Statements of Operations or Consolidated Statements of Operations. Net payments of interest are recorded as realized gains or losses. Daily changes in valuation of Centrally Cleared swaps, if any, are recorded as a receivable or payable for the change in value as appropriate (“variation margin”) on the Statements of Assets and Liabilities or Consolidated Statements of Assets and Liabilities.
Entering into swap agreements involves, to varying degrees, elements of credit and market risk in excess of the amounts recognized on the Statements of Assets and Liabilities or Consolidated Statements of Assets and Liabilities. Such risks involve the possibility that there will be no liquid market for these agreements, that the counterparty to the agreement may default on its obligation to perform and that there may be unfavorable changes in the fluctuation of interest rates. Risks also arise from potential losses from adverse market movements.
This risk is mitigated by having a master netting arrangement between a Fund and the counterparty and by having the counterparty post collateral to cover a Fund’s exposure to the counterparty. See Note 3 for further details. Refer to each Fund’s Schedule of Investments, Summary Schedule of Investments or Consolidated Schedule of Investments. for details regarding open swap agreements as of May 31, 2015, if applicable.
Forward Treasury Commitments — To the extent consistent with its Investment Objective and Strategies, a Fund may invest in commitments to purchase U.S. Treasury securities on an extended settlement basis. Such transactions involve the commitment to purchase a security with payment and delivery taking place in the future, sometimes a month or more after the transaction date. The Funds account for such transactions as purchases and sales and record an unrealized gain or loss each day equal to the difference between the cost of the purchase commitment and the current market value. Realized gains or losses are recorded upon closure or settlement of such commitments. No interest
| 318 | SEI Institutional Investments Trust / Annual Report / May 31, 2015 |
is earned prior to settlement of the transaction. These instruments are subject to market fluctuation due to changes in interest rates and the market value at the time of settlement could be higher or lower than the purchase price. A Fund may incur losses due to changes in the value of the underlying treasury securities from interest rate fluctuations or as a result of counterparty nonperformance.
Delayed Delivery Transactions — To the extent consistent with its Investment Objective and Strategies, a Fund may purchase or sell securities on a when-issued or delayed delivery basis. These transactions involve a commitment by the Fund to purchase or sell securities for a predetermined price or yield, with payment and delivery taking place beyond the customary settlement period. When purchasing a security on a delayed delivery basis, the Fund assumes the rights and risks of ownership of the security, including the risk of price and yield fluctuations, and takes such fluctuations into account when determining its net asset value. The Funds may dispose of or renegotiate a delayed delivery transaction after it is entered into, and may sell when-issued securities before they are delivered, which may result in a capital gain or loss. When the Fund has sold a security on a delayed delivery basis, the Fund does not participate in future gains and losses with respect to the security.
Participation Notes (P-Notes) — To the extent consistent with its Investment Objective and Strategies, a Fund may acquire P-Notes issued by participating banks or broker-dealers. P-Notes are participation interest notes that are designed to offer a return linked to a particular underlying equity, debt, currency or market. The P-Notes in which the Fund may invest will typically have a maturity of one year. When purchasing a P-Note, the posting of margin is not required because the full cost of the P-Note (plus commission) is paid at the time of purchase. When the P-Note matures, the issuer will pay to, or receive from, the purchaser the difference between the minimal value of the underlying instrument at the time of purchase and that instrument’s value at maturity. Investments in P-Notes involve the same risks associated with a direct investment in the underlying foreign companies of foreign securities markets that they seek to replicate.
In addition, there can be no assurance that the trading price of P-Notes will equal the underlying value of the foreign companies or foreign securities markets that they seek to replicate. The holder of a participation note that is linked to a particular underlying security is entitled to receive any dividends paid in connection with an underlying security or instrument. However, the holder of a participation note does not receive voting rights as it would if it directly owned the underlying security or instrument. P-Notes are generally traded over-the-counter. P-Notes constitute general unsecured contractual obligations of the banks or broker-dealers that issue them and the counterparty. There is also counterparty risk associated with these investments because the Fund is relying on the creditworthiness of such counterparty and has no rights under a participation note against the issuer of the underlying security. In addition, the Fund will incur transaction costs as a result of investments in P-Notes.
Loan Participations and Brady Bonds — To the extent consistent with its Investment Objective and Strategies, a Fund may invest in U.S. dollar-denominated fixed- and floating-rate loans (“Loans”) arranged through private negotiations between a foreign sovereign entity and one or more financial institutions (“Lenders”). The Fund
invests in such Loans in the form of participations in Loans (“Participations”) or assignments of all or a portion of Loans from third parties. Participations typically result in this Fund having a contractual relationship only with the Lenders, not with the sovereign borrowers. This Fund has the right to receive payments of principal, interest and any fees to which it is entitled from the Lender selling the Participation and only upon receipt by the Lender of the payments from the borrower. In connection with purchasing Participations, the Fund generally has no right to enforce compliance by the borrower with the terms of the loan agreement relating to the Loan, nor any rights of set-off against the borrower, and the Fund will not benefit directly from any collateral supporting the Loan in which it has purchased the Participation. As a result, the Fund assumes the credit risk of both the borrower and the Lender that is selling the Participation.
Certain debt obligations, customarily referred to as “Brady Bonds,” are created through the exchange of existing commercial bank loans to foreign entities for new obligations in connection with debt restructuring under a plan introduced by former U.S. Secretary of the Treasury Nicholas F. Brady. Brady Bonds have only been issued since 1989, and, accordingly, do not have a long payment history. They are issued by governments that may have previously defaulted on the loans being restructured by the Brady Bonds, so they are subject to the risk of default by the issuer. They may be fully or partially collateralized or uncollateralized and issued in various currencies.
Collateralized Debt Obligations — To the extent consistent with its Investment Objective and Strategies, a Fund may invest in collateralized debt obligations (“CDOs”), which include collateralized loan obligations (“CLOs”) if it holds only loans and other similarly structured securities. Multiple levels of securities are issued by the CDO, offering various maturity and credit risk characteristics that are characterized according to their degree of credit risk. Purchasers in CDOs are credited with their portion of the scheduled payments of interest and principal on the underlying assets plus all unscheduled prepayments of principal based on a predetermined priority schedule. Accordingly, the CDOs in the longer maturity series are less likely than other asset pass-throughs to be prepaid prior to their stated maturity.
Dividends and Distributions to Shareholders — Dividends from net investment income are declared and paid to shareholders quarterly for the Large Cap, Large Cap Diversified Alpha, Large Cap Disciplined Equity, Large Cap Index, S&P 500 Index, Extended Market Index, Small Cap, Small Cap II, Small/Mid Cap Equity, U.S. Managed Volatility, Opportunistic Income, Emerging Markets Debt and Real Return Funds; declared daily and paid monthly for the Core Fixed Income, High Yield Bond, Long Duration, Long Duration Credit and Ultra Short Duration Bond Funds; declared and paid at least annually for the World Equity Ex-US, Screened World Equity Ex-US, Emerging Markets Equity, Limited Duration Bond, Intermediate Duration Credit, Dynamic Asset Allocation and Multi-Asset Real Return Funds. Dividends and distributions are recorded on the ex-dividend date. Any net realized capital gains will be distributed at least annually by the Funds.
Illiquid Securities — A security is considered illiquid if it cannot be sold or disposed of in the ordinary course of business within seven days or less for its approximate carrying value on the books of a Fund.
| SEI Institutional Investments Trust / Annual Report / May 31, 2015 | 319 |
Notes to Financial Statements/Consolidated Notes to Financial Statements (Continued)
May 31, 2015
Valuations of illiquid securities may differ significantly from the values that would have been used had an active market value for these securities existed.
Restricted Securities — As of May 31, 2015, the following Fund owned private placement investments that were purchased through private offerings or acquired through initial public offerings and cannot be sold without prior registration under the Securities Act of 1933 or pursuant to an
exemption therefrom. In addition, this Fund has generally agreed to further restrictions on the disposition of certain holdings as set forth in various agreements entered into in connection with the purchase of these private placement investments. The acquisition dates of these investments, the enforceable right to acquire these private placement investments, along with the cost and values at May 31, 2015, were as follows:
| Face Amount ($ Thousands)/ Shares | Acquisition Date | Right to Acquire Date | Cost ($ Thousands) | Market Value ($ Thousands) | % of Net Assets | |||||||||||||||||||
| High Yield Bond Fund | ||||||||||||||||||||||||
Aventine (escrow security) | $ | 2,600 | 11/30/2010 | 11/30/2010 | $ | — | $ | 1 | 0.00 | % | ||||||||||||||
VSS AHC, Cl A | 29,628 | 09/25/2009 | 09/25/2009 | — | 28 | 0.00 | ||||||||||||||||||
|
|
|
|
|
| |||||||||||||||||||
| $ | — | $ | 29 | 0.00 | % | |||||||||||||||||||
|
|
|
|
|
| |||||||||||||||||||
Investments in Real Estate Investment Trusts (“REITs”) — With respect to the Funds, with the exception of the World Equity Ex-US, Screened World Equity Ex-US and Real Return Funds, dividend income is recorded based on the income included in distributions received from the REIT investments using published REIT reclassifications including some management estimates when actual amounts are not available. Distributions received in excess of this estimated amount are recorded as a reduction of the cost of investments or reclassified to capital gains. The actual amounts of income, return of capital, and capital gains are only determined by each REIT after its fiscal year-end, and may differ from the estimated amounts.
Investment in Subsidiary — The Dynamic Asset Allocation and Multi-Asset Real Return Funds may invest in their own Subsidiary. By investing in its Subsidiary, each Fund is indirectly exposed to the risks associated with the Subsidiary’s investments. The commodity-related instruments held by a Subsidiary are generally similar to those that are permitted to be held by the applicable Fund and are subject to the same risks that apply to similar investments if held directly by the Fund. A Subsidiary, however, is not registered under the 1940 Act and will not be subject to all of the investor protections of the 1940 Act. Thus, the Dynamic Asset Allocation and Multi-Asset Real Return Funds, as investors in their own Subsidiary, will not have all of the protections offered to investors in registered investment companies.
However, each Fund wholly owns and controls its respective Subsidiary, and the Funds and the Subsidiaries are all managed by SIMC, making it unlikely that the Subsidiary will take action contrary to the interests of the applicable Fund or its shareholders. While a Subsidiary has its own Board of Directors (“Board”) that is responsible for overseeing the operations of such Subsidiary, the respective Fund’s Board has oversight responsibility for the investment activities of the Fund, including its investment in the respective Subsidiary, and the Fund’s role as the sole shareholder of such Subsidiary. It is not currently expected that shares of the Subsidiary will be sold or offered to investors other than the respective Fund.
Changes in the laws of the United States and/or the Cayman Islands or governmental interpretation of such laws, under which the Fund and the Subsidiary, respectively, are organized, could result in the inability
of the Fund and/or its respective Subsidiary to operate as intended and could negatively affect the Fund and its shareholders. For example, Cayman Islands law does not currently impose any income, corporate or capital gains tax, estate duty, inheritance tax, gift tax or withholding tax on the Subsidiaries. If Cayman Islands law changes such that the Subsidiaries must pay Cayman Islands governmental authority taxes, Fund shareholders would likely suffer decreased investment return.
3. CREDIT DERIVATIVES
A Fund may use credit default swaps to reduce risk where a Fund has exposure to the issuer, or to take an active long or short position with respect to the likelihood of an event of default. The reference obligation of the swap can be a single issuer, a “basket” of issuers, or an index. The underlying referenced assets are corporate debt, sovereign debt and asset backed securities.
The buyer of a credit default swap is generally obligated to pay the seller a periodic stream of payments over the term of the contract in return for a contingent payment upon the occurrence of a credit event with respect to an underlying reference obligation. Generally, a credit event for corporate or sovereign reference obligations means bankruptcy, failure to pay, obligation acceleration, repudiation/moratorium or restructuring. For credit default swaps on asset-backed securities, a credit event may be triggered by events such as failure to pay principal, maturity extension, rating downgrade or write-down.
If a Fund is a seller of protection, and a credit event occurs, as defined under the terms of that particular swap agreement, a Fund will generally either (i) pay to the buyer an amount equal to the notional amount of the swap and take delivery of the referenced obligation, other deliverable obligations, or underlying securities comprising a referenced index or (ii) pay a net settlement amount in the form of cash or securities equal to the notional amount of the swap less the recovery value of the referenced obligation or underlying securities comprising a referenced index.
If a Fund is a buyer of protection and a credit event occurs, as defined under the terms of that particular swap agreement, a Fund will either (i) receive from the seller of protection an amount equal to
| 320 | SEI Institutional Investments Trust / Annual Report / May 31, 2015 |
the notional amount of the swap and deliver the referenced obligation, other deliverable obligations or underlying securities comprising the referenced index or (ii) receive a net settlement amount in the form of cash or securities equal to the notional amount of the swap less the recovery value of the referenced obligation or underlying securities comprising the referenced index. Recovery values are assumed by market makers considering either industry standard recovery rates or entity specific factors and considerations until a credit event occurs. If a credit event has occurred, the recovery value is determined by a facilitated auction whereby a minimum number of allowable broker bids, together with a specified valuation method, are used to calculate the settlement value.
As of May 31, 2015, the High Yield Bond Fund is the buyer (“receiving protection”) on a total notional amount of $19.4 million. Additionally, the High Yield Bond, the Core Fixed Income and Multi-Asset Real Return Funds are the sellers (“providing protection”) on a total notional amount of $14.6 million, $6.8 million and $1.3 million, respectively. The notional amounts of the swaps are not recorded in the financial statements; however the notional amounts approximate the maximum potential amount of future payments that the Fund could be required to make if the Fund was the seller of protection and a credit event were to occur. Those credit default swaps (“CDS”) for which the Fund is providing protection at balance sheet date are summarized as follows:
| HIGH YIELD BOND FUND WRITTEN CREDIT DERIVATIVE CONTRACTS | SINGLE NAME CDS | CDS INDEX | ||||||||||||||||||
| Reference Asset | CORP US$ | SOVEREIGN US$ | ABS US$ | CORP US$ | Total | |||||||||||||||
Fair value of written credit derivatives | $ | — | $ | — | $ | 1,090,404 | $ | — | $ | 1,090,404 | ||||||||||
Maximum potential amount of future payments | — | — | 14,660,000 | — | 14,660,000 | |||||||||||||||
Recourse provisions with third parties to recover any amounts paid under the credit derivative (including any purchased credit protection)1 | — | — | — | — | — | |||||||||||||||
Collateral held by the Partnership or other third parties which the Partnership can obtain upon occurrence of triggering event | — | — | — | — | — | |||||||||||||||
| 1 | Potential recoveries would include purchased credit derivatives to the extent they offset written credit derivatives which have an identical underlying, or a netting arrangement or credit support annex with the counterparty. There may be other potential recoveries from recourse provisions where agreements cover multiple derivative arrangements but those amounts have not been included. |
| MAXIMUM POTENTIAL AMOUNT OF FUTURE PAYMENTS BY CONTRACT TERM | ||||||||||||||||||||||||
| 0-6 MONTHS | 6-12 MONTHS | 1-5 YEARS | 5-10 YEARS | > 10 YEARS | Total | |||||||||||||||||||
Current credit spread* on underlying (in basis points) | ||||||||||||||||||||||||
0-100 | $ | — | $ | — | $ | — | $ | — | $ | — | $ | — | ||||||||||||
101-200 | — | — | — | — | — | — | ||||||||||||||||||
> than 200 | — | — | 4,660,000 | 10,000,000 | — | 14,660,000 | ||||||||||||||||||
Total | $ | — | $ | — | $ | 4,660,000 | $ | 10,000,000 | $ | — | $ | 14,660,000 | ||||||||||||
| * | The credit spread on the underlying asset is generally indicative of the current status of the underlying risk of the Fund having to perform. The spread also reflects the cost of buying/selling protection and may include upfront payments required to be made to enter into a contract. Higher credit spreads with a shorter contract term is indicative of a higher likelihood of performance by the Fund. |
| CORE FIXED INCOME FUND WRITTEN CREDIT DERIVATIVE CONTRACTS | SINGLE NAME CDS | CDS ON AN INDEX | ||||||||||||||||||
| REFERENCE ASSET | CORP US$ | SOVEREIGN US$ | ABS US$ | CORP US$ | Total | |||||||||||||||
Fair value of written credit derivatives | $ | 49,544 | $ | — | $ | — | $ | — | $ | 49,544 | ||||||||||
Maximum potential amount of future payments | 6,840,000 | — | — | �� | — | 6,840,000 | ||||||||||||||
Recourse provisions with third parties to recover any amounts paid under the credit derivative (including any purchased credit protection)1 | — | — | — | — | — | |||||||||||||||
Collateral held by the Fund can obtain upon occurrence of triggering event | — | — | — | — | — | |||||||||||||||
| 1 | Potential recoveries would include purchased credit derivatives to the extent they offset written credit derivatives which have an identical underlying, or a netting arrangement or credit support annex with the counterparty. There may be other potential recoveries from recourse provisions where agreements cover multiple derivative arrangements but those amounts have not been included. |
| MAXIMUM POTENTIAL AMOUNT OF FUTURE PAYMENTS BY CONTRACT TERM | ||||||||||||||||||||||||
| CORE FIXED INCOME FUND | 0-6 MONTHS | 6-12 MONTHS | 1-5 YEARS | 5-10 YEARS | > 10 YEARS | Total | ||||||||||||||||||
Current credit spread* on underlying (in basis points) | ||||||||||||||||||||||||
0-100 | $ | — | $ | — | $ | — | $ | 6,840,000 | $ | — | $ | 6,840,000 | ||||||||||||
> than 100 | — | — | — | — | — | — | ||||||||||||||||||
Total | $ | — | $ | — | $ | — | $ | 6,840,000 | $ | — | $ | 6,840,000 | ||||||||||||
| * | The credit spread on the underlying asset is generally indicative of the current status of the underlying risk of the Fund having to perform. The spread also reflects the cost of buying/selling protection and may include upfront payments required to be made to enter into a contract. Higher credit spreads with a shorter contract term is indicative of a higher likelihood of performance by the Fund. |
| SEI Institutional Investments Trust / Annual Report / May 31, 2015 | 321 |
Notes to Financial Statements/Consolidated Notes to Financial Statements (Continued)
May 31, 2015
| MULTI-ASSET REAL RETURN FUND WRITTEN CREDIT DERIVATIVE CONTRACTS | SINGLE NAME CDS | CDS ON AN INDEX | ||||||||||||||||||
| REFERENCE ASSET | CORP US$ | SOVEREIGN US$ | ABS US$ | CORP US$ | Total | |||||||||||||||
Fair value of written credit derivatives | $ | 33,822 | $ | — | $ | — | $ | — | $ | 33,822 | ||||||||||
Maximum potential amount of future payments | 1,299,269 | — | — | — | 1,299,269 | |||||||||||||||
Recourse provisions with third parties to recover any amounts paid under the credit derivative (including any purchased credit protection)1 | — | — | — | — | — | |||||||||||||||
Collateral held by the Fund can obtain upon occurrence of triggering event | — | — | — | — | — | |||||||||||||||
| 1 | Potential recoveries would include purchased credit derivatives to the extent they offset written credit derivatives which have an identical underlying, or a netting arrangement or credit support annex with the counterparty. There may be other potential recoveries from recourse provisions where agreements cover multiple derivative arrangements but those amounts have not been included. |
| MAXIMUM POTENTIAL AMOUNT OF FUTURE PAYMENTS BY CONTRACT TERM | ||||||||||||||||||||||||
| MULTI-ASSET REAL RETURN FUND | 0-6 MONTHS | 6-12 MONTHS | 1-5 YEARS | 5-10 YEARS | > 10 YEARS | Total | ||||||||||||||||||
Current credit spread* on underlying (in basis points) | ||||||||||||||||||||||||
0-100 | $ | — | $ | — | $ | 1,299,269 | $ | — | $ | — | $ | 1,299,269 | ||||||||||||
100-200 | — | — | — | — | — | — | �� | |||||||||||||||||
> than 200 | — | — | — | — | — | — | ||||||||||||||||||
Total | $ | — | $ | — | $ | 1,299,269 | $ | — | $ | — | $ | 1,299,269 | ||||||||||||
| * | The credit spread on the underlying asset is generally indicative of the current status of the underlying risk of the Fund having to perform. The spread also reflects the cost of buying/selling protection and may include upfront payments required to be made to enter into a contract. Higher credit spreads with a shorter contract term is indicative of a higher likelihood of performance by the Fund. |
The credit spread disclosed above for each reference obligation where the Fund is the seller of protection is a representation of the current payment/performance risk of the swap.
4. DERIVATIVE TRANSACTIONS
The following tables include only Funds that had exposure to more than one type of risk on derivatives held throughout the year. For Funds that held derivatives throughout the period with only one type of risk exposure, additional information can be found on the Schedule of Investments, Consolidated Summary Schedule of Investments or Consolidated Schedule of Investments and the Statements of Operations or Consolidated Statements of Operations.
The fair value of derivative instruments as of May 31, 2015 was as follows:
| Asset Derivatives | Liability Derivatives | |||||||||||
| Year ended May 31, 2015 ($ Thousands) | Year ended May 31, 2015 ($ Thousands) | |||||||||||
| Statements of Assets and Liabilities Location | Fair Value | Statements of Assets and Liabilities Location | Fair Value | |||||||||
Derivatives not accounted for as hedging instruments: | ||||||||||||
| Core Fixed Income Fund | ||||||||||||
Interest rate contracts | Net Assets — Unrealized appreciation on futures contracts | $ | 4,110 | * | Net Assets — Unrealized depreciation on futures contracts | $ | 2,922 | * | ||||
Net Assets — Unrealized appreciation on swap contracts | 660 | † | Net Assets — Unrealized depreciation on swap contracts | 2,061 | † | |||||||
Options purchased, at value | 33 | Options written, at value | 476 | |||||||||
Swaptions purchased, at value | 109 | Swaptions written, at value | 156 | |||||||||
Foreign exchange contracts | Unrealized gain on forward foreign currency contracts | 2,336 | Unrealized loss on forward foreign currency contracts | 584 | ||||||||
Credit contracts | Net Assets — Unrealized appreciation on swap contracts | 83 | † | Net Assets — Unrealized depreciation on swap contracts | 10 | † | ||||||
|
|
|
| |||||||||
Total Derivatives not accounted for as hedging instruments | $ | 7,331 | $ | 6,209 | ||||||||
|
|
|
| |||||||||
| Long Duration Fund | ||||||||||||
Interest rate contracts | Net Assets — Unrealized appreciation on futures contracts | $ | 2,748 | Net Assets — Unrealized depreciation on futures contracts | $ | 1,153 | * | |||||
Net Assets — Unrealized appreciation on swap contracts | — | † | Net Assets — Unrealized depreciation on swap contracts | 1,389 | † | |||||||
|
|
|
| |||||||||
Total Derivatives not accounted for as hedging instruments | $ | 2,748 | $ | 2,542 | ||||||||
|
|
|
| |||||||||
| Emerging Markets Debt Fund | ||||||||||||
Equity contracts | Net Assets — Unrealized appreciation on futures contracts | $ | 100 | * | Net Assets — Unrealized depreciation on futures contracts | $ | 347 | * | ||||
Interest rate contracts | Net Assets — Unrealized appreciation on swap contracts | 704 | † | Net Assets — Unrealized depreciation on swap contracts | 2,110 | † | ||||||
Foreign exchange contracts | Unrealized gain on forward foreign currency contracts | 9,527 | Unrealized loss on forward foreign currency contracts | 9,206 | ||||||||
Net Assets — Unrealized appreciation on swap contracts | — | Net Assets — Unrealized depreciation on swap contracts | 519 | † | ||||||||
|
|
|
| |||||||||
Total Derivatives not accounted for as hedging instruments | $ | 10,331 | $ | 12,182 | ||||||||
|
|
|
| |||||||||
| 322 | SEI Institutional Investments Trust / Annual Report / May 31, 2015 |
| Asset Derivatives | Liability Derivatives | |||||||||||
| Year ended May 31, 2015 ($ Thousands) | Year ended May 31, 2015 ($ Thousands) | |||||||||||
| Consolidated Statements of Assets and Liabilities Location | Fair Value | Consolidated Statements of Assets and Liabilities Location | Fair Value | |||||||||
| Dynamic Asset Allocation Fund | ||||||||||||
Foreign exchange contracts | Unrealized gain on forward foreign currency contracts | $ | 1,692 | Unrealized loss on forward foreign currency contracts | $ | 14,156 | ||||||
Equity contracts | Net Assets — Unrealized appreciation on futures contracts | 16,973 | * | Net Assets — Unrealized depreciation on futures contracts | 5,194 | * | ||||||
Options purchased, at value | 210 | Options written, at value | — | |||||||||
|
|
|
| |||||||||
Total Derivatives not accounted for as hedging instruments | $ | 18,875 | $ | 19,350 | ||||||||
|
|
|
| |||||||||
| Multi-Asset Real Return Fund | ||||||||||||
Interest rate contracts | Net Assets — Unrealized appreciation on futures contracts | $ | 113 | * | Net Assets — Unrealized depreciation on futures contracts | $ | 290 | * | ||||
Net Assets — Unrealized appreciation on swap contracts | 594 | † | Net Assets — Unrealized depreciation on swap contracts | (1,181 | )† | |||||||
Foreign exchange contracts | Unrealized gain on forward foreign currency contracts | 382 | Unrealized loss on forward foreign currency contracts | 120 | ||||||||
Credit contracts | Net Assets — Unrealized appreciation on swap contracts | 40 | † | Net Assets — Unrealized depreciation on swap contracts | — | |||||||
Equity contracts | Net Assets — Unrealized appreciation on futures contracts | — | Net Assets — Unrealized depreciation on futures contracts | 938 | * | |||||||
Commodity contracts | Net Assets — Unrealized appreciation on futures contracts | 3,865 | * | Net Assets — Unrealized depreciation on futures contracts | 3,995 | * | ||||||
Options purchased, at value | 196 | Options written, at value | — | |||||||||
|
|
|
| |||||||||
Total Derivatives not accounted for as hedging instruments | $ | 5,190 | $ | 4,162 | ||||||||
|
|
|
| |||||||||
| * | Includes cumulative appreciation/depreciation of futures contracts as reported in the Schedules of Investments, Consolidated Summary Schedule of Investments or Consolidated Schedule of Investments. Only current day’s variation margin is reported within the Statements of Assets and Liabilities or Consolidated Statements of Assets and Liabilities. |
| † | Includes cumulative appreciation/depreciation of swap contracts as reported in the Schedules of Investments or Consolidated Schedule of Investments. Market Value is reported within the Statements of Assets and Liabilities or Consolidated Statements of Assets and Liabilities for swap contracts that have paid premiums. |
The effect of derivative instruments on the Statements of Operations or Consolidated Statements of Operations for the year ended May 31, 2015.
Amount of realized gain or (loss) on derivatives recognized in income ($ Thousands):
| Derivatives Not Accounted for as Hedging Instruments | Options | Futures | Forward Currency Contracts | Swaps | Total | |||||||||||||||
Core Fixed Income Fund | ||||||||||||||||||||
Interest rate contracts | $ | 289 | $ | (6,460 | ) | $ | — | $ | (1,159 | ) | $ | (7,330 | ) | |||||||
Foreign exchange contracts | — | — | 7,236 | — | 7,236 | |||||||||||||||
Credit contracts | — | — | — | 78 | 78 | |||||||||||||||
Total | $ | 289 | $ | (6,460 | ) | $ | 7,236 | $ | (1,081 | ) | $ | (16 | ) | |||||||
Long Duration Fund | ||||||||||||||||||||
Interest rate contracts | $ | — | $ | 13,947 | $ | — | $ | 1 | $ | 13,948 | ||||||||||
Credit contracts | — | — | — | (528 | ) | (528 | ) | |||||||||||||
Total | $ | — | $ | 13,947 | $ | — | $ | (527 | ) | $ | 13,420 | |||||||||
Emerging Markets Debt Fund | ||||||||||||||||||||
Interest rate contracts | $ | — | $ | (1,354 | ) | $ | — | $ | 2,163 | $ | 809 | |||||||||
Foreign exchange contracts | — | — | 7,459 | — | 7,459 | |||||||||||||||
Total | $ | — | $ | (1,354 | ) | $ | 7,459 | $ | 2,163 | $ | 8,268 | |||||||||
Dynamic Asset Allocation Fund | ||||||||||||||||||||
Foreign exchange contracts | $ | — | $ | — | $ | 150,309 | $ | — | $ | 150,309 | ||||||||||
Equity contracts | 7,350 | 15,613 | — | — | 22,963 | |||||||||||||||
Total | $ | 7,350 | $ | 15,613 | $ | 150,309 | $ | — | $ | 173,272 | ||||||||||
Multi-Asset Real Return Fund | ||||||||||||||||||||
Interest rate contracts | $ | — | $ | (1,156 | ) | $ | — | $ | 181 | $ | (975 | ) | ||||||||
Foreign exchange contracts | — | — | 2,187 | — | 2,187 | |||||||||||||||
Commodity contracts | (283 | ) | (41,129 | ) | — | — | (41,412 | ) | ||||||||||||
Equity contracts | — | (1,083 | ) | — | — | (1,083 | ) | |||||||||||||
Credit contracts | — | — | — | 98 | 98 | |||||||||||||||
Total | $ | (283 | ) | $ | (43,368 | ) | $ | 2,187 | $ | 279 | $ | (41,185 | ) | |||||||
| SEI Institutional Investments Trust / Annual Report / May 31, 2015 | 323 |
Notes to Financial Statements/Consolidated Notes to Financial Statements (Continued)
May 31, 2015
Change in unrealized appreciation or (depreciation) on derivatives recognized in income ($ Thousands):
| Derivatives Not Accounted for as Hedging Instruments | Swaptions | Options | Futures | Forward Currency Contracts | Swaps | Total | ||||||||||||||||||
World Equity Ex-US Fund | ||||||||||||||||||||||||
Foreign exchange contracts | $ | — | $ | — | $ | — | $ | 421 | $ | — | $ | 421 | ||||||||||||
Equity contracts | — | — | 964 | — | — | 964 | ||||||||||||||||||
Total | $ | — | $ | — | $ | 964 | $ | 421 | $ | — | $ | 1,385 | ||||||||||||
Core Fixed Income Fund | ||||||||||||||||||||||||
Interest rate contracts | $ | 594 | $ | 515 | $ | 1,939 | $ | — | $ | (1,849 | ) | $ | 1,199 | |||||||||||
Foreign exchange contracts | — | — | — | 613 | — | 613 | ||||||||||||||||||
Credit contracts | — | — | — | — | (45 | ) | (45 | ) | ||||||||||||||||
Total | $ | 594 | $ | 515 | $ | 1,939 | $ | 613 | $ | (1,894 | ) | $ | 1,767 | |||||||||||
Long Duration Fund | ||||||||||||||||||||||||
Interest rate contracts | $ | — | $ | — | $ | 1,568 | $ | — | $ | (1,701 | ) | $ | (133 | ) | ||||||||||
Credit contracts | — | — | — | — | 245 | 245 | ||||||||||||||||||
Total | $ | — | $ | — | $ | 1,568 | $ | — | $ | (1,456 | ) | $ | 112 | |||||||||||
Emerging Markets Debt Fund | ||||||||||||||||||||||||
Interest rate contracts | $ | — | $ | — | $ | — | $ | — | $ | (1,637 | ) | $ | (1,637 | ) | ||||||||||
Foreign exchange contracts | — | — | — | (2,239 | ) | (454 | ) | (2,693 | ) | |||||||||||||||
Equity contracts | — | — | (21 | ) | — | — | (21 | ) | ||||||||||||||||
Total | $ | — | $ | — | $ | (21 | ) | $ | (2,239 | ) | $ | (2,091 | ) | $ | (4,351 | ) | ||||||||
Dynamic Asset Allocation Fund | ||||||||||||||||||||||||
Foreign exchange contracts | $ | — | $ | — | $ | — | $ | (20,815 | ) | $ | — | $ | (20,815 | ) | ||||||||||
Equity contracts | — | 1,137 | 11,779 | — | — | 12,916 | ||||||||||||||||||
Total | $ | — | $ | 1,137 | $ | 11,779 | $ | (20,815 | ) | $ | — | $ | (7,899 | ) | ||||||||||
Multi-Asset Real Return Fund | ||||||||||||||||||||||||
Interest rate contracts | $ | — | $ | — | $ | (22 | ) | $ | — | $ | (468 | ) | $ | (490 | ) | |||||||||
Foreign exchange contracts | — | — | — | 266 | — | 266 | ||||||||||||||||||
Credit contracts | — | — | — | — | 15 | 15 | ||||||||||||||||||
Equity contracts | — | — | (149 | ) | — | — | (149 | ) | ||||||||||||||||
Commodity contracts | — | (61 | ) | 1,543 | — | — | 1,482 | |||||||||||||||||
Total | $ | — | $ | (61 | ) | $ | 1,372 | $ | 266 | $ | (453 | ) | $ | 1,124 | ||||||||||
A Fund is subject to various netting arrangements with select counterparties (“Master Agreements”). Master Agreements govern the terms of certain transactions, and reduce the counterparty risk associated with relevant transactions by specifying credit protection mechanisms and providing standardization that improves legal certainty. Since different types of transactions have different mechanics and are sometimes traded out of different legal entities of a particular counterparty organization, each type of transaction may be covered by a different Master Agreement, resulting in the need for multiple agreements with a single counterparty. As the Master Agreements are specific to unique operations of different asset types, they allow a Fund to close out and net its total exposure to a specific counterparty entity in the event of a default with respect to all the transactions governed under a single agreement with a specific counterparty entity.
Master Agreements can also help limit counterparty risk by specifying collateral posting arrangements at pre-arranged exposure levels. Under the Master Agreements, collateral is routinely transferred if the total net exposure to certain transactions (net of existing collateral already in place) governed under the relevant Master Agreement with a counterparty in a given account exceeds a specified threshold, which typically ranges from zero to $250,000 depending on the counterparty and the type of Master Agreement. United States Treasury Securities and U.S. dollar cash are generally the preferred forms of
collateral. Securities and cash pledged as collateral are reflected as assets on the Statements of Assets and Liabilities/Consolidated Statements of Assets and Liabilities as either a component of investments at value (securities) or deposits due from counterparties (cash). Cash collateral received is not typically held in a segregated account and as such is reflected as a liability on the Statements of Assets and Liabilities/Consolidated Statements of Assets and Liabilities as deposits due to counterparties. The market value of any securities received as collateral is not reflected as a component of net asset value. A Fund’s overall exposure to counterparty risk can change substantially within a short period, as it is affected by each transaction subject to the relevant Master Agreement.
Customer Account Agreements and related addendums govern exchange traded derivatives transactions such as futures, options on futures, and centrally cleared swaps. Exchange traded derivative transactions require posting of initial margin as determined by each relevant clearing agency which is segregated at a broker account registered with the Commodities Futures Trading Commission (CFTC), or the applicable regulator. In the US, counterparty risk is significantly reduced as creditors of the futures broker do not have claim to Fund assets in the segregated account. Additionally, portability of exposure in the event of default further reduces risk to the Funds. Variation margin, or changes in market value, are exchanged daily, but may not be netted between futures and cleared OTC derivatives.
| 324 | SEI Institutional Investments Trust / Annual Report / May 31, 2015 |
The following is a summary of the market value and variation margin of exchange-traded or centrally cleared financial derivative instruments of the Funds as of May 31, 2015 ($ Thousands):
| Financial Derivative Assets | Financial Derivative Liabilities | |||||||||||||||||||||||||||||||||
| Market value | Variation Margin Asset | Market value | Variation Margin Liability | |||||||||||||||||||||||||||||||
| Fund | Purchased Options/ Swaptions | Futures | Swap Agreements | Total | Written Options/ Swaptions | Futures | Swap Agreements | Total | ||||||||||||||||||||||||||
Large Cap Fund | $ | — | $ | — | $ | — | $ | — | $ | — | $ | 248 | $ | — | $ | 248 | ||||||||||||||||||
Large Cap Disciplined Equity Fund | — | — | — | — | — | 163 | — | 163 | ||||||||||||||||||||||||||
Large Cap Index Fund | — | — | — | — | — | 342 | — | 342 | ||||||||||||||||||||||||||
S&P 500 Index Fund | — | — | — | — | — | 429 | — | 429 | ||||||||||||||||||||||||||
Extended Market Index Fund | — | — | — | — | — | 108 | — | 108 | ||||||||||||||||||||||||||
Small Cap Fund | — | — | — | — | — | 110 | — | 110 | ||||||||||||||||||||||||||
Small Cap II Fund | — | — | — | — | — | 85 | — | 85 | ||||||||||||||||||||||||||
World Equity Ex-US Fund | — | 148 | — | 148 | — | 2,047 | — | 2,047 | ||||||||||||||||||||||||||
Screened World Equity Ex-US Fund | — | — | — | — | — | 3 | — | 3 | ||||||||||||||||||||||||||
Opportunistic Income Fund | — | 1 | — | 1 | — | 66 | — | 66 | ||||||||||||||||||||||||||
Core Fixed Income Fund | 142 | 609 | — | 751 | 632 | 1,052 | 139 | 1,823 | ||||||||||||||||||||||||||
High Yield Bond Fund | — | — | 5 | 5 | — | — | 7 | 7 | ||||||||||||||||||||||||||
Long Duration Fund | — | 1,385 | — | 1,385 | — | 349 | 27 | 376 | ||||||||||||||||||||||||||
Long Duration Credit Fund | — | 452 | — | 452 | — | 375 | — | 375 | ||||||||||||||||||||||||||
Ultra Short Duration Bond Fund | — | 1 | — | 1 | — | 20 | — | 20 | ||||||||||||||||||||||||||
Emerging Markets Debt Fund | — | 47 | — | 47 | — | 120 | 42 | 162 | ||||||||||||||||||||||||||
Intermediate Duration Credit Fund | — | — | — | — | — | 158 | — | 158 | ||||||||||||||||||||||||||
Dynamic Asset Allocation Fund | 210 | 1,475 | — | 1,685 | — | 648 | — | 648 | ||||||||||||||||||||||||||
Multi-Asset Real Return Fund | 196 | 3,179 | 42 | 3,417 | — | 1,473 | 103 | 1,576 | ||||||||||||||||||||||||||
Total Exchange-Traded or Centrally Cleared | $ | 548 | $ | 7,297 | $ | 47 | $ | 7,892 | $ | 632 | $ | 7,796 | $ | 318 | $ | 8,746 | ||||||||||||||||||
Securities with an aggregate fair market value of $52,451,547 have been pledged as collateral for exchange-traded and centrally cleared derivative instruments as of May 31, 2015.
International Swaps and Derivatives Association, Inc. Master Agreements and Credit Support Annexes (“ISDA Master Agreements”) govern OTC financial derivative transactions entered into by a Fund and select counterparties. ISDA Master Agreements maintain provisions for general obligations, representations, agreements, collateral and events of default or termination. Events of termination include
conditions that may entitle counterparties to elect to terminate early and cause settlement of all outstanding transactions under the applicable ISDA Master Agreement. Any election to terminate early could be material to the financial statements. In limited circumstances, the ISDA Master Agreement may contain additional provisions that add additional counterparty protection beyond coverage of existing daily exposure if the counterparty has a decline in credit quality below a predefined level. These amounts, if any, may be segregated with a third party custodian.
The following is a summary by derivative type of the market value of OTC financial derivative instruments and collateral (received)/pledged as of May 31, 2015 ($ Thousands):
| Financial Derivative Assets |
| Financial Derivative Liabilities | ||||||||||||||||||||||||||||||||||||||||||||||||||
| Fund | Forward Foreign Currency Contracts | Purchased Options and Swaptions | Swap Agreements | Total Over the Counter | Forward Foreign Currency Contracts | Written Options and Swaptions | Swap Agreements | Reverse Repurchase Agreements | Total Over the | Net Market Value of OTC Derivatives | Collateral (Received)/ Pledged | Net Exposures(1) | ||||||||||||||||||||||||||||||||||||||||
Core Fixed Income Fund | $ | 2,336 | $ | — | $ | 83 | $ | 2,419 | $ | 584 | $ | — | $ | 927 | $ | — | $ | 1,511 | $ | 908 | $ | — | $ | 908 | ||||||||||||||||||||||||||||
High Yield Bond Fund | — | — | 30 | 30 | — | — | 120 | — | 120 | (90 | ) | — | (90 | ) | ||||||||||||||||||||||||||||||||||||||
Long Duration Fund | — | — | — | — | — | — | 586 | — | 586 | (586 | ) | — | (586 | ) | ||||||||||||||||||||||||||||||||||||||
Emerging Markets Debt Fund | 9,527 | — | 687 | 10,214 | 9,206 | — | 2,570 | — | 11,776 | (1,562 | ) | — | (1,562 | ) | ||||||||||||||||||||||||||||||||||||||
Dynamic Asset Allocation Fund | 1,692 | — | — | 1,692 | 14,156 | — | — | — | 14,156 | (12,464 | ) | — | (12,464 | ) | ||||||||||||||||||||||||||||||||||||||
Multi-Asset Real Return Fund | 382 | — | 50 | 432 | 120 | — | 58 | 135,632 | 135,810 | (135,378 | ) | 135,632 | (2) | 254 | ||||||||||||||||||||||||||||||||||||||
| Total Over the Counter | $ | 13,937 | $ | — | $ | 850 | $ | 14,787 | $ | 24,066 | $ | — | $ | 4,261 | $ | 135,632 | $ | 163,959 | ||||||||||||||||||||||||||||||||||
| (1) | Net Exposures represents the net receivable/(payable) that would be due from /to the counterparty in the event of default. Exposure from OTC financial derivative instruments can only be netted across transactions governed under the same master agreement with the same legal entity. |
| (2) | Excess collateral received is not shown for financial reporting purposes. |
| SEI Institutional Investments Trust / Annual Report / May 31, 2015 | 325 |
Notes to Financial Statements/Consolidated Notes to Financial Statements (Continued)
May 31, 2015
Securities with an aggregate fair market value of $0 have been pledged and $0 have been received as collateral for financial derivative instruments as governed by International Swaps and Derivatives Association, Inc. master agreements as of May 31, 2015.
Written options transactions entered into during the year ended May 31, 2015, are summarized as follows:
| Core Fixed Income Fund | ||||||||
| Number of Contracts | Premium ($ Thousands) | |||||||
| Balance at beginning of period | 7,021,149 | $ | 710 | |||||
| Written | 13,317,171 | 4,613 | ||||||
| Expired | (13,306,461 | ) | (1,898 | ) | ||||
| Closing Buys | (7,030,058 | ) | (2,839 | ) | ||||
| Balance at end of period | 1,801 | $ | 586 | |||||
As of May 31, 2015, the Funds had cash and/or securities at least equal to the value of written options.
5. BASIS FOR CONSOLIDATION FOR THE DYNAMIC ASSET ALLOCATION AND MULTI-ASSET REAL RETURN FUNDS
The Consolidated Summary Schedule of Investments, Consolidated Schedule of Investments, Consolidated Statements of Assets and Liabilities, Consolidated Statements of Operations, Consolidated Statements of Changes in Net Assets, Consolidated Statement of Cash Flows, and the Consolidated Financial Highlights of the Dynamic Asset Allocation and Multi-Asset Real Return Funds include the accounts of their respective Subsidiaries. All intercompany accounts and transactions have been eliminated in consolidation for the Funds. The Subsidiaries have a fiscal year end of May 31 for financial statement consolidation purposes and a nonconforming tax year end of April 30.
The Subsidiaries are classified as controlled foreign corporations under the Internal Revenue Code of 1986 (“IRC”). The Subsidiaries taxable income is included in the calculation of the Funds’ taxable income. Net losses of the Subsidiaries are not deductible by the Funds either in the current period or carried forward to future periods.
The Dynamic Asset Allocation and Multi-Asset Real Return Funds may invest up to 25% of their total assets in their respective Subsidiary.
A summary of the Funds’ investments in the Subsidiaries are as follows:
| INCEPTION DATE OF SUBSIDIARY | SUBSIDIARY ($ THOUSANDS) | % OF TOTAL NET ASSETS AT MAY 31, 2015 | ||||||||||
Dynamic Asset Allocation Commodity Strategy Subsidiary, Ltd. | January 28, 2014 | $ | 7,060 | 0.4 | % | |||||||
Multi-Asset | June 27, 2013 | 136,311 | 18.7 | % | ||||||||
6. INVESTMENT ADVISORY, ADMINISTRATION AND DISTRIBUTION AGREEMENTS, INVESTMENT SUB-ADVISORY AGREEMENTS AND OTHER TRANSACTIONS WITH AFFILIATES
Investment Advisory, Administration and Distribution Agreements — SEI Investments Global Funds Services (the “Administrator”) serves as administrator to the Funds. The Administrator provides certain administrative and shareholder servicing for an annual fee of 0.05% of the average daily net assets of each Fund. For the year ended May 31, 2015, the Administrator has voluntarily agreed to waive all of its fee. The Funds’ Administrator may discontinue all or part of these voluntary waiver at any time.
SIMC serves as investment adviser (the “Adviser”) to each Fund. In connection with serving as Adviser, SIMC is entitled to a fee that is calculated daily and paid monthly, based on the average daily net assets of each Fund. SIMC plans to voluntarily waive a portion of its fees in order to keep investment advisory fees at a specified level. The Funds’ Adviser may discontinue all or part of these voluntary waivers at any time. Accordingly, the advisory fee and voluntary expense limitations for each Fund are as follows:
| Advisory Fees | Voluntary Expense Limitations | |||||||
Large Cap Fund | 0.40 | % | 0.26 | % | ||||
Large Cap Diversified Alpha Fund | 0.40 | 0.31 | ||||||
Large Cap Disciplined Equity Fund | 0.40 | 0.18 | ||||||
Large Cap Index Fund | 0.17 | 0.06 | ||||||
S&P 500 Index Fund | 0.03 | — | ||||||
Extended Market Index Fund | 0.12 | 0.06 | ||||||
Small Cap Fund | 0.65 | 0.54 | ||||||
Small Cap II Fund | 0.65 | 0.59 | ||||||
Small/Mid Cap Equity Fund | 0.65 | 0.50 | ||||||
U.S. Managed Volatility Fund | 0.65 | 0.35 | ||||||
World Equity Ex-US Fund | 0.55 | 0.45 | ||||||
Screened World Equity Ex-US Fund | 0.65 | 0.80 | ||||||
Emerging Markets Equity Fund | 1.05 | — | ||||||
Opportunistic Income Fund | 0.45 | 0.41 | ||||||
Core Fixed Income Fund | 0.30 | 0.14 | ||||||
High Yield Bond Fund | 0.4875 | 0.35 | ||||||
Long Duration Fund | 0.30 | 0.20 | ||||||
Long Duration Credit Fund | 0.30 | 0.20 | ||||||
Ultra Short Duration Bond Fund | 0.15 | 0.18 | ||||||
Emerging Markets Debt Fund | 0.85 | 0.55 | ||||||
Real Return Fund | 0.22 | 0.20 | ||||||
Limited Duration Bond Fund | 0.25 | — | ||||||
Intermediate Duration Credit Fund | 0.25 | — | ||||||
Dynamic Asset Allocation Fund | 0.60 | 0.50 | ||||||
Multi-Asset Real Return Fund | 0.55 | 0.40 | ||||||
| 326 | SEI Institutional Investments Trust / Annual Report / May 31, 2015 |
As of May 31, 2015, SIMC has entered into investment sub-advisory agreements with the following parties and pays the sub-advisers out of the fee that it receives from the Funds:
| Investment Sub-Adviser |
Large Cap Fund |
AJO, L.P. |
AQR Capital Management, LLC |
Brown Advisory LLC |
Jackson Square Partners, LLC |
LSV Asset Management |
Waddell & Reed Investment Management Co. |
Large Cap Diversified Alpha Fund |
AJO, L.P. |
Brandywine Global Investment Management, LLC |
Jackson Square Partners, LLC |
Parametric Portfolio Associates LLC |
Large Cap Disciplined Equity Fund |
Analytic Investors, LLC |
INTECH Investment Management LLC |
Lazard Asset Management LLC |
Oppenheimer Funds, Inc. |
Quantitative Management Associates LLC |
Large Cap Index Fund |
SSgA Funds Management, Inc. |
S&P 500 Index Fund |
SSgA Funds Management, Inc. |
Extended Market Index Fund |
SSgA Funds Management, Inc. |
Small Cap Fund |
AQR Capital Management, LLC |
EAM Investors, LLC |
J.P. Morgan Investment Management Inc. |
LSV Asset Management |
Montibus Capital Management LLC |
Robeco Investment Management, Inc. |
Security Capital Research & Management Incorporated |
William Blair & Company L.L.C. |
Small Cap II Fund |
AllianceBernstein L.P. |
AQR Capital Management, LLC |
EAM Investors, LLC |
Fiduciary Management Associates, LLC |
LMCG Investments, LLC |
Montibus Capital Management LLC |
Snow Capital Management L.P. |
Small/Mid Cap Equity Fund |
AllianceBernstein L.P. |
Arrowpoint Asset Management, LLC |
CastleArk Management LLC |
Integrity Asset Management |
LMCG Investments, LLC |
LSV Asset Management |
Montibus Capital Management LLC |
Robeco Investment Management, Inc. |
Security Capital Research & Management Incorporated |
U.S. Managed Volatility Fund |
AJO, L.P. |
Analytic Investors, LLC |
LSV Asset Management |
| Investment Sub-Adviser |
World Equity Ex-US Fund |
Acadian Asset Management LLC |
Bailie Gifford Overseas Ltd |
EARNEST Partners LLC |
JO Hambro Capital Management Limited |
McKinley Capital Management, LLC |
NFJ Investment Group LLC |
Screened World Equity Ex-US Fund |
Acadian Asset Management LLC |
Bailie Gifford Overseas Ltd. |
EARNEST Partners LLC |
McKinley Capital Management, LLC |
Emerging Markets Equity Fund |
AllianceBernstein L.P. |
Causeway Capital Management LLC |
JO Hambro Capital Management Limited |
Kleinwort Benson Investors International Ltd |
RWC Asset Advisors (US) LLC |
WCM Investment Management |
Opportunistic Income Fund |
Ares Management LLC |
Brookfield Investment Management Inc. |
Declaration Management & Research LLC |
Wellington Management Company, LLP |
Core Fixed Income Fund |
Jennison Associates LLC |
J.P. Morgan Investment Management Inc. |
Metropolitan West Asset Management LLC |
Wells Capital Management Incorporated |
Western Asset Management Company |
Western Asset Management Company Limited |
High Yield Bond Fund |
Ares Management LLC |
Benefit Street Partners L.L.C. |
Brigade Capital Management, LP |
Delaware Investments Fund Advisers, a Series of Delaware Management Business Trust |
J.P. Morgan Investment Management Inc. |
Long Duration Fund |
Income Research & Management |
Jennison Associates LLC |
Legal & General Investment Management America Inc. |
Metropolitan West Asset Management LLC |
Long Duration Credit Fund |
Income Research & Management |
Jennison Associates LLC |
Legal & General Investment Management America, Inc. |
Logan Circle Partners, L.P. |
Metropolitan West Asset Management LLC |
Ultra Short Duration Bond Fund |
Logan Circle Partners, L.P. |
Wellington Management Company, LLP |
Emerging Markets Debt Fund |
Investec Asset Management Ltd. |
Neuberger Berman Fixed Income LLC |
Stone Harbor Investment Partners LP |
Limited Duration Bond Fund |
Logan Circle Partners, L.P. |
| SEI Institutional Investments Trust / Annual Report / May 31, 2015 | 327 |
Notes to Financial Statements/Consolidated Notes to Financial Statements (Continued)
May 31, 2015
| Investment Sub-Adviser |
Intermediate Duration Credit Fund |
Income Research & Management |
Legal & General Investment Management America Inc. |
Logan Circle Partners, L.P. |
Dynamic Asset Allocation Fund |
SSgA Funds Management, Inc. |
Multi-Asset Real Return Fund |
AllianceBernstein L.P. |
QS Investors, LLC |
SEI Investments Distribution Co. (the “Distributor”), a wholly owned subsidiary of SEI Investments Company (“SEI”), serves as each Fund’s Distributor pursuant to a Distribution Agreement with the Trust.
Other — The Distribution Agreement between the Distributor and the Trust provides that the Distributor may receive compensation on fund transactions effected for the Trust in accordance with Securities and Exchange Commission (“SEC”) rules. Accordingly, it is expected that fund transactions may result in brokerage commissions being paid to the Distributor. The SEC rules require that such commissions not exceed usual and customary commissions.
Such commissions for the year ended May 31, 2015, were as follows ($ Thousands):
| Large Cap Fund | $ | 18 | ||
| Large Cap Disciplined Equity Fund | 9 | |||
| Large Cap Index Fund | 1 | |||
| S&P 500 Index Fund | 10 | |||
| Small Cap Fund | 143 | |||
| Small Cap II Fund | 18 | |||
| Small/Mid Cap Equity Fund | 6 | |||
| World Equity Ex-US Fund | 247 | |||
| Screened World Equity Ex-US Fund | 8 |
Payments to Affiliates — Certain officers and/or trustees of the Trust are also officers and/or Directors of the Distributor, the Adviser and/or the Administrator. The Trust pays each unaffiliated Trustee an annual fee for attendance at quarterly and interim meetings. Compensation of officers and affiliated Trustees of the Trust is paid by the Distributor or Administrator.
A portion of the services provided by the Chief Compliance Officer (“CCO”) and his staff, whom are employees of the Administrator, are paid for by the Trust as incurred. The services include regulatory oversight of the Trust’s Adviser, sub-advisers and service providers as required by SEC regulations.
LSV Asset Management (partially-owned subsidiary of SIMC) serves as a sub-adviser to the Large Cap, Small Cap, Small/Mid Cap Equity and U.S. Managed Volatility Funds. For this service, LSV Asset Management is entitled to receive a fee from SIMC. Such fees for the year ended May 31, 2015, were as follows ($ Thousands):
| Large Cap Fund | $ | 449 | ||
| Small Cap Fund | 301 | |||
| Small/Mid Cap Equity Fund | 1,152 | |||
| U.S. Managed Volatility Fund | 1,329 |
Fees Paid Indirectly — The Funds may direct certain fund trades to the Distributor who pays a portion of each Fund’s expenses. Accordingly, the expenses reduced, which were used to pay third party expenses, can be found on the Statements of Operations and the effect on each Fund’s expense ratio, as a percentage of each Fund’s average daily net assets for the year ended May 31, 2015, can be found on the Financial Highlights.
Investment in Affiliated Security — The Funds may invest in the SEI Daily Income Trust (“SDIT”) Prime Obligation Fund, an affiliated money market fund to manage excess cash or to serve as margin or collateral for derivative positions. Additionally, the Funds may invest the cash collateral from the securities lending program in the SEI Liquidity Fund, L.P.
The following is summary of the transactions with affiliates for the year ended May 31, 2015 ($ Thousands):
| SEI Liquidity Fund, L.P. | Purchases at Cost | Proceeds from Sales | Value 5/31/2015 | Dividend Income | ||||||||||||
Large Cap Fund | $ | 382,746 | $ | (422,308 | ) | $ | 36,555 | $ | 190 | |||||||
Large Cap Disciplined Equity Fund | 602,846 | (733,261 | ) | 29,683 | 243 | |||||||||||
Large Cap Index Fund | 220,668 | (289,589 | ) | 25,575 | 244 | |||||||||||
S&P 500 Index Fund | 130,986 | (132,069 | ) | 12,329 | 98 | |||||||||||
Extended Market Index Fund | 141,069 | (151,435 | ) | 42,794 | 646 | |||||||||||
Small Cap Fund | 202,895 | (241,354 | ) | 60,495 | 989 | |||||||||||
Small Cap II Fund | 107,950 | (99,096 | ) | 29,914 | 222 | |||||||||||
Small/Mid Cap Equity Fund | 605,001 | (659,854 | ) | 191,809 | 1,356 | |||||||||||
World Equity Ex-US Fund | 2,147,574 | (2,417,733 | ) | 347,865 | 6,047 | |||||||||||
Core Fixed Income Fund | 2,398,911 | (2,549,750 | ) | 256,062 | 370 | |||||||||||
Emerging Markets Debt Fund | 114,870 | (112,598 | ) | 7,895 | 32 | |||||||||||
| SEI Daily Income Trust, Prime Obligation | ||||||||||||||||
Large Cap Fund | 1,096,146 | (1,005,553 | ) | 118,861 | 10 | |||||||||||
Large Cap Diversified Alpha Fund | 49,135 | (50,434 | ) | 3,685 | — | |||||||||||
Large Cap Disciplined Equity Fund | 1,578,984 | (1,522,334 | ) | 172,335 | 15 | |||||||||||
Large Cap Index Fund | 334,378 | (328,336 | ) | 36,002 | 4 | |||||||||||
S&P 500 Index Fund | 497,108 | (460,118 | ) | 45,190 | 4 | |||||||||||
Extended Market Index Fund | 168,579 | (163,249 | ) | 14,157 | 2 | |||||||||||
Small Cap Fund | 303,161 | (281,505 | ) | 38,294 | 3 | |||||||||||
Small Cap II Fund | 296,143 | (287,288 | ) | 19,426 | 1 | |||||||||||
Small/Mid Cap Equity Fund | 1,067,483 | (1,038,638 | ) | 98,885 | 9 | |||||||||||
U.S. Managed Volatility Fund | 564,633 | (547,310 | ) | 58,844 | 4 | |||||||||||
World Equity Ex-US Fund | 1,383,450 | (1,336,483 | ) | 159,794 | 23 | |||||||||||
Screened World Equity Ex-US Fund | 18,181 | (19,863 | ) | 296 | — | |||||||||||
Emerging Markets Equity Fund | 259,757 | (256,957 | ) | — | — | |||||||||||
Opportunistic Income Fund | 809,173 | (771,029 | ) | 78,062 | 8 | |||||||||||
Core Fixed Income Fund | 3,851,463 | (3,923,651 | ) | 275,149 | 34 | |||||||||||
High Yield Bond Fund | 1,173,902 | (1,157,197 | ) | 86,501 | 10 | |||||||||||
Long Duration Fund | 1,247,026 | (1,220,618 | ) | 47,931 | 5 | |||||||||||
Long Duration Credit Fund | 1,615,770 | (1,599,467 | ) | 50,312 | 6 | |||||||||||
Ultra Short Duration Bond Fund | 344,783 | (343,845 | ) | 3,761 | 1 | |||||||||||
Limited Duration Bond Fund | 644,839 | (639,903 | ) | 4,936 | 1 | |||||||||||
Intermediate Duration Credit Fund | 993,110 | (967,567 | ) | 25,543 | 2 | |||||||||||
| SEI | ||||||||||||||||
Large Cap Index Fund | — | (51 | ) | 562 | 6 | |||||||||||
Extended Market Index Fund | 50,139 | (100,689 | ) | 667 | 4 | |||||||||||
| 328 | SEI Institutional Investments Trust / Annual Report / May 31, 2015 |
Interfund Lending — The SEC has granted an exemption that permits the Trust to participate in an interfund lending program (“The Program”) with existing or future investment companies registered under the 1940 Act that are advised by SIMC (the “SEI Funds”). The Program allows the SEI Funds to lend money to and borrow money from each other for temporary or emergency purposes. Participation in The Program is voluntary for both borrowing and lending funds. Interfund loans may be made only when the rate of interest to be charged is more favorable to the lending fund than an investment in overnight repurchase agreements (“Repo Rate”), and more favorable to the borrowing fund than the rate of interest that would be charged by a bank for short-term borrowings (“Bank Loan Rate”). The Bank Loan Rate will be determined using a formula annually reviewed by the SEI Funds’ Board of Trustees. The interest rate imposed on inter fund loans is the average of the Repo Rate and the Bank Loan Rate.
During the year ended May 31, 2015, the Trust borrowed funds from SEI Liquid Asset Trust Prime Obligation Fund. The amount borrowed, interest paid on the borrowing and the corresponding interest rate were as follows ($ Thousands):
| Account Name | Date | Amount Borrowed | Interest Paid | Rate | ||||||||||||
Large Cap Fund | 07/02/2014 | $ | 25,500 | $ | — | 0.32 | % | |||||||||
Large Cap Disciplined Equity Fund | 06/02/2014 | 54,165 | 1 | 0.22 | ||||||||||||
Large Cap Disciplined Equity Fund | 01/02/2015 | 50,000 | — | 0.24 | ||||||||||||
Large Cap Disciplined Equity Fund | 02/18/2015 | 22,000 | — | 0.22 | ||||||||||||
Small Cap Fund | 08/01/2014 | 8,000 | — | 0.24 | ||||||||||||
Small/Mid Cap Equity Fund | 06/02/2014 | 30,500 | — | 0.22 | ||||||||||||
At May 31, 2015, the Trust had no outstanding borrowings.
7. CAPITAL SHARE TRANSACTIONS
Capital share transactions for the Funds were as follows (Thousands):
| Large Cap Fund | Large Cap Diversified Alpha Fund | Large Cap Disciplined Equity Fund | Large Cap Index Fund | |||||||||||||||||||||||||||||
| 2015 | 2014 | 2015 | 2014 | 2015 | 2014 | 2015 | 2014 | |||||||||||||||||||||||||
Class A: | ||||||||||||||||||||||||||||||||
Shares Issued | 22,923 | 32,418 | 497 | 1,926 | 26,998 | 33,938 | 1,846 | 2,690 | ||||||||||||||||||||||||
Shares Issued In Lieu of Dividends and Distributions | 10,902 | 10,227 | 241 | 222 | 45,065 | 25,395 | 908 | 458 | ||||||||||||||||||||||||
Shares Redeemed | (31,917 | ) | (31,819 | ) | (6,447 | ) | (18,989 | ) | (92,482 | ) | (162,350 | ) | (2,714 | ) | (7,260 | ) | ||||||||||||||||
Increase (Decrease) in Net Assets Derived from Class A Transactions | 1,908 | 10,826 | (5,709 | ) | (16,841 | ) | (20,419 | ) | (103,017 | ) | 40 | (4,112 | ) | |||||||||||||||||||
| S&P 500 Index Fund(2) | Extended Market Index Fund | Small Cap Fund | Small Cap II Fund | |||||||||||||||||||||||||||||
| 2015 | 2014 | 2015 | 2014 | 2015 | 2014 | 2015 | 2014 | |||||||||||||||||||||||||
Class A: | ||||||||||||||||||||||||||||||||
Shares Issued | 234,645 | (1) | 83,355 | 19,886 | 29,988 | 3,754 | 3,374 | 11,622 | 11,230 | |||||||||||||||||||||||
Shares Issued In Lieu of Dividends and Distributions | 2,925 | 243 | 1,655 | 549 | 1,007 | 305 | 1,901 | 2,046 | ||||||||||||||||||||||||
Shares Redeemed | (42,674 | ) | (5,245 | ) | (7,991 | ) | (6,395 | ) | (7,478 | ) | (15,632 | ) | (4,848 | ) | (11,200 | ) | ||||||||||||||||
Increase (Decrease) in Net Assets Derived from Class A Transactions | 194,896 | 78,353 | 13,550 | 24,142 | (2,717 | ) | (11,953 | ) | 8,675 | 2,076 | ||||||||||||||||||||||
| Small/Mid Cap Equity Fund | U.S. Managed Volatility Fund | World Equity Ex-US Fund | Screened World Equity Ex-US Fund | |||||||||||||||||||||||||||||
| 2015 | 2014 | 2015 | 2014 | 2015 | 2014 | 2015 | 2014 | |||||||||||||||||||||||||
Class A: | ||||||||||||||||||||||||||||||||
Shares Issued | 13,690 | 14,441 | 20,365 | 15,975 | 137,907 | 123,974 | 1,865 | 1,770 | ||||||||||||||||||||||||
Shares Issued In Lieu of Dividends and Distributions | 18,497 | 22,382 | 11,373 | 8,729 | 17,907 | 11,661 | 102 | 90 | ||||||||||||||||||||||||
Shares Redeemed | (24,682 | ) | (56,669 | ) | (18,977 | ) | (25,465 | ) | (75,565 | ) | (151,258 | ) | (1,109 | ) | (1,120 | ) | ||||||||||||||||
Increase (Decrease) in Net Assets Derived from Class A Transactions | 7,505 | (19,846 | ) | 12,761 | (761 | ) | 80,249 | (15,623 | ) | 858 | 740 | |||||||||||||||||||||
| Emerging Markets Equity Fund(3) | Opportunistic Income Fund | Core Fixed Income Fund | High Yield Bond Fund | |||||||||||||||||||||||||||
| 2015 | 2015 | 2014 | 2015 | 2014 | 2015 | 2014 | ||||||||||||||||||||||||
Class A: | ||||||||||||||||||||||||||||||
Shares Issued | 61,812 | 91,373 | 132,830 | 150,096 | 183,435 | (1) | 71,047 | 42,553 | ||||||||||||||||||||||
Shares Issued In Lieu of Dividends and Distributions | 70 | 6,100 | 3,757 | 16,690 | 18,787 | 19,237 | 16,744 | |||||||||||||||||||||||
Shares Redeemed | (2,735 | ) | (60,713 | ) | (31,325 | ) | (199,854 | ) | (256,784 | ) | (41,258 | ) | (56,812 | ) | ||||||||||||||||
Increase (Decrease) in Net Assets Derived from Class A Transactions | 59,147 | 36,760 | 105,262 | (33,068 | ) | (54,562 | ) | 49,026 | 2,485 | |||||||||||||||||||||
| SEI Institutional Investments Trust / Annual Report / May 31, 2015 | 329 |
Notes to Financial Statements/Consolidated Notes to Financial Statements (Continued)
May 31, 2015
| Long Duration Fund | Long Duration Credit Fund | Ultra Short Duration Bond Fund | Emerging Markets Debt Fund | |||||||||||||||||||||||||||||
| 2015 | 2014 | 2015 | 2014 | 2015 | 2014 | 2015 | 2014 | |||||||||||||||||||||||||
Class A: | ||||||||||||||||||||||||||||||||
Shares Issued | 56,339 | 155,849 | 136,641 | (1) | 86,243 | (1) | 39,520 | 43,329 | 59,071 | 51,153 | ||||||||||||||||||||||
Shares Issued In Lieu of Dividends and Distributions | 21,114 | 19,446 | 12,551 | 12,811 | 832 | 575 | 5,979 | 5,793 | ||||||||||||||||||||||||
Shares Redeemed | (155,587 | ) | (101,757 | ) | (85,266 | ) | (32,461 | ) | (47,326 | ) | (24,460 | ) | (24,191 | ) | (34,622 | ) | ||||||||||||||||
Increase (Decrease) in Net Assets Derived from Class A Transactions | (78,134 | ) | 73,538 | 63,926 | 66,593 | (6,974 | ) | 19,444 | 40,859 | 22,324 | ||||||||||||||||||||||
| Real Return Fund | Limited Duration Bond Fund(4) | Intermediate Duration Credit Fund(5) | Dynamic Asset Allocation Fund | Multi-Asset Real Return Fund | ||||||||||||||||||||||||||||||||
| 2015 | 2014 | 2015 | 2015 | 2015 | 2014 | 2015 | 2014 | |||||||||||||||||||||||||||||
Class A: | ||||||||||||||||||||||||||||||||||||
Shares Issued | 6,116 | 7,016 | 69,230 | 165,014 | (1) | 25,892 | 35,745 | 25,248 | 52,354 | |||||||||||||||||||||||||||
Shares Issued In Lieu of Dividends and Distributions | 160 | 284 | 285 | 509 | 5,216 | 1,766 | 1,610 | — | ||||||||||||||||||||||||||||
Shares Redeemed | (3,703 | ) | (11,700 | ) | (2,521 | ) | (2,655 | ) | (20,816 | ) | (18,988 | ) | (19,286 | ) | (8,423 | ) | ||||||||||||||||||||
Increase (Decrease) in Net Assets Derived from Class A Transactions | 2,573 | (4,400 | ) | 66,994 | 162,868 | 10,292 | 18,523 | 7,572 | 43,931 | |||||||||||||||||||||||||||
| (1) | Includes subscriptions/redemptions as a result of an in-kind transfer of securities (see Note 11). |
| (2) | Fund commenced operations on December 18, 2013. |
| (3) | Fund commenced operations on October 31, 2014. |
| (4) | Fund commenced operations on July 31, 2014. |
| (5) | Fund commenced operations on March 31, 2015. |
8. INVESTMENT TRANSACTIONS
The cost of security purchases and proceeds from the sale and maturities of securities other than temporary cash investments, during the year ended May 31, 2015, were as follows:
U.S. Gov’t ($ Thousands) | Other ($ Thousands) | Total ($ Thousands) | ||||||||||
Large Cap Fund |
| |||||||||||
Purchases | $ | — | $ | 1,359,445 | $ | 1,359,445 | ||||||
Sales | — | 1,566,105 | 1,566,105 | |||||||||
Large Cap Diversified Alpha Fund | ||||||||||||
Purchases | — | 119,656 | 119,656 | |||||||||
Sales | — | 203,936 | 203,936 | |||||||||
Large Cap Disciplined Equity Fund | ||||||||||||
Purchases | — | 4,987,127 | 4,987,127 | |||||||||
Sales | — | 5,874,601 | 5,874,601 | |||||||||
Large Cap Index Fund | ||||||||||||
Purchases | — | 228,547 | 228,547 | |||||||||
Sales | — | 336,299 | 336,299 | |||||||||
S&P 500 Index Fund | ||||||||||||
Purchases | — | 2,453,506 | 2,453,506 | |||||||||
Sales | — | 271,569 | 271,569 | |||||||||
Extended Market Index Fund | ||||||||||||
Purchases | — | 271,577 | 271,577 | |||||||||
Sales | — | 108,319 | 108,319 | |||||||||
Small Cap Fund | ||||||||||||
Purchases | — | 733,750 | 733,750 | |||||||||
Sales | — | 812,344 | 812,344 | |||||||||
Small Cap II Fund | ||||||||||||
Purchases | — | 385,015 | 385,015 | |||||||||
Sales | — | 303,997 | 303,997 | |||||||||
Small/Mid Cap Fund | ||||||||||||
Purchases | — | 1,703,121 | 1,703,121 | |||||||||
Sales | — | 1,862,318 | 1,862,318 | |||||||||
U.S. Gov’t ($ Thousands) | Other ($ Thousands) | Total ($ Thousands) | ||||||||||
U.S. Managed Volatility Fund |
| |||||||||||
Purchases | $ | — | $ | 787,462 | $ | 787,462 | ||||||
Sales | — | 745,403 | 745,403 | |||||||||
World Equity Ex-US Fund | ||||||||||||
Purchases | — | 3,776,215 | 3,776,215 | |||||||||
Sales | — | 2,991,267 | 2,991,267 | |||||||||
Screened World Equity Ex-US Fund | ||||||||||||
Purchases | — | 58,296 | 58,296 | |||||||||
Sales | — | 47,654 | 47,654 | |||||||||
Emerging Markets Equity Fund |
| |||||||||||
Purchases | — | 920,196 | 920,196 | |||||||||
Sales | — | 349,952 | 349,952 | |||||||||
Opportunistic Income Fund | ||||||||||||
Purchases | 137,407 | 451,743 | 589,150 | |||||||||
Sales | 105,214 | 383,074 | 488,288 | |||||||||
Core Fixed Income Fund | ||||||||||||
Purchases | 16,290,725 | 1,901,466 | 18,192,191 | |||||||||
Sales | 16,657,593 | 2,073,096 | 18,730,689 | |||||||||
High Yield Bond Fund | ||||||||||||
Purchases | — | 1,531,024 | 1,531,024 | |||||||||
Sales | — | 1,028,476 | 1,028,476 | |||||||||
Long Duration Fund | ||||||||||||
Purchases | 1,838,356 | 936,358 | 2,774,714 | |||||||||
Sales | 2,239,221 | 1,263,530 | 3,502,751 | |||||||||
Long Duration Credit Fund | ||||||||||||
Purchases | 2,382,182 | 2,887,963 | 5,270,145 | |||||||||
Sales | 2,390,294 | 2,242,445 | 4,632,739 | |||||||||
Ultra Short Duration Bond Fund | ||||||||||||
Purchases | 244,795 | 330,232 | 575,027 | |||||||||
Sales | 252,783 | 330,654 | 583,437 | |||||||||
Emerging Markets Debt Fund |
| |||||||||||
Purchases | — | 1,578,323 | 1,578,323 | |||||||||
Sales | — | 1,210,151 | 1,210,151 | |||||||||
| 330 | SEI Institutional Investments Trust / Annual Report / May 31, 2015 |
U.S. Gov’t ($ Thousands) | Other ($ Thousands) | Total ($ Thousands) | ||||||||||
Real Return Fund |
| |||||||||||
Purchases | $ | 113,181 | $ | — | $ | 113,181 | ||||||
Sales | 86,641 | — | 86,641 | |||||||||
Limited Duration Bond Fund |
| |||||||||||
Purchases | 227,332 | 444,335 | 671,667 | |||||||||
Sales | 111,483 | 63,028 | 174,511 | |||||||||
Intermediate Duration Credit Fund | ||||||||||||
Purchases | 1,550,580 | 1,674,431 | 3,225,011 | |||||||||
Sales | 1,521,311 | 175,569 | 1,696,880 | |||||||||
Dynamic Asset Allocation Fund | ||||||||||||
Purchases | — | 429,893 | 429,893 | |||||||||
Sales | — | 155,248 | 155,248 | |||||||||
Multi-Asset Real Return Fund | ||||||||||||
Purchases | 275,385 | 336,534 | 611,919 | |||||||||
Sales | 247,904 | 255,443 | 503,347 | |||||||||
9. FEDERAL TAX INFORMATION
It is each Fund’s intention to continue to qualify as a regulated investment company under Subchapter M of the Internal Revenue Code and distribute all of its taxable income (including net capital gains). Accordingly, no provision for Federal income taxes is required.
The Dynamic Asset Allocation and Multi-Asset Real Return Funds have each requested private letter rulings from the Internal Revenue Service (“IRS”) concluding that the income generated from their investment in their respective Subsidiaries, each of which invests in commodity-linked derivatives, will be “qualifying income” for regulated investment company (“RIC”) qualification purposes, regardless of whether actual distributions are made to the Funds by the respective Subsidiary.
In July 2011, the IRS suspended the issuance of private letter rulings regarding the investment by RICs into controlled foreign corporations which principally invest in commodities, such as the Subsidiaries, indicating that it was reconsidering its policies surrounding the issuance of these rulings. The IRS subsequently stated that it intends to issue public guidance regarding the use of controlled foreign corporations by RICs to indirectly invest in commodities. It is unclear whether this guidance will continue to permit or somehow restrict the distributions from controlled foreign corporations to be treated as “qualifying income” for purposes of the RIC qualification rules. As a result, there can be no assurance that the IRS will grant the private letter ruling requested by the Funds. While the private letter ruling request is pending with the IRS, the Dynamic Asset Allocation and Multi-Asset Real Return Funds have secured an opinion of counsel based on customary representations that actual distributions made to the Funds should be treated as “qualifying income.” If the IRS does issue public guidance that results in an adverse determination relating
to the treatment of income and gain to the Funds from controlled for-
eign corporations such as the Subsidiaries, the Funds would likely need to significantly change their investment strategies, which could adversely affect such Funds.
Dividends from net investment income and distributions from net realized capital gains are determined in accordance with U.S. Federal income tax regulations, which may differ from those amounts determined under U.S. GAAP. These book/tax differences are either temporary or permanent in nature. To the extent these differences are permanent, they are charged or credited to paid-in capital, undistributed net investment income or accumulated net realized gain, as appropriate, in the period that the differences arise.
Accordingly, the following permanent differences, primarily attributable to different treatment for gains and losses on paydowns of mortgage and asset-backed securities for tax purposes, defaulted bond basis adjustments, reclassification of long term capital gain distributions on Real Estate Investment Trust securities, reclassification of income and expense from swap transactions, basis adjustments for investments in partnerships, and gains and losses on passive foreign investment companies and certain foreign currency related transactions and non taxable in-kind redemption, have been reclassified to/from the following accounts as of May 31, 2015:
Undistributed Net Investment Income (Loss) ($ Thousands) | Accumulated Realized Gain (Loss) ($ Thousands) | Paid-in Capital ($ Thousands) | ||||||||||
Large Cap Fund | $ | (311 | ) | $ | 311 | $ | — | |||||
Large Cap Diversified Alpha Fund | 157 | (157 | ) | — | ||||||||
Large Cap Disciplined Equity Fund | (262 | ) | 262 | — | ||||||||
Large Cap Index Fund | 164 | (164 | ) | — | ||||||||
S&P 500 Index Fund | 117 | (117 | ) | — | ||||||||
Extended Market Index Fund | 137 | (137 | ) | — | ||||||||
Small Cap Fund | 576 | (576 | ) | — | ||||||||
Small Cap II Fund | 122 | (122 | ) | — | ||||||||
Small/Mid Cap Equity Fund | 580 | (580 | ) | — | ||||||||
U.S. Managed Volatility Fund | 357 | (357 | ) | — | ||||||||
World Equity Ex-US Fund | 6,874 | (6,874 | ) | — | ||||||||
Screened World Equity Ex-US Fund | (56 | ) | 56 | — | ||||||||
Emerging Markets Equity Fund | 532 | (532 | ) | — | ||||||||
Opportunistic Income Fund | (881 | ) | (1,308 | ) | 2,189 | |||||||
Core Fixed Income Fund | 10,375 | (10,375 | ) | — | ||||||||
High Yield Bond Fund | (9,231 | ) | 9,231 | — | ||||||||
Long Duration Fund | (345 | ) | 345 | — | ||||||||
Long Duration Credit Fund | 96 | (3,172 | ) | 3,076 | ||||||||
Ultra Short Duration Bond Fund | 1,191 | (1,191 | ) | — | ||||||||
Emerging Markets Debt Fund | (40,565 | ) | 40,565 | — | ||||||||
Real Return Fund | 35 | (35 | ) | — | ||||||||
Limited Duration Bond Fund | 162 | (162 | ) | — | ||||||||
Intermediate Duration Credit Fund | 159 | (30 | ) | (129 | ) | |||||||
Dynamic Asset Allocation Fund | 148,629 | (148,629 | ) | — | ||||||||
Multi-Asset Real Return Fund | 4,819 | (2,774 | ) | (2,045 | ) | |||||||
These reclassifications have no impact on net assets or net asset value per share.
| SEI Institutional Investments Trust / Annual Report / May 31, 2015 | 331 |
Notes to Financial Statements/Consolidated Notes to Financial Statements (Continued)
May 31, 2015
The tax character of dividends and distributions paid during the last two years or periods ended May 31, 2015 were as follows:
Ordinary Income ($ Thousands) | Long-Term Capital Gain ($ Thousands) | Return of Capital ($ Thousands) | Total ($ Thousands) | |||||||||||||||||
Large Cap Fund | 2015 | $ | 59,060 | $ | 186,918 | $ | — | $ | 245,978 | |||||||||||
| 2014 | 69,042 | 155,872 | — | 224,914 | ||||||||||||||||
Large Cap Diversified Alpha Fund | 2015 | 1,987 | 2,247 | — | 4,234 | |||||||||||||||
| 2014 | 2,968 | — | — | 2,968 | ||||||||||||||||
Large Cap Disciplined Equity Fund | 2015 | 123,271 | 508,968 | — | 632,239 | |||||||||||||||
| 2014 | 70,879 | 284,707 | — | 355,586 | ||||||||||||||||
Large Cap Index Fund | 2015 | 43,351 | 106,205 | — | 149,556 | |||||||||||||||
| 2014 | 45,418 | 24,543 | — | 69,961 | ||||||||||||||||
S&P 500 Index Fund | 2015 | 32,451 | 1,115 | — | 33,566 | |||||||||||||||
| 2014 | 2,597 | — | — | 2,597 | ||||||||||||||||
Extended Market Index Fund | 2015 | 17,020 | 4,377 | — | 21,397 | |||||||||||||||
| 2014 | 6,348 | 302 | — | 6,650 | ||||||||||||||||
Small Cap Fund | 2015 | 4,749 | 17,304 | — | 22,053 | |||||||||||||||
| 2014 | 6,428 | — | — | 6,428 | ||||||||||||||||
Small Cap II Fund | 2015 | 5,493 | 18,511 | — | 24,004 | |||||||||||||||
| 2014 | 15,170 | 11,533 | — | 26,703 | ||||||||||||||||
Small/Mid Cap Equity Fund | 2015 | 56,049 | 206,547 | — | 262,596 | |||||||||||||||
| 2014 | 118,792 | 215,732 | — | 334,524 | ||||||||||||||||
U.S. Managed Volatility Fund | 2015 | 64,197 | 102,025 | — | 166,222 | |||||||||||||||
| 2014 | 56,144 | 63,960 | — | 120,104 | ||||||||||||||||
World Equity Ex-US Fund | 2015 | 135,664 | 82,563 | — | 218,227 | |||||||||||||||
| 2014 | 149,128 | — | — | 149,128 | ||||||||||||||||
Screened World Equity Ex-US Fund | 2015 | 1,372 | — | — | 1,372 | |||||||||||||||
| 2014 | 1,227 | — | — | 1,227 | ||||||||||||||||
Emerging Markets Equity Fund | 2015 | 668 | — | — | 668 | |||||||||||||||
Opportunistic Income Fund | 2015 | 51,651 | — | — | 51,651 | |||||||||||||||
| 2014 | 31,408 | — | — | 31,408 | ||||||||||||||||
Core Fixed Income Fund | 2015 | 181,213 | — | — | 181,213 | |||||||||||||||
| 2014 | 200,834 | — | — | 200,834 | ||||||||||||||||
High Yield Bond Fund | 2015 | 148,070 | 39,852 | — | 187,922 | |||||||||||||||
| 2014 | 149,192 | 20,664 | — | 169,856 | ||||||||||||||||
Long Duration Fund | 2015 | 190,776 | 8,164 | — | 198,940 | |||||||||||||||
| 2014 | 150,263 | 17,995 | — | 168,258 | ||||||||||||||||
Long Duration Credit Fund | 2015 | 131,283 | — | — | 131,283 | |||||||||||||||
| 2014 | 122,688 | — | — | 122,688 | ||||||||||||||||
Ultra Short Duration Bond Fund | 2015 | 8,484 | — | — | 8,484 | |||||||||||||||
| 2014 | 5,851 | — | — | 5,851 | ||||||||||||||||
Emerging Markets Debt Fund | 2015 | 62,267 | — | — | 62,267 | |||||||||||||||
| 2014 | 54,928 | 6,233 | — | 61,161 | ||||||||||||||||
Real Return Fund | 2015 | 1,584 | — | — | 1,584 | |||||||||||||||
| 2014 | 2,905 | — | — | 2,905 | ||||||||||||||||
Limited Duration Bond Fund | 2015 | 2,937 | — | — | 2,937 | |||||||||||||||
Intermediate Duration Credit Fund | 2015 | 4,969 | — | 129 | 5,098 | |||||||||||||||
Dynamic Asset Allocation Fund | 2015 | 84,817 | — | — | 84,817 | |||||||||||||||
| 2014 | 24,183 | — | — | 24,183 | ||||||||||||||||
Multi-Asset Real Return Fund | 2015 | 12,380 | — | 2,378 | 14,758 | |||||||||||||||
| 2014 | — | — | — | — | ||||||||||||||||
| 332 | SEI Institutional Investments Trust / Annual Report / May 31, 2015 |
As of May 31, 2015, the components of distributable earnings/(accumulated losses) were as follows:
Undistributed Ordinary Income ($ Thousands) | Undistributed Long-Term Capital Gain | Capital Loss Carryforwards ($ Thousands) | Post October Losses ($ Thousands) | Late Year Ordinary Losses ($ Thousands) | Unrealized Appreciation (Depreciation) ($ Thousands) | Other Temporary Differences ($ Thousands) | Total Distributable Earnings (Accumulated Losses) | |||||||||||||||||||||||||
Large Cap Fund | $ | 5,556 | $ | 199,654 | $ | — | $ | — | $ | — | $ | 565,175 | $ | — | $ | 770,385 | ||||||||||||||||
Large Cap Diversified Alpha Fund | 1,778 | 15,827 | — | — | — | 9,820 | (37 | ) | 27,388 | |||||||||||||||||||||||
Large Cap Disciplined Equity Fund | 97,273 | 232,828 | — | — | — | 635,037 | (1,971 | ) | 963,167 | |||||||||||||||||||||||
Large Cap Index Fund | 7,598 | 45,303 | — | — | — | 853,645 | (998 | ) | 905,548 | |||||||||||||||||||||||
S&P 500 Index Fund | 13,950 | 4,236 | — | — | — | 162,167 | (1,552 | ) | 178,801 | |||||||||||||||||||||||
Extended Market Index Fund | 3,391 | 12,929 | — | — | — | 81,484 | (247 | ) | 97,557 | |||||||||||||||||||||||
Small Cap Fund | 913 | 30,448 | — | — | — | 91,279 | (367 | ) | 122,273 | |||||||||||||||||||||||
Small Cap II Fund | 2,245 | 15,996 | — | — | — | 43,491 | (216 | ) | 61,516 | |||||||||||||||||||||||
Small/Mid Cap Equity Fund | 22,765 | 163,024 | — | — | — | 337,993 | (630 | ) | 523,152 | |||||||||||||||||||||||
U.S. Managed Volatility Fund | 12,712 | 61,092 | — | — | — | 244,765 | (1,136 | ) | 317,433 | |||||||||||||||||||||||
World Equity Ex-US Fund | 74,372 | 30,136 | — | — | — | 850,619 | (228 | ) | 954,899 | |||||||||||||||||||||||
Screened World Equity Ex-US Fund | 1,076 | — | (9,158 | ) | — | — | 4,074 | 4 | (4,004 | ) | ||||||||||||||||||||||
Emerging Markets Equity Fund | 6,150 | — | — | — | — | 4,574 | — | 10,724 | ||||||||||||||||||||||||
Opportunistic Income Fund | 18,618 | — | (51,183 | ) | (4,215 | ) | — | 4,592 | (235 | ) | (32,423 | ) | ||||||||||||||||||||
Core Fixed Income Fund | 83,373 | 34,771 | — | — | — | 123,905 | (53,450 | ) | 188,599 | |||||||||||||||||||||||
High Yield Bond Fund | 29,490 | 54 | — | (5,667 | ) | — | (24,520 | ) | (12,855 | ) | (13,498 | ) | ||||||||||||||||||||
Long Duration Fund | 74,586 | 52,534 | — | — | — | 185,413 | (53,839 | ) | 258,694 | |||||||||||||||||||||||
Long Duration Credit Fund | 51,169 | 28,467 | — | — | — | (13,148 | ) | (12,743 | ) | 53,745 | ||||||||||||||||||||||
Ultra Short Duration Bond Fund | 711 | — | (1,137 | ) | (816 | ) | — | 78 | (707 | ) | (1,871 | ) | ||||||||||||||||||||
Emerging Markets Debt Fund | 5 | — | (13,559 | ) | (14,305 | ) | — | (139,794 | ) | (12,231 | ) | (179,884 | ) | |||||||||||||||||||
Real Return Fund | — | — | (1,505 | ) | — | (846 | ) | (1,746 | ) | (448 | ) | (4,545 | ) | |||||||||||||||||||
Limited Duration Bond Fund | 122 | — | — | — | — | 817 | (75 | ) | 864 | |||||||||||||||||||||||
Intermediate Duration Credit Fund | — | — | — | (1,135 | ) | — | (24,283 | ) | 69 | (25,349 | ) | |||||||||||||||||||||
Dynamic Asset Allocation Fund | 95,912 | 1,364 | — | — | — | 481,944 | 17,653 | 596,873 | ||||||||||||||||||||||||
Multi-Asset Real Return Fund | — | — | (6,448 | ) | (17,656 | ) | — | (21,595 | ) | (736 | ) | (46,435 | ) | |||||||||||||||||||
Post-October losses represent losses realized on investment transactions from November 1, 2014 through May 31, 2015 that, in accordance with Federal income tax regulations, the Funds may elect to defer and treat as having arisen in the following fiscal year. For Federal income tax purposes, capital losses incurred in taxable years beginning before December 22, 2010 may be carried forward for a maximum period of eight years and applied against future net capital gains as follows:
| Expires 2017 ($ Thousands) | Expires 2018 ($ Thousands) | Expires 2019 ($ Thousands) | Total Capital Loss Carryforwards May 31, 2015 ($ Thousands) | |||||||||||||
Screened World Equity Ex-US Fund | $ | — | $ | 9,158 | $ | — | $ | 9,158 | ||||||||
Opportunistic Income Fund | 7,753 | 23,512 | 19,071 | 50,336 | ||||||||||||
Funds are permitted to carry forward capital losses incurred in taxable years beginning after December 22, 2010 for an unlimited period. However, any losses incurred during those future taxable years will be required to be utilized prior to the losses incurred in pre-enactment taxable years. As a result of this ordering rule, pre-enactment capital loss carryforwards may be more likely to expire unused. Additionally, post-enactment capital losses that are carried forward will retain their character as either short-term or long-term capital losses rather than being considered all short-term as under previous law. Losses carried forward under these new provisions are as follows:
Short-Term Loss ($ Thousands) | Long-Term Loss ($ Thousands) | Total * ($ Thousands) | ||||||||||
Opportunistic Income Fund | $ | 638 | $ | 208 | $ | 846 | ||||||
Ultra Short Duration Bond Fund | 473 | 664 | 1,137 | |||||||||
Emerging Markets Debt Fund | 13,559 | — | 13,559 | |||||||||
Real Return Fund | — | 1,505 | 1,505 | |||||||||
Multi-Asset Real Return Fund | 1,047 | 5,401 | 6,448 | |||||||||
| * | This table should be used in conjunction with the capital loss carryforwards table. |
| SEI Institutional Investments Trust / Annual Report / May 31, 2015 | 333 |
Notes to Financial Statements/Consolidated Notes to Financial Statements (Continued)
May 31, 2015
During the fiscal year ended May 31, 2015, the following Funds utilized capital loss carryforwards to offset capital gains:
Amount Utilized ($ Thousands) | ||||
Large Cap Diversified Alpha Fund | $ | 1,702 | ||
Small Cap Fund | 4,081 | |||
World Equity Ex-US Fund | 43,388 | |||
Screened World Equity Ex-US Fund | 3,582 | |||
Core Fixed Income Fund | 9,478 | |||
Long Duration Credit Fund | 21,930 | |||
Dynamic Asset Allocation Fund | 353 | |||
Multi-Asset Real Return Fund | 1,141 | |||
For Federal income tax purposes, the cost of securities owned at May 31, 2015, and the net realized gains or losses on securities sold for the period were not materially different from amounts reported for financial reporting purposes. These differences are primarily due to investments in partnerships, passive foreign investment companies, defaulted bond and wash sales which cannot be used for Federal income tax purposes in the current year and have been deferred for use in future years. The aggregate gross unrealized appreciation and depreciation on total investments held by the Funds at May 31, 2015, was as follows:
| Federal Tax Cost ($ Thousands) | Appreciated Securities ($ Thousands) | Depreciated Securities ($ Thousands) | Net Unrealized Appreciation (Depreciation) ($ Thousands) | |||||||||||||
Large Cap Fund | $ | 1,872,338 | $ | 620,609 | $ | (55,434 | ) | $ | 565,175 | |||||||
Large Cap Diversified Alpha Fund | 54,445 | 11,261 | (1,478 | ) | 9,783 | |||||||||||
Large Cap Disciplined Equity Fund | 3,617,767 | 722,748 | (89,670 | ) | 633,078 | |||||||||||
Large Cap Index Fund | 1,145,178 | 887,960 | (35,313 | ) | 852,647 | |||||||||||
S&P 500 Index Fund | 3,036,474 | 252,626 | (92,012 | ) | 160,614 | |||||||||||
Extended Market Index Fund | 698,884 | 118,914 | (37,677 | ) | 81,237 | |||||||||||
Small Cap Fund | 651,898 | 121,437 | (30,525 | ) | 90,912 | |||||||||||
Small Cap II Fund | 362,749 | 54,801 | (11,526 | ) | 43,275 | |||||||||||
Small/Mid Cap Equity Fund | 1,734,728 | 377,895 | (40,531 | ) | 337,364 | |||||||||||
U.S. Managed Volatility Fund | 1,181,355 | 263,463 | (19,819 | ) | 243,644 | |||||||||||
World Equity Ex-US Fund | 7,096,758 | 1,202,784 | (352,747 | ) | 850,037 | |||||||||||
Screened World Equity Ex-US Fund | 78,381 | 9,791 | (5,701 | ) | 4,090 | |||||||||||
Emerging Markets Equity Fund | 583,492 | 36,046 | (31,452 | ) | 4,594 | |||||||||||
Opportunistic Income Fund | 2,101,825 | 19,460 | (14,925 | ) | 4,535 | |||||||||||
Core Fixed Income Fund | 6,169,825 | 184,111 | (62,103 | ) | 122,008 | |||||||||||
High Yield Bond Fund | 2,547,014 | 46,754 | (71,184 | ) | (24,430 | ) | ||||||||||
Long Duration Fund | 3,169,367 | 218,627 | (33,419 | ) | 185,208 | |||||||||||
Long Duration Credit Fund | 3,441,496 | 63,975 | (77,348 | ) | (13,373 | ) | ||||||||||
Ultra Short Duration Bond Fund | 674,778 | 2,037 | (1,930 | ) | 107 | |||||||||||
Emerging Markets Debt Fund | 1,930,671 | 30,582 | (175,006 | ) | (144,424 | ) | ||||||||||
Real Return Fund | 229,740 | 800 | (2,546 | ) | (1,746 | ) | ||||||||||
Limited Duration Bond Fund | 563,155 | 1,311 | (494 | ) | 817 | |||||||||||
Intermediate Duration Credit Fund | 1,607,123 | 1,906 | (25,934 | ) | (24,028 | ) | ||||||||||
Dynamic Asset Allocation Fund | 1,505,265 | 516,056 | (33,001 | ) | 483,055 | |||||||||||
Multi-Asset Real Return Fund | 852,606 | 23,694 | (10,675 | ) | 13,019 | |||||||||||
Management has analyzed the Funds’ tax positions taken on Federal income tax returns for all open tax years and has concluded that as of May 31, 2015, no provision for income tax would be required in the Funds’ financial statements. The Funds’ Federal and state income and Federal excise tax returns for tax years for which the applicable statutes of limitations have not expired are subject to examination by the Internal Revenue Service and state departments of revenue.
10. CONCENTRATION/RISKS
In the normal course of business, the Trust enters into contracts that provide general indemnifications by the Trust to the counterparty to the contract. The Trust’s maximum exposure under these arrangements is dependent on future claims that may be made against the Trust and, therefore, cannot be estimated; however, Management believes that, based on experience, the risk of loss from such claims is considered remote.
The market values of the Core Fixed Income, High Yield Bond, Long Duration, Long Duration Credit, Ultra Short Duration Bond, Limited Duration Bond, Intermediate Duration Credit and Multi-Asset Real Return Funds’ investments will change in response to interest rate changes and other factors. During periods of falling interest rates, the values of fixed income securities generally rise. Conversely, during periods of rising interest rates, the values of such securities generally decline. Changes by recognized rating agencies in the ratings of any fixed income security and in the ability of an issuer to make payments of interest and principal may also affect the value of these investments.
The World Equity Ex-US, Screened World Equity Ex-US, Emerging Markets Equity and Emerging Markets Debt Funds concentrate their investments in securities of foreign issuers in various countries. These investments may involve certain considerations and risks not typically associated with investments in the United States, as a result of, among other factors, the possibility of future political and economic developments and the level of governmental supervision and regulation of securities markets in the respective countries.
The following descriptions provide additional information about some of the risks of investing in the Funds:
Asset-Backed Securities Risk — Payment of principal and interest on asset-backed securities is dependent largely on the cash flows generated by the assets backing the securities, and asset-backed securities may not have the benefit of any security interest in the related assets.
Bank Loans Risk — With respect to bank loans, the Fund will assume the credit risk of both the borrower and the lender that is selling the participation. The Fund may also have difficulty disposing of bank loans because, in certain cases, the market for such instruments is not highly liquid.
Credit Risk — The risk that the issuer of a security or the counterparty to a contract will default or otherwise become unable to honor a financial obligation.
| 334 | SEI Institutional Investments Trust / Annual Report / May 31, 2015 |
Currency Risk — To the extent a Fund takes positions in currencies, it will be subject to the risk that currency exchange rates may fluctuate in response to, among other things, changes in interest rates, intervention
(or failure to intervene) by U.S. or foreign governments, central banks or supranational entities, or by the imposition of currency controls or other political developments in the United States or abroad.
Fixed Income Market Risk — The prices of a Fund’s fixed income securities respond to economic developments, particularly interest rate changes, as well as to perceptions about the creditworthiness of individual issuers, including governments and their agencies. Generally, the Fund’s fixed income securities will decrease in value if interest rates rise and vice versa. In the case of foreign securities, price fluctuations will reflect international economic and political events, as well as changes in currency valuations relative to the U.S. dollar.
Foreign Investment/Emerging Markets Risk — The risk that non-U.S. securities may be subject to additional risks due to, among other things, political, social and economic developments abroad, currency movements, and different legal, regulatory and tax environments. These additional risks may be heightened with respect to emerging market countries since political turmoil and rapid changes in economic conditions are more likely to occur in these countries.
Interest Rate Risk — The risk that a rise in interest rates will cause a fall in the value of fixed income securities, including U.S. Government Securities, in which the Fund invests. Although U.S. Government securities are considered to be among the safest investments, they are not guaranteed against price movements due to changing interest rates. A low interest rate environment may present greater interest rate risk, because there may be a greater likelihood of rates increasing and rates may increase more rapidly.
Leverage Risk — Certain Fund transactions, such as derivatives or reverse repurchase agreements, may give rise to a form of leverage. The use of leverage can amplify the effects of market volatility on the Funds’ share price and make the Funds’ returns more volatile. This is because leverage tends to exaggerate the effect of any increase or decrease in the value of the Funds’ portfolio securities. The use of leverage may also cause the Funds to liquidate portfolio positions when it would not be advantageous to do so in order to satisfy its obligations.
Mortgage-Backed Securities Risk — Mortgage-backed securities are affected by, among other things, interest rate changes and the possibility of prepayment of the underlying mortgage loans. Mortgage-backed securities are also subject to the risk that underlying borrowers will be unable to meet their obligations.
Please refer to each Fund’s current prospectus for additional disclosure regarding the risks associated with investing in the Funds. The foregoing is not intended to be a complete discussion of the risks associated with the investment strategies of the Funds.
11. IN-KIND TRANSFERS OF SECURITIES
During the year ended May 31, 2015, the S&P 500 Index, Long Duration Credit and Intermediate Duration Credit Funds issued shares of beneficial interest in exchange for securities. These securities were transferred at their fair value on the date of such transactions.
| Shares Issued (Thousands) | Value ($ Thousands) | Gain (Loss) ($ Thousands) | ||||||||||
S&P 500 Index Fund | ||||||||||||
10/31/2014 | 73,459 | $ | 821,276 | $ | — | |||||||
12/30/2014 | 70,090 | 806,037 | — | |||||||||
02/27/2015 | 7,008 | 81,779 | — | |||||||||
03/31/2015 | 418 | 4,800 | — | |||||||||
04/30/2015 | 3,574 | 41,249 | — | |||||||||
Long Duration Credit Fund | ||||||||||||
04/30/2015 | 8,812 | 91,729 | — | |||||||||
Intermediate Duration Credit Fund | ||||||||||||
04/30/2015 | 1,153 | 11,402 | — | |||||||||
During the year ended May 31, 2014, the Core Fixed Income and Long Duration Credit Funds issued shares of beneficial interest in exchange for securities. These securities were transferred at their fair value on the date of such transactions.
| Shares Issued (Thousands) | Value ($ Thousands) | Gain (Loss) ($ Thousands) | ||||||||||
Core Fixed Income Fund | ||||||||||||
08/30/2013 | 2,827 | $ | 28,973 | $ | — | |||||||
Long Duration Credit Fund | ||||||||||||
01/09/2014 | 9,745 | 91,703 | — | |||||||||
02/19/2014 | 1,369 | 13,171 | — | |||||||||
12. SECURITIES LENDING
To the extent consistent with its Investment Objective and Strategies, a Fund may lend portfolio securities to brokers, dealers and other financial organizations that meet capital and other credit requirements or other criteria established by the Trust’s Board of Trustees. These loans may not exceed 33 1/3% of the total asset value of the Fund (including the loan collateral). No Fund will lend portfolio securities to its Adviser, sub-adviser or their affiliates unless it has applied for and received specific authority to do so from the SEC. Loans of portfolio securities will be fully collateralized by cash. Collateral will be maintained in an amount equal to at least 100% of the current market value of the loaned securities by marking-to-market daily, although the borrower will be required to deliver collateral between 102% and 105% of the market value of borrowed securities for domestic and foreign securities, respectively. However, due to market fluctuations during the day, the value of securities loaned on a particular day may, during the course of the day, exceed the value of collateral. On each business day, the amount of collateral is adjusted based on the prior day’s market fluctuations and the current day’s lending activity.
Income from lending activity is determined by the amount of interest earned on collateral, less any amounts payable to the borrowers of the securities and the lending agent. Lending securities involves certain risks, including the risk that the Fund may be delayed or prevented from recovering the collateral if the borrower fails to return the securities.
| SEI Institutional Investments Trust / Annual Report / May 31, 2015 | 335 |
Notes to Financial Statements/Consolidated Notes to Financial Statements (Concluded)
May 31, 2015
Cash collateral received in connection with securities lending is invested in short-term investments by the lending agent. These investments may include the SEI Liquidity Fund, L.P., and the Fund bears all of the gains and losses on such investment. There is no guarantee that these investments will not lose value.
The following is a summary of securities lending agreements held by certain Funds which would be subject to offset as of May 31, 2015 (in $Thousands):
| Fund | Securities Loaned at Value | Cash Collateral Received(1) | Net Amount | |||||||||
Large Cap Fund | $ | 35,431 | $ | 35,431 | $ | — | ||||||
Large Cap Disciplined Equity Fund | 28,661 | 28,661 | — | |||||||||
Large Cap Index Fund | 24,808 | 24,808 | — | |||||||||
S&P 500 Index Fund | 11,973 | 11,973 | — | |||||||||
Extended Market Index Fund | 41,297 | 41,297 | — | |||||||||
Small Cap Fund | 58,596 | 58,596 | — | |||||||||
Small Cap II Fund | 28,796 | 28,796 | — | |||||||||
Small/Mid Cap Equity Fund | 186,581 | 186,581 | — | |||||||||
World Equity Ex-US Fund | 326,306 | 326,306 | — | |||||||||
Core Fixed Income Fund | 250,380 | 250,380 | — | |||||||||
Emerging Markets Debt Fund | 7,567 | 7,567 | — | |||||||||
| (1) | Excess collateral received in connection with the above securities lending transactions is not shown for financial reporting purposes. See each Fund’s Summary Schedule of Investments or Schedule of Investments for the total collateral received. |
13. SUBSEQUENT EVENTS
Management has evaluated the need for disclosures and/or adjustments resulting from subsequent events through the date the financial statements were issued. Based on this evaluation, no disclosure and/or adjustments were required to the financial statements as of May 31, 2015.
| 336 | SEI Institutional Investments Trust / Annual Report / May 31, 2015 |
Report of Independent Registered Public Accounting Firm
The Board of Trustees and Shareholders
SEI Institutional Investments Trust:
We have audited the accompanying statements of assets and liabilities, including the summary schedules of investments, of the Large Cap Fund, Large Cap Diversified Alpha Fund, Large Cap Disciplined Equity Fund, Large Cap Index Fund, S&P 500 Index Fund, Extended Market Index Fund, Small Cap Fund, Small Cap II Fund, Small/Mid Cap Equity Fund, U.S. Managed Volatility Fund, World Equity Ex-US Fund, Screened World Equity Ex-US Fund and Emerging Markets Equity Fund and the statements of assets and liabilities, including the schedules of investments, of the Opportunistic Income Fund, Core Fixed Income Fund, High Yield Bond Fund, Long Duration Fund, Long Duration Credit Fund (formerly, Long Duration Corporate Bond Fund), Ultra Short Duration Bond Fund, Emerging Markets Debt Fund, Real Return Fund, Limited Duration Bond Fund and Intermediate Duration Credit Fund (twenty-three of the twenty-five funds comprising the SEI Institutional Investments Trust (the Trust)), as of May 31, 2015, and the related statements of operations for the year or period then ended, the statements of changes in net assets for each of the years or periods in the two-year period then ended, and the financial highlights for each of the years or periods in the five-year period then ended. We have also audited the accompanying consolidated statement of assets and liabilities, including the consolidated summary schedule of investments of the Dynamic Asset Allocation Fund and the consolidated statement of assets and liabilities, including the consolidated schedule of investments, of the Multi-Asset Real Return Fund, as of May 31, 2015 (two of the twenty-five funds comprising the Trust), and the related consolidated statements of operations for the year then ended, the consolidated statements of changes in net assets for each of the years in the two-year period then ended, the consolidated statement of cash flows for the year then ended for the Multi-Asset Real Return Fund, and the consolidated financial highlights for each of the years or periods in the five-year period then ended. These financial statements and consolidated financial statements and financial highlights and consolidated financial highlights are the responsibility of the Trust’s management. Our responsibility is to express an opinion on these financial statements and consolidated financial statements and financial highlights and consolidated financial highlights based on our audits.
We conducted our audits in accordance with the standards of the Public Company Accounting Oversight Board (United States). Those standards require that we plan and perform the audit to obtain reasonable assurance about whether the financial statements and financial highlights are free of material misstatement. An audit includes examining, on a test basis, evidence supporting the amounts and disclosures in the financial statements. Our procedures included confirmation of securities owned as of May 31, 2015, by correspondence with custodians and brokers or other appropriate auditing procedures. An audit also includes assessing the accounting principles used and significant estimates made by management, as well as evaluating the overall financial statement presentation. We believe that our audits provide a reasonable basis for our opinion.
In our opinion, the financial statements and consolidated financial statements and financial highlights and consolidated financial highlights referred to above present fairly, in all material respects, the financial position of each of the funds comprising the SEI Institutional Investments Trust as of May 31, 2015, the results of their operations, the changes in their net assets, their cash flows, and the financial highlights for each of the years or periods described in the first paragraph, in conformity with U.S. generally accepted accounting principles.

Philadelphia, Pennsylvania
July 30, 2015
| SEI Institutional Investments Trust / Annual Report / May 31, 2015 | 337 |
TRUSTEES AND OFFICERS OF THE TRUST (Unaudited)
The following chart lists Trustees and Officers as of May 31, 2015.
Set forth below are the names, addresses, ages, position with the Trust, Term of Office and Length of Time Served, the principal occupations for the last five years, number of portfolios in fund complex overseen by trustee, and other directorships outside the fund complex of each of the persons currently serving as Trustees and Officers of the Trust. The Trust’s Statement of Additional Information (“SAI”) includes additional information about the Trustees and Officers. The SAI may be obtained without charge by calling 1-800-342-5734.
| Name Address, and Age | Position(s) Held with Trusts | Term of Office and Length of Time Served1 | Principal Occupation(s) During Past Five Years | Number of Portfolios in Fund Complex Overseen by Trustee2 | Other Directorships Held by Trustee | |||||
| INTERESTED TRUSTEES | ||||||||||
Robert A. Nesher One Freedom Valley Drive Oaks, PA 19456 68 yrs. old | Chairman of the Board of Trustees* | since 1982 | Currently performs various services on behalf of SEI for which Mr. Nesher is compensated. | 99 | Trustee of The Advisors’ Inner Circle Fund, The Advisors’ Inner Circle Fund II, Bishop Street Funds, Director of SEI Global Master Fund, plc, SEI Global Assets Fund, plc, SEI Global Investments Fund, plc, SEI Investments Global, Limited, SEI Investments — Global Fund Services, Limited, SEI Investments (Europe), Limited, SEI Global Nominee Ltd., SEI Structured Credit Fund, L.P. | |||||
William M. Doran One Freedom Valley Drive Oaks, PA 19456 74 yrs. old | Trustee* | since 1982 | Self-employed consultant since 2003. Partner, Morgan, Lewis & Bockius LLP (law firm) from 1976 to 2003, counsel to the Trust, SEI, SIMC, the Administrator and the Distributor. Secretary of SEI since 1978. | 99 | Trustee of The Advisors’ Inner Circle Fund, The Advisors’ Inner Circle Fund II, Bishop Street Funds, Director of SEI since 1974. Director of the Distributor since 2003. Director of SEI Investments — Global Fund Services, Limited, SEI Investments Global, Limited, SEI Investments (Europe), Limited, SEI Investments (Asia), SEI Global Nominee Ltd., Limited and SEI Asset Korea Co., Ltd. | |||||
| TRUSTEES | ||||||||||
George J. Sullivan, Jr. One Freedom Valley Drive Oaks, PA 19456 72 yrs. old | Trustee | since 1996 | Retired since January 2012. Self- Employed Consultant, Newfound Consultants Inc. since April 1997- December 2011. | 99 | Trustee of The Advisors’ Inner Circle Fund, The Advisors’ Inner Circle Fund II, Bishop Street Funds, State Street Navigator Securities Lending Trust, and SEI Structured Credit Fund, L.P., member of the independent review committee for SEI’s Canadian-registered mutual funds. | |||||
| * | Messrs. Nesher and Doran are Trustees who may be deemed as “interested” persons of the Trust as that term is defined in the 1940 Act by virtue of their affiliation with SIMC and the Trust’s Distributor. |
| 1 | Each trustee shall hold office during the lifetime of this Trust until the election and qualification of his or her successor, or until he or she sooner dies, resigns or is removed in accordance with the Trust’s Declaration of Trust. |
| 2 | The Fund Complex includes the following Trusts: SEI Asset Allocation Trust, SEI Daily Income Trust, SEI Institutional Investments Trust, Adviser Managed Trust, SEI Institutional International Trust, SEI Institutional Managed Trust, SEI Liquid Asset Trust, SEI Tax Exempt Trust, SEI Insurance Products Trust, New Covenant Funds and SEI Catholic Values Trust. |
| 338 | SEI Institutional Investments Trust / Annual Report / May 31, 2015 |
Name Address, and Age | Position(s) Held with Trusts | Term of Office and Length of Time Served1 | Principal Occupation(s) During Past Five Years | Number of by Trustee2 | Other Directorships Held by Trustee | |||||
| TRUSTEES (continued) | ||||||||||
Nina Lesavoy One Freedom Valley Drive Oaks, PA 19456 57 yrs. old | Trustee | since 2003 | Founder and Managing Director, Avec Capital since 2008. Managing Director, Cue Capital from March 2002-March 2008. | 99 | Director of SEI Structured Credit Fund, L.P. | |||||
James M. Williams Valley Drive Oaks, PA 19456 67 yrs. old | Trustee | since 2004 | Vice President and Chief Investment Officer, J. Paul Getty Trust, Non-Profit Foundation for Visual Arts, since December 2002. | 99 | Trustee/Director of Ariel Mutual Funds, and SEI Strucured Credit Fund, L.P. | |||||
Mitchell A. Johnson One Freedom Valley Drive Oaks, PA 19456 73 yrs. old | Trustee | Since 2007 | Private Investor since 1994. | 99 | Trustee of the Advisors’ Inner Circle Fund, The Advisors’ Inner Circle Fund II, and Bishop Street Funds | |||||
Hubert L. Harris, Jr. One Freedom Valley Drive Oaks, PA 19456 71 yrs. old | Trustee | since 2008 | Retired since December 2005. Chief Executive Officer and Chair of the Board of Directors, AMVESCAP Retirement, Inc., 1997-December 2005. Chief Executive Officer, INVESCO North America, September 2003-December 2005. | 99 | Director of Colonial BancGroup, Inc. and St. Joseph’s Translational Research Institute; Chair of the Board of Trustees, Georgia Tech Foundation, Inc. (nonprofit corporation); Board of Councilors of the Carter Center. | |||||
| OFFICERS | ||||||||||
Robert A. Nesher One Freedom Valley Drive Oaks, PA 19456 68 yrs. old | President and CEO | since 2005 | Currently performs various services on behalf of SEI for which Mr. Nesher is compensated. | N/A | N/A | |||||
Arthur Ramanjulu Valley Drive Oaks, PA 19456 51 yrs. old | Controller and Chief Financial Officer | since 2015 | Director, Funds Accounting, SEI Investments Global Funds Services (March 2015); Senior Manager, Funds Accounting, SEI Global Funds Services (March 2007 to February 2015). | N/A | N/A | |||||
Russell Emery One Freedom Valley Drive Oaks, PA 19456 52 yrs. old | Chief Compliance Officer | since 2006 | Chief Compliance Officer of SEI Institutional Managed Trust, SEI Asset Allocation Trust, SEI Daily Income Trust, SEI Institutional International Trust, SEI Liquid Asset Trust, SEI Tax Exempt Trust, SEI Institutional Investments Trust, The Advisors’ Inner Circle Fund, The Advisors’ Inner Circle Fund II, and Bishop Street Funds, since March 2006. Chief Compliance Officer of SEI Structured Credit Fund, LP since June 2007. Chief Compliance Officer of Adviser Managed Trust since December 2010. Chief Compliance Officer of New Covenant Funds since February 2012. Chief Compliance Officer of SEI Insurance Products Trust since 2013. Chief Compliance Officer of SEI Catholic Values Trust since 2015. | N/A | N/A | |||||
Timothy D. Barto One Freedom Valley Drive Oaks, PA 19456 47 yrs. old | Vice President and Secretary | since 2002 | General Counsel, Vice President and Secretary of SIMC and the Administrator since 2004. Vice President and Assistant Secretary of SEI since 2001. Vice President of SIMC and the Administrator since 1999. | N/A | N/A | |||||
| SEI Institutional Investments Trust / Annual Report / May 31, 2015 | 339 |
TRUSTEES AND OFFICERS OF THE TRUST (Unaudited)
Name Address, and Age | Position(s) Held with Trusts | Term of Office and Length of Time Served1 | Principal Occupation(s) During Past Five Years | Number of by Trustee2 | Other Directorships Held by Trustee | |||||
| OFFICERS (continued) | ||||||||||
Aaron Buser One Freedom Valley Drive Oaks, PA 19456 44 yrs. old | Vice President and Assistant Secretary | since 2008 | Vice President and Assistant Secretary of SIMC since 2007. Associate at Stark & Stark (2004-2007). | N/A | N/A | |||||
David F. McCann One Freedom Valley Drive Oaks, PA 19456 39 yrs. old | Vice President and Assistant Secretary | since 2009 | Vice President and Assistant Secretary of SIMC since 2008. Attorney, Drinker Biddle & Reath, LLP (law firm), May 2005-October 2008. Attorney, Pepper Hamilton, LLP (law firm), September 2001-May 2005. | N/A | N/A | |||||
Stephen G. MacRae One Freedom Valley Drive Oaks, PA 19456 47 yrs. old | Vice President | since 2012 | Director of Global Investment Product Management, January 2004 to present. | N/A | N/A | |||||
Bridget E. Sudall One Freedom Valley Drive Oaks, PA 19456 35 yrs. old | Anti-Money Laundering Compliance Officer and Privacy Officer | Since 2015 | Anti-Money Laundering Compliance Officer and Privacy Officer since 2015. Senior Associate and AML Officer, Morgan Stanley Alternative Investment Partners, April 2011 to March 2015. Investor Services Team Lead, Morgan Stanley Alternative Investment Partners, July 2007 to April 2011. | N/A | N/A | |||||
| 1 | Each trustee shall hold office during the lifetime of this Trust until the election and qualification of his or her successor, or until he or she sooner dies, resigns or is removed in accordance with the Trust’s Declaration of Trust. |
| 2 | The Fund Complex includes the following Trusts: SEI Asset Allocation Trust, SEI Daily Income Trust, SEI Institutional Investments Trust, Adviser Managed Trust, SEI Institutional International Trust, SEI Institutional Managed Trust, SEI Liquid Asset Trust, SEI Tax Exempt Trust, SEI Insurance Products Trust, New Covenant Funds and SEI Catholic Values Trust. |
| 340 | SEI Institutional Investments Trust / Annual Report / May 31, 2015 |
Disclosure of Fund Expenses (Unaudited)
May 31, 2015
All mutual funds have operating expenses. As a shareholder of a fund, your investment is affected by these ongoing costs, which include (among others) costs for portfolio management, administrative services, and shareholder reports like this one. It is important for you to understand the impact of these costs on your investment returns.
Operating expenses such as these are deducted from the fund’s gross income and directly reduce your final investment return. These expenses are expressed as a percentage of the fund’s average net assets; this percentage is known as the fund’s expense ratio.
The following examples use the expense ratio and are intended to help you understand the ongoing costs (in dollars) of investing in your Fund and to compare these costs with those of other mutual funds. The examples are based on an investment of $1,000 made at the beginning of the period shown and held for the entire period (December 1, 2014 through May 31, 2015).
The table on the next page illustrates your Fund’s costs in two ways:
• Actual Fund return. This section helps you to estimate the actual expenses after fee waivers that your Fund incurred over the period. The “Expenses Paid During Period” column shows the actual dollar expense cost incurred by a $1,000 investment in the Fund, and the “Ending Account Value” number is derived from deducting that expense cost from the Fund’s gross investment return.
You can use this information, together with the actual amount you invested in the Fund, to estimate the expenses you paid over that period. Simply divide your actual starting account value by $1,000 to arrive at a ratio (for example, an $8,600 account value divided by $1,000 = 8.6), then multiply that ratio by the number shown for your Fund under “Expenses Paid During Period.”
• Hypothetical 5% return. This section helps you compare your Fund’s costs with those of other mutual funds. It assumes that the Fund had an annual 5% return before expenses during the year, but that the expense ratio (Column 3) is unchanged. This example is useful in making comparisons because the Securities and Exchange Commission requires all mutual funds to make this 5% calculation. You can assess your Fund’s comparative cost by comparing the hypothetical result for your Fund in the “Expense Paid During Period” column with those that appear in the same charts in the shareholder reports for other funds.
NOTE: Because the return is set at 5% for comparison purposes — NOT your Fund’s actual return — the account values shown do not apply to your specific investment.
| Beginning Account Value 12/1/2014 | Ending Account Value 5/31/2015 | Annualized Expense Ratios | Expense Paid During Period* | |||||||||||||
Large Cap Fund |
| |||||||||||||||
Actual Fund Return |
| |||||||||||||||
Class A Shares | $ | 1,000.00 | $ | 1,041.80 | 0.20 | % | $ | 1.02 | ||||||||
Hypothetical 5% Return |
| |||||||||||||||
Class A Shares | $ | 1,000.00 | $ | 1,023.93 | 0.20 | % | $ | 1.01 | ||||||||
Large Cap Diversified Alpha Fund |
| |||||||||||||||
Actual Fund Return |
| |||||||||||||||
Class A Shares | $ | 1,000.00 | $ | 1,042.50 | 0.24 | % | $ | 1.22 | ||||||||
Hypothetical 5% Return |
| |||||||||||||||
Class A Shares | $ | 1,000.00 | $ | 1,023.73 | 0.24 | % | $ | 1.21 | ||||||||
Large Cap Disciplined Equity Fund |
| |||||||||||||||
Actual Fund Return |
| |||||||||||||||
Class A Shares | $ | 1,000.00 | $ | 1,039.00 | 0.19 | % | $ | 0.97 | ||||||||
Hypothetical 5% Return |
| |||||||||||||||
Class A Shares | $ | 1,000.00 | $ | 1,023.98 | 0.19 | % | $ | 0.96 | ||||||||
Large Cap Index Fund |
| |||||||||||||||
Actual Fund Return |
| |||||||||||||||
Class A Shares | $ | 1,000.00 | $ | 1,034.10 | 0.03 | % | $ | 0.15 | ||||||||
Hypothetical 5% Return |
| |||||||||||||||
Class A Shares | $ | 1,000.00 | $ | 1,024.78 | 0.03 | % | $ | 0.15 | ||||||||
| Beginning Account Value 12/1/2014 | Ending Account Value 5/31/2015 | Annualized Expense Ratios | Expense Paid During Period* | |||||||||||||
S&P 500 Index Fund |
| |||||||||||||||
Actual Fund Return |
| |||||||||||||||
Class A Shares | $ | 1,000.00 | $ | 1,029.30 | 0.04 | % | $ | 0.20 | ||||||||
Hypothetical 5% Return |
| |||||||||||||||
Class A Shares | $ | 1,000.00 | $ | 1,024.73 | 0.04 | % | $ | 0.20 | ||||||||
Exented Market Index Fund |
| |||||||||||||||
Actual Fund Return |
| |||||||||||||||
Class A Shares | $ | 1,000.00 | $ | 1,063.70 | 0.06 | % | $ | 0.31 | ||||||||
Hypothetical 5% Return |
| |||||||||||||||
Class A Shares | $ | 1,000.00 | $ | 1,024.63 | 0.06 | % | $ | 0.30 | ||||||||
Small Cap Fund |
| |||||||||||||||
Actual Fund Return |
| |||||||||||||||
Class A Shares | $ | 1,000.00 | $ | 1,055.00 | 0.48 | % | $ | 2.46 | ||||||||
Hypothetical 5% Return |
| |||||||||||||||
Class A Shares | $ | 1,000.00 | $ | 1,022.54 | 0.48 | % | $ | 2.42 | ||||||||
Small Cap II Fund |
| |||||||||||||||
Actual Fund Return |
| |||||||||||||||
Class A Shares | $ | 1,000.00 | $ | 1,071.40 | 0.47 | % | $ | 2.43 | ||||||||
Hypothetical 5% Return |
| |||||||||||||||
Class A Shares | $ | 1,000.00 | $ | 1,022.59 | 0.47 | % | $ | 2.37 | ||||||||
| SEI Institutional Investments Trust / Annual Report / May 31, 2015 | 341 |
Disclosure of Fund Expenses (Unaudited) (Concluded)
May 31, 2015
| Beginning Account Value 12/1/2014 | Ending Account Value 5/31/2015 | Annualized Expense Ratios | Expense Paid During Period* | |||||||||||||
Small/Mid Cap Equity Fund |
| |||||||||||||||
Actual Fund Return | ||||||||||||||||
Class A Shares | $ | 1,000.00 | $ | 1,057.90 | 0.47 | % | $ | 2.41 | ||||||||
Hypothetical 5% Return |
| |||||||||||||||
Class A Shares | $ | 1,000.00 | $ | 1,022.59 | 0.47 | % | $ | 2.37 | ||||||||
U.S. Managed Volatility Fund |
| |||||||||||||||
Actual Fund Return | ||||||||||||||||
Class A Shares | $ | 1,000.00 | $ | 1,035.30 | 0.24 | % | $ | 1.22 | ||||||||
Hypothetical 5% Return |
| |||||||||||||||
Class A Shares | $ | 1,000.00 | $ | 1,023.73 | 0.24 | % | $ | 1.21 | ||||||||
World Equity Ex-US Fund |
| |||||||||||||||
Actual Fund Return | ||||||||||||||||
Class A Shares | $ | 1,000.00 | $ | 1,041.90 | 0.33 | % | $ | 1.68 | ||||||||
Hypothetical 5% Return |
| |||||||||||||||
Class A Shares | $ | 1,000.00 | $ | 1,023.29 | 0.33 | % | $ | 1.66 | ||||||||
Screened World Equity Ex-US Fund |
| |||||||||||||||
Actual Fund Return | ||||||||||||||||
Class A Shares | $ | 1,000.00 | $ | 1,030.40 | 0.34 | % | $ | 1.72 | ||||||||
Hypothetical 5% Return |
| |||||||||||||||
Class A Shares | $ | 1,000.00 | $ | 1,023.24 | 0.34 | % | $ | 1.72 | ||||||||
Emerging Markets Equity Fund |
| |||||||||||||||
Actual Fund Return | ||||||||||||||||
Class A Shares | $ | 1,000.00 | $ | 1,013.50 | 0.64 | % | $ | 3.21 | ||||||||
Hypothetical 5% Return |
| |||||||||||||||
Class A Shares | $ | 1,000.00 | $ | 1,021.74 | 0.64 | % | $ | 3.23 | ||||||||
Opportunistic Income Fund |
| |||||||||||||||
Actual Fund Return | ||||||||||||||||
Class A Shares | $ | 1,000.00 | $ | 1,010.90 | 0.26 | % | $ | 1.30 | ||||||||
Hypothetical 5% Return |
| |||||||||||||||
Class A Shares | $ | 1,000.00 | $ | 1,023.64 | 0.26 | % | $ | 1.31 | ||||||||
Core Fixed Income Fund |
| |||||||||||||||
Actual Fund Return | ||||||||||||||||
Class A Shares | $ | 1,000.00 | $ | 1,015.20 | 0.13 | % | $ | 0.65 | ||||||||
Hypothetical 5% Return |
| |||||||||||||||
Class A Shares | $ | 1,000.00 | $ | 1,024.28 | 0.13 | % | $ | 0.66 | ||||||||
High Yield Bond Fund |
| |||||||||||||||
Actual Fund Return | ||||||||||||||||
Class A Shares | $ | 1,000.00 | $ | 1,030.40 | 0.30 | % | $ | 1.52 | ||||||||
Hypothetical 5% Return |
| |||||||||||||||
Class A Shares | $ | 1,000.00 | $ | 1,023.44 | 0.30 | % | $ | 1.51 | ||||||||
Long Duration Fund |
| |||||||||||||||
Actual Fund Return | ||||||||||||||||
Class A Shares | $ | 1,000.00 | $ | 1,008.50 | 0.15 | % | $ | 0.75 | ||||||||
Hypothetical 5% Return |
| |||||||||||||||
Class A Shares | $ | 1,000.00 | $ | 1,024.18 | 0.15 | % | $ | 0.76 | ||||||||
Long Duration Credit Fund |
| |||||||||||||||
Actual Fund Return |
| |||||||||||||||
Class A Shares | $ | 1,000.00 | $ | 1,001.70 | 0.15 | % | $ | 0.75 | ||||||||
Hypothetical 5% Return |
| |||||||||||||||
Class A Shares | $ | 1,000.00 | $ | 1,024.18 | 0.15 | % | $ | 0.76 | ||||||||
Ultra Short Duration Bond Fund |
| |||||||||||||||
Actual Fund Return | ||||||||||||||||
Class A Shares | $ | 1,000.00 | $ | 1,004.90 | 0.12 | % | $ | 0.60 | ||||||||
Hypothetical 5% Return |
| |||||||||||||||
Class A Shares | $ | 1,000.00 | $ | 1,024.33 | 0.12 | % | $ | 0.61 | ||||||||
Emerging Markets Debt Fund |
| |||||||||||||||
Actual Fund Return | ||||||||||||||||
Class A Shares | $ | 1,000.00 | $ | 960.90 | 0.40 | % | $ | 1.96 | ||||||||
Hypothetical 5% Return |
| |||||||||||||||
Class A Shares | $ | 1,000.00 | $ | 1,022.94 | 0.40 | % | $ | 2.02 | ||||||||
Real Return Fund |
| |||||||||||||||
Actual Fund Return | ||||||||||||||||
Class A Shares | $ | 1,000.00 | $ | 996.90 | 0.08 | % | $ | 0.40 | ||||||||
Hypothetical 5% Return |
| |||||||||||||||
Class A Shares | $ | 1,000.00 | $ | 1,024.53 | 0.08 | % | $ | 0.40 | ||||||||
| Beginning Account Value 12/1/2014 | Ending Account Value 5/31/2015 | Annualized Expense Ratios | Expense Paid During Period* | |||||||||||||
Limited Duration Bond Fund |
| |||||||||||||||
Actual Fund Return | ||||||||||||||||
Class A Shares | $ | 1,000.00 | $ | 1,005.80 | 0.14 | % | $ | 0.70 | ||||||||
Hypothetical 5% Return |
| |||||||||||||||
Class A Shares | $ | 1,000.00 | $ | 1,024.23 | 0.14 | % | $ | 0.71 | ||||||||
Intermediate Duration Credit Fund (Commenced 3/31/15) |
| |||||||||||||||
Actual Fund Return | ||||||||||||||||
Class A Shares | $ | 1,000.00 | $ | 985.40 | 0.20 | % | $ | 0.33 | ** | |||||||
Hypothetical 5% Return |
| |||||||||||||||
Class A Shares | $ | 1,000.00 | $ | 1,023.93 | 0.20 | % | $ | 1.01 | * | |||||||
Dynamic Asset Allocation Fund |
| |||||||||||||||
Actual Fund Return | ||||||||||||||||
Class A Shares | $ | 1,000.00 | $ | 1,083.00 | 0.08 | % | $ | 0.42 | ||||||||
Hypothetical 5% Return |
| |||||||||||||||
Class A Shares | $ | 1,000.00 | $ | 1,024.53 | 0.08 | % | $ | 0.40 | ||||||||
Multi-Asset Real Return Fund |
| |||||||||||||||
Actual Fund Return | ||||||||||||||||
Class A Shares | $ | 1,000.00 | $ | 992.10 | 0.32 | % | $ | 1.59 | ||||||||
Hypothetical 5% Return |
| |||||||||||||||
Class A Shares | $ | 1,000.00 | $ | 1,023.34 | 0.32 | % | $ | 1.61 | ||||||||
| * | Expenses are equal to the Fund’s annualized expense ratio multiplied by the average account value over the period, multiplied by 182/365 (to reflect the one-half year period shown). |
| ** | Expenses are equal to the Fund’s annualized expense ratio multiplied by the average account value over the period, multiplied by 61/365 (to reflect the period since inception to period end). |
| 342 | SEI Institutional Investments Trust / Annual Report / May 31, 2015 |
Board of Trustees Considerations in Approving the Advisory and Sub-Advisory Agreements (Unaudited)
SEI Institutional Investments Trust (the “Trust”) and SEI Investments Management Corporation (“SIMC”) have entered into an investment advisory agreement (the “Advisory Agreement”). Pursuant to the Advisory Agreement, SIMC is responsible for the investment advisory services provided to the series of the Trust (the “Funds”). Pursuant to separate sub-advisory agreements with SIMC (the “Sub-Advisory Agreements” and, together with the Advisory Agreement, the “Investment Advisory Agreements”), and under the supervision of SIMC and the Trust’s Board of Trustees (the “Board”), the sub-advisers (each, a “Sub-Adviser” and collectively, the “Sub-Advisers”) provide security selection and certain other advisory services with respect to all or a discrete portion of the assets of the Funds. The Sub-Advisers are also responsible for managing their employees who provide services to these Funds. The Sub-Advisers are selected based primarily upon the research and recommendations of SIMC, which evaluates quantitatively and qualitatively the Sub-Advisers’ skills and investment results in managing assets for specific asset classes, investment styles and strategies.
The Investment Company Act of 1940, as amended (the “1940 Act”), requires that the initial approval of, as well as the continuation of, the Funds’ Investment Advisory Agreements must be specifically approved: (i) by the vote of the Board or by a vote of the shareholders of the Funds; and (ii) by the vote of a majority of the Trustees who are not parties to the Investment Advisory Agreements or “interested persons” of any party (the “Independent Trustees”), cast in person at a meeting called for the purpose of voting on such approval(s). In connection with their consideration of such approval(s), the Funds’ Trustees must request and evaluate, and SIMC and the Sub-Advisers are required to furnish, such information as may be reasonably necessary to evaluate the terms of the Investment Advisory Agreements. In addition, the Securities and Exchange Commission takes the position that, as part of their fiduciary duties with respect to a mutual fund’s fees, mutual fund boards are required to evaluate the material factors applicable to a decision to approve an Investment Advisory Agreement.
Consistent with these responsibilities, the Board calls and holds meetings each year to consider whether to approve new and/or renew existing Investment Advisory Agreements between the Trust and SIMC and SIMC and the Sub-Advisers with respect to the Funds of the Trust. In preparation for these meetings, the Board requests and reviews a wide variety of materials provided by SIMC and the Sub-Advisers, including information about SIMC’s and the Sub-Advisers’ affiliates, personnel and operations and the services provided pursuant to the Investment Advisory Agreements. The Board also receives data from third parties. This information is provided in addition to the detailed information about the Funds that the Board reviews during the course of each year, including information that relates to Fund operations and Fund performance. The Trustees also receive a memorandum from counsel regarding the responsibilities of Trustees in connection with their consideration of whether to approve the Trust’s Investment Advisory Agreements. Finally, the Independent Trustees receive advice from independent counsel to the Independent Trustees, meet in executive sessions outside the presence of Fund management and participate in question and answer sessions with representatives of SIMC and the Sub-Advisers.
Specifically, during the course of the Trust’s fiscal year, the Board requested and received written materials from SIMC and the Sub-Advisers regarding: (i) the quality of SIMC’s and the Sub-Advisers’ investment management and other services; (ii) SIMC’s and the Sub-Advisers’ investment management personnel; (iii) SIMC’s and the Sub-Advisers’ operations and financial condition; (iv) SIMC’s and the Sub-Advisers’ brokerage practices (including any soft dollar arrangements) and investment strategies; (v) the level of the advisory fees that SIMC charges the Funds and the level of the sub-advisory fees that SIMC pays the Sub-Advisers, compared with fees each charge to comparable accounts; (vi) the advisory fees charged by SIMC and the Funds’ overall fees and operating expenses compared with peer groups of mutual funds prepared by Lipper, an independent provider of investment company data; (vii) the level of SIMC’s and the Sub-Advisers’ profitability from their Fund-related operations; (viii) SIMC’s and the Sub-Advisers’ compliance program, including a description of material compliance matters and material compliance violations; (ix) SIMC’s potential economies of scale; (x) SIMC’s and the Sub-Advisers’ policies on and compliance procedures for personal securities transactions; (xi) SIMC’s and the Sub-Advisers’ expertise and resources in domestic and/or international financial markets; and (xii) the Funds’ performance over various periods of time compared with peer groups of mutual funds prepared by Lipper and the Funds’ benchmark indices.
| SEI Institutional Investments Trust / Annual Report / May 31, 2015 | 343 |
Board of Trustees Considerations in Approving the Advisory and Sub-Advisory Agreements (Unaudited) (Continued)
At the March 24, 2015 meeting of the Board of Trustees, the Trustees, including a majority of the Independent Trustees, approved the renewal of the Advisory Agreement. Also, each Sub-Advisory Agreement (other than certain of those operating under an initial two-year term) was either initially approved or, if the Sub-Advisory Agreement was already in effect, renewed at a meeting of the Board of Trustees during the course of the Trust’s fiscal year. During the Trust’s fiscal year, the Board met for in-person meetings on June 24, 2014, September 15, 2014, December 9, 2014 and March 24, 2015. In each case, the Board’s approvals were based on its consideration and evaluation of the factors described above, as discussed at the meetings and at prior meetings. The following discusses some, but not all, of the factors that were considered by the Board in connection with its assessment of the Investment Advisory Agreements.
Nature, Extent and Quality of Services. The Board considered the nature, extent and quality of the services provided by SIMC and the Sub-Advisers to the Funds and the resources of SIMC and the Sub-Advisers and their affiliates dedicated to the Funds. In this regard, the Trustees evaluated, among other things, SIMC’s and each Sub-Adviser’s personnel, experience, track record and compliance program. Following evaluation, the Board concluded that, within the context of its full deliberations, the nature, extent and quality of services provided by SIMC and the Sub-Advisers to the Funds and the resources of SIMC and the Sub-Advisers and their affiliates dedicated to the Funds were sufficient to support renewal of the Investment Advisory Agreements. In addition to advisory services, the Board considered the nature and quality of certain administrative, transfer agency and other non-investment advisory services provided to the Funds by SIMC and/or its affiliates.
Performance. In determining whether to renew SIMC’s Advisory Agreement, the Trustees considered the Funds’ performance relative to their peer groups and appropriate indices/benchmarks. The Trustees reviewed performance information for each Fund, noting that they receive performance reports that permit them to monitor each Fund’s performance at board meetings throughout the year. As part of this review, the Trustees considered the composition of each peer group and selection criteria. In assessing Fund performance, the Trustees considered a report compiled by Lipper, an independent third-party, which was engaged to prepare an assessment of the Funds in connection with the renewal of the Advisory Agreement (the “Lipper Report”). The Lipper Report included metrics on risk analysis, volatility versus total return, net total return and performance consistency for the Funds and a universe of comparable funds. Based on the materials considered and discussed at the meetings, the Trustees found Fund performance satisfactory, or, where performance was materially below the benchmark and/or peer group, the Trustees were satisfied of the reasons provided to explain such performance. In connection with the approval or renewal of Sub-Advisory Agreements, the Board considered the performance of the Sub-Adviser relative to appropriate indices/benchmarks. Following evaluation, the Board concluded that, within the context of its full deliberations, the performance of the Funds was sufficient to support renewal of SIMC’s Advisory Agreement, and the performance of each Sub-Adviser was sufficient to support approval or renewal of the Sub-Advisory Agreement.
Fees. With respect to the Funds’ expenses under the Investment Advisory Agreements, the Trustees considered the rate of compensation called for by the Investment Advisory Agreements and the Funds’ net operating expense ratio in comparison to those of the Funds’ respective peer groups. In assessing Fund expenses, the Trustees considered the information in the Lipper Report, which included various metrics related to fund expenses, including, but not limited to, contractual management fees at various fee levels, actual management fees, and actual total expenses (including underlying fund expenses) for the Funds and a universe of comparable funds. Based on the materials considered and discussion at the meetings, the Trustees further determined that fees were either shown to be below the peer average in the comparative fee analysis, or that there was a reasonable basis for the fee level. The Trustees also considered the effects of SIMC’s voluntary waiver of management and other fees to prevent total Fund expenses from exceeding a specified cap and concluded that SIMC, through waivers, has maintained the Funds’ net operating expenses at competitive levels for its distribution channels. In determining the appropriateness of fees, the Board also took into consideration the impact of fees incurred indirectly by the Funds as a result of investments into underlying funds, including funds from which SIMC or its affiliates earn fees. The Board also took into consideration compensation earned from the Funds by SIMC or its affiliates for non-advisory services, such as administration, transfer agency, shareholder services or brokerage, and considered whether SIMC and its affiliates may have realized other benefits from their
| 344 | SEI Institutional Investments Trust / Annual Report / May 31, 2015 |
relationship with the Funds, such as any research and brokerage services received under soft dollar arrangements. When considering fees paid to Sub-Advisers, the Board took into account the fact that the Sub-Advisers are compensated by SIMC and not by the Funds directly, and that such compensation with respect to any unaffiliated Sub-Adviser reflects an arms-length negotiation between the Sub-Adviser and SIMC. Following evaluation, the Board concluded that, within the context of its full deliberations, the expenses of the Funds are reasonable and supported renewal of the Investment Advisory Agreements. The Board also considered whether the Sub-Advisers and their affiliates may have realized other benefits from their relationship with the Funds, such as any research and brokerage services received under soft dollar arrangements.
Profitability. With regard to profitability, the Trustees considered compensation flowing to SIMC and the Sub-Advisers and their affiliates, directly or indirectly. The Trustees considered whether the levels of compensation and profitability were reasonable. As with the fee levels, when considering the profitability of the Sub-Advisers, the Board took into account the fact that compensation with respect to any unaffiliated Sub-Adviser reflects an arms-length negotiation between the Sub-Adviser and SIMC. In connection with the approval or renewal of each Sub-Advisory Agreement, the Board also took into consideration the impact that the fees paid to the Sub-Adviser have on SIMC’s advisory fee margin and profitability. Based on this evaluation, the Board concluded that, within the context of its full deliberations, the profitability of each of SIMC and the Sub-Advisers is reasonable and supported renewal of the Investment Advisory Agreements.
Economies of Scale. With respect to the Advisory Agreement, the Trustees considered whether any economies of scale were being realized by SIMC and their affiliates and, if so, whether the benefits of such economies of scale were passed along to the Funds’ shareholders through a graduated investment advisory fee schedule or other means, including any fee waivers by SIMC and its affiliates. The Trustees recognized that economies of scale are difficult to identify and quantify and are rarely identifiable on a fund-by-fund basis. Based on this evaluation, the Board determined that the fees were reasonable in light of the information that was provided by SIMC with respect to economies of scale.
Based on the Trustees’ deliberation and their evaluation of the information described above, the Board, including all of the Independent Trustees, with the assistance of Fund counsel and Independent Trustees’ counsel, unanimously approved the approval or renewal, as applicable, of the Investment Advisory Agreements and concluded that the compensation under the Investment Advisory Agreements is fair and reasonable in light of such services and expenses and such other matters as the Trustees considered to be relevant in the exercise of their reasonable judgment. In the course of its deliberations, the Board did not identify any particular factor (or conclusion with respect thereto) or single piece of information that was all-important, controlling or determinative of its decision, but considered all of the factors together, and each Trustee may have attributed different weights to the various factors (and conclusions with respect thereto) and information.
| SEI Institutional Investments Trust / Annual Report / May 31, 2015 | 345 |
Shareholder Voting Results (Unaudited)
At a special meeting held on April 9, 2015, the shareholders of the SIIT Long Duration Fund (the “Fund”), voted on the proposals listed below. The results of the voting were as follows:
Proposal 1: To approve a change in the Fund’s investment goal from “Return characteristics similar to those of high quality corporate bonds, with a duration range of between nine and fourteen years” to “Return characteristics similar to those of high quality bonds.”
| Long Duration Fund | ||||||||||||
| Number of Shares | % of Outstanding Shares | % of Shares Present | ||||||||||
| Affirmative | 238,012,692.447 | 56.58 | % | 100.00 | % | |||||||
| Against | 0 | 0.00 | % | 0.00 | % | |||||||
| Abstain | 0 | 0.00 | % | 0.00 | % | |||||||
|
|
|
|
|
| |||||||
| Total | 238,012,692.447 | 56.58 | % | 100.00 | % | |||||||
|
|
|
|
|
| |||||||
Proposal 2: To approve reclassification of the Fund’s investment goal from “fundamental” to “non-fundamental.”
| Long Duration Fund | ||||||||||||
| Number of Shares | % of Outstanding Shares | % of Shares Present | ||||||||||
| Affirmative | 238,012,692.447 | 56.58 | % | 100.00 | % | |||||||
| Against | 0 | 0.00 | % | 0.00 | % | |||||||
| Abstain | 0 | 0.00 | % | 0.00 | % | |||||||
|
|
|
|
|
| |||||||
| Total | 238,012,692.447 | 56.58 | % | 100.00 | % | |||||||
|
|
|
|
|
| |||||||
| 346 | SEI Institutional Investments Trust / Annual Report / May 31, 2015 |
Notice to Shareholders (Unaudited)
For shareholders who do not have a May 31, 2015, taxable year end, this notice is for informational purposes only. For shareholders with a May 31, 2015, taxable year end, please consult your tax adviser as to the pertinence of this notice.
For the fiscal year ended May 31, 2015, the Funds are designating long term and qualifying dividend income with regard to distributions paid during the year as follows:
| (A) Long Term Capital Gains Distributions (Tax Basis) | (B) Return of Capital (Tax Basis) | (C) Ordinary Income Distributions (Tax Basis) | Total Distributions (Tax Basis) | (D) Dividends Qualifying for Corporate Dividends Rec. Deduction (1) | ||||||||||||||||
| Large Cap Fund | 75.99 | % | 0.00 | % | 24.01 | % | 100.00 | % | 65.37 | % | ||||||||||
| Large Cap Diversified Alpha Fund | 53.08 | % | 0.00 | % | 46.92 | % | 100.00 | % | 49.05 | % | ||||||||||
| Large Cap Disciplined Equity Fund | 80.50 | % | 0.00 | % | 19.50 | % | 100.00 | % | 39.31 | % | ||||||||||
| Large Cap Index Fund | 71.01 | % | 0.00 | % | 28.99 | % | 100.00 | % | 80.50 | % | ||||||||||
| S&P 500 Index Fund | 3.32 | % | 0.00 | % | 96.68 | % | 100.00 | % | 85.06 | % | ||||||||||
| Extended Market Index Fund | 20.45 | % | 0.00 | % | 79.55 | % | 100.00 | % | 32.91 | % | ||||||||||
| Small Cap Fund | 78.47 | % | 0.00 | % | 21.53 | % | 100.00 | % | 95.24 | % | ||||||||||
| Small Cap II Fund | 77.12 | % | 0.00 | % | 22.88 | % | 100.00 | % | 23.15 | % | ||||||||||
| Small/Mid Cap Equity Fund | 78.66 | % | 0.00 | % | 21.34 | % | 100.00 | % | 21.07 | % | ||||||||||
| U.S. Managed Volatility Fund | 61.38 | % | 0.00 | % | 38.62 | % | 100.00 | % | 48.27 | % | ||||||||||
| World Equity Ex-US Fund (6) | 36.75 | % | 0.00 | % | 63.25 | % | 100.00 | % | 0.00 | % | ||||||||||
| Screened World Equity Ex-US Fund (7) | 0.00 | % | 0.00 | % | 100.00 | % | 100.00 | % | 0.00 | % | ||||||||||
| Emerging Markets Equity Fund (8) | 0.00 | % | 0.00 | % | 100.00 | % | 100.00 | % | 2.41 | % | ||||||||||
| Opportunistic Income Fund | 0.00 | % | 0.00 | % | 100.00 | % | 100.00 | % | 0.39 | % | ||||||||||
| Core Fixed Income Fund | 0.00 | % | 0.00 | % | 100.00 | % | 100.00 | % | 0.00 | % | ||||||||||
| High Yield Bond Fund | 21.40 | % | 0.00 | % | 78.60 | % | 100.00 | % | 0.00 | % | ||||||||||
| Long Duration Fund | 4.05 | % | 0.00 | % | 95.95 | % | 100.00 | % | 0.00 | % | ||||||||||
| Long Duration Credit Fund | 0.00 | % | 0.00 | % | 100.00 | % | 100.00 | % | 0.00 | % | ||||||||||
| Ultra Short Duration Bond Fund | 0.00 | % | 0.00 | % | 100.00 | % | 100.00 | % | 0.00 | % | ||||||||||
| Emerging Markets Debt Fund | 0.00 | % | 0.00 | % | 100.00 | % | 100.00 | % | 0.00 | % | ||||||||||
| Real Return Fund | 0.00 | % | 0.00 | % | 100.00 | % | 100.00 | % | 0.00 | % | ||||||||||
| Limited Duration Bond Fund | 0.00 | % | 0.00 | % | 100.00 | % | 100.00 | % | 0.00 | % | ||||||||||
| Intermediate Duration Credit Fund | 0.00 | % | 0.00 | % | 100.00 | % | 100.00 | % | 0.00 | % | ||||||||||
| Dynamic Asset Allocation Fund | 0.00 | % | 0.00 | % | 100.00 | % | 100.00 | % | 20.70 | % | ||||||||||
| Multi-Asset Real Return Fund | 0.00 | % | 16.11 | % | 83.89 | % | 100.00 | % | 30.31 | % | ||||||||||
| (E) Qualifying Dividend Income (15% Tax Rate for QDI) (2) | (F) U.S. Government Interest (3) | Interest Related Dividends (4) | Short-Term Capital Gain Dividends (5) | |||||||||||||
| Large Cap Fund | 66.99 | % | 0.00 | % | 0.00 | % | 100.00 | % | ||||||||
| Large Cap Diversified Alpha Fund | 52.01 | % | 0.00 | % | 0.00 | % | 100.00 | % | ||||||||
| Large Cap Disciplined Equity Fund | 39.36 | % | 0.00 | % | 0.00 | % | 100.00 | % | ||||||||
| Large Cap Index Fund | 81.82 | % | 0.00 | % | 0.00 | % | 100.00 | % | ||||||||
| S&P 500 Index Fund | 85.60 | % | 0.00 | % | 0.00 | % | 100.00 | % | ||||||||
| Extended Market Index Fund | 34.19 | % | 0.00 | % | 0.00 | % | 100.00 | % | ||||||||
| Small Cap Fund | 97.52 | % | 0.01 | % | 0.01 | % | 0.00 | % | ||||||||
| Small Cap II Fund | 23.07 | % | 0.01 | % | 0.01 | % | 100.00 | % | ||||||||
| Small/Mid Cap Equity Fund | 21.73 | % | 0.00 | % | 0.00 | % | 100.00 | % | ||||||||
| U.S. Managed Volatility Fund | 51.72 | % | 0.00 | % | 0.00 | % | 100.00 | % | ||||||||
| World Equity Ex-US Fund (6) | 83.45 | % | 0.00 | % | 0.02 | % | 0.00 | % | ||||||||
| Screened World Equity Ex-US Fund (7) | 99.11 | % | 0.00 | % | 0.16 | % | 0.00 | % | ||||||||
| Emerging Markets Equity Fund (8) | 55.81 | % | 0.00 | % | 6.57 | % | 0.00 | % | ||||||||
| Opportunistic Income Fund | 0.39 | % | 0.50 | % | 95.61 | % | 0.00 | % | ||||||||
| Core Fixed Income Fund | 0.00 | % | 16.27 | % | 67.00 | % | 100.00 | % | ||||||||
| High Yield Bond Fund | 0.00 | % | 0.00 | % | 88.11 | % | 100.00 | % | ||||||||
| Long Duration Fund | 0.00 | % | 12.37 | % | 64.47 | % | 100.00 | % | ||||||||
| Long Duration Credit Fund | 0.00 | % | 1.75 | % | 79.27 | % | 0.00 | % | ||||||||
| Ultra Short Duration Bond Fund | 0.00 | % | 1.09 | % | 99.97 | % | 0.00 | % | ||||||||
| Emerging Markets Debt Fund | 0.00 | % | 0.00 | % | 0.00 | % | 0.00 | % | ||||||||
| Real Return Fund | 0.00 | % | 0.00 | % | 0.00 | % | 0.00 | % | ||||||||
| Limited Duration Bond Fund | 0.00 | % | 13.02 | % | 95.38 | % | 100.00 | % | ||||||||
| Intermediate Duration Credit Fund | 0.00 | % | 6.15 | % | 99.96 | % | 0.00 | % | ||||||||
| Dynamic Asset Allocation Fund | 20.93 | % | 0.00 | % | 0.00 | % | 0.00 | % | ||||||||
| Multi-Asset Real Return Fund | 34.17 | % | 0.00 | % | 19.94 | % | 0.00 | % | ||||||||
| (1) | Qualifying dividends represent dividends which qualify for the corporate dividends received deduction. |
| (2) | The percentage in this column represents the amount of “Qualifying Dividend Income” is reflected as a percentage of “Ordinary Income Distributions.” It is the intention of each of the aforementioned funds to designate the maximum amount permitted by the law. The information reported herein may differ from the information and distributions taxable to the shareholders for the calendar year ending December 31, 2015. Complete information will be computed and reported in conjunction with your 2015 Form 1099-DIV. |
| SEI Institutional Investments Trust / Annual Report / May 31, 2015 | 347 |
Notice to Shareholders (Unaudited) (Concluded)
| (3) | “U.S. Government Interest” represents the amount of interest that was derived from direct U.S. Government obligations and distributed during the fiscal year. This amount is reflected as a percentage of total ordinary income distributions (the total of short term capital gain and net investment income distributions). Generally, interest from direct U.S. Government obligations is exempt from state income tax. However, for shareholders who are residents of California, Connecticut and New York, the statutory threshold requirements were not satisfied to permit exemption of these amounts from state income. |
| (4) | The percentage in this column represents the amount of “Interest Related Dividend” is reflected as a percentage of ordinary income distribution. Interest related dividends are exempted from U.S. withholding tax when paid to foreign investors. |
| (5) | The percentage of this column represents the amount of “Short Term Capital Gain Dividend” is reflected as a percentage of short term capital gain distribution that is exempted from U.S. withholding tax when paid to foreign investors. |
| (6) | The Fund intends to pass through a foreign tax credit to shareholders. For fiscal year ended 2015, the total amount of foreign source income is $140,434,227. The total amount of foreign tax to be paid is $6,447,960. Your allocable share of the foreign tax credit will be reported on Form 1099 DIV. |
| (7) | The Fund intends to pass through a foreign tax credit to shareholders. For fiscal year ended 2015, the total amount of foreign source income is $1,749,476. The total amount of foreign tax paid is $144,256. Your allocable share of the foreign tax credit will be reported on Form 1099 DIV. |
| (8) | The Fund intends to pass through a foreign tax credit to shareholders. For fiscal year ended 2015, the total amount of foreign source income is $4,836,753. The total amount of foreign tax to be paid is $441,449. Your allocable share of the foreign tax credit will be reported on Form 1099 DIV. |
Items (A), (B) and (C) are based on the percentage of each Fund’s total distribution.
Items (D) and (E) are based on the percentage of ordinary income distributions of each Fund. Item (F) is based on the percentage of gross income of each Fund.
Please consult your tax adviser for proper treatment of this information. This notification should be kept with your permanent tax records.
| 348 | SEI Institutional Investments Trust / Annual Report / May 31, 2015 |
SEI INSTITUTIONAL INVESTMENTS TRUST ANNUAL REPORT MAY 31, 2015
Robert A. Nesher, Chairman
Trustees
William M. Doran
George J. Sullivan, Jr.
Nina Lesavoy
James M. Williams
Mitchell A. Johnson
Hubert L. Harris, Jr.
Officers
Robert A. Nesher
President and Chief Executive Officer
Arthur Ramanjulu
Controller and Chief Financial Officer
Russell Emery
Chief Compliance Officer
Timothy D. Barto
Vice President, Secretary
Aaron Buser
Vice President, Assistant Secretary
David F. McCann
Vice President, Assistant Secretary
Stephen G. MacRae
Vice President
Bridget E. Sudall
Anti-Money Laundering Compliance Officer
Privacy Officer
Investment Adviser
SEI Investments Management Corporation
Administrator
SEI Investments Global Funds Services
Distributor
SEI Investments Distribution Co.
Legal Counsel
Morgan, Lewis & Bockius LLP
Independent Registered Public Accounting Firm
KPMG LLP
This report and the financial statements contained herein are submitted for the general information of the shareholders of the Trust and must be preceded or accompanied by a current prospectus. Shares of the Funds are not deposits or obligations of, or guaranteed or endorsed by, any bank. The shares are not federally insured by the Federal Deposit Insurance Corporation (FDIC), the Federal Reserve Board, or any other government agency. Investment in the shares involves risk, including the possible loss of principal.
For more information call
1.800.DIAL.SEI
(1.800.342.5734)

1 Freedom Valley Drive, P.O. Box 1100, Oaks, PA 19456
SEI-F-140 (5/15)
| Item 2. | Code of Ethics. |
The Registrant has adopted a code of ethics that applies to the Registrant’s principal executive officer, principal financial officer, comptroller or principal accounting officer, and any person who performs a similar function.
| Item 3. | Audit Committee Financial Expert. |
(a)(1) The Registrant’s Board of Trustees has determined that the Registrant has at least two audit committee financial experts serving on the audit committee.
(a) (2) The audit committee financial experts are George J. Sullivan, Jr. and Hubert L. Harris, Jr. Messrs. Sullivan and Harris are independent as defined in Form N-CSR Item 3 (a) (2).
| Item 4. | Principal Accountant Fees and Services. |
Fees billed by KPMG LLP (“KPMG”) related to the Registrant.
KPMG billed the Registrant aggregate fees for services rendered to the Registrant for the fiscal years 2015 and 2014 as follows:
| Fiscal Year 2015 | Fiscal Year 2014 | |||||||||||||||||||||||||
| All fees and services to the Registrant that were pre- approved | All fees and services to service affiliates that were pre- approved | All other fees and services to service affiliates that did not require pre- approval | All fees and services to the Registrant that were pre- approved | All fees and services to service affiliates that were pre- approved | All other fees and services to service affiliates that did not require pre- approval | |||||||||||||||||||||
(a) | Audit Fees(1) | $ | 814,500 | $ | 0 | N/A | $ | 693,000 | $ | 0 | N/A | |||||||||||||||
(b) | Audit-Related Fees | $ | 0 | $ | 0 | $ | 0 | $ | 0 | $ | 0 | $ | 0 | |||||||||||||
(c) | Tax Fees(3) | $ | 0 | $ | 0 | $ | 0 | $ | 0 | $ | 28,000 | $ | 0 | |||||||||||||
(d) | All Other Fees(2) | $ | 0 | $ | 240,350 | $ | 0 | $ | 0 | $ | 237,000 | $ | 0 | |||||||||||||
Notes:
| (1) | Audit fees include amounts related to the audit of the Registrant’s annual financial statements and services normally provided by the accountant in connection with statutory and regulatory filings. |
| (2) | See Item 4 (g) for a description of the services comprising the fees disclosed under this category. |
| (3) | Tax fees include amounts related to tax compliance and consulting services for various service affiliates of the Registrant. |
(e)(1) The Registrant’s Audit Committee has adopted an Audit and Non-Audit Services Pre-Approval Policy (the “Policy”), which sets forth the procedures and the conditions pursuant to which services proposed to be performed by the independent auditor of the Registrant may be pre-approved.
The Policy provides that all requests or applications for proposed services to be provided by the independent auditor must be submitted to the Registrant’s Chief Financial Officer (“CFO”) and must include a detailed description of the services proposed to be rendered. The CFO will determine whether such services: (1) require specific pre-approval; (2) are included within the list of services that have received the general pre-approval of the Audit Committee pursuant to the Policy; or (3) have been previously pre-approved in connection with the independent auditor’s annual engagement letter for the applicable year or otherwise. In any instance where services require pre-approval, the Audit Committee will consider whether such services are consistent with SEC’s rules and whether the provision of such services would impair the auditor’s independence.
Requests or applications to provide services that require specific pre-approval by the Audit Committee will be submitted to the Audit Committee by the CFO. The Audit Committee will be informed by the CFO on a quarterly basis of all services rendered by the independent auditor. The Audit Committee has delegated specific pre-approval authority to either the Audit Committee Chair or financial experts, provided that the estimated fee for any such proposed pre-approved service does not exceed $100,000 and any pre-approval decisions are reported to the Audit Committee at its next regularly scheduled meeting.
Services that have received the general pre-approval of the Audit Committee are identified and described in the Policy. In addition, the Policy sets forth a maximum fee per engagement with respect to each identified service that has received general pre-approval.
All services to be provided by the independent auditor shall be provided pursuant to a signed written engagement letter with the Registrant, the investment advisor or applicable control affiliate (except that matters as to which an engagement letter would be impractical because of timing issues or because the matter is small may not be the subject of an engagement letter) that sets forth both the services to be provided by the independent auditor and the total fees to be paid to the independent auditor for those services.
In addition, the Audit Committee has determined to take additional measures on an annual basis to meet its responsibility to oversee the work of the independent auditor and to assure the auditor’s independence from the Registrant, such as reviewing a formal written statement from the independent auditor delineating all relationships between the independent auditor and the Registrant, and discussing with the independent auditor its methods and procedures for ensuring independence.
(e)(2) Percentage of fees billed applicable to non-audit services pursuant to waiver of pre-approval requirement were as follows:
| Fiscal Year 2015 | Fiscal Year 2014 | |||||||
Audit-Related Fees | 0 | % | 0 | % | ||||
Tax Fees | 0 | % | 0 | % | ||||
All Other Fees | 0 | % | 0 | % | ||||
(f) Not Applicable.
(g) The aggregate non-audit fees and services billed by KPMG for the fiscal years 2015 and 2014 were $240,350 and $237,000, respectively. Non-audit fees consist of SSAE No.16 review of fund accounting and administration operations, attestation report in accordance with Rule 17Ad-13, agreed upon procedures report over certain internal controls related to compliance with federal securities laws and regulations and tax compliance and consulting services for various service affiliates of the registrant.
(h) During the past fiscal year, Registrant’s principal accountant provided certain non-audit services to Registrant’s investment adviser or to entities controlling, controlled by, or under common control with Registrant’s investment adviser that provide ongoing services to Registrant that were not subject to pre-approval pursuant to paragraph (c)(7)(ii) of Rule 2-01 of Regulation S-X. The Audit Committee of Registrant’s Board of Trustees reviewed and considered these non-audit services provided by Registrant’s principal accountant to Registrant’s affiliates, including whether the provision of these non-audit services is compatible with maintaining the principal accountant’s independence.
| Item 5. | Audit Committee of Listed Registrants. |
Not applicable.
| Item 6. | Schedule of Investments |
(a) The Schedules of Investments in securities of unaffiliated issuers as of the close of the reporting period for the Large Cap Fund, Large Cap Diversified Alpha Fund, Large Cap Disciplined Equity Fund, Large Cap Index Fund, S&P 500 Index Fund, Extended Market Index Fund, Small Cap Fund, Small Cap II Fund, Small/Mid Cap Equity Fund, U.S. Managed Volatility Fund, World Equity Ex-US Fund, Screened World Equity Ex-US Fund and Emerging Markets Equity Fund and the Consolidated Schedule of Investments in securities of unaffiliated issuers as of the close of the reporting period for the Dynamic Asset Allocation Fund are listed below. The Schedule of Investments in securities of unaffiliated issuers as of the close of the reporting period for the Opportunistic Income Fund, Core Fixed Income Fund, High Yield Bond Fund, Long Duration Fund, Long Duration Credit Fund, Ultra Short Duration Bond Fund, Emerging Markets Debt Fund, Real Return Fund, Limited Duration Bond Fund and Intermediate Duration Credit Fund and the Consolidated Schedule of Investments in securities of unaffiliated issuers as of the close of the reporting period for the Multi-Asset Real Return Fund are included as part of the report to shareholders filed under Item 1 of this form.
SCHEDULE OF INVESTMENTS
Large Cap Fund
May 31, 2015
| Description | Shares | Market Value ($ Thousands) | ||||||
COMMON STOCK — 96.2% | ||||||||
Consumer Discretionary — 12.0% | ||||||||
Abercrombie & Fitch, Cl A | 22,900 | $ | 469 | |||||
Amazon.com * | 50,902 | 21,849 | ||||||
Apollo Education Group, Cl A * | 94,800 | 1,572 | ||||||
Autoliv (A) | 12,300 | 1,552 | ||||||
Best Buy | 70,460 | 2,445 | ||||||
Big Lots | 60,000 | 2,634 | ||||||
CBS, Cl B | 127,304 | 7,857 | ||||||
Coach | 6,220 | 220 | ||||||
Comcast, Cl A | 124,260 | 7,264 | ||||||
Cooper Tire & Rubber | 103,870 | 3,813 | ||||||
Darden Restaurants | 34,320 | 2,249 | ||||||
Deckers Outdoor * | 12,440 | 848 | ||||||
Delphi Automotive | 116,590 | 10,141 | ||||||
Dillard’s, Cl A | 45,683 | 5,300 | ||||||
DIRECTV * | 52,000 | 4,734 | ||||||
Discovery Communications, Cl A *(A) | 98,136 | 3,331 | ||||||
Discovery Communications, Cl C * | 264,214 | 8,308 | ||||||
Dollar General | 138,230 | 10,034 | ||||||
Foot Locker | 80,790 | 5,106 | ||||||
Ford Motor | 382,760 | 5,806 | ||||||
GameStop, Cl A (A) | 28,800 | 1,250 | ||||||
Gannett | 38,700 | 1,385 | ||||||
General Motors | 163,150 | 5,869 | ||||||
Graham Holdings, Cl B | 400 | 429 | ||||||
Harley-Davidson | 30,200 | 1,615 | ||||||
Harman International Industries | 1,600 | 193 | ||||||
Hilton Worldwide Holdings * | 191,070 | 5,534 | ||||||
Home Depot | 142,352 | 15,861 | ||||||
Interpublic Group | 9,600 | 196 | ||||||
Kohl’s | 67,670 | 4,432 | ||||||
L Brands | 126,775 | 10,969 | ||||||
Lear | 57,620 | 6,685 | ||||||
Liberty Interactive, Cl A * | 548,375 | 15,338 | ||||||
Lowe’s | 41,300 | 2,890 | ||||||
Macy’s | 64,980 | 4,350 | ||||||
Murphy USA * | 6,800 | 396 | ||||||
NIKE, Cl B | 87,400 | 8,886 | ||||||
Priceline Group * | 8,075 | 9,464 | ||||||
Ralph Lauren, Cl A | 22,050 | 2,875 | ||||||
Regal Entertainment Group, Cl A | — | — | ||||||
Restaurant Brands International | — | — | ||||||
Sally Beauty Holdings * | 163,325 | 5,097 | ||||||
Sears Holdings * | — | — | ||||||
Staples | 238,539 | 3,927 | ||||||
Starbucks | 418,425 | 21,741 | ||||||
Target | 13,100 | 1,039 | ||||||
Tesla Motors * | — | — | ||||||
Time Warner | 57,000 | 4,816 | ||||||
Time Warner Cable, Cl A | 62,176 | 11,247 | ||||||
TripAdvisor * | 242,687 | 18,507 | ||||||
Viacom, Cl B | 15,300 | 1,023 | ||||||
Whirlpool | 49,700 | 9,157 | ||||||
Wynn Resorts | 28,400 | 2,860 | ||||||
Zulily, Cl A *(A) | 28,786 | 381 | ||||||
|
| |||||||
| 283,944 | ||||||||
|
| |||||||
Consumer Staples — 8.2% | ||||||||
Altria Group | 72,270 | 3,700 | ||||||
Anheuser-Busch InBev ADR | 73,514 | 8,863 | ||||||
Archer-Daniels-Midland | 170,900 | 9,032 | ||||||
Bunge | 74,710 | 6,915 | ||||||
| Description | Shares | Market Value ($ Thousands) | ||||||
Coca-Cola | 84,600 | $ | 3,465 | |||||
Coca-Cola Enterprises | 31,900 | 1,411 | ||||||
ConAgra Foods | 40,200 | 1,552 | ||||||
Costco Wholesale | 118,102 | 16,840 | ||||||
CVS Health | 76,456 | 7,827 | ||||||
Dr. Pepper Snapple Group | 50,540 | 3,873 | ||||||
Estee Lauder, Cl A | 154,842 | 13,538 | ||||||
Herbalife * | 4,130 | 215 | ||||||
Ingredion | 27,000 | 2,213 | ||||||
Kimberly-Clark | 33,379 | 3,634 | ||||||
Kraft Foods Group | 58,520 | 4,942 | ||||||
Kroger | 122,840 | 8,943 | ||||||
Mead Johnson Nutrition, Cl A | 132,204 | 12,864 | ||||||
Monster Beverage * | 26,303 | 3,348 | ||||||
Nu Skin Enterprises, Cl A | — | — | ||||||
PepsiCo | 22,000 | 2,122 | ||||||
Philip Morris International | 254,240 | 21,120 | ||||||
Pilgrim’s Pride (A) | 127,731 | 3,267 | ||||||
Procter & Gamble | 118,144 | 9,261 | ||||||
SUPERVALU * | 60,800 | 537 | ||||||
Tyson Foods, Cl A | 181,250 | 7,694 | ||||||
Walgreens Boots Alliance | 197,662 | 16,967 | ||||||
Wal-Mart Stores | 113,693 | 8,444 | ||||||
Whole Foods Market | 285,016 | 11,754 | ||||||
|
| |||||||
| 194,341 | ||||||||
|
| |||||||
Energy — 7.1% | ||||||||
Apache | 19,600 | 1,173 | ||||||
Cabot Oil & Gas | 201,460 | 6,842 | ||||||
California Resources | 265,561 | 2,085 | ||||||
Cameron International * | 104,500 | 5,364 | ||||||
Chevron | 38,000 | 3,914 | ||||||
Cimarex Energy | 26,133 | 3,019 | ||||||
ConocoPhillips | 22,900 | 1,458 | ||||||
Ensco, Cl A | 193,660 | 4,551 | ||||||
EOG Resources | 122,321 | 10,849 | ||||||
Exxon Mobil | 252,052 | 21,475 | ||||||
FMC Technologies * | 191,974 | 8,023 | ||||||
Halliburton | 34,100 | 1,548 | ||||||
Helmerich & Payne | 18,300 | 1,336 | ||||||
Hess | 14,500 | 979 | ||||||
Kinder Morgan | 202,400 | 8,398 | ||||||
Marathon Oil | 53,300 | 1,449 | ||||||
Marathon Petroleum | 113,548 | 11,748 | ||||||
MarkWest Energy Partners | 105,700 | 6,831 | ||||||
Murphy Oil | 14,900 | 647 | ||||||
Nabors Industries | 63,590 | 938 | ||||||
National Oilwell Varco | 28,200 | 1,387 | ||||||
Noble (A) | 164,530 | 2,756 | ||||||
Noble Energy | 122,205 | 5,350 | ||||||
Oil States International * | 95,640 | 3,910 | ||||||
Paragon Offshore (A) | 17,500 | 29 | ||||||
Patterson-UTI Energy | 62,000 | 1,252 | ||||||
Peabody Energy | — | — | ||||||
Phillips 66 | 88,220 | 6,980 | ||||||
Rowan, Cl A | 88,550 | 1,902 | ||||||
RPC | — | — | ||||||
SandRidge Energy * | — | — | ||||||
Schlumberger | 107,299 | 9,739 | ||||||
Seadrill | — | — | ||||||
Tesoro | 53,630 | 4,746 | ||||||
Tidewater | — | — | ||||||
Valero Energy | 279,279 | 16,544 | ||||||
Williams | 195,500 | 9,990 | ||||||
|
| |||||||
| 167,212 | ||||||||
|
| |||||||
| 1 | SEI Institutional Investments Trust / Annual Report / May 31, 2015 |
SCHEDULE OF INVESTMENTS
Large Cap Fund
May 31, 2015
| Description | Shares | Market Value ($ Thousands) | ||||||
Financials — 15.2% |
| |||||||
ACE | 14,235 | $ | 1,516 | |||||
Aflac | 76,257 | 4,745 | ||||||
Allied World Assurance Holdings | 10,800 | 459 | ||||||
Allstate | 152,310 | 10,254 | ||||||
Ally Financial * | 172,250 | 3,905 | ||||||
American Financial Group | 32,286 | 2,050 | ||||||
American International Group | 287,260 | 16,836 | ||||||
American Tower, Cl A ‡ | 86,110 | 7,990 | ||||||
Ameriprise Financial | 42,840 | 5,338 | ||||||
Annaly Capital Management ‡ | 71,700 | 748 | ||||||
Assurant | 94,640 | 6,232 | ||||||
Assured Guaranty | 76,560 | 2,189 | ||||||
Axis Capital Holdings | 52,750 | 2,903 | ||||||
Bank of America | 359,620 | 5,934 | ||||||
Bank of New York Mellon | 30,400 | 1,318 | ||||||
BB&T | 53,900 | 2,127 | ||||||
Berkshire Hathaway, Cl B * | 32,858 | 4,699 | ||||||
Brandywine Realty Trust ‡ | 56,000 | 788 | ||||||
Capital One Financial | 235,470 | 19,676 | ||||||
CBL & Associates Properties ‡ | 65,600 | 1,158 | ||||||
CBOE Holdings | 29,040 | 1,699 | ||||||
CBRE Group, Cl A * | 114,240 | 4,368 | ||||||
Charles Schwab | 506,219 | 16,022 | ||||||
CIT Group | 26,600 | 1,231 | ||||||
Citigroup | 633,330 | 34,250 | ||||||
CNA Financial | 21,600 | 835 | ||||||
Crown Castle International ‡ | 163,800 | 13,358 | ||||||
Discover Financial Services | 154,677 | 9,013 | ||||||
Endurance Specialty Holdings | 19,600 | 1,191 | ||||||
Everest Re Group | 38,827 | 7,048 | ||||||
Fifth Third Bancorp | 118,600 | 2,401 | ||||||
Goldman Sachs Group | 45,890 | 9,462 | ||||||
Hartford Financial Services Group | 79,650 | 3,274 | ||||||
HCP ‡ | 8,000 | 310 | ||||||
Hospitality Properties Trust ‡ | 96,460 | 2,912 | ||||||
Host Hotels & Resorts, Cl REIT ‡ | 14,300 | 285 | ||||||
Huntington Bancshares | 499,000 | 5,554 | ||||||
Intercontinental Exchange | 38,475 | 9,110 | ||||||
Jones Lang LaSalle | 4,900 | 849 | ||||||
JPMorgan Chase | 464,970 | 30,586 | ||||||
KeyCorp | 151,100 | 2,203 | ||||||
Lincoln National | 101,670 | 5,796 | ||||||
McGraw Hill Financial | 34,580 | 3,588 | ||||||
MetLife | 77,913 | 4,072 | ||||||
Montpelier Re Holdings | 37,300 | 1,420 | ||||||
Moody’s | 55,930 | 6,046 | ||||||
Morgan Stanley | 131,580 | 5,026 | ||||||
Navient | 168,500 | 3,247 | ||||||
New York Community Bancorp | — | — | ||||||
Ocwen Financial *(A) | 18,500 | 188 | ||||||
PartnerRe | 22,400 | 2,944 | ||||||
PNC Financial Services Group | 103,840 | 9,936 | ||||||
Prudential Financial | 22,370 | 1,893 | ||||||
Public Storage ‡ | 5,700 | 1,103 | ||||||
Regions Financial | 134,700 | 1,359 | ||||||
Reinsurance Group of America, Cl A | 57,371 | 5,367 | ||||||
RenaissanceRe Holdings | 17,550 | 1,792 | ||||||
Simon Property Group ‡ | 5,841 | 1,060 | ||||||
State Street | 23,600 | 1,839 | ||||||
Synchrony Financial * | — | — | ||||||
T. Rowe Price Group | 29,670 | 2,394 | ||||||
Travelers | 154,776 | 15,651 | ||||||
| Description | Shares | Market Value ($ Thousands) | ||||||
Unum Group | 193,710 | $ | 6,772 | |||||
Validus Holdings | 31,300 | 1,343 | ||||||
Voya Financial | 120,150 | 5,444 | ||||||
Wells Fargo | 260,556 | 14,581 | ||||||
Weyerhaeuser, Cl REIT ‡ | 15,600 | 508 | ||||||
|
| |||||||
| 360,195 | ||||||||
|
| |||||||
Health Care — 17.1% | ||||||||
AbbVie | 113,000 | 7,525 | ||||||
Actavis * | 85,832 | 26,334 | ||||||
Aetna | 75,990 | 8,965 | ||||||
Alexion Pharmaceuticals * | 86,980 | 14,251 | ||||||
Amgen | 18,400 | 2,875 | ||||||
Anthem | 103,660 | 17,399 | ||||||
Baxter International | 28,700 | 1,912 | ||||||
Biogen * | 49,795 | 19,768 | ||||||
Bristol-Myers Squibb | 302,624 | 19,549 | ||||||
Cardinal Health | 81,000 | 7,142 | ||||||
Celgene * | 230,490 | 26,377 | ||||||
Cigna | 38,600 | 5,436 | ||||||
DaVita HealthCare Partners * | 123,908 | 10,381 | ||||||
Edwards Lifesciences * | 32,800 | 4,287 | ||||||
Express Scripts Holding * | 191,352 | 16,674 | ||||||
Gilead Sciences | 177,630 | 19,943 | ||||||
HCA Holdings * | 67,530 | 5,526 | ||||||
Health Net * | 98,200 | 6,112 | ||||||
Humana | 88,317 | 18,957 | ||||||
Intuitive Surgical * | 26,960 | 13,150 | ||||||
Johnson & Johnson | 193,142 | 19,341 | ||||||
McKesson | 24,420 | 5,793 | ||||||
Medtronic | 155,990 | 11,905 | ||||||
Merck | 180,683 | 11,002 | ||||||
Myriad Genetics *(A) | 17,300 | 587 | ||||||
Novo Nordisk ADR | 226,800 | 12,810 | ||||||
Omnicare | 56,560 | 5,390 | ||||||
Pfizer | 735,170 | 25,547 | ||||||
QIAGEN * | — | — | ||||||
Quest Diagnostics | 44,800 | 3,370 | ||||||
Seattle Genetics * | — | — | ||||||
Shire ADR | 41,320 | 10,749 | ||||||
Teleflex | — | — | ||||||
Teva Pharmaceutical Industries ADR | 232,642 | 13,982 | ||||||
United Therapeutics * | 72,395 | 13,301 | ||||||
UnitedHealth Group | 21,500 | 2,585 | ||||||
Valeant Pharmaceuticals International * | 64,816 | 15,476 | ||||||
Varian Medical Systems * | — | — | ||||||
Veeva Systems, Cl A * | — | — | ||||||
|
| |||||||
| 404,401 | ||||||||
|
| |||||||
Industrials — 7.3% | ||||||||
3M | 6,300 | 1,002 | ||||||
AGCO (A) | 44,200 | 2,244 | ||||||
Alaska Air Group | 93,290 | 6,030 | ||||||
AMERCO | 3,500 | 1,151 | ||||||
American Airlines Group | 26,670 | 1,130 | ||||||
Avis Budget Group * | 23,490 | 1,198 | ||||||
Boeing | 47,090 | 6,617 | ||||||
Canadian Pacific Railway | 42,911 | 7,068 | ||||||
Caterpillar | 21,200 | 1,809 | ||||||
Colfax * | 154,453 | 7,783 | ||||||
Con-way | 2,100 | 85 | ||||||
Danaher | 157,823 | 13,623 | ||||||
Deere | 46,300 | 4,337 | ||||||
| 2 | SEI Institutional Investments Trust / Annual Report / May 31, 2015 |
SCHEDULE OF INVESTMENTS
Large Cap Fund
May 31, 2015
| Description | Shares | Market Value ($ Thousands) | ||||||
Delta Air Lines | 211,313 | $ | 9,069 | |||||
Engility Holdings | 6,500 | 181 | ||||||
Fastenal (A) | 231,310 | 9,602 | ||||||
FedEx | 48,070 | 8,327 | ||||||
General Dynamics | 39,830 | 5,583 | ||||||
Huntington Ingalls Industries | 52,010 | 6,449 | ||||||
ITT | 12,500 | 534 | ||||||
JetBlue Airways * | 33,320 | 672 | ||||||
Kansas City Southern | 70,890 | 6,416 | ||||||
L-3 Communications Holdings, Cl 3 | 3,400 | 400 | ||||||
Lincoln Electric Holdings | 3,900 | 262 | ||||||
Lockheed Martin | 14,459 | 2,721 | ||||||
Norfolk Southern | 13,100 | 1,205 | ||||||
Northrop Grumman | 104,584 | 16,648 | ||||||
NOW * | — | — | ||||||
Owens Corning | 3,285 | 139 | ||||||
Raytheon | 28,720 | 2,966 | ||||||
Rockwell Collins | 40,460 | 3,851 | ||||||
RR Donnelley & Sons | 70,900 | 1,360 | ||||||
Southwest Airlines | 250,333 | 9,275 | ||||||
Spirit AeroSystems Holdings, Cl A * | 100,970 | 5,512 | ||||||
Stericycle * | 102,175 | 14,028 | ||||||
Timken | 19,938 | 780 | ||||||
Trinity Industries | 68,762 | 2,062 | ||||||
Union Pacific | 48,450 | 4,889 | ||||||
United Continental Holdings * | 83,140 | 4,539 | ||||||
Valmont Industries | — | — | ||||||
Vectrus * | 900 | 23 | ||||||
|
| |||||||
| 171,570 | ||||||||
|
| |||||||
Information Technology — 22.7% | ||||||||
Adobe Systems * | 224,245 | 17,735 | ||||||
Akamai Technologies * | 7,400 | 564 | ||||||
Alliance Data Systems * | 18,875 | 5,625 | ||||||
Amdocs | 88,780 | 4,870 | ||||||
Amphenol, Cl A | 216,954 | 12,377 | ||||||
Ansys * | 80,578 | 7,171 | ||||||
AOL * | 10,100 | 505 | ||||||
Apple | 240,123 | 31,283 | ||||||
Applied Materials | 520,070 | 10,469 | ||||||
Arrow Electronics * | 32,120 | 1,953 | ||||||
Autodesk * | 103,200 | 5,588 | ||||||
Avnet | 11,600 | 510 | ||||||
Baidu ADR * | 44,500 | 8,784 | ||||||
Booz Allen Hamilton Holding, Cl A | 49,100 | 1,245 | ||||||
Broadcom, Cl A | 75,802 | 4,309 | ||||||
Broadridge Financial Solutions | 7,900 | 428 | ||||||
Brocade Communications Systems | 398,957 | 4,933 | ||||||
CA | 50,200 | 1,529 | ||||||
CDW | 26,700 | 991 | ||||||
Cisco Systems | 489,587 | 14,350 | ||||||
Cognizant Technology Solutions, Cl A * | 313,603 | 20,296 | ||||||
Computer Sciences | 4,200 | 288 | ||||||
CoreLogic * | 19,900 | 776 | ||||||
Corning | 203,800 | 4,263 | ||||||
DST Systems | 2,000 | 237 | ||||||
eBay * | 301,625 | 18,508 | ||||||
Electronic Arts * | 190,300 | 11,942 | ||||||
Equinix ‡ | 64,177 | 17,204 | ||||||
Facebook, Cl A * | 164,989 | 13,065 | ||||||
FactSet Research Systems | 17,380 | 2,871 | ||||||
| Description | Shares | Market Value ($ Thousands) | ||||||
Fidelity National Information Services | 17,000 | $ | 1,066 | |||||
Flextronics International * | 311,670 | 3,787 | ||||||
Genpact * | 361,348 | 8,127 | ||||||
Google, Cl A * | 35,597 | 19,412 | ||||||
Google, Cl C * | 29,945 | 15,934 | ||||||
Harris | 25,609 | 2,029 | ||||||
Hewlett-Packard | 313,296 | 10,464 | ||||||
Ingram Micro, Cl A * | 95,082 | 2,549 | ||||||
Intel | 514,420 | 17,727 | ||||||
Intuit | 75,205 | 7,833 | ||||||
Jabil Circuit | 153,450 | 3,770 | ||||||
Keysight Technologies * | 18,100 | 595 | ||||||
Lexmark International, Cl A | 73,330 | 3,372 | ||||||
MasterCard, Cl A | 298,120 | 27,504 | ||||||
Microchip Technology | — | — | ||||||
Micron Technology * | 13,600 | 380 | ||||||
Microsoft | 786,045 | 36,834 | ||||||
National Instruments | 187,276 | 5,601 | ||||||
NetSuite *(A) | 55,523 | 5,187 | ||||||
NXP Semiconductor * | 140,061 | 15,722 | ||||||
Oracle | 39,000 | 1,696 | ||||||
Qualcomm | 323,360 | 22,532 | ||||||
Rovi * | — | — | ||||||
Salesforce.com * | 178,306 | 12,972 | ||||||
Seagate Technology | 41,100 | 2,287 | ||||||
Skyworks Solutions | 58,737 | 6,424 | ||||||
Stratasys * | — | — | ||||||
SunEdison * | — | — | ||||||
Symantec | 143,140 | 3,525 | ||||||
Take-Two Interactive Software * | 19,860 | 543 | ||||||
TE Connectivity | 21,400 | 1,477 | ||||||
Tech Data * | 25,100 | 1,584 | ||||||
Texas Instruments | 172,820 | 9,664 | ||||||
VeriSign *(A) | 70,070 | 4,428 | ||||||
Visa, Cl A | 527,434 | 36,224 | ||||||
Vishay Intertechnology | 59,500 | 775 | ||||||
Western Digital | 121,654 | 11,844 | ||||||
Western Union | — | — | ||||||
Xerox | 237,800 | 2,716 | ||||||
Yahoo! * | 38,500 | 1,653 | ||||||
Yelp, Cl A *(A) | 71,125 | 3,408 | ||||||
Zillow Group, Cl A * | — | — | ||||||
|
| |||||||
| 536,314 | ||||||||
|
| |||||||
Materials — 2.8% | ||||||||
Air Products & Chemicals | 59,250 | 8,696 | ||||||
Alcoa | 124,230 | 1,553 | ||||||
Celanese, Cl A | 25,100 | 1,728 | ||||||
CF Industries Holdings | 25,425 | 8,031 | ||||||
Domtar | 28,600 | 1,236 | ||||||
Eastman Chemical | 20,300 | 1,559 | ||||||
Ecolab | 105,257 | 12,068 | ||||||
Freeport-McMoRan, Cl B | 43,500 | 855 | ||||||
Huntsman | 68,200 | 1,530 | ||||||
International Paper | 63,920 | 3,313 | ||||||
LyondellBasell Industries, Cl A | 87,351 | 8,831 | ||||||
Mosaic | 47,110 | 2,160 | ||||||
NewMarket | — | — | ||||||
Owens-Illinois * | 45,900 | 1,097 | ||||||
PPG Industries | 36,036 | 8,248 | ||||||
Rock-Tenn, Cl A | 25,100 | 1,635 | ||||||
Steel Dynamics | 55,200 | 1,204 | ||||||
United States Steel (A) | 83,351 | 2,034 | ||||||
Westlake Chemical | 4,500 | 317 | ||||||
|
| |||||||
| 66,095 | ||||||||
|
| |||||||
| 3 | SEI Institutional Investments Trust / Annual Report / May 31, 2015 |
SCHEDULE OF INVESTMENTS
Large Cap Fund
May 31, 2015
| Description | Shares/Face Amount ($ Thousands) | Market Value ($ Thousands) | ||||||
Telecommunication Services — 1.1% |
| |||||||
AT&T | 335,580 | $ | 11,591 | |||||
CenturyLink | 88,000 | 2,925 | ||||||
Level 3 Communications * | 120,300 | 6,674 | ||||||
Sprint * | — | — | ||||||
Verizon Communications | 107,610 | 5,320 | ||||||
Windstream Holdings | — | — | ||||||
|
| |||||||
| 26,510 | ||||||||
|
| |||||||
Utilities — 2.7% | ||||||||
AES | 292,440 | 3,977 | ||||||
Ameren | 41,800 | 1,681 | ||||||
American Electric Power | 225,830 | 12,712 | ||||||
Calpine * | 68,520 | 1,377 | ||||||
DTE Energy | 34,582 | 2,740 | ||||||
Duke Energy | 8,100 | 614 | ||||||
Edison International | 134,781 | 8,196 | ||||||
Entergy | 148,219 | 11,334 | ||||||
Exelon | 64,000 | 2,165 | ||||||
FirstEnergy | 40,200 | 1,434 | ||||||
PG&E | 53,020 | 2,835 | ||||||
Pinnacle West Capital | 16,800 | 1,024 | ||||||
Public Service Enterprise Group | 297,460 | 12,681 | ||||||
SCANA | 25,700 | 1,366 | ||||||
Vectren | 16,508 | 703 | ||||||
|
| |||||||
| 64,839 | ||||||||
|
| |||||||
Total Common Stock | 2,275,421 | |||||||
|
| |||||||
AFFILIATED PARTNERSHIP — 1.5% |
| |||||||
SEI Liquidity Fund, L.P. | ||||||||
0.060% ** †(B) | 36,554,719 | 36,555 | ||||||
|
| |||||||
Total Affiliated Partnership | 36,555 | |||||||
|
| |||||||
CASH EQUIVALENTS — 5.2% |
| |||||||
Investors Cash Trust - Treasury | ||||||||
0.010% ** | 5,088,441 | 5,089 | ||||||
SEI Daily Income Trust, Prime | ||||||||
0.010% ** † | 118,861,228 | 118,861 | ||||||
| �� |
|
| ||||||
Total Cash Equivalents | 123,950 | |||||||
|
| |||||||
U.S. TREASURY OBLIGATIONS — 0.1% |
| |||||||
U.S. Treasury Bills | ||||||||
0.109%, 02/04/2016 (C) (D) | $ | 788 | 787 | |||||
0.010%, 08/20/2015 (C) (D) | 800 | 800 | ||||||
|
| |||||||
Total U.S. Treasury Obligations | 1,587 | |||||||
|
| |||||||
Total Investments — 103.0% | $ | 2,437,513 | ||||||
|
| |||||||
Percentages are based on a Net Assets of $2,366,204 ($ Thousands).
| * | Non-income producing security. |
| ** | The rate reported is the 7-day effective yield as of May 31, 2015. |
| ‡ | Real Estate Investment Trust. |
| † | Investment in Affiliated Security (see Note 6). |
| (A) | This security or a partial position of this security is on loan at May 31, 2015 (see Note 12). The total market value of securities on loan at May 31, 2015 was $35,431 ($ Thousands). |
| (B) | This security was purchased with cash collateral held from securities on loan (See Note 12). The total value of such securities as of May 31, 2015 was $36,555 ($ Thousands). |
| (C) | The rate reported is the effective yield at time of purchase. |
| (D) | Security, or portion thereof, has been pledged as collateral on open futures contracts. |
ADR — American Depositary Receipt
Cl — Class
L.P. — Limited Partnership
The following is a list of the level of inputs used as of May 31, 2015, in valuing the Fund’s investments carried at value ($ Thousands):
| Investments in Securities | Level 1 | Level 2 | Level 3 | Total | ||||||||||||
Common Stock | $ | 2,275,421 | $ | — | $ | — | $ | 2,275,421 | ||||||||
Affiliated Partnership | — | 36,555 | — | 36,555 | ||||||||||||
Cash Equivalents | 123,950 | — | — | 123,950 | ||||||||||||
U.S. Treasury Obligations | — | 1,587 | — | 1,587 | ||||||||||||
|
|
|
|
|
|
|
| |||||||||
Total Investments in Securities | $ | 2,399,371 | $ | 38,142 | $ | — | $ | 2,437,513 | ||||||||
|
|
|
|
|
|
|
| |||||||||
For the year ended May 31, 2015, there were no transfers between Level 1 and Level 2 assets and liabilities.
For the year ended May 31, 2015, there were no transfers between Level 2 and Level 3 assets and liabilities.
For more information on valuation inputs, see Note 2 — Significant Accounting Policies in Notes to Financial Statements.
Amounts designated as “—” are $0 or have been rounded to $0.
The accompanying notes are an integral part of the financial statements.
| 4 | SEI Institutional Investments Trust / Annual Report / May 31, 2015 |
SCHEDULE OF INVESTMENTS
Large Cap Diversified Alpha Fund
May 31, 2015
| Description | Shares | Market Value ($ Thousands) | ||||||
COMMON STOCK — 94.9% |
| |||||||
Consumer Discretionary — 14.2% | ||||||||
Advance Auto Parts | 483 | $ | 74 | |||||
AutoZone * | 291 | 196 | ||||||
Best Buy | 849 | 30 | ||||||
Deckers Outdoor * | 1,543 | 105 | ||||||
Dick’s Sporting Goods | 2,104 | 113 | ||||||
DIRECTV * | 6,777 | 617 | ||||||
Discovery Communications, Cl C * | 16,680 | 525 | ||||||
Foot Locker | 3,565 | 225 | ||||||
Gap | 4,278 | 164 | ||||||
General Motors | 22,425 | 807 | ||||||
Goodyear Tire & Rubber | 1,379 | 44 | ||||||
Kohl’s | 2,520 | 165 | ||||||
L Brands | 3,367 | 291 | ||||||
Lear | 1,105 | 128 | ||||||
Liberty Interactive, Cl A * | 15,569 | 436 | ||||||
Macy’s | 2,014 | 135 | ||||||
Marriott International, Cl A | 4,113 | 321 | ||||||
Michael Kors Holdings * | 10,271 | 477 | ||||||
NIKE, Cl B | 6,941 | 706 | ||||||
Nordstrom | 4,265 | 310 | ||||||
NVR * | 102 | 139 | ||||||
Priceline Group * | 407 | 477 | ||||||
Sally Beauty Holdings * | 11,675 | 364 | ||||||
Toyota Motor ADR | 7,902 | 1,089 | ||||||
Tribune Media, Cl A | 7,593 | 402 | ||||||
TripAdvisor * | 4,657 | 355 | ||||||
Whirlpool | 1,055 | 194 | ||||||
Wynn Resorts | 1,201 | 121 | ||||||
|
| |||||||
| 9,010 | ||||||||
|
| |||||||
Consumer Staples — 4.2% | ||||||||
Altria Group | 5,645 | 289 | ||||||
Bunge | 4,478 | 414 | ||||||
Clorox | 1,983 | 214 | ||||||
Dr. Pepper Snapple Group | 3,747 | 287 | ||||||
Herbalife * | 745 | 39 | ||||||
Hershey | 1,116 | 104 | ||||||
Kimberly-Clark | 3,107 | 338 | ||||||
Kroger | 2,168 | 158 | ||||||
Lorillard | 1,986 | 144 | ||||||
Philip Morris International | 1,317 | 109 | ||||||
Walgreens Boots Alliance | 5,963 | 512 | ||||||
Whole Foods Market | 2,099 | 86 | ||||||
|
| |||||||
| 2,694 | ||||||||
|
| |||||||
Energy — 8.6% | ||||||||
Apache | 3,909 | 234 | ||||||
BP PLC ADR | 8,541 | 354 | ||||||
Cameron International * | 3,622 | 186 | ||||||
Canadian Natural Resources | 7,430 | 229 | ||||||
Cimarex Energy | 2,121 | 245 | ||||||
Continental Resources * | 1,473 | 67 | ||||||
Devon Energy | 4,940 | 322 | ||||||
Ensco, Cl A | 3,563 | 84 | ||||||
EOG Resources | 4,972 | 441 | ||||||
Exxon Mobil | 4,877 | 416 | ||||||
Halliburton | 8,374 | 380 | ||||||
Hess | 5,654 | 382 | ||||||
Kinder Morgan | 11,051 | 458 | ||||||
Marathon Petroleum | 3,165 | 327 | ||||||
Occidental Petroleum | 4,709 | 368 | ||||||
Oil States International * | 2,711 | 111 | ||||||
| Description | Shares | Market Value ($ Thousands) | ||||||
Schlumberger | 2,648 | $ | 240 | |||||
Tesoro | 341 | 30 | ||||||
Valero Energy | 3,655 | 217 | ||||||
Williams | 7,585 | 388 | ||||||
|
| |||||||
| 5,479 | ||||||||
|
| |||||||
Financials — 15.5% | ||||||||
Affiliated Managers Group * | 141 | 32 | ||||||
Aflac | 4,589 | 285 | ||||||
Allstate | 7,915 | 533 | ||||||
Ally Financial * | 10,004 | 227 | ||||||
American International Group | 3,430 | 201 | ||||||
Ameriprise Financial | 334 | 42 | ||||||
Assurant | 480 | 32 | ||||||
Bank of America | 15,225 | 251 | ||||||
Berkshire Hathaway, Cl B * | 1,866 | 267 | ||||||
Blackstone Group | 4,765 | 209 | ||||||
CBOE Holdings | 1,246 | 73 | ||||||
CBRE Group, Cl A * | 8,057 | 308 | ||||||
Citigroup | 22,116 | 1,196 | ||||||
Crown Castle International ‡ | 7,396 | 603 | ||||||
Franklin Resources | 6,210 | 316 | ||||||
Hartford Financial Services Group | 13,279 | 546 | ||||||
Hatteras Financial ‡ | 14,251 | 256 | ||||||
Intercontinental Exchange | 1,327 | 314 | ||||||
JPMorgan Chase | 14,961 | 984 | ||||||
KKR, Cl Miscellaneous | 19,784 | 454 | ||||||
MetLife | 12,349 | 645 | ||||||
PNC Financial Services Group | 5,000 | 478 | ||||||
Principal Financial Group | 930 | 48 | ||||||
Prudential Financial | 1,146 | 97 | ||||||
Santander Consumer USA Holdings * | 14,283 | 350 | ||||||
T. Rowe Price Group | 4,243 | 342 | ||||||
Travelers | 4,172 | 422 | ||||||
Voya Financial | 6,000 | 272 | ||||||
Wells Fargo | 930 | 52 | ||||||
|
| |||||||
| 9,835 | ||||||||
|
| |||||||
Health Care — 13.1% | ||||||||
AbbVie | 1,978 | 132 | ||||||
Actavis * | 2,043 | 627 | ||||||
AmerisourceBergen | 2,857 | 322 | ||||||
Biogen * | 1,849 | 734 | ||||||
Cardinal Health | 6,812 | 601 | ||||||
Celgene * | 9,013 | 1,031 | ||||||
DaVita HealthCare Partners * | 696 | 58 | ||||||
Endo International * | 384 | 32 | ||||||
Express Scripts Holding * | 2,654 | 231 | ||||||
Gilead Sciences | 5,925 | 665 | ||||||
Henry Schein * | 2,318 | 328 | ||||||
Horizon Pharma * | 3,404 | 110 | ||||||
Humana | 274 | 59 | ||||||
Jazz Pharmaceuticals * | 254 | 45 | ||||||
Johnson & Johnson | 1,608 | 161 | ||||||
Keryx Biopharmaceuticals * | 3,924 | 41 | ||||||
McKesson | 1,054 | 250 | ||||||
Merck | 7,943 | 484 | ||||||
Novo Nordisk ADR | 11,999 | 678 | ||||||
Omnicare | 1,868 | 178 | ||||||
Pfizer | 13,383 | 465 | ||||||
Quest Diagnostics | 3,342 | 252 | ||||||
United Therapeutics * | 701 | �� | 129 | |||||
Valeant Pharmaceuticals International * | 2,714 | 648 | ||||||
ZS Pharma * | 1,122 | 66 | ||||||
|
| |||||||
| 8,327 | ||||||||
|
| |||||||
| 1 | SEI Institutional Investments Trust / Annual Report / May 31, 2015 |
SCHEDULE OF INVESTMENTS
Large Cap Diversified Alpha Fund
May 31, 2015
| Description | Shares | Market Value ($ Thousands) | ||||||
Industrials — 8.8% | ||||||||
Alaska Air Group | 4,156 | $ | 269 | |||||
American Airlines Group | 10,485 | 444 | ||||||
Avis Budget Group * | 3,250 | 166 | ||||||
Boeing | 1,492 | 209 | ||||||
Caterpillar | 4,771 | 407 | ||||||
Chicago Bridge & Iron | 5,445 | 296 | ||||||
Cummins | 2,550 | 346 | ||||||
Delta Air Lines | 14,088 | 605 | ||||||
Eaton | 4,777 | 342 | ||||||
FedEx | 2,519 | 436 | ||||||
Hertz Global Holdings * | 9,676 | 192 | ||||||
Joy Global | 2,767 | 108 | ||||||
Lockheed Martin | 1,975 | 372 | ||||||
Masco | 3,729 | 101 | ||||||
Northrop Grumman | 635 | 101 | ||||||
Oshkosh Truck | 7,497 | 376 | ||||||
Rockwell Collins | 3,172 | 302 | ||||||
Southwest Airlines | 5,586 | 207 | ||||||
Terex | 5,303 | 131 | ||||||
United Continental Holdings * | 3,557 | 194 | ||||||
United Rentals * | 308 | 27 | ||||||
|
| |||||||
| 5,631 | ||||||||
|
| |||||||
Information Technology — 23.8% | ||||||||
Adobe Systems * | 2,542 | 201 | ||||||
Amdocs | 704 | 39 | ||||||
Apple | 7,993 | 1,041 | ||||||
Applied Materials | 12,330 | 248 | ||||||
Arrow Electronics * | 1,516 | 92 | ||||||
Baidu ADR * | 2,248 | 444 | ||||||
CA | 6,240 | 190 | ||||||
Check Point Software Technologies * | 1,955 | 166 | ||||||
Cisco Systems | 22,554 | 661 | ||||||
Citrix Systems * | 4,212 | 274 | ||||||
Computer Sciences | 1,342 | 92 | ||||||
Corning | 14,121 | 295 | ||||||
eBay * | 14,999 | 920 | ||||||
Electronic Arts * | 8,699 | 546 | ||||||
EMC | 8,985 | 237 | ||||||
Equinix ‡ | 3,465 | 929 | ||||||
FactSet Research Systems | 1,595 | 263 | ||||||
Flextronics International * | 21,872 | 266 | ||||||
Google, Cl A * | 865 | 472 | ||||||
Google, Cl C * | 1,223 | 651 | ||||||
Hewlett-Packard | 6,620 | 221 | ||||||
IAC | 1,068 | 80 | ||||||
Intel | 13,953 | 481 | ||||||
International Business Machines | 2,542 | 431 | ||||||
Intuit | 4,540 | 473 | ||||||
Jabil Circuit | 5,873 | 144 | ||||||
Lam Research | 4,002 | 329 | ||||||
Lexmark International, Cl A | 3,236 | 149 | ||||||
Linear Technology | 1,681 | 81 | ||||||
MasterCard, Cl A | 8,025 | 740 | ||||||
Micron Technology * | 18,842 | 526 | ||||||
Microsoft | 20,362 | 954 | ||||||
Qualcomm | 15,526 | 1,082 | ||||||
Symantec | 7,296 | 180 | ||||||
Take-Two Interactive Software * | 4,071 | 111 | ||||||
Texas Instruments | 897 | 50 | ||||||
| Description | Shares/Face Amount ($ Thousands) | Market Value ($ Thousands) | ||||||
VeriSign * | 1,617 | $ | 102 | |||||
Visa, Cl A | 8,728 | 600 | ||||||
Western Digital | 740 | 72 | ||||||
Western Union | 4,845 | 106 | ||||||
Xerox | 5,670 | 65 | ||||||
Yelp, Cl A * | 2,380 | 114 | ||||||
|
| |||||||
| 15,118 | ||||||||
|
| |||||||
Materials — 3.1% | ||||||||
Alcoa | 14,116 | 176 | ||||||
Ball | 3,719 | 264 | ||||||
CF Industries Holdings | 104 | 33 | ||||||
Dow Chemical | 4,678 | 244 | ||||||
Eastman Chemical | 3,221 | 247 | ||||||
Louisiana-Pacific * | 5,991 | 109 | ||||||
Mosaic | 5,744 | 263 | ||||||
Reliance Steel & Aluminum | 5,029 | 321 | ||||||
Rio Tinto ADR | 2,446 | 107 | ||||||
Sherwin-Williams | 669 | 193 | ||||||
|
| |||||||
| 1,957 | ||||||||
|
| |||||||
Telecommunication Services — 2.2% | ||||||||
CenturyLink | 6,434 | 214 | ||||||
China Mobile ADR | 2,865 | 188 | ||||||
Verizon Communications | 20,340 | 1,006 | ||||||
|
| |||||||
| 1,408 | ||||||||
|
| |||||||
Utilities — 1.4% | ||||||||
AES | 7,518 | 102 | ||||||
Edison International | 8,057 | 490 | ||||||
Entergy | 2,982 | 228 | ||||||
Public Service Enterprise Group | 1,348 | 58 | ||||||
|
| |||||||
| 878 | ||||||||
|
| |||||||
Total Common Stock | 60,337 | |||||||
|
| |||||||
CASH EQUIVALENT — 5.8% | ||||||||
SEI Daily Income Trust, Prime | ||||||||
0.010% ** † | 3,684,519 | 3,685 | ||||||
|
| |||||||
Total Cash Equivalent | 3,685 | |||||||
|
| |||||||
U.S. TREASURY OBLIGATION — 0.3% |
| |||||||
U.S. Treasury Bills | ||||||||
0.109%, 02/04/2016 (A) (B) | $ | 207 | 206 | |||||
|
| |||||||
Total U.S. Treasury Obligation | 206 | |||||||
|
| |||||||
Total Investments — 101.0% | $ | 64,228 | ||||||
|
| |||||||
A list of the open futures contracts held by the Fund at May 31, 2015, is as follows:
| Type of Contract | Number of Contracts Long | Expiration Date | Unrealized Appreciation ($ Thousands) | |||||||||
S&P 500 Index E-M INI | 10 | Jun-2015 | $ | 37 | ||||||||
|
| |||||||||||
For the year ended May 31, 2015, the total amount of open futures contracts as presented in the table above, are representative of the volume of activity for this derivative type during the year.
Percentages are based on a Net Assets of $63,607 ($ Thousands).
| * | Non-income producing security. |
| ** | The rate reported is the 7-day effective yield as of May 31, 2015. |
| † | Investment in Affiliated Security (see Note 6). |
| 2 | SEI Institutional Investments Trust / Annual Report / May 31, 2015 |
SCHEDULE OF INVESTMENTS
Large Cap Diversified Alpha Fund
May 31, 2015
| ‡ | Real Estate Investment Trust. |
| (A) | Security, or portion thereof, has been pledged as collateral on open futures contracts. |
| (B) | The rate reported is the effective yield at time of purchase. |
ADR — American Depositary Receipt
Cl — Class
L.P. — Limited Partnership
PLC — Public Limited Company
S&P — Standard and Poor’s
The following is a list of the level of inputs used as of May 31, 2015, in valuing the Fund’s investments and other financial investments carried at value ($ Thousands):
| Investments in Securities | Level 1 | Level 2 | Level 3 | Total | ||||||||||||
Common Stock | $ | 60,337 | $ | — | $ | — | $ | 60,337 | ||||||||
Cash Equivalent | 3,685 | — | — | 3,685 | ||||||||||||
U.S. Treasury Obligation | — | 206 | — | 206 | ||||||||||||
|
|
|
|
|
|
|
| |||||||||
Total Investments in Securities | $ | 64,022 | $ | 206 | $ | — | $ | 64,228 | ||||||||
|
|
|
|
|
|
|
| |||||||||
| Other Financial Instruments | Level 1 | Level 2 | Level 3 | Total | ||||||||||||
Futures Contracts * | ||||||||||||||||
Unrealized Appreciation | $ | 37 | $ | — | $ | — | $ | 37 | ||||||||
|
|
|
|
|
|
|
| |||||||||
| * | Futures contracts are valued at the unrealized appreciation on the instrument. |
For the year ended May 31, 2015, there were no transfers between Level 1 and Level 2 assets and liabilities.
For the year ended May 31, 2015, there were no transfers between Level 2 and Level 3 assets and liabilities.
For more information on valuation inputs, see Note 2 – Significant Accounting Policies in Notes to Financial Statements.
Amounts designated as “—” are either $0 or have been rounded to $0.
The accompanying notes are an integral part of the financial statements.
| 3 | SEI Institutional Investments Trust / Annual Report / May 31, 2015 |
SCHEDULE OF INVESTMENTS
Large Cap Disciplined Equity Fund
May 31, 2015
| Description | Shares | Market Value ($ Thousands) | ||||||
COMMON STOCK — 96.1% |
| |||||||
Consumer Discretionary — 10.6% |
| |||||||
Advance Auto Parts | 96,029 | $ | 14,714 | |||||
Amazon.com * | 24,540 | 10,533 | ||||||
AutoNation * | 87,500 | 5,461 | ||||||
AutoZone * | 40,438 | 27,240 | ||||||
Best Buy | 104,200 | 3,616 | ||||||
Bloomin’ Brands | 65,845 | 1,479 | ||||||
Cablevision Systems, Cl A (A) | 24,100 | 591 | ||||||
Carter’s | 28,945 | 2,988 | ||||||
Chico’s FAS | 83,310 | 1,384 | ||||||
Chipotle Mexican Grill, Cl A * | 2,700 | 1,662 | ||||||
Cinemark Holdings | 24,600 | 997 | ||||||
Coach | 4,800 | 170 | ||||||
Comcast, Cl A | 1,056,567 | 61,767 | ||||||
Cracker Barrel Old Country Store | 8,600 | 1,213 | ||||||
Darden Restaurants | 34,200 | 2,242 | ||||||
Delphi Automotive | 203,280 | 17,681 | ||||||
Dick’s Sporting Goods | 26,405 | 1,419 | ||||||
Dillard’s, Cl A | 80,258 | 9,311 | ||||||
DineEquity | 7,800 | 761 | ||||||
DIRECTV * | 64,611 | 5,882 | ||||||
Discovery Communications, Cl C * | 12,700 | 399 | ||||||
Dollar Tree * | 16,300 | 1,222 | ||||||
DR Horton | 38,900 | 1,016 | ||||||
Dunkin’ Brands Group (A) | 109,370 | 5,836 | ||||||
Express * | 20,600 | 363 | ||||||
Fox Factory Holding * | 91,380 | 1,490 | ||||||
Gannett | 139,285 | 4,985 | ||||||
Gap | 186,800 | 7,160 | ||||||
General Motors | 122,630 | 4,411 | ||||||
Gentherm * | 26,405 | 1,353 | ||||||
Genuine Parts | 62,631 | 5,666 | ||||||
H&R Block | 201,511 | 6,394 | ||||||
Hanesbrands | 35,100 | 1,118 | ||||||
Harley-Davidson | 46,445 | 2,484 | ||||||
Helen of Troy * | 14,000 | 1,225 | ||||||
Home Depot | 271,652 | 30,267 | ||||||
Houghton Mifflin Harcourt * | 97,089 | 2,561 | ||||||
Hyatt Hotels, Cl A * | 28,325 | 1,628 | ||||||
Interpublic Group | 52,000 | 1,062 | ||||||
J.C. Penney *(A) | 49,270 | 423 | ||||||
Johnson Controls | 49,100 | 2,554 | ||||||
Kohl’s | 152,565 | 9,992 | ||||||
L Brands | 49,800 | 4,309 | ||||||
Lear | 1,703 | 198 | ||||||
Leggett & Platt | 50,900 | 2,407 | ||||||
Lennar, Cl A | 12,300 | 573 | ||||||
LifeLock * | 51,710 | 787 | ||||||
Lowe’s | 85,300 | 5,969 | ||||||
Macy’s | 114,596 | 7,672 | ||||||
Madison Square Garden, Cl A * | 26,080 | 2,228 | ||||||
Marriott International, Cl A | 155,399 | 12,120 | ||||||
Marriott Vacations Worldwide | 13,200 | 1,165 | ||||||
McDonald’s | 96,666 | 9,273 | ||||||
MDC Partners, Cl A (A) | 62,395 | 1,323 | ||||||
Michael Kors Holdings * | 121,400 | 5,645 | ||||||
Modine Manufacturing * | 92,898 | 1,040 | ||||||
Mohawk Industries * | 1,600 | 299 | ||||||
Morningstar | 4,500 | 348 | ||||||
NetFlix * | 700 | 437 | ||||||
Newell Rubbermaid | 50,100 | 1,980 | ||||||
NIKE, Cl B | 77,292 | 7,858 | ||||||
| Description | Shares | Market Value ($ Thousands) | ||||||
Norwegian Cruise Line Holdings * | 83,655 | $ | 4,564 | |||||
O’Reilly Automotive * | 16,200 | 3,556 | ||||||
PulteGroup | 41,500 | 796 | ||||||
Ross Stores | 79,300 | 7,666 | ||||||
Royal Caribbean Cruises | 38,400 | 2,918 | ||||||
Scholastic | 25,300 | 1,125 | ||||||
ServiceMaster Global Holdings * | 207,685 | 6,976 | ||||||
Staples | 72,200 | 1,189 | ||||||
Steven Madden * | 28,320 | 1,070 | ||||||
Target | 102,100 | 8,099 | ||||||
Tenneco * | 19,055 | 1,119 | ||||||
Thor Industries | 23,500 | 1,436 | ||||||
Time Warner | 125,469 | 10,600 | ||||||
Time Warner Cable, Cl A | 14,800 | 2,677 | ||||||
Twenty-First Century Fox, Cl A | 641,255 | 21,546 | ||||||
Ulta Salon Cosmetics & Fragrance * | 14,300 | 2,182 | ||||||
Under Armour, Cl A * | 41,000 | 3,215 | ||||||
Urban Outfitters * | 23,800 | 818 | ||||||
VF | 26,900 | 1,895 | ||||||
Viacom, Cl B | 194,685 | 13,020 | ||||||
Walt Disney | 142,950 | 15,777 | ||||||
Whirlpool | 6,300 | 1,161 | ||||||
Wyndham Worldwide | 900 | 76 | ||||||
|
| |||||||
| 443,832 | ||||||||
|
| |||||||
Consumer Staples — 10.3% |
| |||||||
Altria Group | 684,375 | 35,040 | ||||||
Archer-Daniels-Midland | 341,687 | 18,058 | ||||||
Bunge | 13,700 | 1,268 | ||||||
Coca-Cola | 610,652 | 25,012 | ||||||
Colgate-Palmolive | 27,300 | 1,823 | ||||||
ConAgra Foods | 124,600 | 4,811 | ||||||
Constellation Brands, Cl A | 58,100 | 6,850 | ||||||
Costco Wholesale | 23,000 | 3,280 | ||||||
CVS Health | 289,446 | 29,633 | ||||||
Diageo | 170,990 | 4,737 | ||||||
Dr. Pepper Snapple Group | 73,200 | 5,610 | ||||||
Henkel | 234,293 | 23,978 | ||||||
Hormel Foods | 13,400 | 767 | ||||||
JM Smucker | 49,830 | 5,907 | ||||||
Kellogg | 158,660 | 9,959 | ||||||
Kimberly-Clark | 55,572 | 6,050 | ||||||
Kraft Foods Group | 22,190 | 1,874 | ||||||
Kroger | 330,073 | 24,029 | ||||||
Lorillard | 45,124 | 3,271 | ||||||
Molson Coors Brewing, Cl B | 92,563 | 6,792 | ||||||
Mondelez International, Cl A | 793,530 | 33,003 | ||||||
Monster Beverage * | 39,300 | 5,002 | ||||||
PepsiCo | 575,989 | 55,543 | ||||||
Philip Morris International | 388,821 | 32,299 | ||||||
Pilgrim’s Pride (A) | 194,645 | 4,979 | ||||||
Procter & Gamble | 452,941 | 35,506 | ||||||
Reynolds American | 62,497 | 4,797 | ||||||
SunOpta * | 129,125 | 1,309 | ||||||
Sysco | 116,565 | 4,332 | ||||||
Tyson Foods, Cl A | 28,500 | 1,210 | ||||||
Walgreens Boots Alliance | 29,200 | 2,506 | ||||||
Wal-Mart Stores | 441,645 | 32,801 | ||||||
Whole Foods Market | 5,700 | 235 | ||||||
|
| |||||||
| 432,271 | ||||||||
|
| |||||||
| 1 | SEI Institutional Investments Trust / Annual Report / May 31, 2015 |
SCHEDULE OF INVESTMENTS
Large Cap Disciplined Equity Fund
May 31, 2015
| Description | Shares | Market Value ($ Thousands) | ||||||
Energy — 6.5% |
| |||||||
Atwood Oceanics | 36,800 | $ | 1,132 | |||||
Baker Hughes | 16,368 | 1,055 | ||||||
Cabot Oil & Gas | 173,500 | 5,892 | ||||||
Cameron International * | 88,800 | 4,558 | ||||||
Chevron | 420,044 | 43,265 | ||||||
Cimarex Energy | 9,700 | 1,120 | ||||||
ConocoPhillips | 99,050 | 6,308 | ||||||
Ensco, Cl A | 55,800 | 1,311 | ||||||
EOG Resources | 98,816 | 8,764 | ||||||
EQT | 54,400 | 4,628 | ||||||
Exxon Mobil | 499,039 | 42,518 | ||||||
FMSA Holdings *(A) | 173,390 | 1,549 | ||||||
Halliburton | 166,675 | 7,567 | ||||||
Hess | 100,100 | 6,759 | ||||||
HollyFrontier | 135,785 | 5,655 | ||||||
Magellan Midstream Partners (A) | 58,080 | 4,630 | ||||||
Marathon Oil | 52,700 | 1,433 | ||||||
Marathon Petroleum | 190,287 | 19,687 | ||||||
Memorial Resource Development * | 89,220 | 1,687 | ||||||
Newfield Exploration * | 35,200 | 1,331 | ||||||
Noble (A) | 44,400 | 744 | ||||||
Noble Energy | 329,300 | 14,417 | ||||||
ONEOK | 16,300 | 683 | ||||||
PBF Energy, Cl A | 16,100 | 432 | ||||||
Phillips 66 | 260,611 | 20,620 | ||||||
Schlumberger | 211,050 | 19,157 | ||||||
Suncor Energy | 361,600 | 10,570 | ||||||
Tesco | 98,270 | 1,181 | ||||||
Tesoro | 127,157 | 11,253 | ||||||
Valero Energy | 309,546 | 18,338 | ||||||
Western Refining | 21,700 | 954 | ||||||
Williams | 18,300 | 935 | ||||||
World Fuel Services | 78,281 | 3,916 | ||||||
|
| |||||||
| 274,049 | ||||||||
|
| |||||||
Financials — 15.4% |
| |||||||
Aflac | 62,200 | 3,870 | ||||||
Allstate | 198,998 | 13,397 | ||||||
Ally Financial * | 69,189 | 1,568 | ||||||
American Equity Investment Life Holding | 8,900 | 226 | ||||||
American Express | 29,581 | 2,358 | ||||||
American Financial Group | 4,700 | 298 | ||||||
American International Group | 419,988 | 24,615 | ||||||
American Tower, Cl A ‡ | 13,400 | 1,243 | ||||||
Ameriprise Financial | 36,221 | 4,513 | ||||||
Annaly Capital Management ‡ | 302,300 | 3,156 | ||||||
Apartment Investment & Management, Cl A ‡ | 60,100 | 2,280 | ||||||
Arch Capital Group * | 23,460 | 1,499 | ||||||
Argo Group International Holdings | 25,255 | 1,330 | ||||||
Assured Guaranty | 30,000 | 858 | ||||||
AvalonBay Communities ‡ | 11,700 | 1,948 | ||||||
Bank of America | 998,073 | 16,468 | ||||||
Bank of New York Mellon | 327,830 | 14,215 | ||||||
Berkshire Hathaway, Cl B * | 424,804 | 60,747 | ||||||
BlackRock, Cl A | 2,500 | 914 | ||||||
Boston Properties ‡ | 8,500 | 1,105 | ||||||
Capital One Financial | 59,200 | 4,947 | ||||||
CBOE Holdings | 29,480 | 1,725 | ||||||
CBRE Group, Cl A * | 242,113 | 9,258 | ||||||
Chambers Street Properties ‡ | 77,500 | 590 | ||||||
Charles Schwab | 265,520 | 8,404 | ||||||
Chimera Investment ‡ | 16,561 | 239 | ||||||
Citigroup | 897,315 | 48,527 | ||||||
CME Group, Cl A | 233,850 | 22,029 | ||||||
| Description | Shares | Market Value ($ Thousands) | ||||||
Comerica | 80,295 | $ | 3,930 | |||||
Crown Castle International ‡ | 9,600 | 783 | ||||||
DCT Industrial Trust ‡ | 37,530 | 1,228 | ||||||
Digital Realty Trust ‡ | 87,150 | 5,755 | ||||||
Discover Financial Services | 403,927 | 23,537 | ||||||
E*TRADE Financial * | 22,200 | 654 | ||||||
East West Bancorp | 68,767 | 2,950 | ||||||
Endurance Specialty Holdings | 6,900 | 419 | ||||||
Equity Residential ‡ | 45,800 | 3,404 | ||||||
Essex Property Trust ‡ | 14,600 | 3,250 | ||||||
Extra Space Storage ‡ | 21,975 | 1,539 | ||||||
Franklin Resources | 63,200 | 3,217 | ||||||
Franklin Street Properties ‡ | 42,800 | 497 | ||||||
General Growth Properties ‡ | 67,200 | 1,904 | ||||||
Genworth Financial, Cl A * | 717,110 | 5,694 | ||||||
Geo Group ‡ | 51,500 | 1,953 | ||||||
Goldman Sachs Group | 54,900 | 11,320 | ||||||
Great Western Bancorp | 63,900 | 1,481 | ||||||
Hartford Financial Services Group | 279,000 | 11,470 | ||||||
Health Care ‡ | 26,400 | 1,855 | ||||||
Hospitality Properties Trust ‡ | 61,500 | 1,857 | ||||||
Host Hotels & Resorts, Cl REIT ‡ | 25,800 | 514 | ||||||
Iberiabank | 26,835 | 1,725 | ||||||
Intercontinental Exchange | 45,008 | 10,657 | ||||||
Iron Mountain ‡ | 30,100 | 1,098 | ||||||
Jones Lang LaSalle | 86,733 | 15,025 | ||||||
JPMorgan Chase | 724,401 | 47,651 | ||||||
KeyCorp | 255,600 | 3,727 | ||||||
Kilroy Realty ‡ | 24,195 | 1,671 | ||||||
Kimco Realty ‡ | 26,700 | 640 | ||||||
Lamar Advertising, Cl A ‡ | 172,656 | 10,466 | ||||||
LaSalle Hotel Properties ‡ | 43,850 | 1,599 | ||||||
Lazard, Cl A | 196,377 | 10,911 | ||||||
Legg Mason | 27,400 | 1,462 | ||||||
Lexington Realty Trust, Cl REIT ‡ | 133,000 | 1,221 | ||||||
Lincoln National | 30,259 | 1,725 | ||||||
M&T Bank (A) | 61,360 | 7,417 | ||||||
Macerich ‡ | 140,623 | 11,546 | ||||||
Marsh & McLennan | 244,530 | 14,239 | ||||||
McGraw Hill Financial | 186,950 | 19,396 | ||||||
MFA Mortgage Investments, Cl REIT ‡ | 159,943 | 1,270 | ||||||
Moody’s | 16,100 | 1,741 | ||||||
Morgan Stanley | 86,500 | 3,304 | ||||||
NASDAQ OMX Group | 30,300 | 1,568 | ||||||
Nationstar Mortgage Holdings *(A) | 10,000 | 197 | ||||||
Navient | 408,514 | 7,872 | ||||||
Nelnet, Cl A | 11,500 | 473 | ||||||
PacWest Bancorp | 45,615 | 2,048 | ||||||
Parkway Properties ‡ | 42,000 | 722 | ||||||
PNC Financial Services Group | 8,100 | 775 | ||||||
Popular * | 27,300 | 887 | ||||||
Principal Financial Group | 400 | 21 | ||||||
Prologis ‡ | 187,900 | 7,439 | ||||||
Realty Income, Cl REIT ‡ | 11,100 | 506 | ||||||
Regions Financial | 484,100 | 4,884 | ||||||
RLJ Lodging Trust ‡ | 22,800 | 689 | ||||||
Ryman Hospitality Properties ‡ | 5,200 | 287 | ||||||
Signature Bank NY * | 52,925 | 7,391 | ||||||
Simon Property Group ‡ | 35,990 | 6,529 | ||||||
SL Green Realty ‡ | 5,100 | 605 | ||||||
Springleaf Holdings, Cl A * | 169,505 | 8,055 | ||||||
State Street | 95,000 | 7,403 | ||||||
Sunstone Hotel Investors ‡ | 86,700 | 1,323 | ||||||
Torchmark | 33,000 | 1,883 | ||||||
| 2 | SEI Institutional Investments Trust / Annual Report / May 31, 2015 |
SCHEDULE OF INVESTMENTS
Large Cap Disciplined Equity Fund
May 31, 2015
| Description | Shares | Market Value ($ Thousands) | ||||||
Travelers | 27,300 | $ | 2,761 | |||||
United Bankshares (A) | 2,875 | 109 | ||||||
Unum Group | 31,700 | 1,108 | ||||||
US Bancorp | 155,966 | 6,724 | ||||||
Ventas ‡ | 2,700 | 180 | ||||||
Vornado Realty Trust ‡ | 13,600 | 1,358 | ||||||
Voya Financial | 553,303 | 25,070 | ||||||
Wells Fargo | 666,132 | 37,277 | ||||||
Wintrust Financial | 28,485 | 1,427 | ||||||
|
| |||||||
| 647,600 | ||||||||
|
| |||||||
Health Care — 15.3% |
| |||||||
Abbott Laboratories | 125,300 | 6,090 | ||||||
AbbVie | 226,637 | 15,092 | ||||||
Actavis * | 112,566 | 34,536 | ||||||
Aetna | 106,195 | 12,528 | ||||||
Alexion Pharmaceuticals * | 1,400 | 229 | ||||||
AMAG Pharmaceuticals * | 16,625 | 1,157 | ||||||
AmerisourceBergen | 117,551 | 13,231 | ||||||
Amgen | 153,329 | 23,959 | ||||||
Anthem | 50,100 | 8,409 | ||||||
Aratana Therapeutics * | 35,610 | 483 | ||||||
Baxter International | 32,740 | 2,181 | ||||||
Biogen * | 27,100 | 10,758 | ||||||
Boston Scientific * | 573,290 | 10,474 | ||||||
Bristol-Myers Squibb | 566,665 | 36,607 | ||||||
Brookdale Senior Living, Cl A * | 43,740 | 1,648 | ||||||
Bruker * | 76,760 | 1,523 | ||||||
C.R. Bard | 28,800 | 4,905 | ||||||
Cardinal Health | 169,106 | 14,910 | ||||||
Celgene * | 44,700 | 5,116 | ||||||
Cellectis ADR (A) | 31,085 | 1,334 | ||||||
Cerner * | 10,300 | 693 | ||||||
Cigna | 53,100 | 7,478 | ||||||
Dentsply International | 11,500 | 599 | ||||||
Edwards Lifesciences * | 54,700 | 7,150 | ||||||
Eli Lilly | 266,564 | 21,032 | ||||||
Endo International * | 9,800 | 821 | ||||||
Express Scripts Holding * | 297,670 | 25,939 | ||||||
Fluidigm * | 31,390 | 742 | ||||||
Gilead Sciences | 426,771 | 47,914 | ||||||
HCA Holdings * | 249,030 | 20,378 | ||||||
Henry Schein * | 2,300 | 326 | ||||||
Hospira * | 14,421 | 1,275 | ||||||
Humana | 15,500 | 3,327 | ||||||
Intuitive Surgical * | 600 | 293 | ||||||
Johnson & Johnson | 521,334 | 52,206 | ||||||
Mallinckrodt * | 38,100 | 4,932 | ||||||
McKesson | 68,882 | 16,341 | ||||||
Medtronic | 126,876 | 9,683 | ||||||
Merck | 620,155 | 37,761 | ||||||
Mylan * | 64,215 | 4,664 | ||||||
Patterson | 4,700 | 225 | ||||||
Perrigo | 4,956 | 943 | ||||||
Pfizer | 1,214,196 | 42,193 | ||||||
Phibro Animal Health, Cl A | 26,760 | 927 | ||||||
Press Ganey Holdings * | 9,265 | 254 | ||||||
Quest Diagnostics | 2,600 | 196 | ||||||
Quintiles Transnational Holdings * | 141,775 | 9,883 | ||||||
Regeneron Pharmaceuticals * | 15,300 | 7,842 | ||||||
Sirona Dental Systems * | 12,290 | 1,213 | ||||||
Stryker | 65,400 | 6,287 | ||||||
Thermo Fisher Scientific | 184,220 | 23,880 | ||||||
United Therapeutics * | 7,835 | 1,439 | ||||||
UnitedHealth Group | 352,150 | 42,332 | ||||||
| Description | �� | Shares | Market Value ($ Thousands) | |||||
Universal Health Services, Cl B | 10,400 | $ | 1,348 | |||||
Vertex Pharmaceuticals * | 48,945 | 6,279 | ||||||
Zoetis, Cl A | 547,941 | 27,271 | ||||||
|
| |||||||
| 641,236 | ||||||||
|
| |||||||
Industrials — 10.6% |
| |||||||
3M | 201,559 | 32,064 | ||||||
Actuant, Cl A | 47,795 | 1,123 | ||||||
Acuity Brands | 3,600 | 635 | ||||||
ADT (A) | 19,300 | 704 | ||||||
Advanced Drainage Systems | 27,860 | 809 | ||||||
Air Lease, Cl A | 41,780 | 1,572 | ||||||
Alaska Air Group | 74,940 | 4,844 | ||||||
Allegion | 2,333 | 146 | ||||||
Altra Industrial Motion | 34,300 | 943 | ||||||
American Airlines Group | 154,315 | 6,538 | ||||||
AO Smith | 21,900 | 1,563 | ||||||
Applied Industrial Technologies | 24,730 | 1,048 | ||||||
B/E Aerospace | 16,370 | 939 | ||||||
Babcock & Wilcox | 10,700 | 356 | ||||||
Boeing | 19,487 | 2,738 | ||||||
C.H. Robinson Worldwide | 26,500 | 1,636 | ||||||
Canadian National Railway | 218,940 | 12,996 | ||||||
Carlisle | 6,700 | 664 | ||||||
Cintas | 29,200 | 2,514 | ||||||
Continental Building Products * | 60,210 | 1,343 | ||||||
CSX | 177,610 | 6,053 | ||||||
Danaher | 36,000 | 3,108 | ||||||
Deere | 202,015 | 18,925 | ||||||
Delta Air Lines | 132,400 | 5,683 | ||||||
Dun & Bradstreet | 6,100 | 780 | ||||||
Eaton | 79,730 | 5,708 | ||||||
Echo Global Logistics * | 44,814 | 1,442 | ||||||
EMCOR Group | 22,485 | 1,020 | ||||||
Fastenal (A) | 104,910 | 4,355 | ||||||
FedEx | 85,445 | 14,801 | ||||||
General Dynamics | 111,932 | 15,689 | ||||||
General Electric | 1,324,993 | 36,133 | ||||||
Honeywell International | 226,998 | 23,653 | ||||||
Huntington Ingalls Industries | 10,000 | 1,240 | ||||||
Huron Consulting Group * | 20,265 | 1,303 | ||||||
Joy Global | 113,545 | 4,421 | ||||||
Kansas City Southern | 15,800 | 1,430 | ||||||
KLX * | 17,450 | 765 | ||||||
L-3 Communications Holdings, Cl 3 | 3,100 | 365 | ||||||
Lockheed Martin | 154,400 | 29,058 | ||||||
Masco | 406,905 | 11,015 | ||||||
Nielsen Holdings | 242,650 | 10,917 | ||||||
Norfolk Southern | 11,200 | 1,031 | ||||||
Northrop Grumman | 75,100 | 11,955 | ||||||
On Assignment * | 36,920 | 1,384 | ||||||
Paccar | 94,769 | 6,024 | ||||||
Parker Hannifin | 42,000 | 5,058 | ||||||
PGT * | 61,915 | 740 | ||||||
Quanta Services * | 53,240 | 1,561 | ||||||
Raytheon | 30,700 | 3,170 | ||||||
Republic Services, Cl A | 250,620 | 10,097 | ||||||
Robert Half International | 228,095 | 12,858 | ||||||
Rockwell Automation | 47,615 | 5,852 | ||||||
Ryder System | 12,200 | 1,118 | ||||||
Southwest Airlines | 705,214 | 26,128 | ||||||
TAL International Group (A) | 22,590 | 819 | ||||||
Toro | 19,615 | 1,341 | ||||||
TriMas * | 39,565 | 1,143 | ||||||
| 3 | SEI Institutional Investments Trust / Annual Report / May 31, 2015 |
SCHEDULE OF INVESTMENTS
Large Cap Disciplined Equity Fund
May 31, 2015
| Description | Shares | Market Value ($ Thousands) | ||||||
Tyco International | 543,795 | $ | 21,948 | |||||
Union Pacific | 245,545 | 24,778 | ||||||
United Parcel Service, Cl B | 122,500 | 12,154 | ||||||
United Rentals * | 19,400 | 1,725 | ||||||
United Technologies | 184,333 | 21,598 | ||||||
Woodward Governor | 26,690 | 1,360 | ||||||
|
| |||||||
| 446,881 | ||||||||
|
| |||||||
Information Technology — 19.5% |
| |||||||
Accenture, Cl A | 137,966 | 13,250 | ||||||
Alliance Data Systems * | 4,000 | 1,192 | ||||||
Amdocs | 364,350 | 19,985 | ||||||
Amphenol, Cl A | 41,800 | 2,385 | ||||||
Apple | 1,196,834 | 155,924 | ||||||
Applied Materials | 558,100 | 11,235 | ||||||
Automatic Data Processing | 208,878 | 17,861 | ||||||
Avago Technologies, Cl A | 100,500 | 14,881 | ||||||
Blackhawk Network Holdings, Cl A * | 53,860 | 1,853 | ||||||
Booz Allen Hamilton Holding, Cl A | 188,960 | 4,790 | ||||||
Broadcom, Cl A | 44,200 | 2,513 | ||||||
Broadridge Financial Solutions | 17,800 | 965 | ||||||
BroadSoft * | 44,600 | 1,628 | ||||||
CDW | 30,000 | 1,113 | ||||||
Cisco Systems | 1,501,752 | 44,016 | ||||||
Citrix Systems * | 85,350 | 5,549 | ||||||
Computer Sciences | 23,362 | 1,603 | ||||||
Corning | 72,200 | 1,510 | ||||||
DST Systems | 109,898 | 13,012 | ||||||
eBay * | 255,920 | 15,703 | ||||||
Electronic Arts * | 34,300 | 2,152 | ||||||
EMC | 722,705 | 19,036 | ||||||
EVERTEC | 51,200 | 1,138 | ||||||
F5 Networks * | 37,100 | 4,663 | ||||||
Facebook, Cl A * | 240,420 | 19,039 | ||||||
Fidelity National Information Services | 26,800 | 1,680 | ||||||
Fiserv * | 72,800 | 5,835 | ||||||
FLIR Systems | 58,735 | 1,794 | ||||||
Google, Cl A * | 61,675 | 33,632 | ||||||
Google, Cl C * | 95,479 | 50,805 | ||||||
Hewlett-Packard | 526,157 | 17,574 | ||||||
Integrated Device Technology * | 23,600 | 558 | ||||||
Intel | 1,238,298 | 42,672 | ||||||
International Business Machines | 109,611 | 18,595 | ||||||
Intuit | 10,300 | 1,073 | ||||||
j2 Global (A) | 24,825 | 1,649 | ||||||
Jabil Circuit | 40,900 | 1,005 | ||||||
Kla-Tencor | 28,200 | 1,682 | ||||||
Lam Research | 38,000 | 3,126 | ||||||
Littelfuse | 7,450 | 720 | ||||||
MA-Com Technology Solutions Holdings * | 22,270 | 850 | ||||||
MasterCard, Cl A | 241,115 | 22,245 | ||||||
Maxim Integrated Products | 20,000 | 701 | ||||||
MAXIMUS | 21,500 | 1,406 | ||||||
Micron Technology * | 501,079 | 13,995 | ||||||
Microsemi * | 23,570 | 858 | ||||||
Microsoft | 1,365,561 | 63,990 | ||||||
NXP Semiconductor * | 64,045 | 7,189 | ||||||
Oracle | 406,416 | 17,675 | ||||||
Qualcomm | 285,240 | 19,876 | ||||||
Red Hat * | 21,355 | 1,650 | ||||||
SanDisk | 25,900 | 1,771 | ||||||
Seagate Technology | 259,238 | 14,424 | ||||||
| Description | Shares | Market Value ($ Thousands) | ||||||
Skyworks Solutions | 102,400 | $ | 11,198 | |||||
SolarWinds * | 6,900 | 327 | ||||||
Symantec | 227,800 | 5,610 | ||||||
Synopsys * | 21,300 | 1,063 | ||||||
Texas Instruments | 125,700 | 7,029 | ||||||
Universal Display * | 20,085 | 1,079 | ||||||
Vantiv, Cl A * | 32,135 | 1,285 | ||||||
Visa, Cl A | 152,061 | 10,444 | ||||||
Western Digital | 143,960 | 14,016 | ||||||
Xerox | 2,736,062 | 31,246 | ||||||
Yahoo! * | 181,175 | 7,779 | ||||||
|
| |||||||
| 817,102 | ||||||||
|
| |||||||
Materials — 3.0% |
| |||||||
Alcoa | 524,900 | 6,561 | ||||||
Ball | 21,200 | 1,505 | ||||||
Bemis | 14,100 | 648 | ||||||
Calgon Carbon | 85,670 | 1,779 | ||||||
Celanese, Cl A | 8,700 | 599 | ||||||
Dow Chemical | 368,203 | 19,172 | ||||||
E.I. du Pont de Nemours | 49,591 | 3,521 | ||||||
Eastman Chemical | 89,000 | 6,833 | ||||||
Ecolab | 1,200 | 138 | ||||||
International Flavors & Fragrances | 3,000 | 357 | ||||||
International Paper | 146,100 | 7,572 | ||||||
KapStone Paper and Packaging | 35,730 | 963 | ||||||
LyondellBasell Industries, Cl A | 270,549 | 27,352 | ||||||
Martin Marietta Materials | 1,200 | 179 | ||||||
Monsanto | 92,810 | 10,857 | ||||||
Mosaic | 161,100 | 7,386 | ||||||
Packaging Corp of America | 20,500 | 1,418 | ||||||
Praxair | 8,900 | 1,093 | ||||||
Schweitzer-Mauduit International | 32,450 | 1,310 | ||||||
Sealed Air | 27,400 | 1,334 | ||||||
Sherwin-Williams | 16,600 | 4,784 | ||||||
Sigma-Aldrich | 3,608 | 503 | ||||||
Teck Resources, Cl B | 150,060 | 1,747 | ||||||
Tronox, Cl A | 70,520 | 1,189 | ||||||
Vulcan Materials | 188,880 | 16,986 | ||||||
Westlake Chemical | 13,000 | 917 | ||||||
|
| |||||||
| 126,703 | ||||||||
|
| |||||||
Telecommunication Services — 1.8% |
| |||||||
AT&T | 455,707 | 15,740 | ||||||
CenturyLink | 60,800 | 2,021 | ||||||
Frontier Communications | 138,000 | 711 | ||||||
Verizon Communications | 1,155,747 | 57,140 | ||||||
|
| |||||||
| 75,612 | ||||||||
|
| |||||||
Utilities — 3.1% |
| |||||||
AES | 173,400 | 2,358 | ||||||
AGL Resources | 95,500 | 4,810 | ||||||
Ameren | 18,100 | 728 | ||||||
American Electric Power | 98,471 | 5,543 | ||||||
AmeriGas Partners | 102,350 | 5,046 | ||||||
Calpine * | 30,700 | 617 | ||||||
CMS Energy | 98,800 | 3,373 | ||||||
Consolidated Edison | 3,700 | 229 | ||||||
Dominion Resources | 67,200 | 4,739 | ||||||
DTE Energy | 84,535 | 6,698 | ||||||
Duke Energy | 51,100 | 3,870 | ||||||
Dynegy, Cl A * | 47,525 | 1,537 | ||||||
Edison International | 51,500 | 3,132 | ||||||
Entergy | 147,600 | 11,287 | ||||||
Eversource Energy | 15,900 | 783 | ||||||
| 4 | SEI Institutional Investments Trust / Annual Report / May 31, 2015 |
SCHEDULE OF INVESTMENTS
Large Cap Disciplined Equity Fund
May 31, 2015
| Description | Shares/Face Amount ($ Thousands) | Market Value ($ Thousands) | ||||||
Exelon | 47,300 | $ | 1,600 | |||||
FirstEnergy | 8,300 | 296 | ||||||
Integrys Energy Group | 26,200 | 1,884 | ||||||
ITC Holdings | 129,540 | 4,571 | ||||||
New Jersey Resources | 53,850 | 1,619 | ||||||
NextEra Energy | 55,800 | 5,711 | ||||||
NiSource | 71,200 | 3,359 | ||||||
NRG Energy | 14,200 | 358 | ||||||
Pepco Holdings | 68,500 | 1,867 | ||||||
PG&E | 253,700 | 13,565 | ||||||
Pinnacle West Capital | 20,175 | 1,229 | ||||||
PPL | 215,200 | 7,470 | ||||||
Public Service Enterprise Group | 181,400 | 7,733 | ||||||
SCANA | 6,500 | 346 | ||||||
Sempra Energy | 38,700 | 4,159 | ||||||
Southern | 329,722 | 14,405 | ||||||
TECO Energy | 42,800 | 807 | ||||||
UGI | 49,700 | 1,859 | ||||||
Vectren | 10,200 | 434 | ||||||
Wisconsin Energy | 5,100 | 246 | ||||||
Xcel Energy | 17,800 | 606 | ||||||
|
| |||||||
| 128,874 | ||||||||
|
| |||||||
Total Common Stock |
| 4,034,160 | ||||||
|
| |||||||
| Number of Rights | ||||||||
|
| |||||||
RIGHTS — 0.0% | ||||||||
United States — 0.0% | ||||||||
Safeway – PDC # | 85,749 | 4 | ||||||
Safeway CVR—Casa Ley # | 85,749 | 87 | ||||||
|
| |||||||
Total Rights | 91 | |||||||
|
| |||||||
AFFILIATED PARTNERSHIP — 0.7% |
| |||||||
SEI Liquidity Fund, L.P. | ||||||||
0.060% ** †(B) | 29,683,177 | 29,683 | ||||||
|
| |||||||
Total Affiliated Partnership | 29,683 | |||||||
|
| |||||||
CASH EQUIVALENT — 4.1% | ||||||||
SEI Daily Income Trust, Prime Obligation Fund, Cl A | ||||||||
0.010% ** † | 172,334,872 | 172,335 | ||||||
|
| |||||||
Total Cash Equivalent (Cost $172,335) ($ Thousands) | 172,335 | |||||||
|
| |||||||
U.S. TREASURY OBLIGATIONS — 0.3% |
| |||||||
U.S. Treasury Bills | ||||||||
0.109%, 02/04/2016 (C) (D) | $ | 11,086 | 11,076 | |||||
0.329%, 09/17/2015 (C) (D) | 3,500 | 3,500 | ||||||
|
| |||||||
Total U.S. Treasury Obligations (Cost $14,577) ($ Thousands) | 14,576 | |||||||
|
| |||||||
Total Investments — 101.2% (Cost $3,579,148) ($ Thousands) | $ | 4,250,845 | ||||||
|
| |||||||
A list of the open futures contracts held by the Fund at May 31, 2015, is as follows:
| Type of Contract | Number of Contracts Long | Expiration Date | Unrealized ($ Thousands) | |||||||||
S&P 500 Index E-MINI | 770 | Jun-2015 | $ | 1,652 | ||||||||
S&P 500 Index E-MINI | 181 | Sep-2015 | 318 | |||||||||
|
| |||||||||||
| $ | 1,970 | |||||||||||
|
| |||||||||||
For the year ended May 31, 2015, the total amount of all open futures contracts, as presented in the table above, is representative of the volume of activity for this derivative type during the year.
Percentages are based on a Net Assets of $4,198,645 ($ Thousands).
| * | Non-income producing security. |
| ** | The rate reported is the 7-day effective yield as of May 31, 2015. |
| ‡ | Real Estate Investment Trust. |
| † | Investment in Affiliated Security (see Note 6). |
| # | Expiration date is unavailable. |
| (A) | This security or a partial position of this security is on loan at May 31, 2015 (see Note 12). The total market value of securities on loan at May 31, 2015 was $28,661 ($ Thousands). |
| (B) | This security was purchased with cash collateral held from securities on loan (See Note 12). The total value of such securities as of May 31, 2015 was $29,683 ($ Thousands). |
| (C) | Security, or portion thereof, has been pledged as collateral on open futures contracts. |
| (D) | The rate reported is the effective yield at time of purchase. |
Cl — Class
L.P. — Limited Partnership
S&P — Standard & Poor’s
The following is a list of the level of inputs used as of May 31, 2015, in valuing the Fund’s investments and other financial instruments carried at value ($ Thousands):
| Investments in Securities | Level 1 | Level 2 | Level 3 | Total | ||||||||||||
Common Stock | $ | 4,034,160 | $ | — | $ | — | $ | 4,034,160 | ||||||||
Rights | — | 91 | — | 91 | ||||||||||||
U.S. Treasury Obligations | — | 14,576 | — | 14,576 | ||||||||||||
Cash Equivalent | 172,335 | — | — | 172,335 | ||||||||||||
Affiliated Partnership | — | 29,683 | — | 29,683 | ||||||||||||
|
|
|
|
|
|
|
| |||||||||
Total Investments in Securities | $ | 4,206,495 | $ | 44,350 | $ | — | $ | 4,250,845 | ||||||||
|
|
|
|
|
|
|
| |||||||||
| Other Financial Instruments | Level 1 | Level 2 | Level 3 | Total | ||||||||||||
Futures Contracts* | ||||||||||||||||
Unrealized Appreciation | $ | 1,970 | $ | — | $ | — | $ | 1,970 | ||||||||
|
|
|
|
|
|
|
| |||||||||
| * | Futures contracts are valued at the unrealized appreciation on the instrument. |
For the year ended May 31, 2015, there were no transfers between Level 1 and Level 2 assets and liabilities.
For the year ended May 31, 2015, there were no transfers between Level 2 and Level 3 assets and liabilities.
For more information on valuation inputs, see Note 2 – Significant Accounting Policies in Notes to Financial Statements.
Amounts designated as ���—” are $0 or have been rounded to $0.
The accompanying notes are an integral part of the financial statements.
| 5 | SEI Institutional Investments Trust / Annual Report / May 31, 2015 |
SCHEDULE OF INVESTMENTS
Large Cap Index Fund
May 31, 2015
| Description | Shares | Market Value ($ Thousands) | ||||||
COMMON STOCK — 98.1% |
| |||||||
Consumer Discretionary — 12.6% |
| |||||||
Aaron’s | 5,400 | $ | 189 | |||||
Abercrombie & Fitch, Cl A | 6,702 | 137 | ||||||
Advance Auto Parts | 7,208 | 1,104 | ||||||
Amazon.com * | 33,989 | 14,589 | ||||||
AMC Networks, Cl A * | 5,485 | 431 | ||||||
Apollo Education Group, Cl A * | 8,864 | 147 | ||||||
Aramark | 4,500 | 141 | ||||||
Ascena Retail Group * | 11,700 | 173 | ||||||
AutoNation * | 5,632 | 352 | ||||||
AutoZone * | 2,807 | 1,891 | ||||||
Bed Bath & Beyond * | 16,515 | 1,178 | ||||||
Best Buy | 24,947 | 866 | ||||||
Big Lots | 5,200 | 228 | ||||||
BorgWarner | 20,464 | 1,231 | ||||||
Brinker International | 5,283 | 292 | ||||||
Cabela’s *(A) | 4,800 | 245 | ||||||
Cablevision Systems, Cl A (A) | 17,542 | 430 | ||||||
Carmax * | 17,460 | 1,240 | ||||||
Carnival, Cl A | 36,300 | 1,682 | ||||||
Carter’s | 4,300 | 444 | ||||||
CBS, Cl B | 44,299 | 2,734 | ||||||
Charter Communications, Cl A *(A) | 7,500 | 1,343 | ||||||
Chico’s FAS | 13,700 | 228 | ||||||
Chipotle Mexican Grill, Cl A * | 2,919 | 1,797 | ||||||
Choice Hotels International | 2,584 | 146 | ||||||
Cinemark Holdings | 11,000 | 446 | ||||||
Clear Channel Outdoor Holdings, Cl A | 700 | 8 | ||||||
Coach | 23,367 | 826 | ||||||
Comcast, Cl A | 234,625 | 13,716 | ||||||
CST Brands | 7,148 | 284 | ||||||
Darden Restaurants | 11,222 | 735 | ||||||
Deckers Outdoor * | 3,200 | 218 | ||||||
DeVry Education Group | 5,700 | 182 | ||||||
Dick’s Sporting Goods | 8,758 | 470 | ||||||
Dillard’s, Cl A | 1,900 | 221 | ||||||
DIRECTV * | 43,139 | 3,927 | ||||||
Discovery Communications, Cl C * | 19,400 | 610 | ||||||
Discovery Communications, Cl A * | 19,400 | 658 | ||||||
DISH Network, Cl A * | 18,362 | 1,300 | ||||||
Dollar General | 29,400 | 2,134 | ||||||
Dollar Tree * | 17,858 | 1,339 | ||||||
Domino’s Pizza | 5,000 | 543 | ||||||
DR Horton | 28,568 | 746 | ||||||
DreamWorks Animation SKG, Cl A *(A) | 6,434 | 173 | ||||||
DSW, Cl A | 7,200 | 250 | ||||||
Dunkin’ Brands Group | 9,800 | 523 | ||||||
Expedia | 8,567 | 919 | ||||||
Family Dollar Stores | 8,762 | 679 | ||||||
Foot Locker | 12,369 | 782 | ||||||
Ford Motor | 356,284 | 5,405 | ||||||
Fossil Group * | 4,000 | 284 | ||||||
GameStop, Cl A (A) | 10,100 | 438 | ||||||
Gannett | 20,059 | 718 | ||||||
Gap | 21,721 | 833 | ||||||
Garmin | 11,200 | 509 | ||||||
General Motors | 147,300 | 5,298 | ||||||
Gentex | 26,264 | 451 | ||||||
Genuine Parts | 13,371 | 1,210 | ||||||
| Description | Shares | Market Value ($ Thousands) | ||||||
GNC Holdings, Cl A | 8,000 | $ | 356 | |||||
Goodyear Tire & Rubber | 23,252 | 740 | ||||||
GoPro, Cl A * | 1,900 | 105 | ||||||
Graham Holdings, Cl B | 257 | 275 | ||||||
Groupon, Cl A *(A) | 44,900 | 287 | ||||||
H&R Block | 23,325 | 740 | ||||||
Hanesbrands | 34,572 | 1,101 | ||||||
Harley-Davidson | 20,603 | 1,102 | ||||||
Harman International Industries | 5,768 | 695 | ||||||
Hasbro (A) | 10,667 | 769 | ||||||
Hilton Worldwide Holdings * | 12,400 | 359 | ||||||
Home Depot | 116,315 | 12,960 | ||||||
Hyatt Hotels, Cl A * | 3,800 | 218 | ||||||
Interpublic Group | 37,575 | 767 | ||||||
J.C. Penney *(A) | 29,251 | 251 | ||||||
Jarden * | 17,175 | 911 | ||||||
John Wiley & Sons, Cl A | 4,042 | 235 | ||||||
Johnson Controls | 61,645 | 3,207 | ||||||
Kate Spade * | 11,900 | 295 | ||||||
Kohl’s | 18,119 | 1,187 | ||||||
L Brands | 22,957 | 1,986 | ||||||
Las Vegas Sands | 35,893 | 1,824 | ||||||
Lear | 6,900 | 801 | ||||||
Leggett & Platt | 11,219 | 530 | ||||||
Lennar, Cl A | 15,430 | 720 | ||||||
Liberty Broadband, Cl A * | 2,080 | 112 | ||||||
Liberty Broadband, Ser C, Cl C * | 5,408 | 289 | ||||||
Liberty Interactive, Cl A * | 41,947 | 1,173 | ||||||
Liberty Media * | 16,640 | 632 | ||||||
Liberty Media * | 8,320 | 319 | ||||||
Liberty Tripadvisor Holdings, Cl A * | 5,806 | 163 | ||||||
Liberty Ventures, Ser A * | 12,082 | 501 | ||||||
Lions Gate Entertainment | 7,400 | 245 | ||||||
Live Nation * | 13,600 | 389 | ||||||
LKQ * | 27,200 | 777 | ||||||
Lowe’s | 84,510 | 5,914 | ||||||
Macy’s | 30,330 | 2,031 | ||||||
Madison Square Garden, Cl A * | 5,360 | 458 | ||||||
Marriott International, Cl A | 19,087 | 1,489 | ||||||
Mattel | 28,942 | 747 | ||||||
McDonald’s | 89,880 | 8,622 | ||||||
MGM Resorts International * | 31,639 | 634 | ||||||
Michael Kors Holdings * | 17,500 | 814 | ||||||
Michaels * | 2,500 | 68 | ||||||
Mohawk Industries * | 5,266 | 983 | ||||||
Morningstar | 1,800 | 139 | ||||||
Murphy USA * | 4,188 | 244 | ||||||
NetFlix * | 5,300 | 3,308 | ||||||
Newell Rubbermaid | 23,665 | 936 | ||||||
News, Cl A * | 44,846 | 679 | ||||||
NIKE, Cl B | 63,734 | 6,480 | ||||||
Nordstrom | 11,812 | 858 | ||||||
Norwegian Cruise Line Holdings * | 8,200 | 447 | ||||||
NVR * | 324 | 441 | ||||||
Omnicom Group | 23,444 | 1,747 | ||||||
O’Reilly Automotive * | 9,240 | 2,028 | ||||||
Panera Bread, Cl A * | 2,262 | 412 | ||||||
Penske Auto Group | 4,000 | 206 | ||||||
Polaris Industries | 5,900 | 844 | ||||||
Priceline Group * | 4,600 | 5,391 | ||||||
PulteGroup | 31,745 | 609 | ||||||
PVH | 8,300 | 869 | ||||||
Ralph Lauren, Cl A | 5,080 | 662 | ||||||
| 1 | SEI Institutional Investments Trust / Annual Report / May 31, 2015 |
SCHEDULE OF INVESTMENTS
Large Cap Index Fund
May 31, 2015
| Description | Shares | Market Value ($ Thousands) | ||||||
Regal Entertainment Group, Cl A (A) | 7,388 | $ | 155 | |||||
Restaurant Brands International (A) | 18,703 | 723 | ||||||
Ross Stores | 20,253 | 1,958 | ||||||
Royal Caribbean Cruises | 14,800 | 1,125 | ||||||
Sally Beauty Holdings * | 14,200 | 443 | ||||||
Scripps Networks Interactive, Cl A | 9,172 | 615 | ||||||
Sears Holdings *(A) | 2,128 | 91 | ||||||
SeaWorld Entertainment | 6,400 | 138 | ||||||
Service International | 17,694 | 514 | ||||||
ServiceMaster Global Holdings * | 3,700 | 124 | ||||||
Signet Jewelers | 7,000 | 905 | ||||||
Sirius XM Holdings * | 232,500 | 897 | ||||||
Six Flags Entertainment | 6,500 | 318 | ||||||
Staples | 56,364 | 928 | ||||||
Starbucks | 137,412 | 7,140 | ||||||
Starwood Hotels & Resorts Worldwide | 15,584 | 1,290 | ||||||
Starz * | 8,820 | 370 | ||||||
Target | 56,785 | 4,504 | ||||||
Taylor Morrison Home, Cl A * | 3,900 | 75 | ||||||
Tempur Sealy International * | 5,600 | 334 | ||||||
Tesla Motors *(A) | 8,200 | 2,057 | ||||||
Thomson Reuters | 33,600 | 1,343 | ||||||
Thor Industries | 4,100 | 250 | ||||||
Tiffany | 9,825 | 921 | ||||||
Time Warner | 75,979 | 6,419 | ||||||
Time Warner Cable, Cl A | 25,684 | 4,646 | ||||||
TJX | 62,808 | 4,044 | ||||||
Toll Brothers * | 15,751 | 570 | ||||||
Tractor Supply | 12,300 | 1,072 | ||||||
TripAdvisor * | 9,467 | 722 | ||||||
Tupperware Brands | 4,800 | 316 | ||||||
Twenty-First Century Fox, Cl A | 155,985 | 5,241 | ||||||
Ulta Salon Cosmetics & Fragrance * | 5,452 | 832 | ||||||
Under Armour, Cl A * | 14,800 | 1,160 | ||||||
Urban Outfitters * | 10,120 | 348 | ||||||
VF | 32,268 | 2,273 | ||||||
Viacom, Cl B | 36,469 | 2,439 | ||||||
Vista Outdoor * | 5,672 | 262 | ||||||
Visteon * | 3,900 | 427 | ||||||
Walt Disney | 156,572 | 17,281 | ||||||
Wendy’s | 24,175 | 272 | ||||||
Whirlpool | 6,687 | 1,232 | ||||||
Williams-Sonoma | 7,962 | 626 | ||||||
Wyndham Worldwide | 10,868 | 923 | ||||||
Wynn Resorts | 6,896 | 694 | ||||||
Yum! Brands | 40,848 | 3,681 | ||||||
Zulily, Cl A *(A) | 1,700 | 23 | ||||||
|
| |||||||
| 247,875 | ||||||||
|
| |||||||
Consumer Staples — 8.6% |
| |||||||
Altria Group | 180,540 | 9,244 | ||||||
Archer-Daniels-Midland | 54,179 | 2,863 | ||||||
Avon Products (A) | 40,706 | 274 | ||||||
Brown-Forman, Cl B | 13,127 | 1,237 | ||||||
Bunge | 14,400 | 1,333 | ||||||
Campbell Soup | 14,778 | 714 | ||||||
Church & Dwight | 11,807 | 991 | ||||||
Clorox | 12,103 | 1,303 | ||||||
Coca-Cola | 359,340 | 14,719 | ||||||
Coca-Cola Enterprises | 21,415 | 947 | ||||||
Colgate-Palmolive | 83,650 | 5,587 | ||||||
| Description | Shares | Market Value ($ Thousands) | ||||||
ConAgra Foods | 36,186 | $ | 1,397 | |||||
Constellation Brands, Cl A | 14,931 | 1,760 | ||||||
Costco Wholesale | 40,181 | 5,729 | ||||||
Coty, Cl A | 6,400 | 160 | ||||||
CVS Health | 106,052 | 10,858 | ||||||
Dr. Pepper Snapple Group | 17,500 | 1,341 | ||||||
Energizer Holdings | 5,241 | 743 | ||||||
Estee Lauder, Cl A | 19,608 | 1,714 | ||||||
Flowers Foods | 16,525 | 371 | ||||||
General Mills | 56,992 | 3,200 | ||||||
Hain Celestial Group * | 8,400 | 531 | ||||||
Herbalife *(A) | 6,500 | 338 | ||||||
Hershey | 13,998 | 1,300 | ||||||
Hormel Foods | 12,278 | 703 | ||||||
Ingredion | 6,600 | 541 | ||||||
JM Smucker | 9,211 | 1,092 | ||||||
Kellogg | 22,103 | 1,387 | ||||||
Keurig Green Mountain | 12,100 | 1,043 | ||||||
Kimberly-Clark | 34,818 | 3,790 | ||||||
Kraft Foods Group | 54,602 | 4,611 | ||||||
Kroger | 47,073 | 3,427 | ||||||
Lorillard | 34,050 | 2,468 | ||||||
McCormick | 11,093 | 871 | ||||||
Mead Johnson Nutrition, Cl A | 19,286 | 1,877 | ||||||
Molson Coors Brewing, Cl B | 12,262 | 900 | ||||||
Mondelez International, Cl A | 155,106 | 6,451 | ||||||
Monster Beverage * | 12,500 | 1,591 | ||||||
Nu Skin Enterprises, Cl A (A) | 5,500 | 278 | ||||||
PepsiCo | 137,352 | 13,245 | ||||||
Philip Morris International | 142,668 | 11,851 | ||||||
Pilgrim’s Pride (A) | 5,700 | 146 | ||||||
Pinnacle Foods | 4,900 | 207 | ||||||
Procter & Gamble | 242,974 | 19,047 | ||||||
Reynolds American | 26,620 | 2,043 | ||||||
Rite Aid * | 84,200 | 734 | ||||||
Spectrum Brands Holdings | 1,900 | 184 | ||||||
Sprouts Farmers Market * | 9,200 | 276 | ||||||
Sysco | 51,048 | 1,897 | ||||||
Tyson Foods, Cl A | 25,765 | 1,094 | ||||||
Walgreens Boots Alliance | 86,925 | 7,462 | ||||||
Wal-Mart Stores | 144,379 | 10,723 | ||||||
WhiteWave Foods, Cl A * | 15,722 | 755 | ||||||
Whole Foods Market | 31,704 | 1,307 | ||||||
|
| |||||||
| 170,655 | ||||||||
|
| |||||||
Energy — 7.5% |
| |||||||
Anadarko Petroleum | 46,540 | 3,891 | ||||||
Antero Resources * | 5,000 | 200 | ||||||
Apache | 36,459 | 2,182 | ||||||
Atwood Oceanics | 5,800 | 178 | ||||||
Baker Hughes | 40,740 | 2,626 | ||||||
Cabot Oil & Gas | 37,200 | 1,263 | ||||||
California Resources | 28,181 | 221 | ||||||
Cameron International * | 18,344 | 942 | ||||||
Cheniere Energy * | 20,500 | 1,555 | ||||||
Chesapeake Energy (A) | 47,266 | 667 | ||||||
Chevron | 172,102 | 17,727 | ||||||
Cimarex Energy | 7,400 | 855 | ||||||
Cobalt International Energy * | 33,000 | 335 | ||||||
Concho Resources * | 11,600 | 1,395 | ||||||
ConocoPhillips | 111,876 | 7,124 | ||||||
CONSOL Energy | 19,644 | 547 | ||||||
Continental Resources *(A) | 8,000 | 364 | ||||||
CVR Energy (A) | 1,800 | 70 | ||||||
Denbury Resources (A) | 32,324 | 238 | ||||||
| 2 | SEI Institutional Investments Trust / Annual Report / May 31, 2015 |
SCHEDULE OF INVESTMENTS
Large Cap Index Fund
May 31, 2015
| Description | Shares | Market Value ($ Thousands) | ||||||
Devon Energy | 38,413 | $ | 2,505 | |||||
Diamond Offshore Drilling (A) | 6,209 | 188 | ||||||
Dresser-Rand Group * | 6,734 | 570 | ||||||
Dril-Quip * | 3,700 | 280 | ||||||
Energen | 6,637 | 459 | ||||||
EOG Resources | 48,990 | 4,345 | ||||||
EP Energy, Cl A *(A) | 4,000 | 53 | ||||||
EQT | 13,266 | 1,129 | ||||||
Exxon Mobil | 386,338 | 32,916 | ||||||
FMC Technologies * | 20,920 | 874 | ||||||
Frank’s International | 4,000 | 79 | ||||||
Golar LNG | 4,500 | 214 | ||||||
Gulfport Energy * | 7,200 | 311 | ||||||
Halliburton | 78,136 | 3,547 | ||||||
Helmerich & Payne | 8,650 | 631 | ||||||
Hess | 24,012 | 1,621 | ||||||
HollyFrontier | 16,726 | 697 | ||||||
Kinder Morgan | 124,422 | 5,162 | ||||||
Kosmos Energy * | 9,200 | 82 | ||||||
Laredo Petroleum Holdings *(A) | 7,000 | 95 | ||||||
Marathon Oil | 64,476 | 1,753 | ||||||
Marathon Petroleum | 21,688 | 2,244 | ||||||
Memorial Resource Development * | 4,600 | 87 | ||||||
Murphy Oil | 15,454 | 672 | ||||||
Nabors Industries | 26,800 | 395 | ||||||
National Oilwell Varco | 37,580 | 1,849 | ||||||
Newfield Exploration * | 12,799 | 484 | ||||||
Noble Energy | 36,824 | 1,612 | ||||||
Oasis Petroleum * | 8,600 | 146 | ||||||
Occidental Petroleum | 72,054 | 5,634 | ||||||
Oceaneering International | 9,700 | 493 | ||||||
Oil States International * | 4,300 | 176 | ||||||
ONEOK | 17,758 | 744 | ||||||
Patterson-UTI Energy | 13,232 | 267 | ||||||
PBF Energy, Cl A | 7,000 | 188 | ||||||
Peabody Energy (A) | 24,774 | 84 | ||||||
Phillips 66 | 52,088 | 4,121 | ||||||
Pioneer Natural Resources | 13,544 | 2,002 | ||||||
QEP Resources | 16,646 | 313 | ||||||
Range Resources | 14,239 | 789 | ||||||
Rice Energy * | 4,600 | 101 | ||||||
Rowan, Cl A | 10,886 | 234 | ||||||
RPC (A) | 5,550 | 80 | ||||||
SandRidge Energy *(A) | 45,400 | 55 | ||||||
Schlumberger | 118,063 | 10,717 | ||||||
Seadrill (A) | 30,700 | 366 | ||||||
Seventy Seven Energy * | 3,547 | 21 | ||||||
SM Energy | 5,500 | 288 | ||||||
Southwestern Energy * | 38,376 | 989 | ||||||
Spectra Energy | 63,409 | 2,230 | ||||||
Superior Energy Services | 14,700 | 339 | ||||||
Targa Resources | 5,400 | 497 | ||||||
Teekay | 3,800 | 174 | ||||||
Tesoro | 11,046 | 978 | ||||||
Tidewater (A) | 4,570 | 112 | ||||||
Ultra Petroleum * | 14,100 | 196 | ||||||
Unit * | 4,527 | 143 | ||||||
Valero Energy | 46,536 | 2,757 | ||||||
Whiting Petroleum * | 21,348 | 704 | ||||||
Williams | 69,046 | 3,528 | ||||||
World Fuel Services | 5,500 | 275 | ||||||
WPX Energy * | 18,748 | 242 | ||||||
|
| |||||||
| 147,217 | ||||||||
|
| |||||||
| Description | Shares | Market Value ($ Thousands) | ||||||
Financials — 16.7% |
| |||||||
ACE | 31,200 | $ | 3,322 | |||||
Affiliated Managers Group * | 4,820 | 1,078 | ||||||
Aflac | 42,656 | 2,654 | ||||||
Alexandria Real Estate Equities ‡ | 6,600 | 612 | ||||||
Alleghany * | 1,504 | 715 | ||||||
Allied World Assurance Holdings | 8,900 | 378 | ||||||
Allstate | 35,425 | 2,385 | ||||||
Ally Financial * | 23,900 | 542 | ||||||
American Campus Communities ‡ | 9,500 | 371 | ||||||
American Capital Agency ‡ | 31,659 | 660 | ||||||
American Express | 82,834 | 6,603 | ||||||
American Financial Group | 6,414 | 407 | ||||||
American Homes 4 Rent, Cl A ‡ | 13,200 | 220 | ||||||
American International Group | 125,423 | 7,351 | ||||||
American National Insurance | 222 | 23 | ||||||
American Realty Capital Properties ‡ | 81,400 | 722 | ||||||
American Tower, Cl A ‡ | 39,022 | 3,621 | ||||||
Ameriprise Financial | 16,600 | 2,068 | ||||||
Annaly Capital Management ‡ | 82,111 | 857 | ||||||
Aon | 25,144 | 2,545 | ||||||
Apartment Investment & Management, Cl A ‡ | 12,299 | 467 | ||||||
Arch Capital Group * | 12,000 | 767 | ||||||
Arthur J Gallagher | 17,204 | 834 | ||||||
Artisan Partners Asset Management, Cl A | 2,500 | 110 | ||||||
Aspen Insurance Holdings | 5,700 | 264 | ||||||
Associated Banc | 14,684 | 279 | ||||||
Assurant | 6,293 | 414 | ||||||
Assured Guaranty | 15,100 | 432 | ||||||
AvalonBay Communities ‡ | 11,341 | 1,888 | ||||||
Axis Capital Holdings | 8,800 | 484 | ||||||
Bank of America | 951,663 | 15,703 | ||||||
Bank of Hawaii | 4,082 | 256 | ||||||
Bank of New York Mellon | 102,409 | 4,440 | ||||||
BankUnited | 9,600 | 322 | ||||||
BB&T | 62,406 | 2,463 | ||||||
Berkshire Hathaway, Cl B * | 164,500 | 23,524 | ||||||
BioMed Realty Trust ‡ | 16,900 | 345 | ||||||
BlackRock, Cl A | 11,385 | 4,164 | ||||||
BOK Financial | 2,475 | 160 | ||||||
Boston Properties ‡ | 14,584 | 1,896 | ||||||
Brandywine Realty Trust ‡ | 15,500 | 218 | ||||||
Brixmor Property Group ‡ | 5,100 | 126 | ||||||
Brown & Brown | 11,124 | 360 | ||||||
Camden Property Trust ‡ | 7,547 | 566 | ||||||
Capital One Financial | 51,325 | 4,289 | ||||||
CBL & Associates Properties ‡ | 15,700 | 277 | ||||||
CBOE Holdings | 7,900 | 462 | ||||||
CBRE Group, Cl A * | 24,917 | 953 | ||||||
Charles Schwab | 104,285 | 3,301 | ||||||
Chimera Investment ‡ | 18,880 | 272 | ||||||
Chubb | 21,118 | 2,059 | ||||||
Cincinnati Financial | 14,486 | 733 | ||||||
CIT Group | 16,600 | 768 | ||||||
Citigroup | 275,004 | 14,872 | ||||||
Citizens Financial Group | 14,100 | 378 | ||||||
City National | 4,538 | 418 | ||||||
CME Group, Cl A | 29,670 | 2,795 | ||||||
CNA Financial | 1,700 | 66 | ||||||
Columbia Property Trust ‡ | 11,800 | 307 | ||||||
Comerica | 15,553 | 761 | ||||||
| 3 | SEI Institutional Investments Trust / Annual Report / May 31, 2015 |
SCHEDULE OF INVESTMENTS
Large Cap Index Fund
May 31, 2015
| Description | Shares | Market Value ($ Thousands) | ||||||
Commerce Bancshares | 7,442 | $ | 332 | |||||
Communications Sales & Leasing ‡ | 10,829 | 282 | ||||||
Corporate Office Properties Trust ‡ | 7,900 | 203 | ||||||
Corrections Corp of America ‡ | 10,240 | 360 | ||||||
Crown Castle International ‡ | 31,396 | 2,560 | ||||||
Cullen/Frost Bankers | 4,568 | 335 | ||||||
DDR ‡ | 24,700 | 418 | ||||||
Digital Realty Trust ‡ | 12,000 | 793 | ||||||
Discover Financial Services | 38,289 | 2,231 | ||||||
Douglas Emmett ‡ | 12,600 | 370 | ||||||
Duke Realty ‡ | 29,509 | 577 | ||||||
E*TRADE Financial * | 26,500 | 781 | ||||||
East West Bancorp | 12,300 | 528 | ||||||
Eaton Vance | 11,010 | 447 | ||||||
Endurance Specialty Holdings | 4,000 | 243 | ||||||
Equity Commonwealth *‡ | 11,525 | 297 | ||||||
Equity Lifestyle Properties ‡ | 7,700 | 422 | ||||||
Equity Residential ‡ | 33,687 | 2,504 | ||||||
Erie Indemnity, Cl A | 2,419 | 197 | ||||||
Essex Property Trust ‡ | 5,354 | 1,192 | ||||||
Everest Re Group | 4,200 | 762 | ||||||
Extra Space Storage ‡ | 10,100 | 707 | ||||||
Federal Realty Investment Trust, Cl REIT ‡ | 6,096 | 820 | ||||||
Federated Investors, Cl B (A) | 8,158 | 284 | ||||||
Fifth Third Bancorp | 73,282 | 1,483 | ||||||
First Horizon National | 21,756 | 321 | ||||||
First Niagara Financial Group | 34,200 | 305 | ||||||
First Republic Bank | 11,600 | 702 | ||||||
FNF Group | 24,852 | 943 | ||||||
FNFV Group * | 5,497 | 84 | ||||||
Forest City Enterprises, Cl A * | 14,742 | 340 | ||||||
Franklin Resources | 33,909 | 1,726 | ||||||
Fulton Financial | 17,395 | 220 | ||||||
Gaming and Leisure Properties ‡ | 7,591 | 278 | ||||||
General Growth Properties ‡ | 49,353 | 1,398 | ||||||
Genworth Financial, Cl A * | 44,092 | 350 | ||||||
Goldman Sachs Group | 40,675 | 8,387 | ||||||
Hanover Insurance Group | 3,793 | 270 | ||||||
Hartford Financial Services Group | 38,810 | 1,595 | ||||||
HCC Insurance Holdings | 9,041 | 517 | ||||||
HCP ‡ | 43,774 | 1,695 | ||||||
Health Care ‡ | 32,583 | 2,289 | ||||||
Healthcare Trust of America, Cl A ‡ | 11,200 | 278 | ||||||
Home Properties ‡ | 5,500 | 409 | ||||||
Hospitality Properties Trust ‡ | 13,466 | 407 | ||||||
Host Hotels & Resorts, Cl REIT ‡ | 64,940 | 1,294 | ||||||
Howard Hughes * | 3,673 | 541 | ||||||
Hudson City Bancorp | 48,328 | 460 | ||||||
Huntington Bancshares | 70,434 | 784 | ||||||
Interactive Brokers Group, Cl A | 5,600 | 200 | ||||||
Intercontinental Exchange | 10,780 | 2,553 | ||||||
Invesco | 37,300 | 1,486 | ||||||
Iron Mountain ‡ | 16,503 | 602 | ||||||
Jones Lang LaSalle | 4,000 | 693 | ||||||
JPMorgan Chase | 340,034 | 22,368 | ||||||
KeyCorp | 79,195 | 1,155 | ||||||
Kilroy Realty ‡ | 7,300 | 504 | ||||||
Kimco Realty ‡ | 35,644 | 854 | ||||||
Lamar Advertising, Cl A ‡ | 7,040 | 427 | ||||||
Lazard, Cl A | 11,000 | 611 | ||||||
Legg Mason (A) | 9,181 | 490 | ||||||
| Description | Shares | Market Value ($ Thousands) | ||||||
Leucadia National | 31,306 | $ | 771 | |||||
Liberty Property Trust ‡ | 12,806 | 447 | ||||||
Lincoln National | 24,788 | 1,413 | ||||||
Loews | 27,836 | 1,117 | ||||||
LPL Financial Holdings (A) | 7,900 | 337 | ||||||
M&T Bank (A) | 11,534 | 1,394 | ||||||
Macerich ‡ | 14,811 | 1,216 | ||||||
Markel * | 1,250 | 966 | ||||||
Marsh & McLennan | 51,065 | 2,974 | ||||||
MBIA * | 13,559 | 122 | ||||||
McGraw Hill Financial | 24,839 | 2,577 | ||||||
Mercury General | 2,396 | 133 | ||||||
MetLife | 83,909 | 4,385 | ||||||
MFA Mortgage Investments, Cl REIT ‡ | 33,700 | 268 | ||||||
Mid-America Apartment Communities ‡ | 6,600 | 504 | ||||||
Moody’s | 16,327 | 1,765 | ||||||
Morgan Stanley | 137,178 | 5,240 | ||||||
MSCI, Cl A | 10,300 | 639 | ||||||
NASDAQ OMX Group | 10,500 | 543 | ||||||
National Retail Properties, Cl REIT ‡ | 11,400 | 428 | ||||||
Nationstar Mortgage Holdings * | 2,500 | 49 | ||||||
Navient | 35,614 | 686 | ||||||
New York Community Bancorp (A) | 40,672 | 722 | ||||||
Northern Trust | 20,005 | 1,491 | ||||||
NorthStar Asset Management Group | 17,300 | 378 | ||||||
NorthStar Realty Finance ‡ | 27,100 | 492 | ||||||
Ocwen Financial *(A) | 9,200 | 93 | ||||||
Old Republic International | 23,390 | 362 | ||||||
Omega Healthcare Investors ‡ | 16,600 | 598 | ||||||
Outfront Media ‡ | 12,680 | 351 | ||||||
PacWest Bancorp | 9,600 | 431 | ||||||
Paramount Group ‡ | 13,200 | 242 | ||||||
PartnerRe | 4,500 | 591 | ||||||
People’s United Financial | 28,134 | 438 | ||||||
Piedmont Office Realty Trust, Cl A ‡ | 14,600 | 251 | ||||||
Plum Creek Timber ‡ | 15,921 | 657 | ||||||
PNC Financial Services Group | 49,022 | 4,691 | ||||||
Popular * | 9,053 | 294 | ||||||
Post Properties ‡ | 5,000 | 284 | ||||||
Principal Financial Group | 27,608 | 1,427 | ||||||
ProAssurance | 5,500 | 248 | ||||||
Progressive | 50,680 | 1,386 | ||||||
Prologis ‡ | 47,618 | 1,885 | ||||||
Prudential Financial | 42,563 | 3,601 | ||||||
Public Storage ‡ | 13,068 | 2,529 | ||||||
Raymond James Financial | 11,321 | 658 | ||||||
Rayonier ‡ | 11,704 | 302 | ||||||
Realogy Holdings * | 12,400 | 582 | ||||||
Realty Income, Cl REIT ‡ | 19,500 | 889 | ||||||
Regency Centers ‡ | 8,308 | 525 | ||||||
Regions Financial | 130,787 | 1,320 | ||||||
Reinsurance Group of America, Cl A | 6,099 | 571 | ||||||
RenaissanceRe Holdings | 5,100 | 521 | ||||||
Retail Properties of America, Cl A ‡ | 21,400 | 321 | ||||||
Santander Consumer USA Holdings * | 8,000 | 196 | ||||||
SEI (B) | 11,742 | 562 | ||||||
| 4 | SEI Institutional Investments Trust / Annual Report / May 31, 2015 |
SCHEDULE OF INVESTMENTS
Large Cap Index Fund
May 31, 2015
| Description | Shares | Market Value ($ Thousands) | ||||||
Senior Housing Properties Trust ‡ | 18,400 | $ | 368 | |||||
Signature Bank NY * | 4,300 | 601 | ||||||
Simon Property Group ‡ | 28,481 | 5,166 | ||||||
SL Green Realty ‡ | 8,268 | 981 | ||||||
SLM | 37,014 | 380 | ||||||
Spirit Realty Capital ‡ | 32,700 | 353 | ||||||
StanCorp Financial Group | 4,042 | 300 | ||||||
Starwood Property Trust ‡ | 19,500 | 466 | ||||||
State Street | 39,994 | 3,117 | ||||||
SunTrust Banks | 45,846 | 1,957 | ||||||
SVB Financial Group * | 4,200 | 567 | ||||||
Synchrony Financial *(A) | 11,700 | 378 | ||||||
Synovus Financial | 12,096 | 351 | ||||||
T. Rowe Price Group | 24,980 | 2,016 | ||||||
Tanger Factory Outlet Centers ‡ | 8,200 | 276 | ||||||
Taubman Centers ‡ | 5,800 | 429 | ||||||
TCF Financial | 15,001 | 236 | ||||||
TD Ameritrade Holding | 23,945 | 890 | ||||||
TFS Financial | 6,200 | 92 | ||||||
Torchmark | 12,087 | 690 | ||||||
Travelers | 29,775 | 3,011 | ||||||
Two Harbors Investment ‡ | 31,800 | 340 | ||||||
UDR, Cl REIT ‡ | 21,293 | 693 | ||||||
Unum Group | 21,905 | 766 | ||||||
Urban Edge Properties ‡ | 8,168 | 176 | ||||||
US Bancorp | 156,597 | 6,751 | ||||||
Validus Holdings | 7,926 | 340 | ||||||
Ventas ‡ | 28,892 | 1,922 | ||||||
Vornado Realty Trust ‡ | 16,336 | 1,632 | ||||||
Voya Financial | 11,500 | 521 | ||||||
Waddell & Reed Financial, Cl A | 6,900 | 330 | ||||||
Weingarten Realty Investors ‡ | 11,267 | 380 | ||||||
Wells Fargo | 429,266 | 24,022 | ||||||
Weyerhaeuser, Cl REIT ‡ | 45,373 | 1,477 | ||||||
White Mountains Insurance Group | 547 | 355 | ||||||
WP Carey ‡ | 8,800 | 560 | ||||||
WP GLIMCHER ‡ | 15,090 | 212 | ||||||
WR Berkley | 8,814 | 432 | ||||||
XL Group, Cl A | 24,700 | 931 | ||||||
Zions Bancorporation | 17,002 | 491 | ||||||
|
| |||||||
| 329,810 | ||||||||
|
| |||||||
Health Care — 14.4% | ||||||||
Abbott Laboratories | 137,076 | 6,662 | ||||||
AbbVie | 153,062 | 10,192 | ||||||
Actavis * | 32,954 | 10,111 | ||||||
Aetna | 33,035 | 3,897 | ||||||
Agilent Technologies | 28,464 | 1,172 | ||||||
Alere * | 7,400 | 382 | ||||||
Alexion Pharmaceuticals * | 18,300 | 2,998 | ||||||
Align Technology * | 7,700 | 467 | ||||||
Alkermes * | 12,800 | 782 | ||||||
Allscripts Healthcare Solutions * | 16,500 | 232 | ||||||
Alnylam Pharmaceuticals * | 5,900 | 774 | ||||||
AmerisourceBergen | 19,524 | 2,198 | ||||||
Amgen | 68,658 | 10,729 | ||||||
Anthem | 23,231 | 3,899 | ||||||
athenahealth *(A) | 3,200 | 373 | ||||||
Baxter International | 50,175 | 3,342 | ||||||
Becton Dickinson | 19,578 | 2,751 | ||||||
Biogen * | 21,500 | 8,535 | ||||||
BioMarin Pharmaceutical * | 14,900 | 1,871 | ||||||
Bio-Rad Laboratories, Cl A * | 1,900 | 274 | ||||||
Bio-Techne | 3,441 | 348 | ||||||
| Description | Shares | Market Value ($ Thousands) | ||||||
Boston Scientific * | 124,639 | $ | 2,277 | |||||
Bristol-Myers Squibb | 150,459 | 9,720 | ||||||
Brookdale Senior Living, Cl A * | 15,100 | 569 | ||||||
Bruker * | 9,400 | 187 | ||||||
C.R. Bard | 6,585 | 1,122 | ||||||
Cardinal Health | 31,629 | 2,789 | ||||||
Catamaran * | 18,348 | 1,098 | ||||||
Celgene * | 72,760 | 8,327 | ||||||
Centene * | 9,600 | 723 | ||||||
Cerner * | 28,396 | 1,911 | ||||||
Charles River Laboratories International * | 4,443 | 321 | ||||||
Cigna | 24,355 | 3,430 | ||||||
Community Health Systems * | 10,191 | 564 | ||||||
Cooper | 4,004 | 728 | ||||||
DaVita HealthCare Partners * | 15,216 | 1,275 | ||||||
Dentsply International | 11,998 | 624 | ||||||
Edwards Lifesciences * | 9,414 | 1,231 | ||||||
Eli Lilly | 89,761 | 7,082 | ||||||
Endo International * | 16,997 | 1,424 | ||||||
Envision Healthcare Holdings * | 7,700 | 284 | ||||||
Express Scripts Holding * | 67,236 | 5,859 | ||||||
Gilead Sciences | 139,034 | 15,609 | ||||||
Halyard Health * | 4,227 | 175 | ||||||
HCA Holdings * | 28,300 | 2,316 | ||||||
Health Net * | 7,602 | 473 | ||||||
Henry Schein * | 7,584 | 1,074 | ||||||
Hill-Rom Holdings | 5,224 | 269 | ||||||
Hologic * | 21,200 | 758 | ||||||
Hospira * | 14,481 | 1,280 | ||||||
Humana | 14,475 | 3,107 | ||||||
Idexx Laboratories * | 4,252 | 577 | ||||||
Illumina * | 13,005 | 2,680 | ||||||
IMS Health Holdings * | 6,800 | 202 | ||||||
Incyte * | 12,900 | 1,421 | ||||||
Intercept Pharmaceuticals *(A) | 1,200 | 306 | ||||||
Intuitive Surgical * | 3,400 | 1,659 | ||||||
Jazz Pharmaceuticals * | 5,300 | 950 | ||||||
Johnson & Johnson | 254,309 | 25,466 | ||||||
Laboratory Corp of America Holdings * | 8,590 | 1,013 | ||||||
LifePoint Hospitals * | 3,976 | 299 | ||||||
Mallinckrodt * | 9,812 | 1,270 | ||||||
McKesson | 20,366 | 4,831 | ||||||
Medivation * | 6,900 | 911 | ||||||
MEDNAX * | 8,500 | 605 | ||||||
Medtronic | 129,826 | 9,908 | ||||||
Merck | 264,443 | 16,102 | ||||||
Mettler Toledo International * | 2,636 | 856 | ||||||
Mylan * | 32,419 | 2,355 | ||||||
Myriad Genetics *(A) | 6,900 | 234 | ||||||
Omnicare | 8,331 | 794 | ||||||
Patterson | 7,683 | 368 | ||||||
PerkinElmer | 10,134 | 534 | ||||||
Perrigo | 13,200 | 2,512 | ||||||
Pfizer | 572,822 | 19,906 | ||||||
Premier, Cl A * | 3,500 | 134 | ||||||
QIAGEN *(A) | 21,400 | 526 | ||||||
Quest Diagnostics | 12,744 | 959 | ||||||
Quintiles Transnational Holdings * | 4,400 | 307 | ||||||
Regeneron Pharmaceuticals * | 7,300 | 3,742 | ||||||
ResMed | 11,935 | 702 | ||||||
Seattle Genetics *(A) | 9,100 | 392 | ||||||
Sirona Dental Systems * | 5,200 | 513 | ||||||
| 5 | SEI Institutional Investments Trust / Annual Report / May 31, 2015 |
SCHEDULE OF INVESTMENTS
Large Cap Index Fund
May 31, 2015
| Description | Shares | Market Value ($ Thousands) | ||||||
St. Jude Medical | 24,346 | $ | 1,796 | |||||
Stryker | 31,204 | 3,000 | ||||||
Teleflex (A) | 3,740 | 482 | ||||||
Tenet Healthcare * | 8,698 | 463 | ||||||
Thermo Fisher Scientific | 36,625 | 4,748 | ||||||
United Therapeutics * | 4,300 | 790 | ||||||
UnitedHealth Group | 88,920 | 10,689 | ||||||
Universal Health Services, Cl B | 7,576 | 982 | ||||||
Varian Medical Systems *(A) | 8,930 | 773 | ||||||
VCA Antech * | 8,139 | 427 | ||||||
Veeva Systems, Cl A *(A) | 4,000 | 109 | ||||||
Vertex Pharmaceuticals * | 22,000 | 2,822 | ||||||
Waters * | 7,272 | 972 | ||||||
Zimmer Holdings | 16,025 | 1,828 | ||||||
Zoetis, Cl A | 43,244 | 2,152 | ||||||
|
| |||||||
| 283,662 | ||||||||
|
| |||||||
Industrials — 10.6% | ||||||||
3M | 59,433 | 9,454 | ||||||
Acuity Brands | 3,800 | 671 | ||||||
ADT (A) | 15,400 | 562 | ||||||
AECOM Technology * | 13,116 | 433 | ||||||
AGCO (A) | 8,600 | 437 | ||||||
Air Lease, Cl A | 7,900 | 297 | ||||||
Alaska Air Group | 12,200 | 788 | ||||||
Allegion | 8,866 | 554 | ||||||
Allison Transmission Holdings, Cl A | 12,700 | 389 | ||||||
AMERCO | 700 | 230 | ||||||
American Airlines Group | 66,500 | 2,817 | ||||||
Ametek | 21,380 | 1,149 | ||||||
AO Smith | 6,800 | 485 | ||||||
Armstrong World Industries * | 4,100 | 225 | ||||||
Avis Budget Group * | 9,700 | 495 | ||||||
B/E Aerospace | 8,866 | 508 | ||||||
Babcock & Wilcox | 9,850 | 328 | ||||||
Boeing | 61,691 | 8,669 | ||||||
C.H. Robinson Worldwide | 12,686 | 783 | ||||||
Carlisle | 5,766 | 572 | ||||||
Caterpillar | 55,888 | 4,768 | ||||||
Chicago Bridge & Iron (A) | 9,095 | 494 | ||||||
Cintas | 8,957 | 771 | ||||||
Clean Harbors * | 5,800 | 327 | ||||||
Colfax * | 7,900 | 398 | ||||||
Con-way | 4,223 | 171 | ||||||
Copa Holdings, Cl A (A) | 3,000 | 256 | ||||||
Copart * | 10,318 | 357 | ||||||
Covanta Holding | 9,700 | 214 | ||||||
Crane | 4,700 | 284 | ||||||
CSX | 93,196 | 3,176 | ||||||
Cummins | 17,212 | 2,333 | ||||||
Danaher | 54,402 | 4,696 | ||||||
Deere | 30,919 | 2,896 | ||||||
Delta Air Lines | 78,300 | 3,361 | ||||||
Donaldson (A) | 13,144 | 469 | ||||||
Dover | 14,457 | 1,090 | ||||||
Dun & Bradstreet | 3,256 | 417 | ||||||
Eaton | 44,318 | 3,173 | ||||||
Emerson Electric | 64,820 | 3,909 | ||||||
Equifax | 10,956 | 1,099 | ||||||
Expeditors International of Washington | 16,848 | 772 | ||||||
Fastenal (A) | 29,124 | 1,209 | ||||||
FedEx | 26,444 | 4,581 | ||||||
Flowserve | 11,600 | 638 | ||||||
| Description | Shares | Market Value ($ Thousands) | ||||||
Fluor | 14,308 | $ | 804 | |||||
Fortune Brands Home & Security | 14,020 | 643 | ||||||
GATX | 4,200 | 234 | ||||||
General Dynamics | 27,472 | 3,851 | ||||||
General Electric | 901,423 | 24,582 | ||||||
Genesee & Wyoming, Cl A * | 4,600 | 379 | ||||||
Graco | 5,424 | 394 | ||||||
HD Supply Holdings * | 9,600 | 311 | ||||||
Hertz Global Holdings * | 40,100 | 798 | ||||||
Hexcel | 8,800 | 433 | ||||||
Honeywell International | 71,290 | 7,428 | ||||||
Hubbell, Cl B | 5,392 | 583 | ||||||
Huntington Ingalls Industries | 4,096 | 508 | ||||||
IDEX | 7,093 | 548 | ||||||
IHS, Cl A * | 6,200 | 765 | ||||||
Illinois Tool Works | 26,480 | 2,485 | ||||||
Ingersoll-Rand | 23,300 | 1,603 | ||||||
ITT | 7,951 | 339 | ||||||
Jacobs Engineering Group * | 12,302 | 532 | ||||||
JB Hunt Transport Services | 7,772 | 653 | ||||||
Joy Global | 8,933 | 348 | ||||||
Kansas City Southern | 9,500 | 860 | ||||||
KAR Auction Services | 11,600 | 432 | ||||||
KBR | 13,180 | 252 | ||||||
Kennametal | 7,000 | 252 | ||||||
Kirby * | 5,200 | 399 | ||||||
KLX * | 4,883 | 214 | ||||||
L-3 Communications Holdings, Cl 3 | 7,377 | 869 | ||||||
Landstar System | 4,165 | 272 | ||||||
Lennox International | 3,900 | 439 | ||||||
Lincoln Electric Holdings | 7,400 | 497 | ||||||
Lockheed Martin | 24,229 | 4,560 | ||||||
Manitowoc | 10,500 | 198 | ||||||
Manpowergroup | 7,184 | 608 | ||||||
Masco | 30,409 | 823 | ||||||
Middleby * | 5,200 | 565 | ||||||
MRC Global * | 8,800 | 135 | ||||||
MSC Industrial Direct, Cl A | 4,220 | 293 | ||||||
Navistar International * | 4,900 | 130 | ||||||
Nielsen Holdings | 24,100 | 1,084 | ||||||
Nordson | 5,800 | 469 | ||||||
Norfolk Southern | 28,733 | 2,643 | ||||||
Northrop Grumman | 18,278 | 2,910 | ||||||
NOW *(A) | 9,870 | 228 | ||||||
Old Dominion Freight Line * | 5,800 | 394 | ||||||
Orbital ATK | 6,536 | 500 | ||||||
Oshkosh Truck | 6,659 | 334 | ||||||
Owens Corning | 10,800 | 458 | ||||||
Paccar | 33,470 | 2,127 | ||||||
Pall | 9,345 | 1,163 | ||||||
Parker Hannifin | 11,704 | 1,410 | ||||||
Pentair | 16,873 | 1,080 | ||||||
Pitney Bowes | 18,085 | 395 | ||||||
Precision Castparts | 13,446 | 2,846 | ||||||
Quanta Services * | 19,700 | 578 | ||||||
Raytheon | 28,968 | 2,991 | ||||||
Regal-Beloit | 4,000 | 313 | ||||||
Republic Services, Cl A | 22,742 | 916 | ||||||
Robert Half International | 11,676 | 658 | ||||||
Rockwell Automation | 12,904 | 1,586 | ||||||
Rockwell Collins | 12,079 | 1,150 | ||||||
Rollins | 8,850 | 220 | ||||||
Roper Industries | 9,500 | 1,662 | ||||||
| 6 | SEI Institutional Investments Trust / Annual Report / May 31, 2015 |
SCHEDULE OF INVESTMENTS
Large Cap Index Fund
May 31, 2015
| Description | Shares | Market Value ($ Thousands) | ||||||
RR Donnelley & Sons | 19,177 | $ | 368 | |||||
Ryder System | 4,806 | 441 | ||||||
Snap-on | 4,991 | 776 | ||||||
SolarCity * | 4,000 | 240 | ||||||
Southwest Airlines | 64,320 | 2,383 | ||||||
Spirit AeroSystems Holdings, Cl A * | 10,800 | 590 | ||||||
Spirit Airlines * | 6,400 | 407 | ||||||
SPX | 3,511 | 261 | ||||||
Stanley Black & Decker | 14,693 | 1,505 | ||||||
Stericycle * | 7,426 | 1,020 | ||||||
Terex | 10,048 | 248 | ||||||
Textron | 24,022 | 1,086 | ||||||
Timken | 7,869 | 308 | ||||||
Toro | 5,020 | 343 | ||||||
Towers Watson, Cl A | 5,500 | 759 | ||||||
TransDigm Group | 4,700 | 1,062 | ||||||
Trinity Industries | 14,400 | 432 | ||||||
Triumph Group | 4,800 | 320 | ||||||
Tyco International | 36,700 | 1,481 | ||||||
Union Pacific | 82,332 | 8,308 | ||||||
United Continental Holdings * | 32,600 | 1,780 | ||||||
United Parcel Service, Cl B | 64,641 | 6,414 | ||||||
United Rentals * | 8,700 | 773 | ||||||
United Technologies | 83,190 | 9,747 | ||||||
USG * | 8,800 | 254 | ||||||
Valmont Industries (A) | 2,400 | 299 | ||||||
Vectrus * | 1,011 | 25 | ||||||
Verisk Analytics, Cl A * | 14,200 | 1,031 | ||||||
Veritiv * | 771 | 32 | ||||||
WABCO Holdings * | 4,624 | 585 | ||||||
Wabtec | 8,600 | 863 | ||||||
Waste Connections | 11,350 | 551 | ||||||
Waste Management | 43,594 | 2,164 | ||||||
WESCO International * | 4,100 | 295 | ||||||
WW Grainger | 5,181 | 1,245 | ||||||
Xylem | 15,502 | 567 | ||||||
|
| |||||||
| 208,802 | ||||||||
|
| |||||||
Information Technology — 19.2% | ||||||||
3D Systems *(A) | 10,400 | 227 | ||||||
Accenture, Cl A | 58,100 | 5,580 | ||||||
Activision Blizzard | 44,256 | 1,118 | ||||||
Adobe Systems * | 46,102 | 3,646 | ||||||
Advanced Micro Devices *(A) | 63,134 | 144 | ||||||
Akamai Technologies * | 15,818 | 1,207 | ||||||
Alliance Data Systems * | 5,612 | 1,673 | ||||||
Altera | 27,173 | 1,327 | ||||||
Amdocs | 13,500 | 741 | ||||||
Amphenol, Cl A | 30,184 | 1,722 | ||||||
Analog Devices | 27,512 | 1,870 | ||||||
Ansys * | 7,800 | 694 | ||||||
AOL * | 7,434 | 372 | ||||||
Apple | 543,415 | 70,796 | ||||||
Applied Materials | 113,655 | 2,288 | ||||||
Arista Networks * | 500 | 35 | ||||||
ARRIS Group * | 11,900 | 393 | ||||||
Arrow Electronics * | 8,789 | 534 | ||||||
Atmel | 37,700 | 334 | ||||||
Autodesk * | 20,237 | 1,096 | ||||||
Automatic Data Processing | 44,492 | 3,804 | ||||||
Avago Technologies, Cl A | 21,900 | 3,243 | ||||||
Avnet | 12,410 | 546 | ||||||
AVX | 1,424 | 20 | ||||||
Booz Allen Hamilton Holding, Cl A | 6,700 | 170 | ||||||
| Description | Shares | Market Value ($ Thousands) | ||||||
Broadcom, Cl A | 46,568 | $ | 2,647 | |||||
Broadridge Financial Solutions | 9,773 | 529 | ||||||
Brocade Communications Systems | 39,300 | 486 | ||||||
CA | 28,538 | 869 | ||||||
Cadence Design Systems * | 25,563 | 506 | ||||||
CDK Global | 14,397 | 767 | ||||||
CDW | 8,200 | 304 | ||||||
Cisco Systems | 464,027 | 13,601 | ||||||
Citrix Systems * | 14,187 | 922 | ||||||
Cognizant Technology Solutions, Cl A * | 54,876 | 3,552 | ||||||
CommScope Holding * | 5,600 | 174 | ||||||
Computer Sciences | 12,364 | 848 | ||||||
CoreLogic * | 7,984 | 311 | ||||||
Corning | 121,758 | 2,547 | ||||||
CoStar Group * | 2,700 | 564 | ||||||
Cree *(A) | 10,722 | 325 | ||||||
Diebold | 5,529 | 189 | ||||||
Dolby Laboratories, Cl A | 4,343 | 170 | ||||||
DST Systems | 2,695 | 319 | ||||||
eBay * | 115,611 | 7,094 | ||||||
EchoStar, Cl A * | 3,732 | 187 | ||||||
Electronic Arts * | 26,865 | 1,686 | ||||||
EMC | 171,597 | 4,520 | ||||||
Equinix ‡ | 4,715 | 1,264 | ||||||
F5 Networks * | 6,738 | 847 | ||||||
Facebook, Cl A * | 178,700 | 14,151 | ||||||
FactSet Research Systems | 3,900 | 644 | ||||||
Fidelity National Information Services | 27,590 | 1,730 | ||||||
FireEye * | 8,100 | 377 | ||||||
First Solar * | 6,600 | 328 | ||||||
Fiserv * | 21,238 | 1,702 | ||||||
FleetCor Technologies * | 7,400 | 1,126 | ||||||
FLIR Systems | 11,700 | 358 | ||||||
Fortinet * | 12,600 | 505 | ||||||
Freescale Semiconductor * | 9,500 | 429 | ||||||
Gartner * | 7,600 | 665 | ||||||
Genpact * | 15,700 | 353 | ||||||
Global Payments | 6,034 | 630 | ||||||
Google, Cl A * | 25,429 | 13,867 | ||||||
Google, Cl C * | 25,799 | 13,728 | ||||||
Harris | 10,855 | 860 | ||||||
Hewlett-Packard | 173,470 | 5,794 | ||||||
HomeAway * | 8,500 | 239 | ||||||
IAC | 6,632 | 498 | ||||||
Informatica * | 8,500 | 411 | ||||||
Ingram Micro, Cl A * | 14,723 | 395 | ||||||
Intel | 450,658 | 15,530 | ||||||
International Business Machines | 85,598 | 14,522 | ||||||
Intuit | 24,686 | 2,571 | ||||||
IPG Photonics * | 3,000 | 285 | ||||||
Jabil Circuit | 17,874 | 439 | ||||||
Jack Henry & Associates | 7,900 | 514 | ||||||
JDS Uniphase * | 21,240 | 272 | ||||||
Juniper Networks | 37,525 | 1,043 | ||||||
Keysight Technologies * | 14,932 | 491 | ||||||
Kla-Tencor | 14,809 | 883 | ||||||
Knowles *(A) | 8,378 | 162 | ||||||
Lam Research | 14,452 | 1,189 | ||||||
Leidos Holdings | 5,900 | 251 | ||||||
LendingClub *(A) | 10,900 | 209 | ||||||
Lexmark International, Cl A | 5,386 | 248 | ||||||
| 7 | SEI Institutional Investments Trust / Annual Report / May 31, 2015 |
SCHEDULE OF INVESTMENTS
Large Cap Index Fund
May 31, 2015
| Description | Shares | Market Value ($ Thousands) | ||||||
Linear Technology | 21,057 | $ | 1,008 | |||||
LinkedIn, Cl A * | 9,800 | 1,910 | ||||||
Marvell Technology Group | 36,400 | 509 | ||||||
MasterCard, Cl A | 91,500 | 8,442 | ||||||
Maxim Integrated Products | 25,000 | 877 | ||||||
Microchip Technology (A) | 17,022 | 836 | ||||||
Micron Technology * | 99,816 | 2,788 | ||||||
Microsoft | 743,400 | 34,836 | ||||||
Motorola Solutions | 17,333 | 1,023 | ||||||
National Instruments | 8,704 | 260 | ||||||
NCR * | 15,189 | 456 | ||||||
NetApp | 27,155 | 907 | ||||||
NetSuite * | 3,600 | 336 | ||||||
Nuance Communications * | 24,100 | 407 | ||||||
Nvidia | 48,456 | 1,072 | ||||||
ON Semiconductor * | 39,300 | 521 | ||||||
Oracle | 297,520 | 12,939 | ||||||
Palo Alto Networks * | 4,800 | 814 | ||||||
Pandora Media * | 19,400 | 362 | ||||||
Paychex | 30,407 | 1,502 | ||||||
PTC * | 11,200 | 462 | ||||||
Qualcomm | 153,159 | 10,672 | ||||||
Rackspace Hosting * | 9,800 | 393 | ||||||
Red Hat * | 16,427 | 1,269 | ||||||
Rovi *(A) | 8,500 | 142 | ||||||
Sabre | 5,100 | 133 | ||||||
Salesforce.com * | 55,252 | 4,020 | ||||||
SanDisk | 19,169 | 1,311 | ||||||
ServiceNow * | 12,800 | 981 | ||||||
Skyworks Solutions | 16,900 | 1,848 | ||||||
SolarWinds * | 5,900 | 280 | ||||||
Solera Holdings | 6,200 | 306 | ||||||
Splunk * | 10,800 | 730 | ||||||
Stratasys *(A) | 4,400 | 156 | ||||||
SunEdison *(A) | 22,300 | 668 | ||||||
SunPower, Cl A * | 4,100 | 125 | ||||||
Symantec | 59,648 | 1,469 | ||||||
Synopsys * | 13,982 | 698 | ||||||
Tableau Software, Cl A * | 3,600 | 408 | ||||||
Tech Data * | 3,550 | 224 | ||||||
Teradata * | 13,289 | 517 | ||||||
Teradyne | 17,863 | 378 | ||||||
Texas Instruments | 99,008 | 5,536 | ||||||
Total System Services | 14,991 | 618 | ||||||
Trimble Navigation * | 23,928 | 561 | ||||||
Twitter * | 48,300 | 1,771 | ||||||
Vantiv, Cl A * | 11,100 | 444 | ||||||
VeriFone Holdings * | 10,200 | 389 | ||||||
VeriSign *(A) | 9,785 | 618 | ||||||
Visa, Cl A | 181,800 | 12,486 | ||||||
Vishay Intertechnology | 12,950 | 169 | ||||||
VMware, Cl A * | 7,400 | 646 | ||||||
Western Digital | 19,430 | 1,892 | ||||||
Western Union (A) | 46,728 | 1,026 | ||||||
Workday, Cl A * | 8,300 | 655 | ||||||
Xerox | 99,996 | 1,142 | ||||||
Xilinx | 22,857 | 1,084 | ||||||
Yahoo! * | 87,281 | 3,747 | ||||||
Yelp, Cl A *(A) | 4,800 | 230 | ||||||
Zebra Technologies, Cl A * | 4,825 | 529 | ||||||
Zillow Group, Cl A *(A) | 4,143 | 379 | ||||||
Zynga, Cl A * | 61,800 | 182 | ||||||
|
| |||||||
| 379,306 | ||||||||
|
| |||||||
| Description | Shares | Market Value ($ Thousands) | ||||||
Materials — 3.5% | ||||||||
Air Products & Chemicals | 19,694 | $ | 2,890 | |||||
Airgas | 6,615 | 674 | ||||||
Albemarle | 9,573 | 576 | ||||||
Alcoa | 100,602 | 1,257 | ||||||
Allegheny Technologies | 10,297 | 335 | ||||||
AptarGroup | 6,000 | 383 | ||||||
Ashland | 5,976 | 761 | ||||||
Avery Dennison | 8,310 | 515 | ||||||
Axalta Coating Systems * | 2,300 | 79 | ||||||
Ball | 11,850 | 841 | ||||||
Bemis | 9,174 | 422 | ||||||
Cabot | 6,173 | 256 | ||||||
Carpenter Technology | 4,600 | 188 | ||||||
Celanese, Cl A | 13,683 | 942 | ||||||
CF Industries Holdings | 4,566 | 1,442 | ||||||
Cliffs Natural Resources (A) | 13,700 | 73 | ||||||
Compass Minerals International | 3,100 | 267 | ||||||
Crown Holdings * | 11,651 | 644 | ||||||
Cytec Industries | 6,962 | 421 | ||||||
Domtar | 6,100 | 264 | ||||||
Dow Chemical | 110,570 | 5,757 | ||||||
E.I. du Pont de Nemours | 83,892 | 5,957 | ||||||
Eagle Materials | 4,500 | 376 | ||||||
Eastman Chemical | 13,428 | 1,031 | ||||||
Ecolab | 24,808 | 2,844 | ||||||
FMC | 11,820 | 676 | ||||||
Freeport-McMoRan, Cl B | 90,624 | 1,781 | ||||||
Greif, Cl A | 2,700 | 103 | ||||||
Huntsman | 18,929 | 425 | ||||||
International Flavors & Fragrances | 6,891 | 820 | ||||||
International Paper | 37,855 | 1,962 | ||||||
LyondellBasell Industries, Cl A | 34,800 | 3,518 | ||||||
Martin Marietta Materials | 5,463 | 814 | ||||||
MeadWestvaco | 15,058 | 761 | ||||||
Monsanto | 44,350 | 5,188 | ||||||
Mosaic | 29,278 | 1,343 | ||||||
NewMarket (A) | 800 | 368 | ||||||
Newmont Mining | 45,033 | 1,227 | ||||||
Nucor | 27,290 | 1,291 | ||||||
Owens-Illinois * | 13,491 | 323 | ||||||
Packaging Corp of America | 8,299 | 574 | ||||||
Platform Specialty Products * | 8,000 | 209 | ||||||
PPG Industries | 12,823 | 2,935 | ||||||
Praxair | 27,125 | 3,333 | ||||||
Rayonier Advanced Materials | 3,901 | 64 | ||||||
Reliance Steel & Aluminum | 7,100 | 453 | ||||||
Rock-Tenn, Cl A | 12,700 | 827 | ||||||
Royal Gold | 6,100 | 395 | ||||||
RPM International | 12,269 | 614 | ||||||
Scotts Miracle-Gro, Cl A | 4,006 | 246 | ||||||
Sealed Air | 18,468 | 899 | ||||||
Sherwin-Williams | 7,537 | 2,172 | ||||||
Sigma-Aldrich | 11,148 | �� | 1,553 | |||||
Silgan Holdings | 3,004 | 163 | ||||||
Sonoco Products | 9,046 | 407 | ||||||
Southern Copper | 12,868 | 386 | ||||||
Steel Dynamics | 20,200 | 440 | ||||||
Tahoe Resources | 21,300 | 297 | ||||||
TimkenSteel | 3,934 | 117 | ||||||
United States Steel (A) | 12,783 | 312 | ||||||
Valspar | 7,464 | 623 | ||||||
Vulcan Materials | 11,557 | 1,039 | ||||||
Westlake Chemical | 3,800 | 268 | ||||||
WR Grace * | 6,500 | 637 | ||||||
|
| |||||||
| 68,758 | ||||||||
|
| |||||||
| 8 | SEI Institutional Investments Trust / Annual Report / May 31, 2015 |
SCHEDULE OF INVESTMENTS
Large Cap Index Fund
May 31, 2015
| Description | Shares | Market Value ($ Thousands) | ||||||
Telecommunication Services — 2.1% |
| |||||||
AT&T | 469,633 | $ | 16,221 | |||||
CenturyLink | 54,754 | 1,820 | ||||||
Frontier Communications | 89,895 | 463 | ||||||
Level 3 Communications * | 24,686 | 1,370 | ||||||
SBA Communications, Cl A * | 12,100 | 1,353 | ||||||
Sprint *(A) | 59,715 | 278 | ||||||
Telephone & Data Systems | 7,880 | 234 | ||||||
T-Mobile US * | 23,600 | 917 | ||||||
US Cellular * | 831 | 32 | ||||||
Verizon Communications | 371,776 | 18,381 | ||||||
Windstream Holdings (A) | 9,024 | 73 | ||||||
|
| |||||||
| 41,142 | ||||||||
|
| |||||||
Utilities — 2.9% | ||||||||
AES | 62,924 | 856 | ||||||
AGL Resources | 10,947 | 551 | ||||||
Alliant Energy | 9,976 | 611 | ||||||
Ameren | 21,590 | 869 | ||||||
American Electric Power | 44,450 | 2,502 | ||||||
American Water Works | 15,900 | 841 | ||||||
Aqua America | 16,246 | 427 | ||||||
Atmos Energy | 9,191 | 497 | ||||||
Calpine * | 33,700 | 677 | ||||||
Centerpoint Energy | 38,515 | 785 | ||||||
CMS Energy | 23,942 | 817 | ||||||
Consolidated Edison | 25,316 | 1,566 | ||||||
Dominion Resources | 53,612 | 3,781 | ||||||
DTE Energy | 15,264 | 1,209 | ||||||
Duke Energy | 65,016 | 4,924 | ||||||
Edison International | 28,179 | 1,714 | ||||||
Entergy | 17,398 | 1,330 | ||||||
Eversource Energy | 27,108 | 1,335 | ||||||
Exelon | 80,076 | 2,709 | ||||||
FirstEnergy | 36,027 | 1,285 | ||||||
Great Plains Energy | 12,071 | 315 | ||||||
Hawaiian Electric Industries | 9,146 | 279 | ||||||
Integrys Energy Group | 6,702 | 482 | ||||||
ITC Holdings | 14,100 | 498 | ||||||
MDU Resources Group | 17,521 | 367 | ||||||
National Fuel Gas | 7,089 | 455 | ||||||
NextEra Energy | 40,173 | 4,111 | ||||||
NiSource | 27,421 | 1,294 | ||||||
NRG Energy | 30,200 | 761 | ||||||
OGE Energy | 16,736 | 527 | ||||||
Pepco Holdings | 23,044 | 628 | ||||||
PG&E | 43,618 | 2,332 | ||||||
Pinnacle West Capital | 9,392 | 572 | ||||||
PPL | 58,026 | 2,014 | ||||||
Public Service Enterprise Group | 43,352 | 1,848 | ||||||
Questar | 15,646 | 355 | ||||||
SCANA | 11,920 | 634 | ||||||
Sempra Energy | 22,923 | 2,463 | ||||||
Southern | 82,303 | 3,596 | ||||||
TECO Energy | 18,500 | 349 | ||||||
UGI | 15,525 | 581 | ||||||
Vectren | 7,391 | 315 | ||||||
Westar Energy, Cl A | 10,800 | 396 | ||||||
Wisconsin Energy | 19,598 | 946 | ||||||
| Description | Shares/Face Amount ($ Thousands) | Market Value ($ Thousands) | ||||||
Xcel Energy | 43,081 | $ | 1,467 | |||||
|
| |||||||
| 56,871 | ||||||||
|
| |||||||
Total Common Stock | 1,934,098 | |||||||
|
| |||||||
AFFILIATED PARTNERSHIP — 1.3% |
| |||||||
SEI Liquidity Fund, L.P. | ||||||||
0.060% ** †(C) | 25,575,279 | 25,575 | ||||||
|
| |||||||
Total Affiliated Partnership | 25,575 | |||||||
|
| |||||||
CASH EQUIVALENT — 1.8% |
| |||||||
SEI Daily Income Trust, Prime Obligation Fund, Cl A | ||||||||
0.010% ** † | 36,001,609 | 36,002 | ||||||
|
| |||||||
Total Cash Equivalent | 36,002 | |||||||
|
| |||||||
U.S. TREASURY OBLIGATION — 0.1% |
| |||||||
U.S. Treasury Bills | ||||||||
0.005%, 07/09/2015 (C) (D) | $ | 2,150 | 2,150 | |||||
|
| |||||||
Total U.S. Treasury Obligation | 2,150 | |||||||
|
| |||||||
Total Investments — 101.3% |
| $ | 1,997,825 | |||||
|
| |||||||
A list of the open futures contracts held by the Fund at May 31, 2015, is as follows:
| Type of Contract | Number of Contracts Long | Expiration Date | Unrealized Appreciation ($ Thousands) | |||||||||
S&P 500 Index E-MINI | 322 | Jun-2015 | $ | 893 | ||||||||
S&P Mid 400 Index E-MINI | 35 | Jun-2015 | 105 | |||||||||
|
| |||||||||||
| $ | 998 | |||||||||||
|
| |||||||||||
For the year ended May 31, 2015, the total amount of all open futures contracts, as presented in the table above, are representative of the volume of activity for this derivative type during the year.
Percentages are based on a Net Assets of $1,972,254 ($ Thousands).
| * | Non-income producing security. |
| ** | The rate reported is the 7-day effective yield as of May 31, 2015. |
| † | Investment in Affiliated Security (see Note 6). |
| ‡ | Real Estate Investment Trust. |
| (A) | This security or a partial position of this security is on loan at May 31, 2015 (see Note 12). The total market value of securities on loan at May 31, 2015 was $24,808 ($ Thousands). |
| (B) | This security was purchased with cash collateral held from securities on loan (See Note 12). The total value of such securities as of May 31, 2015 was $25,575 ($ Thousands). |
| (C) | Security, or portion thereof, has been pledged as collateral on open futures contracts. |
| (D) | The rate reported is the effective yield at time of purchase. |
AID — Agency for International Development
Cl — Class
L.P. — Limited Partnership
Ser — Series
S&P — Standard & Poor’s
| 9 | SEI Institutional Investments Trust / Annual Report / May 31, 2015 |
SCHEDULE OF INVESTMENTS
Large Cap Index Fund
May 31, 2015
The following is a list of the level of inputs used as of May 31, 2015, in valuing the Fund’s investments and other financial instruments carried at value ($ Thousands):
| Investments in Securities | Level 1 | Level 2 | Level 3 | Total | ||||||||||||
Common Stock | $ | 1,934,098 | $ | — | $ | — | $ | 1,934,098 | ||||||||
Affiliated Partnership | — | 25,575 | — | 25,575 | ||||||||||||
Cash Equivalent | 36,002 | — | — | 36,002 | ||||||||||||
U.S. Treasury Obligation | — | 2,150 | — | 2,150 | ||||||||||||
|
|
|
|
|
|
|
| |||||||||
Total Investments in Securities | $ | 1,970,100 | $ | 27,725 | $ | — | $ | 1,997,825 | ||||||||
|
|
|
|
|
|
|
| |||||||||
| Other Financial Instruments | Level 1 | Level 2 | Level 3 | Total | ||||||||||||
Futures Contracts * | ||||||||||||||||
Unrealized Appreciation | $ | 998 | $ | — | $ | — | $ | 998 | ||||||||
|
|
|
|
|
|
|
| |||||||||
| * | Futures contracts are valued at the unrealized appreciation on the instrument. |
For the year ended May 31, 2015, there were no transfers between Level 1 and Level 2 assets and liabilities.
For the year ended May 31, 2015, there were no transfers between Level 2 and Level 3 assets and liabilities.
For more information on valuation inputs, see Note 2 – Significant Accounting Policies in Notes to Financial Statements.
Amounts designated as “—” are either $0 or have been rounded to $0.
The accompanying notes are an integral part of the financial statements.
| 10 | SEI Institutional Investments Trust / Annual Report / May 31, 2015 |
SCHEDULE OF INVESTMENTS
S&P 500 Index Fund
May 31, 2015
| Description | Shares | Market Value ($ Thousands) | ||||||
COMMON STOCK — 98.2% |
| |||||||
Consumer Discretionary — 12.2% | ||||||||
Amazon.com * | 63,960 | $ | 27,454 | |||||
AutoNation * | 11,600 | 724 | ||||||
AutoZone * | 5,345 | 3,600 | ||||||
Bed Bath & Beyond * | 29,800 | 2,125 | ||||||
Best Buy | 49,387 | 1,714 | ||||||
BorgWarner | 38,300 | 2,304 | ||||||
Cablevision Systems, Cl A (A) | 35,200 | 863 | ||||||
Carmax * | 35,500 | 2,522 | ||||||
Carnival, Cl A | 76,000 | 3,521 | ||||||
CBS, Cl B | 77,082 | 4,758 | ||||||
Chipotle Mexican Grill, Cl A * | 5,220 | 3,213 | ||||||
Coach | 46,791 | 1,655 | ||||||
Comcast, Cl A | 426,974 | 24,961 | ||||||
Darden Restaurants | 21,095 | 1,383 | ||||||
Delphi Automotive | 48,900 | 4,253 | ||||||
DIRECTV * | 84,591 | 7,701 | ||||||
Discovery Communications, Cl A * | 23,900 | 811 | ||||||
Discovery Communications, Cl C * | 43,400 | 1,365 | ||||||
Dollar General | 51,200 | 3,717 | ||||||
Dollar Tree * | 34,696 | 2,602 | ||||||
DR Horton | 56,391 | 1,473 | ||||||
Expedia | 15,895 | 1,705 | ||||||
Family Dollar Stores | 15,400 | 1,194 | ||||||
Ford Motor | 665,343 | 10,093 | ||||||
Fossil Group * | 6,900 | 490 | ||||||
GameStop, Cl A (A) | 17,400 | 755 | ||||||
Gannett | 38,500 | 1,378 | ||||||
Gap | 43,000 | 1,648 | ||||||
Garmin | 19,395 | 882 | ||||||
General Motors | 227,587 | 8,187 | ||||||
Genuine Parts | 25,800 | 2,334 | ||||||
Goodyear Tire & Rubber | 43,300 | 1,379 | ||||||
H&R Block | 44,191 | 1,402 | ||||||
Hanesbrands | 67,800 | 2,160 | ||||||
Harley-Davidson | 35,800 | 1,915 | ||||||
Harman International Industries | 11,695 | 1,410 | ||||||
Hasbro (A) | 17,995 | 1,298 | ||||||
Home Depot | 221,487 | 24,678 | ||||||
Interpublic Group | 66,300 | 1,354 | ||||||
Johnson Controls | 110,696 | 5,758 | ||||||
Kohl’s | 32,791 | 2,147 | ||||||
L Brands | 41,500 | 3,591 | ||||||
Leggett & Platt | 22,195 | 1,049 | ||||||
Lennar, Cl A | 28,691 | 1,338 | ||||||
Lowe’s | 163,587 | 11,448 | ||||||
Macy’s | 57,400 | 3,843 | ||||||
Marriott International, Cl A | 34,996 | 2,729 | ||||||
Mattel | 54,387 | 1,404 | ||||||
McDonald’s | 161,587 | 15,501 | ||||||
Michael Kors Holdings * | 32,300 | 1,502 | ||||||
Mohawk Industries * | 10,500 | 1,960 | ||||||
NetFlix * | 10,197 | 6,363 | ||||||
Newell Rubbermaid | 43,591 | 1,723 | ||||||
News, Cl A * | 80,283 | 1,216 | ||||||
NIKE, Cl B | 117,691 | 11,966 | ||||||
Nordstrom | 22,595 | 1,641 | ||||||
Omnicom Group | 41,600 | 3,100 | ||||||
O’Reilly Automotive * | 17,100 | 3,754 | ||||||
Priceline Group * | 8,784 | 10,295 | ||||||
PulteGroup | 53,283 | 1,022 | ||||||
PVH | 13,200 | 1,381 | ||||||
| Description | Shares | Market Value ($ Thousands) | ||||||
Ralph Lauren, Cl A | 9,695 | $ | 1,264 | |||||
Ross Stores | 34,900 | 3,374 | ||||||
Royal Caribbean Cruises | 26,700 | 2,029 | ||||||
Scripps Networks Interactive, Cl A | 15,500 | 1,039 | ||||||
Staples | 102,878 | 1,694 | ||||||
Starbucks | 252,182 | 13,103 | ||||||
Starwood Hotels & Resorts Worldwide | 29,000 | 2,400 | ||||||
Target | 107,191 | 8,502 | ||||||
Tiffany | 19,095 | 1,790 | ||||||
Time Warner | 139,687 | 11,801 | ||||||
Time Warner Cable, Cl A | 47,296 | 8,555 | ||||||
TJX | 114,891 | 7,397 | ||||||
Tractor Supply | 23,000 | 2,004 | ||||||
TripAdvisor * | 18,895 | 1,441 | ||||||
Twenty-First Century Fox, Cl A | 307,574 | 10,334 | ||||||
Under Armour, Cl A * | 27,095 | 2,125 | ||||||
Urban Outfitters * | 16,300 | 560 | ||||||
VF | 57,691 | 4,063 | ||||||
Viacom, Cl B | 61,600 | 4,120 | ||||||
Walt Disney | 262,683 | 28,992 | ||||||
Whirlpool | 13,200 | 2,432 | ||||||
Wyndham Worldwide | 19,400 | 1,647 | ||||||
Wynn Resorts | 13,800 | 1,390 | ||||||
Yum! Brands | 72,900 | 6,569 | ||||||
|
| |||||||
| 390,337 | ||||||||
|
| |||||||
Consumer Staples — 9.3% | ||||||||
Altria Group | 330,983 | 16,946 | ||||||
Archer-Daniels-Midland | 106,791 | 5,644 | ||||||
Brown-Forman, Cl B | 26,296 | 2,479 | ||||||
Campbell Soup | 28,591 | 1,382 | ||||||
Clorox | 22,200 | 2,390 | ||||||
Coca-Cola | 660,257 | 27,044 | ||||||
Coca-Cola Enterprises | 34,900 | 1,544 | ||||||
Colgate-Palmolive | 143,391 | 9,577 | ||||||
ConAgra Foods | 71,887 | 2,776 | ||||||
Constellation Brands, Cl A | 28,400 | 3,348 | ||||||
Costco Wholesale | 74,000 | 10,552 | ||||||
CVS Health | 189,083 | 19,358 | ||||||
Dr. Pepper Snapple Group | 32,600 | 2,498 | ||||||
Estee Lauder, Cl A | 37,600 | 3,287 | ||||||
General Mills | 101,696 | 5,710 | ||||||
Hershey | 25,000 | 2,321 | ||||||
Hormel Foods | 21,596 | 1,236 | ||||||
JM Smucker | 16,495 | 1,955 | ||||||
Kellogg | 42,800 | 2,686 | ||||||
Keurig Green Mountain | 19,500 | 1,682 | ||||||
Kimberly-Clark | 61,496 | 6,695 | ||||||
Kraft Foods Group | 98,891 | 8,351 | ||||||
Kroger | 82,691 | 6,020 | ||||||
Lorillard | 60,696 | 4,399 | ||||||
McCormick | 20,595 | 1,617 | ||||||
Mead Johnson Nutrition, Cl A | 34,100 | 3,318 | ||||||
Molson Coors Brewing, Cl B | 27,095 | 1,988 | ||||||
Mondelez International, Cl A | 277,378 | 11,536 | ||||||
Monster Beverage * | 24,700 | 3,144 | ||||||
PepsiCo | 249,078 | 24,019 | ||||||
Philip Morris International | 259,978 | 21,597 | ||||||
Procter & Gamble | 453,670 | 35,563 | ||||||
Reynolds American | 52,000 | 3,991 | ||||||
Sysco | 99,900 | 3,712 | ||||||
Tyson Foods, Cl A | 49,487 | 2,101 | ||||||
Walgreens Boots Alliance | 146,587 | 12,583 | ||||||
Wal-Mart Stores | 265,483 | 19,718 | ||||||
Whole Foods Market | 60,991 | 2,515 | ||||||
|
| |||||||
| 297,282 | ||||||||
|
| |||||||
| 1 | SEI Institutional Investments Trust / Annual Report / May 31, 2015 |
SCHEDULE OF INVESTMENTS
S&P 500 Index Fund
May 31, 2015
| Description | Shares | Market Value ($ Thousands) | ||||||
Energy — 7.8% | ||||||||
Anadarko Petroleum | 85,295 | $ | 7,132 | |||||
Apache | 63,500 | 3,800 | ||||||
Baker Hughes | 73,200 | 4,718 | ||||||
Cabot Oil & Gas | 69,887 | 2,373 | ||||||
Cameron International * | 31,100 | 1,596 | ||||||
Chesapeake Energy (A) | 83,178 | 1,174 | ||||||
Chevron | 315,878 | 32,536 | ||||||
Cimarex Energy | 15,896 | 1,836 | ||||||
ConocoPhillips | 207,083 | 13,187 | ||||||
CONSOL Energy | 37,000 | 1,030 | ||||||
Devon Energy | 65,100 | 4,246 | ||||||
Diamond Offshore Drilling (A) | 9,500 | 288 | ||||||
Ensco, Cl A | 37,600 | 884 | ||||||
EOG Resources | 92,291 | 8,185 | ||||||
EQT | 25,695 | 2,186 | ||||||
Exxon Mobil | 704,600 | 60,032 | ||||||
FMC Technologies * | 37,200 | 1,555 | ||||||
Halliburton | 142,991 | 6,492 | ||||||
Helmerich & Payne | 17,295 | 1,262 | ||||||
Hess | 41,000 | 2,768 | ||||||
Kinder Morgan | 286,583 | 11,890 | ||||||
Marathon Oil | 113,900 | 3,097 | ||||||
Marathon Petroleum | 45,996 | 4,759 | ||||||
Murphy Oil | 26,791 | 1,164 | ||||||
National Oilwell Varco | 65,900 | 3,242 | ||||||
Newfield Exploration * | 25,800 | 976 | ||||||
Noble | 37,878 | 634 | ||||||
Noble Energy | 65,300 | 2,859 | ||||||
Occidental Petroleum | 129,595 | 10,133 | ||||||
ONEOK | 35,391 | 1,484 | ||||||
Phillips 66 | 91,496 | 7,239 | ||||||
Pioneer Natural Resources | 25,096 | 3,710 | ||||||
QEP Resources | 24,387 | 459 | ||||||
Range Resources | 28,100 | 1,557 | ||||||
Schlumberger | 214,383 | 19,460 | ||||||
Southwestern Energy * | 65,200 | 1,680 | ||||||
Spectra Energy | 113,100 | 3,978 | ||||||
Tesoro | 21,200 | 1,876 | ||||||
Transocean (A) | 54,700 | 1,031 | ||||||
Valero Energy | 86,700 | 5,136 | ||||||
Williams | 113,296 | 5,789 | ||||||
|
| |||||||
| 249,433 | ||||||||
|
| |||||||
Financials — 15.9% | ||||||||
ACE | 55,095 | 5,866 | ||||||
Affiliated Managers Group * | 9,200 | 2,058 | ||||||
Aflac | 73,991 | 4,604 | ||||||
Allstate | 70,200 | 4,726 | ||||||
American Express | 147,387 | 11,750 | ||||||
American International Group | 230,778 | 13,526 | ||||||
American Tower, Cl A ‡ | 71,100 | 6,597 | ||||||
Ameriprise Financial | 30,800 | 3,837 | ||||||
Aon | 47,200 | 4,778 | ||||||
Apartment Investment & Management, Cl A ‡ | 25,100 | 952 | ||||||
Assurant | 10,695 | 704 | ||||||
AvalonBay Communities ‡ | 22,300 | 3,713 | ||||||
Bank of America | 1,767,483 | 29,163 | ||||||
Bank of New York Mellon | 187,387 | 8,125 | ||||||
| Description | Shares | Market Value ($ Thousands) | ||||||
BB&T | 121,491 | $ | 4,795 | |||||
Berkshire Hathaway, Cl B * | 306,328 | 43,805 | ||||||
BlackRock, Cl A | 21,396 | 7,826 | ||||||
Boston Properties ‡ | 25,800 | 3,355 | ||||||
Capital One Financial | 92,796 | 7,754 | ||||||
CBRE Group, Cl A * | 47,391 | 1,812 | ||||||
Charles Schwab | 194,291 | 6,149 | ||||||
Chubb | 38,900 | 3,793 | ||||||
Cincinnati Financial | 25,096 | 1,269 | ||||||
Citigroup | 509,757 | 27,568 | ||||||
CME Group, Cl A | 53,395 | 5,030 | ||||||
Comerica | 28,691 | 1,404 | ||||||
Crown Castle International ‡ | 56,296 | 4,591 | ||||||
Discover Financial Services | 75,400 | 4,393 | ||||||
E*TRADE Financial * | 46,391 | 1,367 | ||||||
Equity Residential ‡ | 61,296 | 4,556 | ||||||
Essex Property Trust ‡ | 11,000 | 2,449 | ||||||
Fifth Third Bancorp | 137,600 | 2,785 | ||||||
Franklin Resources | 66,095 | 3,365 | ||||||
General Growth Properties ‡ | 106,100 | 3,006 | ||||||
Genworth Financial, Cl A * | 79,800 | 634 | ||||||
Goldman Sachs Group | 68,091 | 14,040 | ||||||
Hartford Financial Services Group | 71,100 | 2,923 | ||||||
HCP ‡ | 77,800 | 3,012 | ||||||
Health Care ‡ | 58,900 | 4,138 | ||||||
Host Hotels & Resorts, Cl REIT ‡ | 127,974 | 2,549 | ||||||
Hudson City Bancorp | 77,300 | 736 | ||||||
Huntington Bancshares | 130,161 | 1,449 | ||||||
Intercontinental Exchange | 18,900 | 4,475 | ||||||
Invesco | 72,500 | 2,888 | ||||||
Iron Mountain ‡ | 30,001 | 1,094 | ||||||
JPMorgan Chase | 626,357 | 41,202 | ||||||
KeyCorp | 144,700 | 2,110 | ||||||
Kimco Realty ‡ | 69,887 | 1,674 | ||||||
Legg Mason | 15,895 | 848 | ||||||
Leucadia National | 50,687 | 1,248 | ||||||
Lincoln National | 43,300 | 2,468 | ||||||
Loews | 50,487 | 2,025 | ||||||
M&T Bank (A) | 22,400 | 2,708 | ||||||
Macerich ‡ | 23,796 | 1,954 | ||||||
Marsh & McLennan | 90,791 | 5,287 | ||||||
McGraw Hill Financial | 46,100 | 4,783 | ||||||
MetLife | 187,987 | 9,824 | ||||||
Moody’s | 30,000 | 3,243 | ||||||
Morgan Stanley | 259,300 | 9,905 | ||||||
NASDAQ OMX Group | 18,700 | 968 | ||||||
Navient | 64,500 | 1,243 | ||||||
Northern Trust | 37,096 | 2,766 | ||||||
People’s United Financial | 49,500 | 770 | ||||||
Plum Creek Timber ‡ | 29,900 | 1,234 | ||||||
PNC Financial Services Group | 87,591 | 8,382 | ||||||
Principal Financial Group | 46,191 | 2,388 | ||||||
Progressive | 90,583 | 2,477 | ||||||
Prologis ‡ | 86,400 | 3,421 | ||||||
Prudential Financial | 76,400 | 6,464 | ||||||
Public Storage ‡ | 24,495 | 4,741 | ||||||
Realty Income, Cl REIT ‡ | 36,200 | 1,650 | ||||||
Regions Financial | 227,100 | 2,291 | ||||||
Simon Property Group ‡ | 52,296 | 9,486 | ||||||
SL Green Realty ‡ | 16,700 | 1,982 | ||||||
State Street | 69,400 | 5,408 | ||||||
SunTrust Banks | 88,500 | 3,777 | ||||||
T. Rowe Price Group | 44,000 | 3,550 | ||||||
Torchmark | 20,446 | 1,167 | ||||||
| 2 | SEI Institutional Investments Trust / Annual Report / May 31, 2015 |
SCHEDULE OF INVESTMENTS
S&P 500 Index Fund
May 31, 2015
| Description | Shares | Market Value ($ Thousands) | ||||||
Travelers | 54,096 | $ | 5,470 | |||||
Unum Group | 40,391 | 1,412 | ||||||
US Bancorp | 299,483 | 12,911 | ||||||
Ventas ‡ | 55,800 | 3,712 | ||||||
Vornado Realty Trust ‡ | 29,496 | 2,946 | ||||||
Wells Fargo | 787,648 | 44,077 | ||||||
Weyerhaeuser, Cl REIT ‡ | 88,685 | 2,888 | ||||||
XL Group, Cl A | 51,200 | 1,929 | ||||||
Zions Bancorporation | 32,600 | 941 | ||||||
|
| |||||||
| 509,139 | ||||||||
|
| |||||||
Health Care — 14.9% | ||||||||
Abbott Laboratories | 253,683 | 12,329 | ||||||
AbbVie | 289,178 | 19,256 | ||||||
Actavis * | 65,599 | 20,126 | ||||||
Aetna | 59,195 | 6,983 | ||||||
Agilent Technologies | 56,791 | 2,339 | ||||||
Alexion Pharmaceuticals * | 34,000 | 5,571 | ||||||
AmerisourceBergen | 35,196 | 3,962 | ||||||
Amgen | 127,491 | 19,922 | ||||||
Anthem | 44,896 | 7,536 | ||||||
Baxter International | 91,396 | 6,088 | ||||||
Becton Dickinson | 35,138 | 4,937 | ||||||
Biogen * | 39,400 | 15,641 | ||||||
Boston Scientific * | 224,300 | 4,098 | ||||||
Bristol-Myers Squibb | 279,383 | 18,048 | ||||||
C.R. Bard | 12,600 | 2,146 | ||||||
Cardinal Health | 55,596 | 4,902 | ||||||
Celgene * | 134,587 | 15,402 | ||||||
Cerner * | 51,400 | 3,459 | ||||||
Cigna | 43,500 | 6,126 | ||||||
DaVita HealthCare Partners * | 29,195 | 2,446 | ||||||
Dentsply International | 22,591 | 1,175 | ||||||
Edwards Lifesciences * | 18,200 | 2,379 | ||||||
Eli Lilly | 164,391 | 12,971 | ||||||
Endo International * | 30,000 | 2,513 | ||||||
Express Scripts Holding * | 122,291 | 10,656 | ||||||
Gilead Sciences | 250,278 | 28,099 | ||||||
HCA Holdings * | 49,595 | 4,058 | ||||||
Henry Schein * | 14,200 | 2,012 | ||||||
Hospira * | 29,000 | 2,564 | ||||||
Humana | 23,996 | 5,151 | ||||||
Intuitive Surgical * | 6,200 | 3,024 | ||||||
Johnson & Johnson | 467,070 | 46,772 | ||||||
Laboratory Corp of America Holdings * | 17,000 | 2,005 | ||||||
Mallinckrodt * | 19,696 | 2,550 | ||||||
McKesson | 39,200 | 9,299 | ||||||
Medtronic | 239,561 | 18,283 | ||||||
Merck | 476,870 | 29,037 | ||||||
Mylan * | 68,496 | 4,975 | ||||||
Patterson | 13,800 | 660 | ||||||
PerkinElmer | 18,200 | 960 | ||||||
Perrigo | 23,696 | 4,509 | ||||||
Pfizer | 1,029,735 | 35,783 | ||||||
Quest Diagnostics | 24,400 | 1,836 | ||||||
Regeneron Pharmaceuticals * | 12,400 | 6,356 | ||||||
St. Jude Medical | 47,400 | 3,496 | ||||||
Stryker | 50,396 | 4,845 | ||||||
Tenet Healthcare * | 15,800 | 840 | ||||||
Thermo Fisher Scientific | 66,791 | 8,658 | ||||||
UnitedHealth Group | 160,287 | 19,268 | ||||||
Universal Health Services, Cl B | 15,400 | 1,996 | ||||||
Varian Medical Systems * | 16,095 | 1,394 | ||||||
| Description | Shares | Market Value ($ Thousands) | ||||||
Vertex Pharmaceuticals * | 40,800 | $ | 5,234 | |||||
Waters * | 14,100 | 1,884 | ||||||
Zimmer Holdings | 28,695 | 3,274 | ||||||
Zoetis, Cl A | 84,400 | 4,201 | ||||||
|
| |||||||
| 474,034 | ||||||||
|
| |||||||
Industrials — 10.0% | ||||||||
3M | 106,691 | 16,973 | ||||||
ADT | 27,500 | 1,003 | ||||||
Allegion | 15,396 | 961 | ||||||
American Airlines Group | 120,791 | 5,118 | ||||||
Ametek | 40,800 | 2,193 | ||||||
Boeing | 110,091 | 15,470 | ||||||
C.H. Robinson Worldwide | 23,495 | 1,450 | ||||||
Caterpillar | 101,991 | 8,702 | ||||||
Cintas | 15,695 | 1,351 | ||||||
CSX | 166,778 | 5,684 | ||||||
Cummins | 28,396 | 3,849 | ||||||
Danaher | 103,300 | 8,917 | ||||||
Deere | 57,196 | 5,358 | ||||||
Delta Air Lines | 138,787 | 5,957 | ||||||
Dover | 27,600 | 2,081 | ||||||
Dun & Bradstreet | 5,795 | 741 | ||||||
Eaton | 79,895 | 5,720 | ||||||
Emerson Electric | 115,291 | 6,953 | ||||||
Equifax | 20,195 | 2,026 | ||||||
Expeditors International of Washington | 30,791 | 1,411 | ||||||
Fastenal (A) | 45,991 | 1,909 | ||||||
FedEx | 44,300 | 7,674 | ||||||
Flowserve | 21,600 | 1,188 | ||||||
Fluor | 25,100 | 1,411 | ||||||
General Dynamics | 52,996 | 7,428 | ||||||
General Electric | 1,690,770 | 46,107 | ||||||
Honeywell International | 131,587 | 13,711 | ||||||
Illinois Tool Works | 58,795 | 5,517 | ||||||
Ingersoll-Rand | 44,496 | 3,060 | ||||||
Jacobs Engineering Group * | 19,796 | 856 | ||||||
Joy Global | 15,600 | 607 | ||||||
Kansas City Southern | 18,700 | 1,692 | ||||||
L-3 Communications Holdings, Cl 3 | 13,300 | 1,567 | ||||||
Lockheed Martin | 45,096 | 8,487 | ||||||
Masco | 56,200 | 1,522 | ||||||
Nielsen Holdings | 62,700 | 2,821 | ||||||
Norfolk Southern | 51,796 | 4,765 | ||||||
Northrop Grumman | 33,396 | 5,316 | ||||||
Paccar | 59,800 | 3,801 | ||||||
Pall | 18,000 | 2,240 | ||||||
Parker Hannifin | 24,100 | 2,902 | ||||||
Pentair | 30,900 | 1,979 | ||||||
Pitney Bowes | 32,400 | 708 | ||||||
Precision Castparts | 23,896 | 5,057 | ||||||
Quanta Services * | 34,000 | 997 | ||||||
Raytheon | 51,795 | 5,348 | ||||||
Republic Services, Cl A | 42,500 | 1,712 | ||||||
Robert Half International | 21,695 | 1,223 | ||||||
Rockwell Automation | 22,896 | 2,814 | ||||||
Rockwell Collins | 22,500 | 2,142 | ||||||
Roper Industries | 16,900 | 2,957 | ||||||
Ryder System | 8,495 | 779 | ||||||
Snap-on | 9,900 | 1,539 | ||||||
Southwest Airlines | 113,987 | 4,223 | ||||||
Stanley Black & Decker | 26,595 | 2,724 | ||||||
| 3 | SEI Institutional Investments Trust / Annual Report / May 31, 2015 |
SCHEDULE OF INVESTMENTS
S&P 500 Index Fund
May 31, 2015
| Description | Shares | Market Value ($ Thousands) | ||||||
Stericycle * | 14,396 | $ | 1,977 | |||||
Textron | 46,791 | 2,116 | ||||||
Tyco International | 70,900 | 2,862 | ||||||
Union Pacific | 148,187 | 14,953 | ||||||
United Parcel Service, Cl B | 116,887 | 11,598 | ||||||
United Rentals * | 15,500 | 1,378 | ||||||
United Technologies | 138,891 | 16,274 | ||||||
Waste Management | 72,000 | 3,575 | ||||||
WW Grainger | 10,100 | 2,427 | ||||||
Xylem | 29,300 | 1,072 | ||||||
|
| |||||||
| 318,933 | ||||||||
|
| |||||||
Information Technology — 19.8% | ||||||||
Accenture, Cl A | 105,596 | 10,141 | ||||||
Adobe Systems * | 80,095 | 6,335 | ||||||
Akamai Technologies * | 30,196 | 2,303 | ||||||
Alliance Data Systems * | 10,600 | 3,159 | ||||||
Altera | 50,900 | 2,486 | ||||||
Amphenol, Cl A | 52,391 | 2,989 | ||||||
Analog Devices | 52,600 | 3,575 | ||||||
Apple | 978,246 | 127,446 | ||||||
Applied Materials | 207,100 | 4,169 | ||||||
Autodesk * | 38,400 | 2,079 | ||||||
Automatic Data Processing | 79,991 | 6,840 | ||||||
Avago Technologies, Cl A | 43,200 | 6,397 | ||||||
Broadcom, Cl A | 91,800 | 5,219 | ||||||
CA | 51,187 | 1,559 | ||||||
Cisco Systems | 857,743 | 25,140 | ||||||
Citrix Systems * | 25,700 | 1,671 | ||||||
Cognizant Technology Solutions, Cl A * | 102,595 | 6,640 | ||||||
Computer Sciences | 22,695 | 1,557 | ||||||
Corning | 214,270 | 4,482 | ||||||
eBay * | 185,183 | 11,363 | ||||||
Electronic Arts * | 52,500 | 3,295 | ||||||
EMC | 334,474 | 8,810 | ||||||
Equinix ‡ | 9,500 | 2,547 | ||||||
F5 Networks * | 11,600 | 1,458 | ||||||
Facebook, Cl A * | 352,778 | 27,936 | ||||||
Fidelity National Information Services | 48,100 | 3,016 | ||||||
First Solar * | 12,100 | 602 | ||||||
Fiserv * | 40,300 | 3,230 | ||||||
FLIR Systems | 22,500 | 687 | ||||||
Google, Cl A * | 47,941 | 26,143 | ||||||
Google, Cl C * | 48,263 | 25,681 | ||||||
Harris | 20,900 | 1,656 | ||||||
Hewlett-Packard | 305,674 | 10,209 | ||||||
Intel | 795,752 | 27,422 | ||||||
International Business Machines | 154,451 | 26,203 | ||||||
Intuit | 46,600 | 4,853 | ||||||
Juniper Networks | 61,400 | 1,707 | ||||||
Kla-Tencor | 26,100 | 1,557 | ||||||
Lam Research | 26,995 | 2,220 | ||||||
Linear Technology | 40,496 | 1,938 | ||||||
MasterCard, Cl A | 164,147 | 15,144 | ||||||
Microchip Technology | 34,196 | 1,680 | ||||||
Micron Technology * | 181,500 | 5,069 | ||||||
Microsoft | 1,378,004 | 64,573 | ||||||
Motorola Solutions | 32,300 | 1,906 | ||||||
NetApp | 52,791 | 1,763 | ||||||
Nvidia | 87,383 | 1,934 | ||||||
Oracle | 538,665 | 23,427 | ||||||
Paychex | 55,187 | 2,727 | ||||||
| Description | Shares | Market Value ($ Thousands) | ||||||
Qualcomm | 277,278 | $ | 19,321 | |||||
Red Hat * | 31,000 | 2,395 | ||||||
Salesforce.com * | 101,791 | 7,405 | ||||||
SanDisk | 36,000 | 2,462 | ||||||
Seagate Technology | 55,400 | 3,082 | ||||||
Skyworks Solutions | 32,196 | 3,521 | ||||||
Symantec | 115,200 | 2,837 | ||||||
TE Connectivity | 68,491 | 4,726 | ||||||
Teradata * | 23,100 | 900 | ||||||
Texas Instruments | 176,083 | 9,846 | ||||||
Total System Services | 26,491 | 1,091 | ||||||
VeriSign *(A) | 17,900 | 1,131 | ||||||
Visa, Cl A | 325,970 | 22,388 | ||||||
Western Digital | 36,596 | 3,563 | ||||||
Western Union (A) | 88,278 | 1,938 | ||||||
Xerox | 176,900 | 2,020 | ||||||
Xilinx | 44,200 | 2,096 | ||||||
Yahoo! * | 146,591 | 6,294 | ||||||
|
| |||||||
| 631,959 | ||||||||
|
| |||||||
Materials — 3.2% | ||||||||
Air Products & Chemicals | 32,500 | 4,770 | ||||||
Airgas | 10,900 | 1,111 | ||||||
Alcoa | 206,500 | 2,581 | ||||||
Allegheny Technologies | 17,500 | 569 | ||||||
Avery Dennison | 14,500 | 898 | ||||||
Ball | 22,096 | 1,568 | ||||||
CF Industries Holdings | 8,100 | 2,559 | ||||||
Dow Chemical | 183,083 | 9,533 | ||||||
E.I. du Pont de Nemours | 152,287 | 10,814 | ||||||
Eastman Chemical | 25,196 | 1,934 | ||||||
Ecolab | 45,396 | 5,205 | ||||||
FMC | 21,400 | 1,223 | ||||||
Freeport-McMoRan, Cl B | 175,400 | 3,447 | ||||||
International Flavors & Fragrances | 13,700 | 1,631 | ||||||
International Paper | 71,296 | 3,696 | ||||||
LyondellBasell Industries, Cl A | 66,696 | 6,743 | ||||||
Martin Marietta Materials | 10,500 | 1,565 | ||||||
MeadWestvaco | 28,396 | 1,435 | ||||||
Monsanto | 81,291 | 9,509 | ||||||
Mosaic | 52,591 | 2,411 | ||||||
Newmont Mining | 84,383 | 2,298 | ||||||
Nucor | 53,887 | 2,549 | ||||||
Owens-Illinois * | 26,400 | 631 | ||||||
PPG Industries | 22,900 | 5,242 | ||||||
Praxair | 48,600 | 5,971 | ||||||
Sealed Air | 33,800 | 1,646 | ||||||
Sherwin-Williams | 13,600 | 3,919 | ||||||
Sigma-Aldrich | 20,200 | 2,814 | ||||||
Vulcan Materials | 22,400 | 2,014 | ||||||
|
| |||||||
| 100,286 | ||||||||
|
| |||||||
Telecommunication Services — 2.2% | ||||||||
AT&T | 872,043 | 30,120 | ||||||
CenturyLink | 95,587 | 3,177 | ||||||
Frontier Communications | 161,065 | 830 | ||||||
Level 3 Communications * | 48,400 | 2,685 | ||||||
Verizon Communications | 698,152 | 34,517 | ||||||
|
| |||||||
| 71,329 | ||||||||
|
| |||||||
Utilities — 2.9% | ||||||||
AES | 115,800 | 1,575 | ||||||
AGL Resources | 18,900 | 952 | ||||||
Ameren | 41,091 | 1,653 | ||||||
| 4 | SEI Institutional Investments Trust / Annual Report / May 31, 2015 |
SCHEDULE OF INVESTMENTS
S&P 500 Index Fund
May 31, 2015
| Description | Shares/Face Amount ($ Thousands) | Market Value ($ Thousands) | ||||||
American Electric Power | 82,500 | $ | 4,644 | |||||
Centerpoint Energy | 69,083 | 1,407 | ||||||
CMS Energy | 46,691 | 1,594 | ||||||
Consolidated Edison | 49,400 | 3,055 | ||||||
Dominion Resources | 99,000 | 6,981 | ||||||
DTE Energy | 30,000 | 2,377 | ||||||
Duke Energy | 118,991 | 9,011 | ||||||
Edison International | 54,996 | 3,344 | ||||||
Entergy | 29,300 | 2,241 | ||||||
Eversource Energy | 53,500 | 2,635 | ||||||
Exelon | 144,891 | 4,902 | ||||||
FirstEnergy | 71,187 | 2,540 | ||||||
Integrys Energy Group | 12,796 | 920 | ||||||
NextEra Energy | 74,600 | 7,634 | ||||||
NiSource | 53,387 | 2,519 | ||||||
NRG Energy | 54,287 | 1,368 | ||||||
Pepco Holdings | 39,900 | 1,087 | ||||||
PG&E | 80,300 | 4,294 | ||||||
Pinnacle West Capital | 17,800 | 1,084 | ||||||
PPL | 112,500 | 3,905 | ||||||
Public Service Enterprise Group | 85,400 | 3,641 | ||||||
SCANA | 22,996 | 1,222 | ||||||
Sempra Energy | 38,995 | 4,191 | ||||||
Southern | 153,200 | 6,693 | ||||||
TECO Energy | 37,800 | 713 | ||||||
Wisconsin Energy | 38,195 | 1,844 | ||||||
Xcel Energy | 85,483 | 2,911 | ||||||
|
| |||||||
| 92,937 | ||||||||
|
| |||||||
Total Common Stock | 3,135,669 | |||||||
|
| |||||||
AFFILIATED PARTNERSHIP — 0.4% |
| |||||||
SEI Liquidity Fund, L.P. | ||||||||
0.060% ** †(B) | 12,329,426 | 12,329 | ||||||
|
| |||||||
Total Affiliated Partnership (Cost $12,329) ($ Thousands) | 12,329 | |||||||
|
| |||||||
CASH EQUIVALENT — 1.4% |
| |||||||
SEI Daily Income Trust, Prime | ||||||||
0.010% ** † | 45,190,230 | 45,190 | ||||||
|
| |||||||
Total Cash Equivalent | ||||||||
(Cost $45,190) ($ Thousands) | 45,190 | |||||||
|
| |||||||
U.S. TREASURY OBLIGATIONS — 0.1% |
| |||||||
U.S. Treasury Bills | ||||||||
0.005%, 06/04/2015 (C) | $ | 2,800 | 2,800 | |||||
0.005%, 07/09/2015 (C) (D) | 1,100 | 1,100 | ||||||
|
| |||||||
Total U.S. Treasury Obligations | 3,900 | |||||||
|
| |||||||
Total Investments — 100.1% |
| $ | 3,197,088 | |||||
|
| |||||||
A list of the open futures contracts held by the Fund at May 31, 2015, is as follows:
| Type of Contract | Number of Contracts Long | Expiration Date | Unrealized Appreciation ($ Thousands) | |||||||||
S&P 500 Index E-MINI | 547 | Jun-2015 | $ | 1,553 | ||||||||
|
| |||||||||||
For the year ended May 31, 2015, the total amount of all open futures contracts, as presented in the table above, are representative of the volume of activity for this derivative type during the year.
Percentages are based on a Net Assets of $3,194,844 ($ Thousands).
| * | Non-income producing security. |
| ** | The rate reported is the 7-day effective yield as of May 31, 2015. |
| † | Investment in Affiliated Security (see Note 6). |
| ‡ | Real Estate Investment Trust. |
| (A) | This security or a partial position of this security is on loan at May 31, 2015 (see Note 12). The total market value of securities on loan at May 31, 2015 was $11,973 ($ Thousands). |
| (B) | This security was purchased with cash collateral held from securities on loan (See Note 12). The total value of such securities as of May 31, 2015 was $12,329 ($ Thousands). |
| (C) | The rate reported is the effective yield at time of purchase. |
| (D) | Security, or portion thereof, has been pledged as collateral on open futures contracts. |
| Cl | — Class |
| L.P. | — Limited Partnership |
| S&P | — Standard and Poor’s |
The following is a list of the level of inputs used as of May 31, 2015, in valuing the Fund’s investments and other financial instruments carried at value ($ Thousands):
| Investments in Securities | Level 1 | Level 2 | Level 3 | Total | ||||||||||||
Common Stock | $ | 3,135,669 | $ | — | $ | — | $ | 3,135,669 | ||||||||
Affiliated Partnership | — | 12,329 | — | 12,329 | ||||||||||||
Cash Equivalent | 45,190 | — | — | 45,190 | ||||||||||||
U.S. Treasury Obligations | — | 3,900 | — | 3,900 | ||||||||||||
|
|
|
|
|
|
|
| |||||||||
Total Investments in Securities | $ | 3,180,859 | $ | 16,229 | $ | — | $ | 3,197,088 | ||||||||
|
|
|
|
|
|
|
| |||||||||
| Other Financial Instruments | Level 1 | Level 2 | Level 3 | Total | ||||||||||||
Futures Contracts * | ||||||||||||||||
Unrealized Appreciation | $ | 1,553 | $ | — | $ | — | $ | 1,553 | ||||||||
|
|
|
|
|
|
|
| |||||||||
| * | Futures contracts are valued at the unrealized appreciation on the instrument. |
For the year ended May 31, 2015, there were no transfers between Level 1, Level 2 and Level 3 assets and liabilities.
For the year ended May 31, 2015, there were no Level 3 securities.
For more information on valuation inputs, see Note 2 — Significant Accounting Policies in Notes to Financial Statements.
Amounts designated as “—” are $0 or have been rounded to $0.
The accompanying notes are an integral part of the financial statements.
| 5 | SEI Institutional Investments Trust / Annual Report / May 31, 2015 |
SCHEDULE OF INVESTMENTS
Extended Market Index Fund
May 31, 2015
| Description | Shares | Market Value ($ Thousands) | ||||||
COMMON STOCK — 98.0% | ||||||||
Consumer Discretionary — 14.9% | ||||||||
1-800-Flowers.com, Cl A * | 1,700 | $ | 16 | |||||
2U * | 1,300 | 36 | ||||||
Aaron’s | 9,616 | 337 | ||||||
Abercrombie & Fitch, Cl A | 12,300 | 252 | ||||||
Advance Auto Parts | 12,199 | 1,869 | ||||||
Aeropostale *(A) | 8,049 | 15 | ||||||
AH Belo, Cl A | 2,700 | 16 | ||||||
AMC Entertainment Holdings, Cl A | 4,100 | 119 | ||||||
AMC Networks, Cl A * | 10,260 | 806 | ||||||
American Axle & Manufacturing Holdings * | 11,298 | 284 | ||||||
American Eagle Outfitters | 34,022 | 557 | ||||||
American Public Education * | 2,727 | 66 | ||||||
America’s Car-Mart * | 850 | 45 | ||||||
ANN * | 7,735 | 362 | ||||||
Apollo Education Group, Cl A * | 16,100 | 267 | ||||||
Aramark | 6,500 | 204 | ||||||
Arctic Cat | 1,535 | 51 | ||||||
Asbury Automotive Group * | 4,098 | 349 | ||||||
Ascena Retail Group * | 21,568 | 319 | ||||||
Ascent Capital Group, Cl A * | 1,754 | 71 | ||||||
Barnes & Noble * | 5,927 | 139 | ||||||
Beazer Homes USA * | 2,961 | 54 | ||||||
bebe stores | 1,520 | 4 | ||||||
Belmond, Cl A * | 17,030 | 208 | ||||||
Big 5 Sporting Goods | 923 | 13 | ||||||
Big Lots | 7,946 | 349 | ||||||
Biglari Holdings * | 202 | 71 | ||||||
BJ’s Restaurants *(A) | 2,742 | 126 | ||||||
Black Diamond * | 4,204 | 39 | ||||||
Bloomin’ Brands | 11,050 | 248 | ||||||
Blue Nile * | 1,431 | 39 | ||||||
Bob Evans Farms | 3,287 | 151 | ||||||
Bon-Ton Stores (A) | 800 | 5 | ||||||
Boyd Gaming * | 12,945 | 185 | ||||||
Bravo Brio Restaurant Group * | 3,676 | 49 | ||||||
Bridgepoint Education * | 2,679 | 25 | ||||||
Bright Horizons Family Solutions * | 4,635 | 258 | ||||||
Brinker International | 10,182 | 562 | ||||||
Brunswick | 15,883 | 811 | ||||||
Buckle (A) | 4,851 | 207 | ||||||
Buffalo Wild Wings * | 3,327 | 508 | ||||||
Build-A-Bear Workshop, Cl A * | 2,700 | 43 | ||||||
Burlington Stores * | 4,400 | 232 | ||||||
Cabela’s *(A) | 8,939 | 456 | ||||||
Caesars Acquisition, Cl A * | 5,300 | 39 | ||||||
Caesars Entertainment *(A) | 7,783 | 73 | ||||||
Caleres | 6,276 | 194 | ||||||
Callaway Golf | 13,906 | 131 | ||||||
Capella Education | 2,138 | 114 | ||||||
Career Education * | 10,054 | 38 | ||||||
Carmike Cinemas * | 3,042 | 85 | ||||||
Carriage Services, Cl A | 2,006 | 50 | ||||||
Carrols Restaurant Group * | 3,300 | 33 | ||||||
Carter’s | 9,170 | 947 | ||||||
Cato, Cl A | 4,096 | 153 | ||||||
Cavco Industries * | 1,331 | 97 | ||||||
Central European Media Enterprises, Cl A * | 7,006 | 16 | ||||||
| Description | Shares | Market Value ($ Thousands) | ||||||
Charter Communications, Cl A *(A) | 13,165 | $ | 2,357 | |||||
Cheesecake Factory | 7,523 | 388 | ||||||
Chegg * | 8,600 | 65 | ||||||
Chico’s FAS | 22,151 | 368 | ||||||
Children’s Place Retail Stores | 2,933 | 192 | ||||||
Choice Hotels International | 6,377 | 361 | ||||||
Christopher & Banks * | 3,400 | 20 | ||||||
Churchill Downs | 2,234 | 279 | ||||||
Chuy’s Holdings * | 2,335 | 61 | ||||||
Cinedigm, Cl A *(A) | 9,100 | 8 | ||||||
Cinemark Holdings | 17,940 | 727 | ||||||
Citi Trends * | 3,097 | 74 | ||||||
Clear Channel Outdoor Holdings, Cl A | 6,796 | 76 | ||||||
ClubCorp Holdings | 2,800 | 64 | ||||||
Collectors Universe | 1,500 | 32 | ||||||
Columbia Sportswear | 3,844 | 215 | ||||||
Conn’s *(A) | 3,909 | 145 | ||||||
Container Store Group *(A) | 1,600 | 29 | ||||||
Cooper Tire & Rubber | 8,832 | 324 | ||||||
Cooper-Standard Holding * | 2,800 | 175 | ||||||
Core-Mark Holdings | 3,918 | 210 | ||||||
Cracker Barrel Old Country Store | 3,344 | 472 | ||||||
Crocs * | 11,003 | 165 | ||||||
CSS Industries | 492 | 14 | ||||||
CST Brands | 13,300 | 529 | ||||||
Culp | 361 | 10 | ||||||
Cumulus Media, Cl A * | 18,139 | 43 | ||||||
Daily Journal * | 100 | 20 | ||||||
Dana Holdings | 26,698 | 581 | ||||||
Dave & Buster’s Entertainment * | 1,900 | 60 | ||||||
Deckers Outdoor * | 5,604 | 382 | ||||||
Del Frisco’s Restaurant Group * | 2,800 | 52 | ||||||
Demand Media * | 337 | 2 | ||||||
Denny’s * | 14,463 | 151 | ||||||
Destination Maternity | 2,256 | 25 | ||||||
Destination XL Group * | 4,342 | 21 | ||||||
DeVry Education Group | 10,381 | 330 | ||||||
Dex Media *(A) | 1,500 | 1 | ||||||
Diamond Resorts International * | 5,800 | 180 | ||||||
Dick’s Sporting Goods | 16,435 | 883 | ||||||
Dillard’s, Cl A | 4,262 | 494 | ||||||
DineEquity | 2,772 | 271 | ||||||
DISH Network, Cl A * | 35,419 | 2,507 | ||||||
Domino’s Pizza | 9,458 | 1,028 | ||||||
Dorman Products *(A) | 4,440 | 207 | ||||||
DreamWorks Animation SKG, Cl A *(A) | 13,591 | 366 | ||||||
Drew Industries | 4,049 | 249 | ||||||
DSW, Cl A | 11,992 | 416 | ||||||
Dunkin’ Brands Group | 16,630 | 887 | ||||||
Eastman Kodak * | 2,100 | 40 | ||||||
El Pollo Loco Holdings *(A) | 1,400 | 29 | ||||||
Entercom Communications, Cl A * | 4,782 | 54 | ||||||
Entravision Communications, Cl A | 6,700 | 45 | ||||||
Eros International * | 2,300 | 46 | ||||||
Ethan Allen Interiors | 3,176 | 80 | ||||||
EVINE Live * | 4,000 | 13 | ||||||
EW Scripps, Cl A | 10,496 | 246 | ||||||
Express * | 13,362 | 236 | ||||||
| 1 | SEI Institutional Investments Trust / Annual Report / May 31, 2015 |
SCHEDULE OF INVESTMENTS
Extended Market Index Fund
May 31, 2015
| Description | Shares | Market Value ($ Thousands) | ||||||
Federal-Mogul Holdings, Cl A * | 3,316 | $ | 41 | |||||
Fiesta Restaurant Group * | 4,005 | 186 | ||||||
Finish Line, Cl A | 9,311 | 244 | ||||||
Five Below * | 9,005 | 299 | ||||||
Flexsteel Industries | 600 | 23 | ||||||
Foot Locker | 24,414 | 1,543 | ||||||
Fox Factory Holding * | 1,400 | 23 | ||||||
Francesca’s Holdings * | 8,224 | 129 | ||||||
Fred’s, Cl A | 6,579 | 115 | ||||||
FTD * | 2,392 | 66 | ||||||
Fuel Systems Solutions * | 1,394 | 11 | ||||||
Genesco * | 4,469 | 296 | ||||||
Gentex | 49,790 | 855 | ||||||
Gentherm * | 6,448 | 331 | ||||||
G-III Apparel Group * | 5,806 | 330 | ||||||
Global Eagle Entertainment * | 4,900 | 66 | ||||||
GNC Holdings, Cl A | 14,178 | 631 | ||||||
GoPro, Cl A * | 4,200 | 233 | ||||||
Graham Holdings, Cl B | 600 | 643 | ||||||
Grand Canyon Education * | 7,715 | 329 | ||||||
Gray Television * | 12,300 | 196 | ||||||
Group 1 Automotive | 4,435 | 365 | ||||||
Groupon, Cl A * | 84,341 | 538 | ||||||
Guess? | 8,217 | 144 | ||||||
Habit Restaurants, Cl A * | 1,600 | 56 | ||||||
Harte-Hanks | 7,846 | 49 | ||||||
Haverty Furniture | 2,163 | 45 | ||||||
Helen of Troy * | 4,348 | 380 | ||||||
hhgregg *(A) | 1,100 | 4 | ||||||
Hibbett Sports * | 4,012 | 187 | ||||||
Hillenbrand | 10,385 | 319 | ||||||
Hilton Worldwide Holdings * | 21,300 | 617 | ||||||
Houghton Mifflin Harcourt * | 17,600 | 464 | ||||||
Hovnanian Enterprises, Cl A *(A) | 10,715 | 35 | ||||||
HSN | 5,111 | 343 | ||||||
Hyatt Hotels, Cl A * | 6,327 | 364 | ||||||
Iconix Brand Group * | 8,051 | 208 | ||||||
International Speedway, Cl A | 5,498 | 205 | ||||||
Interval Leisure Group | 5,698 | 148 | ||||||
iRobot * | 3,702 | 118 | ||||||
Isle of Capri Casinos * | 4,779 | 68 | ||||||
ITT Educational Services *(A) | 2,156 | 9 | ||||||
J.C. Penney *(A) | 49,395 | 424 | ||||||
Jack in the Box | 6,321 | 549 | ||||||
JAKKS Pacific * | 427 | 3 | ||||||
Jamba *(A) | 1,407 | 22 | ||||||
Jarden * | 32,310 | 1,714 | ||||||
John Wiley & Sons, Cl A | 7,872 | 457 | ||||||
Johnson Outdoors, Cl A | 700 | 17 | ||||||
Journal Media Group | 2,271 | 18 | ||||||
K12 * | 3,988 | 55 | ||||||
Kate Spade * | 22,098 | 548 | ||||||
KB Home (A) | 13,785 | 204 | ||||||
Kimball International, Cl B | 4,125 | 50 | ||||||
Kirkland’s * | 2,028 | 53 | ||||||
Krispy Kreme Doughnuts * | 12,771 | 222 | ||||||
La Quinta Holdings * | 8,000 | 199 | ||||||
Lands’ End * | 1,662 | 49 | ||||||
Las Vegas Sands | 62,204 | 3,162 | ||||||
La-Z-Boy, Cl Z | 8,926 | 237 | ||||||
LeapFrog Enterprises, Cl A * | 11,338 | 23 | ||||||
Lear | 12,971 | 1,505 | ||||||
Lee Enterprises * | 6,300 | 19 | ||||||
LGI Homes *(A) | 1,700 | 32 | ||||||
| Description | Shares | Market Value ($ Thousands) | ||||||
Libbey | 2,785 | $ | 110 | |||||
Liberty Broadband, Cl C * | 10,768 | 576 | ||||||
Liberty Broadband, Cl A * | 4,583 | 247 | ||||||
Liberty Interactive, Cl A * | 81,516 | 2,280 | ||||||
Liberty Media * | 16,435 | 630 | ||||||
Liberty Media * | 31,970 | 1,214 | ||||||
Liberty Tripadvisor Holdings, Cl A * | 10,892 | 305 | ||||||
Liberty Ventures, Ser A * | 24,379 | 1,012 | ||||||
Life Time Fitness * | 7,178 | 516 | ||||||
LifeLock * | 13,463 | 205 | ||||||
Lifetime Brands | 300 | 4 | ||||||
Lions Gate Entertainment | 12,909 | 427 | ||||||
Lithia Motors, Cl A | 3,489 | 371 | ||||||
Live Nation * | 24,903 | 712 | ||||||
LKQ * | 50,604 | 1,446 | ||||||
Loral Space & Communications * | 1,900 | 127 | ||||||
Lumber Liquidators Holdings *(A) | 4,126 | 84 | ||||||
M/I Homes * | 2,694 | 63 | ||||||
Madison Square Garden, Cl A * | 10,540 | 900 | ||||||
Malibu Boats, Cl A * | 1,100 | 23 | ||||||
Marcus | 2,761 | 54 | ||||||
MarineMax * | 3,996 | 96 | ||||||
Marriott Vacations Worldwide | 4,374 | 386 | ||||||
Martha Stewart Living Omnimedia, Cl A * | 8,900 | 46 | ||||||
Mattress Firm Holding *(A) | 2,411 | 142 | ||||||
McClatchy, Cl A * | 11,254 | 12 | ||||||
MDC Holdings | 7,689 | 215 | ||||||
MDC Partners, Cl A | 5,776 | 122 | ||||||
Media General * | 12,600 | 209 | ||||||
Men’s Wearhouse | 7,268 | 422 | ||||||
Meredith | 5,944 | 314 | ||||||
Meritage Homes * | 7,211 | 316 | ||||||
Metaldyne Performance Group | 3,400 | 65 | ||||||
MGM Resorts International * | 62,774 | 1,259 | ||||||
Michaels * | 3,500 | 96 | ||||||
Modine Manufacturing * | 7,374 | 83 | ||||||
Monarch Casino & Resort * | 1,100 | 21 | ||||||
Monro Muffler (A) | 4,828 | 285 | ||||||
Morgans Hotel Group * | 2,200 | 15 | ||||||
Morningstar | 3,120 | 241 | ||||||
Motorcar Parts & Accessories * | 1,800 | 52 | ||||||
Movado Group | 2,720 | 71 | ||||||
Murphy USA * | 8,300 | 483 | ||||||
Nathan’s Famous | 400 | 16 | ||||||
National CineMedia | 7,907 | 126 | ||||||
Nautilus * | 6,200 | 131 | ||||||
New Media Investment | 8,900 | 196 | ||||||
New York * | 3,100 | 8 | ||||||
New York Times, Cl A | 22,982 | 319 | ||||||
Nexstar Broadcasting Group, Cl A | 5,622 | 320 | ||||||
Noodles, Cl A * | 700 | 10 | ||||||
Norwegian Cruise Line Holdings * | 15,469 | 844 | ||||||
Nutrisystem | 4,559 | 104 | ||||||
NVR * | 725 | 986 | ||||||
Office Depot * | 91,347 | 847 | ||||||
Orbitz Worldwide * | 6,000 | 68 | ||||||
Outerwall (A) | 3,343 | 256 | ||||||
Overstock.com * | 700 | 15 | ||||||
Oxford Industries | 2,854 | 217 | ||||||
| 2 | SEI Institutional Investments Trust / Annual Report / May 31, 2015 |
SCHEDULE OF INVESTMENTS
Extended Market Index Fund
May 31, 2015
| Description | Shares | Market Value ($ Thousands) | ||||||
Pacific Sunwear of California * | 5,000 | $ | 8 | |||||
Panera Bread, Cl A * | 3,820 | 695 | ||||||
Papa John’s International | 5,042 | 346 | ||||||
Penn National Gaming *(A) | 12,454 | 207 | ||||||
Penske Auto Group | 7,688 | 397 | ||||||
Pep Boys-Manny Moe & Jack * | 8,065 | 82 | ||||||
Perry Ellis International * | 2,439 | 60 | ||||||
PetMed Express | 3,796 | 63 | ||||||
Pier 1 Imports (A) | 18,189 | 231 | ||||||
Pinnacle Entertainment * | 10,760 | 398 | ||||||
Polaris Industries | 11,007 | 1,575 | ||||||
Pool | 7,870 | 522 | ||||||
Popeyes Louisiana Kitchen * | 3,539 | 197 | ||||||
Potbelly * | 1,400 | 20 | ||||||
Quiksilver *(A) | 19,450 | 27 | ||||||
ReachLocal * | 600 | 2 | ||||||
Reading International, Cl A * | 3,800 | 51 | ||||||
Red Robin Gourmet Burgers * | 1,967 | 164 | ||||||
Regal Entertainment Group, Cl A | 13,705 | 287 | ||||||
Regis * | 6,527 | 105 | ||||||
Remy International * | 3,371 | 74 | ||||||
Rent-A-Center, Cl A | 9,840 | 298 | ||||||
Rentrak *(A) | 1,088 | 74 | ||||||
Restaurant Brands International (A) | 33,868 | 1,310 | ||||||
Restoration Hardware Holdings * | 5,511 | 501 | ||||||
Ruby Tuesday * | 9,879 | 62 | ||||||
Ruth’s Hospitality Group | 4,272 | 63 | ||||||
Ryland Group | 7,616 | 320 | ||||||
Saga Communications, Cl A | 593 | 23 | ||||||
Sally Beauty Holdings * | 27,591 | 861 | ||||||
Scholastic | 4,467 | 199 | ||||||
Scientific Games, Cl A *(A) | 5,862 | 89 | ||||||
Sears Holdings *(A) | 4,726 | 203 | ||||||
Sears Hometown and Outlet Stores * | 449 | 3 | ||||||
SeaWorld Entertainment | 10,900 | 235 | ||||||
Select Comfort * | 9,009 | 281 | ||||||
Sequential Brands Group * | 2,000 | 28 | ||||||
Service International | 32,889 | 956 | ||||||
ServiceMaster Global Holdings * | 7,100 | 238 | ||||||
SFX Entertainment * | 3,300 | 16 | ||||||
Shake Shack, Cl A *(A) | 900 | 75 | ||||||
Shoe Carnival | 2,076 | 57 | ||||||
Shutterfly * | 7,025 | 327 | ||||||
Signet Jewelers | 13,455 | 1,740 | ||||||
Sinclair Broadcast Group, Cl A (A) | 10,311 | 310 | ||||||
Sirius XM Holdings * | 433,479 | 1,673 | ||||||
Six Flags Entertainment | 12,658 | �� | 618 | |||||
Sizmek * | 2,348 | 16 | ||||||
Skechers U.S.A., Cl A * | 6,782 | 718 | ||||||
Skullcandy * | 2,500 | 19 | ||||||
Smith & Wesson Holding * | 10,383 | 153 | ||||||
Sonic | 10,033 | 302 | ||||||
Sonic Automotive, Cl A | 5,064 | 118 | ||||||
Sotheby’s (A) | 10,761 | 482 | ||||||
Spartan Motors | 1,248 | 6 | ||||||
Speedway Motorsports | 1,635 | 36 | ||||||
Stage Stores | 3,854 | 62 | ||||||
Standard Motor Products | 3,066 | 108 | ||||||
Standard Pacific * | 28,069 | 231 | ||||||
Starz * | 13,539 | 568 | ||||||
| Description | Shares | Market Value ($ Thousands) | ||||||
Stein Mart | 4,791 | $ | 51 | |||||
Steiner Leisure * | 2,077 | 102 | ||||||
Steven Madden * | 10,501 | 397 | ||||||
Stoneridge * | 3,730 | 44 | ||||||
Strattec Security | 400 | 28 | ||||||
Strayer Education * | 1,817 | 83 | ||||||
Sturm Ruger | 3,842 | 206 | ||||||
Superior Industries International | 2,823 | 54 | ||||||
Systemax * | 1,400 | 12 | ||||||
Taylor Morrison Home, Cl A * | 3,800 | 73 | ||||||
Tempur Sealy International * | 10,523 | 627 | ||||||
Tenneco * | 10,563 | 620 | ||||||
Tesla Motors *(A) | 15,679 | 3,932 | ||||||
Texas Roadhouse, Cl A | 11,266 | 395 | ||||||
Thomson Reuters | 58,985 | 2,357 | ||||||
Thor Industries | 7,390 | 451 | ||||||
Tile Shop Holdings * | 3,300 | 41 | ||||||
Tilly’s, Cl A * | 843 | 8 | ||||||
Time | 19,600 | 441 | ||||||
Toll Brothers * | 30,039 | 1,087 | ||||||
Tower International * | 2,400 | 66 | ||||||
Travelport Worldwide (A) | 3,800 | 58 | ||||||
TRI Pointe Homes * | 21,473 | 310 | ||||||
Tuesday Morning * | 6,886 | 88 | ||||||
Tumi Holdings * | 6,398 | 123 | ||||||
Tupperware Brands | 8,824 | 580 | ||||||
Ulta Salon Cosmetics & Fragrance * | 10,773 | 1,644 | ||||||
Unifi * | 2,480 | 81 | ||||||
Universal Electronics * | 2,487 | 129 | ||||||
Universal Technical Institute | 3,013 | 25 | ||||||
Vail Resorts | 6,212 | 644 | ||||||
Vera Bradley * | 2,470 | 33 | ||||||
Vince Holding * | 1,500 | 24 | ||||||
Vista Outdoor * | 11,188 | 516 | ||||||
Visteon * | 6,865 | 752 | ||||||
Vitamin Shoppe * | 5,384 | 214 | ||||||
VOXX International, Cl A * | 2,864 | 24 | ||||||
Wayfair, Cl A * | 2,900 | 87 | ||||||
WCI Communities * | 1,400 | 33 | ||||||
Weight Watchers International *(A) | 2,374 | 13 | ||||||
Wendy’s | 48,175 | 541 | ||||||
West Marine * | 537 | 5 | ||||||
Weyco Group | 263 | �� | 7 | |||||
William Lyon Homes, Cl A * | 3,000 | 68 | ||||||
Williams-Sonoma | 15,837 | 1,245 | ||||||
Winmark | 95 | 9 | ||||||
Winnebago Industries | 4,035 | 88 | ||||||
Wolverine World Wide | 15,996 | 470 | ||||||
World Wrestling Entertainment, Cl A (A) | 4,234 | 61 | ||||||
Zoe’s Kitchen *(A) | 700 | 22 | ||||||
Zulily, Cl A *(A) | 1,500 | 20 | ||||||
Zumiez *(A) | 3,903 | 117 | ||||||
|
| |||||||
| 109,632 | ||||||||
|
| |||||||
Consumer Staples — 3.2% |
| |||||||
Alico | 143 | 7 | ||||||
Alliance One International * | 4,660 | 6 | ||||||
Andersons | 5,399 | 239 | ||||||
Avon Products | 68,600 | 461 | ||||||
B&G Foods, Cl A | 9,111 | 282 | ||||||
Boston Beer, Cl A * | 1,383 | 365 | ||||||
Boulder Brands * | 6,678 | 62 | ||||||
| 3 | SEI Institutional Investments Trust / Annual Report / May 31, 2015 |
SCHEDULE OF INVESTMENTS
Extended Market Index Fund
May 31, 2015
| Description | Shares | Market Value ($ Thousands) | ||||||
Bunge | 24,443 | $ | 2,262 | |||||
Calavo Growers | 2,126 | 107 | ||||||
Cal-Maine Foods (A) | 5,228 | 296 | ||||||
Casey’s General Stores | 6,059 | 528 | ||||||
Central Garden and Pet, Cl A * | 7,929 | 77 | ||||||
Chefs’ Warehouse *(A) | 3,921 | 74 | ||||||
Church & Dwight | 22,699 | 1,906 | ||||||
Coca-Cola Bottling | 589 | 67 | ||||||
Coty, Cl A | 11,100 | 277 | ||||||
Craft Brew Alliance * | 1,600 | 17 | ||||||
Darling International * | 29,257 | 459 | ||||||
Dean Foods | 17,250 | 318 | ||||||
Diamond Foods * | 2,519 | 72 | ||||||
Diplomat Pharmacy * | 1,900 | 73 | ||||||
Elizabeth Arden *(A) | 3,000 | 42 | ||||||
Energizer Holdings | 10,345 | 1,466 | ||||||
Fairway Group Holdings, Cl A *(A) | 1,200 | 5 | ||||||
Farmer Bros * | 900 | 22 | ||||||
Female Health | 1,300 | 3 | ||||||
Flowers Foods | 29,808 | 669 | ||||||
Fresh Del Monte Produce | 5,681 | 214 | ||||||
Fresh Market * | 7,188 | 228 | ||||||
Freshpet *(A) | 3,400 | 67 | ||||||
Hain Celestial Group * | 16,960 | 1,073 | ||||||
Herbalife *(A) | 12,072 | 628 | ||||||
HRG Group * | 14,978 | 197 | ||||||
Ingles Markets, Cl A | 2,245 | 110 | ||||||
Ingredion | 12,665 | 1,038 | ||||||
Inter Parfums | 1,806 | 60 | ||||||
Inventure Foods * | 900 | 9 | ||||||
J&J Snack Foods | 2,364 | 255 | ||||||
John B Sanfilippo & Son | 1,019 | 52 | ||||||
Lancaster Colony | 3,429 | 306 | ||||||
Landec * | 4,693 | 67 | ||||||
Limoneira | 1,295 | 28 | ||||||
Medifast * | 1,564 | 50 | ||||||
National Beverage * | 2,352 | 49 | ||||||
Natural Grocers by Vitamin Cottage * | 1,085 | 26 | ||||||
Nature’s Sunshine Products | 437 | 6 | ||||||
Nu Skin Enterprises, Cl A (A) | 10,405 | 527 | ||||||
Nutraceutical International * | 362 | 8 | ||||||
Oil-Dri Corp of America | 210 | 7 | ||||||
Omega Protein * | 3,866 | 53 | ||||||
Orchids Paper Products | 800 | 18 | ||||||
Pilgrim’s Pride (A) | 11,807 | 302 | ||||||
Pinnacle Foods | 9,800 | 413 | ||||||
Post Holdings * | 7,669 | 332 | ||||||
PriceSmart | 3,123 | 255 | ||||||
Revlon, Cl A * | 1,120 | 41 | ||||||
Rite Aid * | 163,727 | 1,428 | ||||||
Roundy’s * | 1,300 | 5 | ||||||
Sanderson Farms (A) | 3,541 | 289 | ||||||
Seaboard * | 36 | 123 | ||||||
Seneca Foods, Cl A * | 462 | 13 | ||||||
Smart & Final Stores * | 3,500 | 59 | ||||||
Snyder’s-Lance | 8,086 | 242 | ||||||
SpartanNash | 7,336 | 229 | ||||||
Spectrum Brands Holdings | 4,039 | 390 | ||||||
Sprouts Farmers Market * | 17,200 | 516 | ||||||
SUPERVALU * | 32,916 | 291 | ||||||
Tootsie Roll Industries (A) | 3,028 | 93 | ||||||
TreeHouse Foods * | 7,409 | 528 | ||||||
| Description | Shares | Market Value ($ Thousands) | ||||||
United Natural Foods * | 7,798 | $ | 523 | |||||
Universal | 4,545 | 234 | ||||||
USANA Health Sciences * | 816 | 105 | ||||||
Vector Group | 11,304 | 250 | ||||||
Village Super Market, Cl A | 462 | 15 | ||||||
WD-40 | 2,086 | 176 | ||||||
Weis Markets | 1,704 | 74 | ||||||
WhiteWave Foods, Cl A * | 29,152 | 1,400 | ||||||
|
| |||||||
| 23,564 | ||||||||
|
| |||||||
Energy — 4.5% |
| |||||||
Abraxas Petroleum * | 16,494 | 48 | ||||||
Adams Resources & Energy | 300 | 13 | ||||||
Alon USA Energy (A) | 3,296 | 58 | ||||||
Alpha Natural Resources *(A) | 25,323 | 13 | ||||||
Antero Resources * | 8,300 | 332 | ||||||
Approach Resources *(A) | 4,198 | 29 | ||||||
Arch Coal (A) | 29,816 | 15 | ||||||
Ardmore Shipping | 2,100 | 24 | ||||||
Atwood Oceanics | 9,540 | 294 | ||||||
Basic Energy Services * | 3,973 | 35 | ||||||
Bill Barrett * | 6,264 | 55 | ||||||
Bonanza Creek Energy * | 6,388 | 133 | ||||||
Bristow Group | 5,303 | 308 | ||||||
C&J Energy Services * | 5,495 | 83 | ||||||
California Resources | 56,000 | 440 | ||||||
Callon Petroleum * | 6,485 | 51 | ||||||
CARBO Ceramics (A) | 2,350 | 100 | ||||||
Carrizo Oil & Gas * | 9,109 | 457 | ||||||
CHC Group * | 7,800 | 10 | ||||||
Cheniere Energy * | 39,365 | 2,985 | ||||||
Clayton Williams Energy * | 916 | 47 | ||||||
Clean Energy Fuels *(A) | 7,588 | 57 | ||||||
Cloud Peak Energy * | 8,089 | 47 | ||||||
Cobalt International Energy * | 61,015 | 620 | ||||||
Comstock Resources (A) | 6,473 | 23 | ||||||
Concho Resources * | 19,942 | 2,399 | ||||||
Contango Oil & Gas * | 2,535 | 35 | ||||||
Continental Resources *(A) | 13,496 | 615 | ||||||
CVR Energy | 1,897 | 74 | ||||||
Delek US Holdings | 9,609 | 364 | ||||||
Denbury Resources (A) | 56,500 | 416 | ||||||
DHT Holdings | 14,000 | 110 | ||||||
Diamondback Energy * | 8,275 | 644 | ||||||
Dresser-Rand Group * | 12,955 | 1,096 | ||||||
Dril-Quip * | 6,087 | 460 | ||||||
Eclipse Resources *(A) | 3,800 | 24 | ||||||
Emerald Oil *(A) | 465 | 3 | ||||||
Energen | 12,389 | 857 | ||||||
Energy XXI Bermuda (A) | 11,983 | 41 | ||||||
EP Energy, Cl A * | 3,800 | 50 | ||||||
Era Group * | 2,093 | 44 | ||||||
Evolution Petroleum | 627 | 4 | ||||||
EXCO Resources | 19,913 | 31 | ||||||
Exterran Holdings | 9,683 | 320 | ||||||
FMSA Holdings *(A) | 7,500 | 67 | ||||||
Forum Energy Technologies * | 8,005 | 166 | ||||||
Frank’s International | 5,300 | 105 | ||||||
Frontline * | 7,400 | 19 | ||||||
FX Energy *(A) | 11,563 | 11 | ||||||
GasLog | 8,650 | 179 | ||||||
Gastar Exploration * | 6,900 | 21 | ||||||
Geospace Technologies * | 1,598 | 33 | ||||||
Golar LNG | 8,502 | 404 | ||||||
Goodrich Petroleum * | 4,793 | 13 | ||||||
| 4 | SEI Institutional Investments Trust / Annual Report / May 31, 2015 |
SCHEDULE OF INVESTMENTS
Extended Market Index Fund
May 31, 2015
| Description | Shares | Market Value ($ Thousands) | ||||||
Green Plains Renewable Energy | 5,590 | $ | 184 | |||||
Gulf Island Fabrication | 2,872 | 32 | ||||||
Gulfmark Offshore, Cl A | 3,380 | 45 | ||||||
Gulfport Energy * | 16,381 | 707 | ||||||
Halcon Resources * | 32,806 | 34 | ||||||
Harvest Natural Resources * | 5,000 | 10 | ||||||
Helix Energy Solutions Group * | 19,569 | 307 | ||||||
Hercules Offshore *(A) | 21,026 | 14 | ||||||
HollyFrontier | 33,354 | 1,389 | ||||||
Hornbeck Offshore Services * | 4,612 | 103 | ||||||
ION Geophysical * | 20,869 | 30 | ||||||
Jones Energy, Cl A * | 2,600 | 25 | ||||||
Key Energy Services * | 20,159 | 45 | ||||||
Kosmos Energy * | 12,975 | 115 | ||||||
Laredo Petroleum Holdings *(A) | 17,189 | 234 | ||||||
Magnum Hunter Resources *(A) | 23,893 | 44 | ||||||
Matador Resources * | 13,100 | 361 | ||||||
Matrix Service * | 2,981 | 50 | ||||||
McDermott International *(A) | 32,970 | 180 | ||||||
Memorial Resource Development * | 6,300 | 119 | ||||||
Midstates Petroleum *(A) | 7,191 | 9 | ||||||
Miller Energy Resources *(A) | 1,800 | 1 | ||||||
Mitcham Industries * | 256 | 1 | ||||||
Nabors Industries | 51,100 | 754 | ||||||
Natural Gas Services Group * | 944 | 23 | ||||||
Navios Maritime Acquisition | 9,600 | 34 | ||||||
Newpark Resources * | 18,020 | 153 | ||||||
Nordic American Offshore (A) | 2,300 | 21 | ||||||
Nordic American Tankers | 17,377 | 224 | ||||||
North Atlantic Drilling (A) | 7,600 | 10 | ||||||
Northern Oil And Gas *(A) | 7,039 | 48 | ||||||
Nuverra Environmental Solutions *(A) | 2,758 | 14 | ||||||
Oasis Petroleum *(A) | 20,697 | 351 | ||||||
Oceaneering International | 17,046 | 866 | ||||||
Oil States International * | 6,999 | 286 | ||||||
Pacific Ethanol *(A) | 2,400 | 28 | ||||||
Panhandle Oil and Gas, Cl A | 1,682 | 34 | ||||||
Parker Drilling * | 16,551 | 56 | ||||||
Parsley Energy, Cl A * | 7,500 | 131 | ||||||
Patterson-UTI Energy | 21,822 | 441 | ||||||
PBF Energy, Cl A | 10,277 | 276 | ||||||
PDC Energy * | 6,493 | 387 | ||||||
Peabody Energy (A) | 46,500 | 157 | ||||||
Penn Virginia *(A) | 7,986 | 37 | ||||||
PetroQuest Energy * | 4,723 | 8 | ||||||
PHI * | 1,443 | 47 | ||||||
Pioneer Energy Services * | 9,836 | 69 | ||||||
Renewable Energy Group * | 3,800 | 40 | ||||||
Resolute Energy * | 10,094 | 12 | ||||||
REX American Resources * | 800 | 51 | ||||||
Rex Energy *(A) | 4,990 | 25 | ||||||
Rice Energy * | 10,400 | 228 | ||||||
RigNet * | 1,441 | 51 | ||||||
Ring Energy * | 2,200 | 25 | ||||||
Rosetta Resources * | 10,985 | 257 | ||||||
Rowan, Cl A | 22,000 | 473 | ||||||
RPC | 8,499 | 123 | ||||||
RSP Permian * | 5,000 | 142 | ||||||
Sanchez Energy *(A) | 6,830 | 69 | ||||||
SandRidge Energy *(A) | 64,393 | 79 | ||||||
Scorpio Tankers | 33,143 | 302 | ||||||
| Description | Shares | Market Value ($ Thousands) | ||||||
SEACOR Holdings * | 2,574 | $ | 181 | |||||
Seadrill | 55,100 | 656 | ||||||
SemGroup, Cl A | 7,444 | 586 | ||||||
Seventy Seven Energy * | 4,500 | 27 | ||||||
Ship Finance International | 7,476 | 122 | ||||||
Silver Spring Networks * | 4,100 | 56 | ||||||
SM Energy | 11,713 | 613 | ||||||
Solazyme *(A) | 7,830 | 25 | ||||||
Stone Energy * | 6,684 | 91 | ||||||
Superior Energy Services | 27,160 | 627 | ||||||
Swift Energy *(A) | 4,583 | 10 | ||||||
Synergy Resources * | 13,562 | 156 | ||||||
Targa Resources | 8,359 | 769 | ||||||
Teekay | 7,454 | 342 | ||||||
Teekay Tankers, Cl A | 7,823 | 53 | ||||||
Tesco | 5,269 | 63 | ||||||
TETRA Technologies * | 8,605 | 54 | ||||||
Tidewater (A) | 6,246 | 153 | ||||||
TransAtlantic Petroleum * | 2,700 | 15 | ||||||
Triangle Petroleum *(A) | 11,537 | 59 | ||||||
Ultra Petroleum * | 23,292 | 324 | ||||||
Unit * | 8,395 | 265 | ||||||
US Silica Holdings (A) | 8,926 | 275 | ||||||
VAALCO Energy * | 10,870 | 24 | ||||||
Vantage Drilling *(A) | 34,246 | 12 | ||||||
W&T Offshore (A) | 3,238 | 18 | ||||||
Warren Resources *(A) | 14,749 | 10 | ||||||
Western Refining | 7,899 | 347 | ||||||
Westmoreland Coal * | 2,400 | 62 | ||||||
Whiting Petroleum * | 34,860 | 1,150 | ||||||
Willbros Group * | 4,854 | 9 | ||||||
World Fuel Services | 11,241 | 562 | ||||||
WPX Energy * | 30,900 | 398 | ||||||
|
| |||||||
| 33,367 | ||||||||
|
| |||||||
Financials — 22.7% | ||||||||
1st Source | 1,780 | 56 | ||||||
Acadia Realty Trust ‡ | 11,039 | 342 | ||||||
Agree Realty ‡ | 1,847 | 56 | ||||||
Alexander & Baldwin | 8,877 | 365 | ||||||
Alexander’s ‡ | 288 | 116 | ||||||
Alexandria Real Estate Equities ‡ | 12,061 | 1,118 | ||||||
Alleghany * | 2,767 | 1,315 | ||||||
Allied World Assurance Holdings | 17,012 | 723 | ||||||
Ally Financial * | 45,800 | 1,038 | ||||||
Altisource Asset Management * | 200 | 34 | ||||||
Altisource Portfolio Solutions *(A) | 1,700 | 47 | ||||||
Altisource Residential, Cl B ‡ | 11,300 | 202 | ||||||
Ambac Financial Group * | 6,300 | 147 | ||||||
American Assets Trust ‡ | 6,791 | 267 | ||||||
American Campus Communities ‡ | 17,362 | 677 | ||||||
American Capital Agency ‡ | 59,421 | 1,240 | ||||||
American Capital Mortgage Investment ‡ | 7,965 | 139 | ||||||
American Equity Investment Life Holding | 12,178 | 309 | ||||||
American Financial Group | 12,453 | 791 | ||||||
American Homes 4 Rent, Cl A ‡ | 22,300 | 372 | ||||||
American National Bankshares | 306 | 7 | ||||||
American National Insurance | 1,031 | 106 | ||||||
| 5 | SEI Institutional Investments Trust / Annual Report / May 31, 2015 |
SCHEDULE OF INVESTMENTS
Extended Market Index Fund
May 31, 2015
| Description | Shares | Market Value ($ Thousands) | ||||||
American Realty Capital Properties ‡ | 152,500 | $ | 1,353 | |||||
American Residential Properties *‡ | 3,700 | 69 | ||||||
Ameris Bancorp | 5,752 | 145 | ||||||
AMERISAFE | 3,033 | 130 | ||||||
Ames National | 310 | 7 | ||||||
AmTrust Financial Services | 5,559 | 335 | ||||||
Anchor BanCorp Wisconsin * | 600 | 22 | ||||||
Annaly Capital Management ‡ | 158,514 | 1,655 | ||||||
Anworth Mortgage Asset ‡ | 10,868 | 56 | ||||||
Apollo Commercial Real Estate Finance ‡ | 10,637 | 183 | ||||||
Apollo Residential Mortgage ‡ | 4,987 | 79 | ||||||
Arch Capital Group * | 21,436 | 1,370 | ||||||
Ares Commercial Real Estate ‡ | 4,800 | 56 | ||||||
Argo Group International Holdings | 5,434 | 286 | ||||||
Arlington Asset Investment, Cl A | 3,412 | 71 | ||||||
Armada Hoffler Properties ‡ | 1,800 | 19 | ||||||
ARMOUR Residential ‡ | 63,396 | 190 | ||||||
Arrow Financial | 1,042 | 27 | ||||||
Arthur J Gallagher | 27,991 | 1,356 | ||||||
Artisan Partners Asset Management, Cl A | 4,500 | 198 | ||||||
Ashford * | 108 | 10 | ||||||
Ashford Hospitality Prime ‡ | 3,994 | 63 | ||||||
Ashford Hospitality Trust ‡ | 9,471 | 81 | ||||||
Aspen Insurance Holdings | 10,895 | 505 | ||||||
Associated Banc | 23,786 | 451 | ||||||
Associated Estates Realty ‡ | 8,489 | 243 | ||||||
Assured Guaranty | 26,487 | 757 | ||||||
Astoria Financial | 11,265 | 148 | ||||||
Atlas Financial Holdings * | 2,600 | 49 | ||||||
AV Homes * | 407 | 6 | ||||||
Axis Capital Holdings | 17,368 | 956 | ||||||
Baldwin & Lyons, Cl B | 1,481 | 33 | ||||||
Banc of California | 3,500 | 45 | ||||||
BancFirst | 1,025 | 60 | ||||||
Banco Latinoamericano de Comercio Exterior, Cl E | 4,012 | 122 | ||||||
Bancorp * | 3,104 | 30 | ||||||
Bancorpsouth (A) | 14,182 | 343 | ||||||
Bank Mutual | 3,899 | 28 | ||||||
Bank of Hawaii | 7,124 | 447 | ||||||
Bank of Kentucky Financial | 733 | 36 | ||||||
Bank of Marin Bancorp | 907 | 43 | ||||||
Bank of the Ozarks (A) | 14,670 | 645 | ||||||
BankFinancial | 797 | 9 | ||||||
BankUnited | 17,696 | 594 | ||||||
Banner | 3,851 | 173 | ||||||
BBCN Bancorp | 15,495 | 223 | ||||||
BBX Capital, Cl A * | 521 | 8 | ||||||
Beneficial Bancorp * | 4,788 | 59 | ||||||
Berkshire Hills Bancorp | 3,750 | 103 | ||||||
BGC Partners, Cl A | 26,736 | 253 | ||||||
BioMed Realty Trust ‡ | 31,529 | 643 | ||||||
Blue Hills Bancorp * | 4,700 | 64 | ||||||
BNC Bancorp | 1,800 | 33 | ||||||
BofI Holding * | 2,209 | 208 | ||||||
BOK Financial | 4,993 | 323 | ||||||
Boston Private Financial Holdings | 13,415 | 168 | ||||||
Brandywine Realty Trust ‡ | 31,739 | 447 | ||||||
| Description | Shares | Market Value ($ Thousands) | ||||||
Bridge Bancorp | 1,412 | $ | 35 | |||||
Bridge Capital Holdings * | 1,300 | 36 | ||||||
Brixmor Property Group ‡ | 7,800 | 193 | ||||||
Brookline Bancorp | 8,874 | 97 | ||||||
Brown & Brown | 20,876 | 676 | ||||||
Bryn Mawr Bank | 1,822 | 53 | ||||||
Calamos Asset Management, Cl A | 4,282 | 52 | ||||||
Camden National | 539 | 21 | ||||||
Camden Property Trust ‡ | 14,438 | 1,083 | ||||||
Campus Crest Communities ‡ | 9,972 | 56 | ||||||
Capital Bank Financial, Cl A * | 2,860 | 82 | ||||||
Capital City Bank Group | 800 | 12 | ||||||
Capitol Federal Financial | 21,387 | 259 | ||||||
Capstead Mortgage ‡ | 18,718 | 221 | ||||||
Cardinal Financial | 4,941 | 102 | ||||||
CareTrust ‡ | 3,253 | 42 | ||||||
Cascade Bancorp * | 915 | 5 | ||||||
Cash America International | 3,679 | 99 | ||||||
CatchMark Timber Trust, Cl A ‡ | 3,700 | 44 | ||||||
Cathay General Bancorp | 13,015 | 393 | ||||||
CBL & Associates Properties ‡ | 29,282 | 517 | ||||||
CBOE Holdings | 14,638 | 857 | ||||||
Cedar Realty Trust ‡ | 8,938 | 60 | ||||||
Centerstate Banks | 4,485 | 56 | ||||||
Central Pacific Financial | 2,910 | 68 | ||||||
Chambers Street Properties ‡ | 39,400 | 300 | ||||||
Charter Financial | 2,200 | 27 | ||||||
Chatham Lodging Trust ‡ | 4,935 | 138 | ||||||
Chemical Financial | 4,499 | 136 | ||||||
Chesapeake Lodging Trust ‡ | 9,967 | 310 | ||||||
Chimera Investment ‡ | 36,165 | 522 | ||||||
CIT Group | 30,737 | 1,422 | ||||||
Citizens, Cl A *(A) | 7,833 | 44 | ||||||
Citizens & Northern | 1,840 | 36 | ||||||
Citizens Financial Group | 25,300 | 679 | ||||||
City Holding | 1,985 | 90 | ||||||
City National | 7,440 | 686 | ||||||
Clifton Bancorp | 3,100 | 43 | ||||||
CNA Financial | 3,875 | 150 | ||||||
CNB Financial | 2,048 | 34 | ||||||
CNO Financial Group | 35,525 | 639 | ||||||
CoBiz Financial | 5,671 | 67 | ||||||
Cohen & Steers | 2,936 | 110 | ||||||
Colony Financial ‡ | 17,200 | 441 | ||||||
Columbia Banking System | 8,409 | 254 | ||||||
Columbia Property Trust ‡ | 21,800 | 567 | ||||||
Commerce Bancshares | 14,802 | 660 | ||||||
Communications Sales & Leasing ‡ | 21,060 | 549 | ||||||
Community Bank System | 5,602 | 198 | ||||||
Community Trust Bancorp | 1,493 | 49 | ||||||
ConnectOne Bancorp | 2,883 | 56 | ||||||
Consolidated-Tomoka Land | 500 | 28 | ||||||
Consumer Portfolio Services * | 5,000 | 29 | ||||||
CorEnergy Infrastructure Trust ‡ | 3,700 | 25 | ||||||
CoreSite Realty ‡ | 2,773 | 131 | ||||||
Corporate Office Properties Trust ‡ | 16,630 | 427 | ||||||
Corrections Corp of America ‡ | 18,102 | 636 | ||||||
Cousins Properties ‡ | 33,546 | 324 | ||||||
Cowen Group, Cl A * | 14,521 | 86 | ||||||
Crawford, Cl B | 3,520 | 26 | ||||||
Credit Acceptance * | 912 | 210 | ||||||
| 6 | SEI Institutional Investments Trust / Annual Report / May 31, 2015 |
SCHEDULE OF INVESTMENTS
Extended Market Index Fund
May 31, 2015
| Description | Shares | Market Value ($ Thousands) | ||||||
CU Bancorp * | 1,200 | $ | 25 | |||||
CubeSmart ‡ | 25,422 | 605 | ||||||
Cullen/Frost Bankers | 9,105 | 668 | ||||||
Customers Bancorp * | 4,070 | 102 | ||||||
CVB Financial | 19,479 | 319 | ||||||
CyrusOne ‡ | 7,829 | 253 | ||||||
CYS Investments ‡ | 30,562 | 274 | ||||||
DCT Industrial Trust ‡ | 14,571 | 477 | ||||||
DDR ‡ | 51,414 | 870 | ||||||
Diamond Hill Investment Group | 554 | 106 | ||||||
DiamondRock Hospitality ‡ | 31,307 | 412 | ||||||
Digital Realty Trust ‡ | 22,674 | 1,497 | ||||||
Dime Community Bancshares | 3,683 | 60 | ||||||
Douglas Emmett ‡ | 22,485 | 661 | ||||||
Duke Realty ‡ | 55,695 | 1,089 | ||||||
DuPont Fabros Technology ‡ | 9,821 | 317 | ||||||
Dynex Capital ‡ | 6,593 | 51 | ||||||
Eagle Bancorp * | 4,406 | 175 | ||||||
East West Bancorp | 24,266 | 1,041 | ||||||
Easterly Government Properties ‡ | 4,100 | 64 | ||||||
EastGroup Properties ‡ | 5,785 | 322 | ||||||
Eaton Vance | 20,525 | 833 | ||||||
Education Realty Trust ‡ | 7,857 | 259 | ||||||
eHealth * | 1,874 | 24 | ||||||
EMC Insurance Group | 700 | 25 | ||||||
Empire State Realty Trust, Cl A ‡ | 15,300 | 277 | ||||||
Employers Holdings | 5,274 | 119 | ||||||
Encore Capital Group * | 5,075 | 202 | ||||||
Endurance Specialty Holdings | 6,683 | 406 | ||||||
Enova International * | 3,366 | 66 | ||||||
Enstar Group * | 1,151 | 174 | ||||||
Enterprise Bancorp | 1,100 | 23 | ||||||
Enterprise Financial Services | 2,449 | 52 | ||||||
EPR Properties ‡ | 9,051 | 522 | ||||||
Equity Commonwealth *‡ | 22,444 | 578 | ||||||
Equity Lifestyle Properties ‡ | 14,332 | 785 | ||||||
Equity One ‡ | 10,985 | 272 | ||||||
Erie Indemnity, Cl A | 4,487 | 365 | ||||||
Essent Group * | 6,900 | 176 | ||||||
EverBank Financial | 16,824 | 310 | ||||||
Evercore Partners, Cl A | 6,076 | 310 | ||||||
Everest Re Group | 7,744 | 1,406 | ||||||
Excel Trust ‡ | 8,818 | 140 | ||||||
Extra Space Storage ‡ | 19,518 | 1,367 | ||||||
Ezcorp, Cl A *(A) | 7,457 | 59 | ||||||
FBL Financial Group, Cl A | 1,682 | 97 | ||||||
FBR * | 1,869 | 40 | ||||||
FCB Financial Holdings, Cl A * | 1,700 | 49 | ||||||
Federal Agricultural Mortgage, Cl C | 1,988 | 63 | ||||||
Federal Realty Investment Trust ‡ | 11,286 | 1,518 | ||||||
Federated Investors, Cl B | 16,370 | 570 | ||||||
Federated National Holding | 1,300 | 33 | ||||||
FelCor Lodging Trust ‡ | 21,263 | 228 | ||||||
Fidelity & Guaranty Life | 2,700 | 59 | ||||||
Fidelity Southern | 1,513 | 23 | ||||||
Financial Engines (A) | 8,464 | 363 | ||||||
Financial Institutions | 1,767 | 41 | ||||||
First American Financial | 18,472 | 660 | ||||||
First Bancorp | 2,097 | 34 | ||||||
First BanCorp * | 18,716 | 115 | ||||||
First Busey | 11,811 | 74 | ||||||
| Description | Shares | Market Value ($ Thousands) | ||||||
First Business Financial Services | 500 | $ | 22 | |||||
First Cash Financial Services * | 4,958 | 231 | ||||||
First Citizens BancShares, Cl A | 1,691 | 408 | ||||||
First Commonwealth Financial | 15,201 | 138 | ||||||
First Community Bancshares | 942 | 16 | ||||||
First Connecticut Bancorp | 1,048 | 15 | ||||||
First Defiance Financial | 592 | 21 | ||||||
First Financial | 1,612 | 55 | ||||||
First Financial Bancorp | 11,549 | 201 | ||||||
First Financial Bankshares (A) | 11,656 | 351 | ||||||
First Financial Northwest | 1,491 | 17 | ||||||
First Horizon National | 37,400 | 552 | ||||||
First Industrial Realty Trust ‡ | 17,853 | 348 | ||||||
First Interstate Bancsystem, Cl A | 2,212 | 60 | ||||||
First Merchants | 5,933 | 138 | ||||||
First Midwest Bancorp | 13,142 | 233 | ||||||
First NBC Bank Holding * | 1,700 | 58 | ||||||
First Niagara Financial Group | 62,147 | 554 | ||||||
First of Long Island | 1,130 | 29 | ||||||
First Potomac Realty Trust ‡ | 6,922 | 70 | ||||||
First Republic Bank | 23,143 | 1,401 | ||||||
FirstMerit | 28,897 | 568 | ||||||
Flagstar Bancorp * | 1,800 | 34 | ||||||
Flushing Financial | 4,470 | 87 | ||||||
FNB (Pennsylvania) | 28,308 | 382 | ||||||
FNF Group | 46,258 | 1,756 | ||||||
FNFV Group * | 15,962 | 245 | ||||||
Forest City Enterprises, Cl A * | 32,945 | 760 | ||||||
Forestar Group * | 4,832 | 64 | ||||||
Fox Chase Bancorp | 1,553 | 25 | ||||||
Franklin Street Properties ‡ | 11,696 | 136 | ||||||
FRP Holdings * | 838 | 25 | ||||||
Fulton Financial | 27,812 | 352 | ||||||
FXCM, Cl A (A) | 5,250 | 8 | ||||||
Gain Capital Holdings | 5,300 | 49 | ||||||
GAMCO Investors, Cl A | 822 | 57 | ||||||
Gaming and Leisure Properties ‡ | 14,769 | 541 | ||||||
Geo Group ‡ | 12,790 | 485 | ||||||
German American Bancorp | 1,544 | 45 | ||||||
Getty Realty ‡ | 3,072 | 52 | ||||||
Glacier Bancorp | 13,480 | 379 | ||||||
Gladstone Commercial ‡ | 3,119 | 54 | ||||||
Global Indemnity, Cl A * | 1,002 | 28 | ||||||
Government Properties Income Trust ‡ | 12,966 | 253 | ||||||
Gramercy Property Trust ‡ | 9,773 | 260 | ||||||
Great Southern Bancorp | 1,299 | 51 | ||||||
Great Western Bancorp | 2,300 | 53 | ||||||
Green Dot, Cl A * | 3,855 | 56 | ||||||
Greenhill | 3,971 | 155 | ||||||
Greenlight Capital Re, Cl A * | 3,509 | 108 | ||||||
Guaranty Bancorp | 605 | 10 | ||||||
Hancock Holding | 12,314 | 359 | ||||||
Hanmi Financial | 4,178 | 92 | ||||||
Hannon Armstrong Sustainable Infrastructure Capital ‡ | 7,100 | 145 | ||||||
Hanover Insurance Group | 7,717 | 549 | ||||||
Hatteras Financial ‡ | 17,783 | 319 | ||||||
HCC Insurance Holdings | 16,921 | 968 | ||||||
HCI Group | 915 | 40 | ||||||
Healthcare Realty Trust ‡ | 15,455 | 368 | ||||||
| 7 | SEI Institutional Investments Trust / Annual Report / May 31, 2015 |
SCHEDULE OF INVESTMENTS
Extended Market Index Fund
May 31, 2015
| Description | Shares | Market Value ($ Thousands) | ||||||
Healthcare Trust of America, Cl A ‡ | 19,750 | $ | 490 | |||||
Heartland Financial USA | 2,575 | 88 | ||||||
Heritage Commerce | 1,100 | 10 | ||||||
Heritage Financial | 4,271 | 73 | ||||||
Heritage Oaks Bancorp | 1,400 | 11 | ||||||
Hersha Hospitality Trust, Cl A ‡ | 38,478 | 245 | ||||||
HFF, Cl A | 5,695 | 229 | ||||||
Highwoods Properties ‡ | 14,068 | 590 | ||||||
Hilltop Holdings * | 10,838 | 237 | ||||||
Home BancShares | 9,896 | 338 | ||||||
Home Properties ‡ | 8,935 | 664 | ||||||
HomeStreet * | 4,372 | 101 | ||||||
HomeTrust Bancshares * | 4,102 | 63 | ||||||
Horace Mann Educators | 7,714 | 266 | ||||||
Horizon Bancorp | 900 | 22 | ||||||
Hospitality Properties Trust ‡ | 25,641 | 774 | ||||||
Howard Hughes * | 6,717 | 989 | ||||||
Hudson Pacific Properties ‡ | 11,870 | 362 | ||||||
Hudson Valley Holding | 1,305 | 34 | ||||||
Iberiabank | 5,684 | 365 | ||||||
Independent Bank | 3,502 | 158 | ||||||
Independent Bank Corp. | 2,700 | 37 | ||||||
Independent Bank Group | 1,100 | 45 | ||||||
Infinity Property & Casualty | 1,614 | 117 | ||||||
InfraREIT ‡ | 4,600 | 139 | ||||||
Inland Real Estate ‡ | 10,982 | 111 | ||||||
Interactive Brokers Group, Cl A | 8,927 | 319 | ||||||
International Bancshares | 9,350 | 244 | ||||||
International. FCStone * | 3,268 | 115 | ||||||
Invesco Mortgage Capital ‡ | 19,071 | 303 | ||||||
Investment Technology Group | 6,017 | 162 | ||||||
Investors Bancorp | 56,143 | 674 | ||||||
Investors Real Estate Trust ‡ | 13,531 | 98 | ||||||
iStar Financial *‡ | 16,418 | 233 | ||||||
James River Group Holdings | 3,100 | 73 | ||||||
Janus Capital Group | 26,412 | 479 | ||||||
JG Wentworth Company, Cl A * | 2,500 | 23 | ||||||
Jones Lang LaSalle | 7,459 | 1,292 | ||||||
Kansas City Life Insurance | 165 | 7 | ||||||
KCG Holdings, Cl A * | 7,407 | 100 | ||||||
Kearny Financial * | 837 | 9 | ||||||
Kemper | 6,736 | 241 | ||||||
Kennedy-Wilson Holdings | 11,929 | 305 | ||||||
Kilroy Realty ‡ | 14,643 | 1,011 | ||||||
Kite Realty Group Trust ‡ | 5,055 | 137 | ||||||
Ladder Capital, Cl A ‡ | 3,500 | 62 | ||||||
Ladenburg Thalmann Financial Services * | 12,600 | 41 | ||||||
Lakeland Bancorp | 4,693 | 54 | ||||||
Lakeland Financial | 3,305 | 131 | ||||||
Lamar Advertising, Cl A ‡ | 13,597 | 824 | ||||||
LaSalle Hotel Properties ‡ | 19,242 | 702 | ||||||
Lazard, Cl A | 20,831 | 1,157 | ||||||
LegacyTexas Financial Group | 5,810 | 151 | ||||||
LendingTree * | 800 | 47 | ||||||
Lexington Realty Trust ‡ | 37,490 | 344 | ||||||
Liberty Property Trust ‡ | 25,175 | 880 | ||||||
LPL Financial Holdings (A) | 15,162 | 646 | ||||||
LTC Properties ‡ | 5,917 | 249 | ||||||
Mack-Cali Realty ‡ | 16,567 | 280 | ||||||
Maiden Holdings | 7,723 | 108 | ||||||
MainSource Financial Group | 2,690 | 54 | ||||||
Manning & Napier, Cl A | 1,972 | 22 | ||||||
| Description | Shares | Market Value ($ Thousands) | ||||||
Marcus & Millichap * | 1,700 | $ | 80 | |||||
Markel * | 2,313 | 1,787 | ||||||
MarketAxess Holdings | 5,952 | 526 | ||||||
Marlin Business Services | 322 | 6 | ||||||
MB Financial | 10,226 | 329 | ||||||
MBIA * | 22,582 | 204 | ||||||
Meadowbrook Insurance Group | 6,353 | 54 | ||||||
Medical Properties Trust ‡ | 36,662 | 497 | ||||||
Mercantile Bank | 2,257 | 45 | ||||||
Merchants Bancshares | 207 | 6 | ||||||
Mercury General | 4,578 | 255 | ||||||
Meridian Bancorp * | 4,127 | 53 | ||||||
Meta Financial Group | 700 | 28 | ||||||
Metro Bancorp | 1,177 | 30 | ||||||
MFA Mortgage Investments ‡ | 64,597 | 513 | ||||||
MGIC Investment *(A) | 58,718 | 637 | ||||||
Mid-America Apartment Communities ‡ | 12,753 | 974 | ||||||
MidSouth Bancorp | 400 | 6 | ||||||
MidWestOne Financial Group | 269 | 8 | ||||||
Moelis, Cl A | 900 | 26 | ||||||
Monmouth Real Estate Investment, Cl A ‡ | 13,346 | 129 | ||||||
Montpelier Re Holdings | 6,289 | 239 | ||||||
Mortgage Investment Trust ‡ | 2,788 | 53 | ||||||
MSCI, Cl A | 19,669 | 1,220 | ||||||
National Bank Holdings, Cl A | 4,600 | 88 | ||||||
National Bankshares | 1,036 | 29 | ||||||
National General Holdings | 4,100 | 80 | ||||||
National Health Investors ‡ | 6,664 | 441 | ||||||
National Interstate | 924 | 24 | ||||||
National Penn Bancshares | 20,089 | 215 | ||||||
National Retail Properties ‡(A) | 22,543 | 846 | ||||||
National Western Life Insurance, Cl A | 341 | 84 | ||||||
Nationstar Mortgage Holdings * | 2,646 | 52 | ||||||
Navigators Group * | 1,283 | 100 | ||||||
NBT Bancorp | 6,708 | 165 | ||||||
Nelnet, Cl A | 2,531 | 104 | ||||||
New Residential Investments ‡ | 34,650 | 591 | ||||||
New York ‡ | 27,200 | 252 | ||||||
New York Community Bancorp (A) | 74,439 | 1,321 | ||||||
New York Mortgage Trust ‡(A) | 16,838 | 133 | ||||||
NewBridge Bancorp | 2,600 | 20 | ||||||
NewStar Financial * | 3,393 | 36 | ||||||
Nicholas Financial * | 700 | 9 | ||||||
NMI Holdings, Cl A * | 5,900 | 47 | ||||||
Northfield Bancorp | 6,705 | 98 | ||||||
Northrim BanCorp | 269 | 7 | ||||||
NorthStar Asset Management Group | 28,658 | 627 | ||||||
NorthStar Realty Finance ‡ | 47,258 | 857 | ||||||
Northwest Bancshares | 18,499 | 224 | ||||||
OceanFirst Financial | 1,788 | 31 | ||||||
Ocwen Financial *(A) | 13,361 | 136 | ||||||
OFG Bancorp | 5,625 | 74 | ||||||
Old National Bancorp | 18,561 | 253 | ||||||
Old Republic International | 44,944 | 695 | ||||||
OM Asset Management | 3,100 | 60 | ||||||
Omega Healthcare Investors ‡ | 26,547 | 956 | ||||||
On Deck Capital *(A) | 3,300 | 50 | ||||||
One Liberty Properties ‡ | 1,124 | 25 | ||||||
| 8 | SEI Institutional Investments Trust / Annual Report / May 31, 2015 |
SCHEDULE OF INVESTMENTS
Extended Market Index Fund
May 31, 2015
| Description | Shares | Market Value ($ Thousands) | ||||||
OneBeacon Insurance Group, Cl A | 4,135 | $ | 60 | |||||
Oppenheimer Holdings, Cl A | 2,164 | 56 | ||||||
Opus Bank | 1,100 | 35 | ||||||
Oritani Financial | 7,124 | 105 | ||||||
Outfront Media ‡ | 23,509 | 651 | ||||||
Owens Realty Mortgage ‡ | 1,300 | 17 | ||||||
Pacific Continental | 2,665 | 34 | ||||||
Pacific Premier Bancorp * | 1,600 | 25 | ||||||
PacWest Bancorp | 17,483 | 785 | ||||||
Paramount Group ‡ | 26,600 | 488 | ||||||
Park National | 2,505 | 207 | ||||||
Park Sterling | 3,770 | 25 | ||||||
Parkway Properties ‡ | 10,770 | 185 | ||||||
PartnerRe | 8,034 | 1,056 | ||||||
Peapack Gladstone Financial | 2,654 | 54 | ||||||
Pebblebrook Hotel Trust ‡ | 11,303 | 485 | ||||||
Penns Woods Bancorp | 652 | 28 | ||||||
Pennsylvania Real Estate Investment Trust ‡ | 11,599 | 259 | ||||||
PennyMac Financial Services, Cl A * | 1,100 | 21 | ||||||
PennyMac Mortgage Investment Trust ‡ | 14,063 | 258 | ||||||
Peoples Bancorp | 1,710 | 39 | ||||||
Peoples Financial Services | 900 | 34 | ||||||
PHH * | 7,132 | 197 | ||||||
Phoenix * | 841 | 15 | ||||||
Physicians Realty Trust ‡ | 11,000 | 177 | ||||||
PICO Holdings * | 2,621 | 41 | ||||||
Piedmont Office Realty Trust, Cl A ‡ | 27,366 | 470 | ||||||
Pinnacle Financial Partners | 6,525 | 323 | ||||||
Piper Jaffray * | 2,277 | 108 | ||||||
Popular * | 18,056 | 587 | ||||||
Post Properties ‡ | 9,511 | 540 | ||||||
Potlatch ‡ | 6,820 | 247 | ||||||
PRA Group *(A) | 8,058 | 457 | ||||||
Preferred Bank | 1,937 | 53 | ||||||
Primerica | 7,929 | 351 | ||||||
PrivateBancorp, Cl A | 12,619 | 481 | ||||||
ProAssurance | 8,725 | 394 | ||||||
Prosperity Bancshares | 12,069 | 647 | ||||||
Provident Financial Services | 8,679 | 158 | ||||||
PS Business Parks ‡ | 3,628 | 265 | ||||||
QTS Realty Trust * | 2,000 | 74 | ||||||
Radian Group (A) | 33,248 | 596 | ||||||
RAIT Financial Trust ‡ | 13,021 | 83 | ||||||
Ramco-Gershenson Properties ‡ | 13,237 | 228 | ||||||
Raymond James Financial | 21,081 | 1,225 | ||||||
Rayonier ‡ | 22,053 | 569 | ||||||
RCS Capital, Cl A (A) | 2,000 | 16 | ||||||
RE, Cl A | 1,600 | 54 | ||||||
Realogy Holdings * | 24,702 | 1,160 | ||||||
Redwood Trust ‡ | 11,305 | 182 | ||||||
Regency Centers ‡ | 15,667 | 989 | ||||||
Regional Management * | 700 | 12 | ||||||
Reinsurance Group of America, Cl A | 11,716 | 1,096 | ||||||
RenaissanceRe Holdings | 7,106 | 726 | ||||||
Renasant | 3,960 | 117 | ||||||
Republic Bancorp, Cl A | 1,298 | 32 | ||||||
Resource Capital ‡ | 13,505 | 56 | ||||||
Retail Opportunity Investments ‡ | 16,959 | 277 | ||||||
| Description | Shares | Market Value ($ Thousands) | ||||||
Retail Properties of America, Cl A ‡ | 37,303 | $ | 560 | |||||
Rexford Industrial Realty ‡ | 9,800 | 143 | ||||||
RLI | 7,782 | 379 | ||||||
RLJ Lodging Trust ‡ | 20,437 | 618 | ||||||
Rouse Properties ‡ | 6,017 | 104 | ||||||
Ryman Hospitality Properties ‡ | 6,960 | 384 | ||||||
S&T Bancorp | 4,732 | 128 | ||||||
Sabra Health Care ‡ | 8,762 | 232 | ||||||
Safeguard Scientifics * | 3,396 | 61 | ||||||
Safety Insurance Group | 1,531 | 85 | ||||||
Sandy Spring Bancorp | 2,947 | 77 | ||||||
Santander Consumer USA Holdings * | 13,300 | 326 | ||||||
Saul Centers ‡ | 1,444 | 73 | ||||||
Seacoast Banking Corporation of Florida *(B) | 3,898 | 58 | ||||||
SEI | 22,519 | 1,077 | ||||||
Select Income ‡ | 7,521 | 176 | ||||||
Selective Insurance Group | 8,284 | 225 | ||||||
Senior Housing Properties Trust ‡ | 40,207 | 805 | ||||||
Sierra Bancorp | 478 | 8 | ||||||
Signature Bank NY * | 8,470 | 1,183 | ||||||
Silver Bay Realty Trust ‡ | 4,446 | 69 | ||||||
Simmons First National, Cl A | 4,118 | 177 | ||||||
SLM | 72,700 | 746 | ||||||
South State | 3,686 | 265 | ||||||
Southside Bancshares | 3,725 | 100 | ||||||
Southwest Bancorp | 1,679 | �� | 30 | |||||
Sovran Self Storage ‡ | 5,593 | 510 | ||||||
Spirit Realty Capital ‡ | 68,766 | 742 | ||||||
Springleaf Holdings, Cl A * | 3,900 | 185 | ||||||
St. Joe *(A) | 8,420 | 134 | ||||||
STAG Industrial ‡ | 8,656 | 184 | ||||||
StanCorp Financial Group | 7,010 | 520 | ||||||
Starwood Property Trust ‡ | 40,480 | 967 | ||||||
Starwood Waypoint Residential Trust ‡ | 7,076 | 178 | ||||||
State Auto Financial | 1,890 | 40 | ||||||
State Bank Financial | 6,384 | 131 | ||||||
State National | 5,800 | 62 | ||||||
Sterling Bancorp | 12,729 | 172 | ||||||
Stewart Information Services | 3,341 | 126 | ||||||
Stifel Financial * | 11,382 | 606 | ||||||
Stock Yards Bancorp | 1,635 | 57 | ||||||
Stonegate Bank | 1,200 | 36 | ||||||
Stonegate Mortgage *(A) | 3,100 | 30 | ||||||
STORE Capital ‡ | 4,000 | 83 | ||||||
Strategic Hotels & Resorts *‡ | 42,288 | 511 | ||||||
Suffolk Bancorp | 600 | 14 | ||||||
Summit Hotel Properties ‡ | 11,929 | 159 | ||||||
Sun Bancorp * | 332 | 6 | ||||||
Sun Communities ‡ | 7,621 | 481 | ||||||
Sunstone Hotel Investors ‡ | 35,922 | 548 | ||||||
Susquehanna Bancshares | 33,323 | 463 | ||||||
SVB Financial Group * | 8,482 | 1,144 | ||||||
Symetra Financial | 12,583 | 308 | ||||||
Synchrony Financial *(A) | 20,100 | 649 | ||||||
Synovus Financial | 21,892 | 635 | ||||||
Talmer Bancorp, Cl A | 4,300 | 68 | ||||||
Tanger Factory Outlet Centers ‡ | 15,949 | 536 | ||||||
Taubman Centers ‡ | 10,787 | 799 | ||||||
TCF Financial | 29,539 | 465 | ||||||
| 9 | SEI Institutional Investments Trust / Annual Report / May 31, 2015 |
SCHEDULE OF INVESTMENTS
Extended Market Index Fund
May 31, 2015
| Description | Shares | Market Value ($ Thousands) | ||||||
TD Ameritrade Holding | 44,973 | $ | 1,671 | |||||
Tejon Ranch * | 1,647 | 41 | ||||||
Terreno Realty ‡ | 6,663 | 136 | ||||||
Territorial Bancorp | 773 | 18 | ||||||
Texas Capital Bancshares * | 6,823 | 371 | ||||||
TFS Financial | 13,443 | 200 | ||||||
Third Point Reinsurance * | 11,800 | 170 | ||||||
Tompkins Financial | 1,905 | 97 | ||||||
Towne Bank | 7,180 | 113 | ||||||
TriCo Bancshares | 2,509 | 59 | ||||||
TriState Capital Holdings * | 2,600 | 30 | ||||||
TrustCo Bank NY | 11,926 | 81 | ||||||
Trustmark | 11,339 | 270 | ||||||
Two Harbors Investment ‡ | 63,240 | 676 | ||||||
UDR ‡ | 42,179 | 1,373 | ||||||
UMB Financial | 6,245 | 323 | ||||||
UMH Properties ‡ | 900 | 9 | ||||||
Umpqua Holdings | 29,331 | 516 | ||||||
Union Bankshares | 6,142 | 133 | ||||||
United Bankshares (A) | 11,083 | 420 | ||||||
United Community Banks | 6,574 | 126 | ||||||
United Community Financial | 4,200 | 23 | ||||||
United Financial Bancorp | 6,173 | 78 | ||||||
United Fire Group | 3,071 | 94 | ||||||
United Insurance Holdings | 1,900 | 27 | ||||||
Universal Health Realty Income Trust ‡ | 2,016 | 97 | ||||||
Universal Insurance Holdings | 5,200 | 133 | ||||||
Univest Corp of Pennsylvania | 2,123 | 41 | ||||||
Urban Edge Properties ‡ | 17,900 | 387 | ||||||
Urstadt Biddle Properties, Cl A ‡ | 2,956 | 59 | ||||||
Validus Holdings | 14,526 | 623 | ||||||
Valley National Bancorp | 34,770 | 340 | ||||||
Virtus Investment Partners | 1,308 | 163 | ||||||
Voya Financial | 21,900 | 992 | ||||||
Waddell & Reed Financial, Cl A | 14,702 | 702 | ||||||
Walker & Dunlop * | 1,423 | 35 | ||||||
Walter Investment Management *(A) | 4,636 | 77 | ||||||
Washington Federal | 15,236 | 337 | ||||||
Washington Real Estate Investment Trust ‡ | 11,113 | 278 | ||||||
Washington Trust Bancorp | 2,270 | 85 | ||||||
Waterstone Financial | 4,000 | 52 | ||||||
Webster Financial | 15,751 | 597 | ||||||
Weingarten Realty Investors ‡ | 19,068 | 643 | ||||||
WesBanco | 5,324 | 168 | ||||||
West Bancorporation | 1,985 | 36 | ||||||
Westamerica Bancorporation | 5,055 | 231 | ||||||
Western Alliance Bancorp * | 11,503 | 361 | ||||||
Western Asset Mortgage Capital ‡(A) | 6,644 | 101 | ||||||
Westwood Holdings Group | 928 | 53 | ||||||
White Mountains Insurance Group | 955 | 620 | ||||||
Whitestone, Cl B ‡ | 1,577 | 22 | ||||||
Wilshire Bancorp | 10,663 | 118 | ||||||
Wintrust Financial | 7,149 | 358 | ||||||
WisdomTree Investments | 16,375 | 350 | ||||||
World Acceptance *(A) | 976 | 80 | ||||||
WP Carey ‡ | 17,600 | 1,121 | ||||||
WP GLIMCHER ‡ | 32,702 | 460 | ||||||
WR Berkley | 17,124 | 839 | ||||||
WSFS Financial | 5,829 | 144 | ||||||
Yadkin Financial * | 3,400 | 67 | ||||||
|
| |||||||
| 167,615 | ||||||||
|
| |||||||
| Description | Shares | Market Value ($ Thousands) | ||||||
Health Care — 12.9% | ||||||||
AAC Holdings * | 1,600 | $ | 62 | |||||
Abaxis | 3,093 | 164 | ||||||
ABIOMED * | 7,112 | 425 | ||||||
Acadia Healthcare * | 8,087 | 600 | ||||||
ACADIA Pharmaceuticals *(A) | 12,700 | 523 | ||||||
Accelerate Diagnostics *(A) | 2,800 | 62 | ||||||
Acceleron Pharma * | 2,600 | 88 | ||||||
Accuray *(A) | 14,863 | 91 | ||||||
AcelRx Pharmaceuticals *(A) | 2,300 | 8 | ||||||
Aceto | 6,217 | 147 | ||||||
Achillion Pharmaceuticals * | 17,898 | 177 | ||||||
Acorda Therapeutics * | 7,142 | 218 | ||||||
Actinium Pharmaceuticals *(A) | 3,600 | 14 | ||||||
Adeptus Health, Cl A * | 800 | 56 | ||||||
Aegerion Pharmaceuticals * | 3,706 | 72 | ||||||
Aerie Pharmaceuticals * | 1,200 | 13 | ||||||
Affymetrix *(A) | 11,760 | 138 | ||||||
Agenus * | 7,400 | 61 | ||||||
Agios Pharmaceuticals * | 2,500 | 305 | ||||||
Air Methods * | 7,277 | 307 | ||||||
Akebia Therapeutics * | 900 | 7 | ||||||
Akorn * | 11,027 | 506 | ||||||
Albany Molecular Research *(A) | 3,800 | 77 | ||||||
Alder Biopharmaceuticals * | 1,900 | 81 | ||||||
Alere * | 14,221 | 734 | ||||||
Align Technology * | 13,913 | 844 | ||||||
Alimera Sciences *(A) | 3,300 | 14 | ||||||
Alkermes * | 24,253 | 1,482 | ||||||
Alliance HealthCare Services * | 800 | 15 | ||||||
Allscripts Healthcare Solutions * | 27,453 | 386 | ||||||
Almost Family * | 1,009 | 39 | ||||||
Alnylam Pharmaceuticals * | 12,089 | 1,585 | ||||||
AMAG Pharmaceuticals * | 4,503 | 313 | ||||||
Amedisys * | 4,171 | 129 | ||||||
AMN Healthcare Services * | 8,909 | 237 | ||||||
Ampio Pharmaceuticals *(A) | 7,400 | 18 | ||||||
Amsurg, Cl A * | 6,766 | 456 | ||||||
Anacor Pharmaceuticals * | 4,900 | 349 | ||||||
Analogic | 1,620 | 137 | ||||||
AngioDynamics * | 2,070 | 33 | ||||||
ANI Pharmaceuticals * | 800 | 40 | ||||||
Anika Therapeutics * | 1,470 | 50 | ||||||
Antares Pharma *(A) | 13,708 | 29 | ||||||
Aratana Therapeutics * | 2,800 | 38 | ||||||
Arena Pharmaceuticals * | 39,753 | 156 | ||||||
ARIAD Pharmaceuticals *(A) | 25,624 | 235 | ||||||
Array BioPharma * | 20,560 | 157 | ||||||
Arrowhead Research *(A) | 6,000 | 38 | ||||||
Atara Biotherapeutics * | 1,700 | 72 | ||||||
athenahealth *(A) | 5,892 | 687 | ||||||
AtriCure * | 2,820 | 65 | ||||||
Atrion | 230 | 86 | ||||||
Avalanche Biotechnologies * | 1,300 | 48 | ||||||
BioCryst Pharmaceuticals * | 8,200 | 92 | ||||||
BioDelivery Sciences International * | 7,400 | 63 | ||||||
BioMarin Pharmaceutical * | 25,946 | 3,258 | ||||||
Bio-Path Holdings *(A) | 8,700 | 10 | ||||||
Bio-Rad Laboratories, Cl A * | 3,153 | 455 | ||||||
Bio-Reference Labs *(A) | 3,547 | 118 | ||||||
BioScrip *(A) | 9,311 | 33 | ||||||
| 10 | SEI Institutional Investments Trust / Annual Report / May 31, 2015 |
SCHEDULE OF INVESTMENTS
Extended Market Index Fund
May 31, 2015
| Description | Shares | Market Value ($ Thousands) | ||||||
Bio-Techne | 6,425 | $ | 651 | |||||
BioTelemetry * | 5,500 | 53 | ||||||
BioTime *(A) | 5,100 | 24 | ||||||
Bluebird Bio * | 4,200 | 816 | ||||||
Brookdale Senior Living, Cl A * | 29,009 | 1,093 | ||||||
Bruker * | 18,132 | 360 | ||||||
Cambrex * | 5,360 | 215 | ||||||
Cantel Medical | 4,777 | 222 | ||||||
Capital Senior Living * | 3,612 | 93 | ||||||
Cardiovascular Systems * | 3,425 | 96 | ||||||
Castlight Health, Cl B *(A) | 2,800 | 24 | ||||||
Catalent * | 8,300 | 265 | ||||||
Catamaran * | 34,407 | 2,059 | ||||||
Celldex Therapeutics * | 15,756 | 455 | ||||||
Cempra * | 5,000 | 184 | ||||||
Centene * | 19,318 | 1,455 | ||||||
Cepheid * | 12,069 | 666 | ||||||
Cerus *(A) | 15,197 | 76 | ||||||
Charles River Laboratories International * | 8,406 | 608 | ||||||
Chemed | 2,845 | 353 | ||||||
ChemoCentryx * | 2,000 | 17 | ||||||
Chimerix * | 4,600 | 193 | ||||||
Civitas Solutions * | 3,000 | 67 | ||||||
Clovis Oncology * | 3,766 | 348 | ||||||
Coherus Biosciences * | 1,900 | 47 | ||||||
Community Health Systems * | 19,529 | 1,080 | ||||||
Computer Programs & Systems | 1,702 | 89 | ||||||
CONMED | 5,108 | 284 | ||||||
Cooper | 8,034 | 1,460 | ||||||
Corcept Therapeutics * | 13,100 | 80 | ||||||
CorVel * | 1,434 | 51 | ||||||
Cross Country Healthcare * | 5,079 | 54 | ||||||
CryoLife | 5,045 | 54 | ||||||
CTI BioPharma *(A) | 17,100 | 33 | ||||||
Cyberonics * | 4,146 | 265 | ||||||
Cynosure, Cl A * | 4,339 | 155 | ||||||
Cytokinetics * | 2,100 | 13 | ||||||
Cytori Therapeutics * | 2,432 | 2 | ||||||
CytRx * | 6,500 | 27 | ||||||
Depomed * | 9,255 | 193 | ||||||
Derma Sciences * | 3,783 | 25 | ||||||
DexCom * | 12,724 | 913 | ||||||
Dyax * | 22,882 | 603 | ||||||
Dynavax Technologies *(A) | 3,189 | 73 | ||||||
Emergent Biosolutions * | 4,984 | 159 | ||||||
Enanta Pharmaceuticals * | 1,200 | 49 | ||||||
Endocyte * | 4,870 | 30 | ||||||
Endologix * | 9,095 | 152 | ||||||
Ensign Group | 3,718 | 172 | ||||||
Envision Healthcare Holdings * | 14,200 | 525 | ||||||
Enzo Biochem * | 4,300 | 10 | ||||||
Epizyme * | 1,600 | 30 | ||||||
Esperion Therapeutics * | 1,300 | 140 | ||||||
Exact Sciences *(A) | 14,554 | 393 | ||||||
Exactech * | 1,239 | 26 | ||||||
ExamWorks Group * | 5,945 | 243 | ||||||
Exelixis *(A) | 25,200 | 79 | ||||||
FibroGen * | 2,000 | 36 | ||||||
Five Prime Therapeutics * | 2,000 | 51 | ||||||
Five Star Quality Care * | 8,527 | 39 | ||||||
Fluidigm * | 4,553 | 108 | ||||||
Foundation Medicine *(A) | 2,952 | 106 | ||||||
Galectin Therapeutics *(A) | 2,100 | 5 | ||||||
| Description | Shares | Market Value ($ Thousands) | ||||||
Galena Biopharma *(A) | 8,900 | $ | 14 | |||||
Genesis Healthcare, Cl A * | 2,900 | 18 | ||||||
GenMark Diagnostics * | 5,900 | 54 | ||||||
Genomic Health * | 1,797 | 49 | ||||||
Geron *(A) | 23,970 | 93 | ||||||
Globus Medical, Cl A * | 9,900 | 257 | ||||||
Greatbatch * | 3,430 | 178 | ||||||
Haemonetics * | 8,447 | 349 | ||||||
Halozyme Therapeutics *(A) | 18,958 | 329 | ||||||
Halyard Health * | 7,200 | 298 | ||||||
Hanger * | 4,309 | 99 | ||||||
Health Net * | 13,670 | 851 | ||||||
HealthEquity * | 2,100 | 56 | ||||||
HealthSouth | 15,241 | 658 | ||||||
HealthStream * | 3,264 | 93 | ||||||
Healthways * | 3,221 | 49 | ||||||
HeartWare International * | 2,579 | 190 | ||||||
Heron Therapeutics * | 2,300 | 45 | ||||||
Hill-Rom Holdings | 10,101 | 521 | ||||||
HMS Holdings * | 13,031 | 222 | ||||||
Hologic * | 40,355 | 1,443 | ||||||
Horizon Pharma *(A) | 13,300 | 431 | ||||||
ICU Medical * | 1,827 | 177 | ||||||
Idera Pharmaceuticals *(A) | 7,600 | 29 | ||||||
Idexx Laboratories * | 8,101 | 1,098 | ||||||
IGI Laboratories *(A) | 6,200 | 40 | ||||||
Illumina * | 22,979 | 4,736 | ||||||
ImmunoGen *(A) | 10,752 | 97 | ||||||
Immunomedics *(A) | 7,257 | 28 | ||||||
Impax Laboratories * | 12,188 | 573 | ||||||
IMS Health Holdings * | 12,300 | 366 | ||||||
INC Research Holdings, Cl A * | 2,200 | 76 | ||||||
Incyte * | 23,971 | 2,640 | ||||||
Infinity Pharmaceuticals * | 6,394 | 83 | ||||||
Inovalon Holdings, Cl A * | 4,900 | 130 | ||||||
Inovio Pharmaceuticals * | 16,000 | 135 | ||||||
Insmed * | 8,400 | 184 | ||||||
Insulet * | 10,421 | 295 | ||||||
Insys Therapeutics *(A) | 1,900 | 113 | ||||||
Integra LifeSciences Holdings * | 4,652 | 312 | ||||||
Intercept Pharmaceuticals *(A) | 2,176 | 555 | ||||||
Intra-Cellular Therapies * | 2,000 | 52 | ||||||
Intrexon *(A) | 6,000 | 253 | ||||||
Invacare | 6,889 | 150 | ||||||
IPC The Hospitalist * | 2,300 | 114 | ||||||
Ironwood Pharmaceuticals, Cl A * | 22,154 | 313 | ||||||
Isis Pharmaceuticals *(A) | 19,794 | 1,333 | ||||||
Jazz Pharmaceuticals * | 9,934 | 1,782 | ||||||
Juno Therapeutics *(A) | 2,100 | 111 | ||||||
K2M Group Holdings * | 2,800 | 73 | ||||||
Karyopharm Therapeutics *(A) | 1,600 | 43 | ||||||
Keryx Biopharmaceuticals *(A) | 17,594 | 183 | ||||||
Kindred Healthcare | 14,973 | 343 | ||||||
Kite Pharma *(A) | 1,600 | 88 | ||||||
KYTHERA Biopharmaceuticals * | 2,900 | 146 | ||||||
Landauer | 1,073 | 37 | ||||||
Lannett * | 3,900 | 217 | ||||||
LDR Holding * | 1,900 | 77 | ||||||
Lexicon Pharmaceuticals *(A) | 3,105 | 22 | ||||||
LHC Group * | 2,284 | 84 | ||||||
LifePoint Hospitals * | 7,796 | 587 | ||||||
Ligand Pharmaceuticals, Cl B *(A) | 2,928 | 258 | ||||||
| 11 | SEI Institutional Investments Trust / Annual Report / May 31, 2015 |
SCHEDULE OF INVESTMENTS
Extended Market Index Fund
May 31, 2015
| Description | Shares | Market Value ($ Thousands) | ||||||
Luminex * | 4,755 | $ | 80 | |||||
MacroGenics * | 3,400 | 110 | ||||||
Magellan Health Services * | 5,040 | 341 | ||||||
MannKind *(A) | 34,843 | 180 | ||||||
Masimo * | 8,293 | 291 | ||||||
MedAssets * | 11,739 | 245 | ||||||
Medicines * | 9,357 | 265 | ||||||
Medidata Solutions * | 9,494 | 551 | ||||||
Medivation * | 12,804 | 1,691 | ||||||
MEDNAX * | 15,356 | 1,093 | ||||||
Merge Healthcare * | 16,099 | 73 | ||||||
Meridian Bioscience | 6,141 | 112 | ||||||
Merit Medical Systems * | 7,375 | 152 | ||||||
Merrimack Pharmaceuticals *(A) | 14,600 | 172 | ||||||
Mettler Toledo International * | 4,882 | 1,585 | ||||||
MiMedx Group *(A) | 16,900 | 175 | ||||||
Mirati Therapeutics * | 2,400 | 88 | ||||||
Molina Healthcare * | 5,436 | 395 | ||||||
Momenta Pharmaceuticals * | 7,254 | 144 | ||||||
Myriad Genetics *(A) | 10,726 | 364 | ||||||
NanoViricides *(A) | 9,400 | 15 | ||||||
National Healthcare | 1,494 | 94 | ||||||
National Research, Cl A | 312 | 4 | ||||||
Natus Medical * | 6,158 | 241 | ||||||
Navidea Biopharmaceuticals *(A) | 7,605 | 9 | ||||||
Nektar Therapeutics * | 23,895 | 275 | ||||||
Neogen * | 5,480 | 256 | ||||||
Neuralstem *(A) | 8,000 | 12 | ||||||
Neurocrine Biosciences * | 14,700 | 645 | ||||||
Nevro * | 1,000 | 51 | ||||||
NewLink Genetics * | 2,516 | 109 | ||||||
Northwest Biotherapeutics *(A) | 4,100 | 34 | ||||||
Novavax * | 43,853 | 395 | ||||||
NuVasive * | 8,378 | 424 | ||||||
NxStage Medical * | 8,747 | 142 | ||||||
Ocular Therapeutix * | 1,700 | 41 | ||||||
Ohr Pharmaceutical * | 2,500 | 7 | ||||||
Omeros *(A) | 5,200 | 103 | ||||||
Omnicare | 16,596 | 1,581 | ||||||
Omnicell * | 6,412 | 237 | ||||||
OncoMed Pharmaceuticals * | 1,500 | 37 | ||||||
Oncothyreon * | 8,400 | 29 | ||||||
Ophthotech * | 2,300 | 115 | ||||||
OPKO Health *(A) | 31,429 | 556 | ||||||
OraSure Technologies * | 5,539 | 34 | ||||||
Orexigen Therapeutics * | 15,061 | 74 | ||||||
Organovo Holdings *(A) | 7,300 | 37 | ||||||
Orthofix International * | 2,440 | 80 | ||||||
Osiris Therapeutics * | 4,100 | 76 | ||||||
Otonomy * | 1,500 | 37 | ||||||
OvaScience * | 2,500 | 85 | ||||||
Owens & Minor | 9,239 | 308 | ||||||
Oxford Immunotec Global * | 1,500 | 21 | ||||||
Pacific Biosciences of California * | 8,700 | 49 | ||||||
Pacira Pharmaceuticals * | 6,245 | 488 | ||||||
Pain Therapeutics * | 4,500 | 9 | ||||||
PAREXEL International * | 9,846 | 654 | ||||||
PDL BioPharma (A) | 31,600 | 211 | ||||||
Peregrine Pharmaceuticals *(A) | 15,000 | 21 | ||||||
Pernix Therapeutics Holdings * | 3,900 | 25 | ||||||
PharMerica * | 4,250 | 141 | ||||||
Phibro Animal Health, Cl A | 1,700 | 59 | ||||||
PhotoMedex * | 265 | — | ||||||
| Description | Shares | Market Value ($ Thousands) | ||||||
Portola Pharmaceuticals, Cl A * | 8,400 | $ | 351 | |||||
Pozen * | 5,328 | 34 | ||||||
PRA Health Sciences * | 2,500 | 84 | ||||||
Premier, Cl A * | 4,700 | 180 | ||||||
Prestige Brands Holdings * | 7,979 | 350 | ||||||
Progenics Pharmaceuticals * | 11,596 | 65 | ||||||
Prothena * | 3,900 | 154 | ||||||
Providence Service * | 1,758 | 84 | ||||||
PTC Therapeutics * | 3,800 | 221 | ||||||
Puma Biotechnology * | 4,200 | 821 | ||||||
QIAGEN * | 39,648 | 974 | ||||||
Quality Systems | 7,215 | 114 | ||||||
Quidel * | 3,412 | 74 | ||||||
Quintiles Transnational Holdings * | 8,400 | 586 | ||||||
Radius Health * | 1,500 | 72 | ||||||
RadNet * | 3,900 | 25 | ||||||
Raptor Pharmaceutical *(A) | 13,007 | 160 | ||||||
Receptos * | 3,800 | 627 | ||||||
Regulus Therapeutics * | 3,400 | 48 | ||||||
Relypsa * | 4,000 | 147 | ||||||
Repligen * | 5,222 | 213 | ||||||
Repros Therapeutics * | 2,942 | 21 | ||||||
ResMed | 23,599 | 1,388 | ||||||
Retrophin * | 5,400 | 171 | ||||||
Revance Therapeutics *(A) | 1,700 | 44 | ||||||
Rigel Pharmaceuticals * | 17,759 | 62 | ||||||
Rockwell Medical *(A) | 4,300 | 48 | ||||||
RTI Surgical * | 6,918 | 45 | ||||||
Sage Therapeutics * | 1,200 | 90 | ||||||
Sagent Pharmaceuticals * | 3,875 | 87 | ||||||
Sangamo BioSciences * | 11,070 | 136 | ||||||
Sarepta Therapeutics *(A) | 5,200 | 133 | ||||||
Sciclone Pharmaceuticals * | 6,501 | 60 | ||||||
Seattle Genetics * | 17,400 | 750 | ||||||
Select Medical Holdings | 13,065 | 214 | ||||||
Sequenom *(A) | 22,017 | 74 | ||||||
Sirona Dental Systems * | 9,822 | 970 | ||||||
Spark Therapeutics * | 1,600 | 118 | ||||||
Spectranetics *(A) | 6,524 | 162 | ||||||
Spectrum Pharmaceuticals * | 7,079 | 44 | ||||||
STAAR Surgical *(A) | 5,378 | 50 | ||||||
Stemline Therapeutics * | 900 | 12 | ||||||
STERIS | 10,198 | 682 | ||||||
Sucampo Pharmaceuticals, Cl A * | 2,200 | 36 | ||||||
Sunesis Pharmaceuticals * | 10,135 | 24 | ||||||
Supernus Pharmaceuticals * | 5,000 | 71 | ||||||
Surgical Care Affiliates * | 1,500 | 57 | ||||||
SurModics * | 2,444 | 60 | ||||||
Symmetry Surgical * | 1,222 | 11 | ||||||
Synageva BioPharma * | 4,006 | 855 | ||||||
Synergy Pharmaceuticals *(A) | 10,515 | 45 | ||||||
Synta Pharmaceuticals * | 9,354 | 20 | ||||||
Tandem Diabetes Care * | 1,500 | 18 | ||||||
Team Health Holdings * | 12,108 | 708 | ||||||
Teleflex | 7,002 | 901 | ||||||
TESARO * | 3,700 | 217 | ||||||
Tetraphase Pharmaceuticals * | 5,400 | 232 | ||||||
TG Therapeutics *(A) | 2,800 | 44 | ||||||
TherapeuticsMD *(A) | 21,900 | 155 | ||||||
Theravance (A) | 14,209 | 240 | ||||||
Theravance Biopharma * | 2,945 | 41 | ||||||
Thoratec * | 9,527 | 432 | ||||||
| 12 | SEI Institutional Investments Trust / Annual Report / May 31, 2015 |
SCHEDULE OF INVESTMENTS
Extended Market Index Fund
May 31, 2015
| Description | Shares | Market Value ($ Thousands) | ||||||
Threshold Pharmaceuticals * | 9,295 | $ | 36 | |||||
Tornier * | 4,408 | 117 | ||||||
Triple-S Management, Cl B * | 2,866 | 69 | ||||||
Ultragenyx Pharmaceutical * | 1,200 | 104 | ||||||
Unilife *(A) | 18,171 | 45 | ||||||
United Therapeutics * | 8,064 | 1,482 | ||||||
Universal American * | 7,316 | 75 | ||||||
US Physical Therapy | 1,926 | 96 | ||||||
Utah Medical Products | 200 | 11 | ||||||
Vanda Pharmaceuticals * | 4,100 | 41 | ||||||
Vascular Solutions * | 2,718 | 89 | ||||||
VCA Antech * | 14,283 | 749 | ||||||
Veeva Systems, Cl A * | 5,600 | 152 | ||||||
Verastem * | 6,700 | 58 | ||||||
VIVUS *(A) | 8,977 | 23 | ||||||
Vocera Communications * | 1,742 | 19 | ||||||
VWR * | 3,700 | 101 | ||||||
WellCare Health Plans * | 7,566 | 648 | ||||||
West Pharmaceutical Services | 12,230 | 662 | ||||||
Wright Medical Group * | 6,859 | 188 | ||||||
Xencor * | 3,000 | 54 | ||||||
XenoPort * | 9,916 | 59 | ||||||
XOMA * | 9,730 | 34 | ||||||
Zafgen * | 1,600 | 52 | ||||||
Zeltiq Aesthetics * | 4,400 | 121 | ||||||
ZIOPHARM Oncology *(A) | 14,973 | 142 | ||||||
Zogenix *(A) | 10,400 | 18 | ||||||
ZS Pharma * | 1,200 | 70 | ||||||
|
| |||||||
| 95,335 | ||||||||
|
| |||||||
Industrials — 13.7% | ||||||||
AAON | 6,950 | 165 | ||||||
AAR | 5,729 | 169 | ||||||
ABM Industries | 9,355 | 303 | ||||||
Acacia Research | 8,749 | 89 | ||||||
ACCO Brands * | 15,629 | 115 | ||||||
Accuride * | 10,900 | 47 | ||||||
Actuant, Cl A | 8,542 | 201 | ||||||
Acuity Brands | 7,246 | 1,279 | ||||||
Advanced Drainage Systems | 2,600 | 76 | ||||||
Advisory Board * | 6,384 | 324 | ||||||
AECOM Technology * | 25,648 | 847 | ||||||
Aegion, Cl A * | 4,503 | 80 | ||||||
Aerojet Rocketdyne Holdings * | 8,779 | 182 | ||||||
Aerovironment * | 2,125 | 55 | ||||||
AGCO | 15,123 | 768 | ||||||
Air Lease, Cl A | 17,631 | 663 | ||||||
Air Transport Services Group * | 6,336 | 67 | ||||||
Aircastle | 12,057 | 293 | ||||||
Alamo Group | 935 | 50 | ||||||
Alaska Air Group | 20,922 | 1,352 | ||||||
Albany International, Cl A | 4,098 | 162 | ||||||
Allegiant Travel, Cl A | 2,050 | 323 | ||||||
Allison Transmission Holdings, Cl A | 21,076 | 645 | ||||||
Altra Industrial Motion | 3,389 | 93 | ||||||
AMERCO | 1,300 | 428 | ||||||
Ameresco, Cl A * | 779 | 6 | ||||||
American Railcar Industries (A) | 1,277 | 69 | ||||||
American Science & Engineering | 955 | 37 | ||||||
American Woodmark * | 1,684 | 86 | ||||||
AO Smith | 12,858 | 918 | ||||||
Apogee Enterprises | 5,411 | 291 | ||||||
Applied Industrial Technologies | 7,661 | 325 | ||||||
| Description | Shares | Market Value ($ Thousands) | ||||||
ARC Document Solutions * | 4,300 | $ | 32 | |||||
ArcBest | 3,290 | 112 | ||||||
Argan | 1,879 | 67 | ||||||
Armstrong World Industries * | 8,077 | 444 | ||||||
Astec Industries | 3,163 | 131 | ||||||
Astronics * | 3,274 | 229 | ||||||
Astronics, Cl B * | 454 | 32 | ||||||
Atlas Air Worldwide Holdings * | 4,769 | 260 | ||||||
Avis Budget Group * | 17,960 | 916 | ||||||
AZZ | 4,896 | 235 | ||||||
B/E Aerospace | 17,830 | 1,022 | ||||||
Babcock & Wilcox | 19,124 | 637 | ||||||
Baltic Trading (A) | 5,700 | 9 | ||||||
Barnes Group | 8,152 | 328 | ||||||
Barrett Business Services | 834 | 30 | ||||||
Beacon Roofing Supply * | 8,370 | 262 | ||||||
Blount International * | 6,185 | 72 | ||||||
Brady, Cl A | 7,827 | 198 | ||||||
Briggs & Stratton (A) | 6,749 | 129 | ||||||
Brink’s | 7,606 | 243 | ||||||
Builders FirstSource * | 7,970 | 98 | ||||||
CAI International * | 1,272 | 27 | ||||||
Capstone Turbine *(A) | 50,135 | 21 | ||||||
Carlisle | 10,877 | 1,078 | ||||||
Casella Waste Systems, Cl A * | 1,391 | 8 | ||||||
CBIZ * | 3,745 | 34 | ||||||
CDI | 2,269 | 28 | ||||||
CEB | 5,461 | 462 | ||||||
Ceco Environmental | 2,047 | 23 | ||||||
Celadon Group | 3,375 | 79 | ||||||
Cenveo *(A) | 7,100 | 18 | ||||||
Chart Industries * | 3,972 | 129 | ||||||
Chicago Bridge & Iron (A) | 16,792 | 911 | ||||||
CIRCOR International | 2,315 | 123 | ||||||
Civeo | 11,798 | 47 | ||||||
CLARCOR | 8,023 | 494 | ||||||
Clean Harbors * | 10,576 | 596 | ||||||
Colfax * | 16,289 | 821 | ||||||
Columbus McKinnon | 2,465 | 56 | ||||||
Comfort Systems USA | 7,791 | 175 | ||||||
Commercial Vehicle Group * | 5,592 | 35 | ||||||
Continental Building Products * | 3,000 | 67 | ||||||
Con-way | 9,168 | 371 | ||||||
Copa Holdings, Cl A (A) | 5,828 | 497 | ||||||
Copart * | 17,550 | 607 | ||||||
Covanta Holding | 17,558 | 388 | ||||||
CRA International * | 2,105 | 58 | ||||||
Crane | 8,529 | 516 | ||||||
Cubic | 2,989 | 143 | ||||||
Curtiss-Wright | 8,378 | 604 | ||||||
Deluxe | 8,754 | 559 | ||||||
DigitalGlobe * | 11,232 | 337 | ||||||
Donaldson | 24,346 | 868 | ||||||
Douglas Dynamics | 4,222 | 86 | ||||||
Ducommun * | 1,000 | 23 | ||||||
DXP Enterprises * | 1,662 | 68 | ||||||
Dycom Industries * | 6,207 | 357 | ||||||
Dynamic Materials | 1,365 | 15 | ||||||
Echo Global Logistics * | 4,586 | 148 | ||||||
EMCOR Group | 9,787 | 444 | ||||||
Encore Wire | 3,103 | 136 | ||||||
Energy Recovery *(A) | 4,487 | 12 | ||||||
EnerNOC * | 4,160 | 40 | ||||||
EnerSys | 6,783 | 452 | ||||||
| 13 | SEI Institutional Investments Trust / Annual Report / May 31, 2015 |
SCHEDULE OF INVESTMENTS
Extended Market Index Fund
May 31, 2015
| Description | Shares | Market Value ($ Thousands) | ||||||
Engility Holdings | 2,010 | $ | 56 | |||||
Ennis | 3,488 | 59 | ||||||
Enphase Energy *(A) | 2,300 | 22 | ||||||
EnPro Industries | 3,568 | 216 | ||||||
ESCO Technologies | 3,777 | 141 | ||||||
Esterline Technologies * | 5,490 | 594 | ||||||
ExOne *(A) | 1,900 | 24 | ||||||
Exponent | 1,743 | 148 | ||||||
Federal Signal | 9,547 | 142 | ||||||
Fortune Brands Home & Security | 27,973 | 1,283 | ||||||
Forward Air | 4,918 | 255 | ||||||
Franklin Covey * | 491 | 10 | ||||||
Franklin Electric | 8,781 | 309 | ||||||
FreightCar America | 1,733 | 39 | ||||||
FTI Consulting * | 6,968 | 274 | ||||||
FuelCell Energy *(A) | 34,361 | 42 | ||||||
Furmanite * | 3,137 | 26 | ||||||
G&K Services, Cl A | 3,439 | 240 | ||||||
GATX | 8,152 | 454 | ||||||
Generac Holdings *(A) | 12,145 | 507 | ||||||
General Cable | 6,137 | 116 | ||||||
Genesee & Wyoming, Cl A * | 8,074 | 665 | ||||||
Gibraltar Industries * | 3,560 | 64 | ||||||
Global Brass & Copper Holdings | 2,700 | 47 | ||||||
Global Power Equipment Group | 3,430 | 26 | ||||||
Golden Ocean Group (A) | 5,743 | 24 | ||||||
Gorman-Rupp | 1,977 | 55 | ||||||
GP Strategies * | 2,500 | 78 | ||||||
Graco | 9,435 | 685 | ||||||
GrafTech International * | 15,817 | 80 | ||||||
Graham | 796 | 18 | ||||||
Granite Construction | 6,811 | 244 | ||||||
Great Lakes Dredge & Dock * | 9,180 | 51 | ||||||
Greenbrier (A) | 5,123 | 309 | ||||||
Griffon | 4,237 | 68 | ||||||
H&E Equipment Services | 3,725 | 81 | ||||||
Harsco | 11,028 | 178 | ||||||
Hawaiian Holdings * | 6,780 | 164 | ||||||
HD Supply Holdings * | 18,500 | 600 | ||||||
Healthcare Services Group | 11,439 | 346 | ||||||
Heartland Express | 10,572 | 225 | ||||||
Heico | 10,481 | 601 | ||||||
Heidrick & Struggles International | 2,952 | 74 | ||||||
Heritage-Crystal Clean * | 1,200 | 17 | ||||||
Herman Miller | 9,943 | 275 | ||||||
Hertz Global Holdings * | 75,014 | 1,492 | ||||||
Hexcel | 16,698 | 822 | ||||||
HNI | 7,249 | 352 | ||||||
Houston Wire & Cable | 3,755 | 34 | ||||||
Hub Group, Cl A * | 5,762 | 244 | ||||||
Hubbell, Cl B | 9,989 | 1,079 | ||||||
Huntington Ingalls Industries | 8,359 | 1,036 | ||||||
Hurco | 1,235 | 41 | ||||||
Huron Consulting Group * | 4,011 | 258 | ||||||
Hyster-Yale Materials Handling | 2,002 | 142 | ||||||
ICF International * | 2,468 | 88 | ||||||
IDEX | 13,641 | 1,054 | ||||||
IHS, Cl A * | 11,399 | 1,407 | ||||||
InnerWorkings * | 3,487 | 22 | ||||||
Insperity | 3,012 | 158 | ||||||
Insteel Industries | 2,941 | 58 | ||||||
Interface, Cl A | 10,545 | 227 | ||||||
| Description | Shares | Market Value ($ Thousands) | ||||||
International Shipholding | 800 | $ | 6 | |||||
ITT | 15,863 | 677 | ||||||
JB Hunt Transport Services | 15,449 | 1,298 | ||||||
JetBlue Airways * | 44,781 | 903 | ||||||
John Bean Technologies | 4,431 | 166 | ||||||
Kadant | 1,725 | 81 | ||||||
Kaman | 3,973 | 168 | ||||||
KAR Auction Services | 23,829 | 888 | ||||||
KBR | 26,045 | 499 | ||||||
Kelly Services, Cl A | 2,795 | 43 | ||||||
Kennametal | 13,814 | 498 | ||||||
KEYW Holding *(A) | 4,068 | 28 | ||||||
Kforce | 4,537 | 100 | ||||||
Kirby * | 8,926 | 685 | ||||||
KLX * | 8,665 | 380 | ||||||
Knight Transportation | 10,937 | 313 | ||||||
Knoll | 8,163 | 186 | ||||||
Korn/Ferry International | 9,258 | 297 | ||||||
Kratos Defense & Security Solutions * | 5,216 | 31 | ||||||
Landstar System | 7,944 | 520 | ||||||
Layne Christensen *(A) | 3,469 | 28 | ||||||
LB Foster, Cl A | 1,171 | 45 | ||||||
Lennox International | 7,629 | 859 | ||||||
Lincoln Electric Holdings | 12,933 | 869 | ||||||
Lindsay Manufacturing (A) | 1,627 | 131 | ||||||
LMI Aerospace * | 181 | 2 | ||||||
LSI Industries | 2,000 | 19 | ||||||
Lydall * | 1,632 | 45 | ||||||
Manitex International * | 1,800 | 14 | ||||||
Manitowoc | 24,050 | 454 | ||||||
Manpowergroup | 13,456 | 1,139 | ||||||
Marten Transport | 3,095 | 70 | ||||||
Masonite International * | 5,300 | 362 | ||||||
MasTec * | 12,762 | 225 | ||||||
Matson | 7,152 | 288 | ||||||
Matthews International, Cl A | 5,013 | 249 | ||||||
McGrath RentCorp | 3,748 | 114 | ||||||
Meritor * | 18,495 | 265 | ||||||
Middleby * | 9,725 | 1,057 | ||||||
Miller Industries | 2,311 | 47 | ||||||
Mistras Group * | 2,697 | 50 | ||||||
Mobile Mini | 8,583 | 341 | ||||||
Moog, Cl A * | 6,024 | 413 | ||||||
MRC Global * | 17,212 | 264 | ||||||
MSA Safety | 4,744 | 212 | ||||||
MSC Industrial Direct, Cl A | 8,303 | 576 | ||||||
Mueller Industries | 8,708 | 304 | ||||||
Mueller Water Products, Cl A | 27,012 | 249 | ||||||
Multi-Color | 1,957 | 125 | ||||||
MYR Group * | 4,179 | 124 | ||||||
NACCO Industries, Cl A | 305 | 17 | ||||||
National Presto Industries | 591 | 41 | ||||||
Navigant Consulting * | 7,641 | 104 | ||||||
Navios Maritime Holdings (A) | 9,200 | 31 | ||||||
Navistar International *(A) | 10,291 | 273 | ||||||
NCI Building Systems * | 3,548 | 53 | ||||||
NN | 2,487 | 68 | ||||||
Nordson | 11,012 | 891 | ||||||
Nortek * | 1,242 | 103 | ||||||
Northwest Pipe * | 1,186 | 25 | ||||||
NOW *(A) | 19,100 | 442 | ||||||
Old Dominion Freight Line * | 9,790 | 666 | ||||||
On Assignment * | 8,069 | 303 | ||||||
| 14 | SEI Institutional Investments Trust / Annual Report / May 31, 2015 |
SCHEDULE OF INVESTMENTS
Extended Market Index Fund
May 31, 2015
| Description | Shares | Market Value ($ Thousands) | ||||||
Orbital ATK | 10,092 | $ | 772 | |||||
Orion Marine Group * | 1,874 | 14 | ||||||
Oshkosh Truck | 13,517 | 678 | ||||||
Owens Corning | 20,060 | 850 | ||||||
PAM Transportation Services * | 900 | 55 | ||||||
Park-Ohio Holdings | 1,118 | 54 | ||||||
Patriot Transportation Holding * | 279 | 7 | ||||||
Paylocity Holding * | 1,100 | 37 | ||||||
Pendrell * | 8,751 | 9 | ||||||
Performant Financial * | 2,000 | 6 | ||||||
PGT * | 4,900 | 59 | ||||||
Plug Power *(A) | 19,400 | 53 | ||||||
Ply Gem Holdings * | 1,300 | 16 | ||||||
Polypore International * | 7,260 | 435 | ||||||
Powell Industries | 1,364 | 49 | ||||||
Power Solutions International * | 800 | 44 | ||||||
PowerSecure International * | 3,700 | 55 | ||||||
Preformed Line Products | 90 | 3 | ||||||
Primoris Services | 5,347 | 100 | ||||||
Proto Labs * | 4,199 | 290 | ||||||
Quad, Cl A | 3,562 | 73 | ||||||
Quality Distribution * | 3,910 | 62 | ||||||
Quanex Building Products | 5,765 | 103 | ||||||
Raven Industries | 4,155 | 80 | ||||||
RBC Bearings * | 4,295 | 301 | ||||||
Regal-Beloit | 7,825 | 612 | ||||||
Republic Airways Holdings * | 7,596 | 79 | ||||||
Resources Connection | 7,181 | 113 | ||||||
Rexnord * | 11,626 | 298 | ||||||
Roadrunner Transportation Systems * | 3,272 | 81 | ||||||
Rollins | 14,462 | 359 | ||||||
RPX * | 6,510 | 104 | ||||||
RR Donnelley & Sons | 31,360 | 601 | ||||||
Rush Enterprises, Cl A * | 5,399 | 143 | ||||||
Safe Bulkers (A) | 4,500 | 15 | ||||||
Saia * | 3,392 | 139 | ||||||
Scorpio Bulkers *(A) | 15,200 | 36 | ||||||
Simpson Manufacturing | 6,543 | 222 | ||||||
SkyWest | 6,622 | 98 | ||||||
SolarCity *(A) | 6,331 | 381 | ||||||
SP Plus * | 2,498 | 61 | ||||||
Sparton * | 1,100 | 29 | ||||||
Spirit AeroSystems Holdings, Cl A * | 20,375 | 1,112 | ||||||
Spirit Airlines * | 12,447 | 791 | ||||||
SPX | 7,194 | 535 | ||||||
Standex International | 1,629 | 130 | ||||||
Steelcase, Cl A | 14,057 | 242 | ||||||
Sterling Construction * | 591 | 2 | ||||||
Stock Building Supply Holdings * | 1,700 | 28 | ||||||
Sun Hydraulics | 2,877 | 108 | ||||||
Swift Transporation, Cl A * | 13,809 | 321 | ||||||
TAL International Group | 5,884 | 214 | ||||||
Taser International * | 9,069 | 286 | ||||||
Team * | 4,257 | 169 | ||||||
Teledyne Technologies * | 6,137 | 622 | ||||||
Tennant | 2,738 | 175 | ||||||
Terex | 19,470 | 481 | ||||||
Tetra Tech | 11,442 | 299 | ||||||
Textainer Group Holdings | 2,253 | 64 | ||||||
Thermon Group Holdings * | 6,882 | 156 | ||||||
Timken | 11,809 | 462 | ||||||
Titan International | 5,472 | 58 | ||||||
| Description | Shares | Market Value ($ Thousands) | ||||||
Titan Machinery * | 3,312 | $ | 53 | |||||
Toro | 9,700 | 663 | ||||||
Towers Watson, Cl A | 10,933 | 1,508 | ||||||
TransDigm Group | 8,805 | 1,990 | ||||||
Trex * | 4,940 | 250 | ||||||
TriMas * | 6,176 | 178 | ||||||
TriNet Group * | 1,800 | 54 | ||||||
Trinity Industries | 26,542 | 796 | ||||||
Triumph Group | 7,796 | 520 | ||||||
TrueBlue * | 5,928 | 169 | ||||||
Tutor Perini * | 4,551 | 95 | ||||||
Twin Disc | 1,870 | 33 | ||||||
UniFirst | 2,440 | 279 | ||||||
United Continental Holdings * | 61,752 | 3,371 | ||||||
United Stationers | 7,337 | 285 | ||||||
Universal Forest Products | 3,955 | 219 | ||||||
Universal Truckload Services | 700 | 14 | ||||||
US Ecology | 3,040 | 140 | ||||||
USA Truck * | 1,700 | 39 | ||||||
USG * | 15,082 | 435 | ||||||
UTi Worldwide *(A) | 14,295 | 138 | ||||||
Valmont Industries (A) | 3,914 | 487 | ||||||
Vectrus * | 1,379 | 35 | ||||||
Verisk Analytics, Cl A * | 27,672 | 2,008 | ||||||
Veritiv * | 1,000 | 41 | ||||||
Viad | 2,271 | 61 | ||||||
Vicor * | 2,500 | 34 | ||||||
Virgin America *(A) | 1,900 | 54 | ||||||
VSE | 500 | 31 | ||||||
Wabash National * | 11,741 | 159 | ||||||
WABCO Holdings * | 9,510 | 1,202 | ||||||
Wabtec | 16,106 | 1,615 | ||||||
WageWorks * | 6,571 | 282 | ||||||
Waste Connections | 21,003 | 1,019 | ||||||
Watsco | 4,059 | 511 | ||||||
Watts Water Technologies, Cl A | 5,356 | 285 | ||||||
Werner Enterprises | 5,990 | 165 | ||||||
Wesco Aircraft Holdings * | 6,146 | 91 | ||||||
WESCO International * | 7,766 | 558 | ||||||
West | 5,700 | 174 | ||||||
Woodward Governor | 11,542 | 588 | ||||||
Xerium Technologies * | 2,400 | 41 | ||||||
XPO Logistics *(A) | 9,290 | 457 | ||||||
YRC Worldwide * | 4,500 | 59 | ||||||
|
| |||||||
| 101,142 | ||||||||
|
| |||||||
Information Technology — 16.6% | ||||||||
3D Systems *(A) | 19,547 | 428 | ||||||
ACI Worldwide * | 17,212 | 410 | ||||||
Activision Blizzard | 82,406 | 2,082 | ||||||
Actua * | 5,188 | 66 | ||||||
Acxiom * | 10,574 | 175 | ||||||
ADTRAN | 6,797 | 117 | ||||||
Advanced Energy Industries * | 8,019 | 229 | ||||||
Advanced Micro Devices *(A) | 103,900 | 237 | ||||||
Advent Software | 9,268 | 406 | ||||||
Agilysys * | 900 | 8 | ||||||
Alliance Fiber Optic Products | 600 | 12 | ||||||
Alpha & Omega Semiconductor * | 1,100 | 9 | ||||||
Ambarella *(A) | 4,400 | 397 | ||||||
Amber Road * | 1,900 | 14 | ||||||
Amdocs | 26,868 | 1,474 | ||||||
American Software, Cl A | 2,872 | 25 | ||||||
Amkor Technology * | 11,313 | 76 | ||||||
Angie’s List * | 3,748 | 24 | ||||||
| 15 | SEI Institutional Investments Trust / Annual Report / May 31, 2015 |
SCHEDULE OF INVESTMENTS
Extended Market Index Fund
May 31, 2015
| Description | Shares | Market Value ($ Thousands) | ||||||
Anixter International * | 4,441 | $ | 302 | |||||
Ansys * | 15,517 | 1,381 | ||||||
AOL * | 13,765 | 688 | ||||||
Applied Micro Circuits * | 8,998 | 58 | ||||||
Applied Optoelectronics * | 1,700 | 30 | ||||||
Arista Networks * | 800 | 56 | ||||||
ARRIS Group * | 19,770 | 653 | ||||||
Arrow Electronics * | 16,925 | 1,029 | ||||||
Aspen Technology * | 13,167 | 564 | ||||||
Atmel | 72,982 | 647 | ||||||
AVG Technologies * | 4,300 | 105 | ||||||
Avnet | 23,399 | 1,030 | ||||||
AVX | 7,078 | 100 | ||||||
Axcelis Technologies * | 7,300 | 23 | ||||||
Badger Meter | 1,862 | 120 | ||||||
Bankrate * | 13,949 | 170 | ||||||
Barracuda Networks * | 900 | 35 | ||||||
Bazaarvoice * | 8,300 | 47 | ||||||
Bel Fuse, Cl B | 888 | 20 | ||||||
Belden | 6,823 | 576 | ||||||
Benchmark Electronics * | 10,330 | 240 | ||||||
Benefitfocus * | 700 | 25 | ||||||
Black Box | 2,509 | 50 | ||||||
Blackbaud | 7,055 | 362 | ||||||
Blackhawk Network Holdings, Cl A * | 12,700 | 437 | ||||||
Blucora * | 6,429 | 102 | ||||||
Booz Allen Hamilton Holding, Cl A | 13,565 | 344 | ||||||
Bottomline Technologies de * | 7,771 | 205 | ||||||
Box, Cl A *(A) | 3,600 | 64 | ||||||
Brightcove * | 2,600 | 18 | ||||||
Broadridge Financial Solutions | 20,397 | 1,105 | ||||||
BroadSoft * | 5,694 | 208 | ||||||
Brocade Communications Systems | 74,047 | 916 | ||||||
Brooks Automation | 8,403 | 94 | ||||||
Cabot Microelectronics * | 3,624 | 167 | ||||||
CACI International, Cl A * | 3,632 | 311 | ||||||
Cadence Design Systems * | 49,147 | 973 | ||||||
CalAmp *(A) | 4,756 | 94 | ||||||
Calix * | 4,945 | 40 | ||||||
Callidus Software * | 8,056 | 115 | ||||||
Carbonite * | 1,400 | 15 | ||||||
Cardtronics * | �� | 7,485 | 273 | |||||
Cascade Microtech * | 3,600 | 58 | ||||||
Cass Information Systems | 1,490 | 74 | ||||||
Cavium * | 9,131 | 643 | ||||||
CDK Global | 26,900 | 1,434 | ||||||
CDW | 15,200 | 564 | ||||||
CEVA * | 3,838 | 79 | ||||||
ChannelAdvisor * | 2,400 | 27 | ||||||
Checkpoint Systems | 6,545 | 64 | ||||||
Ciber * | 13,787 | 46 | ||||||
Ciena *(A) | 17,286 | 417 | ||||||
Cimpress * | 5,899 | 486 | ||||||
Cirrus Logic * | 10,195 | 385 | ||||||
Clearfield *(A) | 1,400 | 21 | ||||||
Cognex | 14,958 | 755 | ||||||
Coherent * | 4,153 | 258 | ||||||
Cohu | 2,077 | 28 | ||||||
CommScope Holding * | 9,300 | 290 | ||||||
CommVault Systems * | 6,984 | 310 | ||||||
Computer Task Group | 792 | 6 | ||||||
| Description | Shares | Market Value ($ Thousands) | ||||||
comScore * | 5,347 | $ | 303 | |||||
Comtech Telecommunications | 1,932 | 58 | ||||||
Comverse * | 2,100 | 51 | ||||||
Constant Contact * | 4,666 | 127 | ||||||
Control4 * | 1,400 | 13 | ||||||
Convergys | 18,087 | 449 | ||||||
CoreLogic * | 15,983 | 623 | ||||||
Cornerstone OnDemand * | 9,799 | 305 | ||||||
CoStar Group * | 5,463 | 1,141 | ||||||
Coupons.com * | 1,400 | 18 | ||||||
Covisint * | 4,989 | 13 | ||||||
Cray * | 7,870 | 241 | ||||||
Cree *(A) | 17,523 | 531 | ||||||
CSG Systems International | 5,617 | 175 | ||||||
CTS | 4,045 | 76 | ||||||
CUI Global * | 4,400 | 24 | ||||||
Cvent * | 2,100 | 55 | ||||||
Cypress Semiconductor | 51,835 | 712 | ||||||
Daktronics | 4,580 | 49 | ||||||
Datalink * | 3,697 | 34 | ||||||
Dealertrack Technologies * | 8,800 | 367 | ||||||
Demandware * | 4,545 | 283 | ||||||
DHI Group * | 6,690 | 57 | ||||||
Diebold | 10,533 | 360 | ||||||
Digi International * | 3,601 | 36 | ||||||
Digimarc * | 276 | 9 | ||||||
Diodes * | 5,742 | 152 | ||||||
Dolby Laboratories, Cl A | 8,704 | 341 | ||||||
Dot Hill Systems * | 7,000 | 49 | ||||||
DSP Group * | 862 | 10 | ||||||
DST Systems | 4,350 | 515 | ||||||
DTS * | 3,044 | 97 | ||||||
EarthLink Holdings | 11,833 | 82 | ||||||
Ebix | 3,825 | 136 | ||||||
EchoStar, Cl A * | 7,003 | 351 | ||||||
Electro Rent | 1,059 | 11 | ||||||
Electro Scientific Industries | 2,445 | 13 | ||||||
Electronics For Imaging * | 7,728 | 334 | ||||||
Ellie Mae * | 4,463 | 282 | ||||||
Endurance International Group Holdings *(A) | 3,100 | 63 | ||||||
Entegris * | 25,308 | 353 | ||||||
Envestnet * | 5,095 | 223 | ||||||
EPAM Systems * | 6,300 | 453 | ||||||
Epiq Systems | 3,690 | 62 | ||||||
ePlus * | 644 | 50 | ||||||
Euronet Worldwide * | 8,088 | 484 | ||||||
EVERTEC | 10,200 | 227 | ||||||
Exar * | 4,992 | 54 | ||||||
ExlService Holdings * | 5,323 | 191 | ||||||
Extreme Networks * | 10,187 | 28 | ||||||
Fabrinet * | 5,515 | 100 | ||||||
FactSet Research Systems | 7,186 | 1,187 | ||||||
Fair Isaac | 5,691 | 499 | ||||||
Fairchild Semiconductor International, Cl A * | 19,009 | 379 | ||||||
FARO Technologies * | 2,208 | 96 | ||||||
FEI | 7,352 | 600 | ||||||
Finisar * | 15,454 | 338 | ||||||
FireEye * | 14,300 | 666 | ||||||
FleetCor Technologies * | 13,773 | 2,095 | ||||||
FleetMatics Group * | 5,778 | 242 | ||||||
FormFactor * | 6,967 | 65 | ||||||
Forrester Research | 1,564 | 53 | ||||||
| 16 | SEI Institutional Investments Trust / Annual Report / May 31, 2015 |
SCHEDULE OF INVESTMENTS
Extended Market Index Fund
May 31, 2015
| Description | Shares | Market Value ($ Thousands) | ||||||
Fortinet * | 23,299 | $ | 933 | |||||
Freescale Semiconductor * | 16,507 | 745 | ||||||
Gartner * | 14,237 | 1,245 | ||||||
Genpact * | 27,750 | 624 | ||||||
Gigamon * | 2,800 | 86 | ||||||
Global Cash Access Holdings * | 7,316 | 57 | ||||||
Global Payments | 11,528 | 1,203 | ||||||
Global Sources * | 751 | 4 | ||||||
Glu Mobile * | 16,800 | 109 | ||||||
Gogo * | 9,200 | 197 | ||||||
GrubHub * | 1,000 | 40 | ||||||
GSI Group * | 5,462 | 82 | ||||||
GTT Communications * | 1,800 | 40 | ||||||
Guidance Software * | 594 | 4 | ||||||
Guidewire Software * | 11,869 | 575 | ||||||
Hackett Group | 3,300 | 39 | ||||||
Harmonic * | 14,394 | 98 | ||||||
Heartland Payment Systems | 6,511 | 348 | ||||||
Higher One Holdings * | 1,534 | 4 | ||||||
HomeAway * | 13,977 | 392 | ||||||
HubSpot * | 1,600 | 81 | ||||||
IAC | 12,621 | 947 | ||||||
iGATE * | 6,186 | 294 | ||||||
II-VI * | 8,943 | 167 | ||||||
Immersion * | 3,567 | 43 | ||||||
Imperva * | 4,583 | 279 | ||||||
Infinera * | 22,884 | 472 | ||||||
Infoblox * | 10,603 | 276 | ||||||
Informatica * | 17,785 | 861 | ||||||
Ingram Micro, Cl A * | 24,446 | 655 | ||||||
Inphi * | 4,962 | 119 | ||||||
Insight Enterprises * | 7,198 | 211 | ||||||
Integrated Device Technology * | 23,345 | 552 | ||||||
Integrated Silicon Solution | 3,805 | 78 | ||||||
Interactive Intelligence Group *(A) | 2,268 | 98 | ||||||
InterDigital | 6,130 | 359 | ||||||
Internap Network Services * | 8,784 | 86 | ||||||
Intersil, Cl A | 19,572 | 264 | ||||||
Intevac * | 3,000 | 16 | ||||||
Intralinks Holdings * | 3,326 | 35 | ||||||
InvenSense, Cl A *(A) | 9,677 | 137 | ||||||
IPG Photonics * | 5,820 | 552 | ||||||
Itron * | 5,411 | 194 | ||||||
Ixia * | 12,258 | 154 | ||||||
IXYS | 1,980 | 24 | ||||||
j2 Global (A) | 8,357 | 555 | ||||||
Jabil Circuit | 34,700 | 853 | ||||||
Jack Henry & Associates | 14,419 | 938 | ||||||
JDS Uniphase * | 40,700 | 522 | ||||||
Jive Software * | 7,834 | 44 | ||||||
Kemet * | 2,462 | 8 | ||||||
Keysight Technologies * | 28,400 | 933 | ||||||
Kimball Electronics * | 3,093 | 48 | ||||||
Knowles *(A) | 15,800 | 306 | ||||||
Kopin * | 8,823 | 31 | ||||||
KVH Industries * | 1,997 | 25 | ||||||
Lattice Semiconductor * | 16,962 | 106 | ||||||
Leidos Holdings | 10,350 | 440 | ||||||
LendingClub *(A) | 11,600 | 223 | ||||||
Lexmark International, Cl A | 9,980 | 459 | ||||||
Limelight Networks * | 15,000 | 66 | ||||||
LinkedIn, Cl A * | 17,206 | 3,354 | ||||||
Lionbridge Technologies * | 7,618 | 42 | ||||||
| Description | Shares | Market Value ($ Thousands) | ||||||
Liquidity Services * | 2,222 | $ | 22 | |||||
Littelfuse | 3,703 | 358 | ||||||
LivePerson * | 8,091 | 77 | ||||||
LogMeIn * | 4,513 | 286 | ||||||
Luxoft Holding, Cl A * | 1,100 | 59 | ||||||
MA-COM Tech * | 1,300 | 50 | ||||||
Manhattan Associates * | 13,080 | 717 | ||||||
ManTech International, Cl A | 2,822 | 80 | ||||||
Marchex, Cl B | 2,900 | 14 | ||||||
Marin Software * | 1,400 | 8 | ||||||
Marketo * | 3,000 | 90 | ||||||
Marvell Technology Group | 68,902 | 964 | ||||||
Maxim Integrated Products | 47,304 | 1,659 | ||||||
MAXIMUS | 11,616 | 759 | ||||||
MaxLinear, Cl A * | 5,545 | 56 | ||||||
Maxwell Technologies *(A) | 2,864 | 15 | ||||||
Mentor Graphics | 15,740 | 411 | ||||||
Mercury Systems * | 6,123 | 84 | ||||||
Mesa Laboratories | 300 | 26 | ||||||
Methode Electronics | 6,984 | 328 | ||||||
Micrel | 6,093 | 85 | ||||||
Microsemi * | 16,514 | 601 | ||||||
MicroStrategy, Cl A * | 1,653 | 291 | ||||||
Millennial Media * | 3,000 | 5 | ||||||
Mitel Networks * | 5,313 | 49 | ||||||
MKS Instruments | 8,323 | 314 | ||||||
Model N * | 900 | 10 | ||||||
ModusLink Global Solutions * | 6,400 | 22 | ||||||
MoneyGram International * | 2,905 | 28 | ||||||
Monolithic Power Systems | 5,751 | 314 | ||||||
Monotype Imaging Holdings | 6,860 | 178 | ||||||
Monster Worldwide * | 12,508 | 76 | ||||||
MTS Systems | 1,989 | 135 | ||||||
Multi-Fineline Electronix * | 1,200 | 30 | ||||||
Nanometrics * | 3,644 | 57 | ||||||
National Instruments | 17,467 | 522 | ||||||
NCR * | 28,683 | 862 | ||||||
NETGEAR * | 4,892 | 152 | ||||||
NetScout Systems *(A) | 6,858 | 275 | ||||||
NetSuite * | 7,203 | 673 | ||||||
NeuStar, Cl A *(A) | 10,532 | 288 | ||||||
Newport * | 5,995 | 113 | ||||||
NIC | 10,822 | 182 | ||||||
Nimble Storage * | 800 | 21 | ||||||
Nuance Communications * | 41,081 | 693 | ||||||
Numerex, Cl A * | 477 | 4 | ||||||
NVE | 694 | 50 | ||||||
Oclaro *(A) | 11,100 | 29 | ||||||
OmniVision Technologies * | 8,142 | 220 | ||||||
ON Semiconductor * | 74,900 | 993 | ||||||
OSI Systems * | 3,768 | 272 | ||||||
Palo Alto Networks * | 9,133 | 1,548 | ||||||
Pandora Media * | 35,471 | 662 | ||||||
Park Electrochemical | 1,982 | 43 | ||||||
ParkerVision *(A) | 14,552 | 5 | ||||||
Paycom Software * | 1,800 | 63 | ||||||
PC Connection | 831 | 21 | ||||||
PDF Solutions * | 4,653 | 74 | ||||||
Pegasystems | 5,136 | 112 | ||||||
Perficient * | 6,700 | 127 | ||||||
Pericom Semiconductor | 4,211 | 55 | ||||||
Photronics * | 14,429 | 146 | ||||||
Plantronics | 6,969 | 384 | ||||||
Plexus * | 5,828 | 265 | ||||||
| 17 | SEI Institutional Investments Trust / Annual Report / May 31, 2015 |
SCHEDULE OF INVESTMENTS
Extended Market Index Fund
May 31, 2015
| Description | Shares | Market Value ($ Thousands) | ||||||
PMC-Sierra * | 32,354 | $ | 294 | |||||
Polycom * | 25,247 | 340 | ||||||
Power Integrations | 5,689 | 289 | ||||||
PRGX Global * | 936 | 4 | ||||||
Procera Networks * | 1,381 | 16 | ||||||
Progress Software * | 9,758 | 257 | ||||||
Proofpoint * | 7,000 | 414 | ||||||
PROS Holdings * | 3,399 | 65 | ||||||
PTC * | 18,490 | 763 | ||||||
Q2 Holdings * | 2,400 | 57 | ||||||
Qlik Technologies * | 15,625 | 565 | ||||||
QLogic * | 13,122 | 204 | ||||||
Qorvo * | 23,880 | 1,962 | ||||||
Qualys * | 2,500 | 102 | ||||||
Quantum * | 41,478 | 85 | ||||||
Quicklogic * | 6,400 | 10 | ||||||
QuinStreet * | 1,186 | 7 | ||||||
Rackspace Hosting * | 20,077 | 805 | ||||||
Rally Software Development * | 4,700 | 91 | ||||||
Rambus * | 16,110 | 246 | ||||||
RealD * | 7,764 | 98 | ||||||
RealNetworks * | 844 | 5 | ||||||
RealPage * | 7,046 | 129 | ||||||
Reis | 500 | 11 | ||||||
RetailMeNot * | 3,600 | 73 | ||||||
Rightside Group * | 337 | 3 | ||||||
Rocket Fuel *(A) | 2,100 | 17 | ||||||
Rofin-Sinar Technologies * | 3,515 | 100 | ||||||
Rogers * | 2,493 | 180 | ||||||
Rosetta Stone * | 700 | 5 | ||||||
Rovi * | 13,934 | 234 | ||||||
Rubicon Technology * | 1,000 | 3 | ||||||
Ruckus Wireless * | 7,817 | 82 | ||||||
Rudolph Technologies * | 5,507 | 70 | ||||||
Sabre | 8,100 | 211 | ||||||
Sanmina * | 12,666 | 274 | ||||||
Sapiens International | 5,300 | 48 | ||||||
ScanSource * | 4,096 | 159 | ||||||
Science Applications International | 6,442 | 341 | ||||||
SciQuest * | 2,538 | 39 | ||||||
Seachange International * | 3,843 | 26 | ||||||
Semtech * | 12,675 | 271 | ||||||
ServiceNow * | 25,569 | 1,959 | ||||||
ServiceSource International * | 9,746 | 43 | ||||||
ShoreTel * | 5,870 | 40 | ||||||
Shutterstock * | 2,697 | 173 | ||||||
Silicon Graphics International * | 3,190 | 20 | ||||||
Silicon Laboratories * | 7,082 | 393 | ||||||
SolarWinds * | 10,360 | 492 | ||||||
Solera Holdings | 12,027 | 593 | ||||||
Sonus Networks * | 5,720 | 45 | ||||||
Speed Commerce * | 5,400 | 1 | ||||||
Splunk * | 20,984 | 1,419 | ||||||
SPS Commerce * | 2,129 | 138 | ||||||
SS&C Technologies Holdings | 10,709 | 631 | ||||||
Stamps.com * | 2,355 | 158 | ||||||
Stratasys * | 7,069 | 251 | ||||||
SunEdison *(A) | 45,009 | 1,349 | ||||||
SunPower, Cl A * | 7,836 | 238 | ||||||
Super Micro Computer * | 4,851 | 162 | ||||||
Sykes Enterprises * | 6,211 | 151 | ||||||
Synaptics * | 6,287 | 626 | ||||||
Synchronoss Technologies * | 5,397 | 238 | ||||||
| Description | Shares | Market Value ($ Thousands) | ||||||
SYNNEX | 5,070 | $ | 419 | |||||
Synopsys * | 26,052 | 1,300 | ||||||
Syntel * | 4,854 | 231 | ||||||
Tableau Software, Cl A * | 6,600 | 747 | ||||||
Take-Two Interactive Software * | 12,839 | 351 | ||||||
Tangoe *(A) | 4,655 | 59 | ||||||
Tech Data��* | 6,265 | 395 | ||||||
TechTarget * | 4,700 | 43 | ||||||
TeleCommunication Systems, Cl A * | 11,300 | 36 | ||||||
Telenav * | 3,400 | 31 | ||||||
TeleTech Holdings | 3,427 | 87 | ||||||
Teradyne | 32,200 | 681 | ||||||
Tessco Technologies | 700 | 13 | ||||||
Tessera Technologies | 8,730 | 337 | ||||||
Textura * | 2,200 | 64 | ||||||
TiVo * | 14,386 | 151 | ||||||
Travelzoo * | 287 | 3 | ||||||
Trimble Navigation * | 44,220 | 1,037 | ||||||
TrueCar *(A) | 1,700 | 24 | ||||||
TTM Technologies * | 7,087 | 70 | ||||||
Twitter * | 85,300 | 3,128 | ||||||
Tyler Technologies * | 5,687 | 691 | ||||||
Ubiquiti Networks | 6,000 | 191 | ||||||
Ultimate Software Group * | 4,835 | 782 | ||||||
Ultra Clean Holdings * | 4,452 | 29 | ||||||
Ultratech * | 2,968 | 59 | ||||||
Unisys * | 7,183 | 148 | ||||||
Universal Display * | 6,308 | 339 | ||||||
Unwired Planet * | 3,460 | 2 | ||||||
Vantiv, Cl A * | 21,308 | 852 | ||||||
Varonis Systems * | 1,500 | 30 | ||||||
Vasco Data Security International *(A) | 4,254 | 113 | ||||||
Veeco Instruments * | 7,001 | 212 | ||||||
VeriFone Holdings * | 19,229 | 734 | ||||||
Verint Systems * | 10,350 | 669 | ||||||
ViaSat * | 6,256 | 394 | ||||||
Violin Memory *(A) | 9,300 | 31 | ||||||
VirnetX Holding *(A) | 4,742 | 23 | ||||||
Virtusa * | 4,649 | 212 | ||||||
Vishay Intertechnology | 22,517 | 293 | ||||||
Vishay Precision Group * | 464 | 6 | ||||||
VMware, Cl A * | 14,717 | 1,285 | ||||||
Vringo *(A) | 6,600 | 4 | ||||||
Web.com Group * | 7,239 | 164 | ||||||
WebMD Health, Cl A * | 7,127 | 327 | ||||||
WEX * | 6,676 | 757 | ||||||
Wix.com * | 1,300 | 32 | ||||||
Workday, Cl A * | 15,789 | 1,246 | ||||||
Xcerra * | 7,941 | 61 | ||||||
XO Group * | 4,415 | 72 | ||||||
Xoom *(A) | 3,570 | 67 | ||||||
Yelp, Cl A *(A) | 8,198 | 393 | ||||||
Zebra Technologies, Cl A * | 8,564 | 939 | ||||||
Zendesk * | 2,400 | 55 | ||||||
Zillow Group, Cl A *(A) | 7,391 | 675 | ||||||
Zix * | 6,113 | 28 | ||||||
Zynga, Cl A * | 119,074 | 351 | ||||||
|
| |||||||
| 122,309 | ||||||||
|
| |||||||
Materials — 5.2% | ||||||||
A. Schulman | 4,729 | 202 | ||||||
AEP Industries * | 180 | 9 | ||||||
AK Steel Holding *(A) | 24,300 | 128 | ||||||
| 18 | SEI Institutional Investments Trust / Annual Report / May 31, 2015 |
SCHEDULE OF INVESTMENTS
Extended Market Index Fund
May 31, 2015
| Description | Shares | Market Value ($ Thousands) | ||||||
Albemarle | 19,264 | $ | 1,159 | |||||
AM Castle *(A) | 923 | 5 | ||||||
American Vanguard | 3,999 | 55 | ||||||
Ampco-Pittsburgh | 333 | 5 | ||||||
AptarGroup | 10,266 | 655 | ||||||
Ashland | 11,608 | 1,479 | ||||||
Axalta Coating Systems * | 9,700 | 332 | ||||||
Axiall | 12,425 | 469 | ||||||
Balchem | 5,088 | 287 | ||||||
Bemis | 15,700 | 721 | ||||||
Berry Plastics Group * | 15,738 | 527 | ||||||
Boise Cascade * | 5,970 | 212 | ||||||
Cabot | 11,432 | 474 | ||||||
Calgon Carbon | 8,218 | 171 | ||||||
Carpenter Technology | 8,701 | 355 | ||||||
Celanese, Cl A | 25,992 | 1,790 | ||||||
Century Aluminum * | 6,659 | 74 | ||||||
Chase | 800 | 33 | ||||||
Chemtura * | 10,729 | 298 | ||||||
Clearwater Paper * | 2,951 | 177 | ||||||
Cliffs Natural Resources | 18,900 | 100 | ||||||
Coeur Mining * | 26,161 | 143 | ||||||
Commercial Metals | 19,541 | 314 | ||||||
Compass Minerals International | 5,940 | 512 | ||||||
Crown Holdings * | 23,335 | 1,290 | ||||||
Cytec Industries | 11,234 | 680 | ||||||
Deltic Timber | 1,596 | 103 | ||||||
Domtar | 11,350 | 491 | ||||||
Eagle Materials | 8,583 | 716 | ||||||
Ferro * | 14,205 | 215 | ||||||
Flotek Industries * | 6,296 | 72 | ||||||
FutureFuel | 3,876 | 46 | ||||||
Glatfelter | 5,471 | 128 | ||||||
Globe Specialty Metals | 11,102 | 215 | ||||||
Gold Resource | 1,558 | 5 | ||||||
Graphic Packaging Holding | 56,017 | 798 | ||||||
Greif, Cl A | 4,419 | 169 | ||||||
H.B. Fuller | 8,233 | 347 | ||||||
Handy & Harman * | 800 | 25 | ||||||
Hawkins | 1,773 | 72 | ||||||
Haynes International | 2,823 | 133 | ||||||
Headwaters * | 10,820 | 205 | ||||||
Hecla Mining | 65,556 | 204 | ||||||
Horsehead Holding * | 7,009 | 87 | ||||||
Huntsman | 34,624 | 777 | ||||||
Innophos Holdings | 2,889 | 151 | ||||||
Innospec | 3,113 | 133 | ||||||
Intrepid Potash * | 7,060 | 82 | ||||||
Kaiser Aluminum | 3,354 | 272 | ||||||
KapStone Paper and Packaging | 12,542 | 338 | ||||||
KMG Chemicals | 2,509 | 75 | ||||||
Koppers Holdings | 4,773 | 123 | ||||||
Kraton Performance Polymers * | 4,880 | 116 | ||||||
Kronos Worldwide | 3,484 | 42 | ||||||
Louisiana-Pacific * | 22,942 | 415 | ||||||
LSB Industries * | 2,939 | 125 | ||||||
Materion | 3,474 | 129 | ||||||
Minerals Technologies | 6,224 | 419 | ||||||
Molycorp *(A) | 16,247 | 9 | ||||||
Myers Industries | 3,418 | 59 | ||||||
Neenah Paper | 2,593 | 156 | ||||||
NewMarket | 1,397 | 643 | ||||||
Noranda Aluminum Holding | 9,100 | 16 | ||||||
Olin (A) | 14,116 | 413 | ||||||
| Description | Shares | Market Value ($ Thousands) | ||||||
Olympic Steel | 1,927 | $ | 34 | |||||
OM Group | 5,583 | 148 | ||||||
OMNOVA Solutions * | 7,567 | 57 | ||||||
Packaging Corp of America | 16,549 | 1,145 | ||||||
Patrick Industries * | 2,900 | 173 | ||||||
Platform Specialty Products * | 16,900 | 442 | ||||||
PolyOne | 14,132 | 550 | ||||||
Quaker Chemical | 1,934 | 165 | ||||||
Rayonier Advanced Materials | 4,917 | 81 | ||||||
Reliance Steel & Aluminum | 13,238 | 845 | ||||||
Rentech * | 37,265 | 44 | ||||||
Resolute Forest Products * | 9,092 | 109 | ||||||
Rock-Tenn, Cl A | 24,070 | 1,568 | ||||||
Royal Gold | 11,102 | 719 | ||||||
RPM International | 22,488 | 1,125 | ||||||
RTI International Metals * | 4,743 | 167 | ||||||
Ryerson Holding * | 1,400 | 12 | ||||||
Schnitzer Steel Industries, Cl A | 3,456 | 62 | ||||||
Schweitzer-Mauduit International | 4,938 | 199 | ||||||
Scotts Miracle-Gro, Cl A | 7,159 | 439 | ||||||
Senomyx *(A) | 4,900 | 28 | ||||||
Sensient Technologies | 8,135 | 551 | ||||||
Silgan Holdings | 7,030 | 382 | ||||||
Sonoco Products | 17,521 | 789 | ||||||
Southern Copper (A) | 25,029 | 751 | ||||||
Steel Dynamics | 40,937 | 893 | ||||||
Stepan | 2,725 | 140 | ||||||
Stillwater Mining * | 18,980 | 275 | ||||||
SunCoke Energy | 8,646 | 141 | ||||||
Tahoe Resources | 23,588 | 329 | ||||||
TimkenSteel | 7,904 | 235 | ||||||
Trecora Resources * | 2,517 | 35 | ||||||
Tredegar | 2,341 | 46 | ||||||
Trinseo * | 2,300 | 67 | ||||||
Tronox, Cl A | 10,100 | 170 | ||||||
United States Steel (A) | 25,200 | 615 | ||||||
Universal Stainless & Alloy Products * | 1,034 | 19 | ||||||
US Concrete * | 3,000 | 113 | ||||||
Valspar | 14,226 | 1,187 | ||||||
Walter Industries (A) | 5,626 | 3 | ||||||
Wausau Paper | 4,619 | 45 | ||||||
Westlake Chemical | 6,210 | 438 | ||||||
Worthington Industries | 7,502 | 204 | ||||||
WR Grace * | 12,824 | 1,256 | ||||||
Zep | 3,721 | 74 | ||||||
|
| |||||||
| 38,050 | ||||||||
|
| |||||||
Telecommunication Services — 1.0% | ||||||||
8x8 * | 10,914 | 91 | ||||||
Atlantic Telegraph-Network | 1,367 | 92 | ||||||
Boingo Wireless * | 2,700 | 24 | ||||||
Cincinnati Bell * | 30,086 | 110 | ||||||
Cogent Communications Holdings | 8,804 | 277 | ||||||
Consolidated Communications Holdings | 7,576 | 157 | ||||||
FairPoint Communications * | 4,570 | 92 | ||||||
General Communication, Cl A * | 4,403 | 71 | ||||||
Globalstar * | 32,000 | 85 | ||||||
Hawaiian Telcom Holdco * | 905 | 23 | ||||||
IDT, Cl B | 3,103 | 56 | ||||||
inContact * | 7,628 | 74 | ||||||
Inteliquent | 7,353 | 130 | ||||||
| 19 | SEI Institutional Investments Trust / Annual Report / May 31, 2015 |
SCHEDULE OF INVESTMENTS
Extended Market Index Fund
May 31, 2015
| Description | Shares | Market Value ($ Thousands) | ||||||
Intelsat *(A) | 5,200 | $ | 56 | |||||
Iridium Communications *(A) | 11,746 | 122 | ||||||
Lumos Networks | 2,271 | 32 | ||||||
magicJack VocalTec *(A) | 3,636 | 30 | ||||||
NTELOS Holdings | 1,498 | 13 | ||||||
ORBCOMM * | 7,786 | 53 | ||||||
Premiere Global Services * | 5,618 | 57 | ||||||
RingCentral, Cl A * | 4,700 | 80 | ||||||
SBA Communications, Cl A * | 21,419 | 2,395 | ||||||
Shenandoah Telecommunications | 2,752 | 86 | ||||||
Spok Holdings | 4,132 | 72 | ||||||
Sprint *(A) | 126,990 | 590 | ||||||
Telephone & Data Systems | 14,055 | 417 | ||||||
T-Mobile US * | 44,405 | 1,726 | ||||||
US Cellular * | 1,452 | 57 | ||||||
Vonage Holdings * | 30,720 | 143 | ||||||
Windstream Holdings (A) | 14,883 | 121 | ||||||
Zayo Group Holdings * | 3,000 | 79 | ||||||
|
| |||||||
| 7,411 | ||||||||
|
| |||||||
Utilities — 3.3% | ||||||||
Abengoa Yield (A) | 5,600 | 215 | ||||||
ALLETE | 7,870 | 396 | ||||||
Alliant Energy | 18,718 | 1,147 | ||||||
American States Water | 6,574 | 253 | ||||||
American Water Works | 29,918 | 1,582 | ||||||
Aqua America | 27,537 | 725 | ||||||
Artesian Resources, Cl A | 284 | 6 | ||||||
Atlantic Power (A) | 12,421 | 37 | ||||||
Atmos Energy | 17,082 | 923 | ||||||
Avista | 9,252 | 296 | ||||||
Black Hills | 7,302 | 349 | ||||||
California Water Service Group | 7,141 | 171 | ||||||
Calpine * | 65,472 | 1,316 | ||||||
Chesapeake Utilities | 3,115 | 164 | ||||||
Cleco | 10,522 | 571 | ||||||
Connecticut Water Service | 1,906 | 67 | ||||||
Dynegy, Cl A * | 19,300 | 624 | ||||||
El Paso Electric | 6,836 | 249 | ||||||
Empire District Electric | 6,356 | 148 | ||||||
Great Plains Energy | 24,123 | 629 | ||||||
Hawaiian Electric Industries | 18,758 | 573 | ||||||
IDACORP | 8,824 | 525 | ||||||
ITC Holdings | 26,775 | 945 | ||||||
Laclede Group | 7,003 | 375 | ||||||
MDU Resources Group | 29,932 | 627 | ||||||
MGE Energy | 5,914 | 229 | ||||||
Middlesex Water | 2,701 | 59 | ||||||
National Fuel Gas | 14,288 | 918 | ||||||
New Jersey Resources | 13,594 | 409 | ||||||
Northwest Natural Gas | 5,276 | 236 | ||||||
NorthWestern | 8,346 | 434 | ||||||
NRG Yield, Cl A (A) | 3,000 | 79 | ||||||
NRG Yield, Cl C (A) | 3,000 | 81 | ||||||
OGE Energy | 33,676 | 1,061 | ||||||
ONE Gas | 9,300 | 412 | ||||||
Ormat Technologies | 5,434 | 202 | ||||||
Otter Tail | 4,846 | 131 | ||||||
Pattern Energy Group, Cl A | 7,000 | 199 | ||||||
Piedmont Natural Gas | 13,692 | 510 | ||||||
PNM Resources | 13,017 | 346 | ||||||
Portland General Electric | 13,800 | 482 | ||||||
Questar | 27,408 | 622 | ||||||
SJW | 2,464 | 74 | ||||||
| Description | Shares/Face Amount ($ Thousands) | Market Value ($ Thousands) | ||||||
South Jersey Industries | 12,196 | $ | 322 | |||||
Southwest Gas | 8,241 | 449 | ||||||
TerraForm Power, Cl A | 4,700 | 189 | ||||||
UGI | 29,196 | 1,092 | ||||||
UIL Holdings | 9,050 | 459 | ||||||
Unitil | 1,358 | 46 | ||||||
Vectren | 14,343 | 610 | ||||||
Vivint Solar *(A) | 4,900 | 70 | ||||||
Westar Energy, Cl A | 22,070 | 809 | ||||||
WGL Holdings | 8,261 | 475 | ||||||
York Water | 752 | 17 | ||||||
|
| |||||||
| 23,935 | ||||||||
|
| |||||||
Total Common Stock | 722,360 | |||||||
|
| |||||||
| Number Of Warrants | ||||||||
WARRANTS ‡‡ — 0.0% | ||||||||
Magnum Hunter Resources *(A) | 1,239 | — | ||||||
Tejon Ranch * | 96 | — | ||||||
|
| |||||||
Total Warrants | — | |||||||
|
| |||||||
| Number Of Rights | ||||||||
RIGHTS ‡‡ — 0.0% | ||||||||
Bermuda — 0.0% | ||||||||
Central European Media Enterprises * | 112 | — | ||||||
|
| |||||||
United States — 0.0% | ||||||||
CHC Group * | 7,800 | — | ||||||
Chelsea Therapeutics International * | 4,000 | — | ||||||
Durata Therapeutics * | 800 | — | ||||||
Furiex Pharmaceuticals * | 942 | — | ||||||
Leap Wireless * | 7,532 | — | ||||||
Trius Contingent Value * | 2,885 | — | ||||||
|
| |||||||
Total Rights | — | |||||||
|
| |||||||
AFFILIATED PARTNERSHIP — 5.8% |
| |||||||
SEI Liquidity Fund, L.P. | ||||||||
0.060% ** †(C) | 42,794,061 | 42,794 | ||||||
|
| |||||||
Total Affiliated Partnership | 42,794 | |||||||
|
| |||||||
CASH EQUIVALENT — 1.9% | ||||||||
SEI Daily Income Trust, Prime Obligation Fund, Cl A | ||||||||
0.010% ** † | 14,157,347 | 14,157 | ||||||
|
| |||||||
Total Cash Equivalent | 14,157 | |||||||
|
| |||||||
U.S. TREASURY OBLIGATIONS (D) (E) — 0.1% | ||||||||
U.S. Treasury Bill | ||||||||
0.011%, 07/23/2015 | $ | 300 | 300 | |||||
U.S. Treasury Bills | ||||||||
0.005%, 07/09/2015 | 510 | 510 | ||||||
| 20 | SEI Institutional Investments Trust / Annual Report / May 31, 2015 |
SCHEDULE OF INVESTMENTS
Extended Market Index Fund
May 31, 2015
| Description | Market Value ($ Thousands) | |||||
Total U.S. Treasury Obligations | $ | 810 | ||||
|
| |||||
Total Investments — 105.8% | $ | 780,121 | ||||
|
| |||||
A list of the open futures contracts held by the Fund at May 31, 2015, is as follows:
| Type of Contract | Number of Contracts Long (Short) | Expiration Date | Unrealized Appreciation (Depreciation) ($ Thousands) | |||||||||
Russell 2000 Index E-MINI | 47 | Jun-2015 | $ | 71 | ||||||||
S&P Mid 400 Index E-MINI | 60 | Jun-2015 | 176 | |||||||||
|
| |||||||||||
| $ | 247 | |||||||||||
|
| |||||||||||
For the year ended May 31, 2015, the total amount of all open futures contracts, as presented in the table above, are representative of the volume of activity for this derivative type during the year.
Percentages are based on a Net Assets of $737,363 ($ Thousands).
| * | Non-income producing security. |
| ** | The rate reported is the 7-day effective yield as of May 31, 2015. |
| † | Investment in Affiliated Security (see Note 6). |
| ‡ | Real Estate Investment Trust. |
| ‡‡ | Expiration date unavailable. |
| (A) | This security or a partial position of this security is on loan at May 31, 2015. The total market value of securities on loan at May 31, 2015 was $ 41,297 ($ Thousands). |
| (B) | Securities sold within terms of a private placement memorandum, exempt from registration under Section 144A of the Securities Act of 1933, as amended, and may be sold only to dealers in that program or other “accredited investors.” These securities have been determined to be liquid under guidelines established by the Board of Trustees. |
| (C) | This security was purchased with cash collateral held from securities on loan (See Note 12). The total value of such securities as of May 31, 2015 was $42,794 ($ Thousands). |
| (D) | The rate reported is the effective yield at time of purchase. |
| (E) | Security, or portion thereof, has been pledged as collateral on open futures contracts. |
Cl — Class
L.P. — Limited Partnership
Ser — Series
S&P — Standard & Poor’s
The following is a list of the level of inputs used as of May 31, 2015, in valuing the Fund’s investments and other financial instruments carried at value ($ Thousands):
| Investments in Securities | Level 1 | Level 2 | Level 3 | Total | ||||||||||||
Common Stock | $ | 722,360 | $ | — | $ | — | $ | 722,360 | ||||||||
Warrants | — | — | — | — | ||||||||||||
Rights | — | — | — | — | ||||||||||||
Affiliated Partnership | — | 42,794 | — | 42,794 | ||||||||||||
Cash Equivalent | 14,157 | — | — | 14,157 | ||||||||||||
U.S. Treasury Obligations | — | 810 | — | 810 | ||||||||||||
|
|
|
|
|
|
|
| |||||||||
Total Investments in Securities | $ | 736,517 | $ | 43,604 | $ | — | $ | 780,121 | ||||||||
|
|
|
|
|
|
|
| |||||||||
| Other Financial Instruments | Level 1 | Level 2 | Level 3 | Total | ||||||||||||
Futures Contracts * | $ | 247 | $ | — | $ | — | $ | 247 | ||||||||
|
|
|
|
|
|
|
| |||||||||
Total Futures Contracts * | $ | 247 | $ | — | $ | — | $ | 247 | ||||||||
|
|
|
|
|
|
|
| |||||||||
* Futures contracts are valued at the unrealized appreciation on the instrument.
For the year ended May 31, 2015, there were no transfers between Level 1, Level 2 and Level 3 assets and liabilities.
For the year ended May 31, 2015, there were no Level 3 securities.
For more information on valuation inputs, see Note 2 — Significant Accounting Policies in Notes to Financial Statements.
Amounts designated as “—” are $0 or have been rounded to $0.
The accompanying notes are an integral part of the financial statements.
| 21 | SEI Institutional Investments Trust / Annual Report / May 31, 2015 |
SCHEDULE OF INVESTMENTS
Small Cap Fund
May 31, 2015
| Description | Shares | Market Value ($ Thousands) | ||||||
COMMON STOCK — 93.8% |
| |||||||
Consumer Discretionary — 12.6% |
| |||||||
1-800-Flowers.com, Cl A * | 33,956 | $ | 323 | |||||
2U *(A) | 62,869 | 1,745 | ||||||
Aeropostale *(A) | 19,600 | 37 | ||||||
AMC Entertainment Holdings, Cl A | 4,050 | 117 | ||||||
American Axle & Manufacturing Holdings * | 38,567 | 968 | ||||||
American Eagle Outfitters | 1,805 | 30 | ||||||
America’s Car-Mart * | 600 | 32 | ||||||
Arctic Cat | 600 | 20 | ||||||
Ascena Retail Group * | 29,270 | 433 | ||||||
bebe stores | 25,639 | 67 | ||||||
Big 5 Sporting Goods | 19,100 | 278 | ||||||
Big Lots | 13,500 | 593 | ||||||
Bloomin’ Brands | 15,100 | 339 | ||||||
Boyd Gaming * | 29,097 | 416 | ||||||
Bravo Brio Restaurant Group * | 53,200 | 713 | ||||||
Brinker International | 7,700 | 425 | ||||||
Brunswick | 44,524 | 2,273 | ||||||
Buffalo Wild Wings * | 200 | 31 | ||||||
Build-A-Bear Workshop, Cl A * | 13,000 | 209 | ||||||
Burlington Stores * | 42,089 | 2,221 | ||||||
Caleres | 8,800 | 272 | ||||||
Callaway Golf (A) | 107,486 | 1,015 | ||||||
Capella Education | 3,789 | 202 | ||||||
Career Education * | 62,900 | 237 | ||||||
Carmike Cinemas * | 32,300 | 899 | ||||||
Cato, Cl A | 8,600 | 321 | ||||||
Children’s Place Retail Stores | 21,550 | 1,409 | ||||||
Christopher & Banks * | 13,700 | 79 | ||||||
Chuy’s Holdings *(A) | 62,620 | 1,628 | ||||||
Citi Trends * | 11,202 | 269 | ||||||
ClubCorp Holdings | 24,857 | 565 | ||||||
Container Store Group *(A) | 35,549 | 653 | ||||||
Cooper Tire & Rubber | 28,353 | 1,041 | ||||||
Cooper-Standard Holding * | 1,800 | 112 | ||||||
Core-Mark Holding | 4,611 | 247 | ||||||
Cracker Barrel Old Country Store | 1,545 | 218 | ||||||
Crocs * | 61,200 | 921 | ||||||
CSS Industries | 10,800 | 298 | ||||||
Dana Holdings | 77,650 | 1,690 | ||||||
Dave & Buster’s Entertainment * | 13,441 | 425 | ||||||
Demand Media * | 2,972 | 17 | ||||||
Denny’s * | 25,900 | 270 | ||||||
Destination Maternity | 2,500 | 27 | ||||||
Destination XL Group * | 43,400 | 211 | ||||||
Dex Media *(A) | 11,400 | 10 | ||||||
Diamond Resorts International * | 13,311 | 414 | ||||||
DineEquity | 1,900 | 185 | ||||||
Drew Industries | 4,400 | 270 | ||||||
Entravision Communications, Cl A | 69,995 | 473 | ||||||
Ethan Allen Interiors | 39,830 | 1,000 | ||||||
EW Scripps, Cl A | 6,107 | 143 | ||||||
Express * | 97,058 | 1,712 | ||||||
Fiesta Restaurant Group * | 35,602 | 1,657 | ||||||
Five Below *(A) | 43,196 | 1,436 | ||||||
Francesca’s Holdings * | 3,400 | 53 | ||||||
Fred’s, Cl A | 15,500 | 271 | ||||||
Fuel Systems Solutions * | 1,441 | 12 | ||||||
| Description | Shares | Market Value ($ Thousands) | ||||||
Genesco * | 16,595 | $ | 1,098 | |||||
G-III Apparel Group * | 9,169 | 521 | ||||||
Grand Canyon Education * | 5,900 | 252 | ||||||
Gray Television * | 42,352 | 676 | ||||||
Group 1 Automotive | 3,300 | 272 | ||||||
Harte-Hanks | 12,674 | 79 | ||||||
Haverty Furniture | 14,300 | 300 | ||||||
Helen of Troy * | 8,700 | 761 | ||||||
hhgregg *(A) | 12,200 | 47 | ||||||
Houghton Mifflin Harcourt * | 2,965 | 78 | ||||||
Hovnanian Enterprises, Cl A *(A) | 20,100 | 65 | ||||||
Hyatt Hotels, Cl A * | 1,150 | 66 | ||||||
Imax * | 42,918 | 1,731 | ||||||
Isle of Capri Casinos * | 21,336 | 303 | ||||||
Jack in the Box | 29,767 | 2,584 | ||||||
Journal Media Group | 2,301 | 18 | ||||||
K12 * | 55,400 | 759 | ||||||
Kate Spade * | 25,464 | 631 | ||||||
Kirkland’s * | 16,723 | 439 | ||||||
Krispy Kreme Doughnuts * | 92,768 | 1,613 | ||||||
La Quinta Holdings * | 18,112 | 450 | ||||||
La-Z-Boy, Cl Z | 7,200 | 191 | ||||||
LeapFrog Enterprises, Cl A *(A) | 38,600 | 78 | ||||||
Libbey | 50,322 | 1,988 | ||||||
Lithia Motors, Cl A | 11,665 | 1,242 | ||||||
Loral Space & Communications * | 10,000 | 668 | ||||||
Marriott Vacations Worldwide | 2,800 | 247 | ||||||
MDC Partners, Cl A | 89,700 | 1,902 | ||||||
Men’s Wearhouse | 21,431 | 1,243 | ||||||
Meredith | 23,375 | 1,234 | ||||||
Modine Manufacturing * | 29,106 | 326 | ||||||
Movado Group | 3,900 | 102 | ||||||
NACCO Industries, Cl A | 1,400 | 80 | ||||||
Nautilus * | 41,334 | 873 | ||||||
New Media Investment | 15,706 | 346 | ||||||
Noodles, Cl A *(A) | 32,300 | 469 | ||||||
Nutrisystem | 1,662 | 38 | ||||||
Office Depot * | 35,800 | 332 | ||||||
Orbitz Worldwide * | 3,100 | 35 | ||||||
Outerwall (A) | 3,400 | 261 | ||||||
Overstock.com * | 19,700 | 426 | ||||||
Penske Auto Group | 13,421 | 693 | ||||||
Pep Boys-Manny Moe & Jack * | 24,918 | 252 | ||||||
Perry Ellis International * | 6,351 | 156 | ||||||
PetMed Express (A) | 11,646 | 194 | ||||||
Pool | 13,273 | 880 | ||||||
Red Robin Gourmet Burgers * | 17,174 | 1,432 | ||||||
Rent-A-Center, Cl A | 15,700 | 475 | ||||||
Restoration Hardware Holdings * | 14,707 | 1,338 | ||||||
Ruth’s Hospitality Group | 47,900 | 706 | ||||||
Ryland Group | 42,025 | 1,768 | ||||||
Select Comfort * | 12,307 | 383 | ||||||
Shoe Carnival | 16,325 | 451 | ||||||
Shutterfly * | 23,032 | 1,071 | ||||||
Six Flags Entertainment | 8,777 | 429 | ||||||
Skechers U.S.A., Cl A * | 17,384 | 1,840 | ||||||
Skullcandy * | 24,700 | 185 | ||||||
Smith & Wesson Holding * | 16,000 | 235 | ||||||
Sonic | 13,206 | 398 | ||||||
Sportsman’s Warehouse Holdings *(A) | 86,207 | 835 | ||||||
Stage Stores | 17,482 | 283 | ||||||
Standard Motor Products | 2,837 | 100 | ||||||
| 1 | SEI Institutional Investments Trust / Annual Report / May 31, 2015 |
SCHEDULE OF INVESTMENTS
Small Cap Fund
May 31, 2015
| Description | Shares | Market Value ($ Thousands) | ||||||
Starwood Hotels & Resorts Worldwide | 1,200 | $ | 99 | |||||
Stein Mart | 17,491 | 186 | ||||||
Steiner Leisure * | 1,700 | 83 | ||||||
Steven Madden * | 36,601 | 1,383 | ||||||
Stoneridge * | 29,478 | 352 | ||||||
Strayer Education * | 5,600 | 257 | ||||||
TAL Education Group ADR *(A) | 25,067 | 908 | ||||||
Tenneco * | 8,600 | 505 | ||||||
Tile Shop Holdings *(A) | 64,655 | 806 | ||||||
Tilly’s, Cl A * | 13,534 | 130 | ||||||
Time | 6,900 | 155 | ||||||
Tower International * | 14,172 | 390 | ||||||
TRI Pointe Homes * | 48,632 | 701 | ||||||
Tuesday Morning * | 27,213 | 349 | ||||||
Vail Resorts | 32,309 | 3,352 | ||||||
Vitamin Shoppe * | 46,091 | 1,830 | ||||||
Wayfair, Cl A *(A) | 51,127 | 1,528 | ||||||
Wolverine World Wide | 80,526 | 2,366 | ||||||
Zumiez * | 3,600 | 108 | ||||||
|
| |||||||
| 86,348 | ||||||||
|
| |||||||
Consumer Staples — 2.5% |
| |||||||
Cal-Maine Foods (A) | 8,769 | 497 | ||||||
Casey’s General Stores | 14,676 | 1,280 | ||||||
Darling Ingredients * | 56,955 | 894 | ||||||
Diamond Foods * | 26,482 | 754 | ||||||
Fresh Del Monte Produce | 20,900 | 787 | ||||||
Freshpet *(A) | 48,667 | 966 | ||||||
Ingles Markets, Cl A | 12,734 | 622 | ||||||
J&J Snack Foods | 14,020 | 1,511 | ||||||
John B Sanfilippo & Son | 14,032 | 710 | ||||||
Lancaster Colony | 4,700 | 419 | ||||||
Landec * | 95,900 | 1,371 | ||||||
Medifast * | 17,200 | 553 | ||||||
Omega Protein * | 11,592 | 159 | ||||||
Pinnacle Foods | 10,932 | 461 | ||||||
Roundy’s * | 16,200 | 57 | ||||||
Seneca Foods, Cl A * | 3,900 | 110 | ||||||
SpartanNash | 79,391 | 2,482 | ||||||
SUPERVALU * | 131,709 | 1,163 | ||||||
Universal (A) | 21,400 | 1,102 | ||||||
USANA Health Sciences * | 8,000 | 1,025 | ||||||
Weis Markets | 4,900 | 211 | ||||||
|
| |||||||
| 17,134 | ||||||||
|
| |||||||
Energy — 4.0% |
| |||||||
Abraxas Petroleum * | 10,674 | 31 | ||||||
Alberta Oilsands * | 536,100 | 47 | ||||||
Alon USA Energy (A) | 13,300 | 235 | ||||||
Approach Resources *(A) | 221,700 | 1,554 | ||||||
Bill Barrett *(A) | 200,000 | 1,766 | ||||||
Bonanza Creek Energy * | 23,355 | 485 | ||||||
Callon Petroleum * | 57,379 | 451 | ||||||
Carrizo Oil & Gas * | 8,977 | 450 | ||||||
Dawson Geophysical * | 10,919 | 59 | ||||||
Delek US Holdings | 30,742 | 1,164 | ||||||
DHT Holdings | 72,000 | 568 | ||||||
Diamondback Energy * | 8,667 | 674 | ||||||
Dril-Quip * | 8,428 | 637 | ||||||
Eclipse Resources *(A) | 21,544 | 136 | ||||||
Energy XXI Bermuda (A) | 27,233 | 94 | ||||||
Exterran Holdings | 30,495 | 1,008 | ||||||
Forum Energy Technologies * | 24,735 | 513 | ||||||
GasLog | 43,340 | 897 | ||||||
| Description | Shares | Market Value ($ Thousands) | ||||||
Green Plains Renewable Energy | 24,789 | $ | 815 | |||||
Gulfport Energy * | 27,026 | 1,166 | ||||||
Helix Energy Solutions Group * | 45,550 | 714 | ||||||
Hercules Offshore *(A) | 69,300 | 45 | ||||||
ION Geophysical * | 23,700 | 34 | ||||||
Kinder Morgan Escrow * | 69,896 | — | ||||||
Laredo Petroleum *(A) | 57,450 | 782 | ||||||
Matador Resources * | 14,025 | 386 | ||||||
Matrix Service * | 1,727 | 29 | ||||||
Memorial Resource Development * | 38,745 | 733 | ||||||
Navigator Holdings * | 44,600 | 832 | ||||||
Newpark Resources * | 23,300 | 198 | ||||||
Northern Oil And Gas *(A) | 39,500 | 270 | ||||||
Pacific Ethanol *(A) | 43,300 | 498 | ||||||
Parker Drilling * | 86,900 | 295 | ||||||
PBF Energy, Cl A | 16,100 | 432 | ||||||
PDC Energy * | 22,463 | 1,340 | ||||||
PetroQuest Energy * | 18,327 | 32 | ||||||
REX American Resources * | 11,540 | 737 | ||||||
Ring Energy *(A) | 31,224 | 359 | ||||||
Scorpio Tankers | 239,100 | 2,181 | ||||||
StealthGas * | 108,900 | 745 | ||||||
Superior Energy Services | 11,800 | 272 | ||||||
TETRA Technologies * | 260,140 | 1,636 | ||||||
Unit * | 7,300 | 230 | ||||||
US Silica Holdings (A) | 39,681 | 1,224 | ||||||
VAALCO Energy * | 84,825 | 189 | ||||||
Warren Resources *(A) | 47,900 | 34 | ||||||
Westmoreland Coal * | 100 | 3 | ||||||
Willbros Group * | 48,604 | 90 | ||||||
|
| |||||||
| 27,070 | ||||||||
|
| |||||||
Financials — 22.9% |
| |||||||
1st Source | 6,200 | 196 | ||||||
Acadia Realty Trust ‡ | 50,805 | 1,576 | ||||||
Agree Realty ‡ | 9,967 | 302 | ||||||
Alexandria Real Estate Equities ‡ | 2,000 | 185 | ||||||
Altisource Residential, Cl B ‡ | 6,100 | 109 | ||||||
American Assets Trust ‡ | 44,455 | 1,749 | ||||||
American Campus Communities ‡ | 32,750 | 1,278 | ||||||
American Equity Investment Life Holding | 16,200 | 412 | ||||||
AMERISAFE | 700 | 30 | ||||||
AmTrust Financial Services (A) | 19,297 | 1,161 | ||||||
Anworth Mortgage Asset ‡ | 40,800 | 212 | ||||||
Apartment Investment & Management, Cl A ‡ | 4,656 | 177 | ||||||
Apollo Commercial Real Estate Finance ‡ | 9,100 | 156 | ||||||
Ares Capital | 1,950 | 33 | ||||||
Argo Group International Holdings | 21,769 | 1,146 | ||||||
Armada Hoffler Properties ‡ | 6,565 | 69 | ||||||
Ashford * | 387 | 37 | ||||||
Ashford Hospitality Prime ‡ | 9,532 | 150 | ||||||
Ashford Hospitality Trust ‡ | 33,700 | 290 | ||||||
Aspen Insurance Holdings | 6,100 | 283 | ||||||
Associated Banc | 14,000 | 266 | ||||||
AvalonBay Communities ‡ | 1,762 | 293 | ||||||
Banco Latinoamericano de Comercio Exterior, Cl E | 35,200 | 1,068 | ||||||
| 2 | SEI Institutional Investments Trust / Annual Report / May 31, 2015 |
SCHEDULE OF INVESTMENTS
Small Cap Fund
May 31, 2015
| Description | Shares | Market Value ($ Thousands) | ||||||
Bancorp * | 2,400 | $ | 23 | |||||
Bancorpsouth | 1,400 | 34 | ||||||
Bank of the Ozarks (A) | 78,359 | 3,445 | ||||||
Banner | 23,124 | 1,041 | ||||||
BBCN Bancorp | 30,200 | 435 | ||||||
Berkshire Hills Bancorp | 42,195 | 1,157 | ||||||
BGC Partners, Cl A | 45,000 | 425 | ||||||
BioMed Realty Trust ‡ | 10,350 | 211 | ||||||
BlackRock Kelso Capital | 33,900 | 319 | ||||||
BofI Holding *(A) | 13,444 | 1,266 | ||||||
Boston Private Financial Holdings | 47,580 | 597 | ||||||
Boston Properties ‡ | 1,428 | 186 | ||||||
Brandywine Realty Trust ‡ | 23,900 | 336 | ||||||
Brixmor Property Group ‡ | 6,050 | 150 | ||||||
Camden National | 4,600 | 176 | ||||||
Camden Property Trust ‡ | 1,100 | 82 | ||||||
Capital Bank Financial, Cl A * | 26,500 | 756 | ||||||
Capstead Mortgage ‡ | 21,600 | 255 | ||||||
CareTrust ‡ | 6,811 | 89 | ||||||
Cascade Bancorp * | 128,900 | 639 | ||||||
CatchMark Timber Trust, Cl A ‡ | 125,200 | 1,490 | ||||||
Cathay General Bancorp | 2,600 | 79 | ||||||
CBL & Associates Properties ‡ | 25,200 | 445 | ||||||
Cedar Realty Trust ‡ | 248,100 | 1,675 | ||||||
Central Pacific Financial | 90,691 | 2,124 | ||||||
Chatham Lodging Trust ‡ | 22,900 | 640 | ||||||
CNO Financial Group | 211,570 | 3,808 | ||||||
CoBiz Financial | 113,496 | 1,341 | ||||||
Columbia Property Trust ‡ | 2,550 | 66 | ||||||
Community Trust Bancorp | 9,240 | 303 | ||||||
Cousins Properties ‡ | 28,000 | 270 | ||||||
Cowen Group, Cl A * | 3,409 | 20 | ||||||
Credit Acceptance * | 3,908 | 900 | ||||||
CubeSmart ‡ | 17,350 | 413 | ||||||
Customers Bancorp * | 74,400 | 1,867 | ||||||
CyrusOne ‡ | 800 | 26 | ||||||
CYS Investments ‡ | 47,300 | 423 | ||||||
DCT Industrial Trust ‡ | 2,000 | 65 | ||||||
DDR ‡ | 7,550 | 128 | ||||||
DiamondRock Hospitality ‡ | 29,200 | 385 | ||||||
Dime Community Bancshares | 18,500 | 303 | ||||||
Douglas Emmett ‡ | 56,200 | 1,651 | ||||||
Duke Realty ‡ | 8,397 | 164 | ||||||
DuPont Fabros Technology ‡ | 14,400 | 464 | ||||||
Dynex Capital ‡ | 28,900 | 225 | ||||||
Eagle Bancorp * | 41,885 | 1,667 | ||||||
EastGroup Properties ‡ | 32,727 | 1,821 | ||||||
Education Realty Trust ‡ | 46,316 | 1,526 | ||||||
Employers Holdings | 77,268 | 1,748 | ||||||
Endurance Specialty Holdings | 5,700 | 346 | ||||||
EPR Properties ‡ | 24,675 | 1,423 | ||||||
Equity Commonwealth *‡ | 55,400 | 1,427 | ||||||
Equity Lifestyle Properties ‡ | 1,450 | 79 | ||||||
Equity Residential ‡ | 4,237 | 315 | ||||||
Essex Property Trust ‡ | 526 | 117 | ||||||
Extra Space Storage ‡ | 1,250 | 88 | ||||||
Ezcorp, Cl A *(A) | 8,000 | 64 | ||||||
FBR * | 47,375 | 1,003 | ||||||
Federal Agricultural Mortgage, Cl C | 9,600 | 303 | ||||||
Federated National Holding | 18,000 | 462 | ||||||
FelCor Lodging Trust ‡ | 124,100 | 1,333 | ||||||
Fidelity & Guaranty Life | 70,900 | 1,557 | ||||||
| Description | Shares | Market Value ($ Thousands) | ||||||
Financial Engines (A) | 30,839 | $ | 1,323 | |||||
First American Financial | 36,420 | 1,301 | ||||||
First BanCorp * | 27,098 | 166 | ||||||
First Commonwealth Financial | 40,000 | 364 | ||||||
First Industrial Realty Trust ‡ | 13,200 | 257 | ||||||
First Interstate Bancsystem, Cl A | 36,500 | 994 | ||||||
First Merchants | 1,400 | 33 | ||||||
First Midwest Bancorp | 20,600 | 366 | ||||||
First NBC Bank Holding * | 400 | 14 | ||||||
Flushing Financial | 28,000 | 543 | ||||||
FNB (Pennsylvania) | 13,400 | 181 | ||||||
FNFV Group * | 63,800 | 980 | ||||||
Forest City Enterprises, Cl A * | 48,860 | 1,127 | ||||||
Franklin Street Properties ‡ | 37,700 | 438 | ||||||
Fulton Financial | 30,100 | 381 | ||||||
General Growth Properties ‡ | 6,026 | 171 | ||||||
Geo Group ‡ | 72,000 | 2,731 | ||||||
GFI Group * | 13,456 | 79 | ||||||
Glacier Bancorp | 59,815 | 1,683 | ||||||
Government Properties Income Trust ‡ | 14,600 | 285 | ||||||
Gramercy Property Trust ‡ | 51,525 | 1,371 | ||||||
Hanover Insurance Group | 39,135 | 2,786 | ||||||
Hatteras Financial ‡ | 36,000 | 647 | ||||||
HCI Group | 4,500 | 195 | ||||||
HCP ‡ | 5,098 | 197 | ||||||
Health Care ‡ | 4,232 | 297 | ||||||
Healthcare Realty Trust ‡ | 2,100 | 50 | ||||||
Hercules Technology Growth Capital | 34,000 | 436 | ||||||
Hersha Hospitality Trust, Cl A ‡ | 56,600 | 360 | ||||||
Highwoods Properties ‡ | 81,805 | 3,432 | ||||||
Home BancShares | 50,905 | 1,736 | ||||||
Home Loan Servicing Solutions | 20,000 | 14 | ||||||
HomeStreet * | 19,686 | 454 | ||||||
Horace Mann Educators | 45,115 | 1,553 | ||||||
Hospitality Properties Trust ‡ | 8,200 | 248 | ||||||
Host Hotels & Resorts ‡ | 9,009 | 179 | ||||||
Iberiabank | 22,095 | 1,420 | ||||||
Infinity Property & Casualty | 7,400 | 535 | ||||||
Inland Real Estate ‡ | 76,600 | 777 | ||||||
International Bancshares | 16,000 | 418 | ||||||
International FCStone * | 5,071 | 178 | ||||||
Investment Technology Group | 32,000 | 859 | ||||||
Investors Bancorp | 139,065 | 1,670 | ||||||
Investors Real Estate Trust ‡ | 6,900 | 50 | ||||||
Janus Capital Group (A) | 28,800 | 523 | ||||||
Kemper | 43,200 | 1,546 | ||||||
Kennedy-Wilson Holdings | 60,000 | 1,534 | ||||||
Kimco Realty ‡ | 5,200 | 125 | ||||||
Kite Realty Group Trust ‡ | 4,450 | 120 | ||||||
Lakeland Bancorp | 18,085 | 207 | ||||||
LaSalle Hotel Properties ‡ | 44,510 | 1,623 | ||||||
LendingTree * | 5,830 | 345 | ||||||
Levy Acquisition * | 30,179 | 487 | ||||||
Liberty Property Trust ‡ | 2,350 | 82 | ||||||
LTC Properties ‡ | 11,100 | 467 | ||||||
Macerich ‡ | 2,386 | 196 | ||||||
Maiden Holdings | 142,800 | 1,996 | ||||||
MainSource Financial Group | 28,000 | 561 | ||||||
MarketAxess Holdings | 10,730 | 949 | ||||||
Medallion Financial (A) | 23,200 | 225 | ||||||
Mercantile Bank | 6,500 | 130 | ||||||
| 3 | SEI Institutional Investments Trust / Annual Report / May 31, 2015 |
SCHEDULE OF INVESTMENTS
Small Cap Fund
May 31, 2015
| Description | Shares | Market Value ($ Thousands) | ||||||
Meridian Bancorp * | 92,200 | $ | 1,184 | |||||
Mid-America Apartment Communities ‡ | 950 | 73 | ||||||
Montpelier Re Holdings | 19,100 | 727 | ||||||
Mortgage Investment Trust ‡ | 14,400 | 271 | ||||||
National Bank Holdings, Cl A | 33,010 | 631 | ||||||
National Health Investors ‡ | 3,500 | 231 | ||||||
National Penn Bancshares | 37,400 | 400 | ||||||
Navigators Group * | 800 | 62 | ||||||
NBT Bancorp | 32,200 | 793 | ||||||
Nelnet, Cl A | 46,700 | 1,920 | ||||||
Northfield Bancorp | 86,646 | 1,268 | ||||||
OceanFirst Financial | 10,300 | 178 | ||||||
OFG Bancorp | 21,400 | 281 | ||||||
Old National Bancorp | 29,900 | 407 | ||||||
On Deck Capital *(A) | 17,657 | 268 | ||||||
Oppenheimer Holdings, Cl A | 7,500 | 195 | ||||||
PacWest Bancorp | 37,409 | 1,679 | ||||||
Paramount Group ‡ | 3,850 | 71 | ||||||
Pebblebrook Hotel Trust ‡ | 71,615 | 3,071 | ||||||
PennantPark Investment | 59,331 | 572 | ||||||
Pennsylvania Real Estate Investment Trust ‡ | 20,000 | 446 | ||||||
PennyMac Mortgage Investment Trust ‡ | 24,200 | 445 | ||||||
Pinnacle Financial Partners | 725 | 36 | ||||||
Piper Jaffray * | 6,900 | 327 | ||||||
Popular * | 81,800 | 2,658 | ||||||
Potlatch ‡ | 4,200 | 152 | ||||||
Primerica | 2,487 | 110 | ||||||
PrivateBancorp, Cl A | 24,671 | 941 | ||||||
Prologis ‡ | 8,808 | 349 | ||||||
Prosperity Bancshares | 200 | 11 | ||||||
PS Business Parks ‡ | 7,100 | 519 | ||||||
Public Storage ‡ | 1,621 | 314 | ||||||
Radian Group (A) | 92,280 | 1,654 | ||||||
RAIT Financial Trust ‡ | 6,566 | 42 | ||||||
RE, Cl A | 20,232 | 677 | ||||||
Regency Centers ‡ | 1,465 | 92 | ||||||
RenaissanceRe Holdings | 2,036 | 208 | ||||||
Renasant (A) | 36,625 | 1,078 | ||||||
Republic Bancorp, Cl A | 11,400 | 280 | ||||||
Retail Opportunity Investments ‡ | 4,050 | 66 | ||||||
RLJ Lodging Trust ‡ | �� | 17,150 | 518 | |||||
Rouse Properties ‡ | 60,500 | 1,045 | ||||||
Ryman Hospitality Properties ‡ | 7,116 | 392 | ||||||
Safeguard Scientifics * | 58,071 | 1,041 | ||||||
Select Income ‡ | 22,500 | 527 | ||||||
Selective Insurance Group | 44,170 | 1,197 | ||||||
Senior Housing Properties Trust ‡ | 6,150 | 123 | ||||||
Signature Bank NY * | 6,226 | 869 | ||||||
Simon Property Group ‡ | 3,141 | 570 | ||||||
SL Green Realty ‡ | 1,045 | 124 | ||||||
South State | 20,442 | 1,468 | ||||||
Southwest Bancorp | 4,935 | 87 | ||||||
Sovran Self Storage ‡ | 9,800 | 894 | ||||||
Springleaf Holdings, Cl A * | 12,913 | 614 | ||||||
Starwood Property Trust ‡ | 21,500 | 514 | ||||||
State Bank Financial | 86,200 | 1,765 | ||||||
Strategic Hotels & Resorts *‡ | 52,000 | 628 | ||||||
Summit Hotel Properties ‡ | 62,857 | 840 | ||||||
Sunstone Hotel Investors ‡ | 79,370 | 1,211 | ||||||
Susquehanna Bancshares | 13,600 | 189 | ||||||
| Description | Shares | Market Value ($ Thousands) | ||||||
Symetra Financial | 39,200 | $ | 959 | |||||
Taubman Centers ‡ | 1,700 | 126 | ||||||
Texas Capital Bancshares * | 16,843 | 916 | ||||||
THL Credit | 33,600 | 422 | ||||||
Tompkins Financial | 7,300 | 372 | ||||||
TriCo Bancshares | 800 | 19 | ||||||
Two Harbors Investment ‡ | 50,300 | 538 | ||||||
UDR ‡ | 5,100 | 166 | ||||||
Union Bankshares | 9,200 | 199 | ||||||
United Community Banks | 99,400 | 1,903 | ||||||
United Insurance Holdings | 15,300 | 221 | ||||||
Universal Insurance Holdings | 15,900 | 406 | ||||||
Validus Holdings | 10,300 | 442 | ||||||
Ventas ‡ | 3,090 | 206 | ||||||
Vornado Realty Trust ‡ | 1,850 | 185 | ||||||
Walker & Dunlop * | 1,821 | 45 | ||||||
Webster Financial | 18,600 | 705 | ||||||
WesBanco | 7,700 | 244 | ||||||
Western Alliance Bancorp * | 78,945 | 2,475 | ||||||
Winthrop Realty Trust ‡ | 47,400 | 793 | ||||||
WisdomTree Investments | 16,244 | 347 | ||||||
World Acceptance *(A) | 3,200 | 261 | ||||||
WSFS Financial | 53,930 | 1,330 | ||||||
Yadkin Financial * | 112,726 | 2,226 | ||||||
|
| |||||||
| 156,558 | ||||||||
|
| |||||||
Health Care — 14.4% | ||||||||
ABIOMED * | 6,764 | 404 | ||||||
Acadia Healthcare *(A) | 49,328 | 3,657 | ||||||
ACADIA Pharmaceuticals *(A) | 18,202 | 750 | ||||||
Acceleron Pharma * | 12,920 | 436 | ||||||
Accuray *(A) | 276,800 | 1,701 | ||||||
Acorda Therapeutics * | 7,980 | 243 | ||||||
Addus HomeCare * | 23,247 | 651 | ||||||
Aerie Pharmaceuticals * | 18,869 | 210 | ||||||
Affymetrix *(A) | 27,000 | 317 | ||||||
Agenus * | 111,058 | 908 | ||||||
Agios Pharmaceuticals *(A) | 2,400 | 293 | ||||||
Air Methods * | 9,300 | 392 | ||||||
Akorn * | 37,814 | 1,736 | ||||||
Alere * | 8,400 | 433 | ||||||
AMAG Pharmaceuticals * | 16,731 | 1,164 | ||||||
Amedisys * | 2,500 | 78 | ||||||
Amicus Therapeutics * | 45,223 | 557 | ||||||
AMN Healthcare Services * | 18,522 | 493 | ||||||
Amsurg, Cl A * | 7,744 | 521 | ||||||
Analogic | 1,500 | 127 | ||||||
AngioDynamics * | 54,644 | 877 | ||||||
ANI Pharmaceuticals * | 2,100 | 106 | ||||||
Anika Therapeutics * | 20,768 | 700 | ||||||
Arrowhead Research *(A) | 52,840 | 333 | ||||||
AtriCure * | 25,866 | 593 | ||||||
Avalanche Biotechnologies * | 8,437 | 315 | ||||||
Bellicum Pharmaceuticals * | 9,368 | 232 | ||||||
BioDelivery Sciences International * | 52,209 | 445 | ||||||
Bio-Rad Laboratories, Cl A * | 3,258 | 470 | ||||||
Bio-Reference Labs *(A) | 5,100 | 169 | ||||||
BioSpecifics Technologies * | 2,286 | 109 | ||||||
BioTelemetry * | 2,400 | 23 | ||||||
Bluebird Bio * | 9,031 | 1,754 | ||||||
Cambrex * | 36,082 | 1,444 | ||||||
Celldex Therapeutics * | 1,300 | 37 | ||||||
Cempra * | 16,685 | 613 | ||||||
Centene * | 11,132 | 839 | ||||||
| 4 | SEI Institutional Investments Trust / Annual Report / May 31, 2015 |
SCHEDULE OF INVESTMENTS
Small Cap Fund
May 31, 2015
| Description | Shares | Market Value ($ Thousands) | ||||||
Cepheid * | 6,963 | $ | 384 | |||||
Chemed | 3,400 | 422 | ||||||
Chimerix * | 21,402 | 896 | ||||||
Clovis Oncology * | 6,641 | 614 | ||||||
Coherus Biosciences * | 24,171 | 594 | ||||||
CONMED | 35,601 | 1,977 | ||||||
Cynosure, Cl A * | 5,600 | 200 | ||||||
Depomed * | 2,890 | 60 | ||||||
DexCom * | 25,042 | 1,796 | ||||||
Dicerna Pharmaceuticals * | 4,443 | 73 | ||||||
Dyax * | 13,196 | 348 | ||||||
Dynavax Technologies *(A) | 24,697 | 562 | ||||||
Eagle Pharmaceuticals * | 7,170 | 521 | ||||||
Emergent Biosolutions * | 16,700 | 532 | ||||||
Enanta Pharmaceuticals *(A) | 4,400 | 180 | ||||||
Endocyte * | 19,100 | 116 | ||||||
Endologix * | 35,981 | 601 | ||||||
Ensign Group | 11,800 | 547 | ||||||
Esperion Therapeutics * | 12,162 | 1,308 | ||||||
Exact Sciences *(A) | 16,669 | 450 | ||||||
Exactech * | 8,600 | 184 | ||||||
ExamWorks Group *(A) | 31,264 | 1,278 | ||||||
Five Prime Therapeutics * | 14,200 | 364 | ||||||
Flexion Therapeutics * | 3,331 | 66 | ||||||
Fluidigm * | 30,481 | 721 | ||||||
GenMark Diagnostics * | 70,511 | 647 | ||||||
Globus Medical, Cl A * | 13,900 | 361 | ||||||
Greatbatch * | 43,700 | 2,272 | ||||||
Halozyme Therapeutics *(A) | 61,215 | 1,062 | ||||||
Health Net * | 5,602 | 349 | ||||||
HealthSouth | 82,591 | 3,565 | ||||||
Hill-Rom Holdings | 11,633 | 600 | ||||||
Horizon Pharma *(A) | 31,618 | 1,025 | ||||||
ICU Medical * | 5,700 | 553 | ||||||
Idera Pharmaceuticals *(A) | 40,300 | 155 | ||||||
Ignyta * | 32,004 | 287 | ||||||
Inogen * | 682 | 25 | ||||||
Insmed * | 80,955 | 1,776 | ||||||
Insulet * | 27,055 | 765 | ||||||
Intrexon *(A) | 13,940 | 587 | ||||||
Invitae * | 12,859 | 160 | ||||||
Ironwood Pharmaceuticals, Cl A * | 2,053 | 29 | ||||||
Isis Pharmaceuticals *(A) | 21,836 | 1,470 | ||||||
K2M Group Holdings * | 32,381 | 846 | ||||||
Keryx Biopharmaceuticals *(A) | 34,779 | 362 | ||||||
Kite Pharma *(A) | 17,511 | 966 | ||||||
Landauer | 2,200 | 75 | ||||||
Lannett *(A) | 8,300 | 462 | ||||||
LDR Holding * | 34,815 | 1,411 | ||||||
LHC Group * | 635 | 23 | ||||||
Ligand Pharmaceuticals, Cl B *(A) | 5,803 | 511 | ||||||
Luminex * | 11,200 | 188 | ||||||
MacroGenics * | 4,293 | 139 | ||||||
Magellan Health Services * | 13,715 | 928 | ||||||
Medidata Solutions * | 8,016 | 465 | ||||||
MEDNAX * | 17,305 | 1,232 | ||||||
Merge Healthcare * | 21,794 | 100 | ||||||
Merit Medical Systems * | 21,892 | 450 | ||||||
Merrimack Pharmaceuticals *(A) | 36,181 | 427 | ||||||
Molina Healthcare * | 12,724 | 926 | ||||||
Momenta Pharmaceuticals * | 44,717 | 888 | ||||||
National Healthcare | 800 | 50 | ||||||
| Description | Shares | Market Value ($ Thousands) | ||||||
Natus Medical * | 13,800 | $ | 539 | |||||
Nektar Therapeutics * | 30,054 | 346 | ||||||
Neurocrine Biosciences * | 11,928 | 523 | ||||||
Nevro * | 17,778 | 904 | ||||||
NewLink Genetics *(A) | 10,084 | 435 | ||||||
Novadaq Technologies *(A) | 85,750 | 858 | ||||||
Novavax *(A) | 56,007 | 504 | ||||||
NxStage Medical * | 3,300 | 53 | ||||||
Ophthotech * | 19,517 | 976 | ||||||
OPKO Health *(A) | 2,936 | 52 | ||||||
OraSure Technologies * | 59,100 | 366 | ||||||
Orexigen Therapeutics *(A) | 79,177 | 388 | ||||||
Orthofix International * | 13,000 | 426 | ||||||
Pacific Biosciences of California * | 9,300 | 52 | ||||||
PAREXEL International * | 3,500 | 233 | ||||||
PDL BioPharma (A) | 42,900 | 287 | ||||||
Pernix Therapeutics Holdings * | 10,315 | 66 | ||||||
PharMerica * | 13,900 | 462 | ||||||
PhotoMedex *(A) | 12,200 | 21 | ||||||
Portola Pharmaceuticals, Cl A * | 17,321 | 724 | ||||||
Pozen * | 62,400 | 402 | ||||||
Progenics Pharmaceuticals * | 65,928 | 371 | ||||||
Prothena * | 11,360 | 448 | ||||||
Providence Service * | 2,789 | 134 | ||||||
PTC Therapeutics * | 10,271 | 597 | ||||||
Puma Biotechnology *(A) | 5,377 | 1,051 | ||||||
RadNet * | 22,500 | 146 | ||||||
Receptos * | 8,769 | 1,446 | ||||||
Relypsa * | 43,172 | 1,588 | ||||||
Repligen * | 9,500 | 387 | ||||||
Repros Therapeutics * | 12,636 | 91 | ||||||
Retrophin * | 9,000 | 285 | ||||||
Revance Therapeutics *(A) | 16,260 | 416 | ||||||
Sage Therapeutics * | 28,400 | 2,126 | ||||||
Sagent Pharmaceuticals * | 21,948 | 490 | ||||||
Sangamo BioSciences * | 34,917 | 428 | ||||||
Sciclone Pharmaceuticals * | 59,404 | 550 | ||||||
Select Medical Holdings | 52,900 | 865 | ||||||
Spectranetics *(A) | 26,034 | 646 | ||||||
STERIS (A) | 18,632 | 1,245 | ||||||
Sucampo Pharmaceuticals, Cl A * | 15,963 | 259 | ||||||
Supernus Pharmaceuticals * | 14,700 | 209 | ||||||
Surgical Care Affiliates * | 37,444 | 1,423 | ||||||
Symmetry Surgical * | 12,575 | 111 | ||||||
Synageva BioPharma * | 3,353 | 716 | ||||||
Syneron Medical * | 61,024 | 638 | ||||||
TESARO * | 5,368 | 315 | ||||||
Tetraphase Pharmaceuticals * | 19,201 | 823 | ||||||
TG Therapeutics *(A) | 27,709 | 436 | ||||||
Trinity Biotech ADR | 93,200 | 1,612 | ||||||
Triple-S Management, Cl B * | 10,594 | 254 | ||||||
Ultragenyx Pharmaceutical * | 6,885 | 599 | ||||||
Unilife *(A) | 278,566 | 684 | ||||||
US Physical Therapy | 9,124 | 455 | ||||||
Veeva Systems, Cl A *(A) | 37,359 | 1,013 | ||||||
Versartis * | 15,841 | 246 | ||||||
WellCare Health Plans * | 14,253 | 1,221 | ||||||
Xencor * | 7,400 | 134 | ||||||
XenoPort * | 29,400 | 175 | ||||||
ZIOPHARM Oncology *(A) | 38,954 | 369 | ||||||
|
| |||||||
| 98,680 | ||||||||
|
| |||||||
| 5 | SEI Institutional Investments Trust / Annual Report / May 31, 2015 |
SCHEDULE OF INVESTMENTS
Small Cap Fund
May 31, 2015
| Description | Shares | Market Value ($ Thousands) | ||||||
Industrials — 14.0% | ||||||||
AAR | 9,300 | $ | 275 | |||||
ACCO Brands * | 94,500 | 695 | ||||||
Actuant, Cl A | 28,581 | 672 | ||||||
Acuity Brands | 11,411 | 2,014 | ||||||
Advanced Drainage Systems | 22,253 | 646 | ||||||
Aegion, Cl A * | 37,100 | 661 | ||||||
Aerojet Rocketdyne Holdings * | 19,958 | 414 | ||||||
Aerovironment * | 1,677 | 43 | ||||||
Air Transport Services Group * | 114,400 | 1,204 | ||||||
Aircastle | 24,400 | 592 | ||||||
Alamo Group | 4,800 | 254 | ||||||
Alaska Air Group | 7,600 | 491 | ||||||
American Railcar Industries (A) | 4,100 | 221 | ||||||
American Woodmark * | 9,972 | 512 | ||||||
Apogee Enterprises | 7,868 | 423 | ||||||
ArcBest | 8,700 | 298 | ||||||
Argan | 14,400 | 515 | ||||||
Astronics * | 6,311 | 441 | ||||||
Atlas Air Worldwide Holdings * | 5,000 | 272 | ||||||
Barnes Group | 39,080 | 1,573 | ||||||
Beacon Roofing Supply * | 18,684 | 586 | ||||||
Blount International * | 2,500 | 29 | ||||||
Brink’s | 11,800 | 377 | ||||||
Builders FirstSource * | 43,177 | 530 | ||||||
Caesarstone Sdot-Yam | 12,720 | 786 | ||||||
CAI International * | 2,872 | 62 | ||||||
Carlisle | 10,003 | 992 | ||||||
CEB | 16,557 | 1,400 | ||||||
Celadon Group | 32,800 | 765 | ||||||
CIRCOR International | 17,795 | 949 | ||||||
Comfort Systems USA | 21,194 | 476 | ||||||
Continental Building Products * | 6,516 | 145 | ||||||
Covenant Transportation Group, Cl A * | 12,405 | 383 | ||||||
Curtiss-Wright | 32,860 | 2,369 | ||||||
Deluxe | 10,600 | 677 | ||||||
Ducommun * | 8,800 | 205 | ||||||
Dycom Industries * | 10,176 | 586 | ||||||
EMCOR Group | 64,759 | 2,938 | ||||||
Engility Holdings | 2,500 | 70 | ||||||
Ennis | 7,900 | 133 | ||||||
Esterline Technologies * | 15,175 | 1,641 | ||||||
Exponent | 1,300 | 111 | ||||||
Fortune Brands Home & Security | 9,715 | 446 | ||||||
FreightCar America | 79,708 | 1,787 | ||||||
FTI Consulting * | 25,400 | 998 | ||||||
G&K Services, Cl A | 37,167 | 2,590 | ||||||
Generac Holdings *(A) | 54,755 | 2,288 | ||||||
Gibraltar Industries * | 237 | 4 | ||||||
Global Brass & Copper Holdings | 5,200 | 90 | ||||||
Global Power Equipment Group | 76,800 | 574 | ||||||
GP Strategies * | 2,329 | 73 | ||||||
Graco | 9,039 | 656 | ||||||
GrafTech International * | 173,300 | 879 | ||||||
Great Lakes Dredge & Dock * | 381,300 | 2,120 | ||||||
Greenbrier (A) | 8,863 | 534 | ||||||
H&E Equipment Services | 41,319 | 902 | ||||||
Hawaiian Holdings * | 57,400 | 1,390 | ||||||
HEICO | 9,479 | 543 | ||||||
Heidrick & Struggles International | 2,554 | 64 | ||||||
Hexcel | 24,818 | 1,222 | ||||||
| Description | Shares | Market Value ($ Thousands) | ||||||
Hub Group, Cl A * | 13,319 | $ | 565 | |||||
Hyster-Yale Materials Handling | 8,503 | 603 | ||||||
ICF International * | 15,900 | 569 | ||||||
Insperity | 19,001 | 1,000 | ||||||
Interface, Cl A | 95,552 | 2,057 | ||||||
JetBlue Airways * | 89,720 | 1,809 | ||||||
John Bean Technologies | 16,278 | 612 | ||||||
Kadant | 46,769 | 2,203 | ||||||
KAR Auction Services | 7,000 | 261 | ||||||
KBR | 47,600 | 912 | ||||||
Kforce | 8,100 | 178 | ||||||
Korn/Ferry International | 2,165 | 69 | ||||||
Kratos Defense & Security Solutions * | 12,458 | 75 | ||||||
LB Foster, Cl A | 6,900 | 263 | ||||||
Lennox International | 6,487 | 731 | ||||||
Lindsay Manufacturing (A) | 10,730 | 864 | ||||||
Lydall * | 23,673 | 649 | ||||||
Masonite International * | 10,835 | 739 | ||||||
Matson | 14,750 | 594 | ||||||
Matthews International, Cl A | 27,700 | 1,375 | ||||||
Meritor * | 54,526 | 780 | ||||||
Middleby * | 6,793 | 738 | ||||||
Mobile Mini | 22,939 | 910 | ||||||
Moog, Cl A * | 24,641 | 1,691 | ||||||
MYR Group * | 42,393 | 1,255 | ||||||
Navigant Consulting * | 17,600 | 240 | ||||||
Northwest Pipe * | 36,075 | 749 | ||||||
Old Dominion Freight Line * | 9,214 | 627 | ||||||
Orbital ATK | 3,200 | 245 | ||||||
Orion Marine Group * | 76,800 | 577 | ||||||
PAM Transportation Services * | 1,865 | 113 | ||||||
Pitney Bowes | 46,700 | 1,020 | ||||||
Primoris Services | 129,961 | 2,439 | ||||||
Quad, Cl A | 14,200 | 290 | ||||||
Quality Distribution * | 16,329 | 258 | ||||||
Rand Logistics * | 59,672 | 203 | ||||||
Republic Airways Holdings * | 9,300 | 97 | ||||||
Resources Connection | 13,237 | 208 | ||||||
Rush Enterprises, Cl A * | 58,429 | 1,552 | ||||||
Safe Bulkers (A) | 56,200 | 187 | ||||||
Scorpio Bulkers *(A) | 68,800 | 163 | ||||||
SkyWest | 16,164 | 239 | ||||||
Spirit Airlines * | 9,025 | 574 | ||||||
Standex International | 18,515 | 1,481 | ||||||
Steelcase, Cl A | 93,427 | 1,607 | ||||||
Swift Transportation, Cl A * | 75,083 | 1,747 | ||||||
TAL International Group | 8,200 | 298 | ||||||
Textainer Group Holdings | 4,700 | 133 | ||||||
Titan Machinery * | 41,300 | 656 | ||||||
Toro | 20,085 | 1,374 | ||||||
Trex * | 37,074 | 1,876 | ||||||
Triumph Group | 6,200 | 413 | ||||||
TrueBlue * | 28,951 | 825 | ||||||
Tutor Perini * | 111,500 | 2,337 | ||||||
UniFirst | 1,000 | 114 | ||||||
United Stationers | 6,900 | 268 | ||||||
US Ecology | 16,649 | 768 | ||||||
USA Truck * | 1,096 | 25 | ||||||
USG *(A) | 45,878 | 1,323 | ||||||
Viad | 4,300 | 115 | ||||||
Wabash National * | 21,400 | 290 | ||||||
Watsco | 12,557 | 1,581 | ||||||
Werner Enterprises | 24,000 | 661 | ||||||
XPO Logistics *(A) | 24,144 | 1,187 | ||||||
|
| |||||||
| 95,948 | ||||||||
|
| |||||||
| 6 | SEI Institutional Investments Trust / Annual Report / May 31, 2015 |
SCHEDULE OF INVESTMENTS
Small Cap Fund
May 31, 2015
| Description | Shares | Market Value ($ Thousands) | ||||||
Information Technology — 17.6% | ||||||||
Acxiom * | 96,590 | $ | 1,601 | |||||
Advanced Energy Industries * | 23,812 | 679 | ||||||
Alliance Fiber Optic Products | 28,707 | 556 | ||||||
Ambarella * | 1,755 | 158 | ||||||
Amkor Technology * | 74,783 | 506 | ||||||
Applied Micro Circuits * | 103,000 | 658 | ||||||
Applied Optoelectronics * | 24,657 | 440 | ||||||
Aspen Technology * | 48,992 | 2,097 | ||||||
Atmel | 148,725 | 1,319 | ||||||
AVG Technologies * | 26,300 | 645 | ||||||
Barracuda Networks * | 28,901 | 1,137 | ||||||
Bel Fuse, Cl B | 10,088 | 226 | ||||||
Belden | 32,602 | 2,752 | ||||||
Benchmark Electronics * | 36,400 | 846 | ||||||
Black Box | 7,400 | 148 | ||||||
Booz Allen Hamilton Holding, Cl A | 33,503 | 849 | ||||||
Brightcove * | 9,786 | 69 | ||||||
BroadSoft * | 13,614 | 497 | ||||||
Cabot Microelectronics * | 5,900 | 272 | ||||||
CACI International, Cl A * | 2,200 | 188 | ||||||
Cadence Design Systems * | 88,545 | 1,752 | ||||||
Calix * | 37,200 | 298 | ||||||
Callidus Software * | 89,074 | 1,276 | ||||||
Carbonite * | 7,104 | 78 | ||||||
Cavium * | 43,907 | 3,090 | ||||||
Checkpoint Systems | 10,884 | 106 | ||||||
CIBER * | 254,300 | 854 | ||||||
Ciena *(A) | 39,538 | 954 | ||||||
Cimpress * | 2,311 | 190 | ||||||
Cirrus Logic * | 20,986 | 792 | ||||||
CommScope Holding * | 15,632 | 487 | ||||||
CommVault Systems * | 12,849 | 571 | ||||||
Computer Task Group | 31,600 | 235 | ||||||
comScore * | 1,897 | 107 | ||||||
Comtech Telecommunications | 3,700 | 111 | ||||||
Comverse * | 2,300 | 55 | ||||||
Constant Contact * | 5,400 | 147 | ||||||
Cornerstone OnDemand * | 45,220 | 1,408 | ||||||
CoStar Group * | 6,033 | 1,260 | ||||||
CSG Systems International | 13,800 | 430 | ||||||
Daktronics | 3,834 | 41 | ||||||
Dealertrack Technologies * | 38,243 | 1,595 | ||||||
Demandware * | 36,890 | 2,298 | ||||||
DHI Group * | 45,822 | 388 | ||||||
Digi International * | 90,500 | 901 | ||||||
Diodes * | 33,600 | 890 | ||||||
Dot Hill Systems * | 110,200 | 776 | ||||||
DTS * | 1,794 | 57 | ||||||
EarthLink Holdings | 8,200 | 57 | ||||||
Ebix (A) | 10,884 | 387 | ||||||
Ellie Mae * | 8,366 | 529 | ||||||
Entegris * | 32,379 | 451 | ||||||
Envestnet * | 49,075 | 2,150 | ||||||
EPAM Systems * | 7,300 | 525 | ||||||
ePlus * | 9,087 | 706 | ||||||
Euronet Worldwide * | 30,941 | 1,850 | ||||||
EVERTEC | 50,121 | 1,114 | ||||||
Exar * | 189,500 | 2,058 | ||||||
ExlService Holdings * | 4,100 | 147 | ||||||
Extreme Networks * | 210,300 | 570 | ||||||
| Description | Shares | Market Value ($ Thousands) | ||||||
Fabrinet * | 19,515 | $ | 355 | |||||
Fair Isaac | 5,133 | 450 | ||||||
Finisar * | 21,800 | 477 | ||||||
FleetMatics Group *(A) | 19,941 | 834 | ||||||
FormFactor * | 66,597 | 620 | ||||||
Fortinet * | 16,380 | 656 | ||||||
Gigamon * | 24,226 | 745 | ||||||
Global Cash Access Holdings * | 29,929 | 231 | ||||||
GoDaddy, Cl A *(A) | 19,732 | 531 | ||||||
GrubHub * | 20,729 | 836 | ||||||
Guidewire Software *(A) | 40,079 | 1,942 | ||||||
Harmonic * | 18,233 | 124 | ||||||
HomeAway * | 11,898 | 334 | ||||||
HubSpot * | 25,334 | 1,287 | ||||||
Hutchinson Technology *(A) | 17,031 | 36 | ||||||
Immersion * | 39,325 | 475 | ||||||
Imperva * | 27,172 | 1,652 | ||||||
Infinera * | 22,395 | 462 | ||||||
Infoblox * | 91,371 | 2,375 | ||||||
Inphi * | 149,400 | 3,577 | ||||||
Insight Enterprises * | 39,000 | 1,144 | ||||||
Integrated Device Technology * | 66,038 | 1,562 | ||||||
Integrated Silicon Solution | 21,800 | 447 | ||||||
Interactive Intelligence Group *(A) | 13,504 | 584 | ||||||
Intralinks Holdings * | 84,915 | 903 | ||||||
IPG Photonics * | 4,723 | 448 | ||||||
j2 Global | 28,969 | 1,924 | ||||||
Kulicke & Soffa Industries * | 23,600 | 313 | ||||||
Lattice Semiconductor * | 54,117 | 339 | ||||||
LivePerson * | 12,800 | 122 | ||||||
LogMeIn * | 7,007 | 445 | ||||||
Luxoft Holding, Cl A * | 3,507 | 188 | ||||||
MA-Com Technology Solutions Holdings * | 31,390 | 1,198 | ||||||
Manhattan Associates * | 12,900 | 708 | ||||||
Marketo * | 55,763 | 1,663 | ||||||
MAXIMUS | 34,876 | 2,280 | ||||||
MaxLinear, Cl A * | 54,295 | 544 | ||||||
Mentor Graphics | 27,900 | 728 | ||||||
Methode Electronics | 17,403 | 817 | ||||||
MicroStrategy, Cl A * | 207 | 36 | ||||||
MKS Instruments | 18,769 | 708 | ||||||
MoneyGram International * | 23,900 | 232 | ||||||
Monolithic Power Systems | 21,702 | 1,185 | ||||||
Monotype Imaging Holdings | 9,800 | 254 | ||||||
Multi-Fineline Electronix * | 5,200 | 130 | ||||||
NETGEAR * | 14,300 | 443 | ||||||
Newport * | 3,600 | 68 | ||||||
Nimble Storage *(A) | 63,580 | 1,645 | ||||||
OmniVision Technologies * | 13,906 | 375 | ||||||
Paycom Software * | 16,226 | 564 | ||||||
PDF Solutions * | 11,795 | 188 | ||||||
Pegasystems | 1,800 | 39 | ||||||
Pericom Semiconductor | 12,432 | 163 | ||||||
Photronics * | 18,400 | 186 | ||||||
Plantronics | 18,800 | 1,037 | ||||||
Polycom * | 42,000 | 566 | ||||||
PRGX Global * | 3,400 | 15 | ||||||
Procera Networks * | 5,100 | 59 | ||||||
Proofpoint * | 25,129 | 1,486 | ||||||
PTC * | 10,609 | 438 | ||||||
Q2 Holdings * | 18,441 | 437 | ||||||
QAD, Cl A | 5,400 | 129 | ||||||
| 7 | SEI Institutional Investments Trust / Annual Report / May 31, 2015 |
SCHEDULE OF INVESTMENTS
Small Cap Fund
May 31, 2015
| Description | Shares | Market Value ($ Thousands) | ||||||
Qlik Technologies * | 57,144 | $ | 2,067 | |||||
QLogic * | 106,087 | 1,647 | ||||||
Qorvo * | 36,915 | 3,033 | ||||||
RealD * | 32,726 | 413 | ||||||
RetailMeNot *(A) | 29,776 | 600 | ||||||
Rofin-Sinar Technologies * | 2,000 | 57 | ||||||
Rogers * | 800 | 58 | ||||||
Ruckus Wireless * | 126,692 | 1,332 | ||||||
Rudolph Technologies * | 32,455 | 413 | ||||||
Sanmina * | 40,600 | 879 | ||||||
ScanSource * | 1,400 | 55 | ||||||
Science Applications International | 7,500 | 398 | ||||||
Shopify, Cl A *(A) | 16,490 | 449 | ||||||
ShoreTel * | 20,765 | 143 | ||||||
Sigma Designs * | 50,845 | 436 | ||||||
Silicon Laboratories * | 36,017 | 1,997 | ||||||
Sonus Networks * | 18,120 | 142 | ||||||
SPS Commerce * | 33,345 | 2,168 | ||||||
SS&C Technologies Holdings | 4,200 | 248 | ||||||
Stamps.com * | 11,800 | 794 | ||||||
SunEdison *(A) | 18,214 | 546 | ||||||
Super Micro Computer * | 17,636 | 590 | ||||||
Sykes Enterprises * | 21,500 | 521 | ||||||
SYNNEX | 4,400 | 364 | ||||||
Tableau Software, Cl A * | 11,018 | 1,247 | ||||||
Tech Data * | 8,900 | 562 | ||||||
TeleTech Holdings | 16,400 | 417 | ||||||
Tessco Technologies | 4,700 | 87 | ||||||
Tessera Technologies | 17,700 | 682 | ||||||
Ultimate Software Group * | 2,556 | 414 | ||||||
Ultra Clean Holdings * | 16,300 | 105 | ||||||
Ultratech * | 31,400 | 626 | ||||||
Universal Display * | 9,910 | 532 | ||||||
Vasco Data Security International *(A) | 9,200 | 245 | ||||||
Verint Systems * | 12,830 | 830 | ||||||
Virtusa * | 1,200 | 55 | ||||||
WEX * | 13,689 | 1,552 | ||||||
Xcerra * | 143,700 | 1,109 | ||||||
XO Group * | 6,549 | 106 | ||||||
Xoom *(A) | 22,199 | 418 | ||||||
|
| |||||||
| 120,410 | ||||||||
|
| |||||||
Materials — 2.9% | ||||||||
A. Schulman | 8,368 | 358 | ||||||
Ampco-Pittsburgh | 5,400 | 89 | ||||||
Axiall | 5,700 | 215 | ||||||
Berry Plastics Group * | 5,000 | 167 | ||||||
Cabot | 12,700 | 527 | ||||||
Calgon Carbon | 600 | 12 | ||||||
Carpenter Technology | 17,700 | 723 | ||||||
Century Aluminum * | 5,207 | 58 | ||||||
Cytec Industries | 7,333 | 444 | ||||||
Domtar | 4,700 | 203 | ||||||
Eagle Materials | 11,685 | 975 | ||||||
Ferro * | 27,730 | 421 | ||||||
FutureFuel | 5,300 | 64 | ||||||
Glatfelter | 15,000 | 352 | ||||||
Globe Specialty Metals | 35,429 | 685 | ||||||
Gold Resource (A) | 48,642 | 143 | ||||||
Graphic Packaging Holding | 24,000 | 342 | ||||||
H.B. Fuller | 27,009 | 1,137 | ||||||
Handy & Harman * | 677 | 21 | ||||||
Innophos Holdings | 6,000 | 313 | ||||||
| Description | Shares | Market Value ($ Thousands) | ||||||
Kaiser Aluminum | 3,100 | $ | 252 | |||||
KapStone Paper and Packaging | 4,782 | 129 | ||||||
Kraton Performance Polymers * | 600 | 14 | ||||||
Louisiana-Pacific *(A) | 38,386 | 695 | ||||||
LSB Industries * | 22,009 | 936 | ||||||
Materion | 2,783 | 103 | ||||||
Minerals Technologies | 22,177 | 1,493 | ||||||
Neenah Paper | 7,900 | 476 | ||||||
NovaGold Resources *(A) | 126,700 | 518 | ||||||
Olin (A) | 20,000 | 585 | ||||||
Patrick Industries * | 9,571 | 572 | ||||||
PolyOne | 40,050 | 1,557 | ||||||
Schweitzer-Mauduit International | 4,500 | 182 | ||||||
Scotts Miracle-Gro, Cl A | 6,147 | 376 | ||||||
Sensient Technologies | 37,490 | 2,538 | ||||||
Silgan Holdings | 21,639 | 1,176 | ||||||
US Concrete * | 14,943 | 565 | ||||||
|
| |||||||
| 19,416 | ||||||||
|
| |||||||
Telecommunication Services — 0.6% | ||||||||
Boingo Wireless *(A) | 70,637 | 635 | ||||||
Cincinnati Bell * | 10,900 | 40 | ||||||
IDT, Cl B | 7,100 | 128 | ||||||
Inteliquent | 41,247 | 727 | ||||||
Iridium Communications *(A) | 58,200 | 603 | ||||||
magicJack VocalTec *(A) | 11,917 | 98 | ||||||
RingCentral, Cl A * | 75,841 | 1,296 | ||||||
Spok Holdings | 15,200 | 264 | ||||||
Vonage Holdings * | 48,100 | 224 | ||||||
|
| |||||||
| 4,015 | ||||||||
|
| |||||||
Utilities — 2.3% | ||||||||
ALLETE | 30,335 | 1,527 | ||||||
American States Water | 7,800 | 300 | ||||||
Avista | 24,200 | 774 | ||||||
Cadiz *(A) | 89,000 | 767 | ||||||
California Water Service Group | 5,200 | 124 | ||||||
Chesapeake Utilities | 17,400 | 916 | ||||||
Cleco | 200 | 11 | ||||||
Dynegy, Cl A * | 7,400 | 239 | ||||||
Empire District Electric | 31,500 | 735 | ||||||
New Jersey Resources | 14,800 | 445 | ||||||
NorthWestern | 4,500 | 234 | ||||||
ONE Gas | 517 | 23 | ||||||
Piedmont Natural Gas | 22,200 | 828 | ||||||
PNM Resources | 59,375 | 1,579 | ||||||
Portland General Electric (A) | 76,630 | 2,679 | ||||||
South Jersey Industries | 42,040 | 1,109 | ||||||
Southwest Gas | 34,420 | 1,874 | ||||||
UIL Holdings | 18,200 | 923 | ||||||
Vivint Solar *(A) | 33,713 | 486 | ||||||
WGL Holdings | 5,678 | 327 | ||||||
|
| |||||||
| 15,900 | ||||||||
|
| |||||||
Total Common Stock | 641,479 | |||||||
|
| |||||||
EXCHANGE TRADED FUND — 0.3% |
| |||||||
iShares Russell 2000 Growth Fund (A) | 12,135 | 1,849 | ||||||
|
| |||||||
Total Exchange Traded Fund | 1,849 | |||||||
|
| |||||||
| 8 | SEI Institutional Investments Trust / Annual Report / May 31, 2015 |
SCHEDULE OF INVESTMENTS
Small Cap Fund
May 31, 2015
| Description | Face Amount ($ Thousands)/Shares | Market Value ($ Thousands) | ||||||
| Number of Rights | ||||||||
RIGHTS — 0.0% | ||||||||
Allos Therapeutics ‡‡ | 81,300 | $ | — | |||||
Furiex Pharmaceuticals ‡‡ | 3,900 | — | ||||||
|
| |||||||
Total Rights | — | |||||||
|
| |||||||
CONVERTIBLE BOND — 0.0% | ||||||||
Consumer Discretionary — 0.0% | ||||||||
Eddie Bauer Holdings | ||||||||
5.250%, 04/01/2014 (B) (C) | $ | 2,856 | 4 | |||||
|
| |||||||
Total Convertible Bond | 4 | |||||||
|
| |||||||
AFFILIATED PARTNERSHIP — 8.9% | ||||||||
SEI Liquidity Fund, L.P. | ||||||||
0.060% **† (D) | 60,494,618 | 60,495 | ||||||
|
| |||||||
Total Affiliated Partnership | 60,495 | |||||||
|
| |||||||
CASH EQUIVALENT — 5.6% | ||||||||
SEI Daily Income Trust, Prime Obligation Fund, Cl A | ||||||||
0.010% **† | 38,294,397 | 38,294 | ||||||
|
| |||||||
Total Cash Equivalent | 38,294 | |||||||
|
| |||||||
U.S. TREASURY OBLIGATION — 0.1% |
| |||||||
U.S. Treasury Bills | ||||||||
0.109%, 02/04/2016 | 690 | 689 | ||||||
|
| |||||||
Total U.S. Treasury Obligation | 689 | |||||||
|
| |||||||
Total Investments — 108.7% | $ | 742,810 | ||||||
|
| |||||||
A list of the open futures contracts held by the Fund at May 31, 2015, is as follows:
| Type of Contract | Number of Contracts Long | Expiration Date | Unrealized Appreciation ($ Thousands) | |||||||||
Russell 2000 Index E-MINI | 129 | Jun-2015 | $ | 367 | ||||||||
|
| |||||||||||
For the year ended May 31, 2015, the total amount of all open futures contracts, as presented in the table above, are representative of the volume of activity for this derivative type during the year.
Percentages are based on a Net Assets of $683,624 ($ Thousands).
| * | Non-income producing security. |
| ** | The rate reported is the 7-day effective yield as of May 31, 2015. |
| † | Investment in Affiliated Security (see Note 6). |
| ‡ | Real Estate Investment Trust. |
| ‡‡ | Expiration date is unavailable. |
| (A) | This security or a partial position of this security is on loan at May 31, 2015. The total market value of securities on loan at May 31, 2015 was $60,375 ($ Thousands). |
| (B) | Security in default on interest payments. |
| (C) | Security fair valued using methods determined in good faith by the Valuation Committee of the Board of Trustees. The total market value of such securities as of May 31, 2015 was $4 ($ Thousands) and represented 0.0% of Net Assets. |
| (D) | This security was purchased with cash collateral held from securities on loan (see Note 12). The total value of such securities as of May 31, 2015 was $60,495 ($ Thousands). |
ADR — American Depositary Receipt
Cl — Class
L.P. — Limited Partnership
The following is a list of the level of inputs used as of May 31, 2015, in valuing the Fund’s investments and other financial instruments carried at value ($ Thousands):
| Investments in Securities | Level 1 | Level 2 | Level 3(1) | Total | ||||||||||||
Common Stock | $ | 641,479 | $ | — | $ | — | $ | 641,479 | ||||||||
Exchange Traded Fund | 1,849 | — | — | 1,849 | ||||||||||||
Rights | — | — | — | — | ||||||||||||
Convertible Bond | — | — | 4 | 4 | ||||||||||||
Affiliated Partnership | — | 60,495 | — | 60,495 | ||||||||||||
Cash Equivalent | 38,294 | — | — | 38,294 | ||||||||||||
U.S. Treasury Obligation | — | 689 | — | 689 | ||||||||||||
|
|
|
|
|
|
|
| |||||||||
Total Investments in Securities | $ | 681,622 | $ | 61,184 | $ | 4 | $ | 742,810 | ||||||||
|
|
|
|
|
|
|
| |||||||||
| Other Financial Instruments | Level 1 | Level 2 | Level 3 | Total | ||||||||||||
Futures Contracts | ||||||||||||||||
Unrealized Appreciation * | $ | 367 | $ | — | $ | — | $ | 367 | ||||||||
|
|
|
|
|
|
|
| |||||||||
| * | Futures contracts are valued at the unrealized appreciation on the instrument. |
| (1) | A reconciliation of Level 3 investments is presented when the Fund has a significant amount of Level 3 investments at the beginning and/or end of the period in relation to net assets. |
For the year ended May 31, 2015, there were no transfers between Level 1 and Level 2 assets and liabilities.
For the year ended May 31, 2015, there were no transfers between Level 2 and Level 3 assets and liabilities.
For more information on valuation inputs, see Note 2 — Significant Accounting Policies in Notes to Financial Statements.
Amounts designated as “—” are $0 or have been rounded to $0.
| 9 | SEI Institutional Investments Trust / Annual Report / May 31, 2015 |
SCHEDULE OF INVESTMENTS
Small Cap II Fund
May 31, 2015
| Description | Shares | Market Value ($ Thousands) | ||||||
COMMON STOCK — 94.6% | ||||||||
Consumer Discretionary — 13.3% | ||||||||
1-800-Flowers.com, Cl A * | 18,363 | $ | 175 | |||||
2U * | 8,078 | 224 | ||||||
Abercrombie & Fitch, Cl A (A) | 105,200 | 2,153 | ||||||
Aeropostale *(A) | 9,800 | 19 | ||||||
AMC Entertainment Holdings, Cl A | 24,066 | 696 | ||||||
American Axle & Manufacturing Holdings * | 7,128 | 179 | ||||||
American Eagle Outfitters | 43,352 | 710 | ||||||
America’s Car-Mart * | 400 | 21 | ||||||
Arctic Cat | 12,380 | 410 | ||||||
Ascena Retail Group * | 12,153 | 180 | ||||||
bebe stores | 12,307 | 32 | ||||||
Big 5 Sporting Goods | 8,035 | 117 | ||||||
Big Lots | 39,330 | 1,727 | ||||||
Bloomin’ Brands | 8,800 | 198 | ||||||
Boot Barn Holdings * | 24,095 | 589 | ||||||
Bravo Brio Restaurant Group * | 8,900 | 119 | ||||||
Bright Horizons Family Solutions * | 13,569 | 755 | ||||||
Brunswick | 9,202 | 470 | ||||||
Buffalo Wild Wings * | 2,784 | 425 | ||||||
Build-A-Bear Workshop, Cl A * | 6,600 | 106 | ||||||
Burlington Stores * | 23,781 | 1,255 | ||||||
Cabela’s *(A) | 9,145 | 466 | ||||||
Caleres | 1,300 | 40 | ||||||
Callaway Golf (A) | 84,314 | 796 | ||||||
Capella Education | 12,053 | 642 | ||||||
Career Education * | 25,600 | 97 | ||||||
Cato, Cl A | 5,500 | 205 | ||||||
Christopher & Banks * | 6,800 | 39 | ||||||
Chuy’s Holdings *(A) | 34,997 | 910 | ||||||
Citi Trends * | 5,390 | 130 | ||||||
ClubCorp Holdings | 10,321 | 235 | ||||||
Columbia Sportswear | 286 | 16 | ||||||
Cooper Tire & Rubber | 14,194 | 521 | ||||||
Core-Mark Holdings | 13,445 | 722 | ||||||
Cracker Barrel Old Country Store | 1,761 | 248 | ||||||
Dave & Buster’s Entertainment * | 5,581 | 177 | ||||||
Denny’s * | 15,760 | 164 | ||||||
Destination Maternity | 800 | 9 | ||||||
Dex Media *(A) | 8,100 | 7 | ||||||
Diamond Resorts International * | 25,161 | 782 | ||||||
DineEquity | 1,700 | 166 | ||||||
Dorman Products *(A) | 14,003 | 653 | ||||||
Entravision Communications, Cl A | 37,253 | 251 | ||||||
Ethan Allen Interiors | 9,927 | 249 | ||||||
Express * | 39,185 | 691 | ||||||
Fiesta Restaurant Group * | 19,902 | 926 | ||||||
Five Below * | 41,864 | 1,392 | ||||||
Francesca’s Holdings * | 14,800 | 232 | ||||||
Fuel Systems Solutions * | 1,156 | 9 | ||||||
Genesco * | 8,550 | 566 | ||||||
Gentherm * | 10,655 | 546 | ||||||
G-III Apparel Group * | 3,807 | 216 | ||||||
Grand Canyon Education * | 1,900 | 81 | ||||||
Gray Television * | 17,585 | 281 | ||||||
Harte-Hanks | 6,288 | 39 | ||||||
Haverty Furniture | 5,424 | 114 | ||||||
Helen of Troy * | 1,840 | 161 | ||||||
hhgregg *(A) | 11,400 | 44 | ||||||
| Description | Shares | Market Value ($ Thousands) | ||||||
Houghton Mifflin Harcourt * | 4,971 | $ | 131 | |||||
Hovnanian Enterprises, Cl A *(A) | 6,200 | 20 | ||||||
Imax *(A) | 23,986 | 968 | ||||||
Isle of Capri Casinos * | 10,467 | 149 | ||||||
Jack in the Box | 15,441 | 1,340 | ||||||
K12 * | 1,675 | 23 | ||||||
Kirkland’s * | 6,943 | 182 | ||||||
La Quinta Holdings * | 40,673 | 1,011 | ||||||
La-Z-Boy, Cl Z | 32,425 | 860 | ||||||
LeapFrog Enterprises, Cl A *(A) | 13,200 | 27 | ||||||
Libbey | 4,576 | 181 | ||||||
Lithia Motors, Cl A | 2,550 | 271 | ||||||
Loral Space & Communications * | 6,900 | 461 | ||||||
Marriott Vacations Worldwide | 11,037 | 974 | ||||||
Men’s Wearhouse | 9,477 | 550 | ||||||
Modine Manufacturing * | 14,000 | 157 | ||||||
Movado Group | 2,200 | 58 | ||||||
National CineMedia | 34,354 | 547 | ||||||
Nautilus * | 19,467 | 411 | ||||||
New Media Investment | 6,521 | 144 | ||||||
Nutrisystem | 905 | 21 | ||||||
Office Depot * | 6,600 | 61 | ||||||
Orbitz Worldwide * | 11,366 | 128 | ||||||
Overstock.com * | 11,792 | 255 | ||||||
Oxford Industries | 3,808 | 289 | ||||||
Penn National Gaming *(A) | 41,055 | 683 | ||||||
Perry Ellis International * | 3,187 | 78 | ||||||
PetMed Express (A) | 6,453 | 108 | ||||||
Pier 1 Imports (A) | 29,231 | 372 | ||||||
Pool | 24,337 | 1,613 | ||||||
Red Robin Gourmet Burgers * | 8,872 | 740 | ||||||
Restoration Hardware Holdings * | 8,219 | 748 | ||||||
Ruth’s Hospitality Group | 19,891 | 293 | ||||||
Scientific Games, Cl A *(A) | 23,916 | 364 | ||||||
Select Comfort * | 17,200 | 536 | ||||||
Shoe Carnival | 3,136 | 87 | ||||||
Shutterfly * | 12,872 | 599 | ||||||
Six Flags Entertainment | 3,644 | 178 | ||||||
Skechers U.S.A., Cl A * | 7,710 | 816 | ||||||
Skullcandy * | 3,394 | 25 | ||||||
SodaStream International *(A) | 38,200 | 810 | ||||||
Sonic | 5,483 | 165 | ||||||
Sportsman’s Warehouse Holdings *(A) | 48,179 | 467 | ||||||
Stage Stores | 1,349 | 22 | ||||||
Standard Motor Products | 400 | 14 | ||||||
Stein Mart | 8,097 | 86 | ||||||
Steiner Leisure * | 2,200 | 108 | ||||||
Steven Madden * | 31,031 | 1,172 | ||||||
Stoneridge * | 7,620 | 91 | ||||||
Strayer Education * | 3,365 | 154 | ||||||
TAL Education Group ADR *(A) | 14,009 | 507 | ||||||
Tempur Sealy International * | 9,053 | 539 | ||||||
Tenneco * | 1,900 | 112 | ||||||
Tile Shop Holdings *(A) | 36,134 | 451 | ||||||
Tilly’s, Cl A * | 6,178 | 60 | ||||||
Tower International * | 9,100 | 250 | ||||||
Tuesday Morning * | 32,311 | 414 | ||||||
Universal Electronics * | 10,355 | 537 | ||||||
Vail Resorts | 8,978 | 931 | ||||||
Vista Outdoor * | 16,575 | 764 | ||||||
VOXX International, Cl A * | 64,400 | 551 | ||||||
Wayfair, Cl A *(A) | 5,434 | 162 | ||||||
Wolverine World Wide | 12,845 | 377 | ||||||
World Wrestling Entertainment, Cl A (A) | 29,600 | 423 | ||||||
Zoe’s Kitchen *(A) | 17,117 | 542 | ||||||
Zumiez * | 4,000 | 119 | ||||||
|
| |||||||
| 49,670 | ||||||||
|
| |||||||
| 1 | SEI Institutional Investments Trust / Annual Report / May 31, 2015 |
SCHEDULE OF INVESTMENTS
Small Cap II Fund
May 31, 2015
| Description | Shares | Market Value ($ Thousands) | ||||||
Consumer Staples — 2.4% | ||||||||
Andersons | 14,821 | $ | 657 | |||||
Cal-Maine Foods (A) | 3,641 | 206 | ||||||
Casey’s General Stores | 12,906 | 1,125 | ||||||
Chefs’ Warehouse *(A) | 19,919 | 374 | ||||||
Darling International * | 57,260 | 899 | ||||||
Dean Foods | 1,500 | 28 | ||||||
Diplomat Pharmacy * | 12,980 | 502 | ||||||
Fresh Del Monte Produce | 5,100 | 192 | ||||||
Freshpet *(A) | 24,880 | 494 | ||||||
Ingles Markets, Cl A | 1,023 | 50 | ||||||
John B Sanfilippo & Son | 6,458 | 327 | ||||||
Lancaster Colony | 1,600 | 143 | ||||||
Medifast * | 9,600 | 309 | ||||||
Omega Protein * | 57,197 | 786 | ||||||
Pinnacle Foods | 4,539 | 191 | ||||||
Snyder’s-Lance | 27,930 | 834 | ||||||
SpartanNash | 2,926 | 91 | ||||||
Sprouts Farmers Market * | 13,289 | 399 | ||||||
SUPERVALU * | 35,100 | 310 | ||||||
TreeHouse Foods * | 5,931 | 423 | ||||||
USANA Health Sciences * | 3,200 | 410 | ||||||
|
| |||||||
| 8,750 | ||||||||
|
| |||||||
Energy — 3.3% | ||||||||
Abraxas Petroleum * | 2,734 | 8 | ||||||
Callon Petroleum * | 23,825 | 187 | ||||||
CARBO Ceramics (A) | 21,200 | 904 | ||||||
Carrizo Oil & Gas * | 25,009 | 1,255 | ||||||
Delek US Holdings | 2,833 | 107 | ||||||
Diamondback Energy * | 11,108 | 864 | ||||||
Dril-Quip * | 2,903 | 219 | ||||||
Green Plains Renewable Energy | 1,300 | 43 | ||||||
Gulfport Energy * | 4,080 | 176 | ||||||
ION Geophysical * | 9,400 | 13 | ||||||
Laredo Petroleum Holdings *(A) | 22,119 | 301 | ||||||
Matador Resources * | 17,208 | 474 | ||||||
McDermott International *(A) | 18,430 | 101 | ||||||
Nabors Industries | 21,700 | 320 | ||||||
Oasis Petroleum * | 16,441 | 279 | ||||||
Oil States International * | 17,730 | 725 | ||||||
Patterson-UTI Energy | 4,940 | 100 | ||||||
PBF Energy, Cl A | 66,300 | 1,778 | ||||||
PDC Energy * | 3,304 | 197 | ||||||
PetroQuest Energy * | 5,461 | 10 | ||||||
REX American Resources * | 6,486 | 414 | ||||||
Rosetta Resources * | 7,039 | 165 | ||||||
Stone Energy * | 11,500 | 156 | ||||||
Superior Energy Services | 33,843 | 782 | ||||||
Tidewater (A) | 72,165 | 1,771 | ||||||
US Silica Holdings (A) | 22,177 | 684 | ||||||
VAALCO Energy * | 30,542 | 68 | ||||||
Willbros Group * | 14,543 | 27 | ||||||
|
| |||||||
| 12,128 | ||||||||
|
| |||||||
Financials — 17.2% | ||||||||
Agree Realty ‡ | 2,317 | 70 | ||||||
Altisource Residential, Cl B ‡ | 5,100 | 91 | ||||||
Argo Group International Holdings | 12,111 | 638 | ||||||
Armada Hoffler Properties ‡ | 2,292 | 24 | ||||||
Ashford Hospitality Prime ‡ | 2,923 | 46 | ||||||
| Description | Shares | Market Value ($ Thousands) | ||||||
Associated Estates Realty ‡ | 2,900 | $ | 83 | |||||
Banco Latinoamericano de Comercio Exterior, Cl E | 2,000 | 61 | ||||||
Bancorp * | 89,600 | 866 | ||||||
Bancorpsouth | 2,700 | 65 | ||||||
Bank of the Ozarks | 18,300 | 805 | ||||||
BankUnited | 9,388 | 315 | ||||||
Banner | 13,124 | 591 | ||||||
BBCN Bancorp | 400 | 6 | ||||||
BGC Partners, Cl A | 6,400 | 61 | ||||||
Blackstone Mortgage Trust, Cl A ‡ | 42,250 | 1,277 | ||||||
Boston Private Financial Holdings | 25,951 | 325 | ||||||
Brandywine Realty Trust ‡ | 54,010 | 761 | ||||||
Capital Bank Financial, Cl A * | 13,067 | 373 | ||||||
Capitol Federal Financial | 61,195 | 740 | ||||||
Cathay General Bancorp | 400 | 12 | ||||||
Cedar Realty Trust ‡ | 10,800 | 73 | ||||||
Central Pacific Financial | 5,246 | 123 | ||||||
Chatham Lodging Trust ‡ | 5,000 | 140 | ||||||
Chemical Financial | 600 | 18 | ||||||
Chesapeake Lodging Trust ‡ | 16,960 | 527 | ||||||
City National | 4,114 | 379 | ||||||
Columbia Banking System | 22,730 | 687 | ||||||
Corporate Office Properties Trust ‡ | 27,581 | 708 | ||||||
Cousins Properties ‡ | 11,600 | 112 | ||||||
Cowen Group, Cl A * | 2,203 | 13 | ||||||
Credit Acceptance * | 2,033 | 468 | ||||||
CubeSmart ‡ | 5,200 | 124 | ||||||
CyrusOne ‡ | 1,600 | 52 | ||||||
DCT Industrial Trust ‡ | 18,770 | 614 | ||||||
DiamondRock Hospitality ‡ | 20,600 | 271 | ||||||
DuPont Fabros Technology ‡ | 2,900 | 94 | ||||||
Eagle Bancorp * | 27,278 | 1,085 | ||||||
EastGroup Properties ‡ | 6,514 | 362 | ||||||
Education Realty Trust ‡ | 17,527 | 577 | ||||||
Employers Holdings | 18,475 | 418 | ||||||
Endurance Specialty Holdings | 5,984 | 364 | ||||||
EPR Properties ‡ | 2,900 | 167 | ||||||
Equity One ‡ | 20,450 | 507 | ||||||
EverBank Financial | 42,180 | 778 | ||||||
Evercore Partners, Cl A | 14,880 | 758 | ||||||
FBL Financial Group, Cl A | 10,100 | 580 | ||||||
FBR * | 20,800 | 440 | ||||||
Federated Investors, Cl B (A) | 10,997 | 383 | ||||||
Federated National Holding | 11,300 | 290 | ||||||
FelCor Lodging Trust ‡ | 900 | 10 | ||||||
First BanCorp * | 21,909 | 134 | ||||||
First Citizens BancShares, Cl A | 400 | 96 | ||||||
First Commonwealth Financial | 61,800 | 562 | ||||||
First Horizon National | 54,784 | 809 | ||||||
First Interstate Bancsystem, Cl A | 16,452 | 448 | ||||||
First Midwest Bancorp | 9,300 | 165 | ||||||
First NBC Bank Holding * | 9,604 | 326 | ||||||
First Niagara Financial Group | 247,160 | 2,202 | ||||||
FNB (Pennsylvania) | 80,300 | 1,083 | ||||||
Fulton Financial | 57,935 | 733 | ||||||
FXCM, Cl A (A) | 15,600 | 23 | ||||||
Genworth Financial, Cl A * | 77,200 | 613 | ||||||
Geo Group ‡ | 9,700 | 368 | ||||||
GFI Group * | 5,137 | 30 | ||||||
Green Dot, Cl A * | 105,000 | 1,538 | ||||||
Hancock Holding | 20,970 | 611 | ||||||
| 2 | SEI Institutional Investments Trust / Annual Report / May 31, 2015 |
SCHEDULE OF INVESTMENTS
Small Cap II Fund
May 31, 2015
| Description | Shares | Market Value ($ Thousands) | ||||||
Hanover Insurance Group | 24,379 | $ | 1,735 | |||||
HCI Group | 2,000 | 86 | ||||||
Healthcare Realty Trust ‡ | 4,100 | 98 | ||||||
Highwoods Properties ‡ | 30,750 | 1,290 | ||||||
HomeStreet * | 8,174 | 188 | ||||||
Horace Mann Educators | 35,759 | 1,231 | ||||||
Hudson Pacific Properties ‡ | 1,128 | 34 | ||||||
Iberiabank | 30,705 | 1,973 | ||||||
Infinity Property & Casualty | 11,819 | 855 | ||||||
Inland Real Estate ‡ | 33,000 | 335 | ||||||
International FCStone * | 2,311 | 81 | ||||||
Investment Technology Group | 14,200 | 381 | ||||||
Investors Bancorp | 56,533 | 679 | ||||||
Janus Capital Group | 2,417 | 44 | ||||||
LaSalle Hotel Properties ‡ | 5,800 | 212 | ||||||
LendingTree * | 2,420 | 143 | ||||||
Levy Acquisition * | 12,531 | 202 | ||||||
Lexington Realty Trust ‡ | 39,154 | 359 | ||||||
Manning & Napier, Cl A | 38,100 | 421 | ||||||
MarketAxess Holdings | 5,997 | 530 | ||||||
MB Financial | 21,577 | 695 | ||||||
Medical Properties Trust ‡ | 39,575 | 537 | ||||||
MFA Mortgage Investments ‡ | 72,855 | 579 | ||||||
Montpelier Re Holdings | 3,500 | 133 | ||||||
National Health Investors ‡ | 11,195 | 740 | ||||||
National Penn Bancshares | 58,398 | 625 | ||||||
Navigators Group * | 1,716 | 133 | ||||||
NBT Bancorp | 8,900 | 219 | ||||||
Nelnet, Cl A | 10,600 | 436 | ||||||
OFG Bancorp (A) | 160,000 | 2,102 | ||||||
PacWest Bancorp | 17,418 | 782 | ||||||
Pebblebrook Hotel Trust ‡ | 15,974 | 685 | ||||||
Physicians Realty Trust ‡ | 4,700 | 76 | ||||||
Pinnacle Financial Partners | 2,300 | 114 | ||||||
Piper Jaffray * | 2,400 | 114 | ||||||
Primerica | 2,300 | 102 | ||||||
PrivateBancorp, Cl A | 30,150 | 1,150 | ||||||
PS Business Parks ‡ | 4,400 | 322 | ||||||
QTS Realty Trust * | 18,300 | 681 | ||||||
RLJ Lodging Trust ‡ | 9,300 | 281 | ||||||
Ryman Hospitality Properties ‡ | 2,954 | 163 | ||||||
S&T Bancorp | 600 | 16 | ||||||
Saul Centers ‡ | 895 | 45 | ||||||
Selective Insurance Group | 32,197 | 873 | ||||||
Signature Bank NY * | 4,370 | 610 | ||||||
South State | 11,424 | 821 | ||||||
Southwest Bancorp | 1,124 | 20 | ||||||
Sovran Self Storage ‡ | 5,300 | 483 | ||||||
Springleaf Holdings, Cl A * | 5,361 | 255 | ||||||
StanCorp Financial Group | 11,035 | 819 | ||||||
Sterling Bancorp | 71,496 | 966 | ||||||
Stifel Financial * | 20,496 | 1,092 | ||||||
Strategic Hotels & Resorts *‡ | 26,300 | 318 | ||||||
Summit Hotel Properties ‡ | 15,914 | 213 | ||||||
Sunstone Hotel Investors ‡ | 10,898 | 166 | ||||||
SVB Financial Group * | 5,026 | 678 | ||||||
Symetra Financial | 13,200 | 323 | ||||||
TCF Financial | 148,644 | 2,340 | ||||||
Texas Capital Bancshares * | 600 | 33 | ||||||
TriCo Bancshares | 500 | 12 | ||||||
United Community Banks | 12,400 | 238 | ||||||
United Insurance Holdings | 10,700 | 154 | ||||||
Universal Insurance Holdings | 7,500 | 192 | ||||||
Validus Holdings | 17,794 | 764 | ||||||
Virtus Investment Partners | 3,010 | 375 | ||||||
Walker & Dunlop * | 1,928 | 48 | ||||||
| Description | Shares | Market Value ($ Thousands) | ||||||
Webster Financial | 24,655 | $ | 934 | |||||
Western Alliance Bancorp * | 27,625 | 866 | ||||||
Wintrust Financial | 16,975 | 850 | ||||||
WisdomTree Investments | 6,745 | 144 | ||||||
|
| |||||||
| 64,267 | ||||||||
|
| |||||||
Health Care — 15.9% | ||||||||
ABIOMED * | 3,829 | 229 | ||||||
Acadia Healthcare *(A) | 29,158 | 2,162 | ||||||
Achillion Pharmaceuticals * | 19,790 | 196 | ||||||
Acorda Therapeutics * | 5,600 | 171 | ||||||
Addus HomeCare * | 10,965 | 307 | ||||||
Aerie Pharmaceuticals * | 11,246 | 125 | ||||||
Affymetrix *(A) | 13,500 | 158 | ||||||
Agenus * | 51,992 | 425 | ||||||
Agios Pharmaceuticals *(A) | 3,595 | 439 | ||||||
Akorn * | 27,509 | 1,263 | ||||||
Alder Biopharmaceuticals * | 7,353 | 313 | ||||||
Align Technology * | 9,090 | 551 | ||||||
AMAG Pharmaceuticals * | 8,315 | 579 | ||||||
Amedisys * | 621 | 19 | ||||||
Amicus Therapeutics * | 18,778 | 231 | ||||||
AMN Healthcare Services * | 7,690 | 204 | ||||||
Amsurg, Cl A * | 33,946 | 2,286 | ||||||
Analogic | 16,300 | 1,379 | ||||||
AngioDynamics * | 63,171 | 1,014 | ||||||
ANI Pharmaceuticals * | 1,400 | 71 | ||||||
Anika Therapeutics * | 11,200 | 378 | ||||||
Aratana Therapeutics * | 15,539 | 211 | ||||||
Arrowhead Research *(A) | 9,100 | 57 | ||||||
AtriCure * | 10,740 | 246 | ||||||
BioDelivery Sciences International * | 31,368 | 267 | ||||||
Bio-Rad Laboratories, Cl A * | 1,352 | 195 | ||||||
BioSpecifics Technologies * | 1,651 | 79 | ||||||
BioTelemetry * | 3,161 | 31 | ||||||
Bluebird Bio * | 4,375 | 850 | ||||||
Cambrex * | 15,101 | 604 | ||||||
Cardiovascular Systems * | 13,048 | 365 | ||||||
Cempra * | 8,480 | 311 | ||||||
Centene * | 6,203 | 467 | ||||||
Cepheid * | 2,891 | 160 | ||||||
Charles River Laboratories International * | 11,460 | 829 | ||||||
Chimerix * | 2,500 | 105 | ||||||
Clovis Oncology * | 2,757 | 255 | ||||||
Community Health Systems * | 25,200 | 1,394 | ||||||
CONMED | 5,600 | 311 | ||||||
Cynosure, Cl A * | 2,800 | 100 | ||||||
Depomed * | 5,382 | 112 | ||||||
DexCom * | 24,407 | 1,750 | ||||||
Dicerna Pharmaceuticals * | 3,341 | 55 | ||||||
Dyax * | 20,659 | 544 | ||||||
Dynavax Technologies *(A) | 10,255 | 234 | ||||||
Eagle Pharmaceuticals * | 2,977 | 216 | ||||||
Emergent Biosolutions * | 35,685 | 1,137 | ||||||
Endocyte * | 9,000 | 55 | ||||||
Endologix * | 20,109 | 336 | ||||||
Ensign Group | 6,300 | 292 | ||||||
Esperion Therapeutics * | 5,907 | 635 | ||||||
ExamWorks Group *(A) | 17,473 | 714 | ||||||
Five Prime Therapeutics * | 8,000 | 205 | ||||||
Flexion Therapeutics * | 2,521 | 50 | ||||||
Globus Medical, Cl A * | 30,880 | 801 | ||||||
Greatbatch * | 14,475 | 752 | ||||||
GW Pharmaceuticals ADR *(A) | 2,618 | 299 | ||||||
| 3 | SEI Institutional Investments Trust / Annual Report / May 31, 2015 |
SCHEDULE OF INVESTMENTS
Small Cap II Fund
May 31, 2015
| Description | Shares | Market Value ($ Thousands) | ||||||
Halozyme Therapeutics *(A) | 11,908 | $ | 207 | |||||
Halyard Health * | 15,505 | 642 | ||||||
Health Net * | 10,756 | 669 | ||||||
HealthSouth | 46,718 | 2,016 | ||||||
HeartWare International *(A) | 6,332 | 467 | ||||||
Hill-Rom Holdings | 3,418 | 176 | ||||||
Horizon Pharma * | 3,687 | 120 | ||||||
ICON * | 7,713 | 500 | ||||||
ICU Medical * | 2,900 | 281 | ||||||
Idera Pharmaceuticals *(A) | 15,600 | 60 | ||||||
Inogen * | 1,597 | 60 | ||||||
Insmed * | 26,002 | 570 | ||||||
Integra LifeSciences Holdings * | 32,525 | 2,185 | ||||||
Intrexon *(A) | 4,434 | 187 | ||||||
Isis Pharmaceuticals *(A) | 17,142 | 1,154 | ||||||
Jazz Pharmaceuticals * | 2,580 | 463 | ||||||
K2M Group Holdings * | 18,419 | 481 | ||||||
Karyopharm Therapeutics *(A) | 5,181 | 139 | ||||||
Kite Pharma *(A) | 4,963 | 274 | ||||||
KYTHERA Biopharmaceuticals *(A) | 4,321 | 218 | ||||||
Lannett * | 3,700 | 206 | ||||||
LDR Holding * | 33,418 | 1,354 | ||||||
LHC Group * | 1,231 | 45 | ||||||
Ligand Pharmaceuticals, Cl B *(A) | 8,854 | 780 | ||||||
Luminex * | 4,500 | 75 | ||||||
MacroGenics * | 2,500 | 81 | ||||||
Medidata Solutions * | 3,328 | 193 | ||||||
Merge Healthcare * | 17,115 | 78 | ||||||
Merit Medical Systems * | 9,090 | 187 | ||||||
Merrimack Pharmaceuticals *(A) | 15,023 | 177 | ||||||
Molina Healthcare * | 7,743 | 563 | ||||||
Momenta Pharmaceuticals * | 17,884 | 355 | ||||||
Natus Medical * | 8,200 | 320 | ||||||
Neovasc * | 23,914 | 168 | ||||||
Neurocrine Biosciences * | 7,869 | 345 | ||||||
Nevro *(A) | 9,103 | 463 | ||||||
NewLink Genetics *(A) | 5,635 | 243 | ||||||
Novavax *(A) | 23,255 | 209 | ||||||
NuVasive * | 900 | 46 | ||||||
NxStage Medical * | 900 | 15 | ||||||
Ophthotech * | 10,908 | 546 | ||||||
OPKO Health *(A) | 5,688 | 101 | ||||||
OraSure Technologies * | 28,200 | 175 | ||||||
Orexigen Therapeutics * | 44,250 | 217 | ||||||
Orthofix International * | 8,200 | 269 | ||||||
Otonomy * | 7,046 | 173 | ||||||
Pacific Biosciences of California * | 4,800 | 27 | ||||||
PAREXEL International * | 2,445 | 163 | ||||||
PDL BioPharma | 3,230 | 22 | ||||||
PerkinElmer | 14,899 | 786 | ||||||
Pernix Therapeutics Holdings * | 5,124 | 33 | ||||||
Pozen * | 23,600 | 152 | ||||||
Premier, Cl A * | 15,083 | 578 | ||||||
Prestige Brands Holdings * | 17,065 | 749 | ||||||
Progenics Pharmaceuticals * | 27,375 | 154 | ||||||
Prothena * | 4,716 | 186 | ||||||
Providence Service * | 1,968 | 95 | ||||||
PTC Therapeutics * | 9,214 | 535 | ||||||
Puma Biotechnology *(A) | 3,220 | 629 | ||||||
RadNet * | 13,000 | 85 | ||||||
Receptos * | 3,554 | 586 | ||||||
Relypsa * | 24,141 | 888 | ||||||
Repligen * | 754 | 31 | ||||||
| Description | Shares | Market Value ($ Thousands) | ||||||
Repros Therapeutics * | 6,400 | $ | 46 | |||||
Retrophin * | 5,379 | 170 | ||||||
Sage Therapeutics * | 13,031 | 976 | ||||||
Sangamo BioSciences * | 19,541 | 239 | ||||||
Sciclone Pharmaceuticals * | 18,808 | 174 | ||||||
Sirona Dental Systems * | 5,954 | 588 | ||||||
Spectranetics *(A) | 14,526 | 361 | ||||||
STERIS (A) | 7,392 | 494 | ||||||
Sucampo Pharmaceuticals, Cl A * | 10,128 | 164 | ||||||
Supernus Pharmaceuticals * | 6,000 | 85 | ||||||
Surgical Care Affiliates * | 8,426 | 320 | ||||||
SurModics * | 579 | 14 | ||||||
Team Health Holdings * | 14,518 | 849 | ||||||
Teleflex | 4,307 | 554 | ||||||
TESARO * | 7,916 | 465 | ||||||
Tetraphase Pharmaceuticals * | 15,389 | 660 | ||||||
TG Therapeutics *(A) | 11,505 | 181 | ||||||
Triple-S Management, Cl B * | 7,316 | 176 | ||||||
Ultragenyx Pharmaceutical * | 8,171 | 711 | ||||||
US Physical Therapy | 4,579 | 228 | ||||||
WellCare Health Plans * | 900 | 77 | ||||||
Xencor * | 17,631 | 320 | ||||||
XenoPort * | 15,500 | 92 | ||||||
ZIOPHARM Oncology *(A) | 16,174 | 153 | ||||||
|
| |||||||
| 59,573 | ||||||||
|
| |||||||
Industrials — 17.3% | ||||||||
Acacia Research | 87,100 | 889 | ||||||
ACCO Brands * | 189,000 | 1,389 | ||||||
Actuant, Cl A | 50,579 | 1,189 | ||||||
Acuity Brands | 1,257 | 222 | ||||||
Aerojet Rocketdyne Holdings * | 8,287 | 172 | ||||||
Aerovironment * | 900 | 23 | ||||||
AGCO (A) | 10,912 | 554 | ||||||
Air Transport Services Group * | 3,500 | 37 | ||||||
Altra Industrial Motion | 13,436 | 369 | ||||||
American Science & Engineering | 288 | 11 | ||||||
American Woodmark * | 6,977 | 358 | ||||||
Apogee Enterprises | 17,621 | 947 | ||||||
ArcBest | 1,935 | 66 | ||||||
Argan | 7,800 | 279 | ||||||
Astronics * | 8,505 | 594 | ||||||
Astronics, Cl B * | 1,856 | 130 | ||||||
Atlas Air Worldwide Holdings * | 27,400 | 1,493 | ||||||
Barnes Group | 19,355 | 779 | ||||||
Beacon Roofing Supply * | 10,442 | 327 | ||||||
Blount International * | 3,900 | 45 | ||||||
Brady, Cl A | 15,100 | 382 | ||||||
Builders FirstSource * | 17,928 | 220 | ||||||
CAI International * | 2,155 | 47 | ||||||
Carlisle | 8,505 | 843 | ||||||
CEB | 9,253 | 783 | ||||||
CIRCOR International | 9,950 | 531 | ||||||
CLARCOR | 11,880 | 732 | ||||||
Clean Harbors * | 15,102 | 851 | ||||||
Comfort Systems USA | 8,800 | 198 | ||||||
Continental Building Products * | 3,928 | 88 | ||||||
Covenant Transportation Group, Cl A * | 5,151 | 159 | ||||||
Crane | 22,100 | 1,338 | ||||||
Curtiss-Wright | 7,183 | 518 | ||||||
Deluxe | 3,500 | 223 | ||||||
Ducommun * | 12,700 | 296 | ||||||
DXP Enterprises * | 15,400 | 632 | ||||||
| 4 | SEI Institutional Investments Trust / Annual Report / May 31, 2015 |
SCHEDULE OF INVESTMENTS
Small Cap II Fund
May 31, 2015
| Description | Shares | Market Value ($ Thousands) | ||||||
Dycom Industries * | 19,159 | $ | 1,103 | |||||
EMCOR Group | 33,244 | 1,508 | ||||||
Engility Holdings | 2,279 | 64 | ||||||
EnPro Industries | 12,582 | 761 | ||||||
Exponent | 1,400 | 119 | ||||||
Forward Air | 13,845 | 718 | ||||||
FreightCar America | 2,266 | 51 | ||||||
G&K Services, Cl A | 10,446 | 728 | ||||||
Generac Holdings *(A) | 14,799 | 618 | ||||||
Genesee & Wyoming, Cl A * | 7,541 | 621 | ||||||
Global Brass & Copper Holdings | 5,700 | 98 | ||||||
GP Strategies * | 1,427 | 45 | ||||||
GrafTech International * | 2,400 | 12 | ||||||
Greenbrier (A) | 3,680 | 222 | ||||||
H&E Equipment Services | 36,775 | 803 | ||||||
Hawaiian Holdings * | 7,200 | 174 | ||||||
Healthcare Services Group | 24,770 | 748 | ||||||
Heidrick & Struggles International | 2,829 | 71 | ||||||
Hexcel | 32,942 | 1,622 | ||||||
Hub Group, Cl A * | 7,444 | 316 | ||||||
Huron Consulting Group * | 23,465 | 1,509 | ||||||
Hyster-Yale Materials Handling | 15,750 | 1,118 | ||||||
ICF International * | 1,100 | 39 | ||||||
IDEX | 8,502 | 657 | ||||||
Insperity | 9,505 | 500 | ||||||
Interface, Cl A | 40,608 | 874 | ||||||
ITT | 19,282 | 823 | ||||||
JetBlue Airways * | 21,729 | 438 | ||||||
John Bean Technologies | 11,365 | 427 | ||||||
Kadant | 11,185 | 527 | ||||||
KAR Auction Services | 13,982 | 521 | ||||||
Kelly Services, Cl A | 18,500 | 287 | ||||||
Kennametal | 28,700 | 1,035 | ||||||
Kforce | 5,400 | 119 | ||||||
Kirby * | 7,265 | 557 | ||||||
Korn/Ferry International | 19,113 | 613 | ||||||
Kratos Defense & Security Solutions * | 4,762 | 29 | ||||||
LB Foster, Cl A | 14,100 | 538 | ||||||
Lincoln Electric Holdings | 10,039 | 675 | ||||||
Lindsay Manufacturing (A) | 5,997 | 483 | ||||||
Lydall * | 1,563 | 43 | ||||||
Marten Transport | 1,300 | 29 | ||||||
Matthews International, Cl A | 11,974 | 595 | ||||||
Meritor * | 11,900 | 170 | ||||||
Middleby * | 7,595 | 826 | ||||||
Mobile Mini | 12,820 | 509 | ||||||
Moog, Cl A * | 4,000 | 275 | ||||||
MYR Group * | 13,251 | 392 | ||||||
Navigant Consulting * | 4,600 | 63 | ||||||
Orion Marine Group * | 24,774 | 186 | ||||||
PAM Transportation Services * | 817 | 49 | ||||||
Primoris Services | 42,596 | 800 | ||||||
Quality Distribution * | 9,719 | 154 | ||||||
RBC Bearings * | 6,082 | 426 | ||||||
Regal-Beloit | 19,646 | 1,536 | ||||||
Republic Airways Holdings * | 4,700 | 49 | ||||||
Resources Connection | 6,069 | 95 | ||||||
Rush Enterprises, Cl A * | 17,524 | 466 | ||||||
Safe Bulkers (A) | 21,300 | 71 | ||||||
Spirit AeroSystems Holdings, Cl A * | 23,610 | 1,289 | ||||||
Standex International | 9,690 | 775 | ||||||
Steelcase, Cl A | 46,422 | 798 | ||||||
Swift Transporation, Cl A * | 27,812 | 647 | ||||||
| Description | Shares | Market Value ($ Thousands) | ||||||
Team * | 12,274 | $ | 488 | |||||
Teledyne Technologies * | 4,326 | 438 | ||||||
Terex | 9,987 | 247 | ||||||
Tetra Tech | 24,550 | 642 | ||||||
Titan International | 97,200 | 1,035 | ||||||
Titan Machinery * | 52,685 | 837 | ||||||
Trex * | 2,764 | 140 | ||||||
TriMas * | 35,250 | 1,019 | ||||||
Triumph Group | 44,230 | 2,950 | ||||||
TrueBlue * | 16,180 | 461 | ||||||
UniFirst | 1,293 | 148 | ||||||
United Rentals * | 4,895 | 435 | ||||||
US Ecology | 9,305 | 429 | ||||||
USA Truck * | 920 | 21 | ||||||
USG *(A) | 25,640 | 739 | ||||||
Valmont Industries (A) | 4,114 | 512 | ||||||
Viad | 2,000 | 54 | ||||||
VSE | 179 | 11 | ||||||
Watts Water Technologies, Cl A | 10,354 | 550 | ||||||
Wesco Aircraft Holdings * | 130,340 | 1,924 | ||||||
WESCO International *(A) | 8,255 | 593 | ||||||
Woodward Governor | 12,870 | 656 | ||||||
XPO Logistics * | 4,770 | 234 | ||||||
|
| |||||||
| 64,691 | ||||||||
|
| |||||||
Information Technology — 20.1% | ||||||||
ACI Worldwide * | 30,060 | 716 | ||||||
Advanced Energy Industries * | 33,173 | 946 | ||||||
Alliance Fiber Optic Products | 18,789 | 364 | ||||||
Ambarella * | 1,586 | 143 | ||||||
Amkor Technology * | 19,862 | 134 | ||||||
Applied Optoelectronics * | 10,238 | 183 | ||||||
Aspen Technology * | 36,727 | 1,572 | ||||||
AVG Technologies * | 15,192 | 372 | ||||||
Barracuda Networks * | 3,170 | 125 | ||||||
Belden | 7,289 | 615 | ||||||
Benchmark Electronics * | 11,200 | 260 | ||||||
Black Box | 40,400 | 810 | ||||||
Blackbaud | 29,090 | 1,491 | ||||||
Brightcove * | 8,200 | 58 | ||||||
BroadSoft * | 29,212 | 1,067 | ||||||
Cabot Microelectronics * | 5,400 | 249 | ||||||
CACI International, Cl A * | 9,850 | 843 | ||||||
Cadence Design Systems * | 31,030 | 614 | ||||||
Calix * | 18,300 | 146 | ||||||
Callidus Software * | 49,782 | 713 | ||||||
Carbonite * | 3,458 | 38 | ||||||
Cavium * | 26,393 | 1,857 | ||||||
Checkpoint Systems | 4,578 | 45 | ||||||
Cimpress * | 10,118 | 833 | ||||||
Cirrus Logic * | 11,139 | 420 | ||||||
Coherent * | 6,843 | 426 | ||||||
CommScope Holding * | 6,490 | 202 | ||||||
comScore * | 1,971 | 112 | ||||||
Comtech Telecommunications | 3,100 | 93 | ||||||
Constant Contact * | 2,400 | 65 | ||||||
Convergys | 27,385 | 680 | ||||||
Cornerstone OnDemand * | 13,647 | 425 | ||||||
CoStar Group * | 3,551 | 742 | ||||||
Cray * | 18,180 | 556 | ||||||
Daktronics | 3,885 | 42 | ||||||
Dealertrack Technologies * | 41,967 | 1,750 | ||||||
Demandware * | 11,993 | 747 | ||||||
DHI Group * | 11,826 | 100 | ||||||
Diebold | 15,925 | 544 | ||||||
Diodes * | 4,900 | 130 | ||||||
| 5 | SEI Institutional Investments Trust / Annual Report / May 31, 2015 |
SCHEDULE OF INVESTMENTS
Small Cap II Fund
May 31, 2015
| Description | Shares | Market Value ($ Thousands) | ||||||
DTS * | 1,197 | $ | 38 | |||||
EarthLink Holdings | 5,400 | 37 | ||||||
Ebix | 4,519 | 161 | ||||||
Ellie Mae * | 3,474 | 220 | ||||||
Entegris * | 69,899 | 974 | ||||||
Envestnet * | 23,661 | 1,037 | ||||||
EPAM Systems * | 3,900 | 280 | ||||||
ePlus * | 2,315 | 180 | ||||||
Euronet Worldwide * | 26,005 | 1,555 | ||||||
ExlService Holdings * | 21,556 | 774 | ||||||
Extreme Networks * | 12,100 | 33 | ||||||
Fabrinet * | 13,000 | 236 | ||||||
Fair Isaac | 9,024 | 792 | ||||||
Fairchild Semiconductor International, Cl A * | 738 | 15 | ||||||
FormFactor * | 32,023 | 298 | ||||||
Fortinet * | 18,488 | 741 | ||||||
Gigamon * | 11,308 | 348 | ||||||
Global Cash Access Holdings * | 21,625 | 167 | ||||||
GrubHub * | 13,945 | 562 | ||||||
Guidewire Software * | 23,516 | 1,139 | ||||||
Heartland Payment Systems | 10,647 | 569 | ||||||
HomeAway * | 13,020 | 365 | ||||||
HubSpot * | 4,601 | 234 | ||||||
II-VI * | 1,814 | 34 | ||||||
Immersion * | 18,228 | 220 | ||||||
Imperva * | 4,462 | 271 | ||||||
Infinera * | 36,404 | 751 | ||||||
Infoblox * | 79,687 | 2,071 | ||||||
Inphi * | 35,365 | 847 | ||||||
Insight Enterprises * | 15,400 | 452 | ||||||
Integrated Device Technology * | 25,222 | 597 | ||||||
Integrated Silicon Solution | 578 | 12 | ||||||
Interactive Intelligence Group *(A) | 7,547 | 326 | ||||||
InterDigital | 328 | 19 | ||||||
Intersil, Cl A | 22,933 | 310 | ||||||
IPG Photonics * | 1,961 | 186 | ||||||
Ixia * | 40,819 | 513 | ||||||
j2 Global | 2,609 | 173 | ||||||
Lattice Semiconductor * | 35,200 | 220 | ||||||
LivePerson * | 4,100 | 39 | ||||||
LogMeIn * | 3,064 | 194 | ||||||
Luxoft Holding, Cl A * | 3,537 | 189 | ||||||
Manhattan Associates * | 3,800 | 208 | ||||||
Marketo * | 22,177 | 662 | ||||||
MAXIMUS | 20,003 | 1,308 | ||||||
MaxLinear, Cl A * | 24,602 | 247 | ||||||
Mellanox Technologies * | 8,690 | 437 | ||||||
Mentor Graphics | 39,480 | 1,031 | ||||||
Methode Electronics | 9,300 | 436 | ||||||
Microsemi * | 706 | 26 | ||||||
MicroStrategy, Cl A * | 460 | 81 | ||||||
MKS Instruments | 17,394 | 656 | ||||||
MoneyGram International * | 2,700 | 26 | ||||||
Monolithic Power Systems | 10,806 | 590 | ||||||
Monotype Imaging Holdings | 10,800 | 280 | ||||||
Newport * | 2,000 | 38 | ||||||
Nimble Storage *(A) | 16,491 | 427 | ||||||
OmniVision Technologies * | 84,700 | 2,284 | ||||||
Orbotech * | 29,000 | 606 | ||||||
OSI Systems * | 23,900 | 1,727 | ||||||
Pandora Media * | 14,466 | 270 | ||||||
Paycom Software * | 6,737 | 234 | ||||||
PDF Solutions * | 4,500 | 72 | ||||||
Pegasystems | 700 | 15 | ||||||
| Description | Shares | Market Value ($ Thousands) | ||||||
Pericom Semiconductor | 7,254 | $ | 95 | |||||
Plantronics | 1,400 | 77 | ||||||
Procera Networks * | 1,800 | 21 | ||||||
Proofpoint * | 18,423 | 1,089 | ||||||
PTC * | 29,311 | 1,210 | ||||||
Q2 Holdings * | 7,657 | 182 | ||||||
Qlik Technologies * | 30,145 | 1,090 | ||||||
QLogic * | 31,519 | 489 | ||||||
Qorvo * | 11,110 | 913 | ||||||
Qualys * | 800 | 33 | ||||||
RealD *(A) | 13,589 | 171 | ||||||
Rofin-Sinar Technologies * | 1,200 | 34 | ||||||
Rogers * | 10,045 | 726 | ||||||
Ruckus Wireless * | 46,525 | 489 | ||||||
Rudolph Technologies * | 13,476 | 172 | ||||||
Sanmina * | 17,200 | 373 | ||||||
ScanSource * | 1,200 | 47 | ||||||
Science Applications International | 6,900 | 366 | ||||||
Semtech * | 31,567 | 674 | ||||||
ShoreTel * | 12,700 | 87 | ||||||
Shutterstock *(A) | 7,997 | 512 | ||||||
Sigma Designs * | 21,112 | 181 | ||||||
Silicon Graphics International * | 146,600 | 941 | ||||||
Silicon Laboratories * | 32,059 | 1,777 | ||||||
SolarWinds * | 16,281 | 773 | ||||||
Solera Holdings | 14,498 | 715 | ||||||
Sonus Networks * | 8,800 | 69 | ||||||
SPS Commerce * | 17,752 | 1,154 | ||||||
SS&C Technologies Holdings | 14,297 | 843 | ||||||
Stamps.com * | 7,045 | 474 | ||||||
SunEdison *(A) | 7,562 | 227 | ||||||
Super Micro Computer * | 8,400 | 281 | ||||||
Sykes Enterprises * | 9,300 | 225 | ||||||
Synaptics * | 8,579 | 855 | ||||||
Tableau Software, Cl A * | 7,582 | 858 | ||||||
Take-Two Interactive Software * | 36,335 | 994 | ||||||
TeleTech Holdings | 1,300 | 33 | ||||||
Tessera Technologies | 8,800 | 339 | ||||||
Ultimate Software Group * | 6,036 | 977 | ||||||
Ultra Clean Holdings * | 10,300 | 67 | ||||||
Universal Display * | 4,114 | 221 | ||||||
Vasco Data Security International *(A) | 6,484 | 173 | ||||||
VeriFone Holdings * | 10,218 | 390 | ||||||
Verint Systems * | 4,669 | 302 | ||||||
WEX * | 7,651 | 868 | ||||||
Xcerra * | 19,800 | 153 | ||||||
XO Group * | 3,032 | 49 | ||||||
Xoom *(A) | 9,217 | 173 | ||||||
Zebra Technologies, Cl A * | 10,698 | 1,173 | ||||||
|
| |||||||
| 75,203 | ||||||||
|
| |||||||
Materials — 3.0% | ||||||||
A. Schulman | 4,200 | 180 | ||||||
Allegheny Technologies | 30,927 | 1,005 | ||||||
American Vanguard (A) | 21,500 | 296 | ||||||
Axiall | 1,600 | 60 | ||||||
Balchem | 8,925 | 504 | ||||||
Berry Plastics Group * | 4,900 | 164 | ||||||
Boise Cascade * | 937 | 33 | ||||||
Cabot | 10,513 | 436 | ||||||
Calgon Carbon | 1,900 | 39 | ||||||
Century Aluminum * | 10,200 | 114 | ||||||
Chemtura * | 22,770 | 632 | ||||||
Cytec Industries | 10,423 | 631 | ||||||
| 6 | SEI Institutional Investments Trust / Annual Report / May 31, 2015 |
SCHEDULE OF INVESTMENTS
Small Cap II Fund
May 31, 2015
| Description | Shares | Market Value ($ Thousands) | ||||||
Ferro * | 20,300 | $ | 308 | |||||
FutureFuel | 2,600 | 31 | ||||||
Globe Specialty Metals | 13,581 | 263 | ||||||
Gold Resource (A) | 24,086 | 71 | ||||||
Graphic Packaging Holding | 4,600 | 66 | ||||||
H.B. Fuller | 15,095 | 636 | ||||||
Handy & Harman * | 521 | 17 | ||||||
Headwaters * | 37,305 | 708 | ||||||
Innophos Holdings | 12,805 | 667 | ||||||
KapStone Paper and Packaging | 1,100 | 30 | ||||||
Louisiana-Pacific *(A) | 21,453 | 388 | ||||||
LSB Industries * | 16,456 | 700 | ||||||
Materion | 2,820 | 105 | ||||||
Patrick Industries * | 4,584 | 274 | ||||||
PolyOne | 23,326 | 907 | ||||||
Scotts Miracle-Gro, Cl A | 2,552 | 156 | ||||||
Sensient Technologies | 11,764 | 796 | ||||||
Silgan Holdings | 8,487 | 461 | ||||||
Summit Materials, Cl A * | 15,811 | 435 | ||||||
US Concrete * | 6,205 | 234 | ||||||
|
| |||||||
| 11,347 | ||||||||
|
| |||||||
Telecommunication Services — 0.4% | ||||||||
Cincinnati Bell * | 4,300 | 16 | ||||||
Cogent Communications Holdings | 12,332 | 387 | ||||||
IDT, Cl B | 3,500 | 63 | ||||||
Inteliquent | 12,264 | 216 | ||||||
magicJack VocalTec *(A) | 4,884 | 40 | ||||||
RingCentral, Cl A * | 48,329 | 826 | ||||||
Vonage Holdings * | 16,200 | 76 | ||||||
|
| |||||||
| 1,624 | ||||||||
|
| |||||||
Utilities — 1.7% | ||||||||
ALLETE | 14,630 | 737 | ||||||
American States Water | 4,100 | 157 | ||||||
Avista | 100 | 3 | ||||||
California Water Service Group | 5,900 | 141 | ||||||
Cleco | 1,900 | 103 | ||||||
Empire District Electric | 5,400 | 126 | ||||||
Great Plains Energy | 43,389 | 1,131 | ||||||
IDACORP | 10,648 | 633 | ||||||
New Jersey Resources | 9,800 | 295 | ||||||
NorthWestern | 6,304 | 328 | ||||||
ONE Gas | 4,142 | 184 | ||||||
Otter Tail | 2,600 | 70 | ||||||
PNM Resources | 32,940 | 876 | ||||||
Portland General Electric (A) | 32,832 | 1,148 | ||||||
Vivint Solar *(A) | 13,998 | 202 | ||||||
WGL Holdings | 4,059 | 233 | ||||||
|
| |||||||
| 6,367 | ||||||||
|
| |||||||
Total Common Stock | 353,620 | |||||||
|
| |||||||
EXCHANGE TRADED FUNDS — 0.6% |
| |||||||
iShares Russell 2000 Fund (A) | 9,266 | 1,148 | ||||||
iShares Russell 2000 Growth Fund (A) | 6,503 | 991 | ||||||
|
| |||||||
Total Exchange Traded Funds | 2,139 | |||||||
|
| |||||||
| Description | Shares/Face Amount ($ Thousands) | Market Value ($ Thousands) | ||||||
| Number of Rights | ||||||||
RIGHTS — 0.0% | ||||||||
Furiex Pharmaceuticals ‡‡ | 300 | $ | — | |||||
|
| |||||||
Total Rights | — | |||||||
|
| |||||||
AFFILIATED PARTNERSHIP — 8.0% |
| |||||||
SEI Liquidity Fund, L.P. | ||||||||
0.060% **† (B) | 29,913,883 | 29,914 | ||||||
|
| |||||||
Total Affiliated Partnership | 29,914 | |||||||
|
| |||||||
CASH EQUIVALENT — 5.2% |
| |||||||
SEI Daily Income Trust, Prime Obligation Fund, Cl A | ||||||||
0.010% **† | 19,425,519 | 19,426 | ||||||
|
| |||||||
Total Cash Equivalent | 19,426 | |||||||
|
| |||||||
U.S. TREASURY OBLIGATION — 0.2% |
| |||||||
U.S. Treasury Bills | ||||||||
0.010%, 08/20/2015 (C) (D) | $ | 925 | 925 | |||||
|
| |||||||
Total U.S. Treasury Obligation |
| 925 | ||||||
|
| |||||||
Total Investments — 108.6% |
| $ | 406,024 | |||||
|
| |||||||
A list of the open futures contracts held by the Fund at May 31, 2015, is as follows:
| Type of Contract | Number of Contracts Long | Expiration Date | Unrealized Appreciation ($ Thousands) | |||||||||
Russell 2000 Index E-MINI | 66 | Jun-2015 | $ | 217 | ||||||||
|
| |||||||||||
For the year ended May 31, 2015, the total amount of all open futures contracts, as presented in the table above, are representative of the volume of activity for this derivative type during the year.
Percentages are based on a Net Assets of $373,858 ($ Thousands).
| * | Non-income producing security. |
| ** | The rate reported is the 7-day effective yield as of May 31, 2015. |
| † | Investment in Affiliated Security (see Note 6). |
| ‡ | Real Estate Investment Trust. |
| ‡‡ | Expiration date is unavailable. |
| (A) | This security or a partial position of this security is on loan at May 31, 2015. The total market value of securities on loan at May 31, 2015 was $29,875 ($ Thousands). |
| (B) | This security was purchased with cash collateral held from securities on loan (see Note 12). The total value of such securities as of May 31, 2015 was $29,914 ($ Thousands). |
| (C) | The rate reported is the effective yield at time of purchase. |
| (D) | Security, or portion thereof, has been pledged as collateral on open futures contracts. |
ADR — American Depositary Receipt
Cl — Class
L.P. — Limited Partnership
| 7 | SEI Institutional Investments Trust / Annual Report / May 31, 2015 |
SCHEDULE OF INVESTMENTS
Small Cap II Fund
May 31, 2015
The following is a list of the level of inputs used as of May 31, 2015, in valuing the Fund’s investments and other financial instruments carried at value ($ Thousands):
| Investments in Securities | Level 1 | Level 2 | Level 3 | Total | ||||||||||||
Common Stock | $ | 353,620 | $ | — | $ | — | $ | 353,620 | ||||||||
Exchange Traded Funds | 2,139 | — | — | 2,139 | ||||||||||||
Rights | — | — | — | — | ||||||||||||
Affiliated Partnership | — | 29,914 | — | 29,914 | ||||||||||||
Cash Equivalent | 19,426 | — | — | 19,426 | ||||||||||||
U.S. Treasury Obligation | — | 925 | — | 925 | ||||||||||||
|
|
|
|
|
|
|
| |||||||||
Total Investments in Securities | $ | 375,185 | $ | 30,839 | $ | — | $ | 406,024 | ||||||||
|
|
|
|
|
|
|
| |||||||||
| Other Financial Instruments | Level 1 | Level 2 | Level 3 | Total | ||||||||||||
Futures Contracts* | ||||||||||||||||
Unrealized Appreciation | $ | 217 | $ | — | $ | — | $ | 217 | ||||||||
|
|
|
|
|
|
|
| |||||||||
| * | Futures contracts are valued at the unrealized appreciation on the instrument. |
For the year ended May 31, 2015, there were no transfers between Level 1 and Level 2 assets and liabilities.
For the year ended May 31, 2015, there were no transfers between Level 2 and Level 3 assets and liabilities.
For more information on valuation inputs, see Note 2 — Significant Accounting Policies in Notes to Financial Statements.
Amounts designated as “—” are $0 or have been rounded to $0.
| 8 | SEI Institutional Investments Trust / Annual Report / May 31, 2015 |
SCHEDULE OF INVESTMENTS
Small/Mid Cap Equity Fund
May 31, 2015
| Description | Shares | Market Value ($ Thousands) | ||||||
COMMON STOCK — 95.2% | ||||||||
Consumer Discretionary — 13.8% | ||||||||
American Eagle Outfitters | 264,706 | $ | 4,333 | |||||
Arctic Cat | 25,949 | 858 | ||||||
Ascena Retail Group * | 158,262 | 2,339 | ||||||
Autoliv (A) | 8,600 | 1,085 | ||||||
Big Lots | 37,900 | 1,664 | ||||||
Bloomin’ Brands | 102,290 | 2,297 | ||||||
BorgWarner | 38,750 | 2,331 | ||||||
Bravo Brio Restaurant Group * | 66,100 | 886 | ||||||
Bright Horizons Family Solutions * | 53,276 | 2,966 | ||||||
Brinker International | 15,900 | 877 | ||||||
Brunswick | 71,791 | 3,664 | ||||||
Buffalo Wild Wings * | 10,940 | 1,670 | ||||||
Burlington Stores * | 49,070 | 2,589 | ||||||
Cabela’s *(A) | 48,219 | 2,459 | ||||||
Caleres | 72,628 | 2,246 | ||||||
Callaway Golf (A) | 204,292 | 1,929 | ||||||
Capella Education | 37,397 | 1,992 | ||||||
Carmike Cinemas * | 56,600 | 1,575 | ||||||
Carter’s | 54,939 | 5,671 | ||||||
Children’s Place | 16,850 | 1,102 | ||||||
Chuy’s Holdings *(A) | 133,415 | 3,467 | ||||||
Columbia Sportswear | 24,125 | 1,352 | ||||||
Cooper Tire & Rubber | 34,700 | 1,274 | ||||||
Crocs * | 107,200 | 1,612 | ||||||
Darden Restaurants | 56,115 | 3,678 | ||||||
Destination XL Group * | 76,200 | 370 | ||||||
Diamond Resorts International * | 77,140 | 2,399 | ||||||
Dillard’s, Cl A | 20,600 | 2,390 | ||||||
Dorman Products *(A) | 29,352 | 1,369 | ||||||
DR Horton | 89,543 | 2,339 | ||||||
DSW, Cl A | 64,974 | 2,251 | ||||||
Dunkin’ Brands Group (A) | 67,992 | 3,628 | ||||||
Ethan Allen Interiors | 20,809 | 522 | ||||||
Express * | 55,377 | 977 | ||||||
Fiesta Restaurant Group * | 75,871 | 3,530 | ||||||
Five Below *(A) | 261,691 | 8,701 | ||||||
Francesca’s Holdings * | 52,039 | 815 | ||||||
Fred’s, Cl A | 27,300 | 478 | ||||||
GameStop, Cl A (A) | 37,900 | 1,645 | ||||||
Gannett | 201,785 | 7,222 | ||||||
G-III Apparel Group * | 51,600 | 2,934 | ||||||
Goodyear Tire & Rubber | 84,409 | 2,688 | ||||||
Grand Canyon Education * | 70,962 | 3,031 | ||||||
Group 1 Automotive | 500 | 41 | ||||||
Hanesbrands | 84,900 | 2,705 | ||||||
Harley-Davidson | 29,051 | 1,554 | ||||||
Harman International Industries | 18,275 | 2,203 | ||||||
Hasbro (A) | 44,678 | 3,223 | ||||||
Helen of Troy * | 27,860 | 2,437 | ||||||
Hibbett Sports * | 80,900 | 3,766 | ||||||
Hillenbrand | 46,230 | 1,420 | ||||||
HSN | 33,275 | 2,233 | ||||||
Hyatt Hotels, Cl A * | 2,900 | 167 | ||||||
Imax *(A) | 163,740 | 6,605 | ||||||
Interpublic Group | 127,340 | 2,600 | ||||||
Jack in the Box | 74,223 | 6,443 | ||||||
Jarden * | 31,475 | 1,670 | ||||||
K12 * | 97,000 | 1,328 | ||||||
La Quinta Holdings * | 102,211 | 2,541 | ||||||
La-Z-Boy, Cl Z | 60,608 | 1,608 | ||||||
Lear | 45,500 | 5,279 | ||||||
Libbey | 68,500 | 2,706 | ||||||
Lithia Motors, Cl A | 9,910 | 1,055 | ||||||
| Description | Shares | Market Value ($ Thousands) | ||||||
LKQ * | 216,749 | $ | 6,192 | |||||
MDC Partners, Cl A (A) | 157,000 | 3,329 | ||||||
Men’s Wearhouse | 19,865 | 1,152 | ||||||
Monro Muffler | 35,593 | 2,100 | ||||||
National CineMedia | 468,058 | 7,456 | ||||||
Newell Rubbermaid | 44,200 | 1,747 | ||||||
Noodles, Cl A *(A) | 56,600 | 822 | ||||||
Oxford Industries | 7,983 | 606 | ||||||
Penn National Gaming *(A) | 156,673 | 2,606 | ||||||
Pier 1 Imports (A) | 61,272 | 779 | ||||||
Pool | 54,434 | 3,608 | ||||||
Red Robin Gourmet Burgers * | 25,816 | 2,153 | ||||||
Rent-A-Center, Cl A | 29,900 | 905 | ||||||
Restaurant Brands International (A) | 56,650 | 2,191 | ||||||
Restoration Hardware Holdings * | 31,334 | 2,850 | ||||||
Ryland Group | 57,103 | 2,402 | ||||||
Sally Beauty Holdings * | 193,182 | 6,029 | ||||||
Scientific Games, Cl A *(A) | 50,131 | 763 | ||||||
Select Comfort * | 53,116 | 1,655 | ||||||
ServiceMaster Global Holdings * | 137,531 | 4,620 | ||||||
Shoe Carnival | 17,800 | 492 | ||||||
Shutterfly * | 49,070 | 2,282 | ||||||
Signet Jewelers | 11,775 | 1,523 | ||||||
Skechers U.S.A., Cl A * | 16,751 | 1,773 | ||||||
Sportsman’s Warehouse Holdings *(A) | 183,667 | 1,780 | ||||||
Stage Stores | 43,100 | 698 | ||||||
Standard Pacific * | 254,525 | 2,097 | ||||||
Starwood Hotels & Resorts Worldwide | 3,050 | 252 | ||||||
Starz * | 50,200 | 2,107 | ||||||
Steven Madden * | 98,134 | 3,708 | ||||||
TAL Education Group ADR *(A) | 53,405 | 1,934 | ||||||
Tempur Sealy International * | 35,520 | 2,117 | ||||||
Tile Shop Holdings *(A) | 137,750 | 1,718 | ||||||
TRI Pointe Homes * | 32,900 | 475 | ||||||
Tuesday Morning * | 126,920 | 1,627 | ||||||
Tumi Holdings * | 138,871 | 2,680 | ||||||
Ulta Salon Cosmetics & Fragrance * | 7,200 | 1,099 | ||||||
Urban Outfitters * | 37,719 | 1,297 | ||||||
Vail Resorts | 27,984 | 2,903 | ||||||
Vista Outdoor * | 7,300 | 336 | ||||||
Vitamin Shoppe * | 54,400 | 2,160 | ||||||
Wendy’s | 198,400 | 2,230 | ||||||
Whirlpool | 6,200 | 1,142 | ||||||
Wolverine World Wide | 188,915 | 5,550 | ||||||
Wyndham Worldwide | 30,263 | 2,570 | ||||||
Zoe’s Kitchen *(A) | 67,228 | 2,130 | ||||||
|
| |||||||
| 257,434 | ||||||||
|
| |||||||
Consumer Staples — 2.4% | ||||||||
Cal-Maine Foods (A) | 28,695 | 1,627 | ||||||
Casey’s General Stores | 58,885 | 5,134 | ||||||
Chefs’ Warehouse *(A) | 78,282 | 1,468 | ||||||
Coca-Cola Enterprises | 37,627 | 1,664 | ||||||
Darling Ingredients * | 251,901 | 3,955 | ||||||
Diplomat Pharmacy *(A) | 50,892 | 1,967 | ||||||
Fresh Del Monte Produce | 35,600 | 1,340 | ||||||
Freshpet *(A) | 97,420 | 1,933 | ||||||
Hain Celestial Group * | 33,184 | 2,099 | ||||||
Ingredion | 20,598 | 1,688 | ||||||
JM Smucker | 14,814 | 1,756 | ||||||
Kroger | 14,006 | 1,020 | ||||||
Landec * | 171,200 | 2,446 | ||||||
Molson Coors Brewing, Cl B | 24,074 | 1,767 | ||||||
Omega Protein * | 90,700 | 1,247 | ||||||
| 1 | SEI Institutional Investments Trust / Annual Report / May 31, 2015 |
SCHEDULE OF INVESTMENTS
Small/Mid Cap Equity Fund
May 31, 2015
| Description | Shares | Market Value ($ Thousands) | ||||||
Rite Aid * | 544,543 | $ | 4,748 | |||||
Seaboard * | 97 | 333 | ||||||
Snyder’s-Lance | 21,056 | 629 | ||||||
Sprouts Farmers Market * | 52,098 | 1,563 | ||||||
SUPERVALU * | 116,800 | 1,031 | ||||||
Sysco | 41,319 | 1,535 | ||||||
TreeHouse Foods * | 12,432 | 887 | ||||||
Universal (A) | 22,400 | 1,153 | ||||||
Weis Markets | 17,700 | 764 | ||||||
|
| |||||||
| 43,754 | ||||||||
|
| |||||||
Energy — 3.9% | ||||||||
Alberta Oilsands * | 1,600,500 | 141 | ||||||
Approach Resources *(A) | 388,900 | 2,726 | ||||||
Atwood Oceanics | 15,300 | 471 | ||||||
Bill Barrett *(A) | 351,500 | 3,104 | ||||||
Bristow Group | 34,187 | 1,983 | ||||||
Carrizo Oil & Gas * | 36,093 | 1,810 | ||||||
CHC Group *(A) | 241,204 | 321 | ||||||
Core Laboratories (A) | 20,269 | 2,381 | ||||||
DHT Holdings | 126,000 | 994 | ||||||
Diamondback Energy * | 30,366 | 2,363 | ||||||
Dril-Quip * | 51,166 | 3,867 | ||||||
Energy XXI Bermuda (A) | 11,413 | 40 | ||||||
EQT | 23,336 | 1,985 | ||||||
Green Plains Renewable Energy | 41,200 | 1,354 | ||||||
Gulfport Energy * | 67,550 | 2,915 | ||||||
Helmerich & Payne | 9,300 | 679 | ||||||
Laredo Petroleum *(A) | 86,268 | 1,175 | ||||||
Matador Resources * | 116,437 | 3,207 | ||||||
Matrix Service * | 107,953 | 1,821 | ||||||
McDermott International *(A) | 38,630 | 211 | ||||||
Nabors Industries | 67,900 | 1,002 | ||||||
Navigator Holdings * | 78,100 | 1,457 | ||||||
Newfield Exploration * | 29,220 | 1,105 | ||||||
Newpark Resources * | 85,200 | 722 | ||||||
Noble | 50,500 | 846 | ||||||
Oasis Petroleum *(A) | 90,849 | 1,543 | ||||||
Oil States International * | 22,497 | 920 | ||||||
Pacific Ethanol *(A) | 75,900 | 873 | ||||||
Parker Drilling * | 185,500 | 629 | ||||||
PBF Energy, Cl A | 5,600 | 150 | ||||||
Pioneer Natural Resources | 9,068 | 1,340 | ||||||
Rice Energy * | 90,435 | 1,983 | ||||||
RigNet *(A) | 155,504 | 5,519 | ||||||
Rosetta Resources * | 14,755 | 345 | ||||||
Scorpio Tankers | 420,400 | 3,834 | ||||||
Spectra Energy | 29,959 | 1,054 | ||||||
StealthGas * | 190,400 | 1,302 | ||||||
Superior Energy Services | 72,781 | 1,680 | ||||||
Synergy Resources * | 213,526 | 2,458 | ||||||
Tesoro | 28,900 | 2,558 | ||||||
TETRA Technologies * | 254,500 | 1,601 | ||||||
US Silica Holdings (A) | 84,542 | 2,608 | ||||||
Westmoreland Coal * | 300 | 8 | ||||||
Whiting Petroleum * | 62,690 | 2,068 | ||||||
WPX Energy * | 113,973 | 1,469 | ||||||
|
| |||||||
| 72,622 | ||||||||
|
| |||||||
Financials — 20.7% | ||||||||
1st Source | 800 | 25 | ||||||
Alexandria Real Estate Equities ‡ | 31,363 | 2,908 | ||||||
Allied World Assurance Holdings | 45,000 | 1,912 | ||||||
Allstate | 18,083 | 1,217 | ||||||
American Campus Communities ‡ | 49,887 | 1,946 | ||||||
| Description | Shares | Market Value ($ Thousands) | ||||||
American Financial Group | 104,132 | $ | 6,612 | |||||
Ameriprise Financial | 12,668 | 1,578 | ||||||
AmTrust Financial Services (A) | 49,150 | 2,958 | ||||||
Apartment Investment & Management, Cl A ‡ | 11,740 | 445 | ||||||
Arch Capital Group * | 68,647 | 4,386 | ||||||
Ares Capital | 41,500 | 695 | ||||||
Arthur J Gallagher | 48,825 | 2,366 | ||||||
Ashford * | 1,270 | 123 | ||||||
Ashford Hospitality Trust ‡ | 73,300 | 630 | ||||||
Aspen Insurance Holdings | 34,400 | 1,595 | ||||||
Associated Banc | 73,700 | 1,398 | ||||||
Assured Guaranty | 106,412 | 3,042 | ||||||
AvalonBay Communities ‡ | 4,463 | 743 | ||||||
Banco Latinoamericano de Comercio Exterior, Cl E | 65,100 | 1,974 | ||||||
Bancorpsouth (A) | 106,036 | 2,565 | ||||||
Bank of the Ozarks | 169,378 | 7,448 | ||||||
BankUnited | 19,677 | 661 | ||||||
Banner | 49,267 | 2,218 | ||||||
BioMed Realty Trust ‡ | 26,100 | 532 | ||||||
Blackstone Mortgage Trust, Cl A ‡ | 154,816 | 4,679 | ||||||
Boston Private Financial Holdings | 54,395 | 682 | ||||||
Boston Properties ‡ | 3,600 | 468 | ||||||
Brandywine Realty Trust ‡ | 121,300 | 1,708 | ||||||
Brixmor Property Group ‡ | 96,173 | 2,383 | ||||||
Calamos Asset Management, Cl A | 40,900 | 501 | ||||||
Camden Property Trust ‡ | 2,800 | 210 | ||||||
CareTrust ‡ | 2,418 | 32 | ||||||
CatchMark Timber Trust, Cl A ‡ | 219,000 | 2,606 | ||||||
CBL & Associates Properties ‡ | 70,700 | 1,248 | ||||||
Cedar Realty Trust ‡ | 330,000 | 2,228 | ||||||
Central Pacific Financial | 142,200 | 3,330 | ||||||
Chatham Lodging Trust ‡ | 37,400 | 1,045 | ||||||
Chimera Investment ‡ | 49,040 | 708 | ||||||
City National | 16,120 | 1,486 | ||||||
CNA Financial | 28,100 | 1,086 | ||||||
CNO Financial Group | 395,593 | 7,121 | ||||||
Columbia Property Trust ‡ | 6,450 | 168 | ||||||
Comerica | 73,227 | 3,584 | ||||||
Community Trust Bancorp | 17,255 | 565 | ||||||
Corporate Office Properties Trust ‡ | 57,813 | 1,484 | ||||||
CubeSmart ‡ | 94,178 | 2,240 | ||||||
Customers Bancorp * | 130,000 | 3,263 | ||||||
CYS Investments ‡ | 125,100 | 1,120 | ||||||
DCT Industrial Trust ‡ | 5,050 | 165 | ||||||
DDR ‡ | 110,323 | 1,867 | ||||||
DiamondRock Hospitality ‡ | 123,759 | 1,630 | ||||||
Dime Community Bancshares | 43,800 | 718 | ||||||
Douglas Emmett ‡ | 12,500 | 367 | ||||||
Duke Realty ‡ | 154,949 | 3,031 | ||||||
DuPont Fabros Technology ‡ | 79,500 | 2,563 | ||||||
E*TRADE Financial * | 143,836 | 4,237 | ||||||
Eagle Bancorp * | 55,919 | 2,225 | ||||||
East West Bancorp | 29,221 | 1,254 | ||||||
EastGroup Properties ‡ | 24,831 | 1,381 | ||||||
Education Realty Trust ‡ | 36,738 | 1,210 | ||||||
Employers Holdings | 158,651 | 3,589 | ||||||
Endurance Specialty Holdings | 12,543 | 762 | ||||||
Equity Commonwealth *‡ | 97,000 | 2,498 | ||||||
Equity Lifestyle Properties ‡ | 3,650 | 200 | ||||||
Equity One ‡ | 42,864 | 1,062 | ||||||
Equity Residential ‡ | 10,700 | 795 | ||||||
Essex Property Trust ‡ | 1,321 | 294 | ||||||
| 2 | SEI Institutional Investments Trust / Annual Report / May 31, 2015 |
SCHEDULE OF INVESTMENTS
Small/Mid Cap Equity Fund
May 31, 2015
| Description | Shares | Market Value ($ Thousands) | ||||||
Everest Re Group | 11,600 | $ | 2,106 | |||||
Extra Space Storage ‡ | 3,150 | 221 | ||||||
FBR * | 112,033 | 2,372 | ||||||
Federated Investors, Cl B (A) | 23,051 | 802 | ||||||
FelCor Lodging Trust ‡ | 217,100 | 2,332 | ||||||
Fidelity & Guaranty Life | 124,100 | 2,725 | ||||||
Fifth Third Bancorp | 101,728 | 2,059 | ||||||
Financial Engines (A) | 57,123 | 2,451 | ||||||
First BanCorp * | 451,282 | 2,762 | ||||||
First Horizon National | 114,831 | 1,695 | ||||||
First NBC Bank Holding * | 18,454 | 627 | ||||||
First Niagara Financial Group | 111,800 | 996 | ||||||
Flushing Financial | 66,600 | 1,291 | ||||||
FNF Group | 135,731 | 5,152 | ||||||
FNFV Group * | 111,700 | 1,716 | ||||||
Fulton Financial | 93,546 | 1,184 | ||||||
General Growth Properties ‡ | 15,220 | 431 | ||||||
Geo Group ‡ | 111,200 | 4,218 | ||||||
Gramercy Property Trust ‡ | 90,275 | 2,402 | ||||||
Hancock Holding | 83,866 | 2,443 | ||||||
Hanover Insurance Group | 76,048 | 5,413 | ||||||
Hartford Financial Services Group | 47,226 | 1,942 | ||||||
Hatteras Financial ‡ | 47,200 | 848 | ||||||
HCP ‡ | 12,850 | 498 | ||||||
Health Care ‡ | 10,688 | 751 | ||||||
Highwoods Properties ‡ | 53,300 | 2,236 | ||||||
Home Loan Servicing Solutions | 65,800 | 45 | ||||||
Horace Mann Educators | 86,572 | 2,980 | ||||||
Hospitality Properties Trust ‡ | 90,600 | 2,735 | ||||||
Host Hotels & Resorts ‡ | 129,028 | 2,570 | ||||||
Huntington Bancshares | 589,368 | 6,560 | ||||||
Iberiabank | 53,762 | 3,455 | ||||||
Infinity Property & Casualty | 21,001 | 1,519 | ||||||
International Bancshares | 47,046 | 1,228 | ||||||
Investment Technology Group | 91,438 | 2,456 | ||||||
Investors Bancorp | 502,762 | 6,038 | ||||||
Janus Capital Group | 128,135 | 2,326 | ||||||
Kemper | 75,700 | 2,709 | ||||||
Kennedy-Wilson Holdings | 105,100 | 2,687 | ||||||
KeyCorp | 430,211 | 6,272 | ||||||
Kimco Realty ‡ | 13,100 | 314 | ||||||
Kite Realty Group Trust ‡ | 11,250 | 304 | ||||||
LaSalle Hotel Properties ‡ | 6,700 | 244 | ||||||
Lexington Realty Trust ‡ | 444,006 | 4,076 | ||||||
Liberty Property Trust ‡ | 5,950 | 208 | ||||||
Lincoln National | 24,900 | 1,420 | ||||||
LPL Financial Holdings (A) | 165,528 | 7,058 | ||||||
Macerich ‡ | 5,998 | 493 | ||||||
Mack-Cali Realty ‡ | 97,056 | 1,640 | ||||||
Maiden Holdings | 289,500 | 4,047 | ||||||
MarketAxess Holdings | 22,860 | 2,022 | ||||||
MB Financial | 45,228 | 1,457 | ||||||
Meadowbrook Insurance Group | 18,099 | 154 | ||||||
Medical Properties Trust ‡ | 108,473 | 1,471 | ||||||
Meridian Bancorp * | 161,300 | 2,071 | ||||||
MFA Mortgage Investments ‡ | 296,811 | 2,357 | ||||||
MGIC Investment *(A) | 261,500 | 2,837 | ||||||
Mid-America Apartment Communities ‡ | 2,400 | 183 | ||||||
Montpelier Re Holdings | 75,900 | 2,889 | ||||||
Mortgage Investment Trust ‡ | 82,400 | 1,552 | ||||||
National Penn Bancshares | 122,407 | 1,310 | ||||||
National Storage Affiliates Trust *‡ | 99,630 | 1,344 | ||||||
Navient | 53,300 | 1,027 | ||||||
| Description | Shares | Market Value ($ Thousands) | ||||||
NBT Bancorp | 24,000 | $ | 591 | |||||
Nelnet, Cl A | 64,400 | 2,648 | ||||||
Northfield Bancorp | 151,663 | 2,221 | ||||||
NorthStar Asset Management Group | 72,391 | 1,584 | ||||||
NorthStar Realty Finance ‡ | 200,931 | 3,645 | ||||||
OFG Bancorp (A) | 258,355 | 3,395 | ||||||
Omega Healthcare Investors ‡ | 56,200 | 2,025 | ||||||
Opus Bank | 40,860 | 1,291 | ||||||
PacWest Bancorp | 82,210 | 3,690 | ||||||
Paramount Group ‡ | 9,700 | 178 | ||||||
PartnerRe | 20,800 | 2,734 | ||||||
Pebblebrook Hotel Trust ‡ | 60,894 | 2,611 | ||||||
Pennsylvania Real Estate Investment Trust ‡ | 44,700 | 998 | ||||||
Piedmont Office Realty Trust, Cl A ‡ | 52,900 | 909 | ||||||
Popular * | 207,015 | 6,726 | ||||||
PrivateBancorp, Cl A | 29,910 | 1,140 | ||||||
Prologis ‡ | 22,248 | 881 | ||||||
Prospect Capital (A) | 119,800 | 946 | ||||||
Public Storage ‡ | 4,078 | 789 | ||||||
RAIT Financial Trust ‡ | 221,401 | 1,408 | ||||||
Regency Centers ‡ | 3,700 | 234 | ||||||
Regions Financial | 213,300 | 2,152 | ||||||
Reinsurance Group of America, Cl A | 25,406 | 2,377 | ||||||
Republic Bancorp, Cl A | 34,400 | 845 | ||||||
Retail Opportunity Investments ‡ | 10,200 | 167 | ||||||
RLJ Lodging Trust ‡ | 8,700 | 263 | ||||||
Rouse Properties ‡ | 106,000 | 1,831 | ||||||
Ryman Hospitality Properties ‡ | 48,322 | 2,663 | ||||||
Select Income ‡ | 39,300 | 921 | ||||||
Senior Housing Properties Trust ‡ | 15,500 | 310 | ||||||
Signature Bank NY * | 31,161 | 4,352 | ||||||
Simon Property Group ‡ | 7,929 | 1,438 | ||||||
SL Green Realty ‡ | 2,625 | 311 | ||||||
South State | 43,552 | 3,128 | ||||||
StanCorp Financial Group | 15,500 | 1,150 | ||||||
Starwood Property Trust ‡ | 72,400 | 1,730 | ||||||
State Bank Financial | 151,500 | 3,103 | ||||||
Sterling Bancorp | 149,862 | 2,025 | ||||||
Stifel Financial * | 40,095 | 2,135 | ||||||
Sunstone Hotel Investors ‡ | 163,614 | 2,497 | ||||||
SunTrust Banks | 44,603 | 1,904 | ||||||
SVB Financial Group * | 19,712 | 2,659 | ||||||
Synovus Financial | 122,324 | 3,550 | ||||||
Taubman Centers ‡ | 4,300 | 318 | ||||||
TCF Financial | 200,841 | 3,161 | ||||||
THL Credit | 58,800 | 738 | ||||||
Two Harbors Investment ‡ | 88,000 | 941 | ||||||
UDR ‡ | 12,850 | 418 | ||||||
United Community Banks | 135,300 | 2,591 | ||||||
Unum Group | 113,909 | 3,982 | ||||||
Validus Holdings | 76,198 | 3,270 | ||||||
Ventas ‡ | 7,800 | 519 | ||||||
Vornado Realty Trust ‡ | 4,650 | 464 | ||||||
Waddell & Reed Financial, Cl A | 38,459 | 1,838 | ||||||
Washington Federal | 59,400 | 1,313 | ||||||
WesBanco | 24,300 | 769 | ||||||
Westamerica Bancorporation | 15,865 | 726 | ||||||
Western Alliance Bancorp * | 156,156 | 4,896 | ||||||
Winthrop Realty Trust ‡ | 83,000 | 1,389 | ||||||
WisdomTree Investments | 266,233 | 5,687 | ||||||
World Acceptance *(A) | 13,400 | 1,093 | ||||||
Yadkin Financial * | 65,700 | 1,298 | ||||||
Zions Bancorporation | 268,765 | 7,762 | ||||||
|
| |||||||
| 384,829 | ||||||||
|
| |||||||
| 3 | SEI Institutional Investments Trust / Annual Report / May 31, 2015 |
SCHEDULE OF INVESTMENTS
Small/Mid Cap Equity Fund
May 31, 2015
| Description | Shares | Market Value ($ Thousands) | ||||||
Health Care — 13.4% | ||||||||
ABIOMED * | 38,175 | $ | 2,280 | |||||
Acadia Healthcare *(A) | 145,341 | 10,776 | ||||||
Accuray *(A) | 485,900 | 2,986 | ||||||
Achillion Pharmaceuticals *(A) | 77,010 | 762 | ||||||
Aerie Pharmaceuticals * | 40,202 | 447 | ||||||
Agios Pharmaceuticals *(A) | 7,776 | 949 | ||||||
Akorn * | 124,999 | 5,737 | ||||||
Alder Biopharmaceuticals * | 28,929 | 1,230 | ||||||
Alere * | 109,281 | 5,637 | ||||||
Align Technology * | 78,800 | 4,781 | ||||||
Alkermes * | 22,200 | 1,357 | ||||||
Alnylam Pharmaceuticals * | 18,075 | 2,369 | ||||||
AMAG Pharmaceuticals * | 20,298 | 1,412 | ||||||
AmerisourceBergen | 10,376 | 1,168 | ||||||
Amsurg, Cl A * | 85,139 | 5,733 | ||||||
AngioDynamics * | 116,467 | 1,869 | ||||||
Aratana Therapeutics * | 61,056 | 829 | ||||||
athenahealth *(A) | 10,984 | 1,281 | ||||||
BioDelivery Sciences International * | 77,645 | 662 | ||||||
BioMarin Pharmaceutical * | 17,725 | 2,226 | ||||||
Brookdale Senior Living, Cl A * | 61,950 | 2,335 | ||||||
Bruker * | 101,523 | 2,014 | ||||||
C.R. Bard | 10,725 | 1,827 | ||||||
Cardiovascular Systems * | 51,184 | 1,432 | ||||||
Centene * | 46,977 | 3,539 | ||||||
Charles River Laboratories International * | 66,241 | 4,792 | ||||||
Chimerix * | 33,931 | 1,420 | ||||||
Cooper | 35,783 | 6,504 | ||||||
Dentsply International | 25,805 | 1,343 | ||||||
DexCom * | 102,831 | 7,375 | ||||||
Dyax * | 109,441 | 2,883 | ||||||
Endo International * | 24,600 | 2,060 | ||||||
Endologix * | 295,917 | 4,939 | ||||||
Exact Sciences *(A) | 110,455 | 2,983 | ||||||
ExamWorks Group * | 66,609 | 2,723 | ||||||
GW Pharmaceuticals ADR *(A) | 10,234 | 1,168 | ||||||
Health Net * | 95,176 | 5,924 | ||||||
HealthSouth | 155,752 | 6,722 | ||||||
HeartWare International *(A) | 24,865 | 1,834 | ||||||
Hill-Rom Holdings | 52,981 | 2,732 | ||||||
Hologic * | 57,475 | 2,056 | ||||||
Horizon Pharma *(A) | 99,900 | 3,240 | ||||||
Humana | 5,400 | 1,159 | ||||||
ICON * | 30,288 | 1,965 | ||||||
Incyte * | 26,100 | 2,875 | ||||||
Insmed * | 99,125 | 2,175 | ||||||
Insulet * | 97,429 | 2,754 | ||||||
Isis Pharmaceuticals *(A) | 46,253 | 3,114 | ||||||
Jazz Pharmaceuticals * | 22,390 | 4,016 | ||||||
Juno Therapeutics *(A) | 32,406 | 1,706 | ||||||
K2M Group Holdings * | 72,235 | 1,888 | ||||||
Karyopharm Therapeutics *(A) | 20,154 | 543 | ||||||
Kite Pharma *(A) | 18,919 | 1,043 | ||||||
KYTHERA Biopharmaceuticals *(A) | 16,917 | 852 | ||||||
Laboratory Corp of America Holdings * | 15,750 | 1,858 | ||||||
Landauer | 4,200 | 143 | ||||||
Lannett *(A) | 19,092 | 1,062 | ||||||
LDR Holding * | 176,160 | 7,138 | ||||||
Ligand Pharmaceuticals, Cl B *(A) | 33,950 | 2,991 | ||||||
| Description | Shares | Market Value ($ Thousands) | ||||||
Mallinckrodt * | 15,625 | $ | 2,022 | |||||
Medidata Solutions * | 53,345 | 3,095 | ||||||
Medivation * | 13,500 | 1,783 | ||||||
Neovasc * | 95,852 | 672 | ||||||
Neurocrine Biosciences * | 34,188 | 1,499 | ||||||
Nevro *(A) | 18,777 | 954 | ||||||
NewLink Genetics *(A) | 21,480 | 927 | ||||||
Novadaq Technologies * | 121,109 | 1,212 | ||||||
Ophthotech * | 41,581 | 2,080 | ||||||
Orexigen Therapeutics *(A) | 168,690 | 827 | ||||||
Otonomy * | 27,628 | 677 | ||||||
Owens & Minor | 2,400 | 80 | ||||||
PAREXEL International * | 2,160 | 144 | ||||||
Patterson | 31,981 | 1,530 | ||||||
PDL BioPharma (A) | 117,800 | 787 | ||||||
PerkinElmer | 31,229 | 1,647 | ||||||
PharMerica * | 24,700 | 822 | ||||||
Premier, Cl A * | 103,623 | 3,971 | ||||||
Prestige Brands Holdings * | 70,747 | 3,107 | ||||||
PTC Therapeutics * | 16,820 | 977 | ||||||
Puma Biotechnology *(A) | 10,314 | 2,016 | ||||||
Quest Diagnostics | 21,459 | 1,614 | ||||||
Quidel *(A) | 59,054 | 1,280 | ||||||
Receptos * | 9,428 | 1,555 | ||||||
Relypsa * | 92,031 | 3,386 | ||||||
Revance Therapeutics *(A) | 60,515 | 1,549 | ||||||
Sage Therapeutics *(A) | 39,724 | 2,974 | ||||||
Sangamo BioSciences *(A) | 74,492 | 912 | ||||||
SciClone Pharmaceuticals * | 118,100 | 1,094 | ||||||
Select Medical Holdings | 110,400 | 1,805 | ||||||
Sirona Dental Systems * | 23,410 | 2,311 | ||||||
Spectranetics *(A) | 132,991 | 3,302 | ||||||
STERIS (A) | 28,181 | 1,883 | ||||||
Surgical Care Affiliates * | 32,122 | 1,220 | ||||||
Symmetry Surgical * | 18,650 | 165 | ||||||
Synageva BioPharma * | 12,198 | 2,603 | ||||||
Team Health Holdings * | 56,942 | 3,330 | ||||||
Teleflex (A) | 9,029 | 1,162 | ||||||
TESARO * | 22,159 | 1,302 | ||||||
Tetraphase Pharmaceuticals * | 23,710 | 1,017 | ||||||
Trinity Biotech ADR | 163,000 | 2,820 | ||||||
Ultragenyx Pharmaceutical * | 26,568 | 2,311 | ||||||
United Therapeutics * | 17,500 | 3,215 | ||||||
Universal Health Services, Cl B | 33,306 | 4,316 | ||||||
VCA Antech * | 74,059 | 3,885 | ||||||
WellCare Health Plans * | 31,343 | 2,685 | ||||||
Xencor * | 49,635 | 900 | ||||||
|
| |||||||
| 249,043 | ||||||||
|
| |||||||
Industrials — 16.1% | ||||||||
AAR | 37,200 | 1,099 | ||||||
Actuant, Cl A | 107,758 | 2,532 | ||||||
Acuity Brands | 15,550 | 2,744 | ||||||
Advisory Board * | 71,565 | 3,633 | ||||||
Aegion, Cl A * | 65,000 | 1,158 | ||||||
AerCap Holdings * | 44,034 | 2,124 | ||||||
Aerojet Rocketdyne Holdings * | 110,587 | 2,295 | ||||||
AGCO (A) | 49,300 | 2,504 | ||||||
Air Transport Services Group * | 124,500 | 1,310 | ||||||
Aircastle | 67,002 | 1,625 | ||||||
Allegion | 27,000 | 1,686 | ||||||
Altra Industrial Motion | 28,163 | 775 | ||||||
AMERCO | 1,600 | 526 | ||||||
AO Smith | 25,925 | 1,851 | ||||||
Beacon Roofing Supply * | 39,808 | 1,248 | ||||||
Brink’s | 34,900 | 1,115 | ||||||
Carlisle | 52,845 | 5,240 | ||||||
CEB | 98,074 | 8,296 | ||||||
| 4 | SEI Institutional Investments Trust / Annual Report / May 31, 2015 |
SCHEDULE OF INVESTMENTS
Small/Mid Cap Equity Fund
May 31, 2015
| Description | Shares | Market Value ($ Thousands) | ||||||
Celadon Group | 57,700 | $ | 1,346 | |||||
Clean Harbors * | 178,332 | 10,047 | ||||||
Crane | 20,400 | 1,235 | ||||||
Curtiss-Wright | 13,380 | 965 | ||||||
Deluxe | 111,070 | 7,089 | ||||||
Dover | 22,305 | 1,682 | ||||||
Dycom Industries * | 58,577 | 3,373 | ||||||
EMCOR Group | 136,268 | 6,182 | ||||||
EnPro Industries | 26,373 | 1,595 | ||||||
Equifax | 26,200 | 2,629 | ||||||
Esterline Technologies * | 19,802 | 2,142 | ||||||
Expeditors International of Washington | 23,938 | 1,097 | ||||||
Fluor | 24,759 | 1,392 | ||||||
Forward Air | 75,630 | 3,923 | ||||||
FreightCar America | 130,700 | 2,930 | ||||||
FTI Consulting * | 44,700 | 1,757 | ||||||
G&K Services, Cl A | 14,331 | 998 | ||||||
Generac Holdings *(A) | 83,620 | 3,494 | ||||||
Genesee & Wyoming, Cl A * | 49,939 | 4,112 | ||||||
Global Power Equipment Group | 134,500 | 1,006 | ||||||
GrafTech International * | 315,400 | 1,599 | ||||||
Great Lakes Dredge & Dock * | 668,800 | 3,719 | ||||||
H&E Equipment Services | 143,053 | 3,123 | ||||||
Harsco | 81,765 | 1,317 | ||||||
Heartland Express | 212,348 | 4,512 | ||||||
HEICO, Cl A | 93,557 | 4,678 | ||||||
Hexcel | 92,496 | 4,554 | ||||||
Hub Group, Cl A * | 28,378 | 1,204 | ||||||
Huntington Ingalls Industries | 43,367 | 5,377 | ||||||
Huron Consulting Group * | 27,291 | 1,755 | ||||||
ICF International * | 26,600 | 952 | ||||||
IDEX | 33,341 | 2,576 | ||||||
ITT | 40,416 | 1,725 | ||||||
JetBlue Airways *(A) | 336,407 | 6,782 | ||||||
Joy Global | 48,970 | 1,907 | ||||||
Kadant | 39,393 | 1,855 | ||||||
KAR Auction Services | 89,618 | 3,339 | ||||||
KBR | 83,500 | 1,599 | ||||||
Kennametal | 88,665 | 3,197 | ||||||
Kirby * | 64,256 | 4,929 | ||||||
Korn/Ferry International | 37,548 | 1,205 | ||||||
Lincoln Electric Holdings | 39,403 | 2,648 | ||||||
Lindsay Manufacturing (A) | 22,860 | 1,841 | ||||||
Lydall * | 14,600 | 400 | ||||||
Manitowoc | 140,443 | 2,649 | ||||||
Masonite International * | 33,925 | 2,314 | ||||||
Matthews International, Cl A | 73,699 | 3,659 | ||||||
Meritor * | 97,200 | 1,391 | ||||||
Middleby * | 49,570 | 5,388 | ||||||
Mobile Mini | 48,873 | 1,939 | ||||||
MSC Industrial Direct, Cl A | 70,441 | 4,887 | ||||||
MYR Group * | 21,100 | 625 | ||||||
Navistar International *(A) | 61,232 | 1,622 | ||||||
Old Dominion Freight Line * | 40,204 | 2,734 | ||||||
Orbital ATK | 44,360 | 3,393 | ||||||
Orion Marine Group * | 186,430 | 1,400 | ||||||
Oshkosh Truck | 124,368 | 6,238 | ||||||
Owens Corning | 110,181 | 4,667 | ||||||
Parker Hannifin | 11,622 | 1,400 | ||||||
Pentair | 9,430 | 604 | ||||||
Pitney Bowes | 185,200 | 4,047 | ||||||
Primoris Services | 256,584 | 4,816 | ||||||
Proto Labs *(A) | 45,289 | 3,133 | ||||||
Rand Logistics * | 104,800 | 356 | ||||||
RBC Bearings * | 23,950 | 1,679 | ||||||
Regal-Beloit | 50,067 | 3,915 | ||||||
Ritchie Bros Auctioneers (A) | 98,266 | 2,777 | ||||||
| Description | Shares | Market Value ($ Thousands) | ||||||
Roadrunner Transportation Systems * | 97,347 | $ | 2,421 | |||||
RR Donnelley & Sons | 43,256 | 830 | ||||||
Rush Enterprises, Cl A * | 66,806 | 1,775 | ||||||
Ryder System | 17,600 | 1,613 | ||||||
Saia * | 42,025 | 1,721 | ||||||
Scorpio Bulkers *(A) | 120,500 | 286 | ||||||
Sensata Technologies Holding * | 59,468 | 3,276 | ||||||
Steelcase, Cl A | 153,713 | 2,644 | ||||||
Swift Transporation, Cl A * | 106,023 | 2,467 | ||||||
TAL International Group (A) | 24,400 | 885 | ||||||
Team * | 25,727 | 1,024 | ||||||
Teledyne Technologies * | 9,067 | 919 | ||||||
Tennant | 53,697 | 3,424 | ||||||
Terex | 20,935 | 518 | ||||||
Tetra Tech | 51,459 | 1,346 | ||||||
Textainer Group Holdings | 19,900 | 562 | ||||||
Timken | 13,800 | 540 | ||||||
Titan Machinery *(A) | 72,500 | 1,152 | ||||||
TriMas * | 73,887 | 2,135 | ||||||
TriNet Group * | 93,354 | 2,794 | ||||||
Trinity Industries | 72,400 | 2,171 | ||||||
Triumph Group | 51,538 | 3,437 | ||||||
TrueBlue * | 61,682 | 1,757 | ||||||
Tutor Perini * | 200,200 | 4,196 | ||||||
United Rentals * | 19,265 | 1,713 | ||||||
US Ecology | 35,472 | 1,636 | ||||||
USG *(A) | 97,746 | 2,819 | ||||||
Valmont Industries (A) | 17,688 | 2,201 | ||||||
Wabash National * | 42,200 | 571 | ||||||
Watts Water Technologies, Cl A | 21,704 | 1,153 | ||||||
Werner Enterprises | 42,100 | 1,159 | ||||||
WESCO International * | 46,971 | 3,375 | ||||||
Woodward Governor | 77,267 | 3,936 | ||||||
XPO Logistics *(A) | 57,460 | 2,825 | ||||||
Xylem | 32,589 | 1,192 | ||||||
|
| |||||||
| 299,654 | ||||||||
|
| |||||||
Information Technology — 17.8% | ||||||||
Amdocs | 34,300 | 1,881 | ||||||
Applied Micro Circuits * | 180,000 | 1,150 | ||||||
Arrow Electronics * | 50,849 | 3,091 | ||||||
Aspen Technology * | 121,466 | 5,199 | ||||||
Atmel | 253,904 | 2,252 | ||||||
Avnet | 26,800 | 1,179 | ||||||
Belden | 27,787 | 2,346 | ||||||
Benchmark Electronics * | 68,300 | 1,587 | ||||||
Black Box | 36,400 | 730 | ||||||
Blackbaud | 53,310 | 2,733 | ||||||
BroadSoft * | 49,381 | 1,803 | ||||||
Brocade Communications Systems | 198,700 | 2,457 | ||||||
Cadence Design Systems * | 562,814 | 11,138 | ||||||
Callidus Software * | 189,776 | 2,718 | ||||||
Cavium * | 93,789 | 6,600 | ||||||
CDW | 46,755 | 1,735 | ||||||
ChannelAdvisor *(A) | 196,860 | 2,207 | ||||||
Check Point Software Technologies * | 10,600 | 898 | ||||||
Ciber * | 444,500 | 1,494 | ||||||
Ciena *(A) | 96,879 | 2,337 | ||||||
Cimpress * | 44,445 | 3,659 | ||||||
Citrix Systems * | 32,312 | 2,101 | ||||||
Coherent * | 14,344 | 893 | ||||||
Computer Sciences | 30,100 | 2,065 | ||||||
Computer Task Group | 61,900 | 460 | ||||||
comScore * | 44,350 | 2,509 | ||||||
Convergys | 136,302 | 3,384 | ||||||
| 5 | SEI Institutional Investments Trust / Annual Report / May 31, 2015 |
SCHEDULE OF INVESTMENTS
Small/Mid Cap Equity Fund
May 31, 2015
| Description | Shares | Market Value ($ Thousands) | ||||||
CoreLogic * | 50,600 | $ | 1,972 | |||||
Cornerstone OnDemand * | 52,026 | 1,620 | ||||||
CoStar Group * | 19,842 | 4,145 | ||||||
Cypress Semiconductor | 95,450 | 1,310 | ||||||
Dealertrack Technologies * | 158,313 | 6,602 | ||||||
Demandware * | 78,658 | 4,899 | ||||||
Diebold | 76,136 | 2,602 | ||||||
Digi International * | 158,400 | 1,578 | ||||||
Diodes * | 31,300 | 829 | ||||||
Dot Hill Systems * | 199,400 | 1,404 | ||||||
Envestnet * | 91,058 | 3,989 | ||||||
Equinix ‡ | 7,484 | 2,006 | ||||||
Euronet Worldwide * | 107,626 | 6,436 | ||||||
Exar * | 326,400 | 3,545 | ||||||
ExlService Holdings * | 40,991 | 1,472 | ||||||
Extreme Networks * | 269,600 | 731 | ||||||
Fair Isaac | 14,194 | 1,245 | ||||||
Fairchild Semiconductor International, Cl A * | 141,976 | 2,828 | ||||||
Fidelity National Information Services | 31,143 | 1,953 | ||||||
Finisar * | 38,200 | 837 | ||||||
FleetMatics Group * | 30,400 | 1,271 | ||||||
Fortinet * | 111,894 | 4,482 | ||||||
Freescale Semiconductor * | 44,009 | 1,986 | ||||||
Gartner * | 49,147 | 4,299 | ||||||
Global Payments | 15,250 | 1,592 | ||||||
GrubHub * | 38,500 | 1,552 | ||||||
Guidewire Software *(A) | 91,253 | 4,421 | ||||||
Harris | 27,800 | 2,202 | ||||||
Heartland Payment Systems | 22,318 | 1,193 | ||||||
HomeAway * | 51,108 | 1,434 | ||||||
IAC | 47,627 | 3,575 | ||||||
Infinera * | 58,775 | 1,213 | ||||||
Infoblox * | 349,588 | 9,086 | ||||||
Insight Enterprises * | 51,600 | 1,513 | ||||||
Interactive Intelligence Group *(A) | 28,772 | 1,244 | ||||||
Intersil, Cl A | 228,038 | 3,078 | ||||||
Ixia * | 85,560 | 1,076 | ||||||
j2 Global | 36,850 | 2,447 | ||||||
Juniper Networks | 48,580 | 1,350 | ||||||
Lam Research | 25,558 | 2,102 | ||||||
Lexmark International, Cl A | 49,300 | 2,267 | ||||||
Littelfuse | 24,078 | 2,328 | ||||||
LogMeIn * | 23,625 | 1,500 | ||||||
Marketo * | 84,542 | 2,522 | ||||||
Marvell Technology Group | 94,600 | 1,323 | ||||||
MAXIMUS | 57,938 | 3,787 | ||||||
Mellanox Technologies * | 34,150 | 1,718 | ||||||
Microchip Technology (A) | 42,811 | 2,103 | ||||||
MKS Instruments | 36,459 | 1,375 | ||||||
Monolithic Power Systems | 42,429 | 2,317 | ||||||
NETGEAR * | 60,500 | 1,875 | ||||||
NICE Systems ADR | 31,225 | 1,958 | ||||||
Nimble Storage *(A) | 62,865 | 1,627 | ||||||
Nuance Communications * | 88,300 | 1,490 | ||||||
ON Semiconductor * | 200,303 | 2,656 | ||||||
Pandora Media * | 56,718 | 1,059 | ||||||
Plantronics | 33,000 | 1,821 | ||||||
Plexus * | 55,581 | 2,528 | ||||||
Polycom * | 73,500 | 990 | ||||||
PRGX Global * | 6,400 | 27 | ||||||
Proofpoint * | 59,935 | 3,544 | ||||||
PTC * | 109,390 | 4,514 | ||||||
QAD, Cl A | 9,400 | 225 | ||||||
Qlik Technologies * | 139,909 | 5,060 | ||||||
Qorvo * | 67,066 | 5,509 | ||||||
| Description | Shares | Market Value ($ Thousands) | ||||||
RealPage * | 79,676 | $ | 1,455 | |||||
Ruckus Wireless * | 177,361 | 1,864 | ||||||
Seagate Technology | 23,300 | 1,296 | ||||||
Semtech * | 66,227 | 1,415 | ||||||
ServiceNow * | 20,310 | 1,556 | ||||||
Shutterstock *(A) | 49,647 | 3,177 | ||||||
Silicon Laboratories * | 110,351 | 6,118 | ||||||
SolarWinds * | 170,036 | 8,068 | ||||||
Solera Holdings | 212,502 | 10,483 | ||||||
SPS Commerce * | 86,912 | 5,651 | ||||||
SS&C Technologies Holdings | 158,176 | 9,321 | ||||||
Stratasys * | 90,191 | 3,207 | ||||||
SunEdison *(A) | 74,500 | 2,233 | ||||||
Synaptics * | 33,700 | 3,358 | ||||||
SYNNEX | 24,462 | 2,022 | ||||||
Synopsys * | 46,026 | 2,296 | ||||||
Tableau Software, Cl A * | 20,449 | 2,315 | ||||||
Take-Two Interactive Software * | 57,300 | 1,568 | ||||||
Tech Data * | 65,774 | 4,152 | ||||||
Trimble Navigation * | 185,736 | 4,354 | ||||||
Tyler Technologies * | 17,300 | 2,102 | ||||||
Ultimate Software Group * | 19,518 | 3,158 | ||||||
Ultratech * | 55,000 | 1,097 | ||||||
Unisys * | 93,047 | 1,911 | ||||||
VeriFone Holdings * | 40,070 | 1,530 | ||||||
Verint Systems * | 48,700 | 3,149 | ||||||
Western Digital | 20,300 | 1,976 | ||||||
WEX * | 29,166 | 3,307 | ||||||
Xcerra * | 199,200 | 1,538 | ||||||
Zebra Technologies, Cl A * | 53,228 | 5,836 | ||||||
|
| |||||||
| 331,361 | ||||||||
|
| |||||||
Materials — 3.8% | ||||||||
Albemarle | 55,305 | 3,327 | ||||||
Allegheny Technologies | 128,681 | 4,182 | ||||||
Ashland | 16,291 | 2,075 | ||||||
Avery Dennison | 36,474 | 2,258 | ||||||
Bemis | 28,166 | 1,294 | ||||||
Berry Plastics Group * | 133,000 | 4,452 | ||||||
Cabot | 115,570 | 4,793 | ||||||
Carpenter Technology | 31,100 | 1,270 | ||||||
Crown Holdings * | 33,125 | 1,831 | ||||||
Cytec Industries | 15,467 | 936 | ||||||
Domtar | 36,200 | 1,565 | ||||||
Eastman Chemical | 9,900 | 760 | ||||||
FMC | 29,743 | 1,700 | ||||||
Glatfelter | 29,600 | 695 | ||||||
Graphic Packaging Holding | 182,257 | 2,595 | ||||||
H.B. Fuller | 57,544 | 2,423 | ||||||
Huntsman | 89,400 | 2,006 | ||||||
Innophos Holdings | 21,810 | 1,137 | ||||||
Kaiser Aluminum | 18,862 | 1,531 | ||||||
Louisiana-Pacific *(A) | 81,783 | 1,480 | ||||||
LSB Industries * | 21,300 | 906 | ||||||
Martin Marietta Materials | 16,000 | 2,384 | ||||||
Neenah Paper | 14,700 | 886 | ||||||
NovaGold Resources *(A) | 221,600 | 906 | ||||||
Packaging Corp of America | 12,450 | 861 | ||||||
PolyOne | 174,481 | 6,786 | ||||||
Rock-Tenn, Cl A | 20,800 | 1,355 | ||||||
Schweitzer-Mauduit International | 9,300 | 375 | ||||||
Scotts Miracle-Gro, Cl A | 19,578 | 1,199 | ||||||
Sealed Air | 31,700 | 1,544 | ||||||
Sensient Technologies | 19,157 | 1,297 | ||||||
Silgan Holdings | 17,789 | 967 | ||||||
Steel Dynamics | 44,300 | 966 | ||||||
Stillwater Mining * | 154,863 | 2,244 | ||||||
| 6 | SEI Institutional Investments Trust / Annual Report / May 31, 2015 |
SCHEDULE OF INVESTMENTS
Small/Mid Cap Equity Fund
May 31, 2015
| Description | Shares | Market Value ($ Thousands) | ||||||
Summit Materials, Cl A * | 61,802 | $ | 1,700 | |||||
UFP Technologies * | 47,600 | 944 | ||||||
Valspar | 29,403 | 2,454 | ||||||
|
| |||||||
| 70,084 | ||||||||
|
| |||||||
Telecommunication Services — 0.5% | ||||||||
Cogent Communications Holdings | 25,849 | 812 | ||||||
Inteliquent | 55,100 | 971 | ||||||
Iridium Communications *(A) | 204,300 | 2,115 | ||||||
Level 3 Communications * | 19,650 | 1,090 | ||||||
RingCentral, Cl A * | 138,511 | 2,367 | ||||||
SBA Communications, Cl A * | 10,700 | 1,197 | ||||||
Spok Holdings | 72,120 | 1,251 | ||||||
|
| |||||||
| 9,803 | ||||||||
|
| |||||||
Utilities — 2.8% | ||||||||
AGL Resources | 34,858 | 1,756 | ||||||
ALLETE | 64,302 | 3,238 | ||||||
Ameren | 66,300 | 2,667 | ||||||
Atmos Energy | 36,946 | 1,996 | ||||||
Avista | 65,600 | 2,099 | ||||||
Cadiz *(A) | 155,900 | 1,342 | ||||||
Chesapeake Utilities | 30,600 | 1,610 | ||||||
Edison International | 25,505 | 1,551 | ||||||
Empire District Electric | 38,400 | 896 | ||||||
Great Plains Energy | 159,964 | 4,170 | ||||||
IDACORP | 16,455 | 979 | ||||||
NorthWestern | 13,214 | 687 | ||||||
NRG Energy | 98,320 | 2,478 | ||||||
Piedmont Natural Gas (A) | 38,800 | 1,447 | ||||||
Pinnacle West Capital | 91,658 | 5,584 | ||||||
PNM Resources | 51,100 | 1,359 | ||||||
Portland General Electric (A) | 235,176 | 8,222 | ||||||
SCANA | 70,536 | 3,750 | ||||||
UGI | 72,778 | 2,722 | ||||||
UIL Holdings | 32,000 | 1,622 | ||||||
Xcel Energy | 59,517 | 2,026 | ||||||
|
| |||||||
| 52,201 | ||||||||
|
| |||||||
Total Common Stock |
| 1,770,785 | ||||||
|
| |||||||
EXCHANGE TRADED FUNDS — 0.3% |
| |||||||
iShares Russell 2000 Fund(A) | 19,422 | 2,407 | ||||||
iShares Russell 2000 Growth Fund(A) | 25,045 | 3,817 | ||||||
|
| |||||||
Total Exchange Traded Funds | 6,224 | |||||||
|
| |||||||
| Number Of Rights | ||||||||
RIGHT ‡‡ — 0.0% | ||||||||
United States — 0.0% | ||||||||
CHC Group * | 258,244 | — | ||||||
|
| |||||||
Total Right | — | |||||||
|
| |||||||
AFFILIATED PARTNERSHIP — 10.3% |
| |||||||
SEI Liquidity Fund, L.P. | ||||||||
0.060% ** †(B) | 191,808,785 | 191,809 | ||||||
|
| |||||||
Total Affiliated Partnership | 191,809 | |||||||
|
| |||||||
CASH EQUIVALENT — 5.3% |
| |||||||
SEI Daily Income Trust, Prime Obligation Fund, Cl A | ||||||||
0.010% ** † | 98,885,069 | 98,885 | ||||||
|
| |||||||
| Description | Face Amount ($ Thousands) | Market Value ($ Thousands) | ||||||
Total Cash Equivalent | $ | 98,885 | ||||||
|
| |||||||
U.S. TREASURY OBLIGATION — 0.2% |
| |||||||
U.S. Treasury Bills | ||||||||
0.109%, 02/04/2016 (C) | $ | 4,393 | 4,389 | |||||
|
| |||||||
Total U.S. Treasury Obligation | 4,389 | |||||||
|
| |||||||
Total Investments — 111.4% | $ | 2,072,092 | ||||||
|
| |||||||
A list of the open futures contracts held by the Fund at May 31, 2015, is as follows:
| Type of Contract | Number of Contracts Long | Expiration Date | Unrealized ($ Thousands) | |||||||||
S&P 500 Index E-M INI | 222 | Jun-2015 | $ | 629 | ||||||||
|
| |||||||||||
For the year ended May 31, 2015, the total amount of all open futures contracts, as presented in the table above, are representative of the volume of activity for this derivative type during the period.
Percentages are based on a Net Assets of $1,859,609 ($ Thousands).
| * | Non-income producing security. |
| ** | The rate reported is the 7-day effective yield as of May 31, 2015. |
| ‡ | Real Estate Investment Trust. |
| ‡‡ | Expiration date unavailable |
| † | Investment in Affiliated Security (see Note 6). |
| (A) | This security or a partial position of this security is on loan at May 31, 2015 (see Note 12). The total market value of securities on loan at May 31, 2015 was $186,581 ($ Thousands). |
| (B) | This security was purchased with cash collateral held from securities on loan (See Note 12). The total value of such securities as of May 31, 2015 was $191,809 ($ Thousands). |
| (C) | The rate reported is the effective yield at time of purchase. |
ADR — American Depositary Receipt
Cl — Class
L.P. — Limited Partnership
The following is a list of the level of inputs used as of May 31, 2015, in valuing the Fund’s investments and other financial instruments carried at value ($ Thousands):
| Investments in Securities | Level 1 | Level 2 | Level 3 | Total | ||||||||||||
Common Stock | $ | 1,770,785 | $ | — | $ | — | $ | 1,770,785 | ||||||||
Exchange Traded Funds | 6,224 | — | — | 6,224 | ||||||||||||
Right | — | — | — | — | ||||||||||||
Affiliated Partnership | — | 191,809 | — | 191,809 | ||||||||||||
Cash Equivalent | 98,885 | — | — | 98,885 | ||||||||||||
U.S. Treasury Obligation | — | 4,389 | — | 4,389 | ||||||||||||
|
|
|
|
|
|
|
| |||||||||
Total Investments in Securities | $ | 1,875,894 | $ | 196,198 | $ | — | $ | 2,072,092 | ||||||||
|
|
|
|
|
|
|
| |||||||||
| Other Financial Instruments | Level 1 | Level 2 | Level 3 | Total | ||||||||||||
Futures Contracts * | ||||||||||||||||
Unrealized Appreciation | $ | 629 | $ | — | $ | — | $ | 629 | ||||||||
|
|
|
|
|
|
|
| |||||||||
| * | Futures contracts are valued at the unrealized appreciation on the instrument. |
For the year ended May 31, 2015, there were no transfers between Level 1 and Level 2 assets and liabilities.
For the year ended May 31, 2015, there were no transfers between Level 2 and Level 3 assets and liabilities.
For the year ended May 31, 2015, there were no Level 3 securities.
Amounts designated as “—” are either $0 or have been rounded to $0.
The accompanying notes are an integral part of the financial statements.
| 7 | SEI Institutional Investments Trust / Annual Report / May 31, 2015 |
SCHEDULE OF INVESTMENTS
U.S. Managed Volatility Fund
May 31, 2015
| Description | Shares | Market Value ($ Thousands) | ||||||
COMMON STOCK — 96.4% |
| |||||||
Consumer Discretionary — 12.4% |
| |||||||
Aaron’s | 34,052 | $ | 1,193 | |||||
American Eagle Outfitters | 309,900 | 5,073 | ||||||
Aramark | 263,647 | 8,265 | ||||||
AutoZone * | 4,200 | 2,829 | ||||||
Bed Bath & Beyond * | 117,300 | 8,366 | ||||||
Big Lots | 20,000 | 878 | ||||||
BJ’s Restaurants * | 7,943 | 364 | ||||||
Bloomin’ Brands | 4,570 | 103 | ||||||
Brinker International | 38,300 | 2,113 | ||||||
Buckle | 4,614 | 197 | ||||||
Burlington Stores * | 79,730 | 4,207 | ||||||
Canadian Tire, Cl A | 48,700 | 5,031 | ||||||
Carriage Services, Cl A | 18,684 | 465 | ||||||
Carter’s | 37,900 | 3,912 | ||||||
Cheesecake Factory | 102,139 | 5,267 | ||||||
Chico’s FAS | 240,400 | 3,993 | ||||||
Coach | 79,700 | 2,819 | ||||||
Cogeco Cable | 13,400 | 707 | ||||||
Cooper Tire & Rubber | 14,600 | 536 | ||||||
Cooper-Standard Holding * | 12,128 | 759 | ||||||
Core-Mark Holdings | 9,831 | 528 | ||||||
Cracker Barrel Old Country Store | 30,422 | 4,292 | ||||||
Deckers Outdoor * | 26,400 | 1,799 | ||||||
DIRECTV * | 98,000 | 8,922 | ||||||
Dollar General | 105,569 | 7,663 | ||||||
Dollar Tree * | 56,489 | 4,236 | ||||||
Domino’s Pizza | 41,800 | 4,542 | ||||||
DSW, Cl A | 55,900 | 1,937 | ||||||
El Pollo Loco Holdings * | 7,155 | 149 | ||||||
Escalade | 6,097 | 112 | ||||||
Flexsteel Industries | 9,977 | 377 | ||||||
Foot Locker | 64,400 | 4,070 | ||||||
Gap | 40,000 | 1,533 | ||||||
GoPro, Cl A * | 21,672 | 1,202 | ||||||
Graham Holdings, Cl B | 4,000 | 4,284 | ||||||
HSN | 50,800 | 3,409 | ||||||
Jack in the Box | 36,100 | 3,134 | ||||||
Kohl’s | 201,549 | 13,200 | ||||||
Liberty Tripadvisor Holdings, Cl A * | 34,684 | 970 | ||||||
Lions Gate Entertainment | 14,047 | 465 | ||||||
Lululemon Athletica * | 83,130 | 4,970 | ||||||
Michael Kors Holdings * | 20,400 | 949 | ||||||
Morningstar | 3,108 | 240 | ||||||
Nathan’s Famous * | 8,145 | 318 | ||||||
Nutrisystem | 7,799 | 178 | ||||||
NVR * | 1,976 | 2,688 | ||||||
Outerwall | 1,443 | 111 | ||||||
Panera Bread, Cl A * | 43,823 | 7,976 | ||||||
Papa John’s International | 2,756 | 189 | ||||||
Reading International, Cl A * | 12,185 | 163 | ||||||
Regal Entertainment Group, Cl A | 19,324 | 405 | ||||||
Shaw Communications, Cl B | 148,700 | 3,270 | ||||||
Staples | 317,000 | 5,219 | ||||||
Steven Madden * | 82,000 | 3,098 | ||||||
Target | 133,887 | 10,620 | ||||||
Thomson Reuters | 82,963 | 3,315 | ||||||
Vail Resorts | 24,900 | 2,583 | ||||||
Viacom, Cl B | 36,800 | 2,461 | ||||||
Vista Outdoor * | 64,600 | 2,977 | ||||||
Wayfair, Cl A * | 2,875 | 86 | ||||||
|
| |||||||
| 175,717 | ||||||||
|
| |||||||
| Description | Shares | Market Value ($ Thousands) | ||||||
Consumer Staples — 18.0% |
| |||||||
Altria Group | 367,612 | $ | 18,821 | |||||
Archer-Daniels-Midland | 47,000 | 2,484 | ||||||
Bunge | 209,509 | 19,392 | ||||||
Cal-Maine Foods | 132,006 | 7,483 | ||||||
Campbell Soup | 17,591 | 850 | ||||||
Casey’s General Stores | 52,000 | 4,534 | ||||||
Church & Dwight | 46,702 | 3,922 | ||||||
Clorox | 135,737 | 14,613 | ||||||
Coca-Cola Bottling | 8,512 | 967 | ||||||
Colgate-Palmolive | 51,800 | 3,460 | ||||||
ConAgra Foods | 174,500 | 6,738 | ||||||
Costco Wholesale | 100,048 | 14,266 | ||||||
Coty, Cl A | 64,869 | 1,617 | ||||||
CVS Health | 87,904 | 9,000 | ||||||
Dean Foods | 8,368 | 154 | ||||||
Dr. Pepper Snapple Group | 167,972 | 12,873 | ||||||
Fresh Del Monte Produce | 7,785 | 293 | ||||||
Fresh Market * | 16,456 | 522 | ||||||
General Mills | 137,000 | 7,693 | ||||||
Hershey | 73,817 | 6,855 | ||||||
Hormel Foods | 75,866 | 4,341 | ||||||
Ingredion | 51,480 | 4,220 | ||||||
J&J Snack Foods | 2,317 | 250 | ||||||
John B Sanfilippo & Son | 11,072 | 560 | ||||||
Kellogg | 41,300 | 2,592 | ||||||
Kimberly-Clark | 71,194 | 7,750 | ||||||
Kroger | 293,850 | 21,392 | ||||||
Lancaster Colony | 4,568 | 408 | ||||||
Mead Johnson Nutrition, Cl A | 38,100 | 3,707 | ||||||
Metro, Cl A | 88,500 | 2,437 | ||||||
Orchids Paper Products | 12,828 | 289 | ||||||
PepsiCo | 138,543 | 13,360 | ||||||
Philip Morris International | 60,500 | 5,026 | ||||||
Pinnacle Foods | 10,679 | 450 | ||||||
Procter & Gamble | 45,929 | 3,600 | ||||||
Sanderson Farms | 6,825 | 556 | ||||||
SUPERVALU * | 99,500 | 879 | ||||||
TreeHouse Foods * | 9,083 | 648 | ||||||
Tyson Foods, Cl A | 327,069 | 13,884 | ||||||
Universal | 44,942 | 2,314 | ||||||
Vector Group | 22,062 | 488 | ||||||
Wal-Mart Stores | 302,574 | 22,472 | ||||||
Weis Markets | 37,000 | 1,597 | ||||||
Whole Foods Market | 117,000 | 4,825 | ||||||
|
| |||||||
| 254,582 | ||||||||
|
| |||||||
Energy — 1.0% |
| |||||||
Adams Resources & Energy | 3,106 | 133 | ||||||
Chevron | 42,100 | 4,336 | ||||||
ConocoPhillips | 38,400 | 2,445 | ||||||
Exxon Mobil | 89,300 | 7,609 | ||||||
|
| |||||||
| 14,523 | ||||||||
|
| |||||||
Financials — 19.4% |
| |||||||
Allied World Assurance Holdings | 229,620 | 9,757 | ||||||
Allstate | 129,700 | 8,731 | ||||||
American Capital Agency ‡ | 79,200 | 1,652 | ||||||
American Capital Mortgage Investment ‡ | 46,798 | 818 | ||||||
| 1 | SEI Institutional Investments Trust / Annual Report / May 31, 2015 |
SCHEDULE OF INVESTMENTS
U.S. Managed Volatility Fund
May 31, 2015
| Description | Shares | Market Value ($ Thousands) | ||||||
American Financial Group | 100,720 | $ | 6,396 | |||||
American Homes 4 Rent, Cl A ‡ | 19,203 | 321 | ||||||
American National Insurance | 1,396 | 144 | ||||||
AmTrust Financial Services | 5,523 | 332 | ||||||
Annaly Capital Management ‡ | 417,000 | 4,353 | ||||||
Anworth Mortgage Asset ‡ | 41,579 | 216 | ||||||
Apollo Commercial Real Estate Finance ‡ | 44,077 | 757 | ||||||
Apollo Residential Mortgage ‡ | 8,613 | 137 | ||||||
Arch Capital Group * | 68,883 | 4,401 | ||||||
Aspen Insurance Holdings | 96,800 | 4,488 | ||||||
Assurant | 57,300 | 3,773 | ||||||
Assured Guaranty | 136,850 | 3,913 | ||||||
Axis Capital Holdings | 223,775 | 12,317 | ||||||
Beneficial Bancorp * | 16,585 | 203 | ||||||
BOK Financial | 41,123 | 2,660 | ||||||
Brixmor Property Group ‡ | 28,700 | 711 | ||||||
Canadian Imperial Bank of Commerce | 40,100 | 3,049 | ||||||
Capital Bank Financial, Cl A * | 4,916 | 140 | ||||||
Capitol Federal Financial | 17,760 | 215 | ||||||
Capstead Mortgage ‡ | 31,338 | 371 | ||||||
CBL & Associates Properties ‡ | 240,800 | 4,250 | ||||||
CBOE Holdings | 188,375 | 11,024 | ||||||
Charter Financial | 32,315 | 391 | ||||||
Chimera Investment ‡ | 56,375 | 813 | ||||||
Chubb | 68,000 | 6,630 | ||||||
Communications Sales & Leasing ‡ | 44,950 | 1,171 | ||||||
Corporate Office Properties Trust ‡ | 21,000 | 539 | ||||||
CU Bancorp * | 12,535 | 266 | ||||||
Customers Bancorp * | 12,792 | 321 | ||||||
CYS Investments ‡ | 94,190 | 843 | ||||||
Digital Realty Trust ‡ | 14,330 | 946 | ||||||
Employers Holdings | 7,592 | 172 | ||||||
Endurance Specialty Holdings | 71,845 | 4,367 | ||||||
Equity Lifestyle Properties ‡ | 84,800 | 4,646 | ||||||
Essent Group * | 30,302 | 773 | ||||||
Everest Re Group | 128,513 | 23,326 | ||||||
Federated National Holding | 2,996 | 77 | ||||||
Fidelity Southern | 9,539 | 147 | ||||||
First NBC Bank Holding * | 2,968 | 101 | ||||||
Gain Capital Holdings | 7,185 | 67 | ||||||
Gaming and Leisure Properties ‡ | 54,122 | 1,981 | ||||||
Genworth MI Canada | 22,800 | 618 | ||||||
Government Properties Income Trust ‡ | 56,000 | 1,093 | ||||||
Greenlight Capital Re, Cl A * | 8,838 | 271 | ||||||
Hanover Insurance Group | 30,500 | 2,171 | ||||||
Hatteras Financial ‡ | 5,333 | 96 | ||||||
HCC Insurance Holdings | 88,000 | 5,032 | ||||||
HCP ‡ | 121,400 | 4,701 | ||||||
Highwoods Properties ‡ | 104,800 | 4,396 | ||||||
Hospitality Properties Trust ‡ | 127,000 | 3,834 | ||||||
Investors Bancorp | 18,935 | 227 | ||||||
Ladder Capital, Cl A ‡ | 8,976 | 159 | ||||||
LendingTree * | 6,137 | 364 | ||||||
MarketAxess Holdings | 22,400 | 1,981 | ||||||
Medical Properties Trust ‡ | 126,200 | 1,711 | ||||||
Meta Financial Group | 1,936 | 78 | ||||||
MFA Mortgage Investments, Cl REIT ‡ | 643,793 | 5,112 | ||||||
MidWestOne Financial Group | 4,003 | 117 | ||||||
| Description | Shares | Market Value ($ Thousands) | ||||||
Montpelier Re Holdings | 12,701 | $ | 483 | |||||
Mortgage Investment Trust ‡ | 8,689 | 164 | ||||||
National Bank Holdings, Cl A | 14,446 | 276 | ||||||
National Bank of Canada | 74,000 | 2,876 | ||||||
Navient | 10,301 | 198 | ||||||
New Residential Investments ‡ | 6,084 | 104 | ||||||
New York Mortgage Trust ‡ | 125,226 | 992 | ||||||
Omega Healthcare Investors ‡ | 126,700 | 4,565 | ||||||
OneBeacon Insurance Group, Cl A | 11,765 | 169 | ||||||
Pacific Premier Bancorp * | 16,998 | 268 | ||||||
PartnerRe | 128,556 | 16,896 | ||||||
PennyMac Financial Services, Cl A * | 11,992 | 225 | ||||||
PennyMac Mortgage Investment Trust ‡ | 137,200 | 2,520 | ||||||
Peoples Financial Services | 3,680 | 138 | ||||||
Post Properties ‡ | 78,500 | 4,460 | ||||||
PRA Group * | 42,700 | 2,424 | ||||||
Progressive | 149,300 | 4,082 | ||||||
Reinsurance Group of America, Cl A | 31,000 | 2,900 | ||||||
RenaissanceRe Holdings | 152,001 | 15,521 | ||||||
RLJ Lodging Trust ‡ | 79,100 | 2,391 | ||||||
Ryman Hospitality Properties ‡ | 85,200 | 4,695 | ||||||
Santander Consumer USA Holdings * | 7,953 | 195 | ||||||
Select Income ‡ | 10,654 | 250 | ||||||
Silver Bay Realty Trust ‡ | 37,363 | 577 | ||||||
Simon Property Group ‡ | 9,000 | 1,633 | ||||||
State Bank Financial | 28,645 | 587 | ||||||
Stonegate Bank | 11,115 | 334 | ||||||
Talmer Bancorp, Cl A | 3,115 | 49 | ||||||
Travelers | 159,499 | 16,128 | ||||||
Two Harbors Investment ‡ | 536,201 | 5,732 | ||||||
United Insurance Holdings | 20,709 | 299 | ||||||
Validus Holdings | 274,958 | 11,798 | ||||||
Waterstone Financial | 8,424 | 110 | ||||||
Wells Fargo | 106,200 | 5,943 | ||||||
White Mountains Insurance Group | 127 | 82 | ||||||
|
| |||||||
| 274,731 | ||||||||
|
| |||||||
Health Care — 16.9% | ||||||||
Abbott Laboratories | 39,760 | 1,932 | ||||||
Addus HomeCare * | 11,559 | 324 | ||||||
Aetna | 71,200 | 8,399 | ||||||
Air Methods * | 2,429 | 102 | ||||||
AmerisourceBergen | 118,949 | 13,389 | ||||||
Amgen | 20,800 | 3,250 | ||||||
Analogic | 1,946 | 165 | ||||||
Anthem | 62,000 | 10,407 | ||||||
AstraZeneca ADR | 26,200 | 1,770 | ||||||
Atrion | 582 | 218 | ||||||
Baxter International | 145,600 | 9,698 | ||||||
Becton Dickinson | 12,033 | 1,691 | ||||||
Bio-Path Holdings * | 9,690 | 12 | ||||||
Bio-Reference Labs * | 14,639 | 486 | ||||||
Bristol-Myers Squibb | 18,197 | 1,176 | ||||||
C.R. Bard | 16,800 | 2,861 | ||||||
Cardinal Health | 81,372 | 7,175 | ||||||
Chemed | 6,120 | 760 | ||||||
DaVita HealthCare Partners * | 9,700 | 813 | ||||||
Eli Lilly | 131,602 | 10,383 | ||||||
Express Scripts Holding * | 142,819 | 12,445 | ||||||
| 2 | SEI Institutional Investments Trust / Annual Report / May 31, 2015 |
SCHEDULE OF INVESTMENTS
U.S. Managed Volatility Fund
May 31, 2015
| Description | Shares | Market Value ($ Thousands) | ||||||
Haemonetics * | 2,483 | $ | 103 | |||||
HCA Holdings * | 25,100 | 2,054 | ||||||
Henry Schein * | 19,220 | 2,723 | ||||||
Hill-Rom Holdings | 100,300 | 5,171 | ||||||
Hologic * | 148,700 | 5,319 | ||||||
Humana | 12,600 | 2,705 | ||||||
ICON * | 69,800 | 4,528 | ||||||
ICU Medical * | 7,285 | 707 | ||||||
Idexx Laboratories * | 22,454 | 3,045 | ||||||
Inogen * | 5,382 | 201 | ||||||
Insys Therapeutics * | 5,567 | 332 | ||||||
Integra LifeSciences Holdings * | 1,708 | 115 | ||||||
Intuitive Surgical * | 9,500 | 4,634 | ||||||
Johnson & Johnson | 260,604 | 26,097 | ||||||
Laboratory Corp of America Holdings * | 30,700 | 3,621 | ||||||
McKesson | 36,342 | 8,621 | ||||||
Medtronic | 31,100 | 2,373 | ||||||
Merck | 265,111 | 16,143 | ||||||
MiMedx Group * | 11,023 | 114 | ||||||
Myriad Genetics * | 61,200 | 2,078 | ||||||
Omnicare | 89,816 | 8,558 | ||||||
Ophthotech * | 8,680 | 434 | ||||||
Owens & Minor | 20,006 | 667 | ||||||
PAREXEL International * | 5,891 | 392 | ||||||
Patterson | 86,600 | 4,143 | ||||||
Pfizer | 445,700 | 15,488 | ||||||
Phibro Animal Health, Cl A | 7,483 | 259 | ||||||
Quest Diagnostics | 139,300 | 10,479 | ||||||
Sagent Pharmaceuticals * | 7,989 | 178 | ||||||
STERIS | 7,196 | 481 | ||||||
Teleflex | 1,144 | 147 | ||||||
UnitedHealth Group | 47,100 | 5,662 | ||||||
Varian Medical Systems * | 53,600 | 4,642 | ||||||
Waters * | 39,800 | 5,318 | ||||||
Zimmer Holdings | 20,200 | 2,305 | ||||||
Zoetis, Cl A | 34,766 | 1,730 | ||||||
|
| |||||||
| 239,023 | ||||||||
|
| |||||||
Industrials — 3.1% | ||||||||
Boeing | 36,100 | 5,073 | ||||||
Deere | 87,800 | 8,225 | ||||||
Echo Global Logistics * | 12,334 | 397 | ||||||
FedEx | 12,300 | 2,131 | ||||||
Healthcare Services Group | 3,106 | 94 | ||||||
L-3 Communications Holdings, Cl 3 | 22,300 | 2,627 | ||||||
Landstar System | 3,508 | 229 | ||||||
Lockheed Martin | 18,123 | 3,411 | ||||||
Masonite International * | 8,016 | 547 | ||||||
Northrop Grumman | 47,700 | 7,593 | ||||||
Orbital ATK | 32,300 | 2,471 | ||||||
Precision Castparts | 16,369 | 3,464 | ||||||
Raytheon | 56,100 | 5,793 | ||||||
Sparton * | 15,165 | 402 | ||||||
Vectrus * | 24,476 | 614 | ||||||
Wesco Aircraft Holdings * | 21,560 | 318 | ||||||
|
| |||||||
| 43,389 | ||||||||
|
| |||||||
Information Technology — 9.5% | ||||||||
Accenture, Cl A | 47,982 | 4,608 | ||||||
Amdocs | 407,689 | 22,362 | ||||||
Apple | 52,082 | 6,785 | ||||||
Blackhawk Network Holdings, Cl A * | 14,889 | 512 | ||||||
| Description | Shares | Market Value ($ Thousands) | ||||||
Booz Allen Hamilton Holding, Cl A | 85,818 | $ | 2,175 | |||||
Broadridge Financial Solutions | 8,777 | 476 | ||||||
CA | 49,040 | 1,493 | ||||||
Cisco Systems | 238,000 | 6,976 | ||||||
Computer Sciences | 78,732 | 5,401 | ||||||
CSG Systems International | 69,600 | 2,171 | ||||||
DST Systems | 18,964 | 2,245 | ||||||
FactSet Research Systems | 49,690 | 8,207 | ||||||
Forrester Research | 2,561 | 87 | ||||||
GTT Communications * | 11,840 | 261 | ||||||
Harris | 60,600 | 4,801 | ||||||
Hewlett-Packard | 84,314 | 2,816 | ||||||
Ingram Micro, Cl A * | 5,028 | 135 | ||||||
Intel | 253,300 | 8,729 | ||||||
International Business Machines | 133,670 | 22,677 | ||||||
Intuit | 4,364 | 455 | ||||||
Lexmark International, Cl A | 13,900 | 639 | ||||||
Microsoft | 60,100 | 2,816 | ||||||
NeuStar, Cl A * | 12,468 | 341 | ||||||
Oracle | 116,000 | 5,045 | ||||||
Qualcomm | 81,763 | 5,697 | ||||||
Reis | 10,299 | 224 | ||||||
Rubicon Project * | 4,678 | 81 | ||||||
Sapiens International * | 14,640 | 132 | ||||||
Science Applications International | 32,700 | 1,733 | ||||||
Synopsys * | 89,700 | 4,475 | ||||||
VeriSign * | 78,100 | 4,935 | ||||||
Western Union | 220,100 | 4,831 | ||||||
|
| |||||||
| 134,321 | ||||||||
|
| |||||||
Materials — 2.3% | ||||||||
Avery Dennison | 136,330 | 8,440 | ||||||
Bemis | 99,000 | 4,548 | ||||||
Berry Plastics Group * | 21,437 | 718 | ||||||
CF Industries Holdings | 11,830 | 3,737 | ||||||
Clearwater Paper * | 4,825 | 290 | ||||||
Compass Minerals International | 31,033 | 2,674 | ||||||
Kaiser Aluminum | 2,493 | 202 | ||||||
Mosaic | 60,300 | 2,764 | ||||||
Royal Gold | 55,814 | 3,615 | ||||||
Scotts Miracle-Gro, Cl A | 38,523 | 2,360 | ||||||
Sonoco Products | 59,400 | 2,674 | ||||||
|
| |||||||
| 32,022 | ||||||||
|
| |||||||
Telecommunication Services — 5.2% | ||||||||
AT&T | 582,217 | 20,110 | ||||||
BCE | 156,100 | 6,828 | ||||||
Boingo Wireless * | 12,602 | 113 | ||||||
CenturyLink | 169,881 | 5,647 | ||||||
Hawaiian Telcom Holdco * | 18,418 | 466 | ||||||
NTT DOCOMO ADR | 91,700 | 1,645 | ||||||
Rogers Communications, Cl B | 131,400 | 4,507 | ||||||
SK Telecom ADR | 207,600 | 5,074 | ||||||
TELUS | 103,763 | 3,533 | ||||||
TELUS Toronto Stock Exchange | 67,200 | 2,279 | ||||||
Verizon Communications | 462,226 | 22,852 | ||||||
Windstream Holdings | 37,459 | 305 | ||||||
|
| |||||||
| 73,359 | ||||||||
|
| |||||||
Utilities — 8.6% | ||||||||
ALLETE | 6,416 | 323 | ||||||
Ameren | 112,600 | 4,530 | ||||||
| 3 | SEI Institutional Investments Trust / Annual Report / May 31, 2015 |
SCHEDULE OF INVESTMENTS
U.S. Managed Volatility Fund
May 31, 2015
| Description | Shares/Face Amount ($ Thousands) | Market Value ($ Thousands) | ||||||
American Electric Power | 131,200 | $ | 7,385 | |||||
American Water Works | 73,058 | 3,862 | ||||||
Artesian Resources, Cl A | 5,850 | 125 | ||||||
Avista | 10,772 | 345 | ||||||
Cleco | 7,113 | 386 | ||||||
Consolidated Edison | 188,463 | 11,654 | ||||||
DTE Energy | 111,268 | 8,816 | ||||||
Edison International | 324,765 | 19,749 | ||||||
Entergy | 275,063 | 21,034 | ||||||
Exelon | 235,800 | 7,977 | ||||||
IDACORP | 8,399 | 500 | ||||||
Northwest Natural Gas | 9,993 | 447 | ||||||
NorthWestern | 7,434 | 387 | ||||||
PG&E | 130,100 | 6,956 | ||||||
Pinnacle West Capital | 48,800 | 2,973 | ||||||
Portland General Electric | 134,264 | 4,694 | ||||||
Public Service Enterprise Group | 188,500 | 8,036 | ||||||
SCANA | 82,800 | 4,401 | ||||||
Southern | 159,243 | 6,957 | ||||||
Unitil | 24,907 | 843 | ||||||
|
| |||||||
| 122,380 | ||||||||
|
| |||||||
Total Common Stock | 1,364,047 | |||||||
|
| |||||||
CASH EQUIVALENT — 4.2% | ||||||||
SEI Daily Income Trust, Prime | ||||||||
0.010% ** † | 58,843,509 | 58,844 | ||||||
|
| |||||||
Total Cash Equivalent | 58,844 | |||||||
|
| |||||||
U.S. TREASURY OBLIGATIONS — 0.1% |
| |||||||
U.S. Treasury Bills (A) (B) | ||||||||
0.109%, 02/04/2016 | $ | 2,110 | 2,108 | |||||
|
| |||||||
Total U.S. Treasury Obligation |
| 2,108 | ||||||
|
| |||||||
Total Investments — 100.7% |
| $ | 1,424,999 | |||||
|
| |||||||
A list of the open futures contracts held by the Fund at May 31, 2015, is as follows:
| Type of Contract | Number of Contracts Long | Expiration Date | Unrealized Appreciation ($ Thousands) | |||||||||
S&P 500 Index EMINI | 307 | Jun-2015 | $ | 1,137 | ||||||||
|
| |||||||||||
For the year ended May 31, 2015, the total amount of all open futures contracts, as presented in the table above, are representative of the volume of activity for this derivative type during the year.
Percentages are based on a Net Assets of $1,414,638 ($ Thousands).
| * | Non-income producing security. |
| ** | The rate reported is the 7-day effective yield as of May 31, 2015. |
| † | Investment in Affiliated Security (see Note 6). |
| ‡ | Real Estate Investment Trust. |
| (A) | Security, or portion thereof, has been pledged as collateral on open futures contracts. |
| (B) | The rate reported is the effective yield at time of purchase. |
| ADR | — American Depositary Receipt |
| Cl | — Class |
| L.P. | — Limited Partnership |
| S&P | — Standard & Poor’s |
The following is a list of the level of inputs used as of May 31, 2015, in valuing the Fund’s investments and other financial instruments carried at value ($ Thousands):
| Investments in Securities | Level 1 | Level 2 | Level 3 | Total | ||||||||||||
Common Stock | $ | 1,364,047 | $ | — | $ | — | $ | 1,364,047 | ||||||||
Cash Equivalent | 58,844 | — | — | 58,844 | ||||||||||||
U.S. Treasury Obligations | — | 2,108 | — | 2,108 | ||||||||||||
|
|
|
|
|
|
|
| |||||||||
Total Investments in Securities | $ | 1,422,891 | $ | 2,108 | $ | — | $ | 1,424,999 | ||||||||
|
|
|
|
|
|
|
| |||||||||
| Other Financial Instruments | Level 1 | Level 2 | Level 3 | Total | ||||||||||||
Futures Contracts * | ||||||||||||||||
Unrealized Appreciation | $ | 1,137 | $ | — | $ | — | $ | 1,137 | ||||||||
|
|
|
|
|
|
|
| |||||||||
Total Other Financial Instruments | $ | 1,137 | $ | — | $ | — | $ | 1,137 | ||||||||
|
|
|
|
|
|
|
| |||||||||
| * | Futures contracts are valued at the unrealized appreciation on the instrument. |
For the year ended May 31, 2015, there were no transfers between Level 1 and Level 2 assets and liabilities.
For the year ended May 31, 2015, there were no transfers between Level 2 and Level 3 assets and liabilities.
For more information on valuation inputs, see Note 2 — Significant Accounting Policies in Notes to Financial Statements.
Amounts designated as “—” are $0 or have been rounded to $0.
The accompanying notes are an integral part of the financial statements.
| 4 | SEI Institutional Investments Trust / Annual Report / May 31, 2015 |
SCHEDULE OF INVESTMENTS
World Equity Ex-US Fund
May 31, 2015
| Description | Shares | Market Value ($ Thousands) | ||||||
COMMON STOCK — 94.4% | ||||||||
Argentina — 0.3% | ||||||||
MercadoLibre (A) | 157,000 | $ | 22,786 | |||||
Ternium ADR | 42,272 | 825 | ||||||
|
| |||||||
| 23,611 | ||||||||
|
| |||||||
Australia — 3.5% | ||||||||
Adelaide Brighton | 241,942 | 861 | ||||||
Amcor | 1,866,934 | 20,721 | ||||||
ASX | 173,743 | 5,537 | ||||||
Australia & New Zealand Banking Group | 735,882 | 18,696 | ||||||
Australia & New Zealand Banking Group ADR | 1,029,500 | 26,108 | ||||||
AWE * | 899,587 | 985 | ||||||
Beach Energy | 9,640,760 | 8,117 | ||||||
BGP Holdings * | 239,898 | — | ||||||
BHP Billiton ADR (A) | 378,907 | 16,911 | ||||||
Boral | 2,131,681 | 10,214 | ||||||
Brambles | 1,551,250 | 13,584 | ||||||
Caltex Australia | 725,003 | 18,702 | ||||||
Cochlear | 216,526 | 14,676 | ||||||
Commonwealth Bank of Australia | 67,985 | 4,428 | ||||||
CSR | 1,527,541 | 4,923 | ||||||
Downer | 685,040 | 2,701 | ||||||
DuluxGroup | 849,715 | 3,818 | ||||||
Echo Entertainment Group | 548,910 | 1,966 | ||||||
Harvey Norman Holdings | 954,737 | 3,435 | ||||||
Independence Group | 443,816 | 1,648 | ||||||
Insurance Australia Group | 1,399,060 | 6,061 | ||||||
Macquarie Group | 75,951 | 4,753 | ||||||
Magellan Financial Group | 195,311 | 2,794 | ||||||
Newcrest Mining * | 3,596,526 | 38,899 | ||||||
Nine Entertainment Holdings | 475,241 | 782 | ||||||
Orora | 1,532,181 | 2,580 | ||||||
Platinum Asset Management | 224,605 | 1,351 | ||||||
Qantas Airways * | 5,047,623 | 13,600 | ||||||
Resolute Mining * | 1,184,013 | 304 | ||||||
South32 ADR *(A) | 151,563 | 1,253 | ||||||
Tabcorp Holdings | 385,904 | 1,486 | ||||||
Telstra | 1,365,315 | 6,501 | ||||||
Treasury Wine Estates | 1,508,271 | 6,211 | ||||||
Western Areas | 1,117,664 | 3,054 | ||||||
|
| |||||||
| 267,660 | ||||||||
|
| |||||||
Austria — 1.0% | ||||||||
Conwert Immobilien Invest * | 1,074,222 | 14,415 | ||||||
Erste Group Bank | 724,885 | 20,993 | ||||||
Schoeller-Bleckmann Oilfield Equipment | 299,923 | 19,834 | ||||||
Voestalpine | 576,916 | 23,953 | ||||||
|
| |||||||
| 79,195 | ||||||||
|
| |||||||
Belgium — 0.5% | ||||||||
Ageas | 41,599 | 1,555 | ||||||
Anheuser-Busch InBev | 92,910 | 11,149 | ||||||
bpost | 117,128 | 3,375 | ||||||
Delhaize Group | 258,777 | 23,054 | ||||||
Solvay | 14,591 | 2,016 | ||||||
|
| |||||||
| 41,149 | ||||||||
|
| |||||||
Brazil — 1.3% | ||||||||
| Description | Shares | Market Value ($ Thousands) | ||||||
Banco Bradesco ADR | 3,944,022 | $ | 34,707 | |||||
Banco do Brasil | 2,670,125 | 19,111 | ||||||
BRF - Brasil Foods | 39,100 | 792 | ||||||
CETIP - Mercados Organizados | 352,800 | 3,680 | ||||||
Cia Energetica de Minas Gerais ADR | 440,454 | 1,991 | ||||||
Cia Paranaense de Energia ADR (A) | 341,926 | 3,518 | ||||||
Cosan, Cl A | 86,911 | 540 | ||||||
Embraer ADR | 313,856 | 9,453 | ||||||
JBS | 243,600 | 1,188 | ||||||
Light | 519,100 | 2,774 | ||||||
Qualicorp | 2,265,600 | 13,639 | ||||||
Telefonica Brasil ADR (A) | 164,393 | 2,313 | ||||||
Tim Participacoes | 533,000 | 1,583 | ||||||
|
| |||||||
| 95,289 | ||||||||
|
| |||||||
Canada — 4.7% | ||||||||
Advantage Oil & Gas * | 354,600 | 2,142 | ||||||
Bank of Montreal | 239,800 | 14,583 | ||||||
Bankers Petroleum * | 561,600 | 1,368 | ||||||
Birchcliff Energy * | 157,100 | 996 | ||||||
Bonavista Energy (A) | 102,700 | 648 | ||||||
Canadian Imperial Bank of Commerce (A) | 233,300 | 17,737 | ||||||
Canadian National Railway | 157,100 | 9,284 | ||||||
CCL Industries, Cl B | 8,200 | 950 | ||||||
Celestica * | 222,200 | 2,832 | ||||||
CGI Group, Cl A * | 51,600 | 2,178 | ||||||
CI Financial | 65,900 | 1,846 | ||||||
Constellation Software | 19,260 | 7,854 | ||||||
Dominion Diamond | 43,700 | 815 | ||||||
Empire, Cl A | 37,000 | 2,640 | ||||||
Enerplus (A) | 383,242 | 3,690 | ||||||
Fairfax Financial Holdings | 44,606 | 22,384 | ||||||
Gibson Energy | 264,500 | 5,071 | ||||||
Jean Coutu Group, Cl A | 164,900 | 3,081 | ||||||
Laurentian Bank of Canada | 37,300 | 1,428 | ||||||
Linamar | 175,400 | 11,905 | ||||||
Magna International, Cl A | 817,700 | 46,907 | ||||||
Manulife Financial | 1,728,500 | 31,718 | ||||||
Maple Leaf Foods | 223,270 | 4,230 | ||||||
Methanex | 271,800 | 15,082 | ||||||
Open Text | 293,200 | 12,443 | ||||||
Progressive Waste Solutions | 92,911 | 2,586 | ||||||
Quebecor, Cl B | 233,300 | 5,955 | ||||||
Restaurant Brands International (A) | 246,700 | 9,518 | ||||||
Ritchie Bros Auctioneers (A) | 286,821 | 8,105 | ||||||
Rogers Communications, Cl B (A) | 335,938 | 11,529 | ||||||
Royal Bank of Canada | 114,400 | 7,247 | ||||||
Shaw Communications, Cl B (A) | 93,793 | 2,062 | ||||||
Suncor Energy | 160,500 | 4,674 | ||||||
Toronto-Dominion Bank | 657,300 | 28,638 | ||||||
Valeant Pharmaceuticals International * | 212,232 | 50,402 | ||||||
Western Energy Services (A) | 254,300 | 1,275 | ||||||
|
| |||||||
| 355,803 | ||||||||
|
| |||||||
Chile — 0.1% | ||||||||
Enersis ADR | 230,029 | 3,913 | ||||||
|
| |||||||
| 1 | SEI Institutional Investments Trust / Annual Report / May 31, 2015 |
SCHEDULE OF INVESTMENTS
World Equity Ex-US Fund
May 31, 2015
| Description | Shares | Market Value ($ Thousands) | ||||||
China — 4.4% | ||||||||
Agricultural Bank of China | 15,881,000 | $ | 8,625 | |||||
Alibaba Group Holding ADR * | 106,922 | 9,550 | ||||||
Anhui Conch Cement | 14,920,500 | 62,557 | ||||||
ANTA Sports Products | 2,238,000 | 5,191 | ||||||
Baidu ADR * | 99,500 | 19,642 | ||||||
Bank of China | 9,664,000 | 6,420 | ||||||
Bitauto Holdings ADR * | 149,988 | 9,080 | ||||||
China Construction Bank | 40,279,800 | 40,480 | ||||||
China Oilfield Services | 13,593,400 | 25,252 | ||||||
Great Wall Motor | 5,055,230 | 32,641 | ||||||
Industrial & Commercial Bank of China | 24,219,000 | 21,090 | ||||||
Mindray Medical International ADR (A) | 740,940 | 19,983 | ||||||
Tencent Holdings | 2,042,828 | 41,033 | ||||||
Vipshop Holdings ADR * | 66,760 | 1,667 | ||||||
Want Want China Holdings | 7,414,000 | 8,369 | ||||||
Weichai Power | 6,187,600 | 23,109 | ||||||
|
| |||||||
| 334,689 | ||||||||
|
| |||||||
Colombia — 0.2% | ||||||||
Bancolombia ADR, Cl R (A) | 339,845 | 13,842 | ||||||
|
| |||||||
Czech Republic — 0.2% | ||||||||
Komercni Banka | 70,313 | 15,076 | ||||||
|
| |||||||
Denmark — 1.1% | ||||||||
DSV | 475,062 | 16,490 | ||||||
Genmab * | 61,255 | 5,370 | ||||||
Novo Nordisk, Cl B | 414,480 | 23,103 | ||||||
Novozymes, Cl B | 293,176 | 14,076 | ||||||
Pandora | 191,775 | 19,249 | ||||||
Vestas Wind Systems | 163,975 | 8,357 | ||||||
|
| |||||||
| 86,645 | ||||||||
|
| |||||||
Finland — 0.8% | ||||||||
Elisa, Cl A | 25,935 | 795 | ||||||
Huhtamaki | 21,960 | 738 | ||||||
Kone, Cl B (A) | 411,713 | 17,229 | ||||||
Neste Oil (A) | 236,159 | 5,971 | ||||||
Orion, Cl B | 176,467 | 5,881 | ||||||
Sampo, Cl A | 266,435 | 12,525 | ||||||
Stora Enso, Cl R | 900,891 | 9,408 | ||||||
Tieto | 35,692 | 816 | ||||||
UPM-Kymmene | 234,316 | 4,195 | ||||||
|
| |||||||
| 57,558 | ||||||||
|
| |||||||
France — 3.3% | ||||||||
Atos | 7,261 | 557 | ||||||
AXA | 1,248,044 | 31,354 | ||||||
Edenred (A) | 323,129 | 8,148 | ||||||
Essilor International | 178,936 | 21,805 | ||||||
Etablissements Maurel et Prom | 107,514 | 840 | ||||||
Faurecia | 71,093 | 3,193 | ||||||
Lafarge | 226,856 | 15,987 | ||||||
L’Oreal | 206,352 | 38,901 | ||||||
Natixis (A) | 216,687 | 1,622 | ||||||
Peugeot | 215,737 | 4,494 | ||||||
Sanofi-Aventis | 291,428 | 28,484 | ||||||
Societe Generale (A) | 429,532 | 20,026 | ||||||
Sodexo | 205,860 | 21,195 | ||||||
Technicolor | 382,308 | 2,447 | ||||||
Technip | 171,020 | 11,267 | ||||||
Teleperformance | 133,107 | 9,786 | ||||||
| Description | Shares | Market Value ($ Thousands) | ||||||
Thales (A) | 57,065 | $ | 3,544 | |||||
TOTAL | 135,950 | 6,853 | ||||||
Valeo (A) | 124,706 | 19,872 | ||||||
|
| |||||||
| 250,375 | ||||||||
|
| |||||||
Germany — 5.1% | ||||||||
Aareal Bank | 37,925 | 1,502 | ||||||
Allianz | 52,492 | 8,215 | ||||||
BASF | 231,015 | 21,326 | ||||||
Bertrandt | 4,252 | 558 | ||||||
Brenntag | 182,801 | 11,021 | ||||||
Continental | 53,900 | 12,424 | ||||||
Deutsche Boerse | 397,146 | 31,754 | ||||||
Deutsche Euroshop | 155,097 | 7,483 | ||||||
Deutsche Lufthansa | 1,353,798 | 18,998 | ||||||
Deutz | 84,126 | 487 | ||||||
Dialog Semiconductor * | 144,172 | 8,015 | ||||||
Duerr | 100,082 | 10,212 | ||||||
Evonik Industries | 64,400 | 2,401 | ||||||
GEA Group | 758,478 | 36,759 | ||||||
Gerresheimer | 110,250 | 6,278 | ||||||
Hannover Rueck | 62,865 | 6,096 | ||||||
HeidelbergCement | 31,564 | 2,556 | ||||||
Henkel | 355,933 | 36,428 | ||||||
Hochtief | 83,996 | 6,386 | ||||||
K+S | 207,333 | 6,744 | ||||||
KION Group | 10,651 | 505 | ||||||
Krones | 6,610 | 723 | ||||||
KUKA (A) | 66,076 | 5,223 | ||||||
Merck KGaA | 229,272 | 24,475 | ||||||
MTU Aero Engines | 123,626 | 11,773 | ||||||
Norddeutsche Affinerie | 35,972 | 2,229 | ||||||
Nordex * | 104,831 | 2,507 | ||||||
OSRAM Licht | 16,791 | 883 | ||||||
ProSiebenSat.1 Media | 57,286 | 2,735 | ||||||
Rhoen Klinikum | 145,665 | 4,055 | ||||||
SAP (A) | 223,216 | 16,492 | ||||||
Siemens | 260,963 | 27,403 | ||||||
Software | 17,768 | 500 | ||||||
Stada Arzneimittel (A) | 132,973 | 4,606 | ||||||
Symrise | 584,056 | 37,113 | ||||||
TUI | 395,038 | 6,992 | ||||||
United Internet | 87,364 | 4,067 | ||||||
|
| |||||||
| 387,924 | ||||||||
|
| |||||||
Hong Kong — 3.6% | ||||||||
Belle International Holdings | 12,698,000 | 16,218 | ||||||
BOC Hong Kong Holdings | 9,613,500 | 39,562 | ||||||
Chaoda Modern Agriculture | 52,790 | 4 | ||||||
Cheung Kong Property Holdings *(E) | 2,157,500 | 13,109 | ||||||
China Mobile | 7,145,844 | 94,122 | ||||||
China Unicom | 1,430,000 | 2,413 | ||||||
CK Hutchison Holdings | 2,157,500 | 33,678 | ||||||
Hang Seng Bank | 770,900 | 15,475 | ||||||
Hong Kong Exchanges and Clearing | 788,700 | 30,361 | ||||||
Orient Overseas International | 4,886,500 | 27,075 | ||||||
|
| |||||||
| 272,017 | ||||||||
|
| |||||||
India — 2.2% | ||||||||
Amtek Auto | 272,053 | 688 | ||||||
Apollo Tyres | 399,437 | 1,187 | ||||||
Bharat Petroleum | 49,877 | 664 | ||||||
Britannia Industries | 150,150 | 5,983 | ||||||
| 2 | SEI Institutional Investments Trust / Annual Report / May 31, 2015 |
SCHEDULE OF INVESTMENTS
World Equity Ex-US Fund
May 31, 2015
| Description | Shares | Market Value ($ Thousands) | ||||||
HCL Technologies | 885,132 | $ | 14,008 | |||||
HDFC Bank ADR | 581,313 | 34,658 | ||||||
Hindustan Unilever | 312,221 | 4,202 | ||||||
ICICI Bank ADR | 3,122,118 | 32,969 | ||||||
Lupin | 17,675 | 507 | ||||||
Maruti Udyog | 47,744 | 2,830 | ||||||
Tata Motors | 1,247,981 | 9,412 | ||||||
Tata Motors ADR | 1,446,683 | 55,408 | ||||||
UPL | 381,500 | 3,301 | ||||||
|
| |||||||
| 165,817 | ||||||||
|
| |||||||
Indonesia — 0.7% | ||||||||
AVG Technologies * | 134,616 | 3,301 | ||||||
Bank Negara Indonesia Persero | 11,205,700 | 5,826 | ||||||
Bank Rakyat Indonesia Persero | 28,897,200 | 25,731 | ||||||
Indofood Sukses Makmur | 23,066,500 | 12,733 | ||||||
Telekomunikasi Indonesia Persero | 16,080,000 | 3,459 | ||||||
Telekomunikasi Indonesia Persero ADR | 122,352 | 5,293 | ||||||
|
| |||||||
| 56,343 | ||||||||
|
| |||||||
Ireland — 4.0% | ||||||||
Actavis * | 121,618 | 37,314 | ||||||
CRH | 582,365 | 16,278 | ||||||
Endo International * | 437,732 | 36,664 | ||||||
ICON * | 1,135,714 | 73,674 | ||||||
James Hardie Industries | 1,096,021 | 14,816 | ||||||
Jazz Pharmaceuticals * | 205,037 | 36,773 | ||||||
Mallinckrodt * | 288,126 | 37,295 | ||||||
Ryanair Holdings ADR | 348,823 | 23,232 | ||||||
Shire ADR | 33,154 | 8,625 | ||||||
Smurfit Kappa Group | 696,792 | 20,511 | ||||||
|
| |||||||
| 305,182 | ||||||||
|
| |||||||
Israel — 1.0% | ||||||||
Bank Hapoalim | 779,327 | 4,084 | ||||||
Israel Chemicals | 1,760,083 | 12,587 | ||||||
Teva Pharmaceutical Industries ADR | 961,742 | 57,801 | ||||||
|
| |||||||
| 74,472 | ||||||||
|
| |||||||
Italy — 0.8% | ||||||||
Azimut Holding | 28,062 | 795 | ||||||
Brembo | 17,559 | 745 | ||||||
Exor | 345,576 | 17,170 | ||||||
Fiat Chrysler Automobiles * | 2,471,136 | 39,419 | ||||||
FinecoBank Banca Fineco * | 322,663 | 2,418 | ||||||
Recordati | 27,727 | 582 | ||||||
|
| |||||||
| 61,129 | ||||||||
|
| |||||||
Japan — 12.9% | ||||||||
Alfresa Holdings | 471,300 | 7,235 | ||||||
All Nippon Airways | 341,000 | 941 | ||||||
Alpine Electronics | 97,300 | 2,084 | ||||||
Alps Electric | 132,000 | 3,393 | ||||||
Asahi Kasei | 211,000 | 1,878 | ||||||
Bic Camera (A) | 117,000 | 1,165 | ||||||
Calsonic Kansei | 823,000 | 6,201 | ||||||
Canon Marketing Japan | 28,800 | 511 | ||||||
Coca-Cola West | 165,700 | 2,995 | ||||||
CyberAgent | 14,700 | 683 | ||||||
Daiichikosho | 15,600 | 512 | ||||||
Daikyo | 735,000 | 1,090 | ||||||
Daito Trust Construction | 179,400 | 20,015 | ||||||
Daiwa House Industry | 867,200 | 20,874 | ||||||
| Description | Shares | Market Value ($ Thousands) | ||||||
Daiwa Securities Group | 5,078,520 | $ | 40,405 | |||||
DCM Holdings | 96,800 | 888 | ||||||
Denso | 1,222,200 | 64,126 | ||||||
Dowa Holdings | 422,000 | 3,795 | ||||||
FANUC | 244,622 | 54,288 | ||||||
Fast Retailing | 40,200 | 16,618 | ||||||
Haseko | 1,107,000 | 12,979 | ||||||
Hazama Ando | 487,500 | 2,664 | ||||||
Hitachi | 5,730,300 | 39,250 | ||||||
Isuzu Motors | 2,445,800 | 33,338 | ||||||
IT Holdings | 219,300 | 4,305 | ||||||
Itochu | 346,000 | 4,684 | ||||||
Japan Airlines | 799,000 | 27,525 | ||||||
Japan Exchange Group | 2,073,157 | 63,233 | ||||||
JVC Kenwood Holdings | 269,500 | 784 | ||||||
Kawasaki Kisen Kaisha | 4,257,000 | 10,806 | ||||||
Kirin Holdings | 49,700 | 717 | ||||||
Kobe Steel | 9,051,000 | 16,994 | ||||||
Komatsu | 745,700 | 15,765 | ||||||
Kura | 19,300 | 733 | ||||||
Maeda Road Construction | 87,000 | 1,714 | ||||||
Marubeni | 1,262,100 | 7,404 | ||||||
Medipal Holdings | 603,500 | 9,376 | ||||||
MEIJI Holdings | 15,200 | 1,734 | ||||||
Misawa Homes | 98,000 | 891 | ||||||
Mitsubishi UFJ Financial Group | 856,900 | 6,361 | ||||||
Mitsui ADR | 108,000 | 30,087 | ||||||
Mitsui Sumitomo Insurance Group Holdings | 306,800 | 9,555 | ||||||
Mitsui Trust Holdings | 3,310,000 | 15,201 | ||||||
Mizuho Financial Group | 22,035,700 | 48,761 | ||||||
NEC Networks & System Integration | 32,000 | 684 | ||||||
Nexon | 83,500 | 1,126 | ||||||
Nichi-iko Pharmaceutical | 82,800 | 1,922 | ||||||
Nippo | 189,000 | 3,297 | ||||||
Nippon Flour Mills | 78,000 | 429 | ||||||
Nippon Paper Industries | 40,000 | 709 | ||||||
Nippon Steel & Sumitomo Metal | 7,695,000 | 21,201 | ||||||
Nippon Yusen | 321,000 | 972 | ||||||
Nissan Tokyo Sales Holdings | 142,700 | 413 | ||||||
Nissha Printing | 49,000 | 890 | ||||||
Nomura Real Estate Holdings | 320,300 | 6,592 | ||||||
North Pacific Bank | 190,300 | 802 | ||||||
OKUMA | 68,000 | 744 | ||||||
Omron | 867,544 | 40,478 | ||||||
Pigeon | 147,700 | 3,880 | ||||||
Pioneer * | 706,500 | 1,247 | ||||||
Rakuten | 1,300,100 | 21,404 | ||||||
SBI Holdings | 352,600 | 5,069 | ||||||
Secom | 535,200 | 35,844 | ||||||
Seino Holdings | 201,000 | 2,486 | ||||||
Shimano | 107,700 | 15,336 | ||||||
SKY Perfect JSAT Holdings | 425,600 | 2,360 | ||||||
SMC | 65,900 | 19,994 | ||||||
Sony | 1,176,391 | 36,611 | ||||||
Sumitomo Dainippon Pharma | 57,600 | 655 | ||||||
Sumitomo Heavy Industries | 950,000 | 6,270 | ||||||
Sumitomo Metal Mining | 2,282,000 | 35,353 | ||||||
Sumitomo Osaka Cement | 117,000 | 420 | ||||||
Suzuken | 136,390 | 4,457 | ||||||
T&D Holdings | 1,136,700 | 17,047 | ||||||
Takashimaya | 56,000 | 540 | ||||||
Toagosei | 341,000 | 1,470 | ||||||
| 3 | SEI Institutional Investments Trust / Annual Report / May 31, 2015 |
SCHEDULE OF INVESTMENTS
World Equity Ex-US Fund
May 31, 2015
| Description | Shares | Market Value ($ Thousands) | ||||||
Toho Holdings | 157,100 | $ | 3,316 | |||||
Tosoh | 204,000 | 1,223 | ||||||
Toyota Motor | 197,600 | 13,700 | ||||||
Toyota Tsusho | 628,800 | 17,659 | ||||||
West Japan Railway | 55,000 | 3,276 | ||||||
Yamazaki Baking | 136,000 | 2,269 | ||||||
Yaskawa Electric | 2,553,552 | 36,011 | ||||||
Zenkoku Hosho | 146,100 | 4,921 | ||||||
|
| |||||||
| 987,635 | ||||||||
|
| |||||||
Malaysia — 0.1% | ||||||||
DiGi.Com | 1,677,400 | 2,567 | ||||||
Telekom Malaysia | 650,500 | 1,292 | ||||||
Tenaga Nasional | 1,559,400 | 5,683 | ||||||
|
| |||||||
| 9,542 | ||||||||
|
| |||||||
Mexico — 0.6% | ||||||||
America Movil, Ser L | 5,553,644 | 5,826 | ||||||
America Movil ADR, Ser L | 1,868,455 | 39,238 | ||||||
Cemex ADR * | 53,443 | 497 | ||||||
Gruma, Ser B | 59,583 | 782 | ||||||
|
| |||||||
| 46,343 | ||||||||
|
| |||||||
Netherlands — 2.6% | ||||||||
Aegon | 4,135,417 | 31,424 | ||||||
AerCap Holdings * | 206,020 | 9,939 | ||||||
Boskalis Westminster | 91,887 | 4,545 | ||||||
Core Laboratories (A) | 338,868 | 39,810 | ||||||
Heineken Holding | 301,555 | 20,934 | ||||||
Koninklijke Ahold | 203,247 | 4,126 | ||||||
Koninklijke Vopak | 73,408 | 3,646 | ||||||
NXP Semiconductor * | 348,250 | 39,091 | ||||||
TNT * | 693,430 | 3,155 | ||||||
TomTom * | 293,007 | 3,265 | ||||||
Unilever | 674,426 | 28,711 | ||||||
Wolters Kluwer | 290,983 | 9,039 | ||||||
|
| |||||||
| 197,685 | ||||||||
|
| |||||||
Norway — 1.8% | ||||||||
DnB | 3,789,725 | 66,340 | ||||||
Norsk Hydro (A) | 9,868,021 | 46,178 | ||||||
Seadrill (A) | 401,345 | 4,823 | ||||||
Statoil ADR (A) | 1,080,120 | 20,069 | ||||||
Yara International | 50,841 | 2,557 | ||||||
|
| |||||||
| 139,967 | ||||||||
|
| |||||||
Panama — 0.1% | ||||||||
Copa Holdings, Cl A (A) | 88,640 | 7,560 | ||||||
|
| |||||||
Peru — 0.2% | ||||||||
Credicorp | 108,315 | 15,288 | ||||||
|
| |||||||
Philippines — 0.0% | ||||||||
Cebu Air | 143,610 | 277 | ||||||
|
| |||||||
Poland — 0.1% | ||||||||
Energa | 135,995 | 830 | ||||||
Orange Polska | 239,817 | 663 | ||||||
PGE | 937,997 | 5,133 | ||||||
Polski Koncern Naftowy Orlen | 97,237 | 1,829 | ||||||
Tauron Polska Energia | 321,681 | 408 | ||||||
|
| |||||||
| 8,863 | ||||||||
|
| |||||||
Portugal — 0.1% | ||||||||
Galp Energia, Cl B | 236,185 | 2,776 | ||||||
| Description | Shares | Market Value ($ Thousands) | ||||||
Jeronimo Martins | 278,570 | $ | 3,822 | |||||
|
| |||||||
| 6,598 | ||||||||
|
| |||||||
Qatar — 0.1% | ||||||||
Barwa Real Estate | 381,136 | 5,208 | ||||||
|
| |||||||
Russia — 0.6% | ||||||||
Lukoil ADR | 503,500 | 24,037 | ||||||
Magnit GDR | 260,046 | 13,561 | ||||||
Sistema GDR | 164,041 | 1,247 | ||||||
Yandex, Cl A * | 376,100 | 6,781 | ||||||
|
| |||||||
| 45,626 | ||||||||
|
| |||||||
Singapore — 2.2% | ||||||||
Avago Technologies, Cl A | 282,590 | 41,843 | ||||||
DBS Group Holdings | 2,973,000 | 44,742 | ||||||
Keppel | 4,845,100 | 31,429 | ||||||
Singapore Airlines | 99,000 | 833 | ||||||
Singapore Exchange | 116,900 | 731 | ||||||
United Overseas Bank | 1,266,210 | 21,721 | ||||||
United Overseas Bank ADR | 870,200 | 29,917 | ||||||
|
| |||||||
| 171,216 | ||||||||
|
| |||||||
South Africa — 1.4% | ||||||||
FirstRand | 3,076,256 | 13,147 | ||||||
Liberty Holdings | 86,627 | 1,117 | ||||||
Massmart Holdings | 456,356 | 5,654 | ||||||
Naspers, Cl N | 256,094 | 37,570 | ||||||
Sanlam | 1,011,211 | 5,690 | ||||||
Sasol ADR | 937,900 | 33,267 | ||||||
Standard Bank Group | 435,145 | 5,654 | ||||||
Telkom | 1,099,504 | 6,282 | ||||||
|
| |||||||
| 108,381 | ||||||||
|
| |||||||
South Korea — 3.5% | ||||||||
Daewoo Securities | 86,053 | 1,110 | ||||||
Hanssem | 12,948 | 2,629 | ||||||
Hyundai Mobis | 121,451 | 24,493 | ||||||
Kia Motors | 159,632 | 6,864 | ||||||
Korea Electric Power | 13,415 | 559 | ||||||
Korea Electric Power ADR (A) | 1,578,411 | 32,626 | ||||||
LG.Philips LCD | 502,340 | 13,258 | ||||||
NAVER | 20,246 | 11,125 | ||||||
POSCO | 71,992 | 15,850 | ||||||
Samsung Electronics | 65,793 | 77,592 | ||||||
SK Holdings | 60,747 | 9,812 | ||||||
SK Hynix | 1,222,750 | 56,379 | ||||||
SK Telecom | 56,508 | 12,569 | ||||||
|
| |||||||
| 264,866 | ||||||||
|
| |||||||
Spain — 0.9% | ||||||||
ACS Actividades Construcciones y Servicios | 40,267 | 1,296 | ||||||
Amadeus IT Holding, Cl A | 1,039,249 | 47,210 | ||||||
Inditex | 658,495 | 21,774 | ||||||
Mediaset Espana Comunicacion | 134,403 | 1,688 | ||||||
|
| |||||||
| 71,968 | ||||||||
|
| |||||||
Sweden — 2.4% | ||||||||
Atlas Copco, Cl B | 924,563 | 24,835 | ||||||
Betsson | 179,550 | 2,679 | ||||||
BillerudKorsnas | 316,505 | 5,353 | ||||||
Boliden | 129,842 | 2,778 | ||||||
Electrolux, Cl B | 67,995 | 2,070 | ||||||
Getinge, Cl B | 1,214,847 | 29,305 | ||||||
Holmen, Cl B | 15,495 | 463 | ||||||
| 4 | SEI Institutional Investments Trust / Annual Report / May 31, 2015 |
SCHEDULE OF INVESTMENTS
World Equity Ex-US Fund
May 31, 2015
| Description | Shares | Market Value ($ Thousands) | ||||||
Husqvarna, Cl B | 58,914 | $ | 447 | |||||
Industrivarden, Cl C (A) | 167,580 | 3,334 | ||||||
JM | 206,104 | 5,826 | ||||||
Meda, Cl A | 31,819 | 455 | ||||||
Nordea Bank | 2,507,700 | 32,550 | ||||||
Securitas, Cl B | 269,468 | 3,652 | ||||||
Svenska Cellulosa ADR | 663,100 | 17,387 | ||||||
Svenska Handelsbanken, Cl A | 1,903,791 | 28,610 | ||||||
Swedish Orphan Biovitrum * | 120,419 | 1,818 | ||||||
TeliaSonera | 2,584,404 | 15,200 | ||||||
Volvo, Cl B | 729,112 | 9,447 | ||||||
|
| |||||||
| 186,209 | ||||||||
|
| |||||||
Switzerland — 5.6% | ||||||||
Actelion | 367,862 | 51,240 | ||||||
Adecco | 90,782 | 7,189 | ||||||
Baloise Holding | 14,032 | 1,742 | ||||||
Cie Financiere Richemont | 98,528 | 8,481 | ||||||
Credit Suisse Group ADR (A) | 701,096 | 18,558 | ||||||
Forbo Holding | 3,228 | 3,942 | ||||||
Galenica * | 9,583 | 9,559 | ||||||
Geberit | 20,148 | 7,219 | ||||||
Georg Fischer | 8,119 | 6,123 | ||||||
Helvetia Holding | 3,183 | 1,776 | ||||||
Kaba Holding | 2,199 | 1,376 | ||||||
Lonza Group | 151,983 | 21,267 | ||||||
Nestle | 454,399 | 35,115 | ||||||
Novartis | 467,346 | 47,807 | ||||||
Novartis ADR | 407,970 | 41,911 | ||||||
OC Oerlikon | 34,263 | 438 | ||||||
Roche Holding | 280,044 | 81,993 | ||||||
Swiss Life Holding | 88,135 | 21,068 | ||||||
Swiss Re | 143,943 | 12,878 | ||||||
Zurich Insurance Group ADR | 1,469,800 | 46,990 | ||||||
|
| |||||||
| 426,672 | ||||||||
|
| |||||||
Taiwan — 3.7% | ||||||||
Advanced Semiconductor Engineering | 12,596,000 | 18,057 | ||||||
Advanced Semiconductor Engineering ADR | 1,863,544 | 13,157 | ||||||
AU Optronics | 12,408,000 | 6,812 | ||||||
AU Optronics ADR (A) | 5,199,300 | 28,128 | ||||||
Foxconn Technology | 771,000 | 2,713 | ||||||
Fubon Financial Holding | 11,754,949 | 24,205 | ||||||
Hermes Microvision | 57,000 | 4,503 | ||||||
Hon Hai Precision Industry | 7,973,056 | 25,743 | ||||||
Hon Hai Precision Industry GDR | 1,665,009 | 10,789 | ||||||
Innolux, Cl A | 15,521,544 | 9,608 | ||||||
Inotera Memories * | 25,084,172 | 29,585 | ||||||
Pegatron | 4,341,000 | 12,955 | ||||||
Taishin Financial Holding | 1,388,654 | 602 | ||||||
Taiwan PCB Techvest | 948,000 | 1,429 | ||||||
Taiwan Semiconductor Manufacturing | 3,008,000 | 14,308 | ||||||
Taiwan Semiconductor Manufacturing ADR | 3,126,275 | 75,906 | ||||||
TPK Holding * | 490,000 | 3,257 | ||||||
United Microelectronics | 3,643,000 | 1,650 | ||||||
United Microelectronics ADR | 1,211,600 | 2,726 | ||||||
|
| |||||||
| 286,133 | ||||||||
|
| |||||||
Thailand — 0.0% | ||||||||
Krung Thai Bank | 1,480,650 | 797 | ||||||
| Description | Shares | Market Value ($ Thousands) | ||||||
Thanachart Capital | 1,205,600 | $ | 1,227 | |||||
|
| |||||||
| 2,024 | ||||||||
|
| |||||||
Turkey — 1.1% | ||||||||
Akbank | 6,182,621 | 18,418 | ||||||
BIM Birlesik Magazalar | 427,973 | 7,854 | ||||||
Eregli Demir ve Celik Fabrikalari | 1,782,965 | 2,867 | ||||||
KOC Holding ADR | 1,358,750 | 30,327 | ||||||
Tupras Turkiye Petrol Rafinerileri | 56,836 | 1,422 | ||||||
Turkiye Garanti Bankasi | 5,199,390 | 16,465 | ||||||
Turkiye Is Bankasi, Cl C | 4,141,133 | 8,805 | ||||||
Turkiye Vakiflar Bankasi Tao, Cl D | 684,727 | 1,183 | ||||||
|
| |||||||
| 87,341 | ||||||||
|
| |||||||
United Kingdom — 14.0% | ||||||||
3i Group | 905,820 | 7,782 | ||||||
Amlin | 1,897,125 | 14,116 | ||||||
Antofagasta | 555,051 | 6,319 | ||||||
APERAM * | 63,218 | 2,612 | ||||||
ARM Holdings | 1,488,355 | 26,232 | ||||||
ARM Holdings ADR | 1,284,691 | 68,436 | ||||||
Ashtead Group | 469,803 | 8,029 | ||||||
ASOS * | 139,251 | 7,832 | ||||||
Associated British Foods | 410,263 | 18,956 | ||||||
AstraZeneca | 40,849 | 2,726 | ||||||
BAE Systems ADR | 1,149,500 | 36,347 | ||||||
Berkeley Group Holdings | 225,214 | 10,633 | ||||||
BG Group | 769,290 | 13,347 | ||||||
BP PLC ADR | 298,340 | 12,369 | ||||||
British American Tobacco | 265,098 | 14,585 | ||||||
Britvic | 359,249 | 4,016 | ||||||
Burberry Group | 313,994 | 8,121 | ||||||
Capita | 984,107 | 18,801 | ||||||
Centrica | 5,629,985 | 23,849 | ||||||
CSR | 64,970 | 875 | ||||||
Debenhams | 1,711,073 | 2,476 | ||||||
Diageo | 1,191,410 | 33,006 | ||||||
Dixons Carphone | 417,130 | 3,026 | ||||||
DS Smith | 309,689 | 1,678 | ||||||
Experian | 923,108 | 17,551 | ||||||
Halma | 365,551 | 4,259 | ||||||
Hargreaves Lansdown | 689,508 | 13,341 | ||||||
Hays | 643,845 | 1,587 | ||||||
Home Retail Group | 1,009,815 | 2,427 | ||||||
HSBC Holdings | 1,679,458 | 15,958 | ||||||
Hunting | 64,030 | 602 | ||||||
Imperial Tobacco Group | 754,442 | 38,797 | ||||||
Inchcape | 157,269 | 2,028 | ||||||
Indivior * | 822,116 | 2,885 | ||||||
Investec | 532,913 | 4,875 | ||||||
ITV | 10,807,748 | 44,908 | ||||||
Just Eat * | 321,990 | 2,264 | ||||||
Man Group | 5,572,547 | 15,179 | ||||||
Marks & Spencer Group ADR | 2,181,000 | 38,844 | ||||||
Mondi | 496,466 | 11,182 | ||||||
Pace | 116,725 | 734 | ||||||
Persimmon | 1,686,282 | 50,486 | ||||||
Petrofac | 520,463 | 7,188 | ||||||
Playtech | 155,100 | 1,964 | ||||||
Premier Oil | 578,008 | 1,439 | ||||||
Prudential | 1,392,902 | 34,582 | ||||||
QinetiQ | 613,518 | 2,215 | ||||||
Reckitt Benckiser Group | 436,427 | 39,325 | ||||||
| 5 | SEI Institutional Investments Trust / Annual Report / May 31, 2015 |
SCHEDULE OF INVESTMENTS
World Equity Ex-US Fund
May 31, 2015
| Description | Shares/Number of Rights | Market Value ($ Thousands) | ||||||
Rio Tinto | 560,131 | $ | 24,411 | |||||
Rio Tinto ADR (A) | 1,058,977 | 46,351 | ||||||
Rolls-Royce Holdings | 620,263 | 9,446 | ||||||
Royal Dutch Shell, Cl A (GBP) | 120,089 | 3,561 | ||||||
Royal Dutch Shell, Cl A | 1,285,909 | 38,304 | ||||||
Royal Dutch Shell ADR, Cl A | 627,200 | 37,456 | ||||||
RPC Group | 75,736 | 710 | ||||||
Schroders | 25,028 | 1,289 | ||||||
Shire | 1,296,792 | 111,507 | ||||||
Sky | 1,154,042 | 18,579 | ||||||
St. James’s Place | 925,337 | 12,870 | ||||||
Standard Chartered | 752,996 | 12,019 | ||||||
Subsea 7 | 1,539,965 | 16,095 | ||||||
Tullow Oil | 1,588,442 | 9,577 | ||||||
Wolseley | 420,533 | 25,932 | ||||||
|
| |||||||
| 1,068,896 | ||||||||
|
| |||||||
United States — 1.6% | ||||||||
Axis Capital Holdings | 480,678 | 26,456 | ||||||
Carnival, Cl A | 781,916 | 36,226 | ||||||
Everest Re Group | 242,188 | 43,960 | ||||||
PriceSmart | 115,660 | 9,431 | ||||||
Signet Jewelers | 23,180 | 2,998 | ||||||
Taro Pharmaceuticals Industries * | 13,591 | 2,021 | ||||||
|
| |||||||
| 121,092 | ||||||||
|
| |||||||
Total Common Stock | 7,213,079 | |||||||
|
| |||||||
PREFERRED STOCK — 0.9% | ||||||||
Brazil — 0.5% | ||||||||
Banco Bradesco | 641,880 | 5,688 | ||||||
Cia Energetica de Minas Gerais | 645,654 | 2,896 | ||||||
Cia Paranaense de Energia | 44,700 | 463 | ||||||
Itau Unibanco Holding | 1,029,650 | 11,126 | ||||||
Itau Unibanco Holding ADR | 776,631 | 8,310 | ||||||
Telefonica Brasil | 568,400 | 7,969 | ||||||
|
| |||||||
| 36,452 | ||||||||
|
| |||||||
Germany — 0.4% | ||||||||
Porsche Automobil Holding | 20,686 | 1,824 | ||||||
Volkswagen | 136,417 | 33,053 | ||||||
|
| |||||||
| 34,877 | ||||||||
|
| |||||||
Total Preferred Stock | 71,329 | |||||||
|
| |||||||
RIGHTS — 0.0% | ||||||||
Brazil — 0.0% | ||||||||
CETIP - Mercados Organizados, Expires 06/10/15* | 1 | — | ||||||
|
| |||||||
United Kingdom — 0.0% | ||||||||
Just Eat, Expires 06/08/15* | 59,628 | 32 | ||||||
|
| |||||||
Total Rights | 32 | |||||||
|
| |||||||
AFFILIATED PARTNERSHIP — 4.5% |
| |||||||
SEI Liquidity Fund, L.P. | ||||||||
0.060% ** †(B) | 347,864,814 | 347,865 | ||||||
|
| |||||||
Total Affiliated Partnership | 347,865 | |||||||
|
| |||||||
| Description | Shares/Face Amount (Thousands)(1) | Market Value ($ Thousands) | ||||||
CASH EQUIVALENT — 2.1% |
| |||||||
SEI Daily Income Trust, Prime Obligation Fund, Cl A | ||||||||
0.010% ** † | 159,793,968 | $ | 159,794 | |||||
|
| |||||||
Total Cash Equivalent | 159,794 | |||||||
|
| |||||||
U.S. TREASURY OBLIGATIONS (C)(D) — 0.2% |
| |||||||
U.S. Treasury Bills | ||||||||
0.010%, 08/20/2015 | 11,500 | 11,500 | ||||||
0.010%, 08/27/2015 | 1,200 | 1,200 | ||||||
|
| |||||||
Total U.S. Treasury Obligations | 12,700 | |||||||
|
| |||||||
TIME DEPOSITS — 1.9% | ||||||||
Brown Brothers Harriman | ||||||||
5.800%, 06/01/2015 ZAR | 22,339 | 1,836 | ||||||
2.650%, 06/01/2015 NZD | — | — | ||||||
1.250%, 06/01/2015 AUD | 190 | 145 | ||||||
0.427%, 06/01/2015 NOK | 9,408 | 1,207 | ||||||
0.100%, 06/01/2015 CAD | 628 | 503 | ||||||
0.100%, 06/01/2015 SGD | 38 | 28 | ||||||
0.079%, 06/01/2015 GBP | 3,406 | 5,198 | ||||||
0.030%, 06/01/2015 | 124,718 | 124,718 | ||||||
0.005%, 06/01/2015 HKD | 11,299 | 1,458 | ||||||
0.005%, 06/01/2015 JPY | 18,388 | 148 | ||||||
(0.211)%, 06/01/2015 EUR | 5,066 | 5,554 | ||||||
(0.400)%, 06/01/2015 SEK | — | — | ||||||
(1.000)%, 06/01/2015 CHF | 1,133 | 1,201 | ||||||
(1.050)%, 06/01/2015 DKK | 1 | — | ||||||
|
| |||||||
Total Time Deposits | 141,996 | |||||||
|
| |||||||
Total Investments — 104.0% | $ | 7,946,795 | ||||||
|
| |||||||
A list of the open futures contracts held by the Fund at May 31, 2015, is as follows:
| Type of Contract | Number of Contracts Long | Expiration Date | Unrealized (Depreciation) ($Thousands) | |||||||||
Euro-Stoxx | 1,614 | Jun-2015 | $ | 26 | ||||||||
FTSE 100 Index | 434 | Jun-2015 | 191 | |||||||||
Hang Seng Index | 46 | Jun-2015 | (142 | ) | ||||||||
S&P TSX 60 Index | 125 | Jun-2015 | (210 | ) | ||||||||
SPI 200 Index | 147 | Jun-2015 | 62 | |||||||||
Topix Index | 310 | Jun-2015 | 2,000 | |||||||||
|
| |||||||||||
| $ | 1,927 | |||||||||||
|
| |||||||||||
For the year ended May 31, 2015, the total amount of all open futures contracts, as presented in the table above, are representative of the volume of activity for this derivative type during the year.
Percentages are based on a Net Assets of $7,644,844 ($ Thousands).
| * | Non-income producing security. |
| ** | The rate reported is the 7-day effective yield as of May 31, 2015. |
| † | Investment in Affiliated Security (see Note 6). |
| (1) | In U.S. dollars unless otherwise indicated. |
| 6 | SEI Institutional Investments Trust / Annual Report / May 31, 2015 |
SCHEDULE OF INVESTMENTS
World Equity Ex-US Fund
May 31, 2015
| (A) | This security or a partial position of this security is on loan at May 31, 2015. The total market value of securities on loan at May 31, 2015 was $326,306 ($ Thousands). |
| (B) | This security was purchased with cash collateral held from securities on loan. The total value of such securities as of May 31, 2015 was $347,865 ($ Thousands). |
| (C) | Security, or portion thereof, has been pledged as collateral on open futures contracts. |
| (D) | The rate reported is the effective yield at time of purchase. |
| (E) | Security fair valued using methods determined in good faith by the Valuation Committee of the Board of Trustees. The total market value of such securities as of May 31, 2015 was $13,109 ($ Thousands) and represented 0.2% of Net Assets. |
ADR — American Depositary Receipt
AUD — Australian Dollar
CAD — Canadian Dollar
CHF — Swiss Franc
Cl — Class
DKK — Danish Krone
EUR — Euro
FTSE — Financial Times and Stock Exchange
GBP — British Pound Sterling
GDR — Global Depositary Receipt
HKD — Hong Kong Dollar
JPY — Japanese Yen
L.P. — Limited Partnership
NOK — Norwegian Krone
NZD — New Zealand Dollar
PLC — Public Limited Company
S&P — Standard & Poor’s
SEK — Swedish Krona
SGD — Singapore Dollar
SPI — Share Price Index
TSX — Toronto Stock Exchange
ZAR — South African Rand
The following is a list of the level of inputs used as of May 31, 2015, in valuing the Fund’s investments and other financial instruments carried at value ($ Thousands):
| Investments in Securities | Level 1 | Level 2 | Level 3(1) | Total | ||||||||||||
Common Stock | $ | 7,199,966 | $ | — | $ | 13,113 | $ | 7,213,079 | ||||||||
Preferred Stock | 71,329 | — | — | 71,329 | ||||||||||||
Rights | 32 | — | — | 32 | ||||||||||||
Affiliated Partnership | — | 347,865 | — | 347,865 | ||||||||||||
Cash Equivalent | 159,794 | — | — | 159,794 | ||||||||||||
U.S. Treasury Obligations | — | 12,700 | — | 12,700 | ||||||||||||
Time Deposits | — | 141,996 | — | 141,996 | ||||||||||||
|
|
|
|
|
|
|
| |||||||||
Total Investments in Securities | $ | 7,431,121 | $ | 502,561 | $ | 13,113 | $ | 7,946,795 | ||||||||
|
|
|
|
|
|
|
| |||||||||
| Other Financial Instruments | Level 1 | Level 2 | Level 3 | Total | ||||||||||||
Futures Contracts * | ||||||||||||||||
Unrealized Appreciation | $ | 2,279 | $ | — | $ | — | $ | 2,279 | ||||||||
Unrealized Depreciation | (352 | ) | — | — | (352 | ) | ||||||||||
|
|
|
|
|
|
|
| |||||||||
Total Other Financial Instruments | $ | 1,927 | $ | — | $ | — | $ | 1,927 | ||||||||
|
|
|
|
|
|
|
| |||||||||
| (1) | A reconciliation of Level 3 investments is presented when the Fund has a significant amount of Level 3 investments at the beginning and/or end of the period in relation to net assets. |
| * | Futures contracts are valued at the unrealized appreciation (depreciation) on the instrument. |
For the year ended May 31, 2015, there were transfers between Level 1 and Level 2 assets and liabilities. The primary reason for changes in the classifications between Levels 1 and 2 occurs when foreign equity securities are fair valued using other observable market-based inputs in place of the closing exchange price due to events occurring after the close of the exchange or market on which the investment is principally traded.
For the year ended May 31, 2015, there were no transfers between Level 2 and Level 3 assets and liabilities.
For more information on valuation inputs, see Note 2 — Significant Accounting Policies in Notes to Financial Statements.
Amounts designated as “—” are $0 or have been rounded to $0.
The accompanying notes are an integral part of the financial statements.
| 7 | SEI Institutional Investments Trust / Annual Report / May 31, 2015 |
SCHEDULE OF INVESTMENTS
Screened World Equity Ex-US Fund
May 31, 2015
| Description | Shares | Market Value ($ Thousands) | ||||||
COMMON STOCK — 94.3% | ||||||||
Argentina — 0.5% | ||||||||
MercadoLibre | 2,800 | $ | 406 | |||||
|
| |||||||
Australia — 2.9% | ||||||||
Australia & New Zealand Banking Group | 16,376 | 416 | ||||||
BGP Holdings * | 4,500 | — | ||||||
BHP Billiton ADR | 6,122 | 273 | ||||||
Brambles | 27,367 | 240 | ||||||
Caltex Australia | 10,691 | 276 | ||||||
Cochlear | 2,729 | 185 | ||||||
Collins Foods | 16,130 | 33 | ||||||
Commonwealth Bank of Australia | 6,914 | 450 | ||||||
Godfreys Group * | 5,255 | 14 | ||||||
Hansen Technologies | 6,622 | 13 | ||||||
Insurance Australia Group | 40,750 | 177 | ||||||
Objective Corporation | 5,533 | 8 | ||||||
South32 * | 194 | — | ||||||
South32 ADR * | 2,449 | 20 | ||||||
Telstra | 38,090 | 181 | ||||||
Treasury Wine Estates | 29,363 | 121 | ||||||
Watpac | 21,979 | 14 | ||||||
|
| |||||||
| 2,421 | ||||||||
|
| |||||||
Austria — 2.1% | ||||||||
Austria Technologie & Systemtechnik | 3,347 | 57 | ||||||
Conwert Immobilien Invest | 17,356 | 233 | ||||||
Erste Group Bank | 11,712 | 339 | ||||||
OMV | 8,837 | 251 | ||||||
Porr Ag | 1,041 | 68 | ||||||
Schoeller-Bleckmann Oilfield Equipment | 4,846 | 321 | ||||||
Strabag | 1,435 | 34 | ||||||
UBM Development | 435 | 19 | ||||||
Voestalpine | 10,115 | 420 | ||||||
Wienerberger | 1,053 | 17 | ||||||
|
| |||||||
| 1,759 | ||||||||
|
| |||||||
Belgium — 0.4% | ||||||||
Anheuser-Busch InBev | 2,600 | 312 | ||||||
Jensen-Group | 478 | 10 | ||||||
Sioen Industries | 1,719 | 26 | ||||||
TER Beke | 86 | 7 | ||||||
|
| |||||||
| 355 | ||||||||
|
| |||||||
Brazil — 1.5% | ||||||||
Banco Bradesco ADR | 22,680 | 200 | ||||||
Banco do Brasil | 46,100 | 330 | ||||||
CETIP—Mercados Organizados | 9,900 | 103 | ||||||
Embraer ADR | 5,925 | 179 | ||||||
Qualicorp | 36,600 | 220 | ||||||
Telefonica Brasil ADR | 13,097 | 184 | ||||||
|
| |||||||
| 1,216 | ||||||||
|
| |||||||
Canada — 5.2% | ||||||||
Bank of Nova Scotia | 300 | 16 | ||||||
Canadian National Railway | 4,400 | 260 | ||||||
Canfor Pulp Products | 13,500 | 170 | ||||||
Cascades | 2,300 | 14 | ||||||
Cervus Equipment | 350 | 5 | ||||||
Chorus Aviation, Cl A | 5,140 | 26 | ||||||
Cipher Pharmaceuticals * | 16,500 | 162 | ||||||
Cogeco | 1,700 | 71 | ||||||
Cogeco Cable | 1,000 | 53 | ||||||
Constellation Software | 493 | 201 | ||||||
| Description | Shares | Market Value ($ Thousands) | ||||||
Dominion Diamond | 5,600 | $ | 104 | |||||
Fairfax Financial Holdings | 804 | 403 | ||||||
High Arctic Energy Services | 1,529 | 5 | ||||||
Magellan Aerospace | 1,300 | 18 | ||||||
Magna International, Cl A | 8,600 | 492 | ||||||
North American Energy Partners | 908 | 3 | ||||||
OceanaGold | 17,900 | 43 | ||||||
Reitmans Canada, Cl A | 23,900 | 122 | ||||||
Restaurant Brands International | 4,600 | 177 | ||||||
Ritchie Bros Auctioneers | 5,171 | 146 | ||||||
Rogers Communications, Cl B | 5,428 | 186 | ||||||
Royal Bank of Canada | 4,400 | 279 | ||||||
Strad Energy Services | 29,908 | 68 | ||||||
Suncor Energy | 7,000 | 204 | ||||||
Supremex | 10,700 | 43 | ||||||
Toronto-Dominion Bank | 10,400 | 451 | ||||||
Transat AT, Cl A * | 1,300 | 8 | ||||||
Transcontinental, Cl A | 10,500 | 154 | ||||||
Valeant Pharmaceuticals International * | 760 | 180 | ||||||
Vecima Networks | 3,100 | 27 | ||||||
Wesdome Gold Mines * | 20,300 | 18 | ||||||
WestJet Airlines, Cl A | 1,135 | 25 | ||||||
Yellow Pages * | 11,633 | 179 | ||||||
ZCL Composites | 900 | 5 | ||||||
|
| |||||||
| 4,318 | ||||||||
|
| |||||||
Chile — 0.1% | ||||||||
Enersis ADR | 2,614 | 44 | ||||||
|
| |||||||
China — 4.1% | ||||||||
Agricultural Bank of China | 385,000 | 209 | ||||||
Alibaba Group Holding ADR * | 1,993 | 178 | ||||||
Anhui Conch Cement | 100,500 | 421 | ||||||
ANTA Sports Products | 63,000 | 146 | ||||||
Baidu ADR * | 1,800 | 355 | ||||||
Bank of China | 323,000 | 215 | ||||||
Bitauto Holdings ADR * | 2,614 | 158 | ||||||
China Construction Bank | 36,000 | 36 | ||||||
China Oilfield Services | 219,800 | 408 | ||||||
China Telecom | 8,000 | 5 | ||||||
Industrial & Commercial Bank of China | 391,000 | 341 | ||||||
Mindray Medical International ADR | 11,971 | 323 | ||||||
Ping An Insurance Group of China | 3,500 | 52 | ||||||
Vipshop Holdings ADR * | 1,860 | 47 | ||||||
Want Want China Holdings | 134,000 | 151 | ||||||
Weichai Power | 100,200 | 375 | ||||||
|
| |||||||
| 3,420 | ||||||||
|
| |||||||
Colombia — 0.3% | ||||||||
Bancolombia ADR, Cl R | 5,491 | 224 | ||||||
|
| |||||||
Czech Republic — 0.3% | ||||||||
Komercni Banka | 1,136 | 244 | ||||||
|
| |||||||
Denmark — 2.1% | ||||||||
Danske Bank | 4,790 | 140 | ||||||
DSV | 8,421 | 293 | ||||||
Genmab * | 1,712 | 150 | ||||||
Novo Nordisk, Cl B | 8,716 | 486 | ||||||
Novozymes, Cl B | 5,224 | 251 | ||||||
Pandora | 3,090 | 310 | ||||||
Vestas Wind Systems | 3,320 | 169 | ||||||
|
| |||||||
| 1,799 | ||||||||
|
| |||||||
| 1 | SEI Institutional Investments Trust / Annual Report / May 31, 2015 |
SCHEDULE OF INVESTMENTS
Screened World Equity Ex-US Fund
May 31, 2015
| Description | Shares | Market Value ($ Thousands) | ||||||
Finland — 2.0% | ||||||||
Atria, Cl A | 10,693 | $ | 105 | |||||
Cramo | 2,440 | 53 | ||||||
HKScan, Cl A | 6,711 | 41 | ||||||
Kone, Cl B | 6,295 | 264 | ||||||
Neste Oil | 13,023 | 329 | ||||||
Orion, Cl B | 138 | 5 | ||||||
Sampo, Cl A | 4,669 | 220 | ||||||
Stora Enso, Cl R | 25,305 | 264 | ||||||
Tieto | 674 | 15 | ||||||
UPM-Kymmene | 9,844 | 176 | ||||||
Valmet | 14,923 | 167 | ||||||
|
| |||||||
| 1,639 | ||||||||
|
| |||||||
France — 3.7% | ||||||||
Boiron | 670 | 69 | ||||||
Burelle | 141 | 101 | ||||||
Caisse Regionale de Credit Agricole Mutuel Brie Picardie | 144 | 4 | ||||||
Cegedim * | 1,273 | 50 | ||||||
Cegid Group | 1,826 | 81 | ||||||
Credit Agricole Loire Haute-Loire | 140 | 12 | ||||||
Credit Agricole Toulouse | 377 | 41 | ||||||
Credit Industriel et Commercial | 40 | 8 | ||||||
Derichebourg * | 31,217 | 107 | ||||||
Edenred | 6,024 | 152 | ||||||
Essilor International | 3,590 | 438 | ||||||
EuropaCorp * | 2,531 | 15 | ||||||
Faurecia | 1,980 | 89 | ||||||
Groupe Fnac * | 3,005 | 201 | ||||||
Groupe Guillin | 173 | 36 | ||||||
Infotel | 178 | 6 | ||||||
Ipsen | 2,948 | 157 | ||||||
Lafarge | 3,977 | 280 | ||||||
Le Belier | 126 | 4 | ||||||
Linedata * | 339 | 10 | ||||||
Natixis | 6,100 | 46 | ||||||
Plastivaloire | 349 | 18 | ||||||
PSB Industries | 84 | 4 | ||||||
Societe Generale | 6,940 | 324 | ||||||
Sodexo | 3,326 | 343 | ||||||
Tessi | 178 | 18 | ||||||
UBISOFT Entertainment * | 9,335 | 168 | ||||||
Valeo | 1,640 | 261 | ||||||
Vetoquinol | 765 | 30 | ||||||
|
| |||||||
| 3,073 | ||||||||
|
| |||||||
Germany — 3.0% | ||||||||
Allianz | 1,470 | 230 | ||||||
BASF | 3,726 | 344 | ||||||
Brenntag | 3,383 | 204 | ||||||
Constantin Medien * | 9,520 | 18 | ||||||
Continental | 945 | 218 | ||||||
Deutsche Boerse | 4,981 | 398 | ||||||
Deutsche Lufthansa | 16,667 | 234 | ||||||
FRoSTA | 447 | 17 | ||||||
Hannover Rueck | 276 | 27 | ||||||
Hornbach Baumarkt | 922 | 37 | ||||||
Koenig & Bauer | 1,522 | 32 | ||||||
Leifheit | 72 | 4 | ||||||
MTU Aero Engines | 1,457 | 139 | ||||||
Nordex * | 250 | 6 | ||||||
Patrizia Immobilien * | 4,803 | 99 | ||||||
SAP | 3,968 | 293 | ||||||
| Description | Shares | Market Value ($ Thousands) | ||||||
TUI | 256 | $ | 5 | |||||
Ultrasonic * | 1,032 | — | ||||||
United Internet | 2,450 | 114 | ||||||
VERBIO Vereinigte BioEnergie * | 32,474 | 112 | ||||||
|
| |||||||
| 2,531 | ||||||||
|
| |||||||
Hong Kong — 3.1% | ||||||||
1010 Printing Group | 158,180 | 27 | ||||||
Champion Technology Holdings | 72,000 | 2 | ||||||
Cheung Kong Property Holdings *(A) | 15,000 | 91 | ||||||
China Mobile | 38,500 | 507 | ||||||
Chuang’s Consortium International | 132,000 | 20 | ||||||
CK Hutchison Holdings | 15,000 | 234 | ||||||
EcoGreen International Group | 370,000 | 149 | ||||||
Hang Seng Bank | 13,600 | 273 | ||||||
Hong Kong Exchanges and Clearing | 13,800 | 531 | ||||||
Hong Kong Ferry Holdings | 46,000 | 74 | ||||||
Keck Seng Investments | 8,000 | 8 | ||||||
Liu Chong Hing Investment | 46,000 | 61 | ||||||
Luen Thai Holdings | 39,000 | 8 | ||||||
Orient Overseas International | 79,000 | 438 | ||||||
Rykadan Capital | 590,000 | 114 | ||||||
Shun Ho Technology Holdings * | 38,000 | 17 | ||||||
Wing On International | 12,111 | 45 | ||||||
|
| |||||||
| 2,599 | ||||||||
|
| |||||||
India — 1.6% | ||||||||
HDFC Bank ADR | 9,375 | 559 | ||||||
ICICI Bank ADR | 50,443 | 532 | ||||||
Tata Motors ADR | 7,382 | 283 | ||||||
|
| |||||||
| 1,374 | ||||||||
|
| |||||||
Indonesia — 0.8% | ||||||||
Asahimas Flat Glass | 2,500 | 1 | ||||||
Astra Graphia | 22,100 | 4 | ||||||
Bank Negara Indonesia Persero | 256,100 | 133 | ||||||
Bank Rakyat Indonesia Persero | 312,100 | 278 | ||||||
Indofood Sukses Makmur | 372,700 | 206 | ||||||
Samudera Indonesia | 5,400 | 4 | ||||||
Telekomunikasi Indonesia Persero | 104,000 | 22 | ||||||
|
| |||||||
| 648 | ||||||||
|
| |||||||
Ireland — 2.3% | ||||||||
CRH | 10,279 | 287 | ||||||
ICON * | 14,516 | 942 | ||||||
James Hardie Industries | 20,418 | 276 | ||||||
Ryanair Holdings ADR | 6,233 | 415 | ||||||
|
| |||||||
| 1,920 | ||||||||
|
| |||||||
Israel — 0.3% | ||||||||
El Al Israel Airlines * | 202,512 | 48 | ||||||
Teva Pharmaceutical Industries ADR | 2,680 | 161 | ||||||
|
| |||||||
| 209 | ||||||||
|
| |||||||
Italy — 1.2% | ||||||||
Caltagirone | 3,934 | 10 | ||||||
Danieli & C Officine Meccaniche | 145 | 3 | ||||||
El.En. | 704 | 30 | ||||||
Exor | 4,444 | 221 | ||||||
Fiat Chrysler Automobiles * | 22,086 | 352 | ||||||
FinecoBank Banca Fineco | 9,020 | 68 | ||||||
La Doria | 7,970 | 117 | ||||||
Saras * | 120,182 | 199 | ||||||
Servizi Italia | 5,874 | 30 | ||||||
|
| |||||||
| 1,030 | ||||||||
|
| |||||||
| 2 | SEI Institutional Investments Trust / Annual Report / May 31, 2015 |
SCHEDULE OF INVESTMENTS
Screened World Equity Ex-US Fund
May 31, 2015
| Description | Shares | Market Value ($ Thousands) | ||||||
Japan — 11.6% | ||||||||
Aderans Holdings | 4,800 | $ | 43 | |||||
Aichi Bank | 200 | 10 | ||||||
Alps Logistics | 600 | 8 | ||||||
Arata | 9,000 | 27 | ||||||
Asahi Broadcasting | 8,800 | 71 | ||||||
AT-Group | 4,000 | 83 | ||||||
Central Security Patrols | 1,200 | 13 | ||||||
Central Sports | 700 | 13 | ||||||
Chubu Shiryo * | 1,600 | 12 | ||||||
Coco’s Japan | 600 | 9 | ||||||
Computer Engineering & Consulting | 8,400 | 67 | ||||||
Daito Trust Construction | 1,500 | 167 | ||||||
Daiwa Securities Group | 34,000 | 270 | ||||||
Denso | 20,100 | 1,055 | ||||||
Dowa Holdings | 12,000 | 108 | ||||||
FANUC | 1,200 | 266 | ||||||
Fast Retailing | 700 | 289 | ||||||
Fuji Heavy Industries | 1,900 | 72 | ||||||
Fujitsu | 16,000 | 90 | ||||||
G-7 Holdings | 6,400 | 71 | ||||||
Haruyama Trading | 2,700 | 17 | ||||||
Haseko | 26,800 | 314 | ||||||
Hitachi | 56,000 | 384 | ||||||
Hokkaido Coca-Cola Bottling | 3,000 | 16 | ||||||
Hokko Chemical Industry | 11,000 | 42 | ||||||
Hokuriku Gas | 13,000 | 30 | ||||||
Itochu | 9,600 | 130 | ||||||
Japan Airlines | 14,700 | 506 | ||||||
Japan Exchange Group | 13,500 | 412 | ||||||
Kawasumi Laboratories | 2,300 | 18 | ||||||
Keiyo Gas | 1,000 | 5 | ||||||
Kitamura | 2,500 | 16 | ||||||
Komatsu | 3,700 | 78 | ||||||
Kyowa Leather Cloth | 2,600 | 21 | ||||||
Marubeni | 35,500 | 208 | ||||||
Marukyo | 2,000 | 13 | ||||||
Maruzen—General Commercial Kitchen Appliances & Equipment | 4,000 | 35 | ||||||
Matsui Construction | 12,000 | 65 | ||||||
Mitsubishi UFJ Financial Group | 24,100 | 179 | ||||||
Mitsui Sumitomo Insurance Group Holdings | 5,500 | 171 | ||||||
Mitsui Trust Holdings | 58,000 | 266 | ||||||
Nakano | 6,900 | 29 | ||||||
NDS | 7,000 | 18 | ||||||
Nichiban * | 2,000 | 8 | ||||||
NIFTY | 600 | 7 | ||||||
Nihon Yamamura Glass * | 21,000 | 34 | ||||||
Nippon Steel & Sumitomo Metal | 124,000 | 342 | ||||||
Nippon Telegraph & Telephone | 6,700 | 468 | ||||||
Nisshin Fudosan | 8,500 | 32 | ||||||
Nissin Sugar | 2,200 | 46 | ||||||
OKUMA | 5,000 | 55 | ||||||
Pigeon | 4,200 | 110 | ||||||
Pronexus | 2,800 | 17 | ||||||
Rakuten | 23,100 | 380 | ||||||
San-Ai Oil | 7,691 | 52 | ||||||
Secom | 8,600 | 576 | ||||||
Shimano | 1,900 | 271 | ||||||
Shobunsha Publications | 1,300 | 9 | ||||||
| Description | Shares | Market Value ($ Thousands) | ||||||
SMC | 1,200 | $ | 364 | |||||
Soda Nikka | 1,700 | 8 | ||||||
ST | 2,000 | 18 | ||||||
Sumitomo Densetsu | 300 | 4 | ||||||
Sumitomo Metal Mining | 6,000 | 93 | ||||||
Tera Probe | 2,400 | 27 | ||||||
T-Gaia | 1,900 | 26 | ||||||
Togami Electric Manufacturing | 3,000 | 13 | ||||||
Toyota Motor | 13,600 | 943 | ||||||
Yachiyo Industry | 2,000 | 17 | ||||||
Yamae Hisano | 600 | 5 | ||||||
Yonekyu | 600 | 9 | ||||||
Zenkoku Hosho | 2,400 | 81 | ||||||
|
| |||||||
| 9,732 | ||||||||
|
| |||||||
Malaysia — 0.2% | ||||||||
Malaysian Pacific Industries | 41,200 | 77 | ||||||
Tenaga Nasional | 18,600 | 68 | ||||||
|
| |||||||
| 145 | ||||||||
|
| |||||||
Mexico — 1.0% | ||||||||
America Movil, Ser L | 240,285 | 252 | ||||||
America Movil ADR, Ser L | 3,532 | 74 | ||||||
Gruma, Ser B | 3,651 | 48 | ||||||
Grupo Financiero Inbursa, Cl O | 34,789 | 79 | ||||||
Industrias Bachoco | 53,147 | 254 | ||||||
Industrias Bachoco ADR | 2,630 | 151 | ||||||
|
| |||||||
| 858 | ||||||||
|
| |||||||
Netherlands — 3.1% | ||||||||
AerCap Holdings * | 5,800 | 280 | ||||||
Core Laboratories | 5,475 | 643 | ||||||
DOCdata | 492 | 11 | ||||||
Heineken Holding | 4,328 | 301 | ||||||
ING Groep | 288 | 5 | ||||||
KAS Bank | 5,223 | 64 | ||||||
Nederland Apparatenfabriek | 1,164 | 41 | ||||||
SNS Reaal * | 1,762 | 1 | ||||||
Unilever | 25,424 | 1,082 | ||||||
Wolters Kluwer | 4,930 | 153 | ||||||
|
| |||||||
| 2,581 | ||||||||
|
| |||||||
New Zealand — 0.6% | ||||||||
Air New Zealand | 8,185 | 17 | ||||||
Fletcher Building | 34,093 | 213 | ||||||
Spark New Zealand | 134,845 | 265 | ||||||
Tourism Holdings | 3,995 | 5 | ||||||
|
| |||||||
| 500 | ||||||||
|
| |||||||
Norway — 1.7% | ||||||||
DnB | 56,268 | 985 | ||||||
Havyard Group | 1,481 | 3 | ||||||
Norsk Hydro | 65,913 | 308 | ||||||
Seadrill | 7,399 | 89 | ||||||
Yara International | 1,450 | 73 | ||||||
|
| |||||||
| 1,458 | ||||||||
|
| |||||||
Panama — 0.2% | ||||||||
Copa Holdings, Cl A | 1,636 | 140 | ||||||
|
| |||||||
Peru — 0.2% | ||||||||
Credicorp | 1,162 | 164 | ||||||
|
| |||||||
Philippines — 0.1% | ||||||||
Cebu Air | 2,290 | 4 | ||||||
San Miguel | 44,210 | 65 | ||||||
Top Frontier Investment Holdings * | 13,200 | 26 | ||||||
|
| |||||||
| 95 | ||||||||
|
| |||||||
| 3 | SEI Institutional Investments Trust / Annual Report / May 31, 2015 |
SCHEDULE OF INVESTMENTS
Screened World Equity Ex-US Fund
May 31, 2015
| Description | Shares | Market Value ($ Thousands) | ||||||
Poland — 0.3% | ||||||||
ComArch * | 266 | $ | 10 | |||||
PGE | 36,075 | 197 | ||||||
Polish Oil & Gas | 12,652 | 21 | ||||||
Tauron Polska Energia | 35,607 | 45 | ||||||
Zespol Elektrowni Patnow Adamow Konin | 712 | 5 | ||||||
|
| |||||||
| 278 | ||||||||
|
| |||||||
Portugal — 0.2% | ||||||||
Galp Energia, Cl B | 4,787 | 56 | ||||||
Jeronimo Martins | 7,770 | 107 | ||||||
Portucel | 4,792 | 20 | ||||||
|
| |||||||
| 183 | ||||||||
|
| |||||||
Qatar — 0.2% | ||||||||
Barwa Real Estate | 10,982 | 150 | ||||||
|
| |||||||
Russia — 0.5% | ||||||||
Magnit GDR | 547 | 28 | ||||||
Magnit PJSC GDR | 4,122 | 215 | ||||||
Surgutneftegas ADR | 3,407 | 21 | ||||||
Yandex, Cl A * | 7,100 | 128 | ||||||
|
| |||||||
| 392 | ||||||||
|
| |||||||
Singapore — 1.6% | ||||||||
DBS Group Holdings | 28,900 | 435 | ||||||
Frencken Group | 50,000 | 7 | ||||||
Golden Agri-Resources | 8,000 | 3 | ||||||
GP Batteries International | 11,708 | 8 | ||||||
Lantrovision Singapore | 21,100 | 8 | ||||||
NatSteel | 12,700 | 14 | ||||||
New Toyo International Holdings | 112,000 | 21 | ||||||
Oversea-Chinese Banking | 22,900 | 173 | ||||||
QAF | 6,792 | 6 | ||||||
United Industrial | 100,000 | 253 | ||||||
United Overseas Bank | 22,000 | 377 | ||||||
|
| |||||||
| 1,305 | ||||||||
|
| |||||||
South Africa — 2.1% | ||||||||
Cashbuild | 614 | 14 | ||||||
FirstRand | 124,118 | 531 | ||||||
Hulamin | 24,184 | 13 | ||||||
Massmart Holdings | 8,683 | 108 | ||||||
Naspers, Cl N | 4,539 | 666 | ||||||
Sanlam | 30,736 | 173 | ||||||
Standard Bank Group | 7,111 | 92 | ||||||
Telkom | 29,987 | 171 | ||||||
|
| |||||||
| 1,768 | ||||||||
|
| |||||||
South Korea — 3.6% | ||||||||
Hanssem | 350 | 71 | ||||||
Hyundai Mobis | 2,024 | 408 | ||||||
Korea Electric Power | 1,674 | 70 | ||||||
LG.Philips LCD | 510 | 14 | ||||||
NAVER | 360 | 198 | ||||||
POSCO | 1,163 | 256 | ||||||
Samsung Electronics | 1,162 | 1,370 | ||||||
SK Hynix | 9,239 | 426 | ||||||
SK Telecom | 991 | 220 | ||||||
YESCO | 577 | 20 | ||||||
|
| |||||||
| 3,053 | ||||||||
|
| |||||||
Spain — 1.3% | ||||||||
Amadeus IT Holding, Cl A | 15,987 | 726 | ||||||
Inditex | 11,730 | 388 | ||||||
|
| |||||||
| 1,114 | ||||||||
|
| |||||||
| Description | Shares | Market Value ($ Thousands) | ||||||
Sweden — 2.8% | ||||||||
Atlas Copco, Cl B | 16,572 | $ | 445 | |||||
Betsson | 5,055 | 75 | ||||||
BillerudKorsnas | 9,170 | 155 | ||||||
Biotage | 26,437 | 57 | ||||||
Boliden | 7,501 | 161 | ||||||
Catella | 21,753 | 41 | ||||||
Fastighets Balder, Cl B * | 1,442 | 24 | ||||||
Getinge, Cl B | 19,628 | 473 | ||||||
Lundbergforetagen, Cl B | 4,181 | 191 | ||||||
Proact IT Group | 1,997 | 27 | ||||||
Probi | 957 | 16 | ||||||
Svenska Handelsbanken, Cl A | 34,152 | 513 | ||||||
Volvo, Cl B | 12,944 | 168 | ||||||
|
| |||||||
| 2,346 | ||||||||
|
| |||||||
Switzerland — 4.5% | ||||||||
Adecco | 2,530 | 200 | ||||||
Cie Financiere Richemont | 1,807 | 156 | ||||||
Credit Suisse Group ADR | 11,327 | 300 | ||||||
Geberit | 570 | 204 | ||||||
Highlight Communications | 7,326 | 36 | ||||||
Nestle | 8,081 | 624 | ||||||
Novartis | 2,850 | 292 | ||||||
Novartis ADR | 6,591 | 677 | ||||||
Roche Holding | 2,724 | 798 | ||||||
Siegfried Holding | 1,124 | 204 | ||||||
Swiss Life Holding | 31 | 7 | ||||||
Swiss Re | 2,950 | 264 | ||||||
Tamedia | 129 | 21 | ||||||
|
| |||||||
| 3,783 | ||||||||
|
| |||||||
Taiwan — 3.4% | ||||||||
Advanced Semiconductor Engineering | 204,000 | 293 | ||||||
Advanced Semiconductor Engineering ADR | 32,727 | 231 | ||||||
AU Optronics ADR | 14,611 | 79 | ||||||
Hermes Microvision | 1,000 | 79 | ||||||
Hon Hai Precision Industry | 100,097 | 323 | ||||||
Hon Hai Precision Industry GDR | 54,499 | 353 | ||||||
Pegatron | 3,633 | 11 | ||||||
Taiwan Semiconductor Manufacturing | 59,000 | 281 | ||||||
Taiwan Semiconductor Manufacturing ADR | 47,091 | 1,143 | ||||||
TPK Holding * | 14,000 | 93 | ||||||
|
| |||||||
| 2,886 | ||||||||
|
| |||||||
Thailand — 0.0% | ||||||||
PTT | 400 | 4 | ||||||
Thai Vegetable Oil | 38,900 | 26 | ||||||
|
| |||||||
| 30 | ||||||||
|
| |||||||
Turkey — 1.1% | ||||||||
Akbank | 99,890 | 298 | ||||||
BIM Birlesik Magazalar | 7,799 | 143 | ||||||
Is Yatirim Menkul Degerler | 44,696 | 20 | ||||||
Soda Sanayii | 26,484 | 59 | ||||||
Turkiye Garanti Bankasi | 84,005 | 266 | ||||||
Turkiye Is Bankasi, Cl C | 80,913 | 172 | ||||||
|
| |||||||
| 958 | ||||||||
|
| |||||||
United Kingdom — 14.7% | ||||||||
3i Group | 25,250 | 217 | ||||||
Amlin | 33,259 | 247 | ||||||
Antofagasta | 10,613 | 121 | ||||||
ARM Holdings | 26,394 | 465 | ||||||
| 4 | SEI Institutional Investments Trust / Annual Report / May 31, 2015 |
SCHEDULE OF INVESTMENTS
Screened World Equity Ex-US Fund
May 31, 2015
| Description | Shares | Market Value ($ Thousands) | ||||||
ARM Holdings ADR | 20,756 | $ | 1,106 | |||||
Ashtead Group | 13,100 | 224 | ||||||
ASOS * | 2,562 | 144 | ||||||
Associated British Foods | 9,394 | 434 | ||||||
AstraZeneca | 6,447 | 430 | ||||||
Berkeley Group Holdings | 6,290 | 297 | ||||||
BG Group | 13,347 | 232 | ||||||
BHP Billiton | 194 | 4 | ||||||
BP | 21,255 | 146 | ||||||
BP PLC ADR | 5,984 | 248 | ||||||
British American Tobacco | 4,854 | 267 | ||||||
British Polythene Industries | 1,644 | 17 | ||||||
Britvic | 10,025 | 112 | ||||||
Burberry Group | 5,666 | 147 | ||||||
Capita | 17,477 | 334 | ||||||
Cenkos Securities | 9,445 | 27 | ||||||
Character Group * | 1,714 | 11 | ||||||
CML Microsystems | 2,278 | 12 | ||||||
CSR ADR | 1,161 | 63 | ||||||
Dart Group | 7,297 | 46 | ||||||
Dechra Pharmaceuticals | 610 | 10 | ||||||
Diageo | 19,249 | 533 | ||||||
Dixons Carphone | 11,640 | 84 | ||||||
entu UK | 3,698 | 8 | ||||||
Experian | 16,394 | 312 | ||||||
Gem Diamonds | 2,656 | 6 | ||||||
Greggs | 1,752 | 32 | ||||||
Halma | 10,200 | 119 | ||||||
Hargreaves Lansdown | 12,407 | 240 | ||||||
Hargreaves Services | 1,346 | 8 | ||||||
HSBC Holdings | 61,573 | 585 | ||||||
Impellam Group | 683 | 8 | ||||||
Indivior * | 4,527 | 16 | ||||||
ISG | 6,403 | 15 | ||||||
Just Eat * | 8,980 | 63 | ||||||
Man Group | 41,470 | 113 | ||||||
Mondi | 1,927 | 43 | ||||||
NWF Group * | 20,576 | 43 | ||||||
Persimmon | 9,030 | 270 | ||||||
Prudential | 30,062 | 746 | ||||||
Rio Tinto | 10,091 | 440 | ||||||
Rio Tinto ADR | 8,836 | 387 | ||||||
RM | 1,976 | 4 | ||||||
Rolls-Royce Holdings | 11,606 | 177 | ||||||
Schroders | 363 | 19 | ||||||
Shire | 14,843 | 1,276 | ||||||
Shoe Zone | �� | 5,464 | 16 | |||||
St. Ives | 2,512 | 7 | ||||||
St. James’s Place | 16,271 | 226 | ||||||
Standard Chartered | 13,250 | 212 | ||||||
Subsea 7 | 24,881 | 260 | ||||||
Trinity Mirror | 6,418 | 15 | ||||||
Tullow Oil | 28,480 | 172 | ||||||
Vodafone Group ADR | 289 | 11 | ||||||
Wolseley | 8,629 | 532 | ||||||
Xchanging | 2,560 | 5 | ||||||
|
| |||||||
| 12,364 | ||||||||
|
| |||||||
United States — 1.8% | ||||||||
Carnival, Cl A | 12,633 | 585 | ||||||
Everest Re Group | 3,913 | 710 | ||||||
PriceSmart | 2,055 | 168 | ||||||
Signet Jewelers | 660 | 85 | ||||||
| Description | Shares/Face Amount ($ Thousands)/ Number of Rights | Market Value ($ Thousands) | ||||||
| $ | 1,548 | |||||||
|
| |||||||
Total Common Stock | 79,060 | |||||||
|
| |||||||
PREFERRED STOCK — 1.1% | ||||||||
Brazil — 1.1% | ||||||||
Banco Bradesco | 37,680 | 334 | ||||||
Centrais Eletricas Santa Catarina | 8,800 | 43 | ||||||
Itau Unibanco Holding | 42,510 | 459 | ||||||
Itau Unibanco Holding ADR | 13,929 | 149 | ||||||
|
| |||||||
| 985 | ||||||||
|
| |||||||
Germany — 0.0% | ||||||||
Einhell Germany | 165 | 6 | ||||||
Hornbach Holding | 312 | 27 | ||||||
Westag & Getalit | 305 | 7 | ||||||
|
| |||||||
| 40 | ||||||||
|
| |||||||
Total Preferred Stock | 1,025 | |||||||
|
| |||||||
RIGHTS * — 0.0% | ||||||||
Brazil — 0.0% | ||||||||
CETIP—Mercados Organizados, | — | — | ||||||
|
| |||||||
Italy — 0.0% | ||||||||
UnipolSai ‡ | 32 | — | ||||||
UnipolSai ‡ | 32 | — | ||||||
|
| |||||||
| — | ||||||||
|
| |||||||
United Kingdom — 0.0% | ||||||||
Just Eat, Expires 06/08/2015 | 2 | 1 | ||||||
|
| |||||||
Total Rights | 1 | |||||||
|
| |||||||
U.S. TREASURY OBLIGATION (B)(C) — 0.0% |
| |||||||
U.S. Treasury Bills | $ | 16 | 16 | |||||
|
| |||||||
Total U.S. Treasury Obligation | 16 | |||||||
|
| |||||||
CASH EQUIVALENT — 0.4% | ||||||||
SEI Daily Income Trust, Prime | ||||||||
0.010% **† | 296,201 | 296 | ||||||
|
| |||||||
Total Cash Equivalent | 296 | |||||||
|
| |||||||
| 5 | SEI Institutional Investments Trust / Annual Report / May 31, 2015 |
SCHEDULE OF INVESTMENTS
Screened World Equity Ex-US Fund
May 31, 2015
| Description | Face Amount (Thousands)(1) | Market Value ($ Thousands) | ||||||
TIME DEPOSITS — 2.5% |
| |||||||
Brown Brothers Harriman | ||||||||
5.800%, 06/01/2015 | ZAR | 455 | $ | 38 | ||||
2.650%, 06/01/2015 | NZD | 2 | 1 | |||||
1.250%, 06/01/2015 | AUD | 60 | 46 | |||||
0.427%, 06/01/2015 | NOK | 100 | 13 | |||||
0.100%, 06/01/2015 | CAD | 16 | 13 | |||||
0.100%, 06/01/2015 | SGD | 13 | 9 | |||||
0.079%, 06/01/2015 | GBP | 65 | 100 | |||||
0.030%, 06/01/2015 | 1,611 | 1,611 | ||||||
0.005%, 06/01/2015 | HKD | 125 | 16 | |||||
0.005%, 06/01/2015 | JPY | 4,565 | 37 | |||||
(0.211)%, 06/01/2015 | EUR | 104 | 114 | |||||
(0.400)%, 06/01/2015 | SEK | 95 | 11 | |||||
(1.000)%, 06/01/2015 | CHF | 48 | 51 | |||||
(1.050)%, 06/01/2015 | DKK | 87 | 13 | |||||
|
| |||||||
Total Time Deposits |
| 2,073 | ||||||
|
| |||||||
Total Investments — 98.3% |
| $ | 82,471 | |||||
|
| |||||||
A list of the open futures contracts held by the Fund at M ay 31, 2015, is as follows:
| Type of Contract | Number of Contracts Long | Expiration Date | Unrealized Appreciation (Depreciation) ($ Thousands) | |||||||||
Euro-Stoxx | 9 | Jun-2015 | $ | (1 | ) | |||||||
FTSE 100 Index | 3 | Jun-2015 | (1 | ) | ||||||||
SPI 200 Index | 1 | Jun-2015 | — | |||||||||
Topix Index | 2 | Jun-2015 | 7 | |||||||||
|
| |||||||||||
| $ | 5 | |||||||||||
|
| |||||||||||
For the year ended May 31, 2015, the total amount of all open futures contracts, as presented in the table above, are representative of the volume of activity for this derivative type during the year.
Percentages are based on a Net Assets of $83,879 ($ Thousands).
| * | Non-income producing security. |
| ** | The rate reported is the 7-day effective yield as of May 31, 2015. |
| † | Investment in Affiliated Security (see Note 6). |
| ‡ | Expiration date unavailable. |
| (1) | In U.S. dollars unless otherwise indicated. |
| (A) | Security fair valued using methods determined in good faith by the Valuation Committee of the Board of Trustees. The total market value of such securities as of May 31, 2015 was $91 ($ Thousands) and represented 0.1% of Net Assets. |
| (B) | Security, or portion thereof, has been pledged as collateral on open futures contracts. |
| (C) | The rate reported is the effective yield at time of purchase. |
ADR — American Depositary Receipt
AUD — Australian Dollar
CAD — Canadian Dollar
CHF — Swiss Franc
Cl — Class
DKK — Danish Krone
EUR — Euro
FTSE — Financial Times and Stock Exchange
GBP — British Pound Sterling
GDR — Global Depositary Receipt
HKD — Hong Kong Dollar
JPY — Japanese Yen
NOK — Norwegian Krone
NZD — New Zealand Dollar
PLC — Public Limited Company
S&P — Standard & Poor’s
SEK — Swedish Krona
SGD — Singapore Dollar
SPI — Share Price Index
Ser — Series
ZAR — South African Rand
The following is a list of the level of inputs used as of May 31, 2015, in valuing the Fund’s investments and other financial instruments carried at value ($ Thousands):
| Investments in Securities | Level 1 | Level 2 | Level 3(1) | Total | ||||||||||||
Common Stock | $ | 78,968 | $ | 1 | $ | 91 | $ | 79,060 | ||||||||
Preferred Stock | 1,025 | — | — | 1,025 | ||||||||||||
Rights | 1 | — | — | 1 | ||||||||||||
U.S. Treasury Obligation | — | 16 | — | 16 | ||||||||||||
Cash Equivalent | 296 | — | — | 296 | ||||||||||||
Time Deposits | — | 2,073 | — | 2,073 | ||||||||||||
|
|
|
|
|
|
|
| |||||||||
Total Investments in Securities | $ | 80,290 | $ | 2,090 | $ | 91 | $ | 82,471 | ||||||||
|
|
|
|
|
|
|
| |||||||||
| Other Financial Instruments | Level 1 | Level 2 | Level 3 | Total | ||||||||||||
Futures Contracts * | ||||||||||||||||
Unrealized Appreciation | $ | 7 | $ | — | $ | — | $ | 7 | ||||||||
Unrealized Depreciation | (2 | ) | — | — | (2 | ) | ||||||||||
|
|
|
|
|
|
|
| |||||||||
Total Other Financial Instruments | $ | 5 | $ | — | $ | — | $ | 5 | ||||||||
|
|
|
|
|
|
|
| |||||||||
| (1) | A reconciliation of Level 3 investments is presented when the Fund has a significant amount of Level 3 investments at the beginning and/or end of the period in relation to net assets. |
| * | Futures contracts are valued at the unrealized appreciation (depreciation) on the instrument. |
For the year ended May 31, 2015, there were transfers between Level 1 and Level 2 assets and liabilities. The primary reason for changes in the classifications between Levels 1 and 2 occurs when foreign equity securities are fair valued using other observable market-based inputs in place of the closing exchange price due to events occurring after the close of the exchange or market on which the investment is principally traded.
For the year ended May 31, 2015, there were no transfers between Level 2 and Level 3 assets and liabilities.
For more information on valuation inputs, see Note 2 — Significant Accounting Policies in Notes to Financial Statements.
Amounts designated as “—” are $0 or have been rounded to $0.
The accompanying notes are an integral part of the financial statements.
| 6 | SEI Institutional Investments Trust / Annual Report / May 31, 2015 |
SCHEDULE OF INVESTMENTS
Emerging Markets Equity Fund
May 31, 2015
| Description | Shares | Market Value ($ Thousands) | ||||||
COMMON STOCK — 71.6% |
| |||||||
Argentina — 1.5% | ||||||||
Banco Macro ADR | 15,910 | $ | 788 | |||||
Cresud SACIF y A ADR * | 38,927 | 516 | ||||||
Grupo Financiero Galicia ADR | 72,296 | 1,448 | ||||||
MercadoLibre | 26,465 | 3,841 | ||||||
Telecom Argentina ADR | 11,920 | 234 | ||||||
YPF ADR | 80,344 | 2,231 | ||||||
|
| |||||||
| 9,058 | ||||||||
|
| |||||||
Botswana — 0.0% | ||||||||
Sechaba Breweries | 75,550 | 217 | ||||||
|
| |||||||
Brazil — 3.9% | ||||||||
Ambev | 193,100 | 1,113 | ||||||
Ambev ADR | 435,090 | 2,502 | ||||||
B2W Cia Digital * | 67,300 | 519 | ||||||
Banco do Brasil | 146,500 | 1,049 | ||||||
BB Seguridade Participacoes | 41,700 | 439 | ||||||
BR Malls Participacoes | 25,100 | 119 | ||||||
BRF ADR | 92,115 | 1,862 | ||||||
Cia de Saneamento Basico do Estado de Sao Paulo ADR | 72,541 | 421 | ||||||
Cielo | 40,560 | 512 | ||||||
Cosan Industria e Comercio (Brazil) | 25,300 | 197 | ||||||
Cyrela Brazil Realty Empreendimentos e Participacoes | 89,200 | 308 | ||||||
EcoRodovias Infraestrutura e Logistica | 98,500 | 234 | ||||||
Embraer ADR | 68,420 | 2,061 | ||||||
Estacio Participacoes | 32,300 | 187 | ||||||
Even Construtora e Incorporadora | 298,900 | 355 | ||||||
Ez Tec Empreendimentos e Participacoes | 24,299 | 126 | ||||||
JBS | 843,900 | 4,116 | ||||||
Light | 87,900 | 470 | ||||||
Lojas Americanas | 36,800 | 144 | ||||||
Lojas Renner | 19,100 | 646 | ||||||
M Dias Branco | 12,800 | 349 | ||||||
Petroleo Brasileiro ADR, Cl A * | 239,300 | 1,850 | ||||||
Porto Seguro | 42,400 | 486 | ||||||
Raia Drogasil | 25,800 | 292 | ||||||
SLC Agricola | 42,000 | 207 | ||||||
TOTVS | 186,400 | 2,239 | ||||||
Vale ADR, Cl B | 16,400 | 87 | ||||||
|
| |||||||
| 22,890 | ||||||||
|
| |||||||
Canada — 0.3% | ||||||||
Africa Oil * | 258,700 | 543 | ||||||
Bankers Petroleum * | 124,426 | 303 | ||||||
Canacol Energy * | 129,441 | 303 | ||||||
Gran Tierra Energy * | 272,560 | 793 | ||||||
|
| |||||||
| 1,942 | ||||||||
|
| |||||||
Chile — 0.7% | ||||||||
Banco de Chile | 6,805,271 | 783 | ||||||
Banco Santander Chile | 16,057,746 | 864 | ||||||
Cencosud | 178,001 | 451 | ||||||
Empresas COPEC | 17,936 | 205 | ||||||
| Description | Shares | Market Value ($ Thousands) | ||||||
Forus | 107,300 | $ | 397 | |||||
Parque Arauco | 359,880 | 696 | ||||||
Vina Concha y Toro | 276,275 | 533 | ||||||
|
| |||||||
| 3,929 | ||||||||
|
| |||||||
China — 10.2% | ||||||||
Agricultural Bank of China | 1,550,000 | 842 | ||||||
Bank of China | 11,232,000 | 7,462 | ||||||
Bank of Chongqing | 925,000 | 922 | ||||||
BYD Electronic International | 504,500 | 824 | ||||||
Changyou.com ADR * | 17,400 | 542 | ||||||
China CITIC Bank | 152,000 | 129 | ||||||
China Communications Construction | 1,413,000 | 2,443 | ||||||
China Construction Bank | 4,543,000 | 4,566 | ||||||
China Everbright Bank | 3,292,000 | 2,089 | ||||||
China Life Insurance | 275,000 | 1,321 | ||||||
China Minsheng Banking | 216,000 | 298 | ||||||
China Petroleum & Chemical | 618,000 | 545 | ||||||
China Petroleum & Chemical ADR | 8,800 | 771 | ||||||
China Railway Construction | 730,500 | 1,347 | ||||||
China Railway Group | 1,086,000 | 1,404 | ||||||
China Shenhua Energy | 266,500 | 655 | ||||||
Ctrip.com International ADR * | 39,300 | 3,139 | ||||||
Datang International Power Generation | 1,064,000 | 623 | ||||||
Dongfeng Motor Group | 26,000 | 43 | ||||||
Evergrande Real Estate Group | 1,113,000 | 725 | ||||||
Fufeng Group | 995,000 | 817 | ||||||
Great Wall Motor | 283,500 | 1,830 | ||||||
Guangzhou R&F Properties | 836,000 | 980 | ||||||
Huaneng Power International | 714,000 | 956 | ||||||
Industrial & Commercial Bank of China | 4,014,000 | 3,495 | ||||||
JA Solar Holdings ADR * | 45,400 | 385 | ||||||
Jiangnan Group | 2,780,000 | 861 | ||||||
Jiangsu Expressway | 548,000 | 763 | ||||||
Jiangxi Copper | 390,000 | 774 | ||||||
Kingdee International Software Group | 1,116,000 | 893 | ||||||
Maanshan Iron & Steel * | 1,632,000 | 642 | ||||||
NetEase ADR | 6,500 | 919 | ||||||
PetroChina | 750,000 | 889 | ||||||
PetroChina ADR | 800 | 95 | ||||||
PICC Property & Casualty | 74,000 | 170 | ||||||
Qunar Cayman Islands ADR * | 58,435 | 2,576 | ||||||
Sihuan Pharmaceutical Holdings Group | 27,000 | 15 | ||||||
Sinopec Engineering Group | 362,500 | 356 | ||||||
Sinopharm Group | 197,200 | 941 | ||||||
Tencent Holdings | 303,200 | 6,090 | ||||||
Tsingtao Brewery | 244,000 | 1,565 | ||||||
WuXi PharmaTech Cayman ADR * | 35,495 | 1,527 | ||||||
Zhejiang Expressway | 1,312,000 | 2,045 | ||||||
|
| |||||||
| 60,274 | ||||||||
|
| |||||||
Colombia — 1.1% | ||||||||
Bancolombia | 36,850 | 356 | ||||||
Bancolombia ADR, Cl R | 52,265 | 2,129 | ||||||
Canacol Energy * | 47,490 | 110 | ||||||
Constructora Conconcreto | 118,520 | 52 | ||||||
Ecopetrol | 1,114,202 | 797 | ||||||
Ecopetrol ADR | 22,920 | 332 | ||||||
| 1 | SEI Institutional Investments Trust / Annual Report / May 31, 2015 |
SCHEDULE OF INVESTMENTS
Emerging Markets Equity Fund
May 31, 2015
| Description | Shares | Market Value ($ Thousands) | ||||||
Empresa de Telecomunicaciones de Bogota | 1,313,720 | $ | 267 | |||||
Financiera Colombiana | 22,780 | 328 | ||||||
Financiera Colombiana ADR | 12,420 | 333 | ||||||
Grupo Aval Acciones y Valores | 1,021,100 | 507 | ||||||
Grupo Aval Acciones y Valores ADR | 150,242 | 1,511 | ||||||
|
| |||||||
| 6,722 | ||||||||
|
| |||||||
Czech Republic — 0.4% | ||||||||
CEZ | 53,187 | 1,323 | ||||||
Komercni Banka | 3,795 | 814 | ||||||
|
| |||||||
| 2,137 | ||||||||
|
| |||||||
Egypt — 0.7% | ||||||||
Commercial International Bank Egypt GDR | 395,662 | 2,706 | ||||||
Edita Food Industries SAE GDR *(A) | 6,817 | 120 | ||||||
Global Telecom Holding SAE GDR * | 59,420 | 111 | ||||||
Integrated Diagnostics Holdings * | 219,277 | 1,309 | ||||||
|
| |||||||
| 4,246 | ||||||||
|
| |||||||
Georgia — 0.1% | ||||||||
Bank of Georgia Holdings | 14,250 | 406 | ||||||
|
| |||||||
Greece — 0.1% | ||||||||
FF Group | 15,100 | 412 | ||||||
Hellenic Telecommunications Organization | 29,123 | 258 | ||||||
|
| |||||||
| 670 | ||||||||
|
| |||||||
Hong Kong — 4.3% | ||||||||
Belle International Holdings | 285,000 | 364 | ||||||
China Everbright | 330,000 | 1,313 | ||||||
China Machinery Engineering | 303,000 | 404 | ||||||
China Mobile | 150,500 | 1,982 | ||||||
China Mobile ADR | 57,900 | 3,807 | ||||||
China Taiping Insurance Holdings * | 153,600 | 626 | ||||||
China Traditional Chinese Medicine * | 830,000 | 707 | ||||||
CNOOC | 502,000 | 785 | ||||||
EVA Precision Industrial Holdings | 2,832,000 | 881 | ||||||
Far East Horizon | 351,000 | 341 | ||||||
Guotai Junan International Holdings | 774,000 | 1,486 | ||||||
Huabao International Holdings | 782,000 | 755 | ||||||
KWG Property Holding | 1,051,500 | 1,004 | ||||||
Lenovo Group | 26,000 | 41 | ||||||
Nanjing Sinolife United | 908,000 | 463 | ||||||
Poly Property Group | 1,837,000 | 1,012 | ||||||
Shenzhen International Holdings | 248,500 | 443 | ||||||
Shenzhen Investment | 2,470,000 | 1,338 | ||||||
Sinosoft Technology Group | 592,000 | 563 | ||||||
Skyworth Digital Holdings | 1,738,000 | 1,661 | ||||||
Sun Hung Kai | 674,000 | 685 | ||||||
Sunac China Holdings | 658,000 | 773 | ||||||
Sunny Optical Technology Group | 270,000 | 593 | ||||||
Wasion Group Holdings | 768,000 | 1,191 | ||||||
| Description | Shares | Market Value ($ Thousands) | ||||||
Wynn Macau | 708,800 | $ | 1,337 | |||||
Xinyi Solar Holdings | 1,668,000 | 781 | ||||||
|
| |||||||
| 25,336 | ||||||||
|
| |||||||
Hungary — 0.1% | ||||||||
Magyar Telekom Telecommunications | 249,655 | 368 | ||||||
|
| |||||||
India — 2.1% | ||||||||
Dr Reddy’s Laboratories ADR | 108,860 | 6,034 | ||||||
ICICI Bank ADR | 236,900 | 2,502 | ||||||
Infosys ADR | 30,100 | 959 | ||||||
Tata Motors ADR | 80,200 | 3,072 | ||||||
|
| |||||||
| 12,567 | ||||||||
|
| |||||||
Indonesia — 3.3% | ||||||||
Ace Hardware Indonesia | 6,572,000 | 343 | ||||||
Adhi Karya Persero | 2,529,900 | 479 | ||||||
Alam Sutera Realty | 7,425,500 | 337 | ||||||
Astra International | 586,900 | 324 | ||||||
Bank Central Asia | 1,146,727 | 1,225 | ||||||
Bank Negara Indonesia Persero | 4,402,800 | 2,289 | ||||||
Bank Rakyat Indonesia Persero | 2,388,000 | 2,126 | ||||||
Indocement Tunggal Prakarsa | 791,426 | 1,341 | ||||||
Indofood Sukses Makmur | 1,599,300 | 883 | ||||||
Kalbe Farma | 15,937,000 | 2,217 | ||||||
Malindo Feedmill | 2,938,500 | 414 | ||||||
Matahari Department Store | 339,500 | 448 | ||||||
Media Nusantara Citra | 1,003,500 | 156 | ||||||
Mitra Adiperkasa | 638,600 | 280 | ||||||
Pakuwon Jati | 33,244,061 | 1,111 | ||||||
Pan Brothers | 7,176,500 | 288 | ||||||
Panin Financial * | 17,635,500 | 405 | ||||||
Perusahaan Gas Negara Persero | 1,468,000 | 477 | ||||||
Surya Citra Media | 5,715,000 | 1,336 | ||||||
Telekomunikasi Indonesia Persero | 2,666,900 | 574 | ||||||
Tower Bersama Infrastructure | 3,093,500 | 2,205 | ||||||
|
| |||||||
| 19,258 | ||||||||
|
| |||||||
Ivory Coast — 0.0% | ||||||||
Cie Ivoirienne D Elect | 1,376 | 159 | ||||||
|
| |||||||
Jersey — 0.1% | ||||||||
WNS Holdings ADR * | 11,452 | 302 | ||||||
|
| |||||||
Kazakhstan — 0.2% | ||||||||
KazMunaiGas Exploration Production GDR | 27,581 | 290 | ||||||
KCell GDR | 135,361 | 1,179 | ||||||
|
| |||||||
| 1,469 | ||||||||
|
| |||||||
Kenya — 0.2% | ||||||||
ARM Cement | 293,010 | 219 | ||||||
Barclays Bank of Kenya | 1,679,060 | 264 | ||||||
East African Breweries | 81,510 | 251 | ||||||
Equity Group Holdings | 543,690 | 264 | ||||||
Safaricom | 1,561,350 | 254 | ||||||
|
| |||||||
| 1,252 | ||||||||
|
| |||||||
| 2 | SEI Institutional Investments Trust / Annual Report / May 31, 2015 |
SCHEDULE OF INVESTMENTS
Emerging Markets Equity Fund
May 31, 2015
| Description | Shares | Market Value ($ Thousands) | ||||||
Lithuania — 0.1% | ||||||||
Apranga PVA | 113,790 | $ | 334 | |||||
|
| |||||||
Malaysia — 1.0% | ||||||||
AMMB Holdings | 237,300 | 408 | ||||||
Astro Malaysia Holdings | 544,500 | 464 | ||||||
Axiata Group | 129,700 | 233 | ||||||
Berjaya Auto | 680,200 | 696 | ||||||
DiGi.Com | 189,100 | 289 | ||||||
Karex | 993,450 | 851 | ||||||
Malayan Banking | 211,300 | 520 | ||||||
Maxis | 138,400 | 260 | ||||||
Sime Darby | 316,100 | 717 | ||||||
Telekom Malaysia | 239,400 | 475 | ||||||
UMW Holdings | 300,200 | 878 | ||||||
|
| |||||||
| 5,791 | ||||||||
|
| |||||||
Mauritius — 0.0% | ||||||||
MCB Group | 47,500 | 271 | ||||||
|
| |||||||
Mexico — 2.7% | ||||||||
Alfa, Cl A | 185,800 | 364 | ||||||
America Movil, Ser L | 841,800 | 883 | ||||||
Arca Continental | 138,400 | 837 | ||||||
Banregio Grupo Financiero | 284,000 | 1,561 | ||||||
Controladora Vuela Cia de Aviacion ADR * | 32,074 | 383 | ||||||
Fomento Economico Mexicano | 53,300 | 474 | ||||||
Gentera | 337,500 | 579 | ||||||
Grupo Aeroportuario del Centro Norte Sab, Cl B | 111,434 | 522 | ||||||
Grupo Aeroportuario del Pacifico, Ser B | 45,700 | 325 | ||||||
Grupo Herdez | 71,000 | 183 | ||||||
Grupo Mexico, Ser B | 165,100 | 511 | ||||||
Grupo Televisa | 20,000 | 151 | ||||||
Grupo Televisa ADR | 98,565 | 3,731 | ||||||
Kimberly-Clark de Mexico, Cl A | 822,900 | 1,859 | ||||||
Megacable Holdings | 129,100 | 544 | ||||||
Southern Copper | 25,540 | 767 | ||||||
Wal-Mart de Mexico | 865,000 | 2,137 | ||||||
|
| |||||||
| 15,811 | ||||||||
|
| |||||||
Morocco — 0.2% | ||||||||
Attijariwafa Bank | 11,790 | 425 | ||||||
Ciments du Maroc | 4,560 | 562 | ||||||
|
| |||||||
| 987 | ||||||||
|
| |||||||
Nigeria — 0.6% | ||||||||
Guaranty Trust Bank | 8,078,095 | 1,167 | ||||||
Mobil Nigeria | 236,135 | 174 | ||||||
Nigerian Breweries | 264,580 | 200 | ||||||
Presco * | 1,266,930 | 224 | ||||||
SEPLAT Petroleum Development | 616,500 | 1,047 | ||||||
Zenith Bank | 9,013,573 | 960 | ||||||
|
| |||||||
| 3,772 | ||||||||
|
| |||||||
Oman — 0.1% | ||||||||
Bank Muscat | 607,435 | 852 | ||||||
|
| |||||||
Pakistan — 0.6% | ||||||||
| Description | Shares | Market Value ($ Thousands) | ||||||
Habib Bank | 1,800,000 | $ | 3,589 | |||||
|
| |||||||
Panama — 0.5% | ||||||||
Avianca Holdings ADR * | 126,077 | 1,302 | ||||||
Copa Holdings, Cl A | 16,075 | 1,371 | ||||||
InRetail Peru *(A) | 25,000 | 369 | ||||||
|
| |||||||
| 3,042 | ||||||||
|
| |||||||
Peru — 0.7% | ||||||||
Alicorp * | 263,220 | 476 | ||||||
Cementos Pacasmayo | 355,050 | 557 | ||||||
Credicorp | 12,401 | 1,750 | ||||||
Ferreycorp | 734,300 | 332 | ||||||
Intercorp Financial Services | 35,590 | 1,043 | ||||||
|
| |||||||
| 4,158 | ||||||||
|
| |||||||
Philippines — 4.0% | ||||||||
Aboitiz Equity Ventures | 251,130 | 315 | ||||||
Aboitiz Power | 523,700 | 505 | ||||||
Ayala | 44,120 | 782 | ||||||
Ayala Land | 897,100 | 806 | ||||||
BDO Unibank | 1,443,385 | 3,496 | ||||||
East West Banking * | 983,300 | 484 | ||||||
Emperador | 1,206,500 | 270 | ||||||
Globe Telecom | 12,200 | 698 | ||||||
GT Capital Holdings | 24,250 | 759 | ||||||
Jollibee Foods | 365,489 | 1,648 | ||||||
Megaworld | 21,972,084 | 2,341 | ||||||
Philippine Long Distance Telephone | 7,310 | 456 | ||||||
PNOC Energy Development (Philippines) | 4,026,500 | 714 | ||||||
Puregold Price Club | 811,451 | 692 | ||||||
Robinsons Land | 2,621,700 | 1,735 | ||||||
Robinsons Retail Holdings | 500,040 | 841 | ||||||
Security Bank | 331,200 | 1,159 | ||||||
SM Prime Holdings | 2,450,500 | 1,057 | ||||||
Universal Robina | 1,136,240 | 4,863 | ||||||
|
| |||||||
| 23,621 | ||||||||
|
| |||||||
Poland — 1.6% | ||||||||
Agora * | 45,224 | 150 | ||||||
Alior Bank * | 13,701 | �� | 339 | |||||
AmRest Holdings * | 7,587 | 299 | ||||||
CCC | 11,794 | 577 | ||||||
Eurocash | 310,925 | 3,084 | ||||||
PGE | 379,575 | 2,077 | ||||||
Powszechny Zaklad Ubezpieczen | 22,425 | 2,675 | ||||||
Tauron Polska Energia | 465,023 | 589 | ||||||
|
| |||||||
| 9,790 | ||||||||
|
| |||||||
Qatar — 0.5% | ||||||||
Al Khalij Commercial Bank | 76,690 | 462 | ||||||
Barwa Real Estate | 75,434 | 1,031 | ||||||
Qatar Electricity & Water | 8,660 | 505 | ||||||
United Development | 139,740 | 867 | ||||||
|
| |||||||
| 2,865 | ||||||||
|
| |||||||
Romania — 1.1% | ||||||||
Banca Transilvania * | 5,645,850 | 3,372 | ||||||
BRD-Groupe Societe Generale * | 224,005 | 615 | ||||||
OMV Petrom | 6,671,400 | 626 | ||||||
Societatea Nationala de Gaze | 203,673 | 1,794 | ||||||
|
| |||||||
| 6,407 | ||||||||
|
| |||||||
| 3 | SEI Institutional Investments Trust / Annual Report / May 31, 2015 |
SCHEDULE OF INVESTMENTS
Emerging Markets Equity Fund
May 31, 2015
| Description | Shares | Market Value ($ Thousands) | ||||||
Russia — 2.0% | ||||||||
Gazprom ADR | 442,619 | $ | 2,374 | |||||
Lukoil ADR | 36,751 | 1,760 | ||||||
MMC Norilsk Nickel ADR | 34,984 | 616 | ||||||
Sberbank of Russia ADR | 63,680 | 360 | ||||||
Sistema GDR | 50,618 | 385 | ||||||
Surgutneftegas ADR | 299,083 | 1,819 | ||||||
Tatneft ADR | 68,951 | 2,312 | ||||||
Yandex, Cl A * | 114,905 | 2,072 | ||||||
|
| |||||||
| 11,698 | ||||||||
|
| |||||||
South Africa — 2.7% | ||||||||
Aspen Pharmacare Holdings | 10,040 | 301 | ||||||
Aveng | 192,438 | 135 | ||||||
Barclays Africa Group | 50,770 | 733 | ||||||
Capitec Bank Holdings | 4,349 | 181 | ||||||
DataTec | 152,908 | 836 | ||||||
Exxaro Resources | 23,762 | 164 | ||||||
FirstRand | 443,622 | 1,896 | ||||||
Foschini Group | 18,955 | 253 | ||||||
Imperial Holdings | 12,953 | 194 | ||||||
Liberty Holdings | 52,218 | 674 | ||||||
Life Healthcare Group Holdings | 127,164 | 381 | ||||||
MMI Holdings | 695,062 | 1,749 | ||||||
MTN Group | 66,978 | 1,185 | ||||||
Netcare | 188,619 | 603 | ||||||
Northam Platinum * | 121,265 | 482 | ||||||
Redefine Properties ‡ | 792,900 | 697 | ||||||
Sasol | 22,578 | 795 | ||||||
Shoprite Holdings | 104,585 | 1,384 | ||||||
Sibanye Gold | 441,303 | 772 | ||||||
SPAR Group | 36,775 | 563 | ||||||
Standard Bank Group | 29,480 | 383 | ||||||
Steinhoff International Holdings | 146,946 | 909 | ||||||
Truworths International | 39,797 | 284 | ||||||
Tsogo Sun Holdings | 166,135 | 355 | ||||||
|
| |||||||
| 15,909 | ||||||||
|
| |||||||
South Korea — 7.9% | ||||||||
CJ | 2,214 | 479 | ||||||
Coway | 3,010 | 249 | ||||||
Daesang | 13,258 | 442 | ||||||
Daishin Securities | 28,900 | 308 | ||||||
Dongbu Insurance | 8,938 | 415 | ||||||
Halla Visteon Climate Control | 9,564 | 318 | ||||||
Hanmi Pharm * | 2,620 | 974 | ||||||
Hanwha | 19,173 | 747 | ||||||
Hanwha Life Insurance | 56,591 | 421 | ||||||
Heung-A Shipping, Cl A | 177,156 | 473 | ||||||
Hyosung | 2,236 | 232 | ||||||
Hyundai Development - | 15,135 | 826 | ||||||
Hyundai Marine & Fire Insurance | 16,389 | 411 | ||||||
Hyundai Motor | 4,641 | 662 | ||||||
HyVision System | 25,584 | 274 | ||||||
Iljin Display | 42,158 | 405 | ||||||
i-SENS * | 6,569 | 323 | ||||||
Kangwon Land | 19,360 | 704 | ||||||
KC Green Holdings | 26,138 | 289 | ||||||
Kia Motors | 38,360 | 1,649 | ||||||
Korea Aerospace Industries | 16,163 | 929 | ||||||
| Description | Shares | Market Value ($ Thousands) | ||||||
Korea Electric Power ADR | 125,100 | $ | 2,586 | |||||
Korea Investment Holdings | 9,690 | 580 | ||||||
Korea Petro Chemical Industries | 2,790 | 421 | ||||||
Korean Air Lines * | 18,127 | 662 | ||||||
KT&G | 37,256 | 3,241 | ||||||
Kyongnam Bank * | 88,213 | 788 | ||||||
LG | 9,335 | 525 | ||||||
LG Display ADR | 91,600 | 1,210 | ||||||
LG Electronics | 467 | 23 | ||||||
LG.Philips LCD | 23,380 | 617 | ||||||
LS Industrial Systems * | 5,693 | 272 | ||||||
MDS Technology | 15,767 | 332 | ||||||
Medy-Tox | 9,120 | 3,833 | ||||||
Meritz Fire & Marine Insurance | 62,758 | 824 | ||||||
NAVER | 3,195 | 1,756 | ||||||
OCI Materials | 12,844 | 1,328 | ||||||
S&T Motiv | 8,317 | 493 | ||||||
S-1 | 4,860 | 363 | ||||||
Samsung Electronics | 5,525 | 6,516 | ||||||
Samsung Life Insurance | 2,969 | 300 | ||||||
Samsung Techwin | 11,091 | 269 | ||||||
SFA Engineering | 6,515 | 277 | ||||||
Simm Tech | 34,572 | 301 | ||||||
SK C&C | 2,365 | 532 | ||||||
SK Holdings | 1,762 | 284 | ||||||
SK Hynix | 65,784 | 3,033 | ||||||
SK Telecom | 3,221 | 717 | ||||||
SK Telecom ADR | 96,000 | 2,346 | ||||||
Tovis | 39,399 | 562 | ||||||
Woongjin Thinkbig | 45,258 | 447 | ||||||
|
| |||||||
| 46,968 | ||||||||
|
| |||||||
Spain — 0.0% | ||||||||
Cemex Latam Holdings * | 36,170 | 178 | ||||||
|
| |||||||
Taiwan — 9.0% | ||||||||
ASPEED Technology * | 26,000 | 266 | ||||||
Asustek Computer | 205,000 | 2,017 | ||||||
AU Optronics ADR | 356,200 | 1,927 | ||||||
Cathay Financial Holding | 173,000 | 310 | ||||||
Chailease Holding | 94,000 | 238 | ||||||
Cheng Shin Rubber Industry | 116,000 | 268 | ||||||
Chicony Electronics | 387,000 | 1,082 | ||||||
China Life Insurance | 707,000 | 792 | ||||||
Chipbond Technology | 286,000 | 664 | ||||||
Compal Electronics | 1,891,000 | 1,565 | ||||||
Coretronic | 656,000 | 844 | ||||||
CTCI | 144,000 | 248 | ||||||
Delta Electronics | 152,000 | 869 | ||||||
Far Eastern Department Stores | 332,000 | 245 | ||||||
Farglory Land Development | 146,000 | 166 | ||||||
Fubon Financial Holding | 1,085,000 | 2,234 | ||||||
Global Lighting Technologies | 272,000 | 380 | ||||||
Highwealth Construction | 211,000 | 529 | ||||||
Hon Hai Precision Industry | 1,039,000 | 3,355 | ||||||
Innolux, Cl A | 2,336,000 | 1,446 | ||||||
Inventec | 1,455,000 | 1,043 | ||||||
Lite-On Technology | 1,285,000 | 1,650 | ||||||
LuxNet * | 167,000 | 507 | ||||||
Macauto Industrial * | 77,000 | 301 | ||||||
Makalot Industrial | 94,000 | 808 | ||||||
MediaTek | 86,000 | 1,161 | ||||||
Merida Industry | 41,000 | 296 | ||||||
PChome Online | 43,000 | 628 | ||||||
| 4 | SEI Institutional Investments Trust / Annual Report / May 31, 2015 |
SCHEDULE OF INVESTMENTS
Emerging Markets Equity Fund
May 31, 2015
| Description | Shares | Market Value ($ Thousands) | ||||||
Pegatron | 1,392,000 | $ | 4,154 | |||||
POU Chen | 297,000 | 426 | ||||||
Powertech Technology | 414,000 | 882 | ||||||
Quanta Computer | 302,000 | 766 | ||||||
Radiant Opto-Electronics | 224,000 | 821 | ||||||
Realtek Semiconductor | 113,000 | 345 | ||||||
Ruentex Development | 538,000 | 864 | ||||||
Silergy | 65,000 | 652 | ||||||
Silicon Motion Technology ADR | 30,778 | 1,091 | ||||||
Taishin Financial Holding | 893,000 | 387 | ||||||
Taiwan Cement | 789,000 | 1,072 | ||||||
Taiwan PCB Techvest | 448,000 | 675 | ||||||
Taiwan Semiconductor Manufacturing | 360,000 | 1,712 | ||||||
Taiwan Semiconductor Manufacturing ADR | 308,265 | 7,485 | ||||||
Transcend Information | 78,000 | 300 | ||||||
Tung Thih Electronic | 213,000 | 1,149 | ||||||
Vanguard International Semiconductor | 179,000 | 292 | ||||||
Wan Hai Lines | 687,000 | 656 | ||||||
Wistron | 909,000 | 746 | ||||||
WPG Holdings | 1,494,000 | 1,925 | ||||||
XAC Automation * | 288,000 | 904 | ||||||
|
| |||||||
| 53,143 | ||||||||
|
| |||||||
Thailand — 2.5% | ||||||||
Advanced Info Service | 59,200 | 412 | ||||||
Bangchak Petroleum | 1,036,000 | 1,024 | ||||||
Bangkok Dusit Medical Services | 874,700 | 502 | ||||||
Bangkok Expressway | 661,600 | 787 | ||||||
Beauty Community | 5,228,800 | 662 | ||||||
Kasikornbank | 156,506 | 908 | ||||||
Minor International | 932,036 | 845 | ||||||
PTT | 277,200 | 2,859 | ||||||
PTT Global Chemical | 438,900 | 855 | ||||||
Sansiri | 6,733,700 | 376 | ||||||
Siam Cement | 153,522 | 2,410 | ||||||
Siam Commercial Bank | 83,700 | 394 | ||||||
Srisawad Power 1979 | 510,408 | 637 | ||||||
Thai Union Frozen Products | 1,692,200 | 1,026 | ||||||
Thanachart Capital | 843,200 | 858 | ||||||
|
| |||||||
| 14,555 | ||||||||
|
| |||||||
Turkey — 1.3% | ||||||||
Aselsan Elektronik Sanayi Ve Ticaret | 50,222 | 263 | ||||||
Coca-Cola Icecek | 134,565 | 2,280 | ||||||
Eregli Demir ve Celik Fabrikalari | 658,958 | 1,060 | ||||||
Ford Otomotiv Sanayi | 57,874 | 775 | ||||||
Kardemir Karabuk Demir Celik Sanayi ve Ticaret, Cl D * | 746,615 | 454 | ||||||
Kordsa Global Endustriyel Iplik ve Kord Bezi Sanayi ve Ticaret | 246,427 | 426 | ||||||
TAV Havalimanlari Holding | 96,997 | 805 | ||||||
Tofas Turk Otomobil Fabrikasi | 90,693 | 615 | ||||||
Turk Traktor ve Ziraat Makineleri | 25,674 | 718 | ||||||
Yazicilar Holding, Cl A | 32,864 | 282 | ||||||
|
| |||||||
| 7,678 | ||||||||
|
| |||||||
Ukraine — 0.0% | ||||||||
MHP GDR | 21,050 | 230 | ||||||
|
| |||||||
United Arab Emirates — 2.2% | ||||||||
| Description | Shares/Number of P-Notes | Market Value ($ Thousands) | ||||||
Air Arabia | 761,270 | $ | 330 | |||||
Al Noor Hospitals Group | 217,016 | 3,159 | ||||||
DAMAC Properties Dubai * | 3,339,537 | 2,700 | ||||||
Dubai Islamic Bank | 775,887 | 1,420 | ||||||
Dubai Parks & Resorts * | 739,259 | 211 | ||||||
Emaar Properties | 1,111,417 | 2,339 | ||||||
Emirates NBD PJSC | 300,000 | 795 | ||||||
First Gulf Bank | 136,580 | 542 | ||||||
Mashreqbank | 13,325 | 406 | ||||||
NMC Health | 43,284 | 503 | ||||||
Ras Al Khaimah Ceramics | 639,770 | 556 | ||||||
|
| |||||||
| 12,961 | ||||||||
|
| |||||||
United Kingdom — 0.2% | ||||||||
Acacia Mining | 40,291 | 188 | ||||||
Genel Energy * | 45,964 | 370 | ||||||
|
| |||||||
| 558 | ||||||||
|
| |||||||
United States — 0.9% | ||||||||
Kansas City Southern | 18,485 | 1,673 | ||||||
Luxoft Holding, Cl A * | 7,117 | 381 | ||||||
PriceSmart | 42,608 | 3,474 | ||||||
|
| |||||||
| 5,528 | ||||||||
|
| |||||||
Total Common Stock | 423,898 | |||||||
|
| |||||||
EXCHANGE TRADED FUNDS — 17.0% | ||||||||
United States — 17.0% | ||||||||
iPath MSCI India Index ETN | 35,629 | 2,522 | ||||||
iShares MSCI Emerging Markets Index Fund | 2,176,395 | 89,493 | ||||||
iShares MSCI India ETF | 83,000 | 2,537 | ||||||
WisdomTree India Earnings Fund | 279,300 | 6,178 | ||||||
|
| |||||||
Total Exchange Traded Funds | 100,730 | |||||||
|
| |||||||
PARTICIPATION NOTES* — 7.9% | ||||||||
Aisino, Expires 12/09/19 | 97,746 | 1,469 | ||||||
Al Tayyar Travel Group,01/07/16 | 17,866 | 506 | ||||||
Al Tayyar Travel Group, Expires 03/05/18 | 43,829 | 1,242 | ||||||
ALAFCO Aviation Lease & Finance KSCP, Expires 12/20/18 | 236,767 | 170 | ||||||
Almacenes Exito, Expires 10/31/18 | 54,719 | 505 | ||||||
Arcelik, Expires 11/06/17 | 127,487 | 692 | ||||||
Baco Davivienda, Expires 12/05/18 | 49,770 | 506 | ||||||
Bank Alfalah, Expires 01/20/16 | 1,747,330 | 445 | ||||||
Beiqi Foton Motor, Expires 12/09/19 | 294,422 | 440 | ||||||
BRAC Bank, Expires 01/02/25 | 1,049,550 | 471 | ||||||
Bupa Arabia for Cooperative Insurance, Expires 04/05/17 | 47,188 | 2,966 | ||||||
Cemex Latam Holdings 10/31/18 | 266,756 | 1,335 | ||||||
CO For Cooperative Insurance, Expires 07/31/17 | 45,792 | 1,144 | ||||||
Constructora Conconcreto, Expires 12/05/18 | 497,710 | 224 | ||||||
Credit Agricole Egypt, Expires 12/02/19 | 112,880 | 344 | ||||||
| 5 | SEI Institutional Investments Trust / Annual Report / May 31, 2015 |
SCHEDULE OF INVESTMENTS
Emerging Markets Equity Fund
May 31, 2015
| Description | Number of P-Notes | Market Value ($ Thousands) | ||||||
Danang Rubber, Expires 06/03/19 | 173,770 | $ | 486 | |||||
DG Khan Cement, Expires 01/17/17 | 475,500 | 602 | ||||||
East African Breweries, Expires 10/31/17 | 597,938 | 1,831 | ||||||
Empresa de Telecomunicaciones de Bogota, Expires 12/05/18 | 1,784,970 | 362 | ||||||
Envoy Textiles, Expires 01/02/25 | 286,470 | 174 | ||||||
Fauji Cement, Expires 12/02/16 | 834,780 | 277 | ||||||
First Gulf Bank, Expires 08/14/15 | 153,114 | 608 | ||||||
First Gulf Bank, Expires 12/11/17 | 210,692 | 832 | ||||||
Fortis Healthcare, Expires 08/07/20 | 229,281 | 625 | ||||||
FPT, Expires 06/01/15 | 286,000 | 585 | ||||||
Fuyao Glass Industry Group, Expires 11/25/15 | 312,204 | 825 | ||||||
Glenmark Pharmaceuticals, Expires 06/28/18 | 46,738 | 641 | ||||||
GrameenPhone, Expires 07/08/21 | 106,850 | 444 | ||||||
Habib Bank, Expires 04/28/25 | 193,000 | 385 | ||||||
Hemas Holdings, Expires 12/03/15 | 279,260 | 168 | ||||||
Henan Pinggao, Expires 02/18/25 | 139,218 | 528 | ||||||
Huangshan Tourism Development, Expires 12/09/19 | 188,648 | 665 | ||||||
Jazeera Airways, Expires 12/20/18 | 376,700 | 566 | ||||||
John Keells Holdings, Expires 07/05/19 | 231,920 | 338 | ||||||
Kuwait Food Americana, Expires 02/24/16 | 51,210 | 444 | ||||||
LAUGFS Gas, Expires 12/03/15 | 695,016 | 196 | ||||||
LIC Housing Finance, Expires 03/08/19 | 50,141 | 329 | ||||||
LIC Housing Finance, Expires 03/08/19 | 33,512 | 220 | ||||||
Mabanee, Expires 08/05/19 | 147,177 | 461 | ||||||
Mobile World Investment, Expires 08/15/16 | 67,550 | 239 | ||||||
Mouwasat Medical Services, Expires 09/20/17 | 28,578 | 1,136 | ||||||
National Bank of Kuwait, Expires 03/24/16 | 1,412,712 | 3,823 | ||||||
National Bank of Kuwait SAKP, Expires 12/10/15 | 38,713 | 104 | ||||||
NCC, Expires 01/04/18 | 110,954 | 143 | ||||||
Palm Hills Developments SAE, Expires 05/02/18 | 1,509,286 | 604 | ||||||
Pegasus Hava Tasimaciligi, Expires 11/06/17 | 71,795 | 702 | ||||||
Pha Lai Thermal Power, Expires 01/17/17 | 132,400 | 137 | ||||||
Prestige Estates Projects, Expires 11/06/20 | 73,303 | 279 | ||||||
S.A.C.I. Falabella, Expires 11/07/18 | 110,376 | 833 | ||||||
| Description | Number of P-Notes/Shares | Market Value ($ Thousands) | ||||||
Samba Financial Group, Expires 03/02/17 | 210,887 | $ | 1,623 | |||||
Saudi Pharmaceuticals, Expires 12/05/17 | 149,169 | 1,909 | ||||||
Shanghai Jahwa United, Expires 03/20/20 | 76,432 | 578 | ||||||
Shriram Transport, Expires 06/30/15 | 23,362 | 301 | ||||||
Sinotrans Air, Expires 01/21/20 | 136,725 | 646 | ||||||
Sintex Industries, Expires 11/10/20 | 151,172 | 261 | ||||||
SKS Microfinance, Expires 11/05/18 | 89,372 | 647 | ||||||
Tokyo Cement Lanka, Expires 12/03/15 | 326,620 | 130 | ||||||
Turkiye Garanti Bankasi, Expires 11/30/17 | 329,183 | 1,032 | ||||||
United Bank, Expires 10/31/16 | 1,333,130 | 2,064 | ||||||
United Bank, Expires 01/17/17 | 37,560 | 58 | ||||||
United International Transportation, Expires 07/31/17 | 128,575 | 1,977 | ||||||
Vietnam Dairy Products, Expires 12/03/15 | 127,090 | 612 | ||||||
Vingroup, Expires 01/20/16 | 436,130 | 941 | ||||||
Yes Bank, Expires 11/25/19 | 36,258 | 497 | ||||||
|
| |||||||
Total Participation Notes | 46,327 | |||||||
|
| |||||||
PREFERRED STOCK — 1.2% |
| |||||||
Brazil — 1.0% | ||||||||
AES Tiete | 42,400 | 227 | ||||||
Banco do Estado do Rio Grande do Sul | 51,100 | 161 | ||||||
Bradespar | 212,400 | 754 | ||||||
Cia Energetica de Minas Gerais | 83,600 | 375 | ||||||
Cia Energetica de Sao Paulo | 82,300 | 505 | ||||||
Cia Paranaense de Energia | 82,800 | 858 | ||||||
Itau Unibanco Holding | 23,000 | 248 | ||||||
Itausa - Investimentos Itau | 493,570 | 1,376 | ||||||
Marcopolo | 106,100 | 94 | ||||||
Suzano Papel e Celulose, Cl A | 120,580 | 625 | ||||||
Vale, Cl A | 80,700 | 426 | ||||||
|
| |||||||
| 5,649 | ||||||||
|
| |||||||
Colombia — 0.1% | ||||||||
Banco Davivienda | 70,586 | 698 | ||||||
|
| |||||||
South Korea — 0.1% | ||||||||
LG Chemical | 3,939 | 631 | ||||||
|
| |||||||
Total Preferred Stock | 6,978 | |||||||
|
| |||||||
CASH EQUIVALENT — 0.5% | ||||||||
SEI Daily Income Trust, Prime Obligation Fund, Cl A | ||||||||
0.010% ** † | 2,799,884 | 2,800 | ||||||
|
| |||||||
| 6 | SEI Institutional Investments Trust / Annual Report / May 31, 2015 |
SCHEDULE OF INVESTMENTS
Emerging Markets Equity Fund
May 31, 2015
| Description | Face Amount (Thousands)(1) | Market Value ($ Thousands) | ||||||
Total Cash Equivalent | 2,800 | |||||||
|
| |||||||
TIME DEPOSITS — 1.2% | ||||||||
Brown Brothers Harriman | ||||||||
5.800%, 06/01/2015 | ZAR | 7 | 1 | |||||
0.100%, 06/01/2015 | CAD | 3 | 2 | |||||
0.079%, 06/01/2015 | GBP | 43 | 65 | |||||
0.030%, 06/01/2015 | 7,228 | 7,228 | ||||||
0.005%, 06/01/2015 | HKD | 269 | 35 | |||||
(0.211)%, 06/01/2015 | EUR | 20 | 22 | |||||
|
| |||||||
Total Time Deposits | $ | 7,353 | ||||||
|
| |||||||
Total Investments — 99.4% | $ | 588,086 | ||||||
|
| |||||||
Percentages are based on a Net Assets of $592,097 ($ Thousands).
| * | Non-income producing security. |
| ** | The rate reported is the 7-day effective yield as of May 31, 2015. |
| † | Investment in Affiliated Security (see Note 6). |
| ‡ | Real Estate Investment Trust. |
| ‡‡ | Expiration date is unavailable. |
| (1) | In U.S. dollars unless otherwise indicated. |
| (A) | Securities sold within terms of a private placement memorandum, exempt from registration under Section 144A of the Securities Act of 1933, as amended, and may be sold only to dealers in that program or other “accredited investors.” These securities have been determined to be liquid under guidelines established by the Board of Trustees. |
ADR — American Depositary Receipt
CAD — Canadian Dollar
Cl — Class
ETF — Exchange Traded Fund
ETN — Exchange Traded Fund
EUR — Euro
GBP — British Pound Sterling
GDR — Global Depositary Receipt
HKD — Hong Kong Dollar
MSCI — Morgan Stanley Capital International
Ser — Series
ZAR — South African Rand
The following is a list of the level of inputs used as of May 31, 2015, in valuing the Fund’s investments and other financial instruments carried at value ($ Thousands):
| Investments in Securities | Level 1 | Level 2 | Level 3 | Total | ||||||||||||
Common Stock | $ | 422,627 | $ | 1,271 | $ | — | $ | 423,898 | ||||||||
Exchange Traded Funds | 100,730 | — | — | 100,730 | ||||||||||||
Warrants | — | 46,327 | — | 46,327 | ||||||||||||
Preferred Stock | 6,978 | — | — | 6,978 | ||||||||||||
Cash Equivalent | 2,800 | — | — | 2,800 | ||||||||||||
Time Deposits | — | 7,353 | — | 7,353 | ||||||||||||
|
|
|
|
|
|
|
| |||||||||
Total Investments in Securities | $ | 533,135 | $ | 54,951 | $ | — | $ | 588,086 | ||||||||
|
|
|
|
|
|
|
| |||||||||
For the year ended May 31, 2015, there were no transfers between Level 1 and Level 2 and assets and liabilities.
For the year ended May 31, 2015, there were no transfers between Level 2 and Level 3 and assets and liabilities.
For more information on valuation inputs, see Note 2 — Significant Accounting Policies in Notes to Financial Statements.
Amounts designated as “—” are $0 or have been rounded to $0.
The accompanying notes are an integral part of the financial statements.
| 7 | SEI Institutional Investments Trust / Annual Report / May 31, 2015 |
CONSOLIDATED SCHEDULE OF INVESTMENTS
Dynamic Asset Allocation Fund
May 31, 2015
| Description | Shares | Market Value ($ Thousands) | ||||||
COMMON STOCK — 98.6% |
| |||||||
Consumer Discretionary — 12.3% |
| |||||||
Amazon.com * | 40,300 | $ | 17,298 | |||||
AutoNation * | 9,100 | 568 | ||||||
AutoZone * | 3,300 | 2,223 | ||||||
Bed Bath & Beyond * | 20,100 | 1,433 | ||||||
Best Buy | 30,300 | 1,051 | ||||||
BorgWarner | 23,500 | 1,414 | ||||||
Cablevision Systems, Cl A | 20,100 | 493 | ||||||
Carmax * | 21,800 | 1,549 | ||||||
Carnival, Cl A | 46,800 | 2,168 | ||||||
CBS, Cl B | 49,343 | 3,045 | ||||||
Chipotle Mexican Grill, Cl A * | 3,200 | 1,970 | ||||||
Coach | 29,500 | 1,043 | ||||||
Comcast, Cl A | 269,200 | 15,737 | ||||||
Darden Restaurants | 12,300 | 806 | ||||||
Delphi Automotive | 30,000 | 2,609 | ||||||
DIRECTV * | 52,300 | 4,761 | ||||||
Discovery Communications, Cl A * | 15,500 | 526 | ||||||
Discovery Communications, Cl C * | 29,700 | 934 | ||||||
Dollar General | 31,500 | 2,287 | ||||||
Dollar Tree * | 21,500 | 1,612 | ||||||
DR Horton | 35,800 | 935 | ||||||
Expedia | 10,800 | 1,158 | ||||||
Family Dollar Stores | 10,000 | 775 | ||||||
Ford Motor | 421,900 | 6,400 | ||||||
Fossil Group * | 4,400 | 312 | ||||||
GameStop, Cl A | 10,400 | 451 | ||||||
Gannett | 23,600 | 845 | ||||||
Gap | 28,200 | 1,081 | ||||||
Garmin | 14,100 | 641 | ||||||
General Motors | 140,700 | 5,061 | ||||||
Genuine Parts | 16,351 | 1,479 | ||||||
Goodyear Tire & Rubber | 27,200 | 866 | ||||||
H&R Block | 28,600 | 908 | ||||||
Hanesbrands | 41,400 | 1,319 | ||||||
Harley-Davidson | 21,100 | 1,129 | ||||||
Harman International Industries | 7,200 | 868 | ||||||
Hasbro | 12,600 | 909 | ||||||
Home Depot | 139,632 | 15,558 | ||||||
Interpublic Group | 42,900 | 876 | ||||||
Johnson Controls | 68,200 | 3,548 | ||||||
Kohl’s | 21,000 | 1,375 | ||||||
L Brands | 25,500 | 2,206 | ||||||
Leggett & Platt | 14,400 | 681 | ||||||
Lennar, Cl A | 20,000 | 933 | ||||||
Lowe’s | 102,200 | 7,152 | ||||||
Macy’s | 35,800 | 2,397 | ||||||
Marriott International, Cl A | 20,900 | 1,630 | ||||||
Mattel | 36,400 | 939 | ||||||
McDonald’s | 102,100 | 9,794 | ||||||
Michael Kors Holdings * | 20,100 | 935 | ||||||
Mohawk Industries * | 6,728 | 1,256 | ||||||
NetFlix * | 6,300 | 3,932 | ||||||
Newell Rubbermaid | 28,200 | 1,115 | ||||||
News, Cl A * | 54,100 | 820 | ||||||
NIKE, Cl B | 73,500 | 7,473 | ||||||
Nordstrom | 15,000 | 1,090 | ||||||
Omnicom Group | 25,700 | 1,915 | ||||||
O’Reilly Automotive * | 10,800 | 2,371 | ||||||
Priceline Group * | 5,500 | 6,446 | ||||||
PulteGroup | 31,700 | 608 | ||||||
PVH | 8,600 | 900 | ||||||
Description | Shares | Market Value ($ Thousands) | ||||||
Ralph Lauren | 6,500 | $ | 848 | |||||
Ross Stores | 21,700 | 2,098 | ||||||
Royal Caribbean Cruises | 16,500 | 1,254 | ||||||
Scripps Networks Interactive, Cl A | 10,000 | 670 | ||||||
Staples | 69,900 | 1,151 | ||||||
Starbucks | 157,500 | 8,184 | ||||||
Starwood Hotels & Resorts Worldwide | 18,400 | 1,523 | ||||||
Target | 68,100 | 5,402 | ||||||
Tiffany | 11,200 | 1,050 | ||||||
Time Warner | 88,400 | 7,468 | ||||||
Time Warner Cable, Cl A | 30,000 | 5,427 | ||||||
TJX | 71,000 | 4,571 | ||||||
Tractor Supply | 14,700 | 1,281 | ||||||
TripAdvisor * | 11,600 | 885 | ||||||
Twenty-First Century Fox, Cl A | 194,900 | 6,549 | ||||||
Under Armour, Cl A * | 17,900 | 1,404 | ||||||
Urban Outfitters * | 10,300 | 354 | ||||||
VF | 35,700 | 2,514 | ||||||
Viacom, Cl B | 38,100 | 2,548 | ||||||
Walt Disney | 165,562 | 18,273 | ||||||
Whirlpool | 8,100 | 1,492 | ||||||
Wyndham Worldwide | 12,900 | 1,095 | ||||||
Wynn Resorts | 8,400 | 846 | ||||||
Yum! Brands | 46,400 | 4,181 | ||||||
|
| |||||||
| 245,682 | ||||||||
|
| |||||||
Consumer Staples — 9.4% |
| |||||||
Altria Group | 209,100 | 10,706 | ||||||
Archer-Daniels-Midland | 65,900 | 3,483 | ||||||
Brown-Forman, Cl B | 16,200 | 1,527 | ||||||
Campbell Soup | 18,500 | 894 | ||||||
Clorox | 14,000 | 1,507 | ||||||
Coca-Cola | 416,200 | 17,048 | ||||||
Coca-Cola Enterprises | 22,500 | 995 | ||||||
Colgate-Palmolive | 91,000 | 6,078 | ||||||
ConAgra Foods | 45,900 | 1,772 | ||||||
Constellation Brands, Cl A | 17,500 | 2,063 | ||||||
Costco Wholesale | 46,300 | 6,602 | ||||||
CVS Health | 119,400 | 12,224 | ||||||
Dr. Pepper Snapple Group | 20,450 | 1,567 | ||||||
Estee Lauder, Cl A | 23,200 | 2,028 | ||||||
General Mills | 62,800 | 3,526 | ||||||
Hershey | 15,400 | 1,430 | ||||||
Hormel Foods | 14,000 | 801 | ||||||
JM Smucker | 11,182 | 1,326 | ||||||
Kellogg | 26,200 | 1,645 | ||||||
Keurig Green Mountain | 12,600 | 1,087 | ||||||
Kimberly-Clark | 39,200 | 4,267 | ||||||
Kraft Foods Group | 61,166 | 5,166 | ||||||
Kroger | 51,100 | 3,720 | ||||||
Lorillard | 37,200 | 2,696 | ||||||
McCormick | 13,300 | 1,044 | ||||||
Mead Johnson Nutrition, Cl A | 20,700 | 2,014 | ||||||
Molson Coors Brewing, Cl B | 16,600 | 1,218 | ||||||
Mondelez International, Cl A | 175,700 | 7,307 | ||||||
Monster Beverage * | 15,200 | 1,935 | ||||||
PepsiCo | 157,062 | 15,146 | ||||||
Philip Morris International | 164,000 | 13,624 | ||||||
Procter & Gamble | 285,800 | 22,404 | ||||||
Reynolds American | 32,000 | 2,456 | ||||||
Sysco | 60,700 | 2,256 | ||||||
Tyson Foods, Cl A | 30,200 | 1,282 | ||||||
Walgreens Boots Alliance | 91,600 | 7,863 | ||||||
Wal-Mart Stores | 167,555 | 12,444 | ||||||
Whole Foods Market | 37,500 | 1,547 | ||||||
|
| |||||||
| 186,698 | ||||||||
|
| |||||||
| 1 | SEI Institutional Investments Trust / Annual Report / May 31, 2015 |
CONSOLIDATED SCHEDULE OF INVESTMENTS
Dynamic Asset Allocation Fund
May 31, 2015
Description | Shares | Market Value ($ Thousands) | ||||||
Energy — 7.9% |
| |||||||
Anadarko Petroleum | 52,700 | $ | 4,406 | |||||
Apache | 38,700 | 2,316 | ||||||
Baker Hughes | 46,900 | 3,023 | ||||||
Cabot Oil & Gas | 45,300 | 1,538 | ||||||
Cameron International * | 19,600 | 1,006 | ||||||
Chesapeake Energy | 53,800 | 759 | ||||||
Chevron | 199,000 | 20,497 | ||||||
Cimarex Energy | 9,500 | 1,097 | ||||||
ConocoPhillips | 131,000 | 8,342 | ||||||
CONSOL Energy | 22,600 | 629 | ||||||
Devon Energy | 39,700 | 2,589 | ||||||
Diamond Offshore Drilling | 6,400 | 194 | ||||||
Ensco, Cl A | 24,400 | 574 | ||||||
EOG Resources | 57,000 | 5,055 | ||||||
EQT | 16,100 | 1,370 | ||||||
Exxon Mobil | 443,300 | 37,769 | ||||||
FMC Technologies * | 24,100 | 1,007 | ||||||
Halliburton | 88,300 | 4,009 | ||||||
Helmerich & Payne | 11,200 | 818 | ||||||
Hess | 26,400 | 1,783 | ||||||
Kinder Morgan | 178,977 | 7,426 | ||||||
Marathon Oil | 68,700 | 1,868 | ||||||
Marathon Petroleum | 28,855 | 2,985 | ||||||
Murphy Oil | 17,300 | 752 | ||||||
National Oilwell Varco | 42,200 | 2,076 | ||||||
Newfield Exploration * | 18,200 | 688 | ||||||
Noble | 23,600 | 395 | ||||||
Noble Energy | 40,600 | 1,778 | ||||||
Occidental Petroleum | 82,200 | 6,427 | ||||||
ONEOK | 22,400 | 939 | ||||||
Phillips 66 | 56,500 | 4,470 | ||||||
Pioneer Natural Resources | 15,500 | 2,291 | ||||||
QEP Resources | 16,800 | 316 | ||||||
Range Resources | 18,100 | 1,003 | ||||||
Schlumberger | 135,300 | 12,281 | ||||||
Southwestern Energy * | 40,500 | 1,044 | ||||||
Spectra Energy | 69,400 | 2,441 | ||||||
Tesoro | 13,000 | 1,151 | ||||||
Transocean | 38,700 | 730 | ||||||
Valero Energy | 53,400 | 3,164 | ||||||
Williams | 72,400 | 3,700 | ||||||
|
| |||||||
| 156,706 | ||||||||
|
| |||||||
Financials — 15.8% |
| |||||||
ACE | 33,800 | 3,599 | ||||||
Affiliated Managers Group * | 5,900 | 1,320 | ||||||
Aflac | 46,200 | 2,875 | ||||||
Allstate | 43,200 | 2,908 | ||||||
American Express | 93,300 | 7,438 | ||||||
American International Group | 145,900 | 8,551 | ||||||
American Tower, Cl A ‡ | 43,947 | 4,078 | ||||||
Ameriprise Financial | 19,000 | 2,367 | ||||||
Aon | 29,100 | 2,945 | ||||||
Apartment Investment & Management, Cl A ‡ | 18,300 | 694 | ||||||
Assurant | 8,200 | 540 | ||||||
AvalonBay Communities ‡ | 13,700 | 2,281 | ||||||
Bank of America | 1,113,900 | 18,379 | ||||||
Bank of New York Mellon | 115,800 | 5,021 | ||||||
BB&T | 74,100 | 2,925 | ||||||
Berkshire Hathaway, Cl B * | 192,900 | 27,585 | ||||||
BlackRock, Cl A | 13,541 | 4,953 | ||||||
Boston Properties ‡ | 15,800 | 2,055 | ||||||
| Description | Shares | Market Value ($ Thousands) | ||||||
Capital One Financial | 57,400 | $ | 4,796 | |||||
CBRE Group, Cl A * | 31,100 | 1,189 | ||||||
Charles Schwab | 120,000 | 3,798 | ||||||
Chubb | 24,700 | 2,408 | ||||||
Cincinnati Financial | 15,400 | 779 | ||||||
Citigroup | 321,300 | 17,376 | ||||||
CME Group, Cl A | 34,200 | 3,222 | ||||||
Comerica | 18,500 | 906 | ||||||
Crown Castle International ‡ | 34,300 | 2,797 | ||||||
Discover Financial Services | 46,600 | 2,716 | ||||||
E*TRADE Financial * | 30,000 | 884 | ||||||
Equity Residential ‡ | 38,100 | 2,832 | ||||||
Essex Property Trust ‡ | 6,700 | 1,492 | ||||||
Fifth Third Bancorp | 84,700 | 1,714 | ||||||
Franklin Resources | 40,700 | 2,072 | ||||||
General Growth Properties ‡ | 65,300 | 1,850 | ||||||
Genworth Financial, Cl A * | 45,000 | 357 | ||||||
Goldman Sachs Group | 43,100 | 8,887 | ||||||
Hartford Financial Services Group | 43,800 | 1,801 | ||||||
HCP ‡ | 47,300 | 1,831 | ||||||
Health Care ‡ | 36,000 | 2,529 | ||||||
Host Hotels & Resorts ‡ | 80,785 | 1,609 | ||||||
Hudson City Bancorp | 44,300 | 421 | ||||||
Huntington Bancshares | 84,200 | 937 | ||||||
Intercontinental Exchange | 11,569 | 2,739 | ||||||
Invesco | 44,800 | 1,784 | ||||||
Iron Mountain ‡ | 19,471 | 710 | ||||||
JPMorgan Chase | 394,400 | 25,944 | ||||||
KeyCorp | 88,900 | 1,296 | ||||||
Kimco Realty ‡ | 43,900 | 1,052 | ||||||
Legg Mason | 9,300 | 496 | ||||||
Leucadia National | 32,800 | 808 | ||||||
Lincoln National | 27,300 | 1,556 | ||||||
Loews | 32,200 | 1,292 | ||||||
M&T Bank | 14,000 | 1,692 | ||||||
Macerich ‡ | 14,600 | 1,199 | ||||||
Marsh & McLennan | 58,000 | 3,377 | ||||||
McGraw Hill Financial | 29,100 | 3,019 | ||||||
MetLife | 119,200 | 6,229 | ||||||
Moody’s | 18,447 | 1,994 | ||||||
Morgan Stanley | 164,400 | 6,280 | ||||||
NASDAQ OMX Group | 12,300 | 637 | ||||||
Navient | 39,300 | 757 | ||||||
Northern Trust | 23,100 | 1,722 | ||||||
People’s United Financial | 28,900 | 450 | ||||||
Plum Creek Timber ‡ | 18,300 | 755 | ||||||
PNC Financial Services Group | 55,700 | 5,330 | ||||||
Principal Financial Group | 28,800 | 1,489 | ||||||
Progressive | 56,300 | 1,539 | ||||||
Prologis ‡ | 53,300 | 2,110 | ||||||
Prudential Financial | 48,700 | 4,121 | ||||||
Public Storage ‡ | 15,700 | 3,039 | ||||||
Realty Income ‡ | 23,000 | 1,048 | ||||||
Regions Financial | 139,600 | 1,409 | ||||||
Simon Property Group ‡ | 33,200 | 6,023 | ||||||
SL Green Realty ‡ | 10,200 | 1,210 | ||||||
SunTrust Banks | 54,100 | 2,309 | ||||||
T. Rowe Price Group | 26,700 | 2,154 | ||||||
Torchmark | 12,300 | 702 | ||||||
Travelers | 33,800 | 3,418 | ||||||
Unum Group | 26,100 | 912 | ||||||
US Bancorp | 189,500 | 8,169 | ||||||
Ventas ‡ | 34,400 | 2,288 | ||||||
Vornado Realty Trust ‡ | 18,600 | 1,858 | ||||||
Wells Fargo | 495,800 | 27,745 | ||||||
| 2 | SEI Institutional Investments Trust / Annual Report / May 31, 2015 |
CONSOLIDATED SCHEDULE OF INVESTMENTS
Dynamic Asset Allocation Fund
May 31, 2015
| Description | Shares | Market Value ($ Thousands) | ||||||
Weyerhaeuser ‡ | 55,747 | $ | 1,815 | |||||
XL Group, Cl A | 31,400 | 1,183 | ||||||
Zions Bancorporation | 22,900 | 661 | ||||||
|
| |||||||
| 316,037 | ||||||||
|
| |||||||
Health Care — 14.9% |
| |||||||
Abbott Laboratories | 158,500 | 7,703 | ||||||
AbbVie | 182,500 | 12,153 | ||||||
Actavis * | 41,400 | 12,702 | ||||||
Aetna | 36,618 | 4,320 | ||||||
Agilent Technologies | 35,200 | 1,450 | ||||||
Alexion Pharmaceuticals * | 21,100 | 3,457 | ||||||
AmerisourceBergen | 21,761 | 2,449 | ||||||
Amgen | 80,500 | 12,579 | ||||||
Anthem | 28,600 | 4,801 | ||||||
Baxter International | 56,400 | 3,757 | ||||||
Becton Dickinson | 21,677 | 3,046 | ||||||
Biogen * | 24,900 | 9,885 | ||||||
Boston Scientific * | 138,100 | 2,523 | ||||||
Bristol-Myers Squibb | 176,300 | 11,389 | ||||||
C.R. Bard | 7,700 | 1,311 | ||||||
Cardinal Health | 34,000 | 2,998 | ||||||
Celgene * | 85,100 | 9,739 | ||||||
Cerner * | 31,700 | 2,133 | ||||||
Cigna | 26,800 | 3,774 | ||||||
DaVita HealthCare Partners * | 18,500 | 1,550 | ||||||
Dentsply International | 14,600 | 760 | ||||||
Edwards Lifesciences * | 11,200 | 1,464 | ||||||
Eli Lilly | 102,700 | 8,103 | ||||||
Endo International * | 18,300 | 1,533 | ||||||
Express Scripts Holding * | 77,500 | 6,753 | ||||||
Gilead Sciences | 157,756 | 17,711 | ||||||
HCA Holdings * | 30,300 | 2,479 | ||||||
Henry Schein * | 8,500 | 1,204 | ||||||
Hospira * | 17,900 | 1,583 | ||||||
Humana | 15,800 | 3,392 | ||||||
Intuitive Surgical * | 3,800 | 1,853 | ||||||
Johnson & Johnson | 294,000 | 29,441 | ||||||
Laboratory Corp of America Holdings * | 10,854 | 1,280 | ||||||
Mallinckrodt * | 12,200 | 1,579 | ||||||
McKesson | 24,900 | 5,907 | ||||||
Medtronic | 151,255 | 11,544 | ||||||
Merck | 300,600 | 18,303 | ||||||
Mylan * | 42,600 | 3,094 | ||||||
Patterson | 8,900 | 426 | ||||||
PerkinElmer | 12,000 | 633 | ||||||
Perrigo | 14,700 | 2,797 | ||||||
Pfizer | 648,596 | 22,539 | ||||||
Quest Diagnostics | 15,300 | 1,151 | ||||||
Regeneron Pharmaceuticals * | 7,700 | 3,947 | ||||||
St. Jude Medical | 29,500 | 2,176 | ||||||
Stryker | 31,400 | 3,018 | ||||||
Tenet Healthcare * | 9,100 | 484 | ||||||
Thermo Fisher Scientific | 41,300 | 5,354 | ||||||
UnitedHealth Group | 101,200 | 12,165 | ||||||
Universal Health Services, Cl B | 9,700 | 1,257 | ||||||
Varian Medical Systems * | 10,400 | 901 | ||||||
Vertex Pharmaceuticals * | 25,200 | 3,233 | ||||||
Waters * | 8,600 | 1,149 | ||||||
Zimmer Holdings | 17,400 | 1,985 | ||||||
Zoetis, Cl A | 51,967 | 2,586 | ||||||
|
| |||||||
| 297,503 | ||||||||
|
| |||||||
Industrials — 10.0% |
| |||||||
3M | 67,400 | 10,722 | ||||||
ADT | 18,500 | 675 | ||||||
| Description | Shares | Market Value ($ Thousands) | ||||||
Allegion | 10,933 | $ | 683 | |||||
American Airlines Group | 74,600 | 3,161 | ||||||
Ametek | 25,100 | 1,349 | ||||||
Boeing | 69,600 | 9,780 | ||||||
C.H. Robinson Worldwide | 15,200 | 938 | ||||||
Caterpillar | 64,800 | 5,529 | ||||||
Cintas | 10,400 | 895 | ||||||
CSX | 106,500 | 3,629 | ||||||
Cummins | 17,400 | 2,358 | ||||||
Danaher | 65,600 | 5,663 | ||||||
Deere | 36,100 | 3,382 | ||||||
Delta Air Lines | 85,200 | 3,657 | ||||||
Dover | 17,000 | 1,282 | ||||||
Dun & Bradstreet | 3,500 | 448 | ||||||
Eaton | 50,301 | 3,601 | ||||||
Emerson Electric | 71,000 | 4,282 | ||||||
Equifax | 12,400 | 1,244 | ||||||
Expeditors International of Washington | 19,900 | 912 | ||||||
Fastenal | 29,000 | 1,204 | ||||||
FedEx | 27,349 | 4,738 | ||||||
Flowserve | 14,000 | 770 | ||||||
Fluor | 15,200 | 855 | ||||||
General Dynamics | 32,800 | 4,597 | ||||||
General Electric | 1,064,300 | 29,023 | ||||||
Honeywell International | 83,200 | 8,669 | ||||||
Illinois Tool Works | 36,256 | 3,402 | ||||||
Ingersoll-Rand | 27,100 | 1,864 | ||||||
Jacobs Engineering Group * | 12,300 | 532 | ||||||
Joy Global | 9,300 | 362 | ||||||
Kansas City Southern | 11,600 | 1,050 | ||||||
L-3 Communications Holdings, Cl 3 | 8,600 | 1,013 | ||||||
Lockheed Martin | 27,900 | 5,251 | ||||||
Masco | 36,300 | 983 | ||||||
Nielsen Holdings | 40,200 | 1,809 | ||||||
Norfolk Southern | 31,800 | 2,926 | ||||||
Northrop Grumman | 20,600 | 3,279 | ||||||
Paccar | 36,400 | 2,313 | ||||||
Pall | 11,100 | 1,381 | ||||||
Parker Hannifin | 15,500 | 1,867 | ||||||
Pentair | 18,346 | 1,175 | ||||||
Pitney Bowes | 18,800 | 411 | ||||||
Precision Castparts | 14,600 | 3,090 | ||||||
Quanta Services * | 20,300 | 595 | ||||||
Raytheon | 33,100 | 3,418 | ||||||
Republic Services, Cl A | 24,900 | 1,003 | ||||||
Robert Half International | 14,100 | 795 | ||||||
Rockwell Automation | 14,200 | 1,745 | ||||||
Rockwell Collins | 14,500 | 1,380 | ||||||
Roper Industries | 10,400 | 1,820 | ||||||
Ryder System | 6,200 | 568 | ||||||
Snap-on | 6,400 | 994 | ||||||
Southwest Airlines | 70,700 | 2,619 | ||||||
Stanley Black & Decker | 16,400 | 1,680 | ||||||
Stericycle * | 9,000 | 1,236 | ||||||
Textron | 29,800 | 1,348 | ||||||
Tyco International | 43,400 | 1,751 | ||||||
Union Pacific | 93,700 | 9,455 | ||||||
United Parcel Service, Cl B | 74,000 | 7,342 | ||||||
United Rentals * | 10,800 | 960 | ||||||
United Technologies | 87,800 | 10,288 | ||||||
Waste Management | 44,100 | 2,189 | ||||||
WW Grainger | 6,200 | 1,490 | ||||||
Xylem | 19,000 | 695 | ||||||
|
| |||||||
| 200,125 | ||||||||
|
| |||||||
| 3 | SEI Institutional Investments Trust / Annual Report / May 31, 2015 |
CONSOLIDATED SCHEDULE OF INVESTMENTS
Dynamic Asset Allocation Fund
May 31, 2015
| Description | Shares | Market Value ($ Thousands) | ||||||
Information Technology — 19.9% |
| |||||||
Accenture, Cl A | 67,000 | $ | 6,435 | |||||
Adobe Systems * | 49,500 | 3,915 | ||||||
Akamai Technologies * | 18,600 | 1,419 | ||||||
Alliance Data Systems * | 6,600 | 1,967 | ||||||
Altera | 32,000 | 1,563 | ||||||
Amphenol, Cl A | 32,900 | 1,877 | ||||||
Analog Devices | 32,200 | 2,188 | ||||||
Apple | 615,000 | 80,122 | ||||||
Applied Materials | 127,800 | 2,573 | ||||||
Autodesk * | 24,000 | 1,300 | ||||||
Automatic Data Processing | 50,900 | 4,352 | ||||||
Avago Technologies, Cl A | 26,700 | 3,953 | ||||||
Broadcom, Cl A | 58,700 | 3,337 | ||||||
CA | 34,300 | 1,044 | ||||||
Cisco Systems | 540,900 | 15,854 | ||||||
Citrix Systems * | 16,600 | 1,079 | ||||||
Cognizant Technology Solutions, Cl A * | 63,400 | 4,103 | ||||||
Computer Sciences | 15,500 | 1,063 | ||||||
Corning | 131,300 | 2,747 | ||||||
eBay * | 117,300 | 7,197 | ||||||
Electronic Arts * | 32,200 | 2,021 | ||||||
EMC | 212,300 | 5,592 | ||||||
Equinix ‡ | 5,800 | 1,555 | ||||||
F5 Networks * | 7,500 | 942 | ||||||
Facebook, Cl A * | 222,300 | 17,604 | ||||||
Fidelity National Information Services | 29,900 | 1,875 | ||||||
First Solar * | 7,800 | 388 | ||||||
Fiserv * | 25,300 | 2,028 | ||||||
FLIR Systems | 13,200 | 403 | ||||||
Google, Cl A * | 30,245 | 16,493 | ||||||
Google, Cl C * | 30,422 | 16,188 | ||||||
Harris | 13,900 | 1,101 | ||||||
Hewlett-Packard | 193,800 | 6,473 | ||||||
Intel | 501,700 | 17,289 | ||||||
International Business Machines | 97,358 | 16,517 | ||||||
Intuit | 29,400 | 3,062 | ||||||
Juniper Networks | 36,000 | 1,001 | ||||||
Kla-Tencor | 16,900 | 1,008 | ||||||
Lam Research | 16,587 | 1,364 | ||||||
Linear Technology | 24,900 | 1,192 | ||||||
MasterCard, Cl A | 103,700 | 9,567 | ||||||
Microchip Technology | 22,300 | 1,096 | ||||||
Micron Technology * | 111,800 | 3,123 | ||||||
Microsoft | 866,900 | 40,623 | ||||||
Motorola Solutions | 21,000 | 1,239 | ||||||
NetApp | 32,400 | 1,082 | ||||||
Nvidia | 51,800 | 1,146 | ||||||
Oracle | 339,800 | 14,778 | ||||||
Paychex | 34,200 | 1,690 | ||||||
Qualcomm | 175,000 | 12,194 | ||||||
Red Hat * | 19,900 | 1,538 | ||||||
salesforce.com inc * | 64,800 | 4,714 | ||||||
SanDisk | 21,800 | 1,491 | ||||||
Seagate Technology | 33,900 | 1,886 | ||||||
Skyworks Solutions | 19,800 | 2,165 | ||||||
Symantec | 71,400 | 1,758 | ||||||
TE Connectivity | 41,900 | 2,891 | ||||||
Teradata * | 14,700 | 573 | ||||||
Texas Instruments | 111,700 | 6,246 | ||||||
Total System Services | 17,600 | 725 | ||||||
VeriSign * | 12,600 | 796 | ||||||
Visa, Cl A | 205,600 | 14,121 | ||||||
Western Digital | 22,600 | 2,200 | ||||||
| Description | Shares | Market Value ($ Thousands) | ||||||
Western Union | 56,700 | $ | 1,245 | |||||
Xerox | 108,700 | 1,241 | ||||||
Xilinx | 27,200 | 1,290 | ||||||
Yahoo! * | 93,400 | 4,010 | ||||||
|
| |||||||
| 397,612 | ||||||||
|
| |||||||
Materials — 3.2% |
| |||||||
Air Products & Chemicals | 20,300 | 2,979 | ||||||
Airgas | 7,000 | 714 | ||||||
Alcoa | 127,100 | 1,589 | ||||||
Allegheny Technologies | 10,100 | 328 | ||||||
Avery Dennison | 8,900 | 551 | ||||||
Ball | 15,000 | 1,065 | ||||||
CF Industries Holdings | 5,000 | 1,579 | ||||||
Dow Chemical | 116,100 | 6,045 | ||||||
E.I. du Pont de Nemours | 96,500 | 6,852 | ||||||
Eastman Chemical | 16,100 | 1,236 | ||||||
Ecolab | 29,000 | 3,325 | ||||||
FMC | 13,900 | 795 | ||||||
Freeport-McMoRan, Cl B | 110,000 | 2,162 | ||||||
International Flavors & Fragrances | 8,800 | 1,048 | ||||||
International Paper | 44,800 | 2,322 | ||||||
LyondellBasell Industries, Cl A | 41,400 | 4,186 | ||||||
Martin Marietta Materials | 6,900 | 1,028 | ||||||
MeadWestvaco | 18,900 | 955 | ||||||
Monsanto | 51,600 | 6,036 | ||||||
Mosaic | 33,100 | 1,518 | ||||||
Newmont Mining | 52,800 | 1,438 | ||||||
Nucor | 33,000 | 1,561 | ||||||
Owens-Illinois * | 17,100 | 409 | ||||||
PPG Industries | 14,700 | 3,365 | ||||||
Praxair | 30,064 | 3,694 | ||||||
Sealed Air | 21,900 | 1,066 | ||||||
Sherwin-Williams | 8,375 | 2,413 | ||||||
Sigma-Aldrich | 12,700 | 1,769 | ||||||
Vulcan Materials | 14,100 | 1,268 | ||||||
|
| |||||||
| 63,296 | ||||||||
|
| |||||||
Telecommunication Services — 2.3% |
| |||||||
AT&T | 549,500 | 18,980 | ||||||
CenturyLink | 59,100 | 1,964 | ||||||
Frontier Communications | 104,200 | 537 | ||||||
Level 3 Communications * | 30,900 | 1,714 | ||||||
Verizon Communications | 439,800 | 21,744 | ||||||
|
| |||||||
| 44,939 | ||||||||
|
| |||||||
Utilities — 2.9% |
| |||||||
AES | 67,200 | 914 | ||||||
AGL Resources | 12,400 | 624 | ||||||
Ameren | 26,400 | 1,062 | ||||||
American Electric Power | 52,900 | 2,978 | ||||||
Centerpoint Energy | 42,100 | 857 | ||||||
CMS Energy | 30,100 | 1,028 | ||||||
Consolidated Edison | 30,400 | 1,880 | ||||||
Dominion Resources | 61,200 | 4,316 | ||||||
DTE Energy | 18,400 | 1,458 | ||||||
Duke Energy | 75,530 | 5,720 | ||||||
Edison International | 33,500 | 2,037 | ||||||
Entergy | 18,800 | 1,438 | ||||||
Eversource Energy | 33,100 | 1,630 | ||||||
Exelon | 92,700 | 3,136 | ||||||
FirstEnergy | 44,000 | 1,570 | ||||||
Integrys Energy Group | 8,300 | 597 | ||||||
NextEra Energy | 46,100 | 4,718 | ||||||
NiSource | 33,000 | 1,557 | ||||||
NRG Energy | 35,100 | 884 | ||||||
Pepco Holdings | 26,300 | 717 | ||||||
| 4 | SEI Institutional Investments Trust / Annual Report / May 31, 2015 |
CONSOLIDATED SCHEDULE OF INVESTMENTS
Dynamic Asset Allocation Fund
May 31, 2015
| Description | Shares/Face Amount ($ Thousands)/Contracts | Market Value ($ Thousands) | ||||||
PG&E | 48,800 | $ | 2,609 | |||||
Pinnacle West Capital | 11,500 | 700 | ||||||
PPL | 69,400 | 2,409 | ||||||
Public Service Enterprise Group | 52,100 | 2,221 | ||||||
SCANA | 14,300 | 760 | ||||||
Sempra Energy | 24,400 | 2,622 | ||||||
Southern | 94,900 | 4,146 | ||||||
TECO Energy | 27,100 | 511 | ||||||
Wisconsin Energy | 24,500 | 1,183 | ||||||
Xcel Energy | 52,700 | 1,794 | ||||||
|
| |||||||
| 58,076 | ||||||||
|
| |||||||
Total Common Stock | 1,966,674 | |||||||
|
| |||||||
| Number Of Rights | ||||||||
RIGHTS — 0.0% | ||||||||
Safeway - PDC ‡‡ | 21,800 | 1 | ||||||
Safeway CVR - Casa Ley ‡‡ | 21,800 | 22 | ||||||
|
| |||||||
Total Rights | 23 | |||||||
|
| |||||||
EXCHANGE TRADED FUND — 0.4% | ||||||||
SPDR S&P 500 ETF Trust | 33,281 | 7,026 | ||||||
|
| |||||||
Total Exchange Traded Fund | 7,026 | |||||||
|
| |||||||
TIME DEPOSITS — 0.7% | ||||||||
Brown Brothers Harriman | ||||||||
0.030%, 06/01/2015 | $ | 13,980 | 13,980 | |||||
(0.211)%, 06/01/2015 EUR | 562 | 617 | ||||||
|
| |||||||
Total Time Deposits | 14,597 | |||||||
|
| |||||||
Total Investments — 99.7% | $ | 1,988,320 | ||||||
|
| |||||||
PURCHASED OPTION — 0.0% | ||||||||
July 2015, Euro-Bund Call, Expires 06/20/2015, Strike Price: $159 * | 2,400 | $ | 210 | |||||
|
| |||||||
Total Purchased Option | $ | 210 | ||||||
|
| |||||||
A list of the open futures contracts held by the Fund at May 31, 2015, is as follows:
| Type of Contract | Number of Contracts Long (Short) | Expiration Date | Unrealized Appreciation (Depreciation) ($ Thousands) | |||||||||
S&P 500 Index E-MINI | (1,879 | ) | Jun-2015 | $ | (5,194 | ) | ||||||
Topix Index | 1,486 | Jun-2015 | 16,973 | |||||||||
|
| |||||||||||
| $ | 11,779 | |||||||||||
|
| |||||||||||
For the year ended May 31, 2015, the total amount of all open futures contracts, as presented in the table above, are representative of the volume of activity for this derivative type during the year.
A list of the open forward foreign currency contracts held by the Fund at May 31, 2015, is as follows:
| Settlement Date | Currency to Deliver (Thousands) | Currency to Receive (Thousands) | Unrealized (Depreciation) ($ Thousands) | |||||||||||||||||
7/22/15 | EUR | 177,563 | USD | 189,862 | $ | (4,918 | ) | |||||||||||||
7/22/15 | GBP | 65,655 | USD | 97,971 | (2,160 | ) | ||||||||||||||
7/22/15 | INR | 6,173,090 | USD | 95,146 | (504 | ) | ||||||||||||||
7/22/15 | USD | 93,765 | EUR | 87,019 | 1,692 | |||||||||||||||
7/22/15 | USD | 103,263 | GBP | 65,655 | (3,132 | ) | ||||||||||||||
7/22/15 | USD | 196,858 | INR | 12,482,812 | (3,442 | ) | ||||||||||||||
|
| |||||||||||||||||||
| $ | (12,464 | ) | ||||||||||||||||||
|
| |||||||||||||||||||
A list of the counterparties for the open forward foreign currency contracts held by the Fund at May 31, 2015, is as follows:
| Counterparty | Currency to Deliver ($ Thousands) | Currency to Receive ($ Thousands) | Unrealized Appreciation (Depreciation) ($ Thousands) | |||||||||
Bank of America | $ | (485,440 | ) | $ | 481,082 | $ | (4,358 | ) | ||||
Deutsche Bank | (96,050 | ) | 93,584 | (2,466 | ) | |||||||
Societe Generale | (106,790 | ) | 103,602 | (3,188 | ) | |||||||
Standard Bank | (118 | ) | 121 | 3 | ||||||||
UBS | (96,050 | ) | 93,595 | (2,455 | ) | |||||||
|
| |||||||||||
| $ | (12,464 | ) | ||||||||||
|
| |||||||||||
For the year ended May 31, 2015, the total amount of all open forward foreign currency contracts, as presented in the table above, is representative of the volume of activity for this derivative type during the year.
Percentages are based on a Net Assets of $1,993,576 ($ Thousands).
| * | Non-income producing security. |
| ‡ | Real Estate Investment Trust. |
| ‡‡ | Expiration date is unavailable. |
Cl — Class
EUR — Euro
GBP — British Pound Sterling
INR — Indian Rupee
S&P — Standard & Poor’s
SPDR — Standard & Poor’s Depositary Receipts
USD — U.S. Dollar
The following is a list of the level of inputs used as of May 31, 2015, in valuing the Fund’s investments and other financial instruments carried at value ($ Thousands):
| Investments in Securities | Level 1 | Level 2 | Level 3 | Total | ||||||||||||
Common Stock | $ | 1,966,674 | $ | — | $ | — | $ | 1,966,674 | ||||||||
Rights | 23 | — | — | 23 | ||||||||||||
Exchange Traded Fund | 7,026 | — | — | 7,026 | ||||||||||||
Time Deposits | — | 14,597 | — | 14,597 | ||||||||||||
|
|
|
|
|
|
|
| |||||||||
Total Investments in Securities | $ | 1,973,723 | $ | 14,597 | $ | — | $ | 1,988,320 | ||||||||
|
|
|
|
|
|
|
| |||||||||
| Other Financial Instruments | Level 1 | Level 2 | Level 3 | Total | ||||||||||||
Purchased Option | $ | — | $ | 210 | $ | — | $ | 210 | ||||||||
Futures Contracts * | ||||||||||||||||
Unrealized Appreciation | 16,973 | — | — | 16,973 | ||||||||||||
Unrealized Depreciation | (5,194 | ) | — | — | (5,194 | ) | ||||||||||
Forwards Contracts * | ||||||||||||||||
Unrealized Appreciation | — | 1,692 | — | 1,692 | ||||||||||||
Unrealized Depreciation | — | (14,156 | ) | — | (14,156 | ) | ||||||||||
|
|
|
|
|
|
|
| |||||||||
Total Other Financial Instruments | $ | 11,779 | $ | (12,254 | ) | $ | — | $ | (475 | ) | ||||||
|
|
|
|
|
|
|
| |||||||||
| * | Futures contracts and forwards contracts are valued at the unrealized appreciation (depreciation) on the instrument. |
For the year ended May 31, 2015, there were no transfers between Level 1 and Level 2 assets and liabilities.
| 5 | SEI Institutional Investments Trust / Annual Report / May 31, 2015 |
CONSOLIDATED SCHEDULE OF INVESTMENTS
Dynamic Asset Allocation Fund
May 31, 2015
For the year ended May 31, 2015, there were no transfers between Level 2 and Level 3 assets and liabilities.
For more information on valuation inputs, see Note 2 — Significant Accounting Policies in Notes to Financial Statements.
Amounts designated as “—” are $0 or have been rounded to $0.
| 6 | SEI Institutional Investments Trust / Annual Report / May 31, 2015 |
Report of Independent Registered Public Accounting Firm
The Board of Trustees and Shareholders
SEI Institutional Investments Trust:
We have audited the accompanying statements of assets and liabilities, including the summary schedules of investments, of the Large Cap Fund, Large Cap Diversified Alpha Fund, Large Cap Disciplined Equity Fund, Large Cap Index Fund, S&P 500 Index Fund, Extended Market Index Fund, Small Cap Fund, Small Cap II Fund, Small/Mid Cap Equity Fund, U.S. Managed Volatility Fund, World Equity Ex-US Fund, Screened World Equity Ex-US Fund and Emerging Markets Equity Fund, and the accompanying statements of assets and liabilities, including the schedules of investments, of the Opportunistic Income Fund, Core Fixed Income Fund, High Yield Bond Fund, Long Duration Fund, Long Duration Credit Fund (formerly, Long Duration Corporate Bond Fund), Ultra Short Duration Bond Fund, Emerging Markets Debt Fund, Real Return Fund, Limited Duration Bond Fund and Intermediate Duration Credit Fund (twenty-three of the twenty-five funds comprising the SEI Institutional Investments Trust (the Trust)), as of May 31, 2015, and the related statements of operations for the year or period then ended, the statements of changes in net assets for each of the years or periods in the two-year period then ended, and the financial highlights for each of the years or periods in the five-year period then ended. We have also audited the accompanying consolidated statement of assets and liabilities, including the consolidated summary schedule of investments of the Dynamic Asset Allocation Fund and the consolidated statement of assets and liabilities, including the consolidated schedule of investments, of the Multi-Asset Real Return Fund (two of the twenty-five funds comprising the Trust), as of May 31, 2015, and the related consolidated statements of operations for the year then ended, the consolidated statements of changes in net assets for each of the years in the two-year period then ended, the consolidated statement of cash flows for the year then ended for the Multi-Asset Real Return Fund, and the consolidated financial highlights for each of the years or periods in the five-year period then ended. The financial statements and consolidated financial statements and financial highlights and consolidated financial highlights, are included in Item 1 of this Form N-CSR and the schedules of investments in securities of the Large Cap Fund, Large Cap Diversified Alpha Fund, Large Cap Disciplined Equity Fund, Large Cap Index Fund, S&P 500 Index Fund, Extended Market Index Fund, Small Cap Fund, Small Cap II Fund, Small/Mid Cap Equity Fund, U.S. Managed Volatility Fund, World Equity Ex-US Fund, Screened World Equity Ex-US Fund and Emerging Markets Equity Fund and the consolidated schedule of investments in securities of the Dynamic Asset Allocation Fund, as of May 31, 2015 are included in Item 6 of this Form N-CSR. These financial statements and consolidated financial statements and financial highlights and consolidated financial highlights and the schedules of investments in securities and consolidated schedules of investments in securities are the responsibility of the Trust’s management. Our responsibility is to express an opinion on these financial statements, consolidated financial statements, financial highlights, consolidated financial highlights and schedules of investments in securities and consolidated schedules of investments in securities based on our audits.
We conducted our audits in accordance with the standards of the Public Company Accounting Oversight Board (United States). Those standards require that we plan and perform the audits to obtain reasonable assurance about whether the financial statements and financial highlights are free of material misstatement. An audit includes examining, on a test basis, evidence supporting the amounts and disclosures in the financial statements. Our procedures included confirmation of securities owned as of May 31, 2015, by correspondence with custodians and brokers or other appropriate auditing procedures. An audit also includes assessing the accounting principles used and significant estimates made by management, as well as evaluating the overall financial statement presentation. We believe that our audits provide a reasonable basis for our opinion.
In our opinion, the financial statements and consolidated financial statements and financial highlights and consolidated financial highlights and schedules of investments in securities and consolidated schedules of investments in securities referred to above present fairly, in all material respects, the financial position of each of the funds comprising the SEI Institutional Investments Trust as of May 31, 2015, the results of their operations, the changes in their net assets, their cash flows, and the financial highlights for each of the years or periods described in the first paragraph, in conformity with U.S. generally accepted accounting principles.
/s/ KPMG LLP
Philadelphia, Pennsylvania
July 30, 2015
(b) In accordance with Section 13(c) of the Investment Company Act of 1940 the Screened World Equity Ex-US Fund did not hold any divested securities during the fiscal year ended May 31, 2015.
| Item 7. | Disclosure of Proxy Voting Policies and Procedures for Closed-End Management Investment Companies. |
Not applicable.
| Item 8. | Portfolio Managers of Closed-End Management Investment Companies |
Not applicable.
| Item 9. | Purchases of Equity Securities by Closed-End Management Company and Affiliated Purchasers. |
Not applicable.
| Item 10. | Submission of Matters to a Vote of Security Holders. |
The Registrant has a standing Governance Committee (the “Committee”) currently consisting of the Independent Trustees. The Committee is responsible for evaluating and recommending nominees for election to the Registrant’s Board of Trustees (the “Board”). Pursuant to the Committee’s Charter, adopted on June 18, 2004, as amended, the Committee will review all shareholder recommendations for nominations to fill vacancies on the Board if such recommendations are submitted in writing and addressed to the Committee at the Registrant’s office.
| Item 11. | Controls and Procedures. |
(a) The Registrant’s principal executive and principal financial officers, or persons performing similar functions, have concluded that the Registrant’s disclosure controls and procedures (as defined in Rule 30a-3(c) under the Investment Company Act of 1940 (the “1940 Act”)) are effective, based on the evaluation of these controls and procedures required by Rule 30a-3(b) under the 1940 Act and Rules 13a-15(b) or 15d-15(b) under the Securities Exchange Act of 1934 as of a date within 90 days of the filing date of this report.
(b) There were no changes in the Registrant’s internal control over financial reporting (as defined in Rule 30a-3(d) under the 1940 Act) that occurred during the second fiscal quarter of the period covered by this report that have materially affected, or are reasonably likely to materially affect, the Registrant’s internal control over financial reporting.
| Items 12. | Exhibits. |
(a)(1) Code of Ethics attached hereto.
(a)(2) A separate certification for the principal executive officer and the principal financial officer of the Registrant as required by Rule 30a-2(a) under the Investment Company Act of 1940, as amended (17 CFR 270.30a-2(a)), are filed herewith.
(b) Officer certifications as required by Rule 30a-2(b) under the Investment Company Act of 1940, as amended (17 CFR 270.30a-2(b)) also accompany this filing as an exhibit.
SIGNATURES
Pursuant to the requirements of the Securities Exchange Act of 1934 and the Investment Company Act of 1940, the Registrant has duly caused this report to be signed on its behalf by the undersigned, thereunto duly authorized.
| SEI Institutional Investments Trust | ||||||
| By | /s/ Robert A. Nesher | |||||
| Robert A. Nesher | ||||||
| President & CEO | ||||||
Date: August 7, 2015
Pursuant to the requirements of the Securities Exchange Act of 1934 and the Investment Company Act of 1940, this report has been signed below by the following persons on behalf of the Registrant and in the capacities and on the dates indicated.
| By | /s/ Robert A. Nesher | |||||
| Robert A. Nesher | ||||||
| President & CEO |
Date: August 7, 2015
| By | /s/ Arthur Ramanjulu | |||||
| Arthur Ramanjulu | ||||||
| Controller & CFO |
Date: August 7, 2015